UNITED STATES
SECURITIES AND EXCHANGE COMMISSION
Washington, D.C. 20549
FORMN-CSR
CERTIFIED SHAREHOLDER REPORT OF REGISTERED MANAGEMENT
INVESTMENT COMPANIES
Investment Company Act file number 811-07705
Virtus Asset Trust
(Exact name of registrant as specified in charter)
101 Munson Street
Greenfield, MA 01301-9668
(Address of principal executive offices) (Zip code)
Kevin J. Carr, Esq.
Senior Vice President, Chief Legal Officer, Counsel and Secretary for Registrant
One Financial Plaza
Hartford, CT 06103-4506
(Name and address of agent for service)
Registrant’s telephone number, including area code: (800)243-1574
Date of fiscal year end: December 31
Date of reporting period: December 31, 2018
FormN-CSR is to be used by management investment companies to file reports with the Commission not later than 10 days after the transmission to stockholders of any report that is required to be transmitted to stockholders under Rule30e-1 under the Investment Company Act of 1940 (17 CFR270.30e-1). The Commission may use the information provided on FormN-CSR in its regulatory, disclosure review, inspection, and policymaking roles.
A registrant is required to disclose the information specified by FormN-CSR, and the Commission will make this information public. A registrant is not required to respond to the collection of information contained in FormN-CSR unless the Form displays a currently valid Office of Management and Budget (“OMB”) control number. Please direct comments concerning the accuracy of the information collection burden estimate and any suggestions for reducing the burden to Secretary, Securities and Exchange Commission, 450 Fifth Street, NW, Washington, DC 20549-0609. The OMB has reviewed this collection of information under the clearance requirements of 44 U.S.C. § 3507.
Item 1. Reports to Stockholders.
The Report to Shareholders is attached herewith.

| Virtus Seix Core Bond Fund |
| Virtus Seix Corporate Bond Fund |
| Virtus Seix Floating Rate High Income Fund |
| Virtus Seix Georgia Tax-Exempt Bond Fund* |
| Virtus Seix High Grade Municipal Bond Fund* |
| Virtus Seix High Income Fund |
| Virtus Seix High Yield Fund |
| Virtus Seix Investment Grade Tax-Exempt Bond Fund* |
| Virtus Seix North Carolina Tax-Exempt Bond Fund* |
| Virtus Seix Short-Term Bond Fund |
| Virtus Seix Short-Term Municipal Bond Fund |
| Virtus Seix Total Return Bond Fund |
| Virtus Seix U.S. Government Securities Ultra-Short Bond Fund |
| Virtus Seix U.S. Mortgage Fund |
| Virtus Seix Ultra-Short Bond Fund |
| Virtus Seix Virginia Intermediate Municipal Bond Fund* |
Message to Shareholders | 1 | |
Disclosure of Fund Expenses | 2 | |
Key Investment Terms | 6 | |
| Fund | Fund Summary | Schedule of Investments |
Virtus Seix Core Bond Fund (“Seix Core Bond Fund”) | 9 | 52 |
Virtus Seix Corporate Bond Fund (“Seix Corporate Bond Fund”) | 12 | 55 |
Virtus Seix Floating Rate High Income Fund (“Seix Floating Rate High Income Fund”) | 15 | 58 |
Virtus Seix Georgia Tax-Exempt Bond Fund (“Seix Georgia Tax-Exempt Bond Fund”) | 17 | 71 |
Virtus Seix High Grade Municipal Bond Fund (“Seix High Grade Municipal Bond Fund”) | 20 | 73 |
Virtus Seix High Income Fund (“Seix High Income Fund”) | 22 | 75 |
Virtus Seix High Yield Fund (“Seix High Yield Fund”) | 24 | 81 |
Virtus Seix Investment Grade Tax-Exempt Bond Fund (“Seix Investment Grade Tax-Exempt Bond Fund”) | 26 | 87 |
Virtus Seix North Carolina Tax-Exempt Bond Fund (“Seix North Carolina Tax-Exempt Bond Fund”) | 28 | 90 |
Virtus Seix Short-Term Bond Fund (“Seix Short-Term Bond Fund”) | 31 | 92 |
Virtus Seix Short-Term Municipal Bond Fund (“Seix Short-Term Municipal Bond Fund”) | 34 | 94 |
Virtus Seix Total Return Bond Fund (“Seix Total Return Bond Fund”) | 37 | 96 |
Virtus Seix U.S. Government Securities Ultra-Short Bond Fund (“Seix U.S. Government Securities Ultra-Short Bond Fund”) | 40 | 100 |
Virtus Seix U.S. Mortgage Fund (“Seix U.S. Mortgage Fund”) | 43 | 104 |
Virtus Seix Ultra-Short Bond Fund (“Seix Ultra-Short Bond Fund”) | 46 | 106 |
Virtus Seix Virginia Intermediate Municipal Bond Fund (“Seix Virginia Intermediate Municipal Bond Fund”) | 49 | 109 |
Statements of Assets and Liabilities | 111 | |
Statements of Operations | 120 | |
Statements of Changes in Net Assets | 128 | |
Financial Highlights | 141 | |
Notes to Financial Statements | 150 | |
Report of Independent Registered Public Accounting Firm | 179 | |
Tax Information Notice | 180 | |
Consideration of Advisory and Subadvisory Agreements by the Board of Trustees | 181 | |
Fund Management Tables | 187 | |


President, Virtus Mutual Funds
| Beginning Account Value July 1, 2018 | Ending Account value December 31, 2018 | Annualized Expense Ratio | Expenses Paid During Period* | |||||
Seix Core Bond Fund | ||||||||
| Class A | $ 1,000.00 | $ 1,016.00 | 0.64 % | $ 3.25 | ||||
| Class I | 1,000.00 | 1,015.80 | 0.50 | 2.54 | ||||
| Class R | 1,000.00 | 1,014.70 | 0.91 | 4.62 | ||||
| Class R6 | 1,000.00 | 1,016.30 | 0.36 | 1.83 | ||||
Seix Corporate Bond Fund | ||||||||
| Class A | 1,000.00 | 998.70 | 0.95 | 4.79 | ||||
| Class C | 1,000.00 | 995.10 | 1.65 | 8.30 | ||||
| Class I | 1,000.00 | 999.80 | 0.70 | 3.53 | ||||
Seix Floating Rate High Income Fund | ||||||||
| Class A | 1,000.00 | 982.20 | 0.94 | 4.70 | ||||
| Class C | 1,000.00 | 979.30 | 1.52 | 7.58 | ||||
| Class I | 1,000.00 | 983.80 | 0.62 | 3.10 | ||||
| Class R6 | 1,000.00 | 983.10 | 0.52 | 2.60 | ||||
Seix Georgia Tax-Exempt Bond Fund | ||||||||
| Class A | 1,000.00 | 1,009.70 | 0.75 | 3.80 | ||||
| Class I | 1,000.00 | 1,010.20 | 0.65 | 3.29 | ||||
Seix High Grade Municipal Bond Fund | ||||||||
| Class A | 1,000.00 | 1,012.60 | 0.79 | 4.01 | ||||
| Class I | 1,000.00 | 1,013.40 | 0.65 | 3.30 | ||||
Seix High Income Fund | ||||||||
| Class A | 1,000.00 | 961.00 | 1.03 | 5.09 | ||||
| Class I | 1,000.00 | 962.00 | 0.80 | 3.96 | ||||
| Class R | 1,000.00 | 960.10 | 1.22 | 6.03 | ||||
| Class R6 | 1,000.00 | 962.80 | 0.64 | 3.17 | ||||
Seix High Yield Fund | ||||||||
| Class A | 1,000.00 | 980.50 | 0.82 | 4.09 | ||||
| Class I | 1,000.00 | 981.40 | 0.64 | 3.20 | ||||
| Class R | 1,000.00 | 979.40 | 1.04 | 5.19 | ||||
| Class R6 | 1,000.00 | 980.70 | 0.53 | 2.65 | ||||
Seix Investment Grade Tax-Exempt Bond Fund | ||||||||
| Class A | 1,000.00 | 1,012.10 | 0.79 | 4.01 | ||||
| Class I | 1,000.00 | 1,012.00 | 0.64 | 3.25 | ||||
Seix North Carolina Tax-Exempt Bond Fund | ||||||||
| Class A | 1,000.00 | 1,010.10 | 0.80 | 4.05 | ||||
| Class I | 1,000.00 | 1,010.80 | 0.65 | 3.29 |
| Beginning Account Value July 1, 2018 | Ending Account value December 31, 2018 | Annualized Expense Ratio | Expenses Paid During Period* | |||||
Seix Short-Term Bond Fund | ||||||||
| Class A | $1,000.00 | $1,011.50 | 0.80% | $4.06 | ||||
| Class C | 1,000.00 | 1,008.70 | 1.57 | 7.95 | ||||
| Class I | 1,000.00 | 1,012.50 | 0.60 | 3.04 | ||||
Seix Short-Term Municipal Bond Fund | ||||||||
| Class A | 1,000.00 | 1,009.50 | 0.65 | 3.29 | ||||
| Class I | 1,000.00 | 1,010.40 | 0.48 | 2.43 | ||||
Seix Total Return Bond Fund | ||||||||
| Class A | 1,000.00 | 1,013.60 | 0.70 | 3.55 | ||||
| Class I | 1,000.00 | 1,014.00 | 0.46 | 2.34 | ||||
| Class R | 1,000.00 | 1,011.80 | 0.89 | 4.51 | ||||
| Class R6 | 1,000.00 | 1,014.80 | 0.31 | 1.57 | ||||
Seix U.S. Government Securities Ultra-Short Bond Fund | ||||||||
| Class A** | 1,000.00 | 1,007.90 | 0.63 | 2.76 | ||||
| Class I | 1,000.00 | 1,010.10 | 0.41 | 2.08 | ||||
| Class R6 | 1,000.00 | 1,009.90 | 0.26 | 1.32 | ||||
Seix U.S. Mortgage Fund | ||||||||
| Class A | 1,000.00 | 1,015.90 | 0.90 | 4.57 | ||||
| Class C | 1,000.00 | 1,012.00 | 1.65 | 8.37 | ||||
| Class I | 1,000.00 | 1,016.90 | 0.70 | 3.56 | ||||
Seix Ultra-Short Bond Fund | ||||||||
| Class A** | 1,000.00 | 1,004.80 | 0.65 | 2.86 | ||||
| Class I | 1,000.00 | 1,007.30 | 0.40 | 2.02 | ||||
Seix Virginia Intermediate Municipal Bond Fund | ||||||||
| Class A | 1,000.00 | 1,011.90 | 0.79 | 4.01 | ||||
| Class I | 1,000.00 | 1,012.60 | 0.65 | 3.30 |
| * | Expenses are equal to the relevant Fund’s annualized expense ratio, which is net of waived fees and reimbursed expenses, if applicable, multiplied by the average account value over the period, multiplied by the number of days (184) expenses were accrued in the most recent fiscal half-year, then divided by 365 to reflect the one-half year period. |
| ** | July 23, 2018, is the date the Class started accruing expenses. Expenses are equal to the Fund Class’s annualized expense ratio, which is net of waived fees and reimbursed expenses, if applicable, multiplied by the average account value over the period, multiplied by the number of days (159) expenses were accrued in the most recent fiscal half-year, then divided by 365 to reflect the one-half year period. |
| Beginning Account Value July 1, 2018 | Ending Account value December 31, 2018 | Annualized Expense Ratio | Expenses Paid During Period* | |||||
Seix Core Bond Fund | ||||||||
| Class A | $ 1,000.00 | $ 1,021.98 | 0.64 % | $ 3.26 | ||||
| Class I | 1,000.00 | 1,022.68 | 0.50 | 2.55 | ||||
| Class R | 1,000.00 | 1,020.62 | 0.91 | 4.63 | ||||
| Class R6 | 1,000.00 | 1,023.39 | 0.36 | 1.84 |
| Beginning Account Value July 1, 2018 | Ending Account value December 31, 2018 | Annualized Expense Ratio | Expenses Paid During Period* | |||||
Seix Corporate Bond Fund | ||||||||
| Class A | $1,000.00 | $1,020.42 | 0.95% | $4.84 | ||||
| Class C | 1,000.00 | 1,016.89 | 1.65 | 8.39 | ||||
| Class I | 1,000.00 | 1,021.68 | 0.70 | 3.57 | ||||
Seix Floating Rate High Income Fund | ||||||||
| Class A | 1,000.00 | 1,020.47 | 0.94 | 4.79 | ||||
| Class C | 1,000.00 | 1,017.54 | 1.52 | 7.73 | ||||
| Class I | 1,000.00 | 1,022.08 | 0.62 | 3.16 | ||||
| Class R6 | 1,000.00 | 1,022.58 | 0.52 | 2.65 | ||||
Seix Georgia Tax-Exempt Bond Fund | ||||||||
| Class A | 1,000.00 | 1,021.42 | 0.75 | 3.82 | ||||
| Class I | 1,000.00 | 1,021.93 | 0.65 | 3.31 | ||||
Seix High Grade Municipal Bond Fund | ||||||||
| Class A | 1,000.00 | 1,021.22 | 0.79 | 4.02 | ||||
| Class I | 1,000.00 | 1,021.93 | 0.65 | 3.31 | ||||
Seix High Income Fund | ||||||||
| Class A | 1,000.00 | 1,020.01 | 1.03 | 5.24 | ||||
| Class I | 1,000.00 | 1,021.17 | 0.80 | 4.08 | ||||
| Class R | 1,000.00 | 1,019.06 | 1.22 | 6.21 | ||||
| Class R6 | 1,000.00 | 1,021.98 | 0.64 | 3.26 | ||||
Seix High Yield Fund | ||||||||
| Class A | 1,000.00 | 1,021.07 | 0.82 | 4.18 | ||||
| Class I | 1,000.00 | 1,021.98 | 0.64 | 3.26 | ||||
| Class R | 1,000.00 | 1,019.96 | 1.04 | 5.30 | ||||
| Class R6 | 1,000.00 | 1,022.53 | 0.53 | 2.70 | ||||
Seix Investment Grade Tax-Exempt Bond Fund | ||||||||
| Class A | 1,000.00 | 1,021.22 | 0.79 | 4.02 | ||||
| Class I | 1,000.00 | 1,021.98 | 0.64 | 3.26 | ||||
Seix North Carolina Tax-Exempt Bond Fund | ||||||||
| Class A | 1,000.00 | 1,021.17 | 0.80 | 4.08 | ||||
| Class I | 1,000.00 | 1,021.93 | 0.65 | 3.31 | ||||
Seix Short-Term Bond Fund | ||||||||
| Class A | 1,000.00 | 1,021.17 | 0.80 | 4.08 | ||||
| Class C | 1,000.00 | 1,017.29 | 1.57 | 7.98 | ||||
| Class I | 1,000.00 | 1,022.18 | 0.60 | 3.06 | ||||
Seix Short-Term Municipal Bond Fund | ||||||||
| Class A | 1,000.00 | 1,021.93 | 0.65 | 3.31 | ||||
| Class I | 1,000.00 | 1,022.79 | 0.48 | 2.45 | ||||
Seix Total Return Bond Fund | ||||||||
| Class A | 1,000.00 | 1,021.68 | 0.70 | 3.57 | ||||
| Class I | 1,000.00 | 1,022.89 | 0.46 | 2.35 | ||||
| Class R | 1,000.00 | 1,020.72 | 0.89 | 4.53 | ||||
| Class R6 | 1,000.00 | 1,023.64 | 0.31 | 1.58 | ||||
Seix U.S. Government Securities Ultra-Short Bond Fund | ||||||||
| Class A | 1,000.00 | 1,022.03 | 0.63 | 3.21 | ||||
| Class I | 1,000.00 | 1,023.14 | 0.41 | 2.09 | ||||
| Class R6 | 1,000.00 | 1,023.89 | 0.26 | 1.33 | ||||
Seix U.S. Mortgage Fund | ||||||||
| Class A | 1,000.00 | 1,020.67 | 0.90 | 4.58 | ||||
| Class C | 1,000.00 | 1,016.89 | 1.65 | 8.39 | ||||
| Class I | 1,000.00 | 1,021.68 | 0.70 | 3.57 | ||||
Seix Ultra-Short Bond Fund | ||||||||
| Class A | 1,000.00 | 1,021.93 | 0.65 | 3.31 | ||||
| Class I | 1,000.00 | 1,023.19 | 0.40 | 2.04 |
| Beginning Account Value July 1, 2018 | Ending Account value December 31, 2018 | Annualized Expense Ratio | Expenses Paid During Period* | |||||
Seix Virginia Intermediate Municipal Bond Fund | ||||||||
| Class A | $1,000.00 | $1,021.22 | 0.79% | $4.02 | ||||
| Class I | 1,000.00 | 1,021.93 | 0.65 | 3.31 |
| * | Expenses are equal to the relevant Fund’s annualized expense ratio, which is net of waived fees and reimbursed expenses, if applicable, multiplied by the average account value over the period, multiplied by the number of days (184) expenses were accrued in the most recent fiscal half-year, then divided by 365 to reflect the one-half year period. |
| Ticker Symbols: | |
| Class A: STGIX | |
| Class I: STIGX | |
| Class R: SCIGX | |
| Class R6: STGZX |
| U.S. Government Securities | 57% | |
| Mortgage-Backed Securities | 26 | |
| Agency | 20% | |
| Non-Agency | 6 | |
| Corporate Bonds and Notes | 12 | |
| Financials | 5 | |
| Energy | 2 | |
| All other Corporate Bonds and Notes | 5 | |
| Asset-Backed Securities | 5 | |
| Credit Card | 4 | |
| Other | 1 | |
| Total | 100% |
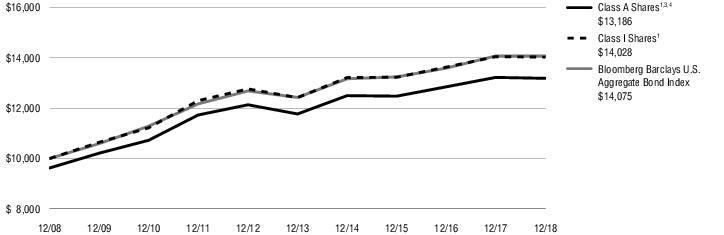
| 1 Year | 5 Years | 10 Years | Since inception | Inception date | ||||||||
| Class A Shares at NAV2 | -0.28% | 2.30% | 3.20% | —% | — | |||||||
| Class A Shares at POP3,4 | -4.02 | 1.52 | 2.80 | — | — | |||||||
| Class I Shares at NAV2 | -0.14 | 2.47 | 3.44 | — | — | |||||||
| Class R Shares at NAV2 | -0.54 | 2.05 | — | 2.64 | 7/31/09 | |||||||
| Class R6 Shares at NAV2 | -0.02 | — | — | 1.62 | 8/3/15 | |||||||
| Bloomberg Barclays U.S. Aggregate Bond Index | 0.01 | 2.52 | 3.48 | —5 | — | |||||||
| Fund Expense Ratios6: A Shares: Gross 0.89%, Net 0.64%; I Shares: Gross 0.62%, Net 0.50%; R Shares: Gross 1.09%, Net 0.91%; R6 Shares: Gross 0.47%, Net 0.36%. | ||||||||||||
| All returns represent past performance which is no guarantee of future results. Current performance may be higher or lower than the performance shown. The investment return and principal value of an investment will fluctuate so that an investor’s shares, when redeemed, may be worth more or less than their original cost. The above table and graph below do not reflect the deduction of taxes that a shareholder would pay on fund distributions or the redemption of shares. Please visit Virtus.com for performance data current to the most recent month-end. | |
| 1 | Total returns are historical and include changes in share price and the reinvestment of both dividends and capital gain distributions. |
| 2 | “NAV” (Net Asset Value) total returns do not include the effect of any sales charge. |
| 3 | “POP” (Public Offering Price) total returns include the effect of the maximum front-end 3.75% sales charge. |
| 4 | “CDSC” (contingent deferred sales charge) is applied to redemptions of certain classes of shares that do not have a sales charge applied at the time of purchase. CDSC charges for certain redemptions of Class A shares made within 18 months of a finder’s fee being paid and all Class C shares are 1% within the first year and 0% thereafter. |
| 5 | The index returned 3.31% since inception of Class R shares and 1.72% since inception of Class R6 shares. |
| 6 | The expense ratios of the Fund are set forth according to the prospectus for the Fund effective July 23, 2018, as supplemented and revised, and may differ from the expense ratios disclosed in the Financial Highlight tables in this report. See the Financial Highlights for more current expense ratios. Net Expense: Expenses reduced by a contractual fee waiver in effect through April 30, 2020. Gross Expense: Does not reflect the effect of the fee waiver. Expense ratios include fees and expenses associated with the underlying funds. |
| Ticker Symbols: | |
| Class A: SAINX | |
| Class C: STIFX | |
| Class I: STICX |
Securities:There is a greater level of credit risk and price volatility involved with high yield securities than investment grade securities.
| Corporate Bonds and Notes | 96% | |
| Financials | 22% | |
| Energy | 22 | |
| Industrials | 10 | |
| Consumer Discretionary | 7 | |
| Utilities | 7 | |
| Information Technology | 6 | |
| Health Care | 6 | |
| All other Corporate Bonds and Notes | 16 | |
| U.S. Government Security | 3 | |
| Short-Term Investment | 1 | |
| Total | 100% |
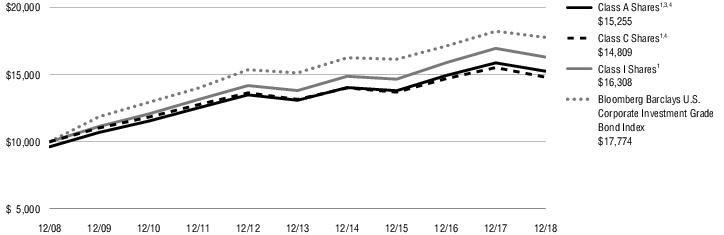
| 1 Year | 5 Years | 10 Years | ||||||
| Class A Shares at NAV2 | -3.90% | 3.11% | 4.71% | |||||
| Class A Shares at POP3,4 | -7.51 | 2.32 | 4.31 | |||||
| Class C Shares at NAV and with CDSC2,4 | -4.61 | 2.40 | 4.00 | |||||
| Class I Shares at NAV2 | -3.81 | 3.38 | 5.01 | |||||
| Bloomberg Barclays U.S. Corporate Investment Grade Bond Index | -2.51 | 3.28 | 5.92 | |||||
| Fund Expense Ratios5: A Shares: Gross 1.50%, Net 0.95%; C Shares: Gross 2.22%, Net 1.65%; I Shares: Gross 1.25%, Net 0.70%. | ||||||||
| All returns represent past performance which is no guarantee of future results. Current performance may be higher or lower than the performance shown. The investment return and principal value of an investment will fluctuate so that an investor’s shares, when redeemed, may be worth more or less than their original cost. The above table and graph below do not reflect the deduction of taxes that a shareholder would pay on fund distributions or the redemption of shares. Please visit Virtus.com for performance data current to the most recent month-end. | |
| 1 | Total returns are historical and include changes in share price and the reinvestment of both dividends and capital gain distributions. |
| 2 | “NAV” (Net Asset Value) total returns do not include the effect of any sales charge. |
| 3 | “POP” (Public Offering Price) total returns include the effect of the maximum front-end 3.75% sales charge. |
| 4 | “CDSC” (contingent deferred sales charge) is applied to redemptions of certain classes of shares that do not have a sales charge applied at the time of purchase. CDSC charges for certain redemptions of Class A shares made within 18 months of a finder’s fee being paid and all Class C shares are 1% within the first year and 0% thereafter. |
| 5 | The expense ratios of the Fund are set forth according to the prospectus for the Fund effective July 23, 2018, as supplemented and revised, and may differ from the expense ratios disclosed in the Financial Highlight tables in this report. See the Financial Highlights for more current expense ratios. Net Expense: Expenses reduced by a contractual fee waiver in effect through April 30, 2020. Gross Expense: Does not reflect the effect of the fee waiver. Expense ratios include fees and expenses associated with the underlying funds. |
| Ticker Symbols: | |
| Class A: SFRAX | |
| Class C: SFRCX | |
| Class I: SAMBX | |
| Class R6: SFRZX |
Securities:There is a greater level of credit risk and price volatility involved with high yield securities than investment grade securities.
| Leveraged Loans | 98% | |
| Media / Telecom - Cable/Wireless Video | 9% | |
| Healthcare | 8 | |
| Chemicals | 7 | |
| Information Technology | 7 | |
| Financial | 7 | |
| Service | 7 | |
| Media / Telecom - Diversified Media | 7 | |
| All other Leveraged Loans | 46 | |
| Corporate Bonds and Notes | 1 | |
| Common Stocks | 1 | |
| Total | 100% |
| 1 Year | 5 Years | 10 Years | Since inception | Inception date | ||||||||
| Class A Shares at NAV2 | -0.11% | 2.57% | 6.65% | —% | — | |||||||
| Class A Shares at POP3,4 | -2.85 | 2.00 | 6.35 | — | — | |||||||
| Class C Shares at NAV and with CDSC2,4 | -0.68 | 1.97 | 5.99 | — | — | |||||||
| Class I Shares at NAV2 | 0.22 | 2.88 | 6.98 | — | — | |||||||
| Class R6 Shares at NAV2 | 0.20 | — | — | 3.51 | 2/1/15 | |||||||
| Credit Suisse Leveraged Loan Index | 1.14 | 3.33 | 8.30 | 3.655 | — | |||||||
| Fund Expense Ratios6: A Shares: Gross 1.00%, Net 0.96%; C Shares: Gross 1.66%, Net 1.54%; I Shares: Gross 0.74%, Net 0.64%; R6 Shares: Gross 0.64%, Net 0.54%. | ||||||||||||
| All returns represent past performance which is no guarantee of future results. Current performance may be higher or lower than the performance shown. The investment return and principal value of an investment will fluctuate so that an investor’s shares, when redeemed, may be worth more or less than their original cost. The above table and graph below do not reflect the deduction of taxes that a shareholder would pay on fund distributions or the redemption of shares. Please visit Virtus.com for performance data current to the most recent month-end. | |
| 1 | Total returns are historical and include changes in share price and the reinvestment of both dividends and capital gain distributions. |
| 2 | “NAV” (Net Asset Value) total returns do not include the effect of any sales charge. |
| 3 | “POP” (Public Offering Price) total returns include the effect of the maximum front-end 2.75% sales charge. |
| 4 | “CDSC” (contingent deferred sales charge) is applied to redemptions of certain classes of shares that do not have a sales charge applied at the time of purchase. CDSC charges for certain redemptions of Class A shares made within 18 months of a finder’s fee being paid and all Class C shares are 1% within the first year and 0% thereafter. |
| 5 | The since inception index return is from the inception date of Class R6 shares. |
| 6 | The expense ratios of the Fund are set forth according to the prospectus for the Fund effective July 23, 2018, as supplemented and revised, and may differ from the expense ratios disclosed in the Financial Highlight tables in this report. See the Financial Highlights for more current expense ratios. Net Expense: Expenses reduced by a contractual fee waiver in effect through April 30, 2020. Gross Expense: Does not reflect the effect of the fee waiver. Expense ratios include fees and expenses associated with the underlying funds. |

| Ticker Symbols: | |
| Class A: SGTEX | |
| Class I: SGATX |
| Municipal Bonds | 95% | |
| General Revenue | 31% | |
| Healthcare Revenue | 13 | |
| Water & Sewer Revenue | 13 | |
| General Obligation | 12 | |
| Tax Allocation Revenue | 11 | |
| Transportation Revenue | 6 | |
| Electric Revenue | 4 | |
| All other Municipal Bonds | 5 | |
| Short-Term Investment | 5 | |
| Total | 100% |
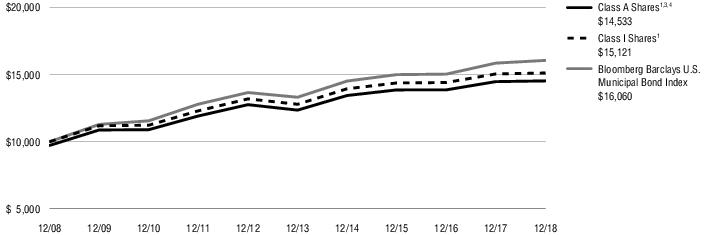
| 1 Year | 5 Years | 10 Years | ||||||
| Class A Shares at NAV2 | 0.38% | 3.30% | 4.10% | |||||
| Class A Shares at POP3,4 | -2.38 | 2.72 | 3.81 | |||||
| Class I Shares at NAV2 | 0.47 | 3.40 | 4.22 | |||||
| Bloomberg Barclays U.S. Municipal Bond Index | 1.28 | 3.82 | 4.85 | |||||
| Fund Expense Ratios5: A Shares: Gross 1.01%, Net 0.76%; I Shares: Gross 0.86%, Net 0.66%. | ||||||||
| All returns represent past performance which is no guarantee of future results. Current performance may be higher or lower than the performance shown. The investment return and principal value of an investment will fluctuate so that an investor’s shares, when redeemed, may be worth more or less than their original cost. The above table and graph below do not reflect the deduction of taxes that a shareholder would pay on fund distributions or the redemption of shares. Please visit Virtus.com for performance data current to the most recent month-end. | |
| 1 | Total returns are historical and include changes in share price and the reinvestment of both dividends and capital gain distributions. |
| 2 | “NAV” (Net Asset Value) total returns do not include the effect of any sales charge. |
| 3 | “POP” (Public Offering Price) total returns include the effect of the maximum front-end 2.75% sales charge. |
| 4 | “CDSC” (contingent deferred sales charge) is applied to redemptions of certain classes of shares that do not have a sales charge applied at the time of purchase. CDSC charges for certain redemptions of Class A shares made within 18 months of a finder’s fee being paid and all Class C shares are 1% within the first year and 0% thereafter. |
| 5 | The expense ratios of the Fund are set forth according to the prospectus for the Fund effective July 23, 2018, as supplemented and revised, and may differ from the expense ratios disclosed in the Financial Highlight tables in this report. See the Financial Highlights for more current expense ratios. Net Expense: Expenses reduced by a contractual fee waiver in effect through April 30, 2020. Gross Expense: Does not reflect the effect of the fee waiver. Expense ratios include fees and expenses associated with the underlying funds. |
| Ticker Symbols: | |
| Class A: SFLTX | |
| Class I: SCFTX |
| Municipal Bonds | 98% |
| Short-Term Investment | 2 |
| Total | 100% |
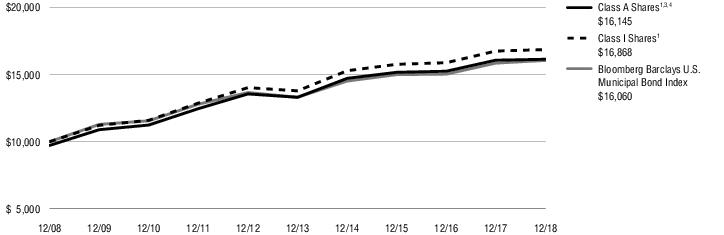
| 1 Year | 5 Years | 10 Years | ||||||
| Class A Shares at NAV2 | 0.44% | 3.94% | 5.20% | |||||
| Class A Shares at POP3,4 | -2.32 | 3.36 | 4.91 | |||||
| Class I Shares at NAV2 | 0.67 | 4.11 | 5.37 | |||||
| Bloomberg Barclays U.S. Municipal Bond Index | 1.28 | 3.82 | 4.85 | |||||
| Fund Expense Ratios5: A Shares: Gross 0.97%, Net 0.77%; I Shares: Gross 0.87%, Net 0.62%. | ||||||||
| All returns represent past performance which is no guarantee of future results. Current performance may be higher or lower than the performance shown. The investment return and principal value of an investment will fluctuate so that an investor’s shares, when redeemed, may be worth more or less than their original cost. The above table and graph below do not reflect the deduction of taxes that a shareholder would pay on fund distributions or the redemption of shares. Please visit Virtus.com for performance data current to the most recent month-end. | |
| 1 | Total returns are historical and include changes in share price and the reinvestment of both dividends and capital gain distributions. |
| 2 | “NAV” (Net Asset Value) total returns do not include the effect of any sales charge. |
| 3 | “POP” (Public Offering Price) total returns include the effect of the maximum front-end 2.75% sales charge. |
| 4 | “CDSC” (contingent deferred sales charge) is applied to redemptions of certain classes of shares that do not have a sales charge applied at the time of purchase. CDSC charges for certain redemptions of Class A shares made within 18 months of a finder’s fee being paid and all Class C shares are 1% within the first year and 0% thereafter. |
| 5 | The expense ratios of the Fund are set forth according to the prospectus for the Fund effective July 23, 2018, as supplemented and revised, and may differ from the expense ratios disclosed in the Financial Highlight tables in this report. See the Financial Highlights for more current expense ratios. Net Expense: Expenses reduced by a contractual fee waiver in effect through April 30, 2020. Gross Expense: Does not reflect the effect of the fee waiver. Expense ratios include fees and expenses associated with the underlying funds. |
| Ticker Symbols: | |
| Class A: SAHIX | |
| Class I: STHTX | |
| Class R: STHIX | |
| Class R6: STHZX |
Securities:There is a greater level of credit risk and price volatility involved with high yield securities than investment grade securities.
| Corporate Bonds and Notes | 93% | |
| Communication Services | 18% | |
| Energy | 16 | |
| Financials | 12 | |
| Consumer Discretionary | 12 | |
| Industrials | 9 | |
| Health Care | 7 | |
| Real Estate | 5 | |
| All other Corporate Bonds and Notes | 14 | |
| Leveraged Loans | 6 | |
| Common Stocks | 1 | |
| Total | 100% |
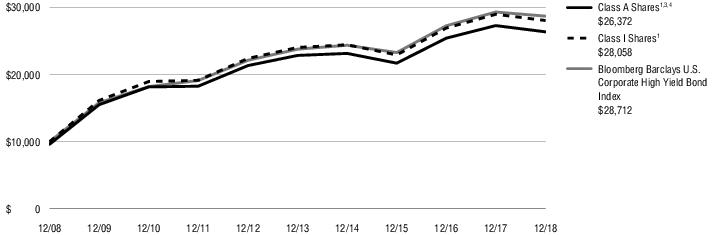
| 1 Year | 5 Years | 10 Years | Since inception | Inception date | ||||||||
| Class A Shares at NAV2 | -3.42% | 2.90% | 10.60% | —% | — | |||||||
| Class A Shares at POP3,4 | -7.04 | 2.12 | 10.18 | — | — | |||||||
| Class I Shares at NAV2 | -3.20 | 3.13 | 10.87 | — | — | |||||||
| Class R Shares at NAV2 | -3.59 | 2.73 | — | 7.44 | 7/31/09 | |||||||
| Class R6 Shares at NAV2 | -3.05 | — | — | 2.75 | 8/1/14 | |||||||
| Bloomberg Barclays U.S. Corporate High Yield Bond Index | -2.08 | 3.83 | 11.12 | —5 | — | |||||||
| Fund Expense Ratios6: A Shares: Gross 1.18%, Net 1.04%; I Shares: Gross 0.91%, Net 0.81%; R Shares: Gross 1.32%, Net 1.23%; R6 Shares: Gross 0.76%, Net 0.65%. | ||||||||||||
| All returns represent past performance which is no guarantee of future results. Current performance may be higher or lower than the performance shown. The investment return and principal value of an investment will fluctuate so that an investor’s shares, when redeemed, may be worth more or less than their original cost. The above table and graph below do not reflect the deduction of taxes that a shareholder would pay on fund distributions or the redemption of shares. Please visit Virtus.com for performance data current to the most recent month-end. | |
| 1 | Total returns are historical and include changes in share price and the reinvestment of both dividends and capital gain distributions. |
| 2 | “NAV” (Net Asset Value) total returns do not include the effect of any sales charge. |
| 3 | “POP” (Public Offering Price) total returns include the effect of the maximum front-end 3.75% sales charge. |
| 4 | “CDSC” (contingent deferred sales charge) is applied to redemptions of certain classes of shares that do not have a sales charge applied at the time of purchase. CDSC charges for certain redemptions of Class A shares made within 18 months of a finder’s fee being paid and all Class C shares are 1% within the first year and 0% thereafter. |
| 5 | The index returned 8.05% since inception of Class R shares and 3.54% since inception of Class R6 shares. |
| 6 | The expense ratios of the Fund are set forth according to the prospectus for the Fund effective July 23, 2018, as supplemented and revised, and may differ from the expense ratios disclosed in the Financial Highlight tables in this report. See the Financial Highlights for more current expense ratios. Net Expense: Expenses reduced by a contractual fee waiver in effect through April 30, 2020. Gross Expense: Does not reflect the effect of the fee waiver. Expense ratios include fees and expenses associated with the underlying funds. |
| Ticker Symbols: | |
| Class A: HYPSX | |
| Class I: SAMHX | |
| Class R: HYLSX | |
| Class R6: HYIZX |
| • | Cable – both satellite and cable providers |
| • | Energy – especially service providers |
| • | Finance – consumer finance and mortgage services |
| • | Chemicals, retail, service, and technology |
Securities:There is a greater level of credit risk and price volatility involved with high yield securities than investment grade securities.
| Corporate Bonds and Notes | 94% | |
| Communication Services | 19% | |
| Energy | 14 | |
| Consumer Discretionary | 13 | |
| Financials | 12 | |
| Health Care | 9 | |
| Industrials | 8 | |
| Materials | 5 | |
| All other Corporate Bonds and Notes | 14 | |
| Leveraged Loans | 6 | |
| Total | 100% |
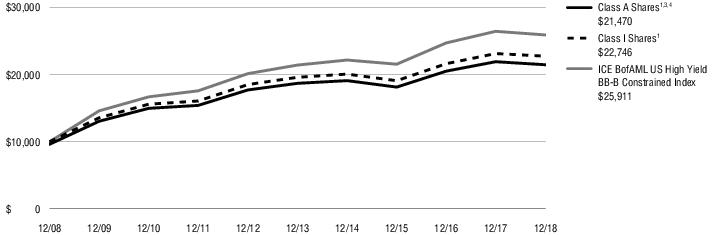
| 1 Year | 5 Years | 10 Years | Since inception | Inception date | ||||||||
| Class A Shares at NAV2 | -2.07% | 2.80% | 8.35% | —% | — | |||||||
| Class A Shares at POP3,4 | -5.74 | 2.01 | 7.94 | — | — | |||||||
| Class I Shares at NAV2 | -1.70 | 3.02 | 8.57 | — | — | |||||||
| Class R Shares at NAV2 | -2.10 | 2.61 | — | 6.11 | 7/31/09 | |||||||
| Class R6 Shares at NAV2 | -1.74 | — | — | 3.85 | 8/1/16 | |||||||
| ICE BofAML U.S. High Yield BB-B Constrained Index | -2.04 | 3.88 | 9.99 | —5 | — | |||||||
| Fund Expense Ratios6: A Shares: Gross 1.00%, Net 0.83%; I Shares: Gross 0.77%, Net 0.65%; R Shares: Gross 1.23%, Net 1.05%; R6 Shares: Gross 0.66%, Net 0.54%. | ||||||||||||
| All returns represent past performance which is no guarantee of future results. Current performance may be higher or lower than the performance shown. The investment return and principal value of an investment will fluctuate so that an investor’s shares, when redeemed, may be worth more or less than their original cost. The above table and graph below do not reflect the deduction of taxes that a shareholder would pay on fund distributions or the redemption of shares. Please visit Virtus.com for performance data current to the most recent month-end. | |
| 1 | Total returns are historical and include changes in share price and the reinvestment of both dividends and capital gain distributions. |
| 2 | “NAV” (Net Asset Value) total returns do not include the effect of any sales charge. |
| 3 | “POP” (Public Offering Price) total returns include the effect of the maximum front-end 3.75% sales charge. |
| 4 | “CDSC” (contingent deferred sales charge) is applied to redemptions of certain classes of shares that do not have a sales charge applied at the time of purchase. CDSC charges for certain redemptions of Class A shares made within 18 months of a finder’s fee being paid and all Class C shares are 1% within the first year and 0% thereafter. |
| 5 | The index returned 7.48% since inception of Class R shares and 3.57% since inception of Class R6 shares. |
| 6 | The expense ratios of the Fund are set forth according to the prospectus for the Fund effective July 23, 2018, as supplemented and revised, and may differ from the expense ratios disclosed in the Financial Highlight tables in this report. See the Financial Highlights for more current expense ratios. Net Expense: Expenses reduced by a contractual fee waiver in effect through April 30, 2020. Gross Expense: Does not reflect the effect of the fee waiver. Expense ratios include fees and expenses associated with the underlying funds. |
| Ticker Symbols: | |
| Class A: SISIX | |
| Class I: STTBX |
| Municipal Bonds | 98% |
| Short-Term Investment | 2 |
| Total | 100% |
| 1 Year | 5 Years | 10 Years | ||||||
| Class A Shares at NAV2 | 0.45% | 2.61% | 3.83% | |||||
| Class A Shares at POP3,4 | -2.31 | 2.04 | 3.54 | |||||
| Class I Shares at NAV2 | 0.60 | 2.75 | 4.02 | |||||
| Bloomberg Barclays U.S. Municipal Bond 1-15 Year Blend (1-17) Index | 1.58 | 3.00 | 3.90 | |||||
| Fund Expense Ratios5: A Shares: Gross 1.02%, Net 0.76%; I Shares: Gross 0.82%, Net 0.61%. | ||||||||
| All returns represent past performance which is no guarantee of future results. Current performance may be higher or lower than the performance shown. The investment return and principal value of an investment will fluctuate so that an investor’s shares, when redeemed, may be worth more or less than their original cost. The above table and graph below do not reflect the deduction of taxes that a shareholder would pay on fund distributions or the redemption of shares. Please visit Virtus.com for performance data current to the most recent month-end. | |
| 1 | Total returns are historical and include changes in share price and the reinvestment of both dividends and capital gain distributions. |
| 2 | “NAV” (Net Asset Value) total returns do not include the effect of any sales charge. |
| 3 | “POP” (Public Offering Price) total returns include the effect of the maximum front-end 2.75% sales charge. |
| 4 | “CDSC” (contingent deferred sales charge) is applied to redemptions of certain classes of shares that do not have a sales charge applied at the time of purchase. CDSC charges for certain redemptions of Class A shares made within 18 months of a finder’s fee being paid and all Class C shares are 1% within the first year and 0% thereafter. |
| 5 | The expense ratios of the Fund are set forth according to the prospectus for the Fund effective July 23, 2018, as supplemented and revised, and may differ from the expense ratios disclosed in the Financial Highlight tables in this report. See the Financial Highlights for more current expense ratios. Net Expense: Expenses reduced by a contractual fee waiver in effect through April 30, 2020. Gross Expense: Does not reflect the effect of the fee waiver. Expense ratios include fees and expenses associated with the underlying funds. |

| Ticker Symbols: | |
| Class A: SNCIX | |
| Class I: CNCFX |
| Municipal Bonds | 91% | |
| General Revenue | 25% | |
| Transportation Revenue | 20 | |
| Healthcare Revenue | 12 | |
| General Obligation | 11 | |
| Water & Sewer Revenue | 9 | |
| Pre-Refunded | 9 | |
| Lease Revenue | 5 | |
| Short-Term Investment | 9 | |
| Total | 100% |
| 1 Year | 5 Years | 10 Years | ||||||
| Class A Shares at NAV2 | -0.52% | 3.01% | 3.89% | |||||
| Class A Shares at POP3,4 | -3.26 | 2.43 | 3.61 | |||||
| Class I Shares at NAV2 | -0.37 | 3.16 | 4.05 | |||||
| Bloomberg Barclays U.S. Municipal Bond Index | 1.28 | 3.82 | 4.85 | |||||
| Fund Expense Ratios5: A Shares: Gross 1.16%, Net 0.81%; I Shares: Gross 1.11%, Net 0.66%. | ||||||||
| All returns represent past performance which is no guarantee of future results. Current performance may be higher or lower than the performance shown. The investment return and principal value of an investment will fluctuate so that an investor’s shares, when redeemed, may be worth more or less than their original cost. The above table and graph below do not reflect the deduction of taxes that a shareholder would pay on fund distributions or the redemption of shares. Please visit Virtus.com for performance data current to the most recent month-end. | |
| 1 | Total returns are historical and include changes in share price and the reinvestment of both dividends and capital gain distributions. |
| 2 | “NAV” (Net Asset Value) total returns do not include the effect of any sales charge. |
| 3 | “POP” (Public Offering Price) total returns include the effect of the maximum front-end 2.75% sales charge. |
| 4 | “CDSC” (contingent deferred sales charge) is applied to redemptions of certain classes of shares that do not have a sales charge applied at the time of purchase. CDSC charges for certain redemptions of Class A shares made within 18 months of a finder’s fee being paid and all Class C shares are 1% within the first year and 0% thereafter. |
| 5 | The expense ratios of the Fund are set forth according to the prospectus for the Fund effective July 23, 2018, as supplemented and revised, and may differ from the expense ratios disclosed in the Financial Highlight tables in this report. See the Financial Highlights for more current expense ratios. Net Expense: Expenses reduced by a contractual fee waiver in effect through April 30, 2020. Gross Expense: Does not reflect the effect of the fee waiver. Expense ratios include fees and expenses associated with the underlying funds. |

| Ticker Symbols: | |
| Class A: STSBX | |
| Class C: SCBSX | |
| Class I: SSBTX |
| U.S. Government Securities | 57% | |
| Corporate Bonds and Notes | 23 | |
| Financials | 7% | |
| Consumer Discretionary | 4 | |
| Utilities | 4 | |
| Materials | 2 | |
| Consumer Staples | 2 | |
| Industrials | 1 | |
| Health Care | 1 | |
| All other Corporate Bonds and Notes | 2 | |
| Mortgage-Backed Securities | 15 | |
| Asset-Backed Securities | 5 | |
| Total | 100% |
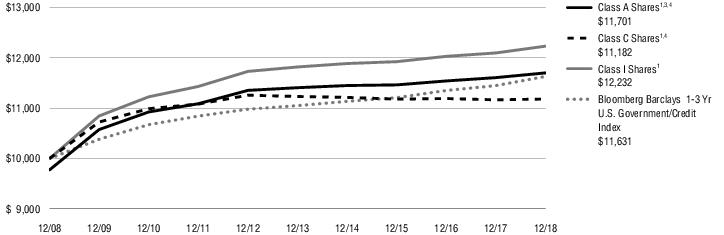
| 1 Year | 5 Years | 10 Years | ||||||
| Class A Shares at NAV2 | 0.81% | 0.51% | 1.81% | |||||
| Class A Shares at POP3,4 | -1.46 | 0.05 | 1.58 | |||||
| Class C Shares at NAV and with CDSC2,4 | 0.14 | -0.09 | 1.12 | |||||
| Class I Shares at NAV2 | 1.11 | 0.69 | 2.03 | |||||
| Bloomberg Barclays 1-3 Year U.S. Government/Credit Index | 1.60 | 1.03 | 1.52 | |||||
| Fund Expense Ratios5: A Shares: Gross 1.53%, Net 0.80%; C Shares: Gross 2.35%, Net 1.57%; I Shares: Gross 1.35%, Net 0.60%. | ||||||||
| All returns represent past performance which is no guarantee of future results. Current performance may be higher or lower than the performance shown. The investment return and principal value of an investment will fluctuate so that an investor’s shares, when redeemed, may be worth more or less than their original cost. The above table and graph below do not reflect the deduction of taxes that a shareholder would pay on fund distributions or the redemption of shares. Please visit Virtus.com for performance data current to the most recent month-end. | |
| 1 | Total returns are historical and include changes in share price and the reinvestment of both dividends and capital gain distributions. |
| 2 | “NAV” (Net Asset Value) total returns do not include the effect of any sales charge. |
| 3 | “POP” (Public Offering Price) total returns include the effect of the maximum front-end 2.25% sales charge. |
| 4 | “CDSC” (contingent deferred sales charge) is applied to redemptions of certain classes of shares that do not have a sales charge applied at the time of purchase. CDSC charges for certain redemptions of Class A shares made within 18 months of a finder’s fee being paid and all Class C shares are 1% within the first year and 0% thereafter. |
| 5 | The expense ratios of the Fund are set forth according to the prospectus for the Fund effective July 23, 2018, as supplemented and revised, and may differ from the expense ratios disclosed in the Financial Highlight tables in this report. See the Financial Highlights for more current expense ratios. Net Expense: Expenses reduced by a contractual fee waiver in effect through April 30, 2020. Gross Expense: Does not reflect the effect of the fee waiver. Expense ratios include fees and expenses associated with the underlying funds. |
| Ticker Symbols: | |
| Class A: SMMAX | |
| Class I: CMDTX |
| Municipal Bonds | 90% |
| Short-Term Investment | 10 |
| Total | 100% |
| 1 Year | 5 Years | 10 Years | ||||||
| Class A Shares at NAV2 | 1.10% | 0.67% | 2.85% | |||||
| Class A Shares at POP3,4 | -1.18 | 0.21 | 2.62 | |||||
| Class I Shares at NAV2 | 1.37 | 0.83 | 3.01 | |||||
| Bloomberg Barclays Municipal Bond 1-5 Year Index | 1.77 | 1.19 | 1.96 | |||||
| Fund Expense Ratios5: A Shares: Gross 1.01%, Net 0.66%; I Shares: Gross 0.83%, Net 0.49%. | ||||||||
| All returns represent past performance which is no guarantee of future results. Current performance may be higher or lower than the performance shown. The investment return and principal value of an investment will fluctuate so that an investor’s shares, when redeemed, may be worth more or less than their original cost. The above table and graph below do not reflect the deduction of taxes that a shareholder would pay on fund distributions or the redemption of shares. Please visit Virtus.com for performance data current to the most recent month-end. | |
| 1 | Total returns are historical and include changes in share price and the reinvestment of both dividends and capital gain distributions. |
| 2 | “NAV” (Net Asset Value) total returns do not include the effect of any sales charge. |
| 3 | “POP” (Public Offering Price) total returns include the effect of the maximum front-end 2.25% sales charge. |
| 4 | “CDSC” (contingent deferred sales charge) is applied to redemptions of certain classes of shares that do not have a sales charge applied at the time of purchase. CDSC charges for certain redemptions of Class A shares made within 18 months of a finder’s fee being paid and all Class C shares are 1% within the first year and 0% thereafter. |
| 5 | The expense ratios of the Fund are set forth according to the prospectus for the Fund effective July 23, 2018, as supplemented and revised, and may differ from the expense ratios disclosed in the Financial Highlight tables in this report. See the Financial Highlights for more current expense ratios. Net Expense: Expenses reduced by a contractual fee waiver in effect through April 30, 2020. Gross Expense: Does not reflect the effect of the fee waiver. Expense ratios include fees and expenses associated with the underlying funds. |

| Ticker Symbols: | |
| Class A: CBPSX | |
| Class I: SAMFX | |
| Class R: SCBLX | |
| Class R6: SAMZX |
Securities:There is a greater level of credit risk and price volatility involved with high yield securities than investment grade securities.
| U.S. Government Securities | 57% | |
| Mortgage-Backed Securities | 25 | |
| Agency | 20% | |
| Non-Agency | 5 | |
| Corporate Bonds and Notes | 13 | |
| Financials | 5 | |
| Energy | 3 | |
| All other Corporate Bonds and Notes | 5 | |
| Asset-Backed Securities | 5 | |
| Credit Card | 4 | |
| Other | 1 | |
| Total | 100% |
| 1 Year | 5 Years | 10 Years | Since inception | Inception date | ||||||||
| Class A Shares at NAV2 | -0.48% | 2.13% | 3.39% | —% | — | |||||||
| Class A Shares at POP3,4 | -4.21 | 1.35 | 3.00 | — | — | |||||||
| Class I Shares at NAV2 | -0.32 | 2.37 | 3.67 | — | — | |||||||
| Class R Shares at NAV2 | -0.79 | 1.80 | — | 3.08 | 2/13/09 | |||||||
| Class R6 Shares at NAV2 | -0.17 | — | — | 1.75 | 8/1/14 | |||||||
| Bloomberg Barclays U.S. Aggregate Bond Index | 0.01 | 2.52 | 3.48 | —5 | — | |||||||
| Fund Expense Ratios6: A Shares: Gross 0.98%, Net 0.70%; I Shares: Gross 0.57%, Net 0.46%; R Shares: Gross 0.93%, Net 0.93%; R6 Shares: Gross 0.43%, Net 0.31%. | ||||||||||||
| All returns represent past performance which is no guarantee of future results. Current performance may be higher or lower than the performance shown. The investment return and principal value of an investment will fluctuate so that an investor’s shares, when redeemed, may be worth more or less than their original cost. The above table and graph below do not reflect the deduction of taxes that a shareholder would pay on fund distributions or the redemption of shares. Please visit Virtus.com for performance data current to the most recent month-end. | |
| 1 | Total returns are historical and include changes in share price and the reinvestment of both dividends and capital gain distributions. |
| 2 | “NAV” (Net Asset Value) total returns do not include the effect of any sales charge. |
| 3 | “POP” (Public Offering Price) total returns include the effect of the maximum front-end 3.75% sales charge. |
| 4 | “CDSC” (contingent deferred sales charge) is applied to redemptions of certain classes of shares that do not have a sales charge applied at the time of purchase. CDSC charges for certain redemptions of Class A shares made within 18 months of a finder’s fee being paid and all Class C shares are 1% within the first year and 0% thereafter. |
| 5 | The index returned 3.58% since inception of Class R shares and 1.97% since inception of Class R6 shares. |
| 6 | The expense ratios of the Fund are set forth according to the prospectus for the Fund effective July 23, 2018, as supplemented and revised, and may differ from the expense ratios disclosed in the Financial Highlight tables in this report. See the Financial Highlights for more current expense ratios. Net Expense: Expenses reduced by a contractual fee waiver in effect through April 30, 2020. Gross Expense: Does not reflect the effect of the fee waiver. Expense ratios include fees and expenses associated with the underlying funds. |

| Ticker Symbols: | |
| Class A: SSAGX | |
| Class I: SIGVX | |
| Class R6: SIGZX |
| Mortgage-Backed Securities | 85% | |
| Agency | 85% | |
| U.S. Government Securities | 12 | |
| Short-Term Investment | 2 | |
| Asset-Backed Security | 1 | |
| Total | 100% |
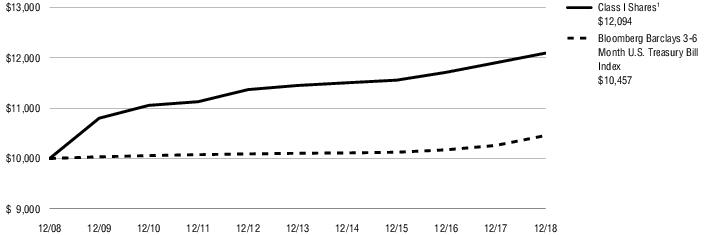
| 1 Year | 5 Years | 10 Years | Since inception | Inception date | ||||||||
| Class A Shares at NAV2 | —% | —% | —% | 0.79% | 7/24/2018 | |||||||
| Class I Shares at NAV2 | 1.733 | 0.91 | 1.46 | — | — | |||||||
| Class R6 Shares at NAV2 | 1.88 | — | — | 1.53 | 8/1/16 | |||||||
| Bloomberg Barclays 3-6 Month U.S. Treasury Bill Index | 1.92 | 0.69 | 0.45 | —4 | — | |||||||
| Fund Expense Ratios5: A Shares: Gross 0.75%, Net 0.67%; I Shares: Gross 0.50%, Net 0.42%; R6 Shares: Gross 0.38%, Net 0.27%. | ||||||||||||
| All returns represent past performance which is no guarantee of future results. Current performance may be higher or lower than the performance shown. The investment return and principal value of an investment will fluctuate so that an investor’s shares, when redeemed, may be worth more or less than their original cost. The above table and graph below do not reflect the deduction of taxes that a shareholder would pay on fund distributions or the redemption of shares. Please visit Virtus.com for performance data current to the most recent month-end. | |
| 1 | Total returns are historical and include changes in share price and the reinvestment of both dividends and capital gain distributions. |
| 2 | “NAV” (Net Asset Value) total returns do not include the effect of any sales charge. |
| 3 | Total Return for the report period presented in the table differs from the return in the Financial Highlights. The total return presented in the above table is calculated based on the NAV at which shareholder transactions were processed. The total return presented in the Financial Highlights section of the report is calculated in the same manner, but also takes into account certain adjustments that are necessary under generally accepted accounting principles required in the annual report and semiannual report. |
| 4 | The index returned 0.97% since inception of Class A shares and 1.22% since inception of Class R6 shares. |
| 5 | The expense ratios of the Fund are set forth according to the prospectus for the Fund effective July 23, 2018, as supplemented and revised, and may differ from the expense ratios disclosed in the Financial Highlight tables in this report. See the Financial Highlights for more current expense ratios. Net Expense: Expenses reduced by a contractual fee waiver in effect through April 30, 2020. Gross Expense: Does not reflect the effect of the fee waiver. Expense ratios include fees and expenses associated with the underlying funds. |
| Ticker Symbols: | |
| Class A: SLTMX | |
| Class C: SCLFX | |
| Class I: SLMTX |
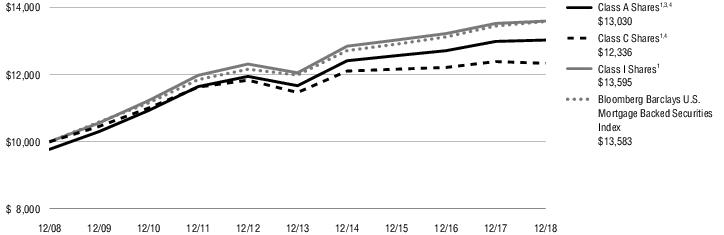
| Mortgage-Backed Securities | 93% | |
| Agency | 91% | |
| Non-Agency | 2 | |
| Short-Term Investment | 6 | |
| Asset-Backed Security | 1 | |
| Total | 100% |
| 1 Year | 5 Years | 10 Years | ||||||
| Class A Shares at NAV2 | 0.31% | 2.23% | 2.92% | |||||
| Class A Shares at POP3,4 | -1.94 | 1.77 | 2.68 | |||||
| Class C Shares at NAV and with CDSC2,4 | -0.43 | 1.47 | 2.12 | |||||
| Class I Shares at NAV2 | 0.52 | 2.44 | 3.12 | |||||
| Bloomberg Barclays U.S. Mortgage Backed Securities Index | 0.99 | 2.53 | 3.11 | |||||
| Fund Expense Ratios5: A Shares: Gross 1.89%, Net 0.91%; C Shares: Gross 1.99%, Net 1.66%; I Shares: Gross 1.06%, Net 0.71%. | ||||||||
| All returns represent past performance which is no guarantee of future results. Current performance may be higher or lower than the performance shown. The investment return and principal value of an investment will fluctuate so that an investor’s shares, when redeemed, may be worth more or less than their original cost. The above table and graph below do not reflect the deduction of taxes that a shareholder would pay on fund distributions or the redemption of shares. Please visit Virtus.com for performance data current to the most recent month-end. | |
| 1 | Total returns are historical and include changes in share price and the reinvestment of both dividends and capital gain distributions. |
| 2 | “NAV” (Net Asset Value) total returns do not include the effect of any sales charge. |
| 3 | “POP” (Public Offering Price) total returns include the effect of the maximum front-end 2.25% sales charge. |
| 4 | “CDSC” (contingent deferred sales charge) is applied to redemptions of certain classes of shares that do not have a sales charge applied at the time of purchase. CDSC charges for certain redemptions of Class A shares made within 18 months of a finder’s fee being paid and all Class C shares are 1% within the first year and 0% thereafter. |
| 5 | The expense ratios of the Fund are set forth according to the prospectus for the Fund effective July 23, 2018, as supplemented and revised, and may differ from the expense ratios disclosed in the Financial Highlight tables in this report. See the Financial Highlights for more current expense ratios. Net Expense: Expenses reduced by a contractual fee waiver in effect through April 30, 2020. Gross Expense: Does not reflect the effect of the fee waiver. Expense ratios include fees and expenses associated with the underlying funds. |
| Ticker Symbols: | |
| Class A: SASSX | |
| Class I: SISSX |
| Mortgage-Backed Securities | 27% | |
| Agency | 21% | |
| Non-Agency | 6 | |
| U.S. Government Securities | 26 | |
| Corporate Bonds and Notes | 25 | |
| Financials | 12 | |
| Health Care | 3 | |
| Consumer Discretionary | 2 | |
| Information Technology | 2 | |
| Utilities | 2 | |
| All other Corporate Bonds and Notes | 4 | |
| Asset-Backed Securities | 17 | |
| Credit Card | 9 | |
| Automobiles | 6 | |
| Student Loan | 2 | |
| Short-Term Investment | 4 | |
| Municipal Bond | 1 | |
| Total | 100% |
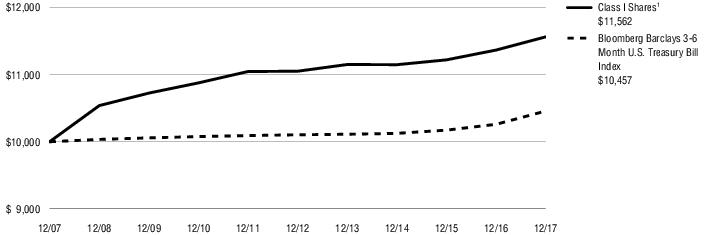
| 1 Year | 5 Years | 10 Years | Since inception | Inception date | ||||||||
| Class A Shares at NAV2 | —% | —% | —% | 0.48% | 7/24/2018 | |||||||
| Class I Shares at NAV2 | 1.61 | 1.10 | 1.92 | — | — | |||||||
| Bloomberg Barclays 3-6 Month U.S. Treasury Bill Index | 1.92 | 0.69 | 0.45 | 0.973 | — | |||||||
| Fund Expense Ratios4: A Shares: Gross 0.87%, Net 0.66%; I Shares: Gross 0.62%, Net 0.41%. | ||||||||||||
| All returns represent past performance which is no guarantee of future results. Current performance may be higher or lower than the performance shown. The investment return and principal value of an investment will fluctuate so that an investor’s shares, when redeemed, may be worth more or less than their original cost. The above table and graph below do not reflect the deduction of taxes that a shareholder would pay on fund distributions or the redemption of shares. Please visit Virtus.com for performance data current to the most recent month-end. | |
| 1 | Total returns are historical and include changes in share price and the reinvestment of both dividends and capital gain distributions. |
| 2 | “NAV” (Net Asset Value) total returns do not include the effect of any sales charge. |
| 3 | The since inception index return is from the inception date of Class A shares. |
| 4 | The expense ratios of the Fund are set forth according to the prospectus for the Fund effective July 23, 2018, as supplemented and revised, and may differ from the expense ratios disclosed in the Financial Highlight tables in this report. See the Financial Highlights for more current expense ratios. Net Expense: Expenses reduced by a contractual fee waiver in effect through April 30, 2020. Gross Expense: Does not reflect the effect of the fee waiver. Expense ratios include fees and expenses associated with the underlying funds. |
| Ticker Symbols: | |
| Class A: CVIAX | |
| Class I: CRVTX |
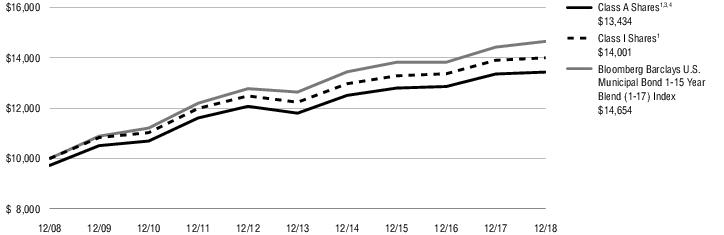
| Municipal Bonds | 98% | |
| General Revenue | 28% | |
| Water & Sewer Revenue | 19 | |
| General Obligation | 17 | |
| Transportation Revenue | 16 | |
| Healthcare Revenue | 7 | |
| Pre-Refunded | 7 | |
| Lease Revenue | 4 | |
| Short-Term Investment | 2 | |
| Total | 100% |
| 1 Year | 5 Years | 10 Years | ||||||
| Class A Shares at NAV2 | 0.57% | 2.62% | 3.28% | |||||
| Class A Shares at POP3,4 | -2.20 | 2.05 | 3.00 | |||||
| Class I Shares at NAV2 | 0.71 | 2.73 | 3.42 | |||||
| Bloomberg Barclays U.S. Municipal Bond 1-15 Year Blend (1-17) Index | 1.58 | 3.00 | 3.90 | |||||
| Fund Expense Ratios5: A Shares: Gross 1.10%, Net 0.80%; I Shares: Gross 0.94%, Net 0.66%. | ||||||||
| All returns represent past performance which is no guarantee of future results. Current performance may be higher or lower than the performance shown. The investment return and principal value of an investment will fluctuate so that an investor’s shares, when redeemed, may be worth more or less than their original cost. The above table and graph below do not reflect the deduction of taxes that a shareholder would pay on fund distributions or the redemption of shares. Please visit Virtus.com for performance data current to the most recent month-end. | |
| 1 | Total returns are historical and include changes in share price and the reinvestment of both dividends and capital gain distributions. |
| 2 | “NAV” (Net Asset Value) total returns do not include the effect of any sales charge. |
| 3 | “POP” (Public Offering Price) total returns include the effect of the maximum front-end 2.75% sales charge. |
| 4 | “CDSC” (contingent deferred sales charge) is applied to redemptions of certain classes of shares that do not have a sales charge applied at the time of purchase. CDSC charges for certain redemptions of Class A shares made within 18 months of a finder’s fee being paid and all Class C shares are 1% within the first year and 0% thereafter. |
| 5 | The expense ratios of the Fund are set forth according to the prospectus for the Fund effective July 23, 2018, as supplemented and revised, and may differ from the expense ratios disclosed in the Financial Highlight tables in this report. See the Financial Highlights for more current expense ratios. Net Expense: Expenses reduced by a contractual fee waiver in effect through April 30, 2020. Gross Expense: Does not reflect the effect of the fee waiver. Expense ratios include fees and expenses associated with the underlying funds. |
| Par Value | Value | ||
| U.S. Government Securities—56.0% | |||
| U.S. Treasury Bond 3.000%, 8/15/48 | $ 11,666 | $11,631 | |
| U.S. Treasury Note | |||
| 1.375%, 4/30/20 | 10,595 | 10,431 | |
| 1.250%, 3/31/21 | 8,966 | 8,726 | |
| 2.750%, 8/15/21 | 5,792 | 5,830 | |
| 1.875%, 7/31/22 | 24,618 | 24,108 | |
| 2.750%, 7/31/23 | 3,942 | 3,984 | |
| 3.125%, 11/15/28 | 16,093 | 16,704 | |
| Total U.S. Government Securities (Identified Cost $79,688) | 81,414 | ||
| Mortgage-Backed Securities—24.8% | |||
| Agency—19.2% | |||
| Federal Home Loan Mortgage Corp. | |||
| Pool #G08347 4.500%, 6/1/39 | 90 | 94 | |
| Pool #G05606 4.500%, 7/1/39 | 546 | 572 | |
| Pool #G08353 4.500%, 7/1/39 | 115 | 121 | |
| Pool #G08372 4.500%, 11/1/39 | 342 | 358 | |
| Pool #G60126 4.500%, 11/1/41 | 33 | 34 | |
| Pool #C04123 4.000%, 7/1/42 | 628 | 646 | |
| Pool #G60019 4.500%, 3/1/44 | 656 | 681 | |
| Pool #Q31645 4.000%, 2/1/45 | 94 | 96 | |
| Pool #Q35611 4.000%, 9/1/45 | 883 | 903 | |
| Pool #V81992 4.000%, 10/1/45 | 1,092 | 1,115 | |
| Pool #Q38473 4.000%, 1/1/46 | 599 | 611 | |
| Pool #G60661 4.000%, 7/1/46 | 1,999 | 2,041 | |
| Pool #Q53881 4.500%, 1/1/48 | 899 | 935 | |
| Federal Home Loan Mortgage Corp. Multifamily Structured Pass-Through Certificates K151, A3 3.511%, 4/25/30 | 150 | 149 | |
| Federal National Mortgage Association | |||
| Pool #AN9721 3.600%, 7/1/27 | 195 | 199 | |
| 2017-M15, ATS2 3.136%, 11/25/27(1) | 630 | 621 | |
| Pool #387885 3.640%, 8/1/28 | 980 | 1,001 | |
| Pool #109461 3.710%, 8/1/28 | 459 | 472 | |
| Pool #AN9768 3.730%, 9/1/28 | 835 | 842 | |
| Pool #AN4045 3.150%, 1/1/29 | 659 | 642 | |
| Pool #AN4605 3.320%, 2/1/29 | 370 | 367 | |
| Pool #AN6456 2.860%, 8/1/29 | 30 | 28 | |
| Pool #AN6444 3.060%, 8/1/29 | 235 | 226 | |
| Par Value | Value | ||
| Agency—continued | |||
| Pool #AN6846 2.930%, 10/1/29 | $65 | $62 | |
| Pool #AN7049 3.050%, 10/1/29 | 120 | 115 | |
| Pool #AN6661 3.090%, 10/1/29 | 655 | 630 | |
| Pool #AN6391 3.110%, 10/1/29 | 545 | 525 | |
| Pool #AN7081 3.170%, 10/1/29 | 245 | 237 | |
| Pool #AN7155 3.180%, 10/1/29 | 65 | 63 | |
| Pool #AN7145 3.030%, 12/1/29 | 970 | 926 | |
| Pool #AN8184 3.120%, 1/1/30 | 140 | 136 | |
| Pool #AM7516 3.550%, 2/1/30 | 210 | 213 | |
| Pool #AM8970 2.870%, 5/1/30 | 306 | 293 | |
| Pool #AM8738 3.250%, 5/1/30 | 317 | 313 | |
| Pool #109681 3.770%, 9/1/30 | 169 | 174 | |
| Pool #AL7497 3.500%, 9/1/40 | 1,527 | 1,539 | |
| Pool #AW8154 3.500%, 1/1/42 | 447 | 450 | |
| Pool #AS9571 3.500%, 5/1/42 | 1,236 | 1,246 | |
| Pool #AL6223 4.500%, 8/1/44 | 576 | 600 | |
| Pool #MA2190 4.000%, 2/1/45 | 487 | 497 | |
| Pool #MA2341 4.500%, 6/1/45 | 40 | 42 | |
| Pool #BE5050 4.000%, 9/1/45 | 810 | 829 | |
| Pool #AZ9213 4.000%, 10/1/45 | 975 | 999 | |
| Pool #AS6515 4.000%, 1/1/46 | 895 | 914 | |
| Pool #BC2470 3.500%, 2/1/46 | 397 | 400 | |
| Pool #BA4799 4.000%, 2/1/46 | 462 | 474 | |
| Pool #BH7587 4.500%, 8/1/47 | 385 | 403 | |
| Government National Mortgage Association | |||
| Pool #MA4072 5.000%, 11/20/46 | 236 | 249 | |
| Pool #MA5596 4.500%, 11/20/48 | 2,141 | 2,217 | |
| Pool #MA5652 4.500%, 12/20/48 | 599 | 621 | |
| 27,921 | |||
| Non-Agency—5.6% | |||
| Caesars Palace Las Vegas Trust 2017-VICI, B 144A 3.835%, 10/15/34(2) | 565 | 567 | |
| FREMF Mortgage Trust 2013-K713, B 144A 3.154%, 4/25/46(1)(2) | 480 | 479 | |
| Par Value | Value | ||
| Non-Agency—continued | |||
| Goldman Sachs Mortgage Securities Trust 2012-ALOH, A 144A 3.551%, 4/10/34(2) | $700 | $705 | |
| GS Mortgage Securities Trust | |||
| 2005-ROCK, A 144A 5.366%, 5/3/32(2) | 370 | 412 | |
| 2012-BWTR, B 144A 3.255%, 11/5/34(2) | 1,195 | 1,175 | |
| MAD Mortgage Trust 2017-330M, A 144A 3.188%, 8/15/34(1)(2) | 485 | 478 | |
| Morgan Stanley Capital I Trust | |||
| 2014-CPT, AM 144A 3.401%, 7/13/29(1)(2) | 615 | 615 | |
| 2014-150E, A 144A 3.912%, 9/9/32(2) | 280 | 284 | |
| 2014-150E, AS 144A 4.012%, 9/9/32(2) | 195 | 197 | |
| US 2018-USDC, A 144A 4.106%, 5/9/38(2) | 840 | 861 | |
| VNDO Mortgage Trust 2013-PENN, B 144A 3.947%, 12/13/29(1)(2) | 1,125 | 1,133 | |
| WFRBS Commercial Mortgage Trust | |||
| 2012-C6, AS 3.835%, 4/15/45 | 638 | 645 | |
| 2012-C10, AS 3.241%, 12/15/45 | 600 | 592 | |
| 8,143 | |||
| Total Mortgage-Backed Securities (Identified Cost $36,292) | 36,064 | ||
| Asset-Backed Securities—4.8% | |||
| Credit Card—4.3% | |||
| Capital One Multi-Asset Execution Trust | |||
| 2005-B3, B3 (3 month LIBOR + 0.550%) 2.986%, 5/15/28(1) | 1,056 | 1,036 | |
| 2017-A5, A5 (1 month LIBOR + 0.580%) 3.035%, 7/15/27(1) | 570 | 571 | |
| Citibank Credit Card Issuance Trust 2017-A6, A6 (1 month LIBOR + 0.770%) 3.210%, 5/14/29(1) | 1,405 | 1,402 | |
| Discover Card Execution Note Trust 2017-A5, A5 (1 month LIBOR + 0.600%) 3.055%, 12/15/26(1) | 1,830 | 1,827 | |
| Golden Credit Card Trust 2018-4A, A 144A 3.440%, 10/15/25(2) | 700 | 697 | |
| World Financial Network Credit Card Master Trust 2017-C, A 2.310%, 8/15/24 | 795 | 784 | |
| 6,317 | |||
| Other—0.5% | |||
| Five Guys Funding LLC 2017-1A, A2 144A 4.600%, 7/25/47(2) | 744 | 759 | |
| Total Asset-Backed Securities (Identified Cost $7,069) | 7,076 | ||
| Corporate Bonds and Notes—12.0% | |||
| Communication Services—0.7% | |||
| AT&T, Inc. 4.500%, 3/9/48 | 479 | 413 | |
| Par Value | Value | ||
| Communication Services—continued | |||
| Comcast Corp. | |||
| 4.150%, 10/15/28 | $244 | $248 | |
| 4.700%, 10/15/48 | 365 | 371 | |
| 1,032 | |||
| Consumer Staples—0.5% | |||
| Walmart, Inc. 3.700%, 6/26/28 | 656 | 666 | |
| Energy—2.3% | |||
| Baker Hughes a GE Co. LLC 4.080%, 12/15/47 | 530 | 437 | |
| Boardwalk Pipelines LP 4.450%, 7/15/27 | 179 | 165 | |
| Enterprise Products Operating LLC 5.375%, 2/15/78 | 534 | 442 | |
| Schlumberger Holdings Corp. | |||
| 144A 3.000%, 12/21/20(2) | 454 | 450 | |
| 144A 4.000%, 12/21/25(2) | 540 | 533 | |
| Schlumberger Investment SA 144A 3.300%, 9/14/21(2) | 285 | 286 | |
| Shell International Finance B.V. 1.750%, 9/12/21 | 402 | 389 | |
| TechnipFMC plc 3.450%, 10/1/22 | 85 | 84 | |
| Transcanada Trust 5.300%, 3/15/77 | 81 | 70 | |
| Woodside Finance Ltd. 144A 4.600%, 5/10/21(2) | 550 | 557 | |
| 3,413 | |||
| Financials—4.8% | |||
| Bank of America Corp. | |||
| 3.366%, 1/23/26 | 809 | 774 | |
| 3.593%, 7/21/28 | 257 | 244 | |
| Chubb INA Holdings, Inc. 2.875%, 11/3/22 | 259 | 257 | |
| Citigroup, Inc. 4.650%, 7/23/48 | 519 | 508 | |
| Fifth Third Bank 2.200%, 10/30/20 | 326 | 319 | |
| JPMorgan Chase & Co. 3.540%, 5/1/28 | 461 | 440 | |
| Morgan Stanley | |||
| 3.591%, 7/22/28 | 340 | 321 | |
| 4.375%, 1/22/47 | 389 | 369 | |
| Nationwide Financial Services, Inc. 144A 5.375%, 3/25/21(2) | 556 | 576 | |
| PNC Bank NA 2.150%, 4/29/21 | 715 | 697 | |
| Progressive Corp. (The) 5.375%,(3) | 420 | 393 | |
| Santander UK Group Holdings plc 3.373%, 1/5/24 | 409 | 388 | |
| SunTrust Banks, Inc. 4.000%, 5/1/25 | 481 | 483 | |
| Travelers Cos., Inc. (The) 4.050%, 3/7/48 | 586 | 569 | |
| US Bank NA 2.050%, 10/23/20 | 374 | 367 | |
| Par Value | Value | ||
| Financials—continued | |||
| Wells Fargo & Co. 3.069%, 1/24/23 | $219 | $213 | |
| 6,918 | |||
| Health Care—0.9% | |||
| CVS Health Corp. 4.780%, 3/25/38 | 479 | 460 | |
| Eli Lilly & Co. 3.950%, 5/15/47 | 341 | 334 | |
| Novartis Securities Investment Ltd. 5.125%, 2/10/19 | 215 | 215 | |
| UnitedHealth Group, Inc. 4.450%, 12/15/48 | 341 | 352 | |
| 1,361 | |||
| Industrials—0.9% | |||
| British Airways plc Pass-Through-Trust 2018-1, AA 144A 3.800%, 9/20/31(2) | 352 | 345 | |
| ERAC USA Finance LLC 144A 5.250%, 10/1/20(2) | 283 | 292 | |
| General Dynamics Corp. 3.375%, 5/15/23 | 322 | 324 | |
| L3 Technologies, Inc. 3.850%, 12/15/26 | 191 | 185 | |
| United Airlines Pass-Through-Trust 2016-1, A 3.450%, 7/7/28 | 197 | 190 | |
| 1,336 | |||
| Information Technology—0.4% | |||
| Apple, Inc. 3.000%, 6/20/27 | 272 | 259 | |
| Trimble, Inc. 4.900%, 6/15/28 | 350 | 345 | |
| 604 | |||
| Materials—1.2% | |||
| Barrick PD Australia Finance Pty Ltd. 5.950%, 10/15/39 | 728 | 777 | |
| DowDuPont, Inc. 5.419%, 11/15/48 | 249 | 259 | |
| Par Value | Value | ||
| Materials—continued | |||
| Newmont Mining Corp. 6.250%, 10/1/39 | $642 | $704 | |
| 1,740 | |||
| Utilities—0.3% | |||
| Duke Energy Corp. 3.750%, 9/1/46 | 439 | 380 | |
| Total Corporate Bonds and Notes (Identified Cost $17,655) | 17,450 | ||
| Total Long-Term Investments—97.6% (Identified Cost $140,704) | 142,004 | ||
| TOTAL INVESTMENTS—97.6% (Identified Cost $140,704) | 142,004 | ||
| Other assets and liabilities, net—2.4% | 3,445 | ||
| NET ASSETS—100.0% | $145,449 | ||
| Abbreviations: | |
| GS | Goldman Sachs & Co. |
| LIBOR | London Interbank Offered Rate |
| LLC | Limited Liability Company |
| LP | Limited Partnership |
| Footnote Legend: | |
| (1) | Variable rate security. Rate disclosed is as of December 31, 2018. For leveraged loans, the rate shown may represent a weighted average interest rate. Information in parenthesis represents benchmark and reference rate for each security. Certain variable rate securities are not based on a published reference rate and spread but are determined by the issuer or agent and are based on current market conditions, or, for mortgage-backed securities, are impacted by the individual mortgages which are paying off over time. These securities do not indicate a reference rate and spread in their descriptions. |
| (2) | Security exempt from registration under Rule 144A of the Securities Act of 1933. These securities may be resold in transactions exempt from registration, normally to qualified institutional buyers. At December 31, 2018, these securities amounted to a value of $11,401 or 7.8% of net assets. |
| (3) | No contractual maturity date. |
| Total Value at December 31, 2018 | Level 2 Significant Observable Inputs | ||
| Debt Securities: | |||
| Asset-Backed Securities | $7,076 | $7,076 | |
| Corporate Bonds and Notes | 17,450 | 17,450 | |
| Mortgage-Backed Securities | 36,064 | 36,064 | |
| U.S. Government Securities | 81,414 | 81,414 | |
| Total Investments | $142,004 | $142,004 |
| Par Value | Value | ||
| U.S. Government Security—3.2% | |||
| U.S. Treasury Note 1.500%, 1/31/19 | $ 1,310 | $1,309 | |
| Total U.S. Government Security (Identified Cost $1,309) | 1,309 | ||
| Corporate Bonds and Notes—94.2% | |||
| Communication Services—5.2% | |||
| AT&T, Inc. 4.500%, 3/9/48 | 663 | 572 | |
| Comcast Corp. | |||
| 4.150%, 10/15/28 | 250 | 254 | |
| 4.700%, 10/15/48 | 433 | 440 | |
| Verizon Communications, Inc. 4.125%, 3/16/27 | 853 | 854 | |
| 2,120 | |||
| Consumer Discretionary—7.4% | |||
| BMW US Capital LLC 144A 3.450%, 4/12/23(1) | 898 | 891 | |
| Daimler Finance North America LLC (3 month LIBOR + 0.550%) 144A 3.132%, 5/4/21(1)(2) | 950 | 942 | |
| Home Depot, Inc. (The) 2.625%, 6/1/22 | 1,219 | 1,206 | |
| 3,039 | |||
| Consumer Staples—5.5% | |||
| Archer-Daniels-Midland Co. 3.375%, 3/15/22 | 1,050 | 1,055 | |
| BAT Capital Corp. 3.222%, 8/15/24 | 563 | 519 | |
| Walmart, Inc. 3.400%, 6/26/23 | 687 | 694 | |
| 2,268 | |||
| Energy—21.4% | |||
| Baker Hughes a GE Co. LLC 4.080%, 12/15/47 | 584 | 482 | |
| Boardwalk Pipelines LP 4.450%, 7/15/27 | 718 | 663 | |
| BP Capital Markets America, Inc. 2.112%, 9/16/21 | 408 | 398 | |
| BP Capital Markets plc 3.814%, 2/10/24 | 642 | 648 | |
| Ensco plc | |||
| 4.500%, 10/1/24 | 412 | 268 | |
| 5.200%, 3/15/25 | 297 | 198 | |
| Enterprise Products Operating LLC 5.375%, 2/15/78 | 718 | 594 | |
| Exxon Mobil Corp. 3.043%, 3/1/26 | 853 | 833 | |
| Oceaneering International, Inc. 6.000%, 2/1/28 | 211 | 170 | |
| Schlumberger Holdings Corp. | |||
| 144A 3.000%, 12/21/20(1) | 507 | 503 | |
| 144A 4.000%, 12/21/25(1) | 754 | 745 | |
| Shell International Finance B.V. 3.875%, 11/13/28 | 1,049 | 1,079 | |
| Par Value | Value | ||
| Energy—continued | |||
| TechnipFMC plc 3.450%, 10/1/22 | $273 | $269 | |
| Total Capital International SA 3.750%, 4/10/24 | 1,265 | 1,279 | |
| Transcanada Trust 5.300%, 3/15/77 | 738 | 637 | |
| 8,766 | |||
| Financials—21.6% | |||
| Bank of America Corp. 3.366%, 1/23/26 | 879 | 841 | |
| Chubb INA Holdings, Inc. 2.875%, 11/3/22 | 277 | 275 | |
| Citigroup, Inc. 4.650%, 7/23/48 | 857 | 839 | |
| Ford Motor Credit Co. LLC (3 month LIBOR + 1.235%) 3.851%, 2/15/23(2) | 1,194 | 1,105 | |
| JPMorgan Chase Bank NA 2.604%, 2/1/21 | 784 | 778 | |
| Manufacturers & Traders Trust Co. 3.400%, 8/17/27 | 518 | 505 | |
| Morgan Stanley | |||
| 3.875%, 4/29/24 | 644 | 641 | |
| 3.591%, 7/22/28 | 363 | 343 | |
| 4.375%, 1/22/47 | 700 | 663 | |
| PNC Bank NA 2.150%, 4/29/21 | 552 | 538 | |
| Progressive Corp. (The) 5.375%,(3) | 452 | 423 | |
| SunTrust Banks, Inc. 4.000%, 5/1/25 | 501 | 503 | |
| Travelers Cos., Inc. (The) 4.050%, 3/7/48 | 887 | 861 | |
| Wells Fargo & Co. 3.069%, 1/24/23 | 563 | 548 | |
| 8,863 | |||
| Health Care—5.7% | |||
| Cigna Corp. 144A 4.900%, 12/15/48(1) | 631 | 618 | |
| CVS Health Corp. 4.780%, 3/25/38 | 490 | 470 | |
| Eli Lilly & Co. 3.950%, 5/15/47 | 872 | 854 | |
| UnitedHealth Group, Inc. 4.450%, 12/15/48 | 389 | 401 | |
| 2,343 | |||
| Industrials—9.8% | |||
| Boeing Co. (The) 3.850%, 11/1/48 | 822 | 787 | |
| British Airways plc Pass-Through-Trust 2018-1, AA 144A 3.800%, 9/20/31(1) | 361 | 354 | |
| General Dynamics Corp. 3.375%, 5/15/23 | 355 | 357 | |
| L3 Technologies, Inc. 3.850%, 12/15/26 | 284 | 275 | |
| Penske Truck Leasing Co., LP 144A 4.125%, 8/1/23(1) | 1,023 | 1,021 | |
| Par Value | Value | ||
| Industrials—continued | |||
| United Airlines Pass-Through-Trust 2016-1, A 3.450%, 7/7/28 | $304 | $293 | |
| United Parcel Service, Inc. 2.500%, 4/1/23 | 976 | 950 | |
| 4,037 | |||
| Information Technology—6.0% | |||
| Apple, Inc. | |||
| 2.850%, 2/23/23 | 641 | 633 | |
| 3.000%, 6/20/27 | 683 | 651 | |
| Jabil, Inc. 3.950%, 1/12/28 | 838 | 746 | |
| Trimble, Inc. 4.900%, 6/15/28 | 442 | 436 | |
| 2,466 | |||
| Materials—3.6% | |||
| Barrick PD Australia Finance Pty Ltd. 5.950%, 10/15/39 | 467 | 499 | |
| DowDuPont, Inc. 5.419%, 11/15/48 | 422 | 439 | |
| Newmont Mining Corp. 6.250%, 10/1/39 | 490 | 537 | |
| 1,475 | |||
| Real Estate—1.0% | |||
| Simon Property Group LP 3.375%, 12/1/27 | 425 | 407 | |
| Utilities—7.0% | |||
| Berkshire Hathaway Energy Co. 3.750%, 11/15/23 | 1,247 | 1,265 | |
| Consumers Energy Co. 4.350%, 4/15/49 | 750 | 780 | |
| Duke Energy Corp. 3.750%, 9/1/46 | 975 | 844 | |
| 2,889 | |||
| Total Corporate Bonds and Notes (Identified Cost $38,953) | 38,673 | ||
| Total Long-Term Investments—97.4% (Identified Cost $40,262) | 39,982 | ||
| Shares | Value | ||
| Short-Term Investment—1.0% | |||
| Money Market Mutual Fund—1.0% | |||
| Dreyfus Government Cash Management Fund - Institutional Shares (seven-day effective yield 2.292%)(4) | 393,295 | $393 | |
| Total Short-Term Investment (Identified Cost $393) | 393 | ||
| TOTAL INVESTMENTS—98.4% (Identified Cost $40,655) | 40,375 | ||
| Other assets and liabilities, net—1.6% | 673 | ||
| NET ASSETS—100.0% | $41,048 | ||
| Abbreviations: | |
| LIBOR | London Interbank Offered Rate |
| LLC | Limited Liability Company |
| LP | Limited Partnership |
| Footnote Legend: | |
| (1) | Security exempt from registration under Rule 144A of the Securities Act of 1933. These securities may be resold in transactions exempt from registration, normally to qualified institutional buyers. At December 31, 2018, these securities amounted to a value of $5,074 or 12.4% of net assets. |
| (2) | Variable rate security. Rate disclosed is as of December 31, 2018. For leveraged loans, the rate shown may represent a weighted average interest rate. Information in parenthesis represents benchmark and reference rate for each security. Certain variable rate securities are not based on a published reference rate and spread but are determined by the issuer or agent and are based on current market conditions, or, for mortgage-backed securities, are impacted by the individual mortgages which are paying off over time. These securities do not indicate a reference rate and spread in their descriptions. |
| (3) | No contractual maturity date. |
| (4) | Shares of this fund are publicly offered, and its prospectus and annual report are publicly available. |
| Counterparties: | |
| JPM | JPMorgan Chase Bank N.A. |
| Country Weightings (Unaudited)† | |
| United States | 88% |
| United Kingdom | 3 |
| France | 3 |
| Netherlands | 3 |
| Canada | 2 |
| Australia | 1 |
| Total | 100% |
| † % of total investments as of December 31, 2018. | |
| Over-the-counter credit default swaps - buy protection(1) outstanding as of December 31, 2018 were as follows: | |||||||||||||
| Reference Entity | Payment Frequency | Counterparty | Fixed Rate | Expiration Date | Notional Amount(2) | Value | Premiums Paid (Received) | Unrealized Appreciation | Unrealized (Depreciation) | ||||
| Westpac Banking Corp. | QTR | JPM | 1.000% | 12/20/23 | (1,700) USD | $(19) | $(24) | $5 | $— | ||||
| Total | $(19) | $(24) | $5 | $— | |||||||||
| (1) | If the Fund is a buyer of protection and a credit event occurs, as defined under the terms of that particular swap agreement, the Fund will either: (i) receive from the seller of protection an amount equal to the notional amount of the swap and deliver the referenced obligation or underlying investments comprising the referenced index; or (ii) receive a net settlement amount in the form of cash or investments equal to the notional amount of the swap less the recovery value of the referenced obligation or underlying investments comprising the referenced index. |
| (2) | The maximum potential amount the Fund could be required to pay as a seller of credit protection or receive as a buyer of credit protection if a credit event occurs as defined under the terms of that particular swap agreement. |
| Total Value at December 31, 2018 | Level 1 Quoted Prices | Level 2 Significant Observable Inputs | |||
| Assets: | |||||
| Debt Securities: | |||||
| Corporate Bonds and Notes | $38,673 | $— | $38,673 | ||
| U.S. Government Security | 1,309 | — | 1,309 | ||
| Short-Term Investment | 393 | 393 | — | ||
| Liabilities: | |||||
| Other Financial Instruments: | |||||
| Over-the-Counter Credit Default Swap | (19) | — | (19) | ||
| Total Investments | $40,356 | $393 | $39,963 |
| Par Value | Value | ||
| Asset-Backed Securities—0.1% | |||
| Collateralized Loan Obligations—0.1% | |||
| Dryden 37 Senior Loan Fund 2015-37A, FR (3 month LIBOR + 7.480%) 144A 9.916%, 1/15/31(1)(2) | $3,000 | $2,676 | |
| GREYWOLF CLO VII Ltd. 2018-2A, D (3 month LIBOR + 5.930%) 144A 0.000%, 10/20/31(1)(2) | 1,000 | 896 | |
| 3,572 | |||
| Total Asset-Backed Securities (Identified Cost $3,937) | 3,572 | ||
| Corporate Bonds and Notes—1.1% | |||
| Communication Services—0.2% | |||
| Altice Luxembourg S.A. 144A 7.625%, 2/15/25(1)(3) | 3,000 | 2,243 | |
| Lions Gate Capital Holdings LLC 144A 5.875%, 11/1/24(1) | 1,415 | 1,397 | |
| Trilogy International Partners LLC 144A 8.875%, 5/1/22(1) | 7,000 | 6,773 | |
| 10,413 | |||
| Consumer Discretionary—0.0% | |||
| Motors Liquidation Co. Escrow | |||
| 8.375%, 7/15/33(4) | 10,000 | — | |
| 7.200%, 1/15/49(4) | 10,000 | — | |
| — | |||
| Energy—0.8% | |||
| California Resources Corp. 144A 8.000%, 12/15/22(1) | 8,000 | 5,420 | |
| Glenn Pool Oil & Gas Trust 6.000%, 8/2/21(5) | 25,890 | 25,372 | |
| McDermott Technology Americas, Inc. 144A 10.625%, 5/1/24(1) | 3,000 | 2,531 | |
| Rowan Cos., Inc. 4.875%, 6/1/22(3) | 12,070 | 9,958 | |
| 43,281 | |||
| Financials—0.0% | |||
| Ditech Holding Corp. PIK Interest Capitalization 9.000%, 12/31/24(6) | 1,885 | 94 | |
| Information Technology—0.0% | |||
| Harland Clarke Holdings Corp. 144A 8.375%, 8/15/22(1) | 1,700 | 1,549 | |
| Utilities—0.1% | |||
| Talen Energy Supply LLC 6.500%, 6/1/25 | 5,000 | 3,550 | |
| Total Corporate Bonds and Notes (Identified Cost $66,974) | 58,887 | ||
| Par Value | Value | ||
| Leveraged Loans(2)—94.2% | |||
| Aerospace—3.2% | |||
| American Airlines, Inc. | |||
| 2017 (1 month LIBOR + 2.000%) 4.387%, 10/10/21 | $6,430 | $6,234 | |
| 2017, Tranche B (1 month LIBOR + 2.000%) 4.522%, 4/28/23 | 11,686 | 11,092 | |
| 2017, Tranche B (1 month LIBOR + 2.000%) 4.455%, 12/14/23 | 17,164 | 16,284 | |
| 2018 (1 month LIBOR + 1.750%) 4.256%, 6/27/25 | 6,575 | 6,139 | |
| Ducommun, Inc. Tranche B (3 month LIBOR + 4.000%) 6.646%, 11/21/25 | 7,543 | 7,355 | |
| Engility Corp. | |||
| Tranche B-1 (1 month LIBOR + 2.250%) 4.772%, 8/12/20 | 9,125 | 9,026 | |
| Tranche B-2 (1 month LIBOR + 2.750%) 5.272%, 8/14/23 | 25,617 | 25,417 | |
| MB Aerospace Holdings II Corp. First Lien (1 month LIBOR + 3.500%) 6.022%, 1/22/25 | 2,054 | 1,956 | |
| StandardAero Aviation Holdings, Inc. (1 month LIBOR + 3.750%) 6.270%, 7/7/22 | 28,905 | 28,507 | |
| TransDigm, Inc. | |||
| 2018, Tranche E (1 month LIBOR + 2.500%) 5.022%, 5/30/25 | 23,607 | 22,224 | |
| 2018, Tranche F (1 month LIBOR + 2.500%) 5.022%, 6/9/23 | 18,372 | 17,293 | |
| WP CPP Holdings LLC | |||
| First Lien (3 month LIBOR + 3.750%) 6.280%, 4/30/25 | 14,202 | 13,688 | |
| Second Lien (3 month LIBOR + 7.750%) 10.280%, 4/30/26 | 4,635 | 4,536 | |
| 169,751 | |||
| Chemicals—7.2% | |||
| Albaugh LLC 2017 (1 month LIBOR + 3.500%) 0.000%, 12/23/24(7) | 5,610 | 5,504 | |
| Alpha US Bidco, Inc. Tranche B-1 (3 month LIBOR + 3.000%) 5.803%, 1/31/24 | 8,051 | 7,637 | |
| Ashland LLC Tranche B (1 month LIBOR + 1.750%) 4.260%, 5/17/24 | 2,777 | 2,698 | |
| ASP Chromaflo Intermediate Holdings, Inc. | |||
| Second Lien (1 month LIBOR + 8.000%) 10.522%, 11/18/24 | 1,648 | 1,615 | |
| Tranche B-1 (1 month LIBOR + 3.500%) 6.022%, 11/20/23 | 1,019 | 989 | |
| Tranche B-2, First Lien (1 month LIBOR + 3.500%) 6.022%, 11/20/23 | 1,325 | 1,286 | |
| Chemours Co. (The) Tranche B-2 (1 month LIBOR + 1.750%) 4.280%, 4/3/25 | 8,550 | 8,187 | |
| Consolidated Energy Finance S.A. (1 month LIBOR + 2.500%) 4.932%, 5/7/25 | 9,852 | 9,532 | |
| Cyanco Intermediate 2 Corp. First Lien (1 month LIBOR + 3.500%) 6.022%, 3/16/25 | 4,516 | 4,354 | |
| Par Value | Value | ||
| Chemicals—continued | |||
| Emerald Performance Materials LLC | |||
| First Lien (1 month LIBOR + 3.500%) 6.022%, 8/2/21 | $1,129 | $1,089 | |
| Second Lien (1 month LIBOR + 7.750%) 10.272%, 8/1/22 | 18,901 | 18,760 | |
| Ferro Corp. | |||
| Tranche B-1 (3 month LIBOR + 2.250%) 5.053%, 2/14/24 | 8,367 | 8,032 | |
| Tranche B-2 (3 month LIBOR + 2.250%) 5.053%, 2/14/24 | 3,644 | 3,498 | |
| Tranche B-3 (3 month LIBOR + 2.250%) 5.053%, 2/14/24 | 3,566 | 3,424 | |
| Gemini HDPE LLC 2024 (3 month LIBOR + 2.500%) 5.027%, 8/7/24 | 20,806 | 19,974 | |
| H.B. Fuller Co. Tranche B (1 month LIBOR + 2.000%) 4.470%, 10/20/24 | 25,173 | 23,625 | |
| Ineos Styrolution US Holding LLC 2024 (1 month LIBOR + 2.000%) 4.522%, 3/29/24 | 7,357 | 6,989 | |
| Ineos U.S. Finance LLC 2024 (1 month LIBOR + 2.000%) 4.522%, 4/1/24 | 62,652 | 59,050 | |
| Invictus US LLC | |||
| First Lien (2 month LIBOR + 3.000%) 5.495%, 3/28/25 | 2,476 | 2,406 | |
| Second Lien (2 month LIBOR + 6.750%) 9.245%, 3/28/26 | 845 | 843 | |
| Kraton Polymers LLC (1 month LIBOR + 2.500%) 5.022%, 3/8/25 | 6,689 | 6,476 | |
| Macdermid, Inc. Tranche B-7 (1 month LIBOR + 2.500%) 5.022%, 6/7/20 | 8,503 | 8,458 | |
| MacDermid, Inc. Tranche B-6 (1 month LIBOR + 3.000%) 5.522%, 6/7/23 | 5,485 | 5,444 | |
| Minerals Technologies, Inc. | |||
| Tranche B-1 (3 month LIBOR + 2.250%) 4.801%, 2/14/24 | 6,894 | 6,670 | |
| Tranche B-2 4.750%, 5/7/21(8) | 14,735 | 14,109 | |
| New Arclin U.S. Holding Corp. (1 month LIBOR + 3.500%) 6.022%, 2/14/24 | 8,469 | 8,105 | |
| Oxea Corp. Tranche B-2 (3 month LIBOR + 3.500%) 5.938%, 10/14/24 | 5,791 | 5,574 | |
| Platform Specialty Products Corp. Tranche B (3 month LIBOR + 2.250%) 0.000%, 11/14/25(7) | 7,545 | 7,309 | |
| Polyone Corp. Tranche B-5 (1 month LIBOR + 1.750%) 4.137%, 1/30/26 | 2,509 | 2,421 | |
| PQ Corp. Tranche B-1 (3 month LIBOR + 2.500%) 5.027%, 2/8/25 | 24,413 | 23,071 | |
| Starfruit Finco B.V. (1 month LIBOR + 3.250%) 5.599%, 10/1/25 | 46,770 | 44,665 | |
| Trinseo Materials Operating SCA 2018 (1 month LIBOR + 2.000%) 4.522%, 9/6/24 | 9,038 | 8,598 | |
| Tronox Finance LLC | |||
| First Lien (1 month LIBOR + 3.000%) 0.000%, 9/23/24(7) | 17,633 | 17,079 | |
| First Lien (1 month LIBOR + 3.000%) 0.000%, 9/23/24(7) | 7,641 | 7,401 | |
| Par Value | Value | ||
| Chemicals—continued | |||
| Univar USA, Inc. Tranche B-3 (1 month LIBOR + 2.250%) 4.772%, 7/1/24 | $4,175 | $3,985 | |
| Vantage Specialty Chemicals, Inc. | |||
| First Lien (2 month LIBOR + 3.500%) 6.012%, 10/28/24 | 7,424 | 7,133 | |
| Second Lien (3 month LIBOR + 8.250%) 10.777%, 10/27/25 | 7,470 | 7,271 | |
| Venator Materials LLC (1 month LIBOR + 3.000%) 5.522%, 8/8/24 | 5,782 | 5,514 | |
| 378,775 | |||
| Consumer Non-Durables—0.7% | |||
| ABG Intermediate Holdings 2 LLC First Lien (1 month LIBOR + 3.500%) 6.022%, 9/27/24 | 3,364 | 3,196 | |
| American Greetings Corp. (1 month LIBOR + 4.500%) 7.006%, 4/6/24 | 6,433 | 6,312 | |
| Coty, Inc. Tranche A (1 month LIBOR + 1.750%) 4.133%, 4/5/23 | 14,349 | 13,345 | |
| Eastman Kodak Co. (3 month LIBOR + 6.250%) 8.777%, 9/3/19 | 9,006 | 8,458 | |
| HLF Financing S.a.r.l. LLC Tranche B (1 month LIBOR + 3.250%) 5.772%, 8/18/25 | 3,766 | 3,655 | |
| 34,966 | |||
| Energy—4.7% | |||
| Apergy Corp. (1 month LIBOR + 2.500%) 0.000%, 5/9/25(7) | 5,565 | 5,217 | |
| APR Operating LLC Second Lien (1 month LIBOR + 7.000%) 9.522%, 5/27/24 | 8,330 | 8,205 | |
| BCP Raptor II LLC (2 month LIBOR + 4.750%) 7.143%, 11/3/25 | 3,985 | 3,681 | |
| BCP Raptor LLC (2 month LIBOR + 4.250%) 6.869%, 6/24/24 | 10,023 | 9,334 | |
| Blackbrush Oil & Gas LP (3 month LIBOR + 8.000%) 10.890%, 1/29/24 | 12,490 | 12,115 | |
| Blackhawk Mining LLC Tranche B-1 (3 month LIBOR + 10.000%) 12.530%, 2/17/22 | 18,459 | 14,029 | |
| Brookfield WEC Holdings, Inc. | |||
| First Lien (1 month LIBOR + 3.750%) 6.272%, 8/1/25 | 21,200 | 20,492 | |
| Second Lien (1 month LIBOR + 6.750%) 9.272%, 8/3/26 | 1,000 | 975 | |
| California Resources Corp. | |||
| 2016 (1 month LIBOR + 10.375%) 12.897%, 12/31/21 | 13,520 | 13,216 | |
| 2017 (1 month LIBOR + 4.750%) 7.256%, 12/31/22 | 5,840 | 5,645 | |
| Crestwood Holdings LLC (1 month LIBOR + 7.500%) 9.930%, 3/6/23 | 18,896 | 18,094 | |
| EMG Utica LLC (3 month LIBOR + 3.750%) 6.553%, 3/27/20(3) | 18,577 | 18,252 | |
| FTS International, Inc. (1 month LIBOR + 4.750%) 7.272%, 4/16/21 | 8,639 | 8,480 | |
| Gavilan Resources LLC Second Lien (1 month LIBOR + 6.000%) 8.504%, 3/1/24 | 6,258 | 4,740 | |
| Par Value | Value | ||
| Energy—continued | |||
| GIP III Stetson I LP (3 month LIBOR + 4.250%) 6.695%, 7/18/25 | $3,135 | $3,014 | |
| HGIM Corp. (3 month LIBOR + 6.000%) 8.508%, 7/3/23 | 7,128 | 7,074 | |
| KCA Deutag Alpha Ltd. Tranche B (3 month LIBOR + 6.750%) 9.553%, 2/28/23 | 15,880 | 12,736 | |
| Keane Group Holdings LLC (1 month LIBOR + 3.750%) 6.313%, 5/25/25 | 9,204 | 8,422 | |
| McDermott International, Inc. (1 month LIBOR + 5.000%) 7.522%, 5/12/25 | 27,259 | 25,374 | |
| Midcoast Holdings LLC Tranche B (3 month LIBOR + 5.500%) 8.303%, 8/1/25 | 6,918 | 6,699 | |
| Natgasoline LLC (3 month LIBOR + 3.500%) 6.250%, 11/14/25 | 2,935 | 2,869 | |
| Osum Production Corp. (3 month LIBOR + 5.500%) 8.303%, 7/31/20 | 6,490 | 5,646 | |
| Riverstone Utopia Member LLC (1 month LIBOR + 4.250%) 6.754%, 10/17/24 | 3,756 | 3,706 | |
| Seadrill Operating LP (3 month LIBOR + 6.000%) 8.803%, 2/21/21(3) | 15,111 | 11,796 | |
| Sheridan Investment Partners II LP (3 month LIBOR + 3.500%) 6.210%, 12/16/20 | 6,066 | 5,156 | |
| Sheridan Production Partners II-A LP (3 month LIBOR + 3.500%) 6.210%, 12/16/20 | 844 | 717 | |
| Sheridan Production Partners II-M LP (3 month LIBOR + 3.500%) 6.210%, 12/16/20 | 315 | 268 | |
| Traverse Midstream Partners LLC (3 month LIBOR + 4.000%) 6.600%, 9/27/24 | 5,646 | 5,406 | |
| Woodford Express LLC (1 month LIBOR + 5.000%) 7.522%, 1/27/25 | 8,267 | 7,847 | |
| 249,205 | |||
| Financial—6.6% | |||
| Advisor Group, Inc. (1 month LIBOR + 3.750%) 0.000%, 8/15/25(7) | 4,988 | 4,888 | |
| AltiSource Solutions S.a.r.l. Tranche B (3 month LIBOR + 4.000%) 6.803%, 4/3/24 | 17,776 | 17,331 | |
| ASP MCS Acquisition Corp. (1 month LIBOR + 4.750%) 7.272%, 5/20/24 | 2,835 | 2,307 | |
| Asurion LLC | |||
| Tranche B-2, Second Lien (1 month LIBOR + 6.500%) 0.000%, 8/4/25(7) | 45,590 | 44,992 | |
| Tranche B-4 (1 month LIBOR + 3.000%) 5.522%, 8/4/22 | 34,266 | 32,846 | |
| Tranche B-6 (1 month LIBOR + 3.000%) 5.522%, 11/3/23 | 30,731 | 29,386 | |
| Tranche B-7 (1 month LIBOR + 3.000%) 0.000%, 11/3/24(7) | 7,465 | 7,127 | |
| Cetera Financial Group, Inc. | |||
| First Lien (1 month LIBOR + 4.250%) 6.772%, 10/1/25 | 16,750 | 16,261 | |
| Par Value | Value | ||
| Financial—continued | |||
| Second Lien (1 month LIBOR + 8.250%) 10.772%, 10/1/26 | $6,775 | $6,690 | |
| Ditech Holding Corp. Tranche B (1 month LIBOR + 6.000%) 8.522%, 6/30/22 | 23,487 | 20,160 | |
| EVO Payments International LLC First Lien (1 month LIBOR + 3.250%) 5.760%, 12/22/23 | 4,938 | 4,757 | |
| Financial & Risk US Holdings, Inc. (1 month LIBOR + 3.750%) 0.000%, 10/1/25(7) | 25,457 | 24,184 | |
| FinCo I LLC 2018, Tranche B (1 month LIBOR + 2.000%) 4.522%, 12/27/22 | 8,486 | 8,219 | |
| First Eagle Holdings, Inc. (3 month LIBOR + 2.750%) 5.563%, 12/2/24 | 6,500 | 6,382 | |
| Franklin Square Holdings LP (1 month LIBOR + 2.500%) 4.875%, 8/1/25 | 5,626 | 5,429 | |
| Freedom Mortgage Corp. (1 month LIBOR + 4.750%) 0.000%, 2/23/22(7) | 7,260 | 7,151 | |
| Greenhill & Co., Inc. First Lien (3 month LIBOR + 3.750%) 6.468%, 10/12/22 | 5,273 | 5,201 | |
| Invitation Homes Operating Partnership LP (1 month LIBOR + 1.700%) 4.204%, 2/7/22 | 31,767 | 30,337 | |
| iStar, Inc. Tranche B (1 month LIBOR + 2.750%) 5.175%, 6/28/23 | 31,384 | 30,051 | |
| Mitchell International, Inc. | |||
| First Lien (1 month LIBOR + 3.250%) 0.000%, 11/29/24(7) | 9,882 | 9,506 | |
| Second Lien (1 month LIBOR + 7.250%) 9.772%, 12/1/25 | 1,070 | 1,037 | |
| Ocwen Loan Servicing LLC (1 month LIBOR + 5.000%) 0.000%, 12/7/20(7) | 3,976 | 3,897 | |
| Russell Investments US Institutional Holdco, Inc. (1 month LIBOR + 3.250%) 0.000%, 6/1/23(7) | 13,547 | 13,194 | |
| Tempo Acquisition LLC (1 month LIBOR + 3.000%) 0.000%, 5/1/24(7) | 15,493 | 14,796 | |
| VFH Parent LLC Tranche B-2 (3 month LIBOR + 2.750%) 5.554%, 12/30/21 | 4,048 | 3,982 | |
| 350,111 | |||
| Food / Tobacco—2.8% | |||
| Aramark Services, Inc. Tranche B-3 (1 month LIBOR + 1.750%) 4.272%, 3/11/25 | 5,181 | 5,021 | |
| BC Unlimited Liability Co. Tranche B-3 (1 month LIBOR + 2.250%) 4.772%, 2/16/24 | 59,199 | 56,289 | |
| CHG PPC Parent LLC First Lien (1 month LIBOR + 2.750%) 5.272%, 3/31/25 | 3,261 | 3,122 | |
| JBS USA LUX S.A. (3 month LIBOR + 2.500%) 5.260%, 10/30/22 | 31,352 | 30,097 | |
| K-Mac Holdings Corp. Second Lien (1 month LIBOR + 6.750%) 9.254%, 3/16/26 | 1,680 | 1,588 | |
| Par Value | Value | ||
| Food / Tobacco—continued | |||
| NPC International, Inc. Second Lien (1 month LIBOR + 7.500%) 10.022%, 4/18/25 | $1,265 | $1,183 | |
| Panera Bread Co. (1 month LIBOR + 1.750%) 4.250%, 6/13/22 | 42,447 | 40,696 | |
| Post Holdings, Inc. Tranche A (1 month LIBOR + 2.000%) 4.510%, 5/24/24 | 10,449 | 10,049 | |
| Tacala Investment Corp. | |||
| First Lien (1 month LIBOR + 3.250%) 5.772%, 1/31/25 | 486 | 465 | |
| Second Lien (1 month LIBOR + 7.000%) 9.522%, 1/30/26 | 1,685 | 1,613 | |
| 150,123 | |||
| Food and Drug—0.6% | |||
| Albertson’s LLC | |||
| 2017-1, Tranche B-5 (3 month LIBOR + 3.000%) 0.000%, 12/21/22(7) | 6,528 | 6,255 | |
| 2017-1, Tranche B-6 (3 month LIBOR + 3.000%) 5.691%, 6/22/23 | 23,705 | 22,461 | |
| United Natural Foods, Inc. (1 month LIBOR + 4.250%) 6.772%, 10/22/25 | 6,835 | 5,553 | |
| 34,269 | |||
| Forest Prod / Containers—0.7% | |||
| BWay Holding Co. (3 month LIBOR + 3.250%) 0.000%, 4/3/24(7) | 19,017 | 17,844 | |
| Crown Americas LLC Tranche B (1 month LIBOR + 2.000%) 4.479%, 4/3/25 | 4,169 | 4,142 | |
| Flex Acquisition Co., Inc. (1 month LIBOR + 3.000%) 5.349%, 12/29/23 | 7,262 | 6,832 | |
| ProAmpac PG Borrower LLC | |||
| First Lien (3 month LIBOR + 3.500%) 6.049%, 11/20/23 | 6,216 | 5,921 | |
| Second Lien (3 month LIBOR + 8.500%) 11.145%, 11/18/24 | 200 | 200 | |
| 34,939 | |||
| Gaming / Leisure—5.8% | |||
| Aristocrat Technologies, Inc. Tranche B-3 (3 month LIBOR + 1.750%) 4.219%, 10/19/24 | 25,477 | 24,394 | |
| Belmond Interfin Ltd. (1 month LIBOR + 2.750%) 5.272%, 7/3/24 | 8,653 | 8,560 | |
| Caesars Resort Collection LLC Tranche B (1 month LIBOR + 2.750%) 5.272%, 12/23/24 | 20,611 | 19,757 | |
| CEOC LLC Tranche B (1 month LIBOR + 2.000%) 4.522%, 10/6/24 | 11,724 | 11,108 | |
| CityCenter Holdings LLC (1 month LIBOR + 2.250%) 4.772%, 4/18/24 | 12,894 | 12,181 | |
| Eldorado Resorts, Inc. (2 month LIBOR + 2.000%) 4.529%, 4/17/24 | 7,832 | 7,473 | |
| ESH Hospitality, Inc. (1 month LIBOR + 2.000%) 0.000%, 8/30/23(7) | 7,292 | 6,990 | |
| Everi Payments, Inc. Tranche B (1 month LIBOR + 3.000%) 5.522%, 5/9/24 | 20,385 | 19,702 | |
| Par Value | Value | ||
| Gaming / Leisure—continued | |||
| Four Seasons Hotels Ltd. (1 month LIBOR + 2.000%) 4.522%, 11/30/23 | $14,586 | $13,963 | |
| Gateway Casinos & Entertainment Ltd. (3 month LIBOR + 3.000%) 5.803%, 12/1/23 | 4,333 | 4,149 | |
| GLP Capital LP Tranche C (1 month LIBOR + 1.500%) 4.004%, 4/29/21 | 32,061 | 31,540 | |
| Golden Entertainment, Inc. Tranche B, First Lien (1 month LIBOR + 3.000%) 5.530%, 10/21/24 | 5,400 | 5,157 | |
| Greektown Holdings LLC (1 month LIBOR + 2.750%) 5.272%, 4/25/24 | 10,948 | 10,784 | |
| GVC Holdings plc Tranche B-2 (1 month LIBOR + 2.500%) 0.000%, 3/29/24(7) | 4,580 | 4,440 | |
| Hilton Worldwide Finance LLC Tranche B-2 (1 month LIBOR + 1.750%) 4.256%, 10/25/23 | 42,052 | 40,475 | |
| Las Vegas Sands LLC Tranche B (1 month LIBOR + 1.750%) 4.272%, 3/27/25 | 29,886 | 28,470 | |
| Marriott Ownership Resorts, Inc. (1 month LIBOR + 2.250%) 4.772%, 8/29/25 | 3,350 | 3,266 | |
| MGM Growth Properties Operating Partnership LP Tranche B (1 month LIBOR + 2.000%) 4.522%, 3/21/25 | 13,809 | 13,193 | |
| Playa Resorts Holding B.V. (1 month LIBOR + 2.750%) 5.270%, 4/29/24 | 4,735 | 4,411 | |
| Scientific Games International, Inc. Tranche B-5 (2 month LIBOR + 2.750%) 0.000%, 8/14/24(7) | 2,903 | 2,717 | |
| Station Casinos LLC Tranche B (1 month LIBOR + 2.500%) 5.030%, 6/8/23 | 8,976 | 8,598 | |
| VICI Properties 1 LLC Tranche B (1 month LIBOR + 2.000%) 0.000%, 12/20/24(7) | 21,561 | 20,541 | |
| Wynn Resorts Ltd. (1 month LIBOR + 2.250%) 4.780%, 10/30/24 | 8,390 | 7,913 | |
| 309,782 | |||
| Healthcare—8.0% | |||
| AHP Health Partners, Inc. (1 month LIBOR + 4.500%) 7.022%, 6/30/25 | 9,204 | 9,043 | |
| Amneal Pharmaceuticals LLC (1 month LIBOR + 3.500%) 6.063%, 5/4/25 | 7,942 | 7,511 | |
| Bausch Health Companies, Inc. (1 month LIBOR + 3.000%) 5.379%, 6/2/25 | 24,605 | 23,450 | |
| Bausch Health Cos., Inc. (1 month LIBOR + 2.750%) 5.129%, 11/27/25 | 3,190 | 3,020 | |
| Change Healthcare Holdings LLC (1 month LIBOR + 2.750%) 5.272%, 3/1/24 | 41,666 | 39,427 | |
| CHG Healthcare Services, Inc. (3 month LIBOR + 3.000%) 0.000%, 6/7/23(7) | 9,783 | 9,368 | |
| Convatec, Inc. Tranche B (3 month LIBOR + 2.250%) 5.053%, 10/31/23 | 6,687 | 6,448 | |
| Par Value | Value | ||
| Healthcare—continued | |||
| Diplomat Pharmacy, Inc. Tranche B (1 month LIBOR + 4.500%) 7.030%, 12/20/24 | $1,356 | $1,342 | |
| Endo Luxembourg Finance Co. I S.a.r.l. (1 month LIBOR + 4.250%) 0.000%, 4/29/24(7) | 15,204 | 14,368 | |
| Envision Healthcare Corp. (1 month LIBOR + 3.750%) 6.272%, 10/10/25 | 22,740 | 21,140 | |
| Explorer Holdings, Inc. (3 month LIBOR + 3.750%) 6.553%, 5/2/23 | 5,145 | 4,955 | |
| Gentiva Health Services, Inc. | |||
| First Lien (1 month LIBOR + 3.750%) 6.313%, 7/2/25 | 9,666 | 9,352 | |
| Second Lien (1 month LIBOR + 7.000%) 9.563%, 7/2/26 | 2,110 | 2,099 | |
| Greatbatch Ltd. | |||
| Tranche A (1 month LIBOR + 2.500%) 5.010%, 10/27/21 | 4,125 | 4,084 | |
| Tranche B (1 month LIBOR + 3.000%) 5.390%, 10/27/22 | 12,095 | 11,760 | |
| Grifols Worldwide Operations USA, Inc. Tranche B (weekly LIBOR + 2.250%) 0.000%, 1/31/25(7) | 30,204 | 28,924 | |
| HCA, Inc. Tranche B-10 (1 month LIBOR + 2.000%) 4.522%, 3/13/25 | 27,257 | 26,644 | |
| Indivior Finance LLC 2017 (3 month LIBOR + 4.500%) 7.030%, 12/19/22 | 13,608 | 13,245 | |
| Innoviva, Inc. (3 month LIBOR + 4.500%) 7.146%, 8/18/22 | 528 | 525 | |
| Iqvia, Inc. Tranche B-3 (1 month LIBOR + 1.750%) 4.272%, 6/11/25 | 17,253 | 16,617 | |
| IQVIA, Inc. | |||
| Tranche B-1 (3 month LIBOR + 2.000%) 4.803%, 3/7/24 | 2,162 | 2,093 | |
| Tranche B-2 (1 month LIBOR + 2.000%) 4.522%, 1/17/25 | 7,288 | 7,057 | |
| Kindred Healthcare, Inc. (1 month LIBOR + 5.000%) 7.563%, 7/2/25 | 10,010 | 9,309 | |
| Lannett Co., Inc. Tranche A (1 month LIBOR + 5.000%) 7.522%, 11/25/20 | 22,724 | 21,095 | |
| MPH Acquisition Holdings LLC (3 month LIBOR + 2.750%) 5.553%, 6/7/23 | 9,364 | 8,849 | |
| Owens & Minor, Inc. Tranche B (1 month LIBOR + 4.500%) 6.849%, 5/2/25 | 10,958 | 8,383 | |
| PharMerica Corp. | |||
| First Lien (1 month LIBOR + 3.500%) 5.955%, 12/6/24 | 2,084 | 1,984 | |
| Second Lien (1 month LIBOR + 7.750%) 10.205%, 12/5/25 | 1,695 | 1,602 | |
| RPI Finance Trust | |||
| Tranche A-4 (1 month LIBOR + 1.500%) 4.022%, 5/4/22 | 10,062 | 9,817 | |
| Tranche B-6 (1 month LIBOR + 2.000%) 4.522%, 3/27/23 | 41,112 | 39,681 | |
| Sound Inpatient Physicians Holdings LLC | |||
| First Lien (1 month LIBOR + 2.750%) 5.272%, 6/27/25 | 3,318 | 3,179 | |
| Second Lien (1 month LIBOR + 6.750%) 9.272%, 6/26/26 | 840 | 806 | |
| Par Value | Value | ||
| Healthcare—continued | |||
| Syneos Health, Inc. | |||
| Tranche A (1 month LIBOR + 1.500%) 4.022%, 8/1/22 | $23,131 | $22,437 | |
| Tranche B (1 month LIBOR + 2.000%) 4.522%, 8/1/24 | 6,005 | 5,783 | |
| Team Health Holdings, Inc. (1 month LIBOR + 2.750%) 5.272%, 2/6/24 | 15,035 | 13,400 | |
| U.S. Renal Care, Inc. First Lien (3 month LIBOR + 4.250%) 7.053%, 12/30/22 | 7,107 | 6,748 | |
| Zotec Partners LLC (1 month LIBOR + 5.000%) 7.510%, 2/14/24 | 9,002 | 8,642 | |
| 424,187 | |||
| Housing—4.2% | |||
| American Builders & Contractors Supply Co., Inc. Tranche B-2 (1 month LIBOR + 2.000%) 4.522%, 10/31/23 | 13,723 | 13,027 | |
| Brookfield Property Reit, Inc. | |||
| Tranche A-2 (1 month LIBOR + 2.250%) 4.772%, 8/28/23 | 7,018 | 6,831 | |
| Tranche B (1 month LIBOR + 2.500%) 5.022%, 8/27/25 | 67,010 | 63,010 | |
| Canam Steel Corp. (1 month LIBOR + 5.000%) 7.506%, 7/1/24 | 12,259 | 11,952 | |
| Capital Automotive LP | |||
| 2017, Tranche B-2 (1 month LIBOR + 2.500%) 0.000%, 3/25/24(7) | 35,821 | 34,334 | |
| Tranche B, Second Lien (1 month LIBOR + 6.000%) 8.522%, 3/24/25 | 37,441 | 36,856 | |
| DTZ US Borrower LLC (1 month LIBOR + 3.250%) 5.772%, 8/21/25 | 22,553 | 21,539 | |
| Installed Building Products, Inc. Tranche B-2 (1 month LIBOR + 2.500%) 5.022%, 4/15/25 | 7,933 | 7,586 | |
| Realogy Group LLC | |||
| 2025 (1 month LIBOR + 2.250%) 4.705%, 2/7/25 | 3,305 | 3,123 | |
| Tranche A (1 month LIBOR + 2.250%) 4.705%, 2/8/23 | 17,128 | 16,443 | |
| Summit Materials LLC Tranche B (1 month LIBOR + 2.000%) 4.522%, 11/21/24 | 7,110 | 6,805 | |
| 221,506 | |||
| Information Technology—7.1% | |||
| Applied Systems, Inc. First Lien (1 month LIBOR + 3.000%) 5.522%, 9/19/24 | 5,385 | 5,121 | |
| Avaya, Inc. Tranche B (2 month LIBOR + 4.250%) 6.701%, 12/15/24 | 22,935 | 22,104 | |
| Barracuda Networks, Inc. | |||
| First Lien (1 month LIBOR + 3.250%) 5.720%, 2/12/25 | 4,398 | 4,175 | |
| Second Lien (1 month LIBOR + 7.250%) 9.720%, 1/9/26 | 835 | 785 | |
| Blackboard, Inc. Tranche B-4 (3 month LIBOR + 5.000%) 7.445%, 6/30/21 | 2,597 | 2,401 | |
| Brave Parent Holdings, Inc. (1 month LIBOR + 4.000%) 6.522%, 4/18/25 | 3,940 | 3,792 | |
| Par Value | Value | ||
| Information Technology—continued | |||
| Ciena Corp. 2018 (1 month LIBOR + 2.000%) 4.470%, 9/26/25 | $4,195 | $4,017 | |
| Dell International LLC | |||
| Tranche A-2 (1 month LIBOR + 1.750%) 4.280%, 9/7/21 | 10,407 | 10,092 | |
| Tranche B (1 month LIBOR + 2.000%) 4.530%, 9/7/23 | 56,988 | 54,661 | |
| DigiCert Holdings, Inc. | |||
| First Lien (1 month LIBOR + 4.000%) 6.522%, 10/31/24 | 3,365 | 3,287 | |
| Second Lien (1 month LIBOR + 8.000%) 10.522%, 10/31/25 | 3,392 | 3,279 | |
| Dynatrace LLC First Lien (1 month LIBOR + 3.250%) 5.772%, 8/22/25 | 5,125 | 4,952 | |
| ECI Macola First Lien (3 month LIBOR + 4.250%) 7.063%, 9/27/24 | 1,847 | 1,810 | |
| EIG Investors Corp. 2018 (3 month LIBOR + 3.750%) 6.441%, 2/9/23 | 12,382 | 11,959 | |
| Ensono LP First Lien (1 month LIBOR + 5.250%) 0.000%, 6/27/25(7) | 4,461 | 4,368 | |
| Finastra USA, Inc. Second Lien (3 month LIBOR + 7.250%) 10.053%, 6/13/25 | 2,540 | 2,331 | |
| Gartner, Inc. Tranche A (1 month LIBOR + 1.500%) 4.022%, 3/21/22 | 3,447 | 3,361 | |
| Gigamon, Inc. First Lien (3 month LIBOR + 4.250%) 7.053%, 12/27/24 | 5,292 | 5,186 | |
| Help Systems Holdings, Inc. First Lien (1 month LIBOR + 3.750%) 6.272%, 3/28/25 | 9,517 | 9,113 | |
| Internap Corp. (1 month LIBOR + 5.750%) 8.190%, 4/6/22 | 6,260 | 6,009 | |
| IPC Corp. Tranche B-1, First Lien (3 month LIBOR + 4.500%) 7.027%, 8/6/21 | 430 | 368 | |
| Iron Mountain Information Management LLC Tranche B (1 month LIBOR + 1.750%) 4.272%, 1/2/26 | 8,322 | 7,892 | |
| KeyW Corp. (The) First Lien (1 month LIBOR + 4.500%) 6.887%, 5/8/24 | 2,316 | 2,279 | |
| Lionbridge Technologies, Inc. First Lien (1 month LIBOR + 5.500%) 8.022%, 2/6/24 | 4,915 | 4,872 | |
| MA Financeco LLC | |||
| Tranche B-2 (1 month LIBOR + 2.250%) 4.772%, 11/19/21 | 3,343 | 3,176 | |
| Tranche B-3 (1 month LIBOR + 2.500%) 5.022%, 6/21/24 | 1,370 | 1,273 | |
| Mavenir Systems, Inc. (1 month LIBOR + 6.000%) 8.390%, 5/8/25 | 9,089 | 9,016 | |
| MaxLinear, Inc. Tranche B Loan (1 month LIBOR + 2.500%) 4.955%, 5/12/24 | 2,836 | 2,694 | |
| McAfee LLC Tranche B (1 month LIBOR + 3.750%) 6.272%, 9/30/24 | 15,562 | 15,102 | |
| Microchip Technology, Inc. (1 month LIBOR + 2.000%) 4.530%, 5/29/25 | 5,277 | 4,991 | |
| Peak 10 Holding Corp. | |||
| First Lien (3 month LIBOR + 3.500%) 6.303%, 8/1/24 | 9,588 | 8,693 | |
| Second Lien (3 month LIBOR + 7.250%) 9.791%, 8/1/25 | 1,620 | 1,444 | |
| Par Value | Value | ||
| Information Technology—continued | |||
| Presidio LLC (3 month LIBOR + 2.750%) 5.148%, 2/2/24 | $8,805 | $8,438 | |
| Rackspace Hosting, Inc. Tranche B, First Lien (3 month LIBOR + 3.000%) 5.582%, 11/3/23 | 15,431 | 13,580 | |
| Sahara Parent, Inc. Tranche B, First Lien (1 month LIBOR + 4.500%) 7.022%, 8/16/24 | 3,308 | 3,263 | |
| Salient CRGT, Inc. (1 month LIBOR + 5.750%) 8.272%, 2/28/22 | 7,884 | 7,687 | |
| Science Applications International Corp. Tranche B (1 month LIBOR + 1.750%) 0.000%, 10/31/25(7) | 8,109 | 7,723 | |
| SCS Holdings I, Inc. Tranche B, First Lien (1 month LIBOR + 4.250%) 6.772%, 10/30/22 | 6,758 | 6,648 | |
| Seattle Escrow Borrower LLC (1 month LIBOR + 2.500%) 5.022%, 6/21/24 | 9,251 | 8,596 | |
| SolarWinds Holdings, Inc. 2018 (1 month LIBOR + 2.750%) 0.000%, 2/5/24(7) | 10,847 | 10,409 | |
| Solera LLC (1 month LIBOR + 2.750%) 5.272%, 3/3/23(5) | 10,787 | 10,147 | |
| SS&C Technologies, Inc. | |||
| 2017, Trance B-1 (1 month LIBOR + 2.250%) 4.772%, 7/8/22 | 2,605 | 2,527 | |
| Tranche B-3 (1 month LIBOR + 2.250%) 0.000%, 4/16/25(7) | 6,867 | 6,464 | |
| Tranche B-4 (1 month LIBOR + 2.250%) 0.000%, 4/16/25(7) | 2,605 | 2,452 | |
| Tranche B-5 (1 month LIBOR + 2.250%) 4.772%, 4/16/25 | 4,593 | 4,326 | |
| SuperMoose Borrower LLC First Lien (1 month LIBOR + 3.750%) 6.272%, 8/29/25 | 7,535 | 7,356 | |
| Symantec Corp. | |||
| Tranche A-2 (1 month LIBOR + 1.500%) 4.063%, 8/1/19 | 11,585 | 11,447 | |
| Tranche A-5 (1 month LIBOR + 1.750%) 4.260%, 8/1/21 | 7,096 | 6,995 | |
| TierPoint LLC First Lien (1 month LIBOR + 3.750%) 6.272%, 5/6/24 | 6,220 | 5,794 | |
| Ultra Clean Holdings, Inc. Tranche B (3 month PRIME + 3.500%) 9.000%, 8/27/25 | 6,900 | 6,520 | |
| Vertiv Group Corp. Tranche B (3 month LIBOR + 4.000%) 6.707%, 11/30/23 | 13,441 | 12,164 | |
| Western Digital Corp. Tranche B-4 (1 month LIBOR + 1.750%) 4.256%, 4/29/23 | 8,220 | 7,823 | |
| 374,962 | |||
| Manufacturing—1.5% | |||
| Big River Steel LLC (3 month LIBOR + 5.000%) 7.803%, 8/15/23 | 9,055 | 8,942 | |
| Brand Energy & Infrastructure Services, Inc. (3 month LIBOR + 4.250%) 0.000%, 6/21/24(7) | 8,098 | 7,672 | |
| Par Value | Value | ||
| Manufacturing—continued | |||
| Bright Bidco B.V. 2018, Tranche B (3 month LIBOR + 3.500%) 6.212%, 6/30/24 | $10,913 | $9,113 | |
| Clark Equipment Co. Tranche B (3 month LIBOR + 2.000%) 4.803%, 5/18/24 | 7,055 | 6,702 | |
| CPM Holdings, Inc. First Lien (2 month LIBOR + 3.750%) 6.272%, 11/15/25 | 5,875 | 5,750 | |
| Dynacast International LLC Tranche B-1, First Lien (3 month LIBOR + 3.250%) 5.772%, 1/28/22 | 7,288 | 6,905 | |
| Excelitas Technologies Corp. | |||
| First Lien (3 month LIBOR + 3.500%) 6.303%, 12/2/24 | 2,479 | 2,386 | |
| Second Lien (1 month LIBOR + 7.500%) 9.849%, 12/1/25 | 1,260 | 1,194 | |
| Gates Global LLC Tranche B-2 (1 month LIBOR + 2.750%) 5.272%, 4/1/24 | 22,998 | 21,798 | |
| Southwire Co. LLC (1 month LIBOR + 2.000%) 4.455%, 5/15/25 | 3,313 | 3,255 | |
| TecoStar Holdings, Inc. 2017, First Lien (1 month LIBOR + 3.500%) 5.887%, 5/1/24 | 7,949 | 7,611 | |
| 81,328 | |||
| Media / Telecom - Broadcasting—1.7% | |||
| CBS Radio, Inc. Tranche B-1 (1 month LIBOR + 2.750%) 5.256%, 11/18/24 | 11,646 | 10,947 | |
| Gray Television, Inc. Tranche C (3 month LIBOR + 2.500%) 0.000%, 11/2/25(7) | 15,105 | 14,566 | |
| Mission Broadcasting, Inc. Tranche B-3 (1 month LIBOR + 2.250%) 4.756%, 1/17/24 | 2,139 | 2,020 | |
| Nexstar Broadcasting, Inc. | |||
| Tranche A-4 (1 month LIBOR + 1.750%) 4.256%, 10/26/23 | 9,794 | 9,451 | |
| Tranche B-3 (1 month LIBOR + 2.250%) 4.756%, 1/17/24 | 12,341 | 11,657 | |
| Quincy Newspapers, Inc. Tranche B (3 month PRIME + 2.000%) 5.537%, 11/2/22 | 3,866 | 3,789 | |
| Tribune Media Co. | |||
| Tranche B (1 month LIBOR + 3.000%) 5.522%, 12/27/20 | 1,038 | 1,028 | |
| Tranche C (1 month LIBOR + 3.000%) 5.522%, 1/26/24 | 12,932 | 12,666 | |
| Univision Communications, Inc. 2017 (1 month LIBOR + 2.750%) 5.272%, 3/15/24 | 26,735 | 24,140 | |
| WXXA-TV LLC Tranche A-4 (3 month LIBOR + 1.750%) 4.256%, 10/20/23 | 271 | 262 | |
| 90,526 | |||
| Media / Telecom - Cable/Wireless Video—8.8% | |||
| Charter Communications Operating LLC Tranche B (1 month LIBOR + 2.000%) 4.530%, 4/30/25 | 74,468 | 71,219 | |
| Par Value | Value | ||
| Media / Telecom - Cable/Wireless Video—continued | |||
| Cogeco Communications (USA) II LP Tranche B (1 month LIBOR + 2.375%) 4.897%, 1/3/25 | $24,114 | $22,768 | |
| Coral US Co-Borrower LLC Tranche B-4 (1 month LIBOR + 3.250%) 5.772%, 2/2/26 | 39,340 | 37,851 | |
| CSC Holdings LLC | |||
| 2017 (1 month LIBOR + 2.250%) 4.705%, 7/17/25 | 15,415 | 14,590 | |
| 2018 (1 month LIBOR + 2.500%) 4.955%, 1/25/26 | 5,791 | 5,542 | |
| Intelsat Jackson Holdings S.A. | |||
| Tranche B-3 (1 month LIBOR + 3.750%) 6.256%, 11/27/23 | 29,715 | 28,707 | |
| Tranche B-4 (1 month LIBOR + 4.500%) 7.006%, 1/2/24 | 2,980 | 2,953 | |
| Tranche B-5 6.625%, 1/2/24(8) | 12,550 | 12,330 | |
| Liberty Cablevision of Puerto Rico LLC | |||
| Second Lien (3 month LIBOR + 6.750%) 5.750%, 7/7/23 | 5,140 | 4,780 | |
| Tranche B, First Lien (3 month LIBOR + 3.500%) 5.936%, 1/7/22 | 19,931 | 19,047 | |
| MCC Iowa LLC Tranche M (weekly LIBOR + 2.000%) 4.420%, 1/15/25 | 2,746 | 2,632 | |
| Mediacom Illinois LLC Tranche N (weekly LIBOR + 1.750%) 4.170%, 2/15/24 | 7,602 | 7,234 | |
| Quebecor Media, Inc. Tranche B-1 (3 month LIBOR + 2.250%) 4.866%, 8/17/20 | 29,077 | 28,592 | |
| Radiate Holdco LLC (1 month LIBOR + 3.000%) 5.522%, 2/1/24 | 12,173 | 11,456 | |
| Telenet Financing USD LLC (1 month LIBOR + 2.250%) 4.705%, 8/15/26 | 17,050 | 16,186 | |
| Unitymedia Finance LLC Tranche D, First Lien (1 month LIBOR + 2.250%) 4.705%, 1/15/26 | 7,435 | 7,163 | |
| UnityMedia Hessen GmbH & Co. KG Tranche B (1 month LIBOR + 2.250%) 4.705%, 9/30/25 | 24,955 | 24,057 | |
| UPC Financing Partnership (1 month LIBOR + 2.500%) 0.000%, 1/15/26(7) | 15,636 | 14,842 | |
| Virgin Media Bristol LLC (1 month LIBOR + 2.500%) 4.955%, 1/15/26 | 37,345 | 35,287 | |
| WideOpenWest Finance LLC Tranche B (1 month LIBOR + 3.250%) 5.720%, 8/18/23 | 28,952 | 26,745 | |
| Ziggo Secured Finance Partnership Tranche E (1 month LIBOR + 2.500%) 4.955%, 4/15/25 | 79,360 | 74,598 | |
| 468,579 | |||
| Media / Telecom - Diversified Media—6.4% | |||
| Alliance Data Systems Corp. 2017 (1 month LIBOR + 1.750%) 4.272%, 6/14/22 | 13,153 | 12,759 | |
| ALM Media LLC Tranche B, First Lien (3 month LIBOR + 4.500%) 7.303%, 7/31/20 | 1,018 | 893 | |
| Par Value | Value | ||
| Media / Telecom - Diversified Media—continued | |||
| Alpha Topco Ltd. 2018, Tranche B-3 (1 month LIBOR + 2.500%) 5.022%, 2/1/24 | $3,088 | $2,913 | |
| AP NMT Acquisition B.V. Tranche B, First Lien (3 month LIBOR + 5.750%) 8.148%, 8/13/21 | 18,003 | 17,219 | |
| Creative Artists Agency LLC (1 month LIBOR + 3.000%) 5.470%, 2/15/24 | 14,107 | 13,578 | |
| Crown Finance US, Inc. (1 month LIBOR + 2.500%) 5.022%, 2/28/25 | 29,060 | 27,414 | |
| Deluxe Entertainment Services Group, Inc. (3 month LIBOR + 5.500%) 8.027%, 2/28/20 | 19,502 | 16,934 | |
| Donnelley Financial Solutions, Inc. 2017 (weekly LIBOR + 3.000%) 5.420%, 9/29/23 | 946 | 923 | |
| Harland Clarke Holdings Corp. (3 month LIBOR + 4.750%) 7.553%, 11/3/23 | 111,332 | 100,226 | |
| Lamar Media Corp. Tranche B (1 month LIBOR + 1.750%) 4.313%, 3/14/25 | 7,409 | 7,193 | |
| Lions Gate Capital Holdings LLC | |||
| Tranche A (1 month LIBOR + 1.750%) 4.272%, 3/24/25 | 9,950 | 9,558 | |
| Tranche B (1 month LIBOR + 2.250%) 4.772%, 3/24/25 | 22,431 | 21,547 | |
| Meredith Corp. Tranche B-1 (1 month LIBOR + 2.750%) 5.272%, 1/31/25 | 11,769 | 11,406 | |
| Merrill Communications LLC (3 month LIBOR + 5.250%) 7.777%, 6/1/22 | 4,702 | 4,679 | |
| MH Sub I LLC | |||
| First Lien (1 month LIBOR + 3.750%) 6.254%, 9/15/24 | 15,708 | 14,864 | |
| Tranche B, Second Lien (1 month LIBOR + 7.500%) 10.004%, 9/15/25 | 1,695 | 1,542 | |
| Nielsen Finance LLC Tranche B-4 (1 month LIBOR + 2.000%) 4.387%, 10/4/23 | 15,996 | 15,496 | |
| Rovi Solutions Corp. Tranche B (1 month LIBOR + 2.500%) 5.030%, 7/2/21 | 3,451 | 3,283 | |
| RR Donnelley & Sons Co. Tranche B (1 month LIBOR + 5.000%) 7.506%, 1/15/24 | 6,370 | 6,227 | |
| William Morris Endeavor Entertainment LLC Tranche B-1 (3 month LIBOR + 2.750%) 5.280%, 5/18/25 | 52,074 | 47,713 | |
| 336,367 | |||
| Media / Telecom - Telecommunications—6.2% | |||
| Altice Financing S.A. | |||
| 2017 (1 month LIBOR + 2.750%) 5.220%, 7/15/25 | 11,234 | 10,600 | |
| 2017 (1 month LIBOR + 2.750%) 5.220%, 1/31/26 | 13,078 | 12,048 | |
| C1 Holdings Corp. (1 month LIBOR + 3.750%) 6.272%, 4/10/25 | 5,358 | 5,310 | |
| Par Value | Value | ||
| Media / Telecom - Telecommunications—continued | |||
| CenturyLink, Inc. Tranche B (1 month LIBOR + 2.750%) 5.272%, 1/31/25 | $85,026 | $79,159 | |
| Colorado Buyer, Inc. | |||
| First Lien (1 month LIBOR + 3.000%) 5.380%, 5/1/24 | 2,309 | 2,205 | |
| Second Lien (1 month LIBOR + 7.250%) 9.630%, 5/1/25 | 2,400 | 2,196 | |
| Gannett Co., Inc. | |||
| (3 month LIBOR + 0.500%) 1.594%, 6/29/20(5) | 1,600 | 1,568 | |
| (3 month LIBOR + 0.500%) 1.594%, 6/29/20(5)(9) | 3,400 | 3,332 | |
| Level 3 Financing, Inc. 2024, Tranche B (1 month LIBOR + 2.250%) 4.754%, 2/22/24 | 79,125 | 74,971 | |
| Neustar, Inc. | |||
| Second Lien (1 month LIBOR + 8.000%) 10.522%, 8/8/25 | 2,749 | 2,681 | |
| Tranche B-3 (1 month LIBOR + 2.500%) 5.022%, 1/8/20 | 5,491 | 5,425 | |
| Tranche B-4, First Lien (1 month LIBOR + 3.500%) 6.022%, 8/8/24 | 8,970 | 8,599 | |
| New LightSquared LLC | |||
| (3 month LIBOR + 8.750%) 11.067%, 6/15/20 | 12,127 | 8,337 | |
| Second Lien (3 month LIBOR + 12.500%) 15.270%, 12/7/20 | 4,972 | 975 | |
| Numericable U.S. LLC | |||
| Tranche B-11 (1 month LIBOR + 2.750%) 5.272%, 7/31/25 | 34,721 | 31,700 | |
| Tranche B-12 (1 month LIBOR + 3.688%) 6.143%, 1/31/26 | 25,986 | 24,063 | |
| Tranche B-13 (1 month LIBOR + 4.000%) 6.455%, 8/14/26 | 22,960 | 21,640 | |
| West Corp. | |||
| Tranche B (3 month LIBOR + 4.000%) 6.527%, 10/10/24 | 14,191 | 12,994 | |
| Tranche B-1 (3 month LIBOR + 3.500%) 6.027%, 10/10/24 | 5,776 | 5,268 | |
| Zacapa LLC (3 month LIBOR + 5.000%) 7.803%, 7/2/25 | 9,082 | 8,938 | |
| Zayo Group LLC 2017, Tranche B-2 (1 month LIBOR + 2.250%) 4.772%, 1/19/24 | 6,999 | 6,687 | |
| 328,696 | |||
| Media / Telecom - Wireless Communications—0.4% | |||
| Sprint Communications, Inc. (1 month LIBOR + 2.500%) 5.063%, 2/2/24 | 22,553 | 21,407 | |
| Metals / Minerals—2.4% | |||
| American Rock Salt Co. LLC 2018 (1 month LIBOR + 3.750%) 6.272%, 3/21/25 | 4,496 | 4,350 | |
| Atkore International, Inc. First Lien (3 month LIBOR + 2.750%) 5.560%, 12/22/23 | 24,848 | 24,020 | |
| CNX Resources Corp. Tranche B (1 month LIBOR + 6.000%) 8.530%, 11/28/22 | 7,177 | 7,231 | |
| Par Value | Value | ||
| Metals / Minerals—continued | |||
| Contura Energy, Inc. (1 month LIBOR + 5.000%) 7.387%, 11/10/25 | $10,560 | $10,428 | |
| Covia Holdings Corp. (3 month LIBOR + 3.750%) 6.553%, 6/1/25 | 12,681 | 9,130 | |
| Global Brass and Copper, Inc. Tranche B (1 month LIBOR + 2.500%) 5.063%, 5/29/25 | 4,137 | 3,982 | |
| GrafTech Finance, Inc. (1 month LIBOR + 3.500%) 6.022%, 2/12/25 | 31,044 | 29,337 | |
| Metallurg, Inc. (2 month LIBOR + 3.000%) 0.000%, 2/1/25(7) | 8,339 | 8,058 | |
| TMS International Corp. Tranche B-2 (3 month LIBOR + 2.750%) 5.275%, 8/14/24 | 4,535 | 4,263 | |
| U.S. Silica Co. | |||
| (1 month LIBOR + 4.000%) 6.563%, 5/1/25 | 19,369 | 16,875 | |
| (3 month LIBOR + 0.500%) 0.500%, 5/1/23(9) | 2,250 | 1,868 | |
| Zekelman Industries, Inc. (2 month LIBOR + 2.250%) 4.862%, 6/14/21 | 7,043 | 6,789 | |
| 126,331 | |||
| Retail—2.2% | |||
| Ascena Retail Group, Inc. Tranche B (1 month LIBOR + 4.500%) 7.063%, 8/19/22 | 6,603 | 6,125 | |
| ASHCO LLC (1 month LIBOR + 5.000%) 7.522%, 9/25/24 | 13,882 | 13,251 | |
| Belk, Inc. (3 month LIBOR + 4.750%) 7.365%, 12/12/22 | 10,216 | 8,215 | |
| CWGS Group LLC (1 month LIBOR + 2.750%) 5.129%, 11/8/23 | 12,769 | 11,503 | |
| Hudsons Bay Co. Tranche B (1 month LIBOR + 3.250%) 5.756%, 9/30/22 | 17,375 | 16,832 | |
| J. Crew Group, Inc. (3 month LIBOR + 3.220%) 5.977%, 3/5/21 | 5,830 | 4,573 | |
| J.C. Penney Corp., Inc. Tranche B (3 month LIBOR + 4.250%) 6.956%, 6/23/23 | 16,386 | 13,928 | |
| Neiman Marcus Group Ltd. LLC (1 month LIBOR + 3.250%) 5.630%, 10/25/20(3) | 10,387 | 8,748 | |
| PetSmart, Inc. Tranche B-2 (1 month LIBOR + 3.000%) 0.000%, 3/11/22(7) | 7,506 | 5,911 | |
| Toys R Us-Delaware, Inc. | |||
| Tranche B-3 (3 month PRIME + 2.750%) 0.000%, 5/25/18(10) | 1,678 | 822 | |
| Tranche B-4 (3 month PRIME + 7.750%) 7.750%, 4/24/20(10) | 19,051 | 9,144 | |
| Toys R Us Property Co. I LLC (1 month LIBOR + 5.000%) 7.522%, 8/21/19(10) | 19,785 | 17,114 | |
| 116,166 | |||
| Service—6.5% | |||
| Adtalem Global Education, Inc. Tranche B (1 month LIBOR + 3.000%) 5.522%, 4/9/25 | 5,572 | 5,451 | |
| Par Value | Value | ||
| Service—continued | |||
| AECOM Tranche B (1 month LIBOR + 1.750%) 4.256%, 2/21/25 | $8,501 | $8,092 | |
| American Teleconferencing Services Ltd. (3 month LIBOR + 6.500%) 9.091%, 12/8/21 | 2,165 | 1,786 | |
| Ascend Learning LLC (1 month LIBOR + 3.000%) 5.522%, 7/12/24 | 6,594 | 6,215 | |
| Capri Acquisitions BidCo Ltd. (3 month LIBOR + 3.250%) 5.777%, 11/1/24 | 4,164 | 3,935 | |
| Conduent Business Services LLC Tranche B (1 month LIBOR + 2.500%) 5.022%, 12/7/23 | 9,273 | 8,792 | |
| DG Investment Intermediate Holdings 2, Inc. | |||
| First Lien (1 month LIBOR + 3.000%) 5.522%, 2/3/25 | 4,966 | 4,693 | |
| Second Lien (1 month LIBOR + 6.750%) 9.272%, 2/1/26 | 845 | 794 | |
| Edelman Financial Center LLC (The) First Lien (3 month LIBOR + 3.250%) 5.686%, 7/21/25 | 9,265 | 8,901 | |
| Exela Intermediate LLC 2018 (3 month LIBOR + 6.500%) 9.377%, 7/12/23 | 7,096 | 6,990 | |
| First Data Corp. | |||
| 2022, Tranche D (1 month LIBOR + 2.000%) 4.504%, 7/8/22 | 5,734 | 5,497 | |
| 2023, Tranche A (3 month LIBOR + 1.500%) 0.000%, 10/26/23(7) | 11,835 | 10,888 | |
| 2024, Tranche A (1 month LIBOR + 2.000%) 4.504%, 4/26/24 | 40,402 | 38,503 | |
| FleetCor Technologies Operating Co. LLC Tranche B-3, First Lien (1 month LIBOR + 2.000%) 4.522%, 8/2/24 | 8,270 | 8,043 | |
| Forest City Enterprises LP (3 month LIBOR + 4.000%) 0.000%, 12/8/25(7) | 5,442 | 5,296 | |
| Frontdoor, Inc. (1 month LIBOR + 2.500%) 5.063%, 8/16/25 | 2,923 | 2,806 | |
| GFL Environmental, Inc. 2018 (1 month LIBOR + 3.000%) 5.522%, 5/30/25 | 16,645 | 15,488 | |
| Global Payments, Inc. Tranche B-4 (1 month LIBOR + 1.750%) 4.272%, 10/17/25 | 4,190 | 3,984 | |
| iQor US Inc Tranche B, First Lien (3 month LIBOR + 5.000%) 7.398%, 4/1/21 | 24,050 | 21,505 | |
| Monitronics International, Inc. Tranche B-2 (3 month LIBOR + 5.500%) 0.000%, 9/30/22(7) | 1,557 | 1,376 | |
| National Intergovernmental Purchasing Alliance Co. | |||
| First Lien (3 month LIBOR + 3.750%) 6.553%, 5/23/25 | 5,731 | 5,559 | |
| Second Lien (3 month LIBOR + 7.500%) 10.303%, 5/22/26 | 3,375 | 3,274 | |
| Octavia Holdco, Inc. Tranche B (3 month LIBOR + 2.250%) 5.042%, 3/20/25 | 2,481 | 2,429 | |
| Pearl Intermediate Parent LLC Second Lien (1 month LIBOR + 6.250%) 8.754%, 2/13/26 | 420 | 414 | |
| Par Value | Value | ||
| Service—continued | |||
| Pi US Mergerco, Inc. Tranche B-1 (1 month LIBOR + 3.500%) 6.022%, 1/3/25 | $11,984 | $11,565 | |
| PricewaterhouseCoopers Public Sector LLP (1 month LIBOR + 3.000%) 5.522%, 5/1/25 | 7,836 | 7,542 | |
| Prime Security Services Borrower LLC Tranche B-1 (1 month LIBOR + 2.750%) 5.272%, 5/2/22 | 9,022 | 8,580 | |
| R1 RCM, Inc. (1 month LIBOR + 5.250%) 7.772%, 5/8/25 | 4,572 | 4,503 | |
| Red Ventures LLC Tranche B-1, First Lien (1 month LIBOR + 3.000%) 5.522%, 11/8/24 | 32,125 | 30,519 | |
| Resideo Funding, Inc. Tranche B (3 month LIBOR + 2.000%) 4.490%, 10/24/25 | 2,515 | 2,427 | |
| Sedgwick Claims Management Services, Inc. (3 month LIBOR + 3.250%) 0.000%, 11/6/25(7) | 27,270 | 25,986 | |
| SGS Cayman LP (3 month LIBOR + 5.375%) 8.178%, 4/23/21 | 2,892 | 2,712 | |
| St. George’s University Scholastic Services LLC | |||
| (1 month LIBOR + 3.500%) 6.030%, 7/17/25 | 4,741 | 4,611 | |
| (3 month LIBOR + 3.500%) 3.500%, 7/17/25(9) | 1,484 | 1,443 | |
| Sutherland Global Services, Inc. (3 month LIBOR + 5.375%) 8.178%, 4/23/21 | 12,428 | 11,651 | |
| TKC Holdings, Inc. | |||
| First Lien (1 month LIBOR + 3.750%) 6.280%, 2/1/23 | 5,237 | 4,965 | |
| Second Lien (1 month LIBOR + 8.000%) 10.530%, 2/1/24 | 2,172 | 2,128 | |
| Trans Union LLC | |||
| 2017, Tranche B-3 (1 month LIBOR + 2.000%) 4.522%, 4/10/23 | 6,186 | 5,938 | |
| 2018, Tranche B-4 (1 month LIBOR + 2.000%) 4.522%, 6/19/25 | 4,905 | 4,721 | |
| Tunnel Hill Partners LP Tranche B, First Lien (3 month LIBOR + 3.500%) 0.000%, 10/1/25(7) | 5,235 | 5,143 | |
| United Rentals, Inc. (1 month LIBOR + 1.750%) 0.000%, 10/31/25(7) | 2,698 | 2,636 | |
| Vantiv LLC Tranche B-4 (1 month LIBOR + 1.750%) 4.190%, 8/9/24 | 9,156 | 8,763 | |
| Ventia Deco LLC 2017, Tranche B (3 month LIBOR + 3.500%) 6.303%, 5/20/22 | 2,892 | 2,805 | |
| Weight Watchers International, Inc. (3 month LIBOR + 4.750%) 7.560%, 11/29/24 | 17,532 | 17,284 | |
| 346,633 | |||
| Transportation - Automotive—1.9% | |||
| American Axle & Manufacturing, Inc. Tranche B (3 month LIBOR + 2.250%) 4.752%, 4/6/24 | 9,954 | 9,394 | |
| Autokiniton US Holdings, Inc. Tranche B (1 month LIBOR + 4.000%) 6.506%, 5/22/25 | 4,975 | 4,826 | |
| Par Value | Value | ||
| Transportation - Automotive—continued | |||
| CH Hold Corp. First Lien (1 month LIBOR + 3.000%) 5.522%, 2/1/24 | $7,507 | $7,406 | |
| Dana, Inc. Tranche B (3 month LIBOR + 2.250%) 0.000%, 11/14/25(7) | 9,470 | 9,067 | |
| DexKo Global, Inc. Tranche B (1 month LIBOR + 3.500%) 6.022%, 7/24/24 | 4,965 | 4,787 | |
| Holley Purchaser, Inc. First Lien (3 month LIBOR + 5.000%) 7.508%, 10/24/25 | 4,190 | 4,085 | |
| K & N Parent, Inc. Second Lien (1 month LIBOR + 8.750%) 11.272%, 10/21/24 | 848 | 797 | |
| Navistar Financial Corp. (1 month LIBOR + 3.750%) 6.313%, 7/30/25 | 7,506 | 7,168 | |
| Navistar, Inc. Tranche B (1 month LIBOR + 3.500%) 5.890%, 11/6/24 | 9,106 | 8,765 | |
| Superior Industries International, Inc. (1 month LIBOR + 4.000%) 0.000%, 5/22/24(7) | 8,023 | 7,582 | |
| Tenneco, Inc. Tranche B (1 month LIBOR + 2.750%) 5.272%, 10/1/25 | 15,845 | 14,847 | |
| Tower Automotive Holdings USA LLC (1 month LIBOR + 2.750%) 5.188%, 3/7/24 | 12,148 | 11,520 | |
| Wabash National Corp. Tranche B-4 (3 month PRIME + 1.250%) 4.720%, 3/18/22 | 11,332 | 11,153 | |
| 101,397 | |||
| Transportation - Land Transportation—0.4% | |||
| Daseke Companies, Inc. (1 month LIBOR + 5.000%) 7.522%, 2/27/24 | 7,583 | 7,375 | |
| Savage Enterprises LLC (1 month LIBOR + 4.500%) 6.880%, 8/1/25 | 12,421 | 12,219 | |
| 19,594 | |||
| Transportation - Shipping—0.5% | |||
| Commercial Barge Line Co. (1 month LIBOR + 8.750%) 0.000%, 11/12/20(7) | 5,883 | 4,213 | |
| Hornblower Sub LLC Tranche B, First Lien (3 month LIBOR + 4.500%) 7.303%, 3/28/25 | 2,675 | 2,568 | |
| Navios Maritime Midstream Partners LP (3 month LIBOR + 4.500%) 7.300%, 6/18/20 | 6,144 | 5,918 | |
| Navios Maritime Partners LP (3 month LIBOR + 5.000%) 0.000%, 9/14/20(7) | 9,021 | 8,915 | |
| PS Holdco LLC (3 month LIBOR + 4.750%) 7.277%, 3/13/25 | 1,671 | 1,621 | |
| REP WWEX Acquisition Parent LLC First Lien (6 month LIBOR + 4.000%) 6.881%, 2/5/24 | 3,340 | 3,262 | |
| 26,497 | |||
| Utility—3.7% | |||
| AES Corp. 2018 (3 month LIBOR + 1.750%) 4.456%, 5/31/22 | 12,576 | 12,269 | |
| APLP Holdings LP (1 month LIBOR + 2.750%) 5.272%, 4/13/23 | 3,242 | 3,155 | |
| Par Value | Value | ||
| Utility—continued | |||
| Bronco Midstream Funding LLC (1 month LIBOR + 3.500%) 6.010%, 8/14/23 | $5,440 | $5,263 | |
| Calpine Construction Finance Co. LP Tranche B (1 month LIBOR + 2.500%) 5.022%, 1/15/25 | 10,809 | 10,198 | |
| Calpine Corp. | |||
| 2015 (3 month LIBOR + 2.500%) 5.310%, 1/15/23 | 5,894 | 5,599 | |
| 2015 (3 month LIBOR + 2.500%) 5.310%, 1/15/24 | 5,870 | 5,566 | |
| 2016 (3 month LIBOR + 2.500%) 5.310%, 5/31/23 | 5,128 | 4,861 | |
| 2017 (1 month LIBOR + 1.750%) 4.280%, 12/31/19 | 5,700 | 5,639 | |
| Eastern Power LLC Tranche B (1 month LIBOR + 3.750%) 6.272%, 10/2/23 | 11,819 | 11,534 | |
| Invenergy Thermal Operating I LLC (3 month LIBOR + 3.500%) 6.303%, 8/28/25 | 6,502 | 6,421 | |
| Longview Power LLC Tranche B (3 month LIBOR + 6.000%) 8.530%, 4/13/21 | 7,784 | 6,534 | |
| Messer Industries LLC (3 month LIBOR + 2.500%) 0.000%, 10/1/25(7) | 3,625 | 3,432 | |
| MRP Generation Holdings LLC (3 month LIBOR + 7.000%) 9.803%, 10/18/22 | 15,963 | 15,245 | |
| NRG Energy, Inc. (1 month LIBOR + 1.750%) 4.272%, 6/30/23 | 18,710 | 17,952 | |
| PowerTeam Services LLC First Lien (3 month LIBOR + 3.250%) 6.063%, 3/6/25 | 8,085 | 7,802 | |
| Summit Midstream Partners Holdings LLC (1 month LIBOR + 6.000%) 8.522%, 5/13/22 | 12,562 | 12,279 | |
| Talen Energy Supply LLC | |||
| (1 month LIBOR + 4.000%) 6.522%, 4/15/24 | 14,976 | 14,745 | |
| Tranche B-1 (1 month LIBOR + 4.000%) 6.522%, 7/17/23 | 5,871 | 5,780 | |
| Vistra Operations Co. LLC | |||
| 2018 (1 month LIBOR + 2.000%) 4.473%, 12/31/25 | 26,069 | 25,030 | |
| Tranche B-1 (1 month LIBOR + 2.000%) 4.522%, 8/4/23 | 17,360 | 16,700 | |
| 196,004 | |||
| Total Leveraged Loans (Identified Cost $5,258,898) | 4,992,101 | ||
| Shares | ||
| Convertible Preferred Stock—0.0% | ||
| Financials—0.0% | ||
| Ditech Holding Corp.(11) | 742 | —(12) |
| Total Convertible Preferred Stock (Identified Cost $853) | —(12) | |
| Shares | Value | ||
| Preferred Stocks—0.0% | |||
| Energy—0.0% | |||
| Templar Energy LLC Class A, 0.000%(5)(11) | 8,569 | $21 | |
| Financials—0.0% | |||
| GMAC Capital Trust I Series 2, 8.401% | 34,000 | 862 | |
| Total Preferred Stocks (Identified Cost $908) | 883 | ||
| Common Stocks—0.5% | |||
| Consumer Discretionary—0.1% | |||
| Caesars Entertainment Corp.(3)(11) | 767,654 | 5,212 | |
| Energy—0.0% | |||
| Riviera Resources, Inc.(3)(11) | 48,521 | 767 | |
| Roan Resources, Inc.(3)(11) | 128,202 | 1,074 | |
| SandRidge Energy, Inc.(3)(11) | 16,109 | 123 | |
| Templar Energy LLC Class A(5)(11) | 1,608,573 | 402 | |
| 2,366 | |||
| Industrials—0.1% | |||
| HGIM Corp.(3)(5)(11) | 91,679 | 3,713 | |
| Information Technology—0.3% | |||
| Avaya Holdings Corp.(3)(11) | 1,101,677 | 16,041 | |
| Total Common Stocks (Identified Cost $83,762) | 27,332 | ||
| Rights—0.0% | |||
| Utilities—0.0% | |||
| Texas Competitive Electric Holdings Co. LLC(5)(11) | 410,667 | 292 | |
| Total Rights (Identified Cost $554) | 292 | ||
| Total Long-Term Investments—95.9% (Identified Cost $5,415,886) | 5,083,067 | ||
| TOTAL INVESTMENTS—95.9% (Identified Cost $5,415,886) | 5,083,067 | ||
| Other assets and liabilities, net—4.1% | 216,572 | ||
| NET ASSETS—100.0% | $5,299,639 | ||
| Abbreviations: | |
| LIBOR | London Interbank Offered Rate |
| LLC | Limited Liability Company |
| LP | Limited Partnership |
| PIK | Payment-in-Kind Security |
| Footnote Legend: | |
| (1) | Security exempt from registration under Rule 144A of the Securities Act of 1933. These securities may be resold in transactions exempt from registration, normally to qualified institutional buyers. At December 31, 2018, these securities amounted to a value of $23,485 or 0.4% of net assets. |
| (2) | Variable rate security. Rate disclosed is as of December 31, 2018. For leveraged loans, the rate shown may represent a weighted average interest rate. Information in parenthesis represents benchmark and reference rate for each security. Certain variable rate securities are not based on a published reference rate and spread but are determined by the issuer or agent and are based on current market conditions, or, for mortgage-backed securities, are impacted by the individual mortgages which are paying off over time. These securities do not indicate a reference rate and spread in their descriptions. |
| (3) | All or a portion segregated as collateral for a delayed delivery transaction. |
| (4) | Security valued at fair value as determined in good faith by or under the direction of the Trustees. This security is disclosed as a Level 3 security in the disclosure table located after the Schedule of Investments. |
| (5) | The value of this security was determined using significant unobservable inputs and is reported as a Level 3 security in the Fair Value Hierarchy table located after the Schedule of Investments. |
| (6) | 80% of the income received was in cash and 20% was in PIK. |
| (7) | This loan will settle after December 31, 2018, at which time the interest rate, based on the LIBOR and the agreed upon spread on trade date, will be reflected. |
| (8) | Security is fixed rate. |
| (9) | Represents unfunded portion of security and commitment fee earned on this portion. |
| (10) | Security in default; no interest payments are being received during the bankruptcy proceedings. |
| (11) | Non-income producing. |
| (12) | Amount is less than $500. |
| Country Weightings (Unaudited)† | |
| United States | 88% |
| Luxembourg | 3 |
| Canada | 3 |
| France | 2 |
| Netherlands | 1 |
| Cayman Islands | 1 |
| Australia | 1 |
| Other | 1 |
| Total | 100% |
| † % of total investments as of December 31, 2018. | |
| Total Value at December 31, 2018 | Level 1 Quoted Prices | Level 2 Significant Observable Inputs | Level 3 Significant Unobservable Inputs | ||||
| Debt Securities: | |||||||
| Asset-Backed Securities | $3,572 | $— | $3,572 | $— | |||
| Corporate Bonds and Notes | 58,887 | — | 33,515 | 25,372 | |||
| Leveraged Loans | 4,992,101 | — | 4,977,054 | 15,047 | |||
| Equity Securities: | |||||||
| Common Stocks | 27,332 | 23,217 | — | 4,115 | |||
| Preferred Stocks | 883 | 862 | — | 21 | |||
| Rights | 292 | — | — | 292 | |||
| Convertible Preferred Stock | —(1) | — | —(1) | — | |||
| Total Investments | $5,083,067 | $24,079 | $5,014,141 | $44,847 |
| (1) | Amount is less than $500. |
| Total | Asset-Backed Securities | Corporate Bonds And Notes | Leveraged Loans | Common Stocks | Preferred Stocks | Right | |||||||
| Investments in Securities | |||||||||||||
| Balance as of December 31, 2017: | $122,806 | $3,910 | $35,539 | $76,342 | $6,645 | $— | $370 | ||||||
| Accrued discount/(premium) | 54 | 2 | 52 | — | — | — | — | ||||||
| Realized gain (loss) | 9,363 | 83 | 21 | (285) | 9,544 | — | — | ||||||
| Change in unrealized appreciation (depreciation)(c) | (4,418) | —(d) | 698 | 653 | (5,655) | (36) | (78) | ||||||
| Purchases | 8,570 | — | — | 4,658 | 3,855 | 57 | — | ||||||
| Sales(b) | (100,782) | (3,995) | (10,938) | (75,575) | (10,274) | — | — | ||||||
| Transfers into Level 3(a) | 10,147 | — | — | 10,147 | — | — | — | ||||||
| Transfers from Level 3(a) | (893) | — | — | (893) | — | — | — | ||||||
| Balance as of December 31, 2018 | $44,847 | $— | $25,372(e) | $15,047 | $4,115 | $21 | $292 |
| Par Value | Value | ||
| Municipal Bonds(1)—91.6% | |||
| California—1.3% | |||
| General Obligation—1.3% | |||
| California, State of 5.000%, 8/1/36 | $870 | $1,009 | |
| Georgia—88.0% | |||
| Electric Revenue—3.8% | |||
| Main Street Natural Gas, Inc., Mandatory Put 9/1/23 2.324%, 4/1/48(2) | 3,000 | 2,964 | |
| General Obligation—9.9% | |||
| Forsyth County School District | |||
| 5.000%, 2/1/26 | 250 | 298 | |
| 5.000%, 2/1/36 | 1,475 | 1,736 | |
| 5.000%, 2/1/37 | 1,500 | 1,759 | |
| Georgia, State of 4.000%, 2/1/35 | 2,000 | 2,125 | |
| Gwinnett County School District 5.000%, 2/1/35 | 1,500 | 1,712 | |
| 7,630 | |||
| General Revenue—27.8% | |||
| Athens Housing Authority, UGA Real Estate Foundation, Inc. East Campus Housing Phase II LLC Project 5.000%, 6/15/31 | 1,000 | 1,158 | |
| Atlanta Development Authority, | |||
| Senior Lien 5.000%, 7/1/34 | 1,000 | 1,128 | |
| Senior Lien 5.250%, 7/1/40 | 2,500 | 2,825 | |
| Fulton County Development Authority, | |||
| Georgia Tech Facilities 5.000%, 5/1/39 | 2,145 | 2,390 | |
| Georgia Tech Facilities 4.000%, 3/1/43 | 750 | 768 | |
| Robert Woodruff Arts Center, Inc. 5.250%, 3/15/24 | 1,145 | 1,153 | |
| Robert Woodruff Arts Center, Inc. 5.000%, 3/15/36 | 2,000 | 2,214 | |
| Gwinnett County Development Authority, | |||
| Georgia Gwinnett College Student Center Project 5.000%, 7/1/33 | 500 | 575 | |
| Georgia Gwinnett College Student Housing Project 5.000%, 7/1/30 | 2,230 | 2,593 | |
| Private Colleges & Universities Authority, | |||
| Emory University 5.000%, 10/1/38 | 3,500 | 3,996 | |
| Savannah College of Art and Design Project 5.000%, 4/1/44 | 2,500 | 2,661 | |
| 21,461 | |||
| Healthcare Revenue—12.8% | |||
| Athens-Clarke County Unified Government Development Authority, Catholic Health East 6.250%, 11/15/32 | 1,250 | 1,270 | |
| Carroll City-County Hospital Authority, Tanner Medical Center, Inc. Project (Country Guaranteed Insured) 5.000%, 7/1/41 | 3,000 | 3,305 | |
| Par Value | Value | ||
| Georgia—continued | |||
| Healthcare Revenue—continued | |||
| DeKalb Private Hospital Authority, Children’s Healthcare of Atlanta, Inc. 5.000%, 11/15/29 | $2,000 | $2,052 | |
| Greene County Development Authority, Catholic Health East 5.000%, 11/15/37 | 2,955 | 3,240 | |
| 9,867 | |||
| Pre-Refunded—3.5% | |||
| Metropolitan Atlanta Rapid Transit Authority Third Indenture (Pre-Refunded 7/1/22 @ 100) 5.000%, 7/1/30 | 1,465 | 1,619 | |
| Thomasville Hospital Authority, John D. Archibold Memorial Hospital, Inc. Project (Pre-Refunded 11/2/20 @ 100) 5.375%, 11/1/40 | 1,000 | 1,062 | |
| 2,681 | |||
| Special Tax Revenue—1.5% | |||
| Metropolitan Atlanta Rapid Transit Authority 5.000%, 7/1/34 | 1,000 | 1,149 | |
| Tax Allocation Revenue—10.5% | |||
| Atlanta, City of, | |||
| Atlantic Station Project 5.000%, 12/1/23 | 1,060 | 1,185 | |
| Atlantic Station Project 5.000%, 12/1/24 | 650 | 739 | |
| Beltline Project 5.000%, 1/1/28 | 855 | 990 | |
| Beltline Project 5.000%, 1/1/30 | 1,055 | 1,211 | |
| Beltline Project 5.000%, 1/1/31 | 1,500 | 1,714 | |
| Eastside Project 5.000%, 1/1/28 | 1,150 | 1,311 | |
| Eastside Project 5.000%, 1/1/29 | 300 | 341 | |
| Eastside Project 5.000%, 1/1/30 | 550 | 623 | |
| 8,114 | |||
| Transportation Revenue—6.0% | |||
| Atlanta, City of, Department of Aviation | |||
| 5.000%, 1/1/27 | 1,000 | 1,131 | |
| 5.000%, 1/1/32 | 1,000 | 1,116 | |
| 5.000%, 1/1/42 | 2,235 | 2,383 | |
| 4,630 | |||
| Water & Sewer Revenue—12.2% | |||
| Athens-Clarke County Unified Government Water & Sewerage Revenue 5.000%, 1/1/24 | 1,250 | 1,427 | |
| Atlanta, City of, Water & Wastewater Revenue 5.000%, 11/1/40 | 4,000 | 4,446 | |
| Fulton County Water & Sewerage Revenue 5.000%, 1/1/26 | 1,810 | 1,913 | |
| Par Value | Value | ||
| Georgia—continued | |||
| Water & Sewer Revenue—continued | |||
| Henry County Water & Sewerage Authority (AMBAC Insured) 6.150%, 2/1/20 | $1,575 | $1,615 | |
| 9,401 | |||
| North Carolina—2.3% | |||
| General Revenue—2.3% | |||
| North Carolina Capital Facilities Finance Agency, High Point University 5.000%, 5/1/32 | 1,700 | 1,796 | |
| Total Municipal Bonds (Identified Cost $69,640) | 70,702 | ||
| Total Long-Term Investments—91.6% (Identified Cost $69,640) | 70,702 | ||
| Shares | ||
| Short-Term Investment—4.8% | ||
| Money Market Mutual Fund—4.8% | ||
| Dreyfus AMT-Free Tax Exempt Cash Management (seven-day effective yield 1.567%)(3) | 3,716,457 | 3,716 |
| Total Short-Term Investment (Identified Cost $3,716) | 3,716 | |
| TOTAL INVESTMENTS—96.4% (Identified Cost $73,356) | 74,418 | |
| Other assets and liabilities, net—3.6% | 2,771 | |
| NET ASSETS—100.0% | $77,189 | |
| Abbreviations: | |
| AMBAC | American Municipal Bond Assurance Corp. |
| LLC | Limited Liability Company |
| Footnote Legend: | |
| (1) | At December 31, 2018, 6.6% of the securities in the portfolio are backed by insurance of financial institutions and financial guaranty assurance agencies. |
| (2) | Variable or step coupon security; interest rate shown reflects the rate in effect at December 31, 2018. For securities based on a published reference rate and spread, the reference rate and spread are indicated in the description above. Certain variable rate securities are not based on a published reference rate and spread but are determined by the issuer or agent and are based on current market conditions. These securities do not indicate a reference rate and spread in their description above. |
| (3) | Shares of this fund are publicly offered, and its prospectus and annual report are publicly available. |
| Total Value at December 31, 2018 | Level 1 Quoted Prices | Level 2 Significant Observable Inputs | |||
| Debt Securities: | |||||
| Municipal Bonds | $70,702 | $— | $70,702 | ||
| Short-Term Investment | 3,716 | 3,716 | — | ||
| Total Investments | $74,418 | $3,716 | $70,702 |
| Par Value | Value | ||
| Municipal Bonds(1)—98.4% | |||
| Alabama—7.2% | |||
| Auburn University Revenue 5.000%, 6/1/32 | $1,035 | $1,231 | |
| Jefferson County, | |||
| Sales Tax Revenue 5.000%, 9/15/33 | 1,000 | 1,136 | |
| Sales Tax Revenue 5.000%, 9/15/35 | 1,000 | 1,127 | |
| 3,494 | |||
| Alaska—1.5% | |||
| Matanuska-Susitna Borough, Goosecreek Correctional Revenue (AGC Insured) (Pre-Refunded 9/1/19 @ 100) 6.000%, 9/1/28 | 730 | 750 | |
| California—24.5% | |||
| California Infrastructure & Economic Development Bank Revenue 5.000%, 10/1/48 | 2,000 | 2,312 | |
| California Municipal Finance Authority, Bowles Hall Foundation Revenue 5.000%, 6/1/50 | 1,750 | 1,849 | |
| California, State of, | |||
| General Obligation 5.000%, 9/1/30 | 1,000 | 1,075 | |
| General Obligation 6.500%, 4/1/33 | 920 | 930 | |
| General Obligation 5.000%, 8/1/24 | 3,500 | 4,060 | |
| California Statewide Communities Development Authority, | |||
| John Muir Health Revenue 5.000%, 12/1/53 | 200 | 222 | |
| John Muir Health Revenue 5.000%, 12/1/57 | 350 | 386 | |
| San Diego Redevelopment Agency Successor Agency | |||
| 5.000%, 9/1/28 | 500 | 589 | |
| 5.000%, 9/1/29 | 405 | 474 | |
| 11,897 | |||
| District of Columbia—6.7% | |||
| District of Columbia, General Obligation 5.000%, 6/1/31 | 1,000 | 1,169 | |
| District of Columbia Revenue 5.500%, 12/1/30 | 2,000 | 2,063 | |
| 3,232 | |||
| Georgia—5.2% | |||
| Atlanta, City of, Water & Wastewater Revenue 5.000%, 11/1/35 | 1,000 | 1,164 | |
| Par Value | Value | ||
| Georgia—continued | |||
| Fulton County Development Authority, Georgia Tech Athletic Association Revenue 5.750%, 10/1/36 | $1,250 | $1,340 | |
| 2,504 | |||
| Illinois—17.4% | |||
| Chicago O’Hare International Airport Revenue, Senior Lien 5.000%, 1/1/48 | 1,500 | 1,667 | |
| Cook County, | |||
| Sales Tax Revenue 5.250%, 11/15/36 | 2,000 | 2,288 | |
| Sales Tax Revenue 4.000%, 11/15/37 | 2,000 | 2,051 | |
| Illinois, State of, General Obligation 5.000%, 11/1/24 | 1,340 | 1,430 | |
| University of Illinois Revenue (Pre-Refunded 4/1/19 @ 100) 5.750%, 4/1/38 | 1,000 | 1,009 | |
| 8,445 | |||
| Maryland—5.7% | |||
| Washington Suburban Sanitary Commission, General Obligation 5.000%, 6/15/30 | 2,320 | 2,771 | |
| Missouri—5.8% | |||
| Metropolitan St Louis Sewer District Revenue 5.000%, 5/1/36 | 2,500 | 2,828 | |
| New York—9.0% | |||
| New York City Water & Sewer System Revenue 5.000%, 6/15/30 | 2,750 | 3,243 | |
| New York State Dormitory Authority, Sales Tax Revenue 5.000%, 3/15/31 | 950 | 1,138 | |
| 4,381 | |||
| Oregon—4.8% | |||
| Portland, Port of, Airport Revenue 5.000%, 7/1/47 | 1,000 | 1,117 | |
| Salem-Keizer School District No. 24J, General Obligation (SCH BD GTY Insured) 5.000%, 6/15/30 | 1,000 | 1,204 | |
| 2,321 | |||
| Texas—5.8% | |||
| Arlington Higher Education Finance Corp., Life School Revenue (PSF-GTD Insured) 5.000%, 8/15/39 | 1,000 | 1,092 | |
| Par Value | Value | ||
| Texas—continued | |||
| San Antonio, City of, Electric & Gas Systems Revenue 5.000%, 2/1/48 | $1,500 | $1,717 | |
| 2,809 | |||
| Washington—4.8% | |||
| Energy Northwest Revenue 5.000%, 7/1/33 | 2,000 | 2,331 | |
| Total Municipal Bonds (Identified Cost $46,948) | 47,763 | ||
| Total Long-Term Investments—98.4% (Identified Cost $46,948) | 47,763 | ||
| Shares | ||
| Short-Term Investment—2.4% | ||
| Money Market Mutual Fund—2.4% | ||
| Dreyfus AMT-Free Tax Exempt Cash Management (seven-day effective yield 1.567%)(2) | 1,152,606 | 1,153 |
| Total Short-Term Investment (Identified Cost $1,153) | 1,153 | |
| TOTAL INVESTMENTS—100.8% (Identified Cost $48,101) | 48,916 | |
| Other assets and liabilities, net—(0.8)% | (380) | |
| NET ASSETS—100.0% | $48,536 | |
| Abbreviations: | |
| AGC | Assured Guaranty Corp. |
| PSF-GTD | Permanent School Fund Guarantee Program |
| SCH BD GTY | School Bond Guaranty |
| Footnote Legend: | |
| (1) | At December 31, 2018, 6.2% of the securities in the portfolio are backed by insurance of financial institutions and financial guaranty assurance agencies. |
| (2) | Shares of this fund are publicly offered, and its prospectus and annual report are publicly available. |
| Total Value at December 31, 2018 | Level 1 Quoted Prices | Level 2 Significant Observable Inputs | |||
| Debt Securities: | |||||
| Municipal Bonds | $47,763 | $— | $47,763 | ||
| Short-Term Investment | 1,153 | 1,153 | — | ||
| Total Investments | $48,916 | $1,153 | $47,763 |
| Par Value | Value | ||
| Corporate Bonds and Notes—91.1% | |||
| Communication Services—17.7% | |||
| Altice Financing S.A. 144A 6.625%, 2/15/23(1) | $1,970 | $1,891 | |
| Altice France S.A. 144A 8.125%, 2/1/27(1) | 1,245 | 1,173 | |
| Altice Luxembourg S.A. 144A 7.750%, 5/15/22(1) | 2,150 | 1,957 | |
| C&W Senior Financing DAC 144A 7.500%, 10/15/26(1) | 875 | 841 | |
| CCO Holdings LLC | |||
| 5.250%, 9/30/22 | 410 | 406 | |
| 5.750%, 9/1/23 | 505 | 502 | |
| 144A 5.750%, 2/15/26(1) | 2,785 | 2,729 | |
| 144A 5.125%, 5/1/27(1) | 1,455 | 1,355 | |
| 144A 5.875%, 5/1/27(1) | 1,480 | 1,436 | |
| CenturyLink, Inc. | |||
| 5.625%, 4/1/20 | 470 | 468 | |
| 6.750%, 12/1/23 | 1,855 | 1,788 | |
| 7.500%, 4/1/24 | 675 | 651 | |
| 7.650%, 3/15/42 | 410 | 323 | |
| Cincinnati Bell, Inc. | |||
| 144A 7.000%, 7/15/24(1) | 1,520 | 1,254 | |
| 144A 8.000%, 10/15/25(1) | 2,114 | 1,744 | |
| Clear Channel Worldwide Holdings, Inc. Series B 7.625%, 3/15/20 | 550 | 536 | |
| Cogent Communications Finance, Inc. 144A 5.625%, 4/15/21(1) | 745 | 741 | |
| Cogent Communications Group, Inc. 144A 5.375%, 3/1/22(1) | 520 | 516 | |
| CSC Holdings LLC | |||
| 144A 7.750%, 7/15/25(1) | 440 | 448 | |
| 144A 6.625%, 10/15/25(1) | 680 | 689 | |
| 144A 7.500%, 4/1/28(1) | 245 | 244 | |
| DISH DBS Corp. | |||
| 5.125%, 5/1/20 | 920 | 909 | |
| 6.750%, 6/1/21 | 1,070 | 1,059 | |
| 7.750%, 7/1/26 | 2,495 | 2,065 | |
| Intelsat Connect Finance S.A. 144A 9.500%, 2/15/23(1) | 5,090 | 4,377 | |
| Intelsat Jackson Holdings S.A. | |||
| 144A 9.500%, 9/30/22(1) | 410 | 467 | |
| 144A 9.750%, 7/15/25(1) | 1,335 | 1,339 | |
| Level 3 Financing, Inc. 5.375%, 5/1/25 | 1,755 | 1,645 | |
| Level 3 Parent LLC 5.750%, 12/1/22 | 850 | 835 | |
| Lions Gate Capital Holdings LLC 144A 5.875%, 11/1/24(1) | 790 | 780 | |
| Netflix, Inc. 5.875%, 2/15/25 | 2,485 | 2,507 | |
| Qwest Capital Funding, Inc. | |||
| 6.875%, 7/15/28 | 385 | 323 | |
| 7.750%, 2/15/31 | 420 | 342 | |
| Sprint Capital Corp. | |||
| 6.875%, 11/15/28 | 1,650 | 1,559 | |
| 8.750%, 3/15/32 | 875 | 923 | |
| Sprint Communications, Inc. | |||
| 11.500%, 11/15/21 | 1,415 | 1,603 | |
| 9.250%, 4/15/22 | 285 | 326 | |
| Sprint Corp. 7.875%, 9/15/23 | 1,060 | 1,088 | |
| Par Value | Value | ||
| Communication Services—continued | |||
| Telenet Finance Luxembourg Notes S.a.r.l. 144A 5.500%, 3/1/28(1) | $1,400 | $1,267 | |
| Trilogy International Partners LLC 144A 8.875%, 5/1/22(1) | 999 | 967 | |
| UPC Holding B.V. 144A 5.500%, 1/15/28(1) | 1,425 | 1,290 | |
| Viacom, Inc. 6.250%, 2/28/57 | 1,025 | 957 | |
| West Corp. 144A 8.500%, 10/15/25(1) | 745 | 585 | |
| WMG Acquisition Corp. 144A 5.625%, 4/15/22(1) | 1,070 | 1,067 | |
| Ziggo B.V. 144A 5.500%, 1/15/27(1) | 1,540 | 1,378 | |
| Ziggo Bond Co. B.V. 144A 5.875%, 1/15/25(1) | 950 | 857 | |
| 52,207 | |||
| Consumer Discretionary—11.8% | |||
| American Axle & Manufacturing, Inc. 6.500%, 4/1/27 | 1,859 | 1,664 | |
| Asbury Automotive Group, Inc. 6.000%, 12/15/24 | 340 | 325 | |
| Boyd Gaming Corp. 6.000%, 8/15/26 | 870 | 813 | |
| Boyne USA, Inc. 144A 7.250%, 5/1/25(1) | 158 | 163 | |
| Caesars Resort Collection LLC 144A 5.250%, 10/15/25(1) | 1,785 | 1,535 | |
| Century Communities, Inc. | |||
| 6.875%, 5/15/22 | 1,680 | 1,625 | |
| 5.875%, 7/15/25 | 1,593 | 1,402 | |
| DriveTime Automotive Group, Inc. 144A 8.000%, 6/1/21(1) | 500 | 500 | |
| Eldorado Resorts, Inc. | |||
| 6.000%, 4/1/25 | 1,045 | 1,008 | |
| 144A 6.000%, 9/15/26(1) | 660 | 624 | |
| frontdoor, Inc. 144A 6.750%, 8/15/26(1) | 565 | 537 | |
| Gateway Casinos & Entertainment Ltd. 144A 8.250%, 3/1/24(1) | 695 | 705 | |
| Golden Nugget, Inc. 144A 6.750%, 10/15/24(1) | 1,075 | 1,013 | |
| Graham Holdings Co. 144A 5.750%, 6/1/26(1) | 630 | 632 | |
| Hilton Grand Vacations Borrower LLC 6.125%, 12/1/24 | 670 | 665 | |
| L Brands, Inc. 6.875%, 11/1/35 | 735 | 614 | |
| Laureate Education, Inc. 144A 8.250%, 5/1/25(1) | 340 | 357 | |
| Lennar Corp. 5.875%, 11/15/24 | 1,255 | 1,255 | |
| Mattel, Inc. 4.350%, 10/1/20 | 1,825 | 1,779 | |
| MGM Resorts International | |||
| 6.750%, 10/1/20 | 1,190 | 1,223 | |
| 7.750%, 3/15/22 | 1,140 | 1,213 | |
| Motors Liquidation Co. Escrow | |||
| 8.375%, 7/15/33(2) | 36,800 | — | |
| 7.200%, 1/15/49(2) | 17,182 | — | |
| Par Value | Value | ||
| Consumer Discretionary—continued | |||
| New Home Co., Inc. (The) 7.250%, 4/1/22 | $1,075 | $976 | |
| New Red Finance, Inc. 144A 5.000%, 10/15/25(1) | 1,815 | 1,670 | |
| Penske Automotive Group, Inc. 5.375%, 12/1/24 | 915 | 857 | |
| Sears Holdings Corp. 8.000%, 12/15/19(3) | 3,561 | 178 | |
| Shea Homes LP 144A 5.875%, 4/1/23(1) | 1,665 | 1,519 | |
| Staples, Inc. 144A 8.500%, 9/15/25(1) | 735 | 663 | |
| Stars Group Holdings B.V. 144A 7.000%, 7/15/26(1) | 520 | 506 | |
| Taylor Morrison Communities, Inc. 144A 5.250%, 4/15/21(1) | 935 | 926 | |
| TRI Pointe Group, Inc. | |||
| 4.875%, 7/1/21 | 2,031 | 1,940 | |
| 5.875%, 6/15/24 | 2,760 | 2,463 | |
| 5.250%, 6/1/27 | 1,850 | 1,461 | |
| Viking Cruises Ltd. 144A 5.875%, 9/15/27(1) | 1,460 | 1,361 | |
| Weight Watchers International, Inc. 144A 8.625%, 12/1/25(1) | 600 | 612 | |
| 34,784 | |||
| Consumer Staples—4.3% | |||
| Albertsons Cos. LLC 6.625%, 6/15/24 | 910 | 844 | |
| Coty, Inc. 144A 6.500%, 4/15/26(1) | 2,815 | 2,421 | |
| JBS Investments GmbH 144A 7.250%, 4/3/24(1) | 1,085 | 1,094 | |
| JBS USA Lux S.A. 144A 6.750%, 2/15/28(1) | 785 | 765 | |
| New Albertson’s, Inc. 7.450%, 8/1/29 | 1,010 | 808 | |
| Pilgrim’s Pride Corp. | |||
| 144A 5.750%, 3/15/25(1) | 2,870 | 2,691 | |
| 144A 5.875%, 9/30/27(1) | 580 | 526 | |
| Post Holdings, Inc. | |||
| 144A 5.500%, 3/1/25(1) | 457 | 439 | |
| 144A 8.000%, 7/15/25(1) | 825 | 862 | |
| 144A 5.750%, 3/1/27(1) | 571 | 535 | |
| US Foods, Inc. 144A 5.875%, 6/15/24(1) | 1,741 | 1,693 | |
| 12,678 | |||
| Energy—15.2% | |||
| Antero Resources Corp. 5.625%, 6/1/23 | 840 | 798 | |
| Apergy Corp. 6.375%, 5/1/26 | 670 | 650 | |
| Ascent Resources Utica Holdings LLC 144A 7.000%, 11/1/26(1) | 770 | 697 | |
| California Resources Corp. 144A 8.000%, 12/15/22(1) | 4,053 | 2,746 | |
| Centennial Resource Production LLC 144A 5.375%, 1/15/26(1) | 682 | 634 | |
| Cheniere Corpus Christi Holdings LLC 7.000%, 6/30/24 | 100 | 105 | |
| Par Value | Value | ||
| Energy—continued | |||
| Chesapeake Energy Corp. | |||
| 8.000%, 1/15/25 | $2,525 | $2,228 | |
| 7.500%, 10/1/26 | 550 | 470 | |
| 8.000%, 6/15/27 | 3,490 | 2,932 | |
| Crestwood Midstream Partners LP 5.750%, 4/1/25 | 1,036 | 961 | |
| Diamond Offshore Drilling, Inc. 7.875%, 8/15/25 | 1,090 | 905 | |
| Diamondback Energy, Inc. | |||
| 5.375%, 5/31/25 | 1,783 | 1,738 | |
| 144A 4.750%, 11/1/24(1) | 185 | 179 | |
| Eclipse Resources Corp. 8.875%, 7/15/23 | 1,015 | 870 | |
| Endeavor Energy Resources LP 144A 5.500%, 1/30/26(1) | 1,335 | 1,368 | |
| Ensco plc | |||
| 8.000%, 1/31/24 | 2,258 | 1,852 | |
| 7.750%, 2/1/26 | 590 | 437 | |
| 5.750%, 10/1/44 | 1,650 | 922 | |
| Enviva Partners LP 8.500%, 11/1/21 | 500 | 512 | |
| Glenn Pool Oil & Gas Trust 6.000%, 8/2/21(4) | 264 | 259 | |
| Halcon Resources Corp. 6.750%, 2/15/25 | 800 | 584 | |
| Hilcorp Energy I LP 144A 6.250%, 11/1/28(1) | 2,340 | 2,059 | |
| Indigo Natural Resources LLC 144A 6.875%, 2/15/26(1) | 955 | 821 | |
| McDermott Technology Americas, Inc. 144A 10.625%, 5/1/24(1) | 1,355 | 1,143 | |
| MEG Energy Corp. 144A 6.500%, 1/15/25(1) | 1,030 | 1,045 | |
| NGPL PipeCo LLC 144A 4.375%, 8/15/22(1) | 196 | 192 | |
| Oceaneering International, Inc. 6.000%, 2/1/28 | 2,380 | 1,920 | |
| Parsley Energy LLC 144A 5.625%, 10/15/27(1) | 925 | 841 | |
| Petrobras Global Finance B.V. | |||
| 8.375%, 5/23/21 | 313 | 340 | |
| 7.375%, 1/17/27 | 935 | 961 | |
| Precision Drilling Corp. | |||
| 6.500%, 12/15/21 | 571 | 531 | |
| 7.750%, 12/15/23 | 800 | 737 | |
| 144A 7.125%, 1/15/26(1) | 356 | 306 | |
| Pride International LLC 7.875%, 8/15/40 | 1,400 | 1,036 | |
| Range Resources Corp. 5.875%, 7/1/22 | 905 | 837 | |
| Rowan Cos., Inc. | |||
| 4.875%, 6/1/22 | 3,345 | 2,760 | |
| 5.850%, 1/15/44 | 1,585 | 991 | |
| SandRidge Energy, Inc. 8.125%, 10/15/22(2) | 1,935 | — | |
| SESI LLC | |||
| 7.125%, 12/15/21 | 1,085 | 922 | |
| 7.750%, 9/15/24 | 465 | 370 | |
| Southwestern Energy Co. 7.500%, 4/1/26 | 955 | 902 | |
| Sunoco LP 4.875%, 1/15/23 | 887 | 865 | |
| Par Value | Value | ||
| Energy—continued | |||
| Transocean Pontus Ltd. 144A 6.125%, 8/1/25(1) | $1,599 | $1,543 | |
| Transocean, Inc. | |||
| 7.500%, 4/15/31 | 905 | 686 | |
| 6.800%, 3/15/38 | 515 | 342 | |
| USA Compression Partners LP 144A 6.875%, 4/1/26(1) | 735 | 706 | |
| 44,703 | |||
| Financials—12.1% | |||
| Ally Financial, Inc. 4.250%, 4/15/21 | 1,255 | 1,232 | |
| Altice Finco S.A. 144A 8.125%, 1/15/24(1) | 530 | 493 | |
| Deck Chassis Acquisition, Inc. 144A 10.000%, 6/15/23(1) | 1,116 | 1,071 | |
| Ditech Holding Corp. PIK Interest Capitalization 9.000%, 12/31/24(5) | 1,687 | 84 | |
| Hilcorp Energy I LP 144A 5.750%, 10/1/25(1) | 3,715 | 3,306 | |
| Jefferies Finance LLC 144A 7.375%, 4/1/20(1) | 1,035 | 1,032 | |
| KCA Deutag UK Finance plc | |||
| 144A 7.250%, 5/15/21(1) | 555 | 450 | |
| 144A 9.875%, 4/1/22(1) | 1,560 | 1,279 | |
| Ladder Capital Finance Holdings LLLP 144A 5.250%, 10/1/25(1) | 1,220 | 1,089 | |
| MGIC Investment Corp. 5.750%, 8/15/23 | 1,415 | 1,408 | |
| Nationstar Mortgage Holdings, Inc. | |||
| 144A 8.125%, 7/15/23(1) | 2,095 | 2,043 | |
| 144A 9.125%, 7/15/26(1) | 2,735 | 2,660 | |
| Nationstar Mortgage LLC 6.500%, 7/1/21 | 1,671 | 1,629 | |
| Navient Corp. 8.000%, 3/25/20 | 2,545 | 2,586 | |
| Ocwen Loan Servicing LLC 144A 8.375%, 11/15/22(1) | 2,525 | 2,424 | |
| Provident Funding Associates LP 144A 6.375%, 6/15/25(1) | 2,121 | 1,909 | |
| Quicken Loans, Inc. | |||
| 144A 5.750%, 5/1/25(1) | 3,485 | 3,258 | |
| 144A 5.250%, 1/15/28(1) | 1,245 | 1,102 | |
| Refinitiv US Holdings, Inc. 144A 6.250%, 5/15/26(1) | 1,125 | 1,086 | |
| Teva Pharmaceutical Finance Co. B.V. 2.950%, 12/18/22 | 2,505 | 2,215 | |
| Teva Pharmaceutical Finance IV B.V. 3.650%, 11/10/21 | 2,235 | 2,118 | |
| VFH Parent LLC 144A 6.750%, 6/15/22(1) | 1,210 | 1,174 | |
| 35,648 | |||
| Health Care—7.1% | |||
| Bausch Health Cos., Inc. | |||
| 144A 5.500%, 3/1/23(1) | 1,545 | 1,409 | |
| 144A 5.875%, 5/15/23(1) | 1,655 | 1,531 | |
| 144A 9.000%, 12/15/25(1) | 2,141 | 2,130 | |
| Centene Corp. 5.625%, 2/15/21 | 1,425 | 1,429 | |
| Par Value | Value | ||
| Health Care—continued | |||
| DaVita, Inc. | |||
| 5.750%, 8/15/22 | $1,405 | $1,398 | |
| 5.000%, 5/1/25 | 3,500 | 3,176 | |
| HCA Healthcare, Inc. 6.250%, 2/15/21 | 1,640 | 1,677 | |
| HCA, Inc. | |||
| 6.500%, 2/15/20 | 1,115 | 1,143 | |
| 7.500%, 11/6/33 | 420 | 441 | |
| 7.500%, 11/15/95 | 455 | 441 | |
| IQVIA, Inc. 144A 5.000%, 10/15/26(1) | 1,060 | 1,012 | |
| Teleflex, Inc. 5.250%, 6/15/24 | 708 | 704 | |
| Tenet Healthcare Corp. 4.750%, 6/1/20 | 360 | 359 | |
| Teva Pharmaceutical Finance Netherlands III B.V. | |||
| 2.800%, 7/21/23 | 1,645 | 1,417 | |
| 6.000%, 4/15/24 | 725 | 698 | |
| 6.750%, 3/1/28 | 375 | 364 | |
| WellCare Health Plans, Inc. | |||
| 5.250%, 4/1/25 | 1,185 | 1,141 | |
| 144A 5.375%, 8/15/26(1) | 340 | 328 | |
| 20,798 | |||
| Industrials—8.5% | |||
| AECOM 5.125%, 3/15/27 | 1,163 | 994 | |
| Air Canada Pass-Through-Trust 2015-1, C 144A 5.000%, 3/15/20(1) | 543 | 546 | |
| Allison Transmission, Inc. 144A 5.000%, 10/1/24(1) | 1,545 | 1,483 | |
| Beacon Roofing Supply, Inc. | |||
| 6.375%, 10/1/23 | 625 | 619 | |
| 144A 4.875%, 11/1/25(1) | 735 | 646 | |
| Bombardier, Inc. | |||
| 144A 7.750%, 3/15/20(1) | 585 | 594 | |
| 144A 8.750%, 12/1/21(1) | 655 | 675 | |
| 144A 7.500%, 3/15/25(1) | 860 | 811 | |
| Cimpress NV 144A 7.000%, 6/15/26(1) | 1,657 | 1,591 | |
| CSC Holdings LLC | |||
| 144A 10.125%, 1/15/23(1) | 1,200 | 1,291 | |
| 144A 10.875%, 10/15/25(1) | 3,580 | 4,020 | |
| Herc Rentals, Inc. 144A 7.500%, 6/1/22(1) | 770 | 805 | |
| Hulk Finance Corp. 144A 7.000%, 6/1/26(1) | 1,110 | 968 | |
| J.B. Poindexter & Co., Inc. 144A 7.125%, 4/15/26(1) | 1,135 | 1,061 | |
| KAR Auction Services, Inc. 144A 5.125%, 6/1/25(1) | 1,185 | 1,069 | |
| Matthews International Corp. 144A 5.250%, 12/1/25(1) | 1,065 | 990 | |
| Plastipak Holdings, Inc. 144A 6.250%, 10/15/25(1) | 723 | 640 | |
| Resideo Funding, Inc. 144A 6.125%, 11/1/26(1) | 645 | 635 | |
| TMS International Corp. 144A 7.250%, 8/15/25(1) | 843 | 788 | |
| TransDigm UK Holdings plc 144A 6.875%, 5/15/26(1) | 425 | 405 | |
| Par Value | Value | ||
| Industrials—continued | |||
| Univar USA, Inc. 144A 6.750%, 7/15/23(1) | $705 | $698 | |
| US Airways, Inc. Pass-Through-Trust 2012-2, B 6.750%, 6/3/21 | 2,472 | 2,583 | |
| Wabash National Corp. 144A 5.500%, 10/1/25(1) | 700 | 599 | |
| WESCO Distribution, Inc. 5.375%, 6/15/24 | 720 | 679 | |
| 25,190 | |||
| Information Technology—4.0% | |||
| Alliance Data Systems Corp. | |||
| 144A 5.875%, 11/1/21(1) | 3,390 | 3,385 | |
| 144A 5.375%, 8/1/22(1) | 1,610 | 1,570 | |
| Dell International LLC 144A 7.125%, 6/15/24(1) | 2,060 | 2,096 | |
| Dell, Inc. 6.500%, 4/15/38 | 867 | 772 | |
| Harland Clarke Holdings Corp. | |||
| 144A 6.875%, 3/1/20(1) | 1,680 | 1,638 | |
| 144A 8.375%, 8/15/22(1) | 1,780 | 1,622 | |
| Nuance Communications, Inc. 5.625%, 12/15/26 | 601 | 571 | |
| 11,654 | |||
| Materials—4.5% | |||
| Axalta Coating Systems LLC 144A 4.875%, 8/15/24(1) | 1,645 | 1,554 | |
| Big River Steel LLC 144A 7.250%, 9/1/25(1) | 875 | 868 | |
| Blue Cube Spinco LLC 9.750%, 10/15/23 | 1,318 | 1,450 | |
| Chemours Co. (The) 7.000%, 5/15/25 | 760 | 766 | |
| First Quantum Minerals Ltd. | |||
| 144A 7.000%, 2/15/21(1) | 340 | 326 | |
| 144A 7.250%, 5/15/22(1) | 1,105 | 1,025 | |
| 144A 6.500%, 3/1/24(1) | 1,155 | 959 | |
| Freeport-McMoRan, Inc. | |||
| 3.550%, 3/1/22 | 1,115 | 1,055 | |
| 6.875%, 2/15/23 | 545 | 562 | |
| Imperial Metals Corp. 144A 7.000%, 3/15/19(1) | 1,948 | 1,305 | |
| Reynolds Group Issuer, Inc. 144A 5.125%, 7/15/23(1) | 1,875 | 1,786 | |
| Summit Materials LLC 8.500%, 4/15/22 | 1,145 | 1,197 | |
| Valvoline, Inc. 5.500%, 7/15/24 | 322 | 315 | |
| 13,168 | |||
| Real Estate—4.5% | |||
| CBL & Associates LP 5.250%, 12/1/23 | 1,546 | 1,225 | |
| Howard Hughes Corp. (The) 144A 5.375%, 3/15/25(1) | 3,172 | 2,982 | |
| iStar, Inc. 4.625%, 9/15/20 | 1,105 | 1,077 | |
| MPT Operating Partnership LP 5.000%, 10/15/27 | 1,020 | 933 | |
| Par Value | Value | ||
| Real Estate—continued | |||
| Realogy Group LLC 144A 5.250%, 12/1/21(1) | $1,440 | $1,368 | |
| SBA Communications Corp. 4.000%, 10/1/22 | 3,526 | 3,358 | |
| Starwood Property Trust, Inc. 5.000%, 12/15/21 | 2,513 | 2,469 | |
| 13,412 | |||
| Utilities—1.4% | |||
| AmeriGas Partners LP 5.750%, 5/20/27 | 1,080 | 956 | |
| Clearway Energy Operating LLC 5.000%, 9/15/26 | 680 | 610 | |
| Foresight Energy LLC 144A 11.500%, 4/1/23(1) | 980 | 833 | |
| NRG Energy, Inc. 7.250%, 5/15/26 | 1,325 | 1,380 | |
| Talen Energy Supply LLC 144A 10.500%, 1/15/26(1) | 540 | 459 | |
| 4,238 | |||
| Total Corporate Bonds and Notes (Identified Cost $288,662) | 268,480 | ||
| Leveraged Loans(6)—5.8% | |||
| Aerospace—0.3% | |||
| American Airlines, Inc. 2017, Tranche B (1 month LIBOR + 2.000%) 4.522%, 4/28/23 | 1,025 | 972 | |
| Consumer Non-Durables—0.1% | |||
| Coty, Inc. Tranche B (1 month LIBOR + 2.250%) 4.633%, 4/7/25 | 348 | 321 | |
| Energy—1.0% | |||
| California Resources Corp. (1 month LIBOR + 10.375%) 12.897%, 12/31/21 | 1,430 | 1,398 | |
| Crestwood Holdings LLC (1 month LIBOR + 7.500%) 9.930%, 3/6/23 | 962 | 921 | |
| KCA Deutag Alpha Ltd. Tranche B (3 month LIBOR + 6.750%) 9.553%, 2/28/23 | 677 | 543 | |
| 2,862 | |||
| Financial—1.6% | |||
| AltiSource Solutions S.a.r.l. Tranche B (3 month LIBOR + 4.000%) 6.803%, 4/3/24 | 1,505 | 1,467 | |
| Ditech Holding Corp. Tranche B (1 month LIBOR + 6.000%) 8.522%, 6/30/22 | 1,600 | 1,374 | |
| Freedom Mortgage Corp. (1 month LIBOR + 4.750%) 7.272%, 2/23/22 | 845 | 832 | |
| Par Value | Value | ||
| Financial—continued | |||
| Ocwen Loan Servicing LLC (1 month LIBOR + 5.000%) 7.504%, 12/7/20 | $907 | $889 | |
| 4,562 | |||
| Food / Tobacco—0.5% | |||
| JBS USA Lux S.A. (3 month LIBOR + 2.500%) 5.260%, 10/30/22 | 1,375 | 1,321 | |
| Food and Drug—0.3% | |||
| Albertson’s LLC 2017-1, Tranche B-6 (3 month LIBOR + 3.000%) 5.691%, 6/22/23 | 1,025 | 971 | |
| Gaming / Leisure—0.3% | |||
| Eldorado Resorts, Inc. (2 month LIBOR + 2.000%) 4.529%, 4/17/24 | 881 | 841 | |
| Information Technology—0.4% | |||
| Dell International LLC Tranche B (1 month LIBOR + 2.000%) 4.530%, 9/7/23 | 1,054 | 1,011 | |
| Media / Telecom - Cable/Wireless Video—0.3% | |||
| Liberty Cablevision of Puerto Rico LLC Tranche B, First Lien (3 month LIBOR + 3.500%) 5.936%, 1/7/22 | 1,005 | 960 | |
| Media / Telecom - Diversified Media—0.3% | |||
| Lions Gate Capital Holdings LLC Tranche B (1 month LIBOR + 2.250%) 4.772%, 3/24/25 | 1,027 | 987 | |
| Media / Telecom - Telecommunications—0.4% | |||
| CenturyLink, Inc. Tranche B (1 month LIBOR + 2.750%) 5.272%, 1/31/25 | 1,322 | 1,230 | |
| Service—0.3% | |||
| Laureate Education, Inc. (3 month LIBOR + 3.500%) 6.027%, 4/26/24 | 336 | 329 | |
| Monitronics International, Inc. Tranche B-2 (3 month LIBOR + 5.500%) 8.303%, 9/30/22 | 757 | 669 | |
| 998 | |||
| Total Leveraged Loans (Identified Cost $18,050) | 17,036 | ||
| Shares | ||
| Convertible Preferred Stock—0.0% | ||
| Financials—0.0% | ||
| Ditech Holding Corp.(7) | 807 | —(8) |
| Total Convertible Preferred Stock (Identified Cost $928) | —(8) | |
| Shares | Value | ||
| Preferred Stock—0.4% | |||
| Financials—0.4% | |||
| GMAC Capital Trust I Series 2, 8.401% | 42,810 | $1,085 | |
| Total Preferred Stock (Identified Cost $1,070) | 1,085 | ||
| Common Stocks—0.4% | |||
| Consumer Discretionary—0.2% | |||
| General Motors Co. | 17,509 | 586 | |
| Energy—0.2% | |||
| Riviera Resources, Inc.(7) | 13,286 | 210 | |
| Roan Resources, Inc.(7) | 35,104 | 294 | |
| SandRidge Energy, Inc.(7) | 26,765 | 204 | |
| Templar Energy LLC Class A(4)(7) | 159,460 | 40 | |
| 748 | |||
| Total Common Stocks (Identified Cost $7,072) | 1,334 | ||
| Warrants—0.0% | |||
| Energy—0.0% | |||
| SandRidge Energy, Inc.(7) | 3,760 | —(8) | |
| SandRidge Energy, Inc.(7) | 1,583 | —(8) | |
| — | |||
| Total Warrants (Identified Cost $0) | —(8) | ||
| Total Long-Term Investments—97.7% (Identified Cost $315,782) | 287,935 | ||
| TOTAL INVESTMENTS—97.7% (Identified Cost $315,782) | 287,935 | ||
| Other assets and liabilities, net—2.3% | 6,920 | ||
| NET ASSETS—100.0% | $294,855 | ||
| Abbreviations: | |
| LIBOR | London Interbank Offered Rate |
| LLC | Limited Liability Company |
| LP | Limited Partnership |
| PIK | Payment-in-Kind Security |
| Footnote Legend: | |
| (1) | Security exempt from registration under Rule 144A of the Securities Act of 1933. These securities may be resold in transactions exempt from registration, normally to qualified institutional buyers. At December 31, 2018, these securities amounted to a value of $144,898 or 49.1% of net assets. |
| (2) | Security valued at fair value as determined in good faith by or under the direction of the Trustees. This security is disclosed as a Level 3 security in the disclosure table located after the Schedule of Investments. |
| (3) | Security in default; no interest payments are being received during the bankruptcy proceedings. |
| (4) | The value of this security was determined using significant unobservable inputs and is reported as a Level 3 security in the Fair Value Hierarchy table located after the Schedule of Investments. |
| (5) | 80% of the income received was in cash and 20% was in PIK. |
| (6) | Variable rate security. Rate disclosed is as of December 31, 2018. For leveraged loans, the rate shown may represent a weighted average interest rate. Information in parenthesis represents benchmark and reference rate for each security. Certain variable rate securities are not based on a published reference rate and spread but are determined by the issuer or agent and are based on current market conditions, or, for mortgage-backed securities, are impacted by the individual mortgages which are paying off over time. These securities do not indicate a reference rate and spread in their descriptions. |
| (7) | Non-income producing. |
| (8) | Amount is less than $500. |
| Country Weightings (Unaudited)† | |
| United States | 80% |
| Canada | 6 |
| Luxembourg | 5 |
| Netherlands | 5 |
| United Kingdom | 2 |
| Cayman Islands | 1 |
| Bermuda | 1 |
| Total | 100% |
| † % of total investments as of December 31, 2018. | |
| Total Value at December 31, 2018 | Level 1 Quoted Prices | Level 2 Significant Observable Inputs | Level 3 Significant Unobservable Inputs | ||||
| Debt Securities: | |||||||
| Corporate Bonds and Notes | $268,480 | $— | $268,221 | $259 | |||
| Leveraged Loans | 17,036 | — | 17,036 | — | |||
| Equity Securities: | |||||||
| Common Stocks | 1,334 | 1,294 | — | 40 | |||
| Preferred Stock | 1,085 | 1,085 | — | — | |||
| Warrants | —(1) | —(1) | — | — | |||
| Convertible Preferred Stock | —(1) | — | —(1) | — | |||
| Total Investments | $287,935 | $2,379 | $285,257 | $299 |
| (1) | Amount is less than $500. |
| Par Value | Value | ||
| Corporate Bonds and Notes—88.8% | |||
| Communication Services—18.2% | |||
| Altice Financing S.A. 144A 6.625%, 2/15/23(1) | $1,465 | $1,406 | |
| Altice France S.A. 144A 8.125%, 2/1/27(1) | 965 | 910 | |
| Altice Luxembourg S.A. 144A 7.750%, 5/15/22(1) | 2,005 | 1,825 | |
| C&W Senior Financing DAC 144A 7.500%, 10/15/26(1) | 780 | 750 | |
| CCO Holdings LLC | |||
| 5.250%, 9/30/22 | 405 | 401 | |
| 5.750%, 9/1/23 | 2,485 | 2,473 | |
| 144A 5.750%, 2/15/26(1) | 2,165 | 2,122 | |
| 144A 5.125%, 5/1/27(1) | 1,990 | 1,853 | |
| 144A 5.875%, 5/1/27(1) | 1,460 | 1,416 | |
| CenturyLink, Inc. | |||
| 6.750%, 12/1/23 | 1,850 | 1,783 | |
| 7.500%, 4/1/24 | 475 | 458 | |
| 7.650%, 3/15/42 | 390 | 307 | |
| Cincinnati Bell, Inc. | |||
| 144A 7.000%, 7/15/24(1) | 1,285 | 1,060 | |
| 144A 8.000%, 10/15/25(1) | 2,330 | 1,922 | |
| Cogent Communications Group, Inc. 144A 5.375%, 3/1/22(1) | 1,055 | 1,047 | |
| CSC Holdings LLC | |||
| 144A 7.750%, 7/15/25(1) | 450 | 458 | |
| 144A 6.625%, 10/15/25(1) | 1,125 | 1,139 | |
| 144A 7.500%, 4/1/28(1) | 245 | 244 | |
| DISH DBS Corp. | |||
| 5.125%, 5/1/20 | 1,010 | 997 | |
| 6.750%, 6/1/21 | 1,150 | 1,138 | |
| 7.750%, 7/1/26 | 2,385 | 1,974 | |
| Intelsat Jackson Holdings S.A. | |||
| 144A 9.500%, 9/30/22(1) | 1,265 | 1,442 | |
| 144A 8.000%, 2/15/24(1) | 1,290 | 1,329 | |
| Level 3 Financing, Inc. | |||
| 6.125%, 1/15/21 | 1,685 | 1,685 | |
| 5.375%, 8/15/22 | 1,330 | 1,304 | |
| 5.125%, 5/1/23 | 620 | 598 | |
| 5.375%, 5/1/25 | 1,755 | 1,645 | |
| Level 3 Parent LLC 5.750%, 12/1/22 | 885 | 869 | |
| Netflix, Inc. 5.875%, 2/15/25 | 2,330 | 2,350 | |
| Quebecor Media, Inc. 5.750%, 1/15/23 | 463 | 465 | |
| Qwest Capital Funding, Inc. | |||
| 6.875%, 7/15/28 | 365 | 306 | |
| 7.750%, 2/15/31 | 400 | 326 | |
| Sprint Capital Corp. | |||
| 6.875%, 11/15/28 | 1,550 | 1,465 | |
| 8.750%, 3/15/32 | 835 | 881 | |
| Sprint Communications, Inc. | |||
| 11.500%, 11/15/21 | 1,325 | 1,501 | |
| 9.250%, 4/15/22 | 280 | 320 | |
| Sprint Corp. 7.875%, 9/15/23 | 935 | 960 | |
| Telenet Finance Luxembourg Notes S.a.r.l. 144A 5.500%, 3/1/28(1) | 1,600 | 1,448 | |
| Trilogy International Partners LLC 144A 8.875%, 5/1/22(1) | 935 | 905 | |
| Par Value | Value | ||
| Communication Services—continued | |||
| UPC Holding B.V. 144A 5.500%, 1/15/28(1) | $1,325 | $1,199 | |
| Viacom, Inc. 6.250%, 2/28/57 | 830 | 775 | |
| Videotron Ltd. 144A 5.375%, 6/15/24(1) | 463 | 458 | |
| WMG Acquisition Corp. | |||
| 144A 5.625%, 4/15/22(1) | 1,258 | 1,255 | |
| 144A 5.000%, 8/1/23(1) | 600 | 584 | |
| 144A 5.500%, 4/15/26(1) | 405 | 387 | |
| Zayo Group LLC | |||
| 6.375%, 5/15/25 | 495 | 460 | |
| 144A 5.750%, 1/15/27(1) | 500 | 446 | |
| Ziggo B.V. 144A 5.500%, 1/15/27(1) | 1,305 | 1,168 | |
| Ziggo Bond Co. B.V. 144A 5.875%, 1/15/25(1) | 815 | 736 | |
| 52,950 | |||
| Consumer Discretionary—12.6% | |||
| American Axle & Manufacturing, Inc. 6.500%, 4/1/27 | 1,735 | 1,553 | |
| Asbury Automotive Group, Inc. 6.000%, 12/15/24 | 600 | 574 | |
| Boyd Gaming Corp. 6.000%, 8/15/26 | 810 | 757 | |
| Boyne USA, Inc. 144A 7.250%, 5/1/25(1) | 171 | 177 | |
| Caesars Resort Collection LLC 144A 5.250%, 10/15/25(1) | 1,820 | 1,565 | |
| Century Communities, Inc. | |||
| 6.875%, 5/15/22 | 1,565 | 1,514 | |
| 5.875%, 7/15/25 | 1,570 | 1,382 | |
| DriveTime Automotive Group, Inc. 144A 8.000%, 6/1/21(1) | 910 | 910 | |
| Eldorado Resorts, Inc. | |||
| 6.000%, 4/1/25 | 985 | 950 | |
| 144A 6.000%, 9/15/26(1) | 620 | 586 | |
| frontdoor, Inc. 144A 6.750%, 8/15/26(1) | 540 | 513 | |
| Graham Holdings Co. 144A 5.750%, 6/1/26(1) | 600 | 601 | |
| Hilton Domestic Operating Co., Inc. 144A 5.125%, 5/1/26(1) | 491 | 471 | |
| Hilton Grand Vacations Borrower LLC 6.125%, 12/1/24 | 625 | 620 | |
| Hilton Worldwide Finance LLC 4.625%, 4/1/25 | 778 | 737 | |
| L Brands, Inc. 6.875%, 11/1/35 | 700 | 585 | |
| Lennar Corp. | |||
| 5.875%, 11/15/24 | 1,391 | 1,391 | |
| 5.000%, 6/15/27 | 440 | 405 | |
| Mattel, Inc. 4.350%, 10/1/20 | 1,605 | 1,565 | |
| MGM Resorts International | |||
| 7.750%, 3/15/22 | 1,080 | 1,149 | |
| 6.000%, 3/15/23 | 915 | 920 | |
| New Home Co., Inc. (The) 7.250%, 4/1/22 | 1,060 | 962 | |
| New Red Finance, Inc. 144A 5.000%, 10/15/25(1) | 2,510 | 2,309 | |
| Par Value | Value | ||
| Consumer Discretionary—continued | |||
| Penske Automotive Group, Inc. 5.375%, 12/1/24 | $910 | $852 | |
| PulteGroup, Inc. | |||
| 4.250%, 3/1/21 | 1,527 | 1,516 | |
| 5.500%, 3/1/26 | 1,000 | 962 | |
| 7.875%, 6/15/32 | 400 | 414 | |
| Shea Homes LP | |||
| 144A 5.875%, 4/1/23(1) | 1,755 | 1,601 | |
| 144A 6.125%, 4/1/25(1) | 440 | 389 | |
| Six Flags Entertainment Corp. 144A 5.500%, 4/15/27(1) | 960 | 905 | |
| Staples, Inc. 144A 8.500%, 9/15/25(1) | 690 | 623 | |
| Taylor Morrison Communities, Inc. 144A 5.250%, 4/15/21(1) | 820 | 812 | |
| TRI Pointe Group, Inc. | |||
| 4.875%, 7/1/21 | 2,260 | 2,158 | |
| 5.875%, 6/15/24 | 2,525 | 2,254 | |
| 5.250%, 6/1/27 | 825 | 652 | |
| Viking Cruises Ltd. 144A 5.875%, 9/15/27(1) | 1,375 | 1,282 | |
| 36,616 | |||
| Consumer Staples—4.2% | |||
| Albertsons Cos. LLC 6.625%, 6/15/24 | 925 | 858 | |
| Coty, Inc. 144A 6.500%, 4/15/26(1) | 2,655 | 2,283 | |
| JBS Investments GmbH 144A 7.250%, 4/3/24(1) | 1,045 | 1,053 | |
| JBS USA Lux S.A. 144A 6.750%, 2/15/28(1) | 850 | 829 | |
| New Albertson’s, Inc. 7.450%, 8/1/29 | 946 | 757 | |
| Pilgrim’s Pride Corp. | |||
| 144A 5.750%, 3/15/25(1) | 2,505 | 2,349 | |
| 144A 5.875%, 9/30/27(1) | 580 | 526 | |
| Post Holdings, Inc. | |||
| 144A 5.500%, 3/1/25(1) | 380 | 365 | |
| 144A 5.000%, 8/15/26(1) | 1,235 | 1,124 | |
| 144A 5.750%, 3/1/27(1) | 474 | 444 | |
| US Foods, Inc. 144A 5.875%, 6/15/24(1) | 1,640 | 1,595 | |
| 12,183 | |||
| Energy—12.9% | |||
| Antero Resources Corp. | |||
| 5.375%, 11/1/21 | 600 | 579 | |
| 5.625%, 6/1/23 | 785 | 746 | |
| Apergy Corp. 6.375%, 5/1/26 | 627 | 608 | |
| Ascent Resources Utica Holdings LLC 144A 7.000%, 11/1/26(1) | 690 | 624 | |
| Centennial Resource Production LLC 144A 5.375%, 1/15/26(1) | 640 | 595 | |
| Cheniere Corpus Christi Holdings LLC 7.000%, 6/30/24 | 560 | 591 | |
| Chesapeake Energy Corp. 8.000%, 1/15/25 | 2,975 | 2,625 | |
| Crestwood Midstream Partners LP 5.750%, 4/1/25 | 960 | 890 | |
| Par Value | Value | ||
| Energy—continued | |||
| Diamond Offshore Drilling, Inc. 7.875%, 8/15/25 | $1,010 | $838 | |
| Diamondback Energy, Inc. | |||
| 5.375%, 5/31/25 | 1,703 | 1,660 | |
| 144A 4.750%, 11/1/24(1) | 175 | 169 | |
| Endeavor Energy Resources LP 144A 5.500%, 1/30/26(1) | 1,075 | 1,102 | |
| Ensco plc | |||
| 8.000%, 1/31/24 | 2,580 | 2,116 | |
| 7.750%, 2/1/26 | 570 | 422 | |
| 5.750%, 10/1/44 | 1,577 | 881 | |
| Enviva Partners LP 8.500%, 11/1/21 | 520 | 533 | |
| Glenn Pool Oil & Gas Trust 6.000%, 8/2/21(2) | 282 | 277 | |
| Hilcorp Energy I LP 144A 6.250%, 11/1/28(1) | 1,445 | 1,272 | |
| Indigo Natural Resources LLC 144A 6.875%, 2/15/26(1) | 935 | 804 | |
| McDermott Technology Americas, Inc. 144A 10.625%, 5/1/24(1) | 739 | 624 | |
| MEG Energy Corp. 144A 6.500%, 1/15/25(1) | 966 | 981 | |
| Murphy Oil Corp. | |||
| 6.875%, 8/15/24 | 1,285 | 1,278 | |
| 5.750%, 8/15/25 | 1,055 | 986 | |
| NGPL PipeCo LLC 144A 4.375%, 8/15/22(1) | 196 | 192 | |
| Oceaneering International, Inc. | |||
| 4.650%, 11/15/24 | 520 | 412 | |
| 6.000%, 2/1/28 | 2,404 | 1,939 | |
| Parsley Energy LLC 144A 5.625%, 10/15/27(1) | 905 | 822 | |
| Petrobras Global Finance B.V. | |||
| 8.375%, 5/23/21 | 293 | 318 | |
| 7.375%, 1/17/27 | 810 | 832 | |
| Precision Drilling Corp. | |||
| 7.750%, 12/15/23 | 805 | 742 | |
| 144A 7.125%, 1/15/26(1) | 348 | 299 | |
| Pride International LLC 7.875%, 8/15/40 | 1,370 | 1,014 | |
| Range Resources Corp. | |||
| 5.750%, 6/1/21 | 809 | 783 | |
| 5.875%, 7/1/22 | 995 | 920 | |
| Rowan Cos., Inc. | |||
| 4.875%, 6/1/22 | 1,556 | 1,284 | |
| 5.850%, 1/15/44 | 1,520 | 950 | |
| SESI LLC | |||
| 7.125%, 12/15/21 | 1,040 | 884 | |
| 7.750%, 9/15/24 | 477 | 379 | |
| Southwestern Energy Co. 7.500%, 4/1/26 | 910 | 860 | |
| Sunoco LP 4.875%, 1/15/23 | 897 | 875 | |
| Tallgrass Energy Partners LP 144A 5.500%, 9/15/24(1) | 579 | 569 | |
| Transocean Pontus Ltd. 144A 6.125%, 8/1/25(1) | 1,671 | 1,613 | |
| Par Value | Value | ||
| Energy—continued | |||
| USA Compression Partners LP 144A 6.875%, 4/1/26(1) | $665 | $638 | |
| 37,526 | |||
| Financials—11.0% | |||
| Ally Financial, Inc. | |||
| 4.250%, 4/15/21 | 1,175 | 1,153 | |
| 5.750%, 11/20/25 | 390 | 388 | |
| Deck Chassis Acquisition, Inc. 144A 10.000%, 6/15/23(1) | 1,010 | 970 | |
| Hilcorp Energy I LP 144A 5.750%, 10/1/25(1) | 3,650 | 3,248 | |
| Icahn Enterprises LP 6.000%, 8/1/20 | 1,000 | 999 | |
| ILFC E-Capital Trust I 144A 4.550%, 12/21/65(1)(3) | 2,390 | 1,858 | |
| Jefferies Finance LLC 144A 7.375%, 4/1/20(1) | 975 | 973 | |
| Ladder Capital Finance Holdings LLLP 144A 5.250%, 10/1/25(1) | 1,195 | 1,067 | |
| MGIC Investment Corp. 5.750%, 8/15/23 | 980 | 975 | |
| Nationstar Mortgage Holdings, Inc. | |||
| 144A 8.125%, 7/15/23(1) | 2,010 | 1,960 | |
| 144A 9.125%, 7/15/26(1) | 2,565 | 2,494 | |
| Nationstar Mortgage LLC 6.500%, 7/1/21 | 1,585 | 1,545 | |
| Navient Corp. 8.000%, 3/25/20 | 1,410 | 1,433 | |
| Provident Funding Associates LP 144A 6.375%, 6/15/25(1) | 2,020 | 1,818 | |
| Quicken Loans, Inc. | |||
| 144A 5.750%, 5/1/25(1) | 3,315 | 3,099 | |
| 144A 5.250%, 1/15/28(1) | 1,250 | 1,106 | |
| Refinitiv US Holdings, Inc. 144A 6.250%, 5/15/26(1) | 1,055 | 1,018 | |
| Silversea Cruise Finance Ltd. 144A 7.250%, 2/1/25(1) | 587 | 621 | |
| Teva Pharmaceutical Finance Co. B.V. 2.950%, 12/18/22 | 2,785 | 2,463 | |
| Teva Pharmaceutical Finance IV B.V. 3.650%, 11/10/21 | 1,720 | 1,630 | |
| VFH Parent LLC 144A 6.750%, 6/15/22(1) | 1,315 | 1,276 | |
| 32,094 | |||
| Health Care—8.2% | |||
| Bausch Health Cos., Inc. | |||
| 144A 5.500%, 3/1/23(1) | 1,520 | 1,386 | |
| 144A 5.875%, 5/15/23(1) | 1,610 | 1,489 | |
| 144A 7.000%, 3/15/24(1) | 900 | 909 | |
| 144A 9.000%, 12/15/25(1) | 2,136 | 2,125 | |
| Centene Corp. | |||
| 5.625%, 2/15/21 | 1,415 | 1,419 | |
| 6.125%, 2/15/24 | 590 | 604 | |
| 144A 5.375%, 6/1/26(1) | 495 | 481 | |
| Charles River Laboratories International, Inc. 144A 5.500%, 4/1/26(1) | 900 | 887 | |
| DaVita, Inc. | |||
| 5.750%, 8/15/22 | 1,310 | 1,303 | |
| 5.000%, 5/1/25 | 3,255 | 2,954 | |
| Par Value | Value | ||
| Health Care—continued | |||
| HCA Healthcare, Inc. 6.250%, 2/15/21 | $1,525 | $1,559 | |
| HCA, Inc. | |||
| 7.500%, 11/6/33 | 400 | 420 | |
| 7.500%, 11/15/95 | 455 | 441 | |
| IQVIA, Inc. 144A 5.000%, 10/15/26(1) | 995 | 950 | |
| MEDNAX, Inc. 144A 5.250%, 12/1/23(1) | 1,045 | 1,024 | |
| Quintiles IMS, Inc. 144A 4.875%, 5/15/23(1) | 1,060 | 1,039 | |
| Teleflex, Inc. 5.250%, 6/15/24 | 699 | 696 | |
| Tenet Healthcare Corp. 4.750%, 6/1/20 | 345 | 344 | |
| Teva Pharmaceutical Finance Netherlands III B.V. | |||
| 2.800%, 7/21/23 | 1,570 | 1,352 | |
| 6.000%, 4/15/24 | 750 | 722 | |
| 6.750%, 3/1/28 | 400 | 388 | |
| WellCare Health Plans, Inc. | |||
| 5.250%, 4/1/25 | 1,105 | 1,064 | |
| 144A 5.375%, 8/15/26(1) | 320 | 309 | |
| 23,865 | |||
| Industrials—7.5% | |||
| Air Canada Pass-Through-Trust 2015-1, C 144A 5.000%, 3/15/20(1) | 490 | 492 | |
| Allison Transmission, Inc. 144A 5.000%, 10/1/24(1) | 1,100 | 1,056 | |
| Beacon Roofing Supply, Inc. | |||
| 6.375%, 10/1/23 | 600 | 594 | |
| 144A 4.875%, 11/1/25(1) | 690 | 606 | |
| Bombardier, Inc. | |||
| 144A 7.750%, 3/15/20(1) | 490 | 497 | |
| 144A 8.750%, 12/1/21(1) | 630 | 649 | |
| 144A 7.500%, 3/15/25(1) | 825 | 778 | |
| Cimpress NV 144A 7.000%, 6/15/26(1) | 1,535 | 1,474 | |
| CSC Holdings LLC | |||
| 144A 10.125%, 1/15/23(1) | 1,950 | 2,098 | |
| 144A 10.875%, 10/15/25(1) | 3,157 | 3,545 | |
| J.B. Poindexter & Co., Inc. 144A 7.125%, 4/15/26(1) | 1,115 | 1,043 | |
| KAR Auction Services, Inc. 144A 5.125%, 6/1/25(1) | 1,130 | 1,020 | |
| Matthews International Corp. 144A 5.250%, 12/1/25(1) | 995 | 925 | |
| Plastipak Holdings, Inc. 144A 6.250%, 10/15/25(1) | 780 | 690 | |
| Resideo Funding, Inc. 144A 6.125%, 11/1/26(1) | 605 | 596 | |
| Ritchie Bros. Auctioneers, Inc. 144A 5.375%, 1/15/25(1) | 645 | 626 | |
| Sensata Technologies B.V. 144A 5.000%, 10/1/25(1) | 470 | 442 | |
| Sensata Technologies UK Financing Co. plc 144A 6.250%, 2/15/26(1) | 475 | 477 | |
| TMS International Corp. 144A 7.250%, 8/15/25(1) | 855 | 799 | |
| US Airways, Inc. Pass-Through-Trust 2012-2, B 6.750%, 6/3/21 | 1,527 | 1,595 | |
| Par Value | Value | ||
| Industrials—continued | |||
| USG Corp. 144A 5.500%, 3/1/25(1) | $640 | $645 | |
| Wabash National Corp. 144A 5.500%, 10/1/25(1) | 670 | 574 | |
| WESCO Distribution, Inc. 5.375%, 6/15/24 | 700 | 660 | |
| 21,881 | |||
| Information Technology—4.5% | |||
| Alliance Data Systems Corp. | |||
| 144A 5.875%, 11/1/21(1) | 2,020 | 2,017 | |
| 144A 5.375%, 8/1/22(1) | 1,845 | 1,799 | |
| CDK Global, Inc. 5.875%, 6/15/26 | 570 | 572 | |
| CommScope Technologies LLC 144A 6.000%, 6/15/25(1) | 940 | 856 | |
| Dell International LLC 144A 7.125%, 6/15/24(1) | 1,455 | 1,481 | |
| Dell, Inc. 6.500%, 4/15/38 | 890 | 792 | |
| Gartner, Inc. 144A 5.125%, 4/1/25(1) | 655 | 637 | |
| Harland Clarke Holdings Corp. | |||
| 144A 6.875%, 3/1/20(1) | 2,545 | 2,481 | |
| 144A 8.375%, 8/15/22(1) | 1,740 | 1,586 | |
| MSCI, Inc. 144A 5.250%, 11/15/24(1) | 780 | 776 | |
| 12,997 | |||
| Materials—4.8% | |||
| Axalta Coating Systems LLC 144A 4.875%, 8/15/24(1) | 1,560 | 1,474 | |
| Big River Steel LLC 144A 7.250%, 9/1/25(1) | 885 | 878 | |
| Blue Cube Spinco LLC 9.750%, 10/15/23 | 1,150 | 1,265 | |
| Chemours Co. (The) 7.000%, 5/15/25 | 735 | 741 | |
| First Quantum Minerals Ltd. | |||
| 144A 7.000%, 2/15/21(1) | 315 | 302 | |
| 144A 7.250%, 5/15/22(1) | 995 | 923 | |
| 144A 6.500%, 3/1/24(1) | 1,140 | 946 | |
| Freeport-McMoRan, Inc. | |||
| 3.550%, 3/1/22 | 1,130 | 1,069 | |
| 6.875%, 2/15/23 | 565 | 583 | |
| Imperial Metals Corp. 144A 7.000%, 3/15/19(1) | 1,289 | 864 | |
| Kaiser Aluminum Corp. 5.875%, 5/15/24 | 934 | 913 | |
| Reynolds Group Issuer, Inc. 144A 5.125%, 7/15/23(1) | 1,003 | 955 | |
| Steel Dynamics, Inc. 5.125%, 10/1/21 | 1,010 | 1,009 | |
| Summit Materials LLC 8.500%, 4/15/22 | 1,065 | 1,113 | |
| Par Value | Value | ||
| Materials—continued | |||
| Valvoline, Inc. 5.500%, 7/15/24 | $922 | $901 | |
| 13,936 | |||
| Real Estate—3.5% | |||
| CBL & Associates LP 5.250%, 12/1/23 | 1,440 | 1,141 | |
| Equinix, Inc. 5.875%, 1/15/26 | 725 | 730 | |
| Howard Hughes Corp. (The) 144A 5.375%, 3/15/25(1) | 3,225 | 3,032 | |
| MPT Operating Partnership LP 5.000%, 10/15/27 | 945 | 864 | |
| SBA Communications Corp. | |||
| 4.000%, 10/1/22 | 2,036 | 1,939 | |
| 4.875%, 9/1/24 | 905 | 851 | |
| Starwood Property Trust, Inc. 5.000%, 12/15/21 | 1,660 | 1,631 | |
| 10,188 | |||
| Utilities—1.4% | |||
| Calpine Corp. 5.750%, 1/15/25 | 900 | 823 | |
| Clearway Energy Operating LLC | |||
| 5.375%, 8/15/24 | 685 | 651 | |
| 5.000%, 9/15/26 | 650 | 583 | |
| NRG Energy, Inc. 7.250%, 5/15/26 | 1,885 | 1,963 | |
| 4,020 | |||
| Total Corporate Bonds and Notes (Identified Cost $272,603) | 258,256 | ||
| Leveraged Loans(3)—5.8% | |||
| Aerospace—0.3% | |||
| American Airlines, Inc. 2017, Tranche B (1 month LIBOR + 2.000%) 4.522%, 4/28/23 | 1,034 | 982 | |
| Consumer Non-Durables—0.1% | |||
| Coty, Inc. Tranche B (1 month LIBOR + 2.250%) 4.633%, 4/7/25 | 348 | 321 | |
| Energy—1.0% | |||
| California Resources Corp. (1 month LIBOR + 10.375%) 12.897%, 12/31/21 | 1,195 | 1,168 | |
| Crestwood Holdings LLC (1 month LIBOR + 7.500%) 9.930%, 3/6/23 | 1,046 | 1,002 | |
| KCA Deutag Alpha Ltd. Tranche B (3 month LIBOR + 6.750%) 9.553%, 2/28/23 | 731 | 586 | |
| 2,756 | |||
| Financial—1.5% | |||
| AltiSource Solutions S.a.r.l. Tranche B (3 month LIBOR + 4.000%) 6.803%, 4/3/24 | 1,404 | 1,369 | |
| Par Value | Value | ||
| Financial—continued | |||
| Ditech Holding Corp. Tranche B (1 month LIBOR + 6.000%) 8.522%, 6/30/22 | $1,609 | $1,381 | |
| Freedom Mortgage Corp. (1 month LIBOR + 4.750%) 7.272%, 2/23/22 | 703 | 692 | |
| Ocwen Loan Servicing LLC (1 month LIBOR + 5.000%) 7.504%, 12/7/20 | 907 | 889 | |
| 4,331 | |||
| Food / Tobacco—0.6% | |||
| JBS USA Lux S.A. (3 month LIBOR + 2.500%) 5.260%, 10/30/22 | 1,695 | 1,627 | |
| Food and Drug—0.3% | |||
| Albertson’s LLC 2017-1, Tranche B-6 (3 month LIBOR + 3.000%) 5.691%, 6/22/23 | 1,035 | 980 | |
| Gaming / Leisure—0.3% | |||
| Eldorado Resorts, Inc. (2 month LIBOR + 2.000%) 4.529%, 4/17/24 | 868 | 828 | |
| Media / Telecom - Cable/Wireless Video—0.3% | |||
| Liberty Cablevision of Puerto Rico LLC Tranche B, First Lien (3 month LIBOR + 3.500%) 5.936%, 1/7/22 | 1,025 | 980 | |
| Media / Telecom - Diversified Media—0.4% | |||
| Lions Gate Capital Holdings LLC Tranche B (1 month LIBOR + 2.250%) 4.772%, 3/24/25 | 1,037 | 996 | |
| Media / Telecom - Telecommunications—0.4% | |||
| CenturyLink, Inc. Tranche B (1 month LIBOR + 2.750%) 5.272%, 1/31/25 | 1,302 | 1,212 | |
| Service—0.6% | |||
| Conduent Business Services LLC Tranche B (1 month LIBOR + 2.500%) 5.022%, 12/7/23 | 1,572 | 1,490 | |
| Laureate Education, Inc. (3 month LIBOR + 3.500%) 6.027%, 4/26/24 | 328 | 321 | |
| 1,811 | |||
| Total Leveraged Loans (Identified Cost $17,805) | 16,824 | ||
| Shares | Value | ||
| Common Stock—0.0% | |||
| Energy—0.0% | |||
| Templar Energy LLC Class A(2)(4) | 134,055 | $33 | |
| Total Common Stock (Identified Cost $4,781) | 33 | ||
| Total Long-Term Investments—94.6% (Identified Cost $295,189) | 275,113 | ||
| TOTAL INVESTMENTS—94.6% (Identified Cost $295,189) | 275,113 | ||
| Other assets and liabilities, net—5.4% | 15,789 | ||
| NET ASSETS—100.0% | $290,902 | ||
| Abbreviations: | |
| LIBOR | London Interbank Offered Rate |
| LLC | Limited Liability Company |
| LP | Limited Partnership |
| Footnote Legend: | |
| (1) | Security exempt from registration under Rule 144A of the Securities Act of 1933. These securities may be resold in transactions exempt from registration, normally to qualified institutional buyers. At December 31, 2018, these securities amounted to a value of $133,271 or 45.8% of net assets. |
| (2) | The value of this security was determined using significant unobservable inputs and is reported as a Level 3 security in the Fair Value Hierarchy table located after the Schedule of Investments. |
| (3) | Variable rate security. Rate disclosed is as of December 31, 2018. For leveraged loans, the rate shown may represent a weighted average interest rate. Information in parenthesis represents benchmark and reference rate for each security. Certain variable rate securities are not based on a published reference rate and spread but are determined by the issuer or agent and are based on current market conditions, or, for mortgage-backed securities, are impacted by the individual mortgages which are paying off over time. These securities do not indicate a reference rate and spread in their descriptions. |
| (4) | Non-income producing. |
| Country Weightings (Unaudited)† | |
| United States | 81% |
| Canada | 6 |
| Netherlands | 5 |
| Luxembourg | 4 |
| United Kingdom | 2 |
| Cayman Islands | 1 |
| Bermuda | 1 |
| Total | 100% |
| † % of total investments as of December 31, 2018. | |
| Total Value at December 31, 2018 | Level 2 Significant Observable Inputs | Level 3 Significant Unobservable Inputs | |||
| Debt Securities: | |||||
| Corporate Bonds and Notes | $258,256 | $257,979 | $277 | ||
| Leveraged Loans | 16,824 | 16,824 | — | ||
| Equity Securities: | |||||
| Common Stock | 33 | — | 33 | ||
| Total Investments | $275,113 | $274,803 | $310 |
| Par Value | Value | ||
| Municipal Bonds(1)—100.1% | |||
| Alabama—0.5% | |||
| Jefferson County, Sales Tax Revenue 5.000%, 9/15/33 | $1,500 | $1,704 | |
| Alaska—4.2% | |||
| Matanuska-Susitna Borough, | |||
| Goosecreek Correctional Revenue (AGC Insured) (Pre-Refunded 9/1/19 @ 100) 6.000%, 9/1/28 | 5,650 | 5,806 | |
| Goosecreek Correctional Revenue (AGC Insured) (Pre-Refunded 9/1/19 @ 100) 6.000%, 9/1/32 | 7,250 | 7,451 | |
| 13,257 | |||
| California—22.5% | |||
| California Infrastructure & Economic Development Bank Revenue 5.000%, 10/1/35 | 5,725 | 6,785 | |
| California Infrastructure & Economic Development Bank Revenue, Mandatory Put 4/1/20 2.287%, 4/1/38(2) | 3,825 | 3,832 | |
| California, State of, | |||
| General Obligation 6.500%, 4/1/33 | 11,230 | 11,359 | |
| General Obligation 5.000%, 8/1/24 | 9,845 | 11,419 | |
| General Obligation 5.000%, 8/1/30 | 13,500 | 16,295 | |
| East Bay Municipal Utility District Water System Revenue 5.000%, 6/1/33 | 1,940 | 2,307 | |
| Los Angeles Department of Water & Power System Revenue | |||
| 5.000%, 7/1/36 | 4,410 | 5,146 | |
| 5.000%, 7/1/37 | 1,000 | 1,162 | |
| Los Angeles Department of Water Revenue | |||
| 5.000%, 7/1/34 | 2,645 | 3,041 | |
| 5.000%, 7/1/36 | 2,000 | 2,280 | |
| San Juan Unified School District, | |||
| General Obligation 4.000%, 8/1/30 | 3,000 | 3,264 | |
| General Obligation 4.000%, 8/1/31 | 2,000 | 2,155 | |
| Santa Monica-Malibu Unified School District, | |||
| General Obligation 5.000%, 8/1/39 | 400 | 447 | |
| General Obligation 5.000%, 8/1/43 | 1,500 | 1,674 | |
| 71,166 | |||
| Connecticut—1.6% | |||
| Connecticut, State of, Sales Tax Revenue 5.000%, 10/1/25 | 4,500 | 5,149 | |
| District of Columbia—3.6% | |||
| District of Columbia, General Obligation 5.000%, 6/1/31 | 2,825 | 3,303 | |
| Par Value | Value | ||
| District of Columbia—continued | |||
| District of Columbia Revenue 5.500%, 12/1/30 | $8,000 | $8,252 | |
| 11,555 | |||
| Florida—3.1% | |||
| Miami-Dade County Water & Sewer System Revenue | |||
| 5.000%, 10/1/32 | 6,100 | 6,939 | |
| 5.000%, 10/1/33 | 2,650 | 3,006 | |
| 9,945 | |||
| Georgia—2.4% | |||
| Atlanta, City of, Water & Wastewater Revenue | |||
| 5.000%, 11/1/34 | 2,000 | 2,340 | |
| 5.000%, 11/1/35 | 4,585 | 5,338 | |
| 7,678 | |||
| Hawaii—2.6% | |||
| Hawaii, State of, | |||
| Airports System Revenue 5.000%, 7/1/30 | 1,250 | 1,451 | |
| Airports System Revenue 5.000%, 7/1/31 | 1,275 | 1,473 | |
| General Obligation (Pre-Refunded 11/1/22 @ 100) 5.000%, 11/1/29 | 60 | 67 | |
| General Obligation (Pre-Refunded 11/1/22 @ 100) 5.000%, 11/1/29 | 160 | 178 | |
| General Obligation (Pre-Refunded 11/1/22 @ 100) 5.000%, 11/1/29 | 4,495 | 4,970 | |
| 8,139 | |||
| Illinois—12.9% | |||
| Chicago O’Hare International Airport, | |||
| Passenger Facilities Charge Revenue 5.000%, 1/1/25 | 2,420 | 2,596 | |
| Passenger Facilities Charge Revenue 4.000%, 1/1/27 | 2,730 | 2,787 | |
| Chicago O’Hare International Airport Revenue, | |||
| Senior Lien 5.000%, 1/1/25 | 3,000 | 3,218 | |
| Senior Lien 5.000%, 1/1/48 | 3,500 | 3,889 | |
| Cook County, | |||
| Sales Tax Revenue 5.250%, 11/15/35 | 6,000 | 6,893 | |
| Sales Tax Revenue 5.250%, 11/15/36 | 8,000 | 9,151 | |
| Sales Tax Revenue 4.000%, 11/15/37 | 3,000 | 3,076 | |
| Illinois, State of, | |||
| General Obligation 5.000%, 10/1/22 | 1,000 | 1,054 | |
| General Obligation 5.000%, 11/1/24 | 3,000 | 3,201 | |
| Sales Tax Securitization Corp., Sales Tax Revenue 5.000%, 1/1/25 | 1,700 | 1,890 | |
| Sales Tax Securitization Corp., Chicago Sales Tax Revenue, Sales Tax Revenue 5.000%, 1/1/30 | 1,000 | 1,130 | |
| Par Value | Value | ||
| Illinois—continued | |||
| University of Illinois Revenue (Pre-Refunded 4/1/19 @ 100) 5.750%, 4/1/38 | $2,000 | $2,019 | |
| 40,904 | |||
| Louisiana—0.3% | |||
| New Orleans Aviation Board, General Airport North Terminal Project Revenue 5.000%, 1/1/35 | 760 | 842 | |
| Maryland—5.0% | |||
| Maryland, State of, General Obligation (Pre-Refunded 8/1/22 @ 100) 5.000%, 8/1/25 | 5,920 | 6,554 | |
| Montgomery County, General Obligation 5.000%, 11/1/27 | 5,000 | 5,765 | |
| Washington Suburban Sanitary Commission, General Obligation 5.000%, 6/15/30 | 3,000 | 3,583 | |
| 15,902 | |||
| Massachusetts—3.0% | |||
| Massachusetts School Building Authority, Sales Tax Revenue 5.000%, 8/15/36 | 5,000 | 5,637 | |
| Massachusetts State College Building Authority Revenue (ST INTERCEPT Insured) 5.000%, 5/1/34 | 3,545 | 3,966 | |
| 9,603 | |||
| Michigan—1.0% | |||
| Michigan Finance Authority Revenue 5.000%, 7/1/21 | 3,110 | 3,110 | |
| Minnesota—0.8% | |||
| Hennepin County, General Obligation 5.000%, 12/1/25 | 2,000 | 2,368 | |
| Missouri—0.5% | |||
| Metropolitan St. Louis Sewer District Revenue 5.000%, 5/1/35 | 1,500 | 1,704 | |
| Nevada—1.8% | |||
| Clark County School District, General Obligation (AGM-CR Insured) 5.000%, 6/15/27 | 4,775 | 5,600 | |
| New Jersey—0.5% | |||
| New Jersey Turnpike Authority, Toll Highway Revenue 5.000%, 1/1/34 | 1,500 | 1,669 | |
| New York—11.1% | |||
| New York City Transitional Finance Authority Future Tax Secured Revenue 5.000%, 8/1/34 | 5,060 | 5,858 | |
| New York City Water & Sewer System Revenue 5.000%, 6/15/30 | 2,250 | 2,653 | |
| New York State Dormitory Authority, | |||
| 5.000%, 3/15/32 | 5,050 | 5,993 | |
| Par Value | Value | ||
| New York—continued | |||
| Lease Revenue (State AID Withholding Insured) 5.000%, 10/1/32 | $3,000 | $3,459 | |
| Lease Revenue (State AID Withholding Insured) 5.000%, 10/1/33 | 1,000 | 1,149 | |
| Sales Tax Revenue 5.000%, 3/15/28 | 2,500 | 2,838 | |
| Sales Tax Revenue 5.000%, 3/15/31 | 3,300 | 3,953 | |
| Sales Tax Revenue 5.000%, 3/15/35 | 5,000 | 5,651 | |
| New York, City of, | |||
| General Obligation 5.000%, 8/1/26 | 1,000 | 1,188 | |
| General Obligation 5.000%, 12/1/34 | 2,000 | 2,354 | |
| 35,096 | |||
| Ohio—2.8% | |||
| Ohio, State of, General Obligation 5.000%, 6/15/32 | 7,735 | 8,930 | |
| Oregon—5.3% | |||
| Portland, Port of, Airport Revenue | |||
| 5.000%, 7/1/26 | 750 | 866 | |
| 5.000%, 7/1/30 | 1,000 | 1,141 | |
| 5.000%, 7/1/33 | 1,000 | 1,128 | |
| 5.000%, 7/1/34 | 1,000 | 1,125 | |
| 5.000%, 7/1/35 | 1,000 | 1,122 | |
| Salem-Keizer School District No. 24J, | |||
| General Obligation (SCH BD GTY Insured) 5.000%, 6/15/30 | 4,460 | 5,368 | |
| General Obligation (SCH BD GTY Insured) 5.000%, 6/15/31 | 4,000 | 4,792 | |
| Washington County School District No 1 West Union, General Obligation (SCH BD GTY Insured) 5.000%, 6/15/31 | 1,000 | 1,179 | |
| 16,721 | |||
| Pennsylvania—6.2% | |||
| Delaware River Port Authority, | |||
| Toll Highway Revenue 5.000%, 1/1/25 | 2,250 | 2,595 | |
| Toll Highway Revenue 5.000%, 1/1/31 | 1,500 | 1,786 | |
| Toll Highway Revenue 5.000%, 1/1/32 | 1,500 | 1,777 | |
| Pennsylvania Economic Development Financing Authority Revenue 5.000%, 7/1/21 | 1,340 | 1,340 | |
| Philadelphia, City of, Airport Revenue | |||
| 5.000%, 7/1/22 | 1,765 | 1,921 | |
| 5.000%, 7/1/23 | 2,000 | 2,217 | |
| 5.000%, 7/1/27 | 1,000 | 1,161 | |
| Par Value | Value | ||
| Pennsylvania—continued | |||
| University of Pittsburgh of the Commonwealth System of Higher Education, Capital Projects Revenue (Pre-Refunded 3/15/19 @ 100) 5.500%, 9/15/23 | $6,750 | $6,802 | |
| 19,599 | |||
| Texas—1.2% | |||
| Austin Convention Enterprises, Inc., Convention Center Revenue 5.000%, 1/1/25 | 1,100 | 1,226 | |
| San Antonio, City of, Electric & Gas Systems Revenue | |||
| 5.000%, 2/1/26 | 1,000 | 1,180 | |
| 5.000%, 2/1/44 | 1,250 | 1,438 | |
| 3,844 | |||
| Virginia—1.8% | |||
| Virginia College Building Authority Revenue 5.000%, 2/1/29 | 4,750 | 5,539 | |
| Washington—5.4% | |||
| Energy Northwest Revenue 5.000%, 7/1/33 | 1,570 | 1,829 | |
| Washington, State of, | |||
| General Obligation 5.000%, 2/1/30 | 5,000 | 5,796 | |
| General Obligation (Pre-Refunded 8/1/21 @ 100) 5.000%, 8/1/24 | 8,880 | 9,583 | |
| 17,208 | |||
| Total Municipal Bonds (Identified Cost $314,773) | 317,232 | ||
| Total Long-Term Investments—100.1% (Identified Cost $314,773) | 317,232 | ||
| Shares | Value | ||
| Short-Term Investment—1.8% | |||
| Money Market Mutual Fund—1.8% | |||
| Dreyfus AMT-Free Tax Exempt Cash Management (seven-day effective yield 1.567%)(3) | 5,776,245 | $5,776 | |
| Total Short-Term Investment (Identified Cost $5,776) | 5,776 | ||
| TOTAL INVESTMENTS—101.9% (Identified Cost $320,549) | 323,008 | ||
| Other assets and liabilities, net—(1.9)% | (6,008) | ||
| NET ASSETS—100.0% | $317,000 | ||
| Abbreviations: | |
| AGC | Assured Guaranty Corp. |
| CR | Custodial Receipts |
| SCH BD GTY | School Bond Guaranty |
| Footnote Legend: | |
| (1) | At December 31, 2018, 12.0% of the securities in the portfolio are backed by insurance of financial institutions and financial guaranty assurance agencies. None of the insurers concentration exceeds 10% of the Fund’s net assets. |
| (2) | Variable or step coupon security; interest rate shown reflects the rate in effect at December 31, 2018. For securities based on a published reference rate and spread, the reference rate and spread are indicated in the description above. Certain variable rate securities are not based on a published reference rate and spread but are determined by the issuer or agent and are based on current market conditions. These securities do not indicate a reference rate and spread in their description above. |
| (3) | Shares of this fund are publicly offered, and its prospectus and annual report are publicly available. |
| Total Value at December 31, 2018 | Level 1 Quoted Prices | Level 2 Significant Observable Inputs | |||
| Debt Securities: | |||||
| Municipal Bonds | $317,232 | $— | $317,232 | ||
| Short-Term Investment | 5,776 | 5,776 | — | ||
| Total Investments | $323,008 | $5,776 | $317,232 |
| Par Value | Value | ||
| Municipal Bonds—89.9% | |||
| California—3.7% | |||
| General Obligation—3.7% | |||
| California, State of 5.000%, 8/1/36 | $495 | $574 | |
| North Carolina—86.2% | |||
| General Obligation—7.4% | |||
| Mecklenburg County 5.000%, 9/1/24 | 1,000 | 1,161 | |
| General Revenue—24.8% | |||
| North Carolina Capital Facilities Finance Agency, | |||
| University of Duke 5.000%, 10/1/41 | 1,000 | 1,122 | |
| University of Wake Forest 5.000%, 1/1/33 | 500 | 577 | |
| Pitt County 5.000%, 4/1/28 | 750 | 861 | |
| University of North Carolina at Chapel Hill, Mandatory Put 11/9/22 1.974%, 12/1/41(1) | 750 | 747 | |
| Wake County 5.000%, 12/1/35 | 500 | 580 | |
| 3,887 | |||
| Healthcare Revenue—12.2% | |||
| Charlotte-Mecklenburg Hospital Authority, Carolinas Healthcare System 4.000%, 1/15/45 | 750 | 758 | |
| North Carolina Medical Care Commission, Mission Healthcare System 5.000%, 10/1/35 | 1,125 | 1,158 | |
| 1,916 | |||
| Lease Revenue—5.1% | |||
| Cabarrus County, Public Improvements 4.000%, 6/1/33 | 750 | 800 | |
| Pre-Refunded—8.4% | |||
| Forsyth County, Educational Facilities (Pre-Refunded 2/1/19 @ 100) 5.000%, 2/1/22 | 750 | 752 | |
| North Carolina Municipal Power Agency (Pre-Refunded 1/1/19 @ 100) 5.000%, 1/1/25 | 570 | 570 | |
| 1,322 | |||
| Transportation Revenue—19.2% | |||
| Charlotte, City of, Charlotte Douglas International Airport 5.000%, 7/1/26 | 900 | 1,023 | |
| Par Value | Value | ||
| North Carolina—continued | |||
| Transportation Revenue—continued | |||
| North Carolina Turnpike Authority, Senior Lien 5.000%, 1/1/32 | $750 | $834 | |
| Raleigh Durham Airport Authority 5.000%, 5/1/29 | 1,000 | 1,146 | |
| 3,003 | |||
| Water & Sewer Revenue—9.1% | |||
| Buncombe County Metropolitan Sewerage District 5.000%, 7/1/39 | 750 | 837 | |
| Charlotte, City of, Water & Sewer System Revenue 5.000%, 7/1/44 | 500 | 582 | |
| 1,419 | |||
| Total Municipal Bonds (Identified Cost $14,215) | 14,082 | ||
| Total Long-Term Investments—89.9% (Identified Cost $14,215) | 14,082 | ||
| Shares | ||
| Short-Term Investment—8.9% | ||
| Money Market Mutual Fund—8.9% | ||
| Dreyfus AMT-Free Tax Exempt Cash Management (seven-day effective yield 1.567%)(2) | 1,403,243 | 1,403 |
| Total Short-Term Investment (Identified Cost $1,403) | 1,403 | |
| TOTAL INVESTMENTS—98.8% (Identified Cost $15,618) | 15,485 | |
| Other assets and liabilities, net—1.2% | 187 | |
| NET ASSETS—100.0% | $15,672 | |
| Footnote Legend: | |
| (1) | Variable or step coupon security; interest rate shown reflects the rate in effect at December 31, 2018. For securities based on a published reference rate and spread, the reference rate and spread are indicated in the description above. Certain variable rate securities are not based on a published reference rate and spread but are determined by the issuer or agent and are based on current market conditions. These securities do not indicate a reference rate and spread in their description above. |
| (2) | Shares of this fund are publicly offered, and its prospectus and annual report are publicly available. |
| Total Value at December 31, 2018 | Level 1 Quoted Prices | Level 2 Significant Observable Inputs | |||
| Debt Securities: | |||||
| Municipal Bonds | $14,082 | $— | $14,082 | ||
| Short-Term Investment | 1,403 | 1,403 | — | ||
| Total Investments | $15,485 | $1,403 | $14,082 |
| Par Value | Value | ||
| U.S. Government Securities—55.7% | |||
| U.S. Treasury Note | |||
| 1.375%, 10/31/20 | $598 | $585 | |
| 1.250%, 3/31/21 | 1,167 | 1,136 | |
| 1.125%, 7/31/21 | 2,211 | 2,136 | |
| 1.875%, 1/31/22 | 1,294 | 1,271 | |
| Total U.S. Government Securities (Identified Cost $5,101) | 5,128 | ||
| Mortgage-Backed Securities—15.0% | |||
| Agency—9.2% | |||
| Federal Home Loan Mortgage Corp. Multifamily Structured Pass-Through Certificates K712, A2 1.869%, 11/25/19 | 206 | 204 | |
| Federal Home Loan Mortgage Corp. REMIC 3786, EB 4.000%, 8/15/35 | 13 | 13 | |
| Federal National Mortgage Association | |||
| Pool #AM2314 1.680%, 1/1/20 | 238 | 235 | |
| Pool #MA1104 2.500%, 7/1/22 | 405 | 402 | |
| 854 | |||
| Non-Agency—5.8% | |||
| FREMF Mortgage Trust 2014-K503, B 144A 3.045%, 10/25/47(1)(2) | 290 | 289 | |
| Goldman Sachs Mortgage Securities Trust 2012-ALOH, A 144A 3.551%, 4/10/34(1) | 100 | 101 | |
| OBP Depositor LLC Trust 2010-OBP, A 144A 4.646%, 7/15/45(1) | 140 | 142 | |
| 532 | |||
| Total Mortgage-Backed Securities (Identified Cost $1,401) | 1,386 | ||
| Asset-Backed Securities—4.7% | |||
| Credit Card—2.2% | |||
| Citibank Credit Card Issuance Trust 2018-A1, A1 2.490%, 1/20/23 | 100 | 99 | |
| World Financial Network Credit Card Master Trust 2017-C, A 2.310%, 8/15/24 | 100 | 99 | |
| 198 | |||
| Other—2.5% | |||
| BMW Floorplan Master Owner Trust 2018-1, A1 144A 3.150%, 5/15/23(1) | 100 | 100 | |
| JCP&L Transition Funding II LLC 2006-A, A4 5.610%, 6/5/23 | 40 | 41 | |
| Verizon Owner Trust 2018-A, A1A 3.230%, 4/20/23 | 90 | 91 | |
| 232 | |||
| Total Asset-Backed Securities (Identified Cost $429) | 430 | ||
| Par Value | Value | ||
| Corporate Bonds and Notes—22.8% | |||
| Communication Services—0.5% | |||
| AT&T, Inc. (3 month LIBOR + 1.180%) 3.956%, 6/12/24(2) | $48 | $47 | |
| Consumer Discretionary—4.2% | |||
| BMW US Capital LLC 144A 1.500%, 4/11/19(1) | 111 | 110 | |
| Daimler Finance North America LLC 144A 3.000%, 2/22/21(1) | 200 | 198 | |
| Newell Brands, Inc. 2.600%, 3/29/19 | 77 | 77 | |
| 385 | |||
| Consumer Staples—2.0% | |||
| Anheuser-Busch InBev Worldwide, Inc. (3 month LIBOR + 0.740%) 3.165%, 1/12/24(2) | 54 | 52 | |
| Walmart, Inc. 2.850%, 6/23/20 | 135 | 135 | |
| 187 | |||
| Financials—6.6% | |||
| Bank of America Corp. 2.600%, 1/15/19 | 98 | 98 | |
| Citigroup, Inc. 2.650%, 10/26/20 | 76 | 75 | |
| Goldman Sachs Bank USA 3.200%, 6/5/20 | 95 | 95 | |
| Morgan Stanley 2.375%, 7/23/19 | 96 | 96 | |
| New York Life Global Funding 144A 3.250%, 8/6/21(1) | 80 | 80 | |
| PACCAR Financial Corp. 2.800%, 3/1/21 | 86 | 85 | |
| Shell International Finance B.V. 1.375%, 9/12/19 | 76 | 75 | |
| 604 | |||
| Health Care—1.3% | |||
| CVS Health Corp. (3 month LIBOR + 0.630%) 3.397%, 3/9/20(2) | 116 | 116 | |
| Industrials—1.3% | |||
| Fortive Corp. 1.800%, 6/15/19 | 18 | 18 | |
| Wabtec Corp. (3 month LIBOR + 1.050%) 3.838%, 9/15/21(2) | 107 | 106 | |
| 124 | |||
| Information Technology—0.9% | |||
| Dell International LLC 144A 3.480%, 6/1/19(1) | 83 | 83 | |
| Materials—2.4% | |||
| DowDuPont, Inc. 3.766%, 11/15/20 | 87 | 88 | |
| Par Value | Value | ||
| Materials—continued | |||
| Sherwin-Williams Co. (The) 2.250%, 5/15/20 | $132 | $130 | |
| 218 | |||
| Utilities—3.6% | |||
| Dominion Energy, Inc. 2.579%, 7/1/20 | 140 | 138 | |
| Emera US Finance LP 2.150%, 6/15/19 | 196 | 194 | |
| 332 | |||
| Total Corporate Bonds and Notes (Identified Cost $2,110) | 2,096 | ||
| Total Long-Term Investments—98.2% (Identified Cost $9,041) | 9,040 | ||
| TOTAL INVESTMENTS—98.2% (Identified Cost $9,041) | 9,040 | ||
| Other assets and liabilities, net—1.8% | 168 | ||
| NET ASSETS—100.0% | $9,208 | ||
| Abbreviations: | |
| LIBOR | London Interbank Offered Rate |
| LLC | Limited Liability Company |
| LP | Limited Partnership |
| REMIC | Real Estate Mortgage Investment Conduit |
| Footnote Legend: | |
| (1) | Security exempt from registration under Rule 144A of the Securities Act of 1933. These securities may be resold in transactions exempt from registration, normally to qualified institutional buyers. At December 31, 2018, these securities amounted to a value of $1,103 or 12.0% of net assets. |
| (2) | Variable rate security. Rate disclosed is as of December 31, 2018. For leveraged loans, the rate shown may represent a weighted average interest rate. Information in parenthesis represents benchmark and reference rate for each security. Certain variable rate securities are not based on a published reference rate and spread but are determined by the issuer or agent and are based on current market conditions, or, for mortgage-backed securities, are impacted by the individual mortgages which are paying off over time. These securities do not indicate a reference rate and spread in their descriptions. |
| Total Value at December 31, 2018 | Level 2 Significant Observable Inputs | ||
| Debt Securities: | |||
| Asset-Backed Securities | $430 | $430 | |
| Corporate Bonds and Notes | 2,096 | 2,096 | |
| Mortgage-Backed Securities | 1,386 | 1,386 | |
| U.S. Government Securities | 5,128 | 5,128 | |
| Total Investments | $9,040 | $9,040 |
| Par Value | Value | ||
| Municipal Bonds(1)—92.7% | |||
| California—11.4% | |||
| California Infrastructure & Economic Development Bank Revenue, Mandatory Put 4/1/20 2.287%, 4/1/38(2) | $1,250 | $1,252 | |
| California Municipal Finance Authority, Bowles Hall Foundation Revenue, 4.000%, 6/1/21 | 200 | 207 | |
| California, State of, General Obligation 5.000%, 8/1/24 | 750 | 870 | |
| 2,329 | |||
| Connecticut—4.7% | |||
| New Canaan, Town of, General Obligation 5.000%, 4/1/25 | 825 | 968 | |
| Florida—1.2% | |||
| Central Florida Expressway Authority, Toll Highway Revenue, Senior Lien 5.000%, 7/1/28 | 200 | 240 | |
| Georgia—6.6% | |||
| Clarke County Board of Education, General Obligation (State Aid Withholding Insured) 5.000%, 9/1/21 | 1,240 | 1,342 | |
| Illinois—20.4% | |||
| Chicago O’Hare International Airport, Passenger Facilities Charge Revenue 5.000%, 1/1/25 | 1,020 | 1,094 | |
| Chicago O’Hare International Airport Revenue 5.000%, 1/1/19 | 1,500 | 1,500 | |
| Illinois, State of, General Obligation 5.000%, 10/1/21 | 1,000 | 1,044 | |
| Sales Tax Securitization Corp., Sales Tax Revenue 5.000%, 1/1/23 | 500 | 542 | |
| 4,180 | |||
| New Jersey—5.0% | |||
| New Jersey Transportation Trust Fund Authority, Federal Highway Reimbursement Revenue 5.000%, 6/15/19 | 1,000 | 1,013 | |
| New York—6.2% | |||
| Metropolitan Transportation Authority Revenue 5.000%, 5/15/21 | 500 | 532 | |
| New York City Transitional Finance Authority Future Tax Secured Revenue 5.000%, 8/1/22 | 665 | 736 | |
| 1,268 | |||
| North Carolina—4.9% | |||
| Charlotte, City of, Water & Sewer System Revenue 1.660%, 7/1/36(2) | 1,000 | 1,000 | |
| Oregon—2.2% | |||
| Washington County School District No. 1 West Union, General Obligation (SCH BD GTY Insured) 5.000%, 6/15/23 | 400 | 451 | |
| Par Value | Value | ||
| Pennsylvania—3.9% | |||
| Delaware River Port Authority, | |||
| Toll Highway Revenue 5.000%, 1/1/25 | $250 | $288 | |
| Toll Highway Revenue (Pre-Refunded 1/1/20 @ 100) 5.000%, 1/1/28 | 500 | 516 | |
| 804 | |||
| Texas—12.5% | |||
| Austin Convention Enterprises, Inc., Convention Center Hotel Revenue 5.000%, 1/1/22 | 300 | 322 | |
| North Texas Tollway Authority, | |||
| Toll Highway Revenue 5.000%, 1/1/25 | 625 | 691 | |
| Toll Highway Revenue 5.000%, 1/1/26 | 500 | 552 | |
| University of Texas System Revenue 1.710%, 8/1/33(2) | 1,000 | 1,000 | |
| 2,565 | |||
| Virginia—5.5% | |||
| Virginia Commonwealth Transportation Board Revenue 5.000%, 5/15/23 | 1,000 | 1,127 | |
| Washington—8.2% | |||
| Energy Northwest, Project 3 Electric Revenue 5.000%, 7/1/24 | 500 | 576 | |
| Seattle, Port of, General Obligation 5.250%, 12/1/20 | 1,030 | 1,093 | |
| 1,669 | |||
| Total Municipal Bonds (Identified Cost $18,975) | 18,956 | ||
| Total Long-Term Investments—92.7% (Identified Cost $18,975) | 18,956 | ||
| Shares | ||
| Short-Term Investment—10.0% | ||
| Money Market Mutual Fund—10.0% | ||
| Dreyfus AMT-Free Tax Exempt Cash Management (seven-day effective yield 1.567%)(3) | 2,048,882 | 2,049 |
| Total Short-Term Investment (Identified Cost $2,049) | 2,049 | |
| TOTAL INVESTMENTS—102.7% (Identified Cost $21,024) | 21,005 | |
| Other assets and liabilities, net—(2.7)% | (551) | |
| NET ASSETS—100.0% | $20,454 | |
| Abbreviation: | |
| SCH BD GTY | School Bond Guaranty |
| Footnote Legend: | |
| (1) | At December 31, 2018, 8.5% of the securities in the portfolio are backed by insurance of financial institutions and financial guaranty assurance agencies. |
| (2) | Variable or step coupon security; interest rate shown reflects the rate in effect at December 31, 2018. For securities based on a published reference rate and spread, the reference rate and spread are indicated in the description above. Certain variable rate securities are not based on a published reference rate and spread but are determined by the issuer or agent and are based on current market conditions. These securities do not indicate a reference rate and spread in their description above. |
| (3) | Shares of this fund are publicly offered, and its prospectus and annual report are publicly available. |
| Total Value at December 31, 2018 | Level 1 Quoted Prices | Level 2 Significant Observable Inputs | |||
| Debt Securities: | |||||
| Municipal Bonds | $18,956 | $— | $18,956 | ||
| Short-Term Investment | 2,049 | 2,049 | — | ||
| Total Investments | $21,005 | $2,049 | $18,956 |
| Par Value | Value | ||
| U.S. Government Securities—55.5% | |||
| U.S. Treasury Bond 3.000%, 8/15/48 | $ 36,562 | $36,452 | |
| U.S. Treasury Note | |||
| 1.375%, 4/30/20(1)(2) | 46,325 | 45,610 | |
| 1.250%, 3/31/21 | 7,812 | 7,603 | |
| 2.750%, 8/15/21 | 26,620 | 26,796 | |
| 1.875%, 7/31/22 | 81,027 | 79,347 | |
| 2.750%, 7/31/23 | 3,856 | 3,897 | |
| 3.125%, 11/15/28 | 45,445 | 47,170 | |
| Total U.S. Government Securities (Identified Cost $241,691) | 246,875 | ||
| Mortgage-Backed Securities—24.8% | |||
| Agency—19.4% | |||
| Federal Home Loan Mortgage Corp. | |||
| Pool #G08347 4.500%, 6/1/39 | 914 | 956 | |
| Pool #G05606 4.500%, 7/1/39 | 1,637 | 1,714 | |
| Pool #G08372 4.500%, 11/1/39 | 552 | 578 | |
| Pool #G60126 4.500%, 11/1/41 | 243 | 255 | |
| Pool #C04123 4.000%, 7/1/42 | 2,551 | 2,625 | |
| Pool #G60019 4.500%, 3/1/44 | 2,188 | 2,271 | |
| Pool #Q31645 4.000%, 2/1/45 | 3,242 | 3,315 | |
| Pool #Q35611 4.000%, 9/1/45 | 3,769 | 3,854 | |
| Pool #V81992 4.000%, 10/1/45 | 3,276 | 3,345 | |
| Pool #G60661 4.000%, 7/1/46 | 6,818 | 6,960 | |
| Pool #Q53881 4.500%, 1/1/48 | 3,604 | 3,746 | |
| Federal National Mortgage Association | |||
| Pool #AN9721 3.600%, 7/1/27 | 825 | 841 | |
| 2017-M15, ATS2 3.136%, 11/25/27(3) | 1,075 | 1,060 | |
| Pool #387885 3.640%, 8/1/28 | 3,465 | 3,541 | |
| Pool #109461 3.710%, 8/1/28 | 100 | 103 | |
| Pool #AN9768 3.730%, 9/1/28 | 2,945 | 2,971 | |
| Pool #AN4045 3.150%, 1/1/29 | 2,525 | 2,461 | |
| Pool #AN4605 3.320%, 2/1/29 | 1,295 | 1,285 | |
| Pool #AN6846 2.930%, 10/1/29 | 686 | 653 | |
| Pool #AN7049 3.050%, 10/1/29 | 495 | 475 | |
| Pool #AN6661 3.090%, 10/1/29 | 2,295 | 2,207 | |
| Pool #AN6391 3.110%, 10/1/29 | 2,190 | 2,109 | |
| Par Value | Value | ||
| Agency—continued | |||
| Pool #AN7081 3.170%, 10/1/29 | $860 | $833 | |
| Pool #AN7155 3.180%, 10/1/29 | 160 | 156 | |
| Pool #AN6807 2.960%, 11/1/29 | 1,000 | 951 | |
| Pool #AN7145 3.030%, 12/1/29 | 3,400 | 3,246 | |
| Pool #AM7516 3.550%, 2/1/30 | 735 | 745 | |
| Pool #AM8970 2.870%, 5/1/30 | 1,068 | 1,020 | |
| Pool #AM8738 3.250%, 5/1/30 | 1,108 | 1,094 | |
| Pool #109681 3.770%, 9/1/30 | 585 | 600 | |
| Pool #AL7497 3.500%, 9/1/40 | 3,272 | 3,298 | |
| Pool #AW8154 3.500%, 1/1/42 | 1,103 | 1,112 | |
| Pool #AS9571 3.500%, 5/1/42 | 5,501 | 5,546 | |
| Pool #AL6223 4.500%, 8/1/44 | 391 | 407 | |
| Pool #BE5050 4.000%, 9/1/45 | 3,725 | 3,814 | |
| Pool #AZ9213 4.000%, 10/1/45 | 994 | 1,018 | |
| Pool #AS6515 4.000%, 1/1/46 | 1,816 | 1,853 | |
| Pool #BC2470 3.500%, 2/1/46 | 1,637 | 1,650 | |
| Pool #BE7213 4.000%, 4/1/47 | 31 | 32 | |
| Pool #BH7587 4.500%, 8/1/47 | 1,587 | 1,660 | |
| Government National Mortgage Association | |||
| Pool #MA4072 5.000%, 11/20/46 | 1,019 | 1,075 | |
| Pool #MA5596 4.500%, 11/20/48 | 6,697 | 6,936 | |
| Pool #MA5652 4.500%, 12/20/48 | 1,829 | 1,896 | |
| 86,267 | |||
| Non-Agency—5.4% | |||
| Caesars Palace Las Vegas Trust 2017-VICI, B 144A 3.835%, 10/15/34(4) | 2,525 | 2,532 | |
| FREMF Mortgage Trust 2013-K713, B 144A 3.154%, 4/25/46(3)(4) | 1,925 | 1,921 | |
| Goldman Sachs Mortgage Securities Trust 2012-ALOH, A 144A 3.551%, 4/10/34(4) | 2,500 | 2,519 | |
| GS Mortgage Securities Trust | |||
| 2005-ROCK, A 144A 5.366%, 5/3/32(4) | 1,340 | 1,491 | |
| 2012-BWTR, B 144A 3.255%, 11/5/34(4) | 2,890 | 2,843 | |
| MAD Mortgage Trust 2017-330M, A 144A 3.188%, 8/15/34(3)(4) | 2,040 | 2,013 | |
| Morgan Stanley Capital I Trust | |||
| Par Value | Value | ||
| Non-Agency—continued | |||
| 2014-CPT, AM 144A 3.401%, 7/13/29(3)(4) | $2,530 | $2,529 | |
| 2014-150E, A 144A 3.912%, 9/9/32(4) | 1,175 | 1,193 | |
| US 2018-USDC, A 144A 4.106%, 5/9/38(4) | 2,900 | 2,972 | |
| VNDO Mortgage Trust 2013-PENN, A 144A 3.808%, 12/13/29(4) | 1,375 | 1,388 | |
| WFRBS Commercial Mortgage Trust 2012-C10, AS 3.241%, 12/15/45 | 2,510 | 2,475 | |
| 23,876 | |||
| Total Mortgage-Backed Securities (Identified Cost $110,774) | 110,143 | ||
| Asset-Backed Securities—4.8% | |||
| Credit Card—4.1% | |||
| Capital One Multi-Asset Execution Trust 2005-B3, B3 (3 month LIBOR + 0.550%) 2.986%, 5/15/28(3) | 4,334 | 4,250 | |
| Citibank Credit Card Issuance Trust 2017-A6, A6 (1 month LIBOR + 0.770%) 3.210%, 5/14/29(3) | 4,000 | 3,991 | |
| Discover Card Execution Note Trust 2017-A5, A5 (1 month LIBOR + 0.600%) 3.055%, 12/15/26(3) | 4,000 | 3,994 | |
| Golden Credit Card Trust 2018-4A, A 144A 3.440%, 10/15/25(4) | 2,450 | 2,440 | |
| World Financial Network Credit Card Master Trust 2017-C, A 2.310%, 8/15/24 | 3,540 | 3,491 | |
| 18,166 | |||
| Other—0.7% | |||
| Five Guys Funding LLC 2017-1A, A2 144A 4.600%, 7/25/47(4) | 3,067 | 3,128 | |
| Total Asset-Backed Securities (Identified Cost $21,258) | 21,294 | ||
| Corporate Bonds and Notes—12.8% | |||
| Communication Services—0.7% | |||
| AT&T, Inc. 4.500%, 3/9/48 | 1,335 | 1,151 | |
| Comcast Corp. | |||
| 4.150%, 10/15/28 | 766 | 778 | |
| 4.700%, 10/15/48 | 1,143 | 1,163 | |
| 3,092 | |||
| Consumer Staples—0.4% | |||
| Walmart, Inc. 3.700%, 6/26/28 | 1,914 | 1,943 | |
| Energy—3.0% | |||
| Baker Hughes a GE Co. LLC 4.080%, 12/15/47 | 1,532 | 1,264 | |
| Boardwalk Pipelines LP 4.450%, 7/15/27 | 517 | 478 | |
| Par Value | Value | ||
| Energy—continued | |||
| Ensco plc | |||
| 4.500%, 10/1/24 | $540 | $351 | |
| 5.200%, 3/15/25 | 1,737 | 1,155 | |
| Enterprise Products Operating LLC 5.375%, 2/15/78 | 1,543 | 1,277 | |
| Oceaneering International, Inc. 6.000%, 2/1/28 | 1,175 | 948 | |
| Schlumberger Holdings Corp. | |||
| 144A 3.000%, 12/21/20(4) | 1,726 | 1,711 | |
| 144A 4.000%, 12/21/25(4) | 1,548 | 1,529 | |
| Schlumberger Investment SA 144A 3.300%, 9/14/21(4) | 1,309 | 1,312 | |
| Shell International Finance B.V. 1.750%, 9/12/21 | 968 | 935 | |
| TechnipFMC plc 3.450%, 10/1/22 | 243 | 240 | |
| Transcanada Trust 5.300%, 3/15/77 | 232 | 200 | |
| Woodside Finance Ltd. 144A 4.600%, 5/10/21(4) | 2,086 | 2,111 | |
| 13,511 | |||
| Financials—5.1% | |||
| Bank of America Corp. | |||
| 3.366%, 1/23/26 | 2,626 | 2,512 | |
| 3.593%, 7/21/28 | 707 | 671 | |
| Chubb INA Holdings, Inc. 2.875%, 11/3/22 | 828 | 821 | |
| Citigroup, Inc. 4.650%, 7/23/48 | 1,513 | 1,481 | |
| Fifth Third Bank 2.200%, 10/30/20 | 1,428 | 1,400 | |
| JPMorgan Chase & Co. 3.540%, 5/1/28 | 1,328 | 1,267 | |
| Manufacturers & Traders Trust Co. 3.400%, 8/17/27 | 1,113 | 1,086 | |
| Morgan Stanley | |||
| 3.875%, 4/29/24 | 943 | 938 | |
| 3.591%, 7/22/28 | 974 | 920 | |
| 4.375%, 1/22/47 | 1,116 | 1,058 | |
| Nationwide Financial Services, Inc. 144A 5.375%, 3/25/21(4) | 1,746 | 1,809 | |
| PNC Bank NA 2.150%, 4/29/21 | 1,221 | 1,189 | |
| Progressive Corp. (The) 5.375%,(5) | 1,354 | 1,269 | |
| Santander UK Group Holdings plc 3.373%, 1/5/24 | 1,132 | 1,074 | |
| SunTrust Banks, Inc. 4.000%, 5/1/25 | 1,394 | 1,399 | |
| Travelers Cos., Inc. (The) 4.050%, 3/7/48 | 1,701 | 1,651 | |
| US Bank NA 2.050%, 10/23/20 | 1,636 | 1,606 | |
| Wells Fargo & Co. 3.069%, 1/24/23 | 605 | 589 | |
| 22,740 | |||
| Health Care—0.9% | |||
| CVS Health Corp. 4.780%, 3/25/38 | 1,388 | 1,332 | |
| Par Value | Value | ||
| Health Care—continued | |||
| Eli Lilly & Co. 3.950%, 5/15/47 | $983 | $962 | |
| Novartis Securities Investment Ltd. 5.125%, 2/10/19 | 765 | 767 | |
| UnitedHealth Group, Inc. 4.450%, 12/15/48 | 1,036 | 1,068 | |
| 4,129 | |||
| Industrials—1.0% | |||
| British Airways plc Pass-Through-Trust 2018-1, AA 144A 3.800%, 9/20/31(4) | 1,023 | 1,003 | |
| ERAC USA Finance LLC 144A 5.250%, 10/1/20(4) | 1,149 | 1,186 | |
| General Dynamics Corp. 3.375%, 5/15/23 | 1,039 | 1,046 | |
| L3 Technologies, Inc. 3.850%, 12/15/26 | 544 | 527 | |
| United Airlines Pass-Through-Trust 2016-1, A 3.450%, 7/7/28 | 634 | 611 | |
| 4,373 | |||
| Information Technology—0.2% | |||
| Trimble, Inc. 4.900%, 6/15/28 | 983 | 968 | |
| Materials—1.2% | |||
| Barrick PD Australia Finance Pty Ltd. 5.950%, 10/15/39 | 2,143 | 2,288 | |
| DowDuPont, Inc. 5.419%, 11/15/48 | 776 | 807 | |
| Newmont Mining Corp. 6.250%, 10/1/39 | 1,849 | 2,028 | |
| 5,123 | |||
| Utilities—0.3% | |||
| Duke Energy Corp. 3.750%, 9/1/46 | 1,258 | 1,089 | |
| Total Corporate Bonds and Notes (Identified Cost $57,881) | 56,968 | ||
| Total Long-Term Investments—97.9% (Identified Cost $431,604) | 435,280 | ||
| TOTAL INVESTMENTS—97.9% (Identified Cost $431,604) | 435,280 | ||
| Other assets and liabilities, net—2.1% | 9,499 | ||
| NET ASSETS—100.0% | $444,779 | ||
| Abbreviations: | |
| GS | Goldman Sachs & Co. |
| LIBOR | London Interbank Offered Rate |
| LLC | Limited Liability Company |
| LP | Limited Partnership |
| Footnote Legend: | |
| (1) | All or a portion of the security is segregated as collateral for forward foreign currency exchange contracts. |
| (2) | All or a portion of the security is segregated as collateral for open swap contracts. |
| (3) | Variable rate security. Rate disclosed is as of December 31, 2018. For leveraged loans, the rate shown may represent a weighted average interest rate. Information in parenthesis represents benchmark and reference rate for each security. Certain variable rate securities are not based on a published reference rate and spread but are determined by the issuer or agent and are based on current market conditions, or, for mortgage-backed securities, are impacted by the individual mortgages which are paying off over time. These securities do not indicate a reference rate and spread in their descriptions. |
| (4) | Security exempt from registration under Rule 144A of the Securities Act of 1933. These securities may be resold in transactions exempt from registration, normally to qualified institutional buyers. At December 31, 2018, these securities amounted to a value of $37,630 or 8.5% of net assets. |
| (5) | No contractual maturity date. |
| Counterparties: | |
| JPM | JPMorgan Chase Bank N.A. |
| Currencies: | |
| AUD | Australian Dollar |
| CNH | Chinese Yuan |
| EUR | Euro |
| KRW | South Korean Won |
| USD | United States Dollar |
| Forward foreign currency exchange contracts as of December 31, 2018 were as follows: | |||||||
| Currency Purchased | Currency Amount Purchased | Currency Sold | Currency Amount Sold | Counterparty | Settlement Date | Unrealized Appreciation | Unrealized (Depreciation) |
| AUD | 13,834 | USD | 10,120 | JPM | 01/14/19 | $— | $(37) |
| CNH | 74,062 | USD | 10,664 | JPM | 01/29/19 | — | (64) |
| Forward foreign currency exchange contracts as of December 31, 2018 were as follows: | ||||||||
| Currency Purchased | Currency Amount Purchased | Currency Sold | Currency Amount Sold | Counterparty | Settlement Date | Unrealized Appreciation | Unrealized (Depreciation) | |
| EUR | 13,773 | USD | 15,681 | JPM | 01/14/19 | $319 | $— | |
| KRW | 11,315,000 | USD | 10,118 | JPM | 01/15/19 | — | (118) | |
| Total | $319 | $(219) | ||||||
| Over-the-counter credit default swaps - buy protection(1) outstanding as of December 31, 2018 were as follows: | |||||||||||||
| Reference Entity | Payment Frequency | Counterparty | Fixed Rate | Expiration Date | Notional Amount(2) | Value | Premiums Paid (Received) | Unrealized Appreciation | Unrealized (Depreciation) | ||||
| Westpac Banking Corp. | QTR | JPM | 1.000% | 12/20/23 | (26,300) USD | $(301) | $(373) | $72 | $— | ||||
| Total | $(301) | $(373) | $72 | $— | |||||||||
| Footnote Legend | |
| (1) | If the Fund is a buyer of protection and a credit event occurs, as defined under the terms of that particular swap agreement, the Fund will either: (i) receive from the seller of protection an amount equal to the notional amount of the swap and deliver the referenced obligation or underlying investments comprising the referenced index; or (ii) receive a net settlement amount in the form of cash or investments equal to the notional amount of the swap less the recovery value of the referenced obligation or underlying investments comprising the referenced index. |
| (2) | The maximum potential amount the Fund could be required to pay as a seller of credit protection or receive as a buyer of credit protection if a credit event occurs as defined under the terms of that particular swap agreement. |
| Total Value at December 31, 2018 | Level 2 Significant Observable Inputs | ||
| Assets: | |||
| Debt Securities: | |||
| Asset-Backed Securities | $21,294 | $21,294 | |
| Corporate Bonds and Notes | 56,968 | 56,968 | |
| Mortgage-Backed Securities | 110,143 | 110,143 | |
| U.S. Government Securities | 246,875 | 246,875 | |
| Other Financial Instruments: | |||
| Forward Foreign Currency Exchange Contract | 319 | 319 | |
| Liabilities: | |||
| Other Financial Instruments: | |||
| Forward Foreign Currency Exchange Contracts | (219) | (219) | |
| Over-the-Counter Credit Default Swap | (301) | (301) | |
| Total Investments | $435,079 | $435,079 |
| Par Value | Value | ||
| U.S. Government Securities—11.7% | |||
| Federal Agricultural Mortgage Corp. | |||
| (1 month LIBOR + 0.140%) 2.660%, 6/2/20(1) | $10,500 | $10,524 | |
| (3 month LIBOR + 0.300%) 2.790%, 1/25/23(1) | 3,000 | 3,024 | |
| Federal Farm Credit Banks | |||
| (1 month LIBOR + 0.090%) 2.522%, 12/13/21(1) | 14,500 | 14,488 | |
| (1 month LIBOR + 0.550%) 3.056%, 1/26/27(1) | 14,700 | 14,805 | |
| (1 month LIBOR + 0.600%) 2.987%, 12/8/26(1) | 4,700 | 4,753 | |
| U.S. Treasury Bill | |||
| 0.000%, 1/17/19 | 35,000 | 34,966 | |
| 0.000%, 1/31/19 | 5,000 | 4,991 | |
| 0.000%, 2/19/19 | 20,000 | 19,935 | |
| 0.000%, 2/26/19 | 20,000 | 19,925 | |
| U.S. Treasury Note | |||
| 1.500%, 1/31/19 | 20,000 | 19,987 | |
| (U.S. Treasury 3 month Bill Money Market Yield + 0.048%) 2.528%, 10/31/19(1) | 900 | 900 | |
| Total U.S. Government Securities (Identified Cost $148,120) | 148,298 | ||
| Mortgage-Backed Securities—84.0% | |||
| Agency—84.0% | |||
| Federal Home Loan Mortgage Corp. | |||
| Pool #848744 (12 month LIBOR + 1.789%) 4.383%, 5/1/34(1) | 8,176 | 8,553 | |
| Pool #848736 (12 month LIBOR + 1.750%) 4.275%, 5/1/35(1) | 12,844 | 13,433 | |
| Pool #848747 (12 month LIBOR + 1.872%) 4.393%, 7/1/36(1) | 7,788 | 8,166 | |
| Pool #1Q1195 (12 month LIBOR + 1.617%) 3.967%, 5/1/37(1) | 5,631 | 5,872 | |
| Pool #848796 (12 month LIBOR + 1.815%) 4.161%, 5/1/37(1) | 13,695 | 14,370 | |
| Pool #1Q1420 (12 month LIBOR + 1.827%) 4.440%, 9/1/39(1) | 6,876 | 7,194 | |
| Pool #2B3257 (12 month LIBOR + 1.630%) 3.162%, 10/1/44(1) | 4,818 | 4,850 | |
| Federal Home Loan Mortgage Corp. Multifamily Structured Pass-Through Certificates | |||
| K708, A2 2.130%, 1/25/19 | 544 | 543 | |
| K711, A2 1.730%, 7/25/19 | 3,098 | 3,079 | |
| K712, A2 1.869%, 11/25/19 | 5,262 | 5,218 | |
| KP04, AG1 (1 month LIBOR + 0.220%) 2.567%, 7/25/20(1) | 46,500 | 46,472 | |
| K017, A2 2.873%, 12/25/21 | 1,995 | 1,994 | |
| KLH3, A (1 month LIBOR + 0.700%) 3.047%, 11/25/22(1) | 8,158 | 8,150 | |
| KS05, A (1 month LIBOR + 0.500%) 2.847%, 1/25/23(1) | 5,890 | 5,879 | |
| KF15, A (1 month LIBOR + 0.670%) 3.017%, 2/25/23(1) | 5,118 | 5,121 | |
| Par Value | Value | ||
| Agency—continued | |||
| KF22, A (1 month LIBOR + 0.500%) 2.847%, 7/25/23(1) | $7,060 | $7,054 | |
| KF28, A (1 month LIBOR + 0.360%) 2.707%, 1/25/24(1) | 14,628 | 14,548 | |
| KF29, A (1 month LIBOR + 0.360%) 2.707%, 2/25/24(1) | 7,103 | 7,063 | |
| KL3W, AFLW (1 month LIBOR + 0.450%) 2.797%, 8/25/25(1) | 9,000 | 9,017 | |
| KSKY, AT (1 month LIBOR + 0.440%) 2.787%, 8/25/27(1) | 17,000 | 16,989 | |
| 4203, PF (1 month LIBOR + 0.250%) 2.705%, 9/15/42(1) | 15,053 | 15,027 | |
| Federal Home Loan Mortgage Corp. REMIC | |||
| 2781, FA (1 month LIBOR + 0.350%) 2.805%, 4/15/34(1) | 6,181 | 6,195 | |
| 2796, F (1 month LIBOR + 0.500%) 2.955%, 5/15/34(1) | 3,826 | 3,859 | |
| 3136, FA (1 month LIBOR + 0.550%) 3.005%, 4/15/36(1) | 12,985 | 13,082 | |
| 4057, CF (1 month LIBOR + 0.450%) 2.905%, 4/15/39(1) | 5,896 | 5,917 | |
| 3990, GF (1 month LIBOR + 0.400%) 2.855%, 3/15/41(1) | 7,379 | 7,384 | |
| Federal National Mortgage Association | |||
| 2014-M10, ASQ2 2.171%, 9/25/19(1) | 5,417 | 5,383 | |
| Pool #AM7028 (1 month LIBOR + 0.240%) 2.546%, 10/1/19(1) | 5,000 | 4,994 | |
| Pool #AM2078 1.670%, 1/1/20 | 10,748 | 10,596 | |
| Pool #AM3370 1.735%, 5/1/20 | 4,033 | 3,983 | |
| Pool #465872 4.150%, 8/1/20 | 870 | 869 | |
| Pool #AL4705 2.986%, 11/1/20 | 1,513 | 1,516 | |
| 2011-M1, FA (1 month LIBOR + 0.450%) 2.956%, 6/25/21(1) | 19,322 | 19,332 | |
| Pool #AM1999 1.870%, 7/1/21 | 1,322 | 1,293 | |
| Pool #AN3539 (1 month LIBOR + 0.470%) 2.777%, 11/1/21(1) | 16,799 | 16,817 | |
| Pool #AN5208 (1 month LIBOR + 0.390%) 2.697%, 3/1/22(1) | 4,658 | 4,668 | |
| 2012-M13, A2 2.377%, 5/25/22 | 1,020 | 1,002 | |
| Pool #AM9651 (1 month LIBOR + 0.300%) 2.607%, 8/1/22(1) | 14,248 | 14,218 | |
| Pool #AM7213 (1 month LIBOR + 0.650%) 2.957%, 8/1/22(1) | 4,467 | 4,484 | |
| Pool #AN5986 (1 month LIBOR + 0.370%) 2.677%, 12/1/22(1) | 8,250 | 8,246 | |
| Pool #AN3414 (1 month LIBOR + 0.600%) 2.907%, 1/1/23(1) | 11,534 | 11,549 | |
| Pool #AN2256 (1 month LIBOR + 0.580%) 2.887%, 7/1/23(1) | 17,249 | 17,207 | |
| Pool #AN2605 (1 month LIBOR + 0.460%) 2.767%, 8/1/23(1) | 10,000 | 9,979 | |
| Pool #AN1582 (1 month LIBOR + 0.440%) 2.747%, 9/1/23(1) | 14,525 | 14,476 | |
| 2016-M9, FA (1 month LIBOR + 0.590%) 2.891%, 9/25/23(1) | 22,720 | 22,753 | |
| Par Value | Value | ||
| Agency—continued | |||
| Pool #AM4510 (1 month LIBOR + 0.490%) 2.797%, 11/1/23(1) | $1,661 | $1,658 | |
| 2016-M13, FA (1 month LIBOR + 0.670%) 2.971%, 11/25/23(1) | 9,182 | 9,191 | |
| Pool #AN3845 (1 month LIBOR + 0.540%) 2.847%, 12/1/23(1) | 16,011 | 15,978 | |
| Pool #AN4300 (1 month LIBOR + 0.560%) 2.867%, 1/1/24(1) | 14,229 | 14,200 | |
| Pool #AN4364 (1 month LIBOR + 0.590%) 2.897%, 1/1/24(1) | 2,990 | 2,980 | |
| 2017-M2, FA (1 month LIBOR + 0.530%) 2.812%, 2/25/24(1) | 8,037 | 8,032 | |
| 2017-M11, FA (1 month LIBOR + 0.470%) 2.771%, 9/25/24(1) | 15,383 | 15,384 | |
| Pool #AN6591 (1 month LIBOR + 0.400%) 2.707%, 12/1/24(1) | 10,600 | 10,658 | |
| Pool #AN6559 (1 month LIBOR + 0.450%) 2.757%, 4/1/25(1) | 1,900 | 1,906 | |
| 2018-M12, FA (1 month LIBOR + 0.400%) 2.749%, 8/25/25(1) | 4,193 | 4,187 | |
| 2016-M8, FA (1 month LIBOR + 0.500%) 3.006%, 7/25/26(1) | 31,446 | 31,447 | |
| Pool #AN3661 (1 month LIBOR + 0.580%) 2.887%, 11/1/26(1) | 2,995 | 2,995 | |
| Pool #AN9657 (1 month LIBOR + 0.370%) 2.677%, 6/1/28(1) | 5,601 | 5,602 | |
| Pool #AD0064 (6 month LIBOR + 1.548%) 4.052%, 1/1/35(1) | 3,478 | 3,591 | |
| Pool #AL2202 (12 month LIBOR + 1.696%) 4.093%, 6/1/36(1) | 4,127 | 4,322 | |
| Pool #AL0960 (12 month LIBOR + 1.696%) 4.414%, 7/1/37(1) | 7,609 | 7,959 | |
| Pool #AL0270 (12 month LIBOR + 1.640%) 4.093%, 8/1/38(1) | 4,086 | 4,255 | |
| Pool #AL6516 (12 month LIBOR + 1.748%) 4.074%, 4/1/40(1) | 6,589 | 6,880 | |
| Pool #AL7812 (12 month LIBOR + 1.731%) 4.528%, 11/1/40(1) | 10,511 | 10,932 | |
| Pool #AE0544 (12 month LIBOR + 1.745%) 4.564%, 11/1/40(1) | 3,916 | 4,078 | |
| Pool #AL0323 (12 month LIBOR + 1.816%) 4.329%, 6/1/41(1) | 4,450 | 4,650 | |
| Pool #AL8796 (12 month LIBOR + 1.805%) 4.313%, 9/1/41(1) | 13,545 | 14,130 | |
| Pool #AL8872 (12 month LIBOR + 1.798%) 4.330%, 7/1/42(1) | 21,138 | 22,045 | |
| Federal National Mortgage Association REMIC | |||
| 2013-62, FQ (1 month LIBOR + 0.250%) 2.756%, 9/25/32(1) | 9,066 | 9,049 | |
| 2016-32, FA (1 month LIBOR + 0.400%) 2.906%, 10/25/34(1) | 19,620 | 19,697 | |
| 2005-58, KF (1 month LIBOR + 0.500%) 3.006%, 7/25/35(1) | 5,244 | 5,255 | |
| 2006-113, NF (1 month LIBOR + 0.350%) 2.856%, 9/25/36(1) | 6,321 | 6,320 | |
| 2011-117, PF (1 month LIBOR + 0.350%) 2.856%, 7/25/39(1) | 5,478 | 5,490 | |
| 2010-137, WB 4.529%, 7/25/40(1) | 2,911 | 3,019 | |
| 2013-34, PF (1 month LIBOR + 0.350%) 2.856%, 8/25/42(1) | 10,076 | 10,098 | |
| 2013-58, FY (1 month LIBOR + 0.250%) 2.756%, 2/25/43(1) | 6,614 | 6,603 | |
| Par Value | Value | ||
| Agency—continued | |||
| FMPRE Multifamily Aggregation Risk Transfer Trust 2017-KT01, A (1 month LIBOR + 0.320%) 2.824%, 2/25/20(1) | $29,013 | $28,977 | |
| FRESB Mortgage Trust | |||
| 2015-SB6, A5 (1 month LIBOR + 2.270%) 2.270%, 9/25/35(1) | 6,634 | 6,538 | |
| 2015-SB9, A5 (1 month LIBOR + 0.700%) 2.535%, 11/25/35(1) | 35,209 | 34,814 | |
| 2016-SB13, A5H (1 month LIBOR + 2.060%) 2.060%, 1/25/36(1) | 2,190 | 2,155 | |
| 2016-SB18, A5H (1 month LIBOR + 0.700%) 2.110%, 5/25/36(1) | 4,022 | 3,955 | |
| 2016-SB16, A5H (1 month LIBOR + 2.130%) 2.130%, 5/25/36(1) | 5,244 | 5,160 | |
| 2015-SB3, A5 (1 month LIBOR + 2.012%) 2.012%, 8/25/42(1) | 2,667 | 2,644 | |
| Government National Mortgage Association | |||
| 2003-57, FA (1 month LIBOR + 0.450%) 2.905%, 7/16/33(1) | 5,737 | 5,789 | |
| 2003-67, FP (1 month LIBOR + 0.900%) 3.370%, 8/20/33(1) | 4,940 | 5,047 | |
| 2004-38, FA (1 month LIBOR + 0.400%) 2.855%, 5/16/34(1) | 7,251 | 7,295 | |
| 2004-106, F (1 month LIBOR + 0.250%) 2.705%, 12/16/34(1) | 6,031 | 6,009 | |
| 2005-41, FC (1 month LIBOR + 0.300%) 2.770%, 5/20/35(1) | 8,494 | 8,500 | |
| 2017-116, F (1 month LIBOR + 0.250%) 2.705%, 8/16/35(1) | 7,071 | 7,070 | |
| 2014-94, FB (1 month LIBOR + 0.250%) 2.720%, 9/20/35(1) | 12,671 | 12,676 | |
| 2011-133, PF (1 month LIBOR + 0.400%) 2.870%, 12/20/35(1) | 5,097 | 5,125 | |
| 2009-121, NF (1 month LIBOR + 0.500%) 2.970%, 2/20/37(1) | 12,099 | 12,225 | |
| Pool #MA4673 (U.S. Treasury Yield Curve CMT 1 year + 1.500%) 2.500%, 8/20/47(1) | 860 | 860 | |
| Pool #MA4731 (U.S. Treasury Yield Curve CMT 1 year + 1.500%) 2.500%, 9/20/47(1) | 1,030 | 1,021 | |
| Pool #MA4800 (U.S. Treasury Yield Curve CMT 1 year + 1.500%) 2.500%, 10/20/47(1) | 2,449 | 2,447 | |
| Pool #BD4157 (U.S. Treasury Yield Curve CMT 1 year + 1.500%) 2.500%, 11/20/47(1) | 13,085 | 13,075 | |
| Pool #MA5155 (U.S. Treasury Yield Curve CMT 1 year + 1.500%) 2.500%, 4/20/48(1) | 1,756 | 1,748 | |
| Pool #BG8679 (U.S. Treasury Yield Curve CMT 1 year + 1.500%) 2.500%, 5/20/48(1) | 9,419 | 9,374 | |
| Pool #BH1807 (U.S. Treasury Yield Curve CMT 1 year + 1.500%) 2.500%, 7/20/48(1) | 4,170 | 4,148 | |
| 2016-H22, FJ (1 month LIBOR + 0.390%) 2.704%, 10/20/66(1) | 11,998 | 11,995 | |
| 2017-H13, FJ (1 month LIBOR + 0.200%) 2.514%, 5/20/67(1) | 6,523 | 6,515 | |
| NCUA Guaranteed Notes Trust | |||
| 2011-R1, 1A (1 month LIBOR + 0.450%) 2.829%, 1/8/20(1) | 14,035 | 14,054 | |
| Par Value | Value | ||
| Agency—continued | |||
| 2011-R2, 1A (1 month LIBOR + 0.400%) 2.780%, 2/6/20(1) | $23,111 | $23,112 | |
| 2011-R3, 1A (1 month LIBOR + 0.400%) 2.800%, 3/11/20(1) | 693 | 694 | |
| 2010-R1, 1A (1 month LIBOR + 0.450%) 2.829%, 10/7/20(1) | 18,911 | 18,934 | |
| 2010-R2, 2A (1 month LIBOR + 0.470%) 2.849%, 11/5/20(1) | 47,280 | 47,454 | |
| 2010-R3, 1A (1 month LIBOR + 0.560%) 2.939%, 12/8/20(1) | 7,384 | 7,404 | |
| 2010-R3, 2A (1 month LIBOR + 0.560%) 2.939%, 12/8/20(1) | 1,963 | 1,971 | |
| Small Business Administration | |||
| Pool #510076 (PRIME minus 2.650%) 2.600%, 5/25/27(1) | 8,702 | 8,635 | |
| Pool #510083 (PRIME minus 2.650%) 2.600%, 9/25/27(1) | 1,694 | 1,680 | |
| Pool #510241 (PRIME minus 2.600%) 2.650%, 10/25/27(1) | 5,177 | 5,139 | |
| Pool #510254 (PRIME minus 2.600%) 2.650%, 5/25/28(1) | 12,166 | 12,075 | |
| Pool #510219 (PRIME minus 2.650%) 2.600%, 11/25/28(1) | 4,586 | 4,547 | |
| Pool #510273 (PRIME minus 2.500%) 2.750%, 11/25/28(1) | 8,805 | 8,728 | |
| Pool #510256 (PRIME minus 2.600%) 2.650%, 12/25/28(1) | 11,074 | 10,982 | |
| Pool #510032 (PRIME minus 2.650%) 2.600%, 6/25/34(1) | 5,854 | 5,809 | |
| 1,067,365 | |||
| Total Mortgage-Backed Securities (Identified Cost $1,065,140) | 1,067,365 | ||
| Asset-Backed Security—1.5% | |||
| Student Loan—1.5% | |||
| NCUA Guaranteed Notes Trust 2010-A1, A (1 month LIBOR + 0.350%) 2.737%, 12/7/20(1) | 19,838 | 19,853 | |
| Total Asset-Backed Security (Identified Cost $19,839) | 19,853 | ||
| Total Long-Term Investments—97.2% (Identified Cost $1,233,099) | 1,235,516 | ||
| Shares | Value | ||
| Short-Term Investment—2.0% | |||
| Money Market Mutual Fund—2.0% | |||
| Dreyfus Government Cash Management Fund - Institutional Shares (seven-day effective yield 2.292%)(2) | 25,024,974 | $25,025 | |
| Total Short-Term Investment (Identified Cost $25,025) | 25,025 | ||
| TOTAL INVESTMENTS—99.2% (Identified Cost $1,258,124) | 1,260,541 | ||
| Other assets and liabilities, net—0.8% | 10,369 | ||
| NET ASSETS—100.0% | $1,270,910 | ||
| Abbreviations: | |
| LIBOR | London Interbank Offered Rate |
| REMIC | Real Estate Mortgage Investment Conduit |
| Footnote Legend: | |
| (1) | Variable rate security. Rate disclosed is as of December 31, 2018. For leveraged loans, the rate shown may represent a weighted average interest rate. Information in parenthesis represents benchmark and reference rate for each security. Certain variable rate securities are not based on a published reference rate and spread but are determined by the issuer or agent and are based on current market conditions, or, for mortgage-backed securities, are impacted by the individual mortgages which are paying off over time. These securities do not indicate a reference rate and spread in their descriptions. |
| (2) | Shares of this fund are publicly offered, and its prospectus and annual report are publicly available. |
| Total Value at December 31, 2018 | Level 1 Quoted Prices | Level 2 Significant Observable Inputs | |||
| Debt Securities: | |||||
| Asset-Backed Security | $19,853 | $— | $19,853 | ||
| Mortgage-Backed Securities | 1,067,365 | — | 1,067,365 | ||
| U.S. Government Securities | 148,298 | — | 148,298 | ||
| Short-Term Investment | 25,025 | 25,025 | — | ||
| Total Investments | $1,260,541 | $25,025 | $1,235,516 |
| Par Value | Value | ||
| U.S. Government Security—0.5% | |||
| U.S. Treasury Note 2.750%, 7/31/23 | $ 120 | $121 | |
| Total U.S. Government Security (Identified Cost $119) | 121 | ||
| Mortgage-Backed Securities—90.3% | |||
| Agency—88.6% | |||
| Federal Home Loan Mortgage Corp. | |||
| Pool #G05477 4.500%, 5/1/39 | 135 | 140 | |
| Pool #G08347 4.500%, 6/1/39 | 23 | 25 | |
| Pool #G05606 4.500%, 7/1/39 | 273 | 286 | |
| Pool #G08372 4.500%, 11/1/39 | 115 | 121 | |
| Pool #G07491 4.500%, 3/1/42 | 202 | 211 | |
| Pool #G07031 4.000%, 5/1/42 | 379 | 390 | |
| Pool #C04123 4.000%, 7/1/42 | 238 | 245 | |
| Pool #Q10929 3.500%, 9/1/42 | 321 | 324 | |
| Pool #G60019 4.500%, 3/1/44 | 347 | 361 | |
| Pool #Q26366 4.000%, 5/1/44 | 154 | 159 | |
| Pool #V81283 4.000%, 7/1/44 | 306 | 313 | |
| Pool #G60183 4.000%, 12/1/44 | 162 | 165 | |
| Pool #Q31645 4.000%, 2/1/45 | 72 | 73 | |
| Pool #V81992 4.000%, 10/1/45 | 447 | 456 | |
| Pool #Q38473 4.000%, 1/1/46 | 490 | 500 | |
| Pool #Q39440 4.000%, 3/1/46 | 617 | 630 | |
| Pool #G08706 3.500%, 5/1/46 | 312 | 313 | |
| Pool #Q40815 3.500%, 6/1/46 | 413 | 415 | |
| Pool #G60661 4.000%, 7/1/46 | 80 | 82 | |
| Pool #V83115 4.500%, 3/1/47 | 441 | 457 | |
| Pool #Q53881 4.500%, 1/1/48 | 469 | 488 | |
| Federal Home Loan Mortgage Corp. Multifamily Structured Pass-Through Certificates K151, A3 3.511%, 4/25/30 | 70 | 70 | |
| Federal National Mortgage Association | |||
| Pool #AN1497 2.610%, 6/1/26 | 356 | 345 | |
| Pool #AN1634 2.530%, 7/1/26 | 778 | 754 | |
| Pool #AN5579 3.080%, 5/1/27 | 903 | 891 | |
| Par Value | Value | ||
| Agency—continued | |||
| Pool #AM9830 3.190%, 9/1/27 | $207 | $205 | |
| 2017-M15, ATS2 3.136%, 11/25/27(1) | 115 | 113 | |
| Pool #AN9768 3.730%, 9/1/28 | 255 | 257 | |
| 2017-M5, A2 3.178%, 4/25/29(1) | 605 | 595 | |
| Pool #AN6349 2.990%, 9/1/29 | 500 | 476 | |
| Pool #AN6391 3.110%, 10/1/29 | 500 | 482 | |
| Pool #AM7516 3.550%, 2/1/30 | 150 | 152 | |
| Pool #AM9955 3.250%, 11/1/30 | 475 | 469 | |
| Pool #AL7497 3.500%, 9/1/40 | 574 | 579 | |
| Pool #MA0639 4.000%, 2/1/41 | 429 | 441 | |
| Pool #AL0215 4.500%, 4/1/41 | 153 | 161 | |
| Pool #AI5868 4.500%, 7/1/41 | 199 | 208 | |
| Pool #890381 3.500%, 10/1/41 | 277 | 279 | |
| Pool #AJ9327 3.500%, 1/1/42 | 163 | 164 | |
| Pool #AW8154 3.500%, 1/1/42 | 500 | 504 | |
| Pool #AS9571 3.500%, 5/1/42 | 397 | 400 | |
| Pool #AO8632 3.500%, 7/1/42 | 844 | 851 | |
| Pool #AL6223 4.500%, 8/1/44 | 425 | 442 | |
| Pool #AX2491 4.000%, 10/1/44 | 536 | 547 | |
| Pool #MA2190 4.000%, 2/1/45 | 743 | 759 | |
| Pool #MA2341 4.500%, 6/1/45 | 123 | 128 | |
| Pool #AY8851 4.000%, 8/1/45 | 205 | 209 | |
| Pool #BE5050 4.000%, 9/1/45 | 188 | 192 | |
| Pool #AZ9213 4.000%, 10/1/45 | 497 | 510 | |
| Pool #AS6515 4.000%, 1/1/46 | 66 | 67 | |
| Pool #BC2470 3.500%, 2/1/46 | 144 | 145 | |
| Pool #BA4799 4.000%, 2/1/46 | 532 | 546 | |
| Pool #BE7213 4.000%, 4/1/47 | 391 | 399 | |
| Pool #BE9598 4.000%, 5/1/47 | 384 | 392 | |
| Pool #BH7587 4.500%, 8/1/47 | 274 | 286 | |
| Pool #MA3257 3.500%, 1/1/48 | 141 | 140 | |
| Par Value | Value | ||
| Agency—continued | |||
| Pool #BK6440 4.000%, 6/1/48 | $292 | $301 | |
| Government National Mortgage Association | |||
| Pool #AE8170 4.000%, 2/15/44 | 87 | 89 | |
| Pool #MA5596 4.500%, 11/20/48 | 1,657 | 1,716 | |
| Pool #MA5652 4.500%, 12/20/48 | 300 | 311 | |
| 21,729 | |||
| Non-Agency—1.7% | |||
| GS Mortgage Securities Trust | |||
| 2012-BWTR, A 144A 2.954%, 11/5/34(2) | 205 | 203 | |
| 2012-BWTR, B 144A 3.255%, 11/5/34(2) | 109 | 107 | |
| US 2018-USDC, A 144A 4.106%, 5/9/38(2) | 100 | 103 | |
| 413 | |||
| Total Mortgage-Backed Securities (Identified Cost $22,163) | 22,142 | ||
| Asset-Backed Security—1.2% | |||
| Credit Card—1.2% | |||
| Cabela’s Credit Card Master Note Trust 2013-1A, A 144A 2.710%, 2/17/26(2) | 300 | 295 | |
| Total Asset-Backed Security (Identified Cost $289) | 295 | ||
| Total Long-Term Investments—92.0% (Identified Cost $22,571) | 22,558 | ||
| Shares | Value | ||
| Short-Term Investment—5.5% | |||
| Money Market Mutual Fund—5.5% | |||
| Dreyfus Government Cash Management Fund - Institutional Shares (seven-day effective yield 2.292%)(3) | 1,357,034 | $1,357 | |
| Total Short-Term Investment (Identified Cost $1,357) | 1,357 | ||
| TOTAL INVESTMENTS—97.5% (Identified Cost $23,928) | 23,915 | ||
| Other assets and liabilities, net—2.5% | 601 | ||
| NET ASSETS—100.0% | $24,516 | ||
| Abbreviation: | |
| GS | Goldman Sachs & Co. |
| Footnote Legend: | |
| (1) | Variable rate security. Rate disclosed is as of December 31, 2018. For leveraged loans, the rate shown may represent a weighted average interest rate. Information in parenthesis represents benchmark and reference rate for each security. Certain variable rate securities are not based on a published reference rate and spread but are determined by the issuer or agent and are based on current market conditions, or, for mortgage-backed securities, are impacted by the individual mortgages which are paying off over time. These securities do not indicate a reference rate and spread in their descriptions. |
| (2) | Security exempt from registration under Rule 144A of the Securities Act of 1933. These securities may be resold in transactions exempt from registration, normally to qualified institutional buyers. At December 31, 2018, these securities amounted to a value of $708 or 2.9% of net assets. |
| (3) | Shares of this fund are publicly offered, and its prospectus and annual report are publicly available. |
| Total Value at December 31, 2018 | Level 1 Quoted Prices | Level 2 Significant Observable Inputs | |||
| Debt Securities: | |||||
| Asset-Backed Security | $295 | $— | $295 | ||
| Mortgage-Backed Securities | 22,142 | — | 22,142 | ||
| U.S. Government Security | 121 | — | 121 | ||
| Short-Term Investment | 1,357 | 1,357 | — | ||
| Total Investments | $23,915 | $1,357 | $22,558 |
| Par Value | Value | ||
| U.S. Government Securities—25.8% | |||
| U.S. Treasury Bill | |||
| 0.000%, 2/21/19 | $8,550 | $8,522 | |
| 0.000%, 2/26/19 | 1,500 | 1,494 | |
| U.S. Treasury Note | |||
| 3.625%, 8/15/19 | 5,760 | 5,796 | |
| (U.S. Treasury 3 month Bill Money Market Yield + 0.048%) 2.528%, 10/31/19(1) | 100 | 100 | |
| Total U.S. Government Securities (Identified Cost $15,910) | 15,912 | ||
| Municipal Bond—1.2% | |||
| New York—1.2% | |||
| Utility Debt Securitization Authority Revenue 2.042%, 6/15/21 | 773 | 771 | |
| Total Municipal Bond (Identified Cost $769) | 771 | ||
| Mortgage-Backed Securities—27.1% | |||
| Agency—21.3% | |||
| Federal Home Loan Mortgage Corp. Multifamily Structured Pass-Through Certificates K711, A2 1.730%, 7/25/19 | 306 | 304 | |
| Federal National Mortgage Association | |||
| Pool #AM3370 1.735%, 5/1/20 | 237 | 234 | |
| Pool #AN3539 (1 month LIBOR + 0.470%) 2.777%, 11/1/21(1) | 959 | 960 | |
| Pool #AN3414 (1 month LIBOR + 0.600%) 2.907%, 1/1/23(1) | 960 | 961 | |
| Pool #AN1582 (1 month LIBOR + 0.440%) 2.747%, 9/1/23(1) | 1,000 | 997 | |
| Pool #AN3845 (1 month LIBOR + 0.540%) 2.847%, 12/1/23(1) | 2,599 | 2,594 | |
| Pool #AN4300 (1 month LIBOR + 0.560%) 2.867%, 1/1/24(1) | 2,977 | 2,970 | |
| Pool #AN4364 (1 month LIBOR + 0.590%) 2.897%, 1/1/24(1) | 1,000 | 996 | |
| FRESB Mortgage Trust | |||
| 2016-SB21, A5F 1.810%, 9/25/21(1) | 380 | 371 | |
| 2015-SB7, A5 (1 month LIBOR + 2.370%) 2.370%, 9/25/35(1) | 400 | 396 | |
| NCUA Guaranteed Notes Trust 2011-R2, 1A (1 month LIBOR + 0.400%) 2.780%, 2/6/20(1) | 638 | 638 | |
| Small Business Administration Pool #510273 (PRIME minus 2.500%) 2.750%, 11/25/28(1) | 1,761 | 1,746 | |
| 13,167 | |||
| Non-Agency—5.8% | |||
| BBCMS Mortgage Trust 2018-TALL, A (1 month LIBOR + 0.722%) 144A 3.177%, 3/15/37(1)(2) | 1,000 | 982 | |
| FREMF Mortgage Trust 2013-K713, B 144A 3.154%, 4/25/46(1)(2) | 240 | 240 | |
| Par Value | Value | ||
| Non-Agency—continued | |||
| Holmes Master Issuer plc 2018-2A, A1 (1 month LIBOR + 0.350%) 144A 2.805%, 7/15/19(1)(2) | $500 | $500 | |
| SLIDE 2018-FUN, A (1 month LIBOR + 0.900%) 144A 3.355%, 6/15/31(1)(2) | 993 | 988 | |
| VNDO Mortgage Trust 2013-PENN, B 144A 3.947%, 12/13/29(1)(2) | 830 | 836 | |
| 3,546 | |||
| Total Mortgage-Backed Securities (Identified Cost $16,761) | 16,713 | ||
| Asset-Backed Securities—17.1% | |||
| Automobiles—5.7% | |||
| AmeriCredit Automobile Receivables Trust | |||
| 2014-4, C 2.470%, 11/9/20 | 854 | 853 | |
| 2016-2, A3 1.600%, 11/9/20 | 165 | 165 | |
| Ford Credit Floorplan Master Owner Trust 2016-1, A1 1.760%, 2/15/21 | 1,019 | 1,017 | |
| Honda Auto Receivables Owner Trust 2017-3, A2 1.570%, 1/21/20 | 362 | 361 | |
| Nissan Master Owner Trust Receivables 2016-A, A2 1.540%, 6/15/21 | 1,125 | 1,117 | |
| 3,513 | |||
| Credit Card—9.2% | |||
| American Express Credit Account Master Trust 2018-3, A (1 month LIBOR + 0.320%) 2.775%, 10/15/25(1) | 1,000 | 993 | |
| Cabela’s Credit Card Master Note Trust 2015-2, A1 2.250%, 7/17/23 | 1,207 | 1,193 | |
| Capital One Multi-Asset Execution Trust 2005-B3, B3 (3 month LIBOR + 0.550%) 2.986%, 5/15/28(1) | 1,253 | 1,229 | |
| Citibank Credit Card Issuance Trust 2017-A2, A2 1.740%, 1/19/21 | 1,000 | 999 | |
| GE Capital Credit Card Master Note Trust 2012-2, A 2.220%, 1/15/22 | 230 | 230 | |
| World Financial Network Credit Card Master Trust 2012-D, M 3.090%, 4/17/23 | 1,045 | 1,044 | |
| 5,688 | |||
| Student Loan—2.2% | |||
| Goal Capital Funding Trust 2005-2, A3 (3 month LIBOR + 0.170%) 2.847%, 5/28/30(1) | 1,104 | 1,102 | |
| NCUA Guaranteed Notes Trust 2010-A1, A (1 month LIBOR + 0.350%) 2.737%, 12/7/20(1) | 284 | 285 | |
| 1,387 | |||
| Total Asset-Backed Securities (Identified Cost $10,544) | 10,588 | ||
| Par Value | Value | ||
| Corporate Bonds and Notes—25.0% | |||
| Communication Services—0.8% | |||
| Comcast Corp. (3 month LIBOR + 0.630%) 3.038%, 4/15/24(1) | $200 | $195 | |
| Verizon Communications, Inc. (3 month LIBOR + 1.100%) 3.716%, 5/15/25(1) | 300 | 291 | |
| 486 | |||
| Consumer Discretionary—2.5% | |||
| BMW US Capital LLC (3 month LIBOR + 0.500%) 144A 3.118%, 8/13/21(1)(2) | 440 | 436 | |
| Daimler Finance North America LLC (3 month LIBOR + 0.450%) 144A 3.127%, 2/22/21(1)(2) | 580 | 573 | |
| Newell Brands, Inc. 2.600%, 3/29/19 | 528 | 527 | |
| 1,536 | |||
| Consumer Staples—0.9% | |||
| Anheuser-Busch InBev Worldwide, Inc. (3 month LIBOR + 0.740%) 3.165%, 1/12/24(1) | 270 | 262 | |
| General Mills, Inc. (3 month LIBOR + 1.010%) 3.459%, 10/17/23(1) | 300 | 293 | |
| 555 | |||
| Energy—1.4% | |||
| Phillips 66 (3 month LIBOR + 0.600%) 3.289%, 2/26/21(1) | 580 | 574 | |
| Shell International Finance B.V. (3 month LIBOR + 0.400%) 3.018%, 11/13/23(1) | 300 | 294 | |
| 868 | |||
| Financials—11.8% | |||
| Allstate Corp. (The) (3 month LIBOR + 0.630%) 3.433%, 3/29/23(1) | 500 | 490 | |
| American Express Co. (3 month LIBOR + 0.525%) 3.165%, 5/17/21(1) | 290 | 289 | |
| Bank of Montreal (3 month LIBOR + 0.460%) 2.896%, 4/13/21(1) | 580 | 577 | |
| Caterpillar Financial Services Corp. (3 month LIBOR + 0.510%) 3.126%, 5/15/23(1) | 290 | 284 | |
| Citigroup, Inc. 2.650%, 10/26/20 | 679 | 670 | |
| Cooperatieve Rabobank UA (3 month LIBOR + 0.430%) 2.938%, 4/26/21(1) | 440 | 438 | |
| Diageo Capital plc (3 month LIBOR + 0.240%) 2.880%, 5/18/20(1) | 585 | 583 | |
| Ford Motor Credit Co. LLC (3 month LIBOR + 0.810%) 3.605%, 4/5/21(1) | 440 | 429 | |
| Goldman Sachs Group, Inc. (The) (3 month LIBOR + 1.170%) 3.786%, 5/15/26(1) | 300 | 288 | |
| JPMorgan Chase Bank NA (3 month LIBOR + 0.250%) 2.868%, 2/13/20(1) | 600 | 599 | |
| Lloyds Bank plc (3 month LIBOR + 0.490%) 3.079%, 5/7/21(1) | 450 | 445 | |
| Par Value | Value | ||
| Financials—continued | |||
| Morgan Stanley (3 month LIBOR + 0.550%) 3.168%, 2/10/21(1) | $590 | $583 | |
| New York Life Global Funding (3 month LIBOR + 0.320%) 144A 2.912%, 8/6/21(1)(2) | 440 | 439 | |
| Toyota Motor Credit Corp. (3 month LIBOR + 0.280%) 2.716%, 4/13/21(1) | 590 | 585 | |
| US Bank NA (3 month LIBOR + 0.320%) 2.828%, 4/26/21(1) | 580 | 578 | |
| 7,277 | |||
| Health Care—3.3% | |||
| Becton Dickinson & Co. (3 month LIBOR + 0.875%) 3.678%, 12/29/20(1) | 1,000 | 990 | |
| CVS Health Corp. (3 month LIBOR + 0.630%) 3.397%, 3/9/20(1) | 623 | 622 | |
| GlaxoSmithKline Capital plc (3 month LIBOR + 0.350%) 2.964%, 5/14/21(1) | 440 | 437 | |
| 2,049 | |||
| Industrials—0.7% | |||
| Fortive Corp. 1.800%, 6/15/19 | 122 | 120 | |
| Wabtec Corp. (3 month LIBOR + 1.050%) 3.838%, 9/15/21(1) | 289 | 288 | |
| 408 | |||
| Information Technology—1.6% | |||
| Dell International LLC 144A 3.480%, 6/1/19(2) | 1,019 | 1,016 | |
| Materials—0.5% | |||
| DowDuPont, Inc. (3 month LIBOR + 1.110%) 3.817%, 11/15/23(1) | 290 | 285 | |
| Utilities—1.5% | |||
| Emera US Finance LP 2.150%, 6/15/19 | 963 | 955 | |
| Total Corporate Bonds and Notes (Identified Cost $15,596) | 15,435 | ||
| Total Long-Term Investments—96.2% (Identified Cost $59,580) | 59,419 | ||
| Shares | Value | ||
| Short-Term Investment—3.5% | |||
| Money Market Mutual Fund—3.5% | |||
| Dreyfus Government Cash Management Fund - Institutional Shares (seven-day effective yield 2.292%)(3) | 2,140,414 | $2,140 | |
| Total Short-Term Investment (Identified Cost $2,140) | 2,140 | ||
| TOTAL INVESTMENTS—99.7% (Identified Cost $61,720) | 61,559 | ||
| Other assets and liabilities, net—0.3% | 180 | ||
| NET ASSETS—100.0% | $61,739 | ||
| Abbreviations: | |
| LIBOR | London Interbank Offered Rate |
| LLC | Limited Liability Company |
| LP | Limited Partnership |
| Footnote Legend: | |
| (1) | Variable rate security. Rate disclosed is as of December 31, 2018. For leveraged loans, the rate shown may represent a weighted average interest rate. Information in parenthesis represents benchmark and reference rate for each security. Certain variable rate securities are not based on a published reference rate and spread but are determined by the issuer or agent and are based on current market conditions, or, for mortgage-backed securities, are impacted by the individual mortgages which are paying off over time. These securities do not indicate a reference rate and spread in their descriptions. |
| (2) | Security exempt from registration under Rule 144A of the Securities Act of 1933. These securities may be resold in transactions exempt from registration, normally to qualified institutional buyers. At December 31, 2018, these securities amounted to a value of $6,010 or 9.7% of net assets. |
| (3) | Shares of this fund are publicly offered, and its prospectus and annual report are publicly available. |
| Country Weightings (Unaudited)† | |
| United States | 95% |
| United Kingdom | 3 |
| Netherlands | 1 |
| Canada | 1 |
| Total | 100% |
| † % of total investments as of December 31, 2018. | |
| Total Value at December 31, 2018 | Level 1 Quoted Prices | Level 2 Significant Observable Inputs | |||
| Debt Securities: | |||||
| Asset-Backed Securities | $10,588 | $— | $10,588 | ||
| Corporate Bonds and Notes | 15,435 | — | 15,435 | ||
| Mortgage-Backed Securities | 16,713 | — | 16,713 | ||
| Municipal Bond | 771 | — | 771 | ||
| U.S. Government Securities | 15,912 | — | 15,912 | ||
| Short-Term Investment | 2,140 | 2,140 | — | ||
| Total Investments | $61,559 | $2,140 | $59,419 |
| Par Value | Value | ||
| Municipal Bonds(1)—98.2% | |||
| District of Columbia—7.3% | |||
| Transportation Revenue—7.3% | |||
| Metropolitan Washington Airports Authority (BHAC Insured) 5.000%, 10/1/26 | $1,675 | $1,714 | |
| North Carolina—5.6% | |||
| General Revenue—5.6% | |||
| North Carolina Capital Facilities Finance Agency, High Point University 5.000%, 5/1/32 | 1,240 | 1,310 | |
| Virginia—85.3% | |||
| General Obligation—16.9% | |||
| Alexandria, City of (State Aid Withholding Insured) 5.000%, 7/1/25 | 750 | 884 | |
| Commonwealth of Virginia 4.000%, 6/1/27 | 1,000 | 1,084 | |
| Isle Wight County (State Aid Withholding Insured) 5.000%, 7/1/35 | 750 | 845 | |
| Suffolk, City of (State Aid Withholding Insured) 5.000%, 2/1/26 | 1,000 | 1,136 | |
| 3,949 | |||
| General Revenue—22.4% | |||
| Greater Richmond Convention Center Authority 5.000%, 6/15/32 | 1,000 | 1,135 | |
| Northern Virginia Transportation Authority 5.000%, 6/1/26 | 1,250 | 1,434 | |
| Virginia College Building Authority, Washington & Lee University 5.375%, 1/1/21 | 1,415 | 1,468 | |
| Virginia Public School Authority (State Aid Withholding Insured) 5.000%, 8/1/27 | 1,060 | 1,188 | |
| 5,225 | |||
| Healthcare Revenue—7.0% | |||
| Fairfax County Industrial Development Authority, Inova Health System Project 5.000%, 5/15/27 | 500 | 545 | |
| Roanoke Economic Development Authority, Carilion Clinic Obligated Group 5.000%, 7/1/27 | 1,000 | 1,087 | |
| 1,632 | |||
| Lease Revenue—4.6% | |||
| Loudoun County Economic Development Authority, Sycolin Road Project 5.000%, 6/1/31 | 1,000 | 1,067 | |
| Pre-Refunded—6.6% | |||
| Virginia Port Authority (Pre-Refunded 7/1/25 @ 100) 5.000%, 7/1/32 | 1,000 | 1,162 | |
| Par Value | Value | ||
| Virginia—continued | |||
| Pre-Refunded—continued | |||
| Virginia Public Building Authority (Pre-Refunded 8/1/21 @ 100) 5.000%, 8/1/31 | $10 | $11 | |
| Virginia Resources Authority (Pre-Refunded 11/1/22 @ 100) 5.000%, 11/1/28 | 330 | 367 | |
| 1,540 | |||
| Transportation Revenue—9.1% | |||
| Virginia Commonwealth Transportation Board | |||
| 5.000%, 3/15/20 | 1,000 | 1,038 | |
| 4.000%, 5/15/31 | 1,000 | 1,077 | |
| 2,115 | |||
| Water & Sewer Revenue—18.7% | |||
| Fairfax County Water Authority 5.000%, 4/1/27 | 1,100 | 1,206 | |
| Hampton Roads Sanitation District 5.000%, 8/1/34 | 1,000 | 1,154 | |
| Norfolk, City of, Water Revenue 5.250%, 11/1/44 | 1,750 | 2,015 | |
| 4,375 | |||
| Total Municipal Bonds (Identified Cost $22,317) | 22,927 | ||
| Total Long-Term Investments—98.2% (Identified Cost $22,317) | 22,927 | ||
| Shares | ||
| Short-Term Investment—1.8% | ||
| Money Market Mutual Fund—1.8% | ||
| Dreyfus AMT-Free Tax Exempt Cash Management (seven-day effective yield 1.567%)(2) | 419,007 | 419 |
| Total Short-Term Investment (Identified Cost $419) | 419 | |
| TOTAL INVESTMENTS—100.0% (Identified Cost $22,736) | 23,346 | |
| Other assets and liabilities, net—0.0% | —(3) | |
| NET ASSETS—100.0% | $23,346 | |
| Abbreviation: | |
| BHAC | Berkshire Hathaway Assurance Corp. |
| Footnote Legend: | |
| (1) | At December 31, 2018, 24.7% of the securities in the portfolio are backed by insurance of financial institutions and financial guaranty assurance agencies. None of the insurers concentration exceeds 10% of the Fund’s net assets. |
| (2) | Shares of this fund are publicly offered, and its prospectus and annual report are publicly available. |
| (3) | Amount is less than $500. |
| Total Value at December 31, 2018 | Level 1 Quoted Prices | Level 2 Significant Observable Inputs | |||
| Debt Securities: | |||||
| Municipal Bonds | $22,927 | $— | $22,927 | ||
| Short-Term Investment | 419 | 419 | — | ||
| Total Investments | $23,346 | $419 | $22,927 |
| Seix Core Bond Fund | Seix Corporate Bond Fund | Seix Floating Rate High Income Fund | |||
| Assets | |||||
Investment in securities at value(1) | $142,004 | $40,375 | $5,083,067 | ||
Foreign currency at value(2) | — | 6 | — | ||
Cash | 3,029 | 319 | 100,717 | ||
| Receivables | |||||
Investment securities sold | 1,378 | — | 246,499 | ||
Fund shares sold | 38 | 1 | 36,869 | ||
Dividends and interest | 859 | 392 | 15,889 | ||
Prepaid expenses | 30 | 30 | 281 | ||
Other assets | 6 | 2 | 253 | ||
Total assets | 147,344 | 41,125 | 5,483,575 | ||
| Liabilities | |||||
Swaps at value(3) | — | 19 | — | ||
| Payables | |||||
Fund shares repurchased | 647 | 5 | 52,523 | ||
Investment securities purchased | 1,123 | — | 123,226 | ||
Dividend distributions | 11 | — | 4,014 | ||
Investment advisory fees | 16 | 5 | 1,501 | ||
Distribution and service fees | 3 | 5 | 56 | ||
Administration and accounting fees | 15 | 5 | 554 | ||
Transfer agent and sub-transfer agent fees and expenses | 40 | 10 | 1,255 | ||
Professional fees | 24 | 24 | 9 | ||
Trustee deferred compensation plan | 6 | 2 | 253 | ||
Other accrued expenses | 10 | 2 | 545 | ||
Total liabilities | 1,895 | 77 | 183,936 | ||
Net Assets | $145,449 | $41,048 | �� | $5,299,639 | |
| Net Assets Consist of: | |||||
Capital paid in on shares of beneficial interest | $151,038 | $42,392 | $5,935,779 | ||
Accumulated earnings (loss) | (5,589) | (1,344) | (636,140) | ||
Total Net Assets | $145,449 | $41,048 | $5,299,639 | ||
| Net Assets: | |||||
Class A | $5,993 | $345 | $68,213 | ||
Class C | $— | $5,459 | $45,588 | ||
Class I | $136,247 | $35,244 | $4,380,792 | ||
Class R | $3,095 | $— | $— | ||
Class R6 | $114 | $— | $805,046 | ||
| Shares Outstanding (unlimited number of shares authorized, no par value): | |||||
Class A | 578,664 | 42,337 | 8,217,948 | ||
Class C | — | 672,808 | 5,490,460 | ||
Class I | 13,150,396 | 4,347,101 | 527,786,475 | ||
Class R | 298,459 | — | — | ||
Class R6 | 11,006 | — | 96,938,520 | ||
| Net Asset Value and Redemption Price Per Share: | |||||
Class A | $10.36 | $8.15 | $8.30 | ||
Class C | $— | $8.11 | $8.30 | ||
Class I | $10.36 | $8.11 | $8.30 | ||
Class R | $10.37 | $— | $— | ||
Class R6 | $10.36 | $— | $8.30 |
| Seix Core Bond Fund | Seix Corporate Bond Fund | Seix Floating Rate High Income Fund | |||
| Offering Price per Share (NAV/(1-Maximum Sales Charge)): | |||||
Class A | $10.76 | $8.47 | $8.53 | ||
Maximum Sales Charge - Class A | 3.75% | 3.75% | 2.75% | ||
(1)Investment in securities at cost | $140,704 | $40,655 | $5,415,886 | ||
(2) Foreign currency at cost | $— | $6 | $— | ||
(3) Includes premiums paid on over-the-counter credit default swaps | — | (24) | — |
| Seix Georgia Tax-Exempt Bond Fund | Seix High Grade Municipal Bond Fund | Seix High Income Fund | |||
| Assets | |||||
Investment in securities at value(1) | $74,418 | $48,916 | $287,935 | ||
Cash | — | 1 | 2,940 | ||
| Receivables | |||||
Investment securities sold | — | — | 2,257 | ||
Fund shares sold | 2,746 | 116 | 582 | ||
Receivable from adviser | 21 | — | — | ||
Dividends and interest | 1,070 | 419 | 4,940 | ||
Prepaid expenses | 16 | 18 | 40 | ||
Other assets | 3 | 2 | 14 | ||
Total assets | 78,274 | 49,472 | 298,708 | ||
| Liabilities | |||||
Cash overdraft | —(a) | — | — | ||
| Payables | |||||
Fund shares repurchased | 474 | 864 | 3,490 | ||
Dividend distributions | 553 | 22 | 45 | ||
Investment advisory fees | — | 2 | 129 | ||
Distribution and service fees | —(a) | 1 | 8 | ||
Administration and accounting fees | 8 | 6 | 31 | ||
Transfer agent and sub-transfer agent fees and expenses | 20 | 11 | 89 | ||
Professional fees | 24 | 24 | 24 | ||
Trustee deferred compensation plan | 3 | 2 | 14 | ||
Other accrued expenses | 3 | 4 | 23 | ||
Total liabilities | 1,085 | 936 | 3,853 | ||
Net Assets | $77,189 | $48,536 | $294,855 | ||
| Net Assets Consist of: | |||||
Capital paid in on shares of beneficial interest | $76,016 | $48,172 | $401,837 | ||
Accumulated earnings (loss) | 1,173 | 364 | (106,982) | ||
Total Net Assets | $77,189 | $48,536 | $294,855 | ||
| Net Assets: | |||||
Class A | $3,114 | $6,767 | $14,327 | ||
Class I | $74,075 | $41,769 | $264,435 | ||
Class R | $— | $— | $11,166 | ||
Class R6 | $— | $— | $4,927 | ||
| Shares Outstanding (unlimited number of shares authorized, no par value): | |||||
Class A | 303,818 | 582,371 | 2,404,239 | ||
Class I | 7,237,941 | 3,595,328 | 44,431,334 | ||
Class R | — | — | 1,874,988 | ||
Class R6 | — | — | 828,404 | ||
| Net Asset Value and Redemption Price Per Share: | |||||
Class A | $10.25 | $11.62 | $5.96 | ||
Class I | $10.23 | $11.62 | $5.95 | ||
Class R | $— | $— | $5.96 | ||
Class R6 | $— | $— | $5.95 | ||
| Offering Price per Share (NAV/(1-Maximum Sales Charge)): | |||||
Class A | $10.54 | $11.95 | $6.19 | ||
Maximum Sales Charge - Class A | 2.75% | 2.75% | 3.75% | ||
(1)Investment in securities at cost | $73,356 | $48,101 | $315,782 |
| (a) | Amount is less than $500. |
| Seix High Yield Fund | Seix Investment Grade Tax-Exempt Bond Fund | Seix North Carolina Tax-Exempt Bond Fund | |||
| Assets | |||||
Investment in securities at value(1) | $275,113 | $323,008 | $15,485 | ||
Cash | 9,515 | 2 | —(a) | ||
| Receivables | |||||
Investment securities sold | 2,293 | — | — | ||
Fund shares sold | 291 | 1,977 | 127 | ||
Receivable from adviser | — | — | 9 | ||
Dividends and interest | 4,700 | 3,738 | 208 | ||
Prepaid expenses | 47 | 26 | 15 | ||
Other assets | 13 | 14 | 1 | ||
Total assets | 291,972 | 328,765 | 15,845 | ||
| Liabilities | |||||
| Payables | |||||
Fund shares repurchased | 767 | 6,021 | 47 | ||
Investment securities purchased | — | 5,383 | — | ||
Dividend distributions | 54 | 156 | 93 | ||
Investment advisory fees | 88 | 37 | — | ||
Distribution and service fees | 1 | 2 | —(a) | ||
Administration and accounting fees | 29 | 32 | 3 | ||
Transfer agent and sub-transfer agent fees and expenses | 72 | 78 | 4 | ||
Professional fees | 26 | 24 | 24 | ||
Trustee deferred compensation plan | 13 | 14 | 1 | ||
Other accrued expenses | 20 | 18 | 1 | ||
Total liabilities | 1,070 | 11,765 | 173 | ||
Net Assets | $290,902 | $317,000 | $15,672 | ||
| Net Assets Consist of: | |||||
Capital paid in on shares of beneficial interest | $368,615 | $317,388 | $15,741 | ||
Accumulated earnings (loss) | (77,713) | (388) | (69) | ||
Total Net Assets | $290,902 | $317,000 | $15,672 | ||
| Net Assets: | |||||
Class A | $2,910 | $9,999 | $466 | ||
Class I | $286,931 | $307,001 | $15,206 | ||
Class R | $52 | $— | $— | ||
Class R6 | $1,009 | $— | $— | ||
| Shares Outstanding (unlimited number of shares authorized, no par value): | |||||
Class A | 381,825 | 873,644 | 47,859 | ||
Class I | 36,704,618 | 26,853,460 | 1,557,082 | ||
Class R | 6,621 | — | — | ||
Class R6 | 129,029 | — | — | ||
| Net Asset Value and Redemption Price Per Share: | |||||
Class A | $7.62 | $11.45 | $9.74 | ||
Class I | $7.82 | $11.43 | $9.77 | ||
Class R | $7.82 | $— | $— | ||
Class R6 | $7.82 | $— | $— | ||
| Offering Price per Share (NAV/(1-Maximum Sales Charge)): | |||||
Class A | $7.92 | $11.77 | $10.02 | ||
Maximum Sales Charge - Class A | 3.75% | 2.75% | 2.75% | ||
(1)Investment in securities at cost | $295,189 | $320,549 | $15,618 |
| (a) | Amount is less than $500. |
| Seix Short-Term Bond Fund | Seix Short-Term Municipal Bond Fund | Seix Total Return Bond Fund | |||
| Assets | |||||
Investment in securities at value(1) | $9,040 | $21,005 | $435,280 | ||
Foreign currency at value(2) | — | — | 110 | ||
Cash | 124 | —(a) | 2,694 | ||
Unrealized appreciation on forward foreign currency exchange contracts | — | — | 319 | ||
| Receivables | |||||
Investment securities sold | — | — | 4,749 | ||
Fund shares sold | 1 | 211 | 733 | ||
Receivable from adviser | 8 | 3 | — | ||
Dividends and interest | 43 | 225 | 2,722 | ||
Prepaid expenses | 25 | 13 | 52 | ||
Other assets | —(a) | 1 | 19 | ||
Total assets | 9,241 | 21,458 | 446,678 | ||
| Liabilities | |||||
Swaps at value(3) | — | — | 301 | ||
Unrealized depreciation on forward foreign currency exchange contracts | — | — | 219 | ||
| Payables | |||||
Fund shares repurchased | 3 | 26 | 1,049 | ||
Investment securities purchased | — | 945 | — | ||
Investment advisory fees | — | — | 104 | ||
Distribution and service fees | 1 | —(a) | 14 | ||
Administration and accounting fees | 2 | 3 | 43 | ||
Transfer agent and sub-transfer agent fees and expenses | 2 | 4 | 96 | ||
Professional fees | 24 | 24 | 26 | ||
Trustee deferred compensation plan | —(a) | 1 | 19 | ||
Other accrued expenses | 1(a) | 1 | 28 | ||
Total liabilities | 33 | 1,004 | 1,899 | ||
Net Assets | $9,208 | $20,454 | $444,779 | ||
| Net Assets Consist of: | |||||
Capital paid in on shares of beneficial interest | $9,494 | $20,532 | $473,609 | ||
Accumulated earnings (loss) | (286) | (78) | (28,830) | ||
Total Net Assets | $9,208 | $20,454 | $444,779 | ||
| Net Assets: | |||||
Class A | $2,028 | $1,411 | $10,717 | ||
Class C | $1,461 | $— | $— | ||
Class I | $5,719 | $19,043 | $335,999 | ||
Class R | $— | $— | $27,437 | ||
Class R6 | $— | $— | $70,626 | ||
| Shares Outstanding (unlimited number of shares authorized, no par value): | |||||
Class A | 206,270 | 142,170 | 1,019,117 | ||
Class C | 148,673 | — | — | ||
Class I | 583,514 | 1,918,576 | 33,031,538 | ||
Class R | — | — | 2,696,799 | ||
Class R6 | — | — | 6,942,858 | ||
| Net Asset Value and Redemption Price Per Share: | |||||
Class A | $9.83 | $9.92 | $10.52 | ||
Class C | $9.83 | $— | $— | ||
Class I | $9.80 | $9.93 | $10.17 | ||
Class R | $— | $— | $10.17 | ||
Class R6 | $— | $— | $10.17 |
| Seix Short-Term Bond Fund | Seix Short-Term Municipal Bond Fund | Seix Total Return Bond Fund | |||
| Offering Price per Share (NAV/(1-Maximum Sales Charge)): | |||||
Class A | $10.06 | $10.15 | $10.93 | ||
Maximum Sales Charge - Class A | 2.25% | 2.25% | 3.75% | ||
(1)Investment in securities at cost | $9,041 | $21,024 | $431,604 | ||
(2) Foreign currency at cost | $— | $— | $109 | ||
(3) Includes premiums paid on over-the-counter credit default swaps | — | — | (373) |
| (a) | Amount is less than $500. |
| Seix U.S. Government Securities Ultra-Short Bond Fund | Seix U.S. Mortgage Fund | Seix Ultra-Short Bond Fund | |||
| Assets | |||||
Investment in securities at value(1) | $1,260,541 | $23,915 | $61,559 | ||
Cash | 9,025 | 747 | 1,282 | ||
| Receivables | |||||
Investment securities sold | 1,382 | — | 117 | ||
Fund shares sold | 25,240 | 7 | 661 | ||
Receivable from adviser | — | 7 | 2 | ||
Dividends and interest | 2,536 | 72 | 212 | ||
Prepaid expenses | 71 | 21 | 24 | ||
Other assets | 53 | 1 | 3 | ||
Total assets | 1,298,848 | 24,770 | 63,860 | ||
| Liabilities | |||||
| Payables | |||||
Fund shares repurchased | 4,234 | 206 | 101 | ||
Investment securities purchased | 22,798 | — | 1,959 | ||
Dividend distributions | 222 | 1 | 8 | ||
Investment advisory fees | 108 | — | — | ||
Distribution and service fees | 1 | 3 | —(a) | ||
Administration and accounting fees | 116 | 3 | 7 | ||
Transfer agent and sub-transfer agent fees and expenses | 316 | 12 | 15 | ||
Professional fees | 23 | 24 | 24 | ||
Trustee deferred compensation plan | 53 | 1 | 3 | ||
Other accrued expenses | 67 | 4 | 4 | ||
Total liabilities | 27,938 | 254 | 2,121 | ||
Net Assets | $1,270,910 | $24,516 | $61,739 | ||
| Net Assets Consist of: | |||||
Capital paid in on shares of beneficial interest | $1,274,011 | $24,961 | $62,026 | ||
Accumulated earnings (loss) | (3,101) | (445) | (287) | ||
Total Net Assets | $1,270,910 | $24,516 | $61,739 | ||
| Net Assets: | |||||
Class A | $5,497 | $3,727 | $1,698 | ||
Class C | $— | $3,174 | $— | ||
Class I | $1,232,473 | $17,615 | $60,041 | ||
Class R6 | $32,940 | $— | $— | ||
| Shares Outstanding (unlimited number of shares authorized, no par value): | |||||
Class A | 550,196 | 342,817 | 171,168 | ||
Class C | — | 291,480 | — | ||
Class I | 123,382,797 | 1,617,290 | 6,057,221 | ||
Class R6 | 3,293,192 | — | — | ||
| Net Asset Value and Redemption Price Per Share: | |||||
Class A | $9.99 | $10.87 | $9.92 | ||
Class C | $— | $10.89 | $— | ||
Class I | $9.99 | $10.89 | $9.91 | ||
Class R6 | $10.00 | $— | $— |
| Seix U.S. Government Securities Ultra-Short Bond Fund | Seix U.S. Mortgage Fund | Seix Ultra-Short Bond Fund | |||
| Offering Price per Share (NAV/(1-Maximum Sales Charge)): | |||||
Class A | $— | $11.12 | $— | ||
Maximum Sales Charge - Class A | —% | 2.25% | —% | ||
(1)Investment in securities at cost | $1,258,124 | $23,928 | $61,720 |
| (a) | Amount is less than $500. |
| Seix Virginia Intermediate Municipal Bond Fund | |
| Assets | |
Investment in securities at value(1) | $23,346 |
Cash | —(a) |
| Receivables | |
Fund shares sold | 100 |
Receivable from adviser | 7 |
Dividends and interest | 293 |
Prepaid expenses | 15 |
Other assets | 1 |
Total assets | 23,762 |
| Liabilities | |
| Payables | |
Fund shares repurchased | 347 |
Dividend distributions | 31 |
Distribution and service fees | —(a) |
Administration and accounting fees | 4 |
Transfer agent and sub-transfer agent fees and expenses | 6 |
Professional fees | 25 |
Trustee deferred compensation plan | 1 |
Other accrued expenses | 2 |
Total liabilities | 416 |
Net Assets | $23,346 |
| Net Assets Consist of: | |
Capital paid in on shares of beneficial interest | $22,828 |
Accumulated earnings (loss) | 518 |
Total Net Assets | $23,346 |
| Net Assets: | |
Class A | $2,751 |
Class I | $20,595 |
| Shares Outstanding (unlimited number of shares authorized, no par value): | |
Class A | 296,227 |
Class I | 2,216,926 |
| Net Asset Value and Redemption Price Per Share: | |
Class A | $9.29 |
Class I | $9.29 |
| Offering Price per Share (NAV/(1-Maximum Sales Charge)): | |
Class A | $9.55 |
Maximum Sales Charge - Class A | 2.75% |
(1)Investment in securities at cost | $22,736 |
| (a) | Amount is less than $500. |
| Seix Core Bond Fund | Seix Corporate Bond Fund | ||
| Investment Income | |||
Dividends | $36 | $7 | |
Interest | 4,807 | 890 | |
Total investment income | 4,843 | 897 | |
| Expenses | |||
Investment advisory fees | 431 | 89 | |
Distribution and service fees, Class A | 19 | 1 | |
Distribution and service fees, Class C | — | 59 | |
Distribution and service fees, Class R | 15 | — | |
Administration and accounting fees | 184 | 27 | |
Transfer agent fees and expenses | 74 | 10 | |
Sub-transfer agent fees and expenses, Class A | 11 | —(1) | |
Sub-transfer agent fees and expenses, Class C | — | 6 | |
Sub-transfer agent fees and expenses, Class I | 221 | 18 | |
Printing fees and expenses | 11 | 4 | |
Professional fees | 30 | 27 | |
Registration fees | 62 | 48 | |
Trustees’ fees and expenses | 15 | 1 | |
Miscellaneous expenses | 21 | 4 | |
Total expenses | 1,094 | 294 | |
Less expenses reimbursed and/or waived by investment adviser(2) | (213) | (82) | |
Low balance account fees | —(1) | — | |
Net expenses | 881 | 212 | |
Net investment income (loss) | 3,962 | 685 | |
| Net Realized and Unrealized Gain (Loss) on Investments | |||
| Net realized gain (loss) from: | |||
Investments | (5,286) | (1,173) | |
Foreign currency transactions | — | —(1) | |
Swaps | — | 85 | |
| Net change in unrealized appreciation (depreciation) from: | |||
Investments | 206 | (621) | |
Foreign currency transactions | — | —(1) | |
Swaps | — | 5 | |
Net realized and unrealized gain (loss) on investments | (5,080) | (1,704) | |
Net increase (decrease) in net assets resulting from operations | $(1,118) | $(1,019) |
| (1) | Amount is less than $500. |
| (2) | See note 4D in the Notes to Financial Statements for information on recapture of expenses previously waived. |
| Seix Floating Rate High Income Fund | Seix Georgia Tax-Exempt Bond Fund | ||
| Investment Income | |||
Dividends | $4,554 | $11 | |
Interest | 345,102 | 2,721 | |
Total investment income | 349,656 | 2,732 | |
| Expenses | |||
Investment advisory fees | 25,609 | 415 | |
Distribution and service fees, Class A | 260 | 4 | |
Distribution and service fees, Class C | 496 | — | |
Administration and accounting fees | 6,607 | 90 | |
Transfer agent fees and expenses | 2,754 | 35 | |
Sub-transfer agent fees and expenses, Class A | 119 | 3 | |
Sub-transfer agent fees and expenses, Class C | 18 | — | |
Sub-transfer agent fees and expenses, Class I | 5,584 | 82 | |
Printing fees and expenses | 339 | 5 | |
Professional fees | 157 | 29 | |
Registration fees | 243 | 38 | |
Trustees’ fees and expenses | 513 | 7 | |
Miscellaneous expenses | 802 | 5 | |
Total expenses | 43,501 | 713 | |
Less expenses reimbursed and/or waived by investment adviser(1) | (4,515) | (171) | |
Net expenses | 38,986 | 542 | |
Net investment income (loss) | 310,670 | 2,190 | |
| Net Realized and Unrealized Gain (Loss) on Investments | |||
| Net realized gain (loss) from: | |||
Investments | (36,071) | 578 | |
| Net change in unrealized appreciation (depreciation) from: | |||
Investments | (257,198) | (2,460) | |
Net realized and unrealized gain (loss) on investments | (293,269) | (1,882) | |
Net increase (decrease) in net assets resulting from operations | $17,401 | $308 |
| (1) | See note 4D in the Notes to Financial Statements for information on recapture of expenses previously waived. |
| Seix High Grade Municipal Bond Fund | Seix High Income Fund | ||
| Investment Income | |||
Dividends | $34 | $230 | |
Interest | 2,511 | 24,399 | |
Total investment income | 2,545 | 24,629 | |
| Expenses | |||
Investment advisory fees | 373 | 2,033 | |
Distribution and service fees, Class A | 11 | 49 | |
Distribution and service fees, Class R | — | 63 | |
Administration and accounting fees | 81 | 384 | |
Transfer agent fees and expenses | 32 | 159 | |
Sub-transfer agent fees and expenses, Class A | 3 | 20 | |
Sub-transfer agent fees and expenses, Class I | 59 | 442 | |
Printing fees and expenses | 5 | 22 | |
Professional fees | 29 | 34 | |
Registration fees | 36 | 73 | |
Trustees’ fees and expenses | 7 | 33 | |
Miscellaneous expenses | 3 | 41 | |
Total expenses | 639 | 3,353 | |
Less expenses reimbursed and/or waived by investment adviser(1) | (146) | (307) | |
Net expenses | 493 | 3,046 | |
Net investment income (loss) | 2,052 | 21,583 | |
| Net Realized and Unrealized Gain (Loss) on Investments | |||
| Net realized gain (loss) from: | |||
Investments | (447) | 2,706 | |
Swaps | — | (5) | |
| Net change in unrealized appreciation (depreciation) from: | |||
Investments | (1,633) | (34,758) | |
Net realized and unrealized gain (loss) on investments | (2,080) | (32,057) | |
Net increase (decrease) in net assets resulting from operations | $(28) | $(10,474) |
| (1) | See note 4D in the Notes to Financial Statements for information on recapture of expenses previously waived. |
| Seix High Yield Fund | Seix Investment Grade Tax-Exempt Bond Fund | ||
| Investment Income | |||
Dividends | $127 | $170 | |
Interest | 22,194 | 13,502 | |
Total investment income | 22,321 | 13,672 | |
| Expenses | |||
Investment advisory fees | 1,632 | 2,098 | |
Distribution and service fees, Class A | 10 | 26 | |
Administration and accounting fees | 380 | 440 | |
Transfer agent fees and expenses | 157 | 179 | |
Sub-transfer agent fees and expenses, Class A | 4 | 6 | |
Sub-transfer agent fees and expenses, Class I | 380 | 453 | |
Printing fees and expenses | 20 | 17 | |
Professional fees | 35 | 35 | |
Registration fees | 69 | 45 | |
Trustees’ fees and expenses | 33 | 38 | |
Miscellaneous expenses | 39 | 30 | |
Total expenses | 2,759 | 3,367 | |
Less expenses reimbursed and/or waived by investment adviser(1) | (443) | (638) | |
Net expenses | 2,316 | 2,729 | |
Net investment income (loss) | 20,005 | 10,943 | |
| Net Realized and Unrealized Gain (Loss) on Investments | |||
| Net realized gain (loss) from: | |||
Investments | 2,166 | (2,831) | |
Swaps | (6) | — | |
| Net change in unrealized appreciation (depreciation) from: | |||
Investments | (27,367) | (7,836) | |
Net realized and unrealized gain (loss) on investments | (25,207) | (10,667) | |
Net increase (decrease) in net assets resulting from operations | $(5,202) | $276 |
| (1) | See note 4D in the Notes to Financial Statements for information on recapture of expenses previously waived. |
| Seix North Carolina Tax-Exempt Bond Fund | Seix Short-Term Bond Fund | ||
| Investment Income | |||
Dividends | $7 | $2 | |
Interest | 573 | 215 | |
Total investment income | 580 | 217 | |
| Expenses | |||
Investment advisory fees | 100 | 39 | |
Distribution and service fees, Class A | 1 | 4 | |
Distribution and service fees, Class C | — | 9 | |
Administration and accounting fees | 25 | 14 | |
Transfer agent fees and expenses | 9 | 4 | |
Sub-transfer agent fees and expenses, Class A | —(1) | 1 | |
Sub-transfer agent fees and expenses, Class C | — | 1 | |
Sub-transfer agent fees and expenses, Class I | 19 | 2 | |
Printing fees and expenses | 2 | 3 | |
Professional fees | 28 | 27 | |
Interest expense | —(1) | — | |
Registration fees | 38 | 46 | |
Trustees’ fees and expenses | 2 | 1 | |
Miscellaneous expenses | 2 | 4 | |
Total expenses | 226 | 155 | |
Less expenses reimbursed and/or waived by investment adviser(2) | (94) | (83) | |
Net expenses | 132 | 72 | |
Net investment income (loss) | 448 | 145 | |
| Net Realized and Unrealized Gain (Loss) on Investments | |||
| Net realized gain (loss) from: | |||
Investments | 211 | (123) | |
| Net change in unrealized appreciation (depreciation) from: | |||
Investments | (819) | 50 | |
Net realized and unrealized gain (loss) on investments | (608) | (73) | |
Net increase (decrease) in net assets resulting from operations | $(160) | $72 |
| (1) | Amount is less than $500. |
| (2) | See note 4D in the Notes to Financial Statements for information on recapture of expenses previously waived. |
| Seix Short-Term Municipal Bond Fund | Seix Total Return Bond Fund | ||
| Investment Income | |||
Dividends | $6 | $186 | |
Interest | 391 | 18,901 | |
Total investment income | 397 | 19,087 | |
| Expenses | |||
Investment advisory fees | 87 | 1,649 | |
Distribution and service fees, Class A | 2 | 29 | |
Distribution and service fees, Class R | — | 145 | |
Administration and accounting fees | 30 | 698 | |
Transfer agent fees and expenses | 11 | 286 | |
Sub-transfer agent fees and expenses, Class A | 2 | 19 | |
Sub-transfer agent fees and expenses, Class I | 22 | 587 | |
Custodian fees | —(1) | 1 | |
Printing fees and expenses | 2 | 33 | |
Professional fees | 28 | 43 | |
Registration fees | 34 | 71 | |
Trustees’ fees and expenses | 2 | 64 | |
Miscellaneous expenses | 3 | 69 | |
Total expenses | 223 | 3,694 | |
Less expenses reimbursed and/or waived by investment adviser(2) | (102) | (649) | |
Net expenses | 121 | 3,045 | |
Net investment income (loss) | 276 | 16,042 | |
| Net Realized and Unrealized Gain (Loss) on Investments | |||
| Net realized gain (loss) from: | |||
Investments | (57) | (22,746) | |
Foreign currency transactions | — | (1,588) | |
Forward foreign currency transactions | — | (127) | |
Swaps | — | (2,776) | |
| Net change in unrealized appreciation (depreciation) from: | |||
Investments | 56 | (1,702) | |
Foreign currency transactions | — | 1 | |
Forward foreign currency transactions | — | 830 | |
Swaps | — | 2,737 | |
Net realized and unrealized gain (loss) on investments | (1) | (25,371) | |
Net increase (decrease) in net assets resulting from operations | $275 | $(9,329) |
| (1) | Amount is less than $500. |
| (2) | See note 4D in the Notes to Financial Statements for information on recapture of expenses previously waived. |
| Seix U.S. Government Securities Ultra-Short Bond Fund | Seix U.S. Mortgage Fund | ||
| Investment Income | |||
Dividends | $253 | $14 | |
Interest | 30,292 | 665 | |
Total investment income | 30,545 | 679 | |
| Expenses | |||
Investment advisory fees | 2,539 | 99 | |
Distribution and service fees, Class A | 1 | 6 | |
Distribution and service fees, Class C | — | 34 | |
Administration and accounting fees | 1,385 | 30 | |
Transfer agent fees and expenses | 569 | 11 | |
Sub-transfer agent fees and expenses, Class A | —(1) | 28 | |
Sub-transfer agent fees and expenses, Class C | — | 3 | |
Sub-transfer agent fees and expenses, Class I | 1,627 | 31 | |
Custodian fees | 4 | —(1) | |
Printing fees and expenses | 67 | 4 | |
Professional fees | 56 | 28 | |
Registration fees | 80 | 48 | |
Trustees’ fees and expenses | 112 | 2 | |
Miscellaneous expenses | 93 | 4 | |
Total expenses | 6,533 | 328 | |
Less expenses reimbursed and/or waived by investment adviser(2) | (1,149) | (116) | |
Low balance account fees | —(1) | — | |
Net expenses | 5,384 | 212 | |
Net investment income (loss) | 25,161 | 467 | |
| Net Realized and Unrealized Gain (Loss) on Investments | |||
| Net realized gain (loss) from: | |||
Investments | (599) | (368) | |
Futures | 631 | — | |
| Net change in unrealized appreciation (depreciation) from: | |||
Investments | (1,862) | (11) | |
Futures | (138) | — | |
Net realized and unrealized gain (loss) on investments | (1,968) | (379) | |
Net increase (decrease) in net assets resulting from operations | $23,193 | $88 |
| (1) | Amount is less than $500. |
| (2) | See note 4D in the Notes to Financial Statements for information on recapture of expenses previously waived. |
| Seix Ultra-Short Bond Fund | Seix Virginia Intermediate Municipal Bond Fund | ||
| Investment Income | |||
Dividends | $23 | $6 | |
Interest | 1,411 | 1,066 | |
Total investment income | 1,434 | 1,072 | |
| Expenses | |||
Investment advisory fees | 121 | 172 | |
Distribution and service fees, Class A | 1 | 4 | |
Administration and accounting fees | 59 | 40 | |
Transfer agent fees and expenses | 24 | 15 | |
Sub-transfer agent fees and expenses, Class A | —(1) | 3 | |
Sub-transfer agent fees and expenses, Class I | 61 | 28 | |
Printing fees and expenses | 5 | 3 | |
Professional fees | 31 | 27 | |
Registration fees | 30 | 37 | |
Trustees’ fees and expenses | 5 | 3 | |
Miscellaneous expenses | 4 | 3 | |
Total expenses | 341 | 335 | |
Less expenses reimbursed and/or waived by investment adviser(2) | (120) | (107) | |
Net expenses | 221 | 228 | |
Net investment income (loss) | 1,213 | 844 | |
| Net Realized and Unrealized Gain (Loss) on Investments | |||
| Net realized gain (loss) from: | |||
Investments | (195) | (107) | |
Futures | 84 | — | |
| Net change in unrealized appreciation (depreciation) from: | |||
Investments | (215) | (684) | |
Futures | (21) | — | |
Net realized and unrealized gain (loss) on investments | (347) | (791) | |
Net increase (decrease) in net assets resulting from operations | $866 | $53 |
| (1) | Amount is less than $500. |
| (2) | See note 4D in the Notes to Financial Statements for information on recapture of expenses previously waived. |
| Seix Core Bond Fund | Seix Corporate Bond Fund | ||||||||||
| Year Ended December 31, 2018 | Fiscal Period Ended December 31, 2017(1) | Year Ended March 31, 2017 | Year Ended December 31, 2018 | Fiscal Period Ended December 31, 2017(1) | Year Ended March 31, 2017 | ||||||
| Increase (Decrease) in Net Assets Resulting From Operations | |||||||||||
Net investment income (loss) | $3,962 | $3,016 | $3,851 | $685 | $355 | $504 | |||||
Net realized gain (loss) | (5,286) | 1,535 | 1,154 | (1,088) | 309 | 493 | |||||
Net change in unrealized appreciation (depreciation) | 206 | 83 | (1,911) | (616) | 184 | 61 | |||||
Increase (decrease) in net assets resulting from operations | (1,118) | 4,634 | 3,094 | (1,019) | 848 | 1,058 | |||||
| Dividends and Distributions to Shareholders: | |||||||||||
| Net Investment Income and Net Realized Gains: | |||||||||||
Class A | (164) | (116)(2) | (374)(2) | (11) | (16)(2) | (20)(2) | |||||
Class C | — | —(2) | —(2) | (149) | (212)(2) | (232)(2) | |||||
Class I | (3,680) | (2,512)(2) | (8,552)(2) | (536) | (372)(2) | (418)(2) | |||||
Class R | (60) | (30)(2) | (114)(2) | — | —(2) | —(2) | |||||
Class R6 | (60) | (35)(2) | (42)(2) | — | —(2) | —(2) | |||||
| Tax Return on Capital | |||||||||||
Class A | (8) | (28) | — | — | — | — | |||||
Class I | (175) | (554) | — | — | — | — | |||||
Class R | (3) | (9) | — | — | — | — | |||||
Class R6 | (3) | (7) | — | �� | — | — | |||||
Total Dividends and Distributions to Shareholders | (4,153) | (3,291) | (9,082) | (696) | (600) | (670) | |||||
| Change in Net Assets From Capital Transactions (See Note 6) | |||||||||||
Class A | (2,213) | (1,992) | 477 | 7 | (237) | 94 | |||||
Class C | — | — | — | (618) | (924) | (917) | |||||
Class I | (44,955) | (14,856) | (50,330) | 28,111 | (4,434) | 3,497 | |||||
Class R | 24 | 11 | (232) | — | — | — | |||||
Class R6 | (3,030) | 1,927 | 1,371 | — | — | — | |||||
Increase (decrease) in net assets from share transactions | (50,174) | (14,910) | (48,714) | 27,500 | (5,595) | 2,674 | |||||
Net increase (decrease) in net assets | (55,445) | (13,567) | (54,702) | 25,785 | (5,347) | 3,062 | |||||
| Net Assets | |||||||||||
Beginning of period | 200,894 | 214,461 | 269,163 | 15,263 | 20,610 | 17,548 | |||||
End of Period | $145,449 | $200,894 | $214,461 | $41,048 | $15,263 | $20,610 | |||||
Accumulated undistributed net investment income (loss) at end of period | N/A | $(6) | $(329) | N/A | $(1) | $(40) | |||||
| (1) | Period from April 1, 2017 to December 31, 2017. The Fund had a fiscal period end change from March 31 to December 31. |
| (2) | For the fiscal period ended December 31, 2017 and the year ended March 31, 2017, the distributions to shareholders for the Funds were as follows: |
| Seix Core Bond Fund | Seix Corporate Bond Fund | |||||||
| Fiscal Period Ended December 31, 2017 | Year Ended March 31, 2017 | Fiscal Period Ended December 31, 2017 | Year Ended March 31, 2017 | |||||
| Dividends and Distributions to Shareholders | ||||||||
| Net investment income: | ||||||||
Class A | $(116) | $(179) | $(9) | $(15) | ||||
Class C | — | — | (89) | (162) | ||||
Class I | (2,512) | (4,357) | (210) | (327) | ||||
Class R | (30) | (50) | — | — | ||||
Class R6 | (35) | (19) | — | — | ||||
| Net realized gains: | ||||||||
Class A | — | (195) | (7) | (5) | ||||
Class C | — | — | (123) | (70) | ||||
Class I | — | (4,195) | (162) | (91) | ||||
Class R | — | (64) | — | — | ||||
Class R6 | — | (23) | — | — | ||||
Total | $(2,693) | $(9,082) | $(600) | $(670) | ||||
| Seix Floating Rate High Income Fund | Seix Georgia Tax-Exempt Bond Fund | ||||||||||
| Year Ended December 31, 2018 | Fiscal Period Ended December 31, 2017(1) | Year Ended March 31, 2017 | Year Ended December 31, 2018 | Fiscal Period Ended December 31, 2017(1) | Year Ended March 31, 2017 | ||||||
| Increase (Decrease) in Net Assets Resulting From Operations | |||||||||||
Net investment income (loss) | $310,670 | $199,279 | $228,136 | $2,190 | $1,954 | $2,883 | |||||
Net realized gain (loss) | (36,071) | (6,481) | (77,681) | 578 | 484 | 1,101 | |||||
Net change in unrealized appreciation (depreciation) | (257,198) | (29,350) | 292,074 | (2,460) | 837 | (4,502) | |||||
Increase (decrease) in net assets resulting from operations | 17,401 | 163,448 | 442,529 | 308 | 3,275 | (518) | |||||
| Dividends and Distributions to Shareholders: | |||||||||||
| Net Investment Income and Net Realized Gains: | |||||||||||
Class A | (4,754) | (3,895)(2) | (6,541)(2) | (109) | (82)(2) | (140)(2) | |||||
Class C | (1,990) | (1,399)(2) | (2,132)(2) | — | —(2) | —(2) | |||||
Class I | (243,162) | (147,478)(2) | (158,634)(2) | (2,928) | (2,358)(2) | (4,159)(2) | |||||
Class R6 | (60,756) | (46,287)(2) | (56,471)(2) | — | —(2) | —(2) | |||||
Total Dividends and Distributions to Shareholders | (310,662) | (199,059) | (223,778) | (3,037) | (2,440) | (4,299) | |||||
| Change in Net Assets From Capital Transactions (See Note 6) | |||||||||||
Class A | (41,834) | (21,471) | (14,713) | 198 | (524) | 44 | |||||
Class C | (3,691) | (5,113) | (953) | — | — | — | |||||
Class I | 70,322 | 114,302 | 1,265,091 | (9,390) | (6,488) | (11,252) | |||||
Class R6 | (421,336) | (22,358) | 124,773 | — | — | — | |||||
Increase (decrease) in net assets from share transactions | (396,539) | 65,360 | 1,374,198 | (9,192) | (7,012) | (11,208) | |||||
Net increase (decrease) in net assets | (689,800) | 29,749 | 1,592,949 | (11,921) | (6,177) | (16,025) | |||||
| Net Assets | |||||||||||
Beginning of period | 5,989,439 | 5,959,690 | 4,366,741 | 89,110 | 95,287 | 111,312 | |||||
End of Period | $5,299,639 | $5,989,439 | $5,959,690 | $77,189 | $89,110 | $95,287 | |||||
Accumulated undistributed net investment income (loss) at end of period | N/A | $1,377 | $1,483 | N/A | $191 | $191 | |||||
| (1) | Period from April 1, 2017 to December 31, 2017. The Fund had a fiscal period end change from March 31 to December 31. |
| (2) | For the fiscal period ended December 31, 2017 and the year ended March 31, 2017, the distributions to shareholders for the Funds were as follows: |
| Dividends and Distributions to Shareholders | ||||||||
| Net investment income: | ||||||||
Class A | $(3,895) | $(6,541) | $(65) | $(92) | ||||
Class C | (1,399) | (2,132) | — | — | ||||
Class I | (147,478) | (158,634) | (1,889) | (2,790) | ||||
Class R6 | (46,287) | (56,471) | — | — | ||||
| Net realized gains: | ||||||||
Class A | — | — | (17) | (48) | ||||
Class I | — | — | (469) | (1,369) | ||||
Total | $(199,059) | $(223,778) | $(2,440) | $(4,299) |
| Seix High Grade Municipal Bond Fund | Seix High Income Fund | ||||||||||
| Year Ended December 31, 2018 | Fiscal Period Ended December 31, 2017(1) | Year Ended March 31, 2017 | Year Ended December 31, 2018 | Fiscal Period Ended December 31, 2017(1) | Year Ended March 31, 2017 | ||||||
| Increase (Decrease) in Net Assets Resulting From Operations | |||||||||||
Net investment income (loss) | $2,052 | $1,628 | $2,238 | $21,583 | $22,069 | $36,494 | |||||
Net realized gain (loss) | (447) | 1,566 | 953 | 2,701 | 6,622 | (7,973) | |||||
Net change in unrealized appreciation (depreciation) | (1,633) | 377 | (3,082) | (34,758) | (1,602) | 59,807 | |||||
Increase (decrease) in net assets resulting from operations | (28) | 3,571 | 109 | (10,474) | 27,089 | 88,328 | |||||
| Dividends and Distributions to Shareholders: | |||||||||||
| Net Investment Income and Net Realized Gains: | |||||||||||
Class A | (233) | (201)(2) | (753)(2) | (1,095) | (1,751)(2) | (3,042)(2) | |||||
Class I | (2,218) | (1,518)(2) | (5,094)(2) | (19,519) | (19,341)(2) | (31,378)(2) | |||||
Class R | — | —(2) | —(2) | (691) | (557)(2) | (852)(2) | |||||
Class R6 | — | —(2) | —(2) | (321) | (233)(2) | (998)(2) | |||||
| Tax Return on Capital | |||||||||||
Class A | — | — | — | — | (15) | — | |||||
Class I | — | — | — | — | (165) | — | |||||
Class R | — | — | — | — | (5) | — | |||||
Class R6 | — | — | — | — | (2) | — | |||||
Total Dividends and Distributions to Shareholders | (2,451) | (1,719) | (5,847) | (21,626) | (22,069) | (36,270) | |||||
| Change in Net Assets From Capital Transactions (See Note 6) | |||||||||||
Class A | (1,189) | (4,341) | (951) | (13,603) | (33,956) | 15,620 | |||||
Class I | (31,655) | (4,657) | (16,105) | (97,416) | (70,658) | (135,559) | |||||
Class R | — | — | — | 144 | (2,673) | (1,159) | |||||
Class R6 | — | — | — | (485) | 1,727 | 1,977 | |||||
Increase (decrease) in net assets from share transactions | (32,844) | (8,998) | (17,056) | (111,360) | (105,560) | (119,121) | |||||
Net increase (decrease) in net assets | (35,323) | (7,146) | (22,794) | (143,460) | (100,540) | (67,063) | |||||
| Net Assets | |||||||||||
Beginning of period | 83,859 | 91,005 | 113,799 | 438,315 | 538,855 | 605,918 | |||||
End of Period | $48,536 | $83,859 | $91,005 | $294,855 | $438,315 | $538,855 | |||||
Accumulated undistributed net investment income (loss) at end of period | N/A | $(2) | $(7) | N/A | $(235) | $(413) | |||||
| (1) | Period from April 1, 2017 to December 31, 2017. The Fund had a fiscal period end change from March 31 to December 31. |
| (2) | For the fiscal period ended December 31, 2017 and the year ended March 31, 2017, the distributions to shareholders for the Funds were as follows: |
| Seix High Grade Municipal Bond Fund | Seix High Income Fund | |||||||
| Fiscal Period Ended December 31, 2017 | Year Ended March 31, 2017 | Fiscal Period Ended December 31, 2017 | Year Ended March 31, 2017 | |||||
| Dividends and Distributions to Shareholders | ||||||||
| Net investment income: | ||||||||
Class A | $(192) | $(273) | $(1,751) | $(3,042) | ||||
Class I | (1,431) | (1,965) | (19,341) | (31,378) | ||||
Class R | — | — | (557) | (852) | ||||
Class R6 | — | — | (233) | (998) | ||||
| Net realized gains: | ||||||||
Class A | (9) | (480) | — | — | ||||
Class I | (87) | (3,129) | — | — | ||||
Total | $(1,719) | $(5,847) | $(21,882) | $(36,270) | ||||
| Seix High Yield Fund | Seix Investment Grade Tax-Exempt Bond Fund | ||||||||||
| Year Ended December 31, 2018 | Fiscal Period Ended December 31, 2017(1) | Year Ended March 31, 2017 | Year Ended December 31, 2018 | Fiscal Period Ended December 31, 2017(1) | Year Ended March 31, 2017 | ||||||
| Increase (Decrease) in Net Assets Resulting From Operations | |||||||||||
Net investment income (loss) | $20,005 | $19,919 | $31,249 | $10,943 | $10,395 | $14,256 | |||||
Net realized gain (loss) | 2,160 | 4,533 | (428) | (2,831) | 9,320 | 925 | |||||
Net change in unrealized appreciation (depreciation) | (27,367) | (1,589) | 37,924 | (7,836) | (4,953) | (18,455) | |||||
Increase (decrease) in net assets resulting from operations | (5,202) | 22,863 | 68,745 | 276 | 14,762 | (3,274) | |||||
| Dividends and Distributions to Shareholders: | |||||||||||
| Net Investment Income and Net Realized Gains: | |||||||||||
Class A | (205) | (165)(2) | (303)(2) | (318) | (291)(2) | (980)(2) | |||||
Class I | (19,212) | (16,760)(2) | (29,771)(2) | (13,182) | (10,106)(2) | (26,719)(2) | |||||
Class R | (4) | (4)(2) | (15)(2) | — | —(2) | —(2) | |||||
Class R6 | (582) | (1,714)(2) | (961)(2) | — | —(2) | —(2) | |||||
| Tax Return on Capital | |||||||||||
Class A | — | (12) | — | — | — | — | |||||
Class I | — | (1,158) | — | — | — | — | |||||
Class R | — | (—)(3) | — | — | — | — | |||||
Class R6 | — | (116) | — | — | — | — | |||||
Total Dividends and Distributions to Shareholders | (20,003) | (19,929) | (31,050) | (13,500) | (10,397) | (27,699) | |||||
| Change in Net Assets From Capital Transactions (See Note 6) | |||||||||||
Class A | (1,645) | (1,432) | (1,687) | (792) | (9,409) | (3,515) | |||||
Class I | (92,163) | (82,553) | (76,498) | (144,018) | (59,987) | (79,743) | |||||
Class R | (62) | (12) | (470) | — | — | — | |||||
Class R6 | (43,185) | 2,106 | 41,837 | — | — | — | |||||
Increase (decrease) in net assets from share transactions | (137,055) | (81,891) | (36,818) | (144,810) | (69,396) | (83,258) | |||||
Net increase (decrease) in net assets | (162,260) | (78,957) | 877 | (158,034) | (65,031) | (114,231) | |||||
| Net Assets | |||||||||||
Beginning of period | 453,162 | 532,119 | 531,242 | 475,034 | 540,065 | 654,296 | |||||
End of Period | $290,902 | $453,162 | $532,119 | $317,000 | $475,034 | $540,065 | |||||
Accumulated undistributed net investment income (loss) at end of period | N/A | $(12) | $(1,080) | N/A | $(13) | $(229) | |||||
| (1) | Period from April 1, 2017 to December 31, 2017. The Fund had a fiscal period end change from March 31 to December 31. |
| (2) | For the fiscal period ended December 31, 2017 and the year ended March 31, 2017, the distributions to shareholders for the Funds were as follows: |
| Seix High Yield Fund | Seix Investment Grade Tax-Exempt Bond Fund | |||||||
| Fiscal Period Ended December 31, 2017 | Year Ended March 31, 2017 | Fiscal Period Ended December 31, 2017 | Year Ended March 31, 2017 | |||||
| Dividends and Distributions to Shareholders | ||||||||
| Net investment income: | ||||||||
Class A | $(165) | $(303) | $(285) | $(488) | ||||
Class I | (16,760) | (29,771) | (9,894) | (13,769) | ||||
Class R | (4) | (15) | — | — | ||||
Class R6 | (1,714) | (961) | — | — | ||||
| Net realized gains: | ||||||||
Class A | — | — | (6) | (492) | ||||
Class I | — | — | (212) | (12,950) | ||||
Total | $(18,643) | $(31,050) | $(10,397) | $(27,699) | ||||
| (3) | Amount is less than $500. |
| Seix North Carolina Tax-Exempt Bond Fund | Seix Short-Term Bond Fund | ||||||||||
| Year Ended December 31, 2018 | Fiscal Period Ended December 31, 2017(1) | Year Ended March 31, 2017 | Year Ended December 31, 2018 | Fiscal Period Ended December 31, 2017(1) | Year Ended March 31, 2017 | ||||||
| Increase (Decrease) in Net Assets Resulting From Operations | |||||||||||
Net investment income (loss) | $448 | $432 | $643 | $145 | $250 | $399 | |||||
Net realized gain (loss) | 211 | 338 | 325 | (123) | 28 | (33) | |||||
Net change in unrealized appreciation (depreciation) | (819) | 16 | (1,112) | 50 | (44) | (244) | |||||
Increase (decrease) in net assets resulting from operations | (160) | 786 | (144) | 72 | 234 | 122 | |||||
| Dividends and Distributions to Shareholders: | |||||||||||
| Net Investment Income and Net Realized Gains: | |||||||||||
Class A | (24) | (44)(2) | (97)(2) | (28) | (16)(2) | (13)(2) | |||||
Class C | — | —(2) | —(2) | (6) | (2)(2) | (1)(2) | |||||
Class I | (570) | (512)(2) | (1,204)(2) | (111) | (230)(2) | (418)(2) | |||||
| Tax Return on Capital | |||||||||||
Class A | — | — | — | (2) | (2) | — | |||||
Class C | — | — | — | (1) | (1) | — | |||||
Class I | — | — | — | (5) | (21) | — | |||||
Total Dividends and Distributions to Shareholders | (594) | (556) | (1,301) | (153) | (272) | (432) | |||||
| Change in Net Assets From Capital Transactions (See Note 6) | |||||||||||
Class A | (928) | (758) | 1,839 | (167) | (87) | 215 | |||||
Class C | — | — | — | 211 | (47) | (422) | |||||
Class I | (4,973) | (1,128) | (5,479) | (2,140) | (44,085) | 2,565 | |||||
Increase (decrease) in net assets from share transactions | (5,901) | (1,886) | (3,640) | (2,096) | (44,219) | 2,358 | |||||
Net increase (decrease) in net assets | (6,655) | (1,656) | (5,085) | (2,177) | (44,257) | 2,048 | |||||
| Net Assets | |||||||||||
Beginning of period | 22,327 | 23,983 | 29,068 | 11,385 | 55,642 | 53,594 | |||||
End of Period | $15,672 | $22,327 | $23,983 | $9,208 | $11,385 | $55,642 | |||||
Accumulated undistributed net investment income (loss) at end of period | N/A | $(1) | $(47) | N/A | $(1) | $(3) | |||||
| (1) | Period from April 1, 2017 to December 31, 2017. The Fund had a fiscal period end change from March 31 to December 31. |
| (2) | For the fiscal period ended December 31, 2017 and the year ended March 31, 2017, the distributions to shareholders for the Funds were as follows: |
| Dividends and Distributions to Shareholders | ||||||||
| Net investment income: | ||||||||
Class A | $(32) | $(41) | $(16) | $(13) | ||||
Class C | — | — | (2) | (1) | ||||
Class I | (354) | (603) | (230) | (418) | ||||
| Net realized gains: | ||||||||
Class A | (12) | (56) | — | — | ||||
Class I | (158) | (601) | — | — | ||||
Total | $(556) | $(1,301) | $(248) | $(432) |
| Seix Short-Term Municipal Bond Fund | Seix Total Return Bond Fund | ||||||||||
| Year Ended December 31, 2018 | Fiscal Period Ended December 31, 2017(1) | Year Ended March 31, 2017 | Year Ended December 31, 2018 | Fiscal Period Ended December 31, 2017(1) | Year Ended March 31, 2017 | ||||||
| Increase (Decrease) in Net Assets Resulting From Operations | |||||||||||
Net investment income (loss) | $276 | $213 | $243 | $16,042 | $15,204 | $20,937 | |||||
Net realized gain (loss) | (57) | 33 | 32 | (27,237) | 3,322 | (758) | |||||
Net change in unrealized appreciation (depreciation) | 56 | (105) | (149) | 1,866 | (3,590) | (5,600) | |||||
Increase (decrease) in net assets resulting from operations | 275 | 141 | 126 | (9,329) | 14,936 | 14,579 | |||||
| Dividends and Distributions to Shareholders: | |||||||||||
| Net Investment Income and Net Realized Gains: | |||||||||||
Class A | (15) | (11)(2) | (25)(2) | (216) | (186)(2) | (1,032)(2) | |||||
Class I | (265) | (222)(2) | (260)(2) | (10,381) | (7,704)(2) | (31,114)(2) | |||||
Class R | — | —(2) | —(2) | (475) | (229)(2) | (1,428)(2) | |||||
Class R6 | — | —(2) | —(2) | (2,860) | (1,379)(2) | (3,505)(2) | |||||
| Tax Return on Capital | |||||||||||
Class A | — | — | — | — | (110) | — | |||||
Class I | — | — | — | — | (3,981) | — | |||||
Class R | — | — | — | — | (192) | — | |||||
Class R6 | — | — | — | — | (641) | — | |||||
Total Dividends and Distributions to Shareholders | (280) | (233) | (285) | (13,932) | (14,422) | (37,079) | |||||
| Change in Net Assets From Capital Transactions (See Note 6) | |||||||||||
Class A | (355) | (41) | (5,514) | (2,204) | (14,204) | (4,496) | |||||
Class I | (12,240) | 4,667 | (5,346) | (327,882) | (110,797) | (161,714) | |||||
Class R | — | — | — | (3,749) | (7,615) | (9,843) | |||||
Class R6 | — | — | — | (69,417) | 44,550 | 47,337 | |||||
Increase (decrease) in net assets from share transactions | (12,595) | 4,626 | (10,860) | (403,252) | (88,066) | (128,716) | |||||
Net increase (decrease) in net assets | (12,600) | 4,534 | (11,019) | (426,513) | (87,552) | (151,216) | |||||
| Net Assets | |||||||||||
Beginning of period | 33,054 | 28,520 | 39,539 | 871,292 | 958,844 | 1,110,060 | |||||
End of Period | $20,454 | $33,054 | $28,520 | $444,779 | $871,292 | $958,844 | |||||
Accumulated undistributed net investment income (loss) at end of period | N/A | $(2) | $(2) | N/A | $2,090 | $(1,594) | |||||
| (1) | Period from April 1, 2017 to December 31, 2017. The Fund had a fiscal period end change from March 31 to December 31. |
| (2) | For the fiscal period ended December 31, 2017 and the year ended March 31, 2017, the distributions to shareholders for the Funds were as follows: |
| Seix Short-Term Municipal Bond Fund | Seix Total Return Bond Fund | |||||||
| Fiscal Period Ended December 31, 2017 | Year Ended March 31, 2017 | Fiscal Period Ended December 31, 2017 | Year Ended March 31, 2017 | |||||
| Dividends and Distributions to Shareholders | ||||||||
| Net investment income: | ||||||||
Class A | $(10) | $(23) | $(186) | $(603) | ||||
Class I | (203) | (221) | (7,704) | (18,605) | ||||
Class R | — | — | (229) | (723) | ||||
Class R6 | — | — | (1,379) | (1,826) | ||||
| Net realized gains: | ||||||||
Class A | (1) | (2) | — | (429) | ||||
Class I | (19) | (39) | — | (12,509) | ||||
Class R | — | — | — | (705) | ||||
Class R6 | — | — | — | (1,679) | ||||
Total | $(233) | $(285) | $(9,498) | $(37,079) | ||||
| Seix U.S. Government Securities Ultra-Short Bond Fund | Seix U.S. Mortgage Fund | ||||||||||
| Year Ended December 31, 2018 | Fiscal Period Ended December 31, 2017(1) | Year Ended March 31, 2017 | Year Ended December 31, 2018 | Fiscal Period Ended December 31, 2017(1) | Year Ended March 31, 2017 | ||||||
| Increase (Decrease) in Net Assets Resulting From Operations | |||||||||||
Net investment income (loss) | $25,161 | $12,427 | $10,835 | $467 | $260 | $159 | |||||
Net realized gain (loss) | 32 | 1,191 | 10,330 | (368) | 46 | 390 | |||||
Net change in unrealized appreciation (depreciation) | (2,000) | (1,193) | (6,990) | (11) | 62 | (560) | |||||
Increase (decrease) in net assets resulting from operations | 23,193 | 12,425 | 14,175 | 88 | 368 | (11) | |||||
| Dividends and Distributions to Shareholders: | |||||||||||
| Net Investment Income and Net Realized Gains: | |||||||||||
Class A | (6) | —(2) | —(2) | (58) | (30)(2) | (124)(2) | |||||
Class C | — | —(2) | —(2) | (38) | (15)(2) | (56)(2) | |||||
Class I | (24,392) | (11,911)(2) | (14,555)(2) | (371) | (200)(2) | (454)(2) | |||||
Class R6 | (782) | (549)(2) | (71)(2) | — | —(2) | —(2) | |||||
| Tax Return on Capital | |||||||||||
Class A | (1) | — | — | (15) | (18) | — | |||||
Class C | — | — | — | (16) | (22) | — | |||||
Class I | (1,434) | (1,767) | — | (85) | (103) | — | |||||
Class R6 | (43) | (72) | — | — | — | — | |||||
Total Dividends and Distributions to Shareholders | (26,658) | (14,299) | (14,626) | (583) | (388) | (634) | |||||
| Change in Net Assets From Capital Transactions (See Note 6) | |||||||||||
Class A | 5,497 | — | — | 1,205 | (1,036) | (2,814) | |||||
Class C | — | — | — | (471) | (577) | (1,087) | |||||
Class I | (107,201) | (22,393) | (190,202) | (978) | 1,374 | (7,046) | |||||
Class R6 | (10,035) | 10,482 | 32,653 | — | — | — | |||||
Increase (decrease) in net assets from share transactions | (111,739) | (11,911) | (157,549) | (244) | (239) | (10,947) | |||||
Net increase (decrease) in net assets | (115,204) | (13,785) | (158,000) | (739) | (259) | (11,592) | |||||
| Net Assets | |||||||||||
Beginning of period | 1,386,114 | 1,399,899 | 1,557,899 | 25,255 | 25,514 | 37,106 | |||||
End of Period | $1,270,910 | $1,386,114 | $1,399,899 | $24,516 | $25,255 | $25,514 | |||||
Accumulated undistributed net investment income (loss) at end of period | N/A | $(36) | $(3) | N/A | $(1) | $(16) | |||||
| (1) | Period from April 1, 2017 to December 31, 2017. The Fund had a fiscal period end change from March 31 to December 31. |
| (2) | For the fiscal period ended December 31, 2017 and the year ended March 31, 2017, the distributions to shareholders for the Funds were as follows: |
| Seix U.S. Government Securities Ultra-Short Bond Fund | Seix U.S. Mortgage Fund | |||||||
| Fiscal Period Ended December 31, 2017 | Year Ended March 31, 2017 | Fiscal Period Ended December 31, 2017 | Year Ended March 31, 2017 | |||||
| Dividends and Distributions to Shareholders | ||||||||
| Net investment income: | ||||||||
Class A | $— | $— | $(30) | $(100) | ||||
Class C | — | — | (15) | (41) | ||||
Class I | (11,911) | (14,555) | (200) | (391) | ||||
Class R6 | (549) | (71) | — | — | ||||
| Net realized gains: | ||||||||
Class A | — | — | — | (24) | ||||
Class C | — | — | — | (15) | ||||
Class I | — | — | — | (63) | ||||
Total | $(12,460) | $(14,626) | $(245) | $(634) | ||||
| Seix Ultra-Short Bond Fund | Seix Virginia Intermediate Municipal Bond Fund | ||||||||||
| Year Ended December 31, 2018 | Fiscal Period Ended December 31, 2017(1) | Year Ended March 31, 2017 | Year Ended December 31, 2018 | Fiscal Period Ended December 31, 2017(1) | Year Ended March 31, 2017 | ||||||
| Increase (Decrease) in Net Assets Resulting From Operations | |||||||||||
Net investment income (loss) | $1,213 | $734 | $1,071 | $844 | $838 | $1,538 | |||||
Net realized gain (loss) | (111) | 160 | 377 | (107) | 822 | 438 | |||||
Net change in unrealized appreciation (depreciation) | (236) | (64) | (14) | (684) | (277) | (2,099) | |||||
Increase (decrease) in net assets resulting from operations | 866 | 830 | 1,434 | 53 | 1,383 | (123) | |||||
| Dividends and Distributions to Shareholders: | |||||||||||
| Net Investment Income and Net Realized Gains: | |||||||||||
Class A | (7) | —(2) | —(2) | (91) | (108)(2) | (204)(2) | |||||
Class I | (1,198) | (740)(2) | (1,126)(2) | (1,026) | (1,289)(2) | (3,113)(2) | |||||
Total Dividends and Distributions to Shareholders | (1,205) | (740) | (1,126) | (1,117) | (1,397) | (3,317) | |||||
| Change in Net Assets From Capital Transactions (See Note 6) | |||||||||||
Class A | 1,705 | — | — | (518) | (265) | (532) | |||||
Class I | 825 | (27,886) | (17,914) | (16,050) | (8,336) | (15,453) | |||||
Increase (decrease) in net assets from share transactions | 2,530 | (27,886) | (17,914) | (16,568) | (8,601) | (15,985) | |||||
Net increase (decrease) in net assets | 2,191 | (27,796) | (17,606) | (17,632) | (8,615) | (19,425) | |||||
| Net Assets | |||||||||||
Beginning of period | 59,548 | 87,344 | 104,950 | 40,978 | 49,593 | 69,018 | |||||
End of Period | $61,739 | $59,548 | $87,344 | $23,346 | $40,978 | $49,593 | |||||
Accumulated undistributed net investment income (loss) at end of period | N/A | $(2) | $(2) | N/A | $19 | $19 | |||||
| (1) | Period from April 1, 2017 to December 31, 2017. The Fund had a fiscal period end change from March 31 to December 31. |
| (2) | For the fiscal period ended December 31, 2017 and the year ended March 31, 2017, the distributions to shareholders for the Funds were as follows: |
| Dividends and Distributions to Shareholders | ||||||||
| Net investment income: | ||||||||
Class A | $— | $— | $(63) | $(94) | ||||
Class I | (740) | (1,126) | (775) | (1,444) | ||||
| Net realized gains: | ||||||||
Class A | — | — | (45) | (110) | ||||
Class I | — | — | (514) | (1,669) | ||||
Total | $(740) | $(1,126) | $(1,397) | $(3,317) |
THROUGHOUT EACH PERIOD
| Net Asset Value, Beginning of Period | Net Investment Income (Loss)(1) | Net Realized and Unrealized Gain (Loss) | Total from Investment Operations | Dividends from Net Investment Income | Distributions from Tax Return of Capital | Distributions from Net Realized Gains | Total Distributions | Change in Net Asset Value | Net Asset Value, End of Period | Total Return(2)(3) | Net Assets, End of Period (in thousands) | Ratio of Net Expenses to Average Net Assets(4)(5) | Ratio of Gross Expenses to Average Net Assets(4)(5) | Ratio of Net Investment Income (Loss) to Average Net Assets(4) | Portfolio Turnover Rate(3) | ||
| Seix Core Bond Fund | |||||||||||||||||
| Class A | |||||||||||||||||
| 1/1/18 to 12/31/18 | $10.63 | 0.22 | (0.25) | (0.03) | (0.23) | (0.01) | — | (0.24) | (0.27) | 10.36 | (0.28) % | $5,993 | 0.64 % | 0.89 % | 2.18 % | 172 % | |
| 4/1/17 to 12/31/17(6) | 10.56 | 0.14 | 0.08 | 0.22 | (0.12) | (0.03) | — | (0.15) | 0.07 | 10.63 | 2.12 | 8,433 | 0.65 (7) | 0.79 | 1.73 | 130 | |
| 4/1/16 to 3/31/17 | 10.86 | 0.16 | (0.06) | 0.10 | (0.19) | — | (0.21) | (0.40) | (0.30) | 10.56 | 0.90 | 10,363 | 0.64 | 0.64 | 1.45 | 210 | |
| 4/1/15 to 3/31/16 | 11.04 | 0.18 | (0.07) | 0.11 | (0.20) | — | (0.09) | (0.29) | (0.18) | 10.86 | 1.01 | 10,170 | 0.65 | 0.65 | 1.65 | 232 | |
| 4/1/14 to 3/31/15 | 10.65 | 0.18 | 0.41 | 0.59 | (0.20) | — | — | (0.20) | 0.39 | 11.04 | 5.58 | 7,411 | 0.67 | 0.67 | 1.70 | 168 | |
| 4/1/13 to 3/31/14 | 11.16 | 0.15 | (0.23) | (0.08) | (0.19) | — | (0.24) | (0.43) | (0.51) | 10.65 | (0.66) | 9,848 | 0.71 | 0.71 | 1.38 | 208 | |
| Class I | |||||||||||||||||
| 1/1/18 to 12/31/18 | $10.63 | 0.24 | (0.26) | (0.02) | (0.24) | (0.01) | — | (0.25) | (0.27) | 10.36 | (0.14) % | $136,247 | 0.50 % | 0.62 % | 2.31 % | 172 % | |
| 4/1/17 to 12/31/17(6) | 10.57 | 0.15 | 0.07 | 0.22 | (0.13) | (0.03) | — | (0.16) | 0.06 | 10.63 | 2.13 | 186,029 | 0.51 (7) | 0.58 | 1.87 | 130 | |
| 4/1/16 to 3/31/17 | 10.86 | 0.17 | (0.04) | 0.13 | (0.21) | — | (0.21) | (0.42) | (0.29) | 10.57 | 1.15 | 199,622 | 0.49 | 0.49 | 1.58 | 210 | |
| 4/1/15 to 3/31/16 | 11.04 | 0.20 | (0.08) | 0.12 | (0.21) | — | (0.09) | (0.30) | (0.18) | 10.86 | 1.18 | 255,522 | 0.48 | 0.48 | 1.82 | 232 | |
| 4/1/14 to 3/31/15 | 10.65 | 0.21 | 0.40 | 0.61 | (0.22) | — | — | (0.22) | 0.39 | 11.04 | 5.80 | 191,905 | 0.45 | 0.45 | 1.90 | 168 | |
| 4/1/13 to 3/31/14 | 11.16 | 0.18 | (0.23) | (0.05) | (0.22) | — | (0.24) | (0.46) | (0.51) | 10.65 | (0.38) | 200,371 | 0.42 | 0.42 | 1.67 | 208 | |
| Class R | |||||||||||||||||
| 1/1/18 to 12/31/18 | $10.64 | 0.20 | (0.26) | (0.06) | (0.20) | (0.01) | — | (0.21) | (0.27) | 10.37 | (0.54) % | $3,095 | 0.91 % | 0.98 % | 1.92 % | 172 % | |
| 4/1/17 to 12/31/17(6) | 10.58 | 0.12 | 0.07 | 0.19 | (0.10) | (0.03) | — | (0.13) | 0.06 | 10.64 | 1.82 | 3,153 | 0.92 (7) | 1.05 | 1.45 | 130 | |
| 4/1/16 to 3/31/17 | 10.87 | 0.13 | (0.05) | 0.08 | (0.16) | — | (0.21) | (0.37) | (0.29) | 10.58 | 0.73 | 3,124 | 0.91 | 0.91 | 1.18 | 210 | |
| 4/1/15 to 3/31/16 | 11.05 | 0.15 | (0.07) | 0.08 | (0.17) | — | (0.09) | (0.26) | (0.18) | 10.87 | 0.78 | 3,448 | 0.88 | 0.88 | 1.41 | 232 | |
| 4/1/14 to 3/31/15 | 10.66 | 0.16 | 0.41 | 0.57 | (0.18) | — | — | (0.18) | 0.39 | 11.05 | 5.37 | 3,490 | 0.85 | 0.85 | 1.51 | 168 | |
| 4/1/13 to 3/31/14 | 11.17 | 0.14 | (0.24) | (0.10) | (0.17) | — | (0.24) | (0.41) | (0.51) | 10.66 | (0.80) | 4,115 | 0.85 | 0.85 | 1.29 | 208 | |
| Class R6* | |||||||||||||||||
| 1/1/18 to 12/31/18 | $10.63 | 0.25 | (0.26) | (0.01) | (0.25) | (0.01) | — | (0.26) | (0.27) | 10.36 | (0.02) % | $114 | 0.36 % | 0.48 % | 2.40 % | 172 % | |
| 4/1/17 to 12/31/17(6) | 10.57 | 0.16 | 0.08 | 0.24 | (0.15) | (0.03) | — | (0.18) | 0.06 | 10.63 | 2.24 | 3,279 | 0.36 | 0.46 | 1.96 | 130 | |
| 4/1/16 to 3/31/17 | 10.86 | 0.19 | (0.05) | 0.14 | (0.22) | — | (0.21) | (0.43) | (0.29) | 10.57 | 1.29 | 1,352 | 0.35 | 0.35 | 1.78 | 210 | |
| 8/3/15 to 3/31/16(8) | 10.77 | 0.14 | 0.13 | 0.27 | (0.15) | — | (0.03) | (0.18) | 0.09 | 10.86 | 2.51 | 22 | 0.34 | 0.34 | 2.00 | 232 | |
| Seix Corporate Bond Fund | |||||||||||||||||
| Class A | |||||||||||||||||
| 1/1/18 to 12/31/18 | $8.76 | 0.26 | (0.60) | (0.34) | (0.25) | — | (0.02) | (0.27) | (0.61) | 8.15 | (3.90) % | $345 | 0.95 % | 1.35 % | 3.08 % | 299 % | |
| 4/1/17 to 12/31/17(6) | 8.69 | 0.18 | 0.21 | 0.39 | (0.16) | — | (0.16) | (0.32) | 0.07 | 8.76 | 4.53 | 363 | 0.95 | 1.34 | 2.68 | 80 | |
| 4/1/16 to 3/31/17 | 8.50 | 0.24 | 0.27 | 0.51 | (0.24) | — | (0.08) | (0.32) | 0.19 | 8.69 | 6.01 | 591 | 0.95 | 1.15 | 2.75 | 182 | |
| 4/1/15 to 3/31/16 | 8.99 | 0.23 | (0.29) | (0.06) | (0.22) | (0.01) | (0.20) | (0.43) | (0.49) | 8.50 | (0.52) | 500 | 0.95 | 1.11 | 2.68 | 84 | |
| 4/1/14 to 3/31/15 | 8.84 | 0.24 | 0.32 | 0.56 | (0.24) | — | (0.17) | (0.41) | 0.15 | 8.99 | 6.40 | 807 | 0.95 | 0.99 | 2.67 | 90 | |
| 4/1/13 to 3/31/14 | 9.35 | 0.25 | (0.21) | 0.04 | (0.26) | — | (0.29) | (0.55) | (0.51) | 8.84 | 0.52 | 783 | 0.92 | 0.93 | 2.76 | 143 | |
| Class C | |||||||||||||||||
| 1/1/18 to 12/31/18 | $8.72 | 0.20 | (0.60) | (0.40) | (0.19) | — | (0.02) | (0.21) | (0.61) | 8.11 | (4.61) % | $5,459 | 1.65 % | 2.12 % | 2.37 % | 299 % | |
| 4/1/17 to 12/31/17(6) | 8.65 | 0.13 | 0.21 | 0.34 | (0.11) | — | (0.16) | (0.27) | 0.07 | 8.72 | 4.02 | 6,518 | 1.62 | 2.10 | 2.02 | 80 | |
| 4/1/16 to 3/31/17 | 8.46 | 0.18 | 0.27 | 0.45 | (0.18) | — | (0.08) | (0.26) | 0.19 | 8.65 | 5.29 | 7,369 | 1.65 | 1.82 | 2.03 | 182 | |
| 4/1/15 to 3/31/16 | 8.95 | 0.17 | (0.29) | (0.12) | (0.16) | (0.01) | (0.20) | (0.37) | (0.49) | 8.46 | (1.22) | 8,105 | 1.65 | 1.80 | 2.01 | 84 | |
| 4/1/14 to 3/31/15 | 8.80 | 0.18 | 0.32 | 0.50 | (0.18) | — | (0.17) | (0.35) | 0.15 | 8.95 | 5.69 | 9,289 | 1.64 | 1.67 | 1.97 | 90 | |
| 4/1/13 to 3/31/14 | 9.30 | 0.19 | (0.21) | (0.02) | (0.19) | — | (0.29) | (0.48) | (0.50) | 8.80 | (0.07) | 10,385 | 1.62 | 1.63 | 2.18 | 143 |
| Net Asset Value, Beginning of Period | Net Investment Income (Loss)(1) | Net Realized and Unrealized Gain (Loss) | Total from Investment Operations | Dividends from Net Investment Income | Distributions from Tax Return of Capital | Distributions from Net Realized Gains | Total Distributions | Change in Net Asset Value | Net Asset Value, End of Period | Total Return(2)(3) | Net Assets, End of Period (in thousands) | Ratio of Net Expenses to Average Net Assets(4)(5) | Ratio of Gross Expenses to Average Net Assets(4)(5) | Ratio of Net Investment Income (Loss) to Average Net Assets(4) | Portfolio Turnover Rate(3) | ||
| Seix Corporate Bond Fund (Continued) | |||||||||||||||||
| Class I | |||||||||||||||||
| 1/1/18 to 12/31/18 | $8.73 | 0.27 | (0.60) | (0.33) | (0.27) | — | (0.02) | (0.29) | (0.62) | 8.11 | (3.81) % | $35,244 | 0.70 % | 1.03 % | 3.33 % | 299 % | |
| 4/1/17 to 12/31/17(6) | 8.65 | 0.19 | 0.23 | 0.42 | (0.18) | — | (0.16) | (0.34) | 0.08 | 8.73 | 4.86 | 8,382 | 0.70 | 1.18 | 2.93 | 80 | |
| 4/1/16 to 3/31/17 | 8.46 | 0.26 | 0.27 | 0.53 | (0.26) | — | (0.08) | (0.34) | 0.19 | 8.65 | 6.29 | 12,651 | 0.70 | 0.93 | 2.99 | 182 | |
| 4/1/15 to 3/31/16 | 8.95 | 0.25 | (0.29) | (0.04) | (0.24) | (0.01) | (0.20) | (0.45) | (0.49) | 8.46 | (0.29) | 8,943 | 0.70 | 0.83 | 2.86 | 84 | |
| 4/1/14 to 3/31/15 | 8.80 | 0.26 | 0.32 | 0.58 | (0.26) | — | (0.17) | (0.43) | 0.15 | 8.95 | 6.73 | 24,172 | 0.66 | 0.69 | 2.95 | 90 | |
| 4/1/13 to 3/31/14 | 9.30 | 0.28 | (0.21) | 0.07 | (0.28) | — | (0.29) | (0.57) | (0.50) | 8.80 | 0.91 | 28,017 | 0.63 | 0.64 | 3.18 | 143 | |
| Seix Floating Rate High Income Fund | |||||||||||||||||
| Class A | |||||||||||||||||
| 1/1/18 to 12/31/18 | $8.70 | 0.40 | (0.40) | — | (0.40) | — | — | (0.40) | (0.40) | 8.30 | (0.11) % | $68,213 | 0.94 % | 0.95 % | 4.58 % | 75 % | |
| 4/1/17 to 12/31/17(6) | 8.75 | 0.26 | (0.05) | 0.21 | (0.26) | — | — | (0.26) | (0.05) | 8.70 | 2.47 | 113,611 | 0.92 | 0.93 | 4.00 | 55 | |
| 4/1/16 to 3/31/17 | 8.33 | 0.39 | 0.41 | 0.80 | (0.38) | — | — | (0.38) | 0.42 | 8.75 | 9.78 | 135,833 | 0.94 | 0.94 | 4.51 | 79 | |
| 4/1/15 to 3/31/16 | 8.86 | 0.38 | (0.54) | (0.16) | (0.37) | — | — | (0.37) | (0.53) | 8.33 | (1.79) | 143,325 | 0.92 | 0.92 | 4.42 | 33 | |
| 4/1/14 to 3/31/15 | 9.06 | 0.36 | (0.19) | 0.17 | (0.37) | — | — | (0.37) | (0.20) | 8.86 | 1.88 | 147,560 | 0.91 | 0.91 | 4.06 | 29 | |
| 4/1/13 to 3/31/14 | 9.06 | 0.35 | (0.01) | 0.34 | (0.34) | — | — | (0.34) | — | 9.06 | 3.86 | 212,336 | 0.89 | 0.89 | 3.82 | 47 | |
| Class C | |||||||||||||||||
| 1/1/18 to 12/31/18 | $8.70 | 0.35 | (0.40) | (0.05) | (0.35) | — | — | (0.35) | (0.40) | 8.30 | (0.68) % | $45,588 | 1.52 % | 1.62 % | 4.01 % | 75 % | |
| 4/1/17 to 12/31/17(6) | 8.76 | 0.22 | (0.06) | 0.16 | (0.22) | — | — | (0.22) | (0.06) | 8.70 | 1.89 | 51,551 | 1.52 | 1.60 | 3.40 | 55 | |
| 4/1/16 to 3/31/17 | 8.33 | 0.34 | 0.42 | 0.76 | (0.33) | — | — | (0.33) | 0.43 | 8.76 | 9.28 | 56,981 | 1.52 | 1.52 | 3.94 | 79 | |
| 4/1/15 to 3/31/16 | 8.86 | 0.33 | (0.54) | (0.21) | (0.32) | — | — | (0.32) | (0.53) | 8.33 | (2.37) | 55,203 | 1.51 | 1.51 | 3.82 | 33 | |
| 4/1/14 to 3/31/15 | 9.07 | 0.31 | (0.21) | 0.10 | (0.31) | — | — | (0.31) | (0.21) | 8.86 | 1.16 | 64,445 | 1.50 | 1.50 | 3.46 | 29 | |
| 4/1/13 to 3/31/14 | 9.06 | 0.29 | 0.01 | 0.30 | (0.29) | — | — | (0.29) | 0.01 | 9.07 | 3.33 | 83,149 | 1.51 | 1.51 | 3.21 | 47 | |
| Class I | |||||||||||||||||
| 1/1/18 to 12/31/18 | $8.70 | 0.43 | (0.40) | 0.03 | (0.43) | — | — | (0.43) | (0.40) | 8.30 | 0.22 % | $4,380,792 | 0.62 % | 0.70 % | 4.92 % | 75 % | |
| 4/1/17 to 12/31/17(6) | 8.75 | 0.28 | (0.05) | 0.23 | (0.28) | — | — | (0.28) | (0.05) | 8.70 | 2.70 | 4,546,547 | 0.62 | 0.69 | 4.29 | 55 | |
| 4/1/16 to 3/31/17 | 8.33 | 0.41 | 0.42 | 0.83 | (0.41) | — | — | (0.41) | 0.42 | 8.75 | 10.13 | 4,459,175 | 0.63 | 0.63 | 4.80 | 79 | |
| 4/1/15 to 3/31/16 | 8.86 | 0.40 | (0.53) | (0.13) | (0.40) | — | — | (0.40) | (0.53) | 8.33 | (1.50) | 3,040,875 | 0.62 | 0.62 | 4.69 | 33 | |
| 4/1/14 to 3/31/15 | 9.06 | 0.39 | (0.20) | 0.19 | (0.39) | — | — | (0.39) | (0.20) | 8.86 | 2.17 | 6,048,771 | 0.61 | 0.61 | 4.34 | 29 | |
| 4/1/13 to 3/31/14 | 9.06 | 0.38 | (0.01) | 0.37 | (0.37) | — | — | (0.37) | — | 9.06 | 4.16 | 8,965,312 | 0.60 | 0.60 | 4.13 | 47 | |
| Class R6* | |||||||||||||||||
| 1/1/18 to 12/31/18 | $8.71 | 0.43 | (0.40) | 0.03 | (0.44) | — | — | (0.44) | (0.41) | 8.30 | 0.20 % | $805,046 | 0.52 % | 0.58 % | 5.00 % | 75 % | |
| 4/1/17 to 12/31/17(6) | 8.76 | 0.29 | (0.05) | 0.24 | (0.29) | — | — | (0.29) | (0.05) | 8.71 | 2.78 | 1,277,730 | 0.52 | 0.59 | 4.39 | 55 | |
| 4/1/16 to 3/31/17 | 8.33 | 0.43 | 0.42 | 0.85 | (0.42) | — | — | (0.42) | 0.43 | 8.76 | 10.37 | 1,307,701 | 0.52 | 0.52 | 4.94 | 79 | |
| 4/1/15 to 3/31/16 | 8.86 | 0.41 | (0.53) | (0.12) | (0.41) | — | — | (0.41) | (0.53) | 8.33 | (1.39) | 1,127,337 | 0.51 | 0.51 | 4.83 | 33 | |
| 2/1/15 to 3/31/15(9) | 8.74 | 0.07 | 0.12 | 0.19 | (0.07) | — | — | (0.07) | 0.12 | 8.86 | 2.15 | 12,629 | 0.47 | 0.47 | 5.08 | 29 |
| Net Asset Value, Beginning of Period | Net Investment Income (Loss)(1) | Net Realized and Unrealized Gain (Loss) | Total from Investment Operations | Dividends from Net Investment Income | Distributions from Tax Return of Capital | Distributions from Net Realized Gains | Total Distributions | Change in Net Asset Value | Net Asset Value, End of Period | Total Return(2)(3) | Net Assets, End of Period (in thousands) | Ratio of Net Expenses to Average Net Assets(4)(5) | Ratio of Gross Expenses to Average Net Assets(4)(5) | Ratio of Net Investment Income (Loss) to Average Net Assets(4) | Portfolio Turnover Rate(3) | ||
| Seix Georgia Tax-Exempt Bond Fund | |||||||||||||||||
| Class A | |||||||||||||||||
| 1/1/18 to 12/31/18 | $10.59 | 0.26 | (0.23) | 0.03 | (0.26) | — | (0.11) | (0.37) | (0.34) | 10.25 | 0.38 % | $3,114 | 0.75 % | 1.00 % | 2.54 % | 31 % | |
| 4/1/17 to 12/31/17(6) | 10.49 | 0.22 | 0.16 | 0.38 | (0.22) | — | (0.06) | (0.28) | 0.10 | 10.59 | 3.62 | 3,011 | 0.76 (7) | 0.92 | 2.73 | 23 | |
| 4/1/16 to 3/31/17 | 10.98 | 0.28 | (0.35) | (0.07) | (0.28) | — | (0.14) | (0.42) | (0.49) | 10.49 | (0.66) | 3,504 | 0.75 | 0.75 | 2.56 | 46 | |
| 4/1/15 to 3/31/16 | 10.88 | 0.26 | 0.10 | 0.36 | (0.26) | — | — | (0.26) | 0.10 | 10.98 | 3.40 | 3,621 | 0.75 | 0.75 | 2.43 | 41 | |
| 4/1/14 to 3/31/15 | 10.44 | 0.27 | 0.44 | 0.71 | (0.27) | — | — | (0.27) | 0.44 | 10.88 | 6.89 | 3,637 | 0.73 | 0.73 | 2.55 | 55 | |
| 4/1/13 to 3/31/14 | 10.80 | 0.30 | (0.36) | (0.06) | (0.30) | — | — | (0.30) | (0.36) | 10.44 | (0.52) | 4,139 | 0.72 | 0.72 | 2.87 | 67 | |
| Class I | |||||||||||||||||
| 1/1/18 to 12/31/18 | $10.57 | 0.27 | (0.23) | 0.04 | (0.27) | — | (0.11) | (0.38) | (0.34) | 10.23 | 0.47 % | $74,075 | 0.65 % | 0.86 % | 2.64 % | 31 % | |
| 4/1/17 to 12/31/17(6) | 10.48 | 0.23 | 0.15 | 0.38 | (0.23) | — | (0.06) | (0.29) | 0.09 | 10.57 | 3.61 | 86,099 | 0.65 | 0.81 | 2.84 | 23 | |
| 4/1/16 to 3/31/17 | 10.96 | 0.29 | (0.34) | (0.05) | (0.29) | — | (0.14) | (0.43) | (0.48) | 10.48 | (0.47) | 91,782 | 0.65 | 0.70 | 2.66 | 46 | |
| 4/1/15 to 3/31/16 | 10.86 | 0.27 | 0.10 | 0.37 | (0.27) | — | — | (0.27) | 0.10 | 10.96 | 3.50 | 107,691 | 0.65 | 0.68 | 2.52 | 41 | |
| 4/1/14 to 3/31/15 | 10.42 | 0.28 | 0.44 | 0.72 | (0.28) | — | — | (0.28) | 0.44 | 10.86 | 7.00 | 131,881 | 0.64 | 0.64 | 2.63 | 55 | |
| 4/1/13 to 3/31/14 | 10.78 | 0.31 | (0.36) | (0.05) | (0.31) | — | — | (0.31) | (0.36) | 10.42 | (0.37) | 120,835 | 0.57 | 0.57 | 3.01 | 67 | |
| Seix High Grade Municipal Bond Fund | |||||||||||||||||
| Class A | |||||||||||||||||
| 1/1/18 to 12/31/18 | $11.94 | 0.31 | (0.26) | 0.05 | (0.31) | — | (0.06) | (0.37) | (0.32) | 11.62 | 0.44 % | $6,767 | 0.80 %(7) | 0.95 % | 2.63 % | 130 % | |
| 4/1/17 to 12/31/17(6) | 11.69 | 0.21 | 0.27 | 0.48 | (0.22) | — | (0.01) | (0.23) | 0.25 | 11.94 | 4.12 | 8,175 | 0.80 | 0.91 | 2.39 | 173 | |
| 4/1/16 to 3/31/17 | 12.36 | 0.24 | (0.22) | 0.02 | (0.24) | — | (0.45) | (0.69) | (0.67) | 11.69 | 0.27 | 12,276 | 0.80 | 0.80 | 1.99 | 218 | |
| 4/1/15 to 3/31/16 | 12.29 | 0.25 | 0.19 | 0.44 | (0.25) | — | (0.12) | (0.37) | 0.07 | 12.36 | 3.70 | 13,996 | 0.79 | 0.79 | 2.07 | 171 | |
| 4/1/14 to 3/31/15 | 11.86 | 0.29 | 0.59 | 0.88 | (0.29) | — | (0.16) | (0.45) | 0.43 | 12.29 | 7.48 | 16,499 | 0.80 | 0.80 | 2.38 | 228 | |
| 4/1/13 to 3/31/14 | 12.11 | 0.32 | (0.20) | 0.12 | (0.32) | — | (0.05) | (0.37) | (0.25) | 11.86 | 1.16 | 8,967 | 0.80 | 0.82 | 2.75 | 227 | |
| Class I | |||||||||||||||||
| 1/1/18 to 12/31/18 | $11.93 | 0.32 | (0.25) | 0.07 | (0.32) | — | (0.06) | (0.38) | (0.31) | 11.62 | 0.67 % | $41,769 | 0.65 %(7) | 0.85 % | 2.77 % | 130 % | |
| 4/1/17 to 12/31/17(6) | 11.68 | 0.23 | 0.26 | 0.49 | (0.23) | — | (0.01) | (0.24) | 0.25 | 11.93 | 4.24 | 75,684 | 0.65 | 0.82 | 2.55 | 173 | |
| 4/1/16 to 3/31/17 | 12.36 | 0.26 | (0.23) | 0.03 | (0.26) | — | (0.45) | (0.71) | (0.68) | 11.68 | 0.33 | 78,729 | 0.65 | 0.71 | 2.12 | 218 | |
| 4/1/15 to 3/31/16 | 12.29 | 0.27 | 0.19 | 0.46 | (0.27) | — | (0.12) | (0.39) | 0.07 | 12.36 | 3.85 | 99,803 | 0.65 | 0.69 | 2.21 | 171 | |
| 4/1/14 to 3/31/15 | 11.86 | 0.31 | 0.59 | 0.90 | (0.31) | — | (0.16) | (0.47) | 0.43 | 12.29 | 7.64 | 95,761 | 0.65 | 0.69 | 2.53 | 228 | |
| 4/1/13 to 3/31/14 | 12.10 | 0.34 | (0.19) | 0.15 | (0.34) | — | (0.05) | (0.39) | (0.24) | 11.86 | 1.40 | 47,737 | 0.65 | 0.68 | 2.90 | 227 | |
| Seix High Income Fund | |||||||||||||||||
| Class A | |||||||||||||||||
| 1/1/18 to 12/31/18 | $6.53 | 0.36 | (0.57) | (0.21) | (0.36) | — | — | (0.36) | (0.57) | 5.96 | (3.42) % | $14,327 | 1.03 % | 1.11 % | 5.56 % | 77 % | |
| 4/1/17 to 12/31/17(6) | 6.46 | 0.28 | 0.07 | 0.35 | (0.28) | —(10) | — | (0.28) | 0.07 | 6.53 | 5.52 | 29,592 | 1.02 | 1.10 | 5.69 | 45 | |
| 4/1/16 to 3/31/17 | 5.92 | 0.38 | 0.53 | 0.91 | (0.37) | — | — | (0.37) | 0.54 | 6.46 | 15.69 | 63,104 | 1.04 | 1.04 | 5.92 | 95 | |
| 4/1/15 to 3/31/16 | 6.68 | 0.38 | (0.75) | (0.37) | (0.39) | — | — | (0.39) | (0.76) | 5.92 | (5.68) | 43,433 | 1.03 | 1.03 | 6.08 | 77 | |
| 4/1/14 to 3/31/15 | 7.27 | 0.38 | (0.38) | — | (0.38) | — | (0.21) | (0.59) | (0.59) | 6.68 | 0.26 | 65,121 | 0.99 | 0.99 | 5.34 | 86 | |
| 4/1/13 to 3/31/14 | 7.32 | 0.42 | 0.11 | 0.53 | (0.42) | — | (0.16) | (0.58) | (0.05) | 7.27 | 7.60 | 157,360 | 0.97 | 0.97 | 5.82 | 110 |
| Net Asset Value, Beginning of Period | Net Investment Income (Loss)(1) | Net Realized and Unrealized Gain (Loss) | Total from Investment Operations | Dividends from Net Investment Income | Distributions from Tax Return of Capital | Distributions from Net Realized Gains | Total Distributions | Change in Net Asset Value | Net Asset Value, End of Period | Total Return(2)(3) | Net Assets, End of Period (in thousands) | Ratio of Net Expenses to Average Net Assets(4)(5) | Ratio of Gross Expenses to Average Net Assets(4)(5) | Ratio of Net Investment Income (Loss) to Average Net Assets(4) | Portfolio Turnover Rate(3) | ||
| Seix High Income Fund (Continued) | |||||||||||||||||
| Class I | |||||||||||||||||
| 1/1/18 to 12/31/18 | $6.52 | 0.37 | (0.57) | (0.20) | (0.37) | — | — | (0.37) | (0.57) | 5.95 | (3.20) % | $264,435 | 0.80 % | 0.88 % | 5.87 % | 77 % | |
| 4/1/17 to 12/31/17(6) | 6.46 | 0.29 | 0.06 | 0.35 | (0.29) | —(10) | — | (0.29) | 0.06 | 6.52 | 5.53 | 390,665 | 0.81 (7) | 0.87 | 5.93 | 45 | |
| 4/1/16 to 3/31/17 | 5.92 | 0.39 | 0.54 | 0.93 | (0.39) | — | — | (0.39) | 0.54 | 6.46 | 15.95 | 456,928 | 0.80 | 0.81 | 6.15 | 95 | |
| 4/1/15 to 3/31/16 | 6.67 | 0.40 | (0.75) | (0.35) | (0.40) | — | — | (0.40) | (0.75) | 5.92 | (5.31) | 546,793 | 0.79 | 0.79 | 6.34 | 77 | |
| 4/1/14 to 3/31/15 | 7.26 | 0.40 | (0.38) | 0.02 | (0.40) | — | (0.21) | (0.61) | (0.59) | 6.67 | 0.47 | 753,851 | 0.77 | 0.77 | 5.63 | 86 | |
| 4/1/13 to 3/31/14 | 7.32 | 0.43 | 0.11 | 0.54 | (0.44) | — | (0.16) | (0.60) | (0.06) | 7.26 | 7.68 | 783,072 | 0.77 | 0.77 | 6.00 | 110 | |
| Class R | |||||||||||||||||
| 1/1/18 to 12/31/18 | $6.53 | 0.35 | (0.57) | (0.22) | (0.35) | — | — | (0.35) | (0.57) | 5.96 | (3.59) % | $11,166 | 1.22 % | 1.25 % | 5.46 % | 77 % | |
| 4/1/17 to 12/31/17(6) | 6.46 | 0.27 | 0.07 | 0.34 | (0.27) | —(10) | — | (0.27) | 0.07 | 6.53 | 5.36 | 12,160 | 1.23 (7) | 1.30 | 5.49 | 45 | |
| 4/1/16 to 3/31/17 | 5.92 | 0.360 | 0.54 | 0.90 | (0.36) | — | — | (0.36) | 0.54 | 6.46 | 15.47 | 14,699 | 1.22 | 1.22 | 5.73 | 95 | |
| 4/1/15 to 3/31/16 | 6.68 | 0.37 | (0.76) | (0.39) | (0.37) | — | — | (0.37) | (0.76) | 5.92 | (5.87) | 14,574 | 1.23 | 1.23 | 5.92 | 77 | |
| 4/1/14 to 3/31/15 | 7.27 | 0.37 | (0.38) | (0.01) | (0.37) | — | (0.21) | (0.58) | (0.59) | 6.68 | 0.05 | 20,887 | 1.21 | 1.21 | 5.20 | 86 | |
| 4/1/13 to 3/31/14 | 7.32 | 0.40 | 0.12 | 0.52 | (0.41) | — | (0.16) | (0.57) | (0.05) | 7.27 | 7.37 | 22,317 | 1.20 | 1.20 | 5.57 | 110 | |
| Class R6* | |||||||||||||||||
| 1/1/18 to 12/31/18 | $6.52 | 0.38 | (0.57) | (0.19) | (0.38) | — | — | (0.38) | (0.57) | 5.95 | (3.05) % | $4,927 | 0.64 % | 0.75 % | 6.03 % | 77 % | |
| 4/1/17 to 12/31/17(6) | 6.45 | 0.30 | 0.07 | 0.37 | (0.30) | —(10) | — | (0.30) | 0.07 | 6.52 | 5.82 | 5,898 | 0.64 | 0.73 | 6.09 | 45 | |
| 4/1/16 to 3/31/17 | 5.92 | 0.40 | 0.53 | 0.93 | (0.40) | — | — | (0.40) | 0.53 | 6.45 | 15.96 | 4,125 | 0.64 | 0.64 | 6.26 | 95 | |
| 4/1/15 to 3/31/16 | 6.68 | 0.40 | (0.75) | (0.35) | (0.41) | — | — | (0.41) | (0.76) | 5.92 | (5.30) | 1,117 | 0.63 | 0.63 | 6.27 | 77 | |
| 8/1/14 to 3/31/15(11) | 7.22 | 0.28 | (0.33) | (0.05) | (0.28) | — | (0.21) | (0.49) | (0.54) | 6.68 | (0.51) | 3,455 | 0.63 | 0.63 | 5.99 | 86 | |
| Seix High Yield Fund | |||||||||||||||||
| Class A | |||||||||||||||||
| 1/1/18 to 12/31/18 | $8.21 | 0.43 | (0.59) | (0.16) | (0.43) | — | — | (0.43) | (0.59) | 7.62 | (2.07) % | $2,910 | 0.82 % | 1.02 % | 5.32 % | 59 % | |
| 4/1/17 to 12/31/17(6) | 8.16 | 0.34 | 0.03 | 0.37 | (0.30) | (0.02) | — | (0.32) | 0.05 | 8.21 | 4.63 | 4,810 | 0.83 (7) | 0.97 | 5.43 | 41 | |
| 4/1/16 to 3/31/17 | 7.61 | 0.44 | 0.55 | 0.99 | (0.44) | — | — | (0.44) | 0.55 | 8.16 | 13.20 | 6,214 | 0.82 | 0.82 | 5.51 | 87 | |
| 4/1/15 to 3/31/16 | 8.51 | 0.44 | (0.89) | (0.45) | (0.45) | — | — | (0.45) | (0.90) | 7.61 | (5.36) | 7,463 | 0.84 | 0.84 | 5.48 | 76 | |
| 4/1/14 to 3/31/15 | 9.72 | 0.51 | (0.43) | 0.08 | (0.50) | — | (0.79) | (1.29) | (1.21) | 8.51 | 1.24 | 8,110 | 0.87 | 0.87 | 5.31 | 72 | |
| 4/1/13 to 3/31/14 | 10.03 | 0.55 | 0.05 | 0.60 | (0.55) | — | (0.36) | (0.91) | (0.31) | 9.72 | 6.39 | 69,921 | 0.81 | 0.81 | 5.57 | 89 | |
| Class I | |||||||||||||||||
| 1/1/18 to 12/31/18 | $8.41 | 0.45 | (0.58) | (0.13) | (0.46) | — | — | (0.46) | (0.59) | 7.82 | (1.70) % | $286,931 | 0.64 % | 0.76 % | 5.53 % | 59 % | |
| 4/1/17 to 12/31/17(6) | 8.37 | 0.34 | 0.04 | 0.38 | (0.32) | (0.02) | — | (0.34) | 0.04 | 8.41 | 4.64 | 403,198 | 0.65 (7) | 0.73 | 5.38 | 41 | |
| 4/1/16 to 3/31/17 | 7.80 | 0.46 | 0.57 | 1.03 | (0.46) | — | — | (0.46) | 0.57 | 8.37 | 13.48 | 483,080 | 0.64 | 0.64 | 5.65 | 87 | |
| 4/1/15 to 3/31/16 | 8.73 | 0.47 | (0.92) | (0.45) | (0.48) | — | — | (0.48) | (0.93) | 7.80 | (5.23) | 523,206 | 0.61 | 0.61 | 5.71 | 76 | |
| 4/1/14 to 3/31/15 | 9.95 | 0.54 | (0.43) | 0.11 | (0.54) | — | (0.79) | (1.33) | (1.22) | 8.73 | 1.53 | 695,060 | 0.58 | 0.58 | 5.63 | 72 | |
| 4/1/13 to 3/31/14 | 10.26 | 0.58 | 0.06 | 0.64 | (0.59) | — | (0.36) | (0.95) | (0.31) | 9.95 | 6.65 | 1,211,146 | 0.55 | 0.55 | 5.79 | 89 | |
| Class R | |||||||||||||||||
| 1/1/18 to 12/31/18 | $8.41 | 0.42 | (0.59) | (0.17) | (0.42) | — | — | (0.42) | (0.59) | 7.82 | (2.10) % | $52 | 1.04 % | 1.16 % | 5.11 % | 59 % | |
| 4/1/17 to 12/31/17(6) | 8.36 | 0.30 | 0.07 | 0.37 | (0.30) | (0.02) | — | (0.32) | 0.05 | 8.41 | 4.45 | 119 | 1.04 | 1.20 | 4.80 | 41 | |
| 4/1/16 to 3/31/17 | 7.80 | 0.43 | 0.56 | 0.99 | (0.43) | — | — | (0.43) | 0.56 | 8.36 | 12.90 | 130 | 1.04 | 1.04 | 5.32 | 87 | |
| 4/1/15 to 3/31/16 | 8.72 | 0.44 | (0.91) | (0.47) | (0.45) | — | — | (0.45) | (0.92) | 7.80 | (5.52) | 573 | 1.04 | 1.04 | 5.29 | 76 | |
| 4/1/14 to 3/31/15 | 9.94 | 0.49 | (0.42) | 0.07 | (0.50) | — | (0.79) | (1.29) | (1.22) | 8.72 | 1.05 | 782 | 1.04 | 1.04 | 5.18 | 72 | |
| 4/1/13 to 3/31/14 | 10.26 | 0.53 | 0.05 | 0.58 | (0.54) | — | (0.36) | (0.90) | (0.32) | 9.94 | 6.04 | 1,237 | 1.04 | 1.04 | 5.31 | 89 |
| Net Asset Value, Beginning of Period | Net Investment Income (Loss)(1) | Net Realized and Unrealized Gain (Loss) | Total from Investment Operations | Dividends from Net Investment Income | Distributions from Tax Return of Capital | Distributions from Net Realized Gains | Total Distributions | Change in Net Asset Value | Net Asset Value, End of Period | Total Return(2)(3) | Net Assets, End of Period (in thousands) | Ratio of Net Expenses to Average Net Assets(4)(5) | Ratio of Gross Expenses to Average Net Assets(4)(5) | Ratio of Net Investment Income (Loss) to Average Net Assets(4) | Portfolio Turnover Rate(3) | ||
| Seix High Yield Fund (Continued) | |||||||||||||||||
| Class R6* | |||||||||||||||||
| 1/1/18 to 12/31/18 | $8.42 | 0.44 | (0.58) | (0.14) | (0.46) | — | — | (0.46) | (0.60) | 7.82 | (1.74) % | $1,009 | 0.53 % | 0.64 % | 5.31 % | 59 % | |
| 4/1/17 to 12/31/17(6) | 8.37 | 0.35 | 0.05 | 0.40 | (0.33) | (0.02) | — | (0.35) | 0.05 | 8.42 | 4.85 | 45,035 | 0.54 (7) | 0.62 | 5.50 | 41 | |
| 8/1/16 to 3/31/17(12) | 8.17 | 0.33 | 0.18 | 0.51 | (0.31) | — | — | (0.31) | 0.20 | 8.37 | 6.34 | 42,695 | 0.54 | 0.54 | 5.86 | 87 | |
| Seix Investment Grade Tax-Exempt Bond Fund | |||||||||||||||||
| Class A | |||||||||||||||||
| 1/1/18 to 12/31/18 | $11.75 | 0.28 | (0.23) | 0.05 | (0.28) | — | (0.07) | (0.35) | (0.30) | 11.45 | 0.45 % | $9,999 | 0.80 %(7) | 1.00 % | 2.47 % | 105 % | |
| 4/1/17 to 12/31/17(6) | 11.65 | 0.22 | 0.10 | 0.32 | (0.22) | — | — | (0.22) | 0.10 | 11.75 | 2.76 | 11,066 | 0.80 | 0.96 | 2.46 | 130 | |
| 4/1/16 to 3/31/17 | 12.24 | 0.26 | (0.32) | (0.06) | (0.26) | — | (0.27) | (0.53) | (0.59) | 11.65 | (0.48) | 20,281 | 0.80 | 0.92 | 2.16 | 138 | |
| 4/1/15 to 3/31/16 | 12.30 | 0.26 | 0.08 | 0.34 | (0.26) | — | (0.14) | (0.40) | (0.06) | 12.24 | 2.89 | 24,861 | 0.80 | 0.93 | 2.17 | 139 | |
| 4/1/14 to 3/31/15 | 12.14 | 0.29 | 0.32 | 0.61 | (0.29) | — | (0.16) | (0.45) | 0.16 | 12.30 | 5.09 | 29,439 | 0.80 | 0.91 | 2.37 | 144 | |
| 4/1/13 to 3/31/14 | 12.47 | 0.26 | (0.24) | 0.02 | (0.26) | — | (0.09) | (0.35) | (0.33) | 12.14 | 0.23 | 30,100 | 0.80 | 0.90 | 2.13 | 104 | |
| Class I | |||||||||||||||||
| 1/1/18 to 12/31/18 | $11.73 | 0.30 | (0.23) | 0.07 | (0.30) | — | (0.07) | (0.37) | (0.30) | 11.43 | 0.60 % | $307,001 | 0.65 %(7) | 0.80 % | 2.61 % | 105 % | |
| 4/1/17 to 12/31/17(6) | 11.64 | 0.23 | 0.09 | 0.32 | (0.23) | — | — | (0.23) | 0.09 | 11.73 | 2.79 | 463,968 | 0.65 | 0.76 | 2.62 | 130 | |
| 4/1/16 to 3/31/17 | 12.22 | 0.28 | (0.31) | (0.03) | (0.28) | — | (0.27) | (0.55) | (0.58) | 11.64 | (0.24) | 519,784 | 0.65 | 0.70 | 2.30 | 138 | |
| 4/1/15 to 3/31/16 | 12.29 | 0.28 | 0.07 | 0.35 | (0.28) | — | (0.14) | (0.42) | (0.07) | 12.22 | 2.96 | 629,435 | 0.65 | 0.68 | 2.32 | 139 | |
| 4/1/14 to 3/31/15 | 12.13 | 0.31 | 0.32 | 0.63 | (0.31) | — | (0.16) | (0.47) | 0.16 | 12.29 | 5.25 | 657,851 | 0.65 | 0.68 | 2.53 | 144 | |
| 4/1/13 to 3/31/14 | 12.45 | 0.28 | (0.23) | 0.05 | (0.28) | — | (0.09) | (0.37) | (0.32) | 12.13 | 0.48 | 643,828 | 0.64 | 0.64 | 2.29 | 104 | |
| Seix North Carolina Tax-Exempt Bond Fund | �� | ||||||||||||||||
| Class A | |||||||||||||||||
| 1/1/18 to 12/31/18 | $10.09 | 0.21 | (0.27) | (0.06) | (0.20) | — | (0.09) | (0.29) | (0.35) | 9.74 | (0.52) % | $466 | 0.80 % | 1.18 % | 2.13 % | 54 % | |
| 4/1/17 to 12/31/17(6) | 10.00 | 0.18 | 0.15 | 0.33 | (0.16) | — | (0.08) | (0.24) | 0.09 | 10.09 | 3.30 | 1,436 | 0.80 | 1.10 | 2.37 | 29 | |
| 4/1/16 to 3/31/17 | 10.50 | 0.21 | (0.28) | (0.07) | (0.21) | — | (0.22) | (0.43) | (0.50) | 10.00 | (0.59) | 2,170 | 0.80 | 0.82 | 2.02 | 61 | |
| 4/1/15 to 3/31/16 | 10.46 | 0.22 | 0.12 | 0.34 | (0.23) | — | (0.07) | (0.30) | 0.04 | 10.50 | 3.23 | 492 | 0.80 | 0.81 | 2.15 | 42 | |
| 4/1/14 to 3/31/15 | 10.04 | 0.23 | 0.42 | 0.65 | (0.23) | — | — | (0.23) | 0.42 | 10.46 | 6.56 | 795 | 0.79 | 0.79 | 2.27 | 51 | |
| 4/1/13 to 3/31/14 | 10.65 | 0.25 | (0.31) | (0.06) | (0.25) | — | (0.30) | (0.55) | (0.61) | 10.04 | (0.45) | 861 | 0.77 | 0.77 | 2.44 | 77 | |
| Class I | |||||||||||||||||
| 1/1/18 to 12/31/18 | $10.12 | 0.22 | (0.26) | (0.04) | (0.22) | — | (0.09) | (0.31) | (0.35) | 9.77 | (0.37) % | $15,206 | 0.65 % | 1.12 % | 2.23 % | 54 % | |
| 4/1/17 to 12/31/17(6) | 10.02 | 0.19 | 0.16 | 0.35 | (0.17) | — | (0.08) | (0.25) | 0.10 | 10.12 | 3.51 | 20,891 | 0.65 | 1.04 | 2.52 | 29 | |
| 4/1/16 to 3/31/17 | 10.53 | 0.23 | (0.29) | (0.06) | (0.23) | — | (0.22) | (0.45) | (0.51) | 10.02 | (0.53) | 21,813 | 0.65 | 0.74 | 2.22 | 61 | |
| 4/1/15 to 3/31/16 | 10.49 | 0.24 | 0.11 | 0.35 | (0.24) | — | (0.07) | (0.31) | 0.04 | 10.53 | 3.39 | 28,576 | 0.65 | 0.73 | 2.31 | 42 | |
| 4/1/14 to 3/31/15 | 10.06 | 0.25 | 0.43 | 0.68 | (0.25) | — | — | (0.25) | 0.43 | 10.49 | 6.80 | 37,190 | 0.65 | 0.69 | 2.40 | 51 | |
| 4/1/13 to 3/31/14 | 10.68 | 0.26 | (0.31) | (0.05) | (0.27) | — | (0.30) | (0.57) | (0.62) | 10.06 | (0.38) | 37,311 | 0.61 | 0.61 | 2.59 | 77 |
| Net Asset Value, Beginning of Period | Net Investment Income (Loss)(1) | Net Realized and Unrealized Gain (Loss) | Total from Investment Operations | Dividends from Net Investment Income | Distributions from Tax Return of Capital | Distributions from Net Realized Gains | Total Distributions | Change in Net Asset Value | Net Asset Value, End of Period | Total Return(2)(3) | Net Assets, End of Period (in thousands) | Ratio of Net Expenses to Average Net Assets(4)(5) | Ratio of Gross Expenses to Average Net Assets(4)(5) | Ratio of Net Investment Income (Loss) to Average Net Assets(4) | Portfolio Turnover Rate(3) | ||
| Seix Short-Term Bond Fund | |||||||||||||||||
| Class A | |||||||||||||||||
| 1/1/18 to 12/31/18 | $9.90 | 0.14 | (0.06) | 0.08 | (0.14) | (0.01) | — | (0.15) | (0.07) | 9.83 | 0.81 % | $2,028 | 0.80 % | 1.68 % | 1.43 % | 93 % | |
| 4/1/17 to 12/31/17(6) | 9.95 | 0.07 | (0.04) | 0.03 | (0.07) | (0.01) | — | (0.08) | (0.05) | 9.90 | 0.27 | 2,210 | 0.80 | 1.26 | 0.89 | 145 | |
| 4/1/16 to 3/31/17 | 10.01 | 0.06 | (0.06) | — | (0.06) | — | — | (0.06) | (0.06) | 9.95 | 0.03 | 2,308 | 0.80 | 0.80 | 0.58 | 129 | |
| 4/1/15 to 3/31/16 | 10.00 | 0.04 | 0.02 | 0.06 | (0.05) | — | — | (0.05) | 0.01 | 10.01 | 0.58 | 2,104 | 0.80 | 0.81 | 0.38 | 87 | |
| 4/1/14 to 3/31/15 | 9.98 | 0.04 | 0.02 | 0.06 | (0.04) | — | — | (0.04) | 0.02 | 10.00 | 0.63 | 2,316 | 0.80 | 0.81 | 0.37 | 199 | |
| 4/1/13 to 3/31/14 | 10.03 | 0.10 | (0.05) | 0.05 | (0.10) | — | — | (0.10) | (0.05) | 9.98 | 0.54 | 2,748 | 0.78 | 0.80 | 1.00 | 79 | |
| Class C | |||||||||||||||||
| 1/1/18 to 12/31/18 | $9.89 | 0.07 | (0.06) | 0.01 | (0.06) | (0.01) | — | (0.07) | (0.06) | 9.83 | 0.14 % | $1,461 | 1.57 % | 2.48 % | 0.66 % | 93 % | |
| 4/1/17 to 12/31/17(6) | 9.94 | 0.02 | (0.05) | (0.03) | (0.01) | (0.01) | — | (0.02) | (0.05) | 9.89 | (0.26) | 1,257 | 1.48 | 2.04 | 0.21 | 145 | |
| 4/1/16 to 3/31/17 | 10.00 | —(10) | (0.06) | (0.06) | — | — | — | — | (0.06) | 9.94 | (0.57) | 1,310 | 1.40 | 1.57 | (0.03) | 129 | |
| 4/1/15 to 3/31/16 | 10.00 | (0.01) | 0.01 | — | —(10) | — | — | —(10) | — | 10.00 | — | 1,742 | 1.29 | 1.58 | (0.10) | 87 | |
| 4/1/14 to 3/31/15 | 9.97 | (0.01) | 0.04 | 0.03 | —(10) | — | — | —(10) | 0.03 | 10.00 | 0.31 | 1,730 | 1.22 | 1.58 | (0.06) | 199 | |
| 4/1/13 to 3/31/14 | 10.02 | 0.02 | (0.04) | (0.02) | (0.03) | — | — | (0.03) | (0.05) | 9.97 | (0.24) | 1,899 | 1.56 | 1.56 | 0.23 | 79 | |
| Class I | |||||||||||||||||
| 1/1/18 to 12/31/18 | $9.86 | 0.16 | (0.05) | 0.11 | (0.16) | (0.01) | — | (0.17) | (0.06) | 9.80 | 1.11 % | $5,719 | 0.60 % | 1.43 % | 1.62 % | 93 % | |
| 4/1/17 to 12/31/17(6) | 9.92 | 0.08 | (0.05) | 0.03 | (0.08) | (0.01) | — | (0.09) | (0.06) | 9.86 | 0.31 | 7,918 | 0.60 | 0.91 | 1.05 | 145 | |
| 4/1/16 to 3/31/17 | 9.98 | 0.08 | (0.06) | 0.02 | (0.08) | — | — | (0.08) | (0.06) | 9.92 | 0.23 | 52,024 | 0.60 | 0.69 | 0.77 | 129 | |
| 4/1/15 to 3/31/16 | 9.98 | 0.06 | 0.01 | 0.07 | (0.07) | — | — | (0.07) | — | 9.98 | 0.68 | 49,749 | 0.60 | 0.68 | 0.58 | 87 | |
| 4/1/14 to 3/31/15 | 9.95 | 0.05 | 0.04 | 0.09 | (0.06) | — | — | (0.06) | 0.03 | 9.98 | 0.93 | 50,689 | 0.60 | 0.67 | 0.52 | 199 | |
| 4/1/13 to 3/31/14 | 10.00 | 0.12 | (0.05) | 0.07 | (0.12) | — | — | (0.12) | (0.05) | 9.95 | 0.75 | 38,400 | 0.58 | 0.58 | 1.22 | 79 | |
| Seix Short-Term Municipal Bond Fund | |||||||||||||||||
| Class A | |||||||||||||||||
| 1/1/18 to 12/31/18 | $9.91 | 0.09 | 0.02 | 0.11 | (0.10) | — | —(10) | (0.10) | 0.01 | 9.92 | 1.10 % | $1,411 | 0.65 % | 1.05 % | 0.96 % | 50 % | |
| 4/1/17 to 12/31/17(6) | 9.93 | 0.05 | (0.01) | 0.04 | (0.05) | — | (0.01) | (0.06) | (0.02) | 9.91 | 0.39 | 1,765 | 0.65 | 0.95 | 0.70 | 56 | |
| 4/1/16 to 3/31/17 | 9.98 | 0.05 | (0.03) | 0.02 | (0.06) | — | (0.01) | (0.07) | (0.05) | 9.93 | 0.26 | 1,810 | 0.65 | 0.74 | 0.54 | 59 | |
| 4/1/15 to 3/31/16 | 10.00 | 0.02 | —(10) | 0.02 | (0.02) | — | (0.02) | (0.04) | (0.02) | 9.98 | 0.23 | 7,354 | 0.67 | 0.72 | 0.24 | 82 | |
| 4/1/14 to 3/31/15 | 9.99 | 0.03 | 0.08 | 0.11 | (0.03) | — | (0.07) | (0.10) | 0.01 | 10.00 | 1.06 | 3,863 | 0.70 | 0.75 | 0.26 | 148 | |
| 4/1/13 to 3/31/14 | 10.01 | 0.01 | 0.01 | 0.02 | (0.01) | — | (0.03) | (0.04) | (0.02) | 9.99 | 0.25 | 5,900 | 0.65 | 0.82 | 0.10 | 260 | |
| Class I | |||||||||||||||||
| 1/1/18 to 12/31/18 | $9.91 | 0.11 | 0.02 | 0.13 | (0.11) | — | —(10) | (0.11) | 0.02 | 9.93 | 1.37 % | $19,043 | 0.48 % | 0.89 % | 1.12 % | 50 % | |
| 4/1/17 to 12/31/17(6) | 9.93 | 0.07 | (0.01) | 0.06 | (0.07) | — | (0.01) | (0.08) | (0.02) | 9.91 | 0.52 | 31,289 | 0.48 | 0.81 | 0.87 | 56 | |
| 4/1/16 to 3/31/17 | 9.98 | 0.08 | (0.04) | 0.04 | (0.08) | — | (0.01) | (0.09) | (0.05) | 9.93 | 0.40 | 26,710 | 0.48 | 0.66 | 0.75 | 59 | |
| 4/1/15 to 3/31/16 | 10.00 | 0.04 | —(10) | 0.04 | (0.04) | — | (0.02) | (0.06) | (0.02) | 9.98 | 0.41 | 32,184 | 0.51 | 0.62 | 0.41 | 82 | |
| 4/1/14 to 3/31/15 | 9.99 | 0.04 | 0.08 | 0.12 | (0.04) | — | (0.07) | (0.11) | 0.01 | 10.00 | 1.21 | 38,669 | 0.55 | 0.62 | 0.42 | 148 | |
| 4/1/13 to 3/31/14 | 10.01 | 0.02 | 0.01 | 0.03 | (0.02) | — | (0.03) | (0.05) | (0.02) | 9.99 | 0.37 | 30,852 | 0.54 | 0.71 | 0.21 | 260 |
| Net Asset Value, Beginning of Period | Net Investment Income (Loss)(1) | Net Realized and Unrealized Gain (Loss) | Total from Investment Operations | Dividends from Net Investment Income | Distributions from Tax Return of Capital | Distributions from Net Realized Gains | Total Distributions | Change in Net Asset Value | Net Asset Value, End of Period | Total Return(2)(3) | Net Assets, End of Period (in thousands) | Ratio of Net Expenses to Average Net Assets(4)(5) | Ratio of Gross Expenses to Average Net Assets(4)(5) | Ratio of Net Investment Income (Loss) to Average Net Assets(4) | Portfolio Turnover Rate(3) | ||
| Seix Total Return Bond Fund | |||||||||||||||||
| Class A | |||||||||||||||||
| 1/1/18 to 12/31/18 | $10.77 | 0.23 | (0.28) | (0.05) | (0.20) | — | — | (0.20) | (0.25) | 10.52 | (0.48) % | $10,717 | 0.70 % | 0.85 % | 2.18 % | 169 % | |
| 4/1/17 to 12/31/17(6) | 10.77 | 0.15 | — | 0.15 | (0.09) | (0.06) | — | (0.15) | — | 10.77 | 1.37 | 13,227 | 0.71 (7) | 0.84 | 1.86 | 150 | |
| 4/1/16 to 3/31/17 | 11.02 | 0.20 | (0.06) | 0.14 | (0.22) | — | (0.17) | (0.39) | (0.25) | 10.77 | 1.22 | 27,284 | 0.70 | 0.70 | 1.85 | 210 | |
| 4/1/15 to 3/31/16 | 11.11 | 0.17 | (0.06) | 0.11 | (0.19) | — | (0.01) | (0.20) | (0.09) | 11.02 | 1.02 | 32,366 | 0.71 | 0.71 | 1.55 | 181 | |
| 4/1/14 to 3/31/15 | 10.77 | 0.21 | 0.35 | 0.56 | (0.22) | — | — | (0.22) | 0.34 | 11.11 | 5.28 | 43,401 | 0.71 | 0.71 | 1.90 | 173 | |
| 4/1/13 to 3/31/14 | 11.15 | 0.20 | (0.28) | (0.08) | (0.20) | — | (0.10) | (0.30) | (0.38) | 10.77 | (0.70) | 41,134 | 0.70 | 0.70 | 1.82 | 217 | |
| Class I | |||||||||||||||||
| 1/1/18 to 12/31/18 | $10.42 | 0.24 | (0.28) | (0.04) | (0.21) | — | — | (0.21) | (0.25) | 10.17 | (0.32) % | $335,999 | 0.46 % | 0.55 % | 2.39 % | 169 % | |
| 4/1/17 to 12/31/17(6) | 10.42 | 0.17 | (0.01) | 0.16 | (0.10) | (0.06) | — | (0.16) | — | 10.42 | 1.56 | 681,009 | 0.46 | 0.53 | 2.15 | 150 | |
| 4/1/16 to 3/31/17 | 10.67 | 0.22 | (0.07) | 0.15 | (0.23) | — | (0.17) | (0.40) | (0.25) | 10.42 | 1.44 | 790,997 | 0.46 | 0.46 | 2.10 | 210 | |
| 4/1/15 to 3/31/16 | 10.75 | 0.19 | (0.05) | 0.14 | (0.21) | — | (0.01) | (0.22) | (0.08) | 10.67 | 1.35 | 971,159 | 0.45 | 0.45 | 1.82 | 181 | |
| 4/1/14 to 3/31/15 | 10.43 | 0.23 | 0.34 | 0.57 | (0.25) | — | — | (0.25) | 0.32 | 10.75 | 5.47 | 972,117 | 0.44 | 0.44 | 2.17 | 173 | |
| 4/1/13 to 3/31/14 | 10.79 | 0.22 | (0.26) | (0.04) | (0.22) | — | (0.10) | (0.32) | (0.36) | 10.43 | (0.31) | 1,022,101 | 0.41 | 0.41 | 2.12 | 217 | |
| Class R | |||||||||||||||||
| 1/1/18 to 12/31/18 | $10.42 | 0.20 | (0.28) | (0.08) | (0.17) | — | — | (0.17) | (0.25) | 10.17 | (0.79) % | $27,437 | 0.93 %(13) | 0.93 % | 1.95 % | 169 % | |
| 4/1/17 to 12/31/17(6) | 10.42 | 0.13 | (0.01) | 0.12 | (0.06) | (0.06) | — | (0.12) | — | 10.42 | 1.18 | 31,959 | 0.99 | 1.00 | 1.62 | 150 | |
| 4/1/16 to 3/31/17 | 10.67 | 0.16 | (0.07) | 0.09 | (0.17) | — | (0.17) | (0.34) | (0.25) | 10.42 | 0.83 | 39,541 | 1.06 | 1.06 | 1.48 | 210 | |
| 4/1/15 to 3/31/16 | 10.75 | 0.13 | (0.05) | 0.08 | (0.15) | — | (0.01) | (0.16) | (0.08) | 10.67 | 0.74 | 50,402 | 1.06 | 1.06 | 1.21 | 181 | |
| 4/1/14 to 3/31/15 | 10.43 | 0.17 | 0.33 | 0.50 | (0.18) | — | — | (0.18) | 0.32 | 10.75 | 4.83 | 64,539 | 1.05 | 1.06 | 1.56 | 173 | |
| 4/1/13 to 3/31/14 | 10.80 | 0.16 | (0.27) | (0.11) | (0.16) | — | (0.10) | (0.26) | (0.37) | 10.43 | (1.02) | 72,556 | 1.03 | 1.07 | 1.52 | 217 | |
| Class R6* | |||||||||||||||||
| 1/1/18 to 12/31/18 | $10.42 | 0.26 | (0.28) | (0.02) | (0.23) | — | — | (0.23) | (0.25) | 10.17 | (0.17) % | $70,626 | 0.31 % | 0.44 % | 2.55 % | 169 % | |
| 4/1/17 to 12/31/17(6) | 10.42 | 0.19 | (0.02) | 0.17 | (0.11) | (0.06) | — | (0.17) | — | 10.42 | 1.68 | 145,096 | 0.31 | 0.40 | 2.38 | 150 | |
| 4/1/16 to 3/31/17 | 10.67 | 0.25 | (0.08) | 0.17 | (0.25) | — | (0.17) | (0.42) | (0.25) | 10.42 | 1.58 | 101,022 | 0.31 | 0.31 | 2.40 | 210 | |
| 4/1/15 to 3/31/16 | 10.75 | 0.21 | (0.06) | 0.15 | (0.22) | — | (0.01) | (0.23) | (0.08) | 10.67 | 1.49 | 56,133 | 0.31 | 0.31 | 1.95 | 181 | |
| 8/1/14 to 3/31/15(11) | 10.56 | 0.16 | 0.20 | 0.36 | (0.17) | — | — | (0.17) | 0.19 | 10.75 | 3.39 | 71,520 | 0.31 | 0.31 | 2.20 | 173 | |
| Seix U.S. Government Securities Ultra-Short Bond Fund | |||||||||||||||||
| Class A | |||||||||||||||||
| 7/24/2018 to 12/31/18 | $10.00 | 0.09 | (0.01) | 0.08 | (0.08) | (0.01) | — | (0.09) | (0.01) | 9.99 | 0.79 % | $5,497 | 0.63 %(13) | 0.63 % | 2.10 % | 28 %(14) | |
| Class I | |||||||||||||||||
| 1/1/18 to 12/31/18 | $10.01 | 0.19 | (0.01) | 0.18 | (0.19) | (0.01) | — | (0.20) | (0.02) | 9.99 | 1.83 % | $1,232,473 | 0.41 % | 0.50 % | 1.89 % | 28 % | |
| 4/1/17 to 12/31/17(6) | 10.03 | 0.09 | (0.01) | 0.08 | (0.09) | (0.01) | — | (0.10) | (0.02) | 10.01 | 0.82 | 1,343,042 | 0.41 | 0.47 | 1.17 | 48 | |
| 4/1/16 to 3/31/17 | 10.03 | 0.07 | 0.03 | 0.10 | (0.10) | — | — | (0.10) | — | 10.03 | 0.98 | 1,367,242 | 0.42 | 0.42 | 0.72 | 77 | |
| 4/1/15 to 3/31/16 | 10.12 | 0.06 | (0.07) | (0.01) | (0.08) | — | — | (0.08) | (0.09) | 10.03 | (0.11) | 1,557,899 | 0.41 | 0.41 | 0.57 | 52 | |
| 4/1/14 to 3/31/15 | 10.12 | 0.06 | 0.02 | 0.08 | (0.08) | — | — | (0.08) | — | 10.12 | 0.77 | 1,665,888 | 0.39 | 0.39 | 0.55 | 34 | |
| 4/1/13 to 3/31/14 | 10.17 | 0.03 | (0.02) | 0.01 | (0.06) | — | — | (0.06) | (0.05) | 10.12 | 0.13 | 1,993,215 | 0.38 | 0.38 | 0.31 | 36 | |
| Class R6* | |||||||||||||||||
| 1/1/18 to 12/31/18 | $10.03 | 0.20 | (0.01) | 0.19 | (0.21) | (0.01) | — | (0.22) | (0.03) | 10.00 | 1.88 % | $32,940 | 0.26 % | 0.37 % | 2.01 % | 28 % | |
| 4/1/17 to 12/31/17(6) | 10.04 | 0.10 | —(10) | 0.10 | (0.10) | (0.01) | — | (0.11) | (0.01) | 10.03 | 1.04 | 43,072 | 0.26 | 0.33 | 1.32 | 48 | |
| 8/1/16 to 3/31/17(12) | 10.04 | 0.08 | — | 0.08 | (0.08) | — | — | (0.08) | — | 10.04 | 0.77 | 32,657 | 0.26 | 0.26 | 1.12 | 77 |
| Net Asset Value, Beginning of Period | Net Investment Income (Loss)(1) | Net Realized and Unrealized Gain (Loss) | Total from Investment Operations | Dividends from Net Investment Income | Distributions from Tax Return of Capital | Distributions from Net Realized Gains | Total Distributions | Change in Net Asset Value | Net Asset Value, End of Period | Total Return(2)(3) | Net Assets, End of Period (in thousands) | Ratio of Net Expenses to Average Net Assets(4)(5) | Ratio of Gross Expenses to Average Net Assets(4)(5) | Ratio of Net Investment Income (Loss) to Average Net Assets(4) | Portfolio Turnover Rate(3) | ||
| Seix U.S. Mortgage Fund | |||||||||||||||||
| Class A | |||||||||||||||||
| 1/1/18 to 12/31/18 | $11.09 | 0.20 | (0.17) | 0.03 | (0.20) | (0.05) | — | (0.25) | (0.22) | 10.87 | 0.31 % | $3,727 | 0.90 % | 2.01 % | 1.88 % | 129 % | |
| 4/1/17 to 12/31/17(6) | 11.10 | 0.12 | 0.04 | 0.16 | (0.11) | (0.06) | — | (0.17) | (0.01) | 11.09 | 1.45 | 2,566 | 0.90 | 1.59 | 1.48 | 89 | |
| 4/1/16 to 3/31/17 | 11.31 | 0.05 | (0.04) | 0.01 | (0.18) | — | (0.04) | (0.22) | (0.21) | 11.10 | 0.04 | 3,594 | 0.90 | 0.98 | 0.41 | 118 | |
| 4/1/15 to 3/31/16 | 11.29 | 0.08 | 0.11 | 0.19 | (0.17) | — | — | (0.17) | 0.02 | 11.31 | 1.72 | 6,560 | 0.90 | 1.10 | 0.76 | 223 | |
| 4/1/14 to 3/31/15 | 10.88 | 0.16 | 0.47 | 0.63 | (0.22) | — | — | (0.22) | 0.41 | 11.29 | 5.86 | 5,201 | 0.89 | 1.43 | 1.45 | 165 | |
| 4/1/13 to 3/31/14 | 11.14 | 0.11 | (0.18) | (0.07) | (0.19) | — | — | (0.19) | (0.26) | 10.88 | (0.58) | 1,721 | 0.86 | 1.27 | 1.02 | 236 | |
| Class C | |||||||||||||||||
| 1/1/18 to 12/31/18 | $11.11 | 0.12 | (0.17) | (0.05) | (0.12) | (0.05) | — | (0.17) | (0.22) | 10.89 | (0.43) % | $3,174 | 1.65 % | 2.00 % | 1.09 % | 129 % | |
| 4/1/17 to 12/31/17(6) | 11.11 | 0.05 | 0.06 | 0.11 | (0.05) | (0.06) | — | (0.11) | — | 11.11 | 0.99 | 3,722 | 1.62 | 1.98 | 0.65 | 89 | |
| 4/1/16 to 3/31/17 | 11.33 | (0.03) | (0.06) | (0.09) | (0.09) | — | (0.04) | (0.13) | (0.22) | 11.11 | (0.79) | 4,301 | 1.65 | 1.71 | 0.26 | 118 | |
| 4/1/15 to 3/31/16 | 11.32 | —(10) | 0.10 | 0.10 | (0.09) | — | — | (0.09) | 0.01 | 11.33 | 0.88 | 5,478 | 1.65 | 1.79 | 0.01 | 223 | |
| 4/1/14 to 3/31/15 | 10.90 | 0.09 | 0.47 | 0.56 | (0.14) | — | — | (0.14) | 0.42 | 11.32 | 5.15 | 3,989 | 1.65 | 2.15 | 0.79 | 165 | |
| 4/1/13 to 3/31/14 | 11.16 | 0.03 | (0.18) | (0.15) | (0.11) | — | — | (0.11) | (0.26) | 10.90 | (1.36) | 4,780 | 1.66 | 2.04 | 0.23 | 236 | |
| Class I | |||||||||||||||||
| 1/1/18 to 12/31/18 | $11.11 | 0.22 | (0.17) | 0.05 | (0.22) | (0.05) | — | (0.27) | (0.22) | 10.89 | 0.52 % | $17,615 | 0.70 % | 1.08 % | 2.05 % | 129 % | |
| 4/1/17 to 12/31/17(6) | 11.12 | 0.13 | 0.05 | 0.18 | (0.13) | (0.06) | — | (0.19) | (0.01) | 11.11 | 1.60 | 18,967 | 0.70 | 1.08 | 1.52 | 89 | |
| 4/1/16 to 3/31/17 | 11.33 | 0.07 | (0.04) | 0.03 | (0.20) | — | (0.04) | (0.24) | (0.21) | 11.12 | 0.24 | 17,620 | 0.70 | 0.86 | 0.66 | 118 | |
| 4/1/15 to 3/31/16 | 11.32 | 0.12 | 0.09 | (0.21) | (0.20) | — | — | (0.20) | 0.01 | 11.33 | 1.84 | 25,068 | 0.70 | 0.86 | 1.03 | 223 | |
| 4/1/14 to 3/31/15 | 10.90 | 0.19 | 0.48 | 0.67 | (0.25) | — | — | (0.25) | 0.42 | 11.32 | 6.16 | 3,650 | 0.69 | 1.26 | 1.75 | 165 | |
| 4/1/13 to 3/31/14 | 11.16 | 0.12 | (0.16) | (0.04) | (0.22) | — | — | (0.22) | (0.26) | 10.90 | (0.38) | 3,692 | 0.66 | 1.10 | 1.08 | 236 | |
| Seix Ultra-Short Bond Fund | |||||||||||||||||
| Class A | |||||||||||||||||
| 7/24/2018 to 12/31/18 | $9.97 | 0.11 | (0.06) | 0.05 | (0.10) | — | — | (0.10) | (0.05) | 9.92 | 0.48 % | $1,698 | 0.65 % | 0.84 % | 2.46 % | 112 %(14) | |
| Class I | |||||||||||||||||
| 1/1/18 to 12/31/18 | $9.97 | 0.22 | (0.06) | 0.16 | (0.22) | — | — | (0.22) | (0.06) | 9.91 | 1.61 % | $60,041 | 0.40 % | 0.62 % | 2.21 % | 112 % | |
| 4/1/17 to 12/31/17(6) | 9.96 | 0.11 | 0.01 | 0.12 | (0.11) | — | — | (0.11) | 0.01 | 9.97 | 1.21 | 59,548 | 0.42 (7) | 0.56 | 1.44 | 53 | |
| 4/1/16 to 3/31/17 | 9.93 | 0.10 | 0.04 | 0.14 | (0.11) | — | — | (0.11) | 0.03 | 9.96 | 1.41 | 87,344 | 0.40 | 0.40 | 1.05 | 142 | |
| 4/1/15 to 3/31/16 | 9.97 | 0.08 | (0.04) | 0.04 | (0.08) | — | — | (0.08) | (0.04) | 9.93 | 0.42 | 104,950 | 0.38 | 0.38 | 0.77 | 59 | |
| 4/1/14 to 3/31/15 | 9.98 | 0.06 | —(10) | 0.06 | (0.07) | — | — | (0.07) | (0.01) | 9.97 | 0.55 | 142,680 | 0.37 | 0.37 | 0.57 | 54 | |
| 4/1/13 to 3/31/14 | 9.98 | 0.07 | 0.01 | 0.08 | (0.08) | — | — | (0.08) | — | 9.98 | 0.76 | 122,053 | 0.35 | 0.35 | 0.65 | 134 | |
| Seix Virginia Intermediate Municipal Bond Fund | |||||||||||||||||
| Class A | |||||||||||||||||
| 1/1/18 to 12/31/18 | $9.53 | 0.22 | (0.17) | 0.05 | (0.22) | — | (0.07) | (0.29) | (0.24) | 9.29 | 0.57 % | $2,751 | 0.79 % | 1.13 % | 2.34 % | 31 % | |
| 4/1/17 to 12/31/17(6) | 9.55 | 0.16 | 0.10 | 0.26 | (0.16) | — | (0.12) | (0.28) | (0.02) | 9.53 | 2.80 | 3,352 | 0.79 | 1.02 | 2.26 | 34 | |
| 4/1/16 to 3/31/17 | 10.06 | 0.23 | (0.23) | — | (0.23) | — | (0.28) | (0.51) | (0.51) | 9.55 | (0.01) | 3,624 | 0.79 | 0.79 | 2.28 | 49 | |
| 4/1/15 to 3/31/16 | 10.23 | 0.23 | 0.09 | 0.32 | (0.23) | — | (0.26) | (0.49) | (0.17) | 10.06 | 3.29 | 4,365 | 0.76 | 0.76 | 2.29 | 48 | |
| 4/1/14 to 3/31/15 | 10.11 | 0.24 | 0.21 | 0.45 | (0.24) | — | (0.09) | (0.33) | 0.12 | 10.23 | 4.45 | 5,152 | 0.74 | 0.74 | 2.34 | 59 | |
| 4/1/13 to 3/31/14 | 10.53 | 0.27 | (0.32) | (0.05) | (0.27) | — | (0.10) | (0.37) | (0.42) | 10.11 | (0.35) | 7,668 | 0.73 | 0.73 | 2.67 | 65 |
| Net Asset Value, Beginning of Period | Net Investment Income (Loss)(1) | Net Realized and Unrealized Gain (Loss) | Total from Investment Operations | Dividends from Net Investment Income | Distributions from Tax Return of Capital | Distributions from Net Realized Gains | Total Distributions | Change in Net Asset Value | Net Asset Value, End of Period | Total Return(2)(3) | Net Assets, End of Period (in thousands) | Ratio of Net Expenses to Average Net Assets(4)(5) | Ratio of Gross Expenses to Average Net Assets(4)(5) | Ratio of Net Investment Income (Loss) to Average Net Assets(4) | Portfolio Turnover Rate(3) | ||
| Seix Virginia Intermediate Municipal Bond Fund (Continued) | |||||||||||||||||
| Class I | |||||||||||||||||
| 1/1/18 to 12/31/18 | $9.53 | 0.23 | (0.17) | 0.06 | (0.23) | — | (0.07) | (0.30) | (0.24) | 9.29 | 0.71 % | $20,595 | 0.65 % | 0.96 % | 2.47 % | 31 % | |
| 4/1/17 to 12/31/17(6) | 9.55 | 0.17 | 0.11 | 0.28 | (0.18) | — | (0.12) | (0.30) | (0.02) | 9.53 | 2.91 | 37,626 | 0.65 | 0.88 | 2.40 | 34 | |
| 4/1/16 to 3/31/17 | 10.06 | 0.24 | (0.23) | 0.01 | (0.24) | — | (0.28) | (0.52) | (0.51) | 9.55 | 0.13 | 45,969 | 0.65 | 0.70 | 2.41 | 49 | |
| 4/1/15 to 3/31/16 | 10.24 | 0.24 | 0.08 | 0.32 | (0.24) | — | (0.26) | (0.50) | (0.18) | 10.06 | 3.30 | 64,653 | 0.65 | 0.68 | 2.38 | 48 | |
| 4/1/14 to 3/31/15 | 10.12 | 0.25 | 0.21 | 0.46 | (0.25) | — | (0.09) | (0.34) | 0.12 | 10.24 | 4.54 | 119,103 | 0.65 | 0.65 | 2.42 | 59 | |
| 4/1/13 to 3/31/14 | 10.54 | 0.29 | (0.32) | (0.03) | (0.29) | — | (0.10) | (0.39) | (0.42) | 10.12 | (0.20) | 120,600 | 0.58 | 0.58 | 2.83 | 65 |
| Footnote Legend | |
| * | On September 18, 2017, Class IS shares were renamed Class R6 shares. |
| (1) | Calculated using average shares outstanding. |
| (2) | Sales charges, where applicable, are not reflected in the total return calculation. |
| (3) | Not Annualized for periods less than one year. |
| (4) | Annualized for periods less than one year. |
| (5) | The Funds will also indirectly bear their prorated share of expenses of the underlying funds in which they invest. Such expenses are not included in the calculation of this ratio. |
| (6) | The Fund changed its fiscal period end to December 31 during the period. |
| (7) | Due to a change in expense cap, the ratio shown is a blended expense ratio. |
| (8) | Class R6 (formerly IS) commenced operations on August 3, 2015 for the predecessor fund (see Note 1). |
| (9) | Class R6 (formerly IS) commenced operations on February 2, 2015 for the predecessor fund (see Note 1). |
| (10) | Rounds to less than $0.005 per share or less than 0.01%, as applicable. |
| (11) | Class R6 (formerly IS) commenced operations on August 1, 2014 for the predecessor fund (see Note 1). |
| (12) | Class R6 (formerly IS) commenced operations on August 1, 2016 for the predecessor fund (see Note 1). |
| (13) | The Fund and/or specific share class, is currently under its expense limitation. |
| (14) | Portfolio turnover is representative of the Fund for the entire year ended December 31, 2018. |
| Predecessor Fund | Fund | |
RidgeWorth Seix Core Bond Fund | Seix Core Bond Fund | |
RidgeWorth Seix Corporate Bond Fund | Seix Corporate Bond Fund | |
RidgeWorth Seix Floating Rate High Income Fund | Seix Floating Rate High Income Fund | |
RidgeWorth Seix Georgia Tax-Exempt Bond Fund | Seix Georgia Tax-Exempt Bond Fund | |
RidgeWorth Seix High Grade Municipal Bond Fund | Seix High Grade Municipal Bond Fund | |
RidgeWorth Seix High Income Fund | Seix High Income Fund | |
RidgeWorth Seix High Yield Fund | Seix High Yield Fund | |
RidgeWorth Seix Investment Grade Tax-Exempt Bond Fund | Seix Investment Grade Tax-Exempt Bond Fund | |
RidgeWorth Seix North Carolina Tax-Exempt Bond Fund | Seix North Carolina Tax-Exempt Bond Fund | |
RidgeWorth Seix Short-Term Bond Fund | Seix Short-Term Bond Fund | |
RidgeWorth Seix Short-Term Municipal Bond Fund | Seix Short-Term Municipal Bond Fund | |
RidgeWorth Seix Total Return Bond Fund | Seix Total Return Bond Fund | |
RidgeWorth Seix U.S. Government Securities Ultra-Short Bond Fund | Seix U.S. Government Securities Ultra-Short Bond Fund | |
RidgeWorth Seix U.S. Mortgage Fund | Seix U.S. Mortgage Fund | |
RidgeWorth Seix Ultra-Short Bond Fund | Seix Ultra-Short Bond Fund | |
RidgeWorth Seix Virginia Intermediate Municipal Bond Fund | Seix Virginia Intermediate Municipal Bond Fund |
| A. | Security Valuation |
| Each Fund utilizes a fair value hierarchy which prioritizes the inputs to valuation techniques used to measure fair value into three broad levels. The Funds’ policy is to recognize transfers into or out of Level 3 at the end of the reporting period. |
| • | Level 1 – quoted prices in active markets for identical securities (security types generally include listed equities). |
| • | Level 2 – prices determined using other significant observable inputs (including quoted prices for similar securities, interest rates, prepayment speeds, credit risk, etc.). |
| • | Level 3 – prices determined using significant unobservable inputs (including the Valuation Committee’s own assumptions in determining the fair value of investments). |
| B. | Security Transactions and Investment Income |
| Security transactions are recorded on the trade date. Realized gains and losses from the sale of securities are determined on the identified cost basis. Dividend income is recognized on the ex-dividend date or, in the case of certain foreign securities, as soon as a Fund is notified. Interest income is recorded on the accrual basis. Each Fund amortizes premiums and accretes discounts using the effective interest method. Any distributions from underlying funds are recorded in accordance with the character of the distributions as designated by the underlying funds. | |
| Dividend income from REIT investments is recorded using management’s estimate of the percentage of income included in distributions received from such investments based on historical information and other industry sources. The return of capital portion of the estimate is a reduction to investment income and a reduction in the cost basis of each investment which increases net realized gain (loss) and net change in unrealized appreciation (depreciation). If the return of capital distributions exceed its cost basis, the distributions are treated as realized gains. The actual amounts of income, return of capital, and capital gains are only determined by each REIT after its fiscal year-end, and may differ from the estimated amounts. | |
| C. | Income Taxes |
| Each Fund is treated as a separate taxable entity. It is the intention of each Fund to comply with the requirements of Subchapter M of the Internal Revenue Code and to distribute substantially all of its taxable income to its shareholders. Therefore, no provision for federal income taxes or excise taxes has been made. | |
| Certain Funds may be subject to foreign taxes on income, gains on investments or currency repatriation, a portion of which may be recoverable. Each Fund will accrue such taxes and recoveries as applicable based upon current interpretations of the tax rules and regulations that exist in the markets in which it invests. | |
| Management of the Funds has concluded that there are no significant uncertain tax positions that would require recognition in the financial statements. As of December 31, 2018, the tax years that remain subject to examination by the major tax jurisdictions under the statute of limitations are from the year 2015 forward (with limited exceptions). | |
| D. | Distributions to Shareholders |
| Distributions are recorded by each Fund on the ex-dividend date. Income and capital gain distributions are determined in accordance with income tax regulations which may differ from U.S. GAAP. | |
| E. | Expenses |
| Expenses incurred together by a Fund and other affiliated mutual funds are allocated in proportion to the net assets of each such fund, except where allocation of direct expenses to each fund or an alternative allocation method can be more appropriately used. | |
| In addition to the net annual operating expenses that a Fund bears directly, the shareholders of a Fund indirectly bear the pro rata expenses of any underlying mutual funds in which the Fund invests. | |
| F. | Foreign Currency Transactions |
| Non-U.S. investment securities and other assets and liabilities denominated in foreign currencies are translated into U.S. dollar amounts at the foreign currency exchange rate effective at the end of the reporting period. Cost of investments is translated at the currency exchange rate effective at the trade date. The gain or loss resulting from a change in currency exchange rates between the trade and settlement date of a portfolio transaction is treated as a gain or loss on foreign currency. Likewise, the gain or loss resulting from a change in currency exchange rates between the date income is accrued and the date it is paid is treated as a gain or loss on foreign currency. The Funds do not isolate that portion of the results of operations arising from changes in foreign exchange rates on investments from the fluctuations arising from changes in the market prices of securities held. Such fluctuations are included with the net realized and unrealized gain or loss on investments. | |
| G. | Securities Traded on a To-Be-Announced Basis |
| Certain Funds may trade securities on a to-be-announced (“TBA”) basis. In a TBA transaction, a Fund commits to purchasing or selling securities which have not yet been issued by the issuer and for which specific information, such as the face amount, maturity date and underlying pool of investments in U.S. government agency mortgage pass-through securities, is not announced. Securities purchased on a TBA basis are not settled until they are delivered to the Fund. Beginning on the date a Fund enters into a TBA transaction, cash, U.S. government securities or other liquid high-grade debt obligations are segregated in an amount equal in value to the purchase price of the TBA security. These securities are subject to market fluctuations and their current value is determined in the same manner as for other securities. | |
| H. | When-issued Purchases and Forward Commitments (Delayed Delivery) |
| Certain Funds may engage in when-issued or forward commitment transactions. Securities purchased on a when-issued or forward commitment basis are also known as delayed delivery transactions. Delayed delivery transactions involve a commitment by a Fund to purchase or sell a security at a future date (ordinarily up to 90 days later). When-issued or forward commitments enable the Fund to lock in what is believed to be an attractive price or yield on a particular security for a period of time, regardless of future changes in interest rates. Each Fund records when-issued and forward commitment securities on the trade date. Each Fund maintains collateral for the securities purchased. Securities purchased on a when-issued or forward commitment basis begin earning interest on the settlement date. |
| I. | Leveraged Loans |
| ($ reported in thousands) | |
| Certain Funds may invest in direct debt instruments which are interests in amounts owed by a corporate, governmental, or other borrower to lenders or lending syndicates. Leveraged loans are generally non-investment grade and often involve borrowers that are highly leveraged. The Funds may invest in obligations of borrowers who are in bankruptcy proceedings. Leveraged loans are typically senior in the corporate capital structure of the borrower. A loan is often administered by a bank or other financial institution (the “lender”) that acts as agent for all holders. The agent administers the terms of the loan, as specified in the loan agreement. A Fund’s investments in loans may be in the form of participations in loans or assignments of all or a portion of loans from third parties. When investing in loan participations, a Fund has the right to receive payments of principal, interest and any fees to which it is entitled only from the lender selling the loan participation and only upon receipt by the lender of payments from the borrower. A Fund generally has no right to enforce compliance with the terms of the leveraged loan with the borrower. As a result, a Fund may be subject to the credit risk of both the borrower and the lender that is selling the leveraged loan. When a Fund purchases assignments from lenders it acquires direct rights against the borrower on the loan. | |
| A Fund may invest in multiple series or tranches of a loan, which may have varying terms and carry different associated risks. Leveraged loans may involve foreign borrowers and investments may be denominated in foreign currencies. Direct indebtedness of emerging countries involves a risk that the government entities responsible for the repayment of the debt may be unable, or unwilling, to pay the principal and interest when due. | |
| The leveraged loans have floating rate loan interests which generally pay interest at rates that are periodically determined by reference to a base lending rate plus a premium. The base lending rates are generally LIBOR, the prime rate offered by one or more U.S. banks or the certificate of deposit rate. When a leveraged loan is purchased a Fund may pay an assignment fee. On an ongoing basis, a Fund may receive a commitment fee based on the undrawn portion of the underlying line of credit portion of a leveraged loan. Prepayment penalty fees are received upon the prepayment of a leveraged loan by a borrower. Prepayment penalty, facility, commitment, consent and amendment fees are recorded to income as earned or paid. | |
| As of December 31, 2018, the Funds had the following unfunded loan commitments: |
| Unfunded Loan Commitment | ||
| Seix Floating | ||
| Rate High Income | ||
| Borrower | Fund | |
| Gannett Co., Inc. | $3,332 | |
| St. George’s University Scholastic Services LLC | 1,443 | |
| U.S. Silica Co. | 1,868 |
| J. | Regulation S-X |
| In August 2018, the SEC adopted amendments to Regulation S-X which are intended to facilitate the disclosure of information to investors and simplify compliance without significantly altering the information provided to investors. The amendments include eliminating the requirement to: separately state book basis components of net assets on the Statement of Assets & Liabilities; separately state the sources of distributions paid (except tax return of capital distributions must still be separately disclosed) on the Statements of Changes in Net Assets; and state the book basis amount of undistributed net investment income on the Statements of Changes in Net Assets. Certain prior year amounts have been reclassified for consistency with the current year presentation (see footnotes on Statement of Changes for separate disclosure). These reclassifications have no effect on total net assets, total distributions, the statement of operations, financial highlights, net asset value or total return. | |
| K. | Securities Lending |
| ($ reported in thousands) | |
| The Funds may loan securities to qualified brokers through a securities lending agency agreement with The Bank of New York Mellon (“BNYM”). Under the securities lending policy, when lending securities a Fund is required to maintain collateral with a market value not less than 100% of the market value of loaned securities. Collateral is adjusted daily in connection with changes in the market value of securities on loan. Collateral may consist of cash and securities issued by the U.S. Government or its agencies. Cash collateral is invested in a short-term money market fund. Dividends earned on the collateral and premiums paid by the broker are recorded as income by the Fund net of fees and rebates charged/paid by BNYM for its services as securities lending agent and in connection with this securities lending program. Lending portfolio securities involves a risk of delay in the recovery of the loaned securities or in the declining value of the collateral. At December 31, 2018, the Funds did not loan securities. |
| A. | Futures Contracts |
| A futures contract is an agreement between two parties to purchase (long) or sell (short) a security at a set price for delivery on a future date. Upon entering into a futures contract, a Fund is required to pledge to the broker an amount of cash and/or securities equal to the “initial margin” requirements of the futures exchange on which the contract is traded. Pursuant to the contract, the Fund agrees to receive from or pay to the broker an amount of cash equal to the daily fluctuation in value of the contract. Such receipts or payments are known as variation margin and are recorded by the Fund for financial statement purposes on a daily basis as unrealized appreciation or depreciation. When the contract expires or is closed, gain or loss equal to the difference between the value of the contract at the time it was opened and the value at the time it was closed is realized. This is presented in the Statement of Operations as net realized gain (loss) on futures contracts. | |
| During the fiscal period, the Seix U.S. Government Securities Ultra-Short Bond Fund and Seix Ultra-Short Bond Fund utilized futures to optimize performance by gaining exposure to broad markets or to hedge the risk of securities within the portfolios. The potential risks of doing so are that 1) the use of futures may result in larger losses or smaller gains than the use of more traditional investments, 2) the prices of futures and the price movements of the securities that the future is intended to simulate may not correlate well, 3) the Fund’s success in using futures will be dependent upon the subadviser’s ability to correctly predict such price movements, 4) liquidity of futures can be adversely affected by market factors, and the prices of such securities may move in unexpected ways, and 5) if the Fund cannot close out a futures position, it may be compelled to continue to make daily cash payments to the broker to meet margin requirements, thus increasing transaction costs. Futures contracts outstanding at period end, if any, are listed after each Fund’s Schedule of Investments. | |
| B. | Forward Foreign Currency Exchange Contracts |
| A forward foreign currency exchange contract is an agreement between two parties to buy and sell a currency at a set exchange rate on a future date. Forward foreign currency exchange contracts, when used by a Fund, help to manage the overall exposure to the currencies in which some of the investments held by the Fund are denominated. The contract is marked-to-market daily and the change in market value is recorded by the Fund as an unrealized appreciation or depreciation. When the contract is closed, the Fund records a realized gain or loss equal to the difference between the value at the time it was opened and the value at the time it was closed. The use of forward foreign currency exchange contracts involves the risk that the value of the contract changes unfavorably due to movements in the value of the referenced foreign currencies. Non-deliverable forward foreign currency exchange contracts are settled with the counterparty in U.S. dollars without the delivery of foreign currency. | |
| During the fiscal period, the Seix Corporate Bond Fund and Seix Total Return Bond Fund entered into forward foreign currency exchange contracts as an economic hedge against either specific transactions or portfolio instruments or to obtain exposure to, or hedge exposure away from, foreign currencies (foreign currency exchange rate risk). Forward foreign currency contracts outstanding at period end, if any, are listed after each Fund’s Schedule of Investments. | |
| C. | Swaps |
| Certain Funds enter into swap agreements, in which the Fund and a counterparty agree either to make periodic net payments on a specified notional amount or a net payment upon termination. Swap agreements are negotiated in the OTC market and may be entered into as a bilateral contract (“OTC swaps”) or centrally cleared (“centrally cleared swaps”). The value of the swap is reflected on the Statements of Assets and Liabilities as “Swaps at value”. Swaps are marked-to-market daily and changes in value are recorded as “Net change in unrealized appreciation (depreciation) on swaps” in the Statements of Operations. | |
| Any upfront premiums paid are recorded as assets and any upfront fees received are recorded as liabilities and are shown under “Swaps at value” in the Statements of Assets and Liabilities and are amortized over the term of the swap. When a swap is terminated, the Fund records a realized gain or loss equal to the difference between the proceeds from (or cost of) the closing transaction and the Fund’s basis in the contract, if any. Generally, the basis of the contracts is the unamortized premium received or paid. Cash settlements between the Fund and the counterparty are recognized as “Net realized gain (loss) on swaps” in the Statements of Operations. Swap contracts outstanding at period end, if any, are listed after each Fund’s Schedule of Investments. | |
| In a centrally cleared swap, immediately following execution of the swap agreement, the swap agreement is submitted to a central counterparty (the “CCP”) and the Fund’s counterparty on the swap agreement becomes the CCP. The Fund is required to interface with the CCP through a clearing broker. Upon entering into a centrally cleared swap, a Fund is required to deposit initial margin with the clearing broker in the form of cash or securities in an amount that varies depending on the size and risk profile of the particular swap. | |
| Swap transactions involve, to varying degrees, elements of interest rate, credit and market risk in excess of the amounts recognized in the statements of Assets and Liabilities. Such risks involve the possibility that there will be no liquid market for these agreements, that the counterparty to the agreements may default on its obligation to perform or disagree as to the meaning of the contractual terms in the agreements, and that there may be unfavorable changes in interest rates and/or market values associated with these transactions. |
| Credit default swaps – A Fund may either buy or sell (write) credit default swaps on single-name issuers (corporate or sovereign), a combination or basket of single-name issuers or traded indexes. Credit default swaps on single-name issuers are agreements in which the buyer pays fixed periodic payments to the seller in consideration for a guarantee from the protection seller to make specific payment should a negative credit event take place with respect to the referenced entity (e.g., bankruptcy, failure to pay, obligation accelerators, repudiation, moratorium or restructuring). Credit default swaps on a combination or basket of single-name issuers are agreements in which the buyer pays fixed periodic payments to the seller in consideration for a guarantee from the protection seller to make specific payment should a negative credit event take place with respect to any of the referenced entities (e.g., bankruptcy, failure to pay, obligation accelerators, repudiation, moratorium or restructuring). Credit default swaps on traded indexes are agreements in which the buyer pays fixed periodic payments to the seller in consideration for a guarantee from the seller to make a specific payment should a write-down, principal or interest shortfall or default of all or individual underlying securities included in the index occurs. As a buyer, if an underlying credit event occurs, the Fund will either receive from the seller an amount equal to the notional amount of the swap and deliver the referenced security or underlying securities comprising the index or receive a net settlement of cash equal to the notional amount of the swap less the recovery value of the security or underlying securities comprising the index. As a seller (writer), if an underlying credit event occurs, the Fund will either pay the buyer an amount equal to the notional amount of the swap and take delivery of the referenced security or underlying securities comprising the index or pay a net settlement of cash equal to the notional amount of the swap less the recovery value of the security or underlying securities comprising the index. The Funds may enter into credit default swaps to manage their exposure to the market or certain sectors of the market, to reduce their risk exposure to defaults of corporate and/or sovereign issuers or to create exposure to corporate and/or sovereign issuers to which they are not otherwise exposed (credit risk). | |
| During the period, the Seix Corporate Bond Fund and Seix Total Return Bond Fund utilized both single name credit default swaps and credit index swaps to gain exposure to short individual securities or to gain exposure to a credit or asset-backed index. | |
| The following is a summary of derivative instruments categorized by primary risk exposure, presented in the financial statements as of December 31, 2018: |
| Fair Values of Derivative Financial Instruments as of December 31, 2018 | ||||||
| Derivative Assets | ||||||
| Seix Corporate Bond Fund | Seix Total Return Bond Fund | |||||
| Primary Risk | Statement of Assets and Liabilities Location | Value | Value | |||
| Foreign currency exchange contracts | Unrealized appreciation on forward foreign currency exchange contracts | $— | $319 | |||
| Total | $— | $319 | ||||
| Primary Risk | Value | Value | ||
| Foreign currency exchange contracts | $— | $219 | ||
| Credit Contracts | 19 | 301 | ||
| Total | $19 | $520 | ||
| The Effect of Derivative Financial Instruments in the Statement of Operations Period Ended December 31, 2018 | ||||||||||
| Net Realized Gain (Loss) From | ||||||||||
| Seix Corporate Bond Fund | Seix High Income Fund | Seix High Yield Fund | ||||||||
| Foreign currency exchange contracts: | ||||||||||
| Forward foreign currency transactions(2) | $—(3) | $— | $— | |||||||
| Credit contracts: | ||||||||||
| Swaps(4) | 85 | (5) | (6) | |||||||
| Total | $85 | $(5) | $(6) | |||||||
| The Effect of Derivative Financial Instruments in the Statement of Operations Period Ended December 31, 2018 | ||||||||||
| Net Realized Gain (Loss) From | ||||||||||
| Seix Total Return Bond Fund | Seix U.S. Government Securities Ultra-Short Bond Fund | Seix Ultra-Short Bond Fund | ||||||||
| Interest rate contracts: | ||||||||||
| Futures contracts(1) | $— | $631 | $84 | |||||||
| Foreign currency exchange contracts: | ||||||||||
| Forward foreign currency transactions(2) | (127) | — | — | |||||||
| Credit contracts: | ||||||||||
| Swaps(4) | (2,776) | — | — | |||||||
| Total | $(2,903) | $631 | $84 | |||||||
| (1) | Included in net realized gain (loss) from futures within the Statement of Operations. |
| (2) | Included in net realized gain (loss) from forward foreign currency transactions within the Statement of Operations. |
| (3) | Amount is less than $500. |
| (4) | Included in net realized gain (loss) from swaps within the Statement of Operations. |
| The Effect of Derivative Financial Instruments in the Statement of Operations Period Ended December 31, 2018 | ||||||||||
| Net Change in Unrealized Appreciation/(Depreciation) on | ||||||||||
| Seix Corporate Bond Fund | Seix Total Return Bond Fund | Seix U.S. Government Securities Ultra-Short Bond Fund | ||||||||
| Interest rate contracts: | ||||||||||
| Futures contracts(1) | $— | $— | $(138) | |||||||
| Foreign currency exchange contracts: | ||||||||||
| Forward foreign currency transactions(2) | — | 830 | — | |||||||
| Credit contracts: | ||||||||||
| Swaps(3) | 5 | 2,737 | — | |||||||
| Total | $5 | $3,567 | $(138) | |||||||
| The Effect of Derivative Financial Instruments in the Statement of Operations Period Ended December 31, 2018 | |||||
| Net Change in Unrealized Appreciation/(Depreciation) on | |||||
| Seix Ultra-Short Bond Fund | |||||
| Interest rate contracts: | |||||
| Futures contracts(1) | $(21) | ||||
| Total | $(21) | ||||
| (1) | Included in net change in unrealized appreciation (depreciation) from futures within the Statement of Operations. |
| (2) | Included in net change in unrealized appreciation (depreciation) from forward foreign currency transactions within the Statement of Operations. |
| (3) | Included in net change in unrealized appreciation (depreciation) from swaps within the Statement of Operations. |
| Seix Corporate Bond Fund | Seix High Income Fund | Seix High Yield Fund | Seix Total Return Bond Fund | ||||
Forward Foreign Currency Exchange Purchase Contracts(1) | $18 | $— | $— | $36,405 | |||
Forward Foreign Currency Exchange Sale Contracts(2) | (13) | — | — | (41,879) | |||
Credit Default Swap Agreements - Buy Protection(3) | 1,829 | 1,500 | 1,500 | 101,456 | |||
Credit Default Swap Agreements - Sell Protection(3) | — | 2,500 | — | — |
| Seix U.S. Government Securities Ultra-Short Bond Fund | Seix Ultra-Short Bond Fund | ||
Futures Contracts - Short Positions(4) | $(32,823) | $(8,034) |
| (1) | Average value of currency purchased. |
| (2) | Average value of currency sold. |
| (3) | Notional amount. |
| (4) | Notional value. |
| D. | Derivative Risks |
| A derivative contract may suffer a mark-to-market loss if the value of the contract decreases due to an unfavorable change in the market rates or values of the underlying instrument. Losses can also occur if the counterparty does not perform under the contract. | |
| A Fund’s risk of loss from counterparty credit risk on OTC derivatives is generally limited to the aggregate unrealized gain netted against any collateral held by such Fund. For OTC purchased options, each Fund bears the risk of loss of the amount of the premiums paid plus the positive change in market values net of any collateral held by such Fund should the counterparty fail to perform under the contracts. Options written by a Fund do not typically give rise to counterparty credit risk, as options written generally obligate the Fund, and not the counterparty to perform. | |
| With exchange traded purchased options and futures and centrally cleared swaps generally speaking, there is less counterparty credit risk to the Fund since the exchange or clearinghouse, as counterparty to such instruments, guarantees against a possible default. The clearinghouse stands between the buyer and the seller of the contract; therefore, credit risk is limited to failure of the clearinghouse. While offset rights may exist under applicable law, a Fund does not have a contractual right of offset against a clearing broker or clearinghouse in the event of a default (including the bankruptcy or insolvency) of the clearing broker or clearinghouse. Additionally, credit risk exists in exchange traded futures and centrally cleared swaps with respect to initial and variation margin that is held in a clearing broker’s customer accounts. While clearing brokers are required to segregate customer margin from their own assets, in the event that a clearing broker becomes insolvent or goes into bankruptcy and at that time there is a shortfall in the aggregate amount of margin held by the clearing broker for all its clients, typically the shortfall would be allocated on a pro rata basis across all the clearing broker’s customers, potentially resulting in losses to the Fund. | |
| In order to better define its contractual rights and to secure rights that will help a Fund mitigate its counterparty risk, each Fund may enter into an International Swaps and Derivatives Association, Inc. Master Agreement (“ISDA Master Agreement”) or similar agreement with its derivative contract counterparties. An ISDA Master Agreement is a bilateral agreement between a Fund and a counterparty that governs certain OTC derivatives and typically contains, among other things, collateral posting terms and netting provisions in the event of a default and/or termination event. Under an ISDA Master Agreement, a Fund may, under certain circumstances, offset with the counterparty certain derivative financial instruments’ payables and/or receivables with collateral held and/or posted and create one single net payment. The provisions of the ISDA Master Agreement typically permit a single net payment in the event of default including the bankruptcy or insolvency of the counterparty. However, bankruptcy or insolvency laws of a particular jurisdiction may impose restrictions on or prohibitions against the right of offset in bankruptcy, insolvency or other events. In addition, certain ISDA Master Agreements allow counterparties to OTC derivatives to terminate derivative contracts prior to maturity in the event a Fund’s net assets decline by a stated percentage or the Fund fails to meet the terms of its ISDA Master Agreements, which would cause the Fund to accelerate payment of any net liability owed to the counterparty. | |
| E. | Collateral Requirements and Master Netting Agreements (“MNA”) |
| For derivatives traded under an ISDA Master Agreement, the collateral requirements are typically calculated by netting the mark-to-market amount for each transaction under such agreement and comparing that amount to the value of any collateral currently pledged by the Funds and the counterparty. |
| Cash collateral that has been pledged to cover obligations of a Fund and cash collateral received from the counterparty, if any, is reported separately on the Statements of Assets and Liabilities as cash pledged as collateral and cash received as collateral, respectively. Noncash collateral pledged by a Fund, if any, is noted in the Schedules of Investments. Typically, the Funds and counterparties are not permitted to sell, re-pledge or use the collateral they receive. To the extent amounts due to a Fund from its counterparties are not fully collateralized, contractually or otherwise, the Fund bears the risk of loss from counterparty non-performance. The Funds attempt to mitigate counterparty risk by only entering into agreements with counterparties that they believe have the financial resources to honor their obligations and by monitoring the financial stability of those counterparties. | |
| For financial reporting purposes, the Funds do not offset derivative assets and derivative liabilities that are subject to netting arrangements in the Statements of Assets and Liabilities. |
| At December 31, 2018, the Funds’ derivative assets and liabilities (by type) are as follows: | |||||||||||
| Seix Corporate Bond Fund | Seix Total Return Bond Fund | ||||||||||
| Assets | Liabilities | Assets | Liabilities | ||||||||
| Derivative Financial Instruments: | |||||||||||
| Futures contracts | $— | $— | $— | $— | |||||||
| Forward foreign currency exchange contracts | — | — | 319 | 219 | |||||||
| Swaps | — | 19 | — | 301 | |||||||
| Total derivative assets and liabilities in the Statement of Assets and Liabilities | $— | $19 | $319 | $520 | |||||||
| Derivatives not subject to a MNA or similar agreement | — | — | — | — | |||||||
| Total assets and liabilities subject to a MNA | $— | $19 | $319 | $520 | |||||||
| Seix Corporate Bond Fund | ||||||||||
| Counterparty | Derivative Assets Subject to a MNA by Counterparty | Derivatives Available for Offset | Non-Cash Collateral Received | Cash Collateral Received | Net Amount of Derivative Assets | |||||
JPMorgan Securities LLC | $— | $— | $— | $— | $— | |||||
Total | $— | $— | $— | $— | $— | |||||
| Counterparty | Derivatives Liabilities Subject to a MNA by Counterparty | Derivatives Available for Offset | Non-cash Collateral Pledged | Cash Collateral Pledged | Net Amount of Derivative Liabilities | |||||
JPMorgan Securities LLC | $19 | $— | $— | $— | $19 | |||||
Total | $19 | $— | $— | $— | $19 |
| Seix Total Return Bond Fund | ||||||||||
| Counterparty | Derivative Assets Subject to a MNA by Counterparty | Derivatives Available for Offset | Non-Cash Collateral Received | Cash Collateral Received | Net Amount of Derivative Assets | |||||
JPMorgan Securities LLC | $319 | $(319) | $— | $— | $— | |||||
Total | $319 | $(319) | $— | $— | $— | |||||
| Counterparty | Derivatives Liabilities Subject to a MNA by Counterparty | Derivatives Available for Offset | Non-cash Collateral Pledged | Cash Collateral Pledged | Net Amount of Derivative Liabilities(1) | |||||
JPMorgan Securities LLC | $520 | $(319) | $(201) | $— | $— | |||||
Total | $520 | $(319) | $(201) | $— | $— |
| A. | Investment Adviser |
| Virtus Fund Advisers, LLC (the “Adviser”), an indirect, wholly - owned subsidiary of Virtus Investment Partners, Inc. (“Virtus”), is the investment adviser to the Funds. The Adviser manages the Funds’ investment programs and general operations of the Funds, including oversight of the Funds’ subadvisers. | |
| As compensation for its services to the Funds, the Adviser is entitled to a fee, which is calculated daily and paid monthly, based upon the following annual rates as a percentage of the average daily net assets of each Fund: |
Seix Core Bond Fund | 0.25% |
Seix Corporate Bond Fund | 0.40 |
Seix Floating Rate High Income Fund | 0.45 |
Seix Georgia Tax-Exempt Bond Fund | 0.50 |
Seix High Grade Municipal Bond Fund | 0.50 |
Seix High Income Fund | 0.55 |
Seix High Yield Fund | 0.45 |
Seix Investment Grade Tax-Exempt Bond Fund | 0.50 |
Seix North Carolina Tax-Exempt Bond Fund | 0.50 |
Seix Short-Term Bond Fund | 0.40 |
Seix Short-Term Municipal Bond Fund | 0.35 |
Seix Total Return Bond Fund | 0.25 |
Seix U.S. Government Securities Ultra-Short Bond Fund | 0.20 |
Seix U.S. Mortgage Fund | 0.40 |
Seix Ultra-Short Bond Fund | 0.22 |
Seix Virginia Intermediate Municipal Bond Fund | 0.50 |
| B. | Subadviser |
| The subadviser manages the investments of each Fund, for which it is paid a fee by the Adviser. Seix Investment Advisors LLC is the subadviser to the Funds. |
| C. | Expense Limits and Fee Waivers |
| The Adviser has contractually agreed to limit each Fund’s annual total operating expenses (excluding front-end or contingent deferred loads, taxes, leverage expenses, interest, brokerage commissions, expenses incurred in connection with any merger or reorganization, unusual or infrequently occurring expenses (such as litigation), acquired fund fees and expenses, and dividend expenses, if any), so that such expenses do not exceed, on an annualized basis, the following respective percentages of average daily net assets through April 30, 2020. The waivers and reimbursements are accrued daily and received monthly. |
| Fund | Class A | Class C | Class I | Class R | Class R6 | |||||
Seix Core Bond Fund | 0.64 % | N/A % | 0.50 % | 0.91 % | 0.36 % | |||||
Seix Corporate Bond Fund | 0.95 | 1.65 | 0.70 | N/A | N/A | |||||
Seix Floating Rate High Income Fund | 0.94 | 1.52 | 0.62 | N/A | 0.52 | |||||
Seix Georgia Tax-Exempt Bond Fund | 0.75 | N/A | 0.65 | N/A | N/A | |||||
Seix High Grade Municipal Bond Fund(1) | 0.75 | N/A | 0.60 | N/A | N/A | |||||
Seix High Income Fund | 1.03 | N/A | 0.80 | 1.22 | 0.64 | |||||
Seix High Yield Fund | 0.82 | N/A | 0.64 | 1.04 | 0.53 | |||||
Seix Investment Grade Tax-Exempt Bond Fund(1) | 0.75 | N/A | 0.60 | N/A | N/A | |||||
Seix North Carolina Tax-Exempt Bond Fund | 0.80 | N/A | 0.65 | N/A | N/A | |||||
Seix Short-Term Bond Fund | 0.80 | 1.57 | 0.60 | N/A | N/A | |||||
Seix Short-Term Municipal Bond Fund | 0.65 | N/A | 0.48 | N/A | N/A | |||||
Seix Total Return Bond Fund | 0.70 | N/A | 0.46 | 1.06 | 0.31 | |||||
Seix U.S. Government Securities Ultra-Short Bond Fund | 0.66 | N/A | 0.41 | N/A | 0.26 | |||||
Seix U.S. Mortgage Fund | 0.90 | 1.65 | 0.70 | N/A | N/A | |||||
Seix Ultra-Short Bond Fund | 0.65 | N/A | 0.40 | N/A | N/A | |||||
Seix Virginia Intermediate Municipal Bond Fund | 0.79 | N/A | 0.65 | N/A | N/A |
| D. | Expense Recapture |
| ($ reported in thousands) | |
| Under certain conditions, the Adviser may recapture operating expenses reimbursed or fees waived under these arrangements within three years after the date on which such amounts were incurred or waived. A Fund must pay its ordinary operating expenses before the Adviser is entitled to any reimbursement and must remain in compliance with any applicable expense limitations or, if none, the expense limitation in effect at the time of the waiver or reimbursement. All or a portion of the following Adviser reimbursed expenses may be recaptured by the fiscal year ending: |
| Expiration | ||||||||
| Fund | 2019 | 2020 | 2021 | Total | ||||
| Seix Core Bond Fund | ||||||||
Class A | $ — | $ 10 | $ 18 | $ 28 | ||||
Class I | — | 115 | 190 | 305 | ||||
Class R | — | 2 | 3 | 5 | ||||
Class R6 | — | 2 | 3 | 5 | ||||
| Seix Corporate Bond Fund | ||||||||
Class A | 1 | 2 | 1 | 4 | ||||
Class C | 14 | 18 | 28 | 60 | ||||
Class I | 23 | 47 | 53 | 123 | ||||
| Seix Floating Rate High Income Fund | ||||||||
Class A | — | — | 6 | 6 | ||||
Class C | — | 15 | 49 | 64 | ||||
Class I | — | 2,269 | 3,727 | 5,996 | ||||
Class R6 | — | 709 | 733 | 1,442 | ||||
| Seix Georgia Tax-Exempt Bond Fund | ||||||||
Class A | — | 4 | 7 | 11 | ||||
Class I | 48 | 120 | 164 | 332 | ||||
| Seix High Grade Municipal Bond Fund | ||||||||
Class A | — | 7 | 11 | 18 | ||||
Class I | 56 | 102 | 135 | 293 | ||||
| Expiration | ||||||||
| Fund | 2019 | 2020 | 2021 | Total | ||||
| Seix High Income Fund | ||||||||
Class A | $— | $14 | $17 | $31 | ||||
Class I | 26 | 179 | 282 | 487 | ||||
Class R | — | 2 | 8 | 10 | ||||
Class R6 | — | 3 | 6 | 9 | ||||
| Seix High Yield Fund | ||||||||
Class A | — | 4 | 8 | 12 | ||||
Class I | — | 263 | 422 | 685 | ||||
Class R | — | —(1) | —(1) | —(1) | ||||
Class R6 | — | 26 | 13 | 39 | ||||
| Seix Investment Grade Tax-Exempt Bond Fund | ||||||||
Class A | 30 | 20 | 22 | 72 | ||||
Class I | 260 | 481 | 616 | 1,357 | ||||
| Seix North Carolina Tax-Exempt Bond Fund | ||||||||
Class A | 1 | 4 | 4 | 9 | ||||
Class I | 27 | 67 | 90 | 184 | ||||
| Seix Short-Term Bond Fund | ||||||||
Class A | —(1) | 7 | 17 | 24 | ||||
Class C | — | 2 | 9 | 11 | ||||
Class I | 42 | 83 | 57 | 182 | ||||
| Seix Short-Term Municipal Bond Fund | ||||||||
Class A | 4 | 5 | 7 | 16 | ||||
Class I | 54 | 90 | 95 | 239 | ||||
| Seix Total Return Bond Fund | ||||||||
Class A | — | 17 | 19 | 36 | ||||
Class I | — | 334 | 484 | 818 | ||||
Class R6 | — | 78 | 162 | 240 | ||||
| Seix U.S. Government Securities Ultra-Short Bond Fund | ||||||||
Class I | — | 560 | 1,107 | 1,667 | ||||
Class R6 | — | 29 | 42 | 71 | ||||
| Seix U.S. Mortgage Fund | ||||||||
Class A | 6 | 16 | 35 | 57 | ||||
Class C | 2 | 5 | 12 | 19 | ||||
Class I | 33 | 64 | 69 | 166 | ||||
| Seix Ultra-Short Bond Fund | ||||||||
Class A | — | — | —(1) | —(1) | ||||
Class I | — | 74 | 120 | 194 | ||||
| Seix Virginia Intermediate Municipal Bond Fund | ||||||||
Class A | — | 6 | 10 | 16 | ||||
Class I | 29 | 81 | 97 | 207 | ||||
| (1) | Amount is less than $500. |
| Fund | Class A | Class C | Class I | Class R | Class R6 | Total | ||||||
| Seix Core Bond Fund | $ — | $ — | $ — | $1 | $ — | $1 | ||||||
| Seix Floating Rate High Income Fund | 12 | — | — | — | — | 12 | ||||||
| Seix High Income Fund | 2 | — | — | 4 | — | 6 | ||||||
| Seix High Yield Fund | — | — | — | —(1) | —(1) | —(1) | ||||||
| Seix Total Return Bond Fund | 1 | — | 15 | —(1) | — | 16 | ||||||
| Seix U.S. Government Securities Ultra-Short Bond Fund | —(1) | — | — | — | — | —(1) |
| (1) | Amount is less than $500. |
| E. | Distributor |
| ($ reported in thousands) | |
| VP Distributors, LLC (“VP Distributors”), an indirect wholly-owned subsidiary of Virtus, serves as the distributor of each Fund’s shares. VP Distributors has advised the Funds that for the six months (the “period”) ended December 31, 2018, it retained net commissions of $12 for Class A shares and CDSC of $0 and $0 for Class A shares and Class C shares, respectively. | |
| In addition, each Fund pays VP Distributors 12b-1 fees under a 12b-1 Plan as a percentage of the average daily net assets of each respective class at the annual rates of 0.25% for Class A shares (0.15% for Seix Georgia Tax-Exempt Bond Fund, Seix High Grade Municipal Bond Fund, Seix North Carolina Tax-Exempt Bond Fund, Seix Short-Term Municipal Bond Fund and Seix Virginia Intermediate Municipal Bond Fund, and 0.20% for Seix Short-Term Bond Fund and Seix U.S. Mortgage Fund), 1.00% for Class C shares, and 0.50% for Class R shares; Class I shares and Class R6 shares are not subject to a 12b-1 Plan. | |
| Under certain circumstances, shares of certain Virtus Mutual Funds may be exchanged for shares of the same class of certain other Virtus Mutual Funds on the basis of the relative NAV per share at the time of the exchange. On exchanges with share classes that carry a CDSC, the CDSC schedule of the original shares purchased continues to apply. | |
| F. | Administrator and Transfer Agent |
| ($ reported in thousands) | |
| Virtus Fund Services, LLC, an indirect, wholly-owned subsidiary of Virtus, serves as the administrator and transfer agent to the Funds. | |
| For the period ended December 31, 2018, the Funds incurred administration fees in aggregate totaling $8,232 which are included in the Statements of Operations within the line item “Administration and accounting fees.” The fees are calculated daily and paid monthly. | |
| For the period ended December 31, 2018, the Funds incurred transfer agent fees in aggregate totaling $11,971 which are included in the Statements of Operations within the line item “Transfer agent fees and expenses” and “Sub-transfer agent fees and expenses.” A portion of these fees was paid to outside entities that also provide services to the Funds. The fees are calculated daily and paid monthly. | |
| G. | Trustee Compensation |
| The Trust provides a deferred compensation plan for its Trustees who receive compensation from the Trust. Under the deferred compensation plan, Trustees may elect to defer all or a portion of their compensation. Amounts deferred are retained by the Trust, and then, to the extent permitted by the 1940 Act, in turn, may be invested in the shares of affiliated or unaffiliated mutual funds selected by the participating Trustees. Investments in such instruments are included in “Other Assets” on the Statement of Assets and Liabilities at December 31, 2018. |
| Purchases | Sales | ||
Seix Core Bond Fund | $31,235 | $53,184 | |
Seix Corporate Bond Fund | 80,005 | 54,664 | |
Seix Floating Rate High Income Fund | 4,497,432 | 4,782,129 | |
Seix Georgia Tax-Exempt Bond Fund | 25,083 | 36,505 | |
Seix High Grade Municipal Bond Fund | 90,905 | 121,863 | |
Seix High Income Fund | 274,045 | 378,349 | |
Seix High Yield Fund | 206,889 | 339,470 | |
Seix Investment Grade Tax-Exempt Bond Fund | 417,608 | 546,327 | |
Seix North Carolina Tax-Exempt Bond Fund | 10,271 | 16,502 | |
Seix Short-Term Bond Fund | 2,327 | 5,422 | |
Seix Short-Term Municipal Bond Fund | 11,087 | 19,563 | |
Seix Total Return Bond Fund | 141,905 | 298,481 | |
Seix U.S. Mortgage Fund | 791 | 402 | |
Seix Ultra-Short Bond Fund | 50,905 | 58,349 | |
Seix Virginia Intermediate Municipal Bond Fund | 10,285 | 24,256 |
| Purchases | Sales | ||
| Seix Core Bond Fund | $262,136 | $290,361 | |
| Seix Corporate Bond Fund | 5,691 | 5,690 | |
| Seix Short-Term Bond Fund | 6,672 | 5,753 |
| Purchases | Sales | ||
| Seix Total Return Bond Fund | $962,227 | $1,181,801 | |
| Seix U.S. Government Securities Ultra-Short Bond Fund | 353,620 | 565,583 | |
| Seix U.S. Mortgage Fund | 29,438 | 30,910 | |
| Seix Ultra-Short Bond Fund | 5,662 | 10,943 |
| Seix Core Bond Fund | |||||||||||
| Year Ended December 31, 2018 | Fiscal Period Ended December 31, 2017(1) | Year Ended March 31, 2017 | |||||||||
| SHARES | AMOUNT | SHARES | AMOUNT | SHARES | AMOUNT | ||||||
| Class A | |||||||||||
| Shares sold and cross class conversions | 82 | $845 | 142 | $1,506 | 160 | $1,723 | |||||
| Reinvestment of distributions | 14 | 144 | 11 | 118 | 29 | 305 | |||||
| Shares repurchased and cross class conversions | (311) | (3,202) | (340) | (3,616) | (144) | (1,551) | |||||
| Net Increase / (Decrease) | (215) | $(2,213) | (187) | $(1,992) | 45 | $477 | |||||
| Class I | |||||||||||
| Shares sold and cross class conversions | 1,414 | $14,647 | 3,207 | $34,123 | 3,326 | $36,165 | |||||
| Reinvestment of distributions | 350 | 3,609 | 272 | 2,900 | 749 | 7,981 | |||||
| Shares repurchased and cross class conversions | (6,114) | (63,211) | (4,868) | (51,879) | (8,708) | (94,476) | |||||
| Net Increase / (Decrease) | (4,350) | $(44,955) | (1,389) | $(14,856) | (4,633) | $(50,330) | |||||
| Class R | |||||||||||
| Shares sold and cross class conversions | 41 | $424 | 31 | $331 | 27 | $293 | |||||
| Reinvestment of distributions | 5 | 56 | 3 | 35 | 10 | 107 | |||||
| Shares repurchased and cross class conversions | (44) | (456) | (33) | (355) | (59) | (632) | |||||
| Net Increase / (Decrease) | 2 | $24 | 1 | $11 | (22) | $(232) | |||||
| Class R6 | |||||||||||
| Shares sold and cross class conversions | 19 | $196 | 217 | $2,323 | 122 | $1,335 | |||||
| Reinvestment of distributions | 6 | 60 | 4 | 42 | 4 | 42 | |||||
| Shares repurchased and cross class conversions | (322) | (3,286) | (41) | (438) | (1) | (6) | |||||
| Net Increase / (Decrease) | (297) | $(3,030) | 180 | $1,927 | 125 | $1,371 | |||||
| Seix Corporate Bond Fund | |||||||||||
| Year Ended December 31, 2018 | Fiscal Period Ended December 31, 2017(1) | Year Ended March 31, 2017 | |||||||||
| SHARES | AMOUNT | SHARES | AMOUNT | SHARES | AMOUNT | ||||||
| Class A | |||||||||||
| Shares sold and cross class conversions | 11 | $90 | 20 | $173 | 95 | $843 | |||||
| Reinvestment of distributions | 1 | 10 | 2 | 13 | 2 | 13 | |||||
| Shares repurchased and cross class conversions | (11) | (93) | (49) | (423) | (87) | (762) | |||||
| Net Increase / (Decrease) | 1 | $7 | (27) | $(237) | 10 | $94 | |||||
| Class C | |||||||||||
| Shares sold and cross class conversions | 16 | $133 | 9 | $81 | 12 | $106 | |||||
| Reinvestment of distributions | 18 | 148 | 24 | 210 | 26 | 223 | |||||
| Shares repurchased and cross class conversions | (108) | (899) | (138) | (1,215) | (144) | (1,246) | |||||
| Net Increase / (Decrease) | (74) | $(618) | (105) | $(924) | (106) | $(917) | |||||
| Class I | |||||||||||
| Shares sold and cross class conversions | 7,038 | $57,885 | 131 | $1,154 | 828 | $7,180 | |||||
| Reinvestment of distributions | 64 | 524 | 42 | 366 | 47 | 409 | |||||
| Shares repurchased and cross class conversions | (3,716) | (30,298) | (674) | (5,954) | (469) | (4,092) | |||||
| Net Increase / (Decrease) | 3,386 | $28,111 | (501) | $(4,434) | 406 | $3,497 | |||||
| Seix Floating Rate High Income Fund | |||||||||||
| Year Ended December 31, 2018 | Fiscal Period Ended December 31, 2017(1) | Year Ended March 31, 2017 | |||||||||
| SHARES | AMOUNT | SHARES | AMOUNT | SHARES | AMOUNT | ||||||
| Class A | |||||||||||
| Shares sold and cross class conversions | 4,455 | $38,698 | 3,509 | $30,655 | 7,680 | $66,617 | |||||
| Reinvestment of distributions | 492 | 4,263 | 415 | 3,623 | 705 | 6,095 | |||||
| Shares repurchased and cross class conversions | (9,784) | (84,795) | (6,387) | (55,749) | (10,072) | (87,425) | |||||
| Net Increase / (Decrease) | (4,837) | $(41,834) | (2,463) | $(21,471) | (1,687) | $(14,713) | |||||
| Class C | |||||||||||
| Shares sold and cross class conversions | 1,161 | $10,053 | 738 | $6,434 | 1,370 | $11,881 | |||||
| Reinvestment of distributions | 203 | 1,755 | 137 | 1,199 | 203 | 1,758 | |||||
| Shares repurchased and cross class conversions | (1,797) | (15,499) | (1,460) | (12,746) | (1,690) | (14,592) | |||||
| Net Increase / (Decrease) | (433) | $(3,691) | (585) | $(5,113) | (117) | $(953) | |||||
| Class I | |||||||||||
| Shares sold and cross class conversions | 238,479 | $2,069,083 | 138,184 | $1,206,418 | 289,064 | $2,509,599 | |||||
| Reinvestment of distributions | 23,652 | 204,583 | 14,356 | 125,246 | 15,590 | 134,820 | |||||
| Shares repurchased and cross class conversions | (256,852) | (2,203,344) | (139,520) | (1,217,362) | (160,237) | (1,379,328) | |||||
| Net Increase / (Decrease) | 5,279 | $70,322 | 13,020 | $114,302 | 144,417 | $1,265,091 | |||||
| Seix Floating Rate High Income Fund | |||||||||||
| Year Ended December 31, 2018 | Fiscal Period Ended December 31, 2017(1) | Year Ended March 31, 2017 | |||||||||
| SHARES | AMOUNT | SHARES | AMOUNT | SHARES | AMOUNT | ||||||
| Class R6 | |||||||||||
| Shares sold and cross class conversions | 33,303 | $289,034 | 47,124 | $411,562 | 84,999 | $737,727 | |||||
| Reinvestment of distributions | 4,512 | 39,086 | 3,094 | 27,019 | 3,072 | 26,613 | |||||
| Shares repurchased and cross class conversions | (87,642) | (749,456) | (52,785) | (460,939) | (74,014) | (639,567) | |||||
| Net Increase / (Decrease) | (49,827) | $(421,336) | (2,567) | $(22,358) | 14,057 | $124,773 | |||||
| Seix Georgia Tax-Exempt Bond Fund | |||||||||||
| Year Ended December 31, 2018 | Fiscal Period Ended December 31, 2017(1) | Year Ended March 31, 2017 | |||||||||
| SHARES | AMOUNT | SHARES | AMOUNT | SHARES | AMOUNT | ||||||
| Class A | |||||||||||
| Shares sold and cross class conversions | 32 | $328 | 5 | $50 | 14 | $147 | |||||
| Reinvestment of distributions | 10 | 107 | 7 | 80 | 13 | 138 | |||||
| Shares repurchased and cross class conversions | (22) | (237) | (62) | (654) | (22) | (241) | |||||
| Net Increase / (Decrease) | 20 | $198 | (50) | $(524) | 5 | $44 | |||||
| Class I | |||||||||||
| Shares sold and cross class conversions | 1,064 | $10,966 | 588 | $6,223 | 1,619 | $17,390 | |||||
| Reinvestment of distributions | 95 | 982 | 220 | 2,331 | 382 | 4,085 | |||||
| Shares repurchased and cross class conversions | (2,066) | (21,338) | (1,423) | (15,042) | (3,068) | (32,727) | |||||
| Net Increase / (Decrease) | (907) | $(9,390) | (615) | $(6,488) | (1,067) | $(11,252) | |||||
| Seix High Grade Municipal Bond Fund | |||||||||||
| Year Ended December 31, 2018 | Fiscal Period Ended December 31, 2017(1) | Year Ended March 31, 2017 | |||||||||
| SHARES | AMOUNT | SHARES | AMOUNT | SHARES | AMOUNT | ||||||
| Class A | |||||||||||
| Shares sold and cross class conversions | 9 | $100 | 82 | $973 | 203 | $2,544 | |||||
| Reinvestment of distributions | 20 | 228 | 15 | 182 | 57 | 673 | |||||
| Shares repurchased and cross class conversions | (132) | (1,517) | (462) | (5,496) | (342) | (4,168) | |||||
| Net Increase / (Decrease) | (103) | $(1,189) | (365) | $(4,341) | (82) | $(951) | |||||
| Seix High Grade Municipal Bond Fund | |||||||||||
| Year Ended December 31, 2018 | Fiscal Period Ended December 31, 2017(1) | Year Ended March 31, 2017 | |||||||||
| SHARES | AMOUNT | SHARES | AMOUNT | SHARES | AMOUNT | ||||||
| Class I | |||||||||||
| Shares sold and cross class conversions | 1,046 | $12,177 | 945 | $11,233 | 2,707 | $32,497 | |||||
| Reinvestment of distributions | 159 | 1,841 | 110 | 1,304 | 355 | 4,179 | |||||
| Shares repurchased and cross class conversions | (3,952) | (45,673) | (1,451) | (17,194) | (4,399) | (52,781) | |||||
| Net Increase / (Decrease) | (2,747) | $(31,655) | (396) | $(4,657) | (1,337) | $(16,105) | |||||
| Seix High Income Fund | |||||||||||
| Year Ended December 31, 2018 | Fiscal Period Ended December 31, 2017(1) | Year Ended March 31, 2017 | |||||||||
| SHARES | AMOUNT | SHARES | AMOUNT | SHARES | AMOUNT | ||||||
| Class A | |||||||||||
| Shares sold and cross class conversions | 1,984 | $12,703 | 1,524 | $9,892 | 9,702 | $61,422 | |||||
| Reinvestment of distributions | 160 | 1,019 | 258 | 1,678 | 444 | 2,825 | |||||
| Shares repurchased and cross class conversions | (4,271) | (27,325) | (7,013) | (45,526) | (7,716) | (48,627) | |||||
| Net Increase / (Decrease) | (2,127) | $(13,603) | (5,231) | $(33,956) | 2,430 | $15,620 | |||||
| Class I | |||||||||||
| Shares sold and cross class conversions | 11,602 | $74,417 | 17,529 | $113,774 | 36,932 | $233,696 | |||||
| Reinvestment of distributions | 3,020 | 19,157 | 2,947 | 19,166 | 4,836 | 30,650 | |||||
| Shares repurchased and cross class conversions | (30,092) | (190,990) | (31,340) | (203,598) | (63,396) | (399,905) | |||||
| Net Increase / (Decrease) | (15,470) | $(97,416) | (10,864) | $(70,658) | (21,628) | $(135,559) | |||||
| Class R | |||||||||||
| Shares sold and cross class conversions | 579 | $3,738 | 119 | $774 | 422 | $2,687 | |||||
| Reinvestment of distributions | 104 | 661 | 83 | 543 | 129 | 822 | |||||
| Shares repurchased and cross class conversions | (671) | (4,255) | (614) | (3,990) | (738) | (4,668) | |||||
| Net Increase / (Decrease) | 12 | $144 | (412) | $(2,673) | (187) | $(1,159) | |||||
| Class R6 | |||||||||||
| Shares sold and cross class conversions | 203 | $1,288 | 571 | $3,709 | 3,829 | $23,657 | |||||
| Reinvestment of distributions | 37 | 234 | 29 | 187 | 157 | 997 | |||||
| Shares repurchased and cross class conversions | (317) | (2,007) | (334) | (2,169) | (3,536) | (22,677) | |||||
| Net Increase / (Decrease) | (77) | $(485) | 266 | $1,727 | 450 | $1,977 | |||||
| Seix High Yield Fund | |||||||||||
| Year Ended December 31, 2018 | Fiscal Period Ended December 31, 2017(1) | Year Ended March 31, 2017 | |||||||||
| SHARES | AMOUNT | SHARES | AMOUNT | SHARES | AMOUNT | ||||||
| Class A | |||||||||||
| Shares sold and cross class conversions | 396 | $3,224 | 407 | $3,348 | 584 | $4,707 | |||||
| Reinvestment of distributions | 24 | 194 | 20 | 167 | 36 | 285 | |||||
| Shares repurchased and cross class conversions | (624) | (5,063) | (603) | (4,947) | (839) | (6,679) | |||||
| Net Increase / (Decrease) | (204) | $(1,645) | (176) | $(1,432) | (219) | $(1,687) | |||||
| Class I | |||||||||||
| Shares sold and cross class conversions | 5,892 | $48,557 | 7,644 | $64,282 | 26,285 | $215,421 | |||||
| Reinvestment of distributions | 2,153 | 17,646 | 1,888 | 15,904 | 2,744 | 22,584 | |||||
| Shares repurchased and cross class conversions | (19,276) | (158,366) | (19,342) | (162,739) | (38,319) | (314,503) | |||||
| Net Increase / (Decrease) | (11,231) | $(92,163) | (9,810) | $(82,553) | (9,290) | $(76,498) | |||||
| Class R | |||||||||||
| Reinvestment of distributions | 1 | $4 | 1 | $5 | 2 | $14 | |||||
| Shares repurchased and cross class conversions | (8) | (66) | (2) | (17) | (60) | (484) | |||||
| Net Increase / (Decrease) | (7) | $(62) | (1) | $(12) | (58) | $(470) | |||||
| Class R6 | |||||||||||
| Shares sold and cross class conversions | — | $— | 263 | $2,219 | 5,141 | $42,159 | |||||
| Reinvestment of distributions | 39 | 324 | 158 | 1,329 | 78 | 649 | |||||
| Shares repurchased and cross class conversions | (5,261) | (43,509) | (171) | (1,442) | (118) | (971) | |||||
| Net Increase / (Decrease) | (5,222) | $(43,185) | 250 | $2,106 | 5,101 | $41,837 | |||||
| Seix Investment Grade Tax-Exempt Bond Fund | |||||||||||
| Year Ended December 31, 2018 | Fiscal Period Ended December 31, 2017(1) | Year Ended March 31, 2017 | |||||||||
| SHARES | AMOUNT | SHARES | AMOUNT | SHARES | AMOUNT | ||||||
| Class A | |||||||||||
| Shares sold and cross class conversions | 82 | $928 | 50 | $595 | 90 | $1,088 | |||||
| Reinvestment of distributions | 22 | 255 | 20 | 239 | 70 | 826 | |||||
| Shares repurchased and cross class conversions | (172) | (1,975) | (869) | (10,243) | (451) | (5,429) | |||||
| Net Increase / (Decrease) | (68) | $(792) | (799) | $(9,409) | (291) | $(3,515) | |||||
| Class I | |||||||||||
| Shares sold and cross class conversions | 11,752 | $134,639 | 5,989 | $70,386 | 16,053 | $191,642 | |||||
| Reinvestment of distributions | 901 | 10,308 | 764 | 8,968 | 2,015 | 23,781 | |||||
| Shares repurchased and cross class conversions | (25,345) | (288,965) | (11,870) | (139,341) | (24,907) | (295,166) | |||||
| Net Increase / (Decrease) | (12,692) | $(144,018) | (5,117) | $(59,987) | (6,839) | $(79,743) | |||||
| Seix North Carolina Tax-Exempt Bond Fund | |||||||||||
| Year Ended December 31, 2018 | Fiscal Period Ended December 31, 2017(1) | Year Ended March 31, 2017 | |||||||||
| SHARES | AMOUNT | SHARES | AMOUNT | SHARES | AMOUNT | ||||||
| Class A | |||||||||||
| Shares sold and cross class conversions | 8 | $79 | 7 | $73 | 209 | $2,227 | |||||
| Reinvestment of distributions | 2 | 15 | 2 | 17 | 7 | 67 | |||||
| Shares repurchased and cross class conversions | (104) | (1,022) | (84) | (848) | (46) | (455) | |||||
| Net Increase / (Decrease) | (94) | $(928) | (75) | $(758) | 170 | $1,839 | |||||
| Class I | |||||||||||
| Shares sold and cross class conversions | 391 | $3,861 | 248 | $2,519 | 732 | $7,454 | |||||
| Reinvestment of distributions | 26 | 259 | 47 | 478 | 114 | 1,156 | |||||
| Shares repurchased and cross class conversions | (925) | (9,093) | (406) | (4,125) | (1,384) | (14,089) | |||||
| Net Increase / (Decrease) | (508) | $(4,973) | (111) | $(1,128) | (538) | $(5,479) | |||||
| Seix Short-Term Bond Fund | |||||||||||
| Year Ended December 31, 2018 | Fiscal Period Ended December 31, 2017(1) | Year Ended March 31, 2017 | |||||||||
| SHARES | AMOUNT | SHARES | AMOUNT | SHARES | AMOUNT | ||||||
| Class A | |||||||||||
| Shares sold and cross class conversions | 48 | $473 | 9 | $84 | 48 | $481 | |||||
| Reinvestment of distributions | 3 | 28 | 1 | 14 | 1 | 13 | |||||
| Shares repurchased and cross class conversions | (68) | (668) | (19) | (185) | (28) | (279) | |||||
| Net Increase / (Decrease) | (17) | $(167) | (9) | $(87) | 21 | $215 | |||||
| Class C | |||||||||||
| Shares sold and cross class conversions | 72 | $705 | 23 | $229 | 9 | $87 | |||||
| Reinvestment of distributions | 1 | 7 | — | 3 | — | — | |||||
| Shares repurchased and cross class conversions | (51) | (501) | (28) | (279) | (51) | (509) | |||||
| Net Increase / (Decrease) | 22 | $211 | (5) | $(47) | (42) | $(422) | |||||
| Class I | |||||||||||
| Shares sold and cross class conversions | 111 | $1,083 | 808 | $8,019 | 1,738 | $17,312 | |||||
| Reinvestment of distributions | 10 | 100 | 22 | 218 | 37 | 367 | |||||
| Shares repurchased and cross class conversions | (340) | (3,323) | (5,269) | (52,322) | (1,516) | (15,114) | |||||
| Net Increase / (Decrease) | (219) | $(2,140) | (4,439) | $(44,085) | 259 | $2,565 | |||||
| Seix Short-Term Municipal Bond Fund | |||||||||||
| Year Ended December 31, 2018 | Fiscal Period Ended December 31, 2017(1) | Year Ended March 31, 2017 | |||||||||
| SHARES | AMOUNT | SHARES | AMOUNT | SHARES | AMOUNT | ||||||
| Class A | |||||||||||
| Shares sold and cross class conversions | 89 | $872 | 53 | $528 | 21 | $210 | |||||
| Reinvestment of distributions | 1 | 14 | 1 | 10 | 2 | 18 | |||||
| Shares repurchased and cross class conversions | (126) | (1,241) | (58) | (579) | (578) | (5,742) | |||||
| Net Increase / (Decrease) | (36) | $(355) | (4) | $(41) | (555) | $(5,514) | |||||
| Class I | |||||||||||
| Shares sold and cross class conversions | 207 | $2,047 | 937 | $9,338 | 1,181 | $11,750 | |||||
| Reinvestment of distributions | 23 | 225 | 12 | 116 | 12 | 114 | |||||
| Shares repurchased and cross class conversions | (1,468) | (14,512) | (481) | (4,787) | (1,728) | (17,210) | |||||
| Net Increase / (Decrease) | (1,238) | $(12,240) | 468 | $4,667 | (535) | $(5,346) | |||||
| Seix Total Return Bond Fund | |||||||||||
| Year Ended December 31, 2018 | Fiscal Period Ended December 31, 2017(1) | Year Ended March 31, 2017 | |||||||||
| SHARES | AMOUNT | SHARES | AMOUNT | SHARES | AMOUNT | ||||||
| Class A | |||||||||||
| Shares sold and cross class conversions | 242 | $2,529 | 256 | $2,775 | 489 | $5,404 | |||||
| Reinvestment of distributions | 16 | 166 | 22 | 235 | 80 | 869 | |||||
| Shares repurchased and cross class conversions | (467) | (4,899) | (1,583) | (17,214) | (972) | (10,769) | |||||
| Net Increase / (Decrease) | (209) | $(2,204) | (1,305) | $(14,204) | (403) | $(4,496) | |||||
| Class I | |||||||||||
| Shares sold and cross class conversions | 4,792 | $48,667 | 9,963 | $104,413 | 23,029 | $245,458 | |||||
| Reinvestment of distributions | 1,020 | 10,330 | 1,113 | 11,666 | 2,937 | 30,888 | |||||
| Shares repurchased and cross class conversions | (38,154) | (386,879) | (21,632) | (226,876) | (41,093) | (438,060) | |||||
| Net Increase / (Decrease) | (32,342) | $(327,882) | (10,556) | $(110,797) | (15,127) | $(161,714) | |||||
| Class R | |||||||||||
| Shares sold and cross class conversions | 391 | $3,961 | 297 | $3,111 | 683 | $7,286 | |||||
| Reinvestment of distributions | 47 | 473 | 40 | 423 | 136 | 1,422 | |||||
| Shares repurchased and cross class conversions | (808) | (8,183) | (1,065) | (11,149) | (1,749) | (18,551) | |||||
| Net Increase / (Decrease) | (370) | $(3,749) | (728) | $(7,615) | (930) | $(9,843) | |||||
| Seix Total Return Bond Fund | |||||||||||
| Year Ended December 31, 2018 | Fiscal Period Ended December 31, 2017(1) | Year Ended March 31, 2017 | |||||||||
| SHARES | AMOUNT | SHARES | AMOUNT | SHARES | AMOUNT | ||||||
| Class R6 | |||||||||||
| Shares sold and cross class conversions | 533 | $5,399 | 5,870 | $61,786 | 5,600 | $59,720 | |||||
| Reinvestment of distributions | 259 | 2,621 | 180 | 1,889 | 318 | 3,323 | |||||
| Shares repurchased and cross class conversions | (7,775) | (77,437) | (1,820) | (19,125) | (1,484) | (15,706) | |||||
| Net Increase / (Decrease) | (6,983) | $(69,417) | 4,230 | $44,550 | 4,434 | $47,337 | |||||
| Seix U.S. Government Securities Ultra-Short Bond Fund | |||||||||||
| Year Ended December 31, 2018 | Fiscal Period Ended December 31, 2017(1) | Year Ended March 31, 2017 | |||||||||
| SHARES | AMOUNT | SHARES | AMOUNT | SHARES | AMOUNT | ||||||
| Class A | |||||||||||
| Shares sold and cross class conversions | 580 | $5,801 | — | $— | — | $— | |||||
| Reinvestment of distributions | 1 | 5 | — | — | — | — | |||||
| Shares repurchased and cross class conversions | (31) | (309) | — | — | — | — | |||||
| Net Increase / (Decrease) | 550 | $5,497 | — | $— | — | $— | |||||
| Class I | |||||||||||
| Shares sold and cross class conversions | 49,452 | $494,558 | 35,471 | $355,547 | 50,879 | $510,268 | |||||
| Reinvestment of distributions | 2,251 | 22,508 | 1,196 | 11,988 | 1,293 | 12,962 | |||||
| Shares repurchased and cross class conversions | (62,425) | (624,267) | (38,900) | (389,928) | (71,148) | (713,432) | |||||
| Net Increase / (Decrease) | (10,722) | $(107,201) | (2,233) | $(22,393) | (18,976) | $(190,202) | |||||
| Class R6 | |||||||||||
| Shares sold and cross class conversions | 2,685 | $26,895 | 5,174 | $51,935 | 4,059 | $40,750 | |||||
| Reinvestment of distributions | 58 | 582 | 51 | 512 | 7 | 71 | |||||
| Shares repurchased and cross class conversions | (3,745) | (37,512) | (4,182) | (41,965) | (814) | (8,168) | |||||
| Net Increase / (Decrease) | (1,002) | $(10,035) | 1,043 | $10,482 | 3,252 | $32,653 | |||||
| Seix U.S. Mortgage Fund | |||||||||||
| Year Ended December 31, 2018 | Fiscal Period Ended December 31, 2017(1) | Year Ended March 31, 2017 | |||||||||
| SHARES | AMOUNT | SHARES | AMOUNT | SHARES | AMOUNT | ||||||
| Class A | |||||||||||
| Shares sold and cross class conversions | 139 | $1,500 | 14 | $156 | 111 | $1,252 | |||||
| Reinvestment of distributions | 6 | 64 | 4 | 43 | 11 | 121 | |||||
| Shares repurchased and cross class conversions | (33) | (359) | (111) | (1,235) | (378) | (4,187) | |||||
| Net Increase / (Decrease) | 112 | $1,205 | (93) | $(1,036) | (256) | $(2,814) | |||||
| Seix U.S. Mortgage Fund | |||||||||||
| Year Ended December 31, 2018 | Fiscal Period Ended December 31, 2017(1) | Year Ended March 31, 2017 | |||||||||
| SHARES | AMOUNT | SHARES | AMOUNT | SHARES | AMOUNT | ||||||
| Class C | |||||||||||
| Shares sold and cross class conversions | 5 | $52 | 2 | $27 | 6 | $63 | |||||
| Reinvestment of distributions | 5 | 53 | 4 | 38 | 5 | 55 | |||||
| Shares repurchased and cross class conversions | (54) | (576) | (58) | (642) | (107) | (1,205) | |||||
| Net Increase / (Decrease) | (44) | $(471) | (52) | $(577) | (96) | $(1,087) | |||||
| Class I | |||||||||||
| Shares sold and cross class conversions | 376 | $4,078 | 379 | $4,236 | 309 | $3,480 | |||||
| Reinvestment of distributions | 42 | 451 | 27 | 300 | 40 | 449 | |||||
| Shares repurchased and cross class conversions | (509) | (5,507) | (283) | (3,162) | (975) | (10,975) | |||||
| Net Increase / (Decrease) | (91) | $(978) | 123 | $1,374 | (626) | $(7,046) | |||||
| Seix Ultra-Short Bond Fund | |||||||||||
| Year Ended December 31, 2018 | Fiscal Period Ended December 31, 2017(1) | Year Ended March 31, 2017 | |||||||||
| SHARES | AMOUNT | SHARES | AMOUNT | SHARES | AMOUNT | ||||||
| Class A | |||||||||||
| Shares sold and cross class conversions | 554 | $5,513 | — | $— | — | $— | |||||
| Reinvestment of distributions | 1 | 6 | — | — | — | — | |||||
| Shares repurchased and cross class conversions | (384) | (3,814) | — | — | — | — | |||||
| Net Increase / (Decrease) | 171 | $1,705 | — | $— | — | $— | |||||
| Class I | |||||||||||
| Shares sold and cross class conversions | 4,360 | $43,406 | 1,464 | $14,594 | 8,013 | $79,739 | |||||
| Reinvestment of distributions | 105 | 1,047 | 64 | 638 | 97 | 966 | |||||
| Shares repurchased and cross class conversions | (4,381) | (43,628) | (4,327) | (43,118) | (9,911) | (98,619) | |||||
| Net Increase / (Decrease) | 84 | $825 | (2,799) | $(27,886) | (1,801) | $(17,914) | |||||
| Seix Virginia Intermediate Municipal Bond Fund | |||||||||||
| Year Ended December 31, 2018 | Fiscal Period Ended December 31, 2017(1) | Year Ended March 31, 2017 | |||||||||
| SHARES | AMOUNT | SHARES | AMOUNT | SHARES | AMOUNT | ||||||
| Class A | |||||||||||
| Shares sold and cross class conversions | 13 | $131 | 30 | $284 | 39 | $383 | |||||
| Reinvestment of distributions | 10 | 89 | 11 | 104 | 19 | 187 | |||||
| Shares repurchased and cross class conversions | (79) | (738) | (68) | (653) | (112) | (1,102) | |||||
| Net Increase / (Decrease) | (56) | $(518) | (27) | $(265) | (54) | $(532) | |||||
| Seix Virginia Intermediate Municipal Bond Fund | |||||||||||
| Year Ended December 31, 2018 | Fiscal Period Ended December 31, 2017(1) | Year Ended March 31, 2017 | |||||||||
| SHARES | AMOUNT | SHARES | AMOUNT | SHARES | AMOUNT | ||||||
| Class I | |||||||||||
| Shares sold and cross class conversions | 477 | $4,476 | 532 | $5,124 | 1,488 | $14,610 | |||||
| Reinvestment of distributions | 33 | 303 | 37 | 357 | 106 | 1,024 | |||||
| Shares repurchased and cross class conversions | (2,241) | (20,829) | (1,434) | (13,817) | (3,206) | (31,087) | |||||
| Net Increase / (Decrease) | (1,731) | $(16,050) | (865) | $(8,336) | (1,612) | $(15,453) | |||||
| (1) | Period from April 1, 2017 to December 31, 2017. The Fund had a fiscal period end change from March 31 to December 31. |
| % of Shares Outstanding | Number of Accounts | ||
| Seix Core Bond Fund | 63% | 2 | |
| Seix Corporate Bond Fund | 74 | 2 | |
| Seix Floating Rate High Income Fund | 33 | 1 | |
| Seix Georgia Tax-Exempt Bond Fund | 73 | 2 | |
| Seix High Grade Municipal Bond Fund | 45 | 2 | |
| Seix High Income Fund | 54 | 1 | |
| Seix High Yield Fund | 67 | 2 | |
| Seix Investment Grade Tax-Exempt Bond Fund | 56 | 3 | |
| Seix North Carolina Tax-Exempt Bond Fund | 66 | 2 | |
| Seix Short-Term Bond Fund | 39 | 2 | |
| Seix Short-Term Municipal Bond Fund | 86 | 3 | |
| Seix Total Return Bond Fund | 39 | 1 | |
| Seix U.S. Government Securities Ultra-Short Bond Fund | 54 | 1 | |
| Seix U.S. Mortgage Fund | 63 | 2 | |
| Seix Ultra-Short Bond Fund | 46 | 2 | |
| Seix Virginia Intermediate Municipal Bond Fund | 70 | 3 |
| Fund | Interest Incurred on Borrowing | Average Dollar Amount of Borrowing | Weighted Average Interest Rate on Borrowing | Days Loan was Open | ||||
Seix North Carolina Tax-Exempt Bond Fund | $—(1) | $750 | 3.63% | 2 |
| Fund | Federal tax cost | Unrealized Appreciation | Unrealized (Depreciation) | Net Unrealized Appreciation (Depreciation) | ||||
Seix Core Bond Fund | $140,901 | $2,206 | $(1,103) | $1,103 | ||||
Seix Corporate Bond Fund | 40,978 | 288 | (886) | (598) | ||||
Seix Floating Rate High Income Fund | 5,419,455 | 272 | (336,660) | (336,388) | ||||
Seix Georgia Tax-Exempt Bond Fund | 73,356 | 1,342 | (280) | 1,062 | ||||
Seix High Grade Municipal Bond Fund | 48,101 | 829 | (14) | 815 | ||||
Seix High Income Fund | 316,453 | 904 | (29,422) | (28,518) | ||||
Seix High Yield Fund | 295,570 | 534 | (20,991) | (20,457) | ||||
Seix Investment Grade Tax-Exempt Bond Fund | 320,549 | 3,234 | (775) | 2,459 | ||||
Seix North Carolina Tax-Exempt Bond Fund | 15,618 | 78 | (211) | (133) | ||||
Seix Short-Term Bond Fund | 9,057 | 15 | (32) | (17) | ||||
Seix Short-Term Municipal Bond Fund | 21,024 | 59 | (78) | (19) | ||||
Seix Total Return Bond Fund | 432,904 | 6,174 | (3,626) | 2,548 | ||||
Seix U.S. Government Securities Ultra-Short Bond Fund | 1,258,125 | 4,408 | (1,992) | 2,416 | ||||
Seix U.S. Mortgage Fund | 23,928 | 158 | (171) | (13) | ||||
Seix Ultra-Short Bond Fund | 61,724 | 53 | (218) | (165) | ||||
Seix Virginia Intermediate Municipal Bond Fund | 22,736 | 634 | (24) | 610 |
| No Expiration | Total | ||||||
| Short - Term | Long-Term | Short - Term | Long-Term | ||||
Seix Core Bond Fund | $4,621 | $772 | $4,621 | $772 | |||
Seix Corporate Bond Fund | 729 | 121 | 729 | 121 | |||
Seix Floating Rate High Income Fund | 52,167 | 225,890 | 52,167 | 225,890 | |||
Seix High Grade Municipal Bond Fund | 315 | — | 315 | — | |||
Seix High Income Fund | 18,837 | 58,878 | 18,837 | 58,878 | |||
Seix High Yield Fund | 17,071 | 39,422 | 17,071 | 39,422 | |||
Seix Investment Grade Tax-Exempt Bond Fund | 2,415 | — | 2,415 | — | |||
Seix Short-Term Bond Fund | 211 | 23 | 211 | 23 | |||
Seix Short-Term Municipal Bond Fund | 48 | 10 | 48 | 10 | |||
Seix Total Return Bond Fund | 24,374 | 1,937 | 24,374 | 1,937 | |||
Seix U.S. Government Securities Ultra-Short Bond Fund | 5,382 | 41 | 5,382 | 41 | |||
Seix U.S. Mortgage Fund | 226 | 128 | 226 | 128 | |||
Seix Ultra-Short Bond Fund | 51 | 16 | 51 | 16 | |||
Seix Virginia Intermediate Municipal Bond Fund | 45 | — | 45 | — | |||
| Fund | |
Seix Floating Rate High Income Fund | $ 679 |
Seix High Income Fund | 3,059 |
Seix High Yield Fund | 3,679 |
| Late Year Ordinary Losses Deferred | Late Year Ordinary Losses Recognized | Capital Loss Deferred | Capital Loss Recognized | |||||
Seix Core Bond Fund | $ — | $ — | $ 1,291 | $ (9) | ||||
Seix Corporate Bond Fund | — | — | 7 | — | ||||
Seix Floating Rate High Income Fund | — | — | 27,078 | (25,499) | ||||
Seix Georgia Tax-Exempt Bond Fund | — | — | 80 | — | ||||
Seix High Grade Municipal Bond Fund | — | — | 133 | — | ||||
Seix High Income Fund | — | — | 784 | — | ||||
Seix High Yield Fund | — | — | 748 | — | ||||
Seix Investment Grade Tax-Exempt Bond Fund | — | — | 417 | — | ||||
Seix Short-Term Bond Fund | — | — | 34 | (26) | ||||
Seix Total Return Bond Fund | — | (398) | 5,287 | (339) |
| Late Year Ordinary Losses Deferred | Late Year Ordinary Losses Recognized | Capital Loss Deferred | Capital Loss Recognized | |||||
Seix U.S. Government Securities Ultra-Short Bond Fund | $— | $— | $39 | $— | ||||
Seix U.S. Mortgage Fund | — | — | 77 | — | ||||
Seix Ultra-Short Bond Fund | — | — | 61 | — | ||||
Seix Virginia Intermediate Municipal Bond Fund | — | — | 62 | — |
| Undistributed Ordinary Income | Undistributed Long-Term Capital Gains | Undistributed Tax-Exempt Income | |||
Seix Corporate Bond Fund | $112 | $— | $ — | ||
Seix Floating Rate High Income Fund | 5,630 | — | — | ||
Seix Georgia Tax-Exempt Bond Fund | — | — | 194 | ||
Seix High Income Fund | 52 | — | — | ||
Seix High Yield Fund | —(1) | — | — | ||
Seix Investment Grade Tax-Exempt Bond Fund | — | — | 3 | ||
Seix North Carolina Tax-Exempt Bond Fund | — | 65 | — | ||
Seix Total Return Bond Fund | 248 | — | — | ||
Seix Ultra-Short Bond Fund | 9 | — | — | ||
Seix Virginia Intermediate Municipal Bond Fund | — | — | 16 |
| (1) | Amount is less than $500. |
| Ordinary Income | Long-Term Capital Gains | Tax-Exempt Distributions | Return of Capital | Total | |||||
| Seix Core Bond Fund | |||||||||
12/31/18 | $ 3,964 | $ — | $ — | $ 189 | $4,153 | ||||
12/31/17 | 2,693 | — | — | 598 | 3,291 | ||||
3/31/17 | 7,693 | 1,389 | — | — | 9,082 | ||||
| Seix Corporate Bond Fund | |||||||||
12/31/18 | 691 | 5 | — | — | 696 | ||||
12/31/17 | 362 | 238 | — | — | 600 | ||||
3/31/17 | 594 | 76 | — | — | 670 | ||||
| Seix Floating Rate High Income Fund | |||||||||
12/31/18 | 310,662 | — | — | — | 310,662 | ||||
12/31/17 | 199,059 | — | — | — | 199,059 | ||||
3/31/17 | 223,778 | — | — | — | 223,778 | ||||
| Seix Georgia Tax-Exempt Bond Fund | |||||||||
12/31/18 | — | 847 | 2,190 | — | 3,037 | ||||
12/31/17 | —(1) | 486 | 1,954 | — | 2,440 | ||||
3/31/17 | 73 | 1,344 | 2,882 | — | 4,299 |
| Ordinary Income | Long-Term Capital Gains | Tax-Exempt Distributions | Return of Capital | Total | |||||
| Seix High Grade Municipal Bond Fund | |||||||||
12/31/18 | $18 | $380 | $2,053 | $— | $2,451 | ||||
12/31/17 | 5 | 91 | 1,623 | — | 1,719 | ||||
3/31/17 | 2,783 | 827 | 2,237 | — | 5,847 | ||||
| Seix High Income Fund | |||||||||
12/31/18 | 21,626 | — | — | — | 21,626 | ||||
12/31/17 | 21,882 | — | — | 187 | 22,069 | ||||
3/31/17 | 36,270 | — | — | — | 36,270 | ||||
| Seix High Yield Fund | |||||||||
12/31/18 | 20,003 | — | — | — | 20,003 | ||||
12/31/17 | 18,643 | — | — | 1,286 | 19,929 | ||||
3/31/17 | 31,050 | — | — | — | 31,050 | ||||
| Seix Investment Grade Tax-Exempt Bond Fund | |||||||||
12/31/18 | —(1) | 2,554 | 10,946 | — | 13,500 | ||||
12/31/17 | — | 218 | 10,179 | — | 10,397 | ||||
3/31/17 | 10,668 | 2,775 | 14,256 | — | 27,699 | ||||
| Seix North Carolina Tax-Exempt Bond Fund | |||||||||
12/31/18 | —(1) | 146 | 448 | — | 594 | ||||
12/31/17 | —(1) | 170 | 386 | — | 556 | ||||
3/31/17 | 17 | 640 | 644 | — | 1,301 | ||||
| Seix Short-Term Bond Fund | |||||||||
12/31/18 | 145 | — | — | 8 | 153 | ||||
12/31/17 | 248 | — | — | 24 | 272 | ||||
3/31/17 | 432 | — | — | — | 432 | ||||
| Seix Short-Term Municipal Bond Fund | |||||||||
12/31/18 | 2 | 2 | 276 | — | 280 | ||||
12/31/17 | 20 | — | 213 | — | 233 | ||||
3/31/17 | 41 | — | 244 | — | 285 | ||||
| Seix Total Return Bond Fund | |||||||||
12/31/18 | 13,932 | — | — | — | 13,932 | ||||
12/31/17 | 9,498 | — | — | 4,924 | 14,422 | ||||
3/31/17 | 31,312 | 5,767 | — | — | 37,079 | ||||
| Seix U.S. Government Securities Ultra-Short Bond Fund | |||||||||
12/31/18 | 25,180 | — | — | 1,478 | 26,658 | ||||
12/31/17 | 12,460 | — | — | 1,839 | 14,299 | ||||
3/31/17 | 14,626 | — | — | — | 14,626 | ||||
| Seix U.S. Mortgage Fund | |||||||||
12/31/18 | 467 | — | — | 116 | 583 | ||||
12/31/17 | 245 | — | — | 143 | 388 | ||||
3/31/17 | 532 | 102 | — | — | 634 | ||||
| Seix Ultra-Short Bond Fund | |||||||||
12/31/18 | 1,205 | — | — | — | 1,205 | ||||
12/31/17 | 740 | — | — | — | 740 | ||||
3/31/17 | 1,126 | — | — | — | 1,126 | ||||
| Seix Virginia Intermediate Municipal Bond Fund | |||||||||
12/31/18 | — | 268 | 849 | — | 1,117 | ||||
12/31/17 | — | 559 | 838 | — | 1,397 | ||||
3/31/17 | 631 | 1,148 | 1,538 | — | 3,317 |
| (1) | Amount is less than $500. |
| Capital Paid in on Shares of Beneficial Interest | Total Distributable Earnings (Loss) | ||
Seix Georgia Tax-Exempt Bond Fund | $ —(1) | $ —(1) | |
Seix High Grade Municipal Bond Fund | (2) | 2 | |
Seix Short-Term Municipal Bond Fund | —(1) | —(1) | |
Seix U.S. Government Securities Ultra-Short Bond Fund | (8,408) | 8,408 | |
Seix Ultra-Short Bond Fund | (451) | 451 |
| (1) | Amount is less than $500. |
| Seix Corporate Bond Fund | Seix Floating Rate High Income Fund | ||||||
| (reported in thousands) | SHARES | AMOUNT | SHARES | AMOUNT | |||
| Class A | |||||||
| Conversion from Class C shares | 591 | $4,829 | 136 | $1,157 | |||
| Class C | |||||||
| Conversion to Class A shares | (594) | (4,829) | (136) | (1,157) | |||
| Seix Short-Term Bond Fund | Seix U.S. Mortgage Fund | ||||||
| (reported in thousands) | SHARES | AMOUNT | SHARES | AMOUNT | |||
| Class A | |||||||
| Conversion from Class C shares | 46 | $449 | 220 | $2,392 | |||
| Class C | |||||||
| Conversion to Class A shares | (46) | (449) | (220) | (2,392) | |||

| DRD | LTCG | ||
| Seix Georgia Tax-Exempt Bond Fund | — % | $ 659 | |
| Seix North Carolina Tax-Exempt Bond Fund | — | 211 |
| Name, Year of Birth, Length of Time Served and Number of Portfolios in Complex | Principal Occupation(s) During Past 5 Years and Other Directorships Held by Trustee |
| Brown, Thomas J. YOB: 1945 Served Since: 2017 70 Portfolios | Retired. Trustee (since 2016), Virtus Mutual Fund Family (58 portfolios) and Virtus Alternative Solutions Trust (4 portfolios); Trustee (since 2011), Virtus Variable Insurance Trust (8 portfolios); Director (since 2010), D’Youville Senior Care Center; and Director (since 2005), VALIC Company Funds (49 portfolios). |
| Burke, Donald C. YOB: 1960 Served Since: 2017 74 Portfolios | Retired. Trustee (since 2016), Virtus Mutual Fund Family (58 portfolios), Virtus Variable Insurance Trust (8 portfolios) and Virtus Alternative Solutions Trust (4 portfolios); Director (since 2014) closed-end funds managed by Duff & Phelps Investment Management Co. (4 funds); Director, Avista Corp. (energy company) (since 2011); Trustee, Goldman Sachs Fund Complex (2010 to 2014); and Director, BlackRock Luxembourg and Cayman Funds (2006 to 2010). |
| Harris, Sidney E. YOB: 1949 Served Since: 2017 70 Portfolios | Professor and Dean Emeritus (since April 2015), Professor (1997 to 2014), Dean (1997 to 2004), J. Mack Robinson College of Business, Georgia State University; Trustee (since 2019), Mutual Fund Directors Forum; Trustee (since 2017), Virtus Mutual Fund Family (58 portfolios), Virtus Variable Insurance Trust (8 portfolios), and Virtus Alternative Solutions Trust (4 portfolios); Trustee (since 2013), KIPP Metro Atlanta; Trustee (since 1999) Total System Services, Inc.; Trustee (2004 to 2017), RidgeWorth Funds; Trustee (since 2012), International University of the Grand Bassam; and Trustee (2011 to 2015), Genspring Family Offices, LLC. |
| Mallin, John R. YOB: 1950 Served Since: 2017 70 Portfolios | Partner/Attorney (since 2003), McCarter & English LLP (law firm), Real Property Practice Group; and Member (since 2014), Counselors of Real Estate. Trustee (since 2016), Virtus Mutual Fund Family (58 portfolios) and Virtus Alternative Solutions Trust (4 portfolios); Director (since 2013), Horizons, Inc. (non-profit); and Trustee (since 1999), Virtus Variable Insurance Trust (8 portfolios). |
| McClellan, Hassell H. YOB: 1945 Served Since: 2017 70 Portfolios | Retired (since 2013); and Professor (1984 to 2013), Wallace E. Carroll School of Management, Boston College. Chairperson of the Board (since 2017) and Trustee (since 2000), John Hancock Fund Complex (collectively, 227 portfolios); Trustee (since 2016), Virtus Alternative Solutions Trust (3 portfolios); Trustee (since 2015), Virtus Mutual Fund Family (74 portfolios); Director (since 2010), Barnes Group, Inc. (diversified global components manufacturer and logistical services company); and Trustee (since 2008), Virtus Variable Insurance Trust (9 portfolios). |
| McDaniel, Connie D. YOB: 1958 Served Since: 2017 70 Portfolios | Retired (since 2013); and Vice President, Chief of Internal Audit, Corporate Audit Department (2009 to 2013); Vice President Global Finance Transformation (2007 to 2009); Vice President and Controller (1999 to 2007), The Coca-Cola Company. Trustee (since 2017), Virtus Mutual Fund Family (58 portfolios), Virtus Variable Insurance Trust (8 portfolios), and Virtus Alternative Solutions Trust (4 portfolios); Trustee (since 2014), Total System Services, Inc.; and Trustee (2005 to 2017), RidgeWorth Funds. |
| McLoughlin, Philip YOB: 1946 Served Since: 1989 78 Portfolios | Retired. Director and Chairman (since 2016), Virtus Total Return Fund Inc. and Virtus Global Dividend & Income Fund Inc.; Director and Chairman (since 2014), Duff & Phelps Select MLP and Midstream Energy Fund Inc.; Trustee and Chairman (since 2013), Virtus Alternative Solutions Trust (4 portfolios); Trustee and Chairman (since 2011), Virtus Global Multi-Sector Income Fund; Chairman and Trustee (since 2003), Virtus Variable Insurance Trust (8 portfolios); Director (since 1995), closed-end funds managed by Duff & Phelps Investment Management Co. (4 funds); Director (since 1991) and Chairman (since 2010), Lazard World Trust Fund (closed-end investment firm in Luxembourg); and Trustee (since 1989) and Chairman (since 2002), Virtus Mutual Fund Family (58 portfolios). |
| McNamara, Geraldine M. YOB: 1951 Served Since: 2002 74 Portfolios | Retired. Trustee (since 2016), Virtus Alternative Solutions Trust (4 portfolios); Trustee (since 2015), Virtus Variable Insurance Trust (8 portfolios); Director (since 2003), closed-end funds managed by Duff & Phelps Investment Management Co. (4 funds); and Trustee (since 2001), Virtus Mutual Fund Family (58 portfolios). |
| Oates, James M. YOB: 1946 Served Since: 2005 74 Portfolios | Managing Director (since 1994), Wydown Group (consulting firm). Director (since 2016), Virtus Total Return Fund Inc. and Virtus Global Dividend & Income Fund Inc.; Trustee (since 2016), Virtus Variable Insurance Trust (8 portfolios); Director (since 2014), Duff & Phelps Select MLP and Midstream Energy Fund Inc.; Trustee (since 2013), Virtus Alternative Solutions Trust (4 portfolios); Trustee (since 2011), Virtus Global Multi-Sector Income Fund; Trustee (since 2005) and Chairman (2005 to 2017), John Hancock Fund Complex (227 portfolios); Director (2002 to 2014), New Hampshire Trust Company; Chairman (2000 to 2016), Emerson Investment Management, Inc.; Non-Executive Chairman (2000 to 2014), Hudson Castle Group, Inc. (formerly IBEX Capital Markets, Inc.) (financial services); Chairman and Director (1999 to 2014), Connecticut River Bank; Director (since 1996), Stifel Financial; and Trustee (since 1987), Virtus Mutual Fund Family (58 portfolios). |
| Segerson, Richard E. YOB: 1948 Served Since: 2005 70 Portfolios | Retired; and Managing Director (1998 to 2013), Northway Management Company. Trustee (since 2016), Virtus Alternative Solutions Trust (4 portfolios) and Virtus Variable Insurance Trust (8 portfolios); and Trustee (since 1983), Virtus Mutual Fund Family (58 portfolios). |
| Name, Year of Birth, Year Elected and Number of Funds Overseen | Principal Occupation(s) During Past 5 Years and Other Directorships Held by Trustee |
| Aylward, George R.* Trustee and President YOB: 1964 Elected: 2006 75 Portfolios | Director, President and Chief Executive Officer (since 2008), Virtus Investment Partners, Inc. and/or certain of its subsidiaries; various senior officer positions with Virtus affiliates (since 2005). Chairman and Trustee (since 2015), Virtus ETF Trust II (1 portfolio); Director, President and Chief Executive Officer (since 2014), Duff & Phelps Select MLP and Midstream Energy Fund Inc.; Trustee and President (since 2013), Virtus Alternative Solutions Trust (4 portfolios); Director (since 2013), Virtus Global Funds, PLC (4 portfolios); Trustee (since 2012) and President (since 2010), Virtus Variable Insurance Trust (8 portfolios); Trustee, President and Chief Executive Officer (since 2011), Virtus Global Multi-Sector Income Fund; Trustee and President (since 2006) and Executive Vice President (2004 to 2006), Virtus Mutual Fund Family (58 portfolios); and Director, President and Chief Executive Officer (since 2006), Virtus Global Dividend & Income Fund Inc. and Virtus Total Return Fund Inc. |
| Name, Address and Year of Birth | Position(s) Held with Trust and Length of Time Served | Principal Occupation(s) During Past 5 Years |
| Batchelar, Peter YOB: 1970 | Senior Vice President (since 2017), Vice President (2008 to 2017). | Senior Vice President (since 2017) and Vice President (2008 to 2017), Product Development, Virtus Investment Partners, Inc. and/or certain of its subsidiaries; Senior Vice President (since 2017), Virtus Asset Trust and Virtus Retirement Trust; Senior Vice President (since 2017) and Vice President (2008 to 2017), Virtus Equity Trust and Virtus Opportunities Trust; Senior Vice President (since 2017) and Vice President (2010 to 2017), Virtus Variable Insurance Trust; Senior Vice President (since 2017), Virtus Total Return Fund Inc. and Virtus Global Dividend & Income Fund Inc.; Senior Vice President (since 2017) and Vice President (2016 to 2017), Virtus Global Multi-Sector Income Fund and Duff & Phelps Select Energy MLP Fund Inc.; and Senior Vice President (since 2017) and Vice President (2013 to 2017), Virtus Alternative Solutions Trust. |
| Bradley, W. Patrick YOB: 1972 | Executive Vice President (since 2016); Senior Vice President (2013 to 2016); Vice President (2011 to 2013); Chief Financial Officer and Treasurer (since 2006). | Executive Vice President, Fund Services (since 2016), Senior Vice President, Fund Services (2010 to 2016), Virtus Investment Partners, Inc. and/or certain of its subsidiaries; various officer positions (since 2006) with Virtus affiliates; Executive Vice President (since 2016), Senior Vice President (2013 to 2016), Vice President (2011 to 2013), Chief Financial Officer and Treasurer (since 2004), Virtus Variable Insurance Trust; Executive Vice President (since 2016), Senior Vice President (2013 to 2016), Vice President (2011 to 2013), Chief Financial Officer and Treasurer (since 2006), Virtus Mutual Fund Family; Executive Vice President (since 2016), Senior Vice President (2013 to 2016), Vice President (2012 to 2013) and Treasurer and Chief Financial Officer (since 2010), Virtus Total Return Fund Inc. and Virtus Global Dividend & Income Fund Inc.; Executive Vice President (since 2016), Senior Vice President (2013 to 2016), Vice President (2011 to 2013), Chief Financial Officer and Treasurer (since 2011), Virtus Global Multi-Sector Income Fund; Executive Vice President (since 2016), Senior Vice President (2014 to 2016), Chief Financial Officer and Treasurer (since 2014), Duff & Phelps Select Energy MLP and Midstream Energy Fund Inc.; Vice President and Assistant Treasurer (since 2011), Duff & Phelps Global Utility Income Fund Inc.; Director (since 2013), Virtus Global Funds, PLC; and Executive Vice President (since 2016), Senior Vice President (2013 to 2016), and Chief Financial Officer and Treasurer (since 2013), Virtus Alternative Solutions Trust. |
| Name, Address and Year of Birth | Position(s) Held with Trust and Length of Time Served | Principal Occupation(s) During Past 5 Years |
| Carr, Kevin J. YOB: 1954 | Senior Vice President (since 2013), Vice President (2005 to 2013), Chief Legal Officer, Counsel and Secretary (since 2005). | Vice President and Senior Counsel (2017 to Present), Senior Vice President (2009 to 2017), Vice President, Counsel and Secretary (2008 to 2009), Virtus Investment Partners, Inc. and/or certain of its subsidiaries; various senior officer positions (since 2005) with Virtus affiliates; Senior Vice President (since 2013), Vice President (2005 to 2013), Chief Legal Officer, Counsel and Secretary (since 2005), Virtus Mutual Fund Family; Senior Vice President (2013 to 2014), Vice President (2012 to 2013), Virtus Total Return Fund Inc. and Virtus Global Dividend & Income Fund Inc.; Senior Vice President (since 2017), Assistant Secretary (since 2013), Vice President, Chief Legal Officer, Counsel and Secretary (2010 to 2013), Virtus Variable Insurance Trust; Senior Vice President (2013 to 2014), Vice President (2011 to 2013), Virtus Global Multi-Sector Income Fund; Assistant Secretary (since 2015), Duff & Phelps Select MLP and Midstream Energy Fund Inc.; Senior Vice President (since 2017) and Assistant Secretary (since 2013), Virtus Alternative Solutions Trust; Secretary (since 2015), ETFis Series Trust I; and Secretary (since 2015), Virtus ETF Trust II. |
| Engberg, Nancy J. YOB: 1956 | Senior Vice President (since 2017), Vice President and Chief Compliance Officer (2011 to 2017), and Chief Compliance Officer (since 2011). | Senior Vice President (since 2017), Vice President (2008 to 2017) and Chief Compliance Officer (2008 to 2011 and since 2016), Virtus Investment Partners, Inc. and/or certain of its subsidiaries; various officer positions (since 2003) with Virtus affiliates; Senior Vice President (since 2017), Vice President (2011 to 2017) and Chief Compliance Officer (since 2011), Virtus Mutual Fund Family; Senior Vice President (since 2017), Vice President (2010 to 2017) and Chief Compliance Officer (since 2011), Virtus Variable Insurance Trust; Senior Vice President (since 2017), Vice President (2011 to 2016) and Chief Compliance Officer (since 2011), Virtus Global Multi-Sector Income Fund; Senior Vice President (since 2017), Vice President (2012 to 2017) and Chief Compliance Officer (since 2012), Virtus Total Return Fund Inc. and Virtus Global Dividend & Income Fund Inc.; Senior Vice President (since 2017), Vice President (2013 to 2016) and Chief Compliance Officer (since 2013), Virtus Alternative Solutions Trust; Senior Vice President (since 2017), Vice President (2014 to 2017) and Chief Compliance Officer (since 2014), Duff & Phelps Select MLP and Midstream Energy Fund Inc.; Chief Compliance Officer (since 2015), ETFis Series Trust I; and Chief Compliance Officer (since 2015), Virtus ETF Trust II. |
| Short, Julia R. YOB: 1972 | Senior Vice President (since 2017). | Senior Vice President, Product Development (since 2017), Virtus Investment Partners, Inc. and/or certain of its subsidiaries; Senior Vice President (since 2017), Virtus Mutual Fund Family; President and Chief Executive Officer, RidgeWorth Funds (2007 to 2017); and Managing Director, Product Manager, RidgeWorth Investments (2004 to 2017). |
| Waltman, Francis G. YOB: 1962 | Executive Vice President (since 2013), Senior Vice President (2008 to 2013). | Executive Vice President, Product Development (since 2009), Virtus Investment Partners, Inc. and/or certain of its subsidiaries; various senior officer positions (since 2006) with Virtus affiliates; Executive Vice President (since 2013), Senior Vice President (2008 to 2013), Virtus Mutual Fund Family; Executive Vice President (since 2013), Senior Vice President (2010 to 2013), Virtus Variable Insurance Trust; Executive Vice President (since 2013), Senior Vice President (2011 to 2013), Virtus Global Multi-Sector Income Fund; Executive Vice President (since 2014), Duff & Phelps Select Energy MLP and Midstream Energy Fund Inc.; Director (since 2013), Virtus Global Funds PLC; and Executive Vice President (since 2013), Virtus Alternative Solutions Trust. |
| Virtus Seix Georgia Tax-Exempt Bond Fund | Ronald Schwartz (since August 2018) Dusty Self (since June 2018) |
| Virtus Seix North Carolina Tax-Exempt Bond Fund | Ronald Schwartz (since August 2018) Dusty Self (since June 2018) |
| Virtus Seix Virginia Intermediate Municipal Bond Fund | Ronald Schwartz (since August 2018) Dusty Self (since June 2018) |
Prospectuses for future reference.
and the Virtus Asset Trust Statutory Prospectus,
dated July 23, 2018, each as supplemented
| Annual Fund Operating Expenses (expenses that you pay each year as a percentage of the value of your investment) | Class A | Class I | Class T |
| Management Fees | 0.50% | 0.50% | 0.50% |
| Distribution and Shareholder Servicing (12b-1) Fees | 0.15% | None | 0.25% |
| Other Expenses | 0.30%(a) | 0.35%(a) | 0.30%(b) |
| Acquired Fund Fees and Expenses | 0.02% | 0.02% | 0.02% |
| Total Annual Fund Operating Expenses(c) | 0.97% | 0.87% | 1.07% |
| Less: Fee Waiver and/or Expense Reimbursement(d) | (0.20)% | (0.25)% | (0.15)% |
| Total Annual Fund Operating Expenses After Expense Reimbursement(d) | 0.77% | 0.62% | 0.92% |
| (a) | Restated to reflect current fees and expenses. |
| (b) | Estimated for current fiscal year, as annualized. |
| (c) | The Total Annual Fund Operating Expenses do not correlate to the ratio of expenses to average net assets appearing the Financial Highlights tables, which tables reflect only the operating expenses of the fund and do not include acquired fund fees and expenses. |
| (d) | The fund’s investment adviser has contractually agreed to limit the fund’s total operating expenses (excluding certain expenses, such as front-end or contingent deferred sales charges, taxes, leverage expenses, interest, brokerage commissions, expenses incurred in conneection with any merger or reorganization, unusual or infrequently occuring expenses (such as litigation), acquired fund fees and expenses, and divided expenses, if any) so that such expenses do not exceed 0.75% for Class A Shares, 0.60% for Class I Shares and 0.90% for Class T Shares, through April 30, 2020. Following the contractual period, the adviser may discontinue these expense reimbursement arrangements at any time. Under certain conditions, the adviser may recapture operating expenses reimbursed under these arrangements for a period of three years after the date on which incurred or waived. |
| Share Status | 1 Year | 3 Years | 5 Years | 10 Years | |
| Class A | Sold or Held | $351 | $556 | $778 | $1,414 |
| Class I | Sold or Held | $63 | $253 | $458 | $1,049 |
| Class T | Sold or Held | $342 | $567 | $811 | $1,510 |
| Annual Fund Operating Expenses (expenses that you pay each year as a percentage of the value of your invetment) | Class A | Class I | Class T |
| Management Fees | 50% | 50% | 50% |
| Distribution and Shareholder Servicing (12b-1) Fees | 25% | None | 25% |
| Other Expenses | 0.26%(a) | 0.31%(a) | 0.26%(b) |
| Acquired Fund Fees and Expenses | 0.01% | 0.01% | 0.01% |
| Total Annual Fund Operating Expenses(c) | 1.02% | 0.82% | 1.02% |
| Less: Fee Waiver and/or Expense Reimbursement(d) | (0.26)% | (0.21)% | (0.21)% |
| Total Annual Fund Operating Expenses After Expense Reimbursement(d) | 0.76% | 0.61% | 0.81% |
| (a) | Restated to reflect current fees and expenses. |
| (b) | Estimated for current fiscal year, as annualized. |
| (c) | The Total Annual Fund Operating Expenses do not correlate to the ratio of expenses to average net assets appearing the Financial Highlights tables, which tables reflect only the operating expenses of the fund and do not include acquired fund fees and expenses. |
| (d) | The fund’s investment adviser has contractually agreed to limit the fund’s total operating expenses (excluding certain expenses, such as front-end or contingent deferred sales charges, taxes, leverage expenses, interest, brokerage commissions, expenses incurred in conneection with any merger or reorganization, unusual or infrequently occuring expenses (such as litigation), acquired fund fees and expenses, and divided expenses, if any) so that such expenses do not exceed 0.75% for Class A Shares, 0.60% for Class I Shares and 0.90% for Class T Shares, through April 30, 2020. Following the contractual period, the adviser may discontinue these expense reimbursement arrangements at any time. Under certain conditions, the adviser may recapture operating expenses reimbursed under these arrangements for a period of three years after the date on which incurred or waived. |
| Share Status | 1 Year | 3 Years | 5 Years | 10 Years | |
| Class A | Sold or Held | $350 | $566 | $798 | $1,466 |
| Class I | Sold or Held | $62 | $241 | $434 | $994 |
| Class T | Sold or Held | $331 | $546 | $779 | $1,448 |
| Class A Shares | Class C Shares | Class I Shares | Class R Shares | Class R6 Shares | Class T Shares | Through Dates | |
| Virtus Seix High Grade Municipal Bond Fund | 0.75% | N/A | 0.60% | N/A | N/A | 0.90% | April 30, 2020 |
| Virtus Seix Investment Grade Tax-Exempt Bond Fund | 0.75% | N/A | 0.60% | N/A | N/A | 0.80% | April 30, 2020 |
Accounting Firm
| Mutual Fund Services | 1-800-243-1574 |
| Adviser Consulting Group | 1-800-243-4361 |
| Website | Virtus.com |
The Securities and Exchange Commission has modified mailing regulations for semiannual and annual shareholder fund reports to allow mutual fund companies to send a single copy of these reports to shareholders who share the same mailing address. If you would like additional copies, please call Mutual Fund Services at 1-800-243-1574.

please contact us at1-800-243-1574, orVirtus.com.
| 8636 | 02-19 |

| Virtus Ceredex Large-Cap Value Equity Fund |
| Virtus Ceredex Mid-Cap Value Equity Fund |
| Virtus Ceredex Small-Cap Value Equity Fund* |
| Virtus Silvant Large-Cap Growth Stock Fund |
| Virtus Silvant Small-Cap Growth Stock Fund* |
| Virtus WCM International Equity Fund |
| Virtus Zevenbergen Innovative Growth Stock Fund* |
Message to Shareholders | 1 | |
Disclosure of Fund Expenses | 2 | |
Key Investment Terms | 4 | |
| Fund | Fund Summary | Schedule of Investments |
Virtus Ceredex Large-Cap Value Equity Fund (“Ceredex Large-Cap Value Equity Fund”) | 6 | 21 |
Virtus Ceredex Mid-Cap Value Equity Fund (“Ceredex Mid-Cap Value Equity Fund”) | 8 | 22 |
Virtus Ceredex Small-Cap Value Equity Fund (“Ceredex Small-Cap Value Equity Fund”) | 10 | 23 |
Virtus Silvant Large-Cap Growth Stock Fund (“Silvant Large-Cap Growth Stock Fund”) | 12 | 24 |
Virtus Silvant Small-Cap Growth Stock Fund (“Silvant Small-Cap Growth Stock Fund”) | 14 | 25 |
Virtus WCM International Equity Fund (“WCM International Equity Fund”) | 16 | 27 |
Virtus Zevenbergen Innovative Growth Stock Fund (“Zevenbergen Innovative Growth Stock Fund”) | 18 | 28 |
Statements of Assets and Liabilities | 29 | |
Statements of Operations | 33 | |
Statements of Changes in Net Assets | 37 | |
Financial Highlights | 41 | |
Notes to Financial Statements | 46 | |
Report of Independent Registered Public Accounting Firm | 61 | |
Tax Information Notice | 62 | |
Consideration of Advisory and Subadvisory Agreements by the Board of Trustees | 63 | |
Fund Management Tables | 67 | |


President, Virtus Mutual Funds
| Beginning Account Value July 1, 2018 | Ending Account value December 31, 2018 | Annualized Expense Ratio | Expenses Paid During Period* | |||||
Ceredex Large-Cap Value Equity Fund | ||||||||
| Class A | $ 1,000.00 | $ 918.90 | 1.24 % | $ 6.00 | ||||
| Class C | 1,000.00 | 916.10 | 1.72 | 8.31 | ||||
| Class I | 1,000.00 | 920.00 | 0.97 | 4.69 | ||||
| Class R6 | 1,000.00 | 920.50 | 0.72 | 3.49 | ||||
Ceredex Mid-Cap Value Equity Fund | ||||||||
| Class A | 1,000.00 | 894.50 | 1.38 | 6.59 | ||||
| Class C | 1,000.00 | 892.40 | 1.79 | 8.54 | ||||
| Class I | 1,000.00 | 895.90 | 1.00 | 4.78 | ||||
| Class R6 | 1,000.00 | 897.00 | 0.79 | 3.78 | ||||
Ceredex Small-Cap Value Equity Fund | ||||||||
| Class A | 1,000.00 | 839.60 | 1.45 | 6.72 | ||||
| Class C | 1,000.00 | 837.00 | 1.90 | 8.80 | ||||
| Class I | 1,000.00 | 840.10 | 1.17 | 5.43 | ||||
Silvant Large-Cap Growth Stock Fund | ||||||||
| Class A | 1,000.00 | 909.60 | 1.23 | 5.92 | ||||
| Class C | 1,000.00 | 908.40 | 1.90 | 9.14 | ||||
| Class I | 1,000.00 | 909.70 | 0.97 | 4.67 | ||||
| Class R6 | 1,000.00 | 910.50 | 0.90 | 4.33 | ||||
Silvant Small-Cap Growth Stock Fund | ||||||||
| Class A | 1,000.00 | 859.10 | 1.40 | 6.56 | ||||
| Class C | 1,000.00 | 855.90 | 2.06 | 9.64 | ||||
| Class I | 1,000.00 | 858.70 | 1.28 | 6.00 | ||||
WCM International Equity Fund | ||||||||
| Class A | 1,000.00 | 901.20 | 1.42 | 6.80 | ||||
| Class I | 1,000.00 | 901.90 | 1.20 | 5.75 | ||||
| Class R6 | 1,000.00 | 902.80 | 1.10 | 5.28 | ||||
Zevenbergen Innovative Growth Stock Fund | ||||||||
| Class A | 1,000.00 | 891.70 | 1.50 | 7.15 | ||||
| Class I | 1,000.00 | 892.70 | 1.30 | 6.20 |
| * | Expenses are equal to the relevant Fund’s annualized expense ratio, which is net of waived fees and reimbursed expenses, if applicable, multiplied by the average account value over the period, multiplied by the number of days (184) expenses were accrued in the most recent fiscal half-year, then divided by 365 to reflect the one-half year period. |
| Beginning Account Value July 1, 2018 | Ending Account value December 31, 2018 | Annualized Expense Ratio | Expenses Paid During Period* | |||||
Ceredex Large-Cap Value Equity Fund | ||||||||
| Class A | $ 1,000.00 | $ 1,018.95 | 1.24 % | $ 6.31 | ||||
| Class C | 1,000.00 | 1,016.53 | 1.72 | 8.74 | ||||
| Class I | 1,000.00 | 1,020.32 | 0.97 | 4.94 | ||||
| Class R6 | 1,000.00 | 1,021.58 | 0.72 | 3.67 | ||||
Ceredex Mid-Cap Value Equity Fund | ||||||||
| Class A | 1,000.00 | 1,018.25 | 1.38 | 7.02 | ||||
| Class C | 1,000.00 | 1,016.18 | 1.79 | 9.10 | ||||
| Class I | 1,000.00 | 1,020.16 | 1.00 | 5.09 | ||||
| Class R6 | 1,000.00 | 1,021.22 | 0.79 | 4.02 | ||||
Ceredex Small-Cap Value Equity Fund | ||||||||
| Class A | 1,000.00 | 1,017.90 | 1.45 | 7.38 | ||||
| Class C | 1,000.00 | 1,015.63 | 1.90 | 9.65 | ||||
| Class I | 1,000.00 | 1,019.31 | 1.17 | 5.96 | ||||
Silvant Large-Cap Growth Stock Fund | ||||||||
| Class A | 1,000.00 | 1,019.00 | 1.23 | 6.26 | ||||
| Class C | 1,000.00 | 1,015.63 | 1.90 | 9.65 | ||||
| Class I | 1,000.00 | 1,020.32 | 0.97 | 4.94 | ||||
| Class R6 | 1,000.00 | 1,020.67 | 0.90 | 4.58 | ||||
Silvant Small-Cap Growth Stock Fund | ||||||||
| Class A | 1,000.00 | 1,018.15 | 1.40 | 7.12 | ||||
| Class C | 1,000.00 | 1,014.82 | 2.06 | 10.46 | ||||
| Class I | 1,000.00 | 1,018.75 | 1.28 | 6.51 | ||||
WCM International Equity Fund | ||||||||
| Class A | 1,000.00 | 1,018.05 | 1.42 | 7.22 | ||||
| Class I | 1,000.00 | 1,019.16 | 1.20 | 6.11 | ||||
| Class R6 | 1,000.00 | 1,019.66 | 1.10 | 5.60 | ||||
Zevenbergen Innovative Growth Stock Fund | ||||||||
| Class A | 1,000.00 | 1,017.64 | 1.50 | 7.63 | ||||
| Class I | 1,000.00 | 1,018.85 | 1.30 | 6.61 |
| * | Expenses are equal to the relevant Fund’s annualized expense ratio, which is net of waived fees and reimbursed expenses, if applicable, multiplied by the average account value over the period, multiplied by the number of days (184) expenses were accrued in the most recent fiscal half-year, then divided by 365 to reflect the one-half year period. |
| Ticker Symbols: | |
| Class A: SVIIX | |
| Class C: SVIFX | |
| Class I: STVTX | |
| Class R6: STVZX |
| • | Abbott performed well due to multiple new products, which accelerated growth in the high end of the medical technology sector. This led to an expansion of the company’s price-earnings multiple during the period. |
| • | Verizon outperformed after data showed that wireless revenue growth was improving. The company also benefited from the market’s belief that the pending Sprint/T-Mobile merger presents further upside potential. |
| • | Perrigo underperformed after the company was levied a significant tax liability for an acquisition of a competitor, which had been designed to minimize taxes through a tax inversion. |
| • | Schlumberger declined after lower oil prices raised concerns that exploration & production capital expenditures would be lower than previously expected, resulting in a delayed recovery for oilfield service companies. |
| Industrials | 19% |
| Financials | 18 |
| Health Care | 16 |
| Information Technology | 10 |
| Energy | 9 |
| Materials | 8 |
| Consumer Staples | 7 |
| Other | 13 |
| Total | 100% |
| 1 Year | 5 Years | 10 Years | Since inception | Inception date | ||||||||
| Class A Shares at NAV2 | -10.63% | 4.66% | 10.87% | —% | — | |||||||
| Class A Shares at POP3,4 | -15.77 | 3.43 | 10.22 | — | — | |||||||
| Class C Shares at NAV and with CDSC2,4 | -11.09 | 4.17 | 10.25 | — | — | |||||||
| Class I Shares at NAV2 | -10.39 | 4.96 | 11.19 | — | — | |||||||
| Class R6 Shares at NAV2 | -10.22 | — | — | 4.90 | 8/1/14 | |||||||
| Russell 1000® Value Index | -8.27 | 5.95 | 11.18 | 5.335 | — | |||||||
| Fund Expense Ratios6: A Shares: Gross 1.28%, Net 1.24%; C Shares: Gross 1.93%, Net 1.72%; I Shares: Gross 1.02%, Net 0.97%; R6 Shares: Gross 0.83%, Net 0.72%. | ||||||||||||
| All returns represent past performance which is no guarantee of future results. Current performance may be higher or lower than the performance shown. The investment return and principal value of an investment will fluctuate so that an investor’s shares, when redeemed, may be worth more or less than their original cost. The above table and graph below do not reflect the deduction of taxes that a shareholder would pay on fund distributions or the redemption of shares. Please visit Virtus.com for performance data current to the most recent month-end. | |
| 1 | Total returns are historical and include changes in share price and the reinvestment of both dividends and capital gain distributions. |
| 2 | “NAV” (Net Asset Value) total returns do not include the effect of any sales charge. |
| 3 | “POP” (Public Offering Price) total returns include the effect of the maximum front-end 5.75% sales charge. |
| 4 | “CDSC” (contingent deferred sales charge) is applied to redemptions of certain classes of shares that do not have a sales charge applied at the time of purchase. CDSC charges for certain redemptions of Class A shares made within 18 months of a finder’s fee being paid and all Class C shares are 1% within the first year and 0% thereafter. |
| 5 | The since inception index return is from the inception date of Class R6 shares. |
| 6 | The expense ratios of the Fund are set forth according to the prospectus for the Fund effective July 23, 2018, as supplemented and revised, and may differ from the expense ratios disclosed in the Financial Highlight tables in this report. See the Financial Highlights for more current expense ratios. Net Expense: Expenses reduced by a contractual fee waiver in effect through April 30, 2020. Gross Expense: Does not reflect the effect of the fee waiver. Expense ratios include fees and expenses associated with the underlying funds. |
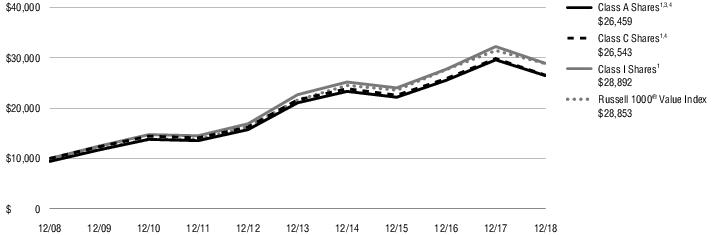
| Ticker Symbols: | |
| Class A: SAMVX | |
| Class C: SMVFX | |
| Class I: SMVTX | |
| Class R6: SMVZX |
| • | Andeavor outperformed as the company was acquired by a larger refining peer. |
| • | XL Group was acquired by a large global insurance conglomerate during the period. |
| • | Affiliated Manager Group adversely impacted results due to the company’s global exposure. Many of its funds are global or focused on the emerging markets. Affiliated was affected by tense relations around the globe coupled with concerns surrounding outflows from active managers during the period. |
| • | Perrigo underperformed after the company was levied a significant tax liability for an acquisition of a competitor, which had been designed to minimize taxes through a tax inversion. |
| Financials | 20% |
| Industrials | 14 |
| Information Technology | 11 |
| Health Care | 11 |
| Real Estate | 10 |
| Utilities | 9 |
| Energy | 8 |
| Other | 17 |
| Total | 100% |
| 1 Year | 5 Years | 10 Years | Since inception | Inception date | ||||||||
| Class A Shares at NAV2 | -8.08% | 4.92% | 13.29% | —% | — | |||||||
| Class A Shares at POP3,4 | -13.36 | 3.68 | 12.62 | — | — | |||||||
| Class C Shares at NAV and with CDSC2,4 | -8.53 | 4.48 | 12.72 | — | — | |||||||
| Class I Shares at NAV2 | -7.83 | 5.23 | 13.62 | — | — | |||||||
| Class R6 Shares at NAV2 | -7.58 | — | — | 5.19 | 8/1/14 | |||||||
| Russell Midcap® Value Index | -12.29 | 5.44 | 13.03 | 4.425 | — | |||||||
| Fund Expense Ratios6: A Shares: Gross 1.32%, Net 1.39%; C Shares: Gross 1.98%, Net 1.80%; I Shares: Gross 1.02%, Net 1.02%; R6 Shares: Gross 0.87%, Net 0.80%. | ||||||||||||
| All returns represent past performance which is no guarantee of future results. Current performance may be higher or lower than the performance shown. The investment return and principal value of an investment will fluctuate so that an investor’s shares, when redeemed, may be worth more or less than their original cost. The above table and graph below do not reflect the deduction of taxes that a shareholder would pay on fund distributions or the redemption of shares. Please visit Virtus.com for performance data current to the most recent month-end. | |
| 1 | Total returns are historical and include changes in share price and the reinvestment of both dividends and capital gain distributions. |
| 2 | “NAV” (Net Asset Value) total returns do not include the effect of any sales charge. |
| 3 | “POP” (Public Offering Price) total returns include the effect of the maximum front-end 5.75% sales charge. |
| 4 | “CDSC” (contingent deferred sales charge) is applied to redemptions of certain classes of shares that do not have a sales charge applied at the time of purchase. CDSC charges for certain redemptions of Class A shares made within 18 months of a finder’s fee being paid and all Class C shares are 1% within the first year and 0% thereafter. |
| 5 | The since inception index return is from the inception date of Class R6 shares. |
| 6 | The expense ratios of the Fund are set forth according to the prospectus for the Fund effective July 23, 2018, as supplemented and revised, and may differ from the expense ratios disclosed in the Financial Highlight tables in this report. See the Financial Highlights for more current expense ratios. Net Expense: Expenses reduced by a contractual fee waiver in effect through April 30, 2020. Gross Expense: Does not reflect the effect of the fee waiver. Expense ratios include fees and expenses associated with the underlying funds. |

| Ticker Symbols: | |
| Class A: SASVX | |
| Class C: STCEX | |
| Class I: SCETX |
| • | Education Realty Trust outperformed during the 12 months as it was taken private by Greystar Real Estate Partners. |
| • | Kemper benefitted as auto results continued to improve for the non-standard focused carrier. The mid-year close of the Infinity acquisition also had a positive impact. |
| • | Lithia Motors adversely impacted Fund results as cyclical headwinds for the auto dealer industry affected sentiment for the security. |
| • | U.S. Silica underperformed after the company was levied a significant tax liability for an acquisition of a competitor, which had been designed to minimize taxes through a tax inversion. |
| Industrials | 29% |
| Financials | 14 |
| Real Estate | 11 |
| Consumer Staples | 10 |
| Information Technology | 9 |
| Consumer Discretionary | 7 |
| Communication Services | 7 |
| Other | 13 |
| Total | 100% |
| 1 Year | 5 Years | 10 Years | ||||||
| Class A Shares at NAV2 | -12.70% | 3.39% | 11.97% | |||||
| Class A Shares at POP3,4 | -17.72 | 2.18 | 11.31 | |||||
| Class C Shares at NAV and with CDSC2,4 | -13.07 | 2.99 | 11.40 | |||||
| Class I Shares at NAV2 | -12.425 | 3.70 | 12.30 | |||||
| Russell 2000® Value Index | -12.86 | 3.61 | 10.40 | |||||
| Fund Expense Ratios6: A Shares: Gross 1.45%, Net 1.45%; C Shares: Gross 2.12%, Net 1.90%; I Shares: Gross 1.18%, Net 1.18%. | ||||||||
| All returns represent past performance which is no guarantee of future results. Current performance may be higher or lower than the performance shown. The investment return and principal value of an investment will fluctuate so that an investor’s shares, when redeemed, may be worth more or less than their original cost. The above table and graph below do not reflect the deduction of taxes that a shareholder would pay on fund distributions or the redemption of shares. Please visit Virtus.com for performance data current to the most recent month-end. | |
| 1 | Total returns are historical and include changes in share price and the reinvestment of both dividends and capital gain distributions. |
| 2 | “NAV” (Net Asset Value) total returns do not include the effect of any sales charge. |
| 3 | “POP” (Public Offering Price) total returns include the effect of the maximum front-end 5.75% sales charge. |
| 4 | “CDSC” (contingent deferred sales charge) is applied to redemptions of certain classes of shares that do not have a sales charge applied at the time of purchase. CDSC charges for certain redemptions of Class A shares made within 18 months of a finder’s fee being paid and all Class C shares are 1% within the first year and 0% thereafter. |
| 5 | Total Return for the report period presented in the table differs from the return in the Financial Highlights. The total return presented in the above table is calculated based on the NAV at which shareholder transactions were processed. The total return presented in the Financial Highlights section of the report is calculated in the same manner, but also takes into account certain adjustments that are necessary under generally accepted accounting principles required in the annual report and semiannual report. |
| 6 | The expense ratios of the Fund are set forth according to the prospectus for the Fund effective July 23, 2018, as supplemented and revised, and may differ from the expense ratios disclosed in the Financial Highlight tables in this report. See the Financial Highlights for more current expense ratios. Net Expense: Expenses reduced by a contractual fee waiver in effect through April 30, 2020. Gross Expense: Does not reflect the effect of the fee waiver. Expense ratios include fees and expenses associated with the underlying funds. |
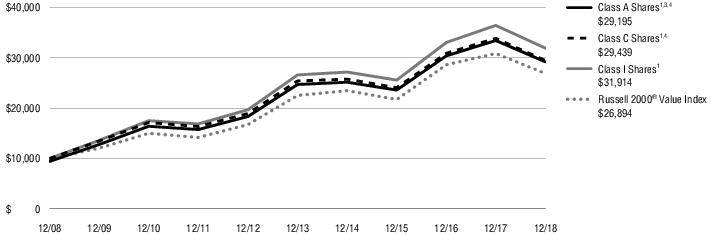
| Ticker Symbols: | |
| Class A: STCIX | |
| Class C: STCFX | |
| Class I: STCAX | |
| Class R6: STCZX |
| Information Technology | 35% |
| Health Care | 14 |
| Communication Services | 14 |
| Consumer Discretionary | 13 |
| Industrials | 12 |
| Financials | 5 |
| Consumer Staples | 4 |
| Other | 3 |
| Total | 100% |
| 1 Year | 5 Years | 10 Years | Since inception | Inception date | ||||||||
| Class A Shares at NAV2 | -0.83% | 7.37% | 13.41% | —% | — | |||||||
| Class A Shares at POP3,4 | -6.53 | 6.10 | 12.74 | — | — | |||||||
| Class C Shares at NAV and with CDSC2,4 | -1.44 | 6.69 | 12.68 | — | — | |||||||
| Class I Shares at NAV2 | -0.75 | 7.61 | 13.70 | — | — | |||||||
| Class R6 Shares at NAV2 | -0.73 | — | — | 8.00 | 8/1/14 | |||||||
| Russell 1000® Growth Index | -1.51 | 10.40 | 15.29 | 10.765 | — | |||||||
| Fund Expense Ratios6: A Shares: Gross 1.56%, Net 1.23%; C Shares: Gross 2.03%, Net 1.90%; I Shares: Gross 1.11%, Net 0.97%; R6 Shares: Gross 0.95%, Net 0.90%. | ||||||||||||
| All returns represent past performance which is no guarantee of future results. Current performance may be higher or lower than the performance shown. The investment return and principal value of an investment will fluctuate so that an investor’s shares, when redeemed, may be worth more or less than their original cost. The above table and graph below do not reflect the deduction of taxes that a shareholder would pay on fund distributions or the redemption of shares. Please visit Virtus.com for performance data current to the most recent month-end. | |
| 1 | Total returns are historical and include changes in share price and the reinvestment of both dividends and capital gain distributions. |
| 2 | “NAV” (Net Asset Value) total returns do not include the effect of any sales charge. |
| 3 | “POP” (Public Offering Price) total returns include the effect of the maximum front-end 5.75% sales charge. |
| 4 | “CDSC” (contingent deferred sales charge) is applied to redemptions of certain classes of shares that do not have a sales charge applied at the time of purchase. CDSC charges for certain redemptions of Class A shares made within 18 months of a finder’s fee being paid and all Class C shares are 1% within the first year and 0% thereafter. |
| 5 | The since inception index return is from the inception date of Class R6 shares. |
| 6 | The expense ratios of the Fund are set forth according to the prospectus for the Fund effective July 23, 2018, as supplemented and revised, and may differ from the expense ratios disclosed in the Financial Highlight tables in this report. See the Financial Highlights for more current expense ratios. Net Expense: Expenses reduced by a contractual fee waiver in effect through April 30, 2020. Gross Expense: Does not reflect the effect of the fee waiver. Expense ratios include fees and expenses associated with the underlying funds. |
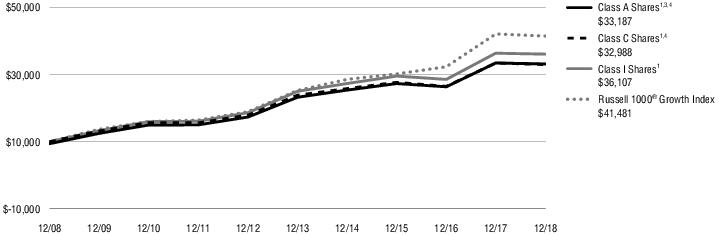
| Ticker Symbols: | |
| Class A: SCGIX | |
| Class C: SSCFX | |
| Class I: SSCTX |
| Health Care | 30% |
| Information Technology | 22 |
| Industrials | 16 |
| Consumer Discretionary | 12 |
| Financials | 7 |
| Materials | 6 |
| Consumer Staples | 3 |
| Other (includes short-term investment and securities lending collateral) | 4 |
| Total | 100% |
| 1 Year | 5 Years | 10 Years | ||||||
| Class A Shares at NAV2 | -6.69% | 1.52% | 11.24% | |||||
| Class A Shares at POP3,4 | -12.05 | 0.32 | 10.59 | |||||
| Class C Shares at NAV and with CDSC2,4 | -7.57 | 0.83 | 10.50 | |||||
| Class I Shares at NAV2 | -6.64 | 1.60 | 11.42 | |||||
| Russell 2000® Growth Index | -9.31 | 5.13 | 13.52 | |||||
| Fund Expense Ratios5: A Shares: Gross 1.64%, Net 1.27%; C Shares: Gross 2.40%, Net 1.93%; I Shares: Gross 1.49%, Net 1.15%. | ||||||||
| All returns represent past performance which is no guarantee of future results. Current performance may be higher or lower than the performance shown. The investment return and principal value of an investment will fluctuate so that an investor’s shares, when redeemed, may be worth more or less than their original cost. The above table and graph below do not reflect the deduction of taxes that a shareholder would pay on fund distributions or the redemption of shares. Please visit Virtus.com for performance data current to the most recent month-end. | |
| 1 | Total returns are historical and include changes in share price and the reinvestment of both dividends and capital gain distributions. |
| 2 | “NAV” (Net Asset Value) total returns do not include the effect of any sales charge. |
| 3 | “POP” (Public Offering Price) total returns include the effect of the maximum front-end 5.75% sales charge. |
| 4 | “CDSC” (contingent deferred sales charge) is applied to redemptions of certain classes of shares that do not have a sales charge applied at the time of purchase. CDSC charges for certain redemptions of Class A shares made within 18 months of a finder’s fee being paid and all Class C shares are 1% within the first year and 0% thereafter. |
| 5 | The expense ratios of the Fund are set forth according to the prospectus for the Fund effective July 23, 2018, as supplemented and revised, and may differ from the expense ratios disclosed in the Financial Highlight tables in this report. See the Financial Highlights for more current expense ratios. Net Expense: Expenses reduced by a contractual fee waiver in effect through April 30, 2020. Gross Expense: Does not reflect the effect of the fee waiver. Expense ratios include fees and expenses associated with the underlying funds. |
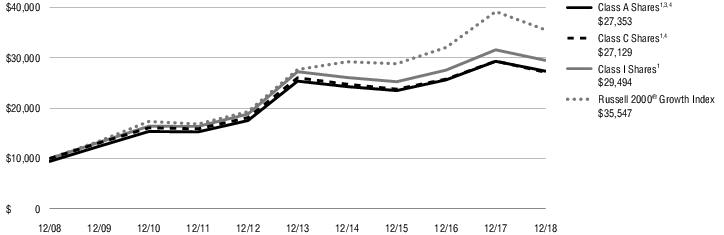
| Ticker Symbols: | |
| Class A: SCIIX | |
| Class I: STITX | |
| Class R6: SCIZX |
| Information Technology | 22% |
| Health Care | 18 |
| Industrials | 14 |
| Consumer Discretionary | 13 |
| Financials | 12 |
| Consumer Staples | 10 |
| Materials | 5 |
| Other | 6 |
| Total | 100% |
| 1 Year | 5 Years | 10 Years | Since inception | Inception date | ||||||||
| Class A Shares at NAV2 | -7.90% | 2.72% | 8.57% | —% | — | |||||||
| Class A Shares at POP3,4 | -13.19 | 1.51 | 7.93 | — | — | |||||||
| Class I Shares at NAV2 | -7.69 | 2.92 | 8.81 | — | — | |||||||
| Class R6 Shares at NAV2 | -7.63 | — | — | 8.17 | 9/1/15 | |||||||
| MSCI All Country World ex USA Index | -14.20 | 0.67 | 6.57 | 4.275 | — | |||||||
| Fund Expense Ratios6: A Shares: Gross 1.48%, Net 1.44%; I Shares: Gross 1.24%, Net 1.22%; R6 Shares: Gross 1.16%, Net 1.12%. | ||||||||||||
| All returns represent past performance which is no guarantee of future results. Current performance may be higher or lower than the performance shown. The investment return and principal value of an investment will fluctuate so that an investor’s shares, when redeemed, may be worth more or less than their original cost. The above table and graph below do not reflect the deduction of taxes that a shareholder would pay on fund distributions or the redemption of shares. Please visit Virtus.com for performance data current to the most recent month-end. | |
| 1 | Total returns are historical and include changes in share price and the reinvestment of both dividends and capital gain distributions. |
| 2 | “NAV” (Net Asset Value) total returns do not include the effect of any sales charge. |
| 3 | “POP” (Public Offering Price) total returns include the effect of the maximum front-end 5.75% sales charge. |
| 4 | “CDSC” (contingent deferred sales charge) is applied to redemptions of certain classes of shares that do not have a sales charge applied at the time of purchase. CDSC charges for certain redemptions of Class A shares made within 18 months of a finder’s fee being paid and all Class C shares are 1% within the first year and 0% thereafter. |
| 5 | The since inception index return is from the inception date of Class R6 shares. |
| 6 | The expense ratios of the Fund are set forth according to the prospectus for the Fund effective July 23, 2018, as supplemented and revised, and may differ from the expense ratios disclosed in the Financial Highlight tables in this report. See the Financial Highlights for more current expense ratios. Net Expense: Expenses reduced by a contractual fee waiver in effect through April 30, 2020. Gross Expense: Does not reflect the effect of the fee waiver. Expense ratios include fees and expenses associated with the underlying funds. |
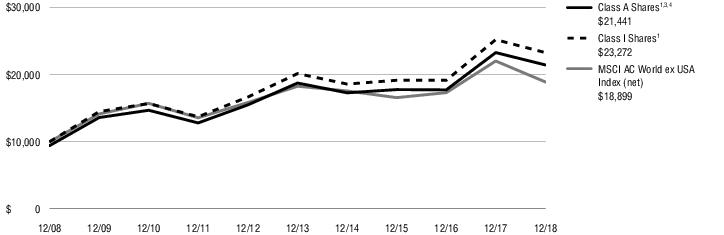
| Ticker Symbols: | |
| Class A: SAGAX | |
| Class I: SCATX |
| • | Tilray led all contributors as the Canadian cannabis company successfully completed its initial public offering (IPO) in July 2018, ahead of Canada’s legalization of recreational cannabis. The company benefited from first-mover advantages, capacity investments, brand strength, and a focus on medicinal applications in a marketplace rapidly moving toward the end of global prohibition. Shares also benefitted from large investments in the industry by alcohol, pharmaceutical, and tobacco companies, for which Tilray remained well-positioned as a preferred partner. |
| • | Shares of Exact Sciences had another strong year, with robust fundamental results and a groundbreaking co-promote agreement with Pfizer, which was announced at the end of the summer. The deal accelerates the growth trajectory for Cologuard® by providing a significantly larger sales presence, key physician relationships, and access to Pfizer’s marketing expertise. |
| • | Despite negative headlines and short-term price movements, Tesla finished the year on a positive note as a top contributor to Fund performance. The company cut through the noise and posted strong fundamental results, with Model 3 production ramping up and surprising critics with its profitability. |
| • | Shares of high-powered graphics chip maker NVIDIA weighed on Fund performance as the company saw stalled demand for its chips resulting from the boom-to-bust cycle in cryptocurrency mining. Despite the near-term inventory imbalance, we remained confident in NVIDIA’s position within the datacenter, automotive, and gaming industries, as well as its ability to stimulate growth with its next generation graphics card. |
| • | 2U’s underperformance was driven by a well-timed short seller report and leadership turnover at two key university partners. Despite these short-term distractions, online education trends continued to accelerate. 2U remained the clear leader, with proven success and a strong roadmap to offering an expanded selection of graduate degrees and in-demand short courses. |
| • | Shares of Portola Pharmaceuticals suffered due to leadership turnover and delayed regulatory actions, as well as manufacturing and commercialization execution challenges for both of its commercial products. With the lack of a clear path to improving sales, and limited cash resources, we sold the position in favor of better growth alternatives. |
| Information Technology | 36% |
| Consumer Discretionary | 24 |
| Health Care | 19 |
| Communication Services | 16 |
| Financials | 3 |
| Industrials | 2 |
| Total | 100% |
| 1 Year | 5 Years | 10 Years | ||||||
| Class A Shares at NAV2 | 10.80% | 9.62% | 16.43% | |||||
| Class A Shares at POP3,4 | 4.43 | 8.32 | 15.75 | |||||
| Class I Shares at NAV2 | 11.07 | 9.82 | 16.71 | |||||
| Russell 3000® Growth Index | -2.12 | 9.99 | 15.15 | |||||
| Fund Expense Ratios5: A Shares: Gross 1.61%, Net 1.25%; I Shares: Gross 1.38%, Net 1.00%. | ||||||||
| All returns represent past performance which is no guarantee of future results. Current performance may be higher or lower than the performance shown. The investment return and principal value of an investment will fluctuate so that an investor’s shares, when redeemed, may be worth more or less than their original cost. The above table and graph below do not reflect the deduction of taxes that a shareholder would pay on fund distributions or the redemption of shares. Please visit Virtus.com for performance data current to the most recent month-end. | |
| 1 | Total returns are historical and include changes in share price and the reinvestment of both dividends and capital gain distributions. |
| 2 | “NAV” (Net Asset Value) total returns do not include the effect of any sales charge. |
| 3 | “POP” (Public Offering Price) total returns include the effect of the maximum front-end 5.75% sales charge. |
| 4 | “CDSC” (contingent deferred sales charge) is applied to redemptions of certain classes of shares that do not have a sales charge applied at the time of purchase. CDSC charges for certain redemptions of Class A shares made within 18 months of a finder’s fee being paid and all Class C shares are 1% within the first year and 0% thereafter. |
| 5 | The expense ratios of the Fund are set forth according to the prospectus for the Fund effective July 23, 2018, as supplemented and revised, and may differ from the expense ratios disclosed in the Financial Highlight tables in this report. See the Financial Highlights for more current expense ratios. Net Expense: Expenses reduced by a contractual fee waiver in effect through April 30, 2020. Gross Expense: Does not reflect the effect of the fee waiver. Expense ratios include fees and expenses associated with the underlying funds. |

| Shares | Value | ||
| Common Stocks—99.4% | |||
| Communication Services—5.5% | |||
| Verizon Communications, Inc. | 701,641 | $39,446 | |
| Walt Disney Co. (The) | 304,352 | 33,372 | |
| 72,818 | |||
| Consumer Staples—6.6% | |||
| Colgate-Palmolive Co. | 597,089 | 35,539 | |
| Kellogg Co. | 623,824 | 35,564 | |
| Mondelez International, Inc. Class A | 398,353 | 15,946 | |
| 87,049 | |||
| Energy—9.4% | |||
| Chevron Corp. | 430,004 | 46,780 | |
| Diamondback Energy, Inc. | 178,639 | 16,560 | |
| Marathon Petroleum Corp. | 796,937 | 47,027 | |
| Schlumberger Ltd. | 357,121 | 12,885 | |
| 123,252 | |||
| Financials—17.5% | |||
| Allstate Corp. (The) | 254,042 | 20,992 | |
| American International Group, Inc. | 1,128,325 | 44,467 | |
| Bank of America Corp. | 1,644,940 | 40,531 | |
| Citigroup, Inc. | 717,703 | 37,364 | |
| JPMorgan Chase & Co. | 476,194 | 46,486 | |
| Wells Fargo & Co. | 851,239 | 39,225 | |
| 229,065 | |||
| Health Care—15.5% | |||
| Abbott Laboratories | 509,469 | 36,850 | |
| Shares | Value | ||
| Health Care—continued | |||
| AmerisourceBergen Corp. | 446,452 | $33,216 | |
| Cigna Corp. | 182,613 | 34,682 | |
| Humana, Inc. | 123,153 | 35,281 | |
| UnitedHealth Group, Inc. | 66,432 | 16,549 | |
| Zimmer Biomet Holdings, Inc. | 453,140 | 47,000 | |
| 203,578 | |||
| Industrials—19.1% | |||
| A.O. Smith Corp. | 499,482 | 21,328 | |
| Emerson Electric Co. | 524,815 | 31,358 | |
| FedEx Corp. | 122,858 | 19,821 | |
| General Dynamics Corp. | 129,727 | 20,394 | |
| Harris Corp. | 157,330 | 21,184 | |
| Honeywell International, Inc. | 325,713 | 43,033 | |
| Rockwell Automation, Inc. | 131,871 | 19,844 | |
| Stanley Black & Decker, Inc. | 287,966 | 34,481 | |
| United Technologies Corp. | 363,203 | 38,674 | |
| 250,117 | |||
| Information Technology—10.1% | |||
| Analog Devices, Inc. | 409,883 | 35,180 | |
| Microchip Technology, Inc. | 480,235 | 34,539 | |
| Microsoft Corp. | 356,375 | 36,197 | |
| Motorola Solutions, Inc. | 225,886 | 25,986 | |
| 131,902 | |||
| Materials—8.5% | |||
| Air Products & Chemicals, Inc. | 140,354 | 22,463 | |
| DowDuPont, Inc. | 910,168 | 48,676 | |
| Shares | Value | ||
| Materials—continued | |||
| Vulcan Materials Co. | 401,760 | $39,694 | |
| 110,833 | |||
| Real Estate—4.2% | |||
| Crown Castle International Corp. | 356,060 | 38,679 | |
| Mid-America Apartment Communities, Inc. | 169,705 | 16,241 | |
| 54,920 | |||
| Utilities—3.0% | |||
| NextEra Energy, Inc. | 223,352 | 38,823 | |
| Total Common Stocks (Identified Cost $1,246,117) | 1,302,357 | ||
| Total Long-Term Investments—99.4% (Identified Cost $1,246,117) | 1,302,357 | ||
| TOTAL INVESTMENTS—99.4% (Identified Cost $1,246,117) | 1,302,357 | ||
| Other assets and liabilities, net—0.6% | 7,979 | ||
| NET ASSETS—100.0% | $1,310,336 | ||
| Total Value at December 31, 2018 | Level 1 Quoted Prices | ||
| Equity Securities: | |||
| Common Stocks | $1,302,357 | $1,302,357 | |
| Total Investments | $1,302,357 | $1,302,357 |
| Shares | Value | ||
| Common Stocks—97.3% | |||
| Communication Services—2.4% | |||
| Interpublic Group of Cos., Inc. (The) | 915,000 | $18,876 | |
| Meredith Corp. | 790,000 | 41,033 | |
| 59,909 | |||
| Consumer Discretionary—2.2% | |||
| BorgWarner, Inc. | 700,000 | 24,318 | |
| MGM Resorts International | 1,275,000 | 30,932 | |
| 55,250 | |||
| Consumer Staples—5.6% | |||
| Energizer Holdings, Inc. | 1,700,000 | 76,755 | |
| Kellogg Co. | 670,000 | 38,197 | |
| Tyson Foods, Inc. Class A | 515,000 | 27,501 | |
| 142,453 | |||
| Energy—7.9% | |||
| Cabot Oil & Gas Corp. | 550,000 | 12,293 | |
| Devon Energy Corp. | 1,385,000 | 31,218 | |
| Diamondback Energy, Inc. | 275,000 | 25,492 | |
| Marathon Petroleum Corp. | 800,000 | 47,208 | |
| Noble Energy, Inc. | 1,675,000 | 31,423 | |
| Williams Cos., Inc. (The) | 2,300,000 | 50,715 | |
| 198,349 | |||
| Financials—19.9% | |||
| Affiliated Managers Group, Inc. | 700,000 | 68,208 | |
| American International Group, Inc. | 1,100,000 | 43,351 | |
| Capital One Financial Corp. | 400,000 | 30,236 | |
| Everest Re Group Ltd. | 65,000 | 14,154 | |
| First Republic Bank | 585,000 | 50,837 | |
| Hartford Financial Services Group, Inc. (The) | 1,450,000 | 64,452 | |
| PacWest Bancorp | 1,200,000 | 39,936 | |
| Pinnacle Financial Partners, Inc. | 1,470,000 | 67,767 | |
| Shares | Value | ||
| Financials—continued | |||
| Progressive Corp. (The) | 475,000 | $28,657 | |
| Willis Towers Watson plc | 345,000 | 52,392 | |
| Zions Bancorp NA | 965,000 | 39,314 | |
| 499,304 | |||
| Health Care—10.4% | |||
| AmerisourceBergen Corp. | 675,000 | 50,220 | |
| Humana, Inc. | 390,000 | 111,727 | |
| Zimmer Biomet Holdings, Inc. | 955,000 | 99,053 | |
| 261,000 | |||
| Industrials—14.0% | |||
| A.O. Smith Corp. | 750,000 | 32,025 | |
| Alaska Air Group, Inc. | 375,000 | 22,819 | |
| Dover Corp. | 380,000 | 26,961 | |
| Hubbell, Inc. | 415,000 | 41,226 | |
| Ingersoll-Rand plc | 200,000 | 18,246 | |
| L3 Technologies, Inc. | 450,000 | 78,147 | |
| Masco Corp. | 915,000 | 26,755 | |
| Rockwell Automation, Inc. | 175,000 | 26,334 | |
| Stanley Black & Decker, Inc. | 390,000 | 46,698 | |
| Xylem, Inc. | 485,000 | 32,359 | |
| 351,570 | |||
| Information Technology—11.1% | |||
| Analog Devices, Inc. | 525,000 | 45,061 | |
| Cabot Microelectronics Corp. | 500,000 | 47,675 | |
| Cypress Semiconductor Corp. | 4,200,000 | 53,424 | |
| Motorola Solutions, Inc. | 730,000 | 83,979 | |
| Xilinx, Inc. | 575,000 | 48,973 | |
| 279,112 | |||
| Materials—5.7% | |||
| Air Products & Chemicals, Inc. | 245,000 | 39,212 | |
| Cabot Corp. | 635,000 | 27,267 | |
| Louisiana-Pacific Corp. | 1,250,000 | 27,775 | |
| Shares | Value | ||
| Materials—continued | |||
| Martin Marietta Materials, Inc. | 290,000 | $49,842 | |
| 144,096 | |||
| Real Estate—9.7% | |||
| American Campus Communities, Inc. | 1,400,000 | 57,946 | |
| American Homes 4 Rent Class A | 3,500,000 | 69,475 | |
| Cousins Properties, Inc. | 3,300,000 | 26,070 | |
| Crown Castle International Corp. | 470,000 | 51,056 | |
| Medical Properties Trust, Inc. | 2,400,000 | 38,592 | |
| 243,139 | |||
| Utilities—8.4% | |||
| American Electric Power Co., Inc. | 550,000 | 41,107 | |
| FirstEnergy Corp. | 1,350,000 | 50,693 | |
| PPL Corp. | 2,050,000 | 58,076 | |
| Sempra Energy | 560,000 | 60,586 | |
| 210,462 | |||
| Total Common Stocks (Identified Cost $2,557,041) | 2,444,644 | ||
| Total Long-Term Investments—97.3% (Identified Cost $2,557,041) | 2,444,644 | ||
| TOTAL INVESTMENTS—97.3% (Identified Cost $2,557,041) | 2,444,644 | ||
| Other assets and liabilities, net—2.7% | 67,960 | ||
| NET ASSETS—100.0% | $2,512,604 | ||
| Total Value at December 31, 2018 | Level 1 Quoted Prices | ||
| Equity Securities: | |||
| Common Stocks | $2,444,644 | $2,444,644 | |
| Total Investments | $2,444,644 | $2,444,644 |
| Shares | Value | ||
| Common Stocks—99.3% | |||
| Communication Services—6.9% | |||
| AMC Entertainment Holdings, Inc. Class A | 366,491 | $4,500 | |
| Emerald Expositions Events, Inc. | 322,330 | 3,978 | |
| Meredith Corp. | 522,180 | 27,122 | |
| Scholastic Corp. | 73,854 | 2,973 | |
| 38,573 | |||
| Consumer Discretionary—7.0% | |||
| American Eagle Outfitters, Inc. | 587,517 | 11,357 | |
| Bloomin’ Brands, Inc. | 304,920 | 5,455 | |
| Lithia Motors, Inc. Class A | 146,685 | 11,197 | |
| Movado Group, Inc. | 87,864 | 2,778 | |
| Sonic Automotive, Inc. Class A | 167,604 | 2,306 | |
| Standard Motor Products, Inc. | 46,344 | 2,244 | |
| Tupperware Brands Corp. | 112,996 | 3,567 | |
| 38,904 | |||
| Consumer Staples—9.7% | |||
| B&G Foods, Inc. | 918,048 | 26,541 | |
| Energizer Holdings, Inc. | 561,147 | 25,336 | |
| PriceSmart, Inc. | 36,729 | 2,170 | |
| 54,047 | |||
| Energy—1.7% | |||
| SM Energy Co. | 274,049 | 4,242 | |
| U.S. Silica Holdings, Inc. | 504,000 | 5,131 | |
| 9,373 | |||
| Financials—13.9% | |||
| Artisan Partners Asset Management, Inc. Class A | 66,838 | 1,478 | |
| Bank of Hawaii Corp. | 141,967 | 9,557 | |
| Cohen & Steers, Inc. | 171,923 | 5,900 | |
| Evercore, Inc. Class A | 200,507 | 14,348 | |
| First Interstate BancSystem, Inc. Class A | 190,804 | 6,976 | |
| Hanover Insurance Group, Inc. (The) | 87,701 | 10,241 | |
| Horace Mann Educators Corp. | 155,832 | 5,836 | |
| Kemper Corp. | 343,148 | 22,778 | |
| TrustCo Bank Corp. NY | 118,936 | 816 | |
| 77,930 | |||
| Health Care—6.0% | |||
| Hill-Rom Holdings, Inc. | 289,551 | 25,640 | |
| Shares | Value | ||
| Health Care—continued | |||
| Phibro Animal Health Corp. Class A | 251,795 | $8,098 | |
| 33,738 | |||
| Industrials—28.7% | |||
| Altra Industrial Motion Corp. | 153,242 | 3,854 | |
| Apogee Enterprises, Inc. | 298,546 | 8,912 | |
| Brady Corp. Class A | 33,878 | 1,472 | |
| Columbus McKinnon Corp. | 30,708 | 926 | |
| Covanta Holding Corp. | 744,187 | 9,987 | |
| Cubic Corp. | 242,563 | 13,035 | |
| EnPro Industries, Inc. | 83,278 | 5,005 | |
| Granite Construction, Inc. | 163,262 | 6,576 | |
| Greenbrier Cos., Inc. (The) | 124,262 | 4,913 | |
| Herman Miller, Inc. | 439,446 | 13,293 | |
| Interface, Inc. | 195,437 | 2,785 | |
| Kadant, Inc. | 10,699 | 872 | |
| Kelly Services, Inc. Class A | 249,794 | 5,116 | |
| Kennametal, Inc. | 27,111 | 902 | |
| Kforce, Inc. | 138,143 | 4,271 | |
| Knoll, Inc. | 479,840 | 7,908 | |
| Korn Ferry | 151,060 | 5,973 | |
| Lindsay Corp. | 18,921 | 1,821 | |
| Matson, Inc. | 47,448 | 1,519 | |
| Matthews International Corp. Class A | 66,996 | 2,721 | |
| Multi-Color Corp. | 73,344 | 2,574 | |
| Resideo Technologies, Inc.(1) | 52,699 | 1,083 | |
| Ritchie Bros. Auctioneers, Inc. | 230,668 | 7,547 | |
| Simpson Manufacturing Co., Inc. | 75,329 | 4,078 | |
| Standex International Corp. | 9,906 | 666 | |
| Sun Hydraulics Corp. | 77,974 | 2,588 | |
| Tennant Co. | 40,636 | 2,118 | |
| Tetra Tech, Inc. | 372,950 | 19,308 | |
| Valmont Industries, Inc. | 36,552 | 4,055 | |
| Viad Corp. | 54,410 | 2,725 | |
| Wabash National Corp. | 435,255 | 5,693 | |
| Werner Enterprises, Inc. | 195,043 | 5,762 | |
| 160,058 | |||
| Information Technology—9.1% | |||
| AVX Corp. | 148,883 | 2,270 | |
| Cabot Microelectronics Corp. | 116,788 | 11,136 | |
| Cohu, Inc. | 178,599 | 2,870 | |
| Comtech Telecommunications Corp. | 168,198 | 4,094 | |
| Daktronics, Inc. | 419,305 | 3,103 | |
| Shares | Value | ||
| Information Technology—continued | |||
| Power Integrations, Inc. | 447,339 | $27,279 | |
| 50,752 | |||
| Materials—5.2% | |||
| Boise Cascade Co. | 198,708 | 4,739 | |
| Cabot Corp. | 50,420 | 2,165 | |
| Carpenter Technology Corp. | 111,472 | 3,969 | |
| Commercial Metals Co. | 250,611 | 4,015 | |
| Haynes International, Inc. | 49,115 | 1,297 | |
| Hecla Mining Co. | 2,152,095 | 5,079 | |
| Neenah, Inc. | 65,477 | 3,858 | |
| Sensient Technologies Corp. | 75,482 | 4,216 | |
| 29,338 | |||
| Real Estate—11.1% | |||
| Alexander & Baldwin, Inc. | 275,740 | 5,068 | |
| DiamondRock Hospitality Co. | 411,566 | 3,737 | |
| Monmouth Real Estate Investment Corp. | 40,173 | 498 | |
| Outfront Media, Inc. | 889,315 | 16,114 | |
| Physicians Realty Trust | 1,188,957 | 19,059 | |
| Tanger Factory Outlet Centers, Inc. | 795,431 | 16,084 | |
| Taubman Centers, Inc. | 29,122 | 1,325 | |
| 61,885 | |||
| Total Common Stocks (Identified Cost $528,153) | 554,598 | ||
| Total Long-Term Investments—99.3% (Identified Cost $528,153) | 554,598 | ||
| TOTAL INVESTMENTS—99.3% (Identified Cost $528,153) | 554,598 | ||
| Other assets and liabilities, net—0.7% | 3,689 | ||
| NET ASSETS—100.0% | $558,287 | ||
| Footnote Legend: | |
| (1) | Non-income producing. |
| Total Value at December 31, 2018 | Level 1 Quoted Prices | ||
| Equity Securities: | |||
| Common Stocks | $554,598 | $554,598 | |
| Total Investments | $554,598 | $554,598 |
| Shares | Value | ||
| Common Stocks—100.0% | |||
| Communication Services—14.1% | |||
| Alphabet, Inc. Class A(1) | 3,358 | $3,509 | |
| Alphabet, Inc. Class C(1) | 3,447 | 3,570 | |
| Comcast Corp. Class A | 48,097 | 1,638 | |
| Facebook, Inc. Class A(1) | 9,002 | 1,180 | |
| Netflix, Inc.(1) | 7,204 | 1,928 | |
| Walt Disney Co. (The) | 16,993 | 1,863 | |
| 13,688 | |||
| Consumer Discretionary—12.8% | |||
| Amazon.com, Inc.(1) | 4,908 | 7,372 | |
| Booking Holdings, Inc.(1) | 752 | 1,295 | |
| Las Vegas Sands Corp. | 22,152 | 1,153 | |
| O’Reilly Automotive, Inc.(1) | 5,499 | 1,894 | |
| Royal Caribbean Cruises Ltd. | 6,917 | 676 | |
| 12,390 | |||
| Consumer Staples—4.2% | |||
| Colgate-Palmolive Co. | 14,614 | 870 | |
| Costco Wholesale Corp. | 9,535 | 1,942 | |
| Estee Lauder Cos., Inc. (The) Class A | 10,042 | 1,307 | |
| 4,119 | |||
| Energy—1.1% | |||
| Devon Energy Corp. | 11,810 | 266 | |
| EOG Resources, Inc. | 9,731 | 849 | |
| 1,115 | |||
| Financials—4.8% | |||
| American Express Co. | 11,500 | 1,096 | |
| Charles Schwab Corp. (The) | 24,964 | 1,037 | |
| Goldman Sachs Group, Inc. (The) | 2,994 | 500 | |
| Morgan Stanley | 25,908 | 1,027 | |
| Shares | Value | ||
| Financials—continued | |||
| SunTrust Banks, Inc. | 19,247 | $971 | |
| 4,631 | |||
| Health Care—14.2% | |||
| Agilent Technologies, Inc. | 17,605 | 1,188 | |
| Alexion Pharmaceuticals, Inc.(1) | 8,675 | 844 | |
| Becton, Dickinson & Co. | 2,395 | 540 | |
| Biogen, Inc.(1) | 5,287 | 1,591 | |
| Bristol-Myers Squibb Co. | 24,918 | 1,295 | |
| Edwards Lifesciences Corp.(1) | 12,906 | 1,977 | |
| Intuitive Surgical, Inc.(1) | 2,286 | 1,095 | |
| Mettler-Toledo International, Inc.(1) | 1,657 | 937 | |
| Thermo Fisher Scientific, Inc. | 2,390 | 535 | |
| UnitedHealth Group, Inc. | 10,723 | 2,671 | |
| Vertex Pharmaceuticals, Inc.(1) | 6,421 | 1,064 | |
| 13,737 | |||
| Industrials—12.0% | |||
| A.O. Smith Corp. | 19,004 | 811 | |
| Boeing Co. (The) | 5,510 | 1,777 | |
| Deere & Co. | 9,498 | 1,417 | |
| Emerson Electric Co. | 19,534 | 1,167 | |
| Fortune Brands Home & Security, Inc. | 10,600 | 403 | |
| Honeywell International, Inc. | 16,795 | 2,219 | |
| IHS Markit Ltd.(1) | 15,362 | 737 | |
| Knight-Swift Transportation Holdings, Inc. | 23,661 | 593 | |
| Roper Technologies, Inc. | 2,015 | 537 | |
| Waste Management, Inc. | 9,056 | 806 | |
| Xylem, Inc. | 17,532 | 1,170 | |
| 11,637 | |||
| Information Technology—34.7% | |||
| Adobe, Inc.(1) | 11,616 | 2,628 | |
| Analog Devices, Inc. | 8,048 | 691 | |
| Apple, Inc. | 30,182 | 4,761 | |
| Shares | Value | ||
| Information Technology—continued | |||
| Applied Materials, Inc. | 28,678 | $939 | |
| Autodesk, Inc.(1) | 13,868 | 1,784 | |
| Cognex Corp. | 9,950 | 385 | |
| Corning, Inc. | 42,710 | 1,290 | |
| Mastercard, Inc. Class A | 11,539 | 2,177 | |
| Microsoft Corp. | 81,175 | 8,245 | |
| NVIDIA Corp. | 8,723 | 1,164 | |
| salesforce.com, Inc.(1) | 13,348 | 1,828 | |
| Splunk, Inc.(1) | 6,171 | 647 | |
| Universal Display Corp. | 11,029 | 1,032 | |
| Visa, Inc. Class A | 36,340 | 4,795 | |
| Workday, Inc. Class A(1) | 7,675 | 1,225 | |
| 33,591 | |||
| Materials—1.5% | |||
| Air Products & Chemicals, Inc. | 3,108 | 497 | |
| Vulcan Materials Co. | 9,534 | 942 | |
| 1,439 | |||
| Real Estate—0.6% | |||
| Equinix, Inc. | 1,546 | 545 | |
| Total Common Stocks (Identified Cost $58,302) | 96,892 | ||
| Total Long-Term Investments—100.0% (Identified Cost $58,302) | 96,892 | ||
| TOTAL INVESTMENTS—100.0% (Identified Cost $58,302) | 96,892 | ||
| Other assets and liabilities, net—0.0% | 13 | ||
| NET ASSETS—100.0% | $96,905 | ||
| Footnote Legend: | |
| (1) | Non-income producing. |
| Total Value at December 31, 2018 | Level 1 Quoted Prices | ||
| Equity Securities: | |||
| Common Stocks | $96,892 | $96,892 | |
| Total Investments | $96,892 | $96,892 |
| Shares | Value | ||
| Common Stocks—96.4% | |||
| Communication Services—2.4% | |||
| Cable One, Inc. | 407 | $334 | |
| E.W. Scripps Co. (The) Class A | 14,897 | 234 | |
| 568 | |||
| Consumer Discretionary—11.4% | |||
| American Eagle Outfitters, Inc. | 9,320 | 180 | |
| Boyd Gaming Corp. | 8,727 | 181 | |
| Carvana Co.(1) | 1,492 | 49 | |
| Cavco Industries, Inc.(1) | 569 | 74 | |
| Churchill Downs, Inc. | 900 | 219 | |
| Dorman Products, Inc.(1) | 2,141 | 193 | |
| Five Below, Inc.(1) | 1,628 | 167 | |
| iRobot Corp.(1)(2) | 1,864 | 156 | |
| National Vision Holdings, Inc.(1) | 6,848 | 193 | |
| Planet Fitness, Inc. Class A(1) | 6,748 | 362 | |
| Roku, Inc.(1) | 8,283 | 254 | |
| Texas Roadhouse, Inc. | 9,290 | 555 | |
| Wingstop, Inc. | 2,096 | 134 | |
| 2,717 | |||
| Consumer Staples—2.6% | |||
| J&J Snack Foods Corp. | 1,376 | 199 | |
| USANA Health Sciences, Inc.(1) | 746 | 88 | |
| WD-40 Co. | 1,859 | 341 | |
| 628 | |||
| Energy—0.5% | |||
| ProPetro Holding Corp.(1) | 9,475 | 117 | |
| Financials—6.4% | |||
| Ameris Bancorp | 6,270 | 199 | |
| Cadence BanCorp | 6,065 | 102 | |
| First Financial Bankshares, Inc. | 5,861 | 338 | |
| Guaranty Bancorp | 3,571 | 74 | |
| Heritage Commerce Corp. | 17,290 | 196 | |
| Home BancShares, Inc. | 21,465 | 351 | |
| RLI Corp. | 3,834 | 264 | |
| 1,524 | |||
| Health Care—29.4% | |||
| AMN Healthcare Services, Inc.(1) | 7,578 | 429 | |
| Array BioPharma, Inc.(1) | 25,426 | 362 | |
| AxoGen, Inc.(1) | 5,628 | 115 | |
| Bio-Techne Corp. | 2,301 | 333 | |
| Cantel Medical Corp. | 1,497 | 112 | |
| Chemed Corp. | 1,589 | 450 | |
| Encompass Health Corp. | 8,195 | 506 | |
| HealthEquity, Inc.(1) | 6,644 | 396 | |
| ICU Medical, Inc.(1) | 1,865 | 428 | |
| Inspire Medical Systems, Inc.(1) | 4,324 | 183 | |
| Shares | Value | ||
| Health Care—continued | |||
| Insulet Corp.(1) | 4,201 | $333 | |
| LHC Group, Inc.(1) | 3,409 | 320 | |
| Loxo Oncology, Inc.(1) | 2,975 | 417 | |
| Madrigal Pharmaceuticals, Inc.(1) | 666 | 75 | |
| Merit Medical Systems, Inc.(1) | 7,570 | 423 | |
| Neurocrine Biosciences, Inc.(1) | 3,038 | 217 | |
| Novocure Ltd.(1) | 5,536 | 185 | |
| Penumbra, Inc.(1) | 2,758 | 337 | |
| Reata Pharmaceuticals, Inc. Class A(1) | 2,503 | 140 | |
| Sarepta Therapeutics, Inc.(1) | 4,393 | 479 | |
| Spark Therapeutics, Inc.(1) | 2,120 | 83 | |
| Supernus Pharmaceuticals, Inc.(1) | 5,576 | 185 | |
| Tandem Diabetes Care, Inc.(1) | 7,307 | 278 | |
| Ultragenyx Pharmaceutical, Inc.(1) | 4,570 | 199 | |
| 6,985 | |||
| Industrials—15.8% | |||
| Air Transport Services Group, Inc.(1) | 12,216 | 279 | |
| Alamo Group, Inc. | 1,670 | 129 | |
| ASGN, Inc.(1) | 3,508 | 191 | |
| Atlas Air Worldwide Holdings, Inc.(1) | 3,144 | 133 | |
| Barnes Group, Inc. | 1,772 | 95 | |
| Brink’s Co. (The) | 3,787 | 245 | |
| Chart Industries, Inc.(1) | 2,835 | 184 | |
| Dycom Industries, Inc.(1) | 5,289 | 286 | |
| Forward Air Corp. | 5,419 | 297 | |
| Franklin Electric Co., Inc. | 6,541 | 281 | |
| Mercury Systems, Inc.(1) | 10,519 | 497 | |
| Patrick Industries, Inc.(1) | 2,280 | 68 | |
| Proto Labs, Inc.(1) | 2,883 | 325 | |
| Simpson Manufacturing Co., Inc. | 3,603 | 195 | |
| Teledyne Technologies, Inc.(1) | 2,687 | 556 | |
| 3,761 | |||
| Information Technology—21.7% | |||
| Coupa Software, Inc.(1) | 3,351 | 211 | |
| Everbridge, Inc.(1) | 4,521 | 257 | |
| Fair Isaac Corp.(1) | 3,353 | 627 | |
| Five9, Inc.(1) | 11,627 | 508 | |
| II-VI, Inc.(1) | 12,387 | 402 | |
| InterXion Holding N.V.(1) | 10,333 | 560 | |
| Monolithic Power Systems, Inc. | 1,874 | 218 | |
| Paycom Software, Inc.(1) | 2,596 | 318 | |
| Proofpoint, Inc.(1) | 2,416 | 202 | |
| Q2 Holdings, Inc.(1) | 13,572 | 672 | |
| Rogers Corp.(1) | 2,761 | 273 | |
| Semtech Corp.(1) | 3,243 | 149 | |
| Versum Materials, Inc. | 7,874 | 218 | |
| ViaSat, Inc.(1) | 5,903 | 348 | |
| Shares | Value | ||
| Information Technology—continued | |||
| Workiva, Inc.(1) | 5,894 | $212 | |
| 5,175 | |||
| Materials—6.2% | |||
| Balchem Corp. | 5,551 | 435 | |
| HB Fuller Co. | 7,503 | 320 | |
| Quaker Chemical Corp. | 2,493 | 443 | |
| W.R. Grace & Co. | 4,143 | 269 | |
| 1,467 | |||
| Total Common Stocks (Identified Cost $20,311) | 22,942 | ||
| Total Long-Term Investments—96.4% (Identified Cost $20,311) | 22,942 | ||
| Short-Term Investment—1.4% | |||
| Money Market Mutual Fund—1.4% | |||
| Dreyfus Government Cash Management Fund - Institutional Shares (seven-day effective yield 2.292%)(3) | 346,385 | 346 | |
| Total Short-Term Investment (Identified Cost $346) | 346 | ||
| Securities Lending Collateral—0.3% | |||
| Dreyfus Government Cash Management Fund - Institutional Shares (seven-day effective yield 2.292%)(3)(4) | 61,088 | 61 | |
| Total Securities Lending Collateral (Identified Cost $61) | 61 | ||
| TOTAL INVESTMENTS—98.1% (Identified Cost $20,718) | 23,349 | ||
| Other assets and liabilities, net—1.9% | 454 | ||
| NET ASSETS—100.0% | $23,803 | ||
| Footnote Legend: | |
| (1) | Non-income producing. |
| (2) | All or a portion of security is on loan. |
| (3) | Shares of this fund are publicly offered, and its prospectus and annual report are publicly available. |
| (4) | Represents security purchased with cash collateral received for securities on loan. |
| Total Value at December 31, 2018 | Level 1 Quoted Prices | ||
| Equity Securities: | |||
| Common Stocks | $22,942 | $22,942 | |
| Securities Lending Collateral | 61 | 61 | |
| Short-Term Investment | 346 | 346 | |
| Total Investments | $23,349 | $23,349 |
| Shares | Value | ||
| Common Stocks—96.5% | |||
| Australia—4.5% | |||
| CSL Ltd. | 31,226 | $4,073 | |
| Brazil—0.2% | |||
| Raia Drogasil SA | 13,290 | 196 | |
| Canada—8.8% | |||
| Canadian Pacific Railway Ltd. | 20,082 | 3,567 | |
| Dollarama, Inc. | 47,489 | 1,129 | |
| Shopify, Inc. Class A(1) | 22,910 | 3,172 | |
| 7,868 | |||
| China—3.9% | |||
| Tencent Holdings Ltd. | 86,840 | 3,482 | |
| Denmark—3.0% | |||
| Chr. Hansen Holding A/S | 30,471 | 2,696 | |
| France—11.2% | |||
| EssilorLuxottica SA | 29,761 | 3,766 | |
| LVMH Moet Hennessy Louis Vuitton SE | 11,199 | 3,313 | |
| Pernod Ricard SA | 18,100 | 2,972 | |
| 10,051 | |||
| Germany—3.3% | |||
| adidas AG | 14,017 | 2,929 | |
| Hong Kong—3.7% | |||
| AIA Group Ltd. | 397,600 | 3,301 | |
| India—3.9% | |||
| HDFC Bank Ltd. ADR | 33,669 | 3,488 | |
| Ireland—4.3% | |||
| ICON plc(1) | 20,278 | 2,620 | |
| Shares | Value | ||
| Ireland—continued | |||
| Ryanair Holdings plc Sponsored ADR(1) | 17,118 | $1,221 | |
| 3,841 | |||
| Japan—4.0% | |||
| Keyence Corp. | 7,100 | 3,607 | |
| Jersey—4.1% | |||
| Experian plc | 152,531 | 3,704 | |
| Mexico—2.6% | |||
| Wal-Mart de Mexico SAB de C.V. | 937,290 | 2,384 | |
| Netherlands—1.9% | |||
| ASML Holding N.V. | 10,860 | 1,690 | |
| Spain—2.9% | |||
| Amadeus IT Group SA | 25,350 | 1,767 | |
| Industria de Diseno Textil SA | 32,076 | 822 | |
| 2,589 | |||
| Sweden—4.5% | |||
| Atlas Copco AB Class A | 67,510 | 1,603 | |
| Hexagon AB Class B | 52,170 | 2,402 | |
| 4,005 | |||
| Switzerland—11.6% | |||
| Chubb Ltd. | 25,576 | 3,304 | |
| Geberit AG | 4,985 | 1,939 | |
| Nestle S.A. Registered Shares | 40,208 | 3,264 | |
| Sika AG Registered Shares | 15,210 | 1,928 | |
| 10,435 | |||
| Taiwan—3.5% | |||
| Taiwan Semiconductor Manufacturing Co., Ltd. Sponsored ADR | 85,097 | 3,141 | |
| United Kingdom—3.6% | |||
| Compass Group plc | 154,203 | 3,243 | |
| Shares | Value | ||
| United States—11.0% | |||
| Accenture plc Class A | 25,149 | $3,546 | |
| Core Laboratories N.V. | 20,468 | 1,221 | |
| Mettler-Toledo International, Inc.(1) | 5,400 | 3,054 | |
| ResMed, Inc. | 18,406 | 2,096 | |
| 9,917 | |||
| Total Common Stocks (Identified Cost $76,208) | 86,640 | ||
| Total Long-Term Investments—96.5% (Identified Cost $76,208) | 86,640 | ||
| TOTAL INVESTMENTS—96.5% (Identified Cost $76,208) | 86,640 | ||
| Other assets and liabilities, net—3.5% | 3,184 | ||
| NET ASSETS—100.0% | $89,824 | ||
| Abbreviation: | |
| ADR | American Depositary Receipt |
| Footnote Legend: | |
| (1) | Non-income producing. |
| Country Weightings (Unaudited)† | |
| Switzerland | 12% |
| France | 12 |
| United States | 11 |
| Canada | 9 |
| Australia | 5 |
| Sweden | 5 |
| Ireland | 4 |
| Other | 42 |
| Total Investments | 100% |
| † % of total investments as of December 31, 2018. | |
| Total Value at December 31, 2018 | Level 1 Quoted Prices | ||
| Equity Securities: | |||
| Common Stocks | $86,640 | $86,640 | |
| Total Investments | $86,640 | $86,640 |
| Shares | Value | ||
| Common Stocks—97.5% | |||
| Communication Services—15.5% | |||
| Alphabet, Inc. Class A(1) | 3,000 | $3,135 | |
| Facebook, Inc. Class A(1) | 24,000 | 3,146 | |
| Netflix, Inc.(1) | 23,500 | 6,290 | |
| Zillow Group, Inc. Class C(1) | 80,000 | 2,527 | |
| 15,098 | |||
| Consumer Discretionary—22.9% | |||
| Amazon.com, Inc.(1) | 4,700 | 7,059 | |
| lululemon athletica, Inc.(1) | 19,000 | 2,311 | |
| MercadoLibre, Inc. | 13,500 | 3,953 | |
| Shake Shack, Inc. Class A(1) | 48,000 | 2,180 | |
| Tesla, Inc.(1) | 15,000 | 4,992 | |
| Wayfair, Inc. Class A(1) | 20,000 | 1,802 | |
| 22,297 | |||
| Financials—3.2% | |||
| Charles Schwab Corp. (The) | 74,950 | 3,113 | |
| Health Care—18.8% | |||
| BioMarin Pharmaceutical, Inc.(1) | 15,000 | 1,277 | |
| Exact Sciences Corp.(1) | 92,000 | 5,805 | |
| Inogen, Inc.(1) | 4,000 | 497 | |
| Medidata Solutions, Inc.(1) | 34,600 | 2,333 | |
| Sientra, Inc.(1) | 65,000 | 826 | |
| Teladoc Health, Inc.(1) | 83,500 | 4,139 | |
| Tilray, Inc.(1) | 48,700 | 3,435 | |
| 18,312 | |||
| Industrials—1.8% | |||
| CoStar Group, Inc.(1) | 5,000 | 1,687 | |
| Information Technology—35.3% | |||
| 2U, Inc.(1) | 50,000 | 2,486 | |
| Adobe, Inc.(1) | 10,000 | 2,262 | |
| Shares | Value | ||
| Information Technology—continued | |||
| Monolithic Power Systems, Inc. | 34,000 | $3,952 | |
| NVIDIA Corp. | 14,000 | 1,869 | |
| Okta, Inc.(1) | 52,500 | 3,350 | |
| Paylocity Holding Corp.(1) | 36,000 | 2,168 | |
| PayPal Holdings, Inc.(1) | 42,000 | 3,532 | |
| Pluralsight, Inc. Class A(1) | 65,000 | 1,531 | |
| ServiceNow, Inc.(1) | 16,000 | 2,849 | |
| Shopify, Inc. Class A(1) | 34,000 | 4,707 | |
| Square, Inc. Class A(1) | 25,000 | 1,402 | |
| Trade Desk, Inc. (The) Class A(1) | 36,500 | 4,236 | |
| 34,344 | |||
| Total Common Stocks (Identified Cost $88,638) | 94,851 | ||
| Total Long-Term Investments—97.5% (Identified Cost $88,638) | 94,851 | ||
| Short-Term Investment—0.4% | |||
| Money Market Mutual Fund—0.4% | |||
| Dreyfus Government Cash Management Fund - Institutional Shares (seven-day effective yield 2.292%)(2) | 447,311 | 447 | |
| Total Short-Term Investment (Identified Cost $447) | 447 | ||
| TOTAL INVESTMENTS—97.9% (Identified Cost $89,085) | 95,298 | ||
| Other assets and liabilities, net—2.1% | 2,008 | ||
| NET ASSETS—100.0% | $97,306 | ||
| Footnote Legend: | |
| (1) | Non-income producing. |
| (2) | Shares of this fund are publicly offered, and its prospectus and annual report are publicly available. |
| Country Weightings (Unaudited)† | |
| United States | 95% |
| Canada | 5 |
| Total | 100% |
| † % of total investments as of December 31, 2018. | |
| Total Value at December 31, 2018 | Level 1 Quoted Prices | ||
| Equity Securities: | |||
| Common Stocks | $94,851 | $94,851 | |
| Short-Term Investment | 447 | 447 | |
| Total Investments | $95,298 | $95,298 |
| Ceredex Large-Cap Value Equity Fund | Ceredex Mid-Cap Value Equity Fund | Ceredex Small-Cap Value Equity Fund | |||
| Assets | |||||
Investment in securities at value(1) | $1,302,357 | $2,444,644 | $554,598 | ||
Cash | 6,811 | 62,039 | 1,753 | ||
| Receivables | |||||
Investment securities sold | 13,645 | — | — | ||
Fund shares sold | 1,568 | 19,124 | 3,385 | ||
Dividends and interest | 1,475 | 4,556 | 1,002 | ||
Prepaid expenses | 67 | 102 | 57 | ||
Other assets | 59 | 112 | 25 | ||
Total assets | 1,325,982 | 2,530,577 | 560,820 | ||
| Liabilities | |||||
| Payables | |||||
Fund shares repurchased | 9,379 | 14,959 | 1,721 | ||
Investment securities purchased | 4,712 | — | — | ||
Dividend distributions | —(a) | 9 | — | ||
Investment advisory fees | 686 | 1,538 | 416 | ||
Distribution and service fees | 62 | 109 | 28 | ||
Administration and accounting fees | 129 | 246 | 55 | ||
Transfer agent and sub-transfer agent fees and expenses | 527 | 833 | 235 | ||
Professional fees | 18 | 23 | 20 | ||
Trustee deferred compensation plan | 59 | 112 | 25 | ||
Other accrued expenses | 74 | 144 | 33 | ||
Total liabilities | 15,646 | 17,973 | 2,533 | ||
Net Assets | $1,310,336 | $2,512,604 | $558,287 | ||
| Net Assets Consist of: | |||||
Capital paid in on shares of beneficial interest | $1,269,157 | $2,692,688 | $535,626 | ||
Accumulated earnings (loss) | 41,179 | (180,084) | 22,661 | ||
Total Net Assets | $1,310,336 | $2,512,604 | $558,287 | ||
| Net Assets: | |||||
Class A | $223,853 | $271,620 | $69,223 | ||
Class C | $14,625 | $53,419 | $14,473 | ||
Class I | $799,262 | $1,775,643 | $474,591 | ||
Class R6 | $272,596 | $411,922 | $— | ||
| Shares Outstanding (unlimited number of shares authorized, no par value): | |||||
Class A | 19,975,551 | 26,876,198 | 8,193,213 | ||
Class C | 1,346,234 | 5,427,042 | 1,952,444 | ||
Class I | 70,506,647 | 173,183,939 | 53,734,548 | ||
Class R6 | 23,925,182 | 40,122,380 | — | ||
| Net Asset Value and Redemption Price Per Share: | |||||
Class A | $11.21 | $10.11 | $8.45 | ||
Class C | $10.86 | $9.84 | $7.41 | ||
Class I | $11.34 | $10.25 | $8.83 | ||
Class R6 | $11.39 | $10.27 | $— | ||
| Offering Price per Share (NAV/(1-5.75%)): | |||||
Class A | $11.89 | $10.73 | $8.97 | ||
(1)Investment in securities at cost | $1,246,117 | $2,557,041 | $528,153 |
| (a) | Amount is less than $500. |
| Silvant Large-Cap Growth Stock Fund | Silvant Small-Cap Growth Stock Fund | WCM International Equity Fund | |||
| Assets | |||||
Investment in securities at value(1)(2) | $96,892 | $23,349 | $86,640 | ||
Cash | 1,388 | 573 | 2,934 | ||
| Receivables | |||||
Investment securities sold | 765 | — | 50 | ||
Fund shares sold | 7 | 32 | 701 | ||
Dividends and interest | 43 | 11 | 36 | ||
Tax reclaims | — | — | 147 | ||
Securities lending | —(a) | —(a) | 1 | ||
Prepaid expenses | 27 | 25 | 24 | ||
Other assets | 4 | 1 | 4 | ||
Total assets | 99,126 | 23,991 | 90,537 | ||
| Liabilities | |||||
Foreign currency overdraft(3) | — | — | 2 | ||
| Payables | |||||
Fund shares repurchased | 450 | 82 | 561 | ||
Investment securities purchased | 1,612 | — | 11 | ||
Collateral on securities loaned | — | 61 | — | ||
Investment advisory fees | 30 | 5 | 63 | ||
Distribution and service fees | 38 | 4 | 4 | ||
Administration and accounting fees | 11 | 3 | 9 | ||
Transfer agent and sub-transfer agent fees and expenses | 47 | 8 | 18 | ||
Professional fees | 20 | 21 | 24 | ||
Trustee deferred compensation plan | 4 | 1 | 4 | ||
Other accrued expenses | 9 | 3 | 17 | ||
Total liabilities | 2,221 | 188 | 713 | ||
Net Assets | $96,905 | $23,803 | $89,824 | ||
| Net Assets Consist of: | |||||
Capital paid in on shares of beneficial interest | $52,481 | $20,960 | $76,453 | ||
Accumulated earnings (loss) | 44,424 | 2,843 | 13,371 | ||
Total Net Assets | $96,905 | $23,803 | $89,824 | ||
| Net Assets: | |||||
Class A | $45,779 | $5,725 | $22,233 | ||
Class C | $31,782 | $3,565 | $— | ||
Class I | $19,234 | $14,513 | $67,543 | ||
Class R6 | $110 | $— | $48 | ||
| Shares Outstanding (unlimited number of shares authorized, no par value): | |||||
Class A | 9,960,373 | 1,008,707 | 2,030,249 | ||
Class C | 20,693,161 | 2,213,609 | — | ||
Class I | 2,899,181 | 1,956,166 | 6,067,140 | ||
Class R6 | 16,496 | — | 4,336 | ||
| Net Asset Value and Redemption Price Per Share: | |||||
Class A | $4.60 | $5.68 | $10.95 | ||
Class C | $1.54 | $1.61 | $— | ||
Class I | $6.63 | $7.42 | $11.13 | ||
Class R6 | $6.69 | $— | $11.15 |
| Silvant Large-Cap Growth Stock Fund | Silvant Small-Cap Growth Stock Fund | WCM International Equity Fund | |||
| Offering Price per Share (NAV/(1-5.75%)): | |||||
Class A | $4.88 | $6.03 | $11.62 | ||
(1)Investment in securities at cost | $58,302 | $20,718 | $76,208 | ||
(2) Market value of securities on loan | $— | $62 | $— | ||
(3) Foreign currency at cost | — | — | —(a) |
| (a) | Amount is less than $500. |
| Zevenbergen Innovative Growth Stock Fund | |
| Assets | |
Investment in securities at value(1) | $95,298 |
Cash | 350 |
| Receivables | |
Investment securities sold | 477 |
Fund shares sold | 1,664 |
Dividends and interest | 16 |
Prepaid expenses | 21 |
Other assets | 4 |
Total assets | 97,830 |
| Liabilities | |
| Payables | |
Fund shares repurchased | 181 |
Investment securities purchased | 213 |
Investment advisory fees | 54 |
Distribution and service fees | 6 |
Administration and accounting fees | 11 |
Transfer agent and sub-transfer agent fees and expenses | 30 |
Professional fees | 20 |
Trustee deferred compensation plan | 4 |
Other accrued expenses | 5 |
Total liabilities | 524 |
Net Assets | $97,306 |
| Net Assets Consist of: | |
Capital paid in on shares of beneficial interest | $100,680 |
Accumulated earnings (loss) | (3,374) |
Total Net Assets | $97,306 |
| Net Assets: | |
Class A | $24,902 |
Class I | $72,404 |
| Shares Outstanding (unlimited number of shares authorized, no par value): | |
Class A | 1,195,205 |
Class I | 3,268,991 |
| Net Asset Value and Redemption Price Per Share: | |
Class A | $20.83 |
Class I | $22.15 |
| Offering Price per Share (NAV/(1-5.75%)): | |
Class A | $22.10 |
(1)Investment in securities at cost | $89,085 |
| Ceredex Large-Cap Value Equity Fund | Ceredex Mid-Cap Value Equity Fund | ||
| Investment Income | |||
Dividends | $41,125 | $55,691 | |
Interest | 103 | 337 | |
Security lending, net of fees | 3 | —(1) | |
Foreign taxes withheld | — | (21) | |
Total investment income | 41,231 | 56,007 | |
| Expenses | |||
Investment advisory fees | 11,347 | 20,062 | |
Distribution and service fees, Class A | 716 | 834 | |
Distribution and service fees, Class C | 164 | 652 | |
Administration and accounting fees | 1,783 | 2,996 | |
Transfer agent fees and expenses | 736 | 1,246 | |
Sub-transfer agent fees and expenses, Class A | 517 | 618 | |
Sub-transfer agent fees and expenses, Class C | 14 | 62 | |
Sub-transfer agent fees and expenses, Class I | 1,988 | 2,903 | |
Printing fees and expenses | 57 | 240 | |
Professional fees | 53 | 82 | |
Registration fees | 87 | 109 | |
Trustees’ fees and expenses | 151 | 241 | |
Miscellaneous expenses | 121 | 203 | |
Total expenses | 17,734 | 30,248 | |
Less expenses reimbursed and/or waived by investment adviser(2) | (973) | (201) | |
Low balance account fees | —(1) | —(1) | |
Net expenses | 16,761 | 30,047 | |
Net investment income (loss) | 24,470 | 25,960 | |
| Net Realized and Unrealized Gain (Loss) on Investments | |||
| Net realized gain (loss) from: | |||
Investments | 270,639 | 200,467 | |
| Net change in unrealized appreciation (depreciation) from: | |||
Investments | (452,928) | (438,316) | |
Net realized and unrealized gain (loss) on investments | (182,289) | (237,849) | |
Net increase (decrease) in net assets resulting from operations | $(157,819) | $(211,889) |
| (1) | Amount is less than $500. |
| (2) | See note 3D in the Notes to Financial Statements for information on recapture of expenses previously waived. |
| Ceredex Small-Cap Value Equity Fund | Silvant Large-Cap Growth Stock Fund | ||
| Investment Income | |||
Dividends | $15,675 | $1,177 | |
Interest | 17 | 6 | |
Security lending, net of fees | — | 1 | |
Foreign taxes withheld | (28) | — | |
Total investment income | 15,664 | 1,184 | |
| Expenses | |||
Investment advisory fees | 6,046 | 875 | |
Distribution and service fees, Class A | 235 | 158 | |
Distribution and service fees, Class C | 189 | 372 | |
Administration and accounting fees | 752 | 132 | |
Transfer agent fees and expenses | 309 | 57 | |
Sub-transfer agent fees and expenses, Class A | 178 | 249 | |
Sub-transfer agent fees and expenses, Class C | 13 | 35 | |
Sub-transfer agent fees and expenses, Class I | 973 | 35 | |
Custodian fees | 1 | — | |
Printing fees and expenses | 64 | 20 | |
Professional fees | 38 | 25 | |
Registration fees | 60 | 64 | |
Trustees’ fees and expenses | 62 | 11 | |
Miscellaneous expenses | 54 | 15 | |
Total expenses | 8,974 | 2,048 | |
Less expenses reimbursed and/or waived by investment adviser(1) | (36) | (325) | |
Low balance account fees | —(2) | —(2) | |
Net expenses | 8,938 | 1,723 | |
Net investment income (loss) | 6,726 | (539) | |
| Net Realized and Unrealized Gain (Loss) on Investments | |||
| Net realized gain (loss) from: | |||
Investments | 83,332 | 19,079 | |
| Net change in unrealized appreciation (depreciation) from: | |||
Investments | (169,458) | (17,667) | |
Net realized and unrealized gain (loss) on investments | (86,126) | 1,412 | |
Net increase (decrease) in net assets resulting from operations | $(79,400) | $873 |
| (1) | See note 3D in the Notes to Financial Statements for information on recapture of expenses previously waived. |
| (2) | Amount is less than $500. |
| Silvant Small-Cap Growth Stock Fund | WCM International Equity Fund | ||
| Investment Income | |||
Dividends | $139 | $1,548 | |
Interest | 11 | 25 | |
Security lending, net of fees | 1 | 3 | |
Foreign taxes withheld | — | (165) | |
Total investment income | 151 | 1,411 | |
| Expenses | |||
Investment advisory fees | 244 | 812 | |
Distribution and service fees, Class A | 17 | 47 | |
Distribution and service fees, Class C | 43 | — | |
Administration and accounting fees | 34 | 104 | |
Transfer agent fees and expenses | 14 | 41 | |
Sub-transfer agent fees and expenses, Class A | 5 | 13 | |
Sub-transfer agent fees and expenses, Class C | 4 | — | |
Sub-transfer agent fees and expenses, Class I | 32 | 47 | |
Printing fees and expenses | 13 | 7 | |
Professional fees | 24 | 31 | |
Registration fees | 53 | 51 | |
Trustees’ fees and expenses | 2 | 8 | |
Miscellaneous expenses | 4 | 16 | |
Total expenses | 489 | 1,177 | |
Less expenses reimbursed and/or waived by investment adviser(1) | (78) | 3 | |
Low balance account fees | —(2) | — | |
Net expenses | 411 | 1,180 | |
Net investment income (loss) | (260) | 231 | |
| Net Realized and Unrealized Gain (Loss) on Investments | |||
| Net realized gain (loss) from: | |||
Investments | 3,012 | 2,902 | |
Foreign currency transactions | — | (10) | |
| Net change in unrealized appreciation (depreciation) from: | |||
Investments | (4,387) | (10,042) | |
Foreign currency transactions | — | (2) | |
Net realized and unrealized gain (loss) on investments | (1,375) | (7,152) | |
Net increase (decrease) in net assets resulting from operations | $(1,635) | $(6,921) |
| (1) | See note 3D in the Notes to Financial Statements for information on recapture of expenses previously waived. |
| (2) | Amount is less than $500. |
| Zevenbergen Innovative Growth Stock Fund | |
| Investment Income | |
Dividends | $82 |
Interest | 10 |
Total investment income | 92 |
| Expenses | |
Investment advisory fees | 637 |
Distribution and service fees, Class A | 43 |
Administration and accounting fees | 81 |
Transfer agent fees and expenses | 33 |
Sub-transfer agent fees and expenses, Class A | 19 |
Sub-transfer agent fees and expenses, Class I | 72 |
Printing fees and expenses | 7 |
Professional fees | 24 |
Interest expense | 6 |
Registration fees | 38 |
Trustees’ fees and expenses | 4 |
Miscellaneous expenses | 6 |
Total expenses | 970 |
Less expenses reimbursed and/or waived by investment adviser(1) | 26 |
Net expenses | 996 |
Net investment income (loss) | (904) |
| Net Realized and Unrealized Gain (Loss) on Investments | |
| Net realized gain (loss) from: | |
Investments | (4,755) |
| Net change in unrealized appreciation (depreciation) from: | |
Investments | (6,273) |
Net realized and unrealized gain (loss) on investments | (11,028) |
Net increase (decrease) in net assets resulting from operations | $(11,932) |
| (1) | See note 3D in the Notes to Financial Statements for information on recapture of expenses previously waived. |
| Ceredex Large-Cap Value Equity Fund | Ceredex Mid-Cap Value Equity Fund | ||||||||||
| Year Ended December 31, 2018 | Fiscal Period Ended December 31, 2017(1) | Year Ended March 31, 2017 | Year Ended December 31, 2018 | Fiscal Period Ended December 31, 2017(1) | Year Ended March 31, 2017 | ||||||
| Increase (Decrease) in Net Assets Resulting From Operations | |||||||||||
Net investment income (loss) | $24,470 | $19,624 | $36,457 | $25,960 | $24,387 | $35,799 | |||||
Net realized gain (loss) | 270,639 | 156,109 | 198,054 | 200,467 | 318,771 | 416,382 | |||||
Net change in unrealized appreciation (depreciation) | (452,928) | 56,565 | 129,587 | (438,316) | (166,469) | 220,581 | |||||
Increase (decrease) in net assets resulting from operations | (157,819) | 232,298 | 364,098 | (211,889) | 176,689 | 672,762 | |||||
| Dividends and Distributions to Shareholders: | |||||||||||
| Net Investment Income and Net Realized Gains: | |||||||||||
Class A | (53,457) | (50,118)(2) | (6,236)(2) | (35,327) | (60,884)(2) | (16,666)(2) | |||||
Class C | (3,328) | (2,737)(2) | (246)(2) | (7,006) | (9,261)(2) | (2,274)(2) | |||||
Class I | (194,163) | (202,949)(2) | (29,227)(2) | (234,040) | (413,017)(2) | (123,298)(2) | |||||
Class R6 | (65,935) | (54,852)(2) | (6,698)(2) | (51,699) | (70,499)(2) | (12,191)(2) | |||||
Total Dividends and Distributions to Shareholders | (316,883) | (310,656) | (42,407) | (328,072) | (553,661) | (154,429) | |||||
| Change in Net Assets From Capital Transactions (See Note 5) | |||||||||||
Class A | (19,255) | 1,064 | (81,052) | 10,046 | (6,422) | (87,956) | |||||
Class C | 1,976 | (79) | (3,284) | 17,005 | (139) | (17,440) | |||||
Class I | (209,198) | (81,764) | (229,798) | (30,972) | (248,008) | (416,649) | |||||
Class R6 | 33,668 | 28,012 | 6,109 | 110,772 | 144,459 | 64,349 | |||||
Increase (decrease) in net assets from share transactions | (192,809) | (52,767) | (308,025) | 106,851 | (110,110) | (457,696) | |||||
Net increase (decrease) in net assets | (667,511) | (131,125) | 13,666 | (433,110) | (487,082) | 60,637 | |||||
| Net Assets | |||||||||||
Beginning of period | 1,977,847 | 2,108,972 | 2,095,306 | 2,945,714 | 3,432,796 | 3,372,159 | |||||
End of Period | $1,310,336 | $1,977,847 | $2,108,972 | $2,512,604 | $2,945,714 | $3,432,796 | |||||
Accumulated undistributed net investment income (loss) at end of period | N/A | $67 | $8,368 | N/A | $293 | $2,004 | |||||
| (1) | Period from April 1, 2017 to December 31, 2017. The Fund had a fiscal period end change from March 31 to December 31. |
| (2) | For the fiscal period ended December 31, 2017 and the year ended March 31, 2017, the distributions to shareholders for the Funds were as follows: |
| Dividends and Distributions to Shareholders | ||||||||
| Net investment income: | ||||||||
Class A | $(3,620) | $(4,823) | $(1,936) | $(3,509) | ||||
Class C | (125) | (171) | (99) | (286) | ||||
Class I | (17,469) | (23,506) | (19,862) | (31,949) | ||||
Class R6 | (5,496) | (5,537) | (4,155) | (3,721) | ||||
| Net realized gains: | ||||||||
Class A | (46,498) | (1,413) | (58,948) | (13,157) | ||||
Class C | (2,612) | (75) | (9,162) | (1,988) | ||||
Class I | (185,480) | (5,721) | (393,155) | (91,349) | ||||
Class R6 | (49,356) | (1,161) | (66,344) | (8,470) | ||||
Total | $(310,656) | $(42,407) | $(553,661) | $(154,429) |
| Ceredex Small-Cap Value Equity Fund | Silvant Large-Cap Growth Stock Fund | ||||||||||
| Year Ended December 31, 2018 | Fiscal Period Ended December 31, 2017(1) | Year Ended March 31, 2017 | Year Ended December 31, 2018 | Fiscal Period Ended December 31, 2017(1) | Year Ended March 31, 2017 | ||||||
| Increase (Decrease) in Net Assets Resulting From Operations | |||||||||||
Net investment income (loss) | $6,726 | $10,800 | $7,641 | $(539) | $(143) | $(517) | |||||
Net realized gain (loss) | 83,332 | 68,490 | 123,271 | 19,079 | 50,580 | 51,579 | |||||
Net change in unrealized appreciation (depreciation) | (169,458) | (11,900) | 47,650 | (17,667) | (24,440) | (34,343) | |||||
Increase (decrease) in net assets resulting from operations | (79,400) | 67,390 | 178,562 | 873 | 25,997 | 16,719 | |||||
| Dividends and Distributions to Shareholders: | |||||||||||
| Net Investment Income and Net Realized Gains: | |||||||||||
Class A | (11,429) | (18,899)(2) | (6,358)(2) | (9,081) | (24,485)(2) | (8,690)(2) | |||||
Class C | (2,616) | (3,749)(2) | (1,413)(2) | (13,661) | (24,341)(2) | (7,643)(2) | |||||
Class I | (78,044) | (112,345)(2) | (41,140)(2) | (2,603) | (8,681)(2) | (11,447)(2) | |||||
Class R6 | — | —(2) | —(2) | (35) | (2,009)(2) | (3,486)(2) | |||||
Total Dividends and Distributions to Shareholders | (92,089) | (134,993) | (48,911) | (25,380) | (59,516) | (31,266) | |||||
| Change in Net Assets From Capital Transactions (See Note 5) | |||||||||||
Class A | (23,950) | 846 | (14,300) | (9,053) | 16,370 | 2,917 | |||||
Class C | (1,347) | (1,722) | (6,505) | 8,694 | 19,256 | 1,175 | |||||
Class I | (53,716) | (57,002) | (143,477) | (2,937) | (66,828) | (13,861) | |||||
Class R6 | — | — | — | (358) | (24,152) | (11,595) | |||||
Increase (decrease) in net assets from share transactions | (79,013) | (57,878) | (164,282) | (3,654) | (55,354) | (21,364) | |||||
Net increase (decrease) in net assets | (250,502) | (125,481) | (34,631) | (28,161) | (88,873) | (35,911) | |||||
| Net Assets | |||||||||||
Beginning of period | 808,789 | 934,270 | 968,901 | 125,066 | 213,939 | 249,850 | |||||
End of Period | $558,287 | $808,789 | $934,270 | $96,905 | $125,066 | $213,939 | |||||
Accumulated undistributed net investment income (loss) at end of period | N/A | $(20) | $— | N/A | $(3) | $(129) | |||||
| (1) | Period from April 1, 2017 to December 31, 2017. The Fund had a fiscal period end change from March 31 to December 31. |
| (2) | For the fiscal period ended December 31, 2017 and the year ended March 31, 2017, the distributions to shareholders for the Funds were as follows: |
| Dividends and Distributions to Shareholders | ||||||||
| Net investment income: | ||||||||
Class A | $(1,424) | $(919) | $— | $— | ||||
Class C | (197) | (131) | — | — | ||||
Class I | (9,199) | (7,849) | — | — | ||||
| Net realized gains: | ||||||||
Class A | (17,475) | (5,439) | (24,485) | (8,690) | ||||
Class C | (3,552) | (1,282) | (24,341) | (7,643) | ||||
Class I | (103,146) | (33,291) | (8,681) | (11,447) | ||||
Class R6 | — | — | (2,009) | (3,486) | ||||
Total | $(134,993) | $(48,911) | $(59,516) | $(31,266) |
| Silvant Small-Cap Growth Stock Fund | WCM International Equity Fund | ||||||||||
| Year Ended December 31, 2018 | Fiscal Period Ended December 31, 2017(1) | Year Ended March 31, 2017 | Year Ended December 31, 2018 | Fiscal Period Ended December 31, 2017(1) | Year Ended March 31, 2017 | ||||||
| Increase (Decrease) in Net Assets Resulting From Operations | |||||||||||
Net investment income (loss) | $(260) | $(182) | $(245) | $231 | $252 | $193 | |||||
Net realized gain (loss) | 3,012 | 3,773 | 6,630 | 2,892 | 825 | (210) | |||||
Net change in unrealized appreciation (depreciation) | (4,387) | (231) | 2,168 | (10,044) | 13,350 | 5,751 | |||||
Increase (decrease) in net assets resulting from operations | (1,635) | 3,360 | 8,553 | (6,921) | 14,427 | 5,734 | |||||
| Dividends and Distributions to Shareholders: | |||||||||||
| Net Investment Income and Net Realized Gains: | |||||||||||
Class A | (757) | (1,011)(2) | (1,016)(2) | (17) | (15)(2) | (140)(2) | |||||
Class C | (1,343) | (1,459)(2) | (1,293)(2) | — | —(2) | —(2) | |||||
Class I | (1,526) | (2,493)(2) | (3,661)(2) | (193) | (82)(2) | (424)(2) | |||||
Class R6 | — | —(2) | (441)(2) | (28) | (13)(2) | (65)(2) | |||||
Total Dividends and Distributions to Shareholders | (3,626) | (4,963) | (6,411) | (238) | (110) | (629) | |||||
| Change in Net Assets From Capital Transactions (See Note 5) | |||||||||||
Class A | 25 | 144 | (77) | 5,263 | 1,737 | 9,517 | |||||
Class C | 865 | 594 | 563 | — | — | — | |||||
Class I | (1,622) | (9,959) | (11,756) | 2,640 | 8,947 | 18,634 | |||||
Class R6 | — | (300) | (1,218) | (9,108) | 1,393 | 194 | |||||
Increase (decrease) in net assets from share transactions | (732) | (9,521) | (12,488) | (1,205) | 12,077 | 28,345 | |||||
Net increase (decrease) in net assets | (5,993) | (11,124) | (10,346) | (8,364) | 26,394 | 33,450 | |||||
| Net Assets | |||||||||||
Beginning of period | 29,796 | 40,920 | 51,266 | 98,188 | 71,794 | 38,344 | |||||
End of Period | $23,803 | $29,796 | $40,920 | $89,824 | $98,188 | $71,794 | |||||
Accumulated undistributed net investment income (loss) at end of period | N/A | $(1) | $(67) | N/A | $233 | $110 | |||||
| (1) | Period from April 1, 2017 to December 31, 2017. The Fund had a fiscal period end change from March 31 to December 31. |
| (2) | For the fiscal period ended December 31, 2017 and the year ended March 31, 2017, the distributions to shareholders for the Funds were as follows: |
| Dividends and Distributions to Shareholders | ||||||||
| Net investment income: | ||||||||
Class A | $— | $— | $(15) | $(61) | ||||
Class I | — | — | (82) | (198) | ||||
Class R6 | — | — | (13) | (33) | ||||
| Net realized gains: | ||||||||
Class A | (1,011) | (1,016) | — | (79) | ||||
Class C | (1,459) | (1,293) | — | — | ||||
Class I | (2,493) | (3,661) | — | (226) | ||||
Class R6 | — | (441) | — | (32) | ||||
Total | $(4,963) | $(6,411) | $(110) | $(629) |
| Zevenbergen Innovative Growth Stock Fund | |||||
| Year Ended December 31, 2018 | Fiscal Period Ended December 31, 2017(1) | Year Ended March 31, 2017 | |||
| Increase (Decrease) in Net Assets Resulting From Operations | |||||
Net investment income (loss) | $(904) | $(263) | $(298) | ||
Net realized gain (loss) | (4,755) | 3,302 | 3,193 | ||
Net change in unrealized appreciation (depreciation) | (6,273) | 1,372 | 1,488 | ||
Increase (decrease) in net assets resulting from operations | (11,932) | 4,411 | 4,383 | ||
| Dividends and Distributions to Shareholders: | |||||
| Net Investment Income and Net Realized Gains: | |||||
Class A | (1,337) | (584)(2) | (971)(2) | ||
Class I | (4,041) | (1,867)(2) | (2,005)(2) | ||
Total Dividends and Distributions to Shareholders | (5,378) | (2,451) | (2,976) | ||
| Change in Net Assets From Capital Transactions (See Note 5) | |||||
Class A | 23,715 | (1,424) | (2,020) | ||
Class I | 67,787 | (6,127) | 2,988 | ||
Increase (decrease) in net assets from share transactions | 91,502 | (7,551) | 968 | ||
Net increase (decrease) in net assets | 74,192 | (5,591) | 2,375 | ||
| Net Assets | |||||
Beginning of period | 23,114 | 28,705 | 26,330 | ||
End of Period | $97,306 | $23,114 | $28,705 | ||
Accumulated undistributed net investment income (loss) at end of period | N/A | $(1) | $(78) | ||
| (1) | Period from April 1, 2017 to December 31, 2017. The Fund had a fiscal period end change from March 31 to December 31. |
| (2) | For the fiscal period ended December 31, 2017 and the year ended March 31, 2017, the distributions to shareholders for the Funds were as follows: |
| Dividends and Distributions to Shareholders | ||||
| Net realized gains: | ||||
Class A | $ | $(584) | $(971) | |
Class I | (1,867) | (2,005) | ||
Total | $(2,451) | $(2,976) |
THROUGHOUT EACH PERIOD
| Net Asset Value, Beginning of Period | Net Investment Income (Loss)(1) | Net Realized and Unrealized Gain (Loss) | Total from Investment Operations | Dividends from Net Investment Income | Distributions from Net Realized Gains | Total Distributions | Change in Net Asset Value | Net Asset Value, End of Period | Total Return(2) | Net Assets, End of Period (in thousands) | Ratio of Net Expenses to Average Net Assets(3)(4) | Ratio of Gross Expenses to Average Net Assets(3)(4) | Ratio of Net Investment Income (Loss) to Average Net Assets(3) | Portfolio Turnover Rate(5) | ||
| Ceredex Large-Cap Value Equity Fund | ||||||||||||||||
| Class A | ||||||||||||||||
| 1/1/18 to 12/31/18 | $16.20 | 0.18 | (1.81) | (1.63) | (0.24) | (3.12) | (3.36) | (4.99) | 11.21 | (10.63) % | $223,853 | 1.24 % | 1.27 % | 1.16 % | 128 % | |
| 4/1/17 to 12/31/17(6) | 16.98 | 0.13 | 1.84 | 1.97 | (0.20) | (2.55) | (2.75) | (0.78) | 16.20 | 12.14 | 323,202 | 1.24 | 1.30 | 1.04 | 54 | |
| 4/1/16 to 3/31/17 | 14.60 | 0.23 | 2.43 | 2.66 | (0.22) | (0.06) | (0.28) | 2.38 | 16.98 | 18.31 | 335,256 | 1.25 | 1.36 | 1.45 | 77 | |
| 4/1/15 to 3/31/16 | 16.48 | 0.17 | (0.56) | (0.39) | (0.19) | (1.30) | (1.49) | (1.88) | 14.60 | (2.46) | 362,805 | 1.27 | 1.37 | 1.09 | 66 | |
| 4/1/14 to 3/31/15 | 16.90 | 0.18 | 0.99 | 1.17 | (0.18) | (1.41) | (1.59) | (0.42) | 16.48 | 6.98 | 461,642 | 1.25 | 1.36 | 1.03 | 73 | |
| 4/1/13 to 3/31/14 | 15.67 | 0.19 | 3.27 | 3.46 | (0.19) | (2.04) | (2.23) | 1.23 | 16.90 | 22.60 | 379,768 | 1.19 | 1.37 | 1.13 | 81 | |
| Class C | ||||||||||||||||
| 1/1/18 to 12/31/18 | $15.78 | 0.11 | (1.77) | (1.66) | (0.14) | (3.12) | (3.26) | (4.92) | 10.86 | (11.09) % | $14,625 | 1.72 % | 1.92 % | 0.69 % | 128 % | |
| 4/1/17 to 12/31/17(6) | 16.59 | 0.08 | 1.78 | 1.86 | (0.12) | (2.55) | (2.67) | (0.81) | 15.78 | 11.76 | 17,744 | 1.68 | 1.86 | 0.61 | 54 | |
| 4/1/16 to 3/31/17 | 14.28 | 0.15 | 2.37 | 2.52 | (0.15) | (0.06) | (0.21) | 2.31 | 16.59 | 17.70 | 18,590 | 1.72 | 1.72 | 0.98 | 77 | |
| 4/1/15 to 3/31/16 | 16.15 | 0.10 | (0.55) | (0.45) | (0.12) | (1.30) | (1.42) | (1.87) | 14.28 | (2.88) | 19,053 | 1.71 | 1.71 | 0.65 | 66 | |
| 4/1/14 to 3/31/15 | 16.59 | 0.10 | 0.97 | 1.07 | (0.10) | (1.41) | (1.51) | (0.44) | 16.15 | 6.50 | 21,207 | 1.71 | 1.71 | 0.57 | 73 | |
| 4/1/13 to 3/31/14 | 15.42 | 0.10 | 3.22 | 3.32 | (0.11) | (2.04) | (2.15) | 1.17 | 16.59 | 21.98 | 20,239 | 1.71 | 1.71 | 0.62 | 81 | |
| Class I | ||||||||||||||||
| 1/1/18 to 12/31/18 | $16.35 | 0.23 | (1.84) | (1.61) | (0.28) | (3.12) | (3.40) | (5.01) | 11.34 | (10.39) % | $799,262 | 0.97 % | 1.02 % | 1.43 % | 128 % | |
| 4/1/17 to 12/31/17(6) | 17.11 | 0.17 | 1.86 | 2.03 | (0.24) | (2.55) | (2.79) | (0.76) | 16.35 | 12.42 | 1,300,385 | 0.97 | 1.05 | 1.31 | 54 | |
| 4/1/16 to 3/31/17 | 14.71 | 0.28 | 2.45 | 2.73 | (0.27) | (0.06) | (0.33) | 2.40 | 17.11 | 18.63 | 1,432,996 | 0.97 | 1.09 | 1.73 | 77 | |
| 4/1/15 to 3/31/16 | 16.60 | 0.22 | (0.57) | (0.35) | (0.24) | (1.30) | (1.54) | (1.89) | 14.71 | (2.19) | 1,440,587 | 0.97 | 1.09 | 1.40 | 66 | |
| 4/1/14 to 3/31/15 | 17.02 | 0.23 | 0.99 | 1.22 | (0.23) | (1.41) | (1.64) | (0.42) | 16.60 | 7.25 | 1,927,039 | 0.95 | 1.07 | 1.33 | 73 | |
| 4/1/13 to 3/31/14 | 15.76 | 0.24 | 3.29 | 3.53 | (0.23) | (2.04) | (2.27) | 1.26 | 17.02 | 22.94 | 1,799,158 | 0.91 | 1.06 | 1.42 | 81 | |
| Class R6* | ||||||||||||||||
| 1/1/18 to 12/31/18 | $16.41 | 0.27 | (1.85) | (1.58) | (0.32) | (3.12) | (3.44) | (5.02) | 11.39 | (10.22) % | $272,596 | 0.72 % | 0.83 % | 1.69 % | 128 % | |
| 4/1/17 to 12/31/17(6) | 17.18 | 0.21 | 1.85 | 2.06 | (0.28) | (2.55) | (2.83) | (0.77) | 16.41 | 12.60 | 336,516 | 0.72 | 0.80 | 1.57 | 54 | |
| 4/1/16 to 3/31/17 | 14.77 | 0.32 | 2.46 | 2.78 | (0.31) | (0.06) | (0.37) | 2.41 | 17.18 | 18.92 | 322,129 | 0.72 | 0.72 | 1.98 | 77 | |
| 4/1/15 to 3/31/16 | 16.66 | 0.23 | (0.53) | (0.30) | (0.29) | (1.30) | (1.59) | (1.89) | 14.77 | (1.90) | 272,861 | 0.72 | 0.72 | 1.48 | 66 | |
| 8/1/14 to 3/31/15(7) | 17.54 | 0.19 | 0.54 | 0.73 | (0.20) | (1.41) | (1.61) | (0.88) | 16.66 | 4.26 | 37,570 | 0.71 | 0.71 | 1.65 | 73 | |
| Ceredex Mid-Cap Value Equity Fund | ||||||||||||||||
| Class A | ||||||||||||||||
| 1/1/18 to 12/31/18 | $12.50 | 0.07 | (1.02) | (0.95) | (0.09) | (1.35) | (1.44) | (2.39) | 10.11 | (8.08) % | $271,620 | 1.38 %(8) | 1.31 % | 0.55 % | 109 % | |
| 4/1/17 to 12/31/17(6) | 14.33 | 0.08 | 0.69 | 0.77 | (0.08) | (2.52) | (2.60) | (1.83) | 12.50 | 5.87 | 320,717 | 1.38 | 1.37 (9) | 0.75 (9) | 82 | |
| 4/1/16 to 3/31/17 | 12.22 | 0.11 | 2.63 | 2.74 | (0.13) | (0.50) | (0.63) | 2.11 | 14.33 | 22.69 | 369,102 | 1.39 | 1.45 | 0.81 | 108 | |
| 4/1/15 to 3/31/16 | 13.60 | 0.11 | (0.70) | (0.59) | (0.10) | (0.69) | (0.79) | (1.38) | 12.22 | (4.11) | 397,599 | 1.40 | 1.45 | 0.86 | 98 | |
| 4/1/14 to 3/31/15 | 13.96 | 0.09 | 0.92 | 1.01 | (0.08) | (1.29) | (1.37) | (0.36) | 13.60 | 7.45 | 590,327 | 1.38 | 1.41 | 0.64 | 94 | |
| 4/1/13 to 3/31/14 | 12.96 | 0.10 | 2.62 | 2.72 | (0.09) | (1.63) | (1.72) | 1.00 | 13.96 | 21.68 | 611,880 | 1.35 | 1.40 | 0.76 | 108 | |
| Class C | ||||||||||||||||
| 1/1/18 to 12/31/18 | $12.18 | 0.02 | (1.00) | (0.98) | (0.01) | (1.35) | (1.36) | (2.34) | 9.84 | (8.53) % | $53,419 | 1.79 % | 1.97 % | 0.17 % | 109 % | |
| 4/1/17 to 12/31/17(6) | 14.02 | 0.03 | 0.68 | 0.71 | (0.03) | (2.52) | (2.55) | (1.84) | 12.18 | 5.52 | 48,877 | 1.80 | 1.92 | 0.33 | 82 | |
| 4/1/16 to 3/31/17 | 11.96 | 0.05 | 2.58 | 2.63 | (0.07) | (0.50) | (0.57) | 2.06 | 14.02 | 22.23 | 55,580 | 1.80 | 1.80 | 0.39 | 108 | |
| 4/1/15 to 3/31/16 | 13.34 | 0.06 | (0.68) | (0.62) | (0.07) | (0.69) | (0.76) | (1.38) | 11.96 | (4.49) | 64,160 | 1.78 | 1.78 | 0.50 | 98 | |
| 4/1/14 to 3/31/15 | 13.72 | 0.04 | 0.90 | 0.94 | (0.03) | (1.29) | (1.32) | (0.38) | 13.34 | 7.06 | 87,115 | 1.75 | 1.75 | 0.28 | 94 | |
| 4/1/13 to 3/31/14 | 12.77 | 0.05 | 2.58 | 2.63 | (0.05) | (1.63) | (1.68) | 0.95 | 13.72 | 21.26 | 81,961 | 1.76 | 1.76 | 0.36 | 108 |
| Net Asset Value, Beginning of Period | Net Investment Income (Loss)(1) | Net Realized and Unrealized Gain (Loss) | Total from Investment Operations | Dividends from Net Investment Income | Distributions from Net Realized Gains | Total Distributions | Change in Net Asset Value | Net Asset Value, End of Period | Total Return(2) | Net Assets, End of Period (in thousands) | Ratio of Net Expenses to Average Net Assets(3)(4) | Ratio of Gross Expenses to Average Net Assets(3)(4) | Ratio of Net Investment Income (Loss) to Average Net Assets(3) | Portfolio Turnover Rate(5) | ||
| Ceredex Mid-Cap Value Equity Fund (Continued) | ||||||||||||||||
| Class I | ||||||||||||||||
| 1/1/18 to 12/31/18 | $12.66 | 0.12 | (1.05) | (0.93) | (0.13) | (1.35) | (1.48) | (2.41) | 10.25 | (7.83) % | $1,775,643 | 1.01 %(10) | 1.01 % | 0.92 % | 109 % | |
| 4/1/17 to 12/31/17(6) | 14.48 | 0.12 | 0.70 | 0.82 | (0.12) | (2.52) | (2.64) | (1.82) | 12.66 | 6.21 | 2,187,625 | 1.04 | 1.04 | 1.09 | 82 | |
| 4/1/16 to 3/31/17 | 12.34 | 0.15 | 2.66 | 2.81 | (0.17) | (0.50) | (0.67) | 2.14 | 14.48 | 23.08 | 2,716,560 | 1.08 | 1.08 | 1.12 | 108 | |
| 4/1/15 to 3/31/16 | 13.74 | 0.15 | (0.71) | (0.56) | (0.15) | (0.69) | (0.84) | (1.40) | 12.34 | (3.85) | 2,717,761 | 1.12 | 1.12 | 1.16 | 98 | |
| 4/1/14 to 3/31/15 | 14.09 | 0.13 | 0.93 | 1.06 | (0.12) | (1.29) | (1.41) | (0.35) | 13.74 | 7.76 | 3,552,288 | 1.10 | 1.10 | 0.92 | 94 | |
| 4/1/13 to 3/31/14 | 13.06 | 0.14 | 2.64 | 2.78 | (0.12) | (1.63) | (1.75) | 1.03 | 14.09 | 22.03 | 3,159,585 | 1.09 | 1.10 | 1.02 | 108 | |
| Class R6* | ||||||||||||||||
| 1/1/18 to 12/31/18 | $12.67 | 0.15 | (1.05) | (0.90) | (0.15) | (1.35) | (1.50) | (2.40) | 10.27 | (7.58) % | $411,922 | 0.79 % | 0.87 % | 1.17 % | 109 % | |
| 4/1/17 to 12/31/17(6) | 14.49 | 0.15 | 0.70 | 0.85 | (0.15) | (2.52) | (2.67) | (1.82) | 12.67 | 6.41 | 388,495 | 0.80 | 0.85 | 1.37 | 82 | |
| 4/1/16 to 3/31/17 | 12.36 | 0.19 | 2.66 | 2.85 | (0.22) | (0.50) | (0.72) | 2.13 | 14.49 | 23.34 | 291,554 | 0.80 | 0.80 | 1.44 | 108 | |
| 4/1/15 to 3/31/16 | 13.76 | 0.21 | (0.72) | (0.51) | (0.20) | (0.69) | (0.89) | (1.40) | 12.36 | (3.45) | 192,640 | 0.80 | 0.80 | 1.68 | 98 | |
| 8/1/14 to 3/31/15(7) | 14.28 | 0.13 | 0.77 | 0.90 | (0.13) | (1.29) | (1.42) | (0.52) | 13.76 | 6.54 | 23,398 | 0.75 | 0.75 | 1.39 | 94 | |
| Ceredex Small-Cap Value Equity Fund | ||||||||||||||||
| Class A | ||||||||||||||||
| 1/1/18 to 12/31/18 | $11.53 | 0.08 | (1.51) | (1.43) | (0.15) | (1.50) | (1.65) | (3.08) | 8.45 | (12.70) % | $69,223 | 1.46 %(10) | 1.46 % | 0.68 % | 44 % | |
| 4/1/17 to 12/31/17(6) | 12.58 | 0.14 | 0.90 | 1.04 | (0.16) | (1.93) | (2.09) | (1.05) | 11.53 | 8.74 | 114,673 | 1.47 | 1.50 | 1.52 | 15 | |
| 4/1/16 to 3/31/17 | 10.96 | 0.07 | 2.20 | 2.27 | (0.09) | (0.56) | (0.65) | 1.62 | 12.58 | 20.81 | 123,495 | 1.55 | 1.55 | 0.58 | 29 | |
| 4/1/15 to 3/31/16 | 15.25 | 0.08 | (0.50) | (0.42) | (0.15) | (3.72) | (3.87) | (4.29) | 10.96 | (1.07) | 121,367 | 1.55 | 1.55 | 0.62 | 36 | |
| 4/1/14 to 3/31/15 | 17.61 | 0.15 | 0.38 | 0.53 | (0.10) | (2.79) | (2.89) | (2.36) | 15.25 | 3.79 | 162,732 | 1.52 | 1.52 | 0.89 | 10 | |
| 4/1/13 to 3/31/14 | 15.19 | 0.12 | 3.05 | 3.17 | (0.11) | (0.64) | (0.75) | 2.42 | 17.61 | 20.96 | 195,098 | 1.50 | 1.50 | 0.73 | 37 | |
| Class C | ||||||||||||||||
| 1/1/18 to 12/31/18 | $10.31 | 0.02 | (1.34) | (1.32) | (0.08) | (1.50) | (1.58) | (2.90) | 7.41 | (13.07) % | $14,473 | 1.90 % | 2.09 % | 0.23 % | 44 % | |
| 4/1/17 to 12/31/17(6) | 11.46 | 0.09 | 0.80 | 0.89 | (0.11) | (1.93) | (2.04) | (1.15) | 10.31 | 8.28 | 20,658 | 1.90 | 2.07 | 1.05 | 15 | |
| 4/1/16 to 3/31/17 | 10.04 | 0.02 | 2.02 | 2.04 | (0.06) | (0.56) | (0.62) | 1.42 | 11.46 | 20.35 | 24,529 | 1.90 | 1.90 | 0.22 | 29 | |
| 4/1/15 to 3/31/16 | 14.31 | 0.03 | (0.47) | (0.44) | (0.11) | (3.72) | (3.83) | (4.27) | 10.04 | (1.34) | 27,410 | 1.90 | 1.90 | 0.28 | 36 | |
| 4/1/14 to 3/31/15 | 16.71 | 0.08 | 0.36 | 0.44 | (0.05) | (2.79) | (2.84) | (2.40) | 14.31 | 3.42 | 33,793 | 1.88 | 1.88 | 0.54 | 10 | |
| 4/1/13 to 3/31/14 | 14.47 | 0.06 | 2.90 | 2.96 | (0.08) | (0.64) | (0.72) | 2.24 | 16.71 | 20.53 | 38,408 | 1.87 | 1.87 | 0.36 | 37 | |
| Class I | ||||||||||||||||
| 1/1/18 to 12/31/18 | $11.98 | 0.12 | (1.58) | (1.46) | (0.19) | (1.50) | (1.69) | (3.15) | 8.83 | (12.50) % | $474,591 | 1.18 %(10) | 1.18 % | 0.99 % | 44 % | |
| 4/1/17 to 12/31/17(6) | 12.99 | 0.16 | 0.94 | 1.10 | (0.18) | (1.93) | (2.11) | (1.01) | 11.98 | 8.94 | 673,458 | 1.22 | 1.22 | 1.72 | 15 | |
| 4/1/16 to 3/31/17 | 11.30 | 0.11 | 2.27 | 2.38 | (0.13) | (0.56) | (0.69) | 1.69 | 12.99 | 21.15 | 786,245 | 1.24 | 1.24 | 0.87 | 29 | |
| 4/1/15 to 3/31/16 | 15.59 | 0.13 | (0.50) | (0.37) | (0.20) | (3.72) | (3.92) | (4.29) | 11.30 | (0.64) | 820,124 | 1.21 | 1.21 | 0.93 | 36 | |
| 4/1/14 to 3/31/15 | 17.95 | 0.20 | 0.38 | 0.58 | (0.15) | (2.79) | (2.94) | (2.36) | 15.59 | 4.07 | 1,118,190 | 1.21 | 1.21 | 1.16 | 10 | |
| 4/1/13 to 3/31/14 | 15.45 | 0.17 | 3.11 | 3.28 | (0.14) | (0.64) | (0.78) | 2.50 | 17.95 | 21.34 | 1,528,174 | 1.22 | 1.22 | 1.01 | 37 |
| Net Asset Value, Beginning of Period | Net Investment Income (Loss)(1) | Net Realized and Unrealized Gain (Loss) | Total from Investment Operations | Dividends from Net Investment Income | Distributions from Net Realized Gains | Total Distributions | Change in Net Asset Value | Net Asset Value, End of Period | Total Return(2) | Net Assets, End of Period (in thousands) | Ratio of Net Expenses to Average Net Assets(3)(4) | Ratio of Gross Expenses to Average Net Assets(3)(4) | Ratio of Net Investment Income (Loss) to Average Net Assets(3) | Portfolio Turnover Rate(5) | ||
| Silvant Large-Cap Growth Stock Fund | ||||||||||||||||
| Class A | ||||||||||||||||
| 1/1/18 to 12/31/18 | $5.49 | (0.02) | 0.03 | 0.01 | — | (0.90) | (0.90) | (0.89) | 4.60 | (0.83) % | $45,779 | 1.23 % | 1.60 % | (0.29) % | 11 % | |
| 4/1/17 to 12/31/17(6) | 7.20 | (0.01) | 1.21 | 1.20 | — | (2.91) | (2.91) | (1.71) | 5.49 | 17.88 | 63,051 | 1.23 | 1.46 | (0.09) | 14 | |
| 4/1/16 to 3/31/17 | 7.81 | (0.02) | 0.57 | 0.55 | — | (1.16) | (1.16) | (0.61) | 7.20 | 7.83 | 60,900 | 1.23 | 1.24 | (0.27) | 42 | |
| 4/1/15 to 3/31/16 | 8.75 | (0.03) | (0.11) | (0.14) | — | (0.80) | (0.80) | (0.94) | 7.81 | (2.13) | 62,115 | 1.20 | 1.21 | (0.39) | 10 | |
| 4/1/14 to 3/31/15 | 8.35 | (0.02) | 1.20 | 1.18 | — | (0.78) | (0.78) | 0.40 | 8.75 | 14.83 | 65,953 | 1.18 | 1.19 | (0.26) | 13 | |
| 4/1/13 to 3/31/14 | 7.27 | (0.02) | 1.96 | 1.94 | — | (0.86) | (0.86) | 1.08 | 8.35 | 26.99 | 64,288 | 1.19 | 1.20 | (0.20) | 21 | |
| Class C | ||||||||||||||||
| 1/1/18 to 12/31/18 | $2.42 | (0.02) | 0.04 | 0.02 | — | (0.90) | (0.90) | (0.88) | 1.54 | (1.44) % | $31,782 | 1.90 % | 2.05 % | (0.95) % | 11 % | |
| 4/1/17 to 12/31/17(6) | 4.62 | (0.03) | 0.74 | 0.71 | — | (2.91) | (2.91) | (2.20) | 2.42 | 17.32 | 36,930 | 1.91 | 2.02 | (0.77) | 14 | |
| 4/1/16 to 3/31/17 | 5.45 | (0.05) | 0.38 | 0.33 | — | (1.16) | (1.16) | (0.83) | 4.62 | 7.16 | 36,141 | 1.90 | 1.90 | (0.95) | 42 | |
| 4/1/15 to 3/31/16 | 6.38 | (0.06) | (0.07) | (0.13) | — | (0.80) | (0.80) | (0.93) | 5.45 | (2.77) | 40,086 | 1.88 | 1.89 | (1.06) | 10 | |
| 4/1/14 to 3/31/15 | 6.32 | (0.06) | 0.90 | 0.84 | — | (0.78) | (0.78) | 0.06 | 6.38 | 14.20 | 46,678 | 1.86 | 1.87 | (0.90) | 13 | |
| 4/1/13 to 3/31/14 | 5.71 | (0.06) | 1.53 | 1.47 | — | (0.86) | (0.86) | 0.61 | 6.32 | 26.09 | 34,249 | 1.88 | 1.88 | (0.90) | 21 | |
| Class I | ||||||||||||||||
| 1/1/18 to 12/31/18 | $7.53 | —(11) | —(11) | — | — | (0.90) | (0.90) | (0.90) | 6.63 | (0.75) % | $19,234 | 0.97 % | 1.10 % | (0.02) % | 11 % | |
| 4/1/17 to 12/31/17(6) | 8.92 | 0.01 | 1.51 | 1.52 | — | (2.91) | (2.91) | (1.39) | 7.53 | 18.04 | 24,621 | 0.97 | 1.22 | 0.22 | 14 | |
| 4/1/16 to 3/31/17 | 9.38 | —(11) | 0.70 | 0.70 | — | (1.16) | (1.16) | (0.46) | 8.92 | 8.14 | 92,638 | 0.97 | 1.26 | (0.02) | 42 | |
| 4/1/15 to 3/31/16 | 10.32 | (0.02) | (0.12) | (0.14) | — | (0.80) | (0.80) | (0.94) | 9.38 | (1.79) | 110,562 | 0.97 | 1.24 | (0.15) | 10 | |
| 4/1/14 to 3/31/15 | 9.70 | — | 1.40 | 1.40 | — | (0.78) | (0.78) | 0.62 | 10.32 | 15.03 | 127,236 | 0.94 | 1.17 | (0.04) | 13 | |
| 4/1/13 to 3/31/14 | 8.31 | 0.01 | 2.24 | 2.25 | — | (0.86) | (0.86) | 1.39 | 9.70 | 27.35 | 188,294 | 0.92 | 1.09 | 0.07 | 21 | |
| Class R6* | ||||||||||||||||
| 1/1/18 to 12/31/18 | $7.59 | —(11) | —(11) | — | — | (0.90) | (0.90) | (0.90) | 6.69 | (0.73) % | $110 | 0.90 % | 0.95 % | 0.03 % | 11 % | |
| 4/1/17 to 12/31/17(6) | 8.94 | 0.02 | 1.54 | 1.56 | — | (2.91) | (2.91) | (1.35) | 7.59 | 18.53 | 464 | 0.91 | 0.93 | 0.28 | 14 | |
| 4/1/16 to 3/31/17 | 9.39 | 0.01 | 0.70 | 0.71 | — | (1.16) | (1.16) | (0.45) | 8.94 | 8.23 | 2,426 | 0.90 | 0.90 | 0.05 | 42 | |
| 4/1/15 to 3/31/16 | 10.33 | (0.01) | (0.13) | (0.14) | — | (0.80) | (0.80) | (0.94) | 9.39 | (1.80) | 37,087 | 0.88 | 0.89 | (0.06) | 10 | |
| 8/1/14 to 3/31/15(7) | 9.97 | 0.01 | 1.13 | 1.14 | — | (0.78) | (0.78) | 0.36 | 10.33 | 12.02 | 52,967 | 0.85 | 0.87 | 0.16 | 13 | |
| Silvant Small-Cap Growth Stock Fund | ||||||||||||||||
| Class A | ||||||||||||||||
| 1/1/18 to 12/31/18 | $6.92 | (0.06) | (0.36) | (0.42) | — | (0.82) | (0.82) | (1.24) | 5.68 | (6.69) % | $5,725 | 1.41 %(12) | 1.68 % | (0.88) % | 36 % | |
| 4/1/17 to 12/31/17(6) | 7.28 | (0.04) | 0.80 | 0.76 | — | (1.12) | (1.12) | (0.36) | 6.92 | 10.73 | 6,840 | 1.42 | 1.64 | (0.70) | 24 | |
| 4/1/16 to 3/31/17 | 7.13 | (0.04) | 1.38 | 1.34 | — | (1.19) | (1.19) | 0.15 | 7.28 | 19.30 | 7,008 | 1.41 | 1.43 | (0.55) | 56 | |
| 4/1/15 to 3/31/16 | 13.23 | (0.08) | (1.35) | (1.43) | — | (4.67) | (4.67) | (6.10) | 7.13 | (13.38) | 6,856 | 1.37 | 1.37 | (0.76) | 73 | |
| 4/1/14 to 3/31/15 | 15.30 | (0.13) | 0.56 | 0.43 | — | (2.50) | (2.50) | (2.07) | 13.23 | 4.21 | 9,889 | 1.32 | 1.32 | (0.96) | 31 | |
| 4/1/13 to 3/31/14 | 14.46 | (0.15) | 3.90 | 3.75 | — | (2.91) | (2.91) | 0.84 | 15.30 | 25.92 | 10,880 | 1.29 | 1.29 | (0.94) | 90 | |
| Class C | ||||||||||||||||
| 1/1/18 to 12/31/18 | $2.58 | (0.04) | (0.11) | (0.15) | — | (0.82) | (0.82) | (0.97) | 1.61 | (7.57) % | $3,565 | 2.07 %(12) | 2.45 % | (1.54) % | 36 % | |
| 4/1/17 to 12/31/17(6) | 3.37 | (0.03) | 0.36 | 0.33 | — | (1.12) | (1.12) | (0.79) | 2.58 | 10.46 | 4,319 | 2.09 | 2.39 | (1.37) | 24 | |
| 4/1/16 to 3/31/17 | 3.88 | (0.05) | 0.73 | 0.68 | — | (1.19) | (1.19) | (0.51) | 3.37 | 18.39 | 4,758 | 2.08 | 2.09 | (1.21) | 56 | |
| 4/1/15 to 3/31/16 | 9.53 | (0.10) | (0.88) | (0.98) | — | (4.67) | (4.67) | (5.65) | 3.88 | (13.91) | 4,686 | 2.02 | 2.02 | (1.40) | 73 | |
| 4/1/14 to 3/31/15 | 11.82 | (0.17) | 0.38 | 0.21 | — | (2.50) | (2.50) | (2.29) | 9.53 | 3.55 | 6,397 | 1.96 | 1.96 | (1.60) | 31 | |
| 4/1/13 to 3/31/14 | 11.77 | (0.20) | 3.16 | 2.96 | — | (2.91) | (2.91) | 0.05 | 11.82 | 25.10 | 7,255 | 1.94 | 1.94 | (1.59) | 90 |
| Net Asset Value, Beginning of Period | Net Investment Income (Loss)(1) | Net Realized and Unrealized Gain (Loss) | Total from Investment Operations | Dividends from Net Investment Income | Distributions from Net Realized Gains | Total Distributions | Change in Net Asset Value | Net Asset Value, End of Period | Total Return(2) | Net Assets, End of Period (in thousands) | Ratio of Net Expenses to Average Net Assets(3)(4) | Ratio of Gross Expenses to Average Net Assets(3)(4) | Ratio of Net Investment Income (Loss) to Average Net Assets(3) | Portfolio Turnover Rate(5) | ||
| Silvant Small-Cap Growth Stock Fund (Continued) | ||||||||||||||||
| Class I | ||||||||||||||||
| 1/1/18 to 12/31/18 | $8.78 | (0.07) | (0.47) | (0.54) | — | (0.82) | (0.82) | (1.36) | 7.42 | (6.64) % | $14,513 | 1.29 %(12) | 1.53 % | (0.76) % | 36 % | |
| 4/1/17 to 12/31/17(6) | 8.95 | (0.04) | 0.99 | 0.95 | — | (1.12) | (1.12) | (0.17) | 8.78 | 10.86 | 18,637 | 1.30 | 1.53 | (0.58) | 24 | |
| 4/1/16 to 3/31/17 | 8.52 | (0.04) | 1.66 | 1.62 | — | (1.19) | (1.19) | 0.43 | 8.95 | 19.45 | 26,929 | 1.29 | 1.43 | (0.44) | 56 | |
| 4/1/15 to 3/31/16 | 14.83 | (0.10) | (1.54) | (1.64) | — | (4.67) | (4.67) | (6.31) | 8.52 | (13.36) | 36,436 | 1.30 | 1.39 | (0.74) | 73 | |
| 4/1/14 to 3/31/15 | 16.82 | (0.14) | 0.65 | 0.51 | — | (2.50) | (2.50) | (1.99) | 14.83 | 4.31 | 126,223 | 1.28 | 1.34 | (0.92) | 31 | |
| 4/1/13 to 3/31/14 | 15.66 | (0.16) | 4.23 | 4.07 | — | (2.91) | (2.91) | 1.16 | 16.82 | 25.98 | 170,409 | 1.26 | 1.31 | (0.91) | 90 | |
| WCM International Equity Fund | ||||||||||||||||
| Class A | ||||||||||||||||
| 1/1/18 to 12/31/18 | $11.90 | —(11) | (0.94) | (0.94) | (0.01) | — | (0.01) | (0.95) | 10.95 | (7.90) % | $22,233 | 1.42 % | 1.44 % | 0.03 % | 37 % | |
| 4/1/17 to 12/31/17(6) | 10.05 | 0.02 | 1.84 | 1.86 | (0.01) | — | (0.01) | 1.85 | 11.90 | 18.50 | 18,567 | 1.43 | 1.56 | 0.20 | 17 | |
| 4/1/16 to 3/31/17 | 9.18 | 0.01 | 0.93 | 0.94 | (0.03) | (0.04) | (0.07) | 0.87 | 10.05 | 10.41 | 14,116 | 1.33 (13) | 1.43 (13) | 0.12 | 37 | |
| 4/1/15 to 3/31/16 | 10.34 | 0.09 | (0.27) | (0.18) | (0.06) | (0.92) | (0.98) | (1.16) | 9.18 | (1.77) | 3,756 | 1.51 | 1.77 | 0.89 | 114 | |
| 4/1/14 to 3/31/15 | 12.35 | 0.20 | (0.87) | (0.67) | (0.22) | (1.12) | (1.34) | (2.01) | 10.34 | (4.87) | 4,123 | 1.57 | 1.66 | 1.79 | 41 | |
| 4/1/13 to 3/31/14 | 11.51 | 0.20 | 2.00 | 2.20 | (1.14) | (0.22) | (1.36) | 0.84 | 12.35 | 19.72 | 4,802 | 1.47 | 1.47 | 1.66 | 43 | |
| Class I | ||||||||||||||||
| 1/1/18 to 12/31/18 | $12.09 | 0.03 | (0.96) | (0.93) | (0.03) | — | (0.03) | (0.96) | 11.13 | (7.69) % | $67,543 | 1.20 %(8) | 1.19 % | 0.28 % | 37 % | |
| 4/1/17 to 12/31/17(6) | 10.19 | 0.04 | 1.87 | 1.91 | (0.01) | — | (0.01) | 1.90 | 12.09 | 18.79 | 70,342 | 1.20 | 1.27 | 0.42 | 17 | |
| 4/1/16 to 3/31/17 | 9.30 | 0.03 | 0.94 | 0.97 | (0.04) | (0.04) | (0.08) | 0.89 | 10.19 | 10.54 | 51,120 | 1.14 (13) | 1.24 (13) | 0.34 | 37 | |
| 4/1/15 to 3/31/16 | 10.45 | 0.13 | (0.29) | (0.16) | (0.07) | (0.92) | (0.99) | (1.15) | 9.30 | (1.59) | 28,756 | 1.30 | 1.67 | 1.28 | 114 | |
| 4/1/14 to 3/31/15 | 12.45 | 0.25 | (0.90) | (0.65) | (0.23) | (1.12) | (1.35) | (2.00) | 10.45 | (4.59) | 19,023 | 1.37 | 1.48 | 2.15 | 41 | |
| 4/1/13 to 3/31/14 | 11.64 | 0.55 | 1.65 | 2.20 | (1.17) | (0.22) | (1.39) | 0.81 | 12.45 | 19.52 | 26,932 | 1.20 | 1.20 | 4.55 (14) | 43 | |
| Class R6* | ||||||||||||||||
| 1/1/18 to 12/31/18(15) | $12.11 | 0.05 | (0.97) | (0.92) | (0.04) | — | (0.04) | (0.96) | 11.15 | (7.63) % | $48 | 1.10 % | 1.11 % | 0.43 % | 37 % | |
| 4/1/17 to 12/31/17(6) | 10.20 | 0.04 | 1.89 | 1.93 | (0.02) | — | (0.02) | 1.91 | 12.11 | 18.89 | 9,279 | 1.10 | 1.19 | 0.42 | 17 | |
| 4/1/16 to 3/31/17 | 9.31 | 0.05 | 0.93 | 0.98 | (0.05) | (0.04) | (0.09) | 0.89 | 10.20 | 10.62 | 6,558 | 1.03 (13) | 1.14 (13) | 0.49 | 37 | |
| 9/1/15 to 3/31/16(16) | 9.85 | —(11) | 0.38 | 0.38 | — | (0.92) | (0.92) | (0.54) | 9.31 | 3.81 | 5,832 | 1.14 | 1.54 | 0.09 | 114 | |
| Zevenbergen Innovative Growth Stock Fund | ||||||||||||||||
| Class A | ||||||||||||||||
| 1/1/18 to 12/31/18 | $19.96 | (0.33) | 2.57 | 2.24 | — | (1.37) | (1.37) | 0.87 | 20.83 | 10.80 % | $24,902 | 1.48 %(8)(12) | 1.47 % | (1.35) % | 103 % | |
| 4/1/17 to 12/31/17(6) | 18.56 | (0.21) | 3.74 | 3.53 | — | (2.13) | (2.13) | 1.40 | 19.96 | 19.18 | 5,484 | 1.51 | 1.66 | (1.40) | 50 | |
| 4/1/16 to 3/31/17 | 18.37 | (0.26) | 3.67 | 3.41 | — | (3.22) | (3.22) | 0.19 | 18.56 | 20.42 | 6,375 | 1.50 | 1.55 | (1.39) | 64 | |
| 4/1/15 to 3/31/16 | 20.76 | (0.29) | (0.57) | (0.86) | — | (1.53) | (1.53) | (2.39) | 18.37 | (4.96) | 8,127 | 1.49 | 1.49 | (1.38) | 59 | |
| 4/1/14 to 3/31/15 | 20.53 | (0.28) | 1.17 | 0.89 | — | (0.66) | (0.66) | 0.23 | 20.76 | 4.47 | 10,535 | 1.45 | 1.45 | (1.34) | 42 | |
| 4/1/13 to 3/31/14 | 15.16 | (0.24) | 6.80 | 6.56 | — | (1.19) | (1.19) | 5.37 | 20.53 | 43.45 | 19,950 | 1.40 | 1.40 | (1.18) | 49 |
| Net Asset Value, Beginning of Period | Net Investment Income (Loss)(1) | Net Realized and Unrealized Gain (Loss) | Total from Investment Operations | Dividends from Net Investment Income | Distributions from Net Realized Gains | Total Distributions | Change in Net Asset Value | Net Asset Value, End of Period | Total Return(2) | Net Assets, End of Period (in thousands) | Ratio of Net Expenses to Average Net Assets(3)(4) | Ratio of Gross Expenses to Average Net Assets(3)(4) | Ratio of Net Investment Income (Loss) to Average Net Assets(3) | Portfolio Turnover Rate(5) | ||
| Zevenbergen Innovative Growth Stock Fund (Continued) | ||||||||||||||||
| Class I | ||||||||||||||||
| 1/1/18 to 12/31/18 | $21.10 | (0.30) | 2.72 | 2.42 | — | (1.37) | (1.37) | 1.05 | 22.15 | 11.07 % | $72,404 | 1.27 %(8)(12) | 1.23 % | (1.15) % | 103 % | |
| 4/1/17 to 12/31/17(6) | 19.49 | (0.19) | 3.93 | 3.74 | — | (2.13) | (2.13) | 1.61 | 21.10 | 19.34 | 17,630 | 1.31 | 1.50 | (1.19) | 50 | |
| 4/1/16 to 3/31/17 | 19.11 | (0.23) | 3.83 | 3.60 | — | (3.22) | (3.22) | 0.38 | 19.49 | 20.63 | 22,330 | 1.30 | 1.44 | (1.18) | 64 | |
| 4/1/15 to 3/31/16 | 21.49 | (0.26) | (0.59) | (0.85) | — | (1.53) | (1.53) | (2.38) | 19.11 | (4.74) | 18,203 | 1.31 | 1.39 | (1.20) | 59 | |
| 4/1/14 to 3/31/15 | 21.20 | (0.26) | 1.21 | 0.95 | — | (0.66) | (0.66) | 0.29 | 21.49 | 4.61 | 24,321 | 1.31 | 1.34 | (1.20) | 42 | |
| 4/1/13 to 3/31/14 | 15.60 | (0.22) | 7.01 | 6.79 | — | (1.19) | (1.19) | 5.60 | 21.20 | 43.70 | 39,495 | 1.29 | 1.37 | (1.08) | 49 |
| Footnote Legend | |
| * | On September 18, 2017, Class IS shares were renamed Class R6 shares. |
| (1) | Calculated using average shares outstanding. |
| (2) | Sales charges, where applicable, are not reflected in the total return calculation. |
| (3) | Annualized for periods less than one year. |
| (4) | The Funds will also indirectly bear their prorated share of expenses of the underlying funds in which they invest. Such expenses are not included in the calculation of this ratio. |
| (5) | Not Annualized for periods less than one year. |
| (6) | The Fund changed its fiscal period end to December 31 during the period. |
| (7) | Class R6 (formerly IS) commenced operations on August 1, 2014 for the predecessor fund (see Note 1). |
| (8) | See note 3D in the Notes to Financial Statements for information on recapture of expenses previously waived. |
| (9) | The ratio excludes expenses waived/reimbursed net of amount recaptured. If expenses waived/reimbursed net of amount recaptured were included, the ratio would have been higher than the ratio shown. |
| (10) | The Share Class is currently under its expense limitation. |
| (11) | Rounds to less than $0.005 per share or less than 0.01%, as applicable. |
| (12) | Due to a change in expense cap, the ratio shown is a blended expense ratio. |
| (13) | Net investment income per share and the ratio of net investment income to average net assets include a non-recurring refund for overbilling of prior years’ custodian out-of-pocket fees which amounted to $0.01 per share and 0.09%, 0.07%, and 0.07% of average net assets for the Class A, Class I and Class IS, respectively. |
| (14) | The amount shown for the net investment income ratio does not represent the actual pro rata amount allocated to the share class due to large redemptions during the year. |
| (15) | From November 9 through November 13, 2018, the Fund’s Class R6 shares did not have any investors, though the net asset value continued to be calculated using another share class adjusted for class expenses. |
| (16) | Class R6 (formerly IS) commenced operations on September 1, 2015 for the predecessor fund (see Note 1). |
| Predecessor Fund | Fund | |
RidgeWorth Ceredex Large-Cap Value Equity Fund | Ceredex Large-Cap Value Equity Fund | |
RidgeWorth Ceredex Mid-Cap Value Equity Fund | Ceredex Mid-Cap Value Equity Fund | |
RidgeWorth Ceredex Small-Cap Value Equity Fund | Ceredex Small-Cap Value Equity Fund | |
RidgeWorth Silvant Large-Cap Growth Stock Fund | Silvant Large-Cap Growth Stock Fund | |
RidgeWorth Silvant Small-Cap Growth Stock Fund | Silvant Small-Cap Growth Stock Fund | |
RidgeWorth International Equity Fund | WCM International Equity Fund | |
RidgeWorth Innovative Growth Stock Fund | Zevenbergen Innovative Growth Stock Fund |
| A. | Security Valuation |
| Each Fund utilizes a fair value hierarchy which prioritizes the inputs to valuation techniques used to measure fair value into three broad levels. The Funds’ policy is to recognize transfers into or out of Level 3 at the end of the reporting period. |
| • | Level 1 – quoted prices in active markets for identical securities (security types generally include listed equities). |
| • | Level 2 – prices determined using other significant observable inputs (including quoted prices for similar securities, interest rates, prepayment speeds, credit risk, etc.). |
| • | Level 3 – prices determined using significant unobservable inputs (including the Valuation Committee’s own assumptions in determining the fair value of investments). |
| B. | Security Transactions and Investment Income |
| Security transactions are recorded on the trade date. Realized gains and losses from the sale of securities are determined on the identified cost basis. Dividend income is recognized on the ex-dividend date or, in the case of certain foreign securities, as soon as a Fund is notified. Interest income is recorded on the accrual basis. Each Fund amortizes premiums and accretes discounts using the effective interest method. Any distributions from underlying funds are recorded in accordance with the character of the distributions as designated by the underlying funds. | |
| Dividend income from REIT investments is recorded using management’s estimate of the percentage of income included in distributions received from such investments based on historical information and other industry sources. The return of capital portion of the estimate is a reduction to investment income and a reduction in the cost basis of each investment which increases net realized gain (loss) and net change in unrealized appreciation (depreciation). If the return of capital distributions exceed its cost basis, the distributions are treated as realized gains. The actual amounts of income, return of capital, and capital gains are only determined by each REIT after its fiscal year-end, and may differ from the estimated amounts. | |
| C. | Income Taxes |
| Each Fund is treated as a separate taxable entity. It is the intention of each Fund to comply with the requirements of Subchapter M of the Internal Revenue Code and to distribute substantially all of its taxable income to its shareholders. Therefore, no provision for federal income taxes or excise taxes has been made. | |
| Certain Funds may be subject to foreign taxes on income, gains on investments or currency repatriation, a portion of which may be recoverable. Each Fund will accrue such taxes and recoveries as applicable based upon current interpretations of the tax rules and regulations that exist in the markets in which it invests. | |
| Management of the Funds has concluded that there are no significant uncertain tax positions that would require recognition in the financial statements. As of December 31, 2018, the tax years that remain subject to examination by the major tax jurisdictions under the statute of limitations are from the year 2015 forward (with limited exceptions). | |
| D. | Distributions to Shareholders |
| Distributions are recorded by each Fund on the ex-dividend date. Income and capital gain distributions are determined in accordance with income tax regulations which may differ from U.S. GAAP. |
| E. | Expenses |
| Expenses incurred together by a Fund and other affiliated mutual funds are allocated in proportion to the net assets of each such fund, except where allocation of direct expenses to each fund or an alternative allocation method can be more appropriately used. | |
| In addition to the net annual operating expenses that a Fund bears directly, the shareholders of a Fund indirectly bear the pro rata expenses of any underlying mutual funds in which the Fund invests. | |
| F. | Foreign Currency Transactions |
| Non-U.S. investment securities and other assets and liabilities denominated in foreign currencies are translated into U.S. dollar amounts at the foreign currency exchange rate effective at the end of the reporting period. Cost of investments is translated at the currency exchange rate effective at the trade date. The gain or loss resulting from a change in currency exchange rates between the trade and settlement date of a portfolio transaction is treated as a gain or loss on foreign currency. Likewise, the gain or loss resulting from a change in currency exchange rates between the date income is accrued and the date it is paid is treated as a gain or loss on foreign currency. The Funds do not isolate that portion of the results of operations arising from changes in foreign exchange rates on investments from the fluctuations arising from changes in the market prices of securities held. Such fluctuations are included with the net realized and unrealized gain or loss on investments. | |
| G. | Regulation S-X |
| In August 2018, the SEC adopted amendments to Regulation S-X which are intended to facilitate the disclosure of information to investors and simplify compliance without significantly altering the information provided to investors. The amendments include eliminating the requirement to: separately state book basis components of net assets on the Statement of Assets & Liabilities; separately state the sources of distributions paid (except tax return of capital distributions must still be separately disclosed) on the Statements of Changes in Net Assets; and state the book basis amount of undistributed net investment income on the Statements of Changes in Net Assets. Certain prior year amounts have been reclassified for consistency with the current year presentation (see footnotes on Statement of Changes for separate disclosure). These reclassifications have no effect on total net assets, total distributions, the statement of operations, financial highlights, net asset value or total return. | |
| H. | Securities Lending |
| ($ reported in thousands) | |
| The Funds may loan securities to qualified brokers through a securities lending agency agreement with The Bank of New York Mellon (“BNYM”). Under the securities lending policy, when lending securities a Fund is required to maintain collateral with a market value not less than 100% of the market value of loaned securities. Collateral is adjusted daily in connection with changes in the market value of securities on loan. Collateral may consist of cash and securities issued by the U.S. Government or its agencies. Cash collateral is invested in a short-term money market fund. Dividends earned on the collateral and premiums paid by the broker are recorded as income by the Fund net of fees and rebates charged/paid by BNYM for its services as securities lending agent and in connection with this securities lending program. Lending portfolio securities involves a risk of delay in the recovery of the loaned securities or in the declining value of the collateral. At December 31, 2018, the Silvant Small-Cap Growth Stock Fund had securities on loan with a market value of $62 and cash collateral of $61. |
| A. | Investment Adviser |
| Virtus Fund Advisers, LLC (the “Adviser”), an indirect, wholly - owned subsidiary of Virtus Investment Partners, Inc. (“Virtus”), is the investment adviser to the Funds. The Adviser manages the Funds’ investment programs and general operations of the Funds, including oversight of the Funds’ subadvisers. | |
| As compensation for its services to the Funds, the Adviser is entitled to a fee, which is calculated daily and paid monthly, based upon the following annual rates as a percentage of the average daily net assets of each Fund: |
Ceredex Large-Cap Value Equity Fund | 0.70% |
Ceredex Mid-Cap Value Equity Fund | 0.75 |
Ceredex Small-Cap Value Equity Fund | 0.85 |
Silvant Large-Cap Growth Stock Fund | 0.70 |
Silvant Small-Cap Growth Stock Fund | 0.85 |
WCM International Equity Fund | 0.85 |
Zevenbergen Innovative Growth Stock Fund | 0.80 * |
| * | Prior to December 1, 2018, the management fee was 0.85%. |
| B. | Subadvisers |
| The subadvisers manage the investments of each Fund for which they are paid a fee by the Adviser. The subadvisers and the Fund(s) they serve are as follows: |
| Fund | Subadviser | |
| Ceredex Large-Cap Value Equity Fund | Ceredex(1) | |
| Ceredex Mid-Cap Value Equity Fund | Ceredex(1) | |
| Ceredex Small-Cap Value Equity Fund | Ceredex(1) | |
| Silvant Large-Cap Growth Stock Fund | Silvant(2) |
| Fund | Subadviser | |
| Silvant Small-Cap Growth Stock Fund | Silvant(2) | |
| WCM International Equity Fund | WCM(3) | |
| Zevenbergen Innovative Growth Stock Fund | Zevenbergen(4) |
| (1) | Ceredex Value Advisors LLC, an indirect wholly-owned subsidiary of Virtus. |
| (2) | Silvant Capital Management LLC, an indirect wholly-owned subsidiary of Virtus. |
| (3) | WCM Investment Management. |
| (4) | Zevenbergen Capital Investments LLC, a minority-owned affiliate of the Adviser. |
| C. | Expense Limits and Fee Waivers |
| The Adviser has contractually agreed to limit each Fund’s annual total operating expenses (excluding front-end or contingent deferred loads, taxes, leverage expenses, interest, brokerage commissions, expenses incurred in connection with any merger or reorganization, unusual or infrequently occurring expenses (such as litigation), acquired fund fees and expenses, and dividend expenses, if any), so that such expenses do not exceed, on an annualized basis, the following respective percentages of average daily net assets through April 30, 2020. The waivers and reimbursements are accrued daily and received monthly. |
| Fund | Class A | Class C | Class I | Class R6 | ||||
Ceredex Large-Cap Value Equity Fund | 1.24 % | 1.72 % | 0.97 % | 0.72 % | ||||
Ceredex Mid-Cap Value Equity Fund | 1.38 | 1.79 | 1.08 | 0.79 | ||||
Ceredex Small-Cap Value Equity Fund | 1.55 | 1.90 | 1.24 | N/A | ||||
Silvant Large-Cap Growth Stock Fund | 1.23 | 1.90 | 0.97 | 0.90 | ||||
Silvant Small-Cap Growth Stock Fund(1) | 1.27 | 1.93 | 1.15 | N/A | ||||
WCM International Equity Fund | 1.42 | N/A | 1.20 | 1.10 | ||||
Zevenbergen Innovative Growth Stock Fund(2) | 1.25 | N/A | 1.00 | N/A |
| D. | Expense Recapture |
| ($ reported in thousands) | |
| Under certain conditions, the Adviser may recapture operating expenses reimbursed or fees waived under these arrangements within three years after the date on which such amounts were incurred or waived. A Fund must pay its ordinary operating expenses before the Adviser is entitled to any reimbursement and must remain in compliance with any applicable expense limitations or, if none, the expense limitation in effect at the time of the waiver or reimbursement. All or a portion of the following Adviser reimbursed expenses may be recaptured by the fiscal year ending: |
| Expiration | ||||||||
| Fund | 2019 | 2020 | 2021 | Total | ||||
| Ceredex Large-Cap Value Equity Fund | ||||||||
Class A | $ 397 | $ 144 | $ 85 | $ 626 | ||||
Class C | — | 4 | 33 | 37 | ||||
Class I | 1,835 | 1,209 | 499 | 3,543 | ||||
Class R6 | — | 187 | 366 | 553 | ||||
| Ceredex Mid-Cap Value Equity Fund | ||||||||
Class A | 134 | — | — | 134 | ||||
Class C | — | 35 | 114 | 149 | ||||
Class R6 | — | 129 | 335 | 464 | ||||
| Ceredex Small-Cap Value Equity Fund | ||||||||
Class C | — | 21 | 36 | 57 | ||||
| Expiration | ||||||||
| Fund | 2019 | 2020 | 2021 | Total | ||||
| Silvant Large-Cap Growth Stock Fund | ||||||||
Class A | $3 | $90 | $236 | $329 | ||||
Class C | — | 16 | 57 | 73 | ||||
Class I | 302 | 157 | 32 | 491 | ||||
Class R6 | — | 2 | —(1) | 2 | ||||
| Silvant Small-Cap Growth Stock Fund | ||||||||
Class A | 1 | 7 | 19 | 27 | ||||
Class C | 1 | 7 | 16 | 24 | ||||
Class I | 48 | 41 | 43 | 132 | ||||
| WCM International Equity Fund | ||||||||
Class A | 10 | 17 | 5 | 32 | ||||
Class I | 74 | 43 | 3 | 120 | ||||
Class R6 | 13 | 7 | 1 | 21 | ||||
| Zevenbergen Innovative Growth Stock Fund | ||||||||
Class A | — | 1 | 6 | 7 | ||||
Class I | — | 21 | 22 | 43 | ||||
| (1) | Amount is less than $500. |
| Fund | Class A | Class C | Class I | Class R6 | Total | |||||
| Ceredex Large-Cap Value Equity Fund | $10 | $ — | $ — | $ — | $10 | |||||
| Ceredex Mid-Cap Value Equity Fund | 248 | — | 14 | — | 262 | |||||
| Ceredex Small Cap Value Equity Fund | — | — | 22 | — | 22 | |||||
| WCM International Equity Fund | 1 | — | 10 | 1 | 12 | |||||
| Zevenbergen Innovative Growth Stock Fund | 7 | — | 47 | — | 54 |
| E. | Distributor |
| ($ reported in thousands) | |
| VP Distributors, LLC (“VP Distributors”), an indirect wholly-owned subsidiary of Virtus, serves as the distributor of each Fund’s shares. VP Distributors has advised the Funds that for the six months (the “period”) ended December 31, 2018, it retained net commissions of $28 for Class A shares and CDSC of $0 and $0 for Class A shares and Class C shares, respectively. | |
| In addition, each Fund pays VP Distributors 12b-1 fees under a 12b-1 Plan as a percentage of the average daily net assets of each respective class at the annual rates of 0.25% for Class A shares and 1.00% for Class C shares; Class I shares and Class R6 shares are not subject to a 12b-1 Plan. | |
| Under certain circumstances, shares of certain Virtus Mutual Funds may be exchanged for shares of the same class of certain other Virtus Mutual Funds on the basis of the relative NAV per share at the time of the exchange. On exchanges with share classes that carry a CDSC, the CDSC schedule of the original shares purchased continues to apply. | |
| F. | Administrator and Transfer Agent |
| ($ reported in thousands) | |
| Virtus Fund Services, LLC, an indirect, wholly-owned subsidiary of Virtus, serves as the administrator and transfer agent to the Funds. | |
| For the period ended December 31, 2018, the Funds incurred administration fees in aggregate totaling $6,641 which are included in the Statements of Operations within the line item “Administration and accounting fees.” The fees are calculated daily and paid monthly. | |
| For the period ended December 31, 2018, the Funds incurred transfer agent fees in aggregate totaling $12,411 which are included in the Statements of Operations within the line item “Transfer agent fees and expenses” and “Sub-transfer agent fees and expenses.” A portion of these fees was paid to outside entities that also provide services to the Funds. The fees are calculated daily and paid monthly. | |
| G. | Trustee Compensation |
| The Trust provides a deferred compensation plan for its Trustees who receive compensation from the Trust. Under the deferred compensation plan, Trustees may elect to defer all or a portion of their compensation. Amounts deferred are retained by the Trust, and then, to the extent permitted by the 1940 Act, in turn, may be invested in the shares of affiliated or unaffiliated mutual funds selected by the participating Trustees. Investments in such instruments are included in “Other Assets” on the Statement of Assets and Liabilities at December 31, 2018. |
| Purchases | Sales | ||
Ceredex Large-Cap Value Equity Fund | $2,154,980 | $2,635,171 | |
Ceredex Mid-Cap Value Equity Fund | 3,028,777 | 3,242,561 | |
Ceredex Small-Cap Value Equity Fund | 315,934 | 476,403 | |
Silvant Large-Cap Growth Stock Fund | 13,917 | 42,860 | |
Silvant Small-Cap Growth Stock Fund | 9,833 | 15,176 | |
WCM International Equity Fund | 34,356 | 33,348 | |
Zevenbergen Innovative Growth Stock Fund | 156,988 | 74,199 |
| Ceredex Large-Cap Value Equity Fund | |||||||||||
| Year Ended December 31, 2018 | Fiscal Period Ended December 31, 2017(1) | Year Ended March 31, 2017 | |||||||||
| SHARES | AMOUNT | SHARES | AMOUNT | SHARES | AMOUNT | ||||||
| Class A | |||||||||||
| Shares sold and cross class conversions | 2,614 | $39,624 | 1,493 | $25,611 | 2,363 | $37,561 | |||||
| Reinvestment of distributions | 4,320 | 50,367 | 2,925 | 47,789 | 364 | 5,996 | |||||
| Shares repurchased and cross class conversions | (6,911) | (109,246) | (4,213) | (72,336) | (7,828) | (124,609) | |||||
| Net Increase / (Decrease) | 23 | $(19,255) | 205 | $1,064 | (5,101) | $(81,052) | |||||
| Class C | |||||||||||
| Shares sold and cross class conversions | 163 | $2,076 | 38 | $621 | 47 | $738 | |||||
| Reinvestment of distributions | 279 | 3,146 | 160 | 2,550 | 14 | 223 | |||||
| Shares repurchased and cross class conversions | (220) | (3,246) | (195) | (3,250) | (275) | (4,245) | |||||
| Net Increase / (Decrease) | 222 | $1,976 | 3 | $(79) | (214) | $(3,284) | |||||
| Class I | |||||||||||
| Shares sold and cross class conversions | 8,020 | $126,515 | 7,636 | $132,118 | 14,988 | $240,165 | |||||
| Reinvestment of distributions | 16,369 | 193,176 | 12,215 | 201,266 | 1,747 | 28,989 | |||||
| Shares repurchased and cross class conversions | (33,432) | (528,889) | (24,033) | (415,148) | (30,907) | (498,952) | |||||
| Net Increase / (Decrease) | (9,043) | $(209,198) | (4,182) | $(81,764) | (14,172) | $(229,798) | |||||
| Class R6 | |||||||||||
| Shares sold and cross class conversions | 3,774 | $59,946 | 3,319 | $58,140 | 3,915 | $64,141 | |||||
| Reinvestment of distributions | 5,265 | 62,237 | 3,179 | 52,635 | 398 | 6,630 | |||||
| Shares repurchased and cross class conversions | (5,622) | (88,515) | (4,742) | (82,763) | (4,038) | (64,662) | |||||
| Net Increase / (Decrease) | 3,417 | $33,668 | 1,756 | $28,012 | 275 | $6,109 | |||||
| Ceredex Mid-Cap Value Equity Fund | |||||||||||
| Year Ended December 31, 2018 | Fiscal Period Ended December 31, 2017(1) | Year Ended March 31, 2017 | |||||||||
| SHARES | AMOUNT | SHARES | AMOUNT | SHARES | AMOUNT | ||||||
| Class A | |||||||||||
| Shares sold and cross class conversions | 4,726 | $58,075 | 3,065 | $42,974 | 6,034 | $79,220 | |||||
| Shares Issued-Merger (Note 12) | 5,225 | 66,645 | — | — | — | — | |||||
| Reinvestment of distributions | 3,073 | 33,047 | 4,658 | 59,495 | 1,198 | 16,295 | |||||
| Shares repurchased and cross class conversions | (11,799) | (147,721) | (7,831) | (108,891) | (14,007) | (183,471) | |||||
| Net Increase / (Decrease) | 1,225 | $10,046 | (108) | $(6,422) | (6,775) | $(87,956) | |||||
| Class C | |||||||||||
| Shares sold and cross class conversions | 534 | $6,218 | 265 | $3,547 | 455 | $5,984 | |||||
| Shares Issued-Merger (Note 12) | 1,910 | 23,733 | — | — | — | — | |||||
| Reinvestment of distributions | 609 | 6,381 | 646 | 8,031 | 138 | 1,839 | |||||
| Shares repurchased and cross class conversions | (1,638) | (19,327) | (864) | (11,717) | (1,992) | (25,263) | |||||
| Net Increase / (Decrease) | 1,415 | $17,005 | 47 | $(139) | (1,399) | $(17,440) | |||||
| Class I | |||||||||||
| Shares sold and cross class conversions | 34,345 | $426,122 | 20,468 | $289,813 | 47,771 | $642,136 | |||||
| Shares Issued-Merger (Note 12) | 2,755 | 35,576 | — | — | — | — | |||||
| Reinvestment of distributions | 20,645 | 224,582 | 30,598 | 395,261 | 8,628 | 118,378 | |||||
| Shares repurchased and cross class conversions | (57,387) | (717,252) | (65,834) | (933,082) | (88,993) | (1,177,163) | |||||
| Net Increase / (Decrease) | 358 | $(30,972) | (14,768) | $(248,008) | (32,594) | $(416,649) | |||||
| Class R6 | |||||||||||
| Shares sold and cross class conversions | 13,728 | $172,709 | 10,844 | $153,932 | 10,499 | $144,037 | |||||
| Shares Issued-Merger (Note 12) | 11 | 136 | — | — | — | — | |||||
| Reinvestment of distributions | 4,531 | 49,173 | 5,102 | 65,951 | 827 | 11,348 | |||||
| Shares repurchased and cross class conversions | (8,818) | (111,246) | (5,394) | (75,424) | (6,799) | (91,036) | |||||
| Net Increase / (Decrease) | 9,452 | $110,772 | 10,552 | $144,459 | 4,527 | $64,349 | |||||
| Ceredex Small-Cap Value Equity Fund | |||||||||||
| Year Ended December 31, 2018 | Fiscal Period Ended December 31, 2017(1) | Year Ended March 31, 2017 | |||||||||
| SHARES | AMOUNT | SHARES | AMOUNT | SHARES | AMOUNT | ||||||
| Class A | |||||||||||
| Shares sold and cross class conversions | 687 | $7,541 | 542 | $6,609 | 1,682 | $20,262 | |||||
| Reinvestment of distributions | 1,305 | 11,341 | 1,602 | 18,703 | 503 | 6,261 | |||||
| Shares repurchased and cross class conversions | (3,748) | (42,832) | (2,010) | (24,466) | (3,438) | (40,823) | |||||
| Net Increase / (Decrease) | (1,756) | $(23,950) | 134 | $846 | (1,253) | $(14,300) | |||||
| Ceredex Small-Cap Value Equity Fund | |||||||||||
| Year Ended December 31, 2018 | Fiscal Period Ended December 31, 2017(1) | Year Ended March 31, 2017 | |||||||||
| SHARES | AMOUNT | SHARES | AMOUNT | SHARES | AMOUNT | ||||||
| Class C | |||||||||||
| Shares sold and cross class conversions | 24 | $230 | 15 | $160 | 35 | $392 | |||||
| Reinvestment of distributions | 335 | 2,552 | 347 | 3,645 | 118 | 1,337 | |||||
| Shares repurchased and cross class conversions | (410) | (4,129) | (500) | (5,527) | (743) | (8,234) | |||||
| Net Increase / (Decrease) | (51) | $(1,347) | (138) | $(1,722) | (590) | $(6,505) | |||||
| Class I | |||||||||||
| Shares sold and cross class conversions | 7,279 | $86,665 | 4,527 | $57,251 | 16,019 | $199,169 | |||||
| Reinvestment of distributions | 8,502 | 77,107 | 9,217 | 111,707 | 3,186 | 40,943 | |||||
| Shares repurchased and cross class conversions | (18,285) | (217,488) | (18,031) | (225,960) | (31,259) | (383,589) | |||||
| Net Increase / (Decrease) | (2,504) | $(53,716) | (4,287) | $(57,002) | (12,054) | $(143,477) | |||||
| Silvant Large-Cap Growth Stock Fund | |||||||||||
| Year Ended December 31, 2018 | Fiscal Period Ended December 31, 2017(1) | Year Ended March 31, 2017 | |||||||||
| SHARES | AMOUNT | SHARES | AMOUNT | SHARES | AMOUNT | ||||||
| Class A | |||||||||||
| Shares sold and cross class conversions | 796 | $4,546 | 989 | $6,249 | 605 | $4,478 | |||||
| Reinvestment of distributions | 1,575 | 8,045 | 3,445 | 20,319 | 1,101 | 7,512 | |||||
| Shares repurchased and cross class conversions | (3,890) | (21,644) | (1,409) | (10,198) | (1,204) | (9,073) | |||||
| Net Increase / (Decrease) | (1,519) | $(9,053) | 3,025 | $16,370 | 502 | $2,917 | |||||
| Class C | |||||||||||
| Shares sold and cross class conversions | 302 | $687 | 58 | $199 | 55 | $271 | |||||
| Reinvestment of distributions | 7,522 | 13,627 | 8,685 | 24,203 | 1,727 | 7,564 | |||||
| Shares repurchased and cross class conversions | (2,406) | (5,620) | (1,296) | (5,146) | (1,312) | (6,660) | |||||
| Net Increase / (Decrease) | 5,418 | $8,694 | 7,447 | $19,256 | 470 | $1,175 | |||||
| Class I | |||||||||||
| Shares sold and cross class conversions | 294 | $2,350 | 392 | $3,609 | 974 | $9,014 | |||||
| Reinvestment of distributions | 319 | 2,320 | 1,063 | 8,443 | 1,340 | 11,295 | |||||
| Shares repurchased and cross class conversions | (984) | (7,607) | (8,576) | (78,880) | (3,716) | (34,170) | |||||
| Net Increase / (Decrease) | (371) | $(2,937) | (7,121) | $(66,828) | (1,402) | $(13,861) | |||||
| Silvant Large-Cap Growth Stock Fund | |||||||||||
| Year Ended December 31, 2018 | Fiscal Period Ended December 31, 2017(1) | Year Ended March 31, 2017 | |||||||||
| SHARES | AMOUNT | SHARES | AMOUNT | SHARES | AMOUNT | ||||||
| Class R6 | |||||||||||
| Shares sold and cross class conversions | 2 | $20 | 24 | $222 | 59 | $541 | |||||
| Reinvestment of distributions | 4 | 35 | 109 | 925 | 412 | 3,486 | |||||
| Shares repurchased and cross class conversions | (51) | (413) | (2,785) | (25,299) | (1,706) | (15,622) | |||||
| Net Increase / (Decrease) | (45) | $(358) | (2,652) | $(24,152) | (1,235) | $(11,595) | |||||
| Silvant Small-Cap Growth Stock Fund | |||||||||||
| Year Ended December 31, 2018 | Fiscal Period Ended December 31, 2017(1) | Year Ended March 31, 2017 | |||||||||
| SHARES | AMOUNT | SHARES | AMOUNT | SHARES | AMOUNT | ||||||
| Class A | |||||||||||
| Shares sold and cross class conversions | 54 | $390 | 14 | $100 | 21 | $159 | |||||
| Reinvestment of distributions | 121 | 744 | 141 | 994 | 141 | 992 | |||||
| Shares repurchased and cross class conversions | (154) | (1,109) | (130) | (950) | (162) | (1,228) | |||||
| Net Increase / (Decrease) | 21 | $25 | 25 | $144 | — | $(77) | |||||
| Class C | |||||||||||
| Shares sold and cross class conversions | 45 | $89 | 1 | $6 | 2 | $9 | |||||
| Reinvestment of distributions | 735 | 1,340 | 528 | 1,455 | 394 | 1,287 | |||||
| Shares repurchased and cross class conversions | (242) | (564) | (264) | (867) | (194) | (733) | |||||
| Net Increase / (Decrease) | 538 | $865 | 265 | $594 | 202 | $563 | |||||
| Class I | |||||||||||
| Shares sold and cross class conversions | 327 | $3,033 | 259 | $2,353 | 817 | $7,443 | |||||
| Reinvestment of distributions | 187 | 1,493 | 278 | 2,459 | 416 | 3,603 | |||||
| Shares repurchased and cross class conversions | (680) | (6,148) | (1,423) | (14,771) | (2,503) | (22,802) | |||||
| Net Increase / (Decrease) | (166) | $(1,622) | (886) | $(9,959) | (1,270) | $(11,756) | |||||
| Class R6 | |||||||||||
| Shares sold and cross class conversions | — | $— | 1 | $9 | 75 | $705 | |||||
| Reinvestment of distributions | — | — | — | — | 50 | 439 | |||||
| Shares repurchased and cross class conversions | — | — | (247) | (309) | (263) | (2,362) | |||||
| Net Increase / (Decrease) | — | $— | (246) | $(300) | (138) | $(1,218) | |||||
| WCM International Equity Fund | |||||||||||
| Year Ended December 31, 2018 | Fiscal Period Ended December 31, 2017(1) | Year Ended March 31, 2017 | |||||||||
| SHARES | AMOUNT | SHARES | AMOUNT | SHARES | AMOUNT | ||||||
| Class A | |||||||||||
| Shares sold and cross class conversions | 828 | $9,578 | 347 | $3,852 | 1,538 | $14,514 | |||||
| Reinvestment of distributions | 1 | 17 | 1 | 14 | 15 | 138 | |||||
| Shares repurchased and cross class conversions | (359) | (4,332) | (193) | (2,129) | (557) | (5,135) | |||||
| Net Increase / (Decrease) | 470 | $5,263 | 155 | $1,737 | 996 | $9,517 | |||||
| Class I | |||||||||||
| Shares sold and cross class conversions | 2,266 | $26,945 | 1,758 | $19,828 | 4,014 | $38,584 | |||||
| Reinvestment of distributions | 14 | 180 | 7 | 79 | 40 | 366 | |||||
| Shares repurchased and cross class conversions | (2,031) | (24,485) | (961) | (10,960) | (2,131) | (20,316) | |||||
| Net Increase / (Decrease) | 249 | $2,640 | 804 | $8,947 | 1,923 | $18,634 | |||||
| Class R6 | |||||||||||
| Shares sold and cross class conversions | 68 | $823 | 250 | $2,815 | 265 | $2,584 | |||||
| Reinvestment of distributions | 2 | 28 | 1 | 13 | 7 | 65 | |||||
| Shares repurchased and cross class conversions | (832) | (9,959) | (128) | (1,435) | (256) | (2,455) | |||||
| Net Increase / (Decrease) | (762) | $(9,108) | 123 | $1,393 | 16 | $194 | |||||
| Zevenbergen Innovative Growth Stock Fund | |||||||||||
| Year Ended December 31, 2018 | Fiscal Period Ended December 31, 2017(1) | Year Ended March 31, 2017 | |||||||||
| SHARES | AMOUNT | SHARES | AMOUNT | SHARES | AMOUNT | ||||||
| Class A | |||||||||||
| Shares sold and cross class conversions | 1,662 | $41,024 | 71 | $1,470 | 63 | $1,151 | |||||
| Reinvestment of distributions | 59 | 1,297 | 28 | 554 | 55 | 928 | |||||
| Shares repurchased and cross class conversions | (801) | (18,606) | (167) | (3,448) | (217) | (4,099) | |||||
| Net Increase / (Decrease) | 920 | $23,715 | (68) | $(1,424) | (99) | $(2,020) | |||||
| Class I | |||||||||||
| Shares sold and cross class conversions | 5,080 | $132,175 | 525 | $11,528 | 736 | $14,008 | |||||
| Reinvestment of distributions | 161 | 3,773 | 75 | 1,598 | 101 | 1,778 | |||||
| Shares repurchased and cross class conversions | (2,807) | (68,161) | (911) | (19,253) | (644) | (12,798) | |||||
| Net Increase / (Decrease) | 2,434 | $67,787 | (311) | $(6,127) | 193 | $2,988 | |||||
| (1) | Period from April 1, 2017 to December 31, 2017. The Fund had a fiscal period end change from March 31 to December 31. |
| % of Shares Outstanding | Number of Accounts | ||
| Ceredex Large-Cap Value Equity Fund | 28% | 2 | |
| Ceredex Mid-Cap Value Equity Fund | 40 | 2 | |
| Ceredex Small-Cap Value Equity Fund | 44 | 3 | |
| Silvant Large-Cap Growth Stock Fund | 66 | 2 | |
| Silvant Small-Cap Growth Stock Fund | 52 | 2 | |
| WCM International Equity Fund | 72 | 4 | |
| Zevenbergen Innovative Growth Stock Fund | 41 | 2 |
| Fund | Sector | Percentage of Total Investments | ||
Ceredex Small-Cap Value Equity Fund | Industrials | 29% | ||
Silvant Large-Cap Growth Stock Fund | Information Technology | 35 | ||
Silvant Small-Cap Growth Stock Fund | Health Care | 30 | ||
Zevenbergen Innovative Growth Stock Fund | Information Technology | 36 |
| Fund | Interest Incurred on Borrowing | Average Dollar Amount of Borrowing | Weighted Average Interest Rate on Borrowing | Days Loan was Open | ||||
Zevenbergen Innovative Growth Stock Fund | $6 | $11,800 | 3.57% | 5 |
| Fund | Federal tax cost | Unrealized Appreciation | Unrealized (Depreciation) | Net Unrealized Appreciation (Depreciation) | ||||
Ceredex Large-Cap Value Equity Fund | $1,255,583 | $143,026 | $(96,252) | $46,774 | ||||
Ceredex Mid-Cap Value Equity Fund | 2,571,297 | 102,037 | (228,690) | (126,653) | ||||
Ceredex Small-Cap Value Equity Fund | 533,694 | 81,385 | (60,481) | 20,904 | ||||
Silvant Large-Cap Growth Stock Fund | 58,458 | 41,370 | (2,936) | 38,434 | ||||
Silvant Small-Cap Growth Stock Fund | 20,752 | 4,918 | (2,321) | 2,597 | ||||
WCM International Equity Fund | 76,377 | 15,014 | (4,751) | 10,263 | ||||
Zevenbergen Innovative Growth Stock Fund | 95,453 | 4,025 | (4,180) | (155) |
| Late Year Ordinary Losses Deferred | Late Year Ordinary Losses Recognized | Capital Loss Deferred | Capital Loss Recognized | |||||
Ceredex Large-Cap Value Equity Fund | $ — | $ — | $ 5,527 | $ (3,569) | ||||
Ceredex Mid-Cap Value Equity Fund | — | (134) | 54,623 | (6,517) | ||||
Ceredex Small-Cap Value Equity Fund | — | — | 592 | — | ||||
Silvant Large-Cap Growth Stock Fund | — | — | 209 | — | ||||
Zevenbergen Innovative Growth Stock Fund | — | — | 3,216 | — |
| Undistributed Ordinary Income | Undistributed Long-Term Capital Gains | Undistributed Tax-Exempt Income | |||
Ceredex Large-Cap Value Equity Fund | $5 | $— | $ — | ||
Ceredex Mid-Cap Value Equity Fund | 1,316 | — | — | ||
Ceredex Small-Cap Value Equity Fund | — | 2,378 | — | ||
Silvant Large-Cap Growth Stock Fund | — | 6,204 | — | ||
Silvant Small-Cap Growth Stock Fund | 23 | 224 | — | ||
WCM International Equity Fund | 197 | 2,917 | — |
| Ordinary Income | Long-Term Capital Gains | Total | |||
| Ceredex Large-Cap Value Equity Fund | |||||
12/31/18 | $ 35,701 | $ 281,182 | $316,883 | ||
12/31/17 | 58,969 | 251,687 | 310,656 | ||
3/31/17 | 34,037 | 8,370 | 42,407 | ||
| Ceredex Mid-Cap Value Equity Fund | |||||
12/31/18 | 167,194 | 160,878 | 328,072 | ||
12/31/17 | 200,162 | 353,499 | 553,661 | ||
3/31/17 | 115,777 | 38,652 | 154,429 | ||
| Ceredex Small-Cap Value Equity Fund | |||||
12/31/18 | 17,110 | 74,979 | 92,089 | ||
12/31/17 | 11,664 | 123,329 | 134,993 | ||
3/31/17 | 8,202 | 40,709 | 48,911 | ||
| Silvant Large-Cap Growth Stock Fund | |||||
12/31/18 | 371 | 25,009 | 25,380 | ||
12/31/17 | 2,217 | 57,299 | 59,516 | ||
3/31/17 | — | 31,266 | 31,266 | ||
| Silvant Small-Cap Growth Stock Fund | |||||
12/31/18 | 381 | 3,245 | 3,626 | ||
12/31/17 | 206 | 4,757 | 4,963 | ||
3/31/17 | — | 6,411 | 6,411 | ||
| WCM International Equity Fund | |||||
12/31/18 | 238 | — | 238 | ||
12/31/17 | 110 | — | 110 | ||
3/31/17 | 292 | 337 | 629 | ||
| Zevenbergen Innovative Growth Stock Fund | |||||
12/31/18 | 3,201 | 2,177 | 5,378 | ||
12/31/17 | — | 2,451 | 2,451 | ||
3/31/17 | — | 2,976 | 2,976 |
| Capital Paid in on Shares of Beneficial Interest | Total Distributable Earnings (Loss) | ||
Ceredex Mid-Cap Value Equity Fund | $ 255 | $ (255) | |
Ceredex Small-Cap Value Equity Fund | —(1) | — | |
Silvant Large-Cap Growth Stock Fund | (151) | 151 | |
WCM International Equity Fund | —(1) | — | |
Zevenbergen Innovative Growth Stock Fund | (24) | 24 |
| (1) | Amount is less than $500. |
| Merged Fund | Shares Outstanding | Acquiring Fund | Shares Converted | Merged Fund Net Asset Value of Converted Shares | ||||||
| Virtus Contrarian Value Fund | Class A | 1,995 | Virtus Ceredex Mid-Cap Value Equity Fund | Class A | 5,225 | $66,645 | ||||
| Class C | 747 | Class C | 1,910 | 23,733 | ||||||
| Class I | 1,067 | Class I | 2,755 | 35,576 | ||||||
| Class R | 4 | Class R | 11 | 136 | ||||||
| Merged Fund | Net Assets | Unrealized Appreciation (Depreciation) | Acquiring Fund | Net Assets | ||||
Virtus Contrarian Value Fund | $126,090 | $51,560 | Virtus Ceredex Mid-Cap Value Equity Fund | $2,975,539 |
Net investment income (loss) | $26,073(a) |
Net realized and unrealized gain (loss) on investments | (225,475)(b) |
Net increase (decrease) in net assets resulting from operations | $(199,402) |
| Ceredex Large-Cap Value Equity Fund | Ceredex Mid-Cap Value Equity Fund | Ceredex Small-Cap Value Equity Fund | |||||||||
| (reported in thousands) | SHARES | AMOUNT | SHARES | AMOUNT | SHARES | AMOUNT | |||||
| Class A | |||||||||||
| Conversion from Class C shares | 940 | $10,882 | 1,505 | $15,891 | 863 | $7,765 | |||||
| Class C | |||||||||||
| Conversion to Class A shares | (969) | (10,882) | (1,545) | (15,891) | (983) | (7,765) | |||||
| Silvant Large-Cap Growth Stock Fund | Silvant Small-Cap Growth Stock Fund | ||||||
| (reported in thousands) | SHARES | AMOUNT | SHARES | AMOUNT | |||
| Class A | |||||||
| Conversion from Class C shares | 4,629 | $22,268 | 452 | $2,755 | |||
| Class C | |||||||
| Conversion to Class A shares | (13,831) | (22,268) | (1,593) | (2,755) | |||

| Qualified REIT Dividends | QDI | DRD | LTCG | ||||
| Ceredex Large-Cap Value Equity Fund | — % | 100 % | 90 % | $ 261,329 | |||
| Ceredex Mid-Cap Value Equity Fund | 3 | 30 | 29 | 112,648 | |||
| Ceredex Small-Cap Value Equity Fund | 11 | 89 | 87 | 73,466 | |||
| Silvant Large-Cap Growth Stock Fund | — | 100 | 100 | 18,749 | |||
| Silvant Small-Cap Growth Stock Fund | — | 34 | 34 | 2,489 | |||
| WCM International Equity Fund | — | 100 | — | 2,917 | |||
| Zevenbergen Innovative Growth Stock Fund | — | 2 | 2 | 690 |
| Foreign Source Income Recognized | Foreign Taxes Paid on Foreign Source Income | ||
| WCM International Equity Fund | $ 1,498 | $ 165 |
| Name, Year of Birth, Length of Time Served and Number of Portfolios in Complex | Principal Occupation(s) During Past 5 Years and Other Directorships Held by Trustee |
| Brown, Thomas J. YOB: 1945 Served Since: 2017 70 Portfolios | Retired. Trustee (since 2016), Virtus Mutual Fund Family (58 portfolios) and Virtus Alternative Solutions Trust (4 portfolios); Trustee (since 2011), Virtus Variable Insurance Trust (8 portfolios); Director (since 2010), D’Youville Senior Care Center; and Director (since 2005), VALIC Company Funds (49 portfolios). |
| Burke, Donald C. YOB: 1960 Served Since: 2017 74 Portfolios | Retired. Trustee (since 2016), Virtus Mutual Fund Family (58 portfolios), Virtus Variable Insurance Trust (8 portfolios) and Virtus Alternative Solutions Trust (4 portfolios); Director (since 2014) closed-end funds managed by Duff & Phelps Investment Management Co. (4 funds); Director, Avista Corp. (energy company) (since 2011); Trustee, Goldman Sachs Fund Complex (2010 to 2014); and Director, BlackRock Luxembourg and Cayman Funds (2006 to 2010). |
| Harris, Sidney E. YOB: 1949 Served Since: 2017 70 Portfolios | Professor and Dean Emeritus (since April 2015), Professor (1997 to 2014), Dean (1997 to 2004), J. Mack Robinson College of Business, Georgia State University; Trustee (since 2019), Mutual Fund Directors Forum; Trustee (since 2017), Virtus Mutual Fund Family (58 portfolios), Virtus Variable Insurance Trust (8 portfolios), and Virtus Alternative Solutions Trust (4 portfolios); Trustee (since 2013), KIPP Metro Atlanta; Trustee (since 1999) Total System Services, Inc.; Trustee (2004 to 2017), RidgeWorth Funds; Trustee (since 2012), International University of the Grand Bassam; and Trustee (2011 to 2015), Genspring Family Offices, LLC. |
| Mallin, John R. YOB: 1950 Served Since: 2017 70 Portfolios | Partner/Attorney (since 2003), McCarter & English LLP (law firm), Real Property Practice Group; and Member (since 2014), Counselors of Real Estate. Trustee (since 2016), Virtus Mutual Fund Family (58 portfolios) and Virtus Alternative Solutions Trust (4 portfolios); Director (since 2013), Horizons, Inc. (non-profit); and Trustee (since 1999), Virtus Variable Insurance Trust (8 portfolios). |
| McClellan, Hassell H. YOB: 1945 Served Since: 2017 70 Portfolios | Retired (since 2013); and Professor (1984 to 2013), Wallace E. Carroll School of Management, Boston College. Chairperson of the Board (since 2017) and Trustee (since 2000), John Hancock Fund Complex (collectively, 227 portfolios); Trustee (since 2016), Virtus Alternative Solutions Trust (3 portfolios); Trustee (since 2015), Virtus Mutual Fund Family (74 portfolios); Director (since 2010), Barnes Group, Inc. (diversified global components manufacturer and logistical services company); and Trustee (since 2008), Virtus Variable Insurance Trust (9 portfolios). |
| McDaniel, Connie D. YOB: 1958 Served Since: 2017 70 Portfolios | Retired (since 2013); and Vice President, Chief of Internal Audit, Corporate Audit Department (2009 to 2013); Vice President Global Finance Transformation (2007 to 2009); Vice President and Controller (1999 to 2007), The Coca-Cola Company. Trustee (since 2017), Virtus Mutual Fund Family (58 portfolios), Virtus Variable Insurance Trust (8 portfolios), and Virtus Alternative Solutions Trust (4 portfolios); Trustee (since 2014), Total System Services, Inc.; and Trustee (2005 to 2017), RidgeWorth Funds. |
| McLoughlin, Philip YOB: 1946 Served Since: 1989 78 Portfolios | Retired. Director and Chairman (since 2016), Virtus Total Return Fund Inc. and Virtus Global Dividend & Income Fund Inc.; Director and Chairman (since 2014), Duff & Phelps Select MLP and Midstream Energy Fund Inc.; Trustee and Chairman (since 2013), Virtus Alternative Solutions Trust (4 portfolios); Trustee and Chairman (since 2011), Virtus Global Multi-Sector Income Fund; Chairman and Trustee (since 2003), Virtus Variable Insurance Trust (8 portfolios); Director (since 1995), closed-end funds managed by Duff & Phelps Investment Management Co. (4 funds); Director (since 1991) and Chairman (since 2010), Lazard World Trust Fund (closed-end investment firm in Luxembourg); and Trustee (since 1989) and Chairman (since 2002), Virtus Mutual Fund Family (58 portfolios). |
| McNamara, Geraldine M. YOB: 1951 Served Since: 2002 74 Portfolios | Retired. Trustee (since 2016), Virtus Alternative Solutions Trust (4 portfolios); Trustee (since 2015), Virtus Variable Insurance Trust (8 portfolios); Director (since 2003), closed-end funds managed by Duff & Phelps Investment Management Co. (4 funds); and Trustee (since 2001), Virtus Mutual Fund Family (58 portfolios). |
| Oates, James M. YOB: 1946 Served Since: 2005 74 Portfolios | Managing Director (since 1994), Wydown Group (consulting firm). Director (since 2016), Virtus Total Return Fund Inc. and Virtus Global Dividend & Income Fund Inc.; Trustee (since 2016), Virtus Variable Insurance Trust (8 portfolios); Director (since 2014), Duff & Phelps Select MLP and Midstream Energy Fund Inc.; Trustee (since 2013), Virtus Alternative Solutions Trust (4 portfolios); Trustee (since 2011), Virtus Global Multi-Sector Income Fund; Trustee (since 2005) and Chairman (2005 to 2017), John Hancock Fund Complex (227 portfolios); Director (2002 to 2014), New Hampshire Trust Company; Chairman (2000 to 2016), Emerson Investment Management, Inc.; Non-Executive Chairman (2000 to 2014), Hudson Castle Group, Inc. (formerly IBEX Capital Markets, Inc.) (financial services); Chairman and Director (1999 to 2014), Connecticut River Bank; Director (since 1996), Stifel Financial; and Trustee (since 1987), Virtus Mutual Fund Family (58 portfolios). |
| Segerson, Richard E. YOB: 1948 Served Since: 2005 70 Portfolios | Retired; and Managing Director (1998 to 2013), Northway Management Company. Trustee (since 2016), Virtus Alternative Solutions Trust (4 portfolios) and Virtus Variable Insurance Trust (8 portfolios); and Trustee (since 1983), Virtus Mutual Fund Family (58 portfolios). |
| Name, Year of Birth, Year Elected and Number of Funds Overseen | Principal Occupation(s) During Past 5 Years and Other Directorships Held by Trustee |
| Aylward, George R.* Trustee and President YOB: 1964 Elected: 2006 75 Portfolios | Director, President and Chief Executive Officer (since 2008), Virtus Investment Partners, Inc. and/or certain of its subsidiaries; various senior officer positions with Virtus affiliates (since 2005). Chairman and Trustee (since 2015), Virtus ETF Trust II (1 portfolio); Director, President and Chief Executive Officer (since 2014), Duff & Phelps Select MLP and Midstream Energy Fund Inc.; Trustee and President (since 2013), Virtus Alternative Solutions Trust (4 portfolios); Director (since 2013), Virtus Global Funds, PLC (4 portfolios); Trustee (since 2012) and President (since 2010), Virtus Variable Insurance Trust (8 portfolios); Trustee, President and Chief Executive Officer (since 2011), Virtus Global Multi-Sector Income Fund; Trustee and President (since 2006) and Executive Vice President (2004 to 2006), Virtus Mutual Fund Family (58 portfolios); and Director, President and Chief Executive Officer (since 2006), Virtus Global Dividend & Income Fund Inc. and Virtus Total Return Fund Inc. |
| Name, Address and Year of Birth | Position(s) Held with Trust and Length of Time Served | Principal Occupation(s) During Past 5 Years |
| Batchelar, Peter YOB: 1970 | Senior Vice President (since 2017), Vice President (2008 to 2017). | Senior Vice President (since 2017) and Vice President (2008 to 2017), Product Development, Virtus Investment Partners, Inc. and/or certain of its subsidiaries; Senior Vice President (since 2017), Virtus Asset Trust and Virtus Retirement Trust; Senior Vice President (since 2017) and Vice President (2008 to 2017), Virtus Equity Trust and Virtus Opportunities Trust; Senior Vice President (since 2017) and Vice President (2010 to 2017), Virtus Variable Insurance Trust; Senior Vice President (since 2017), Virtus Total Return Fund Inc. and Virtus Global Dividend & Income Fund Inc.; Senior Vice President (since 2017) and Vice President (2016 to 2017), Virtus Global Multi-Sector Income Fund and Duff & Phelps Select Energy MLP Fund Inc.; and Senior Vice President (since 2017) and Vice President (2013 to 2017), Virtus Alternative Solutions Trust. |
| Bradley, W. Patrick YOB: 1972 | Executive Vice President (since 2016); Senior Vice President (2013 to 2016); Vice President (2011 to 2013); Chief Financial Officer and Treasurer (since 2006). | Executive Vice President, Fund Services (since 2016), Senior Vice President, Fund Services (2010 to 2016), Virtus Investment Partners, Inc. and/or certain of its subsidiaries; various officer positions (since 2006) with Virtus affiliates; Executive Vice President (since 2016), Senior Vice President (2013 to 2016), Vice President (2011 to 2013), Chief Financial Officer and Treasurer (since 2004), Virtus Variable Insurance Trust; Executive Vice President (since 2016), Senior Vice President (2013 to 2016), Vice President (2011 to 2013), Chief Financial Officer and Treasurer (since 2006), Virtus Mutual Fund Family; Executive Vice President (since 2016), Senior Vice President (2013 to 2016), Vice President (2012 to 2013) and Treasurer and Chief Financial Officer (since 2010), Virtus Total Return Fund Inc. and Virtus Global Dividend & Income Fund Inc.; Executive Vice President (since 2016), Senior Vice President (2013 to 2016), Vice President (2011 to 2013), Chief Financial Officer and Treasurer (since 2011), Virtus Global Multi-Sector Income Fund; Executive Vice President (since 2016), Senior Vice President (2014 to 2016), Chief Financial Officer and Treasurer (since 2014), Duff & Phelps Select Energy MLP and Midstream Energy Fund Inc.; Vice President and Assistant Treasurer (since 2011), Duff & Phelps Global Utility Income Fund Inc.; Director (since 2013), Virtus Global Funds, PLC; and Executive Vice President (since 2016), Senior Vice President (2013 to 2016), and Chief Financial Officer and Treasurer (since 2013), Virtus Alternative Solutions Trust. |
| Name, Address and Year of Birth | Position(s) Held with Trust and Length of Time Served | Principal Occupation(s) During Past 5 Years |
| Carr, Kevin J. YOB: 1954 | Senior Vice President (since 2013), Vice President (2005 to 2013), Chief Legal Officer, Counsel and Secretary (since 2005). | Vice President and Senior Counsel (2017 to Present), Senior Vice President (2009 to 2017), Vice President, Counsel and Secretary (2008 to 2009), Virtus Investment Partners, Inc. and/or certain of its subsidiaries; various senior officer positions (since 2005) with Virtus affiliates; Senior Vice President (since 2013), Vice President (2005 to 2013), Chief Legal Officer, Counsel and Secretary (since 2005), Virtus Mutual Fund Family; Senior Vice President (2013 to 2014), Vice President (2012 to 2013), Virtus Total Return Fund Inc. and Virtus Global Dividend & Income Fund Inc.; Senior Vice President (since 2017), Assistant Secretary (since 2013), Vice President, Chief Legal Officer, Counsel and Secretary (2010 to 2013), Virtus Variable Insurance Trust; Senior Vice President (2013 to 2014), Vice President (2011 to 2013), Virtus Global Multi-Sector Income Fund; Assistant Secretary (since 2015), Duff & Phelps Select MLP and Midstream Energy Fund Inc.; Senior Vice President (since 2017) and Assistant Secretary (since 2013), Virtus Alternative Solutions Trust; Secretary (since 2015), ETFis Series Trust I; and Secretary (since 2015), Virtus ETF Trust II. |
| Engberg, Nancy J. YOB: 1956 | Senior Vice President (since 2017), Vice President and Chief Compliance Officer (2011 to 2017), and Chief Compliance Officer (since 2011). | Senior Vice President (since 2017), Vice President (2008 to 2017) and Chief Compliance Officer (2008 to 2011 and since 2016), Virtus Investment Partners, Inc. and/or certain of its subsidiaries; various officer positions (since 2003) with Virtus affiliates; Senior Vice President (since 2017), Vice President (2011 to 2017) and Chief Compliance Officer (since 2011), Virtus Mutual Fund Family; Senior Vice President (since 2017), Vice President (2010 to 2017) and Chief Compliance Officer (since 2011), Virtus Variable Insurance Trust; Senior Vice President (since 2017), Vice President (2011 to 2016) and Chief Compliance Officer (since 2011), Virtus Global Multi-Sector Income Fund; Senior Vice President (since 2017), Vice President (2012 to 2017) and Chief Compliance Officer (since 2012), Virtus Total Return Fund Inc. and Virtus Global Dividend & Income Fund Inc.; Senior Vice President (since 2017), Vice President (2013 to 2016) and Chief Compliance Officer (since 2013), Virtus Alternative Solutions Trust; Senior Vice President (since 2017), Vice President (2014 to 2017) and Chief Compliance Officer (since 2014), Duff & Phelps Select MLP and Midstream Energy Fund Inc.; Chief Compliance Officer (since 2015), ETFis Series Trust I; and Chief Compliance Officer (since 2015), Virtus ETF Trust II. |
| Short, Julia R. YOB: 1972 | Senior Vice President (since 2017). | Senior Vice President, Product Development (since 2017), Virtus Investment Partners, Inc. and/or certain of its subsidiaries; Senior Vice President (since 2017), Virtus Mutual Fund Family; President and Chief Executive Officer, RidgeWorth Funds (2007 to 2017); and Managing Director, Product Manager, RidgeWorth Investments (2004 to 2017). |
| Waltman, Francis G. YOB: 1962 | Executive Vice President (since 2013), Senior Vice President (2008 to 2013). | Executive Vice President, Product Development (since 2009), Virtus Investment Partners, Inc. and/or certain of its subsidiaries; various senior officer positions (since 2006) with Virtus affiliates; Executive Vice President (since 2013), Senior Vice President (2008 to 2013), Virtus Mutual Fund Family; Executive Vice President (since 2013), Senior Vice President (2010 to 2013), Virtus Variable Insurance Trust; Executive Vice President (since 2013), Senior Vice President (2011 to 2013), Virtus Global Multi-Sector Income Fund; Executive Vice President (since 2014), Duff & Phelps Select Energy MLP and Midstream Energy Fund Inc.; Director (since 2013), Virtus Global Funds PLC; and Executive Vice President (since 2013), Virtus Alternative Solutions Trust. |
and the Virtus Asset Trust Statutory Prospectus,
dated July 23, 2018, each as supplemented
Statement of Additional Information for future reference.
and the Virtus Asset Trust Statutory Prospectus,
dated July 23, 2018, each as supplemented
| Annual Fund Operating Expenses(expenses that you pay each year as a percentage of the value of your investment) | Class A | Class C | Class I | Class T |
| Management Fees | 0.85% | 0.85% | 0.85% | 0.85% |
| Distribution and Shareholder Servicing (12b-1) Fees | 0.25% | 1.00% | None | 0.25% |
| Other Expenses | 0.54%(b) | 0.55%(b) | 0.64%(b) | 0.54%(c) |
| Total Annual Fund Operating Expenses | 1.64% | 2.40% | 1.49% | 1.64% |
| Less: Fee Waiver and/or Expense Reimbursement(d) | (0.37)% | (0.47)% | (0.34)% | (0.22)% |
| Total Annual Fund Operating Expenses After Expense Reimbursement(d) | 1.27% | 1.93% | 1.15% | 1.42% |
| (b) | Restated to reflect current fees and expenses. |
| (c) | Estimated for current fiscal year, as annualized. |
| (d) | The fund’s investment adviser has contractually agreed to limit the fund’s total operating expenses (excluding certain expenses, such as front-end or contingent deferred sales charges, taxes, leverage expenses, interest, brokerage commissions, expenses incurred in connection with any merger or reorganization, unusual or infrequently occurring expenses (such as litigation), acquired fund fees and expenses, and dividend expenses, if any) so that such expenses do not exceed 1.27% for Class A Shares, 1.93% for Class C Shares, 1.15% for Class I Shares and 1.42% for Class T Shares through April 30, 2020. Following the contractual period, the adviser may discontinue these expense reimbursement arrangements at any time. Under certain conditions, the adviser may recapture operating expenses reimbursed under these arrangements for a period of three years following the date on which incurred or waived. |
| Share Status | 1 Year | 3 Years | 5 Years | 10 Years | |
| Class A | Sold or Held | $697 | $1,028 | $1,383 | $2,378 |
| Class C | Sold | $296 | $704 | $1,238 | $2,701 |
| Held | $196 | $704 | $1,238 | $2,701 | |
| Class I | Sold or Held | $117 | $438 | $781 | $1,750 |
| Class T | Sold or Held | $391 | $733 | $1,099 | $2,127 |
| Annual Fund Operating Expenses(expenses that you pay each year as a percentage of the value of your investment) | Class A | Class I | Class T |
| Management Fees | 0.80% | 0.80% | 0.80% |
| Distribution and Shareholder Servicing (12b-1) Fees | 0.25% | None | 0.25% |
| Other Expenses | 0.56%(a) | 0.58%(a) | 0.56%(b) |
| Total Annual Fund Operating Expenses | 1.61% | 1.38% | 1.61% |
| Less: Fee Waiver and/or Expense Reimbursement(c) | (0.36)% | (0.38)% | (0.11)% |
| Total Annual Fund Operating Expenses After Expense Reimbursement(c) | 1.25% | 1.00% | 1.50% |
| (a) | Restated to reflect certain contract and expense allocation changes. |
| (b) | Estimated for current fiscal year, as annualized. |
| (c) | The fund’s investment adviser has contractually agreed to limit the fund’s total operating expenses (excluding certain expenses, such as front-end or contingent deferred sales charges, taxes, leverage expenses, interest, brokerage commissions, expenses incurred in connection with any merger or reorganization, unusual or infrequently occurring expenses (such as litigation), acquired fund fees and expenses, and dividend expenses, if any) so that such expenses do not exceed 1.25% for Class A Shares, 1.00% for Class I Shares and 1.50% for Class T Shares through April 30, 2020. Following the contractual period, the adviser may discontinue these expense reimbursement arrangements at any time. Under certain conditions, the adviser may recapture operating expenses reimbursed under these arrangements for a period of three years following the date on which incurred or waived. |
| Share Status | 1 Year | 3 Years | 5 Years | 10 Years | |
| Class A | Sold or Held | $695 | $1,021 | $1,369 | $2,348 |
| Class I | Sold or Held | $102 | $400 | $719 | $1,624 |
| Class T | Sold or Held | $399 | $745 | $1,115 | $2,153 |
| Class A Shares | Class C Shares | Class I Shares | Class R Shares | Class R6 Shares | Class T Shares | Through Date | |
| Virtus Silvant Small-Cap Growth Stock Fund | 1.27% | 1.93% | 1.15% | N/A | N/A | 1.42% | April 30, 2020 |
| Virtus Zevenbergen Innovative Grwoth Stock Fund | 1.25% | N/A | 1.00% | N/A | N/A | 1.50% | April 30, 2020 |
Accounting Firm
| Mutual Fund Services | 1-800-243-1574 |
| Adviser Consulting Group | 1-800-243-4361 |
| Website | Virtus.com |
The Securities and Exchange Commission has modified mailing regulations for semiannual and annual shareholder fund reports to allow mutual fund companies to send a single copy of these reports to shareholders who share the same mailing address. If you would like additional copies, please call Mutual Fund Services at 1-800-243-1574.

please contact us at1-800-243-1574, orVirtus.com.
| 8635 | 02-19 |
Item 2. Code of Ethics.
| (a) | The registrant, as of the end of the period covered by this report, has adopted a code of ethics that applies to the registrant’s principal executive officer, principal financial officer, principal accounting officer or controller, or persons performing similar functions, regardless of whether these individuals are employed by the registrant or a third party. |
| (c) | Other than certainnon-substantive changes, there have been no amendments, during the period covered by this report, to a provision of the code of ethics that applies to the registrant’s principal executive officer, principal financial officer, principal accounting officer or controller, or persons performing similar functions, regardless of whether these individuals are employed by the registrant or a third party, and that relates to any element of the code of ethics described in Item 2(b) of the instructions for completion of FormN-CSR. |
| (d) | The registrant has not granted any waivers, during the period covered by this report, including an implicit waiver, from a provision of the code of ethics that applies to the registrant’s principal executive officer, principal financial officer, principal accounting officer or controller, or persons performing similar functions, regardless of whether these individuals are employed by the registrant or a third party, that relates to one or more of the items set forth in paragraph (b) of the instructions for completion of this Item. |
Item 3. Audit Committee Financial Expert.
| (a)(1) | The Registrant’s Board of Trustees has determined that the Registrant has an “audit committee financial expert” serving on its Audit Committee. |
| (a)(2) | The Registrant’s Board of Trustees has determined that each of Thomas J. Brown, Donald C. Burke, Connie D. McDaniel and Richard E. Segerson possesses the technical attributes identified in Instruction 2(b) of Item 3 to FormN-CSR to qualify as an “audit committee financial expert.” Each of Messrs. Brown, Burke and Segerson is an “independent” trustee pursuant to paragraph (a)(2) of Item 3 to FormN-CSR. |
| (a)(3) | Not applicable. |
Item 4. Principal Accountant Fees and Services.
Audit Fees
| (a) | The aggregate fees billed for each of the last two fiscal years for professional services rendered by the principal accountant for the audit of the registrant’s annual financial statements or services that are normally provided by the accountant in connection with statutory and regulatory filings or engagements for those fiscal years are $435,260 for 2018 and $43,600 for the nine months ended December 31, 2017. The fiscal year end was changed from March 31 to December 31 during the prior period. |
Audit-Related Fees
| (b) | The aggregate fees billed in each of the last two fiscal years for assurance and related services by the principal accountant that are reasonably related to the performance of the audit of the registrant’s financial statements and are not reported under paragraph (a) of this Item are $74,572 for 2018 and $15,025 for the nine months ended December 31, 2017. The fiscal year end was changed from March 31 to December 31 during the prior period. Such audit-related fees include out of pocket expenses and system conversion fees. |
Tax Fees
| (c) | The aggregate fees billed in each of the last two fiscal years for professional services rendered by the principal accountant for tax compliance, tax advice, and tax planning are $168,642 for 2018 and $80,110 for the nine months ended December 31, 2017. The fiscal year end was changed from March 31 to December 31 during the prior period. |
“Tax Fees” are those primarily associated with review of the Trust’s tax provision and qualification as a regulated investment company (RIC) in connection with audits of the Trust’s financial statement, review ofyear-end distributions by the Fund to avoid excise tax for the Trust, periodic discussion with management on tax issues affecting the Trust, and reviewing and signing the Fund’s federal income tax returns.
All Other Fees
| (d) | The aggregate fees billed in each of the last two fiscal years for products and services provided by the principal accountant, other than the services reported in paragraphs (a) through (c) of this Item are $0 for 2018 and $0 for the nine months ended December 31, 2017. The fiscal year end was changed from March 31 to December 31 during the prior period. |
| (e)(1) | Disclose the audit committee’spre-approval policies and procedures described in paragraph (c)(7) of Rule2-01 of RegulationS-X. |
The Virtus Asset Trust (the “Fund”) Board has adopted policies and procedures with regard to thepre-approval of services provided by PwC. Audit, audit-related and tax compliance services provided to the Fund on an annual basis require specificpre-approval by the Audit Committee. The Audit Committee must also approve othernon-audit services provided to the Fund and thosenon-audit services provided to the Fund’s Affiliated Service Providers that relate directly to the operations and financial reporting of the Fund. Certain of thesenon-audit services that the Audit Committee believes are a) consistent with the SEC’s auditor independence rules and b) routine and recurring services that will not impair the independence of the independent auditors may be
approved by the Audit Committee without consideration on a specificcase-by-case basis (“generalpre-approval”).
The Audit Committee has determined that Mr. Thomas J. Brown, Chair of the Audit Committee, may providepre-approval for such services that meet the above requirements in the event such approval is sought between regularly scheduled meetings. In any event, the Audit Committee is informed of each service approved subject to generalpre-approval at the next regularly scheduledin-person Audit Committee meeting.
| (e)(2) | The percentage of services described in each of paragraphs (b) through (d) of this Item that were approved by the audit committee pursuant to paragraph (c)(7)(i)(C) of Rule2-01 of RegulationS-X are as follows: |
(b) 0%
(c) 0%
(d) N/A
| (f) | The percentage of hours expended on the principal accountant’s engagement to audit the registrant’s financial statements for the most recent fiscal year that were attributed to work performed by persons other than the principal accountant’s full-time, permanent employees was less than fifty percent. |
| (g) | The aggregatenon-audit fees billed by the registrant’s accountant for services rendered to the registrant, and rendered to the registrant’s investment adviser (not including anysub-adviser whose role is primarily portfolio management and is subcontracted with or overseen by another investment adviser), and any entity controlling, controlled by, or under common control with the adviser that provides ongoing services to the registrant for each of the last two fiscal years of the registrant was $243,213 for 2018 and $95,135* for the nine months ended December 31, 2017. The fiscal year end was changed from March 31 to December 31 during the prior period. |
*Prior year fees were restated to removenon-audit fees paid by affiliated registrants not requested by the item.
| (h) | The registrant’s audit committee of the board of directors has considered whether the provision ofnon-audit services that were rendered to the registrant’s investment adviser (not including anysub-adviser whose role is primarily portfolio management and is subcontracted with or overseen by another investment adviser), and any entity controlling, controlled by, or under common control with the investment adviser that provides ongoing services to the registrant that were notpre-approved pursuant to paragraph (c)(7)(ii) of Rule2-01 of RegulationS-X is compatible with maintaining the principal accountant’s independence. |
Item 5. Audit Committee of Listed Registrants.
Not applicable.
Item 6. Investments.
| (a) | Schedule of Investments in securities of unaffiliated issuers as of the close of the reporting period is included as part of the report to shareholders filed under Item 1 of this form. |
| (b) | Not applicable. |
| Item 7. | Disclosure of Proxy Voting Policies and Procedures forClosed-End Management Investment Companies. |
Not applicable.
| Item 8. | Portfolio Managers ofClosed-End Management Investment Companies. |
Not applicable.
| Item 9. | Purchases of Equity Securities byClosed-End Management Investment Company and Affiliated Purchasers. |
Not applicable.
Item 10. Submission of Matters to a Vote of Security Holders.
There have been no material changes to the procedures by which the shareholders may recommend nominees to the registrant’s board of trustees, where those changes were implemented after the registrant last provided disclosure in response to the requirements of Item 407(c)(2)(iv) of RegulationS-K (17 CFR 229.407) (as required by Item 22(b)(15) of Schedule 14A (17 CFR240.14a-101)), or this Item.
Item 11. Controls and Procedures.
| (a) | The registrant’s principal executive and principal financial officers, or persons performing similar functions, have concluded that the registrant’s disclosure controls and procedures (as defined in Rule30a-3(c) under the Investment Company Act of 1940, as amended (the “1940 Act”) (17 CFR270.30a-3(c))) are effective, as of a date within 90 days of the filing date of the report that includes the disclosure required by this paragraph, based on their evaluation of these controls and procedures required by Rule30a-3(b) under the 1940 Act (17 CFR270.30a-3(b)) and Rules13a-15(b) or15d-15(b) under the Securities Exchange Act of 1934, as amended (17 CFR240.13a-15(b) or240.15d-15(b)). |
| (b) | There were no changes in the registrant’s internal control over financial reporting (as defined in Rule30a-3(d) under the 1940 Act (17 CFR270.30a-3(d))) that occurred during the registrant’s |
last fiscal quarter that has materially affected, or is reasonably likely to materially affect, the registrant’s internal control over financial reporting. |
Item 12. Disclosure of Securities Lending Activities forClosed-End Management Investment Companies.
Not applicable.
Item 13. Exhibits.
| (a)(1) | Code of ethics, or any amendment thereto, that is the subject of disclosure required by Item 2 is attached hereto. |
| (a)(2) | Certifications pursuant to Rule30a-2(a) under the 1940 Act and Section 302 of the Sarbanes-Oxley Act of 2002 are attached hereto. |
| (a)(3) | Not applicable. |
| (a)(4) | Not applicable. |
| (b) | Certifications pursuant to Rule30a-2(b) under the 1940 Act and Section 906 of the Sarbanes-Oxley Act of 2002 are attached hereto. |
SIGNATURES
Pursuant to the requirements of the Securities Exchange Act of 1934 and the Investment Company Act of 1940, the registrant has duly caused this report to be signed on its behalf by the undersigned, thereunto duly authorized.
(Registrant) | Virtus Asset Trust |
By (Signature and Title)* | /s/ George R. Aylward | |
George R. Aylward, President | ||
(principal executive officer) | ||
Date | 3/8/2019 | |
Pursuant to the requirements of the Securities Exchange Act of 1934 and the Investment Company Act of 1940, this report has been signed below by the following persons on behalf of the registrant and in the capacities and on the dates indicated.
By (Signature and Title)* | /s/ George R. Aylward | |
George R. Aylward, President | ||
(principal executive officer) |
Date | 3/8/2019 | |
By (Signature and Title)* | /s/ W. Patrick Bradley | |
W. Patrick Bradley, Executive Vice President, | ||
Chief Financial Officer and Treasurer | ||
(principal financial officer) | ||
Date | 3/8/2019 | |
* Print the name and title of each signing officer under his or her signature.