UNITED STATES
SECURITIES AND EXCHANGE COMMISSION
Washington, D.C. 20549
FORM N-CSR
CERTIFIED SHAREHOLDER REPORT OF REGISTERED
MANAGEMENT INVESTMENT COMPANIES
Investment Company Act file number 811-07705
Virtus Asset Trust
(Exact name of registrant as specified in charter)
101 Munson Street
Greenfield, MA 01301-9668
(Address of principal executive offices) (Zip code)
Kevin J. Carr, Esq.
Senior Vice President, Chief Legal Officer, Counsel and Secretary for Registrant
One Financial Plaza
Hartford, CT 06103-4506
(Name and address of agent for service)
Registrant’s telephone number, including area code: (800) 243-1574
Date of fiscal year end: December 31
Date of reporting period: December 31, 2020
Form N-CSR is to be used by management investment companies to file reports with the Commission not later than 10 days after the transmission to stockholders of any report that is required to be transmitted to stockholders under Rule 30e-1 under the Investment Company Act of 1940 (17 CFR 270.30e-1). The Commission may use the information provided on Form N-CSR in its regulatory, disclosure review, inspection, and policymaking roles.
A registrant is required to disclose the information specified by Form N-CSR, and the Commission will make this information public. A registrant is not required to respond to the collection of information contained in Form N-CSR unless the Form displays a currently valid Office of Management and Budget (“OMB”) control number. Please direct comments concerning the accuracy of the information collection burden estimate and any suggestions for reducing the burden to Secretary, Securities and Exchange Commission, 450 Fifth Street, NW, Washington, DC 20549-0609. The OMB has reviewed this collection of information under the clearance requirements of 44 U.S.C. § 3507.
| Item 1. | Reports to Stockholders. |
| (a) | The Report to Shareholders is attached herewith. |
| (b) | Not applicable. |

| Virtus Seix Core Bond Fund* |
| Virtus Seix Corporate Bond Fund* |
| Virtus Seix Floating Rate High Income Fund* |
| Virtus Seix High Grade Municipal Bond Fund* |
| Virtus Seix High Income Fund* |
| Virtus Seix High Yield Fund* |
| Virtus Seix Investment Grade Tax-Exempt Bond Fund* |
| Virtus Seix Short-Term Bond Fund* |
| Virtus Seix Short-Term Municipal Bond Fund* |
| Virtus Seix Total Return Bond Fund* |
| Virtus Seix U.S. Government Securities Ultra-Short Bond Fund |
| Virtus Seix U.S. Mortgage Fund* |
| Virtus Seix Ultra-Short Bond Fund |
| 1 | ||
| 2 | ||
| 5 | ||
| Fund | Fund Summary | Schedule of Investments |
| 8 | 44 | |
| 11 | 49 | |
| 14 | 52 | |
| 17 | 62 | |
| 19 | 64 | |
| 22 | 69 | |
| 25 | 74 | |
| 27 | 78 | |
| 30 | 81 | |
| 32 | 83 | |
| 35 | 88 | |
| 38 | 93 | |
| 41 | 95 | |
| 98 | ||
| 103 | ||
| 108 | ||
| 115 | ||
| 123 | ||
| 143 | ||
| 144 | ||
| 145 | ||
| 150 | ||


President, Virtus Funds
| Beginning Account Value July 1, 2020 | Ending Account Value December 31, 2020 | Annualized Expense Ratio | Expenses Paid During Period* | |||||
Seix Core Bond Fund | ||||||||
| Class A | $ 1,000.00 | $ 1,015.70 | 0.64 % | $ 3.24 | ||||
| Class I | 1,000.00 | 1,017.30 | 0.50 | 2.54 | ||||
| Class R6 | 1,000.00 | 1,017.10 | 0.36 | 1.83 | ||||
Seix Corporate Bond Fund | ||||||||
| Class A | 1,000.00 | 1,066.30 | 0.95 | 4.93 | ||||
| Class C | 1,000.00 | 1,061.60 | 1.65 | 8.55 | ||||
| Class I | 1,000.00 | 1,067.90 | 0.70 | 3.64 | ||||
| Class R6** | 1,000.00 | 1,047.50 | 0.43 | 0.87 | ||||
Seix Floating Rate High Income Fund | ||||||||
| Class A | 1,000.00 | 1,061.80 | 0.97 | 5.03 | ||||
| Class C | 1,000.00 | 1,058.70 | 1.55 | 8.02 | ||||
| Class I | 1,000.00 | 1,063.50 | 0.65 | 3.37 | ||||
| Class R6 | 1,000.00 | 1,065.40 | 0.55 | 2.86 | ||||
Seix High Grade Municipal Bond Fund | ||||||||
| Class A | 1,000.00 | 1,026.90 | 0.75 | 3.82 | ||||
| Class I | 1,000.00 | 1,027.70 | 0.60 | 3.06 | ||||
Seix High Income Fund | ||||||||
| Class A | 1,000.00 | 1,123.00 | 0.93 | 4.96 | ||||
| Class I | 1,000.00 | 1,124.50 | 0.68 | 3.63 | ||||
| Class R6 | 1,000.00 | 1,125.10 | 0.59 | 3.15 | ||||
Seix High Yield Fund | ||||||||
| Class A | 1,000.00 | 1,108.60 | 0.82 | 4.35 | ||||
| Class I | 1,000.00 | 1,110.10 | 0.64 | 3.39 | ||||
| Class R6 | 1,000.00 | 1,110.70 | 0.53 | 2.81 | ||||
Seix Investment Grade Tax-Exempt Bond Fund | ||||||||
| Class A | 1,000.00 | 1,021.10 | 0.73 | 3.71 | ||||
| Class I | 1,000.00 | 1,022.80 | 0.58 | 2.95 | ||||
Seix Short-Term Bond Fund | ||||||||
| Class A | 1,000.00 | 1,003.60 | 0.80 | 4.03 | ||||
| Class C | 1,000.00 | 1,002.00 | 1.31 | 6.59 | ||||
| Class I | 1,000.00 | 1,005.60 | 0.60 | 3.02 | ||||
Seix Short-Term Municipal Bond Fund | ||||||||
| Class A | 1,000.00 | 1,009.10 | 0.63 | 3.18 | ||||
| Class I | 1,000.00 | 1,010.90 | 0.46 | 2.33 |
| Beginning Account Value July 1, 2020 | Ending Account Value December 31, 2020 | Annualized Expense Ratio | Expenses Paid During Period* | |||||
Seix Total Return Bond Fund | ||||||||
| Class A | $1,000.00 | $1,021.30 | 0.70% | $3.56 | ||||
| Class I | 1,000.00 | 1,022.20 | 0.46 | 2.34 | ||||
| Class R6 | 1,000.00 | 1,023.10 | 0.31 | 1.58 | ||||
Seix U.S. Government Securities Ultra-Short Bond Fund | ||||||||
| Class A | 1,000.00 | 1,001.60 | 0.66 | 3.32 | ||||
| Class I | 1,000.00 | 1,002.90 | 0.41 | 2.06 | ||||
| Class R6 | 1,000.00 | 1,003.60 | 0.26 | 1.31 | ||||
Seix U.S. Mortgage Fund | ||||||||
| Class A | 1,000.00 | 996.10 | 0.90 | 4.52 | ||||
| Class C | 1,000.00 | 992.30 | 1.65 | 8.26 | ||||
| Class I | 1,000.00 | 997.10 | 0.70 | 3.51 | ||||
Seix Ultra-Short Bond Fund | ||||||||
| Class A | 1,000.00 | 1,006.60 | 0.65 | 3.28 | ||||
| Class I | 1,000.00 | 1,007.90 | 0.40 | 2.02 |
| * | Expenses are equal to the relevant Fund’s annualized expense ratio, which is net of waived fees and reimbursed expenses, if applicable, multiplied by the average account value over the period, multiplied by the number of days (184) expenses were accrued in the most recent fiscal half-year, then divided by 366 to reflect the one-half year period. |
| ** | October 21, 2020, is the date the Class started accruing expenses. Expenses are equal to the Class’s annualized expense ratio, which is net of waived fees and reimbursed expenses, if applicable, multiplied by the average account value over the period, multiplied by the number of days (72) expenses were accrued in the most recent fiscal half-year, then divided by 366 to reflect the one-half year period. |
| Beginning Account Value July 1, 2020 | Ending Account Value December 31, 2020 | Annualized Expense Ratio | Expenses Paid During Period* | |||||
Seix Core Bond Fund | ||||||||
| Class A | $ 1,000.00 | $ 1,021.92 | 0.64 % | $ 3.25 | ||||
| Class I | 1,000.00 | 1,022.62 | 0.50 | 2.54 | ||||
| Class R6 | 1,000.00 | 1,023.33 | 0.36 | 1.83 | ||||
Seix Corporate Bond Fund | ||||||||
| Class A | 1,000.00 | 1,020.36 | 0.95 | 4.82 | ||||
| Class C | 1,000.00 | 1,016.84 | 1.65 | 8.36 | ||||
| Class I | 1,000.00 | 1,021.62 | 0.70 | 3.56 | ||||
| Class R6** | 1,000.00 | 1,008.99 | 0.43 | 0.85 | ||||
Seix Floating Rate High Income Fund | ||||||||
| Class A | 1,000.00 | 1,020.26 | 0.97 | 4.93 | ||||
| Class C | 1,000.00 | 1,017.34 | 1.55 | 7.86 | ||||
| Class I | 1,000.00 | 1,021.87 | 0.65 | 3.30 | ||||
| Class R6 | 1,000.00 | 1,022.37 | 0.55 | 2.80 | ||||
Seix High Grade Municipal Bond Fund | ||||||||
| Class A | 1,000.00 | 1,021.37 | 0.75 | 3.81 | ||||
| Class I | 1,000.00 | 1,022.12 | 0.60 | 3.05 |
| Beginning Account Value July 1, 2020 | Ending Account Value December 31, 2020 | Annualized Expense Ratio | Expenses Paid During Period* | |||||
Seix High Income Fund | ||||||||
| Class A | $1,000.00 | $1,020.46 | 0.93% | $4.72 | ||||
| Class I | 1,000.00 | 1,021.72 | 0.68 | 3.46 | ||||
| Class R6 | 1,000.00 | 1,022.17 | 0.59 | 3.00 | ||||
Seix High Yield Fund | ||||||||
| Class A | 1,000.00 | 1,021.01 | 0.82 | 4.17 | ||||
| Class I | 1,000.00 | 1,021.92 | 0.64 | 3.25 | ||||
| Class R6 | 1,000.00 | 1,022.47 | 0.53 | 2.69 | ||||
Seix Investment Grade Tax-Exempt Bond Fund | ||||||||
| Class A | 1,000.00 | 1,021.47 | 0.73 | 3.71 | ||||
| Class I | 1,000.00 | 1,022.22 | 0.58 | 2.95 | ||||
Seix Short-Term Bond Fund | ||||||||
| Class A | 1,000.00 | 1,021.12 | 0.80 | 4.06 | ||||
| Class C | 1,000.00 | 1,018.55 | 1.31 | 6.65 | ||||
| Class I | 1,000.00 | 1,022.12 | 0.60 | 3.05 | ||||
Seix Short-Term Municipal Bond Fund | ||||||||
| Class A | 1,000.00 | 1,021.97 | 0.63 | 3.20 | ||||
| Class I | 1,000.00 | 1,022.82 | 0.46 | 2.34 | ||||
Seix Total Return Bond Fund | ||||||||
| Class A | 1,000.00 | 1,021.62 | 0.70 | 3.56 | ||||
| Class I | 1,000.00 | 1,022.82 | 0.46 | 2.34 | ||||
| Class R6 | 1,000.00 | 1,023.58 | 0.31 | 1.58 | ||||
Seix U.S. Government Securities Ultra-Short Bond Fund | ||||||||
| Class A | 1,000.00 | 1,021.82 | 0.66 | 3.35 | ||||
| Class I | 1,000.00 | 1,023.08 | 0.41 | 2.08 | ||||
| Class R6 | 1,000.00 | 1,023.83 | 0.26 | 1.32 | ||||
Seix U.S. Mortgage Fund | ||||||||
| Class A | 1,000.00 | 1,020.61 | 0.90 | 4.57 | ||||
| Class C | 1,000.00 | 1,016.84 | 1.65 | 8.36 | ||||
| Class I | 1,000.00 | 1,021.62 | 0.70 | 3.56 | ||||
Seix Ultra-Short Bond Fund | ||||||||
| Class A | 1,000.00 | 1,021.87 | 0.65 | 3.30 | ||||
| Class I | 1,000.00 | 1,023.13 | 0.40 | 2.03 |
| * | Expenses are equal to the relevant Fund’s annualized expense ratio, which is net of waived fees and reimbursed expenses, if applicable, multiplied by the average account value over the period, multiplied by the number of days (184) expenses were accrued in the most recent fiscal half-year, then divided by 366 to reflect the one-half year period. |
| ** | October 21, 2020, is the date the Class started accruing expenses. Expenses are equal to the Class’s annualized expense ratio, which is net of waived fees and reimbursed expenses, if applicable, multiplied by the average account value over the period, multiplied by the number of days (72) expenses were accrued in the most recent fiscal half-year, then divided by 366 to reflect the one-half year period. |
December 31, 2020
December 31, 2020
| Ticker Symbols: | |
| Class A: STGIX | |
| Class I: STIGX | |
| Class R6: STGZX |
Seix Investment Advisors LLC
| ■ | The Fund is diversified and has an investment objective of seeking to maximize long term total return through a combination of current income and capital appreciation, consistent with capital preservation. There is no guarantee that the Fund will meet its objective. |
| ■ | For the fiscal year ended December 31, 2020, the Fund’s Class A shares at NAV returned 8.91%, Class I shares at NAV returned 9.15%, and Class R6 shares at NAV returned 9.31%. For the same period, the Bloomberg Barclays U.S. Aggregate Bond Index, the Fund’s style-specific benchmark appropriate for comparison, returned 7.51%. |
| U.S. Government Securities | 43% | |
| Corporate Bonds and Notes | 31 | |
| Financials | 9% | |
| Industrials | 5 | |
| Energy | 4 | |
| Utilities | 3 | |
| Information Technology | 3 | |
| Materials | 2 | |
| Communication Services | 2 | |
| All other Corporate Bonds and Notes | 3 | |
| Mortgage-Backed Securities | 21 | |
| Agency | 18 | |
| Non-Agency | 3 | |
| Asset-Backed Securities | 4 | |
| Credit Card | 2 | |
| All other Asset-Backed Securities | 2 | |
| Short-Term Investment | 1 | |
| Total | 100% |
| 1 Year | 5 Years | 10 Years | Since inception | Inception date | ||||||||
| Class A shares at NAV2 | 8.91 % | 4.35 % | 3.71 % | — % | — | |||||||
| Class A shares at POP3,4 | 4.82 | 3.55 | 3.31 | — | — | |||||||
| Class I shares at NAV2 | 9.15 | 4.49 | 3.92 | — | — | |||||||
| Class R6 shares at NAV2 | 9.31 | 4.65 | — | 4.12 | 8/3/15 | |||||||
| Bloomberg Barclays U.S. Aggregate Bond Index | 7.51 | 4.44 | 3.84 | 4.03 5 | — | |||||||
| Fund Expense Ratios6: Class A shares: Gross 0.91%, Net 0.64%; Class I shares: Gross 0.64%, Net 0.50%; Class R6 shares: Gross 0.50%, Net 0.36%. | ||||||||||||
| All returns represent past performance which is no guarantee of future results. Current performance may be higher or lower than the performance shown. The investment return and principal value of an investment will fluctuate so that an investor’s shares, when redeemed, may be worth more or less than their original cost. The above table and graph below do not reflect the deduction of taxes that a shareholder would pay on fund distributions or the redemption of shares. Please visit Virtus.com for performance data current to the most recent month-end. |

| 1 | Total returns are historical and include changes in share price and the reinvestment of both dividends and capital gain distributions. |
| 2 | “NAV” (Net Asset Value) total returns do not include the effect of any sales charge. |
| 3 | “POP” (Public Offering Price) total returns include the effect of the maximum front-end 3.75% sales charge. |
| 4 | “CDSC” (contingent deferred sales charge) is applied to redemptions of certain classes of shares that do not have a sales charge applied at the time of purchase. CDSC for certain redemptions of Class A shares made within 18 months of a finder’s fee being paid and all Class C shares are 1% within the first year and 0% thereafter. |
| 5 | The since inception index return is from the inception date of Class R6 shares. |
| 6 | The expense ratios of the Fund are set forth according to the prospectus for the Fund effective April 28, 2020, as supplemented and revised, and may differ from the expense ratios disclosed in the Financial Highlights tables in this report. See the Financial Highlights for more current expense ratios. Net Expense: Expenses reduced by a contractual expense limitation in effect through April 30, 2021. Gross Expense: Does not reflect the effect of the expense limitation. Expense ratios include fees and expenses associated with any underlying funds. |
| Ticker Symbols: | |
| Class A: SAINX | |
| Class C: STIFX | |
| Class I: STICX | |
| Class R6: VRSBX |
Seix Investment Advisors LLC
| ■ | The Fund is diversified and has an investment objective of seeking to maximize long term total return through a combination of current income and capital appreciation, consistent with capital preservation. There is no guarantee that the Fund will meet its objective. |
| ■ | For the fiscal year ended December 31, 2020, the Fund’s Class A shares at NAV returned 17.44%, Class C shares at NAV returned 16.57%, Class I shares at NAV returned 17.82% and Class R6 shares at NAV from October 20, 2020 (inception date) through December 31, 2020, returned 4.75%*. For the fiscal year ended December 31, 2020, the Bloomberg Barclays U.S. Corporate Investment Grade Bond Index, the Fund’s style-specific benchmark appropriate for comparison, returned 9.89%. |
| Corporate Bonds and Notes | 99% | |
| Financials | 27% | |
| Industrials | 15 | |
| Energy | 15 | |
| Materials | 8 | |
| Utilities | 8 | |
| Information Technology | 7 | |
| Consumer Discretionary | 6 | |
| All other Corporate Bonds and Notes | 13 | |
| Short-Term Investment | 1 | |
| Total | 100% |
| 1 Year | 5 Years | 10 Years | Since inception | Inception date | ||||||||
| Class A shares at NAV2 | 17.44 % | 7.86 % | 5.73 % | — % | — | |||||||
| Class A shares at POP3,4 | 13.04 | 7.04 | 5.33 | — | — | |||||||
| Class C shares at NAV2 and with CDSC4 | 16.57 | 7.07 | 4.99 | — | — | |||||||
| Class I shares at NAV2 | 17.82 | 8.10 | 6.02 | — | — | |||||||
| Class R6 shares at NAV2 | — | — | — | 4.75 | 10/20/20 | |||||||
| Bloomberg Barclays U.S. Corporate Investment Grade Bond Index | 9.89 | 6.74 | 5.63 | 2.84 5 | — | |||||||
| Fund Expense Ratios6: Class A shares: Gross 1.08%, Net 0.95%; Class C shares: Gross 1.83%, Net 1.65%; Class I shares: Gross 0.85%, Net 0.70%; Class R6: Gross 0.72%, Net 043%. | ||||||||||||
| All returns represent past performance which is no guarantee of future results. Current performance may be higher or lower than the performance shown. The investment return and principal value of an investment will fluctuate so that an investor’s shares, when redeemed, may be worth more or less than their original cost. The above table and graph below do not reflect the deduction of taxes that a shareholder would pay on fund distributions or the redemption of shares. Please visit Virtus.com for performance data current to the most recent month-end. |

| 1 | Total returns are historical and include changes in share price and the reinvestment of both dividends and capital gain distributions. |
| 2 | “NAV” (Net Asset Value) total returns do not include the effect of any sales charge. |
| 3 | “POP” (Public Offering Price) total returns include the effect of the maximum front-end 3.75% sales charge. |
| 4 | “CDSC” (contingent deferred sales charge) is applied to redemptions of certain classes of shares that do not have a sales charge applied at the time of purchase. CDSC for certain redemptions of Class A shares made within 18 months of a finder’s fee being paid and all Class C shares are 1% within the first year and 0% thereafter. |
| 5 | The since inception index return is from the inception date of Class R6 shares. |
| 6 | The expense ratios of the Fund are set forth according to the prospectus for the Fund effective April 28, 2020, as supplemented and revised, and may differ from the expense ratios disclosed in the Financial Highlights tables in this report. See the Financial Highlights for more current expense ratios. Net Expense: Expenses reduced by a contractual expense limitation in effect through April 30, 2022. Gross Expense: Does not reflect the effect of the expense limitation. Expense ratios include fees and expenses associated with any underlying funds. |
| Ticker Symbols: | |
| Class A: SFRAX | |
| Class C: SFRCX | |
| Class I: SAMBX | |
| Class R6: SFRZX |
Seix Investment Advisors LLC
| ■ | The Fund is diversified and has an investment objective of attempting to provide a high level of current income. There is no guarantee that the Fund will meet its objective. |
| ■ | For the fiscal year ended December 31, 2020, the Fund’s Class A shares at NAV returned 0.06%, Class C shares at NAV returned -0.52%, Class I shares at NAV returned 0.38%, and Class R6 shares at NAV returned 0.61%. For the same period, the Credit Suisse Leveraged Loan Index, the Fund’s style-specific benchmark appropriate for comparison, returned 2.78%. |
| Leveraged Loans | 93% | |
| Service | 12% | |
| Information Technology | 10 | |
| Financial | 8 | |
| Healthcare | 8 | |
| Media / Telecom - Telecommunications | 8 | |
| Media / Telecom - Diversified Media | 6 | |
| Chemicals | 6 | |
| All other Leveraged Loans | 35 | |
| Corporate Bonds and Notes | 6 | |
| Common Stocks | 1 | |
| Total | 100% |
| 1 Year | 5 Years | 10 Years | Since inception | Inception date | ||||||||
| Class A shares at NAV2 | 0.06 % | 4.04 % | 3.44 % | — % | — | |||||||
| Class A shares at POP3,4 | -2.69 | 3.46 | 3.15 | — | — | |||||||
| Class C shares at NAV2 and with CDSC4 | -0.52 | 3.44 | 2.82 | — | — | |||||||
| Class I shares at NAV2 | 0.38 | 4.37 | 3.75 | — | — | |||||||
| Class R6 shares at NAV2 | 0.61 | 4.48 | — | 3.55 | 2/1/15 | |||||||
| Credit Suisse Leveraged Loan Index | 2.78 | 5.19 | 4.47 | 4.25 5 | — | |||||||
| Fund Expense Ratios6: Class A shares: Gross 0.93%, Net 0.93%; Class C shares: Gross 1.64%, Net 1.52%; Class I shares: Gross 0.72%, Net 0.62%; Class R6 shares: Gross 0.60%, Net 0.52%. | ||||||||||||
| All returns represent past performance which is no guarantee of future results. Current performance may be higher or lower than the performance shown. The investment return and principal value of an investment will fluctuate so that an investor’s shares, when redeemed, may be worth more or less than their original cost. The above table and graph below do not reflect the deduction of taxes that a shareholder would pay on fund distributions or the redemption of shares. Please visit Virtus.com for performance data current to the most recent month-end. |

| 1 | Total returns are historical and include changes in share price and the reinvestment of both dividends and capital gain distributions. |
| 2 | “NAV” (Net Asset Value) total returns do not include the effect of any sales charge. |
| 3 | “POP” (Public Offering Price) total returns include the effect of the maximum front-end 2.75% sales charge. |
| 4 | “CDSC” (contingent deferred sales charge) is applied to redemptions of certain classes of shares that do not have a sales charge applied at the time of purchase. CDSC for certain redemptions of Class A shares made within 18 months of a finder’s fee being paid and all Class C shares are 1% within the first year and 0% thereafter. |
| 5 | The since inception index return is from the inception date of Class R6 shares. |
| 6 | The expense ratios of the Fund are set forth according to the prospectus for the Fund effective April 28, 2020, as supplemented and revised, and may differ from the expense ratios disclosed in the Financial Highlights tables in this report. See the Financial Highlights for more current expense ratios. Net Expense: Expenses reduced by a contractual expense limitation in effect through April 30, 2021. Gross Expense: Does not reflect the effect of the expense limitation. Expense ratios include fees and expenses associated with any underlying funds. |
| Ticker Symbols: | |
| Class A: SFLTX | |
| Class I: SCFTX |
Seix Investment Advisors LLC
| ■ | The Fund is diversified and has an investment objective of seeking to maximize total return through (i) current income that is exempt from federal income taxes and (ii) capital appreciation consistent with capital preservation. There is no guarantee that the Fund will meet its objective. |
| ■ | For the fiscal year ended December 31, 2020, the Fund’s Class A shares at NAV returned 6.85% and Class I shares at NAV returned 7.01%. For the same period, the Bloomberg Barclays U.S. Municipal Bond Index, the Fund’s style-specific benchmark appropriate for comparison, returned 5.21%. |
| Municipal Bonds | 88% |
| Short-Term Investment | 12 |
| Total | 100% |
| 1 Year | 5 Years | 10 Years | ||||||
| Class A shares at NAV2 | 6.85% | 4.13% | 5.15% | |||||
| Class A shares at POP3,4 | 3.91 | 3.55 | 4.85 | |||||
| Class I shares at NAV2 | 7.01 | 4.30 | 5.31 | |||||
| Bloomberg Barclays U.S. Municipal Bond Index | 5.21 | 3.91 | 4.63 | |||||
| Fund Expense Ratios5: Class A shares: Gross 0.98%, Net 0.76%; Class I shares: Gross 0.88%, Net 0.61%. | ||||||||
| All returns represent past performance which is no guarantee of future results. Current performance may be higher or lower than the performance shown. The investment return and principal value of an investment will fluctuate so that an investor’s shares, when redeemed, may be worth more or less than their original cost. The above table and graph below do not reflect the deduction of taxes that a shareholder would pay on fund distributions or the redemption of shares. Please visit Virtus.com for performance data current to the most recent month-end. |

| 1 | Total returns are historical and include changes in share price and the reinvestment of both dividends and capital gain distributions. |
| 2 | “NAV” (Net Asset Value) total returns do not include the effect of any sales charge. |
| 3 | “POP” (Public Offering Price) total returns include the effect of the maximum front-end 2.75% sales charge. |
| 4 | “CDSC” (contingent deferred sales charge) is applied to redemptions of certain classes of shares that do not have a sales charge applied at the time of purchase. CDSC for certain redemptions of Class A shares made within 18 months of a finder’s fee being paid and all Class C shares are 1% within the first year and 0% thereafter. |
| 5 | The expense ratios of the Fund are set forth according to the prospectus for the Fund effective April 28, 2020, as supplemented and revised, and may differ from the expense ratios disclosed in the Financial Highlights tables in this report. See the Financial Highlights for more current expense ratios. Net Expense: Expenses reduced by a contractual expense limitation in effect through April 30, 2022. Gross Expense: Does not reflect the effect of the expense limitation. Expense ratios include fees and expenses associated with any underlying funds. |
| Ticker Symbols: | |
| Class A: SAHIX | |
| Class I: STHTX | |
| Class R6: STHZX |
Seix Investment Advisors LLC
| ■ | The Fund is diversified and has an investment objective of seeking high current income and, secondarily, total return (comprised of capital appreciation and income). There is no guarantee that the Fund will meet its objective. |
| ■ | For the fiscal year ended December 31, 2020, the Fund’s Class A shares at NAV returned 7.31%†, Class I shares at NAV returned 7.58%, and Class R6 shares at NAV returned 7.85%. For the same period, the Bloomberg Barclays U.S. Corporate High Yield Bond Index, the Fund’s style-specific benchmark appropriate for comparison, returned 7.11%. |
| Corporate Bonds and Notes | 98% | |
| Consumer Discretionary | 24% | |
| Communication Services | 17 | |
| Financials | 16 | |
| Energy | 10 | |
| Industrials | 8 | |
| Health Care | 7 | |
| Information Technology | 7 | |
| All other Corporate Bonds and Notes | 9 | |
| Leveraged Loans | 1 | |
| Other (includes securities lending collateral) | 1 | |
| Total | 100% |
| 1 Year | 5 Years | 10 Years | Since inception | Inception date | ||||||||
| Class A shares at NAV2 | 7.31 % 3 | 7.83 % | 5.71 % | — % | — | |||||||
| Class A shares at POP4,5 | 3.28 | 7.01 | 5.30 | — | — | |||||||
| Class I shares at NAV2 | 7.58 | 8.09 | 5.96 | — | — | |||||||
| Class R6 shares at NAV2 | 7.85 | 8.24 | — | 4.93 | 8/1/14 | |||||||
| Bloomberg Barclays U.S. Corporate High Yield Bond Index | 7.11 | 8.59 | 6.80 | 5.70 6 | — | |||||||
| Fund Expense Ratios7: Class A shares: Gross 1.13%, Net 0.93%; Class I shares: Gross 0.90%, Net 0.68%; Class R6 shares: Gross 0.76%, Net 0.59%. | ||||||||||||
| All returns represent past performance which is no guarantee of future results. Current performance may be higher or lower than the performance shown. The investment return and principal value of an investment will fluctuate so that an investor’s shares, when redeemed, may be worth more or less than their original cost. The above table and graph below do not reflect the deduction of taxes that a shareholder would pay on fund distributions or the redemption of shares. Please visit Virtus.com for performance data current to the most recent month-end. |

| 1 | Total returns are historical and include changes in share price and the reinvestment of both dividends and capital gain distributions. |
| 2 | “NAV” (Net Asset Value) total returns do not include the effect of any sales charge. |
| 3 | Total Return for the report period presented in the table differs from the return in the Financial Highlights. The total return presented in the above table is calculated based on the NAV at which shareholder transactions were processed. The total return presented in the Financial Highlights section of the report is calculated in the same manner, but also takes into account certain adjustments that are necessary under generally accepted accounting principles required in the annual report and semiannual report. |
| 4 | “POP” (Public Offering Price) total returns include the effect of the maximum front-end 3.75% sales charge. |
| 5 | “CDSC” (contingent deferred sales charge) is applied to redemptions of certain classes of shares that do not have a sales charge applied at the time of purchase. CDSC for certain redemptions of Class A shares made within 18 months of a finder’s fee being paid and all Class C shares are 1% within the first year and 0% thereafter. |
| 6 | The since inception index return is from the inception date of Class R6 shares. |
| 7 | The expense ratios of the Fund are set forth according to the prospectus for the Fund effective April 28, 2020, as supplemented and revised, and may differ from the expense ratios disclosed in the Financial Highlights tables in this report. See the Financial Highlights for more current expense ratios. Net Expense: Expenses reduced by a contractual expense limitation in effect through April 30, 2021. Gross Expense: Does not reflect the effect of the expense limitation. Expense ratios include fees and expenses associated with any underlying funds. |
| Ticker Symbols: | |
| Class A: HYPSX | |
| Class I: SAMHX | |
| Class R6: HYIZX |
Seix Investment Advisors LLC
| ■ | The Fund is diversified and has an investment objective of seeking high income and, secondarily, capital appreciation. There is no guarantee that the Fund will meet its objective. |
| ■ | For the fiscal year ended December 31, 2020, the Fund’s Class A shares at NAV returned 9.86%, Class I shares at NAV returned 9.93%, and Class R6 shares at NAV returned 10.05%. For the same period, the ICE BofA U.S. High Yield BB-B Constrained Index, the Fund’s style-specific benchmark appropriate for comparison, returned 6.28%. |
| Corporate Bonds and Notes | 95% | |
| Communication Services | 20% | |
| Consumer Discretionary | 19 | |
| Financials | 16 | |
| Health Care | 8 | |
| Energy | 8 | |
| Industrials | 6 | |
| Information Technology | 6 | |
| All other Corporate Bonds and Notes | 12 | |
| Leveraged Loans | 2 | |
| Other (includes short-term investments and securities lending collateral) | 3 | |
| Total | 100% |
| 1 Year | 5 Years | 10 Years | Since inception | Inception date | ||||||||
| Class A shares at NAV2 | 9.86 % | 7.93 % | 5.90 % | — % | — | |||||||
| Class A shares at POP3,4 | 5.74 | 7.10 | 5.49 | — | — | |||||||
| Class I shares at NAV2 | 9.93 | 8.14 | 6.11 | — | — | |||||||
| Class R6 shares at NAV2 | 10.05 | — | — | 7.26 | 8/1/16 | |||||||
| ICE BofA U.S. High Yield BB-B Constrained Index | 6.28 | 8.02 | 6.63 | 6.69 5 | — | |||||||
| Fund Expense Ratios6: Class A shares: Gross 1.04%, Net 0.82%; Class I shares: Gross 0.77%, Net 0.64%; Class R6 shares: Gross 0.67%, Net 0.53%. | ||||||||||||
| All returns represent past performance which is no guarantee of future results. Current performance may be higher or lower than the performance shown. The investment return and principal value of an investment will fluctuate so that an investor’s shares, when redeemed, may be worth more or less than their original cost. The above table and graph below do not reflect the deduction of taxes that a shareholder would pay on fund distributions or the redemption of shares. Please visit Virtus.com for performance data current to the most recent month-end. |

| 1 | Total returns are historical and include changes in share price and the reinvestment of both dividends and capital gain distributions. |
| 2 | “NAV” (Net Asset Value) total returns do not include the effect of any sales charge. |
| 3 | “POP” (Public Offering Price) total returns include the effect of the maximum front-end 3.75% sales charge. |
| 4 | “CDSC” (contingent deferred sales charge) is applied to redemptions of certain classes of shares that do not have a sales charge applied at the time of purchase. CDSC for certain redemptions of Class A shares made within 18 months of a finder’s fee being paid and all Class C shares are 1% within the first year and 0% thereafter. |
| 5 | The since inception index return is from the inception date of Class R6 shares. |
| 6 | The expense ratios of the Fund are set forth according to the prospectus for the Fund effective April 28, 2020, as supplemented and revised, and may differ from the expense ratios disclosed in the Financial Highlights tables in this report. See the Financial Highlights for more current expense ratios. Net Expense: Expenses reduced by a contractual expense limitation in effect through April 30, 2021. Gross Expense: Does not reflect the effect of the expense limitation. Expense ratios include fees and expenses associated with any underlying funds. |
| Ticker Symbols: | |
| Class A: SISIX | |
| Class I: STTBX |
Seix Investment Advisors LLC
| ■ | The Fund is diversified and has an investment objective of seeking to maximize high total return through (i) current income that is exempt from federal income taxes and (ii) capital appreciation consistent with capital preservation. There is no guarantee that the Fund will meet its objective. |
| ■ | For the fiscal year ended December 31, 2020, the Fund’s Class A shares at NAV returned 5.73% and Class I shares at NAV returned 5.98%. For the same period, the Bloomberg Barclays U.S. Municipal Bond 1-15 Year Blend (1-17) Index, the Fund’s style-specific benchmark appropriate for comparison, returned 4.73%. |
| Municipal Bonds | 87% |
| Short-Term Investment | 13 |
| Total | 100% |
| 1 Year | 5 Years | 10 Years | ||||||
| Class A shares at NAV2 | 5.73% | 3.24% | 3.81% | |||||
| Class A shares at POP3,4 | 2.82 | 2.66 | 3.52 | |||||
| Class I shares at NAV2 | 5.98 | 3.41 | 3.98 | |||||
| Bloomberg Barclays U.S. Municipal Bond 1-15 Year Blend (1-17) Index | 4.73 | 3.39 | 3.84 | |||||
| Fund Expense Ratios5: Class A shares: Gross 1.02%, Net 0.72%; Class I shares: Gross 0.82%, Net 0.57%. | ||||||||
| All returns represent past performance which is no guarantee of future results. Current performance may be higher or lower than the performance shown. The investment return and principal value of an investment will fluctuate so that an investor’s shares, when redeemed, may be worth more or less than their original cost. The above table and graph below do not reflect the deduction of taxes that a shareholder would pay on fund distributions or the redemption of shares. Please visit Virtus.com for performance data current to the most recent month-end. |

| 1 | Total returns are historical and include changes in share price and the reinvestment of both dividends and capital gain distributions. |
| 2 | “NAV” (Net Asset Value) total returns do not include the effect of any sales charge. |
| 3 | “POP” (Public Offering Price) total returns include the effect of the maximum front-end 2.75% sales charge. |
| 4 | “CDSC” (contingent deferred sales charge) is applied to redemptions of certain classes of shares that do not have a sales charge applied at the time of purchase. CDSC for certain redemptions of Class A shares made within 18 months of a finder’s fee being paid and all Class C shares are 1% within the first year and 0% thereafter. |
| 5 | The expense ratios of the Fund are set forth according to the prospectus for the Fund effective April 28, 2020, as supplemented and revised, and may differ from the expense ratios disclosed in the Financial Highlights tables in this report. See the Financial Highlights for more current expense ratios. Net Expense: Expenses reduced by a contractual expense limitation in effect through April 30, 2022. Gross Expense: Does not reflect the effect of the expense limitation. Expense ratios include fees and expenses associated with any underlying funds. |
| Ticker Symbols: | |
| Class A: STSBX | |
| Class C: SCBSX | |
| Class I: SSBTX |
Seix Investment Advisors LLC
| ■ | The Fund is diversified and has an investment objective of seeking to maximize long term total return through a combination of current income and capital appreciation, consistent with capital preservation. There is no guarantee that the Fund will meet its objective. |
| ■ | For the fiscal year ended December 31, 2020, the Fund’s Class A shares at NAV returned 3.59%, Class C shares at NAV returned 2.96%, and Class I shares at NAV returned 3.91%. For the same period, the Bloomberg Barclays 1-3 Year U.S. Government/Credit Index, the Fund’s style-specific benchmark appropriate for comparison, returned 3.33%. |
| U.S. Government Securities | 43% | |
| Corporate Bonds and Notes | 36 | |
| Financials | 12% | |
| Industrials | 9 | |
| Energy | 5 | |
| Consumer Discretionary | 3 | |
| Health Care | 2 | |
| Utilities | 2 | |
| Consumer Staples | 1 | |
| All other Corporate Bonds and Notes | 2 | |
| Mortgage-Backed Securities | 15 | |
| Asset-Backed Securities | 6 | |
| Total | 100% |
| 1 Year | 5 Years | 10 Years | ||||||
| Class A shares at NAV2 | 3.59% | 1.74% | 1.35% | |||||
| Class A shares at POP3,4 | 1.26 | 1.28 | 1.12 | |||||
| Class C shares at NAV2 and with CDSC4 | 2.96 | 1.04 | 0.69 | |||||
| Class I shares at NAV2 | 3.91 | 1.94 | 1.58 | |||||
| Bloomberg Barclays 1-3 Year U.S. Government/Credit Index | 3.33 | 2.21 | 1.60 | |||||
| Fund Expense Ratios5: Class A shares: Gross 1.81%, Net 0.80%; Class C shares: Gross 2.58%, Net 1.57%; Class I shares: Gross 1.61%, Net 0.60%. | ||||||||
| All returns represent past performance which is no guarantee of future results. Current performance may be higher or lower than the performance shown. The investment return and principal value of an investment will fluctuate so that an investor’s shares, when redeemed, may be worth more or less than their original cost. The above table and graph below do not reflect the deduction of taxes that a shareholder would pay on fund distributions or the redemption of shares. Please visit Virtus.com for performance data current to the most recent month-end. |

| 1 | Total returns are historical and include changes in share price and the reinvestment of both dividends and capital gain distributions. |
| 2 | “NAV” (Net Asset Value) total returns do not include the effect of any sales charge. |
| 3 | “POP” (Public Offering Price) total returns include the effect of the maximum front-end 2.25% sales charge. |
| 4 | “CDSC” (contingent deferred sales charge) is applied to redemptions of certain classes of shares that do not have a sales charge applied at the time of purchase. CDSC for certain redemptions of Class A shares made within 18 months of a finder’s fee being paid and all Class C shares are 1% within the first year and 0% thereafter. |
| 5 | The expense ratios of the Fund are set forth according to the prospectus for the Fund effective April 28, 2020, as supplemented and revised, and may differ from the expense ratios disclosed in the Financial Highlights tables in this report. See the Financial Highlights for more current expense ratios. Net Expense: Expenses reduced by a contractual expense limitation in effect through April 30, 2021. Gross Expense: Does not reflect the effect of the expense limitation. Expense ratios include fees and expenses associated with any underlying funds. |
| Ticker Symbols: | |
| Class A: SMMAX | |
| Class I: CMDTX |
Seix Investment Advisors LLC
| ■ | The Fund is diversified and has an investment objective of seeking to maximize total return through (i) current income that is exempt from federal income taxes and (ii) capital appreciation consistent with capital preservation. There is no guarantee that the Fund will meet its objective. |
| ■ | For the fiscal year ended December 31, 2020, the Fund’s Class A shares at NAV returned 2.86% and Class I shares at NAV returned 3.03%. For the same period, the Bloomberg Barclays Municipal Bond 1-5 Year Index, the Fund’s style-specific benchmark appropriate for comparison, returned 2.83%. |
| Municipal Bonds | 87% |
| Short-Term Investment | 13 |
| Total | 100% |
| 1 Year | 5 Years | 10 Years | ||||||
| Class A shares at NAV2 | 2.86% | 1.70% | 2.24% | |||||
| Class A shares at POP3,4 | 0.55 | 1.24 | 2.00 | |||||
| Class I shares at NAV2 | 3.03 | 1.88 | 2.40 | |||||
| Bloomberg Barclays Municipal Bond 1-5 Year Index | 2.83 | 1.98 | 1.87 | |||||
| Fund Expense Ratios5: Class A shares: Gross 1.24%, Net 0.56%; Class I shares: Gross 1.12%, Net 0.39%. | ||||||||
| All returns represent past performance which is no guarantee of future results. Current performance may be higher or lower than the performance shown. The investment return and principal value of an investment will fluctuate so that an investor’s shares, when redeemed, may be worth more or less than their original cost. The above table and graph below do not reflect the deduction of taxes that a shareholder would pay on fund distributions or the redemption of shares. Please visit Virtus.com for performance data current to the most recent month-end. |

| 1 | Total returns are historical and include changes in share price and the reinvestment of both dividends and capital gain distributions. |
| 2 | “NAV” (Net Asset Value) total returns do not include the effect of any sales charge. |
| 3 | “POP” (Public Offering Price) total returns include the effect of the maximum front-end 2.25% sales charge. |
| 4 | “CDSC” (contingent deferred sales charge) is applied to redemptions of certain classes of shares that do not have a sales charge applied at the time of purchase. CDSC for certain redemptions of Class A shares made within 18 months of a finder’s fee being paid and all Class C shares are 1% within the first year and 0% thereafter. |
| 5 | The expense ratios of the Fund are set forth according to the prospectus for the Fund effective April 28, 2020, as supplemented and revised, and may differ from the expense ratios disclosed in the Financial Highlights tables in this report. See the Financial Highlights for more current expense ratios. Net Expense: Expenses reduced by a contractual expense limitation in effect through April 30, 2022. Gross Expense: Does not reflect the effect of the expense limitation. Expense ratios include fees and expenses associated with any underlying funds. |
| Ticker Symbols: | |
| Class A: CBPSX | |
| Class I: SAMFX | |
| Class R6: SAMZX |
Seix Investment Advisors LLC
| ■ | The Fund is diversified and has an investment objective of seeking to maximize long term total return through a combination of current income and capital appreciation, consistent with capital preservation. There is no guarantee that the Fund will meet its objective. |
| ■ | For the fiscal year ended December 31, 2020, the Fund’s Class A shares at NAV returned 10.91%, Class I shares at NAV returned 11.12%, and Class R6 shares at NAV returned 11.30%. For the same period, the Bloomberg Barclays U.S. Aggregate Bond Index, the Fund’s style-specific benchmark appropriate for comparison, returned 7.51%. |
| U.S. Government Securities | 40% | |
| Corporate Bonds and Notes | 34 | |
| Financials | 10% | |
| Energy | 5 | |
| Industrials | 5 | |
| Utilities | 3 | |
| Information Technology | 3 | |
| Materials | 2 | |
| Consumer Discretionary | 2 | |
| All other Corporate Bonds and Notes | 4 | |
| Mortgage-Backed Securities | 22 | |
| Agency | 18 | |
| Non-Agency | 4 | |
| Asset-Backed Securities | 4 | |
| Credit Card | 2 | |
| All other Asset-Backed Securities | 2 | |
| Total | 100% |
| 1 Year | 5 Years | 10 Years | Since inception | Inception date | ||||||||
| Class A shares at NAV2 | 10.91 % | 4.39 % | 3.83 % | — % | — | |||||||
| Class A shares at POP3,4 | 6.75 | 3.60 | 3.44 | — | — | |||||||
| Class I shares at NAV2 | 11.12 | 4.66 | 4.11 | — | — | |||||||
| Class R6 shares at NAV2 | 11.30 | 4.78 | — | 4.02 | 8/1/14 | |||||||
| Bloomberg Barclays U.S. Aggregate Bond Index | 7.51 | 4.44 | 3.84 | 3.84 5 | — | |||||||
| Fund Expense Ratios6: Class A shares: Gross 0.94%, Net 0.70%; Class I shares: Gross 0.59%, Net 0.46%; Class R6 shares: Gross 0.45%, Net 0.31%. | ||||||||||||
| All returns represent past performance which is no guarantee of future results. Current performance may be higher or lower than the performance shown. The investment return and principal value of an investment will fluctuate so that an investor’s shares, when redeemed, may be worth more or less than their original cost. The above table and graph below do not reflect the deduction of taxes that a shareholder would pay on fund distributions or the redemption of shares. Please visit Virtus.com for performance data current to the most recent month-end. |

| 1 | Total returns are historical and include changes in share price and the reinvestment of both dividends and capital gain distributions. |
| 2 | “NAV” (Net Asset Value) total returns do not include the effect of any sales charge. |
| 3 | “POP” (Public Offering Price) total returns include the effect of the maximum front-end 3.75% sales charge. |
| 4 | “CDSC” (contingent deferred sales charge) is applied to redemptions of certain classes of shares that do not have a sales charge applied at the time of purchase. CDSC for certain redemptions of Class A shares made within 18 months of a finder’s fee being paid and all Class C shares are 1% within the first year and 0% thereafter. |
| 5 | The since inception index return is from the inception date of Class R6 shares. |
| 6 | The expense ratios of the Fund are set forth according to the prospectus for the Fund effective April 28, 2020, as supplemented and revised, and may differ from the expense ratios disclosed in the Financial Highlights tables in this report. See the Financial Highlights for more current expense ratios. Net Expense: Expenses reduced by a contractual expense limitation in effect through April 30, 2021. Gross Expense: Does not reflect the effect of the expense limitation. Expense ratios include fees and expenses associated with any underlying funds. |
| Ticker Symbols: | |
| Class A: SSAGX | |
| Class I: SIGVX | |
| Class R6: SIGZX |
Seix Investment Advisors LLC
| ■ | The Fund is diversified and has an investment objective of seeking to maximize current income consistent with capital preservation. There is no guarantee that the Fund will meet its objective. |
| ■ | For the fiscal year ended December 31, 2020, the Fund’s Class A shares at NAV returned 0.99%, Class I shares at NAV returned 1.25%, and Class R6 shares at NAV returned 1.40%. For the same period, the Bloomberg Barclays 3-6 Month U.S. Treasury Bill Index, the Fund’s style-specific benchmark appropriate for comparison, returned 0.87%. |
| Mortgage-Backed Securities | 90% | |
| Agency | 90% | |
| Short-Term Investment | 9 | |
| Asset-Backed Securities | 1 | |
| Total | 100% |
| 1 Year | 5 Years | 10 Years | Since inception | Inception date | ||||||||
| Class A shares at NAV2 | 0.99 % | — % | — % | 1.59 % | 7/24/18 | |||||||
| Class I shares at NAV2 | 1.25 | 1.45 | 1.11 | — | — | |||||||
| Class R6 shares at NAV2 | 1.40 | — | — | 1.72 | 8/1/16 | |||||||
| Bloomberg Barclays 3-6 Month U.S. Treasury Bill Index | 0.87 | 1.30 | 0.72 | — 3 | — | |||||||
| Fund Expense Ratios4: Class A shares: Gross 0.65%, Net 0.65%; Class I shares: Gross 0.50%, Net 0.41%; Class R6 shares: Gross 0.37%, Net 0.26%. | ||||||||||||
| All returns represent past performance which is no guarantee of future results. Current performance may be higher or lower than the performance shown. The investment return and principal value of an investment will fluctuate so that an investor’s shares, when redeemed, may be worth more or less than their original cost. The above table and graph below do not reflect the deduction of taxes that a shareholder would pay on fund distributions or the redemption of shares. Please visit Virtus.com for performance data current to the most recent month-end. |

| 1 | Total returns are historical and include changes in share price and the reinvestment of both dividends and capital gain distributions. |
| 2 | “NAV” (Net Asset Value) total returns do not include the effect of any sales charge. |
| 3 | The index return is 1.74% since inception of Class A shares and 1.41% since inception of Class R6 shares. |
| 4 | The expense ratios of the Fund are set forth according to the prospectus for the Fund effective April 28, 2020, as supplemented and revised, and may differ from the expense ratios disclosed in the Financial Highlights tables in this report. See the Financial Highlights for more current expense ratios. Net Expense: Expenses reduced by a contractual expense limitation in effect through April 30, 2021. Gross Expense: Does not reflect the effect of the expense limitation. Expense ratios include fees and expenses associated with any underlying funds. |
| Ticker Symbols: | |
| Class A: SLTMX | |
| Class C: SCLFX | |
| Class I: SLMTX |
Seix Investment Advisors LLC
| ■ | The Fund is diversified and has an investment objective of seeking to maximize long term total return through a combination of current income and capital appreciation, consistent with capital preservation. There is no guarantee that the Fund will meet its objective. |
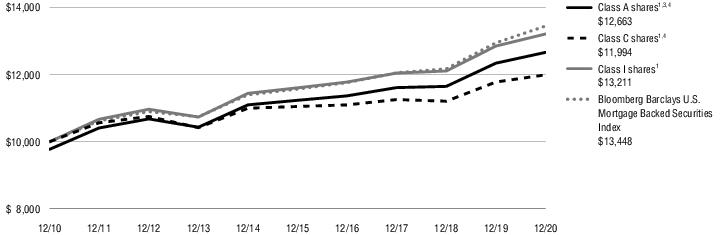
| ■ | For the fiscal year ended December 31, 2020, the Fund’s Class A shares at NAV returned 2.60%, Class C shares at NAV returned 1.83%, and Class I shares at NAV returned 2.80%. For the same period, the Bloomberg Barclays U.S. Mortgage Backed Securities Index, the Fund’s style-specific benchmark appropriate for comparison, returned 3.87%. |
| Mortgage-Backed Securities | 94% | |
| Agency | 94% | |
| Short-Term Investment | 6 | |
| Total | 100% |
| 1 Year | 5 Years | 10 Years | ||||||
| Class A shares at NAV2 | 2.60% | 2.42% | 2.62% | |||||
| Class A shares at POP3,4 | 0.30 | 1.96 | 2.39 | |||||
| Class C shares at NAV2 and with CDSC4 | 1.83 | 1.65 | 1.84 | |||||
| Class I shares at NAV2 | 2.80 | 2.62 | 2.82 | |||||
| Bloomberg Barclays U.S. Mortgage Backed Securities Index | 3.87 | 3.05 | 3.01 | |||||
| Fund Expense Ratios5: Class A shares: Gross 1.74%, Net 0.90%; Class C shares: Gross 1.99%, Net 1.65%; Class I shares: Gross 1.10%, Net 0.70%. | ||||||||
| All returns represent past performance which is no guarantee of future results. Current performance may be higher or lower than the performance shown. The investment return and principal value of an investment will fluctuate so that an investor’s shares, when redeemed, may be worth more or less than their original cost. The above table and graph below do not reflect the deduction of taxes that a shareholder would pay on fund distributions or the redemption of shares. Please visit Virtus.com for performance data current to the most recent month-end. |
| 1 | Total returns are historical and include changes in share price and the reinvestment of both dividends and capital gain distributions. |
| 2 | “NAV” (Net Asset Value) total returns do not include the effect of any sales charge. |
| 3 | “POP” (Public Offering Price) total returns include the effect of the maximum front-end 2.25% sales charge. |
| 4 | “CDSC” (contingent deferred sales charge) is applied to redemptions of certain classes of shares that do not have a sales charge applied at the time of purchase. CDSC for certain redemptions of Class A shares made within 18 months of a finder’s fee being paid and all Class C shares are 1% within the first year and 0% thereafter. |
| 5 | The expense ratios of the Fund are set forth according to the prospectus for the Fund effective April 28, 2020, as supplemented and revised, and may differ from the expense ratios disclosed in the Financial Highlights tables in this report. See the Financial Highlights for more current expense ratios. Net Expense: Expenses reduced by a contractual expense limitation in effect through April 30, 2021. Gross Expense: Does not reflect the effect of the expense limitation. Expense ratios include fees and expenses associated with any underlying funds. |
| Ticker Symbols: | |
| Class A: SASSX | |
| Class I: SISSX |
Seix Investment Advisors LLC
| ■ | The Fund is diversified and has an investment objective of seeking to maximize current income consistent with capital preservation. There is no guarantee that the Fund will meet its objective. |
| ■ | For the fiscal year ended December 31, 2020, the Fund’s Class A shares at NAV returned 1.13% and Class I shares at NAV returned 1.39%. For the same period, the Bloomberg Barclays 3-6 Month U.S. Treasury Bill Index, the Fund’s style-specific benchmark appropriate for comparison, returned 0.87%. |
| Corporate Bonds and Notes | 52% | |
| Financials | 23% | |
| Industrials | 7 | |
| Health Care | 6 | |
| Energy | 5 | |
| Utilities | 4 | |
| Consumer Discretionary | 4 | |
| Materials | 1 | |
| All other Corporate Bonds and Notes | 2 | |
| Mortgage-Backed Securities | 25 | |
| Non-Agency | 14 | |
| Agency | 11 | |
| Asset-Backed Securities | 18 | |
| Credit Card | 12 | |
| Student Loan | 3 | |
| Other | 3 | |
| Short-Term Investment | 5 | |
| Total | 100% |
| 1 Year | 5 Years | 10 Years | Since inception | Inception date | ||||||||
| Class A shares at NAV2 | 1.13 % | — % | — % | 1.71 % | 7/24/2018 | |||||||
| Class I shares at NAV2 | 1.39 | 1.76 | 1.32 | — | — | |||||||
| Bloomberg Barclays 3-6 Month U.S. Treasury Bill Index | 0.87 | 1.30 | 0.72 | 1.74 3 | — | |||||||
| Fund Expense Ratios4: Class A shares: Gross 0.83%, Net 0.65%; Class I shares: Gross 0.61%, Net 0.40%. | ||||||||||||
| All returns represent past performance which is no guarantee of future results. Current performance may be higher or lower than the performance shown. The investment return and principal value of an investment will fluctuate so that an investor’s shares, when redeemed, may be worth more or less than their original cost. The above table and graph below do not reflect the deduction of taxes that a shareholder would pay on fund distributions or the redemption of shares. Please visit Virtus.com for performance data current to the most recent month-end. |

| 1 | Total returns are historical and include changes in share price and the reinvestment of both dividends and capital gain distributions. |
| 2 | “NAV” (Net Asset Value) total returns do not include the effect of any sales charge. |
| 3 | The since inception index return is from the inception date of Class A shares. |
| 4 | The expense ratios of the Fund are set forth according to the prospectus for the Fund effective April 28, 2020, as supplemented and revised, and may differ from the expense ratios disclosed in the Financial Highlights tables in this report. See the Financial Highlights for more current expense ratios. Net Expense: Expenses reduced by a contractual expense limitation in effect through April 30, 2021. Gross Expense: Does not reflect the effect of the expense limitation. Expense ratios include fees and expenses associated with any underlying funds. |
| Par Value | Value | ||
| U.S. Government Securities—43.1% | |||
| U.S. Treasury Bills 0.000%, 2/25/21 | $ 40,489 | $ 40,485 | |
| U.S. Treasury Bonds 1.375%, 8/15/50 | 13,926 | 13,012 | |
| U.S. Treasury Notes | |||
| 1.250%, 3/31/21 | 2,527 | 2,534 | |
| 2.750%, 8/15/21 | 510 | 518 | |
| 1.750%, 5/31/22 | 909 | 930 | |
| 1.375%, 6/30/23 | 18,392 | 18,954 | |
| 1.500%, 10/31/24 | 433 | 454 | |
| 0.500%, 3/31/25 | 8,290 | 8,365 | |
| 0.250%, 9/30/25 | 429 | 427 | |
| 0.875%, 11/15/30 | 665 | 662 | |
| Total U.S. Government Securities (Identified Cost $86,245) | 86,341 | ||
| Mortgage-Backed Securities—21.0% | |||
| Agency—18.3% | |||
| Federal Home Loan Mortgage Corp. | |||
| Pool #C04123 4.000%, 7/1/42 | 241 | 263 | |
| Pool #G60019 4.500%, 3/1/44 | 222 | 249 | |
| Pool #Q31645 4.000%, 2/1/45 | 65 | 70 | |
| Pool #Q35611 4.000%, 9/1/45 | 570 | 617 | |
| Pool #V81992 4.000%, 10/1/45 | 348 | 378 | |
| Pool #G60661 4.000%, 7/1/46 | 569 | 615 | |
| Pool #Q42921 3.500%, 9/1/46 | 684 | 739 | |
| Pool #Q51758 3.500%, 10/1/47 | 108 | 115 | |
| Pool #Q52115 3.500%, 11/1/47 | 51 | 54 | |
| Pool #Q52135 3.500%, 11/1/47 | 1,223 | 1,302 | |
| Pool #ZM5226 3.500%, 12/1/47 | 707 | 766 | |
| Pool #Q53881 4.500%, 1/1/48 | 559 | 616 | |
| Pool #Q61680 4.000%, 2/1/49 | 579 | 622 | |
| Pool #QA3079 3.500%, 10/1/49 | 353 | 385 | |
| Pool #QA4766 3.500%, 11/1/49 | 601 | 652 | |
| Pool #SD0164 3.500%, 12/1/49 | 970 | 1,050 | |
| Pool #SD0176 3.500%, 12/1/49 | 652 | 689 | |
| Pool #QA6331 3.500%, 1/1/50 | 860 | 914 | |
| Pool #QA7571 3.000%, 2/1/50 | 759 | 795 | |
| Pool #QA8967 3.000%, 4/1/50 | 1,476 | 1,547 | |
| Pool #QA9935 3.000%, 6/1/50 | 332 | 352 | |
| Par Value | Value | ||
| Agency—continued | |||
| Federal National Mortgage Association | |||
| Pool #FM1039 3.500%, 4/1/39 | $ 738 | $ 786 | |
| Pool #BO8589 3.000%, 3/1/40 | 110 | 116 | |
| Pool #AL7497 3.500%, 9/1/40 | 261 | 282 | |
| Pool #AW8154 3.500%, 1/1/42 | 302 | 328 | |
| Pool #BK0396 3.000%, 11/1/44 | 182 | 192 | |
| Pool #MA2341 4.500%, 6/1/45 | 23 | 25 | |
| Pool #BE5050 4.000%, 9/1/45 | 517 | 570 | |
| Pool #AZ9213 4.000%, 10/1/45 | 577 | 631 | |
| Pool #AS6515 4.000%, 1/1/46 | 67 | 73 | |
| Pool #BA4799 4.000%, 2/1/46 | 224 | 245 | |
| Pool #BE9567 3.500%, 4/1/47 | 1,816 | 1,936 | |
| Pool #BE7213 4.000%, 4/1/47 | 107 | 115 | |
| Pool #BE9598 4.000%, 5/1/47 | 89 | 96 | |
| Pool #BE3774 4.000%, 7/1/47 | 240 | 259 | |
| Pool #BH7058 3.500%, 12/1/47 | 638 | 675 | |
| Pool #MA3211 4.000%, 12/1/47 | 148 | 159 | |
| Pool #BH9215 3.500%, 1/1/48 | 1,128 | 1,195 | |
| Pool #MA3238 3.500%, 1/1/48 | 1,021 | 1,082 | |
| Pool #BJ0650 3.500%, 3/1/48 | 181 | 191 | |
| Pool #MA3305 3.500%, 3/1/48 | 1,184 | 1,254 | |
| Pool #BJ8599 3.500%, 4/1/48 | 138 | 147 | |
| Pool #BK6111 4.000%, 7/1/48 | 1,454 | 1,554 | |
| Pool #BN4542 4.500%, 2/1/49 | 165 | 180 | |
| Pool #BO1345 3.500%, 8/1/49 | 2,030 | 2,161 | |
| Pool #BO1351 4.000%, 8/1/49 | 1,791 | 1,928 | |
| Pool #BO3024 3.500%, 10/1/49 | 353 | 382 | |
| Pool #BO5325 3.000%, 11/1/49 | 202 | 212 | |
| Pool #BO4386 3.500%, 11/1/49 | 1,086 | 1,151 | |
| Pool #BO8894 3.000%, 12/1/49 | 381 | 404 | |
| Pool #BP5431 3.000%, 6/1/50 | 517 | 549 | |
| Pool #BP5432 3.000%, 6/1/50 | 479 | 510 | |
| Par Value | Value | ||
| Agency—continued | |||
| Pool #BQ1405 3.000%, 8/1/50 | $ 1,087 | $ 1,141 | |
| Government National Mortgage Association I Pool #BQ1140 3.000%, 11/15/49 | 737 | 768 | |
| Government National Mortgage Association II | |||
| Pool #MA4262 3.500%, 2/20/47 | 144 | 155 | |
| Pool #MA4586 3.500%, 7/20/47 | 451 | 484 | |
| Pool #MA5596 4.500%, 11/20/48 | 308 | 333 | |
| Pool #MA6656 3.000%, 5/20/50 | 1,356 | 1,419 | |
| 36,478 | |||
| Non-Agency—2.7% | |||
| BB-UBS Trust | |||
| 2012-SHOW, A 144A 3.430%, 11/5/36(1) | 200 | 208 | |
| 2012-SHOW, B 144A 3.882%, 11/5/36(1) | 605 | 605 | |
| Century Plaza Towers 2019-CPT, B 144A 2.997%, 11/13/39(1)(2) | 635 | 686 | |
| CF Hippolyta LLC 2020-1, A1 144A 1.690%, 7/15/60(1) | 349 | 355 | |
| Goldman Sachs Mortgage Securities Corp. II | |||
| 2005-ROCK, A 144A 5.366%, 5/3/32(1) | 325 | 375 | |
| 2012-BWTR, A 144A 2.954%, 11/5/34(1) | 195 | 195 | |
| Goldman Sachs Mortgage Securities Corp. Trust 2018-HULA, A (1 month LIBOR + 0.920%) 144A 1.079%, 7/15/25(1)(2) | 175 | 172 | |
| JPMBB Commercial Mortgage Securities Trust 2013-C15, A4 4.096%, 11/15/45 | 514 | 557 | |
| MAD Mortgage Trust 2017-330M, A 144A 3.188%, 8/15/34(1)(2) | 260 | 270 | |
| Morgan Stanley Capital I Trust 2014-150E, A 144A 3.912%, 9/9/32(1) | 670 | 721 | |
| SBA Tower Trust 144A 1.884%, 1/15/26(1) | 480 | 494 | |
| Wells Fargo Commercial Mortgage Trust 2013-BTC, A 144A 3.544%, 4/16/35(1) | 190 | 191 | |
| WFRBS Commercial Mortgage Trust 2012-C10, AS 3.241%, 12/15/45 | 600 | 596 | |
| 5,425 | |||
| Total Mortgage-Backed Securities (Identified Cost $40,799) | 41,903 | ||
| Asset-Backed Securities—3.7% | |||
| Automobiles—1.1% | |||
| Ford Credit Auto Owner Trust 2020-1, A 144A 2.040%, 8/15/31(1) | 1,355 | 1,429 | |
| Mercedes-Benz Master Owner Trust 2019-BA, A 144A 2.610%, 5/15/24(1) | 320 | 331 | |
| Par Value | Value | ||
| Automobiles—continued | |||
| Nissan Master Owner Trust Receivables 2019-A, A (1 month LIBOR + 0.560%) 0.719%, 2/15/24(2) | $ 480 | $ 482 | |
| 2,242 | |||
| Credit Card—1.6% | |||
| Capital One Multi-Asset Execution Trust 2005-B3, B3 (3 month LIBOR + 0.550%) 0.787%, 5/15/28(2) | 1,075 | 1,053 | |
| Citibank Credit Card Issuance Trust 2017-A6, A6 (1 month LIBOR + 0.770%) 0.924%, 5/14/29(2) | 1,305 | 1,307 | |
| Discover Card Execution Note Trust 2017-A5, A5 (1 month LIBOR + 0.600%) 0.759%, 12/15/26(2) | 790 | 798 | |
| 3,158 | |||
| Other—1.0% | |||
| Arby’s Funding LLC 2020-1A, A2 144A 3.237%, 7/30/50(1) | 259 | 265 | |
| Five Guys Funding LLC 2017-1A, A2 144A 4.600%, 7/25/47(1) | 357 | 372 | |
| Jersey Mike’s Funding 2019-1A, A2 144A 4.433%, 2/15/50(1) | 680 | 726 | |
| Vantage Data Centers LLC 2020-2A, A2 144A 1.992%, 9/15/45(1) | 675 | 679 | |
| 2,042 | |||
| Total Asset-Backed Securities (Identified Cost $7,301) | 7,442 | ||
| Corporate Bonds and Notes—30.7% | |||
| Communication Services—1.9% | |||
| AT&T, Inc. | |||
| 2.250%, 2/1/32 | 477 | 484 | |
| 3.650%, 6/1/51 | 993 | 1,038 | |
| 3.300%, 2/1/52 | 508 | 503 | |
| Comcast Corp. 2.650%, 2/1/30 | 956 | 1,044 | |
| Verizon Communications, Inc. 3.150%, 3/22/30 | 228 | 255 | |
| ViacomCBS, Inc. 4.200%, 5/19/32 | 370 | 446 | |
| 3,770 | |||
| Consumer Discretionary—1.0% | |||
| Dollar General Corp. 3.500%, 4/3/30 | 557 | 639 | |
| Marriott International, Inc. 3.500%, 10/15/32 | 683 | 747 | |
| NIKE, Inc. 3.375%, 3/27/50 | 460 | 565 | |
| 1,951 | |||
| Consumer Staples—1.4% | |||
| Coca-Cola Co. (The) 1.000%, 3/15/28 | 926 | 929 | |
| Par Value | Value | ||
| Consumer Staples—continued | |||
| Kroger Co. (The) 3.950%, 1/15/50 | $ 688 | $ 834 | |
| Mars, Inc. 144A 2.450%, 7/16/50(1) | 1,013 | 1,007 | |
| 2,770 | |||
| Energy—3.8% | |||
| Boardwalk Pipelines LP 4.450%, 7/15/27 | 175 | 196 | |
| EOG Resources, Inc. 4.950%, 4/15/50 | 811 | 1,097 | |
| Exxon Mobil Corp. 4.327%, 3/19/50 | 791 | 1,026 | |
| HollyFrontier Corp. 4.500%, 10/1/30 | 758 | 800 | |
| Marathon Petroleum Corp. | |||
| 4.500%, 5/1/23 | 476 | 517 | |
| 4.700%, 5/1/25 | 296 | 339 | |
| Pioneer Natural Resources Co. 1.900%, 8/15/30 | 1,383 | 1,369 | |
| Plains All American Pipeline LP 3.800%, 9/15/30 | 1,289 | 1,385 | |
| Shell International Finance B.V. 2.375%, 4/6/25 | 255 | 274 | |
| TechnipFMC plc 3.450%, 10/1/22 | 85 | 88 | |
| Woodside Finance Ltd. 144A 4.600%, 5/10/21(1) | 550 | 552 | |
| 7,643 | |||
| Financials—9.1% | |||
| AerCap Ireland Capital DAC 6.500%, 7/15/25 | 1,275 | 1,524 | |
| Athene Holding Ltd. 3.500%, 1/15/31 | 437 | 462 | |
| Avolon Holdings Funding Ltd. | |||
| 144A 5.500%, 1/15/26(1) | 567 | 642 | |
| 144A 4.250%, 4/15/26(1) | 397 | 428 | |
| Bank of America Corp. 3.366%, 1/23/26 | 254 | 280 | |
| BP Capital Markets America, Inc. 3.633%, 4/6/30 | 1,492 | 1,735 | |
| Chubb INA Holdings, Inc. 1.375%, 9/15/30 | 901 | 899 | |
| Citigroup, Inc. | |||
| 3.106%, 4/8/26 | 480 | 524 | |
| 3.980%, 3/20/30 | 772 | 907 | |
| Fidelity National Financial, Inc. 3.400%, 6/15/30 | 381 | 418 | |
| General Motors Financial Co., Inc. | |||
| 2.750%, 6/20/25 | 828 | 885 | |
| 3.600%, 6/21/30 | 1,112 | 1,241 | |
| Hartford Financial Services Group, Inc. (The) 2.800%, 8/19/29 | 422 | 458 | |
| JPMorgan Chase & Co. | |||
| 3.207%, 4/1/23 | 318 | 330 | |
| 2.301%, 10/15/25 | 398 | 422 | |
| 2.739%, 10/15/30 | 430 | 468 | |
| Lazard Group LLC 4.375%, 3/11/29 | 557 | 653 | |
| Par Value | Value | ||
| Financials—continued | |||
| Morgan Stanley | |||
| 3.875%, 4/29/24 | $ 425 | $ 470 | |
| 3.971%, 7/22/38 | 441 | 543 | |
| Nationwide Financial Services, Inc. 144A 3.900%, 11/30/49(1) | 834 | 927 | |
| Newcrest Finance Pty Ltd. 144A 4.200%, 5/13/50(1) | 514 | 627 | |
| Schlumberger Investment S.A. 2.650%, 6/26/30 | 1,127 | 1,206 | |
| Travelers Cos., Inc. (The) | |||
| 4.050%, 3/7/48 | 490 | 649 | |
| 2.550%, 4/27/50 | 446 | 469 | |
| Truist Bank 2.250%, 3/11/30 | 500 | 524 | |
| US Bank NA 2.050%, 1/21/25 | 500 | 529 | |
| 18,220 | |||
| Health Care—1.2% | |||
| AbbVie, Inc. 4.250%, 11/21/49 | 874 | 1,095 | |
| Bristol-Myers Squibb Co. 4.250%, 10/26/49 | 196 | 265 | |
| CommonSpirit Health 4.187%, 10/1/49 | 277 | 322 | |
| Danaher Corp. 2.600%, 10/1/50 | 807 | 836 | |
| 2,518 | |||
| Industrials—4.8% | |||
| 3M Co. 3.700%, 4/15/50 | 234 | 290 | |
| Baker Hughes a GE Co. LLC 4.486%, 5/1/30 | 866 | 1,040 | |
| Boeing Co. (The) | |||
| 3.625%, 2/1/31 | 1,638 | 1,794 | |
| 5.805%, 5/1/50 | 1,305 | 1,800 | |
| Carrier Global Corp. 3.577%, 4/5/50 | 953 | 1,057 | |
| General Dynamics Corp. 4.250%, 4/1/50 | 565 | 767 | |
| General Electric Co. 4.350%, 5/1/50 | 958 | 1,163 | |
| Honeywell International, Inc. 2.800%, 6/1/50 | 391 | 428 | |
| United Airlines Pass-Through-Trust 2020-1, A 5.875%, 10/15/27 | 657 | 710 | |
| United Parcel Service, Inc. 4.450%, 4/1/30 | 382 | 478 | |
| 9,527 | |||
| Information Technology—2.6% | |||
| Dell International LLC 144A 6.200%, 7/15/30(1) | 297 | 386 | |
| HP, Inc. | |||
| 3.000%, 6/17/27 | 421 | 464 | |
| 3.400%, 6/17/30 | 804 | 894 | |
| Intel Corp. 3.100%, 2/15/60 | 899 | 988 | |
| Par Value | Value | ||
| Information Technology—continued | |||
| Intuit, Inc. 0.950%, 7/15/25 | $ 595 | $ 602 | |
| NetApp, Inc. | |||
| 1.875%, 6/22/25 | 303 | 317 | |
| 2.700%, 6/22/30 | 1,420 | 1,525 | |
| 5,176 | |||
| Materials—1.9% | |||
| Barrick PD Australia Finance Pty Ltd. 5.950%, 10/15/39 | 799 | 1,149 | |
| Bemis Co., Inc. 2.630%, 6/19/30 | 250 | 270 | |
| LYB International Finance III LLC 3.625%, 4/1/51 | 327 | 357 | |
| Newmont Corp. | |||
| 2.250%, 10/1/30 | 720 | 757 | |
| 6.250%, 10/1/39 | 521 | 788 | |
| Nucor Corp. 2.000%, 6/1/25 | 289 | 306 | |
| Packaging Corporation of America 4.050%, 12/15/49 | 228 | 282 | |
| 3,909 | |||
| Utilities—3.0% | |||
| Berkshire Hathaway Energy Co. 144A 2.850%, 5/15/51(1) | 809 | 830 | |
| Boardwalk Pipelines LP 3.400%, 2/15/31 | 298 | 311 | |
| Cheniere Corpus Christi Holdings LLC 3.700%, 11/15/29 | 751 | 836 | |
| Consolidated Edison Co. of New York, Inc. 3.950%, 4/1/50 | 726 | 883 | |
| Dominion Energy, Inc. 3.375%, 4/1/30 | 714 | 813 | |
| Pacific Gas and Electric Co. 2.500%, 2/1/31 | 448 | 449 | |
| Southern Co. (The) 3.700%, 4/30/30 | 1,192 | 1,380 | |
| Transcontinental Gas Pipe Line Co. LLC 3.950%, 5/15/50 | 437 | 493 | |
| 5,995 | |||
| Total Corporate Bonds and Notes (Identified Cost $56,317) | 61,479 | ||
| Total Long-Term Investments—98.5% (Identified Cost $190,662) | 197,165 | ||
| Shares | Value | ||
| Short-Term Investment—0.9% | |||
| Money Market Mutual Fund—0.9% | |||
| Dreyfus Government Cash Management Fund - Institutional Shares (seven-day effective yield 0.030%)(3) | 1,886,687 | $ 1,887 | |
| Total Short-Term Investment (Identified Cost $1,887) | 1,887 | ||
| TOTAL INVESTMENTS—99.4% (Identified Cost $192,549) | $199,052 | ||
| Other assets and liabilities, net—0.6% | 1,171 | ||
| NET ASSETS—100.0% | $200,223 | ||
| Abbreviations: | |
| LIBOR | London Interbank Offered Rate |
| LLC | Limited Liability Company |
| LP | Limited Partnership |
| Footnote Legend: | |
| (1) | Security exempt from registration under Rule 144A of the Securities Act of 1933. These securities may be resold in transactions exempt from registration, normally to qualified institutional buyers. At December 31, 2020, these securities amounted to a value of $13,473 or 6.7% of net assets. |
| (2) | Variable rate security. Rate disclosed is as of December 31, 2020. For leveraged loans, the rate shown may represent a weighted average interest rate. Information in parenthesis represents benchmark and reference rate for each security. Certain variable rate securities are not based on a published reference rate and spread but are determined by the issuer or agent and are based on current market conditions, or, for mortgage-backed securities, are impacted by the individual mortgages which are paying off over time. These securities do not indicate a reference rate and spread in their descriptions. |
| (3) | Shares of this fund are publicly offered, and its prospectus and annual report are publicly available. |
| Total Value at December 31, 2020 | Level 1 Quoted Prices | Level 2 Significant Observable Inputs | |||
| Assets: | |||||
| Debt Securities: | |||||
| Asset-Backed Securities | $ 7,442 | $ — | $ 7,442 | ||
| Corporate Bonds and Notes | 61,479 | — | 61,479 | ||
| Mortgage-Backed Securities | 41,903 | — | 41,903 | ||
| U.S. Government Securities | 86,341 | — | 86,341 | ||
| Money Market Mutual Fund | 1,887 | 1,887 | — | ||
| Total Investments | $199,052 | $1,887 | $197,165 |
December 31, 2020
| Par Value | Value | ||
| Corporate Bonds and Notes—97.1% | |||
| Communication Services—6.0% | |||
| AT&T, Inc. | |||
| 2.250%, 2/1/32 | $ 670 | $ 679 | |
| 3.650%, 6/1/51 | 827 | 864 | |
| Comcast Corp. 2.650%, 2/1/30 | 1,950 | 2,130 | |
| Verizon Communications, Inc. 4.125%, 3/16/27 | 1,565 | 1,845 | |
| ViacomCBS, Inc. 4.200%, 5/19/32 | 1,064 | 1,282 | |
| 6,800 | |||
| Consumer Discretionary—6.2% | |||
| BMW US Capital LLC 144A 3.150%, 4/18/24(1) | 1,967 | 2,121 | |
| Dollar General Corp. 3.500%, 4/3/30 | 624 | 716 | |
| Ford Motor Co. 9.000%, 4/22/25 | 715 | 878 | |
| Marriott International, Inc. 3.500%, 10/15/32 | 3,100 | 3,390 | |
| 7,105 | |||
| Consumer Staples—5.6% | |||
| Coca-Cola Co. (The) 1.000%, 3/15/28 | 1,450 | 1,454 | |
| Hershey Co. (The) 2.650%, 6/1/50 | 1,900 | 2,009 | |
| Kroger Co. (The) 3.950%, 1/15/50 | 936 | 1,135 | |
| Mars, Inc. 144A 2.450%, 7/16/50(1) | 1,850 | 1,840 | |
| 6,438 | |||
| Energy—14.1% | |||
| Boardwalk Pipelines LP 4.450%, 7/15/27 | 1,518 | 1,699 | |
| EOG Resources, Inc. 4.950%, 4/15/50 | 1,697 | 2,296 | |
| Exxon Mobil Corp. | |||
| 3.482%, 3/19/30 | 1,106 | 1,287 | |
| 4.327%, 3/19/50 | 1,443 | 1,872 | |
| HollyFrontier Corp. 4.500%, 10/1/30 | 1,600 | 1,689 | |
| Marathon Petroleum Corp. | |||
| 4.500%, 5/1/23 | 879 | 954 | |
| 4.700%, 5/1/25 | 480 | 550 | |
| Petroleos Mexicanos 6.875%, 8/4/26 | 1,666 | 1,820 | |
| Pioneer Natural Resources Co. 1.900%, 8/15/30 | 2,050 | 2,030 | |
| Plains All American Pipeline LP 3.800%, 9/15/30 | 1,535 | 1,649 | |
| TechnipFMC plc 3.450%, 10/1/22 | 273 | 282 | |
| 16,128 | |||
| Par Value | Value | ||
| Financials—26.3% | |||
| AerCap Ireland Capital DAC 6.500%, 7/15/25 | $1,404 | $ 1,678 | |
| Athene Holding Ltd. 3.500%, 1/15/31 | 840 | 887 | |
| Avolon Holdings Funding Ltd. 144A 5.500%, 1/15/26(1) | 2,328 | 2,637 | |
| BP Capital Markets America, Inc. 3.633%, 4/6/30 | 1,293 | 1,503 | |
| Chubb INA Holdings, Inc. 1.375%, 9/15/30 | 2,000 | 1,995 | |
| Citigroup, Inc. 3.106%, 4/8/26 | 2,454 | 2,681 | |
| Fidelity National Financial, Inc. 3.400%, 6/15/30 | 612 | 672 | |
| Ford Motor Credit Co. LLC 3.375%, 11/13/25 | 2,377 | 2,434 | |
| General Motors Financial Co., Inc. | |||
| 2.750%, 6/20/25 | 1,290 | 1,379 | |
| 3.600%, 6/21/30 | 1,310 | 1,462 | |
| JPMorgan Chase & Co. 2.739%, 10/15/30 | 1,428 | 1,554 | |
| Lazard Group LLC 4.375%, 3/11/29 | 1,428 | 1,674 | |
| Morgan Stanley | |||
| 3.875%, 4/29/24 | 452 | 500 | |
| 3.971%, 7/22/38 | 735 | 905 | |
| Newcrest Finance Pty Ltd. 144A 4.200%, 5/13/50(1) | 1,760 | 2,148 | |
| OneMain Finance Corp. 4.000%, 9/15/30 | 998 | 1,035 | |
| Schlumberger Investment S.A. 2.650%, 6/26/30 | 1,778 | 1,902 | |
| Truist Bank 2.250%, 3/11/30 | 720 | 755 | |
| UBS Group AG 144A 1.364%, 1/30/27(1) | 1,065 | 1,077 | |
| Wells Fargo & Co. 1.654%, 6/2/24 | 1,121 | 1,152 | |
| 30,030 | |||
| Health Care—1.2% | |||
| Danaher Corp. 2.600%, 10/1/50 | 1,298 | 1,345 | |
| Industrials—14.5% | |||
| 3M Co. | |||
| 2.375%, 8/26/29 | 795 | 860 | |
| 3.700%, 4/15/50 | 1,725 | 2,137 | |
| Baker Hughes a GE Co. LLC 4.486%, 5/1/30 | 1,449 | 1,740 | |
| Boeing Co. (The) | |||
| 3.625%, 2/1/31 | 1,905 | 2,087 | |
| 5.805%, 5/1/50 | 1,001 | 1,381 | |
| Carrier Global Corp. | |||
| 2.722%, 2/15/30 | 1,500 | 1,602 | |
| 3.577%, 4/5/50 | 1,443 | 1,600 | |
| General Electric Co. | |||
| 3.625%, 5/1/30 | 1,134 | 1,295 | |
| 4.350%, 5/1/50 | 746 | 906 | |
| L3Harris Technologies, Inc. 3.850%, 12/15/26 | 1,053 | 1,219 | |
| Par Value | Value | ||
| Industrials—continued | |||
| United Airlines Pass-Through-Trust 2020-1, A 5.875%, 10/15/27 | $1,600 | $ 1,728 | |
| 16,555 | |||
| Information Technology—7.2% | |||
| Dell International LLC 144A 6.200%, 7/15/30(1) | 1,531 | 1,989 | |
| HP, Inc. | |||
| 3.000%, 6/17/27 | 604 | 666 | |
| 3.400%, 6/17/30 | 970 | 1,079 | |
| Intuit, Inc. 1.650%, 7/15/30 | 600 | 616 | |
| NetApp, Inc. | |||
| 1.875%, 6/22/25 | 485 | 506 | |
| 2.700%, 6/22/30 | 1,674 | 1,798 | |
| Oracle Corp. 2.950%, 4/1/30 | 1,400 | 1,565 | |
| 8,219 | |||
| Materials—8.0% | |||
| Barrick PD Australia Finance Pty Ltd. 5.950%, 10/15/39 | 478 | 687 | |
| Bemis Co., Inc. 2.630%, 6/19/30 | 1,054 | 1,141 | |
| LYB International Finance III LLC 3.625%, 4/1/51 | 1,065 | 1,162 | |
| Newmont Corp. | |||
| 2.250%, 10/1/30 | 2,451 | 2,578 | |
| 6.250%, 10/1/39 | 450 | 680 | |
| Nucor Corp. 2.000%, 6/1/25 | 1,913 | 2,026 | |
| Packaging Corporation of America 4.050%, 12/15/49 | 665 | 823 | |
| 9,097 | |||
| Utilities—8.0% | |||
| Berkshire Hathaway Energy Co. 144A 2.850%, 5/15/51(1) | 1,050 | 1,078 | |
| Boardwalk Pipelines LP 3.400%, 2/15/31 | 1,525 | 1,590 | |
| Cheniere Corpus Christi Holdings LLC 3.700%, 11/15/29 | 2,224 | 2,475 | |
| Dominion Energy, Inc. 3.375%, 4/1/30 | 348 | 396 | |
| Pacific Gas and Electric Co. 2.500%, 2/1/31 | 1,254 | 1,256 | |
| Transcontinental Gas Pipe Line Co. LLC 3.950%, 5/15/50 | 2,017 | 2,278 | |
| 9,073 | |||
| Total Corporate Bonds and Notes (Identified Cost $103,316) | 110,790 | ||
| Total Long-Term Investments—97.1% (Identified Cost $103,316) | 110,790 | ||
| Shares | Value | ||
| Short-Term Investment—0.9% | |||
| Money Market Mutual Fund—0.9% | |||
| Dreyfus Government Cash Management Fund - Institutional Shares (seven-day effective yield 0.030%)(2) | 1,004,425 | $ 1,004 | |
| Total Short-Term Investment (Identified Cost $1,004) | 1,004 | ||
| TOTAL INVESTMENTS—98.0% (Identified Cost $104,320) | $111,794 | ||
| Other assets and liabilities, net—2.0% | 2,303 | ||
| NET ASSETS—100.0% | $114,097 | ||
| Abbreviations: | |
| LLC | Limited Liability Company |
| LP | Limited Partnership |
| Footnote Legend: | |
| (1) | Security exempt from registration under Rule 144A of the Securities Act of 1933. These securities may be resold in transactions exempt from registration, normally to qualified institutional buyers. At December 31, 2020, these securities amounted to a value of $12,890 or 11.3% of net assets. |
| (2) | Shares of this fund are publicly offered, and its prospectus and annual report are publicly available. |
| Country Weightings (Unaudited)† | |
| United States | 87% |
| Australia | 3 |
| Cayman Islands | 2 |
| Luxembourg | 2 |
| Mexico | 2 |
| Ireland | 2 |
| Switzerland | 1 |
| Other | 1 |
| Total | 100% |
| † % of total investments as of December 31, 2020. | |
| Total Value at December 31, 2020 | Level 1 Quoted Prices | Level 2 Significant Observable Inputs | |||
| Assets: | |||||
| Debt Securities: | |||||
| Corporate Bonds and Notes | $110,790 | $ — | $110,790 | ||
| Money Market Mutual Fund | 1,004 | 1,004 | — | ||
| Total Investments | $111,794 | $1,004 | $110,790 |
December 31, 2020
| Par Value | Value | ||
| Corporate Bonds and Notes—5.4% | |||
| Communication Services—1.2% | |||
| Cars.com, Inc. 144A 6.375%, 11/1/28(1) | $ 2,900 | $ 3,078 | |
| Diamond Sports Group LLC 144A 5.375%, 8/15/26(1) | 2,000 | 1,625 | |
| DISH DBS Corp. 7.375%, 7/1/28 | 3,000 | 3,195 | |
| Entercom Media Corp. 144A 6.500%, 5/1/27(1) | 665 | 676 | |
| iHeartCommunications, Inc. 8.375%, 5/1/27 | 4,900 | 5,230 | |
| Liberty Interactive LLC 4.000%, 11/15/29 | 3,000 | 2,295 | |
| Live Nation Entertainment, Inc. 144A 4.875%, 11/1/24(1) | 2,000 | 2,025 | |
| Meredith Corp. 6.875%, 2/1/26 | 2,000 | 1,950 | |
| 20,074 | |||
| Consumer Discretionary—1.9% | |||
| Bed Bath & Beyond, Inc. 4.915%, 8/1/34 | 1,950 | 1,735 | |
| Ford Motor Co. 8.500%, 4/21/23 | 2,800 | 3,157 | |
| Ford Motor Credit Co. LLC | |||
| 3.370%, 11/17/23 | 4,000 | 4,079 | |
| 5.125%, 6/16/25 | 3,000 | 3,262 | |
| 4.125%, 8/17/27 | 4,000 | 4,190 | |
| Installed Building Products, Inc. 144A 5.750%, 2/1/28(1) | 4,437 | 4,726 | |
| Motors Liquidation Co. Escrow 7.200%, 1/15/49(2) | 20,000 | — | |
| Nordstrom, Inc. 4.375%, 4/1/30 | 3,165 | 3,116 | |
| Prime Security Services Borrower LLC 144A 5.250%, 4/15/24(1) | 1,680 | 1,793 | |
| QVC, Inc. 4.750%, 2/15/27 | 3,000 | 3,218 | |
| Winnebago Industries, Inc. 144A 6.250%, 7/15/28(1) | 3,000 | 3,225 | |
| 32,501 | |||
| Consumer Staples—0.2% | |||
| Kraft Heinz Foods Co. 5.200%, 7/15/45 | 3,000 | 3,562 | |
| Energy—0.2% | |||
| Glenn Pool Oil & Gas Trust 6.000%, 8/2/21(2) | 4,436 | 3,992 | |
| Financials—0.4% | |||
| Nationstar Mortgage Holdings, Inc. 144A 5.125%, 12/15/30(1) | 2,000 | 2,090 | |
| Quicken Loans, Inc. 144A 5.250%, 1/15/28 | 2,013 | 2,149 | |
| Refinitiv US Holdings, Inc. 144A 6.250%, 5/15/26(1) | 3,000 | 3,203 | |
| 7,442 | |||
| Par Value | Value | ||
| Health Care—0.7% | |||
| Charles River Laboratories International, Inc. 144A 5.500%, 4/1/26(1) | $ 2,000 | $ 2,095 | |
| Encompass Health Corp. 4.500%, 2/1/28 | 3,000 | 3,135 | |
| Molina Healthcare, Inc. 144A 4.375%, 6/15/28(1) | 2,000 | 2,105 | |
| Teva Pharmaceutical Finance Netherlands III B.V. | |||
| 6.000%, 4/15/24 | 3,650 | 3,869 | |
| 3.150%, 10/1/26 | 1,400 | 1,346 | |
| 12,550 | |||
| Industrials—0.1% | |||
| Griffon Corp. 5.750%, 3/1/28 | 2,000 | 2,116 | |
| Information Technology—0.6% | |||
| Alliance Data Systems Corp. 144A 4.750%, 12/15/24(1) | 2,000 | 2,020 | |
| ams AG 144A 7.000%, 7/31/25(1) | 3,000 | 3,255 | |
| Dell International LLC 144A 8.100%, 7/15/36(1) | 3,000 | 4,432 | |
| 9,707 | |||
| Materials—0.1% | |||
| Ardagh Packaging Finance plc 144A 4.125%, 8/15/26(1) | 2,000 | 2,090 | |
| Total Corporate Bonds and Notes (Identified Cost $91,445) | 94,034 | ||
| Leveraged Loans(3)—91.5% | |||
| Aerospace—3.9% | |||
| AI Convoy (Luxembourg) S.a.r.l. Tranche B (6 month LIBOR + 3.500%) 4.500%, 1/18/27 | 4,652 | 4,644 | |
| American Airlines, Inc. | |||
| 2017, Tranche B (1 month LIBOR + 2.000%) 2.148%, 4/28/23 | 3,747 | 3,367 | |
| 2017, Tranche B (1 month LIBOR + 2.000%) 2.159%, 12/14/23 | 13,436 | 12,040 | |
| Delta Air Lines, Inc. (3 month LIBOR + 3.750%) 4.750%, 10/20/27 | 8,490 | 8,790 | |
| Ducommun, Inc. Tranche B (1 month LIBOR + 4.000%) 4.145%, 11/21/25 | 7,432 | 7,265 | |
| Dynasty Acquisition Co., Inc. | |||
| 2020, Tranche B-1 (3 month LIBOR + 3.500%) 3.754%, 4/6/26 | 2,579 | 2,450 | |
| 2020, Tranche B-2 (3 month LIBOR + 3.500%) 0.000%, 4/6/26 | 1,386 | 1,317 | |
| MB Aerospace Holdings II Corp. First Lien (3 month LIBOR + 3.500%) 4.500%, 1/22/25 | 7,130 | 6,029 | |
| Spirit AeroSystems, Inc. (1 month LIBOR + 5.250%) 6.000%, 1/15/25 | 2,900 | 2,922 | |
| TransDigm, Inc. | |||
| Tranche E (1 month LIBOR + 2.250%) 2.397%, 5/30/25 | 12,014 | 11,758 | |
| Par Value | Value | ||
| Aerospace—continued | |||
| Tranche F (1 month LIBOR + 2.250%) 2.397%, 12/9/25 | $ 2,205 | $ 2,158 | |
| WP CPP Holdings LLC First Lien (3 month LIBOR + 3.750%) 4.750%, 4/30/25 | 4,599 | 4,287 | |
| 67,027 | |||
| Chemicals—5.6% | |||
| Aruba Investments Holdings LLC First Lien (3 month LIBOR + 4.000%) 4.750%, 11/24/27 | 2,665 | 2,662 | |
| Ascend Performance Materials Operations LLC (3 month LIBOR + 5.250%) 6.250%, 8/27/26 | 2,859 | 2,866 | |
| Consolidated Energy Finance S.A. (1 month LIBOR + 2.500%) 2.645%, 5/7/25 | 9,654 | 9,208 | |
| Emerald Performance Materials LLC Tranche B, First Lien (1 month LIBOR + 4.000%) 5.000%, 8/12/25 | 3,192 | 3,206 | |
| Ferro Corp. | |||
| Tranche B-1 (3 month LIBOR + 2.250%) 2.504%, 2/14/24 | 5,251 | 5,198 | |
| Tranche B-2 (3 month LIBOR + 2.250%) 2.504%, 2/14/24 | 3,370 | 3,334 | |
| Tranche B-3 (3 month LIBOR + 2.250%) 2.504%, 2/14/24 | 2,912 | 2,881 | |
| Gemini HDPE LLC Tranche B (3 month LIBOR + 3.250%) 0.000%, 12/11/27(4) | 5,450 | 5,409 | |
| Ineos U.S. Finance LLC 2024 (3 month LIBOR + 2.000%) 2.147%, 4/1/24 | 27,341 | 27,007 | |
| Minerals Technologies, Inc. Tranche B-1 (1 month LIBOR + 2.250%) 3.000%, 2/14/24 | 5,741 | 5,713 | |
| Momentive Performance Materials, Inc. First Lien (3 month LIBOR + 3.250%) 0.000%, 5/15/24(4) | 997 | 982 | |
| PQ Corp. Tranche B (3 month LIBOR + 2.250%) 2.464%, 2/8/27 | 9,634 | 9,547 | |
| Starfruit Finco B.V. (3 month LIBOR + 3.000%) 3.153%, 10/1/25 | 5,726 | 5,659 | |
| Tronox Finance LLC First Lien (3 month LIBOR + 3.000%) 3.197%, 9/23/24 | 3,079 | 3,059 | |
| Vantage Specialty Chemicals, Inc. | |||
| First Lien (3 month LIBOR + 3.500%) 4.500%, 10/28/24 | 3,380 | 3,204 | |
| Second Lien (3 month LIBOR + 8.250%) 9.250%, 10/27/25 | 7,470 | 6,370 | |
| 96,305 | |||
| Consumer Durables—0.7% | |||
| Acproducts, Inc. First Lien (3 month LIBOR + 6.500%) 0.000%, 8/18/25(4) | 2,547 | 2,611 | |
| Energizer Holdings, Inc. | |||
| (3 month LIBOR + 2.500%) 0.000%, 12/16/27(4) | 1,462 | 1,460 | |
| (3 month LIBOR + 2.500%) 0.000%, 12/22/27(4) | 1,238 | 1,235 | |
| Par Value | Value | ||
| Consumer Durables—continued | |||
| Ozark Holdings LLC 2020 (1 month LIBOR + 4.000%) 4.750%, 12/10/27 | $ 2,700 | $ 2,700 | |
| Weber-Stephen Products LLC Tranche B (1 month LIBOR + 3.250%) 4.000%, 10/30/27 | 3,235 | 3,237 | |
| 11,243 | |||
| Consumer Non-Durables—1.0% | |||
| ABG Intermediate Holdings 2 LLC | |||
| First Lien (3 month LIBOR + 3.500%) 4.500%, 9/27/24 | 5,134 | 5,090 | |
| First Lien (3 month LIBOR + 5.250%) 5.397%, 9/27/24 | 2,828 | 2,828 | |
| Coty, Inc. | |||
| Tranche A (1 month LIBOR + 1.750%) 1.902%, 4/5/23 | 8,009 | 7,549 | |
| Tranche B (3 month LIBOR + 2.250%) 2.402%, 4/7/25 | 996 | 936 | |
| 16,403 | |||
| Energy—2.2% | |||
| BCP Raptor II LLC (1 month LIBOR + 4.750%) 4.896%, 11/3/25 | 3,733 | 3,345 | |
| BCP Raptor LLC (1 month LIBOR + 4.250%) 5.250%, 6/24/24 | 7,851 | 7,168 | |
| Blackbrush Oil & Gas LP PIK (3 month LIBOR + 5.000%) 6.000%, 9/3/25(2)(5) | 4,707 | 4,707 | |
| ConvergeOne Holdings, Inc. First Lien (1 month LIBOR + 5.000%) 5.146%, 1/5/26 | 2,066 | 1,940 | |
| Crestwood Holdings LLC (1 month LIBOR + 7.500%) 7.660%, 3/6/23 | 16,730 | 12,548 | |
| Keane Group Holdings LLC (1 month LIBOR + 3.500%) 4.500%, 5/26/25 | 3,943 | 3,785 | |
| Osum Production Corp. 2022 (3 month LIBOR + 7.500%) 8.500%, 7/31/22 | 4,696 | 4,461 | |
| 37,954 | |||
| Financial—8.2% | |||
| AltiSource Solutions S.a.r.l. Tranche B (3 month LIBOR + 4.000%) 5.000%, 4/3/24 | 3,235 | 2,642 | |
| Aretec Group, Inc. | |||
| First Lien (1 month LIBOR + 4.250%) 4.397%, 10/1/25 | 12,778 | 12,475 | |
| Second Lien (1 month LIBOR + 8.250%) 8.397%, 10/1/26 | 5,930 | 5,515 | |
| Asurion LLC | |||
| Tranche B-2, Second Lien (1 month LIBOR + 6.500%) 6.647%, 8/4/25 | 7,398 | 7,444 | |
| Tranche B-6 (1 month LIBOR + 3.000%) 3.147%, 11/3/23 | 1,817 | 1,798 | |
| Tranche B-8 (1 month LIBOR + 3.250%) 0.000%, 12/23/26(4) | 27,300 | 26,992 | |
| Blackstone Mortgage Trust, Inc. Tranche B-2 (1 month LIBOR + 4.750%) 5.750%, 4/23/26 | 3,383 | 3,417 | |
| Par Value | Value | ||
| Financial—continued | |||
| Broadstreet Partners, Inc. Tranche B-1 (1 month LIBOR + 3.750%) 4.750%, 1/27/27 | $ 2,985 | $ 2,978 | |
| Citadel Securities LP Tranche B (1 month LIBOR + 2.750%) 2.897%, 2/27/26 | 3,491 | 3,490 | |
| Ditech Holding Corp. Tranche B (3 month PRIME + 0.000%) 3.250%, 6/30/22(6) | 5,094 | 1,553 | |
| DRW Holdings LLC First Lien (1 month LIBOR + 4.250%) 4.397%, 11/27/26 | 5,579 | 5,509 | |
| EVO Payments International LLC First Lien (3 month LIBOR + 3.250%) 3.400%, 12/22/23 | 7,206 | 7,197 | |
| Financial & Risk US Holdings, Inc. (1 month LIBOR + 3.250%) 3.397%, 10/1/25 | 18,606 | 18,568 | |
| First Eagle Holdings, Inc. 2018, Tranche B (3 month LIBOR + 2.500%) 2.754%, 2/1/27 | 4,000 | 3,955 | |
| Franklin Square Holdings LP Tranche B (1 month LIBOR + 2.250%) 2.438%, 8/1/25 | 1,528 | 1,515 | |
| iStar, Inc. Tranche B (1 month LIBOR + 2.750%) 2.903%, 6/28/23 | 16,057 | 16,017 | |
| Jane Street Group LLC (3 month LIBOR + 3.000%) 3.233%, 1/31/25 | 4,363 | 4,351 | |
| Nexus Buyer LLC (1 month LIBOR + 3.750%) 3.902%, 11/9/26 | 2,992 | 2,968 | |
| Orion Advisor Solutions, Inc. (3 month LIBOR + 4.000%) 5.000%, 9/24/27 | 6,189 | 6,206 | |
| VFH Parent LLC (3 month LIBOR + 3.000%) 3.153%, 3/1/26 | 7,811 | 7,789 | |
| 142,379 | |||
| Food / Tobacco—1.0% | |||
| JBS USA Lux S.A. (1 month LIBOR + 2.000%) 2.147%, 5/1/26 | 2,361 | 2,341 | |
| Panera Bread Co. (1 month LIBOR + 2.250%) 2.438%, 7/18/22 | 14,811 | 14,070 | |
| 16,411 | |||
| Food and Drug—0.2% | |||
| United Natural Foods, Inc. (1 month LIBOR + 4.250%) 4.397%, 10/22/25 | 3,946 | 3,919 | |
| Forest Prod / Containers—1.3% | |||
| Anchor Packaging LLC (1 month LIBOR + 4.000%) 4.147%, 7/18/26 | 2,798 | 2,791 | |
| Graham Packaging Co., Inc. (1 month LIBOR + 3.750%) 4.500%, 8/4/27 | 8,757 | 8,778 | |
| Pregis TopCo LLC First Lien (1 month LIBOR + 3.750%) 3.897%, 7/31/26 | 2,686 | 2,673 | |
| Reynolds Group Holdings, Inc. | |||
| (1 month LIBOR + 2.750%) 2.897%, 2/6/23 | 3,121 | 3,105 | |
| Par Value | Value | ||
| Forest Prod / Containers—continued | |||
| Tranche B-2 (1 month LIBOR + 3.250%) 3.397%, 2/5/26 | $ 5,650 | $ 5,601 | |
| 22,948 | |||
| Gaming / Leisure—3.6% | |||
| Aimbridge Acquisition Co., Inc. 2020 (3 month LIBOR + 6.000%) 6.750%, 2/2/26 | 1,915 | 1,906 | |
| Bombardier Recreational Products, Inc. 2020 (3 month LIBOR + 5.000%) 6.000%, 5/24/27 | 1,496 | 1,523 | |
| Caesars Resort Collection LLC | |||
| Tranche B (1 month LIBOR + 2.750%) 2.897%, 12/23/24 | 11,705 | 11,470 | |
| Tranche B-1 (3 month LIBOR + 4.500%) 4.647%, 7/21/25 | 11,870 | 11,874 | |
| Everi Payments, Inc. Tranche B (1 month LIBOR + 2.750%) 3.750%, 5/9/24 | 9,693 | 9,572 | |
| Golden Entertainment, Inc. Tranche B, First Lien (1 month LIBOR + 3.000%) 3.750%, 10/21/24 | 2,764 | 2,695 | |
| Playa Resorts Holding B.V. (1 month LIBOR + 2.750%) 3.750%, 4/29/24 | 2,567 | 2,350 | |
| Playtika Holding Corp. Tranche B (3 month LIBOR + 6.000%) 7.000%, 12/10/24 | 8,293 | 8,333 | |
| Scientific Games International, Inc. Tranche B-5 (1 month LIBOR + 2.750%) 2.897%, 8/14/24 | 6,124 | 5,972 | |
| Station Casinos LLC Tranche B-1 (1 month LIBOR + 2.250%) 2.500%, 2/8/27 | 7,070 | 6,952 | |
| 62,647 | |||
| Healthcare—7.8% | |||
| Agiliti Health, Inc. (3 month LIBOR + 3.000%) 3.750%, 1/4/26 | 5,340 | 5,313 | |
| AHP Health Partners, Inc. (1 month LIBOR + 4.500%) 5.500%, 6/30/25 | 8,781 | 8,803 | |
| Amneal Pharmaceuticals LLC (1 month LIBOR + 3.500%) 3.688%, 5/4/25 | 7,597 | 7,390 | |
| ASP Navigate Acquisition Corp. (3 month LIBOR + 4.500%) 5.500%, 10/6/27 | 3,835 | 3,825 | |
| Bausch Health Cos., Inc. (1 month LIBOR + 3.000%) 3.148%, 6/2/25 | 6,015 | 5,989 | |
| Cano Health LLC | |||
| (3 month LIBOR + 1.000%) 1.000%, 11/19/27(7) | 868 | 865 | |
| (3 month LIBOR + 5.250%) 6.000%, 11/19/27 | 2,382 | 2,373 | |
| Change Healthcare Holdings LLC (3 month LIBOR + 2.500%) 3.250%, 3/1/24 | 4,305 | 4,281 | |
| Endo Luxembourg Finance Co. S.a.r.l. (3 month LIBOR + 4.250%) 5.000%, 4/29/24 | 2,313 | 2,273 | |
| Par Value | Value | ||
| Healthcare—continued | |||
| Gentiva Health Services, Inc. Tranche B (1 month LIBOR + 3.250%) 3.438%, 7/2/25 | $ 3,674 | $ 3,649 | |
| GoodRx, Inc. First Lien (1 month LIBOR + 2.750%) 2.897%, 10/10/25 | 3,030 | 3,006 | |
| Greatbatch Ltd. Tranche B (1 month LIBOR + 2.500%) 3.500%, 10/27/22 | 5,592 | 5,579 | |
| HCA, Inc. Tranche B-12 (1 month LIBOR + 1.750%) 1.897%, 3/13/25 | 16,200 | 16,180 | |
| Indivior Finance LLC 2017 (3 month LIBOR + 4.500%) 5.500%, 12/19/22 | 13,144 | 12,815 | |
| Kindred Healthcare LLC (1 month LIBOR + 5.000%) 5.188%, 7/2/25 | 8,823 | 8,801 | |
| Lannett Co., Inc. Tranche B (3 month LIBOR + 5.375%) 6.375%, 11/25/22 | 4,202 | 4,112 | |
| LifePoint Health, Inc. Tranche B, First Lien (1 month LIBOR + 3.750%) 3.897%, 11/17/25 | 3,565 | 3,552 | |
| Milano Acquisition Corp. Tranche B (3 month LIBOR + 4.000%) 4.750%, 10/1/27 | 5,725 | 5,715 | |
| MPH Acquisition Holdings LLC (3 month LIBOR + 2.750%) 3.750%, 6/7/23 | 2,975 | 2,958 | |
| Owens & Minor, Inc. Tranche B (3 month LIBOR + 4.500%) 4.655%, 4/30/25 | 9,474 | 9,433 | |
| Packaging Coordinators Midco, Inc. Tranche B, First Lien (6 month LIBOR + 3.750%) 4.500%, 11/30/27 | 5,835 | 5,835 | |
| Pluto Acquisition I, Inc. 2020, First Lien (3 month LIBOR + 5.000%) 5.500%, 6/22/26 | 2,400 | 2,400 | |
| Sotera Health Holdings LLC First Lien (3 month LIBOR + 4.500%) 5.500%, 12/11/26 | 3,993 | 4,005 | |
| Syneos Health, Inc. Tranche A, First Lien (1 month LIBOR + 1.500%) 1.647%, 3/25/24 | 2,652 | 2,609 | |
| Team Health Holdings, Inc. (1 month LIBOR + 2.750%) 3.750%, 2/6/24 | 3,506 | 3,114 | |
| 134,875 | |||
| Housing—2.8% | |||
| Beacon Roofing Supply, Inc. (1 month LIBOR + 2.250%) 2.397%, 1/2/25 | 2,395 | 2,376 | |
| Brookfield Property REIT, Inc. | |||
| Tranche A-2 (1 month LIBOR + 3.000%) 3.147%, 8/28/23 | 6,833 | 6,474 | |
| Tranche B (1 month LIBOR + 2.500%) 2.647%, 8/27/25 | 14,206 | 13,381 | |
| Cushman & Wakefield US Borrower LLC (1 month LIBOR + 2.750%) 2.895%, 8/21/25 | 11,208 | 10,989 | |
| LBM Acquisition LLC | |||
| (3 month LIBOR + 3.750%) 0.000%, 12/8/27(4)(7) | 543 | 543 | |
| First Lien (3 month LIBOR + 3.750%) 0.000%, 12/17/27(4) | 2,446 | 2,443 | |
| Par Value | Value | ||
| Housing—continued | |||
| Realogy Group LLC Tranche A (1 month LIBOR + 2.000%) 2.147%, 2/8/23 | $13,077 | $ 12,772 | |
| 48,978 | |||
| Information Technology—10.3% | |||
| Ahead DB Holdings LLC First Lien (3 month LIBOR + 5.000%) 6.000%, 10/18/27 | 3,700 | 3,632 | |
| Allegro MicroSystems, Inc. (1 month LIBOR + 4.000%) 4.500%, 9/24/27 | 283 | 282 | |
| Avaya, Inc. | |||
| Tranche B (1 month LIBOR + 4.250%) 4.398%, 12/15/24 | 426 | 426 | |
| Tranche B-1 (1 month LIBOR + 4.250%) 4.409%, 12/15/27 | 9,478 | 9,474 | |
| Barracuda Networks, Inc. First Lien (3 month LIBOR + 3.750%) 4.500%, 2/12/25 | 4,267 | 4,254 | |
| Brave Parent Holdings, Inc. (1 month LIBOR + 4.000%) 4.147%, 4/18/25 | 4,269 | 4,242 | |
| Brooks Automation, Inc. Tranche B (6 month LIBOR + 2.500%) 2.740%, 10/4/24 | 2,229 | 2,196 | |
| Cablevision Lightpath LLC Tranche B (3 month LIBOR + 3.250%) 3.750%, 11/30/27 | 3,075 | 3,066 | |
| Cornerstone OnDemand, Inc. (1 month LIBOR + 4.250%) 4.394%, 4/22/27 | 3,507 | 3,519 | |
| Dell International LLC Tranche B-1 (1 month LIBOR + 2.000%) 2.750%, 9/19/25 | 10,814 | 10,816 | |
| EIG Investors Corp. 2018 (3 month LIBOR + 3.750%) 4.750%, 2/9/23 | 9,932 | 9,920 | |
| Gigamon, Inc. First Lien (3 month LIBOR + 4.250%) 5.250%, 12/27/24 | 6,355 | 6,275 | |
| Greeneden US Holdings II LLC Tranche B-4 (3 month LIBOR + 4.000%) 4.750%, 12/1/27 | 5,280 | 5,285 | |
| Internap Holding LLC PIK Interest Capitalization (3 month LIBOR + 6.500%) 7.500%, 5/8/25(8) | 1,512 | 665 | |
| LogMeIn, Inc. First Lien (1 month LIBOR + 4.750%) 4.903%, 8/31/27 | 9,525 | 9,483 | |
| MA Financeco LLC | |||
| Tranche B-3 (1 month LIBOR + 2.750%) 2.897%, 6/21/24 | 1,320 | 1,300 | |
| Tranche B-4 (3 month LIBOR + 4.250%) 4.260%, 6/5/25 | 6,807 | 6,853 | |
| Macom Technology Solutions Holdings, Inc. (1 month LIBOR + 2.250%) 2.397%, 5/17/24 | 6,694 | 6,520 | |
| Marcel Lux IV S.a.r.l. (3 month LIBOR + 4.000%) 4.750%, 12/31/27 | 4,500 | 4,500 | |
| Mavenir Systems, Inc. (3 month LIBOR + 6.000%) 7.000%, 5/8/25 | 7,484 | 7,428 | |
| McAfee LLC Tranche B (1 month LIBOR + 3.750%) 3.898%, 9/30/24 | 8,081 | 8,075 | |
| Rackspace Hosting, Inc. Tranche B, First Lien (3 month LIBOR + 3.000%) 4.000%, 11/3/23 | 10,721 | 10,697 | |
| Par Value | Value | ||
| Information Technology—continued | |||
| Redstone Holdco 2 LP (2 month LIBOR + 5.000%) 6.000%, 9/1/27 | $ 4,160 | $ 4,172 | |
| Seattle Escrow Borrower LLC (1 month LIBOR + 2.750%) 2.897%, 6/21/24 | 8,912 | 8,779 | |
| SolarWinds Holdings, Inc. 2018 (3 month LIBOR + 2.750%) 2.897%, 2/5/24 | 5,980 | 5,701 | |
| Surf Holdings S.a.r.l First Lien (3 month LIBOR + 3.500%) 3.726%, 3/5/27 | 5,687 | 5,631 | |
| Tech Data Corp. | |||
| (1 month LIBOR + 3.500%) 3.645%, 6/30/25 | 4,728 | 4,753 | |
| (1 month LIBOR + 5.500%) 5.645%, 6/30/25 | 3,756 | 3,746 | |
| TIBCO Software, Inc. Tranche B-3 (1 month LIBOR + 3.750%) 3.900%, 6/30/26 | 2,416 | 2,365 | |
| Ultimate Software Group, Inc. (The) | |||
| 2020 (3 month LIBOR + 4.000%) 4.750%, 5/4/26 | 7,065 | 7,096 | |
| Second Lien (3 month LIBOR + 6.750%) 7.500%, 5/3/27 | 250 | 257 | |
| Ultra Clean Holdings, Inc. Tranche B (1 month LIBOR + 4.500%) 4.647%, 8/27/25 | 6,145 | 6,083 | |
| Vertiv Group Corp. (1 month LIBOR + 3.000%) 3.153%, 3/2/27 | 1,344 | 1,335 | |
| Virtusa Corp. Tranche B (3 month LIBOR + 4.250%) 0.000%, 12/9/27(4) | 2,400 | 2,382 | |
| Xperi Holding Corp. Tranche B (1 month LIBOR + 4.000%) 4.147%, 6/1/25 | 5,917 | 5,923 | |
| 177,131 | |||
| Manufacturing—0.8% | |||
| Alliance Laundry Systems LLC Tranche B (3 month LIBOR + 3.500%) 4.250%, 10/8/27 | 2,260 | 2,257 | |
| Bright Bidco B.V. 2018, Tranche B (3 month LIBOR + 3.500%) 4.500%, 6/30/24 | 10,691 | 6,092 | |
| Canada Goose, Inc. 2020 (3 month LIBOR + 4.250%) 5.000%, 10/7/27 | 3,065 | 3,061 | |
| Dynacast International LLC Tranche B-1, First Lien (3 month LIBOR + 3.250%) 4.250%, 1/28/22 | 2,687 | 2,539 | |
| 13,949 | |||
| Media / Telecom - Broadcasting—2.6% | |||
| Diamond Sports Group LLC (1 month LIBOR + 3.250%) 3.400%, 8/24/26 | 2,633 | 2,320 | |
| Gray Television, Inc. Tranche C (3 month LIBOR + 2.500%) 2.655%, 1/2/26 | 9,169 | 9,096 | |
| Hubbard Radio LLC (6 month LIBOR + 4.250%) 5.250%, 3/28/25 | 5,500 | 5,308 | |
| Par Value | Value | ||
| Media / Telecom - Broadcasting—continued | |||
| iHeartCommunications, Inc. (1 month LIBOR + 4.000%) 4.750%, 5/1/26 | $ 4,672 | $ 4,668 | |
| LCPR Loan Financing LLC (1 month LIBOR + 5.000%) 5.159%, 10/15/26 | 13,745 | 13,782 | |
| Nexstar Broadcasting, Inc. Tranche B-3 (1 month LIBOR + 2.250%) 2.395%, 1/17/24 | 7,238 | 7,164 | |
| Quincy Newspapers, Inc. Tranche B (3 month PRIME + 2.000%) 4.007%, 11/2/22 | 2,217 | 2,200 | |
| 44,538 | |||
| Media / Telecom - Cable/Wireless Video—4.0% | |||
| Charter Communications Operating LLC Tranche B2 (1 month LIBOR + 1.750%) 1.900%, 2/1/27 | 6,623 | 6,579 | |
| Coral-US Co-Borrower LLC Tranche B-5 (1 month LIBOR + 2.250%) 2.397%, 1/31/28 | 5,306 | 5,234 | |
| CSC Holdings LLC | |||
| 2017 (1 month LIBOR + 2.250%) 2.409%, 7/17/25 | 8,117 | 7,984 | |
| 2019 (1 month LIBOR + 2.500%) 2.659%, 4/15/27 | 3,219 | 3,185 | |
| Intelsat Jackson Holdings S.A. | |||
| (3 month LIBOR + 5.500%) 6.500%, 7/14/21 | 2,438 | 2,483 | |
| Tranche B-3 (3 month PRIME + 0.000%) 3.250%, 11/27/23(9) | 16,345 | 16,549 | |
| Radiate Holdco LLC Tranche B (1 month LIBOR + 3.500%) 4.250%, 9/25/26 | 5,445 | 5,448 | |
| Virgin Media Bristol LLC Tranche N (1 month LIBOR + 2.500%) 2.659%, 1/31/28 | 13,665 | 13,526 | |
| Ziggo Financing Partnership Tranche I (1 month LIBOR + 2.500%) 2.659%, 4/30/28 | 8,350 | 8,290 | |
| 69,278 | |||
| Media / Telecom - Diversified Media—6.2% | |||
| Alchemy Copyrights LLC 2020 (3 month LIBOR + 3.250%) 4.000%, 8/16/27 | 6,574 | 6,590 | |
| Alliance Data Systems Corp. 2017 (1 month LIBOR + 1.750%) 1.897%, 6/14/22 | 6,708 | 6,562 | |
| Alpha Topco Ltd. 2018, Tranche B-3 (1 month LIBOR + 2.500%) 3.500%, 2/1/24 | 4,277 | 4,225 | |
| Banijay Entertainment SAS Tranche B (1 month LIBOR + 3.750%) 3.903%, 3/3/25 | 5,636 | 5,551 | |
| Cambium Learning Group, Inc. First Lien (3 month LIBOR + 4.500%) 4.754%, 12/18/25 | 2,992 | 2,971 | |
| Camelot US Acquisition I Co. (1 month LIBOR + 3.000%) 4.000%, 10/30/26 | 5,110 | 5,105 | |
| Par Value | Value | ||
| Media / Telecom - Diversified Media—continued | |||
| CD&R Artemis UK Bidco Ltd. Tranche B (3 month LIBOR + 6.000%) 6.141%, 5/11/27 | $ 2,500 | $ 2,375 | |
| Deluxe Entertainment Services Group, Inc., Second Lien (3 month LIBOR + 8.500%) 9.500%, 9/25/24(2)(6) | 4,153 | — | |
| Harland Clarke Holdings Corp. (3 month LIBOR + 4.750%) 5.750%, 11/3/23 | 13,505 | 11,900 | |
| Lions Gate Capital Holdings LLC | |||
| Tranche A (1 month LIBOR + 1.750%) 1.897%, 3/22/23 | 8,930 | 8,774 | |
| Tranche B (1 month LIBOR + 2.250%) 2.397%, 3/24/25 | 12,790 | 12,582 | |
| Meredith Corp. | |||
| Tranche B-2 (1 month LIBOR + 2.500%) 2.647%, 1/31/25 | 2,227 | 2,201 | |
| Tranche B-3 (3 month LIBOR + 4.250%) 5.250%, 1/31/25 | 3,682 | 3,698 | |
| MH Sub I LLC | |||
| 2020 (1 month LIBOR + 3.750%) 4.750%, 9/13/24 | 1,378 | 1,373 | |
| First Lien (1 month LIBOR + 3.500%) 3.647%, 9/13/24 | 9,483 | 9,344 | |
| Tranche B, Second Lien (1 month LIBOR + 7.500%) 7.647%, 9/15/25 | 1,695 | 1,701 | |
| Newco Financing Partnership Tranche AV1 (3 month LIBOR + 3.500%) 3.673%, 1/31/29 | 1,800 | 1,801 | |
| Nielsen Finance LLC Tranche B-5 (1 month LIBOR + 3.750%) 4.750%, 6/6/25 | 2,239 | 2,250 | |
| UPC Financing Partnership Tranche AV (3 month LIBOR + 3.500%) 3.677%, 1/31/29 | 1,800 | 1,801 | |
| William Morris Endeavor Entertainment LLC Tranche B-1 (1 month LIBOR + 2.750%) 2.900%, 5/18/25 | 18,242 | 16,752 | |
| 107,556 | |||
| Media / Telecom - Telecommunications—7.4% | |||
| Altice Financing S.A. | |||
| 2017 (1 month LIBOR + 2.750%) 2.909%, 7/15/25 | 7,386 | 7,216 | |
| 2017 (1 month LIBOR + 2.750%) 2.897%, 1/31/26 | 13,208 | 12,897 | |
| CenturyLink, Inc. Tranche B (1 month LIBOR + 2.250%) 2.397%, 3/15/27 | 14,019 | 13,858 | |
| Cincinnati Bell, Inc. Tranche B (3 month LIBOR + 3.250%) 4.250%, 10/2/24 | 15,594 | 15,587 | |
| Connect US Finco LLC (1 month LIBOR + 4.500%) 5.500%, 12/12/26 | 8,565 | 8,585 | |
| Consolidated Communications, Inc. (1 month LIBOR + 4.750%) 5.750%, 10/2/27 | 3,491 | 3,502 | |
| Frontier Communications Corp. (1 month LIBOR + 4.750%) 5.750%, 10/8/21 | 2,500 | 2,508 | |
| Par Value | Value | ||
| Media / Telecom - Telecommunications—continued | |||
| Level 3 Financing, Inc. 2027, Tranche B (1 month LIBOR + 1.750%) 1.897%, 3/1/27 | $ 8,986 | $ 8,827 | |
| Neustar, Inc. Tranche B-4, First Lien (3 month LIBOR + 3.500%) 4.500%, 8/8/24 | 6,689 | 6,467 | |
| Numericable U.S. LLC | |||
| Tranche B-11 (1 month LIBOR + 2.750%) 2.897%, 7/31/25 | 3,085 | 3,015 | |
| Tranche B-12 (1 month LIBOR + 3.688%) 3.846%, 1/31/26 | 20,040 | 19,809 | |
| Tranche B-13 (3 month LIBOR + 4.000%) 4.237%, 8/14/26 | 16,870 | 16,771 | |
| Zacapa LLC (6 month LIBOR + 4.500%) 4.769%, 7/2/25 | 8,900 | 8,864 | |
| 127,906 | |||
| Media / Telecom - Wireless Communications—0.3% | |||
| Iridium Satellite LLC (1 month LIBOR + 3.750%) 4.750%, 11/4/26 | 4,622 | 4,640 | |
| Metals / Minerals—1.5% | |||
| Atkore International, Inc. First Lien (3 month LIBOR + 2.750%) 3.750%, 12/22/23 | 10,697 | 10,719 | |
| CNX Resources Corp. Tranche B (1 month LIBOR + 4.500%) 4.650%, 9/27/24 | 5,524 | 4,559 | |
| GrafTech Finance, Inc. (1 month LIBOR + 3.500%) 4.500%, 2/12/25 | 9,051 | 9,032 | |
| U.S. Silica Co. | |||
| (1 month LIBOR + 4.000%) 4.188%, 5/1/23(2)(7) | 1,687 | 1,405 | |
| (3 month LIBOR + 0.500%) 0.500%, 5/1/23(2) | 563 | 469 | |
| 26,184 | |||
| Retail—2.3% | |||
| Ascena Retail Group, Inc. Tranche B (3 month LIBOR + 0.750%) 1.500%, 8/19/22(2)(6) | 2,496 | 474 | |
| Bass Pro Group, LLC (3 month LIBOR + 5.000%) 5.750%, 9/25/24 | 6,070 | 6,081 | |
| Belk, Inc. (3 month LIBOR + 6.750%) 7.750%, 7/31/25 | 9,483 | 3,309 | |
| CNT Holdings I Corp. First Lien (6 month LIBOR + 3.750%) 4.500%, 11/8/27 | 3,740 | 3,734 | |
| CWGS Group LLC (1 month LIBOR + 2.750%) 3.500%, 11/8/23 | 12,049 | 11,901 | |
| J.C. Penney Corp., Inc. Tranche B (3 month LIBOR + 4.250%) 0.000%, 6/23/23(9) | 3,733 | 248 | |
| Michaels Stores, Inc. 2020, Tranche B (1 month LIBOR + 3.500%) 4.250%, 10/1/27 | 3,747 | 3,715 | |
| Par Value | Value | ||
| Retail—continued | |||
| Petco Animal Supplies, Inc. (3 month LIBOR + 3.250%) 4.250%, 1/26/23 | $ 9,845 | $ 9,403 | |
| 38,865 | |||
| Service—11.9% | |||
| Academy Ltd. (1 month LIBOR + 5.000%) 5.750%, 11/5/27 | 4,150 | 4,130 | |
| Adtalem Global Education, Inc. Tranche B (1 month LIBOR + 3.000%) 3.147%, 4/11/25 | 3,465 | 3,426 | |
| American Residential Services LLC First Lien (3 month LIBOR + 3.500%) 4.250%, 10/15/27 | 2,190 | 2,185 | |
| APX Group, Inc. (1 month LIBOR + 5.000%) 5.147%, 12/31/25 | 4,800 | 4,768 | |
| Arches Buyer, Inc. (1 month LIBOR + 4.000%) 4.500%, 12/6/27 | 2,700 | 2,701 | |
| Array Technologies, Inc. (3 month LIBOR + 4.000%) 5.000%, 10/14/27 | 2,923 | 2,861 | |
| Ascend Learning LLC | |||
| (1 month LIBOR + 3.000%) 4.000%, 7/12/24 | 6,755 | 6,713 | |
| (1 month LIBOR + 3.750%) 4.750%, 7/12/24 | 1,900 | 1,903 | |
| Asplundh Tree Expert LLC (1 month LIBOR + 2.500%) 2.647%, 9/4/27 | 2,953 | 2,958 | |
| Avantor Funding, Inc. Tranche B-4 (1 month LIBOR + 2.500%) 3.500%, 11/8/27 | 3,350 | 3,352 | |
| Buzz Finco LLC (1 month LIBOR + 3.250%) 3.750%, 1/29/27 | 1,995 | 1,993 | |
| CCI Buyer, Inc. First Lien (3 month LIBOR + 4.250%) 0.000%, 12/10/27(4) | 4,300 | 4,293 | |
| Cloudera, Inc. (1 month LIBOR + 2.500%) 3.250%, 12/22/27 | 2,200 | 2,195 | |
| CommerceHub, Inc. First Lien (1 month LIBOR + 4.000%) 4.750%, 12/29/27 | 3,000 | 2,996 | |
| Conservice Midco LLC First Lien (3 month LIBOR + 4.250%) 4.503%, 5/13/27 | 3,541 | 3,541 | |
| DG Investment Intermediate Holdings 2, Inc. | |||
| First Lien (1 month LIBOR + 3.000%) 3.750%, 2/3/25 | 3,162 | 3,122 | |
| Second Lien (1 month LIBOR + 6.750%) 7.500%, 2/2/26 | 845 | 811 | |
| DiscoverOrg LLC First Lien (1 month LIBOR + 3.750%) 3.897%, 2/2/26 | 8,657 | 8,646 | |
| Dun & Bradstreet Corp. (The) 0.000%, 2/6/26(4) | 1,995 | 1,994 | |
| E2open LLC First Lien (3 month LIBOR + 3.500%) 0.000%, 10/29/27(4) | 3,425 | 3,414 | |
| Exela Intermediate LLC 2018 (3 month LIBOR + 6.500%) 7.500%, 7/12/23 | 6,501 | 2,221 | |
| GFL Environmental, Inc. 2020 (3 month LIBOR + 3.000%) 0.000%, 5/30/25(10) | 3,002 | 3,005 | |
| IRB Holding Corp. (3 month LIBOR + 3.250%) 0.000%, 12/15/27(4) | 4,250 | 4,251 | |
| Par Value | Value | ||
| Service—continued | |||
| Ivanti Software, Inc. First Lien (1 month LIBOR + 4.750%) 5.750%, 11/22/27 | $ 3,490 | $ 3,478 | |
| Lakeland Holdings LLC First Lien 0.000%, 9/25/27 | 80 | 13 | |
| Mermaid Bidco, Inc. Tranche B (3 month LIBOR + 4.250%) 0.000%, 12/10/27(4) | 3,100 | 3,092 | |
| MHI Holdings LLC First Lien (1 month LIBOR + 5.000%) 5.147%, 9/20/26 | 4,862 | 4,838 | |
| Midas Intermediate Holdco II LLC First Lien (3 month LIBOR + 6.750%) 0.000%, 12/22/25(4) | 2,900 | 2,936 | |
| National Intergovernmental Purchasing Alliance Co. First Lien (3 month LIBOR + 3.750%) 4.004%, 5/23/25 | 3,427 | 3,384 | |
| Oxbow Carbon LLC Tranche B, First Lien (1 month LIBOR + 4.250%) 5.000%, 10/17/25 | 3,851 | 3,842 | |
| Packers Holdings LLC (1 month LIBOR + 4.000%) 4.750%, 12/4/24 | 2,275 | 2,274 | |
| PAE, Inc. First Lien (3 month LIBOR + 4.500%) 5.250%, 10/19/27 | 3,250 | 3,254 | |
| Penney Borrower LLC 0.000%, 12/7/26(2) | 123 | 105 | |
| Pi US Mergerco, Inc. Tranche B-1 (1 month LIBOR + 3.500%) 4.500%, 1/3/25 | 11,743 | 11,703 | |
| Planview Parent, Inc. | |||
| First Lien (3 month LIBOR + 4.000%) 0.000%, 12/17/27(4) | 2,432 | 2,426 | |
| First Lien (3 month LIBOR + 4.000%) 0.000%, 12/17/27(4)(7) | 568 | 567 | |
| Pregis TopCo LLC (1 month LIBOR + 4.250%) 5.000%, 7/31/26 | 4,900 | 4,863 | |
| PricewaterhouseCoopers Public Sector LLP (1 month LIBOR + 4.500%) 4.647%, 5/1/25 | 8,378 | 8,364 | |
| Prime Security Services Borrower LLC 2019, Tranche B-1 (3 month LIBOR + 3.250%) 4.250%, 9/23/26 | 5,791 | 5,805 | |
| Quirch Foods Holdings LLC (6 month LIBOR + 5.250%) 6.250%, 10/27/27 | 5,000 | 4,963 | |
| Red Ventures LLC | |||
| Tranche B-2 (1 month LIBOR + 2.500%) 2.647%, 11/8/24 | 3,498 | 3,434 | |
| Tranche B-3, First Lien (1 month LIBOR + 3.500%) 4.250%, 11/8/24 | 2,580 | 2,561 | |
| Refficiency Holdings LLC | |||
| (1 month LIBOR + 4.000%) 4.750%, 12/10/27 | 2,306 | 2,299 | |
| (3 month LIBOR + 1.000%) 1.000%, 12/10/27(7) | 444 | 442 | |
| Russell Investments US Institutional Holdco, Inc. 2025 (3 month LIBOR + 3.000%) 4.000%, 5/30/25 | 3,800 | 3,784 | |
| RXB Holdings, Inc. First Lien (3 month LIBOR + 5.250%) 6.000%, 12/17/27 | 3,000 | 2,970 | |
| Sabre GLBL, Inc. 2020 (3 month LIBOR + 4.000%) 0.000%, 12/17/27(4) | 2,600 | 2,603 | |
| Par Value | Value | ||
| Service—continued | |||
| Smartbear Software, Inc. First Lien (3 month LIBOR + 4.250%) 0.000%, 11/19/27(4) | $ 2,200 | $ 2,186 | |
| St. George’s University Scholastic Services LLC (1 month LIBOR + 3.250%) 3.400%, 7/17/25 | 2,544 | 2,504 | |
| Symplr Software, Inc. First Lien (3 month LIBOR + 4.500%) 5.250%, 12/22/27 | 2,315 | 2,286 | |
| TKC Holdings, Inc. | |||
| First Lien (3 month LIBOR + 3.750%) 4.750%, 2/1/23 | 5,070 | 4,967 | |
| Second Lien (6 month LIBOR + 8.000%) 9.000%, 2/1/24 | 2,172 | 1,923 | |
| Travelport Finance (Luxembourg) S.a.r.l. | |||
| (3 month LIBOR + 8.000%) 9.000%, 2/28/25 | 4,194 | 4,130 | |
| First Lien (3 month LIBOR + 5.000%) 5.254%, 5/29/26 | 3,442 | 2,323 | |
| Valkyr Purchaser LLC (3 month LIBOR + 4.000%) 4.750%, 10/29/27 | 3,200 | 3,160 | |
| Ventia Finco Pty Ltd. 2019, Tranche B (3 month LIBOR + 4.000%) 5.000%, 5/21/26 | 9,066 | 8,998 | |
| Weight Watchers International, Inc. (1 month LIBOR + 4.750%) 5.500%, 11/29/24 | 3,957 | 3,951 | |
| White Cap Buyer LLC (3 month LIBOR + 4.000%) 4.500%, 10/19/27 | 3,965 | 3,960 | |
| Woof Holdings, Inc. | |||
| First Lien (3 month LIBOR + 3.750%) 4.500%, 12/21/27 | 3,900 | 3,892 | |
| Second Lien (3 month LIBOR + 7.250%) 8.000%, 12/16/28 | 500 | 501 | |
| 206,260 | |||
| Transportation - Automotive—3.1% | |||
| Adient US LLC (3 month LIBOR + 4.250%) 4.414%, 5/6/24 | 5,215 | 5,206 | |
| American Axle & Manufacturing, Inc. Tranche B (3 month LIBOR + 2.250%) 2.758%, 4/6/24 | 2,748 | 2,699 | |
| Autokiniton US Holdings, Inc. | |||
| 2019, Tranche B (1 month LIBOR + 5.750%) 5.897%, 5/22/25 | 4,553 | 4,485 | |
| Tranche B (1 month LIBOR + 6.375%) 6.522%, 5/22/25(2) | 4,875 | 4,802 | |
| Dana, Inc. 2018, Tranche B (1 month LIBOR + 2.250%) 2.397%, 2/27/26 | 4,462 | 4,434 | |
| DexKo Global, Inc. Tranche B (3 month LIBOR + 3.500%) 4.500%, 7/24/24 | 7,264 | 7,264 | |
| Navistar, Inc. Tranche B (1 month LIBOR + 3.500%) 3.660%, 11/6/24 | 4,026 | 4,017 | |
| Superior Industries International, Inc. (1 month LIBOR + 4.000%) 4.147%, 5/22/24 | 7,319 | 7,182 | |
| Tenneco, Inc. Tranche B (1 month LIBOR + 3.000%) 3.147%, 10/1/25 | 8,733 | 8,500 | |
| TI Group Automotive Systems LLC First Lien (3 month LIBOR + 3.750%) 4.004%, 12/16/24 | 2,070 | 2,070 | |
| Par Value | Value | ||
| Transportation - Automotive—continued | |||
| Wabash National Corp. (1 month LIBOR + 3.250%) 4.000%, 9/28/27 | $ 2,545 | $ 2,529 | |
| 53,188 | |||
| Transportation - Land Transportation—0.6% | |||
| Daseke Companies, Inc. (1 month LIBOR + 5.000%) 6.000%, 2/27/24 | 7,430 | 7,363 | |
| Savage Enterprises LLC Tranche B, First Lien (1 month LIBOR + 3.000%) 3.150%, 8/1/25 | 3,472 | 3,455 | |
| 10,818 | |||
| Utility—2.2% | |||
| Brookfield WEC Holdings, Inc. (1 month LIBOR + 3.000%) 3.750%, 8/1/25 | 6,351 | 6,328 | |
| Calpine Corp. 2020 (1 month LIBOR + 2.500%) 2.650%, 12/2/27 | 3,000 | 2,977 | |
| Eastern Power LLC Tranche B (3 month LIBOR + 3.750%) 4.750%, 10/2/25 | 9,613 | 9,033 | |
| Granite Acquisition, Inc. Tranche B, First Lien (1 month LIBOR + 3.750%) 4.750%, 9/19/22 | 2,539 | 2,543 | |
| Granite Generation LLC (1 month LIBOR + 3.750%) 4.750%, 11/9/26 | 6,736 | 6,739 | |
| Invenergy Thermal Operating I LLC (1 month LIBOR + 3.000%) 3.147%, 8/28/25 | 3,776 | 3,778 | |
| Longview Power LLC (2 month LIBOR + 10.000%) 0.000%, 7/30/25 | 1,540 | 1,494 | |
| Talen Energy Supply LLC (1 month LIBOR + 3.750%) 3.897%, 7/8/26 | 5,115 | 5,017 | |
| 37,909 | |||
| Total Leveraged Loans (Identified Cost $1,616,718) | 1,579,311 | ||
| Shares | ||
| Preferred Stocks—0.1% | ||
| Energy—0.1% | ||
| Blackbrush Oil & Gas PIK, 1.000%(2)(11) | 14 (12) | 2,123 |
| Templar Energy LLC Class A, 0.000%(2)(13) | 9,283 | — |
| 2,123 | ||
| Total Preferred Stocks (Identified Cost $4,133) | 2,123 | |
| Common Stocks—0.9% | ||
| Communication Services—0.0% | ||
| Desg Holdings, Inc.(2) | 475,758 | — |
| Consumer Discretionary—0.4% | ||
| TRU Kids, Inc.(2)(13) | 2,073 | 6,694 |
| Shares | Value | ||
| Consumer Discretionary—continued | |||
| Wayne Services Legacy, Inc. (2)(13) | 2,073 | $ — | |
| 6,694 | |||
| Energy—0.3% | |||
| Blackbrush Oil & Gas(2) | 437,150 | — | |
| FTS International, Inc. Class A(13) | 196,319 | 3,769 | |
| Summit Midstream Partners LP | 113,583 | 1,419 | |
| Sunshine Oil & Gas, Inc.(2) | 120,539 | 12 | |
| Templar Energy LLC Class A(2)(13) | 1,608,573 | 209 | |
| 5,409 | |||
| Financials—0.0% | |||
| Earnout Trust Certificates(2)(13) | 2,376 | 15 | |
| Information Technology—0.0% | |||
| Internap Holding LLC(2) | 681,392 | 7 | |
| Real Estate—0.1% | |||
| Hill Street Properties(2)(13) | 85,002 | 2,040 | |
| Utilities—0.1% | |||
| Longview Intermediate Holdings LLC(2) | 350,306 | 525 | |
| Total Common Stocks (Identified Cost $70,594) | 14,690 | ||
| Rights—0.0% | |||
| Utilities—0.0% | |||
| Vistra Energy Corp.(13) | 410,667 | 411 | |
| Total Rights (Identified Cost $554) | 411 | ||
| Warrant—0.0% | |||
| Real Estate—0.0% | |||
| Hill Street Properties(13) | 144,733 | — | |
| Total Warrant (Identified Cost $1) | — | ||
| Total Long-Term Investments—97.9% (Identified Cost $1,783,445) | 1,690,569 | ||
| TOTAL INVESTMENTS—97.9% (Identified Cost $1,783,445) | $1,690,569 | ||
| Other assets and liabilities, net—2.1% | 35,919 | ||
| NET ASSETS—100.0% | $1,726,488 | ||
| Abbreviations: | |
| LIBOR | London Interbank Offered Rate |
| LLC | Limited Liability Company |
| LP | Limited Partnership |
| PIK | Payment-in-Kind Security |
| REIT | Real Estate Investment Trust |
| Footnote Legend: | |
| (1) | Security exempt from registration under Rule 144A of the Securities Act of 1933. These securities may be resold in transactions exempt from registration, normally to qualified institutional buyers. At December 31, 2020, these securities amounted to a value of $38,438 or 2.2% of net assets. |
| (2) | The value of this security was determined using significant unobservable inputs and is reported as a Level 3 security in the Fair Value Hierarchy table located after the Schedule of Investments. |
| (3) | Variable rate security. Rate disclosed is as of December 31, 2020. For leveraged loans, the rate shown may represent a weighted average interest rate. Information in parenthesis represents benchmark and reference rate for each security. Certain variable rate securities are not based on a published reference rate and spread but are determined by the issuer or agent and are based on current market conditions, or, for mortgage-backed securities, are impacted by the individual mortgages which are paying off over time. These securities do not indicate a reference rate and spread in their descriptions. |
| (4) | This loan will settle after December 31, 2020, at which time the interest rate, based on the LIBOR and the agreed upon spread on trade date, will be reflected. |
| (5) | 67% of the income received was in cash and 23% was in PIK. |
| (6) | Security in default; no interest payments are being received during the bankruptcy proceedings. |
| (7) | Represents unfunded portion of security and commitment fee earned on this portion. |
| (8) | 27% of the income received was in cash and 73% was in PIK. |
| (9) | Security in default, interest payments are being received during the bankruptcy proceedings. |
| (10) | This loan will settle after December 31, 2020, at which time the interest rate, based on the London Interbank Offered Rate (“LIBOR”) and the agreed upon spread on trade date, will be reflected. |
| (11) | 100% of the income received was in PIK. |
| (12) | Value shown as par value. |
| (13) | Non-income producing. |
| Country Weightings (Unaudited)† | |
| United States | 89% |
| Luxembourg | 6 |
| France | 2 |
| Netherlands | 2 |
| United Kingdom | 1 |
| Total | 100% |
| † % of total investments as of December 31, 2020. | |
| Total Value at December 31, 2020 | Level 1 Quoted Prices | Level 2 Significant Observable Inputs | Level 3 Significant Unobservable Inputs | ||||
| Assets: | |||||||
| Debt Securities: | |||||||
| Corporate Bonds and Notes | $ 94,034 | $ — | $ 90,042 | $ 3,992(1) | |||
| Leveraged Loans | 1,579,311 | — | 1,567,349 | 11,962 (1) | |||
| Equity Securities: | |||||||
| Common Stocks | 14,690 | 5,188 | — | 9,502 (1) | |||
| Preferred Stocks | 2,123 | — | — | 2,123 (1) | |||
| Rights | 411 | — | 411 | — | |||
| Warrant | — | — | — | — | |||
| Total Investments | $1,690,569 | $5,188 | $1,657,802 | $27,579 |
| (1) | Includes internally fair valued securities currently priced at zero ($0). |
| Total | Corporate Bonds and Notes | Leveraged Loans | Common Stocks | Preferred Stock | |||||
| Investments in Securities | |||||||||
| Balance as of December 31, 2019: | $ 53,363 | $ 14,962 (a) | $ 23,411 | $ 14,990 (a) | $ —(a) | ||||
| Accrued discount/(premium) | 120 | 38 | 82 | — | — | ||||
| Realized gain (loss) | (6,454) | 86 | (201) | (6,339) | — | ||||
| Change in unrealized appreciation (depreciation)(b) | (4,890) | (351) | 299 | (2,886) | (1,952) | ||||
| Purchases | 13,376 | — | 5,364 | 3,937 | 4,075 | ||||
| Sales (c) | (25,096) | (10,743) | (14,153) | (200) | — | ||||
| Transfers into Level 3(d) | 5,276 | — | 5,276 | — | — | ||||
| Transfers from Level 3(d) | (8,116) | — | (8,116) | — | — | ||||
| Balance as of December 31, 2020 | $ 27,579 | $ 3,992(a) | $ 11,962 (a) | $ 9,502(a) | $ 2,123 (a) |
December 31, 2020
| Par Value | Value | ||
| Municipal Bonds(1)—98.0% | |||
| Alabama—3.0% | |||
| Jefferson County, | |||
| Sales Tax Revenue 5.000%, 9/15/33 | $1,000 | $ 1,227 | |
| Sales Tax Revenue 5.000%, 9/15/35 | 1,000 | 1,223 | |
| 2,450 | |||
| Arizona—1.2% | |||
| Salt River Project Agricultural Improvement & Power District Revenue 5.000%, 1/1/28 | 750 | 950 | |
| California—14.2% | |||
| California Infrastructure & Economic Development Bank Revenue 5.000%, 10/1/48 | 2,000 | 2,519 | |
| California, State of, General Obligation 5.000%, 9/1/30 | 1,000 | 1,031 | |
| California State Public Works Board 5.000%, 2/1/32 | 1,500 | 1,975 | |
| Port of Oakland | |||
| 5.000%, 5/1/28 | 1,500 | 1,907 | |
| 5.000%, 5/1/29 | 1,500 | 1,944 | |
| San Diego Redevelopment Agency Successor Agency | |||
| 5.000%, 9/1/28 | 500 | 597 | |
| 5.000%, 9/1/29 | 405 | 482 | |
| San Mateo Foster, City of, Public Financing Authority Revenue | |||
| 4.000%, 5/1/45 | 500 | 588 | |
| 4.000%, 5/1/48 | 500 | 585 | |
| 11,628 | |||
| Colorado—4.5% | |||
| E-470 Public Highway Authority | |||
| Toll Highway Revenue 5.000%, 9/1/35 | 800 | 1,061 | |
| Toll Highway Revenue 5.000%, 9/1/36 | 1,000 | 1,322 | |
| Regional Transportation District, Sales Tax Revenue 5.000%, 1/15/28 | 1,000 | 1,264 | |
| 3,647 | |||
| Connecticut—4.0% | |||
| Connecticut, State of, | |||
| Sales Tax Revenue 5.000%, 10/1/27 | 985 | 1,263 | |
| Sales Tax Revenue 5.000%, 5/1/37 | 1,500 | 1,971 | |
| 3,234 | |||
| District of Columbia—1.5% | |||
| District of Columbia, General Obligation 5.000%, 6/1/31 | 1,000 | 1,254 | |
| Florida—2.9% | |||
| Collier County, Water-Sewer District Revenue 5.000%, 7/1/33 | 1,000 | 1,239 | |
| Par Value | Value | ||
| Florida—continued | |||
| Hillsborough County Industrial Development Authority 4.000%, 8/1/45 | $1,000 | $ 1,157 | |
| 2,396 | |||
| Georgia—1.6% | |||
| Development Authority for Fulton County, Georgia Tech Athletic Association Revenue (Pre-Refunded 4/1/21 @ 100) 5.750%, 10/1/36 | 1,250 | 1,267 | |
| Hawaii—0.4% | |||
| Hawaii, State of, Harbor System Revenue 4.000%, 7/1/38 | 250 | 304 | |
| Illinois—11.4% | |||
| Chicago O’Hare International Airport Revenue, Senior Lien 4.000%, 1/1/35 | 1,000 | 1,185 | |
| Du Page County, 3.000%, 5/15/47 | 500 | 510 | |
| Illinois Finance Authority Revenue | |||
| 5.000%, 7/1/28 | 1,000 | 1,268 | |
| 4.000%, 7/1/39 | 3,000 | 3,702 | |
| Illinois State Toll Highway Authority Toll Highway Revenue 5.000%, 1/1/41 | 2,000 | 2,608 | |
| 9,273 | |||
| Maryland—6.0% | |||
| Maryland, State of, General Obligation 5.000%, 3/15/31 | 1,500 | 1,948 | |
| Washington Suburban Sanitary Commission Revenue (CNTY GTD Insured) 5.000%, 6/15/30 | 2,320 | 2,964 | |
| 4,912 | |||
| Minnesota—1.5% | |||
| Minnesota, State of, General Obligation 5.000%, 8/1/29 | 1,000 | 1,209 | |
| New York—5.9% | |||
| New York City Transitional Finance Authority Future Tax Secured, Sales Tax Revenue 5.000%, 2/1/28 | 1,000 | 1,139 | |
| New York City Water & Sewer System 4.000%, 6/15/42 | 1,500 | 1,826 | |
| New York State Dormitory Authority 5.000%, 7/1/31 | 500 | 692 | |
| Port Authority of New York & New Jersey Revenue 4.000%, 7/15/45 | 1,000 | 1,163 | |
| 4,820 | |||
| Oregon—1.4% | |||
| Portland, Port of, Airport Revenue 5.000%, 7/1/47 | 1,000 | 1,178 | |
| Par Value | Value | ||
| Tennessee—3.2% | |||
| Chattanooga Health Educational & Housing Facility Board 5.000%, 8/1/30 | $1,010 | $ 1,309 | |
| Tennessee, State of, General Obligation 5.000%, 9/1/30 | 1,000 | 1,289 | |
| 2,598 | |||
| Texas—16.3% | |||
| Arlington Higher Education Finance Corp., Life School Revenue (PSF-GTD Insured) 5.000%, 8/15/39 | 1,000 | 1,113 | |
| Central Texas Regional Mobility Authority | |||
| 5.000%, 1/1/45 | 500 | 626 | |
| 4.000%, 1/1/50 | 1,500 | 1,720 | |
| Dallas, City of, Fort Worth International Airport Revenue, 4.000%, 11/1/45 | 1,000 | 1,180 | |
| Fort Worth, City of, Water & Sewer System Revenue 5.000%, 2/15/30 | 1,000 | 1,294 | |
| North Texas Municipal Water District Water System Revenue 5.000%, 9/1/32 | 750 | 974 | |
| Texas Water Development Board Implementation Revenue 5.000%, 10/15/31 | 5,000 | 6,441 | |
| 13,348 | |||
| Washington—13.0% | |||
| Energy Northwest Revenue | |||
| 5.000%, 7/1/33 | 2,000 | 2,516 | |
| 5.000%, 7/1/34 | 2,000 | 2,370 | |
| University of Washington | |||
| 5.000%, 4/1/33 | 500 | 672 | |
| 5.000%, 4/1/34 | 500 | 668 | |
| 5.000%, 4/1/35 | 500 | 667 | |
| Washington Health Care Facilities Authority 5.000%, 8/1/44 | 940 | 1,152 | |
| Washington, State of, General Obligation 5.000%, 8/1/29 | 2,000 | 2,560 | |
| 10,605 | |||
| Par Value | Value | ||
| Wisconsin—6.0% | |||
| City of Milwaukee General Obligation 5.000%, 4/1/27 | $1,505 | $ 1,901 | |
| Wisconsin, State of, | |||
| General Obligation 5.000%, 5/1/28 | 1,250 | 1,638 | |
| General Obligation 5.000%, 5/1/31 | 1,000 | 1,372 | |
| 4,911 | |||
| Total Municipal Bonds (Identified Cost $76,308) | 79,984 | ||
| Total Long-Term Investments—98.0% (Identified Cost $76,308) | 79,984 | ||
| Shares | ||
| Short-Term Investment—13.5% | ||
| Money Market Mutual Fund—13.5% | ||
| Dreyfus Government Cash Management Fund - Institutional Shares (seven-day effective yield 0.030%)(2) | 11,039,425 | 11,039 |
| Total Short-Term Investment (Identified Cost $11,039) | 11,039 | |
| TOTAL INVESTMENTS—111.5% (Identified Cost $87,347) | $91,023 | |
| Other assets and liabilities, net—(11.5)% | (9,393) | |
| NET ASSETS—100.0% | $81,630 | |
| Abbreviations: | |
| CNTY GTD | County Guarantee Program |
| PSF-GTD | Permanent School Fund Guarantee Program |
| Footnote Legend: | |
| (1) | At December 31, 2020, 4.5% of the securities in the portfolio are backed by insurance of financial institutions and financial guaranty assurance agencies. |
| (2) | Shares of this fund are publicly offered, and its prospectus and annual report are publicly available. |
| Total Value at December 31, 2020 | Level 1 Quoted Prices | Level 2 Significant Observable Inputs | |||
| Assets: | |||||
| Debt Securities: | |||||
| Municipal Bonds | $79,984 | $ — | $79,984 | ||
| Money Market Mutual Fund | 11,039 | 11,039 | — | ||
| Total Investments | $91,023 | $11,039 | $79,984 |
December 31, 2020
| Par Value | Value | ||
| Corporate Bonds and Notes—96.8% | |||
| Communication Services—17.2% | |||
| Altice France S.A. 144A 8.125%, 2/1/27(1) | $ 1,565 | $ 1,725 | |
| ANGI Group LLC 144A 3.875%, 8/15/28(1) | 575 | 585 | |
| C&W Senior Financing DAC 144A 7.500%, 10/15/26(1) | 1,820 | 1,936 | |
| Cable One, Inc. 144A 4.000%, 11/15/30(1) | 2,121 | 2,203 | |
| Cablevision Lightpath LLC | |||
| 144A 3.875%, 9/15/27(1) | 1,110 | 1,117 | |
| 144A 5.625%, 9/15/28(1) | 1,095 | 1,146 | |
| Cars.com, Inc. 144A 6.375%, 11/1/28(1) | 870 | 923 | |
| CCO Holdings LLC 144A 4.500%, 8/15/30(1) | 2,060 | 2,186 | |
| CenturyLink, Inc. 7.600%, 9/15/39 | 287 | 349 | |
| Consolidated Communications, Inc. 144A 6.500%, 10/1/28(1) | 1,040 | 1,113 | |
| CSC Holdings LLC | |||
| 144A 6.500%, 2/1/29(1) | 900 | 1,016 | |
| 144A 4.625%, 12/1/30(1) | 3,285 | 3,429 | |
| Diamond Sports Group LLC 144A 5.375%, 8/15/26(1) | 1,825 | 1,483 | |
| DISH DBS Corp. | |||
| 5.875%, 11/15/24 | 935 | 980 | |
| 7.375%, 7/1/28 | 2,012 | 2,143 | |
| Entercom Media Corp. 144A 6.500%, 5/1/27(1) | 570 | 579 | |
| Frontier Communications Corp. 144A 6.750%, 5/1/29(1) | 595 | 637 | |
| Gray Television, Inc. 144A 4.750%, 10/15/30(1) | 1,085 | 1,101 | |
| iHeartCommunications, Inc. | |||
| 8.375%, 5/1/27 | 1,425 | 1,521 | |
| 144A 5.250%, 8/15/27(1) | 1,100 | 1,152 | |
| LCPR Senior Secured Financing DAC 144A 6.750%, 10/15/27(1) | 1,895 | 2,039 | |
| Live Nation Entertainment, Inc. | |||
| 144A 4.875%, 11/1/24(1) | 1,591 | 1,611 | |
| 144A 5.625%, 3/15/26(1) | 1,110 | 1,138 | |
| Meredith Corp. 6.875%, 2/1/26 | 995 | 970 | |
| SeaWorld Parks & Entertainment, Inc. 144A 9.500%, 8/1/25(1) | 1,025 | 1,113 | |
| Sinclair Television Group, Inc. 144A 4.125%, 12/1/30(1) | 540 | 553 | |
| TripAdvisor, Inc. 144A 7.000%, 7/15/25(1) | 2,020 | 2,182 | |
| ViacomCBS, Inc. 6.250%, 2/28/57 | 1,025 | 1,151 | |
| Ziggo B.V. 144A 5.500%, 1/15/27(1) | 1,850 | 1,931 | |
| 40,012 | |||
| Consumer Discretionary—23.5% | |||
| Academy Ltd. 144A 6.000%, 11/15/27(1) | 1,079 | 1,130 | |
| American Axle & Manufacturing, Inc. 6.500%, 4/1/27 | 1,080 | 1,137 | |
| Par Value | Value | ||
| Consumer Discretionary—continued | |||
| Bally’s Corp. 144A 6.750%, 6/1/27(1) | $ 1,630 | $ 1,748 | |
| Bed Bath & Beyond, Inc. 4.915%, 8/1/34(2) | 630 | 561 | |
| Boyd Gaming Corp. | |||
| 6.375%, 4/1/26 | 618 | 642 | |
| 6.000%, 8/15/26 | 495 | 514 | |
| 4.750%, 12/1/27 | 535 | 556 | |
| Caesars Entertainment, Inc. | |||
| 144A 6.250%, 7/1/25(1) | 1,520 | 1,619 | |
| 144A 8.125%, 7/1/27(1) | 1,110 | 1,229 | |
| Carnival Corp. 144A 11.500%, 4/1/23(1) | 925 | 1,070 | |
| Carvana Co. 144A 5.625%, 10/1/25(1) | 1,120 | 1,149 | |
| Cedar Fair LP 5.250%, 7/15/29 | 885 | 911 | |
| Century Communities, Inc. 6.750%, 6/1/27 | 1,515 | 1,618 | |
| FirstCash, Inc. 144A 4.625%, 9/1/28(1) | 1,075 | 1,109 | |
| Ford Motor Co. 9.000%, 4/22/25 | 1,320 | 1,622 | |
| Ford Motor Credit Co. LLC | |||
| 5.584%, 3/18/24 | 400 | 431 | |
| 5.125%, 6/16/25 | 2,005 | 2,180 | |
| Golden Nugget, Inc. 144A 6.750%, 10/15/24(1) | 1,135 | 1,127 | |
| Guitar Center, Inc. 144A 8.500%, 1/15/26(1) | 140 | 146 | |
| Hasbro, Inc. | |||
| 6.350%, 3/15/40 | 458 | 590 | |
| 5.100%, 5/15/44 | 485 | 554 | |
| Hilton Grand Vacations Borrower LLC 6.125%, 12/1/24 | 855 | 896 | |
| Installed Building Products, Inc. 144A 5.750%, 2/1/28(1) | 1,550 | 1,651 | |
| L Brands, Inc. | |||
| 6.950%, 3/1/33(2) | 450 | 467 | |
| 6.750%, 7/1/36 | 705 | 785 | |
| 144A 9.375%, 7/1/25(1) | 955 | 1,175 | |
| 144A 6.625%, 10/1/30(1) | 730 | 812 | |
| Liberty Interactive LLC 8.250%, 2/1/30 | 1,515 | 1,699 | |
| Marriott Ownership Resorts, Inc. 4.750%, 1/15/28 | 2,805 | 2,847 | |
| Michaels Stores, Inc. | |||
| 144A 8.000%, 7/15/27(1) | 1,040 | 1,118 | |
| 144A 4.750%, 10/1/27(1) | 1,090 | 1,117 | |
| Motors Liquidation Co. Escrow 7.200%, 1/15/49(3) | 53,982 | — | |
| New Home Co., Inc. (The) 144A 7.250%, 10/15/25(1) | 1,075 | 1,104 | |
| Newell Brands, Inc. 6.000%, 4/1/46 | 270 | 344 | |
| Nordstrom, Inc. | |||
| 4.000%, 3/15/27 | 490 | 485 | |
| 4.375%, 4/1/30 | 2,305 | 2,269 | |
| Penn National Gaming, Inc. 144A 5.625%, 1/15/27(1) | 1,040 | 1,085 | |
| Prime Security Services Borrower LLC | |||
| 144A 5.250%, 4/15/24(1) | 662 | 707 | |
| 144A 5.750%, 4/15/26(1) | 1,627 | 1,782 | |
| Par Value | Value | ||
| Consumer Discretionary—continued | |||
| QVC, Inc. | |||
| 4.750%, 2/15/27 | $ 990 | $ 1,062 | |
| 5.450%, 8/15/34 | 1,710 | 1,778 | |
| Royal Caribbean Cruises Ltd. 144A 10.875%, 6/1/23(1) | 960 | 1,092 | |
| Sally Holdings LLC 144A 8.750%, 4/30/25(1) | 908 | 1,008 | |
| Shea Homes LP | |||
| 144A 4.750%, 2/15/28(1) | 1,140 | 1,180 | |
| 144A 4.750%, 4/1/29(1) | 1,075 | 1,104 | |
| Six Flags Entertainment Corp. 144A 5.500%, 4/15/27(1)(2) | 900 | 925 | |
| Sonic Automotive, Inc. 6.125%, 3/15/27 | 84 | 88 | |
| Station Casinos LLC 144A 5.000%, 10/1/25(1) | 1,225 | 1,239 | |
| Tenneco, Inc. 5.375%, 12/15/24 | 30 | 29 | |
| White Cap Buyer LLC 144A 6.875%, 10/15/28(1) | 530 | 565 | |
| Winnebago Industries, Inc. 144A 6.250%, 7/15/28(1) | 1,185 | 1,274 | |
| Wyndham Destinations, Inc. | |||
| 4.250%, 3/1/22 | 503 | 514 | |
| 144A 6.625%, 7/31/26(1) | 780 | 893 | |
| 54,737 | |||
| Consumer Staples—2.2% | |||
| Coty, Inc. 144A 6.500%, 4/15/26(1) | 595 | 579 | |
| Kraft Heinz Foods Co. 144A 4.625%, 10/1/39(1) | 840 | 937 | |
| Pilgrim’s Pride Corp. 144A 5.750%, 3/15/25(1) | 2,030 | 2,084 | |
| Vector Group Ltd. | |||
| 144A 6.125%, 2/1/25(1) | 625 | 635 | |
| 144A 10.500%, 11/1/26(1) | 715 | 771 | |
| 5,006 | |||
| Energy—9.6% | |||
| Ascent Resources Utica Holdings LLC 144A 8.250%, 12/31/28(1) | 575 | 574 | |
| ChampionX Corp. 6.375%, 5/1/26 | 931 | 940 | |
| DCP Midstream Operating LP 5.125%, 5/15/29 | 550 | 610 | |
| Endeavor Energy Resources LP 144A 6.625%, 7/15/25(1) | 225 | 241 | |
| Energy Transfer Operating LP 5.800%, 6/15/38 | 825 | 947 | |
| Ensign Drilling, Inc. 144A 9.250%, 4/15/24(1) | 995 | 597 | |
| EQM Midstream Partners LP | |||
| 5.500%, 7/15/28 | 390 | 426 | |
| 6.500%, 7/15/48 | 645 | 669 | |
| 144A 6.500%, 7/1/27(1) | 505 | 569 | |
| EQT Corp. | |||
| 7.875%, 2/1/25 | 285 | 325 | |
| 8.750%, 2/1/30 | 570 | 697 | |
| Glenn Pool Oil & Gas Trust 6.000%, 8/2/21(3) | 46 | 41 | |
| Par Value | Value | ||
| Energy—continued | |||
| Hilcorp Energy I LP 144A 6.250%, 11/1/28(1) | $ 615 | $ 629 | |
| Magnolia Oil & Gas Operating LLC 144A 6.000%, 8/1/26(1) | 1,145 | 1,165 | |
| Nabors Industries, Inc. 144A 9.000%, 2/1/25(1) | 349 | 332 | |
| New Fortress Energy, Inc. 144A 6.750%, 9/15/25(1) | 645 | 683 | |
| Occidental Petroleum Corp. | |||
| 8.000%, 7/15/25 | 490 | 558 | |
| 5.875%, 9/1/25 | 1,155 | 1,230 | |
| 5.500%, 12/1/25 | 47 | 49 | |
| 6.125%, 1/1/31 | 552 | 591 | |
| 6.450%, 9/15/36 | 783 | 820 | |
| Oceaneering International, Inc. 6.000%, 2/1/28 | 640 | 572 | |
| Parkland Corp. 144A 5.875%, 7/15/27(1) | 1,100 | 1,189 | |
| Petroleos Mexicanos | |||
| 6.875%, 8/4/26 | 690 | 754 | |
| 144A 6.875%, 10/16/25(1) | 530 | 580 | |
| Rockies Express Pipeline LLC | |||
| 144A 4.950%, 7/15/29(1) | 1,050 | 1,092 | |
| 144A 7.500%, 7/15/38(1) | 215 | 236 | |
| SandRidge Energy, Inc. 8.125%, 10/15/22(3) | 1,935 | — | |
| Tallgrass Energy Partners LP 144A 7.500%, 10/1/25(1) | 645 | 696 | |
| Transocean Phoenix 2 Ltd. 144A 7.750%, 10/15/24(1) | 513 | 498 | |
| Transocean Proteus Ltd. 144A 6.250%, 12/1/24(1) | 846 | 794 | |
| USA Compression Partners LP 6.875%, 4/1/26 | 610 | 637 | |
| Western Midstream Operating LP | |||
| 4.750%, 8/15/28 | 670 | 697 | |
| 6.250%, 2/1/50 | 705 | 775 | |
| WPX Energy, Inc. 5.250%, 10/15/27 | 1,085 | 1,150 | |
| 22,363 | |||
| Financials—16.0% | |||
| AHP Health Partners, Inc. 144A 9.750%, 7/15/26(1) | 1,480 | 1,633 | |
| Aircastle Ltd. 4.250%, 6/15/26 | 720 | 758 | |
| Altice Financing S.A. 144A 5.000%, 1/15/28(1) | 750 | 768 | |
| Altice France Holding S.A. 144A 10.500%, 5/15/27(1) | 3,480 | 3,906 | |
| AssuredPartners, Inc. | |||
| 144A 7.000%, 8/15/25(1) | 515 | 534 | |
| 144A 5.625%, 1/15/29(1) | 1,675 | 1,748 | |
| Cimpress plc 144A 7.000%, 6/15/26(1) | 2,727 | 2,867 | |
| Credit Acceptance Corp. | |||
| 6.625%, 3/15/26 | 345 | 367 | |
| 144A 5.125%, 12/31/24(1) | 670 | 697 | |
| Dell International LLC 144A 8.350%, 7/15/46(1) | 880 | 1,330 | |
| Freedom Mortgage Corp. 144A 7.625%, 5/1/26(1) | 555 | 587 | |
| Par Value | Value | ||
| Financials—continued | |||
| GrafTech Finance, Inc. 144A 4.625%, 12/15/28(1) | $ 275 | $ 279 | |
| HAT Holdings I LLC | |||
| 144A 6.000%, 4/15/25(1) | 485 | 519 | |
| 144A 3.750%, 9/15/30(1) | 150 | 156 | |
| Hilcorp Energy I LP 144A 5.750%, 10/1/25(1) | 500 | 506 | |
| HUB International Ltd. 144A 7.000%, 5/1/26(1) | 495 | 518 | |
| Markel Corp. 6.000% (4) | 2,015 | 2,229 | |
| MGIC Investment Corp. 5.250%, 8/15/28 | 2,040 | 2,183 | |
| MPH Acquisition Holdings LLC 144A 5.750%, 11/1/28(1) | 590 | 577 | |
| Nationstar Mortgage Holdings, Inc. | |||
| 144A 6.000%, 1/15/27(1) | 2,130 | 2,260 | |
| 144A 5.500%, 8/15/28(1) | 1,180 | 1,242 | |
| 144A 5.125%, 12/15/30(1) | 820 | 857 | |
| New Residential Investment Corp. 144A 6.250%, 10/15/25(1) | 915 | 920 | |
| OneMain Finance Corp. | |||
| 6.875%, 3/15/25 | 1,876 | 2,178 | |
| 4.000%, 9/15/30 | 1,155 | 1,198 | |
| PennyMac Financial Services, Inc. 144A 5.375%, 10/15/25(1) | 1,094 | 1,157 | |
| Radian Group, Inc. | |||
| 4.500%, 10/1/24 | 840 | 886 | |
| 4.875%, 3/15/27 | 1,505 | 1,653 | |
| Societe Generale SA 144A 5.375% (1)(4) | 1,090 | 1,156 | |
| Terrier Media Buyer, Inc. 144A 8.875%, 12/15/27(1) | 1,015 | 1,119 | |
| Transocean Pontus Ltd. 144A 6.125%, 8/1/25(1) | 584 | 555 | |
| 37,343 | |||
| Health Care—7.0% | |||
| DaVita, Inc. 144A 3.750%, 2/15/31(1) | 1,090 | 1,107 | |
| Encompass Health Corp. | |||
| 4.500%, 2/1/28 | 950 | 993 | |
| 4.750%, 2/1/30 | 710 | 761 | |
| 4.625%, 4/1/31 | 137 | 147 | |
| Endo Dac 144A 6.000%, 6/30/28(1) | 660 | 561 | |
| Jaguar Holding Co. II 144A 5.000%, 6/15/28(1) | 570 | 608 | |
| LifePoint Health, Inc. 144A 5.375%, 1/15/29(1) | 1,735 | 1,734 | |
| Molina Healthcare, Inc. 144A 4.375%, 6/15/28(1) | 1,890 | 1,989 | |
| Par Pharmaceutical, Inc. 144A 7.500%, 4/1/27(1) | 1,899 | 2,060 | |
| Tenet Healthcare Corp. | |||
| 6.875%, 11/15/31 | 516 | 544 | |
| 144A 5.125%, 11/1/27(1) | 185 | 196 | |
| 144A 6.125%, 10/1/28(1) | 1,085 | 1,132 | |
| Teva Pharmaceutical Finance Netherlands III B.V. | |||
| 6.000%, 4/15/24 | 2,340 | 2,480 | |
| 6.750%, 3/1/28(2) | 1,385 | 1,567 | |
| Par Value | Value | ||
| Health Care—continued | |||
| Varex Imaging Corp. 144A 7.875%, 10/15/27(1) | $ 485 | $ 517 | |
| 16,396 | |||
| Industrials—7.4% | |||
| Delta Air Lines, Inc. 144A 7.000%, 5/1/25(1) | 1,960 | 2,263 | |
| Griffon Corp. 5.750%, 3/1/28 | 1,045 | 1,106 | |
| LBM Acquisition LLC 144A 6.250%, 1/15/29(1) | 675 | 702 | |
| Manitowoc Co., Inc. (The) 144A 9.000%, 4/1/26(1) | 565 | 610 | |
| Spirit AeroSystems, Inc. | |||
| 3.850%, 6/15/26 | 211 | 222 | |
| 144A 5.500%, 1/15/25(1) | 1,338 | 1,411 | |
| Spirit Loyalty Cayman Ltd. 144A 8.000%, 9/20/25(1) | 604 | 677 | |
| Stericycle, Inc. 144A 3.875%, 1/15/29(1) | 15 | 15 | |
| Tms International Holding Corp. 144A 7.250%, 8/15/25(1) | 908 | 922 | |
| TransDigm UK Holdings plc 6.875%, 5/15/26 | 1,140 | 1,205 | |
| TransDigm, Inc. | |||
| 144A 6.250%, 3/15/26(1) | 2,045 | 2,178 | |
| 5.500%, 11/15/27 | 545 | 573 | |
| Uber Technologies, Inc. 144A 6.250%, 1/15/28(1) | 1,050 | 1,142 | |
| United Airlines Pass-Through-Trust 2020-1, A 5.875%, 10/15/27 | 1,065 | 1,150 | |
| Univar Solutions USA, Inc. 144A 5.125%, 12/1/27(1) | 273 | 288 | |
| Vizient, Inc. 144A 6.250%, 5/15/27(1) | 601 | 646 | |
| Wabash National Corp. 144A 5.500%, 10/1/25(1) | 700 | 714 | |
| WESCO Distribution, Inc. | |||
| 144A 7.125%, 6/15/25(1) | 101 | 111 | |
| 144A 7.250%, 6/15/28(1) | 490 | 557 | |
| XPO Logistics, Inc. 144A 6.750%, 8/15/24(1) | 750 | 797 | |
| 17,289 | |||
| Information Technology—7.0% | |||
| Alliance Data Systems Corp. | |||
| 144A 4.750%, 12/15/24(1) | 1,660 | 1,677 | |
| 144A 7.000%, 1/15/26(1) | 1,630 | 1,724 | |
| ams AG 144A 7.000%, 7/31/25(1) | 995 | 1,080 | |
| Austin BidCo, Inc. 144A 7.125%, 12/15/28(1) | 805 | 840 | |
| CommScope, Inc. 144A 8.250%, 3/1/27(1) | 2,065 | 2,204 | |
| Dell International LLC | |||
| 144A 7.125%, 6/15/24(1) | 925 | 959 | |
| 144A 8.100%, 7/15/36(1) | 1,160 | 1,714 | |
| Plantronics, Inc. 144A 5.500%, 5/31/23(1) | 535 | 536 | |
| Sabre GLBL, Inc. 144A 9.250%, 4/15/25(1) | 766 | 912 | |
| Par Value | Value | ||
| Information Technology—continued | |||
| Science Applications International Corp. 144A 4.875%, 4/1/28(1) | $ 590 | $ 625 | |
| Unisys Corp. 144A 6.875%, 11/1/27(1) | 520 | 568 | |
| ViaSat, Inc. | |||
| 144A 5.625%, 9/15/25(1) | 1,065 | 1,089 | |
| 144A 6.500%, 7/15/28(1) | 1,045 | 1,131 | |
| Xerox Holdings Corp. 144A 5.000%, 8/15/25(1) | 1,065 | 1,134 | |
| 16,193 | |||
| Materials—3.7% | |||
| Chemours Co. (The) 144A 5.750%, 11/15/28(1) | 1,005 | 1,025 | |
| Cleveland-Cliffs, Inc. | |||
| 5.750%, 3/1/25 | 545 | 553 | |
| 144A 9.875%, 10/17/25(1) | 1,027 | 1,208 | |
| Freeport-McMoRan, Inc. | |||
| 5.400%, 11/14/34 | 370 | 463 | |
| 5.450%, 3/15/43 | 600 | 747 | |
| Graham Packaging Co., Inc. 144A 7.125%, 8/15/28(1) | 520 | 575 | |
| Summit Materials LLC | |||
| 144A 5.125%, 6/1/25(1) | 1,070 | 1,089 | |
| 144A 6.500%, 3/15/27(1) | 665 | 706 | |
| US Concrete, Inc. 144A 5.125%, 3/1/29(1) | 2,140 | 2,204 | |
| 8,570 | |||
| Real Estate—1.8% | |||
| Brookfield Property REIT, Inc. 144A 5.750%, 5/15/26(1) | 2,527 | 2,493 | |
| Howard Hughes Corp. (The) 144A 5.375%, 3/15/25(1) | 517 | 533 | |
| Iron Mountain, Inc. 144A 4.875%, 9/15/29(1) | 1,050 | 1,108 | |
| 4,134 | |||
| Utilities—1.4% | |||
| DCP Midstream Operating LP 5.375%, 7/15/25 | 920 | 1,011 | |
| PG&E Corp. | |||
| 5.000%, 7/1/28 | 1,065 | 1,134 | |
| 5.250%, 7/1/30 | 1,050 | 1,155 | |
| 3,300 | |||
| Total Corporate Bonds and Notes (Identified Cost $212,478) | 225,343 | ||
| Leveraged Loans(5)—1.0% | |||
| Consumer Non-Durables—0.1% | |||
| Coty, Inc. Tranche A (1 month LIBOR + 1.750%) 1.902%, 4/5/23 | 311 | 293 | |
| Energy—0.6% | |||
| BCP Raptor II LLC (1 month LIBOR + 4.750%) 4.896%, 11/3/25 | 762 | 683 | |
| Par Value | Value | ||
| Energy—continued | |||
| BCP Raptor LLC (1 month LIBOR + 4.250%) 5.250%, 6/24/24 | $ 762 | $ 696 | |
| 1,379 | |||
| Financial—0.0% | |||
| Ditech Holding Corp. Tranche B (3 month PRIME + 0.000%) 3.250%, 6/30/22(6) | 350 | 107 | |
| Information Technology—0.3% | |||
| SolarWinds Holdings, Inc. 2018 (3 month LIBOR + 2.750%) 0.000%, 2/5/24(7) | 605 | 576 | |
| Total Leveraged Loans (Identified Cost $2,594) | 2,355 | ||
| Shares | ||
| Common Stock—0.0% | ||
| Energy—0.0% | ||
| Templar Energy LLC Class A(3)(8) | 159,460 | 21 |
| Total Common Stock (Identified Cost $5,654) | 21 | |
| Warrants—0.0% | ||
| Energy—0.0% | ||
| SandRidge Energy, Inc.(8) | 3,760 | — (9) |
| SandRidge Energy, Inc.(8) | 1,583 | — (9) |
| — (9) | ||
| Total Warrants (Identified Cost $—) | — (9) | |
| Total Long-Term Investments—97.8% (Identified Cost $220,726) | 227,719 | |
| Short-Term Investment—1.3% | ||
| Securities Lending Collateral—1.3% | ||
| Dreyfus Government Cash Management Fund - Institutional Shares (seven-day effective yield 0.030%)(10)(11) | 2,946,916 | 2,947 |
| Total Short-Term Investment (Identified Cost $2,947) | 2,947 | |
| TOTAL INVESTMENTS—99.1% (Identified Cost $223,673) | $230,666 | |
| Other assets and liabilities, net—0.9% | 2,147 | |
| NET ASSETS—100.0% | $232,813 | |
| Abbreviations: | |
| LIBOR | London Interbank Offered Rate |
| LLC | Limited Liability Company |
| LP | Limited Partnership |
| REIT | Real Estate Investment Trust |
| Footnote Legend: | |
| (1) | Security exempt from registration under Rule 144A of the Securities Act of 1933. These securities may be resold in transactions exempt from registration, normally to qualified institutional buyers. At December 31, 2020, these securities amounted to a value of $153,899 or 66.1% of net assets. |
| (2) | All or a portion of security is on loan. |
| (3) | The value of this security was determined using significant unobservable inputs and is reported as a Level 3 security in the Fair Value Hierarchy table located after the Schedule of Investments. |
| (4) | No contractual maturity date. |
| (5) | Variable rate security. Rate disclosed is as of December 31, 2020. For leveraged loans, the rate shown may represent a weighted average interest rate. Information in parenthesis represents benchmark and reference rate for each security. Certain variable rate securities are not based on a published reference rate and spread but are determined by the issuer or agent and are based on current market conditions, or, for mortgage-backed securities, are impacted by the individual mortgages which are paying off over time. These securities do not indicate a reference rate and spread in their descriptions. |
| (6) | Security in default; no interest payments are being received during the bankruptcy proceedings. |
| (7) | This loan will settle after December 31, 2020, at which time the interest rate, based on the LIBOR and the agreed upon spread on trade date, will be reflected. |
| (8) | Non-income producing. |
| (9) | Amount is less than $500. |
| (10) | Shares of this fund are publicly offered, and its prospectus and annual report are publicly available. |
| (11) | Represents security purchased with cash collateral received for securities on loan. |
| Country Weightings (Unaudited)† | |
| United States | 86% |
| Netherlands | 4 |
| Luxembourg | 2 |
| Ireland | 2 |
| France | 1 |
| Cayman Islands | 1 |
| Canada | 1 |
| Other | 3 |
| Total | 100% |
| † % of total investments as of December 31, 2020. | |
| Total Value at December 31, 2020 | Level 1 Quoted Prices | Level 2 Significant Observable Inputs | Level 3 Significant Unobservable Inputs | ||||
| Assets: | |||||||
| Debt Securities: | |||||||
| Corporate Bonds and Notes | $225,343 | $ — | $225,302 | $41 (1) | |||
| Leveraged Loans | 2,355 | — | 2,355 | — | |||
| Equity Securities: | |||||||
| Warrants | — (2) | — (2) | — | — | |||
| Common Stock | 21 | — | — | 21 | |||
| Securities Lending Collateral | 2,947 | 2,947 | — | — | |||
| Total Investments | $230,666 | $2,947 | $227,657 | $62 |
| (1) | Includes internally fair valued securities currently priced at zero ($0). |
| (2) | Amount is less than $500. |
December 31, 2020
| Par Value | Value | ||
| Corporate Bonds and Notes—93.1% | |||
| Communication Services—19.4% | |||
| Altice France S.A. 144A 8.125%, 2/1/27(1) | $1,535 | $ 1,692 | |
| ANGI Group LLC 144A 3.875%, 8/15/28(1) | 1,005 | 1,023 | |
| C&W Senior Financing DAC 144A 7.500%, 10/15/26(1) | 1,490 | 1,585 | |
| Cable One, Inc. 144A 4.000%, 11/15/30(1) | 3,451 | 3,585 | |
| Cablevision Lightpath LLC | |||
| 144A 3.875%, 9/15/27(1) | 2,380 | 2,395 | |
| 144A 5.625%, 9/15/28(1) | 1,640 | 1,716 | |
| Cars.com, Inc. 144A 6.375%, 11/1/28(1) | 1,410 | 1,497 | |
| CCO Holdings LLC 144A 4.500%, 8/15/30(1) | 3,240 | 3,438 | |
| CenturyLink, Inc. | |||
| 6.750%, 12/1/23 | 1,850 | 2,060 | |
| 7.600%, 9/15/39 | 464 | 564 | |
| 144A 4.000%, 2/15/27(1) | 3,125 | 3,227 | |
| Consolidated Communications, Inc. 144A 6.500%, 10/1/28(1) | 1,590 | 1,701 | |
| CSC Holdings LLC | |||
| 144A 6.500%, 2/1/29(1) | 2,890 | 3,263 | |
| 144A 4.625%, 12/1/30(1) | 3,194 | 3,334 | |
| Diamond Sports Group LLC 144A 5.375%, 8/15/26(1) | 1,845 | 1,499 | |
| DISH DBS Corp. | |||
| 5.875%, 11/15/24 | 1,528 | 1,602 | |
| 7.375%, 7/1/28 | 3,262 | 3,474 | |
| Entercom Media Corp. 144A 6.500%, 5/1/27(1) | 695 | 706 | |
| Frontier Communications Corp. 144A 5.000%, 5/1/28(1) | 1,100 | 1,147 | |
| Gray Television, Inc. 144A 4.750%, 10/15/30(1) | 1,803 | 1,830 | |
| iHeartCommunications, Inc. 144A 5.250%, 8/15/27(1) | 2,153 | 2,255 | |
| LCPR Senior Secured Financing DAC 144A 6.750%, 10/15/27(1) | 2,925 | 3,148 | |
| Level 3 Financing, Inc. 5.375%, 5/1/25 | 755 | 777 | |
| Live Nation Entertainment, Inc. | |||
| 144A 4.875%, 11/1/24(1) | 2,614 | 2,647 | |
| 144A 5.625%, 3/15/26(1) | 825 | 846 | |
| Nexstar Broadcasting, Inc. 144A 4.750%, 11/1/28(1) | 3,630 | 3,798 | |
| Quebecor Media, Inc. 5.750%, 1/15/23 | 463 | 500 | |
| Sinclair Television Group, Inc. 144A 4.125%, 12/1/30(1) | 3,740 | 3,830 | |
| Sprint Communications, Inc. | |||
| 11.500%, 11/15/21 | 2,010 | 2,181 | |
| 9.250%, 4/15/22 | 280 | 306 | |
| Sprint Corp. 7.625%, 2/15/25 | 950 | 1,136 | |
| TEGNA, Inc. 144A 4.625%, 3/15/28(1) | 3,575 | 3,655 | |
| T-Mobile USA, Inc. 6.500%, 1/15/26 | 865 | 895 | |
| TripAdvisor, Inc. 144A 7.000%, 7/15/25(1) | 3,080 | 3,326 | |
| Par Value | Value | ||
| Communication Services—continued | |||
| ViacomCBS, Inc. 6.250%, 2/28/57 | $ 830 | $ 932 | |
| Videotron Ltd. 144A 5.375%, 6/15/24(1) | 463 | 511 | |
| Ziggo B.V. 144A 5.500%, 1/15/27(1) | 2,650 | 2,766 | |
| 74,847 | |||
| Consumer Discretionary—19.2% | |||
| Academy Ltd. 144A 6.000%, 11/15/27(1) | 1,750 | 1,833 | |
| Allison Transmission, Inc. 144A 3.750%, 1/30/31(1) | 1,915 | 1,959 | |
| American Axle & Manufacturing, Inc. 6.500%, 4/1/27 | 1,760 | 1,852 | |
| Bed Bath & Beyond, Inc. 4.915%, 8/1/34(2) | 1,024 | 911 | |
| Caesars Entertainment, Inc. 144A 6.250%, 7/1/25(1) | 2,420 | 2,577 | |
| Carnival Corp. 144A 11.500%, 4/1/23(1) | 2,535 | 2,931 | |
| Century Communities, Inc. | |||
| 5.875%, 7/15/25 | 990 | 1,030 | |
| 6.750%, 6/1/27 | 2,075 | 2,216 | |
| Churchill Downs, Inc. 144A 5.500%, 4/1/27(1) | 1,765 | 1,869 | |
| FirstCash, Inc. 144A 4.625%, 9/1/28(1) | 1,742 | 1,797 | |
| Ford Motor Co. 9.000%, 4/22/25 | 2,290 | 2,814 | |
| Ford Motor Credit Co. LLC | |||
| 5.584%, 3/18/24 | 525 | 566 | |
| 5.125%, 6/16/25 | 3,257 | 3,541 | |
| Hasbro, Inc. | |||
| 6.350%, 3/15/40 | 696 | 897 | |
| 5.100%, 5/15/44 | 745 | 851 | |
| Hilton Grand Vacations Borrower LLC 6.125%, 12/1/24 | 825 | 864 | |
| Installed Building Products, Inc. 144A 5.750%, 2/1/28(1) | 2,525 | 2,689 | |
| L Brands, Inc. | |||
| 6.750%, 7/1/36 | 705 | 786 | |
| 144A 9.375%, 7/1/25(1) | 710 | 873 | |
| 144A 6.625%, 10/1/30(1) | 1,095 | 1,218 | |
| Liberty Interactive LLC 8.250%, 2/1/30 | 2,485 | 2,786 | |
| Marriott Ownership Resorts, Inc. 4.750%, 1/15/28 | 4,566 | 4,635 | |
| MGM Resorts International 7.750%, 3/15/22 | 355 | 378 | |
| Michaels Stores, Inc. 144A 4.750%, 10/1/27(1) | 2,070 | 2,122 | |
| New Home Co., Inc. (The) 144A 7.250%, 10/15/25(1) | 1,710 | 1,756 | |
| Newell Brands, Inc. 6.000%, 4/1/46 | 440 | 561 | |
| Nordstrom, Inc. | |||
| 4.000%, 3/15/27 | 780 | 773 | |
| 4.375%, 4/1/30 | 3,810 | 3,751 | |
| Penn National Gaming, Inc. 144A 5.625%, 1/15/27(1) | 1,580 | 1,649 | |
| Par Value | Value | ||
| Consumer Discretionary—continued | |||
| Prime Security Services Borrower LLC | |||
| 144A 5.250%, 4/15/24(1) | $ 761 | $ 812 | |
| 144A 5.750%, 4/15/26(1) | 1,765 | 1,933 | |
| QVC, Inc. | |||
| 4.750%, 2/15/27 | 1,005 | 1,078 | |
| 5.450%, 8/15/34 | 2,775 | 2,886 | |
| Royal Caribbean Cruises Ltd. 144A 10.875%, 6/1/23(1) | 1,520 | 1,730 | |
| Sally Holdings LLC 144A 8.750%, 4/30/25(1) | 1,108 | 1,230 | |
| Shea Homes LP | |||
| 144A 4.750%, 2/15/28(1) | 2,039 | 2,110 | |
| 144A 4.750%, 4/1/29(1) | 1,635 | 1,680 | |
| Six Flags Entertainment Corp. 144A 5.500%, 4/15/27(1)(2) | 1,460 | 1,500 | |
| Sonic Automotive, Inc. 6.125%, 3/15/27 | 138 | 145 | |
| TRI Pointe Group, Inc. 5.875%, 6/15/24 | 1,030 | 1,124 | |
| William Carter Co. (The) 144A 5.625%, 3/15/27(1) | 963 | 1,014 | |
| Winnebago Industries, Inc. 144A 6.250%, 7/15/28(1) | 1,795 | 1,930 | |
| Wyndham Destinations, Inc. | |||
| 4.250%, 3/1/22 | 809 | 827 | |
| 144A 6.625%, 7/31/26(1) | 1,269 | 1,453 | |
| 73,937 | |||
| Consumer Staples—1.7% | |||
| Kraft Heinz Foods Co. 144A 4.625%, 10/1/39(1) | 1,360 | 1,517 | |
| Pilgrim’s Pride Corp. 144A 5.750%, 3/15/25(1) | 3,170 | 3,254 | |
| Vector Group Ltd. 144A 6.125%, 2/1/25(1) | 1,815 | 1,845 | |
| 6,616 | |||
| Energy—7.5% | |||
| ChampionX Corp. 6.375%, 5/1/26 | 730 | 737 | |
| DCP Midstream Operating LP 5.125%, 5/15/29 | 868 | 963 | |
| Energy Transfer Operating LP 5.800%, 6/15/38 | 1,345 | 1,543 | |
| EQM Midstream Partners LP | |||
| 5.500%, 7/15/28 | 595 | 650 | |
| 6.500%, 7/15/48 | 950 | 986 | |
| 144A 6.500%, 7/1/27(1) | 826 | 930 | |
| EQT Corp. | |||
| 7.875%, 2/1/25 | 430 | 490 | |
| 8.750%, 2/1/30 | 870 | 1,064 | |
| Glenn Pool Oil & Gas Trust 6.000%, 8/2/21(3) | 49 | 44 | |
| Hilcorp Energy I LP 144A 6.250%, 11/1/28(1) | 1,050 | 1,074 | |
| Magnolia Oil & Gas Operating LLC 144A 6.000%, 8/1/26(1) | 1,877 | 1,910 | |
| New Fortress Energy, Inc. 144A 6.750%, 9/15/25(1) | 1,050 | 1,112 | |
| Occidental Petroleum Corp. | |||
| 8.000%, 7/15/25 | 778 | 886 | |
| Par Value | Value | ||
| Energy—continued | |||
| 5.875%, 9/1/25 | $1,895 | $ 2,018 | |
| 5.500%, 12/1/25 | 76 | 79 | |
| 6.125%, 1/1/31 | 901 | 964 | |
| 6.450%, 9/15/36 | 1,280 | 1,340 | |
| Parkland Corp. 144A 5.875%, 7/15/27(1) | 1,515 | 1,638 | |
| Petroleos Mexicanos | |||
| 6.875%, 8/4/26 | 1,108 | 1,210 | |
| 144A 6.875%, 10/16/25(1)(2) | 835 | 914 | |
| Rockies Express Pipeline LLC | |||
| 144A 4.950%, 7/15/29(1) | 1,665 | 1,732 | |
| 144A 7.500%, 7/15/38(1) | 355 | 391 | |
| Transocean Phoenix 2 Ltd. 144A 7.750%, 10/15/24(1) | 693 | 672 | |
| Transocean Proteus Ltd. 144A 6.250%, 12/1/24(1) | 789 | 741 | |
| USA Compression Partners LP 6.875%, 4/1/26 | 918 | 959 | |
| Western Midstream Operating LP | |||
| 4.750%, 8/15/28 | 1,060 | 1,102 | |
| 6.250%, 2/1/50 | 1,070 | 1,177 | |
| WPX Energy, Inc. 5.250%, 10/15/27 | 1,625 | 1,722 | |
| 29,048 | |||
| Financials—15.6% | |||
| Aircastle Ltd. 4.250%, 6/15/26 | 1,160 | 1,221 | |
| Altice Financing S.A. 144A 5.000%, 1/15/28(1) | 8,450 | 8,658 | |
| CCO Holdings LLC 144A 5.000%, 2/1/28(1) | 950 | 1,005 | |
| Cimpress plc 144A 7.000%, 6/15/26(1) | 4,355 | 4,578 | |
| Credit Acceptance Corp. | |||
| 6.625%, 3/15/26 | 560 | 596 | |
| 144A 5.125%, 12/31/24(1) | 1,010 | 1,050 | |
| Dell International LLC 144A 8.350%, 7/15/46(1) | 1,855 | 2,803 | |
| Delta Air Lines, Inc. | |||
| 144A 4.500%, 10/20/25(1) | 1,680 | 1,795 | |
| 144A 4.750%, 10/20/28(1) | 1,720 | 1,877 | |
| Freedom Mortgage Corp. 144A 7.625%, 5/1/26(1) | 905 | 957 | |
| GrafTech Finance, Inc. 144A 4.625%, 12/15/28(1) | 450 | 456 | |
| HAT Holdings I LLC 144A 3.750%, 9/15/30(1) | 230 | 239 | |
| Hilcorp Energy I LP 144A 5.750%, 10/1/25(1) | 780 | 789 | |
| ILFC E-Capital Trust I 144A 3.230%, 12/21/65(1)(4) | 1,390 | 931 | |
| Markel Corp. 6.000% (5) | 3,215 | 3,557 | |
| MGIC Investment Corp. 5.250%, 8/15/28 | 3,349 | 3,584 | |
| Nationstar Mortgage Holdings, Inc. | |||
| 144A 6.000%, 1/15/27(1) | 3,490 | 3,704 | |
| 144A 5.500%, 8/15/28(1) | 3,115 | 3,279 | |
| 144A 5.125%, 12/15/30(1) | 448 | 468 | |
| New Residential Investment Corp. 144A 6.250%, 10/15/25(1) | 1,485 | 1,492 | |
| Par Value | Value | ||
| Financials—continued | |||
| OneMain Finance Corp. | |||
| 6.875%, 3/15/25 | $2,832 | $ 3,289 | |
| 4.000%, 9/15/30 | 1,875 | 1,946 | |
| PennyMac Financial Services, Inc. 144A 5.375%, 10/15/25(1) | 1,781 | 1,883 | |
| Quicken Loans LLC 144A 3.625%, 3/1/29(1) | 3,660 | 3,733 | |
| Radian Group, Inc. | |||
| 4.500%, 10/1/24 | 1,078 | 1,137 | |
| 4.875%, 3/15/27 | 2,168 | 2,381 | |
| Societe Generale SA 144A 5.375% (1)(5) | 1,785 | 1,893 | |
| Transocean Pontus Ltd. 144A 6.125%, 8/1/25(1) | 867 | 824 | |
| 60,125 | |||
| Health Care—7.8% | |||
| Bausch Health Cos., Inc. 144A 7.000%, 3/15/24(1) | 900 | 926 | |
| Charles River Laboratories International, Inc. 144A 5.500%, 4/1/26(1) | 900 | 943 | |
| DaVita, Inc. 144A 3.750%, 2/15/31(1) | 3,755 | 3,813 | |
| Encompass Health Corp. | |||
| 4.500%, 2/1/28 | 1,120 | 1,170 | |
| 4.750%, 2/1/30 | 1,895 | 2,030 | |
| 4.625%, 4/1/31 | 217 | 232 | |
| HCA, Inc. 5.375%, 2/1/25 | 2,080 | 2,339 | |
| Hill-Rom Holdings, Inc. 144A 5.000%, 2/15/25(1) | 550 | 565 | |
| Jaguar Holding Co. II 144A 5.000%, 6/15/28(1) | 920 | 982 | |
| Molina Healthcare, Inc. 144A 4.375%, 6/15/28(1) | 3,080 | 3,242 | |
| Par Pharmaceutical, Inc. 144A 7.500%, 4/1/27(1) | 1,801 | 1,954 | |
| Syneos Health, Inc. 144A 3.625%, 1/15/29(1) | 1,843 | 1,848 | |
| Tenet Healthcare Corp. | |||
| 4.625%, 7/15/24 | 2,455 | 2,516 | |
| 144A 5.125%, 11/1/27(1) | 1,463 | 1,549 | |
| Teva Pharmaceutical Finance Netherlands III B.V. | |||
| 6.000%, 4/15/24 | 2,625 | 2,783 | |
| 6.750%, 3/1/28(2) | 2,055 | 2,325 | |
| Varex Imaging Corp. 144A 7.875%, 10/15/27(1) | 760 | 809 | |
| 30,026 | |||
| Industrials—6.2% | |||
| AECOM 5.875%, 10/15/24 | 1,405 | 1,567 | |
| Delta Air Lines, Inc. 144A 7.000%, 5/1/25(1) | 3,070 | 3,544 | |
| Griffon Corp. 5.750%, 3/1/28 | 1,707 | 1,806 | |
| Hilton Domestic Operating Co., Inc. 5.125%, 5/1/26 | 701 | 724 | |
| IAA, Inc. 144A 5.500%, 6/15/27(1) | 535 | 567 | |
| Par Value | Value | ||
| Industrials—continued | |||
| Manitowoc Co., Inc. (The) 144A 9.000%, 4/1/26(1) | $ 720 | $ 778 | |
| Spirit AeroSystems, Inc. | |||
| 3.850%, 6/15/26 | 320 | 336 | |
| 144A 5.500%, 1/15/25(1) | 2,153 | 2,271 | |
| Spirit Loyalty Cayman Ltd. 144A 8.000%, 9/20/25(1) | 990 | 1,109 | |
| Stericycle, Inc. 144A 3.875%, 1/15/29(1) | 24 | 25 | |
| TransDigm, Inc. | |||
| 144A 6.250%, 3/15/26(1) | 3,395 | 3,616 | |
| 5.500%, 11/15/27 | 825 | 867 | |
| United Airlines Pass-Through-Trust 2020-1, A 5.875%, 10/15/27 | 1,725 | 1,863 | |
| Univar Solutions USA, Inc. 144A 5.125%, 12/1/27(1) | 1,284 | 1,356 | |
| Vizient, Inc. 144A 6.250%, 5/15/27(1) | 732 | 787 | |
| Wabash National Corp. 144A 5.500%, 10/1/25(1) | 670 | 683 | |
| WESCO Distribution, Inc. | |||
| 144A 7.125%, 6/15/25(1) | 161 | 177 | |
| 144A 7.250%, 6/15/28(1) | 790 | 898 | |
| XPO Logistics, Inc. 144A 6.750%, 8/15/24(1) | 970 | 1,031 | |
| 24,005 | |||
| Information Technology—5.8% | |||
| Alliance Data Systems Corp. | |||
| 144A 4.750%, 12/15/24(1) | 2,645 | 2,671 | |
| 144A 7.000%, 1/15/26(1) | 2,575 | 2,724 | |
| ams AG 144A 7.000%, 7/31/25(1) | 1,620 | 1,758 | |
| Dell International LLC | |||
| 144A 7.125%, 6/15/24(1) | 1,180 | 1,224 | |
| 144A 8.100%, 7/15/36(1) | 1,895 | 2,800 | |
| Plantronics, Inc. 144A 5.500%, 5/31/23(1) | 870 | 872 | |
| Sabre GLBL, Inc. 144A 9.250%, 4/15/25(1) | 716 | 852 | |
| Science Applications International Corp. 144A 4.875%, 4/1/28(1) | 1,504 | 1,594 | |
| SS&C Technologies, Inc. 144A 5.500%, 9/30/27(1) | 1,475 | 1,575 | |
| Unisys Corp. 144A 6.875%, 11/1/27(1) | 850 | 929 | |
| ViaSat, Inc. | |||
| 144A 5.625%, 9/15/25(1) | 1,721 | 1,760 | |
| 144A 6.500%, 7/15/28(1) | 1,655 | 1,791 | |
| Xerox Holdings Corp. 144A 5.000%, 8/15/25(1) | 1,695 | 1,804 | |
| 22,354 | |||
| Materials—4.4% | |||
| Ardagh Packaging Finance plc | |||
| 144A 5.250%, 4/30/25(1) | 1,530 | 1,614 | |
| 144A 4.125%, 8/15/26(1) | 240 | 251 | |
| Chemours Co. (The) 144A 5.750%, 11/15/28(1) | 1,635 | 1,668 | |
| Cleveland-Cliffs, Inc. 144A 9.875%, 10/17/25(1) | 1,650 | 1,941 | |
| Par Value | Value | ||
| Materials—continued | |||
| Freeport-McMoRan, Inc. | |||
| 5.400%, 11/14/34 | $ 605 | $ 757 | |
| 5.450%, 3/15/43 | 980 | 1,220 | |
| HB Fuller Co. 4.250%, 10/15/28 | 1,710 | 1,753 | |
| Reynolds Group Issuer, Inc. 144A 5.125%, 7/15/23(1) | 37 | 37 | |
| Sealed Air Corp. | |||
| 144A 5.500%, 9/15/25(1) | 720 | 806 | |
| 144A 6.875%, 7/15/33(1) | 400 | 528 | |
| Summit Materials LLC | |||
| 144A 5.125%, 6/1/25(1) | 1,000 | 1,017 | |
| 144A 6.500%, 3/15/27(1) | 660 | 701 | |
| 144A 5.250%, 1/15/29(1) | 445 | 467 | |
| US Concrete, Inc. 144A 5.125%, 3/1/29(1) | 3,855 | 3,971 | |
| 16,731 | |||
| Real Estate—3.6% | |||
| Brookfield Property REIT, Inc. 144A 5.750%, 5/15/26(1) | 4,027 | 3,973 | |
| GLP Capital LP 5.250%, 6/1/25 | 910 | 1,024 | |
| Howard Hughes Corp. (The) 144A 5.375%, 3/15/25(1) | 850 | 877 | |
| Iron Mountain, Inc. | |||
| 144A 4.875%, 9/15/29(1) | 1,691 | 1,784 | |
| 144A 4.500%, 2/15/31(1) | 956 | 1,001 | |
| SBA Communications Corp. 144A 3.875%, 2/15/27(1) | 3,911 | 4,108 | |
| VICI Properties LP 144A 4.250%, 12/1/26(1) | 1,160 | 1,203 | |
| 13,970 | |||
| Utilities—1.9% | |||
| DCP Midstream Operating LP 5.375%, 7/15/25 | 1,505 | 1,654 | |
| NextEra Energy Operating Partners LP 144A 4.250%, 7/15/24(1) | 1,920 | 2,054 | |
| PG&E Corp. | |||
| 5.000%, 7/1/28 | 1,680 | 1,789 | |
| 5.250%, 7/1/30 | 1,641 | 1,805 | |
| 7,302 | |||
| Total Corporate Bonds and Notes (Identified Cost $339,059) | 358,961 | ||
| Leveraged Loans(4)—2.3% | |||
| Consumer Non-Durables—0.1% | |||
| Coty, Inc. Tranche A (1 month LIBOR + 1.750%) 1.902%, 4/5/23 | 456 | 430 | |
| Energy—0.4% | |||
| BCP Raptor II LLC (1 month LIBOR + 4.750%) 4.896%, 11/3/25 | 822 | 736 | |
| Par Value | Value | ||
| Energy—continued | |||
| BCP Raptor LLC (1 month LIBOR + 4.250%) 5.250%, 6/24/24 | $ 821 | $ 750 | |
| 1,486 | |||
| Financial—0.0% | |||
| Ditech Holding Corp. Tranche B (3 month PRIME + 0.000%) 3.250%, 6/30/22(6) | 354 | 108 | |
| Healthcare—1.0% | |||
| AHP Health Partners, Inc. (1 month LIBOR + 4.500%) 0.000%, 6/30/25 | 1,900 | 1,905 | |
| Kindred Healthcare LLC (1 month LIBOR + 5.000%) 0.000%, 7/2/25(7) | 1,895 | 1,890 | |
| 3,795 | |||
| Information Technology—0.3% | |||
| SolarWinds Holdings, Inc. 2018 (3 month LIBOR + 2.750%) 0.000%, 2/5/24(7) | 994 | 948 | |
| Media / Telecom - Telecommunications—0.5% | |||
| Cincinnati Bell, Inc. Tranche B (3 month LIBOR + 3.250%) 0.000%, 10/2/24(7) | 1,895 | 1,894 | |
| Total Leveraged Loans (Identified Cost $8,932) | 8,661 | ||
| Shares | ||
| Common Stock—0.0% | ||
| Energy—0.0% | ||
| Templar Energy LLC Class A(3)(8) | 134,055 | 18 |
| Total Common Stock (Identified Cost $4,781) | 18 | |
| Total Long-Term Investments—95.4% (Identified Cost $352,772) | 367,640 | |
| Short-Term Investments—3.2% | ||
| Money Market Mutual Fund—2.1% | ||
| Dreyfus Government Cash Management Fund - Institutional Shares (seven-day effective yield 0.030%)(9) | 8,256,236 | 8,256 |
| Total Money Market Mutual Fund (Identified Cost $8,256) | 8,256 | |
| Shares | Value | ||
| Securities Lending Collateral—1.1% | |||
| Dreyfus Government Cash Management Fund - Institutional Shares (seven-day effective yield 0.030%)(9)(10) | 4,204,323 | $ 4,204 | |
| Total Securities Lending Collateral (Identified Cost $4,204) | 4,204 | ||
| Total Short-Term Investments (Identified Cost $12,460) | 12,460 | ||
| TOTAL INVESTMENTS—98.6% (Identified Cost $365,232) | $380,100 | ||
| Other assets and liabilities, net—1.4% | 5,496 | ||
| NET ASSETS—100.0% | $385,596 | ||
| Abbreviations: | |
| LIBOR | London Interbank Offered Rate |
| LLC | Limited Liability Company |
| LP | Limited Partnership |
| REIT | Real Estate Investment Trust |
| Footnote Legend: | |
| (1) | Security exempt from registration under Rule 144A of the Securities Act of 1933. These securities may be resold in transactions exempt from registration, normally to qualified institutional buyers. At December 31, 2020, these securities amounted to a value of $243,057 or 63.0% of net assets. |
| (2) | All or a portion of security is on loan. |
| (3) | The value of this security was determined using significant unobservable inputs and is reported as a Level 3 security in the Fair Value Hierarchy table located after the Schedule of Investments. |
| (4) | Variable rate security. Rate disclosed is as of December 31, 2020. For leveraged loans, the rate shown may represent a weighted average interest rate. Information in parenthesis represents benchmark and reference rate for each security. Certain variable rate securities are not based on a published reference rate and spread but are determined by the issuer or agent and are based on current market conditions, or, for mortgage-backed securities, are impacted by the individual mortgages which are paying off over time. These securities do not indicate a reference rate and spread in their descriptions. |
| (5) | No contractual maturity date. |
| (6) | Security in default; no interest payments are being received during the bankruptcy proceedings. |
| (7) | This loan will settle after December 31, 2020, at which time the interest rate, based on the LIBOR and the agreed upon spread on trade date, will be reflected. |
| (8) | Non-income producing. |
| (9) | Shares of this fund are publicly offered, and its prospectus and annual report are publicly available. |
| (10) | Represents security purchased with cash collateral received for securities on loan. |
| Country Weightings (Unaudited)† | |
| United States | 89% |
| Netherlands | 4 |
| Luxembourg | 2 |
| Ireland | 1 |
| France | 1 |
| Canada | 1 |
| Other | 2 |
| Total | 100% |
| † % of total investments as of December 31, 2020. | |
| Total Value at December 31, 2020 | Level 1 Quoted Prices | Level 2 Significant Observable Inputs | Level 3 Significant Unobservable Inputs | ||||
| Assets: | |||||||
| Debt Securities: | |||||||
| Corporate Bonds and Notes | $358,961 | $ — | $358,917 | $44 | |||
| Leveraged Loans | 8,661 | — | 8,661 | — | |||
| Equity Securities: | |||||||
| Common Stock | 18 | — | — | 18 | |||
| Securities Lending Collateral | 4,204 | 4,204 | — | — | |||
| Money Market Mutual Fund | 8,256 | 8,256 | — | — | |||
| Total Investments | $380,100 | $12,460 | $367,578 | $62 |
December 31, 2020
| Par Value | Value | ||
| Municipal Bonds(1)—98.1% | |||
| Alabama—0.6% | |||
| Jefferson County, Sales Tax Revenue 5.000%, 9/15/33 | $1,500 | $ 1,841 | |
| Arizona—3.5% | |||
| Salt River Project Agricultural Improvement & Power District Revenue | |||
| 5.000%, 1/1/26 | 500 | 598 | |
| 5.000%, 1/1/27 | 2,000 | 2,467 | |
| 5.000%, 1/1/28 | 1,000 | 1,266 | |
| 5.000%, 1/1/30 | 1,750 | 2,398 | |
| 5.000%, 12/1/32 | 3,020 | 3,602 | |
| 10,331 | |||
| California—12.1% | |||
| California County Tobacco Securitization Agency Revenue | |||
| 5.000%, 6/1/24 | 100 | 116 | |
| 5.000%, 6/1/25 | 200 | 240 | |
| 5.000%, 6/1/27 | 100 | 128 | |
| 5.000%, 6/1/28 | 100 | 131 | |
| California State Public Works Board | |||
| 5.000%, 2/1/27 | 3,000 | 3,611 | |
| 5.000%, 2/1/30 | 2,000 | 2,548 | |
| 5.000%, 2/1/31 | 2,000 | 2,593 | |
| California, State of, General Obligation 5.000%, 4/1/37 | 4,000 | 4,563 | |
| East Bay Municipal Utility District Water System Revenue 5.000%, 6/1/33 | 1,940 | 2,457 | |
| Port of Oakland 5.000%, 5/1/27 | 2,750 | 3,423 | |
| San Diego County Water Authority | |||
| 5.000%, 5/1/26 | 2,250 | 2,796 | |
| 5.000%, 5/1/28 | 1,700 | 2,235 | |
| 5.000%, 5/1/29 | 2,000 | 2,694 | |
| 5.000%, 5/1/30 | 4,000 | 5,505 | |
| 5.000%, 5/1/31 | 1,000 | 1,408 | |
| Southern California Public Power Authority Revenue 5.000%, 4/1/24 | 1,500 | 1,713 | |
| 36,161 | |||
| Colorado—2.0% | |||
| E-470 Public Highway Authority | |||
| 5.000%, 9/1/26 | 550 | 686 | |
| 5.000%, 9/1/34 | 1,000 | 1,330 | |
| 5.000%, 9/1/40 | 1,500 | 1,710 | |
| Regional Transportation District | |||
| Sales Tax Revenue 5.000%, 1/15/27 | 900 | 1,114 | |
| Sales Tax Revenue 5.000%, 7/15/27 | 1,025 | 1,281 | |
| 6,121 | |||
| Connecticut—1.5% | |||
| Connecticut, State of, General Obligation 4.000%, 1/15/29 | 1,350 | 1,676 | |
| State of Connecticut Special Tax Revenue | |||
| 5.000%, 5/1/25 | 825 | 985 | |
| Par Value | Value | ||
| Connecticut—continued | |||
| 5.000%, 5/1/26 | $1,000 | $ 1,235 | |
| 4.000%, 5/1/39 | 500 | 590 | |
| 4,486 | |||
| District of Columbia—1.2% | |||
| District of Columbia, General Obligation 5.000%, 6/1/31 | 2,825 | 3,543 | |
| Florida—1.0% | |||
| Greater Orlando Aviation Authority Revenue 5.000%, 10/1/25 | 2,500 | 3,005 | |
| Georgia—0.4% | |||
| Atlanta, City of, Department of Aviation Revenue 5.000%, 1/1/28 | 1,000 | 1,133 | |
| Hawaii—0.1% | |||
| Hawaii, State of, | |||
| General Obligation (Pre-Refunded 11/1/22 @ 100) 5.000%, 11/1/29 | 60 | 65 | |
| General Obligation (Pre-Refunded 11/1/22 @ 100) 5.000%, 11/1/29 | 160 | 174 | |
| 239 | |||
| Illinois—10.5% | |||
| Chicago O’Hare International Airport Revenue, | |||
| Senior Lien 5.000%, 1/1/26 | 2,000 | 2,400 | |
| Senior Lien 5.000%, 1/1/29 | 1,595 | 2,075 | |
| Senior Lien 5.000%, 1/1/30 | 1,500 | 1,982 | |
| Senior Lien 4.000%, 1/1/35 | 1,000 | 1,185 | |
| Du Page County, 3.000%, 5/15/47 | 1,000 | 1,021 | |
| Illinois Finance Authority Revenue | |||
| 5.000%, 7/1/28 | 2,605 | 3,303 | |
| 5.000%, 1/1/31 | 3,800 | 5,301 | |
| 4.000%, 1/1/32 | 5,000 | 6,417 | |
| 4.000%, 7/1/37 | 4,000 | 4,977 | |
| Illinois State Toll Highway Authority 5.000%, 1/1/39 | 2,000 | 2,621 | |
| 31,282 | |||
| Maryland—8.1% | |||
| Anne Arundel County, General Obligation 5.000%, 10/1/30 | 2,615 | 3,270 | |
| Maryland, State of, General Obligation 5.000%, 3/15/31 | 3,500 | 4,546 | |
| Prince George’s County, | |||
| General Obligation 5.000%, 7/15/30 | 4,000 | 5,264 | |
| General Obligation 5.000%, 7/15/31 | 5,515 | 7,228 | |
| Par Value | Value | ||
| Maryland—continued | |||
| Washington Suburban Sanitary Commission Revenue (CNTY GTD Insured) 5.000%, 6/15/30 | $3,000 | $ 3,833 | |
| 24,141 | |||
| Michigan—1.6% | |||
| Michigan, State of, | |||
| General Obligation 5.000%, 5/15/31 | 2,000 | 2,757 | |
| General Obligation 5.000%, 5/15/32 | 1,500 | 2,057 | |
| 4,814 | |||
| Minnesota—3.5% | |||
| Edina Independent School District No. 273, General Obligation (SD CRED PROG Insured) 5.000%, 2/1/30 | 4,700 | 5,568 | |
| Minnesota, State of, General Obligation 5.000%, 8/1/29 | 4,000 | 4,835 | |
| 10,403 | |||
| New Jersey—1.6% | |||
| New Jersey, State of, | |||
| Sales Tax Revenue 5.000%, 6/1/29 | 1,250 | 1,619 | |
| Sales Tax Revenue 4.000%, 6/1/30 | 1,500 | 1,837 | |
| Sales Tax Revenue 4.000%, 6/1/31 | 1,000 | 1,236 | |
| 4,692 | |||
| New York—7.4% | |||
| Monroe County Industrial Development Corp. | |||
| 5.000%, 12/1/26 | 700 | 864 | |
| 5.000%, 12/1/27 | 1,200 | 1,511 | |
| 5.000%, 12/1/29 | 725 | 945 | |
| 5.000%, 12/1/30 | 500 | 659 | |
| New York, City of, General Obligation 5.000%, 8/1/26 | 1,000 | 1,247 | |
| New York City Transitional Finance Authority Future Tax Secured Revenue 5.000%, 2/1/30 | 6,400 | 6,710 | |
| New York City Transitional Finance Authority Future Tax Secured, Sales Tax Revenue 5.000%, 2/1/28 | 4,000 | 4,556 | |
| New York City Water & Sewer System Revenue 5.000%, 6/15/29 | 2,050 | 2,671 | |
| New York State Dormitory Authority, Sales Tax Revenue 5.000%, 3/15/28 | 2,500 | 2,850 | |
| 22,013 | |||
| North Carolina—0.9% | |||
| County of Mecklenburg, General Obligation 5.000%, 3/1/28 | 2,000 | 2,640 | |
| North Dakota—1.2% | |||
| North Dakota Public Finance Authority Revenue 5.000%, 10/1/28 | 3,000 | 3,514 | |
| Par Value | Value | ||
| Ohio—3.2% | |||
| Ohio, State of, General Obligation 5.000%, 6/15/32 | $7,735 | $ 9,486 | |
| Oklahoma—0.9% | |||
| Oklahoma Water Resources Board | |||
| 5.000%, 4/1/28 | 850 | 1,120 | |
| 5.000%, 4/1/30 | 600 | 828 | |
| 4.000%, 4/1/33 | 525 | 660 | |
| 2,608 | |||
| Oregon—1.1% | |||
| Hillsboro School District No. 1J, General Obligation (SCH BD GTY Insured) 5.000%, 6/15/31 | 1,000 | 1,265 | |
| Portland, Port of, Airport Revenue | |||
| 5.000%, 7/1/26 | 750 | 916 | |
| 5.000%, 7/1/30 | 1,000 | 1,209 | |
| 3,390 | |||
| South Carolina—0.9% | |||
| South Carolina Public Service Authority | |||
| 5.000%, 12/1/31 | 1,000 | 1,360 | |
| 5.000%, 12/1/32 | 1,000 | 1,351 | |
| 2,711 | |||
| Tennessee—1.9% | |||
| Tennessee, State of, | |||
| General Obligation 5.000%, 8/1/28 | 1,595 | 1,935 | |
| General Obligation 5.000%, 9/1/30 | 3,005 | 3,872 | |
| 5,807 | |||
| Texas—14.3% | |||
| Austin, City of, General Obligation 5.000%, 9/1/28 | 1,150 | 1,529 | |
| Brazosport Independent School District | |||
| General Obligation (PSF-GTD Insured) 5.000%, 2/15/27 | 1,400 | 1,786 | |
| General Obligation (PSF-GTD Insured) 5.000%, 2/15/28 | 1,080 | 1,416 | |
| Central Texas Regional Mobility Authority | |||
| Revenue 5.000%, 1/1/25 | 950 | 1,092 | |
| Senior Lien 5.000%, 1/1/29 | 500 | 650 | |
| Senior Lien 5.000%, 1/1/30 | 1,300 | 1,728 | |
| Senior Lien 5.000%, 1/1/32 | 1,200 | 1,572 | |
| Senior Lien 5.000%, 1/1/35 | 500 | 646 | |
| Senior Lien 4.000%, 1/1/36 | 500 | 595 | |
| Senior Lien 4.000%, 1/1/37 | 1,250 | 1,479 | |
| Comal Independent School District | |||
| General Obligation (PSF-GTD Insured) 5.000%, 2/1/26 | 1,000 | 1,238 | |
| Par Value | Value | ||
| Texas—continued | |||
| General Obligation (PSF-GTD Insured) 5.000%, 2/1/29 | $1,250 | $ 1,680 | |
| Cypress-Fairbanks Independent School District | |||
| General Obligation (PSF-GTD Insured) 5.000%, 2/15/27 | 1,500 | 1,915 | |
| General Obligation (PSF-GTD Insured) 5.000%, 2/15/28 | 1,500 | 1,967 | |
| Dallas, City of, Fort Worth International Airport Revenue, | |||
| 5.000%, 11/1/26 | 1,000 | 1,252 | |
| 4.000%, 11/1/45 | 1,000 | 1,180 | |
| Dallas, City of, Waterworks & Sewer System Revenue 5.000%, 10/1/31 | 6,845 | 8,449 | |
| Fort Worth, City of, General Obligation 5.000%, 3/1/26 | 1,510 | 1,871 | |
| North Texas Municipal Water District Upper East Fork Wastewater Interceptor System Revenue 4.500%, 6/1/30 | 1,040 | 1,348 | |
| North Texas Municipal Water District Water System Revenue 5.000%, 9/1/31 | 500 | 651 | |
| Northwest Independent School District, General Obligation (PSF-GTD Insured) 5.000%, 2/15/27 | 2,600 | 3,113 | |
| San Antonio, City of, Electric & Gas Systems Revenue 5.000%, 2/1/26 | 1,000 | 1,237 | |
| Texas Water Development Board Revenue 5.000%, 4/15/26 | 900 | 1,121 | |
| Texas, State of, General Obligation 5.000%, 8/1/27 | 2,540 | 2,957 | |
| 42,472 | |||
| Virginia—2.9% | |||
| County of Fairfax, General Obligation (State AID Withholding Insured) 5.000%, 10/1/28 | 1,000 | 1,341 | |
| Virginia College Building Authority Revenue 5.000%, 2/1/29 | 4,750 | 5,844 | |
| Virginia Public Building Authority Revenue 5.000%, 8/1/28 | 1,000 | 1,328 | |
| 8,513 | |||
| Washington—11.0% | |||
| Energy Northwest Revenue | |||
| 5.000%, 7/1/33 | 1,570 | 1,975 | |
| 5.000%, 7/1/34 | 8,000 | 9,479 | |
| University of Washington | |||
| 5.000%, 4/1/27 | 700 | 890 | |
| 5.000%, 4/1/28 | 2,000 | 2,612 | |
| 5.000%, 4/1/29 | 1,750 | 2,339 | |
| 5.000%, 4/1/30 | 1,000 | 1,367 | |
| 5.000%, 4/1/31 | 750 | 1,017 | |
| 5.000%, 4/1/32 | 500 | 675 | |
| Washington, State of, | |||
| General Obligation 5.000%, 6/1/29 | 1,250 | 1,675 | |
| General Obligation 5.000%, 8/1/29 | 2,045 | 2,618 | |
| General Obligation 5.000%, 2/1/30 | 5,000 | 6,106 | |
| Par Value | Value | ||
| Washington—continued | |||
| General Obligation 5.000%, 6/1/33 | $ 500 | $ 672 | |
| General Obligation 5.000%, 6/1/36 | 1,000 | 1,330 | |
| 32,755 | |||
| Wisconsin—4.7% | |||
| Milwaukee, City of, General Obligation 5.000%, 4/1/28 | 3,185 | 4,123 | |
| Public Finance Authority | |||
| 5.000%, 6/1/27 | 300 | 377 | |
| 5.000%, 6/1/28 | 500 | 639 | |
| 5.000%, 6/1/29 | 700 | 911 | |
| 5.000%, 6/1/30 | 1,000 | 1,322 | |
| Wisconsin, State of, | |||
| General Obligation 5.000%, 5/1/26 | 1,000 | 1,242 | |
| General Obligation 5.000%, 5/1/27 | 2,000 | 2,560 | |
| General Obligation 5.000%, 5/1/29 | 1,000 | 1,343 | |
| General Obligation 5.000%, 5/1/30 | 1,000 | 1,373 | |
| 13,890 | |||
| Total Municipal Bonds (Identified Cost $279,936) | 291,991 | ||
| Total Long-Term Investments—98.1% (Identified Cost $279,936) | 291,991 | ||
| Shares | ||
| Short-Term Investment—15.2% | ||
| Money Market Mutual Fund—15.2% | ||
| Dreyfus Government Cash Management Fund - Institutional Shares (seven-day effective yield 0.030%)(2) | 45,112,257 | 45,112 |
| Total Short-Term Investment (Identified Cost $45,112) | 45,112 | |
| TOTAL INVESTMENTS—113.3% (Identified Cost $325,048) | $337,103 | |
| Other assets and liabilities, net—(13.3)% | (39,502) | |
| NET ASSETS—100.0% | $297,601 | |
| Abbreviations: | |
| CNTY GTD | County Guarantee Program |
| PSF-GTD | Permanent School Fund Guarantee Program |
| SCH BD GTY | School Bond Guaranty |
| SD CRED PROG | State Credit Enhancement Program |
| Footnote Legend: | |
| (1) | At December 31, 2020, 7.5% of the securities in the portfolio are backed by insurance of financial institutions and financial guaranty assurance agencies. |
| (2) | Shares of this fund are publicly offered, and its prospectus and annual report are publicly available. |
| Total Value at December 31, 2020 | Level 1 Quoted Prices | Level 2 Significant Observable Inputs | |||
| Assets: | |||||
| Debt Securities: | |||||
| Municipal Bonds | $291,991 | $ — | $291,991 | ||
| Money Market Mutual Fund | 45,112 | 45,112 | — | ||
| Total Investments | $337,103 | $45,112 | $291,991 |
December 31, 2020
| Par Value | Value | ||
| U.S. Government Securities—42.8% | |||
| U.S. Treasury Notes | |||
| 1.750%, 5/31/22 | $ 473 | $ 484 | |
| 2.000%, 10/31/22 | 718 | 743 | |
| 0.500%, 3/15/23 | 1,791 | 1,805 | |
| 0.125%, 8/15/23 | 3,266 | 3,264 | |
| 0.125%, 12/15/23 | 426 | 425 | |
| Total U.S. Government Securities (Identified Cost $6,679) | 6,721 | ||
| Mortgage-Backed Securities—14.3% | |||
| Agency—10.1% | |||
| Federal Home Loan Mortgage Corp. Multifamily Structured Pass-Through Certificates KJ27, A1 2.092%, 7/25/24 | 294 | 304 | |
| Federal Home Loan Mortgage Corp. REMIC | |||
| 4309, B 3.000%, 8/15/39 | 78 | 79 | |
| 4612, HA 2.500%, 5/15/41 | 150 | 151 | |
| Federal National Mortgage Association REMIC | |||
| 2014-74, AE 3.000%, 9/25/40 | 142 | 147 | |
| 2017-33, DA 3.500%, 7/25/43 | 186 | 192 | |
| 2018-76, NA 3.500%, 7/25/43 | 563 | 579 | |
| Government National Mortgage Association II 2013-23, VU 2.500%, 11/20/42 | 128 | 134 | |
| 1,586 | |||
| Non-Agency—4.2% | |||
| COMM Mortgage Trust | |||
| 2013-WWP, D 144A 3.898%, 3/10/31(1) | 170 | 182 | |
| 2012-CR2, A3 144A 2.841%, 8/15/45(1) | 100 | 102 | |
| 2012-CR5, A3 2.540%, 12/10/45 | 73 | 75 | |
| 2013-CR7, A4 3.213%, 3/10/46 | 111 | 116 | |
| FRESB Mortgage Trust 2016-SB17, A5H 2.160%, 5/25/36(2) | 88 | 88 | |
| Goldman Sachs Mortgage Securities Corp. II 2012-BWTR, A 144A 2.954%, 11/5/34(1) | 100 | 100 | |
| 663 | |||
| Total Mortgage-Backed Securities (Identified Cost $2,218) | 2,249 | ||
| Asset-Backed Securities—6.2% | |||
| Automobiles—3.2% | |||
| BMW Vehicle Owner Trust 2019-A, A3 1.920%, 1/25/24 | 100 | 102 | |
| Ford Credit Auto Owner Trust 2020-B, A3 0.560%, 10/15/24 | 155 | 156 | |
| Par Value | Value | ||
| Automobiles—continued | |||
| Mercedes-Benz Master Owner Trust 2019-BA, A 144A 2.610%, 5/15/24(1) | $ 100 | $ 103 | |
| Nissan Master Owner Trust Receivables 2019-B, A (1 month LIBOR + 0.430%) 0.589%, 11/15/23(2) | 140 | 140 | |
| 501 | |||
| Credit Card—3.0% | |||
| Barclays Dryrock Issuance Trust 2019-1, A 1.960%, 5/15/25 | 145 | 149 | |
| Citibank Credit Card Issuance Trust 2018-A4, A4 (1 month LIBOR + 0.340%) 0.493%, 6/7/25(2) | 205 | 205 | |
| Discover Card Execution Note Trust 2019-A3, A 1.890%, 10/15/24 | 65 | 67 | |
| World Financial Network Credit Card Master Trust 2016-A, M 2.330%, 4/15/25 | 50 | 50 | |
| 471 | |||
| Total Asset-Backed Securities (Identified Cost $960) | 972 | ||
| Corporate Bonds and Notes—35.8% | |||
| Consumer Discretionary—2.8% | |||
| Daimler Finance North America LLC 144A 3.000%, 2/22/21(1) | 200 | 201 | |
| Ford Motor Co. 8.500%, 4/21/23 | 145 | 164 | |
| Ralph Lauren Corp. 1.700%, 6/15/22 | 81 | 82 | |
| 447 | |||
| Consumer Staples—1.1% | |||
| Estee Lauder Cos., Inc. (The) 1.700%, 5/10/21 | 178 | 179 | |
| Energy—5.0% | |||
| EOG Resources, Inc. 2.625%, 3/15/23 | 155 | 162 | |
| Exxon Mobil Corp. 1.571%, 4/15/23 | 282 | 290 | |
| HollyFrontier Corp. 2.625%, 10/1/23 | 157 | 160 | |
| Marathon Petroleum Corp. 4.500%, 5/1/23 | 160 | 174 | |
| 786 | |||
| Financials—12.2% | |||
| Barclays plc 1.007%, 12/10/24 | 200 | 201 | |
| BP Capital Markets America, Inc. 2.937%, 4/6/23 | 107 | 113 | |
| Credit Suisse AG 2.800%, 4/8/22 | 250 | 258 | |
| General Motors Financial Co., Inc. 1.700%, 8/18/23 | 164 | 168 | |
| PACCAR Financial Corp. 2.800%, 3/1/21 | 86 | 86 | |
| Par Value | Value | ||
| Financials—continued | |||
| Royal Bank of Canada 1.600%, 4/17/23 | $ 129 | $ 133 | |
| State Street Corp. 2.825%, 3/30/23 | 187 | 193 | |
| Swedbank AB 144A 0.600%, 9/25/23(1) | 202 | 202 | |
| Truist Bank 2.800%, 5/17/22 | 77 | 80 | |
| UBS AG 144A 1.750%, 4/21/22(1) | 206 | 210 | |
| USAA Capital Corp. 144A 1.500%, 5/1/23(1) | 270 | 277 | |
| 1,921 | |||
| Health Care—2.1% | |||
| AbbVie, Inc. 2.300%, 11/21/22 | 216 | 224 | |
| Bristol-Myers Squibb Co. 2.600%, 5/16/22 | 104 | 107 | |
| 331 | |||
| Industrials—8.9% | |||
| Boeing Co. (The) 4.508%, 5/1/23 | 378 | 408 | |
| Carrier Global Corp. 1.923%, 2/15/23 | 200 | 206 | |
| Eaton Corp. 2.750%, 11/2/22 | 160 | 167 | |
| General Electric Co. 2.700%, 10/9/22 | 156 | 163 | |
| Honeywell International, Inc. 0.483%, 8/19/22 | 280 | 280 | |
| Park Aerospace Holdings Ltd. 144A 4.500%, 3/15/23(1) | 162 | 170 | |
| 1,394 | |||
| Information Technology—0.9% | |||
| Intuit, Inc. 0.650%, 7/15/23 | 132 | 133 | |
| Materials—0.9% | |||
| Newmont Corp. 3.700%, 3/15/23 | 140 | 148 | |
| Utilities—1.9% | |||
| Pacific Gas and Electric Co. 1.750%, 6/16/22 | 123 | 123 | |
| Par Value | Value | ||
| Utilities—continued | |||
| Southern Co. (The) 2.950%, 7/1/23 | $ 159 | $ 169 | |
| 292 | |||
| Total Corporate Bonds and Notes (Identified Cost $5,478) | 5,631 | ||
| Total Long-Term Investments—99.1% (Identified Cost $15,335) | 15,573 | ||
| TOTAL INVESTMENTS—99.1% (Identified Cost $15,335) | $15,573 | ||
| Other assets and liabilities, net—0.9% | 141 | ||
| NET ASSETS—100.0% | $15,714 | ||
| Abbreviations: | |
| LIBOR | London Interbank Offered Rate |
| LLC | Limited Liability Company |
| REMIC | Real Estate Mortgage Investment Conduit |
| Footnote Legend: | |
| (1) | Security exempt from registration under Rule 144A of the Securities Act of 1933. These securities may be resold in transactions exempt from registration, normally to qualified institutional buyers. At December 31, 2020, these securities amounted to a value of $1,547 or 9.8% of net assets. |
| (2) | Variable rate security. Rate disclosed is as of December 31, 2020. For leveraged loans, the rate shown may represent a weighted average interest rate. Information in parenthesis represents benchmark and reference rate for each security. Certain variable rate securities are not based on a published reference rate and spread but are determined by the issuer or agent and are based on current market conditions, or, for mortgage-backed securities, are impacted by the individual mortgages which are paying off over time. These securities do not indicate a reference rate and spread in their descriptions. |
| Country Weightings (Unaudited)† | |
| United States | 93% |
| Switzerland | 3 |
| Sweden | 1 |
| United Kingdom | 1 |
| Cayman Islands | 1 |
| Canada | 1 |
| Total | 100% |
| † % of total investments as of December 31, 2020. | |
| Total Value at December 31, 2020 | Level 2 Significant Observable Inputs | ||
| Assets: | |||
| Debt Securities: | |||
| Asset-Backed Securities | $ 972 | $ 972 | |
| Corporate Bonds and Notes | 5,631 | 5,631 | |
| Mortgage-Backed Securities | 2,249 | 2,249 | |
| U.S. Government Securities | 6,721 | 6,721 | |
| Total Investments | $15,573 | $15,573 |
December 31, 2020
| Par Value | Value | ||
| Municipal Bonds(1)—88.0% | |||
| Arizona—4.4% | |||
| Salt River Project Agricultural Improvement & Power District Revenue 5.000%, 1/1/26 | $500 | $ 598 | |
| California—5.1% | |||
| California County Tobacco Securitization Agency Revenue 5.000%, 6/1/26 | 100 | 124 | |
| Southern California Public Power Authority Revenue 5.000%, 4/1/24 | 500 | 571 | |
| 695 | |||
| Colorado—7.7% | |||
| Colorado, City of, Springs Co. Utilities System Revenue 0.080%, 11/1/41(2) | 500 | 500 | |
| E-470 Public Highway Authority 5.000%, 9/1/26 | 450 | 561 | |
| 1,061 | |||
| Connecticut—3.1% | |||
| Connecticut, State of, Special Tax Revenue 5.000%, 5/1/22 | 400 | 425 | |
| Florida—4.4% | |||
| Greater Orlando Aviation Authority Revenue 5.000%, 10/1/25 | 500 | 601 | |
| Georgia—4.3% | |||
| Atlanta, City of, Department of Aviation Revenue 5.000%, 1/1/28 | 250 | 283 | |
| Forsyth County School District General Obligation 5.000%, 2/1/26 | 250 | 310 | |
| 593 | |||
| Maryland—3.6% | |||
| Maryland Health & Higher Educational Facilities Authority 0.070%, 4/1/35(2) | 500 | 500 | |
| New Jersey—4.5% | |||
| New Jersey, State of, General Obligation 5.000%, 6/1/26 | 500 | 612 | |
| New York—15.5% | |||
| Long Island Power Authority Revenue 5.000%, 9/1/26 | 650 | 817 | |
| Monroe County Industrial Development Corp. 5.000%, 12/1/26 | 300 | 370 | |
| New York City Transitional Finance Authority Future Tax Secured Revenue 5.000%, 8/1/22 | 665 | 715 | |
| New York City Water & Sewer System Revenue 5.000%, 6/15/25 | 200 | 228 | |
| 2,130 | |||
| Par Value | Value | ||
| North Carolina—5.1% | |||
| Charlotte, City of, Water & Sewer System Revenue 0.070%, 7/1/36(2) | $700 | $ 700 | |
| Oregon—4.0% | |||
| Multnomah County School District No. 1 General Obligation (SCH BD GTY Insured) 5.000%, 6/15/25 | 450 | 544 | |
| Texas—13.7% | |||
| Central Texas Regional Mobility Authority Revenue 5.000%, 1/1/25 | 300 | 345 | |
| North Texas Tollway Authority, | |||
| Toll Highway Revenue 5.000%, 1/1/25 | 625 | 681 | |
| Toll Highway Revenue 5.000%, 1/1/26 | 500 | 545 | |
| Texas Water Development Board Revenue 5.000%, 4/15/26 | 250 | 312 | |
| 1,883 | |||
| Utah—5.9% | |||
| University of Utah Revenue 5.000%, 8/1/26 | 250 | 315 | |
| Utah County, Revenue 0.110%, 5/15/51(2) | 500 | 500 | |
| 815 | |||
| Washington—6.7% | |||
| University of Washington 5.000%, 4/1/27 | 300 | 382 | |
| Washington, State of, General Obligation 5.000%, 7/1/22 | 500 | 536 | |
| 918 | |||
| Total Municipal Bonds (Identified Cost $11,818) | 12,075 | ||
| Total Long-Term Investments—88.0% (Identified Cost $11,818) | 12,075 | ||
| Shares | ||
| Short-Term Investment—13.5% | ||
| Money Market Mutual Fund—13.5% | ||
| Dreyfus Government Cash Management Fund - Institutional Shares (seven-day effective yield 0.030%)(3) | 1,854,381 | 1,854 |
| Total Short-Term Investment (Identified Cost $1,854) | 1,854 | |
| TOTAL INVESTMENTS—101.5% (Identified Cost $13,672) | $13,929 | |
| Other assets and liabilities, net—(1.5)% | (206) | |
| NET ASSETS—100.0% | $13,723 | |
| Abbreviation: | |
| SCH BD GTY | School Bond Guaranty |
| Footnote Legend: | |
| (1) | At December 31, 2020, 3.9% of the securities in the portfolio are backed by insurance of financial institutions and financial guaranty assurance agencies. |
| (2) | Variable or step coupon security; interest rate shown reflects the rate in effect at December 31, 2020. For securities based on a published reference rate and spread, the reference rate and spread are indicated in the description above. Certain variable rate securities are not based on a published reference rate and spread but are determined by the issuer or agent and are based on current market conditions. These securities do not indicate a reference rate and spread in their description above. |
| (3) | Shares of this fund are publicly offered, and its prospectus and annual report are publicly available. |
| Total Value at December 31, 2020 | Level 1 Quoted Prices | Level 2 Significant Observable Inputs | |||
| Assets: | |||||
| Debt Securities: | |||||
| Municipal Bonds | $12,075 | $ — | $12,075 | ||
| Money Market Mutual Fund | 1,854 | 1,854 | — | ||
| Total Investments | $13,929 | $1,854 | $12,075 |
December 31, 2020
| Par Value | Value | ||
| U.S. Government Securities—39.5% | |||
| U.S. Treasury Bills 0.000%, 2/25/21 | $ 67,600 | $ 67,593 | |
| U.S. Treasury Bonds 1.375%, 8/15/50 | 28,834 | 26,942 | |
| U.S. Treasury Notes | |||
| 1.250%, 3/31/21 | 8,085 | 8,106 | |
| 2.750%, 8/15/21 | 7,589 | 7,713 | |
| 1.750%, 5/31/22 | 15,975 | 16,343 | |
| 1.375%, 6/30/23 | 33,433 | 34,454 | |
| 0.500%, 3/31/25 | 4,477 | 4,518 | |
| 0.250%, 9/30/25 | 2,761 | 2,750 | |
| 0.875%, 11/15/30 | 2,184 | 2,175 | |
| Total U.S. Government Securities (Identified Cost $170,025) | 170,594 | ||
| Mortgage-Backed Securities—20.9% | |||
| Agency—17.7% | |||
| Federal Home Loan Mortgage Corp. | |||
| Pool #C04123 4.000%, 7/1/42 | 543 | 592 | |
| Pool #G60019 4.500%, 3/1/44 | 645 | 721 | |
| Pool #Q31645 4.000%, 2/1/45 | 1,426 | 1,538 | |
| Pool #Q35611 4.000%, 9/1/45 | 2,154 | 2,332 | |
| Pool #V81992 4.000%, 10/1/45 | 1,333 | 1,450 | |
| Pool #G60661 4.000%, 7/1/46 | 1,946 | 2,103 | |
| Pool #Q42921 3.500%, 9/1/46 | 1,989 | 2,149 | |
| Pool #Q51758 3.500%, 10/1/47 | 344 | 365 | |
| Pool #Q52115 3.500%, 11/1/47 | 158 | 168 | |
| Pool #ZM5226 3.500%, 12/1/47 | 1,812 | 1,963 | |
| Pool #Q53881 4.500%, 1/1/48 | 2,238 | 2,468 | |
| Pool #Q61680 4.000%, 2/1/49 | 1,823 | 1,960 | |
| Pool #QA3079 3.500%, 10/1/49 | 935 | 1,018 | |
| Pool #QA4766 3.500%, 11/1/49 | 1,752 | 1,900 | |
| Pool #SD0164 3.500%, 12/1/49 | 3,718 | 4,026 | |
| Pool #SD0176 3.500%, 12/1/49 | 1,518 | 1,603 | |
| Pool #QA6331 3.500%, 1/1/50 | 382 | 406 | |
| Pool #QA7571 3.000%, 2/1/50 | 2,203 | 2,308 | |
| Pool #QA8967 3.000%, 4/1/50 | 2,653 | 2,781 | |
| Federal National Mortgage Association | |||
| Pool #FM1039 3.500%, 4/1/39 | 1,720 | 1,831 | |
| Pool #BO8589 3.000%, 3/1/40 | 318 | 335 | |
| Par Value | Value | ||
| Agency—continued | |||
| Pool #AL7497 3.500%, 9/1/40 | $ 816 | $ 881 | |
| Pool #AW8154 3.500%, 1/1/42 | 746 | 811 | |
| Pool #BK0396 3.000%, 11/1/44 | 524 | 553 | |
| Pool #BE5050 4.000%, 9/1/45 | 2,378 | 2,620 | |
| Pool #AZ9213 4.000%, 10/1/45 | 588 | 643 | |
| Pool #AS6515 4.000%, 1/1/46 | 611 | 662 | |
| Pool #BE7213 4.000%, 4/1/47 | 14 | 15 | |
| Pool #BE3774 4.000%, 7/1/47 | 874 | 942 | |
| Pool #BH2594 3.500%, 8/1/47 | 1,095 | 1,164 | |
| Pool #BH4101 3.500%, 10/1/47 | 1,282 | 1,358 | |
| Pool #BH7058 3.500%, 12/1/47 | 1,653 | 1,751 | |
| Pool #BH9215 3.500%, 1/1/48 | 2,136 | 2,262 | |
| Pool #MA3238 3.500%, 1/1/48 | 819 | 868 | |
| Pool #BJ0650 3.500%, 3/1/48 | 232 | 245 | |
| Pool #MA3305 3.500%, 3/1/48 | 856 | 907 | |
| Pool #BN8510 3.500%, 5/1/49 | 633 | 669 | |
| Pool #BO1345 3.500%, 8/1/49 | 2,802 | 2,982 | |
| Pool #BO1351 4.000%, 8/1/49 | 1,242 | 1,337 | |
| Pool #BO2843 3.500%, 10/1/49 | 854 | 907 | |
| Pool #BO3024 3.500%, 10/1/49 | 1,781 | 1,929 | |
| Pool #BO5325 3.000%, 11/1/49 | 576 | 605 | |
| Pool #BO4386 3.500%, 11/1/49 | 3,990 | 4,227 | |
| Pool #BO8894 3.000%, 12/1/49 | 421 | 447 | |
| Pool #BP5431 3.000%, 6/1/50 | 941 | 1,000 | |
| Pool #BP5432 3.000%, 6/1/50 | 1,229 | 1,308 | |
| Pool #BQ1405 3.000%, 8/1/50 | 2,129 | 2,235 | |
| Government National Mortgage Association I Pool #BQ1140 3.000%, 11/15/49 | 2,335 | 2,433 | |
| Government National Mortgage Association II | |||
| Pool #MA4262 3.500%, 2/20/47 | 395 | 425 | |
| Pool #MA4586 3.500%, 7/20/47 | 1,057 | 1,135 | |
| Pool #MA5596 4.500%, 11/20/48 | 743 | 804 | |
| Par Value | Value | ||
| Agency—continued | |||
| Pool #MA6656 3.000%, 5/20/50 | $ 4,160 | $ 4,352 | |
| 76,494 | |||
| Non-Agency—3.2% | |||
| BB-UBS Trust | |||
| 2012-SHOW, A 144A 3.430%, 11/5/36(1) | 200 | 208 | |
| 2012-SHOW, B 144A 3.882%, 11/5/36(1) | 1,465 | 1,464 | |
| Century Plaza Towers 2019-CPT, B 144A 2.997%, 11/13/39(1)(2) | 1,600 | 1,730 | |
| CF Hippolyta LLC 2020-1, A1 144A 1.690%, 7/15/60(1) | 983 | 1,001 | |
| Goldman Sachs Mortgage Securities Corp. II | |||
| 2005-ROCK, A 144A 5.366%, 5/3/32(1) | 1,445 | 1,666 | |
| 2012-BWTR, A 144A 2.954%, 11/5/34(1) | 575 | 574 | |
| Goldman Sachs Mortgage Securities Corp. Trust 2018-HULA, A (1 month LIBOR + 0.920%) 144A 1.079%, 7/15/25(1)(2) | 526 | 515 | |
| MAD Mortgage Trust 2017-330M, A 144A 3.188%, 8/15/34(1)(2) | 635 | 659 | |
| Morgan Stanley Capital I Trust 2014-150E, A 144A 3.912%, 9/9/32(1) | 1,175 | 1,265 | |
| SBA Tower Trust 144A 1.884%, 1/15/26(1) | 1,045 | 1,076 | |
| Wells Fargo Commercial Mortgage Trust 2013-BTC, A 144A 3.544%, 4/16/35(1) | 1,320 | 1,331 | |
| WFRBS Commercial Mortgage Trust 2012-C10, AS 3.241%, 12/15/45 | 2,410 | 2,392 | |
| 13,881 | |||
| Total Mortgage-Backed Securities (Identified Cost $87,489) | 90,375 | ||
| Asset-Backed Securities—4.2% | |||
| Automobiles—1.2% | |||
| Ford Credit Auto Owner Trust 2020-1, A 144A 2.040%, 8/15/31(1) | 2,870 | 3,026 | |
| Mercedes-Benz Master Owner Trust 2019-BA, A 144A 2.610%, 5/15/24(1) | 635 | 656 | |
| Nissan Master Owner Trust Receivables 2019-A, A (1 month LIBOR + 0.560%) 0.719%, 2/15/24(2) | 1,395 | 1,402 | |
| 5,084 | |||
| Credit Card—1.8% | |||
| Capital One Multi-Asset Execution Trust 2005-B3, B3 (3 month LIBOR + 0.550%) 0.787%, 5/15/28(2) | 2,584 | 2,532 | |
| Citibank Credit Card Issuance Trust 2017-A6, A6 (1 month LIBOR + 0.770%) 0.924%, 5/14/29(2) | 2,710 | 2,713 | |
| Par Value | Value | ||
| Credit Card—continued | |||
| Discover Card Execution Note Trust 2017-A5, A5 (1 month LIBOR + 0.600%) 0.759%, 12/15/26(2) | $ 2,365 | $ 2,389 | |
| 7,634 | |||
| Other—1.2% | |||
| Arby’s Funding LLC 2020-1A, A2 144A 3.237%, 7/30/50(1) | 569 | 581 | |
| Five Guys Funding LLC 2017-1A, A2 144A 4.600%, 7/25/47(1) | 982 | 1,023 | |
| Jersey Mike’s Funding 2019-1A, A2 144A 4.433%, 2/15/50(1) | 1,975 | 2,109 | |
| Vantage Data Centers LLC 2020-2A, A2 144A 1.992%, 9/15/45(1) | 1,425 | 1,434 | |
| 5,147 | |||
| Total Asset-Backed Securities (Identified Cost $17,455) | 17,865 | ||
| Corporate Bonds and Notes—33.2% | |||
| Communication Services—1.8% | |||
| AT&T, Inc. | |||
| 2.250%, 2/1/32 | 967 | 980 | |
| 3.650%, 6/1/51 | 2,119 | 2,215 | |
| 3.300%, 2/1/52 | 1,085 | 1,074 | |
| Comcast Corp. 2.650%, 2/1/30 | 1,898 | 2,073 | |
| Verizon Communications, Inc. 3.150%, 3/22/30 | 472 | 529 | |
| ViacomCBS, Inc. 4.200%, 5/19/32 | 759 | 914 | |
| 7,785 | |||
| Consumer Discretionary—1.9% | |||
| Dollar General Corp. 3.500%, 4/3/30 | 990 | 1,136 | |
| Ford Motor Co. | |||
| 8.500%, 4/21/23 | 488 | 550 | |
| 9.000%, 4/22/25 | 2,080 | 2,556 | |
| 9.625%, 4/22/30 | 712 | 1,005 | |
| Marriott International, Inc. 3.500%, 10/15/32 | 1,451 | 1,587 | |
| NIKE, Inc. 3.375%, 3/27/50 | 984 | 1,208 | |
| 8,042 | |||
| Consumer Staples—1.2% | |||
| Coca-Cola Co. (The) 1.000%, 3/15/28 | 1,989 | 1,995 | |
| Kroger Co. (The) 3.950%, 1/15/50 | 1,050 | 1,273 | |
| Mars, Inc. 144A 2.450%, 7/16/50(1) | 2,160 | 2,148 | |
| 5,416 | |||
| Energy—5.3% | |||
| Boardwalk Pipelines LP 4.450%, 7/15/27 | 368 | 412 | |
| Par Value | Value | ||
| Energy—continued | |||
| EOG Resources, Inc. 4.950%, 4/15/50 | $ 1,938 | $ 2,622 | |
| Exxon Mobil Corp. 4.327%, 3/19/50 | 1,855 | 2,406 | |
| HollyFrontier Corp. 4.500%, 10/1/30 | 1,616 | 1,706 | |
| Marathon Petroleum Corp. | |||
| 4.500%, 5/1/23 | 1,377 | 1,495 | |
| 4.700%, 5/1/25 | 624 | 715 | |
| Petroleos Mexicanos 6.875%, 8/4/26 | 4,142 | 4,525 | |
| Pioneer Natural Resources Co. 1.900%, 8/15/30 | 2,941 | 2,912 | |
| Plains All American Pipeline LP 3.800%, 9/15/30 | 2,580 | 2,772 | |
| Shell International Finance B.V. 2.375%, 4/6/25 | 824 | 884 | |
| TechnipFMC plc 3.450%, 10/1/22 | 243 | 251 | |
| Woodside Finance Ltd. 144A 4.600%, 5/10/21(1) | 2,086 | 2,094 | |
| 22,794 | |||
| Financials—9.9% | |||
| AerCap Ireland Capital DAC 6.500%, 7/15/25 | 3,008 | 3,595 | |
| Athene Holding Ltd. 3.500%, 1/15/31 | 1,002 | 1,058 | |
| Avolon Holdings Funding Ltd. | |||
| 144A 5.500%, 1/15/26(1) | 1,196 | 1,355 | |
| 144A 4.250%, 4/15/26(1) | 797 | 859 | |
| Bank of America Corp. 3.366%, 1/23/26 | 568 | 625 | |
| BP Capital Markets America, Inc. 3.633%, 4/6/30 | 2,981 | 3,466 | |
| Chubb INA Holdings, Inc. 1.375%, 9/15/30 | 1,905 | 1,901 | |
| Citigroup, Inc. | |||
| 3.106%, 4/8/26 | 1,270 | 1,387 | |
| 3.980%, 3/20/30 | 1,311 | 1,541 | |
| Fidelity National Financial, Inc. 3.400%, 6/15/30 | 792 | 869 | |
| Ford Motor Credit Co. LLC 4.000%, 11/13/30 | 2,670 | 2,809 | |
| General Motors Financial Co., Inc. | |||
| 2.750%, 6/20/25 | 1,995 | 2,133 | |
| 3.600%, 6/21/30 | 2,002 | 2,234 | |
| Hartford Financial Services Group, Inc. (The) 2.800%, 8/19/29 | 869 | 944 | |
| JPMorgan Chase & Co. | |||
| 3.207%, 4/1/23 | 1,100 | 1,141 | |
| 2.301%, 10/15/25 | 1,123 | 1,192 | |
| 2.739%, 10/15/30 | 885 | 963 | |
| Lazard Group LLC 4.375%, 3/11/29 | 943 | 1,105 | |
| Morgan Stanley | |||
| 3.875%, 4/29/24 | 579 | 641 | |
| 3.971%, 7/22/38 | 944 | 1,162 | |
| Nationwide Financial Services, Inc. 144A 3.900%, 11/30/49(1) | 1,778 | 1,977 | |
| Newcrest Finance Pty Ltd. 144A 4.200%, 5/13/50(1) | 1,096 | 1,337 | |
| Par Value | Value | ||
| Financials—continued | |||
| OneMain Finance Corp. 4.000%, 9/15/30 | $ 2,551 | $ 2,647 | |
| Schlumberger Investment S.A. 2.650%, 6/26/30 | 1,846 | 1,975 | |
| Travelers Cos., Inc. (The) | |||
| 4.050%, 3/7/48 | 1,271 | 1,683 | |
| 2.550%, 4/27/50 | 955 | 1,003 | |
| Truist Bank 2.250%, 3/11/30 | 500 | 524 | |
| US Bank NA 2.050%, 1/21/25 | 712 | 753 | |
| 42,879 | |||
| Health Care—1.3% | |||
| AbbVie, Inc. 4.250%, 11/21/49 | 1,872 | 2,346 | |
| Bristol-Myers Squibb Co. 4.250%, 10/26/49 | 463 | 626 | |
| CommonSpirit Health 4.187%, 10/1/49 | 690 | 802 | |
| Danaher Corp. 2.600%, 10/1/50 | 1,725 | 1,788 | |
| 5,562 | |||
| Industrials—4.6% | |||
| 3M Co. 3.700%, 4/15/50 | 545 | 675 | |
| Baker Hughes a GE Co. LLC 4.486%, 5/1/30 | 1,724 | 2,071 | |
| Boeing Co. (The) | |||
| 3.625%, 2/1/31 | 2,265 | 2,481 | |
| 5.805%, 5/1/50 | 3,035 | 4,186 | |
| Carrier Global Corp. 3.577%, 4/5/50 | 2,034 | 2,255 | |
| General Dynamics Corp. 4.250%, 4/1/50 | 1,489 | 2,022 | |
| General Electric Co. 4.350%, 5/1/50 | 2,049 | 2,488 | |
| Honeywell International, Inc. 2.800%, 6/1/50 | 831 | 910 | |
| United Airlines Pass-Through-Trust 2020-1, A 5.875%, 10/15/27 | 1,483 | 1,602 | |
| United Parcel Service, Inc. 4.450%, 4/1/30 | 783 | 979 | |
| 19,669 | |||
| Information Technology—2.5% | |||
| Dell International LLC 144A 6.200%, 7/15/30(1) | 618 | 803 | |
| HP, Inc. | |||
| 3.000%, 6/17/27 | 884 | 975 | |
| 3.400%, 6/17/30 | 1,446 | 1,608 | |
| Intel Corp. 3.100%, 2/15/60 | 1,924 | 2,114 | |
| Intuit, Inc. 0.950%, 7/15/25 | 1,591 | 1,611 | |
| NetApp, Inc. | |||
| 1.875%, 6/22/25 | 750 | 783 | |
| Par Value | Value | ||
| Information Technology—continued | |||
| 2.700%, 6/22/30 | $ 2,834 | $ 3,043 | |
| 10,937 | |||
| Materials—2.0% | |||
| Barrick PD Australia Finance Pty Ltd. 5.950%, 10/15/39 | 1,797 | 2,584 | |
| Bemis Co., Inc. 2.630%, 6/19/30 | 544 | 589 | |
| LYB International Finance III LLC 3.625%, 4/1/51 | 764 | 833 | |
| Newmont Corp. | |||
| 2.250%, 10/1/30 | 1,254 | 1,319 | |
| 6.250%, 10/1/39 | 1,269 | 1,918 | |
| Nucor Corp. 2.000%, 6/1/25 | 629 | 666 | |
| Packaging Corporation of America 4.050%, 12/15/49 | 532 | 659 | |
| 8,568 | |||
| Utilities—2.7% | |||
| Berkshire Hathaway Energy Co. 144A 2.850%, 5/15/51(1) | 1,688 | 1,733 | |
| Boardwalk Pipelines LP 3.400%, 2/15/31 | 700 | 730 | |
| Cheniere Corpus Christi Holdings LLC 3.700%, 11/15/29 | 1,751 | 1,948 | |
| Consolidated Edison Co. of New York, Inc. 3.950%, 4/1/50 | 995 | 1,210 | |
| Dominion Energy, Inc. 3.375%, 4/1/30 | 1,245 | 1,417 | |
| Pacific Gas and Electric Co. 2.500%, 2/1/31 | 948 | 950 | |
| Southern Co. (The) 3.700%, 4/30/30 | 2,380 | 2,755 | |
| Transcontinental Gas Pipe Line Co. LLC 3.950%, 5/15/50 | 915 | 1,033 | |
| 11,776 | |||
| Total Corporate Bonds and Notes (Identified Cost $128,359) | 143,428 | ||
| Total Long-Term Investments—97.8% (Identified Cost $403,328) | 422,262 | ||
| TOTAL INVESTMENTS—97.8% (Identified Cost $403,328) | $422,262 | ||
| Other assets and liabilities, net—2.2% | 9,469 | ||
| NET ASSETS—100.0% | $431,731 | ||
| Abbreviations: | |
| LIBOR | London Interbank Offered Rate |
| LLC | Limited Liability Company |
| LP | Limited Partnership |
| Footnote Legend: | |
| (1) | Security exempt from registration under Rule 144A of the Securities Act of 1933. These securities may be resold in transactions exempt from registration, normally to qualified institutional buyers. At December 31, 2020, these securities amounted to a value of $32,624 or 7.6% of net assets. |
| (2) | Variable rate security. Rate disclosed is as of December 31, 2020. For leveraged loans, the rate shown may represent a weighted average interest rate. Information in parenthesis represents benchmark and reference rate for each security. Certain variable rate securities are not based on a published reference rate and spread but are determined by the issuer or agent and are based on current market conditions, or, for mortgage-backed securities, are impacted by the individual mortgages which are paying off over time. These securities do not indicate a reference rate and spread in their descriptions. |
| Country Weightings (Unaudited)† | |
| United States | 95% |
| Australia | 1 |
| Mexico | 1 |
| Ireland | 1 |
| Cayman Islands | 1 |
| Luxembourg | 1 |
| Total | 100% |
| † % of total investments as of December 31, 2020. | |
| Total Value at December 31, 2020 | Level 2 Significant Observable Inputs | ||
| Assets: | |||
| Debt Securities: | |||
| Asset-Backed Securities | $ 17,865 | $ 17,865 | |
| Corporate Bonds and Notes | 143,428 | 143,428 | |
| Mortgage-Backed Securities | 90,375 | 90,375 | |
| U.S. Government Securities | 170,594 | 170,594 | |
| Total Investments | $422,262 | $422,262 |
December 31, 2020
| Par Value | Value | ||
| Mortgage-Backed Securities—92.1% | |||
| Agency—92.1% | |||
| Federal Home Loan Mortgage Corp. | |||
| Pool #WV0004 (1 month LIBOR + 0.330%) 1.433%, 1/1/30(1) | $13,950 | $ 13,942 | |
| Pool #RD5035 2.500%, 9/1/30 | 10,466 | 10,964 | |
| Pool #RD5039 2.000%, 10/1/30 | 2,996 | 3,135 | |
| Pool #RD5041 2.500%, 10/1/30 | 1,507 | 1,579 | |
| Pool #RD5051 2.500%, 12/1/30 | 2,419 | 2,546 | |
| Pool #G15762 3.000%, 1/1/31 | 2,511 | 2,699 | |
| Pool #RC1375 2.500%, 7/1/31 | 1,690 | 1,766 | |
| Pool #RC1374 2.000%, 1/1/33 | 3,679 | 3,857 | |
| Pool #848744 (12 month LIBOR + 1.789%) 2.749%, 5/1/34(1) | 5,083 | 5,325 | |
| Pool #SB0260 2.500%, 2/1/35 | 1,372 | 1,430 | |
| Pool #848736 (12 month LIBOR + 1.750%) 2.742%, 5/1/35(1) | 8,158 | 8,551 | |
| Pool #QN3826 2.500%, 10/1/35 | 1,043 | 1,094 | |
| Pool #QN4515 2.500%, 12/1/35 | 5,278 | 5,506 | |
| Pool #848747 (12 month LIBOR + 1.868%) 2.992%, 7/1/36(1) | 4,610 | 4,856 | |
| Pool #1Q1195 (12 month LIBOR + 1.613%) 3.005%, 5/1/37(1) | 3,272 | 3,416 | |
| Pool #848796 (12 month LIBOR + 1.827%) 3.274%, 5/1/37(1) | 8,581 | 9,028 | |
| Pool #1Q1420 (12 month LIBOR + 1.870%) 2.990%, 9/1/39(1) | 3,275 | 3,450 | |
| Pool #2B3257 (12 month LIBOR + 1.630%) 3.152%, 10/1/44(1) | 2,771 | 2,887 | |
| Pool #1B6503 (12 month LIBOR + 1.607%) 1.937%, 1/1/51(1) | 3,148 | 3,270 | |
| Pool #1B6504 (12 month LIBOR + 1.610%) 2.270%, 1/1/51(1) | 8,425 | 8,832 | |
| Federal Home Loan Mortgage Corp. Multifamily Structured Pass-Through Certificates | |||
| KF06, A (1 month LIBOR + 0.330%) 0.483%, 11/25/21(1) | 967 | 965 | |
| KS05, A (1 month LIBOR + 0.500%) 0.653%, 1/25/23(1) | 5,641 | 5,632 | |
| KF15, A (1 month LIBOR + 0.670%) 0.823%, 2/25/23(1) | 2,151 | 2,149 | |
| KF22, A (1 month LIBOR + 0.500%) 0.653%, 7/25/23(1) | 1,522 | 1,524 | |
| KF29, A (1 month LIBOR + 0.360%) 0.513%, 2/25/24(1) | 14,148 | 14,166 | |
| KF31, A (1 month LIBOR + 0.370%) 0.523%, 4/25/24(1) | 2,295 | 2,298 | |
| KF32, A (1 month LIBOR + 0.370%) 0.523%, 5/25/24(1) | 2,590 | 2,593 | |
| KJ27, A1 2.092%, 7/25/24 | 3,582 | 3,705 | |
| KF36, A (1 month LIBOR + 0.340%) 0.493%, 8/25/24(1) | 5,920 | 5,928 | |
| Par Value | Value | ||
| Agency—continued | |||
| KF34, A (1 month LIBOR + 0.360%) 0.513%, 8/25/24(1) | $ 2,577 | $ 2,585 | |
| KF39, A (1 month LIBOR + 0.320%) 0.473%, 11/25/24(1) | 6,589 | 6,601 | |
| KL3W, AFLW (1 month LIBOR + 0.450%) 0.590%, 8/25/25(1) | 21,805 | 21,935 | |
| KF55, A (1 month LIBOR + 0.510%) 0.663%, 11/25/25(1) | 7,022 | 7,065 | |
| KF16, A (1 month LIBOR + 0.630%) 0.783%, 3/25/26(1) | 427 | 428 | |
| KF74, AS (SOFRRATE + 0.530%) 0.615%, 1/25/27(1) | 16,107 | 16,200 | |
| KF30, A (1 month LIBOR + 0.370%) 0.523%, 3/25/27(1) | 3,197 | 3,201 | |
| KF81, AS (SOFR30A + 0.400%) 0.485%, 6/25/27(1) | 9,773 | 9,803 | |
| KF33, A (1 month LIBOR + 0.400%) 0.553%, 6/25/27(1) | 2,354 | 2,356 | |
| KF86, AL (1 month LIBOR + 0.290%) 0.435%, 8/25/27(1) | 6,905 | 6,922 | |
| KSKY, ATE (1 month LIBOR + 0.360%) 0.513%, 8/25/27(1) | 11,000 | 11,048 | |
| KF93, AL (1 month LIBOR + 0.280%) 0.420%, 10/25/27(1) | 11,175 | 11,193 | |
| KL06, AFL (1 month LIBOR + 0.370%) 0.523%, 12/25/29(1) | 8,000 | 8,000 | |
| KS14, AL (1 month LIBOR + 0.340%) 0.485%, 4/25/30(1) | 8,150 | 8,178 | |
| KF79, AS (SOFR30A + 0.580%) 0.665%, 5/25/30(1) | 14,446 | 14,518 | |
| KF82, AS (SOFR30A + 0.420%) 0.505%, 6/25/30(1) | 5,750 | 5,818 | |
| KF80, AS (SOFR30A + 0.510%) 0.595%, 6/25/30(1) | 9,800 | 9,847 | |
| KF92, AL (1 month LIBOR + 0.330%) 0.475%, 10/25/30(1) | 10,655 | 10,684 | |
| Federal Home Loan Mortgage Corp. REMIC | |||
| 3990, UA 2.500%, 1/15/26 | 1,023 | 1,026 | |
| 4224, KC 3.000%, 5/15/32 | 3,509 | 3,672 | |
| 2781, FA (1 month LIBOR + 0.350%) 0.509%, 4/15/34(1) | 4,586 | 4,570 | |
| 2796, F (1 month LIBOR + 0.500%) 0.659%, 5/15/34(1) | 2,668 | 2,692 | |
| 4879, DF (1 month LIBOR + 0.400%) 0.559%, 8/15/34(1) | 6,853 | 6,911 | |
| 2980, FJ (1 month LIBOR + 0.300%) 0.459%, 11/15/34(1) | 7,063 | 7,089 | |
| 3107, FC (1 month LIBOR + 0.300%) 0.459%, 6/15/35(1) | 5,357 | 5,369 | |
| 3284, BF (1 month LIBOR + 0.300%) 0.459%, 3/15/37(1) | 3,940 | 3,963 | |
| 4664, CB 3.000%, 4/15/37 | 256 | 256 | |
| 4057, CF (1 month LIBOR + 0.450%) 0.609%, 4/15/39(1) | 1,340 | 1,342 | |
| 4323, CB 2.000%, 3/15/40 | 846 | 851 | |
| 4387, JA 3.000%, 6/15/40 | 318 | 318 | |
| 4048, GF (1 month LIBOR + 0.350%) 0.509%, 10/15/40(1) | 5,380 | 5,389 | |
| Par Value | Value | ||
| Agency—continued | |||
| 3820, FA (1 month LIBOR + 0.350%) 0.509%, 3/15/41(1) | $ 9,915 | $ 9,977 | |
| 3990, GF (1 month LIBOR + 0.400%) 0.559%, 3/15/41(1) | 4,344 | 4,356 | |
| 3954, PF (1 month LIBOR + 0.500%) 0.659%, 7/15/41(1) | 978 | 984 | |
| 4547, A 3.000%, 12/15/41 | 1,997 | 2,033 | |
| 4571, GA 3.000%, 1/15/42 | 1,507 | 1,533 | |
| 4654, LA 3.500%, 3/15/42 | 2,435 | 2,449 | |
| 4203, PF (1 month LIBOR + 0.250%) 0.409%, 9/15/42(1) | 9,631 | 9,557 | |
| 4136, EF (1 month LIBOR + 0.250%) 0.409%, 11/15/42(1) | 3,701 | 3,702 | |
| 4665, JG 3.500%, 12/15/42 | 259 | 260 | |
| 4763, DA 4.000%, 1/15/43 | 2,941 | 2,957 | |
| 4690, QA 3.500%, 5/15/44 | 1,511 | 1,539 | |
| 4753, UA 3.000%, 8/15/45 | 5,080 | 5,250 | |
| 4717, LA 3.000%, 11/15/45 | 1,938 | 2,011 | |
| Federal National Mortgage Association | |||
| 2016-M3, ASQ2 2.263%, 2/25/23 | 626 | 633 | |
| 2013-M10, AFL (1 month LIBOR + 0.300%) 0.450%, 6/25/23(1) | 3,728 | 3,728 | |
| Pool #109523 (1 month LIBOR + 0.320%) 0.473%, 9/1/23(1) | 21,760 | 21,754 | |
| Pool #AN1582 (1 month LIBOR + 0.440%) 0.593%, 9/1/23(1) | 14,144 | 14,126 | |
| 2016-M9, FA (1 month LIBOR + 0.590%) 0.734%, 9/25/23(1) | 5,428 | 5,442 | |
| Pool #BL0422 (1 month LIBOR + 0.370%) 0.523%, 11/1/23(1) | 21,000 | 20,985 | |
| 2016-M13, FA (1 month LIBOR + 0.670%) 0.821%, 11/25/23(1) | 2,068 | 2,076 | |
| Pool #AN4300 (1 month LIBOR + 0.560%) 0.713%, 1/1/24(1) | 13,714 | 13,682 | |
| Pool #AN4364 (1 month LIBOR + 0.590%) 0.743%, 1/1/24(1) | 2,888 | 2,882 | |
| 2017-M2, FA (1 month LIBOR + 0.530%) 0.681%, 2/25/24(1) | 3,324 | 3,320 | |
| 2017-M11, FA (1 month LIBOR + 0.470%) 0.621%, 9/25/24(1) | 2,291 | 2,290 | |
| 2017-M13, FA (1 month LIBOR + 0.400%) 0.551%, 10/25/24(1) | 3,074 | 3,068 | |
| 2015-M14, FA (1 month LIBOR + 0.620%) 0.768%, 10/25/25(1) | 11,405 | 11,502 | |
| 2015-M6, FA (1 month LIBOR + 0.300%) 0.495%, 1/25/26(1) | 19,644 | 19,598 | |
| Pool #BL4613 (1 month LIBOR + 0.660%) 0.813%, 9/1/26(1) | 8,700 | 8,667 | |
| Pool #BL5697 (1 month LIBOR + 0.650%) 0.803%, 2/1/30(1) | 6,300 | 6,293 | |
| Pool #MA3929 3.000%, 2/1/30 | 8,121 | 8,577 | |
| Pool #BL7250 (1 month LIBOR + 0.590%) 0.743%, 6/1/30(1) | 18,960 | 18,944 | |
| Par Value | Value | ||
| Agency—continued | |||
| Pool #BQ2292 2.000%, 8/1/30 | $24,192 | $ 25,236 | |
| Pool #CA7127 2.000%, 9/1/30 | 14,314 | 14,937 | |
| Pool #CA7533 1.500%, 10/1/30 | 2,105 | 2,173 | |
| Pool #CA7539 2.000%, 10/1/30 | 8,847 | 9,234 | |
| Pool #MA4148 2.000%, 10/1/30 | 23,235 | 24,217 | |
| Pool #MA4150 2.500%, 10/1/30 | 2,303 | 2,413 | |
| Pool #CA7879 2.000%, 11/1/30 | 13,811 | 14,443 | |
| Pool #CA7884 2.500%, 11/1/30 | 2,391 | 2,507 | |
| Pool #FM4697 2.500%, 11/1/30 | 3,829 | 4,009 | |
| Pool #MA4212 2.500%, 12/1/30 | 929 | 974 | |
| Pool #BS0168 (SOFR30A + 0.420%) 0.505%, 1/1/31(1) | 31,100 | 31,091 | |
| Pool #AD0064 (6 month LIBOR + 1.545%) 1.942%, 1/1/35(1) | 2,020 | 2,091 | |
| Pool #FM2994 3.000%, 3/1/35 | 778 | 824 | |
| Pool #CA6847 2.500%, 8/1/35 | 11,321 | 11,925 | |
| Pool #FM4709 2.500%, 10/1/35 | 12,091 | 12,723 | |
| Pool #MA2496 3.000%, 1/1/36 | 392 | 414 | |
| Pool #AL2202 (12 month LIBOR + 1.709%) 3.176%, 6/1/36(1) | 2,229 | 2,333 | |
| Pool #AL0960 (12 month LIBOR + 1.690%) 2.512%, 7/1/37(1) | 4,731 | 4,942 | |
| Pool #AL0270 (12 month LIBOR + 1.666%) 2.961%, 8/1/38(1) | 1,597 | 1,670 | |
| Pool #AL6516 (12 month LIBOR + 1.759%) 2.909%, 4/1/40(1) | 3,127 | 3,258 | |
| Pool #AE0544 (12 month LIBOR + 1.743%) 2.259%, 11/1/40(1) | 2,127 | 2,208 | |
| Pool #AL7812 (12 month LIBOR + 1.728%) 2.281%, 11/1/40(1) | 5,573 | 5,790 | |
| Pool #AL7477 (12 month LIBOR + 1.797%) 2.452%, 12/1/40(1) | 2,867 | 2,992 | |
| Pool #AL0323 (12 month LIBOR + 1.819%) 3.082%, 6/1/41(1) | 2,391 | 2,498 | |
| Pool #AL8796 (12 month LIBOR + 1.823%) 2.899%, 9/1/41(1) | 7,488 | 7,827 | |
| Pool #AL1886 (12 month LIBOR + 1.748%) 3.350%, 6/1/42(1) | 706 | 733 | |
| Pool #AL8872 (12 month LIBOR + 1.801%) 2.987%, 7/1/42(1) | 11,163 | 11,664 | |
| Pool #BM4557 (12 month LIBOR + 1.759%) 2.827%, 5/1/45(1) | 3,381 | 3,521 | |
| Pool #BO7214 (U.S. Treasury Yield Curve CMT 1 year + 1.525%) 2.426%, 7/1/47(1) | 5,798 | 6,069 | |
| Pool #BO6296 (U.S. Treasury Yield Curve CMT 1 year + 1.525%) 3.005%, 7/1/47(1) | 1,400 | 1,462 | |
| Par Value | Value | ||
| Agency—continued | |||
| Pool #BM1805 (12 month LIBOR + 1.603%) 2.835%, 9/1/47(1) | $13,647 | $ 14,223 | |
| Pool #CA4499 (12 month LIBOR + 1.600%) 2.775%, 9/1/48(1) | 3,960 | 4,134 | |
| Pool #BM4556 (12 month LIBOR + 1.598%) 3.282%, 10/1/48(1) | 6,899 | 7,178 | |
| Pool #BO7215 (U.S. Treasury Yield Curve CMT 1 year + 1.650%) 3.036%, 4/1/49(1) | 1,551 | 1,617 | |
| Pool #BO7216 (U.S. Treasury Yield Curve CMT 1 year + 1.650%) 2.809%, 5/1/49(1) | 845 | 867 | |
| Pool #BP5563 (12 month LIBOR + 1.600%) 2.575%, 4/1/50(1) | 5,302 | 5,569 | |
| Federal National Mortgage Association REMIC | |||
| 2011-62, LF (1 month LIBOR + 0.400%) 0.548%, 1/25/32(1) | 8,228 | 8,274 | |
| 2013-62, FQ (1 month LIBOR + 0.250%) 0.398%, 9/25/32(1) | 5,165 | 5,195 | |
| 2013-51, GB 1.500%, 10/25/32 | 1,647 | 1,680 | |
| 2018-92, AF (1 month LIBOR + 0.400%) 0.548%, 5/25/33(1) | 8,268 | 8,319 | |
| 2005-17, FA (1 month LIBOR + 0.300%) 0.448%, 3/25/35(1) | 6,496 | 6,501 | |
| 2005-74, NA (1 month LIBOR + 0.420%) 0.568%, 5/25/35(1) | 11,342 | 11,398 | |
| 2005-58, KF (1 month LIBOR + 0.500%) 0.648%, 7/25/35(1) | 4,025 | 4,066 | |
| 2018-96, FC (1 month LIBOR + 0.450%) 0.598%, 10/25/35(1) | 8,851 | 8,905 | |
| 2006-31, FP (1 month LIBOR + 0.300%) 0.448%, 5/25/36(1) | 4,128 | 4,131 | |
| 2006-63, FD (1 month LIBOR + 0.450%) 0.598%, 7/25/36(1) | 4,904 | 4,942 | |
| 2006-113, NF (1 month LIBOR + 0.350%) 0.498%, 9/25/36(1) | 3,935 | 3,946 | |
| 2017-22, BA 3.500%, 10/25/37 | 2,899 | 2,925 | |
| 2007-106, FN (1 month LIBOR + 0.590%) 0.738%, 11/25/37(1) | 4,850 | 4,940 | |
| 2011-104, FE (1 month LIBOR + 0.350%) 0.498%, 3/25/39(1) | 1,875 | 1,877 | |
| 2011-117, PF (1 month LIBOR + 0.350%) 0.498%, 7/25/39(1) | 1,790 | 1,791 | |
| 2011-144, PF (1 month LIBOR + 0.450%) 0.598%, 10/25/39(1) | 840 | 841 | |
| 2011-84, F (1 month LIBOR + 0.350%) 0.498%, 1/25/40(1) | 562 | 562 | |
| 2010-59, FC (1 month LIBOR + 1.000%) 1.148%, 1/25/40(1) | 4,196 | 4,284 | |
| 2011-101, FN (1 month LIBOR + 0.550%) 0.698%, 4/25/40(1) | 260 | 260 | |
| 2012-17, GF (1 month LIBOR + 0.450%) 0.598%, 7/25/40(1) | 1,428 | 1,431 | |
| 2010-137, WB 2.660%, 7/25/40(1) | 1,758 | 1,822 | |
| 2012-112, AP 2.000%, 9/25/40 | 7,431 | 7,506 | |
| 2012-71, FP (1 month LIBOR + 0.350%) 0.498%, 3/25/41(1) | 3,715 | 3,719 | |
| 2012-17, EF (1 month LIBOR + 0.450%) 0.598%, 3/25/41(1) | 2,254 | 2,264 | |
| Par Value | Value | ||
| Agency—continued | |||
| 2012-38, PF (1 month LIBOR + 0.400%) 0.548%, 9/25/41(1) | $ 1,288 | $ 1,295 | |
| 2016-2, LA 3.000%, 12/25/41 | 728 | 740 | |
| 2016-21, BA 3.000%, 3/25/42 | 6,084 | 6,195 | |
| 2012-133, FC (1 month LIBOR + 0.300%) 0.448%, 6/25/42(1) | 2,368 | 2,359 | |
| 2012-99, LA 3.500%, 6/25/42 | 836 | 849 | |
| 2013-34, PF (1 month LIBOR + 0.350%) 0.498%, 8/25/42(1) | 6,675 | 6,633 | |
| 2017-18, CA 3.000%, 1/25/43 | 745 | 759 | |
| 2013-58, FY (1 month LIBOR + 0.250%) 0.398%, 2/25/43(1) | 3,968 | 3,966 | |
| 2016-36, FB (1 month LIBOR + 0.500%) 0.648%, 3/25/43(1) | 1,206 | 1,211 | |
| 2017-33, DA 3.500%, 7/25/43 | 3,628 | 3,737 | |
| 2017-104, PA 3.000%, 2/25/46 | 11,364 | 11,769 | |
| 2019-37, GB 2.500%, 3/25/47 | 3,456 | 3,577 | |
| 2019-13, FG (1 month LIBOR + 0.400%) 0.548%, 4/25/49(1) | 13,909 | 14,057 | |
| FRESB Mortgage Trust | |||
| 2015-SB6, A5 (1 month LIBOR + 0.700%) 0.853%, 9/25/35(1) | 4,273 | 4,273 | |
| 2016-SB13, A5H 2.060%, 1/25/36(1) | 16,220 | 16,209 | |
| 2016-SB18, A5H 2.110%, 5/25/36(1) | 3,793 | 3,793 | |
| 2016-SB16, A5H 2.130%, 5/25/36(1) | 8,491 | 8,497 | |
| 2016-SB23, A5H 1.980%, 9/25/36(1) | 1,398 | 1,403 | |
| 2016-SB22, A7H 2.190%, 9/25/36(1) | 763 | 785 | |
| 2016-SB23, A7H 2.200%, 9/25/36(1) | 9,172 | 9,428 | |
| 2018-SB50, A5H 3.000%, 4/25/38(1) | 988 | 1,018 | |
| 2015-SB3, A5 (1 month LIBOR + 0.700%) 0.853%, 8/25/42(1) | 307 | 307 | |
| 2016-SB19, A5H 2.180%, 1/25/46(1) | 1,718 | 1,718 | |
| Government National Mortgage Association | |||
| 2003-57, FA (1 month LIBOR + 0.450%) 0.603%, 7/16/33(1) | 3,683 | 3,699 | |
| 2003-67, FP (1 month LIBOR + 0.900%) 1.052%, 8/20/33(1) | 3,265 | 3,304 | |
| 2004-38, FA (1 month LIBOR + 0.400%) 0.553%, 5/16/34(1) | 4,875 | 4,883 | |
| 2013-117, FH (1 month LIBOR + 0.350%) 0.502%, 6/20/39(1) | 986 | 986 | |
| 2014-4, KL 2.500%, 7/20/39 | 2,063 | 2,089 | |
| 2013-124, F (1 month LIBOR + 0.400%) 0.552%, 8/20/39(1) | 6,689 | 6,697 | |
| 2009-88, FA (1 month LIBOR + 0.750%) 0.903%, 10/16/39(1) | 6,628 | 6,723 | |
| Par Value | Value | ||
| Agency—continued | |||
| 2011-28, FG (1 month LIBOR + 0.500%) 0.652%, 12/20/40(1) | $10,206 | $ 10,244 | |
| 2012-36, LF (1 month LIBOR + 0.330%) 0.482%, 3/20/42(1) | 1,664 | 1,668 | |
| 2017-95, PG 2.500%, 12/20/45 | 1,392 | 1,430 | |
| 2019-38, BA 2.500%, 8/20/48 | 13,722 | 13,999 | |
| 2016-H22, FJ (1 month LIBOR + 0.390%) 0.530%, 10/20/66(1) | 511 | 511 | |
| 2017-H24, FJ (1 month LIBOR + 0.250%) 0.390%, 10/20/67(1) | 48 | 48 | |
| Government National Mortgage Association I | |||
| Pool #AC3667 1.660%, 8/15/26 | 1,144 | 1,177 | |
| Pool #778668 3.000%, 12/15/26 | 119 | 125 | |
| Pool #778776 3.000%, 1/15/27 | 152 | 159 | |
| Pool #AA8329 2.000%, 2/15/28 | 616 | 640 | |
| Pool #AF1057 2.000%, 7/15/28 | 199 | 208 | |
| Government National Mortgage Association II | |||
| Pool #4954 3.000%, 2/20/26 | 209 | 220 | |
| Pool #MA0299 2.500%, 8/20/27 | 677 | 701 | |
| Pool #MA0908 2.500%, 4/20/28 | 256 | 267 | |
| Pool #MA1132 2.000%, 7/20/28 | 9,631 | 9,981 | |
| Pool #MA6968 2.500%, 11/20/35 | 488 | 514 | |
| Small Business Administration | |||
| Pool #510076 (PRIME minus 2.650%) 0.600%, 5/25/27(1) | 3,481 | 3,464 | |
| Pool #510083 (PRIME minus 2.650%) 0.600%, 9/25/27(1) | 1,157 | 1,150 | |
| Pool #510241 (PRIME minus 2.600%) 0.650%, 10/25/27(1) | 3,694 | 3,680 | |
| Pool #510254 (PRIME minus 2.600%) 0.650%, 5/25/28(1) | 7,234 | 7,202 | |
| Pool #510228 (PRIME minus 2.500%) 0.750%, 7/25/28(1) | 1,032 | 1,029 | |
| Pool #510219 (PRIME minus 2.650%) 0.600%, 11/25/28(1) | 3,613 | 3,590 | |
| Pool #510273 (PRIME minus 2.500%) 0.750%, 11/25/28(1) | 6,755 | 6,735 | |
| Pool #510256 (PRIME minus 2.600%) 0.650%, 12/25/28(1) | 7,412 | 7,382 | |
| Pool #510032 (PRIME minus 2.650%) 0.600%, 6/25/34(1) | 3,176 | 3,152 | |
| 1,114,678 | |||
| Total Mortgage-Backed Securities (Identified Cost $1,106,924) | 1,114,678 | ||
| Par Value | Value | ||
| Asset-Backed Securities—1.0% | |||
| Other—1.0% | |||
| .KLINGBEIL SARM 0.461%, 10/1/28(2) | $ 7,750 | $ 7,753 | |
| .SQUIRE VILL SARM 0.487%, 1/1/30(2) | 4,545 | 4,546 | |
| 12,299 | |||
| Total Asset-Backed Securities (Identified Cost $12,299) | 12,299 | ||
| Total Long-Term Investments—93.1% (Identified Cost $1,119,223) | 1,126,977 | ||
| Shares | ||
| Short-Term Investment—8.7% | ||
| Money Market Mutual Fund—8.7% | ||
| Dreyfus Government Cash Management Fund - Institutional Shares (seven-day effective yield 0.030%)(3) | 105,604,403 | 105,604 |
| Total Short-Term Investment (Identified Cost $105,604) | 105,604 | |
| TOTAL INVESTMENTS—101.8% (Identified Cost $1,224,827) | $1,232,581 | |
| Other assets and liabilities, net—(1.8)% | (21,929) | |
| NET ASSETS—100.0% | $1,210,652 | |
| Abbreviations: | |
| CMT | Constant Maturity Treasury |
| LIBOR | London Interbank Offered Rate |
| REMIC | Real Estate Mortgage Investment Conduit |
| SOFR30A | Secured Overnight Financing Rate 30 Day Average |
| SOFRRATE | Secured Overnight Financing Rate |
| Footnote Legend: | |
| (1) | Variable rate security. Rate disclosed is as of December 31, 2020. For leveraged loans, the rate shown may represent a weighted average interest rate. Information in parenthesis represents benchmark and reference rate for each security. Certain variable rate securities are not based on a published reference rate and spread but are determined by the issuer or agent and are based on current market conditions, or, for mortgage-backed securities, are impacted by the individual mortgages which are paying off over time. These securities do not indicate a reference rate and spread in their descriptions. |
| (2) | The value of this security was determined using significant unobservable inputs and is reported as a Level 3 security in the Fair Value Hierarchy table located after the Schedule of Investments. |
| (3) | Shares of this fund are publicly offered, and its prospectus and annual report are publicly available. |
| Total Value at December 31, 2020 | Level 1 Quoted Prices | Level 2 Significant Observable Inputs | Level 3 Significant Unobservable Inputs | ||||
| Assets: | |||||||
| Debt Securities: | |||||||
| Asset-Backed Securities | $ 12,299 | $ — | $ — | $12,299 | |||
| Mortgage-Backed Securities | 1,114,678 | — | 1,114,678 | — | |||
| Money Market Mutual Fund | 105,604 | 105,604 | — | — | |||
| Total Investments | $1,232,581 | $105,604 | $1,114,678 | $12,299 |
| Total | Asset- Backed Securities | ||
| Investments in Securities | |||
| Balance as of December 31, 2019: | $ — | $ — | |
| Purchases | 12,299 | 12,299 | |
| Balance as of December 31, 2020 | $12,299 | $12,299 |
December 31, 2020
| Par Value | Value | ||
| U.S. Government Security—0.4% | |||
| U.S. Treasury Notes 0.875%, 11/15/30 | $ 75 | $ 75 | |
| Total U.S. Government Security (Identified Cost $74) | 75 | ||
| Mortgage-Backed Securities—89.6% | |||
| Agency—89.6% | |||
| Federal Home Loan Mortgage Corp. | |||
| Pool #C91887 3.000%, 9/1/36 | 329 | 348 | |
| Pool #C91912 3.000%, 2/1/37 | 297 | 313 | |
| Pool #C04123 4.000%, 7/1/42 | 136 | 148 | |
| Pool #Q10929 3.500%, 9/1/42 | 185 | 200 | |
| Pool #Q26366 4.000%, 5/1/44 | 99 | 109 | |
| Pool #V81283 4.000%, 7/1/44 | 206 | 226 | |
| Pool #G60183 4.000%, 12/1/44 | 80 | 87 | |
| Pool #Q31645 4.000%, 2/1/45 | 31 | 34 | |
| Pool #V81992 4.000%, 10/1/45 | 145 | 158 | |
| Pool #Q38473 4.000%, 1/1/46 | 287 | 312 | |
| Pool #Q39440 4.000%, 3/1/46 | 246 | 267 | |
| Pool #Q40815 3.500%, 6/1/46 | 295 | 327 | |
| Pool #G60661 4.000%, 7/1/46 | 36 | 39 | |
| Pool #G61721 3.500%, 11/1/46 | 52 | 56 | |
| Pool #ZA4786 3.000%, 12/1/46 | 171 | 185 | |
| Pool #Q46110 3.500%, 2/1/47 | 193 | 209 | |
| Pool #ZM4703 3.000%, 11/1/47 | 169 | 178 | |
| Pool #Q51962 3.500%, 11/1/47 | 106 | 112 | |
| Pool #Q51951 4.000%, 11/1/47 | 49 | 52 | |
| Pool #Q53881 4.500%, 1/1/48 | 292 | 321 | |
| Pool #Q54449 3.500%, 2/1/48 | 58 | 63 | |
| Pool #ZT0509 3.000%, 8/1/48 | 161 | 173 | |
| Pool #SD0164 3.500%, 12/1/49 | 342 | 370 | |
| Pool #QA6331 3.500%, 1/1/50 | 195 | 207 | |
| Pool #QA7571 3.000%, 2/1/50 | 149 | 156 | |
| Pool #QA8967 3.000%, 4/1/50 | 159 | 167 | |
| Par Value | Value | ||
| Agency—continued | |||
| Federal National Mortgage Association | |||
| Pool #CA7539 2.000%, 10/1/30 | $ 341 | $ 356 | |
| Pool #FM4697 2.500%, 11/1/30 | 406 | 426 | |
| Pool #MA4174 2.500%, 11/1/30 | 386 | 404 | |
| Pool #MA2164 3.500%, 2/1/35 | 134 | 144 | |
| Pool #AL7497 3.500%, 9/1/40 | 653 | 705 | |
| Pool #MA0639 4.000%, 2/1/41 | 273 | 299 | |
| Pool #AL0215 4.500%, 4/1/41 | 102 | 115 | |
| Pool #890381 3.500%, 10/1/41 | 160 | 172 | |
| Pool #AW8154 3.500%, 1/1/42 | 338 | 368 | |
| Pool #AO8632 3.500%, 7/1/42 | 276 | 300 | |
| Pool #MA2190 4.000%, 2/1/45 | 454 | 500 | |
| Pool #MA2341 4.500%, 6/1/45 | 70 | 77 | |
| Pool #AY8851 4.000%, 8/1/45 | 107 | 116 | |
| Pool #BE5050 4.000%, 9/1/45 | 120 | 132 | |
| Pool #AZ9213 4.000%, 10/1/45 | 294 | 322 | |
| Pool #AS6515 4.000%, 1/1/46 | 32 | 34 | |
| Pool #AS6640 3.500%, 2/1/46 | 188 | 204 | |
| Pool #BA4799 4.000%, 2/1/46 | 258 | 283 | |
| Pool #BE7155 3.500%, 2/1/47 | 365 | 395 | |
| Pool #BE7213 4.000%, 4/1/47 | 172 | 185 | |
| Pool #BE9598 4.000%, 5/1/47 | 243 | 262 | |
| Pool #BE3695 3.500%, 6/1/47 | 74 | 79 | |
| Pool #BM3564 3.000%, 7/1/47 | 271 | 284 | |
| Pool #BH9313 3.500%, 9/1/47 | 64 | 71 | |
| Pool #MA3182 3.500%, 11/1/47 | 204 | 217 | |
| Pool #BH7058 3.500%, 12/1/47 | 242 | 257 | |
| Pool #BH9215 3.500%, 1/1/48 | 60 | 64 | |
| Pool #FM1222 3.500%, 1/1/48 | 63 | 67 | |
| Pool #BH9277 3.500%, 2/1/48 | 593 | 628 | |
| Pool #BJ0650 3.500%, 3/1/48 | 88 | 93 | |
| Pool #BO2843 3.500%, 10/1/49 | 131 | 139 | |
| Par Value | Value | ||
| Agency—continued | |||
| Pool #BO5325 3.000%, 11/1/49 | $ 144 | $ 152 | |
| Pool #BQ1405 3.000%, 8/1/50 | 323 | 339 | |
| Government National Mortgage Association I | |||
| Pool #AE8170 4.000%, 2/15/44 | 56 | 61 | |
| Pool #635099 3.000%, 7/15/46 | 60 | 67 | |
| Pool #774031 3.000%, 8/15/47 | 109 | 121 | |
| Pool #AD6354 3.000%, 1/15/48 | 84 | 93 | |
| Pool #BQ1140 3.000%, 11/15/49 | 363 | 378 | |
| Government National Mortgage Association II | |||
| Pool #MA2891 3.000%, 6/20/45 | 81 | 87 | |
| Pool #MA3173 3.500%, 10/20/45 | 90 | 98 | |
| Pool #MA3310 3.500%, 12/20/45 | 176 | 189 | |
| Pool #MA3802 3.000%, 7/20/46 | 64 | 68 | |
| Pool #MA4003 3.000%, 10/20/46 | 269 | 287 | |
| Pool #MA4261 3.000%, 2/20/47 | 61 | 65 | |
| Pool #MA4586 3.500%, 7/20/47 | 147 | 158 | |
| Pool #MA6599 3.000%, 4/20/50 | 186 | 194 | |
| Pool #MA6656 3.000%, 5/20/50 | 231 | 241 | |
| 15,113 | |||
| Total Mortgage-Backed Securities (Identified Cost $14,494) | 15,113 | ||
| Total Long-Term Investments—90.0% (Identified Cost $14,568) | 15,188 | ||
| Shares | Value | ||
| Short-Term Investment—5.4% | |||
| Money Market Mutual Fund—5.4% | |||
| Dreyfus Government Cash Management Fund - Institutional Shares (seven-day effective yield 0.030%)(1) | 914,355 | $ 914 | |
| Total Short-Term Investment (Identified Cost $914) | 914 | ||
| TOTAL INVESTMENTS—95.4% (Identified Cost $15,482) | $16,102 | ||
| Other assets and liabilities, net—4.6% | 769 | ||
| NET ASSETS—100.0% | $16,871 | ||
| Footnote Legend: | |
| (1) | Shares of this fund are publicly offered, and its prospectus and annual report are publicly available. |
| Total Value at December 31, 2020 | Level 1 Quoted Prices | Level 2 Significant Observable Inputs | |||
| Assets: | |||||
| Debt Securities: | |||||
| Mortgage-Backed Securities | $15,113 | $ — | $15,113 | ||
| U.S. Government Security | 75 | — | 75 | ||
| Money Market Mutual Fund | 914 | 914 | — | ||
| Total Investments | $16,102 | $914 | $15,188 |
December 31, 2020
| Par Value | Value | ||
| Mortgage-Backed Securities—25.2% | |||
| Agency—10.6% | |||
| Federal Home Loan Mortgage Corp. Multifamily Structured Pass-Through Certificates KL06, AFL (1 month LIBOR + 0.370%) 0.523%, 12/25/29(1) | $ 750 | $ 750 | |
| Federal National Mortgage Association | |||
| Pool #AN0777 2.750%, 11/1/21 | 460 | 464 | |
| Pool #AM2292 (1 month LIBOR + 0.350%) 0.503%, 1/1/23(1) | 289 | 288 | |
| Pool #AN4300 (1 month LIBOR + 0.560%) 0.713%, 1/1/24(1) | 466 | 465 | |
| FRESB Mortgage Trust | |||
| 2015-SB7, A5 (1 month LIBOR + 0.700%) 0.853%, 9/25/35(1) | 156 | 156 | |
| 2016-SB16, A5H 2.130%, 5/25/36(1) | 558 | 558 | |
| 2016-SB23, A7H 2.200%, 9/25/36(1) | 750 | 771 | |
| 2018-SB50, A5H 3.000%, 4/25/38(1) | 395 | 407 | |
| Small Business Administration Pool #510273 (PRIME minus 2.500%) 0.750%, 11/25/28(1) | 1,351 | 1,347 | |
| 5,206 | |||
| Non-Agency—14.6% | |||
| BBCMS Mortgage Trust 2018-TALL, A (1 month LIBOR + 0.722%) 144A 0.881%, 3/15/37(1)(2) | 1,000 | 983 | |
| BX Commercial Mortgage Trust 2018-BIOA, A (1 month LIBOR + 0.671%) 144A 0.830%, 3/15/37(1)(2) | 1,000 | 1,000 | |
| CFCRE Commercial Mortgage Trust 2011-C1, A4 144A 4.961%, 4/15/44(1)(2) | 87 | 87 | |
| Cold Storage Trust 2020-ICE5, A (1 month LIBOR + 0.900%) 144A 1.059%, 11/15/37(1)(2) | 1,000 | 1,003 | |
| Hawaii Hotel Trust 2019-MAUI, A (1 month LIBOR + 1.150%) 144A 1.309%, 5/15/38(1)(2) | 1,180 | 1,170 | |
| JPMorgan Chase Commercial Mortgage Securities Trust 2012-C6, ASB 3.144%, 5/15/45 | 325 | 330 | |
| MAD Mortgage Trust 2017-330M, A 144A 3.188%, 8/15/34(1)(2) | 1,000 | 1,037 | |
| WFRBS Commercial Mortgage Trust 2012-C8, AFL (1 month LIBOR + 1.000%) 144A 1.153%, 8/15/45(1)(2) | 1,503 | 1,505 | |
| 7,115 | |||
| Total Mortgage-Backed Securities (Identified Cost $12,310) | 12,321 | ||
| Asset-Backed Securities—17.6% | |||
| Credit Card—12.2% | |||
| American Express Credit Account Master Trust 2017-5, B (1 month LIBOR + 0.580%) 0.739%, 2/18/25(1) | 1,570 | 1,576 | |
| Par Value | Value | ||
| Credit Card—continued | |||
| Capital One Multi-Asset Execution Trust 2005-B3, B3 (3 month LIBOR + 0.550%) 0.787%, 5/15/28(1) | $1,253 | $ 1,228 | |
| Citibank Credit Card Issuance Trust 2017-A6, A6 (1 month LIBOR + 0.770%) 0.924%, 5/14/29(1) | 1,100 | 1,101 | |
| Discover Card Execution Note Trust 2017-A5, A5 (1 month LIBOR + 0.600%) 0.759%, 12/15/26(1) | 1,100 | 1,111 | |
| World Financial Network Credit Card Master Trust 2016-A, M 2.330%, 4/15/25 | 945 | 952 | |
| 5,968 | |||
| Other—2.5% | |||
| Domino’s Pizza Master Issuer LLC 2017-1A, A2I (3 month LIBOR + 1.250%) 144A 1.465%, 7/25/47(1)(2) | 1,223 | 1,224 | |
| Student Loan—2.9% | |||
| Collegiate Funding Services Education Loan Trust 2005-A, A3 (3 month LIBOR + 0.130%) 0.381%, 3/29/27(1) | 127 | 127 | |
| SLM Student Loan Trust | |||
| 2005-7, A4 (3 month LIBOR + 0.150%) 0.365%, 10/25/29(1) | 1,119 | 1,109 | |
| 2005-8, A4 (3 month LIBOR + 0.550%) 0.765%, 1/25/28(1) | 200 | 200 | |
| 1,436 | |||
| Total Asset-Backed Securities (Identified Cost $8,579) | 8,628 | ||
| Corporate Bonds and Notes—51.6% | |||
| Consumer Discretionary—3.8% | |||
| BMW US Capital LLC (3 month LIBOR + 0.500%) 144A 0.714%, 8/13/21(1)(2) | 900 | 902 | |
| Daimler Finance North America LLC (3 month LIBOR + 0.450%) 144A 0.663%, 2/22/21(1)(2) | 730 | 731 | |
| Ralph Lauren Corp. 1.700%, 6/15/22 | 228 | 232 | |
| 1,865 | |||
| Consumer Staples—0.9% | |||
| Estee Lauder Cos., Inc. (The) 1.700%, 5/10/21 | 455 | 457 | |
| Energy—5.5% | |||
| EOG Resources, Inc. 4.100%, 2/1/21 | 450 | 451 | |
| HollyFrontier Corp. 2.625%, 10/1/23 | 528 | 540 | |
| Marathon Petroleum Corp. 4.500%, 5/1/23 | 445 | 483 | |
| Phillips 66 (3 month LIBOR + 0.600%) 0.833%, 2/26/21(1) | 665 | 665 | |
| Par Value | Value | ||
| Energy—continued | |||
| Woodside Finance Ltd. 144A 4.600%, 5/10/21(2) | $ 550 | $ 552 | |
| 2,691 | |||
| Financials—22.8% | |||
| American Express Co. (3 month LIBOR + 0.525%) 0.747%, 5/17/21(1) | 890 | 891 | |
| Bank of America Corp. (3 month LIBOR + 0.650%) 0.901%, 6/25/22(1) | 635 | 637 | |
| Bank of Montreal (3 month LIBOR + 0.460%) 0.684%, 4/13/21(1) | 740 | 741 | |
| Barclays plc 1.007%, 12/10/24 | 630 | 634 | |
| BP Capital Markets America, Inc. 2.937%, 4/6/23 | 279 | 294 | |
| Citigroup, Inc. (3 month LIBOR + 1.070%) 1.296%, 12/8/21(1) | 450 | 453 | |
| Cooperatieve Rabobank UA (3 month LIBOR + 0.430%) 0.645%, 4/26/21(1) | 440 | 441 | |
| Credit Suisse AG (SOFRRATE + 0.450%) 0.536%, 2/4/22(1) | 535 | 536 | |
| General Motors Financial Co., Inc. 1.700%, 8/18/23 | 1,185 | 1,215 | |
| John Deere Capital Corp. (3 month LIBOR + 0.400%) 0.625%, 6/7/21(1) | 840 | 841 | |
| New York Life Global Funding (3 month LIBOR + 0.320%) 144A 0.552%, 8/6/21(1)(2) | 440 | 441 | |
| PNC Bank NA (3 month LIBOR + 0.430%) 0.660%, 12/9/22(1) | 750 | 752 | |
| Regions Bank 2.750%, 4/1/21 | 500 | 502 | |
| Swedbank AB 144A 0.600%, 9/25/23(2) | 462 | 463 | |
| Toyota Motor Credit Corp. (3 month LIBOR + 0.280%) 0.504%, 4/13/21(1) | 623 | 623 | |
| US Bank NA (3 month LIBOR + 0.320%) 0.535%, 4/26/21(1) | 830 | 831 | |
| Wells Fargo & Co. | |||
| 2.100%, 7/26/21 | 380 | 384 | |
| 1.654%, 6/2/24 | 457 | 470 | |
| 11,149 | |||
| Health Care—5.9% | |||
| AbbVie, Inc. (3 month LIBOR + 0.460%) 0.691%, 11/19/21(1) | 800 | 802 | |
| CVS Health Corp. 3.350%, 3/9/21 | 600 | 603 | |
| GlaxoSmithKline Capital plc (3 month LIBOR + 0.350%) 0.571%, 5/14/21(1) | 1,070 | 1,071 | |
| UnitedHealth Group, Inc. (3 month LIBOR + 0.260%) 0.477%, 6/15/21(1) | 383 | 384 | |
| 2,860 | |||
| Industrials—6.5% | |||
| Boeing Co. (The) 4.508%, 5/1/23 | 1,290 | 1,394 | |
| Carrier Global Corp. 1.923%, 2/15/23 | 240 | 247 | |
| Par Value | Value | ||
| Industrials—continued | |||
| Eaton Corp. 2.750%, 11/2/22 | $ 494 | $ 516 | |
| General Electric Co. 2.700%, 10/9/22 | 420 | 438 | |
| Park Aerospace Holdings Ltd. 144A 4.500%, 3/15/23(2) | 574 | 602 | |
| 3,197 | |||
| Information Technology—0.8% | |||
| Intuit, Inc. 0.650%, 7/15/23 | 371 | 374 | |
| Materials—1.5% | |||
| Newmont Corp. 3.500%, 3/15/22 | 685 | 704 | |
| Utilities—3.9% | |||
| Duke Energy Corp. (3 month LIBOR + 0.500%) 144A 0.721%, 5/14/21(1)(2) | 850 | 851 | |
| Pacific Gas and Electric Co. 1.750%, 6/16/22 | 542 | 544 | |
| Southern Co. (The) 2.950%, 7/1/23 | 500 | 529 | |
| 1,924 | |||
| Total Corporate Bonds and Notes (Identified Cost $25,006) | 25,221 | ||
| Total Long-Term Investments—94.4% (Identified Cost $45,895) | 46,170 | ||
| Shares | ||
| Short-Term Investment—4.8% | ||
| Money Market Mutual Fund—4.8% | ||
| Dreyfus Government Cash Management Fund - Institutional Shares (seven-day effective yield 0.030%)(3) | 2,354,357 | 2,354 |
| Total Short-Term Investment (Identified Cost $2,354) | 2,354 | |
| TOTAL INVESTMENTS—99.2% (Identified Cost $48,249) | $48,524 | |
| Other assets and liabilities, net—0.8% | 376 | |
| NET ASSETS—100.0% | $48,900 | |
| Abbreviations: | |
| LIBOR | London Interbank Offered Rate |
| LLC | Limited Liability Company |
| SOFRRATE | Secured Overnight Financing Rate |
| Footnote Legend: | |
| (1) | Variable rate security. Rate disclosed is as of December 31, 2020. For leveraged loans, the rate shown may represent a weighted average interest rate. Information in parenthesis represents benchmark and reference rate for each security. Certain variable rate securities are not based on a published reference rate and spread but are determined by the issuer or agent and are based on current market conditions, or, for mortgage-backed securities, are impacted by the individual mortgages which are paying off over time. These securities do not indicate a reference rate and spread in their descriptions. |
| (2) | Security exempt from registration under Rule 144A of the Securities Act of 1933. These securities may be resold in transactions exempt from registration, normally to qualified institutional buyers. At December 31, 2020, these securities amounted to a value of $12,551 or 25.7% of net assets. |
| (3) | Shares of this fund are publicly offered, and its prospectus and annual report are publicly available. |
| Country Weightings (Unaudited)† | |
| United States | 91% |
| United Kingdom | 3 |
| Canada | 1 |
| Cayman Islands | 1 |
| Australia | 1 |
| Switzerland | 1 |
| Sweden | 1 |
| Other | 1 |
| Total | 100% |
| † % of total investments as of December 31, 2020. | |
| Total Value at December 31, 2020 | Level 1 Quoted Prices | Level 2 Significant Observable Inputs | |||
| Assets: | |||||
| Debt Securities: | |||||
| Asset-Backed Securities | $ 8,628 | $ — | $ 8,628 | ||
| Corporate Bonds and Notes | 25,221 | — | 25,221 | ||
| Mortgage-Backed Securities | 12,321 | — | 12,321 | ||
| Money Market Mutual Fund | 2,354 | 2,354 | — | ||
| Total Investments | $48,524 | $2,354 | $46,170 |
December 31, 2020
| Seix Core Bond Fund | Seix Corporate Bond Fund | Seix Floating Rate High Income Fund | |||
| Assets | |||||
Investment in securities at value(1) | $ 199,052 | $ 111,794 | $ 1,690,569 | ||
Cash | 5,219 | 318 | 94,220 | ||
| Receivables | |||||
Investment securities sold | — | — | 38,643 | ||
Fund shares sold | 158 | 1,969 | 4,061 | ||
Receivable from affiliate(a) | — | — | 15 | ||
Dividends and interest | 687 | 869 | 5,445 | ||
Securities lending income | — (b) | — | — | ||
Prepaid expenses | 15 | 33 | 23 | ||
Other assets | 19 | 10 | 163 | ||
Total assets | 205,150 | 114,993 | 1,833,139 | ||
| Liabilities | |||||
| Payables | |||||
Fund shares repurchased | 1,677 | 801 | 6,633 | ||
Investment securities purchased | 3,072 | — | 98,143 | ||
Dividend distributions | 29 | — | 366 | ||
Investment advisory fees | 37 | 20 | 606 | ||
Distribution and service fees | 2 | 3 | 27 | ||
Administration and accounting fees | 18 | 10 | 152 | ||
Transfer agent and sub-transfer agent fees and expenses | 38 | 23 | 405 | ||
Professional fees | 25 | 24 | 43 | ||
Trustee deferred compensation plan | 19 | 10 | 163 | ||
Interest expense and/or commitment fees | — (b) | — (b) | — | ||
Other accrued expenses | 10 | 5 | 113 | ||
Total liabilities | 4,927 | 896 | 106,651 | ||
Net Assets | $ 200,223 | $ 114,097 | $ 1,726,488 | ||
| Net Assets Consist of: | |||||
Capital paid in on shares of beneficial interest | $ 193,957 | $ 106,361 | $ 2,492,130 | ||
Accumulated earnings (loss) | 6,266 | 7,736 | (765,642) | ||
Net Assets | $ 200,223 | $ 114,097 | $ 1,726,488 | ||
| Net Assets: | |||||
Class A | $ 10,943 | $ 8,765 | $ 35,224 | ||
Class C | $ — | $ 1,365 | $ 21,841 | ||
Class I | $ 187,741 | $ 103,866 | $ 1,526,917 | ||
Class R6 | $ 1,539 | $ 101 | $ 142,506 | ||
| Shares Outstanding (unlimited number of shares authorized, no par value): | |||||
Class A | 949,561 | 886,190 | 4,354,350 | ||
Class C | — | 138,679 | 2,698,734 | ||
Class I | 16,286,935 | 10,557,857 | 188,732,975 | ||
Class R6 | 133,496 | 10,256 | 17,602,698 | ||
| Net Asset Value and Redemption Price Per Share:* | |||||
Class A | $ 11.52 | $ 9.89 | $ 8.09 | ||
Class C | $ — | $ 9.84 | $ 8.09 | ||
Class I | $ 11.53 | $ 9.84 | $ 8.09 | ||
Class R6 | $ 11.53 | $ 9.83 | $ 8.10 | ||
| Maximum Offering Price per Share (NAV/(1-Maximum Sales Charge)): | |||||
Class A | $ 11.97 | $ 10.28 | $ 8.32 | ||
Maximum Sales Charge - Class A | 3.75% | 3.75% | 2.75% | ||
(1) Investment in securities at cost | $ 192,549 | $ 104,320 | $ 1,783,445 |
| (a) | See Note 4G in the Notes to Financial Statements. |
| (b) | Amount is less than $500. |
| * | Net Asset Value and Redemption Price Per Share are calculated using unrounded net assets. |
| Seix High Grade Municipal Bond Fund | Seix High Income Fund | Seix High Yield Fund | |||
| Assets | |||||
Investment in securities at value(1)(2) | $ 91,023 | $ 230,666 | $ 380,100 | ||
Cash | 2,271 | 1,414 | 10,569 | ||
| Receivables | |||||
Investment securities sold | — | 767 | — | ||
Fund shares sold | 223 | 668 | 1,043 | ||
Dividends and interest | 732 | 3,655 | 5,513 | ||
Securities lending income | — | 3 | 3 | ||
Prepaid expenses | 15 | 23 | 41 | ||
Other assets | 8 | 21 | 35 | ||
Total assets | 94,272 | 237,217 | 397,304 | ||
| Liabilities | |||||
| Payables | |||||
Fund shares repurchased | 834 | 667 | 436 | ||
Investment securities purchased | 11,520 | 581 | 6,675 | ||
Collateral on securities loaned | — | 2,947 | 4,204 | ||
Dividend distributions | 216 | — | 93 | ||
Investment advisory fees | 14 | 64 | 118 | ||
Distribution and service fees | 1 | 4 | 2 | ||
Administration and accounting fees | 8 | 21 | 34 | ||
Transfer agent and sub-transfer agent fees and expenses | 14 | 61 | 65 | ||
Professional fees | 25 | 26 | 29 | ||
Trustee deferred compensation plan | 8 | 21 | 35 | ||
Interest expense and/or commitment fees | — (a) | — (a) | — (a) | ||
Other accrued expenses | 2 | 12 | 17 | ||
Total liabilities | 12,642 | 4,404 | 11,708 | ||
Net Assets | $ 81,630 | $ 232,813 | $ 385,596 | ||
| Net Assets Consist of: | |||||
Capital paid in on shares of beneficial interest | $ 77,752 | $ 324,493 | $ 424,521 | ||
Accumulated earnings (loss) | 3,878 | (91,680) | (38,925) | ||
Net Assets | $ 81,630 | $ 232,813 | $ 385,596 | ||
| Net Assets: | |||||
Class A | $ 7,626 | $ 20,133 | $ 11,608 | ||
Class I | $ 74,004 | $ 203,543 | $ 362,138 | ||
Class R6 | $ — | $ 9,137 | $ 11,850 | ||
| Shares Outstanding (unlimited number of shares authorized, no par value): | |||||
Class A | 614,006 | 3,116,739 | 1,351,733 | ||
Class I | 5,959,255 | 31,559,302 | 41,108,646 | ||
Class R6 | — | 1,417,396 | 1,344,480 | ||
| Net Asset Value and Redemption Price Per Share:* | |||||
Class A | $ 12.42 | $ 6.46 | $ 8.59 | ||
Class I | $ 12.42 | $ 6.45 | $ 8.81 | ||
Class R6 | $ — | $ 6.45 | $ 8.81 | ||
| Maximum Offering Price per Share (NAV/(1-Maximum Sales Charge)): | |||||
Class A | $ 12.77 | $ 6.71 | $ 8.92 | ||
Maximum Sales Charge - Class A | 2.75% | 3.75% | 3.75% | ||
(1) Investment in securities at cost | $ 87,347 | $ 223,673 | $ 365,232 | ||
(2) Market value of securities on loan | $ — | $ 2,821 | $ 4,030 |
| (a) | Amount is less than $500. |
| * | Net Asset Value and Redemption Price Per Share are calculated using unrounded net assets. |
| Seix Investment Grade Tax-Exempt Bond Fund | Seix Short-Term Bond Fund | Seix Short-Term Municipal Bond Fund | |||
| Assets | |||||
Investment in securities at value(1) | $ 337,103 | $ 15,573 | $ 13,929 | ||
Cash | 11,588 | 83 | 690 | ||
| Receivables | |||||
Fund shares sold | 566 | 22 | 1 | ||
Receivable from adviser | — | 8 | 7 | ||
Dividends and interest | 2,600 | 45 | 129 | ||
Prepaid expenses | 19 | 19 | 11 | ||
Other assets | 28 | 1 | 1 | ||
Total assets | 351,904 | 15,751 | 14,768 | ||
| Liabilities | |||||
| Payables | |||||
Fund shares repurchased | 1,955 | 3 | 54 | ||
Investment securities purchased | 50,431 | — | 957 | ||
Dividend distributions | 1,694 | — | 3 | ||
Investment advisory fees | 54 | — | — | ||
Distribution and service fees | 2 | 3 | — (a) | ||
Administration and accounting fees | 27 | 2 | 2 | ||
Transfer agent and sub-transfer agent fees and expenses | 75 | 3 | 3 | ||
Professional fees | 26 | 25 | 25 | ||
Trustee deferred compensation plan | 28 | 1 | 1 | ||
Interest expense and/or commitment fees | — (a) | — (a) | — (a) | ||
Other accrued expenses | 11 | — (a) | — (a) | ||
Total liabilities | 54,303 | 37 | 1,045 | ||
Net Assets | $ 297,601 | $ 15,714 | $ 13,723 | ||
| Net Assets Consist of: | |||||
Capital paid in on shares of beneficial interest | $ 284,077 | $ 15,499 | $ 13,374 | ||
Accumulated earnings (loss) | 13,524 | 215 | 349 | ||
Net Assets | $ 297,601 | $ 15,714 | $ 13,723 | ||
| Net Assets: | |||||
Class A | $ 8,902 | $ 6,280 | $ 1,474 | ||
Class C | $ — | $ 2,082 | $ — | ||
Class I | $ 288,699 | $ 7,352 | $ 12,249 | ||
| Shares Outstanding (unlimited number of shares authorized, no par value): | |||||
Class A | 742,416 | 613,029 | 145,125 | ||
Class C | — | 203,219 | — | ||
Class I | 24,105,764 | 719,723 | 1,205,041 | ||
| Net Asset Value and Redemption Price Per Share:* | |||||
Class A | $ 11.99 | $ 10.24 | $ 10.16 | ||
Class C | $ — | $ 10.24 | $ — | ||
Class I | $ 11.98 | $ 10.22 | $ 10.17 | ||
| Maximum Offering Price per Share (NAV/(1-Maximum Sales Charge)): | |||||
Class A | $ 12.33 | $ 10.48 | $ 10.39 | ||
Maximum Sales Charge - Class A | 2.75% | 2.25% | 2.25% | ||
(1) Investment in securities at cost | $ 325,048 | $ 15,335 | $ 13,672 |
| (a) | Amount is less than $500. |
| * | Net Asset Value and Redemption Price Per Share are calculated using unrounded net assets. |
| Seix Total Return Bond Fund | Seix U.S. Government Securities Ultra-Short Bond Fund | Seix U.S. Mortgage Fund | |||
| Assets | |||||
Investment in securities at value(1) | $ 422,262 | $ 1,232,581 | $ 16,102 | ||
Cash | 19,206 | 9,008 | 745 | ||
| Receivables | |||||
Investment securities sold | — | 1,689 | — | ||
Fund shares sold | 948 | 11,030 | 1 | ||
Receivable from adviser | — | — | 4 | ||
Dividends and interest | 1,740 | 1,215 | 41 | ||
Securities lending income | — (a) | — | — | ||
Prepaid expenses | 65 | 30 | 16 | ||
Other assets | 40 | 114 | 2 | ||
Total assets | 444,261 | 1,255,667 | 16,911 | ||
| Liabilities | |||||
| Payables | |||||
Fund shares repurchased | 1,622 | 923 | 2 | ||
Investment securities purchased | 10,570 | 43,414 | — | ||
Dividend distributions | 94 | 3 | — | ||
Investment advisory fees | 29 | 102 | — | ||
Distribution and service fees | 3 | 7 | 1 | ||
Administration and accounting fees | 38 | 108 | 2 | ||
Transfer agent and sub-transfer agent fees and expenses | 83 | 249 | 8 | ||
Professional fees | 30 | 31 | 25 | ||
Trustee deferred compensation plan | 40 | 114 | 2 | ||
Interest expense and/or commitment fees | 1 | 2 | — (a) | ||
Other accrued expenses | 20 | 62 | — | ||
Total liabilities | 12,530 | 45,015 | 40 | ||
Net Assets | $ 431,731 | $ 1,210,652 | $ 16,871 | ||
| Net Assets Consist of: | |||||
Capital paid in on shares of beneficial interest | $ 414,344 | $ 1,208,368 | $ 16,164 | ||
Accumulated earnings (loss) | 17,387 | 2,284 | 707 | ||
Net Assets | $ 431,731 | $ 1,210,652 | $ 16,871 | ||
| Net Assets: | |||||
Class A | $ 12,879 | $ 33,092 | $ 6,395 | ||
Class C | $ — | $ — | $ 499 | ||
Class I | $ 295,811 | $ 1,090,217 | $ 9,977 | ||
Class R6 | $ 123,041 | $ 87,343 | $ — | ||
| Shares Outstanding (unlimited number of shares authorized, no par value): | |||||
Class A | 1,079,152 | 3,297,225 | 557,978 | ||
Class C | — | — | 43,453 | ||
Class I | 25,638,325 | 108,621,869 | 869,056 | ||
Class R6 | 10,667,520 | 8,690,212 | — | ||
| Net Asset Value and Redemption Price Per Share:* | |||||
Class A | $ 11.93 | $ 10.04 | $ 11.46 | ||
Class C | $ — | $ — | $ 11.48 | ||
Class I | $ 11.54 | $ 10.04 | $ 11.48 | ||
Class R6 | $ 11.53 | $ 10.05 | $ — | ||
| Maximum Offering Price per Share (NAV/(1-Maximum Sales Charge)): | |||||
Class A | $ 12.39 | $ — | $ 11.72 | ||
Maximum Sales Charge - Class A | 3.75% | —% | 2.25% | ||
(1) Investment in securities at cost | $ 403,328 | $ 1,224,827 | $ 15,482 |
| (a) | Amount is less than $500. |
| * | Net Asset Value and Redemption Price Per Share are calculated using unrounded net assets. |
| Seix Ultra-Short Bond Fund | |
| Assets | |
Investment in securities at value(1) | $ 48,524 |
Cash | 1,280 |
| Receivables | |
Investment securities sold | 17 |
Fund shares sold | 128 |
Dividends and interest | 117 |
Prepaid expenses | 21 |
Other assets | 5 |
Total assets | 50,092 |
| Liabilities | |
| Payables | |
Fund shares repurchased | 19 |
Investment securities purchased | 1,125 |
Dividend distributions | 1 |
Investment advisory fees | 2 |
Distribution and service fees | 1 |
Administration and accounting fees | 5 |
Transfer agent and sub-transfer agent fees and expenses | 9 |
Professional fees | 25 |
Trustee deferred compensation plan | 5 |
Interest expense and/or commitment fees | — (a) |
Total liabilities | 1,192 |
Net Assets | $ 48,900 |
| Net Assets Consist of: | |
Capital paid in on shares of beneficial interest | $ 49,274 |
Accumulated earnings (loss) | (374) |
Net Assets | $ 48,900 |
| Net Assets: | |
Class A | $ 4,189 |
Class I | $ 44,711 |
| Shares Outstanding (unlimited number of shares authorized, no par value): | |
Class A | 420,252 |
Class I | 4,488,126 |
| Net Asset Value and Redemption Price Per Share:* | |
Class A | $ 9.97 |
Class I | $ 9.96 |
| Maximum Offering Price per Share (NAV/(1-Maximum Sales Charge)): | |
Class A | $ — |
Maximum Sales Charge - Class A | —% |
(1) Investment in securities at cost | $ 48,249 |
| (a) | Amount is less than $500. |
| * | Net Asset Value and Redemption Price Per Share are calculated using unrounded net assets. |
YEAR ENDED December 31, 2020
| Seix Core Bond Fund | Seix Corporate Bond Fund | Seix Floating Rate High Income Fund | |||
| Investment Income | |||||
Dividends | $ 12 | $ 5 | $ 649 | ||
Interest | 2,113 | 2,247 | 103,832 | ||
Securities lending, net of fees | 5 | — | — | ||
Total investment income | 2,130 | 2,252 | 104,481 | ||
| Expenses | |||||
Investment advisory fees | 377 | 304 | 9,246 | ||
Distribution and service fees, Class A | 26 | 16 | 97 | ||
Distribution and service fees, Class C | — | 8 | 278 | ||
Administration and accounting fees | 165 | 87 | 2,303 | ||
Transfer agent fees and expenses | 66 | 34 | 997 | ||
Sub-transfer agent fees and expenses, Class A | 15 | 5 | 30 | ||
Sub-transfer agent fees and expenses, Class C | — | 1 | 14 | ||
Sub-transfer agent fees and expenses, Class I | 151 | 81 | 2,135 | ||
Custodian fees | 1 | 1 | 2 | ||
Printing fees and expenses | 10 | 5 | 70 | ||
Professional fees | 30 | 28 | 107 | ||
Interest expense and/or commitment fees | 1 | — (1) | 435 | ||
Registration fees | 46 | 42 | 153 | ||
Trustees’ fees and expenses | 11 | 5 | 231 | ||
Miscellaneous expenses | 22 | 13 | 407 | ||
Total expenses | 921 | 630 | 16,505 | ||
Less net expenses reimbursed and/or waived by investment adviser(2) | (155) | (74) | (2,308) | ||
Net expenses | 766 | 556 | 14,197 | ||
Net investment income (loss) | 1,364 | 1,696 | 90,284 | ||
| Net Realized and Unrealized Gain (Loss) on Investments | |||||
| Net realized gain (loss) from: | |||||
Investments | 4,202 | 3,537 | (236,209) | ||
Swaps | — | 316 | — | ||
| Net change in unrealized appreciation (depreciation) on: | |||||
Investments | 5,015 | 5,379 | 27,799 | ||
Swaps | — | 193 | — | ||
Net realized and unrealized gain (loss) on investments | 9,217 | 9,425 | (208,410) | ||
Net increase (decrease) in net assets resulting from operations | $10,581 | $11,121 | $(118,126) |
| (1) | Amount is less than $500. |
| (2) | See Note 4D in the Notes to Financial Statements. |
| Seix High Grade Municipal Bond Fund | Seix High Income Fund | Seix High Yield Fund | |||
| Investment Income | |||||
Dividends | $ 27 | $ 68 | $ 50 | ||
Interest | 1,226 | 13,478 | 17,277 | ||
Securities lending, net of fees | — | 22 | 7 | ||
Total investment income | 1,253 | 13,568 | 17,334 | ||
| Expenses | |||||
Investment advisory fees | 352 | 1,232 | 1,432 | ||
Distribution and service fees, Class A | 11 | 53 | 15 | ||
Administration and accounting fees | 81 | 242 | 340 | ||
Transfer agent fees and expenses | 31 | 99 | 138 | ||
Sub-transfer agent fees and expenses, Class A | 2 | 28 | 8 | ||
Sub-transfer agent fees and expenses, Class I | 62 | 270 | 275 | ||
Custodian fees | — (1) | 1 | 1 | ||
Printing fees and expenses | 5 | 12 | 18 | ||
Professional fees | 28 | 33 | 36 | ||
Interest expense and/or commitment fees | — (1) | 1 | 2 | ||
Registration fees | 28 | 54 | 77 | ||
Trustees’ fees and expenses | 6 | 21 | 27 | ||
Miscellaneous expenses | 5 | 38 | 47 | ||
Total expenses | 611 | 2,084 | 2,416 | ||
Less net expenses reimbursed and/or waived by investment adviser(2) | (179) | (520) | (376) | ||
Net expenses | 432 | 1,564 | 2,040 | ||
Net investment income (loss) | 821 | 12,004 | 15,294 | ||
| Net Realized and Unrealized Gain (Loss) on Investments | |||||
| Net realized gain (loss) from: | |||||
Investments | 1,981 | (7,102) | 6,887 | ||
| Net change in unrealized appreciation (depreciation) on: | |||||
Investments | 1,856 | 3,906 | 10,083 | ||
Net realized and unrealized gain (loss) on investments | 3,837 | (3,196) | 16,970 | ||
Net increase (decrease) in net assets resulting from operations | $4,658 | $ 8,808 | $32,264 |
| (1) | Amount is less than $500. |
| (2) | See Note 4D in the Notes to Financial Statements. |
| Seix Investment Grade Tax-Exempt Bond Fund | Seix Short-Term Bond Fund | Seix Short-Term Municipal Bond Fund | |||
| Investment Income | |||||
Dividends | $ 142 | $ 1 | $ 4 | ||
Interest | 4,544 | 254 | 147 | ||
Total investment income | 4,686 | 255 | 151 | ||
| Expenses | |||||
Investment advisory fees | 1,500 | 69 | 48 | ||
Distribution and service fees, Class A | 22 | 14 | 3 | ||
Distribution and service fees, Class C | — | 17 | — | ||
Administration and accounting fees | 321 | 26 | 22 | ||
Transfer agent fees and expenses | 129 | 8 | 6 | ||
Sub-transfer agent fees and expenses, Class A | 6 | 2 | 1 | ||
Sub-transfer agent fees and expenses, Class C | — | 1 | — | ||
Sub-transfer agent fees and expenses, Class I | 351 | 11 | 15 | ||
Custodian fees | — (1) | — (1) | — (1) | ||
Printing fees and expenses | 16 | 2 | 1 | ||
Professional fees | 33 | 27 | 27 | ||
Interest expense and/or commitment fees | 2 | — (1) | — (1) | ||
Registration fees | 43 | 39 | 32 | ||
Trustees’ fees and expenses | 26 | 1 | 1 | ||
Miscellaneous expenses | 22 | 7 | 3 | ||
Total expenses | 2,471 | 224 | 159 | ||
Less net expenses reimbursed and/or waived by investment adviser(2) | (721) | (93) | (92) | ||
Net expenses | 1,750 | 131 | 67 | ||
Net investment income (loss) | 2,936 | 124 | 84 | ||
| Net Realized and Unrealized Gain (Loss) on Investments | |||||
| Net realized gain (loss) from: | |||||
Investments | 7,902 | 235 | 224 | ||
| Net change in unrealized appreciation (depreciation) on: | |||||
Investments | 5,316 | 154 | 110 | ||
Net realized and unrealized gain (loss) on investments | 13,218 | 389 | 334 | ||
Net increase (decrease) in net assets resulting from operations | $16,154 | $513 | $418 |
| (1) | Amount is less than $500. |
| (2) | See Note 4D in the Notes to Financial Statements. |
| Seix Total Return Bond Fund | Seix U.S. Government Securities Ultra-Short Bond Fund | Seix U.S. Mortgage Fund | |||
| Investment Income | |||||
Dividends | $ 30 | $ 102 | $ 2 | ||
Interest | 6,671 | 11,703 | 241 | ||
Securities lending, net of fees | 16 | — (1) | — (1) | ||
Total investment income | 6,717 | 11,805 | 243 | ||
| Expenses | |||||
Investment advisory fees | 909 | 1,989 | 75 | ||
Distribution and service fees, Class A | 45 | 54 | 14 | ||
Distribution and service fees, Class C | — | — | 5 | ||
Administration and accounting fees | 388 | 1,078 | 27 | ||
Transfer agent fees and expenses | 158 | 449 | 9 | ||
Sub-transfer agent fees and expenses, Class A | 29 | 5 | 43 | ||
Sub-transfer agent fees and expenses, Class I | 325 | 1,040 | 18 | ||
Custodian fees | 1 | 1 | 1 | ||
Printing fees and expenses | 22 | 58 | 2 | ||
Professional fees | 37 | 46 | 27 | ||
Interest expense and/or commitment fees | 2 | 5 | — (1) | ||
Registration fees | 67 | 88 | 36 | ||
Trustees’ fees and expenses | 30 | 84 | 2 | ||
Miscellaneous expenses | 50 | 94 | 4 | ||
Total expenses | 2,063 | 4,991 | 263 | ||
Less net expenses reimbursed and/or waived by investment adviser(2) | (450) | (800) | (113) | ||
Net expenses | 1,613 | 4,191 | 150 | ||
Net investment income (loss) | 5,104 | 7,614 | 93 | ||
| Net Realized and Unrealized Gain (Loss) on Investments | |||||
| Net realized gain (loss) from: | |||||
Investments | 13,459 | (124) | 298 | ||
Forward foreign currency transactions | (1,454) | — | — | ||
Swaps | 2,099 | — | — | ||
| Net change in unrealized appreciation (depreciation) on: | |||||
Investments | 14,403 | 4,410 | 117 | ||
Swaps | 1,360 | — | — | ||
Net realized and unrealized gain (loss) on investments | 29,867 | 4,286 | 415 | ||
Net increase (decrease) in net assets resulting from operations | $34,971 | $11,900 | $ 508 |
| (1) | Amount is less than $500. |
| (2) | See Note 4D in the Notes to Financial Statements. |
| Seix Ultra-Short Bond Fund | |
| Investment Income | |
Dividends | $ 7 |
Interest | 783 |
Securities lending, net of fees | — (1) |
Total investment income | 790 |
| Expenses | |
Investment advisory fees | 103 |
Distribution and service fees, Class A | 8 |
Administration and accounting fees | 57 |
Transfer agent fees and expenses | 21 |
Sub-transfer agent fees and expenses, Class A | 2 |
Sub-transfer agent fees and expenses, Class I | 35 |
Printing fees and expenses | 3 |
Professional fees | 28 |
Interest expense and/or commitment fees | — (1) |
Registration fees | 30 |
Trustees’ fees and expenses | 4 |
Miscellaneous expenses | 5 |
Total expenses | 296 |
Less net expenses reimbursed and/or waived by investment adviser(2) | (100) |
Net expenses | 196 |
Net investment income (loss) | 594 |
| Net Realized and Unrealized Gain (Loss) on Investments | |
| Net realized gain (loss) from: | |
Investments | (520) |
| Net change in unrealized appreciation (depreciation) on: | |
Investments | 186 |
Net realized and unrealized gain (loss) on investments | (334) |
Net increase (decrease) in net assets resulting from operations | $ 260 |
| (1) | Amount is less than $500. |
| (2) | See Note 4D in the Notes to Financial Statements. |
| Seix Core Bond Fund | Seix Corporate Bond Fund | ||||||
| Year Ended December 31, 2020 | Year Ended December 31, 2019 | Year Ended December 31, 2020 | Year Ended December 31, 2019 | ||||
| Increase (Decrease) in Net Assets Resulting from Operations | |||||||
Net investment income (loss) | $ 1,364 | $ 2,915 | $ 1,696 | $ 1,246 | |||
Net realized gain (loss) | 4,202 | 6,797 | 3,853 | 1,629 | |||
Net change in unrealized appreciation (depreciation) | 5,015 | 188 | 5,572 | 2,178 | |||
Increase (decrease) in net assets resulting from operations | 10,581 | 9,900 | 11,121 | 5,053 | |||
| Dividends and Distributions to Shareholders | |||||||
| Net Investment Income and Net Realized Gains: | |||||||
Class A | (327) | (128) | (447) | (122) | |||
Class C | — | — | (60) | (13) | |||
Class I | (5,327) | (2,730) | (5,456) | (992) | |||
Class R | — | (50) | — | — | |||
Class R6 | (57) | (7) | (4) | — | |||
Total Dividends and Distributions to Shareholders | (5,711) | (2,915) | (5,967) | (1,127) | |||
| Change in Net Assets from Capital Transactions (See Note 6): | |||||||
Class A | 1,228 | 2,890 | 2,634 | 4,781 | |||
Class C | — | — | 633 | (4,852) | |||
Class I | 89,947 | (49,184) | 66,410 | (5,737) | |||
Class R | — | (3,262) | — | — | |||
Class R6 | (606) | 1,906 | 100 | — | |||
Increase (decrease) in net assets from capital transactions | 90,569 | (47,650) | 69,777 | (5,808) | |||
Net increase (decrease) in net assets | 95,439 | (40,665) | 74,931 | (1,882) | |||
| Net Assets | |||||||
Beginning of period | 104,784 | 145,449 | 39,166 | 41,048 | |||
End of Period | $ 200,223 | $ 104,784 | $ 114,097 | $ 39,166 | |||
| Seix Floating Rate High Income Fund | Seix High Grade Municipal Bond Fund | ||||||
| Year Ended December 31, 2020 | Year Ended December 31, 2019 | Year Ended December 31, 2020 | Year Ended December 31, 2019 | ||||
| Increase (Decrease) in Net Assets Resulting from Operations | |||||||
Net investment income (loss) | $ 90,284 | $ 221,192 | $ 821 | $ 1,004 | |||
Net realized gain (loss) | (236,209) | (126,937) | 1,981 | 1,906 | |||
Net change in unrealized appreciation (depreciation) | 27,799 | 212,166 | 1,856 | 1,000 | |||
Increase (decrease) in net assets resulting from operations | (118,126) | 306,421 | 4,658 | 3,910 | |||
| Dividends and Distributions to Shareholders | |||||||
| Net Investment Income and Net Realized Gains: | |||||||
Class A | (1,489) | (2,650) | (278) | (261) | |||
Class C | (902) | (1,849) | — | — | |||
Class I | (76,765) | (187,268) | (2,584) | (1,931) | |||
Class R6 | (12,298) | (34,576) | — | — | |||
Total Dividends and Distributions to Shareholders | (91,454) | (226,343) | (2,862) | (2,192) | |||
| Change in Net Assets from Capital Transactions (See Note 6): | |||||||
Class A | (10,319) | (21,243) | 535 | (135) | |||
Class C | (13,980) | (8,593) | — | — | |||
Class I | (1,004,745) | (1,745,945) | 19,100 | 10,080 | |||
Class R6 | (373,965) | (264,859) | — | — | |||
Increase (decrease) in net assets from capital transactions | (1,403,009) | (2,040,640) | 19,635 | 9,945 | |||
Net increase (decrease) in net assets | (1,612,589) | (1,960,562) | 21,431 | 11,663 | |||
| Net Assets | |||||||
Beginning of period | 3,339,077 | 5,299,639 | 60,199 | 48,536 | |||
End of Period | $ 1,726,488 | $ 3,339,077 | $ 81,630 | $ 60,199 | |||
| Seix High Income Fund | Seix High Yield Fund | ||||||
| Year Ended December 31, 2020 | Year Ended December 31, 2019 | Year Ended December 31, 2020 | Year Ended December 31, 2019 | ||||
| Increase (Decrease) in Net Assets Resulting from Operations | |||||||
Net investment income (loss) | $ 12,004 | $ 16,753 | $ 15,294 | $ 14,944 | |||
Net realized gain (loss) | (7,102) | (12,562) | 6,887 | (3,240) | |||
Net change in unrealized appreciation (depreciation) | 3,906 | 30,983 | 10,083 | 24,890 | |||
Increase (decrease) in net assets resulting from operations | 8,808 | 35,174 | 32,264 | 36,594 | |||
| Dividends and Distributions to Shareholders | |||||||
| Net Investment Income and Net Realized Gains: | |||||||
Class A | (1,081) | (871) | (275) | (164) | |||
Class I | (10,159) | (13,691) | (14,542) | (14,596) | |||
Class R | — | (486) | — | (2) | |||
Class R6 | (755) | (1,637) | (419) | (72) | |||
Total Dividends and Distributions to Shareholders | (11,995) | (16,685) | (15,236) | (14,834) | |||
| Change in Net Assets from Capital Transactions (See Note 6): | |||||||
Class A | (5,511) | 9,888 | 6,415 | 1,464 | |||
Class I | (30,506) | (46,460) | 54,159 | (16,055) | |||
Class R | — | (11,661) | — | (56) | |||
Class R6 | (24,334) | 31,240 | 5,442 | 4,537 | |||
Increase (decrease) in net assets from capital transactions | (60,351) | (16,993) | 66,016 | (10,110) | |||
Net increase (decrease) in net assets | (63,538) | 1,496 | 83,044 | 11,650 | |||
| Net Assets | |||||||
Beginning of period | 296,351 | 294,855 | 302,552 | 290,902 | |||
End of Period | $ 232,813 | $ 296,351 | $ 385,596 | $ 302,552 | |||
| Seix Investment Grade Tax-Exempt Bond Fund | Seix Short-Term Bond Fund | ||||||
| Year Ended December 31, 2020 | Year Ended December 31, 2019 | Year Ended December 31, 2020 | Year Ended December 31, 2019 | ||||
| Increase (Decrease) in Net Assets Resulting from Operations | |||||||
Net investment income (loss) | $ 2,936 | $ 5,770 | $ 124 | $ 147 | |||
Net realized gain (loss) | 7,902 | 10,942 | 235 | 26 | |||
Net change in unrealized appreciation (depreciation) | 5,316 | 4,279 | 154 | 85 | |||
Increase (decrease) in net assets resulting from operations | 16,154 | 20,991 | 513 | 258 | |||
| Dividends and Distributions to Shareholders | |||||||
| Net Investment Income and Net Realized Gains: | |||||||
Class A | (291) | (385) | (48) | (41) | |||
Class C | — | — | (1) | (8) | |||
Class I | (9,962) | (12,595) | (74) | (98) | |||
Total Dividends and Distributions to Shareholders | (10,253) | (12,980) | (123) | (147) | |||
| Change in Net Assets from Capital Transactions (See Note 6): | |||||||
Class A | (546) | (930) | 3,790 | 240 | |||
Class C | — | — | 1,307 | (739) | |||
Class I | (12,363) | (19,472) | 2,039 | (632) | |||
Increase (decrease) in net assets from capital transactions | (12,909) | (20,402) | 7,136 | (1,131) | |||
Net increase (decrease) in net assets | (7,008) | (12,391) | 7,526 | (1,020) | |||
| Net Assets | |||||||
Beginning of period | 304,609 | 317,000 | 8,188 | 9,208 | |||
End of Period | $ 297,601 | $ 304,609 | $ 15,714 | $ 8,188 | |||
| Seix Short-Term Municipal Bond Fund | Seix Total Return Bond Fund | ||||||
| Year Ended December 31, 2020 | Year Ended December 31, 2019 | Year Ended December 31, 2020 | Year Ended December 31, 2019 | ||||
| Increase (Decrease) in Net Assets Resulting from Operations | |||||||
Net investment income (loss) | $ 84 | $ 203 | $ 5,104 | $ 8,868 | |||
Net realized gain (loss) | 224 | 221 | 14,104 | 19,672 | |||
Net change in unrealized appreciation (depreciation) | 110 | 166 | 15,763 | (678) | |||
Increase (decrease) in net assets resulting from operations | 418 | 590 | 34,971 | 27,862 | |||
| Dividends and Distributions to Shareholders | |||||||
| Net Investment Income and Net Realized Gains: | |||||||
Class A | (23) | (37) | (391) | (123) | |||
Class I | (204) | (317) | (7,922) | (4,117) | |||
Class R | — | — | — | (229) | |||
Class R6 | — | — | (2,773) | (1,061) | |||
| Return of Capital: | |||||||
Class A | — | — | — | (61) | |||
Class I | — | — | — | (1,635) | |||
Class R | — | — | — | (149) | |||
Class R6 | — | — | — | (375) | |||
Total Dividends and Distributions to Shareholders | (227) | (354) | (11,086) | (7,750) | |||
| Change in Net Assets from Capital Transactions (See Note 6): | |||||||
Class A | (81) | 106 | (13,879) | 13,692 | |||
Class I | 1,245 | (8,428) | 58,104 | (130,692) | |||
Class R | — | — | — | (28,882) | |||
Class R6 | — | — | 57,411 | (12,799) | |||
Increase (decrease) in net assets from capital transactions | 1,164 | (8,322) | 101,636 | (158,681) | |||
Net increase (decrease) in net assets | 1,355 | (8,086) | 125,521 | (138,569) | |||
| Net Assets | |||||||
Beginning of period | 12,368 | 20,454 | 306,210 | 444,779 | |||
End of Period | $ 13,723 | $ 12,368 | $ 431,731 | $ 306,210 | |||
| Seix U.S. Government Securities Ultra-Short Bond Fund | Seix U.S. Mortgage Fund | ||||||
| Year Ended December 31, 2020 | Year Ended December 31, 2019 | Year Ended December 31, 2020 | Year Ended December 31, 2019 | ||||
| Increase (Decrease) in Net Assets Resulting from Operations | |||||||
Net investment income (loss) | $ 7,614 | $ 28,891 | $ 93 | $ 472 | |||
Net realized gain (loss) | (124) | 234 | 298 | 334 | |||
Net change in unrealized appreciation (depreciation) | 4,410 | 927 | 117 | 516 | |||
Increase (decrease) in net assets resulting from operations | 11,900 | 30,052 | 508 | 1,322 | |||
| Dividends and Distributions to Shareholders | |||||||
| Net Investment Income and Net Realized Gains: | |||||||
Class A | (94) | (174) | (68) | (125) | |||
Class C | — | — | (1) | (9) | |||
Class I | (7,500) | (28,008) | (136) | (339) | |||
Class R6 | (313) | (716) | — | — | |||
| Return of Capital: | |||||||
Class A | — | — | — | (5) | |||
Class C | — | — | — | — (1) | |||
Class I | — | — | — | (12) | |||
Total Dividends and Distributions to Shareholders | (7,907) | (28,898) | (205) | (490) | |||
| Change in Net Assets from Capital Transactions (See Note 6): | |||||||
Class A | 19,270 | 8,243 | (374) | 2,692 | |||
Class C | — | — | 110 | (2,813) | |||
Class I | 221,890 | (369,064) | (4,684) | (3,711) | |||
Class R6 | 61,689 | (7,433) | — | — | |||
Increase (decrease) in net assets from capital transactions | 302,849 | (368,254) | (4,948) | (3,832) | |||
Net increase (decrease) in net assets | 306,842 | (367,100) | (4,645) | (3,000) | |||
| Net Assets | |||||||
Beginning of period | 903,810 | 1,270,910 | 21,516 | 24,516 | |||
End of Period | $ 1,210,652 | $ 903,810 | $ 16,871 | $ 21,516 | |||
| (1) | Amount is less than $500. |
| Seix Ultra-Short Bond Fund | |||
| Year Ended December 31, 2020 | Year Ended December 31, 2019 | ||
| Increase (Decrease) in Net Assets Resulting from Operations | |||
Net investment income (loss) | $ 594 | $ 1,464 | |
Net realized gain (loss) | (520) | (6) | |
Net change in unrealized appreciation (depreciation) | 186 | 250 | |
Increase (decrease) in net assets resulting from operations | 260 | 1,708 | |
| Dividends and Distributions to Shareholders | |||
| Net Investment Income and Net Realized Gains: | |||
Class A | (34) | (42) | |
Class I | (559) | (1,420) | |
Total Dividends and Distributions to Shareholders | (593) | (1,462) | |
| Change in Net Assets from Capital Transactions (See Note 6): | |||
Class A | 1,091 | 1,408 | |
Class I | (3,152) | (12,099) | |
Increase (decrease) in net assets from capital transactions | (2,061) | (10,691) | |
Net increase (decrease) in net assets | (2,394) | (10,445) | |
| Net Assets | |||
Beginning of period | 51,294 | 61,739 | |
End of Period | $ 48,900 | $ 51,294 | |
THROUGHOUT EACH PERIOD
| Net Asset Value, Beginning of Period | Net Investment Income (Loss)(1) | Net Realized and Unrealized Gain (Loss) | Total from Investment Operations | Dividends from Net Investment Income | Return of Capital | Distributions from Net Realized Gains | Total Distributions | Change in Net Asset Value | Net Asset Value, End of Period | Total Return(2)(3) | Net Assets, End of Period (in thousands) | Ratio of Net Expenses to Average Net Assets(4)(5) | Ratio of Gross Expenses to Average Net Assets(4)(5) | Ratio of Net Investment Income (Loss) to Average Net Assets(4) | Portfolio Turnover Rate(3) | ||
| Seix Core Bond Fund | |||||||||||||||||
| Class A | |||||||||||||||||
| 1/1/20 to 12/31/20 | $10.91 | 0.10 | 0.87 | 0.97 | (0.11) | — | (0.25) | (0.36) | 0.61 | $11.52 | 8.91 % | $ 10,943 | 0.64 % | 0.89 % | 0.88 % | 221 % | |
| 1/1/19 to 12/31/19 | 10.36 | 0.22 | 0.55 | 0.77 | (0.22) | — | — | (0.22) | 0.55 | 10.91 | 7.48 | 9,183 | 0.64 | 0.91 | 2.03 | 197 | |
| 1/1/18 to 12/31/18 | 10.63 | 0.22 | (0.25) | (0.03) | (0.23) | (0.01) | — | (0.24) | (0.27) | 10.36 | (0.28) | 5,993 | 0.64 | 0.89 | 2.18 | 172 | |
| 4/1/17 to 12/31/17(6) | 10.56 | 0.14 | 0.08 | 0.22 | (0.12) | (0.03) | — | (0.15) | 0.07 | 10.63 | 2.12 | 8,433 | 0.65 (7) | 0.79 | 1.73 | 130 | |
| 4/1/16 to 3/31/17 | 10.86 | 0.16 | (0.06) | 0.10 | (0.19) | — | (0.21) | (0.40) | (0.30) | 10.56 | 0.90 | 10,363 | 0.64 | 0.64 | 1.45 | 210 | |
| 4/1/15 to 3/31/16 | 11.04 | 0.18 | (0.07) | 0.11 | (0.20) | — | (0.09) | (0.29) | (0.18) | 10.86 | 1.01 | 10,170 | 0.65 | 0.65 | 1.65 | 232 | |
| Class I | |||||||||||||||||
| 1/1/20 to 12/31/20 | $10.91 | 0.10 | 0.89 | 0.99 | (0.12) | — | (0.25) | (0.37) | 0.62 | $11.53 | 9.15 % | $ 187,741 | 0.50 % | 0.59 % | 0.90 % | 221 % | |
| 1/1/19 to 12/31/19 | 10.36 | 0.24 | 0.54 | 0.78 | (0.23) | — | — | (0.23) | 0.55 | 10.91 | 7.63 | 93,576 | 0.50 | 0.64 | 2.21 | 197 | |
| 1/1/18 to 12/31/18 | 10.63 | 0.24 | (0.26) | (0.02) | (0.24) | (0.01) | — | (0.25) | (0.27) | 10.36 | (0.14) | 136,247 | 0.50 | 0.62 | 2.31 | 172 | |
| 4/1/17 to 12/31/17(6) | 10.57 | 0.15 | 0.07 | 0.22 | (0.13) | (0.03) | — | (0.16) | 0.06 | 10.63 | 2.13 | 186,029 | 0.51 (7) | 0.58 | 1.87 | 130 | |
| 4/1/16 to 3/31/17 | 10.86 | 0.17 | (0.04) | 0.13 | (0.21) | — | (0.21) | (0.42) | (0.29) | 10.57 | 1.15 | 199,622 | 0.49 | 0.49 | 1.58 | 210 | |
| 4/1/15 to 3/31/16 | 11.04 | 0.20 | (0.08) | 0.12 | (0.21) | — | (0.09) | (0.30) | (0.18) | 10.86 | 1.18 | 255,522 | 0.48 | 0.48 | 1.82 | 232 | |
| Class R6* | |||||||||||||||||
| 1/1/20 to 12/31/20 | $10.91 | 0.14 | 0.87 | 1.01 | (0.14) | — | (0.25) | (0.39) | 0.62 | $11.53 | 9.31 % | $ 1,539 | 0.36 % | 0.49 % | 1.21 % | 221 % | |
| 1/1/19 to 12/31/19 | 10.36 | 0.23 | 0.57 | 0.80 | (0.25) | — | — | (0.25) | 0.55 | 10.91 | 7.78 | 2,025 | 0.36 | 0.50 | 2.12 | 197 | |
| 1/1/18 to 12/31/18 | 10.63 | 0.25 | (0.26) | (0.01) | (0.25) | (0.01) | — | (0.26) | (0.27) | 10.36 | (0.02) | 114 | 0.36 | 0.48 | 2.40 | 172 | |
| 4/1/17 to 12/31/17(6) | 10.57 | 0.16 | 0.08 | 0.24 | (0.15) | (0.03) | — | (0.18) | 0.06 | 10.63 | 2.24 | 3,279 | 0.36 | 0.46 | 1.96 | 130 | |
| 4/1/16 to 3/31/17 | 10.86 | 0.19 | (0.05) | 0.14 | (0.22) | — | (0.21) | (0.43) | (0.29) | 10.57 | 1.29 | 1,352 | 0.35 | 0.35 | 1.78 | 210 | |
| 8/3/15 to 3/31/16(8) | 10.77 | 0.14 | 0.13 | 0.27 | (0.15) | — | (0.03) | (0.18) | 0.09 | 10.86 | 2.51 | 22 | 0.34 | 0.34 | 2.00 | 232 | |
| Seix Corporate Bond Fund | |||||||||||||||||
| Class A | |||||||||||||||||
| 1/1/20 to 12/31/20 | $ 8.95 | 0.20 | 1.34 | 1.54 | (0.24) | — | (0.36) | (0.60) | 0.94 | $ 9.89 | 17.44 % | $ 8,765 | 0.95 % | 1.03 % | 2.07 % | 135 % | |
| 1/1/19 to 12/31/19 | 8.15 | 0.23 | 0.78 | 1.01 | (0.21) | — | — | (0.21) | 0.80 | 8.95 | 12.47 | 5,599 | 0.95 | 1.10 | 2.69 | 118 | |
| 1/1/18 to 12/31/18 | 8.76 | 0.26 | (0.60) | (0.34) | (0.25) | — | (0.02) | (0.27) | (0.61) | 8.15 | (3.90) | 345 | 0.95 | 1.35 | 3.08 | 299 | |
| 4/1/17 to 12/31/17(6) | 8.69 | 0.18 | 0.21 | 0.39 | (0.16) | — | (0.16) | (0.32) | 0.07 | 8.76 | 4.53 | 363 | 0.95 | 1.34 | 2.68 | 80 | |
| 4/1/16 to 3/31/17 | 8.50 | 0.24 | 0.27 | 0.51 | (0.24) | — | (0.08) | (0.32) | 0.19 | 8.69 | 6.01 | 591 | 0.95 | 1.15 | 2.75 | 182 | |
| 4/1/15 to 3/31/16 | 8.99 | 0.23 | (0.29) | (0.06) | (0.22) | (0.01) | (0.20) | (0.43) | (0.49) | 8.50 | (0.52) | 500 | 0.95 | 1.11 | 2.68 | 84 | |
| Class C | |||||||||||||||||
| 1/1/20 to 12/31/20 | $ 8.91 | 0.13 | 1.33 | 1.46 | (0.17) | — | (0.36) | (0.53) | 0.93 | $ 9.84 | 16.57 % | $ 1,365 | 1.65 % | 1.78 % | 1.34 % | 135 % | |
| 1/1/19 to 12/31/19 | 8.11 | 0.16 | 0.78 | 0.94 | (0.14) | — | — | (0.14) | 0.80 | 8.91 | 11.60 | 671 | 1.65 | 1.84 | 1.87 | 118 | |
| 1/1/18 to 12/31/18 | 8.72 | 0.20 | (0.60) | (0.40) | (0.19) | — | (0.02) | (0.21) | (0.61) | 8.11 | (4.61) | 5,459 | 1.65 | 2.12 | 2.37 | 299 | |
| 4/1/17 to 12/31/17(6) | 8.65 | 0.13 | 0.21 | 0.34 | (0.11) | — | (0.16) | (0.27) | 0.07 | 8.72 | 4.02 | 6,518 | 1.62 | 2.10 | 2.02 | 80 | |
| 4/1/16 to 3/31/17 | 8.46 | 0.18 | 0.27 | 0.45 | (0.18) | — | (0.08) | (0.26) | 0.19 | 8.65 | 5.29 | 7,369 | 1.65 | 1.82 | 2.03 | 182 | |
| 4/1/15 to 3/31/16 | 8.95 | 0.17 | (0.29) | (0.12) | (0.16) | (0.01) | (0.20) | (0.37) | (0.49) | 8.46 | (1.22) | 8,105 | 1.65 | 1.80 | 2.01 | 84 |
| Net Asset Value, Beginning of Period | Net Investment Income (Loss)(1) | Net Realized and Unrealized Gain (Loss) | Total from Investment Operations | Dividends from Net Investment Income | Return of Capital | Distributions from Net Realized Gains | Total Distributions | Change in Net Asset Value | Net Asset Value, End of Period | Total Return(2)(3) | Net Assets, End of Period (in thousands) | Ratio of Net Expenses to Average Net Assets(4)(5) | Ratio of Gross Expenses to Average Net Assets(4)(5) | Ratio of Net Investment Income (Loss) to Average Net Assets(4) | Portfolio Turnover Rate(3) | ||
| Seix Corporate Bond Fund (Continued) | �� | ||||||||||||||||
| Class I | |||||||||||||||||
| 1/1/20 to 12/31/20 | $ 8.90 | 0.22 | 1.35 | 1.57 | (0.27) | — | (0.36) | (0.63) | 0.94 | $ 9.84 | 17.82 % | $ 103,866 | 0.70 % | 0.80 % | 2.26 % | 135 % | |
| 1/1/19 to 12/31/19 | 8.11 | 0.25 | 0.77 | 1.02 | (0.23) | — | — | (0.23) | 0.79 | 8.90 | 12.66 | 32,896 | 0.70 | 0.86 | 2.90 | 118 | |
| 1/1/18 to 12/31/18 | 8.73 | 0.27 | (0.60) | (0.33) | (0.27) | — | (0.02) | (0.29) | (0.62) | 8.11 | (3.81) | 35,244 | 0.70 | 1.03 | 3.33 | 299 | |
| 4/1/17 to 12/31/17(6) | 8.65 | 0.19 | 0.23 | 0.42 | (0.18) | — | (0.16) | (0.34) | 0.08 | 8.73 | 4.86 | 8,382 | 0.70 | 1.18 | 2.93 | 80 | |
| 4/1/16 to 3/31/17 | 8.46 | 0.26 | 0.27 | 0.53 | (0.26) | — | (0.08) | (0.34) | 0.19 | 8.65 | 6.29 | 12,651 | 0.70 | 0.93 | 2.99 | 182 | |
| 4/1/15 to 3/31/16 | 8.95 | 0.25 | (0.29) | (0.04) | (0.24) | (0.01) | (0.20) | (0.45) | (0.49) | 8.46 | (0.29) | 8,943 | 0.70 | 0.83 | 2.86 | 84 | |
| Class R6 | |||||||||||||||||
| 10/20/20 (9) to 12/31/20 | $ 9.75 | 0.05 | 0.41 | 0.46 | (0.10) | — | (0.28) | (0.38) | 0.08 | $ 9.83 | 4.75 % | $ 101 | 0.43 % | 0.71 % | 2.51 % | 135 % (10) | |
| Seix Floating Rate High Income Fund | |||||||||||||||||
| Class A | |||||||||||||||||
| 1/1/20 to 12/31/20 | $ 8.40 | 0.30 | (0.31) | (0.01) | (0.30) | — | — | (0.30) | (0.31) | $ 8.09 | 0.06 % | $ 35,224 | 0.96 % (11) | 0.96 % | 3.76 % | 68 % | |
| 1/1/19 to 12/31/19 | 8.30 | 0.41 | 0.11 | 0.52 | (0.42) | — | — | (0.42) | 0.10 | 8.40 | 6.30 | 47,938 | 0.95 (11)(12) | 0.93 | 4.79 | 17 | |
| 1/1/18 to 12/31/18 | 8.70 | 0.40 | (0.40) | — | (0.40) | — | — | (0.40) | (0.40) | 8.30 | (0.11) | 68,213 | 0.94 | 0.95 | 4.58 | 75 | |
| 4/1/17 to 12/31/17(6) | 8.75 | 0.26 | (0.05) | 0.21 | (0.26) | — | — | (0.26) | (0.05) | 8.70 | 2.47 | 113,611 | 0.92 | 0.93 | 4.00 | 55 | |
| 4/1/16 to 3/31/17 | 8.33 | 0.39 | 0.41 | 0.80 | (0.38) | — | — | (0.38) | 0.42 | 8.75 | 9.78 | 135,833 | 0.94 | 0.94 | 4.51 | 79 | |
| 4/1/15 to 3/31/16 | 8.86 | 0.38 | (0.54) | (0.16) | (0.37) | — | — | (0.37) | (0.53) | 8.33 | (1.79) | 143,325 | 0.92 | 0.92 | 4.42 | 33 | |
| Class C | |||||||||||||||||
| 1/1/20 to 12/31/20 | $ 8.40 | 0.25 | (0.31) | (0.06) | (0.25) | — | — | (0.25) | (0.31) | $ 8.09 | (0.52) % | $ 21,841 | 1.54 % (11) | 1.68 % | 3.19 % | 68 % | |
| 1/1/19 to 12/31/19 | 8.30 | 0.36 | 0.11 | 0.47 | (0.37) | — | — | (0.37) | 0.10 | 8.40 | 5.68 | 37,586 | 1.53 (11) | 1.65 | 4.21 | 17 | |
| 1/1/18 to 12/31/18 | 8.70 | 0.35 | (0.40) | (0.05) | (0.35) | — | — | (0.35) | (0.40) | 8.30 | (0.68) | 45,588 | 1.52 | 1.62 | 4.01 | 75 | |
| 4/1/17 to 12/31/17(6) | 8.76 | 0.22 | (0.06) | 0.16 | (0.22) | — | — | (0.22) | (0.06) | 8.70 | 1.89 | 51,551 | 1.52 | 1.60 | 3.40 | 55 | |
| 4/1/16 to 3/31/17 | 8.33 | 0.34 | 0.42 | 0.76 | (0.33) | — | — | (0.33) | 0.43 | 8.76 | 9.28 | 56,981 | 1.52 | 1.52 | 3.94 | 79 | |
| 4/1/15 to 3/31/16 | 8.86 | 0.33 | (0.54) | (0.21) | (0.32) | — | — | (0.32) | (0.53) | 8.33 | (2.37) | 55,203 | 1.51 | 1.51 | 3.82 | 33 | |
| Class I | |||||||||||||||||
| 1/1/20 to 12/31/20 | $ 8.40 | 0.32 | (0.30) | 0.02 | (0.33) | — | — | (0.33) | (0.31) | $ 8.09 | 0.38 % | $1,526,917 | 0.64 % (11) | 0.75 % | 4.10 % | 68 % | |
| 1/1/19 to 12/31/19 | 8.30 | 0.43 | 0.11 | 0.54 | (0.44) | — | — | (0.44) | 0.10 | 8.40 | 6.63 | 2,701,126 | 0.63 (11) | 0.72 | 5.13 | 17 | |
| 1/1/18 to 12/31/18 | 8.70 | 0.43 | (0.40) | 0.03 | (0.43) | — | — | (0.43) | (0.40) | 8.30 | 0.22 | 4,380,792 | 0.62 | 0.70 | 4.92 | 75 | |
| 4/1/17 to 12/31/17(6) | 8.75 | 0.28 | (0.05) | 0.23 | (0.28) | — | — | (0.28) | (0.05) | 8.70 | 2.70 | 4,546,547 | 0.62 | 0.69 | 4.29 | 55 | |
| 4/1/16 to 3/31/17 | 8.33 | 0.41 | 0.42 | 0.83 | (0.41) | — | — | (0.41) | 0.42 | 8.75 | 10.13 | 4,459,175 | 0.63 | 0.63 | 4.80 | 79 | |
| 4/1/15 to 3/31/16 | 8.86 | 0.40 | (0.53) | (0.13) | (0.40) | — | — | (0.40) | (0.53) | 8.33 | (1.50) | 3,040,875 | 0.62 | 0.62 | 4.69 | 33 | |
| Class R6* | |||||||||||||||||
| 1/1/20 to 12/31/20 | $ 8.40 | 0.34 | (0.31) | 0.03 | (0.33) | — | — | (0.33) | (0.30) | $ 8.10 | 0.61 % | $ 142,506 | 0.54 % (11) | 0.63 % | 4.30 % | 68 % | |
| 1/1/19 to 12/31/19 | 8.30 | 0.44 | 0.11 | 0.55 | (0.45) | — | — | (0.45) | 0.10 | 8.40 | 6.74 | 552,427 | 0.53 (11) | 0.61 | 5.21 | 17 | |
| 1/1/18 to 12/31/18 | 8.71 | 0.43 | (0.40) | 0.03 | (0.44) | — | — | (0.44) | (0.41) | 8.30 | 0.20 | 805,046 | 0.52 | 0.58 | 5.00 | 75 | |
| 4/1/17 to 12/31/17(6) | 8.76 | 0.29 | (0.05) | 0.24 | (0.29) | — | — | (0.29) | (0.05) | 8.71 | 2.78 | 1,277,730 | 0.52 | 0.59 | 4.39 | 55 | |
| 4/1/16 to 3/31/17 | 8.33 | 0.43 | 0.42 | 0.85 | (0.42) | — | — | (0.42) | 0.43 | 8.76 | 10.37 | 1,307,701 | 0.52 | 0.52 | 4.94 | 79 | |
| 4/1/15 to 3/31/16 | 8.86 | 0.41 | (0.53) | (0.12) | (0.41) | — | — | (0.41) | (0.53) | 8.33 | (1.39) | 1,127,337 | 0.51 | 0.51 | 4.83 | 33 |
| Net Asset Value, Beginning of Period | Net Investment Income (Loss)(1) | Net Realized and Unrealized Gain (Loss) | Total from Investment Operations | Dividends from Net Investment Income | Return of Capital | Distributions from Net Realized Gains | Total Distributions | Change in Net Asset Value | Net Asset Value, End of Period | Total Return(2)(3) | Net Assets, End of Period (in thousands) | Ratio of Net Expenses to Average Net Assets(4)(5) | Ratio of Gross Expenses to Average Net Assets(4)(5) | Ratio of Net Investment Income (Loss) to Average Net Assets(4) | Portfolio Turnover Rate(3) | ||
| Seix High Grade Municipal Bond Fund | |||||||||||||||||
| Class A | |||||||||||||||||
| 1/1/20 to 12/31/20 | $12.05 | 0.13 | 0.69 | 0.82 | (0.13) | — | (0.32) | (0.45) | 0.37 | $12.42 | 6.85 % | $ 7,626 | 0.75 % (7) | 0.95 % | 1.04 % | 203 % | |
| 1/1/19 to 12/31/19 | 11.62 | 0.21 | 0.67 | 0.88 | (0.21) | — | (0.24) | (0.45) | 0.43 | 12.05 | 7.67 | 6,893 | 0.75 | 0.98 | 1.78 | 233 | |
| 1/1/18 to 12/31/18 | 11.94 | 0.31 | (0.26) | 0.05 | (0.31) | — | (0.06) | (0.37) | (0.32) | 11.62 | 0.44 | 6,767 | 0.80 (7) | 0.95 | 2.63 | 130 | |
| 4/1/17 to 12/31/17(6) | 11.69 | 0.21 | 0.27 | 0.48 | (0.22) | — | (0.01) | (0.23) | 0.25 | 11.94 | 4.12 | 8,175 | 0.80 | 0.91 | 2.39 | 173 | |
| 4/1/16 to 3/31/17 | 12.36 | 0.24 | (0.22) | 0.02 | (0.24) | — | (0.45) | (0.69) | (0.67) | 11.69 | 0.27 | 12,276 | 0.80 | 0.80 | 1.99 | 218 | |
| 4/1/15 to 3/31/16 | 12.29 | 0.25 | 0.19 | 0.44 | (0.25) | — | (0.12) | (0.37) | 0.07 | 12.36 | 3.70 | 13,996 | 0.79 | 0.79 | 2.07 | 171 | |
| Class I | |||||||||||||||||
| 1/1/20 to 12/31/20 | $12.05 | 0.15 | 0.69 | 0.84 | (0.15) | — | (0.32) | (0.47) | 0.37 | $12.42 | 7.01 % | $ 74,004 | 0.60 % (7) | 0.86 % | 1.18 % | 203 % | |
| 1/1/19 to 12/31/19 | 11.62 | 0.23 | 0.67 | 0.90 | (0.23) | — | (0.24) | (0.47) | 0.43 | 12.05 | 7.83 | 53,306 | 0.60 | 0.89 | 1.91 | 233 | |
| 1/1/18 to 12/31/18 | 11.93 | 0.32 | (0.25) | 0.07 | (0.32) | — | (0.06) | (0.38) | (0.31) | 11.62 | 0.67 | 41,769 | 0.65 (7) | 0.85 | 2.77 | 130 | |
| 4/1/17 to 12/31/17(6) | 11.68 | 0.23 | 0.26 | 0.49 | (0.23) | — | (0.01) | (0.24) | 0.25 | 11.93 | 4.24 | 75,684 | 0.65 | 0.82 | 2.55 | 173 | |
| 4/1/16 to 3/31/17 | 12.36 | 0.26 | (0.23) | 0.03 | (0.26) | — | (0.45) | (0.71) | (0.68) | 11.68 | 0.33 | 78,729 | 0.65 | 0.71 | 2.12 | 218 | |
| 4/1/15 to 3/31/16 | 12.29 | 0.27 | 0.19 | 0.46 | (0.27) | — | (0.12) | (0.39) | 0.07 | 12.36 | 3.85 | 99,803 | 0.65 | 0.69 | 2.21 | 171 | |
| Seix High Income Fund | |||||||||||||||||
| Class A | |||||||||||||||||
| 1/1/20 to 12/31/20 | $ 6.33 | 0.31 | 0.13 | 0.44 | (0.31) | — | — | (0.31) | 0.13 | $ 6.46 | 7.48 % | $ 20,133 | 0.93 % (7) | 1.16 % | 5.14 % | 201 % | |
| 1/1/19 to 12/31/19 | 5.96 | 0.32 | 0.37 | 0.69 | (0.32) | — | — | (0.32) | 0.37 | 6.33 | 11.67 | 25,338 | 0.98 (7) | 1.13 | 5.03 | 113 | |
| 1/1/18 to 12/31/18 | 6.53 | 0.36 | (0.57) | (0.21) | (0.36) | — | — | (0.36) | (0.57) | 5.96 | (3.42) | 14,327 | 1.03 | 1.11 | 5.56 | 77 | |
| 4/1/17 to 12/31/17(6) | 6.46 | 0.28 | 0.07 | 0.35 | (0.28) | — (13) | — | (0.28) | 0.07 | 6.53 | 5.52 | 29,592 | 1.02 | 1.10 | 5.69 | 45 | |
| 4/1/16 to 3/31/17 | 5.92 | 0.38 | 0.53 | 0.91 | (0.37) | — | — | (0.37) | 0.54 | 6.46 | 15.69 | 63,104 | 1.04 | 1.04 | 5.92 | 95 | |
| 4/1/15 to 3/31/16 | 6.68 | 0.38 | (0.75) | (0.37) | (0.39) | — | — | (0.39) | (0.76) | 5.92 | (5.68) | 43,433 | 1.03 | 1.03 | 6.08 | 77 | |
| Class I | |||||||||||||||||
| 1/1/20 to 12/31/20 | $ 6.33 | 0.32 | 0.13 | 0.45 | (0.33) | — | — | (0.33) | 0.12 | $ 6.45 | 7.58 % | $ 203,543 | 0.68 % (7) | 0.92 % | 5.38 % | 201 % | |
| 1/1/19 to 12/31/19 | 5.95 | 0.33 | 0.38 | 0.71 | (0.33) | — | — | (0.33) | 0.38 | 6.33 | 12.12 | 234,101 | 0.74 (7) | 0.90 | 5.29 | 113 | |
| 1/1/18 to 12/31/18 | 6.52 | 0.37 | (0.57) | (0.20) | (0.37) | — | — | (0.37) | (0.57) | 5.95 | (3.20) | 264,435 | 0.80 | 0.88 | 5.87 | 77 | |
| 4/1/17 to 12/31/17(6) | 6.46 | 0.29 | 0.06 | 0.35 | (0.29) | — (13) | — | (0.29) | 0.06 | 6.52 | 5.53 | 390,665 | 0.81 (7) | 0.87 | 5.93 | 45 | |
| 4/1/16 to 3/31/17 | 5.92 | 0.39 | 0.54 | 0.93 | (0.39) | — | — | (0.39) | 0.54 | 6.46 | 15.95 | 456,928 | 0.80 | 0.81 | 6.15 | 95 | |
| 4/1/15 to 3/31/16 | 6.67 | 0.40 | (0.75) | (0.35) | (0.40) | — | — | (0.40) | (0.75) | 5.92 | (5.31) | 546,793 | 0.79 | 0.79 | 6.34 | 77 | |
| Class R6 | |||||||||||||||||
| 1/1/20 to 12/31/20 | $ 6.32 | 0.33 | 0.13 | 0.46 | (0.33) | — | — | (0.33) | 0.13 | $ 6.45 | 7.85 % | $ 9,137 | 0.59 % (7) | 0.77 % | 5.39 % | 201 % | |
| 1/1/19 to 12/31/19 | 5.95 | 0.33 | 0.38 | 0.71 | (0.34) | — | — | (0.34) | 0.37 | 6.32 | 12.08 | 36,912 | 0.61 (7) | 0.76 | 5.30 | 113 | |
| 1/1/18 to 12/31/18 | 6.52 | 0.38 | (0.57) | (0.19) | (0.38) | — | — | (0.38) | (0.57) | 5.95 | (3.05) | 4,927 | 0.64 | 0.75 | 6.03 | 77 | |
| 4/1/17 to 12/31/17(6) | 6.45 | 0.30 | 0.07 | 0.37 | (0.30) | — (13) | — | (0.30) | 0.07 | 6.52 | 5.82 | 5,898 | 0.64 | 0.73 | 6.09 | 45 | |
| 4/1/16 to 3/31/17 | 5.92 | 0.40 | 0.53 | 0.93 | (0.40) | — | — | (0.40) | 0.53 | 6.45 | 15.96 | 4,125 | 0.64 | 0.64 | 6.26 | 95 | |
| 4/1/15 to 3/31/16 | 6.68 | 0.40 | (0.75) | (0.35) | (0.41) | — | — | (0.41) | (0.76) | 5.92 | (5.30) | 1,117 | 0.63 | 0.63 | 6.27 | 77 |
| Net Asset Value, Beginning of Period | Net Investment Income (Loss)(1) | Net Realized and Unrealized Gain (Loss) | Total from Investment Operations | Dividends from Net Investment Income | Return of Capital | Distributions from Net Realized Gains | Total Distributions | Change in Net Asset Value | Net Asset Value, End of Period | Total Return(2)(3) | Net Assets, End of Period (in thousands) | Ratio of Net Expenses to Average Net Assets(4)(5) | Ratio of Gross Expenses to Average Net Assets(4)(5) | Ratio of Net Investment Income (Loss) to Average Net Assets(4) | Portfolio Turnover Rate(3) | ||
| Seix High Yield Fund | |||||||||||||||||
| Class A | |||||||||||||||||
| 1/1/20 to 12/31/20 | $ 8.19 | 0.37 | 0.40 | 0.77 | (0.37) | — | — | (0.37) | 0.40 | $ 8.59 | 9.86 % | $ 11,608 | 0.82 % | 1.05 % | 4.54 % | 182 % | |
| 1/1/19 to 12/31/19 | 7.62 | 0.38 | 0.57 | 0.95 | (0.38) | — | — | (0.38) | 0.57 | 8.19 | 12.64 | 4,623 | 0.82 | 1.04 | 4.70 | 98 | |
| 1/1/18 to 12/31/18 | 8.21 | 0.43 | (0.59) | (0.16) | (0.43) | — | — | (0.43) | (0.59) | 7.62 | (2.07) | 2,910 | 0.82 | 1.02 | 5.32 | 59 | |
| 4/1/17 to 12/31/17(6) | 8.16 | 0.34 | 0.03 | 0.37 | (0.30) | (0.02) | — | (0.32) | 0.05 | 8.21 | 4.63 | 4,810 | 0.83 (7) | 0.97 | 5.43 | 41 | |
| 4/1/16 to 3/31/17 | 7.61 | 0.44 | 0.55 | 0.99 | (0.44) | — | — | (0.44) | 0.55 | 8.16 | 13.20 | 6,214 | 0.82 | 0.82 | 5.51 | 87 | |
| 4/1/15 to 3/31/16 | 8.51 | 0.44 | (0.89) | (0.45) | (0.45) | — | — | (0.45) | (0.90) | 7.61 | (5.36) | 7,463 | 0.84 | 0.84 | 5.48 | 76 | |
| Class I | |||||||||||||||||
| 1/1/20 to 12/31/20 | $ 8.41 | 0.40 | 0.40 | 0.80 | (0.40) | — | — | (0.40) | 0.40 | $ 8.81 | 9.93 % | $ 362,138 | 0.64 % | 0.76 % | 4.81 % | 182 % | |
| 1/1/19 to 12/31/19 | 7.82 | 0.41 | 0.58 | 0.99 | (0.40) | — | — | (0.40) | 0.59 | 8.41 | 12.91 | 292,284 | 0.64 | 0.77 | 4.93 | 98 | |
| 1/1/18 to 12/31/18 | 8.41 | 0.45 | (0.58) | (0.13) | (0.46) | — | — | (0.46) | (0.59) | 7.82 | (1.70) | 286,931 | 0.64 | 0.76 | 5.53 | 59 | |
| 4/1/17 to 12/31/17(6) | 8.37 | 0.34 | 0.04 | 0.38 | (0.32) | (0.02) | — | (0.34) | 0.04 | 8.41 | 4.64 | 403,198 | 0.65 (7) | 0.73 | 5.38 | 41 | |
| 4/1/16 to 3/31/17 | 7.80 | 0.46 | 0.57 | 1.03 | (0.46) | — | — | (0.46) | 0.57 | 8.37 | 13.48 | 483,080 | 0.64 | 0.64 | 5.65 | 87 | |
| 4/1/15 to 3/31/16 | 8.73 | 0.47 | (0.92) | (0.45) | (0.48) | — | — | (0.48) | (0.93) | 7.80 | (5.23) | 523,206 | 0.61 | 0.61 | 5.71 | 76 | |
| Class R6* | |||||||||||||||||
| 1/1/20 to 12/31/20 | $ 8.41 | 0.41 | 0.40 | 0.81 | (0.41) | — | — | (0.41) | 0.40 | $ 8.81 | 10.05 % | $ 11,850 | 0.53 % | 0.67 % | 4.92 % | 182 % | |
| 1/1/19 to 12/31/19 | 7.82 | 0.40 | 0.60 | 1.00 | (0.41) | — | — | (0.41) | 0.59 | 8.41 | 13.03 | 5,645 | 0.53 | 0.67 | 4.89 | 98 | |
| 1/1/18 to 12/31/18 | 8.42 | 0.44 | (0.58) | (0.14) | (0.46) | — | — | (0.46) | (0.60) | 7.82 | (1.74) | 1,009 | 0.53 | 0.64 | 5.31 | 59 | |
| 4/1/17 to 12/31/17(6) | 8.37 | 0.35 | 0.05 | 0.40 | (0.33) | (0.02) | — | (0.35) | 0.05 | 8.42 | 4.85 | 45,035 | 0.54 (7) | 0.62 | 5.50 | 41 | |
| 8/1/16 to 3/31/17(14) | 8.17 | 0.33 | 0.18 | 0.51 | (0.31) | — | — | (0.31) | 0.20 | 8.37 | 6.34 | 42,695 | 0.54 | 0.54 | 5.86 | 87 | |
| Seix Investment Grade Tax-Exempt Bond Fund | |||||||||||||||||
| Class A | |||||||||||||||||
| 1/1/20 to 12/31/20 | $11.72 | 0.10 | 0.57 | 0.67 | (0.10) | — | (0.30) | (0.40) | 0.27 | $11.99 | 5.73 % | $ 8,902 | 0.73 % (7) | 1.01 % | 0.84 % | 173 % | |
| 1/1/19 to 12/31/19 | 11.45 | 0.19 | 0.55 | 0.74 | (0.19) | — | (0.28) | (0.47) | 0.27 | 11.72 | 6.54 | 9,329 | 0.75 (7) | 1.00 | 1.65 | 203 | |
| 1/1/18 to 12/31/18 | 11.75 | 0.28 | (0.23) | 0.05 | (0.28) | — | (0.07) | (0.35) | (0.30) | 11.45 | 0.45 | 9,999 | 0.80 (7) | 1.00 | 2.47 | 105 | |
| 4/1/17 to 12/31/17(6) | 11.65 | 0.22 | 0.10 | 0.32 | (0.22) | — | — | (0.22) | 0.10 | 11.75 | 2.76 | 11,066 | 0.80 | 0.96 | 2.46 | 130 | |
| 4/1/16 to 3/31/17 | 12.24 | 0.26 | (0.32) | (0.06) | (0.26) | — | (0.27) | (0.53) | (0.59) | 11.65 | (0.48) | 20,281 | 0.80 | 0.92 | 2.16 | 138 | |
| 4/1/15 to 3/31/16 | 12.30 | 0.26 | 0.08 | 0.34 | (0.26) | — | (0.14) | (0.40) | (0.06) | 12.24 | 2.89 | 24,861 | 0.80 | 0.93 | 2.17 | 139 | |
| Class I | |||||||||||||||||
| 1/1/20 to 12/31/20 | $11.70 | 0.12 | 0.58 | 0.70 | (0.12) | — | (0.30) | (0.42) | 0.28 | $11.98 | 5.98 % | $ 288,699 | 0.58 % (7) | 0.82 % | 0.98 % | 173 % | |
| 1/1/19 to 12/31/19 | 11.43 | 0.21 | 0.55 | 0.76 | (0.21) | — | (0.28) | (0.49) | 0.27 | 11.70 | 6.71 | 295,280 | 0.60 (7) | 0.81 | 1.80 | 203 | |
| 1/1/18 to 12/31/18 | 11.73 | 0.30 | (0.23) | 0.07 | (0.30) | — | (0.07) | (0.37) | (0.30) | 11.43 | 0.60 | 307,001 | 0.65 (7) | 0.80 | 2.61 | 105 | |
| 4/1/17 to 12/31/17(6) | 11.64 | 0.23 | 0.09 | 0.32 | (0.23) | — | — | (0.23) | 0.09 | 11.73 | 2.79 | 463,968 | 0.65 | 0.76 | 2.62 | 130 | |
| 4/1/16 to 3/31/17 | 12.22 | 0.28 | (0.31) | (0.03) | (0.28) | — | (0.27) | (0.55) | (0.58) | 11.64 | (0.24) | 519,784 | 0.65 | 0.70 | 2.30 | 138 | |
| 4/1/15 to 3/31/16 | 12.29 | 0.28 | 0.07 | 0.35 | (0.28) | — | (0.14) | (0.42) | (0.07) | 12.22 | 2.96 | 629,435 | 0.65 | 0.68 | 2.32 | 139 |
| Net Asset Value, Beginning of Period | Net Investment Income (Loss)(1) | Net Realized and Unrealized Gain (Loss) | Total from Investment Operations | Dividends from Net Investment Income | Return of Capital | Distributions from Net Realized Gains | Total Distributions | Change in Net Asset Value | Net Asset Value, End of Period | Total Return(2)(3) | Net Assets, End of Period (in thousands) | Ratio of Net Expenses to Average Net Assets(4)(5) | Ratio of Gross Expenses to Average Net Assets(4)(5) | Ratio of Net Investment Income (Loss) to Average Net Assets(4) | Portfolio Turnover Rate(3) | ||
| Seix Short-Term Bond Fund | |||||||||||||||||
| Class A | |||||||||||||||||
| 1/1/20 to 12/31/20 | $ 9.96 | 0.07 | 0.29 | 0.36 | (0.08) | — | — | (0.08) | 0.28 | $10.24 | 3.59 % | $ 6,280 | 0.80 % | 1.27 % | 0.66 % | 171 % | |
| 1/1/19 to 12/31/19 | 9.83 | 0.17 | 0.13 | 0.30 | (0.17) | — | — | (0.17) | 0.13 | 9.96 | 3.08 | 2,300 | 0.80 | 1.81 | 1.73 | 77 | |
| 1/1/18 to 12/31/18 | 9.90 | 0.14 | (0.06) | 0.08 | (0.14) | (0.01) | — | (0.15) | (0.07) | 9.83 | 0.81 | 2,028 | 0.80 | 1.68 | 1.43 | 93 | |
| 4/1/17 to 12/31/17(6) | 9.95 | 0.07 | (0.04) | 0.03 | (0.07) | (0.01) | — | (0.08) | (0.05) | 9.90 | 0.27 | 2,210 | 0.80 | 1.26 | 0.89 | 145 | |
| 4/1/16 to 3/31/17 | 10.01 | 0.06 | (0.06) | — | (0.06) | — | — | (0.06) | (0.06) | 9.95 | 0.03 | 2,308 | 0.80 | 0.80 | 0.58 | 129 | |
| 4/1/15 to 3/31/16 | 10.00 | 0.04 | 0.02 | 0.06 | (0.05) | — | — | (0.05) | 0.01 | 10.01 | 0.58 | 2,104 | 0.80 | 0.81 | 0.38 | 87 | |
| Class C | |||||||||||||||||
| 1/1/20 to 12/31/20 | $ 9.96 | 0.01 | 0.28 | 0.29 | (0.01) | — | — | (0.01) | 0.28 | $10.24 | 2.96 % | $ 2,082 | 1.39 % | 2.10 % | 0.08 % | 171 % | |
| 1/1/19 to 12/31/19 | 9.83 | 0.09 | 0.13 | 0.22 | (0.09) | — | — | (0.09) | 0.13 | 9.96 | 2.29 | 733 | 1.57 | 2.58 | 0.95 | 77 | |
| 1/1/18 to 12/31/18 | 9.89 | 0.07 | (0.06) | 0.01 | (0.06) | (0.01) | — | (0.07) | (0.06) | 9.83 | 0.14 | 1,461 | 1.57 | 2.48 | 0.66 | 93 | |
| 4/1/17 to 12/31/17(6) | 9.94 | 0.02 | (0.05) | (0.03) | (0.01) | (0.01) | — | (0.02) | (0.05) | 9.89 | (0.26) | 1,257 | 1.48 | 2.04 | 0.21 | 145 | |
| 4/1/16 to 3/31/17 | 10.00 | — (13) | (0.06) | (0.06) | — | — | — | — | (0.06) | 9.94 | (0.57) | 1,310 | 1.40 | 1.57 | (0.03) | 129 | |
| 4/1/15 to 3/31/16 | 10.00 | (0.01) | 0.01 | — | — (13) | — | — | — (13) | — | 10.00 | — | 1,742 | 1.29 | 1.58 | (0.10) | 87 | |
| Class I | |||||||||||||||||
| 1/1/20 to 12/31/20 | $ 9.93 | 0.09 | 0.30 | 0.39 | (0.10) | — | — | (0.10) | 0.29 | $10.22 | 3.91 % | $ 7,352 | 0.60 % | 1.16 % | 0.88 % | 171 % | |
| 1/1/19 to 12/31/19 | 9.80 | 0.19 | 0.13 | 0.32 | (0.19) | — | — | (0.19) | 0.13 | 9.93 | 3.29 | 5,155 | 0.60 | 1.61 | 1.93 | 77 | |
| 1/1/18 to 12/31/18 | 9.86 | 0.16 | (0.05) | 0.11 | (0.16) | (0.01) | — | (0.17) | (0.06) | 9.80 | 1.11 | 5,719 | 0.60 | 1.43 | 1.62 | 93 | |
| 4/1/17 to 12/31/17(6) | 9.92 | 0.08 | (0.05) | 0.03 | (0.08) | (0.01) | — | (0.09) | (0.06) | 9.86 | 0.31 | 7,918 | 0.60 | 0.91 | 1.05 | 145 | |
| 4/1/16 to 3/31/17 | 9.98 | 0.08 | (0.06) | 0.02 | (0.08) | — | — | (0.08) | (0.06) | 9.92 | 0.23 | 52,024 | 0.60 | 0.69 | 0.77 | 129 | |
| 4/1/15 to 3/31/16 | 9.98 | 0.06 | 0.01 | 0.07 | (0.07) | — | — | (0.07) | — | 9.98 | 0.68 | 49,749 | 0.60 | 0.68 | 0.58 | 87 | |
| Seix Short-Term Municipal Bond Fund | |||||||||||||||||
| Class A | |||||||||||||||||
| 1/1/20 to 12/31/20 | $10.03 | 0.05 | 0.24 | 0.29 | (0.05) | — | (0.11) | (0.16) | 0.13 | $10.16 | 2.86 % | $ 1,474 | 0.64 % (7) | 1.25 % | 0.49 % | 125 % | |
| 1/1/19 to 12/31/19 | 9.92 | 0.12 | 0.23 | 0.35 | (0.12) | — | (0.12) | (0.24) | 0.11 | 10.03 | 3.54 | 1,535 | 0.65 | 1.17 | 1.15 | 77 | |
| 1/1/18 to 12/31/18 | 9.91 | 0.09 | 0.02 | 0.11 | (0.10) | — | — (13) | (0.10) | 0.01 | 9.92 | 1.10 | 1,411 | 0.65 | 1.05 | 0.96 | 50 | |
| 4/1/17 to 12/31/17(6) | 9.93 | 0.05 | (0.01) | 0.04 | (0.05) | — | (0.01) | (0.06) | (0.02) | 9.91 | 0.39 | 1,765 | 0.65 | 0.95 | 0.70 | 56 | |
| 4/1/16 to 3/31/17 | 9.98 | 0.05 | (0.03) | 0.02 | (0.06) | — | (0.01) | (0.07) | (0.05) | 9.93 | 0.26 | 1,810 | 0.65 | 0.74 | 0.54 | 59 | |
| 4/1/15 to 3/31/16 | 10.00 | 0.02 | — (13) | 0.02 | (0.02) | — | (0.02) | (0.04) | (0.02) | 9.98 | 0.23 | 7,354 | 0.67 | 0.72 | 0.24 | 82 | |
| Class I | |||||||||||||||||
| 1/1/20 to 12/31/20 | $10.04 | 0.06 | 0.25 | 0.31 | (0.07) | — | (0.11) | (0.18) | 0.13 | $10.17 | 3.03 % | $ 12,249 | 0.47 % (7) | 1.15 % | 0.64 % | 125 % | |
| 1/1/19 to 12/31/19 | 9.93 | 0.13 | 0.23 | 0.36 | (0.13) | — | (0.12) | (0.25) | 0.11 | 10.04 | 3.71 | 10,833 | 0.48 | 1.05 | 1.34 | 77 | |
| 1/1/18 to 12/31/18 | 9.91 | 0.11 | 0.02 | 0.13 | (0.11) | — | — (13) | (0.11) | 0.02 | 9.93 | 1.37 | 19,043 | 0.48 | 0.89 | 1.12 | 50 | |
| 4/1/17 to 12/31/17(6) | 9.93 | 0.07 | (0.01) | 0.06 | (0.07) | — | (0.01) | (0.08) | (0.02) | 9.91 | 0.52 | 31,289 | 0.48 | 0.81 | 0.87 | 56 | |
| 4/1/16 to 3/31/17 | 9.98 | 0.08 | (0.04) | 0.04 | (0.08) | — | (0.01) | (0.09) | (0.05) | 9.93 | 0.40 | 26,710 | 0.48 | 0.66 | 0.75 | 59 | |
| 4/1/15 to 3/31/16 | 10.00 | 0.04 | — (13) | 0.04 | (0.04) | — | (0.02) | (0.06) | (0.02) | 9.98 | 0.41 | 32,184 | 0.51 | 0.62 | 0.41 | 82 |
| Net Asset Value, Beginning of Period | Net Investment Income (Loss)(1) | Net Realized and Unrealized Gain (Loss) | Total from Investment Operations | Dividends from Net Investment Income | Return of Capital | Distributions from Net Realized Gains | Total Distributions | Change in Net Asset Value | Net Asset Value, End of Period | Total Return(2)(3) | Net Assets, End of Period (in thousands) | Ratio of Net Expenses to Average Net Assets(4)(5) | Ratio of Gross Expenses to Average Net Assets(4)(5) | Ratio of Net Investment Income (Loss) to Average Net Assets(4) | Portfolio Turnover Rate(3) | ||
| Seix Total Return Bond Fund | |||||||||||||||||
| Class A | |||||||||||||||||
| 1/1/20 to 12/31/20 | $11.03 | 0.15 | 1.05 | 1.20 | (0.21) | — | (0.09) | (0.30) | 0.90 | $11.93 | 10.91 % | $ 12,879 | 0.70 % | 0.87 % | 1.27 % | 186 % | |
| 1/1/19 to 12/31/19 | 10.52 | 0.22 | 0.48 | 0.70 | (0.13) | (0.06) | — | (0.19) | 0.51 | 11.03 | 6.69 | 24,861 | 0.70 | 0.94 | 2.04 | 190 | |
| 1/1/18 to 12/31/18 | 10.77 | 0.23 | (0.28) | (0.05) | (0.20) | — | — | (0.20) | (0.25) | 10.52 | (0.48) | 10,717 | 0.70 | 0.85 | 2.18 | 169 | |
| 4/1/17 to 12/31/17(6) | 10.77 | 0.15 | — | 0.15 | (0.09) | (0.06) | — | (0.15) | — | 10.77 | 1.37 | 13,227 | 0.71 (7) | 0.84 | 1.86 | 150 | |
| 4/1/16 to 3/31/17 | 11.02 | 0.20 | (0.06) | 0.14 | (0.22) | — | (0.17) | (0.39) | (0.25) | 10.77 | 1.22 | 27,284 | 0.70 | 0.70 | 1.85 | 210 | |
| 4/1/15 to 3/31/16 | 11.11 | 0.17 | (0.06) | 0.11 | (0.19) | — | (0.01) | (0.20) | (0.09) | 11.02 | 1.02 | 32,366 | 0.71 | 0.71 | 1.55 | 181 | |
| Class I | |||||||||||||||||
| 1/1/20 to 12/31/20 | $10.68 | 0.16 | 1.03 | 1.19 | (0.24) | — | (0.09) | (0.33) | 0.86 | $11.54 | 11.12 % | $ 295,811 | 0.46 % | 0.57 % | 1.38 % | 186 % | |
| 1/1/19 to 12/31/19 | 10.17 | 0.24 | 0.48 | 0.72 | (0.15) | (0.06) | — | (0.21) | 0.51 | 10.68 | 7.12 | 220,036 | 0.46 | 0.59 | 2.32 | 190 | |
| 1/1/18 to 12/31/18 | 10.42 | 0.24 | (0.28) | (0.04) | (0.21) | — | — | (0.21) | (0.25) | 10.17 | (0.32) | 335,999 | 0.46 | 0.55 | 2.39 | 169 | |
| 4/1/17 to 12/31/17(6) | 10.42 | 0.17 | (0.01) | 0.16 | (0.10) | (0.06) | — | (0.16) | — | 10.42 | 1.56 | 681,009 | 0.46 | 0.53 | 2.15 | 150 | |
| 4/1/16 to 3/31/17 | 10.67 | 0.22 | (0.07) | 0.15 | (0.23) | — | (0.17) | (0.40) | (0.25) | 10.42 | 1.44 | 790,997 | 0.46 | 0.46 | 2.10 | 210 | |
| 4/1/15 to 3/31/16 | 10.75 | 0.19 | (0.05) | 0.14 | (0.21) | — | (0.01) | (0.22) | (0.08) | 10.67 | 1.35 | 971,159 | 0.45 | 0.45 | 1.82 | 181 | |
| Class R6* | |||||||||||||||||
| 1/1/20 to 12/31/20 | $10.67 | 0.17 | 1.03 | 1.20 | (0.25) | — | (0.09) | (0.34) | 0.86 | $11.53 | 11.30 % | $ 123,041 | 0.31 % | 0.46 % | 1.53 % | 186 % | |
| 1/1/19 to 12/31/19 | 10.17 | 0.26 | 0.46 | 0.72 | (0.16) | (0.06) | — | (0.22) | 0.50 | 10.67 | 7.18 | 61,313 | 0.31 | 0.45 | 2.51 | 190 | |
| 1/1/18 to 12/31/18 | 10.42 | 0.26 | (0.28) | (0.02) | (0.23) | — | — | (0.23) | (0.25) | 10.17 | (0.17) | 70,626 | 0.31 | 0.44 | 2.55 | 169 | |
| 4/1/17 to 12/31/17(6) | 10.42 | 0.19 | (0.02) | 0.17 | (0.11) | (0.06) | — | (0.17) | — | 10.42 | 1.68 | 145,096 | 0.31 | 0.40 | 2.38 | 150 | |
| 4/1/16 to 3/31/17 | 10.67 | 0.25 | (0.08) | 0.17 | (0.25) | — | (0.17) | (0.42) | (0.25) | 10.42 | 1.58 | 101,022 | 0.31 | 0.31 | 2.40 | 210 | |
| 4/1/15 to 3/31/16 | 10.75 | 0.21 | (0.06) | 0.15 | (0.22) | — | (0.01) | (0.23) | (0.08) | 10.67 | 1.49 | 56,133 | 0.31 | 0.31 | 1.95 | 181 | |
| Seix U.S. Government Securities Ultra-Short Bond Fund | |||||||||||||||||
| Class A | |||||||||||||||||
| 1/1/20 to 12/31/20 | $10.00 | 0.04 | 0.06 | 0.10 | (0.06) | — | — | (0.06) | 0.04 | $10.04 | 0.99 % | $ 33,092 | 0.66 % | 0.66 % | 0.41 % | 54 % | |
| 1/1/19 to 12/31/19 | 9.99 | 0.19 | 0.02 | 0.21 | (0.20) | — | — | (0.20) | 0.01 | 10.00 | 2.11 | 13,741 | 0.65 (15) | 0.65 | 1.91 | 63 | |
| 7/24/18 to 12/31/18(16) | 10.00 | 0.09 | (0.01) | 0.08 | (0.08) | (0.01) | — | (0.09) | (0.01) | 9.99 | 0.79 | 5,497 | 0.63 (15) | 0.63 | 2.10 | 28 (10) | |
| Class I | |||||||||||||||||
| 1/1/20 to 12/31/20 | $10.00 | 0.08 | 0.04 | 0.12 | (0.08) | — | — | (0.08) | 0.04 | $10.04 | 1.25 % | $1,090,217 | 0.41 % | 0.49 % | 0.76 % | 54 % | |
| 1/1/19 to 12/31/19 | 9.99 | 0.23 | — | 0.23 | (0.22) | — | — | (0.22) | 0.01 | 10.00 | 2.36 | 864,548 | 0.41 | 0.50 | 2.27 | 63 | |
| 1/1/18 to 12/31/18 | 10.01 | 0.19 | (0.01) | 0.18 | (0.19) | (0.01) | — | (0.20) | (0.02) | 9.99 | 1.83 | 1,232,473 | 0.41 | 0.50 | 1.89 | 28 | |
| 4/1/17 to 12/31/17(6) | 10.03 | 0.09 | (0.01) | 0.08 | (0.09) | (0.01) | — | (0.10) | (0.02) | 10.01 | 0.82 | 1,343,042 | 0.41 | 0.47 | 1.17 | 48 | |
| 4/1/16 to 3/31/17 | 10.03 | 0.07 | 0.03 | 0.10 | (0.10) | — | — | (0.10) | — | 10.03 | 0.98 | 1,367,242 | 0.42 | 0.42 | 0.72 | 77 | |
| 4/1/15 to 3/31/16 | 10.12 | 0.06 | (0.07) | (0.01) | (0.08) | — | — | (0.08) | (0.09) | 10.03 | (0.11) | 1,557,899 | 0.41 | 0.41 | 0.57 | 52 |
| Net Asset Value, Beginning of Period | Net Investment Income (Loss)(1) | Net Realized and Unrealized Gain (Loss) | Total from Investment Operations | Dividends from Net Investment Income | Return of Capital | Distributions from Net Realized Gains | Total Distributions | Change in Net Asset Value | Net Asset Value, End of Period | Total Return(2)(3) | Net Assets, End of Period (in thousands) | Ratio of Net Expenses to Average Net Assets(4)(5) | Ratio of Gross Expenses to Average Net Assets(4)(5) | Ratio of Net Investment Income (Loss) to Average Net Assets(4) | Portfolio Turnover Rate(3) | ||
| Seix U.S. Government Securities Ultra-Short Bond Fund (Continued) | |||||||||||||||||
| Class R6* | |||||||||||||||||
| 1/1/20 to 12/31/20 | $10.01 | 0.07 | 0.07 | 0.14 | (0.10) | — | — | (0.10) | 0.04 | $10.05 | 1.40 % | $ 87,343 | 0.26 % | 0.38 % | 0.66 % | 54 % | |
| 1/1/19 to 12/31/19 | 10.00 | 0.24 | 0.01 | 0.25 | (0.24) | — | — | (0.24) | 0.01 | 10.01 | 2.51 | 25,521 | 0.26 | 0.37 | 2.39 | 63 | |
| 1/1/18 to 12/31/18 | 10.03 | 0.20 | (0.01) | 0.19 | (0.21) | (0.01) | — | (0.22) | (0.03) | 10.00 | 1.88 | 32,940 | 0.26 | 0.37 | 2.01 | 28 | |
| 4/1/17 to 12/31/17(6) | 10.04 | 0.10 | — (13) | 0.10 | (0.10) | (0.01) | — | (0.11) | (0.01) | 10.03 | 1.04 | 43,072 | 0.26 | 0.33 | 1.32 | 48 | |
| 8/1/16 to 3/31/17(14) | 10.04 | 0.08 | — | 0.08 | (0.08) | — | — | (0.08) | — | 10.04 | 0.77 | 32,657 | 0.26 | 0.26 | 1.12 | 77 | |
| Seix U.S. Mortgage Fund | |||||||||||||||||
| Class A | |||||||||||||||||
| 1/1/20 to 12/31/20 | $11.28 | 0.04 | 0.25 | 0.29 | (0.11) | — | — | (0.11) | 0.18 | $11.46 | 2.60 % | $ 6,395 | 0.90 % | 1.81 % | 0.39 % | 53 % | |
| 1/1/19 to 12/31/19 | 10.87 | 0.22 | 0.42 | 0.64 | (0.22) | (0.01) | — | (0.23) | 0.41 | 11.28 | 5.94 | 6,657 | 0.90 | 1.74 | 1.97 | 101 | |
| 1/1/18 to 12/31/18 | 11.09 | 0.20 | (0.17) | 0.03 | (0.20) | (0.05) | — | (0.25) | (0.22) | 10.87 | 0.31 | 3,727 | 0.90 | 2.01 | 1.88 | 129 | |
| 4/1/17 to 12/31/17(6) | 11.10 | 0.12 | 0.04 | 0.16 | (0.11) | (0.06) | — | (0.17) | (0.01) | 11.09 | 1.45 | 2,566 | 0.90 | 1.59 | 1.48 | 89 | |
| 4/1/16 to 3/31/17 | 11.31 | 0.05 | (0.04) | 0.01 | (0.18) | — | (0.04) | (0.22) | (0.21) | 11.10 | 0.04 | 3,594 | 0.90 | 0.98 | 0.41 | 118 | |
| 4/1/15 to 3/31/16 | 11.29 | 0.08 | 0.11 | 0.19 | (0.17) | — | — | (0.17) | 0.02 | 11.31 | 1.72 | 6,560 | 0.90 | 1.10 | 0.76 | 223 | |
| Class C | |||||||||||||||||
| 1/1/20 to 12/31/20 | $11.30 | (0.05) | 0.26 | 0.21 | (0.03) | — | — | (0.03) | 0.18 | $11.48 | 1.83 % | $ 499 | 1.65 % | 2.05 % | (0.46) % | 53 % | |
| 1/1/19 to 12/31/19 | 10.89 | 0.14 | 0.41 | 0.55 | (0.13) | (0.01) | — | (0.14) | 0.41 | 11.30 | 5.09 | 383 | 1.65 | 1.99 | 1.29 | 101 | |
| 1/1/18 to 12/31/18 | 11.11 | 0.12 | (0.17) | (0.05) | (0.12) | (0.05) | — | (0.17) | (0.22) | 10.89 | (0.43) | 3,174 | 1.65 | 2.00 | 1.09 | 129 | |
| 4/1/17 to 12/31/17(6) | 11.11 | 0.05 | 0.06 | 0.11 | (0.05) | (0.06) | — | (0.11) | — | 11.11 | 0.99 | 3,722 | 1.62 | 1.98 | 0.65 | 89 | |
| 4/1/16 to 3/31/17 | 11.33 | (0.03) | (0.06) | (0.09) | (0.09) | — | (0.04) | (0.13) | (0.22) | 11.11 | (0.79) | 4,301 | 1.65 | 1.71 | 0.26 | 118 | |
| 4/1/15 to 3/31/16 | 11.32 | — (13) | 0.10 | 0.10 | (0.09) | — | — | (0.09) | 0.01 | 11.33 | 0.88 | 5,478 | 1.65 | 1.79 | 0.01 | 223 | |
| Class I | |||||||||||||||||
| 1/1/20 to 12/31/20 | $11.30 | 0.07 | 0.25 | 0.32 | (0.14) | — | — | (0.14) | 0.18 | $11.48 | 2.80 % | $ 9,977 | 0.70 % | 1.13 % | 0.60 % | 53 % | |
| 1/1/19 to 12/31/19 | 10.89 | 0.24 | 0.42 | 0.66 | (0.24) | (0.01) | — | (0.25) | 0.41 | 11.30 | 6.13 | 14,476 | 0.70 | 1.10 | 2.19 | 101 | |
| 1/1/18 to 12/31/18 | 11.11 | 0.22 | (0.17) | 0.05 | (0.22) | (0.05) | — | (0.27) | (0.22) | 10.89 | 0.52 | 17,615 | 0.70 | 1.08 | 2.05 | 129 | |
| 4/1/17 to 12/31/17(6) | 11.12 | 0.13 | 0.05 | 0.18 | (0.13) | (0.06) | — | (0.19) | (0.01) | 11.11 | 1.60 | 18,967 | 0.70 | 1.08 | 1.52 | 89 | |
| 4/1/16 to 3/31/17 | 11.33 | 0.07 | (0.04) | 0.03 | (0.20) | — | (0.04) | (0.24) | (0.21) | 11.12 | 0.24 | 17,620 | 0.70 | 0.86 | 0.66 | 118 | |
| 4/1/15 to 3/31/16 | 11.32 | 0.12 | 0.09 | 0.21 | (0.20) | — | — | (0.20) | 0.01 | 11.33 | 1.84 | 25,068 | 0.70 | 0.86 | 1.03 | 223 | |
| Seix Ultra-Short Bond Fund | |||||||||||||||||
| Class A | |||||||||||||||||
| 1/1/20 to 12/31/20 | $ 9.96 | 0.10 | 0.01 | 0.11 | (0.10) | — | — | (0.10) | 0.01 | $ 9.97 | 1.13 % | $ 4,189 | 0.65 % | 0.84 % | 1.03 % | 101 % | |
| 1/1/19 to 12/31/19 | 9.92 | 0.21 | 0.04 | 0.25 | (0.21) | — | — | (0.21) | 0.04 | 9.96 | 2.58 | 3,111 | 0.65 | 0.83 | 2.07 | 97 | |
| 7/24/18 to 12/31/18(16) | 9.97 | 0.11 | (0.06) | 0.05 | (0.10) | — | — | (0.10) | (0.05) | 9.92 | 0.48 | 1,698 | 0.65 | 0.84 | 2.46 | 112 (10) |
| Net Asset Value, Beginning of Period | Net Investment Income (Loss)(1) | Net Realized and Unrealized Gain (Loss) | Total from Investment Operations | Dividends from Net Investment Income | Return of Capital | Distributions from Net Realized Gains | Total Distributions | Change in Net Asset Value | Net Asset Value, End of Period | Total Return(2)(3) | Net Assets, End of Period (in thousands) | Ratio of Net Expenses to Average Net Assets(4)(5) | Ratio of Gross Expenses to Average Net Assets(4)(5) | Ratio of Net Investment Income (Loss) to Average Net Assets(4) | Portfolio Turnover Rate(3) | ||
| Seix Ultra-Short Bond Fund (Continued) | |||||||||||||||||
| Class I | |||||||||||||||||
| 1/1/20 to 12/31/20 | $ 9.95 | 0.13 | 0.01 | 0.14 | (0.13) | — | — | (0.13) | 0.01 | $ 9.96 | 1.39 % | $ 44,711 | 0.40 % | 0.62 % | 1.29 % | 101 % | |
| 1/1/19 to 12/31/19 | 9.91 | 0.24 | 0.04 | 0.28 | (0.24) | — | — | (0.24) | 0.04 | 9.95 | 2.84 | 48,183 | 0.40 | 0.61 | 2.42 | 97 | |
| 1/1/18 to 12/31/18 | 9.97 | 0.22 | (0.06) | 0.16 | (0.22) | — | — | (0.22) | (0.06) | 9.91 | 1.61 | 60,041 | 0.40 | 0.62 | 2.21 | 112 | |
| 4/1/17 to 12/31/17(6) | 9.96 | 0.11 | 0.01 | 0.12 | (0.11) | — | — | (0.11) | 0.01 | 9.97 | 1.21 | 59,548 | 0.42 (7) | 0.56 | 1.44 | 53 | |
| 4/1/16 to 3/31/17 | 9.93 | 0.10 | 0.04 | 0.14 | (0.11) | — | — | (0.11) | 0.03 | 9.96 | 1.41 | 87,344 | 0.40 | 0.40 | 1.05 | 142 | |
| 4/1/15 to 3/31/16 | 9.97 | 0.08 | (0.04) | 0.04 | (0.08) | — | — | (0.08) | (0.04) | 9.93 | 0.42 | 104,950 | 0.38 | 0.38 | 0.77 | 59 |
| Footnote Legend: | |
| * | On September 18, 2017, Class IS shares were renamed Class R6 shares. |
| (1) | Calculated using average shares outstanding. |
| (2) | Sales charges, where applicable, are not reflected in the total return calculation. |
| (3) | Not annualized for periods less than one year. |
| (4) | Annualized for periods less than one year. |
| (5) | The Funds will also indirectly bear their prorated share of expenses of any underlying funds in which they invest. Such expenses are not included in the calculation of this ratio. |
| (6) | The Fund changed its fiscal year end to December 31 during the period. |
| (7) | Due to a change in expense cap, the ratio shown is a blended expense ratio. |
| (8) | Class R6 (formerly IS) commenced operations on August 3, 2015. |
| (9) | Inception date. |
| (10) | Portfolio turnover is representative of the Fund for the entire period. |
| (11) | Ratio of total expenses excluding interest expense on borrowings for the years ended December 31, 2020 and 2019 were 0.94% (Class A), 1.52% (Class C), 0.62% (Class I) and 0.52% (Class R6). |
| (12) | See Note 4D in the Notes to Financial Statements for information on recapture of expenses previously reimbursed. |
| (13) | Amount is less than $0.005 per share. |
| (14) | Class R6 (formerly IS) commenced operations on August 1, 2016. |
| (15) | The share class is currently under its expense limitation. |
| (16) | Class A commenced operations on July 24, 2018. |
December 31, 2020
| A. | Security Valuation |
| Each Fund utilizes a fair value hierarchy which prioritizes the inputs to valuation techniques used to measure fair value into three broad levels. The Funds’ policy is to recognize transfers into or out of Level 3 at the end of the reporting period. |
| • Level 1 – quoted prices in active markets for identical securities (security types generally include listed equities). |
| B. | Security Transactions and Investment Income |
| Security transactions are recorded on the trade date. Realized gains and losses from the sale of securities are determined on the identified cost basis. Dividend income is recognized on the ex-dividend date or, in the case of certain foreign securities, as soon as a Fund is notified. Interest income is recorded on the accrual basis. Each Fund amortizes premiums and accretes discounts using the effective interest method. Premiums on callable debt securities are amortized to interest income to the earliest call date using the effective interest method. Any distributions from underlying funds are recorded in accordance with the character of the distributions as designated by the underlying funds. | |
| Dividend income from REITs is recorded using management’s estimate of the percentage of income included in distributions received from such investments based on historical information and other industry sources. The return of capital portion of the estimate is a reduction to investment income and a reduction in the cost basis of each investment which increases net realized gain (loss) and net change in unrealized appreciation (depreciation). If the return of capital distributions exceed their cost basis, the distributions are treated as realized gains. The actual amounts of income, return of capital, and capital gains are only determined by each REIT after its fiscal year-end, and may differ from the estimated amounts. | |
| C. | Income Taxes |
| Each Fund is treated as a separate taxable entity. It is the intention of each Fund to comply with the requirements of Subchapter M of the Internal Revenue Code and to distribute substantially all of its taxable income to its shareholders. Therefore, no provision for federal income taxes or excise taxes has been made. |
| Certain Funds may be subject to foreign taxes on income, gains on investments or currency repatriation, a portion of which may be recoverable. Each Fund will accrue such taxes and recoveries as applicable based upon current interpretations of the tax rules and regulations that exist in the markets in which it invests. | |
| Management of the Funds has concluded that there are no significant uncertain tax positions that would require recognition in the financial statements. As of December 31, 2020, the tax years that remain subject to examination by the major tax jurisdictions under the statute of limitations are from the year 2017 forward (with limited exceptions). | |
| D. | Distributions to Shareholders |
| Distributions are recorded by each Fund on the ex-dividend date. Income and capital gain distributions are determined in accordance with income tax regulations which may differ from U.S. GAAP. | |
| E. | Expenses |
| Expenses incurred together by a Fund and other affiliated mutual funds are allocated in proportion to the net assets of each such fund, except where allocation of direct expenses to each Fund or an alternative allocation method can be more appropriately used. | |
| In addition to the net annual operating expenses that a Fund bears directly, the shareholders of a Fund indirectly bear the pro-rata expenses of any underlying mutual funds in which the Fund invests. | |
| F. | Foreign Currency Transactions |
| Non-U.S. investment securities and other assets and liabilities denominated in foreign currencies are translated into U.S. dollar amounts at the foreign currency exchange rate effective at the end of the reporting period. Cost of investments is translated at the currency exchange rate effective at the trade date. The gain or loss resulting from a change in currency exchange rates between the trade and settlement date of a portfolio transaction is treated as a gain or loss on foreign currency. Likewise, the gain or loss resulting from a change in currency exchange rates between the date income is accrued and the date it is paid is treated as a gain or loss on foreign currency. The Funds do not isolate that portion of the results of operations arising from changes in foreign exchange rates on investments from the fluctuations arising from changes in the market prices of securities held. Such fluctuations are included with the net realized and unrealized gain or loss on investments. | |
| G. | Securities Traded on a To-Be-Announced Basis |
| Certain Funds may trade securities on a to-be-announced (“TBA”) basis. In a TBA transaction, a Fund commits to purchasing or selling securities which have not yet been issued by the issuer and for which specific information, such as the face amount, maturity date and underlying pool of investments in U.S. government agency mortgage pass-through securities, is not announced. Securities purchased on a TBA basis are not settled until they are delivered to the Fund. Beginning on the date a Fund enters into a TBA transaction, cash, U.S. government securities or other liquid high-grade debt obligations are segregated in an amount equal in value to the purchase price of the TBA security. These securities are subject to market fluctuations and their current value is determined in the same manner as for other securities. | |
| H. | When-issued Purchases and Forward Commitments (Delayed Delivery) |
| Certain Funds may engage in when-issued or forward commitment transactions. Securities purchased on a when-issued or forward commitment basis are also known as delayed delivery transactions. Delayed delivery transactions involve a commitment by a Fund to purchase or sell a security at a future date (ordinarily up to 90 days later). When-issued or forward commitments enable the Funds to lock in what is believed to be an attractive price or yield on a particular security for a period of time, regardless of future changes in interest rates. Each Fund records when-issued and forward commitment securities on the trade date. Each Fund maintains collateral for the securities purchased. Securities purchased on a when-issued or forward commitment basis begin earning interest on the settlement date. | |
| I. | Leveraged Loans |
| Certain Funds may invest in direct debt instruments which are interests in amounts owed by a corporate, governmental, or other borrower to lenders or lending syndicates. Leveraged loans are generally non-investment grade and often involve borrowers that are highly leveraged. The Funds may invest in obligations of borrowers who are in bankruptcy proceedings. Leveraged loans are typically senior in the corporate capital structure of the borrower. A loan is often administered by a bank or other financial institution (the “lender”) that acts as agent for all holders. The agent administers the terms of the loan, as specified in the leveraged loan. A Fund’s investments in loans may be in the form of participations in loans or assignments of all or a portion of loans from third parties. When investing in loan participations, a Fund has the right to receive payments of principal, interest and any fees to which it is entitled only from the lender selling the loan participation and only upon receipt by the lender of payments from the borrower. A Fund generally has no right to enforce compliance with the terms of the leveraged loan with the borrower. As a result, a Fund may be subject to the credit risk of both the borrower and the lender that is selling the leveraged loan. When a Fund purchases assignments from lenders it acquires direct rights against the borrower on the loan. | |
| A Fund may invest in multiple series or tranches of a loan, which may have varying terms and carry different associated risks. Leveraged loans may involve foreign borrowers and investments may be denominated in foreign currencies. Direct indebtedness of emerging countries involves a risk that the government entities responsible for the repayment of the debt may be unable, or unwilling, to pay the principal and interest when due. | |
| The leveraged loans have floating rate loan interests which generally pay interest at rates that are periodically determined by reference to a base lending rate plus a premium. The base lending rates are generally LIBOR, the prime rate offered by one or more U.S. banks or the certificate of deposit rate. When a leveraged loan is purchased a Fund may pay an assignment fee. On an ongoing basis, a Fund may receive a commitment fee based on the undrawn portion of the underlying line of credit portion of a leveraged loan. Prepayment penalty fees are received upon the prepayment of a leveraged loan by a borrower. Prepayment penalty, facility, commitment, consent and amendment fees are recorded to income as earned or paid. |
| As of December 31, 2020, the Seix Floating Rate High Income Fund had the following unfunded loan commitments: |
| Unfunded Loan Commitment | ||
| Borrower | Seix Floating Rate High Income Fund | |
| Cano Health LLC | $ 865 | |
| LBM Acquisition LLC | 543 | |
| Planview Parent, Inc. | 567 | |
| Refficiency Holdings LLC | 442 | |
| U.S. Silica Co. | 1,405 |
| J. | Securities Lending |
| The Funds may loan securities to qualified brokers through a securities lending agency agreement with The Bank of New York Mellon (“BNYM”). Under the securities lending policy, when lending securities a Fund is required to maintain collateral with a market value not less than 100% of the market value of loaned securities. Collateral is adjusted daily in connection with changes in the market value of securities on loan. Collateral may consist of cash and securities issued by the U.S. Government or its agencies. Cash collateral is invested in a short-term money market fund. Dividends earned on the collateral and premiums paid by the broker are recorded as income by the Fund net of fees and rebates charged/paid by BNYM for its services as securities lending agent and in connection with this securities lending program. Lending portfolio securities involves a risk of delay in the recovery of the loaned securities or in the declining value of the collateral. | |
| Securities lending transactions are entered into by each Fund under a Master Securities Lending Agreement (“MSLA”) which permit the Fund, under certain circumstances including an event of default (such as bankruptcy or insolvency), to offset amounts payable by the Fund to the same counterparty against amounts to be received and create one single net payment due to or from the Fund. | |
| Effective March 13, 2020, the securities lending program was put on hold and all securities on loan were recalled. Effective October 1, 2020, the Funds may resume loaning portfolio securities under the securities lending program. |
| Fund | Counterparty | Value of Securities on Loan | Cash Collateral Received(1) | Net Amount(2) | ||||
| Seix High Income Fund | BNYM | $2,821 | $2,821 | $— | ||||
| Seix High Yield Fund | BNYM | 4,030 | 4,030 | — |
| A. | Forward Foreign Currency Exchange Contracts |
| A forward foreign currency exchange contract is an agreement between two parties to buy and sell a currency at a set exchange rate on a future date. Forward foreign currency exchange contracts, when used by a Fund, help to manage the overall exposure to the currencies in which some of the investments held by the Fund are denominated. The contract is marked-to-market daily and the change in market value is recorded by the Fund as an unrealized appreciation or depreciation. When the contract is closed, the Fund records a realized gain or loss equal to the difference between the value at the time it was opened and the value at the time it was closed. The use of forward foreign currency exchange contracts involves the risk that the value of the contract changes unfavorably due to movements in the value of the referenced foreign currencies. Non-deliverable forward foreign currency exchange contracts are settled with the counterparty in U.S. dollars without the delivery of foreign currency. | |
| During the fiscal period, the Seix Total Return Bond Fund entered into forward foreign currency exchange contracts as an economic hedge against either specific transactions or portfolio instruments or to obtain exposure to, or hedge exposure away from, foreign currencies (foreign currency exchange rate risk). Forward foreign currency contracts outstanding at period end, if any, are listed after each Fund’s Schedule of Investments. |
| B. | Swaps |
| Certain Funds enter into swap agreements, in which the Fund and a counterparty agree either to make periodic net payments on a specified notional amount or a net payment upon termination. Swap agreements are negotiated in the OTC market and may be entered into as a bilateral contract (“OTC swaps”) or centrally cleared (“centrally cleared swaps”). The value of the swap is reflected on the Statements of Assets and Liabilities as “Swaps at value”. Swaps are marked-to-market daily and changes in value are recorded as “Net change in unrealized appreciation (depreciation) on swaps” in the Statements of Operations. | |
| Any upfront premiums paid are recorded as assets and any upfront fees received are recorded as liabilities and are shown under “Swaps at value” in the Statements of Assets and Liabilities and are amortized over the term of the swap. When a swap is terminated, the Fund records a realized gain or loss equal to the difference between the proceeds from (or cost of) the closing transaction and the Fund’s basis in the contract, if any. Generally, the basis of the contracts is the unamortized premium received or paid. Cash settlements between the Fund and the counterparty are recognized as “Net realized gain (loss) on swaps” in the Statements of Operations. Swap contracts outstanding at period end, if any, are listed after each Fund’s Schedule of Investments. | |
| In a centrally cleared swap, immediately following execution of the swap agreement, the swap agreement is submitted to a central counterparty (the “CCP”) and the Fund’s counterparty on the swap agreement becomes the CCP. The Fund is required to interface with the CCP through a clearing broker. Upon entering into a centrally cleared swap, a Fund is required to deposit initial margin with the clearing broker in the form of cash or securities in an amount that varies depending on the size and risk profile of the particular swap. | |
| Securities deposited as margin are designated on the Schedule of Investments and cash deposited is recorded on the Statements of Assets and Liabilities as “Deposits with prime broker”. | |
| Swap transactions involve, to varying degrees, elements of interest rate, credit and market risk in excess of the amounts recognized in the Statements of Assets and Liabilities. Such risks involve the possibility that there will be no liquid market for these agreements, that the counterparty to the agreements may default on its obligation to perform or disagree as to the meaning of the contractual terms in the agreements, and that there may be unfavorable changes in interest rates and/or market values associated with these transactions. | |
| Credit default swaps – A Fund may either buy or sell (write) credit default swaps on single-name issuers (corporate or sovereign), a combination or basket of single-name issuers or traded indexes. Credit default swaps on single-name issuers are agreements in which the buyer pays fixed periodic payments to the seller in consideration for a guarantee from the protection seller to make specific payment should a negative credit event take place with respect to the referenced entity (e.g., bankruptcy, failure to pay, obligation accelerators, repudiation, moratorium or restructuring). Credit default swaps on a combination or basket of single-name issuers are agreements in which the buyer pays fixed periodic payments to the seller in consideration for a guarantee from the protection seller to make specific payment should a negative credit event take place with respect to any of the referenced entities (e.g., bankruptcy, failure to pay, obligation accelerators, repudiation, moratorium or restructuring). Credit default swaps on traded indexes are agreements in which the buyer pays fixed periodic payments to the seller in consideration for a guarantee from the seller to make a specific payment should a write-down, principal or interest shortfall or default of all or individual underlying securities included in the index occurs. As a buyer, if an underlying credit event occurs, the Fund will either receive from the seller an amount equal to the notional amount of the swap and deliver the referenced security or underlying securities comprising the index or receive a net settlement of cash equal to the notional amount of the swap less the recovery value of the security or underlying securities comprising the index. As a seller (writer), if an underlying credit event occurs, the Fund will either pay the buyer an amount equal to the notional amount of the swap and take delivery of the referenced security or underlying securities comprising the index or pay a net settlement of cash equal to the notional amount of the swap less the recovery value of the security or underlying securities comprising the index. The Funds may enter into credit default swaps to manage their exposure to the market or certain sectors of the market, to reduce their risk exposure to defaults of corporate and/or sovereign issuers or to create exposure to corporate and/or sovereign issuers to which they are not otherwise exposed (credit risk). | |
| During the period, the Seix Corporate Bond Fund and Seix Total Return Bond Fund utilized both single name credit default swaps and credit index swaps to gain exposure to short individual securities or to gain exposure to a credit or asset-backed index. |
| The Effect of Derivative Financial Instruments in the Statements of Operations for the Period Ended December 31, 2020 | |||||
| Net Realized Gain (Loss) From | |||||
| Seix Corporate Bond Fund | Seix Total Return Bond Fund | ||||
| Foreign currency exchange contracts: | |||||
| Forward foreign currency transactions(1) | $ — | $(1,454) | |||
| Commodity contracts: | |||||
| Swaps (2) | 316 | 2,099 | |||
| Total | $316 | $ 645 | |||
| (1) Included in net realized gain (loss) from forward foreign currency transactions within the Statements of Operations. |
| (2) Included in net realized gain (loss) from swaps within the Statements of Operations. |
| The Effect of Derivative Financial Instruments in the Statements of Operations for the Period Ended December 31, 2020 | |||||
| Net Change in Unrealized Appreciation/(Depreciation) on | |||||
| Seix Corporate Bond Fund | Seix Total Return Bond Fund | ||||
| Credit contracts: | |||||
| Swaps (1) | $193 | $1,360 | |||
| Total | $193 | $1,360 | |||
| (1) Included in net change in unrealized appreciation (depreciation) from swaps within the Statement of Operations. |
| Seix Corporate Bond Fund | Seix Total Return Bond Fund | ||
Forward Foreign Currency Exchange Purchase Contracts(1) | $ — | $ 3,086 | |
Forward Foreign Currency Exchange Sale Contracts(2) | — | (3,087) | |
Credit Default Swap Agreements - Buy Protection(3) | 1,774 | 13,258 |
| (1) Average value of currency purchased. |
| (2) Average value of currency sold. |
| (3) Notional amount. |
| C. | Derivative Risks |
| A derivative contract may suffer a mark-to-market loss if the value of the contract decreases due to an unfavorable change in the market rates or values of the underlying instrument. Losses can also occur if the counterparty does not perform under the contract. | |
| A Fund’s risk of loss from counterparty credit risk on OTC derivatives is generally limited to the aggregate unrealized gain netted against any collateral held by such Fund. For OTC purchased options, each Fund bears the risk of loss of the amount of the premiums paid plus the positive change in market values net of any collateral held by such Fund should the counterparty fail to perform under the contracts. Options written by a Fund do not typically give rise to counterparty credit risk, as options written generally obligate the Fund, and not the counterparty to perform. |
| With exchange traded purchased options and futures and centrally cleared swaps generally speaking, there is less counterparty credit risk to the Fund since the exchange or clearinghouse, as counterparty to such instruments, guarantees against a possible default. The clearinghouse stands between the buyer and the seller of the contract; therefore, credit risk is limited to failure of the clearinghouse. While offset rights may exist under applicable law, a Fund does not have a contractual right of offset against a clearing broker or clearinghouse in the event of a default (including the bankruptcy or insolvency) of the clearing broker or clearinghouse. Additionally, credit risk exists in exchange traded futures and centrally cleared swaps with respect to initial and variation margin that is held in a clearing broker’s customer accounts. While clearing brokers are required to segregate customer margin from their own assets, in the event that a clearing broker becomes insolvent or goes into bankruptcy and at that time there is a shortfall in the aggregate amount of margin held by the clearing broker for all its clients, typically the shortfall would be allocated on a pro rata basis across all the clearing broker’s customers, potentially resulting in losses to the Fund. | |
| In order to better define its contractual rights and to secure rights that will help a Fund mitigate its counterparty risk, each Fund may enter into an International Swaps and Derivatives Association, Inc. Master Agreement (“ISDA Master Agreement”) or similar agreement with its derivative contract counterparties. An ISDA Master Agreement is a bilateral agreement between a Fund and a counterparty that governs certain OTC derivatives and typically contains, among other things, collateral posting terms and netting provisions in the event of a default and/or termination event. Under an ISDA Master Agreement, a Fund may, under certain circumstances, offset with the counterparty certain derivative financial instruments’ payables and/or receivables with collateral held and/or posted and create one single net payment. The provisions of the ISDA Master Agreement typically permit a single net payment in the event of default including the bankruptcy or insolvency of the counterparty. However, bankruptcy or insolvency laws of a particular jurisdiction may impose restrictions on or prohibitions against the right of offset in bankruptcy, insolvency or other events. In addition, certain ISDA Master Agreements allow counterparties to OTC derivatives to terminate derivative contracts prior to maturity in the event a Fund’s net assets decline by a stated percentage or the Fund fails to meet the terms of its ISDA Master Agreements, which would cause the Fund to accelerate payment of any net liability owed to the counterparty. |
| A. | Investment Adviser |
| Virtus Fund Advisers, LLC (the “Adviser”), an indirect, wholly-owned subsidiary of Virtus Investment Partners, Inc. (“Virtus”), is the investment adviser to the Funds. The Adviser manages the Funds’ investment programs and general operations of the Funds, including oversight of the Funds’ subadviser. | |
| As compensation for its services to the Funds, the Adviser is entitled to a fee, which is calculated daily and paid monthly based upon the following annual rates as a percentage of the average daily net assets of each Fund: |
| First $500 Million | |
Seix Core Bond Fund | 0.25 % |
Seix Corporate Bond Fund | 0.40 |
Seix Floating Rate High Income Fund | 0.45 |
Seix High Grade Municipal Bond Fund | 0.50 |
Seix High Income Fund | 0.55 |
Seix High Yield Fund | 0.45 |
Seix Investment Grade Tax-Exempt Bond Fund | 0.50 |
Seix Short-Term Bond Fund | 0.40 |
Seix Short-Term Municipal Bond Fund | 0.35 |
Seix Total Return Bond Fund | 0.25 |
Seix U.S. Government Securities Ultra-Short Bond Fund | 0.20 |
Seix U.S. Mortgage Fund | 0.40 |
Seix Ultra-Short Bond Fund | 0.22 |
| B. | Subadviser |
| The subadviser manages the investments of each Fund, for which it is paid a fee by the Adviser. Seix Investment Advisors LLC, an indirect, wholly owned subsidiary of Virtus, is the subadviser to the Funds. |
| C. | Expense Limitations |
| The Adviser has contractually agreed to limit each Fund’s annual total operating expenses, subject to the exceptions listed below, so that such expenses do not exceed, on an annualized basis, the following respective percentages of average daily net assets through April 30, 2021 (except as noted). Following the contractual period, the Adviser may discontinue these expense reimbursement arrangements at any time. The waivers and reimbursements are accrued daily and received monthly. |
| Fund | Class A | Class C | Class I | Class R6 | ||||
Seix Core Bond Fund | 0.64 % | N/A % | 0.50 % | 0.36 % | ||||
Seix Corporate Bond Fund* | 0.95 | 1.65 | 0.70 | 0.43 | ||||
Seix Floating Rate High Income Fund | 0.94 | 1.52 | 0.62 | 0.52 | ||||
Seix High Grade Municipal Bond Fund** | 0.73 | N/A | 0.58 | N/A | ||||
Seix High Income Fund | 0.93 | N/A | 0.68 | 0.59 | ||||
Seix High Yield Fund | 0.82 | N/A | 0.64 | 0.53 | ||||
Seix Investment Grade Tax-Exempt Bond Fund*** | 0.71 | N/A | 0.56 | N/A | ||||
Seix Short-Term Bond Fund | 0.80 | 1.57 | 0.60 | N/A | ||||
Seix Short-Term Municipal Bond Fund**** | 0.54 | N/A | 0.37 | N/A | ||||
Seix Total Return Bond Fund | 0.70 | N/A | 0.46 | 0.31 | ||||
Seix U.S. Government Securities Ultra-Short Bond Fund | 0.66 | N/A | 0.41 | 0.26 | ||||
Seix U.S. Mortgage Fund | 0.90 | 1.65 | 0.70 | N/A | ||||
Seix Ultra-Short Bond Fund | 0.65 | N/A | 0.40 | N/A |
| * | Effective through April 30, 2022. |
| ** | Effective December 1, 2020 through April 30, 2022. For the period January 1, 2020 through November 30, 2020, the expense caps were as follows for Class A shares and Class I shares, respectively: 0.75% and 0.60%. |
| *** | Effective December 1, 2020 through April 30, 2022. For the period January 1, 2020 through November 30, 2020, the expense caps were as follows for Class A shares and Class I shares, respectively: 0.73% and 0.58%. |
| **** | Effective December 1, 2020 through April 30, 2022. For the period January 1, 2020 through November 30, 2020, the expense caps were as follows for Class A shares and Class I shares, respectively: 0.65% and 0.48%. |
| D. | Expense Recapture |
| Under certain conditions, the Adviser may recapture operating expenses reimbursed or fees waived under these arrangements within three years after the date on which such amounts were incurred or waived. A Fund must pay its ordinary operating expenses before the Adviser is entitled to any reimbursement and must remain in compliance with any applicable expense limitations or, if none, the expense limitation in effect at the time of the waiver or reimbursement. All or a portion of the following Adviser reimbursed expenses may be recaptured by the fiscal year ending: |
| Expiration | ||||||||
| Fund | 2021 | 2022 | 2023 | Total | ||||
| Seix Core Bond Fund | ||||||||
Class A | $ 19 | $ 17 | $ 26 | $ 62 | ||||
Class I | 190 | 174 | 126 | 490 | ||||
Class R6 | 3 | 1 | 3 | 7 | ||||
| Seix Corporate Bond Fund | ||||||||
Class A | 1 | 8 | 5 | 14 | ||||
Class C | 28 | 2 | 1 | 31 | ||||
Class I | 53 | 61 | 68 | 182 | ||||
Class R6 | — | — | — (1) | — | ||||
| Seix Floating Rate High Income Fund | ||||||||
Class A | — | — | — (1) | — (1) | ||||
Class C | 49 | 51 | 39 | 139 | ||||
Class I | 3,727 | 3,400 | 2,005 | 9,132 | ||||
Class R6 | 733 | 514 | 264 (1) | 1,511 | ||||
| Seix High Grade Municipal Bond Fund | ||||||||
Class A | 11 | 16 | 14 | 41 | ||||
Class I | 135 | 132 | 165 | 432 | ||||
| Expiration | ||||||||
| Fund | 2021 | 2022 | 2023 | Total | ||||
| Seix High Income Fund | ||||||||
Class A | $ 17 | $ 26 | $ 48 | $ 91 | ||||
Class I | 282 | 413 | 446 | 1,141 | ||||
Class R6 | 6 | 46 | 26 | 78 | ||||
| Seix High Yield Fund | ||||||||
Class A | 8 | 8 | 14 | 30 | ||||
Class I | 422 | 391 | 351 | 1,164 | ||||
Class R6 | 13 | 2 | 11 | 26 | ||||
| Seix Investment Grade Tax-Exempt Bond Fund | ||||||||
Class A | 22 | 25 | 25 | 72 | ||||
Class I | 616 | 672 | 696 | 1,984 | ||||
| Seix Short-Term Bond Fund | ||||||||
Class A | 17 | 24 | 34 | 75 | ||||
Class C | 8 | 9 | 9 | 26 | ||||
Class I | 57 | 51 | 47 | 155 | ||||
| Seix Short-Term Municipal Bond Fund | ||||||||
Class A | 6 | 8 | 10 | 24 | ||||
Class I | 95 | 78 | 82 | 255 | ||||
| Seix Total Return Bond Fund | ||||||||
Class A | 19 | 26 | 31 | 76 | ||||
Class I | 485 | 362 | 314 | 1,161 | ||||
Class R6 | 162 | 92 | 105 | 359 | ||||
| Seix U.S. Government Securities Ultra-Short Bond Fund | ||||||||
Class I | 1,107 | 1,095 | 748 | 2,950 | ||||
Class R6 | 42 | 34 | 52 | 128 | ||||
| Seix U.S. Mortgage Fund | ||||||||
Class A | 35 | 53 | 62 | 150 | ||||
Class C | 12 | 2 | 2 | 16 | ||||
Class I | 69 | 63 | 49 | 181 | ||||
| Seix Ultra-Short Bond Fund | ||||||||
Class A | 1 | 4 | 6 | 11 | ||||
Class I | 120 | 125 | 94 | 339 | ||||
| (1) | Amount is less than $500. |
| Fund | Class A | Total | ||
Seix Floating Rate High Income Fund | $ 4 | $ 4 | ||
Seix U.S. Government Securities Ultra-Short Bond Fund | — (1) | — (1) |
| (1) | Amount is less than $500. |
| E. | Distributor |
| VP Distributors, LLC (“VP Distributors”), an indirect, wholly-owned subsidiary of Virtus, serves as the distributor of each Fund’s shares. VP Distributors has advised the Funds that for the fiscal year (the “period”) ended December 31, 2020, it retained net commissions of $24 for Class A shares and CDSC of $1 and $3 for Class A shares and Class C shares, respectively. | |
| In addition, each Fund pays VP Distributors 12b-1 fees under a 12b-1 Plan as a percentage of the average daily net assets of each respective class at the annual rates of 0.25% for Class A shares (0.15% for Seix High Grade Municipal Bond Fund and Seix Short-Term Municipal Bond Fund, and 0.20% for Seix Short-Term Bond Fund and Seix U.S. Mortgage Fund), and 1.00% for Class C shares; Class I shares and Class R6 shares are not subject to a 12b-1 Plan. | |
| Under certain circumstances, shares of certain Virtus Mutual Funds may be exchanged for shares of the same class of certain other Virtus Mutual Funds on the basis of the relative NAV per share at the time of the exchange. On exchanges with share classes that carry a CDSC, the CDSC schedule of the original shares purchased continues to apply. |
| F. | Administrator and Transfer Agent |
| Virtus Fund Services, LLC, an indirect, wholly-owned subsidiary of Virtus, serves as the administrator and transfer agent to the Funds. | |
| For the period ended December 31, 2020, the Funds incurred administration fees totaling $4,604 which are included in the Statements of Operations within the line item “Administration and accounting fees.” The fees are calculated daily and paid monthly. | |
| For the period ended December 31, 2020, the Funds incurred transfer agent fees totaling $2,064 which are included in the Statements of Operations within the line item “Transfer agent fees and expenses.” The fees are calculated daily and paid monthly. | |
| G. | Payments from Affiliate |
| The Seix Floating Rate High Income Fund will be reimbursed by the administrator for costs incurred due to a pricing error during the period ended December 31, 2020. The reimbursement amount for the Fund is disclosed in the Fund’s “Statements of Assets and Liabilities” as a “Receivable from affiliate”. | |
| H. | Trustee Compensation |
| The Trust provides a deferred compensation plan for its Trustees who receive compensation from the Trust. Under the deferred compensation plan, Trustees may elect to defer all or a portion of their compensation. Amounts deferred are retained by the Trust, and then, to the extent permitted by the 1940 Act, in turn, may be invested in the shares of affiliated or unaffiliated mutual funds selected by the participating Trustees. Investments in such instruments are included in “Other assets” in the Statements of Assets and Liabilities at December 31, 2020. |
| Purchases | Sales | ||
Seix Core Bond Fund | $ 73,320 | $ 28,235 | |
Seix Corporate Bond Fund | 156,321 | 92,883 | |
Seix Floating Rate High Income Fund | 1,463,342 | 2,774,319 | |
Seix High Grade Municipal Bond Fund | 158,265 | 133,004 | |
Seix High Income Fund | 439,228 | 498,848 | |
Seix High Yield Fund | 624,211 | 557,188 | |
Seix Investment Grade Tax-Exempt Bond Fund | 507,102 | 497,380 | |
Seix Short-Term Bond Fund | 8,409 | 3,231 | |
Seix Short-Term Municipal Bond Fund | 16,276 | 14,700 | |
Seix Total Return Bond Fund | 161,768 | 74,102 | |
Seix U.S. Government Securities Ultra-Short Bond Fund | 23,150 | — | |
Seix Ultra-Short Bond Fund | 39,743 | 28,964 |
| Purchases | Sales | ||
Seix Core Bond Fund | $250,813 | $251,641 | |
Seix Corporate Bond Fund | 8,970 | 8,966 | |
Seix Short-Term Bond Fund | 26,569 | 24,623 | |
Seix Total Return Bond Fund | 457,060 | 521,453 | |
Seix U.S. Government Securities Ultra-Short Bond Fund | 813,565 | 515,999 | |
Seix U.S. Mortgage Fund | 9,270 | 15,072 | |
Seix Ultra-Short Bond Fund | 1,987 | 15,138 |
| Seix Core Bond Fund | Seix Corporate Bond Fund | ||||||||||||||
| Year Ended December 31, 2020 | Year Ended December 31, 2019 | Year Ended December 31, 2020 | Year Ended December 31, 2019 | ||||||||||||
| SHARES | AMOUNT | SHARES | AMOUNT | SHARES | AMOUNT | SHARES | AMOUNT | ||||||||
| Class A | |||||||||||||||
| Shares sold and cross class conversions | 322 | $ 3,692 | 351 | $ 3,828 | 473 | $ 4,627 | 716 | $ 5,945 | |||||||
| Reinvestment of distributions | 24 | 275 | 9 | 99 | 45 | 444 | 14 | 122 | |||||||
| Shares repurchased and cross class conversions | (238) | (2,739) | (97) | (1,037) | (258) | (2,437) | (147) | (1,286) | |||||||
| Net Increase / (Decrease) | 108 | $ 1,228 | 263 | $ 2,890 | 260 | $ 2,634 | 583 | $ 4,781 | |||||||
| Class C | |||||||||||||||
| Shares sold and cross class conversions | — | $ — | — | $ — | 101 | $ 985 | 19 | $ 169 | |||||||
| Reinvestment of distributions | — | — | — | — | 6 | 59 | 1 | 12 | |||||||
| Shares repurchased and cross class conversions | — | — | — | — | (44) | (411) | (618) | (5,033) | |||||||
| Net Increase / (Decrease) | — | $ — | — | $ — | 63 | $ 633 | (598) | $ (4,852) | |||||||
| Class I | |||||||||||||||
| Shares sold and cross class conversions | 14,006 | $ 162,003 | 1,130 | $ 12,114 | 9,860 | $ 95,933 | 1,514 | $ 13,159 | |||||||
| Reinvestment of distributions | 459 | 5,296 | 236 | 2,528 | 558 | 5,448 | 113 | 977 | |||||||
| Shares repurchased and cross class conversions | (6,755) | (77,352) | (5,940) | (63,826) | (3,555) | (34,971) | (2,278) | (19,873) | |||||||
| Net Increase / (Decrease) | 7,710 | $ 89,947 | (4,574) | $ (49,184) | 6,863 | $ 66,410 | (651) | $ (5,737) | |||||||
| Class R | |||||||||||||||
| Shares sold and cross class conversions | — | $ — | 15 | $ 159 | — | $ — | — | $ — | |||||||
| Reinvestment of distributions | — | — | 4 | 45 | — | — | — | — | |||||||
| Shares repurchased and cross class conversions | — | — | (317) | (3,466) | — | — | — | — | |||||||
| Net Increase / (Decrease) | — | $ — | (298) | $ (3,262) | — | $ — | — | $ — | |||||||
| Class R6 | |||||||||||||||
| Shares sold and cross class conversions | 110 | $ 1,289 | 179 | $ 1,952 | 10 | $ 100 | — | $ — | |||||||
| Reinvestment of distributions | 5 | 57 | 1 | 7 | — | — | — | — | |||||||
| Shares repurchased and cross class conversions | (167) | (1,952) | (5) | (53) | — | — | — | — | |||||||
| Net Increase / (Decrease) | (52) | $ (606) | 175 | $ 1,906 | 10 | $ 100 | — | $ — | |||||||
| Seix Floating Rate High Income Fund | Seix High Grade Municipal Bond Fund | ||||||||||||||
| Year Ended December 31, 2020 | Year Ended December 31, 2019 | Year Ended December 31, 2020 | Year Ended December 31, 2019 | ||||||||||||
| SHARES | AMOUNT | SHARES | AMOUNT | SHARES | AMOUNT | SHARES | AMOUNT | ||||||||
| Class A | |||||||||||||||
| Shares sold and cross class conversions | 1,026 | $ 8,156 | 1,755 | $ 14,862 | 129 | $ 1,612 | 69 | $ 830 | |||||||
| Reinvestment of distributions | 157 | 1,229 | 264 | 2,236 | 22 | 276 | 21 | 258 | |||||||
| Shares repurchased and cross class conversions | (2,536) | (19,704) | (4,530) | (38,341) | (109) | (1,353) | (101) | (1,223) | |||||||
| Net Increase / (Decrease) | (1,353) | $ (10,319) | (2,511) | $ (21,243) | 42 | $ 535 | (11) | $ (135) | |||||||
| Class C | |||||||||||||||
| Shares sold and cross class conversions | 188 | $ 1,495 | 573 | $ 4,850 | — | $ — | — | $ — | |||||||
| Reinvestment of distributions | 104 | 818 | 192 | 1,628 | — | — | — | — | |||||||
| Shares repurchased and cross class conversions | (2,066) | (16,293) | (1,783) | (15,071) | — | — | — | — | |||||||
| Net Increase / (Decrease) | (1,774) | $ (13,980) | (1,018) | $ (8,593) | — | $ — | — | $ — | |||||||
| Class I | |||||||||||||||
| Shares sold and cross class conversions | 77,421 | $ 609,210 | 88,463 | $ 749,789 | 2,544 | $ 31,489 | 1,646 | $ 19,860 | |||||||
| Reinvestment of distributions | 8,551 | 67,165 | 18,983 | 160,882 | 178 | 2,203 | 125 | 1,502 | |||||||
| Shares repurchased and cross class conversions | (218,814) | (1,681,120) | (313,658) | (2,656,616) | (1,187) | (14,592) | (941) | (11,282) | |||||||
| Net Increase / (Decrease) | (132,842) | $ (1,004,745) | (206,212) | $ (1,745,945) | 1,535 | $ 19,100 | 830 | $ 10,080 | |||||||
| Class R6 | |||||||||||||||
| Shares sold and cross class conversions | 4,461 | $ 35,681 | 37,802 | $ 320,528 | — | $ — | — | $ — | |||||||
| Reinvestment of distributions | 1,163 | 9,086 | 2,676 | 22,663 | — | — | — | — | |||||||
| Shares repurchased and cross class conversions | (53,749) | (418,732) | (71,688) | (608,050) | — | — | — | — | |||||||
| Net Increase / (Decrease) | (48,125) | $ (373,965) | (31,210) | $ (264,859) | — | $ — | — | $ — | |||||||
| Seix High Income Fund | Seix High Yield Fund | ||||||||||||||
| Year Ended December 31, 2020 | Year Ended December 31, 2019 | Year Ended December 31, 2020 | Year Ended December 31, 2019 | ||||||||||||
| SHARES | AMOUNT | SHARES | AMOUNT | SHARES | AMOUNT | SHARES | AMOUNT | ||||||||
| Class A | |||||||||||||||
| Shares sold and cross class conversions | 1,017 | $ 6,104 | 2,702 | $ 16,827 | 1,363 | $ 11,150 | 611 | $ 4,900 | |||||||
| Reinvestment of distributions | 172 | 1,038 | 130 | 816 | 30 | 243 | 19 | 153 | |||||||
| Shares repurchased and cross class conversions | (2,072) | (12,653) | (1,236) | (7,755) | (605) | (4,978) | (447) | (3,589) | |||||||
| Net Increase / (Decrease) | (883) | $ (5,511) | 1,596 | $ 9,888 | 788 | $ 6,415 | 183 | $ 1,464 | |||||||
| Class I | |||||||||||||||
| Shares sold and cross class conversions | 12,164 | $ 73,430 | 7,914 | $ 49,385 | 20,539 | $ 167,587 | 7,527 | $ 62,140 | |||||||
| Reinvestment of distributions | 1,680 | 10,106 | 2,175 | 13,628 | 1,524 | 12,631 | 1,570 | 12,975 | |||||||
| Shares repurchased and cross class conversions | (19,297) | (114,042) | (17,508) | (109,473) | (15,728) | (126,059) | (11,029) | (91,170) | |||||||
| Net Increase / (Decrease) | (5,453) | $ (30,506) | (7,419) | $ (46,460) | 6,335 | $ 54,159 | (1,932) | $ (16,055) | |||||||
| Seix High Income Fund | Seix High Yield Fund | ||||||||||||||
| Year Ended December 31, 2020 | Year Ended December 31, 2019 | Year Ended December 31, 2020 | Year Ended December 31, 2019 | ||||||||||||
| SHARES | AMOUNT | SHARES | AMOUNT | SHARES | AMOUNT | SHARES | AMOUNT | ||||||||
| Class R | |||||||||||||||
| Shares sold and cross class conversions | — | $ — | 299 | $ 1,870 | — | $ — | 2 | $ 17 | |||||||
| Reinvestment of distributions | — | — | 74 | 462 | — | — | — (1) | 2 | |||||||
| Shares repurchased and cross class conversions | — | — | (2,248) | (13,993) | — | — | (9) | (75) | |||||||
| Net Increase / (Decrease) | — | $ — | (1,875) | $ (11,661) | — | $ — | (7) | $ (56) | |||||||
| Class R6 | |||||||||||||||
| Shares sold and cross class conversions | 1,035 | $ 6,328 | 5,927 | $ 36,986 | 791 | $ 6,417 | 558 | $ 4,670 | |||||||
| Reinvestment of distributions | 23 | 140 | 29 | 185 | 21 | 178 | 6 | 47 | |||||||
| Shares repurchased and cross class conversions | (5,479) | (30,802) | (948) | (5,931) | (139) | (1,153) | (22) | (180) | |||||||
| Net Increase / (Decrease) | (4,421) | $ (24,334) | 5,008 | $ 31,240 | 673 | $ 5,442 | 542 | $ 4,537 | |||||||
| Seix Investment Grade Tax-Exempt Bond Fund | Seix Short-Term Bond Fund | ||||||||||||||
| Year Ended December 31, 2020 | Year Ended December 31, 2019 | Year Ended December 31, 2020 | Year Ended December 31, 2019 | ||||||||||||
| SHARES | AMOUNT | SHARES | AMOUNT | SHARES | AMOUNT | SHARES | AMOUNT | ||||||||
| Class A | |||||||||||||||
| Shares sold and cross class conversions | 56 | $ 672 | 44 | $ 512 | 1,265 | $ 12,808 | 83 | $ 816 | |||||||
| Reinvestment of distributions | 22 | 267 | 27 | 314 | 5 | 46 | 4 | 40 | |||||||
| Shares repurchased and cross class conversions | (132) | (1,485) | (148) | (1,756) | (888) | (9,064) | (62) | (616) | |||||||
| Net Increase / (Decrease) | (54) | $ (546) | (77) | $ (930) | 382 | $ 3,790 | 25 | $ 240 | |||||||
| Class C | |||||||||||||||
| Shares sold and cross class conversions | — | $ — | — | $ — | 260 | $ 2,639 | 27 | $ 266 | |||||||
| Reinvestment of distributions | — | — | — | — | — (1) | 1 | 1 | 8 | |||||||
| Shares repurchased and cross class conversions | — | — | — | — | (131) | (1,333) | (103) | (1,013) | |||||||
| Net Increase / (Decrease) | — | $ — | — | $ — | 129 | $ 1,307 | (75) | $ (739) | |||||||
| Class I | |||||||||||||||
| Shares sold and cross class conversions | 8,339 | $ 99,676 | 6,119 | $ 71,920 | 961 | $ 9,775 | 32 | $ 321 | |||||||
| Reinvestment of distributions | 602 | 7,212 | 781 | 9,159 | 7 | 72 | 9 | 92 | |||||||
| Shares repurchased and cross class conversions | (10,062) | (119,251) | (8,526) | (100,551) | (767) | (7,808) | (106) | (1,045) | |||||||
| Net Increase / (Decrease) | (1,121) | $ (12,363) | (1,626) | $ (19,472) | 201 | $ 2,039 | (65) | $ (632) | |||||||
| Seix Short-Term Municipal Bond Fund | Seix Total Return Bond Fund | ||||||||||||||
| Year Ended December 31, 2020 | Year Ended December 31, 2019 | Year Ended December 31, 2020 | Year Ended December 31, 2019 | ||||||||||||
| SHARES | AMOUNT | SHARES | AMOUNT | SHARES | AMOUNT | SHARES | AMOUNT | ||||||||
| Class A | |||||||||||||||
| Shares sold and cross class conversions | 75 | $ 769 | 51 | $ 512 | 1,019 | $ 11,996 | 2,054 | $ 22,739 | |||||||
| Reinvestment of distributions | 2 | 19 | 3 | 30 | 33 | 385 | 14 | 152 | |||||||
| Shares repurchased and cross class conversions | (85) | (869) | (43) | (436) | (2,226) | (26,260) | (834) | (9,199) | |||||||
| Net Increase / (Decrease) | (8) | $ (81) | 11 | $ 106 | (1,174) | $ (13,879) | 1,234 | $ 13,692 | |||||||
| Class I | |||||||||||||||
| Shares sold and cross class conversions | 463 | $ 4,662 | 91 | $ 924 | 17,761 | $ 203,694 | 3,913 | $ 40,873 | |||||||
| Reinvestment of distributions | 20 | 201 | 31 | 309 | 690 | 7,927 | 540 | 5,680 | |||||||
| Shares repurchased and cross class conversions | (357) | (3,618) | (961) | (9,661) | (13,423) | (153,517) | (16,875) | (177,245) | |||||||
| Net Increase / (Decrease) | 126 | $ 1,245 | (839) | $ (8,428) | 5,028 | $ 58,104 | (12,422) | $ (130,692) | |||||||
| Class R | |||||||||||||||
| Shares sold and cross class conversions | — | $ — | — | $ — | — | $ — | 552 | $ 5,847 | |||||||
| Reinvestment of distributions | — | — | — | — | — | — | 36 | 375 | |||||||
| Shares repurchased and cross class conversions | — | — | — | — | — | — | (3,284) | (35,104) | |||||||
| Net Increase / (Decrease) | — | $ — | — | $ — | — | $ — | (2,696) | $ (28,882) | |||||||
| Class R6 | |||||||||||||||
| Shares sold and cross class conversions | — | $ — | — | $ — | 5,942 | $ 68,723 | 3,554 | $ 36,876 | |||||||
| Reinvestment of distributions | — | — | — | — | 222 | 2,548 | 117 | 1,226 | |||||||
| Shares repurchased and cross class conversions | — | — | — | — | (1,241) | (13,860) | (4,869) | (50,901) | |||||||
| Net Increase / (Decrease) | — | $ — | — | $ — | 4,923 | $ 57,411 | (1,198) | $ (12,799) | |||||||
| Seix U.S. Government Securities Ultra-Short Bond Fund | Seix U.S. Mortgage Fund | ||||||||||||||
| Year Ended December 31, 2020 | Year Ended December 31, 2019 | Year Ended December 31, 2020 | Year Ended December 31, 2019 | ||||||||||||
| SHARES | AMOUNT | SHARES | AMOUNT | SHARES | AMOUNT | SHARES | AMOUNT | ||||||||
| Class A | |||||||||||||||
| Shares sold and cross class conversions | 3,052 | $ 30,577 | 1,940 | $ 19,389 | 100 | $ 1,139 | 303 | $ 3,320 | |||||||
| Reinvestment of distributions | 9 | 93 | 17 | 167 | 5 | 62 | 11 | 119 | |||||||
| Shares repurchased and cross class conversions | (1,138) | (11,400) | (1,132) | (11,313) | (137) | (1,575) | (67) | (747) | |||||||
| Net Increase / (Decrease) | 1,923 | $ 19,270 | 825 | $ 8,243 | (32) | $ (374) | 247 | $ 2,692 | |||||||
| Class C | |||||||||||||||
| Shares sold and cross class conversions | — | $ — | — | $ — | 28 | $ 325 | 3 | $ 31 | |||||||
| Reinvestment of distributions | — | — | — | — | — | 1 | 1 | 9 | |||||||
| Shares repurchased and cross class conversions | — | — | — | — | (19) | (216) | (261) | (2,853) | |||||||
| Net Increase / (Decrease) | — | $ — | — | $ — | 9 | $ 110 | (257) | $ (2,813) | |||||||
| Seix U.S. Government Securities Ultra-Short Bond Fund | Seix U.S. Mortgage Fund | ||||||||||||||
| Year Ended December 31, 2020 | Year Ended December 31, 2019 | Year Ended December 31, 2020 | Year Ended December 31, 2019 | ||||||||||||
| SHARES | AMOUNT | SHARES | AMOUNT | SHARES | AMOUNT | SHARES | AMOUNT | ||||||||
| Class I | |||||||||||||||
| Shares sold and cross class conversions | 101,190 | $ 1,013,220 | 52,199 | $ 521,658 | 584 | $ 6,747 | 320 | $ 3,551 | |||||||
| Reinvestment of distributions | 625 | 6,261 | 2,452 | 24,506 | 12 | 134 | 31 | 349 | |||||||
| Shares repurchased and cross class conversions | (79,686) | (797,591) | (91,541) | (915,228) | (1,007) | (11,565) | (688) | (7,611) | |||||||
| Net Increase / (Decrease) | 22,129 | $ 221,890 | (36,890) | $ (369,064) | (411) | $ (4,684) | (337) | $ (3,711) | |||||||
| Class R6 | |||||||||||||||
| Shares sold and cross class conversions | 13,175 | $ 132,299 | 1,697 | $ 16,974 | — | $ — | — | $ — | |||||||
| Reinvestment of distributions | 12 | 117 | 49 | 493 | — | — | — | — | |||||||
| Shares repurchased and cross class conversions | (7,046) | (70,727) | (2,489) | (24,900) | — | — | — | — | |||||||
| Net Increase / (Decrease) | 6,141 | $ 61,689 | (743) | $ (7,433) | — | $ — | — | $ — | |||||||
| Seix Ultra-Short Bond Fund | |||||||
| Year Ended December 31, 2020 | Year Ended December 31, 2019 | ||||||
| SHARES | AMOUNT | SHARES | AMOUNT | ||||
| Class A | |||||||
| Shares sold and cross class conversions | 303 | $ 3,004 | 279 | $ 2,780 | |||
| Reinvestment of distributions | 3 | 34 | 4 | 40 | |||
| Shares repurchased and cross class conversions | (198) | (1,947) | (142) | (1,412) | |||
| Net Increase / (Decrease) | 108 | $ 1,091 | 141 | $ 1,408 | |||
| Class I | |||||||
| Shares sold and cross class conversions | 3,071 | $ 30,457 | 2,702 | $ 26,849 | |||
| Reinvestment of distributions | 51 | 503 | 130 | 1,294 | |||
| Shares repurchased and cross class conversions | (3,476) | (34,112) | (4,046) | (40,242) | |||
| Net Increase / (Decrease) | (354) | $ (3,152) | (1,214) | $ (12,099) | |||
| (1) | Amount is less than 500 shares. |
| % of Shares Outstanding | Number of Accounts* | ||
Seix Core Bond Fund | 74% | 4 | |
Seix Corporate Bond Fund | 68 | 3 | |
Seix Floating Rate High Income Fund | 39 | 2 | |
Seix High Grade Municipal Bond Fund | 50 | 2 |
| % of Shares Outstanding | Number of Accounts* | ||
Seix High Income Fund | 45% | 1 | |
Seix High Yield Fund | 72 | 5 | |
Seix Investment Grade Tax-Exempt Bond Fund | 58 | 3 | |
Seix Short-Term Bond Fund | 46 | 3 | |
Seix Short-Term Municipal Bond Fund | 74 | 4 | |
Seix Total Return Bond Fund | 51 | 3 | |
Seix U.S. Government Securities Ultra-Short Bond Fund | 57 | 2 | |
Seix U.S. Mortgage Fund | 58 | 3 | |
Seix Ultra-Short Bond Fund | 47 | 2 |
| * | None of the accounts are affiliated. |
| Fund | Interest Incurred on Borrowing | Average Dollar Amount of Borrowing | Weighted Average Interest Rate on Borrowing | Days Loan was Open | ||||
Seix Floating Rate High Income Fund | $81 | $61,363 | 1.99% | 24 |
| Fund | Federal Tax Cost | Unrealized Appreciation | Unrealized (Depreciation) | Net Unrealized Appreciation (Depreciation) | ||||
Seix Core Bond Fund | $ 192,625 | $ 6,567 | $ (140) | $ 6,427 | ||||
Seix Corporate Bond Fund | 104,327 | 7,618 | (151) | 7,467 | ||||
Seix Floating Rate High Income Fund | 1,784,397 | 19,343 | (113,171) | (93,828) | ||||
Seix High Grade Municipal Bond Fund | 87,344 | 3,679 | — | 3,679 | ||||
Seix High Income Fund | 223,806 | 13,457 | (6,597) | 6,860 | ||||
Seix High Yield Fund | 365,321 | 20,202 | (5,423) | 14,779 | ||||
Seix Investment Grade Tax-Exempt Bond Fund | 325,042 | 12,061 | — | 12,061 | ||||
Seix Short-Term Bond Fund | 15,338 | 240 | (5) | 235 | ||||
Seix Short-Term Municipal Bond Fund | 13,672 | 257 | — | 257 | ||||
Seix Total Return Bond Fund | 403,391 | 19,107 | (236) | 18,871 | ||||
Seix U.S. Government Securities Ultra-Short Bond Fund | 1,224,827 | 8,367 | (613) | 7,754 | ||||
Seix U.S. Mortgage Fund | 15,482 | 627 | (7) | 620 | ||||
Seix Ultra-Short Bond Fund | 48,251 | 310 | (37) | 273 |
| Short-Term | Long-Term | ||
Seix Floating Rate High Income Fund | $155,321 | $498,390 | |
Seix High Income Fund | 24,660 | 73,858 | |
Seix High Yield Fund | 10,901 | 42,769 | |
Seix Short-Term Bond Fund | 20 | — | |
Seix U.S. Government Securities Ultra-Short Bond Fund | 5,077 | 276 | |
Seix Ultra-Short Bond Fund | 431 | 225 |
| Fund | |
Seix Core Bond Fund | $ 30 |
Seix High Yield Fund | 7,693 |
| Fund | |
Seix Short-Term Bond Fund | $ 235 |
Seix Total Return Bond Fund | 10,080 |
Seix U.S. Government Securities Ultra-Short Bond Fund | 152 |
Seix U.S. Mortgage Fund | 96 |
| Late Year Ordinary Losses Recognized | Capital Loss Deferred | Capital Loss Recognized | |||
Seix Core Bond Fund | $ — | $ 145 | $ (33) | ||
Seix Floating Rate High Income Fund | — | 19,548 | (35,120) | ||
Seix High Income Fund | — | — | (4,640) | ||
Seix High Yield Fund | — | — | (206) | ||
Seix Short-Term Municipal Bond Fund | — | — | (1) | ||
Seix Total Return Bond Fund | (484) | 1,607 | (394) | ||
Seix Ultra-Short Bond Fund | — | — | (1) |
| Undistributed Ordinary Income | Undistributed Long-Term Capital Gains | Undistributed Tax-Exempt Income | |||
Seix Corporate Bond Fund | $ 194 | $ 81 | $ — | ||
Seix Floating Rate High Income Fund | 1,830 | — | — | ||
Seix High Grade Municipal Bond Fund | 202 | — | 4 | ||
Seix High Income Fund | 9 | — | — | ||
Seix High Yield Fund | 2 | — | — | ||
Seix Investment Grade Tax-Exempt Bond Fund | 776 | 698 | 23 | ||
Seix Short-Term Bond Fund | 1 | — | — | ||
Seix Short-Term Municipal Bond Fund | 61 | 32 | — (1) | ||
Seix Total Return Bond Fund | 174 | — | — | ||
Seix U.S. Mortgage Fund | 48 | 42 | — | ||
Seix Ultra-Short Bond Fund | 15 | — | — |
| (1) | Amount is less than $500. |
| Ordinary Income | Long-Term Capital Gains | Tax-Exempt Distributions | Return of Capital | Total | |||||
Seix Core Bond Fund | |||||||||
12/31/20 | $ 5,272 | $ 439 | $ — | $ — | $ 5,711 | ||||
12/31/19 | 2,915 | — | — | — | 2,915 | ||||
Seix Corporate Bond Fund | |||||||||
12/31/20 | 4,666 | 1,301 | — | — | 5,967 | ||||
12/31/19 | 1,127 | — | — | — | 1,127 | ||||
Seix Floating Rate High Income Fund | |||||||||
12/31/20 | 91,454 | — | — | — | 91,454 | ||||
12/31/19 | 226,343 | — | — | — | 226,343 | ||||
Seix High Grade Municipal Bond Fund | |||||||||
12/31/20 | 1,557 | 484 | 821 | — | 2,862 | ||||
12/31/19 | 1,026 | 166 | 1,000 | — | 2,192 | ||||
Seix High Income Fund | |||||||||
12/31/20 | 11,995 | — | — | — | 11,995 | ||||
12/31/19 | 16,685 | — | — | — | 16,685 | ||||
Seix High Yield Fund | |||||||||
12/31/20 | 15,236 | — | — | — | 15,236 | ||||
12/31/19 | 14,834 | — | — | — | 14,834 | ||||
Seix Investment Grade Tax-Exempt Bond Fund | |||||||||
12/31/20 | 3,819 | 3,491 | 2,943 | — | 10,253 | ||||
12/31/19 | 5,263 | 1,960 | 5,757 | — | 12,980 | ||||
Seix Short-Term Bond Fund | |||||||||
12/31/20 | 123 | — | — | — | 123 | ||||
12/31/19 | 147 | — | — | — | 147 | ||||
Seix Short-Term Municipal Bond Fund | |||||||||
12/31/20 | 110 | 33 | 84 | — | 227 | ||||
12/31/19 | 125 | 26 | 203 | — | 354 | ||||
Seix Total Return Bond Fund | |||||||||
12/31/20 | 10,122 | 964 | — | — | 11,086 | ||||
12/31/19 | 5,530 | — | — | 2,220 | 7,750 | ||||
Seix U.S. Government Securities Ultra-Short Bond Fund | |||||||||
12/31/20 | 7,907 | — | — | — | 7,907 | ||||
12/31/19 | 28,898 | — | — | — | 28,898 | ||||
Seix U.S. Mortgage Fund | |||||||||
12/31/20 | 205 | — | — | — | 205 | ||||
12/31/19 | 473 | — | — | 17 | 490 | ||||
Seix Ultra-Short Bond Fund | |||||||||
12/31/20 | 593 | — | — | — | 593 | ||||
12/31/19 | 1,462 | — | — | — | 1,462 |
| Capital Paid in on Shares of Beneficial Interest | Total Distributable Earnings (Accumulated Losses) | ||
Seix Core Bond Fund | $ — (1) | $ —(1) | |
Seix Floating Rate High Income Fund | — (1) | — (1) | |
Seix High Grade Municipal Bond Fund | — (1) | — (1) | |
Seix High Income Fund | — (1) | — (1) | |
Seix High Yield Fund | — (1) | — (1) | |
Seix Investment Grade Tax-Exempt Bond Fund | — (1) | — (1) | |
Seix Short-Term Bond Fund | — (1) | — (1) |
| Capital Paid in on Shares of Beneficial Interest | Total Distributable Earnings (Accumulated Losses) | ||
Seix Total Return Bond Fund | $ — (1) | $ —(1) | |
Seix U.S. Government Securities Ultra-Short Bond Fund | (238) | 238 | |
Seix Ultra-Short Bond Fund | — (1) | — (1) |
| (1) | Amount is less than $500. |

Philadelphia, Pennsylvania
began serving as auditor.
| LTCG | |
Seix Core Bond Fund | $ 439 |
Seix Corporate Bond Fund | 942 |
Seix High Grade Municipal Bond Fund | 484 |
Seix Investment Grade Tax-Exempt Bond Fund | 3,973 |
Seix Short-Term Municipal Bond Fund | 52 |
Seix Total Return Bond Fund | 964 |
Seix U.S. Mortgage Fund | 42 |
| Name, Year of Birth, Length of Time Served and Number of Portfolios in Fund Complex Overseen by Trustee | Principal Occupation(s) During Past 5 Years | Other Directorships Held by Trustee During Past 5 Years |
| Burke, Donald C. YOB: 1960 Served Since: 2017 97 Portfolios | Retired. | Trustee (since 2021), Virtus Investment Trust (13 portfolios) and Virtus Strategy Trust (12 portfolios); Director (since 2020), Duff & Phelps Select MLP and Midstream Energy Fund Inc. and Virtus Total Return Fund Inc.; Trustee (since 2020), Virtus Global Multi-Sector Income Fund; Trustee (since 2016), Virtus Mutual Fund Family (54 portfolios), Virtus Variable Insurance Trust (8 portfolios) and Virtus Alternative Solutions Trust (3 portfolios); Director (since 2014), closed-end funds managed by Duff & Phelps Investment Management Co. (4 funds); Director, Avista Corp. (energy company) (since 2011); Trustee, Goldman Sachs Fund Complex (2010 to 2014); and Director, BlackRock Luxembourg and Cayman Funds (2006 to 2010). |
| Harris, Sidney E. YOB: 1949 Served Since: 2017 93 Portfolios | Professor and Dean Emeritus (since April 2015), Professor (1997 to 2014), Dean (1997 to 2004), J. Mack Robinson College of Business, Georgia State University. | Trustee (since 2021), Virtus Investment Trust (13 portfolios) and Virtus Strategy Trust (12 portfolios); Director (since 2020), Duff & Phelps Select MLP and Midstream Energy Fund Inc. and Virtus Total Return Fund Inc.; Trustee (since 2020), Virtus Global Multi-Sector Income Fund; Trustee (since 2019), Mutual Fund Directors Forum; Trustee (since 2017), Virtus Mutual Fund Family (54 portfolios), Virtus Variable Insurance Trust (8 portfolios) and Virtus Alternative Solutions Trust (3 portfolios); Trustee (2013 to 2020) and Honorary Trustee (since 2020), KIPP Metro Atlanta; Director (1999 to 2019), Total System Services, Inc.; Trustee (2004 to 2017), RidgeWorth Funds; Trustee (since 2012), International University of the Grand Bassam Foundation; and Trustee (2011 to 2015), Genspring Family Offices, LLC. |
| Mallin, John R. YOB: 1950 Served Since: 2017 93 Portfolios | Partner/Attorney (since 2003), McCarter & English LLP (law firm) Real Property Practice Group; Member (since 2014), Counselors of Real Estate. | Trustee (since 2021), Virtus Investment Trust (13 portfolios) and Virtus Strategy Trust (12 portfolios); Director (since 2020), Duff & Phelps Select MLP and Midstream Energy Fund Inc. and Virtus Total Return Fund Inc.; Trustee (since 2020), Virtus Global Multi-Sector Income Fund; Trustee (since 2016), Virtus Mutual Fund Family (54 portfolios) and Virtus Alternative Solutions Trust (3 portfolios); Director (since 2019), 1892 Club, Inc. (non-profit); Director (2013 to 2020), Horizons, Inc. (non-profit); and Trustee (since 1999), Virtus Variable Insurance Trust (8 portfolios). |
| McDaniel, Connie D. YOB: 1958 Served Since: 2017 93 Portfolios | Retired (since 2013). Vice President, Chief of Internal Audit, Corporate Audit Department (2009 to 2013), Vice President Global Finance Transformation (2007 to 2009), Vice President and Controller (1999 to 2007), The Coca-Cola Company. | Trustee (since 2021), Virtus Investment Trust (13 portfolios) and Virtus Strategy Trust (12 portfolios); Director (since 2020), Duff & Phelps Select MLP and Midstream Energy Fund Inc. and Virtus Total Return Fund Inc.; Trustee (since 2020), Virtus Global Multi-Sector Income Fund; Director (since 2019), Global Payments Inc.; Trustee (since 2017), Virtus Mutual Fund Family (54 portfolios), Virtus Variable Insurance Trust (8 portfolios) and Virtus Alternative Solutions Trust (3 portfolios); Director (since 2021), North Florida Land Trust; Member (since 2011) and Chair (2014 to 2016), Georgia State University, Robinson College of Business Board of Advisors; Director (2014 to 2019), Total System Services, Inc.; and Trustee (2005 to 2017), RidgeWorth Funds. |
| Name, Year of Birth, Length of Time Served and Number of Portfolios in Fund Complex Overseen by Trustee | Principal Occupation(s) During Past 5 Years | Other Directorships Held by Trustee During Past 5 Years |
| McLoughlin, Philip YOB: 1946 Served Since: 1989 103 Portfolios | Retired. | Trustee (since 2021), Virtus Investment Trust (13 portfolios) and Virtus Strategy Trust (12 portfolios); Trustee (since 2021), Virtus AllianzGI AI & Tech Opportunities Fund, Virtus AllianzGI Convertible & Income Fund II, Virtus AllianzGI Diversified Income & Convertible, Virtus AllianzGI Equity & Convertible Income Fund and Virtus Dividend, Interest & Premium Strategy Fund; Advisory Board Member (since 2021), Virtus AllianzGI Convertible & Income 2024 Target Term Fund and Virtus AllianzGI Convertible & Income Fund; Director and Chairman (since 2016), Virtus Total Return Fund Inc.; Director and Chairman (2016 to 2019), the former Virtus Total Return Fund Inc.; Director and Chairman (since 2014) Duff & Phelps Select MLP and Midstream Energy Fund Inc.; Trustee and Chairman (since 2013), Virtus Alternative Solutions Trust (3 portfolios); Trustee and Chairman (since 2011), Virtus Global Multi-Sector Income Fund; Chairman and Trustee (since 2003), Virtus Variable Insurance Trust (8 portfolios); Director (since 1995), closed-end funds managed by Duff & Phelps Investment Management Co. (4 funds); Director (1991 to 2019) and Chairman ( 2010 to 2019), Lazard World Trust Fund (closed-end investment firm in Luxembourg); and Trustee (since 1989) and Chairman (since 2002), Virtus Mutual Fund Family (54 portfolios). |
| McNamara, Geraldine M. YOB: 1951 Served Since: 2002 97 Portfolios | Retired. | Trustee (since 2021), Virtus Investment Trust (13 portfolios) and Virtus Strategy Trust (12 portfolios); Director (since 2020), Duff & Phelps Select MLP and Midstream Energy Fund Inc. and Virtus Total Return Fund Inc.; Trustee (since 2020), Virtus Global Multi-Sector Income Fund; Trustee (since 2016), Virtus Alternative Solutions Trust (3 portfolios); Trustee (since 2015), Virtus Variable Insurance Trust (8 portfolios); Director (since 2003), closed-end funds managed by Duff & Phelps Investment Management Co. (4 funds); and Trustee (since 2001), Virtus Mutual Fund Family (54 portfolios). |
| Oates, James M. YOB: 1946 Served Since: 2005 93 Portfolios | Managing Director (since 1994), Wydown Group (consulting firm). | Trustee (since 2021), Virtus Investment Trust (13 portfolios) and Virtus Strategy Trust (12 portfolios); Director (since 2016), Virtus Total Return Fund Inc.; Director (2016 to 2019), the former Virtus Total Return Fund Inc.; Trustee (since 2016), Virtus Variable Insurance Trust (8 portfolios); Director (since 2014), Duff & Phelps Select MLP and Midstream Energy Fund Inc.; Trustee (since 2013), Virtus Alternative Solutions Trust (3 portfolios); Trustee (since 2013), Virtus Global Multi-Sector Income Fund; Trustee (since 2005) and Chairman (2005 to 2017), John Hancock Fund Complex (227 portfolios); Director (2002 to 2014), New Hampshire Trust Company; Chairman (2000 to 2016), Emerson Investment Management, Inc.; Non-Executive Chairman (2000 to 2014), Hudson Castle Group, Inc. (formerly IBEX Capital Markets, Inc.) (financial services); Chairman and Director (1999 to 2014), Connecticut River Bank; Director (since 1996), Stifel Financial; and Trustee (since 1987), Virtus Mutual Fund Family (54 portfolios). |
| Walton, R. Keith YOB: 1964 Served Since: 2020 93 Portfolios | Managing Director (since 2020), Lafayette Square Holding Company LLC; Venture and Operating Partner (since 2020), Plexo Capital, LLC; Venture Partner (since 2019) and Senior Adviser (2018 to 2019), Plexo, LLC; Senior Adviser (2018 to 2019), Vatic Labs, LLC; Executive Vice President, Strategy (2017 to 2019), Zero Mass Water, LLC; Vice President, Strategy (2013 to 2017), Arizona State University; Partner (since 2006), Global Infrastructure Partners. | Trustee (since 2021), Virtus Investment Trust (13 portfolios) and Virtus Strategy Trust (12 portfolios); Trustee (since 2020) Virtus Alternative Solutions Trust (3 portfolios), Virtus Variable Insurance Trust (8 portfolios) and Virtus Mutual Fund Family (54 portfolios); Director (since 2017), certain funds advised by Bessemer Investment Management LLC; Director (since 2016), Duff & Phelps Select MLP and Midstream Energy Fund Inc.; Trustee (since 2016), Virtus Global Multi-Sector Income Fund; Director (2006 to 2019), Systematica Investments Limited Funds; Director (2006 to 2017), BlueCrest Capital Management Funds; Trustee (2014 to 2017), AZ Service; Director (since 2004), Virtus Total Return Fund Inc.; and Director (2004 to 2019), the former Virtus Total Return Fund Inc. |
| Name, Year of Birth, Length of Time Served and Number of Portfolios in Fund Complex Overseen by Trustee | Principal Occupation(s) During Past 5 Years | Other Directorships Held by Trustee During Past 5 Years |
| Zino, Brian T. YOB: 1952 Served Since: 2020 93 Portfolios | Retired. Various roles (1982 to 2008), J. & W. Seligman & Co. Incorporated, including President (1994 to 2008). | Trustee (since 2021), Virtus Investment Trust (13 portfolios) and Virtus Strategy Trust (12 portfolios); Advisory Board Member (since 2021), Virtus AllianzGI AI & Tech Opportunities Fund, Virtus AllianzGI Convertible & Income Fund, Virtus AllianzGI Convertible & Income Fund II, Virtus AllianzGI Convertible & Income 2024 Target Term Fund, Virtus AllianzGI Diversified Income & Convertible, Virtus AllianzGI Equity & Convertible Income Fund and Virtus Dividend, Interest & Premium Strategy Fund; Trustee (since 2020) Virtus Alternative Solutions Trust (3 portfolios), Virtus Variable Insurance Trust (8 portfolios) and Virtus Mutual Fund Family (54 portfolios); Director (since 2016), Duff & Phelps Select MLP and Midstream Energy Fund Inc.; Trustee (since 2016), Virtus Global Multi-Sector Income Fund; Director (since 2014), Virtus Total Return Fund Inc.; Director (2014 to 2019), the former Virtus Total Return Fund Inc.; Trustee (since 2011), Bentley University; Director (1986 to 2008) and President (1994 to 2008), J&W Seligman Co. Inc.; Director (1998 to 2009), Chairman (2002 to 2004) and Vice Chairman (2000 to 2002), ICI Mutual Insurance Company; Member, Board of Governors of ICI (1998 to 2008). |
| Name, Year of Birth, Length of Time Served and Number of Funds Overseen | Principal Occupation(s) During Past 5 Years | Principal Occupation(s) During Past 5 Years and Other Directorships Held by Trustee |
| Aylward, George R.* Trustee and President YOB: 1964 Served Since: 2006 102 Portfolios | Director, President and Chief Executive Officer (since 2008),Virtus Investment Partners, Inc. and/or certain of its subsidiaries, and various senior officer positions with Virtus affiliates (since 2005). | Trustee and President (since 2021), Virtus Investment Trust (13 portfolios) and Virtus Strategy Trust (12 portfolios); Trustee, President and Chief Executive Officer (since 2021), Virtus AllianzGI AI & Tech Opportunities Fund, Virtus AllianzGI Convertible & Income 2024 Target Term Fund, Virtus AllianzGI Convertible & Income Fund, Virtus AllianzGI Convertible & Income Fund II, Virtus AllianzGI Diversified Income & Convertible, Virtus AllianzGI Equity & Convertible Income Fund and Virtus Dividend, Interest & Premium Strategy Fund; Chairman and Trustee (since 2015), Virtus ETF Trust II (3 portfolios); Director, President and Chief Executive Officer (since 2014), Duff & Phelps Select MLP and Midstream Energy Fund Inc.; Trustee and President (since 2013), Virtus Alternative Solutions Trust (3 portfolios); Director (since 2013), Virtus Global Funds, PLC (5 portfolios); Trustee (since 2012) and President (since 2010), Virtus Variable Insurance Trust (8 portfolios); Trustee, President and Chief Executive Officer (since 2011), Virtus Global Multi-Sector Income Fund; Trustee and President (since 2006) and Executive Vice President (2004 to 2006), Virtus Mutual Fund Family (54 portfolios); Director, President and Chief Executive Officer (since 2006), Virtus Total Return Fund Inc.; and Director, President and Chief Executive Officer (2006 to 2019), the former Virtus Total Return Fund Inc. |
| Name, Year of Birth, Length of Time Served, and Number of Portfolios in Fund Complex Overseen | Principal Occupation(s) During Past 5 Years | Other Directorships Held by Trustee During Past 5 Years |
| Cogan, Sarah E. YOB: 1956 Served Since: 2021 93 Portfolios | Retired Partner. Simpson Thacher & Bartlett LLP (“STB”) (law firm) (since 2018); Director, Girl Scouts of Greater New York (since 2016); Trustee, Natural Resources Defense Council, Inc. (since 2013); and formerly, Partner, STB (1989 to 2018). | Advisory Board Member (since 2021), Virtus Alternative Solutions Trust (3 portfolios), Virtus Mutual Fund Family (54 portfolios), Virtus Variable Insurance Trust (8 portfolios), Duff & Phelps Select MLP and Midstream Energy Fund Inc., Virtus Total Return Fund Inc. and Virtus Global Multi-Sector Income Fund; Trustee (since 2019), Virtus Investment Trust (13 portfolios) and Virtus Strategy Trust (12 portfolios); Trustee (since 2019), PIMCO California Municipal Income Fund, PIMCO California Municipal Income Fund II, PIMCO California Municipal Income Fund III, PIMCO Municipal Income Fund, PIMCO Municipal Income Fund II, PIMCO Municipal Income Fund III, PIMCO New York Municipal Income Fund, PIMCO New York Municipal Income Fund II, PIMCO New York Municipal Income Fund III, PIMCO Energy and Tactical Credit Opportunities Fund, PCM Fund, Inc, PIMCO Corporate & Income Strategy Fund, PIMCO Corporate & Income Opportunity Fund, PIMCO Dynamic Credit and Mortgage Income Fund, PIMCO Dynamic Income Fund, PIMCO Global StocksPLUS® & Income Fund, PIMCO High Income Fund, PIMCO Income Opportunity Fund, PIMCO Income Strategy Fund, PIMCO Income Strategy Fund II, PIMCO Strategic Income Fund, Inc., PIMCO Flexible Credit Income Fund and PIMCO Flexible Municipal Income Fund; and Trustee (since 2019), PIMCO Managed Accounts Trust (5 portfolios). |
| DeCotis, Deborah A. YOB: 1952 Served Since: 2021 93 Portfolios | Advisory Director, Morgan Stanley & Co., Inc. (since 1996); Member, Circle Financial Group (since 2009); Member, Council on Foreign Relations (since 2013); Trustee, Smith College (since 2017); and Director, Watford Re (since 2017). Formerly, Co-Chair Special Projects Committee, Memorial Sloan Kettering (2005 to 2015); Trustee, Stanford University (2010 to 2015); and Principal, LaLoop LLC, a retail accessories company (1999 to 2014). | Advisory Board Member (since 2021), Virtus Alternative Solutions Trust (3 portfolios), Virtus Mutual Fund Family (54 portfolios), Virtus Variable Insurance Trust (8 portfolios), Duff & Phelps Select MLP and Midstream Energy Fund Inc., Virtus Total Return Fund Inc. and Virtus Global Multi-Sector Income Fund; Trustee (since 2014), Virtus Investment Trust (13 portfolios); Trustee (since 2011), Virtus Strategy Trust (12 portfolios); Trustee (since 2011), PIMCO California Municipal Income Fund II, PIMCO California Municipal Income Fund III, PIMCO Municipal Income Fund, PIMCO Municipal Income Fund II, PIMCO Municipal Income Fund III, PIMCO New York Municipal Income Fund, PIMCO New York Municipal Income Fund II, PIMCO New York Municipal Income Fund III, PCM Fund, Inc., PIMCO Corporate & Income Strategy Fund, PIMCO Corporate & Income Opportunity Fund, PIMCO Global StocksPLUS® & Income Fund, PIMCO High Income Fund, PIMCO Income Opportunity Fund, PIMCO Income Strategy Fund, PIMCO Income Strategy Fund II, PIMCO Strategic Income Fund, Inc. and PIMCO Managed Accounts Trust (5 portfolios); Trustee (since 2019), PIMCO Energy and Tactical Credit Opportunities Fund; Trustee (since 2013), PIMCO Dynamic Credit and Mortgage Income Fund; Trustee (since 2012), PIMCO Dynamic Income Fund; Trustee (since 2020), PIMCO Dynamic Income Opportunities Fund; Trustee (since 2017), PIMCO Flexible Credit Income Fund; and Trustee (since 2018), PIMCO Flexible Municipal Income Fund. |
| Drummond, F. Ford YOB: 1962 Served Since: 2021 93 Portfolios | Owner/Operator (since 1998), Drummond Ranch; formerly Board Member (2006 to 2020) and Chairman (2016 to 2018), Oklahoma Water Resources Board; Director (1998 to 2008), The Cleveland Bank; and General Counsel (1998 to 2008), BMIHealth Plans (benefits administration). | Advisory Board Member (since 2021), Virtus Alternative Solutions Trust (3 portfolios), Virtus Mutual Fund Family (54 portfolios), Virtus Variable Insurance Trust (8 portfolios), Duff & Phelps Select MLP and Midstream Energy Fund Inc., Virtus Total Return Fund Inc. and Virtus Global Multi-Sector Income Fund; Trustee (since 2006), Virtus Investment Trust (13 portfolios); Trustee (since 2014), Virtus Strategy Trust (12 portfolios); and Director (since 2011), Bancfirst Corporation. |
| Moyer, William R. YOB: 1944 Served Since: 2020 93 Portfolios | Private investor (since 2004); Financial and Operations Principal (2006 to 2017), Newcastle Distributors LLC (broker dealer). | Advisory Board Member (since 2021), Virtus Investment Trust (13 portfolios) and Virtus Strategy Trust (12 portfolios); Advisory Board Member (since 2020), Virtus Variable Insurance Trust (8 portfolios) and Virtus Mutual Fund Family (54 portfolios); Advisory Board Member (since 2020) and Director (2016 to 2019), Virtus Total Return Fund Inc.; Director (2016 to 2019), the former Virtus Total Return Fund Inc.; Advisory Board Member (since 2020) and Director (2014 to 2019), Duff & Phelps Select MLP and Midstream Energy Fund Inc.; Advisory Board Member (since 2020) and Trustee (2011 to 2019), Virtus Global Multi-Sector Income Fund; Advisory Board Member (since 2020) and Trustee (2013 to 2016), Virtus Alternative Solutions Trust (3 portfolios). |
| Name, Address and Year of Birth | Position(s) Held with Trust and Length of Time Served | Principal Occupation(s) During Past 5 Years |
| Batchelar, Peter J. YOB: 1970 | Senior Vice President (since 2017), and Vice President (2008 to 2016). | Senior Vice President, Product Development (since 2017), Vice President, Product Development (2008 to 2016), and various officer positions (since 2008), Virtus Investment Partners, Inc. and/or certain of its subsidiaries; Senior Vice President (since 2021), Virtus Investment Trust and Virtus Strategy Trust; Senior Vice President (since 2021), AllianzGI Closed-End Funds; Senior Vice President (since 2017) and Vice President (2008 to 2016), Virtus Mutual Fund Family; Senior Vice President (since 2017) and Vice President (2010 to 2016), Virtus Variable Insurance Trust; Senior Vice President (since 2017) and Vice President (2013 to 2016), Virtus Alternative Solutions Trust; Senior Vice President (since 2017) and Vice President (2016 to 2017), Duff & Phelps Select MLP and Midstream Energy Fund Inc., Virtus Total Return Fund Inc. and Virtus Global Multi-Sector Income Fund; and Senior Vice President (2017 to 2019) and Vice President (2016 to 2017), the former Virtus Total Return Fund Inc. |
| Bradley, W. Patrick YOB: 1972 | Executive Vice President (since 2016); Senior Vice President (2013 to 2016); Vice President (2011 to 2013); Chief Financial Officer and Treasurer (since 2006). | Executive Vice President, Fund Services (since 2016), Senior Vice President, Fund Services (2010 to 2016), and various officer positons (since 2006), Virtus Investment Partners, Inc. and/or certain of its subsidiaries; Executive Vice President, Chief Financial Officer and Treasurer (since 2021), Virtus Investment Trust and Virtus Strategy Trust; Executive Vice President, Chief Financial Officer and Treasurer (since 2021), AllianzGI Closed-End Funds; Director (since 2019), Virtus Global Funds ICAV; Executive Vice President (since 2016), Senior Vice President (2013 to 2016), Vice President (2011 to 2013), Chief Financial Officer and Treasurer (since 2004), Virtus Variable Insurance Trust; Executive Vice President (since 2016), Senior Vice President (2013 to 2016), Vice President (2011 to 2013), Chief Financial Officer and Treasurer (since 2006), Virtus Mutual Fund Family; Executive Vice President (since 2016), Senior Vice President (2013 to 2016), Vice President (2012 to 2013) and Chief Financial Officer and Treasurer (since 2010), Virtus Total Return Fund Inc.; Executive Vice President (2016 to 2019), Senior Vice President (2013 to 2016), Vice President (2012 to 2013), Chief Financial Officer and Treasurer (since 2010), the former Virtus Total Return Fund Inc.; Executive Vice President (since 2016), Senior Vice President (2013 to 2016), Vice President (2011 to 2013), Chief Financial Officer and Treasurer (since 2011), Virtus Global Multi-Sector Income Fund; Executive Vice President (since 2016), Senior Vice President (2014 to 2016), Chief Financial Officer and Treasurer (since 2014), Duff & Phelps Select MLP and Midstream Energy Fund Inc.; Executive Vice President (since 2016), Senior Vice President (2013 to 2016), and Chief Financial Officer and Treasurer (since 2013), Virtus Alternative Solutions Trust; Director (since 2013), Virtus Global Funds, PLC; and Vice President and Assistant Treasurer (since 2011), Duff & Phelps Utility and Infrastructure Fund Inc. |
| Carr, Kevin J. YOB: 1954 | Senior Vice President (since 2013); Vice President (2005 to 2013); Chief Legal Officer, Counsel and Secretary (since 2005). | Vice President and Senior Counsel (2017 to Present), Senior Vice President (2009 to 2017), Vice President, Counsel and Secretary (2008 to 2009), and various officer positions (since 2005), Virtus Investment Partners, Inc. and/or certain of its subsidiaries; Senior Vice President and Assistant Secretary (since 2021), Virtus Investment Trust and Virtus Strategy Trust; Assistant Secretary, (since 2021), AllianzGI Closed-End Funds; Senior Vice President (since 2013), Vice President (2005 to 2013), Chief Legal Officer, Counsel and Secretary (since 2005), Virtus Mutual Fund Family; Senior Vice President (2013 to 2014), Vice President (2012 to 2013), Secretary and Chief Legal Officer (2005 to 2013), and Assistant Secretary (2013 to 2014 and since 2017), Virtus Total Return Fund Inc.; Senior Vice President (2013 to 2014), Vice President (2012 to 2013), Secretary and Chief Legal Officer (2005 to 2013) and Assistant Secretary (2013 to 2014 and 2017 to 2019), the former Virtus Total Return Fund Inc.; Senior Vice President (since 2017), Assistant Secretary (since 2013), Vice President, Chief Legal Officer, Counsel and Secretary (2010 to 2013), Virtus Variable Insurance Trust; Senior Vice President (2013 to 2014), Vice President (2011 to 2013), and Assistant Secretary (since 2011), Virtus Global Multi-Sector Income Fund; Assistant Secretary (since 2015), Duff & Phelps Select MLP and Midstream Energy Fund Inc.; Senior Vice President (since 2017) and Assistant Secretary (since 2013), Virtus Alternative Solutions Trust; Secretary (since 2015), ETFis Series Trust I; and Secretary (since 2015), Virtus ETF Trust II. |
| Name, Address and Year of Birth | Position(s) Held with Trust and Length of Time Served | Principal Occupation(s) During Past 5 Years |
| Engberg, Nancy J. YOB: 1956 | Senior Vice President (since 2017); Vice President (2011 to 2017); and Chief Compliance Officer (since 2011). | Senior Vice President (since 2017), Vice President (2008 to 2017) and Chief Compliance Officer (2008 to 2011 and since 2016), and various officer positions (since 2003), Virtus Investment Partners, Inc. and/or certain of its subsidiaries; Senior Vice President and Chief Compliance Officer (since 2021), Virtus Investment Trust and Virtus Strategy Trust; Senior Vice President and Chief Compliance Officer, (since 2021), AllianzGI Closed-End Funds; Senior Vice President (since 2017), Vice President (2011 to 2017) and Chief Compliance Officer (since 2011), Virtus Mutual Fund Family; Senior Vice President (since 2017), Vice President (2010 to 2017) and Chief Compliance Officer (since 2011), Virtus Variable Insurance Trust; Senior Vice President (since 2017), Vice President (2011 to 2017) and Chief Compliance Officer (since 2011), Virtus Global Multi-Sector Income Fund; Senior Vice President (since 2017), Vice President (2012 to 2017) and Chief Compliance Officer (since 2012), Virtus Total Return Fund Inc.; Senior Vice President (2017 to 2019), Vice President (2012 to 2017) and Chief Compliance Officer (since 2012), the former Virtus Total Return Fund Inc.; Senior Vice President (since 2017), Vice President (2013 to 2016) and Chief Compliance Officer (since 2013), Virtus Alternative Solutions Trust; Senior Vice President (since 2017), Vice President (2014 to 2017) and Chief Compliance Officer (since 2014), Duff & Phelps Select MLP and Midstream Energy Fund Inc.; Chief Compliance Officer (since 2015), ETFis Series Trust I; and Chief Compliance Officer (since 2015), Virtus ETF Trust II. |
| Short, Julia R. YOB: 1972 | Senior Vice President (since 2017). | Senior Vice President, Product Development (since 2017), Virtus Investment Partners, Inc. and/or certain of its subsidiaries; Senior Vice President (since 2021), Virtus Investment Trust and Virtus Strategy Trust; Senior Vice President, (since 2021), AllianzGI Closed-End Funds; Senior Vice President (since 2018), Duff & Phelps Select MLP and Midstream Energy Fund Inc., Virtus Global Multi-Sector Income Fund and Virtus Total Return Fund Inc.; Senior Vice President (2018 to 2019), the former Virtus Total Return Fund Inc.; Senior Vice President (since 2017), Virtus Mutual Fund Family; President and Chief Executive Officer, RidgeWorth Funds (2007 to 2017); and Managing Director, Product Manager, RidgeWorth Investments (2004 to 2017). |
| Waltman, Francis G. YOB: 1962 | Executive Vice President (since 2013); Senior Vice President (2008 to 2013). | Executive Vice President, Product Management (since 2009), and various senior officer positions (since 2006), Virtus Investment Partners, Inc. and/or certain of its subsidiaries; Executive Vice President (since 2021), Virtus Investment Trust and Virtus Strategy Trust; Executive Vice President, (since 2021), AllianzGI Closed-End Funds; Director (since 2019), Virtus Global Funds ICAV; Executive Vice President (since 2017), Virtus Total Return Fund Inc.; Executive Vice President (2017 to 2019), the former Virtus Total Return Fund Inc.; Executive Vice President (since 2014), Duff & Phelps Select MLP and Midstream Energy Fund Inc.; Executive Vice President (since 2013), Senior Vice President (2008 to 2013), Virtus Mutual Fund Family; Executive Vice President (since 2013), Senior Vice President (2010 to 2013), Virtus Variable Insurance Trust; Executive Vice President (since 2013), Senior Vice President (2011 to 2013), Virtus Global Multi-Sector Income Fund; Director (since 2013), Virtus Global Funds PLC; and Executive Vice President (since 2013), Virtus Alternative Solutions Trust. |
and the Virtus Asset Trust Statutory Prospectus,
| Annual Fund Operating Expenses (expenses that you pay each year as a percentage of the value of your investment) | Class A | Class I |
| Management Fees | 0.50% | 0.50% |
| Distribution and Shareholder Servicing (12b-1) Fees | 0.15% | None |
| Other Expenses | 0.30% | 0.35% |
| Acquired Fund Fees and Expenses | 0.03% | 0.03% |
| Total Annual Fund Operating Expenses(a) | 0.98% | 0.88% |
| Less: Fee Waiver and/or Expense Reimbursement(b) | (0.22)% | (0.27)% |
| Total Annual Fund Operating Expenses After Expense(a)(b) | 0.76% | 0.61% |
| Share Status | 1 Year | 3 Years | 5 Years | 10 Years | |
| Class A | Sold or Held | $347 | $562 | $794 | $1,462 |
| Class I | Sold or Held | $58 | $237 | $430 | $990 |
| Annual Fund Operating Expenses (expenses that you pay each year as a percentage of the value of your investment) | Class A | Class I |
| Management Fees | 0.50% | 0.50% |
| Distribution and Shareholder Servicing (12b-1) Fees | 0.25% | None |
| Other Expenses | 0.26% | 0.31% |
| Acquired Fund Fees and Expenses | 0.01% | 0.01% |
| Total Annual Fund Operating Expenses(a) | 1.02% | 0.82% |
| Less: Fee Waiver and/or Expense Reimbursement(b) | (0.30)% | (0.25)% |
| Total Annual Fund Operating Expenses After Expense Reimbursement(a)(b) | 0.72% | 0.57% |
| Share Status | 1 Year | 3 Years | 5 Years | 10 Years | |
| Class A | Sold or Held | $347 | $562 | $794 | $1,462 |
| Class I | Sold or Held | $58 | $237 | $430 | $990 |
| Annual Fund Operating Expenses (expenses that you pay each year as a percentage of the value of your investment) | Class A | Class I |
| Management Fees | 0.35% | 0.35% |
| Distribution and Shareholder Servicing (12b-1) Fees | 0.15% | None |
| Other Expenses | 0.72% | 0.75% |
| Acquired Fund Fees and Expenses | 0.02% | 0.02% |
| Total Annual Fund Operating Expenses(a) | 1.24% | 1.12% |
| Less: Fee Waiver and/or Expense Reimbursement(b) | (0.68)% | (0.73)% |
| Total Annual Fund Operating Expenses After Expense | 0.56% | 0.39% |
| Share Status | 1 Year | 3 Years | 5 Years | 10 Years | |
| Class A | Sold or Held | $281 | $544 | $827 | $1,632 |
| Class I | Sold or Held | $40 | $283 | $546 | $1,298 |
| Class A Shares | Class C Shares | Class I Shares | Class R6 Shares | |
| Virtus Seix High Grade Municipal Bond Fund* | 0.73% | N/A | 0.58% | N/A |
| Virtus Seix Investment Grade Tax-Exempt Bond Fund* | 0.71% | N/A | 0.56% | N/A |
| Virtus Seix Short-Term Municipal Bond Fund* | 0.54% | N/A | 0.37% | N/A |
dated April 28, 2020, as supplemented
(Unaudited)
| Amount of Transaction at Offering Price | Sales Charge as a Percentage of Offering Price | Sales Charge as a Percentage of Amount Invested |
| Under $50,000 | 5.50% | 5.82% |
| $50,000 but under $100,000 | 4.50% | 4.71% |
| $100,000 but under $250,000 | 3.50% | 3.63% |
| $250,000 but under $500,000 | 2.50% | 2.56% |
| $500,000 but under $1,000,000 | 2.00% | 2.04% |
| $1,000,000 or more | None | None |
| Amount of Transaction at Offering Price | Sales Charge as a Percentage of Offering Price | Sales Charge as a Percentage of Amount Invested | Dealer Discount as a Percentage of Offering Price |
| Under $50,000 | 5.50% | 5.82% | 4.75% |
| $50,000 but under $100,000 | 4.50% | 4.71% | 4.00% |
| $100,000 but under $250,000 | 3.50% | 3.63% | 3.00% |
| $250,000 but under $500,000 | 2.50% | 2.56% | 2.00% |
| $500,000 but under $1,000,000 | 2.00% | 2.04% | 1.75% |
| $1,000,000 or more | None | None | None |
Accounting Firm
| Mutual Fund Services | 1-800-243-1574 |
| Adviser Consulting Group | 1-800-243-4361 |
| Website | Virtus.com |
The Securities and Exchange Commission has modified mailing regulations for semiannual and annual shareholder fund reports to allow mutual fund companies to send a single copy of these reports to shareholders who share the same mailing address. If you would like additional copies, please call Mutual Fund Services at 1-800-243-1574.

please contact us at 1-800-243-1574, or Virtus.com.
| 8636 | 02-21 |

| Virtus Ceredex Large-Cap Value Equity Fund* |
| Virtus Ceredex Mid-Cap Value Equity Fund* |
| Virtus Ceredex Small-Cap Value Equity Fund* |
| Virtus SGA International Growth Fund* |
| Virtus Silvant Large-Cap Growth Stock Fund* |
| Virtus Silvant Small-Cap Growth Stock Fund* |
| Virtus Zevenbergen Innovative Growth Stock Fund* |
| 1 | ||
| 2 | ||
| 4 | ||
| Fund | Fund Summary | Schedule of Investments |
| 6 | 23 | |
| 8 | 24 | |
| 10 | 25 | |
| 12 | 26 | |
| 15 | 28 | |
| 18 | 29 | |
| 20 | 31 | |
| 32 | ||
| 36 | ||
| 38 | ||
| 42 | ||
| 48 | ||
| 60 | ||
| 61 | ||
| 62 | ||
| 67 | ||


President, Virtus Funds
| Beginning Account Value July 1, 2020 | Ending Account Value December 31, 2020 | Annualized Expense Ratio | Expenses Paid During Period* | |||||
Ceredex Large-Cap Value Equity Fund | ||||||||
| Class A | $ 1,000.00 | $ 1,250.50 | 1.24 % | $ 7.01 | ||||
| Class C | 1,000.00 | 1,247.50 | 1.72 | 9.72 | ||||
| Class I | 1,000.00 | 1,252.70 | 0.97 | 5.49 | ||||
| Class R6 | 1,000.00 | 1,254.50 | 0.72 | 4.08 | ||||
Ceredex Mid-Cap Value Equity Fund | ||||||||
| Class A | 1,000.00 | 1,245.60 | 1.31 | 7.39 | ||||
| Class C | 1,000.00 | 1,243.50 | 1.79 | 10.09 | ||||
| Class I | 1,000.00 | 1,248.20 | 1.04 | 5.88 | ||||
| Class R6 | 1,000.00 | 1,249.10 | 0.79 | 4.47 | ||||
Ceredex Small-Cap Value Equity Fund | ||||||||
| Class A | 1,000.00 | 1,299.00 | 1.46 | 8.44 | ||||
| Class C | 1,000.00 | 1,295.50 | 1.89 | 10.91 | ||||
| Class I | 1,000.00 | 1,300.80 | 1.21 | 7.00 | ||||
| Class R6 | 1,000.00 | 1,302.20 | 0.88 | 5.09 | ||||
SGA International Growth Fund | ||||||||
| Class A | 1,000.00 | 1,225.70 | 1.43 | 8.00 | ||||
| Class I | 1,000.00 | 1,227.70 | 1.19 | 6.66 | ||||
| Class R6 | 1,000.00 | 1,227.80 | 1.09 | 6.10 | ||||
Silvant Large-Cap Growth Stock Fund | ||||||||
| Class A | 1,000.00 | 1,234.50 | 1.23 | 6.91 | ||||
| Class I | 1,000.00 | 1,236.10 | 0.97 | 5.45 | ||||
| Class R6 | 1,000.00 | 1,235.70 | 0.90 | 5.06 | ||||
Silvant Small-Cap Growth Stock Fund | ||||||||
| Class A | 1,000.00 | 1,370.80 | 1.27 | 7.57 | ||||
| Class I | 1,000.00 | 1,371.50 | 1.15 | 6.86 | ||||
Zevenbergen Innovative Growth Stock Fund | ||||||||
| Class A | 1,000.00 | 1,473.80 | 1.25 | 7.77 | ||||
| Class I | 1,000.00 | 1,475.70 | 1.00 | 6.22 | ||||
| Class R6** | 1,000.00 | 1,149.40 | 0.90 | 1.90 |
| * | Expenses are equal to the relevant Fund’s annualized expense ratio, which is net of waived fees and reimbursed expenses, if applicable, multiplied by the average account value over the period, multiplied by the number of days (184) expenses were accrued in the most recent fiscal half-year, then divided by 366 to reflect the one-half year period. |
| ** | October 21, 2020, is the date the Class started accruing expenses. Expenses are equal to the Class’ annualized expense ratio, which is net of waived fees and reimbursed expenses, if applicable, multiplied by the average account value over the period, multiplied by the number of days (72) expenses were accrued in the most recent fiscal half-year, then divided by 366 to reflect the one-half year period. |
| Beginning Account Value July 1, 2020 | Ending Account Value December 31, 2020 | Annualized Expense Ratio | Expenses Paid During Period* | |||||
Ceredex Large-Cap Value Equity Fund | ||||||||
| Class A | $ 1,000.00 | $ 1,018.90 | 1.24 % | $ 6.29 | ||||
| Class C | 1,000.00 | 1,016.49 | 1.72 | 8.72 | ||||
| Class I | 1,000.00 | 1,020.26 | 0.97 | 4.93 | ||||
| Class R6 | 1,000.00 | 1,021.52 | 0.72 | 3.66 | ||||
Ceredex Mid-Cap Value Equity Fund | ||||||||
| Class A | 1,000.00 | 1,018.55 | 1.31 | 6.65 | ||||
| Class C | 1,000.00 | 1,016.14 | 1.79 | 9.07 | ||||
| Class I | 1,000.00 | 1,019.91 | 1.04 | 5.28 | ||||
| Class R6 | 1,000.00 | 1,021.17 | 0.79 | 4.01 | ||||
Ceredex Small-Cap Value Equity Fund | ||||||||
| Class A | 1,000.00 | 1,017.80 | 1.46 | 7.41 | ||||
| Class C | 1,000.00 | 1,015.63 | 1.89 | 9.58 | ||||
| Class I | 1,000.00 | 1,019.05 | 1.21 | 6.14 | ||||
| Class R6 | 1,000.00 | 1,020.71 | 0.88 | 4.47 | ||||
SGA International Growth Fund | ||||||||
| Class A | 1,000.00 | 1,017.95 | 1.43 | 7.25 | ||||
| Class I | 1,000.00 | 1,019.15 | 1.19 | 6.04 | ||||
| Class R6 | 1,000.00 | 1,019.66 | 1.09 | 5.53 | ||||
Silvant Large-Cap Growth Stock Fund | ||||||||
| Class A | 1,000.00 | 1,018.95 | 1.23 | 6.24 | ||||
| Class I | 1,000.00 | 1,020.26 | 0.97 | 4.93 | ||||
| Class R6 | 1,000.00 | 1,020.61 | 0.90 | 4.57 | ||||
Silvant Small-Cap Growth Stock Fund | ||||||||
| Class A | 1,000.00 | 1,018.75 | 1.27 | 6.44 | ||||
| Class I | 1,000.00 | 1,019.36 | 1.15 | 5.84 | ||||
Zevenbergen Innovative Growth Stock Fund | ||||||||
| Class A | 1,000.00 | 1,018.85 | 1.25 | 6.34 | ||||
| Class I | 1,000.00 | 1,020.11 | 1.00 | 5.08 | ||||
| Class R6** | 1,000.00 | 1,008.07 | 0.90 | 1.78 |
| * | Expenses are equal to the relevant Fund’s annualized expense ratio, which is net of waived fees and reimbursed expenses, if applicable, multiplied by the average account value over the period, multiplied by the number of days (184) expenses were accrued in the most recent fiscal half-year, then divided by 366 to reflect the one-half year period. |
| ** | October 21, 2020, is the date the Class started accruing expenses. Expenses are equal to the Class’ annualized expense ratio, which is net of waived fees and reimbursed expenses, if applicable, multiplied by the average account value over the period, multiplied by the number of days (72) expenses were accrued in the most recent fiscal half-year, then divided by 366 to reflect the one-half year period. |
December 31, 2020
| Ticker Symbols: | |
| Class A: SVIIX | |
| Class C: SVIFX | |
| Class I: STVTX | |
| Class R6: STVZX |
Ceredex Value Advisors LLC
| ■ | The Fund is diversified and has an investment objective of seeking to provide a high level of capital appreciation. As a secondary goal, the Fund also seeks to provide current income. There is no guarantee that the Fund will meet its objectives. |
| ■ | For the fiscal year ended December 31, 2020, the Fund’s Class A shares at NAV returned 3.47%, Class C shares at NAV returned 2.98%, Class I shares at NAV returned 3.76%, and Class R6 Shares at NAV returned 4.03%. For the same period, the Russell 1000® Value Index, the Fund’s style-specific benchmark appropriate for comparison, returned 2.80%. |
| Industrials | 25% |
| Financials | 16 |
| Health Care | 16 |
| Information Technology | 13 |
| Materials | 8 |
| Real Estate | 6 |
| Consumer Discretionary | 4 |
| Other | 12 |
| Total | 100% |
| 1 Year | 5 Years | 10 Years | Since inception | Inception date | ||||||||
| Class A shares at NAV2 | 3.47 % | 10.02 % | 9.98 % | — % | — | |||||||
| Class A shares at POP3,4 | -2.48 | 8.72 | 9.33 | — | — | |||||||
| Class C shares at NAV2 and with CDSC4 | 2.98 | 9.49 | 9.42 | — | — | |||||||
| Class I shares at NAV2 | 3.76 | 10.31 | 10.29 | — | — | |||||||
| Class R6 shares at NAV2 | 4.03 | 10.60 | — | 8.49 | 8/1/14 | |||||||
| Russell 1000® Value Index | 2.80 | 9.74 | 10.50 | 7.97 5 | — | |||||||
| Fund Expense Ratios6: Class A shares: Gross 1.29%, Net 1.24%; Class C shares: Gross 1.94%, Net 1.72%; Class I shares: Gross 1.04%, Net 0.97%; Class R6 shares: Gross 0.85%, Net 0.72%. | ||||||||||||
| All returns represent past performance which is no guarantee of future results. Current performance may be higher or lower than the performance shown. The investment return and principal value of an investment will fluctuate so that an investor’s shares, when redeemed, may be worth more or less than their original cost. The above table and graph below do not reflect the deduction of taxes that a shareholder would pay on fund distributions or the redemption of shares. Please visit Virtus.com for performance data current to the most recent month-end. |
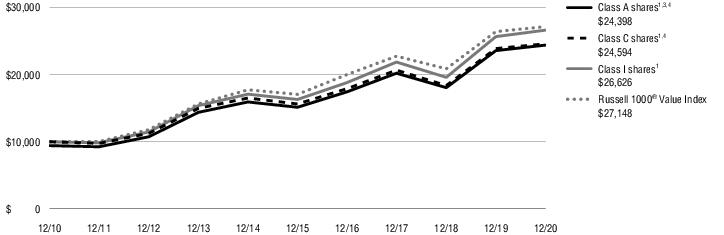
| 1 | Total returns are historical and include changes in share price and the reinvestment of both dividends and capital gain distributions. |
| 2 | “NAV” (Net Asset Value) total returns do not include the effect of any sales charge. |
| 3 | “POP” (Public Offering Price) total returns include the effect of the maximum front-end 5.75% sales charge. |
| 4 | “CDSC” (contingent deferred sales charge) is applied to redemptions of certain classes of shares that do not have a sales charge applied at the time of purchase. CDSC for certain redemptions of Class A shares made within 18 months of a finder’s fee being paid and all Class C shares are 1% within the first year and 0% thereafter. |
| 5 | The since inception index return is from the inception date of Class R6 shares. |
| 6 | The expense ratios of the Fund are set forth according to the prospectus for the Fund effective April 28, 2020, as supplemented and revised, and may differ from the expense ratios disclosed in the Financial Highlights tables in this report. See the Financial Highlights for more current expense ratios. Net Expense: Expenses reduced by a contractual expense limitation in effect through April 30, 2021. Gross Expense: Does not reflect the effect of the expense limitation. Expense ratios include fees and expenses associated with any underlying funds. |
| Ticker Symbols: | |
| Class A: SAMVX | |
| Class C: SMVFX | |
| Class I: SMVTX | |
| Class R6: SMVZX |
Ceredex Value Advisors LLC
| ■ | The Fund is diversified and has an investment objective of seeking to provide capital appreciation. As a secondary goal, the Fund also seeks to provide current income. There is no guarantee that the Fund will meet its objectives. |
| ■ | For the fiscal year ended December 31, 2020, the Fund’s Class A shares at NAV returned -1.52%, Class C shares at NAV returned -1.88%, Class I shares at NAV returned -1.20%, and Class R6 Shares at NAV returned -0.97%. For the same period, the Russell Midcap® Value Index, the Fund’s style-specific benchmark appropriate for comparison, returned 4.96%. |
| Information Technology | 24% |
| Industrials | 22 |
| Health Care | 18 |
| Financials | 14 |
| Materials | 6 |
| Consumer Discretionary | 5 |
| Real Estate | 4 |
| Other (includes short-term investment) | 7 |
| Total | 100% |
| 1 Year | 5 Years | 10 Years | Since inception | Inception date | ||||||||
| Class A shares at NAV2 | -1.52 % | 9.86 % | 9.33 % | — % | — | |||||||
| Class A shares at POP3,4 | -7.18 | 8.57 | 8.68 | — | — | |||||||
| Class C shares at NAV2 and with CDSC4 | -1.88 | 9.40 | 8.82 | — | — | |||||||
| Class I shares at NAV2 | -1.20 | 10.22 | 9.65 | — | — | |||||||
| Class R6 shares at NAV2 | -0.97 | 10.49 | — | 8.12 | 8/1/14 | |||||||
| Russell Midcap® Value Index | 4.96 | 9.73 | 10.49 | 7.74 5 | — | |||||||
| Fund Expense Ratios6: Class A shares: Gross 1.30%, Net 1.30%; Class C shares: Gross 1.95%, Net 1.79%; Class I shares: 1.04%; Class R6 shares: Gross 0.87%, Net 0.79%. | ||||||||||||
| All returns represent past performance which is no guarantee of future results. Current performance may be higher or lower than the performance shown. The investment return and principal value of an investment will fluctuate so that an investor’s shares, when redeemed, may be worth more or less than their original cost. The above table and graph below do not reflect the deduction of taxes that a shareholder would pay on fund distributions or the redemption of shares. Please visit Virtus.com for performance data current to the most recent month-end. |

| 1 | Total returns are historical and include changes in share price and the reinvestment of both dividends and capital gain distributions. |
| 2 | “NAV” (Net Asset Value) total returns do not include the effect of any sales charge. |
| 3 | “POP” (Public Offering Price) total returns include the effect of the maximum front-end 5.75% sales charge. |
| 4 | “CDSC” (contingent deferred sales charge) is applied to redemptions of certain classes of shares that do not have a sales charge applied at the time of purchase. CDSC for certain redemptions of Class A shares made within 18 months of a finder’s fee being paid and all Class C shares are 1% within the first year and 0% thereafter. |
| 5 | The since inception index return is from the inception date of Class R6 shares. |
| 6 | The expense ratios of the Fund are set forth according to the prospectus for the Fund effective April 28, 2020, as supplemented and revised, and may differ from the expense ratios disclosed in the Financial Highlights tables in this report. See the Financial Highlights for more current expense ratios. Net Expense: Expenses reduced by a contractual expense limitation in effect through April 30, 2021. Gross Expense: Does not reflect the effect of the expense limitation. Expense ratios include fees and expenses associated with any underlying funds. |
| Ticker Symbols: | |
| Class A: SASVX | |
| Class C: STCEX | |
| Class I: SCETX | |
| Class R6: VVERX |
Ceredex Value Advisors LLC
| ■ | The Fund is diversified and has an investment objective of seeking to provide capital appreciation. As a secondary goal, the Fund also seeks to provide current income. There is no guarantee that the Fund will meet its objectives. |
| ■ | For the fiscal year ended December 31, 2020, the Fund’s Class A shares at NAV returned 0.62%, Class C shares at NAV returned 0.23%, Class I shares at NAV returned 0.91%, and Class R6 shares at NAV returned 1.19%. For the same period, the Russell 2000® Value Index, the Fund’s style-specific benchmark appropriate for comparison, returned 4.63%. |
| Financials | 32% |
| Information Technology | 14 |
| Real Estate | 11 |
| Industrials | 11 |
| Materials | 9 |
| Health Care | 8 |
| Utilities | 5 |
| Other | 10 |
| Total | 100% |
| 1 Year | 5 Years | 10 Years | Since inception | Inception date | ||||||||
| Class A shares at NAV2 | 0.62 % | 7.85 % | 7.69 % | — % | — | |||||||
| Class A shares at POP3,4 | -5.16 | 6.58 | 7.06 | — | — | |||||||
| Class C shares at NAV2 and with CDSC4 | 0.23 | 7.41 | 7.21 | — | — | |||||||
| Class I shares at NAV2 | 0.91 | 8.16 | 8.01 | — | — | |||||||
| Class R6 shares at NAV 2 | 1.19 | — | — | 2.63 | 2/26/19 | |||||||
| Russell 2000® Value Index | 4.63 | 9.65 | 8.66 | 5.66 5 | — | |||||||
| Fund Expense Ratios6: Class A shares: Gross 1.48%, Net 1.48%; Class C shares: Gross 2.20%, Net 1.84%; Class I shares: Gross 1.20%, Net 1.18%; Class R6 shares: Gross 1.05%, Net 0.88%. | ||||||||||||
| All returns represent past performance which is no guarantee of future results. Current performance may be higher or lower than the performance shown. The investment return and principal value of an investment will fluctuate so that an investor’s shares, when redeemed, may be worth more or less than their original cost. The above table and graph below do not reflect the deduction of taxes that a shareholder would pay on fund distributions or the redemption of shares. Please visit Virtus.com for performance data current to the most recent month-end. |
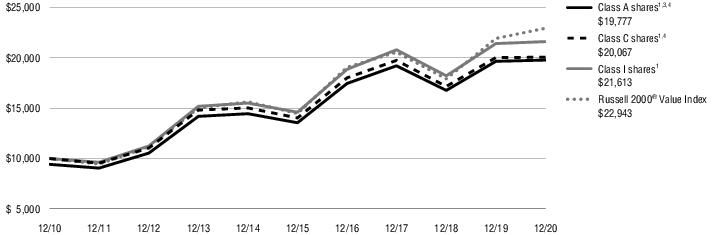
| 1 | Total returns are historical and include changes in share price and the reinvestment of both dividends and capital gain distributions. |
| 2 | “NAV” (Net Asset Value) total returns do not include the effect of any sales charge. |
| 3 | “POP” (Public Offering Price) total returns include the effect of the maximum front-end 5.75% sales charge. |
| 4 | “CDSC” (contingent deferred sales charge) is applied to redemptions of certain classes of shares that do not have a sales charge applied at the time of purchase. CDSC for certain redemptions of Class A shares made within 18 months of a finder’s fee being paid and all Class C shares are 1% within the first year and 0% thereafter. |
| 5 | The since inception index return is from the inception date of Class R6 shares. |
| 6 | The expense ratios of the Fund are set forth according to the prospectus for the Fund effective April 28, 2020, as supplemented and revised, and may differ from the expense ratios disclosed in the Financial Highlights tables in this report. See the Financial Highlights for more current expense ratios. Net Expense: Expenses reduced by a contractual expense limitation in effect through April 30, 2022. Gross Expense: Does not reflect the effect of the expense limitation. Expense ratios include fees and expenses associated with any underlying funds. |
| Ticker Symbols: | |
| Class A: SCIIX | |
| Class I: STITX | |
| Class R6: SCIZX |
Sustainable Growth Advisers, LP
| ■ | The Fund is diversified and has an investment objective of seeking to provide long-term capital appreciation. There is no guarantee that the Fund will meet its objective. |
| ■ | For the fiscal year ended December 31, 2020, the Fund’s Class A shares at NAV returned 22.74%†, Class I shares at NAV returned 23.17%†, and Class R6 Shares at NAV returned 23.18%†. For the same period, the MSCI All Country World ex USA Index, the Fund’s style-specific benchmark appropriate for comparison, returned 10.65%. |
| Consumer Staples | 20% |
| Health Care | 18 |
| Financials | 16 |
| Information Technology | 14 |
| Consumer Discretionary | 13 |
| Materials | 6 |
| Communication Services | 4 |
| Other (includes short-term investment and securities lending collateral) | 9 |
| Total | 100% |
| 1 Year | 5 Years | 10 Years | Since inception | Inception date | ||||||||
| Class A shares at NAV2 | 22.74 % 3 | 13.71 % | 8.69 % | — % | — | |||||||
| Class A shares at POP4,5 | 15.68 | 12.38 | 8.05 | — | — | |||||||
| Class I shares at NAV2 | 23.17 3 | 13.99 | 8.91 | — | — | |||||||
| Class R6 shares at NAV2 | 23.18 3 | 14.08 | — | 14.52 | 9/1/15 | |||||||
| MSCI All Country World ex USA Index (net) | 10.65 | 8.93 | 4.92 | 8.51 6 | — | |||||||
| Fund Expense Ratios7: Class A shares: Gross 1.58%, Net 1.32%; Class I shares: Gross 1.32%, Net 1.07%; Class R6 shares: Gross 1.22%, Net 0.95%. | ||||||||||||
| All returns represent past performance which is no guarantee of future results. Current performance may be higher or lower than the performance shown. The investment return and principal value of an investment will fluctuate so that an investor’s shares, when redeemed, may be worth more or less than their original cost. The above table and graph below do not reflect the deduction of taxes that a shareholder would pay on fund distributions or the redemption of shares. Please visit Virtus.com for performance data current to the most recent month-end. |

| 1 | Total returns are historical and include changes in share price and the reinvestment of both dividends and capital gain distributions. |
| 2 | “NAV” (Net Asset Value) total returns do not include the effect of any sales charge. |
| 3 | Total Return for the report period presented in the table differs from the return in the Financial Highlights. The total return presented in the above table is calculated based on the NAV at which shareholder transactions were processed. The total return presented in the Financial Highlights section of the report is calculated in the same manner, but also takes into account certain adjustments that are necessary under generally accepted accounting principles required in the annual report and semiannual report. |
| 4 | “POP” (Public Offering Price) total returns include the effect of the maximum front-end 5.75% sales charge. |
| 5 | “CDSC” (contingent deferred sales charge) is applied to redemptions of certain classes of shares that do not have a sales charge applied at the time of purchase. CDSC for certain redemptions of Class A shares made within 18 months of a finder’s fee being paid. |
| 6 | The since inception index return is from the inception date of Class R6 shares. |
| 7 | The expense ratios of the Fund are set forth according to the prospectus for the Fund effective April 28, 2020, as supplemented and revised, and may differ from the expense ratios disclosed in the Financial Highlights tables in this report. See the Financial Highlights for more current expense ratios. Net Expense: Expenses reduced by a contractual expense limitation in effect through April 30, 2022. Gross Expense: Does not reflect the effect of the expense limitation. Expense ratios include fees and expenses associated with any underlying funds. |
| Ticker Symbols: | |
| Class A: STCIX | |
| Class I: STCAX | |
| Class R6: STCZX |
Silvant Capital Management LLC
| ■ | The Fund is diversified and has an investment objective of seeking to provide capital appreciation. There is no guarantee that the Fund will meet its objective. |
| ■ | For the fiscal year ended December 31, 2020, the Fund’s Class A shares at NAV returned 35.90%, Class I shares at NAV returned 36.43%, and Class R6 shares at NAV returned 36.39%. For the same period, the Russell 1000® Growth Index, the Fund’s style-specific benchmark appropriate for comparison, returned 38.49%. |
| Information Technology | 45% |
| Consumer Discretionary | 17 |
| Communication Services | 13 |
| Health Care | 12 |
| Industrials | 6 |
| Consumer Staples | 4 |
| Financials | 1 |
| Other | 2 |
| Total | 100% |
| 1 Year | 5 Years | 10 Years | Since inception | Inception date | ||||||||
| Class A shares at NAV2 | 35.90 % | 17.18 % | 14.96 % | — % | — | |||||||
| Class A shares at POP3,4 | 28.08 | 15.80 | 14.28 | — | — | |||||||
| Class I shares at NAV2 | 36.43 | 17.50 | 15.26 | — | — | |||||||
| Class R6 shares at NAV2 | 36.39 | 17.62 | — | 15.90 | 8/1/14 | |||||||
| Russell 1000® Growth Index | 38.49 | 21.00 | 17.21 | 18.45 5 | — | |||||||
| Fund Expense Ratios6: Class A shares: Gross 1.26%, Net 1.23%; Class I shares: Gross 1.12%, Net 0.97%; Class R6 shares: Gross 0.98%, Net 0.90%. | ||||||||||||
| All returns represent past performance which is no guarantee of future results. Current performance may be higher or lower than the performance shown. The investment return and principal value of an investment will fluctuate so that an investor’s shares, when redeemed, may be worth more or less than their original cost. The above table and graph below do not reflect the deduction of taxes that a shareholder would pay on fund distributions or the redemption of shares. Please visit Virtus.com for performance data current to the most recent month-end. |

| 1 | Total returns are historical and include changes in share price and the reinvestment of both dividends and capital gain distributions. |
| 2 | “NAV” (Net Asset Value) total returns do not include the effect of any sales charge. |
| 3 | “POP” (Public Offering Price) total returns include the effect of the maximum front-end 5.75% sales charge. |
| 4 | “CDSC” (contingent deferred sales charge) is applied to redemptions of certain classes of shares that do not have a sales charge applied at the time of purchase. CDSC for certain redemptions of Class A shares made within 18 months of a finder’s fee being paid. |
| 5 | The since inception index return is from the inception date of Class R6 shares. |
| 6 | The expense ratios of the Fund are set forth according to the prospectus for the Fund effective April 28, 2020, as supplemented and revised, and may differ from the expense ratios disclosed in the Financial Highlights tables in this report. See the Financial Highlights for more current expense ratios. Net Expense: Expenses reduced by a contractual expense limitation in effect through April 30, 2021. Gross Expense: Does not reflect the effect of the expense limitation. Expense ratios include fees and expenses associated with any underlying funds. |
| Ticker Symbols: | |
| Class A: SCGIX | |
| Class I: SSCTX |
Silvant Capital Management LLC
| ■ | The Fund is diversified and has an investment objective of seeking to provide long-term capital appreciation. There is no guarantee that the Fund will meet its objective. |
| ■ | For the fiscal year ended December 31, 2020, the Fund’s Class A shares at NAV returned 38.99% and Class I shares at NAV returned 39.01%. For the same period, the Russell 2000® Growth Index, the Fund’s style-specific benchmark appropriate for comparison, returned 34.63%. |
| Health Care | 31% |
| Information Technology | 22 |
| Industrials | 17 |
| Consumer Discretionary | 14 |
| Financials | 5 |
| Communication Services | 3 |
| Materials | 3 |
| Other (includes short-term investment and securities lending collateral) | 5 |
| Total | 100% |
| 1 Year | 5 Years | 10 Years | ||||||
| Class A shares at NAV2 | 38.99% | 17.05% | 12.88% | |||||
| Class A shares at POP3,4 | 31.00 | 15.68 | 12.22 | |||||
| Class I shares at NAV2 | 39.01 | 17.17 | 13.02 | |||||
| Russell 2000® Growth Index | 34.63 | 16.36 | 13.48 | |||||
| Fund Expense Ratios5: Class A shares: Gross 1.64%, Net 1.27%; Class I shares: Gross 1.48%, Net 1.15%. | ||||||||
| All returns represent past performance which is no guarantee of future results. Current performance may be higher or lower than the performance shown. The investment return and principal value of an investment will fluctuate so that an investor’s shares, when redeemed, may be worth more or less than their original cost. The above table and graph below do not reflect the deduction of taxes that a shareholder would pay on fund distributions or the redemption of shares. Please visit Virtus.com for performance data current to the most recent month-end. |

| 1 | Total returns are historical and include changes in share price and the reinvestment of both dividends and capital gain distributions. |
| 2 | “NAV” (Net Asset Value) total returns do not include the effect of any sales charge. |
| 3 | “POP” (Public Offering Price) total returns include the effect of the maximum front-end 5.75% sales charge. |
| 4 | “CDSC” (contingent deferred sales charge) is applied to redemptions of certain classes of shares that do not have a sales charge applied at the time of purchase. CDSC for certain redemptions of Class A shares made within 18 months of a finder’s fee being paid. |
| 5 | The expense ratios of the Fund are set forth according to the prospectus for the Fund effective April 28, 2020, as supplemented and revised, and may differ from the expense ratios disclosed in the Financial Highlights tables in this report. See the Financial Highlights for more current expense ratios. Net Expense: Expenses reduced by a contractual expense limitation in effect through April 30, 2021. Gross Expense: Does not reflect the effect of the expense limitation. Expense ratios include fees and expenses associated with any underlying funds. |
| Ticker Symbols: | |
| Class A: SAGAX | |
| Class I: SCATX | |
| Class R6: VZGRX |
Zevenbergen Capital Investments LLC
| ■ | The Fund is diversified and has an investment objective of seeking to provide long-term capital appreciation. There is no guarantee that the Fund will meet its objective. |
| ■ | For the fiscal year ended December 31, 2020, the Fund’s Class A shares at NAV returned 119.10%, Class I shares at NAV returned 119.67%, and Class R6 shares at NAV from October 20, 2020 (inception date) through December 31, 2020, returned 14.95%*. For the fiscal year ended December 31, 2020, the Russell 3000® Growth Index, the Fund’s style-specific benchmark appropriate for comparison, returned 38.26%. |
| Information Technology | 42% |
| Consumer Discretionary | 26 |
| Health Care | 14 |
| Communication Services | 9 |
| Industrials | 5 |
| Financials | 2 |
| Consumer Staples | 1 |
| Short-Term Investment | 1 |
| Total | 100% |
| 1 Year | 5 Years | 10 Years | Since inception | Inception date | ||||||||
| Class A shares at NAV2 | 119.10 % | 34.15 % | 21.92 % | — % | — | |||||||
| Class A shares at POP3,4 | 106.50 | 32.57 | 21.20 | — | — | |||||||
| Class I shares at NAV2 | 119.67 | 34.46 | 22.19 | — | — | |||||||
| Class R6 shares | — | — | — | 14.95 | 10/20/20 | |||||||
| Russell 3000® Growth Index | 38.26 | 20.67 | 16.93 | 9.485 | — | |||||||
| Fund Expense Ratios6: Class A shares: Gross 1.37%, Net 1.25%; Class I shares: Gross 1.11%, Net 1.00%, Net 1.00%; Class R6 shares: Gross 0.99%, Net 0.90%. | ||||||||||||
| All returns represent past performance which is no guarantee of future results. Current performance may be higher or lower than the performance shown. The investment return and principal value of an investment will fluctuate so that an investor’s shares, when redeemed, may be worth more or less than their original cost. The above table and graph below do not reflect the deduction of taxes that a shareholder would pay on fund distributions or the redemption of shares. Please visit Virtus.com for performance data current to the most recent month-end. |
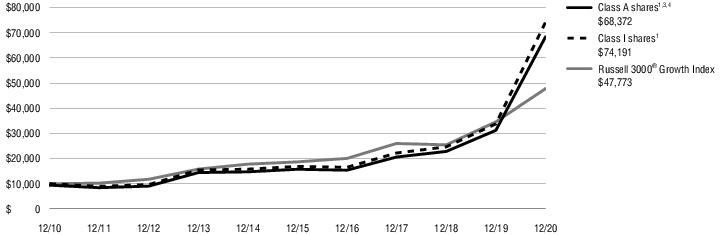
| 1 | Total returns are historical and include changes in share price and the reinvestment of both dividends and capital gain distributions. |
| 2 | “NAV” (Net Asset Value) total returns do not include the effect of any sales charge. |
| 3 | “POP” (Public Offering Price) total returns include the effect of the maximum front-end 5.75% sales charge. |
| 4 | “CDSC” (contingent deferred sales charge) is applied to redemptions of certain classes of shares that do not have a sales charge applied at the time of purchase. CDSC for certain redemptions of Class A shares made within 18 months of a finder’s fee being paid. |
| 5 | The since inception index return is from the inception date of Class R6 shares. |
| 6 | The expense ratios of the Fund are set forth according to the prospectus for the Fund effective April 28, 2020, as supplemented and revised, and may differ from the expense ratios disclosed in the Financial Highlights tables in this report. See the Financial Highlights for more current expense ratios. Net Expense: Expenses reduced by a contractual expense limitation in effect through April 30, 2022. Gross Expense: Does not reflect the effect of the expense limitation. Expense ratios include fees and expenses associated with any underlying funds. |
December 31, 2020
| Shares | Value | ||
| Common Stocks—98.0% | |||
| Communication Services—2.8% | |||
| Verizon Communications, Inc. | 618,696 | $ 36,348 | |
| Consumer Discretionary—4.3% | |||
| Advance Auto Parts, Inc. | 125,257 | 19,729 | |
| BorgWarner, Inc. | 917,472 | 35,451 | |
| 55,180 | |||
| Consumer Staples—4.2% | |||
| Coca-Cola European Partners plc | 705,486 | 35,155 | |
| Sysco Corp. | 261,746 | 19,437 | |
| 54,592 | |||
| Energy—1.5% | |||
| Marathon Petroleum Corp. | 469,993 | 19,439 | |
| Financials—15.9% | |||
| Bank of America Corp. | 1,976,470 | 59,907 | |
| Capital One Financial Corp. | 620,768 | 61,363 | |
| Hartford Financial Services Group, Inc. (The) | 425,118 | 20,822 | |
| Progressive Corp. (The) | 264,498 | 26,153 | |
| Willis Towers Watson plc | 180,870 | 38,106 | |
| 206,351 | |||
| Health Care—15.9% | |||
| Agilent Technologies, Inc. | 116,368 | 13,788 | |
| Becton Dickinson and Co. | 223,506 | 55,926 | |
| Shares | Value | ||
| Health Care—continued | |||
| Humana, Inc. | 147,281 | $ 60,425 | |
| Merck & Co., Inc. | 294,259 | 24,070 | |
| Zimmer Biomet Holdings, Inc. | 338,158 | 52,107 | |
| 206,316 | |||
| Industrials—24.0% | |||
| AMETEK, Inc. | 162,502 | 19,653 | |
| CSX Corp. | 281,264 | 25,525 | |
| Emerson Electric Co. | 488,215 | 39,238 | |
| Honeywell International, Inc. | 182,364 | 38,789 | |
| Hunt (JB) Transport Services, Inc. | 189,331 | 25,872 | |
| L3Harris Technologies, Inc. | 132,740 | 25,091 | |
| Nordson Corp. | 93,536 | 18,796 | |
| Otis Worldwide Corp. | 276,822 | 18,699 | |
| Raytheon Technologies Corp. | 558,748 | 39,956 | |
| Rockwell Automation, Inc. | 79,284 | 19,885 | |
| Stanley Black & Decker, Inc. | 221,667 | 39,581 | |
| 311,085 | |||
| Information Technology—12.8% | |||
| Global Payments, Inc. | 134,418 | 28,956 | |
| KLA Corp. | 104,619 | 27,087 | |
| Microsoft Corp. | 107,959 | 24,012 | |
| Motorola Solutions, Inc. | 203,930 | 34,680 | |
| QUALCOMM, Inc. | 338,607 | 51,584 | |
| 166,319 | |||
| Materials—8.2% | |||
| Air Products and Chemicals, Inc. | 168,728 | 46,100 | |
| Shares | Value | ||
| Materials—continued | |||
| AptarGroup, Inc. | 146,167 | $ 20,009 | |
| Avery Dennison Corp. | 123,212 | 19,111 | |
| Vulcan Materials Co. | 138,886 | 20,598 | |
| 105,818 | |||
| Real Estate—5.4% | |||
| American Homes 4 Rent Class A | 671,733 | 20,152 | |
| Crown Castle International Corp. | 310,930 | 49,497 | |
| 69,649 | |||
| Utilities—3.0% | |||
| NextEra Energy, Inc. | 503,159 | 38,819 | |
| Total Common Stocks (Identified Cost $1,023,200) | 1,269,916 | ||
| Total Long-Term Investments—98.0% (Identified Cost $1,023,200) | 1,269,916 | ||
| TOTAL INVESTMENTS—98.0% (Identified Cost $1,023,200) | $1,269,916 | ||
| Other assets and liabilities, net—2.0% | 26,005 | ||
| NET ASSETS—100.0% | $1,295,921 | ||
| Country Weightings (Unaudited)† | |
| United States | 94% |
| Ireland | 3 |
| United Kingdom | 3 |
| Total | 100% |
| † % of total investments as of December 31, 2020. | |
| Total Value at December 31, 2020 | Level 1 Quoted Prices | ||
| Assets: | |||
| Equity Securities: | |||
| Common Stocks | $1,269,916 | $1,269,916 | |
| Total Investments | $1,269,916 | $1,269,916 |
December 31, 2020
| Shares | Value | ||
| Common Stocks—96.7% | |||
| Consumer Discretionary—4.7% | |||
| Advance Auto Parts, Inc. | 350,000 | $ 55,128 | |
| BorgWarner, Inc. | 2,500,000 | 96,600 | |
| 151,728 | |||
| Consumer Staples—1.6% | |||
| Energizer Holdings, Inc. | 1,200,000 | 50,616 | |
| Energy—0.9% | |||
| ConocoPhillips | 750,000 | 29,993 | |
| Financials—13.6% | |||
| Capital One Financial Corp. | 1,300,000 | 128,505 | |
| Hartford Financial Services Group, Inc. (The) | 1,350,000 | 66,123 | |
| Progressive Corp. (The) | 650,000 | 64,272 | |
| Signature Bank | 255,000 | 34,499 | |
| Synchrony Financial | 2,525,000 | 87,643 | |
| Willis Towers Watson plc | 265,000 | 55,830 | |
| 436,872 | |||
| Health Care—17.3% | |||
| Agilent Technologies, Inc. | 550,000 | 65,169 | |
| Cooper Cos., Inc. (The) | 140,000 | 50,865 | |
| Humana, Inc. | 265,000 | 108,722 | |
| McKesson Corp. | 350,000 | 60,872 | |
| PerkinElmer, Inc. | 1,050,000 | 150,675 | |
| Teleflex, Inc. | 60,000 | 24,694 | |
| Zimmer Biomet Holdings, Inc. | 620,000 | 95,536 | |
| 556,533 | |||
| Industrials—21.7% | |||
| AMETEK, Inc. | 535,000 | 64,703 | |
| Carrier Global Corp. | 1,000,000 | 37,720 | |
| Cummins, Inc. | 150,000 | 34,065 | |
| Dover Corp. | 400,000 | 50,500 | |
| Hubbell, Inc. | 380,000 | 59,580 | |
| Hunt (JB) Transport Services, Inc. | 370,000 | 50,561 | |
| Shares | Value | ||
| Industrials—continued | |||
| L3Harris Technologies, Inc. | 435,000 | $ 82,224 | |
| Nordson Corp. | 395,000 | 79,375 | |
| Oshkosh Corp. | 535,000 | 46,047 | |
| Otis Worldwide Corp. | 700,000 | 47,285 | |
| Republic Services, Inc. | 585,000 | 56,335 | |
| Stanley Black & Decker, Inc. | 400,000 | 71,424 | |
| Woodward, Inc. | 175,000 | 21,268 | |
| 701,087 | |||
| Information Technology—23.4% | |||
| Citrix Systems, Inc. | 600,000 | 78,060 | |
| Dolby Laboratories, Inc. Class A | 900,000 | 87,417 | |
| FLIR Systems, Inc. | 1,500,000 | 65,745 | |
| Global Payments, Inc. | 375,000 | 80,782 | |
| KLA Corp. | 270,000 | 69,906 | |
| Marvell Technology Group Ltd. | 3,085,000 | 146,661 | |
| Motorola Solutions, Inc. | 750,000 | 127,545 | |
| NXP Semiconductors NV | 625,000 | 99,381 | |
| 755,497 | |||
| Materials—5.5% | |||
| Ashland Global Holdings, Inc. | 800,000 | 63,360 | |
| Celanese Corp. | 360,000 | 46,779 | |
| Martin Marietta Materials, Inc. | 55,000 | 15,618 | |
| PPG Industries, Inc. | 355,000 | 51,198 | |
| 176,955 | |||
| Real Estate—4.4% | |||
| American Homes 4 Rent Class A | 2,200,000 | 66,000 | |
| SBA Communications, Corp. | 265,000 | 74,764 | |
| 140,764 | |||
| Utilities—3.6% | |||
| Ameren Corp. | 500,000 | 39,030 | |
| CMS Energy Corp. | 650,000 | 39,657 | |
| Shares | Value | ||
| Utilities—continued | |||
| Sempra Energy | 300,000 | $ 38,223 | |
| 116,910 | |||
| Total Common Stocks (Identified Cost $2,480,436) | 3,116,955 | ||
| Total Long-Term Investments—96.7% (Identified Cost $2,480,436) | 3,116,955 | ||
| Short-Term Investment—1.3% | |||
| Money Market Mutual Fund—1.3% | |||
| Dreyfus Government Cash Management Fund - Institutional Shares (seven-day effective yield 0.030%)(1) | 40,611,886 | 40,612 | |
| Total Short-Term Investment (Identified Cost $40,612) | 40,612 | ||
| TOTAL INVESTMENTS—98.0% (Identified Cost $2,521,048) | $3,157,567 | ||
| Other assets and liabilities, net—2.0% | 64,911 | ||
| NET ASSETS—100.0% | $3,222,478 | ||
| Footnote Legend: | |
| (1) | Shares of this fund are publicly offered, and its prospectus and annual report are publicly available. |
| Country Weightings (Unaudited)† | |
| United States | 90% |
| Bermuda | 5 |
| Netherlands | 3 |
| Ireland | 2 |
| Total | 100% |
| † % of total investments as of December 31, 2020. | |
| Total Value at December 31, 2020 | Level 1 Quoted Prices | ||
| Assets: | |||
| Equity Securities: | |||
| Common Stocks | $3,116,955 | $3,116,955 | |
| Money Market Mutual Fund | 40,612 | 40,612 | |
| Total Investments | $3,157,567 | $3,157,567 |
December 31, 2020
| Shares | Value | ||
| Common Stocks—99.7% | |||
| Communication Services—4.8% | |||
| Interpublic Group of Cos., Inc. (The) | 990,968 | $ 23,308 | |
| Consumer Discretionary—2.0% | |||
| Cooper Tire & Rubber Co. | 38,167 | 1,546 | |
| Gentex Corp. | 90,803 | 3,081 | |
| Penske Automotive Group, Inc. | 82,370 | 4,892 | |
| 9,519 | |||
| Consumer Staples—2.9% | |||
| Calavo Growers, Inc. | 105,508 | 7,325 | |
| Energizer Holdings, Inc. | 58,214 | 2,456 | |
| Reynolds Consumer Products, Inc. | 144,508 | 4,341 | |
| 14,122 | |||
| Financials—32.3% | |||
| Ameris Bancorp | 106,783 | 4,065 | |
| AMERISAFE, Inc. | 51,435 | 2,954 | |
| Bank of Hawaii Corp. | 133,078 | 10,196 | |
| Cathay General Bancorp | 126,592 | 4,075 | |
| Cullen/Frost Bankers, Inc. | 32,075 | 2,798 | |
| Evercore, Inc. Class A | 154,601 | 16,950 | |
| First American Financial Corp. | 299,199 | 15,448 | |
| First Citizens BancShares, Inc. Class A | 19,258 | 11,059 | |
| First Hawaiian, Inc. | 509,750 | 12,020 | |
| First Interstate BancSystem, Inc. Class A | 175,437 | 7,153 | |
| Hanover Insurance Group, Inc. (The) | 21,602 | 2,526 | |
| Horace Mann Educators Corp. | 135,956 | 5,716 | |
| Shares | Value | ||
| Financials—continued | |||
| Jefferies Financial Group, Inc. | 503,562 | $ 12,388 | |
| Kemper Corp. | 254,149 | 19,526 | |
| SLM Corp. | 1,751,492 | 21,701 | |
| South State Corp. | 9,353 | 676 | |
| Zions Bancorp NA | 136,384 | 5,924 | |
| 155,175 | |||
| Health Care—8.1% | |||
| Bruker Corp. | 146,257 | 7,917 | |
| CONMED Corp. | 111,198 | 12,454 | |
| Hill-Rom Holdings, Inc. | 187,720 | 18,391 | |
| 38,762 | |||
| Industrials—10.5% | |||
| Apogee Enterprises, Inc. | 95,949 | 3,040 | |
| Donaldson Co., Inc. | 136,829 | 7,646 | |
| EMCOR Group, Inc. | 69,276 | 6,336 | |
| EnerSys | 139,667 | 11,601 | |
| EnPro Industries, Inc. | 48,375 | 3,653 | |
| Pentair plc | 80,894 | 4,295 | |
| Stantec, Inc. | 269,981 | 8,766 | |
| Tennant Co. | 29,244 | 2,052 | |
| Wabash National Corp. | 163,444 | 2,816 | |
| 50,205 | |||
| Information Technology—13.7% | |||
| Dolby Laboratories, Inc. Class A | 71,801 | 6,974 | |
| Entegris, Inc. | 17,083 | 1,642 | |
| FLIR Systems, Inc. | 257,809 | 11,300 | |
| Littelfuse, Inc. | 35,821 | 9,122 | |
| MKS Instruments, Inc. | 61,152 | 9,200 | |
| National Instruments Corp. | 164,222 | 7,216 | |
| Power Integrations, Inc. | 247,450 | 20,256 | |
| 65,710 | |||
| Shares | Value | ||
| Materials—9.1% | |||
| AptarGroup, Inc. | 153,006 | $ 20,945 | |
| Ashland Global Holdings, Inc. | 128,148 | 10,149 | |
| Sensient Technologies Corp. | 15,345 | 1,132 | |
| W.R. Grace & Co. | 208,942 | 11,454 | |
| 43,680 | |||
| Real Estate—11.3% | |||
| American Campus Communities, Inc. | 162,828 | 6,964 | |
| CubeSmart | 34,136 | 1,147 | |
| Healthcare Realty Trust, Inc. | 317,082 | 9,386 | |
| Healthcare Trust of America, Inc. Class A | 655,822 | 18,061 | |
| Physicians Realty Trust | 1,038,146 | 18,479 | |
| 54,037 | |||
| Utilities—5.0% | |||
| Essential Utilities, Inc. | 229,013 | 10,830 | |
| IDACORP, Inc. | 23,890 | 2,294 | |
| NiSource, Inc. | 465,817 | 10,686 | |
| 23,810 | |||
| Total Common Stocks (Identified Cost $370,772) | 478,328 | ||
| Total Long-Term Investments—99.7% (Identified Cost $370,772) | 478,328 | ||
| TOTAL INVESTMENTS—99.7% (Identified Cost $370,772) | $478,328 | ||
| Other assets and liabilities, net—0.3% | 1,418 | ||
| NET ASSETS—100.0% | $479,746 | ||
| Total Value at December 31, 2020 | Level 1 Quoted Prices | ||
| Assets: | |||
| Equity Securities: | |||
| Common Stocks | $478,328 | $478,328 | |
| Total Investments | $478,328 | $478,328 |
December 31, 2020
| Shares | Value | ||
| Common Stocks—97.2% | |||
| China—14.4% | |||
| Alibaba Group Holding Ltd. Sponsored ADR(1) | 9,081 | $ 2,113 | |
| New Oriental Education & Technology Group, Inc. Sponsored ADR(1) | 7,113 | 1,322 | |
| Shandong Weigao Group Medical Polymer Co. Ltd. Class H | 752,865 | 1,701 | |
| Tencent Holdings Ltd. | 24,544 | 1,786 | |
| 6,922 | |||
| Denmark—2.8% | |||
| Novo Nordisk A/S Sponsored ADR | 19,345 | 1,351 | |
| France—6.8% | |||
| Dassault Systemes SE | 8,036 | 1,631 | |
| L’Oreal SA | 4,314 | 1,638 | |
| 3,269 | |||
| Germany—8.3% | |||
| adidas AG(1) | 4,505 | 1,640 | |
| SAP SE Sponsored ADR(2) | 10,881 | 1,419 | |
| Sartorius AG | 2,226 | 934 | |
| 3,993 | |||
| Hong Kong—6.2% | |||
| AIA Group Ltd. | 241,596 | 2,961 | |
| India—9.7% | |||
| Asian Paints Ltd. | 26,701 | 1,010 | |
| HDFC Bank Ltd. ADR(1) | 33,204 | 2,399 | |
| Infosys Ltd. Sponsored ADR | 74,005 | 1,255 | |
| 4,664 | |||
| Japan—4.8% | |||
| Fast Retailing Co. Ltd. | 1,475 | 1,321 | |
| Sysmex Corp. | 8,170 | 981 | |
| 2,302 | |||
| Mexico—5.8% | |||
| Fomento Economico Mexicano SAB de C.V. Sponsored ADR | 18,330 | 1,389 | |
| Wal-Mart de Mexico SAB de C.V. | 489,199 | 1,374 | |
| 2,763 | |||
| Netherlands—6.7% | |||
| Adyen NV(1) | 593 | 1,380 | |
| Heineken NV | 16,684 | 1,859 | |
| 3,239 | |||
| Switzerland—8.9% | |||
| Alcon, Inc.(1) | 25,095 | 1,656 | |
| Shares | Value | ||
| Switzerland—continued | |||
| Nestle S.A. Registered Shares | 12,113 | $ 1,427 | |
| Temenos AG Registered Shares | 8,700 | 1,215 | |
| 4,298 | |||
| Thailand—1.9% | |||
| CP ALL PCL(1) | 459,494 | 893 | |
| United Kingdom—15.1% | |||
| Aon plc Class A | 10,754 | 2,272 | |
| Diageo plc | 35,209 | 1,386 | |
| IHS Markit Ltd. | 16,238 | 1,458 | |
| Linde plc | 8,106 | 2,136 | |
| 7,252 | |||
| United States—5.8% | |||
| Medtronic plc | 8,161 | 956 | |
| STERIS plc | 9,555 | 1,811 | |
| 2,767 | |||
| Total Common Stocks (Identified Cost $33,387) | 46,674 | ||
| Total Long-Term Investments—97.2% (Identified Cost $33,387) | 46,674 | ||
| Short-Term Investments—5.7% | |||
| Money Market Mutual Fund—2.7% | |||
| Dreyfus Government Cash Management Fund - Institutional Shares (seven-day effective yield 0.030%)(3) | 1,313,710 | 1,314 | |
| Total Money Market Mutual Fund (Identified Cost $1,314) | 1,314 | ||
| Securities Lending Collateral—3.0% | |||
| Dreyfus Government Cash Management Fund - Institutional Shares (seven-day effective yield 0.030%)(3)(4) | 1,423,511 | 1,424 | |
| Total Securities Lending Collateral (Identified Cost $1,424) | 1,424 | ||
| Total Short-Term Investments (Identified Cost $2,738) | 2,738 | ||
| TOTAL INVESTMENTS—102.9% (Identified Cost $36,125) | $49,412 | ||
| Other assets and liabilities, net—(2.9)% | (1,415) | ||
| NET ASSETS—100.0% | $47,997 | ||
| Abbreviation: | |
| ADR | American Depositary Receipt |
| Footnote Legend: | |
| (1) | Non-income producing. |
| (2) | All or a portion of security is on loan. |
| (3) | Shares of this fund are publicly offered, and its prospectus and annual report are publicly available. |
| (4) | Represents security purchased with cash collateral received for securities on loan. |
| Country Weightings (Unaudited)† | |
| United Kingdom | 15% |
| China | 14 |
| United States | 11 |
| India | 9 |
| Switzerland | 9 |
| Germany | 8 |
| France | 7 |
| Other | 27 |
| Total | 100% |
| † % of total investments as of December 31, 2020. | |
| Total Value at December 31, 2020 | Level 1 Quoted Prices | ||
| Assets: | |||
| Equity Securities: | |||
| Common Stocks | $46,674 | $46,674 | |
| Securities Lending Collateral | 1,424 | 1,424 | |
| Money Market Mutual Fund | 1,314 | 1,314 | |
| Total Investments | $49,412 | $49,412 |
December 31, 2020
| Shares | Value | ||
| Common Stocks—99.8% | |||
| Communication Services—12.6% | |||
| Alphabet, Inc. Class A(1) | 2,323 | $ 4,071 | |
| Alphabet, Inc. Class C(1) | 2,400 | 4,205 | |
| Comcast Corp. Class A | 24,847 | 1,302 | |
| Facebook, Inc. Class A(1) | 18,538 | 5,064 | |
| Snap, Inc. Class A(1) | 10,033 | 502 | |
| Walt Disney Co. (The)(1) | 4,364 | 791 | |
| 15,935 | |||
| Consumer Discretionary—17.2% | |||
| Amazon.com, Inc.(1) | 3,385 | 11,025 | |
| Booking Holdings, Inc.(1) | 598 | 1,332 | |
| Chipotle Mexican Grill, Inc.(1) | 706 | 979 | |
| DraftKings, Inc. Class A(1) | 6,561 | 305 | |
| Home Depot, Inc. (The) | 7,033 | 1,868 | |
| Las Vegas Sands Corp. | 21,898 | 1,305 | |
| O’Reilly Automotive, Inc.(1) | 3,973 | 1,798 | |
| Royal Caribbean Cruises Ltd. | 13,529 | 1,011 | |
| TJX Cos., Inc. (The) | 30,074 | 2,054 | |
| 21,677 | |||
| Consumer Staples—4.1% | |||
| Colgate-Palmolive Co. | 7,419 | 634 | |
| Costco Wholesale Corp. | 6,886 | 2,595 | |
| Estee Lauder Cos., Inc. (The) Class A | 7,250 | 1,930 | |
| 5,159 | |||
| Financials—1.2% | |||
| American Express Co. | 8,300 | 1,004 | |
| Goldman Sachs Group, Inc. (The) | 2,169 | 572 | |
| 1,576 | |||
| Shares | Value | ||
| Health Care—12.3% | |||
| Bristol-Myers Squibb Co. | 17,979 | $ 1,115 | |
| DexCom, Inc.(1) | 3,354 | 1,240 | |
| Edwards Lifesciences Corp.(1) | 18,556 | 1,693 | |
| Eli Lilly and Co. | 7,716 | 1,303 | |
| Exact Sciences Corp.(1) | 9,139 | 1,211 | |
| Insulet Corp.(1) | 2,031 | 519 | |
| Intuitive Surgical, Inc.(1) | 1,657 | 1,356 | |
| Mettler-Toledo International, Inc.(1) | 1,204 | 1,372 | |
| Teladoc Health, Inc.(1) | 5,198 | 1,039 | |
| Thermo Fisher Scientific, Inc. | 1,756 | 818 | |
| UnitedHealth Group, Inc. | 7,741 | 2,715 | |
| Vertex Pharmaceuticals, Inc.(1) | 4,639 | 1,096 | |
| 15,477 | |||
| Industrials—5.5% | |||
| Boeing Co. (The) | 9,906 | 2,121 | |
| Deere & Co. | 5,099 | 1,372 | |
| Emerson Electric Co. | 8,103 | 651 | |
| Fair Isaac Corp.(1) | 1,364 | 697 | |
| Honeywell International, Inc. | 2,357 | 501 | |
| IHS Markit Ltd. | 11,087 | 996 | |
| Roper Technologies, Inc. | 1,459 | 629 | |
| 6,967 | |||
| Information Technology—45.1% | |||
| Apple, Inc. | 98,552 | 13,077 | |
| Applied Materials, Inc. | 20,691 | 1,786 | |
| Autodesk, Inc.(1) | 7,122 | 2,175 | |
| Avalara, Inc.(1) | 6,010 | 991 | |
| DocuSign, Inc.(1) | 2,841 | 632 | |
| Five9, Inc.(1) | 4,657 | 812 | |
| Mastercard, Inc. Class A | 8,331 | 2,974 | |
| Microsoft Corp. | 57,437 | 12,775 | |
| Shares | Value | ||
| Information Technology—continued | |||
| NVIDIA Corp. | 6,377 | $ 3,330 | |
| Paycom Software, Inc.(1) | 2,322 | 1,050 | |
| PayPal Holdings, Inc.(1) | 12,261 | 2,871 | |
| QUALCOMM, Inc. | 19,241 | 2,931 | |
| salesforce.com, Inc.(1) | 7,865 | 1,750 | |
| Splunk, Inc.(1) | 4,458 | 757 | |
| Twilio Inc. Class A(1) | 2,816 | 953 | |
| Universal Display Corp. | 5,248 | 1,206 | |
| Visa, Inc. Class A | 23,827 | 5,212 | |
| Workday, Inc. Class A(1) | 7,007 | 1,679 | |
| 56,961 | |||
| Materials—0.9% | |||
| Air Products and Chemicals, Inc. | 2,250 | 614 | |
| Vulcan Materials Co. | 3,417 | 507 | |
| 1,121 | |||
| Real Estate—0.9% | |||
| Equinix, Inc. | 1,667 | 1,190 | |
| Total Common Stocks (Identified Cost $49,848) | 126,063 | ||
| Total Long-Term Investments—99.8% (Identified Cost $49,848) | 126,063 | ||
| TOTAL INVESTMENTS—99.8% (Identified Cost $49,848) | $126,063 | ||
| Other assets and liabilities, net—0.2% | 262 | ||
| NET ASSETS—100.0% | $126,325 | ||
| Footnote Legend: | |
| (1) | Non-income producing. |
| Total Value at December 31, 2020 | Level 1 Quoted Prices | ||
| Assets: | |||
| Equity Securities: | |||
| Common Stocks | $126,063 | $126,063 | |
| Total Investments | $126,063 | $126,063 |
December 31, 2020
| Shares | Value | ||
| Common Stocks—97.7% | |||
| Communication Services—3.4% | |||
| Cable One, Inc. | 183 | $ 408 | |
| Cardlytics, Inc.(1) | 6,196 | 884 | |
| 1,292 | |||
| Consumer Discretionary—13.7% | |||
| CarParts.com, Inc.(1)(2) | 10,272 | 127 | |
| Churchill Downs, Inc. | 2,700 | 526 | |
| Five Below, Inc.(1) | 2,702 | 473 | |
| KB Home | 7,062 | 237 | |
| LGI Homes, Inc.(1) | 2,037 | 216 | |
| Lithia Motors, Inc. Class A | 1,193 | 349 | |
| Magnite, Inc.(1) | 21,197 | 651 | |
| Monarch Casino & Resort, Inc.(1) | 4,359 | 267 | |
| Murphy USA, Inc. | 1,333 | 175 | |
| Ollie’s Bargain Outlet Holdings, Inc.(1) | 2,153 | 176 | |
| Papa John’s International, Inc. | 2,020 | 171 | |
| Planet Fitness, Inc. Class A(1) | 4,492 | 349 | |
| RH (1) | 660 | 295 | |
| Texas Roadhouse, Inc. | 9,290 | 726 | |
| Wingstop, Inc. | 3,735 | 495 | |
| 5,233 | |||
| Consumer Staples—2.5% | |||
| Boston Beer Co., Inc. (The) Class A(1) | 460 | 457 | |
| WD-40 Co. | 1,859 | 494 | |
| 951 | |||
| Financials—5.1% | |||
| Ares Management Corp. Class A | 7,623 | 359 | |
| Essent Group Ltd. | 5,699 | 246 | |
| First Financial Bankshares, Inc. | 5,299 | 192 | |
| Goosehead Insurance, Inc. Class A | 3,777 | 471 | |
| NMI Holdings, Inc. Class A(1) | 12,092 | 274 | |
| RLI Corp. | 3,834 | 399 | |
| 1,941 | |||
| Health Care—30.6% | |||
| Addus HomeCare Corp.(1) | 1,297 | 152 | |
| Akero Therapeutics, Inc.(1) | 4,482 | 116 | |
| Allakos, Inc.(1) | 2,242 | 314 | |
| Amedisys, Inc.(1) | 866 | 254 | |
| Amicus Therapeutics, Inc.(1) | 16,168 | 373 | |
| Chemed Corp. | 1,589 | 846 | |
| ChemoCentryx, Inc.(1) | 5,699 | 353 | |
| Encompass Health Corp. | 6,073 | 502 | |
| Fate Therapeutics, Inc.(1) | 4,230 | 385 | |
| Shares | Value | ||
| Health Care—continued | |||
| GW Pharmaceuticals plc ADR(1) | 2,095 | $ 242 | |
| Insmed, Inc.(1) | 7,813 | 260 | |
| Inspire Medical Systems, Inc.(1) | 4,324 | 813 | |
| Insulet Corp.(1) | 2,870 | 734 | |
| Karyopharm Therapeutics, Inc.(1) | 11,386 | 176 | |
| LHC Group, Inc.(1) | 3,409 | 727 | |
| Madrigal Pharmaceuticals, Inc.(1) | 1,291 | 144 | |
| Natera, Inc.(1) | 9,493 | 945 | |
| Novocure Ltd.(1) | 5,536 | 958 | |
| Penumbra, Inc.(1)(2) | 1,491 | 261 | |
| Phreesia, Inc.(1) | 10,231 | 555 | |
| Reata Pharmaceuticals, Inc. Class A(1) | 3,483 | 431 | |
| REGENXBIO, Inc.(1) | 3,971 | 180 | |
| Sarepta Therapeutics, Inc.(1) | 4,393 | 749 | |
| Tandem Diabetes Care, Inc.(1) | 7,307 | 699 | |
| Ultragenyx Pharmaceutical, Inc.(1) | 3,578 | 495 | |
| 11,664 | |||
| Industrials—17.2% | |||
| Bloom Energy Corp. Class A(1) | 5,912 | 169 | |
| Brink’s Co. (The) | 3,117 | 224 | |
| Casella Waste Systems, Inc. Class A(1) | 11,066 | 686 | |
| Chart Industries, Inc.(1) | 5,212 | 614 | |
| ESCO Technologies, Inc. | 2,104 | 217 | |
| Herc Holdings, Inc.(1) | 5,969 | 396 | |
| IAA, Inc.(1) | 3,822 | 248 | |
| Mercury Systems, Inc.(1) | 7,788 | 686 | |
| MSA Safety, Inc. | 2,366 | 354 | |
| Parsons Corp.(1) | 2,539 | 93 | |
| Proto Labs, Inc.(1) | 2,883 | 442 | |
| Saia, Inc.(1) | 4,501 | 814 | |
| Simpson Manufacturing Co., Inc. | 4,538 | 424 | |
| Teledyne Technologies, Inc.(1) | 2,687 | 1,053 | |
| Vicor Corp.(1) | 1,497 | 138 | |
| 6,558 | |||
| Information Technology—21.2% | |||
| Agilysys, Inc.(1) | 9,012 | 346 | |
| Brooks Automation, Inc. | 7,400 | 502 | |
| CMC Materials, Inc. | 3,147 | 476 | |
| Coupa Software, Inc.(1) | 2,353 | 798 | |
| Everbridge, Inc.(1) | 3,140 | 468 | |
| Five9, Inc.(1) | 9,094 | 1,586 | |
| FormFactor, Inc.(1) | 10,018 | 431 | |
| Limelight Networks, Inc.(1) | 28,639 | 114 | |
| Q2 Holdings, Inc.(1) | 13,572 | 1,717 | |
| Qualys, Inc.(1) | 2,082 | 254 | |
| Shares | Value | ||
| Information Technology—continued | |||
| Repay Holdings Corp.(1) | 9,958 | $ 271 | |
| Tenable Holdings, Inc.(1) | 7,624 | 399 | |
| Tower Semiconductor Ltd.(1) | 12,576 | 325 | |
| Varonis Systems, Inc.(1) | 2,538 | 415 | |
| 8,102 | |||
| Materials—2.8% | |||
| Balchem Corp. | 5,551 | 640 | |
| Quaker Chemical Corp. | 1,647 | 417 | |
| 1,057 | |||
| Real Estate—1.2% | |||
| Essential Properties Realty Trust, Inc. | 22,654 | 480 | |
| Total Common Stocks (Identified Cost $18,809) | 37,278 | ||
| Total Long-Term Investments—97.7% (Identified Cost $18,809) | 37,278 | ||
| Short-Term Investment—1.0% | |||
| Money Market Mutual Fund—1.0% | |||
| Dreyfus Government Cash Management Fund - Institutional Shares (seven-day effective yield 0.030%)(3) | 380,704 | 381 | |
| Total Short-Term Investment (Identified Cost $381) | 381 | ||
| Securities Lending Collateral—0.4% | |||
| Dreyfus Government Cash Management Fund - Institutional Shares (seven-day effective yield 0.030%)(3)(4) | 128,342 | 128 | |
| Total Securities Lending Collateral (Identified Cost $128) | 128 | ||
| TOTAL INVESTMENTS—99.1% (Identified Cost $19,318) | $37,787 | ||
| Other assets and liabilities, net—0.9% | 362 | ||
| NET ASSETS—100.0% | $38,149 | ||
| Abbreviation: | |
| ADR | American Depositary Receipt |
| Footnote Legend: | |
| (1) | Non-income producing. |
| (2) | All or a portion of security is on loan. |
| (3) | Shares of this fund are publicly offered, and its prospectus and annual report are publicly available. |
| (4) | Represents security purchased with cash collateral received for securities on loan. |
| Country Weightings (Unaudited)† | |
| United States | 95% |
| Jersey | 2 |
| Israel | 1 |
| Bermuda | 1 |
| United Kingdom | 1 |
| Total | 100% |
| † % of total investments as of December 31, 2020. | |
| Total Value at December 31, 2020 | Level 1 Quoted Prices | ||
| Assets: | |||
| Equity Securities: | |||
| Common Stocks | $37,278 | $37,278 | |
| Securities Lending Collateral | 128 | 128 | |
| Money Market Mutual Fund | 381 | 381 | |
| Total Investments | $37,787 | $37,787 |
December 31, 2020
| Shares | Value | ||
| Common Stocks—98.3% | |||
| Communication Services—9.0% | |||
| Netflix, Inc.(1) | 89,550 | $ 48,422 | |
| Snap, Inc. Class A(1) | 421,050 | 21,082 | |
| Zillow Group, Inc. Class C(1) | 422,035 | 54,780 | |
| 124,284 | |||
| Consumer Discretionary—26.4% | |||
| Amazon.com, Inc.(1) | 19,300 | 62,859 | |
| Chegg, Inc.(1) | 303,725 | 27,435 | |
| Chewy, Inc. Class A(1) | 336,600 | 30,257 | |
| Lululemon Athletica, Inc.(1) | 51,455 | 17,908 | |
| MercadoLibre, Inc.(1) | 45,075 | 75,511 | |
| Peloton Interactive, Inc. Class A(1) | 220,000 | 33,378 | |
| Tesla, Inc.(1) | 162,940 | 114,982 | |
| 362,330 | |||
| Consumer Staples—0.9% | |||
| Beyond Meat, Inc.(1) | 95,250 | 11,906 | |
| Financials—1.8% | |||
| Goosehead Insurance, Inc. Class A | 109,600 | 13,674 | |
| Lemonade, Inc.(1) | 93,715 | 11,480 | |
| 25,154 | |||
| Health Care—13.9% | |||
| Adaptive Biotechnologies Corp.(1) | 258,875 | 15,307 | |
| Exact Sciences Corp.(1) | 465,000 | 61,608 | |
| GoodRx Holdings, Inc. Class A(1) | 402,100 | 16,221 | |
| Seagen, Inc.(1) | 101,150 | 17,715 | |
| Teladoc Health, Inc.(1) | 275,425 | 55,074 | |
| Veeva Systems, Inc. Class A(1) | 90,250 | 24,571 | |
| 190,496 | |||
| Shares | Value | ||
| Industrials—4.5% | |||
| CoStar Group, Inc.(1) | 22,240 | $ 20,556 | |
| Uber Technologies, Inc.(1) | 815,750 | 41,603 | |
| 62,159 | |||
| Information Technology—41.8% | |||
| Coupa Software, Inc.(1) | 81,000 | 27,452 | |
| NVIDIA Corp. | 96,900 | 50,601 | |
| Okta, Inc.(1) | 206,225 | 52,435 | |
| Paylocity Holding Corp.(1) | 101,375 | 20,874 | |
| PayPal Holdings, Inc.(1) | 160,075 | 37,490 | |
| QUALCOMM, Inc. | 239,100 | 36,424 | |
| RingCentral, Inc. Class A(1) | 143,850 | 54,515 | |
| ServiceNow, Inc.(1) | 81,225 | 44,709 | |
| Shopify, Inc. Class A(1) | 64,225 | 72,699 | |
| Snowflake, Inc. Class A(1) | 21,550 | 6,064 | |
| Sprout Social, Inc. Class A(1) | 196,300 | 8,914 | |
| Square, Inc. Class A(1) | 241,025 | 52,457 | |
| Trade Desk, Inc. (The) Class A(1) | 82,170 | 65,818 | |
| Unity Software, Inc.(1) | 160,150 | 24,578 | |
| Zoom Video Communications, Inc. Class A(1) | 54,900 | 18,519 | |
| 573,549 | |||
| Total Common Stocks (Identified Cost $783,218) | 1,349,878 | ||
| Total Long-Term Investments—98.3% (Identified Cost $783,218) | 1,349,878 | ||
| Shares | Value | ||
| Short-Term Investment—1.2% | |||
| Money Market Mutual Fund—1.2% | |||
| Dreyfus Government Cash Management Fund - Institutional Shares (seven-day effective yield 0.030%)(2) | 16,171,773 | $ 16,172 | |
| Total Short-Term Investment (Identified Cost $16,172) | 16,172 | ||
| TOTAL INVESTMENTS—99.5% (Identified Cost $799,390) | $1,366,050 | ||
| Other assets and liabilities, net—0.5% | 7,242 | ||
| NET ASSETS—100.0% | $1,373,292 | ||
| Footnote Legend: | |
| (1) | Non-income producing. |
| (2) | Shares of this fund are publicly offered, and its prospectus and annual report are publicly available. |
| Country Weightings (Unaudited)† | |
| United States | 88% |
| Canada | 6 |
| Brazil | 6 |
| Total | 100% |
| † % of total investments as of December 31, 2020. | |
| Total Value at December 31, 2020 | Level 1 Quoted Prices | ||
| Assets: | |||
| Equity Securities: | |||
| Common Stocks | $1,349,878 | $1,349,878 | |
| Money Market Mutual Fund | 16,172 | 16,172 | |
| Total Investments | $1,366,050 | $1,366,050 |
December 31, 2020
| Ceredex Large-Cap Value Equity Fund | Ceredex Mid-Cap Value Equity Fund | Ceredex Small-Cap Value Equity Fund | SGA International Growth Fund | ||||
| Assets | |||||||
Investment in securities at value(1) | $ 1,269,916 | $ 3,157,567 | $ 478,328 | $ 49,412 | |||
Cash | 27,049 | 68,669 | 2,797 | — | |||
| Receivables | |||||||
Investment securities sold | — | — | 80 | 195 | |||
Fund shares sold | 741 | 2,582 | 250 | 60 | |||
Dividends | 963 | 2,889 | 87 | — (a) | |||
Tax reclaims | — | — | — | 99 | |||
Securities lending income | — | — | — | 1 | |||
Prepaid expenses | 32 | 44 | 29 | 18 | |||
Other assets | 120 | 297 | 44 | 4 | |||
Total assets | 1,298,821 | 3,232,048 | 481,615 | 49,789 | |||
| Liabilities | |||||||
Due to custodian | — | — | — | — (a) | |||
| Payables | |||||||
Fund shares repurchased | 1,517 | 6,039 | 1,258 | 5 | |||
Investment securities purchased | — | — | — | 233 | |||
Foreign capital gains tax | — | — | — | 63 | |||
Collateral on securities loaned | — | — | — | 1,424 | |||
Investment advisory fees | 717 | 1,819 | 328 | 25 | |||
Distribution and service fees | 42 | 87 | 14 | 1 | |||
Administration and accounting fees | 114 | 280 | 42 | 5 | |||
Transfer agent and sub-transfer agent fees and expenses | 324 | 895 | 144 | 10 | |||
Professional fees | 28 | 50 | 25 | 22 | |||
Trustee deferred compensation plan | 120 | 297 | 44 | 4 | |||
Interest expense and/or commitment fees | 1 | 4 | 1 | — (a) | |||
Other accrued expenses | 37 | 99 | 13 | — | |||
Total liabilities | 2,900 | 9,570 | 1,869 | 1,792 | |||
Net Assets | $ 1,295,921 | $ 3,222,478 | $ 479,746 | $ 47,997 | |||
| Net Assets Consist of: | |||||||
Capital paid in on shares of beneficial interest | $ 1,029,805 | $ 2,940,173 | $ 403,497 | $ 34,181 | |||
Accumulated earnings (loss) | 266,116 | 282,305 | 76,249 | 13,816 | |||
Net Assets | $ 1,295,921 | $ 3,222,478 | $ 479,746 | $ 47,997 | |||
| Net Assets: | |||||||
Class A | $ 185,257 | $ 282,186 | $ 54,984 | $ 6,917 | |||
Class C | $ 4,486 | $ 31,476 | $ 2,410 | $ — | |||
Class I | $ 594,834 | $ 2,135,663 | $ 332,391 | $ 40,249 | |||
Class R6 | $ 511,344 | $ 773,153 | $ 89,961 | $ 831 | |||
| Shares Outstanding (unlimited number of shares authorized, no par value): | |||||||
Class A | 13,935,281 | 23,216,747 | 5,905,906 | 663,745 | |||
Class C | 349,854 | 2,663,611 | 297,041 | — | |||
Class I | 44,060,906 | 172,626,793 | 34,021,446 | 3,754,533 | |||
Class R6 | 37,565,229 | 62,227,756 | 9,184,398 | 77,171 | |||
| Net Asset Value and Redemption Price Per Share:* | |||||||
Class A | $ 13.29 | $ 12.15 | $ 9.31 | $ 10.42 | |||
Class C | $ 12.82 | $ 11.82 | $ 8.11 | $ — | |||
Class I | $ 13.50 | $ 12.37 | $ 9.77 | $ 10.72 | |||
Class R6 | $ 13.61 | $ 12.42 | $ 9.79 | $ 10.77 |
| Ceredex Large-Cap Value Equity Fund | Ceredex Mid-Cap Value Equity Fund | Ceredex Small-Cap Value Equity Fund | SGA International Growth Fund | ||||
| Maximum Offering Price per Share (NAV/(1-Maximum Sales Charge)): | |||||||
Class A | $ 14.10 | $ 12.89 | $ 9.88 | $ 11.06 | |||
Maximum Sales Charge - Class A | 5.75% | 5.75% | 5.75% | 5.75% | |||
(1) Investment in securities at cost | $ 1,023,200 | $ 2,521,048 | $ 370,772 | $ 36,125 | |||
Market value of securities on loan | $ — | $ — | $ — | $ 1,390 |
| (a) | Amount is less than $500. |
| * | Net Asset Value and Redemption Price Per Share are calculated using unrounded net assets. |
| Silvant Large-Cap Growth Stock Fund | Silvant Small-Cap Growth Stock Fund | Zevenbergen Innovative Growth Stock Fund | |||
| Assets | |||||
Investment in securities at value(1)(2) | $ 126,063 | $ 37,787 | $ 1,366,050 | ||
Cash | 492 | 572 | 350 | ||
Securities lending cash collateral received | — | 264 | — | ||
| Receivables | |||||
Investment securities sold | 2,234 | — | — | ||
Fund shares sold | 38 | 5 | 9,461 | ||
Dividends | 16 | 14 | — (a) | ||
Securities lending income | — | — (a) | — | ||
Prepaid expenses | 14 | 11 | 93 | ||
Other assets | 12 | 3 | 123 | ||
Total assets | 128,869 | 38,656 | 1,376,077 | ||
| Liabilities | |||||
| Payables | |||||
Fund shares repurchased | 145 | 53 | 1,450 | ||
Investment securities purchased | 2,235 | — | — | ||
Collateral on securities loaned | — | 392 | — | ||
Investment advisory fees | 69 | 22 | 782 | ||
Distribution and service fees | 23 | 3 | 67 | ||
Administration and accounting fees | 12 | 4 | 118 | ||
Transfer agent and sub-transfer agent fees and expenses | 22 | 9 | 199 | ||
Professional fees | 22 | 21 | 18 | ||
Trustee deferred compensation plan | 12 | 3 | 123 | ||
Interest expense and/or commitment fees | — (a) | — (a) | 1 | ||
Other accrued expenses | 4 | — | 27 | ||
Total liabilities | 2,544 | 507 | 2,785 | ||
Net Assets | $ 126,325 | $ 38,149 | $ 1,373,292 | ||
| Net Assets Consist of: | |||||
Capital paid in on shares of beneficial interest | $ 43,697 | $ 19,420 | $ 822,043 | ||
Accumulated earnings (loss) | 82,628 | 18,729 | 551,249 | ||
Net Assets | $ 126,325 | $ 38,149 | $ 1,373,292 | ||
| Net Assets: | |||||
Class A | $ 110,884 | $ 14,837 | $ 335,809 | ||
Class I | $ 15,093 | $ 23,312 | $ 1,037,368 | ||
Class R6 | $ 348 | $ — | $ 115 | ||
| Shares Outstanding (unlimited number of shares authorized, no par value): | |||||
Class A | 17,056,281 | 1,585,984 | 5,381,794 | ||
Class I | 1,468,514 | 1,839,394 | 15,560,697 | ||
Class R6 | 33,527 | — | 1,724 | ||
| Net Asset Value and Redemption Price Per Share:* | |||||
Class A | $ 6.50 | $ 9.36 | $ 62.40 | ||
Class I | $ 10.28 | $ 12.67 | $ 66.67 | ||
Class R6 | $ 10.40 | $ — | $ 66.67 |
| Silvant Large-Cap Growth Stock Fund | Silvant Small-Cap Growth Stock Fund | Zevenbergen Innovative Growth Stock Fund | |||
| Maximum Offering Price per Share (NAV/(1-Maximum Sales Charge)): | |||||
Class A | $ 6.90 | $ 9.93 | $ 66.21 | ||
Maximum Sales Charge - Class A | 5.75% | 5.75% | 5.75% | ||
(1) Investment in securities at cost | $ 49,848 | $ 19,318 | $ 799,390 | ||
(2) Market value of securities on loan | $ — | $ 380 | $ — |
| (a) | Amount is less than $500. |
| * | Net Asset Value and Redemption Price Per Share are calculated using unrounded net assets. |
YEAR ENDED December 31, 2020
| Ceredex Large-Cap Value Equity Fund | Ceredex Mid-Cap Value Equity Fund | Ceredex Small-Cap Value Equity Fund | SGA International Growth Fund | ||||
| Investment Income | |||||||
Dividends | $ 24,668 | $ 59,246 | $ 7,887 | $ 465 | |||
Securities lending, net of fees | — | 39 | — | 1 | |||
Foreign taxes withheld | — | (61) | (26) | (39) | |||
Total investment income | 24,668 | 59,224 | 7,861 | 427 | |||
| Expenses | |||||||
Investment advisory fees | 7,271 | 20,984 | 3,745 | 350 | |||
Distribution and service fees, Class A | 421 | 729 | 131 | 16 | |||
Distribution and service fees, Class C | 50 | 333 | 32 | — | |||
Administration and accounting fees | 1,125 | 3,158 | 468 | 51 | |||
Transfer agent fees and expenses | 466 | 1,322 | 192 | 7 | |||
Sub-transfer agent fees and expenses, Class A | 262 | 521 | 93 | 7 | |||
Sub-transfer agent fees and expenses, Class C | 3 | 35 | 4 | — | |||
Sub-transfer agent fees and expenses, Class I | 918 | 3,210 | 561 | 38 | |||
Custodian fees | 2 | 5 | 1 | 1 | |||
Printing fees and expenses | 56 | 233 | 39 | 3 | |||
Professional fees | 44 | 90 | 33 | 42 | |||
Interest expense and/or commitment fees | 5 | 18 | 2 | — (1) | |||
Registration fees | 81 | 147 | 68 | 42 | |||
Trustees’ fees and expenses | 98 | 281 | 42 | 4 | |||
Miscellaneous expenses | 96 | 250 | 40 | 9 | |||
Total expenses | 10,898 | 31,316 | 5,451 | 570 | |||
Less net expenses reimbursed and/or waived by investment adviser(2) | (876) | (663) | (69) | (75) | |||
Less low balance account fees | — (1) | — (1) | — (1) | — | |||
Net expenses | 10,022 | 30,653 | 5,382 | 495 | |||
Net investment income (loss) | 14,646 | 28,571 | 2,479 | (68) | |||
| Net Realized and Unrealized Gain (Loss) on Investments | |||||||
| Net realized gain (loss) from: | |||||||
Investments | 29,248 | (340,054) | (28,331) | 2,071 | |||
Foreign currency transactions | (3) | — | — | (10) | |||
Foreign capital gains tax | — | — | — | (33) | |||
| Net change in unrealized appreciation (depreciation) on: | |||||||
Investments | (14,612) | 206,586 | 22,562 | 5,592 | |||
Foreign currency transactions | — | — | — | 8 | |||
Foreign capital gains tax | — | — | — | (21) | |||
Net realized and unrealized gain (loss) on investments | 14,633 | (133,468) | (5,769) | 7,607 | |||
Net increase (decrease) in net assets resulting from operations | $ 29,279 | $(104,897) | $ (3,290) | $7,539 |
| (1) | Amount is less than $500. |
| (2) | See Note 3D in the Notes to Financial Statements. |
| Silvant Large-Cap Growth Stock Fund | Silvant Small-Cap Growth Stock Fund | Zevenbergen Innovative Growth Stock Fund | |||
| Investment Income | |||||
Dividends | $ 825 | $ 125 | $ 446 | ||
Securities lending, net of fees | — (1) | — (1) | — | ||
Total investment income | 825 | 125 | 446 | ||
| Expenses | |||||
Investment advisory fees | 780 | 251 | 4,981 | ||
Distribution and service fees, Class A | 242 | 29 | 389 | ||
Administration and accounting fees | 124 | 39 | 673 | ||
Transfer agent fees and expenses | 52 | 15 | 278 | ||
Sub-transfer agent fees and expenses, Class A | 69 | 9 | 169 | ||
Sub-transfer agent fees and expenses, Class I | 21 | 32 | 480 | ||
Custodian fees | — (1) | — (1) | 1 | ||
Printing fees and expenses | 7 | 2 | 46 | ||
Professional fees | 25 | 23 | 30 | ||
Interest expense and/or commitment fees | 1 | — (1) | 15 | ||
Registration fees | 43 | 29 | 93 | ||
Trustees’ fees and expenses | 10 | 3 | 34 | ||
Miscellaneous expenses | 18 | 7 | 31 | ||
Total expenses | 1,392 | 439 | 7,220 | ||
Less net expenses reimbursed and/or waived by investment adviser(2) | (58) | (85) | (447) | ||
Less low balance account fees | — (1) | — (1) | — (1) | ||
Net expenses | 1,334 | 354 | 6,773 | ||
Net investment income (loss) | (509) | (229) | (6,327) | ||
| Net Realized and Unrealized Gain (Loss) on Investments | |||||
| Net realized gain (loss) from: | |||||
Investments | 16,501 | 497 | 3,286 | ||
| Net change in unrealized appreciation (depreciation) on: | |||||
Investments | 18,957 | 10,184 | 516,552 | ||
Net realized and unrealized gain (loss) on investments | 35,458 | 10,681 | 519,838 | ||
Net increase (decrease) in net assets resulting from operations | $34,949 | $10,452 | $513,511 |
| (1) | Amount is less than $500. |
| (2) | See Note 3D in the Notes to Financial Statements. |
| Ceredex Large-Cap Value Equity Fund | Ceredex Mid-Cap Value Equity Fund | ||||||
| Year Ended December 31, 2020 | Year Ended December 31, 2019 | Year Ended December 31, 2020 | Year Ended December 31, 2019 | ||||
| Increase (Decrease) in Net Assets Resulting from Operations | |||||||
Net investment income (loss) | $ 14,646 | $ 16,919 | $ 28,571 | $ 32,518 | |||
Net realized gain (loss) | 29,245 | 125,177 | (340,054) | 283,559 | |||
Net change in unrealized appreciation (depreciation) | (14,612) | 205,088 | 206,586 | 542,330 | |||
Increase (decrease) in net assets resulting from operations | 29,279 | 347,184 | (104,897) | 858,407 | |||
| Dividends and Distributions to Shareholders | |||||||
| Net Investment Income and Net Realized Gains: | |||||||
Class A | (10,415) | (13,518) | (8,109) | (19,585) | |||
Class C | (308) | (339) | (817) | (2,225) | |||
Class I | (33,878) | (45,230) | (56,746) | (136,674) | |||
Class R6 | (23,159) | (25,235) | (20,907) | (46,058) | |||
Total Dividends and Distributions to Shareholders | (67,760) | (84,322) | (86,579) | (204,542) | |||
| Change in Net Assets from Capital Transactions (See Note 5): | |||||||
Class A | (13,875) | (60,021) | (59,181) | 19,274 | |||
Class C | (526) | (10,334) | (10,647) | (17,758) | |||
Class I | (54,001) | (286,380) | (200,396) | 242,187 | |||
Class R6 | 117,594 | 68,747 | (13,964) | 287,970 | |||
Increase (decrease) in net assets from capital transactions | 49,192 | (287,988) | (284,188) | 531,673 | |||
Net increase (decrease) in net assets | 10,711 | (25,126) | (475,664) | 1,185,538 | |||
| Net Assets | |||||||
Beginning of period | 1,285,210 | 1,310,336 | 3,698,142 | 2,512,604 | |||
End of Period | $ 1,295,921 | $ 1,285,210 | $ 3,222,478 | $ 3,698,142 | |||
| Ceredex Small-Cap Value Equity Fund | SGA International Growth Fund | ||||||
| Year Ended December 31, 2020 | Year Ended December 31, 2019 | Year Ended December 31, 2020 | Year Ended December 31, 2019 | ||||
| Increase (Decrease) in Net Assets Resulting from Operations | |||||||
Net investment income (loss) | $ 2,479 | $ 7,121 | $ (68) | $ (17) | |||
Net realized gain (loss) | (28,331) | 27,892 | 2,028 | 23,904 | |||
Net change in unrealized appreciation (depreciation) | 22,562 | 58,549 | 5,579 | (2,778) | |||
Increase (decrease) in net assets resulting from operations | (3,290) | 93,562 | 7,539 | 21,109 | |||
| Dividends and Distributions to Shareholders | |||||||
| Net Investment Income and Net Realized Gains: | |||||||
Class A | (676) | (3,931) | (1,242) | (3,190) | |||
Class C | (36) | (300) | — | — | |||
Class I | (5,048) | (25,070) | (6,531) | (17,106) | |||
Class R6 | (887) | (736) | (119) | (15) | |||
Total Dividends and Distributions to Shareholders | (6,647) | (30,037) | (7,892) | (20,311) | |||
| Change in Net Assets from Capital Transactions (See Note 5): | |||||||
Class A | (13,082) | (6,402) | 456 | (16,772) | |||
Class C | (2,553) | (10,278) | — | — | |||
Class I | (109,636) | (68,963) | 5,075 | (31,786) | |||
Class R6 | 61,568 | 17,217 | 754 | 1 | |||
Increase (decrease) in net assets from capital transactions | (63,703) | (68,426) | 6,285 | (48,557) | |||
Net increase (decrease) in net assets | (73,640) | (4,901) | 5,932 | (47,759) | |||
| Net Assets | |||||||
Beginning of period | 553,386 | 558,287 | 42,065 | 89,824 | |||
End of Period | $ 479,746 | $ 553,386 | $ 47,997 | $ 42,065 | |||
| Silvant Large-Cap Growth Stock Fund | Silvant Small-Cap Growth Stock Fund | ||||||
| Year Ended December 31, 2020 | Year Ended December 31, 2019 | Year Ended December 31, 2020 | Year Ended December 31, 2019 | ||||
| Increase (Decrease) in Net Assets Resulting from Operations | |||||||
Net investment income (loss) | $ (509) | $ (271) | $ (229) | $ (207) | |||
Net realized gain (loss) | 16,501 | 12,609 | 497 | 2,992 | |||
Net change in unrealized appreciation (depreciation) | 18,957 | 18,668 | 10,184 | 5,654 | |||
Increase (decrease) in net assets resulting from operations | 34,949 | 31,006 | 10,452 | 8,439 | |||
| Dividends and Distributions to Shareholders | |||||||
| Net Investment Income and Net Realized Gains: | |||||||
Class A | (11,918) | (11,652) | (279) | (1,287) | |||
Class C | — | (1,787) | — | (38) | |||
Class I | (1,077) | (1,579) | (321) | (1,508) | |||
Class R6 | (22) | (14) | — | — | |||
Total Dividends and Distributions to Shareholders | (13,017) | (15,032) | (600) | (2,833) | |||
| Change in Net Assets from Capital Transactions (See Note 5): | |||||||
Class A | (127) | 36,853 | (637) | 4,461 | |||
Class C | — | (33,736) | — | (4,040) | |||
Class I | (4,051) | (7,584) | (979) | 83 | |||
Class R6 | 130 | 29 | — | — | |||
Increase (decrease) in net assets from capital transactions | (4,048) | (4,438) | (1,616) | 504 | |||
Net increase (decrease) in net assets | 17,884 | 11,536 | 8,236 | 6,110 | |||
| Net Assets | |||||||
Beginning of period | 108,441 | 96,905 | 29,913 | 23,803 | |||
End of Period | $ 126,325 | $ 108,441 | $ 38,149 | $ 29,913 | |||
| Zevenbergen Innovative Growth Stock Fund | |||
| Year Ended December 31, 2020 | Year Ended December 31, 2019 | ||
| Increase (Decrease) in Net Assets Resulting from Operations | |||
Net investment income (loss) | $ (6,327) | $ (1,811) | |
Net realized gain (loss) | 3,286 | (9,063) | |
Net change in unrealized appreciation (depreciation) | 516,552 | 43,895 | |
Increase (decrease) in net assets resulting from operations | 513,511 | 33,021 | |
| Change in Net Assets from Capital Transactions (See Note 5): | |||
Class A | 163,432 | 13,124 | |
Class I | 559,458 | (6,660) | |
Class R6 | 100 | — | |
Increase (decrease) in net assets from capital transactions | 722,990 | 6,464 | |
Net increase (decrease) in net assets | 1,236,501 | 39,485 | |
| Net Assets | |||
Beginning of period | 136,791 | 97,306 | |
End of Period | $ 1,373,292 | $ 136,791 | |
THROUGHOUT EACH PERIOD
| Net Asset Value, Beginning of Period | Net Investment Income (Loss)(1) | Net Realized and Unrealized Gain (Loss) | Total from Investment Operations | Dividends from Net Investment Income | Distributions from Net Realized Gains | Total Distributions | Change in Net Asset Value | Net Asset Value, End of Period | Total Return(2)(3) | Net Assets, End of Period (in thousands) | Ratio of Net Expenses to Average Net Assets(4)(5) | Ratio of Gross Expenses to Average Net Assets(4)(5) | Ratio of Net Investment Income (Loss) to Average Net Assets(4) | Portfolio Turnover Rate(2) | ||
| Ceredex Large-Cap Value Equity Fund | ||||||||||||||||
| Class A | ||||||||||||||||
| 1/1/20 to 12/31/20 | $13.70 | 0.13 | 0.21 | 0.34 | (0.14) | (0.61) | (0.75) | (0.41) | $13.29 | 3.47% | $ 185,257 | 1.24 % | 1.27 % | 1.07 % | 193 % | |
| 1/1/19 to 12/31/19 | 11.21 | 0.13 | 3.30 | 3.43 | (0.17) | (0.77) | (0.94) | 2.49 | 13.70 | 30.56 | 206,528 | 1.24 | 1.29 | 1.04 | 118 | |
| 1/1/18 to 12/31/18 | 16.20 | 0.18 | (1.81) | (1.63) | (0.24) | (3.12) | (3.36) | (4.99) | 11.21 | (10.63) | 223,853 | 1.24 | 1.27 | 1.16 | 128 | |
| 4/1/17 to 12/31/17(6) | 16.98 | 0.13 | 1.84 | 1.97 | (0.20) | (2.55) | (2.75) | (0.78) | 16.20 | 12.14 | 323,202 | 1.24 | 1.30 | 1.04 | 54 | |
| 4/1/16 to 3/31/17 | 14.60 | 0.23 | 2.43 | 2.66 | (0.22) | (0.06) | (0.28) | 2.38 | 16.98 | 18.31 | 335,256 | 1.25 | 1.36 | 1.45 | 77 | |
| 4/1/15 to 3/31/16 | 16.48 | 0.17 | (0.56) | (0.39) | (0.19) | (1.30) | (1.49) | (1.88) | 14.60 | (2.46) | 362,805 | 1.27 | 1.37 | 1.09 | 66 | |
| Class C | ||||||||||||||||
| 1/1/20 to 12/31/20 | $13.26 | 0.07 | 0.19 | 0.26 | (0.09) | (0.61) | (0.70) | (0.44) | $12.82 | 2.98% | $ 4,486 | 1.72 % | 1.94 % | 0.61 % | 193 % | |
| 1/1/19 to 12/31/19 | 10.86 | 0.06 | 3.20 | 3.26 | (0.09) | (0.77) | (0.86) | 2.40 | 13.26 | 30.00 | 5,531 | 1.72 | 1.94 | 0.51 | 118 | |
| 1/1/18 to 12/31/18 | 15.78 | 0.11 | (1.77) | (1.66) | (0.14) | (3.12) | (3.26) | (4.92) | 10.86 | (11.09) | 14,625 | 1.72 | 1.92 | 0.69 | 128 | |
| 4/1/17 to 12/31/17(6) | 16.59 | 0.08 | 1.78 | 1.86 | (0.12) | (2.55) | (2.67) | (0.81) | 15.78 | 11.76 | 17,744 | 1.68 | 1.86 | 0.61 | 54 | |
| 4/1/16 to 3/31/17 | 14.28 | 0.15 | 2.37 | 2.52 | (0.15) | (0.06) | (0.21) | 2.31 | 16.59 | 17.70 | 18,590 | 1.72 | 1.72 | 0.98 | 77 | |
| 4/1/15 to 3/31/16 | 16.15 | 0.10 | (0.55) | (0.45) | (0.12) | (1.30) | (1.42) | (1.87) | 14.28 | (2.88) | 19,053 | 1.71 | 1.71 | 0.65 | 66 | |
| Class I | ||||||||||||||||
| 1/1/20 to 12/31/20 | $13.88 | 0.16 | 0.22 | 0.38 | (0.15) | (0.61) | (0.76) | (0.38) | $13.50 | 3.76% | $ 594,834 | 0.97 % | 1.03 % | 1.33 % | 193 % | |
| 1/1/19 to 12/31/19 | 11.34 | 0.17 | 3.34 | 3.51 | (0.20) | (0.77) | (0.97) | 2.54 | 13.88 | 30.94 | 668,846 | 0.97 | 1.04 | 1.30 | 118 | |
| 1/1/18 to 12/31/18 | 16.35 | 0.23 | (1.84) | (1.61) | (0.28) | (3.12) | (3.40) | (5.01) | 11.34 | (10.39) | 799,262 | 0.97 | 1.02 | 1.43 | 128 | |
| 4/1/17 to 12/31/17(6) | 17.11 | 0.17 | 1.86 | 2.03 | (0.24) | (2.55) | (2.79) | (0.76) | 16.35 | 12.42 | 1,300,385 | 0.97 | 1.05 | 1.31 | 54 | |
| 4/1/16 to 3/31/17 | 14.71 | 0.28 | 2.45 | 2.73 | (0.27) | (0.06) | (0.33) | 2.40 | 17.11 | 18.63 | 1,432,996 | 0.97 | 1.09 | 1.73 | 77 | |
| 4/1/15 to 3/31/16 | 16.60 | 0.22 | (0.57) | (0.35) | (0.24) | (1.30) | (1.54) | (1.89) | 14.71 | (2.19) | 1,440,587 | 0.97 | 1.09 | 1.40 | 66 | |
| Class R6* | ||||||||||||||||
| 1/1/20 to 12/31/20 | $13.96 | 0.19 | 0.23 | 0.42 | (0.16) | (0.61) | (0.77) | (0.35) | $13.61 | 4.03% | $ 511,344 | 0.72 % | 0.86 % | 1.57 % | 193 % | |
| 1/1/19 to 12/31/19 | 11.39 | 0.21 | 3.36 | 3.57 | (0.23) | (0.77) | (1.00) | 2.57 | 13.96 | 31.33 | 404,305 | 0.72 | 0.85 | 1.55 | 118 | |
| 1/1/18 to 12/31/18 | 16.41 | 0.27 | (1.85) | (1.58) | (0.32) | (3.12) | (3.44) | (5.02) | 11.39 | (10.22) | 272,596 | 0.72 | 0.83 | 1.69 | 128 | |
| 4/1/17 to 12/31/17(6) | 17.18 | 0.21 | 1.85 | 2.06 | (0.28) | (2.55) | (2.83) | (0.77) | 16.41 | 12.60 | 336,516 | 0.72 | 0.80 | 1.57 | 54 | |
| 4/1/16 to 3/31/17 | 14.77 | 0.32 | 2.46 | 2.78 | (0.31) | (0.06) | (0.37) | 2.41 | 17.18 | 18.92 | 322,129 | 0.72 | 0.72 | 1.98 | 77 | |
| 4/1/15 to 3/31/16 | 16.66 | 0.23 | (0.53) | (0.30) | (0.29) | (1.30) | (1.59) | (1.89) | 14.77 | (1.90) | 272,861 | 0.72 | 0.72 | 1.48 | 66 | |
| Ceredex Mid-Cap Value Equity Fund | ||||||||||||||||
| Class A | ||||||||||||||||
| 1/1/20 to 12/31/20 | $12.69 | 0.07 | (0.31) | (0.24) | (0.09) | (0.21) | (0.30) | (0.54) | $12.15 | (1.52)% | $ 282,186 | 1.31 % (7) | 1.31 % | 0.66 % | 179 % | |
| 1/1/19 to 12/31/19 | 10.11 | 0.09 | 3.21 | 3.30 | (0.10) | (0.62) | (0.72) | 2.58 | 12.69 | 32.63 | 362,322 | 1.34 (7)(8) | 1.30 | 0.73 | 121 | |
| 1/1/18 to 12/31/18 | 12.50 | 0.07 | (1.02) | (0.95) | (0.09) | (1.35) | (1.44) | (2.39) | 10.11 | (8.08) | 271,620 | 1.38 (8) | 1.31 | 0.55 | 109 | |
| 4/1/17 to 12/31/17(6) | 14.33 | 0.08 | 0.69 | 0.77 | (0.08) | (2.52) | (2.60) | (1.83) | 12.50 | 5.87 | 320,717 | 1.38 | 1.37 (9) | 0.75 (9) | 82 | |
| 4/1/16 to 3/31/17 | 12.22 | 0.11 | 2.63 | 2.74 | (0.13) | (0.50) | (0.63) | 2.11 | 14.33 | 22.69 | 369,102 | 1.39 | 1.45 | 0.81 | 108 | |
| 4/1/15 to 3/31/16 | 13.60 | 0.11 | (0.70) | (0.59) | (0.10) | (0.69) | (0.79) | (1.38) | 12.22 | (4.11) | 397,599 | 1.40 | 1.45 | 0.86 | 98 |
| Net Asset Value, Beginning of Period | Net Investment Income (Loss)(1) | Net Realized and Unrealized Gain (Loss) | Total from Investment Operations | Dividends from Net Investment Income | Distributions from Net Realized Gains | Total Distributions | Change in Net Asset Value | Net Asset Value, End of Period | Total Return(2)(3) | Net Assets, End of Period (in thousands) | Ratio of Net Expenses to Average Net Assets(4)(5) | Ratio of Gross Expenses to Average Net Assets(4)(5) | Ratio of Net Investment Income (Loss) to Average Net Assets(4) | Portfolio Turnover Rate(2) | ||
| Ceredex Mid-Cap Value Equity Fund (Continued) | ||||||||||||||||
| Class C | ||||||||||||||||
| 1/1/20 to 12/31/20 | $12.36 | 0.02 | (0.30) | (0.28) | (0.05) | (0.21) | (0.26) | (0.54) | $11.82 | (1.88)% | $ 31,476 | 1.79 % | 1.98 % | 0.20 % | 179 % | |
| 1/1/19 to 12/31/19 | 9.84 | 0.03 | 3.13 | 3.16 | (0.02) | (0.62) | (0.64) | 2.52 | 12.36 | 32.08 | 45,867 | 1.79 | 1.95 | 0.26 | 121 | |
| 1/1/18 to 12/31/18 | 12.18 | 0.02 | (1.00) | (0.98) | (0.01) | (1.35) | (1.36) | (2.34) | 9.84 | (8.53) | 53,419 | 1.79 | 1.97 | 0.17 | 109 | |
| 4/1/17 to 12/31/17(6) | 14.02 | 0.03 | 0.68 | 0.71 | (0.03) | (2.52) | (2.55) | (1.84) | 12.18 | 5.52 | 48,877 | 1.80 | 1.92 | 0.33 | 82 | |
| 4/1/16 to 3/31/17 | 11.96 | 0.05 | 2.58 | 2.63 | (0.07) | (0.50) | (0.57) | 2.06 | 14.02 | 22.23 | 55,580 | 1.80 | 1.80 | 0.39 | 108 | |
| 4/1/15 to 3/31/16 | 13.34 | 0.06 | (0.68) | (0.62) | (0.07) | (0.69) | (0.76) | (1.38) | 11.96 | (4.49) | 64,160 | 1.78 | 1.78 | 0.50 | 98 | |
| Class I | ||||||||||||||||
| 1/1/20 to 12/31/20 | $12.89 | 0.10 | (0.31) | (0.21) | (0.10) | (0.21) | (0.31) | (0.52) | $12.37 | (1.20)% | $2,135,663 | 1.04 % (7) | 1.04 % | 0.92 % | 179 % | |
| 1/1/19 to 12/31/19 | 10.25 | 0.13 | 3.26 | 3.39 | (0.13) | (0.62) | (0.75) | 2.64 | 12.89 | 33.08 | 2,469,800 | 1.04 (7) | 1.04 | 1.04 | 121 | |
| 1/1/18 to 12/31/18 | 12.66 | 0.12 | (1.05) | (0.93) | (0.13) | (1.35) | (1.48) | (2.41) | 10.25 | (7.83) | 1,775,643 | 1.01 (7) | 1.01 | 0.92 | 109 | |
| 4/1/17 to 12/31/17(6) | 14.48 | 0.12 | 0.70 | 0.82 | (0.12) | (2.52) | (2.64) | (1.82) | 12.66 | 6.21 | 2,187,625 | 1.04 | 1.04 | 1.09 | 82 | |
| 4/1/16 to 3/31/17 | 12.34 | 0.15 | 2.66 | 2.81 | (0.17) | (0.50) | (0.67) | 2.14 | 14.48 | 23.08 | 2,716,560 | 1.08 | 1.08 | 1.12 | 108 | |
| 4/1/15 to 3/31/16 | 13.74 | 0.15 | (0.71) | (0.56) | (0.15) | (0.69) | (0.84) | (1.40) | 12.34 | (3.85) | 2,717,761 | 1.12 | 1.12 | 1.16 | 98 | |
| Class R6* | ||||||||||||||||
| 1/1/20 to 12/31/20 | $12.92 | 0.13 | (0.31) | (0.18) | (0.11) | (0.21) | (0.32) | (0.50) | $12.42 | (0.97)% | $ 773,153 | 0.79 % | 0.88 % | 1.16 % | 179 % | |
| 1/1/19 to 12/31/19 | 10.27 | 0.16 | 3.26 | 3.42 | (0.15) | (0.62) | (0.77) | 2.65 | 12.92 | 33.31 | 820,153 | 0.79 | 0.87 | 1.28 | 121 | |
| 1/1/18 to 12/31/18 | 12.67 | 0.15 | (1.05) | (0.90) | (0.15) | (1.35) | (1.50) | (2.40) | 10.27 | (7.58) | 411,922 | 0.79 | 0.87 | 1.17 | 109 | |
| 4/1/17 to 12/31/17(6) | 14.49 | 0.15 | 0.70 | 0.85 | (0.15) | (2.52) | (2.67) | (1.82) | 12.67 | 6.41 | 388,495 | 0.80 | 0.85 | 1.37 | 82 | |
| 4/1/16 to 3/31/17 | 12.36 | 0.19 | 2.66 | 2.85 | (0.22) | (0.50) | (0.72) | 2.13 | 14.49 | 23.34 | 291,554 | 0.80 | 0.80 | 1.44 | 108 | |
| 4/1/15 to 3/31/16 | 13.76 | 0.21 | (0.72) | (0.51) | (0.20) | (0.69) | (0.89) | (1.40) | 12.36 | (3.45) | 192,640 | 0.80 | 0.80 | 1.68 | 98 | |
| Ceredex Small-Cap Value Equity Fund | ||||||||||||||||
| Class A | ||||||||||||||||
| 1/1/20 to 12/31/20 | $ 9.38 | 0.02 | 0.02 | 0.04 | (0.03) | (0.08) | (0.11) | (0.07) | $ 9.31 | 0.62% | $ 54,984 | 1.48 % (7) | 1.48 % | 0.29 % | 69 % | |
| 1/1/19 to 12/31/19 | 8.45 | 0.09 | 1.37 | 1.46 | (0.14) | (0.39) | (0.53) | 0.93 | 9.38 | 17.21 | 70,847 | 1.47 (7) | 1.47 | 0.99 | 42 | |
| 1/1/18 to 12/31/18 | 11.53 | 0.08 | (1.51) | (1.43) | (0.15) | (1.50) | (1.65) | (3.08) | 8.45 | (12.70) | 69,223 | 1.46 (7) | 1.46 | 0.68 | 44 | |
| 4/1/17 to 12/31/17(6) | 12.58 | 0.14 | 0.90 | 1.04 | (0.16) | (1.93) | (2.09) | (1.05) | 11.53 | 8.74 | 114,673 | 1.47 | 1.50 | 1.52 | 15 | |
| 4/1/16 to 3/31/17 | 10.96 | 0.07 | 2.20 | 2.27 | (0.09) | (0.56) | (0.65) | 1.62 | 12.58 | 20.81 | 123,495 | 1.55 | 1.55 | 0.58 | 29 | |
| 4/1/15 to 3/31/16 | 15.25 | 0.08 | (0.50) | (0.42) | (0.15) | (3.72) | (3.87) | (4.29) | 10.96 | (1.07) | 121,367 | 1.55 | 1.55 | 0.62 | 36 | |
| Class C | ||||||||||||||||
| 1/1/20 to 12/31/20 | $ 8.19 | (0.01) | 0.01 | — | — | (0.08) | (0.08) | (0.08) | $ 8.11 | 0.23% | $ 2,410 | 1.90 % (10) | 2.19 % | (0.19) % | 69 % | |
| 1/1/19 to 12/31/19 | 7.41 | 0.05 | 1.19 | 1.24 | (0.07) | (0.39) | (0.46) | 0.78 | 8.19 | 16.66 | 5,457 | 1.90 | 2.14 | 0.61 | 42 | |
| 1/1/18 to 12/31/18 | 10.31 | 0.02 | (1.34) | (1.32) | (0.08) | (1.50) | (1.58) | (2.90) | 7.41 | (13.07) | 14,473 | 1.90 | 2.09 | 0.23 | 44 | |
| 4/1/17 to 12/31/17(6) | 11.46 | 0.09 | 0.80 | 0.89 | (0.11) | (1.93) | (2.04) | (1.15) | 10.31 | 8.28 | 20,658 | 1.90 | 2.07 | 1.05 | 15 | |
| 4/1/16 to 3/31/17 | 10.04 | 0.02 | 2.02 | 2.04 | (0.06) | (0.56) | (0.62) | 1.42 | 11.46 | 20.35 | 24,529 | 1.90 | 1.90 | 0.22 | 29 | |
| 4/1/15 to 3/31/16 | 14.31 | 0.03 | (0.47) | (0.44) | (0.11) | (3.72) | (3.83) | (4.27) | 10.04 | (1.34) | 27,410 | 1.90 | 1.90 | 0.28 | 36 |
| Net Asset Value, Beginning of Period | Net Investment Income (Loss)(1) | Net Realized and Unrealized Gain (Loss) | Total from Investment Operations | Dividends from Net Investment Income | Distributions from Net Realized Gains | Total Distributions | Change in Net Asset Value | Net Asset Value, End of Period | Total Return(2)(3) | Net Assets, End of Period (in thousands) | Ratio of Net Expenses to Average Net Assets(4)(5) | Ratio of Gross Expenses to Average Net Assets(4)(5) | Ratio of Net Investment Income (Loss) to Average Net Assets(4) | Portfolio Turnover Rate(2) | ||
| Ceredex Small-Cap Value Equity Fund (Continued) | ||||||||||||||||
| Class I | ||||||||||||||||
| 1/1/20 to 12/31/20 | $ 9.83 | 0.04 | 0.03 | 0.07 | (0.05) | (0.08) | (0.13) | (0.06) | $ 9.77 | 0.91 % | $ 332,391 | 1.21 % (10) | 1.21 % | 0.55 % | 69 % | |
| 1/1/19 to 12/31/19 | 8.83 | 0.13 | 1.42 | 1.55 | (0.16) | (0.39) | (0.55) | 1.00 | 9.83 | 17.58 | 460,284 | 1.20 (7) | 1.20 | 1.26 | 42 | |
| 1/1/18 to 12/31/18 | 11.98 | 0.12 | (1.58) | (1.46) | (0.19) | (1.50) | (1.69) | (3.15) | 8.83 | (12.50) | 474,591 | 1.18 (7) | 1.18 | 0.99 | 44 | |
| 4/1/17 to 12/31/17(6) | 12.99 | 0.16 | 0.94 | 1.10 | (0.18) | (1.93) | (2.11) | (1.01) | 11.98 | 8.94 | 673,458 | 1.22 | 1.22 | 1.72 | 15 | |
| 4/1/16 to 3/31/17 | 11.30 | 0.11 | 2.27 | 2.38 | (0.13) | (0.56) | (0.69) | 1.69 | 12.99 | 21.15 | 786,245 | 1.24 | 1.24 | 0.87 | 29 | |
| 4/1/15 to 3/31/16 | 15.59 | 0.13 | (0.50) | (0.37) | (0.20) | (3.72) | (3.92) | (4.29) | 11.30 | (0.64) | 820,124 | 1.21 | 1.21 | 0.93 | 36 | |
| Class R6* | ||||||||||||||||
| 1/1/20 to 12/31/20 | $ 9.84 | 0.10 | — (11) | 0.10 | (0.07) | (0.08) | (0.15) | (0.05) | $ 9.79 | 1.19 % | $ 89,961 | 0.88 % | 1.05 % | 1.19 % | 69 % | |
| 2/26/19 (12) to 12/31/19 | 10.04 | 0.15 | 0.22 | 0.37 | (0.18) | (0.39) | (0.57) | (0.20) | 9.84 | 3.69 | 16,798 | 0.88 | 1.04 | 1.83 | 42 (13) | |
| SGA International Growth Fund | ||||||||||||||||
| Class A | ||||||||||||||||
| 1/1/20 to 12/31/20 | $10.50 | (0.03) | 2.02 | 1.99 | — | (2.07) | (2.07) | (0.08) | $10.42 | 22.86 % | $ 6,917 | 1.41 % (10)(14) | 1.60 % | (0.36) % | 53 % | |
| 1/1/19 to 12/31/19 | 10.95 | (0.02) | 2.92 | 2.90 | — | (3.35) | (3.35) | (0.45) | 10.50 | 28.28 | 6,376 | 1.46 (10)(14)(15) | 1.52 | (0.20) | 147 (16) | |
| 1/1/18 to 12/31/18 | 11.90 | — (11) | (0.94) | (0.94) | (0.01) | — | (0.01) | (0.95) | 10.95 | (7.90) | 22,233 | 1.42 | 1.44 | 0.03 | 37 | |
| 4/1/17 to 12/31/17(6) | 10.05 | 0.02 | 1.84 | 1.86 | (0.01) | — | (0.01) | 1.85 | 11.90 | 18.50 | 18,567 | 1.43 | 1.56 | 0.20 | 17 | |
| 4/1/16 to 3/31/17 | 9.18 | 0.01 | 0.93 | 0.94 | (0.03) | (0.04) | (0.07) | 0.87 | 10.05 | 10.41 | 14,116 | 1.33 (17) | 1.43 (17) | 0.12 | 37 | |
| 4/1/15 to 3/31/16 | 10.34 | 0.09 | (0.27) | (0.18) | (0.06) | (0.92) | (0.98) | (1.16) | 9.18 | (1.77) | 3,756 | 1.51 | 1.77 | 0.89 | 114 | |
| Class I | ||||||||||||||||
| 1/1/20 to 12/31/20 | $10.71 | (0.01) | 2.09 | 2.08 | — | (2.07) | (2.07) | 0.01 | $10.72 | 23.28 % | $ 40,249 | 1.16 % (10)(14) | 1.35 % | (0.13) % | 53 % | |
| 1/1/19 to 12/31/19 | 11.13 | — (11) | 2.97 | 2.97 | (0.04) | (3.35) | (3.39) | (0.42) | 10.71 | 28.49 | 35,641 | 1.25 (10)(14)(15) | 1.30 | 0.01 | 147 (16) | |
| 1/1/18 to 12/31/18 | 12.09 | 0.03 | (0.96) | (0.93) | (0.03) | — | (0.03) | (0.96) | 11.13 | (7.69) | 67,543 | 1.20 (8) | 1.19 | 0.28 | 37 | |
| 4/1/17 to 12/31/17(6) | 10.19 | 0.04 | 1.87 | 1.91 | (0.01) | — | (0.01) | 1.90 | 12.09 | 18.79 | 70,342 | 1.20 | 1.27 | 0.42 | 17 | |
| 4/1/16 to 3/31/17 | 9.30 | 0.03 | 0.94 | 0.97 | (0.04) | (0.04) | (0.08) | 0.89 | 10.19 | 10.54 | 51,120 | 1.14 (17) | 1.24 (17) | 0.34 | 37 | |
| 4/1/15 to 3/31/16 | 10.45 | 0.13 | (0.29) | (0.16) | (0.07) | (0.92) | (0.99) | (1.15) | 9.30 | (1.59) | 28,756 | 1.30 | 1.67 | 1.28 | 114 | |
| Class R6* | ||||||||||||||||
| 1/1/20 to 12/31/20 | $10.74 | — (11) | 2.10 | 2.10 | — | (2.07) | (2.07) | 0.03 | $10.77 | 23.41 % | $ 831 | 1.07 % (10)(14) | 1.25 % | 0.05 % | 53 % | |
| 1/1/19 to 12/31/19 | 11.15 | — (11) | 2.99 | 2.99 | (0.05) | (3.35) | (3.40) | (0.41) | 10.74 | 28.59 | 48 | 1.16 (10)(14)(15) | 1.25 | (0.02) | 147 (16) | |
| 1/1/18 to 12/31/18(18) | 12.11 | 0.05 | (0.97) | (0.92) | (0.04) | — | (0.04) | (0.96) | 11.15 | (7.63) | 48 | 1.10 | 1.11 | 0.43 | 37 | |
| 4/1/17 to 12/31/17(6) | 10.20 | 0.04 | 1.89 | 1.93 | (0.02) | — | (0.02) | 1.91 | 12.11 | 18.89 | 9,279 | 1.10 | 1.19 | 0.42 | 17 | |
| 4/1/16 to 3/31/17 | 9.31 | 0.05 | 0.93 | 0.98 | (0.05) | (0.04) | (0.09) | 0.89 | 10.20 | 10.62 | 6,558 | 1.03 (17) | 1.14 (17) | 0.49 | 37 | |
| 9/1/15 (19) to 3/31/16 | 9.85 | — (11) | 0.38 | 0.38 | — | (0.92) | (0.92) | (0.54) | 9.31 | 3.81 | 5,832 | 1.14 | 1.54 | 0.09 | 114 |
| Net Asset Value, Beginning of Period | Net Investment Income (Loss)(1) | Net Realized and Unrealized Gain (Loss) | Total from Investment Operations | Dividends from Net Investment Income | Distributions from Net Realized Gains | Total Distributions | Change in Net Asset Value | Net Asset Value, End of Period | Total Return(2)(3) | Net Assets, End of Period (in thousands) | Ratio of Net Expenses to Average Net Assets(4)(5) | Ratio of Gross Expenses to Average Net Assets(4)(5) | Ratio of Net Investment Income (Loss) to Average Net Assets(4) | Portfolio Turnover Rate(2) | ||
| Silvant Large-Cap Growth Stock Fund | ||||||||||||||||
| Class A | ||||||||||||||||
| 1/1/20 to 12/31/20 | $ 5.37 | (0.03) | 1.91 | 1.88 | — | (0.75) | (0.75) | 1.13 | $ 6.50 | 35.90 % | $ 110,884 | 1.23 % | 1.27 % | (0.49) % | 13 % | |
| 1/1/19 to 12/31/19 | 4.60 | (0.01) | 1.55 | 1.54 | — | (0.77) | (0.77) | 0.77 | 5.37 | 33.95 | 92,556 | 1.23 | 1.26 | (0.25) | 15 | |
| 1/1/18 to 12/31/18 | 5.49 | (0.02) | 0.03 | 0.01 | — | (0.90) | (0.90) | (0.89) | 4.60 | (0.83) | 45,779 | 1.23 | 1.60 | (0.29) | 11 | |
| 4/1/17 to 12/31/17(6) | 7.20 | (0.01) | 1.21 | 1.20 | — | (2.91) | (2.91) | (1.71) | 5.49 | 17.88 | 63,051 | 1.23 | 1.46 | (0.09) | 14 | |
| 4/1/16 to 3/31/17 | 7.81 | (0.02) | 0.57 | 0.55 | — | (1.16) | (1.16) | (0.61) | 7.20 | 7.83 | 60,900 | 1.23 | 1.24 | (0.27) | 42 | |
| 4/1/15 to 3/31/16 | 8.75 | (0.03) | (0.11) | (0.14) | — | (0.80) | (0.80) | (0.94) | 7.81 | (2.13) | 62,115 | 1.20 | 1.21 | (0.39) | 10 | |
| Class I | ||||||||||||||||
| 1/1/20 to 12/31/20 | $ 8.12 | (0.02) | 2.93 | 2.91 | — | (0.75) | (0.75) | 2.16 | $10.28 | 36.43 % | $ 15,093 | 0.97 % | 1.09 % | (0.23) % | 13 % | |
| 1/1/19 to 12/31/19 | 6.63 | — (11) | 2.26 | 2.26 | — | (0.77) | (0.77) | 1.49 | 8.12 | 34.41 | 15,720 | 0.97 | 1.12 | 0.01 | 15 | |
| 1/1/18 to 12/31/18 | 7.53 | — (11) | — (11) | — | — | (0.90) | (0.90) | (0.90) | 6.63 | (0.75) | 19,234 | 0.97 | 1.10 | (0.02) | 11 | |
| 4/1/17 to 12/31/17(6) | 8.92 | 0.01 | 1.51 | 1.52 | — | (2.91) | (2.91) | (1.39) | 7.53 | 18.04 | 24,621 | 0.97 | 1.22 | 0.22 | 14 | |
| 4/1/16 to 3/31/17 | 9.38 | — (11) | 0.70 | 0.70 | — | (1.16) | (1.16) | (0.46) | 8.92 | 8.14 | 92,638 | 0.97 | 1.26 | (0.02) | 42 | |
| 4/1/15 to 3/31/16 | 10.32 | (0.02) | (0.12) | (0.14) | — | (0.80) | (0.80) | (0.94) | 9.38 | (1.79) | 110,562 | 0.97 | 1.24 | (0.15) | 10 | |
| Class R6* | ||||||||||||||||
| 1/1/20 to 12/31/20 | $ 8.21 | (0.01) | 2.95 | 2.94 | — | (0.75) | (0.75) | 2.19 | $10.40 | 36.39 % | $ 348 | 0.90 % | 0.96 % | (0.16) % | 13 % | |
| 1/1/19 to 12/31/19 | 6.69 | 0.01 | 2.28 | 2.29 | — | (0.77) | (0.77) | 1.52 | 8.21 | 34.57 | 165 | 0.90 | 0.98 | 0.08 | 15 | |
| 1/1/18 to 12/31/18 | 7.59 | — (11) | — (11) | — | — | (0.90) | (0.90) | (0.90) | 6.69 | (0.73) | 110 | 0.90 | 0.95 | 0.03 | 11 | |
| 4/1/17 to 12/31/17(6) | 8.94 | 0.02 | 1.54 | 1.56 | — | (2.91) | (2.91) | (1.35) | 7.59 | 18.53 | 464 | 0.91 | 0.93 | 0.28 | 14 | |
| 4/1/16 to 3/31/17 | 9.39 | 0.01 | 0.70 | 0.71 | — | (1.16) | (1.16) | (0.45) | 8.94 | 8.23 | 2,426 | 0.90 | 0.90 | 0.05 | 42 | |
| 4/1/15 to 3/31/16 | 10.33 | (0.01) | (0.13) | (0.14) | — | (0.80) | (0.80) | (0.94) | 9.39 | (1.80) | 37,087 | 0.88 | 0.89 | (0.06) | 10 | |
| Silvant Small-Cap Growth Stock Fund | ||||||||||||||||
| Class A | ||||||||||||||||
| 1/1/20 to 12/31/20 | $ 6.89 | (0.06) | 2.71 | 2.65 | — | (0.18) | (0.18) | 2.47 | $ 9.36 | 38.99 % | $ 14,837 | 1.27 % | 1.59 % | (0.85) % | 29 % | |
| 1/1/19 to 12/31/19 | 5.68 | (0.05) | 2.09 | 2.04 | — | (0.83) | (0.83) | 1.21 | 6.89 | 35.81 | 11,694 | 1.27 | 1.64 | (0.76) | 32 | |
| 1/1/18 to 12/31/18 | 6.92 | (0.06) | (0.36) | (0.42) | — | (0.82) | (0.82) | (1.24) | 5.68 | (6.69) | 5,725 | 1.41 (10) | 1.68 | (0.88) | 36 | |
| 4/1/17 to 12/31/17(6) | 7.28 | (0.04) | 0.80 | 0.76 | — | (1.12) | (1.12) | (0.36) | 6.92 | 10.73 | 6,840 | 1.42 | 1.64 | (0.70) | 24 | |
| 4/1/16 to 3/31/17 | 7.13 | (0.04) | 1.38 | 1.34 | — | (1.19) | (1.19) | 0.15 | 7.28 | 19.30 | 7,008 | 1.41 | 1.43 | (0.55) | 56 | |
| 4/1/15 to 3/31/16 | 13.23 | (0.08) | (1.35) | (1.43) | — | (4.67) | (4.67) | (6.10) | 7.13 | (13.38) | 6,856 | 1.37 | 1.37 | (0.76) | 73 | |
| Class I | ||||||||||||||||
| 1/1/20 to 12/31/20 | $ 9.27 | (0.07) | 3.65 | 3.58 | — | (0.18) | (0.18) | 3.40 | $12.67 | 39.01 % | $ 23,312 | 1.15 % | 1.42 % | (0.73) % | 29 % | |
| 1/1/19 to 12/31/19 | 7.42 | (0.06) | 2.74 | 2.68 | — | (0.83) | (0.83) | 1.85 | 9.27 | 36.04 | 18,219 | 1.15 | 1.48 | (0.64) | 32 | |
| 1/1/18 to 12/31/18 | 8.78 | (0.07) | (0.47) | (0.54) | — | (0.82) | (0.82) | (1.36) | 7.42 | (6.64) | 14,513 | 1.29 (10) | 1.53 | (0.76) | 36 | |
| 4/1/17 to 12/31/17(6) | 8.95 | (0.04) | 0.99 | 0.95 | — | (1.12) | (1.12) | (0.17) | 8.78�� | 10.86 | 18,637 | 1.30 | 1.53 | (0.58) | 24 | |
| 4/1/16 to 3/31/17 | 8.52 | (0.04) | 1.66 | 1.62 | — | (1.19) | (1.19) | 0.43 | 8.95 | 19.45 | 26,929 | 1.29 | 1.43 | (0.44) | 56 | |
| 4/1/15 to 3/31/16 | 14.83 | (0.10) | (1.54) | (1.64) | — | (4.67) | (4.67) | (6.31) | 8.52 | (13.36) | 36,436 | 1.30 | 1.39 | (0.74) | 73 |
| Net Asset Value, Beginning of Period | Net Investment Income (Loss)(1) | Net Realized and Unrealized Gain (Loss) | Total from Investment Operations | Dividends from Net Investment Income | Distributions from Net Realized Gains | Total Distributions | Change in Net Asset Value | Net Asset Value, End of Period | Total Return(2)(3) | Net Assets, End of Period (in thousands) | Ratio of Net Expenses to Average Net Assets(4)(5) | Ratio of Gross Expenses to Average Net Assets(4)(5) | Ratio of Net Investment Income (Loss) to Average Net Assets(4) | Portfolio Turnover Rate(2) | ||
| Zevenbergen Innovative Growth Stock Fund | ||||||||||||||||
| Class A | ||||||||||||||||
| 1/1/20 to 12/31/20 | $28.48 | (0.55) | 34.47 | 33.92 | — | — | — | 33.92 | $62.40 | 119.10 % | $ 335,809 | 1.25 % | 1.33 % | (1.18) % | 33 % | |
| 1/1/19 to 12/31/19 | 20.83 | (0.32) | 7.97 | 7.65 | — | — | — | 7.65 | 28.48 | 36.73 | 46,655 | 1.26 (20) | 1.41 | (1.20) | 91 | |
| 1/1/18 to 12/31/18 | 19.96 | (0.33) | 2.57 | 2.24 | — | (1.37) | (1.37) | 0.87 | 20.83 | 10.80 | 24,902 | 1.48 (8)(10) | 1.47 | (1.35) | 103 | |
| 4/1/17 to 12/31/17(6) | 18.56 | (0.21) | 3.74 | 3.53 | — | (2.13) | (2.13) | 1.40 | 19.96 | 19.18 | 5,484 | 1.51 | 1.66 | (1.40) | 50 | |
| 4/1/16 to 3/31/17 | 18.37 | (0.26) | 3.67 | 3.41 | — | (3.22) | (3.22) | 0.19 | 18.56 | 20.42 | 6,375 | 1.50 | 1.55 | (1.39) | 64 | |
| 4/1/15 to 3/31/16 | 20.76 | (0.29) | (0.57) | (0.86) | — | (1.53) | (1.53) | (2.39) | 18.37 | (4.96) | 8,127 | 1.49 | 1.49 | (1.38) | 59 | |
| Class I | ||||||||||||||||
| 1/1/20 to 12/31/20 | $30.35 | (0.47) | 36.79 | 36.32 | — | — | — | 36.32 | $66.67 | 119.67 % | $1,037,368 | 1.00 % | 1.07 % | (0.93) % | 33 % | |
| 1/1/19 to 12/31/19 | 22.15 | (0.26) | 8.46 | 8.20 | — | — | — | 8.20 | 30.35 | 37.02 | 90,136 | 1.01 (20) | 1.15 | (0.94) | 91 | |
| 1/1/18 to 12/31/18 | 21.10 | (0.30) | 2.72 | 2.42 | — | (1.37) | (1.37) | 1.05 | 22.15 | 11.07 | 72,404 | 1.27 (8)(10) | 1.23 | (1.15) | 103 | |
| 4/1/17 to 12/31/17(6) | 19.49 | (0.19) | 3.93 | 3.74 | — | (2.13) | (2.13) | 1.61 | 21.10 | 19.34 | 17,630 | 1.31 | 1.50 | (1.19) | 50 | |
| 4/1/16 to 3/31/17 | 19.11 | (0.23) | 3.83 | 3.60 | — | (3.22) | (3.22) | 0.38 | 19.49 | 20.63 | 22,330 | 1.30 | 1.44 | (1.18) | 64 | |
| 4/1/15 to 3/31/16 | 21.49 | (0.26) | (0.59) | (0.85) | — | (1.53) | (1.53) | (2.38) | 19.11 | (4.74) | 18,203 | 1.31 | 1.39 | (1.20) | 59 | |
| Class R6 | ||||||||||||||||
| 10/20/20 (12) to 12/31/20 | $58.00 | (0.10) | 8.77 | 8.67 | — | — | — | 8.67 | $66.67 | 14.95 % | $ 115 | 0.90 % | 1.03 % | (0.83) % | 33 % (13) |
| Footnote Legend: | |
| * | On September 18, 2017, Class IS shares were renamed Class R6 shares. |
| (1) | Calculated using average shares outstanding. |
| (2) | Not annualized for periods less than one year. |
| (3) | Sales charges, where applicable, are not reflected in the total return calculation. |
| (4) | Annualized for periods less than one year. |
| (5) | The Funds will also indirectly bear their prorated share of expenses of any underlying funds in which they invest. Such expenses are not included in the calculation of this ratio. |
| (6) | The Fund changed its fiscal year end to December 31 during the period. |
| (7) | The share class is currently under its expense limitation. |
| (8) | See Note 3D in the Notes to Financial Statements for information on recapture of expenses previously reimbursed. |
| (9) | The ratio excludes expenses waived/reimbursed net of amount recaptured. If expenses waived/reimbursed net of amount recaptured were included, the ratio would have been higher than the ratio shown. |
| (10) | Due to a change in expense cap, the ratio shown is a blended expense ratio. |
| (11) | Amount is less than $0.005 per share. |
| (12) | Inception date. |
| (13) | Portfolio turnover is representative of the Fund for the entire period. |
| (14) | Net expense ratio includes extraordinary proxy expenses. |
| (15) | Ratios of total expenses excluding interest expense on borrowings for the year ended December 31, 2019 were 1.45% (Class A), 1.24% (Class I) and 1.15% (Class R6). |
| (16) | The Fund’s portfolio turnover rate increased substantially during the year ended December 31, 2019 due to a change in the Fund’s subadviser and associated repositioning. |
| (17) | Net investment income per share and the ratio of net investment income to average net assets include a non-recurring refund for overbilling of prior years’ custodian out-of-pocket fees which amounted to $0.01 per share and 0.09%, 0.07%, and 0.07% of average net assets for the Class A, Class I and Class R6 (formerly IS), respectively. |
| (18) | From November 9 through November 13, 2018, the Fund’s Class R6 shares did not have any investors, though the net asset value continued to be calculated using another share class adjusted for class expenses. |
| (19) | Class R6 (formerly IS) commenced operations. |
| (20) | Ratios of total expenses excluding interest expense on borrowings for the year ended December 31, 2019 were 1.25% (Class A) and 1.00% (Class I). |
December 31, 2020
| A. | Security Valuation |
| Each Fund utilizes a fair value hierarchy which prioritizes the inputs to valuation techniques used to measure fair value into three broad levels. The Funds’ policy is to recognize transfers into or out of Level 3 at the end of the reporting period. | |
| • Level 1 – quoted prices in active markets for identical securities (security types generally include listed equities). | |
| • Level 2 – prices determined using other significant observable inputs (including quoted prices for similar securities, interest rates, | |
| prepayment speeds, credit risk, etc.). |
| B. | Security Transactions and Investment Income |
| Security transactions are recorded on the trade date. Realized gains and losses from the sale of securities are determined on the identified cost basis. Dividend income is recognized on the ex-dividend date or, in the case of certain foreign securities, as soon as a Fund is notified. Interest income is recorded on the accrual basis. Each Fund amortizes premiums and accretes discounts using the effective interest method. Any distributions from underlying funds are recorded in accordance with the character of the distributions as designated by the underlying funds. | |
| Dividend income from REITs is recorded using management’s estimate of the percentage of income included in distributions received from such investments based on historical information and other industry sources. The return of capital portion of the estimate is a reduction to investment income and a reduction in the cost basis of each investment which increases net realized gain (loss) and net change in unrealized appreciation (depreciation). If the return of capital distributions exceed their cost basis, the distributions are treated as realized gains. The actual amounts of income, return of capital, and capital gains are only determined by each REIT after its fiscal year-end, and may differ from the estimated amounts. | |
| C. | Income Taxes |
| Each Fund is treated as a separate taxable entity. It is the intention of each Fund to comply with the requirements of Subchapter M of the Internal Revenue Code and to distribute substantially all of its taxable income to its shareholders. Therefore, no provision for federal income taxes or excise taxes has been made. | |
| Certain Funds may be subject to foreign taxes on income, gains on investments or currency repatriation, a portion of which may be recoverable. Each Fund will accrue such taxes and recoveries as applicable based upon current interpretations of the tax rules and regulations that exist in the markets in which it invests. | |
| Management of the Funds has concluded that there are no significant uncertain tax positions that would require recognition in the financial statements. As of December 31, 2020, the tax years that remain subject to examination by the major tax jurisdictions under the statute of limitations are from the year 2017 forward (with limited exceptions). | |
| D. | Distributions to Shareholders |
| Distributions are recorded by each Fund on the ex-dividend date. Income and capital gain distributions are determined in accordance with income tax regulations which may differ from U.S. GAAP. | |
| E. | Expenses |
| Expenses incurred together by a Fund and other affiliated mutual funds are allocated in proportion to the net assets of each such fund, except where allocation of direct expenses to each Fund or an alternative allocation method can be more appropriately used. | |
| In addition to the net annual operating expenses that a Fund bears directly, the shareholders of a Fund indirectly bear the pro-rata expenses of any underlying mutual funds in which the Fund invests. |
| F. | Foreign Currency Transactions |
| Non-U.S. investment securities and other assets and liabilities denominated in foreign currencies are translated into U.S. dollar amounts at the foreign currency exchange rate effective at the end of the reporting period. Cost of investments is translated at the currency exchange rate effective at the trade date. The gain or loss resulting from a change in currency exchange rates between the trade and settlement date of a portfolio transaction is treated as a gain or loss on foreign currency. Likewise, the gain or loss resulting from a change in currency exchange rates between the date income is accrued and the date it is paid is treated as a gain or loss on foreign currency. The Funds do not isolate that portion of the results of operations arising from changes in foreign exchange rates on investments from the fluctuations arising from changes in the market prices of securities held. Such fluctuations are included with the net realized and unrealized gain or loss on investments. | |
| G. | Securities Lending |
| The Funds may loan securities to qualified brokers through a securities lending agency agreement with The Bank of New York Mellon (“BNYM”). Under the securities lending policy, when lending securities a Fund is required to maintain collateral with a market value not less than 100% of the market value of loaned securities. Collateral is adjusted daily in connection with changes in the market value of securities on loan. Collateral may consist of cash and securities issued by the U.S. Government or its agencies. Cash collateral is invested in a short-term money market fund. Dividends earned on the collateral and premiums paid by the broker are recorded as income by the Fund net of fees and rebates charged/paid by BNYM for its services as securities lending agent and in connection with this securities lending program. Lending portfolio securities involves a risk of delay in the recovery of the loaned securities or in the declining value of the collateral. | |
| Securities lending transactions are entered into by each Fund under a Master Securities Lending Agreement (“MSLA”) which permit the Fund, under certain circumstances including an event of default (such as bankruptcy or insolvency), to offset amounts payable by the Fund to the same counterparty against amounts to be received and create one single net payment due to or from the Fund. | |
| Effective March 13, 2020, the securities lending program was put on hold and all securities on loan were recalled. Effective October 1, 2020, the Funds may resume loaning portfolio securities under the securities lending program. | |
| At December 31, 2020, the securities loaned were subject to a MSLA on a net payment basis as follows: |
| Fund | Counterparty | Value of Securities on Loan | Cash Collateral Received(1) | Net Amount(2) | ||||
| SGA International Growth Fund | BNYM | $1,390 | $1,390 | $— | ||||
| Silvant Small-Cap Growth Stock Fund | BNYM | 380 | 380 | — |
| (1) | Collateral received in excess of the market value of securities on loan is not presented in this table. The cash collateral received in connection with securities lending transactions has been used for the purchase of securities as disclosed in the Fund’s Schedule of Investments. |
| (2) | Net amount represents the net amount receivable due from the counterparty in the event of default. |
| A. | Investment Adviser |
| Virtus Fund Advisers, LLC (the “Adviser”), an indirect, wholly-owned subsidiary of Virtus Investment Partners, Inc. (“Virtus”), is the investment adviser to the Funds. The Adviser manages the Funds’ investment programs and general operations of the Funds, including oversight of the Funds’ subadvisers. | |
| As compensation for its services to the Funds, the Adviser is entitled to a fee, which is calculated daily and paid monthly based upon the following annual rates as a percentage of the average daily net assets of each Fund: |
| First $500 Million | |
Ceredex Large-Cap Value Equity Fund | 0.70 % |
Ceredex Mid-Cap Value Equity Fund | 0.75 |
Ceredex Small-Cap Value Equity Fund | 0.85 |
SGA International Growth Fund | 0.85 |
Silvant Large-Cap Growth Stock Fund | 0.70 |
Silvant Small-Cap Growth Stock Fund | 0.85 |
Zevenbergen Innovative Growth Stock Fund | 0.80 |
| B. | Subadvisers |
| The subadvisers manage the investments of each Fund for which they are paid a fee by the Adviser. A list of the subadvisers and the Funds they serve as of the end of the period is as follows: |
| Fund | Subadviser | |
Ceredex Large-Cap Value Equity Fund | Ceredex (1) | |
Ceredex Mid-Cap Value Equity Fund | Ceredex (1) | |
Ceredex Small-Cap Value Equity Fund | Ceredex (1) | |
SGA International Growth Fund | SGA (2) | |
Silvant Large-Cap Growth Stock Fund | Silvant (3) | |
Silvant Small-Cap Growth Stock Fund | Silvant (3) | |
Zevenbergen Innovative Growth Stock Fund | Zevenbergen (4) |
| (1) | Ceredex Value Advisors LLC, an indirect, wholly-owned subsidiary of Virtus. |
| (2) | Sustainable Growth Advisers, LP, an indirect, majority-owned subsidiary of Virtus. |
| (3) | Silvant Capital Management LLC, an indirect, wholly-owned subsidiary of Virtus. |
| (4) | Zevenbergen Capital Investments LLC, a minority-owned affiliate of the Adviser. |
| C. | Expense Limitations |
| The Adviser has contractually agreed to limit each Fund’s annual total operating expenses, subject to the exceptions listed below, so that such expenses do not exceed, on an annualized basis, the following respective percentages of average daily net assets through April 30, 2021 (except as noted). Following the contractual period, the Adviser may discontinue these expense reimbursement arrangements at any time. The waivers and reimbursements are accrued daily and received monthly. |
| Fund | Class A | Class C | Class I | Class R6 | ||||
Ceredex Large-Cap Value Equity Fund | 1.24 % | 1.72 % | 0.97 % | 0.72 % | ||||
Ceredex Mid-Cap Value Equity Fund | 1.38 ‡ | 1.79 | 1.08 ‡ | 0.79 | ||||
Ceredex Small-Cap Value Equity Fund* | 1.49 ‡ | 1.84 | 1.18 | 0.88 | ||||
SGA International Growth Fund** | 1.32 | N/A | 1.07 | 0.95 | ||||
Silvant Large-Cap Growth Stock Fund | 1.23 | N/A | 0.97 | 0.90 | ||||
Silvant Small-Cap Growth Stock Fund | 1.27 | N/A | 1.15 | N/A | ||||
Zevenbergen Innovative Growth Stock Fund*** | 1.25 | N/A | 1.00 | 0.90 |
| * | Effective December 1, 2020 through April 30, 2022. For the period January 1, 2020 through November 30, 2020, the expense caps were as follows for Class A shares, Class C shares, and Class I shares, respectively: 1.55%, 1.90%, and 1.24%. |
| ** | Effective December 1, 2020 through April 30, 2022. For the period January 1, 2020 through November 30, 2020, the expense caps were as follows for Class A shares, Class I shares, and Class R6 shares, respectively: 1.39%, 1.14%, and 1.04%. |
| ‡ | Share class is currently below its expense cap. |
| *** | Through April 30, 2022. |
| D. | Expense Recapture |
| Under certain conditions, the Adviser may recapture operating expenses reimbursed or fees waived under these arrangements within three years after the date on which such amounts were incurred or waived. A Fund must pay its ordinary operating expenses before the Adviser is entitled to any reimbursement and must remain in compliance with any applicable expense limitations or, if none, the expense limitation in effect at the time of the waiver or reimbursement. All or a portion of the following Adviser reimbursed expenses may be recaptured by the fiscal year ending: |
| Expiration | ||||||||
| Fund | 2021 | 2022 | 2023 | Total | ||||
| Ceredex Large-Cap Value Equity Fund | ||||||||
Class A | $ 60 | $ 103 | $ 75 | $ 238 | ||||
Class C | 33 | 11 | 11 | 55 | ||||
Class I | 473 | 503 | 350 | 1,326 | ||||
Class R6 | 366 | 441 | 492 | 1,299 | ||||
| Ceredex Mid-Cap Value Equity Fund | ||||||||
Class C | 114 | 68 | 64 | 246 | ||||
Class R6 | 335 | 485 | 599 | 1,419 | ||||
| Ceredex Small-Cap Value Equity Fund | ||||||||
Class C | 36 | 17 | 9 | 62 | ||||
Class I | — | — | 2 | 2 | ||||
Class R6 | — | 6 | 58 | 64 | ||||
| SGA International Growth Fund | ||||||||
Class A | 5 | 7 | 12 | 24 | ||||
Class I | 3 | 37 | 62 | 102 | ||||
Class R6 | 1 | — (1) | 1 | 2 | ||||
| Silvant Large-Cap Growth Stock Fund | ||||||||
Class A | 236 | 77 | 40 | 353 | ||||
Class I | 32 | 27 | 18 | 77 | ||||
Class R6 | — (1) | — (1) | — (1) | — (1) | ||||
| Silvant Small-Cap Growth Stock Fund | ||||||||
Class A | 19 | 40 | 37 | 96 | ||||
Class I | 43 | 58 | 48 | 149 | ||||
| Zevenbergen Innovative Growth Stock Fund | ||||||||
Class A | 6 | 72 | 124 | 202 | ||||
Class I | 22 | 180 | 323 | 525 | ||||
Class R6 | — | — | — (1) | — (1) | ||||
| Fund | Class A | Class I | Total | |||
Ceredex Large-Cap Value Equity Fund | $ 26 | $ 26 | $ 52 | |||
Ceredex Mid-Cap Value Equity Fund | — (1) | — | — (1) | |||
Ceredex Small-Cap Value Equity Fund | — (1) | — | — (1) |
| (1) | Amount is less than $500. |
| E. | Distributor |
| VP Distributors, LLC (“VP Distributors”), an indirect, wholly-owned subsidiary of Virtus, serves as the distributor of each Fund’s shares. VP Distributors has advised the Funds that for the fiscal year (the “period”) ended December 31, 2020, it retained net commissions of $198 for Class A shares and CDSC of $5 and $2 for Class A shares and Class C shares, respectively. | |
| In addition, each Fund pays VP Distributors 12b-1 fees under a 12b-1 Plan as a percentage of the average daily net assets of each respective class at the annual rates of 0.25% for Class A shares and 1.00% for Class C shares. Class I shares and Class R6 shares are not subject to a 12b-1 Plan. | |
| Under certain circumstances, shares of certain Virtus Mutual Funds may be exchanged for shares of the same class of certain other Virtus Mutual Funds on the basis of the relative NAV per share at the time of the exchange. On exchanges with share classes that carry a CDSC, the CDSC schedule of the original shares purchased continues to apply. | |
| F. | Administrator and Transfer Agent |
| Virtus Fund Services, LLC, an indirect, wholly-owned subsidiary of Virtus, serves as the administrator and transfer agent to the Funds. | |
| For the period ended December 31, 2020, the Funds incurred administration fees totaling $5,111, which are included in the Statements of Operations within the line item “Administration and accounting fees.” The fees are calculated daily and paid monthly. | |
| For the period ended December 31, 2020, the Funds incurred transfer agent fees totaling $2,291, which are included in the Statements of Operations within the line item “Transfer agent fees and expenses.” The fees are calculated daily and paid monthly. | |
| G. | Trustee Compensation |
| The Trust provides a deferred compensation plan for its Trustees who receive compensation from the Trust. Under the deferred compensation plan, Trustees may elect to defer all or a portion of their compensation. Amounts deferred are retained by the Trust, and then, to the extent permitted by the 1940 Act, in turn, may be invested in the shares of affiliated or unaffiliated mutual funds selected by the participating Trustees. Investments in such instruments are included in “Other assets” in the Statements of Assets and Liabilities at December 31, 2020. |
| Purchases | Sales | ||
Ceredex Large-Cap Value Equity Fund | $2,033,032 | $2,037,246 | |
Ceredex Mid-Cap Value Equity Fund | 5,288,547 | 5,569,778 | |
Ceredex Small-Cap Value Equity Fund | 304,101 | 370,465 | |
SGA International Growth Fund | 21,265 | 22,949 | |
Silvant Large-Cap Growth Stock Fund | 14,530 | 31,827 | |
Silvant Small-Cap Growth Stock Fund | 8,468 | 10,999 | |
Zevenbergen Innovative Growth Stock Fund | 902,455 | 208,486 |
| Ceredex Large-Cap Value Equity Fund | Ceredex Mid-Cap Value Equity Fund | ||||||||||||||
| Year Ended December 31, 2020 | Year Ended December 31, 2019 | Year Ended December 31, 2020 | Year Ended December 31, 2019 | ||||||||||||
| SHARES | AMOUNT | SHARES | AMOUNT | SHARES | AMOUNT | SHARES | AMOUNT | ||||||||
| Class A | |||||||||||||||
| Shares sold and cross class conversions | 4,108 | $ 46,998 | 3,072 | $ 38,300 | 7,983 | $ 81,172 | 9,555 | $ 112,353 | |||||||
| Reinvestment of distributions | 840 | 9,511 | 924 | 12,649 | 743 | 7,634 | 1,459 | 18,481 | |||||||
| Shares repurchased and cross class conversions | (6,090) | (70,384) | (8,895) | (110,970) | (14,070) | (147,987) | (9,329) | (111,560) | |||||||
| Net Increase / (Decrease) | (1,142) | $ (13,875) | (4,899) | $ (60,021) | (5,344) | $ (59,181) | 1,685 | $ 19,274 | |||||||
| Class C | |||||||||||||||
| Shares sold and cross class conversions | 159 | $ 2,019 | 128 | $ 1,615 | 297 | $ 3,013 | 799 | $ 9,255 | |||||||
| Reinvestment of distributions | 18 | 196 | 19 | 252 | 74 | 730 | 160 | 1,988 | |||||||
| Shares repurchased and cross class conversions | (245) | (2,741) | (1,076) | (12,201) | (1,417) | (14,390) | (2,677) | (29,001) | |||||||
| Net Increase / (Decrease) | (68) | $ (526) | (929) | $ (10,334) | (1,046) | $ (10,647) | (1,718) | $ (17,758) | |||||||
| Class I | |||||||||||||||
| Shares sold and cross class conversions | 9,103 | $ 106,595 | 7,032 | $ 91,024 | 48,455 | $ 504,947 | 62,142 | $ 749,099 | |||||||
| Reinvestment of distributions | 2,924 | 33,686 | 3,239 | 44,928 | 5,133 | 54,303 | 10,010 | 128,823 | |||||||
| Shares repurchased and cross class conversions | (16,170) | (194,282) | (32,573) | (422,332) | (72,568) | (759,646) | (53,728) | (635,735) | |||||||
| Net Increase / (Decrease) | (4,143) | $ (54,001) | (22,302) | $ (286,380) | (18,980) | $ (200,396) | 18,424 | $ 242,187 | |||||||
| Class R6 | |||||||||||||||
| Shares sold and cross class conversions | 18,412 | $ 239,258 | 8,603 | $ 114,089 | 21,959 | $ 234,598 | 28,378 | $ 347,267 | |||||||
| Reinvestment of distributions | 1,653 | 19,311 | 1,732 | 24,166 | 1,860 | 19,820 | 3,455 | 44,568 | |||||||
| Shares repurchased and cross class conversions | (11,465) | (140,975) | (5,295) | (69,508) | (25,063) | (268,382) | (8,484) | (103,865) | |||||||
| Net Increase / (Decrease) | 8,600 | $ 117,594 | 5,040 | $ 68,747 | (1,244) | $ (13,964) | 23,349 | $ 287,970 | |||||||
| Ceredex Small-Cap Value Equity Fund | SGA International Growth Fund | ||||||||||||||
| Year Ended December 31, 2020 | Year Ended December 31, 2019 | Year Ended December 31, 2020 | Year Ended December 31, 2019 | ||||||||||||
| SHARES | AMOUNT | SHARES | AMOUNT | SHARES | AMOUNT | SHARES | AMOUNT | ||||||||
| Class A | |||||||||||||||
| Shares sold and cross class conversions | 880 | $ 6,026 | 1,431 | $ 13,127 | 108 | $ 1,057 | 216 | $ 2,232 | |||||||
| Reinvestment of distributions | 89 | 675 | 412 | 3,889 | 137 | 1,224 | 317 | 3,138 | |||||||
| Shares repurchased and cross class conversions | (2,619) | (19,783) | (2,480) | (23,418) | (189) | (1,825) | (1,956) | (22,142) | |||||||
| Net Increase / (Decrease) | (1,650) | $ (13,082) | (637) | $ (6,402) | 56 | $ 456 | (1,423) | $ (16,772) | |||||||
| Ceredex Small-Cap Value Equity Fund | SGA International Growth Fund | ||||||||||||||
| Year Ended December 31, 2020 | Year Ended December 31, 2019 | Year Ended December 31, 2020 | Year Ended December 31, 2019 | ||||||||||||
| SHARES | AMOUNT | SHARES | AMOUNT | SHARES | AMOUNT | SHARES | AMOUNT | ||||||||
| Class C | |||||||||||||||
| Shares sold and cross class conversions | 48 | $ 344 | 27 | $ 227 | — | $ — | — | $ — | |||||||
| Reinvestment of distributions | 6 | 36 | 34 | 280 | — | — | — | — | |||||||
| Shares repurchased and cross class conversions | (423) | (2,933) | (1,347) | (10,785) | — | — | — | — | |||||||
| Net Increase / (Decrease) | (369) | $ (2,553) | (1,286) | $ (10,278) | — | $ — | — | $ — | |||||||
| Class I | |||||||||||||||
| Shares sold and cross class conversions | 8,930 | $ 70,968 | 6,622 | $ 65,246 | 1,893 | $ 19,586 | 2,293 | $ 25,984 | |||||||
| Reinvestment of distributions | 616 | 5,008 | 2,506 | 24,798 | 703 | 6,461 | 1,677 | 16,935 | |||||||
| Shares repurchased and cross class conversions | (22,368) | (185,612) | (16,019) | (159,007) | (2,169) | (20,972) | (6,711) | (74,705) | |||||||
| Net Increase / (Decrease) | (12,822) | $ (109,636) | (6,891) | $ (68,963) | 427 | $ 5,075 | (2,741) | $ (31,786) | |||||||
| Class R6 | |||||||||||||||
| Shares sold and cross class conversions | 8,456 | $ 69,852 | 1,691 | $ 17,061 | 61 | $ 648 | — (1) | $ 1 | |||||||
| Reinvestment of distributions | 95 | 841 | 74 | 736 | 12 | 110 | — (1) | — (2) | |||||||
| Shares repurchased and cross class conversions | (1,073) | (9,125) | (58) | 580) | (1) | (4) | (—) (1) | (—) (2) | |||||||
| Net Increase / (Decrease) | 7,478 | $ 61,568 | 1,707 | $ 17,217 | 72 | $ 754 | — | $ 1 | |||||||
| Silvant Large-Cap Growth Stock Fund | Silvant Small-Cap Growth Stock Fund | ||||||||||||||
| Year Ended December 31, 2020 | Year Ended December 31, 2019 | Year Ended December 31, 2020 | Year Ended December 31, 2019 | ||||||||||||
| SHARES | AMOUNT | SHARES | AMOUNT | SHARES | AMOUNT | SHARES | AMOUNT | ||||||||
| Class A | |||||||||||||||
| Shares sold and cross class conversions | 308 | $ 1,832 | 7,178 | $ 36,377 | 113 | $ 912 | 803 | $ 5,317 | |||||||
| Reinvestment of distributions | 1,879 | 11,733 | 2,134 | 11,472 | 36 | 276 | 183 | 1,273 | |||||||
| Shares repurchased and cross class conversions | (2,373) | (13,692) | (2,031) | (10,996) | (260) | (1,825) | (297) | (2,129) | |||||||
| Net Increase / (Decrease) | (186) | $ (127) | 7,281 | $ 36,853 | (111) | $ (637) | 689 | $ 4,461 | |||||||
| Class C | |||||||||||||||
| Shares sold and cross class conversions | — | $ — | 325 | $ 546 | — | $ — | 69 | $ 137 | |||||||
| Reinvestment of distributions | — | — | 1,096 | 1,776 | — | — | 18 | 37 | |||||||
| Shares repurchased and cross class conversions | — | — | (22,114) | (36,058) | — | — | (2,301) | (4,214) | |||||||
| Net Increase / (Decrease) | — | $ — | (20,693) | $ (33,736) | — | $ — | (2,214) | $ (4,040) | |||||||
| Class I | |||||||||||||||
| Shares sold and cross class conversions | 93 | $ 837 | 162 | $ 1,242 | 448 | $ 4,514 | 282 | $ 2,596 | |||||||
| Reinvestment of distributions | 98 | 954 | 170 | 1,366 | 30 | 315 | 158 | 1,477 | |||||||
| Shares repurchased and cross class conversions | (657) | (5,842) | (1,296) | (10,192) | (605) | (5,808) | (430) | (3,990) | |||||||
| Net Increase / (Decrease) | (466) | $ (4,051) | (964) | $ (7,584) | (127) | $ (979) | 10 | $ 83 | |||||||
| Silvant Large-Cap Growth Stock Fund | Silvant Small-Cap Growth Stock Fund | ||||||||||||||
| Year Ended December 31, 2020 | Year Ended December 31, 2019 | Year Ended December 31, 2020 | Year Ended December 31, 2019 | ||||||||||||
| SHARES | AMOUNT | SHARES | AMOUNT | SHARES | AMOUNT | SHARES | AMOUNT | ||||||||
| Class R6 | |||||||||||||||
| Shares sold and cross class conversions | 13 | $ 124 | 2 | $ 18 | — | $ — | — | $ — | |||||||
| Reinvestment of distributions | 2 | 22 | 2 | 14 | — | — | — | — | |||||||
| Shares repurchased and cross class conversions | (2) | (16) | (—) (1) | (3) | — | — | — | — | |||||||
| Net Increase / (Decrease) | 13 | $ 130 | 4 | $ 29 | — | $ — | — | $ — | |||||||
| Zevenbergen Innovative Growth Stock Fund | |||||||
| Year Ended December 31, 2020 | Year Ended December 31, 2019 | ||||||
| SHARES | AMOUNT | SHARES | AMOUNT | ||||
| Class A | |||||||
| Shares sold and cross class conversions | 6,234 | $ 271,684 | 1,974 | $ 53,101 | |||
| Shares repurchased and cross class conversions | (2,490) | (108,252) | (1,532) | (39,977) | |||
| Net Increase / (Decrease) | 3,744 | $ 163,432 | 442 | $ 13,124 | |||
| Class I | |||||||
| Shares sold and cross class conversions | 19,603 | $ 884,352 | 5,739 | $ 160,109 | |||
| Shares repurchased and cross class conversions | (7,012) | (324,894) | (6,038) | (166,769) | |||
| Net Increase / (Decrease) | 12,591 | $ 559,458 | (299) | $ (6,660) | |||
| Class R6 | |||||||
| Shares sold and cross class conversions | 2 | $ 100 | — | $ — | |||
| Net Increase / (Decrease) | 2 | $ 100 | — | $ — | |||
| (1) | Amount is less than 500 shares. |
| (2) | Amount is less than $500. |
| % of Shares Outstanding | Number of Accounts* | ||
Ceredex Large-Cap Value Equity Fund | 25% | 2 | |
Ceredex Mid-Cap Value Equity Fund | 38 | 2 | |
Ceredex Small-Cap Value Equity Fund | 46 | 3 | |
SGA International Growth Fund | 29 | 2 | |
Silvant Large-Cap Growth Stock Fund | 55 | 1 | |
Silvant Small-Cap Growth Stock Fund | 49 | 2 | |
Zevenbergen Innovative Growth Stock Fund | 39 | 3 |
| * | None of the accounts are affiliated. |
| Fund | Sector | Percentage of Total Investments | ||
Ceredex Large-Cap Value Equity Fund | Industrials | 25% | ||
Ceredex Small-Cap Value Equity Fund | Financials | 32 | ||
Silvant Large-Cap Growth Stock Fund | Information Technology | 45 | ||
Silvant Small-Cap Growth Stock Fund | Health Care | 31 | ||
Zevenbergen Innovative Growth Stock Fund | Information Technology | 42 | ||
Zevenbergen Innovative Growth Stock Fund | Consumer Discretionary | 26 |
| Fund | Interest Incurred on Borrowing | Average Dollar Amount of Borrowing | Weighted Average Interest Rate on Borrowing | Days Loan was Open | ||||
Ceredex Small-Cap Value Equity Fund | $ —(1) | $ 1,600 | 1.92% | 1 | ||||
SGA International Growth Fund | — (1) | 519 | 2.06 | 12 | ||||
Zevenbergen Innovative Growth Stock Fund | 11 | 13,569 | 1.91 | 16 |
| (1) | Amount is less than $500. |
| Fund | Federal Tax Cost | Unrealized Appreciation | Unrealized (Depreciation) | Net Unrealized Appreciation (Depreciation) | ||||
Ceredex Large-Cap Value Equity Fund | $ 1,032,428 | $ 246,716 | $ (9,228) | $ 237,488 | ||||
Ceredex Mid-Cap Value Equity Fund | 2,544,026 | 645,293 | (31,752) | 613,541 | ||||
Ceredex Small-Cap Value Equity Fund | 374,086 | 113,054 | (8,812) | 104,242 | ||||
SGA International Growth Fund | 36,388 | 13,893 | (869) | 13,024 | ||||
Silvant Large-Cap Growth Stock Fund | 49,885 | 76,658 | (480) | 76,178 | ||||
Silvant Small-Cap Growth Stock Fund | 19,324 | 18,852 | (389) | 18,463 | ||||
Zevenbergen Innovative Growth Stock Fund | 803,644 | 571,326 | (8,920) | 562,406 |
| Short-Term | Long-Term | ||
Ceredex Mid-Cap Value Equity Fund | $218,669 | $113,981 | |
Ceredex Small-Cap Value Equity Fund | 7,963 | 21,511 | |
Zevenbergen Innovative Growth Stock Fund | 11,108 | — |
| Fund | |
Zevenbergen Innovative Growth Stock Fund | $ 1,645 |
| Capital Loss Recognized | |
Zevenbergen Innovative Growth Stock Fund | $ (339) |
| Undistributed Ordinary Income | Undistributed Long-Term Capital Gains | ||
Ceredex Large-Cap Value Equity Fund | $ 38 | $28,735 | |
Ceredex Mid-Cap Value Equity Fund | 1,731 | — | |
Ceredex Small-Cap Value Equity Fund | 1,541 | — | |
SGA International Growth Fund | 236 | 619 | |
Silvant Large-Cap Growth Stock Fund | — | 6,462 | |
Silvant Small-Cap Growth Stock Fund | — | 270 |
| Ordinary Income | Long-Term Capital Gains | Total | |||
Ceredex Large-Cap Value Equity Fund | |||||
12/31/20 | $ 35,157 | $ 32,603 | $ 67,760 | ||
12/31/19 | 26,548 | 57,774 | 84,322 | ||
Ceredex Mid-Cap Value Equity Fund | |||||
12/31/20 | 70,150 | 16,429 | 86,579 | ||
12/31/19 | 83,751 | 120,791 | 204,542 | ||
Ceredex Small-Cap Value Equity Fund | |||||
12/31/20 | 2,502 | 4,145 | 6,647 | ||
12/31/19 | 8,564 | 21,473 | 30,037 | ||
SGA International Growth Fund | |||||
12/31/20 | 3,086 | 4,806 | 7,892 | ||
12/31/19 | 1,909 | 18,402 | 20,311 | ||
Silvant Large-Cap Growth Stock Fund | |||||
12/31/20 | — | 13,017 | 13,017 | ||
12/31/19 | — | 15,032 | 15,032 | ||
Silvant Small-Cap Growth Stock Fund | |||||
12/31/20 | — | 600 | 600 | ||
12/31/19 | 17 | 2,816 | 2,833 |
| Capital Paid in on Shares of Beneficial Interest | Total Distributable Earnings (Accumulated Losses) | ||
Silvant Large-Cap Growth Stock Fund | $ (165) | $ 165 | |
Silvant Small-Cap Growth Stock Fund | (227) | 227 | |
Zevenbergen Innovative Growth Stock Fund | (6,284) | 6,284 |

Mid-Cap Value Equity Fund, Virtus Ceredex Small-Cap Value Equity Fund, Virtus SGA International Growth Fund, Virtus Silvant
Large-Cap Growth Stock Fund, Virtus Silvant Small-Cap Growth Stock Fund and Virtus Zevenbergen Innovative Growth Stock Fund
began serving as auditor.
percentages, or the maximum amount allowable, of its ordinary dividends that qualify for a deduction of 20% of qualified REIT dividends allowed to individual shareholders, of its ordinary income dividends (“QDI”) to qualify for the lower tax rates applicable to individual shareholders, and the percentage of ordinary income dividends earned by the Funds which qualifies for the dividends received deduction (“DRD”) for corporate shareholders. The actual percentage of Qualified REIT dividends, QDI and DRD for the calendar year will be designated in year-end tax statements. The Funds designate the amounts below as long-term capital gains (“LTCG”) dividends taxable at a 20% rate, or lower depending on the shareholder’s income ($ reported in thousands). LTCG amounts, if subsequently different, will be designated in the next annual report.
| Qualified REIT Dividends | QDI | DRD | LTCG | ||||
Ceredex Large-Cap Value Equity Fund | 1.86 % | 61.46% | 58.17% | $34,652 | |||
Ceredex Mid-Cap Value Equity Fund | 2.07 | 72.21 | 70.08 | — | |||
Ceredex Small-Cap Value Equity Fund | — | 100.00 | 100.00 | 969 | |||
SGA International Growth Fund | — | 11.93 | — | 1,520 | |||
Silvant Large-Cap Growth Stock Fund | — | — | — | 16,063 | |||
Silvant Small-Cap Growth Stock Fund | — | — | — | 471 |
| Foreign Source Income Recognized | Foreign Taxes Paid on Foreign Source Income | ||
SGA International Growth Fund | $ 460 | $ 72 |
| Name, Year of Birth, Length of Time Served and Number of Portfolios in Fund Complex Overseen by Trustee | Principal Occupation(s) During Past 5 Years | Other Directorships Held by Trustee During Past 5 Years |
| Burke, Donald C. YOB: 1960 Served Since: 2017 97 Portfolios | Retired. | Trustee (since 2021), Virtus Investment Trust (13 portfolios) and Virtus Strategy Trust (12 portfolios); Director (since 2020), Duff & Phelps Select MLP and Midstream Energy Fund Inc. and Virtus Total Return Fund Inc.; Trustee (since 2020), Virtus Global Multi-Sector Income Fund; Trustee (since 2016), Virtus Mutual Fund Family (54 portfolios), Virtus Variable Insurance Trust (8 portfolios) and Virtus Alternative Solutions Trust (3 portfolios); Director (since 2014), closed-end funds managed by Duff & Phelps Investment Management Co. (4 funds); Director, Avista Corp. (energy company) (since 2011); Trustee, Goldman Sachs Fund Complex (2010 to 2014); and Director, BlackRock Luxembourg and Cayman Funds (2006 to 2010). |
| Harris, Sidney E. YOB: 1949 Served Since: 2017 93 Portfolios | Professor and Dean Emeritus (since April 2015), Professor (1997 to 2014), Dean (1997 to 2004), J. Mack Robinson College of Business, Georgia State University. | Trustee (since 2021), Virtus Investment Trust (13 portfolios) and Virtus Strategy Trust (12 portfolios); Director (since 2020), Duff & Phelps Select MLP and Midstream Energy Fund Inc. and Virtus Total Return Fund Inc.; Trustee (since 2020), Virtus Global Multi-Sector Income Fund; Trustee (since 2019), Mutual Fund Directors Forum; Trustee (since 2017), Virtus Mutual Fund Family (54 portfolios), Virtus Variable Insurance Trust (8 portfolios) and Virtus Alternative Solutions Trust (3 portfolios); Trustee (2013 to 2020) and Honorary Trustee (since 2020), KIPP Metro Atlanta; Director (1999 to 2019), Total System Services, Inc.; Trustee (2004 to 2017), RidgeWorth Funds; Trustee (since 2012), International University of the Grand Bassam Foundation; and Trustee (2011 to 2015), Genspring Family Offices, LLC. |
| Mallin, John R. YOB: 1950 Served Since: 2017 93 Portfolios | Partner/Attorney (since 2003), McCarter & English LLP (law firm) Real Property Practice Group; Member (since 2014), Counselors of Real Estate. | Trustee (since 2021), Virtus Investment Trust (13 portfolios) and Virtus Strategy Trust (12 portfolios); Director (since 2020), Duff & Phelps Select MLP and Midstream Energy Fund Inc. and Virtus Total Return Fund Inc.; Trustee (since 2020), Virtus Global Multi-Sector Income Fund; Trustee (since 2016), Virtus Mutual Fund Family (54 portfolios) and Virtus Alternative Solutions Trust (3 portfolios); Director (since 2019), 1892 Club, Inc. (non-profit); Director (2013 to 2020), Horizons, Inc. (non-profit); and Trustee (since 1999), Virtus Variable Insurance Trust (8 portfolios). |
| McDaniel, Connie D. YOB: 1958 Served Since: 2017 93 Portfolios | Retired (since 2013). Vice President, Chief of Internal Audit, Corporate Audit Department (2009 to 2013), Vice President Global Finance Transformation (2007 to 2009), Vice President and Controller (1999 to 2007), The Coca-Cola Company. | Trustee (since 2021), Virtus Investment Trust (13 portfolios) and Virtus Strategy Trust (12 portfolios); Director (since 2020), Duff & Phelps Select MLP and Midstream Energy Fund Inc. and Virtus Total Return Fund Inc.; Trustee (since 2020), Virtus Global Multi-Sector Income Fund; Director (since 2019), Global Payments Inc.; Trustee (since 2017), Virtus Mutual Fund Family (54 portfolios), Virtus Variable Insurance Trust (8 portfolios) and Virtus Alternative Solutions Trust (3 portfolios); Director (since 2021), North Florida Land Trust; Member (since 2011) and Chair (2014 to 2016), Georgia State University, Robinson College of Business Board of Advisors; Director (2014 to 2019), Total System Services, Inc.; and Trustee (2005 to 2017), RidgeWorth Funds. |
| Name, Year of Birth, Length of Time Served and Number of Portfolios in Fund Complex Overseen by Trustee | Principal Occupation(s) During Past 5 Years | Other Directorships Held by Trustee During Past 5 Years |
| McLoughlin, Philip YOB: 1946 Served Since: 1989 103 Portfolios | Retired. | Trustee (since 2021), Virtus Investment Trust (13 portfolios) and Virtus Strategy Trust (12 portfolios); Trustee (since 2021), Virtus AllianzGI AI & Tech Opportunities Fund, Virtus AllianzGI Convertible & Income Fund II, Virtus AllianzGI Diversified Income & Convertible, Virtus AllianzGI Equity & Convertible Income Fund and Virtus Dividend, Interest & Premium Strategy Fund; Advisory Board Member (since 2021), Virtus AllianzGI Convertible & Income 2024 Target Term Fund and Virtus AllianzGI Convertible & Income Fund; Director and Chairman (since 2016), Virtus Total Return Fund Inc.; Director and Chairman (2016 to 2019), the former Virtus Total Return Fund Inc.; Director and Chairman (since 2014) Duff & Phelps Select MLP and Midstream Energy Fund Inc.; Trustee and Chairman (since 2013), Virtus Alternative Solutions Trust (3 portfolios); Trustee and Chairman (since 2011), Virtus Global Multi-Sector Income Fund; Chairman and Trustee (since 2003), Virtus Variable Insurance Trust (8 portfolios); Director (since 1995), closed-end funds managed by Duff & Phelps Investment Management Co. (4 funds); Director (1991 to 2019) and Chairman (2010 to 2019), Lazard World Trust Fund (closed-end investment firm in Luxembourg); and Trustee (since 1989) and Chairman (since 2002), Virtus Mutual Fund Family (54 portfolios). |
| McNamara, Geraldine M. YOB: 1951 Served Since: 2002 97 Portfolios | Retired. | Trustee (since 2021), Virtus Investment Trust (13 portfolios) and Virtus Strategy Trust (12 portfolios); Director (since 2020), Duff & Phelps Select MLP and Midstream Energy Fund Inc. and Virtus Total Return Fund Inc.; Trustee (since 2020), Virtus Global Multi-Sector Income Fund; Trustee (since 2016), Virtus Alternative Solutions Trust (3 portfolios); Trustee (since 2015), Virtus Variable Insurance Trust (8 portfolios); Director (since 2003), closed-end funds managed by Duff & Phelps Investment Management Co. (4 funds); and Trustee (since 2001), Virtus Mutual Fund Family (54 portfolios). |
| Oates, James M. YOB: 1946 Served Since: 2005 93 Portfolios | Managing Director (since 1994), Wydown Group (consulting firm). | Trustee (since 2021), Virtus Investment Trust (13 portfolios) and Virtus Strategy Trust (12 portfolios); Director (since 2016), Virtus Total Return Fund Inc.; Director (2016 to 2019), the former Virtus Total Return Fund Inc.; Trustee (since 2016), Virtus Variable Insurance Trust (8 portfolios); Director (since 2014), Duff & Phelps Select MLP and Midstream Energy Fund Inc.; Trustee (since 2013), Virtus Alternative Solutions Trust (3 portfolios); Trustee (since 2013), Virtus Global Multi-Sector Income Fund; Trustee (since 2005) and Chairman (2005 to 2017), John Hancock Fund Complex (227 portfolios); Director (2002 to 2014), New Hampshire Trust Company; Chairman (2000 to 2016), Emerson Investment Management, Inc.; Non-Executive Chairman (2000 to 2014), Hudson Castle Group, Inc. (formerly IBEX Capital Markets, Inc.) (financial services); Chairman and Director (1999 to 2014), Connecticut River Bank; Director (since 1996), Stifel Financial; and Trustee (since 1987), Virtus Mutual Fund Family (54 portfolios). |
| Walton, R. Keith YOB: 1964 Served Since: 2020 93 Portfolios | Managing Director (since 2020), Lafayette Square Holding Company LLC; Venture and Operating Partner (since 2020), Plexo Capital, LLC; Venture Partner (since 2019) and Senior Adviser (2018 to 2019), Plexo, LLC; Senior Adviser (2018 to 2019), Vatic Labs, LLC; Executive Vice President, Strategy (2017 to 2019), Zero Mass Water, LLC; Vice President, Strategy (2013 to 2017), Arizona State University; Partner (since 2006), Global Infrastructure Partners. | Trustee (since 2021), Virtus Investment Trust (13 portfolios) and Virtus Strategy Trust (12 portfolios); Trustee (since 2020) Virtus Alternative Solutions Trust (3 portfolios), Virtus Variable Insurance Trust (8 portfolios) and Virtus Mutual Fund Family (54 portfolios); Director (since 2017), certain funds advised by Bessemer Investment Management LLC; Director (since 2016), Duff & Phelps Select MLP and Midstream Energy Fund Inc.; Trustee (since 2016), Virtus Global Multi-Sector Income Fund; Director (2006 to 2019), Systematica Investments Limited Funds; Director (2006 to 2017), BlueCrest Capital Management Funds; Trustee (2014 to 2017), AZ Service; Director (since 2004), Virtus Total Return Fund Inc.; and Director (2004 to 2019), the former Virtus Total Return Fund Inc. |
| Name, Year of Birth, Length of Time Served and Number of Portfolios in Fund Complex Overseen by Trustee | Principal Occupation(s) During Past 5 Years | Other Directorships Held by Trustee During Past 5 Years |
| Zino, Brian T. YOB: 1952 Served Since: 2020 93 Portfolios | Retired. Various roles (1982 to 2008), J. & W. Seligman & Co. Incorporated, including President (1994 to 2008). | Trustee (since 2021), Virtus Investment Trust (13 portfolios) and Virtus Strategy Trust (12 portfolios); Advisory Board Member (since 2021), Virtus AllianzGI AI & Tech Opportunities Fund, Virtus AllianzGI Convertible & Income Fund, Virtus AllianzGI Convertible & Income Fund II, Virtus AllianzGI Convertible & Income 2024 Target Term Fund, Virtus AllianzGI Diversified Income & Convertible, Virtus AllianzGI Equity & Convertible Income Fund and Virtus Dividend, Interest & Premium Strategy Fund; Trustee (since 2020) Virtus Alternative Solutions Trust (3 portfolios), Virtus Variable Insurance Trust (8 portfolios) and Virtus Mutual Fund Family (54 portfolios); Director (since 2016), Duff & Phelps Select MLP and Midstream Energy Fund Inc.; Trustee (since 2016), Virtus Global Multi-Sector Income Fund; Director (since 2014), Virtus Total Return Fund Inc.; Director (2014 to 2019), the former Virtus Total Return Fund Inc.; Trustee (since 2011), Bentley University; Director (1986 to 2008) and President (1994 to 2008), J&W Seligman Co. Inc.; Director (1998 to 2009), Chairman (2002 to 2004) and Vice Chairman (2000 to 2002), ICI Mutual Insurance Company; Member, Board of Governors of ICI (1998 to 2008). |
| Name, Year of Birth, Length of Time Served and Number of Funds Overseen | Principal Occupation(s) During Past 5 Years | Principal Occupation(s) During Past 5 Years and Other Directorships Held by Trustee |
| Aylward, George R.* Trustee and President YOB: 1964 Served Since: 2006 102 Portfolios | Director, President and Chief Executive Officer (since 2008), Virtus Investment Partners, Inc. and/or certain of its subsidiaries, and various senior officer positions with Virtus affiliates (since 2005). | Trustee and President (since 2021), Virtus Investment Trust (13 portfolios) and Virtus Strategy Trust (12 portfolios); Trustee, President and Chief Executive Officer (since 2021), Virtus AllianzGI AI & Tech Opportunities Fund, Virtus AllianzGI Convertible & Income 2024 Target Term Fund, Virtus AllianzGI Convertible & Income Fund, Virtus AllianzGI Convertible & Income Fund II, Virtus AllianzGI Diversified Income & Convertible, Virtus AllianzGI Equity & Convertible Income Fund and Virtus Dividend, Interest & Premium Strategy Fund; Chairman and Trustee (since 2015), Virtus ETF Trust II (3 portfolios); Director, President and Chief Executive Officer (since 2014), Duff & Phelps Select MLP and Midstream Energy Fund Inc.; Trustee and President (since 2013), Virtus Alternative Solutions Trust (3 portfolios); Director (since 2013), Virtus Global Funds, PLC (5 portfolios); Trustee (since 2012) and President (since 2010), Virtus Variable Insurance Trust (8 portfolios); Trustee, President and Chief Executive Officer (since 2011), Virtus Global Multi-Sector Income Fund; Trustee and President (since 2006) and Executive Vice President (2004 to 2006), Virtus Mutual Fund Family (54 portfolios); Director, President and Chief Executive Officer (since 2006), Virtus Total Return Fund Inc.; and Director, President and Chief Executive Officer (2006 to 2019), the former Virtus Total Return Fund Inc. |
| Name, Year of Birth, Length of Time Served, and Number of Portfolios in Fund Complex Overseen | Principal Occupation(s) During Past 5 Years | Other Directorships Held During Past 5 Years |
| Cogan, Sarah E. YOB: 1956 Served Since: 2021 93 Portfolios | Retired Partner, Simpson Thacher & Bartlett LLP (“STB”) (law firm) (since 2018); Director, Girl Scouts of Greater New York (since 2016); Trustee, Natural Resources Defense Council, Inc. (since 2013); and formerly, Partner, STB (1989 to 2018). | Advisory Board Member (since 2021), Virtus Alternative Solutions Trust (3 portfolios), Virtus Mutual Fund Family (54 portfolios), Virtus Variable Insurance Trust (8 portfolios), Duff & Phelps Select MLP and Midstream Energy Fund Inc., Virtus Total Return Fund Inc. and Virtus Global Multi-Sector Income Fund; Trustee (since 2019), Virtus Investment Trust (13 portfolios) and Virtus Strategy Trust (12 portfolios); Trustee (since 2019), PIMCO California Municipal Income Fund, PIMCO California Municipal Income Fund II, PIMCO California Municipal Income Fund III, PIMCO Municipal Income Fund, PIMCO Municipal Income Fund II, PIMCO Municipal Income Fund III, PIMCO New York Municipal Income Fund, PIMCO New York Municipal Income Fund II, PIMCO New York Municipal Income Fund III, PIMCO Energy and Tactical Credit Opportunities Fund, PCM Fund, Inc., PIMCO Corporate & Income Strategy Fund, PIMCO Corporate & Income Opportunity Fund, PIMCO Dynamic Credit and Mortgage Income Fund, PIMCO Dynamic Income Fund, PIMCO Global StocksPLUS® & Income Fund, PIMCO High Income Fund, PIMCO Income Opportunity Fund, PIMCO Income Strategy Fund, PIMCO Income Strategy Fund II, PIMCO Strategic Income Fund, Inc., PIMCO Flexible Credit Income Fund and PIMCO Flexible Municipal Income Fund; and Trustee (since 2019), PIMCO Managed Accounts Trust (5 portfolios). |
| Name, Year of Birth, Length of Time Served, and Number of Portfolios in Fund Complex Overseen | Principal Occupation(s) During Past 5 Years | Other Directorships Held During Past 5 Years |
| DeCotis, Deborah A. YOB: 1952 Served Since: 2021 93 Portfolios | Advisory Director, Morgan Stanley & Co., Inc. (since 1996); Member, Circle Financial Group (since 2009); Member, Council on Foreign Relations (since 2013); Trustee, Smith College (since 2017); and Director, Watford Re (since 2017). Formerly, Co-Chair Special Projects Committee, Memorial Sloan Kettering (2005 to 2015); Trustee, Stanford University (2010 to 2015); and Principal, LaLoop LLC, a retail accessories company (1999 to 2014). | Advisory Board Member (since 2021), Virtus Alternative Solutions Trust (3 portfolios), Virtus Mutual Fund Family (54 portfolios), Virtus Variable Insurance Trust (8 portfolios), Duff & Phelps Select MLP and Midstream Energy Fund Inc., Virtus Total Return Fund Inc. and Virtus Global Multi-Sector Income Fund; Trustee (since 2014), Virtus Investment Trust (13 portfolios); Trustee (since 2011), Virtus Strategy Trust (12 portfolios); Trustee (since 2011), PIMCO California Municipal Income Fund II, PIMCO California Municipal Income Fund III, PIMCO Municipal Income Fund, PIMCO Municipal Income Fund II, PIMCO Municipal Income Fund III, PIMCO New York Municipal Income Fund, PIMCO New York Municipal Income Fund II, PIMCO New York Municipal Income Fund III, PCM Fund, Inc., PIMCO Corporate & Income Strategy Fund, PIMCO Corporate & Income Opportunity Fund, PIMCO Global StocksPLUS® & Income Fund, PIMCO High Income Fund, PIMCO Income Opportunity Fund, PIMCO Income Strategy Fund, PIMCO Income Strategy Fund II, PIMCO Strategic Income Fund, Inc. and PIMCO Managed Accounts Trust (5 portfolios); Trustee (since 2019), PIMCO Energy and Tactical Credit Opportunities Fund; Trustee (since 2013), PIMCO Dynamic Credit and Mortgage Income Fund; Trustee (since 2012), PIMCO Dynamic Income Fund; Trustee (since 2020), PIMCO Dynamic Income Opportunities Fund; Trustee (since 2017), PIMCO Flexible Credit Income Fund; and Trustee (since 2018), PIMCO Flexible Municipal Income Fund. |
| Drummond, F. Ford YOB: 1962 Served Since: 2021 93 Portfolios | Owner/Operator (since 1998), Drummond Ranch; formerly Board Member (2006 to 2020) and Chairman (2016 to 2018), Oklahoma Water Resources Board; Director (1998 to 2008), The Cleveland Bank; and General Counsel (1998 to 2008), BMIHealth Plans (benefits administration). | Advisory Board Member (since 2021), Virtus Alternative Solutions Trust (3 portfolios), Virtus Mutual Fund Family (54 portfolios), Virtus Variable Insurance Trust (8 portfolios), Duff & Phelps Select MLP and Midstream Energy Fund Inc., Virtus Total Return Fund Inc. and Virtus Global Multi-Sector Income Fund; Trustee (since 2006), Virtus Investment Trust (13 portfolios); Trustee (since 2014), Virtus Strategy Trust (12 portfolios); and Director (since 2011), Bancfirst Corporation. |
| Moyer, William R. YOB: 1944 Served Since: 2020 93 Portfolios | Private investor (since 2004); Financial and Operations Principal (2006 to 2017), Newcastle Distributors LLC (broker dealer). | Advisory Board Member (since 2021), Virtus Investment Trust (13 portfolios) and Virtus Strategy Trust (12 portfolios); Advisory Board Member (since 2020), Virtus Variable Insurance Trust (8 portfolios) and Virtus Mutual Fund Family (54 portfolios); Advisory Board Member (since 2020) and Director (2016 to 2019), Virtus Total Return Fund Inc.; Director (2016 to 2019), the former Virtus Total Return Fund Inc.; Advisory Board Member (since 2020) and Director (2014 to 2019), Duff & Phelps Select MLP and Midstream Energy Fund Inc.; Advisory Board Member (since 2020) and Trustee (2011 to 2019), Virtus Global Multi-Sector Income Fund; Advisory Board Member (since 2020) and Trustee (2013 to 2016), Virtus Alternative Solutions Trust (3 portfolios). |
| Name, Address and Year of Birth | Position(s) Held with Trust and Length of Time Served | Principal Occupation(s) During Past 5 Years |
| Batchelar, Peter J. YOB: 1970 | Senior Vice President (since 2017), and Vice President (2008 to 2016). | Senior Vice President, Product Development (since 2017), Vice President, Product Development (2008 to 2016), and various officer positions (since 2008), Virtus Investment Partners, Inc. and/or certain of its subsidiaries; Senior Vice President (since 2021), Virtus Investment Trust and Virtus Strategy Trust; Senior Vice President (since 2021), AllianzGI Closed-End Funds; Senior Vice President (since 2017) and Vice President (2008 to 2016), Virtus Mutual Fund Family; Senior Vice President (since 2017) and Vice President (2010 to 2016), Virtus Variable Insurance Trust; Senior Vice President (since 2017) and Vice President (2013 to 2016), Virtus Alternative Solutions Trust; Senior Vice President (since 2017) and Vice President (2016 to 2017), Duff & Phelps Select MLP and Midstream Energy Fund Inc., Virtus Total Return Fund Inc. and Virtus Global Multi-Sector Income Fund; and Senior Vice President (2017 to 2019) and Vice President (2016 to 2017), the former Virtus Total Return Fund Inc. |
| Name, Address and Year of Birth | Position(s) Held with Trust and Length of Time Served | Principal Occupation(s) During Past 5 Years |
| Bradley, W. Patrick YOB: 1972 | Executive Vice President (since 2016); Senior Vice President (2013 to 2016); Vice President (2011 to 2013); Chief Financial Officer and Treasurer (since 2006). | Executive Vice President, Fund Services (since 2016), Senior Vice President, Fund Services (2010 to 2016), and various officer positons (since 2006), Virtus Investment Partners, Inc. and/or certain of its subsidiaries; Executive Vice President, Chief Financial Officer and Treasurer (since 2021), Virtus Investment Trust and Virtus Strategy Trust; Executive Vice President, Chief Financial Officer and Treasurer (since 2021), AllianzGI Closed-End Funds; Director (since 2019), Virtus Global Funds ICAV; Executive Vice President (since 2016), Senior Vice President (2013 to 2016), Vice President (2011 to 2013), Chief Financial Officer and Treasurer (since 2004), Virtus Variable Insurance Trust; Executive Vice President (since 2016), Senior Vice President (2013 to 2016), Vice President (2011 to 2013), Chief Financial Officer and Treasurer (since 2006), Virtus Mutual Fund Family; Executive Vice President (since 2016), Senior Vice President (2013 to 2016), Vice President (2012 to 2013) and Chief Financial Officer and Treasurer (since 2010), Virtus Total Return Fund Inc.; Executive Vice President (2016 to 2019), Senior Vice President (2013 to 2016), Vice President (2012 to 2013), Chief Financial Officer and Treasurer (since 2010), the former Virtus Total Return Fund Inc.; Executive Vice President (since 2016), Senior Vice President (2013 to 2016), Vice President (2011 to 2013), Chief Financial Officer and Treasurer (since 2011), Virtus Global Multi-Sector Income Fund; Executive Vice President (since 2016), Senior Vice President (2014 to 2016), Chief Financial Officer and Treasurer (since 2014), Duff & Phelps Select MLP and Midstream Energy Fund Inc.; Executive Vice President (since 2016), Senior Vice President (2013 to 2016), and Chief Financial Officer and Treasurer (since 2013), Virtus Alternative Solutions Trust; Director (since 2013), Virtus Global Funds, PLC; and Vice President and Assistant Treasurer (since 2011), Duff & Phelps Utility and Infrastructure Fund Inc. |
| Carr, Kevin J. YOB: 1954 | Senior Vice President (since 2013); Vice President (2005 to 2013); Chief Legal Officer, Counsel and Secretary (since 2005). | Vice President and Senior Counsel (2017 to Present), Senior Vice President (2009 to 2017), Vice President, Counsel and Secretary (2008 to 2009), and various officer positions (since 2005), Virtus Investment Partners, Inc. and/or certain of its subsidiaries; Senior Vice President and Assistant Secretary (since 2021), Virtus Investment Trust and Virtus Strategy Trust; Assistant Secretary, (since 2021), AllianzGI Closed-End Funds; Senior Vice President (since 2013), Vice President (2005 to 2013), Chief Legal Officer, Counsel and Secretary (since 2005), Virtus Mutual Fund Family; Senior Vice President (2013 to 2014), Vice President (2012 to 2013), Secretary and Chief Legal Officer (2005 to 2013), and Assistant Secretary (2013 to 2014 and since 2017), Virtus Total Return Fund Inc.; Senior Vice President (2013 to 2014), Vice President (2012 to 2013), Secretary and Chief Legal Officer (2005 to 2013) and Assistant Secretary (2013 to 2014 and 2017 to 2019), the former Virtus Total Return Fund Inc.; Senior Vice President (since 2017), Assistant Secretary (since 2013), Vice President, Chief Legal Officer, Counsel and Secretary (2010 to 2013), Virtus Variable Insurance Trust; Senior Vice President (2013 to 2014), Vice President (2011 to 2013), and Assistant Secretary (since 2011), Virtus Global Multi-Sector Income Fund; Assistant Secretary (since 2015), Duff & Phelps Select MLP and Midstream Energy Fund Inc.; Senior Vice President (since 2017) and Assistant Secretary (since 2013), Virtus Alternative Solutions Trust; Secretary (since 2015), ETFis Series Trust I; and Secretary (since 2015), Virtus ETF Trust II. |
| Name, Address and Year of Birth | Position(s) Held with Trust and Length of Time Served | Principal Occupation(s) During Past 5 Years |
| Engberg, Nancy J. YOB: 1956 | Senior Vice President (since 2017); Vice President (2011 to 2017); and Chief Compliance Officer (since 2011). | Senior Vice President (since 2017), Vice President (2008 to 2017) and Chief Compliance Officer (2008 to 2011 and since 2016), and various officer positions (since 2003), Virtus Investment Partners, Inc. and/or certain of its subsidiaries; Senior Vice President and Chief Compliance Officer (since 2021), Virtus Investment Trust and Virtus Strategy Trust; Senior Vice President and Chief Compliance Officer, (since 2021), AllianzGI Closed-End Funds; Senior Vice President (since 2017), Vice President (2011 to 2017) and Chief Compliance Officer (since 2011), Virtus Mutual Fund Family; Senior Vice President (since 2017), Vice President (2010 to 2017) and Chief Compliance Officer (since 2011), Virtus Variable Insurance Trust; Senior Vice President (since 2017), Vice President (2011 to 2017) and Chief Compliance Officer (since 2011), Virtus Global Multi-Sector Income Fund; Senior Vice President (since 2017), Vice President (2012 to 2017) and Chief Compliance Officer (since 2012), Virtus Total Return Fund Inc.; Senior Vice President (2017 to 2019), Vice President (2012 to 2017) and Chief Compliance Officer (since 2012), the former Virtus Total Return Fund Inc.; Senior Vice President (since 2017), Vice President (2013 to 2016) and Chief Compliance Officer (since 2013), Virtus Alternative Solutions Trust; Senior Vice President (since 2017), Vice President (2014 to 2017) and Chief Compliance Officer (since 2014), Duff & Phelps Select MLP and Midstream Energy Fund Inc.; Chief Compliance Officer (since 2015), ETFis Series Trust I; and Chief Compliance Officer (since 2015), Virtus ETF Trust II. |
| Short, Julia R. YOB: 1972 | Senior Vice President (since 2017). | Senior Vice President, Product Development (since 2017), Virtus Investment Partners, Inc. and/or certain of its subsidiaries; Senior Vice President (since 2021), Virtus Investment Trust and Virtus Strategy Trust; Senior Vice President, (since 2021), AllianzGI Closed-End Funds; Senior Vice President (since 2018), Duff & Phelps Select MLP and Midstream Energy Fund Inc., Virtus Global Multi-Sector Income Fund and Virtus Total Return Fund Inc.; Senior Vice President (2018 to 2019), the former Virtus Total Return Fund Inc.; Senior Vice President (since 2017), Virtus Mutual Fund Family; President and Chief Executive Officer, RidgeWorth Funds (2007 to 2017); and Managing Director, Product Manager, RidgeWorth Investments (2004 to 2017). |
| Waltman, Francis G. YOB: 1962 | Executive Vice President (since 2013); Senior Vice President (2008 to 2013). | Executive Vice President, Product Management (since 2009), and various senior officer positions (since 2006), Virtus Investment Partners, Inc. and/or certain of its subsidiaries; Executive Vice President (since 2021), Virtus Investment Trust and Virtus Strategy Trust; Executive Vice President, (since 2021), AllianzGI Closed-End Funds; Director (since 2019), Virtus Global Funds ICAV; Executive Vice President (since 2017), Virtus Total Return Fund Inc.; Executive Vice President (2017 to 2019), the former Virtus Total Return Fund Inc.; Executive Vice President (since 2014), Duff & Phelps Select MLP and Midstream Energy Fund Inc.; Executive Vice President (since 2013), Senior Vice President (2008 to 2013), Virtus Mutual Fund Family; Executive Vice President (since 2013), Senior Vice President (2010 to 2013), Virtus Variable Insurance Trust; Executive Vice President (since 2013), Senior Vice President (2011 to 2013), Virtus Global Multi-Sector Income Fund; Director (since 2013), Virtus Global Funds PLC; and Executive Vice President (since 2013), Virtus Alternative Solutions Trust. |
dated April 28, 2020, as supplemented
| Amount of Transaction at Offering Price | Sales Charge as a Percentage of Offering Price | Sales Charge as a Percentage of Amount Invested |
| Under $50,000 | 5.50% | 5.82% |
| $50,000 but under $100,000 | 4.50% | 4.71% |
| $100,000 but under $250,000 | 3.50% | 3.63% |
| $250,000 but under $500,000 | 2.50% | 2.56% |
| $500,000 but under $1,000,000 | 2.00% | 2.04% |
| $1,000,000 or more | None | None |
| Amount of Transaction at Offering Price | Sales Charge as a Percentage of Offering Price | Sales Charge as a Percentage of Amount Invested | Dealer Discount as a Percentage of Offering Price |
| Under $50,000 | 5.50% | 5.82% | 4.75% |
| $50,000 but under $100,000 | 4.50% | 4.71% | 4.00% |
| $100,000 but under $250,000 | 3.50% | 3.63% | 3.00% |
| $250,000 but under $500,000 | 2.50% | 2.56% | 2.00% |
| $500,000 but under $1,000,000 | 2.00% | 2.04% | 1.75% |
| $1,000,000 or more | None | None | None |
each a series of Virtus Asset Trust
(Unaudited)
and the Virtus Asset Trust Statutory Prospectus,
| Annual Fund Operating Expenses (expenses that you pay each year as a percentage of the value of your investment) | Class A | Class C | Class I | Class R6 |
| Management Fees | 0.85% | 0.85% | 0.85% | 0.85% |
| Distribution and Shareholder Servicing (12b-1) Fees | 0.25% | 1.00% | None | None |
| Other Expenses | 0.38% | 0.35% | 0.35% | 0.20% |
| Total Annual Fund Operating Expenses | 1.48% | 2.20% | 1.20% | 1.05% |
| Less: Fee Waivers and/or Expense Reimbursements(b) | (0.00)% | (0.36)% | (0.02)% | (0.17)% |
| Total Annual Fund Operating Expenses After Expense Reimbursement(b) | 1.48% | 1.84% | 1.18% | 0.88% |
| Share Status | 1 Year | 3 Years | 5 Years | 10 Years | |
| Class A | Sold or Held | $718 | $1,019 | $1,341 | $2,252 |
| Class C | Sold | $287 | $652 | $1,143 | $2,496 |
| Held | $187 | $652 | $1,143 | $2,496 | |
| Class I | Sold or Held | $120 | $381 | $662 | $1,463 |
| Class R6 | Sold or Held | $90 | $317 | $563 | $1,267 |
| Annual Fund Operating Expenses (expenses that you pay each year as a percentage of the value of your investment) | Class A | Class I | Class R6 |
| Management Fees | 0.85% | 0.85% | 0.85% |
| Distribution and Shareholder Servicing (12b-1) Fees | 0.25% | None | None |
| Other Expenses | 0.48% | 0.47% | 0.37% |
| Total Annual Fund Operating Expenses | 1.58% | 1.32% | 1.22% |
| Less: Fee Waivers and/or Expense Reimbursements(a) | (0.26)% | (0.25)% | (0.27)% |
| Total Annual Fund Operating Expenses After Expense Reimbursement(a) | 1.32% | 1.07% | 0.95% |
| Share Status | 1 Year | 3 Years | 5 Years | 10 Years | |
| Class A | Sold or Held | $702 | $1,025 | $1,371 | $2,344 |
| Class I | Sold or Held | $109 | $398 | $708 | $1,589 |
| Class R6 | Sold or Held | $97 | $363 | $649 | $1,464 |
| Class A Shares | Class C Shares | Class I Shares | Class R6 Shares | |
| Ceredex Small-Cap Value Equity Fund* | 1.49% | 1.84% | 1.18% | 0.88% |
| SGA International Growth Fund* | 1.32% | N/A | 1.07% | 0.95% |
a series of Virtus Asset Trust
(Unaudited)
dated October 19, 2020, as supplemented
| Amount of Transaction at Offering Price | Sales Charge as a Percentage of Offering Price | Sales Charge as a Percentage of Amount Invested |
| Under $50,000 | 5.50% | 5.82% |
| $50,000 but under $100,000 | 4.50% | 4.71% |
| $100,000 but under $250,000 | 3.50% | 3.63% |
| $250,000 but under $500,000 | 2.50% | 2.56% |
| $500,000 but under $1,000,000 | 2.00% | 2.04% |
| $1,000,000 or more | None | None |
| Amount of Transaction at Offering Price | Sales Charge as a Percentage of Offering Price | Sales Charge as a Percentage of Amount Invested | Dealer Discount as a Percentage of Offering Price |
| Under $50,000 | 5.50% | 5.82% | 4.75% |
| $50,000 but under $100,000 | 4.50% | 4.71% | 4.00% |
| $100,000 but under $250,000 | 3.50% | 3.63% | 3.00% |
| $250,000 but under $500,000 | 2.50% | 2.56% | 2.00% |
| $500,000 but under $1,000,000 | 2.00% | 2.04% | 1.75% |
| $1,000,000 or more | None | None | None |
Accounting Firm
| Mutual Fund Services | 1-800-243-1574 |
| Adviser Consulting Group | 1-800-243-4361 |
| Website | Virtus.com |
The Securities and Exchange Commission has modified mailing regulations for semiannual and annual shareholder fund reports to allow mutual fund companies to send a single copy of these reports to shareholders who share the same mailing address. If you would like additional copies, please call Mutual Fund Services at 1-800-243-1574.

please contact us at 1-800-243-1574, or Virtus.com.
| 8635 | 02-21 |
| Item 2. | Code of Ethics. |
| (a) | The registrant, as of the end of the period covered by this report, has adopted a code of ethics that applies to the registrant’s principal executive officer, principal financial officer, principal accounting officer or controller, or persons performing similar functions, regardless of whether these individuals are employed by the registrant or a third party. |
| (c) | Other than certain non-substantive changes, there have been no amendments, during the period covered by this report, to a provision of the code of ethics that applies to the registrant’s principal executive officer, principal financial officer, principal accounting officer or controller, or persons performing similar functions, regardless of whether these individuals are employed by the registrant or a third party, and that relates to any element of the code of ethics described in Item 2(b) of the instructions for completion of Form N-CSR. |
| (d) | The registrant has not granted any waivers, during the period covered by this report, including an implicit waiver, from a provision of the code of ethics that applies to the registrant’s principal executive officer, principal financial officer, principal accounting officer or controller, or persons performing similar functions, regardless of whether these individuals are employed by the registrant or a third party, that relates to one or more of the items set forth in paragraph (b) of the instructions for completion of this Item. |
| Item 3. | Audit Committee Financial Expert. |
| (a)(1) | The Registrant’s Board of Trustees has determined that the Registrant has an “audit committee financial expert” serving on its Audit Committee. |
| (a)(2) | As of the beginning of the period covered by the report, the Registrant’s Board of Trustees had determined that each of Thomas J. Brown, Donald C. Burke and Richard E. Segerson possessed the technical attributes identified in Instruction 2(b) of Item 3 to Form N-CSR to qualify as an “audit committee financial expert.” On January 14, 2020, the members of the audit committee changed and as a result the Registrant’s Board of Trustees reviewed the new membership to determine whether the members possess the technical attributes identified in Instruction 2(b) of Item 3 to Form N-CSR to qualify as an “audit committee financial expert” and determined that each of Thomas J. Brown, Donald C. Burke, Connie D. McDaniel and Brian T. Zino possesses such attributes. Each of Messrs. Brown, Burke, Segerson and Zino, and Ms. McDaniel, was an “independent” trustee pursuant to paragraph (a)(2) of Item 3 to Form N-CSR as of the end of the period covered by the report. Messrs. Brown and Segerson have since retired from the Board, so as of the date of this filing Messrs. Burke and Zino, and Ms. McDaniel, are those members of the audit committee who have been determined to qualify as audit committee financial experts. |
| (a)(3) | Not applicable. |
| Item 4. | Principal Accountant Fees and Services. |
Audit Fees
| (a) | The aggregate fees billed for each of the last two fiscal years for professional services rendered by the principal accountant for the audit of the registrant’s annual financial statements or services that are normally provided by the accountant in connection with statutory and regulatory filings or engagements for those fiscal years are $400,523 for 2020 and $425,494 for 2019. |
Audit-Related Fees
| (b) | The aggregate fees billed in each of the last two fiscal years for assurance and related services by the principal accountant that are reasonably related to the performance of the audit of the registrant’s financial statements and are not reported under paragraph (a) of this Item are $26,808 for 2020 and $32,311 for 2019. Such audit-related fees include out of pocket expenses and system conversion fees. |
Tax Fees
| (c) | The aggregate fees billed in each of the last two fiscal years for professional services rendered by the principal accountant for tax compliance, tax advice, and tax planning are $77,751 for 2020 and $89,912 for 2019. |
“Tax Fees” are those primarily associated with review of the Trust’s tax provision and qualification as a regulated investment company (RIC) in connection with audits of the Trust’s financial statement, review of year-end distributions by the Fund to avoid excise tax for the Trust, periodic discussion with management on tax issues affecting the Trust, and reviewing and signing the Fund’s federal income tax returns.
All Other Fees
| (d) | The aggregate fees billed in each of the last two fiscal years for products and services provided by the principal accountant, other than the services reported in paragraphs (a) through (c) of this Item are $0 for 2020 and $0 for 2019. |
| (e)(1) | Disclose the audit committee’s pre-approval policies and procedures described in paragraph (c)(7) of Rule 2-01 of Regulation S-X. |
The Virtus Asset Trust (the “Fund”) Board has adopted policies and procedures with regard to the pre-approval of services provided by PwC. Audit, audit-related and tax compliance services provided to the Fund on an annual basis require specific pre-approval by the Audit Committee. The Audit Committee must also approve other non-audit services provided to the Fund and those non-audit services provided to the Fund’s Affiliated Service Providers that relate directly to the operations and financial reporting of the Fund. Certain of these non-audit services that the Audit Committee believes are a) consistent with the SEC’s auditor independence rules and b) routine and recurring services that will not impair the independence of the independent auditors may be approved by the Audit Committee without consideration on a specific case-by-case basis (“general pre-approval”).
The Audit Committee has determined that the Chair of the Audit Committee may provide pre-approval for such services that meet the above requirements in the event such approval is sought between regularly scheduled meetings. In any event, the Audit Committee is informed of each service approved subject to general pre-approval at the next regularly scheduled in-person Audit Committee meeting.
| (e)(2) | The percentage of services described in each of paragraphs (b) through (d) of this Item that were approved by the audit committee pursuant to paragraph (c)(7)(i)(C) of Rule 2-01 of Regulation S-X are as follows: |
(b) 0%
(c) 0%
(d) N/A
| (f) | The percentage of hours expended on the principal accountant’s engagement to audit the registrant’s financial statements for the most recent fiscal year that were attributed to work performed by persons other than the principal accountant’s full-time, permanent employees was less than fifty percent. |
| (g) | The aggregate non-audit fees billed by the registrant’s accountant for services rendered to the registrant, and rendered to the registrant’s investment adviser (not including any sub-adviser whose role is primarily portfolio management and is subcontracted with or overseen by another investment adviser), and any entity controlling, controlled by, or under common control with the adviser that provides ongoing services to the registrant for each of the last two fiscal years of the registrant was $104,559 for 2020 and $122,223 for 2019. |
| (h) | The registrant’s audit committee of the board of directors has considered whether the provision of non-audit services that were rendered to the registrant’s investment adviser (not including any sub-adviser whose role is primarily portfolio management and is subcontracted with or overseen by another investment adviser), and any entity controlling, controlled by, or under common control with the investment adviser that provides ongoing services to the registrant that were not pre-approved pursuant to paragraph (c)(7)(ii) of Rule 2-01 of Regulation S-X is compatible with maintaining the principal accountant’s independence. |
| Item 5. | Audit Committee of Listed Registrants. |
Not applicable.
| Item 6. | Investments. |
| (a) | Schedule of Investments in securities of unaffiliated issuers as of the close of the reporting period is included as part of the report to shareholders filed under Item 1 of this form. |
| (b) | Not applicable. |
| Item 7. | Disclosure of Proxy Voting Policies and Procedures for Closed-End Management Investment Companies. |
Not applicable.
| Item 8. | Portfolio Managers of Closed-End Management Investment Companies. |
Not applicable.
| Item 9. | Purchases of Equity Securities by Closed-End Management Investment Company and Affiliated Purchasers. |
Not applicable.
| Item 10. | Submission of Matters to a Vote of Security Holders. |
There have been no material changes to the procedures by which the shareholders may recommend nominees to the registrant’s board of trustees, where those changes were implemented after the registrant last provided disclosure in response to the requirements of Item 407(c)(2)(iv) of Regulation S-K (17 CFR 229.407) (as required by Item 22(b)(15) of Schedule 14A (17 CFR 240.14a-101)), or this Item.
| Item 11. | Controls and Procedures. |
| (a) | The registrant’s principal executive and principal financial officers, or persons performing similar functions, have concluded that the registrant’s disclosure controls and procedures (as defined in Rule 30a-3(c) under the Investment Company Act of 1940, as amended (the “1940 Act”) (17 CFR 270.30a-3(c))) are effective, as of a date within 90 days of the filing date of the report that includes the disclosure required by this paragraph, based on their evaluation of these controls and procedures required by Rule 30a-3(b) under the 1940 Act (17 CFR 270.30a-3(b)) and Rules 13a-15(b) or 15d-15(b) under the Securities Exchange Act of 1934, as amended (17 CFR 240.13a-15(b) or 240.15d-15(b)). |
| (b) | There were no changes in the registrant’s internal control over financial reporting (as defined in Rule 30a-3(d) under the 1940 Act (17 CFR 270.30a-3(d))) that occurred during the period covered by this report that has materially affected, or is reasonably likely to materially affect, the registrant’s internal control over financial reporting. |
| Item 12. | Disclosure of Securities Lending Activities for Closed-End Management Investment Companies. |
Not applicable.
| Item 13. | Exhibits. |
SIGNATURES
Pursuant to the requirements of the Securities Exchange Act of 1934 and the Investment Company Act of 1940, the registrant has duly caused this report to be signed on its behalf by the undersigned, thereunto duly authorized.
| (Registrant) | Virtus Asset Trust | |
| By (Signature and Title)* | /s/ George R. Aylward | |
| George R. Aylward, President | ||
| (principal executive officer) | ||
Date 3/9/2021
Pursuant to the requirements of the Securities Exchange Act of 1934 and the Investment Company Act of 1940, this report has been signed below by the following persons on behalf of the registrant and in the capacities and on the dates indicated.
| By (Signature and Title)* | /s/ George R. Aylward | |
| George R. Aylward, President | ||
| (principal executive officer) |
Date 3/9/2021
| By (Signature and Title)* | /s/ W. Patrick Bradley | |
| W. Patrick Bradley, Executive Vice President, | ||
| Chief Financial Officer and Treasurer | ||
| (principal financial officer) | ||
Date 3/9/2021
| * | Print the name and title of each signing officer under his or her signature. |