American Depositary Receipt (“ADR”)
Represents shares of foreign companies traded in U.S. dollars on U.S. exchanges that are held by a U.S. bank or a trust. Foreign companies use ADRs in order to make it easier for Americans to buy their shares.
Adjustable Rate Mortgages (“ARMS”)
ARMs, also known as variable-rate mortgages, have an interest rate that may change periodically depending on changes in a corresponding financial index that is associated with the loan.
Asset-Backed Securities (“ABS”)
Asset-backed securities represent interests in pools of underlying assets such as motor vehicle installment sales or installment loan contracts, leases of various types of real and personal property, and receivables from credit card arrangements.
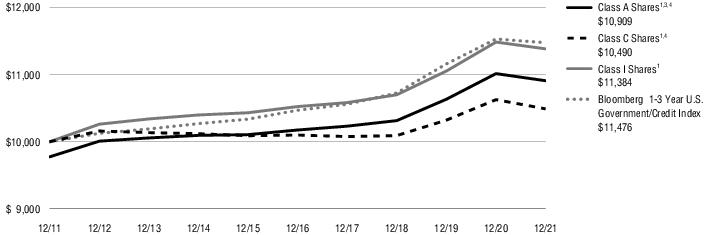
Bloomberg 1-3 Year U.S. Government/Credit Index
The Bloomberg 1-3 Yr. U.S. Government/Credit Bond Index measures U.S. investment grade government and corporate debt securities with an average maturity of 1 to 3 years. The index is calculated on a total return basis. The index is unmanaged, its returns do not reflect any fees, expenses, or sales charges, and is not available for direct investment.
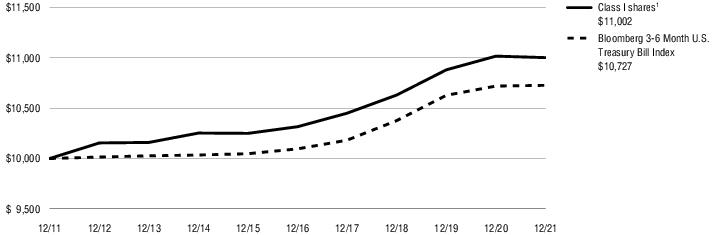
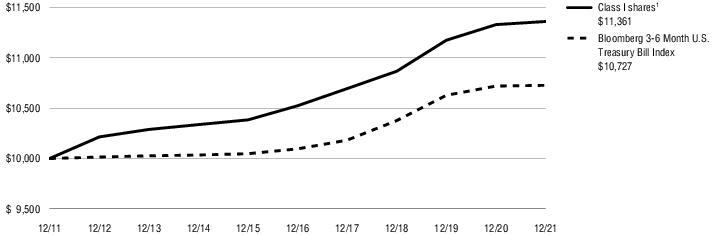
Bloomberg 3-6 Month U.S. Treasury Bill Index
The Bloomberg 3-6 Month U.S. Treasury Bill Index is comprised of all publicly issued zero-coupon U.S. Treasury Bills that have a remaining maturity of less than 6 months and more than 3 months, are rated investment grade, and have $250 million or more of outstanding face value. In addition, the securities must be denominated in US dollars and must be fixed rate and non-convertible. The index is unmanaged, its returns do not reflect any fees, expenses, or sales charges, and it is not available for direct investment.
Bloomberg Municipal AAA Index
The Bloomberg Municipal AAA Index is a subset of the Bloomberg Municipal Bond Index with an index rating of AAA. The index is calculated on a total return basis. The index is unmanaged, its returns do not reflect any fees, expenses, or sales charges, and it is not available for direct investment.
Bloomberg Municipal Baa Index
The Bloomberg Municipal Baa Index is a subset of the Bloomberg Municipal Bond Index with an index rating of Baa1, Baa2 or Baa3. The index is calculated on a total return basis. The index is unmanaged, its returns do not reflect any fees, expenses, or sales charges, and it is not available for direct investment.
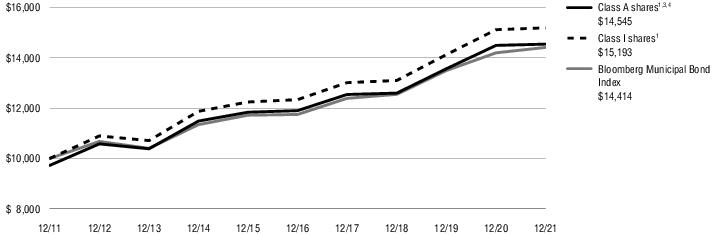
Bloomberg Municipal Bond Index
The Bloomberg Municipal Bond Index is a rules-based, market-value-weighted index engineered for the long-term, tax-exempt bond market. The index is calculated on a total return basis. The index is unmanaged, its returns do not reflect any fees, expenses, or sales charges, and it is not available for direct investment.
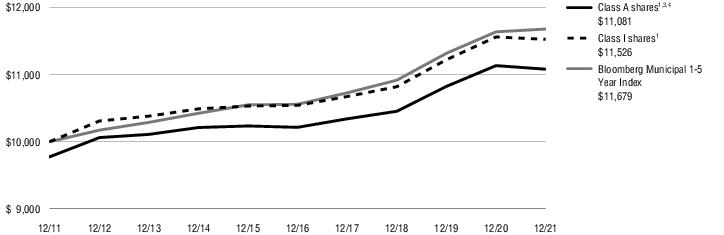
Bloomberg Municipal Bond 1-5 Year Index
The Bloomberg Municipal Bond 1-5 Year Index is a market capitalization-weighted index of investment grade tax-exempt municipal bonds with maturities of 1-5 years. The index is calculated on a total return basis. The index is unmanaged, its returns do not reflect any fees, expenses, or sales charges, and is not available for direct investment.
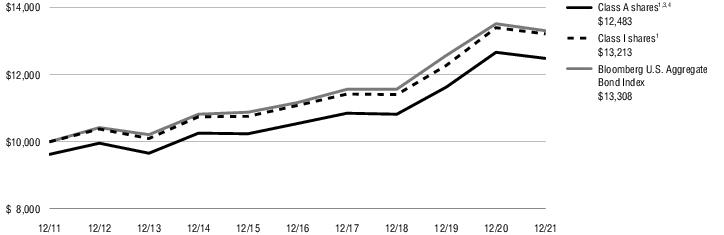
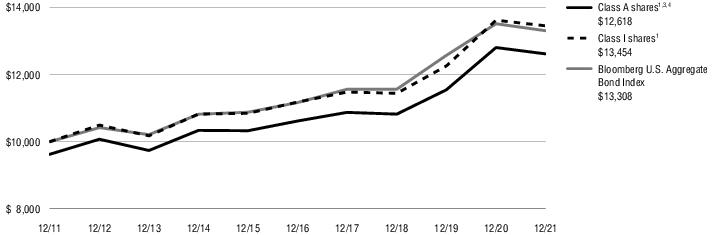
Bloomberg U.S. Aggregate Bond Index
The Bloomberg U.S. Aggregate Bond Index measures the U.S. investment-grade fixed-rate bond market. The index is calculated on a total return basis. The index is unmanaged, its returns do not reflect any fees, expenses, or sales charges, and it is not available for direct investment.
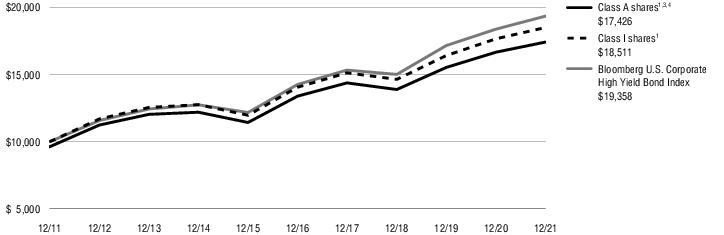
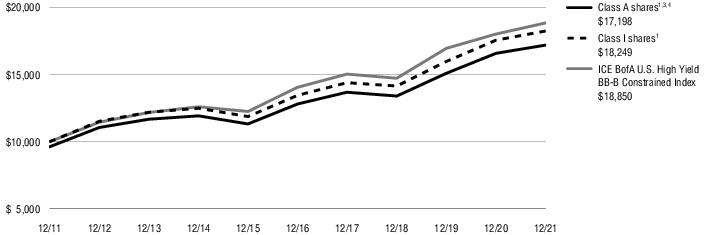
Bloomberg U.S. Corporate High Yield Bond Index
The Bloomberg U.S. Corporate High Yield Bond Index measures the U.S. dollar-denominated, high yield, fixed-rate corporate bond market. The index is calculated on a total return basis. The index is unmanaged, its returns do not reflect any fees, expenses, or sales charges, and it is not available for direct investment.
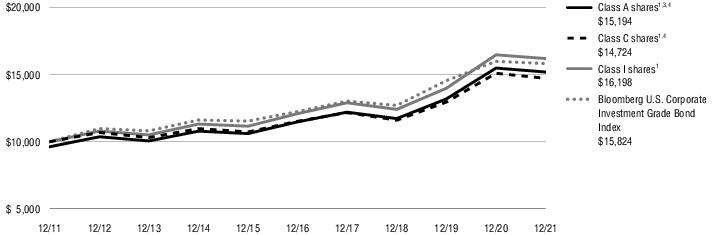
Bloomberg U.S. Corporate Investment Grade Bond Index
The Bloomberg U.S. Corporate Investment Grade Bond Index measures performance of investment grade corporate bond funds. The index is calculated on a total return basis. The index is unmanaged, its returns do not reflect any fees, expenses, or sales charges, and is not available for direct investment.
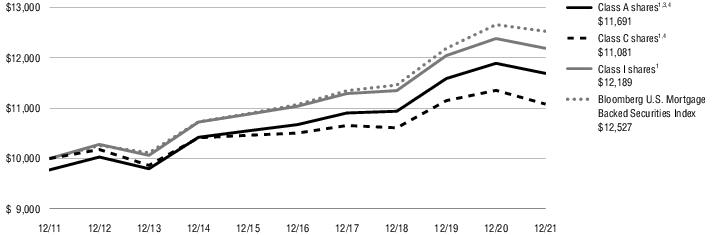
Bloomberg U.S. Mortgage Backed Securities Index
The Bloomberg U.S. Mortgage Backed Securities Index measures agency mortgage-backed pass through securities (fixed-rate and hybrid adjustable-rate mortgages) issued by Government National Mortgage Association (GNMA or Ginnie Mae), Federal National Mortgage Association (FNMA or Fannie Mae), and Federal Home Loan Mortgage Corporation (FHLMC or Freddie Mac). The index is calculated on a total return basis. The index is unmanaged, its returns do not reflect any fees, expenses, or sales charges, and is not available for direct investment.