UNITED STATES
SECURITIES AND EXCHANGE COMMISSION
Washington, D.C. 20549
FORM N-CSR
CERTIFIED SHAREHOLDER REPORT OF REGISTERED
MANAGEMENT INVESTMENT COMPANIES
Investment Company Act file number 811-07705
Virtus Asset Trust
(Exact name of registrant as specified in charter)
101 Munson Street
Greenfield, MA 01301-9668
(Address of principal executive offices) (Zip code)
Jennifer Fromm, Esq.
Vice President, Chief Legal Officer, Counsel and Secretary for Registrant
One Financial Plaza
Hartford, CT 06103-2608
(Name and address of agent for service)
Registrant’s telephone number, including area code: (800) 243-1574
Date of fiscal year end: December 31
Date of reporting period: December 31, 2023
Form N-CSR is to be used by management investment companies to file reports with the Commission not later than 10 days after the transmission to stockholders of any report that is required to be transmitted to stockholders under Rule 30e-1 under the Investment Company Act of 1940 (17 CFR 270.30e-1). The Commission may use the information provided on Form N-CSR in its regulatory, disclosure review, inspection, and policymaking roles.
A registrant is required to disclose the information specified by Form N-CSR, and the Commission will make this information public. A registrant is not required to respond to the collection of information contained in Form N-CSR unless the Form displays a currently valid Office of Management and Budget (“OMB”) control number. Please direct comments concerning the accuracy of the information collection burden estimate and any suggestions for reducing the burden to Secretary, Securities and Exchange Commission, 450 Fifth Street, NW, Washington, DC 20549-0609. The OMB has reviewed this collection of information under the clearance requirements of 44 U.S.C. § 3507.
Item 1. Reports to Stockholders.
| (a) | The Report to Shareholders is attached herewith. |

| Virtus Seix Core Bond Fund |
| Virtus Seix Corporate Bond Fund |
| Virtus Seix Floating Rate High Income Fund |
| Virtus Seix High Grade Municipal Bond Fund |
| Virtus Seix High Income Fund |
| Virtus Seix High Yield Fund |
| Virtus Seix Investment Grade Tax-Exempt Bond Fund |
| Virtus Seix Total Return Bond Fund |
| Virtus Seix U.S. Government Securities Ultra-Short Bond Fund |
| Virtus Seix Ultra-Short Bond Fund |
| 1 | ||
| 2 | ||
| 5 | ||
| Fund | Fund Summary | Schedule of Investments |
| 9 | 40 | |
| 12 | 44 | |
| 15 | 47 | |
| 18 | 58 | |
| 21 | 60 | |
| 25 | 65 | |
| 29 | 70 | |
| 32 | 73 | |
| 36 | 77 | |
| 38 | 80 | |
| 83 | ||
| 88 | ||
| 91 | ||
| 96 | ||
| 102 | ||
| 120 | ||
| 121 | ||
| 122 | ||
| 127 | ||


President, Virtus Funds
February 2024
| Beginning Account Value July 1, 2023 | Ending Account Value December 31, 2023 | Annualized Expense Ratio | Expenses Paid During Period* | |||||
Seix Core Bond Fund | ||||||||
| Class A | $ 1,000.00 | $ 1,025.40 | 0.64 % | $ 3.27 | ||||
| Class I | 1,000.00 | 1,027.20 | 0.50 | 2.55 | ||||
| Class R6 | 1,000.00 | 1,028.00 | 0.36 | 1.84 | ||||
Seix Corporate Bond Fund | ||||||||
| Class A | 1,000.00 | 1,037.70 | 0.94 | 4.83 | ||||
| Class C | 1,000.00 | 1,032.80 | 1.64 | 8.40 | ||||
| Class I | 1,000.00 | 1,039.10 | 0.69 | 3.55 | ||||
| Class R6 | 1,000.00 | 1,040.50 | 0.42 | 2.16 | ||||
Seix Floating Rate High Income Fund | ||||||||
| Class A | 1,000.00 | 1,055.70 | 0.95 | 4.92 | ||||
| Class C | 1,000.00 | 1,052.70 | 1.53 | 7.92 | ||||
| Class I | 1,000.00 | 1,057.40 | 0.63 | 3.27 | ||||
| Class R6 | 1,000.00 | 1,059.30 | 0.53 | 2.75 | ||||
Seix High Grade Municipal Bond Fund | ||||||||
| Class A | 1,000.00 | 1,033.70 | 0.73 | 3.74 | ||||
| Class I | 1,000.00 | 1,033.60 | 0.58 | 2.97 | ||||
Seix High Income Fund | ||||||||
| Class A | 1,000.00 | 1,069.30 | 0.92 | 4.80 | ||||
| Class I | 1,000.00 | 1,072.60 | 0.67 | 3.50 | ||||
| Class R6 | 1,000.00 | 1,071.20 | 0.58 | 3.03 | ||||
Seix High Yield Fund | ||||||||
| Class A | 1,000.00 | 1,070.00 | 0.81 | 4.23 | ||||
| Class I | 1,000.00 | 1,071.40 | 0.63 | 3.29 | ||||
| Class R6 | 1,000.00 | 1,070.60 | 0.52 | 2.71 | ||||
Seix Investment Grade Tax-Exempt Bond Fund | ||||||||
| Class A | 1,000.00 | 1,030.50 | 0.66 | 3.38 | ||||
| Class I | 1,000.00 | 1,032.20 | 0.51 | 2.61 | ||||
Seix Total Return Bond Fund | ||||||||
| Class A | 1,000.00 | 1,021.40 | 0.68 | 3.46 | ||||
| Class I | 1,000.00 | 1,022.70 | 0.44 | 2.24 | ||||
| Class R6 | 1,000.00 | 1,023.50 | 0.29 | 1.48 |
| Beginning Account Value July 1, 2023 | Ending Account Value December 31, 2023 | Annualized Expense Ratio | Expenses Paid During Period* | |||||
Seix U.S. Government Securities Ultra-Short Bond Fund | ||||||||
| Class A | $1,000.00 | $1,031.00 | 0.64% | $3.28 | ||||
| Class I | 1,000.00 | 1,032.30 | 0.39 | 2.00 | ||||
| Class R6 | 1,000.00 | 1,033.00 | 0.24 | 1.23 | ||||
Seix Ultra-Short Bond Fund | ||||||||
| Class A | 1,000.00 | 1,031.60 | 0.63 | 3.23 | ||||
| Class I | 1,000.00 | 1,033.90 | 0.38 | 1.95 |
| * | Expenses are equal to the relevant Fund’s annualized expense ratio, which is net of waived fees and reimbursed expenses, if applicable, multiplied by the average account value over the period, multiplied by the number of days (184) expenses were accrued in the most recent fiscal half-year, then divided by 365 to reflect the one-half year period. |
| Beginning Account Value July 1, 2023 | Ending Account Value December 31, 2023 | Annualized Expense Ratio | Expenses Paid During Period* | |||||
Seix Core Bond Fund | ||||||||
| Class A | $ 1,000.00 | $ 1,021.98 | 0.64 % | $ 3.26 | ||||
| Class I | 1,000.00 | 1,022.68 | 0.50 | 2.55 | ||||
| Class R6 | 1,000.00 | 1,023.39 | 0.36 | 1.84 | ||||
Seix Corporate Bond Fund | ||||||||
| Class A | 1,000.00 | 1,020.47 | 0.94 | 4.79 | ||||
| Class C | 1,000.00 | 1,016.94 | 1.64 | 8.34 | ||||
| Class I | 1,000.00 | 1,021.73 | 0.69 | 3.52 | ||||
| Class R6 | 1,000.00 | 1,023.09 | 0.42 | 2.14 | ||||
Seix Floating Rate High Income Fund | ||||||||
| Class A | 1,000.00 | 1,020.42 | 0.95 | 4.84 | ||||
| Class C | 1,000.00 | 1,017.49 | 1.53 | 7.78 | ||||
| Class I | 1,000.00 | 1,022.03 | 0.63 | 3.21 | ||||
| Class R6 | 1,000.00 | 1,022.53 | 0.53 | 2.70 | ||||
Seix High Grade Municipal Bond Fund | ||||||||
| Class A | 1,000.00 | 1,021.53 | 0.73 | 3.72 | ||||
| Class I | 1,000.00 | 1,022.28 | 0.58 | 2.96 | ||||
Seix High Income Fund | ||||||||
| Class A | 1,000.00 | 1,020.57 | 0.92 | 4.69 | ||||
| Class I | 1,000.00 | 1,021.83 | 0.67 | 3.41 | ||||
| Class R6 | 1,000.00 | 1,022.28 | 0.58 | 2.96 | ||||
Seix High Yield Fund | ||||||||
| Class A | 1,000.00 | 1,021.12 | 0.81 | 4.13 | ||||
| Class I | 1,000.00 | 1,022.03 | 0.63 | 3.21 | ||||
| Class R6 | 1,000.00 | 1,022.58 | 0.52 | 2.65 | ||||
Seix Investment Grade Tax-Exempt Bond Fund | ||||||||
| Class A | 1,000.00 | 1,021.88 | 0.66 | 3.36 | ||||
| Class I | 1,000.00 | 1,022.63 | 0.51 | 2.60 |
| Beginning Account Value July 1, 2023 | Ending Account Value December 31, 2023 | Annualized Expense Ratio | Expenses Paid During Period* | |||||
Seix Total Return Bond Fund | ||||||||
| Class A | $1,000.00 | $1,021.78 | 0.68% | $3.47 | ||||
| Class I | 1,000.00 | 1,022.99 | 0.44 | 2.24 | ||||
| Class R6 | 1,000.00 | 1,023.74 | 0.29 | 1.48 | ||||
Seix U.S. Government Securities Ultra-Short Bond Fund | ||||||||
| Class A | 1,000.00 | 1,021.98 | 0.64 | 3.26 | ||||
| Class I | 1,000.00 | 1,023.24 | 0.39 | 1.99 | ||||
| Class R6 | 1,000.00 | 1,024.00 | 0.24 | 1.22 | ||||
Seix Ultra-Short Bond Fund | ||||||||
| Class A | 1,000.00 | 1,022.03 | 0.63 | 3.21 | ||||
| Class I | 1,000.00 | 1,023.29 | 0.38 | 1.94 |
| * | Expenses are equal to the relevant Fund’s annualized expense ratio, which is net of waived fees and reimbursed expenses, if applicable, multiplied by the average account value over the period, multiplied by the number of days (184) expenses were accrued in the most recent fiscal half-year, then divided by 365 to reflect the one-half year period. |
December 31, 2023
December 31, 2023
December 31, 2023
| Ticker Symbols: | |
| Class A: STGIX | |
| Class I: STIGX | |
| Class R6: STGZX |
Seix Investment Advisors
| ■ | The Fund is diversified and has an investment objective of seeking to maximize long term total return through a combination of current income and capital appreciation, consistent with capital preservation. There is no guarantee that the Fund will meet its objective. |
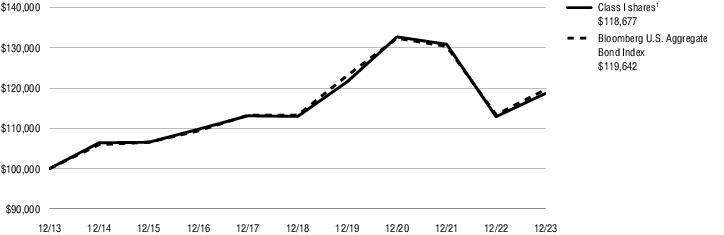
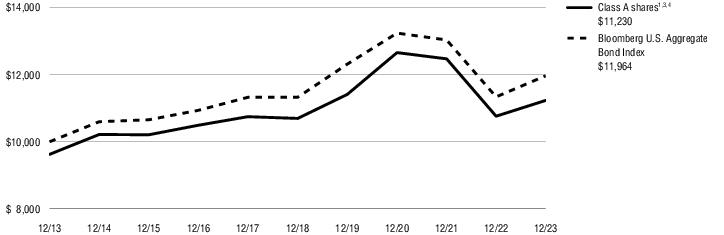
| ■ | For the fiscal year ended December 31, 2023, the Fund’s Class A shares at NAV returned 4.86%, Class I shares at NAV returned 5.11%, and Class R6 shares at NAV returned 5.26%. For the same period, the Bloomberg U.S. Aggregate Bond Index, the Fund’s style-specific benchmark appropriate for comparison, returned 5.53%. |
| 2023 | |
| U.S. Aggregate Bond | 5.53% |
| Investment Grade (IG) Corporate | 8.52% |
| Residential Mortgage-Backed Securities (RMBS) | 5.05% |
| 3-6 Month Treasury Bills | 5.15% |
| Treasury | 4.05% |
| U.S. Government Securities | 43% | |
| Mortgage-Backed Securities | 32 | |
| Agency | 32% | |
| Corporate Bonds and Notes | 20 | |
| Financials | 11 | |
| Consumer Staples | 2 | |
| Energy | 2 | |
| All other Corporate Bonds and Notes | 5 | |
| Asset-Backed Securities | 5 | |
| Other | 3 | |
| Credit Card | 2 | |
| Total | 100% | |
| 1 Year | 5 Years | 10 Years | Since inception | Inception date | ||
| Class A shares at NAV2 | 4.86 % | 0.83 % | 1.56 % | — % | — | |
| Class A shares at POP3,4 | 0.92 | 0.06 | 1.17 | — | — | |
| Class I shares at NAV2 | 5.11 | 0.99 | 1.73 | — | — | |
| Class R6 shares at NAV2 | 5.26 | 1.13 | — | — | 8/3/15 | |
| Bloomberg U.S. Aggregate Bond Index | 5.53 | 1.10 | 1.81 | 1.35 5 | — | |
| Fund Expense Ratios6: Class A shares: Gross 0.93%, Net 0.64%; Class I shares: Gross 0.64%, Net 0.50%; Class R6 shares: Gross 0.52%, Net 0.36%. | ||||||
| All returns represent past performance which is no guarantee of future results. Current performance may be higher or lower than the performance shown. The investment return and principal value of an investment will fluctuate so that an investor’s shares, when redeemed, may be worth more or less than their original cost. The above table and graph below do not reflect the deduction of taxes that a shareholder would pay on fund distributions or the redemption of shares. Please visit Virtus.com for performance data current to the most recent month-end. |

| 1 | Total returns are historical and include changes in share price and the reinvestment of both dividends and capital gain distributions. |
| 2 | “NAV” (Net Asset Value) total returns do not include the effect of any sales charge. |
| 3 | “POP” (Public Offering Price) total returns include the effect of the maximum front-end 3.75% sales charge. |
| 4 | “CDSC” (contingent deferred sales charge) is applied to redemptions of certain classes of shares that do not have a sales charge applied at the time of purchase. CDSC for certain redemptions of Class A shares made within 18 months of a finder’s fee being paid and all Class C shares are 1% within the first year and 0% thereafter. |
| 5 | The since inception index return is from the inception date of Class R6 shares. |
| 6 | The expense ratios of the Fund are set forth according to the prospectus for the Fund effective April 28, 2023, as supplemented and revised, and may differ from the expense ratios disclosed in the Financial Highlights tables in this report. See the Financial Highlights for more current expense ratios. Net Expense: Expenses reduced by a contractual expense limitation in effect through April 30, 2024. Gross Expense: Does not reflect the effect of the expense limitation. Expense ratios include fees and expenses associated with any underlying funds. |
| Ticker Symbols: | |
| Class A: SAINX | |
| Class C: STIFX | |
| Class I: STICX | |
| Class R6: VRSBX |
Seix Investment Advisors
| ■ | The Fund is diversified and has an investment objective of seeking to maximize long term total return through a combination of current income and capital appreciation, consistent with capital preservation. There is no guarantee that the Fund will meet its objective. |
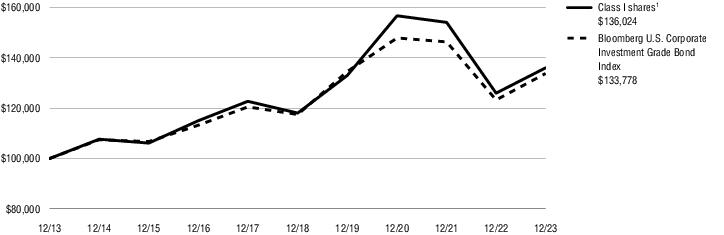
| ■ | For the fiscal year ended December 31, 2023, the Fund’s Class A shares at NAV returned 7.69%, Class C shares at NAV returned 6.82%, Class I shares at NAV returned 7.98%, and Class R6 shares at NAV returned 8.27%†. For the same period, the Bloomberg U.S. Corporate Investment Grade Bond Index, the Fund’s style-specific benchmark appropriate for comparison, returned 8.52%. |
| 2023 | |
| U.S. Aggregate Bond | 5.53% |
| Investment Grade (IG) Corporate | 8.52% |
| Residential Mortgage-Backed Securities (RMBS) | 5.05% |
| 3-6 Month Treasury Bills | 5.15% |
| Treasury | 4.05% |
| Corporate Bonds and Notes | 93% | |
| Financials | 48% | |
| Consumer Staples | 9 | |
| Energy | 8 | |
| Consumer Discretionary | 6 | |
| Health Care | 5 | |
| Materials | 5 | |
| Industrials | 4 | |
| All other Corporate Bonds and Notes | 8 | |
| U.S. Government Securities | 7 | |
| Total | 100% | |
| 1 Year | 5 Years | 10 Years | Since inception | Inception date | ||
| Class A shares at NAV2 | 7.69 % | 2.62 % | 2.86 % | — % | — | |
| Class A shares at POP3,4 | 3.65 | 1.84 | 2.47 | — | — | |
| Class C shares at NAV2 without CDSC4 | 6.82 | 1.88 | 2.14 | — | — | |
| Class C shares with CDSC4 | 5.82 | 1.88 | 2.14 | — | — | |
| Class I shares at NAV2 | 7.98 | 2.87 | 3.12 | — | — | |
| Class R6 shares at NAV2 | 8.27 5 | — | — | -2.66 | 10/20/20 | |
| Bloomberg U.S. Corporate Investment Grade Bond Index | 8.52 | 2.63 | 2.95 | -2.24 6 | — | |
| Fund Expense Ratios7: Class A shares: Gross 1.13%, Net 0.95%; Class C shares: Gross 1.88%, Net 1.65%; Class I shares: Gross 0.96%, Net 0.70%; Class R6 shares: Gross 0.77%, Net 0.43%. | ||||||
| All returns represent past performance which is no guarantee of future results. Current performance may be higher or lower than the performance shown. The investment return and principal value of an investment will fluctuate so that an investor’s shares, when redeemed, may be worth more or less than their original cost. The above table and graph below do not reflect the deduction of taxes that a shareholder would pay on fund distributions or the redemption of shares. Please visit Virtus.com for performance data current to the most recent month-end. |

| 1 | Total returns are historical and include changes in share price and the reinvestment of both dividends and capital gain distributions. |
| 2 | “NAV” (Net Asset Value) total returns do not include the effect of any sales charge. |
| 3 | “POP” (Public Offering Price) total returns include the effect of the maximum front-end 3.75% sales charge. |
| 4 | “CDSC” (contingent deferred sales charge) is applied to redemptions of certain classes of shares that do not have a sales charge applied at the time of purchase. CDSC for certain redemptions of Class A shares made within 18 months of a finder’s fee being paid and all Class C shares are 1% within the first year and 0% thereafter. |
| 5 | Total Return for the report period presented in the table differs from the return in the Financial Highlights. The total return presented in the above table is calculated based on the NAV at which shareholder transactions were processed. The total return presented in the Financial Highlights section of the report is calculated in the same manner, but also takes into account certain adjustments that are necessary under generally accepted accounting principles required in the annual report and semiannual report. |
| 6 | The since inception index return is from the inception date of Class R6 shares. |
| 7 | The expense ratios of the Fund are set forth according to the prospectus for the Fund effective April 28, 2023, as supplemented and revised, and may differ from the expense ratios disclosed in the Financial Highlights tables in this report. See the Financial Highlights for more current expense ratios. Net Expense: Expenses reduced by a contractual expense limitation in effect through April 30, 2024. Gross Expense: Does not reflect the effect of the expense limitation. Expense ratios include fees and expenses associated with any underlying funds. |
| Ticker Symbols: | |
| Class A: SFRAX | |
| Class C: SFRCX | |
| Class I: SAMBX | |
| Class R6: SFRZX |
Seix Investment Advisors
| ■ | The Fund is diversified and has an investment objective of attempting to provide a high level of current income. There is no guarantee that the Fund will meet its objective. |
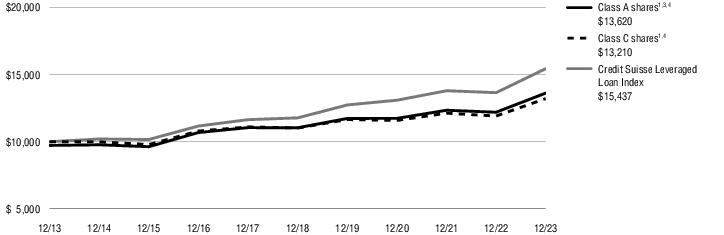
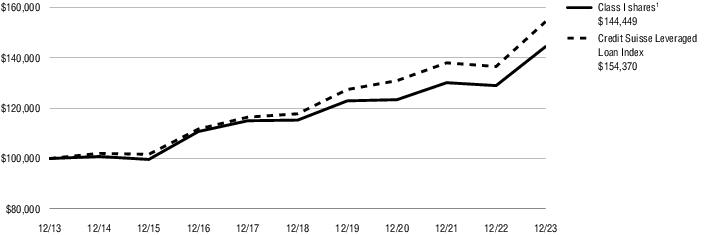
| ■ | For the fiscal year ended December 31, 2023, the Fund’s Class A shares at NAV returned 11.65%, Class C shares at NAV returned 10.87%, Class I shares at NAV returned 12.00%, and Class R6 shares at NAV returned 12.11%†. For the same period, the Credit Suisse Leveraged Loan Index, the Fund’s style-specific benchmark appropriate for comparison, returned 13.04%. |
| Leveraged Loans | 90% | |
| Information Technology | 10% | |
| Financials | 9 | |
| Aerospace | 8 | |
| Health Care | 7 | |
| Service | 7 | |
| Media / Telecom - Telecommunications | 6 | |
| Chemicals | 6 | |
| All other Leveraged Loans | 37 | |
| Corporate Bonds and Notes | 8 | |
| Common Stocks | 1 | |
| Asset-Backed Security | 1 | |
| Total | 100% | |
| 1 Year | 5 Years | 10 Years | Since inception | Inception date | ||
| Class A shares at NAV2 | 11.65 % | 4.29 % | 3.43 % | — % | — | |
| Class A shares at POP3,4 | 8.58 | 3.71 | 3.14 | — | — | |
| Class C shares at NAV2 without CDSC4 | 10.87 | 3.68 | 2.82 | — | — | |
| Class C shares with CDSC4 | 9.87 | 3.68 | 2.82 | — | — | |
| Class I shares at NAV2 | 12.00 | 4.62 | 3.75 | — | — | |
| Class R6 shares at NAV2 | 12.11 5 | 4.75 | — | 4.20 | 1/30/15 | |
| Credit Suisse Leveraged Loan Index | 13.04 | 5.56 | 4.44 | 4.72 6 | — | |
| Fund Expense Ratios7: Class A shares: Gross 0.94%, Net 0.94%; Class C shares: Gross 1.70%, Net 1.52%; Class I shares: Gross 0.72%, Net 0.62%; Class R6 shares: Gross 0.60%, Net 0.52%. | ||||||
| All returns represent past performance which is no guarantee of future results. Current performance may be higher or lower than the performance shown. The investment return and principal value of an investment will fluctuate so that an investor’s shares, when redeemed, may be worth more or less than their original cost. The above table and graph below do not reflect the deduction of taxes that a shareholder would pay on fund distributions or the redemption of shares. Please visit Virtus.com for performance data current to the most recent month-end. |
| 1 | Total returns are historical and include changes in share price and the reinvestment of both dividends and capital gain distributions. |
| 2 | “NAV” (Net Asset Value) total returns do not include the effect of any sales charge. |
| 3 | “POP” (Public Offering Price) total returns include the effect of the maximum front-end 2.75% sales charge. |
| 4 | “CDSC” (contingent deferred sales charge) is applied to redemptions of certain classes of shares that do not have a sales charge applied at the time of purchase. CDSC for certain redemptions of Class A shares made within 18 months of a finder’s fee being paid and all Class C shares are 1% within the first year and 0% thereafter. |
| 5 | Total Return for the report period presented in the table differs from the return in the Financial Highlights. The total return presented in the above table is calculated based on the NAV at which shareholder transactions were processed. The total return presented in the Financial Highlights section of the report is calculated in the same manner, but also takes into account certain adjustments that are necessary under generally accepted accounting principles required in the annual report and semiannual report. |
| 6 | The since inception index return is from the inception date of Class R6 shares. |
| 7 | The expense ratios of the Fund are set forth according to the prospectus for the Fund effective April 28, 2023, as supplemented and revised, and may differ from the expense ratios disclosed in the Financial Highlights tables in this report. See the Financial Highlights for more current expense ratios. Net Expense: Expenses reduced by a contractual expense limitation in effect through April 30, 2024. Gross Expense: Does not reflect the effect of the expense limitation. Expense ratios include fees and expenses associated with any underlying funds. |
| Ticker Symbols: | |
| Class A: SFLTX | |
| Class I: SCFTX |
Seix Investment Advisors
| ■ | The Fund is diversified and has an investment objective of seeking to maximize total return through (i) current income that is exempt from federal income taxes and (ii) capital appreciation consistent with capital preservation. There is no guarantee that the Fund will meet its objective. |
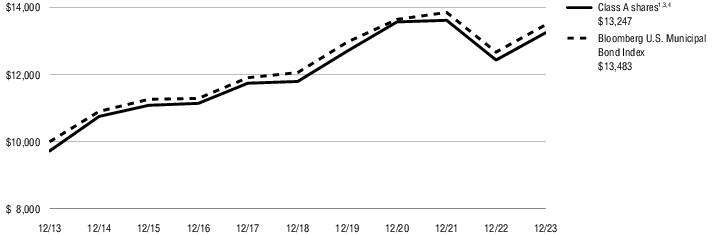
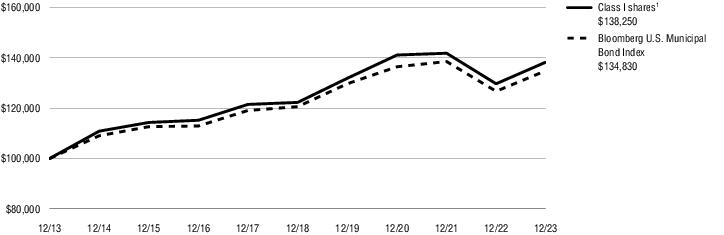
| ■ | For the fiscal year ended December 31, 2023, the Fund’s Class A shares at NAV returned 6.53% and Class I shares at NAV returned 6.60%. For the same period, the Bloomberg U.S. Municipal Bond Index, the Fund’s style-specific benchmark appropriate for comparison, returned 6.40%. |
| Municipal Bonds | 100% |
| Total | 100% |
| 1 Year | 5 Years | 10 Years | ||
| Class A shares at NAV2 | 6.53 % | 2.35% | 3.14% | |
| Class A shares at POP3,4 | 3.60 | 1.78 | 2.85 | |
| Class I shares at NAV2 | 6.60 | 2.48 | 3.29 | |
| Bloomberg U.S. Municipal Bond Index | 6.40 | 2.25 | 3.03 | |
| Fund Expense Ratios5: Class A shares: Gross 1.01%, Net 0.73%; Class I shares: Gross 0.93%, Net 0.58%. | ||||
| All returns represent past performance which is no guarantee of future results. Current performance may be higher or lower than the performance shown. The investment return and principal value of an investment will fluctuate so that an investor’s shares, when redeemed, may be worth more or less than their original cost. The above table and graph below do not reflect the deduction of taxes that a shareholder would pay on fund distributions or the redemption of shares. Please visit Virtus.com for performance data current to the most recent month-end. |
| 1 | Total returns are historical and include changes in share price and the reinvestment of both dividends and capital gain distributions. |
| 2 | “NAV” (Net Asset Value) total returns do not include the effect of any sales charge. |
| 3 | “POP” (Public Offering Price) total returns include the effect of the maximum front-end 2.75% sales charge. |
| 4 | “CDSC” (contingent deferred sales charge) is applied to redemptions of certain classes of shares that do not have a sales charge applied at the time of purchase. CDSC for certain redemptions of Class A shares made within 18 months of a finder’s fee being paid and all Class C shares are 1% within the first year and 0% thereafter. |
| 5 | The expense ratios of the Fund are set forth according to the prospectus for the Fund effective April 28, 2023, as supplemented and revised, and may differ from the expense ratios disclosed in the Financial Highlights tables in this report. See the Financial Highlights for more current expense ratios. Net Expense: Expenses reduced by a contractual expense limitation in effect through April 30, 2024. Gross Expense: Does not reflect the effect of the expense limitation. Expense ratios include fees and expenses associated with any underlying funds. |
| Ticker Symbols: | |
| Class A: SAHIX | |
| Class I: STHTX | |
| Class R6: STHZX |
Seix Investment Advisors
| ■ | The Fund is diversified and has an investment objective of seeking high current income and, secondarily, total return (comprised of capital appreciation and income). There is no guarantee that the Fund will meet its objective(s). |
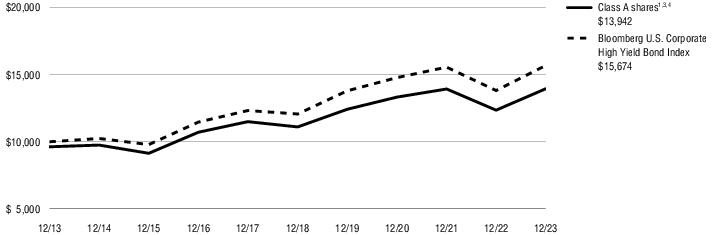
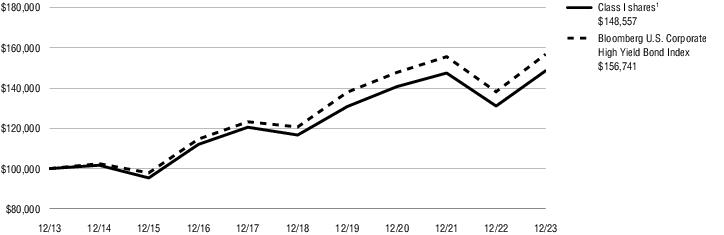
| ■ | For the fiscal year ended December 31, 2023, the Fund’s Class A shares at NAV returned 12.85%, Institutional Class shares at NAV returned 13.35%, and Class R6 shares at NAV returned 13.25%. For the fiscal year ended December 31, 2023, the Bloomberg U.S. Corporate High Yield Index, the Fund’s style-specific benchmark appropriate for comparison, returned 13.44%. |
| Corporate Bonds and Notes | 94% | |
| Financials | 22% | |
| Consumer Discretionary | 19 | |
| Energy | 16 | |
| Communication Services | 11 | |
| Industrials | 10 | |
| Materials | 5 | |
| Real Estate | 3 | |
| All other Corporate Bonds and Notes | 8 | |
| Leveraged Loans | 4 | |
| Other (includes securities lending collateral) | 2 | |
| Total | 100% | |
| 1 Year | 5 Years | 10 Years | Since inception | Inception date | ||
| Class A shares at NAV2 | 12.85 % | 4.66 % | 3.77 % | — % | — | |
| Class A shares at POP3,4 | 8.62 | 3.86 | 3.38 | — | — | |
| Class I shares at NAV2 | 13.35 | 4.95 | 4.04 | — | — | |
| Class R6 shares at NAV2 | 13.25 | 5.02 | — | 3.95 | 8/1/14 | |
| Bloomberg U.S. Corporate High Yield Bond Index | 13.44 | 5.37 | 4.60 | 4.60 5 | — | |
| Fund Expense Ratios6: Class A shares: Gross 1.16%, Net 0.93%; Class I shares: Gross 0.92%, Net 0.68%; Class R6 shares: Gross 0.77%, Net 0.59%. | ||||||
| All returns represent past performance which is no guarantee of future results. Current performance may be higher or lower than the performance shown. The investment return and principal value of an investment will fluctuate so that an investor’s shares, when redeemed, may be worth more or less than their original cost. The above table and graph below do not reflect the deduction of taxes that a shareholder would pay on fund distributions or the redemption of shares. Please visit Virtus.com for performance data current to the most recent month-end. |
| 1 | Total returns are historical and include changes in share price and the reinvestment of both dividends and capital gain distributions. |
| 2 | “NAV” (Net Asset Value) total returns do not include the effect of any sales charge. |
| 3 | “POP” (Public Offering Price) total returns include the effect of the maximum front-end 3.75% sales charge. |
| 4 | “CDSC” (contingent deferred sales charge) is applied to redemptions of certain classes of shares that do not have a sales charge applied at the time of purchase. CDSC for certain redemptions of Class A shares made within 18 months of a finder’s fee being paid and all Class C shares are 1% within the first year and 0% thereafter. |
| 5 | The since inception index return is from the inception date of Class R6 shares. |
| 6 | The expense ratios of the Fund are set forth according to the prospectus for the Fund effective April 28, 2023, as supplemented and revised, and may differ from the expense ratios disclosed in the Financial Highlights tables in this report. See the Financial Highlights for more current expense ratios. Net Expense: Expenses reduced by a contractual expense limitation in effect through April 30, 2024. Gross Expense: Does not reflect the effect of the expense limitation. Expense ratios include fees and expenses associated with any underlying funds. |
| Ticker Symbols: | |
| Class A: HYPSX | |
| Class I: SAMHX | |
| Class R6: HYIZX |
Seix Investment Advisors
| ■ | The Fund is diversified and has an investment objective of seeking high income and, secondarily, capital appreciation. There is no guarantee that the Fund will meet its objective(s). |
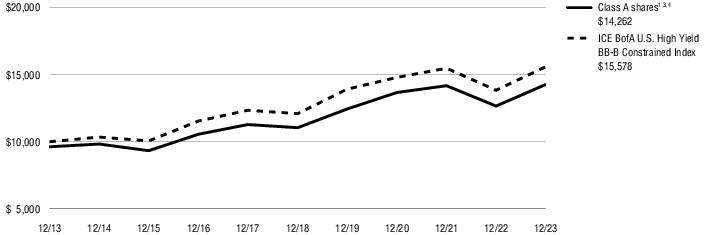
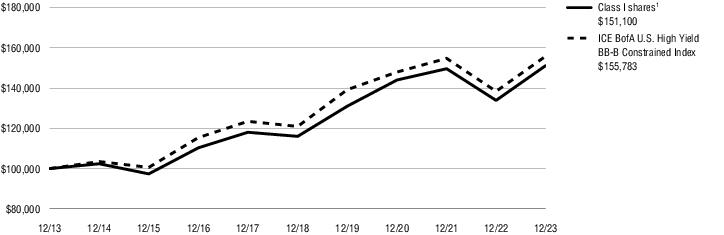
| ■ | For the fiscal year ended December 31, 2023, the Fund’s Class A shares at NAV returned 12.68%, Class I shares at NAV returned 12.87%, and Class R6 shares at NAV returned 12.99%. For the same period, the ICE BofA U.S. High Yield BB-B Constrained Index, the Fund’s style-specific benchmark appropriate for comparison, returned 12.58%. |
| Corporate Bonds and Notes | 94% | |
| Consumer Discretionary | 22% | |
| Financials | 19 | |
| Energy | 15 | |
| Industrials | 13 | |
| Communication Services | 9 | |
| Materials | 5 | |
| Real Estate | 3 | |
| All other Corporate Bonds and Notes | 8 | |
| Leveraged Loans | 5 | |
| Other (includes securities lending collateral) | 1 | |
| Total | 100% |
| 1 Year | 5 Years | 10 Years | Since inception | Inception date | ||
| Class A shares at NAV2 | 12.68 % | 5.24 % | 4.01 % | — % | — | |
| Class A shares at POP3,4 | 8.46 | 4.44 | 3.61 | — | — | |
| Class I shares at NAV2 | 12.87 | 5.43 | 4.21 | — | — | |
| Class R6 shares at NAV2 | 12.99 | 5.54 | — | 4.99 | 8/1/16 | |
| ICE BofA U.S. High Yield BB-B Constrained Index | 12.58 | 5.19 | 4.53 | 4.66 5 | — | |
| Fund Expense Ratios6: Class A shares: Gross 1.02%, Net 0.82%; Class I shares: Gross 0.75%, Net 0.64%; Class R6 shares: Gross 0.65%, Net 0.53%. | ||||||
| All returns represent past performance which is no guarantee of future results. Current performance may be higher or lower than the performance shown. The investment return and principal value of an investment will fluctuate so that an investor’s shares, when redeemed, may be worth more or less than their original cost. The above table and graph below do not reflect the deduction of taxes that a shareholder would pay on fund distributions or the redemption of shares. Please visit Virtus.com for performance data current to the most recent month-end. |
| 1 | Total returns are historical and include changes in share price and the reinvestment of both dividends and capital gain distributions. |
| 2 | “NAV” (Net Asset Value) total returns do not include the effect of any sales charge. |
| 3 | “POP” (Public Offering Price) total returns include the effect of the maximum front-end 3.75% sales charge. |
| 4 | “CDSC” (contingent deferred sales charge) is applied to redemptions of certain classes of shares that do not have a sales charge applied at the time of purchase. CDSC for certain redemptions of Class A shares made within 18 months of a finder’s fee being paid and all Class C shares are 1% within the first year and 0% thereafter. |
| 5 | The since inception index return is from the inception date of Class R6 shares. |
| 6 | The expense ratios of the Fund are set forth according to the prospectus for the Fund effective April 28, 2023, as supplemented and revised, and may differ from the expense ratios disclosed in the Financial Highlights tables in this report. See the Financial Highlights for more current expense ratios. Net Expense: Expenses reduced by a contractual expense limitation in effect through April 30, 2024. Gross Expense: Does not reflect the effect of the expense limitation. Expense ratios include fees and expenses associated with any underlying funds. |
| Ticker Symbols: | |
| Class A: SISIX | |
| Class I: STTBX |
Seix Investment Advisors
| ■ | The Fund is diversified and has an investment objective of seeking to maximize high total return through (i) current income that is exempt from federal income taxes and (ii) capital appreciation consistent with capital preservation. There is no guarantee that the Fund will meet its objective. |
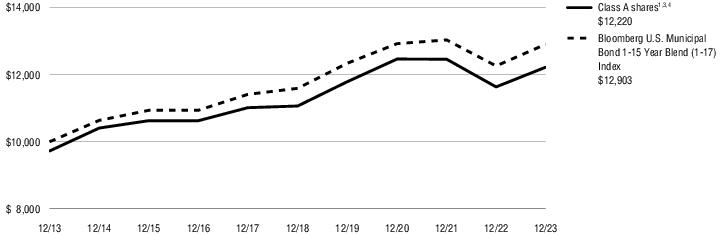
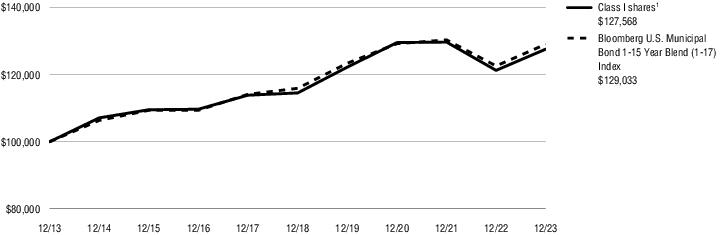
| ■ | For the fiscal year ended December 31, 2023, the Fund’s Class A shares at NAV returned 5.04% and Class I shares at NAV returned 5.19%. For the same period, the Bloomberg U.S. Municipal Bond 1-15 Year Blend (1-17) Index, the Fund’s style-specific benchmark appropriate for comparison, returned 5.26%. |
| Municipal Bonds | 100% |
| Total | 100% |
| 1 Year | 5 Years | 10 Years | ||
| Class A shares at NAV2 | 5.04 % | 2.01% | 2.31% | |
| Class A shares at POP3,4 | 2.15 | 1.44 | 2.02 | |
| Class I shares at NAV2 | 5.19 | 2.18 | 2.46 | |
| Bloomberg U.S. Municipal Bond 1-15 Year Blend (1-17) Index | 5.26 | 2.17 | 2.58 | |
| Fund Expense Ratios5: Class A shares: Gross 1.02%, Net 0.67%; Class I shares: Gross 0.83%, Net 0.52%. | ||||
| All returns represent past performance which is no guarantee of future results. Current performance may be higher or lower than the performance shown. The investment return and principal value of an investment will fluctuate so that an investor’s shares, when redeemed, may be worth more or less than their original cost. The above table and graph below do not reflect the deduction of taxes that a shareholder would pay on fund distributions or the redemption of shares. Please visit Virtus.com for performance data current to the most recent month-end. |
| 1 | Total returns are historical and include changes in share price and the reinvestment of both dividends and capital gain distributions. |
| 2 | “NAV” (Net Asset Value) total returns do not include the effect of any sales charge. |
| 3 | “POP” (Public Offering Price) total returns include the effect of the maximum front-end 2.75% sales charge. |
| 4 | “CDSC” (contingent deferred sales charge) is applied to redemptions of certain classes of shares that do not have a sales charge applied at the time of purchase. CDSC for certain redemptions of Class A shares made within 18 months of a finder’s fee being paid and all Class C shares are 1% within the first year and 0% thereafter. |
| 5 | The expense ratios of the Fund are set forth according to the prospectus for the Fund effective April 28, 2023, as supplemented and revised, and may differ from the expense ratios disclosed in the Financial Highlights tables in this report. See the Financial Highlights for more current expense ratios. Net Expense: Expenses reduced by a contractual expense limitation in effect through April 30, 2024. Gross Expense: Does not reflect the effect of the expense limitation. Expense ratios include fees and expenses associated with any underlying funds. |
| Ticker Symbols: | |
| Class A: CBPSX | |
| Class I: SAMFX | |
| Class R6: SAMZX |
Seix Investment Advisors
| ■ | The Fund is diversified and has an investment objective of seeking to maximize long term total return through a combination of current income and capital appreciation, consistent with capital preservation. There is no guarantee that the Fund will meet its objective. |
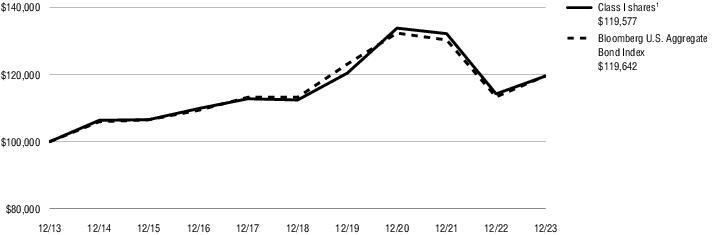
| ■ | For the fiscal year ended December 31, 2023, the Fund’s Class A shares at NAV returned 4.37%, Class I shares at NAV returned 4.65%, and Class R6 shares at NAV returned 4.81%. For the same period, the Bloomberg U.S. Aggregate Bond Index, the Fund’s style-specific benchmark appropriate for comparison, returned 5.53%. |
| 2023 | |
| U.S. Aggregate Bond | 5.53% |
| Investment Grade (IG) Corporate | 8.52% |
| Residential Mortgage-Backed Securities (RMBS) | 5.05% |
| 3-6 Month Treasury Bills | 5.15% |
| Treasury | 4.05% |
| U.S. Government Securities | 42% | |
| Mortgage-Backed Securities | 33 | |
| Agency | 32% | |
| Non-Agency | 1 | |
| Corporate Bonds and Notes | 20 | |
| Financials | 11 | |
| Consumer Staples | 2 | |
| Energy | 2 | |
| All other Corporate Bonds and Notes | 5 | |
| Asset-Backed Securities | 5 | |
| Other | 3 | |
| Credit Card | 2 | |
| Total | 100% |
| 1 Year | 5 Years | 10 Years | Since inception | Inception date | ||
| Class A shares at NAV2 | 4.37 % | 0.98 % | 1.55 % | — % | — | |
| Class A shares at POP3,4 | 0.45 | 0.21 | 1.17 | — | — | |
| Class I shares at NAV2 | 4.65 | 1.24 | 1.80 | — | — | |
| Class R6 shares at NAV2 | 4.81 | 1.39 | — | 1.56 | 8/1/14 | |
| Bloomberg U.S. Aggregate Bond Index | 5.53 | 1.10 | 1.81 | 1.51 5 | — | |
| Fund Expense Ratios6: Class A shares: Gross 0.88%, Net 0.70%; Class I shares: Gross 0.58%, Net 0.46%; Class R6 shares: Gross 0.45%, Net 0.31%. | ||||||
| All returns represent past performance which is no guarantee of future results. Current performance may be higher or lower than the performance shown. The investment return and principal value of an investment will fluctuate so that an investor’s shares, when redeemed, may be worth more or less than their original cost. The above table and graph below do not reflect the deduction of taxes that a shareholder would pay on fund distributions or the redemption of shares. Please visit Virtus.com for performance data current to the most recent month-end. |
| 1 | Total returns are historical and include changes in share price and the reinvestment of both dividends and capital gain distributions. |
| 2 | “NAV” (Net Asset Value) total returns do not include the effect of any sales charge. |
| 3 | “POP” (Public Offering Price) total returns include the effect of the maximum front-end 3.75% sales charge. |
| 4 | “CDSC” (contingent deferred sales charge) is applied to redemptions of certain classes of shares that do not have a sales charge applied at the time of purchase. CDSC for certain redemptions of Class A shares made within 18 months of a finder’s fee being paid and all Class C shares are 1% within the first year and 0% thereafter. |
| 5 | The since inception index return is from the inception date of Class R6 shares. |
| 6 | The expense ratios of the Fund are set forth according to the prospectus for the Fund effective April 28, 2023, as supplemented and revised, and may differ from the expense ratios disclosed in the Financial Highlights tables in this report. See the Financial Highlights for more current expense ratios. Net Expense: Expenses reduced by a contractual expense limitation in effect through April 30, 2024. Gross Expense: Does not reflect the effect of the expense limitation. Expense ratios include fees and expenses associated with any underlying funds. |
| Ticker Symbols: | |
| Class A: SSAGX | |
| Class I: SIGVX | |
| Class R6: SIGZX |
Seix Investment Advisors
| ■ | The Fund is diversified and has an investment objective of seeking to maximize current income consistent with capital preservation. There is no guarantee that the Fund will meet its objective. |
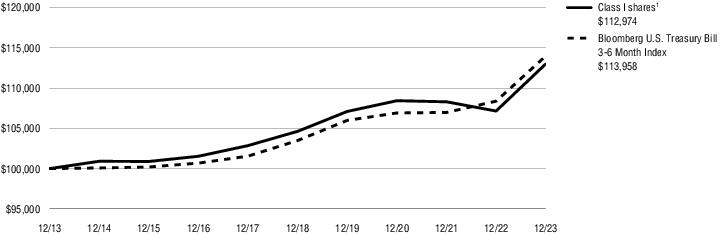
| ■ | For the fiscal year ended December 31, 2023, the Fund’s Class A shares at NAV returned 5.17%, Class I shares at NAV returned 5.44%, and Class R6 shares at NAV returned 5.59%†. For the same period, the Bloomberg U.S. Treasury Bill 3-6 Month Index, the Fund’s style-specific benchmark appropriate for comparison, returned 5.15%. |
| 2023 | |
| U.S. Aggregate Bond | 5.53% |
| Investment Grade (IG) Corporate | 8.52% |
| Residential Mortgage-Backed Securities (RMBS) | 5.05% |
| 3-6 Month Treasury Bills | 5.15% |
| Treasury | 4.05% |
| Mortgage-Backed Securities | 94% | |
| Agency | 94% | |
| U.S. Government Securities | 6 | |
| Total | 100% |
| 1 Year | 5 Years | 10 Years | Since inception | Inception date | ||
| Class A shares at NAV2 | 5.17 % | 1.29 % | — % | 1.34 % | 7/24/18 | |
| Class I shares at NAV2 | 5.44 | 1.55 | 1.23 | — | — | |
| Class R6 shares at NAV2 | 5.59 3 | 1.70 | — | 1.64 | 8/1/16 | |
| Bloomberg U.S. Treasury Bill 3-6 Month Index | 5.15 | 1.95 | 1.32 | — 4 | — | |
| Fund Expense Ratios5: Class A shares: Gross 0.65%, Net 0.65%; Class I shares: Gross 0.55%, Net 0.41%; Class R6 shares: Gross 0.38%, Net 0.26%. | ||||||
| All returns represent past performance which is no guarantee of future results. Current performance may be higher or lower than the performance shown. The investment return and principal value of an investment will fluctuate so that an investor’s shares, when redeemed, may be worth more or less than their original cost. The above table and graph below do not reflect the deduction of taxes that a shareholder would pay on fund distributions or the redemption of shares. Please visit Virtus.com for performance data current to the most recent month-end. |
| 1 | Total returns are historical and include changes in share price and the reinvestment of both dividends and capital gain distributions. |
| 2 | “NAV” (Net Asset Value) total returns do not include the effect of any sales charge. |
| 3 | Total Return for the report period presented in the table differs from the return in the Financial Highlights. The total return presented in the above table is calculated based on the NAV at which shareholder transactions were processed. The total return presented in the Financial Highlights section of the report is calculated in the same manner, but also takes into account certain adjustments that are necessary under generally accepted accounting principles required in the annual report and semiannual report. |
| 4 | The index return is 1.34% since inception of Class A shares and 1.64% since inception of Class R6 shares. |
| 5 | The expense ratios of the Fund are set forth according to the prospectus for the Fund effective April 28, 2023, as supplemented and revised, and may differ from the expense ratios disclosed in the Financial Highlights tables in this report. See the Financial Highlights for more current expense ratios. Net Expense: Expenses reduced by a contractual expense limitation in effect through April 30, 2024. Gross Expense: Does not reflect the effect of the expense limitation. Expense ratios include fees and expenses associated with any underlying funds. |
| Ticker Symbols: | |
| Class A: SASSX | |
| Class I: SISSX |
Seix Investment Advisors
| ■ | The Fund is diversified and has an investment objective of seeking to maximize current income consistent with capital preservation. There is no guarantee that the Fund will meet its objective. |
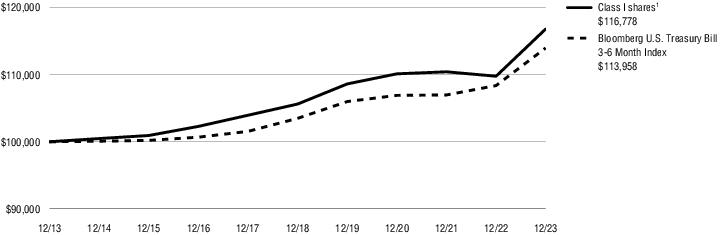
| ■ | For the fiscal year ended December 31, 2023, the Fund’s Class A shares at NAV returned 6.13% and Class I shares at NAV returned 6.39%. For the same period, the Bloomberg U.S. Treasury Bill 3-6 Month Index, the Fund’s style-specific benchmark appropriate for comparison, returned 5.15%. |
| 2023 | |
| U.S. Aggregate Bond | 5.53% |
| Investment Grade (IG) Corporate | 8.52% |
| Residential Mortgage-Backed Securities (RMBS) | 5.05% |
| 3-6 Month Treasury Bills | 5.15% |
| Treasury | 4.05% |
| Corporate Bonds and Notes | 45% | |
| Financials | 24% | |
| Communication Services | 7 | |
| Energy | 5 | |
| Consumer Staples | 4 | |
| Health Care | 3 | |
| Consumer Discretionary | 2 | |
| Mortgage-Backed Securities | 25 | |
| Agency | 18 | |
| Non-Agency | 7 | |
| U.S. Government Securities | 18 | |
| Asset-Backed Securities | 12 | |
| Credit Card | 10 | |
| Student Loan | 2 | |
| Total | 100% |
| 1 Year | 5 Years | 10 Years | Since inception | Inception date | ||
| Class A shares at NAV2 | 6.13 % | 1.75 % | — % | 1.70 % | 7/24/18 | |
| Class I shares at NAV2 | 6.39 | 2.03 | 1.56 | — | — | |
| Bloomberg U.S. Treasury Bill 3-6 Month Index 2 | 5.15 | 1.95 | 1.32 | 1.97 3 | — | |
| Fund Expense Ratios4: Class A shares: Gross 0.86%, Net 0.65%; Class I shares: Gross 0.64%, Net 0.40%. | ||||||
| All returns represent past performance which is no guarantee of future results. Current performance may be higher or lower than the performance shown. The investment return and principal value of an investment will fluctuate so that an investor’s shares, when redeemed, may be worth more or less than their original cost. The above table and graph below do not reflect the deduction of taxes that a shareholder would pay on fund distributions or the redemption of shares. Please visit Virtus.com for performance data current to the most recent month-end. |
| 1 | Total returns are historical and include changes in share price and the reinvestment of both dividends and capital gain distributions. |
| 2 | “NAV” (Net Asset Value) total returns do not include the effect of any sales charge. |
| 3 | The since inception index return is from the inception date of Class A shares. |
| 4 | The expense ratios of the Fund are set forth according to the prospectus for the Fund effective April 28, 2023, as supplemented and revised, and may differ from the expense ratios disclosed in the Financial Highlights tables in this report. See the Financial Highlights for more current expense ratios. Net Expense: Expenses reduced by a contractual expense limitation in effect through April 30, 2024. Gross Expense: Does not reflect the effect of the expense limitation. Expense ratios include fees and expenses associated with any underlying funds. |
December 31, 2023
| Par Value | Value | ||
| U.S. Government Securities—42.5% | |||
| U.S. Treasury Bond 4.125%, 8/15/53 | $ 5,356 | $ 5,414 | |
| U.S. Treasury Notes | |||
| 0.250%, 9/30/25 | 2,965 | 2,761 | |
| 3.625%, 5/15/26 | 3,656 | 3,613 | |
| 4.750%, 10/15/26 | 2,118 | 2,150 | |
| 2.750%, 7/31/27 | 814 | 781 | |
| 3.625%, 5/31/28 | 2,150 | 2,127 | |
| 4.500%, 11/15/33 | 5,551 | 5,828 | |
| Total U.S. Government Securities (Identified Cost $21,844) | 22,674 | ||
| Mortgage-Backed Securities—31.4% | |||
| Agency—31.2% | |||
| Federal Home Loan Mortgage Corporation | |||
| Pool #A95259 4.000%, 12/1/40 | 252 | 246 | |
| Pool #G60019 4.500%, 3/1/44 | 113 | 113 | |
| Pool #Q42921 3.500%, 9/1/46 | 340 | 321 | |
| Pool #Q53881 4.500%, 1/1/48 | 193 | 191 | |
| Pool #QA3079 3.500%, 10/1/49 | 178 | 165 | |
| Pool #QA4766 3.500%, 11/1/49 | 320 | 301 | |
| Pool #QA9935 3.000%, 6/1/50 | 136 | 122 | |
| Pool #QD9468 3.500%, 4/1/52 | 139 | 130 | |
| Pool #QE1443 4.000%, 5/1/52 | 303 | 288 | |
| Pool #QE1985 4.500%, 5/1/52 | 252 | 245 | |
| Pool #QE2366 5.000%, 5/1/52 | 82 | 82 | |
| Pool #QE4826 4.500%, 7/1/52 | 485 | 470 | |
| Pool #QE9908 5.500%, 9/1/52 | 177 | 179 | |
| Pool #QF8190 6.000%, 2/1/53 | 267 | 275 | |
| Pool #QF8551 5.500%, 3/1/53 | 133 | 133 | |
| Pool #QF8817 6.000%, 3/1/53 | 211 | 214 | |
| Pool #RA2622 3.000%, 5/1/50 | 88 | 79 | |
| Pool #RA8188 4.500%, 11/1/52 | 93 | 90 | |
| Pool #RA8285 4.500%, 10/1/47 | 503 | 490 | |
| Pool #RJ0194 6.000%, 11/1/53 | 314 | 319 | |
| Pool #SC0203 2.500%, 12/1/41 | 388 | 345 | |
| Pool #SD0164 3.500%, 12/1/49 | 292 | 272 | |
| Pool #SD1618 5.000%, 9/1/52 | 619 | 614 | |
| Par Value | Value | ||
| Agency—continued | |||
| Pool #SD2317 6.000%, 1/1/53 | $ 944 | $ 960 | |
| Pool #ZM5226 3.500%, 12/1/47 | 183 | 170 | |
| Federal National Mortgage Association | |||
| Pool #AB3692 4.000%, 10/1/41 | 203 | 197 | |
| Pool #AB3878 4.000%, 11/1/41 | 228 | 221 | |
| Pool #AB5924 3.000%, 8/1/42 | 351 | 320 | |
| Pool #BN4542 4.500%, 2/1/49 | 69 | 68 | |
| Pool #BO1277 3.000%, 7/1/49 | 197 | 176 | |
| Pool #BP5431 3.000%, 6/1/50 | 60 | 55 | |
| Pool #BT7914 5.000%, 10/1/52 | 471 | 468 | |
| Pool #BV3044 3.000%, 2/1/52 | 317 | 286 | |
| Pool #BW0044 5.000%, 7/1/52 | 280 | 281 | |
| Pool #BW3311 4.500%, 7/1/52 | 492 | 479 | |
| Pool #BX1225 5.500%, 10/1/52 | 238 | 240 | |
| Pool #BY8494 5.500%, 8/1/53 | 566 | 571 | |
| Pool #CA5122 3.000%, 2/1/50 | 181 | 162 | |
| Pool #CB3110 2.500%, 3/1/47 | 408 | 347 | |
| Pool #CB3630 4.000%, 5/1/52 | 301 | 284 | |
| Pool #CB3875 3.500%, 6/1/47 | 472 | 437 | |
| Pool #CB4451 4.000%, 8/1/42 | 157 | 151 | |
| Pool #FM7290 3.000%, 5/1/51 | 380 | 341 | |
| Pool #FM8210 3.000%, 4/1/50 | 189 | 170 | |
| Pool #FS1443 3.500%, 4/1/52 | 299 | 275 | |
| Pool #FS2249 5.000%, 6/1/52 | 458 | 456 | |
| Pool #FS2692 5.000%, 8/1/52 | 501 | 501 | |
| Pool #FS3262 4.000%, 10/1/46 | 577 | 563 | |
| Pool #FS3386 3.500%, 5/1/38 | 493 | 469 | |
| Pool #FS3687 5.000%, 11/1/52 | 443 | 440 | |
| Government National Mortgage Association | |||
| Pool #CO1904 5.000%, 8/15/52 | 278 | 286 | |
| Pool #CO1918 5.500%, 9/15/52 | 192 | 195 | |
| Pool #CP7106 5.500%, 8/20/52 | 59 | 61 | |
| Par Value | Value | ||
| Agency—continued | |||
| Pool #CP7113 5.500%, 9/20/52 | $ 39 | $ 41 | |
| Pool #CR2361 6.000%, 12/15/52 | 139 | 145 | |
| Pool #CR3025 5.500%, 12/20/52 | 275 | 280 | |
| Pool #CR9210 5.500%, 1/20/53 | 203 | 205 | |
| Pool #CS5391 6.000%, 1/20/53 | 236 | 241 | |
| Pool #CS5448 6.000%, 1/20/53 | 321 | 328 | |
| Pool #CS7736 6.000%, 4/20/53 | 134 | 137 | |
| 16,691 | |||
| Non-Agency—0.2% | |||
| BWAY Mortgage Trust 2013-1515, A2 144A 3.454%, 3/10/33(1) | 100 | 94 | |
| Total Mortgage-Backed Securities (Identified Cost $17,096) | 16,785 | ||
| Asset-Backed Securities—5.3% | |||
| Automobiles—0.3% | |||
| Ford Credit Auto Owner Trust 2023-1, A 144A 4.850%, 8/15/35(1) | 140 | 140 | |
| Credit Card—1.9% | |||
| American Express Credit Account Master Trust 2023-3, A 5.230%, 9/15/28 | 285 | 290 | |
| Capital One Multi-Asset Execution Trust 2005-B3, B3 (3 month Term SOFR + 0.812%, Cap N/A, Floor 0.550%) 6.205%, 5/15/28(2) | 470 | 467 | |
| Citibank Credit Card Issuance Trust 2017-A6, A6 (1 month Term SOFR + 0.884%) 6.249%, 5/14/29(2) | 280 | 281 | |
| 1,038 | |||
| Other—3.1% | |||
| CF Hippolyta Issuer LLC | |||
| 2020-1, A1 144A 1.690%, 7/15/60(1) | 171 | 158 | |
| 2020-1, B1 144A 2.280%, 7/15/60(1) | 243 | 222 | |
| DB Master Finance LLC 2021-1A, A23 144A 2.791%, 11/20/51(1) | 230 | 190 | |
| Jersey Mike’s Funding 2019-1A, A2 144A 4.433%, 2/15/50(1) | 263 | 249 | |
| PSNH Funding LLC 2018-1, A3 3.814%, 2/1/35 | 100 | 94 | |
| Stack Infrastructure Issuer LLC 2023-1A, A2 144A 5.900%, 3/25/48(1) | 50 | 49 | |
| Taco Bell Funding LLC 2021-1A, A23 144A 2.542%, 8/25/51(1) | 216 | 175 | |
| Vantage Data Centers LLC 2020-2A, A2 144A 1.992%, 9/15/45(1) | 240 | 209 | |
| Par Value | Value | ||
| Other—continued | |||
| Verizon Master Trust 2023-7, A1A 5.670%, 11/20/29 | $ 320 | $ 329 | |
| 1,675 | |||
| Total Asset-Backed Securities (Identified Cost $2,996) | 2,853 | ||
| Corporate Bonds and Notes—19.8% | |||
| Communication Services—0.3% | |||
| AT&T, Inc. 3.550%, 9/15/55 | 208 | 150 | |
| Consumer Discretionary—0.9% | |||
| General Motors Financial Co., Inc. 5.850%, 4/6/30 | 108 | 112 | |
| Hyatt Hotels Corp. 1.800%, 10/1/24 | 203 | 197 | |
| Tapestry, Inc. 7.350%, 11/27/28 | 147 | ��� 154 | |
| 463 | |||
| Consumer Staples—2.0% | |||
| Kimberly-Clark Corp. 4.500%, 2/16/33 | 190 | 191 | |
| Mars, Inc. 144A 2.450%, 7/16/50(1)(3) | 150 | 94 | |
| PepsiCo, Inc. 4.650%, 2/15/53 | 426 | 423 | |
| Philip Morris International, Inc. 5.375%, 2/15/33 | 363 | 372 | |
| 1,080 | |||
| Energy—1.3% | |||
| Boardwalk Pipelines LP 4.450%, 7/15/27 | 82 | 80 | |
| Enterprise Products Operating LLC 4.200%, 1/31/50 | 154 | 134 | |
| Pioneer Natural Resources Co. 1.900%, 8/15/30 | 294 | 250 | |
| Targa Resources Corp. 4.200%, 2/1/33 | 132 | 121 | |
| Williams Cos., Inc. (The) 3.500%, 10/15/51 | 149 | 109 | |
| 694 | |||
| Financials—11.0% | |||
| AerCap Ireland Capital DAC 3.000%, 10/29/28 | 150 | 137 | |
| American Express Co. 6.338%, 10/30/26 | 134 | 137 | |
| Bank of America Corp. | |||
| 2.087%, 6/14/29 | 198 | 174 | |
| 2.572%, 10/20/32 | 214 | 177 | |
| Bank of New York Mellon Corp. (The) 4.414%, 7/24/26 | 315 | 312 | |
| BP Capital Markets America, Inc. 4.812%, 2/13/33 | 303 | 305 | |
| Par Value | Value | ||
| Financials—continued | |||
| BPCE S.A. 144A 5.748%, 7/19/33(1) | $ 250 | $ 251 | |
| Charles Schwab Corp. (The) | |||
| 5.643%, 5/19/29 | 110 | 113 | |
| 5.853%, 5/19/34 | 98 | 101 | |
| Daimler Truck Finance North America LLC 144A 2.500%, 12/14/31(1) | 182 | 151 | |
| Goldman Sachs Group, Inc. (The) 1.542%, 9/10/27 | 421 | 382 | |
| Hartford Financial Services Group, Inc. (The) 2.800%, 8/19/29 | 163 | 148 | |
| Hyundai Capital America 144A 5.700%, 6/26/30(1) | 207 | 212 | |
| John Deere Capital Corp. 5.150%, 3/3/25 | 129 | 130 | |
| JPMorgan Chase & Co. | |||
| 0.824%, 6/1/25 | 412 | 403 | |
| 1.578%, 4/22/27 | 49 | 45 | |
| 5.350%, 6/1/34 | 177 | 180 | |
| KeyBank N.A. 4.390%, 12/14/27 | 250 | 235 | |
| Morgan Stanley | |||
| 0.791%, 1/22/25 | 472 | 471 | |
| 1.593%, 5/4/27 | 355 | 327 | |
| Pfizer Investment Enterprises Pte Ltd. 5.300%, 5/19/53 | 328 | 335 | |
| PG&E Wildfire Recovery Funding LLC Series A-2 4.263%, 6/1/38(3) | 250 | 237 | |
| PNC Financial Services Group, Inc. (The) 6.615%, 10/20/27 | 172 | 178 | |
| Sigeco Securitization I LLC Series A1 5.026%, 11/15/38 | 130 | 131 | |
| United Airlines Pass-Through-Trust 2020-1, A 5.875%, 4/15/29 | 287 | 290 | |
| Wells Fargo & Co. | |||
| 3.526%, 3/24/28 | 250 | 238 | |
| 3.350%, 3/2/33 | 95 | 83 | |
| 5,883 | |||
| Health Care—1.1% | |||
| AbbVie, Inc. 4.250%, 11/21/49 | 272 | 243 | |
| Amgen, Inc. | |||
| 5.250%, 3/2/33 | 206 | 211 | |
| 5.650%, 3/2/53 | 116 | 122 | |
| 576 | |||
| Industrials—0.9% | |||
| Ingersoll Rand, Inc. 5.700%, 8/14/33 | 101 | 107 | |
| United Parcel Service, Inc. 5.050%, 3/3/53 | 253 | 262 | |
| Veralto Corp. 144A 5.450%, 9/18/33(1) | 127 | 131 | |
| 500 | |||
| Materials—1.2% | |||
| Air Products & Chemicals, Inc. 4.800%, 3/3/33 | 227 | 234 | |
| Par Value | Value | ||
| Materials—continued | |||
| Newmont Corp. | |||
| 2.250%, 10/1/30 | $ 211 | $ 182 | |
| 6.250%, 10/1/39 | 189 | 210 | |
| 626 | |||
| Real Estate—0.2% | |||
| Tanger Properties LP 2.750%, 9/1/31 | 156 | 125 | |
| Utilities—0.9% | |||
| Boardwalk Pipelines LP 3.400%, 2/15/31 | 100 | 89 | |
| Consolidated Edison Co. of New York, Inc. 3.200%, 12/1/51 | 157 | 111 | |
| Consumers 2023 Securitization Funding LLC Series A2 5.210%, 9/1/31 | 110 | 112 | |
| Southern Co. (The) Series A 3.700%, 4/30/30 | 181 | 171 | |
| 483 | |||
| Total Corporate Bonds and Notes (Identified Cost $10,960) | 10,580 | ||
| Total Long-Term Investments—99.0% (Identified Cost $52,896) | 52,892 | ||
| Shares | ||
| Securities Lending Collateral—0.3% | ||
| Dreyfus Government Cash Management Fund - Institutional Shares (seven-day effective yield 5.250%)(4)(5) | 144,550 | 145 |
| Total Securities Lending Collateral (Identified Cost $145) | 145 | |
| TOTAL INVESTMENTS—99.3% (Identified Cost $53,041) | $53,037 | |
| Other assets and liabilities, net—0.7% | 377 | |
| NET ASSETS—100.0% | $53,414 | |
| Abbreviations: | |
| DAC | Designated Activity Company |
| LLC | Limited Liability Company |
| LP | Limited Partnership |
| SOFR | Secured Overnight Financing Rate |
| Footnote Legend: | |
| (1) | Security exempt from registration under Rule 144A of the Securities Act of 1933. These securities may be resold in transactions exempt from registration, normally to qualified institutional buyers. At December 31, 2023, these securities amounted to a value of $2,325 or 4.4% of net assets. |
| (2) | Variable rate security. Rate disclosed is as of December 31, 2023. Information in parenthesis represents benchmark and reference rate for each security. Certain variable rate securities are not based on a published reference rate and spread but are determined by the issuer or agent and are based on current market conditions, or, for mortgage-backed securities, are impacted by the individual mortgages which are paying off over time. These securities do not indicate a reference rate and spread in their descriptions. |
| (3) | All or a portion of security is on loan. |
| (4) | Shares of this fund are publicly offered, and its prospectus and annual report are publicly available. |
| (5) | Represents security purchased with cash collateral received for securities on loan. |
| Total Value at December 31, 2023 | Level 1 Quoted Prices | Level 2 Significant Observable Inputs | |||
| Assets: | |||||
| Debt Instruments: | |||||
| U.S. Government Securities | $22,674 | $ — | $22,674 | ||
| Mortgage-Backed Securities | 16,785 | — | 16,785 | ||
| Asset-Backed Securities | 2,853 | — | 2,853 | ||
| Corporate Bonds and Notes | 10,580 | — | 10,580 | ||
| Securities Lending Collateral | 145 | 145 | — | ||
| Total Investments | $53,037 | $145 | $52,892 |
December 31, 2023
| Par Value | Value | ||
| U.S. Government Securities—6.7% | |||
| U.S. Treasury Bond 4.125%, 8/15/53 | $ 1,160 | $ 1,172 | |
| U.S. Treasury Notes | |||
| 2.500%, 1/31/24 | 1,714 | 1,710 | |
| 3.625%, 5/31/28 | 320 | 317 | |
| Total U.S. Government Securities (Identified Cost $3,071) | 3,199 | ||
| Corporate Bonds and Notes—91.6% | |||
| Communication Services—1.4% | |||
| AT&T, Inc. 3.550%, 9/15/55 | 925 | 665 | |
| Consumer Discretionary—5.4% | |||
| General Motors Financial Co., Inc. 5.850%, 4/6/30 | 480 | 495 | |
| Hyatt Hotels Corp. 1.800%, 10/1/24 | 1,116 | 1,083 | |
| Tapestry, Inc. 7.350%, 11/27/28 | 940 | 986 | |
| 2,564 | |||
| Consumer Staples—8.9% | |||
| Hershey Co. (The) 2.650%, 6/1/50 | 360 | 247 | |
| Kimberly-Clark Corp. 4.500%, 2/16/33 | 1,044 | 1,050 | |
| Mars, Inc. 144A 2.450%, 7/16/50(1)(2) | 922 | 574 | |
| PepsiCo, Inc. 4.650%, 2/15/53 | 1,172 | 1,165 | |
| Philip Morris International, Inc. 5.375%, 2/15/33 | 1,156 | 1,186 | |
| 4,222 | |||
| Energy—8.3% | |||
| Boardwalk Pipelines LP 4.450%, 7/15/27 | 579 | 567 | |
| Enterprise Products Operating LLC 4.200%, 1/31/50 | 1,307 | 1,133 | |
| Pioneer Natural Resources Co. 1.900%, 8/15/30 | 888 | 754 | |
| Targa Resources Corp. 4.200%, 2/1/33 | 709 | 652 | |
| Williams Cos., Inc. (The) 3.500%, 10/15/51 | 1,132 | 826 | |
| 3,932 | |||
| Financials—47.3% | |||
| AerCap Ireland Capital DAC 3.000%, 10/29/28 | 603 | 550 | |
| American Express Co. 6.338%, 10/30/26 | 441 | 450 | |
| Bank of America Corp. 2.572%, 10/20/32 | 1,428 | 1,184 | |
| Bank of New York Mellon Corp. (The) 4.414%, 7/24/26 | 963 | 953 | |
| Par Value | Value | ||
| Financials—continued | |||
| BMW U.S. Capital LLC 144A 1.950%, 8/12/31(1) | $ 1,433 | $ 1,180 | |
| BP Capital Markets America, Inc. 4.812%, 2/13/33 | 1,166 | 1,176 | |
| BPCE S.A. 144A 5.748%, 7/19/33(1) | 1,203 | 1,208 | |
| Charles Schwab Corp. (The) | |||
| 5.643%, 5/19/29 | 391 | 401 | |
| 5.853%, 5/19/34 | 428 | 442 | |
| Daimler Truck Finance North America LLC | |||
| 144A 1.625%, 12/13/24(1) | 650 | 626 | |
| 144A 2.500%, 12/14/31(1) | 615 | 510 | |
| Goldman Sachs Group, Inc. (The) 1.542%, 9/10/27 | 1,306 | 1,185 | |
| Hartford Financial Services Group, Inc. (The) 2.800%, 8/19/29 | 623 | 566 | |
| Hyundai Capital America 144A 2.000%, 6/15/28(1) | 1,370 | 1,197 | |
| John Deere Capital Corp. 5.150%, 3/3/25 | 464 | 466 | |
| JPMorgan Chase & Co. | |||
| 1.578%, 4/22/27 | 677 | 625 | |
| 5.350%, 6/1/34 | 604 | 613 | |
| Morgan Stanley | |||
| 0.791%, 1/22/25 | 700 | 698 | |
| 1.593%, 5/4/27 | 522 | 481 | |
| NatWest Group plc 1.642%, 6/14/27 | 1,150 | 1,050 | |
| Pfizer Investment Enterprises Pte Ltd. 5.300%, 5/19/53 | 1,163 | 1,187 | |
| PNC Financial Services Group, Inc. (The) 6.615%, 10/20/27 | 449 | 466 | |
| Pricoa Global Funding I 144A 1.200%, 9/1/26(1) | 902 | 819 | |
| Shell International Finance B.V. 2.500%, 9/12/26 | 1,138 | 1,083 | |
| UBS Group AG 144A 4.751%, 5/12/28(1) | 1,172 | 1,154 | |
| United Airlines Pass-Through-Trust | |||
| 2020-1, A 5.875%, 4/15/29 | 426 | 431 | |
| 2020-1, B 4.875%, 7/15/27 | 696 | 674 | |
| Wells Fargo & Co. | |||
| 3.526%, 3/24/28 | 889 | 848 | |
| 3.350%, 3/2/33 | 312 | 272 | |
| 22,495 | |||
| Health Care—5.1% | |||
| AbbVie, Inc. 4.250%, 11/21/49 | 1,380 | 1,230 | |
| Amgen, Inc. | |||
| 5.250%, 3/2/33 | 682 | 699 | |
| 5.650%, 3/2/53 | 453 | 477 | |
| 2,406 | |||
| Industrials—4.2% | |||
| Ingersoll Rand, Inc. 5.700%, 8/14/33 | 359 | 380 | |
| Par Value | Value | ||
| Industrials—continued | |||
| United Parcel Service, Inc. 5.050%, 3/3/53 | $ 1,107 | $ 1,147 | |
| Veralto Corp. 144A 5.450%, 9/18/33(1) | 452 | 468 | |
| 1,995 | |||
| Information Technology—0.7% | |||
| Dell International LLC 3.450%, 12/15/51 | 468 | 338 | |
| Materials—5.0% | |||
| Air Products & Chemicals, Inc. 4.800%, 3/3/33 | 1,127 | 1,163 | |
| Newmont Corp. 6.250%, 10/1/39 | 1,086 | 1,204 | |
| 2,367 | |||
| Real Estate—2.1% | |||
| Tanger Properties LP 2.750%, 9/1/31 | 1,240 | 997 | |
| Utilities—3.2% | |||
| Boardwalk Pipelines LP 3.400%, 2/15/31 | 682 | 609 | |
| Consolidated Edison Co. of New York, Inc. 3.200%, 12/1/51 | 1,328 | 939 | |
| 1,548 | |||
| Total Corporate Bonds and Notes (Identified Cost $44,522) | 43,529 | ||
| Total Long-Term Investments—98.3% (Identified Cost $47,593) | 46,728 | ||
| Shares | ||
| Securities Lending Collateral—0.2% | ||
| Dreyfus Government Cash Management Fund - Institutional Shares (seven-day effective yield 5.250%)(3)(4) | 99,047 | 99 |
| Total Securities Lending Collateral (Identified Cost $99) | 99 | |
| TOTAL INVESTMENTS—98.5% (Identified Cost $47,692) | $46,827 | |
| Other assets and liabilities, net—1.5% | 702 | |
| NET ASSETS—100.0% | $47,529 | |
| Abbreviations: | |
| DAC | Designated Activity Company |
| LLC | Limited Liability Company |
| LP | Limited Partnership |
| Footnote Legend: | |
| (1) | Security exempt from registration under Rule 144A of the Securities Act of 1933. These securities may be resold in transactions exempt from registration, normally to qualified institutional buyers. At December 31, 2023, these securities amounted to a value of $7,736 or 16.3% of net assets. |
| (2) | All or a portion of security is on loan. |
| (3) | Shares of this fund are publicly offered, and its prospectus and annual report are publicly available. |
| (4) | Represents security purchased with cash collateral received for securities on loan. |
| Country Weightings (Unaudited)† | |
| United States | 87% |
| France | 3 |
| Singapore | 3 |
| Switzerland | 2 |
| Netherlands | 2 |
| United Kingdom | 2 |
| Ireland | 1 |
| Total | 100% |
| † % of total investments as of December 31, 2023. | |
| Total Value at December 31, 2023 | Level 1 Quoted Prices | Level 2 Significant Observable Inputs | |||
| Assets: | |||||
| Debt Instruments: | |||||
| U.S. Government Securities | $ 3,199 | $— | $ 3,199 | ||
| Corporate Bonds and Notes | 43,529 | — | 43,529 | ||
| Securities Lending Collateral | 99 | 99 | — | ||
| Total Investments | $46,827 | $99 | $46,728 |
December 31, 2023
| Par Value | Value | ||
| Asset-Backed Security—0.3% | |||
| Collateralized Loan Obligation—0.3% | |||
| Mountain View CLO XVI Ltd. 2022-1A, E (3 month Term SOFR + 9.080%, Cap N/A, Floor 9.080%) 144A 14.474%, 10/15/32(1)(2) | $ 5,000 | $ 4,941 | |
| Total Asset-Backed Security (Identified Cost $4,648) | 4,941 | ||
| Convertible Bonds and Notes—0.1% | |||
| Communication Services—0.1% | |||
| Liberty Interactive LLC 4.000%, 11/15/29 | 8,000 | 2,000 | |
| Total Convertible Bonds and Notes (Identified Cost $6,765) | 2,000 | ||
| Corporate Bonds and Notes—7.9% | |||
| Communication Services—1.7% | |||
| Allen Media LLC 144A 10.500%, 2/15/28(1) | 3,750 | 2,006 | |
| Cable One, Inc. 144A 4.000%, 11/15/30(1) | 4,200 | 3,400 | |
| CCO Holdings LLC 144A 4.750%, 3/1/30(1) | 5,000 | 4,569 | |
| Gray Television, Inc. 144A 4.750%, 10/15/30(1) | 2,000 | 1,506 | |
| Iliad Holding SASU | |||
| 144A 6.500%, 10/15/26(1) | 10,550 | 10,529 | |
| 144A 7.000%, 10/15/28(1) | 3,000 | 2,985 | |
| Rocket Mortgage LLC 144A 3.875%, 3/1/31(1) | 1,000 | 880 | |
| 25,875 | |||
| Consumer Discretionary—1.3% | |||
| Fertitta Entertainment LLC 144A 6.750%, 1/15/30(1) | 3,500 | 3,073 | |
| Foot Locker, Inc. 144A 4.000%, 10/1/29(1) | 4,000 | 3,310 | |
| Installed Building Products, Inc. 144A 5.750%, 2/1/28(1) | 6,027 | 5,846 | |
| QVC, Inc. 4.750%, 2/15/27 | 3,000 | 2,375 | |
| Signal Parent, Inc. 144A 6.125%, 4/1/29(1) | 3,000 | 2,145 | |
| Winnebago Industries, Inc. 144A 6.250%, 7/15/28(1) | 3,000 | 2,948 | |
| 19,697 | |||
| Consumer Staples—0.1% | |||
| Albertsons Cos., Inc. 144A 3.250%, 3/15/26(1) | 2,000 | 1,887 | |
| Financials—1.7% | |||
| Altice Financing S.A. 144A 5.750%, 8/15/29(1) | 5,000 | 4,437 | |
| CCO Holdings LLC 144A 4.250%, 2/1/31(1) | 2,000 | 1,748 | |
| Par Value | Value | ||
| Financials—continued | |||
| Domtar Corp. 144A 6.750%, 10/1/28(1) | $ 2,000 | $ 1,807 | |
| Ford Motor Credit Co. LLC 2.700%, 8/10/26 | 3,000 | 2,779 | |
| Global Payments, Inc. 2.900%, 5/15/30 | 3,751 | 3,299 | |
| LSF11 A5 HoldCo. LLC 144A 6.625%, 10/15/29(1) | 2,610 | 2,207 | |
| MPH Acquisition Holdings LLC 144A 5.500%, 9/1/28(1) | 5,900 | 5,283 | |
| Summit Midstream Holdings LLC 144A 9.000%, 10/15/26(1)(2) | 990 | 982 | |
| United Wholesale Mortgage LLC 144A 5.500%, 11/15/25(1) | 3,866 | 3,842 | |
| 26,384 | |||
| Health Care—1.2% | |||
| DaVita, Inc. 144A 4.625%, 6/1/30(1) | 4,500 | 3,926 | |
| Emergent BioSolutions, Inc. 144A 3.875%, 8/15/28(1) | 3,465 | 1,403 | |
| Encompass Health Corp. 4.500%, 2/1/28 | 3,000 | 2,870 | |
| Tenet Healthcare Corp. | |||
| 6.125%, 10/1/28 | 8,500 | 8,476 | |
| 4.375%, 1/15/30 | 2,090 | 1,937 | |
| 18,612 | |||
| Industrials—0.1% | |||
| Griffon Corp. 5.750%, 3/1/28 | 2,000 | 1,965 | |
| Information Technology—0.9% | |||
| Crowdstrike Holdings, Inc. 3.000%, 2/15/29 | 5,250 | 4,744 | |
| Sensata Technologies B.V. 144A 4.000%, 4/15/29(1) | 5,000 | 4,647 | |
| Virtusa Corp. 144A 7.125%, 12/15/28(1) | 4,700 | 4,024 | |
| 13,415 | |||
| Materials—0.4% | |||
| Graham Packaging Co., Inc. 144A 7.125%, 8/15/28(1) | 3,615 | 3,254 | |
| Mativ Holdings, Inc. 144A 6.875%, 10/1/26(1) | 2,500 | 2,398 | |
| 5,652 | |||
| Real Estate—0.5% | |||
| Brookfield Property REIT, Inc. 144A 5.750%, 5/15/26(1) | 2,000 | 1,941 | |
| Forestar Group, Inc. 144A 3.850%, 5/15/26(1) | 2,000 | 1,905 | |
| Par Value | Value | ||
| Real Estate—continued | |||
| SBA Communications Corp. 3.125%, 2/1/29 | $ 3,250 | $ 2,920 | |
| 6,766 | |||
| Total Corporate Bonds and Notes (Identified Cost $127,600) | 120,253 | ||
| Leveraged Loans—87.8% | |||
| Aerospace—8.1% | |||
| Amentum Government Services Holdings LLC (1 month Term SOFR + 4.000%) 9.358%, 2/15/29(2) | 10,638 | 10,622 | |
| American Airlines, Inc. (3 month Term SOFR + 5.012%) 10.427%, 4/20/28(2) | 19,450 | 19,954 | |
| Barnes Group, Inc. (1 month Term SOFR + 3.100%) 8.456%, 8/9/30(2) | 6,444 | 6,457 | |
| Cobham Ultra Seniorco S.a r.l. (6 month Term SOFR + 3.928%) 9.363%, 8/6/29(2) | 5,967 | 5,870 | |
| Delos Aircraft DAC (3 month Term SOFR + 2.000%) 7.348%, 10/31/27(2) | 5,511 | 5,529 | |
| Delta Air Lines, Inc. (3 month Term SOFR + 3.750%) 9.166%, 10/20/27(2) | 7,207 | 7,371 | |
| Dynasty Acquisition Co., Inc. | |||
| 2023, Tranche B-1 (1 month Term SOFR + 4.000%) 9.356%, 8/24/28(2) | 6,435 | 6,448 | |
| 2023, Tranche B-2 (1 month Term SOFR + 4.000%) 9.356%, 8/24/28(2) | 2,758 | 2,763 | |
| LSF11 Trinity Bidco, Inc. 2023-2, Tranche B (1 month Term SOFR + 4.000%) 9.358%, 6/14/30(2) | 5,443 | 5,471 | |
| Mileage Plus Holdings LLC (3 month Term SOFR + 5.400%) 10.770%, 6/21/27(2) | 13,067 | 13,496 | |
| Peraton Corp. | |||
| Tranche B, First Lien (1 month Term SOFR + 3.850%) 9.206%, 2/1/28(2) | 13,208 | 13,225 | |
| Tranche B-1, Second Lien (3 month Term SOFR + 7.850%) 13.222%, 2/1/29(2) | 2,976 | 2,954 | |
| Rand Parent LLC Tranche B (3 month Term SOFR + 4.250%) 9.598%, 3/18/30(2) | 5,156 | 5,129 | |
| Spirit AeroSystems, Inc. (3 month Term SOFR + 4.250%) 9.633%, 1/15/27(2) | 5,096 | 5,106 | |
| Transdigm, Inc. Tranche J (3 month Term SOFR + 3.250%) 8.598%, 2/14/31(2) | 3,250 | 3,262 | |
| United AirLines, Inc. Tranche B (1 month Term SOFR + 3.864%) 9.220%, 4/21/28(2) | 5,202 | 5,213 | |
| Vertex Aerospace Services Corp. 2023 (1 month Term SOFR + 3.350%) 8.706%, 12/6/28(2) | 5,122 | 5,124 | |
| 123,994 | |||
| Par Value | Value | ||
| Chemicals—6.0% | |||
| ARC Falcon I, Inc. | |||
| (1 month Term SOFR + 3.600%) 8.956%, 9/30/28(2) | $ 5,669 | $ 5,598 | |
| (1 month Term SOFR + 7.100%) 12.456%, 9/30/29(2) | 5,000 | 4,488 | |
| Ascend Performance Materials Operations LLC 2021 (3 month Term SOFR + 4.850%) 10.317%, 8/27/26(2) | 5,033 | 4,828 | |
| Chemours Co. (The) Tranche B-3 (1 month Term SOFR + 3.500%) 8.856%, 8/18/28(2) | 2,623 | 2,616 | |
| Consolidated Energy Finance S.A. | |||
| (1 month Term SOFR + 2.600%) 7.956%, 5/7/25(2) | 7,376 | 7,137 | |
| (1 month Term SOFR + 3.600%) 8.956%, 5/7/25(2) | 1,290 | 1,252 | |
| Cyanco Intermediate 2 Corp. Tranche B (1 month Term SOFR + 4.750%) 10.106%, 6/29/28(2) | 3,741 | 3,747 | |
| Geon Performance Solutions LLC (3 month Term SOFR + 5.012%) 10.360%, 8/18/28(2) | 3,997 | 3,987 | |
| Herens Holdco S.a.r.l. Tranche B (3 month Term SOFR + 4.025%) 9.373%, 7/3/28(2) | 4,412 | 3,984 | |
| Hexion Holdings Corp. Second Lien (1 month Term SOFR + 7.848%) 13.203%, 3/15/30(2) | 4,305 | 3,600 | |
| Ineos Enterprises Holdings U.S. Finco LLC Tranche B (3 month Term SOFR + 3.850%) 9.238%, 7/7/30(2) | 4,420 | 4,414 | |
| Ineos U.S. Finance LLC 2030 (1 month Term SOFR + 3.600%) 8.956%, 2/18/30(2) | 7,411 | 7,411 | |
| Ineos U.S. Petrochem LLC Tranche B (1 month Term SOFR + 4.350%) 9.706%, 3/9/29(2) | 3,755 | 3,717 | |
| LSF11 A5 Holdco LLC (1 month Term SOFR + 4.350%) 9.706%, 10/15/28(2) | 1,990 | 1,993 | |
| LSF11 AS Holdco LLC (1 month Term SOFR + 3.614%) 8.970%, 10/15/28(2) | 2,977 | 2,979 | |
| Manchester Acquisition Sub LLC (3 month Term SOFR + 5.900%) 11.277%, 12/1/26(2) | 4,940 | 4,330 | |
| Neptune Husky U.S. Bidco LLC (3 month Term SOFR + 5.250%) 10.434%, 1/3/29(2) | 5,043 | 2,227 | |
| PMHC II, Inc. (3 month Term SOFR + 4.400%) 9.807%, 4/23/29(2) | 5,767 | 5,503 | |
| Trinseo Materials Operating SCA 2021 (3 month Term SOFR + 2.762%) 8.150%, 5/3/28(2) | 5,036 | 3,916 | |
| Tronox Finance LLC | |||
| 2022, First Lien (1 month Term SOFR + 3.250%) 8.598%, 4/4/29(2) | 1,515 | 1,514 | |
| 2023 (3 month Term SOFR + 3.500%) 8.848%, 8/16/28(2) | 2,930 | 2,924 | |
| Vantage Specialty Chemicals, Inc. 2023, First Lien (1 month Term SOFR + 4.750%) 10.108%, 10/26/26(2) | 4,277 | 4,111 | |
| Par Value | Value | ||
| Chemicals—continued | |||
| Windsor Holdings III LLC Tranche B (1 month Term SOFR + 4.500%) 9.841%, 8/1/30(2) | $ 5,601 | $ 5,631 | |
| 91,907 | |||
| Consumer Durables—0.7% | |||
| Lakeshore Learning Materials (1 month Term SOFR + 3.614%) 8.970%, 9/29/28(2) | 4,497 | 4,489 | |
| Safety Products | |||
| First Lien (1 month Term SOFR + 4.600%) 9.956%, 6/26/26(2) | 1,863 | 1,815 | |
| First Lien (1 month Term SOFR + 4.600%) 9.956%, 6/28/26(2) | 101 | 98 | |
| Weber-Stephen Products LLC | |||
| 2022, Tranche B (1 month Term SOFR + 4.350%) 9.706%, 10/30/27(2) | 1,916 | 1,668 | |
| Tranche B (1 month Term SOFR + 3.364%) 8.720%, 10/30/27(2) | 3,622 | 3,155 | |
| 11,225 | |||
| Consumer Non-Durables—0.4% | |||
| ABG Intermediate Holdings 2 LLC Tranche B-1 (1 month Term SOFR + 3.600%) 8.956%, 12/21/28(2) | 4,344 | 4,360 | |
| Ascena Retail Group, Inc. Tranche B (3 month LIBOR + 4.500%) 0.000%, 8/21/22(3)(4) | 2,496 | 9 | |
| Recess Holdings, Inc. (3 month Term SOFR + 4.000%) 9.388%, 3/24/27(2) | 2,085 | 2,095 | |
| 6,464 | |||
| Energy—4.7% | |||
| AL NGPL Holdings LLC (1 month Term SOFR + 3.500%) 8.845%, 4/14/28(2) | 5,253 | 5,250 | |
| BCP Renaissance Parent LLC Tranche B-4 (3 month Term SOFR + 3.500%) 8.871%, 10/31/28(2) | 4,505 | 4,510 | |
| Bip Pipeco Holdings LLC (1 month Term SOFR + 3.250%) 8.616%, 12/5/30(2) | 2,495 | 2,486 | |
| Brazos Delaware II LLC (1 month Term SOFR + 3.750%) 9.108%, 2/11/30(2) | 5,247 | 5,253 | |
| Buckeye Partners LP 2023, Tranche B-2 (1 month Term SOFR + 2.500%) 7.856%, 11/22/30(2) | 3,435 | 3,445 | |
| Championx Corp. Tranche B-2 (1 month Term SOFR + 2.850%) 8.206%, 6/7/29(2) | 6,009 | 6,022 | |
| GIP III Stetson I LP (1 month Term SOFR + 4.350%) 9.706%, 10/31/28(2) | 5,156 | 5,152 | |
| GIP Pilot Acquisition Partners LP (3 month Term SOFR + 3.000%) 8.388%, 10/4/30(2) | 1,670 | 1,669 | |
| Invenergy Thermal Operating I LLC Tranche C (3 month Term SOFR + 4.500%) 9.810%, 8/14/29(2) | 345 | 344 | |
| M6 ETX Holdings II Midco LLC (1 month Term SOFR + 4.600%) 9.955%, 9/19/29(2) | 5,923 | 5,929 | |
| Par Value | Value | ||
| Energy—continued | |||
| Medallion Midland Acquisition LLC First Lien (3 month Term SOFR + 3.500%) 8.864%, 10/18/28(2) | $ 2,999 | $ 3,007 | |
| New Fortress Energy, Inc. (3 month Term SOFR + 5.000%) 10.390%, 10/30/28(2) | 10,150 | 9,972 | |
| Oryx Midstream Services Permian Basin LLC 2023 (1 month Term SOFR + 3.364%) 8.710%, 10/5/28(2) | 6,508 | 6,517 | |
| Par Petroleum LLC Tranche B (3 month Term SOFR + 4.350%) 9.738%, 2/28/30(2) | 8,878 | 8,871 | |
| Whitewater Whistler Holdings LLC Tranche B-1 (3 month Term SOFR + 2.750%) 8.188%, 2/15/30(2) | 3,473 | 3,476 | |
| 71,903 | |||
| Financials—8.5% | |||
| Advisor Group Holdings, Inc. Tranche B-2 (1 month Term SOFR + 4.500%) 0.000%, 8/17/28(2)(5) | 5,750 | 5,762 | |
| Apollo Commercial Real Estate Finance, Inc. (1 month Term SOFR + 2.864%) 8.220%, 5/15/26(2) | 4,241 | 4,173 | |
| Aretec Group, Inc. Tranche B-1 (1 month Term SOFR + 4.600%) 9.956%, 8/9/30(2) | 7,182 | 7,166 | |
| Asurion LLC | |||
| Tranche B-10 (1 month Term SOFR + 4.100%) 9.456%, 8/19/28(2) | 1,572 | 1,563 | |
| Tranche B-11 (1 month Term SOFR + 4.350%) 9.706%, 8/21/28(2) | 16,444 | 16,364 | |
| Tranche B-4 (1 month Term SOFR + 5.364%) 10.720%, 1/20/29(2) | 10,796 | 10,152 | |
| Blackstone Mortgage Trust, Inc. Tranche B (1 month Term SOFR + 2.864%) 8.220%, 4/23/26(2) | 4,899 | 4,826 | |
| Castlelake Aviation One Designated Activity Co. 2023 (3 month Term SOFR + 2.750%) 8.135%, 10/22/27(2) | 3,335 | 3,337 | |
| Citadel Securities LP Tranche B (1 month Term SOFR + 2.614%) 7.970%, 7/29/30(2) | 8,602 | 8,613 | |
| CTC Holdings LP (3 month Term SOFR + 5.150%) 10.522%, 2/20/29(2) | 5,529 | 5,473 | |
| DRW Holdings LLC First Lien (1 month Term SOFR + 3.864%) 9.220%, 3/1/28(2) | 9,009 | 8,987 | |
| EIG Management Co. LLC (1 month Term SOFR + 3.850%) 9.206%, 2/24/25(2) | 5,466 | 5,452 | |
| Finco I LLC 2023 (3 month Term SOFR + 3.000%) 8.383%, 6/27/29(2) | 4,909 | 4,923 | |
| HighTower Holding LLC (3 month Term SOFR + 4.262%) 9.641%, 4/21/28(2) | 5,440 | 5,415 | |
| Hudson River Trading LLC (1 month Term SOFR + 3.114%) 8.470%, 3/20/28(2) | 5,217 | 5,194 | |
| Jane Street Group LLC (1 month Term SOFR + 2.864%) 8.220%, 1/26/28(2) | 4,033 | 4,044 | |
| Par Value | Value | ||
| Financials—continued | |||
| Jones DesLauriers Insurance Management, Inc. 2023 (3 month Term SOFR + 4.250%) 9.624%, 3/15/30(2) | $ 3,410 | $ 3,420 | |
| Nexus Buyer LLC | |||
| (1 month Term SOFR + 3.850%) 9.206%, 11/9/26(2) | 3,063 | 3,026 | |
| (1 month Term SOFR + 4.500%) 9.860%, 12/11/28(2) | 880 | 872 | |
| OneDigital Borrower LLC 2021, Tranche B (1 month Term SOFR + 4.350%) 9.706%, 11/16/27(2) | 6,281 | 6,269 | |
| Superannuation and Investments U.S. LLC (1 month Term SOFR + 3.864%) 9.220%, 12/1/28(2) | 4,136 | 4,137 | |
| VFH Parent LLC (1 month Term SOFR + 3.100%) 8.456%, 1/13/29(2) | 6,668 | 6,673 | |
| WH Borrower LLC | |||
| (3 month Term SOFR + 5.500%) 10.903%, 2/15/27(2) | 3,870 | 3,843 | |
| 2023-1 (3 month Term SOFR + 5.500%) 10.903%, 2/15/27(2) | 99 | 98 | |
| 129,782 | |||
| Food / Tobacco—1.3% | |||
| Evergreen AcqCo 1 LP (3 month Term SOFR + 5.512%) 10.860%, 4/26/28(2) | 2,059 | 2,062 | |
| Naked Juice LLC | |||
| (3 month Term SOFR + 3.350%) 8.698%, 1/24/29(2) | 2,175 | 2,098 | |
| Second Lien (3 month Term SOFR + 6.100%) 11.448%, 1/24/30(2) | 2,370 | 1,896 | |
| Primary Products Finance LLC (3 month Term SOFR + 4.150%) 9.546%, 3/30/29(2) | 5,342 | 5,345 | |
| Quirch Foods Holdings LLC (3 month Term SOFR + 5.012%) 10.387%, 10/27/27(2) | 5,436 | 5,426 | |
| Whole Earth Brands, Inc. (3 month Term SOFR + 4.650%) 9.998%, 2/5/28(2) | 3,017 | 2,565 | |
| 19,392 | |||
| Forest Prod / Containers—1.9% | |||
| Domtar Corp. (1 month Term SOFR + 5.614%) 10.970%, 11/30/28(2) | 8,170 | 8,008 | |
| Klockner Pentaplast of America, Inc. Tranche B (6 month Term SOFR + 4.975%) 10.476%, 2/12/26(2) | 7,352 | 6,897 | |
| Schweitzer-Mauduit International, Inc. Tranche B (1 month Term SOFR + 3.864%) 9.220%, 4/20/28(2) | 3,781 | 3,753 | |
| Spa Holdings 3 Oy Tranche B (3 month Term SOFR + 4.262%) 9.610%, 2/4/28(2) | 5,799 | 5,770 | |
| Trident TPI Holdings, Inc. Tranche B-5 (3 month Term SOFR + 4.500%) 9.848%, 9/15/28(2) | 4,553 | 4,551 | |
| 28,979 | |||
| Par Value | Value | ||
| Gaming / Leisure—4.1% | |||
| Aimbridge Acquisition Co., Inc. (1 month Term SOFR + 3.864%) 9.220%, 2/2/26(2) | $ 2,956 | $ 2,744 | |
| AP Gaming I LLC Tranche B (1 month Term SOFR + 4.100%) 9.456%, 2/15/29(2) | 3,046 | 3,050 | |
| Bombardier Recreational Products, Inc. 2023 (1 month Term SOFR + 2.750%) 8.106%, 12/13/29(2) | 6,913 | 6,895 | |
| Caesars Entertainment, Inc. Tranche B (1 month Term SOFR + 3.350%) 8.706%, 2/6/30(2) | 3,102 | 3,106 | |
| Deluxe Entertainment Services Group, Inc., PIK Interest Capitalization Second Lien (3 month PRIME + 8.500%) 16.000%, 9/25/24(3)(4)(6) | 4,451 | — | |
| Flutter Entertainment plc 2028, Tranche B (3 month Term SOFR + 3.250%) 8.863%, 7/22/28(2) | 1,805 | 1,809 | |
| Flutter Entertainment Public Ltd Co. Tranche B (3 month Term SOFR + 2.350%) 7.698%, 11/25/30(2) | 4,290 | 4,294 | |
| Four Seasons Hotels Ltd. 2022 (1 month Term SOFR + 2.600%) 7.956%, 11/30/29(2) | 4,986 | 4,999 | |
| Herschend Entertainment Co. LLC (1 month Term SOFR + 3.864%) 9.220%, 8/27/28(2) | 4,379 | 4,380 | |
| Ontario Gaming GTA Ltd. Partnership Tranche B (3 month Term SOFR + 4.250%) 9.598%, 8/1/30(2) | 3,265 | 3,276 | |
| Oyo Hospitality Netherlands B.V. (3 month Term SOFR + 8.512%) 13.883%, 6/23/26(2) | 4,303 | 3,916 | |
| Playa Hotels & Resorts B.V. (1 month Term SOFR + 3.250%) 8.608%, 1/5/29(2) | 9,692 | 9,700 | |
| Scientific Games International, Inc. Tranche B (1 month Term SOFR + 3.100%) 8.465%, 4/16/29(2) | 11,520 | 11,538 | |
| Travel Leisure Co 2023 (3 month Term SOFR + 3.350%) 8.708%, 12/14/29(2) | 3,642 | 3,646 | |
| 63,353 | |||
| Health Care—7.0% | |||
| AHP Health Partners, Inc. (1 month Term SOFR + 3.614%) 8.970%, 8/24/28(2) | 9,326 | 9,346 | |
| FINThrive Software Intermediate Holdings, Inc. | |||
| (1 month Term SOFR + 4.114%) 9.470%, 12/18/28(2) | 3,115 | 2,470 | |
| Second Lien (1 month Term SOFR + 6.750%) 12.110%, 12/17/29(2) | 2,115 | 1,244 | |
| ICON Luxembourg S.a.r.l. (3 month Term SOFR + 2.512%) 7.860%, 7/3/28(2) | 3,422 | 3,432 | |
| Indivior Finance S.a r.l. (3 month Term SOFR + 5.512%) 10.860%, 6/30/26(2) | 3,812 | 3,793 | |
| Insulet Corp. Tranche B (1 month Term SOFR + 3.364%) 8.720%, 5/4/28(2) | 5,401 | 5,411 | |
| Par Value | Value | ||
| Health Care—continued | |||
| Medical Solutions Holdings, Inc. (1 month Term SOFR + 3.350%) 8.706%, 11/1/28(2) | $ 6,383 | $ 5,939 | |
| Medline Borrower LP (1 month Term SOFR + 3.114%) 8.470%, 10/23/28(2) | 11,359 | 11,405 | |
| MPH Acquisition Holdings LLC (3 month Term SOFR + 4.512%) 9.900%, 9/1/28(2) | 5,273 | 5,070 | |
| NAPA Management Services Corp. (1 month Term SOFR + 5.350%) 10.706%, 2/23/29(2) | 6,386 | 5,837 | |
| National Mentor Holdings, Inc. | |||
| First Lien (1-3 month Term SOFR + 3.850%) 9.198% - 9.206%, 3/2/28(2) | 5,574 | 5,045 | |
| Tranche C, First Lien (3 month Term SOFR + 3.850%) 9.198%, 3/2/28(2) | 168 | 152 | |
| Onex TSG Intermediate Corp. (3 month Term SOFR + 5.012%) 10.395%, 2/28/28(2) | 4,342 | 4,272 | |
| Organon & Co. (1 month Term SOFR + 3.114%) 8.472%, 6/2/28(2) | 12,715 | 12,722 | |
| PetIQ, Inc. First Lien (3 month Term SOFR + 4.678%) 10.167%, 4/13/28(2) | 4,582 | 4,537 | |
| Physician Partners LLC (3 month Term SOFR + 4.150%) 9.533%, 12/22/28(2) | 6,079 | 5,730 | |
| PRA Health Sciences, Inc. (3 month Term SOFR + 2.512%) 7.860%, 7/3/28(2) | 853 | 855 | |
| Sotera Health Holdings LLC (1 month Term SOFR + 3.750%) 9.106%, 12/11/26(2) | 3,497 | 3,495 | |
| Star Parent, Inc. Tranche B (3 month Term SOFR + 4.000%) 9.348%, 9/28/30(2) | 6,490 | 6,406 | |
| Surgery Center Holdings, Inc. First Lien (1 month Term SOFR + 3.500%) 8.835%, 12/19/30(2) | 4,160 | 4,172 | |
| Team Health Holdings, Inc. (3 month Term SOFR + 5.250%) 10.633%, 3/2/27(2) | 8,554 | 6,475 | |
| 107,808 | |||
| Housing—3.0% | |||
| 84 Lumber Co. (1 month Term SOFR + 2.850%) 8.206%, 11/15/30(2) | 3,000 | 3,005 | |
| ACProducts Holdings, Inc. (3 month Term SOFR + 4.512%) 9.860%, 5/17/28(2) | 8,535 | 7,466 | |
| Cushman & Wakefield U.S. Borrower LLC | |||
| (1 month Term SOFR + 2.864%) 8.220%, 8/21/25(2) | 279 | 279 | |
| 2023-1 (1 month Term SOFR + 3.350%) 8.706%, 1/31/30(2) | 3,661 | 3,624 | |
| 2023-2 (1 month Term SOFR + 4.000%) 9.356%, 1/31/30(2) | 2,291 | 2,285 | |
| Empire Today LLC (1 month Term SOFR + 5.114%) 10.470%, 4/3/28(2) | 3,068 | 2,376 | |
| Foley Products Co. LLC (3 month Term SOFR + 4.900%) 10.248%, 12/29/28(2) | 4,098 | 4,101 | |
| Par Value | Value | ||
| Housing—continued | |||
| Forest City Enterprises LP Tranche B (1 month Term SOFR + 3.614%) 8.970%, 12/8/25(2) | $ 5,611 | $ 5,307 | |
| Griffon Corp. Tranche B (3 month Term SOFR + 2.400%) 7.748%, 1/24/29(2) | 5 | 5 | |
| Oscar Acquisitionco LLC Tranche B (3 month Term SOFR + 4.600%) 9.948%, 4/29/29(2) | 9,336 | 9,231 | |
| Smyrna Ready Mix Concrete LLC Tranche B (1 month Term SOFR + 3.500%) 8.858%, 4/2/29(2) | 2,713 | 2,717 | |
| Snap One Holdings Corp. (3 month Term SOFR + 4.650%) 9.998%, 12/8/28(2) | 6,239 | 6,036 | |
| 46,432 | |||
| Information Technology—9.2% | |||
| Cloud Software Group, Inc. Tranche A (2-3 month Term SOFR + 4.600%) 9.848% - 9.948%, 9/29/28(2) | 18,211 | 17,719 | |
| Coherent Corp. Tranche B (1 month Term SOFR + 2.864%) 8.220%, 7/2/29(2) | 37 | 37 | |
| ConvergeOne Holdings Corp. First Lien (3 month PRIME + 4.000%) 12.500%, 1/4/26(2) | 4,254 | 2,356 | |
| Creation Technologies, Inc. (3 month Term SOFR + 5.762%) 11.176%, 10/5/28(2) | 6,659 | 6,459 | |
| GTCR W Merger Sub LLC Tranche B (1 month Term SOFR + 3.000%) 0.000%, 9/20/30(2)(5) | 6,590 | 6,615 | |
| Instructure Holdings, Inc. (3 month Term SOFR + 3.178%) 8.679%, 10/30/28(2) | 3,345 | 3,357 | |
| Iron Mountain Information Management LLC Tranche B (1 month Term SOFR + 2.250%) 7.607%, 1/31/31(2) | 3,875 | 3,873 | |
| Lendingtree, Inc. Tranche B (1 month Term SOFR + 3.864%) 9.213%, 9/15/28(2) | 6,077 | 5,599 | |
| Magenta Buyer LLC | |||
| First Lien (3 month Term SOFR + 5.262%) 10.645%, 7/27/28(2) | 6,537 | 4,592 | |
| Second Lien (3 month Term SOFR + 8.512%) 13.895%, 7/27/29(2) | 2,540 | 965 | |
| Magnite, Inc. (1-3 month Term SOFR + 5.262%) 10.474% - 10.650%, 4/28/28(2) | 5,709 | 5,713 | |
| McAfee Corp. Tranche B-1 (1 month Term SOFR + 3.850%) 9.193%, 3/1/29(2) | 7,855 | 7,801 | |
| Mermaid Bidco, Inc. Tranche B-2 (3 month Term SOFR + 4.500%) 9.875%, 12/22/27(2) | 5,937 | 5,959 | |
| MKS Instruments, Inc. 2023-1, Tranche B (1 month Term SOFR + 2.500%) 7.841%, 8/17/29(2) | 3,464 | 3,468 | |
| Open Text Corp. Tranche B (1 month Term SOFR + 2.850%) 8.206%, 1/31/30(2) | 9,497 | 9,513 | |
| Par Value | Value | ||
| Information Technology—continued | |||
| Orchid Merger Sub II LLC (3 month Term SOFR + 4.900%) 10.290%, 7/27/27(2) | $ 5,023 | $ 2,964 | |
| Rackspace Technology Global, Inc. Tranche B (1 month Term SOFR + 2.864%) 8.230%, 2/15/28(2) | 7,537 | 3,260 | |
| Red Planet Borrower LLC First Lien (1 month Term SOFR + 3.850%) 9.206%, 10/2/28(2) | 4,980 | 4,776 | |
| Sabre GLBL, Inc. 2022, Tranche B-2 (1 month Term SOFR + 5.100%) 10.456%, 6/30/28(2) | 8,016 | 7,098 | |
| TIBCO Software, Inc. 2022, Tranche B (2-3 month Term SOFR + 4.600%) 9.948%, 3/30/29(2) | 1,995 | 1,945 | |
| Ultra Clean Holdings, Inc. Tranche B (1 month Term SOFR + 3.864%) 9.220%, 8/27/25(2) | 12,059 | 12,069 | |
| UST Global, Inc. (1 month Term SOFR + 3.614%) 8.955%, 11/20/28(2) | 4,806 | 4,778 | |
| Virtusa Corp. | |||
| Tranche B (1 month Term SOFR + 3.864%) 9.220%, 2/11/28(2) | 7,324 | 7,327 | |
| Tranche B-1 (1 month Term SOFR + 3.850%) 9.206%, 2/15/29(2) | 1,179 | 1,179 | |
| Xperi Holding Corp. Tranche B (1 month Term SOFR + 3.614%) 8.970%, 6/8/28(2) | 11,414 | 11,388 | |
| 140,810 | |||
| Manufacturing—1.1% | |||
| Chart Industries, Inc. Tranche B (1 month Term SOFR + 3.350%) 8.691%, 3/15/30(2) | 3,053 | 3,056 | |
| CPM Holdings, Inc. (1 month Term SOFR + 4.500%) 9.843%, 9/28/28(2) | 4,175 | 4,186 | |
| VM Consolidated, Inc. (1 month Term SOFR + 3.364%) 8.720%, 3/24/28(2) | 4,110 | 4,124 | |
| WireCo WorldGroup, Inc. 2024, Tranche B (1 month Term SOFR + 4.250%) 0.000%, 11/13/28(2)(5) | 5,903 | 5,888 | |
| 17,254 | |||
| Media / Telecom - Broadcasting—1.6% | |||
| Sinclair Television Group, Inc. | |||
| Tranche B-2 (1 month Term SOFR + 2.614%) 7.970%, 9/30/26(2) | 5,779 | 5,284 | |
| Tranche B-3 (1 month Term SOFR + 3.114%) 8.470%, 4/1/28(2) | 3,652 | 2,999 | |
| Terrier Media Buyer, Inc. 2021, Tranche B (3 month Term SOFR + 3.600%) 8.948%, 12/17/26(2) | 5,482 | 5,057 | |
| United Talent Agency LLC Tranche B (3 month Term SOFR + 4.262%) 9.650%, 7/7/28(2) | 3,312 | 3,313 | |
| Par Value | Value | ||
| Media / Telecom - Broadcasting—continued | |||
| Univision Communications, Inc. 2021 (1 month Term SOFR + 3.364%) 8.720%, 3/15/26(2) | $ 7,063 | $ 7,070 | |
| 23,723 | |||
| Media / Telecom - Cable/Wireless Video—4.4% | |||
| Charter Communications Operating LLC Tranche B-4 (1 month Term SOFR + 2.000%) 7.360%, 12/7/30(2) | 8,830 | 8,793 | |
| Cogeco Communications Finance USA LP Tranche B-1 (1 month Term SOFR + 3.250%) 8.606%, 9/18/30(2) | 3,515 | 3,456 | |
| Coral-U.S. Co-Borrower LLC Tranche B-6 (2 month Term SOFR + 3.190%) 8.543%, 10/15/29(2) | 6,000 | 5,976 | |
| CSC Holdings LLC | |||
| 2017 (1 month LIBOR + 2.250%) 7.726%, 7/17/25(2) | 8,299 | 8,151 | |
| 2019 (1 month LIBOR + 2.500%) 7.948%, 4/15/27(2) | 2,000 | 1,890 | |
| 2022 (1 month Term SOFR + 4.500%) 9.833%, 1/18/28(2) | 2,650 | 2,556 | |
| DIRECTV Financing LLC (3 month Term SOFR + 5.262%) 10.650%, 8/2/27(2) | 8,069 | 8,060 | |
| Radiate Holdco LLC (1 month Term SOFR + 3.364%) 8.720%, 9/25/26(2) | 10,216 | 8,143 | |
| Virgin Media Bristol LLC Tranche N (1 month Term SOFR + 2.614%) 7.976%, 1/31/28(2) | 11,256 | 11,199 | |
| Wide Open West Finance LLC Tranche B (3 month Term SOFR + 3.000%) 8.348%, 12/20/28(2) | 2,499 | 2,301 | |
| Ziggo Financing Partnership Tranche I (1 month Term SOFR + 2.614%) 7.976%, 4/30/28(2) | 7,166 | 7,138 | |
| 67,663 | |||
| Media / Telecom - Diversified Media—3.4% | |||
| Allen Media LLC Tranche B (3 month Term SOFR + 5.650%) 10.998%, 2/10/27(2) | 7,633 | 6,755 | |
| Applovin Corp. | |||
| (1 month Term SOFR + 3.100%) 8.456%, 10/25/28(2) | 5,431 | 5,431 | |
| (1 month Term SOFR + 3.100%) 8.456%, 8/14/30(2) | 3,169 | 3,169 | |
| Banijay Entertainment SAS Tranche B (1 month Term SOFR + 3.850%) 9.191%, 3/1/28(2) | 6,226 | 6,237 | |
| Digital Media Solutions LLC PIK (3 month Term SOFR + 11.262%) 16.610%, 5/25/26(2)(6) | 4,076 | 2,038 | |
| E.W. Scripps Co. (The) Tranche B-2 (1 month Term SOFR + 2.677%) 8.033%, 5/1/26(2) | 4,305 | 4,286 | |
| Houghton Mifflin Harcourt Co. Tranche B, First Lien (1 month Term SOFR + 5.350%) 10.706%, 4/9/29(2) | 4,676 | 4,573 | |
| Par Value | Value | ||
| Media / Telecom - Diversified Media—continued | |||
| McGraw-Hill Education, Inc. (1 month Term SOFR + 4.864%) 10.220%, 7/28/28(2) | $ 4,000 | $ 3,991 | |
| MH Sub I LLC | |||
| 2023 (1 month Term SOFR + 4.250%) 9.606%, 5/3/28(2) | 3,731 | 3,662 | |
| Second Lien (1 month Term SOFR + 6.250%) 11.606%, 2/23/29(2) | 2,565 | 2,381 | |
| Neptune Bidco U.S., Inc. Tranche B (3 month Term SOFR + 5.100%) 10.507%, 4/11/29(2) | 3,955 | 3,604 | |
| Overdrive, Inc. First Lien (1 month Term SOFR + 4.250%) 9.583%, 6/15/28(2) | 2,564 | 2,558 | |
| UPC Financing Partnership Tranche AX (1 month Term SOFR + 3.114%) 8.476%, 1/31/29(2) | 3,000 | 2,986 | |
| 51,671 | |||
| Media / Telecom - Telecommunications—6.2% | |||
| Altice Financing S.A. | |||
| 2017 (3 month Term SOFR + 2.750%) 8.405%, 7/15/25(2) | 1,399 | 1,384 | |
| 2022 (3 month Term SOFR + 5.000%) 10.394%, 10/29/27(2) | 21,072 | 20,927 | |
| Connect U.S. Finco LLC (1 month Term SOFR + 3.500%) 8.856%, 12/11/26(2) | 11,198 | 11,191 | |
| Consolidated Communications, Inc. Tranche B-1 (1 month Term SOFR + 3.614%) 8.970%, 10/2/27(2) | 3,768 | 3,493 | |
| Guardian U.S. Holdco LLC (3 month Term SOFR + 4.000%) 9.348%, 1/31/30(2) | 5,492 | 5,504 | |
| Lumen Technologies, Inc. Tranche B (1 month Term SOFR + 2.364%) 7.720%, 3/15/27(2) | 8,057 | 5,507 | |
| Numericable U.S. LLC Tranche B-14 (3 month Term SOFR + 5.500%) 10.894%, 8/15/28(2) | 23,931 | 21,428 | |
| Patagonia Holdco LLC (3 month Term SOFR + 5.750%) 11.116%, 8/1/29(2) | 4,384 | 3,968 | |
| Voyage Digital NZ Ltd. (3 month Term SOFR + 4.000%) 9.367%, 5/11/29(2) | 3,893 | 3,884 | |
| Zacapa S.a.r.l. 2022 (3 month Term SOFR + 4.038%) 9.348%, 3/22/29(2) | 17,646 | 17,580 | |
| 94,866 | |||
| Media / Telecom - Wireless Communications—1.1% | |||
| Crown Subsea Communications Holding, Inc. (1 month Term SOFR + 5.114%) 10.457%, 4/27/27(2) | 4,174 | 4,194 | |
| Venga Finance S.a.r.l. (3 month Term SOFR + 5.012%) 10.400%, 6/28/29(2) | 12,187 | 12,073 | |
| 16,267 | |||
| Metals / Minerals—1.3% | |||
| AMG Advanced Metallurgical Group N.V. 2021 (1 month Term SOFR + 3.614%) 8.970%, 11/30/28(2) | 4,611 | 4,586 | |
| Par Value | Value | ||
| Metals / Minerals—continued | |||
| Arsenal Aic Parent LLC Tranche B (1 month Term SOFR + 4.500%) 9.856%, 8/19/30(2) | $ 5,279 | $ 5,294 | |
| Oxbow Carbon LLC Tranche B (1-3 month Term SOFR + 4.100%) 9.448% - 9.456%, 5/10/30(2) | 6,457 | 6,440 | |
| TMS International Corp. Tranche B-4 (1-3 month Term SOFR + 4.750%) 10.106% - 10.133%, 3/2/30(2) | 3,945 | 3,965 | |
| 20,285 | |||
| Retail—1.6% | |||
| Academy Ltd. (1 month Term SOFR + 3.864%) 9.207%, 11/5/27(2) | 2,645 | 2,644 | |
| Belk, Inc. First Lien PIK (3 month PRIME + 6.500%) 15.000%, 7/31/25(2)(7) | 4,375 | 3,937 | |
| CWGS Group LLC (1 month Term SOFR + 2.614%) 7.970% - 7.972%, 6/3/28(2) | 6,324 | 6,168 | |
| Jo-Ann Stores LLC Tranche B-1 (3 month Term SOFR + 5.012%) 10.391%, 7/7/28(2) | 4,295 | 196 | |
| LSF9 Atlantis Holdings LLC Tranche B (3 month Term SOFR + 7.250%) 12.598%, 3/31/29(2) | 4,279 | 4,167 | |
| Petco Health & Wellness Co., Inc. First Lien (3 month Term SOFR + 3.512%) 8.860%, 3/3/28(2) | 3,476 | 3,279 | |
| Restoration Hardware, Inc. 2022 (1 month Term SOFR + 3.350%) 8.706%, 10/20/28(2) | 3,506 | 3,414 | |
| Rising Tide Holdings, Inc. 2023 (3 month Term SOFR + 6.250%) 11.616%, 3/11/24(2) | 630 | 529 | |
| 24,334 | |||
| Service—6.3% | |||
| Adtalem Global Education, Inc. Tranche B (1 month Term SOFR + 4.114%) 9.470%, 8/12/28(2) | 6,563 | 6,569 | |
| Altisource S.a.r.l. Tranche B PIK (3 month Term SOFR + 8.850%) 14.198%, 4/3/24(2)(8) | 3,267 | 2,591 | |
| American Public Education, Inc. (1 month Term SOFR + 5.615%) 10.971%, 3/29/27(2) | 2,161 | 2,139 | |
| Apex Group Treasury Ltd. | |||
| 2022 (3 month Term SOFR + 5.000%) 10.403%, 7/27/28(2) | 594 | 592 | |
| First Lien (3 month Term SOFR + 4.012%) 9.377%, 7/27/28(2) | 4,934 | 4,910 | |
| APX Group, Inc. (3 month Term SOFR + 3.512% - 3 month PRIME + 2.250%) 8.924% - 10.750%, 7/10/28(2) | 5,057 | 5,053 | |
| ASP Dream Acquisition Co. LLC (1 month Term SOFR + 4.100%) 9.456%, 12/15/28(2) | 4,162 | 4,141 | |
| Belfor Holdings, Inc. Tranche B-1 (1 month Term SOFR + 3.750%) 9.106%, 11/1/30(2) | 8,500 | 8,516 | |
| Par Value | Value | ||
| Service—continued | |||
| Camelot U.S. Acquisition I Co. (1 month Term SOFR + 3.114%) 8.470%, 10/30/26(2) | $ 5,218 | $ 5,223 | |
| Conduent Business Services LLC Tranche B (1 month Term SOFR + 4.364%) 9.720%, 10/16/28(2) | 5,268 | 5,143 | |
| Employbridge Holding Co. Tranche B (3 month Term SOFR + 5.012%) 10.407%, 7/19/28(2) | 4,883 | 3,979 | |
| Energize Holdco LLC (1 month Term SOFR + 3.864%) 9.220%, 12/8/28(2) | 4,564 | 4,550 | |
| EverCommerce Solutions, Inc. (1 month Term SOFR + 3.114%) 8.470%, 7/6/28(2) | 3,535 | 3,534 | |
| Fugue Finance LLC Tranche B (3 month Term SOFR + 4.000%) 9.388%, 1/31/28(2) | 4,884 | 4,899 | |
| GFL Environmental, Inc. 2023 (3 month Term SOFR + 2.500%) 7.912%, 5/31/27(2) | 2,993 | 3,001 | |
| Lakeland Tours LLC First Lien 8.000%, 9/25/27 | 118 | 87 | |
| Omnia Partners LLC (3 month Term SOFR + 4.250%) 9.628%, 7/19/30(2) | 5,320 | 5,350 | |
| Priority Holdings LLC (1 month Term SOFR + 5.864%) 11.220%, 4/27/27(2) | 5,421 | 5,404 | |
| Signal Parent, Inc. (1 month Term SOFR + 3.600%) 8.956%, 4/3/28(2) | 5,565 | 4,939 | |
| St. George’s University Scholastic Services LLC (1 month Term SOFR + 3.350%) 8.706%, 2/10/29(2) | 4,632 | 4,627 | |
| Summer BC Bidco B LLC Tranche B-2 (3 month Term SOFR + 4.760%) 10.108%, 12/4/26(2) | 5,688 | 5,606 | |
| TTF Holdings LLC (1 month Term SOFR + 4.114%) 9.470%, 3/31/28(2) | 5,525 | 5,518 | |
| 96,371 | |||
| Transportation - Automotive—1.4% | |||
| American Axle & Manufacturing, Inc. Tranche B, First Lien (1-3 month Term SOFR + 3.600%) 8.957% - 9.007%, 12/13/29(2) | 5,246 | 5,260 | |
| Autokiniton U.S. Holdings, Inc. Tranche B (1 month Term SOFR + 4.614%) 9.970%, 4/6/28(2) | 8,453 | 8,479 | |
| Garrett LX I S.a.r.l. Tranche B (3 month Term SOFR + 4.500%) 9.883% - 9.869%, 4/30/28(2) | 3,572 | 3,571 | |
| ILPEA Parent, Inc. (1 month Term SOFR + 4.614%) 9.970%, 6/22/28(2) | 3,632 | 3,559 | |
| 20,869 | |||
| Transportation - Land Transportation—1.2% | |||
| Daseke Cos., Inc. (1 month Term SOFR + 4.114%) 9.470%, 3/9/28(2) | 6,204 | 6,188 | |
| GN Loanco LLC Tranche B (1 month Term SOFR + 4.500%) 9.856%, 9/20/30(2) | 5,185 | 4,904 | |
| Par Value | Value | ||
| Transportation - Land Transportation—continued | |||
| LaserShip, Inc. | |||
| First Lien (3 month Term SOFR + 4.928%) 10.396%, 5/7/28(2) | $ 5,460 | $ 5,001 | |
| Second Lien (3 month Term SOFR + 7.928%) 13.396%, 5/7/29(2) | 3,135 | 2,592 | |
| 18,685 | |||
| Utilities—3.3% | |||
| Eastern Power LLC Tranche B (1 month Term SOFR + 3.864%) 9.220%, 10/2/25(2) | 6,895 | 6,764 | |
| Generation Bridge Northeast LLC Tranche B (1 month Term SOFR + 4.250%) 9.606%, 8/7/29(2) | 3,813 | 3,824 | |
| Granite Generation LLC (1 month Term SOFR + 3.864%) 9.220%, 11/9/26(2) | 5,838 | 5,814 | |
| Helix Gen Funding LLC (1 month Term SOFR + 4.750%) 0.000%, 12/31/27(2)(5) | 1,893 | 1,896 | |
| Invenergy Thermal Operating I LLC Tranche B (1 month Term SOFR + 4.614%) 9.934%, 8/14/29(2) | 4,171 | 4,166 | |
| Lackawanna Energy Center LLC | |||
| Tranche B-2 (1 month Term SOFR + 5.000%) 10.356%, 8/6/29(2) | 5,864 | 5,785 | |
| Tranche C (1 month Term SOFR + 5.000%) 10.356%, 7/20/29(2) | 1,272 | 1,255 | |
| Talen Energy Supply LLC | |||
| Tranche B (3 month Term SOFR + 4.500%) 9.869%, 5/17/30(2) | 2,962 | 2,975 | |
| Tranche C (3 month Term SOFR + 4.500%) 9.869%, 5/17/30(2) | 2,412 | 2,423 | |
| Vistra Operations Co. LLC 2018 (1 month Term SOFR + 2.000%) 7.356%, 12/20/30(2) | 4,580 | 4,579 | |
| WaterBridge Midstream Operating LLC (3 month Term SOFR + 6.012%) 11.390%, 6/22/26(2) | 10,881 | 10,882 | |
| 50,363 | |||
| Total Leveraged Loans (Identified Cost $1,378,230) | 1,344,400 | ||
| Shares | ||
| Preferred Stock—0.1% | ||
| Energy—0.1% | ||
| Blackbrush Oil & Gas, 1.000%(3) | 14,521 | 1,278 |
| Total Preferred Stock (Identified Cost $46) | 1,278 | |
| Common Stocks—0.9% | ||
| Consumer Discretionary—0.5% | ||
| Belk, Inc.(3) | 1,562 | 13 |
| TRU Topco Units(3) | 1,866 | 6,691 |
| Wayne Services Legacy, Inc. (3) | 2,073 | — |
| West Marine(9) | 44,603 | 134 |
| 6,838 | ||
| Shares | Value | ||
| Energy—0.1% | |||
| Blackbrush Oil & Gas(3) | 437,150 | $ — | |
| Summit Midstream Partners LP(9) | 108,293 | 1,939 | |
| 1,939 | |||
| Financials—0.0% | |||
| Copper Property CTL Pass Through Trust(3) | 17,816 | 180 | |
| Health Care—0.0% | |||
| Envision Healthcare Corp.(3)(9) | 46,923 | 352 | |
| Information Technology—0.0% | |||
| Bright Bidco(3) | 26,953 | 10 | |
| Real Estate—0.0% | |||
| Hill Street Properties(3) | 229,735 | 450 | |
| Utilities—0.3% | |||
| Longview Intermediate Holdings LLC(3) | 350,306 | 4,642 | |
| Total Common Stocks (Identified Cost $13,025) | 14,411 | ||
| Rights—0.0% | |||
| Utilities—0.0% | |||
| Vistra Energy Corp., 12/29/49(3)(9) | 410,667 | 530 | |
| Total Rights (Identified Cost $554) | 530 | ||
| Warrants—0.0% | |||
| Consumer Discretionary—0.0% | |||
| West Marine, 06/01/29(3)(9) | 5,583 | — | |
| Real Estate—0.0% | |||
| Altisource Portfolio Solutions S.A. , 05/22/27(9) | 37,960 | 135 | |
| Total Warrants (Identified Cost $—) | 135 | ||
| Total Long-Term Investments—97.1% (Identified Cost $1,530,868) | 1,487,948 | ||
| Short-Term Investment—0.1% | |||
| Money Market Mutual Fund—0.1% | |||
| State Street Institutional U.S. Government Money Market Fund - Institutional Shares (seven-day effective yield 5.236%)(10) | 615,678 | 616 | |
| Total Short-Term Investment (Identified Cost $616) | 616 | ||
| TOTAL INVESTMENTS—97.2% (Identified Cost $1,531,484) | $1,488,564 | ||
| Other assets and liabilities, net—2.8% | 43,325 | ||
| NET ASSETS—100.0% | $1,531,889 | ||
| Abbreviations: | |
| CLO | Collateralized Loan Obligation |
| DAC | Designated Activity Company |
| LIBOR | London Interbank Offered Rate |
| LLC | Limited Liability Company |
| LP | Limited Partnership |
| PIK | Payment-in-Kind Security |
| REIT | Real Estate Investment Trust |
| SOFR | Secured Overnight Financing Rate |
| Footnote Legend: | |
| (1) | Security exempt from registration under Rule 144A of the Securities Act of 1933. These securities may be resold in transactions exempt from registration, normally to qualified institutional buyers. At December 31, 2023, these securities amounted to a value of $93,829 or 6.1% of net assets. |
| (2) | Variable rate security. Rate disclosed is as of December 31, 2023. Information in parenthesis represents benchmark and reference rate for each security. Certain variable rate securities are not based on a published reference rate and spread but are determined by the issuer or agent and are based on current market conditions, or, for mortgage-backed securities, are impacted by the individual mortgages which are paying off over time. These securities do not indicate a reference rate and spread in their descriptions. |
| (3) | The value of this security was determined using significant unobservable inputs and is reported as a Level 3 security in the Fair Value Hierarchy table located after the Schedule of Investments. |
| (4) | Security in default; no interest payments are being received. |
| (5) | This loan will settle after December 31, 2023, at which time the interest rate, calculated on the base lending rate and the agreed upon spread on trade date, will be reflected. |
| (6) | 100% of the income received was in PIK. |
| (7) | 100% of the income received was in cash. |
| (8) | 74% of the income received was in cash and 26% was in PIK. |
| (9) | Non-income producing. |
| (10) | Shares of this fund are publicly offered, and its prospectus and annual report are publicly available. |
| Country Weightings (Unaudited)† | |
| United States | 87% |
| Luxembourg | 5 |
| Canada | 3 |
| France | 2 |
| Netherlands | 2 |
| Ireland | 1 |
| Total | 100% |
| † % of total investments as of December 31, 2023. | |
| Borrower | Par Value | Commitment | Value | Unrealized Appreciation (Depreciation) | ||||
| Omnia Partners LLC, (3 month LIBOR + 4.250%) 0.000%, 7/19/30 | $500 | $495 | $503 | $8 |
| Total Value at December 31, 2023 | Level 1 Quoted Prices | Level 2 Significant Observable Inputs | Level 3 Significant Unobservable Inputs | ||||
| Assets: | |||||||
| Debt Instruments: | |||||||
| Asset-Backed Security | $ 4,941 | $ — | $ 4,941 | $ — | |||
| Convertible Bonds and Notes | 2,000 | — | 2,000 | — | |||
| Corporate Bonds and Notes | 120,253 | — | 120,253 | — | |||
| Leveraged Loans | 1,344,400 | — | 1,344,391 | 9 (1) | |||
| Equity Securities: | |||||||
| Preferred Stock | 1,278 | — | — | 1,278 | |||
| Common Stocks | 14,411 | 1,939 | 134 | 12,338 (1) | |||
| Rights | 530 | — | — | 530 | |||
| Warrants | 135 | — | 135 | — (1) | |||
| Money Market Mutual Fund | 616 | 616 | — | — | |||
| Total Investments | $1,488,564 | $2,555 | $1,471,854 | $14,155 |
| (1) | Includes internally fair valued securities currently priced at zero ($0). |
| Total | Leveraged Loans | Preferred Stocks | Common stock | Rights | Warrants | ||||||
| Investments in Securities | |||||||||||
| Balance as of December 31, 2022: | $ 40,561 | $ 6,690(a) | $ 14,654 | $ 18,724 (a) | $ 493 | $ — (a) | |||||
| Accrued discount/(premium) | 50 | 50 | — | — | — | — | |||||
| Net realized gain (loss) | (7,412) | (6,559) | — | (852) | — | (1) | |||||
| Net change in unrealized appreciation (depreciation)(b) | (9,308) | 4,821 | (9,213) | (4,954) | 37 | 1 | |||||
| Purchases | 2,783 | 2,797 | 211 | (225) | — | — | |||||
| Sales (c) | (9,555) | (4,826) | (4,374) | (355) | — | — | |||||
| Transfers from Level 3(d) | (2,964) | (2,964) | — | — | — | — | |||||
| Balance as of December 31, 2023 | $ 14,155 | $ 9(a) | $ 1,278 | $ 12,338 (a) | $ 530 | $ — (a) |
| Investments in Securities – Assets | Ending Balance at December 31, 2023 | Valuation Technique Used | Unobservable Inputs | Input Values | ||||
| Common Stocks: | ||||||||
| TRU Topco Units | $6,691 | Market and Company Comparables | EV Multiples | 7.07x (2.98x - 10.49x) | ||||
| 9.18x (4.77x - 12.14x) | ||||||||
| Precedent Transaction Multiples | 7.51x (5.50x - 10.50x) | |||||||
| Illiquidity Discount | 10% | |||||||
December 31, 2023
| Par Value | Value | ||
| Municipal Bonds(1)—98.0% | |||
| Alabama—5.7% | |||
| Jefferson County, | |||
| Sales Tax Revenue 5.000%, 9/15/33 | $1,000 | $ 1,072 | |
| Sales Tax Revenue 5.000%, 9/15/35 | 1,000 | 1,067 | |
| 2,139 | |||
| California—1.0% | |||
| State of California, General Obligation 4.000%, 9/1/43 | 370 | 387 | |
| Colorado—8.2% | |||
| E-470 Public Highway Authority | |||
| Toll Highway Revenue, Series A 5.000%, 9/1/35 | 800 | 909 | |
| Toll Highway Revenue, Series A 5.000%, 9/1/36 | 1,000 | 1,126 | |
| Regional Transportation District, Sales Tax Revenue, Series A 5.000%, 1/15/28 | 1,000 | 1,058 | |
| 3,093 | |||
| District of Columbia—6.8% | |||
| District of Columbia, General Obligation, Series D 5.000%, 6/1/31 | 1,000 | 1,066 | |
| Metropolitan Washington Airports Authority Aviation Revenue, Series A 5.000%, 10/1/28 | 1,000 | 1,007 | |
| Washington Metropolitan Area Transit Authority Dedicated Revenue, Sustainability Financed Bond 5.000%, 7/15/48 | 415 | 461 | |
| 2,534 | |||
| Florida—6.7% | |||
| City of Jacksonville, Series B 5.000%, 10/1/26 | 1,085 | 1,157 | |
| Miami-Dade Seaport Department County Revenue, Senior Bonds Series A (AMT) 5.250%, 10/1/52 | 1,000 | 1,088 | |
| Pasco County Revenue (AGM Insured) 5.750%, 9/1/54 | 250 | 284 | |
| 2,529 | |||
| Idaho—3.0% | |||
| Idaho Housing & Finance Association, Sales Tax Revenue, Series A 5.250%, 8/15/48 | 1,000 | 1,135 | |
| Illinois—2.9% | |||
| Illinois Finance Authority Revenue 5.000%, 7/1/28 | 1,000 | 1,071 | |
| Maryland—3.2% | |||
| Maryland Stadium Authority, Series A 5.000%, 3/1/36 | 1,000 | 1,184 | |
| Par Value | Value | ||
| Michigan—2.7% | |||
| Michigan State Hospital Finance Authority, Revenue, Series 200 4.000%, 11/1/24 | $1,010 | $ 1,019 | |
| Nevada—0.7% | |||
| Las Vegas Convention & Visitors Authority, Series A 5.000%, 7/1/49 | 240 | 263 | |
| New Jersey—5.9% | |||
| New Jersey Economic Development Authority, Series A 5.250%, 11/1/42 | 1,000 | 1,129 | |
| New Jersey Turnpike Authority Revenue, Toll Highway Revenue, Series G 5.000%, 1/1/36 | 1,000 | 1,084 | |
| 2,213 | |||
| New York—6.7% | |||
| City of New York, | |||
| General Obligation, Series A 5.000%, 8/1/51 | 410 | 454 | |
| General Obligation, Series B 5.250%, 10/1/47 | 500 | 565 | |
| General Obligation, Series D 5.500%, 5/1/44 | 1,000 | 1,165 | |
| New York Transportation Development Corp., | |||
| Revenue (AMT) 6.000%, 6/30/54 | 160 | 177 | |
| Revenue (AMT) (AGM Insured) 5.000%, 6/30/49 | 160 | 167 | |
| 2,528 | |||
| Ohio—0.3% | |||
| Hamilton County, Life Enriching Communities Pro Revenue, Series A 5.500%, 1/1/43 | 110 | 112 | |
| Oregon—2.8% | |||
| Port of Portland, Airport Revenue, Series 24A 5.000%, 7/1/47 | 1,000 | 1,038 | |
| Pennsylvania—12.6% | |||
| Pennsylvania Economic Development Financing Authority | |||
| 5.500%, 6/30/40 | 1,500 | 1,646 | |
| Series B 4.000%, 5/15/42 | 1,535 | 1,539 | |
| Pennsylvania Turnpike Commission, | |||
| Toll Highway Revenue 5.000%, 12/1/40 | 1,000 | 1,138 | |
| Toll Highway Revenue, Series B 5.250%, 12/1/52 | 350 | 389 | |
| 4,712 | |||
| Texas—18.3% | |||
| Arlington Higher Education Finance Corp., Trinity Basin Preparatory Revenue (PSF-GTD Insured) 4.500%, 8/15/53 | 130 | 135 | |
| City of Fort Worth, Water & Sewer System Revenue 5.000%, 2/15/30 | 1,000 | 1,102 | |
| Par Value | Value | ||
| Texas—continued | |||
| Denton Independent School District, General Obligation (PSF-GTD Insured) 5.000%, 8/15/48 | $ 350 | $ 392 | |
| Katy Independent School District, General Obligation (PSF-GTD Insured) 4.000%, 2/15/39 | 500 | 516 | |
| Klein Independent School District, General Obligation (PSF-GTD Insured) 4.000%, 8/1/46 | 2,000 | 2,037 | |
| North Texas Municipal Water District Water System Revenue 5.000%, 9/1/32 | 750 | 830 | |
| Port Authority of Houston of Harris County Texas, General Obligation, Series A 5.000%, 10/1/36 | 500 | 528 | |
| Texas Public Finance Authority, Texas Southern University Revenue (BAM Insured) 5.250%, 5/1/37 | 200 | 226 | |
| Texas Water Development Board Revenue 4.650%, 10/15/40 | 1,000 | 1,097 | |
| 6,863 | |||
| Utah—1.1% | |||
| Salt Lake City, Airport Revenue, Series A 5.250%, 7/1/38 | 355 | 401 | |
| Washington—8.7% | |||
| Energy Northwest Revenue, Series A 5.000%, 7/1/34 | 2,000 | 2,058 | |
| Grant County Public Hospital District No. 1, General Obligation 5.500%, 12/1/43 | 215 | 233 | |
| Washington Health Care Facilities Authority, Series A 5.000%, 8/1/44 | 940 | 979 | |
| 3,270 | |||
| Par Value | Value | ||
| Wisconsin—0.7% | |||
| Public Finance Authority 4.000%, 8/1/59(2) | $ 270 | $ 267 | |
| Total Municipal Bonds (Identified Cost $36,183) | 36,758 | ||
| Total Long-Term Investments—98.0% (Identified Cost $36,183) | 36,758 | ||
| TOTAL INVESTMENTS—98.0% (Identified Cost $36,183) | $36,758 | ||
| Other assets and liabilities, net—2.0% | 764 | ||
| NET ASSETS—100.0% | $37,522 | ||
| Abbreviations: | |
| AGM | Assured Guaranty Municipal Corp. |
| AMT | Alternative Minimum Tax |
| BAM | Build America Municipal Insured |
| PSF-GTD | Permanent School Fund Guarantee Program |
| Footnote Legend: | |
| (1) | At December 31, 2023, 10.2% of the securities in the portfolio are backed by insurance of financial institutions and financial guaranty assurance agencies. |
| (2) | Variable or step coupon security; interest rate shown reflects the rate in effect at December 31, 2023. For securities based on a published reference rate and spread, the reference rate and spread are indicated in the description above. Certain variable rate securities are not based on a published reference rate and spread but are determined by the issuer or agent and are based on current market conditions. These securities do not indicate a reference rate and spread in their description above. |
| Total Value at December 31, 2023 | Level 2 Significant Observable Inputs | ||
| Assets: | |||
| Debt Instruments: | |||
| Municipal Bonds | $36,758 | $36,758 | |
| Total Investments | $36,758 | $36,758 |
December 31, 2023
| Par Value | Value | ||
| Corporate Bonds and Notes—93.4% | |||
| Communication Services—11.0% | |||
| Allen Media LLC 144A 10.500%, 2/15/28(1) | $ 480 | $ 257 | |
| Altice France S.A. 144A 8.125%, 2/1/27(1) | 1,050 | 968 | |
| ANGI Group LLC 144A 3.875%, 8/15/28(1) | 420 | 355 | |
| Cable One, Inc. 144A 4.000%, 11/15/30(1)(2) | 1,720 | 1,393 | |
| Charter Communications Operating LLC 5.750%, 4/1/48 | 325 | 288 | |
| CMG Media Corp. 144A 8.875%, 12/15/27(1) | 452 | 358 | |
| CSC Holdings LLC | |||
| 144A 11.250%, 5/15/28(1) | 950 | 979 | |
| 144A 6.500%, 2/1/29(1) | 1,015 | 896 | |
| DISH Network Corp. 144A 11.750%, 11/15/27(1) | 632 | 660 | |
| Frontier Communications Holdings LLC 144A 5.875%, 10/15/27(1) | 825 | 797 | |
| Gray Television, Inc. 144A 7.000%, 5/15/27(1) | 525 | 499 | |
| iHeartCommunications, Inc. | |||
| 6.375%, 5/1/26 | 305 | 260 | |
| 8.375%, 5/1/27 | 427 | 277 | |
| Iliad Holding SASU | |||
| 144A 6.500%, 10/15/26(1) | 715 | 714 | |
| 144A 7.000%, 10/15/28(1) | 715 | 711 | |
| LCPR Senior Secured Financing DAC 144A 6.750%, 10/15/27(1) | 1,438 | 1,408 | |
| Live Nation Entertainment, Inc. 144A 5.625%, 3/15/26(1) | 775 | 768 | |
| Scripps Escrow, Inc. 144A 5.875%, 7/15/27(1) | 175 | 155 | |
| Sirius XM Radio, Inc. 144A 4.000%, 7/15/28(1) | 950 | 879 | |
| Virgin Media Secured Finance plc 144A 5.500%, 5/15/29(1) | 1,245 | 1,203 | |
| ZipRecruiter, Inc. 144A 5.000%, 1/15/30(1) | 820 | 716 | |
| 14,541 | |||
| Consumer Discretionary—19.2% | |||
| Academy Ltd. 144A 6.000%, 11/15/27(1) | 347 | 341 | |
| Ashton Woods USA LLC 144A 6.625%, 1/15/28(1) | 705 | 684 | |
| Bath & Body Works, Inc. 6.750%, 7/1/36 | 560 | 564 | |
| Caesars Entertainment, Inc. | |||
| 144A 6.250%, 7/1/25(1) | 680 | 682 | |
| 144A 8.125%, 7/1/27(1) | 1,013 | 1,038 | |
| Carnival Corp. 144A 10.500%, 6/1/30(1) | 1,232 | 1,348 | |
| Dream Finders Homes, Inc. 144A 8.250%, 8/15/28(1) | 640 | 676 | |
| Fertitta Entertainment LLC 144A 6.750%, 1/15/30(1) | 800 | 702 | |
| FirstCash, Inc. 144A 5.625%, 1/1/30(1) | 1,491 | 1,428 | |
| Par Value | Value | ||
| Consumer Discretionary—continued | |||
| Foot Locker, Inc. 144A 4.000%, 10/1/29(1)(2) | $ 890 | $ 736 | |
| Ford Motor Credit Co. LLC 6.950%, 3/6/26 | 1,290 | 1,322 | |
| Installed Building Products, Inc. 144A 5.750%, 2/1/28(1) | 1,515 | 1,470 | |
| LGI Homes, Inc. 144A 8.750%, 12/15/28(1) | 285 | 303 | |
| Macy’s Retail Holdings LLC 5.125%, 1/15/42 | 295 | 230 | |
| Marriott Ownership Resorts, Inc. 4.750%, 1/15/28 | 1,155 | 1,061 | |
| Michaels Cos., Inc. (The) 144A 5.250%, 5/1/28(1) | 928 | 734 | |
| NCL Corp., Ltd. 144A 5.875%, 2/15/27(1) | 990 | 981 | |
| New Home Co., Inc. (The) 144A 8.250%, 10/15/27(1) | 1,400 | 1,306 | |
| Patrick Industries, Inc. 144A 7.500%, 10/15/27(1) | 713 | 715 | |
| QVC, Inc. | |||
| 4.375%, 9/1/28 | 268 | 194 | |
| 5.450%, 8/15/34(2) | 1,575 | 954 | |
| Royal Caribbean Cruises Ltd. | |||
| 144A 5.375%, 7/15/27(1) | 955 | 945 | |
| 144A 7.250%, 1/15/30(1) | 960 | 1,003 | |
| Shea Homes LP 4.750%, 2/15/28 | 800 | 752 | |
| Signal Parent, Inc. 144A 6.125%, 4/1/29(1) | 515 | 368 | |
| Six Flags Entertainment Corp. 144A 7.250%, 5/15/31(1) | 410 | 411 | |
| Station Casinos LLC 144A 4.500%, 2/15/28(1) | 1,518 | 1,431 | |
| Thor Industries, Inc. 144A 4.000%, 10/15/29(1) | 515 | 459 | |
| Travel + Leisure Co. 144A 6.625%, 7/31/26(1) | 675 | 681 | |
| Upbound Group, Inc. 144A 6.375%, 2/15/29(1) | 750 | 704 | |
| VOC Escrow Ltd. 144A 5.000%, 2/15/28(1) | 1,005 | 963 | |
| Winnebago Industries, Inc. 144A 6.250%, 7/15/28(1) | 260 | 255 | |
| 25,441 | |||
| Consumer Staples—2.5% | |||
| Simmons Foods, Inc. 144A 4.625%, 3/1/29(1) | 850 | 735 | |
| Turning Point Brands, Inc. 144A 5.625%, 2/15/26(1) | 1,170 | 1,092 | |
| Vector Group Ltd. 144A 5.750%, 2/1/29(1) | 1,560 | 1,428 | |
| 3,255 | |||
| Energy—15.8% | |||
| Ascent Resources Utica Holdings LLC | |||
| 144A 7.000%, 11/1/26(1) | 690 | 694 | |
| 144A 8.250%, 12/31/28(1) | 650 | 654 | |
| Par Value | Value | ||
| Energy—continued | |||
| Callon Petroleum Co. 144A 8.000%, 8/1/28(1) | $ 525 | $ 536 | |
| Chesapeake Energy Corp. 144A 6.750%, 4/15/29(1) | 665 | 671 | |
| Civitas Resources, Inc. | |||
| 144A 5.000%, 10/15/26(1) | 560 | 543 | |
| 144A 8.375%, 7/1/28(1) | 1,040 | 1,086 | |
| 144A 8.625%, 11/1/30(1) | 14 | 15 | |
| 144A 8.750%, 7/1/31(1) | 520 | 554 | |
| Comstock Resources, Inc. 144A 6.750%, 3/1/29(1) | 308 | 282 | |
| Energy Transfer LP Series B 6.625% (3) | 495 | 413 | |
| EQM Midstream Partners LP 144A 6.500%, 7/1/27(1) | 1,267 | 1,290 | |
| Hilcorp Energy I LP 144A 6.250%, 11/1/28(1) | 681 | 678 | |
| Magnolia Oil & Gas Operating LLC 144A 6.000%, 8/1/26(1) | 2,235 | 2,179 | |
| Nabors Industries, Inc. | |||
| 144A 7.375%, 5/15/27(1) | 985 | 965 | |
| 144A 9.125%, 1/31/30(1) | 255 | 256 | |
| New Fortress Energy, Inc. 144A 6.750%, 9/15/25(1) | 1,435 | 1,424 | |
| PBF Holding Co. LLC 6.000%, 2/15/28 | 700 | 681 | |
| Precision Drilling Corp. 144A 6.875%, 1/15/29(1) | 340 | 328 | |
| Rockies Express Pipeline LLC 144A 7.500%, 7/15/38(1) | 728 | 735 | |
| SM Energy Co. 6.625%, 1/15/27 | 390 | 388 | |
| Tallgrass Energy Partners LP 144A 7.500%, 10/1/25(1) | 825 | 829 | |
| Talos Production, Inc. 12.000%, 1/15/26 | 975 | 1,003 | |
| Transocean Aquila Ltd. 144A 8.000%, 9/30/28(1) | 325 | 330 | |
| Transocean Titan Financing Ltd. 144A 8.375%, 2/1/28(1) | 342 | 355 | |
| Transocean, Inc. 144A 8.750%, 2/15/30(1) | 333 | 348 | |
| Valaris Ltd. 144A 8.375%, 4/30/30(1) | 650 | 666 | |
| Venture Global LNG, Inc. | |||
| 144A 8.125%, 6/1/28(1) | 965 | 975 | |
| 144A 9.875%, 2/1/32(1) | 330 | 344 | |
| Vital Energy, Inc. 10.125%, 1/15/28 | 332 | 341 | |
| Weatherford International Ltd. 144A 8.625%, 4/30/30(1) | 1,294 | 1,351 | |
| 20,914 | |||
| Financials—22.2% | |||
| Acrisure LLC 144A 7.000%, 11/15/25(1) | 165 | 165 | |
| Alliant Holdings Intermediate LLC 144A 6.750%, 4/15/28(1) | 672 | 687 | |
| Altice Financing S.A. 144A 5.750%, 8/15/29(1) | 1,195 | 1,060 | |
| Par Value | Value | ||
| Financials—continued | |||
| Arsenal AIC Parent LLC 144A 8.000%, 10/1/30(1) | $ 430 | $ 449 | |
| AssuredPartners, Inc. 144A 7.000%, 8/15/25(1) | 530 | 531 | |
| Bread Financial Holdings, Inc. 144A 9.750%, 3/15/29(1) | 350 | 363 | |
| CCO Holdings LLC 144A 7.375%, 3/1/31(1) | 1,908 | 1,958 | |
| Churchill Downs, Inc. 144A 5.750%, 4/1/30(1) | 710 | 692 | |
| Cimpress plc 7.000%, 6/15/26 | 377 | 369 | |
| Enact Holdings, Inc. 144A 6.500%, 8/15/25(1) | 1,371 | 1,367 | |
| Entegris Escrow Corp. 144A 5.950%, 6/15/30(1) | 1,413 | 1,405 | |
| Freedom Mortgage Corp. | |||
| 144A 7.625%, 5/1/26(1) | 580 | 572 | |
| 144A 12.000%, 10/1/28(1) | 478 | 522 | |
| GGAM Finance Ltd. 144A 8.000%, 2/15/27(1) | 325 | 333 | |
| Gray Escrow II, Inc. 144A 5.375%, 11/15/31(1) | 475 | 358 | |
| Hightower Holding LLC 144A 6.750%, 4/15/29(1) | 1,409 | 1,270 | |
| Hilcorp Energy I LP 144A 8.375%, 11/1/33(1) | 937 | 993 | |
| Hilton Grand Vacations Borrower Escrow LLC 144A 5.000%, 6/1/29(1) | 460 | 424 | |
| INEOS Finance plc 144A 6.750%, 5/15/28(1) | 710 | 697 | |
| Kinetik Holdings LP 144A 5.875%, 6/15/30(1) | 705 | 692 | |
| LSF11 A5 HoldCo. LLC 144A 6.625%, 10/15/29(1) | 510 | 431 | |
| Macquarie Airfinance Holdings Ltd. 144A 8.125%, 3/30/29(1) | 325 | 340 | |
| Macy’s Retail Holdings LLC 144A 6.125%, 3/15/32(1) | 176 | 167 | |
| Midcap Financial Issuer Trust 144A 6.500%, 5/1/28(1) | 560 | 524 | |
| MPH Acquisition Holdings LLC 144A 5.500%, 9/1/28(1) | 665 | 595 | |
| MPT Operating Partnership LP 5.250%, 8/1/26(2) | 330 | 295 | |
| Nationstar Mortgage Holdings, Inc. | |||
| 144A 6.000%, 1/15/27(1) | 1,060 | 1,052 | |
| 144A 5.750%, 11/15/31(1) | 394 | 367 | |
| NFP Corp. 144A 8.500%, 10/1/31(1) | 649 | 703 | |
| Noble Finance II LLC 144A 8.000%, 4/15/30(1) | 650 | 676 | |
| OneMain Finance Corp. 9.000%, 1/15/29 | 650 | 687 | |
| Organon & Co. 144A 5.125%, 4/30/31(1) | 410 | 351 | |
| PennyMac Financial Services, Inc. | |||
| 144A 5.375%, 10/15/25(1) | 277 | 274 | |
| 144A 7.875%, 12/15/29(1) | 395 | 407 | |
| 144A 5.750%, 9/15/31(1) | 415 | 384 | |
| Radian Group, Inc. 4.500%, 10/1/24 | 530 | 523 | |
| Par Value | Value | ||
| Financials—continued | |||
| Scripps Escrow II, Inc. 144A 5.375%, 1/15/31(1) | $ 435 | $ 319 | |
| Seadrill Finance Ltd. 144A 8.375%, 8/1/30(1) | 385 | 402 | |
| Summit Midstream Holdings LLC 144A 9.000%, 10/15/26(1)(4) | 485 | 481 | |
| Teva Pharmaceutical Finance Netherlands III B.V. 6.750%, 3/1/28 | 315 | 321 | |
| United Wholesale Mortgage LLC | |||
| 144A 5.500%, 11/15/25(1) | 1,160 | 1,153 | |
| 144A 5.500%, 4/15/29(1) | 1,530 | 1,448 | |
| Viking Cruises Ltd. | |||
| 144A 6.250%, 5/15/25(1) | 680 | 678 | |
| 144A 9.125%, 7/15/31(1) | 651 | 694 | |
| Vistra Operations Co. LLC 144A 7.750%, 10/15/31(1) | 663 | 689 | |
| Vmed O2 UK Financing I plc 144A 4.750%, 7/15/31(1) | 530 | 473 | |
| 29,341 | |||
| Health Care—2.5% | |||
| DaVita, Inc. 144A 4.625%, 6/1/30(1) | 780 | 680 | |
| Emergent BioSolutions, Inc. 144A 3.875%, 8/15/28(1) | 630 | 255 | |
| Star Parent, Inc. 144A 9.000%, 10/1/30(1) | 659 | 694 | |
| Surgery Center Holdings, Inc. 144A 10.000%, 4/15/27(1) | 85 | 86 | |
| Tenet Healthcare Corp. | |||
| 6.125%, 10/1/28 | 695 | 693 | |
| 6.125%, 6/15/30 | 704 | 712 | |
| U.S. Acute Care Solutions LLC 144A 6.375%, 3/1/26(1) | 185 | 155 | |
| 3,275 | |||
| Industrials—10.2% | |||
| Allegiant Travel Co. 144A 7.250%, 8/15/27(1) | 845 | 827 | |
| American Airlines, Inc. 144A 5.500%, 4/20/26(1) | 1,387 | 1,377 | |
| BlueLinx Holdings, Inc. 144A 6.000%, 11/15/29(1) | 795 | 736 | |
| Brundage-Bone Concrete Pumping Holdings, Inc. 144A 6.000%, 2/1/26(1) | 920 | 920 | |
| Fortress Transportation & Infrastructure Investors LLC 144A 7.875%, 12/1/30(1) | 338 | 352 | |
| Foundation Building Materials, Inc. 144A 6.000%, 3/1/29(1) | 437 | 393 | |
| Macquarie Airfinance Holdings Ltd. 144A 8.375%, 5/1/28(1) | 340 | 356 | |
| Manitowoc Co., Inc. (The) 144A 9.000%, 4/1/26(1) | 688 | 690 | |
| Mileage Plus Holdings LLC 144A 6.500%, 6/20/27(1) | 315 | 316 | |
| Pike Corp. 144A 8.625%, 1/31/31(1) | 62 | 65 | |
| Regal Rexnord Corp. 144A 6.050%, 2/15/26(1) | 1,035 | 1,046 | |
| Par Value | Value | ||
| Industrials—continued | |||
| Spirit AeroSystems, Inc. | |||
| 144A 9.375%, 11/30/29(1) | $ 305 | $ 334 | |
| 144A 9.750%, 11/15/30(1) | 108 | 116 | |
| Terex Corp. 144A 5.000%, 5/15/29(1) | 375 | 353 | |
| TMS International Corp. 144A 6.250%, 4/15/29(1) | 1,185 | 978 | |
| TransDigm, Inc. 144A 6.250%, 3/15/26(1) | 1,355 | 1,353 | |
| Uber Technologies, Inc. 144A 7.500%, 9/15/27(1) | 1,828 | 1,893 | |
| XPO, Inc. 144A 6.250%, 6/1/28(1) | 1,350 | 1,366 | |
| 13,471 | |||
| Information Technology—1.3% | |||
| Cloud Software Group, Inc. 144A 6.500%, 3/31/29(1) | 890 | 848 | |
| GTCR W-2 Merger Sub LLC 144A 7.500%, 1/15/31(1) | 225 | 238 | |
| Seagate HDD Cayman | |||
| 9.625%, 12/1/32 | 70 | 80 | |
| 144A 8.250%, 12/15/29(1) | 562 | 606 | |
| 1,772 | |||
| Materials—4.4% | |||
| Allegheny Ludlum LLC 6.950%, 12/15/25 | 323 | 326 | |
| First Quantum Minerals Ltd. 144A 7.500%, 4/1/25(1) | 588 | 563 | |
| Graham Packaging Co., Inc. 144A 7.125%, 8/15/28(1) | 390 | 351 | |
| Knife River Corp. 144A 7.750%, 5/1/31(1) | 510 | 543 | |
| Mativ Holdings, Inc. 144A 6.875%, 10/1/26(1) | 1,100 | 1,055 | |
| Mineral Resources Ltd. | |||
| 144A 8.125%, 5/1/27(1) | 339 | 344 | |
| 144A 9.250%, 10/1/28(1) | 463 | 493 | |
| Smyrna Ready Mix Concrete LLC | |||
| 144A 6.000%, 11/1/28(1) | 300 | 295 | |
| 144A 8.875%, 11/15/31(1) | 675 | 710 | |
| Warrior Met Coal, Inc. 144A 7.875%, 12/1/28(1) | 646 | 641 | |
| Windsor Holdings III LLC 144A 8.500%, 6/15/30(1) | 515 | 538 | |
| 5,859 | |||
| Real Estate—2.9% | |||
| Brookfield Property REIT, Inc. 144A 5.750%, 5/15/26(1) | 1,305 | 1,266 | |
| Forestar Group, Inc. 144A 5.000%, 3/1/28(1) | 751 | 723 | |
| Howard Hughes Corp. (The) 144A 5.375%, 8/1/28(1) | 1,347 | 1,295 | |
| Necessity Retail REIT, Inc. (The) 144A 4.500%, 9/30/28(1) | 580 | 488 | |
| 3,772 | |||
| Par Value | Value | ||
| Utilities—1.4% | |||
| AmeriGas Partners LP 144A 9.375%, 6/1/28(1) | $ 232 | $ 239 | |
| NGL Energy Operating LLC 144A 7.500%, 2/1/26(1) | 285 | 288 | |
| Pacific Gas & Electric Co. 4.950%, 7/1/50 | 405 | 346 | |
| Venture Global Calcasieu Pass LLC 144A 6.250%, 1/15/30(1) | 352 | 350 | |
| Vistra Corp. 144A 8.000% (1)(3) | 695 | 692 | |
| 1,915 | |||
| Total Corporate Bonds and Notes (Identified Cost $124,430) | 123,556 | ||
| Leveraged Loans—4.3% | |||
| Aerospace—0.8% | |||
| Mileage Plus Holdings LLC (3 month Term SOFR + 5.400%) 10.770%, 6/21/27(4) | 1,042 | 1,076 | |
| Financials—1.3% | |||
| Alliant Holdings Intermediate LLC Tranche B-6 (1 month Term SOFR + 3.500%) 8.860%, 11/6/30(4) | 573 | 575 | |
| Asurion LLC | |||
| Tranche B-4 (1 month Term SOFR + 5.360%) 10.720%, 1/20/29(4) | 405 | 381 | |
| Tranche B-8 (1 month Term SOFR + 3.360%) 8.720%, 12/23/26(4) | 357 | 356 | |
| Broadstreet Partners, Inc. Tranche B-3 (1 month Term SOFR + 3.110%) 8.470%, 1/27/27(4) | 347 | 346 | |
| 1,658 | |||
| Forest Prod / Containers—0.5% | |||
| Domtar Corp. (1 month Term SOFR + 5.610%) 10.970%, 11/30/28(4) | 669 | 656 | |
| Health Care—0.5% | |||
| Medline Borrower LP (1 month Term SOFR + 3.110%) 8.470%, 10/23/28(4) | 723 | 726 | |
| Housing—0.3% | |||
| ACProducts Holdings, Inc. (3 month Term SOFR + 4.510%) 9.860%, 5/17/28(4) | 421 | 368 | |
| Information Technology—0.5% | |||
| Sabre GLBL, Inc. 2022, Tranche B-2 (1 month Term SOFR + 5.100%) 10.460%, 6/30/28(4) | 730 | 646 | |
| Par Value | Value | ||
| Media / Telecom - Cable/Wireless Video—0.4% | |||
| DIRECTV Financing LLC (3 month Term SOFR + 5.260%) 10.650%, 8/2/27(4) | $ 533 | $ 533 | |
| Total Leveraged Loans (Identified Cost $5,609) | 5,663 | ||
| Shares | ||
| Common Stock—0.0% | ||
| Energy—0.0% | ||
| SandRidge Energy, Inc. | 159 | 2 |
| Total Common Stock (Identified Cost $1) | 2 | |
| Total Long-Term Investments—97.7% (Identified Cost $130,040) | 129,221 | |
| Securities Lending Collateral—1.4% | ||
| Dreyfus Government Cash Management Fund - Institutional Shares (seven-day effective yield 5.250%)(5)(6) | 1,842,085 | 1,842 |
| Total Securities Lending Collateral (Identified Cost $1,842) | 1,842 | |
| TOTAL INVESTMENTS—99.1% (Identified Cost $131,882) | $131,063 | |
| Other assets and liabilities, net—0.9% | 1,161 | |
| NET ASSETS—100.0% | $132,224 | |
| Abbreviations: | |
| DAC | Designated Activity Company |
| LLC | Limited Liability Company |
| LP | Limited Partnership |
| REIT | Real Estate Investment Trust |
| SOFR | Secured Overnight Financing Rate |
| Footnote Legend: | |
| (1) | Security exempt from registration under Rule 144A of the Securities Act of 1933. These securities may be resold in transactions exempt from registration, normally to qualified institutional buyers. At December 31, 2023, these securities amounted to a value of $110,476 or 83.6% of net assets. |
| (2) | All or a portion of security is on loan. |
| (3) | No contractual maturity date. |
| (4) | Variable rate security. Rate disclosed is as of December 31, 2023. Information in parenthesis represents benchmark and reference rate for each security. Certain variable rate securities are not based on a published reference rate and spread but are determined by the issuer or agent and are based on current market conditions, or, for mortgage-backed securities, are impacted by the individual mortgages which are paying off over time. These securities do not indicate a reference rate and spread in their descriptions. |
| (5) | Shares of this fund are publicly offered, and its prospectus and annual report are publicly available. |
| (6) | Represents security purchased with cash collateral received for securities on loan. |
| Country Weightings (Unaudited)† | |
| United States | 84% |
| Bermuda | 4 |
| United Kingdom | 2 |
| France | 2 |
| Cayman Islands | 2 |
| Liberia | 1 |
| Ireland | 1 |
| Other | 4 |
| Total | 100% |
| † % of total investments as of December 31, 2023. | |
| Total Value at December 31, 2023 | Level 1 Quoted Prices | Level 2 Significant Observable Inputs | |||
| Assets: | |||||
| Debt Instruments: | |||||
| Corporate Bonds and Notes | $123,556 | $ — | $123,556 | ||
| Leveraged Loans | 5,663 | — | 5,663 | ||
| Equity Securities: | |||||
| Common Stock | 2 | 2 | — | ||
| Securities Lending Collateral | 1,842 | 1,842 | — | ||
| Total Investments | $131,063 | $1,844 | $129,219 |
December 31, 2023
| Par Value | Value | ||
| Convertible Bonds and Notes—0.1% | |||
| Communication Services—0.1% | |||
| Liberty Interactive LLC 4.000%, 11/15/29 | $ 1,250 | $ 312 | |
| Total Convertible Bonds and Notes (Identified Cost $1,049) | 312 | ||
| Corporate Bonds and Notes—92.2% | |||
| Communication Services—9.1% | |||
| Altice France S.A. 144A 8.125%, 2/1/27(1) | 1,765 | 1,627 | |
| ANGI Group LLC 144A 3.875%, 8/15/28(1) | 714 | 603 | |
| Cable One, Inc. 144A 4.000%, 11/15/30(1)(2) | 2,958 | 2,395 | |
| Charter Communications Operating LLC 5.750%, 4/1/48 | 540 | 479 | |
| CSC Holdings LLC | |||
| 144A 11.250%, 5/15/28(1) | 1,615 | 1,664 | |
| 144A 6.500%, 2/1/29(1) | 1,368 | 1,207 | |
| DISH Network Corp. 144A 11.750%, 11/15/27(1) | 1,088 | 1,136 | |
| Frontier Communications Holdings LLC 144A 5.875%, 10/15/27(1) | 1,474 | 1,424 | |
| Gray Television, Inc. 144A 7.000%, 5/15/27(1) | 180 | 171 | |
| Iliad Holding SASU | |||
| 144A 6.500%, 10/15/26(1) | 1,730 | 1,727 | |
| 144A 7.000%, 10/15/28(1) | 1,135 | 1,130 | |
| LCPR Senior Secured Financing DAC 144A 6.750%, 10/15/27(1) | 2,690 | 2,635 | |
| Scripps Escrow, Inc. 144A 5.875%, 7/15/27(1) | 320 | 284 | |
| Sirius XM Radio, Inc. 144A 4.000%, 7/15/28(1) | 1,925 | 1,780 | |
| Virgin Media Secured Finance plc 144A 5.500%, 5/15/29(1) | 2,160 | 2,087 | |
| ZipRecruiter, Inc. 144A 5.000%, 1/15/30(1) | 1,543 | 1,347 | |
| 21,696 | |||
| Consumer Discretionary—21.8% | |||
| Academy Ltd. 144A 6.000%, 11/15/27(1) | 595 | 584 | |
| Ashton Woods USA LLC 144A 6.625%, 1/15/28(1) | 1,275 | 1,237 | |
| Bath & Body Works, Inc. 6.750%, 7/1/36 | 705 | 710 | |
| Caesars Entertainment, Inc. 144A 8.125%, 7/1/27(1) | 1,820 | 1,866 | |
| Carnival Corp. 144A 10.500%, 6/1/30(1) | 2,290 | 2,505 | |
| Crocs, Inc. 144A 4.125%, 8/15/31(1) | 830 | 702 | |
| Dream Finders Homes, Inc. 144A 8.250%, 8/15/28(1) | 1,233 | 1,303 | |
| Fertitta Entertainment LLC 144A 4.625%, 1/15/29(1) | 850 | 771 | |
| FirstCash, Inc. 144A 5.625%, 1/1/30(1) | 2,706 | 2,591 | |
| Par Value | Value | ||
| Consumer Discretionary—continued | |||
| Foot Locker, Inc. 144A 4.000%, 10/1/29(1)(2) | $ 1,543 | $ 1,277 | |
| Ford Motor Credit Co. LLC 6.950%, 3/6/26 | 4,540 | 4,651 | |
| Installed Building Products, Inc. 144A 5.750%, 2/1/28(1) | 2,710 | 2,629 | |
| LGI Homes, Inc. 144A 8.750%, 12/15/28(1) | 508 | 540 | |
| Macy’s Retail Holdings LLC 5.125%, 1/15/42 | 557 | 435 | |
| Marriott Ownership Resorts, Inc. 4.750%, 1/15/28 | 2,060 | 1,892 | |
| MGM Resorts International 5.500%, 4/15/27 | 1,310 | 1,300 | |
| Michaels Cos., Inc. (The) 144A 5.250%, 5/1/28(1) | 1,580 | 1,249 | |
| NCL Corp., Ltd. 144A 5.875%, 2/15/27(1) | 2,361 | 2,341 | |
| New Home Co., Inc. (The) 144A 8.250%, 10/15/27(1) | 2,495 | 2,327 | |
| Patrick Industries, Inc. 144A 7.500%, 10/15/27(1) | 1,320 | 1,323 | |
| QVC, Inc. | |||
| 4.375%, 9/1/28 | 484 | 350 | |
| 5.450%, 8/15/34(2) | 3,013 | 1,826 | |
| Royal Caribbean Cruises Ltd. | |||
| 144A 5.375%, 7/15/27(1) | 1,673 | 1,656 | |
| 144A 7.250%, 1/15/30(1) | 1,756 | 1,834 | |
| Shea Homes LP | |||
| 4.750%, 2/15/28 | 1,659 | 1,560 | |
| 4.750%, 4/1/29 | 925 | 851 | |
| Six Flags Entertainment Corp. 144A 7.250%, 5/15/31(1) | 785 | 787 | |
| Station Casinos LLC | |||
| 144A 4.500%, 2/15/28(1) | 2,621 | 2,471 | |
| 144A 4.625%, 12/1/31(1) | 250 | 225 | |
| Thor Industries, Inc. 144A 4.000%, 10/15/29(1) | 1,083 | 966 | |
| Travel + Leisure Co. 144A 6.625%, 7/31/26(1) | 1,246 | 1,257 | |
| TRI Pointe Group, Inc. 5.875%, 6/15/24 | 1,030 | 1,030 | |
| Upbound Group, Inc. 144A 6.375%, 2/15/29(1) | 1,336 | 1,254 | |
| VOC Escrow Ltd. 144A 5.000%, 2/15/28(1) | 2,826 | 2,707 | |
| Winnebago Industries, Inc. 144A 6.250%, 7/15/28(1) | 905 | 889 | |
| 51,896 | |||
| Consumer Staples—2.6% | |||
| Simmons Foods, Inc. 144A 4.625%, 3/1/29(1) | 1,495 | 1,293 | |
| Turning Point Brands, Inc. 144A 5.625%, 2/15/26(1) | 2,485 | 2,319 | |
| Vector Group Ltd. 144A 5.750%, 2/1/29(1) | 2,926 | 2,679 | |
| 6,291 | |||
| Par Value | Value | ||
| Energy—14.8% | |||
| Ascent Resources Utica Holdings LLC 144A 7.000%, 11/1/26(1) | $ 2,381 | $ 2,396 | |
| Callon Petroleum Co. 144A 8.000%, 8/1/28(1) | 955 | 975 | |
| Chesapeake Energy Corp. 144A 6.750%, 4/15/29(1) | 1,153 | 1,164 | |
| Civitas Resources, Inc. | |||
| 144A 5.000%, 10/15/26(1) | 1,022 | 991 | |
| 144A 8.375%, 7/1/28(1) | 1,935 | 2,020 | |
| 144A 8.625%, 11/1/30(1) | 26 | 28 | |
| 144A 8.750%, 7/1/31(1) | 967 | 1,029 | |
| Comstock Resources, Inc. 144A 6.750%, 3/1/29(1) | 540 | 494 | |
| Energy Transfer LP Series B 6.625% (2)(3) | 936 | 782 | |
| EQM Midstream Partners LP 144A 6.500%, 7/1/27(1) | 1,740 | 1,772 | |
| Hilcorp Energy I LP 144A 6.250%, 11/1/28(1) | 1,209 | 1,204 | |
| Magnolia Oil & Gas Operating LLC 144A 6.000%, 8/1/26(1) | 2,367 | 2,308 | |
| Nabors Industries, Inc. | |||
| 144A 7.375%, 5/15/27(1) | 1,388 | 1,360 | |
| 144A 9.125%, 1/31/30(1) | 445 | 447 | |
| New Fortress Energy, Inc. 144A 6.750%, 9/15/25(1) | 2,482 | 2,462 | |
| PBF Holding Co. LLC 6.000%, 2/15/28 | 1,215 | 1,183 | |
| Precision Drilling Corp. 144A 6.875%, 1/15/29(1) | 674 | 650 | |
| Rockies Express Pipeline LLC | |||
| 144A 4.950%, 7/15/29(1) | 662 | 633 | |
| 144A 7.500%, 7/15/38(1) | 1,478 | 1,492 | |
| SM Energy Co. 6.625%, 1/15/27 | 805 | 800 | |
| Tallgrass Energy Partners LP 144A 7.500%, 10/1/25(1) | 380 | 382 | |
| Talos Production, Inc. 12.000%, 1/15/26 | 1,827 | 1,880 | |
| Transocean Aquila Ltd. 144A 8.000%, 9/30/28(1) | 610 | 619 | |
| Transocean Titan Financing Ltd. 144A 8.375%, 2/1/28(1) | 640 | 664 | |
| Transocean, Inc. 144A 8.750%, 2/15/30(1) | 620 | 648 | |
| Valaris Ltd. 144A 8.375%, 4/30/30(1) | 1,186 | 1,215 | |
| Venture Global LNG, Inc. | |||
| 144A 8.125%, 6/1/28(1) | 1,720 | 1,737 | |
| 144A 9.875%, 2/1/32(1) | 585 | 609 | |
| Vital Energy, Inc. 10.125%, 1/15/28 | 605 | 622 | |
| Weatherford International Ltd. 144A 8.625%, 4/30/30(1) | 2,369 | 2,473 | |
| Welltec International ApS 144A 8.250%, 10/15/26(1) | 220 | 223 | |
| 35,262 | |||
| Financials—18.4% | |||
| Alliant Holdings Intermediate LLC 144A 6.750%, 4/15/28(1) | 1,140 | 1,166 | |
| Par Value | Value | ||
| Financials—continued | |||
| Altice Financing S.A. 144A 5.750%, 8/15/29(1) | $ 2,055 | $ 1,824 | |
| Arsenal AIC Parent LLC 144A 8.000%, 10/1/30(1) | 745 | 777 | |
| Bread Financial Holdings, Inc. 144A 9.750%, 3/15/29(1) | 610 | 632 | |
| Castlelake Aviation Finance DAC 144A 5.000%, 4/15/27(1) | 647 | 606 | |
| CCO Holdings LLC 144A 7.375%, 3/1/31(1) | 2,974 | 3,052 | |
| Churchill Downs, Inc. 144A 5.750%, 4/1/30(1) | 1,265 | 1,233 | |
| Enact Holdings, Inc. 144A 6.500%, 8/15/25(1) | 1,739 | 1,734 | |
| Entegris Escrow Corp. 144A 5.950%, 6/15/30(1) | 2,590 | 2,575 | |
| Freedom Mortgage Corp. | |||
| 144A 7.625%, 5/1/26(1) | 990 | 977 | |
| 144A 12.000%, 10/1/28(1) | 871 | 951 | |
| GGAM Finance Ltd. 144A 8.000%, 2/15/27(1) | 575 | 589 | |
| Gray Escrow II, Inc. 144A 5.375%, 11/15/31(1) | 1,740 | 1,313 | |
| Hilcorp Energy I LP 144A 8.375%, 11/1/33(1) | 1,668 | 1,767 | |
| Hilton Grand Vacations Borrower Escrow LLC 144A 5.000%, 6/1/29(1) | 832 | 768 | |
| INEOS Finance plc 144A 6.750%, 5/15/28(1) | 1,215 | 1,193 | |
| Kinetik Holdings LP 144A 5.875%, 6/15/30(1) | 1,290 | 1,266 | |
| Macquarie Airfinance Holdings Ltd. 144A 8.125%, 3/30/29(1) | 605 | 632 | |
| Macy’s Retail Holdings LLC 144A 6.125%, 3/15/32(1) | 282 | 267 | |
| MPH Acquisition Holdings LLC 144A 5.500%, 9/1/28(1) | 732 | 656 | |
| MPT Operating Partnership LP 5.250%, 8/1/26(2) | 590 | 527 | |
| Nationstar Mortgage Holdings, Inc. | |||
| 144A 6.000%, 1/15/27(1) | 1,934 | 1,920 | |
| 144A 5.750%, 11/15/31(1) | 715 | 667 | |
| NFP Corp. 144A 8.500%, 10/1/31(1) | 1,206 | 1,307 | |
| Noble Finance II LLC 144A 8.000%, 4/15/30(1) | 1,180 | 1,228 | |
| OneMain Finance Corp. 9.000%, 1/15/29 | 1,132 | 1,197 | |
| Organon & Co. 144A 5.125%, 4/30/31(1) | 730 | 624 | |
| PennyMac Financial Services, Inc. | |||
| 144A 5.375%, 10/15/25(1) | 480 | 474 | |
| 144A 7.875%, 12/15/29(1) | 685 | 705 | |
| 144A 5.750%, 9/15/31(1) | 705 | 653 | |
| Radian Group, Inc. 4.500%, 10/1/24 | 895 | 883 | |
| Scripps Escrow II, Inc. 144A 5.375%, 1/15/31(1) | 755 | 554 | |
| Seadrill Finance Ltd. 144A 8.375%, 8/1/30(1) | 700 | 730 | |
| Summit Midstream Holdings LLC 144A 9.000%, 10/15/26(1)(4) | 1,028 | 1,020 | |
| Par Value | Value | ||
| Financials—continued | |||
| Teva Pharmaceutical Finance Netherlands III B.V. 6.750%, 3/1/28(2) | $ 525 | $ 534 | |
| United Wholesale Mortgage LLC | |||
| 144A 5.500%, 11/15/25(1) | 2,053 | 2,040 | |
| 144A 5.500%, 4/15/29(1) | 2,592 | 2,454 | |
| Vistra Operations Co. LLC 144A 7.750%, 10/15/31(1) | 1,301 | 1,351 | |
| Vmed O2 UK Financing I plc 144A 4.750%, 7/15/31(1) | 1,050 | 937 | |
| 43,783 | |||
| Health Care—2.4% | |||
| DaVita, Inc. 144A 4.625%, 6/1/30(1) | 2,093 | 1,826 | |
| Star Parent, Inc. 144A 9.000%, 10/1/30(1) | 1,142 | 1,204 | |
| Tenet Healthcare Corp. | |||
| 6.125%, 10/1/28 | 1,270 | 1,266 | |
| 6.125%, 6/15/30 | 1,280 | 1,294 | |
| 5,590 | |||
| Industrials—12.2% | |||
| Allegiant Travel Co. 144A 7.250%, 8/15/27(1) | 1,497 | 1,465 | |
| American Airlines, Inc. | |||
| 144A 5.500%, 4/20/26(1) | 2,388 | 2,371 | |
| 144A 5.750%, 4/20/29(1) | 2,588 | 2,523 | |
| BlueLinx Holdings, Inc. 144A 6.000%, 11/15/29(1) | 1,447 | 1,339 | |
| Brundage-Bone Concrete Pumping Holdings, Inc. 144A 6.000%, 2/1/26(1) | 1,587 | 1,586 | |
| Chart Industries, Inc. 144A 7.500%, 1/1/30(1) | 1,095 | 1,145 | |
| Fortress Transportation & Infrastructure Investors LLC 144A 7.875%, 12/1/30(1) | 571 | 595 | |
| Macquarie Airfinance Holdings Ltd. 144A 8.375%, 5/1/28(1) | 589 | 617 | |
| Manitowoc Co., Inc. (The) 144A 9.000%, 4/1/26(1) | 1,315 | 1,319 | |
| Mileage Plus Holdings LLC 144A 6.500%, 6/20/27(1) | 539 | 540 | |
| Pike Corp. 144A 8.625%, 1/31/31(1) | 106 | 111 | |
| Regal Rexnord Corp. 144A 6.050%, 2/15/26(1) | 2,275 | 2,300 | |
| Spirit AeroSystems, Inc. | |||
| 144A 9.375%, 11/30/29(1) | 538 | 589 | |
| 144A 9.750%, 11/15/30(1) | 185 | 199 | |
| Summit Materials LLC 144A 6.500%, 3/15/27(1) | 660 | 659 | |
| Terex Corp. 144A 5.000%, 5/15/29(1) | 660 | 622 | |
| TMS International Corp. 144A 6.250%, 4/15/29(1) | 2,289 | 1,888 | |
| TransDigm, Inc. 144A 6.250%, 3/15/26(1) | 2,470 | 2,466 | |
| Uber Technologies, Inc. | |||
| 144A 8.000%, 11/1/26(1) | 1,630 | 1,660 | |
| 144A 7.500%, 9/15/27(1) | 2,440 | 2,527 | |
| Par Value | Value | ||
| Industrials—continued | |||
| XPO, Inc. 144A 6.250%, 6/1/28(1) | $ 2,350 | $ 2,378 | |
| 28,899 | |||
| Information Technology—1.4% | |||
| Cloud Software Group, Inc. 144A 6.500%, 3/31/29(1) | 1,616 | 1,539 | |
| GTCR W-2 Merger Sub LLC 144A 7.500%, 1/15/31(1) | 415 | 439 | |
| Seagate HDD Cayman | |||
| 9.625%, 12/1/32 | 400 | 457 | |
| 144A 8.250%, 12/15/29(1) | 740 | 798 | |
| 3,233 | |||
| Materials—5.2% | |||
| Allegheny Ludlum LLC 6.950%, 12/15/25 | 633 | 638 | |
| First Quantum Minerals Ltd. 144A 7.500%, 4/1/25(1) | 1,250 | 1,196 | |
| Knife River Corp. 144A 7.750%, 5/1/31(1) | 1,000 | 1,065 | |
| Mativ Holdings, Inc. 144A 6.875%, 10/1/26(1) | 1,915 | 1,837 | |
| Mineral Resources Ltd. | |||
| 144A 8.125%, 5/1/27(1) | 580 | 589 | |
| 144A 9.250%, 10/1/28(1) | 770 | 819 | |
| Smyrna Ready Mix Concrete LLC | |||
| 144A 6.000%, 11/1/28(1) | 509 | 501 | |
| 144A 8.875%, 11/15/31(1) | 1,165 | 1,225 | |
| Standard Industries, Inc. 144A 5.000%, 2/15/27(1) | 2,470 | 2,408 | |
| Warrior Met Coal, Inc. 144A 7.875%, 12/1/28(1) | 1,112 | 1,104 | |
| Windsor Holdings III LLC 144A 8.500%, 6/15/30(1) | 870 | 909 | |
| 12,291 | |||
| Real Estate—2.9% | |||
| Brookfield Property REIT, Inc. 144A 5.750%, 5/15/26(1) | 2,372 | 2,302 | |
| Forestar Group, Inc. 144A 5.000%, 3/1/28(1) | 1,385 | 1,332 | |
| Howard Hughes Corp. (The) 144A 5.375%, 8/1/28(1) | 2,413 | 2,319 | |
| Necessity Retail REIT, Inc. (The) 144A 4.500%, 9/30/28(1) | 1,035 | 872 | |
| 6,825 | |||
| Utilities—1.4% | |||
| AmeriGas Partners LP 144A 9.375%, 6/1/28(1) | 410 | 423 | |
| NGL Energy Operating LLC 144A 7.500%, 2/1/26(1) | 484 | 489 | |
| Pacific Gas & Electric Co. 4.950%, 7/1/50 | 705 | 602 | |
| Venture Global Calcasieu Pass LLC 144A 6.250%, 1/15/30(1) | 640 | 637 | |
| Par Value | Value | ||
| Utilities—continued | |||
| Vistra Corp. 144A 8.000% (1)(3) | $ 1,185 | $ 1,180 | |
| 3,331 | |||
| Total Corporate Bonds and Notes (Identified Cost $219,930) | 219,097 | ||
| Leveraged Loans—4.4% | |||
| Aerospace—0.8% | |||
| Mileage Plus Holdings LLC (3 month Term SOFR + 5.400%) 10.770%, 6/21/27(4) | 1,962 | 2,027 | |
| Financials—1.3% | |||
| Alliant Holdings Intermediate LLC Tranche B-6 (1 month Term SOFR + 3.500%) 8.860%, 11/6/30(4) | 1,074 | 1,077 | |
| Asurion LLC | |||
| Tranche B-4 (1 month Term SOFR + 5.360%) 10.720%, 1/20/29(4) | 720 | 677 | |
| Tranche B-8 (1 month Term SOFR + 3.360%) 8.720%, 12/23/26(4) | 635 | 633 | |
| Broadstreet Partners, Inc. Tranche B-3 (1 month Term SOFR + 3.110%) 8.470%, 1/27/27(4) | 643 | 643 | |
| 3,030 | |||
| Forest Prod / Containers—0.5% | |||
| Domtar Corp. (1 month Term SOFR + 5.610%) 10.970%, 11/30/28(4) | 1,253 | 1,229 | |
| Health Care—0.6% | |||
| Medline Borrower LP (1 month Term SOFR + 3.110%) 8.470%, 10/23/28(4) | 1,356 | 1,362 | |
| Information Technology—0.5% | |||
| Sabre GLBL, Inc. 2022, Tranche B-2 (1 month Term SOFR + 5.100%) 10.460%, 6/30/28(4) | 1,362 | 1,206 | |
| Media / Telecom - Cable/Wireless Video—0.4% | |||
| DIRECTV Financing LLC (3 month Term SOFR + 5.260%) 10.650%, 8/2/27(4) | 905 | 904 | |
| Media / Telecom - Diversified Media—0.3% | |||
| Applovin Corp. (1 month Term SOFR + 3.100%) 8.460%, 10/25/28(4) | 644 | 643 | |
| Total Leveraged Loans (Identified Cost $10,313) | 10,401 | ||
| Total Long-Term Investments—96.7% (Identified Cost $231,292) | 229,810 | ||
| Shares | Value | ||
| Securities Lending Collateral—1.3% | |||
| Dreyfus Government Cash Management Fund - Institutional Shares (seven-day effective yield 5.250%)(5)(6) | 3,119,719 | $ 3,120 | |
| Total Securities Lending Collateral (Identified Cost $3,120) | 3,120 | ||
| TOTAL INVESTMENTS—98.0% (Identified Cost $234,412) | $232,930 | ||
| Other assets and liabilities, net—2.0% | 4,742 | ||
| NET ASSETS—100.0% | $237,672 | ||
| Abbreviations: | |
| DAC | Designated Activity Company |
| LLC | Limited Liability Company |
| LP | Limited Partnership |
| REIT | Real Estate Investment Trust |
| SOFR | Secured Overnight Financing Rate |
| Footnote Legend: | |
| (1) | Security exempt from registration under Rule 144A of the Securities Act of 1933. These securities may be resold in transactions exempt from registration, normally to qualified institutional buyers. At December 31, 2023, these securities amounted to a value of $191,348 or 80.5% of net assets. |
| (2) | All or a portion of security is on loan. |
| (3) | No contractual maturity date. |
| (4) | Variable rate security. Rate disclosed is as of December 31, 2023. Information in parenthesis represents benchmark and reference rate for each security. Certain variable rate securities are not based on a published reference rate and spread but are determined by the issuer or agent and are based on current market conditions, or, for mortgage-backed securities, are impacted by the individual mortgages which are paying off over time. These securities do not indicate a reference rate and spread in their descriptions. |
| (5) | Shares of this fund are publicly offered, and its prospectus and annual report are publicly available. |
| (6) | Represents security purchased with cash collateral received for securities on loan. |
| Country Weightings (Unaudited)† | |
| United States | 84% |
| Bermuda | 4 |
| United Kingdom | 2 |
| France | 2 |
| Cayman Islands | 2 |
| Liberia | 1 |
| Ireland | 1 |
| Other | 4 |
| Total | 100% |
| † % of total investments as of December 31, 2023. | |
| Total Value at December 31, 2023 | Level 1 Quoted Prices | Level 2 Significant Observable Inputs | |||
| Assets: | |||||
| Debt Instruments: | |||||
| Convertible Bonds and Notes | $ 312 | $ — | $ 312 | ||
| Corporate Bonds and Notes | 219,097 | — | 219,097 | ||
| Leveraged Loans | 10,401 | — | 10,401 | ||
| Securities Lending Collateral | 3,120 | 3,120 | — | ||
| Total Investments | $232,930 | $3,120 | $229,810 |
December 31, 2023
| Par Value | Value | ||
| Municipal Bonds(1)—96.0% | |||
| Alabama—1.1% | |||
| Jefferson County, Sales Tax Revenue 5.000%, 9/15/33 | $ 1,500 | $ 1,607 | |
| California—4.1% | |||
| California County Tobacco Securitization Agency Revenue, | |||
| Series A 5.000%, 6/1/24 | 100 | 101 | |
| Series A 5.000%, 6/1/25 | 200 | 204 | |
| Series A 5.000%, 6/1/27 | 100 | 106 | |
| Series A 5.000%, 6/1/28 | 100 | 108 | |
| California, State of, General Obligation 5.000%, 4/1/37 | 4,000 | 4,013 | |
| State of California, General Obligation 4.000%, 9/1/43 | 1,190 | 1,243 | |
| 5,775 | |||
| Colorado—4.3% | |||
| E-470 Public Highway Authority, Series A 5.000%, 9/1/40 | 1,500 | 1,513 | |
| Gunnison Watershed School District No. Re 1J, | |||
| General Obligation (State AID Withholding Insured) 5.000%, 12/1/41 | 1,165 | 1,327 | |
| General Obligation (State AID Withholding Insured) 5.000%, 12/1/42 | 1,000 | 1,134 | |
| Regional Transportation District, | |||
| Sales Tax Revenue, Series A 5.000%, 1/15/27 | 900 | 938 | |
| Sales Tax Revenue, Series A 5.000%, 7/15/27 | 1,025 | 1,077 | |
| 5,989 | |||
| Connecticut—1.4% | |||
| Connecticut State Health & Educational Facilities Authority Revenue Series A 4.100%, 7/1/42(2) | 2,000 | 2,000 | |
| District of Columbia—3.8% | |||
| District of Columbia, General Obligation, Series D 5.000%, 6/1/31 | 2,825 | 3,010 | |
| Metropolitan Washington Airports Authority Aviation Revenue, Series A 5.000%, 10/1/29 | 1,165 | 1,286 | |
| Washington Metropolitan Area Transit Authority Dedicated Revenue, Sustainability Financed Bond 5.000%, 7/15/48 | 1,000 | 1,112 | |
| 5,408 | |||
| Florida—3.0% | |||
| Florida Municipal Power Agency Revenue, | |||
| Series A 3.000%, 10/1/32 | 750 | 742 | |
| Series A 3.000%, 10/1/33 | 750 | 736 | |
| Par Value | Value | ||
| Florida—continued | |||
| Miami-Dade Seaport Department County, Series A 5.000%, 10/1/40 | $ 2,500 | $ 2,713 | |
| 4,191 | |||
| Idaho—1.8% | |||
| Idaho Housing & Finance Association | |||
| 5.000%, 8/15/39 | 1,200 | 1,376 | |
| 5.000%, 8/15/40 | 1,000 | 1,140 | |
| 2,516 | |||
| Illinois—4.9% | |||
| Chicago O’Hare International Airport Revenue, Senior Lien, Series D 5.000%, 1/1/26 | 2,600 | 2,680 | |
| City of Chicago Wastewater Transmission Revenue, | |||
| Series A (AGM Insured) 5.250%, 1/1/40 | 2,650 | 3,058 | |
| Series B (AGM Insured) 5.000%, 1/1/39 | 1,000 | 1,141 | |
| 6,879 | |||
| Indiana—3.1% | |||
| Indianapolis Local Public Improvement Bond Bank 5.250%, 1/1/41 | 3,870 | 4,386 | |
| Maryland—4.3% | |||
| Anne Arundel County, General Obligation 5.000%, 10/1/30 | 2,615 | 2,768 | |
| Washington Suburban Sanitary Commission Revenue (CNTY GTD Insured) 5.000%, 6/15/30 | 3,000 | 3,248 | |
| 6,016 | |||
| Mississippi—2.3% | |||
| Mississippi, State of, General Obligation, Series C 5.000%, 10/1/36 | 3,000 | 3,285 | |
| Missouri—0.6% | |||
| Metropolitan St Louis Sewer District Revenue, Series B 5.000%, 5/1/47 | 750 | 833 | |
| Nevada—0.6% | |||
| Las Vegas Convention & Visitors Authority, Series A 5.000%, 7/1/49 | 760 | 832 | |
| New Jersey—4.0% | |||
| New Jersey Economic Development Authority, Series A 5.250%, 11/1/42 | 4,000 | 4,517 | |
| New Jersey Economic Development Authority, Series QQQ 4.000%, 6/15/38 | 1,150 | 1,176 | |
| 5,693 | |||
| New York—8.2% | |||
| City of New York, | |||
| General Obligation, Series 1 5.500%, 5/1/46 | 500 | 578 | |
| Par Value | Value | ||
| New York—continued | |||
| General Obligation, Series A 5.000%, 8/1/39 | $ 1,000 | $ 1,165 | |
| General Obligation, Series A 5.000%, 8/1/40 | 1,000 | 1,158 | |
| New York City Municipal Water Finance Authority, Series EE 5.000%, 6/15/45 | 1,445 | 1,537 | |
| New York State Dormitory Authority, Sales Tax Revenue, Series A 5.000%, 3/15/28 | 2,500 | 2,509 | |
| New York Transportation Development Corp., | |||
| Revenue (AMT) 6.000%, 6/30/54 | 585 | 646 | |
| Revenue (AMT) (AGM Insured) 5.000%, 6/30/49 | 585 | 611 | |
| Port Authority of New York & New Jersey 5.000%, 1/15/38 | 1,000 | 1,108 | |
| Triborough Bridge & Tunnel Authority, Series A 5.000%, 5/15/43 | 2,000 | 2,238 | |
| 11,550 | |||
| North Dakota—2.2% | |||
| North Dakota Public Finance Authority Revenue, Series A 5.000%, 10/1/28 | 3,000 | 3,043 | |
| Ohio—6.0% | |||
| Hamilton County, Life Enriching Communities Pro Revenue, Series A 5.500%, 1/1/43 | 355 | 361 | |
| Ohio, State of, General Obligation, Series A 5.000%, 6/15/32 | 7,735 | 8,109 | |
| 8,470 | |||
| Oregon—5.5% | |||
| Hillsboro School District No. 1J, General Obligation (SCH BD GTY Insured) 5.000%, 6/15/31 | 1,000 | 1,077 | |
| Oregon State Lottery, | |||
| Series A (MORAL OBLG Insured) 5.000%, 4/1/39 | 1,400 | 1,618 | |
| Series A (MORAL OBLG Insured) 5.000%, 4/1/40 | 2,750 | 3,160 | |
| Port of Portland, Airport Revenue, | |||
| Series 24B 5.000%, 7/1/26 | 750 | 780 | |
| Series 24B 5.000%, 7/1/30 | 1,000 | 1,053 | |
| 7,688 | |||
| Pennsylvania—7.5% | |||
| Lancaster County Hospital Authority Revenue | |||
| 5.000%, 11/1/37 | 580 | 625 | |
| 5.000%, 11/1/40 | 1,100 | 1,170 | |
| Pennsylvania Economic Development Financing Authority | |||
| 5.250%, 6/30/35 | 750 | 842 | |
| 5.500%, 6/30/38 | 1,000 | 1,108 | |
| 5.500%, 6/30/41 | 2,000 | 2,185 | |
| Par Value | Value | ||
| Pennsylvania—continued | |||
| Series B 4.000%, 5/15/40 | $ 1,000 | $ 1,012 | |
| Series B 4.000%, 5/15/41 | 1,000 | 1,006 | |
| Pennsylvania Turnpike Commission, | |||
| 5.000%, 12/1/39 | 1,000 | 1,087 | |
| Series B 5.250%, 12/1/41 | 1,000 | 1,152 | |
| Toll Highway Revenue, Series B 5.250%, 12/1/52 | 400 | 445 | |
| 10,632 | |||
| Texas—13.7% | |||
| Arlington Higher Education Finance Corp., Trinity Basin Preparatory Revenue (PSF-GTD Insured) 4.500%, 8/15/53 | 430 | 447 | |
| Brazosport Independent School District, General Obligation (PSF-GTD Insured) 5.000%, 2/15/28 | 1,080 | 1,181 | |
| Central Texas Regional Mobility Authority Revenue, | |||
| Senior Lien, Series E 5.000%, 1/1/29 | 500 | 552 | |
| Senior Lien, Series E 5.000%, 1/1/30 | 1,300 | 1,458 | |
| City of Austin, General Obligation 5.000%, 9/1/28 | 10 | 11 | |
| City of Corpus Christi, Utility System Revenue, Series B 5.000%, 7/15/40 | 1,450 | 1,625 | |
| City of Dallas, Waterworks & Sewer System Revenue, Series A 5.000%, 10/1/31 | 6,845 | 7,233 | |
| Clifton Higher Education Finance Corp. (PSF-GTD Insured) 5.000%, 8/15/35 | 1,715 | 1,873 | |
| Denton Independent School District, General Obligation (PSF-GTD Insured) 5.000%, 8/15/48 | 1,130 | 1,266 | |
| Klein Independent School District, General Obligation (PSF-GTD Insured) 4.000%, 8/1/46 | 2,000 | 2,037 | |
| North Texas Municipal Water District Water System Revenue 5.000%, 9/1/31 | 500 | 555 | |
| Wichita Falls Independent School District, General Obligation (PSF-GTD Insured) 4.000%, 2/1/29 | 1,000 | 1,067 | |
| 19,305 | |||
| Utah—0.9% | |||
| Salt Lake City, Airport Revenue, Series A 5.250%, 7/1/38 | 1,145 | 1,292 | |
| Washington—10.0% | |||
| Energy Northwest Revenue, Series A 5.000%, 7/1/34 | 8,000 | 8,234 | |
| Grant County Public Hospital District No. 1, General Obligation 5.500%, 12/1/43 | 690 | 748 | |
| Par Value | Value | ||
| Washington—continued | |||
| Washington, State of, General Obligation, Series 1 5.000%, 8/1/29 | $ 5,000 | $ 5,164 | |
| 14,146 | |||
| Wisconsin—2.7% | |||
| Public Finance Authority | |||
| 5.000%, 6/1/27 | 300 | 315 | |
| 5.000%, 6/1/28 | 500 | 533 | |
| 5.000%, 6/1/29 | 700 | 755 | |
| 5.000%, 6/1/30 | 1,000 | 1,088 | |
| 4.000%, 8/1/59(2) | 1,100 | 1,090 | |
| 3,781 | |||
| Total Municipal Bonds (Identified Cost $135,203) | 135,317 | ||
| Total Long-Term Investments—96.0% (Identified Cost $135,203) | 135,317 | ||
| Shares | ||
| Short-Term Investment—0.4% | ||
| Money Market Mutual Fund—0.4% | ||
| Dreyfus Government Cash Management Fund - Institutional Shares (seven-day effective yield 5.250%)(3) | 590,293 | 590 |
| Total Short-Term Investment (Identified Cost $590) | 590 | |
| TOTAL INVESTMENTS—96.4% (Identified Cost $135,793) | $135,907 | |
| Other assets and liabilities, net—3.6% | 5,069 | |
| NET ASSETS—100.0% | $140,976 | |
| Abbreviations: | |
| AGM | Assured Guaranty Municipal Corp. |
| AMT | Alternative Minimum Tax |
| CNTY GTD | County Guarantee Program |
| MORAL OBLG | Moral Obligation Bond |
| PSF-GTD | Permanent School Fund Guarantee Program |
| SCH BD GTY | School Bond Guaranty |
| Footnote Legend: | |
| (1) | At December 31, 2023, 17.8% of the securities in the portfolio are backed by insurance of financial institutions and financial guaranty assurance agencies. |
| (2) | Variable or step coupon security; interest rate shown reflects the rate in effect at December 31, 2023. For securities based on a published reference rate and spread, the reference rate and spread are indicated in the description above. Certain variable rate securities are not based on a published reference rate and spread but are determined by the issuer or agent and are based on current market conditions. These securities do not indicate a reference rate and spread in their description above. |
| (3) | Shares of this fund are publicly offered, and its prospectus and annual report are publicly available. |
| Total Value at December 31, 2023 | Level 1 Quoted Prices | Level 2 Significant Observable Inputs | |||
| Assets: | |||||
| Debt Instruments: | |||||
| Municipal Bonds | $135,317 | $ — | $135,317 | ||
| Money Market Mutual Fund | 590 | 590 | — | ||
| Total Investments | $135,907 | $590 | $135,317 |
December 31, 2023
| Par Value | Value | ||
| U.S. Government Securities—41.3% | |||
| U.S. Treasury Bond 4.125%, 8/15/53 | $ 15,997 | $ 16,170 | |
| U.S. Treasury Notes | |||
| 0.500%, 3/31/25 | 6,504 | 6,184 | |
| 3.625%, 5/15/26 | 14,893 | 14,720 | |
| 4.750%, 10/15/26 | 3,327 | 3,376 | |
| 3.625%, 5/31/28 | 8,607 | 8,516 | |
| 4.500%, 11/15/33 | 16,173 | 16,979 | |
| Total U.S. Government Securities (Identified Cost $63,491) | 65,945 | ||
| Mortgage-Backed Securities—32.3% | |||
| Agency—31.9% | |||
| Federal Home Loan Mortgage Corporation | |||
| Pool #A95259 4.000%, 12/1/40 | 884 | 864 | |
| Pool #G60019 4.500%, 3/1/44 | 329 | 327 | |
| Pool #Q42921 3.500%, 9/1/46 | 989 | 934 | |
| Pool #Q53881 4.500%, 1/1/48 | 772 | 765 | |
| Pool #QA3079 3.500%, 10/1/49 | 471 | 438 | |
| Pool #QA4766 3.500%, 11/1/49 | 934 | 879 | |
| Pool #QC2692 3.000%, 6/1/51 | 306 | 274 | |
| Pool #QE1443 4.000%, 5/1/52 | 755 | 717 | |
| Pool #QE1985 4.500%, 5/1/52 | 635 | 617 | |
| Pool #QE2366 5.000%, 5/1/52 | 307 | 306 | |
| Pool #QE4826 4.500%, 7/1/52 | 653 | 633 | |
| Pool #QE9908 5.500%, 9/1/52 | 640 | 645 | |
| Pool #QF8190 6.000%, 2/1/53 | 906 | 932 | |
| Pool #QF8551 5.500%, 3/1/53 | 441 | 443 | |
| Pool #RA2622 3.000%, 5/1/50 | 323 | 289 | |
| Pool #RA8188 4.500%, 11/1/52 | 745 | 723 | |
| Pool #RA8285 4.500%, 10/1/47 | 1,703 | 1,659 | |
| Pool #RJ0194 6.000%, 11/1/53 | 1,983 | 2,015 | |
| Pool #SC0203 2.500%, 12/1/41 | 1,393 | 1,240 | |
| Pool #SD0164 3.500%, 12/1/49 | 1,459 | 1,358 | |
| Pool #SD1618 5.000%, 9/1/52 | 1,691 | 1,678 | |
| Pool #SD2317 6.000%, 1/1/53 | 1,780 | 1,810 | |
| Pool #ZM5226 3.500%, 12/1/47 | 504 | 466 | |
| Par Value | Value | ||
| Agency—continued | |||
| Federal National Mortgage Association | |||
| Pool #AB3692 4.000%, 10/1/41 | $ 713 | $ 691 | |
| Pool #AB3878 4.000%, 11/1/41 | 801 | 776 | |
| Pool #AB5924 3.000%, 8/1/42 | 1,232 | 1,124 | |
| Pool #BO1277 3.000%, 7/1/49 | 508 | 453 | |
| Pool #BO1345 3.500%, 8/1/49 | 1,045 | 976 | |
| Pool #BO1351 4.000%, 8/1/49 | 397 | 381 | |
| Pool #BT7914 5.000%, 10/1/52 | 1,684 | 1,673 | |
| Pool #BV3044 3.000%, 2/1/52 | 775 | 700 | |
| Pool #BW0044 5.000%, 7/1/52 | 1,018 | 1,021 | |
| Pool #BW3311 4.500%, 7/1/52 | 1,764 | 1,717 | |
| Pool #BY8494 5.500%, 8/1/53 | 1,584 | 1,599 | |
| Pool #CA5122 3.000%, 2/1/50 | 549 | 491 | |
| Pool #CB3110 2.500%, 3/1/47 | 1,376 | 1,172 | |
| Pool #CB3630 4.000%, 5/1/52 | 176 | 166 | |
| Pool #CB3875 3.500%, 6/1/47 | 1,073 | 994 | |
| Pool #CB4451 4.000%, 8/1/42 | 533 | 512 | |
| Pool #CB7240 6.000%, 10/1/53 | 909 | 923 | |
| Pool #FM7290 3.000%, 5/1/51 | 851 | 764 | |
| Pool #FM7539 3.000%, 6/1/51 | 498 | 447 | |
| Pool #FM8210 3.000%, 4/1/50 | 664 | 598 | |
| Pool #FS1443 3.500%, 4/1/52 | 259 | 238 | |
| Pool #FS2249 5.000%, 6/1/52 | 880 | 877 | |
| Pool #FS2692 5.000%, 8/1/52 | 1,784 | 1,784 | |
| Pool #FS3262 4.000%, 10/1/46 | 2,011 | 1,961 | |
| Pool #FS3386 3.500%, 5/1/38 | 1,362 | 1,296 | |
| Pool #FS3687 5.000%, 11/1/52 | 1,063 | 1,056 | |
| Government National Mortgage Association | |||
| Pool #CO1904 5.000%, 8/15/52 | 984 | 1,011 | |
| Pool #CO1918 5.500%, 9/15/52 | 678 | 690 | |
| Pool #CP7106 5.500%, 8/20/52 | 186 | 192 | |
| Pool #CP7113 5.500%, 9/20/52 | 152 | 158 | |
| Par Value | Value | ||
| Agency—continued | |||
| Pool #CR2361 6.000%, 12/15/52 | $ 465 | $ 483 | |
| Pool #CR3025 5.500%, 12/20/52 | 931 | 950 | |
| Pool #CR9210 5.500%, 1/20/53 | 665 | 674 | |
| Pool #CS5391 6.000%, 1/20/53 | 794 | 811 | |
| Pool #CS5448 6.000%, 1/20/53 | 1,063 | 1,085 | |
| Pool #CS7736 6.000%, 4/20/53 | 446 | 456 | |
| 50,912 | |||
| Non-Agency—0.4% | |||
| BWAY Mortgage Trust 2013-1515, A2 144A 3.454%, 3/10/33(1) | 600 | 563 | |
| Total Mortgage-Backed Securities (Identified Cost $52,390) | 51,475 | ||
| Asset-Backed Securities—5.3% | |||
| Automobiles—0.3% | |||
| Ford Credit Auto Owner Trust 2023-1, A 144A 4.850%, 8/15/35(1) | 475 | 476 | |
| Credit Card—1.7% | |||
| American Express Credit Account Master Trust 2023-3, A 5.230%, 9/15/28 | 790 | 803 | |
| Capital One Multi-Asset Execution Trust 2005-B3, B3 (3 month Term SOFR + 0.812%, Cap N/A, Floor 0.550%) 6.205%, 5/15/28(2) | 1,200 | 1,193 | |
| Citibank Credit Card Issuance Trust 2017-A6, A6 (1 month Term SOFR + 0.884%) 6.249%, 5/14/29(2) | 785 | 788 | |
| 2,784 | |||
| Other—3.3% | |||
| CF Hippolyta Issuer LLC | |||
| 2020-1, A1 144A 1.690%, 7/15/60(1) | 495 | 457 | |
| 2020-1, B1 144A 2.280%, 7/15/60(1) | 742 | 679 | |
| DB Master Finance LLC 2021-1A, A23 144A 2.791%, 11/20/51(1) | 760 | 627 | |
| Jersey Mike’s Funding 2019-1A, A2 144A 4.433%, 2/15/50(1) | 883 | 836 | |
| PSNH Funding LLC 2018-1, A3 3.814%, 2/1/35 | 255 | 239 | |
| Stack Infrastructure Issuer LLC 2023-1A, A2 144A 5.900%, 3/25/48(1) | 160 | 157 | |
| Taco Bell Funding LLC 2021-1A, A23 144A 2.542%, 8/25/51(1) | 712 | 577 | |
| Vantage Data Centers LLC 2020-2A, A2 144A 1.992%, 9/15/45(1) | 805 | 700 | |
| Par Value | Value | ||
| Other—continued | |||
| Verizon Master Trust 2023-7, A1A 5.670%, 11/20/29 | $ 900 | $ 925 | |
| 5,197 | |||
| Total Asset-Backed Securities (Identified Cost $8,930) | 8,457 | ||
| Corporate Bonds and Notes—19.9% | |||
| Communication Services—0.3% | |||
| AT&T, Inc. 3.550%, 9/15/55 | 670 | 482 | |
| Consumer Discretionary—0.8% | |||
| General Motors Financial Co., Inc. 5.850%, 4/6/30 | 308 | 318 | |
| Hyatt Hotels Corp. 1.800%, 10/1/24 | 613 | 595 | |
| Tapestry, Inc. 7.350%, 11/27/28(3) | 414 | 434 | |
| 1,347 | |||
| Consumer Staples—2.0% | |||
| Kimberly-Clark Corp. 4.500%, 2/16/33 | 609 | 612 | |
| PepsiCo, Inc. 4.650%, 2/15/53 | 1,371 | 1,362 | |
| Philip Morris International, Inc. 5.375%, 2/15/33 | 1,166 | 1,196 | |
| 3,170 | |||
| Energy—1.4% | |||
| Boardwalk Pipelines LP 4.450%, 7/15/27 | 241 | 236 | |
| Enterprise Products Operating LLC 4.200%, 1/31/50 | 496 | 430 | |
| Pioneer Natural Resources Co. 1.900%, 8/15/30 | 927 | 787 | |
| Targa Resources Corp. 4.200%, 2/1/33 | 423 | 389 | |
| Williams Cos., Inc. (The) 3.500%, 10/15/51 | 477 | 348 | |
| 2,190 | |||
| Financials—10.9% | |||
| AerCap Ireland Capital DAC 3.000%, 10/29/28 | 324 | 296 | |
| American Express Co. 6.338%, 10/30/26 | 377 | 384 | |
| Bank of America Corp. | |||
| 2.087%, 6/14/29 | 585 | 516 | |
| 2.572%, 10/20/32 | 689 | 571 | |
| Bank of New York Mellon Corp. (The) 4.414%, 7/24/26 | 934 | 924 | |
| BMW U.S. Capital LLC 144A 1.950%, 8/12/31(1) | 747 | 615 | |
| BP Capital Markets America, Inc. 4.812%, 2/13/33 | 978 | 986 | |
| Par Value | Value | ||
| Financials—continued | |||
| BPCE S.A. 144A 5.748%, 7/19/33(1) | $ 550 | $ 552 | |
| Charles Schwab Corp. (The) | |||
| 5.643%, 5/19/29 | 325 | 333 | |
| 5.853%, 5/19/34 | 316 | 326 | |
| Daimler Truck Finance North America LLC 144A 2.500%, 12/14/31(1) | 417 | 346 | |
| Goldman Sachs Group, Inc. (The) 1.542%, 9/10/27 | 1,243 | 1,127 | |
| Hartford Financial Services Group, Inc. (The) 2.800%, 8/19/29 | 467 | 424 | |
| Hyundai Capital America 144A 5.700%, 6/26/30(1) | 593 | 607 | |
| John Deere Capital Corp. 5.150%, 3/3/25 | 361 | 363 | |
| JPMorgan Chase & Co. | |||
| 0.824%, 6/1/25 | 945 | 925 | |
| 5.350%, 6/1/34 | 620 | 629 | |
| KeyBank N.A. 4.390%, 12/14/27 | 420 | 395 | |
| Morgan Stanley | |||
| 0.791%, 1/22/25 | 644 | 642 | |
| 1.593%, 5/4/27 | 1,047 | 965 | |
| Pfizer Investment Enterprises Pte Ltd. 5.300%, 5/19/53 | 1,053 | 1,075 | |
| PG&E Wildfire Recovery Funding LLC Series A-2 4.263%, 6/1/38 | 835 | 791 | |
| PNC Financial Services Group, Inc. (The) 6.615%, 10/20/27 | 480 | 498 | |
| Sigeco Securitization I LLC Series A1 5.026%, 11/15/38 | 440 | 443 | |
| UBS Group AG 144A 4.751%, 5/12/28(1) | 805 | 793 | |
| United Airlines Pass-Through-Trust | |||
| 2020-1, A 5.875%, 4/15/29 | 573 | 580 | |
| 2020-1, B 4.875%, 7/15/27 | 291 | 282 | |
| Wells Fargo & Co. | |||
| 3.526%, 3/24/28 | 739 | 705 | |
| 3.350%, 3/2/33 | 281 | 246 | |
| 17,339 | |||
| Health Care—1.1% | |||
| AbbVie, Inc. 4.250%, 11/21/49 | 876 | 781 | |
| Amgen, Inc. | |||
| 5.250%, 3/2/33 | 662 | 679 | |
| 5.650%, 3/2/53 | 373 | 392 | |
| 1,852 | |||
| Industrials—1.0% | |||
| Ingersoll Rand, Inc. 5.700%, 8/14/33 | 313 | 331 | |
| United Parcel Service, Inc. 5.050%, 3/3/53 | 812 | 841 | |
| Par Value | Value | ||
| Industrials—continued | |||
| Veralto Corp. 144A 5.450%, 9/18/33(1) | $ 399 | $ 413 | |
| 1,585 | |||
| Materials—1.3% | |||
| Air Products & Chemicals, Inc. 4.800%, 3/3/33 | 731 | 755 | |
| Newmont Corp. | |||
| 2.250%, 10/1/30 | 678 | 585 | |
| 6.250%, 10/1/39 | 607 | 673 | |
| 2,013 | |||
| Real Estate—0.2% | |||
| Tanger Properties LP 2.750%, 9/1/31 | 503 | 404 | |
| Utilities—0.9% | |||
| Boardwalk Pipelines LP 3.400%, 2/15/31 | 319 | 285 | |
| Consolidated Edison Co. of New York, Inc. 3.200%, 12/1/51 | 508 | 359 | |
| Consumers 2023 Securitization Funding LLC Series A2 5.210%, 9/1/31 | 305 | 312 | |
| Southern Co. (The) Series A 3.700%, 4/30/30 | 519 | 489 | |
| 1,445 | |||
| Total Corporate Bonds and Notes (Identified Cost $32,817) | 31,827 | ||
| Total Long-Term Investments—98.8% (Identified Cost $157,628) | 157,704 | ||
| Shares | ||
| Securities Lending Collateral—0.1% | ||
| Dreyfus Government Cash Management Fund - Institutional Shares (seven-day effective yield 5.250%)(4)(5) | 173,880 | 174 |
| Total Securities Lending Collateral (Identified Cost $174) | 174 | |
| TOTAL INVESTMENTS—98.9% (Identified Cost $157,802) | $157,878 | |
| Other assets and liabilities, net—1.1% | 1,729 | |
| NET ASSETS—100.0% | $159,607 | |
| Abbreviations: | |
| DAC | Designated Activity Company |
| LLC | Limited Liability Company |
| LP | Limited Partnership |
| SOFR | Secured Overnight Financing Rate |
| Footnote Legend: | |
| (1) | Security exempt from registration under Rule 144A of the Securities Act of 1933. These securities may be resold in transactions exempt from registration, normally to qualified institutional buyers. At December 31, 2023, these securities amounted to a value of $8,398 or 5.3% of net assets. |
| (2) | Variable rate security. Rate disclosed is as of December 31, 2023. Information in parenthesis represents benchmark and reference rate for each security. Certain variable rate securities are not based on a published reference rate and spread but are determined by the issuer or agent and are based on current market conditions, or, for mortgage-backed securities, are impacted by the individual mortgages which are paying off over time. These securities do not indicate a reference rate and spread in their descriptions. |
| (3) | All or a portion of security is on loan. |
| (4) | Shares of this fund are publicly offered, and its prospectus and annual report are publicly available. |
| (5) | Represents security purchased with cash collateral received for securities on loan. |
| Total Value at December 31, 2023 | Level 1 Quoted Prices | Level 2 Significant Observable Inputs | |||
| Assets: | |||||
| Debt Instruments: | |||||
| U.S. Government Securities | $ 65,945 | $ — | $ 65,945 | ||
| Mortgage-Backed Securities | 51,475 | — | 51,475 | ||
| Asset-Backed Securities | 8,457 | — | 8,457 | ||
| Corporate Bonds and Notes | 31,827 | — | 31,827 | ||
| Securities Lending Collateral | 174 | 174 | — | ||
| Total Investments | $157,878 | $174 | $157,704 |
December 31, 2023
| Par Value | Value | ||
| Mortgage-Backed Securities—92.7% | |||
| Agency—92.7% | |||
| Federal Home Loan Mortgage Corp. Multifamily Structured Pass-Through Certificates | |||
| KF29, A (SOFR30A + 0.474%, Cap N/A, Floor 0.360%) 5.805%, 2/25/24(1) | $ 3,549 | $ 3,548 | |
| KF55, A (SOFR30A + 0.624%, Cap N/A, Floor 0.510%) 5.955%, 11/25/25(1) | 3,985 | 3,982 | |
| KF79, AL (SOFR30A + 0.584%, Cap N/A, Floor 0.470%) 5.915%, 5/25/30(1) | 13,600 | 13,550 | |
| KIR1, A1 2.446%, 3/25/26 | 2,127 | 2,061 | |
| Federal Home Loan Mortgage Corp. REMIC | |||
| 2980, FJ (SOFR30A + 0.414%, Cap 7.000%, Floor 0.300%) 5.753%, 11/15/34(1) | 5,437 | 5,374 | |
| 3820, FA (SOFR30A + 0.464%, Cap 7.000%, Floor 0.350%) 5.803%, 3/15/41(1) | 4,064 | 4,031 | |
| 4048, GF (SOFR30A + 0.464%, Cap 7.000%, Floor 0.350%) 5.803%, 10/15/40(1) | 157 | 157 | |
| 4203, PF (SOFR30A + 0.364%, Cap 6.500%, Floor 0.250%) 5.703%, 9/15/42(1) | 4,593 | 4,499 | |
| 4794, WF (SOFR30A + 0.464%) 5.123%, 3/15/43(1) | 6,160 | 6,086 | |
| Federal Home Loan Mortgage Corporation | |||
| Pool #1Q1195 (RFUCCT1Y + 1.585%, Cap 10.122%, Floor 1.585%) 4.920%, 5/1/37(1) | 1,707 | 1,738 | |
| Pool #1Q1420 (RFUCCT1Y + 1.838%, Cap 10.633%, Floor 1.838%) 5.561%, 9/1/39(1) | 1,104 | 1,136 | |
| Pool #2B5891 (RFUCCT1Y + 1.640%, Cap 7.887%, Floor 1.640%) 4.080%, 2/1/47(1) | 2,247 | 2,284 | |
| Pool #840337 (RFUCCT1Y + 1.592%, Cap 7.720%, Floor 1.592%) 6.772%, 7/1/46(1) | 1,135 | 1,157 | |
| Pool #841083 (RFUCCT1Y + 1.642%, Cap 7.809%, Floor 1.642%) 2.983%, 5/1/49(1) | 8,421 | 8,374 | |
| Pool #841345 (RFUCCT1Y + 1.625%, Cap 7.671%, Floor 1.625%) 5.652%, 1/1/47(1) | 1,823 | 1,856 | |
| Pool #848736 (RFUCCT1Y + 1.750%, Cap 9.568%, Floor 1.750%) 5.505%, 5/1/35(1) | 4,153 | 4,244 | |
| Pool #848744 (RFUCCT1Y + 1.789%, Cap 9.136%, Floor 1.789%) 5.529%, 5/1/34(1) | 2,396 | 2,448 | |
| Pool #848747 (RFUCCT1Y + 1.865%, Cap 10.004%, Floor 1.865%) 5.523%, 7/1/36(1) | 2,238 | 2,290 | |
| Pool #848796 (RFUCCT1Y + 1.804%, Cap 9.844%, Floor 1.804%) 5.110%, 5/1/37(1) | 4,370 | 4,470 | |
| Federal National Mortgage Association | |||
| 2015-M14, FA (SOFR30A + 0.734%, Cap N/A, Floor 0.620%) 6.072%, 10/25/25(1) | 10,580 | 10,552 | |
| Par Value | Value | ||
| Agency—continued | |||
| 2015-M6, FA (SOFR30A + 0.414%, Cap N/A, Floor 0.300%) 5.752%, 1/25/26(1) | $11,715 | $ 11,684 | |
| Pool #AD0064 (RFUCCT6M + 1.546%, Cap 10.947%, Floor 1.546%) 7.233%, 1/1/35(1) | 823 | 834 | |
| Pool #AE0544 (RFUCCT1Y + 1.742%, Cap 8.077%, Floor 1.742%) 5.993%, 11/1/40(1) | 1,588 | 1,632 | |
| Pool #AL0270 (RFUCCT1Y + 1.695%, Cap 10.566%, Floor 1.695%) 5.206%, 8/1/38(1) | 510 | 511 | |
| Pool #AL0323 (RFUCCT1Y + 1.818%, Cap 8.290%, Floor 1.818%) 5.409%, 6/1/41(1) | 1,012 | 1,042 | |
| Pool #AL0960 (RFUCCT1Y + 1.686%, Cap 9.732%, Floor 1.686%) 5.737%, 7/1/37(1) | 2,420 | 2,473 | |
| Pool #AL1886 (RFUCCT1Y + 1.752%, Cap 8.456%, Floor 1.752%) 5.629%, 6/1/42(1) | 262 | 269 | |
| Pool #AL2202 (RFUCCT1Y + 1.691%, Cap 9.453%, Floor 1.691%) 4.887%, 6/1/36(1) | 938 | 960 | |
| Pool #AL3421 (U.S. Treasury Yield Curve CMT 1 year + 2.375%, Cap 10.750%, Floor 2.375%) 6.445%, 9/1/37(1) | 849 | 855 | |
| Pool #AL6516 (RFUCCT1Y + 1.759%, Cap 8.718%, Floor 1.759%) 5.195%, 4/1/40(1) | 1,672 | 1,724 | |
| Pool #AL7477 (RFUCCT1Y + 1.797%, Cap 8.631%, Floor 1.797%) 5.930%, 12/1/40(1) | 1,221 | 1,260 | |
| Pool #AL7812 (RFUCCT1Y + 1.727%, Cap 8.367%, Floor 1.727%) 5.970%, 11/1/40(1) | 2,887 | 2,971 | |
| Pool #AL8796 (RFUCCT1Y + 1.827%, Cap 8.465%, Floor 1.827%) 5.666%, 9/1/41(1) | 3,406 | 3,507 | |
| Pool #AL8827 3.000%, 2/1/29 | 459 | 445 | |
| Pool #AL8872 (RFUCCT1Y + 1.802%, Cap 8.341%, Floor 1.802%) 5.451%, 7/1/42(1) | 4,664 | 4,800 | |
| Pool #AN4364 (SOFR30A + 0.704%, Cap 98.130%, Floor 0.590%) 6.035%, 1/1/24(1) | 2,728 | 2,717 | |
| Pool #BE3734 (RFUCCT1Y + 1.620%, Cap 7.892%, Floor 1.620%) 5.738%, 7/1/47(1) | 1,725 | 1,749 | |
| Pool #BL5697 (SOFR30A + 0.764%, Cap 98.860%, Floor 0.650%) 6.095%, 2/1/30(1) | 6,300 | 6,251 | |
| Pool #BL6487 (SOFR30A + 0.874%, Cap 98.510%, Floor 0.760%) 6.205%, 4/1/30(1) | 10,000 | 9,985 | |
| Pool #BM1805 (RFUCCT1Y + 1.606%, Cap 7.819%, Floor 1.606%) 2.802%, 9/1/47(1) | 4,000 | 3,996 | |
| Pool #BM3981 (RFUCCT1Y + 1.752%, Cap 8.644%, Floor 1.752%) 5.319%, 2/1/42(1) | 718 | 739 | |
| Par Value | Value | ||
| Agency—continued | |||
| Pool #BM4556 (RFUCCT1Y + 1.595%, Cap 8.519%, Floor 1.595%) 7.078%, 10/1/48(1) | $ 2,041 | $ 2,083 | |
| Pool #BM4557 (RFUCCT1Y + 1.765%, Cap 7.880%, Floor 1.768%) 5.415%, 5/1/45(1) | 1,888 | 1,937 | |
| Pool #BM6855 (RFUCCT1Y + 1.618%, Cap 7.569%, Floor 1.618%) 2.570%, 6/1/50(1) | 8,173 | 7,739 | |
| Pool #BM7025 (RFUCCT1Y + 1.708%, Cap 8.730%, Floor 1.708%) 5.190%, 5/1/42(1) | 7,261 | 7,452 | |
| Pool #BS5709 (SOFR30A + 0.460%, Cap N/A, Floor 0.460%) 5.791%, 5/1/29(1) | 1,000 | 991 | |
| Pool #BW7240 (SOFR30A + 2.120%, Cap 8.901%, Floor 2.120%) 3.901%, 10/1/52(1) | 7,770 | 7,544 | |
| Pool #BX2888 (SOFR30A + 2.110%, Cap 10.203%, Floor 2.110%) 5.203%, 12/1/52(1) | 3,523 | 3,527 | |
| Federal National Mortgage Association REMIC | |||
| 2005-17, FA (SOFR30A + 0.414%, Cap 7.000%, Floor 0.300%) 5.752%, 3/25/35(1) | 3,498 | 3,453 | |
| 2005-74, NA (SOFR30A + 0.534%, Cap 6.500%, Floor 0.420%) 5.872%, 5/25/35(1) | 6,590 | 6,540 | |
| 2009-66, FP (SOFR30A + 1.014%, Cap 7.000%, Floor 0.900%) 6.352%, 9/25/39(1) | 4,072 | 4,106 | |
| 2011-62, LF (SOFR30A + 0.514%, Cap 7.000%, Floor 0.400%) 5.852%, 1/25/32(1) | 4,222 | 4,196 | |
| 2016-67, AF (SOFR30A + 0.514%, Cap 6.500%, Floor 0.400%) 5.852%, 9/25/46(1) | 3,976 | 3,914 | |
| 2018-92, AF (SOFR30A + 0.514%, Cap 6.500%, Floor 0.400%) 5.852%, 5/25/33(1) | 4,178 | 4,127 | |
| 2018-96, FC (SOFR30A + 0.564%, Cap 6.500%, Floor 0.450%) 5.902%, 10/25/35(1) | 4,276 | 4,230 | |
| 2019-13, FG (SOFR30A + 0.514%, Cap 6.500%, Floor 0.400%) 5.852%, 4/25/49(1) | 6,807 | 6,659 | |
| FRESB Mortgage Trust | |||
| 2016-SB13, A5H (SOFR30A + 0.814%, Cap N/A, Floor 0.700%) 6.145%, 1/25/36(1) | 5,829 | 5,796 | |
| 2019-SB66, A7H 2.390%, 6/25/39(1) | 1,477 | 1,375 | |
| Government National Mortgage Association 2009-88, FA (1 month Term SOFR + 0.864%, Cap 7.000%, Floor 0.750%) 6.223%, 10/16/39(1) | 3,761 | 3,779 | |
| Small Business Administration | |||
| Pool #510032 (PRIME minus 2.650%) 5.850%, 6/25/34(1) | 1,651 | 1,646 | |
| Pool #510076 (PRIME minus 2.650%) 5.850%, 5/25/27(1) | 1,084 | 1,085 | |
| Par Value | Value | ||
| Agency—continued | |||
| Pool #510083 (PRIME minus 2.650%) 5.850%, 9/25/27(1) | $ 378 | $ 379 | |
| Pool #510219 (PRIME minus 2.650%) 5.850%, 11/25/28(1) | 1,327 | 1,322 | |
| Pool #510228 (PRIME minus 2.500%) 6.000%, 7/25/28(1) | 320 | 321 | |
| Pool #510241 (PRIME minus 2.600%) 5.900%, 10/25/27(1) | 931 | 929 | |
| Pool #510254 (PRIME minus 2.600%) 5.900%, 5/25/28(1) | 2,206 | 2,205 | |
| Pool #510256 (PRIME minus 2.600%) 5.900%, 12/25/28(1) | 2,944 | 2,945 | |
| Pool #510273 (PRIME minus 2.500%) 6.000%, 11/25/28(1) | 1,958 | 1,965 | |
| Pool #530251 (PRIME minus 2.375%) 6.125%, 4/25/32(1) | 6,000 | 5,966 | |
| Total Mortgage-Backed Securities (Identified Cost $243,066) | 242,452 | ||
| Total Long-Term Investments—92.7% (Identified Cost $243,066) | 242,452 | ||
| Short-Term Investments—5.7% | |||
| U.S. Government Securities—5.7% | |||
| U.S. Treasury Bills | |||
| 0.000%, 2/29/24(2) | 5,000 | 4,957 | |
| 0.000%, 5/2/24(2) | 10,000 | 9,827 | |
| Total Short-Term Investments (Identified Cost $14,775) | 14,784 | ||
| TOTAL INVESTMENTS—98.4% (Identified Cost $257,841) | $257,236 | ||
| Other assets and liabilities, net—1.6% | 4,294 | ||
| NET ASSETS—100.0% | $261,530 | ||
| Abbreviations: | |
| CMT | Constant Maturity Treasury |
| REMIC | Real Estate Mortgage Investment Conduit |
| RFUCCT1Y | Refinitiv USD IBOR Consumer Cash Fallbacks Term 1 Year |
| RFUCCT6M | Refinitiv USD IBOR Consumer Cash Fallbacks Term 6 Months |
| SOFR | Secured Overnight Financing Rate |
| SOFR30A | Secured Overnight Financing Rate 30 Day Average |
| Footnote Legend: | |
| (1) | Variable rate security. Rate disclosed is as of December 31, 2023. Information in parenthesis represents benchmark and reference rate for each security. Certain variable rate securities are not based on a published reference rate and spread but are determined by the issuer or agent and are based on current market conditions, or, for mortgage-backed securities, are impacted by the individual mortgages which are paying off over time. These securities do not indicate a reference rate and spread in their descriptions. |
| (2) | Issued with a zero coupon. Income is recognized through the accretion of discount. |
| Exchange-traded futures contracts as of December 31, 2023 were as follows: | ||||||
| Issue | Expiration | Contracts Purchased/(Sold) | Notional Value | Value / Unrealized Appreciation | Value / Unrealized Depreciation | |
| Short Contracts: | ||||||
| 5 Year U.S. Treasury Note Future | March 2024 | (100) | $(10,877) | $— | $ (246) | |
| Total | $— | $ (246) | ||||
| Total Value at December 31, 2023 | Level 1 Quoted Prices | Level 2 Significant Observable Inputs | |||
| Assets: | |||||
| Debt Instruments: | |||||
| U.S. Government Securities | $ 14,784 | $ — | $ 14,784 | ||
| Mortgage-Backed Securities | 242,452 | — | 242,452 | ||
| Total Assets | 257,236 | — | 257,236 | ||
| Liabilities: | |||||
| Other Financial Instruments: | |||||
| Futures Contracts | (246) | (246) | — | ||
| Total Liabilities | (246) | (246) | — | ||
| Total Investments | $256,990 | $ (246) | $257,236 |
December 31, 2023
| Par Value | Value | ||
| Mortgage-Backed Securities—24.7% | |||
| Agency—17.7% | |||
| Federal Home Loan Mortgage Corp. Multifamily Structured Pass-Through Certificates | |||
| KBF1, A (SOFR30A + 0.504%) 5.835%, 7/25/24(1) | $ 245 | $ 245 | |
| KF68, A (SOFR30A + 0.604%, Cap N/A, Floor 0.490%) 5.935%, 7/25/26(1) | 1,161 | 1,159 | |
| KJ43, AFL (SOFR30A + 0.960%, Cap N/A, Floor 0.960%) 6.291%, 1/25/32(1) | 906 | 906 | |
| KLU2, AFL (SOFR30A + 0.734%, Cap N/A, Floor 0.620%) 6.065%, 6/25/28(1) | 270 | 271 | |
| Federal National Mortgage Association 2015-M6, FA (SOFR30A + 0.414%, Cap N/A, Floor 0.300%) 5.752%, 1/25/26(1) | 586 | 584 | |
| Small Business Administration Pool #510273 (PRIME minus 2.500%) 6.000%, 11/25/28(1) | 392 | 393 | |
| 3,558 | |||
| Non-Agency—7.0% | |||
| BWAY Mortgage Trust 2013-1515, A1 144A 2.809%, 3/10/33(2) | 438 | 427 | |
| Cold Storage Trust 2020-ICE5, A (1 month Term SOFR + 1.014%, Cap N/A, Floor 0.900%) 144A 6.372%, 11/15/37(1)(2) | 491 | 489 | |
| One New York Plaza Trust 2020-1NYP, A (1 month Term SOFR + 1.064%, Cap N/A, Floor 0.950%) 144A 6.426%, 1/15/36(1)(2) | 500 | 476 | |
| 1,392 | |||
| Total Mortgage-Backed Securities (Identified Cost $4,985) | 4,950 | ||
| Asset-Backed Securities—11.7% | |||
| Credit Card—9.7% | |||
| Capital One Multi-Asset Execution Trust 2005-B3, B3 (3 month Term SOFR + 0.812%, Cap N/A, Floor 0.550%) 6.205%, 5/15/28(1) | 750 | 745 | |
| CARDS II Trust 2021-1A, A 144A 0.602%, 4/15/27(2) | 400 | 394 | |
| Citibank Credit Card Issuance Trust 2017-A6, A6 (1 month Term SOFR + 0.884%) 6.249%, 5/14/29(1) | 500 | 502 | |
| Discover Card Execution Note Trust 2017-A5, A5 (1 month Term SOFR + 0.714%) 6.076%, 12/15/26(1) | 300 | 301 | |
| 1,942 | |||
| Student Loan—2.0% | |||
| Goal Capital Funding Trust 2010-1, A (3 month LIBOR + 0.700%, Cap N/A, Floor 0.700%) 144A 6.341%, 8/25/48(1)(2) | 347 | 345 | |
| Par Value | Value | ||
| Student Loan—continued | |||
| SLM Student Loan Trust 2005-7, A4 (SOFR90A + 0.412%) 5.746%, 10/25/29(1) | $ 66 | $ 66 | |
| 411 | |||
| Total Asset-Backed Securities (Identified Cost $2,345) | 2,353 | ||
| Corporate Bonds and Notes—43.8% | |||
| Communication Services—6.7% | |||
| AT&T, Inc. 5.539%, 2/20/26 | 474 | 474 | |
| Verizon Communications, Inc. (SOFR + 0.500%) 5.921%, 3/22/24(1) | 430 | 430 | |
| Warnermedia Holdings, Inc. (SOFR + 1.780%) 7.195%, 3/15/24(1) | 443 | 444 | |
| 1,348 | |||
| Consumer Discretionary—1.9% | |||
| Hyatt Hotels Corp. 1.800%, 10/1/24 | 400 | 388 | |
| Consumer Staples—4.1% | |||
| PepsiCo, Inc. 3.600%, 3/1/24 | 500 | 499 | |
| Philip Morris International, Inc. 4.875%, 2/13/26 | 330 | 331 | |
| 830 | |||
| Energy—4.9% | |||
| Continental Resources, Inc. 144A 2.268%, 11/15/26(2) | 541 | 497 | |
| Williams Cos., Inc. (The) 4.300%, 3/4/24 | 480 | 479 | |
| 976 | |||
| Financials—23.5% | |||
| AerCap Ireland Capital DAC 1.650%, 10/29/24 | 505 | 487 | |
| ANZ New Zealand Int’l Ltd. (SOFR + 0.600%) 144A 5.996%, 2/18/25(1)(2) | 475 | 475 | |
| Banco Santander S.A. (SOFR + 1.240%) 6.637%, 5/24/24(1) | 400 | 401 | |
| Charles Schwab Corp. (The) 0.900%, 3/11/26 | 230 | 211 | |
| Daimler Truck Finance North America LLC (SOFR + 0.750%) 144A 6.159%, 12/13/24(1)(2) | 450 | 450 | |
| General Motors Financial Co., Inc. 5.250%, 3/1/26 | 120 | 120 | |
| Goldman Sachs Group, Inc. (The) (SOFR + 0.500%) 5.910%, 9/10/24(1) | 471 | 470 | |
| Hyundai Capital America 144A 1.000%, 9/17/24(2) | 500 | 484 | |
| Morgan Stanley 0.791%, 1/22/25 | 525 | 524 | |
| UBS AG 144A 0.700%, 8/9/24(2) | 500 | 486 | |
| Par Value | Value | ||
| Financials—continued | |||
| United Airlines Pass-Through-Trust 2020-1, B 4.875%, 7/15/27 | $ 629 | $ 610 | |
| 4,718 | |||
| Health Care—2.4% | |||
| AbbVie, Inc. 3.850%, 6/15/24 | 250 | 248 | |
| Amgen, Inc. 5.507%, 3/2/26 | 228 | 228 | |
| 476 | |||
| Industrials—0.3% | |||
| Veralto Corp. 144A 5.500%, 9/18/26(2) | 66 | 67 | |
| Total Corporate Bonds and Notes (Identified Cost $8,890) | 8,803 | ||
| Total Long-Term Investments—80.2% (Identified Cost $16,220) | 16,106 | ||
| Short-Term Investments—17.5% | |||
| U.S. Government Securities—17.5% | |||
| U.S. Treasury Bills | |||
| 0.000%, 1/2/24(3) | 450 | 450 | |
| 0.000%, 2/29/24(3) | 1,890 | 1,874 | |
| 0.000%, 5/2/24(3) | 1,200 | 1,179 | |
| Total Short-Term Investments (Identified Cost $3,502) | 3,503 | ||
| TOTAL INVESTMENTS—97.7% (Identified Cost $19,722) | $19,609 | ||
| Other assets and liabilities, net—2.3% | 466 | ||
| NET ASSETS—100.0% | $20,075 | ||
| Abbreviations: | |
| DAC | Designated Activity Company |
| LIBOR | London Interbank Offered Rate |
| LLC | Limited Liability Company |
| SOFR | Secured Overnight Financing Rate |
| SOFR30A | Secured Overnight Financing Rate 30 Day Average |
| SOFR90A | Secured Overnight Financing Rate 90 Day Average |
| Footnote Legend: | |
| (1) | Variable rate security. Rate disclosed is as of December 31, 2023. Information in parenthesis represents benchmark and reference rate for each security. Certain variable rate securities are not based on a published reference rate and spread but are determined by the issuer or agent and are based on current market conditions, or, for mortgage-backed securities, are impacted by the individual mortgages which are paying off over time. These securities do not indicate a reference rate and spread in their descriptions. |
| (2) | Security exempt from registration under Rule 144A of the Securities Act of 1933. These securities may be resold in transactions exempt from registration, normally to qualified institutional buyers. At December 31, 2023, these securities amounted to a value of $4,590 or 22.9% of net assets. |
| (3) | Issued with a zero coupon. Income is recognized through the accretion of discount. |
| Country Weightings (Unaudited)† | |
| United States | 89% |
| Ireland | 3 |
| Switzerland | 2 |
| New Zealand | 2 |
| Spain | 2 |
| Canada | 2 |
| Total | 100% |
| † % of total investments as of December 31, 2023. | |
| Exchange-traded futures contracts as of December 31, 2023 were as follows: | ||||||
| Issue | Expiration | Contracts Purchased/(Sold) | Notional Value | Value / Unrealized Appreciation | Value / Unrealized Depreciation | |
| Short Contracts: | ||||||
| 2 Year U.S. Treasury Note Future | March 2024 | (1) | $(206) | $— | $ (2) | |
| 5 Year U.S. Treasury Note Future | March 2024 | (2) | (218) | — | (5) | |
| Total | $— | $ (7) | ||||
| Total Value at December 31, 2023 | Level 1 Quoted Prices | Level 2 Significant Observable Inputs | |||
| Assets: | |||||
| Debt Instruments: | |||||
| U.S. Government Securities | $ 3,503 | $ — | $ 3,503 | ||
| Mortgage-Backed Securities | 4,950 | — | 4,950 | ||
| Asset-Backed Securities | 2,353 | — | 2,353 | ||
| Corporate Bonds and Notes | 8,803 | — | 8,803 | ||
| Total Assets | 19,609 | — | 19,609 | ||
| Liabilities: | |||||
| Other Financial Instruments: | |||||
| Futures Contracts | (7) | (7) | — | ||
| Total Liabilities | (7) | (7) | — | ||
| Total Investments | $19,602 | $ (7) | $19,609 |
December 31, 2023
| Seix Core Bond Fund | Seix Corporate Bond Fund | Seix Floating Rate High Income Fund | Seix High Grade Municipal Bond Fund | ||||
| Assets | |||||||
Investment in securities at value(1)(2) | $ 53,037 | $ 46,827 | $ 1,488,564 | $ 36,758 | |||
Cash | 273 | 575 | 49,512 | 369 | |||
Due from broker | — | 192 | — | — | |||
| Receivables | |||||||
Investment securities sold | — | — | 40,762 | — | |||
Fund shares sold | 226 | 62 | 3,325 | 117 | |||
Dividends and interest | 362 | 517 | 11,275 | 551 | |||
Receivable from adviser | — | — | — | 1 | |||
Unrealized appreciation on unfunded loan commitment(a) | — | — | 8 | — | |||
Securities lending income | — (b) | — (b) | — | — | |||
Prepaid expenses | 12 | 22 | 144 | 12 | |||
Other assets | 7 | 6 | 181 | 4 | |||
Total assets | 53,917 | 48,201 | 1,593,771 | 37,812 | |||
| Liabilities | |||||||
| Payables | |||||||
Fund shares repurchased | 200 | 247 | 7,442 | 230 | |||
Investment securities purchased | 81 | 252 | 52,289 | — | |||
Collateral on securities loaned | 145 | 99 | — | — | |||
Dividend distributions | 1 | — | 696 | 9 | |||
Investment advisory fees | 2 | 5 | 395 | — | |||
Distribution and service fees | 1 | 1 | 13 | 1 | |||
Administration and accounting fees | 5 | 5 | 133 | 4 | |||
Transfer agent and sub-transfer agent fees and expenses | 15 | 17 | 361 | 9 | |||
Professional fees | 31 | 31 | 34 | 30 | |||
Trustee deferred compensation plan | 7 | 6 | 181 | 4 | |||
Interest expense and/or commitment fees | — (b) | — (b) | — | — (b) | |||
Other accrued expenses | 15 | 9 | 338 | 3 | |||
Total liabilities | 503 | 672 | 61,882 | 290 | |||
Net Assets | $ 53,414 | $ 47,529 | $ 1,531,889 | $ 37,522 | |||
| Net Assets Consist of: | |||||||
Capital paid in on shares of beneficial interest | $ 66,327 | $ 59,790 | $ 2,389,378 | $ 39,055 | |||
Accumulated earnings (loss) | (12,913) | (12,261) | (857,489) | (1,533) | |||
Net Assets | $ 53,414 | $ 47,529 | $ 1,531,889 | $ 37,522 | |||
| Net Assets: | |||||||
Class A | $ 5,908 | $ 4,958 | $ 33,242 | $ 4,215 | |||
Class C | $ — | $ 359 | $ 7,183 | $ — | |||
Class I | $ 45,509 | $ 42,135 | $ 1,303,700 | $ 33,307 | |||
Class R6 | $ 1,997 | $ 77 | $ 187,764 | $ — | |||
| Shares Outstanding (unlimited number of shares authorized, no par value): | |||||||
Class A | 620,893 | 654,890 | 4,198,673 | 372,711 | |||
Class C | — | 47,678 | 906,812 | — | |||
Class I | 4,782,072 | 5,594,869 | 164,639,897 | 2,946,449 | |||
Class R6 | 209,839 | 10,256 | 23,693,630 | — | |||
| Net Asset Value and Redemption Price Per Share:* | |||||||
Class A | $ 9.51 | $ 7.57 | $ 7.92 | $ 11.31 | |||
Class C | $ — | $ 7.53 | $ 7.92 | $ — | |||
Class I | $ 9.52 | $ 7.53 | $ 7.92 | $ 11.30 | |||
Class R6 | $ 9.52 | $ 7.52 | $ 7.92 | $ — |
| Seix Core Bond Fund | Seix Corporate Bond Fund | Seix Floating Rate High Income Fund | Seix High Grade Municipal Bond Fund | ||||
| Maximum Offering Price Per Share (NAV/(1-Maximum Sales Charge)): | |||||||
Class A | $ 9.88 | $ 7.86 | $ 8.14 | $ 11.63 | |||
Maximum Sales Charge - Class A | 3.75% | 3.75% | 2.75% | 2.75% | |||
(1) Investment in securities at cost | $ 53,041 | $ 47,692 | $ 1,531,484 | $ 36,183 | |||
(2) Market value of securities on loan | $ 139 | $ 95 | $ — | $ — |
| (a) | See Schedule of Investments for schedule of unfunded loan commitments. |
| (b) | Amount is less than $500 (not in thousands). |
| * | Net Asset Value and Redemption Price Per Share are calculated using unrounded net assets. |
| Seix High Income Fund | Seix High Yield Fund | Seix Investment Grade Tax-Exempt Bond Fund | Seix Total Return Bond Fund | ||||
| Assets | |||||||
Investment in securities at value(1)(2) | $ 131,063 | $ 232,930 | $ 135,907 | $ 157,878 | |||
Cash | 116 | 2,943 | 3,675 | 1,129 | |||
Due from broker | — | — | — | — (a) | |||
| Receivables | |||||||
Investment securities sold | 873 | 1,642 | — | — | |||
Fund shares sold | 122 | 168 | 368 | 146 | |||
Dividends and interest | 2,428 | 4,158 | 1,820 | 1,078 | |||
Securities lending income | 3 | 4 | — | — (a) | |||
Prepaid expenses | 45 | 97 | 14 | 30 | |||
Other assets | 16 | 28 | 16 | 19 | |||
Total assets | 134,666 | 241,970 | 141,800 | 160,280 | |||
| Liabilities | |||||||
| Payables | |||||||
Fund shares repurchased | 332 | 684 | 629 | 339 | |||
Investment securities purchased | 115 | 197 | — | — | |||
Collateral on securities loaned | 1,842 | 3,120 | — | 174 | |||
Dividend distributions | 4 | 69 | 63 | — | |||
Investment advisory fees | 31 | 60 | 25 | 24 | |||
Distribution and service fees | 4 | 2 | 1 | 1 | |||
Administration and accounting fees | 12 | 21 | 13 | 14 | |||
Transfer agent and sub-transfer agent fees and expenses | 38 | 50 | 40 | 30 | |||
Professional fees | 27 | 26 | 28 | 34 | |||
Trustee deferred compensation plan | 16 | 28 | 16 | 19 | |||
Interest expense and/or commitment fees | — (a) | — (a) | — (a) | — (a) | |||
Other accrued expenses | 21 | 41 | 9 | 38 | |||
Total liabilities | 2,442 | 4,298 | 824 | 673 | |||
Net Assets | $ 132,224 | $ 237,672 | $ 140,976 | $ 159,607 | |||
| Net Assets Consist of: | |||||||
Capital paid in on shares of beneficial interest | $ 246,697 | $ 327,572 | $ 149,451 | $ 204,031 | |||
Accumulated earnings (loss) | (114,473) | (89,900) | (8,475) | (44,424) | |||
Net Assets | $ 132,224 | $ 237,672 | $ 140,976 | $ 159,607 | |||
| Net Assets: | |||||||
Class A | $ 17,053 | $ 10,498 | $ 6,902 | $ 6,198 | |||
Class I | $ 107,401 | $ 172,351 | $ 134,074 | $ 116,684 | |||
Class R6 | $ 7,770 | $ 54,823 | $ — | $ 36,725 | |||
| Shares Outstanding (unlimited number of shares authorized, no par value): | |||||||
Class A | 2,968,685 | 1,362,102 | 622,735 | 629,295 | |||
Class I | 18,724,968 | 21,800,019 | 12,112,410 | 12,256,451 | |||
Class R6 | 1,355,475 | 6,930,578 | — | 3,859,155 | |||
| Net Asset Value and Redemption Price Per Share:* | |||||||
Class A | $ 5.74 | $ 7.71 | $ 11.08 | $ 9.85 | |||
Class I | $ 5.74 | $ 7.91 | $ 11.07 | $ 9.52 | |||
Class R6 | $ 5.73 | $ 7.91 | $ — | $ 9.52 |
| Seix High Income Fund | Seix High Yield Fund | Seix Investment Grade Tax-Exempt Bond Fund | Seix Total Return Bond Fund | ||||
| Maximum Offering Price Per Share (NAV/(1-Maximum Sales Charge)): | |||||||
Class A | $ 5.96 | $ 8.01 | $ 11.39 | $ 10.23 | |||
Maximum Sales Charge - Class A | 3.75% | 3.75% | 2.75% | 3.75% | |||
(1) Investment in securities at cost | $ 131,882 | $ 234,412 | $ 135,793 | $ 157,802 | |||
(2) Market value of securities on loan | $ 1,773 | $ 2,997 | $ — | $ 169 |
| (a) | Amount is less than $500 (not in thousands). |
| * | Net Asset Value and Redemption Price Per Share are calculated using unrounded net assets. |
| Seix U.S. Government Securities Ultra-Short Bond Fund | Seix Ultra-Short Bond Fund | ||
| Assets | |||
Investment in securities at value(1) | $ 257,236 | $ 19,609 | |
Cash | 2,887 | 422 | |
Due from broker | — | — (a) | |
Cash pledged as collateral for futures contracts | 140 | 4 | |
| Receivables | |||
Investment securities sold | 998 | 6 | |
Fund shares sold | 1,539 | 807 | |
Dividends and interest | 990 | 92 | |
Receivable from adviser | — | 2 | |
Prepaid expenses | 97 | 10 | |
Other assets | 31 | 2 | |
Total assets | 263,918 | 20,954 | |
| Liabilities | |||
Variation margin payable on futures contracts | 9 | — (a) | |
| Payables | |||
Fund shares repurchased | 1,969 | 9 | |
Investment securities purchased | — | 833 | |
Dividend distributions | 183 | — | |
Investment advisory fees | 53 | — | |
Distribution and service fees | 3 | 1 | |
Administration and accounting fees | 23 | 2 | |
Transfer agent and sub-transfer agent fees and expenses | 71 | 4 | |
Professional fees | 23 | 25 | |
Trustee deferred compensation plan | 31 | 2 | |
Interest expense and/or commitment fees | 1 | — (a) | |
Other accrued expenses | 22 | 3 | |
Total liabilities | 2,388 | 879 | |
Net Assets | $ 261,530 | $ 20,075 | |
| Net Assets Consist of: | |||
Capital paid in on shares of beneficial interest | $ 275,550 | $ 21,500 | |
Accumulated earnings (loss) | (14,020) | (1,425) | |
Net Assets | $ 261,530 | $ 20,075 | |
| Net Assets: | |||
Class A | $ 14,985 | $ 4,362 | |
Class I | $ 204,124 | $ 15,713 | |
Class R6 | $ 42,421 | $ — | |
| Shares Outstanding (unlimited number of shares authorized, no par value): | |||
Class A | 1,523,026 | 443,199 | |
Class I | 20,747,025 | 1,597,301 | |
Class R6 | 4,305,587 | — | |
| Net Asset Value and Redemption Price Per Share:* | |||
Class A | $ 9.84 | $ 9.84 | |
Class I | $ 9.84 | $ 9.84 | |
Class R6 | $ 9.85 | $ — | |
(1) Investment in securities at cost | $ 257,841 | $ 19,722 |
| (a) | Amount is less than $500 (not in thousands). |
| * | Net Asset Value and Redemption Price Per Share are calculated using unrounded net assets. |
YEAR ENDED December 31, 2023
| Seix Core Bond Fund | Seix Corporate Bond Fund | Seix Floating Rate High Income Fund | Seix High Grade Municipal Bond Fund | ||||
| Investment Income | |||||||
Dividends | $ 65 | $ 36 | $ 5,168 | $ 183 | |||
Interest | 2,395 | 2,097 | 158,297 | 1,308 | |||
Securities lending, net of fees | 10 | 1 | — | — | |||
Total investment income | 2,470 | 2,134 | 163,465 | 1,491 | |||
| Expenses | |||||||
Investment advisory fees | 146 | 192 | 7,192 | 221 | |||
Distribution and service fees, Class A | 15 | 13 | 81 | 7 | |||
Distribution and service fees, Class C | — | 4 | 90 | — | |||
Administration and accounting fees | 67 | 57 | 1,730 | 53 | |||
Transfer agent fees and expenses | 26 | 22 | 729 | 19 | |||
Sub-transfer agent fees and expenses, Class A | 10 | 5 | 33 | 2 | |||
Sub-transfer agent fees and expenses, Class C | — | — (1) | 9 | — | |||
Sub-transfer agent fees and expenses, Class I | 61 | 58 | 1,830 | 40 | |||
Custodian fees | 4 | 2 | 6 | 1 | |||
Printing fees and expenses | 8 | 7 | 110 | 4 | |||
Professional fees | 34 | 25 | — | 31 | |||
Interest expense and/or commitment fees | — (1) | — (1) | 491 | — (1) | |||
Registration fees | 32 | 39 | 93 | 29 | |||
Trustees’ fees and expenses | 5 | 4 | 152 | 4 | |||
Miscellaneous expenses | 26 | 21 | 323 | 16 | |||
Total expenses | 434 | 449 | 12,869 | 427 | |||
Less net expenses reimbursed and/or waived by investment adviser(2) | (135) | (100) | (2,104) | (165) | |||
Less low balance account fees | — (1) | — (1) | — (1) | — | |||
Net expenses | 299 | 349 | 10,765 | 262 | |||
Net investment income (loss) | 2,171 | 1,785 | 152,700 | 1,229 | |||
| Net Realized and Unrealized Gain (Loss) on Investments | |||||||
| Net realized gain (loss) from: | |||||||
Investments | (3,655) | (6,481) | (30,777) | (1,084) | |||
Swaps | — | (267) | — | — | |||
| Net change in unrealized appreciation (depreciation) on: | |||||||
Investments | 4,334 | 8,291 | 71,283 | 2,092 | |||
Swaps | — | (28) | — | — | |||
Net realized and unrealized gain (loss) on investments | 679 | 1,515 | 40,506 | 1,008 | |||
Net increase (decrease) in net assets resulting from operations | $ 2,850 | $ 3,300 | $193,206 | $ 2,237 |
| (1) | Amount is less than $500 (not in thousands). |
| (2) | See Note 4D in Notes to Financial Statements. |
| Seix High Income Fund | Seix High Yield Fund | Seix Investment Grade Tax-Exempt Bond Fund | Seix Total Return Bond Fund | ||||
| Investment Income | |||||||
Dividends | $ 192 | $ 369 | $ 439 | $ 199 | |||
Interest | 9,787 | 16,703 | 4,102 | 7,435 | |||
Securities lending, net of fees | 46 | 75 | — | 30 | |||
Total investment income | 10,025 | 17,147 | 4,541 | 7,664 | |||
| Expenses | |||||||
Investment advisory fees | 752 | 1,113 | 775 | 455 | |||
Distribution and service fees, Class A | 40 | 28 | 17 | 16 | |||
Administration and accounting fees | 147 | 260 | 165 | 193 | |||
Transfer agent fees and expenses | 59 | 109 | 66 | 79 | |||
Sub-transfer agent fees and expenses, Class A | 18 | 18 | 4 | 13 | |||
Sub-transfer agent fees and expenses, Class I | 162 | 219 | 163 | 164 | |||
Custodian fees | 2 | 2 | 1 | 5 | |||
Printing fees and expenses | 15 | 14 | 8 | 17 | |||
Professional fees | 27 | 22 | 22 | 20 | |||
Interest expense and/or commitment fees | 1 | 1 | 1 | 1 | |||
Registration fees | 38 | 45 | 30 | 30 | |||
Trustees’ fees and expenses | 11 | 21 | 13 | 16 | |||
Miscellaneous expenses | 36 | 57 | 34 | 55 | |||
Total expenses | 1,308 | 1,909 | 1,299 | 1,064 | |||
Less net expenses reimbursed and/or waived by investment adviser(1) | (353) | (372) | (496) | (288) | |||
Net expenses | 955 | 1,537 | 803 | 776 | |||
Net investment income (loss) | 9,070 | 15,610 | 3,738 | 6,888 | |||
| Net Realized and Unrealized Gain (Loss) on Investments | |||||||
| Net realized gain (loss) from: | |||||||
Investments | (6,146) | (13,840) | (2,339) | (12,839) | |||
Swaps | — | — | — | (1,061) | |||
| Net change in unrealized appreciation (depreciation) on: | |||||||
Investments | 14,066 | 27,618 | 6,014 | 15,293 | |||
Swaps | — | — | — | (124) | |||
Net realized and unrealized gain (loss) on investments | 7,920 | 13,778 | 3,675 | 1,269 | |||
Net increase (decrease) in net assets resulting from operations | $16,990 | $ 29,388 | $ 7,413 | $ 8,157 |
| (1) | See Note 4D in Notes to Financial Statements. |
| Seix U.S. Government Securities Ultra-Short Bond Fund | Seix Ultra-Short Bond Fund | ||
| Investment Income | |||
Dividends | $ 470 | $ 45 | |
Interest | 15,154 | 1,102 | |
Securities lending, net of fees | — (1) | — (1) | |
Total investment income | 15,624 | 1,147 | |
| Expenses | |||
Investment advisory fees | 662 | 53 | |
Distribution and service fees, Class A | 34 | 11 | |
Administration and accounting fees | 344 | 32 | |
Transfer agent fees and expenses | 144 | 12 | |
Sub-transfer agent fees and expenses, Class A | 4 | 3 | |
Sub-transfer agent fees and expenses, Class I | 307 | 19 | |
Custodian fees | 2 | 1 | |
Printing fees and expenses | 16 | 3 | |
Professional fees | 4 | 30 | |
Interest expense and/or commitment fees | — (1) | — (1) | |
Registration fees | 44 | 24 | |
Trustees’ fees and expenses | 31 | 2 | |
Miscellaneous expenses | 60 | 12 | |
Total expenses | 1,652 | 202 | |
Less net expenses reimbursed and/or waived by investment adviser(2) | (380) | (96) | |
Less low balance account fees | — | — (1) | |
Net expenses | 1,272 | 106 | |
Net investment income (loss) | 14,352 | 1,041 | |
| Net Realized and Unrealized Gain (Loss) on Investments | |||
| Net realized gain (loss) from: | |||
Investments | (4,107) | (242) | |
Futures | 641 | 22 | |
| Net change in unrealized appreciation (depreciation) on: | |||
Investments | 6,550 | 669 | |
Futures | (241) | (6) | |
Net realized and unrealized gain (loss) on investments | 2,843 | 443 | |
Net increase (decrease) in net assets resulting from operations | $17,195 | $1,484 |
| (1) | Amount is less than $500 (not in thousands). |
| (2) | See Note 4D in Notes to Financial Statements. |
| Seix Core Bond Fund | Seix Corporate Bond Fund | ||||||
| Year Ended December 31, 2023 | Year Ended December 31, 2022 | Year Ended December 31, 2023 | Year Ended December 31, 2022 | ||||
| Increase (Decrease) in Net Assets Resulting from Operations | |||||||
Net investment income (loss) | $ 2,171 | $ 1,752 | $ 1,785 | $ 1,790 | |||
Net realized gain (loss) | (3,655) | (9,177) | (6,748) | (4,172) | |||
Net change in unrealized appreciation (depreciation) | 4,334 | (5,583) | 8,263 | (10,602) | |||
Increase (decrease) in net assets resulting from operations | 2,850 | (13,008) | 3,300 | (12,984) | |||
| Dividends and Distributions to Shareholders | |||||||
| Net Investment Income and Net Realized Gains: | |||||||
Class A | (221) | (182) | (165) | (264) | |||
Class C | — | — | (11) | (22) | |||
Class I | (1,879) | (1,812) | (1,482) | (2,577) | |||
Class R6 | (72) | (58) | (3) | (4) | |||
Total dividends and distributions to shareholders | (2,172) | (2,052) | (1,661) | (2,867) | |||
| Change in Net Assets from Capital Transactions (See Note 6): | |||||||
Class A | (385) | (1,085) | (242) | (1,211) | |||
Class C | — | — | (149) | (165) | |||
Class I | (7,186) | (30,629) | 971 | (270) | |||
Class R6 | 381 | (558) | — | — | |||
Increase (decrease) in net assets from capital transactions | (7,190) | (32,272) | 580 | (1,646) | |||
Net increase (decrease) in net assets | (6,512) | (47,332) | 2,219 | (17,497) | |||
| Net Assets | |||||||
Beginning of period | 59,926 | 107,258 | 45,310 | 62,807 | |||
End of Period | $ 53,414 | $ 59,926 | $ 47,529 | $ 45,310 | |||
| Seix Floating Rate High Income Fund | Seix High Grade Municipal Bond Fund | ||||||
| Year Ended December 31, 2023 | Year Ended December 31, 2022 | Year Ended December 31, 2023 | Year Ended December 31, 2022 | ||||
| Increase (Decrease) in Net Assets Resulting from Operations | |||||||
Net investment income (loss) | $ 152,700 | $ 129,141 | $ 1,229 | $ 686 | |||
Net realized gain (loss) | (30,777) | (70,206) | (1,084) | (1,000) | |||
Net change in unrealized appreciation (depreciation) | 71,283 | (100,928) | 2,092 | (4,011) | |||
Increase (decrease) in net assets resulting from operations | 193,206 | (41,993) | 2,237 | (4,325) | |||
| Dividends and Distributions to Shareholders | |||||||
| Net Investment Income and Net Realized Gains: | |||||||
Class A | (2,828) | (1,958) | (120) | (97) | |||
Class C | (730) | (525) | — | — | |||
Class I | (129,352) | (112,225) | (1,105) | (715) | |||
Class R6 | (19,794) | (14,310) | — | — | |||
Total dividends and distributions to shareholders | (152,704) | (129,018) | (1,225) | (812) | |||
| Change in Net Assets from Capital Transactions (See Note 6): | |||||||
Class A | (401) | (6,834) | (1,202) | (843) | |||
Class C | (3,818) | (2,710) | — | — | |||
Class I | (526,052) | (156,322) | (5,318) | (9,059) | |||
Class R6 | (69,394) | 13,182 | — | — | |||
Increase (decrease) in net assets from capital transactions | (599,665) | (152,684) | (6,520) | (9,902) | |||
Net increase (decrease) in net assets | (559,163) | (323,695) | (5,508) | (15,039) | |||
| Net Assets | |||||||
Beginning of period | 2,091,052 | 2,414,747 | 43,030 | 58,069 | |||
End of Period | $ 1,531,889 | $ 2,091,052 | $ 37,522 | $ 43,030 | |||
| Seix High Income Fund | Seix High Yield Fund | ||||||
| Year Ended December 31, 2023 | Year Ended December 31, 2022 | Year Ended December 31, 2023 | Year Ended December 31, 2022 | ||||
| Increase (Decrease) in Net Assets Resulting from Operations | |||||||
Net investment income (loss) | $ 9,070 | $ 9,152 | $ 15,610 | $ 17,508 | |||
Net realized gain (loss) | (6,146) | (13,055) | (13,840) | (29,450) | |||
Net change in unrealized appreciation (depreciation) | 14,066 | (17,286) | 27,618 | (32,714) | |||
Increase (decrease) in net assets resulting from operations | 16,990 | (21,189) | 29,388 | (44,656) | |||
| Dividends and Distributions to Shareholders | |||||||
| Net Investment Income and Net Realized Gains: | |||||||
Class A | (1,028) | (779) | (676) | (620) | |||
Class I | (7,546) | (7,762) | (12,009) | (14,880) | |||
Class R6 | (470) | (520) | (2,860) | (1,801) | |||
Total dividends and distributions to shareholders | (9,044) | (9,061) | (15,545) | (17,301) | |||
| Change in Net Assets from Capital Transactions (See Note 6): | |||||||
Class A | 2,933 | (1,758) | (1,274) | (4,878) | |||
Class I | (17,700) | (34,634) | (46,272) | (167,635) | |||
Class R6 | 607 | (2,805) | 11,827 | 25,085 | |||
Increase (decrease) in net assets from capital transactions | (14,160) | (39,197) | (35,719) | (147,428) | |||
Net increase (decrease) in net assets | (6,214) | (69,447) | (21,876) | (209,385) | |||
| Net Assets | |||||||
Beginning of period | 138,438 | 207,885 | 259,548 | 468,933 | |||
End of Period | $ 132,224 | $ 138,438 | $ 237,672 | $ 259,548 | |||
| Seix Investment Grade Tax-Exempt Bond Fund | Seix Total Return Bond Fund | ||||||
| Year Ended December 31, 2023 | Year Ended December 31, 2022 | Year Ended December 31, 2023 | Year Ended December 31, 2022 | ||||
| Increase (Decrease) in Net Assets Resulting from Operations | |||||||
Net investment income (loss) | $ 3,738 | $ 2,935 | $ 6,888 | $ 6,476 | |||
Net realized gain (loss) | (2,339) | (6,245) | (13,900) | (31,538) | |||
Net change in unrealized appreciation (depreciation) | 6,014 | (13,344) | 15,169 | (19,065) | |||
Increase (decrease) in net assets resulting from operations | 7,413 | (16,654) | 8,157 | (44,127) | |||
| Dividends and Distributions to Shareholders | |||||||
| Net Investment Income and Net Realized Gains: | |||||||
Class A | (157) | (101) | (213) | (275) | |||
Class I | (3,565) | (3,038) | (4,749) | (6,643) | |||
Class R6 | — | — | (1,426) | (1,588) | |||
Total dividends and distributions to shareholders | (3,722) | (3,139) | (6,388) | (8,506) | |||
| Change in Net Assets from Capital Transactions (See Note 6): | |||||||
Class A | (368) | 104 | (1,608) | (2,431) | |||
Class I | (21,924) | (77,498) | (37,317) | (80,987) | |||
Class R6 | — | — | (4,887) | (41,381) | |||
Increase (decrease) in net assets from capital transactions | (22,292) | (77,394) | (43,812) | (124,799) | |||
Net increase (decrease) in net assets | (18,601) | (97,187) | (42,043) | (177,432) | |||
| Net Assets | |||||||
Beginning of period | 159,577 | 256,764 | 201,650 | 379,082 | |||
End of Period | $ 140,976 | $ 159,577 | $ 159,607 | $ 201,650 | |||
| Seix U.S. Government Securities Ultra-Short Bond Fund | Seix Ultra-Short Bond Fund | ||||||
| Year Ended December 31, 2023 | Year Ended December 31, 2022 | Year Ended December 31, 2023 | Year Ended December 31, 2022 | ||||
| Increase (Decrease) in Net Assets Resulting from Operations | |||||||
Net investment income (loss) | $ 14,352 | $ 7,769 | $ 1,041 | $ 700 | |||
Net realized gain (loss) | (3,466) | (4,995) | (220) | (475) | |||
Payment by affiliates | — | — | — | 10 | |||
Net change in unrealized appreciation (depreciation) | 6,309 | (11,781) | 663 | (749) | |||
Increase (decrease) in net assets resulting from operations | 17,195 | (9,007) | 1,484 | (514) | |||
| Dividends and Distributions to Shareholders | |||||||
| Net Investment Income and Net Realized Gains: | |||||||
Class A | (560) | (169) | (188) | (76) | |||
Class I | (11,451) | (5,968) | (855) | (624) | |||
Class R6 | (2,344) | (1,629) | — | — | |||
Total dividends and distributions to shareholders | (14,355) | (7,766) | (1,043) | (700) | |||
| Change in Net Assets from Capital Transactions (See Note 6): | |||||||
Class A | 1,251 | (1,338) | (746) | 105 | |||
Class I | (141,905) | (353,233) | (9,998) | (12,525) | |||
Class R6 | (33,012) | (79,694) | — | — | |||
Increase (decrease) in net assets from capital transactions | (173,666) | (434,265) | (10,744) | (12,420) | |||
Net increase (decrease) in net assets | (170,826) | (451,038) | (10,303) | (13,634) | |||
| Net Assets | |||||||
Beginning of period | 432,356 | 883,394 | 30,378 | 44,012 | |||
End of Period | $ 261,530 | $ 432,356 | $ 20,075 | $ 30,378 | |||
THROUGHOUT EACH PERIOD
| Net Asset Value, Beginning of Period | Net Investment Income (Loss)(1) | Net Realized and Unrealized Gain (Loss) | Total from Investment Operations | Dividends from Net Investment Income | Return of Capital | Distributions from Net Realized Gains | Total Distributions | Payments from Affiliates | Change in Net Asset Value | Net Asset Value, End of Period | Total Return(2)(3) | Net Assets, End of Period (in thousands) | Ratio of Net Expenses to Average Net Assets(4)(5) | Ratio of Gross Expenses to Average Net Assets(4)(5) | Ratio of Net Investment Income (Loss) to Average Net Assets(4) | Portfolio Turnover Rate(2) | ||
| Seix Core Bond Fund | ||||||||||||||||||
| Class A | ||||||||||||||||||
| 1/1/23 to 12/31/23 | $ 9.40 | 0.34 | 0.11 | 0.45 | (0.34) | — | — | (0.34) | — | 0.11 | $ 9.51 | 4.86 % | $ 5,908 | 0.64 % | 1.02 % | 3.59 % | 161 % | |
| 1/1/22 to 12/31/22 | 11.20 | 0.21 | (1.75) | (1.54) | (0.22) | — | (0.04) | (0.26) | — | (1.80) | 9.40 | (13.85) | 6,240 | 0.66 (6) | 0.95 | 2.13 | 175 | |
| 1/1/21 to 12/31/21 | 11.52 | 0.09 | (0.26) | (0.17) | (0.09) | — | (0.06) | (0.15) | — | (0.32) | 11.20 | (1.43) | 8,651 | 0.64 | 0.88 | 0.82 | 149 | |
| 1/1/20 to 12/31/20 | 10.91 | 0.10 | 0.87 | 0.97 | (0.11) | — | (0.25) | (0.36) | — | 0.61 | 11.52 | 8.91 | 10,943 | 0.64 | 0.89 | 0.88 | 221 | |
| 1/1/19 to 12/31/19 | 10.36 | 0.22 | 0.55 | 0.77 | (0.22) | — | — | (0.22) | — | 0.55 | 10.91 | 7.48 | 9,183 | 0.64 | 0.91 | 2.03 | 197 | |
| Class I | ||||||||||||||||||
| 1/1/23 to 12/31/23 | $ 9.40 | 0.35 | 0.12 | 0.47 | (0.35) | — | — | (0.35) | — | 0.12 | $ 9.52 | 5.11 % | $ 45,509 | 0.50 % | 0.71 % | 3.72 % | 161 % | |
| 1/1/22 to 12/31/22 | 11.20 | 0.22 | (1.75) | (1.53) | (0.23) | — | (0.04) | (0.27) | — | (1.80) | 9.40 | (13.72) | 52,113 | 0.51 (6) | 0.66 | 2.21 | 175 | |
| 1/1/21 to 12/31/21 | 11.53 | 0.11 | (0.27) | (0.16) | (0.11) | — | (0.06) | (0.17) | — | (0.33) | 11.20 | (1.38) | 96,081 | 0.50 | 0.60 | 0.94 | 149 | |
| 1/1/20 to 12/31/20 | 10.91 | 0.10 | 0.89 | 0.99 | (0.12) | — | (0.25) | (0.37) | — | 0.62 | 11.53 | 9.15 | 187,741 | 0.50 | 0.59 | 0.90 | 221 | |
| 1/1/19 to 12/31/19 | 10.36 | 0.24 | 0.54 | 0.78 | (0.23) | — | — | (0.23) | — | 0.55 | 10.91 | 7.63 | 93,576 | 0.50 | 0.64 | 2.21 | 197 | |
| Class R6 | ||||||||||||||||||
| 1/1/23 to 12/31/23 | $ 9.40 | 0.36 | 0.12 | 0.48 | (0.36) | — | — | (0.36) | — | 0.12 | $ 9.52 | 5.26 % | $ 1,997 | 0.36 % | 0.60 % | 3.90 % | 161 % | |
| 1/1/22 to 12/31/22 | 11.20 | 0.24 | (1.75) | (1.51) | (0.25) | — | (0.04) | (0.29) | — | (1.80) | 9.40 | (13.60) | 1,573 | 0.38 (6) | 0.53 | 2.40 | 175 | |
| 1/1/21 to 12/31/21 | 11.53 | 0.13 | (0.27) | (0.14) | (0.13) | — | (0.06) | (0.19) | — | (0.33) | 11.20 | (1.24) | 2,526 | 0.36 | 0.48 | 1.12 | 149 | |
| 1/1/20 to 12/31/20 | 10.91 | 0.14 | 0.87 | 1.01 | (0.14) | — | (0.25) | (0.39) | — | 0.62 | 11.53 | 9.31 | 1,539 | 0.36 | 0.49 | 1.21 | 221 | |
| 1/1/19 to 12/31/19 | 10.36 | 0.23 | 0.57 | 0.80 | (0.25) | — | — | (0.25) | — | 0.55 | 10.91 | 7.78 | 2,025 | 0.36 | 0.50 | 2.12 | 197 | |
| Seix Corporate Bond Fund | ||||||||||||||||||
| Class A | ||||||||||||||||||
| 1/1/23 to 12/31/23 | $ 7.26 | 0.26 | 0.29 | 0.55 | (0.24) | — | — | (0.24) | — | 0.31 | $ 7.57 | 7.69 % | $ 4,958 | 0.94 % | 1.14 % | 3.50 % | 112 % | |
| 1/1/22 to 12/31/22 | 9.33 | 0.22 | (1.93) | (1.71) | (0.20) | — | (0.16) | (0.36) | — | (2.07) | 7.26 | (18.45) | 5,008 | 0.97 (6) | 1.15 | 2.77 | 99 | |
| 1/1/21 to 12/31/21 | 9.89 | 0.18 | (0.37) | (0.19) | (0.16) | — | (0.21) | (0.37) | — | (0.56) | 9.33 | (1.90) | 7,806 | 0.95 | 1.04 | 1.85 | 164 | |
| 1/1/20 to 12/31/20 | 8.95 | 0.20 | 1.34 | 1.54 | (0.24) | — | (0.36) | (0.60) | — | 0.94 | 9.89 | 17.44 | 8,765 | 0.95 | 1.03 | 2.07 | 135 | |
| 1/1/19 to 12/31/19 | 8.15 | 0.23 | 0.78 | 1.01 | (0.21) | — | — | (0.21) | — | 0.80 | 8.95 | 12.47 | 5,599 | 0.95 | 1.10 | 2.69 | 118 | |
| Class C | ||||||||||||||||||
| 1/1/23 to 12/31/23 | $ 7.23 | 0.20 | 0.29 | 0.49 | (0.19) | — | — | (0.19) | — | 0.30 | $ 7.53 | 6.82 % | $ 359 | 1.64 % | 1.89 % | 2.79 % | 112 % | |
| 1/1/22 to 12/31/22 | 9.29 | 0.16 | (1.92) | (1.76) | (0.14) | — | (0.16) | (0.30) | — | (2.06) | 7.23 | (19.00) | 490 | 1.66 (6) | 1.89 | 2.05 | 99 | |
| 1/1/21 to 12/31/21 | 9.84 | 0.11 | (0.36) | (0.25) | (0.09) | — | (0.21) | (0.30) | — | (0.55) | 9.29 | (2.50) | 819 | 1.65 | 1.76 | 1.14 | 164 | |
| 1/1/20 to 12/31/20 | 8.91 | 0.13 | 1.33 | 1.46 | (0.17) | — | (0.36) | (0.53) | — | 0.93 | 9.84 | 16.57 | 1,365 | 1.65 | 1.78 | 1.34 | 135 | |
| 1/1/19 to 12/31/19 | 8.11 | 0.16 | 0.78 | 0.94 | (0.14) | — | — | (0.14) | — | 0.80 | 8.91 | 11.60 | 671 | 1.65 | 1.84 | 1.87 | 118 | |
| Class I | ||||||||||||||||||
| 1/1/23 to 12/31/23 | $ 7.22 | 0.27 | 0.30 | 0.57 | (0.26) | — | — | (0.26) | — | 0.31 | $ 7.53 | 7.98 % | $ 42,135 | 0.69 % | 0.90 % | 3.75 % | 112 % | |
| 1/1/22 to 12/31/22 | 9.28 | 0.24 | (1.92) | (1.68) | (0.22) | — | (0.16) | (0.38) | — | (2.06) | 7.22 | (18.25) | 39,738 | 0.72 (6) | 0.98 | 3.02 | 99 | |
| 1/1/21 to 12/31/21 | 9.84 | 0.20 | (0.37) | (0.17) | (0.18) | — | (0.21) | (0.39) | — | (0.56) | 9.28 | (1.67) | 54,087 | 0.70 | 0.77 | 2.07 | 164 | |
| 1/1/20 to 12/31/20 | 8.90 | 0.22 | 1.35 | 1.57 | (0.27) | — | (0.36) | (0.63) | — | 0.94 | 9.84 | 17.82 | 103,866 | 0.70 | 0.80 | 2.26 | 135 | |
| 1/1/19 to 12/31/19 | 8.11 | 0.25 | 0.77 | 1.02 | (0.23) | — | — | (0.23) | — | 0.79 | 8.90 | 12.66 | 32,896 | 0.70 | 0.86 | 2.90 | 118 |
| Net Asset Value, Beginning of Period | Net Investment Income (Loss)(1) | Net Realized and Unrealized Gain (Loss) | Total from Investment Operations | Dividends from Net Investment Income | Return of Capital | Distributions from Net Realized Gains | Total Distributions | Payments from Affiliates | Change in Net Asset Value | Net Asset Value, End of Period | Total Return(2)(3) | Net Assets, End of Period (in thousands) | Ratio of Net Expenses to Average Net Assets(4)(5) | Ratio of Gross Expenses to Average Net Assets(4)(5) | Ratio of Net Investment Income (Loss) to Average Net Assets(4) | Portfolio Turnover Rate(2) | ||
| Seix Corporate Bond Fund (Continued) | ||||||||||||||||||
| Class R6 | ||||||||||||||||||
| 1/1/23 to 12/31/23 | $ 7.22 | 0.29 | 0.28 | 0.57 | (0.27) | — | — | (0.27) | — | 0.30 | $ 7.52 | 8.13 % | $ 77 | 0.42 % | 0.79 % | 4.02 % | 112 % | |
| 1/1/22 to 12/31/22 | 9.28 | 0.26 | (1.92) | (1.66) | (0.24) | — | (0.16) | (0.40) | — | (2.06) | 7.22 | (18.02) | 74 | 0.45 (6) | 0.78 | 3.31 | 99 | |
| 1/1/21 to 12/31/21 | 9.83 | 0.23 | (0.36) | (0.13) | (0.21) | — | (0.21) | (0.42) | — | (0.55) | 9.28 | (1.31) | 95 | 0.43 | 0.70 | 2.37 | 164 | |
| 10/20/20 (7) to 12/31/20 | 9.75 | 0.05 | 0.41 | 0.46 | (0.10) | — | (0.28) | (0.38) | — | 0.08 | 9.83 | 4.75 | 101 | 0.43 | 0.71 | 2.51 | 135 (8) | |
| Seix Floating Rate High Income Fund | ||||||||||||||||||
| Class A | ||||||||||||||||||
| 1/1/23 to 12/31/23 | $ 7.74 | 0.69 | 0.18 | 0.87 | (0.69) | — | — | (0.69) | — | 0.18 | $ 7.92 | 11.65 % | $ 33,242 | 0.96 % (9) | 0.99 % | 8.76 % | 45 % | |
| 1/1/22 to 12/31/22 | 8.23 | 0.38 | (0.48) | (0.10) | (0.39) | — | — | (0.39) | — | (0.49) | 7.74 | (1.20) | 32,916 | 0.97 (6)(9)(10) | 0.97 | 4.84 | 57 | |
| 1/1/21 to 12/31/21 | 8.09 | 0.28 | 0.13 | 0.41 | (0.27) | — | — | (0.27) | — | 0.14 | 8.23 | 5.14 | 42,301 | 0.95 (9)(10)(11) | 0.95 | 3.35 | 72 | |
| 1/1/20 to 12/31/20 | 8.40 | 0.30 | (0.31) | (0.01) | (0.30) | — | — | (0.30) | — | (0.31) | 8.09 | 0.06 | 35,224 | 0.96 (9) | 0.96 | 3.76 | 68 | |
| 1/1/19 to 12/31/19 | 8.30 | 0.41 | 0.11 | 0.52 | (0.42) | — | — | (0.42) | — | 0.10 | 8.40 | 6.30 | 47,938 | 0.95 (9)(11) | 0.93 | 4.79 | 17 | |
| Class C | ||||||||||||||||||
| 1/1/23 to 12/31/23 | $ 7.75 | 0.64 | 0.17 | 0.81 | (0.64) | — | — | (0.64) | — | 0.17 | $ 7.92 | 10.87 % | $ 7,183 | 1.54 % (9) | 1.75 % | 8.14 % | 45 % | |
| 1/1/22 to 12/31/22 | 8.24 | 0.33 | (0.48) | (0.15) | (0.34) | — | — | (0.34) | — | (0.49) | 7.75 | (1.77) | 10,793 | 1.55 (6)(9) | 1.73 | 4.22 | 57 | |
| 1/1/21 to 12/31/21 | 8.09 | 0.23 | 0.14 | 0.37 | (0.22) | — | — | (0.22) | — | 0.15 | 8.24 | 4.65 | 14,303 | 1.54 (9) | 1.73 | 2.74 | 72 | |
| 1/1/20 to 12/31/20 | 8.40 | 0.25 | (0.31) | (0.06) | (0.25) | — | — | (0.25) | — | (0.31) | 8.09 | (0.52) | 21,841 | 1.54 (9) | 1.68 | 3.19 | 68 | |
| 1/1/19 to 12/31/19 | 8.30 | 0.36 | 0.11 | 0.47 | (0.37) | — | — | (0.37) | — | 0.10 | 8.40 | 5.68 | 37,586 | 1.53 (9) | 1.65 | 4.21 | 17 | |
| Class I | ||||||||||||||||||
| 1/1/23 to 12/31/23 | $ 7.74 | 0.71 | 0.18 | 0.89 | (0.71) | — | — | (0.71) | — | 0.18 | $ 7.92 | 12.00 % | $1,303,700 | 0.64 % (9) | 0.77 % | 9.02 % | 45 % | |
| 1/1/22 to 12/31/22 | 8.23 | 0.40 | (0.48) | (0.08) | (0.41) | — | — | (0.41) | — | (0.49) | 7.74 | (0.89) | 1,795,243 | 0.65 (6)(9) | 0.75 | 5.09 | 57 | |
| 1/1/21 to 12/31/21 | 8.09 | 0.30 | 0.14 | 0.44 | (0.30) | — | — | (0.30) | — | 0.14 | 8.23 | 5.47 | 2,102,532 | 0.64 (9) | 0.73 | 3.65 | 72 | |
| 1/1/20 to 12/31/20 | 8.40 | 0.32 | (0.30) | 0.02 | (0.33) | — | — | (0.33) | — | (0.31) | 8.09 | 0.38 | 1,526,917 | 0.64 (9) | 0.75 | 4.10 | 68 | |
| 1/1/19 to 12/31/19 | 8.30 | 0.43 | 0.11 | 0.54 | (0.44) | — | — | (0.44) | — | 0.10 | 8.40 | 6.63 | 2,701,126 | 0.63 (9) | 0.72 | 5.13 | 17 | |
| Class R6 | ||||||||||||||||||
| 1/1/23 to 12/31/23 | $ 7.75 | 0.72 | 0.17 | 0.89 | (0.72) | — | — | (0.72) | — | 0.17 | $ 7.92 | 11.97 % | $ 187,764 | 0.54 % (9) | 0.64 % | 9.13 % | 45 % | |
| 1/1/22 to 12/31/22 | 8.24 | 0.42 | (0.49) | (0.07) | (0.42) | — | — | (0.42) | — | (0.49) | 7.75 | (0.78) | 252,100 | 0.55 (6)(9) | 0.63 | 5.26 | 57 | |
| 1/1/21 to 12/31/21 | 8.10 | 0.31 | 0.14 | 0.45 | (0.31) | — | — | (0.31) | — | 0.14 | 8.24 | 5.57 | 255,611 | 0.54 (9) | 0.62 | 3.76 | 72 | |
| 1/1/20 to 12/31/20 | 8.40 | 0.34 | (0.31) | 0.03 | (0.33) | — | — | (0.33) | — | (0.30) | 8.10 | 0.61 | 142,506 | 0.54 (9) | 0.63 | 4.30 | 68 | |
| 1/1/19 to 12/31/19 | 8.30 | 0.44 | 0.11 | 0.55 | (0.45) | — | — | (0.45) | — | 0.10 | 8.40 | 6.74 | 552,427 | 0.53 (9) | 0.61 | 5.21 | 17 | |
| Seix High Grade Municipal Bond Fund | ||||||||||||||||||
| Class A | ||||||||||||||||||
| 1/1/23 to 12/31/23 | $10.90 | 0.29 | 0.41 | 0.70 | (0.29) | — | — | (0.29) | — | 0.41 | $11.31 | 6.53 % | $ 4,215 | 0.73 % | 1.05 % | 2.65 % | 64 % | |
| 1/1/22 to 12/31/22 | 12.18 | 0.18 | (1.24) | (1.06) | (0.18) | — | (0.04) | (0.22) | — | (1.28) | 10.90 | (8.69) | 5,217 | 0.74 (6) | 1.03 | 1.60 | 99 | |
| 1/1/21 to 12/31/21 | 12.42 | 0.11 | (0.07) | 0.04 | (0.11) | — | (0.17) | (0.28) | — | (0.24) | 12.18 | 0.35 | 6,711 | 0.73 | 0.94 | 0.91 | 48 | |
| 1/1/20 to 12/31/20 | 12.05 | 0.13 | 0.69 | 0.82 | (0.13) | — | (0.32) | (0.45) | — | 0.37 | 12.42 | 6.85 | 7,626 | 0.75 (12) | 0.95 | 1.04 | 203 | |
| 1/1/19 to 12/31/19 | 11.62 | 0.21 | 0.67 | 0.88 | (0.21) | — | (0.24) | (0.45) | — | 0.43 | 12.05 | 7.67 | 6,893 | 0.75 | 0.98 | 1.78 | 233 |
| Net Asset Value, Beginning of Period | Net Investment Income (Loss)(1) | Net Realized and Unrealized Gain (Loss) | Total from Investment Operations | Dividends from Net Investment Income | Return of Capital | Distributions from Net Realized Gains | Total Distributions | Payments from Affiliates | Change in Net Asset Value | Net Asset Value, End of Period | Total Return(2)(3) | Net Assets, End of Period (in thousands) | Ratio of Net Expenses to Average Net Assets(4)(5) | Ratio of Gross Expenses to Average Net Assets(4)(5) | Ratio of Net Investment Income (Loss) to Average Net Assets(4) | Portfolio Turnover Rate(2) | ||
| Seix High Grade Municipal Bond Fund (Continued) | ||||||||||||||||||
| Class I | ||||||||||||||||||
| 1/1/23 to 12/31/23 | $10.90 | 0.31 | 0.40 | 0.71 | (0.31) | — | — | (0.31) | — | 0.40 | $11.30 | 6.60 % | $ 33,307 | 0.58 % | 0.96 % | 2.80 % | 64 % | |
| 1/1/22 to 12/31/22 | 12.18 | 0.19 | (1.23) | (1.04) | (0.20) | — | (0.04) | (0.24) | — | (1.28) | 10.90 | (8.56) | 37,813 | 0.59 (6) | 0.94 | 1.73 | 99 | |
| 1/1/21 to 12/31/21 | 12.42 | 0.13 | (0.07) | 0.06 | (0.13) | — | (0.17) | (0.30) | — | (0.24) | 12.18 | 0.50 | 51,358 | 0.58 | 0.85 | 1.06 | 48 | |
| 1/1/20 to 12/31/20 | 12.05 | 0.15 | 0.69 | 0.84 | (0.15) | — | (0.32) | (0.47) | — | 0.37 | 12.42 | 7.01 | 74,004 | 0.60 (12) | 0.86 | 1.18 | 203 | |
| 1/1/19 to 12/31/19 | 11.62 | 0.23 | 0.67 | 0.90 | (0.23) | — | (0.24) | (0.47) | — | 0.43 | 12.05 | 7.83 | 53,306 | 0.60 | 0.89 | 1.91 | 233 | |
| Seix High Income Fund | ||||||||||||||||||
| Class A | ||||||||||||||||||
| 1/1/23 to 12/31/23 | $ 5.42 | 0.35 | 0.32 | 0.67 | (0.35) | — | — | (0.35) | — | 0.32 | $ 5.74 | 12.85 % | $ 17,053 | 0.92 % | 1.16 % | 6.40 % | 73 % | |
| 1/1/22 to 12/31/22 | 6.45 | 0.31 | (1.03) | (0.72) | (0.31) | — | — | (0.31) | — | (1.03) | 5.42 | (11.31) | 13,158 | 0.95 (6) | 1.18 | 5.38 | 70 | |
| 1/1/21 to 12/31/21 | 6.46 | 0.30 | (0.01) | 0.29 | (0.30) | — | — | (0.30) | — | (0.01) | 6.45 | 4.52 | 17,612 | 0.93 | 1.14 | 4.65 | 103 | |
| 1/1/20 to 12/31/20 | 6.33 | 0.31 | 0.13 | 0.44 | (0.31) | — | — | (0.31) | — | 0.13 | 6.46 | 7.48 | 20,133 | 0.93 (12) | 1.16 | 5.14 | 201 | |
| 1/1/19 to 12/31/19 | 5.96 | 0.32 | 0.37 | 0.69 | (0.32) | — | — | (0.32) | — | 0.37 | 6.33 | 11.67 | 25,338 | 0.98 (12) | 1.13 | 5.03 | 113 | |
| Class I | ||||||||||||||||||
| 1/1/23 to 12/31/23 | $ 5.41 | 0.37 | 0.33 | 0.70 | (0.37) | — | — | (0.37) | — | 0.33 | $ 5.74 | 13.35 % | $ 107,401 | 0.67 % | 0.94 % | 6.66 % | 73 % | |
| 1/1/22 to 12/31/22 | 6.44 | 0.32 | (1.03) | (0.71) | (0.32) | — | — | (0.32) | — | (1.03) | 5.41 | (11.12) | 118,562 | 0.70 (6) | 0.93 | 5.62 | 70 | |
| 1/1/21 to 12/31/21 | 6.45 | 0.32 | (0.02) | 0.30 | (0.31) | — | — | (0.31) | — | (0.01) | 6.44 | 4.78 | 179,018 | 0.68 | 0.89 | 4.90 | 103 | |
| 1/1/20 to 12/31/20 | 6.33 | 0.32 | 0.13 | 0.45 | (0.33) | — | — | (0.33) | — | 0.12 | 6.45 | 7.58 | 203,543 | 0.68 (12) | 0.92 | 5.38 | 201 | |
| 1/1/19 to 12/31/19 | 5.95 | 0.33 | 0.38 | 0.71 | (0.33) | — | — | (0.33) | — | 0.38 | 6.33 | 12.12 | 234,101 | 0.74 (12) | 0.90 | 5.29 | 113 | |
| Class R6 | ||||||||||||||||||
| 1/1/23 to 12/31/23 | $ 5.41 | 0.38 | 0.31 | 0.69 | (0.37) | — | — | (0.37) | — | 0.32 | $ 5.73 | 13.25 % | $ 7,770 | 0.58 % | 0.80 % | 6.78 % | 73 % | |
| 1/1/22 to 12/31/22 | 6.44 | 0.33 | (1.04) | (0.71) | (0.32) | — | — | (0.32) | — | (1.03) | 5.41 | (11.04) | 6,718 | 0.60 (6) | 0.78 | 5.69 | 70 | |
| 1/1/21 to 12/31/21 | 6.45 | 0.32 | (0.01) | 0.31 | (0.32) | — | — | (0.32) | — | (0.01) | 6.44 | 4.87 | 11,255 | 0.59 | 0.75 | 4.98 | 103 | |
| 1/1/20 to 12/31/20 | 6.32 | 0.33 | 0.13 | 0.46 | (0.33) | — | — | (0.33) | — | 0.13 | 6.45 | 7.85 | 9,137 | 0.59 (12) | 0.77 | 5.39 | 201 | |
| 1/1/19 to 12/31/19 | 5.95 | 0.33 | 0.38 | 0.71 | (0.34) | — | — | (0.34) | — | 0.37 | 6.32 | 12.08 | 36,912 | 0.61 (12) | 0.76 | 5.30 | 113 | |
| Seix High Yield Fund | ||||||||||||||||||
| Class A | ||||||||||||||||||
| 1/1/23 to 12/31/23 | $ 7.27 | 0.45 | 0.44 | 0.89 | (0.45) | — | — | (0.45) | — | 0.44 | $ 7.71 | 12.68 % | $ 10,498 | 0.81 % | 1.10 % | 6.11 % | 74 % | |
| 1/1/22 to 12/31/22 | 8.56 | 0.38 | (1.29) | (0.91) | (0.38) | — | — | (0.38) | — | (1.29) | 7.27 | (10.70) | 11,178 | 0.84 (6) | 1.04 | 4.99 | 66 | |
| 1/1/21 to 12/31/21 | 8.59 | 0.34 | (0.03) | 0.31 | (0.34) | — | — | (0.34) | — | (0.03) | 8.56 | 3.69 | 18,370 | 0.82 | 1.01 | 4.01 | 93 | |
| 1/1/20 to 12/31/20 | 8.19 | 0.37 | 0.40 | 0.77 | (0.37) | — | — | (0.37) | — | 0.40 | 8.59 | 9.86 | 11,608 | 0.82 | 1.05 | 4.54 | 182 | |
| 1/1/19 to 12/31/19 | 7.62 | 0.38 | 0.57 | 0.95 | (0.38) | — | — | (0.38) | — | 0.57 | 8.19 | 12.64 | 4,623 | 0.82 | 1.04 | 4.70 | 98 | |
| Class I | ||||||||||||||||||
| 1/1/23 to 12/31/23 | $ 7.46 | 0.48 | 0.45 | 0.93 | (0.48) | — | — | (0.48) | — | 0.45 | $ 7.91 | 12.87 % | $ 172,351 | 0.63 % | 0.78 % | 6.28 % | 74 % | |
| 1/1/22 to 12/31/22 | 8.78 | 0.40 | (1.32) | (0.92) | (0.40) | — | — | (0.40) | — | (1.32) | 7.46 | (10.51) | 208,171 | 0.65 (6) | 0.77 | 5.12 | 66 | |
| 1/1/21 to 12/31/21 | 8.81 | 0.37 | (0.03) | 0.34 | (0.37) | — | — | (0.37) | — | (0.03) | 8.78 | 3.88 | 430,620 | 0.64 | 0.73 | 4.21 | 93 | |
| 1/1/20 to 12/31/20 | 8.41 | 0.40 | 0.40 | 0.80 | (0.40) | — | — | (0.40) | — | 0.40 | 8.81 | 9.93 | 362,138 | 0.64 | 0.76 | 4.81 | 182 | |
| 1/1/19 to 12/31/19 | 7.82 | 0.41 | 0.58 | 0.99 | (0.40) | — | — | (0.40) | — | 0.59 | 8.41 | 12.91 | 292,284 | 0.64 | 0.77 | 4.93 | 98 |
| Net Asset Value, Beginning of Period | Net Investment Income (Loss)(1) | Net Realized and Unrealized Gain (Loss) | Total from Investment Operations | Dividends from Net Investment Income | Return of Capital | Distributions from Net Realized Gains | Total Distributions | Payments from Affiliates | Change in Net Asset Value | Net Asset Value, End of Period | Total Return(2)(3) | Net Assets, End of Period (in thousands) | Ratio of Net Expenses to Average Net Assets(4)(5) | Ratio of Gross Expenses to Average Net Assets(4)(5) | Ratio of Net Investment Income (Loss) to Average Net Assets(4) | Portfolio Turnover Rate(2) | ||
| Seix High Yield Fund (Continued) | ||||||||||||||||||
| Class R6 | ||||||||||||||||||
| 1/1/23 to 12/31/23 | $ 7.46 | 0.49 | 0.45 | 0.94 | (0.49) | — | — | (0.49) | — | 0.45 | $ 7.91 | 12.99 % | $ 54,823 | 0.52 % | 0.66 % | 6.47 % | 74 % | |
| 1/1/22 to 12/31/22 | 8.78 | 0.42 | (1.33) | (0.91) | (0.41) | — | — | (0.41) | — | (1.32) | 7.46 | (10.41) | 40,199 | 0.55 (6) | 0.67 | 5.45 | 66 | |
| 1/1/21 to 12/31/21 | 8.81 | 0.38 | (0.03) | 0.35 | (0.38) | — | — | (0.38) | — | (0.03) | 8.78 | 4.00 | 19,943 | 0.53 | 0.64 | 4.32 | 93 | |
| 1/1/20 to 12/31/20 | 8.41 | 0.41 | 0.40 | 0.81 | (0.41) | — | — | (0.41) | — | 0.40 | 8.81 | 10.05 | 11,850 | 0.53 | 0.67 | 4.92 | 182 | |
| 1/1/19 to 12/31/19 | 7.82 | 0.40 | 0.60 | 1.00 | (0.41) | — | — | (0.41) | — | 0.59 | 8.41 | 13.03 | 5,645 | 0.53 | 0.67 | 4.89 | 98 | |
| Seix Investment Grade Tax-Exempt Bond Fund | ||||||||||||||||||
| Class A | ||||||||||||||||||
| 1/1/23 to 12/31/23 | $10.79 | 0.25 | 0.29 | 0.54 | (0.25) | — | — | (0.25) | — | 0.29 | $11.08 | 5.04 % | $ 6,902 | 0.66 % | 1.03 % | 2.28 % | 56 % | |
| 1/1/22 to 12/31/22 | 11.73 | 0.15 | (0.93) | (0.78) | (0.15) | — | (0.01) | (0.16) | — | (0.94) | 10.79 | (6.62) | 7,086 | 0.69 (6) | 1.04 | 1.37 | 71 | |
| 1/1/21 to 12/31/21 | 11.99 | 0.07 | (0.08) | (0.01) | (0.07) | — | (0.18) | (0.25) | — | (0.26) | 11.73 | (0.04) | 7,592 | 0.71 (12) | 1.01 | 0.58 | 95 | |
| 1/1/20 to 12/31/20 | 11.72 | 0.10 | 0.57 | 0.67 | (0.10) | — | (0.30) | (0.40) | — | 0.27 | 11.99 | 5.73 | 8,902 | 0.73 (12) | 1.01 | 0.84 | 173 | |
| 1/1/19 to 12/31/19 | 11.45 | 0.19 | 0.55 | 0.74 | (0.19) | — | (0.28) | (0.47) | — | 0.27 | 11.72 | 6.54 | 9,329 | 0.75 (12) | 1.00 | 1.65 | 203 | |
| Class I | ||||||||||||||||||
| 1/1/23 to 12/31/23 | $10.78 | 0.26 | 0.29 | 0.55 | (0.26) | — | — | (0.26) | — | 0.29 | $11.07 | 5.19 % | $ 134,074 | 0.51 % | 0.83 % | 2.42 % | 56 % | |
| 1/1/22 to 12/31/22 | 11.72 | 0.16 | (0.93) | (0.77) | (0.16) | — | (0.01) | (0.17) | — | (0.94) | 10.78 | (6.49) | 152,491 | 0.53 (6) | 0.84 | 1.48 | 71 | |
| 1/1/21 to 12/31/21 | 11.98 | 0.09 | (0.08) | 0.01 | (0.09) | — | (0.18) | (0.27) | — | (0.26) | 11.72 | 0.11 | 249,172 | 0.56 (12) | 0.80 | 0.73 | 95 | |
| 1/1/20 to 12/31/20 | 11.70 | 0.12 | 0.58 | 0.70 | (0.12) | — | (0.30) | (0.42) | — | 0.28 | 11.98 | 5.98 | 288,699 | 0.58 (12) | 0.82 | 0.98 | 173 | |
| 1/1/19 to 12/31/19 | 11.43 | 0.21 | 0.55 | 0.76 | (0.21) | — | (0.28) | (0.49) | — | 0.27 | 11.70 | 6.71 | 295,280 | 0.60 (12) | 0.81 | 1.80 | 203 | |
| Seix Total Return Bond Fund | ||||||||||||||||||
| Class A | ||||||||||||||||||
| 1/1/23 to 12/31/23 | $ 9.75 | 0.34 | 0.08 | 0.42 | (0.32) | — | — | (0.32) | — | 0.10 | $ 9.85 | 4.37 % | $ 6,198 | 0.69 % | 0.94 % | 3.52 % | 167 % | |
| 1/1/22 to 12/31/22 | 11.63 | 0.22 | (1.80) | (1.58) | (0.19) | — | (0.11) | (0.30) | — | (1.88) | 9.75 | (13.70) | 7,707 | 0.72 (6) | 0.89 | 2.08 | 169 | |
| 1/1/21 to 12/31/21 | 11.93 | 0.12 | (0.30) | (0.18) | (0.09) | — | (0.03) | (0.12) | — | (0.30) | 11.63 | (1.47) | 11,991 | 0.70 | 0.86 | 1.01 | 131 | |
| 1/1/20 to 12/31/20 | 11.03 | 0.15 | 1.05 | 1.20 | (0.21) | — | (0.09) | (0.30) | — | 0.90 | 11.93 | 10.91 | 12,879 | 0.70 | 0.87 | 1.27 | 186 | |
| 1/1/19 to 12/31/19 | 10.52 | 0.22 | 0.48 | 0.70 | (0.13) | (0.06) | — | (0.19) | — | 0.51 | 11.03 | 6.69 | 24,861 | 0.70 | 0.94 | 2.04 | 190 | |
| Class I | ||||||||||||||||||
| 1/1/23 to 12/31/23 | $ 9.42 | 0.35 | 0.08 | 0.43 | (0.33) | — | — | (0.33) | — | 0.10 | $ 9.52 | 4.65 % | $ 116,684 | 0.45 % | 0.60 % | 3.75 % | 167 % | |
| 1/1/22 to 12/31/22 | 11.25 | 0.23 | (1.74) | (1.51) | (0.21) | — | (0.11) | (0.32) | — | (1.83) | 9.42 | (13.57) | 152,706 | 0.48 (6) | 0.59 | 2.30 | 169 | |
| 1/1/21 to 12/31/21 | 11.54 | 0.14 | (0.28) | (0.14) | (0.12) | — | (0.03) | (0.15) | — | (0.29) | 11.25 | (1.23) | 274,304 | 0.46 | 0.56 | 1.25 | 131 | |
| 1/1/20 to 12/31/20 | 10.68 | 0.16 | 1.03 | 1.19 | (0.24) | — | (0.09) | (0.33) | — | 0.86 | 11.54 | 11.12 | 295,811 | 0.46 | 0.57 | 1.38 | 186 | |
| 1/1/19 to 12/31/19 | 10.17 | 0.24 | 0.48 | 0.72 | (0.15) | (0.06) | — | (0.21) | — | 0.51 | 10.68 | 7.12 | 220,036 | 0.46 | 0.59 | 2.32 | 190 | |
| Class R6 | ||||||||||||||||||
| 1/1/23 to 12/31/23 | $ 9.42 | 0.37 | 0.07 | 0.44 | (0.34) | — | — | (0.34) | — | 0.10 | $ 9.52 | 4.81 % | $ 36,725 | 0.30 % | 0.48 % | 3.92 % | 167 % | |
| 1/1/22 to 12/31/22 | 11.24 | 0.24 | (1.73) | (1.49) | (0.22) | — | (0.11) | (0.33) | — | (1.82) | 9.42 | (13.36) | 41,237 | 0.32 (6) | 0.46 | 2.35 | 169 | |
| 1/1/21 to 12/31/21 | 11.53 | 0.16 | (0.28) | (0.12) | (0.14) | — | (0.03) | (0.17) | — | (0.29) | 11.24 | (1.08) | 92,787 | 0.31 | 0.45 | 1.40 | 131 | |
| 1/1/20 to 12/31/20 | 10.67 | 0.17 | 1.03 | 1.20 | (0.25) | — | (0.09) | (0.34) | — | 0.86 | 11.53 | 11.30 | 123,041 | 0.31 | 0.46 | 1.53 | 186 | |
| 1/1/19 to 12/31/19 | 10.17 | 0.26 | 0.46 | 0.72 | (0.16) | (0.06) | — | (0.22) | — | 0.50 | 10.67 | 7.18 | 61,313 | 0.31 | 0.45 | 2.51 | 190 |
| Net Asset Value, Beginning of Period | Net Investment Income (Loss)(1) | Net Realized and Unrealized Gain (Loss) | Total from Investment Operations | Dividends from Net Investment Income | Return of Capital | Distributions from Net Realized Gains | Total Distributions | Payments from Affiliates | Change in Net Asset Value | Net Asset Value, End of Period | Total Return(2)(3) | Net Assets, End of Period (in thousands) | Ratio of Net Expenses to Average Net Assets(4)(5) | Ratio of Gross Expenses to Average Net Assets(4)(5) | Ratio of Net Investment Income (Loss) to Average Net Assets(4) | Portfolio Turnover Rate(2) | ||
| Seix U.S. Government Securities Ultra-Short Bond Fund | ||||||||||||||||||
| Class A | ||||||||||||||||||
| 1/1/23 to 12/31/23 | $ 9.75 | 0.41 | 0.08 | 0.49 | (0.40) | — | — | (0.40) | — | 0.09 | $ 9.84 | 5.17 % | $ 14,985 | 0.65 % | 0.68 % | 4.15 % | 4 % | |
| 1/1/22 to 12/31/22 | 10.01 | 0.12 | (0.26) | (0.14) | (0.12) | — | — | (0.12) | — | (0.26) | 9.75 | (1.39) | 13,607 | 0.68 (6)(10)(11) | 0.66 | 1.17 | 37 | |
| 1/1/21 to 12/31/21 | 10.04 | (0.01) | (0.02) | (0.03) | — (13) | — (13) | — | — (13) | — | (0.03) | 10.01 | (0.29) | 15,323 | 0.66 | 0.67 | (0.07) | 52 | |
| 1/1/20 to 12/31/20 | 10.00 | 0.04 | 0.06 | 0.10 | (0.06) | — | — | (0.06) | — | 0.04 | 10.04 | 0.99 | 33,092 | 0.66 | 0.66 | 0.41 | 54 | |
| 1/1/19 to 12/31/19 | 9.99 | 0.19 | 0.02 | 0.21 | (0.20) | — | — | (0.20) | — | 0.01 | 10.00 | 2.11 | 13,741 | 0.65 (10) | 0.65 | 1.91 | 63 | |
| Class I | ||||||||||||||||||
| 1/1/23 to 12/31/23 | $ 9.75 | 0.42 | 0.10 | 0.52 | (0.43) | — | — | (0.43) | — | 0.09 | $ 9.84 | 5.44 % | $ 204,124 | 0.40 % | 0.51 % | 4.33 % | 4 % | |
| 1/1/22 to 12/31/22 | 10.00 | 0.12 | (0.23) | (0.11) | (0.14) | — | — | (0.14) | — | (0.25) | 9.75 | (1.05) | 343,827 | 0.43 (6) | 0.57 | 1.22 | 37 | |
| 1/1/21 to 12/31/21 | 10.04 | 0.02 | (0.03) | (0.01) | (0.02) | (0.01) | — | (0.03) | — | (0.04) | 10.00 | (0.13) | 710,303 | 0.41 | 0.49 | 0.18 | 52 | |
| 1/1/20 to 12/31/20 | 10.00 | 0.08 | 0.04 | 0.12 | (0.08) | — | — | (0.08) | — | 0.04 | 10.04 | 1.25 | 1,090,217 | 0.41 | 0.49 | 0.76 | 54 | |
| 1/1/19 to 12/31/19 | 9.99 | 0.23 | — | 0.23 | (0.22) | — | — | (0.22) | — | 0.01 | 10.00 | 2.36 | 864,548 | 0.41 | 0.50 | 2.27 | 63 | |
| Class R6 | ||||||||||||||||||
| 1/1/23 to 12/31/23 | $ 9.77 | 0.44 | 0.08 | 0.52 | (0.44) | — | — | (0.44) | — | 0.08 | $ 9.85 | 5.48 % | $ 42,421 | 0.25 % | 0.40 % | 4.45 % | 4 % | |
| 1/1/22 to 12/31/22 | 10.02 | 0.14 | (0.23) | (0.09) | (0.16) | — | — | (0.16) | — | (0.25) | 9.77 | (0.90) | 74,922 | 0.28 (6) | 0.40 | 1.41 | 37 | |
| 1/1/21 to 12/31/21 | 10.05 | 0.03 | (0.02) | 0.01 | (0.03) | (0.01) | — | (0.04) | — | (0.03) | 10.02 | 0.12 | 157,768 | 0.26 | 0.35 | 0.32 | 52 | |
| 1/1/20 to 12/31/20 | 10.01 | 0.07 | 0.07 | 0.14 | (0.10) | — | — | (0.10) | — | 0.04 | 10.05 | 1.40 | 87,343 | 0.26 | 0.38 | 0.66 | 54 | |
| 1/1/19 to 12/31/19 | 10.00 | 0.24 | 0.01 | 0.25 | (0.24) | — | — | (0.24) | — | 0.01 | 10.01 | 2.51 | 25,521 | 0.26 | 0.37 | 2.39 | 63 | |
| Seix Ultra-Short Bond Fund | ||||||||||||||||||
| Class A | ||||||||||||||||||
| 1/1/23 to 12/31/23 | $ 9.67 | 0.41 | 0.17 | 0.58 | (0.41) | — | — | (0.41) | — | 0.17 | $ 9.84 | 6.13 % | $ 4,362 | 0.64 % | 1.03 % | 4.19 % | 36 % | |
| 1/1/22 to 12/31/22 | 9.92 | 0.15 | (0.24) | (0.09) | (0.16) | — | — | (0.16) | — (13) | (0.25) | 9.67 | (0.94) | 5,029 | 0.67 (6) | 0.87 | 1.57 | 60 | |
| 1/1/21 to 12/31/21 | 9.97 | 0.05 | (0.05) | — | (0.05) | — | — | (0.05) | — | (0.05) | 9.92 | 0.02 | 5,049 | 0.65 | 0.86 | 0.49 | 89 | |
| 1/1/20 to 12/31/20 | 9.96 | 0.10 | 0.01 | 0.11 | (0.10) | — | — | (0.10) | — | 0.01 | 9.97 | 1.13 | 4,189 | 0.65 | 0.84 | 1.03 | 101 | |
| 1/1/19 to 12/31/19 | 9.92 | 0.21 | 0.04 | 0.25 | (0.21) | — | — | (0.21) | — | 0.04 | 9.96 | 2.58 | 3,111 | 0.65 | 0.83 | 2.07 | 97 | |
| Class I | ||||||||||||||||||
| 1/1/23 to 12/31/23 | $ 9.67 | 0.43 | 0.18 | 0.61 | (0.44) | — | — | (0.44) | — | 0.17 | $ 9.84 | 6.39 % | $ 15,713 | 0.39 % | 0.79 % | 4.36 % | 36 % | |
| 1/1/22 to 12/31/22 | 9.91 | 0.17 | (0.23) | (0.06) | (0.18) | — | — | (0.18) | — (13) | (0.24) | 9.67 | (0.59) | 25,349 | 0.42 (6) | 0.66 | 1.71 | 60 | |
| 1/1/21 to 12/31/21 | 9.96 | 0.07 | (0.04) | 0.03 | (0.08) | — | — | (0.08) | — | (0.05) | 9.91 | 0.27 | 38,963 | 0.40 | 0.63 | 0.73 | 89 | |
| 1/1/20 to 12/31/20 | 9.95 | 0.13 | 0.01 | 0.14 | (0.13) | — | — | (0.13) | — | 0.01 | 9.96 | 1.39 | 44,711 | 0.40 | 0.62 | 1.29 | 101 | |
| 1/1/19 to 12/31/19 | 9.91 | 0.24 | 0.04 | 0.28 | (0.24) | — | — | (0.24) | — | 0.04 | 9.95 | 2.84 | 48,183 | 0.40 | 0.61 | 2.42 | 97 |
| Footnote Legend: | |
| (1) | Calculated using average shares outstanding. |
| (2) | Not annualized for periods less than one year. |
| (3) | Sales charges, where applicable, are not reflected in the total return calculation. |
| (4) | Annualized for periods less than one year. |
| (5) | The Funds will also indirectly bear their prorated share of expenses of any underlying funds in which they invest. Such expenses are not included in the calculation of this ratio. |
| (6) | Net expense ratio includes extraordinary proxy expenses. |
| (7) | Inception date. |
| (8) | Portfolio turnover is representative of the Fund for the entire period. |
| (9) | Ratio of total expenses excluding interest expense on borrowings for the year ended December 31, 2023 were 0.93% (Class A), 1.51% (Class C), 0.61% (Class I) and 0.51% (Class R6), for the year ended December 31, 2022 were 0.96% (Class A), 1.54% (Class C), 0.64% (Class I) and 0.54% (Class R6), for the year ended December 31, 2021 were 0.93% (Class A), 1.52% (Class C), 0.62% (Class I) and 0.52% (Class R6) and the years ended December 31, 2020 and 2019 were 0.94% (Class A), 1.52% (Class C), 0.62% (Class I) and 0.52% (Class R6). |
| (10) | The share class is currently under its expense limitation. |
| (11) | See Note 4D in the Notes to Financial Statements for information on recapture of expenses previously reimbursed. |
| (12) | Due to a change in expense cap, the ratio shown is a blended expense ratio. |
| (13) | Amount is less than $0.005 per share. |
NOTES TO FINANCIAL STATEMENTS
December 31, 2023
NOTES TO FINANCIAL STATEMENTS (Continued)
| A. | Security Valuation |
| The Fund’s Board of Trustees has designated the investment adviser as the valuation designee to perform fair valuations pursuant to Rule 2a-5 under the Investment Company Act of 1940. Each Fund utilizes a fair value hierarchy which prioritizes the inputs to valuation techniques used to measure fair value into three broad levels. The Funds’ policy is to recognize transfers into or out of Level 3 at the end of the reporting period. |
actively quoted markets including but not limited to: underlying reference entity details, indices, spreads, interest rates, yield curves, dividend and
exchange rates. These instruments are generally categorized as Level 2 in the hierarchy. Centrally cleared swaps listed or traded on a bilateral or
trade facility platform, such as a registered exchange, are valued at the last posted settlement price determined by the respective exchange. These
securities are generally categorized as Level 2 within the hierarchy.
| B. | Security Transactions and Investment Income |
| Security transactions are recorded on the trade date. Realized gains and losses from the sale of securities are determined on the identified cost basis. Dividend income and capital gain distributions are recognized on the ex-dividend date or, in the case of certain foreign securities, as soon as a Fund is notified. Interest income is recorded on the accrual basis. Each Fund amortizes premiums and accretes discounts using the effective |
NOTES TO FINANCIAL STATEMENTS (Continued)
| interest method. Premiums on callable debt instruments are amortized to interest income to the earliest call date using the effective interest method. Any distributions from underlying funds are recorded in accordance with the character of the distributions as designated by the underlying funds. | |
| Dividend income from REITs is recorded using management’s estimate of the percentage of income included in distributions received from such investments based on historical information and other industry sources. The return of capital portion of the estimate is a reduction to investment income and a reduction in the cost basis of each investment which increases net realized gain (loss) and net change in unrealized appreciation (depreciation). If the return of capital distributions exceed their cost basis, the distributions are treated as realized gains. The actual amounts of income, return of capital, and capital gains are only determined by each REIT after its fiscal year-end, and may differ from the estimated amounts. | |
| C. | Income Taxes |
| Each Fund is treated as a separate taxable entity. It is the intention of each Fund to comply with the requirements of Subchapter M of the Internal Revenue Code of 1986, as amended (the “Code”) and to distribute substantially all of its taxable income to its shareholders. Therefore, no provision for federal income taxes or excise taxes has been made. | |
| Certain Funds may be subject to foreign taxes on income, gains on investments or currency repatriation, a portion of which may be recoverable. Each Fund will accrue such taxes and recoveries as applicable based upon current interpretations of the tax rules and regulations that exist in the markets in which it invests. | |
| Management of the Funds has concluded that there are no significant uncertain tax positions that would require recognition in the financial statements. Each Fund’s U.S. federal income tax return is generally subject to examination by the Internal Revenue Service for a period of three years after it is filed. State, local and/or non-U.S. tax returns and/or other filings may be subject to examination for different periods, depending upon the tax rules of each applicable jurisdiction. | |
| D. | Distributions to Shareholders |
| Distributions are recorded by each Fund on the ex-dividend date. Income and capital gain distributions are determined in accordance with income tax regulations which may differ from U.S. GAAP. | |
| E. | Expenses |
| Expenses incurred together by a Fund and other affiliated mutual funds are allocated in proportion to the net assets of each such fund, except where allocation of direct expenses to each Fund and each such other fund, or an alternative allocation method, can be more appropriately used. | |
| In addition to the net annual operating expenses that a Fund bears directly, the shareholders of a Fund indirectly bear the pro-rata expenses of any underlying mutual funds in which the Fund invests. | |
| F. | Foreign Currency Transactions |
| Non-U.S. investment securities and other assets and liabilities denominated in foreign currencies are translated into U.S. dollar amounts at the foreign currency exchange rate effective at the end of the reporting period. Cost of investments is translated at the currency exchange rate effective at the trade date. The gain or loss resulting from a change in currency exchange rates between the trade and settlement date of a portfolio transaction is treated as a gain or loss on foreign currency. Likewise, the gain or loss resulting from a change in currency exchange rates between the date income is accrued and the date it is paid is treated as a gain or loss on foreign currency. For fixed income instruments, the Funds bifurcate that portion of the results of operations arising from changes in foreign exchange rates on investments from the fluctuations arising from changes in the market prices of securities held and such fluctuations are included with the net realized and unrealized gain or loss on foreign currency transactions. For equity securities, the Funds do not isolate that portion of the results of operations arising from changes in foreign exchange rates on investments from the fluctuations arising from changes in the market prices of securities held and such fluctuations are included with the net realized and unrealized gain or loss on investments. | |
| G. | Payment-In-Kind Securities |
| Certain Funds may invest in payment-in-kind securities, which are debt or preferred stock securities that require or permit payment of interest in the form of additional securities. Payment-in-kind securities allow the issuer to avoid or delay the need to generate cash to meet current interest payments and, as a result, may involve greater risk than securities that pay interest currently or in cash. | |
| H. | Securities Traded on a To-Be-Announced Basis |
| Certain Funds may trade securities on a to-be-announced (“TBA”) basis. In a TBA transaction, a Fund commits to purchasing or selling securities which have not yet been issued by the issuer and for which specific information, such as the face amount, maturity date and underlying pool of investments in U.S. government agency mortgage pass-through securities, is not announced. Securities purchased on a TBA basis are not settled until they are delivered to the Fund. Beginning on the date a Fund enters into a TBA transaction, cash, U.S. government securities or other liquid high-grade debt obligations are segregated in an amount equal in value to the purchase price of the TBA security. These securities are subject to market fluctuations and their current value is determined in the same manner as for other securities. | |
| I. | When-issued Purchases and Forward Commitments (Delayed Delivery) |
| Certain Funds may engage in when-issued or forward commitment transactions. Securities purchased on a when-issued or forward commitment basis are also known as delayed delivery transactions. Delayed delivery transactions involve a commitment by a Fund to purchase or sell a security at a future date (ordinarily up to 90 days later). When-issued or forward commitments enable the Funds to lock in what is believed to be an attractive price or yield on a particular security for a period of time, regardless of future changes in interest rates. Each Fund records when-issued and forward commitment securities on the trade date. Each Fund maintains collateral for the securities purchased. Securities purchased on a when-issued or forward commitment basis begin earning interest on the settlement date. |
| J. | Leveraged Loans |
| Certain Funds may invest in direct debt instruments which are interests in amounts owed by a corporate, governmental, or other borrower to lenders or lending syndicates. Leveraged loans are generally non-investment grade and often involve borrowers that are highly leveraged. The Funds may invest in obligations of borrowers who are in bankruptcy proceedings. Leveraged loans are typically senior in the corporate capital structure of the borrower. A loan is often administered by a bank or other financial institution (the “lender”) that acts as agent for all holders. The agent administers the terms of the loan, as specified in the leveraged loan. A Fund’s investments in loans may be in the form of participations in loans or assignments of all or a portion of loans from third parties. When investing in loan participations, a Fund has the right to receive payments of principal, interest and any fees to which it is entitled only from the lender selling the loan participation and only upon receipt by the lender of payments from the borrower. A Fund generally has no right to enforce compliance with the terms of the leveraged loan with the borrower. As a result, a Fund may be subject to the credit risk of both the borrower and the lender that is selling the leveraged loan. When a Fund purchases assignments from lenders it acquires direct rights against the borrower on the loan. | |
| A Fund may invest in multiple series or tranches of a loan, which may have varying terms and carry different associated risks. Leveraged loans may involve foreign borrowers and investments may be denominated in foreign currencies. Direct indebtedness of emerging countries involves a risk that the government entities responsible for the repayment of the debt may be unable, or unwilling, to pay the principal and interest when due. | |
| The leveraged loans have floating rate loan interests which generally pay interest at rates that are periodically determined by reference to a base lending rate plus a premium. The base lending rates are generally LIBOR, SOFR, the prime rate offered by one or more U.S. banks or the certificate of deposit rate. When a leveraged loan is purchased a Fund may pay an assignment fee. On an ongoing basis, a Fund may receive a commitment fee based on the undrawn portion of the underlying line of credit portion of a leveraged loan. Prepayment penalty fees are received upon the prepayment of a leveraged loan by a borrower. Prepayment penalty, facility, commitment, consent and amendment fees are recorded to income as earned or paid. | |
| A Fund may invest in both secured loans and “covenant lite” loans which have few or no financial maintenance covenants that would require a borrower to maintain certain financial metrics. The lack of financial maintenance covenants in covenant lite loans increases the risk that the applicable Fund will experience difficulty or delays in enforcing its rights on its holdings of such loans, which may result in losses, especially during a downturn in the credit cycle. | |
| K. | Warrants |
| The Funds may receive warrants. Warrants are securities that are usually issued together with a debt instrument or preferred stock and that give the holder the right to buy a proportionate amount of common stock at a specified price. Warrants may be freely transferable and are often traded on major exchanges. Warrants normally have a life that is measured in years and entitle the holder to buy common stock of a company at a price that is usually higher than the market price at the time the warrant is issued. Warrants may entail greater risks than certain other types of investments. Generally, warrants do not carry the right to receive dividends or exercise voting rights with respect to the underlying securities, and they do not represent any rights in the assets of the issuer. In addition, their value does not necessarily change with the value of the underlying securities, and they cease to have value if they are not exercised on or before their expiration date. If the market price of the underlying stock does not exceed the exercise price during the life of the warrant, the warrant will expire worthless. Warrants may increase the potential profit or loss to be realized from the investment as compared with investing the same amount in the underlying securities. Similarly, the percentage increase or decrease in the value of an equity security warrant may be greater than the percentage increase or decrease in the value of the underlying common stock. Warrants may relate to the purchase of equity or debt instruments. Debt obligations with warrants attached to purchase equity securities have many characteristics of convertible securities and their prices may, to some degree, reflect the performance of the underlying stock. Debt obligations also may be issued with warrants attached to purchase additional debt instruments at the same coupon rate. A decline in interest rates would permit a Fund to sell such warrants at a profit. If interest rates rise, these warrants would generally expire with no value. | |
| L. | Securities Lending |
| The Funds may loan securities to qualified brokers through a securities lending agency agreement with The Bank of New York Mellon (“BNYM”). Under the securities lending policy, when lending securities a Fund is required to maintain collateral with a market value not less than 100% of the market value of loaned securities. Collateral is adjusted daily in connection with changes in the market value of securities on loan bringing the collateral market value in line with the required percent. Due to timing of collateral adjustments, the market value of collateral held with respect to a loaned security, may be more or less than the value of the security on loan. | |
| Collateral may consist of cash and securities issued by the U.S. government or its agencies. Cash collateral is invested in a short-term money market fund. Dividends earned on the collateral and premiums paid by the broker are recorded as income by the Fund net of fees and rebates charged/paid by BNYM for its services as securities lending agent and in connection with this securities lending program. Lending portfolio securities involves a risk of delay in the recovery of the loaned securities or in the declining value of the collateral. | |
| Securities lending transactions are entered into by each Fund under a Master Securities Lending Agreement (“MSLA”) which permits the Fund, under certain circumstances including an event of default (such as bankruptcy or insolvency), to offset amounts payable by the Fund to the same counterparty against amounts to be received and create one single net payment due to or from the Fund. | |
| At December 31, 2023, the securities loaned were subject to a MSLA on a net payment basis as follows: |
| Fund | Value of Securities on Loan | Cash Collateral Received(1) | Net Amount(2) | |||
Seix Core Bond Fund | $ 139 | $ 139 | $ — | |||
Seix Corporate Bond Fund | 95 | 95 | — | |||
Seix High Income Fund | 1,773 | 1,773 | — | |||
Seix High Yield Fund | 2,997 | 2,997 | — | |||
Seix Total Return Bond Fund | 169 | 169 | — |
| (1) | Collateral received in excess of the value of securities on loan is not presented in this table. The cash collateral received in connection with securities lending transactions has been used for the purchase of securities as disclosed in the Fund’s Schedule of Investments. |
| (2) | Net amount represents the net amount receivable due from the counterparty in the event of default. |
| Fund | Investment of Cash Collateral | Overnight and Continuous | ||
Seix Core Bond Fund | Money Market Mutual Fund | $ 145 | ||
Seix Corporate Bond Fund | Money Market Mutual Fund | 99 | ||
Seix High Income Fund | Money Market Mutual Fund | 1,842 | ||
Seix High Yield Fund | Money Market Mutual Fund | 3,120 | ||
Seix Total Return Bond Fund | Money Market Mutual Fund | 174 |
| A. | Futures Contracts |
| A futures contract is an agreement between two parties to purchase (long) or sell (short) a security at a set price for delivery on a future date. Upon entering into a futures contract, a Fund is required to pledge to the broker an amount of cash and/or securities equal to the “initial margin” requirements of the futures exchange on which the contract is traded. Pursuant to the contract, the Fund agrees to receive from or pay to the broker an amount of cash equal to the daily fluctuation in value of the contract. Such receipts or payments are known as variation margin and are recorded by a Fund for financial statement purposes on a daily basis as unrealized appreciation or depreciation. When the contract expires or is closed, gain or loss equal to the difference between the value of the contract at the time it was opened and the value at the time it was closed is realized. This is presented in the Statement of Operations as net realized gain (loss) from future contracts. | |
| During the year ended December 31, 2023, the Seix U.S. Government Securities Ultra-Short Bond Fund and Seix Ultra-Short Bond Fund utilized futures to optimize performance by gaining exposure to broad markets or to hedge the risk of securities within the portfolios. The potential risks of doing so are that 1) the use of futures may result in larger losses or smaller gains than the use of more traditional investments, 2) the prices of futures and the price movements of the securities that the future is intended to simulate may not correlate well, 3) the Fund’s success in using futures will be dependent upon the subadviser’s ability to correctly predict such price movements, 4) liquidity of futures can be adversely affected by market factors, and the prices of such securities may move in unexpected ways, and 5) if the Fund cannot close out a futures position, it may be compelled to continue to make daily cash payments to the broker to meet margin requirements, thus increasing transaction costs. Futures contracts outstanding at period end, if any, are listed after each Fund’s Schedule of Investments. Securities deposited as margin are designated on the Schedule of Investments and cash deposited is recorded on the Statements of Assets and Liabilities as “Cash pledged as collateral for futures contracts.” | |
| B. | Swaps |
| Certain Funds enter into swap agreements, in which the Fund and a counterparty agree either to make periodic net payments on a specified notional amount or a net payment upon termination. Swap agreements are negotiated in the OTC market and may be entered into as a bilateral contract (“OTC swaps”) or centrally cleared (“centrally cleared swaps”). The value of the swap is reflected on the Statements of Assets and Liabilities as “Over-the-counter swaps at value” for OTC swaps and as “Variation margin receivable/payable on cleared swaps” for centrally cleared swaps. Swaps are marked-to-market daily and changes in value are recorded as “Net change in unrealized appreciation (depreciation) on swaps” in the Statements of Operations. | |
| Any upfront premiums paid are recorded as assets and any upfront fees received are recorded as liabilities and are shown under “Over-the-counter swaps at value” in the Statements of Assets and Liabilities and are amortized over the term of the swap for OTC swaps. When a swap is terminated, the Fund records a realized gain or loss equal to the difference between the proceeds from (or cost of) the closing transaction and the Fund’s basis |
| in the contract, if any. Generally, the basis of the contracts is the unamortized premium received or paid. Cash settlements between the Fund and the counterparty are recognized as “Net realized gain (loss) on swaps” in the Statements of Operations. Swap contracts outstanding at period end, if any, are listed after each Fund’s Schedule of Investments. | |
| In a centrally cleared swap, immediately following execution of the swap agreement, the swap agreement is submitted to a central counterparty (the “CCP”) and the Fund’s counterparty on the swap agreement becomes the CCP. The Fund is required to interface with the CCP through a clearing broker. Upon entering into a centrally cleared swap, a Fund is required to deposit initial margin with the clearing broker in the form of cash or securities in an amount that varies depending on the size and risk profile of the particular swap. | |
| Securities deposited as margin are designated on the Schedule of Investments and cash deposited is recorded on the Statements of Assets and Liabilities as “Cash pledged as collateral for cleared swaps.” | |
| Swap transactions involve, to varying degrees, elements of interest rate, credit and market risk in excess of the amounts recognized in the Statements of Assets and Liabilities. Such risks involve the possibility that there will be no liquid market for these agreements, that the counterparty to the agreements may default on its obligation to perform or disagree as to the meaning of the contractual terms in the agreements, and that there may be unfavorable changes in interest rates and/or market values associated with these transactions. | |
| Credit default swaps – A Fund may either buy or sell (write) credit default swaps on single-name issuers (corporate or sovereign), a combination or basket of single-name issuers or traded indexes. Credit default swaps on single-name issuers are agreements in which the buyer pays fixed periodic payments to the seller in consideration for a guarantee from the protection seller to make specific payment should a negative credit event take place with respect to the referenced entity (e.g., bankruptcy, failure to pay, obligation accelerators, repudiation, moratorium or restructuring). Credit default swaps on a combination or basket of single-name issuers are agreements in which the buyer pays fixed periodic payments to the seller in consideration for a guarantee from the protection seller to make specific payment should a negative credit event take place with respect to any of the referenced entities (e.g., bankruptcy, failure to pay, obligation accelerators, repudiation, moratorium or restructuring). Credit default swaps on traded indexes are agreements in which the buyer pays fixed periodic payments to the seller in consideration for a guarantee from the seller to make a specific payment should a write-down, principal or interest shortfall or default of all or individual underlying securities included in the index occurs. As a buyer, if an underlying credit event occurs, the Fund will either receive from the seller an amount equal to the notional amount of the swap and deliver the referenced security or underlying securities comprising the index or receive a net settlement of cash equal to the notional amount of the swap less the recovery value of the security or underlying securities comprising the index. As a seller (writer), if an underlying credit event occurs, the Fund will either pay the buyer an amount equal to the notional amount of the swap and take delivery of the referenced security or underlying securities comprising the index or pay a net settlement of cash equal to the notional amount of the swap less the recovery value of the security or underlying securities comprising the index. The Funds may enter into credit default swaps to manage their exposure to the market or certain sectors of the market, to reduce their risk exposure to defaults of corporate and/or sovereign issuers or to create exposure to corporate and/or sovereign issuers to which they are not otherwise exposed (credit risk). | |
| During the year ended December 31, 2023, the Seix Corporate Bond Fund and Seix Total Return Bond Fund utilized credit index swaps to gain exposure to short individual securities or to gain exposure to a credit or asset-backed index. | |
| The following is a summary of derivative instruments categorized by primary risk exposure, and location as presented in the Statements of Assets and Liabilities at December 31, 2023: |
| Statement Line Description | Primary Risk | Seix U.S. Government Securities Ultra-Short Bond Fund | Seix Ultra-Short Bond Fund | |
| Liability Derivatives | ||||
| Variation margin payable on futures contracts(1) | Interest rate contracts | $ (246) | $ (7) | |
| Total Liabilities | $ (246) | $ (7) | ||
| (1) | Represents cumulative appreciation (depreciation) on futures contracts as reported in the Schedules of Investments. Only current day’s variation margin is shown in the Statements of Assets and Liabilities for exchange-traded futures contracts. |
NOTES TO FINANCIAL STATEMENTS (Continued)
| Statement Line Description | Primary Risk | Seix Corporate Bond Fund | Seix Total Return Bond Fund | Seix U.S. Government Securities Ultra-Short Bond Fund | Seix Ultra-Short Bond Fund | |||||
| Net Realized Gain (Loss) from | ||||||||||
| Futures | Interest rate contracts | $ — | $ — | $ 641 | $ 22 | |||||
| Swaps | Credit contracts | (267) | (1,061) | — | — | |||||
| Total | $ (267) | $ (1,061) | $ 641 | $ 22 | ||||||
| Net Change in Unrealized Appreciation (Depreciation) on | ||||||||||
| Futures | Interest rate contracts | $ — | $ — | $ (241) | $ (6) | |||||
| Swaps | Credit contracts | (28) | (124) | — | — | |||||
| Total | $ (28) | $ (124) | $ (241) | $ (6) | ||||||
| Seix Corporate Bond Fund | Seix Total Return Bond Fund | Seix U.S. Government Securities Ultra-Short Bond Fund | Seix Ultra-Short Bond Fund | ||||
Futures Contracts - Short Positions(1) | $ — | $ — | $ (3) | $(—) (2) | |||
Credit Default Swap Contracts - Buy Protection(3) | 2,088 | 8,563 | — | — |
| (1) Average unrealized for the period. |
| (2) Amount is less than $500 (not in thousands). |
| (3) Average notional amount. |
| C. | Derivative Risks |
| A derivative contract may suffer a mark-to-market loss if the value of the contract decreases due to an unfavorable change in the market rates or values of the underlying instrument. Losses can also occur if the counterparty does not perform under the contract. | |
| A Fund’s risk of loss from counterparty credit risk on derivatives bought or sold OTC rather than traded on a securities exchange, is generally limited to the aggregate unrealized gain netted against any collateral held by such Fund. For OTC purchased options, each Fund bears the risk of loss of the amount of the premiums paid plus the positive change in market values net of any collateral held by such Fund should the counterparty fail to perform under the contracts. Options written by a Fund do not typically give rise to counterparty credit risk, as options written generally obligate the Fund, and not the counterparty to perform. | |
| With exchange traded purchased options and futures and centrally cleared swaps generally speaking, there is less counterparty credit risk to the Fund since the exchange or clearinghouse, as counterparty to such instruments, guarantees against a possible default. The clearinghouse stands between the buyer and the seller of the contract; therefore, credit risk is limited to failure of the clearinghouse. While offset rights may exist under applicable law, a Fund does not have a contractual right of offset against a clearing broker or clearinghouse in the event of a default (including the bankruptcy or insolvency) of the clearing broker or clearinghouse. Additionally, credit risk exists in exchange traded futures and centrally cleared swaps with respect to initial and variation margin that is held in a clearing broker’s customer accounts. While clearing brokers are required to segregate customer margin from their own assets, in the event that a clearing broker becomes insolvent or goes into bankruptcy and at that time there is a shortfall in the aggregate amount of margin held by the clearing broker for all its clients, typically the shortfall would be allocated on a pro-rata basis across all the clearing broker’s customers, potentially resulting in losses to the Fund. | |
| In order to better define its contractual rights and to secure rights that will help a Fund mitigate its counterparty risk, each Fund may enter into an International Swaps and Derivatives Association, Inc. Master Agreement (“ISDA Master Agreement”) or similar agreement with its derivative contract counterparties. An ISDA Master Agreement is a bilateral agreement between a Fund and a counterparty that governs certain OTC derivatives and typically contains, among other things, collateral posting terms and netting provisions in the event of a default and/or termination event. Under an ISDA Master Agreement, a Fund may, under certain circumstances, offset with the counterparty certain derivative financial instruments’ payables and/or receivables with collateral held and/or posted and create one single net payment. The provisions of the ISDA Master Agreement typically permit a single net payment in the event of default including the bankruptcy or insolvency of the counterparty. However, bankruptcy or insolvency laws of a particular jurisdiction may impose restrictions on or prohibitions against the right of offset in bankruptcy, insolvency or other events. In addition, certain ISDA Master Agreements allow counterparties to OTC derivatives to terminate derivative contracts |
NOTES TO FINANCIAL STATEMENTS (Continued)
| prior to maturity in the event a Fund’s net assets decline by a stated percentage or the Fund fails to meet the terms of its ISDA Master Agreements, which would cause the Fund to accelerate payment of any net liability owed to the counterparty. | |
| D. | Collateral Requirements and Master Netting Agreements (“MNA”) |
| For derivatives traded under an ISDA Master Agreement, the collateral requirements are typically calculated by netting the mark-to-market amount for each transaction under such agreement and comparing that amount to the value of any collateral currently pledged by the Funds and the counterparty. | |
| Cash collateral that has been pledged to cover obligations of a Fund and cash collateral received from the counterparty, if any, is reported separately on the Statements of Assets and Liabilities as cash pledged as collateral and cash received as collateral, respectively. Non-cash collateral pledged by a Fund, if any, is noted in the Schedules of Investments. Typically, the Funds and counterparties are not permitted to sell, re-pledge or use the collateral they receive. To the extent amounts due to a Fund from its counterparties are not fully collateralized, contractually or otherwise, the Fund bears the risk of loss from counterparty non-performance. The Funds attempt to mitigate counterparty risk by only entering into agreements with counterparties that they believe have the financial resources to honor their obligations and by monitoring the financial stability of those counterparties. | |
| For financial reporting purposes, the Funds do not offset derivative assets and derivative liabilities that are subject to netting arrangements in the Statements of Assets and Liabilities. | |
| The following tables present the Funds’ derivative assets and liabilities by counterparty net of amounts available for offset under a MNA and net of the related collateral received/pledged by the Funds as of December 31, 2023: |
| At December 31, 2023, the Funds’ derivative assets and liabilities (by type) are as follows: | |||||||||||
| Seix U.S. Government Securities Ultra-Short Bond Fund | Seix Ultra-Short Bond Fund | ||||||||||
| Assets | Liabilities | Assets | Liabilities | ||||||||
| Derivative Financial Instruments: | |||||||||||
| Futures contracts | $— | $ 9 | $— | $— (1) | |||||||
| Total derivative assets and liabilities in the Statements of Assets and Liabilities | $— | $ 9 | $— | $— (1) | |||||||
| Derivatives not subject to a MNA or similar agreement | — | (9) | — | — (1) | |||||||
| Total assets and liabilities subject to a MNA | $— | $ — | $— | $— | |||||||
| (1) | Amount is less than $500 (not in thousands). |
| A. | Investment Adviser |
| Virtus Fund Advisers, LLC (the “Adviser”), an indirect, wholly-owned subsidiary of Virtus Investment Partners, Inc. (“Virtus”), is the investment adviser to the Funds. The Adviser manages the Funds’ investment programs and general operations of the Funds, including oversight of the Funds’ subadviser. | |
| As compensation for its services to the Funds, the Adviser is entitled to a fee, which is calculated daily and paid monthly based upon the following annual rates as a percentage of the average daily net assets of each Fund: |
| First $500 Million | |
Seix Core Bond Fund | 0.25 % |
Seix Corporate Bond Fund | 0.40 |
Seix Floating Rate High Income Fund | 0.45 |
Seix High Grade Municipal Bond Fund | 0.50 |
Seix High Income Fund | 0.55 |
Seix High Yield Fund | 0.45 |
Seix Investment Grade Tax-Exempt Bond Fund | 0.50 |
NOTES TO FINANCIAL STATEMENTS (Continued)
| First $500 Million | |
Seix Total Return Bond Fund | 0.25% |
Seix U.S. Government Securities Ultra-Short Bond Fund | 0.20 |
Seix Ultra-Short Bond Fund | 0.22 |
| B. | Subadviser |
| Seix Investment Advisors (the “Subadviser”), a division of Virtus Fixed Income Advisers LLC, an indirect, wholly-owned subsidiary of Virtus, is the subadviser to the Funds. The Subadviser manages the investments of each Fund, for which it is paid a fee by the Adviser. | |
| C. | Expense Limitations |
| The Adviser has contractually agreed to limit each Fund’s annual total operating expenses, subject to the exceptions listed below, so that such expenses do not exceed, on an annualized basis, the following respective percentages of average daily net assets through April 30, 2024. Following the contractual period, the Adviser may discontinue these expense limitation arrangements at any time. The waivers and reimbursements are accrued daily and received monthly. |
| Fund | Class A | Class C | Class I | Class R6 | ||||
Seix Core Bond Fund | 0.64% | N/A | 0.50% | 0.36% | ||||
Seix Corporate Bond Fund | 0.95 | 1.65% | 0.70 | 0.43 | ||||
Seix Floating Rate High Income Fund | 0.94 | 1.52 | 0.62 | 0.52 | ||||
Seix High Grade Municipal Bond Fund | 0.73 | N/A | 0.58 | N/A | ||||
Seix High Income Fund | 0.93 | N/A | 0.68 | 0.59 | ||||
Seix High Yield Fund | 0.82 | N/A | 0.64 | 0.53 | ||||
Seix Investment Grade Tax-Exempt Bond Fund | 0.67 | N/A | 0.52 | N/A | ||||
Seix Total Return Bond Fund | 0.70 | N/A | 0.46 | 0.31 | ||||
Seix U.S. Government Securities Ultra-Short Bond Fund | 0.66 | N/A | 0.41 | 0.26 | ||||
Seix Ultra-Short Bond Fund | 0.65 | N/A | 0.40 | N/A |
| D. | Expense Recapture |
| Under certain conditions, the Adviser may recapture operating expenses reimbursed or fees waived under these arrangements within three years after the date on which such amounts were incurred or waived. A Fund must pay its ordinary operating expenses before the Adviser is entitled to any reimbursement and must remain in compliance with any applicable expense limitations or, if none, the expense limitation in effect at the time of the waiver or reimbursement. All or a portion of the following Adviser reimbursed expenses may be recaptured by the year ending December 31: |
| Expiration | ||||||||
| Fund | 2024 | 2025 | 2026 | Total | ||||
| Seix Core Bond Fund | ||||||||
Class A | $ 23 | $ 21 | $ 24 | $ 68 | ||||
Class I | 120 | 99 | 107 | 326 | ||||
Class R6 | 2 | 3 | 4 | 9 | ||||
| Seix Corporate Bond Fund | ||||||||
Class A | 8 | 11 | 10 | 29 | ||||
Class C | 1 | 2 | 1 | 4 | ||||
Class I | 76 | 138 | 89 | 303 | ||||
Class R6 | — (1) | 1 | — (1) | 1 | ||||
NOTES TO FINANCIAL STATEMENTS (Continued)
| Expiration | ||||||||
| Fund | 2024 | 2025 | 2026 | Total | ||||
| Seix Floating Rate High Income Fund | ||||||||
Class A | $ — | $ — | $ 11 | $ 11 | ||||
Class C | 32 | 22 | 19 | 73 | ||||
Class I | 1,679 | 2,228 | 1,846 | 5,753 | ||||
Class R6 | 153 | 217 | 228 | 598 | ||||
| Seix High Grade Municipal Bond Fund | ||||||||
Class A | 15 | 15 | 15 | 45 | ||||
Class I | 168 | 121 | 150 | 439 | ||||
| Seix High Income Fund | ||||||||
Class A | 41 | 34 | 38 | 113 | ||||
Class I | 411 | 330 | 300 | 1,041 | ||||
Class R6 | 17 | 16 | 15 | 48 | ||||
| Seix High Yield Fund | ||||||||
Class A | 31 | 26 | 32 | 89 | ||||
Class I | 369 | 329 | 278 | 976 | ||||
Class R6 | 18 | 41 | 62 | 121 | ||||
| Seix Investment Grade Tax-Exempt Bond Fund | ||||||||
Class A | 25 | 24 | 26 | 75 | ||||
Class I | 664 | 588 | 470 | 1,722 | ||||
| Seix Total Return Bond Fund | ||||||||
Class A | 21 | 18 | 17 | 56 | ||||
Class I | 295 | 256 | 201 | 752 | ||||
Class R6 | 163 | 74 | 70 | 307 | ||||
| Seix U.S. Government Securities Ultra-Short Bond Fund | ||||||||
Class A | — | — | 5 | 5 | ||||
Class I | 771 | 722 | 308 | 1,801 | ||||
Class R6 | 105 | 139 | 78 | 322 | ||||
| Seix Ultra-Short Bond Fund | ||||||||
Class A | 10 | 10 | 17 | 37 | ||||
Class I | 100 | 88 | 79 | 267 | ||||
| (1) | Amount is less than $500 (not in thousands). |
| Fund | Class A | Class I | Total | |||
Seix U.S. Government Securities Ultra-Short Bond Fund | $— (1) | $11 | $11 |
| (1) | Amount is less than $500 (not in thousands). |
| E. | Distributor |
| VP Distributors, LLC (“VP Distributors”), an indirect, wholly-owned subsidiary of Virtus, serves as the distributor of each Fund’s shares. VP Distributors has advised the Funds that for the year ended December 31, 2023, it retained net commissions of $1 for Class A shares and CDSC of $7 for Class C shares, respectively. | |
| In addition, each Fund pays VP Distributors 12b-1 fees under a 12b-1 Plan as a percentage of the average daily net assets of each respective class at the annual rates of 0.25% for Class A shares (0.15% for Seix High Grade Municipal Bond Fund), and 1.00% for Class C shares. Class I shares and Class R6 shares are not subject to a 12b-1 Plan. | |
| Under certain circumstances, shares of certain Virtus Funds may be exchanged for shares of the same class of certain other Virtus Funds on the basis of the relative NAV per share at the time of the exchange. On exchanges with share classes that carry a CDSC, the CDSC schedule of the original shares purchased continues to apply. | |
| F. | Administrator and Transfer Agent |
| Virtus Fund Services, LLC, an indirect, wholly-owned subsidiary of Virtus, serves as the administrator and transfer agent to the Funds. | |
| For the year ended December 31, 2023, the Funds incurred administration fees totaling $2,760 which are included in the Statements of Operations within the line item “Administration and accounting fees.” The fees are calculated daily and paid monthly. | |
| For the year ended December 31, 2023, the Funds incurred transfer agent fees totaling $1,236 which are included in the Statements of Operations within the line item “Transfer agent fees and expenses.” The fees are calculated daily and paid monthly. |
NOTES TO FINANCIAL STATEMENTS (Continued)
| G. | Investments with Affiliates |
| The Funds are permitted to purchase assets from or sell assets to certain related affiliates under specified conditions outlined in procedures adopted by the Board. The procedures have been designed to ensure that any purchase or sale of assets by the Funds from or to another fund or portfolio that are, or could be, considered an affiliate by virtue of having a common investment adviser (or affiliated investment advisers), common Trustees and/or common officers comply with Rule 17a-7 under the 1940 Act. Further, as defined under the procedures, each transaction is effected at the current market price. | |
| During the year ended December 31, 2023, the Funds did not engage in any transactions pursuant to Rule 17a-7 under the 1940 Act. | |
| H. | Trustee Deferred Compensation Plan |
| The Trust provides a deferred compensation plan for its Trustees who receive compensation from the Trust. Under the deferred compensation plan, Trustees may elect to defer all or a portion of their compensation. Amounts deferred are retained by the Trust, and then, to the extent permitted by the 1940 Act, in turn, may be invested in the shares of affiliated or unaffiliated mutual funds selected by the participating Trustees. Investments in such instruments are included in “Other assets” in the Statements of Assets and Liabilities at December 31, 2023. |
| Purchases | Sales | ||
Seix Core Bond Fund | $ 6,917 | $ 11,286 | |
Seix Corporate Bond Fund | 33,785 | 35,489 | |
Seix Floating Rate High Income Fund | 745,538 | 1,310,282 | |
Seix High Grade Municipal Bond Fund | 25,509 | 27,313 | |
Seix High Income Fund | 95,735 | 109,766 | |
Seix High Yield Fund | 175,689 | 211,318 | |
Seix Investment Grade Tax-Exempt Bond Fund | 80,656 | 96,865 | |
Seix Total Return Bond Fund | 23,445 | 45,628 | |
Seix Ultra-Short Bond Fund | 5,043 | 20,292 |
| Purchases | Sales | ||
Seix Core Bond Fund | $ 84,625 | $ 86,692 | |
Seix Corporate Bond Fund | 16,591 | 16,450 | |
Seix Total Return Bond Fund | 273,523 | 293,151 | |
Seix U.S. Government Securities Ultra-Short Bond Fund | 11,766 | 184,711 | |
Seix Ultra-Short Bond Fund | 2,423 | 1,130 |
| Seix Core Bond Fund | Seix Corporate Bond Fund | ||||||||||||||
| Year Ended December 31, 2023 | Year Ended December 31, 2022 | Year Ended December 31, 2023 | Year Ended December 31, 2022 | ||||||||||||
| SHARES | AMOUNT | SHARES | AMOUNT | SHARES | AMOUNT | SHARES | AMOUNT | ||||||||
| Class A | |||||||||||||||
| Shares sold and cross class conversions | 68 | $ 637 | 91 | $ 919 | 72 | $ 539 | 71 | $ 588 | |||||||
| Reinvestment of distributions | 19 | 178 | 15 | 144 | 22 | 164 | 34 | 264 | |||||||
| Shares repurchased and cross class conversions | (130) | (1,200) | (214) | (2,148) | (129) | (945) | (252) | (2,063) | |||||||
| Net Increase / (Decrease) | (43) | $ (385) | (108) | $ (1,085) | (35) | $ (242) | (147) | $ (1,211) | |||||||
NOTES TO FINANCIAL STATEMENTS (Continued)
| Seix Core Bond Fund | Seix Corporate Bond Fund | ||||||||||||||
| Year Ended December 31, 2023 | Year Ended December 31, 2022 | Year Ended December 31, 2023 | Year Ended December 31, 2022 | ||||||||||||
| SHARES | AMOUNT | SHARES | AMOUNT | SHARES | AMOUNT | SHARES | AMOUNT | ||||||||
| Class C | |||||||||||||||
| Shares sold and cross class conversions | — | $ — | — | $ — | 6 | $ 44 | 15 | $ 116 | |||||||
| Reinvestment of distributions | — | — | — | — | 2 | 11 | 3 | 21 | |||||||
| Shares repurchased and cross class conversions | — | — | — | — | (28) | (204) | (38) | (302) | |||||||
| Net Increase / (Decrease) | — | $ — | — | $ — | (20) | $ (149) | (20) | $ (165) | |||||||
| Class I | |||||||||||||||
| Shares sold and cross class conversions | 894 | $ 8,361 | 1,209 | $ 12,139 | 2,540 | $ 18,590 | 4,643 | $ 38,917 | |||||||
| Reinvestment of distributions | 197 | 1,851 | 182 | 1,797 | 200 | 1,470 | 335 | 2,565 | |||||||
| Shares repurchased and cross class conversions | (1,854) | (17,398) | (4,422) | (44,565) | (2,647) | (19,089) | (5,302) | (41,752) | |||||||
| Net Increase / (Decrease) | (763) | $ (7,186) | (3,031) | $ (30,629) | 93 | $ 971 | (324) | $ (270) | |||||||
| Class R6 | |||||||||||||||
| Shares sold and cross class conversions | 136 | $ 1,279 | 43 | $ 438 | — | $ — | — | $ — | |||||||
| Reinvestment of distributions | 8 | 72 | 6 | 58 | — | — | — | — | |||||||
| Shares repurchased and cross class conversions | (102) | (970) | (107) | (1,054) | — | — | — | — | |||||||
| Net Increase / (Decrease) | 42 | $ 381 | (58) | $ (558) | — | $ — | — | $ — | |||||||
| Seix Floating Rate High Income Fund | Seix High Grade Municipal Bond Fund | ||||||||||||||
| Year Ended December 31, 2023 | Year Ended December 31, 2022 | Year Ended December 31, 2023 | Year Ended December 31, 2022 | ||||||||||||
| SHARES | AMOUNT | SHARES | AMOUNT | SHARES | AMOUNT | SHARES | AMOUNT | ||||||||
| Class A | |||||||||||||||
| Shares sold and cross class conversions | 790 | $ 6,223 | 1,146 | $ 9,107 | 86 | $ 927 | 111 | $ 1,256 | |||||||
| Reinvestment of distributions | 335 | 2,626 | 206 | 1,619 | 11 | 119 | 9 | 97 | |||||||
| Shares repurchased and cross class conversions | (1,177) | (9,250) | (2,239) | (17,560) | (203) | (2,248) | (192) | (2,196) | |||||||
| Net Increase / (Decrease) | (52) | $ (401) | (887) | $ (6,834) | (106) | $ (1,202) | (72) | $ (843) | |||||||
| Class C | |||||||||||||||
| Shares sold and cross class conversions | 56 | $ 442 | 332 | $ 2,639 | — | $ — | — | $ — | |||||||
| Reinvestment of distributions | 90 | 711 | 65 | 513 | — | — | — | — | |||||||
| Shares repurchased and cross class conversions | (633) | (4,971) | (740) | (5,862) | — | — | — | — | |||||||
| Net Increase / (Decrease) | (487) | $ (3,818) | (343) | $ (2,710) | — | $ — | — | $ — | |||||||
| Class I | |||||||||||||||
| Shares sold and cross class conversions | 47,427 | $ 372,167 | 159,981 | $ 1,286,311 | 1,268 | $ 13,966 | 2,118 | $ 23,159 | |||||||
| Reinvestment of distributions | 15,295 | 120,070 | 12,969 | 101,920 | 81 | 891 | 49 | 543 | |||||||
| Shares repurchased and cross class conversions | (129,895) | (1,018,289) | (196,464) | (1,544,553) | (1,871) | (20,175) | (2,914) | (32,761) | |||||||
| Net Increase / (Decrease) | (67,173) | $ (526,052) | (23,514) | $ (156,322) | (522) | $ (5,318) | (747) | $ (9,059) | |||||||
NOTES TO FINANCIAL STATEMENTS (Continued)
| Seix Floating Rate High Income Fund | Seix High Grade Municipal Bond Fund | ||||||||||||||
| Year Ended December 31, 2023 | Year Ended December 31, 2022 | Year Ended December 31, 2023 | Year Ended December 31, 2022 | ||||||||||||
| SHARES | AMOUNT | SHARES | AMOUNT | SHARES | AMOUNT | SHARES | AMOUNT | ||||||||
| Class R6 | |||||||||||||||
| Shares sold and cross class conversions | 3,000 | $ 23,599 | 21,715 | $ 173,291 | — | $ — | — | $ — | |||||||
| Reinvestment of distributions | 1,523 | 11,966 | 773 | 6,073 | — | — | — | — | |||||||
| Shares repurchased and cross class conversions | (13,360) | (104,959) | (20,975) | (166,182) | — | — | — | — | |||||||
| Net Increase / (Decrease) | (8,837) | $ (69,394) | 1,513 | $ 13,182 | — | $ — | — | $ — | |||||||
| Seix High Income Fund | Seix High Yield Fund | ||||||||||||||
| Year Ended December 31, 2023 | Year Ended December 31, 2022 | Year Ended December 31, 2023 | Year Ended December 31, 2022 | ||||||||||||
| SHARES | AMOUNT | SHARES | AMOUNT | SHARES | AMOUNT | SHARES | AMOUNT | ||||||||
| Class A | |||||||||||||||
| Shares sold and cross class conversions | 4,232 | $ 23,433 | 249 | $ 1,433 | 763 | $ 5,695 | 747 | $ 5,697 | |||||||
| Reinvestment of distributions | 174 | 969 | 131 | 743 | 77 | 573 | 64 | 487 | |||||||
| Shares repurchased and cross class conversions | (3,865) | (21,469) | (683) | (3,934) | (1,016) | (7,542) | (1,421) | (11,062) | |||||||
| Net Increase / (Decrease) | 541 | $ 2,933 | (303) | $ (1,758) | (176) | $ (1,274) | (610) | $ (4,878) | |||||||
| Class I | |||||||||||||||
| Shares sold and cross class conversions | 3,312 | $ 18,275 | 5,559 | $ 31,393 | 6,577 | $ 50,008 | 10,674 | $ 83,284 | |||||||
| Reinvestment of distributions | 1,348 | 7,476 | 1,356 | 7,679 | 1,454 | 11,109 | 1,662 | 12,959 | |||||||
| Shares repurchased and cross class conversions | (7,843) | (43,451) | (12,801) | (73,706) | (14,147) | (107,389) | (33,489) | (263,878) | |||||||
| Net Increase / (Decrease) | (3,183) | $ (17,700) | (5,886) | $ (34,634) | (6,116) | $ (46,272) | (21,153) | $ (167,635) | |||||||
| Class R6 | |||||||||||||||
| Shares sold and cross class conversions | 536 | $ 2,947 | 125 | $ 729 | 2,110 | $ 16,150 | 4,470 | $ 35,888 | |||||||
| Reinvestment of distributions | 40 | 220 | 27 | 154 | 329 | 2,513 | 203 | 1,542 | |||||||
| Shares repurchased and cross class conversions | (462) | (2,560) | (658) | (3,688) | (897) | (6,836) | (1,556) | (12,345) | |||||||
| Net Increase / (Decrease) | 114 | $ 607 | (506) | $ (2,805) | 1,542 | $ 11,827 | 3,117 | $ 25,085 | |||||||
| Seix Investment Grade Tax-Exempt Bond Fund | Seix Total Return Bond Fund | ||||||||||||||
| Year Ended December 31, 2023 | Year Ended December 31, 2022 | Year Ended December 31, 2023 | Year Ended December 31, 2022 | ||||||||||||
| SHARES | AMOUNT | SHARES | AMOUNT | SHARES | AMOUNT | SHARES | AMOUNT | ||||||||
| Class A | |||||||||||||||
| Shares sold and cross class conversions | 8 | $ 88 | 96 | $ 1,023 | 137 | $ 1,327 | 295 | $ 3,020 | |||||||
| Reinvestment of distributions | 14 | 148 | 9 | 95 | 22 | 211 | 27 | 274 | |||||||
| Shares repurchased and cross class conversions | (56) | (604) | (95) | (1,014) | (320) | (3,146) | (562) | (5,725) | |||||||
| Net Increase / (Decrease) | (34) | $ (368) | 10 | $ 104 | (161) | $ (1,608) | (240) | $ (2,431) | |||||||
NOTES TO FINANCIAL STATEMENTS (Continued)
| Seix Investment Grade Tax-Exempt Bond Fund | Seix Total Return Bond Fund | ||||||||||||||
| Year Ended December 31, 2023 | Year Ended December 31, 2022 | Year Ended December 31, 2023 | Year Ended December 31, 2022 | ||||||||||||
| SHARES | AMOUNT | SHARES | AMOUNT | SHARES | AMOUNT | SHARES | AMOUNT | ||||||||
| Class I | |||||||||||||||
| Shares sold and cross class conversions | 4,207 | $ 45,569 | 7,769 | $ 84,245 | 1,918 | $ 18,212 | 1,975 | $ 20,142 | |||||||
| Reinvestment of distributions | 220 | 2,376 | 193 | 2,091 | 500 | 4,713 | 667 | 6,614 | |||||||
| Shares repurchased and cross class conversions | (6,465) | (69,869) | (15,078) | (163,834) | (6,373) | (60,242) | (10,823) | (107,743) | |||||||
| Net Increase / (Decrease) | (2,038) | $ (21,924) | (7,116) | $ (77,498) | (3,955) | $ (37,317) | (8,181) | $ (80,987) | |||||||
| Class R6 | |||||||||||||||
| Shares sold and cross class conversions | — | $ — | — | $ — | 784 | $ 7,429 | 693 | $ 6,832 | |||||||
| Reinvestment of distributions | — | — | — | — | 151 | 1,420 | 156 | 1,553 | |||||||
| Shares repurchased and cross class conversions | — | — | — | — | (1,455) | (13,736) | (4,723) | (49,766) | |||||||
| Net Increase / (Decrease) | — | $ — | — | $ — | (520) | $ (4,887) | (3,874) | $ (41,381) | |||||||
| Seix U.S. Government Securities Ultra-Short Bond Fund | Seix Ultra-Short Bond Fund | ||||||||||||||
| Year Ended December 31, 2023 | Year Ended December 31, 2022 | Year Ended December 31, 2023 | Year Ended December 31, 2022 | ||||||||||||
| SHARES | AMOUNT | SHARES | AMOUNT | SHARES | AMOUNT | SHARES | AMOUNT | ||||||||
| Class A | |||||||||||||||
| Shares sold and cross class conversions | 592 | $ 5,790 | 660 | $ 6,497 | 82 | $ 808 | 262 | $ 2,555 | |||||||
| Reinvestment of distributions | 57 | 555 | 17 | 169 | 19 | 182 | 8 | 71 | |||||||
| Shares repurchased and cross class conversions | (521) | (5,094) | (813) | (8,004) | (178) | (1,736) | (259) | (2,521) | |||||||
| Net Increase / (Decrease) | 128 | $ 1,251 | (136) | $ (1,338) | (77) | $ (746) | 11 | $ 105 | |||||||
| Class I | |||||||||||||||
| Shares sold and cross class conversions | 4,272 | $ 41,754 | 15,280 | $ 150,311 | 1,212 | $ 11,831 | 1,298 | $ 12,778 | |||||||
| Reinvestment of distributions | 1,108 | 10,836 | 557 | 5,460 | 83 | 811 | 62 | 605 | |||||||
| Shares repurchased and cross class conversions | (19,889) | (194,495) | (51,578) | (509,004) | (2,320) | (22,640) | (2,668) | (25,908) | |||||||
| Net Increase / (Decrease) | (14,509) | $ (141,905) | (35,741) | $ (353,233) | (1,025) | $ (9,998) | (1,308) | $ (12,525) | |||||||
| Class R6 | |||||||||||||||
| Shares sold and cross class conversions | 838 | $ 8,210 | 3,126 | $ 30,949 | — | $ — | — | $ — | |||||||
| Reinvestment of distributions | 34 | 334 | 39 | 384 | — | — | — | — | |||||||
| Shares repurchased and cross class conversions | (4,239) | (41,556) | (11,242) | (111,027) | — | — | — | — | |||||||
| Net Increase / (Decrease) | (3,367) | $ (33,012) | (8,077) | $ (79,694) | — | $ — | — | $ — | |||||||
NOTES TO FINANCIAL STATEMENTS (Continued)
| % of Shares Outstanding | Number of Accounts* | ||
Seix Core Bond Fund | 66 % | 3 | |
Seix Corporate Bond Fund | 69 | 3 | |
Seix Floating Rate High Income Fund | 58 | 3 | |
Seix High Grade Municipal Bond Fund | 65 | 4 | |
Seix High Income Fund | 43 | 1 | |
Seix High Yield Fund | 59 | 3 | |
Seix Investment Grade Tax-Exempt Bond Fund | 59 | 3 | |
Seix Total Return Bond Fund | 49 | 2 | |
Seix U.S. Government Securities Ultra-Short Bond Fund | 62 | 2 | |
Seix Ultra-Short Bond Fund | 36 | 1 |
| * | None of the accounts are affiliated. |
| Fund | Sector | Percentage of Total Investments | ||
Seix Corporate Bond Fund | Financials | 48% |
NOTES TO FINANCIAL STATEMENTS (Continued)
| Fund | Interest Incurred on Borrowing | Average Borrowing | Weighted Average Interest Rate | Days Outstanding | ||||
Seix Floating Rate High Income Fund | $96 | $20,932 | 5.92% | 28 |
| Fund | Federal Tax Cost | Unrealized Appreciation | Unrealized (Depreciation) | Net Unrealized Appreciation (Depreciation) | ||||
Seix Core Bond Fund | $ 53,060 | $ 1,169 | $ (1,192) | $ (23) | ||||
Seix Corporate Bond Fund | 47,844 | 787 | (1,804) | (1,017) | ||||
Seix Floating Rate High Income Fund | 1,525,065 | 26,933 | (63,434) | (36,501) | ||||
Seix High Grade Municipal Bond Fund | 36,181 | 1,037 | (460) | 577 | ||||
Seix High Income Fund | 131,926 | 2,579 | (3,442) | (863) | ||||
Seix High Yield Fund | 234,450 | 4,742 | (6,262) | (1,520) | ||||
Seix Investment Grade Tax-Exempt Bond Fund | 135,781 | 2,186 | (2,060) | 126 | ||||
Seix Total Return Bond Fund | 157,825 | 3,518 | (3,465) | 53 | ||||
Seix U.S. Government Securities Ultra-Short Bond Fund | 257,595 | 1,178 | (1,783) | (605) | ||||
Seix Ultra-Short Bond Fund | 19,719 | 28 | (145) | (117) |
| Fund | Short-Term | Long-Term | ||
Seix Core Bond Fund | $ 8,393 | $ 3,609 | ||
Seix Corporate Bond Fund | 4,791 | 6,202 | ||
Seix Floating Rate High Income Fund | 176,075 | 640,203 | ||
Seix High Grade Municipal Bond Fund | 1,482 | 572 | ||
Seix High Income Fund | 24,582 | 87,820 |
NOTES TO FINANCIAL STATEMENTS (Continued)
| Fund | Short-Term | Long-Term | ||
Seix High Yield Fund | $ 17,862 | $ 68,803 | ||
Seix Investment Grade Tax-Exempt Bond Fund | 3,485 | 4,777 | ||
Seix Total Return Bond Fund | 28,719 | 14,206 | ||
Seix U.S. Government Securities Ultra-Short Bond Fund | 8,427 | 4,454 | ||
Seix Ultra-Short Bond Fund | 725 | 558 |
| Fund | Undistributed Ordinary Income | Undistributed Tax-Exempt Income | Post-October Capital Loss Deferred | Capital Loss Deferred | ||||
Seix Core Bond Fund | $ — | $ — | $ 880 | $ 12,002 | ||||
Seix Corporate Bond Fund | 99 | — | 344 | 10,993 | ||||
Seix Floating Rate High Income Fund | 10,874 | — | 9,242 | 816,278 | ||||
Seix High Grade Municipal Bond Fund | — | — | 51 | 2,054 | ||||
Seix High Income Fund | — | — | 1,194 | 112,402 | ||||
Seix High Yield Fund | — (1) | — | 1,687 | 86,665 | ||||
Seix Investment Grade Tax-Exempt Bond Fund | — | 1 | 323 | 8,262 | ||||
Seix Total Return Bond Fund | 1,264 | — | 2,798 | 42,925 | ||||
Seix U.S. Government Securities Ultra-Short Bond Fund | — | — | 503 | 12,881 | ||||
Seix Ultra-Short Bond Fund | — | — | 22 | 1,283 |
| (1) | Amount is less than $500 (not in thousands). |
| Ordinary Income | Long-Term Capital Gains | Tax-Exempt Distributions | Total | ||||
Seix Core Bond Fund | |||||||
12/31/23 | $ 2,172 | $ — | $ — | $ 2,172 | |||
12/31/22 | 1,752 | 300 | — | 2,052 | |||
Seix Corporate Bond Fund | |||||||
12/31/23 | 1,661 | — | — | 1,661 | |||
12/31/22 | 1,633 | 1,234 | — | 2,867 | |||
Seix Floating Rate High Income Fund | |||||||
12/31/23 | 152,704 | — | — | 152,704 | |||
12/31/22 | 129,018 | — | — | 129,018 | |||
Seix High Grade Municipal Bond Fund | |||||||
12/31/23 | 1 | — | 1,224 | 1,225 | |||
12/31/22 | — | 129 | 683 | 812 | |||
Seix High Income Fund | |||||||
12/31/23 | 9,044 | — | — | 9,044 | |||
12/31/22 | 9,061 | — | — | 9,061 | |||
Seix High Yield Fund | |||||||
12/31/23 | 15,545 | — | — | 15,545 | |||
12/31/22 | 17,301 | — | — | 17,301 | |||
Seix Investment Grade Tax-Exempt Bond Fund | |||||||
12/31/23 | 1 | — | 3,721 | 3,722 | |||
12/31/22 | 145 | 125 | 2,869 | 3,139 | |||
Seix Total Return Bond Fund | |||||||
12/31/23 | 6,388 | — | — | 6,388 | |||
12/31/22 | 5,649 | 2,857 | — | 8,506 | |||
Seix U.S. Government Securities Ultra-Short Bond Fund | |||||||
12/31/23 | 14,355 | — | — | 14,355 | |||
12/31/22 | 7,766 | — | — | 7,766 |
NOTES TO FINANCIAL STATEMENTS (Continued)
| Ordinary Income | Long-Term Capital Gains | Tax-Exempt Distributions | Total | ||||
Seix Ultra-Short Bond Fund | |||||||
12/31/23 | $ 1,043 | $ — | $ — | $ 1,043 | |||
12/31/22 | 700 | — | — | 700 |

Philadelphia, Pennsylvania
February 26, 2024
| Qualified REIT Dividends | QDI | DRD | Long-Term Capital Gain Distributions ($) | ||||
Seix Core Bond Fund | 0.00 % | 0.00% | 0.00 % | $ — | |||
Seix Corporate Bond Fund | 0.00 | 0.00 | 0.00 | — | |||
Seix Floating Rate High Income Fund | 0.00 | 0.00 | 0.00 | — | |||
Seix High Grade Municipal Bond Fund | 0.00 | 0.00 | 0.00 | — | |||
Seix High Income Fund | 0.00 | 0.00 | 0.00 | — | |||
Seix High Yield Fund | 0.00 | 0.00 | 0.00 | — | |||
Seix Investment Grade Tax-Exempt Bond Fund | 0.00 | 0.00 | 0.00 | — | |||
Seix Total Return Bond Fund | 0.00 | 0.00 | 0.00 | — | |||
Seix U.S. Government Securities Ultra-Short Bond Fund | 0.00 | 0.00 | 0.00 | — | |||
Seix Ultra-Short Bond Fund | 0.00 | 0.00 | 0.00 | — |
| Name, Year of Birth, Length of Time Served and Number of Portfolios in Fund Complex Overseen by Trustee | Principal Occupation(s) During Past 5 Years | Other Directorships Held by Trustee During Past 5 Years |
| Burke, Donald C. YOB: 1960 Served Since: 2017 100 Portfolios | Private investor (since 2009). Formerly, President and Chief Executive Officer, BlackRock U.S. Funds (2007 to 2009); Managing Director, BlackRock, Inc. (2006 to 2009); and Managing Director, Merrill Lynch Investment Managers (1990 to 2006). | Trustee (since May 2023) and Advisory Board Member (May 2023), Virtus Artificial Intelligence & Technology Opportunities Fund, Virtus Dividend, Interest & Premium Strategy Fund and Virtus Equity & Convertible Income Fund; Advisory Board Member (since May 2023), Virtus Convertible & Income 2024 Target Term Fund, Virtus Convertible & Income Fund, Virtus Convertible & Income Fund II and Virtus Diversified Income & Convertible Fund; Trustee (since 2022), Virtus Stone Harbor Emerging Markets Income Fund; Trustee (2022 to 2023), Virtus Stone Harbor Emerging Markets Total Income Fund; Trustee (since 2021), The Merger Fund®, The Merger Fund® VL, Virtus Event Opportunities Trust (2 portfolios), Virtus Investment Trust (13 portfolios) and Virtus Strategy Trust (8 portfolios); Director (2020 to 2021), Duff & Phelps Select MLP and Midstream Energy Fund Inc.; Director (since 2020), Virtus Total Return Fund Inc.; Trustee (since 2020), Virtus Global Multi-Sector Income Fund; Trustee (since 2016), Virtus Mutual Fund Family (50 portfolios), Virtus Variable Insurance Trust (8 portfolios) and Virtus Alternative Solutions Trust (4 portfolios); Director (since 2014), closed-end funds managed by Duff & Phelps Investment Management Co. (3 funds); Director, Avista Corp. (energy company) (since 2011); Trustee, Goldman Sachs Fund Complex (2010 to 2014); and Director, BlackRock Luxembourg and Cayman Funds (2006 to 2010). |
| Cogan, Sarah E. YOB: 1956 Served Since: 2022 97 Portfolios | Retired Partner, Simpson Thacher & Bartlett LLP (“STB”) (law firm) (since 2019); Director, Girl Scouts of Greater New York (since 2016); Trustee, Natural Resources Defense Council, Inc. (since 2013); and formerly, Partner, STB (1989 to 2018). | Trustee (since 2022) and Advisory Board Member (2021 to 2022), Virtus Alternative Solutions Trust (4 portfolios), Virtus Mutual Fund Family (50 portfolios) and Virtus Variable Insurance Trust (8 portfolios); Trustee (since 2022), Virtus Stone Harbor Emerging Markets Income Fund; Trustee (2022 to 2023), Virtus Stone Harbor Emerging Markets Total Income Fund; Trustee (since 2021), The Merger Fund®, The Merger Fund® VL, Virtus Event Opportunities Trust (2 portfolios), and Virtus Global Multi-Sector Income Fund; Director (since 2021), Virtus Total Return Fund Inc.; Advisory Board Member (February 2021 to June 2021), Duff & Phelps Select MLP and Midstream Energy Fund Inc.; Trustee (since 2019), Virtus Investment Trust (13 portfolios) and Virtus Strategy Trust (8 portfolios); Trustee (since 2019), Virtus Artificial Intelligence & Technology Opportunities Fund, Virtus Convertible & Income 2024 Target Term Fund, Virtus Convertible & Income Fund, Virtus Convertible & Income Fund II, Virtus Diversified Income & Convertible Fund, Virtus Equity & Convertible Income Fund, and Virtus Dividend, Interest & Premium Strategy Fund; and Trustee (since 2019), PIMCO Closed-End Funds* (30 portfolios). |
| DeCotis, Deborah A. YOB: 1952 Served Since: 2022 97 Portfolios | Director, Cadre Holdings Inc. (since 2022); Advisory Director, Morgan Stanley & Co., Inc. (since 1996); Member, Circle Financial Group (since 2009); Member, Council on Foreign Relations (since 2013); and Trustee, Smith College (since 2017). Formerly, Director, Watford Re (2017 to 2021); Co-Chair Special Projects Committee, Memorial Sloan Kettering (2005 to 2015); and Trustee, Stanford University (2010 to 2015). | Trustee (since 2022) and Advisory Board Member (2021 to 2022), Virtus Alternative Solutions Trust (4 portfolios), Virtus Mutual Fund Family (50 portfolios) and Virtus Variable Insurance Trust (8 portfolios); Trustee (since 2022), Virtus Stone Harbor Emerging Markets Income Fund; Trustee (2022 to 2023), Virtus Stone Harbor Emerging Markets Total Income Fund; Trustee (since 2021), The Merger Fund®, The Merger Fund® VL, Virtus Event Opportunities Trust (2 portfolios), and Virtus Global Multi-Sector Income Fund; Director (since 2021), Virtus Total Return Fund Inc.; Advisory Board Member (February 2021 to June 2021), Duff & Phelps Select MLP and Midstream Energy Fund Inc.; Trustee (since 2019), Virtus Artificial Intelligence & Technology Opportunities Fund; Trustee (since 2017), Virtus Convertible & Income 2024 Target Term Fund; Trustee (since 2015), Virtus Diversified Income & Convertible Fund; Trustee (since 2014), Virtus Investment Trust (13 portfolios); Trustee (since 2011), Virtus Strategy Trust (8 portfolios); Trustee (since 2011), Virtus Convertible & Income Fund, Virtus Convertible & Income Fund II, Virtus Equity & Convertible Income Fund, and Virtus Dividend, Interest & Premium Strategy Fund; and Trustee (since 2011), PIMCO Closed-End Funds* (30 portfolios). |
| Name, Year of Birth, Length of Time Served and Number of Portfolios in Fund Complex Overseen by Trustee | Principal Occupation(s) During Past 5 Years | Other Directorships Held by Trustee During Past 5 Years |
| Drummond, F. Ford YOB: 1962 Served Since: 2022 97 Portfolios | President (since 1998), F.G. Drummond Ranches, Inc.; and Director (since 2015), Texas and Southwestern Cattle Raisers Association. Formerly Chairman, Oklahoma Nature Conservancy (2019 to 2020); Trustee (since 2014), Frank Phillips Foundation; Trustee (since 2008), Oklahoma Nature Conservancy; Board Member (2006 to 2020) and Chairman (2016 to 2018), Oklahoma Water Resources Board; Director (1998 to 2008), The Cleveland Bank; and General Counsel (1998 to 2008), BMIHealth Plans (benefits administration). | Trustee (since 2022) and Advisory Board Member (2021 to 2022), Virtus Alternative Solutions Trust (4 portfolios), Virtus Mutual Fund Family (50 portfolios), and Virtus Variable Insurance Trust (8 portfolios); Trustee (since 2022), Virtus Stone Harbor Emerging Markets Income Fund; Trustee (2022 to 2023), Virtus Stone Harbor Emerging Markets Total Income Fund; Trustee (since 2021), The Merger Fund®, The Merger Fund® VL, and Virtus Event Opportunities Trust (2 portfolios); Advisory Board Member (February 2021 to June 2021), Duff & Phelps Select MLP and Midstream Energy Fund Inc.; Trustee (since 2021), Virtus Global Multi-Sector Income Fund; Director (since 2021), Virtus Total Return Fund Inc.; Trustee (since 2019), Virtus Artificial Intelligence & Technology Opportunities Fund; Trustee (since 2017), Virtus Convertible & Income 2024 Target Term Fund; Trustee (since 2015), Virtus Convertible & Income Fund, Virtus Convertible & Income Fund II, Virtus Diversified Income & Convertible Fund, Virtus Dividend, Interest & Premium Strategy Fund and Virtus Equity & Convertible Income Fund; Trustee (since 2014), Virtus Strategy Trust (8 portfolios); Director (since 2011), Bancfirst Corporation; and Trustee (since 2006), Virtus Investment Trust (13 portfolios). |
| Harris, Sidney E. YOB: 1949 Served Since: 2017 90 Portfolios | Private Investor (since 2021); Dean Emeritus (since 2015), Professor (2015 to 2021 and 1997 to 2014), and Dean (1997 to 2004), J. Mack Robinson College of Business, Georgia State University. | Trustee (since 2022), Virtus Stone Harbor Emerging Markets Income Fund; Trustee (2022 to 2023), Virtus Stone Harbor Emerging Markets Total Income Fund; Trustee (since 2021), The Merger Fund®, The Merger Fund® VL, Virtus Event Opportunities Trust (2 portfolios), Virtus Investment Trust (13 portfolios) and Virtus Strategy Trust (8 portfolios); Director (2020 to 2021), Duff & Phelps Select MLP and Midstream Energy Fund Inc.; Director (since 2020), Virtus Total Return Fund Inc.; Trustee (since 2020), Virtus Global Multi-Sector Income Fund; Trustee (since 2019), Mutual Fund Directors Forum; Trustee (since 2017), Virtus Mutual Fund Family (50 portfolios), Virtus Variable Insurance Trust (8 portfolios), and Virtus Alternative Solutions Trust (4 portfolios); Trustee (2013 to 2020) and Honorary Trustee (since 2020), KIPP Metro Atlanta; Director (1999 to 2019), Total System Services, Inc.; Trustee (2004 to 2017), RidgeWorth Funds; Chairman (2012 to 2017), International University of the Grand Bassam Foundation; Trustee (since 2012), International University of the Grand Bassam Foundation; and Trustee (2011 to 2015), Genspring Family Offices, LLC. |
| Mallin, John R. YOB: 1950 Served Since: 2017 90 Portfolios | Partner/Attorney (since 2003), McCarter & English LLP (law firm) Real Property Practice Group; and Member (2014 to 2022), Counselors of Real Estate. | Trustee (since 2022), Virtus Stone Harbor Emerging Markets Income Fund; Trustee (2022 to 2023), Virtus Stone Harbor Emerging Markets Total Income Fund; Trustee (since 2021), The Merger Fund®, The Merger Fund® VL, Virtus Event Opportunities Trust (2 portfolios), Virtus Investment Trust (13 portfolios) and Virtus Strategy Trust (8 portfolios); Director (2020 to 2021), Duff & Phelps Select MLP and Midstream Energy Fund Inc.; Director (since 2020), Virtus Total Return Fund Inc.; Trustee (since 2020), Virtus Global Multi-Sector Income Fund; Trustee (since 2016), Virtus Mutual Fund Family (50 portfolios) and Virtus Alternative Solutions Trust (4 portfolios); Director (since 2019), 1892 Club, Inc. (non-profit); Director (2013 to 2020), Horizons, Inc. (non-profit); and Trustee (since 1999), Virtus Variable Insurance Trust (8 portfolios). |
| Name, Year of Birth, Length of Time Served and Number of Portfolios in Fund Complex Overseen by Trustee | Principal Occupation(s) During Past 5 Years | Other Directorships Held by Trustee During Past 5 Years |
| McDaniel, Connie D. YOB: 1958 Served Since: 2017 97 Portfolios | Retired (since 2013). Vice President, Chief of Internal Audit, Corporate Audit Department (2009 to 2013); Vice President, Global Finance Transformation (2007 to 2009); and Vice President and Controller (1999 to 2007), The Coca-Cola Company. | Trustee (since May 2023) and Advisory Board Member (May 2023), Virtus Artificial Intelligence & Technology Opportunities Fund, Virtus Convertible & Income 2024 Target Term Fund, Virtus Convertible & Income Fund, Virtus Convertible & Income Fund II, Virtus Diversified Income & Convertible Fund, Virtus Dividend, Interest & Premium Strategy Fund and Virtus Equity & Convertible Income Fund; Trustee (since 2022), Virtus Stone Harbor Emerging Markets Income Fund; Trustee (2022 to 2023), Virtus Stone Harbor Emerging Markets Total Income Fund; Trustee (since 2021), The Merger Fund®, The Merger Fund® VL, Virtus Event Opportunities Trust (2 portfolios), Virtus Investment Trust (13 portfolios) and Virtus Strategy Trust (8 portfolios); Director (2020 to 2021), Duff & Phelps Select MLP and Midstream Energy Fund Inc.; Director (since 2020), Virtus Total Return Fund Inc.; Trustee (since 2020), Virtus Global Multi-Sector Income Fund; Director (since 2019), Global Payments Inc.; Chairperson (since 2021), Governance & Nominating Committee, Global Payments Inc; Trustee (since 2017), Virtus Mutual Fund Family (50 portfolios), Virtus Variable Insurance Trust (8 portfolios), and Virtus Alternative Solutions Trust (4 portfolios); Director (since 2021), North Florida Land Trust; Director (2014 to 2019), Total System Services, Inc.; Member (2011 to 2022) and Chair (2014 to 2016), Georgia State University, Robinson College of Business Board of Advisors; and Trustee (2005 to 2017), RidgeWorth Funds. |
| McLoughlin, Philip YOB: 1946 Served Since: 2002 100 Portfolios | Private investor since 2010. | Trustee and Chairman (since 2022), Virtus Stone Harbor Emerging Markets Income Fund; Trustee and Chairman (2022 to 2023), Virtus Stone Harbor Emerging Markets Total Income Fund; Trustee and Chairman (since 2021), The Merger Fund®, The Merger Fund® VL, Virtus Event Opportunities Trust (2 portfolios), Virtus Investment Trust (13 portfolios) and Virtus Strategy Trust (8 portfolios); Chairman (since 2023) and Trustee (since 2021), Virtus Artificial Intelligence & Technology Opportunities Fund, Virtus Convertible & Income Fund II, Virtus Diversified Income & Convertible Fund, Virtus Equity & Convertible Income Fund and Virtus Dividend, Interest & Premium Strategy Fund; Chairman (since 2023), Trustee (since 2022) and Advisory Board Member (2021), Virtus Convertible & Income 2024 Target Term Fund and Virtus Convertible & Income Fund; Director and Chairman (since 2016), Virtus Total Return Fund Inc.; Director and Chairman (2016 to 2019), the former Virtus Total Return Fund Inc.; Director and Chairman (2014 to 2021), Duff & Phelps Select MLP and Midstream Energy Fund Inc.; Trustee and Chairman (since 2013), Virtus Alternative Solutions Trust (4 portfolios); Trustee and Chairman (since 2011), Virtus Global Multi-Sector Income Fund; Chairman and Trustee (since 2003), Virtus Variable Insurance Trust (8 portfolios); Director (since 1995), closed-end funds managed by Duff & Phelps Investment Management Co. (3 funds); Director (1991 to 2019) and Chairman (2010 to 2019), Lazard World Trust Fund (closed-end investment firm in Luxembourg); and Trustee (since 1989) and Chairman (since 2002), Virtus Mutual Fund Family (50 portfolios). |
| McNamara, Geraldine M. YOB: 1951 Served Since: 2002 100 Portfolios | Private investor (since 2006); and Managing Director, U.S. Trust Company of New York (1982 to 2006). | Trustee (since May 2023) and Advisory Board Member (January 2023 to May 2023), Virtus Convertible & Income Fund, Virtus Convertible & Income Fund II, Virtus Diversified Income & Convertible Fund and Virtus Dividend, Interest & Premium Strategy Fund; Trustee (since 2023), Virtus Artificial Intelligence & Technology Opportunities Fund and Virtus Equity & Convertible Income Fund; Advisory Board Member (since 2023), Virtus Convertible & Income 2024 Target Term Fund; Trustee (since 2022), Virtus Stone Harbor Emerging Markets Income Fund; Trustee (2022 to 2023), Virtus Stone Harbor Emerging Markets Total Income Fund; Trustee (since 2021), The Merger Fund®, The Merger Fund® VL, Virtus Event Opportunities Trust (2 portfolios), Virtus Investment Trust (13 portfolios) and Virtus Strategy Trust (8 portfolios); Director (2020 to 2021), Duff & Phelps Select MLP and Midstream Energy Fund Inc.; Director (since 2020), Virtus Total Return Fund Inc.; Trustee (since 2020), Virtus Global Multi-Sector Income Fund; Trustee (since 2016) Virtus Alternative Solutions Trust (4 portfolios); Trustee (since 2015), Virtus Variable Insurance Trust (8 portfolios); Director (since 2003), closed-end funds managed by Duff & Phelps Investment Management Co. (3 funds); and Trustee (since 2001), Virtus Mutual Fund Family (50 portfolios). |
| Name, Year of Birth, Length of Time Served and Number of Portfolios in Fund Complex Overseen by Trustee | Principal Occupation(s) During Past 5 Years | Other Directorships Held by Trustee During Past 5 Years |
| Walton, R. Keith YOB: 1964 Served Since: 2020 97 Portfolios | Senior Adviser (since 2022), Brightwood Capital LLC; Venture and Operating Partner (2020 to 2021), Plexo Capital, LLC; Venture Partner (2019 to 2020) and Senior Adviser (2018 to 2019), Plexo, LLC; and Partner (since 2006), Global Infrastructure Partners. Formerly, Managing Director (2020 to 2021), Lafayette Square Holding Company LLC; Senior Adviser (2018 to 2019), Vatic Labs, LLC; Executive Vice President, Strategy (2017 to 2019), Zero Mass Water, LLC; and Vice President, Strategy (2013 to 2017), Arizona State University. | Trustee (since 2023) and Advisory Board Member (2022 to 2023), Virtus Convertible & Income 2024 Target Term Fund; Trustee (since 2023) and Advisory Board Member (2022 to 2023), Virtus Convertible & Income Fund II and Virtus Dividend, Interest & Premium Strategy Fund; Trustee (since 2022) and Advisory Board Member (January 2022 to July 2022), Virtus Artificial Intelligence & Technology Opportunities Fund, Virtus Convertible & Income Fund and Virtus Equity & Convertible Income Fund; Trustee (since 2022), Virtus Stone Harbor Emerging Markets Income Fund; Trustee (2022 to 2023), Virtus Stone Harbor Emerging Markets Total Income Fund; Trustee (since 2022), Virtus Diversified Income & Convertible Fund; Trustee (since 2021), The Merger Fund®, The Merger Fund® VL, Virtus Event Opportunities Trust (2 portfolios), Virtus Investment Trust (13 portfolios) and Virtus Strategy Trust (8 portfolios); Trustee (since 2020) Virtus Alternative Solutions Trust (4 portfolios), Virtus Variable Insurance Trust (8 portfolios) and Virtus Mutual Fund Family (50 portfolios); Director (since 2017), certain funds advised by Bessemer Investment Management LLC; Director (2016 to 2021), Duff & Phelps Select MLP and Midstream Energy Fund Inc.; Trustee (since 2016), Virtus Global Multi-Sector Income Fund; Director (2006 to 2019), Systematica Investments Limited Funds; Director (2006 to 2017), BlueCrest Capital Management Funds; Trustee (2014 to 2017), AZ Service; Director (since 2004), Virtus Total Return Fund Inc.; and Director (2004 to 2019), the former Virtus Total Return Fund Inc. |
| Zino, Brian T. YOB: 1952 Served Since: 2020 97 Portfolios | Retired. Various roles (1982 to 2009), J. & W. Seligman & Co. Incorporated, including President (1994 to 2009). | Trustee (since 2022), Virtus Stone Harbor Emerging Markets Income Fund; Trustee (2022 to 2023), Virtus Stone Harbor Emerging Markets Total Income Fund; Trustee (since 2021), The Merger Fund®, The Merger Fund® VL, Virtus Event Opportunities Trust (2 portfolios), Virtus Investment Trust (13 portfolios) and Virtus Strategy Trust (8 portfolios); Trustee (since 2022) and Advisory Board Member (2021), Virtus Artificial Intelligence & Technology Opportunities Fund, Virtus Convertible & Income 2024 Target Term Fund, Virtus Convertible & Income Fund, Virtus Convertible & Income Fund II, Virtus Diversified Income & Convertible Fund, Virtus Equity & Convertible Income Fund, and Virtus Dividend, Interest & Premium Strategy Fund; Trustee (since 2020) Virtus Alternative Solutions Trust (4 portfolios), Virtus Variable Insurance Trust (8 portfolios) and Virtus Mutual Fund Family (50 portfolios); Director (2016 to 2021), Duff & Phelps Select MLP and Midstream Energy Fund Inc.; Trustee (since 2016), Virtus Global Multi-Sector Income Fund; Director (since 2014), Virtus Total Return Fund Inc.; Director (2014 to 2019), the former Virtus Total Return Fund Inc.; Trustee (since 2011), Bentley University; Director (1986 to 2009) and President (1994 to 2009), J&W Seligman Co. Inc.; Director (1998 to 2009), Chairman (2002 to 2004) and Vice Chairman (2000 to 2002), ICI Mutual Insurance Company; Member, Board of Governors of ICI (1998 to 2008). |
| Name, Year of Birth, Length of Time Served and Number of Funds Overseen | Principal Occupation(s) During Past 5 Years | Principal Occupation(s) During Past 5 Years and Other Directorships Held by Trustee |
| Aylward, George R.* Trustee and President YOB: 1964 Served Since: 2006 104 Portfolios | Director, President and Chief Executive Officer (since 2008), Virtus Investment Partners, Inc. and/or certain of its subsidiaries, and various senior officer positions with Virtus affiliates (since 2005). | Director (since 2023), Stone Harbor Investment Funds plc (21 sub-funds), Stone Harbor Global Funds plc (27 sub-funds), and Virtus Global Funds ICAV (5 portfolios); Trustee, President and Chief Executive Officer (since 2022), Virtus Stone Harbor Emerging Markets Income Fund; Trustee (2022 to 2023), Virtus Stone Harbor Emerging Markets Total Income Fund; Member, Board of Governors of the Investment Company Institute (since 2021); Trustee and President (since 2021), The Merger Fund®, The Merger Fund® VL, Virtus Event Opportunities Trust (2 portfolios), Virtus Investment Trust (13 portfolios) and Virtus Strategy Trust (8 portfolios); Trustee, President and Chief Executive Officer (since 2021), Virtus Artificial Intelligence & Technology Opportunities Fund, Virtus Convertible & Income 2024 Target Term Fund, Virtus Convertible & Income Fund, Virtus Convertible & Income Fund II, Virtus Diversified Income & Convertible Fund, Virtus Equity & Convertible Income Fund, and Virtus Dividend, Interest & Premium Strategy Fund; Chairman and Trustee (since 2015), Virtus ETF Trust II (6 portfolios); Director, President and Chief Executive Officer (2014 to 2021), Duff & Phelps Select MLP and Midstream Energy Fund Inc.; Trustee and President (since 2013), Virtus Alternative Solutions Trust (4 portfolios); Director (since 2013), Virtus Global Funds, plc (5 portfolios); Trustee (since 2012) and President (since 2010), Virtus Variable Insurance Trust (8 portfolios); Trustee, President and Chief Executive Officer (since 2011), Virtus Global Multi-Sector Income Fund; Trustee and President (since 2006) and Executive Vice President (2004 to 2006), Virtus Mutual Fund Family (50 portfolios); Director, President and Chief Executive Officer (since 2006), Virtus Total Return Fund Inc.; and Director, President and Chief Executive Officer (2006 to 2019), the former Virtus Total Return Fund Inc. |
| Name, Address and Year of Birth | Position(s) Held with Trust and Length of Time Served | Principal Occupation(s) During Past 5 Years |
| Batchelar, Peter J. YOB: 1970 | Senior Vice President (since 2017), and Vice President (2008 to 2016). | Senior Vice President, Product Development (since 2017), Vice President, Product Development (2008 to 2017), and various officer positions (since 2008), Virtus Investment Partners, Inc. and/or certain of its subsidiaries; various officer positions (since 2008) of various registered funds advised by subsidiaries of Virtus Investment Partners, Inc. |
| Bradley, W. Patrick YOB: 1972 | Executive Vice President (since 2016); Senior Vice President (2013 to 2016); Vice President (2011 to 2013); Chief Financial Officer and Treasurer (since 2006). | Executive Vice President, Fund Services (since 2016), Senior Vice President, Fund Services (2010 to 2016) and various officer positions (since 2004), Virtus Investment Partners, Inc. and/or certain of its subsidiaries; Director (since 2023), Stone Harbor Investment Funds plc and Stone Harbor Global Funds plc; Director (since 2019), Virtus Global Funds ICAV; Director (since 2013), Virtus Global Funds, plc; various officer positions (since 2006) of various registered funds advised by subsidiaries of Virtus Investment Partners, Inc.; Member (since 2022), BNY Mellon Asset Servicing Client Advisory Board. |
| Branigan, Timothy YOB: 1976 | Vice President and Fund Chief Compliance Officer (since 2022); Assistant Vice President and Deputy Fund Chief Compliance Officer (March to May 2022); and Assistant Vice President and Assistant Chief Compliance Officer (2021 to 2022). | Various officer positions (since 2019) of various registered funds advised by subsidiaries of Virtus Investment Partners, Inc. |
| Chisolm, Daphne YOB: 1969 | Vice President, Counsel and Assistant Secretary (since 2023). | Vice President and Senior Counsel (since 2023), Virtus Investment Partners, Inc.; Attorney at Law engaged in private practice as a solo practitioner (2018 to 2023); and various officer positions (since 2023) of various registered funds advised by subsidiaries of Virtus Investment Partners, Inc. |
| Fromm Jennifer YOB: 1973 | Chief Legal Officer, Counsel and Secretary (since 2023); Vice President (since 2017); and Assistant Secretary (2008 to 2022). | Vice President (since 2016) and Senior Counsel, Legal (since 2007) and various officer positions (since 2008), Virtus Investment Partners, Inc. and/or certain of its subsidiaries; various officer positions (since 2008) of various registered funds advised by subsidiaries of Virtus Investment Partners, Inc. |
| Griswold, Heidi YOB: 1973 | Vice President (since 2017). | Vice President, Head of Transfer Agent & Servicing, Mutual Fund Services (since 2018), Virtus Investment Partners, Inc. and/or certain of its subsidiaries; and Vice President (since 2016) of various registered funds advised by subsidiaries of Virtus Investment Partners, Inc. |
| Hackett, Amy YOB: 1968 | Vice President and Assistant Treasurer (since 2017). | Vice President (since 2010) and Assistant Vice President (2007 to 2010), Fund Services, Virtus Investment Partners, Inc. and/or certain of its subsidiaries; and various officer positions (since 2007) of various registered funds advised by subsidiaries of Virtus Investment Partners, Inc. |
| Krishnan, Suneeta YOB: 1965 | Vice President and Assistant Treasurer (since 2018); and Assistant Treasurer (2013 to 2018). | Vice President (since 2017) and Assistant Treasurer (since 2007), Mutual Fund Administration, Virtus Investment Partners, Inc. and/or certain of its subsidiaries; and various officer positions (since 2009) of various registered funds advised by subsidiaries of Virtus Investment Partners, Inc. |
| Lowe, Benjamin YOB: 1978 | Vice President, Controller and Assistant Treasurer (since 2021); and Vice President and Assistant Treasurer (2018 to 2021). | Vice President, Fund Services (since 2017), Virtus Investment Partners, Inc. and/or certain of its subsidiaries; and various officer positions (since 2018) of various registered funds advised by subsidiaries of Virtus Investment Partners, Inc. |
| Martin, David YOB: 1959 | Anti-Money Laundering Compliance Officer (since 2017). | Vice President, Compliance – Broker/Dealer (since 2009), Virtus Investment Partners, Inc.; and Vice President and Chief Compliance Officer of certain Virtus subsidiaries (since 2004). |
| Rahman, Mahmood YOB: 1967 | Assistant Vice President (since 2021). | Vice President (since 2023), Tax Director (since 2020) and Assistant Vice President (2020 to 2023), Fund Administration, Virtus Investment Partners, Inc.; Assistant Vice President (since 2021) of various registered funds advised by subsidiaries of Virtus Investment Partners, Inc.; and Assistant Treasurer and Tax Director, Grantham, Mayo, Van Otterloo & Co. LLC (2007 to 2019). |
| Short, Julia R. YOB: 1972 | Senior Vice President (since 2017). | Senior Vice President, Product Development (since 2017), Virtus Investment Partners, Inc. and/or certain of its subsidiaries; Senior Vice President (since 2017) of various registered funds advised by subsidiaries of Virtus Investment Partners, Inc.; and Managing Director, Product Manager, RidgeWorth Investments (2004 to 2017). |
| Name, Address and Year of Birth | Position(s) Held with Trust and Length of Time Served | Principal Occupation(s) During Past 5 Years |
| Smirl, Richard W. YOB: 1967 | Executive Vice President (since 2021). | Chief Operating Officer (since 2021), Virtus Investment Partners, Inc.; Executive Vice President (since 2021), Virtus Investment Partners, Inc. and/or certain of its subsidiaries; Executive Vice President (since 2021) of various registered funds advised by subsidiaries of Virtus Investment Partners, Inc.; Chief Operating Officer (2018 to 2021), Russell Investments; Executive Director (Jan. to July 2018), State of Wisconsin Investment Board; and Partner and Chief Operating Officer (2004 to 2018), William Blair Investment Management. |
| Suss, Amanda YOB: 1969 | Vice President, Controller and Assistant Treasurer (since 2022). | Vice President and Controller (since 2022), Mutual Fund Administration and Financial Reporting, Virtus Investment Partners, Inc.; Vice President, Controller and Assistant Treasurer (since 2022) of various registered funds advised by subsidiaries of Virtus Investment Partners, Inc.; and Senior Finance Associate (2011 to 2022), Stone Harbor Investment Partners LP. |
Accounting Firm
| Mutual Fund Services | 1-800-243-1574 |
| Adviser Consulting Group | 1-800-243-4361 |
| Website | Virtus.com |
The Securities and Exchange Commission has modified mailing regulations for semiannual and annual shareholder fund reports to allow mutual fund companies to send a single copy of these reports to shareholders who share the same mailing address. If you would like additional copies, please call Mutual Fund Services at 1-800-243-1574.

please contact us at 1-800-243-1574, or visit Virtus.com.
| 8636 | 02-24 |

| Virtus Ceredex Large-Cap Value Equity Fund |
| Virtus Ceredex Mid-Cap Value Equity Fund |
| Virtus Ceredex Small-Cap Value Equity Fund |
| Virtus SGA International Growth Fund |
| Virtus Silvant Large-Cap Growth Stock Fund* |
| Virtus Zevenbergen Innovative Growth Stock Fund* |
| 1 | ||
| 2 | ||
| 4 | ||
| Fund | Fund Summary | Schedule of Investments |
| 6 | 27 | |
| 9 | 28 | |
| 13 | 29 | |
| 16 | 31 | |
| 20 | 33 | |
| 23 | 34 | |
| 35 | ||
| 38 | ||
| 40 | ||
| 43 | ||
| 47 | ||
| 58 | ||
| 59 | ||
| 60 | ||
| 65 | ||


President, Virtus Funds
February 2024
| Beginning Account Value July 1, 2023 | Ending Account Value December 31, 2023 | Annualized Expense Ratio | Expenses Paid During Period* | |||||
Ceredex Large-Cap Value Equity Fund | ||||||||
| Class A | $ 1,000.00 | $ 1,090.50 | 1.23 % | $ 6.48 | ||||
| Class C | 1,000.00 | 1,087.50 | 1.71 | 9.00 | ||||
| Class I | 1,000.00 | 1,091.50 | 0.96 | 5.06 | ||||
| Class R6 | 1,000.00 | 1,093.20 | 0.71 | 3.75 | ||||
Ceredex Mid-Cap Value Equity Fund | ||||||||
| Class A | 1,000.00 | 1,068.70 | 1.30 | 6.78 | ||||
| Class C | 1,000.00 | 1,066.10 | 1.75 | 9.11 | ||||
| Class I | 1,000.00 | 1,070.80 | 1.02 | 5.32 | ||||
| Class R6 | 1,000.00 | 1,071.50 | 0.78 | 4.07 | ||||
Ceredex Small-Cap Value Equity Fund | ||||||||
| Class A | 1,000.00 | 1,082.50 | 1.45 | 7.61 | ||||
| Class C | 1,000.00 | 1,079.50 | 1.80 | 9.43 | ||||
| Class I | 1,000.00 | 1,083.50 | 1.14 | 5.99 | ||||
| Class R6 | 1,000.00 | 1,084.90 | 0.87 | 4.57 | ||||
SGA International Growth Fund | ||||||||
| Class A | 1,000.00 | 1,029.50 | 1.32 | 6.75 | ||||
| Class I | 1,000.00 | 1,030.50 | 1.07 | 5.48 | ||||
| Class R6 | 1,000.00 | 1,031.70 | 0.95 | 4.86 | ||||
Silvant Large-Cap Growth Stock Fund | ||||||||
| Class A | 1,000.00 | 1,102.80 | 1.25 | 6.63 | ||||
| Class I | 1,000.00 | 1,104.20 | 0.99 | 5.25 | ||||
| Class R6 | 1,000.00 | 1,104.30 | 0.92 | 4.88 | ||||
Zevenbergen Innovative Growth Stock Fund | ||||||||
| Class A | 1,000.00 | 1,091.00 | 1.24 | 6.54 | ||||
| Class I | 1,000.00 | 1,092.60 | 0.99 | 5.22 | ||||
| Class R6 | 1,000.00 | 1,093.10 | 0.89 | 4.70 |
| * | Expenses are equal to the relevant Fund’s annualized expense ratio, which is net of waived fees and reimbursed expenses, if applicable, multiplied by the average account value over the period, multiplied by the number of days (184) expenses were accrued in the most recent fiscal half-year, then divided by 365 to reflect the one-half year period. |
| Beginning Account Value July 1, 2023 | Ending Account Value December 31, 2023 | Annualized Expense Ratio | Expenses Paid During Period* | |||||
Ceredex Large-Cap Value Equity Fund | ||||||||
| Class A | $ 1,000.00 | $ 1,019.00 | 1.23 % | $ 6.26 | ||||
| Class C | 1,000.00 | 1,016.59 | 1.71 | 8.69 | ||||
| Class I | 1,000.00 | 1,020.37 | 0.96 | 4.89 | ||||
| Class R6 | 1,000.00 | 1,021.63 | 0.71 | 3.62 | ||||
Ceredex Mid-Cap Value Equity Fund | ||||||||
| Class A | 1,000.00 | 1,018.65 | 1.30 | 6.61 | ||||
| Class C | 1,000.00 | 1,016.38 | 1.75 | 8.89 | ||||
| Class I | 1,000.00 | 1,020.06 | 1.02 | 5.19 | ||||
| Class R6 | 1,000.00 | 1,021.27 | 0.78 | 3.97 | ||||
Ceredex Small-Cap Value Equity Fund | ||||||||
| Class A | 1,000.00 | 1,017.90 | 1.45 | 7.38 | ||||
| Class C | 1,000.00 | 1,016.13 | 1.80 | 9.15 | ||||
| Class I | 1,000.00 | 1,019.46 | 1.14 | 5.80 | ||||
| Class R6 | 1,000.00 | 1,020.82 | 0.87 | 4.43 | ||||
SGA International Growth Fund | ||||||||
| Class A | 1,000.00 | 1,018.55 | 1.32 | 6.72 | ||||
| Class I | 1,000.00 | 1,019.81 | 1.07 | 5.45 | ||||
| Class R6 | 1,000.00 | 1,020.42 | 0.95 | 4.84 | ||||
Silvant Large-Cap Growth Stock Fund | ||||||||
| Class A | 1,000.00 | 1,018.90 | 1.25 | 6.36 | ||||
| Class I | 1,000.00 | 1,020.21 | 0.99 | 5.04 | ||||
| Class R6 | 1,000.00 | 1,020.57 | 0.92 | 4.69 | ||||
Zevenbergen Innovative Growth Stock Fund | ||||||||
| Class A | 1,000.00 | 1,018.95 | 1.24 | 6.31 | ||||
| Class I | 1,000.00 | 1,020.21 | 0.99 | 5.04 | ||||
| Class R6 | 1,000.00 | 1,020.72 | 0.89 | 4.53 |
| * | Expenses are equal to the relevant Fund’s annualized expense ratio, which is net of waived fees and reimbursed expenses, if applicable, multiplied by the average account value over the period, multiplied by the number of days (184) expenses were accrued in the most recent fiscal half-year, then divided by 365 to reflect the one-half year period. |
December 31, 2023
| Ticker Symbols: | |
| Class A: SVIIX | |
| Class C: SVIFX | |
| Class I: STVTX | |
| Class R6: STVZX |
Ceredex Value Advisors LLC
| ■ | The Fund is diversified and has an investment objective of seeking to provide a high level of capital appreciation. As a secondary goal, the Fund also seeks to provide current income. There is no guarantee that the Fund will meet its objectives. |
| ■ | For the fiscal year ended December 31, 2023, the Fund’s Class A shares at NAV returned 14.57%, Class C shares at NAV returned 13.95%, Class I shares at NAV returned 14.87%, and Class R6 Shares at NAV returned 15.09%. For the same period, the Russell 1000® Value Index, the Fund’s style-specific benchmark appropriate for comparison, returned 11.46%. |
| Industrials | 22% |
| Financials | 18 |
| Information Technology | 13 |
| Materials | 12 |
| Health Care | 11 |
| Energy | 7 |
| Consumer Discretionary | 5 |
| Other | 12 |
| Total | 100% |
| 1 Year | 5 Years | 10 Years | Since inception | Inception date | ||
| Class A shares at NAV2 | 14.57 % | 10.67 % | 7.63 % | — % | — | |
| Class A shares at POP3,4 | 8.27 | 9.43 | 7.02 | — | — | |
| Class C shares at NAV2 without CDSC4 | 13.95 | 10.16 | 7.12 | — | — | |
| Class C shares with CDSC4 | 12.95 | 10.16 | 7.12 | — | — | |
| Class I shares at NAV2 | 14.87 | 10.97 | 7.92 | — | — | |
| Class R6 shares at NAV2 | 15.09 | 11.26 | — | 8.23 | 8/1/14 | |
| Russell 1000® Value Index | 11.46 | 10.91 | 8.40 | 8.26 5 | — | |
| Fund Expense Ratios6: Class A shares: Gross 1.26%, Net 1.24%; Class C shares: Gross 1.94%, Net 1.72%; Class I shares: Gross 1.06%, Net 0.97%; Class R6 shares: Gross 0.86%, Net 0.72%. | ||||||
| All returns represent past performance which is no guarantee of future results. Current performance may be higher or lower than the performance shown. The investment return and principal value of an investment will fluctuate so that an investor’s shares, when redeemed, may be worth more or less than their original cost. The above table and graph below do not reflect the deduction of taxes that a shareholder would pay on fund distributions or the redemption of shares. Please visit Virtus.com for performance data current to the most recent month-end. |

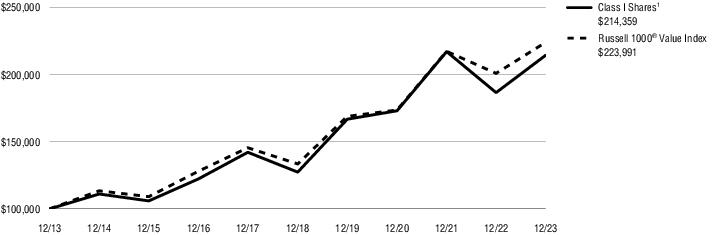
| 1 | Total returns are historical and include changes in share price and the reinvestment of both dividends and capital gain distributions. |
| 2 | “NAV” (Net Asset Value) total returns do not include the effect of any sales charge. |
| 3 | “POP” (Public Offering Price) total returns include the effect of the maximum front-end 5.50% sales charge. |
| 4 | “CDSC” (contingent deferred sales charge) is applied to redemptions of certain classes of shares that do not have a sales charge applied at the time of purchase. CDSC for certain redemptions of Class A shares made within 18 months of a finder’s fee being paid and all Class C shares are 1% within the first year and 0% thereafter. |
| 5 | The since inception index return is from the inception date of Class R6 shares. |
| 6 | The expense ratios of the Fund are set forth according to the prospectus for the Fund effective April 28, 2023, as supplemented and revised, and may differ from the expense ratios disclosed in the Financial Highlights tables in this report. See the Financial Highlights for more current expense ratios. Net Expense: Expenses reduced by a contractual expense limitation in effect through April 30, 2024. Gross Expense: Does not reflect the effect of the expense limitation. Expense ratios include fees and expenses associated with any underlying funds. |
| Ticker Symbols: | |
| Class A: SAMVX | |
| Class C: SMVFX | |
| Class I: SMVTX | |
| Class R6: SMVZX |
Ceredex Value Advisors LLC
| ■ | The Fund is diversified and has an investment objective of seeking to provide capital appreciation. As a secondary goal, the Fund also seeks to provide current income. There is no guarantee that the Fund will meet its objectives. |
| ■ | For the fiscal year ended December 31, 2023, the Fund’s Class A shares at NAV returned 10.63%, Class C shares at NAV returned 10.10%, Class I shares at NAV returned 10.97%, and Class R6 Shares at NAV returned 11.21%. For the same period, the Russell Midcap® Value Index, the Fund’s style-specific benchmark appropriate for comparison, returned 12.71%. |
| Industrials | 23% |
| Financials | 19 |
| Information Technology | 10 |
| Materials | 10 |
| Real Estate | 10 |
| Utilities | 9 |
| Energy | 5 |
| Other (includes short-term investment) | 14 |
| Total | 100% |
| 1 Year | 5 Years | 10 Years | Since inception | Inception date | ||
| Class A shares at NAV2 | 10.63 % | 9.80 % | 7.33 % | — % | — | |
| Class A shares at POP3,4 | 4.55 | 8.56 | 6.72 | — | — | |
| Class C shares at NAV2 without CDSC4 | 10.10 | 9.29 | 6.86 | — | — | |
| Class C shares with CDSC4 | 9.10 | 9.29 | 6.86 | — | — | |
| Class I shares at NAV2 | 10.97 | 10.13 | 7.65 | — | — | |
| Class R6 shares at NAV2 | 11.21 | 10.37 | — | 7.91 | 8/1/14 | |
| Russell Midcap® Value Index | 12.71 | 11.16 | 8.26 | 7.95 5 | — | |
| Fund Expense Ratios6: Class A shares: Gross 1.28%, Net 1.28%; Class C shares: Gross 2.00%, Net 1.76%; Class I shares: Gross 1.01%, Net 1.01%; Class R6 shares: Gross 0.86%, Net 0.79%. | ||||||
| All returns represent past performance which is no guarantee of future results. Current performance may be higher or lower than the performance shown. The investment return and principal value of an investment will fluctuate so that an investor’s shares, when redeemed, may be worth more or less than their original cost. The above table and graph below do not reflect the deduction of taxes that a shareholder would pay on fund distributions or the redemption of shares. Please visit Virtus.com for performance data current to the most recent month-end. |
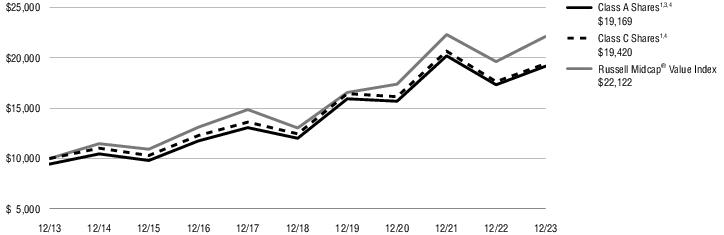
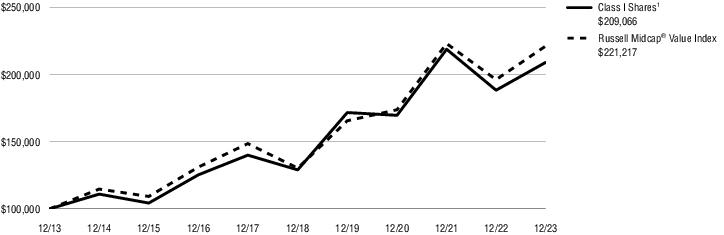
| 1 | Total returns are historical and include changes in share price and the reinvestment of both dividends and capital gain distributions. |
| 2 | “NAV” (Net Asset Value) total returns do not include the effect of any sales charge. |
| 3 | “POP” (Public Offering Price) total returns include the effect of the maximum front-end 5.50% sales charge. |
| 4 | “CDSC” (contingent deferred sales charge) is applied to redemptions of certain classes of shares that do not have a sales charge applied at the time of purchase. CDSC for certain redemptions of Class A shares made within 18 months of a finder’s fee being paid and all Class C shares are 1% within the first year and 0% thereafter. |
| 5 | The since inception index return is from the inception date of Class R6 shares. |
| 6 | The expense ratios of the Fund are set forth according to the prospectus for the Fund effective April 28, 2023, as supplemented and revised, and may differ from the expense ratios disclosed in the Financial Highlights tables in this report. See the Financial Highlights for more current expense ratios. Net Expense: Expenses reduced by a contractual expense limitation in effect through April 30, 2024. Gross Expense: Does not reflect the effect of the expense limitation. Expense ratios include fees and expenses associated with any underlying funds. |
| Ticker Symbols: | |
| Class A: SASVX | |
| Class C: STCEX | |
| Class I: SCETX | |
| Class R6: VVERX |
Ceredex Value Advisors LLC
| ■ | The Fund is diversified and has an investment objective of seeking to provide capital appreciation. As a secondary goal, the Fund also seeks to provide current income. There is no guarantee that the Fund will meet its objectives. |
| ■ | For the fiscal year ended December 31, 2023, the Fund’s Class A shares at NAV returned 14.30%, Class C shares at NAV returned 13.95%, Class I shares at NAV returned 14.70%, and Class R6 shares at NAV returned 14.97%. For the same period, the Russell 2000® Value Index, the Fund’s style-specific benchmark appropriate for comparison, returned 14.65%. |
| Financials | 29% |
| Industrials | 20 |
| Energy | 10 |
| Materials | 10 |
| Information Technology | 9 |
| Real Estate | 6 |
| Consumer Discretionary | 5 |
| Other | 11 |
| Total | 100% |
| 1 Year | 5 Years | 10 Years | Since inception | Inception date | ||
| Class A shares at NAV2 | 14.30 % | 8.94 % | 6.13 % | — % | — | |
| Class A shares at POP3,4 | 8.01 | 7.71 | 5.53 | — | — | |
| Class C shares at NAV2 without CDSC4 | 13.95 | 8.51 | 5.71 | — | — | |
| Class C shares with CDSC4 | 12.95 | 8.51 | 5.71 | — | — | |
| Class I shares at NAV2 | 14.70 | 9.25 | 6.44 | — | — | |
| Class R6 shares at NAV2 | 14.97 | — | — | 7.01 | 2/26/19 | |
| Russell 2000® Value Index | 14.65 | 10.00 | 6.76 | 7.08 5 | — | |
| Fund Expense Ratios6: Class A shares: Gross 1.49%, Net 1.46%; Class C shares: Gross 2.27%, Net 1.81%; Class I shares: Gross 1.23%, Net 1.15%; Class R6 shares: Gross 1.05%, Net 0.88%. | ||||||
| All returns represent past performance which is no guarantee of future results. Current performance may be higher or lower than the performance shown. The investment return and principal value of an investment will fluctuate so that an investor’s shares, when redeemed, may be worth more or less than their original cost. The above table and graph below do not reflect the deduction of taxes that a shareholder would pay on fund distributions or the redemption of shares. Please visit Virtus.com for performance data current to the most recent month-end. |
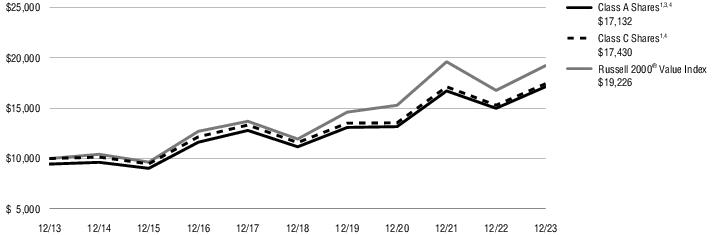
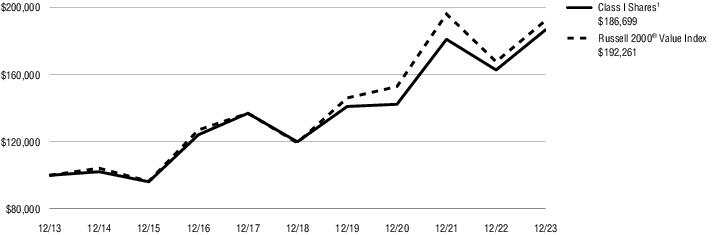
| 1 | Total returns are historical and include changes in share price and the reinvestment of both dividends and capital gain distributions. |
| 2 | “NAV” (Net Asset Value) total returns do not include the effect of any sales charge. |
| 3 | “POP” (Public Offering Price) total returns include the effect of the maximum front-end 5.50% sales charge. |
| 4 | “CDSC” (contingent deferred sales charge) is applied to redemptions of certain classes of shares that do not have a sales charge applied at the time of purchase. CDSC for certain redemptions of Class A shares made within 18 months of a finder’s fee being paid and all Class C shares are 1% within the first year and 0% thereafter. |
| 5 | The since inception index return is from the inception date of Class R6 shares. |
| 6 | The expense ratios of the Fund are set forth according to the prospectus for the Fund effective April 28, 2023, as supplemented and revised, and may differ from the expense ratios disclosed in the Financial Highlights tables in this report. See the Financial Highlights for more current expense ratios. Net Expense: Expenses reduced by a contractual expense limitation in effect through April 30, 2024. Gross Expense: Does not reflect the effect of the expense limitation. Expense ratios include fees and expenses associated with any underlying funds. |
| Ticker Symbols: | |
| Class A: SCIIX | |
| Class I: STITX | |
| Class R6: SCIZX |
Sustainable Growth Advisers, LP
| ■ | The Fund is diversified and has an investment objective of seeking to provide long-term capital appreciation. There is no guarantee that the Fund will meet its objective. |
| ■ | For the fiscal year ended December 31, 2023, the Fund’s Class A shares at NAV returned 17.05%, Class I shares at NAV returned 17.25%, and Class R6 Shares at NAV returned 17.53%. For the same period, the MSCI All Country World ex USA Index, the Fund’s style-specific benchmark appropriate for comparison, returned 15.62%. |
| Health Care | 23% |
| Consumer Staples | 22 |
| Financials | 16 |
| Information Technology | 14 |
| Industrials | 9 |
| Materials | 7 |
| Consumer Discretionary | 4 |
| Other (includes short-term investment and securities lending collateral) | 5 |
| Total | 100% |
| 1 Year | 5 Years | 10 Years | Since inception | Inception date | ||
| Class A shares at NAV2 | 17.05 % | 10.28 % | 6.43 % | — % | — | |
| Class A shares at POP3,4 | 10.61 | 9.04 | 5.83 | — | — | |
| Class I shares at NAV2 | 17.25 | 10.54 | 6.66 | — | — | |
| Class R6 shares at NAV2 | 17.53 | 10.66 | — | 9.66 | 9/1/15 | |
| MSCI All Country World ex USA Index (net) | 15.62 | 7.08 | 3.83 | 5.95 5 | — | |
| Fund Expense Ratios6: Class A shares: Gross 1.60%, Net 1.32%; Class I shares: Gross 1.36%, Net 1.07%; Class R6 shares: Gross 1.24%, Net 0.95%. | ||||||
| All returns represent past performance which is no guarantee of future results. Current performance may be higher or lower than the performance shown. The investment return and principal value of an investment will fluctuate so that an investor’s shares, when redeemed, may be worth more or less than their original cost. The above table and graph below do not reflect the deduction of taxes that a shareholder would pay on fund distributions or the redemption of shares. Please visit Virtus.com for performance data current to the most recent month-end. |
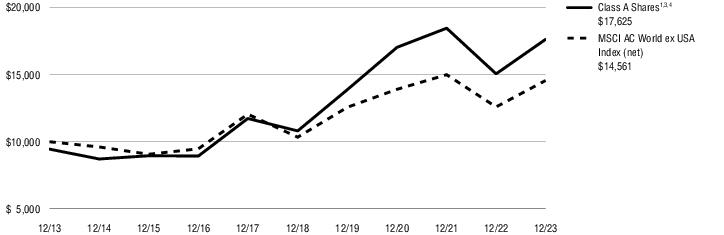
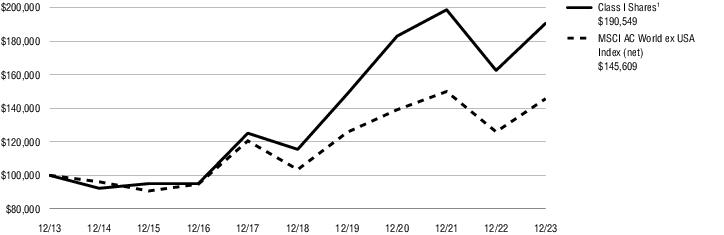
| 1 | Total returns are historical and include changes in share price and the reinvestment of both dividends and capital gain distributions. |
| 2 | “NAV” (Net Asset Value) total returns do not include the effect of any sales charge. |
| 3 | “POP” (Public Offering Price) total returns include the effect of the maximum front-end 5.50% sales charge. |
| 4 | “CDSC” (contingent deferred sales charge) is applied to redemptions of certain classes of shares that do not have a sales charge applied at the time of purchase. CDSC for certain redemptions of Class A shares made within 18 months of a finder’s fee being paid. |
| 5 | The since inception index return is from the inception date of Class R6 shares. |
| 6 | The expense ratios of the Fund are set forth according to the prospectus for the Fund effective April 28, 2023, as supplemented and revised, and may differ from the expense ratios disclosed in the Financial Highlights tables in this report. See the Financial Highlights for more current expense ratios. Net Expense: Expenses reduced by a contractual expense limitation in effect through April 30, 2024. Gross Expense: Does not reflect the effect of the expense limitation. Expense ratios include fees and expenses associated with any underlying funds. |
| Ticker Symbols: | |
| Class A: STCIX | |
| Class I: STCAX | |
| Class R6: STCZX |
Silvant Capital Management LLC
| ■ | The Fund is non-diversified and has an investment objective of seeking to provide capital appreciation. There is no guarantee that the Fund will meet its objective. |
| ■ | For the fiscal year ended December 31, 2023, the Fund’s Class A shares at NAV returned 48.98%, Class I shares at NAV returned 49.28%, and Class R6 shares at NAV returned 49.35%. For the same period, the Russell 1000® Growth Index, the Fund’s style-specific benchmark appropriate for comparison, returned 42.68%. |
| Information Technology | 44% |
| Consumer Discretionary | 15 |
| Communication Services | 12 |
| Health Care | 11 |
| Financials | 8 |
| Industrials | 6 |
| Consumer Staples | 3 |
| Other (includes securities lending collateral) | 1 |
| Total | 100% |
| 1 Year | 5 Years | 10 Years | Since inception | Inception date | ||
| Class A shares at NAV2 | 48.98 % | 18.82 % | 12.95 % | — % | — | |
| Class A shares at POP3,4 | 40.78 | 17.48 | 12.31 | — | — | |
| Class I shares at NAV2 | 49.28 | 19.15 | 13.24 | — | — | |
| Class R6 shares at NAV2 | 49.35 | 19.25 | — | 13.84 | 8/1/14 | |
| Russell 1000® Growth Index | 42.68 | 19.50 | 14.86 | 15.32 5 | — | |
| Fund Expense Ratios6: Class A shares: Gross 1.26%, Net 1.23%; Class I shares: Gross 1.06%, Net 0.97%; Class R6 shares: Gross 0.93%, Net 0.90%. | ||||||
| All returns represent past performance which is no guarantee of future results. Current performance may be higher or lower than the performance shown. The investment return and principal value of an investment will fluctuate so that an investor’s shares, when redeemed, may be worth more or less than their original cost. The above table and graph below do not reflect the deduction of taxes that a shareholder would pay on fund distributions or the redemption of shares. Please visit Virtus.com for performance data current to the most recent month-end. |
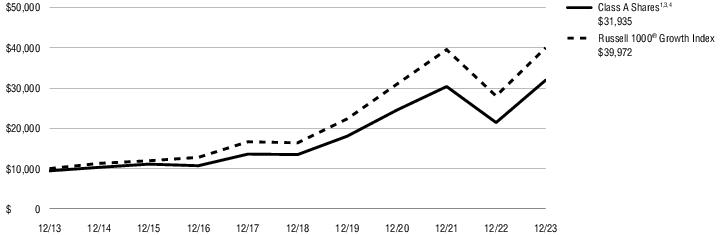
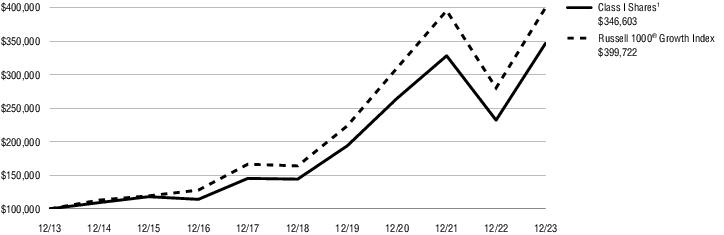
| 1 | Total returns are historical and include changes in share price and the reinvestment of both dividends and capital gain distributions. |
| 2 | “NAV” (Net Asset Value) total returns do not include the effect of any sales charge. |
| 3 | “POP” (Public Offering Price) total returns include the effect of the maximum front-end 5.50% sales charge. |
| 4 | “CDSC” (contingent deferred sales charge) is applied to redemptions of certain classes of shares that do not have a sales charge applied at the time of purchase. CDSC for certain redemptions of Class A shares made within 18 months of a finder’s fee being paid. |
| 5 | The since inception index return is from the inception date of Class R6 shares. |
| 6 | The expense ratios of the Fund are set forth according to the prospectus for the Fund effective April 28, 2023, as supplemented and revised, and may differ from the expense ratios disclosed in the Financial Highlights tables in this report. See the Financial Highlights for more current expense ratios. Net Expense: Expenses reduced by a contractual expense limitation in effect through April 30, 2024. Gross Expense: Does not reflect the effect of the expense limitation. Expense ratios include fees and expenses associated with any underlying funds. |
| Ticker Symbols: | |
| Class A: SAGAX | |
| Class I: SCATX | |
| Class R6: VZGRX |
Zevenbergen Capital Investments LLC
| ■ | The Fund is diversified and has an investment objective of seeking to provide long-term capital appreciation. There is no guarantee that the Fund will meet its objective. |
| ■ | For the fiscal year ended December 31, 2023, the Fund’s Class A shares at NAV returned 65.15%, Class I shares at NAV returned 65.58%, and Class R6 shares at NAV returned 65.74%. For the same period, the Russell 3000® Growth Index, the Fund’s style-specific benchmark appropriate for comparison, returned 41.21%. |
| Information Technology | 38% |
| Consumer Discretionary | 28 |
| Communication Services | 11 |
| Industrials | 10 |
| Health Care | 8 |
| Real Estate | 2 |
| Consumer Staples | 2 |
| Other | 1 |
| Total | 100% |
| 1 Year | 5 Years | 10 Years | Since inception | Inception date | ||
| Class A shares at NAV2 | 65.15 % | 14.66 % | 12.11 % | — % | — | |
| Class A shares at POP3,4 | 56.07 | 13.37 | 11.48 | — | — | |
| Class I shares at NAV2 | 65.58 | 14.94 | 12.35 | — | — | |
| Class R6 shares at NAV2 | 65.74 | — | — | -7.91 | 10/20/20 | |
| Russell 3000® Growth Index | 41.21 | 18.85 | 14.33 | 10.67 5 | — | |
| Fund Expense Ratios6: Class A shares: Gross 1.38%, Net 1.25%; Class I shares: Gross 1.15%, Net 1.00%; Class R6 shares: Gross 0.99%, Net 0.90%. | ||||||
| All returns represent past performance which is no guarantee of future results. Current performance may be higher or lower than the performance shown. The investment return and principal value of an investment will fluctuate so that an investor’s shares, when redeemed, may be worth more or less than their original cost. The above table and graph below do not reflect the deduction of taxes that a shareholder would pay on fund distributions or the redemption of shares. Please visit Virtus.com for performance data current to the most recent month-end. |
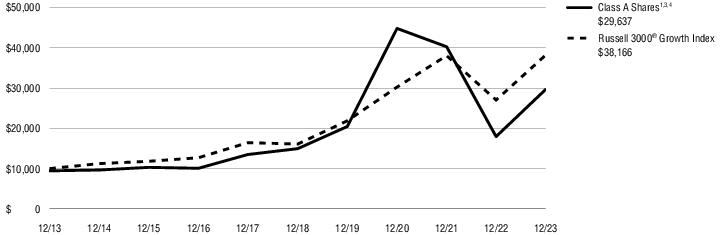
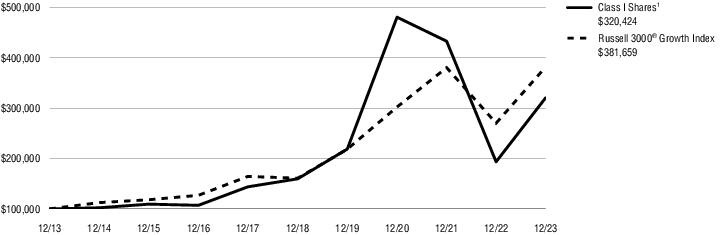
| 1 | Total returns are historical and include changes in share price and the reinvestment of both dividends and capital gain distributions. |
| 2 | “NAV” (Net Asset Value) total returns do not include the effect of any sales charge. |
| 3 | “POP” (Public Offering Price) total returns include the effect of the maximum front-end 5.50% sales charge. |
| 4 | “CDSC” (contingent deferred sales charge) is applied to redemptions of certain classes of shares that do not have a sales charge applied at the time of purchase. CDSC for certain redemptions of Class A shares made within 18 months of a finder’s fee being paid. |
| 5 | The since inception index return is from the inception date of Class R6 shares. |
| 6 | The expense ratios of the Fund are set forth according to the prospectus for the Fund effective April 28, 2023, as supplemented and revised, and may differ from the expense ratios disclosed in the Financial Highlights tables in this report. See the Financial Highlights for more current expense ratios. Net Expense: Expenses reduced by a contractual expense limitation in effect through April 30, 2024. Gross Expense: Does not reflect the effect of the expense limitation. Expense ratios include fees and expenses associated with any underlying funds. |
December 31, 2023
| Shares | Value | ||
| Common Stocks—97.0% | |||
| Consumer Discretionary—5.0% | |||
| Best Buy Co., Inc. | 231,105 | $ 18,091 | |
| Home Depot, Inc. (The) | 52,096 | 18,054 | |
| 36,145 | |||
| Consumer Staples—4.5% | |||
| Kenvue, Inc. | 501,291 | 10,793 | |
| Sysco Corp. | 152,992 | 11,188 | |
| Target Corp. | 77,377 | 11,020 | |
| 33,001 | |||
| Energy—7.2% | |||
| Chesapeake Energy Corp. | 194,690 | 14,979 | |
| Chevron Corp. | 130,811 | 19,512 | |
| EOG Resources, Inc. | 150,135 | 18,159 | |
| 52,650 | |||
| Financials—17.3% | |||
| Allstate Corp. (The) | 66,652 | 9,330 | |
| Bank of America Corp. | 407,095 | 13,707 | |
| Capital One Financial Corp. | 100,101 | 13,125 | |
| JPMorgan Chase & Co. | 92,146 | 15,674 | |
| KeyCorp | 758,570 | 10,923 | |
| Progressive Corp. (The) | 84,561 | 13,469 | |
| Raymond James Financial, Inc. | 91,578 | 10,211 | |
| State Street Corp. | 93,014 | 7,205 | |
| U.S. Bancorp | 439,132 | 19,006 | |
| Willis Towers Watson plc | 56,269 | 13,572 | |
| 126,222 | |||
| Shares | Value | ||
| Health Care—11.0% | |||
| Danaher Corp. | 82,700 | $ 19,132 | |
| Humana, Inc. | 33,352 | 15,269 | |
| Johnson & Johnson | 94,974 | 14,886 | |
| Revvity, Inc. | 172,147 | 18,817 | |
| Zimmer Biomet Holdings, Inc. | 100,377 | 12,216 | |
| 80,320 | |||
| Industrials—20.8% | |||
| Deere & Co. | 30,566 | 12,222 | |
| Equifax, Inc. | 53,525 | 13,236 | |
| FedEx Corp. | 58,756 | 14,864 | |
| Fortive Corp. | 239,325 | 17,622 | |
| Honeywell International, Inc. | 98,599 | 20,677 | |
| IDEX Corp. | 66,558 | 14,450 | |
| Jacobs Solutions, Inc. | 102,353 | 13,285 | |
| Knight-Swift Transportation Holdings, Inc. Class A | 267,506 | 15,422 | |
| L3Harris Technologies, Inc. | 69,314 | 14,599 | |
| Xylem, Inc. | 134,731 | 15,408 | |
| 151,785 | |||
| Information Technology—12.4% | |||
| Cisco Systems, Inc. | 216,580 | 10,942 | |
| Intel Corp. | 429,981 | 21,606 | |
| Marvell Technology, Inc. | 352,413 | 21,254 | |
| QUALCOMM, Inc. | 141,958 | 20,531 | |
| Teradyne, Inc. | 150,227 | 16,303 | |
| 90,636 | |||
| Materials—11.4% | |||
| Air Products & Chemicals, Inc. | 55,170 | 15,106 | |
| Shares | Value | ||
| Materials—continued | |||
| Avery Dennison Corp. | 72,457 | $ 14,648 | |
| Eastman Chemical Co. | 187,130 | 16,808 | |
| Freeport-McMoRan, Inc. | 336,911 | 14,342 | |
| Sherwin-Williams Co. (The) | 35,313 | 11,014 | |
| Vulcan Materials Co. | 48,719 | 11,060 | |
| 82,978 | |||
| Real Estate—3.3% | |||
| Crown Castle, Inc. | 116,974 | 13,474 | |
| Sun Communities, Inc. | 79,226 | 10,589 | |
| 24,063 | |||
| Utilities—4.1% | |||
| CMS Energy Corp. | 181,083 | 10,515 | |
| PPL Corp. | 708,374 | 19,197 | |
| 29,712 | |||
| Total Common Stocks (Identified Cost $614,837) | 707,512 | ||
| Total Long-Term Investments—97.0% (Identified Cost $614,837) | 707,512 | ||
| TOTAL INVESTMENTS—97.0% (Identified Cost $614,837) | $707,512 | ||
| Other assets and liabilities, net—3.0% | 21,539 | ||
| NET ASSETS—100.0% | $729,051 | ||
| Total Value at December 31, 2023 | Level 1 Quoted Prices | ||
| Assets: | |||
| Equity Securities: | |||
| Common Stocks | $707,512 | $707,512 | |
| Total Investments | $707,512 | $707,512 |
December 31, 2023
| Shares | Value | ||
| Common Stocks—97.1% | |||
| Consumer Discretionary—5.0% | |||
| Best Buy Co., Inc. | 375,000 | $ 29,355 | |
| Genuine Parts Co. | 250,000 | 34,625 | |
| Levi Strauss & Co. Class A | 1,300,000 | 21,502 | |
| Vail Resorts, Inc. | 110,000 | 23,482 | |
| 108,964 | |||
| Consumer Staples—3.7% | |||
| Kroger Co. (The) | 635,000 | 29,026 | |
| Target Corp. | 365,000 | 51,983 | |
| 81,009 | |||
| Energy—5.2% | |||
| Chesapeake Energy Corp. | 725,000 | 55,782 | |
| Ovintiv, Inc. | 1,350,000 | 59,292 | |
| 115,074 | |||
| Financials—18.7% | |||
| Allstate Corp. (The) | 335,000 | 46,893 | |
| Capital One Financial Corp. | 255,000 | 33,436 | |
| First Citizens BancShares, Inc. Class A | 42,000 | 59,597 | |
| Global Payments, Inc. | 350,000 | 44,450 | |
| Hartford Financial Services Group, Inc. (The) | 475,000 | 38,180 | |
| Jefferies Financial Group, Inc. | 850,000 | 34,349 | |
| KeyCorp | 1,600,000 | 23,040 | |
| KKR & Co., Inc. | 400,000 | 33,140 | |
| Raymond James Financial, Inc. | 240,000 | 26,760 | |
| U.S. Bancorp | 775,000 | 33,542 | |
| Willis Towers Watson plc | 150,000 | 36,180 | |
| 409,567 | |||
| Health Care—4.9% | |||
| Humana, Inc. | 150,000 | 68,671 | |
| Revvity, Inc. | 350,000 | 38,259 | |
| 106,930 | |||
| Industrials—21.9% | |||
| Carrier Global Corp. | 475,000 | 27,289 | |
| Dover Corp. | 250,000 | 38,452 | |
| Shares | Value | ||
| Industrials—continued | |||
| Equifax, Inc. | 175,000 | $ 43,276 | |
| FedEx Corp. | 115,000 | 29,091 | |
| Fortive Corp. | 500,000 | 36,815 | |
| Howmet Aerospace, Inc. | 590,000 | 31,931 | |
| Hubbell, Inc. Class B | 50,000 | 16,446 | |
| IDEX Corp. | 160,000 | 34,738 | |
| Jacobs Solutions, Inc. | 225,000 | 29,205 | |
| Knight-Swift Transportation Holdings, Inc. Class A | 600,000 | 34,590 | |
| L3Harris Technologies, Inc. | 185,000 | 38,965 | |
| Parker-Hannifin Corp. | 50,000 | 23,035 | |
| Quanta Services, Inc. | 130,000 | 28,054 | |
| Regal Rexnord Corp. | 230,000 | 34,045 | |
| Xylem, Inc. | 300,000 | 34,308 | |
| 480,240 | |||
| Information Technology—9.9% | |||
| Dell Technologies, Inc. Class C | 575,000 | 43,987 | |
| Jabil, Inc. | 255,000 | 32,487 | |
| Marvell Technology, Inc. | 1,050,000 | 63,325 | |
| Microchip Technology, Inc. | 320,000 | 28,858 | |
| MKS Instruments, Inc. | 140,000 | 14,402 | |
| Power Integrations, Inc. | 425,000 | 34,897 | |
| 217,956 | |||
| Materials—9.8% | |||
| Air Products & Chemicals, Inc. | 135,000 | 36,963 | |
| Ashland, Inc. | 400,000 | 33,724 | |
| Avery Dennison Corp. | 165,000 | 33,356 | |
| Freeport-McMoRan, Inc. | 900,000 | 38,313 | |
| Louisiana-Pacific Corp. | 430,000 | 30,457 | |
| Martin Marietta Materials, Inc. | 20,000 | 9,978 | |
| PPG Industries, Inc. | 220,000 | 32,901 | |
| 215,692 | |||
| Real Estate—9.5% | |||
| Alexandria Real Estate Equities, Inc. | 250,000 | 31,692 | |
| American Homes 4 Rent Class A | 900,000 | 32,364 | |
| Americold Realty Trust, Inc. | 1,200,000 | 36,324 | |
| Shares | Value | ||
| Real Estate—continued | |||
| Extra Space Storage, Inc. | 205,000 | $ 32,868 | |
| Mid-America Apartment Communities, Inc. | 260,000 | 34,960 | |
| Realty Income Corp. | 700,000 | 40,194 | |
| 208,402 | |||
| Utilities—8.5% | |||
| CenterPoint Energy, Inc. | 1,300,000 | 37,141 | |
| CMS Energy Corp. | 550,000 | 31,939 | |
| PG&E Corp. | 1,850,000 | 33,355 | |
| PPL Corp. | 1,600,000 | 43,360 | |
| Xcel Energy, Inc. | 650,000 | 40,241 | |
| 186,036 | |||
| Total Common Stocks (Identified Cost $1,916,205) | 2,129,870 | ||
| Total Long-Term Investments—97.1% (Identified Cost $1,916,205) | 2,129,870 | ||
| Short-Term Investment—0.0% | |||
| Money Market Mutual Fund—0.0% | |||
| Dreyfus Government Cash Management Fund - Institutional Shares (seven-day effective yield 5.250%)(1) | 23,252 | 23 | |
| Total Short-Term Investment (Identified Cost $23) | 23 | ||
| TOTAL INVESTMENTS—97.1% (Identified Cost $1,916,228) | $2,129,893 | ||
| Other assets and liabilities, net—2.9% | 64,661 | ||
| NET ASSETS—100.0% | $2,194,554 | ||
| Footnote Legend: | |
| (1) | Shares of this fund are publicly offered, and its prospectus and annual report are publicly available. |
| Total Value at December 31, 2023 | Level 1 Quoted Prices | ||
| Assets: | |||
| Equity Securities: | |||
| Common Stocks | $2,129,870 | $2,129,870 | |
| Money Market Mutual Fund | 23 | 23 | |
| Total Investments | $2,129,893 | $2,129,893 |
December 31, 2023
| Shares | Value | ||
| Common Stocks—96.3% | |||
| Communication Services—4.0% | |||
| Cogent Communications Holdings, Inc. | 15,400 | $ 1,172 | |
| Iridium Communications, Inc. | 32,050 | 1,319 | |
| John Wiley & Sons, Inc. Class A | 23,100 | 733 | |
| Scholastic Corp. | 20,500 | 773 | |
| 3,997 | |||
| Consumer Discretionary—4.8% | |||
| Autoliv, Inc. | 12,050 | 1,328 | |
| Signet Jewelers Ltd. | 11,500 | 1,233 | |
| Steven Madden Ltd. | 29,850 | 1,254 | |
| Vail Resorts, Inc. | 4,500 | 961 | |
| 4,776 | |||
| Consumer Staples—2.2% | |||
| Flowers Foods, Inc. | 55,900 | 1,258 | |
| Reynolds Consumer Products, Inc. | 34,431 | 924 | |
| 2,182 | |||
| Energy—9.4% | |||
| Cactus, Inc. Class A | 34,900 | 1,585 | |
| ChampionX Corp. | 53,850 | 1,573 | |
| Chord Energy Corp. | 9,850 | 1,637 | |
| Matador Resources Co. | 29,100 | 1,655 | |
| NOV, Inc. | 79,800 | 1,618 | |
| Range Resources Corp. | 43,100 | 1,312 | |
| 9,380 | |||
| Financials—27.6% | |||
| American Financial Group, Inc. | 6,100 | 725 | |
| Atlantic Union Bankshares Corp. | 49,300 | 1,802 | |
| Bank of Hawaii Corp. | 27,850 | 2,018 | |
| Columbia Banking System, Inc. | 66,200 | 1,766 | |
| Cullen/Frost Bankers, Inc. | 16,100 | 1,747 | |
| Evercore, Inc. Class A | 6,000 | 1,026 | |
| First American Financial Corp. | 15,450 | 996 | |
| FNB Corp. | 128,850 | 1,774 | |
| Hanover Insurance Group, Inc. (The) | 9,100 | 1,105 | |
| Horace Mann Educators Corp. | 42,061 | 1,375 | |
| Kemper Corp. | 30,500 | 1,485 | |
| Kinsale Capital Group, Inc. | 1,500 | 502 | |
| Shares | Value | ||
| Financials—continued | |||
| Perella Weinberg Partners Class A | 90,600 | $ 1,108 | |
| Pinnacle Financial Partners, Inc. | 21,200 | 1,849 | |
| Prosperity Bancshares, Inc. | 26,550 | 1,798 | |
| Redwood Trust, Inc. | 66,300 | 491 | |
| Seacoast Banking Corp. of Florida | 61,610 | 1,753 | |
| Selective Insurance Group, Inc. | 9,600 | 955 | |
| SouthState Corp. | 21,000 | 1,774 | |
| Wintrust Financial Corp. | 17,450 | 1,619 | |
| 27,668 | |||
| Health Care—0.9% | |||
| Perrigo Co. plc | 28,600 | 920 | |
| Industrials—19.1% | |||
| BWX Technologies, Inc. | 9,100 | 698 | |
| Curtiss-Wright Corp. | 6,600 | 1,470 | |
| Forward Air Corp. | 13,300 | 836 | |
| Helios Technologies, Inc. | 31,400 | 1,424 | |
| Herc Holdings, Inc. | 9,450 | 1,407 | |
| Hexcel Corp. | 24,100 | 1,777 | |
| Huntington Ingalls Industries, Inc. | 3,950 | 1,026 | |
| KBR, Inc. | 36,000 | 1,995 | |
| RB Global, Inc. | 28,300 | 1,893 | |
| Schneider National, Inc. Class B | 75,800 | 1,929 | |
| Science Applications International Corp. | 7,200 | 895 | |
| Stantec, Inc. | 13,100 | 1,051 | |
| Timken Co. (The) | 16,000 | 1,282 | |
| Valmont Industries, Inc. | 6,250 | 1,460 | |
| 19,143 | |||
| Information Technology—9.1% | |||
| Belden, Inc. | 20,600 | 1,591 | |
| Kulicke & Soffa Industries, Inc. | 18,300 | 1,001 | |
| Littelfuse, Inc. | 3,800 | 1,017 | |
| MKS Instruments, Inc. | 5,000 | 514 | |
| Power Integrations, Inc. | 19,300 | 1,585 | |
| Progress Software Corp. | 31,100 | 1,689 | |
| TD SYNNEX Corp. | 15,600 | 1,679 | |
| 9,076 | |||
| Shares | Value | ||
| Materials—9.3% | |||
| Ashland, Inc. | 26,500 | $ 2,234 | |
| Avient Corp. | 26,900 | 1,118 | |
| Carpenter Technology Corp. | 19,450 | 1,377 | |
| Element Solutions, Inc. | 66,400 | 1,537 | |
| Hudbay Minerals, Inc. | 236,100 | 1,303 | |
| Louisiana-Pacific Corp. | 25,500 | 1,806 | |
| 9,375 | |||
| Real Estate—6.2% | |||
| Brixmor Property Group, Inc. | 75,600 | 1,759 | |
| Camden Property Trust | 13,250 | 1,316 | |
| Colliers International Group, Inc. | 12,000 | 1,518 | |
| NNN REIT, Inc. | 38,200 | 1,647 | |
| 6,240 | |||
| Utilities—3.7% | |||
| IDACORP, Inc. | 18,800 | 1,848 | |
| OGE Energy Corp. | 52,500 | 1,834 | |
| 3,682 | |||
| Total Common Stocks (Identified Cost $84,044) | 96,439 | ||
| Total Long-Term Investments—96.3% (Identified Cost $84,044) | 96,439 | ||
| TOTAL INVESTMENTS—96.3% (Identified Cost $84,044) | $ 96,439 | ||
| Other assets and liabilities, net—3.7% | 3,710 | ||
| NET ASSETS—100.0% | $100,149 | ||
| Abbreviation: | |
| REIT | Real Estate Investment Trust |
| Country Weightings (Unaudited)† | |
| United States | 92% |
| Canada | 6 |
| Bermuda | 1 |
| Ireland | 1 |
| Total | 100% |
| † % of total investments as of December 31, 2023. | |
| Total Value at December 31, 2023 | Level 1 Quoted Prices | ||
| Assets: | |||
| Equity Securities: | |||
| Common Stocks | $96,439 | $96,439 | |
| Total Investments | $96,439 | $96,439 |
December 31, 2023
| Shares | Value | ||
| Preferred Stock—2.3% | |||
| Germany—2.3% | |||
| Sartorius AG, 0.450% | 4,954 | $ 1,822 | |
| Total Preferred Stock (Identified Cost $1,721) | 1,822 | ||
| Common Stocks—94.7% | |||
| Brazil—4.0% | |||
| MercadoLibre, Inc.(1) | 989 | 1,554 | |
| XP, Inc. Class A | 62,317 | 1,625 | |
| 3,179 | |||
| Canada—3.5% | |||
| Canadian Pacific Kansas City Ltd. | 34,759 | 2,748 | |
| China—4.2% | |||
| Shandong Weigao Group Medical Polymer Co., Ltd. Class H | 1,715,888 | 1,672 | |
| Yum China Holdings, Inc. | 37,654 | 1,602 | |
| 3,274 | |||
| Denmark—4.6% | |||
| Novo Nordisk A/S Sponsored ADR | 35,085 | 3,630 | |
| France—6.0% | |||
| Dassault Systemes SE | 39,236 | 1,916 | |
| L’Oreal S.A. | 5,731 | 2,851 | |
| 4,767 | |||
| Germany—2.4% | |||
| SAP SE Sponsored ADR(2) | 12,305 | 1,902 | |
| Hong Kong—3.4% | |||
| AIA Group Ltd. | 305,264 | 2,660 | |
| India—8.0% | |||
| HDFC Bank Ltd. ADR | 54,079 | 3,629 | |
| Infosys Ltd. Sponsored ADR | 145,861 | 2,681 | |
| 6,310 | |||
| Ireland—5.0% | |||
| Experian plc | 39,887 | 1,628 | |
| ICON plc ADR(1) | 8,198 | 2,321 | |
| 3,949 | |||
| Japan—4.5% | |||
| Recruit Holdings Co., Ltd. | 55,891 | 2,364 | |
| Sysmex Corp. | 21,244 | 1,184 | |
| 3,548 | |||
| Shares | Value | ||
| Mexico—7.2% | |||
| Fomento Economico Mexicano SAB de C.V. Sponsored ADR | 25,727 | $ 3,354 | |
| Wal-Mart de Mexico SAB de C.V. | 555,939 | 2,337 | |
| 5,691 | |||
| Netherlands—8.7% | |||
| Adyen N.V.(1) | 1,162 | 1,496 | |
| Heineken N.V. | 22,884 | 2,323 | |
| Universal Music Group N.V. | 108,313 | 3,086 | |
| 6,905 | |||
| Switzerland—14.0% | |||
| Alcon, Inc. | 40,911 | 3,196 | |
| Nestle S.A. Registered Shares | 23,503 | 2,725 | |
| Sika AG Registered Shares | 7,209 | 2,346 | |
| Temenos AG Registered Shares | 30,235 | 2,812 | |
| 11,079 | |||
| Thailand—1.6% | |||
| CP ALL PCL Foreign Shares | 776,895 | 1,275 | |
| United Kingdom—10.6% | |||
| Aon plc Class A | 11,772 | 3,426 | |
| Diageo plc | 62,309 | 2,268 | |
| Linde plc | 6,511 | 2,674 | |
| 8,368 | |||
| United States—7.0% | |||
| Atlassian Corp. Class A(1) | 8,296 | 1,973 | |
| STERIS plc | 16,152 | 3,551 | |
| 5,524 | |||
| Total Common Stocks (Identified Cost $61,805) | 74,809 | ||
| Total Long-Term Investments—97.0% (Identified Cost $63,526) | 76,631 | ||
| Short-Term Investment—0.4% | |||
| Money Market Mutual Fund—0.4% | |||
| State Street Institutional U.S. Government Money Market Fund - Institutional Shares (seven-day effective yield 5.236%)(3) | 331,177 | 331 | |
| Total Short-Term Investment (Identified Cost $331) | 331 | ||
| Shares | Value | ||
| Securities Lending Collateral—0.7% | |||
| Dreyfus Government Cash Management Fund - Institutional Shares (seven-day effective yield 5.250%)(3)(4) | 540,067 | $ 540 | |
| Total Securities Lending Collateral—0.7% (Identified Cost $540) | 540 | ||
| TOTAL INVESTMENTS—98.1% (Identified Cost $64,397) | $77,502 | ||
| Other assets and liabilities, net—1.9% | 1,498 | ||
| NET ASSETS—100.0% | $79,000 | ||
| Abbreviation: | |
| ADR | American Depositary Receipt |
| Footnote Legend: | |
| (1) | Non-income producing. |
| (2) | All or a portion of security is on loan. |
| (3) | Shares of this fund are publicly offered, and its prospectus and annual report are publicly available. |
| (4) | Represents security purchased with cash collateral received for securities on loan. |
| Country Weightings (Unaudited)† | |
| Switzerland | 14% |
| United Kingdom | 11 |
| Netherlands | 9 |
| United States | 8 |
| India | 8 |
| Mexico | 7 |
| France | 6 |
| Other | 37 |
| Total | 100% |
| † % of total investments as of December 31, 2023. | |
| Total Value at December 31, 2023 | Level 1 Quoted Prices | ||
| Assets: | |||
| Equity Securities: | |||
| Preferred Stock | $ 1,822 | $ 1,822 | |
| Common Stocks | 74,809 | 74,809 | |
| Money Market Mutual Fund | 331 | 331 | |
| Securities Lending Collateral | 540 | 540 | |
| Total Investments | $77,502 | $77,502 |
December 31, 2023
| Shares | Value | ||
| Common Stocks—99.5% | |||
| Communication Services—11.9% | |||
| Alphabet, Inc. Class A(1) | 37,512 | $ 5,240 | |
| Alphabet, Inc. Class C(1) | 32,555 | 4,588 | |
| Meta Platforms, Inc. Class A(1) | 17,404 | 6,160 | |
| Snap, Inc. Class A(1) | 8,377 | 142 | |
| Trade Desk, Inc. (The) Class A(1) | 6,897 | 496 | |
| 16,626 | |||
| Consumer Discretionary—15.5% | |||
| Amazon.com, Inc.(1) | 60,478 | 9,189 | |
| Booking Holdings, Inc.(1) | 537 | 1,905 | |
| Chipotle Mexican Grill, Inc. Class A(1) | 634 | 1,450 | |
| DraftKings, Inc. Class A(1) | 27,497 | 969 | |
| Las Vegas Sands Corp. | 14,478 | 713 | |
| Lululemon Athletica, Inc.(1) | 1,854 | 948 | |
| MercadoLibre, Inc.(1) | 261 | 410 | |
| O’Reilly Automotive, Inc.(1) | 1,678 | 1,594 | |
| Royal Caribbean Cruises Ltd.(1) | 12,064 | 1,562 | |
| Tesla, Inc.(1) | 3,556 | 884 | |
| TJX Cos., Inc. (The) | 20,849 | 1,956 | |
| 21,580 | |||
| Consumer Staples—2.9% | |||
| Celsius Holdings, Inc.(1) | 7,639 | 416 | |
| Colgate-Palmolive Co. | 6,619 | 528 | |
| Costco Wholesale Corp. | 4,568 | 3,015 | |
| 3,959 | |||
| Financials—7.7% | |||
| American Express Co. | 7,403 | 1,387 | |
| Mastercard, Inc. Class A | 7,432 | 3,170 | |
| S&P Global, Inc. | 4,377 | 1,928 | |
| Visa, Inc. Class A | 13,581 | 3,536 | |
| Wells Fargo & Co. | 14,869 | 732 | |
| 10,753 | |||
| Health Care—11.2% | |||
| Bristol-Myers Squibb Co. | 16,030 | 823 | |
| Dexcom, Inc.(1) | 11,973 | 1,486 | |
| Edwards Lifesciences Corp.(1) | 6,363 | 485 | |
| Shares | Value | ||
| Health Care—continued | |||
| Eli Lilly & Co. | 9,921 | $ 5,783 | |
| Exact Sciences Corp.(1) | 8,153 | 603 | |
| Insulet Corp.(1) | 1,816 | 394 | |
| Intuitive Surgical, Inc.(1) | 4,441 | 1,498 | |
| Mettler-Toledo International, Inc.(1) | 226 | 274 | |
| Natera, Inc.(1) | 7,583 | 475 | |
| Thermo Fisher Scientific, Inc. | 1,569 | 833 | |
| UnitedHealth Group, Inc. | 5,509 | 2,900 | |
| 15,554 | |||
| Industrials—5.6% | |||
| Boeing Co. (The)(1) | 8,833 | 2,302 | |
| Deere & Co. | 2,267 | 907 | |
| Emerson Electric Co. | 7,226 | 703 | |
| Fair Isaac Corp.(1) | 780 | 908 | |
| General Electric Co. | 6,198 | 791 | |
| Honeywell International, Inc. | 2,105 | 441 | |
| Rockwell Automation, Inc. | 2,357 | 732 | |
| Union Pacific Corp. | 4,261 | 1,047 | |
| 7,831 | |||
| Information Technology—43.8% | |||
| Adobe, Inc. (1) | 3,913 | 2,335 | |
| Apple, Inc. | 91,703 | 17,656 | |
| Applied Materials, Inc. | 15,780 | 2,557 | |
| ARM Holdings plc ADR(1)(2) | 2,393 | 180 | |
| ASML Holding N.V. Registered Shares | 693 | 525 | |
| Autodesk, Inc.(1) | 6,354 | 1,547 | |
| DocuSign, Inc. Class A(1) | 2,408 | 143 | |
| HubSpot, Inc.(1) | 1,282 | 744 | |
| Lattice Semiconductor Corp.(1) | 5,161 | 356 | |
| Microsoft Corp. | 49,224 | 18,510 | |
| NVIDIA Corp. | 19,708 | 9,760 | |
| QUALCOMM, Inc. | 14,024 | 2,028 | |
| Roper Technologies, Inc. | 1,307 | 713 | |
| Salesforce, Inc.(1) | 7,016 | 1,846 | |
| SentinelOne, Inc. Class A(1) | 15,317 | 420 | |
| Workday, Inc. Class A(1) | 6,253 | 1,726 | |
| 61,046 | |||
| Shares | Value | ||
| Materials—0.9% | |||
| Air Products & Chemicals, Inc. | 2,010 | $ 551 | |
| Vulcan Materials Co. | 3,049 | 692 | |
| 1,243 | |||
| Total Common Stocks (Identified Cost $48,098) | 138,592 | ||
| Total Long-Term Investments—99.5% (Identified Cost $48,098) | 138,592 | ||
| Securities Lending Collateral—0.1% | |||
| Dreyfus Government Cash Management Fund - Institutional Shares (seven-day effective yield 5.250%)(3)(4) | 185,841 | 186 | |
| Total Securities Lending Collateral (Identified Cost $186) | 186 | ||
| TOTAL INVESTMENTS—99.6% (Identified Cost $48,284) | $138,778 | ||
| Other assets and liabilities, net—0.4% | 586 | ||
| NET ASSETS—100.0% | $139,364 | ||
| Abbreviations: | |
| ADR | American Depositary Receipt |
| S&P | Standard & Poor’s |
| Footnote Legend: | |
| (1) | Non-income producing. |
| (2) | All or a portion of security is on loan. |
| (3) | Shares of this fund are publicly offered, and its prospectus and annual report are publicly available. |
| (4) | Represents security purchased with cash collateral received for securities on loan. |
| Total Value at December 31, 2023 | Level 1 Quoted Prices | ||
| Assets: | |||
| Equity Securities: | |||
| Common Stocks | $138,592 | $138,592 | |
| Securities Lending Collateral | 186 | 186 | |
| Total Investments | $138,778 | $138,778 |
December 31, 2023
| Shares | Value | ||
| Common Stocks—98.1% | |||
| Communication Services—10.3% | |||
| Meta Platforms, Inc. Class A(1) | 41,600 | $ 14,725 | |
| Netflix, Inc.(1) | 29,000 | 14,120 | |
| Trade Desk, Inc. (The) Class A(1) | 365,000 | 26,265 | |
| 55,110 | |||
| Consumer Discretionary—27.9% | |||
| Airbnb, Inc. Class A(1) | 100,000 | 13,614 | |
| Amazon.com, Inc.(1) | 203,100 | 30,859 | |
| Global-e Online Ltd.(1) | 239,900 | 9,507 | |
| MercadoLibre, Inc.(1) | 24,000 | 37,717 | |
| On Holding AG Class A(1) | 215,000 | 5,799 | |
| Tesla, Inc.(1) | 165,975 | 41,241 | |
| Wingstop, Inc. | 41,000 | 10,520 | |
| 149,257 | |||
| Consumer Staples—2.2% | |||
| elf Beauty, Inc.(1) | 81,000 | 11,691 | |
| Financials—1.0% | |||
| Dlocal Ltd. Class A(1) | 148,000 | 2,618 | |
| Toast, Inc. Class A(1) | 166,000 | 3,031 | |
| 5,649 | |||
| Health Care—7.8% | |||
| Evolent Health, Inc. Class A(1) | 64,100 | 2,117 | |
| Exact Sciences Corp.(1) | 239,000 | 17,681 | |
| Natera, Inc.(1) | 93,000 | 5,826 | |
| Repligen Corp.(1) | 30,000 | 5,394 | |
| Veeva Systems, Inc. Class A(1) | 56,000 | 10,781 | |
| 41,799 | |||
| Industrials—9.5% | |||
| Axon Enterprise, Inc.(1) | 83,550 | 21,584 | |
| Paylocity Holding Corp.(1) | 33,000 | 5,440 | |
| Shares | Value | ||
| Industrials—continued | |||
| Uber Technologies, Inc.(1) | 390,000 | $ 24,012 | |
| 51,036 | |||
| Information Technology—37.0% | |||
| Advanced Micro Devices, Inc.(1) | 131,000 | 19,311 | |
| ASML Holding N.V. Registered Shares | 11,000 | 8,326 | |
| BILL Holdings, Inc.(1) | 136,500 | 11,137 | |
| Cadence Design Systems, Inc.(1) | 33,000 | 8,988 | |
| Crowdstrike Holdings, Inc. Class A(1) | 42,900 | 10,953 | |
| DoubleVerify Holdings, Inc.(1) | 355,500 | 13,075 | |
| First Solar, Inc.(1) | 47,000 | 8,097 | |
| HubSpot, Inc.(1) | 4,500 | 2,612 | |
| NVIDIA Corp. | 67,450 | 33,403 | |
| Palo Alto Networks, Inc.(1) | 38,100 | 11,235 | |
| ServiceNow, Inc.(1) | 22,600 | 15,967 | |
| Shopify, Inc. Class A(1) | 403,500 | 31,433 | |
| Snowflake, Inc. Class A(1) | 100,000 | 19,900 | |
| Sprout Social, Inc. Class A(1) | 65,000 | 3,994 | |
| 198,431 | |||
| Real Estate—2.4% | |||
| Zillow Group, Inc. Class C(1) | 220,000 | 12,729 | |
| Total Common Stocks (Identified Cost $309,894) | 525,702 | ||
| Total Long-Term Investments—98.1% (Identified Cost $309,894) | 525,702 | ||
| TOTAL INVESTMENTS—98.1% (Identified Cost $309,894) | $525,702 | ||
| Other assets and liabilities, net—1.9% | 9,963 | ||
| NET ASSETS—100.0% | $535,665 | ||
| Footnote Legend: | |
| (1) | Non-income producing. |
| Country Weightings (Unaudited)† | |
| United States | 82% |
| Uruguay | 8 |
| Canada | 6 |
| Israel | 2 |
| Netherlands | 1 |
| Switzerland | 1 |
| Total | 100% |
| † % of total investments as of December 31, 2023. | |
| Total Value at December 31, 2023 | Level 1 Quoted Prices | ||
| Assets: | |||
| Equity Securities: | |||
| Common Stocks | $525,702 | $525,702 | |
| Total Investments | $525,702 | $525,702 |
December 31, 2023
| Ceredex Large-Cap Value Equity Fund | Ceredex Mid-Cap Value Equity Fund | Ceredex Small-Cap Value Equity Fund | |||
| Assets | |||||
Investment in securities at value(1) | $ 707,512 | $ 2,129,893 | $ 96,439 | ||
Cash | 21,120 | 68,096 | 3,774 | ||
| Receivables | |||||
Fund shares sold | 528 | 1,124 | 44 | ||
Dividends | 1,381 | 4,096 | 89 | ||
Tax reclaims | — | 10 | 15 | ||
Securities lending income | — (a) | — | — | ||
Prepaid expenses | 21 | 33 | 35 | ||
Other assets | 85 | 256 | 12 | ||
Total assets | 730,647 | 2,203,508 | 100,408 | ||
| Liabilities | |||||
| Payables | |||||
Fund shares repurchased | 831 | 6,430 | 66 | ||
Dividend distributions | — (a) | — | — | ||
Investment advisory fees | 255 | 1,251 | 86 | ||
Distribution and service fees | 23 | 44 | 6 | ||
Administration and accounting fees | 64 | 188 | 9 | ||
Transfer agent and sub-transfer agent fees and expenses | 274 | 647 | 38 | ||
Professional fees | 25 | 30 | 29 | ||
Trustee deferred compensation plan | 85 | 256 | 12 | ||
Interest expense and/or commitment fees | 11 | 4 | — (a) | ||
Other accrued expenses | 28 | 104 | 13 | ||
Total liabilities | 1,596 | 8,954 | 259 | ||
Net Assets | $ 729,051 | $ 2,194,554 | $ 100,149 | ||
| Net Assets Consist of: | |||||
Capital paid in on shares of beneficial interest | $ 639,466 | $ 2,094,916 | $ 87,605 | ||
Accumulated earnings (loss) | 89,585 | 99,638 | 12,544 | ||
Net Assets | $ 729,051 | $ 2,194,554 | $ 100,149 | ||
| Net Assets: | |||||
Class A | $ 104,316 | $ 175,541 | $ 29,003 | ||
Class C | $ 1,581 | $ 8,833 | $ 548 | ||
Class I | $ 380,748 | $ 1,441,449 | $ 35,343 | ||
Class R6 | $ 242,406 | $ 568,731 | $ 35,255 | ||
| Shares Outstanding (unlimited number of shares authorized, no par value): | |||||
Class A | 9,705,734 | 15,234,576 | 4,127,042 | ||
Class C | 154,617 | 798,851 | 101,251 | ||
Class I | 34,492,279 | 122,207,693 | 4,498,176 | ||
Class R6 | 21,698,266 | 47,970,432 | 4,588,937 | ||
| Net Asset Value and Redemption Price Per Share:* | |||||
Class A | $ 10.75 | $ 11.52 | $ 7.03 | ||
Class C | $ 10.23 | $ 11.06 | $ 5.41 | ||
Class I | $ 11.04 | $ 11.80 | $ 7.86 | ||
Class R6 | $ 11.17 | $ 11.86 | $ 7.68 | ||
| Maximum Offering Price Per Share (NAV/(1-Maximum Sales Charge)): | |||||
Class A | $ 11.38 | $ 12.19 | $ 7.44 | ||
Maximum Sales Charge - Class A | 5.50% | 5.50% | 5.50% | ||
(1) Investment in securities at cost | $ 614,837 | $ 1,916,228 | $ 84,044 |
| (a) | Amount is less than $500 (not in thousands). |
| * | Net Asset Value and Redemption Price Per Share are calculated using unrounded net assets. |
| SGA International Growth Fund | Silvant Large-Cap Growth Stock Fund | Zevenbergen Innovative Growth Stock Fund | |||
| Assets | |||||
Investment in securities at value(1)(2) | $ 77,502 | $ 138,778 | $ 525,702 | ||
Cash | 1,907 | 822 | 650 | ||
| Receivables | |||||
Investment securities sold | — | 1,046 | 3,786 | ||
Fund shares sold | 219 | 467 | 8,292 | ||
Dividends | 4 | 76 | — (a) | ||
Tax reclaims | 92 | — | — | ||
Securities lending income | — (a) | — (a) | — | ||
Prepaid expenses | 9 | 13 | 21 | ||
Other assets | 9 | 16 | 61 | ||
Total assets | 79,742 | 141,218 | 538,512 | ||
| Liabilities | |||||
| Payables | |||||
Fund shares repurchased | 104 | 24 | 452 | ||
Investment securities purchased | — | 1,466 | 1,800 | ||
Collateral on securities loaned | 540 | 186 | — | ||
Investment advisory fees | 27 | 67 | 282 | ||
Distribution and service fees | 2 | 23 | 27 | ||
Administration and accounting fees | 7 | 13 | 46 | ||
Transfer agent and sub-transfer agent fees and expenses | 24 | 29 | 132 | ||
Professional fees | 25 | 25 | 25 | ||
Trustee deferred compensation plan | 9 | 16 | 61 | ||
Interest expense and/or commitment fees | — (a) | — (a) | 1 | ||
Other accrued expenses | 4 | 5 | 21 | ||
Total liabilities | 742 | 1,854 | 2,847 | ||
Net Assets | $ 79,000 | $ 139,364 | $ 535,665 | ||
| Net Assets Consist of: | |||||
Capital paid in on shares of beneficial interest | $ 66,957 | $ 47,926 | $ 471,963 | ||
Accumulated earnings (loss) | 12,043 | 91,438 | 63,702 | ||
Net Assets | $ 79,000 | $ 139,364 | $ 535,665 | ||
| Net Assets: | |||||
Class A | $ 7,708 | $ 110,076 | $ 127,623 | ||
Class I | $ 64,471 | $ 28,986 | $ 386,061 | ||
Class R6 | $ 6,821 | $ 302 | $ 21,981 | ||
| Shares Outstanding (unlimited number of shares authorized, no par value): | |||||
Class A | 819,305 | 16,411,683 | 3,225,212 | ||
Class I | 6,596,105 | 2,474,393 | 9,037,286 | ||
Class R6 | 692,290 | 25,361 | 512,877 | ||
| Net Asset Value and Redemption Price Per Share:* | |||||
Class A | $ 9.41 | $ 6.71 | $ 39.57 | ||
Class I | $ 9.77 | $ 11.71 | $ 42.72 | ||
Class R6 | $ 9.85 | $ 11.91 | $ 42.86 |
| SGA International Growth Fund | Silvant Large-Cap Growth Stock Fund | Zevenbergen Innovative Growth Stock Fund | |||
| Maximum Offering Price Per Share (NAV/(1-Maximum Sales Charge)): | |||||
Class A | $ 9.96 | $ 7.10 | $ 41.87 | ||
Maximum Sales Charge - Class A | 5.50% | 5.50% | 5.50% | ||
(1) Investment in securities at cost | $ 64,397 | $ 48,284 | $ 309,894 | ||
(2) Market value of securities on loan | $ 530 | $ 176 | $ — |
| (a) | Amount is less than $500 (not in thousands). |
| * | Net Asset Value and Redemption Price Per Share are calculated using unrounded net assets. |
YEAR ENDED December 31, 2023
| Ceredex Large-Cap Value Equity Fund | Ceredex Mid-Cap Value Equity Fund | Ceredex Small-Cap Value Equity Fund | |||
| Investment Income | |||||
Dividends | $ 18,173 | $ 42,861 | $ 4,552 | ||
Securities lending, net of fees | 79 | 563 | — | ||
Foreign taxes withheld | — | — | (76) | ||
Total investment income | 18,252 | 43,424 | 4,476 | ||
| Expenses | |||||
Investment advisory fees | 5,284 | 16,326 | 1,660 | ||
Distribution and service fees, Class A | 260 | 461 | 73 | ||
Distribution and service fees, Class C | 19 | 105 | 6 | ||
Administration and accounting fees | 790 | 2,384 | 206 | ||
Transfer agent fees and expenses | 339 | 1,005 | 86 | ||
Sub-transfer agent fees and expenses, Class A | 146 | 314 | 42 | ||
Sub-transfer agent fees and expenses, Class C | 2 | 4 | — (1) | ||
Sub-transfer agent fees and expenses, Class I | 1,053 | 2,246 | 192 | ||
Custodian fees | 2 | 4 | 1 | ||
Printing fees and expenses | 40 | 167 | 19 | ||
Professional fees | 49 | 91 | 19 | ||
Interest expense and/or commitment fees | 19 | 16 | 4 | ||
Registration fees | 122 | 86 | 40 | ||
Trustees’ fees and expenses | 62 | 200 | 18 | ||
Miscellaneous expenses | 4 | 41 | 17 | ||
Total expenses | 8,191 | 23,450 | 2,383 | ||
Less net expenses reimbursed and/or waived by investment adviser(2) | (1,073) | (560) | (175) | ||
Less low balance account fees | — (1) | — (1) | — | ||
Net expenses | 7,118 | 22,890 | 2,208 | ||
Net investment income (loss) | 11,134 | 20,534 | 2,268 | ||
| Net Realized and Unrealized Gain (Loss) on Investments | |||||
| Net realized gain (loss) from: | |||||
Investments | 11,778 | 19,408 | 20,668 | ||
Foreign currency transactions | — | — | — (1) | ||
Redemption In kind | — | — | 9,800 | ||
| Net change in unrealized appreciation (depreciation) on: | |||||
Investments | 80,276 | 185,238 | (13,764) | ||
Foreign currency transactions | — | 1 | — (1) | ||
Net realized and unrealized gain (loss) on investments | 92,054 | 204,647 | 16,704 | ||
Net increase (decrease) in net assets resulting from operations | $103,188 | $225,181 | $ 18,972 |
| (1) | Amount is less than $500 (not in thousands). |
| (2) | See Note 3D in Notes to Financial Statements. |
| SGA International Growth Fund | Silvant Large-Cap Growth Stock Fund | Zevenbergen Innovative Growth Stock Fund | |||
| Investment Income | |||||
Dividends | $ 881 | $ 845 | $ 337 | ||
Securities lending, net of fees | 2 | 1 | — | ||
Foreign taxes withheld | (68) | (1) | (10) | ||
Total investment income | 815 | 845 | 327 | ||
| Expenses | |||||
Investment advisory fees | 483 | 835 | 3,658 | ||
Distribution and service fees, Class A | 19 | 242 | 291 | ||
Administration and accounting fees | 66 | 129 | 474 | ||
Transfer agent fees and expenses | 27 | 58 | 202 | ||
Sub-transfer agent fees and expenses, Class A | 9 | 68 | 155 | ||
Sub-transfer agent fees and expenses, Class I | 64 | 32 | 361 | ||
Custodian fees | 1 | — (1) | — (1) | ||
Printing fees and expenses | 8 | 11 | 49 | ||
Professional fees | 24 | 40 | 5 | ||
Interest expense and/or commitment fees | — (1) | 3 | 5 | ||
Registration fees | 43 | 30 | 57 | ||
Trustees’ fees and expenses | 4 | 9 | 34 | ||
Miscellaneous expenses | 14 | 13 | 25 | ||
Total expenses | 762 | 1,470 | 5,316 | ||
Less net expenses reimbursed and/or waived by investment adviser(2) | (141) | (47) | (488) | ||
Less low balance account fees | — | — (1) | — (1) | ||
Net expenses | 621 | 1,423 | 4,828 | ||
Net investment income (loss) | 194 | (578) | (4,501) | ||
| Net Realized and Unrealized Gain (Loss) on Investments | |||||
| Net realized gain (loss) from: | |||||
Investments | (531) | 5,178 | (2,649) | ||
Foreign currency transactions | 3 | — | — | ||
| Net change in unrealized appreciation (depreciation) on: | |||||
Investments | 8,960 | 40,560 | 216,476 | ||
Foreign currency transactions | 6 | — | — | ||
Net realized and unrealized gain (loss) on investments | 8,438 | 45,738 | 213,827 | ||
Net increase (decrease) in net assets resulting from operations | $8,632 | $45,160 | $209,326 |
| (1) | Amount is less than $500 (not in thousands). |
| (2) | See Note 3D in Notes to Financial Statements. |
| Ceredex Large-Cap Value Equity Fund | Ceredex Mid-Cap Value Equity Fund | ||||||
| Year Ended December 31, 2023 | Year Ended December 31, 2022 | Year Ended December 31, 2023 | Year Ended December 31, 2022 | ||||
| Increase (Decrease) in Net Assets Resulting from Operations | |||||||
Net investment income (loss) | $ 11,134 | $ 8,565 | $ 20,534 | $ 21,912 | |||
Net realized gain (loss) | 11,778 | 44,688 | 19,408 | (134,426) | |||
Net increase from payment by affiliate | — | 1 | — | — | |||
Net change in unrealized appreciation (depreciation) | 80,276 | (218,055) | 185,239 | (399,599) | |||
Increase (decrease) in net assets resulting from operations | 103,188 | (164,801) | 225,181 | (512,113) | |||
| Dividends and Distributions to Shareholders | |||||||
| Net Investment Income and Net Realized Gains: | |||||||
Class A | (2,518) | (15,377) | (1,594) | (14,235) | |||
Class C | (31) | (248) | (30) | (1,078) | |||
Class I | (10,433) | (37,487) | (16,620) | (114,953) | |||
Class R6 | (6,703) | (30,221) | (7,756) | (53,070) | |||
Total dividends and distributions to shareholders | (19,685) | (83,333) | (26,000) | (183,336) | |||
| Change in Net Assets from Capital Transactions (See Note 5): | |||||||
Class A | (46,730) | (14,369) | (48,373) | (18,022) | |||
Class C | (874) | (172) | (5,781) | (8,179) | |||
Class I | 8,513 | (187,303) | (296,355) | (329,744) | |||
Class R6 | (52,073) | (50,967) | (211,324) | (81,199) | |||
Increase (decrease) in net assets from capital transactions | (91,164) | (252,811) | (561,833) | (437,144) | |||
Net increase (decrease) in net assets | (7,661) | (500,945) | (362,652) | (1,132,593) | |||
| Net Assets | |||||||
Beginning of period | 736,712 | 1,237,657 | 2,557,206 | 3,689,799 | |||
End of Period | $ 729,051 | $ 736,712 | $ 2,194,554 | $ 2,557,206 | |||
| Ceredex Small-Cap Value Equity Fund | SGA International Growth Fund | ||||||
| Year Ended December 31, 2023 | Year Ended December 31, 2022 | Year Ended December 31, 2023 | Year Ended December 31, 2022 | ||||
| Increase (Decrease) in Net Assets Resulting from Operations | |||||||
Net investment income (loss) | $ 2,268 | $ 2,668 | $ 194 | $ —(1) | |||
Net realized gain (loss) | 30,468 | 41,219 | (528) | (315) | |||
Net change in unrealized appreciation (depreciation) | (13,764) | (90,633) | 8,966 | (8,533) | |||
Increase (decrease) in net assets resulting from operations | 18,972 | (46,746) | 8,632 | (8,848) | |||
| Dividends and Distributions to Shareholders | |||||||
| Net Investment Income and Net Realized Gains: | |||||||
Class A | (4,113) | (6,327) | (10) | (288) | |||
Class C | (103) | (172) | — | — | |||
Class I | (5,747) | (30,663) | (184) | (1,582) | |||
Class R6 | (4,837) | (12,393) | (26) | (88) | |||
Total dividends and distributions to shareholders | (14,800) | (49,555) | (220) | (1,958) | |||
| Change in Net Assets from Capital Transactions (See Note 5): | |||||||
Class A | (408) | (11,004) | (1,018) | 1,954 | |||
Class C | (71) | (59) | — | — | |||
Class I | (127,485) | (67,325) | 29,731 | (2,533) | |||
Class R6 | (27,023) | (40,203) | 3,519 | 1,061 | |||
Increase (decrease) in net assets from capital transactions | (154,987) | (118,591) | 32,232 | 482 | |||
Net increase (decrease) in net assets | (150,815) | (214,892) | 40,644 | (10,324) | |||
| Net Assets | |||||||
Beginning of period | 250,964 | 465,856 | 38,356 | 48,680 | |||
End of Period | $ 100,149 | $ 250,964 | $ 79,000 | $ 38,356 | |||
| (1) | Amount is less than $500 (not in thousands). |
| Silvant Large-Cap Growth Stock Fund | Zevenbergen Innovative Growth Stock Fund | ||||||
| Year Ended December 31, 2023 | Year Ended December 31, 2022 | Year Ended December 31, 2023 | Year Ended December 31, 2022 | ||||
| Increase (Decrease) in Net Assets Resulting from Operations | |||||||
Net investment income (loss) | $ (578) | $ (672) | $ (4,501) | $ (5,614) | |||
Net realized gain (loss) | 5,178 | 3,858 | (2,649) | (140,274) | |||
Net change in unrealized appreciation (depreciation) | 40,560 | (43,005) | 216,476 | (379,327) | |||
Increase (decrease) in net assets resulting from operations | 45,160 | (39,819) | 209,326 | (525,215) | |||
| Dividends and Distributions to Shareholders | |||||||
| Net Investment Income and Net Realized Gains: | |||||||
Class A | (3,851) | (5,948) | — | (4,445) | |||
Class I | (598) | (385) | — | (10,257) | |||
Class R6 | (6) | (31) | — | (392) | |||
Total dividends and distributions to shareholders | (4,455) | (6,364) | — | (15,094) | |||
| Change in Net Assets from Capital Transactions (See Note 5): | |||||||
Class A | (3,574) | (1,864) | (14,642) | (39,798) | |||
Class I | 13,665 | (1,116) | 15,918 | (211,843) | |||
Class R6 | 132 | (1,522) | 7,077 | 2,965 | |||
Increase (decrease) in net assets from capital transactions | 10,223 | (4,502) | 8,353 | (248,676) | |||
Net increase (decrease) in net assets | 50,928 | (50,685) | 217,679 | (788,985) | |||
| Net Assets | |||||||
Beginning of period | 88,436 | 139,121 | 317,986 | 1,106,971 | |||
End of Period | $ 139,364 | $ 88,436 | $ 535,665 | $ 317,986 | |||
THROUGHOUT EACH PERIOD
| Net Asset Value, Beginning of Period | Net Investment Income (Loss)(1) | Net Realized and Unrealized Gain (Loss) | Total from Investment Operations | Dividends from Net Investment Income | Distributions from Net Realized Gains | Total Distributions | Payments from Affiliates(1) | Change in Net Asset Value | Net Asset Value, End of Period | Total Return(2)(3) | Net Assets, End of Period (in thousands) | Ratio of Net Expenses to Average Net Assets(4)(5) | Ratio of Gross Expenses to Average Net Assets(4)(5) | Ratio of Net Investment Income (Loss) to Average Net Assets(4) | Portfolio Turnover Rate(2) | ||
| Ceredex Large-Cap Value Equity Fund | |||||||||||||||||
| Class A | |||||||||||||||||
| 1/1/23 to 12/31/23 | $ 9.62 | 0.11 | 1.28 | 1.39 | (0.15) | (0.11) | (0.26) | — | 1.13 | $10.75 | 14.57 % | $ 104,316 | 1.24 % | 1.27 % | 1.12 % | 132 % | |
| 1/1/22 to 12/31/22 | 12.54 | 0.07 | (1.90) | (1.83) | (0.11) | (0.98) | (1.09) | — (6) | (2.92) | 9.62 | (14.34) | 138,781 | 1.26 (7) | 1.28 | 0.64 | 146 | |
| 1/1/21 to 12/31/21 | 13.29 | 0.08 | 3.15 | 3.23 | (0.10) | (3.88) | (3.98) | — | (0.75) | 12.54 | 25.24 | 195,762 | 1.24 (8)(9) | 1.24 | 0.55 | 159 | |
| 1/1/20 to 12/31/20 | 13.70 | 0.13 | 0.21 | 0.34 | (0.14) | (0.61) | (0.75) | — | (0.41) | 13.29 | 3.47 | 185,257 | 1.24 | 1.27 | 1.07 | 193 | |
| 1/1/19 to 12/31/19 | 11.21 | 0.13 | 3.30 | 3.43 | (0.17) | (0.77) | (0.94) | — | 2.49 | 13.70 | 30.56 | 206,528 | 1.24 | 1.29 | 1.04 | 118 | |
| Class C | |||||||||||||||||
| 1/1/23 to 12/31/23 | $ 9.14 | 0.06 | 1.20 | 1.26 | (0.06) | (0.11) | (0.17) | — | 1.09 | $10.23 | 13.95 % | $ 1,581 | 1.72 % | 2.02 % | 0.61 % | 132 % | |
| 1/1/22 to 12/31/22 | 11.95 | 0.02 | (1.80) | (1.78) | (0.05) | (0.98) | (1.03) | — (6) | (2.81) | 9.14 | (14.64) | 2,277 | 1.73 (7) | 1.96 | 0.16 | 146 | |
| 1/1/21 to 12/31/21 | 12.82 | 0.01 | 3.02 | 3.03 | (0.02) | (3.88) | (3.90) | — | (0.87) | 11.95 | 24.57 | 3,294 | 1.72 | 1.92 | 0.06 | 159 | |
| 1/1/20 to 12/31/20 | 13.26 | 0.07 | 0.19 | 0.26 | (0.09) | (0.61) | (0.70) | — | (0.44) | 12.82 | 2.98 | 4,486 | 1.72 | 1.94 | 0.61 | 193 | |
| 1/1/19 to 12/31/19 | 10.86 | 0.06 | 3.20 | 3.26 | (0.09) | (0.77) | (0.86) | — | 2.40 | 13.26 | 30.00 | 5,531 | 1.72 | 1.94 | 0.51 | 118 | |
| Class I | |||||||||||||||||
| 1/1/23 to 12/31/23 | $ 9.86 | 0.14 | 1.31 | 1.45 | (0.16) | (0.11) | (0.27) | — | 1.18 | $11.04 | 14.87 % | $ 380,748 | 0.97 % | 1.12 % | 1.42 % | 132 % | |
| 1/1/22 to 12/31/22 | 12.79 | 0.10 | (1.93) | (1.83) | (0.12) | (0.98) | (1.10) | — (6) | (2.93) | 9.86 | (14.07) | 327,199 | 0.98 (7) | 1.08 | 0.88 | 146 | |
| 1/1/21 to 12/31/21 | 13.50 | 0.12 | 3.20 | 3.32 | (0.15) | (3.88) | (4.03) | — | (0.71) | 12.79 | 25.48 | 632,220 | 0.97 | 1.00 | 0.82 | 159 | |
| 1/1/20 to 12/31/20 | 13.88 | 0.16 | 0.22 | 0.38 | (0.15) | (0.61) | (0.76) | — | (0.38) | 13.50 | 3.76 | 594,834 | 0.97 | 1.03 | 1.33 | 193 | |
| 1/1/19 to 12/31/19 | 11.34 | 0.17 | 3.34 | 3.51 | (0.20) | (0.77) | (0.97) | — | 2.54 | 13.88 | 30.94 | 668,846 | 0.97 | 1.04 | 1.30 | 118 | |
| Class R6 | |||||||||||||||||
| 1/1/23 to 12/31/23 | $ 9.99 | 0.17 | 1.32 | 1.49 | (0.20) | (0.11) | (0.31) | — | 1.18 | $11.17 | 15.09 % | $ 242,406 | 0.72 % | 0.87 % | 1.65 % | 132 % | |
| 1/1/22 to 12/31/22 | 12.96 | 0.13 | (1.96) | (1.83) | (0.16) | (0.98) | (1.14) | — (6) | (2.97) | 9.99 | (13.85) | 268,455 | 0.73 (7) | 0.87 | 1.14 | 146 | |
| 1/1/21 to 12/31/21 | 13.61 | 0.16 | 3.23 | 3.39 | (0.16) | (3.88) | (4.04) | — | (0.65) | 12.96 | 25.85 | 406,381 | 0.72 | 0.83 | 1.05 | 159 | |
| 1/1/20 to 12/31/20 | 13.96 | 0.19 | 0.23 | 0.42 | (0.16) | (0.61) | (0.77) | — | (0.35) | 13.61 | 4.03 | 511,344 | 0.72 | 0.86 | 1.57 | 193 | |
| 1/1/19 to 12/31/19 | 11.39 | 0.21 | 3.36 | 3.57 | (0.23) | (0.77) | (1.00) | — | 2.57 | 13.96 | 31.33 | 404,305 | 0.72 | 0.85 | 1.55 | 118 | |
| Ceredex Mid-Cap Value Equity Fund | |||||||||||||||||
| Class A | |||||||||||||||||
| 1/1/23 to 12/31/23 | $10.51 | 0.06 | 1.06 | 1.12 | (0.11) | — | (0.11) | — | 1.01 | $11.52 | 10.63 % | $ 175,541 | 1.29 % (9) | 1.29 % | 0.56 % | 140 % | |
| 1/1/22 to 12/31/22 | 13.14 | 0.05 | (1.98) | (1.93) | (0.07) | (0.63) | (0.70) | — | (2.63) | 10.51 | (14.22) | 208,364 | 1.29 (7)(9) | 1.29 | 0.45 | 166 | |
| 1/1/21 to 12/31/21 | 12.15 | 0.01 | 3.42 | 3.43 | — | (2.44) | (2.44) | — | 0.99 | 13.14 | 28.73 | 280,185 | 1.28 (9) | 1.28 | 0.05 | 157 | |
| 1/1/20 to 12/31/20 | 12.69 | 0.07 | (0.31) | (0.24) | (0.09) | (0.21) | (0.30) | — | (0.54) | 12.15 | (1.52) | 282,186 | 1.31 (9) | 1.31 | 0.66 | 179 | |
| 1/1/19 to 12/31/19 | 10.11 | 0.09 | 3.21 | 3.30 | (0.10) | (0.62) | (0.72) | — | 2.58 | 12.69 | 32.63 | 362,322 | 1.34 (8)(9) | 1.30 | 0.73 | 121 | |
| Class C | |||||||||||||||||
| 1/1/23 to 12/31/23 | $10.08 | 0.01 | 1.01 | 1.02 | (0.04) | — | (0.04) | — | 0.98 | $11.06 | 10.10 % | $ 8,833 | 1.76 % | 1.91 % | 0.07 % | 140 % | |
| 1/1/22 to 12/31/22 | 12.63 | (0.01) | (1.89) | (1.90) | (0.02) | (0.63) | (0.65) | — | (2.55) | 10.08 | (14.62) | 13,743 | 1.80 (7) | 2.01 | (0.12) | 166 | |
| 1/1/21 to 12/31/21 | 11.82 | (0.06) | 3.31 | 3.25 | — | (2.44) | (2.44) | — | 0.81 | 12.63 | 28.01 | 26,690 | 1.79 | 1.97 | (0.46) | 157 | |
| 1/1/20 to 12/31/20 | 12.36 | 0.02 | (0.30) | (0.28) | (0.05) | (0.21) | (0.26) | — | (0.54) | 11.82 | (1.88) | 31,476 | 1.79 | 1.98 | 0.20 | 179 | |
| 1/1/19 to 12/31/19 | 9.84 | 0.03 | 3.13 | 3.16 | (0.02) | (0.62) | (0.64) | — | 2.52 | 12.36 | 32.08 | 45,867 | 1.79 | 1.95 | 0.26 | 121 |
| Net Asset Value, Beginning of Period | Net Investment Income (Loss)(1) | Net Realized and Unrealized Gain (Loss) | Total from Investment Operations | Dividends from Net Investment Income | Distributions from Net Realized Gains | Total Distributions | Payments from Affiliates(1) | Change in Net Asset Value | Net Asset Value, End of Period | Total Return(2)(3) | Net Assets, End of Period (in thousands) | Ratio of Net Expenses to Average Net Assets(4)(5) | Ratio of Gross Expenses to Average Net Assets(4)(5) | Ratio of Net Investment Income (Loss) to Average Net Assets(4) | Portfolio Turnover Rate(2) | ||
| Ceredex Mid-Cap Value Equity Fund (Continued) | |||||||||||||||||
| Class I | |||||||||||||||||
| 1/1/23 to 12/31/23 | $10.76 | 0.09 | 1.09 | 1.18 | (0.14) | — | (0.14) | — | 1.04 | $11.80 | 10.97 % | $1,441,449 | 1.02 % (9) | 1.02 % | 0.85 % | 140 % | |
| 1/1/22 to 12/31/22 | 13.41 | 0.08 | (2.01) | (1.93) | (0.09) | (0.63) | (0.72) | — | (2.65) | 10.76 | (13.92) | 1,608,611 | 1.02 (7)(9) | 1.02 | 0.70 | 166 | |
| 1/1/21 to 12/31/21 | 12.37 | 0.05 | 3.48 | 3.53 | (0.05) | (2.44) | (2.49) | — | 1.04 | 13.41 | 28.99 | 2,383,753 | 1.00 (9) | 1.00 | 0.34 | 157 | |
| 1/1/20 to 12/31/20 | 12.89 | 0.10 | (0.31) | (0.21) | (0.10) | (0.21) | (0.31) | — | (0.52) | 12.37 | (1.20) | 2,135,663 | 1.04 (9) | 1.04 | 0.92 | 179 | |
| 1/1/19 to 12/31/19 | 10.25 | 0.13 | 3.26 | 3.39 | (0.13) | (0.62) | (0.75) | — | 2.64 | 12.89 | 33.08 | 2,469,800 | 1.04 (9) | 1.04 | 1.04 | 121 | |
| Class R6 | |||||||||||||||||
| 1/1/23 to 12/31/23 | $10.81 | 0.12 | 1.09 | 1.21 | (0.16) | — | (0.16) | — | 1.05 | $11.86 | 11.21 % | $ 568,731 | 0.79 % | 0.87 % | 1.06 % | 140 % | |
| 1/1/22 to 12/31/22 | 13.48 | 0.11 | (2.03) | (1.92) | (0.12) | (0.63) | (0.75) | — | (2.67) | 10.81 | (13.76) | 726,488 | 0.80 (7) | 0.88 | 0.94 | 166 | |
| 1/1/21 to 12/31/21 | 12.42 | 0.08 | 3.50 | 3.58 | (0.08) | (2.44) | (2.52) | — | 1.06 | 13.48 | 29.34 | 999,171 | 0.79 | 0.85 | 0.54 | 157 | |
| 1/1/20 to 12/31/20 | 12.92 | 0.13 | (0.31) | (0.18) | (0.11) | (0.21) | (0.32) | — | (0.50) | 12.42 | (0.97) | 773,153 | 0.79 | 0.88 | 1.16 | 179 | |
| 1/1/19 to 12/31/19 | 10.27 | 0.16 | 3.26 | 3.42 | (0.15) | (0.62) | (0.77) | — | 2.65 | 12.92 | 33.31 | 820,153 | 0.79 | 0.87 | 1.28 | 121 | |
| Ceredex Small-Cap Value Equity Fund | |||||||||||||||||
| Class A | |||||||||||||||||
| 1/1/23 to 12/31/23 | $ 7.15 | 0.07 | 0.92 | 0.99 | (0.27) | (0.84) | (1.11) | — | (0.12) | $ 7.03 | 14.30 % | $ 29,003 | 1.45 % | 1.46 % | 0.91 % | 94 % | |
| 1/1/22 to 12/31/22 | 9.88 | 0.05 | (1.11) | (1.06) | (0.06) | (1.61) | (1.67) | — | (2.73) | 7.15 | (10.31) | 29,680 | 1.47 (7) | 1.50 | 0.52 | 73 | |
| 1/1/21 to 12/31/21 | 9.31 | 0.04 | 2.41 | 2.45 | (0.09) | (1.79) | (1.88) | — | 0.57 | 9.88 | 26.91 | 53,388 | 1.45 (10) | 1.46 | 0.39 | 69 | |
| 1/1/20 to 12/31/20 | 9.38 | 0.02 | 0.02 | 0.04 | (0.03) | (0.08) | (0.11) | — | (0.07) | 9.31 | 0.62 | 54,984 | 1.48 (9) | 1.48 | 0.29 | 69 | |
| 1/1/19 to 12/31/19 | 8.45 | 0.09 | 1.37 | 1.46 | (0.14) | (0.39) | (0.53) | — | 0.93 | 9.38 | 17.21 | 70,847 | 1.47 (9) | 1.47 | 0.99 | 42 | |
| Class C | |||||||||||||||||
| 1/1/23 to 12/31/23 | $ 5.75 | 0.03 | 0.74 | 0.77 | (0.27) | (0.84) | (1.11) | — | (0.34) | $ 5.41 | 13.95 % | $ 548 | 1.80 % | 2.15 % | 0.53 % | 94 % | |
| 1/1/22 to 12/31/22 | 8.38 | 0.01 | (0.94) | (0.93) | (0.09) | (1.61) | (1.70) | — | (2.63) | 5.75 | (10.67) | 646 | 1.83 (7) | 2.28 | 0.19 | 73 | |
| 1/1/21 to 12/31/21 | 8.11 | 0.01 | 2.08 | 2.09 | (0.03) | (1.79) | (1.82) | — | 0.27 | 8.38 | 26.42 | 987 | 1.84 (10) | 2.20 | 0.06 | 69 | |
| 1/1/20 to 12/31/20 | 8.19 | (0.01) | 0.01 | — | — | (0.08) | (0.08) | — | (0.08) | 8.11 | 0.23 | 2,410 | 1.90 (10) | 2.19 | (0.19) | 69 | |
| 1/1/19 to 12/31/19 | 7.41 | 0.05 | 1.19 | 1.24 | (0.07) | (0.39) | (0.46) | — | 0.78 | 8.19 | 16.66 | 5,457 | 1.90 | 2.14 | 0.61 | 42 | |
| Class I | |||||||||||||||||
| 1/1/23 to 12/31/23 | $ 7.66 | 0.09 | 1.00 | 1.09 | (0.05) | (0.84) | (0.89) | — | 0.20 | $ 7.86 | 14.70 % | $ 35,343 | 1.14 % | 1.22 % | 1.11 % | 94 % | |
| 1/1/22 to 12/31/22 | 10.48 | 0.08 | (1.18) | (1.10) | (0.11) | (1.61) | (1.72) | — | (2.82) | 7.66 | (10.09) | 159,199 | 1.17 (7) | 1.25 | 0.83 | 73 | |
| 1/1/21 to 12/31/21 | 9.77 | 0.08 | 2.53 | 2.61 | (0.11) | (1.79) | (1.90) | — | 0.71 | 10.48 | 27.20 | 282,308 | 1.18 (10) | 1.20 | 0.68 | 69 | |
| 1/1/20 to 12/31/20 | 9.83 | 0.04 | 0.03 | 0.07 | (0.05) | (0.08) | (0.13) | — | (0.06) | 9.77 | 0.91 | 332,391 | 1.21 (10) | 1.21 | 0.55 | 69 | |
| 1/1/19 to 12/31/19 | 8.83 | 0.13 | 1.42 | 1.55 | (0.16) | (0.39) | (0.55) | — | 1.00 | 9.83 | 17.58 | 460,284 | 1.20 (9) | 1.20 | 1.26 | 42 | |
| Class R6 | |||||||||||||||||
| 1/1/23 to 12/31/23 | $ 7.69 | 0.12 | 1.00 | 1.12 | (0.29) | (0.84) | (1.13) | — | (0.01) | $ 7.68 | 14.97 % | $ 35,255 | 0.87 % | 1.06 % | 1.47 % | 94 % | |
| 1/1/22 to 12/31/22 | 10.48 | 0.10 | (1.17) | (1.07) | (0.11) | (1.61) | (1.72) | — | (2.79) | 7.69 | (9.79) | 61,439 | 0.89 (7) | 1.06 | 1.06 | 73 | |
| 1/1/21 to 12/31/21 | 9.79 | 0.11 | 2.54 | 2.65 | (0.17) | (1.79) | (1.96) | — | 0.69 | 10.48 | 27.61 | 129,173 | 0.88 | 1.03 | 0.94 | 69 | |
| 1/1/20 to 12/31/20 | 9.84 | 0.10 | — (6) | 0.10 | (0.07) | (0.08) | (0.15) | — | (0.05) | 9.79 | 1.19 | 89,961 | 0.88 | 1.05 | 1.19 | 69 | |
| 2/26/19 (11) to 12/31/19 | 10.04 | 0.15 | 0.22 | 0.37 | (0.18) | (0.39) | (0.57) | — | (0.20) | 9.84 | 3.69 | 16,798 | 0.88 | 1.04 | 1.83 | 42 (12) |
| Net Asset Value, Beginning of Period | Net Investment Income (Loss)(1) | Net Realized and Unrealized Gain (Loss) | Total from Investment Operations | Dividends from Net Investment Income | Distributions from Net Realized Gains | Total Distributions | Payments from Affiliates(1) | Change in Net Asset Value | Net Asset Value, End of Period | Total Return(2)(3) | Net Assets, End of Period (in thousands) | Ratio of Net Expenses to Average Net Assets(4)(5) | Ratio of Gross Expenses to Average Net Assets(4)(5) | Ratio of Net Investment Income (Loss) to Average Net Assets(4) | Portfolio Turnover Rate(2) | ||
| SGA International Growth Fund | |||||||||||||||||
| Class A | |||||||||||||||||
| 1/1/23 to 12/31/23 | $ 8.05 | 0.01 | 1.36 | 1.37 | — | (0.01) | (0.01) | — | 1.36 | $ 9.41 | 17.05 % | $ 7,708 | 1.32 % | 1.57 % | 0.09 % | 10 % | |
| 1/1/22 to 12/31/22 | 10.45 | (0.02) | (1.94) | (1.96) | — | (0.44) | (0.44) | — | (2.40) | 8.05 | (18.42) | 7,530 | 1.33 (7) | 1.62 | (0.20) | 36 | |
| 1/1/21 to 12/31/21 | 10.42 | (0.04) | 0.90 | 0.86 | — | (0.83) | (0.83) | — | 0.03 | 10.45 | 8.36 | 7,129 | 1.32 | 1.55 | (0.39) | 44 | |
| 1/1/20 to 12/31/20 | 10.50 | (0.03) | 2.02 | 1.99 | — | (2.07) | (2.07) | — | (0.08) | 10.42 | 22.86 | 6,917 | 1.41 (7)(10) | 1.60 | (0.36) | 53 | |
| 1/1/19 to 12/31/19 | 10.95 | (0.02) | 2.92 | 2.90 | — | (3.35) | (3.35) | — | (0.45) | 10.50 | 28.28 | 6,376 | 1.46 (7)(10)(13) | 1.52 | (0.20) | 147 (14) | |
| Class I | |||||||||||||||||
| 1/1/23 to 12/31/23 | $ 8.36 | 0.03 | 1.41 | 1.44 | (0.02) | (0.01) | (0.03) | — | 1.41 | $ 9.77 | 17.25 % | $ 64,471 | 1.07 % | 1.32 % | 0.37 % | 10 % | |
| 1/1/22 to 12/31/22 | 10.80 | — (6) | (2.00) | (2.00) | — | (0.44) | (0.44) | — | (2.44) | 8.36 | (18.19) | 28,164 | 1.08 (7) | 1.37 | 0.03 | 36 | |
| 1/1/21 to 12/31/21 | 10.72 | (0.02) | 0.93 | 0.91 | — | (0.83) | (0.83) | — | 0.08 | 10.80 | 8.59 | 39,493 | 1.07 | 1.29 | (0.14) | 44 | |
| 1/1/20 to 12/31/20 | 10.71 | (0.01) | 2.09 | 2.08 | — | (2.07) | (2.07) | — | 0.01 | 10.72 | 23.28 | 40,249 | 1.16 (7)(10) | 1.35 | (0.13) | 53 | |
| 1/1/19 to 12/31/19 | 11.13 | — (6) | 2.97 | 2.97 | (0.04) | (3.35) | (3.39) | — | (0.42) | 10.71 | 28.49��� | 35,641 | 1.25 (7)(10)(13) | 1.30 | 0.01 | 147 (14) | |
| Class R6 | |||||||||||||||||
| 1/1/23 to 12/31/23 | $ 8.42 | 0.04 | 1.43 | 1.47 | (0.03) | (0.01) | (0.04) | — | 1.43 | $ 9.85 | 17.53 % | $ 6,821 | 0.95 % | 1.18 % | 0.45 % | 10 % | |
| 1/1/22 to 12/31/22 | 10.87 | 0.01 | (2.02) | (2.01) | — | (0.44) | (0.44) | — | (2.45) | 8.42 | (18.17) | 2,662 | 0.97 (7) | 1.26 | 0.16 | 36 | |
| 1/1/21 to 12/31/21 | 10.77 | — (6) | 0.93 | 0.93 | — | (0.83) | (0.83) | — | 0.10 | 10.87 | 8.74 | 2,058 | 0.95 | 1.19 | (0.03) | 44 | |
| 1/1/20 to 12/31/20 | 10.74 | — (6) | 2.10 | 2.10 | — | (2.07) | (2.07) | — | 0.03 | 10.77 | 23.41 | 831 | 1.07 (7)(10) | 1.25 | 0.05 | 53 | |
| 1/1/19 to 12/31/19 | 11.15 | — (6) | 2.99 | 2.99 | (0.05) | (3.35) | (3.40) | — | (0.41) | 10.74 | 28.59 | 48 | 1.16 (7)(10)(13) | 1.25 | (0.02) | 147 (14) | |
| Silvant Large-Cap Growth Stock Fund | |||||||||||||||||
| Class A | |||||||||||||||||
| 1/1/23 to 12/31/23 | $ 4.67 | (0.03) | 2.31 | 2.28 | — | (0.24) | (0.24) | — | 2.04 | $ 6.71 | 48.98 % | $ 110,076 | 1.24 % (7) | 1.27 % | (0.53) % | 17 % | |
| 1/1/22 to 12/31/22 | 7.12 | (0.04) | (2.05) | (2.09) | — | (0.36) | (0.36) | — | (2.45) | 4.67 | (29.42) | 79,935 | 1.24 (7) | 1.27 | (0.66) | 3 | |
| 1/1/21 to 12/31/21 | 6.50 | (0.05) | 1.55 | 1.50 | — | (0.88) | (0.88) | — | 0.62 | 7.12 | 23.74 | 123,191 | 1.23 | 1.24 | (0.75) | 5 | |
| 1/1/20 to 12/31/20 | 5.37 | (0.03) | 1.91 | 1.88 | — | (0.75) | (0.75) | — | 1.13 | 6.50 | 35.90 | 110,884 | 1.23 | 1.27 | (0.49) | 13 | |
| 1/1/19 to 12/31/19 | 4.60 | (0.01) | 1.55 | 1.54 | — | (0.77) | (0.77) | — | 0.77 | 5.37 | 33.95 | 92,556 | 1.23 | 1.26 | (0.25) | 15 | |
| Class I | |||||||||||||||||
| 1/1/23 to 12/31/23 | $ 8.01 | (0.03) | 3.97 | 3.94 | — | (0.24) | (0.24) | — | 3.70 | $11.71 | 49.28 % | $ 28,986 | 0.98 % (7) | 1.08 % | (0.29) % | 17 % | |
| 1/1/22 to 12/31/22 | 11.82 | (0.04) | (3.41) | (3.45) | — | (0.36) | (0.36) | — | (3.81) | 8.01 | (29.23) | 8,399 | 0.98 (7) | 1.08 | (0.41) | 3 | |
| 1/1/21 to 12/31/21 | 10.28 | (0.05) | 2.47 | 2.42 | — | (0.88) | (0.88) | — | 1.54 | 11.82 | 23.97 | 13,693 | 0.97 | 1.06 | (0.48) | 5 | |
| 1/1/20 to 12/31/20 | 8.12 | (0.02) | 2.93 | 2.91 | — | (0.75) | (0.75) | — | 2.16 | 10.28 | 36.43 | 15,093 | 0.97 | 1.09 | (0.23) | 13 | |
| 1/1/19 to 12/31/19 | 6.63 | — (6) | 2.26 | 2.26 | — | (0.77) | (0.77) | — | 1.49 | 8.12 | 34.41 | 15,720 | 0.97 | 1.12 | 0.01 | 15 | |
| Class R6 | |||||||||||||||||
| 1/1/23 to 12/31/23 | $ 8.14 | (0.02) | 4.03 | 4.01 | — | (0.24) | (0.24) | — | 3.77 | $11.91 | 49.35 % | $ 302 | 0.91 % (7) | 0.96 % | (0.20) % | 17 % | |
| 1/1/22 to 12/31/22 | 11.98 | (0.03) | (3.45) | (3.48) | — | (0.36) | (0.36) | — | (3.84) | 8.14 | (29.08) | 102 | 0.91 (7) | 0.94 | (0.35) | 3 | |
| 1/1/21 to 12/31/21 | 10.40 | (0.05) | 2.51 | 2.46 | — | (0.88) | (0.88) | — | 1.58 | 11.98 | 24.08 | 2,237 | 0.90 | 0.91 | (0.42) | 5 | |
| 1/1/20 to 12/31/20 | 8.21 | (0.01) | 2.95 | 2.94 | — | (0.75) | (0.75) | — | 2.19 | 10.40 | 36.39 | 348 | 0.90 | 0.96 | (0.16) | 13 | |
| 1/1/19 to 12/31/19 | 6.69 | 0.01 | 2.28 | 2.29 | — | (0.77) | (0.77) | — | 1.52 | 8.21 | 34.57 | 165 | 0.90 | 0.98 | 0.08 | 15 |
| Net Asset Value, Beginning of Period | Net Investment Income (Loss)(1) | Net Realized and Unrealized Gain (Loss) | Total from Investment Operations | Dividends from Net Investment Income | Distributions from Net Realized Gains | Total Distributions | Payments from Affiliates(1) | Change in Net Asset Value | Net Asset Value, End of Period | Total Return(2)(3) | Net Assets, End of Period (in thousands) | Ratio of Net Expenses to Average Net Assets(4)(5) | Ratio of Gross Expenses to Average Net Assets(4)(5) | Ratio of Net Investment Income (Loss) to Average Net Assets(4) | Portfolio Turnover Rate(2) | ||
| Zevenbergen Innovative Growth Stock Fund | |||||||||||||||||
| Class A | |||||||||||||||||
| 1/1/23 to 12/31/23 | $23.96 | (0.39) | 16.00 | 15.61 | — | — | — | — | 15.61 | $39.57 | 65.15 % | $ 127,623 | 1.24 % | 1.37 % | (1.17) % | 20 % | |
| 1/1/22 to 12/31/22 | 56.07 | (0.43) | (30.57) | (31.00) | — | (1.11) | (1.11) | — | (32.11) | 23.96 | (55.42) | 87,437 | 1.27 (7) | 1.40 | (1.26) | 17 | |
| 1/1/21 to 12/31/21 | 62.40 | (0.75) | (5.58) | (6.33) | — | — | — | — | (6.33) | 56.07 | (10.14) | 266,661 | 1.25 | 1.32 | (1.24) | 53 | |
| 1/1/20 to 12/31/20 | 28.48 | (0.55) | 34.47 | 33.92 | — | — | — | — | 33.92 | 62.40 | 119.10 | 335,809 | 1.25 | 1.33 | (1.18) | 33 | |
| 1/1/19 to 12/31/19 | 20.83 | (0.32) | 7.97 | 7.65 | — | — | — | — | 7.65 | 28.48 | 36.73 | 46,655 | 1.26 (15) | 1.41 | (1.20) | 91 | |
| Class I | |||||||||||||||||
| 1/1/23 to 12/31/23 | $25.80 | (0.33) | 17.25 | 16.92 | — | — | — | — | 16.92 | $42.72 | 65.58 % | $ 386,061 | 0.99 % | 1.09 % | (0.92) % | 20 % | |
| 1/1/22 to 12/31/22 | 60.05 | (0.37) | (32.77) | (33.14) | — | (1.11) | (1.11) | — | (34.25) | 25.80 | (55.31) | 221,530 | 1.02 (7) | 1.16 | (1.01) | 17 | |
| 1/1/21 to 12/31/21 | 66.67 | (0.64) | (5.98) | (6.62) | — | — | — | — | (6.62) | 60.05 | (9.93) | 823,212 | 1.00 | 1.05 | (0.99) | 53 | |
| 1/1/20 to 12/31/20 | 30.35 | (0.47) | 36.79 | 36.32 | — | — | — | — | 36.32 | 66.67 | 119.67 | 1,037,368 | 1.00 | 1.07 | (0.93) | 33 | |
| 1/1/19 to 12/31/19 | 22.15 | (0.26) | 8.46 | 8.20 | — | — | — | — | 8.20 | 30.35 | 37.02 | 90,136 | 1.01 (15) | 1.15 | (0.94) | 91 | |
| Class R6 | |||||||||||||||||
| 1/1/23 to 12/31/23 | $25.86 | (0.30) | 17.30 | 17.00 | — | — | — | — | 17.00 | $42.86 | 65.74 % | $ 21,981 | 0.89 % | 0.98 % | (0.82) % | 20 % | |
| 1/1/22 to 12/31/22 | 60.12 | (0.32) | (32.83) | (33.15) | — | (1.11) | (1.11) | — | (34.26) | 25.86 | (55.26) | 9,019 | 0.92 (7) | 1.01 | (0.91) | 17 | |
| 1/1/21 to 12/31/21 | 66.67 | (0.58) | (5.97) | (6.55) | — | — | — | — | (6.55) | 60.12 | (9.82) | 17,098 | 0.90 | 0.95 | (0.90) | 53 | |
| 10/20/20 (11) to 12/31/20 | 58.00 | (0.10) | 8.77 | 8.67 | — | — | — | — | 8.67 | 66.67 | 14.95 | 115 | 0.90 | 1.03 | (0.83) | 33 (12) |
| Footnote Legend: | |
| (1) | Calculated using average shares outstanding. |
| (2) | Not annualized for periods less than one year. |
| (3) | Sales charges, where applicable, are not reflected in the total return calculation. |
| (4) | Annualized for periods less than one year. |
| (5) | The Funds will also indirectly bear their prorated share of expenses of any underlying funds in which they invest. Such expenses are not included in the calculation of this ratio. |
| (6) | Amount is less than $0.005 per share. |
| (7) | Net expense ratio includes extraordinary proxy expenses. |
| (8) | See Note 3D in Notes to Financial Statements for information on recapture of expenses previously reimbursed. |
| (9) | The share class is currently under its expense limitation. |
| (10) | Due to a change in expense cap, the ratio shown is a blended expense ratio. |
| (11) | Inception date. |
| (12) | Portfolio turnover is representative of the Fund for the entire period. |
| (13) | Ratios of total expenses excluding interest expense on borrowings for the year ended December 31, 2019 were 1.45% (Class A), 1.24% (Class I) and 1.15% (Class R6). |
| (14) | The Fund’s portfolio turnover rate increased substantially during the year ended December 31, 2019 due to a change in the Fund’s subadviser and associated repositioning. |
| (15) | Ratios of total expenses excluding interest expense on borrowings for the year ended December 31, 2019 were 1.25% (Class A) and 1.00% (Class I). |
NOTES TO FINANCIAL STATEMENTS
December 31, 2023
| A. | Security Valuation |
| The Funds’ Board of Trustees has designated the investment adviser as the valuation designee to perform fair valuations pursuant to Rule 2a-5 under the Investment Company Act of 1940. Each Fund utilizes a fair value hierarchy which prioritizes the inputs to valuation techniques used to measure fair value into three broad levels. The Funds’ policy is to recognize transfers into or out of Level 3 at the end of the reporting period. |
| B. | Security Transactions and Investment Income |
| Security transactions are recorded on the trade date. Realized gains and losses from the sale of securities are determined on the identified cost basis. Dividend income and capital gain distributions are recognized on the ex-dividend date or, in the case of certain foreign securities, as soon as a Fund is notified. Interest income is recorded on the accrual basis. Each Fund amortizes premiums and accretes discounts using the effective interest method. Any distributions from underlying funds are recorded in accordance with the character of the distributions as designated by the underlying funds. | |
| Dividend income from REITs is recorded using management’s estimate of the percentage of income included in distributions received from such investments based on historical information and other industry sources. The return of capital portion of the estimate is a reduction to investment income and a reduction in the cost basis of each investment which increases net realized gain (loss) and net change in unrealized appreciation (depreciation). If the return of capital distributions exceed their cost basis, the distributions are treated as realized gains. The actual amounts of income, return of capital, and capital gains are only determined by each REIT after its fiscal year-end, and may differ from the estimated amounts. | |
| C. | Income Taxes |
| Each Fund is treated as a separate taxable entity. It is the intention of each Fund to comply with the requirements of Subchapter M of the Internal Revenue Code of 1986, as amended (the “Code”) and to distribute substantially all of its taxable income to its shareholders. Therefore, no provision for federal income taxes or excise taxes has been made. | |
| Certain Funds may be subject to foreign taxes on income, gains on investments or currency repatriation, a portion of which may be recoverable. Each Fund will accrue such taxes and recoveries as applicable based upon current interpretations of the tax rules and regulations that exist in the markets in which it invests. | |
| Management of the Funds has concluded that there are no significant uncertain tax positions that would require recognition in the financial statements. Each Fund’s U.S. federal income tax return is generally subject to examination by the Internal Revenue Service for a period of three |
| years after it is filed. State, local and/or non-U.S. tax returns and/or other filings may be subject to examination for different periods, depending upon the tax rules of each applicable jurisdiction. | |
| D. | Distributions to Shareholders |
| Distributions are recorded by each Fund on the ex-dividend date. Income and capital gain distributions are determined in accordance with income tax regulations which may differ from U.S. GAAP. | |
| E. | Expenses |
| Expenses incurred together by a Fund and other affiliated mutual funds are allocated in proportion to the net assets of each such fund, except where allocation of direct expenses to each Fund and each such other fund, or an alternative allocation method, can be more appropriately used. | |
| In addition to the net annual operating expenses that a Fund bears directly, the shareholders of a Fund indirectly bear the pro-rata expenses of any underlying mutual funds in which the Fund invests. | |
| F. | Foreign Currency Transactions |
| Non-U.S. investment securities and other assets and liabilities denominated in foreign currencies are translated into U.S. dollar amounts at the foreign currency exchange rate effective at the end of the reporting period. Cost of investments is translated at the currency exchange rate effective at the trade date. The gain or loss resulting from a change in currency exchange rates between the trade and settlement date of a portfolio transaction is treated as a gain or loss on foreign currency. Likewise, the gain or loss resulting from a change in currency exchange rates between the date income is accrued and the date it is paid is treated as a gain or loss on foreign currency. For fixed income instruments, the Funds bifurcate that portion of the results of operations arising from changes in foreign exchange rates on investments from the fluctuations arising from changes in the market prices of securities held and such fluctuations are included with the net realized and unrealized gain or loss on foreign currency transactions. For equity securities, the Funds do not isolate that portion of the results of operations arising from changes in foreign exchange rates on investments from the fluctuations arising from changes in the market prices of securities held and such fluctuations are included with the net realized and unrealized gain or loss on investments. | |
| G. | Securities Lending |
| The Funds may loan securities to qualified brokers through a securities lending agency agreement with The Bank of New York Mellon (“BNYM”). Under the securities lending policy, when lending securities a Fund is required to maintain collateral with a market value not less than 100% of the market value of loaned securities. Collateral is adjusted daily in connection with changes in the market value of securities on loan bringing the collateral market value in line with the required percent. Due to timing of collateral adjustments, the market value of collateral held with respect to a loaned security, may be more or less than the value of the security on loan. |
| Fund | Value of Securities on Loan | Cash Collateral Received(1) | Net Amount(2) | |||
SGA International Growth Fund | $ 530 | $ 530 | $ — | |||
Silvant Large-Cap Growth Stock Fund | 176 | 176 | — |
| (1) | Collateral received in excess of the value of securities on loan is not presented in this table. The cash collateral received in connection with securities lending transactions has been used for the purchase of securities as disclosed in the Fund’s Schedule of Investments. |
| (2) | Net amount represents the net amount receivable due from the counterparty in the event of default. |
| Fund | Investment of Cash Collateral | Overnight and Continuous | ||
SGA International Growth Fund | Money Market Mutual Fund | $540 | ||
Silvant Large-Cap Growth Stock Fund | Money Market Mutual Fund | 186 |
| A. | Investment Adviser |
| Virtus Fund Advisers, LLC (the “Adviser”), an indirect, wholly-owned subsidiary of Virtus Investment Partners, Inc. (“Virtus”), is the investment adviser to the Funds. The Adviser manages the Funds’ investment programs and general operations of the Funds, including oversight of the Funds’ subadvisers. | |
| As compensation for its services to the Funds, the Adviser is entitled to a fee, which is calculated daily and paid monthly based upon the following annual rates as a percentage of the average daily net assets of each Fund: |
| First $500 Million | |
Ceredex Large-Cap Value Equity Fund | 0.70 % |
Ceredex Mid-Cap Value Equity Fund | 0.75 |
Ceredex Small-Cap Value Equity Fund | 0.85 |
SGA International Growth Fund | 0.85 |
Silvant Large-Cap Growth Stock Fund | 0.70 |
Zevenbergen Innovative Growth Stock Fund | 0.80 |
| B. | Subadvisers |
| The subadvisers manage the investments of each Fund for which they are paid a fee by the Adviser. A list of the subadvisers and the Funds they serve as of the end of the year is as follows: |
| Fund | Subadviser | |
Ceredex Large-Cap Value Equity Fund | Ceredex (1) | |
Ceredex Mid-Cap Value Equity Fund | Ceredex (1) | |
Ceredex Small-Cap Value Equity Fund | Ceredex (1) | |
SGA International Growth Fund | SGA (2) | |
Silvant Large-Cap Growth Stock Fund | Silvant (3) | |
Zevenbergen Innovative Growth Stock Fund | Zevenbergen (4) |
| (1) | Ceredex Value Advisors LLC (“Ceredex”), an indirect, wholly-owned subsidiary of Virtus. |
| (2) | Sustainable Growth Advisers, LP (“SGA”), an indirect, majority-owned subsidiary of Virtus. |
| (3) | Silvant Capital Management LLC (“Silvant”), an indirect, wholly-owned subsidiary of Virtus. |
| (4) | Zevenbergen Capital Investments LLC (“Zevenbergen”), a minority-owned affiliate of Virtus. |
| C. | Expense Limitations |
| The Adviser has contractually agreed to limit each Fund’s annual total operating expenses, subject to the exceptions listed below, so that such expenses do not exceed, on an annualized basis, the following respective percentages of average daily net assets through April 30, 2024, except as noted below. Following the contractual period, the Adviser may discontinue these expense limitation arrangements at any time. The waivers and reimbursements are accrued daily and received monthly. |
| Fund | Class A | Class C | Class I | Class R6 | ||||
Ceredex Large-Cap Value Equity Fund | 1.24% | 1.72% | 0.97% | 0.72% | ||||
Ceredex Mid-Cap Value Equity Fund | 1.35 | 1.76 | 1.05 | 0.79 | ||||
Ceredex Small-Cap Value Equity Fund | 1.46 | 1.81 | 1.15 | 0.88 | ||||
SGA International Growth Fund | 1.32 | N/A | 1.07 | 0.95 | ||||
Silvant Large-Cap Growth Stock Fund | 1.03 (1) | N/A | 0.77 (1) | 0.72 (1) | ||||
Zevenbergen Innovative Growth Stock Fund | 1.25 | N/A | 1.00 | 0.90 |
| (1) | Effective January 1, 2024 through April 30, 2025. For the period January 1, 2023 through December 31, 2023, the expense caps were as follows for Class A shares, Class I shares, and Class R6 shares, respectively: 1.23%, 0.97%, and 0.90%. |
| D. | Expense Recapture |
| Under certain conditions, the Adviser may recapture operating expenses reimbursed or fees waived under these arrangements within three years after the date on which such amounts were incurred or waived. A Fund must pay its ordinary operating expenses before the Adviser is entitled to any reimbursement and must remain in compliance with any applicable expense limitations or, if none, the expense limitation in effect at the time of the waiver or reimbursement. All or a portion of the following Adviser reimbursed expenses may be recaptured by the years ending December 31: |
| Expiration | ||||||||
| Fund | 2024 | 2025 | 2026 | Total | ||||
| Ceredex Large-Cap Value Equity Fund | ||||||||
Class A | $ 22 | $ 52 | $ 40 | $ 114 | ||||
Class C | 8 | 6 | 6 | 20 | ||||
Class I | 205 | 410 | 653 | 1,268 | ||||
Class R6 | 570 | 444 | 374 | 1,388 | ||||
| Ceredex Mid-Cap Value Equity Fund | ||||||||
Class C | 50 | 39 | 16 | 105 | ||||
Class R6 | 568 | 587 | 544 | 1,699 | ||||
| Ceredex Small-Cap Value Equity Fund | ||||||||
Class A | — | 13 | 4 | 17 | ||||
Class C | 5 | 4 | 2 | 11 | ||||
Class I | 34 | 157 | 107 | 298 | ||||
Class R6 | 170 | 153 | 82 | 405 | ||||
| SGA International Growth Fund | ||||||||
Class A | 16 | 17 | 18 | 51 | ||||
Class I | 92 | 89 | 113 | 294 | ||||
Class R6 | 4 | 6 | 10 | 20 | ||||
| Silvant Large-Cap Growth Stock Fund | ||||||||
Class A | 15 | 24 | 25 | 64 | ||||
Class I | 13 | 9 | 25 | 47 | ||||
Class R6 | — (1) | 1 | — (1) | 1 | ||||
| Zevenbergen Innovative Growth Stock Fund | ||||||||
Class A | 226 | 191 | 150 | 567 | ||||
Class I | 526 | 547 | 327 | 1,400 | ||||
Class R6 | 5 | 11 | 11 | 27 | ||||
| Fund | Class A | Class C | Class I | Total | ||||
Ceredex Mid-Cap Value Equity Fund | $— | $— (1) | $ — | $ —(1) | ||||
Ceredex Small-Cap Value Equity Fund | 2 | — | 18 | 20 | ||||
Silvant Large-Cap Growth Stock Fund | — | — | 3 | 3 |
| (1) | Amount is less than $500 (not in thousands). |
| E. | Distributor |
| VP Distributors, LLC (“VP Distributors”), an indirect, wholly-owned subsidiary of Virtus, serves as the distributor of each Fund’s shares. VP Distributors has advised the Funds that for the year ended December 31, 2023, it retained net commissions of $17 for Class A shares and CDSC of $—(1) and $—(1) for Class A shares and Class C shares, respectively. | |
| In addition, each Fund pays VP Distributors 12b-1 fees under a 12b-1 Plan as a percentage of the average daily net assets of each respective class at the annual rates of 0.25% for Class A shares and 1.00% for Class C shares. Class I shares and Class R6 shares are not subject to a 12b-1 Plan. | |
| Under certain circumstances, shares of certain Virtus Funds may be exchanged for shares of the same class of certain other Virtus Funds on the basis of the relative NAV per share at the time of the exchange. On exchanges with share classes that carry a CDSC, the CDSC schedule of the original shares purchased continues to apply. | |
| (1) Amount is less than $500 (not in thousands). | |
| F. | Administrator and Transfer Agent |
| Virtus Fund Services, LLC, an indirect, wholly-owned subsidiary of Virtus, serves as the administrator and transfer agent to the Funds. | |
| For the year ended December 31, 2023, the Funds incurred administration fees totaling $3,718 which are included in the Statements of Operations |
| within the line item “Administration and accounting fees.” The fees are calculated daily and paid monthly. | |
| For the year ended December 31, 2023, the Funds incurred transfer agent fees totaling $1,664 which are included in the Statements of Operations within the line item “Transfer agent fees and expenses.” The fees are calculated daily and paid monthly. | |
| G. | Investments with Affiliates |
| The Funds are permitted to purchase assets from or sell assets to certain related affiliates under specified conditions outlined in procedures adopted by the Board. The procedures have been designed to ensure that any purchase or sale of assets by the Funds from or to another fund or portfolio that are, or could be, considered an affiliate by virtue of having a common investment adviser (or affiliated investment advisers), common Trustees and/or common officers comply with Rule 17a-7 under the 1940 Act. Further, as defined under the procedures, each transaction is effected at the current market price. | |
| During the year ended December 31, 2023, the Funds did not engage in any transactions pursuant to Rule 17a-7 under the 1940 Act. | |
| H. | Trustee Deferred Compensation Plan |
| The Trust provides a deferred compensation plan for its Trustees who receive compensation from the Trust. Under the deferred compensation plan, Trustees may elect to defer all or a portion of their compensation. Amounts deferred are retained by the Trust, and then, to the extent permitted by the 1940 Act, in turn, may be invested in the shares of affiliated or unaffiliated mutual funds selected by the participating Trustees. Investments in such instruments are included in “Other assets” in the Statements of Assets and Liabilities at December 31, 2023. |
| Purchases | Sales | ||
Ceredex Large-Cap Value Equity Fund | $1,001,738 | $1,111,414 | |
Ceredex Mid-Cap Value Equity Fund | 3,198,445 | 3,772,566 | |
Ceredex Small-Cap Value Equity Fund | 177,688 | 279,737 | |
SGA International Growth Fund | 37,426 | 5,389 | |
Silvant Large-Cap Growth Stock Fund | 25,825 | 20,301 | |
Zevenbergen Innovative Growth Stock Fund | 89,991 | 97,430 |
| Ceredex Large-Cap Value Equity Fund | Ceredex Mid-Cap Value Equity Fund | ||||||||||||||
| Year Ended December 31, 2023 | Year Ended December 31, 2022 | Year Ended December 31, 2023 | Year Ended December 31, 2022 | ||||||||||||
| SHARES | AMOUNT | SHARES | AMOUNT | SHARES | AMOUNT | SHARES | AMOUNT | ||||||||
| Class A | |||||||||||||||
| Shares sold and cross class conversions | 872 | $ 8,606 | 1,797 | $ 19,789 | 2,250 | $ 23,963 | 2,835 | $ 32,050 | |||||||
| Reinvestment of distributions | 228 | 2,336 | 1,484 | 14,286 | 134 | 1,513 | 1,322 | 12,940 | |||||||
| Shares repurchased and cross class conversions | (5,815) | (57,672) | (4,477) | (48,444) | (6,966) | (73,849) | (5,669) | (63,012) | |||||||
| Net Increase / (Decrease) | (4,715) | $ (46,730) | (1,196) | $ (14,369) | (4,582) | $ (48,373) | (1,512) | $ (18,022) | |||||||
| Class C | |||||||||||||||
| Shares sold and cross class conversions | 30 | $ 283 | 118 | $ 1,258 | 32 | $ 332 | 87 | $ 937 | |||||||
| Reinvestment of distributions | 3 | 30 | 26 | 237 | 3 | 30 | 110 | 1,027 | |||||||
| Shares repurchased and cross class conversions | (128) | (1,187) | (170) | (1,667) | (600) | (6,143) | (947) | (10,143) | |||||||
| Net Increase / (Decrease) | (95) | $ (874) | (26) | $ (172) | (565) | $ (5,781) | (750) | $ (8,179) | |||||||
| Ceredex Large-Cap Value Equity Fund | Ceredex Mid-Cap Value Equity Fund | ||||||||||||||
| Year Ended December 31, 2023 | Year Ended December 31, 2022 | Year Ended December 31, 2023 | Year Ended December 31, 2022 | ||||||||||||
| SHARES | AMOUNT | SHARES | AMOUNT | SHARES | AMOUNT | SHARES | AMOUNT | ||||||||
| Class I | |||||||||||||||
| Shares sold and cross class conversions | 31,238 | $ 312,766 | 5,105 | $ 57,269 | 14,939 | $ 162,790 | 16,675 | $ 191,609 | |||||||
| Reinvestment of distributions | 990 | 10,368 | 3,772 | 37,194 | 1,422 | 16,406 | 11,267 | 113,159 | |||||||
| Shares repurchased and cross class conversions | (30,910) | (314,621) | (25,125) | (281,766) | (43,633) | (475,551) | (56,157) | (634,512) | |||||||
| Net Increase / (Decrease) | 1,318 | $ 8,513 | (16,248) | $ (187,303) | (27,272) | $ (296,355) | (28,215) | $ (329,744) | |||||||
| Class R6 | |||||||||||||||
| Shares sold and cross class conversions | 5,020 | $ 52,047 | 4,210 | $ 49,227 | 8,783 | $ 97,215 | 11,130 | $ 129,201 | |||||||
| Reinvestment of distributions | 615 | 6,577 | 2,928 | 29,254 | 619 | 7,173 | 4,846 | 49,098 | |||||||
| Shares repurchased and cross class conversions | (10,809) | (110,697) | (11,627) | (129,448) | (28,633) | (315,712) | (22,904) | (259,498) | |||||||
| Net Increase / (Decrease) | (5,174) | $ (52,073) | (4,489) | $ (50,967) | (19,231) | $ (211,324) | (6,928) | $ (81,199) | |||||||
| Ceredex Small-Cap Value Equity Fund | SGA International Growth Fund | ||||||||||||||
| Year Ended December 31, 2023 | Year Ended December 31, 2022 | Year Ended December 31, 2023 | Year Ended December 31, 2022 | ||||||||||||
| SHARES | AMOUNT | SHARES | AMOUNT | SHARES | AMOUNT | SHARES | AMOUNT | ||||||||
| Class A | |||||||||||||||
| Shares sold and cross class conversions | 351 | $ 2,602 | 336 | $ 2,936 | 161 | $ 1,410 | 400 | $ 3,183 | |||||||
| Reinvestment of distributions | 589 | 4,103 | 870 | 6,304 | 1 | 10 | 38 | 284 | |||||||
| Shares repurchased and cross class conversions | (966) | (7,113) | (2,460) | (20,244) | (278) | (2,438) | (185) | (1,513) | |||||||
| Net Increase / (Decrease) | (26) | $ (408) | (1,254) | $ (11,004) | (116) | $ (1,018) | 253 | $ 1,954 | |||||||
| Class C | |||||||||||||||
| Shares sold and cross class conversions | 26 | $ 161 | 20 | $ 132 | — | $ — | — | $ — | |||||||
| Reinvestment of distributions | 19 | 103 | 29 | 172 | — | — | — | — | |||||||
| Shares repurchased and cross class conversions | (56) | (335) | (54) | (363) | — | — | — | — | |||||||
| Net Increase / (Decrease) | (11) | $ (71) | (5) | $ (59) | — | $ — | — | $ — | |||||||
| Class I | |||||||||||||||
| Shares sold and cross class conversions | 1,809 | $ 14,410 | 1,902 | $ 17,703 | 4,504 | $ 41,502 | 1,955 | $ 16,674 | |||||||
| Reinvestment of distributions | 737 | 5,689 | 3,937 | 30,459 | 19 | 182 | 201 | 1,564 | |||||||
| Shares repurchased and cross class conversions | (18,818) | (147,584) | (12,008) | (115,487) | (1,298) | (11,953) | (2,443) | (20,771) | |||||||
| Net Increase / (Decrease) | (16,272) | $ (127,485) | (6,169) | $ (67,325) | 3,225 | $ 29,731 | (287) | $ (2,533) | |||||||
| Class R6 | |||||||||||||||
| Shares sold and cross class conversions | 628 | $ 5,009 | 1,962 | $ 19,331 | 479 | $ 4,484 | 118 | $ 989 | |||||||
| Reinvestment of distributions | 634 | 4,824 | 1,594 | 12,389 | 3 | 26 | 11 | 86 | |||||||
| Shares repurchased and cross class conversions | (4,659) | (36,856) | (7,893) | (71,923) | (106) | (991) | (2) | (14) | |||||||
| Net Increase / (Decrease) | (3,397) | $ (27,023) | (4,337) | $ (40,203) | 376 | $ 3,519 | 127 | $ 1,061 | |||||||
| Silvant Large-Cap Growth Stock Fund | Zevenbergen Innovative Growth Stock Fund | ||||||||||||||
| Year Ended December 31, 2023 | Year Ended December 31, 2022 | Year Ended December 31, 2023 | Year Ended December 31, 2022 | ||||||||||||
| SHARES | AMOUNT | SHARES | AMOUNT | SHARES | AMOUNT | SHARES | AMOUNT | ||||||||
| Class A | |||||||||||||||
| Shares sold and cross class conversions | 444 | $ 2,734 | 204 | $ 1,112 | 644 | $ 21,562 | 904 | $ 32,355 | |||||||
| Reinvestment of distributions | 576 | 3,789 | 1,222 | 5,899 | — | — | 158 | 4,061 | |||||||
| Shares repurchased and cross class conversions | (1,725) | (10,097) | (1,620) | (8,875) | (1,069) | (36,204) | (2,169) | (76,214) | |||||||
| Net Increase / (Decrease) | (705) | $ (3,574) | (194) | $ (1,864) | (425) | $ (14,642) | (1,107) | $ (39,798) | |||||||
| Class I | |||||||||||||||
| Shares sold and cross class conversions | 2,972 | $ 30,033 | 89 | $ 838 | 3,516 | $ 125,466 | 3,405 | $ 122,509 | |||||||
| Reinvestment of distributions | 50 | 573 | 42 | 342 | — | — | 349 | 9,643 | |||||||
| Shares repurchased and cross class conversions | (1,596) | (16,941) | (241) | (2,296) | (3,066) | (109,548) | (8,876) | (343,995) | |||||||
| Net Increase / (Decrease) | 1,426 | $ 13,665 | (110) | $ (1,116) | 450 | $ 15,918 | (5,122) | $ (211,843) | |||||||
| Class R6 | |||||||||||||||
| Shares sold and cross class conversions | 25 | $ 260 | 11 | $ 106 | 282 | $ 11,274 | 260 | $ 9,874 | |||||||
| Reinvestment of distributions | — (1) | 6 | 4 | 31 | — | — | 13 | 361 | |||||||
| Shares repurchased and cross class conversions | (12) | (134) | (189) | (1,659) | (118) | (4,197) | (209) | (7,270) | |||||||
| Net Increase / (Decrease) | 13 | $ 132 | (174) | $ (1,522) | 164 | $ 7,077 | 64 | $ 2,965 | |||||||
| (1) | Amount is less than 500 shares (not in thousands). |
| % of Shares Outstanding | Number of Accounts* | ||
Ceredex Large-Cap Value Equity Fund | 55 % | 2 | |
Ceredex Mid-Cap Value Equity Fund | 43 | 2 | |
Ceredex Small-Cap Value Equity Fund | 35 | 2 | |
SGA International Growth Fund | 56 | 2 | |
Silvant Large-Cap Growth Stock Fund | 51 | 1 | |
Zevenbergen Innovative Growth Stock Fund | 19 | 1 |
| * | None of the accounts are affiliated. |
| Sector | Percentage of Total Investments | ||
Ceredex Small-Cap Value Equity Fund | Financials | 29% | |
Silvant Large-Cap Growth Stock Fund | Information Technology | 44 | |
Zevenbergen Innovative Growth Stock Fund | Information Technology | 38 | |
Zevenbergen Innovative Growth Stock Fund | Consumer Discretionary | 28 |
| Fund | Interest Incurred on Borrowing | Average Borrowing | Weighted Average Interest Rate | Days Outstanding | ||||
Ceredex Large-Cap Value Equity Fund | $14 | $11,771 | 6.18% | 7 | ||||
Ceredex Small-Cap Value Equity Fund | 3 | 5,600 | 5.65 | 3 | ||||
Silvant Large-Cap Growth Stock Fund | 2 | 5,800 | 6.40 | 2 | ||||
Zevenbergen Innovative Growth Stock Fund | 4 | 2,925 | 6.40 | 8 |
| Fund | Federal Tax Cost | Unrealized Appreciation | Unrealized (Depreciation) | Net Unrealized Appreciation (Depreciation) | ||||
Ceredex Large-Cap Value Equity Fund | $ 628,603 | $ 98,215 | $ (19,306) | $ 78,909 | ||||
Ceredex Mid-Cap Value Equity Fund | 1,932,204 | 251,351 | (53,662) | 197,689 | ||||
Ceredex Small-Cap Value Equity Fund | 84,928 | 14,277 | (2,766) | 11,511 | ||||
SGA International Growth Fund | 64,920 | 15,333 | (2,751) | 12,582 | ||||
Silvant Large-Cap Growth Stock Fund | 48,369 | 92,544 | (2,135) | 90,409 | ||||
Zevenbergen Innovative Growth Stock Fund | 313,585 | 235,303 | (23,186) | 212,117 |
| Fund | Short-Term | Long-Term | ||
Ceredex Mid-Cap Value Equity Fund | $100,436 | $ — | ||
SGA International Growth Fund | 16 | 560 | ||
Zevenbergen Innovative Growth Stock Fund | 84,171 | 59,608 |
| Fund | Undistributed Ordinary Income | Undistributed Long-Term Capital Gains | Post-October Capital Loss Deferred | Capital Loss Deferred | ||||
Ceredex Large-Cap Value Equity Fund | $10,761 | $ — | $ — | $ — | ||||
Ceredex Mid-Cap Value Equity Fund | 2,643 | — | — | 100,436 | ||||
Ceredex Small-Cap Value Equity Fund | 1,044 | — | — | — | ||||
SGA International Growth Fund | 42 | — | — | 576 | ||||
Silvant Large-Cap Growth Stock Fund | — | 1,046 | — | — | ||||
Zevenbergen Innovative Growth Stock Fund | — | — | 4,575 | 143,779 |
| Ordinary Income | Long-Term Capital Gains | Total | |||
Ceredex Large-Cap Value Equity Fund | |||||
12/31/23 | $ 12,911 | $ 6,774 | $ 19,685 | ||
12/31/22 | 23,900 | 59,433 | 83,333 | ||
Ceredex Mid-Cap Value Equity Fund | |||||
12/31/23 | 26,000 | — | 26,000 | ||
12/31/22 | 65,650 | 117,686 | 183,336 | ||
Ceredex Small-Cap Value Equity Fund | |||||
12/31/23 | 6,400 | 8,400 | 14,800 | ||
12/31/22 | 7,125 | 42,430 | 49,555 | ||
SGA International Growth Fund | |||||
12/31/23 | 159 | 61 | 220 | ||
12/31/22 | 421 | 1,537 | 1,958 | ||
Silvant Large-Cap Growth Stock Fund | |||||
12/31/23 | — | 4,455 | 4,455 | ||
12/31/22 | — | 6,364 | 6,364 | ||
Zevenbergen Innovative Growth Stock Fund | |||||
12/31/22 | — | 15,094 | 15,094 |

| Fund | Qualified Dividend Income % (non-corporate shareholder) | Dividend Received Deduction % (corporate shareholders) | Long-Term Capital Gain Distributions ($) | |||
Ceredex Large-Cap Value Equity Fund | 100.00 % | 100.00 % | $ — | |||
Ceredex Mid-Cap Value Equity Fund | 100.00 | 100.00 | — | |||
Ceredex Small-Cap Value Equity Fund | 64.75 | 52.35 | 15,536 | |||
SGA International Growth Fund | 100.00 | 8.10 | — | |||
Silvant Large-Cap Growth Stock Fund | — | — | 5,154 | |||
Zevenbergen Innovative Growth Stock Fund | — | — | — |
| Foreign Source Income Recognized | Foreign Taxes Paid on Foreign Source Income | ||
SGA International Growth Fund | $ 763 | $ 63 |
| Name, Year of Birth, Length of Time Served and Number of Portfolios in Fund Complex Overseen by Trustee | Principal Occupation(s) During Past 5 Years | Other Directorships Held by Trustee During Past 5 Years |
| Burke, Donald C. YOB: 1960 Served Since: 2017 100 Portfolios | Private investor (since 2009). Formerly, President and Chief Executive Officer, BlackRock U.S. Funds (2007 to 2009); Managing Director, BlackRock, Inc. (2006 to 2009); and Managing Director, Merrill Lynch Investment Managers (1990 to 2006). | Trustee (since May 2023) and Advisory Board Member (May 2023), Virtus Artificial Intelligence & Technology Opportunities Fund, Virtus Dividend, Interest & Premium Strategy Fund and Virtus Equity & Convertible Income Fund; Advisory Board Member (since May 2023), Virtus Convertible & Income 2024 Target Term Fund, Virtus Convertible & Income Fund, Virtus Convertible & Income Fund II and Virtus Diversified Income & Convertible Fund; Trustee (since 2022), Virtus Stone Harbor Emerging Markets Income Fund; Trustee (2022 to 2023), Virtus Stone Harbor Emerging Markets Total Income Fund; Trustee (since 2021), The Merger Fund®, The Merger Fund® VL, Virtus Event Opportunities Trust (2 portfolios), Virtus Investment Trust (13 portfolios) and Virtus Strategy Trust (8 portfolios); Director (2020 to 2021), Duff & Phelps Select MLP and Midstream Energy Fund Inc.; Director (since 2020), Virtus Total Return Fund Inc.; Trustee (since 2020), Virtus Global Multi-Sector Income Fund; Trustee (since 2016), Virtus Mutual Fund Family (50 portfolios), Virtus Variable Insurance Trust (8 portfolios) and Virtus Alternative Solutions Trust (4 portfolios); Director (since 2014), closed-end funds managed by Duff & Phelps Investment Management Co. (3 funds); Director, Avista Corp. (energy company) (since 2011); Trustee, Goldman Sachs Fund Complex (2010 to 2014); and Director, BlackRock Luxembourg and Cayman Funds (2006 to 2010). |
| Cogan, Sarah E. YOB: 1956 Served Since: 2022 97 Portfolios | Retired Partner, Simpson Thacher & Bartlett LLP (“STB”) (law firm) (since 2019); Director, Girl Scouts of Greater New York (since 2016); Trustee, Natural Resources Defense Council, Inc. (since 2013); and formerly, Partner, STB (1989 to 2018). | Trustee (since 2022) and Advisory Board Member (2021 to 2022), Virtus Alternative Solutions Trust (4 portfolios), Virtus Mutual Fund Family (50 portfolios) and Virtus Variable Insurance Trust (8 portfolios); Trustee (since 2022), Virtus Stone Harbor Emerging Markets Income Fund; Trustee (2022 to 2023), Virtus Stone Harbor Emerging Markets Total Income Fund; Trustee (since 2021), The Merger Fund®, The Merger Fund® VL, Virtus Event Opportunities Trust (2 portfolios), and Virtus Global Multi-Sector Income Fund; Director (since 2021), Virtus Total Return Fund Inc.; Advisory Board Member (February 2021 to June 2021), Duff & Phelps Select MLP and Midstream Energy Fund Inc.; Trustee (since 2019), Virtus Investment Trust (13 portfolios) and Virtus Strategy Trust (8 portfolios); Trustee (since 2019), Virtus Artificial Intelligence & Technology Opportunities Fund, Virtus Convertible & Income 2024 Target Term Fund, Virtus Convertible & Income Fund, Virtus Convertible & Income Fund II, Virtus Diversified Income & Convertible Fund, Virtus Equity & Convertible Income Fund, and Virtus Dividend, Interest & Premium Strategy Fund; and Trustee (since 2019), PIMCO Closed-End Funds* (30 portfolios). |
| DeCotis, Deborah A. YOB: 1952 Served Since: 2022 97 Portfolios | Director, Cadre Holdings Inc. (since 2022); Advisory Director, Morgan Stanley & Co., Inc. (since 1996); Member, Circle Financial Group (since 2009); Member, Council on Foreign Relations (since 2013); and Trustee, Smith College (since 2017). Formerly, Director, Watford Re (2017 to 2021); Co-Chair Special Projects Committee, Memorial Sloan Kettering (2005 to 2015); and Trustee, Stanford University (2010 to 2015). | Trustee (since 2022) and Advisory Board Member (2021 to 2022), Virtus Alternative Solutions Trust (4 portfolios), Virtus Mutual Fund Family (50 portfolios) and Virtus Variable Insurance Trust (8 portfolios); Trustee (since 2022), Virtus Stone Harbor Emerging Markets Income Fund; Trustee (2022 to 2023), Virtus Stone Harbor Emerging Markets Total Income Fund; Trustee (since 2021), The Merger Fund®, The Merger Fund® VL, Virtus Event Opportunities Trust (2 portfolios), and Virtus Global Multi-Sector Income Fund; Director (since 2021), Virtus Total Return Fund Inc.; Advisory Board Member (February 2021 to June 2021), Duff & Phelps Select MLP and Midstream Energy Fund Inc.; Trustee (since 2019), Virtus Artificial Intelligence & Technology Opportunities Fund; Trustee (since 2017), Virtus Convertible & Income 2024 Target Term Fund; Trustee (since 2015), Virtus Diversified Income & Convertible Fund; Trustee (since 2014), Virtus Investment Trust (13 portfolios); Trustee (since 2011), Virtus Strategy Trust (8 portfolios); Trustee (since 2011), Virtus Convertible & Income Fund, Virtus Convertible & Income Fund II, Virtus Equity & Convertible Income Fund, and Virtus Dividend, Interest & Premium Strategy Fund; and Trustee (since 2011), PIMCO Closed-End Funds* (30 portfolios). |
| Name, Year of Birth, Length of Time Served and Number of Portfolios in Fund Complex Overseen by Trustee | Principal Occupation(s) During Past 5 Years | Other Directorships Held by Trustee During Past 5 Years |
| Drummond, F. Ford YOB: 1962 Served Since: 2022 97 Portfolios | President (since 1998), F.G. Drummond Ranches, Inc.; and Director (since 2015), Texas and Southwestern Cattle Raisers Association. Formerly Chairman, Oklahoma Nature Conservancy (2019 to 2020); Trustee (since 2014), Frank Phillips Foundation; Trustee (since 2008), Oklahoma Nature Conservancy; Board Member (2006 to 2020) and Chairman (2016 to 2018), Oklahoma Water Resources Board; Director (1998 to 2008), The Cleveland Bank; and General Counsel (1998 to 2008), BMIHealth Plans (benefits administration). | Trustee (since 2022) and Advisory Board Member (2021 to 2022), Virtus Alternative Solutions Trust (4 portfolios), Virtus Mutual Fund Family (50 portfolios), and Virtus Variable Insurance Trust (8 portfolios); Trustee (since 2022), Virtus Stone Harbor Emerging Markets Income Fund; Trustee (2022 to 2023), Virtus Stone Harbor Emerging Markets Total Income Fund; Trustee (since 2021), The Merger Fund®, The Merger Fund®VL, and Virtus Event Opportunities Trust (2 portfolios); Advisory Board Member (February 2021 to June 2021), Duff & Phelps Select MLP and Midstream Energy Fund Inc.; Trustee (since 2021), Virtus Global Multi-Sector Income Fund; Director (since 2021), Virtus Total Return Fund Inc.; Trustee (since 2019), Virtus Artificial Intelligence & Technology Opportunities Fund; Trustee (since 2017), Virtus Convertible & Income 2024 Target Term Fund; Trustee (since 2015), Virtus Convertible & Income Fund, Virtus Convertible & Income Fund II, Virtus Diversified Income & Convertible Fund, Virtus Dividend, Interest & Premium Strategy Fund and Virtus Equity & Convertible Income Fund; Trustee (since 2014), Virtus Strategy Trust (8 portfolios); Director (since 2011), Bancfirst Corporation; and Trustee (since 2006), Virtus Investment Trust (13 portfolios). |
| Harris, Sidney E. YOB: 1949 Served Since: 2017 90 Portfolios | Private Investor (since 2021); Dean Emeritus (since 2015), Professor (2015 to 2021 and 1997 to 2014), and Dean (1997 to 2004), J. Mack Robinson College of Business, Georgia State University. | Trustee (since 2022), Virtus Stone Harbor Emerging Markets Income Fund; Trustee (2022 to 2023), Virtus Stone Harbor Emerging Markets Total Income Fund; Trustee (since 2021), The Merger Fund®, The Merger Fund® VL, Virtus Event Opportunities Trust (2 portfolios), Virtus Investment Trust (13 portfolios) and Virtus Strategy Trust (8 portfolios); Director (2020 to 2021), Duff & Phelps Select MLP and Midstream Energy Fund Inc.; Director (since 2020), Virtus Total Return Fund Inc.; Trustee (since 2020), Virtus Global Multi-Sector Income Fund; Trustee (since 2019), Mutual Fund Directors Forum; Trustee (since 2017), Virtus Mutual Fund Family (50 portfolios), Virtus Variable Insurance Trust (8 portfolios), and Virtus Alternative Solutions Trust (4 portfolios); Trustee (2013 to 2020) and Honorary Trustee (since 2020), KIPP Metro Atlanta; Director (1999 to 2019), Total System Services, Inc.; Trustee (2004 to 2017), RidgeWorth Funds; Chairman (2012 to 2017), International University of the Grand Bassam Foundation; Trustee (since 2012), International University of the Grand Bassam Foundation; and Trustee (2011 to 2015), Genspring Family Offices, LLC. |
| Mallin, John R. YOB: 1950 Served Since: 2017 90 Portfolios | Partner/Attorney (since 2003), McCarter & English LLP (law firm) Real Property Practice Group; and Member (2014 to 2022), Counselors of Real Estate. | Trustee (since 2022), Virtus Stone Harbor Emerging Markets Income Fund; Trustee (2022 to 2023), Virtus Stone Harbor Emerging Markets Total Income Fund; Trustee (since 2021), The Merger Fund®, The Merger Fund® VL, Virtus Event Opportunities Trust (2 portfolios), Virtus Investment Trust (13 portfolios) and Virtus Strategy Trust (8 portfolios); Director (2020 to 2021), Duff & Phelps Select MLP and Midstream Energy Fund Inc.; Director (since 2020), Virtus Total Return Fund Inc.; Trustee (since 2020), Virtus Global Multi-Sector Income Fund; Trustee (since 2016), Virtus Mutual Fund Family (50 portfolios) and Virtus Alternative Solutions Trust (4 portfolios); Director (since 2019), 1892 Club, Inc. (non-profit); Director (2013 to 2020), Horizons, Inc. (non-profit); and Trustee (since 1999), Virtus Variable Insurance Trust (8 portfolios). |
| Name, Year of Birth, Length of Time Served and Number of Portfolios in Fund Complex Overseen by Trustee | Principal Occupation(s) During Past 5 Years | Other Directorships Held by Trustee During Past 5 Years |
| McDaniel, Connie D. YOB: 1958 Served Since: 2017 97 Portfolios | Retired (since 2013). Vice President, Chief of Internal Audit, Corporate Audit Department (2009 to 2013); Vice President, Global Finance Transformation (2007 to 2009); and Vice President and Controller (1999 to 2007), The Coca-Cola Company. | Trustee (since May 2023) and Advisory Board Member (May 2023), Virtus Artificial Intelligence & Technology Opportunities Fund, Virtus Convertible & Income 2024 Target Term Fund, Virtus Convertible & Income Fund, Virtus Convertible & Income Fund II, Virtus Diversified Income & Convertible Fund, Virtus Dividend, Interest & Premium Strategy Fund and Virtus Equity & Convertible Income Fund; Trustee (since 2022), Virtus Stone Harbor Emerging Markets Income Fund; Trustee (2022 to 2023), Virtus Stone Harbor Emerging Markets Total Income Fund; Trustee (since 2021), The Merger Fund®, The Merger Fund® VL, Virtus Event Opportunities Trust (2 portfolios), Virtus Investment Trust (13 portfolios) and Virtus Strategy Trust (8 portfolios); Director (2020 to 2021), Duff & Phelps Select MLP and Midstream Energy Fund Inc.; Director (since 2020), Virtus Total Return Fund Inc.; Trustee (since 2020), Virtus Global Multi-Sector Income Fund; Director (since 2019), Global Payments Inc.; Chairperson (since 2021), Governance & Nominating Committee, Global Payments Inc; Trustee (since 2017), Virtus Mutual Fund Family (50 portfolios), Virtus Variable Insurance Trust (8 portfolios), and Virtus Alternative Solutions Trust (4 portfolios); Director (since 2021), North Florida Land Trust; Director (2014 to 2019), Total System Services, Inc.; Member (2011 to 2022) and Chair (2014 to 2016), Georgia State University, Robinson College of Business Board of Advisors; and Trustee (2005 to 2017), RidgeWorth Funds. |
| McLoughlin, Philip YOB: 1946 Served Since: 2002 100 Portfolios | Private investor since 2010. | Trustee and Chairman (since 2022), Virtus Stone Harbor Emerging Markets Income Fund; Trustee and Chairman (2022 to 2023), Virtus Stone Harbor Emerging Markets Total Income Fund; Trustee and Chairman (since 2021), The Merger Fund®, The Merger Fund® VL, Virtus Event Opportunities Trust (2 portfolios), Virtus Investment Trust (13 portfolios) and Virtus Strategy Trust (8 portfolios); Chairman (since 2023) and Trustee (since 2021), Virtus Artificial Intelligence & Technology Opportunities Fund, Virtus Convertible & Income Fund II, Virtus Diversified Income & Convertible Fund, Virtus Equity & Convertible Income Fund and Virtus Dividend, Interest & Premium Strategy Fund; Chairman (since 2023), Trustee (since 2022) and Advisory Board Member (2021), Virtus Convertible & Income 2024 Target Term Fund and Virtus Convertible & Income Fund; Director and Chairman (since 2016), Virtus Total Return Fund Inc.; Director and Chairman (2016 to 2019), the former Virtus Total Return Fund Inc.; Director and Chairman (2014 to 2021), Duff & Phelps Select MLP and Midstream Energy Fund Inc.; Trustee and Chairman (since 2013), Virtus Alternative Solutions Trust (4 portfolios); Trustee and Chairman (since 2011), Virtus Global Multi-Sector Income Fund; Chairman and Trustee (since 2003), Virtus Variable Insurance Trust (8 portfolios); Director (since 1995), closed-end funds managed by Duff & Phelps Investment Management Co. (3 funds); Director (1991 to 2019) and Chairman (2010 to 2019), Lazard World Trust Fund (closed-end investment firm in Luxembourg); and Trustee (since 1989) and Chairman (since 2002), Virtus Mutual Fund Family (50 portfolios). |
| McNamara, Geraldine M. YOB: 1951 Served Since: 2002 100 Portfolios | Private investor (since 2006); and Managing Director, U.S. Trust Company of New York (1982 to 2006). | Trustee (since May 2023) and Advisory Board Member (January 2023 to May 2023), Virtus Convertible & Income Fund, Virtus Convertible & Income Fund II, Virtus Diversified Income & Convertible Fund and Virtus Dividend, Interest & Premium Strategy Fund; Trustee (since 2023), Virtus Artificial Intelligence & Technology Opportunities Fund and Virtus Equity & Convertible Income Fund; Advisory Board Member (since 2023), Virtus Convertible & Income 2024 Target Term Fund; Trustee (since 2022), Virtus Stone Harbor Emerging Markets Income Fund; Trustee (2022 to 2023), Virtus Stone Harbor Emerging Markets Total Income Fund; Trustee (since 2021), The Merger Fund®, The Merger Fund® VL, Virtus Event Opportunities Trust (2 portfolios), Virtus Investment Trust (13 portfolios) and Virtus Strategy Trust (8 portfolios); Director (2020 to 2021), Duff & Phelps Select MLP and Midstream Energy Fund Inc.; Director (since 2020), Virtus Total Return Fund Inc.; Trustee (since 2020), Virtus Global Multi-Sector Income Fund; Trustee (since 2016) Virtus Alternative Solutions Trust (4 portfolios); Trustee (since 2015), Virtus Variable Insurance Trust (8 portfolios); Director (since 2003), closed-end funds managed by Duff & Phelps Investment Management Co. (3 funds); and Trustee (since 2001), Virtus Mutual Fund Family (50 portfolios). |
| Name, Year of Birth, Length of Time Served and Number of Portfolios in Fund Complex Overseen by Trustee | Principal Occupation(s) During Past 5 Years | Other Directorships Held by Trustee During Past 5 Years |
| Walton, R. Keith YOB: 1964 Served Since: 2020 97 Portfolios | Senior Adviser (since 2022), Brightwood Capital LLC; Venture and Operating Partner (2020 to 2021), Plexo Capital, LLC; Venture Partner (2019 to 2020) and Senior Adviser (2018 to 2019), Plexo, LLC; and Partner (since 2006), Global Infrastructure Partners. Formerly, Managing Director (2020 to 2021), Lafayette Square Holding Company LLC; Senior Adviser (2018 to 2019), Vatic Labs, LLC; Executive Vice President, Strategy (2017 to 2019), Zero Mass Water, LLC; and Vice President, Strategy (2013 to 2017), Arizona State University. | Trustee (since 2023) and Advisory Board Member (2022 to 2023), Virtus Convertible & Income 2024 Target Term Fund; Trustee (since 2023) and Advisory Board Member (2022 to 2023), Virtus Convertible & Income Fund II and Virtus Dividend, Interest & Premium Strategy Fund; Trustee (since 2022) and Advisory Board Member (January 2022 to July 2022), Virtus Artificial Intelligence & Technology Opportunities Fund, Virtus Convertible & Income Fund and Virtus Equity & Convertible Income Fund; Trustee (since 2022), Virtus Stone Harbor Emerging Markets Income Fund; Trustee (2022 to 2023), Virtus Stone Harbor Emerging Markets Total Income Fund; Trustee (since 2022), Virtus Diversified Income & Convertible Fund; Trustee (since 2021), The Merger Fund®, The Merger Fund® VL, Virtus Event Opportunities Trust (2 portfolios), Virtus Investment Trust (13 portfolios) and Virtus Strategy Trust (8 portfolios); Trustee (since 2020) Virtus Alternative Solutions Trust (4 portfolios), Virtus Variable Insurance Trust (8 portfolios) and Virtus Mutual Fund Family (50 portfolios); Director (since 2017), certain funds advised by Bessemer Investment Management LLC; Director (2016 to 2021), Duff & Phelps Select MLP and Midstream Energy Fund Inc.; Trustee (since 2016), Virtus Global Multi-Sector Income Fund; Director (2006 to 2019), Systematica Investments Limited Funds; Director (2006 to 2017), BlueCrest Capital Management Funds; Trustee (2014 to 2017), AZ Service; Director (since 2004), Virtus Total Return Fund Inc.; and Director (2004 to 2019), the former Virtus Total Return Fund Inc. |
| Zino, Brian T. YOB: 1952 Served Since: 2020 97 Portfolios | Retired. Various roles (1982 to 2009), J. & W. Seligman & Co. Incorporated, including President (1994 to 2009). | Trustee (since 2022), Virtus Stone Harbor Emerging Markets Income Fund; Trustee (2022 to 2023), Virtus Stone Harbor Emerging Markets Total Income Fund; Trustee (since 2021), The Merger Fund®, The Merger Fund® VL, Virtus Event Opportunities Trust (2 portfolios), Virtus Investment Trust (13 portfolios) and Virtus Strategy Trust (8 portfolios); Trustee (since 2022) and Advisory Board Member (2021), Virtus Artificial Intelligence & Technology Opportunities Fund, Virtus Convertible & Income 2024 Target Term Fund, Virtus Convertible & Income Fund, Virtus Convertible & Income Fund II, Virtus Diversified Income & Convertible Fund, Virtus Equity & Convertible Income Fund, and Virtus Dividend, Interest & Premium Strategy Fund; Trustee (since 2020) Virtus Alternative Solutions Trust (4 portfolios), Virtus Variable Insurance Trust (8 portfolios) and Virtus Mutual Fund Family (50 portfolios); Director (2016 to 2021), Duff & Phelps Select MLP and Midstream Energy Fund Inc.; Trustee (since 2016), Virtus Global Multi-Sector Income Fund; Director (since 2014), Virtus Total Return Fund Inc.; Director (2014 to 2019), the former Virtus Total Return Fund Inc.; Trustee (since 2011), Bentley University; Director (1986 to 2009) and President (1994 to 2009), J&W Seligman Co. Inc.; Director (1998 to 2009), Chairman (2002 to 2004) and Vice Chairman (2000 to 2002), ICI Mutual Insurance Company; Member, Board of Governors of ICI (1998 to 2008). |
| Name, Year of Birth, Length of Time Served and Number of Funds Overseen | Principal Occupation(s) During Past 5 Years | Principal Occupation(s) During Past 5 Years and Other Directorships Held by Trustee |
| Aylward, George R.* Trustee and President YOB: 1964 Served Since: 2006 104 Portfolios | Director, President and Chief Executive Officer (since 2008), Virtus Investment Partners, Inc. and/or certain of its subsidiaries, and various senior officer positions with Virtus affiliates (since 2005). | Director (since 2023), Stone Harbor Investment Funds plc (21 sub-funds), Stone Harbor Global Funds plc (27 sub-funds), and Virtus Global Funds ICAV (5 portfolios); Trustee, President and Chief Executive Officer (since 2022), Virtus Stone Harbor Emerging Markets Income Fund; Trustee (2022 to 2023), Virtus Stone Harbor Emerging Markets Total Income Fund; Member, Board of Governors of the Investment Company Institute (since 2021); Trustee and President (since 2021), The Merger Fund®, The Merger Fund® VL, Virtus Event Opportunities Trust (2 portfolios), Virtus Investment Trust (13 portfolios) and Virtus Strategy Trust (8 portfolios); Trustee, President and Chief Executive Officer (since 2021), Virtus Artificial Intelligence & Technology Opportunities Fund, Virtus Convertible & Income 2024 Target Term Fund, Virtus Convertible & Income Fund, Virtus Convertible & Income Fund II, Virtus Diversified Income & Convertible Fund, Virtus Equity & Convertible Income Fund, and Virtus Dividend, Interest & Premium Strategy Fund; Chairman and Trustee (since 2015), Virtus ETF Trust II (6 portfolios); Director, President and Chief Executive Officer (2014 to 2021), Duff & Phelps Select MLP and Midstream Energy Fund Inc.; Trustee and President (since 2013), Virtus Alternative Solutions Trust (4 portfolios); Director (since 2013), Virtus Global Funds, plc (5 portfolios); Trustee (since 2012) and President (since 2010), Virtus Variable Insurance Trust (8 portfolios); Trustee, President and Chief Executive Officer (since 2011), Virtus Global Multi-Sector Income Fund; Trustee and President (since 2006) and Executive Vice President (2004 to 2006), Virtus Mutual Fund Family (50 portfolios); Director, President and Chief Executive Officer (since 2006), Virtus Total Return Fund Inc.; and Director, President and Chief Executive Officer (2006 to 2019), the former Virtus Total Return Fund Inc. |
| Name, Address and Year of Birth | Position(s) Held with Trust and Length of Time Served | Principal Occupation(s) During Past 5 Years |
| Batchelar, Peter J. YOB: 1970 | Senior Vice President (since 2017), and Vice President (2008 to 2016). | Senior Vice President, Product Development (since 2017), Vice President, Product Development (2008 to 2017), and various officer positions (since 2008), Virtus Investment Partners, Inc. and/or certain of its subsidiaries; various officer positions (since 2008) of various registered funds advised by subsidiaries of Virtus Investment Partners, Inc. |
| Bradley, W. Patrick YOB: 1972 | Executive Vice President (since 2016); Senior Vice President (2013 to 2016); Vice President (2011 to 2013); Chief Financial Officer and Treasurer (since 2006). | Executive Vice President, Fund Services (since 2016), Senior Vice President, Fund Services (2010 to 2016) and various officer positions (since 2004), Virtus Investment Partners, Inc. and/or certain of its subsidiaries; Director (since 2023), Stone Harbor Investment Funds plc and Stone Harbor Global Funds plc; Director (since 2019), Virtus Global Funds ICAV; Director (since 2013), Virtus Global Funds, plc; various officer positions (since 2006) of various registered funds advised by subsidiaries of Virtus Investment Partners, Inc.; Member (since 2022), BNY Mellon Asset Servicing Client Advisory Board. |
| Branigan, Timothy YOB: 1976 | Vice President and Fund Chief Compliance Officer (since 2022); Assistant Vice President and Deputy Fund Chief Compliance Officer (March to May 2022); and Assistant Vice President and Assistant Chief Compliance Officer (2021 to 2022). | Various officer positions (since 2019) of various registered funds advised by subsidiaries of Virtus Investment Partners, Inc. |
| Chisolm, Daphne YOB: 1969 | Vice President, Counsel and Assistant Secretary (since 2023). | Vice President and Senior Counsel (since 2023), Virtus Investment Partners, Inc.; Attorney at Law engaged in private practice as a solo practitioner (2018 to 2023); and various officer positions (since 2023) of various registered funds advised by subsidiaries of Virtus Investment Partners, Inc. |
| Name, Address and Year of Birth | Position(s) Held with Trust and Length of Time Served | Principal Occupation(s) During Past 5 Years |
| Fromm Jennifer YOB: 1973 | Chief Legal Officer, Counsel and Secretary (since 2023); Vice President (since 2017); and Assistant Secretary (2008 to 2022). | Vice President (since 2016) and Senior Counsel, Legal (since 2007) and various officer positions (since 2008), Virtus Investment Partners, Inc. and/or certain of its subsidiaries; various officer positions (since 2008) of various registered funds advised by subsidiaries of Virtus Investment Partners, Inc. |
| Griswold, Heidi YOB: 1973 | Vice President (since 2017). | Vice President, Head of Transfer Agent & Servicing, Mutual Fund Services (since 2018), Virtus Investment Partners, Inc. and/or certain of its subsidiaries; and Vice President (since 2016) of various registered funds advised by subsidiaries of Virtus Investment Partners, Inc. |
| Hackett, Amy YOB: 1968 | Vice President and Assistant Treasurer (since 2017). | Vice President (since 2010) and Assistant Vice President (2007 to 2010), Fund Services, Virtus Investment Partners, Inc. and/or certain of its subsidiaries; and various officer positions (since 2007) of various registered funds advised by subsidiaries of Virtus Investment Partners, Inc. |
| Krishnan, Suneeta YOB: 1965 | Vice President and Assistant Treasurer (since 2018); and Assistant Treasurer (2013 to 2018). | Vice President (since 2017) and Assistant Treasurer (since 2007), Mutual Fund Administration, Virtus Investment Partners, Inc. and/or certain of its subsidiaries; and various officer positions (since 2009) of various registered funds advised by subsidiaries of Virtus Investment Partners, Inc. |
| Lowe, Benjamin YOB: 1978 | Vice President, Controller and Assistant Treasurer (since 2021); and Vice President and Assistant Treasurer (2018 to 2021). | Vice President, Fund Services (since 2017), Virtus Investment Partners, Inc. and/or certain of its subsidiaries; and various officer positions (since 2018) of various registered funds advised by subsidiaries of Virtus Investment Partners, Inc. |
| Martin, David YOB: 1959 | Anti-Money Laundering Compliance Officer (since 2017). | Vice President, Compliance – Broker/Dealer (since 2009), Virtus Investment Partners, Inc.; and Vice President and Chief Compliance Officer of certain Virtus subsidiaries (since 2004). |
| Rahman, Mahmood YOB: 1967 | Assistant Vice President (since 2021). | Vice President (since 2023), Tax Director (since 2020) and Assistant Vice President (2020 to 2023), Fund Administration, Virtus Investment Partners, Inc.; Assistant Vice President (since 2021) of various registered funds advised by subsidiaries of Virtus Investment Partners, Inc.; and Assistant Treasurer and Tax Director, Grantham, Mayo, Van Otterloo & Co. LLC (2007 to 2019). |
| Short, Julia R. YOB: 1972 | Senior Vice President (since 2017). | Senior Vice President, Product Development (since 2017), Virtus Investment Partners, Inc. and/or certain of its subsidiaries; Senior Vice President (since 2017) of various registered funds advised by subsidiaries of Virtus Investment Partners, Inc.; and Managing Director, Product Manager, RidgeWorth Investments (2004 to 2017). |
| Smirl, Richard W. YOB: 1967 | Executive Vice President (since 2021). | Chief Operating Officer (since 2021), Virtus Investment Partners, Inc.; Executive Vice President (since 2021), Virtus Investment Partners, Inc. and/or certain of its subsidiaries; Executive Vice President (since 2021) of various registered funds advised by subsidiaries of Virtus Investment Partners, Inc.; Chief Operating Officer (2018 to 2021), Russell Investments; Executive Director (Jan. to July 2018), State of Wisconsin Investment Board; and Partner and Chief Operating Officer (2004 to 2018), William Blair Investment Management. |
| Suss, Amanda YOB: 1969 | Vice President, Controller and Assistant Treasurer (since 2022). | Vice President and Controller (since 2022), Mutual Fund Administration and Financial Reporting, Virtus Investment Partners, Inc.; Vice President, Controller and Assistant Treasurer (since 2022) of various registered funds advised by subsidiaries of Virtus Investment Partners, Inc.; and Senior Finance Associate (2011 to 2022), Stone Harbor Investment Partners LP. |
| Fund | Class A | Class C | Class I | Class R6 |
| Virtus Silvant Large-Cap Growth Stock Fund(*) | 1.03% | N/A | 0.77% | 0.72% |
a series of Virtus Asset Trust
(Unaudited)
Statutory Prospectus and Statement of Additional Information (“SAI”),
each dated April 28, 2023, as supplemented
Accounting Firm
| Mutual Fund Services | 1-800-243-1574 |
| Adviser Consulting Group | 1-800-243-4361 |
| Website | Virtus.com |
The Securities and Exchange Commission has modified mailing regulations for semiannual and annual shareholder fund reports to allow mutual fund companies to send a single copy of these reports to shareholders who share the same mailing address. If you would like additional copies, please call Mutual Fund Services at 1-800-243-1574.

please contact us at 1-800-243-1574, or visit Virtus.com.
| 8635 | 02-24 |
| (b) | Not applicable. |
| Item 2. | Code of Ethics. |
| (a) | The registrant, as of the end of the period covered by this report, has adopted a code of ethics that applies to the registrant’s principal executive officer, principal financial officer, principal accounting officer or controller, or persons performing similar functions, regardless of whether these individuals are employed by the registrant or a third party. |
| (c) | There have been no amendments during the period covered by this report, to a provision of the code of ethics that applies to the registrant’s principal executive officer, principal financial officer, principal accounting officer or controller, or persons performing similar functions, regardless of whether these individuals are employed by the registrant or a third party, and that relates to any element of the code of ethics described in Item 2(b) of the instructions for completion of Form N-CSR. A copy of the currently applicable code is included as an exhibit. |
| (d) | The registrant has not granted any waivers, during the period covered by this report, including an implicit waiver, from a provision of the code of ethics that applies to the registrant’s principal executive officer, principal financial officer, principal accounting officer or controller, or persons performing similar functions, regardless of whether these individuals are employed by the registrant or a third party, that relates to one or more of the items set forth in paragraph (b) of the instructions for completion of this Item. |
| Item 3. | Audit Committee Financial Expert. |
| (a)(1) | The Registrant’s Board of Trustees has determined that the Registrant has an “audit committee financial expert” serving on its Audit Committee. |
| (a)(2) | The Registrant’s Board of Trustees has determined that each of Connie D. McDaniel, Donald C. Burke and Brian T. Zino possesses the technical attributes identified in Instruction 2(b) of Item 3 to Form N-CSR to qualify as an “audit committee financial expert.” Each such individual is an “independent” trustee pursuant to paragraph (a)(2) of Item 3 to Form N-CSR. |
| (a)(3) | Not applicable. |
| Item 4. | Principal Accountant Fees and Services. |
Audit Fees
| (a) | The aggregate fees billed for each of the last two fiscal years for professional services rendered by the principal accountant for the audit of the registrant’s annual financial statements or services that are normally provided by the accountant in connection with statutory and regulatory filings or engagements for those fiscal years are $384,917 for 2023 and $375,529 for 2022. |
Audit-Related Fees
| (b) | The aggregate fees billed in each of the last two fiscal years for assurance and related services by the principal accountant that are reasonably related to the performance of the audit of the registrant’s financial statements and are not reported under paragraph (a) of this Item are $30,820 for 2023 and $20,438 for 2022. Such audit-related fees include out of pocket expenses and system conversion fees. |
Tax Fees
| (c) | The aggregate fees billed in each of the last two fiscal years for professional services rendered by the principal accountant for tax compliance, tax advice, and tax planning are $52,593 for 2023 and $124,806 for 2022. |
“Tax Fees” are those primarily associated with review of the Trust’s tax provision and qualification as a regulated investment company (RIC) in connection with audits of the Trust’s financial statement, review of year-end distributions by the Fund to avoid excise tax for the Trust, periodic discussion with management on tax issues affecting the Trust, and reviewing and signing the Fund’s federal income tax returns.
All Other Fees
| (d) | The aggregate fees billed in each of the last two fiscal years for products and services provided by the principal accountant, other than the services reported in paragraphs (a) through (c) of this Item are $0 for 2023 and $0 for 2022. |
| (e)(1) | Disclose the audit committee’s pre-approval policies and procedures described in paragraph (c)(7) of Rule 2-01 of Regulation S-X. |
The Virtus Asset Trust (the “Fund”) Board has adopted policies and procedures with regard to the pre-approval of services provided by its independent auditors. Audit, audit-related and tax compliance services provided to the Fund on an annual basis require specific pre-approval by the Audit Committee. The Audit Committee must also approve other non-audit services provided to the Fund and those non-audit services provided to the Fund’s Affiliated Service Providers that relate directly to the operations and financial reporting of the Fund. Certain of these non-audit services that the Audit Committee believes are a) consistent with the SEC’s auditor independence rules and b) routine and recurring services that will not impair the independence of the independent auditors may be approved by the Audit Committee without consideration on a specific case-by-case basis (“general pre-approval”).
The Audit Committee has determined that the Chair of the Audit Committee may provide pre-approval for such services that meet the above requirements but are not included in the general pre-approval in the event such approval is sought between regularly scheduled meetings. In any event, the Audit Committee is informed of, and ratifies, each service approved at the next regularly scheduled in-person Audit Committee meeting.
| (e)(2) | The percentage of services described in each of paragraphs (b) through (d) of this Item that were approved by the audit committee pursuant to paragraph (c)(7)(i)(C) of Rule 2-01 of Regulation S-X are as follows: |
(b) 0%
(c) 0%
(d) N/A
| (f) | The percentage of hours expended on the principal accountant’s engagement to audit the registrant’s financial statements for the most recent fiscal year that were attributed to work performed by persons other than the principal accountant’s full-time, permanent employees was less than fifty percent. |
| (g) | The aggregate non-audit fees billed by the registrant’s accountant for services rendered to the registrant, and rendered to the registrant’s investment adviser (not including any sub-adviser whose role is primarily portfolio management and is subcontracted with or overseen by another investment adviser), and any entity controlling, controlled by, or under common control with the adviser that provides ongoing services to the registrant for each of the last two fiscal years of the registrant was $83,413 for 2023 and $145,244 for 2022. |
| (h) | The registrant’s audit committee of the board of directors has considered whether the provision of non-audit services that were rendered to the registrant’s investment adviser (not including any sub-adviser whose role is primarily portfolio management and is subcontracted with or overseen by another investment adviser), and any entity controlling, controlled by, or under common control with the investment adviser that provides ongoing services to the registrant that were not pre-approved pursuant to paragraph (c)(7)(ii) of Rule 2-01 of Regulation S-X is compatible with maintaining the principal accountant’s independence. |
| (i) | Not applicable. |
| (j) | Not applicable |
| Item 5. | Audit Committee of Listed Registrants. |
Disclosure not required for open-end management investment companies.
| Item 6. | Investments. |
| (a) | Schedule of Investments in securities of unaffiliated issuers as of the close of the reporting period is included as part of the report to shareholders filed under Item 1(a) of this form. |
| (b) | Not applicable. |
| Item 7. | Disclosure of Proxy Voting Policies and Procedures for Closed-End Management Investment Companies. |
Disclosure not required for open-end management investment companies.
| Item 8. | Portfolio Managers of Closed-End Management Investment Companies. |
Disclosure not required for open-end management investment companies.
| Item 9. | Purchases of Equity Securities by Closed-End Management Investment Company and Affiliated Purchasers. |
Disclosure not required for open-end management investment companies.
| Item 10. | Submission of Matters to a Vote of Security Holders. |
There have been no material changes to the procedures by which the shareholders may recommend nominees to the registrant’s board of trustees, where those changes were implemented after the registrant last provided disclosure in response to the requirements of Item 407(c)(2)(iv) of Regulation S-K (17 CFR 229.407) (as required by Item 22(b)(15) of Schedule 14A (17 CFR 240.14a-101)), or this Item.
| Item 11. | Controls and Procedures. |
| (a) | The registrant’s principal executive and principal financial officers, or persons performing similar functions, have concluded that the registrant’s disclosure controls and procedures (as defined in Rule 30a-3(c) under the Investment Company Act of 1940, as amended (the “1940 Act”) (17 CFR 270.30a-3(c))) are effective, as of a date within 90 days of the filing date of the report that includes the disclosure required by this paragraph, based on their evaluation of these controls and procedures required by Rule 30a-3(b) under the 1940 Act (17 CFR 270.30a-3(b)) and Rules 13a-15(b) or 15d-15(b) under the Securities Exchange Act of 1934, as amended (17 CFR 240.13a-15(b) or 240.15d-15(b)). |
| (b) | There were no changes in the registrant’s internal control over financial reporting (as defined in Rule 30a-3(d) under the 1940 Act (17 CFR 270.30a-3(d))) that occurred during the period covered by this report that has materially affected, or is reasonably likely to materially affect, the registrant’s internal control over financial reporting. |
| Item 12. | Disclosure of Securities Lending Activities for Closed-End Management Investment Companies. |
Disclosure not required for open-end management investment companies.
| Item 13. | Exhibits. |
| (a)(2)(1) | Not applicable. | |
| (a)(2)(2) | There was no change in the Registrant’s independent public accountant during the period covered by the report. | |
| (b) | Certifications pursuant to Rule 30a-2(b) under the 1940 Act and Section 906 of the Sarbanes-Oxley Act of 2002 are attached hereto. | |
SIGNATURES
Pursuant to the requirements of the Securities Exchange Act of 1934 and the Investment Company Act of 1940, the registrant has duly caused this report to be signed on its behalf by the undersigned, thereunto duly authorized.
| (Registrant) | Virtus Asset Trust | |
| By (Signature and Title)* | /s/ George R. Aylward | |
| George R. Aylward, President | ||
| (principal executive officer) | ||
| Date 2/29/2024 | ||
Pursuant to the requirements of the Securities Exchange Act of 1934 and the Investment Company Act of 1940, this report has been signed below by the following persons on behalf of the registrant and in the capacities and on the dates indicated.
| By (Signature and Title)* | /s/ George R. Aylward | |
| George R. Aylward, President | ||
| (principal executive officer) | ||
| Date 2/29/2024 | ||
| By (Signature and Title)* | /s/ W. Patrick Bradley | |
| W. Patrick Bradley, Executive Vice President, | ||
| Chief Financial Officer and Treasurer | ||
| (principal financial officer) | ||
| Date 2/29/2024 | ||
| * | Print the name and title of each signing officer under his or her signature. |