UNITED STATES
SECURITIES AND EXCHANGE COMMISSION
Washington, D.C. 20549
FORM N-CSR
CERTIFIED SHAREHOLDER REPORT OF REGISTERED MANAGEMENT
INVESTMENT COMPANIES
Investment Company Act file number 811-07751
Nuveen Multistate Trust IV
(Exact name of registrant as specified in charter)
Nuveen Investments
333 West Wacker Drive Chicago, IL 60606
(Address of principal executive offices) (Zip code)
Jessica R. Droeger
Nuveen Investments
333 West Wacker Drive
Chicago, IL 60606
(Name and address of agent for service)
Registrant’s telephone number, including area code: (312) 917-7700
Date of fiscal year end: May 31
Date of reporting period: November 30, 2006
Form N-CSR is to be used by management investment companies to file reports with the Commission not later than 10 days after the transmission to stockholders of any report that is required to be transmitted to stockholders under Rule 30e-1 under the Investment Company Act of 1940 (17 CFR 270.30e-1). The Commission may use the information provided on Form N-CSR in its regulatory, disclosure review, inspection, and policy making roles.
A registrant is required to disclose the information specified by Form N-CSR, and the Commission will make this information public. A registrant is not required to respond to the collection of information contained in Form N-CSR unless the Form displays a currently valid Office of Management and Budget (“OMB”) control number. Please direct comments concerning the accuracy of the information collection burden estimate and any suggestions for reducing the burden to Secretary, Securities and Exchange Commission, 450 Fifth Street, NW, Washington, DC 20549-0609. The OMB has reviewed this collection of information under the clearance requirements of 44 U.S.C. ss.3507.
Item 1. Reports to Stockholders.
NUVEEN INVESTMENTS MUTUAL FUNDS
Semiannual Report dated November 30, 2006 | Dependable, tax-free income because it’s not what you earn, it’s what you keep.® | |

Nuveen Investments
Municipal Bond Funds
Nuveen Kansas Municipal Bond Fund
Nuveen Kentucky Municipal Bond Fund
Nuveen Michigan Municipal Bond Fund
Nuveen Missouri Municipal Bond Fund
Nuveen Ohio Municipal Bond Fund
Nuveen Wisconsin Municipal Bond Fund


NOW YOU CAN RECEIVE YOUR
NUVEEN INVESTMENTS FUND REPORTS FASTER
NO MORE WAITING.
SIGN UP TODAY TO RECEIVE NUVEEN INVESTMENTS FUND INFORMATION BY
E-MAIL.
It only takes a minute to sign up for E-Reports. Once enrolled, you’ll receive an e-mail as soon as your Nuveen Investments Fund information is ready — no more waiting for delivery by regular mail. Just click on the link within the e-mail to see the report, and save it on your computer if your wish.

IT’S FAST, EASY & FREE:
www.investordelivery.com
if you get your Nuveen Investments Fund dividends and statements from your financial advisor or brokerage account.
(Be sure to have the address sheet that accompanied this report handy. You’ll need it to complete the enrollment process.)
OR
www.nuveen.com/accountaccess
if you get your Nuveen Investments Fund dividends and statements directly from Nuveen Investments.

| Must be preceded by or accompanied by a prospectus. | NOT FDIC INSURED | MAY LOSE VALUE | NO BANK GUARANTEE |

“ But one thing we do know is that a well-balanced portfolio – often including municipal bonds – can provide diversification that can reduce overall investment risk.”
Dear Shareholder,
Once again, I am pleased to report that during the six-month period covered by this report your Fund provided tax-free income and solid performance from a carefully selected portfolio of municipal bonds. Detailed information on your Fund’s performance can be found in the Portfolio Managers’ Comments and Fund Spotlight sections of this report.
As we begin a new year, no one knows for certain what the future will bring. But one thing we do know is that a well-balanced portfolio – often including municipal bonds – can provide diversification that can reduce overall investment risk. To learn more about the potential benefits of portfolio diversification, we encourage you to consult a trusted financial advisor. He or she should be able to help you understand how a municipal bond investment like your Nuveen Fund can be an important building block in a portfolio crafted to perform well through a variety of market conditions.
Since 1898, Nuveen Investments has offered financial products and solutions that incorporate careful research, diversification, and the application of conservative risk-management principles. We are grateful that you have chosen us as a partner as you pursue your financial goals. We look forward to continuing to earn your trust in the months and years ahead.
Sincerely,

Timothy R. Schwertfeger
Chairman of the Board
January 15, 2007
Semiannual Report Page 1
Portfolio Managers’ Comments
Portfolio managers Scott Romans and Cathryn Steeves examine key investment strategies and the performance of the Nuveen Kansas, Kentucky, Michigan, Missouri, Ohio and Wisconsin Municipal Bond Funds. Scott, who has 6 years of investment experience, began managing the Kansas, Missouri and Wisconsin Funds in 2003. Cathryn has 10 years of investment experience and began managing the Kentucky and Ohio Funds in 2004, and the Michigan Fund in 2005.
How did the Funds perform during the six months ended November 30, 2006?
The nearby table provides total return performance information for the six Funds discussed in this report for the six-month, one-year, five-year, and ten-year periods ended November 30, 2006. Each Fund’s performance is compared with the national Lehman Brothers Municipal Bond Index, as well as with its Lipper peer fund category average. The factors determining the performance of each Fund are discussed later in the report.
For the six-month period ended November 30, 2006, the total returns on net asset value for all six Funds’ Class A shares outperformed their respective Lipper peer group averages. The Michigan, Missouri and Wisconsin Funds performed in line with the Lehman Brothers index, while the Kansas, Kentucky and Ohio Funds underperformed the national benchmark. Although we believe that comparing the performance of single state Funds with that of a national municipal index may offer some insights into how the Funds performed relative to the general municipal market, we also think that closely comparing the results of state Funds with a national average can be a bit misleading since most of the national index’s results come from the performance of out-of-state bonds.
What strategies were used to manage the Funds during the period? How did these strategies influence performance?
With the economy slowing down and inflation seemingly in check – two often-favorable characteristics for fixed-income securities – the six-month period covered by this report presented a generally positive environment for the municipal bond market and the Funds. Longer-term municipal bonds did especially well, as their yields tended to fall (and their prices tended to rise) more than their shorter-term counterparts. Another significant trend was the continued relatively strong performance of lower-rated bonds, which benefited as investor demand for these generally higher-yielding bonds remained firm.
Although we managed each of the six Funds discussed in this report with similar overall strategies, there were some differences in how each Fund’s portfolio was structured and the individual market conditions that prevailed in each state. Below we provide more specific information about the performance and management of each Fund.
Nuveen Kansas Municipal Bond Fund
Over this six-month period, we worked carefully to manage the portfolio’s overall position on the yield curve. In the current environment, this led us to investing in bonds with relatively long durations (the longer a bond’s duration, the more its price will fluctuate as interest rates change). This contributed positively to the Fund’s performance over this period as longer-term bonds generally did better than shorter-term bonds.
In a market environment in which many lower-rated bonds outperformed higher-rated securities, the Fund’s performance over the six-month period also was helped by its holdings of A-rated bonds – although that performance was offset to some degree by the relatively short durations of a number of these securities. The Fund’s small allocation to
The views expressed reflect those of the portfolio manager and are subject to change at any time, based on market and other conditions.
Semiannual Report Page 2
Class A Shares—
Total Returns as of 11/30/06
Cumulative | Average Annual | |||||||
| 6-Month | 1-Year | 5-Year | 10-Year | |||||
Nuveen Kansas Municipal Bond Fund | ||||||||
A Shares at NAV | 3.96% | 5.32% | 5.06% | 5.13% | ||||
A Shares at Offer | -0.45% | 0.88% | 4.16% | 4.67% | ||||
Lipper Kansas Municipal Debt Funds Category Average1 | 3.80% | 5.35% | 4.30% | 4.51% | ||||
Lehman Brothers Municipal Bond Index2 | 4.53% | 6.12% | 5.40% | 5.75% | ||||
Nuveen Kentucky Municipal Bond Fund | ||||||||
A Shares at NAV | 4.31% | 5.78% | 5.29% | 5.11% | ||||
A Shares at Offer | -0.07% | 1.29% | 4.39% | 4.66% | ||||
Lipper Kentucky Municipal Debt Funds Category Average1 | 3.75% | 4.98% | 4.31% | 4.69% | ||||
Lehman Brothers Municipal Bond Index2 | 4.53% | 6.12% | 5.40% | 5.75% | ||||
Nuveen Michigan Municipal Bond Fund | ||||||||
A Shares at NAV | 4.56% | 6.10% | 5.23% | 5.21% | ||||
A Shares at Offer | 0.18% | 1.65% | 4.33% | 4.76% | ||||
Lipper Michigan Municipal Debt Funds Category Average1 | 3.94% | 5.19% | 4.45% | 4.76% | ||||
Lehman Brothers Municipal Bond Index2 | 4.53% | 6.12% | 5.40% | 5.75% | ||||
Nuveen Missouri Municipal Bond Fund | ||||||||
A Shares at NAV | 4.55% | 6.14% | 5.31% | 5.25% | ||||
A Shares at Offer | 0.17% | 1.72% | 4.40% | 4.80% | ||||
Lipper Missouri Municipal Debt Funds Category Average1 | 4.25% | 5.61% | 4.73% | 4.99% | ||||
Lehman Brothers Municipal Bond Index2 | 4.53% | 6.12% | 5.40% | 5.75% | ||||
Nuveen Ohio Municipal Bond Fund | ||||||||
A Shares at NAV | 4.34% | 5.73% | 5.26% | 5.03% | ||||
A Shares at Offer | -0.01% | 1.29% | 4.36% | 4.57% | ||||
Lipper Ohio Municipal Debt Funds Category Average1 | 3.96% | 5.15% | 4.38% | 4.68% | ||||
Lehman Brothers Municipal Bond Index2 | 4.53% | 6.12% | 5.40% | 5.75% | ||||
Cumulative | Average Annual | |||||||
| 6-Month | 1-Year | 5-Year | 10-Year | |||||
Nuveen Wisconsin Municipal Bond Fund | ||||||||
A Shares at NAV | 4.60% | 5.79% | 4.96% | 5.12% | ||||
A Shares at Offer | 0.18% | 1.38% | 4.07% | 4.67% | ||||
Lipper Other States Municipal Debt Funds Category Average1 | 3.96% | 5.56% | 4.30% | 4.64% | ||||
Lehman Brothers Municipal Bond Index2 | 4.53% | 6.12% | 5.40% | 5.75% | ||||
Returns quoted represent past performance, which is no guarantee of future results. Returns less than one year are cumulative. Returns at NAV would be lower if the sales charge were included. Current performance may be higher or lower than the performance shown. Investment returns and principal value will fluctuate so that when shares are redeemed, they may be worth more or less than their original cost. Class A shares have a 4.2 percent maximum sales charge. Returns do not reflect the deduction of taxes that a shareholder would pay on Fund distributions or the redemption of shares. You cannot invest directly in an index. For the most recent month-end performance, visit www.nuveen.com or call (800) 257-8787.
non-rated bonds – 3 percent of the portfolio at period end – also added to relative performance over this period. Another positive was our relatively large position in the health care sector, although, again, the short durations of several of these bonds counterbalanced some of the potential gain.
Ironically, the Fund’s holdings of AAA-rated securities acted as a drag on performance over this period, as lower-rated bonds generally performed better. The Fund’s performance also was hindered by its single-family housing bonds, some of which were called at their par values as lower rates led to an increase in mortgage prepayments.
| 1 | For each Fund, the Lipper category average shown represents the average annualized total return for all reporting funds for the periods ended November 30, 2006. The Lipper categories contained 9, 9, 8 and 5 funds in the Lipper Kansas Municipal Debt Funds Category, 18, 17, 17 and 9 funds in the Lipper Kentucky Municipal Debt Funds Category, 30, 29, 29 and 24 funds in the Lipper Michigan Municipal Debt Funds Category, 18, 17, 17 and 13 in the Lipper Missouri Municipal Debt Funds Category, 42, 42, 39 and 32 funds in the Lipper Ohio Municipal Debt Funds Category and 77, 74, 70 and 47 funds in the Lipper Other States Municipal Debt Funds Category for the respective one-, five- and ten-year periods ended May 31, 2006. The returns account for the effects of management fees and assume reinvestment of dividends, but do not reflect any applicable sales charges. You cannot invest directly in a Lipper Category. |
| 2 | The Lehman Brothers Municipal Bond Index is an unmanaged index composed of a broad range of investment-grade municipal bonds and does not reflect any initial or ongoing expenses. An index is not available for direct investment. |
Semiannual Report Page 3
New additions to the portfolio during the period included some lower-rated debt, especially in the health care sector, where we purchased a variety of attractively valued hospital bonds. Even though their recent performance was disappointing, we also added to our single-family housing bond exposure, as we found some well-structured opportunities trading for what we believed were good prices. Although the housing sector has faced recent challenges, we liked these securities for their ability to supplement the portfolio’s income.
To accomplish our duration-management goals, we sold some of our less interest rate sensitive holdings, including some pre-refunded bonds. We also sold some of our stake in U.S. territorial bonds, reinvesting the proceeds in securities issued in Kansas. Finally, as the bond market peaked during the summer, we sold some of our holdings with lower embedded yields, replacing these securities with newer bonds offering better income characteristics.
Nuveen Kentucky Municipal Bond Fund
During this period, the Kentucky Fund benefited from its relatively long duration, a stance that helped greatly as the bond market rallied. Another positive for the Fund during the period was the continued outperformance of lower-rated bonds, as investors proved willing to take on added risk in exchange for a higher yield. On the negative side, the Fund’s relatively large holding of Kentucky housing bonds detracted from overall performance, as investors worried about mortgage prepayment risk in a declining interest rate environment.
Consistent with careful management of the Fund’s yield curve positioning, a primary management focus during the period was to lengthen the Fund’s duration. Accordingly, we took advantage of a relatively modest number of opportunities to add longer-dated Kentucky securities to the portfolio. To fund these purchases, we sold some of our shorter-duration holdings that we believed offered less attractive future value.
In August 2006, the Kentucky Supreme Court ruled that the state could not tax the interest earned from bonds issued outside the state if it did not also tax the interest earned from in-state bonds. This decision contradicted an Ohio court ruling in a similar case, and the matter has been submitted to the United States Supreme Court. We continue to monitor this situation closely. Given the early stage of this issue, we think it is premature to speculate on any eventual outcome, but we believe that the Nuveen Kentucky Fund will continue to provide investors with stable, quality, tax-free income.
Nuveen Michigan Municipal Bond Fund
The Michigan Fund’s relatively long duration had a positive influence on performance over the period, with the portfolio’s increased interest rate sensitivity adding to returns as longer-term bonds generally performed well. A relatively large holding in the state’s strong-performing health care sector also added to returns. In particular, the Fund benefited from its holdings in Henry Ford Health System bonds, whose price appreciated when the securities were pre-refunded during the period. The Fund also benefited from its relatively small position in housing bonds, which lagged during the bond market’s rally. In addition, the Fund’s modest allocation to sub-investment-grade debt proved to be a positive as credit spreads narrowed.
On the negative side over the six-month period, the Fund’s yield curve positioning proved to be disadvantageous. Although the Fund’s average duration was relatively long and overall yield curve positioning was a positive factor, the Fund was relatively heavily concentrated in intermediate-term bonds, which underperformed their longer-term counterparts.
We were actively purchasing new, longer-dated Michigan securities throughout the period, adding positions across a variety of sectors. Many of our purchases were of higher-rated, longer-maturity bonds that we believed were attractively valued. To fund these additions to the portfolio, we generally were selling shorter-dated bonds.
Semiannual Report Page 4
Nuveen Missouri Municipal Bond Fund
The Missouri Fund’s performance over this six-month period was helped by its relatively long
duration – a net positive during an environment of declining yields, especially on the long end of the curve. Most of the Fund’s top performers during the period were long-duration securities such as non-callable bonds or bonds with distant call dates. Also, as lower-rated securities continued to perform well, the portfolio’s allocation to A-rated bonds helped the Fund’s overall return – although this positive impact was somewhat muted by the less
desirable duration characteristics of several of the bonds we owned. Finally, the Fund’s position in industrial development revenue bonds issued for Procter & Gamble added notably to results.
Most of our new purchases during the period tended to be in the lower credit rating categories, where we found an increasing amount of value compared to recent years. We also added to the Fund’s housing bond exposure when we found opportunities that we believed were attractively structured, well priced, and added good income to
the portfolio. These purchases were partly funded by the proceeds from called bonds. We also sold very short-dated pre-refunded bonds, which we did not believe would perform well in the near term and whose sale we believed could help us achieve our duration management goals.
Nuveen Ohio Municipal Bond Fund
During the reporting period, the Ohio Fund benefited as well from its relatively long duration during a favorable rate environment. Also helping performance was our emphasis on lower-rated credits – a positive influence as lower-rated bonds did relatively well during the six-month period. A relatively small holding of the weak-performing housing sector also contributed positively to the Fund’s results for the period. In contrast, the Fund’s relatively large holding of pre-refunded bonds – weak performers owing to their short durations – detracted from overall performance, while our relatively large position in the intermediate part of the yield curve also provided another negative in relative terms.
Portfolio activity was moderate during the six months. Consistent with careful management of the Fund’s yield curve positioning, we looked for opportunities throughout the period to extend duration, purchasing a variety of longer-dated bonds as they became available. We added some health care and higher education bonds that we believed offered good value potential. One notable sale was an unwinding of an inverse floater position. These bonds were positioned toward the short end of the yield curve, and selling this position and reinvesting the proceeds in longer-term securities was a helpful part of our duration-lengthening efforts – a process that was still underway as the period came to a close.
Nuveen Wisconsin Municipal Bond Fund
The Wisconsin Fund’s relatively long duration had a favorable influence on performance over the period as longer-term bonds generally performed well. Another positive was the Fund’s allocation to A-rated bonds, which tended to outperform higher-rated securities. The Fund also benefited from security selection, with many of its longest-duration holdings – such as zero-coupon, long-dated, and non-callable bonds – faring the best. Security selection among our lowest-rated bond positions also boosted results, with positions in higher education Puerto Rico bonds for Ana Mendez University as well as a handful of lower-rated community development authority bonds performing particularly well. Counterbalancing some of these positives, the Fund’s relatively small holding of BBB-rated bonds tended to hurt overall performance over the period.
Portfolio activity was relatively limited in the Wisconsin Fund during the six months. This was not surprising, given the relatively limited number of issuers of fully tax-exempt bonds within the state. We made just two new purchases during the period, both lower-rated bonds that we believed offered good value and helped us achieve several
Semiannual Report Page 5
portfolio management objectives – increasing the Fund’s diversification and reducing its exposure to U.S. territorial bonds. The latter had occupied a significant portion of the portfolio in recent years. However, given our success in identifying suitable in-state alternatives, territorial securities made up a much smaller percentage of the Fund’s portfolio at period end than in the recent past.
Dividend Information
Throughout the six-month period, all six Funds maintained their monthly tax-free dividend.
Each Fund seeks to pay dividends at a rate that reflects the past and projected performance of the Fund. To permit a Fund to maintain a more stable monthly dividend, the Fund may pay dividends at a rate that may be more or less than the amount of net investment income actually earned by the Fund during the period. If the Fund has cumulatively earned more than it has paid in dividends, it will hold the excess in reserve as undistributed net investment income (UNII) as part of the Fund’s net asset value. Conversely, if the Fund has cumulatively paid in dividends more than it has earned, the excess will constitute a negative UNII that will likewise be reflected in the Fund’s net asset value. Each Fund will, over time, pay all its net investment income as dividends to shareholders.
As of November 30, 2006, all six of the Funds in this report had negative UNII balances for financial statement purposes and positive UNII balances, based on our best estimates, for tax purposes.
Semiannual Report Page 6
Fund Spotlight as of 11/30/06 Nuveen Kansas Municipal Bond Fund
| Quick Facts | ||||||||
| A Shares | B Shares | C Shares | R Shares | |||||
NAV | $10.58 | $10.50 | $10.59 | $10.63 | ||||
Latest Monthly Dividend1 | $0.0345 | $0.0280 | $0.0300 | $0.0365 | ||||
Inception Date | 1/09/92 | 2/19/97 | 2/11/97 | 2/25/97 |
Returns quoted represent past performance which is no guarantee of future results. Returns without sales charges would be lower if the sales charge were included. Current performance may be higher or lower than the performance shown. Investment returns and principal value will fluctuate so that when shares are redeemed, they may be worth more or less than their original cost. Returns do not reflect the deduction of taxes that a shareholder would pay on Fund distributions or the redemption of shares. Income is generally exempt from regular federal income taxes. Some income may be subject to state and local taxes and to the federal alternative minimum tax. Capital gains, if any, are subject to tax. For the most recent month-end performance visit www.nuveen.com or call (800) 257-8787.
Class A share returns are actual. Class B, C and R share returns are actual for the period since class inception; returns prior to class inception are Class A share returns adjusted for differences in sales charges and (in the case of Classes B and C) expenses, which are primarily differences in distribution and service fees. Class A shares have a 4.2% maximum sales charge. Class B shares have a contingent deferred sales charge (CDSC), also known as a back-end sales charge, that for redemptions begins at 5% and declines periodically until after 6 years when the charge becomes 0%. Class B shares automatically convert to Class A shares eight years after purchase. Class C shares have a 1% CDSC for redemptions within less than one year, which is not reflected in the one-year total return. Class R shares have no sales charge and may be purchased under limited circumstances or by specified classes of investors.
| Average Annual Total Returns as of 11/30/06 | ||||
| A Shares | NAV | Offer | ||
1-Year | 5.32% | 0.88% | ||
5-Year | 5.06% | 4.16% | ||
10-Year | 5.13% | 4.67% | ||
| B Shares | w/o CDSC | w/CDSC | ||
1-Year | 4.68% | 0.68% | ||
5-Year | 4.29% | 4.12% | ||
10-Year | 4.45% | 4.45% | ||
| C Shares | NAV | |||
1-Year | 4.88% | |||
5-Year | 4.51% | |||
10-Year | 4.59% | |||
| R Shares | NAV | |||
1-Year | 5.64% | |||
5-Year | 5.30% | |||
10-Year | 5.39% | |||
| Tax-Free Yields | ||||
| A Shares | NAV | Offer | ||
Dividend Yield2 | 3.91% | 3.75% | ||
SEC 30-Day Yield3 | 3.35% | 3.21% | ||
Taxable-Equivalent Yield3,4 | 4.96% | 4.76% | ||
| B Shares | NAV | |||
Dividend Yield2 | 3.20% | |||
SEC 30-Day Yield | 2.60% | |||
Taxable-Equivalent Yield4 | 3.85% | |||
| C Shares | NAV | |||
Dividend Yield2 | 3.40% | |||
SEC 30-Day Yield | 2.80% | |||
Taxable-Equivalent Yield4 | 4.15% | |||
| R Shares | NAV | |||
Dividend Yield2 | 4.12% | |||
SEC 30-Day Yield | 3.55% | |||
Taxable-Equivalent Yield4 | 5.26% | |||
| Average Annual Total Returns as of 12/31/06 | ||||
| A Shares | NAV | Offer | ||
1-Year | 4.03% | -0.33% | ||
5-Year | 5.15% | 4.26% | ||
10-Year | 5.12% | 4.67% | ||
| B Shares | w/o CDSC | w/CDSC | ||
1-Year | 3.39% | -0.61% | ||
5-Year | 4.38% | 4.21% | ||
10-Year | 4.44% | 4.44% | ||
| C Shares | NAV | |||
1-Year | 3.59% | |||
5-Year | 4.58% | |||
10-Year | 4.58% | |||
| R Shares | NAV | |||
1-Year | 4.35% | |||
5-Year | 5.36% | |||
10-Year | 5.38% | |||
| Portfolio Statistics | ||
Net Assets ($000) | $131,503 | |
Average Effective Maturity on Securities (Years) | 15.93 | |
Average Duration | 5.12 |
| 1 | Paid December 1, 2006. This is the latest monthly tax-exempt dividend declared during the period ended November 30, 2006. |
| 2 | Dividend Yield is the most recent dividend per share (annualized) divided by the appropriate price per share. The SEC 30-Day Yield is a standardized measure of the current market yield on the Fund’s portfolio and is based on the maximum offer price per share. The Dividend Yield also differs from the SEC 30-Day Yield because the Fund may be paying out more or less than it is earning and it may not include the effect of amortization of bond premium. |
| 3 | The SEC 30-Day Yield and Taxable-Equivalent Yield on A Shares at NAV applies only to A Shares purchased at no-load pursuant to the Fund’s policy permitting waiver of the A Share load in certain specified circumstances. |
| 4 | The Taxable-Equivalent Yield represents the yield that must be earned on a fully taxable investment in order to equal the yield of the Fund on an after-tax basis at a specified tax rate. With respect to investments that generate qualified dividend income that is taxable at a maximum rate of 15%, the Taxable-Equivalent Yield is lower. The Taxable-Equivalent Yield is based on the Fund’s SEC 30-Day Yield on the indicated date and a combined federal and state income tax rate of 32.5%. |
Semiannual Report Page 7
Fund Spotlight as of 11/30/06 Nuveen Kansas Municipal Bond Fund
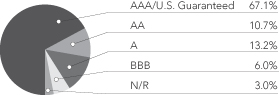
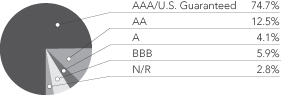
Bond Credit Quality1
Industries1
Tax Obligation/Limited | 27.0% | |
Health Care | 19.3% | |
Tax Obligation/General | 18.0% | |
U.S. Guaranteed | 8.7% | |
Water and Sewer | 7.1% | |
Housing/Single Family | 6.7% | |
Other | 13.2% |
| 1 | As a percentage of total investments as of November 30, 2006. Holdings are subject to change. |
Expense Example
As a shareholder of the Fund, you incur two types of costs: (1) transaction costs, including front and back end sales charges (loads) or redemption fees, where applicable; and (2) ongoing costs, including management fees; distribution and service (12b-1) fees, where applicable; and other Fund expenses. This Example is intended to help you understand your ongoing costs (in dollars) of investing in the Fund and to compare these costs with the ongoing costs of investing in other mutual funds.
The Example below is based on an investment of $1,000 invested at the beginning of the period and held for the period.
The information under “Actual Performance,” together with the amount you invested, allows you to estimate actual expenses incurred over the reporting period. Simply divide your account value by $1,000 (for example, an $8,600 account value divided by $1,000 = 8.60) and multiply the result by the cost shown for your share class, in the row entitled “Expenses Incurred During Period” to estimate the expenses incurred on your account during this period.
The information under “Hypothetical Performance,” provides information about hypothetical account values and hypothetical expenses based on the Fund’s actual expense ratio and an assumed rate of return of 5% per year before expenses, which is not the Fund’s actual return. The hypothetical account values and expenses may not be used to estimate the actual ending account balance or expense you incurred for the period. You may use this information to compare the ongoing costs of investing in the Fund and other Funds. To do so, compare this 5% hypothetical example with the 5% hypothetical examples that appear in the shareholder reports of the other funds.
Please note that the expenses shown in the table are meant to highlight your ongoing costs only and do not reflect any transactional costs, such as front and back end sales charges (loads) or redemption fees, where applicable. Therefore, the hypothetical information is useful in comparing ongoing costs only, and will not help you determine the relative total costs of owning different funds or share classes. In addition, if these transactional costs were included, your costs would have been higher.
| Hypothetical Performance | ||||||||||||||||||||||||
| Actual Performance | (5% annualized return before expenses) | |||||||||||||||||||||||
| A Shares | B Shares | C Shares | R Shares | A Shares | B Shares | C Shares | R Shares | |||||||||||||||||
Beginning Account Value (6/01/06) | $ | 1,000.00 | $ | 1,000.00 | $ | 1,000.00 | $ | 1,000.00 | $ | 1,000.00 | $ | 1,000.00 | $ | 1,000.00 | $ | 1,000.00 | ||||||||
Ending Account Value (11/30/06) | $ | 1,039.60 | $ | 1,036.00 | $ | 1,037.90 | $ | 1,041.60 | $ | 1,020.81 | $ | 1,017.05 | $ | 1,018.05 | $ | 1,021.81 | ||||||||
Expenses Incurred During Period | $ | 4.35 | $ | 8.17 | $ | 7.15 | $ | 3.33 | $ | 4.31 | $ | 8.09 | $ | 7.08 | $ | 3.29 | ||||||||
For each class of the Fund, expenses are equal to the Fund’s annualized net expense ratio of .85%, 1.60%, 1.40% and ..65% for Classes A, B, C and R, respectively, multiplied by the average account value over the period, multiplied by 183/365 (to reflect the one-half year period).
Semiannual Report Page 8
Fund Spotlight as of 11/30/06 Nuveen Kentucky Municipal Bond Fund
| Quick Facts | ||||||||
| A Shares | B Shares | C Shares | R Shares | |||||
NAV | $11.20 | $11.20 | $11.20 | $11.19 | ||||
Latest Monthly Dividend1 | $0.0380 | $0.0310 | $0.0325 | $0.0395 | ||||
Latest Capital Gain Distribution2 | $0.0363 | $0.0363 | $0.0363 | $0.0363 | ||||
Inception Date | 5/04/87 | 2/05/97 | 10/04/93 | 2/07/97 |
Returns quoted represent past performance which is no guarantee of future results. Returns without sales charges would be lower if the sales charge were included. Current performance may be higher or lower than the performance shown. Investment returns and principal value will fluctuate so that when shares are redeemed, they may be worth more or less than their original cost. Returns do not reflect the deduction of taxes that a shareholder would pay on Fund distributions or the redemption of shares. Income is generally exempt from regular federal income taxes. Some income may be subject to state and local taxes and to the federal alternative minimum tax. Capital gains, if any, are subject to tax. For the most recent month-end performance visit www.nuveen.com or call (800) 257-8787.
Class A and C share returns are actual. Class B and R share returns are actual for the period since class inception; returns prior to class inception are Class A share returns adjusted for differences in sales charges and (in the case of Class B) expenses, which are primarily differences in distribution and service fees. Class A shares have a 4.2% maximum sales charge. Class B shares have a contingent deferred sales charge (CDSC), also known as a back-end sales charge, that for redemptions begins at 5% and declines periodically until after 6 years when the charge becomes 0%. Class B shares automatically convert to Class A shares eight years after purchase. Class C shares have a 1% CDSC for redemptions within less than one year, which is not reflected in the one-year total return. Class R shares have no sales charge and may be purchased under limited circumstances or by specified classes of investors.
| Average Annual Total Returns as of 11/30/06 | ||||
| A Shares | NAV | Offer | ||
1-Year | 5.78% | 1.29% | ||
5-Year | 5.29% | 4.39% | ||
10-Year | 5.11% | 4.66% | ||
| B Shares | w/o CDSC | w/CDSC | ||
1-Year | 4.98% | 0.98% | ||
5-Year | 4.49% | 4.32% | ||
10-Year | 4.49% | 4.49% | ||
| C Shares | NAV | |||
1-Year | 5.25% | |||
5-Year | 4.72% | |||
10-Year | 4.54% | |||
| R Shares | NAV | |||
1-Year | 5.95% | |||
5-Year | 5.48% | |||
10-Year | 5.29% | |||
| Tax-Free Yields | ||||
| A Shares | NAV | Offer | ||
Dividend Yield3 | 4.07% | 3.90% | ||
SEC 30-Day Yield4 | 3.18% | 3.05% | ||
Taxable-Equivalent Yield4,5 | 4.71% | 4.52% | ||
| B Shares | NAV | |||
Dividend Yield3 | 3.32% | |||
SEC 30-Day Yield | 2.44% | |||
Taxable-Equivalent Yield5 | 3.61% | |||
| C Shares | NAV | |||
Dividend Yield3 | 3.48% | |||
SEC 30-Day Yield | 2.64% | |||
Taxable-Equivalent Yield5 | 3.91% | |||
| R Shares | NAV | |||
Dividend Yield3 | 4.24% | |||
SEC 30-Day Yield | 3.38% | |||
Taxable-Equivalent Yield5 | 5.01% | |||
| Average Annual Total Returns as of 12/31/06 | ||||
| A Shares | NAV | Offer | ||
1-Year | 4.41% | 0.00% | ||
5-Year | 5.38% | 4.48% | ||
10-Year | 5.11% | 4.66% | ||
| B Shares | w/o CDSC | w/CDSC | ||
1-Year | 3.53% | -0.47% | ||
5-Year | 4.58% | 4.42% | ||
10-Year | 4.50% | 4.50% | ||
| C Shares | NAV | |||
1-Year | 3.70% | |||
5-Year | 4.79% | |||
10-Year | 4.52% | |||
| R Shares | NAV | |||
1-Year | 4.58% | |||
5-Year | 5.57% | |||
10-Year | 5.29% | |||
| Portfolio Statistics | ||
Net Assets ($000) | $468,863 | |
Average Effective Maturity on Securities (Years) | 15.60 | |
Average Duration | 5.20 |
| 1 | Paid December 1, 2006. This is the latest monthly tax-exempt dividend declared during the period ended November 30, 2006. |
| 2 | Paid December 5, 2005. Capital gains are subject to federal taxation. |
| 3 | Dividend Yield is the most recent dividend per share (annualized) divided by the appropriate price per share. The SEC 30-Day Yield is a standardized measure of the current market yield on the Fund’s portfolio and is based on the maximum offer price per share. The Dividend Yield also differs from the SEC 30-Day Yield because the Fund may be paying out more or less than it is earning and it may not include the effect of amortization of bond premium. |
| 4 | The SEC 30-Day Yield and Taxable-Equivalent Yield on A Shares at NAV applies only to A Shares purchased at no-load pursuant to the Fund’s policy permitting waiver of the A Share load in certain specified circumstances. |
| 5 | The Taxable-Equivalent Yield represents the yield that must be earned on a fully taxable investment in order to equal the yield of the Fund on an after-tax basis at a specified tax rate. With respect to investments that generate qualified dividend income that is taxable at a maximum rate of 15%, the Taxable-Equivalent Yield is lower. The Taxable-Equivalent Yield is based on the Fund’s SEC 30-Day Yield on the indicated date and a combined federal and state income tax rate of 32.5%. |
Semiannual Report Page 9
Fund Spotlight as of 11/30/06 Nuveen Kentucky Municipal Bond Fund
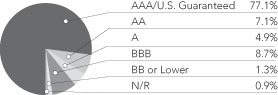
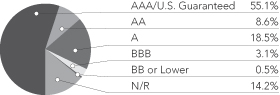
Bond Credit Quality1
Industries1
Tax Obligation/Limited | 32.8% | |
U.S. Guaranteed | 12.0% | |
Water and Sewer | 11.2% | |
Health Care | 9.2% | |
Utilities | 8.8% | |
Tax Obligation/General | 7.4% | |
Transportation | 4.5% | |
Other | 14.1% |
| 1 | As a percentage of total investments as of November 30, 2006. Holdings are subject to change. |
Expense Example
As a shareholder of the Fund, you incur two types of costs: (1) transaction costs, including front and back end sales charges (loads) or redemption fees, where applicable; and (2) ongoing costs, including management fees; distribution and service (12b-1) fees, where applicable; and other Fund expenses. This Example is intended to help you understand your ongoing costs (in dollars) of investing in the Fund and to compare these costs with the ongoing costs of investing in other mutual funds.
The Example below is based on an investment of $1,000 invested at the beginning of the period and held for the period.
The information under “Actual Performance,” together with the amount you invested, allows you to estimate actual expenses incurred over the reporting period. Simply divide your account value by $1,000 (for example, an $8,600 account value divided by $1,000 = 8.60) and multiply the result by the cost shown for your share class, in the row entitled “Expenses Incurred During Period” to estimate the expenses incurred on your account during this period.
The information under “Hypothetical Performance,” provides information about hypothetical account values and hypothetical expenses based on the Fund’s actual expense ratio and an assumed rate of return of 5% per year before expenses, which is not the Fund’s actual return. The hypothetical account values and expenses may not be used to estimate the actual ending account balance or expense you incurred for the period. You may use this information to compare the ongoing costs of investing in the Fund and other Funds. To do so, compare this 5% hypothetical example with the 5% hypothetical examples that appear in the shareholder reports of the other funds.
Please note that the expenses shown in the table are meant to highlight your ongoing costs only and do not reflect any transactional costs, such as front and back end sales charges (loads) or redemption fees, where applicable. Therefore, the hypothetical information is useful in comparing ongoing costs only, and will not help you determine the relative total costs of owning different funds or share classes. In addition, if these transactional costs were included, your costs would have been higher.
| Hypothetical Performance | ||||||||||||||||||||||||
| Actual Performance | (5% annualized return before expenses) | |||||||||||||||||||||||
| A Shares | B Shares | C Shares | R Shares | A Shares | B Shares | C Shares | R Shares | |||||||||||||||||
Beginning Account Value (6/01/06) | $ | 1,000.00 | $ | 1,000.00 | $ | 1,000.00 | $ | 1,000.00 | $ | 1,000.00 | $ | 1,000.00 | $ | 1,000.00 | $ | 1,000.00 | ||||||||
Ending Account Value (11/30/06) | $ | 1,043.10 | $ | 1,038.20 | $ | 1,040.00 | $ | 1,043.00 | $ | 1,020.56 | $ | 1,016.80 | $ | 1,017.80 | $ | 1,021.51 | ||||||||
Expenses Incurred During Period | $ | 4.61 | $ | 8.43 | $ | 7.42 | $ | 3.64 | $ | 4.56 | $ | 8.34 | $ | 7.33 | $ | 3.60 | ||||||||
For each class of the Fund, expenses are equal to the Fund’s annualized net expense ratio of .90%, 1.65%, 1.45% and ..71% for Classes A, B, C and R, respectively, multiplied by the average account value over the period, multiplied by 183/365 (to reflect the one-half year period).
Semiannual Report Page 10
Fund Spotlight as of 11/30/06 Nuveen Michigan Municipal Bond Fund
| Quick Facts | ||||||||
| A Shares | B Shares | C Shares | R Shares | |||||
NAV | $11.73 | $11.76 | $11.73 | $11.74 | ||||
Latest Monthly Dividend1 | $0.0395 | $0.0325 | $0.0340 | $0.0415 | ||||
Latest Capital Gain and Ordinary Income Distribution2 | $0.1321 | $0.1321 | $0.1321 | $0.1321 | ||||
Inception Date | 6/27/85 | 2/03/97 | 6/22/93 | 2/03/97 |
Returns quoted represent past performance which is no guarantee of future results. Returns without sales charges would be lower if the sales charge were included. Current performance may be higher or lower than the performance shown. Investment returns and principal value will fluctuate so that when shares are redeemed, they may be worth more or less than their original cost. Returns do not reflect the deduction of taxes that a shareholder would pay on Fund distributions or the redemption of shares. Income is generally exempt from regular federal income taxes. Some income may be subject to state and local taxes and to the federal alternative minimum tax. Capital gains, if any, are subject to tax. For the most recent month-end performance visit www.nuveen.com or call (800) 257-8787.
Class A and C share returns are actual. Class B and R share returns are actual for the period since class inception; returns prior to class inception are Class A share returns adjusted for differences in sales charges and (in the case of Class B) expenses, which are primarily differences in distribution and service fees. Class A shares have a 4.2% maximum sales charge. Class B shares have a contingent deferred sales charge (CDSC), also known as a back-end sales charge, that for redemptions begins at 5% and declines periodically until after 6 years when the charge becomes 0%. Class B shares automatically convert to Class A shares eight years after purchase. Class C shares have a 1% CDSC for redemptions within less than one year, which is not reflected in the one-year total return. Class R shares have no sales charge and may be purchased under limited circumstances or by specified classes of investors.
| Average Annual Total Returns as of 11/30/06 | ||||
| A Shares | NAV | Offer | ||
1-Year | 6.10% | 1.65% | ||
5-Year | 5.23% | 4.33% | ||
10-Year | 5.21% | 4.76% | ||
| B Shares | w/o CDSC | w/CDSC | ||
1-Year | 5.39% | 1.39% | ||
5-Year | 4.46% | 4.29% | ||
10-Year | 4.59% | 4.59% | ||
| C Shares | NAV | |||
1-Year | 5.69% | |||
5-Year | 4.66% | |||
10-Year | 4.64% | |||
| R Shares | NAV | |||
1-Year | 6.41% | |||
5-Year | 5.46% | |||
10-Year | 5.42% | |||
| Tax-Free Yields | ||||
| A Shares | NAV | Offer | ||
Dividend Yield3 | 4.04% | 3.87% | ||
SEC 30-Day Yield4 | 3.29% | 3.15% | ||
Taxable-Equivalent Yield4,5 | 4.77% | 4.57% | ||
| B Shares | NAV | |||
Dividend Yield3 | 3.32% | |||
SEC 30-Day Yield | 2.54% | |||
Taxable-Equivalent Yield5 | 3.68% | |||
| C Shares | NAV | |||
Dividend Yield3 | 3.48% | |||
SEC 30-Day Yield | 2.74% | |||
Taxable-Equivalent Yield5 | 3.97% | |||
| R Shares | NAV | |||
Dividend Yield3 | 4.24% | |||
SEC 30-Day Yield | 3.48% | |||
Taxable-Equivalent Yield5 | 5.04% | |||
| Average Annual Total Returns as of 12/31/06 | ||||
| A Shares | NAV | Offer | ||
1-Year | 4.89% | 0.46% | ||
5-Year | 5.42% | 4.52% | ||
10-Year | 5.21% | 4.77% | ||
| B Shares | w/o CDSC | w/CDSC | ||
1-Year | 4.10% | 0.11% | ||
5-Year | 4.63% | 4.47% | ||
10-Year | 4.59% | 4.59% | ||
| C Shares | NAV | |||
1-Year | 4.30% | |||
5-Year | 4.84% | |||
10-Year | 4.64% | |||
| R Shares | NAV | |||
1-Year | 5.01% | |||
5-Year | 5.62% | |||
10-Year | 5.42% | |||
| Portfolio Statistics | ||
Net Assets ($000) | $238,507 | |
Average Effective Maturity on Securities (Years) | 14.70 | |
Average Duration | 5.08 |
| 1 | Paid December 1, 2006. This is the latest monthly tax-exempt dividend declared during the period ended November 30, 2006. |
| 2 | Paid December 5, 2005. Capital gains and/or ordinary income are subject to federal taxation. |
| 3 | Dividend Yield is the most recent dividend per share (annualized) divided by the appropriate price per share. The SEC 30-Day Yield is a standardized measure of the current market yield on the Fund’s portfolio and is based on the maximum offer price per share. The Dividend Yield also differs from the SEC 30-Day Yield because the Fund may be paying out more or less than it is earning and it may not include the effect of amortization of bond premium. |
| 4 | The SEC 30-Day Yield and Taxable-Equivalent Yield on A Shares at NAV applies only to A Shares purchased at no-load pursuant to the Fund’s policy permitting waiver of the A Share load in certain specified circumstances. |
| 5 | The Taxable-Equivalent Yield represents the yield that must be earned on a fully taxable investment in order to equal the yield of the Fund on an after-tax basis at a specified tax rate. With respect to investments that generate qualified dividend income that is taxable at a maximum rate of 15%, the Taxable-Equivalent Yield is lower. The Taxable-Equivalent Yield is based on the Fund’s SEC 30-Day Yield on the indicated date and a combined federal and state income tax rate of 31%. |
Semiannual Report Page 11
Fund Spotlight as of 11/30/06 Nuveen Michigan Municipal Bond Fund
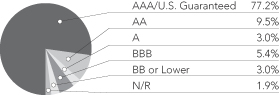
Bond Credit Quality1
Industries1
Tax Obligation/General | 30.4% | |
U.S. Guaranteed | 20.1% | |
Tax Obligation/Limited | 12.7% | |
Water and Sewer | 12.1% | |
Health Care | 8.3% | |
Utilities | 4.4% | |
Other | 12.0% |
| 1 | As a percentage of total investments as of November 30 , 2006. Holdings are subject to change. |
Expense Example
As a shareholder of the Fund, you incur two types of costs: (1) transaction costs, including front and back end sales charges (loads) or redemption fees, where applicable; and (2) ongoing costs, including management fees; distribution and service (12b-1) fees, where applicable; and other Fund expenses. This Example is intended to help you understand your ongoing costs (in dollars) of investing in the Fund and to compare these costs with the ongoing costs of investing in other mutual funds.
The Example below is based on an investment of $1,000 invested at the beginning of the period and held for the period.
The information under “Actual Performance,” together with the amount you invested, allows you to estimate actual expenses incurred over the reporting period. Simply divide your account value by $1,000 (for example, an $8,600 account value divided by $1,000 = 8.60) and multiply the result by the cost shown for your share class, in the row entitled “Expenses Incurred During Period” to estimate the expenses incurred on your account during this period.
The information under “Hypothetical Performance,” provides information about hypothetical account values and hypothetical expenses based on the Fund’s actual expense ratio and an assumed rate of return of 5% per year before expenses, which is not the Fund’s actual return. The hypothetical account values and expenses may not be used to estimate the actual ending account balance or expense you incurred for the period. You may use this information to compare the ongoing costs of investing in the Fund and other Funds. To do so, compare this 5% hypothetical example with the 5% hypothetical examples that appear in the shareholder reports of the other funds.
Please note that the expenses shown in the table are meant to highlight your ongoing costs only and do not reflect any transactional costs, such as front and back end sales charges (loads) or redemption fees, where applicable. Therefore, the hypothetical information is useful in comparing ongoing costs only, and will not help you determine the relative total costs of owning different funds or share classes. In addition, if these transactional costs were included, your costs would have been higher.
| Hypothetical Performance | ||||||||||||||||||||||||
| Actual Performance | (5% annualized return before expenses) | |||||||||||||||||||||||
| A Shares | B Shares | C Shares | R Shares | A Shares | B Shares | C Shares | R Shares | |||||||||||||||||
Beginning Account Value (6/01/06) | $ | 1,000.00 | $ | 1,000.00 | $ | 1,000.00 | $ | 1,000.00 | $ | 1,000.00 | $ | 1,000.00 | $ | 1,000.00 | $ | 1,000.00 | ||||||||
Ending Account Value (11/30/06) | $ | 1,045.60 | $ | 1,041.70 | $ | 1,043.50 | $ | 1,047.50 | $ | 1,020.51 | $ | 1,016.75 | $ | 1,017.75 | $ | 1,021.51 | ||||||||
Expenses Incurred During Period | $ | 4.67 | $ | 8.50 | $ | 7.48 | $ | 3.64 | $ | 4.61 | $ | 8.39 | $ | 7.38 | $ | 3.60 | ||||||||
For each class of the Fund, expenses are equal to the Fund’s annualized net expense ratio of .91%, 1.66%, 1.46% and ..71% for Classes A, B, C and R, respectively, multiplied by the average account value over the period, multiplied by 183/365 (to reflect the one-half year period).
Semiannual Report Page 12
Fund Spotlight as of 11/30/06 Nuveen Missouri Municipal Bond Fund
| Quick Facts | ||||||||
| A Shares | B Shares | C Shares | R Shares | |||||
NAV | $11.25 | $11.26 | $11.24 | $11.26 | ||||
Latest Monthly Dividend1 | $0.0375 | $0.0305 | $0.0325 | $0.0395 | ||||
Inception Date | 8/03/87 | 2/06/97 | 2/02/94 | 2/19/97 |
Returns quoted represent past performance which is no guarantee of future results. Returns without sales charges would be lower if the sales charge were included. Current performance may be higher or lower than the performance shown. Investment returns and principal value will fluctuate so that when shares are redeemed, they may be worth more or less than their original cost. Returns do not reflect the deduction of taxes that a shareholder would pay on Fund distributions or the redemption of shares. Income is generally exempt from regular federal income taxes. Some income may be subject to state and local taxes and to the federal alternative minimum tax. Capital gains, if any, are subject to tax. For the most recent month-end performance visit www.nuveen.com or call (800) 257-8787.
Class A and C share returns are actual. Class B and R share returns are actual for the period since class inception; returns prior to class inception are Class A share returns adjusted for differences in sales charges and (in the case of Class B) expenses, which are primarily differences in distribution and service fees. Class A shares have a 4.2% maximum sales charge. Class B shares have a contingent deferred sales charge (CDSC), also known as a back-end sales charge, that for redemptions begins at 5% and declines periodically until after 6 years when the charge becomes 0%. Class B shares automatically convert to Class A shares eight years after purchase. Class C shares have a 1% CDSC for redemptions within less than one year, which is not reflected in the one-year total return. Class R shares have no sales charge and may be purchased under limited circumstances or by specified classes of investors.
| Average Annual Total Returns as of 11/30/06 | ||||
| A Shares | NAV | Offer | ||
1-Year | 6.14% | 1.72% | ||
5-Year | 5.31% | 4.40% | ||
10-Year | 5.25% | 4.80% | ||
| B Shares | w/o CDSC | w/CDSC | ||
1-Year | 5.34% | 1.34% | ||
5-Year | 4.53% | 4.36% | ||
10-Year | 4.63% | 4.63% | ||
| C Shares | NAV | |||
1-Year | 5.58% | |||
5-Year | 4.74% | |||
10-Year | 4.68% | |||
| R Shares | NAV | |||
1-Year | 6.36% | |||
5-Year | 5.53% | |||
10-Year | 5.45% | |||
| Tax-Free Yields | ||||
| A Shares | NAV | Offer | ||
Dividend Yield2 | 4.00% | 3.83% | ||
SEC 30-Day Yield3 | 3.56% | 3.41% | ||
Taxable-Equivalent Yield3,4 | 5.27% | 5.05% | ||
| B Shares | NAV | |||
Dividend Yield2 | 3.25% | |||
SEC 30-Day Yield | 2.81% | |||
Taxable-Equivalent Yield4 | 4.16% | |||
| C Shares | NAV | |||
Dividend Yield2 | 3.47% | |||
SEC 30-Day Yield | 3.01% | |||
Taxable-Equivalent Yield4 | 4.46% | |||
| R Shares | NAV | |||
Dividend Yield2 | 4.21% | |||
SEC 30-Day Yield | 3.75% | |||
Taxable-Equivalent Yield4 | 5.56% | |||
| Average Annual Total Returns as of 12/31/06 | ||||
| A Shares | NAV | Offer | ||
1-Year | 4.67% | 0.25% | ||
5-Year | 5.39% | 4.49% | ||
10-Year | 5.25% | 4.80% | ||
| B Shares | w/o CDSC | w/CDSC | ||
1-Year | 3.88% | -0.12% | ||
5-Year | 4.61% | 4.44% | ||
10-Year | 4.62% | 4.62% | ||
| C Shares | NAV | |||
1-Year | 4.11% | |||
5-Year | 4.82% | |||
10-Year | 4.68% | |||
| R Shares | NAV | |||
1-Year | 4.79% | |||
5-Year | 5.61% | |||
10-Year | 5.45% | |||
| Portfolio Statistics | ||
Net Assets ($000) | $264,611 | |
Average Effective Maturity on Securities (Years) | 16.31 | |
Average Duration | 5.28 |
| 1 | Paid December 1, 2006. This is the latest monthly tax-exempt dividend declared during the period ended November 30, 2006. |
| 2 | Dividend Yield is the most recent dividend per share (annualized) divided by the appropriate price per share. The SEC 30-Day Yield is a standardized measure of the current market yield on the Fund’s portfolio and is based on the maximum offer price per share. The Dividend Yield also differs from the SEC 30-Day Yield because the Fund may be paying out more or less than it is earning and it may not include the effect of amortization of bond premium. |
| 3 | The SEC 30-Day Yield and Taxable-Equivalent Yield on A Shares at NAV applies only to A Shares purchased at no-load pursuant to the Fund’s policy permitting waiver of the A Share load in certain specified circumstances. |
| 4 | The Taxable-Equivalent Yield represents the yield that must be earned on a fully taxable investment in order to equal the yield of the Fund on an after-tax basis at a specified tax rate. With respect to investments that generate qualified dividend income that is taxable at a maximum rate of 15%, the Taxable-Equivalent Yield is lower. The Taxable-Equivalent Yield is based on the Fund’s SEC 30-Day Yield on the indicated date and a combined federal and state income tax rate of 32.5%. |
Semiannual Report Page 13
Fund Spotlight as of 11/30/06 Nuveen Missouri Municipal Bond Fund
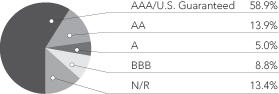
Bond Credit Quality1
Industries1
Tax Obligation/Limited | 18.0% | |
Tax Obligation/General | 16.3% | |
Health Care | 8.6% | |
Transportation | 8.4% | |
Long-Term Care | 8.1% | |
Education and Civic Organizations | 7.3% | |
U.S. Guaranteed | 7.2% | |
Housing/Multifamily | 6.4% | |
Water and Sewer | 5.5% | |
Other | 14.2% |
| 1 | As a percentage of total investments as of November 30, 2006. Holdings are subject to change. |
Expense Example
As a shareholder of the Fund, you incur two types of costs: (1) transaction costs, including front and back end sales charges (loads) or redemption fees, where applicable; and (2) ongoing costs, including management fees; distribution and service (12b-1) fees, where applicable; and other Fund expenses. This Example is intended to help you understand your ongoing costs (in dollars) of investing in the Fund and to compare these costs with the ongoing costs of investing in other mutual funds.
The Example below is based on an investment of $1,000 invested at the beginning of the period and held for the period.
The information under “Actual Performance,” together with the amount you invested, allows you to estimate actual expenses incurred over the reporting period. Simply divide your account value by $1,000 (for example, an $8,600 account value divided by $1,000 = 8.60) and multiply the result by the cost shown for your share class, in the row entitled “Expenses Incurred During Period” to estimate the expenses incurred on your account during this period.
The information under “Hypothetical Performance,” provides information about hypothetical account values and hypothetical expenses based on the Fund’s actual expense ratio and an assumed rate of return of 5% per year before expenses, which is not the Fund’s actual return. The hypothetical account values and expenses may not be used to estimate the actual ending account balance or expense you incurred for the period. You may use this information to compare the ongoing costs of investing in the Fund and other Funds. To do so, compare this 5% hypothetical example with the 5% hypothetical examples that appear in the shareholder reports of the other funds.
Please note that the expenses shown in the table are meant to highlight your ongoing costs only and do not reflect any transactional costs, such as front and back end sales charges (loads) or redemption fees, where applicable. Therefore, the hypothetical information is useful in comparing ongoing costs only, and will not help you determine the relative total costs of owning different funds or share classes. In addition, if these transactional costs were included, your costs would have been higher.
| Hypothetical Performance | ||||||||||||||||||||||||
| Actual Performance | (5% annualized return before expenses) | |||||||||||||||||||||||
| A Shares | B Shares | C Shares | R Shares | A Shares | B Shares | C Shares | R Shares | |||||||||||||||||
Beginning Account Value (6/01/06) | $ | 1,000.00 | $ | 1,000.00 | $ | 1,000.00 | $ | 1,000.00 | $ | 1,000.00 | $ | 1,000.00 | $ | 1,000.00 | $ | 1,000.00 | ||||||||
Ending Account Value (11/30/06) | $ | 1,045.50 | $ | 1,041.50 | $ | 1,042.70 | $ | 1,046.60 | $ | 1,020.96 | $ | 1,017.20 | $ | 1,018.20 | $ | 1,021.96 | ||||||||
Expenses Incurred During Period | $ | 4.20 | $ | 8.03 | $ | 7.02 | $ | 3.18 | $ | 4.15 | $ | 7.94 | $ | 6.93 | $ | 3.14 | ||||||||
For each class of the Fund, expenses are equal to the Fund’s annualized net expense ratio of .82%, 1.57%, 1.37% and ..62% for Classes A, B, C and R, respectively, multiplied by the average account value over the period, multiplied by 183/365 (to reflect the one-half year period).
Semiannual Report Page 14
Fund Spotlight as of 11/30/06 Nuveen Ohio Municipal Bond Fund
| Quick Facts | ||||||||
| A Shares | B Shares | C Shares | R Shares | |||||
NAV | $11.52 | $11.51 | $11.49 | $11.51 | ||||
Latest Monthly Dividend1 | $0.0390 | $0.0320 | $0.0340 | $0.0410 | ||||
Latest Capital Gain and Ordinary Income Distribution2 | $0.0430 | $0.0430 | $0.0430 | $0.0430 | ||||
Inception Date | 6/27/85 | 2/03/97 | 8/03/93 | 2/03/97 |
Returns quoted represent past performance which is no guarantee of future results. Returns without sales charges would be lower if the sales charge were included. Current performance may be higher or lower than the performance shown. Investment returns and principal value will fluctuate so that when shares are redeemed, they may be worth more or less than their original cost. Returns do not reflect the deduction of taxes that a shareholder would pay on Fund distributions or the redemption of shares. Income is generally exempt from regular federal income taxes. Some income may be subject to state and local taxes and to the federal alternative minimum tax. Capital gains, if any, are subject to tax. For the most recent month-end performance visit www.nuveen.com or call (800) 257-8787.
Class A and C share returns are actual. Class B and R share returns are actual for the period since class inception; returns prior to class inception are Class A share returns adjusted for differences in sales charges and (in the case of Class B) expenses, which are primarily differences in distribution and service fees. Class A shares have a 4.2% maximum sales charge. Class B shares have a contingent deferred sales charge (CDSC), also known as a back-end sales charge, that for redemptions begins at 5% and declines periodically until after 6 years when the charge becomes 0%. Class B shares automatically convert to Class A shares eight years after purchase. Class C shares have a 1% CDSC for redemptions within less than one year, which is not reflected in the one-year total return. Class R shares have no sales charge and may be purchased under limited circumstances or by specified classes of investors.
| Average Annual Total Returns as of 11/30/06 | ||||
| A Shares | NAV | Offer | ||
1-Year | 5.73% | 1.29% | ||
5-Year | 5.26% | 4.36% | ||
10-Year | 5.03% | 4.57% | ||
| B Shares | w/o CDSC | w/CDSC | ||
1-Year | 5.05% | 1.05% | ||
5-Year | 4.50% | 4.33% | ||
10-Year | 4.41% | 4.41% | ||
| C Shares | NAV | |||
1-Year | 5.19% | |||
5-Year | 4.68% | |||
10-Year | 4.45% | |||
| R Shares | NAV | |||
1-Year | 5.96% | |||
5-Year | 5.49% | |||
10-Year | 5.24% | |||
| Tax-Free Yields | ||||
| A Shares | NAV | Offer | ||
Dividend Yield3 | 4.06% | 3.89% | ||
SEC 30-Day Yield4 | 3.05% | 2.92% | ||
Taxable-Equivalent Yield4,5 | 4.52% | 4.33% | ||
| B Shares | NAV | |||
Dividend Yield3 | 3.34% | |||
SEC 30-Day Yield | 2.30% | |||
Taxable-Equivalent Yield5 | 3.41% | |||
| C Shares | NAV | |||
Dividend Yield3 | 3.55% | |||
SEC 30-Day Yield | 2.50% | |||
Taxable-Equivalent Yield5 | 3.70% | |||
| R Shares | NAV | |||
Dividend Yield3 | 4.27% | |||
SEC 30-Day Yield | 3.24% | |||
Taxable-Equivalent Yield5 | 4.80% | |||
| Average Annual Total Returns as of 12/31/06 | ||||
| A Shares | NAV | Offer | ||
1-Year | 4.23% | -0.13% | ||
5-Year | 5.37% | 4.48% | ||
10-Year | 5.02% | 4.57% | ||
| B Shares | w/o CDSC | w/CDSC | ||
1-Year | 3.38% | -0.60% | ||
5-Year | 4.59% | 4.42% | ||
10-Year | 4.40% | 4.40% | ||
| C Shares | NAV | |||
1-Year | 3.61% | |||
5-Year | 4.79% | |||
10-Year | 4.44% | |||
| R Shares | NAV | |||
1-Year | 4.37% | |||
5-Year | 5.58% | |||
10-Year | 5.22% | |||
| Portfolio Statistics | ||
Net Assets ($000) | $546,673 | |
Average Effective Maturity on Securities (Years) | 14.31 | |
Average Duration | 5.41 |
| 1 | Paid December 1, 2006. This is the latest monthly tax-exempt dividend declared during the period ended November 30, 2006. |
| 2 | Paid December 5, 2005. Capital gains and/or ordinary income are subject to federal taxation. |
| 3 | Dividend Yield is the most recent dividend per share (annualized) divided by the appropriate price per share. The SEC 30-Day Yield is a standardized measure of the current market yield on the Fund’s portfolio and is based on the maximum offer price per share. The Dividend Yield also differs from the SEC 30-Day Yield because the Fund may be paying out more or less than it is earning and it may not include the effect of amortization of bond premium. |
| 4 | The SEC 30-Day Yield and Taxable-Equivalent Yield on A Shares at NAV applies only to A Shares purchased at no-load pursuant to the Fund’s policy permitting waiver of the A Share load in certain specified circumstances. |
| 5 | The Taxable-Equivalent Yield represents the yield that must be earned on a fully taxable investment in order to equal the yield of the Fund on an after-tax basis at a specified tax rate. With respect to investments that generate qualified dividend income that is taxable at a maximum rate of 15%, the Taxable-Equivalent Yield is lower. The Taxable-Equivalent Yield is based on the Fund’s SEC 30-Day Yield on the indicated date and a combined federal and state income tax rate of 32.5%. |
Semiannual Report Page 15
Fund Spotlight as of 11/30/06 Nuveen Ohio Municipal Bond Fund
Bond Credit Quality1
Industries1
Tax Obligation/General | 22.8% | |
U.S. Guaranteed | 20.5% | |
Tax Obligation/Limited | 14.5% | |
Health Care | 8.1% | |
Education and Civic Organizations | 8.1% | |
Utilities | 5.7% | |
Transportation | 4.7% | |
Water and Sewer | 4.1% | |
Other | 11.5% |
| 1 | As a percentage of total investments as of November 30, 2006. Holdings are subject to change. |
Expense Example
As a shareholder of the Fund, you incur two types of costs: (1) transaction costs, including front and back end sales charges (loads) or redemption fees, where applicable; and (2) ongoing costs, including management fees; distribution and service (12b-1) fees, where applicable; and other Fund expenses. This Example is intended to help you understand your ongoing costs (in dollars) of investing in the Fund and to compare these costs with the ongoing costs of investing in other mutual funds.
The Example below is based on an investment of $1,000 invested at the beginning of the period and held for the period.
The information under “Actual Performance,” together with the amount you invested, allows you to estimate actual expenses incurred over the reporting period. Simply divide your account value by $1,000 (for example, an $8,600 account value divided by $1,000 = 8.60) and multiply the result by the cost shown for your share class, in the row entitled “Expenses Incurred During Period” to estimate the expenses incurred on your account during this period.
The information under “Hypothetical Performance,” provides information about hypothetical account values and hypothetical expenses based on the Fund’s actual expense ratio and an assumed rate of return of 5% per year before expenses, which is not the Fund’s actual return. The hypothetical account values and expenses may not be used to estimate the actual ending account balance or expense you incurred for the period. You may use this information to compare the ongoing costs of investing in the Fund and other Funds. To do so, compare this 5% hypothetical example with the 5% hypothetical examples that appear in the shareholder reports of the other funds.
Please note that the expenses shown in the table are meant to highlight your ongoing costs only and do not reflect any transactional costs, such as front and back end sales charges (loads) or redemption fees, where applicable. Therefore, the hypothetical information is useful in comparing ongoing costs only, and will not help you determine the relative total costs of owning different funds or share classes. In addition, if these transactional costs were included, your costs would have been higher.
| Hypothetical Performance | ||||||||||||||||||||||||
| Actual Performance | (5% annualized return before expenses) | |||||||||||||||||||||||
| A Shares | B Shares | C Shares | R Shares | A Shares | B Shares | C Shares | R Shares | |||||||||||||||||
Beginning Account Value (6/01/06) | $ | 1,000.00 | $ | 1,000.00 | $ | 1,000.00 | $ | 1,000.00 | $ | 1,000.00 | $ | 1,000.00 | $ | 1,000.00 | $ | 1,000.00 | ||||||||
Ending Account Value (11/30/06) | $ | 1,043.40 | $ | 1,040.50 | $ | 1,040.70 | $ | 1,044.50 | $ | 1,019.90 | $ | 1,016.14 | $ | 1,017.15 | $ | 1,020.91 | ||||||||
Expenses Incurred During Period | $ | 5.28 | $ | 9.11 | $ | 8.08 | $ | 4.25 | $ | 5.22 | $ | 9.00 | $ | 7.99 | $ | 4.20 | ||||||||
For each class of the Fund, expenses are equal to the Fund’s annualized net expense ratio of 1.03%, 1.78%, 1.58% and ..83% for Classes A, B, C and R, respectively, multiplied by the average account value over the period, multiplied by 183/365 (to reflect the one-half year period).
Semiannual Report Page 16
Fund Spotlight as of 11/30/06 Nuveen Wisconsin Municipal Bond Fund
| Quick Facts | ||||||||
| A Shares | B Shares | C Shares | R Shares | |||||
NAV | $10.47 | $10.50 | $10.50 | $10.49 | ||||
Latest Monthly Dividend1 | $0.0325 | $0.0260 | $0.0280 | $0.0345 | ||||
Latest Capital Gain and Ordinary Income Distribution2 | $0.0482 | $0.0482 | $0.0482 | $0.0482 | ||||
Inception Date | 6/01/94 | 2/25/97 | 2/25/97 | 2/25/97 |
Returns quoted represent past performance which is no guarantee of future results. Returns without sales charges would be lower if the sales charge were included. Current performance may be higher or lower than the performance shown. Investment returns and principal value will fluctuate so that when shares are redeemed, they may be worth more or less than their original cost. Returns do not reflect the deduction of taxes that a shareholder would pay on Fund distributions or the redemption of shares. Income is generally exempt from regular federal income taxes. Some income may be subject to state and local taxes and to the federal alternative minimum tax. Capital gains, if any, are subject to tax. For the most recent month-end performance visit www.nuveen.com or call (800) 257-8787.
Class A share returns are actual. Class B, C and R share returns are actual for the period since class inception; returns prior to class inception are Class A share returns adjusted for differences in sales charges and (in the case of Classes B and C) expenses, which are primarily differences in distribution and service fees. Class A shares have a 4.2% maximum sales charge. Class B shares have a contingent deferred sales charge (CDSC), also known as a back-end sales charge, that for redemptions begins at 5% and declines periodically until after 6 years when the charge becomes 0%. Class B shares automatically convert to Class A shares eight years after purchase. Class C shares have a 1% CDSC for redemptions within less than one year, which is not reflected in the one-year total return. Class R shares have no sales charge and may be purchased under limited circumstances or by specified classes of investors.
| Average Annual Total Returns as of 11/30/06 | ||||
| A Shares | NAV | Offer | ||
1-Year | 5.79% | 1.38% | ||
5-Year | 4.96% | 4.07% | ||
10-Year | 5.12% | 4.67% | ||
| B Shares | w/o CDSC | w/CDSC | ||
1-Year | 5.09% | 1.09% | ||
5-Year | 4.22% | 4.05% | ||
10-Year | 4.53% | 4.53% | ||
| C Shares | NAV | |||
1-Year | 5.33% | |||
5-Year | 4.43% | |||
10-Year | 4.59% | |||
| R Shares | NAV | |||
1-Year | 5.71% | |||
5-Year | 5.14% | |||
10-Year | 5.34% | |||
| Tax-Free Yields | ||||
| A Shares | NAV | Offer | ||
Dividend Yield3 | 3.72% | 3.57% | ||
SEC 30-Day Yield4 | 3.19% | 3.06% | ||
Taxable-Equivalent Yield4,5 | 4.76% | 4.57% | ||
| B Shares | NAV | |||
Dividend Yield3 | 2.97% | |||
SEC 30-Day Yield | 2.45% | |||
Taxable-Equivalent Yield5 | 3.66% | |||
| C Shares | NAV | |||
Dividend Yield3 | 3.20% | |||
SEC 30-Day Yield | 2.64% | |||
Taxable-Equivalent Yield5 | 3.94% | |||
| R Shares | NAV | |||
Dividend Yield3 | 3.95% | |||
SEC 30-Day Yield | 3.39% | |||
Taxable-Equivalent Yield5 | 5.06% | |||
| Average Annual Total Returns as of 12/31/06 | ||||
| A Shares | NAV | Offer | ||
1-Year | 4.29% | -0.06% | ||
5-Year | 5.10% | 4.20% | ||
10-Year | 5.11% | 4.66% | ||
| B Shares | w/o CDSC | w/CDSC | ||
1-Year | 3.50% | -0.50% | ||
5-Year | 4.32% | 4.15% | ||
10-Year | 4.52% | 4.52% | ||
| C Shares | NAV | |||
1-Year | 3.64% | |||
5-Year | 4.55% | |||
10-Year | 4.57% | |||
| R Shares | NAV | |||
1-Year | 4.21% | |||
5-Year | 5.28% | |||
10-Year | 5.34% | |||
| Portfolio Statistics | ||
Net Assets ($000) | $47,925 | |
Average Effective Maturity on Securities (Years) | 15.18 | |
Average Duration | 5.73 |
| 1 | Paid December 1, 2006. This is the latest monthly tax-exempt dividend declared during the period ended November 30, 2006. |
| 2 | Paid December 5, 2005. Capital gains and/or ordinary income are subject to federal taxation. |
| 3 | Dividend Yield is the most recent dividend per share (annualized) divided by the appropriate price per share. The SEC 30-Day Yield is a standardized measure of the current market yield on the Fund’s portfolio and is based on the maximum offer price per share. The Dividend Yield also differs from the SEC 30-Day Yield because the Fund may be paying out more or less than it is earning and it may not include the effect of amortization of bond premium. |
| 4 | The SEC 30-Day Yield and Taxable-Equivalent Yield on A Shares at NAV applies only to A Shares purchased at no-load pursuant to the Fund’s policy permitting waiver of the A Share load in certain specified circumstances. |
| 5 | The Taxable-Equivalent Yield represents the yield that must be earned on a fully taxable investment in order to equal the yield of the Fund on an after-tax basis at a specified tax rate. With respect to investments that generate qualified dividend income that is taxable at a maximum rate of 15%, the Taxable-Equivalent Yield is lower. The Taxable-Equivalent Yield is based on the Fund’s SEC 30-Day Yield on the indicated date and a combined federal and state income tax rate of 33%. |
Semiannual Report Page 17
Fund Spotlight as of 11/30/06 Nuveen Wisconsin Municipal Bond Fund
Bond Credit Quality1
Industries1
Tax Obligation/Limited | 69.5% | |
U.S. Guaranteed | 12.5% | |
Housing/Multifamily | 9.4% | |
Other | 8.6% |
| 1 | As a percentage of total investments as of November 30, 2006. Holdings are subject to change. |
Expense Example
As a shareholder of the Fund, you incur two types of costs: (1) transaction costs, including front and back end sales charges (loads) or redemption fees, where applicable; and (2) ongoing costs, including management fees; distribution and service (12b-1) fees, where applicable; and other Fund expenses. This Example is intended to help you understand your ongoing costs (in dollars) of investing in the Fund and to compare these costs with the ongoing costs of investing in other mutual funds.
The Example below is based on an investment of $1,000 invested at the beginning of the period and held for the period.
The information under “Actual Performance,” together with the amount you invested, allows you to estimate actual expenses incurred over the reporting period. Simply divide your account value by $1,000 (for example, an $8,600 account value divided by $1,000 = 8.60) and multiply the result by the cost shown for your share class, in the row entitled “Expenses Incurred During Period” to estimate the expenses incurred on your account during this period.
The information under “Hypothetical Performance,” provides information about hypothetical account values and hypothetical expenses based on the Fund’s actual expense ratio and an assumed rate of return of 5% per year before expenses, which is not the Fund’s actual return. The hypothetical account values and expenses may not be used to estimate the actual ending account balance or expense you incurred for the period. You may use this information to compare the ongoing costs of investing in the Fund and other Funds. To do so, compare this 5% hypothetical example with the 5% hypothetical examples that appear in the shareholder reports of the other funds.
Please note that the expenses shown in the table are meant to highlight your ongoing costs only and do not reflect any transactional costs, such as front and back end sales charges (loads) or redemption fees, where applicable. Therefore, the hypothetical information is useful in comparing ongoing costs only, and will not help you determine the relative total costs of owning different funds or share classes. In addition, if these transactional costs were included, your costs would have been higher.
| Hypothetical Performance | ||||||||||||||||||||||||
| Actual Performance | (5% annualized return before expenses) | |||||||||||||||||||||||
| A Shares | B Shares | C Shares | R Shares | A Shares | B Shares | C Shares | R Shares | |||||||||||||||||
Beginning Account Value (6/01/06) | $ | 1,000.00 | $ | 1,000.00 | $ | 1,000.00 | $ | 1,000.00 | $ | 1,000.00 | $ | 1,000.00 | $ | 1,000.00 | $ | 1,000.00 | ||||||||
Ending Account Value (11/30/06) | $ | 1,046.00 | $ | 1,043.00 | $ | 1,044.20 | $ | 1,044.00 | $ | 1,020.61 | $ | 1,016.85 | $ | 1,017.85 | $ | 1,021.66 | ||||||||
Expenses Incurred During Period | $ | 4.56 | $ | 8.40 | $ | 7.38 | $ | 3.48 | $ | 4.51 | $ | 8.29 | $ | 7.28 | $ | 3.45 | ||||||||
For each class of the Fund, expenses are equal to the Fund’s annualized net expense ratio of .89%, 1.64%, 1.44% and ..68% for Classes A, B, C and R, respectively, multiplied by the average account value over the period, multiplied by 183/365 (to reflect the one-half year period).
Semiannual Report Page 18
Portfolio of Investments (Unaudited)
Nuveen Kansas Municipal Bond Fund
November 30, 2006
| Principal Amount (000) | Description | Optional Call Provisions (1) | Ratings (2) | Value | ||||||
| Education and Civic Organizations – 3.9% | ||||||||||
| $ | 1,000 | Kansas Development Finance Authority, Athletic Facility Revenue Bonds, University of Kansas Athletic Corporation Project, Series 2004K, 5.000%, 6/01/19 | 6/14 at 100.00 | A1 | $ | 1,065,000 | ||||
| 1,200 | Kansas Development Finance Authority, Board of Regents, Revenue Bonds, Kansas State University Housing System, Series 2005A, 5.000%, 4/01/22 – MBIA Insured | 4/15 at 100.00 | AAA | 1,294,440 | ||||||
| 1,500 | Puerto Rico Industrial, Tourist, Educational, Medical and Environmental Control Facilities Financing Authority, Higher Education Revenue Bonds, Ana G. Mendez University System, Series 1999, 5.375%, 2/01/19 | 2/09 at 101.00 | BBB– | 1,539,540 | ||||||
| 955 | Washburn University of Topeka, Kansas, Revenue Bonds, Series 2001A, 5.500%, 7/01/16 – AMBAC Insured | 7/09 at 100.00 | AAA | 999,150 | ||||||
| 270 | Washburn University of Topeka, Kansas, Revenue Bonds, Series 2001B, 5.500%, 7/01/16 – AMBAC Insured | 7/09 at 100.00 | AAA | 282,482 | ||||||
| 4,925 | Total Education and Civic Organizations | 5,180,612 | ||||||||
| Health Care – 19.5% | ||||||||||
| 1,005 | Coffeyville Public Building Commission, Kansas, Healthcare Facilities Revenue Bonds, Coffeyville Regional Medical Center, Series 2002, 5.000%, 8/01/18 – AMBAC Insured | 8/12 at 100.00 | AAA | 1,062,215 | ||||||
| 2,000 | Colby, Kansas, Health Facilities Revenue Refunding Bonds, Citizens Medical Center Inc., Series 1998, 5.625%, 8/15/16 | 8/08 at 100.00 | N/R | 2,008,500 | ||||||
| 1,680 | Kansas Development Finance Authority, Health Facilities Revenue Bonds, Hays Medical Center Inc., Series 2005L, 5.000%, 11/15/20 | 11/15 at 100.00 | A2 | 1,783,958 | ||||||
| 4,580 | Kansas Development Finance Authority, Health Facilities Revenue Bonds, Sisters of Charity of Leavenworth Health Services Corporation, Series 2000K, 6.500%, 12/01/16 | 6/10 at 101.00 | AA | 5,025,313 | ||||||
| 1,285 | Kansas Development Finance Authority, Hospital Revenue Bonds, Susan B. Allen Memorial Hospital, Series 2002Q, 5.375%, 12/15/16 – RAAI Insured | 12/12 at 100.00 | AA | 1,385,114 | ||||||
| 1,000 | Lawrence, Kansas, Hospital Revenue Bonds, Lawrence Memorial Hospital, Series 2006, 5.125%, 7/01/26 | 7/16 at 100.00 | A3 | 1,069,490 | ||||||
| Manhattan, Kansas, Hospital Revenue Bonds, Mercy Health Center, Series 2001: | ||||||||||
| 1,025 | 5.000%, 8/15/14 – FSA Insured | 8/11 at 100.00 | AAA | 1,082,175 | ||||||
| 1,075 | 5.000%, 8/15/15 – FSA Insured | 8/11 at 100.00 | AAA | 1,132,588 | ||||||
| Newton, Kansas, Hospital Revenue Refunding Bonds, Newton Healthcare Corporation, Series 1998A: | ||||||||||
| 1,000 | 5.700%, 11/15/18 | 11/08 at 100.00 | BBB– | 1,021,250 | ||||||
| 1,750 | 5.750%, 11/15/24 | 11/08 at 100.00 | BBB– | 1,788,063 | ||||||
| 100 | Puerto Rico Industrial, Tourist, Educational, Medical and Environmental Control Facilities Financing Authority, Hospital Revenue Bonds, Auxilio Mutuo Hospital, Series 1995A, 6.250%, 7/01/24 – MBIA Insured | 1/07 at 100.00 | AAA | 100,807 | ||||||
| 3,000 | University of Kansas Hospital Authority, Health Facilities Revenue Bonds, KU Health System, Series 2006, 5.000%, 9/01/36 (WI/DD, Settling 12/12/06) | 9/16 at 100.00 | A | 3,150,570 | ||||||
| 4,780 | Wichita, Kansas, Hospital Facilities Revenue Refunding and Improvement Bonds, Via Christi Health System Inc., Series 1999-XI, 6.250%, 11/15/24 | 11/09 at 101.00 | A+ | 5,094,142 | ||||||
| 24,280 | Total Health Care | 25,704,185 | ||||||||
| Housing/Multifamily – 2.8% | ||||||||||
| Wichita, Kansas, Multifamily Housing Revenue Refunding Bonds, Shores Apartments, Series 1994XI-A: | ||||||||||
| 1,500 | 6.700%, 4/01/19 – RAAI Insured | 4/09 at 102.00 | AA | 1,584,390 | ||||||
| 2,000 | 6.800%, 4/01/24 – RAAI Insured | 4/09 at 102.00 | AA | 2,113,680 | ||||||
| 3,500 | Total Housing/Multifamily | 3,698,070 | ||||||||
| Housing/Single Family – 6.8% | ||||||||||
| 175 | Sedgwick and Shawnee Counties, Kansas, FNMA/GNMA Mortgage-Backed Securities Program Single Family Revenue Bonds, Series 2001A, 6.300%, 12/01/32 (Alternative Minimum Tax) | 12/10 at 105.00 | Aaa | 177,930 | ||||||
| 3,135 | Sedgwick and Shawnee Counties, Kansas, FNMA/GNMA Mortgage-Backed Securities Program Single Family Revenue Bonds, Series 2002B-1, 5.950%, 12/01/33 (Alternative Minimum Tax) | 12/12 at 105.00 | Aaa | 3,245,258 | ||||||
19
Portfolio of Investments (Unaudited)
Nuveen Kansas Municipal Bond Fund (continued)
November 30, 2006
| Principal Amount (000) | Description | Optional Call Provisions (1) | Ratings (2) | Value | ||||||
| Housing/Single Family (continued) | ||||||||||
| $ | 225 | Sedgwick and Shawnee Counties, Kansas, GNMA Mortgage-Backed Securities Program Single Family Revenue Bonds, Series 1997A-1, 6.950%, 6/01/29 (Alternative Minimum Tax) | No Opt. Call | Aaa | $ | 231,993 | ||||
| 265 | Sedgwick and Shawnee Counties, Kansas, GNMA Mortgage-Backed Securities Program Single Family Revenue Bonds, Series 1998A-1, 6.500%, 12/01/22 (Alternative Minimum Tax) | 6/08 at 105.00 | Aaa | 269,412 | ||||||
| 245 | Sedgwick and Shawnee Counties, Kansas, GNMA Mortgage-Backed Securities Program Single Family Revenue Bonds, Series 2000A-2, 7.600%, 12/01/31 – MBIA Insured (Alternative Minimum Tax) | 12/09 at 105.00 | Aaa | 246,703 | ||||||
| 4,500 | Sedgwick and Shawnee Counties, Kansas, Mortgage Backed Securities Program Single Family Mortgage Revenue Bonds, Series 2006B1, 5.300%, 12/01/38 (Alternative Minimum Tax) | 6/16 at 103.00 | Aaa | 4,812,705 | ||||||
| 8,545 | Total Housing/Single Family | 8,984,001 | ||||||||
| Industrials – 1.6% | ||||||||||
| 1,025 | Wichita Airport Authority, Kansas, Special Facilities Revenue Bonds, Cessna Citation Service Center, Series 2002A, 6.250%, 6/15/32 (Alternative Minimum Tax) | 6/12 at 101.00 | A– | 1,101,732 | ||||||
| 1,000 | Wichita, Kansas, Industrial Revenue Bonds, NMF America Inc. Series 2000-II, 5.800%, 8/01/15 (Alternative Minimum Tax) | 8/07 at 101.00 | AA | 1,020,900 | ||||||
| 2,025 | Total Industrials | 2,122,632 | ||||||||
| Long-Term Care – 0.5% | ||||||||||
| 500 | Sedgwick County, Kansas, Healthcare Facilities Revenue Bonds, Catholic Care Center Inc., Series 2001, 5.750%, 11/15/23 | 11/09 at 100.00 | A | 521,480 | ||||||
| Materials – 2.9% | ||||||||||
| 3,700 | Ford County, Kansas, Sewage and Solid Waste Disposal Revenue Bonds, Excel Corporation/Cargill Inc. Project, Series 1998, 5.400%, 6/01/28 (Alternative Minimum Tax) | 6/08 at 102.00 | A+ | 3,840,230 | ||||||
| Tax Obligation/General – 18.2% | ||||||||||
| 2,500 | Butler and Sedgwick Counties Unified School District 385, Andover, Kansas, General Obligation Refunding and Improvement Bonds, Series 2000, 6.000%, 9/01/16 – FSA Insured | No Opt. Call | AAA | 2,976,475 | ||||||
| Butler County Unified School District 394, Kansas, General Obligation Bonds, Series 2004: | ||||||||||
| 1,055 | 5.000%, 9/01/20 – FSA Insured | 9/14 at 100.00 | AAA | 1,140,371 | ||||||
| 2,615 | 5.000%, 9/01/23 – FSA Insured | 9/14 at 100.00 | AAA | 2,810,236 | ||||||
| 1,170 | Butler County Unified School District 490, Kansas, General Obligation Bonds, Series 2005B, 5.000%, 9/01/25 – FSA Insured | 9/15 at 100.00 | AAA | 1,260,546 | ||||||
| 1,675 | Cowley County Unified School District 465, Winfield, Kansas, General Obligation Bonds, Series 2003, 5.250%, 10/01/23 – MBIA Insured | 10/13 at 100.00 | AAA | 1,845,348 | ||||||
| 560 | Derby, Kansas, General Obligation Bonds, Series 2002B, 5.000%, 12/01/18 – FSA Insured | 12/10 at 100.00 | Aaa | 590,587 | ||||||
| 1,500 | Douglas County Unified School District 497, Kansas, General Obligation Bonds, Series 2006A, 5.000%, 9/01/25 – MBIA Insured | 9/16 at 100.00 | Aaa | 1,632,075 | ||||||
| 1,450 | Leavenworth County Unified School District 464, Tonganoxie, Kansas, General Obligation Bonds, Series 2005A, 5.000%, 9/01/26 – MBIA Insured | 9/15 at 100.00 | AAA | 1,562,216 | ||||||
| 1,020 | Miami County Unified School District 367, Osawatomie, Kansas, General Obligation Bonds, Series 2005A, 5.000%, 9/01/20 – FSA Insured | 9/15 at 100.00 | AAA | 1,111,545 | ||||||
| 1,100 | Montgomery County Unified School District 445, Coffeyville, Kansas, General Obligation Bonds, Series 2002, 5.000%, 4/01/22 – FGIC Insured | 4/12 at 100.00 | AAA | 1,162,073 | ||||||
| 3,000 | Neosho County Unified School District 413, Kansas, General Obligation Bonds, Series 2006, 5.000%, 9/01/31 – FSA Insured | 9/14 at 100.00 | Aaa | 3,207,390 | ||||||
| Puerto Rico, General Obligation and Public Improvement Bonds, Series 2001A: | ||||||||||
| 1,000 | 5.500%, 7/01/20 – MBIA Insured | No Opt. Call | AAA | 1,179,660 | ||||||
| 330 | 5.375%, 7/01/28 | 7/11 at 100.00 | BBB | 349,539 | ||||||
| 1,250 | Sedgwick County Unified School District 259, Wichita, Kansas, General Obligation Bonds, Series 2000, 3.500%, 9/01/16 | 9/10 at 100.00 | AA | 1,221,825 | ||||||
| 1,795 | Wichita, Kansas, General Obligation Bonds, Series 2002, 5.000%, 4/01/17 | 4/09 at 101.00 | AA | 1,864,179 | ||||||
| 22,020 | Total Tax Obligation/General | 23,914,065 | ||||||||
20
| Principal Amount (000) | Description | Optional Call Provisions (1) | Ratings (2) | Value | |||||||
| Tax Obligation/Limited – 27.4% | |||||||||||
| $ | 3,000 | Butler County Public Building Commission, Kansas, Improvement Revenue Bonds, Public Facilities Projects, Series 2000, 5.550%, 10/01/21 – MBIA Insured | 10/10 at 100.00 | Aaa | $ | 3,197,190 | |||||
| Kansas Department of Transportation, Highway Revenue Bonds, Series 2004A: | |||||||||||
| 1,000 | 5.000%, 3/01/20 | 3/14 at 100.00 | AAA | 1,076,380 | |||||||
| 5,000 | 5.000%, 3/01/23 | 3/14 at 100.00 | AAA | 5,352,400 | |||||||
| 5,000 | Kansas Development Finance Authority, Board of Regents, Revenue Bonds, Scientific Research and Development Facilities Projects, Series 2003C, 5.000%, 10/01/23 – AMBAC Insured | 4/13 at 102.00 | AAA | 5,379,800 | |||||||
| 500 | Kansas Development Finance Authority, Lease Revenue Bonds, Department of Administration, State Capitol Restoration Parking Facility Project, Series 2002C, 5.000%, 10/01/21 – FSA Insured | 10/12 at 100.00 | AAA | 534,220 | |||||||
| 1,140 | Kansas Development Finance Authority, Lease Revenue Bonds, Department of Administration, State Capitol Restoration Project, Series 2004G-1, 5.125%, 4/01/21 – MBIA Insured | 4/14 at 100.00 | AAA | 1,235,099 | |||||||
| Kansas Development Finance Authority, Revenue Bonds, Department of Administration, Comprehensive Transportation Program, Series 2006A: | |||||||||||
| 3,900 | 5.000%, 11/01/23 – FGIC Insured | 11/16 at 100.00 | AAA | 4,244,955 | |||||||
| 3,000 | 5.000%, 11/01/25 – FGIC Insured | 11/16 at 100.00 | AAA | 3,257,640 | |||||||
| 1,000 | Kansas Development Finance Authority, Revenue Bonds, State Projects, Series 2001W, 5.000%, | 10/11 at 100.00 | AAA | 1,056,810 | |||||||
| 2,355 | Kansas Development Finance Authority, Revenue Bonds, State Projects, Series 2003J, 5.250%, 8/01/20 – AMBAC Insured | 8/13 at 100.00 | AAA | 2,556,541 | |||||||
| 1,155 | Kansas Development Finance Authority, Revenue Bonds, State Projects, Series 2004A, 5.000%, 4/01/22 – FGIC Insured | 4/14 at 101.00 | AAA | 1,245,171 | |||||||
| 1,500 | Kansas Development Finance Authority, Revenue Bonds, State Projects, Series 2005H, 5.000%, 5/01/20 – MBIA Insured | 5/15 at 100.00 | AAA | 1,626,930 | |||||||
| 1,800 | Overland Park Development Corporation, Kansas, First Tier Revenue Bonds, Overland Park Convention Center, Series 2001A, 7.375%, 1/01/32 | 1/11 at 101.00 | N/R | 1,976,778 | |||||||
| 2,000 | Virgin Islands Public Finance Authority, Gross Receipts Taxes Loan Note, Series 1999A, 6.375%, 10/01/19 | 10/10 at 101.00 | BBB+ | 2,200,540 | |||||||
| 1,000 | Virgin Islands Public Finance Authority, Senior Lien Revenue Refunding Bonds, Matching Fund Loan Note, Series 1998A, 5.625%, 10/01/25 | 10/08 at 101.00 | BBB | 1,035,120 | |||||||
| 33,350 | Total Tax Obligation/Limited | 35,975,574 | |||||||||
| U.S. Guaranteed – 8.8% (3) | |||||||||||
| 12,175 | Johnson County, Kansas, Residual Revenue and Refunding Bonds, Series 1992, 0.000%, 5/01/12 (ETM) | No Opt. Call | Aaa | 9,965,234 | |||||||
| 500 | Lawrence, Kansas, Hospital Revenue Bonds, Lawrence Memorial Hospital, Series 1999, 5.750%, 7/01/24 (Pre-refunded 7/01/09) – RAAI Insured | 7/09 at 100.00 | AA | (3) | 527,380 | ||||||
| 1,010 | Wichita, Kansas, Revenue Bonds, CSJ Health System of Wichita, Inc., Series 1985-XXV, 7.200%, 10/01/15 (ETM) | 1/07 at 100.00 | A+ | (3) | 1,128,877 | ||||||
| 13,685 | Total U.S. Guaranteed | 11,621,491 | |||||||||
| Utilities – 1.6% | |||||||||||
| 1,000 | Wyandotte County-Kansas City Unified Government, Kansas, Utility System Revenue Bonds, Series 2004B, 5.000%, 9/01/24 – FSA Insured | 9/14 at 100.00 | AAA | 1,070,510 | |||||||
| 1,000 | Wynadotte County-Kansas City Unified Government, Kansas, Industrial Revenue Bonds, Board of Public Utilities Office Building Complex, Series 2001, 5.000%, 5/01/21 – MBIA Insured | 5/11 at 100.00 | AAA | 1,053,570 | |||||||
| 2,000 | Total Utilities | 2,124,080 | |||||||||
| Water and Sewer – 7.2% | |||||||||||
| 1,040 | Chisholm Creek Utility Authority, Kansas, Water and Wastewater Facilities Revenue Bonds, Series 2002, 5.250%, 9/01/22 – MBIA Insured | 9/12 at 100.00 | Aaa | 1,121,110 | |||||||
| 2,300 | Kansas Development Finance Authority, Water Pollution Control Revolving Fund Leveraged Bonds, Series 2002-II, 5.000%, 11/01/23 | 11/12 at 100.00 | AAA | 2,442,508 | |||||||
21
Portfolio of Investments (Unaudited)
Nuveen Kansas Municipal Bond Fund (continued)
November 30, 2006
| Principal Amount (000) | Description | Optional Call Provisions (1) | Ratings (2) | Value | |||||||
| Water and Sewer (continued) | |||||||||||
| $ | 5,500 | Wichita, Kansas, Water and Sewerage Utility Revenue Bonds, Series 2003, 5.000%, 10/01/22 – FGIC Insured | 10/13 at 100.00 | AAA | $ | 5,880,105 | |||||
| 8,840 | Total Water and Sewer | 9,443,723 | |||||||||
| $ | 127,370 | Total Investments (cost $126,355,950) – 101.2% | 133,130,143 | ||||||||
Other Assets Less Liabilities – (1.2)% | (1,627,578 | ) | |||||||||
Net Assets – 100% | $ | 131,502,565 | |||||||||
| (1) | Optional Call Provisions: Dates (month and year) and prices of the earliest optional call or redemption. There may be other call provisions at varying prices at later dates. Certain mortgage-backed securities may be subject to periodic principal paydowns. |
| (2) | Ratings: Using the higher of Standard & Poor’s or Moody’s rating. Ratings below BBB by Standard & Poor’s Group or Baa by Moody’s Investor Service, Inc. are considered to be below investment grade. |
| (3) | Backed by an escrow or trust containing sufficient U.S. Government or U.S. Government agency securities which ensure the timely payment of principal and interest. Such investments are normally considered to be equivalent to AAA rated securities. |
| N/R | Not rated. |
| WI/DD | Purchased on a when-issued or delayed delivery basis. |
| (ETM) | Escrowed to maturity. |
See accompanying notes to financial statements.
22
Portfolio of Investments (Unaudited)
Nuveen Kentucky Municipal Bond Fund
November 30, 2006
| Principal Amount (000) | Description | Optional Call Provisions (1) | Ratings (2) | Value | ||||||
| Consumer Staples – 1.1% | ||||||||||
| $ | 4,835 | Puerto Rico, The Children’s Trust Fund, Tobacco Settlement Asset-Backed Refunding Bonds, Series 2002, 5.375%, 5/15/33 | 5/12 at 100.00 | BBB | $ | 5,095,220 | ||||
| Education and Civic Organizations – 3.5% | ||||||||||
| 1,000 | Campbellsville, Kentucky, Revenue Bonds, Campbellsville University, Series 2005, 5.700%, 3/01/34 | 3/15 at 100.00 | N/R | 1,035,080 | ||||||
| 6,535 | Columbia, Kentucky, Educational Development Revenue Bonds, Lindsey Wilson College Project, Series 2001, 6.250%, 4/01/21 | 4/11 at 101.00 | BBB– | 7,075,967 | ||||||
| 1,000 | Kentucky Asset/Liability Commission, General Receipts Revenue Bonds, University of Kentucky, Series 2005, 5.000%, 10/01/16 – FGIC Insured | 10/15 at 100.00 | AAA | 1,101,130 | ||||||
| 1,500 | Kentucky Economic Development Finance Authority, College Revenue Refunding and Improvement Bonds, Centre College Project, Series 2002, 5.000%, 4/01/32 – FSA Insured | 10/12 at 100.00 | AAA | 1,586,100 | ||||||
| 2,500 | Puerto Rico Industrial, Tourist, Educational, Medical and Environmental Control Facilities Financing Authority, Higher Education Revenue Bonds, Ana G. Mendez University System, Series 1999, 5.375%, 2/01/29 | 2/09 at 101.00 | BBB– | 2,566,475 | ||||||
| 3,000 | Puerto Rico Industrial, Tourist, Educational, Medical and Environmental Control Facilities Financing Authority, Higher Education Revenue Bonds, University of the Sacred Heart, Series 2001, 5.250%, 9/01/31 | 9/11 at 100.00 | BBB | 3,112,650 | ||||||
| 15,535 | Total Education and Civic Organizations | 16,477,402 | ||||||||
| Health Care – 9.3% | ||||||||||
| 4,340 | Clark County, Kentucky, Hospital Revenue Refunding and Improvement Bonds, Clark Regional Medical Center Project, Series 1997, 6.200%, 4/01/13 | 3/07 at 102.00 | BBB– | 4,447,502 | ||||||
| 8,880 | Kentucky Economic Development Finance Authority, Health System Revenue Bonds, Norton Healthcare Inc., Series 2000B, 0.000%, 10/01/28 – MBIA Insured | No Opt. Call | AAA | 3,239,246 | ||||||
| 9,500 | Kentucky Economic Development Finance Authority, Hospital Revenue Refunding Bonds, Pikeville, United Methodist Hospital of Kentucky Inc. Project, Series 1997, 5.700%, 2/01/28 – CONNIE LEE/AMBAC Insured | 2/07 at 102.00 | AAA | 9,718,215 | ||||||
| Kentucky Economic Development Finance Authority, Hospital System Revenue Refunding and Improvement Bonds, Appalachian Regional Healthcare Inc., Series 1997: | ||||||||||
| 500 | 5.500%, 10/01/07 | No Opt. Call | BB– | 502,360 | ||||||
| 500 | 5.600%, 10/01/08 | 4/08 at 102.00 | BB– | 505,250 | ||||||
| 3,500 | 5.850%, 10/01/17 | 4/08 at 102.00 | BB– | 3,571,785 | ||||||
| 1,500 | 5.875%, 10/01/22 | 4/08 at 102.00 | BB– | 1,527,990 | ||||||
| 2,195 | Rockcastle County, Kentucky, First Mortgage Revenue Bonds, Rockcastle Hospital and Respiratory Care Center Inc. Project, Series 2005, 5.550%, 6/01/30 | 6/15 at 100.00 | BBB– | 2,279,793 | ||||||
| 16,500 | Russell, Kentucky, Revenue Bonds, Bon Secours Health System, Series 2002A, 5.625%, 11/15/30 | 11/12 at 100.00 | A– | 17,678,430 | ||||||
| 47,415 | Total Health Care | 43,470,571 | ||||||||
| Housing/Multifamily – 0.7% | ||||||||||
| 3,265 | Henderson, Kentucky, Senior Tax-Exempt Residential Facilities Revenue Bonds, Pleasant Pointe Project, Series 1999A, 6.125%, 5/01/29 | 5/09 at 102.00 | N/R | 3,356,159 | ||||||
| Housing/Single Family – 3.7% | ||||||||||
| 400 | Kentucky Housing Corporation, Housing Revenue Bonds, Series 1998F, 5.000%, 7/01/18 (Alternative Minimum Tax) | 1/09 at 101.00 | AAA | 403,464 | ||||||
| 9,480 | Kentucky Housing Corporation, Housing Revenue Bonds, Series 1999A, 5.200%, 1/01/31 | 4/09 at 101.00 | AAA | 9,738,235 | ||||||
| 445 | Kentucky Housing Corporation, Housing Revenue Bonds, Series 1999B, 5.250%, 1/01/28 (Alternative Minimum Tax) | 4/09 at 101.00 | AAA | 445,788 | ||||||
| 4,520 | Kentucky Housing Corporation, Housing Revenue Bonds, Series 2004F, 3.900%, 7/01/31 (Alternative Minimum Tax) | 1/14 at 100.00 | AAA | 4,520,136 | ||||||
| 2,285 | Kentucky Housing Corporation, Housing Revenue Bonds, Series 2005H, 4.000%, 1/01/33 (Alternative Minimum Tax) | 7/14 at 100.00 | AAA | 2,250,702 | ||||||
| 17,130 | Total Housing/Single Family | 17,358,325 | ||||||||
23
Portfolio of Investments (Unaudited)
Nuveen Kentucky Municipal Bond Fund (continued)
November 30, 2006
| Principal Amount (000) | Description | Optional Call Provisions (1) | Ratings (2) | Value | ||||||
| Long-Term Care – 4.0% | ||||||||||
| $ | 4,840 | Florence, Kentucky, Housing Facilities Revenue Bonds, Bluegrass RHF Housing Inc., Series 1999, 6.375%, 8/15/29 – ACA Insured | 8/09 at 101.00 | A | $ | 5,133,110 | ||||
| Kentucky Economic Development Finance Authority, Mortgage Revenue Bonds, South Central Nursing Homes Inc., Series 1997A: | ||||||||||
| 2,000 | 6.000%, 1/01/27 (Mandatory put 7/01/20) – MBIA Insured | 1/08 at 105.00 | AAA | 2,145,780 | ||||||
| 3,700 | 6.000%, 1/01/27 (Mandatory put 1/01/24) – MBIA Insured | 1/08 at 105.00 | AAA | 3,969,693 | ||||||
| 2,000 | Kentucky Economic Development Finance Authority, Multifamily Housing Revenue Bonds, Christian Care Communities Projects, Series 2005, 5.250%, 11/20/25 | 11/15 at 103.00 | AAA | 2,204,100 | ||||||
| Kentucky Economic Development Finance Authority, Revenue Bonds, Christian Church Homes of Kentucky Inc. Obligated Group, Series 1998: | ||||||||||
| 1,800 | 5.375%, 11/15/23 | 5/08 at 102.00 | BBB | 1,831,428 | ||||||
| 3,500 | 5.500%, 11/15/30 | 5/08 at 102.00 | BBB | 3,572,100 | ||||||
| 17,840 | Total Long-Term Care | 18,856,211 | ||||||||
| Materials – 1.0% | ||||||||||
| 2,000 | Perry County, Kentucky, Solid Waste Disposal Revenue Bonds, Weyerhaeuser Company – TJ International Project, Series 1997, 6.550%, 4/15/27 (Alternative Minimum Tax) | 4/07 at 102.00 | Baa2 | 2,058,600 | ||||||
| 2,820 | Wickliffe, Kentucky, Solid Waste Disposal Facility Revenue Bonds, Westvaco Corporation, Series 1996, 6.375%, 4/01/26 (Alternative Minimum Tax) | 4/07 at 101.00 | BBB | 2,863,372 | ||||||
| 4,820 | Total Materials | 4,921,972 | ||||||||
| Tax Obligation/General – 7.2% | ||||||||||
| Bowling Green, Kentucky, General Obligation and Special Revenue Bonds, Series 2002B: | ||||||||||
| 1,785 | 5.000%, 6/01/23 | 6/12 at 100.00 | Aa2 | 1,886,834 | ||||||
| 1,230 | 5.000%, 6/01/24 | 6/12 at 100.00 | Aa2 | 1,300,172 | ||||||
| 1,665 | 5.000%, 6/01/25 | 6/12 at 100.00 | Aa2 | 1,759,988 | ||||||
| 2,500 | Jefferson County, Kentucky, General Obligation Refunding Bonds, Series 1999C, 6.150%, 5/15/16 (Alternative Minimum Tax) | 5/09 at 100.00 | AA+ | 2,634,250 | ||||||
| Louisville and Jefferson County Metropolitan Government, Kentucky, General Obligation Bonds, Series 2004A-B: | ||||||||||
| 1,195 | 5.000%, 11/01/16 – AMBAC Insured | 11/14 at 100.00 | AAA | 1,303,159 | ||||||
| 1,000 | 5.000%, 11/01/17 – AMBAC Insured | 11/14 at 100.00 | AAA | 1,088,360 | ||||||
| 1,175 | Louisville, Kentucky, General Obligation Bonds, Series 2001A, 5.000%, 11/01/21 | 11/11 at 101.00 | AA+ | 1,254,266 | ||||||
| 3,000 | Louisville, Kentucky, General Obligation Bonds, Series 2002A, 5.000%, 10/01/23 – FGIC Insured | 10/12 at 100.00 | AAA | 3,180,240 | ||||||
| 5,000 | Puerto Rico, General Obligation and Public Improvement Bonds, Series 2004A, 5.250%, 7/01/21 – MBIA Insured | 7/14 at 100.00 | AAA | 5,501,450 | ||||||
Puerto Rico, General Obligation and Public Improvement Bonds, Series 2001A: | ||||||||||
| 840 | 5.500%, 7/01/14 – FSA Insured (UB) | No Opt. Call | AAA | 949,565 | ||||||
| 2,550 | 5.500%, 7/01/16 – FSA Insured (UB) | No Opt. Call | AAA | 2,936,415 | ||||||
| 3,000 | 5.500%, 7/01/17 – FSA Insured (UB) | No Opt. Call | AAA | 3,470,775 | ||||||
| 3,440 | 5.500%, 7/01/18 – FSA Insured (UB) | No Opt. Call | AAA | 3,992,619 | ||||||
| 2,250 | 5.500%, 7/01/19 – FSA Insured (UB) | No Opt. Call | AAA | 2,635,931 | ||||||
| 30,630 | Total Tax Obligation/General | 33,894,024 | ||||||||
| Tax Obligation/Limited – 33.2% | ||||||||||
| 1,305 | Ballard County School District Finance Corporation, Kentucky, School Building Revenue Bonds, Series 2004, 5.000%, 6/01/21 – AMBAC Insured | 6/14 at 100.00 | Aaa | 1,401,544 | ||||||
| Boone County School District Finance Corporation, Kentucky, School Building Revenue Bonds, Series 2004B: | ||||||||||
| 1,460 | 5.000%, 5/01/20 – FSA Insured | 5/14 at 100.00 | Aaa | 1,571,821 | ||||||
| 2,580 | 5.000%, 5/01/21 – FSA Insured | 5/14 at 100.00 | Aaa | 2,768,959 | ||||||
| 1,465 | Boone County, Kentucky, Public Properties Corporation, First Mortgage Bonds, AOC Judicial Facility, Series 2001, 5.125%, 9/01/22 | 9/12 at 101.00 | Aa3 | 1,579,329 | ||||||
| Butler County School District Finance Corporation, Kentucky, Revenue Bonds, School Buildings, Series 2004C: | ||||||||||
| 1,220 | 5.000%, 6/01/20 | 6/14 at 100.00 | Aa3 | 1,309,438 | ||||||
| 1,255 | 5.000%, 6/01/22 | 6/14 at 100.00 | Aa3 | 1,341,106 | ||||||
24
| Principal Amount (000) | Description | Optional Call Provisions (1) | Ratings (2) | Value | ||||||
| Tax Obligation/Limited (continued) | ||||||||||
| $ | 4,500 | Kenton County Public Properties Corporation, Kentucky, First Mortgage Revenue Bonds, Courthouse Facilities Project, Series 1998A, 5.000%, 3/01/29 | 3/09 at 101.00 | Aa3 | $ | 4,623,930 | ||||
| Kenton County School District Finance Corporation, Kentucky, School Building Revenue Bonds, Series 2004: | ||||||||||
| 2,115 | 5.000%, 6/01/17 – MBIA Insured | 6/14 at 100.00 | Aaa | 2,293,273 | ||||||
| 3,510 | 5.000%, 6/01/18 – MBIA Insured | 6/14 at 100.00 | Aaa | 3,797,258 | ||||||
| 3,690 | 5.000%, 6/01/19 – MBIA Insured | 6/14 at 100.00 | Aaa | 3,979,444 | ||||||
| Kentucky Area Development Districts Financing Trust, Ewing, Lease Acquisition Program Revenue Bonds, Series 2000C: | ||||||||||
| 750 | 5.850%, 6/01/20 | 6/10 at 102.00 | AA | 810,428 | ||||||
| 1,000 | 6.000%, 6/01/30 | 6/10 at 102.00 | AA | 1,086,120 | ||||||
| 2,000 | Kentucky Asset/Liability Commission, General Fund Revenue Project Notes, First Series 2005, 5.000%, 5/01/25 – MBIA Insured | 5/15 at 100.00 | AAA | 2,146,880 | ||||||
| 2,365 | Kentucky Local Correctional Facilities Authority, Multi-County Lease Revenue Bonds, Series 2004, 5.250%, 11/01/14 – MBIA Insured | No Opt. Call | AAA | 2,622,809 | ||||||
| Kentucky State Property and Buildings Commission, Revenue Bonds, Project 81, Series 2003: | ||||||||||
| 1,000 | 5.000%, 11/01/19 – AMBAC Insured | 11/13 at 100.00 | AAA | 1,079,010 | ||||||
| 2,845 | 5.000%, 11/01/23 – AMBAC Insured | 11/13 at 100.00 | AAA | 3,040,224 | ||||||
| 4,000 | Kentucky State Property and Buildings Commission, Revenue Bonds, Project 84, Series 2005, 5.000%, 8/01/18 – MBIA Insured | No Opt. Call | AAA | 4,466,840 | ||||||
| Kentucky State Property and Buildings Commission, Revenue Bonds, Project 85, Series 2005: | ||||||||||
| 5,000 | 5.000%, 8/01/15 – FSA Insured | No Opt. Call | AAA | 5,510,450 | ||||||
| 2,795 | 5.000%, 8/01/22 – FSA Insured | 8/15 at 100.00 | AAA | 3,030,954 | ||||||
| 5,085 | 5.000%, 8/01/25 – FSA Insured | 8/15 at 100.00 | AAA | 5,487,020 | ||||||
| 10,000 | Kentucky Turnpike Authority, Economic Development Road Revenue Bonds, Revitalization Project, Series 2005B, 5.000%, 7/01/23 – AMBAC Insured | 7/15 at 100.00 | AAA | 10,792,000 | ||||||
| Kentucky Turnpike Authority, Economic Development Road Revenue Bonds, Revitalization Project, Series 2006B: | ||||||||||
| 7,095 | 5.000%, 7/01/15 – AMBAC Insured | No Opt. Call | AAA | 7,814,575 | ||||||
| 5,000 | 5.000%, 7/01/24 – AMBAC Insured | 7/16 at 100.00 | AAA | 5,425,800 | ||||||
| 4,000 | Kentucky Turnpike Authority, Economic Development Road Revenue Refunding Bonds, Revitalization Project, Series 2001B, 5.150%, 7/01/19 – FSA Insured | 7/11 at 100.00 | AAA | 4,247,480 | ||||||
| Letcher County School District Finance Corporation, Kentucky, School Building Revenue Bonds, Series 2004: | ||||||||||
| 1,430 | 5.000%, 6/01/18 – FSA Insured | 6/14 at 100.00 | Aaa | 1,547,031 | ||||||
| 1,585 | 5.000%, 6/01/20 – FSA Insured | 6/14 at 100.00 | Aaa | 1,707,616 | ||||||
| 11,000 | Lexington-Fayette Urban County Government, Kentucky, First Mortgage Bonds, Public Facilities Corporation, Series 1998, 5.125%, 10/01/31 – FSA Insured | 7/08 at 102.00 | AAA | 11,435,820 | ||||||
| 1,695 | Louisville and Jefferson County Visitors and Convention Commission, Kentucky, Dedicated Tax Revenue Bonds, Series 2004A, 5.000%, 12/01/15 – FSA Insured | 6/14 at 101.00 | AAA | 1,860,076 | ||||||
| 650 | Magoffin County School District Finance Corporation, Kentucky, School Building Revenue Bonds, Series 2000, 5.750%, 6/01/20 | 6/10 at 101.00 | Aa3 | 699,894 | ||||||
| 5,100 | Oldham County School District Finance Corporation, Kentucky, School Building Revenue Bonds, Series 2001A, 5.125%, 4/01/21 | 4/11 at 101.00 | Aa3 | 5,418,240 | ||||||
| Oldham County School District Finance Corporation, Kentucky, School Building Revenue Bonds, Series 2004: | ||||||||||
| 1,230 | 5.000%, 5/01/18 – MBIA Insured | 5/14 at 100.00 | Aaa | 1,329,728 | ||||||
| 1,635 | 5.000%, 5/01/20 – MBIA Insured | 5/14 at 100.00 | Aaa | 1,760,225 | ||||||
| 1,715 | 5.000%, 5/01/21 – MBIA Insured | 5/14 at 100.00 | Aaa | 1,840,607 | ||||||
| 1,360 | Owen County School District Finance Corporation, Kentucky, School Building Revenue Bonds, Series 2001, 5.000%, 4/01/21 | 4/11 at 101.00 | Aa3 | 1,443,164 | ||||||
25
Portfolio of Investments (Unaudited)
Nuveen Kentucky Municipal Bond Fund (continued)
November 30, 2006
| Principal Amount (000) | Description | Optional Call Provisions (1) | Ratings (2) | Value | |||||||
| Tax Obligation/Limited (continued) | |||||||||||
| $ | 500 | Pendleton County, Kentucky, Leasing Trust Revenue Bonds, Kentucky Association of Counties, Series 1993A, 6.400%, 3/01/19 (4) | No Opt. Call | A | $ | 592,900 | |||||
| 2,545 | Puerto Rico Highway and Transportation Authority, Highway Revenue Bonds, Series 1998A, 5.500%, 7/01/14 – AMBAC Insured | No Opt. Call | AAA | 2,876,944 | |||||||
| 1,000 | Puerto Rico Highway and Transportation Authority, Highway Revenue Bonds, Series 2002D, 5.000%, 7/01/32 – FSA Insured | 7/12 at 100.00 | AAA | 1,054,450 | |||||||
| 3,185 | Puerto Rico Public Buildings Authority, Guaranteed Government Facilities Revenue Bonds, Series 1993L, 5.500%, 7/01/21 – FSA Insured | No Opt. Call | AAA | 3,765,275 | |||||||
| 5,000 | Puerto Rico Public Buildings Authority, Guaranteed Government Facilities Revenue Refunding Bonds, Series 2002F, 5.250%, 7/01/21 – CIFG Insured | No Opt. Call | AAA | 5,772,500 | |||||||
| 2,755 | Puerto Rico Public Finance Corporation, Commonwealth Appropriation Bonds, Series 2002E, 6.000%, 8/01/26 – AGC Insured | No Opt. Call | AAA | 3,537,668 | |||||||
| 1,875 | Puerto Rico, Highway Revenue Bonds, Highway and Transportation Authority, Reset Option Long Certificates II-R-66, Series 1996Y, 7.200%, 7/01/36 – MBIA Insured (IF) | No Opt. Call | AAA | 2,404,087 | |||||||
| 4,250 | Puerto Rico, Highway Revenue Bonds, Highway and Transportation Authority, Series 1996Y, 5.500%, 7/01/36 – MBIA Insured (UB) | 7/16 at 100.00 | AAA | 4,762,295 | |||||||
| 6,000 | Puerto Rico, Highway Revenue Bonds, Highway and Transportation Authority, Series 2003AA, 5.500%, 7/01/19 – MBIA Insured | No Opt. Call | AAA | 7,029,120 | |||||||
| 1,360 | Shelby County School District Finance Corporation, Kentucky, Revenue Bonds, School Buildings, Series 2004, 5.000%, 5/01/21 – MBIA Insured | 5/14 at 100.00 | Aaa | 1,459,606 | |||||||
| 2,185 | Spencer County School District Finance Corporation, Kentucky, Revenue Bonds, School Buildings, Series 2004, 5.000%, 7/01/21 – FSA Insured | 7/14 at 100.00 | Aaa | 2,352,611 | |||||||
| 1,010 | Virgin Islands Public Finance Authority, Gross Receipts Taxes Loan Note, Series 2003, 5.250%, 10/01/21 – FSA Insured | 10/14 at 100.00 | AAA | 1,114,878 | |||||||
| 7,000 | Warren County Justice Center Expansion Corporation, Kentucky, First Mortgage Revenue Bonds, AOC Judicial Facility, Series 1997A, 5.250%, 9/01/24 – MBIA Insured | 9/07 at 102.00 | AAA | 7,214,550 | |||||||
| 142,100 | Total Tax Obligation/Limited | 155,205,977 | |||||||||
| Transportation – 4.6% | |||||||||||
| Guam International Airport Authority, Revenue Bonds, Series 2003C: | |||||||||||
| 5,000 | 5.250%, 10/01/22 – MBIA Insured (Alternative Minimum Tax) | 10/10 at 100.00 | AAA | 5,257,200 | |||||||
| 2,195 | 5.000%, 10/01/23 – MBIA Insured (Alternative Minimum Tax) | 10/13 at 100.00 | AAA | 2,300,953 | |||||||
| 1,250 | Kenton County Airport Board, Kentucky, Airport Revenue Bonds, Cincinnati/Northern Kentucky International Airport, Series 1996B, 5.750%, 3/01/13 – MBIA Insured | 3/07 at 101.00 | AAA | 1,276,850 | |||||||
| 5,090 | Kenton County Airport Board, Kentucky, Airport Revenue Bonds, Cincinnati/Northern Kentucky International Airport, Series 2003B, 5.000%, 3/01/23 – MBIA Insured (Alternative Minimum Tax) | 3/13 at 100.00 | AAA | 5,317,269 | |||||||
| 1,000 | Louisville and Jefferson County Regional Airport Authority, Kentucky, Airport System Revenue Bonds, Series 2003C, 5.250%, 7/01/22 – FSA Insured (Alternative Minimum Tax) | 7/13 at 100.00 | AAA | 1,065,750 | |||||||
| 6,000 | Louisville and Jefferson County Regional Airport Authority, Kentucky, Special Facilities Revenue Bonds, Airis Louisville LLC Project, Series 1999A, 5.500%, 3/01/19 (Alternative Minimum Tax) | 3/09 at 101.00 | Baa3 | 6,185,580 | |||||||
| 20,535 | Total Transportation | 21,403,602 | |||||||||
| U.S. Guaranteed – 12.1% (3) | |||||||||||
| 1,875 | Bell County Public Properties Corporation, Kentucky, First Mortgage Revenue Bonds, Judicial Center Project, Series 2000, 5.850%, 9/01/28 (Pre-refunded 3/01/11) – AMBAC Insured | 3/11 at 102.00 | AAA | 2,077,200 | |||||||
| 5,085 | Campbellsville, Kentucky, Industrial Building Revenue Bonds, Campbellsville University Project, Series 1999, 5.500%, 3/01/29 (Pre-refunded 3/01/09) | 3/09 at 102.00 | BBB– | (3) | 5,395,490 | ||||||
| Fayette County School District Finance Corporation, Kentucky, School Building Revenue Bonds, Series 2000: | |||||||||||
| 1,665 | 5.500%, 6/01/18 (Pre-refunded 6/01/10) | 6/10 at 101.00 | AA– | (3) | 1,787,777 | ||||||
| 2,795 | 5.500%, 6/01/20 (Pre-refunded 6/01/10) | 6/10 at 101.00 | AA– | (3) | 3,001,103 | ||||||
| 3,155 | Florence Public Properties Corporation, Kentucky, First Mortgage Revenue Bonds, Administrative Office Complex Project, Series 1997, 5.500%, 6/01/27 (Pre-refunded 6/01/07) – MBIA Insured | 6/07 at 102.00 | AAA | 3,248,104 | |||||||
26
| Principal Amount (000) | Description | Optional Call Provisions (1) | Ratings (2) | Value | |||||||
| U.S. Guaranteed (3) (continued) | |||||||||||
| $ | 2,000 | Jefferson County Collegiate Housing Foundation, Kentucky, Student Housing Revenue Bonds, University of Louisville Project, Series 1999A, 7.125%, 9/01/29 (Pre-refunded 9/01/09) | 9/09 at 102.00 | N/R | (3) | $ | 2,215,120 | ||||
| 5,930 | Jefferson County, Kentucky, College Revenue Bonds, Bellarmine College Project, Series 1999, 5.250%, 5/01/29 (Pre-refunded 5/01/09) | 5/09 at 101.00 | Baa2 | (3) | 6,201,238 | ||||||
| Kentucky Economic Development Finance Authority, Revenue Bonds, Catholic Health Initiatives, Series 2001: | |||||||||||
| 1,000 | 5.250%, 9/01/21 (Pre-refunded 9/01/11) | 9/11 at 100.00 | AA | (3) | 1,072,560 | ||||||
| 1,000 | 5.250%, 9/01/24 (Pre-refunded 9/01/11) | 9/11 at 100.00 | AA | (3) | 1,072,560 | ||||||
| 6,080 | Kentucky Economic Development Finance Authority, Revenue Refunding and Improvement Bonds, Catholic Health Initiatives, Series 1998A, 5.000%, 12/01/27 (Pre-refunded 6/01/08) | 6/08 at 101.00 | AA | (3) | 6,268,723 | ||||||
| 400 | Kentucky State Property and Buildings Commission, Agency Fund Revenue Bonds, Project 66A, Series 2000, 5.750%, 5/01/20 (Pre-refunded 5/01/10) – MBIA Insured | 5/10 at 100.00 | AAA | 428,556 | |||||||
| 500 | Kentucky State Property and Buildings Commission, Revenue Bonds, Project 64, Series 1999, 5.500%, 5/01/18 (Pre-refunded 11/01/09) – MBIA Insured | 11/09 at 100.00 | AAA | 527,580 | |||||||
| 5,860 | Kentucky State Property and Buildings Commission, Revenue Refunding Bonds, Project 72, Series 2001, 5.375%, 10/01/19 (Pre-refunded 10/01/11) – MBIA Insured | 10/11 at 100.00 | AAA | 6,335,187 | |||||||
| 2,000 | Kentucky State Property and Buildings Commission, Revenue Refunding Bonds, Project 74, Series 2002, 5.000%, 2/01/21 (Pre-refunded 2/01/12) – FSA Insured | 2/12 at 100.00 | AAA | 2,136,260 | |||||||
| 6,500 | Kentucky State Property and Buildings Commission, Revenue Refunding Bonds, Project 79, Series 2003, 5.000%, 10/01/22 (Pre-refunded 10/01/13) – MBIA Insured | 10/13 at 100.00 | AAA | 7,065,305 | |||||||
| 245 | Puerto Rico Public Finance Corporation, Commonwealth Appropriation Bonds, Series 2002E, 6.000%, 8/01/26 – AGC Insured (ETM) | No Opt. Call | AAA | 315,391 | |||||||
| 2,600 | Puerto Rico, General Obligation and Public Improvement Bonds, Series 2000, 5.750%, 7/01/26 (Pre-refunded 7/01/10) – MBIA Insured | 7/10 at 100.00 | AAA | 2,794,090 | |||||||
| 2,000 | Puerto Rico, General Obligation and Public Improvement Refunding Bonds, Series 1997, 5.375%, 7/01/25 (Pre-refunded 7/01/07) | 7/07 at 100.00 | BBB | (3) | 2,022,140 | ||||||
| 2,800 | Russell, Kentucky, Health System Revenue Bonds, Franciscan Health Partnership Inc. – Our Lady of Bellefonte Hospital, Series 1997, 5.500%, 7/01/15 (Pre-refunded 1/01/10) | 1/10 at 100.00 | Baa2 | (3) | 2,946,860 | ||||||
| 53,490 | Total U.S. Guaranteed | 56,911,244 | |||||||||
| Utilities – 8.9% | |||||||||||
| 1,175 | Boone County, Kentucky, Collateralized Pollution Control Revenue Bonds, Dayton Power & Light Company, Series 2005A, 4.700%, 1/01/28 – FGIC Insured | 7/15 at 100.00 | AAA | 1,214,797 | |||||||
| Owensboro, Kentucky, Electric Light and Power System Revenue Bonds, Series 1991B: | |||||||||||
| 7,100 | 0.000%, 1/01/11 – AMBAC Insured | No Opt. Call | AAA | 6,100,959 | |||||||
| 6,475 | 0.000%, 1/01/12 – AMBAC Insured | No Opt. Call | AAA | 5,353,142 | |||||||
| 5,810 | 0.000%, 1/01/15 – AMBAC Insured | No Opt. Call | AAA | 4,245,367 | |||||||
| 7,900 | 0.000%, 1/01/17 – AMBAC Insured | No Opt. Call | AAA | 5,268,115 | |||||||
| 13,300 | 0.000%, 1/01/18 – AMBAC Insured | No Opt. Call | AAA | 8,473,696 | |||||||
| 3,000 | Puerto Rico Electric Power Authority, Power Revenue Bonds, Series 2003NN, 5.250%, 7/01/23 – MBIA Insured | No Opt. Call | AAA | 3,497,160 | |||||||
| 5,000 | Puerto Rico Electric Power Authority, Power Revenue Bonds, Series 2005RR, 5.000%, 7/01/24 – FGIC Insured | 7/15 at 100.00 | AAA | 5,422,550 | |||||||
| 2,000 | Puerto Rico Electric Power Authority, Power Revenue Bonds, Series 2005SS, 5.000%, 7/01/17 – MBIA Insured | 7/15 at 100.00 | AAA | 2,196,640 | |||||||
| 51,760 | Total Utilities | 41,772,426 | |||||||||
| Water and Sewer – 11.3% | |||||||||||
| 1,405 | Christian County Water District, Kentucky, Waterworks Revenue Bonds, Series 1999, 6.000%, 1/01/30 – AMBAC Insured | 10/09 at 101.00 | Aaa | 1,506,975 | |||||||
| 1,000 | Kentucky Rural Water Finance Corporation, Multimodal Public Projects Revenue Bonds, Flexible Term Program, Series 2001A, 5.375%, 2/01/20 | 2/11 at 102.00 | AA– | 1,075,430 | |||||||
27
Portfolio of Investments (Unaudited)
Nuveen Kentucky Municipal Bond Fund (continued)
November 30, 2006
| Principal Amount (000) | Description | Optional Call Provisions (1) | Ratings (2) | Value | |||||||
| Water and Sewer (continued) | |||||||||||
| $ | 4,990 | Louisville and Jefferson County Metropolitan Government Board of Water Works, Kentucky, Water System Revenue Bonds, Series 2006, 5.000%, 11/15/29 | 11/16 at 100.00 | AA+ | $ | 5,419,988 | |||||
| Louisville and Jefferson County Metropolitan Sewer District, Kentucky, Sewer and Drainage System Revenue Bonds, Series 1997B: | |||||||||||
| 6,000 | 5.350%, 5/15/22 – MBIA Insured | 11/07 at 101.00 | AAA | 6,150,900 | |||||||
| 2,500 | 5.200%, 5/15/25 – MBIA Insured | 11/07 at 101.00 | AAA | 2,557,800 | |||||||
| 3,200 | Louisville and Jefferson County Metropolitan Sewer District, Kentucky, Sewer and Drainage System Revenue Bonds, Series 1998A, 5.000%, 5/15/30 – FGIC Insured | 5/08 at 101.00 | AAA | 3,280,544 | |||||||
| 16,000 | Louisville and Jefferson County Metropolitan Sewer District, Kentucky, Sewer and Drainage System Revenue Bonds, Series 2001A, 5.500%, 5/15/34 – MBIA Insured | 11/11 at 101.00 | AAA | 17,411,680 | |||||||
| 7,365 | Louisville and Jefferson County Metropolitan Sewer District, Kentucky, Sewer and Drainage System Revenue Bonds, Series 2004A, 5.250%, 5/15/37 – FGIC Insured | 5/14 at 101.00 | AAA | 8,098,333 | |||||||
| 7,225 | Northern Kentucky Water District, Revenue Refunding Bonds, Series 2002A, 5.000%, 2/01/27 – FGIC Insured | 2/12 at 100.00 | Aaa | 7,596,871 | |||||||
| 49,685 | Total Water and Sewer | 53,098,521 | |||||||||
| $ | 459,040 | Total Long-Term Investments (cost $445,890,697) – 100.6% | 471,821,654 | ||||||||
| Short-Term Investments – 0.3% | |||||||||||
| $ | 1,200 | Puerto Rico Government Development Bank, Adjustable Refunding Bonds, Variable Rate Demand Obligations, Series 1985, 3.290%, 12/01/15 – MBIA Insured (5) | A-1 | 1,200,000 | |||||||
Total Short-Term Investments (cost $1,200,000) | 1,200,000 | ||||||||||
Total Investments (cost $447,090,697) – 100.9% | 473,021,654 | ||||||||||
Floating Rate Obligations – (2.1%) | (9,805,000 | ) | |||||||||
Other Assets Less Liabilities – 1.2% | 5,646,112 | ||||||||||
Net Assets – 100% | $ | 468,862,766 | |||||||||
| (1) | Optional Call Provisions: Dates (month and year) and prices of the earliest optional call or redemption. There may be other call provisions at varying prices at later dates. Certain mortgage-backed securities may be subject to periodic principal paydowns. |
| (2) | Ratings: Using the higher of Standard & Poor’s or Moody’s rating. Ratings below BBB by Standard & Poor’s Group or Baa by Moody’s Investor Service, Inc. are considered to be below investment grade. |
| (3) | Backed by an escrow or trust containing sufficient U.S. Government or U.S. Government agency securities which ensure the timely payment of principal and interest. Such investments are normally considered to be equivalent to AAA rated securities. |
| (4) | The Internal Revenue Service (the “IRS”) has formally determined that the interest received from the bonds’ coupon payments should be considered taxable. The issuer has stated that if they are not able to resolve this taxability matter with the IRS, or to have the IRS determination of taxability overturned, the issuer will take steps to ensure that the bondholders will be made whole with respect to any federal tax liability. The Adviser will continue to monitor the ongoing progress of this taxability matter and act in what it believes is in the best interest of shareholders. |
| (5) | Investment has a maturity of more than one year, but has variable rate and demand features which qualify it as a short-term investment. The rate disclosed is that in effect at the end of the reporting period. This rate changes periodically based on market conditions or a specified market index. |
| N/R | Not rated. |
| (ETM) | Escrowed to maturity. |
| (IF) | Inverse floating rate investment. |
| (UB) | Underlying bond of an inverse floating rate trust reflected as a financing transaction pursuant to the provisions of SFAS No. 140. |
See accompanying notes to financial statements.
28
Portfolio of Investments (Unaudited)
Nuveen Michigan Municipal Bond Fund
November 30, 2006
| Principal Amount (000) | Description | Optional Call Provisions (1) | Ratings (2) | Value | ||||||
| Consumer Discretionary – 0.8% | ||||||||||
| $ | 2,000 | Michigan Strategic Fund, Multi-Modal Interchangeable Rate Pollution Control Revenue Refunding Bonds, General Motors Corporation, Series 1995, 6.200%, 9/01/20 | 3/07 at 100.50 | B– | $ | 2,005,000 | ||||
| Consumer Staples – 0.3% | ||||||||||
| 895 | Puerto Rico, The Children’s Trust Fund, Tobacco Settlement Asset-Backed Refunding Bonds, Series 2002, 5.375%, 5/15/33 | 5/12 at 100.00 | BBB | 943,169 | ||||||
| Education and Civic Organizations – 4.3% | ||||||||||
| 630 | Chandler Park Academy, Michigan, Public School Academy Charter School Revenue Bonds, Series 2005, 5.125%, 11/01/35 | 11/15 at 100.00 | BBB– | 640,118 | ||||||
| Michigan Technological University, General Revenue Bonds, Series 2004A: | ||||||||||
| 1,230 | 5.000%, 10/01/24 – MBIA Insured | 10/13 at 100.00 | AAA | 1,313,480 | ||||||
| 1,850 | 5.000%, 10/01/29 – MBIA Insured | 10/13 at 100.00 | AAA | 1,970,990 | ||||||
| 6,150 | Wayne State University, Michigan, General Revenue Bonds, Series 1999, 5.125%, 11/15/29 – FGIC Insured | 11/09 at 101.00 | AAA | 6,430,870 | ||||||
| 9,860 | Total Education and Civic Organizations | 10,355,458 | ||||||||
| Health Care – 8.3% | ||||||||||
| 3,530 | Lake View Community Hospital Authority, Michigan, Hospital Revenue Refunding Bonds, Series 1997, 6.250%, 2/15/13 | 2/07 at 101.00 | N/R | 3,574,937 | ||||||
| 1,000 | Michigan State Hospital Finance Authority, Hospital Revenue Bonds, Michigan Community Hospital, Series 1996, 6.250%, 10/01/27 | 4/07 at 102.00 | BBB– | 1,021,150 | ||||||
| 1,475 | Michigan State Hospital Finance Authority, Hospital Revenue Refunding Bonds, Chelsea Community Hospital, Series 1998, 5.375%, 5/15/19 | 5/08 at 101.00 | BBB | 1,507,037 | ||||||
| 1,000 | Michigan State Hospital Finance Authority, Hospital Revenue Refunding Bonds, Crittenton Hospital, Series 2002A, 5.625%, 3/01/27 | 3/12 at 101.00 | A+ | 1,078,190 | ||||||
| 195 | Michigan State Hospital Finance Authority, Hospital Revenue Refunding Bonds, Gratiot Community Hospital, Series 1995, 6.100%, 10/01/07 | No Opt. Call | A– | 197,886 | ||||||
| 500 | Michigan State Hospital Finance Authority, Revenue Bonds, Chelsea Community Hospital, Series 2005, 5.000%, 5/15/37 | 5/15 at 100.00 | BBB | 517,240 | ||||||
| 500 | Michigan State Hospital Finance Authority, Revenue Bonds, Marquette General Hospital, Series 2005A, 5.000%, 5/15/26 | 5/15 at 100.00 | Baa1 | 517,950 | ||||||
| 2,000 | Michigan State Hospital Finance Authority, Revenue Bonds, Sparrow Obligated Group, Series 2005, 5.000%, 11/15/36 – MBIA Insured | 5/15 at 100.00 | AAA | 2,126,800 | ||||||
| 3,755 | Michigan State Hospital Finance Authority, Revenue Refunding Bonds, Detroit Medical Center Obligated Group, Series 1993A, 6.500%, 8/15/18 | 2/07 at 100.00 | BB– | 3,757,854 | ||||||
| 800 | Monroe County Hospital Finance Authority, Michigan, Mercy Memorial Hospital Corporation Revenue Bonds, Series 2006, 5.375%, 6/01/26 | 6/16 at 100.00 | BBB– | 854,280 | ||||||
| 1,600 | Pontiac Hospital Finance Authority, Michigan, Hospital Revenue Refunding Bonds, NOMC Obligated Group, Series 1993, 6.000%, 8/01/23 | 2/07 at 100.00 | BB– | 1,558,784 | ||||||
| Royal Oak Hospital Finance Authority, Michigan, Hospital Revenue Bonds, William Beaumont Hospital, Series 2001M: | ||||||||||
| 1,000 | 5.250%, 11/15/31 – MBIA Insured | 11/11 at 100.00 | AAA | 1,055,470 | ||||||
| 2,000 | 5.250%, 11/15/35 – MBIA Insured | 11/11 at 100.00 | AAA | 2,108,180 | ||||||
| 19,355 | Total Health Care | 19,875,758 | ||||||||
| Housing/Multifamily – 1.9% | ||||||||||
| 1,200 | Michigan Housing Development Authority, Rental Housing Revenue Bonds, Series 2006D, 5.125%, 4/01/31 – FSA Insured (Alternative Minimum Tax) | 7/15 at 100.00 | AAA | 1,255,668 | ||||||
| 6,000 | Michigan Housing Development Authority, Section 8 Assisted Mortgage Revenue Bonds, Series 1983I, 0.000%, 4/01/14 | No Opt. Call | AA | 3,229,560 | ||||||
| 7,200 | Total Housing/Multifamily | 4,485,228 | ||||||||
29
Portfolio of Investments (Unaudited)
Nuveen Michigan Municipal Bond Fund (continued)
November 30, 2006
| Principal Amount (000) | Description | Optional Call Provisions (1) | Ratings (2) | Value | ||||||
| Industrials – 0.9% | ||||||||||
| $ | 2,000 | Michigan Strategic Fund, Solid Waste Disposal Limited Obligation Revenue Bonds, Waste Management Inc., Series 2004, 4.500%, 12/01/13 (Alternative Minimum Tax) | No Opt. Call | BBB | $ | 2,036,440 | ||||
| Long-Term Care – 1.8% | ||||||||||
| 1,000 | Michigan State Hospital Finance Authority, Revenue Bonds, Presbyterian Villages of Michigan Obligated Group, Series 2005, 5.250%, 11/15/25 | 5/15 at 100.00 | N/R | 1,050,460 | ||||||
| 2,695 | Michigan Strategic Fund, Limited Obligation Revenue Bonds, Clark Retirement Community Inc., Series 1998, 5.250%, 6/01/18 | 6/08 at 100.00 | BBB– | 2,718,635 | ||||||
| Michigan Strategic Fund, Limited Obligation Revenue Refunding Bonds, Porter Hills Presbyterian Village, Series 1998: | ||||||||||
| 140 | 5.300%, 7/01/18 | 7/08 at 101.00 | BBB+ | 143,160 | ||||||
| 260 | 5.375%, 7/01/28 | 7/08 at 101.00 | BBB+ | 265,359 | ||||||
| 4,095 | Total Long-Term Care | 4,177,614 | ||||||||
| Materials – 0.7% | ||||||||||
| 1,750 | Dickinson County Economic Development Corporation, Michigan, Pollution Control Revenue Bonds, International Paper Company, Series 2004A, 4.800%, 11/01/18 | 11/14 at 100.00 | BBB | 1,799,035 | ||||||
| Tax Obligation/General – 30.4% | ||||||||||
| 1,175 | Birmingham, Michigan, General Obligation Bonds, Series 2002, 5.000%, 10/01/21 | 10/12 at 100.50 | AAA | 1,250,306 | ||||||
| 1,020 | Caledonia Community Schools, Kent, Allegan and Barry Counties, Michigan, General Obligation Bonds, Series 2003, 5.250%, 5/01/22 | 5/13 at 100.00 | AA | 1,104,119 | ||||||
| Caledonia Community Schools, Kent, Allegan and Barry Counties, Michigan, General Obligation Bonds, Series 2005: | ||||||||||
| 2,000 | 5.000%, 5/01/23 – MBIA Insured | 5/15 at 100.00 | AAA | 2,154,300 | ||||||
| 2,085 | 5.000%, 5/01/24 – MBIA Insured | 5/15 at 100.00 | AAA | 2,242,772 | ||||||
| 1,000 | 5.000%, 5/01/25 – MBIA Insured | 5/15 at 100.00 | AAA | 1,071,220 | ||||||
| 295 | Cedar Springs Public School District, Kent and Newaygo Counties, Michigan, General Obligation Bonds, Series 2003, 5.125%, 5/01/32 | 5/13 at 100.00 | AAA | 314,269 | ||||||
| 1,850 | Chippewa Valley Schools, Macomb County, Michigan, General Obligation Bonds, Series 2005, 5.000%, 5/01/24 – MBIA Insured | 5/15 at 100.00 | AAA | 1,989,989 | ||||||
| 4,085 | Detroit, Michigan, General Obligation Bonds, Series 2004A-1, 5.250%, 4/01/20 – AMBAC Insured | 4/14 at 100.00 | AAA | 4,435,044 | ||||||
| 11,000 | Detroit-Wayne County Stadium Authority, Michigan, Limited Tax General Obligation Building Authority Stadium Bonds, Series 1997, 5.250%, 2/01/27 – FGIC Insured | 2/07 at 102.00 | AAA | 11,245,520 | ||||||
| 1,245 | Edwardsburg Public School, Cass County, Michigan, General Obligation Bonds, Series 2004, 5.000%, 5/01/24 – FSA Insured | 5/14 at 100.00 | AAA | 1,329,560 | ||||||
| 4,350 | Hartland Consolidated School District, Livingston County, Michigan, General Obligation Refunding Bonds, Series 2001, 5.125%, 5/01/29 | 5/11 at 100.00 | AA | 4,556,712 | ||||||
| 2,000 | Howell Public Schools, Livingston County, Michigan, General Obligation Bonds, Series 2003, 5.000%, 5/01/24 | 11/13 at 100.00 | AA | 2,137,240 | ||||||
| 1,000 | Jackson Public Schools, Jackson County, Michigan, General Obligation School Building and Site Bonds, Series 2004, 5.000%, 5/01/22 – FSA Insured | 5/14 at 100.00 | AAA | 1,071,240 | ||||||
| 1,715 | Kalamazoo Public Schools, Michigan, General Obligation Bonds, Series 2006, 5.000%, 5/01/25 – FSA Insured | 5/16 at 100.00 | AAA | 1,856,145 | ||||||
| 1,030 | Kent County, Michigan, General Obligation Bonds, Series 2004A, 5.000%, 12/01/22 | 12/14 at 100.00 | AAA | 1,113,492 | ||||||
| 1,300 | Lansing Community College, Michigan, General Obligation Bonds, Series 2003, 5.000%, 5/01/20 – MBIA Insured | 5/13 at 100.00 | AAA | 1,396,122 | ||||||
| 1,000 | Livonia Municipal Building Authority, Wayne County, Michigan, General Obligation Bonds, Series 2001, 5.000%, 5/01/27 – FGIC Insured | 5/10 at 100.00 | AAA | 1,037,130 | ||||||
| 2,700 | Livonia Public Schools, Wayne County, Michigan, Unlimited Tax General School Building and Site Bonds, Series 1992-II, 0.000%, 5/01/08 – FGIC Insured | No Opt. Call | AAA | 2,566,296 | ||||||
30
| Principal Amount (000) | Description | Optional Call Provisions (1) | Ratings (2) | Value | ||||||
| Tax Obligation/General (continued) | ||||||||||
| $ | 1,500 | Michigan Municipal Bond Authority, General Obligation Bonds, Detroit City School District, Series 2005, 5.000%, 6/01/18 – FSA Insured | 6/15 at 100.00 | AAA | $ | 1,621,935 | ||||
| 2,800 | Michigan Municipal Bond Authority, Local Government Loan Program Revenue Bonds, Pontiac School District, Series 1991C, 0.000%, 6/15/08 – FSA Insured | No Opt. Call | AAA | 2,650,144 | ||||||
| 3,250 | Michigan, General Obligation Bonds, Environmental Protection Program, Series 2003A, 5.250%, 5/01/21 | 5/13 at 100.00 | AA | 3,538,308 | ||||||
| 2,000 | Muskegon Public Schools, Muskegon County, Michigan, General Obligation Bonds, Series 2004, 5.000%, 5/01/20 – FSA Insured | 5/14 at 100.00 | AAA | 2,150,500 | ||||||
| 1,620 | Oakridge Public Schools, Muskegon County, Michigan, General Obligation Bonds, Series 2005, 5.000%, 5/01/24 – MBIA Insured | 5/15 at 100.00 | AAA | 1,742,585 | ||||||
| Okemos Public School District, Ingham County, Michigan, General Obligation Refunding Bonds, Series 1993: | ||||||||||
| 1,000 | 0.000%, 5/01/17 – MBIA Insured | No Opt. Call | AAA | 659,860 | ||||||
| 1,020 | 0.000%, 5/01/18 – MBIA Insured | No Opt. Call | AAA | 643,844 | ||||||
| 1,400 | South Redford School District, Wayne County, Michigan, General Obligation Bonds, Series 2004, 5.000%, 5/01/21 – FGIC Insured | 11/14 at 100.00 | AAA | 1,507,478 | ||||||
| 1,150 | Wayne Westland Community Schools, Michigan, General Obligation Bonds, Series 2004, 5.000%, | 11/14 at 100.00 | AAA | 1,249,970 | ||||||
| 1,915 | West Bloomfield School District, Oakland County, Michigan, General Obligation Bonds, Series 2005, 5.000%, 5/01/20 – FSA Insured | 5/15 at 100.00 | AAA | 2,075,611 | ||||||
| 3,270 | West Ottawa Public School District, Ottawa County, Michigan, General Obligation Refunding Bonds, Series 1992, 0.000%, 5/01/17 – FGIC Insured | No Opt. Call | AAA | 2,157,742 | ||||||
| 5,175 | Williamston Community School District, Michigan, Unlimited Tax General Obligation QSBLF Bonds, Series 1996, 5.500%, 5/01/25 – MBIA Insured | No Opt. Call | AAA | 6,221,333 | ||||||
| 3,170 | Zeeland Public Schools, Ottawa and Allegan Counties, Michigan, General Obligation Bonds, Series 2005, 5.000%, 5/01/22 – FGIC Insured | 5/15 at 100.00 | AAA | 3,421,666 | ||||||
| 70,120 | Total Tax Obligation/General | 72,512,452 | ||||||||
| Tax Obligation/Limited – 12.8% | ||||||||||
| 1,445 | Detroit, Michigan, Building Authority Revenue Bonds, District Court Madison Center, Series 1996A, 6.150%, 2/01/11 | 2/07 at 101.00 | A | 1,448,410 | ||||||
| Grand Rapids Downtown Development Authority, Michigan, Tax Increment Revenue Bonds, Series 1994: | ||||||||||
| 3,985 | 0.000%, 6/01/17 – MBIA Insured | No Opt. Call | AAA | 2,626,195 | ||||||
| 3,295 | 0.000%, 6/01/18 – MBIA Insured | No Opt. Call | AAA | 2,077,563 | ||||||
| 1,650 | 6.875%, 6/01/24 – MBIA Insured | 12/06 at 100.00 | AAA | 1,716,050 | ||||||
| 3,960 | Michigan Building Authority, Revenue Bonds, Series 2006IA, 5.000%, 10/15/36 – FGIC Insured | 10/16 at 100.00 | AAA | 4,292,046 | ||||||
| 6,000 | Michigan House of Representatives, Certificates of Participation, Series 1998, 0.000%, 8/15/23 – AMBAC Insured | No Opt. Call | AAA | 2,961,900 | ||||||
| 250 | Michigan Municipal Bond Authority, Wayne County, Local Government Loan Program Revenue Bonds, Series 1991A, 4.750%, 12/01/09 – FGIC Insured | 12/06 at 100.00 | AAA | 250,230 | ||||||
| Michigan State Building Authority, Revenue Bonds, Facilities Program, Series 2001I: | ||||||||||
| 2,720 | 5.500%, 10/15/19 | 10/11 at 100.00 | AA– | 2,938,334 | ||||||
| 5,000 | 5.000%, 10/15/24 | 10/11 at 100.00 | AA– | 5,248,600 | ||||||
| 4,400 | Michigan State Building Authority, Revenue Bonds, Facilities Program, Series 2005II, 5.000%, 10/15/30 – AMBAC Insured | 10/15 at 100.00 | AAA | 4,744,564 | ||||||
| 2,000 | Michigan State Building Authority, Revenue Refunding Bonds, Facilities Program, Series 2003II, 5.000%, 10/15/22 – MBIA Insured | 10/13 at 100.00 | AAA | 2,136,440 | ||||||
| 34,705 | Total Tax Obligation/Limited | 30,440,332 | ||||||||
| Transportation – 1.3% | ||||||||||
| 3,000 | Wayne County, Michigan, Airport Revenue Bonds, Detroit Metropolitan Airport, Series 1998B, 5.000%, 12/01/28 – MBIA Insured | 12/08 at 101.00 | AAA | 3,090,750 | ||||||
31
Portfolio of Investments (Unaudited)
Nuveen Michigan Municipal Bond Fund (continued)
November 30, 2006
| Principal Amount (000) | Description | Optional Call Provisions (1) | Ratings (2) | Value | |||||||
| U.S. Guaranteed – 20.4% (3) | |||||||||||
| $ | 250 | Detroit City School District, Wayne County, Michigan, Unlimited Tax School Building and Site Improvement Bonds, Series 2001A, 5.125%, 5/01/31 (Pre-refunded 5/01/12) – FSA Insured | 5/12 at 100.00 | AAA | $ | 269,312 | |||||
| 3,000 | Detroit, Michigan, Senior Lien Water Supply System Revenue Bonds, Series 2001A, 5.500%, 7/01/33 (Pre-refunded 7/01/11) – FGIC Insured | 7/11 at 101.00 | AAA | 3,273,000 | |||||||
| 2,505 | Detroit, Michigan, Senior Lien Water Supply System Revenue Bonds, Series 2003A, 5.000%, 7/01/25 (Pre-refunded 7/01/13) – MBIA Insured | 7/13 at 100.00 | Aaa | 2,715,821 | |||||||
| 2,500 | Detroit, Michigan, Sewerage Disposal System Revenue Bonds, Residual Option Long Series II-R-103, 7.656%, 1/01/10 (Pre-refunded 1/01/10) (IF) | 1/10 at 101.00 | AAA | 2,868,875 | |||||||
| 8,000 | Detroit, Michigan, Sewerage Disposal System Revenue Bonds, Series 1999A, 5.750%, 7/01/26 | 1/10 at 101.00 | AAA | 8,590,160 | |||||||
| 2,000 | Garden City School District, Wayne County, Michigan, General Obligation Refunding Bonds, Series 2001, 5.000%, 5/01/26 (Pre-refunded 5/01/11) | 5/11 at 100.00 | AA | (3) | 2,118,860 | ||||||
| 2,500 | Kalamazoo Economic Development Corporation, Michigan, Limited Obligation Revenue and Refunding Bonds, Friendship Village of Kalamazoo, Series 1997A, 6.250%, 5/15/27 (Pre-refunded 5/15/07) | 5/07 at 102.00 | AAA | 2,579,700 | |||||||
| 3,750 | Kent Hospital Finance Authority, Michigan, Revenue Bonds, Spectrum Health, Series 2001A, 5.500%, 1/15/31 (Pre-refunded 7/15/11) | 7/11 at 101.00 | AA | (3) | 4,086,900 | ||||||
| 75 | Michigan South Central Power Agency, Power Supply System Revenue Bonds, Series 2000, 6.000%, 5/01/12 (ETM) | No Opt. Call | A3 | (3) | 82,260 | ||||||
| 5,000 | Michigan State Hospital Finance Authority, Hospital Revenue Bonds, Ascension Health Credit Group, Series 1999A, 6.125%, 11/15/26 (Pre-refunded 11/15/09) | 11/09 at 101.00 | AAA | 5,407,900 | |||||||
| 2,200 | Michigan State Hospital Finance Authority, Hospital Revenue Bonds, Henry Ford Health System, Series 1999A, 6.000%, 11/15/24 (Pre-refunded 11/15/09) | 11/09 at 101.00 | A1 | (3) | 2,372,150 | ||||||
| 3,000 | Michigan State Hospital Finance Authority, Hospital Revenue Refunding Bonds, Henry Ford Health System, Series 2003A, 5.625%, 3/01/17 (Pre-refunded 3/01/13) | 3/13 at 100.00 | A1 | (3) | 3,334,590 | ||||||
| 2,000 | Michigan State Trunk Line, Fund Bonds, Series 2001A, 5.000%, 11/01/25 (Pre-refunded 11/01/11) – FSA Insured | 11/11 at 100.00 | AAA | 2,131,180 | |||||||
| 605 | Michigan Strategic Fund, Limited Obligation Revenue Bonds, Clark Retirement Community Inc., Series 1998, 5.250%, 6/01/18 (Pre-refunded 6/01/08) | 6/08 at 100.00 | N/R | (3) | 619,429 | ||||||
| 1,500 | Michigan, Certificates of Participation, Series 2000, 5.500%, 6/01/20 (Pre-refunded 6/01/10) – AMBAC Insured | 6/10 at 100.00 | AAA | 1,594,275 | |||||||
| 160 | Puerto Rico, The Children’s Trust Fund, Tobacco Settlement Asset-Backed Bonds, Series 2000, 5.750%, 7/01/20 (Pre-refunded 7/01/10) | 7/10 at 100.00 | AAA | 167,114 | |||||||
| 1,235 | Rochester Community School District, Oakland and Macomb Counties, Michigan, General Obligation Bonds, Series 2000I, 5.750%, 5/01/19 (Pre-refunded 5/01/10) – FGIC Insured | 5/10 at 100.00 | AAA | 1,323,167 | |||||||
| Southgate Community School District, Wayne County, Michigan, General Obligation Bonds, Series 1999: | |||||||||||
| 1,500 | 5.000%, 5/01/25 (Pre-refunded 5/01/09) – FGIC Insured | 5/09 at 100.00 | AAA | 1,551,900 | |||||||
| 1,500 | 5.000%, 5/01/25 (Pre-refunded 5/01/09) – FGIC Insured | 5/09 at 100.00 | AAA | 1,551,900 | |||||||
| 1,625 | Walled Lake Consolidated School District, Oakland County, Michigan, General Obligation Bonds, Series 2004, 5.250%, 5/01/22 (Pre-refunded 5/01/14) – MBIA Insured | 5/14 at 100.00 | AAA | 1,802,076 | |||||||
| 44,905 | Total U.S. Guaranteed | �� | 48,440,569 | ||||||||
| Utilities – 4.5% | |||||||||||
| 1,000 | Lansing Board of Water and Light, Michigan, Steam and Electric Utility System Revenue Bonds, Series 2003A, 5.000%, 7/01/21 – FSA Insured | 7/13 at 100.00 | AAA | 1,075,640 | |||||||
| 1,000 | Michigan Public Power Agency, Revenue Bonds, Combustion Turbine 1 Project, Series 2001A, 5.250%, 1/01/27 – AMBAC Insured | 1/12 at 100.00 | AAA | 1,065,030 | |||||||
| 925 | Michigan South Central Power Agency, Power Supply System Revenue Bonds, Series 2000, 6.000%, 5/01/12 | No Opt. Call | A3 | 995,402 | |||||||
| 3,300 | Michigan Strategic Fund, Collateralized Limited Obligation Pollution Control Revenue Refunding Bonds, Fixed Rate Conversion, Detroit Edison Company, Series 1999C, 5.650%, 9/01/29 (Alternative Minimum Tax) | 9/11 at 100.00 | A3 | 3,518,493 | |||||||
32
| Principal Amount (000) | Description | Optional Call Provisions (1) | Ratings (2) | Value | |||||||
| Utilities (continued) | |||||||||||
| $ | 1,000 | Monroe County Economic Development Corporation, Michigan, Collateralized Limited Obligation Revenue Refunding Bonds, Detroit Edison Company, Series 1992AA, 6.950%, 9/01/22 – FGIC Insured | No Opt. Call | AAA | $ | 1,338,990 | |||||
| 4,000 | Puerto Rico Electric Power Authority, Power Revenue Refunding Bonds, Series 1989O, 0.000%, 7/01/17 – MBIA Insured | No Opt. Call | AAA | 2,676,960 | |||||||
| 11,225 | Total Utilities | 10,670,515 | |||||||||
| Water and Sewer – 12.2% | |||||||||||
| 5,000 | Detroit Water Supply System, Michigan, Water Supply System Revenue Bonds, Series 2006A, 5.000%, 7/01/34 – FSA Insured | 7/16 at 100.00 | AAA | 5,372,050 | |||||||
| 3,000 | Detroit, Michigan, Senior Lien Sewerage Disposal System Revenue Bonds, Series 2001A, 5.125%, 7/01/31 – FGIC Insured | 7/11 at 100.00 | AAA | 3,155,430 | |||||||
| 2,500 | Detroit, Michigan, Senior Lien Water Supply System Revenue Bonds, Series 2001A, 5.000%, 7/01/30 – FGIC Insured | 7/11 at 100.00 | AAA | 2,602,125 | |||||||
| 2,495 | Detroit, Michigan, Senior Lien Water Supply System Revenue Bonds, Series 2003A, 5.000%, 7/01/25 – MBIA Insured | 7/13 at 100.00 | AAA | 2,638,862 | |||||||
| 4,455 | Detroit, Michigan, Sewerage Disposal System Revenue Bonds, Series 1999A, 0.000%, 7/01/19 – FGIC Insured | No Opt. Call | AAA | 2,653,309 | |||||||
| 4,000 | Grand Rapids, Michigan, Sanitary Sewer System Revenue Bonds, Series 2005, 5.000%, 1/01/30 – MBIA Insured | 7/15 at 100.00 | AAA | 4,298,640 | |||||||
| 1,625 | Lansing, Michigan, Sewerage Disposal System Revenue Bonds, Series 2003, 5.000%, 5/01/21 – FGIC Insured | 5/14 at 100.00 | AAA | 1,742,943 | |||||||
| 2,075 | Michigan Municipal Bond Authority, Clean Water Revolving Fund Revenue Bonds, Series 2005, 5.000%, 10/01/19 | 10/15 at 100.00 | AAA | 2,268,120 | |||||||
| 4,055 | Michigan Municipal Bond Authority, Drinking Water Revolving Fund Revenue Bonds, Series 2004, 5.000%, 10/01/24 | 10/14 at 100.00 | AAA | 4,366,221 | |||||||
| 29,205 | Total Water and Sewer | 29,097,700 | |||||||||
| $ | 240,315 | Total Long-Term Investments (cost $223,775,630) – 100.6% | 239,930,020 | ||||||||
| Short-Term Investments – 0.2% | |||||||||||
| $ | 500 | Puerto Rico Government Development Bank, Adjustable Refunding Bonds, Variable Rate Demand Obligations, Series 1985, 3.290%, 12/01/15 – MBIA Insured (4) | A-1 | 500,000 | |||||||
Total Short-Term Investments (cost $500,000) | 500,000 | ||||||||||
Total Investments (cost $224,275,630) – 100.8% | 240,430,020 | ||||||||||
Floating Rate Obligations – (1.7%) | (4,000,000 | ) | |||||||||
Other Assets Less Liabilities – 0.9% | 2,076,691 | ||||||||||
Net Assets – 100% | $ | 238,506,711 | |||||||||
| (1) | Optional Call Provisions: Dates (month and year) and prices of the earliest optional call or redemption. There may be other call provisions at varying prices at later dates. Certain mortgage-backed securities may be subject to periodic principal paydowns. |
| (2) | Ratings: Using the higher of Standard & Poor’s or Moody’s rating. Ratings below BBB by Standard & Poor’s Group or Baa by Moody’s Investor Service, Inc. are considered to be below investment grade. |
| (3) | Backed by an escrow or trust containing sufficient U.S. Government or U.S. Government agency securities which ensure the timely payment of principal and interest. Such investments are normally considered to be equivalent to AAA rated securities. |
| (4) | Investment has a maturity of more than one year, but has variable rate and demand features which qualify it as a short-term investment. The rate disclosed is that in effect at the end of the reporting period. This rate changes periodically based on market conditions or a specified market index. |
| N/R | Not rated. |
| (ETM) | Escrowed to maturity. |
| (IF) | Inverse floating rate investment. |
| (UB) | Underlying bond of an inverse floating rate trust reflected as a financing transaction pursuant to the provisions of SFAS No. 140. |
See accompanying notes to financial statements.
33
Portfolio of Investments (Unaudited)
Nuveen Missouri Municipal Bond Fund
November 30, 2006
| Principal Amount (000) | Description | Optional Call Provisions (1) | Ratings (2) | Value | ||||||
| Consumer Discretionary – 0.9% | ||||||||||
| $ | 3,225 | St. Louis Industrial Development Authority, Missouri, Senior Lien Revenue Bonds, St. Louis Convention Center Headquarters Hotel, Series 2000A, 0.000%, 7/15/15 – AMBAC Insured | No Opt. Call | AAA | $ | 2,303,263 | ||||
| Consumer Staples – 4.7% | ||||||||||
| 3,000 | Cape Girardeau County Industrial Development Authority, Missouri, Solid Waste Disposal Revenue Bonds, Procter & Gamble Products Company Project, Series 1998, 5.300%, 5/15/28 (Alternative Minimum Tax) | 5/08 at 101.00 | AA– | 3,074,760 | ||||||
| 8,100 | Missouri Development Finance Board, Solid Waste Disposal Revenue Bonds, Procter and Gamble Inc., Series 1999, 5.200%, 3/15/29 (Alternative Minimum Tax) | No Opt. Call | AA– | 9,296,451 | ||||||
| 11,100 | Total Consumer Staples | 12,371,211 | ||||||||
| Education and Civic Organizations – 7.2% | ||||||||||
| Curators of the University of Missouri, System Facilities Revenue Bonds, Series 2003A: | ||||||||||
| 1,000 | 5.000%, 11/01/21 | 11/13 at 100.00 | AA | 1,079,640 | ||||||
| 1,200 | 5.000%, 11/01/31 | 11/13 at 100.00 | AA | 1,277,844 | ||||||
| 1,500 | Curators of the University of Missouri, System Facilities Revenue Bonds, Series 2006, 5.000%, 11/01/26 | 11/15 at 100.00 | AA | 1,621,485 | ||||||
| 1,100 | Missouri Health and Educational Facilities Authority, Revenue Bonds, Barstow School, Series 1998, 5.250%, 10/01/23 | 10/08 at 100.00 | N/R | 1,112,089 | ||||||
| Missouri Health and Educational Facilities Authority, Revenue Bonds, Maryville University of St. Louis, Series 1997: | ||||||||||
| 1,000 | 5.625%, 6/15/13 | 6/07 at 101.00 | Baa2 | 1,018,300 | ||||||
| 1,750 | 5.750%, 6/15/17 | 6/07 at 101.00 | Baa2 | 1,781,273 | ||||||
| 1,100 | Missouri Health and Educational Facilities Authority, Revenue Bonds, Maryville University of St. Louis, Series 2000, 6.750%, 6/15/30 | 6/10 at 100.00 | Baa2 | 1,181,466 | ||||||
| 900 | Missouri Health and Educational Facilities Authority, Revenue Bonds, Stephens College, Series 1999, 6.000%, 6/01/24 | 6/08 at 102.00 | A1 | 942,489 | ||||||
| 1,000 | Missouri Health and Educational Facilities Authority, Revenue Bonds, Washington University, Series 2001A, 5.500%, 6/15/16 | No Opt. Call | AAA | 1,150,180 | ||||||
| 1,360 | Missouri Health and Educational Facilities Authority, Revenue Bonds, Webster University, Series 2001, 5.500%, 4/01/18 – MBIA Insured | 4/11 at 100.00 | Aaa | 1,460,830 | ||||||
| 4,190 | Missouri Higher Education Loan Authority, Subordinate Lien Student Loan Revenue Bonds, Series 1994F, 6.750%, 2/15/09 (Alternative Minimum Tax) | 2/07 at 100.00 | A2 | 4,202,402 | ||||||
| 2,060 | Southeast Missouri State University, System Facilities Revenue Refunding and Improvement Bonds, Series 2001, 5.000%, 4/01/26 – MBIA Insured | 4/11 at 100.00 | Aaa | 2,147,406 | ||||||
| 18,160 | Total Education and Civic Organizations | 18,975,404 | ||||||||
| Health Care – 8.5% | ||||||||||
| 1,250 | Joplin Industrial Development Authority, Missouri, Health Facilities Revenue Bonds, Freeman Health System, Series 2004, 5.500%, 2/15/29 | 2/15 at 102.00 | BBB+ | 1,360,825 | ||||||
| 1,000 | Missouri Health and Educational Facilities Authority, Revenue Bonds, BJC Health System, Series 2003, 5.125%, 5/15/25 | 5/13 at 100.00 | AA | 1,056,750 | ||||||
| 1,000 | Missouri Health and Educational Facilities Authority, Revenue Bonds, BJC Health System, Series 2005A, 5.000%, 5/15/22 | 5/15 at 100.00 | AA | 1,068,550 | ||||||
| 500 | Missouri Health and Educational Facilities Authority, Revenue Bonds, Capital Region Medical Center, Series 1998, 5.250%, 11/01/23 | 5/07 at 100.00 | BBB+ | 500,275 | ||||||
| Missouri Health and Educational Facilities Authority, Revenue Bonds, Freeman Health System, Series 1998: | ||||||||||
| 1,500 | 5.250%, 2/15/18 | 2/08 at 102.00 | BBB+ | 1,539,195 | ||||||
| 1,300 | 5.250%, 2/15/28 | 2/08 at 102.00 | BBB+ | 1,332,058 | ||||||
| 2,750 | Missouri Health and Educational Facilities Authority, Revenue Bonds, Lake Regional Health System, Series 2003, 5.700%, 2/15/34 | 2/14 at 100.00 | BBB+ | 2,975,638 | ||||||
| Missouri Health and Educational Facilities Authority, Revenue Bonds, Lester E. Cox Medical Center, Series 1992H: | ||||||||||
| 2,650 | 0.000%, 9/01/17 – MBIA Insured | No Opt. Call | AAA | 1,721,891 | ||||||
| 4,740 | 0.000%, 9/01/21 – MBIA Insured | No Opt. Call | AAA | 2,567,231 | ||||||
| 6,300 | 0.000%, 9/01/22 – MBIA Insured | No Opt. Call | AAA | 3,258,108 | ||||||
34
| Principal Amount (000) | Description | Optional Call Provisions (1) | Ratings (2) | Value | ||||||
| Health Care (continued) | ||||||||||
| $ | 1,000 | Missouri Health and Educational Facilities Authority, Revenue Bonds, St. Luke’s Health System, Series 2001, 5.250%, 12/01/26 – FSA Insured | 6/11 at 101.00 | AAA | $ | 1,059,620 | ||||
| 1,000 | New Liberty Hospital District, Missouri, Revenue Bonds, Series 2001, 5.000%, 12/01/21 – AMBAC Insured | 12/11 at 100.00 | AAA | 1,047,470 | ||||||
| 2,880 | Taney County Industrial Development Authority, Missouri, Hospital Revenue Bonds, Skaggs Community Hospital Association, Series 1998, 5.400%, 5/15/28 | 5/08 at 101.00 | BBB | 2,948,774 | ||||||
| 27,870 | Total Health Care | 22,436,385 | ||||||||
| Housing/Multifamily – 6.3% | ||||||||||
| 1,320 | Clay County Industrial Development Authority, Missouri, GNMA Multifamily Housing Revenue Bonds, Oak Creek Apartments, Series 2002, 6.125%, 7/20/25 (Alternative Minimum Tax) | 7/13 at 105.00 | AAA | 1,454,059 | ||||||
| Missouri Housing Development Commission, GNMA Collateralized Multifamily Housing Revenue Bonds, JB Hughes Apartments I and II, Series 2002G: | ||||||||||
| 251 | 6.200%, 5/20/19 | 5/12 at 105.00 | Aaa | 268,327 | ||||||
| 975 | 6.300%, 5/20/37 | 5/12 at 105.00 | Aaa | 1,057,875 | ||||||
| 2,465 | Missouri Housing Development Commission, Multifamily Housing Revenue Bonds, Mansion Apartments II, Series 1999, 6.125%, 4/01/22 (Alternative Minimum Tax) | 4/08 at 102.00 | N/R | 2,525,836 | ||||||
| 1,805 | St. Louis County Industrial Development Authority, Missouri, GNMA Collateralized Subordinate Lien Housing Revenue Refunding Bonds, Southfield and Oak Forest II Apartments, Series 2002A, 5.200%, 1/20/36 | 1/09 at 105.00 | AAA | 1,874,511 | ||||||
| 9,105 | St. Louis County Industrial Development Authority, Missouri, GNMA Mortgage-Backed Multifamily Housing Revenue Bonds, Covington Manor Apartments, Series 1996A, 6.875%, 8/20/36 (Alternative Minimum Tax) | 2/07 at 105.00 | AAA | 9,569,536 | ||||||
| 15,921 | Total Housing/Multifamily | 16,750,144 | ||||||||
| Housing/Single Family – 3.5% | ||||||||||
| Missouri Housing Development Commission, GNMA Single Family Remarketed Mortgage Revenue Bonds, Homeownership Loan Program, Series 1995B: | ||||||||||
| 290 | 6.375%, 9/01/20 (Alternative Minimum Tax) | 3/07 at 102.00 | AAA | 293,233 | ||||||
| 230 | 6.450%, 9/01/27 (Alternative Minimum Tax) | 3/07 at 102.00 | AAA | 232,650 | ||||||
| 125 | Missouri Housing Development Commission, GNMA/FNMA Single Family Mortgage Revenue Bonds, Homeownership Loan Program, Series 1996D, 6.125%, 3/01/28 (Alternative Minimum Tax) | 1/07 at 102.00 | AAA | 127,370 | ||||||
| 20 | Missouri Housing Development Commission, GNMA/FNMA Single Family Mortgage Revenue Bonds, Homeownership Loan Program, Series 1997A-2, 7.300%, 3/01/28 (Alternative Minimum Tax) | 3/07 at 105.00 | AAA | 20,324 | ||||||
| 90 | Missouri Housing Development Commission, Single Family Mortgage Revenue Bonds, Homeownership Loan Program, Series 1995C, 7.250%, 9/01/26 (Alternative Minimum Tax) | 3/07 at 104.00 | AAA | 91,398 | ||||||
| 60 | Missouri Housing Development Commission, Single Family Mortgage Revenue Bonds, Homeownership Loan Program, Series 1996B, 7.550%, 9/01/27 (Alternative Minimum Tax) | 3/07 at 105.00 | AAA | 61,032 | ||||||
| 125 | Missouri Housing Development Commission, Single Family Mortgage Revenue Bonds, Homeownership Loan Program, Series 1998B-2, 6.400%, 3/01/29 (Alternative Minimum Tax) | 3/08 at 105.00 | AAA | 128,411 | ||||||
| 330 | Missouri Housing Development Commission, Single Family Mortgage Revenue Bonds, Homeownership Loan Program, Series 2000A-1, 6.300%, 9/01/25 (Alternative Minimum Tax) | 9/09 at 100.00 | AAA | 333,554 | ||||||
| 230 | Missouri Housing Development Commission, Single Family Mortgage Revenue Bonds, Homeownership Loan Program, Series 2000B-1, 6.200%, 9/01/25 (Alternative Minimum Tax) | 3/10 at 100.00 | AAA | 232,010 | ||||||
| 2,815 | Missouri Housing Development Commission, Single Family Mortgage Revenue Bonds, Homeownership Loan Program, Series 2005A-1, 5.900%, 9/01/35 (Alternative Minimum Tax) | 9/14 at 100.00 | AAA | 3,024,183 | ||||||
| 4,250 | Missouri Housing Development Commission, Single Family Mortgage Revenue Bonds, Homeownership Loan Program, Series 2006E-1, 5.600%, 3/01/37 (Alternative Minimum Tax) | 3/16 at 104.50 | AAA | 4,639,428 | ||||||
| 8,565 | Total Housing/Single Family | 9,183,593 | ||||||||
| Long-Term Care – 8.0% | ||||||||||
| 1,000 | Cole County Industrial Development Authority, Missouri, Revenue Bonds, Lutheran Senior Services – Heisinger Project, Series 2004, 5.500%, 2/01/35 | 2/14 at 100.00 | N/R | 1,068,780 | ||||||
35
Portfolio of Investments (Unaudited)
Nuveen Missouri Municipal Bond Fund (continued)
November 30, 2006
| Principal Amount (000) | Description | Optional Call Provisions (1) | Ratings (2) | Value | ||||||
| Long-Term Care (continued) | ||||||||||
| $ | 4,250 | Kansas City Industrial Development Authority, Missouri, Retirement Center Revenue Refunding and Improvement Bonds, Kingswood Project, Series 1998A, 5.875%, 11/15/29 | 11/08 at 102.00 | N/R | $ | 4,275,882 | ||||
| 1,000 | Lees Summit Industrial Development Authority, Missouri, Health Facilities Revenue Bonds, John Knox Village, Series 1995, 6.625%, 8/15/13 | 2/07 at 101.00 | N/R | 1,011,990 | ||||||
| 5,000 | Lees Summit Industrial Development Authority, Missouri, Health Facilities Revenue Bonds, John Knox Village, Series 1999, 6.000%, 8/15/17 | 8/09 at 101.00 | N/R | 5,270,600 | ||||||
| 1,500 | Lees Summit Industrial Development Authority, Missouri, Health Facilities Revenue Bonds, John Knox Village, Series 2002, 5.700%, 8/15/22 | 8/12 at 101.00 | N/R | 1,617,030 | ||||||
| 1,285 | Missouri Development Finance Board, Healthcare Facilities Revenue Bonds, Lutheran Home for the Aged, Series 2001A, 5.600%, 11/01/21 | 11/11 at 100.00 | A2 | 1,348,029 | ||||||
| 3,500 | Missouri Health and Educational Facilities Authority, Revenue Bonds, Lutheran Senior Services, Series 1997, 5.875%, 2/01/23 | 2/07 at 102.00 | N/R | 3,579,450 | ||||||
| 1,200 | St. Louis County Industrial Development Authority, Missouri, GNMA Collateralized Healthcare Facilities Revenue Bonds, Mary, Queen and Mother Association, Series 2001, 5.400%, 9/20/34 | 3/10 at 102.00 | AAA | 1,271,208 | ||||||
| 1,800 | St. Louis County Industrial Development Authority, Missouri, Revenue Refunding Bonds, Friendship Village of West County, Series 1996A, 6.250%, 9/01/10 | 3/07 at 102.00 | N/R | 1,837,674 | ||||||
| 20,535 | Total Long-Term Care | 21,280,643 | ||||||||
| Materials – 0.3% | ||||||||||
| 1,000 | Sugar Creek, Missouri, Industrial Development Revenue Bonds, Lafarge North America Inc., Series 2003A, 5.650%, 6/01/37 (Alternative Minimum Tax) | 6/13 at 101.00 | BBB | 1,068,960 | ||||||
| Tax Obligation/General – 15.9% | ||||||||||
| 1,500 | Branson Reorganized School District R-4, Taney County, Missouri, General Obligation Bonds, Series 2005, 5.000%, 3/01/25 – FSA Insured | 3/15 at 100.00 | AAA | 1,612,650 | ||||||
| 1,500 | Camdenton Reorganized School District R3, Camden County, Missouri, General Obligation Bonds, Series 2005, 5.250%, 3/01/24 – FSA Insured | No Opt. Call | AAA | 1,652,190 | ||||||
| 2,000 | Cass County Reorganized School District R-II, Raymore and Peculiar, Missouri, General Obligation Bonds, Series 2002, 5.250%, 3/01/20 – FSA Insured | 3/12 at 100.00 | AAA | 2,151,100 | ||||||
| 540 | Clay County Public School District 53, Liberty, Missouri, General Obligation Bonds, Series 2001C, 5.200%, 3/01/21 | 3/12 at 100.00 | AA+ | 579,301 | ||||||
| 1,280 | Clay County Public School District 53, Liberty, Missouri, General Obligation Bonds, Series 2002B, 5.000%, 3/01/22 – FSA Insured | 3/12 at 100.00 | AAA | 1,349,952 | ||||||
| 1,000 | Greene County Reorganized School District R8, Missouri, General Obligation Bonds, Series 2002, 5.250%, 3/01/20 – FSA Insured | 3/12 at 100.00 | AAA | 1,075,550 | ||||||
| 2,500 | Hickman Mills C-1 School District, Jackson County, Missouri, General Obligation Bonds, Series 2003, 5.000%, 3/01/21 – FSA Insured | 3/13 at 100.00 | AAA | 2,681,975 | ||||||
| 1,450 | Jackson County Reorganized School District R-7, Lees Summit, Missouri, General Obligation Bonds, Series 2004, 5.000%, 3/01/21 – MBIA Insured | 3/14 at 100.00 | Aaa | 1,555,038 | ||||||
| 1,000 | Jefferson City School District, Missouri, General Obligation Bonds, Series 1991A, 6.700%, 3/01/11 | No Opt. Call | Aa2 | 1,081,310 | ||||||
| 3,000 | Kansas City, Missouri, General Obligation Bonds, Series 2004F, 5.000%, 2/01/24 | 2/14 at 100.00 | AA | 3,213,240 | ||||||
| 2,000 | Miller County School District R-2, Osage, Missouri, General Obligation Bonds, Series 2006, 5.000%, 3/01/24 – FSA Insured | 3/16 at 100.00 | AAA | 2,166,960 | ||||||
| 1,250 | Nixa, Missouri, Reorganized School District R 02, General Obligation Bonds, Series 2006, 5.250%, | 3/16 at 100.00 | AAA | 1,389,700 | ||||||
| 4,500 | North Kansas City School District 74, Clay County, Missouri, General Obligation Bonds, Series 2005, 5.000%, 3/01/25 | 3/15 at 100.00 | AA+ | 4,831,380 | ||||||
| 1,000 | Pevely, Missouri, General Obligation Bonds, Series 2004, 5.250%, 3/01/24 – RAAI Insured | 3/13 at 100.00 | AA | 1,067,060 | ||||||
| 2,275 | Platte County Reorganized School District R3, Missouri, General Obligation Bonds, Series 2004, 5.000%, 3/01/20 – MBIA Insured | 3/14 at 100.00 | AAA | 2,448,765 | ||||||
| 750 | Polk County R-1 School District, Bolivar, Missouri, General Obligation Bonds, Missouri Direct Deposit Program, Series 2000, 5.700%, 3/01/20 | 3/10 at 100.00 | AA+ | 796,822 | ||||||
36
| Principal Amount (000) | Description | Optional Call Provisions (1) | Ratings (2) | Value | ||||||
| Tax Obligation/General (continued) | ||||||||||
| Springfield School District R12, Missouri, General Obligation Bonds, Series 2003: | ||||||||||
| $ | 2,875 | 5.125%, 3/01/20 – FGIC Insured | 3/13 at 100.00 | AAA | $ | 3,104,166 | ||||
| 3,000 | 5.000%, 3/01/22 – FGIC Insured | 3/13 at 100.00 | AAA | 3,188,220 | ||||||
| 1,250 | 5.000%, 3/01/23 – FGIC Insured | 3/13 at 100.00 | AAA | 1,328,425 | ||||||
| 1,605 | St. Louis Board of Education, Missouri, General Obligation Refunding Bonds, Series 2003A, 5.000%, 4/01/20 – FSA Insured | 4/13 at 100.00 | AAA | 1,723,224 | ||||||
| 1,345 | St. Louis County Pattonville School District R3, Missouri, General Obligation Bonds, Series 2000, 6.500%, 3/01/14 – FGIC Insured | No Opt. Call | AAA | 1,594,955 | ||||||
| 1,450 | St. Louis County Pattonville School District R3, Missouri, General Obligation Bonds, Series 2004, 5.250%, 3/01/20 – FSA Insured | 3/14 at 100.00 | AAA | 1,586,909 | ||||||
| 39,070 | Total Tax Obligation/General | 42,178,892 | ||||||||
| Tax Obligation/Limited – 17.8% | ||||||||||
| 575 | Brentwood, Missouri, Tax Increment Refunding Bonds, Promenade Project, Series 2002, 4.700%, | 4/09 at 100.00 | AA | 582,596 | ||||||
| 1,290 | Cape Girardeau County Building Corporation, Missouri, Leasehold Revenue Bonds, Reorganized School District R-02, Jackson R-II School District High School Project, Series 2005, 5.250%, 3/01/21 – MBIA Insured | 3/16 at 100.00 | AAA | 1,429,913 | ||||||
| 1,875 | Christian County Public Building Corporation, Missouri, Leasehold Revenue Bonds, Justice Center Project, Series 2000, 5.450%, 6/01/15 – RAAI Insured | 6/10 at 100.00 | AA | 1,969,294 | ||||||
| 420 | Cottleville, Missouri, Certificates of Participation, Series 2006, 5.250%, 8/01/31 | 8/14 at 100.00 | N/R | 433,201 | ||||||
| 1,035 | Dunklin County, Missouri, Certificates of Participation, Series 2004, 5.000%, 12/01/19 – FGIC Insured | 12/14 at 100.00 | AAA | 1,125,594 | ||||||
| 2,770 | Fenton, Missouri, Tax Increment Revenue Bonds, Gravois Bluffs Redevelopment Project, Series 2006, 4.500%, 4/01/21 | 4/14 at 100.00 | N/R | 2,822,907 | ||||||
| 1,685 | Fulton, Missouri, Tax Increment Revenue Bonds, Fulton Commons Redevelopment Project, Series 2006, 5.000%, 6/01/28 | 6/16 at 100.00 | N/R | 1,675,109 | ||||||
| 3,000 | Harrisonville, Missouri, Lease Participation Certificates, Series 2003, 5.000%, 12/01/22 – XLCA Insured | 12/13 at 100.00 | AAA | 3,195,780 | ||||||
| 2,525 | Kansas City Tax Increment Financing District, Missouri, Tax Increment Revenue Bonds, Briarcliff West Project, Series 2006A, 5.400%, 6/01/24 | 6/14 at 102.00 | N/R | 2,609,335 | ||||||
| 3,885 | Missouri Association of Rural Education, Pulaski County, Certificates of Participation, Waynesville School District R-6, Series 2004, 5.100%, 3/01/24 – MBIA Insured | 3/09 at 100.00 | AAA | 4,004,697 | ||||||
| 2,335 | Missouri Development Finance Board, Independence, Infrastructure Facilities Revenue Bonds, Crackerneck Creek Project, Series 2006C, 5.000%, 3/01/28 | 3/16 at 100.00 | A+ | 2,464,919 | ||||||
| 4,000 | Missouri Development Finance Board, Independence, Infrastructure Facilities Revenue Bonds, Santa Fe Redevelopment Project, Series 2001, 5.250%, 4/01/23 | 4/11 at 100.00 | A+ | 4,149,440 | ||||||
| 1,920 | Missouri Development Finance Board, Infrastructure Facilities Revenue Bonds, Branson Landing Project, Series 2005A, 5.000%, 6/01/35 | 6/15 at 100.00 | BBB+ | 1,993,382 | ||||||
| 1,500 | Missouri Development Finance Board, Kansas City, Infrastructure Facilities Revenue Bonds, Midtown Redevelopment Project, Series 2000A, 5.750%, 4/01/22 – MBIA Insured | 4/10 at 100.00 | AAA | 1,598,010 | ||||||
| 450 | Monarch-Chesterfield Levee District, St. Louis County, Missouri, Levee District Improvement Bonds, Series 1999, 5.750%, 3/01/19 – MBIA Insured | 3/10 at 101.00 | AAA | 483,210 | ||||||
| 1,705 | O’Fallon, Missouri, Certificates of Participation, Series 2002, 5.250%, 2/01/15 – MBIA Insured | 2/12 at 100.00 | Aaa | 1,831,545 | ||||||
| 3,000 | Puerto Rico Public Buildings Authority, Guaranteed Government Facilities Revenue Bonds, Series 1993L, 5.500%, 7/01/21 | No Opt. Call | BBB | 3,430,860 | ||||||
| 500 | Puerto Rico, Highway Revenue Bonds, Highway and Transportation Authority, Series 1996Y, 5.500%, 7/01/36 | 7/16 at 100.00 | BBB+ | 560,270 | ||||||
| 1,170 | Riverside, Missouri, L-385 Levee Redevelopment Plan Tax Increment Revenue Bonds, Series 2004, 5.250%, 5/01/20 | 5/15 at 100.00 | BBB | 1,222,135 | ||||||
| 1,945 | Springfield Center City Development Corporation, Missouri, Lease Revenue Bonds, Jordan Valley Park Exposition Center, Series 2002A, 5.000%, 6/01/27 – AMBAC Insured | 6/12 at 100.00 | Aaa | 2,042,658 | ||||||
| 2,950 | Springfield Public Building Corporation, Missouri, Lease Revenue Bonds, Jordan Valley Park Projects, Series 2000A, 6.125%, 6/01/21 – AMBAC Insured | 6/10 at 100.00 | AAA | 3,194,585 | ||||||
37
Portfolio of Investments (Unaudited)
Nuveen Missouri Municipal Bond Fund (continued)
November 30, 2006
| Principal Amount (000) | Description | Optional Call Provisions (1) | Ratings (2) | Value | |||||||
| Tax Obligation/Limited (continued) | |||||||||||
| $ | 2,500 | Springfield Public Building Corporation, Missouri, Lease Revenue Bonds, Series 2004, 5.000%, 3/01/24 – AMBAC Insured | 3/14 at 100.00 | Aaa | $ | 2,661,550 | |||||
| 600 | St. Joseph Industrial Development Authority, Missouri, Tax Increment Bonds, Shoppes at North Village Project, Series 2005A, 5.500%, 11/01/27 | 11/14 at 100.00 | N/R | 617,220 | |||||||
| 1,000 | St. Joseph Industrial Development Authority, Missouri, Tax Increment Bonds, Shoppes at North Village Project, Series 2005B, 5.500%, 11/01/27 | 11/14 at 100.00 | N/R | 1,028,700 | |||||||
| 44,635 | Total Tax Obligation/Limited | 47,126,910 | |||||||||
| Transportation – 8.3% | |||||||||||
| 2,000 | Kansas City, Missouri, Passenger Facility Charge Revenue Bonds, Kansas City International Airport, Series 2001, 5.000%, 4/01/23 – AMBAC Insured (Alternative Minimum Tax) | 4/11 at 101.00 | AAA | 2,085,880 | |||||||
| St. Louis Land Clearance Redevelopment Authority, Missouri, Revenue Refunding and Improvement Bonds, LCRA Parking Facilities, Series 1999C: | |||||||||||
| 1,000 | 7.000%, 9/01/19 | 9/09 at 102.00 | N/R | 1,059,820 | |||||||
| 2,400 | 7.050%, 9/01/24 | 9/09 at 102.00 | N/R | 2,536,464 | |||||||
| 5,000 | St. Louis, Missouri, Airport Revenue Bonds, Airport Development Program, Series 2001A, 5.000%, | 7/11 at 100.00 | AAA | 5,212,750 | |||||||
| St. Louis, Missouri, Airport Revenue Bonds, Lambert-St. Louis International Airport, Series 2005: | |||||||||||
| 3,320 | 5.000%, 7/01/22 – MBIA Insured | 7/15 at 100.00 | AAA | 3,565,381 | |||||||
| 2,395 | 5.000%, 7/01/23 – MBIA Insured | 7/15 at 100.00 | AAA | 2,566,626 | |||||||
| St. Louis, Missouri, Airport Revenue Refunding Bonds, Series 2003A: | |||||||||||
| 3,450 | 5.250%, 7/01/16 – FSA Insured | 7/13 at 100.00 | AAA | 3,752,565 | |||||||
| 1,000 | 5.250%, 7/01/18 – FSA Insured | 7/13 at 100.00 | AAA | 1,083,750 | |||||||
| 20,565 | Total Transportation | 21,863,236 | |||||||||
| U.S. Guaranteed – 7.1% (3) | |||||||||||
| 4,500 | Cape Girardeau County, Missouri, Single Family Mortgage Revenue Bonds, Series 1983, 0.000%, 12/01/14 (ETM) | No Opt. Call | Aaa | 3,343,140 | |||||||
| 1,025 | Excelsior Springs School District, Missouri, Leasehold Revenue Bonds, Series 1994, 0.000%, 3/01/14 – FSA Insured (ETM) | No Opt. Call | AAA | 784,002 | |||||||
| 2,500 | Fenton, Missouri, Tax Increment Refunding and Improvement Revenue Bonds, Gravois Bluffs Redevelopment Project, Series 2002, 6.125%, 10/01/21 (Pre-refunded 10/01/12) | 10/12 at 100.00 | N/R | (3) | 2,830,875 | ||||||
| 235 | Greene County, Missouri, Single Family Mortgage Revenue Bonds, Series 1984, 0.000%, 3/01/16 (ETM) | No Opt. Call | Aaa | 164,951 | |||||||
| 1,000 | Kansas City Metropolitan Community Colleges Building Corporation, Missouri, Leasehold Revenue Bonds, Junior College District of Metropolitan Kansas City, Series 2001, 5.500%, 7/01/18 (Pre-refunded 7/01/11) – FGIC Insured | 7/11 at 100.00 | Aaa | 1,080,730 | |||||||
| 2,000 | Missouri Development Finance Board, Infrastructure Facilities Revenue Bonds, Riverside-Quindaro Bend Levee District L-385, Series 2001, 5.800%, 3/01/20 (Pre-refunded 3/01/10) | 3/10 at 100.00 | N/R | (3) | 2,115,220 | ||||||
| 1,895 | Missouri Health and Educational Facilities Authority, Revenue Bonds, BJC Health System, Series 1994A, 6.750%, 5/15/14 (ETM) | No Opt. Call | Aaa | 2,278,245 | |||||||
| 1,000 | Missouri Health and Educational Facilities Authority, Revenue Bonds, Central Institute for the Deaf, Series 1999, 5.850%, 1/01/22 (Pre-refunded 1/01/10) – RAAI Insured | 1/10 at 100.00 | AA | (3) | 1,065,880 | ||||||
| 2,000 | Missouri Health and Educational Facilities Authority, Revenue Bonds, St. Anthony’s Medical Center, Series 2000, 6.250%, 12/01/30 (Pre-refunded 12/01/10) | 12/10 at 101.00 | A | (3) | 2,212,880 | ||||||
| 450 | St. Louis County Pattonville School District R3, Missouri, General Obligation Bonds, Series 2004, 5.250%, 3/01/20 (Pre-refunded 3/01/14) – FSA Insured | 3/14 at 100.00 | AAA | 498,060 | |||||||
| 1,240 | St. Louis Municipal Finance Corporation, Missouri, Leasehold Revenue Bonds, Carnahan Courthouse, Series 2002A, 5.750%, 2/15/17 (Pre-refunded 2/15/12) – FGIC Insured | 2/12 at 100.00 | Aaa | 1,366,443 | |||||||
| 950 | Texas County, Missouri, Hospital Revenue Bonds, Texas County Memorial Hospital, Series 2000, 7.250%, 6/15/25 (Pre-refunded 6/15/10) | 6/10 at 100.00 | N/R | (3) | 1,060,466 | ||||||
| 18,795 | Total U.S. Guaranteed | 18,800,892 | |||||||||
38
| Principal Amount (000) | Description | Optional Call Provisions (1) | �� | Ratings (2) | Value | |||||
| Utilities – 4.6% | ||||||||||
| $ | 2,710 | Columbia, Missouri, Water and Electric Revenue Bonds, Series 2002A, 5.000%, 10/01/26 – AMBAC Insured | 10/12 at 100.00 | AAA | $ | 2,865,554 | ||||
| 1,195 | Nixa, Missouri, Electric System Revenue Bonds, Series 2005, 5.000%, 4/01/25 – XLCA Insured | 4/13 at 100.00 | AAA | 1,256,793 | ||||||
| 2,000 | Puerto Rico Electric Power Authority, Power Revenue Bonds, Series 2003NN, 5.250%, 7/01/23 – MBIA Insured | No Opt. Call | AAA | 2,331,440 | ||||||
| 2,000 | Sikeston, Missouri, Electric System Revenue Bonds, Series 1992, 6.200%, 6/01/10 – MBIA Insured | No Opt. Call | AAA | 2,118,340 | ||||||
| 3,030 | Sikeston, Missouri, Electric System Revenue Refunding Bonds, Series 1996, 6.000%, 6/01/14 – MBIA Insured | No Opt. Call | AAA | 3,510,255 | ||||||
| 10,935 | Total Utilities | 12,082,382 | ||||||||
| Water and Sewer – 5.5% | ||||||||||
| 1,825 | Kansas City, Missouri, Sewerage System Revenue Bonds, Series 2002D-1, 5.375%, 1/01/22 | 1/12 at 100.00 | AA | 1,961,985 | ||||||
| 3,385 | Metropolitan St. Louis Sewerage District, Missouri, Revenue Bonds, Wastewater System, Series 2004A, 5.000%, 5/01/20 – MBIA Insured | 5/14 at 100.00 | AAA | 3,648,793 | ||||||
| 1,600 | Missouri Development Finance Board, Independence, Infrastructure Facilities Revenue Bonds, Water System Improvement Projects, Series 2004, 5.000%, 11/01/24 – AMBAC Insured | 11/14 at 100.00 | AAA | 1,717,184 | ||||||
| 1,635 | Missouri Environmental Improvement and Energy Resources Authority, Water Facility Revenue Refunding Bonds, Tri-County Water Authority, Series 1999, 6.000%, 4/01/22 – RAAI Insured | 4/09 at 100.00 | AA | 1,712,532 | ||||||
| 1,345 | Missouri Environmental Improvement and Energy Resources Authority, Water Pollution Control and Drinking Water Revenue Bonds, Series 2003B, 5.125%, 1/01/21 | 1/13 at 100.00 | Aaa | 1,449,695 | ||||||
| 1,000 | Missouri Environmental Improvement and Energy Resources Authority, Water Pollution Control and Drinking Water Revenue Bonds, State Revolving Fund Program, Series 2005A, 5.000%, 7/01/25 | 7/15 at 100.00 | Aaa | 1,081,470 | ||||||
| St. Charles County Public Water Supply District 2, Missouri, Certificates of Participation, Series 2002A: | ||||||||||
| 750 | 5.000%, 12/01/26 – MBIA Insured | 12/11 at 100.00 | Aaa | 783,525 | ||||||
| 1,000 | 5.250%, 12/01/28 – MBIA Insured | 12/11 at 100.00 | Aaa | 1,065,030 | ||||||
| 1,000 | West Plains, Missouri, Sewerage System Revenue Bonds, Series 2004, 5.125%, 7/01/24 – FSA Insured | 7/12 at 100.00 | AAA | 1,072,850 | ||||||
| 13,540 | Total Water and Sewer | 14,493,064 | ||||||||
| $ | 253,916 | Total Long-Term Investments (cost $245,737,945) – 98.6% | 260,914,979 | |||||||
| Short-Term Investments – 0.1% | ||||||||||
| $ | 300 | Puerto Rico Government Development Bank, Adjustable Refunding Bonds, Variable Rate Demand Obligations, Series 1985, 3.290%, 12/01/15 – MBIA Insured (4) | A-1 | 300,000 | ||||||
Total Short-Term Investments (cost $300,000) | 300,000 | |||||||||
Total Investments (cost $246,037,945) – 98.7% | 261,214,979 | |||||||||
Other Assets Less Liabilities – 1.3% | 3,396,233 | |||||||||
Net Assets – 100% | $ | 264,611,212 | ||||||||
| (1) | Optional Call Provisions: Dates (month and year) and prices of the earliest optional call or redemption. There may be other call provisions at varying prices at later dates. Certain mortgage-backed securities may be subject to periodic principal paydowns. |
| (2) | Ratings: Using the higher of Standard & Poor’s or Moody’s rating. Ratings below BBB by Standard & Poor’s Group or Baa by Moody’s Investor Service, Inc. are considered to be below investment grade. |
| (3) | Backed by an escrow or trust containing sufficient U.S. Government or U.S. Government agency securities which ensure the timely payment of principal and interest. Such investments are normally considered to be equivalent to AAA rated securities. |
| (4) | Investment has a maturity of more than one year, but has variable rate and demand features which qualify it as a short-term investment. The rate disclosed is that in effect at the end of the reporting period. This rate changes periodically based on market conditions or a specified market index. |
| N/R | Not rated. |
| (ETM) | Escrowed to maturity. |
See accompanying notes to financial statements.
39
Portfolio of Investments (Unaudited)
Nuveen Ohio Municipal Bond Fund
November 30, 2006
| Principal Amount (000) | Description | Optional Call Provisions (1) | Ratings (2) | Value | ||||||
| Consumer Staples – 1.3% | ||||||||||
| $ | 6,700 | Puerto Rico, The Children’s Trust Fund, Tobacco Settlement Asset-Backed Refunding Bonds, Series 2002, 5.375%, 5/15/33 | 5/12 at 100.00 | BBB | $ | 7,060,594 | ||||
| Education and Civic Organizations – 8.4% | ||||||||||
| 4,090 | Cleveland State University, Ohio, General Receipts Bonds, Series 2003A, 5.000%, 6/01/23 – FGIC Insured | 6/13 at 100.00 | AAA | 4,355,891 | ||||||
| Ohio Higher Education Facilities Commission, General Revenue Bonds, Case Western Reserve University, Series 2004A: | ||||||||||
| 2,310 | 5.000%, 12/01/16 – AMBAC Insured | 12/13 at 100.00 | AAA | 2,487,431 | ||||||
| 2,825 | 5.000%, 12/01/17 – AMBAC Insured | 12/13 at 100.00 | AAA | 3,034,785 | ||||||
| 2,975 | 5.000%, 12/01/18 – AMBAC Insured | 12/13 at 100.00 | AAA | 3,190,063 | ||||||
| 3,850 | Ohio Higher Education Facilities Commission, General Revenue Bonds, Kenyon College, Series 2006, 5.000%, 7/01/41 | 7/16 at 100.00 | A+ | 4,079,922 | ||||||
| 1,750 | Ohio Higher Education Facilities Commission, General Revenue Bonds, Oberlin College, Series 2003, 5.125%, 10/01/24 | 10/13 at 100.00 | AA | 1,867,285 | ||||||
| 910 | Ohio Higher Education Facilities Commission, Revenue Bonds, Case Western Reserve University, Series 1990B, 6.500%, 10/01/20 | No Opt. Call | AA– | 1,132,568 | ||||||
| 3,000 | Ohio Higher Education Facilities Commission, Revenue Bonds, Case Western Reserve University, Series 2002B, 5.500%, 10/01/22 | 10/12 at 100.00 | AA– | 3,269,460 | ||||||
| Ohio Higher Education Facilities Commission, Revenue Bonds, Wittenberg University, Series 2005: | ||||||||||
| 1,000 | 5.000%, 12/01/24 | 12/15 at 100.00 | Baa1 | 1,043,070 | ||||||
| 1,000 | 5.000%, 12/01/29 | 12/15 at 100.00 | Baa1 | 1,039,300 | ||||||
| 2,730 | Ohio Higher Educational Facilities Commission, Revenue Bonds, Denison University, Series 2004, 5.000%, 11/01/20 | 11/14 at 100.00 | AA | 2,943,431 | ||||||
| Ohio Higher Educational Facilities Commission, Revenue Bonds, University of Dayton, Series 2004: | ||||||||||
| 1,315 | 5.000%, 12/01/25 – AMBAC Insured | 12/14 at 100.00 | AAA | 1,404,762 | ||||||
| 1,060 | 5.000%, 12/01/27 – AMBAC Insured | 12/14 at 100.00 | AAA | 1,132,356 | ||||||
| Ohio Higher Educational Facilities Commission, Revenue Bonds, Wittenberg University, Series 2001: | ||||||||||
| 1,200 | 5.500%, 12/01/21 | 12/11 at 100.00 | Baa1 | 1,274,460 | ||||||
| 2,075 | 5.000%, 12/01/26 | 12/11 at 100.00 | Baa1 | 2,143,994 | ||||||
| Ohio University at Athens, Subordinate Lien General Receipts Bonds, Series 2004: | ||||||||||
| 1,855 | 5.000%, 12/01/21 – MBIA Insured | 6/14 at 100.00 | AAA | 1,990,990 | ||||||
| 1,900 | 5.000%, 12/01/23 – MBIA Insured | 6/14 at 100.00 | AAA | 2,032,905 | ||||||
| 2,000 | University of Cincinnati, Ohio, General Receipts Bonds, Series 2001A, 5.250%, 6/01/24 – FGIC Insured | 6/11 at 101.00 | AAA | 2,141,020 | ||||||
| 1,675 | University of Cincinnati, Ohio, General Receipts Bonds, Series 2004A, 5.000%, 6/01/21 – AMBAC Insured | 6/14 at 100.00 | AAA | 1,797,794 | ||||||
| University of Cincinnati, Ohio, General Receipts Bonds, Series 2004D: | ||||||||||
| 1,325 | 5.000%, 6/01/24 – AMBAC Insured | 6/14 at 100.00 | AAA | 1,415,020 | ||||||
| 1,005 | 5.000%, 6/01/26 – AMBAC Insured | 6/14 at 100.00 | AAA | 1,071,933 | ||||||
| 1,025 | University of Cincinnati, Ohio, General Receipts Bonds, Series 2004E, 5.000%, 6/01/21 ��� AMBAC Insured | 12/14 at 100.00 | AAA | 1,104,427 | ||||||
| 42,875 | Total Education and Civic Organizations | 45,952,867 | ||||||||
| Health Care – 8.4% | ||||||||||
| 7,000 | Akron, Bath and Copley Joint Township Hospital District, Ohio, Hospital Facilities Revenue Bonds, Summa Health System, Series 1998A, 5.375%, 11/15/24 | 11/09 at 101.00 | Baa1 | 7,228,620 | ||||||
| 1,065 | Akron, Bath and Copley Joint Township Hospital District, Ohio, Hospital Revenue Bonds, Children’s Hospital Medical Center, Series 2003, 5.250%, 11/15/25 – FSA Insured | 11/13 at 100.00 | Aaa | 1,149,508 | ||||||
| 1,000 | Cuyahoga County, Ohio, Hospital Revenue Refunding and Improvement Bonds, MetroHealth System, Series 1997, 5.625%, 2/15/17 – MBIA Insured | 2/07 at 102.00 | AAA | 1,023,690 | ||||||
| 4,400 | Cuyahoga County, Ohio, Revenue Refunding Bonds, Cleveland Clinic Health System, Series 2003A, 6.000%, 1/01/32 | 7/13 at 100.00 | Aa3 | 4,913,040 | ||||||
| 2,500 | Erie County, Ohio, Hospital Facilities Revenue Bonds, Firelands Regional Medical Center, Series 2002A, 5.625%, 8/15/32 | 8/12 at 101.00 | A | 2,700,675 | ||||||
| 6,000 | Erie County, Ohio, Hospital Facilities Revenue Bonds, Firelands Regional Medical Center, Series 2006, 5.250%, 8/15/46 | 8/16 at 100.00 | A | 6,405,900 | ||||||
40
| Principal Amount (000) | Description | Optional Call Provisions (1) | Ratings (2) | Value | ||||||
| Health Care (continued) | ||||||||||
| $ | 130 | Franklin County, Ohio, Hospital Revenue Bonds, Holy Cross Health System Corporation, Series 1996, 5.800%, 6/01/16 | 12/06 at 102.00 | Aa2 | $ | 132,791 | ||||
| 2,000 | Miami County, Ohio, Hospital Facilities Revenue Refunding Bonds, Upper Valley Medical Center Inc., Series 2006, 5.250%, 5/15/26 | 5/16 at 100.00 | A– | 2,161,680 | ||||||
| 4,000 | Middleburg Heights, Ohio, Hospital Improvement Revenue Refunding Bonds, Southwest General Hospital, Series 1995, 5.625%, 8/15/15 – FSA Insured | 8/08 at 102.00 | AAA | 4,194,400 | ||||||
| 7,000 | Montgomery County, Ohio, Hospital Facilities Revenue Refunding and Improvement Bonds, Kettering Medical Center, Series 1996, 6.250%, 4/01/20 – MBIA Insured | No Opt. Call | AAA | 8,652,070 | ||||||
| 2,520 | Montgomery County, Ohio, Revenue Bonds, Catholic Health Initiatives, Series 2004A, 5.000%, 5/01/32 | No Opt. Call | AA | 2,653,535 | ||||||
| 665 | Richland County, Ohio, Hospital Facilities Revenue Improvement Bonds, MedCentral Health System Obligated Group, Series 2000B, 6.375%, 11/15/22 | 11/10 at 101.00 | A– | 728,601 | ||||||
| 2,700 | Richland County, Ohio, Hospital Revenue Bonds, MidCentral Health System Group, Series 2006, 5.250%, 11/15/36 | 11/16 at 100.00 | A– | 2,900,286 | ||||||
| 1,200 | Tuscarawas County, Ohio, Hospital Facilities Revenue Bonds, Union Hospital Project, Series 2001, 5.250%, 10/01/31 – RAAI Insured | 10/11 at 101.00 | AA | 1,268,964 | ||||||
| 42,180 | Total Health Care | 46,113,760 | ||||||||
| Housing/Multifamily – 3.0% | ||||||||||
| 1,055 | Clark County, Ohio, Multifamily Housing Revenue Bonds, Church of God Retirement Home, Series 1998, 6.250%, 11/01/30 (Alternative Minimum Tax) | 11/08 at 103.00 | N/R | 955,218 | ||||||
| 3,045 | Franklin County, Ohio, GNMA Collateralized Multifamily Housing Mortgage Revenue Bonds, Carriage House Apartments Project, Series 2002, 5.400%, 3/20/37 | 9/11 at 102.00 | Aaa | 3,205,197 | ||||||
| 2,705 | Henry County, Ohio, GNMA Collateralized Healthcare Facility Revenue Bonds, Alpine Village Project, Series 1999, 6.375%, 2/20/41 | 8/09 at 102.00 | Aaa | 2,906,874 | ||||||
| 4,985 | Ohio Capital Corporation for Housing, FHA-Insured Section 8 Assisted Mortgage Loan Revenue Refunding Bonds, Series 1999D, 5.950%, 2/01/23 | 2/09 at 102.00 | Aa2 | 5,238,986 | ||||||
| 4,000 | Summit County Port Authority, Ohio, Multifamily Housing Revenue Bonds, Collinson Apartments, Series 2006A, 4.800%, 3/20/48 (WI/DD, Settling 12/21/06) (Alternative Minimum Tax) | 3/17 at 102.00 | Aaa | 4,000,000 | ||||||
| 15,790 | Total Housing/Multifamily | 16,306,275 | ||||||||
| Housing/Single Family – 2.1% | ||||||||||
| 3,715 | Ohio Housing Finance Agency, GNMA Mortgage-Backed Securities Program Residential Mortgage Remarketed Revenue Bonds, Series 1997A-1, 6.150%, 3/01/29 (Alternative Minimum Tax) | 9/07 at 102.00 | Aaa | 3,823,292 | ||||||
| 1,925 | Ohio Housing Finance Agency, GNMA Mortgage-Backed Securities Program Residential Mortgage Revenue Bonds, Series 1996B-3, 5.750%, 9/01/28 (Alternative Minimum Tax) | 9/07 at 102.00 | Aaa | 1,961,190 | ||||||
| 1,895 | Ohio Housing Finance Agency, GNMA Mortgage-Backed Securities Program Residential Mortgage Revenue Bonds, Series 1997C, 5.750%, 9/01/28 (Alternative Minimum Tax) | 9/07 at 102.00 | Aaa | 1,947,776 | ||||||
| 1,400 | Ohio Housing Finance Agency, GNMA Mortgage-Backed Securities Program Residential Mortgage Revenue Bonds, Series 1998A-1, 5.300%, 9/01/19 – FSA Insured (Alternative Minimum Tax) | 3/08 at 101.50 | AAA | 1,434,482 | ||||||
| 270 | Ohio Housing Finance Agency, GNMA Mortgage-Backed Securities Program Residential Mortgage Revenue Bonds, Series 1999C, 5.750%, 9/01/30 (Alternative Minimum Tax) | 7/09 at 100.00 | Aaa | 272,165 | ||||||
| 2,000 | Ohio Housing Finance Agency, Single Family Mortgage Revenue Bonds, Series 2006H, 5.000%, 9/01/31 (Alternative Minimum Tax) | 9/15 at 100.00 | Aaa | 2,075,220 | ||||||
| 11,205 | Total Housing/Single Family | 11,514,125 | ||||||||
| Industrials – 2.1% | ||||||||||
| 400 | Cleveland-Cuyahoga County Port Authority, Ohio, Development Revenue Bonds, Bond Fund Program – Columbia National Group Project, Series 2005D, 5.000%, 5/15/20 (Alternative Minimum Tax) | 11/15 at 100.00 | N/R | 405,352 | ||||||
| 2,200 | Cleveland-Cuyahoga County Port Authority, Ohio, Development Revenue Bonds, Jergens Inc., Series 1998A, 5.375%, 5/15/18 (Alternative Minimum Tax) | 5/08 at 102.00 | N/R | 2,238,346 | ||||||
| 6,300 | Dayton, Ohio, Special Facilities Revenue Refunding Bonds, Emery Air Freight Corporation and Emery Worldwide Airlines Inc. – Guarantors, Series 1998A, 5.625%, 2/01/18 | 2/08 at 102.00 | AAA | 6,551,622 | ||||||
41
Portfolio of Investments (Unaudited)
Nuveen Ohio Municipal Bond Fund (continued)
November 30, 2006
| Principal Amount (000) | Description | Optional Call Provisions (1) | Ratings (2) | Value | ||||||
| Industrials (continued) | ||||||||||
| Ohio, Economic Development Revenue Bonds, Enterprise Bond Fund Loan Pool, Series 2002-4: | ||||||||||
| $ | 500 | 5.000%, 6/01/15 (Alternative Minimum Tax) | 6/12 at 102.00 | AA– | $ | 527,225 | ||||
| 675 | 5.450%, 6/01/22 (Alternative Minimum Tax) | 6/12 at 102.00 | AA– | 724,153 | ||||||
| 1,020 | Ohio, Economic Development Revenue Bonds, Enterprise Bond Fund Loan Pool, Series 2002-7, 5.850%, 12/01/22 (Alternative Minimum Tax) | No Opt. Call | AA– | 1,109,495 | ||||||
| 11,095 | Total Industrials | 11,556,193 | ||||||||
| Long-Term Care – 2.9% | ||||||||||
| 430 | Franklin County, Ohio, FHA-Insured Hospital Revenue Refunding Mortgage Loan Bonds, Worthington Christian Village Nursing Home, Series 1992, 7.000%, 8/01/16 | 2/07 at 100.00 | N/R | 430,976 | ||||||
| 3,120 | Franklin County, Ohio, Healthcare Facilities Revenue Bonds, Heinzerling Foundation, Series 1995, 6.200%, 11/01/20 | 5/07 at 101.00 | Aa2 | 3,157,066 | ||||||
| 2,000 | Franklin County, Ohio, Healthcare Facilities Revenue Bonds, Presbyterian Retirement Services, Series 2002A, 5.125%, 7/01/22 – RAAI Insured | 7/12 at 100.00 | AA | 2,099,820 | ||||||
| 8,230 | Hamilton County, Ohio, Health Care Revenue Bonds, Life Enriching Communitys Project, Series 2006A, 5.000%, 1/01/37 (WI/DD, Settling 12/01/06) | 1/17 at 100.00 | BBB | 8,529,983 | ||||||
| 1,455 | Napoleon, Ohio, FHA-Insured Healthcare Facilities Mortgage Revenue Refunding Bonds, Lutheran Orphans and Old Folks Home Society, Series 1994, 6.875%, 8/01/23 | 1/07 at 100.00 | Aa2 | 1,458,608 | ||||||
| 15,235 | Total Long-Term Care | 15,676,453 | ||||||||
| Materials – 0.5% | ||||||||||
| 1,000 | Toledo-Lucas County Port Authority, Ohio, Port Revenue Bonds, Cargill Inc., Series 2004A, 4.800%, 3/01/22 | 3/14 at 101.00 | A+ | 1,030,230 | ||||||
| 2,000 | Toledo-Lucas County Port Authority, Ohio, Port Revenue Bonds, Cargill Inc., Series 2004B, 4.500%, 12/01/15 | No Opt. Call | A+ | 2,072,980 | ||||||
| 3,000 | Total Materials | 3,103,210 | ||||||||
| Tax Obligation/General – 22.2% | ||||||||||
| Adams County Valley School District, Adams and Highland Counties, Ohio, Unlimited Tax School Improvement General Obligation Bonds, Series 1995: | ||||||||||
| 6,000 | 7.000%, 12/01/15 – MBIA Insured | No Opt. Call | AAA | 7,208,220 | ||||||
| 9,500 | 5.250%, 12/01/21 – MBIA Insured | 12/06 at 101.00 | AAA | 9,606,685 | ||||||
| 600 | Anthony Wayne Local School District, Lucas, Wood and Fulton Counties, Ohio, School Facilities Construction and Improvement Bonds, Series 1995, 0.000%, 12/01/13 – FGIC Insured | No Opt. Call | AAA | 460,332 | ||||||
| 700 | Buckeye Local School District, Medina County, Ohio, General Obligation Bonds, Series 2000, 5.500%, 12/01/25 – FGIC Insured | 12/10 at 100.00 | Aaa | 751,058 | ||||||
| 2,305 | Buckeye Valley Local School District, Ohio, Unlimited Tax General Obligation Bonds, Series 1995A, 6.850%, 12/01/15 – MBIA Insured | No Opt. Call | AAA | 2,645,310 | ||||||
| 1,000 | Butler County, Hamilton, Ohio, Limited Tax General Obligation Bonds, One Renaissance Center Acquisition, Series 2001, 5.375%, 11/01/17 – AMBAC Insured | 11/11 at 101.00 | Aaa | 1,086,550 | ||||||
| Canal Winchester Local School District, Franklin and Fairfield Counties, Ohio, General Obligation Bonds, Series 2005B: | ||||||||||
| 3,420 | 5.000%, 12/01/26 – MBIA Insured | 6/15 at 100.00 | Aaa | 3,673,388 | ||||||
| 3,590 | 5.000%, 12/01/27 – MBIA Insured | 6/15 at 100.00 | Aaa | 3,855,983 | ||||||
| 2,515 | Canton City School District, Stark County, Ohio, General Obligation Bonds, Series 2005, 5.000%, | 6/15 at 100.00 | AAA | 2,737,502 | ||||||
| 2,295 | Central Ohio Solid Waste Authority, General Obligation Bonds, Series 2004A, 5.000%, 12/01/15 – AMBAC Insured | 6/14 at 100.00 | AAA | 2,490,006 | ||||||
| Chesapeake-Union Exempt Village School District, Ohio, General Obligation Bonds, Series 1986: | ||||||||||
| 125 | 8.500%, 12/01/06 | No Opt. Call | N/R | 125,015 | ||||||
| 125 | 8.500%, 12/01/07 | No Opt. Call | N/R | 130,561 | ||||||
| 125 | 8.500%, 12/01/08 | No Opt. Call | N/R | 135,811 | ||||||
| 130 | 8.500%, 12/01/09 | No Opt. Call | N/R | 146,575 | ||||||
| 500 | Columbus, Franklin County, Ohio, General Obligation Bonds, Series 1985, 9.375%, 4/15/07 | No Opt. Call | AAA | 510,620 | ||||||
42
| Principal Amount (000) | Description | Optional Call Provisions (1) | Ratings (2) | Value | ||||||
| Tax Obligation/General (continued) | ||||||||||
| $ | 2,675 | Cuyahoga County, Ohio, General Obligation Bonds, Series 2004, 5.000%, 12/01/22 | 12/14 at 100.00 | AA+ | $ | 2,886,111 | ||||
| 1,345 | Cuyahoga County, Ohio, Limited Tax General Obligation Bonds, Series 1993, 5.650%, 5/15/18 | No Opt. Call | Aa1 | 1,570,973 | ||||||
| 1,000 | Cuyahoga County, Ohio, Limited Tax General Obligation Various Purpose Refunding Bonds, Series 1993B, 5.250%, 10/01/13 | No Opt. Call | AA+ | 1,068,450 | ||||||
| Cuyahoga Falls, Ohio, General Obligation Bonds, Series 2004: | ||||||||||
| 1,245 | 5.000%, 12/01/18 – MBIA Insured | 6/14 at 100.00 | Aaa | 1,347,314 | ||||||
| 1,440 | 5.000%, 12/01/21 – MBIA Insured | 6/14 at 100.00 | Aaa | 1,549,454 | ||||||
| 1,170 | Dayton, Ohio, General Obligation Bonds, Series 2004, 5.250%, 12/01/15 – AMBAC Insured | 6/14 at 100.00 | AAA | 1,295,131 | ||||||
| Delaware City School District, Delaware County, Ohio, Unlimited Tax General Obligation School Facilities Construction and Improvement Bonds, Series 1995: | ||||||||||
| 1,000 | 0.000%, 12/01/10 – FGIC Insured | No Opt. Call | AAA | 863,510 | ||||||
| 1,000 | 0.000%, 12/01/11 – FGIC Insured | No Opt. Call | AAA | 830,380 | ||||||
| 1,000 | Fairview Park, Ohio, General Obligation Bonds, Series 2005, 5.000%, 12/01/25 – MBIA Insured | 12/15 at 100.00 | Aaa | 1,081,660 | ||||||
| 1,005 | Findlay, Ohio, General Obligation Bonds, Series 2004, 5.250%, 7/01/15 – MBIA Insured | 7/14 at 100.00 | AAA | 1,113,490 | ||||||
| 3,040 | Franklin County, Ohio, Limited Tax General Obligation Refunding Bonds, Series 1993, 5.375%, 12/01/20 | 12/08 at 102.00 | AAA | 3,202,093 | ||||||
| 420 | Geauga County, Ohio, Limited Tax General Obligation, Sewer District Improvement Bonds, Bainbridge Water Project, Series 1995, 6.850%, 12/01/10 | 12/06 at 101.00 | Aa2 | 425,296 | ||||||
| 3,000 | Granville Exempt Village School District, Ohio, General Obligation Bonds, Series 2001, 5.500%, 12/01/28 | 12/11 at 100.00 | Aa2 | 3,234,630 | ||||||
| 3,810 | Greater Cleveland Regional Transit Authority, Ohio, General Obligation Bonds, Series 2004, 5.000%, 12/01/17 – MBIA Insured | 12/14 at 100.00 | Aaa | 4,149,547 | ||||||
| 1,270 | Kenston Local School District, Geauga County, Ohio, General Obligation Bonds, Series 2003, 5.000%, 12/01/23 – MBIA Insured | 6/13 at 100.00 | Aaa | 1,352,563 | ||||||
| 1,400 | Kent City School District, Portage County, Ohio, General Obligation Library Improvement Bonds, Series 2004, 5.000%, 12/01/20 – FGIC Insured | 12/14 at 100.00 | AAA | 1,515,500 | ||||||
| 945 | Kettering, Ohio, Limited Tax General Obligation Bonds, Series 1991, 6.650%, 12/01/12 | 12/06 at 100.00 | Aa3 | 947,344 | ||||||
| Kings Local School District, Warren County, Ohio, General Obligation School Improvement Bonds, Series 2005: | ||||||||||
| 1,000 | 5.000%, 12/01/22 – MBIA Insured | 6/15 at 100.00 | AAA | 1,083,090 | ||||||
| 1,480 | 5.000%, 12/01/24 – MBIA Insured | 6/15 at 100.00 | AAA | 1,596,298 | ||||||
| 555 | Lake County, Ohio, Limited Tax Sewer District Improvement Bonds, Series 2000, 5.600%, 12/01/20 | No Opt. Call | Aa2 | 648,523 | ||||||
| 155 | Logan County, Ohio, General Obligation Bonds, Series 1986, 7.750%, 12/01/06 | No Opt. Call | A+ | 155,017 | ||||||
| 220 | Lucas County, Ohio, General Obligation Bonds, Various Improvements, Series 1992, 6.650%, 12/01/12 | 12/06 at 100.00 | A1 | 223,093 | ||||||
| 2,855 | Marysville Exempted School District, Union County, Ohio, General Obligation Bonds, Series 2006, 5.000%, 12/01/24 – FSA Insured | 12/15 at 100.00 | AAA | 3,090,395 | ||||||
| 1,265 | Monroe Local School District, Butler County, Ohio, General Obligation Bonds, Series 2002, 5.750%, 12/01/20 – AMBAC Insured | No Opt. Call | Aaa | 1,531,713 | ||||||
| Oak Hills Local School District, Hamilton County, Ohio, General Obligation Bonds, Series 2005: | ||||||||||
| 3,740 | 5.000%, 12/01/23 – FSA Insured | 12/15 at 100.00 | AAA | 4,042,454 | ||||||
| 1,000 | 5.000%, 12/01/25 – FSA Insured | 12/15 at 100.00 | AAA | 1,078,510 | ||||||
| 1,000 | Ohio, Common Schools Capital Facilities, General Obligation Bonds, Series 2001B, 5.000%, 9/15/21 | 9/11 at 100.00 | AA+ | 1,057,670 | ||||||
| 1,000 | Ohio, Full Faith and Credit General Obligation Infrastructure Improvement Bonds, Series 1994, 6.000%, 8/01/10 | No Opt. Call | AA+ | 1,084,790 | ||||||
| 730 | Ohio, General Obligation Bonds, Common Schools, Series 2004B, 5.000%, 3/15/21 | 3/14 at 100.00 | AA+ | 784,093 | ||||||
| 6,055 | Ohio, General Obligation Bonds, Infrastructure Improvements, Series 2003F, 5.000%, 2/01/22 | 2/13 at 100.00 | AA+ | 6,430,410 | ||||||
| 1,845 | Ohio, General Obligation Bonds, Series 2005A, 5.000%, 9/01/16 | 3/15 at 100.00 | AA+ | 2,019,906 | ||||||
| 8,140 | Ohio, General Obligation Higher Education Capital Facilities Bonds, Series 2001A, 5.000%, 2/01/20 | 2/11 at 100.00 | AA+ | 8,553,024 | ||||||
| 1,495 | Otsego Local School District, Wood, Henry and Lucas Counties, Ohio, General Obligation Bonds, Series 2004, 5.375%, 12/01/22 – FSA Insured | 12/14 at 100.00 | Aaa | 1,658,344 | ||||||
43
Portfolio of Investments (Unaudited)
Nuveen Ohio Municipal Bond Fund (continued)
November 30, 2006
| Principal Amount (000) | Description | Optional Call Provisions (1) | Ratings (2) | Value | ||||||
| Tax Obligation/General (continued) | ||||||||||
| $ | 3,315 | South Point Local School District, Lawrence County, Ohio, General Obligation Bonds, Series 2004, 5.000%, 12/01/24 – FSA Insured | 12/14 at 100.00 | AAA | $ | 3,562,432 | ||||
| 3,500 | Springfield City School District, Clark County, Ohio, General Obligation Bonds, Series 2001, 5.200%, 12/01/23 – FGIC Insured | 12/11 at 102.00 | Aaa | 3,785,985 | ||||||
| 30 | Strongsville, Ohio, Limited Tax General Obligation Various Purpose Improvement Bonds, Series 1996, 5.950%, 12/01/21 | 12/06 at 102.00 | Aa1 | 30,654 | ||||||
| 1,185 | Sugarcreek Local School District, Athens County, Ohio, General Obligation Bonds, Series 2003, 5.250%, 12/01/24 – MBIA Insured | 12/13 at 100.00 | Aaa | 1,292,065 | ||||||
| 2,315 | Summit County, Ohio, General Obligation Bonds, Series 2002R, 5.500%, 12/01/21 – FGIC Insured | No Opt. Call | AAA | 2,754,549 | ||||||
| 3,755 | Toledo City School District, Lucas County, Ohio, General Obligation Bonds, Series 2003B, 5.000%, 12/01/22 – FGIC Insured | 12/13 at 100.00 | Aaa | 4,015,484 | ||||||
| 1,500 | Upper Arlington City School District, Ohio, General Obligation Bonds, Series 2005, 5.000%, 12/01/20 – FSA Insured | 6/15 at 100.00 | AAA | 1,630,305 | ||||||
| West Chester Township, Butler County, Ohio, General Obligation Bonds, Series 2003: | ||||||||||
| 1,365 | 5.250%, 12/01/19 – MBIA Insured | 12/13 at 100.00 | Aaa | 1,495,794 | ||||||
| 1,515 | 5.250%, 12/01/21 – MBIA Insured | 12/13 at 100.00 | Aaa | 1,660,167 | ||||||
| 2,000 | Westerville City School District, Franklin and Delaware Counties, Ohio, Various Purpose General Obligation Bonds, Series 2001, 5.000%, 12/01/27 – MBIA Insured | 6/11 at 100.00 | AAA | 2,084,600 | ||||||
| 112,710 | Total Tax Obligation/General | 121,346,427 | ||||||||
| Tax Obligation/Limited – 15.1% | ||||||||||
| 5,690 | Akron, Ohio, Income Tax Revenue Bonds, Community Learning Centers, Series 2004A, 5.000%, 12/01/33 – FGIC Insured | 12/13 at 100.00 | AAA | 6,070,320 | ||||||
| Blue Ash, Ohio, Tax Increment Financing Revenue Bonds, Duke Realty Ohio, Series 2006: | ||||||||||
| 950 | 5.000%, 12/01/25 | 12/16 at 102.00 | N/R | 970,226 | ||||||
| 1,165 | 5.000%, 12/01/30 | 12/16 at 102.00 | N/R | 1,178,118 | ||||||
| 6,300 | Cleveland, Ohio, Certificates of Participation, Cleveland Stadium Project, Series 1997, 5.250%, 11/15/27 – AMBAC Insured | 11/07 at 102.00 | AAA | 6,507,207 | ||||||
| 1,850 | Cleveland-Cuyahoga County Port Authority, Ohio, Development Revenue Bonds, R.I.T.A. Project, Series 2004, 5.000%, 11/15/19 – RAAI Insured | 11/14 at 100.00 | AA | 1,970,583 | ||||||
| 1,380 | Columbus, Ohio, Tax Increment Financing Bonds, Easton Project, Series 2004A, 5.000%, 12/01/25 – AMBAC Insured | 6/14 at 100.00 | AAA | 1,467,313 | ||||||
| 5,615 | Franklin County, Ohio, Excise Tax and Lease Revenue Anticipation Bonds, Convention Facilities Authority, Series 2005, 5.000%, 12/01/25 – AMBAC Insured | 12/15 at 100.00 | AAA | 6,038,203 | ||||||
| 1,210 | Groveport, Ohio, Special Obligation Income Tax Receipts Bonds, Series 2002, 5.000%, 12/01/22 – MBIA Insured | 12/12 at 100.00 | Aaa | 1,284,609 | ||||||
| Hamilton County Convention Facilities Authority, Ohio, First Lien Revenue Bonds, Series 2004: | ||||||||||
| 2,300 | 5.000%, 12/01/20 – FGIC Insured | 6/14 at 100.00 | AAA | 2,470,154 | ||||||
| 1,000 | 5.000%, 12/01/21 – FGIC Insured | 6/14 at 100.00 | AAA | 1,071,290 | ||||||
| 2,535 | 5.000%, 12/01/22 – FGIC Insured | 6/14 at 100.00 | AAA | 2,712,323 | ||||||
| 3,300 | Hamilton County, Ohio, Sales Tax Bonds, Subordinate Series 2000B, 0.000%, 12/01/28 – AMBAC Insured | No Opt. Call | Aaa | 1,302,510 | ||||||
| 1,485 | New Albany Community Authority, Ohio, Community Facilities Revenue Refunding Bonds, Series 2001B, 5.500%, 10/01/16 – AMBAC Insured | 4/12 at 100.00 | AAA | 1,620,046 | ||||||
| 785 | Ohio Department of Transportation, Certificates of Participation, Panhandle Rail Line, Series 1992A, 6.500%, 4/15/12 – FSA Insured | 4/07 at 100.00 | AAA | 786,813 | ||||||
| 1,050 | Ohio State Building Authority, State Facilities Bonds, Administrative Building Fund Projects, Series 2002A, 5.000%, 4/01/22 – FSA Insured | 4/12 at 100.00 | AAA | 1,108,212 | ||||||
| 1,900 | Ohio State Building Authority, State Facilities Bonds, Administrative Building Fund Projects, Series 2005A, 5.000%, 4/01/25 – FSA Insured | 4/15 at 100.00 | AAA | 2,041,132 | ||||||
| 3,135 | Ohio State Building Authority, State Facilities Bonds, Adult Correctional Building Fund Project, Series 2005A, 5.000%, 4/01/23 – FSA Insured | 4/15 at 100.00 | AAA | 3,374,796 | ||||||
44
| Principal Amount (000) | Description | Optional Call Provisions (1) | Ratings (2) | Value | |||||||
| Tax Obligation/Limited (continued) | |||||||||||
| $ | 1,490 | Ohio, State Appropriation Lease Bonds, Mental Health Capital Facilities, Series 2003B-II, 5.000%, 6/01/16 | 6/13 at 100.00 | AA | $ | 1,610,884 | |||||
| 1,000 | Ohio, State Appropriation Lease Bonds, Parks and Recreation Capital Facilities, Series 2004A-II, 5.000%, 12/01/15 | 12/13 at 100.00 | AA | 1,086,620 | |||||||
| 1,000 | Ohio, State Appropriation Lease Bonds, Parks and Recreation Capital Facilities, Series 2005A-II, 5.250%, 2/01/19 – FSA Insured | 2/15 at 100.00 | AAA | 1,101,260 | |||||||
| 5,200 | Puerto Rico Public Buildings Authority, Guaranteed Revenue Bonds, Reset Option Long Trust Certificates II-R56, Series 1993L, 7.200%, 7/01/21 (IF) | No Opt. Call | AAA | 7,094,827 | |||||||
| 2,700 | Puerto Rico Public Buildings Authority, Guaranteed Government Facilities Revenue Bonds, Series 1993L, 5.500%, 7/01/21 – MBIA Insured (UB) | No Opt. Call | AAA | 3,087,774 | |||||||
| 23,400 | Puerto Rico, Highway Revenue Bonds, Highway and Transportation Authority, Series 1996Y, 5.500%, 7/01/36 – MBIA Insured (UB) | 7/16 at 100.00 | AAA | 26,220,635 | |||||||
| 76,440 | Total Tax Obligation/Limited | 82,175,855 | |||||||||
| Transportation – 4.8% | |||||||||||
| 1,000 | Dayton, Ohio, Airport Revenue Bonds, James M. Cox International Airport, Series 2003C, 5.250%, 12/01/27 – RAAI Insured (Alternative Minimum Tax) | 12/13 at 100.00 | AA | 1,054,450 | |||||||
| 1,235 | Dayton, Ohio, Airport Revenue Bonds, James M. Cox International Airport, Series 2005B, 5.000%, 12/01/14 – XLCA Insured | No Opt. Call | AAA | 1,345,952 | |||||||
| 15,000 | Ohio Turnpike Commission, Revenue Refunding Bonds, Series 1998A, 5.500%, 2/15/15 – FGIC Insured (UB) | No Opt. Call | AAA | 16,978,275 | |||||||
| 5,000 | Ohio Turnpike Commission, Revenue Refunding Bonds, ROL Series II-R51, Series 1998A, 7.160%, 2/15/24 (IF) | No Opt. Call | AAA | 7,012,450 | |||||||
| 22,235 | Total Transportation | 26,391,127 | |||||||||
| U.S. Guaranteed – 21.2% (3) | |||||||||||
| 435 | Athens, Ohio, Sanitary Sewer System Mortgage Revenue Bonds, Series 1989, 7.300%, 12/01/14 (Pre-refunded 12/01/09) | 12/09 at 100.00 | N/R | (3) | 469,313 | ||||||
| 1,255 | Cincinnati City School District, Hamilton County, Ohio, General Obligation Bonds, Series 2001, 5.375%, 12/01/17 (Pre-refunded 12/01/11) – MBIA Insured | 12/11 at 100.00 | AAA | 1,360,044 | |||||||
| 7,045 | Columbus, Ohio, General Obligation Bonds, Series 2000, 5.250%, 11/15/17 (Pre-refunded 11/15/10) | 11/10 at 101.00 | Aaa | 7,554,283 | |||||||
| 11,900 | Cuyahoga County, Ohio, Hospital Revenue and Improvement Bonds, MetroHealth System, Series 1999, 6.125%, 2/15/24 (Pre-refunded 2/15/09) | 2/09 at 101.00 | A– | (3) | 12,662,552 | ||||||
| 5,830 | Cuyahoga County, Ohio, Limited Tax General Obligation Capital Improvement Bonds, Series 2000, 5.750%, 12/01/16 (Pre-refunded 12/01/10) | 12/10 at 100.00 | AA+ | (3) | 6,299,024 | ||||||
| 1,000 | Evergreen Local School District, Ohio, Unlimited Tax General Obligation School Improvement Bonds, Series 1999, 5.625%, 12/01/24 (Pre-refunded 12/01/09) – FGIC Insured | 12/09 at 101.00 | Aaa | 1,069,230 | |||||||
| 1,000 | Garfield Heights City School District, Cuyahoga County, Ohio, General Obligation School Improvement Bonds, Series 2001, 5.500%, 12/15/18 (Pre-refunded 12/15/11) – MBIA Insured | 12/11 at 100.00 | Aaa | 1,090,000 | |||||||
| 1,600 | Greene County, Ohio, Water System Revenue Bonds, Series 1996, 6.125%, 12/01/21 (Pre-refunded 12/01/07) – FGIC Insured | 12/07 at 102.00 | AAA | 1,671,616 | |||||||
| 1,250 | Hamilton County, Ohio, Healthcare Facilities Revenue Bonds, Twin Towers, Series 1998A, 5.125%, 10/01/23 (Pre-refunded 10/01/08) | 10/08 at 101.00 | BBB | (3) | 1,295,112 | ||||||
| 1,200 | Heath City School District, Licking County, Ohio, Unlimited Tax General Obligation School Improvement Bonds, Series 2000A, 5.500%, 12/01/27 (Pre-refunded 12/01/10) – FGIC Insured | 12/10 at 100.00 | Aaa | 1,288,224 | |||||||
| 1,000 | Huron County, Ohio, Limited Tax General Obligation Correctional Facility Bonds, Series 1996, 5.850%, 12/01/16 (Pre-refunded 12/01/07) – MBIA Insured | 12/07 at 102.00 | AAA | 1,042,120 | |||||||
| 3,385 | Lakota Local School District, Butler County, Ohio, Unlimited Tax General Obligation School Improvement and Refunding Bonds, Series 2001, 5.125%, 12/01/26 (Pre-refunded 6/01/11) – FGIC Insured | 6/11 at 100.00 | Aaa | 3,607,225 | |||||||
| 565 | Lebanon, Ohio, Electric System Mortgage Revenue Bonds, Series 2001, 5.500%, 12/01/17 (Pre-refunded 12/01/10) – AMBAC Insured | 12/10 at 101.00 | AAA | 611,454 | |||||||
| 945 | Lorain, Ohio, Hospital Revenue Refunding Bonds, Lakeland Community Hospital Inc., Series 1992, 6.500%, 11/15/12 (ETM) | 1/07 at 100.00 | A1 | (3) | 960,507 | ||||||
45
Portfolio of Investments (Unaudited)
Nuveen Ohio Municipal Bond Fund (continued)
November 30, 2006
| Principal Amount (000) | Description | Optional Call Provisions (1) | Ratings (2) | Value | |||||||
| U.S. Guaranteed (3) (continued) | |||||||||||
| $ | 1,750 | Medina City School District, Medina County, Ohio, Unlimited Tax General Obligation School Building Construction Bonds, Series 1999, 5.250%, 12/01/28 (Pre-refunded 12/01/09) – FGIC Insured | 12/09 at 100.00 | AAA | $ | 1,836,835 | |||||
| 2,000 | Montgomery County, Ohio, Health System Revenue Bonds, Franciscan Medical Center – Dayton Campus, Series 1997, 5.500%, 7/01/18 (Pre-refunded 1/01/08) | 1/08 at 102.00 | Baa2 | (3) | 2,092,060 | ||||||
| 9,500 | Montgomery County, Ohio, Hospital Facilities Revenue Bonds, Kettering Medical Center, Series 1999, 6.750%, 4/01/22 (Pre-refunded 4/01/10) | 4/10 at 101.00 | A | (3) | 10,511,845 | ||||||
| 5,610 | Montgomery County, Ohio, Revenue Bonds, Catholic Health Initiatives, Series 2001, 5.375%, 9/01/21 (ETM) | 9/11 at 100.00 | AA | (3) | 6,033,499 | ||||||
| 7,390 | Montgomery County, Ohio, Revenue Bonds, Catholic Health Initiatives, Series 2001, 5.375%, 9/01/21 (Pre-refunded 9/01/11) | 9/11 at 100.00 | AA | (3) | 7,966,272 | ||||||
| North Royalton City School District, Ohio, School Improvement Bonds, Series 1994: | |||||||||||
| 2,200 | 6.000%, 12/01/14 (Pre-refunded 12/01/09) – MBIA Insured | 12/09 at 102.00 | AAA | 2,395,448 | |||||||
| 2,400 | 6.100%, 12/01/19 (Pre-refunded 12/01/09) – MBIA Insured | 12/09 at 102.00 | AAA | 2,619,720 | |||||||
| 1,330 | Ohio Capital Corporation for Housing, FHA-Insured Section 8 Assisted Mortgage Loan Revenue Refunding Bonds, Series 1999D, 5.950%, 2/01/23 (Pre-refunded 2/01/09) | 2/09 at 102.00 | Aa2 | (3) | 1,421,664 | ||||||
| 1,000 | Ohio Higher Educational Facilities Commission, Revenue Bonds, University of Dayton, Series 2000, 5.500%, 12/01/30 (Pre-refunded 12/01/10) – AMBAC Insured | 12/10 at 101.00 | AAA | 1,082,220 | |||||||
| 5,000 | Ohio Higher Educational Facilities Commission, Revenue Bonds, Xavier University, Series 1997, 5.375%, 5/15/22 (Pre-refunded 5/15/07) – MBIA Insured | 5/07 at 102.00 | AAA | 5,140,400 | |||||||
| Ohio Housing Finance Agency, Single Family Mortgage Revenue Bonds, Series 1985B: | |||||||||||
| 6,460 | 0.000%, 1/15/15 (Pre-refunded 1/15/11) – FGIC Insured | 1/11 at 67.04 | AAA | 3,723,027 | |||||||
| 5,700 | 0.000%, 1/15/15 (Pre-refunded 7/15/11) – FGIC Insured | 7/11 at 70.48 | AAA | 3,390,645 | |||||||
| 4,260 | Ohio Water Development Authority, Community Assistance Bonds, Series 1997, 5.375%, 12/01/24 (Pre-refunded 12/01/07) – AMBAC Insured | 12/07 at 102.00 | AAA | 4,419,665 | |||||||
| 5,065 | Ohio Water Development Authority, Loan Revenue Bonds, Pure Water Development, Series 1990I, 6.000%, 12/01/16 – AMBAC Insured (ETM) | No Opt. Call | AAA | 5,717,271 | |||||||
| 2,000 | Ohio Water Development Authority, Revenue Bonds, Fresh Water Development, Series 1998, 5.125%, 12/01/23 (Pre-refunded 6/01/08) – FSA Insured | 6/08 at 101.00 | AAA | 2,066,300 | |||||||
| Olentangy Local School District, Delaware and Franklin Counties, Ohio, General Obligation Bonds, Series 2004A: | |||||||||||
| 400 | 5.250%, 12/01/21 (Pre-refunded 6/01/14) – FGIC Insured | 6/14 at 100.00 | AAA | 444,028 | |||||||
| 3,055 | 5.250%, 12/01/22 (Pre-refunded 6/01/14) – FGIC Insured | 6/14 at 100.00 | AAA | 3,391,264 | |||||||
| Olentangy Local School District, Delaware and Franklin Counties, Ohio, Various Purpose Bonds, Series 1999: | |||||||||||
| 1,825 | 5.000%, 12/01/27 (Pre-refunded 12/01/09) | 12/09 at 101.00 | AA | (3) | 1,919,097 | ||||||
| 2,210 | 5.000%, 12/01/27 (Pre-refunded 12/01/09) | 12/09 at 101.00 | AA | (3) | 2,323,948 | ||||||
| 1,250 | Parma Community General Hospital Association, Ohio, Hospital Revenue Refunding and Improvement Bonds, Series 1998, 5.350%, 11/01/18 (Pre-refunded 11/01/08) | 11/08 at 101.00 | N/R | (3) | 1,302,925 | ||||||
| 500 | Pickerington Local School District, Fairfield County, Ohio, General Obligation Bonds, Series 1993, 0.000%, 12/01/11 – AMBAC Insured (ETM) | No Opt. Call | AAA | 417,030 | |||||||
| 1,335 | Richland County, Ohio, Hospital Facilities Revenue Improvement Bonds, MedCentral Health System Obligated Group, Series 2000B, 6.375%, 11/15/22 (Pre-refunded 11/15/10) | 11/10 at 101.00 | N/R | (3) | 1,481,583 | ||||||
| University of Cincinnati, Ohio, General Receipts Bonds, Series 2001A: | |||||||||||
| 1,500 | 5.750%, 6/01/18 (Pre-refunded 6/01/11) – FGIC Insured | 6/11 at 101.00 | AAA | 1,650,000 | |||||||
| 1,520 | 5.750%, 6/01/19 (Pre-refunded 6/01/11) – FGIC Insured | 6/11 at 101.00 | AAA | 1,672,000 | |||||||
| 113,670 | Total U.S. Guaranteed | 115,999,450 | |||||||||
| Utilities – 5.9% | |||||||||||
| 1,535 | Cleveland Public Power System, Ohio, First Mortgage Improvement Revenue Bonds, Series 1994A, 0.000%, 11/15/13 – MBIA Insured | No Opt. Call | AAA | 1,181,275 | |||||||
| 5,000 | Ohio Air Quality Development Authority, Revenue Bonds, JMG Funding Limited Partnership Project, Series 1997, 5.625%, 1/01/23 – AMBAC Insured (Alternative Minimum Tax) | 4/07 at 102.00 | Aaa | 5,128,000 | |||||||
46
| Principal Amount (000) | Description | Optional Call Provisions (1) | Ratings (2) | Value | |||||||
| Utilities (continued) | |||||||||||
| Ohio Municipal Electric Generation Agency, Beneficial Interest Certificates, Belleville Hydroelectric Project – Joint Venture 5, Series 2004: | |||||||||||
| $ | 1,000 | 5.000%, 2/15/20 – AMBAC Insured | 2/14 at 100.00 | AAA | $ | 1,070,110 | |||||
| 5,450 | 5.000%, 2/15/21 – AMBAC Insured | 2/14 at 100.00 | AAA | 5,817,930 | |||||||
| 1,465 | 5.000%, 2/15/22 – AMBAC Insured | 2/14 at 100.00 | AAA | 1,562,012 | |||||||
| 3,295 | 5.000%, 2/15/23 – AMBAC Insured | 2/14 at 100.00 | AAA | 3,506,803 | |||||||
| 7,950 | Ohio Water Development Authority, Solid Waste Disposal Revenue Bonds, Bay Shore Power, Series 1998A, 5.875%, 9/01/20 (Alternative Minimum Tax) | 9/08 at 102.00 | N/R | 8,096,757 | |||||||
| 1,545 | Puerto Rico Electric Power Authority, Power Revenue Refunding Bonds, Series 1989O, 0.000%, 7/01/17 | No Opt. Call | A3 | 1,011,681 | |||||||
| 4,460 | Puerto Rico Industrial, Tourist, Educational, Medical and Environmental Control Facilities Financing Authority, Co-Generation Facility Revenue Bonds, Series 2000A, 6.625%, 6/01/26 (Alternative Minimum Tax) | 6/10 at 101.00 | Baa3 | 4,862,381 | |||||||
| 31,700 | Total Utilities | 32,236,949 | |||||||||
| Water and Sewer – 4.3% | |||||||||||
| 1,730 | Butler County, Ohio, Sewerage System Revenue Bonds, Series 2005, 5.000%, 12/01/23 – FSA Insured | No Opt. Call | Aaa | 1,954,537 | |||||||
| 2,000 | Cincinnati, Ohio, Water System Revenue Bonds, Series 2003, 5.000%, 12/01/23 | 6/11 at 100.00 | AA+ | 2,092,560 | |||||||
| 10,000 | Cleveland, Ohio, Waterworks First Mortgage Revenue Refunding and Improvement Bonds, Series 1993G, 5.500%, 1/01/21 – MBIA Insured | No Opt. Call | AAA | 11,727,100 | |||||||
| 1,125 | Hebron, Ohio, Mortgage Revenue Bonds, Waterworks System Improvements, Series 2004, 5.875%, 12/01/25 | 6/14 at 100.00 | N/R | 1,188,473 | |||||||
| 1,260 | Lancaster, Ohio, Wastewater System Improvement Revenue Bonds, Series 2004, 5.000%, 12/01/25 – AMBAC Insured | 12/14 at 100.00 | AAA | 1,350,468 | |||||||
| 1,255 | Ohio Water Development Authority, Revenue Bonds, Fresh Water Development, Series 2004, 5.250%, 12/01/15 | 6/14 at 100.00 | AAA | 1,389,222 | |||||||
| 3,500 | Ohio Water Development Authority, Water Pollution Control Loan Fund Revenue Bonds, Water Quality Project, Series 2005B, 5.000%, 6/01/25 | 6/15 at 100.00 | AAA | 3,785,565 | |||||||
| 20,870 | Total Water and Sewer | 23,487,925 | |||||||||
| $ | 525,705 | Total Long-Term Investments (cost $523,161,838) – 102.2% | 558,921,210 | ||||||||
| Short-Term Investments – 1.5% | |||||||||||
| $ | 8,100 | Puerto Rico Government Development Bank, Adjustable Refunding Bonds, Variable Rate Demand Obligations, Series 1985, 3.290%, 12/01/15 – MBIA Insured (4) | A-1 | 8,100,000 | |||||||
Total Short-Term Investments (cost $8,100,000) | 8,100,000 | ||||||||||
Total Investments (cost $531,261,838) – 103.7% | 567,021,210 | ||||||||||
Floating Rate Obligations – (3.8%) | (20,550,000 | ) | |||||||||
Other Assets Less Liabilities – 0.1% | 201,563 | ||||||||||
Net Assets – 100% | $ | 546,672,773 | |||||||||
| (1) | Optional Call Provisions: Dates (month and year) and prices of the earliest optional call or redemption. There may be other call provisions at varying prices at later dates. Certain mortgage-backed securities may be subject to periodic principal paydowns. |
| (2) | Ratings: Using the higher of Standard & Poor’s or Moody’s rating. Ratings below BBB by Standard & Poor’s Group or Baa by Moody’s Investor Service, Inc. are considered to be below investment grade. |
| (3) | Backed by an escrow or trust containing sufficient U.S. Government or U.S. Government agency securities which ensure the timely payment of principal and interest. Such investments are normally considered to be equivalent to AAA rated securities. |
| (4) | Investment has a maturity of more than one year, but has variable rate and demand features which qualify it as a short-term investment. The rate disclosed is that in effect at the end of the reporting period. This rate changes periodically based on market conditions or a specified market index. |
| N/R | Not rated. |
| WI/DD | Purchased on a when-issued or delayed delivery basis. |
| (ETM) | Escrowed to maturity. |
| (IF) | Inverse floating rate investment. |
| (UB) | Underlying bond of an inverse floating rate trust reflected as a financing transaction pursuant to the provisions of SFAS No. 140. |
See accompanying notes to financial statements.
47
Portfolio of Investments (Unaudited)
Nuveen Wisconsin Municipal Bond Fund
November 30, 2006
| Principal Amount (000) | Description | Optional Call Provisions (1) | Ratings (2) | Value | ||||||
| Education and Civic Organizations – 3.9% | ||||||||||
| $ | 475 | Ashland Housing Authority, Wisconsin, Student Housing Revenue Bonds, Northland College Project, Series 1998, 5.100%, 4/01/18 | 4/08 at 100.00 | Aaa | $ | 481,218 | ||||
| 500 | Madison Community Development Authority, Wisconsin, Revenue Bonds, Fluno Center Project, Series 1998A, 5.000%, 11/01/20 | 5/07 at 102.00 | AA– | 510,470 | ||||||
| 370 | Puerto Rico Industrial, Tourist, Educational, Medical and Environmental Control Facilities Financing Authority, Higher Education Revenue Bonds, Ana G. Mendez University System, Series 1999, 5.375%, 2/01/29 | 2/09 at 101.00 | BBB– | 379,838 | ||||||
| 200 | Puerto Rico Industrial, Tourist, Educational, Medical and Environmental Control Facilities Financing Authority, Higher Education Revenue Bonds, University of the Sacred Heart, Series 2001, 5.250%, 9/01/21 | 9/11 at 100.00 | BBB | 207,858 | ||||||
| 250 | Puerto Rico Industrial, Tourist, Educational, Medical and Environmental Control Facilities Financing Authority, Higher Education Revenue Refunding Bonds, Ana G. Mendez University System, Series 2002, 5.500%, 12/01/31 | 12/12 at 101.00 | BBB– | 267,455 | ||||||
| 1,795 | Total Education and Civic Organizations | 1,846,839 | ||||||||
| Health Care – 1.9% | ||||||||||
| 415 | Puerto Rico Industrial, Tourist, Educational, Medical and Environmental Control Facilities Financing Authority, FHA-Insured Mortgage Hospital Revenue Bonds, Doctor Pila Hospital, Series 1995A, 5.875%, 8/01/12 | 2/07 at 100.00 | AAA | 416,399 | ||||||
| 500 | Puerto Rico Industrial, Tourist, Educational, Medical and Environmental Control Facilities Financing Authority, Hospital Revenue Bonds, Auxilio Mutuo Hospital, Series 1995A, 6.250%, 7/01/24 – MBIA Insured | 1/07 at 100.00 | AAA | 504,035 | ||||||
| 915 | Total Health Care | 920,434 | ||||||||
| Housing/Multifamily – 9.3% | ||||||||||
| 675 | Kenosha Housing Authority, Wisconsin, GNMA Collateralized Multifamily Housing Revenue Bonds, Villa Ciera Inc., Series 2000A, 5.900%, 11/20/30 | 5/08 at 102.00 | N/R | 700,549 | ||||||
| 570 | Lake Delton Community Development Agency, Wisconsin, GNMA Collateralized Multifamily Housing Revenue Bonds, Woodland Park Project, Series 2001, 5.300%, 2/20/31 (Alternative Minimum Tax) | 1/12 at 102.00 | N/R | 595,941 | ||||||
| 1,000 | Madison Community Development Authority, Wisconsin, GNMA Multifamily Housing Revenue Refunding Bonds, Greentree Glen Apartments, Series 1999A, 5.500%, 9/20/29 (Alternative Minimum Tax) | 3/07 at 102.00 | AAA | 1,016,300 | ||||||
| 200 | Milwaukee Redevelopment Authority, Wisconsin, FHA-Insured Multifamily Housing Revenue Bonds, City Hall Square Apartments, Series 1993, 6.000%, 8/01/22 (Alternative Minimum Tax) | 8/07 at 102.00 | N/R | 205,576 | ||||||
| 500 | Sheboygan Housing Authority, Wisconsin, GNMA Multifamily Revenue Refunding Bonds, Lake Shore Apartments, Series 1998A, 5.100%, 11/20/26 | 5/07 at 101.00 | AAA | 505,375 | ||||||
| 300 | Walworth County Housing Authority, Wisconsin, FHA-Insured Housing Revenue Bonds, Kiwanis Heritage Inc. Senior Apartments, Series 1997, 5.550%, 9/01/22 | 3/07 at 101.00 | N/R | 302,697 | ||||||
| Waukesha Housing Authority, Wisconsin, GNMA Collateralized Mortgage Loan Multifamily Housing Revenue Refunding Bonds, Westgrove Woods Project, Series 1996A: | ||||||||||
| 350 | 5.800%, 12/01/18 (Alternative Minimum Tax) | 12/06 at 102.00 | AAA | 357,276 | ||||||
| 750 | 6.000%, 12/01/31 (Alternative Minimum Tax) | 12/06 at 102.00 | AAA | 765,600 | ||||||
| 4,345 | Total Housing/Multifamily | 4,449,314 | ||||||||
| Housing/Single Family – 2.2% | ||||||||||
| 50 | Virgin Islands Housing Finance Corporation, GNMA Mortgage-Backed Securities Program Single Family Mortgage Revenue Refunding Bonds, Series 1995A, 6.450%, 3/01/16 (Alternative Minimum Tax) | 3/07 at 100.00 | N/R | 50,151 | ||||||
| 1,000 | Wisconsin Housing and Economic Development Authority, Home Ownership Revenue Bonds, Series 2005E, 4.900%, 11/01/35 | 5/15 at 100.00 | AA | 1,025,270 | ||||||
| 1,050 | Total Housing/Single Family | 1,075,421 | ||||||||
| Tax Obligation/General – 0.5% | ||||||||||
| 250 | Guam, General Obligation Bonds, Series 1993A, 5.400%, 11/15/18 | 5/07 at 100.00 | B | 250,215 | ||||||
48
| Principal Amount (000) | Description | Optional Call Provisions (1) | Ratings (2) | Value | ||||||
| Tax Obligation/Limited – 69.0% | ||||||||||
| $ | 1,500 | Ashwaubenon Community Development Authority, Wisconsin, Lease Revenue Refunding Bonds, Arena Project, Series 2002, 5.150%, 6/01/29 | 6/12 at 100.00 | Aa2 | $ | 1,594,575 | ||||
| 1,000 | De Forest Redevelopment Authority, Wisconsin, Redevelopment Lease Revenue Bonds, Series 1999B, 5.100%, 2/01/18 | 2/08 at 100.00 | N/R | 1,011,080 | ||||||
| 2,000 | Glendale Community Development Authority, Wisconsin, Community Development Lease Revenue Bonds, Bayshore Public Parking Project, Series 2004A, 5.000%, 10/01/24 | 10/14 at 100.00 | A3 | 2,122,920 | ||||||
| 100 | Glendale Community Development Authority, Wisconsin, Community Development Lease Revenue Refunding Bonds, Tax Increment District 6, Series 2001, 5.000%, 10/01/19 | 10/11 at 100.00 | A3 | 104,522 | ||||||
| 350 | Green Bay Brown County Professional Football Stadium District, Wisconsin, Sales Tax Revenue Bonds, Lambeau Field Renovation Project, Series 2001A, 5.000%, 2/01/19 – AMBAC Insured | 2/11 at 100.00 | AAA | 367,759 | ||||||
| 500 | Jackson Community Development Authority, Wisconsin, Revenue Refunding Bonds, Series 1999, 5.100%, 12/01/17 | 12/09 at 100.00 | N/R | 507,400 | ||||||
| 960 | Madison Community Development Authority, Wisconsin, Lease Revenue Refunding Bonds, Monona Terrace, Series 2002, 4.375%, 3/01/20 | 3/12 at 100.00 | Aa2 | 974,352 | ||||||
| 2,000 | Milwaukee Redevelopment Authority, Wisconsin, Lease Revenue Bonds, Neighborhood Public Schools Initiative, Series 2002A, 4.875%, 8/01/21 – AMBAC Insured | 8/12 at 100.00 | AAA | 2,094,600 | ||||||
| Milwaukee Redevelopment Authority, Wisconsin, Lease Revenue Bonds, Public Schools, Series 2003A: | ||||||||||
| 2,000 | 5.125%, 8/01/21 – AMBAC Insured | 8/13 at 100.00 | AAA | 2,139,760 | ||||||
| 1,000 | 5.125%, 8/01/22 – AMBAC Insured | 8/13 at 100.00 | AAA | 1,068,670 | ||||||
| Milwaukee Redevelopment Authority, Wisconsin, Revenue Bonds, Summerfest Project, Series 2001: | ||||||||||
| 400 | 4.850%, 8/01/17 | 8/11 at 100.00 | A | 417,116 | ||||||
| 1,000 | 4.950%, 8/01/20 | 8/11 at 100.00 | A | 1,043,730 | ||||||
| 1,500 | Neenah Community Development Authority, Wisconsin, Lease Revenue Bonds, Series 2004A, 5.000%, 12/01/26 | 12/14 at 100.00 | A1 | 1,602,390 | ||||||
| 1,000 | Onalaska Community Development Authority, Wisconsin, Community Development Lease Revenue Bonds, Series 2003, 4.875%, 10/01/27 | 10/13 at 100.00 | A2 | 1,057,040 | ||||||
| Southeast Wisconsin Professional Baseball Park District, Sales Tax Revenue Refunding Bonds, Series 1998A: | ||||||||||
| 850 | 5.500%, 12/15/18 – MBIA Insured | No Opt. Call | AAA | 987,233 | ||||||
| 400 | 5.500%, 12/15/19 – MBIA Insured | No Opt. Call | AAA | 466,496 | ||||||
| 2,195 | 5.500%, 12/15/20 – MBIA Insured | No Opt. Call | AAA | 2,586,281 | ||||||
| 500 | 5.500%, 12/15/26 – MBIA Insured | No Opt. Call | AAA | 603,645 | ||||||
| 1,220 | Sturgeon Bay Waterfront Redevelopment Authority, Wisconsin, Lease Revenue Bonds, Series 2006A, 4.500%, 10/01/21 | 10/16 at 100.00 | N/R | 1,247,694 | ||||||
| 1,305 | Sun Prairie Community Development Authority, Wisconsin, Lease Revenue Bonds, Tax Increment District 8, Series 2006, 4.250%, 8/01/25 | 8/16 at 100.00 | A2 | 1,309,567 | ||||||
| 600 | Virgin Islands Public Finance Authority, Senior Lien Revenue Refunding Bonds, Matching Fund Loan Note, Series 1998A, 5.625%, 10/01/25 | 10/08 at 101.00 | BBB | 621,072 | ||||||
| 1,100 | Watertown Community Development Authority, Wisconsin, Community Development Lease Revenue Bonds, Series 2006A, 4.700%, 10/01/25 | 10/16 at 100.00 | A3 | 1,162,700 | ||||||
| 500 | Wauwatosa Redevelopment Authority, Milwaukee County, Wisconsin, Lease Revenue Bonds, Series 1997, 5.650%, 12/01/16 – MBIA Insured | 12/07 at 100.00 | AAA | 510,455 | ||||||
| 1,000 | Weston Community Development Authority, Wisconsin, Lease Revenue Bonds, Series 2004A, 5.250%, 10/01/21 | 10/14 at 100.00 | N/R | 1,092,810 | ||||||
| 1,000 | Weston Community Development Authority, Wisconsin, Lease Revenue Bonds, Series 2005A, 5.000%, 10/01/21 | 10/15 at 100.00 | N/R | 1,061,910 | ||||||
| Wisconsin Center District, Junior Dedicated Tax Revenue Refunding Bonds, Series 1999: | ||||||||||
| 3,400 | 5.250%, 12/15/23 – FSA Insured | No Opt. Call | AAA | 3,941,144 | ||||||
| 500 | 5.250%, 12/15/27 – FSA Insured | No Opt. Call | AAA | 588,570 | ||||||
49
Portfolio of Investments (Unaudited)
Nuveen Wisconsin Municipal Bond Fund (continued)
November 30, 2006
| Principal Amount (000) | Description | Optional Call Provisions (1) | Ratings (2) | Value | |||||||
| Tax Obligation/Limited (continued) | |||||||||||
| $ | 2,000 | Wisconsin Center District, Senior Dedicated Tax Revenue Refunding Bonds, Series 2003A, 0.000%, 12/15/28 – FSA Insured | No Opt. Call | AAA | $ | 784,700 | |||||
| 31,880 | Total Tax Obligation/Limited | 33,070,191 | |||||||||
| U.S. Guaranteed – 12.5% (3) | |||||||||||
| Ashwaubenon Community Development Authority, Wisconsin, Lease Revenue Bonds, Arena Project, Series 1999A: | |||||||||||
| 2,000 | 5.700%, 6/01/24 (Pre-refunded 6/01/09) | 6/09 at 100.00 | Aa2 | (3) | 2,104,800 | ||||||
| 700 | 5.800%, 6/01/29 (Pre-refunded 6/01/09) | 6/09 at 100.00 | Aa2 | (3) | 738,346 | ||||||
| Green Bay Redevelopment Authority, Wisconsin, Lease Revenue Bonds, Convention Center Project, Series 1999A: | |||||||||||
| 1,300 | 5.250%, 6/01/24 (Pre-refunded 6/01/09) | 6/09 at 100.00 | Aa2 | (3) | 1,354,223 | ||||||
| 1,150 | 5.100%, 6/01/29 (Pre-refunded 6/01/09) | 6/09 at 100.00 | Aa2 | (3) | 1,193,861 | ||||||
| 190 | Puerto Rico Housing Bank and Finance Agency, Affordable Housing Mortgage Subsidy Program Single Family Mortgage Revenue Bonds, Series 1995I, 6.250%, 4/01/29 (Pre-refunded 4/01/07) (Alternative Minimum Tax) | 4/07 at 100.00 | AAA | 191,497 | |||||||
| 375 | Sturgeon Bay Waterfront Redevelopment Authority, Wisconsin, Lease Revenue Bonds, Series 1998A, 5.200%, 10/01/21 (Pre-refunded 10/01/08) | 10/08 at 100.00 | N/R | (3) | 385,181 | ||||||
| 5,715 | Total U.S. Guaranteed | 5,967,908 | |||||||||
| $ | 45,950 | Total Investments (cost $45,413,280) – 99.3% | 47,580,322 | ||||||||
Other Assets Less Liabilities – 0.7% | 344,604 | ||||||||||
Net Assets – 100% | $ | 47,924,926 | |||||||||
| (1) | Optional Call Provisions: Dates (month and year) and prices of the earliest optional call or redemption. There may be other call provisions at varying prices at later dates. Certain mortgage-backed securities may be subject to periodic principal paydowns. |
| (2) | Ratings: Using the higher of Standard & Poor’s or Moody’s rating. Ratings below BBB by Standard & Poor’s Group or Baa by Moody’s Investor Service, Inc. are considered to be below investment grade. |
| (3) | Backed by an escrow or trust containing sufficient U.S. Government or U.S. Government agency securities which ensure the timely payment of principal and interest. Such investments are normally considered to be equivalent to AAA rated securities. |
| N/R | Not rated. |
See accompanying notes to financial statements.
50
Statement of Assets and Liabilities (Unaudited)
November 30, 2006
| Kansas | Kentucky | Michigan | Missouri | Ohio | Wisconsin | |||||||||||||||||||
Assets | ||||||||||||||||||||||||
Investments, at value (cost $126,355,950, $447,090,697, $224,275,630, $246,037,945, $531,261,838 and $45,413,280, respectively) | $ | 133,130,143 | $ | 473,021,654 | $ | 240,430,020 | $ | 261,214,979 | $ | 567,021,210 | $ | 47,580,322 | ||||||||||||
Cash | 348,217 | 2,060,670 | 833,275 | — | 2,056,963 | — | ||||||||||||||||||
Receivables: | ||||||||||||||||||||||||
Interest | 1,568,437 | 5,668,502 | 2,313,615 | 3,615,222 | 9,372,070 | 776,636 | ||||||||||||||||||
Investments sold | 310,000 | — | — | 2,310,240 | 10,558,484 | — | ||||||||||||||||||
Shares sold | 236,210 | 473,040 | 189,712 | 125,055 | 1,247,421 | 9,663 | ||||||||||||||||||
Other assets | 453 | 43,358 | 24,834 | 10,302 | 639,175 | 152 | ||||||||||||||||||
Total assets | 135,593,460 | 481,267,224 | 243,791,456 | 267,275,798 | 590,895,323 | 48,366,773 | ||||||||||||||||||
Liabilities | ||||||||||||||||||||||||
Cash overdraft | — | — | — | 162,134 | — | 234,397 | ||||||||||||||||||
Floating rate obligations | — | 9,805,000 | 4,000,000 | — | 20,550,000 | — | ||||||||||||||||||
Payables: | ||||||||||||||||||||||||
Investments purchased | 3,150,570 | — | — | — | 20,578,714 | — | ||||||||||||||||||
Shares redeemed | 397,184 | 701,357 | 255,318 | 1,396,070 | 762,200 | 15,009 | ||||||||||||||||||
Accrued expenses: | ||||||||||||||||||||||||
Management fees | 57,730 | 199,837 | 103,500 | 114,890 | 231,525 | 20,872 | ||||||||||||||||||
12b-1 distribution and service fees | 35,460 | 107,463 | 56,290 | 58,037 | 101,728 | 12,129 | ||||||||||||||||||
Other | 32,596 | 28,513 | 81,062 | 58,967 | 155,650 | 15,912 | ||||||||||||||||||
Dividends payable | 417,355 | 1,562,288 | 788,575 | 874,488 | 1,842,733 | 143,528 | ||||||||||||||||||
Total liabilities | 4,090,895 | 12,404,458 | 5,284,745 | 2,664,586 | 44,222,550 | 441,847 | ||||||||||||||||||
Net assets | $ | 131,502,565 | $ | 468,862,766 | $ | 238,506,711 | $ | 264,611,212 | $ | 546,672,773 | $ | 47,924,926 | ||||||||||||
Class A Shares | ||||||||||||||||||||||||
Net assets | $ | 100,888,376 | $ | 403,275,005 | $ | 172,582,149 | $ | 233,633,695 | $ | 351,082,973 | $ | 38,271,541 | ||||||||||||
Shares outstanding | 9,532,338 | 36,015,460 | 14,706,736 | 20,769,319 | 30,467,253 | 3,653,974 | ||||||||||||||||||
Net asset value per share | $ | 10.58 | $ | 11.20 | $ | 11.73 | $ | 11.25 | $ | 11.52 | $ | 10.47 | ||||||||||||
Offering price per share (net asset value per share plus maximum sales charge of 4.20% of offering price) | $ | 11.04 | $ | 11.69 | $ | 12.24 | $ | 11.74 | $ | 12.03 | $ | 10.93 | ||||||||||||
Class B Shares | ||||||||||||||||||||||||
Net assets | $ | 6,837,646 | $ | 15,753,527 | $ | 5,600,139 | $ | 7,977,929 | $ | 18,764,964 | $ | 3,077,924 | ||||||||||||
Shares outstanding | 651,397 | 1,406,174 | 476,140 | 708,609 | 1,630,952 | 293,252 | ||||||||||||||||||
Net asset value and offering price per share | $ | 10.50 | $ | 11.20 | $ | 11.76 | $ | 11.26 | $ | 11.51 | $ | 10.50 | ||||||||||||
Class C Shares | ||||||||||||||||||||||||
Net assets | $ | 22,120,496 | $ | 47,184,965 | $ | 38,421,570 | $ | 21,617,015 | $ | 48,373,686 | $ | 5,738,352 | ||||||||||||
Shares outstanding | 2,089,429 | 4,214,696 | 3,276,635 | 1,923,349 | 4,208,734 | 546,769 | ||||||||||||||||||
Net asset value and offering price per share | $ | 10.59 | $ | 11.20 | $ | 11.73 | $ | 11.24 | $ | 11.49 | $ | 10.50 | ||||||||||||
Class R Shares | ||||||||||||||||||||||||
Net assets | $ | 1,656,047 | $ | 2,649,269 | $ | 21,902,853 | $ | 1,382,573 | $ | 128,451,150 | $ | 837,109 | ||||||||||||
Shares outstanding | 155,814 | 236,702 | 1,866,413 | 122,803 | 11,162,297 | 79,802 | ||||||||||||||||||
Net asset value and offering price per share | $ | 10.63 | $ | 11.19 | $ | 11.74 | $ | 11.26 | $ | 11.51 | $ | 10.49 | ||||||||||||
Net Assets Consist of: | ||||||||||||||||||||||||
Capital paid-in | $ | 126,020,010 | $ | 442,799,910 | $ | 220,833,538 | $ | 249,242,311 | $ | 509,737,896 | $ | 45,712,363 | ||||||||||||
Undistributed (Over-distribution of) net investment income | (17,949 | ) | (683,871 | ) | (114,845 | ) | (144,484 | ) | (376,574 | ) | (42,833 | ) | ||||||||||||
Accumulated net realized gain (loss) from investments | (1,273,689 | ) | 815,770 | 1,633,628 | 336,351 | 1,552,069 | 88,354 | |||||||||||||||||
Net unrealized appreciation (depreciation) of investments | 6,774,193 | 25,930,957 | 16,154,390 | 15,177,034 | 35,759,382 | 2,167,042 | ||||||||||||||||||
Net assets | $ | 131,502,565 | $ | 468,862,766 | $ | 238,506,711 | $ | 264,611,212 | $ | 546,672,773 | $ | 47,924,926 | ||||||||||||
See accompanying notes to financial statements.
51
Statement of Operations (Unaudited)
Six Months Ended November 30, 2006
| Kansas | Kentucky | Michigan | Missouri | Ohio | Wisconsin | |||||||||||||||||||
Investment Income | $ | 3,212,910 | $ | 11,453,423 | $ | 5,983,770 | $ | 6,567,545 | $ | 13,998,210 | $ | 1,094,048 | ||||||||||||
Expenses | ||||||||||||||||||||||||
Management fees | 352,284 | 1,215,724 | 630,644 | 697,331 | 1,411,883 | 124,390 | ||||||||||||||||||
12b-1 service fees – Class A | 100,615 | 400,465 | 171,188 | 232,393 | 348,816 | 37,259 | ||||||||||||||||||
12b-1 distribution and service fees – Class B | 33,766 | 79,268 | 29,152 | 40,329 | 93,122 | 14,834 | ||||||||||||||||||
12b-1 distribution and service fees – Class C | 82,849 | 173,599 | 143,593 | 80,083 | 176,497 | 20,727 | ||||||||||||||||||
Shareholders’ servicing agent fees and expenses | 35,958 | 112,347 | 67,826 | 55,831 | 151,155 | 14,978 | ||||||||||||||||||
Interest expense and fees | — | 189,176 | 77,175 | — | 513,989 | — | ||||||||||||||||||
Custodian’s fees and expenses | 24,023 | 86,320 | 41,092 | 49,845 | 101,368 | 14,155 | ||||||||||||||||||
Trustees’ fees and expenses | 1,728 | 5,965 | 2,962 | 3,403 | 6,914 | 640 | ||||||||||||||||||
Professional fees | 6,673 | 14,035 | 8,890 | 9,176 | 15,220 | 4,725 | ||||||||||||||||||
Shareholders’ reports – printing and mailing expenses | 9,440 | 26,405 | 19,945 | 15,443 | 40,816 | 3,508 | ||||||||||||||||||
Federal and state registration fees | 3,224 | 3,861 | 5,124 | 853 | 4,656 | 3,939 | ||||||||||||||||||
Other expenses | 2,000 | 7,303 | 3,753 | 4,012 | 8,416 | 715 | ||||||||||||||||||
Total expenses before custodian fee credit | 652,560 | 2,314,468 | 1,201,344 | 1,188,699 | 2,872,852 | 239,870 | ||||||||||||||||||
Custodian fee credit | (7,750 | ) | (16,205 | ) | (12,871 | ) | (13,666 | ) | (6,928 | ) | (6,941 | ) | ||||||||||||
Net expenses | 644,810 | 2,298,263 | 1,188,473 | 1,175,033 | 2,865,924 | 232,929 | ||||||||||||||||||
Net investment income | 2,568,100 | 9,155,160 | 4,795,297 | 5,392,512 | 11,132,286 | 861,119 | ||||||||||||||||||
Realized and Unrealized Gain (Loss) | ||||||||||||||||||||||||
Net realized gain (loss) from investments | 268,860 | 504,095 | 1,382,614 | 500,235 | 1,552,069 | (11,306 | ) | |||||||||||||||||
Net change in unrealized appreciation (depreciation) of investments | 2,228,692 | 9,639,401 | 4,371,513 | 5,678,992 | 10,557,977 | 1,215,587 | ||||||||||||||||||
Net realized and unrealized gain (loss) | 2,497,552 | 10,143,496 | 5,754,127 | 6,179,227 | 12,110,046 | 1,204,281 | ||||||||||||||||||
Net increase (decrease) in net assets from operations | $ | 5,065,652 | $ | 19,298,656 | $ | 10,549,424 | $ | 11,571,739 | $ | 23,242,332 | $ | 2,065,400 | ||||||||||||
See accompanying notes to financial statements.
52
Statement of Changes in Net Assets (Unaudited)
| Kansas | Kentucky | |||||||||||||||
Six Months Ended | Year Ended | Six Months Ended | Year Ended 5/31/06 | |||||||||||||
Operations | ||||||||||||||||
Net investment income | $ | 2,568,100 | $ | 5,170,339 | $ | 9,155,160 | $ | 19,384,348 | ||||||||
Net realized gain (loss) from investments | 268,860 | 565,839 | 504,095 | 1,179,410 | ||||||||||||
Net change in unrealized appreciation (depreciation) of investments | 2,228,692 | (4,237,094 | ) | 9,639,401 | (14,470,749 | ) | ||||||||||
Net increase (decrease) in net assets from operations | 5,065,652 | 1,499,084 | 19,298,656 | 6,093,009 | ||||||||||||
Distributions to Shareholders | ||||||||||||||||
From net investment income: | ||||||||||||||||
Class A | (1,994,029 | ) | (3,919,501 | ) | (8,264,317 | ) | (17,003,173 | ) | ||||||||
Class B | (115,023 | ) | (286,327 | ) | (281,182 | ) | (673,805 | ) | ||||||||
Class C | (380,897 | ) | (789,253 | ) | (816,759 | ) | (1,642,318 | ) | ||||||||
Class R | (33,044 | ) | (65,950 | ) | (53,732 | ) | (82,507 | ) | ||||||||
From accumulated net realized gains: | ||||||||||||||||
Class A | — | — | — | (1,336,665 | ) | |||||||||||
Class B | — | — | — | (66,345 | ) | |||||||||||
Class C | — | — | — | (152,711 | ) | |||||||||||
Class R | — | — | — | (5,573 | ) | |||||||||||
Decrease in net assets from distributions to shareholders | (2,522,993 | ) | (5,061,031 | ) | (9,415,990 | ) | (20,963,097 | ) | ||||||||
Fund Share Transactions | ||||||||||||||||
Proceeds from sale of shares | 5,964,598 | 16,867,724 | 16,199,978 | 30,296,652 | ||||||||||||
Proceeds from shares issued to shareholders due to reinvestment of distributions | 1,225,186 | 2,656,786 | 4,988,434 | 11,376,696 | ||||||||||||
| 7,189,784 | 19,524,510 | 21,188,412 | 41,673,348 | |||||||||||||
Cost of shares redeemed | (10,033,395 | ) | (16,334,930 | ) | (27,602,792 | ) | (57,471,401 | ) | ||||||||
Net increase (decrease) in net assets from Fund share transactions | (2,843,611 | ) | 3,189,580 | (6,414,380 | ) | (15,798,053 | ) | |||||||||
Net increase (decrease) in net assets | (300,952 | ) | (372,367 | ) | 3,468,286 | (30,668,141 | ) | |||||||||
Net assets at the beginning of period | 131,803,517 | 132,175,884 | 465,394,480 | 496,062,621 | ||||||||||||
Net assets at the end of period | $ | 131,502,565 | $ | 131,803,517 | $ | 468,862,766 | $ | 465,394,480 | ||||||||
Undistributed (Over-distribution of) net investment income at the end of period | $ | (17,949 | ) | $ | (63,056 | ) | $ | (683,871 | ) | $ | (423,041 | ) | ||||
See accompanying notes to financial statements.
53
Statement of Changes in Net Assets (Unaudited) (continued)
| Michigan | Missouri | |||||||||||||||
Six Months Ended | Year Ended | Six Months Ended | Year Ended | |||||||||||||
Operations | ||||||||||||||||
Net investment income | $ | 4,795,297 | $ | 10,066,680 | $ | 5,392,512 | $ | 10,962,372 | ||||||||
Net realized gain (loss) from investments | 1,382,614 | 749,408 | 500,235 | 711,275 | ||||||||||||
Net change in unrealized appreciation (depreciation) of investments | 4,371,513 | (7,471,815 | ) | 5,678,992 | (6,843,445 | ) | ||||||||||
Net increase (decrease) in net assets from operations | 10,549,424 | 3,344,273 | 11,571,739 | 4,830,202 | ||||||||||||
Distributions to Shareholders | ||||||||||||||||
From net investment income: | ||||||||||||||||
Class A | (3,508,582 | ) | (7,320,042 | ) | (4,716,655 | ) | (9,981,289 | ) | ||||||||
Class B | (103,102 | ) | (263,443 | ) | (140,068 | ) | (316,032 | ) | ||||||||
Class C | (675,892 | ) | (1,354,965 | ) | (375,938 | ) | (791,878 | ) | ||||||||
Class R | (473,861 | ) | (989,172 | ) | (23,288 | ) | (34,312 | ) | ||||||||
From accumulated net realized gains: | ||||||||||||||||
Class A | — | (2,004,133 | ) | — | — | |||||||||||
Class B | — | (88,400 | ) | — | — | |||||||||||
Class C | — | (429,404 | ) | — | — | |||||||||||
Class R | — | (257,250 | ) | — | — | |||||||||||
Decrease in net assets from distributions to shareholders | (4,761,437 | ) | (12,706,809 | ) | (5,255,949 | ) | (11,123,511 | ) | ||||||||
Fund Share Transactions | ||||||||||||||||
Proceeds from sale of shares | 10,590,873 | 22,722,819 | 8,079,507 | 20,137,812 | ||||||||||||
Proceeds from shares issued to shareholders due | 2,003,799 | 5,933,758 | 2,725,650 | 5,640,469 | ||||||||||||
| 12,594,672 | 28,656,577 | 10,805,157 | 25,778,281 | |||||||||||||
Cost of shares redeemed | (16,960,314 | ) | (34,510,153 | ) | (14,739,081 | ) | (19,139,089 | ) | ||||||||
Net increase (decrease) in net assets from Fund share transactions | (4,365,642 | ) | (5,853,576 | ) | (3,933,924 | ) | 6,639,192 | |||||||||
Net increase (decrease) in net assets | 1,422,345 | (15,216,112 | ) | 2,381,866 | 345,883 | |||||||||||
Net assets at the beginning of period | 237,084,366 | 252,300,478 | 262,229,346 | 261,883,463 | ||||||||||||
Net assets at the end of period | $ | 238,506,711 | $ | 237,084,366 | $ | 264,611,212 | $ | 262,229,346 | ||||||||
Undistributed (Over-distribution of) net investment income at the end of period | $ | (114,845 | ) | $ | (148,705 | ) | $ | (144,484 | ) | $ | (281,047 | ) | ||||
See accompanying notes to financial statements.
54
| Ohio | Wisconsin | |||||||||||||||
Six Months Ended | Year Ended | Six Months Ended | Year Ended | |||||||||||||
Operations | ||||||||||||||||
Net investment income | $ | 11,132,286 | $ | 23,326,281 | $ | 861,119 | $ | 1,717,546 | ||||||||
Net realized gain (loss) from investments | 1,552,069 | 1,693,541 | (11,306 | ) | 182,407 | |||||||||||
Net change in unrealized appreciation (depreciation) of investments | 10,557,977 | (18,259,991 | ) | 1,215,587 | (1,464,151 | ) | ||||||||||
Net increase (decrease) in net assets from operations | 23,242,332 | 6,759,831 | 2,065,400 | 435,802 | ||||||||||||
Distributions to Shareholders | ||||||||||||||||
From net investment income: | ||||||||||||||||
Class A | (7,187,290 | ) | (14,991,868 | ) | (704,375 | ) | (1,430,462 | ) | ||||||||
Class B | (332,099 | ) | (813,840 | ) | (47,112 | ) | (127,010 | ) | ||||||||
Class C | (846,306 | ) | (1,732,197 | ) | (89,839 | ) | (177,587 | ) | ||||||||
Class R | (2,778,662 | ) | (5,981,726 | ) | (8,481 | ) | (5,938 | ) | ||||||||
From accumulated net realized gains: | ||||||||||||||||
Class A | — | (1,305,148 | ) | — | (165,451 | ) | ||||||||||
Class B | — | (86,687 | ) | — | (17,703 | ) | ||||||||||
Class C | — | (173,547 | ) | — | (23,830 | ) | ||||||||||
Class R | — | (499,004 | ) | — | (679 | ) | ||||||||||
Decrease in net assets from distributions to shareholders | (11,144,357 | ) | (25,584,017 | ) | (849,807 | ) | (1,948,660 | ) | ||||||||
Fund Share Transactions | ||||||||||||||||
Proceeds from sale of shares | 19,423,538 | 47,994,143 | 2,960,724 | 5,714,314 | ||||||||||||
Proceeds from shares issued to shareholders due | 5,839,904 | 13,656,754 | 463,130 | 1,112,560 | ||||||||||||
| 25,263,442 | 61,650,897 | 3,423,854 | 6,826,874 | |||||||||||||
Cost of shares redeemed | (33,848,293 | ) | (68,625,336 | ) | (2,257,614 | ) | (5,555,171 | ) | ||||||||
Net increase (decrease) in net assets from Fund share transactions | (8,584,851 | ) | (6,974,439 | ) | 1,166,240 | 1,271,703 | ||||||||||
Net increase (decrease) in net assets | 3,513,124 | (25,798,625 | ) | 2,381,833 | (241,155 | ) | ||||||||||
Net assets at the beginning of period | 543,159,649 | 568,958,274 | 45,543,093 | 45,784,248 | ||||||||||||
Net assets at the end of period | $ | 546,672,773 | $ | 543,159,649 | $ | 47,924,926 | $ | 45,543,093 | ||||||||
Undistributed (Over-distribution of) net investment income at the end of period | $ | (376,574 | ) | $ | (364,503 | ) | $ | (42,833 | ) | $ | (54,145 | ) | ||||
See accompanying notes to financial statements.
55
Notes to Financial Statements (Unaudited)
1. General Information and Significant Accounting Policies
The Nuveen Multistate Trust IV (the “Trust”) is an open-end investment company registered under the Investment Company Act of 1940, as amended. The Trust is comprised of Nuveen Kansas Municipal Bond Fund (“Kansas”), Nuveen Kentucky Municipal Bond Fund (“Kentucky”), Nuveen Michigan Municipal Bond Fund (“Michigan”), Nuveen Missouri Municipal Bond Fund (“Missouri”), Nuveen Ohio Municipal Bond Fund (“Ohio”) and Nuveen Wisconsin Municipal Bond Fund (“Wisconsin”) (collectively, the “Funds”). The Trust was organized as a Massachusetts business trust on July 1, 1996. The Funds were each organized as a series of predecessor trusts or corporations prior to that date.
The Funds seek to provide high levels of tax-free income and preservation of capital through investments in diversified portfolios of quality municipal bonds.
The following is a summary of significant accounting policies followed by the Funds in the preparation of their financial statements in accordance with accounting principles generally accepted in the United States.
Investment Valuation
The prices of municipal bonds in each Fund’s investment portfolio are provided by a pricing service approved by the Fund’s Board of Trustees. When market price quotes are not readily available (which is usually the case for municipal securities), the pricing service may establish fair value based on yields or prices of municipal bonds of comparable quality, type of issue, coupon, maturity and rating, indications of value from securities dealers, evaluations of anticipated cash flows or collateral and general market conditions. If the pricing service is unable to supply a price for a municipal bond, each Fund may use a market price or fair market value quote provided by a major broker/dealer in such investments. If it is determined that the market price or fair market value for an investment is unavailable or inappropriate, the Board of Trustees of the Funds, or its designee, may establish a fair value for the investment. Temporary investments in securities that have variable rate and demand features qualifying them as short-term investments are valued at amortized cost, which approximates market value.
Investment Transactions
Investment transactions are recorded on a trade date basis. Realized gains and losses from transactions are determined on the specific identification method. Investments purchased on a when-issued or delayed delivery basis may have extended settlement periods. Any investments so purchased are subject to market fluctuation during this period. The Funds have instructed the custodian to segregate assets with a current value at least equal to the amount of the when-issued/delayed delivery purchase commitments. At November 30, 2006, Kansas and Ohio had outstanding when-issued/delayed delivery purchase commitments of $3,150,570 and $12,484,330, respectively. There were no such outstanding purchase commitments in any of the other funds.
Investment Income
Interest income, which includes the amortization of premiums and accretion of discounts for financial reporting purposes, is recorded on an accrual basis. Investment income also includes paydown gains and losses, if any.
Dividends and Distributions to Shareholders
Tax-exempt net investment income is declared monthly as a dividend. Generally, payment is made or reinvestment is credited to shareholder accounts on the first business day after month-end. Net realized capital gains and/or market discount from investment transactions, if any, are distributed to shareholders not less frequently than annually. Furthermore, capital gains are distributed only to the extent they exceed available capital loss carryforwards.
Distributions to shareholders of tax-exempt net investment income, net realized capital gains and/or market discount, if any, are recorded on the ex-dividend date. The amount and timing of distributions are determined in accordance with federal income tax regulations, which may differ from accounting principles generally accepted in the United States.
Income Taxes
Each Fund is a separate taxpayer for federal income tax purposes. Each Fund intends to distribute substantially all net investment income and net capital gains to shareholders and to otherwise comply with the requirements of Subchapter M of the Internal Revenue Code applicable to regulated investment companies. Therefore, no federal income tax provision is required. Furthermore, each Fund intends to satisfy conditions which will enable interest from municipal securities, which is exempt from regular federal and designated state income taxes, to retain such tax-exempt status when distributed to shareholders of the Funds. Net realized capital gains and ordinary income distributions paid by the Funds are subject to federal taxation.
Flexible Sales Charge Program
Each Fund offers Class A, B, C and R Shares. Class A Shares are generally sold with an up-front sales charge and incur a .20% annual 12b-1 service fee. Class A Share purchases of $1 million or more are sold at net asset value without an up-front sales charge but may be subject to a contingent deferred sales charge (“CDSC”) if redeemed within 18 months of purchase. Class B Shares are sold without an up-front sales charge but incur a .75% annual 12b-1 distribution fee and a .20% annual 12b-1 service fee. An investor purchasing Class B Shares agrees to pay a CDSC of up to 5% depending upon the length of time the shares are held by the investor (CDSC is reduced to 0% at the end of six years). Class B Shares convert to Class A Shares eight years after purchase. Class C Shares are sold without an up-front sales charge but incur a .55% annual 12b-1 distribution fee and a .20% annual
56
12b-1 service fee. An investor purchasing Class C Shares agrees to pay a CDSC of 1% if Class C Shares are redeemed within one year of purchase. Class R Shares are not subject to any sales charge or 12b-1 distribution or service fees. Class R Shares are available only under limited circumstances.
Derivative Financial Instruments
The Funds are authorized to invest in certain derivative financial instruments including futures, forward, swap and option contracts, and other financial instruments with similar characteristics. Although the Funds are authorized to invest in such instruments, and may do so in the future, they did not invest in any such instruments during the six months ended November 30, 2006.
Inverse Floating Rate Securities
Each Fund may invest in inverse floating rate securities. An inverse floating rate security is created by depositing a municipal bond, typically with a fixed interest rate, into a special purpose trust created by a broker-dealer. In turn, this trust (a) issues floating rate certificates, in face amounts equal to some fraction of the deposited bond’s par amount or market value, that typically pay short-term tax-exempt interest rates to third parties, and (b) issues to a long-term investor (such as one of the Funds) an inverse floating rate certificate (sometimes referred to as an “inverse floater”) that represents all remaining or residual interest in the trust. The income received by the inverse floater holder varies inversely with the short-term rate paid to the floating rate certificates’ holders, and in most circumstances the inverse floater holder bears substantially all of the underlying bond’s downside investment risk and also benefits disproportionately from any potential appreciation of the underlying bond’s value. The price of an inverse floating rate security will be more volatile than that of the underlying bond because the interest rate is dependent on not only the fixed coupon rate of the underlying bond but also on the short-term interest paid on the floating rate certificates, and because the inverse floating rate security essentially bears the risk of loss of the greater face value of the underlying bond.
A Fund may purchase an inverse floating rate security in a secondary market transaction without first owning the underlying bond (referred to as an “externally-deposited inverse floater”), or instead by first selling a fixed-rate bond to a broker-dealer for deposit into the special purpose trust and receiving in turn the residual interest in the trust (referred to as a “self-deposited inverse floater”). An investment in an externally-deposited inverse floater is identified in the Portfolio of Investments as an “Inverse floating rate investment”. An investment in a self-deposited inverse floater is accounted for as a financing transaction in accordance with Statement of Financial Accounting Standards (SFAS) No. 140 “Accounting for Transfers and Servicing of Financial Assets and Extinguishment of Liabilities”. In such instances, a fixed-rate bond deposited into a special purpose trust is identified in the Portfolio of Investments as an “Underlying bond of an inverse floating rate trust”, with the Fund accounting for the short-term floating rate certificates issued by the trust as “Floating rate obligations” on the Statement of Assets and Liabilities. In addition, the Fund reflects in Investment Income the entire earnings of the underlying bond and accounts for the related interest paid to the holders of the short-term floating rate certificates as “Interest expense and fees” in the Statement of Operations.
During the six months ended November 30, 2006, Kentucky, Michigan and Ohio invested in externally deposited inverse floaters and/or self-deposited inverse floaters. Kansas, Missouri and Wisconsin did not invest in any such instruments during the six months ended November 30, 2006.
The average floating rate obligations outstanding and average annual interest rate related to self-deposited inverse floaters during the six months ended November 30, 2006, were as follows:
| Kentucky | Michigan | Ohio | ||||||||||
Average floating rate obligations | $ | 9,805,000 | $ | 4,000,000 | $ | 26,641,304 | ||||||
Average annual interest rate | 3.83 | % | 3.83 | % | 3.83 | % | ||||||
Expense Allocation
Expenses of the Funds that are not directly attributable to a specific class of shares are prorated among the classes based on the relative net assets of each class. Expenses directly attributable to a class of shares, which presently only include 12b-1 distribution and service fees, are recorded to the specific class.
Custodian Fee Credit
Each Fund has an arrangement with the custodian bank whereby certain custodian fees and expenses are reduced by credits earned on each Fund’s cash on deposit with the bank. Such deposit arrangements are an alternative to overnight investments.
Indemnifications
Under the Trust’s organizational documents, its Officers and Trustees are indemnified against certain liabilities arising out of the performance of their duties to the Trust. In addition, in the normal course of business, the Trust enters into contracts that provide general indemnifications to other parties. The Trust’s maximum exposure under these arrangements is unknown as this would involve future claims that may be made against the Trust that have not yet occurred. However, the Trust has not had prior claims or losses pursuant to these contracts and expects the risk of loss to be remote.
Use of Estimates
The preparation of financial statements in conformity with accounting principles generally accepted in the United States requires management to make estimates and assumptions that affect the reported amounts of assets and liabilities at the date of the
57
Notes to Financial Statements (Unaudited) (continued)
financial statements and the reported amounts of increases and decreases in net assets from operations during the reporting period. Actual results may differ from those estimates.
2. Fund Shares
Transactions in Fund shares were as follows:
| Kansas | ||||||||||||||
Six Months Ended | Year Ended 5/31/06 | |||||||||||||
Shares | Amount | Shares | Amount | |||||||||||
Shares sold: | ||||||||||||||
Class A | 343,690 | $ | 3,583,347 | 1,181,502 | $ | 12,433,126 | ||||||||
Class A – automatic conversion of Class B shares | 65,634 | 687,395 | 48,920 | 514,062 | ||||||||||
Class B | 15,204 | 156,970 | 20,421 | 213,332 | ||||||||||
Class C | 139,904 | 1,466,546 | 329,605 | 3,466,758 | ||||||||||
Class R | 6,677 | 70,340 | 22,682 | 240,446 | ||||||||||
Shares issued to shareholders due to reinvestment | ||||||||||||||
Class A | 93,568 | 976,795 | 197,498 | 2,078,016 | ||||||||||
Class B | 5,152 | 53,354 | 13,499 | 140,930 | ||||||||||
Class C | 18,356 | 191,692 | 40,915 | 430,702 | ||||||||||
Class R | 319 | 3,345 | 675 | 7,138 | ||||||||||
| 688,504 | 7,189,784 | 1,855,717 | 19,524,510 | |||||||||||
Shares redeemed: | ||||||||||||||
Class A | (617,238 | ) | (6,441,984 | ) | (961,370 | ) | (10,104,393 | ) | ||||||
Class B | (19,569 | ) | (200,948 | ) | (216,150 | ) | (2,247,153 | ) | ||||||
Class B – automatic conversion to Class A shares | (66,186 | ) | (687,395 | ) | (49,310 | ) | (514,062 | ) | ||||||
Class C | (258,332 | ) | (2,693,768 | ) | (321,430 | ) | (3,374,998 | ) | ||||||
Class R | (883 | ) | (9,300 | ) | (8,989 | ) | (94,324 | ) | ||||||
| (962,208 | ) | (10,033,395 | ) | (1,557,249 | ) | (16,334,930 | ) | |||||||
Net increase (decrease) | (273,704 | ) | $ | (2,843,611 | ) | 298,468 | $ | 3,189,580 | ||||||
Kentucky | ||||||||||||||
Six Months Ended | Year Ended | |||||||||||||
Shares | Amount | Shares | Amount | |||||||||||
Shares sold: | ||||||||||||||
Class A | 1,071,008 | $ | 11,817,279 | 1,949,136 | $ | 21,701,035 | ||||||||
Class A – automatic conversion of Class B shares | 117,905 | 1,299,615 | 74,419 | 826,602 | ||||||||||
Class B | 17,087 | 189,070 | 70,072 | 781,861 | ||||||||||
Class C | 243,531 | 2,694,774 | 543,764 | 6,065,560 | ||||||||||
Class R | 18,036 | 199,240 | 82,935 | 921,594 | ||||||||||
Shares issued to shareholders due to reinvestment of distributions: | ||||||||||||||
Class A | 393,078 | 4,338,499 | 888,908 | 9,884,979 | ||||||||||
Class B | 13,872 | 153,148 | 38,296 | 426,211 | ||||||||||
Class C | 41,305 | 455,728 | 89,951 | 999,155 | ||||||||||
Class R | 3,721 | 41,059 | 5,977 | 66,351 | ||||||||||
| 1,919,543 | 21,188,412 | 3,743,458 | 41,673,348 | |||||||||||
Shares redeemed: | ||||||||||||||
Class A | (1,932,244 | ) | (21,305,937 | ) | (4,335,775 | ) | (48,115,573 | ) | ||||||
Class B | (183,641 | ) | (2,022,470 | ) | (233,656 | ) | (2,591,416 | ) | ||||||
Class B – automatic conversion to Class A shares | (117,832 | ) | (1,299,615 | ) | (74,401 | ) | (826,602 | ) | ||||||
Class C | (260,762 | ) | (2,877,627 | ) | (530,467 | ) | (5,881,313 | ) | ||||||
Class R | (8,831 | ) | (97,143 | ) | (5,159 | ) | (56,497 | ) | ||||||
| (2,503,310 | ) | (27,602,792 | ) | (5,179,458 | ) | (57,471,401 | ) | |||||||
Net increase (decrease) | (583,767 | ) | $ | (6,414,380 | ) | (1,436,000 | ) | $ | (15,798,053 | ) | ||||
58
| Michigan | ||||||||||||||
Six Months Ended | Year Ended | |||||||||||||
Shares | Amount | Shares | Amount | |||||||||||
Shares sold: | ||||||||||||||
Class A | 673,398 | $ | 7,765,115 | 1,474,374 | $ | 17,101,996 | ||||||||
Class A – automatic conversion of Class B shares | 35,549 | 412,649 | 29,741 | 346,845 | ||||||||||
Class B | 18,120 | 210,242 | 37,311 | 436,297 | ||||||||||
Class C | 134,357 | 1,548,449 | 388,724 | 4,527,149 | ||||||||||
Class R | 56,561 | 654,418 | 26,644 | 310,532 | ||||||||||
Shares issued to shareholders due to reinvestment of distributions: | ||||||||||||||
Class A | 119,519 | 1,379,853 | 361,150 | 4,200,876 | ||||||||||
Class B | 3,460 | 39,979 | 13,339 | 155,475 | ||||||||||
Class C | 22,593 | 260,616 | 59,845 | 695,093 | ||||||||||
Class R | 28,010 | 323,351 | 75,831 | 882,314 | ||||||||||
| 1,091,567 | 12,594,672 | 2,466,959 | 28,656,577 | |||||||||||
Shares redeemed: | ||||||||||||||
Class A | (991,718 | ) | (11,423,275 | ) | (2,241,711 | ) | (25,920,683 | ) | ||||||
Class B | (101,896 | ) | (1,177,017 | ) | (179,101 | ) | (2,089,282 | ) | ||||||
Class B – automatic conversion to Class A shares | (35,458 | ) | (412,649 | ) | (29,688 | ) | (346,845 | ) | ||||||
Class C | (213,955 | ) | (2,468,318 | ) | (346,109 | ) | (4,024,783 | ) | ||||||
Class R | (127,953 | ) | �� | (1,479,055 | ) | (183,313 | ) | (2,128,560 | ) | |||||
| (1,470,980 | ) | (16,960,314 | ) | (2,979,922 | ) | (34,510,153 | ) | |||||||
Net increase (decrease) | (379,413 | ) | $ | (4,365,642 | ) | (512,963 | ) | $ | (5,853,576 | ) | ||||
| Missouri | ||||||||||||||
Six Months Ended | Year Ended | |||||||||||||
Shares | Amount | Shares | Amount | |||||||||||
Shares sold: | ||||||||||||||
Class A | 542,468 | $ | 6,002,532 | 1,344,371 | $ | 14,935,980 | ||||||||
Class A – automatic conversion of Class B shares | 24,846 | 277,013 | 23,686 | 262,008 | ||||||||||
Class B | 15,367 | 170,309 | 43,459 | 481,709 | ||||||||||
Class C | 98,599 | 1,089,951 | 342,391 | 3,801,421 | ||||||||||
Class R | 48,642 | 539,702 | 59,312 | 656,694 | ||||||||||
Shares issued to shareholders due to reinvestment of distributions: | ||||||||||||||
Class A | 225,136 | 2,491,715 | 464,000 | 5,158,568 | ||||||||||
Class B | 6,839 | 75,761 | 15,165 | 168,703 | ||||||||||
Class C | 14,090 | 155,819 | 27,905 | 309,964 | ||||||||||
Class R | 211 | 2,355 | 290 | 3,234 | ||||||||||
| 976,198 | 10,805,157 | 2,320,579 | 25,778,281 | |||||||||||
Shares redeemed: | ||||||||||||||
Class A | (1,092,121 | ) | (12,085,174 | ) | (1,405,100 | ) | (15,586,486 | ) | ||||||
Class B | (68,540 | ) | (763,278 | ) | (72,332 | ) | (805,092 | ) | ||||||
Class B – automatic conversion to Class A shares | (24,835 | ) | (277,013 | ) | (23,679 | ) | (262,008 | ) | ||||||
Class C | (138,367 | ) | (1,530,447 | ) | (196,602 | ) | (2,176,423 | ) | ||||||
Class R | (7,452 | ) | (83,169 | ) | (28,007 | ) | (309,080 | ) | ||||||
| (1,331,315 | ) | (14,739,081 | ) | (1,725,720 | ) | (19,139,089 | ) | |||||||
Net increase (decrease) | (355,117 | ) | $ | (3,933,924 | ) | 594,859 | $ | 6,639,192 | ||||||
59
Notes to Financial Statements (Unaudited) (continued)
| Ohio | ||||||||||||||
Six Months Ended | Year Ended | |||||||||||||
Shares | Amount | Shares | Amount | |||||||||||
Shares sold: | ||||||||||||||
Class A | 1,286,567 | $ | 14,586,745 | 3,047,528 | $ | 34,770,761 | ||||||||
Class A – automatic conversion of Class B shares | 55,578 | 631,711 | 163,574 | 1,886,705 | ||||||||||
Class B | 28,940 | 328,502 | 71,782 | 822,412 | ||||||||||
Class C | 269,846 | 3,062,990 | 850,872 | 9,713,989 | ||||||||||
Class R | 71,894 | 813,590 | 70,146 | 800,276 | ||||||||||
Shares issued to shareholders due to reinvestment of distributions: | ||||||||||||||
Class A | 290,499 | 3,294,407 | 675,780 | 7,740,442 | ||||||||||
Class B | 13,821 | 156,545 | 32,660 | 373,567 | ||||||||||
Class C | 31,274 | 353,901 | 69,084 | 789,296 | ||||||||||
Class R | 179,653 | 2,035,051 | 415,443 | 4,753,449 | ||||||||||
| 2,228,072 | 25,263,442 | 5,396,869 | 61,650,897 | |||||||||||
Shares redeemed: | ||||||||||||||
Class A | (2,065,798 | ) | (23,409,984 | ) | (3,752,948 | ) | (42,829,746 | ) | ||||||
Class B | (178,388 | ) | (2,016,004 | ) | (319,784 | ) | (3,634,933 | ) | ||||||
Class B – automatic conversion to Class A shares | (55,666 | ) | (631,711 | ) | (163,830 | ) | (1,886,705 | ) | ||||||
Class C | (213,408 | ) | (2,415,554 | ) | (736,627 | ) | (8,387,848 | ) | ||||||
Class R | (474,746 | ) | (5,375,040 | ) | (1,042,790 | ) | (11,886,104 | ) | ||||||
| (2,988,006 | ) | (33,848,293 | ) | (6,015,979 | ) | (68,625,336 | ) | |||||||
Net increase (decrease) | (759,934 | ) | $ | (8,584,851 | ) | (619,110 | ) | $ | (6,974,439 | ) | ||||
| Wisconsin | ||||||||||||||
Six Months Ended | Year Ended | |||||||||||||
Shares | Amount | Shares | Amount | |||||||||||
Shares sold: | ||||||||||||||
Class A | 162,739 | $ | 1,675,622 | 320,170 | $ | 3,324,300 | ||||||||
Class A – automatic conversion of Class B shares | 28,479 | 292,141 | 50,073 | 517,326 | ||||||||||
Class B | 2,973 | 30,803 | 16,460 | 172,128 | ||||||||||
Class C | 33,099 | 342,915 | 150,117 | 1,557,228 | ||||||||||
Class R | 59,435 | 619,243 | 13,705 | 143,332 | ||||||||||
Shares issued to shareholders due to reinvestment | ||||||||||||||
Class A | 36,435 | 374,722 | 85,191 | 882,924 | ||||||||||
Class B | 2,571 | 26,480 | 8,465 | 87,920 | ||||||||||
Class C | 5,388 | 55,519 | 13,056 | 135,564 | ||||||||||
Class R | 618 | 6,409 | 592 | 6,152 | ||||||||||
| 331,737 | 3,423,854 | 657,829 | 6,826,874 | |||||||||||
Shares redeemed: | ||||||||||||||
Class A | (163,034 | ) | (1,676,662 | ) | (310,972 | ) | (3,223,244 | ) | ||||||
Class B | (6,109 | ) | (62,630 | ) | (88,073 | ) | (915,337 | ) | ||||||
Class B – automatic conversion to Class A shares | (28,423 | ) | (292,141 | ) | (49,978 | ) | (517,326 | ) | ||||||
Class C | (21,965 | ) | (226,111 | ) | (86,829 | ) | (894,417 | ) | ||||||
Class R | (7 | ) | (70 | ) | (471 | ) | (4,847 | ) | ||||||
| (219,538 | ) | (2,257,614 | ) | (536,323 | ) | (5,555,171 | ) | |||||||
Net increase (decrease) | 112,199 | $ | 1,166,240 | 121,506 | $ | 1,271,703 | ||||||||
60
3. Investment Transactions
Purchases and sales (including maturities but excluding short-term investments) during the six months ended November 30, 2006, were as follows:
| Kansas | Kentucky | Michigan | Missouri | Ohio | Wisconsin | |||||||||||||
Purchases | $ | 11,522,800 | $ | 20,644,870 | $ | 19,338,085 | $ | 9,188,341 | $ | 40,879,816 | $ | 2,368,510 | ||||||
Sales and maturities | 11,572,938 | 27,085,049 | 24,233,610 | 14,013,482 | 55,208,005 | 1,069,655 | ||||||||||||
4. Income Tax Information
The following information is presented on an income tax basis. Differences between amounts for financial statement and federal income tax purposes are primarily due to the treatment of paydown gains and losses, timing differences in recognizing taxable market discount, timing differences in recognizing certain gains and losses on investment transactions and the treatment of investments in inverse floating rate transactions subject to SFAS No. 140. To the extent that differences arise that are permanent in nature, such amounts are reclassified within the capital accounts on the Statement of Assets and Liabilities presented in the annual report, based on their Federal tax basis treatment; temporary differences do not require reclassification. Temporary and permanent differences do not impact the net asset values of the Funds.
At November 30, 2006, the cost of investments was as follows:
| Kansas | Kentucky | Michigan | Missouri | Ohio | Wisconsin | |||||||||||||
Cost of investments | $ | 126,357,773 | $ | 437,367,874 | $ | 220,359,885 | $ | 245,992,451 | $ | 510,820,693 | $ | 45,407,707 | ||||||
Gross unrealized appreciation and gross unrealized depreciation of investments at November 30, 2006, were as follows:
| Kansas | Kentucky | Michigan | Missouri | Ohio | Wisconsin | ||||||||||||||||||
Gross unrealized: | |||||||||||||||||||||||
Appreciation | $ | 6,895,437 | $ | 26,021,804 | $ | 16,321,498 | $ | 15,236,868 | $ | 36,341,699 | $ | 2,172,615 | |||||||||||
Depreciation | (123,067 | ) | (79,895 | ) | (251,323 | ) | (14,340 | ) | (106,159 | ) | — | ||||||||||||
Net unrealized appreciation (depreciation) of investments | $ | 6,772,370 | $ | 25,941,909 | $ | 16,070,175 | $ | 15,222,528 | $ | 36,235,540 | $ | 2,172,615 | |||||||||||
The tax components of undistributed net tax-exempt income, net ordinary income and net long-term capital gains at May 31, 2006, the Funds’ last tax year end, were as follows:
| Kansas | Kentucky | Michigan | Missouri | Ohio | Wisconsin | |||||||||||||
Undistributed net tax-exempt income* | $ | 346,297 | $ | 1,047,349 | $ | 515,392 | $ | 539,405 | $ | 1,071,408 | $ | 81,780 | ||||||
Undistributed net ordinary income** | — | — | — | — | — | — | ||||||||||||
Undistributed net long-term capital gains | — | 344,542 | 453,850 | — | — | 99,658 | ||||||||||||
* Undistributed net tax-exempt income (on a tax basis) has not been reduced for the dividend declared on May 9, 2006, paid on June 1, 2006.
** Net ordinary income consists of taxable market discount income and net short-term capital gains, if any.
The tax character of distributions paid during the Funds’ last tax year ended May 31, 2006, was designated for purposes of the dividends paid deduction as follows:
| Kansas | Kentucky | Michigan | Missouri | Ohio | Wisconsin | |||||||||||||
Distributions from net tax-exempt income | $ | 5,050,446 | $ | 19,433,344 | $ | 9,980,919 | $ | 11,166,668 | $ | 23,584,206 | $ | 1,740,542 | ||||||
Distributions from net ordinary income** | — | — | 9,969 | — | 40,519 | 3,699 | ||||||||||||
Distributions from net long-term capital gains | — | 1,561,294 | 2,779,778 | — | 1,989,352 | 207,663 | ||||||||||||
** Net ordinary income consists of taxable market discount income and net short-term capital gains, if any.
At May 31, 2006, the Funds’ last tax year end, the following Funds had unused capital loss carryforwards available for federal income tax purposes to be applied against future capital gains, if any. If not applied, the carryforwards will expire as follows:
| Kansas | Missouri | |||||
Expiration year: | ||||||
2010 | $ | — | $ | 163,884 | ||
2011 | — | — | ||||
2012 | 1,523,456 | — | ||||
| $ | 1,523,456 | $ | 163,884 | |||
61
Notes to Financial Statements (Unaudited) (continued)
5. Management Fee and Other Transactions with Affiliates
Each Fund’s management fee is separated into two components – a complex-level component, based on the aggregate amount of all fund assets managed by Nuveen Asset Management (the “Adviser”), a wholly owned subsidiary of Nuveen Investments, Inc. (“Nuveen”), and a specific fund-level component, based only on the amount of assets within each individual fund. This pricing structure enables Nuveen fund shareholders to benefit from growth in the assets within each individual fund as well as from growth in the amount of complex-wide assets managed by the Adviser.
The annual fund-level fee, payable monthly, for each Fund is based upon the average daily net assets of each Fund as follows:
| Average Daily Net Assets | Fund-Level Fee Rate | ||
For the first $125 million | .3500 | % | |
For the next $125 million | .3375 | ||
For the next $250 million | .3250 | ||
For the next $500 million | .3125 | ||
For the next $1 billion | .3000 | ||
For the next $3 billion | .2750 | ||
For net assets over $5 billion | .2500 |
The annual complex-level fee, payable monthly, which is additive to the fund-level fee, for all Nuveen sponsored funds in the U.S., is based on the aggregate amount of total fund assets managed as stated in the table below. As of November 30, 2006, the complex-level fee rate was .1845%.
| Complex-Level Assets (1) | Complex-Level Fee Rate | ||
For the first $55 billion | .2000 | % | |
For the next $1 billion | .1800 | ||
For the next $1 billion | .1600 | ||
For the next $3 billion | .1425 | ||
For the next $3 billion | .1325 | ||
For the next $3 billion | .1250 | ||
For the next $5 billion | .1200 | ||
For the next $5 billion | .1175 | ||
For the next $15 billion | .1150 | ||
For Managed Assets over $91 billion (2) | .1400 |
| (1) | The complex-level fee component of the management fee for the funds is calculated based upon the aggregate Managed Assets (“Managed Assets” means the average daily net assets of each fund including assets attributable to all types of leverage used by the Nuveen funds) of Nuveen-sponsored funds in the U.S. |
| (2) | With respect to the complex-wide Managed Assets over $91 billion, the fee rate or rates that will apply to such assets will be determined at a later date. In the unlikely event that complex-wide Managed Assets reach $91 billion prior to a determination of the complex-level fee rate or rates to be applied to Managed Assets in excess of $91 billion, the complex-level fee rate for such complex-wide Managed Assets shall be .1400% until such time as a different rate or rates is determined. |
The management fee compensates the Adviser for overall investment advisory and administrative services and general office facilities. The Trust pays no compensation directly to those of its Trustees who are affiliated with the Adviser or to its Officers, all of whom receive remuneration for their services to the Trust from the Adviser or its affiliates. The Board of Trustees has adopted a deferred compensation plan for independent Trustees that enables Trustees to elect to defer receipt of all or a portion of the annual compensation they are entitled to receive from certain Nuveen advised Funds. Under the plan, deferred amounts are treated as though equal dollar amounts had been invested in shares of select Nuveen advised Funds.
The Adviser has agreed to waive part of its management fees or reimburse certain expenses of Ohio in order to limit total expenses (excluding 12b-1 distribution and service fees, interest expense and extraordinary expenses) from exceeding ..75% of the average daily net assets. The Adviser may also voluntarily reimburse additional expenses from time to time in any of the Funds. Voluntary reimbursements may be terminated at any time at the Adviser’s discretion.
During the six months ended November 30, 2006, Nuveen Investments, LLC (the “Distributor”), a wholly owned subsidiary of Nuveen, collected sales charges on purchases of Class A Shares, the majority of which were paid out as concessions to authorized dealers as follows:
| Kansas | Kentucky | Michigan | Missouri | Ohio | Wisconsin | |||||||||||||
Sales charges collected | $ | 57,352 | $ | 244,422 | $ | 79,901 | $ | 121,882 | $ | 192,899 | $ | 48,348 | ||||||
Paid to authorized dealers | 49,351 | 206,427 | 71,127 | 107,477 | 168,624 | 40,889 | ||||||||||||
The Distributor also received 12b-1 service fees on Class A Shares, substantially all of which were paid to compensate authorized dealers for providing services to shareholders relating to their investments.
62
During the six months ended November 30, 2006, the Distributor compensated authorized dealers directly with commission advances at the time of purchase as follows:
| Kansas | Kentucky | Michigan | Missouri | Ohio | Wisconsin | |||||||||||||
Commission advances | $ | 20,981 | $ | 39,100 | $ | 38,801 | $ | 33,953 | $ | 63,889 | $ | 4,104 | ||||||
To compensate for commissions advanced to authorized dealers, all 12b-1 service fees collected on Class B Shares during the first year following a purchase, all 12b-1 distribution fees collected on Class B Shares, and all 12b-1 service and distribution fees collected on Class C Shares during the first year following a purchase are retained by the Distributor. During the six months ended November 30, 2006, the Distributor retained such 12b-1 fees as follows:
| Kansas | Kentucky | Michigan | Missouri | Ohio | Wisconsin | |||||||||||||
12b-1 fees retained | $ | 36,112 | $ | 78,488 | $ | 49,310 | $ | 46,019 | $ | 112,157 | $ | 15,950 | ||||||
The remaining 12b-1 fees charged to the Funds were paid to compensate authorized dealers for providing services to shareholders relating to their investments.
The Distributor also collected and retained CDSC on share redemptions during the six months ended November 30, 2006, as follows:
| Kansas | Kentucky | Michigan | Missouri | Ohio | Wisconsin | |||||||||||||
CDSC retained | $ | 5,301 | $ | 28,975 | $ | 16,507 | $ | 9,052 | $ | 32,874 | $ | 541 | ||||||
6. New Accounting Pronouncements
Financial Accounting Standards Board Interpretation No. 48
On July 13, 2006, the Financial Accounting Standards Board (FASB) released FASB Interpretation No. 48 Accounting for Uncertainty in Income Taxes (FIN 48). FIN 48 provides guidance for how uncertain tax positions should be recognized, measured, presented and disclosed in the financial statements. FIN 48 requires the evaluation of tax positions taken or expected to be taken in the course of preparing the Fund’s tax returns to determine whether the tax positions are “more-likely-than-not” of being sustained by the applicable tax authority. Tax positions not deemed to meet the more-likely-than-not threshold would be recorded as a tax benefit or expense in the current year. Adoption of FIN 48 is required for fiscal years beginning after December 15, 2006 and is to be applied to all open tax years as of the effective date. At this time, management is evaluating the implications of FIN 48 and does not expect the adoption of FIN 48 will have a significant impact on the net assets or results of operations of the Funds.
Financial Accounting Standards Board Statement of Financial Accounting Standards No. 157
In September 2006, the Financial Accounting Standards Board (FASB) issued Statement of Financial Accounting Standards (SFAS) No. 157, “Fair Value Measurements.” This standard establishes a single authoritative definition of fair value, sets out a framework for measuring fair value and requires additional disclosures about fair value measurements. SFAS No. 157 applies to fair value measurements already required or permitted by existing standards. SFAS No. 157 is effective for financial statements issued for fiscal years beginning after November 15, 2007 and interim periods within those fiscal years. The changes to current generally accepted accounting principles from the application of this standard relate to the definition of fair value, the methods used to measure fair value, and the expanded disclosures about fair value measurements. As of November 30, 2006, the Funds do not believe the adoption of SFAS No. 157 will impact the financial statement amounts; however, additional disclosures may be required about the inputs used to develop the measurements and the effect of certain of the measurements included within the Statement of Operations for the period.
7. Subsequent Events
Distributions to Shareholders
The Funds declared dividend distributions from their tax-exempt net investment income which were paid on December 27, 2006, to shareholders of record on December 8, 2006, as follows:
| Kansas | Kentucky | Michigan | Missouri | Ohio | Wisconsin | |||||||||||||
Dividend per share: | ||||||||||||||||||
Class A | $ | .0345 | $ | .0380 | $ | .0395 | $ | .0375 | $ | .0390 | $ | .0325 | ||||||
Class B | .0280 | .0310 | .0325 | .0305 | .0320 | .0260 | ||||||||||||
Class C | .0300 | .0325 | .0340 | .0325 | .0340 | .0280 | ||||||||||||
Class R | .0365 | .0395 | .0415 | .0395 | .0410 | .0345 | ||||||||||||
The following Funds also declared capital gain and/or net ordinary income distributions, which were paid on December 5, 2006, to shareholders of record on December 1, 2006, as follows:
| Kentucky | Michigan | Missouri | Ohio | Wisconsin | |||||||||||
Capital gains distribution per share | $ | .0223 | $ | .0983 | $ | .0068 | $ | .0325 | $ | .0218 | |||||
Net ordinary income distribution per share* | — | $ | .0010 | — | — | — | |||||||||
* Net ordinary income consists of taxable market discount income and net short-term capital gains, if any.
63
Financial Highlights (Unaudited)
Selected data for a share outstanding throughout each period:
| Class (Commencement Date) | |||||||||||||||||||||||||||||||||||||||||||||||||||||||
| Investment Operations | Less Distributions | Ratios/Supplemental Data | |||||||||||||||||||||||||||||||||||||||||||||||||||||
| KANSAS | Ratios to Average | Ratios to Average | Ratios to Average | ||||||||||||||||||||||||||||||||||||||||||||||||||||
| Year Ended May 31, | Beginning Net Asset Value | Net Invest- ment Income(a) | Net Realized/ Unrealized Gain (Loss) | Total | Net Invest- ment Income | Capital Gains | Total | Ending Net Asset Value | Total Return(b) | Ending Net Assets (000) | Expenses | Net | Expenses | Net | Expenses | Net | Portfolio | ||||||||||||||||||||||||||||||||||||||
| Class A (1/92) | |||||||||||||||||||||||||||||||||||||||||||||||||||||||
2007(e) | $ | 10.38 | $ | .21 | $ | .20 | $ | .41 | $ | (.21 | ) | $ | — | $ | (.21 | ) | $ | 10.58 | 3.96 | % | $ | 100,888 | .86 | %* | 4.03 | %* | .86 | %* | 4.03 | %* | .85 | %* | 4.04 | %* | 9 | % | |||||||||||||||||||
2006 | 10.66 | .42 | (.29 | ) | .13 | (.41 | ) | — | (.41 | ) | 10.38 | 1.28 | 100,128 | .86 | 4.02 | .86 | 4.02 | .84 | 4.03 | 18 | |||||||||||||||||||||||||||||||||||
2005 | 10.20 | .44 | .46 | .90 | (.44 | ) | — | (.44 | ) | 10.66 | 8.95 | 97,861 | .88 | 4.17 | .88 | 4.17 | .87 | 4.18 | 21 | ||||||||||||||||||||||||||||||||||||
2004 | 10.77 | .46 | (.57 | ) | (.11 | ) | (.46 | ) | — | (.46 | ) | 10.20 | (1.02 | ) | 91,744 | .90 | 4.36 | .90 | 4.36 | .89 | 4.37 | 11 | |||||||||||||||||||||||||||||||||
2003 | 10.25 | .48 | .52 | 1.00 | (.48 | ) | — | (.48 | ) | 10.77 | 10.03 | 102,938 | .88 | 4.57 | .88 | 4.57 | .87 | 4.58 | 12 | ||||||||||||||||||||||||||||||||||||
2002 | 10.16 | .50 | .10 | .60 | (.51 | ) | — | (.51 | ) | 10.25 | 6.06 | 96,411 | .90 | 4.90 | .90 | 4.90 | .89 | 4.91 | 17 | ||||||||||||||||||||||||||||||||||||
| Class B (2/97) | |||||||||||||||||||||||||||||||||||||||||||||||||||||||
2007(e) | 10.30 | .17 | .20 | .37 | (.17 | ) | — | (.17 | ) | 10.50 | 3.60 | 6,838 | 1.61 | * | 3.28 | * | 1.61 | * | 3.28 | * | 1.60 | * | 3.29 | * | 9 | ||||||||||||||||||||||||||||||
2006 | 10.58 | .34 | (.28 | ) | .06 | (.34 | ) | — | (.34 | ) | 10.30 | .54 | 7,379 | 1.61 | 3.26 | 1.61 | 3.26 | 1.59 | 3.28 | 18 | |||||||||||||||||||||||||||||||||||
2005 | 10.12 | .36 | .46 | .82 | (.36 | ) | — | (.36 | ) | 10.58 | 8.21 | 10,031 | 1.63 | 3.42 | 1.63 | 3.42 | 1.61 | 3.43 | 21 | ||||||||||||||||||||||||||||||||||||
2004 | 10.69 | .38 | (.57 | ) | (.19 | ) | (.38 | ) | — | (.38 | ) | 10.12 | (1.77 | ) | 11,001 | 1.64 | 3.61 | 1.64 | 3.61 | 1.64 | 3.62 | 11 | |||||||||||||||||||||||||||||||||
2003 | 10.18 | .40 | .52 | .92 | (.41 | ) | — | (.41 | ) | 10.69 | 9.18 | 12,797 | 1.63 | 3.81 | 1.63 | 3.81 | 1.62 | 3.82 | 12 | ||||||||||||||||||||||||||||||||||||
2002 | 10.09 | .42 | .11 | .53 | (.44 | ) | — | (.44 | ) | 10.18 | 5.30 | 10,210 | 1.65 | 4.13 | 1.65 | 4.13 | 1.64 | 4.15 | 17 | ||||||||||||||||||||||||||||||||||||
| Class C (2/97) | |||||||||||||||||||||||||||||||||||||||||||||||||||||||
2007(e) | 10.38 | .18 | .21 | .39 | (.18 | ) | — | (.18 | ) | 10.59 | 3.79 | 22,120 | 1.41 | * | 3.48 | * | 1.41 | * | 3.48 | * | 1.40 | * | 3.49 | * | 9 | ||||||||||||||||||||||||||||||
2006 | 10.67 | .37 | (.30 | ) | .07 | (.36 | ) | — | (.36 | ) | 10.38 | .67 | 22,736 | 1.41 | 3.47 | 1.41 | 3.47 | 1.39 | 3.48 | 18 | |||||||||||||||||||||||||||||||||||
2005 | 10.21 | .38 | .46 | .84 | (.38 | ) | — | (.38 | ) | 10.67 | 8.39 | 22,836 | 1.43 | 3.62 | 1.43 | 3.62 | 1.42 | 3.63 | 21 | ||||||||||||||||||||||||||||||||||||
2004 | 10.78 | .40 | (.56 | ) | (.16 | ) | (.41 | ) | — | (.41 | ) | 10.21 | (1.53 | ) | 23,656 | 1.45 | 3.81 | 1.45 | 3.81 | 1.44 | 3.82 | 11 | |||||||||||||||||||||||||||||||||
2003 | 10.27 | .42 | .52 | .94 | (.43 | ) | — | (.43 | ) | 10.78 | 9.35 | 25,049 | 1.43 | 4.01 | 1.43 | 4.01 | 1.42 | 4.02 | 12 | ||||||||||||||||||||||||||||||||||||
2002 | 10.17 | .44 | .12 | .56 | (.46 | ) | — | (.46 | ) | 10.27 | 5.60 | 16,943 | 1.44 | 4.31 | 1.44 | 4.31 | 1.43 | 4.32 | 17 | ||||||||||||||||||||||||||||||||||||
| Class R (2/97) | |||||||||||||||||||||||||||||||||||||||||||||||||||||||
2007(e) | 10.42 | .22 | .21 | .43 | (.22 | ) | — | (.22 | ) | 10.63 | 4.16 | 1,656 | .66 | * | 4.23 | * | .66 | * | 4.23 | * | .65 | * | 4.24 | * | 9 | ||||||||||||||||||||||||||||||
2006 | 10.71 | .45 | (.30 | ) | .15 | (.44 | ) | — | (.44 | ) | 10.42 | 1.41 | 1,560 | .66 | 4.22 | .66 | 4.22 | .64 | 4.23 | 18 | |||||||||||||||||||||||||||||||||||
2005 | 10.24 | .46 | .47 | .93 | (.46 | ) | — | (.46 | ) | 10.71 | 9.26 | 1,449 | .68 | 4.37 | .68 | 4.37 | .67 | 4.38 | 21 | ||||||||||||||||||||||||||||||||||||
2004 | 10.82 | .48 | (.58 | ) | (.10 | ) | (.48 | ) | — | (.48 | ) | 10.24 | (.89 | ) | 1,204 | .70 | 4.56 | .70 | 4.56 | .69 | 4.57 | 11 | |||||||||||||||||||||||||||||||||
2003 | 10.30 | .50 | .53 | 1.03 | (.51 | ) | — | (.51 | ) | 10.82 | 10.23 | 1,310 | .68 | 4.77 | .68 | 4.77 | .67 | 4.78 | 12 | ||||||||||||||||||||||||||||||||||||
2002 | 10.20 | .53 | .11 | .64 | (.54 | ) | — | (.54 | ) | 10.30 | 6.38 | 1,475 | .70 | 5.12 | .70 | 5.12 | .69 | 5.13 | 17 | ||||||||||||||||||||||||||||||||||||
| * | Annualized. |
| (a) | Per share Net Investment Income is calculated using the average daily shares method. |
| (b) | Total returns are calculated on net asset value without any sales charge and are not annualized. |
| (c) | After expense reimbursement from the Adviser, where applicable. |
| (d) | After custodian fee credit and expense reimbursement, where applicable. |
| (e) | For the six months ended November 30, 2006. |
See accompanying notes to financial statements.
64
Selected data for a share outstanding throughout each period:
| Class (Commencement Date) | |||||||||||||||||||||||||||||||||||||||||||||||||||||||
| Investment Operations | Less Distributions | Ratios/Supplemental Data | |||||||||||||||||||||||||||||||||||||||||||||||||||||
| KENTUCKY | Ratios to Average | Ratios to Average | Ratios to Average | ||||||||||||||||||||||||||||||||||||||||||||||||||||
| Year Ended May 31, | Beginning Net Asset Value | Net Invest- ment Income(a) | Net Gain | Total | Net | Capital Gains | Total | Ending Net Asset Value | Total Return(b) | Ending Net Assets (000) | Expenses(f) | Net | Expenses(f) | Net | Expenses(f) | Net | Portfolio | ||||||||||||||||||||||||||||||||||||||
| Class A (5/87) | |||||||||||||||||||||||||||||||||||||||||||||||||||||||
2007(e) | $ | 10.96 | $ | .22 | $ | .25 | $ | .47 | $ | (.23 | ) | $ | — | $ | (.23 | ) | $ | 11.20 | 4.31 | % | $ | 403,275 | .91 | %* | 4.00 | %* | .91 | %* | 4.00 | %* | .90 | %* | 4.01 | %* | 4 | % | |||||||||||||||||||
2006 | 11.30 | .46 | (.30 | ) | .16 | (.46 | ) | (.04 | ) | (.50 | ) | 10.96 | 1.38 | 398,636 | .82 | 4.09 | .82 | 4.09 | .81 | 4.10 | 13 | ||||||||||||||||||||||||||||||||||
2005 | 10.88 | .48 | .43 | .91 | (.48 | ) | (.01 | ) | (.49 | ) | 11.30 | 8.51 | 427,106 | .83 | 4.35 | .83 | 4.35 | .82 | 4.36 | 15 | |||||||||||||||||||||||||||||||||||
2004 | 11.35 | .51 | (.42 | ) | .09 | (.52 | ) | (.04 | ) | (.56 | ) | 10.88 | .90 | 410,109 | .84 | 4.58 | .84 | 4.58 | .83 | 4.58 | 16 | ||||||||||||||||||||||||||||||||||
2003 | 10.92 | .53 | .44 | .97 | (.53 | ) | (.01 | ) | (.54 | ) | 11.35 | 9.03 | 426,782 | .84 | 4.79 | .84 | 4.79 | .83 | 4.79 | 14 | |||||||||||||||||||||||||||||||||||
2002 | 10.80 | .54 | .12 | .66 | (.54 | ) | — | (.54 | ) | 10.92 | 6.22 | 407,706 | .85 | 4.99 | .85 | 4.99 | .84 | 5.00 | 14 | ||||||||||||||||||||||||||||||||||||
| Class B (2/97) | |||||||||||||||||||||||||||||||||||||||||||||||||||||||
2007(e) | 10.97 | .18 | .24 | .42 | (.19 | ) | — | (.19 | ) | 11.20 | 3.82 | 15,754 | 1.66 | * | 3.26 | * | 1.66 | * | 3.26 | * | 1.65 | * | 3.26 | * | 4 | ||||||||||||||||||||||||||||||
2006 | 11.31 | .37 | (.30 | ) | .07 | (.37 | ) | (.04 | ) | (.41 | ) | 10.97 | .62 | 18,388 | 1.57 | 3.34 | 1.57 | 3.34 | 1.56 | 3.35 | 13 | ||||||||||||||||||||||||||||||||||
2005 | 10.88 | .40 | .44 | .84 | (.40 | ) | (.01 | ) | (.41 | ) | 11.31 | 7.80 | 21,216 | 1.57 | 3.60 | 1.57 | 3.60 | 1.57 | 3.61 | 15 | |||||||||||||||||||||||||||||||||||
2004 | 11.35 | .43 | (.42 | ) | .01 | (.44 | ) | (.04 | ) | (.48 | ) | 10.88 | .14 | 20,874 | 1.59 | 3.83 | 1.59 | 3.83 | 1.58 | 3.83 | 16 | ||||||||||||||||||||||||||||||||||
2003 | 10.92 | .45 | .44 | .89 | (.45 | ) | (.01 | ) | (.46 | ) | 11.35 | 8.21 | 21,206 | 1.59 | 4.04 | 1.59 | 4.04 | 1.58 | 4.04 | 14 | |||||||||||||||||||||||||||||||||||
2002 | 10.80 | .46 | .12 | .58 | (.46 | ) | — | (.46 | ) | 10.92 | 5.42 | 16,808 | 1.59 | 4.24 | 1.59 | 4.24 | 1.58 | 4.25 | 14 | ||||||||||||||||||||||||||||||||||||
| Class C (10/93) | |||||||||||||||||||||||||||||||||||||||||||||||||||||||
2007(e) | 10.96 | .19 | .25 | .44 | (.20 | ) | — | (.20 | ) | 11.20 | 4.00 | 47,185 | 1.46 | * | 3.45 | * | 1.46 | * | 3.45 | * | 1.45 | * | 3.46 | * | 4 | ||||||||||||||||||||||||||||||
2006 | 11.29 | .39 | (.29 | ) | .10 | (.39 | ) | (.04 | ) | (.43 | ) | 10.96 | .88 | 45,919 | 1.37 | 3.54 | 1.37 | 3.54 | 1.36 | 3.55 | 13 | ||||||||||||||||||||||||||||||||||
2005 | 10.87 | .42 | .43 | .85 | (.42 | ) | (.01 | ) | (.43 | ) | 11.29 | 7.91 | 46,160 | 1.37 | 3.80 | 1.37 | 3.80 | 1.37 | 3.81 | 15 | |||||||||||||||||||||||||||||||||||
2004 | 11.34 | .45 | (.42 | ) | .03 | (.46 | ) | (.04 | ) | (.50 | ) | 10.87 | .35 | 45,303 | 1.39 | 4.03 | 1.39 | 4.03 | 1.38 | 4.03 | 16 | ||||||||||||||||||||||||||||||||||
2003 | 10.91 | .47 | .44 | .91 | (.47 | ) | (.01 | ) | (.48 | ) | 11.34 | 8.45 | 50,194 | 1.39 | 4.24 | 1.39 | 4.24 | 1.38 | 4.24 | 14 | |||||||||||||||||||||||||||||||||||
2002 | 10.79 | .48 | .12 | .60 | (.48 | ) | — | (.48 | ) | 10.91 | 5.64 | 40,746 | 1.40 | 4.44 | 1.40 | 4.44 | 1.39 | 4.45 | 14 | ||||||||||||||||||||||||||||||||||||
| Class R (2/97) | |||||||||||||||||||||||||||||||||||||||||||||||||||||||
2007(e) | 10.96 | .23 | .24 | .47 | (.24 | ) | — | (.24 | ) | 11.19 | 4.30 | 2,649 | .71 | * | 4.20 | * | .71 | * | 4.20 | * | .71 | * | 4.21 | * | 4 | ||||||||||||||||||||||||||||||
2006 | 11.29 | .48 | (.30 | ) | .18 | (.47 | ) | (.04 | ) | (.51 | ) | 10.96 | 1.64 | 2,451 | .62 | 4.29 | .62 | 4.29 | .61 | 4.30 | 13 | ||||||||||||||||||||||||||||||||||
2005 | 10.87 | .51 | .42 | .93 | (.50 | ) | (.01 | ) | (.51 | ) | 11.29 | 8.70 | 1,581 | .63 | 4.54 | .63 | 4.54 | .62 | 4.55 | 15 | |||||||||||||||||||||||||||||||||||
2004 | 11.33 | .53 | (.41 | ) | .12 | (.54 | ) | (.04 | ) | (.58 | ) | 10.87 | 1.15 | 1,285 | .64 | 4.78 | .64 | 4.78 | .63 | 4.78 | 16 | ||||||||||||||||||||||||||||||||||
2003 | 10.90 | .55 | .44 | .99 | (.55 | ) | (.01 | ) | (.56 | ) | 11.33 | 9.23 | 1,172 | .64 | 4.99 | .64 | 4.99 | .63 | 4.99 | 14 | |||||||||||||||||||||||||||||||||||
2002 | 10.78 | .57 | .11 | .68 | (.56 | ) | — | (.56 | ) | 10.90 | 6.40 | 983 | .65 | 5.19 | .65 | 5.19 | .64 | 5.20 | 14 | ||||||||||||||||||||||||||||||||||||
| * | Annualized. |
| (a) | Per share Net Investment Income is calculated using the average daily shares method. |
| (b) | Total returns are calculated on net asset value without any sales charge and are not annualized. |
| (c) | After expense reimbursement from the Adviser, where applicable. |
| (d) | After custodian fee credit and expense reimbursement, where applicable. |
| (e) | For the six months ended November 30, 2006. |
| (f) | The expense ratios for the six months ended November 30, 2006 in the above table reflect, among other things, the interest expense deemed to have been paid by the Fund on the floating rate certificates issued by the special purpose trusts for the self-deposited inverse floaters held by the Fund, as described in Footnote 1 - Inverse Floating Rate Securities. The amount of this deemed interest expense for such period expressed as a percentage of average net assets was 0.08% for each share class. |
See accompanying notes to financial statements.
65
Financial Highlights (Unaudited) (continued)
Selected data for a share outstanding throughout each period:
| Class (Commencement Date) | ||||||||||||||||||||||||||||||||||||||||||||||||||||||||
| Investment Operations | Less Distributions | Ratios/Supplemental Data | ||||||||||||||||||||||||||||||||||||||||||||||||||||||
| MICHIGAN | Ratios to Average | Ratios to Average | Ratios to Average | |||||||||||||||||||||||||||||||||||||||||||||||||||||
| Year Ended May 31, | Beginning Net Asset Value | Net Invest- ment Income(a) | Net Realized/ Unrealized Gain (Loss) | Total | Net Invest- ment Income | Capital Gains | Total | Ending Net Asset Value | Total Return(b) | Ending Net Assets (000) | Expenses(f) | Net | Expenses(f) | Net | Expenses(f) | Net | Portfolio | |||||||||||||||||||||||||||||||||||||||
| Class A (6/85) | ||||||||||||||||||||||||||||||||||||||||||||||||||||||||
2007(e) | $ | 11.45 | $ | .24 | $ | .28 | $ | .52 | $ | (.24 | ) | $ | — | $ | (.24 | ) | $ | 11.73 | 4.56 | % | $ | 172,582 | .92 | %* | 4.11 | %* | .92 | %* | 4.11 | %* | .91 | %* | 4.13 | %* | 8 | % | ||||||||||||||||||||
2006 | 11.89 | .49 | (.32 | ) | .17 | (.48 | ) | (.13 | ) | (.61 | ) | 11.45 | 1.48 | 170,278 | .86 | 4.16 | .86 | 4.16 | .85 | 4.17 | 11 | |||||||||||||||||||||||||||||||||||
2005 | 11.45 | .51 | .45 | .96 | (.51 | ) | (.01 | ) | (.52 | ) | 11.89 | 8.48 | 181,302 | .86 | 4.32 | .86 | 4.32 | .86 | 4.33 | 16 | ||||||||||||||||||||||||||||||||||||
2004 | 12.16 | .54 | (.58 | ) | (.04 | ) | (.55 | ) | (.12 | ) | (.67 | ) | 11.45 | (.27 | ) | 179,956 | .87 | 4.61 | .87 | 4.61 | .86 | 4.61 | 9 | |||||||||||||||||||||||||||||||||
2003 | 11.55 | .55 | .63 | 1.18 | (.56 | ) | (.01 | ) | (.57 | ) | 12.16 | 10.40 | 204,652 | .86 | 4.67 | .86 | 4.67 | .86 | 4.67 | 10 | ||||||||||||||||||||||||||||||||||||
2002 | 11.39 | .56 | .20 | .76 | (.57 | ) | (.03 | ) | (.60 | ) | 11.55 | 6.70 | 205,808 | .87 | 4.86 | .87 | 4.86 | .87 | 4.86 | 19 | ||||||||||||||||||||||||||||||||||||
| Class B (2/97) | ||||||||||||||||||||||||||||||||||||||||||||||||||||||||
2007(e) | 11.48 | .20 | .28 | .48 | (.20 | ) | — | (.20 | ) | 11.76 | 4.17 | 5,600 | 1.67 | * | 3.37 | * | 1.67 | * | 3.37 | * | 1.66 | * | 3.38 | * | 8 | |||||||||||||||||||||||||||||||
2006 | 11.92 | .40 | (.32 | ) | .08 | (.39 | ) | (.13 | ) | (.52 | ) | 11.48 | .71 | 6,794 | 1.61 | 3.41 | 1.61 | 3.41 | 1.60 | 3.41 | 11 | |||||||||||||||||||||||||||||||||||
2005 | 11.47 | .42 | .46 | .88 | (.42 | ) | (.01 | ) | (.43 | ) | 11.92 | 7.73 | 8,938 | 1.61 | 3.57 | 1.61 | 3.57 | 1.60 | 3.58 | 16 | ||||||||||||||||||||||||||||||||||||
2004 | 12.18 | .45 | (.58 | ) | (.13 | ) | (.46 | ) | (.12 | ) | (.58 | ) | 11.47 | (1.03 | ) | 10,112 | 1.62 | 3.86 | 1.62 | 3.86 | 1.61 | 3.86 | 9 | |||||||||||||||||||||||||||||||||
2003 | 11.57 | .46 | .63 | 1.09 | (.47 | ) | (.01 | ) | (.48 | ) | 12.18 | 9.56 | 11,179 | 1.61 | 3.91 | 1.61 | 3.91 | 1.61 | 3.92 | 10 | ||||||||||||||||||||||||||||||||||||
2002 | 11.41 | .48 | .19 | .67 | (.48 | ) | (.03 | ) | (.51 | ) | 11.57 | 5.88 | 9,214 | 1.62 | 4.11 | 1.62 | 4.11 | 1.62 | 4.11 | 19 | ||||||||||||||||||||||||||||||||||||
| Class C (6/93) | ||||||||||||||||||||||||||||||||||||||||||||||||||||||||
2007(e) | 11.44 | .21 | .28 | .49 | (.20 | ) | — | (.20 | ) | 11.73 | 4.35 | 38,422 | 1.47 | * | 3.57 | * | 1.47 | * | 3.57 | * | 1.46 | * | 3.58 | * | 8 | |||||||||||||||||||||||||||||||
2006 | 11.88 | .42 | (.32 | ) | .10 | (.41 | ) | (.13 | ) | (.54 | ) | 11.44 | .91 | 38,141 | 1.41 | 3.61 | 1.41 | 3.61 | 1.40 | 3.62 | 11 | |||||||||||||||||||||||||||||||||||
2005 | 11.43 | .44 | .46 | .90 | (.44 | ) | (.01 | ) | (.45 | ) | 11.88 | 7.98 | 38,386 | 1.41 | 3.77 | 1.41 | 3.77 | 1.40 | 3.78 | 16 | ||||||||||||||||||||||||||||||||||||
2004 | 12.14 | .48 | (.58 | ) | (.10 | ) | (.49 | ) | (.12 | ) | (.61 | ) | 11.43 | (.83 | ) | 36,912 | 1.42 | 4.06 | 1.42 | 4.06 | 1.41 | 4.06 | 9 | |||||||||||||||||||||||||||||||||
2003 | 11.54 | .49 | .61 | 1.10 | (.49 | ) | (.01 | ) | (.50 | ) | 12.14 | 9.71 | 43,693 | 1.41 | 4.12 | 1.41 | 4.12 | 1.41 | 4.12 | 10 | ||||||||||||||||||||||||||||||||||||
2002 | 11.38 | .50 | .19 | .69 | (.50 | ) | (.03 | ) | (.53 | ) | 11.54 | 6.11 | 38,763 | 1.42 | 4.31 | 1.42 | 4.31 | 1.42 | 4.31 | 19 | ||||||||||||||||||||||||||||||||||||
| Class R (2/97) | ||||||||||||||||||||||||||||||||||||||||||||||||||||||||
2007(e) | 11.45 | .25 | .29 | .54 | (.25 | ) | — | (.25 | ) | 11.74 | 4.75 | 21,903 | .72 | * | 4.31 | * | .72 | * | 4.31 | * | .71 | * | 4.33 | * | 8 | |||||||||||||||||||||||||||||||
2006 | 11.89 | .51 | (.32 | ) | .19 | (.50 | ) | (.13 | ) | (.63 | ) | 11.45 | 1.69 | 21,871 | .66 | 4.36 | .66 | 4.36 | .65 | 4.36 | 11 | |||||||||||||||||||||||||||||||||||
2005 | 11.45 | .53 | .45 | .98 | (.53 | ) | (.01 | ) | (.54 | ) | 11.89 | 8.70 | 23,675 | .66 | 4.52 | .66 | 4.52 | .66 | 4.53 | 16 | ||||||||||||||||||||||||||||||||||||
2004 | 12.16 | .57 | (.58 | ) | (.01 | ) | (.58 | ) | (.12 | ) | (.70 | ) | 11.45 | (.07 | ) | 23,618 | .67 | 4.81 | .67 | 4.81 | .66 | 4.81 | 9 | |||||||||||||||||||||||||||||||||
2003 | 11.56 | .58 | .61 | 1.19 | (.58 | ) | (.01 | ) | (.59 | ) | 12.16 | 10.53 | 24,951 | .66 | 4.87 | .66 | 4.87 | .66 | 4.87 | 10 | ||||||||||||||||||||||||||||||||||||
2002 | 11.39 | .59 | .20 | .79 | (.59 | ) | (.03 | ) | (.62 | ) | 11.56 | 6.99 | 23,643 | .67 | 5.06 | .67 | 5.06 | .67 | 5.06 | 19 | ||||||||||||||||||||||||||||||||||||
| * | Annualized. |
| (a) | Per share Net Investment Income is calculated using the average daily shares method. |
| (b) | Total returns are calculated on net asset value without any sales charge and are not annualized. |
| (c) | After expense reimbursement from the Adviser, where applicable. |
| (d) | After custodian fee credit and expense reimbursement, where applicable. |
| (e) | For the six months ended November 30, 2006. |
| (f) | The expense ratios for the six months ended November 30, 2006 in the above table reflect, among other things, the interest expense deemed to have been paid by the Fund on the floating rate certificates issued by the special purpose trusts for the self-deposited inverse floaters held by the Fund, as described in Footnote 1 - Inverse Floating Rate Securities. The amount of this deemed interest expense for such period expressed as a percentage of average net assets was 0.06% for each share class. |
See accompanying notes to financial statements.
66
Selected data for a share outstanding throughout each period:
| Class (Commencement Date) | |||||||||||||||||||||||||||||||||||||||||||||||||||||||
| Investment Operations | Less Distributions | Ratios/Supplemental Data | |||||||||||||||||||||||||||||||||||||||||||||||||||||
| MISSOURI | Ratios to Average | Ratios to Average | Ratios to Average | ||||||||||||||||||||||||||||||||||||||||||||||||||||
| Year Ended May 31, | Beginning Net Asset Value | Net Invest- ment Income(a) | Net Realized/ Unrealized Gain (Loss) | Total | Net Invest- ment Income | Capital Gains | Total | Ending Net Asset Value | Total Return(b) | Ending Net Assets (000) | Expenses | Net | Expenses | Net | Expenses | Net | Portfolio Turnover Rate | ||||||||||||||||||||||||||||||||||||||
| Class A (8/87) | |||||||||||||||||||||||||||||||||||||||||||||||||||||||
2007(e) | $ | 10.98 | $ | .23 | $ | .27 | $ | .50 | $ | (.23 | ) | $ | — | $ | (.23 | ) | $ | 11.25 | 4.55 | % | $ | 233,634 | .83 | %* | 4.15 | %* | .83 | %* | 4.15 | %* | .82 | %* | 4.16 | %* | 4 | % | |||||||||||||||||||
2006 | 11.25 | .47 | (.26 | ) | .21 | (.48 | ) | — | (.48 | ) | 10.98 | 1.88 | 231,378 | .83 | 4.23 | .83 | 4.23 | .82 | 4.24 | 12 | |||||||||||||||||||||||||||||||||||
2005 | 10.78 | .48 | .47 | .95 | (.48 | ) | — | (.48 | ) | 11.25 | 8.97 | 232,171 | .84 | 4.35 | .84 | 4.35 | .83 | 4.35 | 16 | ||||||||||||||||||||||||||||||||||||
2004 | 11.30 | .50 | (.53 | ) | (.03 | ) | (.49 | ) | — | (.49 | ) | 10.78 | (.28 | ) | 221,955 | .85 | 4.50 | .85 | 4.50 | .85 | 4.51 | 13 | |||||||||||||||||||||||||||||||||
2003 | 10.81 | .51 | .51 | 1.02 | (.53 | ) | — | (.53 | ) | 11.30 | 9.63 | 233,996 | .86 | 4.65 | .86 | 4.65 | .85 | 4.66 | 14 | ||||||||||||||||||||||||||||||||||||
2002 | 10.71 | .54 | .11 | .65 | (.55 | ) | — | (.55 | ) | 10.81 | 6.20 | 207,890 | .87 | 5.02 | .87 | 5.02 | .86 | 5.03 | 13 | ||||||||||||||||||||||||||||||||||||
| Class B (2/97) | |||||||||||||||||||||||||||||||||||||||||||||||||||||||
2007(e) | 10.99 | .19 | .26 | .45 | (.18 | ) | — | (.18 | ) | 11.26 | 4.15 | 7,978 | 1.58 | * | 3.40 | * | 1.58 | * | 3.40 | * | 1.57 | * | 3.41 | * | 4 | ||||||||||||||||||||||||||||||
2006 | 11.26 | .39 | (.27 | ) | .12 | (.39 | ) | — | (.39 | ) | 10.99 | 1.12 | 8,570 | 1.58 | 3.48 | 1.58 | 3.48 | 1.57 | 3.49 | 12 | |||||||||||||||||||||||||||||||||||
2005 | 10.79 | .40 | .47 | .87 | (.40 | ) | — | (.40 | ) | 11.26 | 8.15 | 9,197 | 1.58 | 3.60 | 1.58 | 3.60 | 1.58 | 3.60 | 16 | ||||||||||||||||||||||||||||||||||||
2004 | 11.30 | .41 | (.52 | ) | (.11 | ) | (.40 | ) | — | (.40 | ) | 10.79 | (.95 | ) | 9,532 | 1.60 | 3.75 | 1.60 | 3.75 | 1.60 | 3.75 | 13 | |||||||||||||||||||||||||||||||||
2003 | 10.81 | .43 | .50 | .93 | (.44 | ) | — | (.44 | ) | 11.30 | 8.80 | 11,912 | 1.61 | 3.90 | 1.61 | 3.90 | 1.60 | 3.91 | 14 | ||||||||||||||||||||||||||||||||||||
2002 | 10.71 | .46 | .11 | .57 | (.47 | ) | — | (.47 | ) | 10.81 | 5.38 | 9,091 | 1.62 | 4.27 | 1.62 | 4.27 | 1.61 | 4.27 | 13 | ||||||||||||||||||||||||||||||||||||
| Class C (2/94) | |||||||||||||||||||||||||||||||||||||||||||||||||||||||
2007(e) | 10.97 | .20 | .27 | .47 | (.20 | ) | — | (.20 | ) | 11.24 | 4.27 | 21,617 | 1.38 | * | 3.60 | * | 1.38 | * | 3.60 | * | 1.37 | * | 3.61 | * | 4 | ||||||||||||||||||||||||||||||
2006 | 11.24 | .41 | (.26 | ) | .15 | (.42 | ) | — | (.42 | ) | 10.97 | 1.34 | 21,387 | 1.38 | 3.68 | 1.38 | 3.68 | 1.37 | 3.69 | 12 | |||||||||||||||||||||||||||||||||||
2005 | 10.77 | .42 | .47 | .89 | (.42 | ) | — | (.42 | ) | 11.24 | 8.39 | 19,955 | 1.39 | 3.80 | 1.39 | 3.80 | 1.38 | 3.81 | 16 | ||||||||||||||||||||||||||||||||||||
2004 | 11.29 | .44 | (.53 | ) | (.09 | ) | (.43 | ) | — | (.43 | ) | 10.77 | (.84 | ) | 21,402 | 1.40 | 3.95 | 1.40 | 3.95 | 1.40 | 3.95 | 13 | |||||||||||||||||||||||||||||||||
2003 | 10.81 | .45 | .49 | .94 | (.46 | ) | — | (.46 | ) | 11.29 | 8.93 | 23,336 | 1.41 | 4.10 | 1.41 | 4.10 | 1.40 | 4.11 | 14 | ||||||||||||||||||||||||||||||||||||
2002 | 10.70 | .48 | .12 | .60 | (.49 | ) | — | (.49 | ) | 10.81 | 5.72 | 20,076 | 1.41 | 4.46 | 1.41 | 4.46 | 1.41 | 4.47 | 13 | ||||||||||||||||||||||||||||||||||||
| Class R (2/97) | |||||||||||||||||||||||||||||||||||||||||||||||||||||||
2007(e) | 10.99 | .24 | .27 | .51 | (.24 | ) | — | (.24 | ) | 11.26 | 4.66 | 1,383 | .63 | * | 4.34 | * | .63 | * | 4.34 | * | .62 | * | 4.35 | * | 4 | ||||||||||||||||||||||||||||||
2006 | 11.26 | .49 | (.26 | ) | .23 | (.50 | ) | — | (.50 | ) | 10.99 | 2.10 | 895 | .63 | 4.44 | .63 | 4.44 | .62 | 4.45 | 12 | |||||||||||||||||||||||||||||||||||
2005 | 10.79 | .50 | .47 | .97 | (.50 | ) | — | (.50 | ) | 11.26 | 9.20 | 561 | .64 | 4.54 | .64 | 4.54 | .64 | 4.55 | 16 | ||||||||||||||||||||||||||||||||||||
2004 | 11.31 | .52 | (.53 | ) | (.01 | ) | (.51 | ) | — | (.51 | ) | 10.79 | (.10 | ) | 483 | .65 | 4.70 | .65 | 4.70 | .65 | 4.71 | 13 | |||||||||||||||||||||||||||||||||
2003 | 10.82 | .53 | .50 | 1.03 | (.54 | ) | — | (.54 | ) | 11.31 | 9.80 | 534 | .66 | 4.86 | .66 | 4.86 | .65 | 4.86 | 14 | ||||||||||||||||||||||||||||||||||||
2002 | 10.71 | .57 | .11 | .68 | (.57 | ) | — | (.57 | ) | 10.82 | 6.47 | 507 | .67 | 5.22 | .67 | 5.22 | .66 | 5.23 | 13 | ||||||||||||||||||||||||||||||||||||
| * | Annualized. |
| (a) | Per share Net Investment Income is calculated using the average daily shares method. |
| (b) | Total returns are calculated on net asset value without any sales charge and are not annualized. |
| (c) | After expense reimbursement from the Adviser, where applicable. |
| (d) | After custodian fee credit and expense reimbursement, where applicable. |
| (e) | For the six months ended November 30, 2006. |
See accompanying notes to financial statements.
67
Financial Highlights (Unaudited) (continued)
Selected data for a share outstanding throughout each period:
| Class (Commencement Date) | ||||||||||||||||||||||||||||||||||||||||||||||||||||||||
| Investment Operations | Less Distributions | Ratios/Supplemental Data | ||||||||||||||||||||||||||||||||||||||||||||||||||||||
| OHIO | Ratios to Average Net Assets Before Credit/ Reimbursement | Ratios to Average Net Assets After Reimbursement(c) | Ratios to Average Net Assets After Credit/ Reimbursement(d) | |||||||||||||||||||||||||||||||||||||||||||||||||||||
Year Ended May 31, | Beginning Net Asset Value | Net Invest- ment Income(a) | Net Realized/ Unrealized Gain (Loss) | Total | Net Invest- ment Income | Capital Gains | Total | Ending Net Asset Value | Total Return(b) | Ending Net Assets (000) | Expenses(f) | Net Invest- ment Income | Expenses(f) | Net Invest- ment Income | Expenses(f) | Net Invest- ment Income | Portfolio Turnover Rate | |||||||||||||||||||||||||||||||||||||||
| Class A (6/85) | ||||||||||||||||||||||||||||||||||||||||||||||||||||||||
2007(e) | $ | 11.27 | $ | .23 | $ | .25 | $ | .48 | $ | (.23 | ) | $ | — | $ | (.23 | ) | $ | 11.52 | 4.34 | % | $ | 351,083 | 1.03 | %* | 4.12 | %* | 1.03 | %* | 4.12 | %* | 1.03 | %* | 4.12 | %* | 7 | % | ||||||||||||||||||||
2006 | 11.65 | .48 | (.34 | ) | .14 | (.48 | ) | (.04 | ) | (.52 | ) | 11.27 | 1.30 | 348,198 | .83 | 4.21 | .83 | 4.21 | .83 | 4.21 | 13 | |||||||||||||||||||||||||||||||||||
2005 | 11.17 | .51 | .48 | .99 | (.51 | ) | — | (.51 | ) | 11.65 | 9.00 | 358,529 | .84 | 4.43 | .84 | 4.43 | .83 | 4.44 | 11 | |||||||||||||||||||||||||||||||||||||
2004 | 11.78 | .53 | (.60 | ) | (.07 | ) | (.54 | ) | — | (.54 | ) | 11.17 | (.62 | ) | 347,733 | .85 | 4.65 | .85 | 4.65 | .85 | 4.65 | 12 | ||||||||||||||||||||||||||||||||||
2003 | 11.16 | .54 | .62 | 1.16 | (.54 | ) | — | (.54 | ) | 11.78 | 10.65 | 385,619 | .87 | 4.69 | .87 | 4.69 | .87 | 4.69 | 12 | |||||||||||||||||||||||||||||||||||||
2002 | 11.10 | .55 | .06 | .61 | (.55 | ) | — | (.55 | ) | 11.16 | 5.57 | 379,342 | .86 | 4.93 | .86 | 4.93 | .86 | 4.93 | 21 | |||||||||||||||||||||||||||||||||||||
| Class B (2/97) | ||||||||||||||||||||||||||||||||||||||||||||||||||||||||
2007(e) | �� | 11.25 | .19 | .26 | .45 | (.19 | ) | — | (.19 | ) | 11.51 | 4.05 | 18,765 | 1.78 | * | 3.37 | * | 1.78 | * | 3.37 | * | 1.78 | * | 3.38 | * | 7 | ||||||||||||||||||||||||||||||
2006 | 11.64 | .40 | (.35 | ) | .05 | (.40 | ) | (.04 | ) | (.44 | ) | 11.25 | .47 | 20,504 | 1.58 | 3.45 | 1.58 | 3.45 | 1.58 | 3.46 | 13 | |||||||||||||||||||||||||||||||||||
2005 | 11.16 | .42 | .48 | .90 | (.42 | ) | — | (.42 | ) | 11.64 | 8.22 | 25,621 | 1.58 | 3.69 | 1.58 | 3.69 | 1.58 | 3.69 | 11 | |||||||||||||||||||||||||||||||||||||
2004 | 11.77 | .45 | (.61 | ) | (.16 | ) | (.45 | ) | — | (.45 | ) | 11.16 | (1.34 | ) | 26,057 | 1.60 | 3.90 | 1.60 | 3.90 | 1.60 | 3.90 | 12 | ||||||||||||||||||||||||||||||||||
2003 | 11.15 | .45 | .63 | 1.08 | (.46 | ) | — | (.46 | ) | 11.77 | 9.85 | 28,080 | 1.62 | 3.94 | 1.62 | 3.94 | 1.61 | 3.94 | 12 | |||||||||||||||||||||||||||||||||||||
2002 | 11.09 | .47 | .05 | .52 | (.46 | ) | — | (.46 | ) | 11.15 | 4.79 | 22,433 | 1.61 | 4.17 | 1.61 | 4.17 | 1.61 | 4.18 | 21 | |||||||||||||||||||||||||||||||||||||
| Class C (8/93) | ||||||||||||||||||||||||||||||||||||||||||||||||||||||||
2007(e) | 11.24 | .20 | .25 | .45 | (.20 | ) | — | (.20 | ) | 11.49 | 4.07 | 48,374 | 1.58 | * | 3.57 | * | 1.58 | * | 3.57 | * | 1.58 | * | 3.57 | * | 7 | |||||||||||||||||||||||||||||||
2006 | 11.63 | .42 | (.35 | ) | .07 | (.42 | ) | (.04 | ) | (.46 | ) | 11.24 | .68 | 46,325 | 1.38 | 3.66 | 1.38 | 3.66 | 1.38 | 3.66 | 13 | |||||||||||||||||||||||||||||||||||
2005 | 11.15 | .45 | .48 | .93 | (.45 | ) | — | (.45 | ) | 11.63 | 8.45 | 45,791 | 1.38 | 3.88 | 1.38 | 3.88 | 1.38 | 3.89 | 11 | |||||||||||||||||||||||||||||||||||||
2004 | 11.76 | .47 | (.60 | ) | (.13 | ) | (.48 | ) | — | (.48 | ) | 11.15 | (1.14 | ) | 44,575 | 1.40 | 4.10 | 1.40 | 4.10 | 1.40 | 4.10 | 12 | ||||||||||||||||||||||||||||||||||
2003 | 11.15 | .47 | .62 | 1.09 | (.48 | ) | — | (.48 | ) | 11.76 | 9.99 | 50,999 | 1.42 | 4.14 | 1.42 | 4.14 | 1.41 | 4.14 | 12 | |||||||||||||||||||||||||||||||||||||
2002 | 11.09 | .49 | .06 | .55 | (.49 | ) | — | (.49 | ) | 11.15 | 5.01 | 44,984 | 1.41 | 4.37 | 1.41 | 4.37 | 1.41 | 4.38 | 21 | |||||||||||||||||||||||||||||||||||||
| Class R (2/97) | ||||||||||||||||||||||||||||||||||||||||||||||||||||||||
2007(e) | 11.25 | .25 | .26 | .51 | (.25 | ) | — | (.25 | ) | 11.51 | 4.45 | 128,451 | .83 | * | 4.32 | * | .83 | * | 4.32 | * | .83 | * | 4.32 | * | 7 | |||||||||||||||||||||||||||||||
2006 | 11.64 | .50 | (.34 | ) | .16 | (.51 | ) | (.04 | ) | (.55 | ) | 11.25 | 1.51 | 128,133 | .63 | 4.41 | .63 | 4.41 | .63 | 4.41 | 13 | |||||||||||||||||||||||||||||||||||
2005 | 11.16 | .53 | .48 | 1.01 | (.53 | ) | — | (.53 | ) | 11.64 | 9.24 | 139,017 | .64 | 4.64 | .64 | 4.64 | .64 | 4.64 | 11 | |||||||||||||||||||||||||||||||||||||
2004 | 11.77 | .56 | (.61 | ) | (.05 | ) | (.56 | ) | — | (.56 | ) | 11.16 | (.41 | ) | 139,762 | .65 | 4.85 | .65 | 4.85 | .65 | 4.85 | 12 | ||||||||||||||||||||||||||||||||||
2003 | 11.15 | .56 | .62 | 1.18 | (.56 | ) | — | (.56 | ) | 11.77 | 10.89 | 154,781 | .67 | 4.89 | .67 | 4.89 | .67 | 4.89 | 12 | |||||||||||||||||||||||||||||||||||||
2002 | 11.09 | .57 | .06 | .63 | (.57 | ) | — | (.57 | ) | 11.15 | 5.80 | 148,302 | .66 | 5.12 | .66 | 5.12 | .66 | 5.13 | 21 | |||||||||||||||||||||||||||||||||||||
| * | Annualized. |
| (a) | Per share Net Investment Income is calculated using the average daily shares method. |
| (b) | Total returns are calculated on net asset value without any sales charge and are not annualized. |
| (c) | After expense reimbursement from the Adviser, where applicable. |
| (d) | After custodian fee credit and expense reimbursement, where applicable. |
| (e) | For the six months ended November 30, 2006. |
| (f) | The expense ratios for the six months ended November 30, 2006 in the above table reflect, among other things, the interest expense deemed to have been paid by the Fund on the floating rate certificates issued by the special purpose trusts for the self-deposited inverse floaters held by the Fund, as described in Footnote 1 - Inverse Floating Rate Securities. The amount of this deemed interest expense for such period expressed as a percentage of average net assets was 0.19% for each share class. |
See accompanying notes to financial statements.
68
Selected data for a share outstanding throughout each period:
| Class (Commencement Date) | ||||||||||||||||||||||||||||||||||||||||||||||||||||||||
| Investment Operations | Less Distributions | Ratios/Supplemental Data | ||||||||||||||||||||||||||||||||||||||||||||||||||||||
| WISCONSIN | Ratios to Average | Ratios to Average | Ratios to Average | |||||||||||||||||||||||||||||||||||||||||||||||||||||
| Year Ended May 31, | Beginning Net Asset Value | Net Invest- ment Income(a) | Net Realized/ Unrealized Gain (Loss) | Total | Net Invest- ment Income | Capital Gains | Total | Ending Net Asset Value | Total Return(b) | Ending Net Assets (000) | Expenses | Net | Expenses | Net | Expenses | Net | Portfolio | |||||||||||||||||||||||||||||||||||||||
| Class A (6/94) | ||||||||||||||||||||||||||||||||||||||||||||||||||||||||
2007(e) | $ | 10.20 | $ | .20 | $ | .27 | $ | .47 | $ | (.20 | ) | $ | — | $ | (.20 | ) | $ | 10.47 | 4.60 | % | $ | 38,272 | .92 | %* | 3.80 | %* | .92 | %* | 3.80 | %* | .89 | %* | 3.83 | %* | 2 | % | ||||||||||||||||||||
2006 | 10.54 | .40 | (.28 | ) | .12 | (.41 | ) | (.05 | ) | (.46 | ) | 10.20 | 1.11 | 36,624 | .92 | 3.84 | .92 | 3.84 | .89 | 3.88 | 11 | |||||||||||||||||||||||||||||||||||
2005 | 10.16 | .42 | .37 | .79 | (.41 | ) | — | (.41 | ) | 10.54 | 7.94 | 36,325 | .92 | 3.99 | .92 | 3.99 | .90 | 4.00 | 15 | |||||||||||||||||||||||||||||||||||||
2004 | 10.62 | .43 | (.45 | ) | (.02 | ) | (.44 | ) | — | (.44 | ) | 10.16 | (.33 | ) | 39,033 | .92 | 4.12 | .92 | 4.12 | .91 | 4.13 | 21 | ||||||||||||||||||||||||||||||||||
2003 | 10.14 | .43 | .49 | .92 | (.44 | ) | — | (.44 | ) | 10.62 | 9.41 | 42,360 | .93 | 4.19 | .93 | 4.19 | .91 | 4.20 | 8 | |||||||||||||||||||||||||||||||||||||
2002 | 9.97 | .44 | .17 | .61 | (.44 | ) | — | (.44 | ) | 10.14 | 6.26 | 40,199 | .93 | 4.39 | .93 | 4.39 | .92 | 4.40 | 19 | |||||||||||||||||||||||||||||||||||||
| Class B (2/97) | ||||||||||||||||||||||||||||||||||||||||||||||||||||||||
2007(e) | 10.22 | .16 | .28 | .44 | (.16 | ) | — | (.16 | ) | 10.50 | 4.30 | 3,078 | 1.67 | * | 3.05 | * | 1.67 | * | 3.05 | * | 1.64 | * | 3.08 | * | 2 | |||||||||||||||||||||||||||||||
2006 | 10.57 | .32 | (.29 | ) | .03 | (.33 | ) | (.05 | ) | (.38 | ) | 10.22 | .26 | 3,295 | 1.67 | 3.09 | 1.67 | 3.09 | 1.64 | 3.12 | 11 | |||||||||||||||||||||||||||||||||||
2005 | 10.18 | .34 | .39 | .73 | (.34 | ) | — | (.34 | ) | 10.57 | 7.25 | 4,600 | 1.67 | 3.24 | 1.67 | 3.24 | 1.66 | 3.25 | 15 | |||||||||||||||||||||||||||||||||||||
2004 | 10.65 | .35 | (.46 | ) | (.11 | ) | (.36 | ) | — | (.36 | ) | 10.18 | (1.01 | ) | 4,568 | 1.67 | 3.37 | 1.67 | 3.37 | 1.66 | 3.38 | 21 | ||||||||||||||||||||||||||||||||||
2003 | 10.17 | .36 | .49 | .85 | (.37 | ) | — | (.37 | ) | 10.65 | 8.53 | 5,960 | 1.67 | 3.44 | 1.67 | 3.44 | 1.66 | 3.45 | 8 | |||||||||||||||||||||||||||||||||||||
2002 | 10.00 | .37 | .17 | .54 | (.37 | ) | — | (.37 | ) | 10.17 | 5.49 | 5,224 | 1.68 | 3.65 | 1.68 | 3.65 | 1.67 | 3.66 | 19 | |||||||||||||||||||||||||||||||||||||
| Class C (2/97) | ||||||||||||||||||||||||||||||||||||||||||||||||||||||||
2007(e) | 10.23 | .17 | .27 | .44 | (.17 | ) | — | (.17 | ) | 10.50 | 4.42 | 5,738 | 1.47 | * | 3.25 | * | 1.47 | * | 3.25 | * | 1.44 | * | 3.28 | * | 2 | |||||||||||||||||||||||||||||||
2006 | 10.57 | .35 | (.29 | ) | .06 | (.35 | ) | (.05 | ) | (.40 | ) | 10.23 | .49 | 5,422 | 1.47 | 3.29 | 1.47 | 3.29 | 1.44 | 3.33 | 11 | |||||||||||||||||||||||||||||||||||
2005 | 10.18 | .36 | .39 | .75 | (.36 | ) | — | (.36 | ) | 10.57 | 7.47 | 4,797 | 1.47 | 3.44 | 1.47 | 3.44 | 1.45 | 3.45 | 15 | |||||||||||||||||||||||||||||||||||||
2004 | 10.65 | .37 | (.46 | ) | (.09 | ) | (.38 | ) | — | (.38 | ) | 10.18 | (.84 | ) | 4,632 | 1.47 | 3.57 | 1.47 | 3.57 | 1.46 | 3.58 | 21 | ||||||||||||||||||||||||||||||||||
2003 | 10.16 | .38 | .50 | .88 | (.39 | ) | — | (.39 | ) | 10.65 | 8.83 | 4,536 | 1.47 | 3.64 | 1.47 | 3.64 | 1.45 | 3.65 | 8 | |||||||||||||||||||||||||||||||||||||
2002 | 10.00 | .39 | .16 | .55 | (.39 | ) | — | (.39 | ) | 10.16 | 5.58 | 3,282 | 1.51 | 3.85 | 1.51 | 3.85 | 1.49 | 3.86 | 19 | |||||||||||||||||||||||||||||||||||||
| Class R (2/97) | ||||||||||||||||||||||||||||||||||||||||||||||||||||||||
2007(e) | 10.25 | .21 | .24 | .45 | (.21 | ) | — | (.21 | ) | 10.49 | 4.40 | 837 | .71 | * | 3.98 | * | .71 | * | 3.98 | * | .68 | * | 4.01 | * | 2 | |||||||||||||||||||||||||||||||
2006 | 10.59 | .42 | (.28 | ) | .14 | (.43 | ) | (.05 | ) | (.48 | ) | 10.25 | 1.34 | 202 | .72 | 4.04 | .72 | 4.04 | .68 | 4.07 | 11 | |||||||||||||||||||||||||||||||||||
2005 | 10.20 | .44 | .39 | .83 | (.44 | ) | — | (.44 | ) | 10.59 | 8.25 | 63 | .72 | 4.21 | .72 | 4.21 | .71 | 4.22 | 15 | |||||||||||||||||||||||||||||||||||||
2004 | 10.67 | .45 | (.46 | ) | (.01 | ) | (.46 | ) | — | (.46 | ) | 10.20 | (.10 | ) | 177 | .72 | 4.32 | .72 | 4.32 | .71 | 4.33 | 21 | ||||||||||||||||||||||||||||||||||
2003 | 10.18 | .46 | .50 | .96 | (.47 | ) | — | (.47 | ) | 10.67 | 9.62 | 176 | .72 | 4.39 | .72 | 4.39 | .70 | 4.41 | 8 | |||||||||||||||||||||||||||||||||||||
2002 | 10.02 | .47 | .16 | .63 | (.47 | ) | — | (.47 | ) | 10.18 | 6.36 | 97 | .73 | 4.60 | .73 | 4.60 | .72 | 4.62 | 19 | |||||||||||||||||||||||||||||||||||||
| * | Annualized. |
| (a) | Per share Net Investment Income is calculated using the average daily shares method. |
| (b) | Total returns are calculated on net asset value without any sales charge and are not annualized. |
| (c) | After expense reimbursement from the Adviser, where applicable. |
| (d) | After custodian fee credit and expense reimbursement, where applicable. |
| (e) | For the six months ended November 30, 2006. |
See accompanying notes to financial statements.
69
Notes
70
Notes
71
Notes
72
Fund Information
Fund Manager Nuveen Asset Management 333 West Wacker Drive Chicago, IL 60606 | Legal Counsel Chapman and Cutler LLP Chicago, IL
Independent Registered Public Accounting Firm PricewaterhouseCoopers LLP Chicago, IL
Custodian State Street Bank & Trust Company Boston, MA
| Transfer Agent and Shareholder Services Boston Financial Data Services, Inc.
Nuveen Investor Services P.O. Box 8530 Boston, MA 02266-8530 (800) 257-8787 | ||
Glossary of Terms Used in this Report
Average Annual Total Return: This is a commonly used method to express an investment’s performance over a particular, usually multi-year time period. It expresses the return that would have been necessary each year to equal the investment’s actual cumulative performance (including change in NAV or offer price and reinvested dividends and capital gains distributions, if any) over the time period being considered.
Average Effective Maturity: The average of the number of years to maturity of the bonds in a Fund’s portfolio, computed by weighting each bond’s time to maturity (the date the security comes due) by the market value of the security. This figure does not account for the likelihood of prepayments or the exercise of call provisions unless an escrow account has been established to redeem the bond before maturity. The market value weighting for an investment in an inverse floating rate security is the value of the portfolio’s residual interest in the inverse floating rate trust, and does not include the value of the floating rate securities issued by the trust.
Average Duration: Duration is a measure of the expected period over which a bond’s principal and interest will be paid, and consequently is a measure of the sensitivity of a bond’s (or bond fund’s) value to changes when market interest rates change. Generally, the longer a bond or Fund’s
duration, the more the price of the bond or Fund will change as interest rates change.
Dividend Yield (also known as Market Yield or Current Yield): An investment’s current annualized dividend divided by its current offering price.
Inverse Floaters: Inverse floating rate securities are created by depositing a municipal bond, typically with a fixed interest rate, into a special purpose trust created by a broker-dealer. This trust, in turn, (a) issues floating rate certificates typically paying short-term tax-exempt interest rates to third parties in amounts equal to some fraction of the deposited bond’s par amount or market value, and (b) issues an inverse floating rate certificate (sometimes referred to as an “inverse floater”) to an investor (such as a Fund) interested in gaining investment exposure to a long-term municipal bond. The income received by the holder of the inverse floater varies inversely with the short-term rate paid to the floating rate certificates’ holders, and in most circumstances the holder of the inverse floater bears substantially all of the underlying bond’s downside investment risk. The holder of the inverse floater typically also benefits disproportionately from any potential appreciation of the underlying bond’s value. Hence, an inverse floater essentially represents an investment in the underlying bond on a leveraged basis
Net Asset Value (NAV): A Fund’s NAV is the dollar value of one share in the Fund. It is calculated by subtracting the liabilities of the Fund from its total assets and then dividing the remainder by the number of shares outstanding. Fund NAVs are calculated at the end of each business day.
SEC 30-Day Yield: A standardized measure of a Fund’s yield that accounts for the future amortization of premiums or discounts of bonds held in the fund’s portfolio.
Taxable-Equivalent Yield: The yield necessary from a fully taxable investment to equal, on an after-tax basis at a specified assumed tax rate, the yield of a municipal bond investment.
Quarterly Portfolio of Investments and Proxy Voting information: Each Fund’s (i) quarterly portfolio of investments, (ii) information regarding how the Funds voted proxies relating to portfolio securities held during the most recent 12-month period ended June 30, 2006, and (iii) a description of the policies and procedures that the Funds used to determine how to vote proxies relating to portfolio securities are available without charge, upon request, by calling Nuveen Investments at (800) 257-8787 or on Nuveen’s website at www.nuveen.com.
You may also obtain this and other fund information directly from the Securities and Exchange Commission (“SEC”). The SEC may charge a copying fee for this information. Visit the SEC on-line at http://www.sec.gov or in person at the SEC’s Public Reference Room in Washington, D.C. Call the SEC at 1-202-942-8090 for room hours and operation. You may also request fund information by sending an e-mail request to publicinfo@sec.gov or by writing to the SEC’s Public Reference Section at 450 Fifth Street NW, Washington, D.C. 20549.
NASD Regulation, Inc. provides a Public Disclosure Program which supplies certain information regarding the disciplinary history of NASD members and their associated persons in response to either telephone inquiries at (800) 289-9999 or written inquiries at www.nasdr.com. NASD Regulation, Inc. also provides an investor brochure that includes information describing the Public Disclosure Program.
73
Learn more
about Nuveen Funds at
www.nuveen.com/mf
Nuveen Investments:
SERVING Investors
For GENERATIONS
Since 1898, financial advisors and their clients have relied on Nuveen Investments to provide dependable investment solutions. Over this time, Nuveen Investments has adhered to the belief that the best approach to investing is to apply conservative risk-management principles to help minimize volatility.
Building on this tradition, we today offer a range of high quality equity and fixed-income solutions that can be integral parts of a well-diversified core portfolio. Our clients have come to appreciate this diversity, as well as our continued adherence to proven, long-term investing principles.
We offer many different investing solutions for our clients’ different needs.
Managing approximately $160 billion in assets as of December 31, 2006, Nuveen Investments offers access to a number of different asset classes and investing solutions through a variety of products. Nuveen Investments markets its capabilities under six distinct brands: NWQ, specializing in value-style equities; Nuveen, managing fixed-income investments; Santa Barbara, committed to growth equities; Tradewinds NWQ, specializing in global value equities; Rittenhouse, focused on “blue-chip” growth equities; and Symphony, with expertise in alternative investments as well as equity and income portfolios.
Find out how we can help you reach your financial goals.
To learn more about the products and services Nuveen Investments offers and for a prospectus, where applicable, talk to your financial advisor, or call us at (800) 257-8787. Please read the information carefully before you invest.
| • | Share prices |
| • | Fund details |
| • | Daily financial news |
| • | Investor education |
MSA-MS6-1106D
Item 2. Code of Ethics.
Not applicable to this filing.
Item 3. Audit Committee Financial Expert.
Not applicable to this filing.
Item 4. Principal Accountant Fees and Services.
Not applicable to this filing.
Item 5. Audit Committee of Listed Registrants
Not applicable to this registrant.
Item 6. Schedule of Investments
See Portfolio of Investments in Item 1
Item 7. Disclosure of Proxy Voting Policies and Procedures for Closed-End Management Investment Companies
Not applicable to this registrant.
Item 8. Portfolio Managers of Closed-End Management Investment Companies
Not applicable to this registrant.
Item 9. Purchases of Equity Securities by Closed-End Management Investment Company and Affiliated Purchasers
Not applicable to this registrant.
Item 10. Submission of Matters to a Vote of Security Holders
There have been no material changes to the procedures by which shareholders may recommend nominees to the registrant’s Board implemented after the registrant last provided disclosure in response to this Item.
Item 11. Controls and Procedures.
| (a) | The registrant’s principal executive and principal financial officers, or persons performing similar functions, have concluded that the registrant’s disclosure controls and procedures (as defined in Rule 30a-3(c) under the Investment Company Act of 1940, as amended (the “1940 Act”) (17 CFR 270.30a-3(c))) are not effective due to the matter discussed in Item(b) below, as of a date within 90 days of the filing date of this report that includes the disclosure required by this paragraph, based on their evaluation of the controls and procedures required by Rule 30a-3(b) under the 1940 Act (17 CFR 270.30a-3(b)) and Rules 13a-15(b) or 15d-15(b) under the Securities Exchange Act of 1934, as amended (the “Exchange Act”) (17 CFR 240.13a-15(b) or 240.15d-15(b)). |
| (b) | There were no changes in the registrant’s internal control over financial reporting (as defined in Rule 30a-3(d) under the 1940 Act (17 CFR 270.30a-3(d)) that occurred during the second fiscal quarter of the period covered by this report that has materially affected, or is reasonably likely to materially affect, the registrant’s internal control over financial reporting. |
An internal control deficiency exists when the design or operation of a control does not allow management or employees, in the normal course of performing their assigned functions, to prevent or detect misstatements on a timely basis. A significant deficiency is a control deficiency, or combination of control deficiencies, that adversely affects the Fund’s ability to initiate, authorize, record, process or report external financial data reliably in accordance with generally accepted accounting principles such that there is more than a remote likelihood that a misstatement of the Fund’s annual or interim financial statements that is more than inconsequential will not be prevented or detected. A material weakness is a significant deficiency, or combination of significant deficiencies, that results in more than a remote likelihood that a material misstatement of the annual or interim financial statements will not be prevented or detected.
Subsequent to the end of the Funds’ reporting period on November 30, 2006, the following control deficiency was identified and determined to be a material weakness, as defined above, in the Funds’ internal control over financial reporting. The Funds’ controls related to the review and analysis of the relevant terms and conditions of certain transfers of municipal securities were not operating effectively to appropriately determine whether the transfers qualified for sale accounting under the provisions of Statement of Financial Accounting Standards No. 140 “Accounting for Transfers and Servicing of Financial Assets and Extinguishments of Liabilities” (FASB 140). Although the error resulting from the misapplication of FASB 140 did not cause the November 30, 2006 financial statements to become materially misleading requiring restatement, it is management’s opinion that the controls in place were not sufficient to preclude a material misstatement that could have occured in an annual or interim financial statement. Fund Management has taken the necessary actions as it deemed necessary to revise its internal controls over financial reporting to seek to increase the control’s effectiveness.
Item 12. Exhibits
File the exhibits listed below as part of this Form.
(a)(1) Any code of ethics, or amendment thereto, that is the subject of the disclosure required by Item 2, to the extent that the registrant intends to satisfy the Item 2 requirements through filing of an exhibit: Not applicable to this filing.
(a)(2) A separate certification for each principal executive officer and principal financial officer of the registrant as required by Rule 30a-2(a) under the 1940 Act (17 CFR 270.30a-2(a)) in the exact form set forth below: EX-99.CERT Attached hereto.
(a)(3) Any written solicitation to purchase securities under Rule 23c-1 under the 1940 Act (17 CFR 270.23c-1) sent or given during the period covered by the report by or on behalf of the registrant to 10 or more persons: Not applicable to this registrant.
(b) If the report is filed under Section 13(a) or 15(d) of the Exchange Act, provide the certifications required by Rule 30a-2(b) under the 1940 Act (17 CFR 270.30a-2(b)), Rule 13a-14(b) or Rule 15d-14(b) under the Exchange Act (17 CFR 240.13a-14(b) or 240.15d-14(b)), and Section 1350 of Chapter 63 of Title 18 of the United States Code (18 U.S.C. 1350) as an Exhibit. A certification furnished pursuant to this paragraph will not be deemed “filed” for purposes of Section 18 of the Exchange Act (15 U.S.C. 78r), or otherwise subject to the liability of that section. Such certification will not be deemed to be incorporated by reference into any filing under the Securities Act of 1933 or the Exchange Act, except to the extent that the registration specifically incorporates it by reference. EX-99.906 CERT attached hereto.
SIGNATURES
Pursuant to the requirements of the Securities Exchange Act of 1934 and the Investment Company Act of 1940, the registrant has duly caused this report to be signed on its behalf by the undersigned, thereunto duly authorized.
(Registrant) Nuveen Multistate Trust IV
| By | (Signature and Title)* | /s/ Jessica R. Droeger | ||||
Jessica R. Droeger Vice President and Secretary |
Date February 8, 2007
Pursuant to the requirements of the Securities Exchange Act of 1934 and the Investment Company Act of 1940, this report has been signed below by the following persons on behalf of the registrant and in the capacities and on the dates indicated.
| By | (Signature and Title)* | /s/ Gifford R. Zimmerman | ||||
Gifford R. Zimmerman Chief Administrative Officer (principal executive officer) |
Date February 8, 2007
| By | (Signature and Title)* | /s/ Stephen D. Foy | ||||
Stephen D. Foy Vice President and Controller (principal financial officer) |
Date February 8, 2007
| * | Print the name and title of each signing officer under his or her signature. |