UNITED STATES
SECURITIES AND EXCHANGE COMMISSION
Washington, D.C. 20549
FORM N-CSR
CERTIFIED SHAREHOLDER REPORT OF REGISTERED MANAGEMENT
INVESTMENT COMPANIES
Investment Company Act file number 811-07751
Nuveen Multistate Trust IV
(Exact name of registrant as specified in charter)
Nuveen Investments
333 West Wacker Drive Chicago, IL 60606
(Address of principal executive offices) (Zip code)
Kevin J. McCarthy
Nuveen Investments
333 West Wacker Drive Chicago, IL 60606
(Name and address of agent for service)
Registrant’s telephone number, including area code: (312) 917-7700
Date of fiscal year end: May 31
Date of reporting period: November 30, 2008
Form N-CSR is to be used by management investment companies to file reports with the Commission not later than 10 days after the transmission to stockholders of any report that is required to be transmitted to stockholders under Rule 30e-1 under the Investment Company Act of 1940 (17 CFR 270.30e-1). The Commission may use the information provided on Form N-CSR in its regulatory, disclosure review, inspection, and policy making roles.
A registrant is required to disclose the information specified by Form N-CSR, and the Commission will make this information public. A registrant is not required to respond to the collection of information contained in Form N-CSR unless the Form displays a currently valid Office of Management and Budget (“OMB”) control number. Please direct comments concerning the accuracy of the information collection burden estimate and any suggestions for reducing the burden to Secretary, Securities and Exchange Commission, 450 Fifth Street, NW, Washington, DC 20549-0609. The OMB has reviewed this collection of information under the clearance requirements of 44 U.S.C. ss.3507.
Item 1. Reports to Stockholders.
NUVEEN INVESTMENTS MUTUAL FUNDS
Semi-Annual Report November 30, 2008 | Dependable, tax-free income because it’s not what you earn, it’s what you keep.® | |

Nuveen Investments
Municipal Bond Funds
Nuveen Kansas Municipal Bond Fund
Nuveen Kentucky Municipal Bond Fund
Nuveen Michigan Municipal Bond Fund
Nuveen Missouri Municipal Bond Fund
Nuveen Ohio Municipal Bond Fund
Nuveen Wisconsin Municipal Bond Fund


NOW YOU CAN RECEIVE YOUR
NUVEEN INVESTMENTS FUND REPORTS FASTER.
NO MORE WAITING.
SIGN UP TODAY TO RECEIVE NUVEEN INVESTMENTS FUND INFORMATION BY E-MAIL.
It only takes a minute to sign up for E-Reports. Once enrolled, you’ll receive an e-mail as soon as your Nuveen Investments Fund information is ready — no more waiting for delivery by regular mail. Just click on the link within the e-mail to see the report, and save it on your computer if your wish.

IT’S FAST, EASY & FREE:
www.investordelivery.com
if you get your Nuveen Investments Fund dividends and statements from your financial advisor or brokerage account.
(Be sure to have the address sheet that accompanied this report handy. You’ll need it to complete the enrollment process.)
OR
www.nuveen.com/accountaccess
if you get your Nuveen Investments Fund dividends and statements directly from Nuveen Investments.

| Must be preceded by or accompanied by a prospectus. | NOT FDIC INSURED | MAY LOSE VALUE | NO BANK GUARANTEE |

Robert P. Bremner
Chairman of the Board
Dear Shareholders,
I write this letter in a time of continued uncertainty about the current state of the U.S. financial system and pessimism about the future of the global economy. Many have observed that the conditions that led to the crisis have built up over time and will complicate and extend the course of recovery. At the same time, government officials in the U.S. and abroad have implemented a wide range of programs to restore stability to the financial system and encourage economic recovery. History teaches us that these efforts will moderate the extent of the downturn and hasten the inevitable recovery, even though it is hard to envision that outcome in the current environment.
As you will read in this report, the continuing financial and economic problems are weighing heavily on asset values for equities and fixed income, and unfortunately the performance of the Nuveen Funds has been similarly affected. I hope that you will carefully review the Portfolio Managers’ Comments and the Fund Spotlight sections of this report. These comments highlight the individual manager’s pursuit of investment strategies that depend on thoroughly researched securities, diversified portfolio holdings and well established investment disciplines to achieve your Fund’s investment goals. The Fund Board believes that a consistent focus on long term investment goals provides the basis for successful investment over time and we monitor your Fund with that objective in mind.
On behalf of myself and the other members of your Fund’s Board, we look forward to continuing to earn your trust in the months and years ahead.
Sincerely,

Robert P. Bremner
Chairman of the Board
January 20, 2009
Semi-Annual Report Page 1
Portfolio Managers’ Comments for the Nuveen Kansas, Kentucky,
Michigan, Missouri, Ohio and Wisconsin Municipal Bond Funds
Portfolio managers Scott Romans and Daniel Close examine key investment strategies and the performance of the Nuveen Kansas, Kentucky, Michigan, Missouri, Ohio and Wisconsin Municipal Bond Funds. Scott, who has eight years of investment experience, began managing the Kansas, Missouri and Wisconsin Funds in 2003. Dan has nine years of investment experience and began managing the Kentucky, Ohio and Michigan Funds in 2007.
How did the Funds perform during the six-month period ending November 30, 2008?
The table on page three provides Class A Share total returns for the six Funds for the six-month, one-year, five-year, and ten-year periods ending November 30, 2008. Each Fund’s total returns are compared with the returns of its corresponding Lipper peer fund category average, its respective state Barclays Capital Municipal Bond Index, the national Barclays Capital Municipal Bond Index and the Standard & Poor’s (S&P) National Municipal Bond Index.
The market backdrop for municipal bond investing was extraordinarily challenging throughout the past six months. Yields on short-term municipal bonds declined sharply while their prices rose accordingly (bond yields and prices move in opposite directions), reflecting investors’ desire to avoid risk. At the same time, yields on long-term bonds rose and prices fell, leading to significant steepening in the tax-exempt yield curve. Investor caution also led to weak performance from bonds with lower credit ratings. Bonds rated BBB and lower did relatively poorly, less because of deteriorating issuer credit quality than because a substantial reduction in investor demand that sent their yields sharply higher.
Against this backdrop, all six Funds experienced losses when measured in absolute terms. However, the Kansas, Kentucky, Michigan, Ohio and Wisconsin Funds’ Class A Shares at net asset value outperformed their respective Lipper peer groups during the six-month period, while the Missouri Fund’s Class A Shares at net asset value under-performed its Lipper peer group. Five of the six Funds, except Ohio, underperformed their respective state Barclays Capital indexes as well as the Standard & Poor’s National Municipal Bond Index, while all six Funds underperformed the national Barclays Capital Municipal Bond Index. The factors determining the performance of each Fund are discussed later in the report.
What strategies were used to manage the Funds during the period? How did these strategies influence performance?
All six Funds continued to employ the same fundamental investment strategies and tactics used in previous years, although our ability to implement those strategies depended on the individual characteristics of the six portfolios as well as market conditions within each state. Below we outline our specific approaches to managing the Kansas, Kentucky, Michigan, Missouri, Ohio and Wisconsin Funds, as well as discuss noteworthy factors influencing each Fund’s performance.
Nuveen Kansas, Missouri and Wisconsin Municipal Bond Funds
The period was one of the most volatile we have ever seen as municipal bond investors. Demand for tax-exempt securities dried up, as the market became quite illiquid, with only the very-highest-quality, shortest-maturity issues turning in positive performance in a highly risk-averse market climate. The environment was characterized by a general rise in municipal interest rates, with long-dated
Certain statements in this report are forward-looking statements. Discussions of specific investments are for illustration only and are not intended as recommendations of individual investments. The forward-looking statements and other views expressed herein are those of the portfolio managers as of the date of this report. Actual future results or occurrences may differ significantly from those anticipated in any forward-looking statements and the views expressed herein are subject to change at any time, due to numerous market and other factors. The Funds disclaim any obligation to update publicly or revise any forward-looking statements or views expressed herein.
Semi-Annual Report Page 2
Class A Shares—
Average Annual Total Returns
as of 11/30/08
Cumulative Six-Month | Average Annual | |||||||
| 1-Year | 5-Year | 10-Year | ||||||
Nuveen Kansas Municipal Bond Fund | ||||||||
A Shares at NAV | -6.49% | -5.96% | 1.97% | 3.18% | ||||
A Shares at Offer | -10.43% | -9.94% | 1.10% | 2.74% | ||||
Lipper Other States Municipal Debt Funds Average1 | -8.66% | -7.85% | 1.06% | 2.67% | ||||
Barclays Capital Kansas Municipal Bond Index2 | -4.38% | -2.60% | 2.58% | 4.13% | ||||
Barclays Capital Municipal Bond Index3 | -4.98% | -3.60% | 2.59% | 4.14% | ||||
S&P National Municipal Bond Index4 | -5.48% | -4.43% | 2.55% | N/A | ||||
Nuveen Kentucky Municipal Bond Fund | ||||||||
A Shares at NAV | -6.29% | -5.90% | 2.00% | 3.31% | ||||
A Shares at Offer | -10.21% | -9.84% | 1.13% | 2.87% | ||||
Lipper Other States Municipal Debt Funds Average1 | -8.66% | -7.85% | 1.06% | 2.67% | ||||
Barclays Capital Kentucky Municipal Bond Index2 | -5.01% | -3.58% | 2.44% | 3.98% | ||||
Barclays Capital Municipal Bond Index3 | -4.98% | -3.60% | 2.59% | 4.14% | ||||
S&P National Municipal Bond Index4 | -5.48% | -4.43% | 2.55% | N/A | ||||
Nuveen Michigan Municipal Bond Fund | ||||||||
A Shares at NAV | -6.51% | -6.37% | 1.97% | 3.33% | ||||
A Shares at Offer | -10.45% | -10.30% | 1.10% | 2.89% | ||||
Lipper Michigan Municipal Debt Funds Average1 | -9.98% | -10.15% | 1.58% | 3.09% | ||||
Barclays Capital Michigan Municipal Bond Index2 | -4.66% | -3.50% | 2.52% | 4.16% | ||||
Barclays Capital Municipal Bond Index3 | -4.98% | -3.60% | 2.59% | 4.14% | ||||
S&P National Municipal Bond Index4 | -5.48% | -4.43% | 2.55% | N/A | ||||
Cumulative Six-Month | Average Annual | |||||||
| 1-Year | 5-Year | 10-Year | ||||||
Nuveen Missouri Municipal Bond Fund | ||||||||
A Shares at NAV | -9.00% | -9.02% | 1.38% | 2.98% | ||||
A Shares at Offer | -12.82% | -12.83% | 0.52% | 2.54% | ||||
Lipper Missouri Municipal Debt Funds Average1 | -8.93% | -8.58% | 1.03% | 2.83% | ||||
Barclays Capital Missouri Municipal Bond Index2 | -4.03% | -2.85% | 2.81% | 4.22% | ||||
Barclays Capital Municipal Bond Index3 | -4.98% | -3.60% | 2.59% | 4.14% | ||||
S&P National Municipal Bond Index4 | -5.48% | -4.43% | 2.55% | N/A | ||||
Nuveen Ohio Municipal Bond Fund | ||||||||
A Shares at NAV | -5.26% | -4.80% | 2.12% | 3.35% | ||||
A Shares at Offer | -9.22% | -8.78% | 1.26% | 2.91% | ||||
Lipper Ohio Municipal Debt Funds Category Average1 | -7.16% | -7.01% | 1.62% | 3.06% | ||||
Barclays Capital Ohio Municipal Bond Index2 | -7.07% | -6.73% | 1.67% | 3.65% | ||||
Barclays Capital Municipal Bond Index3 | -4.98% | -3.60% | 2.59% | 4.14% | ||||
S&P National Municipal Bond Index4 | -5.48% | -4.43% | 2.55% | N/A | ||||
Nuveen Wisconsin Municipal Bond Fund | ||||||||
A Shares at NAV | -7.84% | -7.14% | 1.42% | 2.96% | ||||
A Shares at Offer | -11.69% | -11.06% | 0.55% | 2.52% | ||||
Lipper Other States Municipal Debt Funds Average1 | -8.66% | -7.85% | 1.06% | 2.67% | ||||
Barclays Capital Wisconsin Municipal Bond Index2 | -3.38% | -1.86% | 3.24% | 4.43% | ||||
Barclays Capital Municipal Bond Index3 | -4.98% | -3.60% | 2.59% | 4.14% | ||||
S&P National Municipal Bond Index4 | -5.48% | -4.43% | 2.55% | N/A | ||||
| 1 | The Lipper category averages shown represent the average annualized total return for all reporting funds in the respective categories. The Lipper Other States Municipal Debt Funds Category Average contained 151, 145, 133 and 114 funds for the six-month, one-year, five-year and ten-year periods ended November 30, 2008. The Lipper Michigan Municipal Debt Funds Category Average had 23, 22, 17 and 16 funds, the Lipper Missouri Municipal Debt Funds Category Average had 16, 16, 14 and 12 funds and the Lipper Ohio Municipal Debt Funds Category Average had 38, 37, 32 and 28 funds, respectively. The returns account for the effects of management fees and assume reinvestment of dividends, but do not reflect any applicable sales charges. You cannot invest directly in a Lipper Category. |
| 2 | The Barclays Capital Kansas Municipal Bond Index is an unmanaged index comprised of investment grade, tax-exempt Kansas bonds with maturities of two years or greater. The Barclays Capital Kentucky Municipal Bond Index is an unmanaged index comprised of investment grade, tax-exempt Kentucky bonds with maturities of two years or greater. The Barclays Capital Michigan Municipal Bond Index is an unmanaged index comprised of investment grade, tax-exempt Michigan bonds with maturities of two years or greater. The Barclays Capital Missouri Municipal Bond Index is an unmanaged index comprised of investment grade, tax-exempt Missouri bonds with maturities of two years or greater. The Barclays Capital Ohio Municipal Bond Index is an unmanaged index comprised of investment grade, tax-exempt Ohio bonds with maturities of two years or greater. The Barclays Capital Wisconsin Municipal Bond Index is an unmanaged index comprised of investment grade, tax-exempt Wisconsin bonds with maturities of two years or greater. The indexes do not reflect any initial or ongoing expenses and are not available for direct investment. |
| 3 | The Barclays Capital Municipal Bond Index is an unmanaged index composed of a broad range of investment-grade municipal bonds and does not reflect any initial or ongoing expenses. An index is not available for direct investment. |
| 4 | The Standard & Poor’s (S&P) National Municipal Bond Index is an unleveraged, market value weighted index designed to measure the performance of the investment-grade municipal bond market. |
Semi-Annual Report Page 3
Returns quoted represent past performance, which is no guarantee of future results. Returns less than one year are cumulative. Returns at NAV would be lower if the sales charge were included. Current performance may be higher or lower than the performance shown. Investment returns and principal value will fluctuate so that when shares are redeemed, they may be worth more or less than their original cost. Class A shares have a 4.2 percent maximum sales charge. Returns do not reflect the deduction of taxes that a shareholder would pay on Fund distributions or the redemption of shares. For the most recent month-end performance, visit www.nuveen.com or call (800) 257-8787.
Please see each Fund’s Spotlight Page later in this report for more complete performance data and expense ratios.
bonds faring the worst. In addition, credit spreads widened dramatically, indicating that investors were demanding higher yields in exchange for taking on credit risk.
As a group, pre-refunded bonds were the only securities in the municipal market to turn in positive performance. As investors participated in a flight to quality, they favored these very defensive securities, which were in high demand in an otherwise very illiquid market. Both the Kansas and Missouri Funds were significantly underweighted in the pre-refunded bond sector, detracting from their performance. Another negative for both Funds was an overweighting relative to our target in the health care and housing bond sectors. Both of these groups did relatively poorly during the period, though a number of our individual holdings in these sectors managed to do well in relative terms.
The Missouri Fund’s performance was hurt by its credit quality allocation. Specifically, the Fund had significant exposure to non-rated and BBB-rated bonds – representing the lowest end of the investment-grade bond universe. These lower-rated credits underperformed the overall national municipal market. In addition, we were relatively underexposed to the highest-rated bonds – those with AAA and AA credit ratings – which did comparitively well. Further hampering the Missouri Fund’s results was an underweighting in the strong-performing tax-backed debt category. Given the challenging market environment, bonds in this sector benefited from being relatively defensive.
In contrast, the Wisconsin municipal market is heavily oriented toward tax-backed bonds. As a result, we had significant exposure to this relatively positive performing group. Credit quality allocation contributed further to performance. Compared to most other states, the Wisconsin municipal market features fewer lower-rated issuers. This left us with a relatively modest allocation to BBB-rated bonds and a higher allocation to AA-rated and A-rated bonds, helping our relative performance.
Insured bonds nationwide encountered challenges as municipal bond insurance companies saw their credit ratings downgraded. This caused the bonds they were backing to get repriced in line with the issuers’ underlying credit quality. In Kansas, however, many of these issuers are higher-quality. Accordingly, many of our insured bond positions in that state did particularly well relative to the national insured municipal bond universe.
In all three Funds – especially Wisconsin – yield curve positioning was a negative performance factor. With long-term municipal yields rising and short-term rates dropping, very-short-duration bonds, to which we were only modestly allocated, outperformed. Meanwhile, intermediate- and longer-duration bonds, both of which we owned more of, underperformed. Given normal market conditions, we believe that owning more longer-dated bonds and fewer shorter-dated issues will generally provide our shareholders with the best long-term values. Unfortunately, conditions were far from normal during the period, and our positioning proved unhelpful.
In the Kansas and Missouri Funds, we were focused on opportunistic buying of bonds we believed were offering unusually good values. Both of these states saw strong individual investor
Semi-Annual Report Page 4
demand for tax-exempt bonds of strong underlying credit quality and intermediate maturities. This situation provided us with a ready market to sell these issues and left us with the proceeds needed to purchase more attractively priced bonds. We bought a number of non-rated or lower-rated issues at yields of eight to ten percent – almost-unheard-of levels for bonds of sound underlying credit quality. All of the bonds added to the portfolio were selected with the invaluable help of Nuveen’s credit research team, providing us with a great deal of confidence in the bonds’ underlying credit strength and risk/reward tradeoffs.
As we have discussed in prior shareholder reports, the Wisconsin municipal market can be challenging for portfolio managers. It is often difficult to find sufficient supply of suitable Wisconsin bonds to purchase. During the period, we did take advantage of recent opportunities to buy in-state bonds in both the primary and secondary Wisconsin market. As a result, we were able to increase our allocation to Wisconsin paper while simultaneously cutting our exposure to Puerto Rico bonds (U.S. territorial bonds are generally fully tax-exempt in all fifty United States.). Our recent purchases included community development district and housing debt. While yields on these bonds were lower than what we were finding in other states, we felt the tradeoff was worth making because we were able to increase our Wisconsin-bond allocation while reducing the size of our position in Puerto Rico, whose financial position we believed had become more vulnerable.
Nuveen Kentucky, Michigan and Ohio Municipal Bond Funds
Duration – meaning the price sensitivity to changes in interest rates – was a noteworthy positive factor for the Kentucky and Ohio Funds but detracted overall from the Michigan Fund’s performance. In all three portfolios, we benefited to varying degrees from being relatively underweighted in poor-performing long-dated bonds, but the Funds’ performance was also hampered by being underrepresented relative to our target in the very-shortest-maturity bonds, the best overall performers on the yield curve.
The Funds’ credit rating allocations hurt performance. In all three portfolios, we were underweighted relative to our target in AAA-rated bonds. The Kentucky Fund lacked sufficient exposure to pre-refunded bonds as well as tax-supported bonds. Both categories tend to be highly rated and benefited from their defensive nature. While we didn’t own many pre-refunded bonds in this portfolio, those we did own performed quite well and were very strong individual contributors. In addition, relative to our target, we were overweighted in the poor-performing health care sector. We saw a number of individual bonds in this sector weaken the Funds’ total returns. Further negative performance came from some of our individual Puerto Rico bonds. Many of these were of weaker credit quality, leading to their recent underperformance.
The Ohio Fund, meanwhile, benefited from being overweighted in the pre-refunded sector. However, in Ohio as well as Michigan we were hurt by underweightings relative to our target in tax-supported bonds as well as overweightings in the health care and predominantly lower-rated industrial development revenue bond sector. Individual health care, continuing care retirement community and tobacco bond performance further reduced the Ohio Fund’s returns, while several charter school bonds were negative performers overall in the Michigan Fund. On the positive side, all three Funds benefited from the utility sector.
In all three Funds, we took advantage of illiquid market conditions to add new bonds trading at what we believed were unusually low prices – and offering unusually high yields – relative to their underlying credit quality. Depending on availability within each state market, some of our purchases were lower- and non-rated bonds, as they offered particularly high yields relative to historical norms. However, we found that even higher-rated bonds were providing unusually attractive levels of income, leading us to take advantage of available value opportunities in that part of the market as well.
Semi-Annual Report Page 5
Because of issuance patterns within the Kentucky municipal market, portfolio managers typically have limited opportunities to purchase in-state lower-rated bonds. The past six months were no exception. We added just two lower-rated bond issues to the portfolio during the period – BBB-rated higher education bonds and an uninsured health care bond issue. In addition, we purchased the insured basketball arena deal for the University of Louisville. In our opinion, all of the issuers provided strong fundamentals and attractive yields relative to their risks.
In the Michigan Fund, we remained active in buying bonds from the state’s qualified school loan program, focusing on schools in the central and western parts of the state. In our view, these types of bonds offer investors a great deal of security. Generally, those securities are backed by both the state’s school loan program and the school district itself (and may also feature bond insurance). Because of their security, these bonds performed very well for the Fund during the difficult market environment of the past six months. The Fund continued to add to these types of holdings when attractive opportunities surfaced. Other Michigan purchases during the period included water/sewer bonds and an airport bond issue. One noteworthy lower-rated purchase was of tobacco settlement bonds during the height of the municipal market dislocation.
Recent purchases for the Ohio portfolio included a number of essential service bonds – several electric utility bonds and a water/sewer bond issue. We also added two tax-backed bond issues, one of which was lower-rated. Other lower-rated bond purchases included an uninsured health care bond issue, two lower-rated industrial development revenue bond issues and tobacco settlement bonds, all of which we believed provided our shareholders with very compelling risk-adjusted total return potential.
As we mentioned, individual investor demand was very strong for short-duration, high-credit-quality bonds. Accordingly, in all three Funds, we took advantage of those times when demand was strongest to sell some of our holdings in this part of the market. With these sales, we were able to finance some of the described purchases. In addition, and as part of our sell discipline, the Michigan Fund pared back its holdings in two health care names.
During the reporting period, we utilized derivative positions to maintain each of the three Funds’ durations in line with our target levels. Throughout the period, however, we sold out of these positions in each Fund because market conditions provided us with the ability to lengthen our duration sufficiently through more-conventional means in the municipal market. At the end of the reporting period, none of the Funds had derivative positions outstanding.
Recent Market Developments
Beginning in October, the nation’s financial institutions and financial markets – including the municipal bond market – experienced significant turmoil. Reductions in demand decreased valuations of municipal bonds across all credit ratings, especially those with lower credit ratings, and this generally reduced the Funds’ net asset values. The municipal market is one in which dealer firms make markets in bonds on a principal basis using their proprietary capital, and during the recent market turmoil these firms’ capital was severely constrained. As a result, some firms were unwilling to commit their capital to purchase and to serve as a dealer for municipal bonds. This reduction in dealer involvement in the market was accompanied by significant net selling pressure by investors, particularly with respect to lower-rated municipal bonds, as institutional investors generally removed money from the municipal bond market, at least in part because of their need to reduce the leveraging of their municipal investments. This deleveraging was in part driven by the overall reduction in the amount of financing available for such leverage, the increased costs of such leverage financing, and the need to reduce leverage levels that had recently increased due to the decline in municipal bond prices.
Municipal bond prices were further negatively impacted by concerns that the need for further
Semi-Annual Report Page 6
de-leveraging and a supply overhang (a large amount of new issues were postponed) would cause selling pressure to persist for a period of time. In addition to falling prices, the following market conditions resulted in greater price volatility of municipal bonds – wider credit spreads (i.e., lower quality bonds fell in price more than higher quality bonds); significantly reduced liquidity (i.e., the ability to sell bonds at a price close to their carrying value), particularly for lower quality bonds; and a lack of price transparency (i.e., the ability to accurately determine the price at which a bond would likely trade). Reduced liquidity was most pronounced in mid-October, and although liquidity improved considerably after that period, it may reoccur if financial turmoil persists or worsens.
Recent Developments Regarding Bond Insurance Companies
As mentioned earlier, another factor that had an impact on the performance of these Funds was their position in bonds backed by municipal bond insurers that experienced downgrades in their credit ratings. During the period covered by this report, ACA, AMBAC, CIFG, FGIC, MBIA, RAAI and SYNCORA (formerly XLCA) experienced one or more rating reductions by at least one or more rating agencies while AGC and FSA received their first rating reductions by at least one rating agency. At the time this report was prepared, at least one rating agency has placed each of these insurers except AGC on “negative outlook” or “negative credit watch,” which may presage one or more rating reductions for such insurer or insurers in the future. As concern increased about the balance sheets of these insurers, prices on bonds insured by these companies – especially those bonds with weaker underlying credits – declined, detracting from the Funds’ performance. By the end of this period, most insured bonds were being valued according to their fundamentals as if they were uninsured. On the whole, the holdings of all of our Funds continued to be well diversified not only between insured and uninsured bonds, but also within the insured bond category. It is important to note that municipal bonds historically have had a very low rate of default.
Dividend Information
In November 2008, the Class C Shares of the Michigan Fund, the Class B Shares of the Missouri Fund and the Class B and C Shares of the Ohio Fund all experienced a dividend increase. In that same month, the Class I Shares of the Kansas and Wisconsin Funds experienced a dividend decrease.
Each Fund seeks to pay dividends at a rate that reflects the past and projected performance of the Fund. To permit a Fund to maintain a more stable monthly dividend, the Fund may pay dividends at a rate that may be more or less than the amount of net investment income actually earned by the Fund during the period. If the Fund has cumulatively earned more than it has paid in dividends, it will hold the excess in reserve as undistributed net investment income (UNII) as part of the Fund’s net asset value. Conversely, if the Fund has cumulatively paid in dividends more than it has earned, the excess will constitute a negative UNII that will likewise be reflected in the Fund’s net asset value. Each Fund will, over time, pay all its net investment income as dividends to shareholders.
As of November 30, 2008, all six Funds had positive UNII balances, based upon our best estimate, for tax purposes. The Kansas and Missouri Funds had a positive UNII balance, while the Kentucky, Michigan, Ohio and Wisconsin Funds had negative UNII balances for financial statement purposes.
Semi-Annual Report Page 7
Fund Spotlight as of 11/30/08 Nuveen Kansas Municipal Bond Fund
| Quick Facts | ||||||||
| A Shares | B Shares1 | C Shares | I Shares1 | |||||
Fund Symbol | FKSTX | FBKSX | FCKSX | FRKSX | ||||
NAV | $9.36 | $9.28 | $9.35 | $9.39 | ||||
Latest Monthly Dividend2 | $0.0355 | $0.0290 | $0.0310 | $0.0370 | ||||
Latest Capital Gain Distribution3 | $0.0243 | $0.0243 | $0.0243 | $0.0243 | ||||
Inception Date | 1/09/92 | 2/19/97 | 2/11/97 | 2/25/97 |
Returns quoted represent past performance which is no guarantee of future results. Investment returns and principal value will fluctuate so that when shares are redeemed, they may be worth more or less than their original cost. Current performance may be higher or lower than the performance shown. Returns without sales charges would be lower if the sales charge were included. Returns do not reflect the deduction of taxes that a shareholder would pay on Fund distributions or the redemption of shares. Income is generally exempt from regular federal income taxes. Some income may be subject to state and local taxes and to the federal alternative minimum tax. Capital gains, if any, are subject to tax. For the most recent month-end performance visit www.nuveen.com or call (800) 257-8787.
Returns reflect differences in sales charges and expenses, which are primarily differences in distribution and service fees. Class A Shares have a 4.2% maximum sales charge. Class A Share purchases of $1 million or more are sold at net asset value without an up-front sales charge but may be subject to a contingent deferred sales charge (CDSC), also known as a back-end sales charge, if redeemed within twelve months of purchase. Class B Shares have a CDSC that begins at 5% for redemptions during the first year and declines periodically until after six years when the charge becomes 0%. Class B Shares automatically convert to Class A Shares eight years after purchase. Class C Shares have a 1% CDSC for redemptions within less than one year, which is not reflected in the one-year total return. Class I Shares have no sales charge and may be purchased under limited circumstances or by specified classes of investors.
| Average Annual Total Returns as of 11/30/08 | ||||
| A Shares | NAV | Offer | ||
1-Year | -5.96% | -9.94% | ||
5-Year | 1.97% | 1.10% | ||
10-Year | 3.18% | 2.74% | ||
| B Shares | w/o CDSC | w/CDSC | ||
1-Year | -6.65% | -10.25% | ||
5-Year | 1.20% | 1.03% | ||
10-Year | 2.56% | 2.56% | ||
| C Shares | NAV | |||
1-Year | -6.56% | |||
5-Year | 1.38% | |||
10-Year | 2.61% | |||
| I Shares | NAV | |||
1-Year | -5.82% | |||
5-Year | 2.16% | |||
10-Year | 3.38% | |||
| Tax-Free Yields | ||||
| A Shares | NAV | Offer | ||
Dividend Yield4 | 4.55% | 4.36% | ||
30-Day Yield4 | 4.27% | — | ||
SEC 30-Day Yield4,5 | — | 4.09% | ||
Taxable-Equivalent Yield5,6 | 6.34% | 6.07% | ||
| B Shares | NAV | |||
Dividend Yield4 | 3.75% | |||
30-Day Yield4 | 3.51% | |||
Taxable-Equivalent Yield6 | 5.21% | |||
| C Shares | NAV | |||
Dividend Yield4 | 3.98% | |||
30-Day Yield4 | 3.71% | |||
Taxable-Equivalent Yield6 | 5.50% | |||
| I Shares | NAV | |||
Dividend Yield4 | 4.73% | |||
SEC 30-Day Yield4 | 4.47% | |||
Taxable-Equivalent Yield6 | 6.63% | |||
| Average Annual Total Returns as of 12/31/08 | ||||
| A Shares | NAV | Offer | ||
1-Year | -6.51% | -10.41% | ||
5-Year | 1.66% | 0.79% | ||
10-Year | 3.10% | 2.66% | ||
| B Shares | w/o CDSC | w/CDSC | ||
1-Year | -7.30% | -10.88% | ||
5-Year | 0.91% | 0.74% | ||
10-Year | 2.49% | 2.49% | ||
| C Shares | NAV | |||
1-Year | -7.02% | |||
5-Year | 1.11% | |||
10-Year | 2.54% | |||
| I Shares | NAV | |||
1-Year | -6.36% | |||
5-Year | 1.89% | |||
10-Year | 3.31% | |||
| Portfolio Statistics | ||
Net Assets ($000) | $122,594 | |
Average Effective Maturity on Securities (Years) | 16.89 | |
Average Duration | 7.44 |
| Expense Ratios | ||||||
| Share Class | Gross Expense Ratios | Net Expense Ratios | As of Date | |||
Class A | 0.87% | 0.86% | 5/31/08 | |||
Class B | 1.62% | 1.61% | 5/31/08 | |||
Class C | 1.42% | 1.41% | 5/31/08 | |||
Class I | 0.67% | 0.66% | 5/31/08 | |||
The expense ratios shown factor in Total Annual Fund Operating Expenses including management fees and other fees and expenses. The Net Expense Ratios reflect a custodian fee credit from the custodian bank whereby certain fees and expenses are reduced by credits earned on the Fund’s cash on deposit with the bank. There is no guarantee that the Fund will earn such credits in the future. Absent the credit, the Net Expense Ratios would be higher and total returns would be less.
| 1 | Effective May 1, 2008, Class B Shares will only be issued upon exchange of Class B Shares from another Nuveen Fund or for purposes of dividend reinvestment. Effective December 31, 2008, the reinstatement privilege for Class B Shares will no longer be available. Effective May 1, 2008, Class R Shares were renamed Class I Shares. See the Fund’s prospectus for more information. |
| 2 | Paid December 1, 2008. This is the latest monthly tax-exempt dividend declared during the period ended November 30, 2008. |
| 3 | Paid December 5, 2007. Capital gains are subject to federal taxation. |
| 4 | Dividend Yield is the most recent dividend per share (annualized) divided by the appropriate price per share. The SEC 30-Day Yield is computed under an SEC standardized formula and is based on the maximum offer price per share. The 30-Day Yield is computed under the same formula but is based on the Net Asset Value (NAV) per share. The Dividend Yield may differ from the SEC 30-Day Yield because the Fund may be paying out more or less than it is earning and it may not include the effect of amortization of bond premium. |
| 5 | The SEC 30-Day Yield and Taxable-Equivalent Yield on A Shares at NAV applies only to A Shares purchased at no-load pursuant to the Fund’s policy permitting waiver of the A Share load in certain specified circumstances. |
| 6 | The Taxable-Equivalent Yield represents the yield that must be earned on a fully taxable investment in order to equal the yield of the Fund on an after-tax basis at a specified tax rate. With respect to investments that generate qualified dividend income that is taxable at a maximum rate of 15%, the Taxable-Equivalent Yield is lower. The Taxable-Equivalent Yield is based on the Fund’s 30-Day Yield on the indicated date and a combined federal and state income tax rate of 32.6%. |
Semi-Annual Report Page 8
Fund Spotlight as of 11/30/08 Nuveen Kansas Municipal Bond Fund
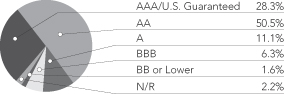
Bond Credit Quality1,2
Industries2
Health Care | 22.1% | |
Tax Obligation/Limited | 19.3% | |
Housing/Single Family | 17.5% | |
Tax Obligation/General | 11.1% | |
Water and Sewer | 10.6% | |
Long-Term Care | 4.9% | |
Other | 14.5% |
| 1 | The percentages shown in the foregoing chart may reflect the ratings on certain bonds insured by ACA, AGC, AMBAC, CIFG, FGIC, FSA, MBIA, RAAI and SYNCORA as of November 30, 2008. Please see the Portfolio Managers’ Commentary for an expanded discussion of the affect on the Fund of changes to the ratings of certain bonds in the portfolio resulting from changes to the ratings of the underlying insurers both during the period and after period end. |
| 2 | As a percentage of total investments as of November 30, 2008. Holdings are subject to change. |
Expense Example
As a shareholder of the Fund, you incur two types of costs: (1) transaction costs, including front and back end sales charges (loads) or redemption fees, where applicable; and (2) ongoing costs, including management fees; distribution and service (12b-1) fees, where applicable; and other Fund expenses. This Example is intended to help you understand your ongoing costs (in dollars) of investing in the Fund and to compare these costs with the ongoing costs of investing in other mutual funds.
The Example below is based on an investment of $1,000 invested at the beginning of the period and held for the period.
The information under “Actual Performance,” together with the amount you invested, allows you to estimate actual expenses incurred over the reporting period. Simply divide your account value by $1,000 (for example, an $8,600 account value divided by $1,000 = 8.60) and multiply the result by the cost shown for your share class, in the row entitled “Expenses Incurred During Period” to estimate the expenses incurred on your account during this period.
The information under “Hypothetical Performance,” provides information about hypothetical account values and hypothetical expenses based on the Fund’s actual expense ratio and an assumed rate of return of 5% per year before expenses, which is not the Fund’s actual return. The hypothetical account values and expenses may not be used to estimate the actual ending account balance or expense you incurred for the period. You may use this information to compare the ongoing costs of investing in the Fund and other Funds. To do so, compare this 5% hypothetical example with the 5% hypothetical examples that appear in the shareholder reports of the other funds.
Please note that the expenses shown in the table are meant to highlight your ongoing costs only and do not reflect any transactional costs, such as front and back end sales charges (loads) or redemption fees, where applicable. Therefore, the hypothetical information is useful in comparing ongoing costs only, and will not help you determine the relative total costs of owning different funds or share classes. In addition, if these transactional costs were included, your costs would have been higher.
| Hypothetical Performance | ||||||||||||||||||||||||
| Actual Performance | (5% annualized return before expenses) | |||||||||||||||||||||||
| A Shares | B Shares | C Shares | I Shares | A Shares | B Shares | C Shares | I Shares | |||||||||||||||||
Beginning Account Value (6/01/08) | $ | 1,000.00 | $ | 1,000.00 | $ | 1,000.00 | $ | 1,000.00 | $ | 1,000.00 | $ | 1,000.00 | $ | 1,000.00 | $ | 1,000.00 | ||||||||
Ending Account Value (11/30/08) | $ | 935.10 | $ | 931.70 | $ | 931.50 | $ | 935.40 | $ | 1,020.96 | $ | 1,017.20 | $ | 1,018.20 | $ | 1,021.96 | ||||||||
Expenses Incurred During Period | $ | 3.98 | $ | 7.60 | $ | 6.63 | $ | 3.01 | $ | 4.15 | $ | 7.94 | $ | 6.93 | $ | 3.14 | ||||||||
For each class of the Fund, expenses are equal to the Fund’s annualized net expense ratio of .82%, 1.57%, 1.37% and ..62% for Classes A, B, C and I, respectively, multiplied by the average account value over the period, multiplied by 183/365 (to reflect the one-half year period).
Semi-Annual Report Page 9
Fund Spotlight as of 11/30/08 Nuveen Kentucky Municipal Bond Fund
| Quick Facts | ||||||||
| A Shares | B Shares1 | C Shares | I Shares1 | |||||
Fund Symbol | FKYTX | FKYBX | FKYCX | FKYRX | ||||
NAV | $9.89 | $9.90 | $9.90 | $9.90 | ||||
Latest Monthly Dividend2 | $0.0365 | $0.0300 | $0.0315 | $0.0380 | ||||
Latest Capital Gain and Ordinary Income Distribution3 | $0.0246 | $0.0246 | $0.0246 | $0.0246 | ||||
Inception Date | 5/04/87 | 2/05/97 | 10/04/93 | 2/07/97 |
Returns quoted represent past performance which is no guarantee of future results. Investment returns and principal value will fluctuate so that when shares are redeemed, they may be worth more or less than their original cost. Current performance may be higher or lower than the performance shown. Returns without sales charges would be lower if the sales charge were included. Returns do not reflect the deduction of taxes that a shareholder would pay on Fund distributions or the redemption of shares. Income is generally exempt from regular federal income taxes. Some income may be subject to state and local taxes and to the federal alternative minimum tax. Capital gains, if any, are subject to tax. For the most recent month-end performance visit www.nuveen.com or call (800) 257-8787.
Returns reflect differences in sales charges and expenses, which are primarily differences in distribution and service fees. Class A Shares have a 4.2% maximum sales charge. Class A Share purchases of $1 million or more are sold at net asset value without an up-front sales charge but may be subject to a contingent deferred sales charge (CDSC), also known as a back-end sales charge, if redeemed within twelve months of purchase. Class B Shares have a CDSC that begins at 5% for redemptions during the first year and declines periodically until after six years when the charge becomes 0%. Class B Shares automatically convert to Class A Shares eight years after purchase. Class C Shares have a 1% CDSC for redemptions within less than one year, which is not reflected in the one-year total return. Class I Shares have no sales charge and may be purchased under limited circumstances or by specified classes of investors.
| Average Annual Total Returns as of 11/30/08 | ||||
| A Shares | NAV | Offer | ||
1-Year | -5.90% | -9.84% | ||
5-Year | 2.00% | 1.13% | ||
10-Year | 3.31% | 2.87% | ||
| B Shares | w/o CDSC | w/CDSC | ||
1-Year | -6.61% | -10.21% | ||
5-Year | 1.24% | 1.07% | ||
10-Year | 2.69% | 2.69% | ||
| C Shares | NAV | |||
1-Year | -6.34% | |||
5-Year | 1.46% | |||
10-Year | 2.75% | |||
| I Shares | NAV | |||
1-Year | -5.65% | |||
5-Year | 2.21% | |||
10-Year | 3.52% | |||
| Tax-Free Yields | ||||
| A Shares | NAV | Offer | ||
Dividend Yield4 | 4.43% | 4.24% | ||
30-Day Yield4 | 4.56% | — | ||
SEC 30-Day Yield4,5 | — | 4.37% | ||
Taxable-Equivalent Yield5,6 | 6.74% | 6.45% | ||
| B Shares | NAV | |||
Dividend Yield4 | 3.64% | |||
30-Day Yield4 | 3.78% | |||
Taxable-Equivalent Yield6 | 5.58% | |||
| C Shares | NAV | |||
Dividend Yield4 | 3.82% | |||
30-Day Yield4 | 3.98% | |||
Taxable-Equivalent Yield6 | 5.88% | |||
| I Shares | NAV | |||
Dividend Yield4 | 4.61% | |||
SEC 30-Day Yield4 | 4.76% | |||
Taxable-Equivalent Yield6 | 7.03% | |||
| Average Annual Total Returns as of 12/31/08 | ||||
| A Shares | NAV | Offer | ||
1-Year | -6.12% | -10.07% | ||
5-Year | 1.77% | 0.90% | ||
10-Year | 3.28% | 2.84% | ||
| B Shares | w/o CDSC | w/CDSC | ||
1-Year | -6.92% | -10.49% | ||
5-Year | 0.98% | 0.82% | ||
10-Year | 2.66% | 2.66% | ||
| C Shares | NAV | |||
1-Year | -6.66% | |||
5-Year | 1.21% | |||
10-Year | 2.71% | |||
| I Shares | NAV | |||
1-Year | -5.96% | |||
5-Year | 1.96% | |||
10-Year | 3.48% | |||
| Portfolio Statistics | ||
Net Assets ($000) | $378,283 | |
Average Effective Maturity on Securities (Years) | 13.99 | |
Average Duration | 7.77 |
| Expense Ratios | ||||||
| Share Class | Gross Expense Ratios | Net Expense Ratios | As of Date | |||
Class A | 0.89% | 0.89% | 5/31/08 | |||
Class B | 1.64% | 1.64% | 5/31/08 | |||
Class C | 1.44% | 1.44% | 5/31/08 | |||
Class I | 0.69% | 0.69% | 5/31/08 | |||
The expense ratios shown factor in Total Annual Fund Operating Expenses including management fees and other fees and expenses.
| 1 | Effective May 1, 2008, Class B Shares will only be issued upon exchange of Class B Shares from another Nuveen Fund or for purposes of dividend reinvestment. Effective December 31, 2008, the reinstatement privilege for Class B Shares will no longer be available. Effective May 1, 2008, Class R Shares were renamed Class I Shares. See the Fund’s prospectus for more information. |
| 2 | Paid December 1, 2008. This is the latest monthly tax-exempt dividend declared during the period ended November 30, 2008. |
| 3 | Paid December 5, 2007. Capital gains and/or ordinary income are subject to federal taxation. |
| 4 | Dividend Yield is the most recent dividend per share (annualized) divided by the appropriate price per share. The SEC 30-Day Yield is computed under an SEC standardized formula and is based on the maximum offer price per share. The 30-Day Yield is computed under the same formula but is based on the Net Asset Value (NAV) per share. The Dividend Yield may differ from the SEC 30-Day Yield because the Fund may be paying out more or less than it is earning and it may not include the effect of amortization of bond premium. |
| 5 | The SEC 30-Day Yield and Taxable-Equivalent Yield on A Shares at NAV applies only to A Shares purchased at no-load pursuant to the Fund’s policy permitting waiver of the A Share load in certain specified circumstances. |
| 6 | The Taxable-Equivalent Yield represents the yield that must be earned on a fully taxable investment in order to equal the yield of the Fund on an after-tax basis at a specified tax rate. With respect to investments that generate qualified dividend income that is taxable at a maximum rate of 15%, the Taxable-Equivalent Yield is lower. The Taxable-Equivalent Yield is based on the Fund’s 30-Day Yield on the indicated date and a combined federal and state income tax rate of 32.3%. |
Semi-Annual Report Page 10
Fund Spotlight as of 11/30/08 Nuveen Kentucky Municipal Bond Fund
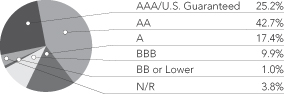
Bond Credit Quality1,2
Industries2
Tax Obligation/Limited | 27.4% | |
U.S. Guaranteed | 12.6% | |
Utilities | 12.4% | |
Water and Sewer | 11.4% | |
Health Care | 10.6% | |
Tax Obligation/General | 9.3% | |
Education and Civic Organizations | 5.4% | |
Transportation | 5.3% | |
Other | 5.6% |
| 1 | The percentages shown in the foregoing chart may reflect the ratings on certain bonds insured by ACA, AGC, AMBAC, CIFG, FGIC, FSA, MBIA, RAAI and SYNCORA as of November 30, 2008. Please see the Portfolio Managers’ Commentary for an expanded discussion of the affect on the Fund of changes to the ratings of certain bonds in the portfolio resulting from changes to the ratings of the underlying insurers both during the period and after period end. |
| 2 | As a percentage of total investments as of November 30, 2008. Holdings are subject to change. |
Expense Example
As a shareholder of the Fund, you incur two types of costs: (1) transaction costs, including front and back end sales charges (loads) or redemption fees, where applicable; and (2) ongoing costs, including management fees; distribution and service (12b-1) fees, where applicable; and other Fund expenses. This Example is intended to help you understand your ongoing costs (in dollars) of investing in the Fund and to compare these costs with the ongoing costs of investing in other mutual funds.
The Example below is based on an investment of $1,000 invested at the beginning of the period and held for the period.
The information under “Actual Performance,” together with the amount you invested, allows you to estimate actual expenses incurred over the reporting period. Simply divide your account value by $1,000 (for example, an $8,600 account value divided by $1,000 = 8.60) and multiply the result by the cost shown for your share class, in the row entitled “Expenses Incurred During Period” to estimate the expenses incurred on your account during this period.
The information under “Hypothetical Performance,” provides information about hypothetical account values and hypothetical expenses based on the Fund’s actual expense ratio and an assumed rate of return of 5% per year before expenses, which is not the Fund’s actual return. The hypothetical account values and expenses may not be used to estimate the actual ending account balance or expense you incurred for the period. You may use this information to compare the ongoing costs of investing in the Fund and other Funds. To do so, compare this 5% hypothetical example with the 5% hypothetical examples that appear in the shareholder reports of the other funds.
Please note that the expenses shown in the table are meant to highlight your ongoing costs only and do not reflect any transactional costs, such as front and back end sales charges (loads) or redemption fees, where applicable. Therefore, the hypothetical information is useful in comparing ongoing costs only, and will not help you determine the relative total costs of owning different funds or share classes. In addition, if these transactional costs were included, your costs would have been higher.
| Hypothetical Performance | ||||||||||||||||||||||||
| Actual Performance | (5% annualized return before expenses) | |||||||||||||||||||||||
| A Shares | B Shares | C Shares | I Shares | A Shares | B Shares | C Shares | I Shares | |||||||||||||||||
Beginning Account Value (6/01/08) | $ | 1,000.00 | $ | 1,000.00 | $ | 1,000.00 | $ | 1,000.00 | $ | 1,000.00 | $ | 1,000.00 | $ | 1,000.00 | $ | 1,000.00 | ||||||||
Ending Account Value (11/30/08) | $ | 937.10 | $ | 933.60 | $ | 934.40 | $ | 938.00 | $ | 1,020.76 | $ | 1,017.00 | $ | 1,018.00 | $ | 1,021.76 | ||||||||
Expenses Incurred During Period | $ | 4.18 | $ | 7.80 | $ | 6.84 | $ | 3.21 | $ | 4.36 | $ | 8.14 | $ | 7.13 | $ | 3.35 | ||||||||
For each class of the Fund, expenses are equal to the Fund’s annualized net expense ratio of .86%, 1.61%, 1.41% and ..66% for Classes A, B, C and I, respectively, multiplied by the average account value over the period, multiplied by 183/365 (to reflect the one-half year period).
Semi-Annual Report Page 11
Fund Spotlight as of 11/30/08 Nuveen Michigan Municipal Bond Fund
| Quick Facts | ||||||||
| A Shares | B Shares1 | C Shares | I Shares1 | |||||
Fund Symbol | FMITX | FMIBX | FLMCX | NMMIX | ||||
NAV | $10.20 | $10.22 | $10.20 | $10.20 | ||||
Latest Monthly Dividend2 | $0.0385 | $0.0320 | $0.0340 | $0.0405 | ||||
Latest Capital Gain Distribution3 | $0.0321 | $0.0321 | $0.0321 | $0.0321 | ||||
Inception Date | 6/27/85 | 2/03/97 | 6/22/93 | 2/03/97 |
Returns quoted represent past performance which is no guarantee of future results. Investment returns and principal value will fluctuate so that when shares are redeemed, they may be worth more or less than their original cost. Current performance may be higher or lower than the performance shown. Returns without sales charges would be lower if the sales charge were included. Returns do not reflect the deduction of taxes that a shareholder would pay on Fund distributions or the redemption of shares. Income is generally exempt from regular federal income taxes. Some income may be subject to state and local taxes and to the federal alternative minimum tax. Capital gains, if any, are subject to tax. For the most recent month-end performance visit www.nuveen.com or call (800) 257-8787.
Returns reflect differences in sales charges and expenses, which are primarily differences in distribution and service fees. Class A Shares have a 4.2% maximum sales charge. Class A Share purchases of $1 million or more are sold at net asset value without an up-front sales charge but may be subject to a contingent deferred sales charge (CDSC), also known as a back-end sales charge, if redeemed within twelve months of purchase. Class B Shares have a CDSC that begins at 5% for redemptions during the first year and declines periodically until after six years when the charge becomes 0%. Class B Shares automatically convert to Class A Shares eight years after purchase. Class C Shares have a 1% CDSC for redemptions within less than one year, which is not reflected in the one-year total return. Class I Shares have no sales charge and may be purchased under limited circumstances or by specified classes of investors.
| Average Annual Total Returns as of 11/30/08 | ||||
| A Shares | NAV | Offer | ||
1-Year | -6.37% | -10.30% | ||
5-Year | 1.97% | 1.10% | ||
10-Year | 3.33% | 2.89% | ||
| B Shares | w/o CDSC | w/CDSC | ||
1-Year | -7.05% | -10.63% | ||
5-Year | 1.21% | 1.04% | ||
10-Year | 2.71% | 2.71% | ||
| C Shares | NAV | |||
1-Year | -6.82% | |||
5-Year | 1.43% | |||
10-Year | 2.76% | |||
| I Shares | NAV | |||
1-Year | -6.16% | |||
5-Year | 2.18% | |||
10-Year | 3.53% | |||
| Tax-Free Yields | ||||
| A Shares | NAV | Offer | ||
Dividend Yield4 | 4.53% | 4.34% | ||
30-Day Yield4 | 4.45% | — | ||
SEC 30-Day Yield4,5 | — | 4.26% | ||
Taxable-Equivalent Yield5,6 | 6.46% | 6.18% | ||
| B Shares | NAV | |||
Dividend Yield4 | 3.76% | |||
30-Day Yield4 | 3.67% | |||
Taxable-Equivalent Yield6 | 5.33% | |||
| C Shares | NAV | |||
Dividend Yield4 | 4.00% | |||
30-Day Yield4 | 3.88% | |||
Taxable-Equivalent Yield6 | 5.63% | |||
| I Shares | NAV | |||
Dividend Yield4 | 4.76% | |||
SEC 30-Day Yield4 | 4.66% | |||
Taxable-Equivalent Yield6 | 6.76% | |||
| Average Annual Total Returns as of 12/31/08 | ||||
| A Shares | NAV | Offer | ||
1-Year | -5.25% | -9.26% | ||
5-Year | 2.12% | 1.26% | ||
10-Year | 3.44% | 3.00% | ||
| B Shares | w/o CDSC | w/CDSC | ||
1-Year | -6.02% | -9.65% | ||
5-Year | 1.36% | 1.19% | ||
10-Year | 2.83% | 2.83% | ||
| C Shares | NAV | |||
1-Year | -5.70% | |||
5-Year | 1.57% | |||
10-Year | 2.88% | |||
| I Shares | NAV | |||
1-Year | -5.04% | |||
5-Year | 2.34% | |||
10-Year | 3.64% | |||
| Portfolio Statistics | ||
Net Assets ($000) | $195,801 | |
Average Effective Maturity on Securities (Years) | 14.76 | |
Average Duration | 8.55 | |
| Expense Ratios | ||||||
| Share Class | Gross Expense Ratios | Net Expense Ratios | As of Date | |||
Class A | 0.86% | 0.85% | 5/31/08 | |||
Class B | 1.61% | 1.60% | 5/31/08 | |||
Class C | 1.41% | 1.40% | 5/31/08 | |||
Class I | 0.66% | 0.65% | 5/31/08 | |||
The expense ratios shown factor in Total Annual Fund Operating Expenses including management fees and other fees and expenses. The Net Expense Ratios reflect a custodian fee credit from the custodian bank whereby certain fees and expenses are reduced by credits earned on the Fund’s cash on deposit with the bank. There is no guarantee that the Fund will earn such credits in the future. Absent the credit, the Net Expense Ratios would be higher and total returns would be less.
| 1 | Effective May 1, 2008, Class B Shares will only be issued upon exchange of Class B Shares from another Nuveen Fund or for purposes of dividend reinvestment. Effective December 31, 2008, the reinstatement privilege for Class B Shares will no longer be available. Effective May 1, 2008, Class R Shares were renamed Class I Shares. See the Fund’s prospectus for more information. |
| 2 | Paid December 1, 2008. This is the latest monthly tax-exempt dividend declared during the period ended November 30, 2008. |
| 3 | Paid December 5, 2007. Capital gains are subject to federal taxation. |
| 4 | Dividend Yield is the most recent dividend per share (annualized) divided by the appropriate price per share. The SEC 30-Day Yield is computed under an SEC standardized formula and is based on the maximum offer price per share. The 30-Day Yield is computed under the same formula but is based on the Net Asset Value (NAV) per share. The Dividend Yield may differ from the SEC 30-Day Yield because the Fund may be paying out more or less than it is earning and it may not include the effect of amortization of bond premium. |
| 5 | The SEC 30-Day Yield and Taxable-Equivalent Yield on A Shares at NAV applies only to A Shares purchased at no-load pursuant to the Fund’s policy permitting waiver of the A Share load in certain specified circumstances. |
| 6 | The Taxable-Equivalent Yield represents the yield that must be earned on a fully taxable investment in order to equal the yield of the Fund on an after-tax basis at a specified tax rate. With respect to investments that generate qualified dividend income that is taxable at a maximum rate of 15%, the Taxable-Equivalent Yield is lower. The Taxable-Equivalent Yield is based on the Fund’s 30-Day Yield on the indicated date and a combined federal and state income tax rate of 31.1%. |
Semi-Annual Report Page 12
Fund Spotlight as of 11/30/08 Nuveen Michigan Municipal Bond Fund
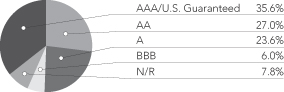
Bond Credit Quality1,2
Industries2
Tax Obligation/General | 35.6% | |
Tax Obligation/Limited | 15.0% | |
U.S. Guaranteed | 14.2% | |
Water and Sewer | 10.4% | |
Health Care | 6.8% | |
Utilities | 5.8% | |
Other | 12.2% |
| 1 | The percentages shown in the foregoing chart may reflect the ratings on certain bonds insured by ACA, AGC, AMBAC, CIFG, FGIC, FSA, MBIA, RAAI and SYNCORA as of November 30, 2008. Please see the Portfolio Managers’ Commentary for an expanded discussion of the affect on the Fund of changes to the ratings of certain bonds in the portfolio resulting from changes to the ratings of the underlying insurers both during the period and after period end. |
| 2 | As a percentage of total investments as of November 30, 2008. Holdings are subject to change. |
Expense Example
As a shareholder of the Fund, you incur two types of costs: (1) transaction costs, including front and back end sales charges (loads) or redemption fees, where applicable; and (2) ongoing costs, including management fees; distribution and service (12b-1) fees, where applicable; and other Fund expenses. This Example is intended to help you understand your ongoing costs (in dollars) of investing in the Fund and to compare these costs with the ongoing costs of investing in other mutual funds.
The Example below is based on an investment of $1,000 invested at the beginning of the period and held for the period.
The information under “Actual Performance,” together with the amount you invested, allows you to estimate actual expenses incurred over the reporting period. Simply divide your account value by $1,000 (for example, an $8,600 account value divided by $1,000 = 8.60) and multiply the result by the cost shown for your share class, in the row entitled “Expenses Incurred During Period” to estimate the expenses incurred on your account during this period.
The information under “Hypothetical Performance,” provides information about hypothetical account values and hypothetical expenses based on the Fund’s actual expense ratio and an assumed rate of return of 5% per year before expenses, which is not the Fund’s actual return. The hypothetical account values and expenses may not be used to estimate the actual ending account balance or expense you incurred for the period. You may use this information to compare the ongoing costs of investing in the Fund and other Funds. To do so, compare this 5% hypothetical example with the 5% hypothetical examples that appear in the shareholder reports of the other funds.
Please note that the expenses shown in the table are meant to highlight your ongoing costs only and do not reflect any transactional costs, such as front and back end sales charges (loads) or redemption fees, where applicable. Therefore, the hypothetical information is useful in comparing ongoing costs only, and will not help you determine the relative total costs of owning different funds or share classes. In addition, if these transactional costs were included, your costs would have been higher.
| Hypothetical Performance | ||||||||||||||||||||||||
| Actual Performance | (5% annualized return before expenses) | |||||||||||||||||||||||
| A Shares | B Shares | C Shares | I Shares | A Shares | B Shares | C Shares | I Shares | |||||||||||||||||
Beginning Account Value (6/01/08) | $ | 1,000.00 | $ | 1,000.00 | $ | 1,000.00 | $ | 1,000.00 | $ | 1,000.00 | $ | 1,000.00 | $ | 1,000.00 | $ | 1,000.00 | ||||||||
Ending Account Value (11/30/08) | $ | 934.90 | $ | 931.60 | $ | 932.30 | $ | 936.00 | $ | 1,020.81 | $ | 1,017.05 | $ | 1,018.05 | $ | 1,021.81 | ||||||||
Expenses Incurred During Period | $ | 4.12 | $ | 7.75 | $ | 6.78 | $ | 3.15 | $ | 4.31 | $ | 8.09 | $ | 7.08 | $ | 3.29 | ||||||||
For each class of the Fund, expenses are equal to the Fund’s annualized net expense ratio of .85%, 1.60%, 1.40% and ..65% for Classes A, B, C and I, respectively, multiplied by the average account value over the period, multiplied by 183/365 (to reflect the one-half year period).
Semi-Annual Report Page 13
Fund Spotlight as of 11/30/08 Nuveen Missouri Municipal Bond Fund
| Quick Facts | ||||||||
| A Shares | B Shares1 | C Shares | I Shares1 | |||||
Fund Symbol | FMOTX | FMMBX | FMOCX | FMMRX | ||||
NAV | $9.55 | $9.57 | $9.54 | $9.56 | ||||
Latest Monthly Dividend2 | $0.0375 | $0.0315 | $0.0330 | $0.0395 | ||||
Latest Capital Gain and Ordinary Income Distribution3 | $0.0198 | $0.0198 | $0.0198 | $0.0198 | ||||
Inception Date | 8/03/87 | 2/06/97 | 2/02/94 | 2/19/97 |
Returns quoted represent past performance which is no guarantee of future results. Investment returns and principal value will fluctuate so that when shares are redeemed, they may be worth more or less than their original cost. Current performance may be higher or lower than the performance shown. Returns without sales charges would be lower if the sales charge were included. Returns do not reflect the deduction of taxes that a shareholder would pay on Fund distributions or the redemption of shares. Income is generally exempt from regular federal income taxes. Some income may be subject to state and local taxes and to the federal alternative minimum tax. Capital gains, if any, are subject to tax. For the most recent month-end performance visit www.nuveen.com or call (800) 257-8787.
Returns reflect differences in sales charges and expenses, which are primarily differences in distribution and service fees. Class A Shares have a 4.2% maximum sales charge. Class A Share purchases of $1 million or more are sold at net asset value without an up-front sales charge but may be subject to a contingent deferred sales charge (CDSC), also known as a back-end sales charge, if redeemed within twelve months of purchase. Class B Shares have a CDSC that begins at 5% for redemptions during the first year and declines periodically until after six years when the charge becomes 0%. Class B Shares automatically convert to Class A Shares eight years after purchase. Class C Shares have a 1% CDSC for redemptions within less than one year, which is not reflected in the one-year total return. Class I Shares have no sales charge and may be purchased under limited circumstances or by specified classes of investors.
| Average Annual Total Returns as of 11/30/08 | ||||
| A Shares | NAV | Offer | ||
1-Year | -9.02% | -12.83% | ||
5-Year | 1.38% | 0.52% | ||
10-Year | 2.98% | 2.54% | ||
| B Shares | w/o CDSC | w/CDSC | ||
1-Year | -9.61% | -13.10% | ||
5-Year | 0.65% | 0.48% | ||
10-Year | 2.38% | 2.38% | ||
| C Shares | NAV | |||
1-Year | -9.52% | |||
5-Year | 0.83% | |||
10-Year | 2.42% | |||
| I Shares | NAV | |||
1-Year | -8.80% | |||
5-Year | 1.60% | |||
10-Year | 3.19% | |||
| Tax-Free Yields | ||||
| A Shares | NAV | Offer | ||
Dividend Yield4 | 4.71% | 4.51% | ||
30-Day Yield4 | 5.01% | — | ||
SEC 30-Day Yield4,5 | — | 4.80% | ||
Taxable-Equivalent Yield5,6 | 7.40% | 7.09% | ||
| B Shares | NAV | |||
Dividend Yield4 | 3.95% | |||
30-Day Yield4 | 4.24% | |||
Taxable-Equivalent Yield6 | 6.26% | |||
| C Shares | NAV | |||
Dividend Yield4 | 4.15% | |||
30-Day Yield4 | 4.45% | |||
Taxable-Equivalent Yield6 | 6.57% | |||
| I Shares | NAV | |||
Dividend Yield4 | 4.96% | |||
SEC 30-Day Yield4 | 5.21% | |||
Taxable-Equivalent Yield6 | 7.70% | |||
| Average Annual Total Returns as of 12/31/08 | ||||
| A Shares | NAV | Offer | ||
1-Year | -9.60% | -13.42% | ||
5-Year | 1.03% | 0.16% | ||
10-Year | 2.86% | 2.42% | ||
| B Shares | w/o CDSC | w/CDSC | ||
1-Year | -10.18% | -13.63% | ||
5-Year | 0.30% | 0.14% | ||
10-Year | 2.25% | 2.25% | ||
| C Shares | NAV | |||
1-Year | -10.10% | |||
5-Year | 0.48% | |||
10-Year | 2.30% | |||
| I Shares | NAV | |||
1-Year | -9.47% | |||
5-Year | 1.23% | |||
10-Year | 3.06% | |||
| Portfolio Statistics | ||
Net Assets ($000) | $200,581 | |
Average Effective Maturity on Securities (Years) | 15.96 | |
Average Duration | 7.80 | |
| Expense Ratios | ||||||
| Share Class | Gross Expense Ratios | Net Expense Ratios | As of Date | |||
Class A | 0.87% | 0.87% | 5/31/08 | |||
Class B | 1.62% | 1.62% | 5/31/08 | |||
Class C | 1.42% | 1.42% | 5/31/08 | |||
Class I | 0.68% | 0.67% | 5/31/08 | |||
The expense ratios shown factor in Total Annual Fund Operating Expenses including management fees and other fees and expenses. The Net Expense Ratios reflect a custodian fee credit from the custodian bank whereby certain fees and expenses are reduced by credits earned on the Fund’s cash on deposit with the bank. There is no guarantee that the Fund will earn such credits in the future. Absent the credit, the Net Expense Ratios would be higher and total returns would be less.
| 1 | Effective May 1, 2008, Class B Shares will only be issued upon exchange of Class B Shares from another Nuveen Fund or for purposes of dividend reinvestment. Effective December 31, 2008, the reinstatement privilege for Class B Shares will no longer be available. Effective May 1, 2008, Class R Shares were renamed Class I Shares. See the Fund’s prospectus for more information. |
| 2 | Paid December 1, 2008. This is the latest monthly tax-exempt dividend declared during the period ended November 30, 2008. |
| 3 | Paid December 5, 2007. Capital gains and/or ordinary income are subject to federal taxation. |
| 4 | Dividend Yield is the most recent dividend per share (annualized) divided by the appropriate price per share. The SEC 30-Day Yield is computed under an SEC standardized formula and is based on the maximum offer price per share. The 30-Day Yield is computed under the same formula but is based on the Net Asset Value (NAV) per share. The Dividend Yield may differ from the SEC 30-Day Yield because the Fund may be paying out more or less than it is earning and it may not include the effect of amortization of bond premium. |
| 5 | The SEC 30-Day Yield and Taxable-Equivalent Yield on A Shares at NAV applies only to A Shares purchased at no-load pursuant to the Fund’s policy permitting waiver of the A Share load in certain specified circumstances. |
| 6 | The Taxable-Equivalent Yield represents the yield that must be earned on a fully taxable investment in order to equal the yield of the Fund on an after-tax basis at a specified tax rate. With respect to investments that generate qualified dividend income that is taxable at a maximum rate of 15%, the Taxable-Equivalent Yield is lower. The Taxable-Equivalent Yield is based on the Fund’s 30-Day Yield on the indicated date and a combined federal and state income tax rate of 32.3%. |
Semi-Annual Report Page 14
Fund Spotlight as of 11/30/08 Nuveen Missouri Municipal Bond Fund
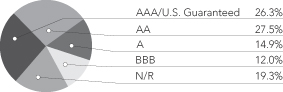
Bond Credit Quality1,2
Industries2
Tax Obligation/Limited | 20.0% | |
Health Care | 16.4% | |
Tax Obligation/General | 15.7% | |
U.S. Guaranteed | 8.6% | |
Long-Term Care | 5.6% | |
Consumer Staples | 5.0% | |
Housing/Single Family | 4.9% | |
Transportation | 4.5% | |
Education and Civic Organizations | 4.2% | |
Utilities | 4.2% | |
Other | 10.9% |
| 1 | The percentages shown in the foregoing chart may reflect the ratings on certain bonds insured by ACA, AGC, AMBAC, CIFG, FGIC, FSA, MBIA, RAAI and SYNCORA as of November 30, 2008. Please see the Portfolio Managers’ Commentary for an expanded discussion of the affect on the Fund of changes to the ratings of certain bonds in the portfolio resulting from changes to the ratings of the underlying insurers both during the period and after period end. |
| 2 | As a percentage of total investments as of November 30, 2008. Holdings are subject to change. |
Expense Example
As a shareholder of the Fund, you incur two types of costs: (1) transaction costs, including front and back end sales charges (loads) or redemption fees, where applicable; and (2) ongoing costs, including management fees; distribution and service (12b-1) fees, where applicable; and other Fund expenses. This Example is intended to help you understand your ongoing costs (in dollars) of investing in the Fund and to compare these costs with the ongoing costs of investing in other mutual funds.
The Example below is based on an investment of $1,000 invested at the beginning of the period and held for the period.
The information under “Actual Performance,” together with the amount you invested, allows you to estimate actual expenses incurred over the reporting period. Simply divide your account value by $1,000 (for example, an $8,600 account value divided by $1,000 = 8.60) and multiply the result by the cost shown for your share class, in the row entitled “Expenses Incurred During Period” to estimate the expenses incurred on your account during this period.
The information under “Hypothetical Performance,” provides information about hypothetical account values and hypothetical expenses based on the Fund’s actual expense ratio and an assumed rate of return of 5% per year before expenses, which is not the Fund’s actual return. The hypothetical account values and expenses may not be used to estimate the actual ending account balance or expense you incurred for the period. You may use this information to compare the ongoing costs of investing in the Fund and other Funds. To do so, compare this 5% hypothetical example with the 5% hypothetical examples that appear in the shareholder reports of the other funds.
Please note that the expenses shown in the table are meant to highlight your ongoing costs only and do not reflect any transactional costs, such as front and back end sales charges (loads) or redemption fees, where applicable. Therefore, the hypothetical information is useful in comparing ongoing costs only, and will not help you determine the relative total costs of owning different funds or share classes. In addition, if these transactional costs were included, your costs would have been higher.
| Hypothetical Performance | ||||||||||||||||||||||||
| Actual Performance | (5% annualized return before expenses) | |||||||||||||||||||||||
| A Shares | B Shares | C Shares | I Shares | A Shares | B Shares | C Shares | I Shares | |||||||||||||||||
Beginning Account Value (6/01/08) | $ | 1,000.00 | $ | 1,000.00 | $ | 1,000.00 | $ | 1,000.00 | $ | 1,000.00 | $ | 1,000.00 | $ | 1,000.00 | $ | 1,000.00 | ||||||||
Ending Account Value (11/30/08) | $ | 910.00 | $ | 907.60 | $ | 907.50 | $ | 912.00 | $ | 1,020.86 | $ | 1,017.10 | $ | 1,018.10 | $ | 1,021.86 | ||||||||
Expenses Incurred During Period | $ | 4.02 | $ | 7.60 | $ | 6.65 | $ | 3.07 | $ | 4.26 | $ | 8.04 | $ | 7.03 | $ | 3.24 | ||||||||
For each class of the Fund, expenses are equal to the Fund’s annualized net expense ratio of .84%, 1.59%, 1.39% and ..64% for Classes A, B, C and I, respectively, multiplied by the average account value over the period, multiplied by 183/365 (to reflect the one-half year period).
Semi-Annual Report Page 15
Fund Spotlight as of 11/30/08 Nuveen Ohio Municipal Bond Fund
| Quick Facts | ||||||||
| A Shares | B Shares1 | C Shares | I Shares1 | |||||
Fund Symbol | FOHTX | FOHBX | FOHCX | NXOHX | ||||
NAV | $10.19 | $10.17 | $10.16 | $10.17 | ||||
Latest Monthly Dividend2 | $0.0380 | $0.0315 | $0.0335 | $0.0400 | ||||
Latest Capital Gain Distribution3 | $0.0735 | $0.0735 | $0.0735 | $0.0735 | ||||
Inception Date | 6/27/85 | 2/03/97 | 8/03/93 | 2/03/97 |
Returns quoted represent past performance which is no guarantee of future results. Investment returns and principal value will fluctuate so that when shares are redeemed, they may be worth more or less than their original cost. Current performance may be higher or lower than the performance shown. Returns without sales charges would be lower if the sales charge were included. Returns do not reflect the deduction of taxes that a shareholder would pay on Fund distributions or the redemption of shares. Income is generally exempt from regular federal income taxes. Some income may be subject to state and local taxes and to the federal alternative minimum tax. Capital gains, if any, are subject to tax. For the most recent month-end performance visit www.nuveen.com or call (800) 257-8787.
Returns reflect differences in sales charges and expenses, which are primarily differences in distribution and service fees. Class A Shares have a 4.2% maximum sales charge. Class A Share purchases of $1 million or more are sold at net asset value without an up-front sales charge but may be subject to a contingent deferred sales charge (CDSC), also known as a back-end sales charge, if redeemed within twelve months of purchase. Class B Shares have a CDSC that begins at 5% for redemptions during the first year and declines periodically until after six years when the charge becomes 0%. Class B Shares automatically convert to Class A Shares eight years after purchase. Class C Shares have a 1% CDSC for redemptions within less than one year, which is not reflected in the one-year total return. Class I Shares have no sales charge and may be purchased under limited circumstances or by specified classes of investors. Returns reflect an expense limitation by the Fund’s investment adviser.
| Average Annual Total Returns as of 11/30/08 | ||||
| A Shares | NAV |
Offer | ||
1-Year | -4.80% | -8.78% | ||
5-Year | 2.12% | 1.26% | ||
10-Year | 3.35% | 2.91% | ||
| B Shares | w/o CDSC |
w/CDSC | ||
1-Year | -5.55% | -9.17% | ||
5-Year | 1.35% | 1.18% | ||
10-Year | 2.74% | 2.74% | ||
| C Shares | NAV | |||
1-Year | -5.34% | |||
5-Year | 1.57% | |||
10-Year | 2.79% | |||
| I Shares |
NAV | |||
1-Year | -4.60% | |||
5-Year | 2.32% | |||
10-Year | 3.55% | |||
| Tax-Free Yields | ||||
| A Shares | NAV | Offer | ||
Dividend Yield4 | 4.47% | 4.29% | ||
30-Day Yield4 | 4.42% | — | ||
SEC 30-Day Yield4,5 | — | 4.23% | ||
Taxable-Equivalent Yield5,6 | 6.51% | 6.23% | ||
| B Shares | NAV | |||
Dividend Yield4 | 3.72% | |||
30-Day Yield4 | 3.66% | |||
Taxable-Equivalent Yield6 | 5.39% | |||
| C Shares | NAV | |||
Dividend Yield4 | 3.96% | |||
30-Day Yield4 | 3.86% | |||
Taxable-Equivalent Yield6 | 5.68% | |||
| I Shares | NAV | |||
Dividend Yield4 | 4.72% | |||
SEC 30-Day Yield4 | 4.62% | |||
Taxable-Equivalent Yield6 | 6.80% | |||
| Average Annual Total Returns as of 12/31/08 | ||||
A Shares | NAV | Offer | ||
1-Year | -4.26% | -8.30% | ||
5-Year | 2.05% | 1.18% | ||
10-Year | 3.39% | 2.94% | ||
B Shares | w/o CDSC | w/CDSC | ||
1-Year | -4.91% | -8.57% | ||
5-Year | 1.30% | 1.13% | ||
10-Year | 2.77% | 2.77% | ||
C Shares | NAV | |||
1-Year | -4.80% | |||
5-Year | 1.50% | |||
10-Year | 2.83% | |||
I Shares | NAV | |||
1-Year | -4.05% | |||
5-Year | 2.25% | |||
10-Year | 3.59% | |||
| Portfolio Statistics | ||
Net Assets ($000) | $468,019 | |
Average Effective Maturity on Securities (Years) | 14.06 | |
Average Duration | 6.90 | |
| Expense Ratios | ||||||
| Share Class | Gross Expense Ratios | Net Expense Ratios | As of Date | |||
Class A | 0.93% | 0.92% | 5/31/08 | |||
Class B | 1.67% | 1.67% | 5/31/08 | |||
Class C | 1.48% | 1.47% | 5/31/08 | |||
Class I | 0.73% | 0.72% | 5/31/08 | |||
The expense ratios shown factor in Total Annual Fund Operating Expenses including management fees and other fees and expenses. The Net Expense Ratios reflect a custodian fee credit from the custodian bank whereby certain fees and expenses are reduced by credits earned on the Fund’s cash on deposit with the bank. There is no guarantee that the Fund will earn such credits in the future. Absent the credit, the Net Expense Ratios would be higher and total returns would be less.
| 1 | Effective May 1, 2008, Class B Shares will only be issued upon exchange of Class B Shares from another Nuveen Fund or for purposes of dividend reinvestment. Effective December 31, 2008, the reinstatement privilege for Class B Shares will no longer be available. Effective May 1, 2008, Class R Shares were renamed Class I Shares. See the Fund’s prospectus for more information. |
| 2 | Paid December 1, 2008. This is the latest monthly tax-exempt dividend declared during the period ended November 30, 2008. |
| 3 | Paid December 5, 2007. Capital gains are subject to federal taxation. |
| 4 | Dividend Yield is the most recent dividend per share (annualized) divided by the appropriate price per share. The SEC 30-Day Yield is computed under an SEC standardized formula and is based on the maximum offer price per share. The 30-Day Yield is computed under the same formula but is based on the Net Asset Value (NAV) per share. The Dividend Yield may differ from the SEC 30-Day Yield because the Fund may be paying out more or less than it is earning and it may not include the effect of amortization of bond premium. |
| 5 | The SEC 30-Day Yield and Taxable-Equivalent Yield on A Shares at NAV applies only to A Shares purchased at no-load pursuant to the Fund’s policy permitting waiver of the A Share load in certain specified circumstances. |
| 6 | The Taxable-Equivalent Yield represents the yield that must be earned on a fully taxable investment in order to equal the yield of the Fund on an after-tax basis at a specified tax rate. With respect to investments that generate qualified dividend income that is taxable at a maximum rate of 15%, the Taxable-Equivalent Yield is lower. The Taxable-Equivalent Yield is based on the Fund’s 30-Day Yield on the indicated date and a combined federal and state income tax rate of 32.1%. |
Semi-Annual Report Page 16
Fund Spotlight as of 11/30/08 Nuveen Ohio Municipal Bond Fund
Bond Credit Quality1,2
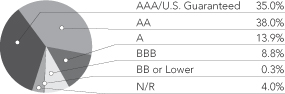
Industries2
Tax Obligation/General | 22.5% | |
U.S. Guaranteed | 20.3% | |
Tax Obligation/Limited | 12.8% | |
Health Care | 8.7% | |
Utilities | 8.1% | |
Education and Civic Organizations | 7.1% | |
Water and Sewer | 6.1% | |
Other | 14.4% |
| 1 | The percentages shown in the foregoing chart may reflect the ratings on certain bonds insured by ACA, AGC, AMBAC, CIFG, FGIC, FSA, MBIA, RAAI and SYNCORA as of November 30, 2008. Please see the Portfolio Managers’ Commentary for an expanded discussion of the affect on the Fund of changes to the ratings of certain bonds in the portfolio resulting from changes to the ratings of the underlying insurers both during the period and after period end. |
| 2 | As a percentage of total investments as of November 30, 2008. Holdings are subject to change. |
Expense Example
As a shareholder of the Fund, you incur two types of costs: (1) transaction costs, including front and back end sales charges (loads) or redemption fees, where applicable; and (2) ongoing costs, including management fees; distribution and service (12b-1) fees, where applicable; and other Fund expenses. This Example is intended to help you understand your ongoing costs (in dollars) of investing in the Fund and to compare these costs with the ongoing costs of investing in other mutual funds.
The Example below is based on an investment of $1,000 invested at the beginning of the period and held for the period.
The information under “Actual Performance,” together with the amount you invested, allows you to estimate actual expenses incurred over the reporting period. Simply divide your account value by $1,000 (for example, an $8,600 account value divided by $1,000 = 8.60) and multiply the result by the cost shown for your share class, in the row entitled “Expenses Incurred During Period” to estimate the expenses incurred on your account during this period.
The information under “Hypothetical Performance,” provides information about hypothetical account values and hypothetical expenses based on the Fund’s actual expense ratio and an assumed rate of return of 5% per year before expenses, which is not the Fund’s actual return. The hypothetical account values and expenses may not be used to estimate the actual ending account balance or expense you incurred for the period. You may use this information to compare the ongoing costs of investing in the Fund and other Funds. To do so, compare this 5% hypothetical example with the 5% hypothetical examples that appear in the shareholder reports of the other funds.
Please note that the expenses shown in the table are meant to highlight your ongoing costs only and do not reflect any transactional costs, such as front and back end sales charges (loads) or redemption fees, where applicable. Therefore, the hypothetical information is useful in comparing ongoing costs only, and will not help you determine the relative total costs of owning different funds or share classes. In addition, if these transactional costs were included, your costs would have been higher.
| Hypothetical Performance | ||||||||||||||||||||||||
| Actual Performance | (5% annualized return before expenses) | |||||||||||||||||||||||
| A Shares | B Shares | C Shares | I Shares | A Shares | B Shares | C Shares | I Shares | |||||||||||||||||
Beginning Account Value (6/01/08) | $ | 1,000.00 | $ | 1,000.00 | $ | 1,000.00 | $ | 1,000.00 | $ | 1,000.00 | $ | 1,000.00 | $ | 1,000.00 | $ | 1,000.00 | ||||||||
Ending Account Value (11/30/08) | $ | 947.40 | $ | 943.60 | $ | 944.60 | $ | 948.40 | $ | 1,020.91 | $ | 1,017.15 | $ | 1,018.15 | $ | 1,021.91 | ||||||||
Expenses Incurred During Period | $ | 4.05 | $ | 7.70 | $ | 6.73 | $ | 3.08 | $ | 4.20 | $ | 7.99 | $ | 6.98 | $ | 3.19 | ||||||||
For each class of the Fund, expenses are equal to the Fund’s annualized net expense ratio of .83%, 1.58%, 1.38% and ..63% for Classes A, B, C and I, respectively, multiplied by the average account value over the period, multiplied by 183/365 (to reflect the one-half year period).
Semi-Annual Report Page 17
Fund Spotlight as of 11/30/08 Nuveen Wisconsin Municipal Bond Fund
| Quick Facts | ||||||||
| A Shares | B Shares1 | C Shares | I Shares1 | |||||
Fund Symbol | FWIAX | FWIBX | FWICX | FWIRX | ||||
NAV | $9.12 | $9.14 | $9.13 | $9.14 | ||||
Latest Monthly Dividend2 | $0.0310 | $0.0250 | $0.0265 | $0.0325 | ||||
Latest Capital Gain and Ordinary Income Distribution3 | $0.0156 | $0.0156 | $0.0156 | $0.0156 | ||||
Inception Date | 6/01/94 | 2/25/97 | 2/25/97 | 2/25/97 |
Returns quoted represent past performance which is no guarantee of future results. Investment returns and principal value will fluctuate so that when shares are redeemed, they may be worth more or less than their original cost. Current performance may be higher or lower than the performance shown. Returns without sales charges would be lower if the sales charge were included. Returns do not reflect the deduction of taxes that a shareholder would pay on Fund distributions or the redemption of shares. Income is generally exempt from regular federal income taxes. Some income may be subject to state and local taxes and to the federal alternative minimum tax. Capital gains, if any, are subject to tax. For the most recent month-end performance visit www.nuveen.com or call (800) 257-8787.
Returns reflect differences in sales charges and expenses, which are primarily differences in distribution and service fees. Class A Shares have a 4.2% maximum sales charge. Class A Share purchases of $1 million or more are sold at net asset value without an up-front sales charge but may be subject to a contingent deferred sales charge (CDSC), also known as a back-end sales charge, if redeemed within twelve months of purchase. Class B Shares have a CDSC that begins at 5% for redemptions during the first year and declines periodically until after six years when the charge becomes 0%. Class B Shares automatically convert to Class A Shares eight years after purchase. Class C Shares have a 1% CDSC for redemptions within less than one year, which is not reflected in the one-year total return. Class I Shares have no sales charge and may be purchased under limited circumstances or by specified classes of investors.
| Average Annual Total Returns as of 11/30/08 | ||||
| A Shares | NAV | Offer | ||
1-Year | -7.14% | -11.06% | ||
5-Year | 1.42% | 0.55% | ||
10-Year | 2.96% | 2.52% | ||
| B Shares | w/o CDSC | w/CDSC | ||
1-Year | -7.83% | -11.40% | ||
5-Year | 0.65% | 0.48% | ||
10-Year | 2.34% | 2.34% | ||
| C Shares | NAV | |||
1-Year | -7.64% | |||
5-Year | 0.84% | |||
10-Year | 2.40% | |||
| I Shares | NAV | |||
1-Year | -7.00% | |||
5-Year | 1.59% | |||
10-Year | 3.16% | |||
| Tax-Free Yields | ||||
| A Shares | NAV | Offer | ||
Dividend Yield4 | 4.08% | 3.91% | ||
30-Day Yield4 | 4.42% | — | ||
SEC 30-Day Yield4,5 | — | 4.24% | ||
Taxable-Equivalent Yield5,6 | 6.59% | 6.32% | ||
| B Shares | NAV | |||
Dividend Yield4 | 3.28% | |||
30-Day Yield4 | 3.66% | |||
Taxable-Equivalent Yield6 | 5.45% | |||
| C Shares | NAV | |||
Dividend Yield4 | 3.48% | |||
30-Day Yield4 | 3.86% | |||
Taxable-Equivalent Yield6 | 5.75% | |||
| I Shares | NAV | |||
Dividend Yield4 | 4.27% | |||
SEC 30-Day Yield4 | 4.63% | |||
Taxable-Equivalent Yield6 | 6.90% | |||
| Average Annual Total Returns as of 12/31/08 | ||||
| A Shares | NAV | Offer | ||
1-Year | -6.35% | -10.32% | ||
5-Year | 1.42% | 0.55% | ||
10-Year | 3.03% | 2.59% | ||
| B Shares | w/o CDSC | w/CDSC | ||
1-Year | -6.95% | -10.56% | ||
5-Year | 0.69% | 0.52% | ||
10-Year | 2.42% | 2.42% | ||
| C Shares | NAV | |||
1-Year | -6.86% | |||
5-Year | 0.88% | |||
10-Year | 2.48% | |||
| I Shares | NAV | |||
1-Year | -6.11% | |||
5-Year | 1.63% | |||
10-Year | 3.24% | |||
| Portfolio Statistics | ||
Net Assets ($000) | $52,141 | |
Average Effective Maturity on Securities (Years) | 15.03 | |
Average Duration | 9.00 |
| Expense Ratios | ||||||
| Share Class | Gross Expense Ratios | Net Expense Ratios | As of Date | |||
Class A | 0.88% | 0.86% | 5/31/08 | |||
Class B | 1.63% | 1.61% | 5/31/08 | |||
Class C | 1.43% | 1.41% | 5/31/08 | |||
Class I | 0.68% | 0.66% | 5/31/08 | |||
The expense ratios shown factor in Total Annual Fund Operating Expenses including management fees and other fees and expenses. The Net Expense Ratios reflect a custodian fee credit from the custodian bank whereby certain fees and expenses are reduced by credits earned on the Fund’s cash on deposit with the bank. There is no guarantee that the Fund will earn such credits in the future. Absent the credit, the Net Expense Ratios would be higher and total returns would be less.
| 1 | Effective May 1, 2008, Class B Shares will only be issued upon exchange of Class B Shares from another Nuveen Fund or for purposes of dividend reinvestment. Effective December 31, 2008, the reinstatement privilege for Class B Shares will no longer be available. Effective May 1, 2008, Class R Shares were renamed Class I Shares. See the Fund’s prospectus for more information. |
| 2 | Paid December 1, 2008. This is the latest monthly tax-exempt dividend declared during the period ended November 30, 2008. |
| 3 | Paid December 5, 2007. Capital gains and/or ordinary income are subject to federal taxation. |
| 4 | Dividend Yield is the most recent dividend per share (annualized) divided by the appropriate price per share. The SEC 30-Day Yield is computed under an SEC standardized formula and is based on the maximum offer price per share. The 30-Day Yield is computed under the same formula but is based on the Net Asset Value (NAV) per share. The Dividend Yield may differ from the SEC 30-Day Yield because the Fund may be paying out more or less than it is earning and it may not include the effect of amortization of bond premium. |
| 5 | The SEC 30-Day Yield and Taxable-Equivalent Yield on A Shares at NAV applies only to A Shares purchased at no-load pursuant to the Fund’s policy permitting waiver of the A Share load in certain specified circumstances. |
| 6 | The Taxable-Equivalent Yield represents the yield that must be earned on a fully taxable investment in order to equal the yield of the Fund on an after-tax basis at a specified tax rate. With respect to investments that generate qualified dividend income that is taxable at a maximum rate of 15%, the Taxable-Equivalent Yield is lower. The Taxable-Equivalent Yield is based on the Fund’s 30-Day Yield on the indicated date and a combined federal and state income tax rate of 32.9%. |
Semi-Annual Report Page 18
Fund Spotlight as of 11/30/08 Nuveen Wisconsin Municipal Bond Fund
Bond Credit Quality1,2
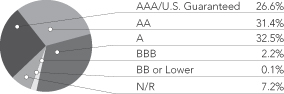
Industries2
Tax Obligation/Limited | 66.8% | |
U.S. Guaranteed | 10.5% | |
Housing/Multifamily | 9.0% | |
Utilities | 6.6% | |
Other | 7.1% |
| 1 | The percentages shown in the foregoing chart may reflect the ratings on certain bonds insured by ACA, AGC, AMBAC, CIFG, FGIC, FSA, MBIA, RAAI and SYNCORA as of November 30, 2008. Please see the Portfolio Managers’ Commentary for an expanded discussion of the affect on the Fund of changes to the ratings of certain bonds in the portfolio resulting from changes to the ratings of the underlying insurers both during the period and after period end. |
| 2 | As a percentage of total investments as of November 30, 2008. Holdings are subject to change. |
Expense Example
As a shareholder of the Fund, you incur two types of costs: (1) transaction costs, including front and back end sales charges (loads) or redemption fees, where applicable; and (2) ongoing costs, including management fees; distribution and service (12b-1) fees, where applicable; and other Fund expenses. This Example is intended to help you understand your ongoing costs (in dollars) of investing in the Fund and to compare these costs with the ongoing costs of investing in other mutual funds.
The Example below is based on an investment of $1,000 invested at the beginning of the period and held for the period.
The information under “Actual Performance,” together with the amount you invested, allows you to estimate actual expenses incurred over the reporting period. Simply divide your account value by $1,000 (for example, an $8,600 account value divided by $1,000 = 8.60) and multiply the result by the cost shown for your share class, in the row entitled “Expenses Incurred During Period” to estimate the expenses incurred on your account during this period.
The information under “Hypothetical Performance,” provides information about hypothetical account values and hypothetical expenses based on the Fund’s actual expense ratio and an assumed rate of return of 5% per year before expenses, which is not the Fund’s actual return. The hypothetical account values and expenses may not be used to estimate the actual ending account balance or expense you incurred for the period. You may use this information to compare the ongoing costs of investing in the Fund and other Funds. To do so, compare this 5% hypothetical example with the 5% hypothetical examples that appear in the shareholder reports of the other funds.
Please note that the expenses shown in the table are meant to highlight your ongoing costs only and do not reflect any transactional costs, such as front and back end sales charges (loads) or redemption fees, where applicable. Therefore, the hypothetical information is useful in comparing ongoing costs only, and will not help you determine the relative total costs of owning different funds or share classes. In addition, if these transactional costs were included, your costs would have been higher.
| Hypothetical Performance | ||||||||||||||||||||||||
| Actual Performance | (5% annualized return before expenses) | |||||||||||||||||||||||
| A Shares | B Shares | C Shares | I Shares | A Shares | B Shares | C Shares | I Shares | |||||||||||||||||
Beginning Account Value (6/01/08) | $ | 1,000.00 | $ | 1,000.00 | $ | 1,000.00 | $ | 1,000.00 | $ | 1,000.00 | $ | 1,000.00 | $ | 1,000.00 | $ | 1,000.00 | ||||||||
Ending Account Value (11/30/08) | $ | 921.60 | $ | 917.40 | $ | 918.20 | $ | 921.90 | $ | 1,020.86 | $ | 1,017.10 | $ | 1,018.10 | $ | 1,021.86 | ||||||||
Expenses Incurred During Period | $ | 4.05 | $ | 7.64 | $ | 6.68 | $ | 3.08 | $ | 4.26 | $ | 8.04 | $ | 7.03 | $ | 3.24 | ||||||||
For each class of the Fund, expenses are equal to the Fund’s annualized net expense ratio of .84%, 1.59%, 1.39% and ..64% for Classes A, B, C and I, respectively, multiplied by the average account value over the period, multiplied by 183/365 (to reflect the one-half year period).
Semi-Annual Report Page 19
Portfolio of Investments (Unaudited)
Nuveen Kansas Municipal Bond Fund
November 30, 2008
| Principal Amount (000) | Description (1) | Optional Call Provisions (2) | Ratings (3) | Value | ||||||
| Education and Civic Organizations – 1.8% | ||||||||||
| $ | 1,000 | Kansas Development Finance Authority, Athletic Facility Revenue Bonds, University of Kansas Athletic Corporation Project, Series 2004K, 5.000%, 6/01/19 | 6/14 at 100.00 | A1 | $ | 999,590 | ||||
| 1,200 | Kansas Development Finance Authority, Board of Regents, Revenue Bonds, Kansas State University Housing System, Series 2005A, 5.000%, 4/01/22 – MBIA Insured | 4/15 at 100.00 | AA | 1,159,116 | ||||||
| 2,200 | Total Education and Civic Organizations | 2,158,706 | ||||||||
| Health Care – 21.2% | ||||||||||
| 1,005 | Coffeyville Public Building Commission, Kansas, Healthcare Facilities Revenue Bonds, Coffeyville Regional Medical Center, Series 2002, 5.000%, 8/01/18 – AMBAC Insured | 8/12 at 100.00 | A | 938,750 | ||||||
| 2,000 | Colby, Kansas, Health Facilities Revenue Refunding Bonds, Citizens Medical Center Inc., Series 1998, 5.625%, 8/15/16 | 2/09 at 100.00 | N/R | 1,768,300 | ||||||
| 1,680 | Kansas Development Finance Authority, Health Facilities Revenue Bonds, Hays Medical Center Inc., | 11/15 at 100.00 | A2 | 1,531,303 | ||||||
| 4,580 | Kansas Development Finance Authority, Health Facilities Revenue Bonds, Sisters of Charity of Leavenworth Health Services Corporation, Series 2000K, 6.500%, 12/01/16 | 6/10 at 101.00 | AA | 4,868,540 | ||||||
| 2,000 | Kansas Development Finance Authority, Health Facilities Revenue Bonds, Stormont-Vail Health Care Inc., Series 2007L, 4.750%, 11/15/36 – MBIA Insured | 11/17 at 100.00 | A2 | 1,392,700 | ||||||
| 2,000 | Kansas Development Finance Authority, Health Facilities Revenue Bonds, Stormont-Vail Health Care Inc., Series 2008F, 5.375%, 11/15/28 | 11/17 at 100.00 | A2 | 1,724,320 | ||||||
| 1,285 | Kansas Development Finance Authority, Hospital Revenue Bonds, Susan B. Allen Memorial Hospital, Series 2002Q, 5.375%, 12/15/16 – RAAI Insured | 12/12 at 100.00 | BBB+ | 1,228,678 | ||||||
| 2,850 | Labette County Medical Center, Kansas, Revenue Bonds, Series 2007A, 5.750%, 9/01/37 | 9/17 at 100.00 | N/R | 1,969,977 | ||||||
| Lawrence, Kansas, Hospital Revenue Bonds, Lawrence Memorial Hospital, Series 2006: | ||||||||||
| 2,500 | 5.125%, 7/01/26 | 7/16 at 100.00 | A3 | 2,002,875 | ||||||
| 500 | 5.125%, 7/01/36 | 7/16 at 100.00 | A3 | 364,890 | ||||||
| 1,075 | Manhattan, Kansas, Hospital Revenue Bonds, Mercy Health Center, Series 2001, | 8/11 at 100.00 | AAA | 1,084,965 | ||||||
| 100 | Puerto Rico Industrial, Tourist, Educational, Medical and Environmental Control Facilities Financing Authority, Hospital Revenue Bonds, Auxilio Mutuo Hospital, Series 1995A, | 1/09 at 100.00 | AA | 95,773 | ||||||
| 3,000 | University of Kansas Hospital Authority, Health Facilities Revenue Bonds, KU Health System, | 9/16 at 100.00 | A | 2,318,940 | ||||||
| 4,780 | Wichita, Kansas, Hospital Facilities Revenue Refunding and Improvement Bonds, Via Christi Health System Inc., Series 1999-XI, 6.250%, 11/15/24 | 11/09 at 101.00 | A+ | 4,664,515 | ||||||
| 29,355 | Total Health Care | 25,954,526 | ||||||||
| Housing/Multifamily – 2.9% | ||||||||||
| Wichita, Kansas, Multifamily Housing Revenue Refunding Bonds, Shores Apartments, Series 1994XI-A: | ||||||||||
| 1,500 | 6.700%, 4/01/19 – RAAI Insured | 4/09 at 102.00 | BBB+ | 1,529,670 | ||||||
| 2,000 | 6.800%, 4/01/24 – RAAI Insured | 4/09 at 102.00 | BBB+ | 2,026,860 | ||||||
| 3,500 | Total Housing/Multifamily | 3,556,530 | ||||||||
| Housing/Single Family – 16.8% | ||||||||||
| 115 | Sedgwick and Shawnee Counties, Kansas, FNMA/GNMA Mortgage-Backed Securities Program Single Family Revenue Bonds, Series 2001A, 6.300%, 12/01/32 (Alternative Minimum Tax) | 12/10 at 105.00 | Aaa | 116,753 | ||||||
| 3,135 | Sedgwick and Shawnee Counties, Kansas, FNMA/GNMA Mortgage-Backed Securities Program Single Family Revenue Bonds, Series 2002B-1, 5.950%, 12/01/33 (Alternative Minimum Tax) | 12/12 at 105.00 | Aaa | 3,096,408 | ||||||
| 2,730 | Sedgwick and Shawnee Counties, Kansas, FNMA/GNMA Mortgage-Backed Securities Program Single Family Revenue Bonds, Series 2005A, 5.550%, 6/01/37 (Alternative Minimum Tax) | 6/15 at 105.00 | Aaa | 2,356,400 | ||||||
| 155 | Sedgwick and Shawnee Counties, Kansas, GNMA Mortgage-Backed Securities Program Single Family Revenue Bonds, Series 1997A-1, 6.950%, 6/01/29 (Alternative Minimum Tax) | No Opt. Call | Aaa | 161,939 | ||||||
20
| Principal Amount (000) | Description (1) | Optional Call Provisions (2) | Ratings (3) | Value | ||||||
| Housing/Single Family (continued) | ||||||||||
| $ | 145 | Sedgwick and Shawnee Counties, Kansas, GNMA Mortgage-Backed Securities Program Single Family Revenue Bonds, Series 2000A-2, 7.600%, 12/01/31 – MBIA Insured (Alternative Minimum Tax) | 12/09 at 105.00 | Aaa | $ | 147,407 | ||||
| 4,755 | Sedgwick and Shawnee Counties, Kansas, Mortgage Backed Securities Program Single Family Mortgage Revenue Bonds, Series 2006A1, 5.500%, 12/01/38 (Alternative Minimum Tax) | 12/16 at 104.00 | Aaa | 4,091,297 | ||||||
| 4,585 | Sedgwick and Shawnee Counties, Kansas, Mortgage Backed Securities Program Single Family Mortgage Revenue Bonds, Series 2006A6, 5.550%, 6/01/38 (Alternative Minimum Tax) | 6/16 at 103.00 | Aaa | 3,961,853 | ||||||
| 3,600 | Sedgwick and Shawnee Counties, Kansas, Mortgage Backed Securities Program Single Family Mortgage Revenue Bonds, Series 2006B1, 5.300%, 12/01/38 (Alternative Minimum Tax) | 6/16 at 103.00 | Aaa | 3,247,092 | ||||||
| 3,965 | Sedgwick and Shawnee Counties, Kansas, Mortgage Backed Securities Program Single Family Mortgage Revenue Bonds, Series 2007B4, 5.550%, 12/01/38 (Alternative Minimum Tax) | 12/16 at 104.00 | Aaa | 3,425,879 | ||||||
| 23,185 | Total Housing/Single Family | 20,605,028 | ||||||||
| Industrials – 1.5% | ||||||||||
| 1,025 | Wichita Airport Authority, Kansas, Special Facilities Revenue Bonds, Cessna Citation Service Center, Series 2002A, 6.250%, 6/15/32 (Alternative Minimum Tax) | 6/12 at 101.00 | A– | 799,090 | ||||||
| 1,000 | Wichita, Kansas, Industrial Revenue Bonds, NMF America Inc. Series 2000-II, 5.800%, 8/01/15 (Alternative Minimum Tax) | 2/09 at 100.50 | AA | 1,002,940 | ||||||
| 2,025 | Total Industrials | 1,802,030 | ||||||||
| Long-Term Care – 2.4% | ||||||||||
| 1,980 | Manhattan Health Care Facility Revenue Bonds, Kansas, Meadowlarks Hills Retirement, Series 2007B, 5.125%, 5/15/42 | 5/14 at 103.00 | N/R | 1,158,003 | ||||||
| 2,000 | Olathe, Kansas, Senior Living Facility Revenue Bonds, Aberdeen Village Inc, Refunding Series 2005A, 5.600%, 5/15/28 | 5/10 at 100.00 | N/R | 1,298,500 | ||||||
| 500 | Sedgwick County, Kansas, Healthcare Facilities Revenue Bonds, Catholic Care Center Inc., Series 2001, 5.750%, 11/15/23 | 11/09 at 100.00 | A | 481,075 | ||||||
| 4,480 | Total Long-Term Care | 2,937,578 | ||||||||
| Materials – 2.7% | ||||||||||
| 3,700 | Ford County, Kansas, Sewage and Solid Waste Disposal Revenue Bonds, Excel Corporation/Cargill Inc. Project, Series 1998, 5.400%, 6/01/28 (Alternative Minimum Tax) | 12/08 at 102.00 | A | 3,292,889 | ||||||
| Tax Obligation/General – 10.6% | ||||||||||
| 2,500 | Butler and Sedgwick Counties Unified School District 385, Andover, Kansas, General Obligation Refunding and Improvement Bonds, Series 2000, 6.000%, 9/01/16 – FSA Insured | No Opt. Call | AAA | 2,839,950 | ||||||
| 2,000 | Butler County Unified School District 402, Kansas, General Obligation Bonds, Series 2008A, | 9/18 at 100.00 | Aa2 | 1,875,860 | ||||||
| 65 | Cowley County Unified School District 465, Winfield, Kansas, General Obligation Bonds, Series 2003, 5.250%, 10/01/23 – MBIA Insured | 10/13 at 100.00 | AA | 65,409 | ||||||
| 1,500 | Douglas County Unified School District 497, Kansas, General Obligation Bonds, Series 2006A, 5.000%, 9/01/25 – MBIA Insured | 9/16 at 100.00 | Aa3 | 1,484,790 | ||||||
| 1,100 | Montgomery County Unified School District 445, Coffeyville, Kansas, General Obligation Bonds, Series 2002, 5.000%, 4/01/22 – FGIC Insured | 4/12 at 100.00 | AA | 1,023,781 | ||||||
| Puerto Rico, General Obligation and Public Improvement Bonds, Series 2001A: | ||||||||||
| 1,000 | 5.500%, 7/01/20 – MBIA Insured | No Opt. Call | AA | 920,150 | ||||||
| 330 | 5.375%, 7/01/28 | 7/11 at 100.00 | BBB– | 271,445 | ||||||
| 1,250 | Sedgwick County Unified School District 259, Wichita, Kansas, General Obligation Bonds, Series 2000, 3.500%, 9/01/16 | 9/10 at 100.00 | AA | 1,223,225 | ||||||
| 1,500 | Sedgwick County Unified School District 262, Kansas, General Obligation Bonds, Series 2008, 5.000%, 9/01/23 – AGC Insured | 9/18 at 100.00 | AAA | 1,487,985 | ||||||
| 1,795 | Wichita, Kansas, General Obligation Bonds, Series 2002, 5.000%, 4/01/17 | 4/09 at 101.00 | AA+ | 1,829,949 | ||||||
| 13,040 | Total Tax Obligation/General | 13,022,544 | ||||||||
21
Portfolio of Investments (Unaudited)
Nuveen Kansas Municipal Bond Fund (continued)
November 30, 2008
| Principal Amount (000) | Description (1) | Optional Call Provisions (2) | Ratings (3) | Value | |||||||
| Tax Obligation/Limited – 18.5% | |||||||||||
| $ | 3,000 | Butler County Public Building Commission, Kansas, Improvement Revenue Bonds, Public Facilities Projects, Series 2000, 5.550%, 10/01/21 – MBIA Insured | 10/10 at 100.00 | A2 | $ | 3,179,760 | |||||
| 1,000 | Kansas Department of Transportation, Highway Revenue Bonds, Series 2004A, 5.000%, 3/01/20 | 3/14 at 100.00 | AAA | 1,021,700 | |||||||
| 3,000 | Kansas Development Finance Authority, Board of Regents, Revenue Bonds, Scientific Research and Development Facilities Projects, Series 2003C, 5.000%, 10/01/23 – AMBAC Insured | 4/13 at 102.00 | AA | 2,869,470 | |||||||
| 500 | Kansas Development Finance Authority, Lease Revenue Bonds, Department of Administration, State Capitol Restoration Parking Facility Project, Series 2002C, 5.000%, 10/01/21 – FSA Insured | 10/12 at 100.00 | AAA | 502,915 | |||||||
| 1,140 | Kansas Development Finance Authority, Lease Revenue Bonds, Department of Administration, State Capitol Restoration Project, Series 2004G-1, 5.125%, 4/01/21 – MBIA Insured | 4/14 at 100.00 | AA | 1,155,595 | |||||||
| 3,900 | Kansas Development Finance Authority, Revenue Bonds, Department of Administration, Comprehensive Transportation Program, Series 2006A, 5.000%, 11/01/23 – FGIC Insured | 11/16 at 100.00 | AA | 3,864,276 | |||||||
| 1,000 | Kansas Development Finance Authority, Revenue Bonds, State Projects, Series 2001W, | 10/11 at 100.00 | AA | 1,011,060 | |||||||
| 1,155 | Kansas Development Finance Authority, Revenue Bonds, State Projects, Series 2004A, | 4/14 at 101.00 | AA | 1,111,387 | |||||||
| 5,000 | Overland Park Development Corporation, Kansas, First Tier Revenue Bonds, Overland Park Convention Center, Series 2007A, 5.250%, 1/01/32 – AMBAC Insured | 1/17 at 100.00 | A | 4,120,850 | |||||||
| 2,000 | Virgin Islands Public Finance Authority, Gross Receipts Taxes Loan Note, Series 1999A, | 10/10 at 101.00 | BBB+ | 2,021,460 | |||||||
| 2,250 | Wyandotte County-Kansas City Unified Government, Kansas, Sales Tax Special Obligation Bonds, Redevelopment Project Area B, Series 2005, 5.000%, 12/01/20 | 12/15 at 100.00 | N/R | 1,886,085 | |||||||
| 23,945 | Total Tax Obligation/Limited | 22,744,558 | |||||||||
| U.S. Guaranteed – 2.6% (4) | |||||||||||
| 1,800 | Overland Park Development Corporation, Kansas, First Tier Revenue Bonds, Overland Park Convention Center, Series 2001A, 7.375%, 1/01/32 (Pre-refunded 1/01/11) | 1/11 at 101.00 | N/R | (4) | 1,998,684 | ||||||
| 1,010 | Wichita, Kansas, Revenue Bonds, CSJ Health System of Wichita, Inc., Series 1985-XXV, | 5/09 at 100.00 | A+ | (4) | 1,197,254 | ||||||
| 2,810 | Total U.S. Guaranteed | 3,195,938 | |||||||||
| Utilities – 2.5% | |||||||||||
| 1,225 | Virgin Islands Water and Power Authority, Electric System Revenue Refunding Bonds, Series 1998, 5.300%, 7/01/18 | 1/09 at 101.00 | N/R | 1,042,536 | |||||||
| 1,000 | Wyandotte County-Kansas City Unified Government, Kansas, Utility System Revenue Bonds, Series 2004B, 5.000%, 9/01/24 – FSA Insured | 9/14 at 100.00 | AAA | 983,860 | |||||||
| 1,000 | Wynadotte County-Kansas City Unified Government, Kansas, Industrial Revenue Bonds, Board of Public Utilities Office Building Complex, Series 2001, 5.000%, 5/01/21 – MBIA Insured | 5/11 at 100.00 | AA | 979,140 | |||||||
| 3,225 | Total Utilities | 3,005,536 | |||||||||
| Water and Sewer – 10.2% | |||||||||||
| 2,300 | Kansas Development Finance Authority, Water Pollution Control Revolving Fund Leveraged Bonds, Series 2002-II, 5.000%, 11/01/23 | 11/12 at 100.00 | AAA | 2,303,151 | |||||||
| 5,000 | Kansas Development Finance Authority, Water Pollution Control Revolving Fund, State Match Program, Series 2008-CW, 5.000%, 11/01/24 (WI/DD, Settling 12/03/08) | 1/13 at 100.00 | AAA | 4,951,100 | |||||||
| 5,500 | Wichita, Kansas, Water and Sewerage Utility Revenue Bonds, Series 2003, | 10/13 at 100.00 | AA | 5,266,361 | |||||||
| 12,800 | Total Water and Sewer | 12,520,612 | |||||||||
| $ | 124,265 | Total Long-Term Investments (cost $124,148,032) – 93.7% | 114,796,475 | ||||||||
22
| Principal Amount (000) | Description (1) | Ratings (3) | Value | |||||
| Short-Term Investments – 2.3% | ||||||||
| $ | 2,845 | Kansas Development Finance Authority, Health Facilities Revenue Bonds, Deaconess Long Term Care, Series 2000C, Variable Rate Demand Obligations, 0.800%, 5/15/30 (5) | VMIG-1 | $ | 2,845,000 | |||
Total Short-Term Investments (cost $2,845,000) | 2,845,000 | |||||||
Total Investments (cost $126,993,032) – 96.0% | 117,641,475 | |||||||
Other Assets Less Liabilities – 4.0% | 4,952,113 | |||||||
Net Assets – 100% | $ | 122,593,588 | ||||||
| (1) | All percentages shown in the Portfolio of Investments are based on net assets. |
| (2) | Optional Call Provisions: Dates (month and year) and prices of the earliest optional call or redemption. There may be other call provisions at varying prices at later dates. Certain mortgage-backed securities may be subject to periodic principal paydowns. |
| (3) | Ratings: Using the higher of Standard & Poor’s Group (“Standard & Poor’s”) or Moody’s Investor Service, Inc. (“Moody’s”) rating. Ratings below BBB by Standard & Poor’s or Baa by Moody’s are considered to be below investment grade. |
| The Portfolio of Investments may reflect the ratings on certain bonds insured by ACA, AGC, AMBAC, CIFG, FGIC, FSA, MBIA, RAAI and SYNCORA as of November 30, 2008. Please see the Portfolio Managers’ Commentary for an expanded discussion of the affect on the Fund of changes to the ratings of certain bonds in the portfolio resulting from changes to the ratings of the underlying insurers both during the period and after period end. |
| (4) | Backed by an escrow or trust containing sufficient U.S. Government or U.S. Government agency securities which ensure the timely payment of principal and interest. Such investments are normally considered to be equivalent to AAA rated securities. |
| (5) | Investment has a maturity of more than one year, but has variable rate and demand features which qualify it as a short-term investment. The rate disclosed is that in effect at the end of the reporting period. This rate changes periodically based on market conditions or a specified market index. |
| N/R | Not rated. |
| WI/DD | Purchased on a when-issued or delayed delivery basis. |
| (ETM) | Escrowed to maturity. |
See accompanying notes to financial statements.
23
Portfolio of Investments (Unaudited)
Nuveen Kentucky Municipal Bond Fund
November 30, 2008
| Principal Amount (000) | Description (1) | Optional Call Provisions (2) | Ratings (3) | Value | ||||||
| Consumer Staples – 0.9% | ||||||||||
| $ | 4,505 | Puerto Rico, The Children’s Trust Fund, Tobacco Settlement Asset-Backed Refunding Bonds, Series 2002, 5.375%, 5/15/33 | 5/12 at 100.00 | BBB | $ | 3,266,125 | ||||
| Education and Civic Organizations – 5.5% | ||||||||||
| 1,000 | Campbellsville, Kentucky, Revenue Bonds, Campbellsville University, Series 2005, 5.700%, 3/01/34 | 3/15 at 100.00 | N/R | 830,560 | ||||||
| 5,970 | Columbia, Kentucky, Educational Development Revenue Bonds, Lindsey Wilson College Project, | 4/11 at 101.00 | BBB– | 5,212,168 | ||||||
| 1,000 | Kentucky Asset/Liability Commission, General Receipts Revenue Bonds, University of Kentucky, | 10/15 at 100.00 | AA | 1,052,070 | ||||||
| Kentucky Asset/Liability Commission, General Receipts Revenue Bonds, University of Kentucky, Series 2007A: | ||||||||||
| 1,345 | 5.000%, 10/01/20 – AMBAC Insured | 10/17 at 100.00 | AA | 1,364,597 | ||||||
| 2,675 | 5.000%, 10/01/21 – AMBAC Insured | 10/17 at 100.00 | AA | 2,683,346 | ||||||
| 4,435 | 5.000%, 10/01/22 – AMBAC Insured | 10/17 at 100.00 | AA | 4,414,998 | ||||||
| 1,500 | Louisville and Jefferson County Metropolitan Government, Kentucky, General Revenue Bonds, Bellarmine University, Series 2008A, 6.000%, 5/01/38 | 5/18 at 100.00 | Baa2 | 1,193,745 | ||||||
| 2,500 | Puerto Rico Industrial, Tourist, Educational, Medical and Environmental Control Facilities Financing Authority, Higher Education Revenue Bonds, Ana G. Mendez University System, Series 1999, | 2/09 at 101.00 | BBB– | 1,805,725 | ||||||
| 3,000 | Puerto Rico Industrial, Tourist, Educational, Medical and Environmental Control Facilities Financing Authority, Higher Education Revenue Bonds, University of the Sacred Heart, Series 2001, | 9/11 at 100.00 | BBB | 2,199,570 | ||||||
| 23,425 | Total Education and Civic Organizations | 20,756,779 | ||||||||
| Health Care – 10.7% | ||||||||||
| 3,000 | Christian County, Kentucky, Hospital Revenue Refunding Bonds, Jennie Stuart Medical Center, | 2/18 at 100.00 | AAA | 2,671,590 | ||||||
| 3,260 | Clark County, Kentucky, Hospital Revenue Refunding and Improvement Bonds, Clark Regional Medical Center Project, Series 1997, 6.200%, 4/01/13 | 3/09 at 100.00 | BBB– | 3,205,688 | ||||||
| 8,880 | Kentucky Economic Development Finance Authority, Health System Revenue Bonds, Norton Healthcare Inc., Series 2000B, 0.000%, 10/01/28 – MBIA Insured | No Opt. Call | AA | 2,096,213 | ||||||
| 9,500 | Kentucky Economic Development Finance Authority, Hospital Revenue Refunding Bonds, Pikeville, United Methodist Hospital of Kentucky Inc. Project, Series 1997, 5.700%, 2/01/28 – CONNIE LEE Insured | 2/09 at 100.00 | A | 7,737,275 | ||||||
| Kentucky Economic Development Finance Authority, Hospital System Revenue Refunding and Improvement Bonds, Appalachian Regional Healthcare Inc., Series 1997: | ||||||||||
| 3,500 | 5.850%, 10/01/17 | 4/09 at 101.00 | BB– | 2,785,055 | ||||||
| 1,500 | 5.875%, 10/01/22 | 4/09 at 101.00 | BB– | 1,103,775 | ||||||
| 6,000 | Murray Hospital Facilities, Kentucky, Revenue Bonds, Murray-Calloway County Public Hospital, Series 2007, 5.125%, 8/01/37 | 8/17 at 100.00 | Baa1 | 4,199,340 | ||||||
| 2,195 | Rockcastle County, Kentucky, First Mortgage Revenue Bonds, Rockcastle Hospital and Respiratory Care Center Inc. Project, Series 2005, 5.550%, 6/01/30 | 6/15 at 100.00 | BBB– | 1,638,326 | ||||||
| 16,500 | Russell, Kentucky, Revenue Bonds, Bon Secours Health System, Series 2002A, 5.625%, 11/15/30 | 11/12 at 100.00 | A– | 14,279,595 | ||||||
| 1,000 | Warren County, Kentucky, Hospital Facilities Revenue Bonds, Community Hospital, Series 2007A, | 8/17 at 100.00 | BBB+ | 728,090 | ||||||
| 55,335 | Total Health Care | 40,444,947 | ||||||||
| Housing/Multifamily – 0.6% | ||||||||||
| 3,130 | Henderson, Kentucky, Senior Tax-Exempt Residential Facilities Revenue Bonds, Pleasant Pointe Project, Series 1999A, 6.125%, 5/01/29 | 5/09 at 102.00 | N/R | 2,448,787 | ||||||
24
| Principal Amount (000) | Description (1) | Optional Call Provisions (2) | Ratings (3) | Value | ||||||
| Housing/Single Family – 1.9% | ||||||||||
| $ | 230 | Kentucky Housing Corporation, Housing Revenue Bonds, Series 1998F, 5.000%, 7/01/18 (Alternative Minimum Tax) | 1/09 at 101.00 | AAA | $ | 222,886 | ||||
| 4,480 | Kentucky Housing Corporation, Housing Revenue Bonds, Series 1999A, 5.200%, 1/01/31 | 4/09 at 101.00 | AAA | 4,019,008 | ||||||
| 165 | Kentucky Housing Corporation, Housing Revenue Bonds, Series 1999B, 5.250%, 1/01/28 (Alternative Minimum Tax) | 4/09 at 101.00 | AAA | 138,801 | ||||||
| 2,855 | Kentucky Housing Corporation, Housing Revenue Bonds, Series 2004F, 3.900%, 7/01/31 (Alternative Minimum Tax) | 1/14 at 100.00 | AAA | 2,639,876 | ||||||
| 7,730 | Total Housing/Single Family | 7,020,571 | ||||||||
| Long-Term Care – 1.8% | ||||||||||
| 4,840 | Florence, Kentucky, Housing Facilities Revenue Bonds, Bluegrass RHF Housing Inc., Series 1999, 6.375%, 8/15/29 – ACA Insured | 8/09 at 101.00 | N/R | 5,063,463 | ||||||
| 2,000 | Kentucky Economic Development Finance Authority, Multifamily Housing Revenue Bonds, Christian Care Communities Projects, Series 2005, 5.250%, 11/20/25 | 11/15 at 103.00 | AAA | 1,904,980 | ||||||
| 6,840 | Total Long-Term Care | 6,968,443 | ||||||||
| Materials – 0.6% | ||||||||||
| 2,820 | Wickliffe, Kentucky, Solid Waste Disposal Facility Revenue Bonds, Westvaco Corporation, Series 1996, 6.375%, 4/01/26 (Alternative Minimum Tax) | 4/09 at 100.00 | BBB | 2,182,906 | ||||||
| Tax Obligation/General – 9.3% | ||||||||||
| Bowling Green, Kentucky, General Obligation and Special Revenue Bonds, Series 2002B: | ||||||||||
| 1,785 | 5.000%, 6/01/23 | 6/12 at 100.00 | Aa2 | 1,770,452 | ||||||
| 1,230 | 5.000%, 6/01/24 | 6/12 at 100.00 | Aa2 | 1,213,038 | ||||||
| 1,700 | 5.000%, 6/01/25 | 6/12 at 100.00 | Aa2 | 1,666,306 | ||||||
| Crittenden County, Kentucky, General Obligation Bonds, Series 2007: | ||||||||||
| 1,085 | 6.000%, 12/01/27 | 12/17 at 100.00 | N/R | 1,018,739 | ||||||
| 1,605 | 6.250%, 12/01/32 | 12/17 at 100.00 | N/R | 1,525,392 | ||||||
| 2,190 | 6.500%, 12/01/37 | 12/17 at 100.00 | N/R | 2,109,934 | ||||||
| 2,500 | Jefferson County, Kentucky, General Obligation Refunding Bonds, Series 1999C, 6.150%, 5/15/16 (Alternative Minimum Tax) | 5/09 at 100.00 | AA+ | 2,513,075 | ||||||
| Louisville and Jefferson County Metropolitan Government, Kentucky, General Obligation Bonds, Series 2004A-B: | ||||||||||
| 1,195 | 5.000%, 11/01/16 – AMBAC Insured | 11/14 at 100.00 | AA+ | 1,271,444 | ||||||
| 1,000 | 5.000%, 11/01/17 – AMBAC Insured | 11/14 at 100.00 | AA+ | 1,053,770 | ||||||
| 1,175 | Louisville, Kentucky, General Obligation Bonds, Series 2001A, 5.000%, 11/01/21 | 11/11 at 101.00 | AA+ | 1,190,299 | ||||||
| 3,000 | Louisville, Kentucky, General Obligation Bonds, Series 2002A, 5.000%, 10/01/23 – FGIC Insured | 10/12 at 100.00 | AA+ | 2,974,980 | ||||||
| 5,000 | Puerto Rico, General Obligation Bonds, Series 2004A, 5.250%, 7/01/21 – MBIA Insured | 7/14 at 100.00 | AA | 4,442,200 | ||||||
| Puerto Rico, General Obligation and Public Improvement Bonds, Series 2001A: | ||||||||||
| 840 | 5.500%, 7/01/14 – FSA Insured (UB) | No Opt. Call | AAA | 895,180 | ||||||
| 2,550 | 5.500%, 7/01/16 – FSA Insured (UB) | No Opt. Call | AAA | 2,693,897 | ||||||
| 3,000 | 5.500%, 7/01/17 – FSA Insured (UB) | No Opt. Call | AAA | 3,133,440 | ||||||
| 3,440 | 5.500%, 7/01/18 – FSA Insured (UB) | No Opt. Call | AAA | 3,564,322 | ||||||
| 2,250 | 5.500%, 7/01/19 – FSA Insured (UB) | No Opt. Call | AAA | 2,303,415 | ||||||
| 35,545 | Total Tax Obligation/General | 35,339,883 | ||||||||
| Tax Obligation/Limited – 27.6% | ||||||||||
| 1,305 | Ballard County School District Finance Corporation, Kentucky, School Building Revenue Bonds, Series 2004, 5.000%, 6/01/21 – AMBAC Insured | 6/14 at 100.00 | Aa3 | 1,277,686 | ||||||
| Boone County School District Finance Corporation, Kentucky, School Building Revenue Bonds, Series 2004B: | ||||||||||
| 1,460 | 5.000%, 5/01/20 – FSA Insured | 5/14 at 100.00 | Aa3 | 1,464,073 | ||||||
| 2,580 | 5.000%, 5/01/21 – FSA Insured | 5/14 at 100.00 | Aa3 | 2,561,063 | ||||||
| 1,465 | Boone County, Kentucky, Public Properties Corporation, First Mortgage Bonds, AOC Judicial Facility, Series 2001, 5.125%, 9/01/22 | 9/12 at 101.00 | Aa3 | 1,471,768 | ||||||
25
Portfolio of Investments (Unaudited)
Nuveen Kentucky Municipal Bond Fund (continued)
November 30, 2008
| Principal Amount (000) | Description (1) | Optional Call Provisions (2) | Ratings (3) | Value | ||||||
| Tax Obligation/Limited (continued) | ||||||||||
| Butler County School District Finance Corporation, Kentucky, Revenue Bonds, School Buildings, Series 2004C: | ||||||||||
| $ | 1,220 | 5.000%, 6/01/20 | 6/14 at 100.00 | Aa3 | $ | 1,235,506 | ||||
| 1,255 | 5.000%, 6/01/22 | 6/14 at 100.00 | Aa3 | 1,255,113 | ||||||
| Kenton County School District Finance Corporation, Kentucky, School Building Revenue Bonds, Series 2004: | ||||||||||
| 2,115 | 5.000%, 6/01/17 – MBIA Insured | 6/14 at 100.00 | Aa3 | 2,146,091 | ||||||
| 3,510 | 5.000%, 6/01/18 – MBIA Insured | 6/14 at 100.00 | Aa3 | 3,552,085 | ||||||
| 3,690 | 5.000%, 6/01/19 – MBIA Insured | 6/14 at 100.00 | Aa3 | 3,704,059 | ||||||
| Kentucky Area Development Districts Financing Trust, Ewing, Lease Acquisition Program Revenue Bonds, Series 2000C: | ||||||||||
| 750 | 5.850%, 6/01/20 | 6/10 at 102.00 | N/R | 674,115 | ||||||
| 1,000 | 6.000%, 6/01/30 | 6/10 at 102.00 | N/R | 807,110 | ||||||
| 2,000 | Kentucky Asset/Liability Commission, General Fund Revenue Project Notes, First Series 2005, 5.000%, 5/01/25 – MBIA Insured | 5/15 at 100.00 | AA | 1,926,160 | ||||||
| Kentucky Economic Development Finance Authority, Louisville Arena Project Revenue Bonds, Louisville Arena Authority, Inc., Series 2008A-1: | ||||||||||
| 2,000 | 6.000%, 12/01/38 – AGC Insured | 6/18 at 100.00 | AAA | 1,893,860 | ||||||
| 3,000 | 6.000%, 12/01/42 – AGC Insured | 6/18 at 100.00 | AAA | 2,801,220 | ||||||
| 2,365 | Kentucky Local Correctional Facilities Authority, Multi-County Lease Revenue Bonds, Series 2004, 5.250%, 11/01/14 – MBIA Insured | No Opt. Call | AA | 2,477,314 | ||||||
| Kentucky State Property and Buildings Commission, Revenue Bonds, Project 81, Series 2003: | ||||||||||
| 1,000 | 5.000%, 11/01/19 – AMBAC Insured | 11/13 at 100.00 | A1 | 996,630 | ||||||
| 2,845 | 5.000%, 11/01/23 – AMBAC Insured | 11/13 at 100.00 | A1 | 2,690,232 | ||||||
| 2,000 | Kentucky State Property and Buildings Commission, Revenue Bonds, Project 84, Series 2005, 5.000%, 8/01/18 – MBIA Insured | No Opt. Call | AA | 2,089,120 | ||||||
| 5,000 | Kentucky State Property and Buildings Commission, Revenue Bonds, Project 85, Series 2005, 5.000%, 8/01/15 – FSA Insured | No Opt. Call | AAA | 5,415,550 | ||||||
| 10,000 | Kentucky Turnpike Authority, Economic Development Road Revenue Bonds, Revitalization Project, | 7/15 at 100.00 | AA+ | 9,892,400 | ||||||
| Kentucky Turnpike Authority, Economic Development Road Revenue Bonds, Revitalization Project, Series 2006B: | ||||||||||
| 5,095 | 5.000%, 7/01/15 – AMBAC Insured | No Opt. Call | AA+ | 5,503,874 | ||||||
| 5,000 | 5.000%, 7/01/24 – AMBAC Insured | 7/16 at 100.00 | AA+ | 4,904,300 | ||||||
| 4,000 | Kentucky Turnpike Authority, Economic Development Road Revenue Refunding Bonds, Revitalization Project, Series 2001B, 5.150%, 7/01/19 – FSA Insured | 7/11 at 100.00 | AAA | 4,061,480 | ||||||
| 2,060 | Laurel County, Kentucky, School District Finance Corporation, School Building Revenue Bonds, Series 2007, 5.000%, 6/01/27 – FSA Insured | 6/17 at 100.00 | Aa3 | 1,914,193 | ||||||
| Letcher County School District Finance Corporation, Kentucky, School Building Revenue Bonds, Series 2004: | ||||||||||
| 1,430 | 5.000%, 6/01/18 – FSA Insured | 6/14 at 100.00 | Aa3 | 1,457,542 | ||||||
| 1,585 | 5.000%, 6/01/20 – FSA Insured | 6/14 at 100.00 | Aa3 | 1,589,533 | ||||||
| 1,695 | Louisville and Jefferson County Visitors and Convention Commission, Kentucky, Dedicated Tax Revenue Bonds, Series 2004A, 5.000%, 12/01/15 – FSA Insured | 6/14 at 101.00 | AAA | 1,794,090 | ||||||
| 5,100 | Oldham County School District Finance Corporation, Kentucky, School Building Revenue Bonds, Series 2001A, 5.125%, 4/01/21 | 4/11 at 101.00 | Aa3 | 5,237,496 | ||||||
| Oldham County School District Finance Corporation, Kentucky, School Building Revenue Bonds, Series 2004: | ||||||||||
| 1,230 | 5.000%, 5/01/18 – MBIA Insured | 5/14 at 100.00 | Aa3 | 1,264,637 | ||||||
| 1,635 | 5.000%, 5/01/20 – MBIA Insured | 5/14 at 100.00 | Aa3 | 1,654,293 | ||||||
| 1,715 | 5.000%, 5/01/21 – MBIA Insured | 5/14 at 100.00 | Aa3 | 1,723,832 | ||||||
26
| Principal Amount (000) | Description (1) | Optional Call Provisions (2) | Ratings (3) | Value | |||||||
| Tax Obligation/Limited (continued) | |||||||||||
| $ | 1,360 | Owen County School District Finance Corporation, Kentucky, School Building Revenue Bonds, Series 2001, 5.000%, 4/01/21 | 4/11 at 101.00 | Aa3 | $ | 1,368,867 | |||||
| 500 | Pendleton County, Kentucky, Leasing Trust Revenue Bonds, Kentucky Association of Counties, Series 1993A, 6.400%, 3/01/19 (4) | No Opt. Call | A | 554,750 | |||||||
| 2,545 | Puerto Rico Highway and Transportation Authority, Highway Revenue Bonds, Series 1998A, | No Opt. Call | A | 2,535,787 | |||||||
| 590 | Puerto Rico Highway and Transportation Authority, Highway Revenue Bonds, Series 2002D, | 7/12 at 100.00 | AAA | 514,002 | |||||||
| 3,185 | Puerto Rico Public Buildings Authority, Guaranteed Government Facilities Revenue Bonds, Series 1993L, 5.500%, 7/01/21 – FSA Insured | No Opt. Call | AAA | 3,181,942 | |||||||
| 5,000 | Puerto Rico Public Buildings Authority, Guaranteed Government Facilities Revenue Refunding Bonds, | No Opt. Call | BBB– | 4,442,200 | |||||||
| 6,000 | Puerto Rico, Highway Revenue Bonds, Highway and Transportation Authority, Series 2003AA, 5.500%, 7/01/19 – MBIA Insured | No Opt. Call | AA | 5,634,900 | |||||||
| 1,360 | Shelby County School District Finance Corporation, Kentucky, Revenue Bonds, School Buildings, Series 2004, 5.000%, 5/01/21 – MBIA Insured | 5/14 at 100.00 | Aa3 | 1,331,630 | |||||||
| 2,185 | Spencer County School District Finance Corporation, Kentucky, Revenue Bonds, School Buildings, | 7/14 at 100.00 | Aaa | 2,168,787 | |||||||
| 1,010 | Virgin Islands Public Finance Authority, Gross Receipts Taxes Loan Note, Series 2003, | 10/14 at 100.00 | AAA | 1,031,301 | |||||||
| 104,840 | Total Tax Obligation/Limited | 104,200,591 | |||||||||
| Transportation – 5.3% | |||||||||||
| Guam International Airport Authority, Revenue Bonds, Series 2003C: | |||||||||||
| 5,000 | 5.250%, 10/01/22 – MBIA Insured (Alternative Minimum Tax) | 10/10 at 100.00 | AA | 4,177,950 | |||||||
| 2,195 | 5.000%, 10/01/23 – MBIA Insured (Alternative Minimum Tax) | 10/13 at 100.00 | AA | 1,751,149 | |||||||
| 5,090 | Kenton County Airport Board, Kentucky, Airport Revenue Bonds, Cincinnati/Northern Kentucky International Airport, Series 2003B, 5.000%, 3/01/23 – MBIA Insured (Alternative Minimum Tax) | 3/13 at 100.00 | AA | 4,083,962 | |||||||
| 2,980 | Kenton County Airport Board, Kentucky, Airport Revenue Bonds, Cincinnati/Northern Kentucky International Airport, Series 2007B, 5.000%, 3/01/13 – SYNCORA GTY Insured (Alternative Minimum Tax) | No Opt. Call | AA | 2,951,779 | |||||||
| 1,000 | Louisville and Jefferson County Regional Airport Authority, Kentucky, Airport System Revenue Bonds, Series 2003C, 5.250%, 7/01/22 – FSA Insured (Alternative Minimum Tax) | 7/13 at 100.00 | AAA | 853,940 | |||||||
| 7,285 | Louisville and Jefferson County Regional Airport Authority, Kentucky, Special Facilities Revenue Bonds, Airis Louisville LLC Project, Series 1999A, 5.500%, 3/01/19 (Alternative Minimum Tax) | 3/09 at 101.00 | Baa3 | 6,205,290 | |||||||
| 23,550 | Total Transportation | 20,024,070 | |||||||||
| U.S. Guaranteed – 12.7% (5) | |||||||||||
| 1,875 | Bell County Public Properties Corporation, Kentucky, First Mortgage Revenue Bonds, Judicial Center Project, Series 2000, 5.850%, 9/01/28 (Pre-refunded 3/01/11) – AMBAC Insured | 3/11 at 102.00 | A | (5) | 2,066,138 | ||||||
| 5,085 | Campbellsville, Kentucky, Industrial Building Revenue Bonds, Campbellsville University Project, Series 1999, 5.500%, 3/01/29 (Pre-refunded 3/01/09) | 3/09 at 102.00 | BBB– | (5) | 5,244,771 | ||||||
| Fayette County School District Finance Corporation, Kentucky, School Building Revenue Bonds, Series 2000: | |||||||||||
| 1,665 | 5.500%, 6/01/18 (Pre-refunded 6/01/10) | 6/10 at 101.00 | AA– | (5) | 1,774,141 | ||||||
| 2,795 | 5.500%, 6/01/20 (Pre-refunded 6/01/10) | 6/10 at 101.00 | AA– | (5) | 2,978,212 | ||||||
| 2,000 | Jefferson County Collegiate Housing Foundation, Kentucky, Student Housing Revenue Bonds, University of Louisville Project, Series 1999A, 7.125%, 9/01/29 (Pre-refunded 9/01/09) | 9/09 at 102.00 | N/R | (5) | 2,127,500 | ||||||
| 5,930 | Jefferson County, Kentucky, College Revenue Bonds, Bellarmine College Project, Series 1999, 5.250%, 5/01/29 (Pre-refunded 5/01/09) | 5/09 at 101.00 | N/R | (5) | 6,090,644 | ||||||
27
Portfolio of Investments (Unaudited)
Nuveen Kentucky Municipal Bond Fund (continued)
November 30, 2008
| Principal Amount (000) | Description (1) | Optional Call Provisions (2) | Ratings (3) | Value | |||||||
| U.S. Guaranteed (5) (continued) | |||||||||||
| $ | 1,500 | Kentucky Economic Development Finance Authority, College Revenue Refunding and Improvement Bonds, Centre College Project, Series 2002, 5.000%, 4/01/32 (Pre-refunded 10/01/12) – FSA Insured | 10/12 at 100.00 | AAA | $ | 1,631,040 | |||||
| 1,000 | Kentucky Economic Development Finance Authority, Revenue Bonds, Catholic Health Initiatives, Series 2001, 5.250%, 9/01/21 (Pre-refunded 9/01/11) | 9/11 at 100.00 | AA | (5) | 1,082,700 | ||||||
| 400 | Kentucky State Property and Buildings Commission, Agency Fund Revenue Bonds, Project 66A, Series 2000, 5.750%, 5/01/20 (Pre-refunded 5/01/10) – MBIA Insured | 5/10 at 100.00 | AA | (5) | 422,560 | ||||||
| Kentucky State Property and Buildings Commission, Revenue Bonds, Project 85, Series 2005: | |||||||||||
| 2,795 | 5.000%, 8/01/22 (Pre-refunded 8/01/15) – FSA Insured | 8/15 at 100.00 | AAA | 3,116,425 | |||||||
| 5,085 | 5.000%, 8/01/25 (Pre-refunded 8/01/15) – FSA Insured | 8/15 at 100.00 | AAA | 5,669,775 | |||||||
| 5,000 | Kentucky State Property and Buildings Commission, Revenue Refunding Bonds, Project 79, Series 2003, 5.000%, 10/01/22 (Pre-refunded 10/01/13) – MBIA Insured | 10/13 at 100.00 | AA | (5) | 5,524,450 | ||||||
| 650 | Magoffin County School District Finance Corporation, Kentucky, School Building Revenue Bonds, Series 2000, 5.750%, 6/01/20 (Pre-refunded 6/01/10) | 6/10 at 101.00 | Aa3 | (5) | 695,019 | ||||||
| 410 | Puerto Rico Highway and Transportation Authority, Highway Revenue Bonds, Series 2002D, 5.000%, 7/01/32 (Pre-refunded 7/01/12) – FSA Insured | 7/12 at 100.00 | Aaa | 449,504 | |||||||
| Puerto Rico Public Finance Corporation, Commonwealth Appropriation Bonds, Series 2002E: | |||||||||||
| 245 | 6.000%, 8/01/26 – AGC Insured (ETM) | No Opt. Call | AAA | 273,356 | |||||||
| 2,755 | 6.000%, 8/01/26 – AGC Insured (ETM) | No Opt. Call | AAA | 3,073,864 | |||||||
| 2,600 | Puerto Rico, General Obligation and Public Improvement Bonds, Series 2000, 5.750%, 7/01/26 (Pre-refunded 7/01/10) – MBIA Insured | 7/10 at 100.00 | AA | (5) | 2,756,780 | ||||||
| 2,760 | Russell, Kentucky, Health System Revenue Bonds, Franciscan Health Partnership Inc. – Our Lady of Bellefonte Hospital, Series 1997, 5.500%, 7/01/15 (Pre-refunded 1/01/10) | 1/10 at 100.00 | Baa2 | (5) | 2,869,075 | ||||||
| 44,550 | Total U.S. Guaranteed | 47,845,954 | |||||||||
| Utilities – 12.4% | |||||||||||
| 1,175 | Boone County, Kentucky, Collateralized Pollution Control Revenue Bonds, Dayton Power & Light Company, Series 2005A, 4.700%, 1/01/28 – FGIC Insured | 7/15 at 100.00 | A2 | 995,119 | |||||||
| Kentucky Municipal Power Agency, Power Supply System Revenue Bonds, Series 2007A: | |||||||||||
| 4,000 | 5.000%, 9/01/37 – MBIA Insured | 9/17 at 100.00 | AA | 3,349,840 | |||||||
| 4,500 | 5.250%, 9/01/42 – MBIA Insured | 9/17 at 100.00 | AA | 3,851,325 | |||||||
| Owensboro, Kentucky, Electric Light and Power System Revenue Bonds, Series 1991B: | |||||||||||
| 7,100 | 0.000%, 1/01/11 – AMBAC Insured | No Opt. Call | A | 6,608,396 | |||||||
| 6,475 | 0.000%, 1/01/12 – AMBAC Insured | No Opt. Call | A | 5,740,929 | |||||||
| 5,810 | 0.000%, 1/01/15 – AMBAC Insured | No Opt. Call | A | 4,377,951 | |||||||
| 7,900 | 0.000%, 1/01/17 – AMBAC Insured | No Opt. Call | A | 5,243,546 | |||||||
| 13,300 | 0.000%, 1/01/18 – AMBAC Insured | No Opt. Call | A | 8,193,332 | |||||||
| 3,000 | Puerto Rico Electric Power Authority, Power Revenue Bonds, Series 2003NN, | No Opt. Call | AA | 2,573,730 | |||||||
| 5,000 | Puerto Rico Electric Power Authority, Power Revenue Bonds, Series 2005RR, 5.000%, 7/01/24 – FGIC Insured | 7/15 at 100.00 | AA | 4,121,800 | |||||||
| 2,000 | Puerto Rico Electric Power Authority, Power Revenue Bonds, Series 2005SS, | 7/15 at 100.00 | AA | 2,018,240 | |||||||
| 60,260 | Total Utilities | 47,074,208 | |||||||||
| Water and Sewer – 11.4% | |||||||||||
| 3,795 | Campbell & Kenton Counties Sanitation District 1, Kentucky, Revenue Bonds, Series 2007, | 8/17 at 100.00 | AA | 3,722,022 | |||||||
| 1,405 | Christian County Water District, Kentucky, Waterworks Revenue Bonds, Series 1999, | 10/09 at 101.00 | Baa1 | 1,439,057 | |||||||
| 1,000 | Kentucky Rural Water Finance Corporation, Multimodal Public Projects Revenue Bonds, Flexible Term Program, Series 2001A, 5.375%, 2/01/20 | 2/11 at 102.00 | AA– | 991,810 | |||||||
28
| Principal Amount (000) | Description (1) | Optional Call Provisions (2) | Ratings (3) | Value | ||||||
| Water and Sewer (continued) | ||||||||||
| $ | 4,990 | Louisville and Jefferson County Metropolitan Government Board of Water Works, Kentucky, Water System Revenue Bonds, Series 2006, 5.000%, 11/15/29 | 11/16 at 100.00 | AA+ | $ | 4,894,591 | ||||
| 3,200 | Louisville and Jefferson County Metropolitan Sewer District, Kentucky, Sewer and Drainage System Revenue Bonds, Series 1998A, 5.000%, 5/15/30 – FGIC Insured | 5/10 at 100.00 | AA | 2,946,848 | ||||||
| 16,000 | Louisville and Jefferson County Metropolitan Sewer District, Kentucky, Sewer and Drainage System Revenue Bonds, Series 2001A, 5.500%, 5/15/34 – MBIA Insured | 11/11 at 101.00 | AA | 15,406,080 | ||||||
| Louisville and Jefferson County Metropolitan Sewer District, Kentucky, Sewer and Drainage System Revenue Bonds, Series 2004A: | ||||||||||
| 7,365 | 5.250%, 5/15/37 – FGIC Insured | 5/14 at 101.00 | AA | 6,784,417 | ||||||
| 750 | 5.000%, 5/15/38 – FGIC Insured | 5/14 at 101.00 | AA | 662,843 | ||||||
| 7,225 | Northern Kentucky Water District, Revenue Refunding Bonds, Series 2002A, | 2/12 at 100.00 | A2 | 6,453,515 | ||||||
| 45,730 | Total Water and Sewer | 43,301,183 | ||||||||
| $ | 418,260 | Total Investments (cost $408,111,972) – 100.7% | 380,874,447 | |||||||
Floating Rate Obligations – (2.0)% | (7,680,000) | |||||||||
Other Assets Less Liabilities – 1.3% | 5,088,994 | |||||||||
Net Assets – 100% | $ | 378,283,441 | ||||||||
| (1) | All percentages shown in the Portfolio of Investments are based on net assets. |
| (2) | Optional Call Provisions: Dates (month and year) and prices of the earliest optional call or redemption. There may be other call provisions at varying prices at later dates. Certain mortgage-backed securities may be subject to periodic principal paydowns. |
| (3) | Ratings: Using the higher of Standard & Poor’s Group (“Standard & Poor’s”) or Moody’s Investor Service, Inc. (“Moody’s”) rating. Ratings below BBB by Standard & Poor’s or Baa by Moody’s are considered to be below investment grade. |
| The Portfolio of Investments may reflect the ratings on certain bonds insured by ACA, AGC, AMBAC, CIFG, FGIC, FSA, MBIA, RAAI and SYNCORA as of November 30, 2008. Please see the Portfolio Managers’ Commentary for an expanded discussion of the affect on the Fund of changes to the ratings of certain bonds in the portfolio resulting from changes to the ratings of the underlying insurers both during the period and after period end. |
| (4) | The issuer has received a formal adverse determination from the Internal Revenue Service (the “IRS”) regarding the tax-exempt status of the bonds’ coupon payments. The Fund will continue to treat coupon payments as tax-exempt income until such time that it is formally determined that the interest on the bonds should be treated as taxable. |
| (5) | Backed by an escrow or trust containing sufficient U.S. Government or U.S. Government agency securities which ensure the timely payment of principal and interest. Such investments are normally considered to be equivalent to AAA rated securities. |
| N/R | Not rated. |
| (ETM) | Escrowed to maturity. |
| (UB) | Underlying bond of an inverse floating rate trust reflected as a financing transaction pursuant to the provisions of SFAS No. 140. |
See accompanying notes to financial statements.
29
Portfolio of Investments (Unaudited)
Nuveen Michigan Municipal Bond Fund
November 30, 2008
| Principal Amount (000) | Description (1) | Optional Call Provisions (2) | Ratings (3) | Value | ||||||
| Consumer Staples – 1.2% | ||||||||||
| $ | 2,450 | Michigan Tobacco Settlement Finance Authority, Tobacco Settlement Asset-Backed Revenue Bonds, | 6/18 at 100.00 | Baa3 | $ | 1,784,556 | ||||
| 835 | Puerto Rico, The Children’s Trust Fund, Tobacco Settlement Asset-Backed Refunding Bonds, Series 2002, | 5/12 at 100.00 | BBB | 605,375 | ||||||
| 3,285 | Total Consumer Staples | 2,389,931 | ||||||||
| Education and Civic Organizations – 4.6% | ||||||||||
| 630 | Chandler Park Academy, Michigan, Public School Academy Charter School Revenue Bonds, Series 2005, | 11/15 at 100.00 | BBB | 401,537 | ||||||
| Michigan Technological University, General Revenue Bonds, Series 2004A: | ||||||||||
| 1,230 | 5.000%, 10/01/24 – MBIA Insured | 10/13 at 100.00 | AA | 1,185,585 | ||||||
| 1,850 | 5.000%, 10/01/29 – MBIA Insured | 10/13 at 100.00 | AA | 1,695,192 | ||||||
| 6,150 | Wayne State University, Michigan, General Revenue Bonds, Series 1999, 5.125%, 11/15/29 – FGIC Insured | 11/09 at 101.00 | AA | 5,756,092 | ||||||
| 9,860 | Total Education and Civic Organizations | 9,038,406 | ||||||||
| Health Care – 6.9% | ||||||||||
| 2,600 | Michigan Hospital Financing Authority, Revenue Bonds, Oakwood Obligated Group, Series 2007A, 5.000%, 7/15/37 | 7/17 at 100.00 | A | 1,798,472 | ||||||
| 1,000 | Michigan State Hospital Finance Authority, Hospital Revenue Bonds, Michigan Community Hospital, Series 1996, 6.250%, 10/01/27 | 4/09 at 100.00 | BBB– | 859,130 | ||||||
| 1,475 | Michigan State Hospital Finance Authority, Hospital Revenue Refunding Bonds, Chelsea Community Hospital, Series 1998, 5.375%, 5/15/19 | 5/09 at 100.50 | BBB | 1,319,904 | ||||||
| 1,000 | Michigan State Hospital Finance Authority, Hospital Revenue Refunding Bonds, Crittenton Hospital, | 3/12 at 101.00 | A+ | 872,860 | ||||||
| 1,000 | Michigan State Hospital Finance Authority, Revenue Bonds, Chelsea Community Hospital, Series 2005, 5.000%, 5/15/37 | 5/15 at 100.00 | BBB | 624,160 | ||||||
| 1,400 | Michigan State Hospital Finance Authority, Revenue Bonds, Marquette General Hospital, Series 2005A, 5.000%, 5/15/26 | 5/15 at 100.00 | Baa3 | 1,015,168 | ||||||
| 2,000 | Michigan State Hospital Finance Authority, Revenue Bonds, Sparrow Obligated Group, Series 2005, 5.000%, 11/15/36 – MBIA Insured | 5/15 at 100.00 | AA | 1,461,160 | ||||||
| 3,755 | Michigan State Hospital Finance Authority, Revenue Refunding Bonds, Detroit Medical Center Obligated Group, Series 1993A, 6.500%, 8/15/18 | 2/09 at 100.00 | BB | 3,179,621 | ||||||
| Royal Oak Hospital Finance Authority, Michigan, Hospital Revenue Bonds, William Beaumont Hospital, Series 2001M: | ||||||||||
| 1,000 | 5.250%, 11/15/31 – MBIA Insured | 11/11 at 100.00 | AA | 795,230 | ||||||
| 2,000 | 5.250%, 11/15/35 – MBIA Insured | 11/11 at 100.00 | AA | 1,533,880 | ||||||
| 17,230 | Total Health Care | 13,459,585 | ||||||||
| Housing/Multifamily – 2.4% | ||||||||||
| 1,200 | Michigan Housing Development Authority, Rental Housing Revenue Bonds, Series 2006D, | 7/15 at 100.00 | AAA | 961,320 | ||||||
| 5,745 | Michigan Housing Development Authority, Section 8 Assisted Mortgage Revenue Bonds, Series 1983I, | No Opt. Call | AA | 3,777,108 | ||||||
| 6,945 | Total Housing/Multifamily | 4,738,428 | ||||||||
| Industrials – 0.9% | ||||||||||
| 2,000 | Michigan Strategic Fund, Solid Waste Disposal Limited Obligation Revenue Bonds, Waste Management Inc., Series 2004, 4.500%, 12/01/13 (Alternative Minimum Tax) | No Opt. Call | BBB | 1,716,840 | ||||||
| Long-Term Care – 1.7% | ||||||||||
| 1,000 | Michigan State Hospital Finance Authority, Revenue Bonds, Presbyterian Villages of Michigan Obligated Group, Series 2005, 5.250%, 11/15/25 | 5/15 at 100.00 | N/R | 673,300 | ||||||
30
| Principal Amount (000) | Description (1) | Optional Call Provisions (2) | Ratings (3) | Value | ||||||
| Long-Term Care (continued) | ||||||||||
| $ | 2,695 | Michigan Strategic Fund, Limited Obligation Revenue Bonds, Clark Retirement Community Inc., | 1/09 at 100.00 | BBB– | $ | 2,394,696 | ||||
| Michigan Strategic Fund, Limited Obligation Revenue Refunding Bonds, Porter Hills Presbyterian Village, Series 1998: | ||||||||||
| 140 | 5.300%, 7/01/18 | 7/09 at 100.00 | BBB | 126,423 | ||||||
| 260 | 5.375%, 7/01/28 | 7/09 at 100.00 | BBB | 198,159 | ||||||
| 4,095 | Total Long-Term Care | 3,392,578 | ||||||||
| Materials – 0.7% | ||||||||||
| 1,750 | Dickinson County Economic Development Corporation, Michigan, Pollution Control Revenue Bonds, International Paper Company, Series 2004A, 4.800%, 11/01/18 | 11/14 at 100.00 | BBB | 1,310,068 | ||||||
| Tax Obligation/General – 35.9% | ||||||||||
| 660 | Ann Arbor Public School District, Washtenaw County, Michigan, General Obligation Bonds, Series 2008, 5.000%, 5/01/23 | 5/18 at 100.00 | AA+ | 654,423 | ||||||
| 800 | Ann Arbor, Michigan, General Obligation Bonds, Court & Police Facilities Capital Improvement | 5/18 at 100.00 | AA+ | 734,352 | ||||||
| 1,435 | Bay City, Michigan, General Obligation Bonds, Series 2008B, 5.500%, 4/01/28 – FSA Insured | 4/18 at 100.00 | AAA | 1,450,555 | ||||||
| 1,020 | Caledonia Community Schools, Kent, Allegan and Barry Counties, Michigan, General Obligation Bonds, Series 2003, 5.250%, 5/01/22 | 5/13 at 100.00 | AA– | 1,028,762 | ||||||
| Caledonia Community Schools, Kent, Allegan and Barry Counties, Michigan, General Obligation Bonds, Series 2005: | ||||||||||
| 1,000 | 5.000%, 5/01/23 – MBIA Insured | 5/15 at 100.00 | AA | 991,550 | ||||||
| 2,085 | 5.000%, 5/01/24 – MBIA Insured | 5/15 at 100.00 | AA | 2,049,722 | ||||||
| 1,000 | 5.000%, 5/01/25 – MBIA Insured | 5/15 at 100.00 | AA | 978,050 | ||||||
| 2,013 | Caledonia Community Schools, Kent, Allegan and Barry Counties, Michigan, General Obligation Bonds, Tender Option Bond Trust 2008-1096, 6.772%, 5/01/32 – MBIA Insured (IF) | 5/17 at 100.00 | AA | 1,510,857 | ||||||
| 1,850 | Chippewa Valley Schools, Macomb County, Michigan, General Obligation Bonds, Series 2005, 5.000%, 5/01/24 – MBIA Insured | 5/15 at 100.00 | AA | 1,818,698 | ||||||
| 4,085 | Detroit, Michigan, General Obligation Bonds, Series 2004A-1, 5.250%, 4/01/20 – AMBAC Insured | 4/14 at 100.00 | A | 3,940,268 | ||||||
| 11,000 | Detroit-Wayne County Stadium Authority, Michigan, Limited Tax General Obligation Building Authority Stadium Bonds, Series 1997, 5.250%, 2/01/27 – FGIC Insured | 2/09 at 100.00 | AA | 10,104,927 | ||||||
| 1,245 | Edwardsburg Public School, Cass County, Michigan, General Obligation Bonds, Series 2004, 5.000%, 5/01/24 – FSA Insured | 5/14 at 100.00 | AAA | 1,229,151 | ||||||
| 4,350 | Hartland Consolidated School District, Livingston County, Michigan, General Obligation Refunding Bonds, Series 2001, 5.125%, 5/01/29 | 5/11 at 100.00 | AA– | 4,171,737 | ||||||
| 1,675 | Hopkins Public Schools, Allegan County, Michigan, General Obligation Bonds, Series 2007, 5.000%, 5/01/25 – MBIA Insured | 5/17 at 100.00 | AA | 1,638,234 | ||||||
| 2,000 | Howell Public Schools, Livingston County, Michigan, General Obligation Bonds, Series 2003, 5.000%, 5/01/24 | 11/13 at 100.00 | AA– | 1,972,440 | ||||||
| 1,000 | Jackson Public Schools, Jackson County, Michigan, General Obligation School Building and Site Bonds, Series 2004, 5.000%, 5/01/22 – FSA Insured | 5/14 at 100.00 | AAA | 987,460 | ||||||
| 1,215 | Kalamazoo Public Schools, Michigan, General Obligation Bonds, Series 2006, 5.000%, 5/01/25 – FSA Insured | 5/16 at 100.00 | AAA | 1,190,955 | ||||||
| 1,300 | Lansing Community College, Michigan, General Obligation Bonds, Series 2003, 5.000%, 5/01/20 – MBIA Insured | 5/13 at 100.00 | AA | 1,315,886 | ||||||
| 840 | Lowell Area Schools, Counties of Ionia and Kent, Michigan, General Obligation Bonds, Series 2007, 5.000%, 5/01/37 – FSA Insured | 5/17 at 100.00 | AAA | 762,056 | ||||||
| 3,250 | Michigan, General Obligation Bonds, Environmental Protection Program, Series 2003A, 5.250%, 5/01/21 | 5/13 at 100.00 | AA– | 3,303,658 | ||||||
| 795 | Oakland Intermediate School District, Oakland County, Michigan, General Obligation Bonds, Series 2007, 5.000%, 5/01/36 – FSA Insured | 5/17 at 100.00 | AAA | 723,347 | ||||||
31
Portfolio of Investments (Unaudited)
Nuveen Michigan Municipal Bond Fund (continued)
November 30, 2008
| Principal Amount (000) | Description (1) | Optional Call Provisions (2) | Ratings (3) | Value | ||||||
| Tax Obligation/General (continued) | ||||||||||
| $ | 1,370 | Oakridge Public Schools, Muskegon County, Michigan, General Obligation Bonds, Series 2005, 5.000%, 5/01/24 – MBIA Insured | 5/15 at 100.00 | AA | $ | 1,352,560 | ||||
| Okemos Public School District, Ingham County, Michigan, General Obligation Refunding Bonds, Series 1993: | ||||||||||
| 1,000 | 0.000%, 5/01/17 – MBIA Insured | No Opt. Call | AA | 651,020 | ||||||
| 1,020 | 0.000%, 5/01/18 – MBIA Insured | No Opt. Call | AA | 615,835 | ||||||
| 4,000 | Ottawa County, Michigan, Water Supply System, General Obligation Bonds, Series 2007, 5.000%, 8/01/30 – MBIA Insured | 8/17 at 100.00 | Aa1 | 3,748,240 | ||||||
| 1,075 | Parchment School District, Kalamazoo County, Michigan, General Obligation Bonds, Tender Option Bond Trust 2836, 8.812%, 5/01/36 – FSA Insured (IF) | 5/17 at 100.00 | AAA | 650,859 | ||||||
| 1,400 | South Redford School District, Wayne County, Michigan, General Obligation Bonds, Series 2004, 5.000%, 5/01/21 – FGIC Insured | 11/14 at 100.00 | AA | 1,412,082 | ||||||
| 1,370 | Thornapple Kellogg School District, Barry County, Michigan, General Obligation Bonds, Series 2007, 5.000%, 5/01/32 – MBIA Insured | 5/17 at 100.00 | AA | �� | 1,268,456 | |||||
| 1,675 | Trenton Public Schools District, Michigan, General Obligation Bonds, Series 2008, 5.000%, 5/01/34 – FSA Insured | 5/18 at 100.00 | AAA | 1,535,288 | ||||||
| 1,350 | Van Dyke Public Schools, Macomb County, Michigan, General Obligation Bonds, School Building and Site, Series 2008, 5.000%, 5/01/38 – FSA Insured | 5/18 at 100.00 | AAA | 1,222,979 | ||||||
| 1,500 | Wayland Union School District, Allegan County, Michigan, General Obligation Bonds, Series 2008, 5.000%, 5/01/28 – FSA Insured | 5/18 at 100.00 | AAA | 1,433,505 | ||||||
| 1,150 | Wayne Westland Community Schools, Michigan, General Obligation Bonds, Series 2004, 5.000%, 5/01/17 – FSA Insured | 11/14 at 100.00 | AAA | 1,210,410 | ||||||
| 1,915 | West Bloomfield School District, Oakland County, Michigan, General Obligation Bonds, Series 2005, 5.000%, 5/01/20 – FSA Insured | 5/15 at 100.00 | AAA | 1,947,536 | ||||||
| 3,270 | West Ottawa Public School District, Ottawa County, Michigan, General Obligation Refunding Bonds, Series 1992, 0.000%, 5/01/17 – FGIC Insured | No Opt. Call | AA | 2,102,774 | ||||||
| 5,175 | Williamston Community School District, Michigan, Unlimited Tax General Obligation QSBLF Bonds, Series 1996, 5.500%, 5/01/25 – MBIA Insured | No Opt. Call | AA | 5,405,494 | ||||||
| 3,170 | Zeeland Public Schools, Ottawa and Allegan Counties, Michigan, General Obligation Bonds, Series 2005, 5.000%, 5/01/22 – FGIC Insured | 5/15 at 100.00 | AA | 3,173,329 | ||||||
| 75,058 | Total Tax Obligation/General | 70,287,455 | ||||||||
| Tax Obligation/Limited – 15.2% | ||||||||||
| 930 | Detroit, Michigan, Building Authority Revenue Bonds, District Court Madison Center, Series 1996A, 6.150%, 2/01/11 | 2/09 at 100.00 | A+ | 932,976 | ||||||
| Grand Rapids Downtown Development Authority, Michigan, Tax Increment Revenue Bonds, Series 1994: | ||||||||||
| 3,985 | 0.000%, 6/01/17 – MBIA Insured | No Opt. Call | AA | 2,581,802 | ||||||
| 3,295 | 0.000%, 6/01/18 – MBIA Insured | No Opt. Call | AA | 1,979,241 | ||||||
| 1,650 | 6.875%, 6/01/24 – MBIA Insured | 12/08 at 100.00 | AA | 1,711,199 | ||||||
| 3,955 | Kalkaska County Hospital Authority, Michigan, Hospital Revenue Bonds, Series 2007, 5.125%, 5/01/14 | No Opt. Call | N/R | 3,792,845 | ||||||
| Michigan Building Authority, Revenue Bonds, Series 2006IA: | ||||||||||
| 3,000 | 0.000%, 10/15/27 – FGIC Insured | 10/16 at 58.27 | AAA | 869,190 | ||||||
| 1,500 | 0.000%, 10/15/28 – FGIC Insured | 10/16 at 55.35 | AAA | 400,710 | ||||||
| 3,960 | 5.000%, 10/15/36 – FGIC Insured | 10/16 at 100.00 | AA | 3,165,228 | ||||||
| 1,230 | Michigan Municipal Bond Authority, AMBAC Insured Bonds, Series 2007B-A, 5.000%, 12/01/34 – AMBAC Insured | 6/17 at 100.00 | A | 1,017,235 | ||||||
| Michigan State Building Authority, Revenue Bonds, Facilities Program, Series 2001I: | ||||||||||
| 2,720 | 5.500%, 10/15/19 | 10/11 at 100.00 | A+ | 2,696,771 | ||||||
| 5,000 | 5.000%, 10/15/24 | 10/11 at 100.00 | A+ | 4,860,899 | ||||||
| 4,400 | Michigan State Building Authority, Revenue Bonds, Facilities Program, Series 2005II, 5.000%, 10/15/30 – AMBAC Insured | 10/15 at 100.00 | AA | 3,684,252 | ||||||
32
| Principal Amount (000) | Description (1) | Optional Call Provisions (2) | Ratings (3) | Value | |||||||
| Tax Obligation/Limited (continued) | |||||||||||
| $ | 2,000 | Michigan State Building Authority, Revenue Refunding Bonds, Facilities Program, Series 2003II, 5.000%, 10/15/22 – MBIA Insured | 10/13 at 100.00 | AA | $ | 1,952,960 | |||||
| 37,625 | Total Tax Obligation/Limited | 29,645,308 | |||||||||
| Transportation – 0.7% | |||||||||||
| 1,450 | Kent County, Michigan, Airport Revenue Bonds, Series 1999, 5.000%, 1/01/25 | 1/09 at 101.00 | AAA | 1,415,490 | |||||||
| U.S. Guaranteed – 14.4% (4) | |||||||||||
| 1,000 | Birmingham, Michigan, General Obligation Bonds, Series 2002, 5.000%, 10/01/21 (Pre-refunded 10/01/12) | 10/12 at 100.50 | AAA | 1,096,120 | |||||||
| 250 | Detroit City School District, Wayne County, Michigan, Unlimited Tax School Building and Site Improvement Bonds, Series 2001A, 5.125%, 5/01/31 (Pre-refunded 5/01/12) – FSA Insured | 5/12 at 100.00 | AAA | 271,570 | |||||||
| 3,000 | Detroit, Michigan, Senior Lien Sewerage Disposal System Revenue Bonds, Series 2001A, 5.125%, 7/01/31 (Pre-refunded 7/01/11) – FGIC Insured | 7/11 at 100.00 | A+ | (4) | 3,225,720 | ||||||
| 2,505 | Detroit, Michigan, Senior Lien Water Supply System Revenue Bonds, Series 2003A, 5.000%, 7/01/25 (Pre-refunded 7/01/13) – MBIA Insured | 7/13 at 100.00 | AA | (4) | 2,758,431 | ||||||
| 3,750 | Kent Hospital Finance Authority, Michigan, Revenue Bonds, Spectrum Health, Series 2001A, 5.500%, 1/15/31 (Pre-refunded 7/15/11) | 7/11 at 101.00 | AA | (4) | 4,087,800 | ||||||
| 1,000 | Livonia Municipal Building Authority, Wayne County, Michigan, General Obligation Bonds, Series 2001, 5.000%, 5/01/27 (Pre-refunded 5/01/10) – FGIC Insured | 5/10 at 100.00 | AA | (4) | 1,045,890 | ||||||
| 6,000 | Michigan House of Representatives, Certificates of Participation, Series 1998, 0.000%, 8/15/23 –AMBAC Insured (ETM) | No Opt. Call | A | (4) | 2,719,860 | ||||||
| 75 | Michigan South Central Power Agency, Power Supply System Revenue Bonds, Series 2000, 6.000%, 5/01/12 (ETM) | No Opt. Call | A3 | (4) | 81,134 | ||||||
| 4,000 | Michigan State Hospital Finance Authority, Hospital Revenue Bonds, Ascension Health Credit Group, Series 1999A, 6.125%, 11/15/26 (Pre-refunded 11/15/09) | 11/09 at 101.00 | AAA | 4,228,759 | |||||||
| 2,200 | Michigan State Hospital Finance Authority, Hospital Revenue Bonds, Henry Ford Health System, Series 1999A, 6.000%, 11/15/24 (Pre-refunded 11/15/09) | 11/09 at 101.00 | A1 | (4) | 2,323,178 | ||||||
| 3,000 | Michigan State Hospital Finance Authority, Hospital Revenue Refunding Bonds, Henry Ford Health System, Series 2003A, 5.625%, 3/01/17 (Pre-refunded 3/01/13) | 3/13 at 100.00 | A1 | (4) | 3,358,950 | ||||||
| 1,500 | Michigan, Certificates of Participation, Series 2000, 5.500%, 6/01/20 (Pre-refunded 6/01/10) – AMBAC Insured | 6/10 at 100.00 | A | (4) | 1,583,715 | ||||||
| 1,235 | Rochester Community School District, Oakland and Macomb Counties, Michigan, General Obligation Bonds, Series 2000I, 5.750%, 5/01/19 (Pre-refunded 5/01/10) – FGIC Insured | 5/10 at 100.00 | AA– | (4) | 1,304,654 | ||||||
| 29,515 | Total U.S. Guaranteed | 28,085,781 | |||||||||
| Utilities – 5.8% | |||||||||||
| 1,000 | Lansing Board of Water and Light, Michigan, Steam and Electric Utility System Revenue Bonds, Series 2003A, 5.000%, 7/01/21 – FSA Insured | 7/13 at 100.00 | AAA | 1,006,880 | |||||||
| 2,130 | Lansing Board of Water and Light, Michigan, Steam and Electric Utility System Revenue Bonds, Series 2008A, 5.000%, 7/01/32 | 7/18 at 100.00 | AA– | 1,971,549 | |||||||
| 1,000 | Michigan Public Power Agency, Revenue Bonds, Combustion Turbine 1 Project, Series 2001A, 5.250%, 1/01/27 – AMBAC Insured | 1/12 at 100.00 | A | 954,990 | |||||||
| 925 | Michigan South Central Power Agency, Power Supply System Revenue Bonds, Series 2000, 6.000%, 5/01/12 | No Opt. Call | A3 | 920,014 | |||||||
| 3,300 | Michigan Strategic Fund, Collateralized Limited Obligation Pollution Control Revenue Refunding Bonds, Fixed Rate Conversion, Detroit Edison Company, Series 1999C, 5.650%, 9/01/29 – SYNCORA GTY Insured (Alternative Minimum Tax) | 9/11 at 100.00 | A3 | 2,732,763 | |||||||
| 1,000 | Monroe County Economic Development Corporation, Michigan, Collateralized Limited Obligation Revenue Refunding Bonds, Detroit Edison Company, Series 1992AA, 6.950%, 9/01/22 – FGIC Insured | No Opt. Call | A3 | 1,101,860 | |||||||
| 4,000 | Puerto Rico Electric Power Authority, Power Revenue Refunding Bonds, Series 1989O, 0.000%, 7/01/17 – MBIA Insured | No Opt. Call | AA | 2,684,720 | |||||||
| 13,355 | Total Utilities | 11,372,776 | |||||||||
33
Portfolio of Investments (Unaudited)
Nuveen Michigan Municipal Bond Fund (continued)
November 30, 2008
| Principal Amount (000) | Description (1) | Optional Call Provisions (2) | Ratings (3) | Value | ||||||
| Water and Sewer – 10.4% | ||||||||||
| $ | 2,495 | Detroit, Michigan, Senior Lien Water Supply System Revenue Bonds, Series 2003A, 5.000%, 7/01/25 – MBIA Insured | 7/13 at 100.00 | AA | $ | 2,271,623 | ||||
| 4,455 | Detroit, Michigan, Sewerage Disposal System Revenue Bonds, Series 1999A, 0.000%, 7/01/19 – FGIC Insured | No Opt. Call | AA | 2,412,650 | ||||||
| 4,000 | Grand Rapids, Michigan, Sanitary Sewer System Revenue Bonds, Series 2005, 5.000%, 1/01/30 – MBIA Insured | 7/15 at 100.00 | AA+ | 3,723,640 | ||||||
| 3,500 | Grand Rapids, Michigan, Sanitary Sewer System Revenue Bonds, Series 2008, 5.000%, 1/01/38 | 1/18 at 100.00 | AA+ | 3,172,155 | ||||||
| 1,625 | Lansing, Michigan, Sewerage Disposal System Revenue Bonds, Series 2003, 5.000%, 5/01/21 – FGIC Insured | 5/14 at 100.00 | AA | 1,633,369 | ||||||
| 2,075 | Michigan Municipal Bond Authority, Clean Water Revolving Fund Revenue Bonds, Series 2005, 5.000%, 10/01/19 | 10/15 at 100.00 | AAA | 2,153,705 | ||||||
| 4,055 | Michigan Municipal Bond Authority, Drinking Water Revolving Fund Revenue Bonds, Series 2004, 5.000%, 10/01/24 | 10/14 at 100.00 | AAA | 4,064,894 | ||||||
| 1,000 | Michigan Municipal Bond Authority, Water Revolving Fund Revenue Bonds, Series 2007, 5.000%, 10/01/23 | 10/17 at 100.00 | AAA | 1,008,610 | ||||||
| 23,205 | Total Water and Sewer | 20,440,646 | ||||||||
| $ | 225,373 | Total Investments (cost $208,294,361) – 100.8% | 197,293,292 | |||||||
Other Assets Less Liabilities – (0.8)% | (1,491,999) | |||||||||
Net Assets – 100% | $ | 195,801,293 | ||||||||
| (1) | All percentages shown in the Portfolio of Investments are based on net assets. |
| (2) | Optional Call Provisions: Dates (month and year) and prices of the earliest optional call or redemption. There may be other call provisions at varying prices at later dates. Certain mortgage-backed securities may be subject to periodic principal paydowns. |
| (3) | Ratings: Using the higher of Standard & Poor’s Group (“Standard & Poor’s”) or Moody’s Investor Service, Inc. (“Moody’s”) rating. Ratings below BBB by Standard & Poor’s or Baa by Moody’s are considered to be below investment grade. |
| The Portfolio of Investments may reflect the ratings on certain bonds insured by ACA, AGC, AMBAC, CIFG, FGIC, FSA, MBIA, RAAI and SYNCORA as of November 30, 2008. Please see the Portfolio Managers’ Commentary for an expanded discussion of the affect on the Fund of changes to the ratings of certain bonds in the portfolio resulting from changes to the ratings of the underlying insurers both during the period and after period end. |
| (4) | Backed by an escrow or trust containing sufficient U.S. Government or U.S. Government agency securities which ensure the timely payment of principal and interest. Such investments are normally considered to be equivalent to AAA rated securities. |
| N/R | Not rated. |
| (ETM) | Escrowed to maturity. |
| (IF) | Inverse floating rate investment. |
See accompanying notes to financial statements.
34
Portfolio of Investments (Unaudited)
Nuveen Missouri Municipal Bond Fund
November 30, 2008
| Principal Amount (000) | Description (1) | Optional Call Provisions (2) | Ratings (3) | Value | ||||||
| Consumer Discretionary – 1.1% | ||||||||||
| $ | 3,225 | St. Louis Industrial Development Authority, Missouri, Senior Lien Revenue Bonds, St. Louis Convention Center Headquarters Hotel, Series 2000A, 0.000%, 7/15/15 – AMBAC Insured | No Opt. Call | A | $ | 2,305,295 | ||||
| Consumer Staples – 5.1% | ||||||||||
| 3,000 | Cape Girardeau County Industrial Development Authority, Missouri, Solid Waste Disposal Revenue Bonds, Procter & Gamble Products Company Project, Series 1998, 5.300%, 5/15/28 (Alternative Minimum Tax) | 5/09 at 100.50 | AA– | 2,602,560 | ||||||
| 8,555 | Missouri Development Finance Board, Solid Waste Disposal Revenue Bonds, Procter and Gamble Inc., Series 1999, 5.200%, 3/15/29 (Alternative Minimum Tax) | No Opt. Call | AA– | 7,529,936 | ||||||
| 11,555 | Total Consumer Staples | 10,132,496 | ||||||||
| Education and Civic Organizations – 4.3% | ||||||||||
| 1,000 | Lincoln University, Missouri, Auxillary System Revenue Bonds, Series 2007, 5.125%, 6/01/37 – | 6/17 at 100.00 | AAA | 861,770 | ||||||
| 900 | Missouri Health and Educational Facilities Authority, Revenue Bonds, Stephens College, Series 1999, | 12/08 at 102.00 | A1 | 899,541 | ||||||
| 1,000 | Missouri Health and Educational Facilities Authority, Revenue Bonds, Washington University, | No Opt. Call | AAA | 1,126,260 | ||||||
| 1,360 | Missouri Health and Educational Facilities Authority, Revenue Bonds, Webster University, Series 2001, | 4/11 at 100.00 | Baa1 | 1,374,756 | ||||||
| 2,590 | Missouri State University, Auxiliary Enterprise System Revenue Bonds, Series 2007A, 5.000%, 4/01/24 – SYNCORA GTY Insured | 4/17 at 100.00 | A | 2,398,521 | ||||||
| 2,060 | Southeast Missouri State University, System Facilities Revenue Refunding and Improvement Bonds, Series 2001, 5.000%, 4/01/26 – MBIA Insured | 4/11 at 100.00 | Baa1 | 1,885,333 | ||||||
| 8,910 | Total Education and Civic Organizations | 8,546,181 | ||||||||
| Energy – 1.4% | ||||||||||
| 3,000 | Missouri Environmental Improvement and Energy Resources Authority, Revenue Bonds, Kansas City | No Opt. Call | A3 | 2,859,660 | ||||||
| Health Care – 16.7% | ||||||||||
| Cape Girardeau County Industrial Development Authority, Missouri, Health Facilities Revenue Bonds, Southeast Missouri Hospital Association, Series 2007: | ||||||||||
| 1,290 | 5.000%, 6/01/27 | 6/17 at 100.00 | N/R | 947,853 | ||||||
| 2,500 | 5.000%, 6/01/36 | 6/17 at 100.00 | N/R | 1,675,875 | ||||||
| 5,520 | Cass County, Missouri, Hospital Revenue Bonds, Series 2007, 5.625%, 5/01/38 | 11/16 at 100.00 | N/R | 3,708,887 | ||||||
| Clinton County Industrial Development Authority, Missouri, Revenue Bonds, Cameron Regional Medical Center, Series 2007: | ||||||||||
| 1,500 | 5.750%, 5/15/31 | 5/17 at 100.00 | N/R | 992,985 | ||||||
| 1,250 | 5.000%, 12/01/32 | 12/17 at 100.00 | N/R | 744,775 | ||||||
| 3,995 | 5.000%, 12/01/37 | 12/17 at 100.00 | N/R | 2,293,929 | ||||||
| 1,250 | Joplin Industrial Development Authority, Missouri, Health Facilities Revenue Bonds, Freeman Health System, Series 2004, 5.500%, 2/15/29 | 2/15 at 102.00 | BBB+ | 990,125 | ||||||
| 1,000 | Missouri Health & Educational Facilities Authority, Saint Lukes Episcopal- Presbyterian Hospitals | 6/11 at 101.00 | AAA | 980,600 | ||||||
| 1,000 | Missouri Health and Educational Facilities Authority, Revenue Bonds, BJC Health System, Series 2003, 5.125%, 5/15/25 | 5/13 at 100.00 | AA | 951,390 | ||||||
| 1,000 | Missouri Health and Educational Facilities Authority, Revenue Bonds, BJC Health System, Series 2005A, 5.000%, 5/15/22 | 5/15 at 100.00 | AA | 924,600 | ||||||
| 500 | Missouri Health and Educational Facilities Authority, Revenue Bonds, Capital Region Medical Center, Series 1998, 5.250%, 11/01/23 | 5/09 at 100.00 | Baa1 | 395,205 | ||||||
35
Portfolio of Investments (Unaudited)
Nuveen Missouri Municipal Bond Fund (continued)
November 30, 2008
| Principal Amount (000) | Description (1) | Optional Call Provisions (2) | Ratings (3) | Value | ||||||
| Health Care (continued) | ||||||||||
| Missouri Health and Educational Facilities Authority, Revenue Bonds, Freeman Health System, Series 1998: | ||||||||||
| $ | 1,500 | 5.250%, 2/15/18 | 2/09 at 101.00 | BBB+ | $ | 1,377,735 | ||||
| 1,300 | 5.250%, 2/15/28 | 2/09 at 101.00 | BBB+ | 999,713 | ||||||
| 2,750 | Missouri Health and Educational Facilities Authority, Revenue Bonds, Lake Regional Health System, Series 2003, 5.700%, 2/15/34 | 2/14 at 100.00 | BBB+ | 2,171,840 | ||||||
| Missouri Health and Educational Facilities Authority, Revenue Bonds, Lester E. Cox Medical Center, Series 1992H: | ||||||||||
| 1,650 | 0.000%, 9/01/17 – MBIA Insured | No Opt. Call | AA | 1,055,192 | ||||||
| 2,955 | 0.000%, 9/01/21 – MBIA Insured | No Opt. Call | AA | 1,398,040 | ||||||
| 3,915 | 0.000%, 9/01/22 – MBIA Insured | No Opt. Call | AA | 1,721,934 | ||||||
| 7,140 | Missouri Health and Educational Facilities Authority, Revenue Refunding Bonds, CoxhHealth Systems Inc., Series 2008A, 5.500%, 11/15/39 | 11/18 at 100.00 | A2 | 5,559,703 | ||||||
| 1,000 | New Liberty Hospital District, Missouri, Revenue Bonds, Series 2001, 5.000%, 12/01/21 – AMBAC Insured | 12/11 at 100.00 | A | 861,030 | ||||||
| St. Louis County Industrial Development Authority, Missouri, Healthcare Facilities Revenue Bonds, Ranken-Jordan Project, Refunding Series 2007: | ||||||||||
| 770 | 5.000%, 11/15/22 | 11/16 at 100.00 | N/R | 484,738 | ||||||
| 675 | 5.000%, 11/15/27 | 11/16 at 100.00 | N/R | 384,089 | ||||||
| 1,300 | 5.000%, 11/15/35 | 11/16 at 100.00 | N/R | 663,780 | ||||||
| 2,880 | Taney County Industrial Development Authority, Missouri, Hospital Revenue Bonds, Skaggs Community Hospital Association, Series 1998, 5.400%, 5/15/28 | 5/09 at 100.50 | BBB | 2,168,611 | ||||||
| 48,640 | Total Health Care | 33,452,629 | ||||||||
| Housing/Multifamily – 3.8% | ||||||||||
| 1,320 | Clay County Industrial Development Authority, Missouri, GNMA Multifamily Housing Revenue Bonds, Oak Creek Apartments, Series 2002, 6.125%, 7/20/25 (Alternative Minimum Tax) | 7/13 at 105.00 | AAA | 1,223,218 | ||||||
| 1,940 | Jefferson County Industrial Development Authority, Missouri, Multifamily Housing Revenue Bonds, Lakewood Apartments Project, Series 2001B, 5.750%, 11/01/34 (Mandatory put 11/01/16) (Alternative Minimum Tax) | 12/11 at 100.00 | N/R | 1,703,339 | ||||||
| Missouri Housing Development Commission, GNMA Collateralized Multifamily Housing Revenue Bonds, JB Hughes Apartments I and II, Series 2002G: | ||||||||||
| 222 | 6.200%, 5/20/19 | 5/12 at 105.00 | Aaa | 239,693 | ||||||
| 975 | 6.300%, 5/20/37 | 5/12 at 105.00 | Aaa | 910,494 | ||||||
| 2,285 | Missouri Housing Development Commission, Multifamily Housing Revenue Bonds, Mansion Apartments II, Series 1999, 6.125%, 4/01/22 (Alternative Minimum Tax) | 4/09 at 101.00 | N/R | 1,885,833 | ||||||
| 1,805 | St. Louis County Industrial Development Authority, Missouri, GNMA Collateralized Subordinate Lien Housing Revenue Refunding Bonds, Southfield and Oak Forest II Apartments, Series 2002A, 5.200%, 1/20/36 | 1/09 at 105.00 | AAA | 1,575,603 | ||||||
| 8,547 | Total Housing/Multifamily | 7,538,180 | ||||||||
| Housing/Single Family – 4.9% | ||||||||||
| Missouri Housing Development Commission, GNMA Single Family Remarketed Mortgage Revenue Bonds, Homeownership Loan Program, Series 1995B: | ||||||||||
| 215 | 6.375%, 9/01/20 (Alternative Minimum Tax) | 3/09 at 100.00 | N/R | 217,903 | ||||||
| 170 | 6.450%, 9/01/27 (Alternative Minimum Tax) | 3/09 at 100.00 | N/R | 172,377 | ||||||
| 5 | Missouri Housing Development Commission, Single Family Mortgage Revenue Bonds, Homeownership Loan Program, Series 1995C, 7.250%, 9/01/26 (Alternative Minimum Tax) | 3/09 at 102.00 | AAA | 5,069 | ||||||
| 90 | Missouri Housing Development Commission, Single Family Mortgage Revenue Bonds, Homeownership Loan Program, Series 1998B-2, 6.400%, 3/01/29 (Alternative Minimum Tax) | 3/09 at 104.00 | AAA | 92,151 | ||||||
| 250 | Missouri Housing Development Commission, Single Family Mortgage Revenue Bonds, Homeownership Loan Program, Series 2000A-1, 6.300%, 9/01/25 (Alternative Minimum Tax) | 9/09 at 100.00 | AAA | 253,320 | ||||||
36
| Principal Amount (000) | Description (1) | Optional Call Provisions (2) | Ratings (3) | Value | ||||||
| Housing/Single Family (continued) | ||||||||||
| $ | 165 | Missouri Housing Development Commission, Single Family Mortgage Revenue Bonds, Homeownership Loan Program, Series 2000B-1, 6.200%, 9/01/25 (Alternative Minimum Tax) | 3/10 at 100.00 | AAA | $ | 167,259 | ||||
| 1,970 | Missouri Housing Development Commission, Single Family Mortgage Revenue Bonds, Homeownership Loan Program, Series 2005A-1, 5.900%, 9/01/35 (Alternative Minimum Tax) | 9/14 at 100.00 | AAA | 1,894,549 | ||||||
| 3,840 | Missouri Housing Development Commission, Single Family Mortgage Revenue Bonds, Homeownership Loan Program, Series 2006E-1, 5.600%, 3/01/37 (Alternative Minimum Tax) | 3/16 at 104.50 | AAA | 3,331,776 | ||||||
| 2,250 | Missouri Housing Development Commission, Single Family Mortgage Revenue Bonds, Homeownership Loan Program, Series 2007A-1, 4.700%, 9/01/27 (Alternative Minimum Tax) | 9/16 at 100.00 | AAA | 1,729,418 | ||||||
| 2,675 | Missouri Housing Development Commission, Single Family Mortgage Revenue Bonds, Homeownership Loan Program, Series 2007E-1, 5.200%, 9/01/38 (Alternative Minimum Tax) | No Opt. Call | AAA | 2,070,183 | ||||||
| 11,630 | Total Housing/Single Family | 9,934,005 | ||||||||
| Long-Term Care – 5.7% | ||||||||||
| 2,250 | Cole County Industrial Development Authority, Missouri, Revenue Bonds, Lutheran Senior Services – Heisinger Project, Series 2004, 5.500%, 2/01/35 | 2/14 at 100.00 | N/R | 1,534,185 | ||||||
| 4,250 | Kansas City Industrial Development Authority, Missouri, Retirement Center Revenue Refunding and Improvement Bonds, Kingswood Project, Series 1998A, 5.875%, 11/15/29 | 5/09 at 102.00 | N/R | 3,029,995 | ||||||
| 2,525 | Lees Summit Industrial Development Authority, Missouri, Revenue Bonds, John Knox Village Obligated Group, Series 2007A, 5.125%, 8/15/32 | 8/17 at 100.00 | N/R | 1,671,626 | ||||||
| 1,285 | Missouri Development Finance Board, Healthcare Facilities Revenue Bonds, Lutheran Home for the Aged, Series 2001A, 5.600%, 11/01/21 | 11/11 at 100.00 | Aa2 | 1,198,982 | ||||||
| 2,000 | Missouri Health and Educational Facilities Authority, Revenue Bonds, Lutheran Senior Services, Series 2007A, 4.875%, 2/01/37 | 2/17 at 100.00 | N/R | 1,332,520 | ||||||
| 1,200 | St. Louis County Industrial Development Authority, Missouri, GNMA Collateralized Healthcare Facilities Revenue Bonds, Mary, Queen and Mother Association, Series 2001, 5.400%, 9/20/34 | 3/10 at 102.00 | AAA | 1,097,184 | ||||||
| 2,000 | St. Louis County Industrial Development Authority, Missouri, Revenue Bonds, Friendship Village of West County, Series 2007A, 5.500%, 9/01/28 | 9/17 at 100.00 | N/R | 1,508,200 | ||||||
| 15,510 | Total Long-Term Care | 11,372,692 | ||||||||
| Materials – 0.3% | ||||||||||
| 1,000 | Sugar Creek, Missouri, Industrial Development Revenue Bonds, Lafarge North America Inc., Series 2003A, 5.650%, 6/01/37 (Alternative Minimum Tax) | 6/13 at 101.00 | BBB | 667,170 | ||||||
| Tax Obligation/General – 16.0% | ||||||||||
| 2,000 | Cass County Reorganized School District R-II, Raymore and Peculiar, Missouri, General Obligation Bonds, Series 2002, 5.250%, 3/01/20 – FSA Insured | 3/12 at 100.00 | AAA | 2,148,060 | ||||||
| 540 | Clay County Public School District 53, Liberty, Missouri, General Obligation Bonds, Series 2001C, 5.200%, 3/01/21 | 3/12 at 100.00 | AA+ | 545,918 | ||||||
| 1,280 | Clay County Public School District 53, Liberty, Missouri, General Obligation Bonds, Series 2002B, 5.000%, 3/01/22 – FSA Insured | 3/12 at 100.00 | AAA | 1,278,669 | ||||||
| 1,000 | Greene County Reorganized School District R8, Missouri, General Obligation Bonds, Series 2002, 5.250%, 3/01/20 – FSA Insured | 3/12 at 100.00 | AAA | 1,074,030 | ||||||
| 1,450 | Jackson County Reorganized School District R-7, Lees Summit, Missouri, General Obligation Bonds, Series 2004, 5.000%, 3/01/21 – MBIA Insured | 3/14 at 100.00 | Aa2 | 1,461,223 | ||||||
| 3,000 | Kansas City, Missouri, General Obligation Bonds, Series 2004F, 5.000%, 2/01/24 | 2/14 at 100.00 | AA | 3,016,080 | ||||||
| 2,000 | Miller County School District R-2, Osage, Missouri, General Obligation Bonds, Series 2006, 5.000%, 3/01/24 – FSA Insured | 3/16 at 100.00 | AAA | 1,970,480 | ||||||
| Missouri School Boards Association, Lease Participation Certificates, Clay County School District 53 Liberty, Series 2007: | ||||||||||
| 1,070 | 5.250%, 3/01/26 – FSA Insured | 3/17 at 100.00 | AAA | 1,069,914 | ||||||
| 625 | 5.250%, 3/01/27 – FSA Insured | 3/17 at 100.00 | AAA | 620,594 | ||||||
37
Portfolio of Investments (Unaudited)
Nuveen Missouri Municipal Bond Fund (continued)
November 30, 2008
| Principal Amount (000) | Description (1) | Optional Call Provisions (2) | Ratings (3) | Value | ||||||
| Tax Obligation/General (continued) | ||||||||||
| $ | 1,250 | Nixa Reorganized School District R 02, Missouri, General Obligation Bonds, Series 2006, 5.250%, 3/01/24 – FSA Insured | 3/16 at 100.00 | AAA | $ | 1,274,063 | ||||
| 1,240 | North Kansas City School District 74, Clay County, Missouri, General Obligation Bonds, Direct Deposit Program, Series 2007, 5.000%, 3/01/27 | 3/18 at 100.00 | AA+ | 1,226,732 | ||||||
| 4,500 | North Kansas City School District 74, Clay County, Missouri, General Obligation Bonds, Series 2005, 5.000%, 3/01/25 | 3/15 at 100.00 | AA+ | 4,502,024 | ||||||
| 1,000 | Pevely, Missouri, General Obligation Bonds, Series 2004, 5.250%, 3/01/24 – RAAI Insured | 3/13 at 100.00 | BBB+ | 917,190 | ||||||
| 750 | Polk County R-1 School District, Bolivar, Missouri, General Obligation Bonds, Missouri Direct Deposit Program, Series 2000, 5.700%, 3/01/20 | 3/10 at 100.00 | AA+ | 783,218 | ||||||
| Springfield School District R12, Missouri, General Obligation Bonds, Series 2003: | ||||||||||
| 2,875 | 5.125%, 3/01/20 – FGIC Insured | 3/13 at 100.00 | AA+ | 2,922,553 | ||||||
| 3,000 | 5.000%, 3/01/22 – FGIC Insured | 3/13 at 100.00 | AA+ | 2,991,150 | ||||||
| 1,250 | 5.000%, 3/01/23 – FGIC Insured | 3/13 at 100.00 | AA+ | 1,239,850 | ||||||
| 1,345 | St. Louis County Pattonville School District R3, Missouri, General Obligation Bonds, Series 2000, 6.500%, 3/01/14 – FGIC Insured | No Opt. Call | AA | 1,550,422 | ||||||
| 1,450 | St. Louis County Pattonville School District R3, Missouri, General Obligation Bonds, Series 2004, 5.250%, 3/01/20 – FSA Insured | 3/14 at 100.00 | AAA | 1,487,338 | ||||||
| 31,625 | Total Tax Obligation/General | 32,079,508 | ||||||||
| Tax Obligation/Limited – 20.4% | ||||||||||
| 150 | Brentwood, Missouri, Tax Increment Refunding Bonds, Promenade Project, Series 2002, 4.700%, 4/01/19 – RAAI Insured | 4/09 at 100.00 | BBB+ | 150,090 | ||||||
| 1,290 | Cape Girardeau County Building Corporation, Missouri, Leasehold Revenue Bonds, Reorganized School District R-02, Jackson R-II School District High School Project, Series 2005, 5.250%, 3/01/21 – MBIA Insured | 3/16 at 100.00 | AA | 1,261,285 | ||||||
| 1,875 | Christian County Public Building Corporation, Missouri, Leasehold Revenue Bonds, Justice Center Project, Series 2000, 5.450%, 6/01/15 – RAAI Insured | 6/10 at 100.00 | BBB+ | 1,937,588 | ||||||
| 420 | Cottleville, Missouri, Certificates of Participation, Series 2006, 5.250%, 8/01/31 | 8/14 at 100.00 | N/R | 333,014 | ||||||
| 1,035 | Dunklin County, Missouri, Certificates of Participation, Series 2004, 5.000%, 12/01/19 – FGIC Insured | 12/14 at 100.00 | AA | 1,006,993 | ||||||
| 1,390 | Fenton, Missouri, Tax Increment Revenue Bonds, Gravois Bluffs Redevelopment Project, Series 2006, 4.500%, 4/01/21 | 4/14 at 100.00 | N/R | 1,368,719 | ||||||
| 1,685 | Fulton, Missouri, Tax Increment Revenue Bonds, Fulton Commons Redevelopment Project, Series 2006, 5.000%, 6/01/28 | 6/16 at 100.00 | N/R | 1,132,118 | ||||||
| 3,000 | Harrisonville, Missouri, Lease Participation Certificates, Series 2003, 5.000%, 12/01/22 – SYNCORA GTY Insured | 12/13 at 100.00 | A– | 2,646,930 | ||||||
| 2,525 | Kansas City Tax Increment Financing District, Missouri, Tax Increment Revenue Bonds, Briarcliff West Project, Series 2006A, 5.400%, 6/01/24 | 6/14 at 102.00 | N/R | 1,886,453 | ||||||
| 500 | Kansas City Tax Increment Financing District, Missouri, Tax Increment Revenue Bonds, Maincor Project, Series 2007A, 5.250%, 3/01/18 | No Opt. Call | N/R | 416,530 | ||||||
| 2,000 | Lakeside 370 Levee District, Saint Charles County, Missouri, Levee District Improvement Bonds, Series 2008, 7.000%, 4/01/28 | 4/16 at 100.00 | N/R | 1,657,520 | ||||||
| 3,885 | Missouri Association of Rural Education, Pulaski County, Certificates of Participation, Waynesville School District R-6, Series 2004, 5.100%, 3/01/24 – MBIA Insured | 3/09 at 100.00 | AA | 3,885,271 | ||||||
| 2,335 | Missouri Development Finance Board, Independence, Infrastructure Facilities Revenue Bonds, Crackerneck Creek Project, Series 2006C, 5.000%, 3/01/28 | 3/16 at 100.00 | A+ | 1,997,709 | ||||||
| 4,920 | Missouri Development Finance Board, Infrastructure Facilities Revenue Bonds, Branson Landing Project, Series 2005A, 5.000%, 6/01/35 | 6/15 at 100.00 | BBB+ | 3,188,504 | ||||||
| 450 | Monarch-Chesterfield Levee District, St. Louis County, Missouri, Levee District Improvement Bonds, Series 1999, 5.750%, 3/01/19 – MBIA Insured | 3/10 at 101.00 | AA | 465,278 | ||||||
38
| Principal Amount (000) | Description (1) | Optional Call Provisions (2) | Ratings (3) | Value | |||||||
| Tax Obligation/Limited (continued) | |||||||||||
| $ | 1,705 | O’Fallon, Missouri, Certificates of Participation, Series 2002, 5.250%, 2/01/15 – MBIA Insured | 2/12 at 100.00 | A1 | $ | 1,785,681 | |||||
| 2,500 | Osage Beach, Missouri, Tax Increment Revenue Bonds, Prewitts Point Transportation Development District, Series 2006, 5.000%, 5/01/23 | 5/12 at 102.00 | N/R | 1,717,075 | |||||||
| 3,000 | Puerto Rico Public Buildings Authority, Guaranteed Government Facilities Revenue Bonds, Series 1993L, 5.500%, 7/01/21 | No Opt. Call | BBB– | 2,728,890 | |||||||
| 1,170 | Riverside, Missouri, L-385 Levee Redevelopment Plan Tax Increment Revenue Bonds, Series 2004, 5.250%, 5/01/20 | 5/15 at 100.00 | A | 1,017,374 | |||||||
| 1,945 | Springfield Center City Development Corporation, Missouri, Lease Revenue Bonds, Jordan Valley Park Exposition Center, Series 2002A, 5.000%, 6/01/27 – AMBAC Insured | 6/12 at 100.00 | A1 | 1,743,381 | |||||||
| 2,950 | Springfield Public Building Corporation, Missouri, Lease Revenue Bonds, Jordan Valley Park Projects, Series 2000A, 6.125%, 6/01/21 – AMBAC Insured | 6/10 at 100.00 | A | 3,057,528 | |||||||
| 2,500 | Springfield Public Building Corporation, Missouri, Lease Revenue Bonds, Series 2004, 5.000%, 3/01/24 – AMBAC Insured | 3/14 at 100.00 | Aa3 | 2,452,750 | |||||||
| St. Joseph Industrial Development Authority, Missouri, Tax Increment Bonds, Shoppes at North Village Project, Series 2005A: | |||||||||||
| 660 | 5.375%, 11/01/24 | 11/14 at 100.00 | N/R | 498,927 | |||||||
| 1,600 | 5.500%, 11/01/27 | 11/14 at 100.00 | N/R | 1,172,928 | |||||||
| 1,800 | St. Joseph Industrial Development Authority, Missouri, Tax Increment Bonds, Shoppes at North Village Project, Series 2005B, 5.500%, 11/01/27 | 11/14 at 100.00 | N/R | 1,319,544 | |||||||
| 47,290 | Total Tax Obligation/Limited | 40,828,080 | |||||||||
| Transportation – 4.5% | |||||||||||
| 2,000 | Kansas City, Missouri, Passenger Facility Charge Revenue Bonds, Kansas City International Airport, | 4/11 at 101.00 | A | 1,603,400 | |||||||
| St. Louis Land Clearance Redevelopment Authority, Missouri, Revenue Refunding and Improvement Bonds, LCRA Parking Facilities, Series 1999C: | |||||||||||
| 1,000 | 7.000%, 9/01/19 | 9/09 at 102.00 | N/R | 896,390 | |||||||
| 2,400 | 7.050%, 9/01/24 | 9/09 at 102.00 | N/R | 2,035,752 | |||||||
| St. Louis, Missouri, Airport Revenue Refunding Bonds, Series 2003A: | |||||||||||
| 3,450 | 5.250%, 7/01/16 – FSA Insured | 7/13 at 100.00 | AAA | 3,534,560 | |||||||
| 1,000 | 5.250%, 7/01/18 – FSA Insured | 7/13 at 100.00 | AAA | 1,006,020 | |||||||
| 9,850 | Total Transportation | 9,076,122 | |||||||||
| U.S. Guaranteed – 8.7% (4) | |||||||||||
| 4,500 | Cape Girardeau County, Missouri, Single Family Mortgage Revenue Bonds, Series 1983, | No Opt. Call | Aaa | 3,628,485 | |||||||
| 1,025 | Excelsior Springs School District, Missouri, Leasehold Revenue Bonds, Series 1994, 0.000%, 3/01/14 – | No Opt. Call | AAA | 852,031 | |||||||
| 2,500 | Fenton, Missouri, Tax Increment Refunding and Improvement Revenue Bonds, Gravois Bluffs Redevelopment Project, Series 2002, 6.125%, 10/01/21 (Pre-refunded 10/01/12) | 10/12 at 100.00 | N/R | (4) | 2,820,600 | ||||||
| 770 | Jefferson City School District, Missouri, General Obligation Bonds, Series 1991A, 6.700%, 3/01/11 (ETM) | No Opt. Call | Aa2 | (4) | 813,605 | ||||||
| 1,500 | Lees Summit Industrial Development Authority, Missouri, Health Facilities Revenue Bonds, John Knox Village, Series 2002, 5.700%, 8/15/22 (Pre-refunded 8/15/12) | 8/12 at 101.00 | N/R | (4) | 1,667,295 | ||||||
| 2,000 | Missouri Development Finance Board, Infrastructure Facilities Revenue Bonds, Riverside-Quindaro Bend Levee District L-385, Series 2001, 5.800%, 3/01/20 (Pre-refunded 3/01/10) | 3/10 at 100.00 | N/R | (4) | 2,091,940 | ||||||
| Missouri Health and Educational Facilities Authority, Revenue Bonds, Lester E. Cox Medical Center, Series 1992H: | |||||||||||
| 1,000 | 0.000%, 9/01/17 – MBIA Insured (ETM) | No Opt. Call | AA | (4) | 656,680 | ||||||
| 1,785 | 0.000%, 9/01/21 – MBIA Insured (ETM) | No Opt. Call | AA | (4) | 886,360 | ||||||
| 2,385 | 0.000%, 9/01/22 – MBIA Insured (ETM) | No Opt. Call | AA | (4) | 1,114,034 | ||||||
39
Portfolio of Investments (Unaudited)
Nuveen Missouri Municipal Bond Fund (continued)
November 30, 2008
| Principal Amount (000) | Description (1) | Optional Call Provisions (2) | Ratings (3) | Value | |||||||
| U.S. Guaranteed (4) (continued) | |||||||||||
| $ | 2,000 | Missouri Health and Educational Facilities Authority, Revenue Bonds, St. Anthony’s Medical Center, Series 2000, 6.250%, 12/01/30 (Pre-refunded 12/01/10) | 12/10 at 101.00 | A | (4) | $ | 2,187,300 | ||||
| 750 | Texas County, Missouri, Hospital Revenue Bonds, Texas County Memorial Hospital, Series 2000, | 6/10 at 100.00 | N/R | (4) | 810,165 | ||||||
| 20,215 | Total U.S. Guaranteed | 17,528,495 | |||||||||
| Utilities – 4.3% | |||||||||||
| 2,710 | Columbia, Missouri, Water and Electric Revenue Bonds, Series 2002A, 5.000%, 10/01/26 – AMBAC Insured | 10/12 at 100.00 | AA– | 2,533,633 | |||||||
| 1,195 | Nixa, Missouri, Electric System Revenue Bonds, Series 2005, 5.000%, 4/01/25 – SYNCORA GTY Insured | 4/13 at 100.00 | BBB– | 1,012,344 | |||||||
| 2,000 | Puerto Rico Electric Power Authority, Power Revenue Bonds, Series 2003NN, 5.250%, 7/01/23 – MBIA Insured | No Opt. Call | AA | 1,715,820 | |||||||
| 3,030 | Sikeston, Missouri, Electric System Revenue Refunding Bonds, Series 1996, 6.000%, 6/01/14 – MBIA Insured | No Opt. Call | AA | 3,274,703 | |||||||
| 8,935 | Total Utilities | 8,536,500 | |||||||||
| Water and Sewer – 4.4% | |||||||||||
| 1,825 | Kansas City, Missouri, Sewerage System Revenue Bonds, Series 2002D-1, 5.375%, 1/01/22 | 1/12 at 100.00 | AA | 1,845,331 | |||||||
| 1,600 | Missouri Development Finance Board, Independence, Infrastructure Facilities Revenue Bonds, Water System Improvement Projects, Series 2004, 5.000%, 11/01/24 – AMBAC Insured | 11/14 at 100.00 | A | 1,520,672 | |||||||
| 2,965 | Missouri Environmental Improvement and Energy Resources Authority, Water Facility Revenue Bonds, Missouri-American Water Company, Series 2006, 4.600%, 12/01/36 – AMBAC Insured (Alternative Minimum Tax) (UB) | 12/16 at 100.00 | AAA | 2,087,864 | |||||||
| 1,635 | Missouri Environmental Improvement and Energy Resources Authority, Water Facility Revenue Refunding Bonds, Tri-County Water Authority, Series 1999, 6.000%, 4/01/22 – RAAI Insured | 4/09 at 100.00 | BBB+ | 1,546,612 | |||||||
| 1,000 | Missouri Environmental Improvement and Energy Resources Authority, Water Pollution Control and Drinking Water Revenue Bonds, State Revolving Fund Program, Series 2005A, 5.000%, 7/01/25 | 7/15 at 100.00 | Aaa | 1,003,300 | |||||||
| 1,000 | St. Charles County Public Water Supply District 2, Missouri, Certificates of Participation, Series 2002A, 5.250%, 12/01/28 – MBIA Insured | 12/11 at 100.00 | Baa1 | 833,290 | |||||||
| 10,025 | Total Water and Sewer | 8,837,069 | |||||||||
| $ | 239,957 | Total Investments (cost $225,445,140) – 101.6% | 203,694,082 | ||||||||
Floating Rate Obligations – (1.1)% | (2,225,000) | ||||||||||
Other Assets Less Liabilities – (0.5)% | (887,698) | ||||||||||
Net Assets – 100% | $ | 200,581,384 | |||||||||
| (1) | All percentages shown in the Portfolio of Investments are based on net assets. |
| (2) | Optional Call Provisions: Dates (month and year) and prices of the earliest optional call or redemption. There may be other call provisions at varying prices at later dates. Certain mortgage-backed securities may be subject to periodic principal paydowns. |
| (3) | Ratings: Using the higher of Standard & Poor’s Group (“Standard & Poor’s”) or Moody’s Investor Service, Inc. (“Moody’s”) rating. Ratings below BBB by Standard & Poor’s or Baa by Moody’s are considered to be below investment grade. |
| The Portfolio of Investments may reflect the ratings on certain bonds insured by ACA, AGC, AMBAC, CIFG, FGIC, FSA, MBIA, RAAI and SYNCORA as of November 30, 2008. Please see the Portfolio Managers’ Commentary for an expanded discussion of the affect on the Fund of changes to the ratings of certain bonds in the portfolio resulting from changes to the ratings of the underlying insurers both during the period and after period end. |
| (4) | Backed by an escrow or trust containing sufficient U.S. Government or U.S. Government agency securities which ensure the timely payment of principal and interest. Such investments are normally considered to be equivalent to AAA rated securities. |
| N/R | Not rated. |
| (ETM) | Escrowed to maturity. |
| (UB) | Underlying bond of an inverse floating rate trust reflected as a financing transaction pursuant to the provisions of SFAS No. 140. |
See accompanying notes to financial statements.
40
Portfolio of Investments (Unaudited)
Nuveen Ohio Municipal Bond Fund
November 30, 2008
| Principal Amount (000) | Description (1) | Optional Call Provisions (2) | Ratings (3) | Value | ||||||
| Consumer Staples – 2.9% | ||||||||||
| Buckeye Tobacco Settlement Financing Authority, Ohio, Tobacco Settlement Asset-Backed Revenue Bonds, Senior Lien, Series 2007A-2: | ||||||||||
| $ | 2,000 | 5.875%, 6/01/30 | 6/17 at 100.00 | BBB | $ | 1,333,820 | ||||
| 12,805 | 5.875%, 6/01/47 | 6/17 at 100.00 | BBB | 7,928,600 | ||||||
| 5,950 | Puerto Rico, The Children’s Trust Fund, Tobacco Settlement Asset-Backed Refunding Bonds, | 5/12 at 100.00 | BBB | 4,313,750 | ||||||
| 20,755 | Total Consumer Staples | 13,576,170 | ||||||||
| Education and Civic Organizations – 7.1% | ||||||||||
| 4,090 | Cleveland State University, Ohio, General Receipts Bonds, Series 2003A, 5.000%, 6/01/23 – FGIC Insured | 6/13 at 100.00 | AA | 3,954,785 | ||||||
| Ohio Higher Education Facilities Commission, General Revenue Bonds, Case Western Reserve University, Series 2004A: | ||||||||||
| 2,310 | 5.000%, 12/01/16 – AMBAC Insured | 12/13 at 100.00 | AA– | 2,436,195 | ||||||
| 2,825 | 5.000%, 12/01/17 – AMBAC Insured | 12/13 at 100.00 | AA– | 2,947,746 | ||||||
| 2,975 | 5.000%, 12/01/18 – AMBAC Insured | 12/13 at 100.00 | AA– | 3,075,644 | ||||||
| 1,600 | Ohio Higher Education Facilities Commission, General Revenue Bonds, Kenyon College, Series 2006, | 7/16 at 100.00 | A+ | 1,370,064 | ||||||
| 1,750 | Ohio Higher Education Facilities Commission, General Revenue Bonds, Oberlin College, Series 2003, | 10/13 at 100.00 | AA | 1,755,460 | ||||||
| 910 | Ohio Higher Education Facilities Commission, Revenue Bonds, Case Western Reserve University, | No Opt. Call | AA– | 1,026,362 | ||||||
| Ohio Higher Education Facilities Commission, Revenue Bonds, Wittenberg University, Series 2005: | ||||||||||
| 1,000 | 5.000%, 12/01/24 | 12/15 at 100.00 | Baa2 | 764,980 | ||||||
| 1,000 | 5.000%, 12/01/29 | 12/15 at 100.00 | Baa2 | 714,160 | ||||||
| Ohio Higher Educational Facilities Commission, Revenue Bonds, University of Dayton, Series 2004: | ||||||||||
| 1,315 | 5.000%, 12/01/25 – AMBAC Insured | 12/14 at 100.00 | A | 1,237,415 | ||||||
| 1,060 | 5.000%, 12/01/27 – AMBAC Insured | 12/14 at 100.00 | A | 985,005 | ||||||
| Ohio Higher Educational Facilities Commission, Revenue Bonds, Wittenberg University, Series 2001: | ||||||||||
| 1,200 | 5.500%, 12/01/21 | 12/11 at 100.00 | Baa2 | 1,030,920 | ||||||
| 2,075 | 5.000%, 12/01/26 | 12/11 at 100.00 | Baa2 | 1,542,991 | ||||||
| 2,000 | Ohio State Higher Education Facilities, Revenue Bonds, Case Western Reserve University, Series 2006, | 12/16 at 100.00 | AA | 1,803,660 | ||||||
| Ohio University at Athens, Subordinate Lien General Receipts Bonds, Series 2004: | ||||||||||
| 1,855 | 5.000%, 12/01/21 – MBIA Insured | 6/14 at 100.00 | AA | 1,870,081 | ||||||
| 1,900 | 5.000%, 12/01/23 – MBIA Insured | 6/14 at 100.00 | AA | 1,824,399 | ||||||
| 1,675 | University of Cincinnati, Ohio, General Receipts Bonds, Series 2004A, 5.000%, 6/01/21 – AMBAC Insured | 6/14 at 100.00 | A | 1,665,754 | ||||||
| University of Cincinnati, Ohio, General Receipts Bonds, Series 2004D: | ||||||||||
| 1,325 | 5.000%, 6/01/24 – AMBAC Insured | 6/14 at 100.00 | A | 1,260,446 | ||||||
| 1,005 | 5.000%, 6/01/26 – AMBAC Insured | 6/14 at 100.00 | A | 941,454 | ||||||
| 1,025 | University of Cincinnati, Ohio, General Receipts Bonds, Series 2004E, 5.000%, 6/01/21 – AMBAC Insured | 12/14 at 100.00 | A | 1,019,342 | ||||||
| 34,895 | Total Education and Civic Organizations | 33,226,863 | ||||||||
| Health Care – 8.7% | ||||||||||
| 7,000 | Akron, Bath and Copley Joint Township Hospital District, Ohio, Hospital Facilities Revenue Bonds, Summa Health System, Series 1998A, 5.375%, 11/15/24 | 11/09 at 101.00 | Baa1 | 5,991,650 | ||||||
| 1,065 | Akron, Bath and Copley Joint Township Hospital District, Ohio, Hospital Revenue Bonds, Children’s Hospital Medical Center, Series 2003, 5.250%, 11/15/25 – FSA Insured | 11/13 at 100.00 | Aa3 | 1,046,213 | ||||||
| 1,000 | Cuyahoga County, Ohio, Hospital Revenue Refunding and Improvement Bonds, MetroHealth System, Series 1997, 5.625%, 2/15/17 – MBIA Insured | 2/09 at 100.00 | AA | 999,880 | ||||||
| 3,900 | Cuyahoga County, Ohio, Revenue Refunding Bonds, Cleveland Clinic Health System, Series 2003A, | 7/13 at 100.00 | Aa2 | 3,706,131 | ||||||
41
Portfolio of Investments (Unaudited)
Nuveen Ohio Municipal Bond Fund (continued)
November 30, 2008
| Principal Amount (000) | Description (1) | Optional Call Provisions (2) | Ratings (3) | Value | ||||||
| Health Care (continued) | ||||||||||
| $ | 6,000 | Erie County, Ohio, Hospital Facilities Revenue Bonds, Firelands Regional Medical Center Project, Series 2006, 5.250%, 8/15/46 | 8/16 at 100.00 | A | $ | 4,270,320 | ||||
| 2,500 | Erie County, Ohio, Hospital Facilities Revenue Bonds, Firelands Regional Medical Center, Series 2002A, | 8/12 at 101.00 | A | 2,022,450 | ||||||
| 130 | Franklin County, Ohio, Hospital Revenue Bonds, Holy Cross Health System Corporation, Series 1996, | 1/09 at 100.00 | AA | 130,012 | ||||||
| 3,000 | Franklin County, Ohio, Hospital Revenue Bonds, Nationwide Children’s Hospital Project, Series 2005, | 11/18 at 100.00 | Aa2 | 2,551,260 | ||||||
| 785 | Lorain County, Ohio, Hospital Revenue Bonds, Catholic Healthcare Partners, Series 1997B, 5.500%, | 3/09 at 101.00 | AA | 676,529 | ||||||
| 2,000 | Miami County, Ohio, Hospital Facilities Revenue Refunding Bonds, Upper Valley Medical Center Inc., Series 2006, 5.250%, 5/15/26 | 5/16 at 100.00 | A– | 1,509,380 | ||||||
| 4,000 | Middleburg Heights, Ohio, Hospital Improvement Revenue Refunding Bonds, Southwest General Hospital, | 2/09 at 102.00 | AAA | 4,089,480 | ||||||
| 7,000 | Montgomery County, Ohio, Hospital Facilities Revenue Refunding and Improvement Bonds, Kettering Medical Center, Series 1996, 6.250%, 4/01/20 – MBIA Insured | No Opt. Call | AA | 7,760,830 | ||||||
| 2,270 | Montgomery County, Ohio, Revenue Bonds, Catholic Health Initiatives, Series 2004A, 5.000%, 5/01/32 | No Opt. Call | AA | 1,836,339 | ||||||
| 665 | Richland County, Ohio, Hospital Facilities Revenue Improvement Bonds, MedCentral Health System Obligated Group, Series 2000B, 6.375%, 11/15/22 | 11/10 at 101.00 | A– | 654,134 | ||||||
| 2,700 | Richland County, Ohio, Hospital Revenue Bonds, MidCentral Health System Group, Series 2006, | 11/16 at 100.00 | A– | 2,014,497 | ||||||
| 750 | Ross County, Ohio, Hospital Revenue Refunding Bonds, Adena Health System Series 2008, | 12/18 at 100.00 | A | 634,170 | ||||||
| 1,200 | Tuscarawas County, Ohio, Hospital Facilities Revenue Bonds, Union Hospital Project, Series 2001, | 10/11 at 101.00 | A3 | 892,716 | ||||||
| 45,965 | Total Health Care | 40,785,991 | ||||||||
| Housing/Multifamily – 3.4% | ||||||||||
| 1,015 | Clark County, Ohio, Multifamily Housing Revenue Bonds, Church of God Retirement Home, Series 1998, | 5/09 at 103.00 | N/R | 723,411 | ||||||
| 3,045 | Franklin County, Ohio, GNMA Collateralized Multifamily Housing Mortgage Revenue Bonds, Carriage House Apartments Project, Series 2002, 5.400%, 3/20/37 | 9/11 at 102.00 | Aaa | 2,728,990 | ||||||
| 2,705 | Henry County, Ohio, GNMA Collateralized Healthcare Facility Revenue Bonds, Alpine Village Project, Series 1999, 6.375%, 2/20/41 | 8/09 at 102.00 | Aaa | 2,721,771 | ||||||
| 1,805 | Montgomery County, Ohio, GNMA Guaranteed Multifamily Housing Revenue Bonds, Canterbury Court Project, Series 2007, 5.500%, 10/20/42 (Alternative Minimum Tax) | 10/18 at 101.00 | Aaa | 1,445,913 | ||||||
| 4,285 | Ohio Capital Corporation for Housing, FHA-Insured Section 8 Assisted Mortgage Loan Revenue Refunding Bonds, Series 1999D, 5.950%, 2/01/23 | 2/09 at 102.00 | Aa2 | 4,311,438 | ||||||
| 2,370 | Summit County Port Authority, Ohio, Multifamily Housing Revenue Bonds, Callis Tower Apartments Project, Series 2007, 5.250%, 9/20/47 (Alternative Minimum Tax) | 9/17 at 102.00 | AAA | 1,796,839 | ||||||
| 3,000 | Trumbull County, Ohio, Multifamily Housing Revenue Bonds, Royal Mall Apartments, Series 2007, | 11/17 at 102.00 | Aaa | 2,168,310 | ||||||
| 18,225 | Total Housing/Multifamily | 15,896,672 | ||||||||
| Housing/Single Family – 0.5% | ||||||||||
| 965 | Ohio Housing Finance Agency, GNMA Mortgage-Backed Securities Program Residential Mortgage | 3/09 at 100.75 | Aaa | 912,436 | ||||||
| 1,995 | Ohio Housing Finance Agency, Single Family Mortgage Revenue Bonds, Series 2006H, 5.000%, 9/01/31 (Alternative Minimum Tax) | 9/15 at 100.00 | Aaa | 1,557,058 | ||||||
| 2,960 | Total Housing/Single Family | 2,469,494 | ||||||||
42
| Principal Amount (000) | Description (1) | Optional Call Provisions (2) | Ratings (3) | Value | ||||||
| Industrials – 2.7% | ||||||||||
| $ | 360 | Cleveland-Cuyahoga County Port Authority, Ohio, Development Revenue Bonds, Bond Fund Program – Columbia National Group Project, Series 2005D, 5.000%, 5/15/20 (Alternative Minimum Tax) | 11/15 at 100.00 | N/R | $ | 288,137 | ||||
| 2,000 | Cleveland-Cuyahoga County Port Authority, Ohio, Development Revenue Bonds, Jergens Inc., Series 1998A, 5.375%, 5/15/18 (Alternative Minimum Tax) | 5/09 at 101.00 | N/R | 1,668,340 | ||||||
| 7,170 | Dayton, Ohio, Special Facilities Revenue Refunding Bonds, Emery Air Freight Corporation and Emery Worldwide Airlines Inc. – Guarantors, Series 1998A, 5.625%, 2/01/18 | 2/09 at 101.00 | AA– | 7,103,606 | ||||||
| 2,000 | Ohio State Water Development Authority, Solid Waste Revenue Bonds, Allied Waste Industries, Inc., | 7/12 at 100.00 | B+ | 1,564,320 | ||||||
| Ohio, Economic Development Revenue Bonds, Enterprise Bond Fund Loan Pool, Series 2002-4: | ||||||||||
| 445 | 5.000%, 6/01/15 (Alternative Minimum Tax) | 6/12 at 102.00 | AA– | 435,766 | ||||||
| 675 | 5.450%, 6/01/22 (Alternative Minimum Tax) | 6/12 at 102.00 | AA– | 625,172 | ||||||
| 1,020 | Ohio, Economic Development Revenue Bonds, Enterprise Bond Fund Loan Pool, Series 2002-7, | No Opt. Call | AA– | 965,899 | ||||||
| 13,670 | Total Industrials | 12,651,240 | ||||||||
| Long-Term Care – 1.8% | ||||||||||
| 3,120 | Franklin County, Ohio, Healthcare Facilities Revenue Bonds, Heinzerling Foundation, Series 1995, | 5/09 at 100.00 | Aaa | 3,120,842 | ||||||
| 2,000 | Franklin County, Ohio, Healthcare Facilities Revenue Bonds, Presbyterian Retirement Services, Series 2002A, 5.125%, 7/01/22 – RAAI Insured | 7/12 at 100.00 | BBB+ | 1,662,880 | ||||||
| 3,930 | Hamilton County, Ohio, Health Care Revenue Refunding Bonds, Life Enriching Communities Project, | 1/17 at 100.00 | BBB | 2,457,547 | ||||||
| 1,210 | Napoleon, Ohio, FHA-Insured Healthcare Facilities Mortgage Revenue Refunding Bonds, Lutheran Orphans and Old Folks Home Society, Series 1994, 6.875%, 8/01/23 | 1/09 at 100.00 | Aa2 | 1,210,871 | ||||||
| 10,260 | Total Long-Term Care | 8,452,140 | ||||||||
| Materials – 0.6% | ||||||||||
| 1,000 | Toledo-Lucas County Port Authority, Ohio, Port Revenue Bonds, Cargill Inc., Series 2004A, | 3/14 at 101.00 | A | 889,140 | ||||||
| 2,000 | Toledo-Lucas County Port Authority, Ohio, Port Revenue Bonds, Cargill Inc., Series 2004B, | No Opt. Call | A | 1,992,620 | ||||||
| 3,000 | Total Materials | 2,881,760 | ||||||||
| Tax Obligation/General – 22.4% | ||||||||||
| Adams County Valley School District, Adams and Highland Counties, Ohio, Unlimited Tax School Improvement General Obligation Bonds, Series 1995: | ||||||||||
| 6,000 | 7.000%, 12/01/15 – MBIA Insured | No Opt. Call | AA | 6,824,700 | ||||||
| 9,500 | 5.250%, 12/01/21 – MBIA Insured | 12/08 at 100.00 | AA | 9,502,470 | ||||||
| 600 | Anthony Wayne Local School District, Lucas, Wood and Fulton Counties, Ohio, School Facilities Construction and Improvement Bonds, Series 1995, 0.000%, 12/01/13 – FGIC Insured | No Opt. Call | A2 | 484,380 | ||||||
| 1,895 | Buckeye Valley Local School District, Ohio, Unlimited Tax General Obligation Bonds, Series 1995A, | No Opt. Call | AA | 2,114,327 | ||||||
| 1,000 | Butler County, Hamilton, Ohio, Limited Tax General Obligation Bonds, One Renaissance Center Acquisition, Series 2001, 5.375%, 11/01/17 – AMBAC Insured | 11/11 at 101.00 | A2 | 1,065,170 | ||||||
| 2,515 | Canton City School District, Stark County, Ohio, General Obligation Bonds, Series 2005, | 6/15 at 100.00 | AA | 2,568,192 | ||||||
| 2,295 | Central Ohio Solid Waste Authority, General Obligation Bonds, Series 2004A, 5.000%, 12/01/15 – AMBAC Insured | 6/14 at 100.00 | AAA | 2,450,463 | ||||||
| Chesapeake-Union Exempt Village School District, Ohio, General Obligation Bonds, Series 1986: | ||||||||||
| 125 | 8.500%, 12/01/08 | No Opt. Call | N/R | 125,048 | ||||||
| 130 | 8.500%, 12/01/09 | No Opt. Call | N/R | 135,645 | ||||||
43
Portfolio of Investments (Unaudited)
Nuveen Ohio Municipal Bond Fund (continued)
November 30, 2008
| Principal Amount (000) | Description (1) | Optional Call Provisions (2) | Ratings (3) | Value | ||||||
| Tax Obligation/General (continued) | ||||||||||
| $ | 1,000 | Clyde-Green Springs Exempt Village School District, Summit County, Ohio, General Obligation Bonds, | 6/18 at 100.00 | Aa2 | $ | 956,260 | ||||
| 2,675 | Cuyahoga County, Ohio, General Obligation Bonds, Series 2004, 5.000%, 12/01/22 | 12/14 at 100.00 | AA+ | 2,690,435 | ||||||
| 1,345 | Cuyahoga County, Ohio, Limited Tax General Obligation Bonds, Series 1993, 5.650%, 5/15/18 | No Opt. Call | Aa1 | 1,388,134 | ||||||
| 1,000 | Cuyahoga County, Ohio, Limited Tax General Obligation Various Purpose Refunding Bonds, Series 1993B, | No Opt. Call | AA+ | 1,030,840 | ||||||
| 1,245 | Cuyahoga Falls, Ohio, General Obligation Bonds, Series 2004, 5.000%, 12/01/18 – MBIA Insured | 6/14 at 100.00 | Aa3 | 1,284,255 | ||||||
| 1,170 | Dayton, Ohio, General Obligation Bonds, Series 2004, 5.250%, 12/01/15 – AMBAC Insured | 6/14 at 100.00 | A1 | 1,259,201 | ||||||
| Delaware City School District, Delaware County, Ohio, Unlimited Tax General Obligation School Facilities Construction and Improvement Bonds, Series 1995: | ||||||||||
| 1,000 | 0.000%, 12/01/10 – FGIC Insured | No Opt. Call | AA | 936,140 | ||||||
| 1,000 | 0.000%, 12/01/11 – FGIC Insured | No Opt. Call | AA | 897,430 | ||||||
| 1,000 | Fairview Park, Ohio, General Obligation Bonds, Series 2005, 5.000%, 12/01/25 – MBIA Insured | 12/15 at 100.00 | A1 | 946,270 | ||||||
| 1,005 | Findlay, Ohio, General Obligation Bonds, Series 2004, 5.250%, 7/01/15 – MBIA Insured | 7/14 at 100.00 | AA | 1,090,395 | ||||||
| 3,160 | Franklin County, Ohio, General Obligation Bonds, Series 2007, 5.000%, 12/01/28 | 12/17 at 100.00 | AAA | 3,128,463 | ||||||
| 3,040 | Franklin County, Ohio, Limited Tax General Obligation Refunding Bonds, Series 1993, 5.375%, 12/01/20 | 12/08 at 102.00 | AAA | 3,089,765 | ||||||
| 225 | Geauga County, Ohio, Limited Tax General Obligation, Sewer District Improvement Bonds, Bainbridge Water Project, Series 1995, 6.850%, 12/01/10 | 12/08 at 100.00 | Aa2 | 225,900 | ||||||
| 3,810 | Greater Cleveland Regional Transit Authority, Ohio, General Obligation Bonds, Series 2004, | 12/14 at 100.00 | Aa3 | 4,015,854 | ||||||
| 2,425 | Hubbard Exempt Village School District, Trumbull County, Ohio, General Obligation Bonds, Classroom Facilities Improvements, Series 2007, 5.000%, 12/01/34 – CIFG Insured | 6/17 at 100.00 | A | 2,122,069 | ||||||
| 1,270 | Kenston Local School District, Geauga County, Ohio, General Obligation Bonds, Series 2003, | 6/13 at 100.00 | Aa3 | 1,259,408 | ||||||
| 1,400 | Kent City School District, Portage County, Ohio, General Obligation Library Improvement Bonds, Series 2004, 5.000%, 12/01/20 – FGIC Insured | 12/14 at 100.00 | AA | 1,418,102 | ||||||
| 1,500 | Kettering City School District, Montgomery County, Ohio, General Obligation Bonds, Series 2007, | No Opt. Call | AAA | 1,478,715 | ||||||
| 670 | Kettering, Ohio, Limited Tax General Obligation Bonds, Series 1991, 6.650%, 12/01/12 | 12/08 at 100.00 | Aa3 | 672,573 | ||||||
| Kings Local School District, Warren County, Ohio, General Obligation School Improvement Bonds, Series 2005: | ||||||||||
| 1,000 | 5.000%, 12/01/22 – MBIA Insured | 6/15 at 100.00 | Aaa | 1,004,400 | ||||||
| 1,480 | 5.000%, 12/01/24 – MBIA Insured | 6/15 at 100.00 | Aaa | 1,471,934 | ||||||
| 555 | Lake County, Ohio, Limited Tax Sewer District Improvement Bonds, Series 2000, 5.600%, 12/01/20 | No Opt. Call | Aa2 | 587,567 | ||||||
| 1,725 | Lakewood City School District, Cuyahoga County, Ohio, General Obligation Bonds, Series 2007, | 12/17 at 100.00 | AA | 1,594,987 | ||||||
| 1,000 | Lorain, Ohio, General Obligation Bonds, Pellet Terminal Improvement Series 2008, 6.750%, 12/01/28 – AMBAC Insured | 12/12 at 100.00 | Baa2 | 950,340 | ||||||
| 1,855 | Marysville Exempted School District, Union County, Ohio, General Obligation Bonds, Series 2006, | 12/15 at 100.00 | AAA | 1,824,893 | ||||||
| 1,000 | Mason City School District, Counties of Warren and Butler, Ohio, General Obligation Bonds, | 6/17 at 100.00 | Aa1 | 953,990 | ||||||
| 1,000 | Milford Exempted Village School District, Ohio, General Obligation Bonds, Series 2008, 5.250%, 12/01/36 | 12/18 at 100.00 | A2 | 890,210 | ||||||
| 1,265 | Monroe Local School District, Butler County, Ohio, General Obligation Bonds, Series 2002, | No Opt. Call | A2 | 1,385,099 | ||||||
| Oak Hills Local School District, Hamilton County, Ohio, General Obligation Bonds, Series 2005: | ||||||||||
| 3,740 | 5.000%, 12/01/23 – FSA Insured | 12/15 at 100.00 | AAA | 3,744,563 | ||||||
| 1,000 | 5.000%, 12/01/25 – FSA Insured | 12/15 at 100.00 | AAA | 987,590 | ||||||
44
| Principal Amount (000) | Description (1) | Optional Call Provisions (2) | Ratings (3) | Value | ||||||
| Tax Obligation/General (continued) | ||||||||||
| $ | 1,000 | Ohio, Common Schools Capital Facilities, General Obligation Bonds, Series 2001B, 5.000%, 9/15/21 | 9/11 at 100.00 | AA+ | $ | 1,007,710 | ||||
| 1,000 | Ohio, Full Faith and Credit General Obligation Infrastructure Improvement Bonds, Series 1994, | No Opt. Call | AA+ | 1,064,220 | ||||||
| 730 | Ohio, General Obligation Bonds, Common Schools, Series 2004B, 5.000%, 3/15/21 | 3/14 at 100.00 | AA+ | 741,140 | ||||||
| 6,055 | Ohio, General Obligation Bonds, Infrastructure Improvements, Series 2003F, 5.000%, 2/01/22 | 2/13 at 100.00 | AA+ | 6,059,117 | ||||||
| 1,845 | Ohio, General Obligation Bonds, Series 2005A, 5.000%, 9/01/16 | 3/15 at 100.00 | AA+ | 1,981,327 | ||||||
| 8,140 | Ohio, General Obligation Higher Education Capital Facilities Bonds, Series 2001A, 5.000%, 2/01/20 | 2/11 at 100.00 | AA+ | 8,212,853 | ||||||
| 1,000 | Olmsted Falls City School District, Cuyahoga County, Ohio, General Obligation Bonds, Series 2007, | 6/17 at 100.00 | A | 869,490 | ||||||
| 3,315 | South Point Local School District, Lawrence County, Ohio, General Obligation Bonds, Series 2004, | 12/14 at 100.00 | AAA | 3,323,520 | ||||||
| 30 | Strongsville, Ohio, Limited Tax General Obligation Various Purpose Improvement Bonds, Series 1996, | 12/08 at 100.00 | Aa1 | 30,069 | ||||||
| 2,315 | Summit County, Ohio, General Obligation Bonds, Series 2002R, 5.500%, 12/01/21 – FGIC Insured | No Opt. Call | AA | 2,459,595 | ||||||
| 3,755 | Toledo City School District, Lucas County, Ohio, General Obligation Bonds, Series 2003B, | 12/13 at 100.00 | N/R | 3,666,344 | ||||||
| West Chester Township, Butler County, Ohio, General Obligation Bonds, Series 2003: | ||||||||||
| 1,365 | 5.250%, 12/01/19 – MBIA Insured | 12/13 at 100.00 | Aa1 | 1,409,212 | ||||||
| 1,515 | 5.250%, 12/01/21 – MBIA Insured | 12/13 at 100.00 | Aa1 | 1,542,997 | ||||||
| 2,000 | West Clermont Local School District, Clermont County, Ohio, General Obligation Bonds, Series 2008, | 12/18 at 100.00 | AAA | 1,913,080 | ||||||
| 103,685 | Total Tax Obligation/General | 104,836,851 | ||||||||
| Tax Obligation/Limited – 12.8% | ||||||||||
| 5,690 | Akron, Ohio, Income Tax Revenue Bonds, Community Learning Centers, Series 2004A, 5.000%, 12/01/33 – FGIC Insured | 12/13 at 100.00 | AA+ | 5,162,537 | ||||||
| Blue Ash, Ohio, Tax Increment Financing Revenue Bonds, Duke Realty Ohio, Series 2006: | ||||||||||
| 950 | 5.000%, 12/01/25 | 12/16 at 102.00 | N/R | 787,531 | ||||||
| 1,165 | 5.000%, 12/01/30 | 12/16 at 102.00 | N/R | 890,375 | ||||||
| 1,150 | Cincinnati, Ohio, Economic Development Revenue Bonds, Keystone Parke Project, Series 2008A, | 11/13 at 102.00 | AA | 1,036,507 | ||||||
| 1,850 | Cleveland-Cuyahoga County Port Authority, Ohio, Development Revenue Bonds, R.I.T.A. Project, Series 2004, 5.000%, 11/15/19 – RAAI Insured | 11/14 at 100.00 | A3 | 1,692,436 | ||||||
| 1,380 | Columbus, Ohio, Tax Increment Financing Bonds, Easton Project, Series 2004A, 5.000%, 12/01/25 – AMBAC Insured | 6/14 at 100.00 | A | 1,186,000 | ||||||
| 5,615 | Franklin County, Ohio, Excise Tax and Lease Revenue Anticipation Bonds, Convention Facilities Authority, Series 2005, 5.000%, 12/01/25 – AMBAC Insured | 12/15 at 100.00 | Aaa | 5,458,342 | ||||||
| Franklin County, Ohio, Excise Tax and Lease Revenue Refunding Anticipation Bonds, Convention Facilities Authority, Series 2007: | ||||||||||
| 2,215 | 5.000%, 12/01/26 | 12/17 at 100.00 | Aaa | 2,143,478 | ||||||
| 2,000 | 5.000%, 12/01/27 | 12/17 at 100.00 | Aaa | 1,921,720 | ||||||
| 1,210 | Groveport, Ohio, Special Obligation Income Tax Receipts Bonds, Series 2002, 5.000%, 12/01/22 – MBIA Insured | 12/12 at 100.00 | A3 | 1,176,749 | ||||||
| Hamilton County Convention Facilities Authority, Ohio, First Lien Revenue Bonds, Series 2004: | ||||||||||
| 2,300 | 5.000%, 12/01/20 – FGIC Insured | 6/14 at 100.00 | AA | 2,209,449 | ||||||
| 2,535 | 5.000%, 12/01/22 – FGIC Insured | 6/14 at 100.00 | AA | 2,372,304 | ||||||
| 10,000 | Hamilton County, Ohio, Sales Tax Bonds, Subordinate Lien, Series 2006, 5.000%, 12/01/32 – AMBAC Insured | 12/16 at 100.00 | A2 | 9,151,400 | ||||||
| 3,300 | Hamilton County, Ohio, Sales Tax Bonds, Subordinate Series 2000B, 0.000%, 12/01/28 – AMBAC Insured | No Opt. Call | A2 | 928,389 | ||||||
45
Portfolio of Investments (Unaudited)
Nuveen Ohio Municipal Bond Fund (continued)
November 30, 2008
| Principal Amount (000) | Description (1) | Optional Call Provisions (2) | Ratings (3) | Value | |||||||
| Tax Obligation/Limited (continued) | |||||||||||
| $ | 1,485 | New Albany Community Authority, Ohio, Community Facilities Revenue Refunding Bonds, Series 2001B, | 4/12 at 100.00 | A | $ | 1,479,936 | |||||
| 600 | Ohio Department of Transportation, Certificates of Participation, Panhandle Rail Line, Series 1992A, | 4/09 at 100.00 | AAA | 602,010 | |||||||
| 1,050 | Ohio State Building Authority, State Facilities Bonds, Administrative Building Fund Projects, Series 2002A, | �� | 4/12 at 100.00 | AAA | 1,046,892 | ||||||
| 1,900 | Ohio State Building Authority, State Facilities Bonds, Administrative Building Fund Projects, Series 2005A, | 4/15 at 100.00 | AAA | 1,876,896 | |||||||
| 3,135 | Ohio State Building Authority, State Facilities Bonds, Adult Correctional Building Fund Project, Series 2005A, 5.000%, 4/01/23 – FSA Insured | 4/15 at 100.00 | AAA | 3,111,989 | |||||||
| 1,490 | Ohio, State Appropriation Lease Bonds, Mental Health Capital Facilities, Series 2003B-II, 5.000%, 6/01/16 | 6/13 at 100.00 | AA | 1,576,226 | |||||||
| 1,000 | Ohio, State Appropriation Lease Bonds, Parks and Recreation Capital Facilities, Series 2004A-II, | 12/13 at 100.00 | AA | 1,058,610 | |||||||
| 1,000 | Ohio, State Appropriation Lease Bonds, Parks and Recreation Capital Facilities, Series 2005A-II, | 2/15 at 100.00 | AAA | 1,042,720 | |||||||
| 13,040 | Puerto Rico Public Buildings Authority, Guaranteed Government Facilities Revenue Bonds, Series 1993L, 5.500%, 7/01/21 – MBIA Insured | No Opt. Call | AA | 11,861,572 | |||||||
| 66,060 | Total Tax Obligation/Limited | 59,774,068 | |||||||||
| Transportation – 2.4% | |||||||||||
| 1,000 | Dayton, Ohio, Airport Revenue Bonds, James M. Cox International Airport, Series 2003C, | 12/13 at 100.00 | BBB+ | 780,330 | |||||||
| 10,000 | Ohio Turnpike Commission, Revenue Refunding Bonds, Series 1998A, 5.500%, 2/15/24 – FGIC Insured | No Opt. Call | AA | 10,462,200 | |||||||
| 11,000 | Total Transportation | 11,242,530 | |||||||||
| U.S. Guaranteed – 20.2% (4) | |||||||||||
| 90 | Athens, Ohio, Sanitary Sewer System Mortgage Revenue Bonds, Series 1989, 7.300%, 12/01/14 | 12/09 at 100.00 | N/R | (4) | 93,857 | ||||||
| 700 | Buckeye Local School District, Medina County, Ohio, General Obligation Bonds, Series 2000, | 12/10 at 100.00 | A2 | (4) | 750,687 | ||||||
| Canal Winchester Local School District, Franklin and Fairfield Counties, Ohio, General Obligation Bonds, Series 2005B: | |||||||||||
| 3,420 | 5.000%, 12/01/26 (Pre-refunded 6/01/15) – MBIA Insured | 6/15 at 100.00 | A3 | (4) | 3,786,521 | ||||||
| 3,590 | 5.000%, 12/01/27 (Pre-refunded 6/01/15) – MBIA Insured | 6/15 at 100.00 | A3 | (4) | 3,974,740 | ||||||
| 1,255 | Cincinnati City School District, Hamilton County, Ohio, General Obligation Bonds, Series 2001, | 12/11 at 100.00 | AA | (4) | 1,371,062 | ||||||
| 7,045 | Columbus, Ohio, General Obligation Bonds, Series 2000, 5.250%, 11/15/17 (Pre-refunded 11/15/10) | 11/10 at 101.00 | Aaa | 7,575,066 | |||||||
| 6,900 | Cuyahoga County, Ohio, Hospital Revenue and Improvement Bonds, MetroHealth System, Series 1999, | 2/09 at 101.00 | A– | (4) | 7,034,826 | ||||||
| 1,235 | Dayton, Ohio, Airport Revenue Bonds, James M. Cox International Airport, Series 2005B, | No Opt. Call | BBB+ | (4) | 1,374,036 | ||||||
| 1,000 | Evergreen Local School District, Ohio, Unlimited Tax General Obligation School Improvement Bonds, Series 1999, 5.625%, 12/01/24 (Pre-refunded 12/01/09) – FGIC Insured | 12/09 at 101.00 | A3 | (4) | 1,055,010 | ||||||
| 1,200 | Heath City School District, Licking County, Ohio, Unlimited Tax General Obligation School Improvement Bonds, Series 2000A, 5.500%, 12/01/27 (Pre-refunded 12/01/10) – FGIC Insured | 12/10 at 100.00 | A2 | (4) | 1,285,908 | ||||||
| 3,385 | Lakota Local School District, Butler County, Ohio, Unlimited Tax General Obligation School Improvement and Refunding Bonds, Series 2001, 5.125%, 12/01/26 (Pre-refunded 6/01/11) – FGIC Insured | 6/11 at 100.00 | Aa1 | (4) | 3,632,613 | ||||||
| 565 | Lebanon, Ohio, Electric System Mortgage Revenue Bonds, Series 2001, 5.500%, 12/01/17 (Pre-refunded 12/01/10) – AMBAC Insured | 12/10 at 101.00 | A | (4) | 610,895 | ||||||
| 670 | Lorain, Ohio, Hospital Revenue Refunding Bonds, Lakeland Community Hospital Inc., Series 1992, 6.500%, 11/15/12 (ETM) | 5/09 at 100.00 | A1 | (4) | 708,599 | ||||||
46
| Principal Amount (000) | Description (1) | Optional Call Provisions (2) | Ratings (3) | Value | |||||||
| U.S. Guaranteed (4) (continued) | |||||||||||
| $ | 1,750 | Medina City School District, Medina County, Ohio, Unlimited Tax General Obligation School Building Construction Bonds, Series 1999, 5.250%, 12/01/28 (Pre-refunded 12/01/09) – FGIC Insured | 12/09 at 100.00 | Aa3 | (4) | $ | 1,822,415 | ||||
| 1,950 | Montgomery County, Ohio, Health System Revenue Bonds, Franciscan Medical Center – Dayton Campus, Series 1997, 5.500%, 7/01/18 (Pre-refunded 1/01/10) | 1/10 at 100.00 | Baa2 | (4) | 2,026,362 | ||||||
| 9,500 | Montgomery County, Ohio, Hospital Facilities Revenue Bonds, Kettering Medical Center, Series 1999, 6.750%, 4/01/22 (Pre-refunded 4/01/10) | 4/10 at 101.00 | A | (4) | 10,215,065 | ||||||
| 5,610 | Montgomery County, Ohio, Revenue Bonds, Catholic Health Initiatives, Series 2001, 5.375%, 9/01/21 (ETM) | 9/11 at 100.00 | Aa2 | (4) | 5,767,978 | ||||||
| 2,390 | Montgomery County, Ohio, Revenue Bonds, Catholic Health Initiatives, Series 2001, 5.375%, 9/01/21 (Pre-refunded 9/01/11) | 9/11 at 100.00 | Aa2 | (4) | 2,593,604 | ||||||
| North Royalton City School District, Ohio, School Improvement Bonds, Series 1994: | |||||||||||
| 2,200 | 6.000%, 12/01/14 (Pre-refunded 12/01/09) – MBIA Insured | 12/09 at 102.00 | AA | (4) | 2,351,030 | ||||||
| 2,400 | 6.100%, 12/01/19 (Pre-refunded 12/01/09) – MBIA Insured | 12/09 at 102.00 | AA | (4) | 2,567,160 | ||||||
| Ohio Capital Corporation for Housing, FHA-Insured Section 8 Assisted Mortgage Loan Revenue Refunding Bonds, Series 1999D: | |||||||||||
| 1,330 | 5.950%, 2/01/23 (Pre-refunded 2/01/09) | 2/09 at 102.00 | Aa2 | (4) | 1,367,998 | ||||||
| 700 | 5.950%, 2/01/23 (Pre-refunded 2/01/09) | 2/09 at 102.00 | Aa2 | (4) | 719,999 | ||||||
| 3,000 | Ohio Higher Education Facilities Commission, Revenue Bonds, Case Western Reserve University, Series 2002B, 5.500%, 10/01/22 (Pre-refunded 10/01/12) | 10/12 at 100.00 | AA– | (4) | 3,325,860 | ||||||
| 1,000 | Ohio Higher Educational Facilities Commission, Revenue Bonds, University of Dayton, Series 2000, | 12/10 at 101.00 | A | (4) | 1,077,300 | ||||||
| Ohio Housing Finance Agency, Single Family Mortgage Revenue Bonds, Series 1985B: | |||||||||||
| 6,460 | 0.000%, 1/15/15 (Pre-refunded 1/15/11) – FGIC Insured | 1/11 at 67.04 | AAA | 4,089,309 | |||||||
| 5,700 | 0.000%, 1/15/15 (Pre-refunded 7/15/11) – FGIC Insured | 7/11 at 70.48 | AAA | 3,729,510 | |||||||
| 5,065 | Ohio Water Development Authority, Loan Revenue Bonds, Pure Water Development, Series 1990I, | No Opt. Call | Aaa | 5,643,524 | |||||||
| Olentangy Local School District, Delaware and Franklin Counties, Ohio, General Obligation Bonds, Series 2004A: | |||||||||||
| 400 | 5.250%, 12/01/21 (Pre-refunded 6/01/14) – FGIC Insured | 6/14 at 100.00 | AA+ | (4) | 445,340 | ||||||
| 3,055 | 5.250%, 12/01/22 (Pre-refunded 6/01/14) – FGIC Insured | 6/14 at 100.00 | AA+ | (4) | 3,401,284 | ||||||
| 1,825 | Olentangy Local School District, Delaware and Franklin Counties, Ohio, Various Purpose Bonds, Series 1999, 5.000%, 12/01/27 (Pre-refunded 12/01/09) | 12/09 at 101.00 | AA+ | (4) | 1,914,005 | ||||||
| 1,495 | Otsego Local School District, Wood, Henry and Lucas Counties, Ohio, General Obligation Bonds, Series 2004, 5.375%, 12/01/22 (Pre-refunded 12/01/14) – FSA Insured | 12/14 at 100.00 | Aa3 | (4) | 1,696,616 | ||||||
| 500 | Pickerington Local School District, Fairfield County, Ohio, General Obligation Bonds, Series 1993, | No Opt. Call | A1 | (4) | 460,425 | ||||||
| 1,335 | Richland County, Ohio, Hospital Facilities Revenue Improvement Bonds, MedCentral Health System Obligated Group, Series 2000B, 6.375%, 11/15/22 (Pre-refunded 11/15/10) | 11/10 at 101.00 | A– | (4) | 1,459,102 | ||||||
| 1,185 | Sugarcreek Local School District, Athens County, Ohio, General Obligation Bonds, Series 2003, | 12/13 at 100.00 | A1 | (4) | 1,324,783 | ||||||
| University of Cincinnati, Ohio, General Receipts Bonds, Series 2001A: | |||||||||||
| 1,500 | 5.750%, 6/01/18 (Pre-refunded 6/01/11) – FGIC Insured | 6/11 at 101.00 | A+ | (4) | 1,646,745 | ||||||
| 1,520 | 5.750%, 6/01/19 (Pre-refunded 6/01/11) – FGIC Insured | 6/11 at 101.00 | A+ | (4) | 1,668,702 | ||||||
| 92,925 | Total U.S. Guaranteed | 94,567,936 | |||||||||
| Utilities – 8.1% | |||||||||||
| 5,000 | American Municipal Power Ohio Inc., General Revenue Bonds, Series 2008, 5.250%, 2/15/43 | 2/18 at 100.00 | A1 | 4,466,450 | |||||||
| 1,535 | Cleveland Public Power System, Ohio, First Mortgage Improvement Revenue Bonds, Series 1994A, | No Opt. Call | AA | 1,241,861 | |||||||
| Cleveland, Ohio, Public Power System Revenue Bonds, Series 2008B: | |||||||||||
| 4,740 | 0.000%, 11/15/34 – MBIA Insured | No Opt. Call | AA | 887,281 | |||||||
47
Portfolio of Investments (Unaudited)
Nuveen Ohio Municipal Bond Fund (continued)
November 30, 2008
| Principal Amount (000) | Description (1) | Optional Call Provisions (2) | Ratings (3) | Value | ||||||
| Utilities (continued) | ||||||||||
| $ | 2,000 | 5.000%, 11/15/38 – MBIA Insured | 5/18 at 100.00 | AA | $ | 1,703,720 | ||||
| 7,500 | 0.000%, 11/15/38 – MBIA Insured | No Opt. Call | AA | 1,073,550 | ||||||
| 5,000 | Ohio Air Quality Development Authority, Revenue Bonds, JMG Funding Limited Partnership Project, | 4/09 at 100.00 | Baa1 | 4,408,350 | ||||||
| Ohio Municipal Electric Generation Agency, Beneficial Interest Certificates, Belleville Hydroelectric Project – Joint Venture 5, Series 2004: | ||||||||||
| 1,000 | 5.000%, 2/15/20 – AMBAC Insured | 2/14 at 100.00 | A1 | 972,820 | ||||||
| 5,450 | 5.000%, 2/15/21 – AMBAC Insured | 2/14 at 100.00 | A1 | 5,209,928 | ||||||
| 1,465 | 5.000%, 2/15/22 – AMBAC Insured | 2/14 at 100.00 | A1 | 1,379,649 | ||||||
| 3,295 | 5.000%, 2/15/23 – AMBAC Insured | 2/14 at 100.00 | A1 | 3,072,093 | ||||||
| 10,850 | Ohio Water Development Authority, Solid Waste Disposal Revenue Bonds, Bay Shore Power, Series 1998A, 5.875%, 9/01/20 (Alternative Minimum Tax) | 3/09 at 102.00 | N/R | 8,568,788 | ||||||
| 1,545 | Puerto Rico Electric Power Authority, Power Revenue Refunding Bonds, Series 1989O, 0.000%, 7/01/17 | No Opt. Call | AAA | 1,044,142 | ||||||
| 4,460 | Puerto Rico Industrial, Tourist, Educational, Medical and Environmental Control Facilities Financing Authority, Co-Generation Facility Revenue Bonds, Series 2000A, 6.625%, 6/01/26 | 6/10 at 101.00 | Baa3 | 3,914,453 | ||||||
| 53,840 | Total Utilities | 37,943,085 | ||||||||
| Water and Sewer – 6.1% | ||||||||||
| 1,730 | Butler County, Ohio, Sewerage System Revenue Bonds, Series 2005, 5.000%, 12/01/23 – FSA Insured | No Opt. Call | Aa3 | 1,712,181 | ||||||
| 4,355 | Cincinnati, Ohio, Water System Revenue Bonds, Series 2007B, 5.000%, 12/01/32 | 12/17 at 100.00 | AA+ | 4,127,756 | ||||||
| 865 | City of Marysville, Ohio, Water System Mortgage Revenue Bonds, Series 2007, 5.000%, 12/01/32 – AMBAC Insured | 12/17 at 100.00 | A3 | 782,142 | ||||||
| 10,325 | Cleveland, Ohio, Waterworks First Mortgage Revenue Refunding and Improvement Bonds, Series 1993G, | No Opt. Call | AA | 10,207,811 | ||||||
| 2,105 | Hebron, Ohio, Mortgage Revenue Bonds, Waterworks System Improvements, Series 2004, | 6/14 at 100.00 | N/R | 1,879,323 | ||||||
| 1,260 | Lancaster, Ohio, Wastewater System Improvement Revenue Bonds, Series 2004, 5.000%, 12/01/25 – AMBAC Insured | 12/14 at 100.00 | A | 1,126,818 | ||||||
| 4,590 | Marysville, Ohio, Wastewater Treatement System Revenue Bonds, Series 2007, 4.750%, 12/01/47 – SYNCORA GTY Insured | 12/17 at 100.00 | BBB+ | 3,210,843 | ||||||
| 530 | Ohio Water Development Authority, Revenue Bonds, Drinking Water Assistance Fund, State Match, Series 2008, 5.000%, 6/01/28 – FSA Insured | 6/18 at 100.00 | AAA | 521,568 | ||||||
| 1,255 | Ohio Water Development Authority, Revenue Bonds, Fresh Water Development, Series 2004, | 6/14 at 100.00 | AAA | 1,350,681 | ||||||
| 3,500 | Ohio Water Development Authority, Water Pollution Control Loan Fund Revenue Bonds, Water Quality Project, Series 2005B, 5.000%, 6/01/25 | 6/15 at 100.00 | AAA | 3,511,550 | ||||||
| 30,515 | Total Water and Sewer | 28,430,673 | ||||||||
| $ | 507,755 | Total Investments (cost $494,459,525) – 99.7% | 466,735,473 | |||||||
Other Assets Less Liabilities – 0.3% | 1,283,344 | |||||||||
Net Assets – 100% | $ | 468,018,817 | ||||||||
| (1) | All percentages shown in the Portfolio of Investments are based on net assets. |
| (2) | Optional Call Provisions: Dates (month and year) and prices of the earliest optional call or redemption. There may be other call provisions at varying prices at later dates. Certain mortgage-backed securities may be subject to periodic principal paydowns. |
| (3) | Ratings: Using the higher of Standard & Poor’s Group (“Standard & Poor’s”) or Moody’s Investor Service, Inc. (“Moody’s”) rating. Ratings below BBB by Standard & Poor’s or Baa by Moody’s are considered to be below investment grade. |
| The Portfolio of Investments may reflect the ratings on certain bonds insured by ACA, AGC, AMBAC, CIFG, FGIC, FSA, MBIA, RAAI and SYNCORA as of November 30, 2008. Please see the Portfolio Managers’ Commentary for an expanded discussion of the affect on the Fund of changes to the ratings of certain bonds in the portfolio resulting from changes to the ratings of the underlying insurers both during the period and after period end. |
| (4) | Backed by an escrow or trust containing sufficient U.S. Government or U.S. Government agency securities which ensure the timely payment of principal and interest. Such investments are normally considered to be equivalent to AAA rated securities. |
| N/R | Not rated. |
| (ETM) | Escrowed to maturity. |
See accompanying notes to financial statements.
48
Portfolio of Investments (Unaudited)
Nuveen Wisconsin Municipal Bond Fund
November 30, 2008
| Principal Amount (000) | Description (1) | Optional Call Provisions (2) | Ratings (3) | Value | ||||||
| Education and Civic Organizations – 1.2% | ||||||||||
| $ | 370 | Puerto Rico Industrial, Tourist, Educational, Medical and Environmental Control Facilities Financing Authority, Higher Education Revenue Bonds, Ana G. Mendez University System, Series 1999, 5.375%, 2/01/29 | 2/09 at 101.00 | BBB- | $ | 267,247 | ||||
| 200 | Puerto Rico Industrial, Tourist, Educational, Medical and Environmental Control Facilities Financing Authority, Higher Education Revenue Bonds, University of the Sacred Heart, Series 2001, 5.250%, 9/01/21 | 9/11 at 100.00 | BBB | 166,240 | ||||||
| 250 | Puerto Rico Industrial, Tourist, Educational, Medical and Environmental Control Facilities Financing Authority, Higher Education Revenue Refunding Bonds, Ana G. Mendez University System, Series 2002, 5.500%, 12/01/31 | 12/12 at 101.00 | BBB– | 178,743 | ||||||
| 820 | Total Education and Civic Organizations | 612,230 | ||||||||
| Health Care – 1.7% | ||||||||||
| 385 | Puerto Rico Industrial, Tourist, Educational, Medical and Environmental Control Facilities Financing Authority, FHA-Insured Mortgage Hospital Revenue Bonds, Doctor Pila Hospital, Series 1995A, 5.875%, 8/01/12 | 2/09 at 100.00 | AAA | 385,705 | ||||||
| 500 | Puerto Rico Industrial, Tourist, Educational, Medical and Environmental Control Facilities Financing Authority, Hospital Revenue Bonds, Auxilio Mutuo Hospital, Series 1995A, 6.250%, 7/01/24 – MBIA Insured | 1/09 at 100.00 | AA | 478,865 | ||||||
| 885 | Total Health Care | 864,570 | ||||||||
| Housing/Multifamily – 8.8% | ||||||||||
| 675 | Kenosha Housing Authority, Wisconsin, GNMA Collateralized Multifamily Housing Revenue Bonds, Villa Ciera Inc., Series 2000A, 5.900%, 11/20/30 | 5/09 at 101.00 | N/R | 650,079 | ||||||
| 570 | Lake Delton Community Development Agency, Wisconsin, GNMA Collateralized Multifamily Housing Revenue Bonds, Woodland Park Project, Series 2001, 5.300%, 2/20/31 (Alternative Minimum Tax) | 1/12 at 102.00 | N/R | 468,141 | ||||||
| 1,000 | Madison Community Development Authority, Wisconsin, GNMA Multifamily Housing Revenue Refunding Bonds, Greentree Glen Apartments, Series 1999A, 5.500%, 9/20/29 (Alternative Minimum Tax) | 3/09 at 100.00 | AAA | 856,260 | ||||||
| 200 | Milwaukee Redevelopment Authority, Wisconsin, FHA-Insured Multifamily Housing Revenue Bonds, City Hall Square Apartments, Series 1993, 6.000%, 8/01/22 (Alternative Minimum Tax) | 2/09 at 101.00 | N/R | 193,998 | ||||||
| 1,000 | Puerto Rico Housing Finance Authority, Subordinate Lien Capital Fund Program Revenue Bonds, Modernization Series 2008, 5.125%, 12/01/27 | 12/18 at 100.00 | AA- | 928,300 | ||||||
| 500 | Sheboygan Housing Authority, Wisconsin, GNMA Multifamily Revenue Refunding Bonds, Lake Shore Apartments, Series 1998A, 5.100%, 11/20/26 | 5/09 at 100.00 | AAA | 461,235 | ||||||
| 300 | Walworth County Housing Authority, Wisconsin, FHA-Insured Housing Revenue Bonds, Kiwanis Heritage Inc. Senior Apartments, Series 1997, 5.550%, 9/01/22 | 3/09 at 100.00 | N/R | 296,367 | ||||||
| 1,000 | Wisconsin Housing and Economic Development Authority, Housing Revenue Bonds, Series 2006A, 4.550%, 5/01/27 (Alternative Minimum Tax) | 5/16 at 100.00 | AA | 747,630 | ||||||
| 5,245 | Total Housing/Multifamily | 4,602,010 | ||||||||
| Housing/Single Family – 4.1% | ||||||||||
| 50 | Virgin Islands Housing Finance Corporation, GNMA Mortgage-Backed Securities Program Single Family Mortgage Revenue Refunding Bonds, Series 1995A, 6.450%, 3/01/16 (Alternative Minimum Tax) | 3/09 at 100.00 | N/R | 50,025 | ||||||
| Wisconsin Housing and Economic Development Authority, Home Ownership Revenue Bonds, Series 2005E: | ||||||||||
| 1,250 | 4.900%, 11/01/35 | 5/15 at 100.00 | AA | 1,015,338 | ||||||
| 1,300 | 4.900%, 11/01/35 – AMBAC Insured | 5/15 at 100.00 | AA | 1,055,951 | ||||||
| 2,600 | Total Housing/Single Family | 2,121,314 | ||||||||
| Tax Obligation/General – 0.1% | ||||||||||
| 95 | Guam, General Obligation Bonds, Series 1993A, 5.400%, 11/15/18 | 5/09 at 100.00 | B+ | 76,649 | ||||||
| Tax Obligation/Limited – 65.5% | ||||||||||
| 1,500 | Ashwaubenon Community Development Authority, Wisconsin, Lease Revenue Refunding Bonds, Arena Project, Series 2002, 5.150%, 6/01/29 | 6/12 at 100.00 | Aa2 | 1,498,110 | ||||||
49
Portfolio of Investments (Unaudited)
Nuveen Wisconsin Municipal Bond Fund (continued)
November 30, 2008
| Principal Amount (000) | Description (1) | Optional Call Provisions (2) | Ratings (3) | Value | ||||||
| Tax Obligation/Limited (continued) | ||||||||||
| $ | 2,000 | Glendale Community Development Authority, Wisconsin, Community Development Lease Revenue Bonds, Bayshore Public Parking Project, Series 2004A, 5.000%, 10/01/24 | 10/14 at 100.00 | A3 | $ | 1,895,020 | ||||
| 100 | Glendale Community Development Authority, Wisconsin, Community Development Lease Revenue Refunding Bonds, Tax Increment District 6, Series 2001, 5.000%, 10/01/19 | 10/11 at 100.00 | A3 | 99,621 | ||||||
| 350 | Green Bay Brown County Professional Football Stadium District, Wisconsin, Sales Tax Revenue Bonds, Lambeau Field Renovation Project, Series 2001A, 5.000%, 2/01/19 – AMBAC Insured | 2/11 at 100.00 | AA | 351,621 | ||||||
| 500 | Jackson Community Development Authority, Wisconsin, Revenue Refunding Bonds, Series 1999, 5.100%, 12/01/17 | 12/09 at 100.00 | N/R | 436,060 | ||||||
| 960 | Madison Community Development Authority, Wisconsin, Lease Revenue Refunding Bonds, Monona Terrace, Series 2002, 4.375%, 3/01/20 | 3/12 at 100.00 | Aa2 | 916,483 | ||||||
| 675 | Milwaukee Redevelopment Authority, Wisconsin, HSI Industrial I LLC Project Revenue Bonds, Series 2008, 5.125%, 6/01/29 | 6/16 at 100.00 | N/R | 513,365 | ||||||
| 2,000 | Milwaukee Redevelopment Authority, Wisconsin, Lease Revenue Bonds, Neighborhood Public Schools Initiative, Series 2002A, 4.875%, 8/01/21 – AMBAC Insured | 8/12 at 100.00 | A1 | 1,929,100 | ||||||
| 1,000 | Milwaukee Redevelopment Authority, Wisconsin, Lease Revenue Bonds, Neighborhood Public Schools Initiative, Series 2007A, 4.000%, 8/01/23 – AMBAC Insured | 8/17 at 100.00 | A1 | 886,120 | ||||||
| 275 | Milwaukee Redevelopment Authority, Wisconsin, Lease Revenue Bonds, Public Schools, Series 2005A, 4.600%, 8/01/22 | 8/15 at 100.00 | A2 | 246,180 | ||||||
| Milwaukee Redevelopment Authority, Wisconsin, Revenue Bonds, Summerfest Project, Series 2001: | ||||||||||
| 400 | 4.850%, 8/01/17 | 8/11 at 100.00 | A | 403,656 | ||||||
| 1,000 | 4.950%, 8/01/20 | 8/11 at 100.00 | A | 969,740 | ||||||
| 1,500 | Neenah Community Development Authority, Wisconsin, Lease Revenue Bonds, Series 2004A, 5.000%, 12/01/26 | 12/14 at 100.00 | A1 | 1,423,170 | ||||||
| Neenah Community Development Authority, Wisconsin, Lease Revenue Bonds, Series 2008A: | ||||||||||
| 500 | 4.625%, 12/01/28 | 12/18 at 100.00 | A1 | 448,715 | ||||||
| 1,000 | 4.750%, 12/01/32 | 12/18 at 100.00 | A1 | 895,800 | ||||||
| 1,000 | Onalaska Community Development Authority, Wisconsin, Community Development Lease Revenue Bonds, Series 2003, 4.875%, 10/01/27 | 10/13 at 100.00 | A2 | 884,280 | ||||||
| 1,500 | Puerto Rico Highway and Transportation Authority, Highway Revenue Bonds, Series 2004-I, 5.000%, 7/01/23 – FGIC Insured | 7/14 at 100.00 | A3 | 1,263,570 | ||||||
| Puerto Rico Highway and Transportation Authority, Highway Revenue Bonds, Series 2007N: | ||||||||||
| 2,500 | 5.500%, 7/01/25 – AGC Insured | No Opt. Call | AAA | 2,444,050 | ||||||
| 2,000 | 5.250%, 7/01/33 – MBIA Insured | No Opt. Call | AA | 1,540,140 | ||||||
| 1,000 | Puerto Rico Infrastructure Financing Authority, Special Tax Revenue Bonds, Series 2005C, 5.500%, 7/01/27 – AMBAC Insured | No Opt. Call | A | 859,190 | ||||||
| Saint Francis Community Development Authority, Wisconsin, Lease Revenue Bonds, Series 2007: | ||||||||||
| 400 | 4.150%, 3/01/20 | 3/17 at 100.00 | A3 | 378,132 | ||||||
| 300 | 4.350%, 3/01/22 | 3/17 at 100.00 | A3 | 275,958 | ||||||
| 280 | 4.500%, 3/01/24 | 3/17 at 100.00 | A3 | 257,015 | ||||||
| 520 | 4.600%, 3/01/27 | 3/17 at 100.00 | A3 | 472,155 | ||||||
| Southeast Wisconsin Professional Baseball Park District, Sales Tax Revenue Refunding Bonds, Series 1998A: | ||||||||||
| 850 | 5.500%, 12/15/18 – MBIA Insured | No Opt. Call | AA | 924,095 | ||||||
| 400 | 5.500%, 12/15/19 – MBIA Insured | No Opt. Call | AA | 428,888 | ||||||
| 2,195 | 5.500%, 12/15/20 – MBIA Insured | No Opt. Call | AA | 2,322,310 | ||||||
| 500 | 5.500%, 12/15/26 – MBIA Insured | No Opt. Call | AA | 501,690 | ||||||
| 1,220 | Sturgeon Bay Waterfront Redevelopment Authority, Wisconsin, Lease Revenue Bonds, Series 2006A, 4.500%, 10/01/21 | 10/16 at 100.00 | N/R | 1,081,237 | ||||||
| 1,305 | Sun Prairie Community Development Authority, Wisconsin, Lease Revenue Bonds, Tax Increment District 8, Series 2006, 4.250%, 8/01/25 | 8/16 at 100.00 | A2 | 1,084,207 | ||||||
50
| Principal Amount (000) | Description (1) | Optional Call Provisions (2) | Ratings (3) | Value | |||||||
| Tax Obligation/Limited (continued) | |||||||||||
| $ | 600 | Virgin Islands Public Finance Authority, Senior Lien Revenue Refunding Bonds, Matching Fund Loan Note, Series 1998A, 5.625%, 10/01/25 | 4/09 at 101.00 | BBB | $ | 503,676 | |||||
| 1,000 | Weston Community Development Authority, Wisconsin, Lease Revenue Bonds, Series 2004A, 5.250%, 10/01/21 | 10/14 at 100.00 | A3 | 994,850 | |||||||
| 1,000 | Weston Community Development Authority, Wisconsin, Lease Revenue Bonds, Series 2005A, 5.000%, 10/01/21 | 10/15 at 100.00 | A3 | 950,070 | |||||||
| Wisconsin Center District, Junior Dedicated Tax Revenue Refunding Bonds, Series 1999: | |||||||||||
| 2,900 | 5.250%, 12/15/23 – FSA Insured | No Opt. Call | AAA | 2,951,356 | |||||||
| 500 | 5.250%, 12/15/27 – FSA Insured | No Opt. Call | AAA | 495,825 | |||||||
| 2,000 | Wisconsin Center District, Senior Dedicated Tax Revenue Refunding Bonds, Series 2003A, 0.000%, 12/15/28 – FSA Insured | No Opt. Call | AAA | 625,500 | |||||||
| 37,730 | Total Tax Obligation/Limited | 34,150,955 | |||||||||
| U.S. Guaranteed – 10.3% (4) | |||||||||||
| 700 | Ashwaubenon Community Development Authority, Wisconsin, Lease Revenue Bonds, Arena Project, Series 1999A, 5.800%, 6/01/29 (Pre-refunded 6/01/09) | 6/09 at 100.00 | Aa2 | (4) | 716,849 | ||||||
| 1,300 | Green Bay Redevelopment Authority, Wisconsin, Lease Revenue Bonds, Convention Center Project, Series 1999A, 5.250%, 6/01/24 (Pre-refunded 6/01/09) | 6/09 at 100.00 | Aa2 | (4) | 1,327,677 | ||||||
| Milwaukee Redevelopment Authority, Wisconsin, Lease Revenue Bonds, Public Schools, Series 2003A: | |||||||||||
| 2,000 | 5.125%, 8/01/21 (Pre-refunded 8/01/13) – AMBAC Insured | 8/13 at 100.00 | A1 | (4) | 2,212,980 | ||||||
| 1,000 | 5.125%, 8/01/22 (Pre-refunded 8/01/13) – AMBAC Insured | 8/13 at 100.00 | A1 | (4) | 1,106,490 | ||||||
| 5,000 | Total U.S. Guaranteed | 5,363,996 | |||||||||
| Utilities – 6.4% | |||||||||||
| 1,000 | Puerto Rico Electric Power Authority, Power Revenue Bonds, Series 2003NN, 5.250%, 7/01/23 – MBIA Insured | No Opt. Call | AA | 857,910 | |||||||
| 2,000 | Puerto Rico Electric Power Authority, Power Revenue Bonds, Series 2007TT, 5.000%, 7/01/24 – MBIA Insured | 7/17 at 100.00 | AA | 1,648,720 | |||||||
| 1,000 | Puerto Rico Electric Power Authority, Power Revenue Bonds, Series 2007VV, 5.250%, 7/01/24 – FGIC Insured | No Opt. Call | AA | 860,100 | |||||||
| 4,000 | Total Utilities | 3,366,730 | |||||||||
| $ | 56,375 | Total Investments (cost $56,678,825) – 98.1% | 51,158,454 | ||||||||
Other Assets Less Liabilities – 1.9% | 982,197 | ||||||||||
Net Assets – 100% | $ | 52,140,651 | |||||||||
| (1) | All percentages shown in the Portfolio of Investments are based on net assets. |
| (2) | Optional Call Provisions: Dates (month and year) and prices of the earliest optional call or redemption. There may be other call provisions at varying prices at later dates. Certain mortgage-backed securities may be subject to periodic principal paydowns. |
| (3) | Ratings: Using the higher of Standard & Poor’s Group (“Standard & Poor’s”) or Moody’s Investor Service, Inc. (“Moody’s”) rating. Ratings below BBB by Standard & Poor’s or Baa by Moody’s are considered to be below investment grade. |
| The Portfolio of Investments may reflect the ratings on certain bonds insured by ACA, AGC, AMBAC, CIFG, FGIC, FSA, MBIA, RAAI and SYNCORA as of November 30, 2008. Please see the Portfolio Managers’ Commentary for an expanded discussion of the affect on the Fund of changes to the ratings of certain bonds in the portfolio resulting from changes to the ratings of the underlying insurers both during the period and after period end. |
| (4) | Backed by an escrow or trust containing sufficient U.S. Government or U.S. Government agency securities which ensure the timely payment of principal and interest. Such investments are normally considered to be equivalent to AAA rated securities. |
| N/R | Not rated. |
See accompanying notes to financial statements.
51
Statement of Assets and Liabilities (Unaudited)
November 30, 2008
| Kansas | Kentucky | Michigan | Missouri | Ohio | Wisconsin | |||||||||||||||||||
Assets | ||||||||||||||||||||||||
Investments, at value (cost $126,993,032, $408,111,972, $208,294,361, $225,445,140, $494,459,525 and $56,678,825, respectively) | $ | 117,641,475 | $ | 380,874,447 | $ | 197,293,292 | $ | 203,694,082 | $ | 466,735,473 | $ | 51,158,454 | ||||||||||||
Cash | 7,723,352 | 728,097 | — | 487,704 | — | 306,747 | ||||||||||||||||||
Receivables: | ||||||||||||||||||||||||
Interest | 1,982,645 | 5,161,352 | 1,926,491 | 3,090,709 | 9,405,175 | 927,023 | ||||||||||||||||||
Investments sold | 625,000 | — | — | — | 730,000 | — | ||||||||||||||||||
Shares sold | 137,554 | 563,528 | 466,038 | 380,739 | 305,664 | 3,024 | ||||||||||||||||||
Other assets | 174 | 41,071 | 23,039 | 12,520 | 50,819 | 83 | ||||||||||||||||||
Total assets | 128,110,200 | 387,368,495 | 199,708,860 | 207,665,754 | 477,227,131 | 52,395,331 | ||||||||||||||||||
Liabilities | ||||||||||||||||||||||||
Cash overdraft | — | — | 3,003,627 | — | 7,156,600 | — | ||||||||||||||||||
Floating rate obligations | — | 7,680,000 | — | 2,225,000 | — | — | ||||||||||||||||||
Payables: | ||||||||||||||||||||||||
Dividends | 202,252 | 536,724 | 367,332 | 349,648 | 771,004 | 64,447 | ||||||||||||||||||
Investments purchased | 5,000,000 | — | — | 1,534,890 | — | — | ||||||||||||||||||
Shares redeemed | 200,819 | 490,858 | 327,683 | 2,785,117 | 815,555 | 138,863 | ||||||||||||||||||
Accrued expenses: | ||||||||||||||||||||||||
Management fees | 55,391 | 169,133 | 89,464 | 92,402 | 208,134 | 24,199 | ||||||||||||||||||
12b-1 distribution and service fees | 31,210 | 87,252 | 46,375 | 45,412 | 87,921 | 12,518 | ||||||||||||||||||
Other | 26,940 | 121,087 | 73,086 | 51,901 | 169,100 | 14,653 | ||||||||||||||||||
Total liabilities | 5,516,612 | 9,085,054 | 3,907,567 | 7,084,370 | 9,208,314 | 254,680 | ||||||||||||||||||
Net assets | $ | 122,593,588 | $ | 378,283,441 | $ | 195,801,293 | $ | 200,581,384 | $ | 468,018,817 | $ | 52,140,651 | ||||||||||||
Class A Shares | ||||||||||||||||||||||||
Net assets | $ | 94,231,274 | $ | 324,905,613 | $ | 144,842,925 | $ | 173,068,462 | $ | 304,191,348 | $ | 43,247,973 | ||||||||||||
Shares outstanding | 10,071,361 | 32,838,813 | 14,199,753 | 18,117,270 | 29,859,416 | 4,742,630 | ||||||||||||||||||
Net asset value per share | $ | 9.36 | $ | 9.89 | $ | 10.20 | $ | 9.55 | $ | 10.19 | $ | 9.12 | ||||||||||||
Offering price per share (net asset value per share plus | $ | 9.77 | $ | 10.32 | $ | 10.65 | $ | 9.97 | $ | 10.63 | $ | 9.52 | ||||||||||||
Class B Shares | ||||||||||||||||||||||||
Net assets | $ | 3,751,415 | $ | 8,105,412 | $ | 3,161,160 | $ | 3,991,580 | $ | 8,941,870 | $ | 1,772,277 | ||||||||||||
Shares outstanding | 404,401 | 818,530 | 309,262 | 417,305 | 879,072 | 193,880 | ||||||||||||||||||
Net asset value and offering price per share | $ | 9.28 | $ | 9.90 | $ | 10.22 | $ | 9.57 | $ | 10.17 | $ | 9.14 | ||||||||||||
Class C Shares | ||||||||||||||||||||||||
Net assets | $ | 20,562,449 | $ | 42,547,050 | $ | 30,914,692 | $ | 20,618,964 | $ | 48,277,653 | $ | 5,992,758 | ||||||||||||
Shares outstanding | 2,198,107 | 4,298,866 | 3,032,047 | 2,160,855 | 4,752,989 | 656,129 | ||||||||||||||||||
Net asset value and offering price per share | $ | 9.35 | $ | 9.90 | $ | 10.20 | $ | 9.54 | $ | 10.16 | $ | 9.13 | ||||||||||||
Class I Shares | ||||||||||||||||||||||||
Net assets | $ | 4,048,450 | $ | 2,725,366 | $ | 16,882,516 | $ | 2,902,378 | $ | 106,607,946 | $ | 1,127,643 | ||||||||||||
Shares outstanding | 430,978 | 275,383 | 1,655,598 | 303,744 | 10,484,415 | 123,345 | ||||||||||||||||||
Net asset value and offering price per share | $ | 9.39 | $ | 9.90 | $ | 10.20 | $ | 9.56 | $ | 10.17 | $ | 9.14 | ||||||||||||
Net Assets Consist of: | ||||||||||||||||||||||||
Capital paid-in | $ | 132,704,332 | $ | 403,655,026 | $ | 208,467,395 | $ | 222,101,934 | $ | 493,921,045 | $ | 57,750,434 | ||||||||||||
Undistributed (Over-distribution of) net investment income | 65,078 | (594,387 | ) | (6,439 | ) | 144,012 | (49,091 | ) | (7,985 | ) | ||||||||||||||
Accumulated net realized gain (loss) from investments and derivative transactions | (824,265 | ) | 2,460,327 | (1,658,594 | ) | 86,496 | 1,870,915 | (81,427 | ) | |||||||||||||||
Net unrealized appreciation (depreciation) of investments and derivative transactions | (9,351,557 | ) | (27,237,525 | ) | (11,001,069 | ) | (21,751,058 | ) | (27,724,052 | ) | (5,520,371 | ) | ||||||||||||
Net assets | $ | 122,593,588 | $ | 378,283,441 | $ | 195,801,293 | $ | 200,581,384 | $ | 468,018,817 | $ | 52,140,651 | ||||||||||||
See accompanying notes to financial statements.
52
Statement of Operations (Unaudited)
Six Months Ended November 30, 2008
| Kansas | Kentucky | Michigan | Missouri | Ohio | Wisconsin | |||||||||||||||||||
Investment Income | $ | 3,218,107 | $ | 10,369,587 | $ | 5,560,398 | $ | 5,831,860 | $ | 12,857,325 | $ | 1,428,956 | ||||||||||||
Expenses | ||||||||||||||||||||||||
Management fees | 341,638 | 1,073,446 | 561,012 | 586,226 | 1,308,824 | 158,032 | ||||||||||||||||||
12b-1 service fees – Class A | 96,738 | 349,970 | 153,462 | 189,699 | 325,241 | 48,616 | ||||||||||||||||||
12b-1 distribution and service fees – Class B | 20,021 | 42,668 | 17,042 | 23,667 | 49,639 | 9,517 | ||||||||||||||||||
12b-1 distribution and service fees – Class C | 79,633 | 169,946 | 127,379 | 79,758 | 188,502 | 24,284 | ||||||||||||||||||
Shareholders’ servicing agent fees and expenses | 26,599 | 88,411 | 57,970 | 44,555 | 132,010 | 12,049 | ||||||||||||||||||
Interest expense on floating rate obligations | — | 97,849 | — | 27,732 | — | — | ||||||||||||||||||
Custodian’s fees and expenses | 14,112 | 45,677 | 26,470 | 18,423 | 61,301 | 8,079 | ||||||||||||||||||
Trustees’ fees and expenses | 1,237 | 4,510 | 2,087 | 2,209 | 4,921 | 745 | ||||||||||||||||||
Professional fees | 5,788 | 9,250 | 7,918 | 8,276 | 15,820 | 5,202 | ||||||||||||||||||
Shareholders’ reports – printing and mailing expenses | 7,100 | 23,158 | 18,204 | 13,560 | 38,861 | 3,978 | ||||||||||||||||||
Federal and state registration fees | 3,159 | 4,513 | 4,763 | 4,613 | 3,850 | 3,960 | ||||||||||||||||||
Other expenses | 1,054 | 4,132 | 2,540 | 2,470 | 5,878 | 639 | ||||||||||||||||||
Total expenses before custodian fee credit | 597,079 | 1,913,530 | 978,847 | 1,001,188 | 2,134,847 | 275,101 | ||||||||||||||||||
Custodian fee credit | (11,585 | ) | (6,088 | ) | (5,127 | ) | (8,509 | ) | (6,822 | ) | (5,363 | ) | ||||||||||||
Net expenses | 585,494 | 1,907,442 | 973,720 | 992,679 | 2,128,025 | 269,738 | ||||||||||||||||||
Net investment income | 2,632,613 | 8,462,145 | 4,586,678 | 4,839,181 | 10,729,300 | 1,159,218 | ||||||||||||||||||
Realized and Unrealized Gain (Loss) | ||||||||||||||||||||||||
Net realized gain (loss) from: | ||||||||||||||||||||||||
Investments | (793,712 | ) | 281,168 | (1,897,847 | ) | (1,063,608 | ) | (61,252 | ) | (88,772 | ) | |||||||||||||
Forward swaps | — | 369,926 | 181,473 | — | — | — | ||||||||||||||||||
Futures | — | 907,789 | — | — | 1,089,084 | — | ||||||||||||||||||
Change in net unrealized appreciation (depreciation) of: | ||||||||||||||||||||||||
Investments | (10,401,466 | ) | (35,869,561 | ) | (16,769,685 | ) | (24,129,686 | ) | (38,913,559 | ) | (5,912,098 | ) | ||||||||||||
Forward swaps | — | (336,570 | ) | (165,110 | ) | — | — | — | ||||||||||||||||
Futures | — | 23,058 | — | — | 35,297 | — | ||||||||||||||||||
Net realized and unrealized gain (loss) | (11,195,178 | ) | (34,624,190 | ) | (18,651,169 | ) | (25,193,294 | ) | (37,850,430 | ) | (6,000,870 | ) | ||||||||||||
Net increase (decrease) in net assets from operations | $ | (8,562,565 | ) | $ | (26,162,045 | ) | $ | (14,064,491 | ) | $ | (20,354,113 | ) | $ | (27,121,130 | ) | $ | (4,841,652 | ) | ||||||
See accompanying notes to financial statements.
53
Statement of Changes in Net Assets (Unaudited)
| Kansas | Kentucky | |||||||||||||||
| Six Months Ended 11/30/08 | Year Ended 5/31/08 | Six Months Ended 11/30/08 | Year Ended 5/31/08 | |||||||||||||
Operations | ||||||||||||||||
Net investment income | $ | 2,632,613 | $ | 5,014,891 | $ | 8,462,145 | $ | 17,269,160 | ||||||||
Net realized gain (loss) from: | ||||||||||||||||
Investments | (793,712 | ) | 159,653 | 281,168 | 1,236,154 | |||||||||||
Forward swaps | — | — | 369,926 | 172,852 | ||||||||||||
Futures | — | — | 907,789 | (45,316 | ) | |||||||||||
Change in net unrealized appreciation (depreciation) of: | ||||||||||||||||
Investments | (10,401,466 | ) | (2,028,472 | ) | (35,869,561 | ) | (8,318,930 | ) | ||||||||
Forward swaps | — | — | (336,570 | ) | 681,583 | |||||||||||
Futures | — | — | 23,058 | (23,058 | ) | |||||||||||
Net increase (decrease) in net assets from operations | (8,562,566 | ) | 3,146,072 | (26,162,045 | ) | 10,972,445 | ||||||||||
Distributions to Shareholders | ||||||||||||||||
From net investment income: | ||||||||||||||||
Class A | (2,087,765 | ) | (3,898,113 | ) | (7,291,819 | ) | (15,125,455 | ) | ||||||||
Class B | (73,989 | ) | (171,165 | ) | (153,395 | ) | (354,402 | ) | ||||||||
Class C | (400,069 | ) | (746,135 | ) | (815,796 | ) | (1,594,319 | ) | ||||||||
Class I (1) | (94,587 | ) | (150,553 | ) | (61,642 | ) | (124,292 | ) | ||||||||
From accumulated net realized gains: | ||||||||||||||||
Class A | — | (222,644 | ) | — | (846,835 | ) | ||||||||||
Class B | — | (11,930 | ) | — | (24,032 | ) | ||||||||||
Class C | — | (48,489 | ) | — | (103,359 | ) | ||||||||||
Class I (1) | — | (7,651 | ) | — | (6,179 | ) | ||||||||||
Decrease in net assets from distributions to shareholders | (2,656,410 | ) | (5,256,680 | ) | (8,322,652 | ) | (18,178,873 | ) | ||||||||
Fund Share Transactions | ||||||||||||||||
Proceeds from sale of shares | 18,336,665 | 15,985,702 | 14,905,568 | 28,462,533 | ||||||||||||
Proceeds from shares issued to shareholders due | 1,444,666 | 2,766,399 | 4,947,391 | 10,811,242 | ||||||||||||
| 19,781,331 | 18,752,101 | 19,852,959 | 39,273,775 | |||||||||||||
Cost of shares redeemed | (10,332,185 | ) | (20,626,797 | ) | (28,983,666 | ) | (65,614,415 | ) | ||||||||
Net increase (decrease) in net assets from Fund share transactions | 9,449,146 | (1,874,696 | ) | (9,130,707 | ) | (26,340,640 | ) | |||||||||
Net increase (decrease) in net assets | (1,769,829 | ) | (3,985,304 | ) | (43,615,404 | ) | (33,547,068 | ) | ||||||||
Net assets at the beginning of period | 124,363,417 | 128,348,721 | 421,898,845 | 455,445,913 | ||||||||||||
Net assets at the end of period | $ | 122,593,588 | $ | 124,363,417 | $ | 378,283,441 | $ | 421,898,845 | ||||||||
Undistributed (Over-distribution of) net investment income at the end of period | $ | 65,078 | $ | 88,875 | $ | (594,387 | ) | $ | (733,880 | ) | ||||||
| (1) | Effective May 1, 2008, Class R Shares were renamed Class I Shares. |
See accompanying notes to financial statements.
54
| Michigan | Missouri | |||||||||||||||
| Six Months Ended 11/30/08 | Year Ended 5/31/08 | Six Months Ended 11/30/08 | Year Ended 5/31/08 | |||||||||||||
Operations | ||||||||||||||||
Net investment income | $ | 4,586,678 | $ | 9,132,698 | $ | 4,839,181 | $ | 9,958,344 | ||||||||
Net realized gain (loss) from: | ||||||||||||||||
Investments | (1,897,847 | ) | 807,050 | (1,063,608 | ) | 1,133,166 | ||||||||||
Forward swaps | 181,473 | (107,121 | ) | — | — | |||||||||||
Futures | — | — | — | — | ||||||||||||
Change in net unrealized appreciation (depreciation) of: | ||||||||||||||||
Investments | (16,769,685 | ) | (5,591,169 | ) | (24,129,686 | ) | (7,408,671 | ) | ||||||||
Forward swaps | (165,110 | ) | 387,285 | — | — | |||||||||||
Futures | — | — | — | — | ||||||||||||
Net increase (decrease) in net assets from operations | (14,064,491 | ) | 4,628,743 | (20,354,113 | ) | 3,682,839 | ||||||||||
Distributions to Shareholders | ||||||||||||||||
From net investment income: | ||||||||||||||||
Class A | (3,282,056 | ) | (6,824,038 | ) | (4,123,851 | ) | (8,773,478 | ) | ||||||||
Class B | (63,070 | ) | (149,335 | ) | (87,921 | ) | (221,642 | ) | ||||||||
Class C | (632,118 | ) | (1,316,103 | ) | (412,056 | ) | (764,474 | ) | ||||||||
Class I (1) | (412,609 | ) | (863,423 | ) | (69,861 | ) | (107,073 | ) | ||||||||
From accumulated net realized gains: | ||||||||||||||||
Class A | — | (464,003 | ) | — | (385,340 | ) | ||||||||||
Class B | — | (12,411 | ) | — | (11,873 | ) | ||||||||||
Class C | — | (103,052 | ) | — | (37,270 | ) | ||||||||||
Class I (1) | — | (55,534 | ) | — | (4,173 | ) | ||||||||||
Decrease in net assets from distributions to shareholders | (4,389,853 | ) | (9,787,899 | ) | (4,693,689 | ) | (10,305,323 | ) | ||||||||
Fund Share Transactions | ||||||||||||||||
Proceeds from sale of shares | 24,082,737 | 27,724,194 | 14,506,327 | 13,915,200 | ||||||||||||
Proceeds from shares issued to shareholders due | 2,112,965 | 4,740,621 | 2,563,267 | 5,536,884 | ||||||||||||
| 26,195,702 | 32,464,815 | 17,069,594 | 19,452,084 | |||||||||||||
Cost of shares redeemed | (30,629,706 | ) | (40,986,096 | ) | (17,115,376 | ) | (45,350,476 | ) | ||||||||
Net increase (decrease) in net assets from Fund share transactions | (4,434,004 | ) | (8,521,281 | ) | (45,782 | ) | (25,898,392 | ) | ||||||||
Net increase (decrease) in net assets | (22,888,348 | ) | (13,680,437 | ) | (25,093,584 | ) | (32,520,876 | ) | ||||||||
Net assets at the beginning of period | 218,689,641 | 232,370,078 | 225,674,968 | 258,195,844 | ||||||||||||
Net assets at the end of period | $ | 195,801,293 | $ | 218,689,641 | $ | 200,581,384 | $ | 225,674,968 | ||||||||
Undistributed (Over-distribution of) net investment income at the end of period | $ | (6,439 | ) | $ | (203,264 | ) | $ | 144,012 | $ | (1,480 | ) | |||||
| (1) | Effective May 1, 2008, Class R Shares were renamed Class I Shares. |
See accompanying notes to financial statements.
55
Statement of Changes in Net Assets (Unaudited) (continued)
| Ohio | Wisconsin | |||||||||||||||
| Six Months Ended 11/30/08 | Year Ended 5/31/08 | Six Months Ended 11/30/08 | Year Ended 5/31/08 | |||||||||||||
Operations | ||||||||||||||||
Net investment income | $ | 10,729,300 | $ | 21,739,437 | $ | 1,159,218 | $ | 2,019,060 | ||||||||
Net realized gain (loss) from: | ||||||||||||||||
Investments | (61,252 | ) | 3,284,990 | (88,772 | ) | 5,579 | ||||||||||
Forward swaps | — | — | — | — | ||||||||||||
Futures | 1,089,084 | (89,407 | ) | — | — | |||||||||||
Change in net unrealized appreciation (depreciation) of: | ||||||||||||||||
Investments | (38,913,559 | ) | (12,303,422 | ) | (5,912,098 | ) | (663,813 | ) | ||||||||
Forward swaps | — | — | — | — | ||||||||||||
Futures | 35,297 | (35,297 | ) | — | — | |||||||||||
Net increase (decrease) in net assets from operations | (27,121,130 | ) | 12,596,301 | (4,841,652 | ) | 1,360,826 | ||||||||||
Distributions to Shareholders | ||||||||||||||||
From net investment income: | ||||||||||||||||
Class A | (6,918,266 | ) | (14,068,873 | ) | (929,585 | ) | (1,730,913 | ) | ||||||||
Class B | (180,688 | ) | (452,727 | ) | (30,630 | ) | (67,666 | ) | ||||||||
Class C | (938,752 | ) | (1,758,809 | ) | (105,614 | ) | (197,970 | ) | ||||||||
Class I (1) | (2,523,316 | ) | (5,218,539 | ) | (26,765 | ) | (59,646 | ) | ||||||||
From accumulated net realized gains: | ||||||||||||||||
Class A | — | (2,246,642 | ) | — | (70,460 | ) | ||||||||||
Class B | — | (88,049 | ) | — | (3,205 | ) | ||||||||||
Class C | — | (321,871 | ) | — | (9,120 | ) | ||||||||||
Class I (1) | — | (787,894 | ) | — | (2,416 | ) | ||||||||||
Decrease in net assets from distributions to shareholders | (10,561,022 | ) | (24,943,404 | ) | (1,092,594 | ) | (2,141,396 | ) | ||||||||
Fund Share Transactions | ||||||||||||||||
Proceeds from sale of shares | 29,626,829 | 54,114,008 | 4,794,031 | 14,979,855 | ||||||||||||
Proceeds from shares issued to shareholders due | 5,825,352 | 14,585,776 | 651,833 | 1,333,633 | ||||||||||||
| 35,452,181 | 68,699,784 | 5,445,864 | 16,313,488 | |||||||||||||
Cost of shares redeemed | (47,458,479 | ) | (75,202,035 | ) | (8,203,169 | ) | (6,449,792 | ) | ||||||||
Net increase (decrease) in net assets from Fund share transactions | (12,006,298 | ) | (6,502,251 | ) | (2,757,305 | ) | 9,863,696 | |||||||||
Net increase (decrease) in net assets | (49,688,450 | ) | (18,849,354 | ) | (8,691,551 | ) | 9,083,126 | |||||||||
Net assets at the beginning of period | 517,707,267 | 536,556,621 | 60,832,202 | 51,749,076 | ||||||||||||
Net assets at the end of period | $ | 468,018,817 | $ | 517,707,267 | $ | 52,140,651 | $ | 60,832,202 | ||||||||
Undistributed (Over-distribution of) net investment income at the end of period | $ | (49,091 | ) | $ | (217,369 | ) | $ | (7,985 | ) | $ | (74,609 | ) | ||||
| (1) | Effective May 1, 2008, Class R Shares were renamed Class I Shares. |
See accompanying notes to financial statements.
56
Notes to Financial Statements (Unaudited)
1. General Information and Significant Accounting Policies
The Nuveen Multistate Trust IV (the “Trust”) is an open-end investment company registered under the Investment Company Act of 1940, as amended. The Trust is comprised of Nuveen Kansas Municipal Bond Fund (“Kansas”), Nuveen Kentucky Municipal Bond Fund (“Kentucky”), Nuveen Michigan Municipal Bond Fund (“Michigan”), Nuveen Missouri Municipal Bond Fund (“Missouri”), Nuveen Ohio Municipal Bond Fund (“Ohio”) and Nuveen Wisconsin Municipal Bond Fund (“Wisconsin”) (collectively, the “Funds”). The Trust was organized as a Massachusetts business trust on July 1, 1996. The Funds were each organized as a series of predecessor trusts or corporations prior to that date.
The Funds seek to provide high levels of tax-free income and preservation of capital through investing primarily in diversified portfolios of quality municipal bonds. Each Fund may also invest up to 20% of their net assets in below investment grade (“high yield”, “high-risk” or “junk”) municipal bonds.
Effective May 1, 2008, the following policy changes are applicable to the Funds:
| • | Class B Shares will only be issued (i) upon the exchange of Class B Shares from another Nuveen fund, (ii) for purposes of dividend reinvestment, and (iii) through December 31, 2008, for defined contribution plans and investors using automatic investment plans with investments in Class B Shares as of March 31, 2008. The reinstatement privilege for Class B Shares will no longer be available as of December 31, 2008. |
| • | Class R Shares have been renamed Class I Shares and are available for (i) purchases of $1 million or more, (ii) purchases using dividends and capital gains distributions on Class I Shares and (iii) purchase by limited categories of investors. |
The following is a summary of significant accounting policies followed by the Funds in the preparation of their financial statements in accordance with accounting principles generally accepted in the United States.
Investment Valuation
The prices of municipal bonds in each Fund’s investment portfolio are provided by a pricing service approved by the Fund’s Board of Trustees. When market price quotes are not readily available (which is usually the case for municipal securities), the pricing service may establish fair value based on yields or prices of municipal bonds of comparable quality, type of issue, coupon, maturity and rating, indications of value from securities dealers, evaluations of anticipated cash flows or collateral and general market conditions. Prices of forward swap contracts are also provided by an independent pricing service approved by each Fund’s Board of Trustees. Futures contracts are valued using the closing settlement price, or, in the absence of such a price, at the mean of the bid and asked prices. If the pricing service is unable to supply a price for an investment or derivative instrument, each Fund may use market quotes provided by major broker/dealers in such investments. If it is determined that the market price for an investment or derivative instrument is unavailable or inappropriate, the Board of Trustees of the Funds, or its designee, may establish fair value in accordance with procedures established in good faith by the Board of Trustees. Temporary investments in securities that have variable rate and demand features qualifying them as short-term investments are valued at amortized cost, which approximates value.
Investment Transactions
Investment transactions are recorded on a trade date basis. Realized gains and losses from transactions are determined on the specific identification method. Investments purchased on a when-issued/delayed delivery basis may have extended settlement periods. Any investments so purchased are subject to market fluctuation during this period. The Funds have instructed the custodian to segregate assets with a current value at least equal to the amount of the when-issued/delayed delivery purchase commitments. At November 30, 2008, Kansas had outstanding when issued/delayed delivery purchase commitments of $5,000,000. There were no such outstanding purchase commitments in any of the other Funds.
Investment Income
Interest income, which includes the amortization of premiums and accretion of discounts for financial reporting purposes, is recorded on an accrual basis. Investment income also includes paydown gains and losses, if any.
Income Taxes
Each Fund is a separate taxpayer for federal income tax purposes. Each Fund intends to distribute substantially all of its net investment income and net capital gains to shareholders and to otherwise comply with the requirements of Subchapter M of the Internal Revenue Code applicable to regulated investment companies. Therefore, no federal income tax provision is required. Furthermore, each Fund intends to satisfy conditions which will enable interest from municipal securities, which is exempt from regular federal and designated state income taxes, to retain such tax-exempt status when distributed to shareholders of the Funds. Net realized capital gains and ordinary income distributions paid by the Funds are subject to federal taxation.
Effective November 30, 2007, the Funds adopted Financial Accounting Standards Board (FASB) Interpretation No. 48 “Accounting for Uncertainty in Income Taxes” (FIN 48). FIN 48 provides guidance for how uncertain tax positions should be recognized, measured, presented and disclosed in the financial statements. FIN 48 requires the affirmative evaluation of tax positions taken or expected to be taken in the course of preparing the Funds’ tax returns to determine whether it is “more-likely-than-not” (i.e., a greater than 50 percent likelihood) of being sustained by the applicable tax authority. Tax positions not deemed to meet the more-likely-than-not threshold may result in a tax expense in the current year.
57
Notes to Financial Statements (Unaudited) (continued)
Implementation of FIN 48 required management of the Funds to analyze all open tax years, as defined by the statute of limitations, for all major jurisdictions, which includes federal and certain states. Open tax years are those that are open for examination by taxing authorities (i.e., generally the last four tax year ends and the interim tax period since then). The Funds have no examinations in progress.
For all open tax years and all major taxing jurisdictions through the end of the reporting period, management of the Funds has reviewed all tax positions taken or expected to be taken in the preparation of the Funds’ tax returns and concluded the adoption of FIN 48 resulted in no impact to the Funds’ net assets or results of operations as of and during the six months ended November 30, 2008.
The Funds are also not aware of any tax positions for which it is reasonably possible that the total amounts of unrecognized tax benefits will significantly change in the next twelve months.
Dividends and Distributions to Shareholders
Tax-exempt net investment income is declared monthly as a dividend. Net realized capital gains from investment transactions, if any, are declared and distributed to shareholders at least annually. Furthermore, capital gains are distributed only to the extent they exceed available capital loss carryforwards.
Distributions to shareholders of tax-exempt net investment income, net realized capital gains and/or market discount, if any, are recorded on the ex-dividend date. The amount and timing of distributions are determined in accordance with federal income tax regulations, which may differ from accounting principles generally accepted in the United States.
Flexible Sales Charge Program
Each Fund offers Class A, C and I Shares. Class A Shares are generally sold with an up-front sales charge and incur a .20% annual 12b-1 service fee. Class A Share purchases of $1 million or more are sold at net asset value without an up-front sales charge but may be subject to a contingent deferred sales charge (“CDSC”) if redeemed within twelve months of purchase. Class B Shares are sold without an up-front sales charge but incur a .75% annual 12b-1 distribution fee and a .20% annual 12b-1 service fee. Class B Shares are subject to a CDSC of up to 5% depending upon the length of time the shares are held by the investor (CDSC is reduced to 0% at the end of six years). Class B Shares convert to Class A Shares eight years after purchase. Class C Shares are sold without an up-front sales charge but incur a .55% annual 12b-1 distribution fee and a .20% annual 12b-1 service fee. Class C Shares are subject to a CDSC of 1% if redeemed within one year of purchase. Class I Shares are not subject to any sales charge or 12b-1 distribution or service fees.
Inverse Floating Rate Securities
Each Fund is authorized to invest in inverse floating rate securities. An inverse floating rate security is created by depositing a municipal bond, typically with a fixed interest rate, into a special purpose trust created by a broker-dealer. In turn, this trust (a) issues floating rate certificates, in face amounts equal to some fraction of the deposited bond’s par amount or market value, that typically pay short-term tax-exempt interest rates to third parties, and (b) issues to a long-term investor (such as one of the Funds) an inverse floating rate certificate (sometimes referred to as an “inverse floater”) that represents all remaining or residual interest in the trust. The income received by the inverse floater holder varies inversely with the short-term rate paid to the floating rate certificates’ holders, and in most circumstances the inverse floater holder bears substantially all of the underlying bond’s downside investment risk and also benefits disproportionately from any potential appreciation of the underlying bond’s value. The price of an inverse floating rate security will be more volatile than that of the underlying bond because the interest rate is dependent on not only the fixed coupon rate of the underlying bond but also on the short-term interest paid on the floating rate certificates, and because the inverse floating rate security essentially bears the risk of loss of the greater face value of the underlying bond.
A Fund may purchase an inverse floating rate security in a secondary market transaction without first owning the underlying bond (referred to as an “externally-deposited inverse floater”), or instead by first selling a fixed-rate bond to a broker-dealer for deposit into the special purpose trust and receiving in turn the residual interest in the trust (referred to as a “self-deposited inverse floater”). The inverse floater held by a Fund gives the Fund the right (a) to cause the holders of the floating rate certificates to tender their notes at par, and (b) to have the broker transfer the fixed-rate bond held by the trust to the Fund, thereby collapsing the trust. An investment in an externally-deposited inverse floater is identified in the Portfolio of Investments as an “Inverse floating rate investment”. An investment in a self-deposited inverse floater is accounted for as a financing transaction in accordance with Statement of Financial Accounting Standards (SFAS) No. 140 “Accounting for Transfers and Servicing of Financial Assets and Extinguishment of Liabilities”. In such instances, a fixed-rate bond deposited into a special purpose trust is identified in the Portfolio of Investments as an “Underlying bond of an inverse floating rate trust”, with the Fund accounting for the short-term floating rate certificates issued by the trust as “Floating rate obligations” on the Statement of Assets and Liabilities. In addition, the Fund reflects in Investment Income the entire earnings of the underlying bond and the related interest paid to the holders of the short-term floating rate certificates is included as “Interest expense on floating rate obligations” on the Statement of Operations.
During the six months ended November 30, 2008, Kentucky, Michigan and Missouri invested in externally-deposited inverse floaters and/or self-deposited inverse floaters. Kansas, Ohio and Wisconsin did not invest in any such instruments during the six months ended November 30, 2008.
58
Each Fund may also enter into shortfall and forbearance agreements (sometimes referred to as a “recourse trust” or “credit recovery swap”) (such agreements referred to herein as “Recourse Trusts”) with a broker-dealer by which a Fund agrees to reimburse the broker-dealer, in certain circumstances, for the difference between the liquidation value of the fixed-rate bond held by the trust and the liquidation value of the floating rate certificates issued by the trust plus any shortfalls in interest cash flows. Under these agreements, a Fund’s potential exposure to losses related to or on inverse floaters may increase beyond the value of a Fund’s inverse floater investments as a Fund may potentially be liable to fulfill all amounts owed to holders of the floating rate certificates. At period end, any such shortfall is included as “Unrealized depreciation on Recourse Trusts” on the Statement of Assets and Liabilities.
At November 30, 2008, the Funds were not invested in any externally-deposited Recourse Trusts.
The average floating rate obligations outstanding and average annual interest rate and fees related to self-deposited inverse floaters during the six months ended November 30, 2008, were as follows:
| Kentucky | Missouri | |||
Average floating rate obligations | $7,680,000 | $2,225,000 | ||
Average annual interest rate and fees | 2.54% | 2.49% |
Forward Swap Transactions
Each Fund is authorized to invest in forward interest rate swap transactions. Each Fund’s use of forward interest rate swap transactions is intended to help the Fund manage its overall interest rate sensitivity, either shorter or longer, generally to more closely align the Fund’s interest rate sensitivity with that of the broader municipal market. Forward interest rate swap transactions involve each Fund’s agreement with a counterparty to pay, in the future, a fixed or variable rate payment in exchange for the counterparty paying the Fund a variable or fixed rate payment, the accruals for which would begin at a specified date in the future (the “effective date”). The amount of the payment obligation is based on the notional amount of the forward swap contract and the termination date of the swap (which is akin to a bond’s maturity). The value of the Fund’s swap commitment would increase or decrease based primarily on the extent to which long-term interest rates for bonds having a maturity of the swap’s termination date increases or decreases. The Funds may terminate a swap contract prior to the effective date, at which point a realized gain or loss is recognized. When a forward swap is terminated, it ordinarily does not involve the delivery of securities or other underlying assets or principal, but rather is settled in cash on a net basis. Each Fund intends, but is not obligated, to terminate its forward swaps before the effective date. Accordingly, the risk of loss with respect to the swap counterparty on such transactions is limited to the credit risk associated with a counterparty failing to honor its commitment to pay any realized gain to the Fund upon termination. To reduce such credit risk, all counterparties are required to pledge collateral daily (based on the daily valuation of each swap) on behalf of each Fund with a value approximately equal to the amount of any unrealized gain above a pre-determined threshold. Reciprocally, when any of the Funds have an unrealized loss on a swap contract, the Funds have instructed the custodian to pledge assets of the Funds as collateral with a value approximately equal to the amount of the unrealized loss above a pre-determined threshold. Collateral pledges are monitored and subsequently adjusted if and when the swap valuations fluctuate, either up or down, by at least the predetermined threshold amount. Kentucky and Michigan invested in forward interest rate swap transactions during the six months ended November 30, 2008.
Futures Contracts
Each Fund is authorized to invest in futures contracts. Upon entering into a futures contract, a Fund is required to deposit with the broker an amount of cash or liquid securities equal to a specified percentage of the contract amount. This is known as the “initial margin.” Subsequent payments (“variation margin”) are made or received by a Fund each day, depending on the daily fluctuation of the value of the contract.
During the period the futures contract is open, changes in the value of the contract are recognized as an unrealized gain or loss by “marking-to-market” on a daily basis to reflect the changes in market value of the contract. When the contract is closed or expired, a Fund records a realized gain or loss equal to the difference between the value of the contract on the closing date and value of the contract when originally entered into. Cash held by the broker to cover initial margin requirements on open futures contracts, if any, is recognized on the Statement of Assets and Liabilities. Additionally, the Statement of Assets and Liabilities reflects a receivable or payable for the variation margin, when applicable. Kentucky and Ohio invested in futures contracts during the six months ended November 30, 2008.
Risks of investments in futures contracts include the possible adverse movement of the securities or indices underlying the contracts, the possibility that there may not be a liquid secondary market for the contracts and/or that a change in the value of the contract may not correlate with a change in the value of the underlying securities or indices.
Zero Coupon Securities
Each Fund is authorized to invest in zero coupon securities. A zero coupon security does not pay a regular interest coupon to its holders during the life of the security. Tax-exempt income to the holder of the security comes from accretion of the difference between the original purchase price of the security at issuance and the par value of the security at maturity and is effectively paid at
59
Notes to Financial Statements (Unaudited) (continued)
maturity. Such securities are included in the Portfolios of Investments with a 0.000% coupon rate in their description. The market prices of zero coupon securities generally are more volatile than the market prices of securities that pay interest periodically.
Expense Allocation
Expenses of the Funds that are not directly attributable to a specific class of shares are prorated among the classes based on the relative net assets of each class. Expenses directly attributable to a class of shares, which presently only include 12b-1 distribution and service fees, are recorded to the specific class.
Custodian Fee Credit
Each Fund has an arrangement with the custodian bank whereby certain custodian fees and expenses are reduced by net credits earned on each Fund’s cash on deposit with the bank. Such deposit arrangements are an alternative to overnight investments. Credits for cash balances may be offset by charges for any days on which a Fund overdraws its account at the custodian bank.
Indemnifications
Under the Trust’s organizational documents, its Officers and Trustees are indemnified against certain liabilities arising out of the performance of their duties to the Trust. In addition, in the normal course of business, the Trust enters into contracts that provide general indemnifications to other parties. The Trust’s maximum exposure under these arrangements is unknown as this would involve future claims that may be made against the Trust that have not yet occurred. However, the Trust has not had prior claims or losses pursuant to these contracts and expects the risk of loss to be remote.
Use of Estimates
The preparation of financial statements in conformity with accounting principles generally accepted in the United States requires management to make estimates and assumptions that affect the reported amounts of assets and liabilities at the date of the financial statements and the reported amounts of increases and decreases in net assets from operations during the reporting period. Actual results may differ from those estimates.
2. Fair Value Measurements
During the current fiscal period, the Funds adopted the provisions of Statement of Financial Accounting Standards No. 157 (SFAS No. 157) “Fair Value Measurements.” SFAS No. 157 defines fair value, establishes a framework for measuring fair value in generally accepted accounting principles, and expands disclosure about fair value measurements. In determining the value of each Fund’s investments various inputs are used. These inputs are summarized in the three broad levels listed below:
Level 1 – Quoted prices in active markets for identical securities.
Level 2 – Other significant observable inputs (including quoted prices for similar securities, interest rates, prepayment speeds, credit risk, etc.).
Level 3 – Significant unobservable inputs (including management’s assumptions in determining the fair value of investments).
The inputs or methodology used for valuing securities are not an indication of the risk associated with investing in those securities.
The following is a summary of each Fund’s fair value measurements as of November 30, 2008:
| Kansas | Level 1 | Level 2 | Level 3 | Total | ||||
Investments | $ — | $117,641,475 | $ — | $117,641,475 | ||||
| Kentucky | Level 1 | Level 2 | Level 3 | Total | ||||
Investments | $ — | $380,874,447 | $ — | $380,874,447 | ||||
| Michigan | Level 1 | Level 2 | Level 3 | Total | ||||
Investments | $ — | $197,293,292 | $ — | $197,293,292 | ||||
| Missouri | Level 1 | Level 2 | Level 3 | Total | ||||
Investments | $ — | $203,694,082 | $ — | $203,694,082 | ||||
| Ohio | Level 1 | Level 2 | Level 3 | Total | ||||
Investments | $ — | $466,735,473 | $ — | $466,735,473 | ||||
| Wisconsin | Level 1 | Level 2 | Level 3 | Total | ||||
Investments | $ — | $51,158,454 | $ — | $51,158,454 | ||||
60
3. Fund Shares
Transactions in Fund shares were as follows:
| Kansas | ||||||||||||||
| Six Months Ended 11/30/08 | Year Ended 5/31/08 | |||||||||||||
| Shares | Amount | Shares | Amount | |||||||||||
Shares sold: | ||||||||||||||
Class A | 1,550,381 | $ | 15,344,464 | 1,010,280 | $ | 10,442,515 | ||||||||
Class A – automatic conversion of Class B shares | 20,194 | 204,849 | 30,371 | 313,454 | ||||||||||
Class B | 138 | 1,344 | 17,029 | 174,237 | ||||||||||
Class C | 248,563 | 2,470,108 | 326,896 | 3,378,206 | ||||||||||
Class I | 31,847 | 315,900 | 163,363 | 1,677,290 | ||||||||||
Shares issued to shareholders due to reinvestment | ||||||||||||||
Class A | 120,299 | 1,175,030 | 212,746 | 2,192,803 | ||||||||||
Class B | 4,016 | 38,943 | 9,055 | 92,608 | ||||||||||
Class C | 21,116 | 206,437 | 42,141 | 434,332 | ||||||||||
Class I | 2,471 | 24,256 | 4,515 | 46,656 | ||||||||||
| 1,999,025 | 19,781,331 | 1,816,396 | 18,752,101 | |||||||||||
Shares redeemed: | ||||||||||||||
Class A | (832,856 | ) | (8,150,433 | ) | (1,411,249 | ) | (14,547,592 | ) | ||||||
Class B | (44,855 | ) | (443,574 | ) | (96,205 | ) | (987,602 | ) | ||||||
Class B – automatic conversion to Class A shares | (20,371 | ) | (204,849 | ) | (30,632 | ) | (313,454 | ) | ||||||
Class C | (133,414 | ) | (1,318,341 | ) | (399,577 | ) | (4,125,958 | ) | ||||||
Class I | (21,283 | ) | (214,988 | ) | (62,422 | ) | (652,191 | ) | ||||||
| (1,052,779 | ) | (10,332,185 | ) | (2,000,085 | ) | (20,626,797 | ) | |||||||
Net increase (decrease) | 946,246 | $ | 9,449,146 | (183,689 | ) | $ | (1,874,696 | ) | ||||||
| Kentucky | ||||||||||||||
| Six Months Ended 11/30/08 | Year Ended 5/31/08 | |||||||||||||
| Shares | Amount | Shares | Amount | |||||||||||
Shares sold: | ||||||||||||||
Class A | 1,118,997 | $ | 11,746,585 | 1,872,810 | $ | 20,386,170 | ||||||||
Class A – automatic conversion of Class B shares | 10,942 | 113,354 | 117,432 | 1,281,429 | ||||||||||
Class B | 2,560 | 25,549 | 14,742 | 160,002 | ||||||||||
Class C | 284,921 | 2,988,246 | 583,345 | 6,334,100 | ||||||||||
Class I | 3,152 | 31,834 | 27,826 | 300,832 | ||||||||||
Shares issued to shareholders due to reinvestment of distributions: | ||||||||||||||
Class A | 418,136 | 4,314,328 | 862,730 | 9,368,364 | ||||||||||
Class B | 10,771 | 111,328 | 25,975 | 282,368 | ||||||||||
Class C | 46,187 | 476,709 | 98,125 | 1,065,450 | ||||||||||
Class I | 4,363 | 45,026 | 8,758 | 95,060 | ||||||||||
| 1,900,029 | 19,852,959 | 3,611,743 | 39,273,775 | |||||||||||
Shares redeemed: | ||||||||||||||
Class A | (2,345,130 | ) | (24,363,578 | ) | (4,996,193 | ) | (54,349,957 | ) | ||||||
Class B | (81,251 | ) | (848,399 | ) | (253,445 | ) | (2,757,000 | ) | ||||||
Class B – automatic conversion to Class A shares | (10,932 | ) | (113,354 | ) | (117,397 | ) | (1,281,429 | ) | ||||||
Class C | (351,510 | ) | (3,656,426 | ) | (616,907 | ) | (6,697,468 | ) | ||||||
Class I | (187 | ) | (1,909 | ) | (48,488 | ) | (528,561 | ) | ||||||
| (2,789,010 | ) | (28,983,666 | ) | (6,032,430 | ) | (65,614,415 | ) | |||||||
Net increase (decrease) | (888,981 | ) | $ | (9,130,707 | ) | (2,420,687 | ) | $ | (26,340,640 | ) | ||||
61
Notes to Financial Statements (Unaudited) (continued)
| Michigan | ||||||||||||||
| Six Months Ended 11/30/08 | Year Ended 5/31/08 | |||||||||||||
| Shares | Amount | Shares | Amount | |||||||||||
Shares sold: | ||||||||||||||
Class A | 2,118,230 | $ | 22,494,634 | 2,038,746 | $ | 22,978,961 | ||||||||
Class A – automatic conversion of Class B shares | 18,614 | 203,397 | 10,060 | 114,165 | ||||||||||
Class B | 1,074 | 11,448 | 25,413 | 287,094 | ||||||||||
Class C | 115,095 | 1,227,400 | 304,327 | 3,434,514 | ||||||||||
Class I | 13,596 | 145,858 | 81,171 | 909,460 | ||||||||||
Shares issued to shareholders due to reinvestment of distributions: | ||||||||||||||
Class A | 142,172 | 1,507,498 | 296,174 | 3,335,734 | ||||||||||
Class B | 2,464 | 26,190 | 6,283 | 70,963 | ||||||||||
Class C | 25,611 | 271,708 | 56,567 | 636,792 | ||||||||||
Class I | 28,988 | 307,569 | 61,902 | 697,132 | ||||||||||
| 2,465,844 | 26,195,702 | 2,880,643 | 32,464,815 | |||||||||||
Shares redeemed: | ||||||||||||||
Class A | (2,402,115 | ) | (25,540,214 | ) | (2,872,765 | ) | (32,348,827 | ) | ||||||
Class B | (40,862 | ) | (441,071 | ) | (80,367 | ) | (907,452 | ) | ||||||
Class B – automatic conversion to Class A shares | (18,563 | ) | (203,397 | ) | (10,036 | ) | (114,165 | ) | ||||||
Class C | (321,939 | ) | (3,399,276 | ) | (461,900 | ) | (5,211,995 | ) | ||||||
Class I | (100,283 | ) | (1,045,748 | ) | (213,874 | ) | (2,403,657 | ) | ||||||
| (2,883,762 | ) | (30,629,706 | ) | (3,638,942 | ) | (40,986,096 | ) | |||||||
Net increase (decrease) | (417,918 | ) | $ | (4,434,004 | ) | (758,299 | ) | $ | (8,521,281 | ) | ||||
| Missouri | ||||||||||||||
| Six Months Ended 11/30/08 | Year Ended 5/31/08 | |||||||||||||
| Shares | Amount | Shares | Amount | |||||||||||
Shares sold: | ||||||||||||||
Class A | 1,030,136 | $ | 10,599,548 | 844,808 | $ | 9,215,168 | ||||||||
Class A – automatic conversion of Class B shares | 18,125 | 191,035 | 20,668 | 226,551 | ||||||||||
Class B | 291 | 2,959 | 6,292 | 68,725 | ||||||||||
Class C | 288,079 | 2,906,215 | 326,347 | 3,532,621 | ||||||||||
Class I | 77,351 | 806,570 | 79,579 | 872,135 | ||||||||||
Shares issued to shareholders due to reinvestment of distributions: | ||||||||||||||
Class A | 227,765 | 2,305,803 | 459,748 | 4,984,678 | ||||||||||
Class B | 5,820 | 59,182 | 14,228 | 154,396 | ||||||||||
Class C | 18,409 | 186,028 | 34,880 | 377,709 | ||||||||||
Class I | 1,210 | 12,254 | 1,854 | 20,101 | ||||||||||
| 1,667,186 | 17,069,594 | 1,788,404 | 19,452,084 | |||||||||||
Shares redeemed: | ||||||||||||||
Class A | (1,400,208 | ) | (14,010,185 | ) | (3,706,773 | ) | (40,359,989 | ) | ||||||
Class B | (109,319 | ) | (1,117,163 | ) | (127,318 | ) | (1,381,458 | ) | ||||||
Class B – automatic conversion to Class A shares | (18,108 | ) | (191,035 | ) | (20,649 | ) | (226,551 | ) | ||||||
Class C | (155,596 | ) | (1,570,659 | ) | (281,372 | ) | (3,049,318 | ) | ||||||
Class I | (22,413 | ) | (226,334 | ) | (30,387 | ) | (333,160 | ) | ||||||
| (1,705,644 | ) | (17,115,376 | ) | (4,166,499 | ) | (45,350,476 | ) | |||||||
Net increase (decrease) | (38,458 | ) | $ | (45,782 | ) | (2,378,095 | ) | $ | (25,898,392 | ) | ||||
62
| Ohio | ||||||||||||||
| Six Months Ended 11/30/08 | Year Ended 5/31/08 | |||||||||||||
| Shares | Amount | Shares | Amount | |||||||||||
Shares sold: | ||||||||||||||
Class A | 2,193,248 | $ | 23,406,190 | 3,814,941 | $ | 42,363,851 | ||||||||
Class A – automatic conversion of Class B shares | 79,637 | 843,476 | 129,281 | 1,441,097 | ||||||||||
Class B | 12,586 | 130,117 | 16,736 | 186,273 | ||||||||||
Class C | 376,519 | 3,990,794 | 753,868 | 8,353,604 | ||||||||||
Class I | 118,720 | 1,256,252 | 159,843 | 1,769,183 | ||||||||||
Shares issued to shareholders due to reinvestment | ||||||||||||||
Class A | 326,131 | 3,440,251 | 763,250 | 8,478,810 | ||||||||||
Class B | 8,323 | 87,752 | 26,244 | 291,409 | ||||||||||
Class C | 39,096 | 411,131 | 86,839 | 961,774 | ||||||||||
Class I | 179,105 | 1,886,218 | 437,624 | 4,853,783 | ||||||||||
| 3,333,365 | 35,452,181 | 6,188,626 | 68,699,784 | |||||||||||
Shares redeemed: | ||||||||||||||
Class A | (3,557,328 | ) | (37,611,788 | ) | (4,658,244 | ) | (51,809,147 | ) | ||||||
Class B | (116,939 | ) | (1,236,130 | ) | (293,633 | ) | (3,262,361 | ) | ||||||
Class B – automatic conversion to Class A shares | (79,765 | ) | (843,476 | ) | (129,513 | ) | (1,441,097 | ) | ||||||
Class C | (283,055 | ) | (2,988,772 | ) | (593,349 | ) | (6,584,562 | ) | ||||||
Class I | (449,365 | ) | (4,778,313 | ) | (1,088,409 | ) | (12,104,868 | ) | ||||||
| (4,486,452 | ) | (47,458,479 | ) | (6,763,148 | ) | (75,202,035 | ) | |||||||
Net increase (decrease) | (1,153,087 | ) | $ | (12,006,298 | ) | (574,522 | ) | $ | (6,502,251 | ) | ||||
| Wisconsin | ||||||||||||||
| Six Months Ended 11/30/08 | Year Ended 5/31/08 | |||||||||||||
| Shares | Amount | Shares | Amount | |||||||||||
Shares sold: | ||||||||||||||
Class A | 443,624 | $ | 4,347,030 | 1,212,481 | $ | 12,229,534 | ||||||||
Class A – automatic conversion of Class B shares | 8,497 | 78,090 | 9,563 | 97,565 | ||||||||||
Class B | 11 | 111 | 8,755 | 88,111 | ||||||||||
Class C | 36,092 | 361,438 | 195,701 | 1,996,742 | ||||||||||
Class I | 728 | 7,362 | 55,776 | 567,903 | ||||||||||
Shares issued to shareholders due to reinvestment | ||||||||||||||
Class A | 56,059 | 535,353 | 107,255 | 1,083,809 | ||||||||||
Class B | 2,253 | 21,593 | 5,002 | 50,689 | ||||||||||
Class C | 7,369 | 70,499 | 13,605 | 137,742 | ||||||||||
Class I | 2,535 | 24,388 | 6,058 | 61,393 | ||||||||||
| 557,168 | 5,445,864 | 1,614,196 | 16,313,488 | |||||||||||
Shares redeemed: | ||||||||||||||
Class A | (783,459 | ) | (7,395,723 | ) | (439,662 | ) | (4,416,336 | ) | ||||||
Class B | (14,843 | ) | (146,024 | ) | (29,396 | ) | (301,573 | ) | ||||||
Class B – automatic conversion to Class A shares | (8,479 | ) | (78,090 | ) | (9,544 | ) | (97,565 | ) | ||||||
Class C | (31,628 | ) | (303,197 | ) | (147,304 | ) | (1,498,302 | ) | ||||||
Class I | (28,765 | ) | (280,135 | ) | (13,255 | ) | (136,016 | ) | ||||||
| (867,174 | ) | (8,203,169 | ) | (639,161 | ) | (6,449,792 | ) | |||||||
Net increase (decrease) | (310,006 | ) | $ | (2,757,305 | ) | 975,035 | $ | 9,863,696 | ||||||
4. Investment Transactions
Purchases and sales (including maturities but excluding short-term investments and derivative transactions) during the six months ended November 30, 2008, were as follows:
| Kansas | Kentucky | Michigan | Missouri | Ohio | Wisconsin | |||||||||||||
Purchases | $ | 16,157,114 | $ | 16,119,631 | $ | 10,857,527 | $ | 20,928,752 | $ | 14,481,452 | $ | 4,548,400 | ||||||
Sales and maturities | 12,609,490 | 26,480,958 | 15,064,688 | 17,960,428 | 18,113,025 | 6,012,740 | ||||||||||||
63
Notes to Financial Statements (Unaudited) (continued)
5. Income Tax Information
The following information is presented on an income tax basis. Differences between amounts for financial statement and federal income tax purposes are primarily due to timing differences in recognizing taxable market discount, timing differences in recognizing certain gains and losses on investment transactions and the treatment of investments in inverse floating rate transactions subject to SFAS No. 140. To the extent that differences arise that are permanent in nature, such amounts are reclassified within the capital accounts on the Statement of Assets and Liabilities presented in the annual report, based on their federal tax basis treatment; temporary differences do not require reclassification. Temporary and permanent differences do not impact the net asset values of the Funds.
At November 30, 2008, the cost of investments was as follows:
| Kansas | Kentucky | Michigan | Missouri | Ohio | Wisconsin | |||||||||||||
Cost of investments | $ | 126,988,711 | $ | 400,432,777 | $ | 208,381,447 | $ | 223,183,770 | $ | 493,854,717 | $ | 56,677,224 | ||||||
Gross unrealized appreciation and gross unrealized depreciation of investments at November 30, 2008, were as follows:
| Kansas | Kentucky | Michigan | Missouri | Ohio | Wisconsin | |||||||||||||||||||
Gross unrealized: | ||||||||||||||||||||||||
Appreciation | $ | 1,242,430 | $ | 6,052,884 | $ | 4,071,714 | $ | 3,010,454 | $ | 9,762,271 | $ | 318,053 | ||||||||||||
Depreciation | (10,589,666 | ) | (33,289,748 | ) | (15,159,869 | ) | (24,723,678 | ) | (36,881,515 | ) | (5,836,823 | ) | ||||||||||||
Net unrealized appreciation (depreciation) of investments | $ | (9,347,236 | ) | $ | (27,236,864 | ) | $ | (11,088,155 | ) | $ | (21,713,224 | ) | $ | (27,119,244 | ) | $ | (5,518,770 | ) | ||||||
The tax components of undistributed net tax-exempt income, net ordinary income and net long-term capital gains at May 31, 2008, the Funds’ last tax year end, were as follows:
| Kansas | Kentucky | Michigan | Missouri | Ohio | Wisconsin | |||||||||||||
Undistributed net tax-exempt income* | $ | 487,066 | $ | 633,547 | $ | 390,445 | $ | 745,258 | $ | 985,260 | $ | 103,069 | ||||||
Undistributed net ordinary income** | — | 142,527 | — | — | 69,663 | — | ||||||||||||
Undistributed net long-term capital gains | — | 768,725 | 261,564 | 1,150,105 | 738,121 | 5,442 | ||||||||||||
* Undistributed net tax-exempt income (on a tax basis) has not been reduced for the dividend declared on May 9, 2008, paid on June 2, 2008.
** Net ordinary income consists of taxable market discount income and net short-term capital gains, if any.
The tax character of distributions paid during the Funds’ last tax year ended May 31, 2008, was designated for purposes of the dividends paid deduction as follows:
| Kansas | Kentucky | Michigan | Missouri | Ohio | Wisconsin | |||||||||||||
Distributions from net tax-exempt income | $ | 4,960,322 | $ | 17,282,866 | $ | 9,202,754 | $ | 9,947,694 | $ | 21,567,276 | $ | 2,033,655 | ||||||
Distributions from net ordinary income** | — | 15,941 | — | 8,048 | — | 3,277 | ||||||||||||
Distributions from net long-term capital gains | 289,831 | 964,464 | 635,000 | 438,656 | 3,444,456 | 81,923 | ||||||||||||
| ** | Net ordinary income consists of taxable market discount income and net short-term capital gains, if any. |
The following Fund has elected to defer net realized losses from investments incurred from November 1, 2007 through May 31, 2008, the Fund’s last tax year end, (“post-October losses”) in accordance with federal income tax regulations. Post-October losses are treated as having arisen on the first day of the current fiscal year:
| Kansas | |||
Post-October capital losses | $ | 11,461 | |
6. Management Fees and Other Transactions with Affiliates
Each Fund’s management fee is separated into two components – a complex-level component, based on the aggregate amount of all fund assets managed by Nuveen Asset Management (the “Adviser”), a wholly owned subsidiary of Nuveen Investments, Inc. (“Nuveen”), and a specific fund-level component, based only on the amount of assets within each individual Fund. This pricing structure enables Nuveen fund shareholders to benefit from growth in the assets within each individual fund as well as from growth in the amount of complex-wide assets managed by the Adviser.
64
The annual fund-level fee, payable monthly, for each Fund is based upon the average daily net assets of each Fund as follows:
| Average Daily Net Assets | Fund-Level Fee Rate | ||
For the first $125 million | .3500 | % | |
For the next $125 million | .3375 | ||
For the next $250 million | .3250 | ||
For the next $500 million | .3125 | ||
For the next $1 billion | .3000 | ||
For the next $3 billion | .2750 | ||
For net assets over $5 billion | .2500 |
The annual complex-level fee, payable monthly, which is additive to the fund-level fee, for all Nuveen sponsored funds in the U.S., is based on the aggregate amount of total fund assets managed as stated in the following table. As of November 30, 2008, the complex-level fee rate was .2000%.
The complex-level fee schedule is as follows:
| Complex-Level Asset Breakpoint Level (1) | Effective Rate at Breakpoint Level | ||
$55 billion | .2000 | % | |
$56 billion | .1996 | ||
$57 billion | .1989 | ||
$60 billion | .1961 | ||
$63 billion | .1931 | ||
$66 billion | .1900 | ||
$71 billion | .1851 | ||
$76 billion | .1806 | ||
$80 billion | .1773 | ||
$91 billion | .1691 | ||
$125 billion | .1599 | ||
$200 billion | .1505 | ||
$250 billion | .1469 | ||
$300 billion | .1445 |
| (1) | The complex-level fee component of the management fee for the funds is calculated based upon the aggregate daily net assets of all Nuveen funds, with such daily net assets to include assets attributable to preferred stock issued by or borrowings by such funds but to exclude assets attributable to investments in other Nuveen funds. |
The management fee compensates the Adviser for overall investment advisory and administrative services and general office facilities. The Trust pays no compensation directly to those of its Trustees who are affiliated with the Adviser or to its Officers, all of whom receive remuneration for their services to the Trust from the Adviser or its affiliates. The Board of Trustees has adopted a deferred compensation plan for independent Trustees that enables Trustees to elect to defer receipt of all or a portion of the annual compensation they are entitled to receive from certain Nuveen advised funds. Under the plan, deferred amounts are treated as though equal dollar amounts had been invested in shares of select Nuveen advised funds.
The Adviser agreed to waive part of its management fees or reimburse certain expenses of Ohio in order to limit total expenses (excluding 12b-1 distribution and service fees, interest expense, taxes, fees incurred in acquiring and disposing of portfolio securities and extraordinary expenses) from exceeding .75% of the average daily net assets. The Adviser may also voluntarily reimburse additional expenses from time to time in any of the Funds. Voluntary reimbursements may be terminated at any time at the Adviser’s discretion.
During the six months ended November 30, 2008, Nuveen Investments, LLC (the “Distributor”), a wholly owned subsidiary of Nuveen, collected sales charges on purchases of Class A Shares, the majority of which were paid out as concessions to financial intermediaries as follows:
| Kansas | Kentucky | Michigan | Missouri | Ohio | Wisconsin | |||||||||||||
Sales charges collected | $ | 189,136 | $ | 202,216 | $ | 80,245 | $ | 126,555 | $ | 184,042 | $ | 24,168 | ||||||
Paid to financial intermediaries | 168,829 | 173,560 | 70,533 | 114,829 | 161,753 | 20,649 | ||||||||||||
The Distributor also received 12b-1 service fees on Class A Shares, substantially all of which were paid to compensate financial intermediaries for providing services to shareholders relating to their investments.
During the six months ended November 30, 2008, the Distributor compensated financial intermediaries directly with commission advances at the time of purchase as follows:
| Kansas | Kentucky | Michigan | Missouri | Ohio | Wisconsin | |||||||||||||
Commission advances | $ | 72,463 | $ | 46,765 | $ | 24,889 | $ | 75,921 | $ | 76,340 | $ | 3,563 | ||||||
65
Notes to Financial Statements (Unaudited) (continued)
To compensate for commissions advanced to financial intermediaries, all 12b-1 service fees collected on Class B Shares during the first year following a purchase, all 12b-1 distribution fees collected on Class B Shares, and all 12b-1 service and distribution fees collected on Class C Shares during the first year following a purchase are retained by the Distributor. During the six months ended November 30, 2008, the Distributor retained such 12b-1 fees as follows:
| Kansas | Kentucky | Michigan | Missouri | Ohio | Wisconsin | |||||||||||||
12b-1 fees retained | $ | 28,362 | $ | 55,614 | $ | 28,248 | $ | 29,427 | $ | 71,875 | $ | 13,225 | ||||||
The remaining 12b-1 fees charged to the Funds were paid to compensate financial intermediaries for providing services to shareholders relating to their investments.
The Distributor also collected and retained CDSC on share redemptions during the six months ended November 30, 2008, as follows:
| Kansas | Kentucky | Michigan | Missouri | Ohio | Wisconsin | |||||||||||||
CDSC retained | $ | 8,803 | $ | 10,106 | $ | 4,521 | $ | 21,208 | $ | 4,667 | $ | 602 | ||||||
7. New Accounting Pronouncement
Financial Accounting Standards Board Statement of Financial Accounting Standards No. 161 (SFAS No. 161)
In March 2008, the FASB issued SFAS No. 161, “Disclosures about Derivative Instruments and Hedging Activities.” This standard is intended to enhance financial statement disclosures for derivative instruments and hedging activities and enable investors to understand: a) how and why a fund uses derivative instruments, b) how derivative instruments and related hedge items are accounted for, and c) how derivative instruments and related hedge items affect a fund’s financial position, results of operations and cash flows. SFAS No. 161 is effective for financial statements issued for fiscal years and interim periods beginning after November 15, 2008. As of November 30, 2008, management does not believe the adoption of SFAS No. 161 will impact the financial statement amounts; however, additional footnote disclosures may be required about the use of derivative instruments and hedging items.
8. Subsequent Events
Distributions to Shareholders
The Funds declared dividend distributions from their tax-exempt net investment income which were paid on December 26, 2008, to shareholders of record on December 23, 2008, as follows:
| Kansas | Kentucky | Michigan | Missouri | Ohio | Wisconsin | |||||||||||||
Dividend per share: | ||||||||||||||||||
Class A | $ | .0355 | $ | .0365 | $ | .0385 | $ | .0375 | $ | .0380 | $ | .0310 | ||||||
Class B | .0290 | .0300 | .0320 | .0315 | .0315 | .0250 | ||||||||||||
Class C | .0310 | .0315 | .0340 | .0330 | .0335 | .0265 | ||||||||||||
Class I | .0370 | .0380 | .0405 | .0395 | .0400 | .0325 | ||||||||||||
The following Funds also declared capital gain and/or net ordinary income distributions, for each share class, which were paid on December 5, 2008, to shareholders of record on December 3, 2008, as follows:
| Kentucky | Michigan | Missouri | Ohio | Wisconsin | |||||||||||
Capital gains distribution per share | $ | .0463 | $ | .0137 | $ | .0547 | $ | .0302 | $ | .0051 | |||||
Net ordinary income distribution per share* | .0238 | — | — | .0111 | — | ||||||||||
* Net ordinary income consists of taxable market discount income and net short-term capital gains, if any.
66
Financial Highlights (Unaudited)
67
Financial Highlights (Unaudited)
Selected data for a share outstanding throughout each period:
| Class (Commencement Date) | ||||||||||||||||||||||||||||||||
| Investment Operations | Less Distributions | |||||||||||||||||||||||||||||||
| KANSAS | ||||||||||||||||||||||||||||||||
| Year Ended May 31, | Beginning Net Asset Value | Net Invest- ment Income(a) | Net Realized/ Unrealized Gain (Loss) | Total | Net Invest- ment Income | Capital Gains | Total | Ending Net Asset Value | Total Return(b) | |||||||||||||||||||||||
| Class A (1/92) | ||||||||||||||||||||||||||||||||
2009(f) | $ | 10.23 | $ | .21 | $ | (.87 | ) | $ | (.66 | ) | $ | (.21 | ) | $ | — | $ | (.21 | ) | $ | 9.36 | (6.49 | )% | ||||||||||
2008 | 10.40 | .43 | (.16 | ) | .27 | (.42 | ) | (.02 | ) | (.44 | ) | 10.23 | 2.70 | |||||||||||||||||||
2007 | 10.38 | .42 | .01 | .43 | (.41 | ) | — | (.41 | ) | 10.40 | 4.22 | |||||||||||||||||||||
2006 | 10.66 | .42 | (.29 | ) | .13 | (.41 | ) | — | (.41 | ) | 10.38 | 1.28 | ||||||||||||||||||||
2005 | 10.20 | .44 | .46 | .90 | (.44 | ) | — | (.44 | ) | 10.66 | 8.95 | |||||||||||||||||||||
2004 | 10.77 | .46 | (.57 | ) | (.11 | ) | (.46 | ) | — | (.46 | ) | 10.20 | (1.02 | ) | ||||||||||||||||||
| Class B (2/97) | ||||||||||||||||||||||||||||||||
2009(f) | 10.14 | .17 | (.86 | ) | (.69 | ) | (.17 | ) | — | (.17 | ) | 9.28 | (6.83 | ) | ||||||||||||||||||
2008 | 10.31 | .35 | (.16 | ) | .19 | (.34 | ) | (.02 | ) | (.36 | ) | 10.14 | 1.95 | |||||||||||||||||||
2007 | 10.30 | .34 | .01 | .35 | (.34 | ) | — | (.34 | ) | 10.31 | 3.38 | |||||||||||||||||||||
2006 | 10.58 | .34 | (.28 | ) | .06 | (.34 | ) | — | (.34 | ) | 10.30 | .54 | ||||||||||||||||||||
2005 | 10.12 | .36 | .46 | .82 | (.36 | ) | — | (.36 | ) | 10.58 | 8.21 | |||||||||||||||||||||
2004 | 10.69 | .38 | (.57 | ) | (.19 | ) | (.38 | ) | — | (.38 | ) | 10.12 | (1.77 | ) | ||||||||||||||||||
| Class C (2/97) | ||||||||||||||||||||||||||||||||
2009(f) | 10.23 | .18 | (.87 | ) | (.69 | ) | (.19 | ) | — | (.19 | ) | 9.35 | (6.85 | ) | ||||||||||||||||||
2008 | 10.40 | .37 | (.15 | ) | .22 | (.37 | ) | (.02 | ) | (.39 | ) | 10.23 | 2.17 | |||||||||||||||||||
2007 | 10.38 | .37 | .01 | .38 | (.36 | ) | — | (.36 | ) | 10.40 | 3.69 | |||||||||||||||||||||
2006 | 10.67 | .37 | (.30 | ) | .07 | (.36 | ) | — | (.36 | ) | 10.38 | .67 | ||||||||||||||||||||
2005 | 10.21 | .38 | .46 | .84 | (.38 | ) | — | (.38 | ) | 10.67 | 8.39 | |||||||||||||||||||||
2004 | 10.78 | .40 | (.56 | ) | (.16 | ) | (.41 | ) | — | (.41 | ) | 10.21 | (1.53 | ) | ||||||||||||||||||
| Class I (2/97)(g) | ||||||||||||||||||||||||||||||||
2009(f) | 10.27 | .22 | (.88 | ) | (.66 | ) | (.22 | ) | — | (.22 | ) | 9.39 | (6.46 | ) | ||||||||||||||||||
2008 | 10.45 | .45 | (.16 | ) | .29 | (.45 | ) | (.02 | ) | (.47 | ) | 10.27 | 2.83 | |||||||||||||||||||
2007 | 10.42 | .45 | .02 | .47 | (.44 | ) | — | (.44 | ) | 10.45 | 4.54 | |||||||||||||||||||||
2006 | 10.71 | .45 | (.30 | ) | .15 | (.44 | ) | — | (.44 | ) | 10.42 | 1.41 | ||||||||||||||||||||
2005 | 10.24 | .46 | .47 | .93 | (.46 | ) | — | (.46 | ) | 10.71 | 9.26 | |||||||||||||||||||||
2004 | 10.82 | .48 | (.58 | ) | (.10 | ) | (.48 | ) | — | (.48 | ) | 10.24 | (.89 | ) | ||||||||||||||||||
68
| Ratios/Supplemental Data | ||||||||||||||||||||||||||||||
| Ratios to Average Net Assets Before Credit/ Reimbursement | Ratios to Average Net Assets After Reimbursement(c) | Ratios to Average Net Assets After Credit/ Reimbursement(d) | ||||||||||||||||||||||||||||
| Ending Net Assets (000) | Expenses Including Interest(e) | Expenses Excluding Interest | Net Invest- ment Income | Expenses Including Interest(e) | Expenses Excluding Interest | Net Invest- ment Income | Expenses Including Interest(e) | Expenses Excluding Interest | Net Invest- ment Income | Portfolio Turnover Rate | ||||||||||||||||||||
| $94,231 | .83 | %* | .83 | %* | 4.26 | %* | .83 | %* | .83 | %* | 4.26 | %* | .82 | %* | .82 | %* | 4.28 | %* | 11 | % | ||||||||||
| 94,259 | .87 | .87 | 4.12 | .87 | .87 | 4.12 | .86 | .86 | 4.12 | 16 | ||||||||||||||||||||
| 97,477 | .85 | .85 | 4.03 | .85 | .85 | 4.03 | .84 | .84 | 4.04 | 22 | ||||||||||||||||||||
| 100,128 | .86 | .86 | 4.02 | .86 | .86 | 4.02 | .84 | .84 | 4.03 | 18 | ||||||||||||||||||||
| 97,861 | .88 | .88 | 4.17 | .88 | .88 | 4.17 | .87 | .87 | 4.18 | 21 | ||||||||||||||||||||
| 91,744 | .90 | .90 | 4.36 | .90 | .90 | 4.36 | .89 | .89 | 4.37 | 11 | ||||||||||||||||||||
| 3,751 | 1.58 | * | 1.58 | * | 3.51 | * | 1.58 | * | 1.58 | * | 3.51 | * | 1.57 | * | 1.57 | * | 3.52 | * | 11 | |||||||||||
| 4,721 | 1.62 | 1.62 | 3.37 | 1.62 | 1.62 | 3.37 | 1.61 | 1.61 | 3.37 | 16 | ||||||||||||||||||||
| 5,840 | 1.61 | 1.61 | 3.28 | 1.61 | 1.61 | 3.28 | 1.59 | 1.59 | 3.29 | 22 | ||||||||||||||||||||
| 7,379 | 1.61 | 1.61 | 3.26 | 1.61 | 1.61 | 3.26 | 1.59 | 1.59 | 3.28 | 18 | ||||||||||||||||||||
| 10,031 | 1.63 | 1.63 | 3.42 | 1.63 | 1.63 | 3.42 | 1.61 | 1.61 | 3.43 | 21 | ||||||||||||||||||||
| 11,001 | 1.64 | 1.64 | 3.61 | 1.64 | 1.64 | 3.61 | 1.64 | 1.64 | 3.62 | 11 | ||||||||||||||||||||
| 20,562 | 1.38 | * | 1.38 | * | 3.71 | * | 1.38 | * | 1.38 | * | 3.71 | * | 1.37 | * | 1.37 | * | 3.73 | * | 11 | |||||||||||
| 21,090 | 1.42 | 1.42 | 3.57 | 1.42 | 1.42 | 3.57 | 1.41 | 1.41 | 3.57 | 16 | ||||||||||||||||||||
| 21,767 | 1.40 | 1.40 | 3.48 | 1.40 | 1.40 | 3.48 | 1.39 | 1.39 | 3.50 | 22 | ||||||||||||||||||||
| 22,736 | 1.41 | 1.41 | 3.47 | 1.41 | 1.41 | 3.47 | 1.39 | 1.39 | 3.48 | 18 | ||||||||||||||||||||
| 22,836 | 1.43 | 1.43 | 3.62 | 1.43 | 1.43 | 3.62 | 1.42 | 1.42 | 3.63 | 21 | ||||||||||||||||||||
| 23,656 | 1.45 | 1.45 | 3.81 | 1.45 | 1.45 | 3.81 | 1.44 | 1.44 | 3.82 | 11 | ||||||||||||||||||||
| 4,048 | .63 | * | .63 | * | 4.46 | * | .63 | * | .63 | * | 4.46 | * | .62 | * | .62 | * | 4.48 | * | 11 | |||||||||||
| 4,293 | .67 | .67 | 4.31 | .67 | .67 | 4.31 | .66 | .66 | 4.32 | 16 | ||||||||||||||||||||
| 3,264 | .65 | .65 | 4.23 | .65 | .65 | 4.23 | .63 | .63 | 4.25 | 22 | ||||||||||||||||||||
| 1,560 | .66 | .66 | 4.22 | .66 | .66 | 4.22 | .64 | .64 | 4.23 | 18 | ||||||||||||||||||||
| 1,449 | .68 | .68 | 4.37 | .68 | .68 | 4.37 | .67 | .67 | 4.38 | 21 | ||||||||||||||||||||
| 1,204 | .70 | .70 | 4.56 | .70 | .70 | 4.56 | .69 | .69 | 4.57 | 11 | ||||||||||||||||||||
| * | Annualized. |
| (a) | Per share Net Investment Income is calculated using the average daily shares method. |
| (b) | Total return is the combination of changes in net asset value without any sales charge, reinvested dividend income at net asset value and reinvested capital gains distributions at net asset value, if any. Total returns are not annualized. |
| (c) | After expense reimbursement from the Adviser, where applicable. |
| (d) | After custodian fee credit and expense reimbursement, where applicable. |
| (e) | The expense ratios in the above table reflect, among other things, the interest expense deemed to have been paid by the Fund on the floating rate certificates issued by the special purpose trusts for the self-deposited inverse floaters held by the Fund, as described in Footnote 1 – Inverse Floating Rate Securities. |
| (f) | For the six months ended November 30, 2008. |
| (g) | Effective May 1, 2008, Class R Shares were renamed Class I Shares. |
See accompanying notes to financial statements.
69
Financial Highlights (Unaudited) (continued)
Selected data for a share outstanding throughout each period:
| Class (Commencement Date) | ||||||||||||||||||||||||||||||||
| Investment Operations | Less Distributions | |||||||||||||||||||||||||||||||
| KENTUCKY | ||||||||||||||||||||||||||||||||
| Year Ended May 31, | Beginning Net Asset Value | Net Invest- ment Income(a) | Net Gain | Total | Net | Capital Gains | Total | Ending Net Asset Value | Total Return(b) | |||||||||||||||||||||||
| Class A (5/87) | ||||||||||||||||||||||||||||||||
2009(f) | $ | 10.78 | $ | .22 | $ | (.89 | ) | $ | (.67 | ) | $ | (.22 | ) | $ | — | $ | (.22 | ) | $ | 9.89 | (6.29 | )% | ||||||||||
2008 | 10.96 | .44 | (.16 | ) | .28 | (.44 | ) | (.02 | ) | (.46 | ) | 10.78 | 2.63 | |||||||||||||||||||
2007 | 10.96 | .44 | .03 | .47 | (.45 | ) | (.02 | ) | (.47 | ) | 10.96 | 4.35 | ||||||||||||||||||||
2006 | 11.30 | .46 | (.30 | ) | .16 | (.46 | ) | (.04 | ) | (.50 | ) | 10.96 | 1.38 | |||||||||||||||||||
2005 | 10.88 | .48 | .43 | .91 | (.48 | ) | (.01 | ) | (.49 | ) | 11.30 | 8.51 | ||||||||||||||||||||
2004 | 11.35 | .51 | (.42 | ) | .09 | (.52 | ) | (.04 | ) | (.56 | ) | 10.88 | .90 | |||||||||||||||||||
| Class B (2/97) | ||||||||||||||||||||||||||||||||
2009(f) | 10.79 | .18 | (.89 | ) | (.71 | ) | (.18 | ) | — | (.18 | ) | 9.90 | (6.64 | ) | ||||||||||||||||||
2008 | 10.97 | .36 | (.17 | ) | .19 | (.35 | ) | (.02 | ) | (.37 | ) | 10.79 | 1.85 | |||||||||||||||||||
2007 | 10.97 | .36 | .03 | .39 | (.37 | ) | (.02 | ) | (.39 | ) | 10.97 | 3.56 | ||||||||||||||||||||
2006 | 11.31 | .37 | (.30 | ) | .07 | (.37 | ) | (.04 | ) | (.41 | ) | 10.97 | .62 | |||||||||||||||||||
2005 | 10.88 | .40 | .44 | .84 | (.40 | ) | (.01 | ) | (.41 | ) | 11.31 | 7.80 | ||||||||||||||||||||
2004 | 11.35 | .43 | (.42 | ) | .01 | (.44 | ) | (.04 | ) | (.48 | ) | 10.88 | .14 | |||||||||||||||||||
| Class C (10/93) | ||||||||||||||||||||||||||||||||
2009(f) | 10.79 | .19 | (.89 | ) | (.70 | ) | (.19 | ) | — | (.19 | ) | 9.90 | (6.56 | ) | ||||||||||||||||||
2008 | 10.96 | .38 | (.15 | ) | .23 | (.38 | ) | (.02 | ) | (.40 | ) | 10.79 | 2.15 | |||||||||||||||||||
2007 | 10.96 | .38 | .02 | .40 | (.38 | ) | (.02 | ) | (.40 | ) | 10.96 | 3.73 | ||||||||||||||||||||
2006 | 11.29 | .39 | (.29 | ) | .10 | (.39 | ) | (.04 | ) | (.43 | ) | 10.96 | .88 | |||||||||||||||||||
2005 | 10.87 | .42 | .43 | .85 | (.42 | ) | (.01 | ) | (.43 | ) | 11.29 | 7.91 | ||||||||||||||||||||
2004 | 11.34 | .45 | (.42 | ) | .03 | (.46 | ) | (.04 | ) | (.50 | ) | 10.87 | .35 | |||||||||||||||||||
| Class I (2/97)(g) | ||||||||||||||||||||||||||||||||
2009(f) | 10.79 | .23 | (.89 | ) | (.66 | ) | (.23 | ) | — | (.23 | ) | 9.90 | (6.20 | ) | ||||||||||||||||||
2008 | 10.96 | .46 | (.15 | ) | .31 | (.46 | ) | (.02 | ) | (.48 | ) | 10.79 | 2.90 | |||||||||||||||||||
2007 | 10.96 | .47 | .02 | .49 | (.47 | ) | (.02 | ) | (.49 | ) | 10.96 | 4.52 | ||||||||||||||||||||
2006 | 11.29 | .48 | (.30 | ) | .18 | (.47 | ) | (.04 | ) | (.51 | ) | 10.96 | 1.64 | |||||||||||||||||||
2005 | 10.87 | .51 | .42 | .93 | (.50 | ) | (.01 | ) | (.51 | ) | 11.29 | 8.70 | ||||||||||||||||||||
2004 | 11.33 | .53 | (.41 | ) | .12 | (.54 | ) | (.04 | ) | (.58 | ) | 10.87 | 1.15 | |||||||||||||||||||
70
| Ratios/Supplemental Data | |||||||||||||||||||||||||||||||
| Ratios to Average Net Assets Before Credit/ Reimbursement | Ratios to Average Net Assets After Reimbursement(c) | Ratios to Average Net Assets After Credit/ Reimbursement(d) | |||||||||||||||||||||||||||||
| Ending Net Assets (000) | Expenses Including Interest(e) | Expenses Excluding Interest | Net Invest- ment Income | Expenses Including Interest(e) | Expenses Excluding Interest | Net Invest- ment Income | Expenses Including Interest(e) | Expenses Excluding Interest | Net Invest- ment Income | Portfolio Turnover Rate | |||||||||||||||||||||
| $ | 324,906 | .87 | %* | .82 | %* | 4.23 | %* | .87 | %* | .82 | %* | 4.23 | %* | .86 | %* | .81 | %* | 4.23 | %* | 4 | % | ||||||||||
| 362,734 | .89 | .83 | 4.04 | .89 | .83 | 4.04 | .89 | .83 | 4.04 | 8 | |||||||||||||||||||||
| 392,262 | .90 | .82 | 4.00 | .90 | .82 | 4.00 | .89 | .81 | 4.01 | 9 | |||||||||||||||||||||
| 398,636 | .82 | .82 | 4.09 | .82 | .82 | 4.09 | .81 | .81 | 4.10 | 13 | |||||||||||||||||||||
| 427,106 | .83 | .83 | 4.35 | .83 | .83 | 4.35 | .82 | .82 | 4.36 | 15 | |||||||||||||||||||||
| 410,109 | .84 | .84 | 4.58 | .84 | .84 | 4.58 | .83 | .83 | 4.58 | 16 | |||||||||||||||||||||
| 8,105 | 1.62 | * | 1.57 | * | 3.48 | * | 1.62 | * | 1.57 | * | 3.48 | * | 1.61 | * | 1.56 | * | 3.48 | * | 4 | ||||||||||||
| 9,685 | 1.64 | 1.58 | 3.29 | 1.64 | 1.58 | 3.29 | 1.64 | 1.58 | 3.29 | 8 | |||||||||||||||||||||
| 13,466 | 1.65 | 1.57 | 3.26 | 1.65 | 1.57 | 3.26 | 1.65 | 1.57 | 3.26 | 9 | |||||||||||||||||||||
| 18,388 | 1.57 | 1.57 | 3.34 | 1.57 | 1.57 | 3.34 | 1.56 | 1.56 | 3.35 | 13 | |||||||||||||||||||||
| 21,216 | 1.57 | 1.57 | 3.60 | 1.57 | 1.57 | 3.60 | 1.57 | 1.57 | 3.61 | 15 | |||||||||||||||||||||
| 20,874 | 1.59 | 1.59 | 3.83 | 1.59 | 1.59 | 3.83 | 1.58 | 1.58 | 3.83 | 16 | |||||||||||||||||||||
| 42,547 | 1.42 | * | 1.37 | * | 3.68 | * | 1.42 | * | 1.37 | * | 3.68 | * | 1.41 | * | 1.36 | * | 3.69 | * | 4 | ||||||||||||
| 46,588 | 1.44 | 1.38 | 3.49 | 1.44 | 1.38 | 3.49 | 1.44 | 1.38 | 3.49 | 8 | |||||||||||||||||||||
| 46,650 | 1.45 | 1.37 | 3.45 | 1.45 | 1.37 | 3.45 | 1.45 | 1.36 | 3.46 | 9 | |||||||||||||||||||||
| 45,919 | 1.37 | 1.37 | 3.54 | 1.37 | 1.37 | 3.54 | 1.36 | 1.36 | 3.55 | 13 | |||||||||||||||||||||
| 46,160 | 1.37 | 1.37 | 3.80 | 1.37 | 1.37 | 3.80 | 1.37 | 1.37 | 3.81 | 15 | |||||||||||||||||||||
| 45,303 | 1.39 | 1.39 | 4.03 | 1.39 | 1.39 | 4.03 | 1.38 | 1.38 | 4.03 | 16 | |||||||||||||||||||||
| 2,725 | .67 | * | .62 | * | 4.43 | * | .67 | * | .62 | * | 4.43 | * | .66 | * | .61 | * | 4.44 | * | 4 | ||||||||||||
| 2,891 | .69 | .63 | 4.24 | .69 | .63 | 4.24 | .69 | .63 | 4.24 | 8 | |||||||||||||||||||||
| 3,069 | .70 | .62 | 4.20 | .70 | .62 | 4.20 | .69 | .61 | 4.21 | 9 | |||||||||||||||||||||
| 2,451 | .62 | .62 | 4.29 | .62 | .62 | 4.29 | .61 | .61 | 4.30 | 13 | |||||||||||||||||||||
| 1,581 | .63 | .63 | 4.54 | .63 | .63 | 4.54 | .62 | .62 | 4.55 | 15 | |||||||||||||||||||||
| 1,285 | .64 | .64 | 4.78 | .64 | .64 | 4.78 | .63 | .63 | 4.78 | 16 | |||||||||||||||||||||
| * | Annualized. |
| (a) | Per share Net Investment Income is calculated using the average daily shares method. |
| (b) | Total return is the combination of changes in net asset value without any sales charge, reinvested dividend income at net asset value and reinvested capital gains distributions at net asset value, if any. Total returns are not annualized. |
| (c) | After expense reimbursement from the Adviser, where applicable. |
| (d) | After custodian fee credit and expense reimbursement, where applicable. |
| (e) | The expense ratios in the above table reflect, among other things, the interest expense deemed to have been paid by the Fund on the floating rate certificates issued by the special purpose trusts for the self-deposited inverse floaters held by the Fund, as described in Footnote 1 – Inverse Floating Rate Securities. |
| (f) | For the six months ended November 30, 2008. |
| (g) | Effective May 1, 2008, Class R Shares were renamed Class I Shares. |
See accompanying notes to financial statements.
71
Financial Highlights (Unaudited) (continued)
Selected data for a share outstanding throughout each period:
| Class (Commencement Date) | ||||||||||||||||||||||||||||||||
| Investment Operations | Less Distributions | |||||||||||||||||||||||||||||||
| MICHIGAN | ||||||||||||||||||||||||||||||||
| Year Ended May 31, | Beginning Net Asset Value | Net Invest- ment Income(a) | Net Realized/ Unrealized Gain (Loss) | Total | Net Invest- ment Income | Capital Gains | Total | Ending Net Asset Value | Total Return(b) | |||||||||||||||||||||||
| Class A (6/85) | ||||||||||||||||||||||||||||||||
2009(f) | $ | 11.15 | $ | .24 | $ | (.96 | ) | $ | (.72 | ) | $ | (.23 | ) | $ | — | $ | (.23 | ) | $ | 10.20 | (6.51 | )% | ||||||||||
2008 | 11.41 | .47 | (.23 | ) | .24 | (.47 | ) | (.03 | ) | (.50 | ) | 11.15 | 2.17 | |||||||||||||||||||
2007 | 11.45 | .47 | .07 | .54 | (.48 | ) | (.10 | ) | (.58 | ) | 11.41 | 4.70 | ||||||||||||||||||||
2006 | 11.89 | .49 | (.32 | ) | .17 | (.48 | ) | (.13 | ) | (.61 | ) | 11.45 | 1.48 | |||||||||||||||||||
2005 | 11.45 | .51 | .45 | .96 | (.51 | ) | (.01 | ) | (.52 | ) | 11.89 | 8.48 | ||||||||||||||||||||
2004 | 12.16 | .54 | (.58 | ) | (.04 | ) | (.55 | ) | (.12 | ) | (.67 | ) | 11.45 | (.27 | ) | |||||||||||||||||
| Class B (2/97) | ||||||||||||||||||||||||||||||||
2009(f) | 11.17 | .20 | (.96 | ) | (.76 | ) | (.19 | ) | — | (.19 | ) | 10.22 | (6.84 | ) | ||||||||||||||||||
2008 | 11.43 | .38 | (.22 | ) | .16 | (.39 | ) | (.03 | ) | (.42 | ) | 11.17 | 1.41 | |||||||||||||||||||
2007 | 11.48 | .39 | .05 | .44 | (.39 | ) | (.10 | ) | (.49 | ) | 11.43 | 3.85 | ||||||||||||||||||||
2006 | 11.92 | .40 | (.32 | ) | .08 | (.39 | ) | (.13 | ) | (.52 | ) | 11.48 | .71 | |||||||||||||||||||
2005 | 11.47 | .42 | .46 | .88 | (.42 | ) | (.01 | ) | (.43 | ) | 11.92 | 7.73 | ||||||||||||||||||||
2004 | 12.18 | .45 | (.58 | ) | (.13 | ) | (.46 | ) | (.12 | ) | (.58 | ) | 11.47 | (1.03 | ) | |||||||||||||||||
| Class C (6/93) | ||||||||||||||||||||||||||||||||
2009(f) | 11.15 | .21 | (.96 | ) | (.75 | ) | (.20 | ) | — | (.20 | ) | 10.20 | (6.77 | ) | ||||||||||||||||||
2008 | 11.40 | .41 | (.23 | ) | .18 | (.40 | ) | (.03 | ) | (.43 | ) | 11.15 | 1.67 | |||||||||||||||||||
2007 | 11.44 | .41 | .06 | .47 | (.41 | ) | (.10 | ) | (.51 | ) | 11.40 | 4.11 | ||||||||||||||||||||
2006 | 11.88 | .42 | (.32 | ) | .10 | (.41 | ) | (.13 | ) | (.54 | ) | 11.44 | .91 | |||||||||||||||||||
2005 | 11.43 | .44 | .46 | .90 | (.44 | ) | (.01 | ) | (.45 | ) | 11.88 | 7.98 | ||||||||||||||||||||
2004 | 12.14 | .48 | (.58 | ) | (.10 | ) | (.49 | ) | (.12 | ) | (.61 | ) | 11.43 | (.83 | ) | |||||||||||||||||
| Class I (2/97)(g) | ||||||||||||||||||||||||||||||||
2009(f) | 11.15 | .25 | (.96 | ) | (.71 | ) | (.24 | ) | — | (.24 | ) | 10.20 | (6.40 | ) | ||||||||||||||||||
2008 | 11.41 | .49 | (.23 | ) | .26 | (.49 | ) | (.03 | ) | (.52 | ) | 11.15 | 2.39 | |||||||||||||||||||
2007 | 11.45 | .50 | .06 | .56 | (.50 | ) | (.10 | ) | (.60 | ) | 11.41 | 4.92 | ||||||||||||||||||||
2006 | 11.89 | .51 | (.32 | ) | .19 | (.50 | ) | (.13 | ) | (.63 | ) | 11.45 | 1.69 | |||||||||||||||||||
2005 | 11.45 | .53 | .45 | .98 | (.53 | ) | (.01 | ) | (.54 | ) | 11.89 | 8.70 | ||||||||||||||||||||
2004 | 12.16 | .57 | (.58 | ) | (.01 | ) | (.58 | ) | (.12 | ) | (.70 | ) | 11.45 | (.07 | ) | |||||||||||||||||
72
| Ratios/Supplemental Data | |||||||||||||||||||||||||||||||
| Ratios to Average Net Assets Before Credit/ Reimbursement | Ratios to Average Net Assets After Reimbursement(c) | Ratios to Average Net Assets After Credit/ Reimbursement(d) | |||||||||||||||||||||||||||||
Ending | Expenses | Expenses Excluding Interest | Net | Expenses | Expenses Excluding Interest | Net | Expenses | Expenses Excluding Interest | Net | Portfolio | |||||||||||||||||||||
| $ | 144,843 | .85 | %* | .85 | %* | 4.46 | %* | .85 | %* | .85 | %* | 4.46 | %* | .85 | %* | .85 | %* | 4.47 | %* | 5 | % | ||||||||||
| 159,696 | .86 | .85 | 4.14 | .86 | .85 | 4.14 | .85 | .84 | 4.15 | 14 | |||||||||||||||||||||
| 169,395 | .91 | .84 | 4.09 | .91 | .84 | 4.09 | .90 | .83 | 4.10 | 12 | |||||||||||||||||||||
| 170,278 | .86 | .86 | 4.16 | .86 | .86 | 4.16 | .85 | .85 | 4.17 | 11 | |||||||||||||||||||||
| 181,302 | .86 | .86 | 4.32 | .86 | .86 | 4.32 | .86 | .86 | 4.33 | 16 | |||||||||||||||||||||
| 179,956 | .87 | .87 | 4.61 | .87 | .87 | 4.61 | .86 | .86 | 4.61 | 9 | |||||||||||||||||||||
| 3,161 | 1.60 | * | 1.60 | * | 3.70 | * | 1.60 | * | 1.60 | * | 3.70 | * | 1.60 | * | 1.60 | * | 3.71 | * | 5 | ||||||||||||
| 4,080 | 1.61 | 1.60 | 3.40 | 1.61 | 1.60 | 3.40 | 1.60 | 1.59 | 3.40 | 14 | |||||||||||||||||||||
| 4,845 | 1.67 | 1.60 | 3.35 | 1.67 | 1.60 | 3.35 | 1.65 | 1.58 | 3.36 | 12 | |||||||||||||||||||||
| 6,794 | 1.61 | 1.61 | 3.41 | 1.61 | 1.61 | 3.41 | 1.60 | 1.60 | 3.41 | 11 | |||||||||||||||||||||
| 8,938 | 1.61 | 1.61 | 3.57 | 1.61 | 1.61 | 3.57 | 1.60 | 1.60 | 3.58 | 16 | |||||||||||||||||||||
| 10,112 | 1.62 | 1.62 | 3.86 | 1.62 | 1.62 | 3.86 | 1.61 | 1.61 | 3.86 | 9 | |||||||||||||||||||||
| 30,915 | 1.40 | * | 1.40 | * | 3.91 | * | 1.40 | * | 1.40 | * | 3.91 | * | 1.40 | * | 1.40 | * | 3.91 | * | 5 | ||||||||||||
| 35,814 | 1.41 | 1.40 | 3.59 | 1.41 | 1.40 | 3.59 | 1.40 | 1.39 | 3.60 | 14 | |||||||||||||||||||||
| 37,779 | 1.46 | 1.39 | 3.54 | 1.46 | 1.39 | 3.54 | 1.45 | 1.38 | 3.56 | 12 | |||||||||||||||||||||
| 38,141 | 1.41 | 1.41 | 3.61 | 1.41 | 1.41 | 3.61 | 1.40 | 1.40 | 3.62 | 11 | |||||||||||||||||||||
| 38,386 | 1.41 | 1.41 | 3.77 | 1.41 | 1.41 | 3.77 | 1.40 | 1.40 | 3.78 | 16 | |||||||||||||||||||||
| 36,912 | 1.42 | 1.42 | 4.06 | 1.42 | 1.42 | 4.06 | 1.41 | 1.41 | 4.06 | 9 | |||||||||||||||||||||
| 16,883 | .65 | * | .65 | * | 4.66 | * | .65 | * | .65 | * | 4.66 | * | .65 | * | .65 | * | 4.66 | * | 5 | ||||||||||||
| 19,100 | .66 | .65 | 4.34 | .66 | .65 | 4.34 | .65 | .64 | 4.35 | 14 | |||||||||||||||||||||
| 20,351 | .71 | .64 | 4.29 | .71 | .64 | 4.29 | .70 | .63 | 4.30 | 12 | |||||||||||||||||||||
| 21,871 | .66 | .66 | 4.36 | .66 | .66 | 4.36 | .65 | .65 | 4.36 | 11 | |||||||||||||||||||||
| 23,675 | .66 | .66 | 4.52 | .66 | .66 | 4.52 | .66 | .66 | 4.53 | 16 | |||||||||||||||||||||
| 23,618 | .67 | .67 | 4.81 | .67 | .67 | 4.81 | .66 | .66 | 4.81 | 9 | |||||||||||||||||||||
| * | Annualized. |
| (a) | Per share Net Investment Income is calculated using the average daily shares method. |
| (b) | Total return is the combination of changes in net asset value without any sales charge, reinvested dividend income at net asset value and reinvested capital gains distributions at net asset value, if any. Total returns are not annualized. |
| (c) | After expense reimbursement from the Adviser, where applicable. |
| (d) | After custodian fee credit and expense reimbursement, where applicable. |
| (e) | The expense ratios in the above table reflect, among other things, the interest expense deemed to have been paid by the Fund on the floating rate certificates issued by the special purpose trusts for the self-deposited inverse floaters held by the Fund, as described in Footnote 1 – Inverse Floating Rate Securities. |
| (f) | For the six months ended November 30, 2008. |
| (g) | Effective May 1, 2008, Class R Shares were renamed Class I Shares. |
See accompanying notes to financial statements.
73
Financial Highlights (Unaudited) (continued)
Selected data for a share outstanding throughout each period:
| Class (Commencement Date) | ||||||||||||||||||||||||||||||||
| Investment Operations | Less Distributions | |||||||||||||||||||||||||||||||
| MISSOURI | ||||||||||||||||||||||||||||||||
| Year Ended May 31, | Beginning Net Asset Value | Net Invest- ment Income(a) | Net Realized/ Unrealized Gain (Loss) | Total | Net Invest- ment Income | Capital Gains | Total | Ending Net Asset Value | Total Return(b) | |||||||||||||||||||||||
| Class A (8/87) | ||||||||||||||||||||||||||||||||
2009(f) | $ | 10.73 | $ | .23 | $ | (1.18 | ) | $ | (.95 | ) | $ | (.23 | ) | $ | — | $ | (.23 | ) | $ | 9.55 | (9.00 | )% | ||||||||||
2008 | 11.03 | .45 | (.28 | ) | .17 | (.45 | ) | (.02 | ) | (.47 | ) | 10.73 | 1.59 | |||||||||||||||||||
2007 | 10.98 | .46 | .05 | .51 | (.45 | ) | (.01 | ) | (.46 | ) | 11.03 | 4.66 | ||||||||||||||||||||
2006 | 11.25 | .47 | (.26 | ) | .21 | (.48 | ) | — | (.48 | ) | 10.98 | 1.88 | ||||||||||||||||||||
2005 | 10.78 | .48 | .47 | .95 | (.48 | ) | — | (.48 | ) | 11.25 | 8.97 | |||||||||||||||||||||
2004 | 11.30 | .50 | (.53 | ) | (.03 | ) | (.49 | ) | — | (.49 | ) | 10.78 | (.28 | ) | ||||||||||||||||||
| Class B (2/97) | ||||||||||||||||||||||||||||||||
2009(f) | 10.74 | .19 | (1.17 | ) | (.98 | ) | (.19 | ) | — | (.19 | ) | 9.57 | (9.24 | ) | ||||||||||||||||||
2008 | 11.04 | .37 | (.28 | ) | .09 | (.37 | ) | (.02 | ) | (.39 | ) | 10.74 | .81 | |||||||||||||||||||
2007 | 10.99 | .38 | .05 | .43 | (.37 | ) | (.01 | ) | (.38 | ) | 11.04 | 3.87 | ||||||||||||||||||||
2006 | 11.26 | .39 | (.27 | ) | .12 | (.39 | ) | — | (.39 | ) | 10.99 | 1.12 | ||||||||||||||||||||
2005 | 10.79 | .40 | .47 | .87 | (.40 | ) | — | (.40 | ) | 11.26 | 8.15 | |||||||||||||||||||||
2004 | 11.30 | .41 | (.52 | ) | (.11 | ) | (.40 | ) | — | (.40 | ) | 10.79 | (.95 | ) | ||||||||||||||||||
| Class C (2/94) | ||||||||||||||||||||||||||||||||
2009(f) | 10.72 | .20 | (1.18 | ) | (.98 | ) | (.20 | ) | — | (.20 | ) | 9.54 | (9.25 | ) | ||||||||||||||||||
2008 | 11.02 | .39 | (.28 | ) | .11 | (.39 | ) | (.02 | ) | (.41 | ) | 10.72 | 1.03 | |||||||||||||||||||
2007 | 10.97 | .40 | .05 | .45 | (.39 | ) | (.01 | ) | (.40 | ) | 11.02 | 4.10 | ||||||||||||||||||||
2006 | 11.24 | .41 | (.26 | ) | .15 | (.42 | ) | — | (.42 | ) | 10.97 | 1.34 | ||||||||||||||||||||
2005 | 10.77 | .42 | .47 | .89 | (.42 | ) | — | (.42 | ) | 11.24 | 8.39 | |||||||||||||||||||||
2004 | 11.29 | .44 | (.53 | ) | (.09 | ) | (.43 | ) | — | (.43 | ) | 10.77 | (.84 | ) | ||||||||||||||||||
| Class I (2/97)(g) | ||||||||||||||||||||||||||||||||
2009(f) | 10.73 | .24 | (1.17 | ) | (.93 | ) | (.24 | ) | — | (.24 | ) | 9.56 | (8.80 | ) | ||||||||||||||||||
2008 | 11.03 | .47 | (.28 | ) | .19 | (.47 | ) | (.02 | ) | (.49 | ) | 10.73 | 1.81 | |||||||||||||||||||
2007 | 10.99 | .48 | .04 | .52 | (.47 | ) | (.01 | ) | (.48 | ) | 11.03 | 4.79 | ||||||||||||||||||||
2006 | 11.26 | .49 | (.26 | ) | .23 | (.50 | ) | — | (.50 | ) | 10.99 | 2.10 | ||||||||||||||||||||
2005 | 10.79 | .50 | .47 | .97 | (.50 | ) | — | (.50 | ) | 11.26 | 9.20 | |||||||||||||||||||||
2004 | 11.31 | .52 | (.53 | ) | (.01 | ) | (.51 | ) | — | (.51 | ) | 10.79 | (.10 | ) | ||||||||||||||||||
74
| Ratios/Supplemental Data | |||||||||||||||||||||||||||||||
| Ratios to Average Net Assets Before Credit/ Reimbursement | Ratios to Average Net Assets After Reimbursement(c) | Ratios to Average Net Assets After Credit/ Reimbursement(d) | |||||||||||||||||||||||||||||
Ending | Expenses | Expenses Excluding Interest | Net | Expenses | Expenses Excluding Interest | Net | Expenses | Expenses Excluding Interest | Net | Portfolio | |||||||||||||||||||||
| $ | 173,068 | .85 | %* | .82 | %* | 4.48 | %* | .85 | %* | .82 | %* | 4.48 | %* | .84 | %* | .81 | %* | 4.49 | %* | 8 | % | ||||||||||
| 195,691 | .87 | .84 | 4.16 | .87 | .84 | 4.16 | .87 | .84 | 4.16 | 14 | |||||||||||||||||||||
| 227,412 | .88 | .84 | 4.13 | .88 | .84 | 4.13 | .87 | .83 | 4.14 | 16 | |||||||||||||||||||||
| 231,378 | .83 | .83 | 4.23 | .83 | .83 | 4.23 | .82 | .82 | 4.24 | 12 | |||||||||||||||||||||
| 232,171 | .84 | .84 | 4.35 | .84 | .84 | 4.35 | .83 | .83 | 4.35 | 16 | |||||||||||||||||||||
| 221,955 | .85 | .85 | 4.50 | .85 | .85 | 4.50 | .85 | .85 | 4.51 | 13 | |||||||||||||||||||||
| 3,992 | 1.60 | * | 1.57 | * | 3.71 | * | 1.60 | * | 1.57 | * | 3.71 | * | 1.59 | * | 1.56 | * | 3.72 | * | 8 | ||||||||||||
| 5,785 | 1.62 | 1.59 | 3.41 | 1.62 | 1.59 | 3.41 | 1.62 | 1.59 | 3.41 | 14 | |||||||||||||||||||||
| 7,351 | 1.63 | 1.59 | 3.38 | 1.63 | 1.59 | 3.38 | 1.61 | 1.57 | 3.39 | 16 | |||||||||||||||||||||
| 8,570 | 1.58 | 1.58 | 3.48 | 1.58 | 1.58 | 3.48 | 1.57 | 1.57 | 3.49 | 12 | |||||||||||||||||||||
| 9,197 | 1.58 | 1.58 | 3.60 | 1.58 | 1.58 | 3.60 | 1.58 | 1.58 | 3.60 | 16 | |||||||||||||||||||||
| 9,532 | 1.60 | 1.60 | 3.75 | 1.60 | 1.60 | 3.75 | 1.60 | 1.60 | 3.75 | 13 | |||||||||||||||||||||
| 20,619 | 1.40 | * | 1.37 | * | 3.93 | * | 1.40 | * | 1.37 | * | 3.93 | * | 1.39 | * | 1.36 | * | 3.94 | * | 8 | ||||||||||||
| 21,541 | 1.42 | 1.39 | 3.61 | 1.42 | 1.39 | 3.61 | 1.42 | 1.39 | 3.62 | 14 | |||||||||||||||||||||
| 21,263 | 1.43 | 1.39 | 3.58 | 1.43 | 1.39 | 3.58 | 1.42 | 1.38 | 3.59 | 16 | |||||||||||||||||||||
| 21,387 | 1.38 | 1.38 | 3.68 | 1.38 | 1.38 | 3.68 | 1.37 | 1.37 | 3.69 | 12 | |||||||||||||||||||||
| 19,955 | 1.39 | 1.39 | 3.80 | 1.39 | 1.39 | 3.80 | 1.38 | 1.38 | 3.81 | 16 | |||||||||||||||||||||
| 21,402 | 1.40 | 1.40 | 3.95 | 1.40 | 1.40 | 3.95 | 1.40 | 1.40 | 3.95 | 13 | |||||||||||||||||||||
| 2,902 | .65 | * | .62 | * | 4.69 | * | .65 | * | .62 | * | 4.69 | * | .64 | * | .61 | * | 4.69 | * | 8 | ||||||||||||
| 2,657 | .68 | .65 | 4.36 | .68 | .65 | 4.36 | .67 | .64 | 4.37 | 14 | |||||||||||||||||||||
| 2,169 | .68 | .64 | 4.31 | .68 | .64 | 4.31 | .67 | .63 | 4.33 | 16 | |||||||||||||||||||||
| 895 | .63 | .63 | 4.44 | .63 | .63 | 4.44 | .62 | .62 | 4.45 | 12 | |||||||||||||||||||||
| 561 | .64 | .64 | 4.54 | .64 | .64 | 4.54 | .64 | .64 | 4.55 | 16 | |||||||||||||||||||||
| 483 | .65 | .65 | 4.70 | .65 | .65 | 4.70 | .65 | .65 | 4.71 | 13 | |||||||||||||||||||||
| * | Annualized. |
| (a) | Per share Net Investment Income is calculated using the average daily shares method. |
| (b) | Total return is the combination of changes in net asset value without any sales charge, reinvested dividend income at net asset value and reinvested capital gains distributions at net asset value, if any. Total returns are not annualized. |
| (c) | After expense reimbursement from the Adviser, where applicable. |
| (d) | After custodian fee credit and expense reimbursement, where applicable. |
| (e) | The expense ratios in the above table reflect, among other things, the interest expense deemed to have been paid by the Fund on the floating rate certificates issued by the special purpose trusts for the self-deposited inverse floaters held by the Fund, as described in Footnote 1 – Inverse Floating Rate Securities. |
| (f) | For the six months ended November 30, 2008. |
| (g) | Effective May 1, 2008, Class R Shares were renamed Class I Shares. |
See accompanying notes to financial statements.
75
Financial Highlights (Unaudited) (continued)
Selected data for a share outstanding throughout each period:
| Class (Commencement Date) | ||||||||||||||||||||||||||||||||
| Investment Operations | Less Distributions | |||||||||||||||||||||||||||||||
| OHIO | ||||||||||||||||||||||||||||||||
| Year Ended May 31, | Beginning Net Asset Value | Net Invest- ment Income(a) | Net Realized/ Unrealized Gain (Loss) | Total | Net Invest- ment Income | Capital Gains | Total | Ending Net Asset Value | Total Return(b) | |||||||||||||||||||||||
| Class A (6/85) | ||||||||||||||||||||||||||||||||
2009(f) | $ | 10.99 | $ | .23 | $ | (.80 | ) | $ | (.57 | ) | $ | (.23 | ) | $ | — | $ | (.23 | ) | $ | 10.19 | (5.26 | )% | ||||||||||
2008 | 11.25 | .46 | (.19 | ) | .27 | (.46 | ) | (.07 | ) | (.53 | ) | 10.99 | 2.47 | |||||||||||||||||||
2007 | 11.27 | .47 | .01 | .48 | (.47 | ) | (.03 | ) | (.50 | ) | 11.25 | 4.30 | ||||||||||||||||||||
2006 | 11.65 | .48 | (.34 | ) | .14 | (.48 | ) | (.04 | ) | (.52 | ) | 11.27 | 1.30 | |||||||||||||||||||
2005 | 11.17 | .51 | .48 | .99 | (.51 | ) | — | (.51 | ) | 11.65 | 9.00 | |||||||||||||||||||||
2004 | 11.78 | .53 | (.60 | ) | (.07 | ) | (.54 | ) | — | (.54 | ) | 11.17 | (.62 | ) | ||||||||||||||||||
| Class B (2/97) | ||||||||||||||||||||||||||||||||
2009(f) | 10.97 | .19 | (.80 | ) | (.61 | ) | (.19 | ) | — | (.19 | ) | 10.17 | (5.64 | ) | ||||||||||||||||||
2008 | 11.24 | .38 | (.21 | ) | .17 | (.37 | ) | (.07 | ) | (.44 | ) | 10.97 | 1.61 | |||||||||||||||||||
2007 | 11.25 | .38 | .02 | .40 | (.38 | ) | (.03 | ) | (.41 | ) | 11.24 | 3.64 | ||||||||||||||||||||
2006 | 11.64 | .40 | (.35 | ) | .05 | (.40 | ) | (.04 | ) | (.44 | ) | 11.25 | .47 | |||||||||||||||||||
2005 | 11.16 | .42 | .48 | .90 | (.42 | ) | — | (.42 | ) | 11.64 | 8.22 | |||||||||||||||||||||
2004 | 11.77 | .45 | (.61 | ) | (.16 | ) | (.45 | ) | — | (.45 | ) | 11.16 | (1.34 | ) | ||||||||||||||||||
| Class C (8/93) | ||||||||||||||||||||||||||||||||
2009(f) | 10.96 | .20 | (.80 | ) | (.60 | ) | (.20 | ) | — | (.20 | ) | 10.16 | (5.54 | ) | ||||||||||||||||||
2008 | 11.22 | .40 | (.19 | ) | .21 | (.40 | ) | (.07 | ) | (.47 | ) | 10.96 | 1.93 | |||||||||||||||||||
2007 | 11.24 | .40 | .02 | .42 | (.41 | ) | (.03 | ) | (.44 | ) | 11.22 | 3.77 | ||||||||||||||||||||
2006 | 11.63 | .42 | (.35 | ) | .07 | (.42 | ) | (.04 | ) | (.46 | ) | 11.24 | .68 | |||||||||||||||||||
2005 | 11.15 | .45 | .48 | .93 | (.45 | ) | — | (.45 | ) | 11.63 | 8.45 | |||||||||||||||||||||
2004 | 11.76 | .47 | (.60 | ) | (.13 | ) | (.48 | ) | — | (.48 | ) | 11.15 | (1.14 | ) | ||||||||||||||||||
| Class I (2/97)(g) | ||||||||||||||||||||||||||||||||
2009(f) | 10.97 | .24 | (.80 | ) | (.56 | ) | (.24 | ) | — | (.24 | ) | 10.17 | (5.16 | ) | ||||||||||||||||||
2008 | 11.24 | .49 | (.21 | ) | .28 | (.48 | ) | (.07 | ) | (.55 | ) | 10.97 | 2.60 | |||||||||||||||||||
2007 | 11.25 | .49 | .02 | .51 | (.49 | ) | (.03 | ) | (.52 | ) | 11.24 | 4.53 | ||||||||||||||||||||
2006 | 11.64 | .50 | (.34 | ) | .16 | (.51 | ) | (.04 | ) | (.55 | ) | 11.25 | 1.51 | |||||||||||||||||||
2005 | 11.16 | .53 | .48 | 1.01 | (.53 | ) | — | (.53 | ) | 11.64 | 9.24 | |||||||||||||||||||||
2004 | 11.77 | .56 | (.61 | ) | (.05 | ) | (.56 | ) | — | (.56 | ) | 11.16 | (.41 | ) | ||||||||||||||||||
76
| Ratios/Supplemental Data | |||||||||||||||||||||||||||||||
| Ratios to Average Net Assets Before Credit/ Reimbursement | Ratios to Average Net Assets After Reimbursement(c) | Ratios to Average Net Assets After Credit/ Reimbursement(d) | |||||||||||||||||||||||||||||
| Ending Net Assets (000) | Expenses Including Interest(e) | Expenses Excluding Interest | Net Invest- ment Income | Expenses Including Interest(e) | Expenses Excluding Interest | Net Invest- ment Income | Expenses Including Interest(e) | Expenses Excluding Interest | Net Invest- ment Income | Portfolio Turnover Rate | |||||||||||||||||||||
| $ | 304,191 | .83 | %* | .83 | %* | 4.33 | %* | .83 | %* | .83 | %* | 4.33 | %* | .83 | %* | .83 | %* | 4.33 | %* | 3 | % | ||||||||||
| 338,770 | .93 | .84 | 4.16 | .93 | .84 | 4.16 | .92 | .83 | 4.17 | 20 | |||||||||||||||||||||
| 346,298 | .98 | .83 | 4.11 | .98 | .83 | 4.11 | .98 | .83 | 4.12 | 10 | |||||||||||||||||||||
| 348,198 | .83 | .83 | 4.21 | .83 | .83 | 4.21 | .83 | .83 | 4.21 | 13 | |||||||||||||||||||||
| 358,529 | .84 | .84 | 4.43 | .84 | .84 | 4.43 | .83 | .83 | 4.44 | 11 | |||||||||||||||||||||
| 347,733 | .85 | .85 | 4.65 | .85 | .85 | 4.65 | .85 | .85 | 4.65 | 12 | |||||||||||||||||||||
| 8,942 | 1.58 | * | 1.58 | * | 3.57 | * | 1.58 | * | 1.58 | * | 3.57 | * | 1.58 | * | 1.58 | * | 3.57 | * | 3 | ||||||||||||
| 11,577 | 1.67 | 1.58 | 3.42 | 1.67 | 1.58 | 3.42 | 1.67 | 1.58 | 3.42 | 20 | |||||||||||||||||||||
| 16,125 | 1.73 | 1.58 | 3.36 | 1.73 | 1.58 | 3.36 | 1.73 | 1.58 | 3.37 | 10 | |||||||||||||||||||||
| 20,504 | 1.58 | 1.58 | 3.45 | 1.58 | 1.58 | 3.45 | 1.58 | 1.58 | 3.46 | 13 | |||||||||||||||||||||
| 25,621 | 1.58 | 1.58 | 3.69 | 1.58 | 1.58 | 3.69 | 1.58 | 1.58 | 3.69 | 11 | |||||||||||||||||||||
| 26,057 | 1.60 | 1.60 | 3.90 | 1.60 | 1.60 | 3.90 | 1.60 | 1.60 | 3.90 | 12 | |||||||||||||||||||||
| 48,278 | 1.38 | * | 1.38 | * | 3.78 | * | 1.38 | * | 1.38 | * | 3.78 | * | 1.38 | * | 1.38 | * | 3.78 | * | 3 | ||||||||||||
| 50,642 | 1.48 | 1.39 | 3.61 | 1.48 | 1.39 | 3.61 | 1.47 | 1.38 | 3.62 | 20 | |||||||||||||||||||||
| 49,084 | 1.53 | 1.38 | 3.56 | 1.53 | 1.38 | 3.56 | 1.53 | 1.38 | 3.57 | 10 | |||||||||||||||||||||
| 46,325 | 1.38 | 1.38 | 3.66 | 1.38 | 1.38 | 3.66 | 1.38 | 1.38 | 3.66 | 13 | |||||||||||||||||||||
| 45,791 | 1.38 | 1.38 | 3.88 | 1.38 | 1.38 | 3.88 | 1.38 | 1.38 | 3.89 | 11 | |||||||||||||||||||||
| 44,575 | 1.40 | 1.40 | 4.10 | 1.40 | 1.40 | 4.10 | 1.40 | 1.40 | 4.10 | 12 | |||||||||||||||||||||
| 106,608 | .63 | * | .63 | * | 4.53 | * | .63 | * | .63 | * | 4.53 | * | .63 | * | .63 | * | 4.53 | * | 3 | ||||||||||||
| 116,718 | .73 | .64 | 4.36 | .73 | .64 | 4.36 | .72 | .63 | 4.37 | 20 | |||||||||||||||||||||
| 125,050 | .78 | .63 | 4.31 | .78 | .63 | 4.31 | .78 | .63 | 4.32 | 10 | |||||||||||||||||||||
| 128,133 | .63 | .63 | 4.41 | .63 | .63 | 4.41 | .63 | .63 | 4.41 | 13 | |||||||||||||||||||||
| 139,017 | .64 | .64 | 4.64 | .64 | .64 | 4.64 | .64 | .64 | 4.64 | 11 | |||||||||||||||||||||
| 139,762 | .65 | .65 | 4.85 | .65 | .65 | 4.85 | .65 | .65 | 4.85 | 12 | |||||||||||||||||||||
| * | Annualized. |
| (a) | Per share Net Investment Income is calculated using the average daily shares method. |
| (b) | Total return is the combination of changes in net asset value without any sales charge, reinvested dividend income at net asset value and reinvested capital gains distributions at net asset value, if any. Total returns are not annualized. |
| (c) | After expense reimbursement from the Adviser, where applicable. |
| (d) | After custodian fee credit and expense reimbursement, where applicable. |
| (e) | The expense ratios in the above table reflect, among other things, the interest expense deemed to have been paid by the Fund on the floating rate certificates issued by the special purpose trusts for the self-deposited inverse floaters held by the Fund, as described in Footnote 1 – Inverse Floating Rate Securities. |
| (f) | For the six months ended November 30, 2008. |
| (g) | Effective May 1, 2008, Class R Shares were renamed Class I Shares. |
See accompanying notes to financial statements.
77
Financial Highlights (Unaudited) (continued)
Selected data for a share outstanding throughout each period:
| Class (Commencement Date) | ||||||||||||||||||||||||||||||||
| Investment Operations | Less Distributions | |||||||||||||||||||||||||||||||
| WISCONSIN | ||||||||||||||||||||||||||||||||
| Year Ended May 31, | Beginning Net Asset Value | Net Invest- ment Income(a) | Net Realized/ Unrealized Gain (Loss) | Total | Net Invest- ment Income | Capital Gains | Total | Ending Net Asset Value | Total Return(b) | |||||||||||||||||||||||
| Class A (6/94) | ||||||||||||||||||||||||||||||||
2009(f) | $ | 10.09 | $ | .20 | $ | (.98 | ) | $ | (.78 | ) | $ | (.19 | ) | $ | — | $ | (.19 | ) | $ | 9.12 | (7.84 | )% | ||||||||||
2008 | 10.24 | .38 | (.13 | ) | .25 | (.38 | ) | (.02 | ) | (.40 | ) | 10.09 | 2.51 | |||||||||||||||||||
2007 | 10.20 | .39 | .06 | .45 | (.39 | ) | (.02 | ) | (.41 | ) | 10.24 | 4.46 | ||||||||||||||||||||
2006 | 10.54 | .40 | (.28 | ) | .12 | (.41 | ) | (.05 | ) | (.46 | ) | 10.20 | 1.11 | |||||||||||||||||||
2005 | 10.16 | .42 | .37 | .79 | (.41 | ) | — | (.41 | ) | 10.54 | 7.94 | |||||||||||||||||||||
2004 | 10.62 | .43 | (.45 | ) | (.02 | ) | (.44 | ) | — | (.44 | ) | 10.16 | (.33 | ) | ||||||||||||||||||
| Class B (2/97) | ||||||||||||||||||||||||||||||||
2009(f) | 10.12 | .16 | (.99 | ) | (.83 | ) | (.15 | ) | — | (.15 | ) | 9.14 | (8.26 | ) | ||||||||||||||||||
2008 | 10.26 | .30 | (.11 | ) | .19 | (.31 | ) | (.02 | ) | (.33 | ) | 10.12 | 1.82 | |||||||||||||||||||
2007 | 10.22 | .32 | .05 | .37 | (.31 | ) | (.02 | ) | (.33 | ) | 10.26 | 3.67 | ||||||||||||||||||||
2006 | 10.57 | .32 | (.29 | ) | .03 | (.33 | ) | (.05 | ) | (.38 | ) | 10.22 | .26 | |||||||||||||||||||
2005 | 10.18 | .34 | .39 | .73 | (.34 | ) | — | (.34 | ) | 10.57 | 7.25 | |||||||||||||||||||||
2004 | 10.65 | .35 | (.46 | ) | (.11 | ) | (.36 | ) | — | (.36 | ) | 10.18 | (1.01 | ) | ||||||||||||||||||
| Class C (2/97) | ||||||||||||||||||||||||||||||||
2009(f) | 10.11 | .17 | (.99 | ) | (.82 | ) | (.16 | ) | — | (.16 | ) | 9.13 | (8.18 | ) | ||||||||||||||||||
2008 | 10.26 | .32 | (.12 | ) | .20 | (.33 | ) | (.02 | ) | (.35 | ) | 10.11 | 1.96 | |||||||||||||||||||
2007 | 10.23 | .34 | .05 | .39 | (.34 | ) | (.02 | ) | (.36 | ) | 10.26 | 3.91 | ||||||||||||||||||||
2006 | 10.57 | .35 | (.29 | ) | .06 | (.35 | ) | (.05 | ) | (.40 | ) | 10.23 | .49 | |||||||||||||||||||
2005 | 10.18 | .36 | .39 | .75 | (.36 | ) | — | (.36 | ) | 10.57 | 7.47 | |||||||||||||||||||||
2004 | 10.65 | .37 | (.46 | ) | (.09 | ) | (.38 | ) | — | (.38 | ) | 10.18 | (.84 | ) | ||||||||||||||||||
| Class I (2/97)(g) | ||||||||||||||||||||||||||||||||
2009(f) | 10.12 | .21 | (.99 | ) | (.78 | ) | (.20 | ) | — | (.20 | ) | 9.14 | (7.81 | ) | ||||||||||||||||||
2008 | 10.28 | .40 | (.13 | ) | .27 | (.41 | ) | (.02 | ) | (.43 | ) | 10.12 | 2.64 | |||||||||||||||||||
2007 | 10.25 | .42 | .04 | .46 | (.41 | ) | (.02 | ) | (.43 | ) | 10.28 | 4.59 | ||||||||||||||||||||
2006 | 10.59 | .42 | (.28 | ) | .14 | (.43 | ) | (.05 | ) | (.48 | ) | 10.25 | 1.34 | |||||||||||||||||||
2005 | 10.20 | .44 | .39 | .83 | (.44 | ) | — | (.44 | ) | 10.59 | 8.25 | |||||||||||||||||||||
2004 | 10.67 | .45 | (.46 | ) | (.01 | ) | (.46 | ) | — | (.46 | ) | 10.20 | (.10 | ) | ||||||||||||||||||
78
| Ratios/Supplemental Data | |||||||||||||||||||||||||||||||
| Ratios to Average Net Assets Before Credit/ Reimbursement | Ratios to Average Net Assets After Reimbursement(c) | Ratios to Average Net Assets After Credit/ Reimbursement(d) | |||||||||||||||||||||||||||||
| Ending Net Assets (000) | Expenses Including Interest(e) | Expenses Excluding Interest | Net Invest- ment Income | Expenses Including Interest(e) | Expenses Excluding Interest | Net Invest- ment Income | Expenses Including Interest(e) | Expenses Excluding Interest | Net Invest- ment Income | Portfolio Turnover Rate | |||||||||||||||||||||
| $ | 43,248 | .86 | %* | .86 | %* | 4.03 | %* | .86 | %* | .86 | %* | 4.03 | %* | .84 | %* | .84 | %* | 4.05 | %* | 8 | % | ||||||||||
| 50,640 | .88 | .88 | 3.72 | .88 | .88 | 3.72 | .86 | .86 | 3.74 | 3 | |||||||||||||||||||||
| 42,279 | .90 | .90 | 3.78 | .90 | .90 | 3.78 | .87 | .87 | 3.82 | 10 | |||||||||||||||||||||
| 36,624 | .92 | .92 | 3.84 | .92 | .92 | 3.84 | .89 | .89 | 3.88 | 11 | |||||||||||||||||||||
| 36,325 | .92 | .92 | 3.99 | .92 | .92 | 3.99 | .90 | .90 | 4.00 | 15 | |||||||||||||||||||||
| 39,033 | .92 | .92 | 4.12 | .92 | .92 | 4.12 | .91 | .91 | 4.13 | 21 | |||||||||||||||||||||
| 1,772 | 1.61 | * | 1.61 | * | 3.28 | * | 1.61 | * | 1.61 | * | 3.28 | * | 1.59 | * | 1.59 | * | 3.30 | * | 8 | ||||||||||||
| 2,174 | 1.63 | 1.63 | 2.98 | 1.63 | 1.63 | 2.98 | 1.61 | 1.61 | 3.00 | 3 | |||||||||||||||||||||
| 2,464 | 1.65 | 1.65 | 3.04 | 1.65 | 1.65 | 3.04 | 1.62 | 1.62 | 3.07 | 10 | |||||||||||||||||||||
| 3,295 | 1.67 | 1.67 | 3.09 | 1.67 | 1.67 | 3.09 | 1.64 | 1.64 | 3.12 | 11 | |||||||||||||||||||||
| 4,600 | 1.67 | 1.67 | 3.24 | 1.67 | 1.67 | 3.24 | 1.66 | 1.66 | 3.25 | 15 | |||||||||||||||||||||
| 4,568 | 1.67 | 1.67 | 3.37 | 1.67 | 1.67 | 3.37 | 1.66 | 1.66 | 3.38 | 21 | |||||||||||||||||||||
| 5,993 | 1.41 | * | 1.41 | * | 3.48 | * | 1.41 | * | 1.41 | * | 3.48 | * | 1.39 | * | 1.39 | * | 3.50 | * | 8 | ||||||||||||
| 6,512 | 1.43 | 1.43 | 3.17 | 1.43 | 1.43 | 3.17 | 1.41 | 1.41 | 3.19 | 3 | |||||||||||||||||||||
| 5,975 | 1.45 | 1.45 | 3.24 | 1.45 | 1.45 | 3.24 | 1.42 | 1.42 | 3.27 | 10 | |||||||||||||||||||||
| 5,422 | 1.47 | 1.47 | 3.29 | 1.47 | 1.47 | 3.29 | 1.44 | 1.44 | 3.33 | 11 | |||||||||||||||||||||
| 4,797 | 1.47 | 1.47 | 3.44 | 1.47 | 1.47 | 3.44 | 1.45 | 1.45 | 3.45 | 15 | |||||||||||||||||||||
| 4,632 | 1.47 | 1.47 | 3.57 | 1.47 | 1.47 | 3.57 | 1.46 | 1.46 | 3.58 | 21 | |||||||||||||||||||||
| 1,128 | .66 | * | .66 | * | 4.21 | * | .66 | * | .66 | * | 4.21 | * | .64 | * | .64 | * | 4.23 | * | 8 | ||||||||||||
| 1,506 | .68 | .68 | 3.92 | .68 | .68 | 3.92 | .66 | .66 | 3.94 | 3 | |||||||||||||||||||||
| 1,031 | .69 | .69 | 3.97 | .69 | .69 | 3.97 | .66 | .66 | 4.00 | 10 | |||||||||||||||||||||
| 202 | .72 | .72 | 4.04 | .72 | .72 | 4.04 | .68 | .68 | 4.07 | 11 | |||||||||||||||||||||
| 63 | .72 | .72 | 4.21 | .72 | .72 | 4.21 | .71 | .71 | 4.22 | 15 | |||||||||||||||||||||
| 177 | .72 | .72 | 4.32 | .72 | .72 | 4.32 | .71 | .71 | 4.33 | 21 | |||||||||||||||||||||
| * | Annualized. |
| (a) | Per share Net Investment Income is calculated using the average daily shares method. |
| (b) | Total return is the combination of changes in net asset value without any sales charge, reinvested dividend income at net asset value and reinvested capital gains distributions at net asset value, if any. Total returns are not annualized. |
| (c) | After expense reimbursement from the Adviser, where applicable. |
| (d) | After custodian fee credit and expense reimbursement, where applicable. |
| (e) | The expense ratios in the above table reflect, among other things, the interest expense deemed to have been paid by the Fund on the floating rate certificates issued by the special purpose trusts for the self-deposited inverse floaters held by the Fund, as described in Footnote 1 – Inverse Floating Rate Securities. |
| (f) | For the six months ended November 30, 2008. |
| (g) | Effective May 1, 2008, Class R Shares were renamed Class I Shares. |
See accompanying notes to financial statements.
79
Glossary of Terms Used in this Report
Auction Rate Bond: An auction rate bond is a security whose interest payments are adjusted periodically through an auction process, which process typically also serves as a means for buying and selling the bond. Auctions that fail to attract enough buyers for all the shares offered for sale are deemed to have “failed”, with current holders receiving a formula-based interest rate until the next scheduled auction.
Pre-refundings: Pre-refundings, also known as advance refundings or refinancings, occur when an issuer sells new bonds and uses the proceeds to fund principal and interest payments of older existing bonds. This process often results in lower borrowing costs for bond issuers.
Average Annual Total Return: This is a commonly used method to express an investment’s performance over a particular, usually multi-year time period. It expresses the return that would have been necessary each year to equal the investment’s actual cumulative performance (including change in NAV or offer price and reinvested dividends and capital gains distributions, if any) over the time period being considered.
Average Effective Maturity: The average of the number of years to maturity of the bonds in a Fund’s portfolio, computed by weighting each bond’s time to maturity (the date the security comes due) by the market value of the security. This figure does not account for the likelihood of prepayments or the exercise of call provisions unless an escrow account has been established to redeem the bond before maturity. The market value weighting for an investment in an inverse floating rate security is the value of the portfolio’s residual interest in the inverse floating rate trust, and does not include the value of the floating rate securities issued by the trust.
Average Duration: Duration is a measure of the expected period over which a bond’s principal and interest will be paid, and consequently is a measure of the sensitivity of a bond’s (or bond fund’s) value to changes when market interest rates change. Generally, the longer a bond or Fund’s duration, the more the price of the bond or Fund will change as interest rates change.
Dividend Yield (also known as Market Yield or Current Yield): An investment’s current annualized dividend divided by its current offering price.
Inverse Floaters: Inverse floating rate securities are created by depositing a municipal bond, typically with a fixed interest rate, into a special purpose trust created by a broker-dealer. This trust, in turn, (a) issues floating rate certificates typically paying short-term tax-exempt interest rates to third parties in amounts equal to some fraction of the deposited bond’s par amount or market value, and (b) issues an inverse floating rate certificate (sometimes referred to as an “inverse floater”) to an investor (such as a Fund) interested in gaining investment exposure to a long-term municipal bond. The income received by the holder of the inverse floater varies inversely with the short-term rate paid to the floating rate certificates’ holders, and in most circumstances the holder of the inverse floater bears substantially all of the underlying bond’s downside investment risk. The holder of the inverse floater typically also benefits disproportionately from any potential appreciation of the underlying bond’s value. Hence, an inverse floater essentially represents an investment in the underlying bond on a leveraged basis.
Net Asset Value (NAV): A Fund’s NAV is the dollar value of one share in the Fund. It is calculated by subtracting the liabilities of the Fund from its total assets and then dividing the remainder by the number of shares outstanding. Fund NAVs are calculated at the end of each business day.
SEC 30-Day Yield: A standardized measure of a Fund’s yield that accounts for the future amortization of premiums or discounts of bonds held in the Fund’s portfolio.
Taxable-Equivalent Yield: The yield necessary from a fully taxable investment to equal, on an after-tax basis at a specified assumed tax rate, the yield of a municipal bond investment.
Zero Coupon Bond: A zero coupon bond does not pay a regular interest coupon to its holders during the life of the bond. Tax-exempt income to the holder of the bond comes from accretion of the difference between the original purchase price of the bond at issuance and the par value of the bond at maturity and is effectively paid at maturity. The market prices of zero coupon bonds generally are more volatile than the market prices of bonds that pay interest periodically.
80
Fund Information
Fund Manager Nuveen Asset Management 333 West Wacker Drive Chicago, IL 60606 | Legal Counsel Chapman and Cutler LLP Chicago, IL
Independent Registered Public Accounting Firm PricewaterhouseCoopers LLP Chicago, IL
Custodian State Street Bank & Trust Company Boston, MA | Transfer Agent and Shareholder Services Boston Financial Data Services, Inc.
Nuveen Investor Services P.O. Box 8530 Boston, MA 02266-8530 (800) 257-8787 | ||
Quarterly Portfolio of Investments and Proxy Voting Information: You may obtain (i) each Fund’s quarterly portfolio of investments, (ii) information regarding how the Funds voted proxies relating to portfolio securities held during the most recent twelve-month period ended June 30, 2008, and (iii) a description of the policies and procedures that the Funds used to determine how to vote proxies relating to portfolio securities without charge, upon request, by calling Nuveen Investments at (800) 257-8787 or on Nuveen’s website at www.nuveen.com. You may also obtain this and other Fund information directly from the Securities and Exchange Commission (“SEC”). The SEC may charge a copying fee for this information. Visit the SEC on-line at http://www.sec.gov or in person at the SEC’s Public Reference Room in Washington, D.C. Call the SEC at (202) 942-8090 for room hours and operation. You may also request Fund information by sending an e-mail request to publicinfo@sec.gov or by writing to the SEC’s Public Reference Section at 100 F Street NE, Washington, D.C. 20549.
The Financial Industry Regulatory Authority (FINRA) provides a Public Disclosure Program which supplies certain information regarding the disciplinary history of FINRA members and their associated persons in response to either telephone inquiries at (800) 289-9999 or written inquiries at www.finra.org. Financial Industry Regulatory Authority also provides an investor brochure that includes information describing the Public Disclosure Program.
81
Learn more
about Nuveen Funds at
www.nuveen.com/mf
Nuveen Investments:
SERVING Investors
For GENERATIONS
Since 1898, financial advisors and their clients have relied on Nuveen Investments to provide dependable investment solutions. Over this time, Nuveen Investments has adhered to the belief that the best approach to investing is to apply conservative risk-management principles to help minimize volatility.
Building on this tradition, we today offer a range of high quality equity and fixed-income solutions that can be integral parts of a well-diversified core portfolio. Our clients have come to appreciate this diversity, as well as our continued adherence to proven, long-term investing principles.
We offer many different investing solutions for our clients’ different needs.
Nuveen Investments is a global investment management firm that seeks to help secure the long-term goals of institutions and high net worth investors as well as the consultants and financial advisors who serve them. Nuveen Investments markets its growing range of specialized investment solutions under the high-quality brands of HydePark, NWQ, Nuveen, Rittenhouse, Santa Barbara, Symphony and Tradewinds. In total, the Company managed $134 billion of assets on September 30, 2008.
Find out how we can help you reach your financial goals.
An investor should carefully consider the Fund’s objectives, risks, charges and expenses before investing. For a prospectus containing this and other information about the Fund, please contact your financial advisor or Nuveen Investments at (800) 257-8787. Read the prospectus carefully before you invest or send money.
| • | Share prices |
| • | Fund details |
| • | Daily financial news |
| • | Investor education |
MSA-MS6-1108D
Item 2. Code of Ethics.
Not applicable to this filing.
Item 3. Audit Committee Financial Expert.
Not applicable to this filing.
Item 4. Principal Accountant Fees and Services.
Not applicable to this filing.
Item 5. Audit Committee of Listed Registrants.
Not applicable to this registrant.
Item 6. Schedule of Investments.
See Portfolio of Investments in Item 1.
Item 7. Disclosure of Proxy Voting Policies and Procedures for Closed-End Management Investment Companies.
Not applicable to this registrant.
Item 8. Portfolio Managers of Closed-End Management Investment Companies.
Not applicable to this registrant.
Item 9. Purchases of Equity Securities by Closed-End Management Investment Company and Affiliated Purchasers.
Not applicable to this registrant.
Item 10. Submission of Matters to a Vote of Security Holders.
There have been no material changes to the procedures by which shareholders may recommend nominees to the registrant’s Board implemented after the registrant last provided disclosure in response to this Item.
Item 11. Controls and Procedures.
| (a) | The registrant’s principal executive and principal financial officers, or persons performing similar functions, have concluded that the registrant’s disclosure controls and procedures (as defined in Rule 30a-3(c) under the Investment Company Act of 1940, as amended (the “1940 Act”) (17 CFR 270.30a-3(c))) are effective, as of a date within 90 days of the filing date of this report that includes the disclosure required by this paragraph, based on their evaluation of the controls and procedures required by Rule 30a-3(b) under the 1940 Act (17 CFR 270.30a-3(b)) and Rules 13a-15(b) or 15d-15(b) under the Securities Exchange Act of 1934, as amended (the “Exchange Act”) (17 CFR 240.13a-15(b) or 240.15d-15(b)). |
| (b) | There were no changes in the registrant’s internal control over financial reporting (as defined in Rule 30a-3(d) under the 1940 Act (17 CFR 270.30a-3(d)) that occurred during the second fiscal quarter of the period covered by this report that has materially affected, or is reasonably likely to materially affect, the registrant’s internal control over financial reporting. |
Item 12. Exhibits.
File the exhibits listed below as part of this Form.
(a)(1) Any code of ethics, or amendment thereto, that is the subject of the disclosure required by Item 2, to the extent that the registrant intends to satisfy the Item 2 requirements through filing of an exhibit: Not applicable to this filing.
(a)(2) A separate certification for each principal executive officer and principal financial officer of the registrant as required by Rule 30a-2(a) under the 1940 Act (17 CFR 270.30a-2(a)) in the exact form set forth below: See EX-99.CERT attached hereto.
(a)(3) Any written solicitation to purchase securities under Rule 23c-1 under the 1940 Act (17 CFR 270.23c-1) sent or given during the period covered by the report by or on behalf of the registrant to 10 or more persons: Not applicable to this registrant.
(b) If the report is filed under Section 13(a) or 15(d) of the Exchange Act, provide the certifications required by Rule 30a-2(b) under the 1940 Act (17 CFR 270.30a-2(b)), Rule 13a-14(b) or Rule 15d-14(b) under the Exchange Act (17 CFR 240.13a-14(b) or 240.15d-14(b)), and Section 1350 of Chapter 63 of Title 18 of the United States Code (18 U.S.C. 1350) as an Exhibit. A certification furnished pursuant to this paragraph will not be deemed “filed” for purposes of Section 18 of the Exchange Act (15 U.S.C. 78r), or otherwise subject to the liability of that section. Such certification will not be deemed to be incorporated by reference into any filing under the Securities Act of 1933 or the Exchange Act, except to the extent that the registration specifically incorporates it by reference: See EX-99.906 CERT attached hereto.
SIGNATURES
Pursuant to the requirements of the Securities Exchange Act of 1934 and the Investment Company Act of 1940, the registrant has duly caused this report to be signed on its behalf by the undersigned, thereunto duly authorized.
(Registrant) Nuveen Multistate Trust IV
| By | (Signature and Title) | /s/ Kevin J. McCarthy | ||||
Kevin J. McCarthy Vice President and Secretary |
Date February 6, 2009
Pursuant to the requirements of the Securities Exchange Act of 1934 and the Investment Company Act of 1940, this report has been signed below by the following persons on behalf of the registrant and in the capacities and on the dates indicated.
| By | (Signature and Title) | /s/ Gifford R. Zimmerman | ||||
Gifford R. Zimmerman Chief Administrative Officer (principal executive officer) |
Date February 6, 2009
| By | (Signature and Title) | /s/ Stephen D. Foy | ||||
Stephen D. Foy Vice President and Controller (principal financial officer) |
Date February 6, 2009