UNITED STATES
SECURITIES AND EXCHANGE COMMISSION
Washington, D.C. 20549
FORM N-CSR
CERTIFIED SHAREHOLDER REPORT OF REGISTERED MANAGEMENT
INVESTMENT COMPANIES
Investment Company Act file number 811-07751
Nuveen Multistate Trust IV
(Exact name of registrant as specified in charter)
Nuveen Investments
333 West Wacker Drive Chicago, IL 60606
(Address of principal executive offices) (Zip code)
Kevin J. McCarthy
Nuveen Investments
333 West Wacker Drive Chicago, IL 60606
(Name and address of agent for service)
Registrant’s telephone number, including area code: (312) 917-7700
Date of fiscal year end: May 31
Date of reporting period: November 30, 2007
Form N-CSR is to be used by management investment companies to file reports with the Commission not later than 10 days after the transmission to stockholders of any report that is required to be transmitted to stockholders under Rule 30e-1 under the Investment Company Act of 1940 (17 CFR 270.30e-1). The Commission may use the information provided on Form N-CSR in its regulatory, disclosure review, inspection, and policy making roles.
A registrant is required to disclose the information specified by Form N-CSR, and the Commission will make this information public. A registrant is not required to respond to the collection of information contained in Form N-CSR unless the Form displays a currently valid Office of Management and Budget (“OMB”) control number. Please direct comments concerning the accuracy of the information collection burden estimate and any suggestions for reducing the burden to Secretary, Securities and Exchange Commission, 450 Fifth Street, NW, Washington, DC 20549-0609. The OMB has reviewed this collection of information under the clearance requirements of 44 U.S.C. ss.3507.
Item 1. Reports to Stockholders.
NUVEEN INVESTMENTS MUTUAL FUNDS
Semi-Annual Report dated November 30, 2007 | Dependable, tax-free income because it’s not what you earn, it’s what you keep.® | |

Nuveen Investments
Municipal Bond Funds
Nuveen Kansas Municipal Bond Fund
Nuveen Kentucky Municipal Bond Fund
Nuveen Michigan Municipal Bond Fund
Nuveen Missouri Municipal Bond Fund
Nuveen Ohio Municipal Bond Fund
Nuveen Wisconsin Municipal Bond Fund


NOW YOU CAN RECEIVE YOUR
NUVEEN INVESTMENTS FUND REPORTS FASTER.
NO MORE WAITING.
SIGN UP TODAY TO RECEIVE NUVEEN INVESTMENTS FUND INFORMATION BY E-MAIL.
It only takes a minute to sign up for E-Reports. Once enrolled, you’ll receive an e-mail as soon as your Nuveen Investments Fund information is ready — no more waiting for delivery by regular mail. Just click on the link within the e-mail to see the report, and save it on your computer if your wish.

IT’S FAST, EASY & FREE:
www.investordelivery.com
if you get your Nuveen Investments Fund dividends and statements from your financial advisor or brokerage account.
(Be sure to have the address sheet that accompanied this report handy. You’ll need it to complete the enrollment process.)
OR
www.nuveen.com/accountaccess
if you get your Nuveen Investments Fund dividends and statements directly from Nuveen Investments.

| Must be preceded by or accompanied by a prospectus. | NOT FDIC INSURED | MAY LOSE VALUE | NO BANK GUARANTEE |
Dear Shareholder,
Once again, I am pleased to report that during the six-month period covered by this report your Fund provided tax-free income and solid performance from a carefully selected portfolio of municipal bonds. Detailed information on your Fund’s performance can be found in the Portfolio Managers’ Comments and Fund Spotlight sections of this report.
As we begin a new year, no one knows for certain what the future will bring. But one thing we do know is that a well-balanced portfolio – often including municipal bonds – can provide diversification that can reduce overall investment risk. To learn more about the potential benefits of portfolio diversification, we encourage you to consult a trusted financial advisor. He or she should be able to help you understand how a municipal bond investment like your Nuveen Fund can be an important building block in a portfolio crafted to perform well through a variety of market conditions.
I also wanted to update you on some important news about Nuveen Investments. The firm recently was acquired by a group led by Madison Dearborn Partners, LLC. While this affected the corporate structure of Nuveen Investments, it has no impact on the investment objectives, portfolio management strategies or dividend policy of your Fund.
Since 1898, Nuveen Investments has offered financial products and solutions that incorporate careful research, diversification, and the application of conservative risk-management principles. We are grateful that you have chosen us as a partner as you pursue your financial goals. We look forward to continuing to earn your trust in the months and years ahead.
Sincerely,

Timothy R. Schwertfeger
Chairman of the Board
January 15, 2008

[PHOTO]

Timothy R. Schwertfeger
“But one thing we do know is that a well-balanced portfolio – often including municipal bonds – can provide diversification that can reduce overall investment risk.”
Semi-Annual Report Page 1
Portfolio Managers’ Comments for the Nuveen Kansas,
Kentucky, Michigan, Missouri, Ohio and Wisconsin Municipal Bond Funds
Portfolio managers Scott Romans and Daniel Close examine key investment strategies and the performance of the Nuveen Kansas, Kentucky, Michigan, Missouri, Ohio and Wisconsin Municipal Bond Funds. Scott, who has 7 years of investment experience, began managing the Kansas, Missouri and Wisconsin Funds in 2003. Dan has 6 years of investment experience and began managing the Kentucky, Ohio and Michigan Funds in March 2007.
How did the Funds perform during the six-month period ended November 30, 2007?
The table on page three provides total return performance information for the six Funds discussed in this report for the six-month, one-year, five-year, and ten-year periods ended November 30, 2007. Each Fund’s performance is compared with its respective state-specific Lehman Brothers Indexes, the national Lehman Brothers Municipal Bond Index, and its Lipper peer fund category average. The factors determining the performance of each Fund are discussed later in this report.
Over this six-month reporting period, all six Funds’ Class A shares total return at net asset value outperformed their respective Lipper peer group averages while lagging both their state-specific and the national Lehman Brothers Index to varying degrees.
What strategies were used to manage the Funds during the period? How did these strategies influence performance?
Our management strategies were consistent across all six Funds, although our ability to implement those strategies depended on the individual characteristics of each portfolio as well as market conditions within each state. Below we provide more specific information about the performance and management of the Funds.
During the first half of the six-month reporting period, the municipal bond market was relatively subdued. Yields moved slightly upward, while bond prices fell modestly (bond yields and prices move in opposite directions). In August, however, market conditions changed dramatically. The subprime mortgage crisis left investors worried about potential exposure to bad debts. As these worries grew, the municipal market became less liquid, and credit spreads – the premium paid to investors for taking on added credit risk – widened considerably, causing lower-rated bonds to underperform higher-rated securities.
Nuveen Kansas Municipal Bond Fund
Favorable credit-quality positioning proved to be helpful for the Kansas Fund’s recent performance. Specifically, the Fund benefited from its relatively sizeable allocation to higher-quality bonds and its relative underexposure to lower-quality bonds – both of which were beneficial given the risk-averse market environment of the period. Duration positioning also contributed to performance, with an underweighting in longer-duration bonds and an overweighting in the better-performing short-duration segment of the yield curve both having a favorable influence on the portfolio’s returns.
On the negative side, the Fund’s weakest performers tended to be lower-rated bonds, which suffered as the municipal market environment became more challenging beginning in August. As credit spreads widened, the underperformance in the municipal market occurred in some surprising places – for example, insured bonds backed by Radian Asset Assurance, whose parent company disclosed some exposure to subprime debt. Although the subsidiary had no subprime exposure of its own, the market’s concern caused Radian-insured bonds to substantially lag the rest of the insured municipal market to levels close to what one would expect from uninsured bonds from the underlying municipal issuers. The Kansas portfolio had some exposure to these Radian-insured bonds, which detracted from the Fund’s performance.
Discussions of specific investments are for illustration only and are not intended as recommendations of individual investments. The views expressed herein represent those of the portfolio managers as of the date of this report and are subject to change at any time, based on market conditions and other factors. The Funds disclaim any obligation to advise shareholders of such changes.
Semi-Annual Report Page 2
Class A Shares—
Average Annual Total Returns
as of 11/30/07
| 6-Month | 1-Year | 5-Year | 10-Year | |||||
Nuveen Kansas Municipal Bond Fund | 2.12% -2.21% | 2.38% -1.88% | 4.45% 3.56% | 4.59% 4.14% | ||||
Lipper Kansas Municipal Debt Funds Category Average1 | 1.51% | 1.67% | 3.66% | 4.13% | ||||
Lehman Brothers Kansas Municipal Bond Index2 | 2.81% | 3.18% | 4.35% | 5.10% | ||||
Lehman Brothers Municipal Bond Index3 | 2.40% | 2.71% | 4.68% | 5.30% | ||||
Nuveen Kentucky Municipal Bond Fund | 2.21% -2.08% | 2.25% -2.04% | 4.66% 3.76% | 4.62% 4.17% | ||||
Lipper Kentucky Municipal Debt Funds Category Average1 | 1.75% | 1.63% | 3.73% | 4.20% | ||||
Lehman Brothers Kentucky Municipal Bond Index2 | 2.88% | 3.22% | 4.50% | 5.09% | ||||
Lehman Brothers Municipal Bond Index3 | 2.40% | 2.71% | 4.68% | 5.30% | ||||
Nuveen Michigan Municipal Bond Fund | 2.02% -2.26% | 2.16% -2.10% | 4.50% 3.62% | 4.72% 4.26% | ||||
Lipper Michigan Municipal Debt Funds Category Average1 | 1.08% | 1.15% | 3.76% | 4.30% | ||||
Lehman Brothers Michigan Municipal Bond Index2 | 2.75% | 3.00% | 4.64% | 5.33% | ||||
Lehman Brothers Municipal Bond Index3 | 2.40% | 2.71% | 4.68% | 5.30% | ||||
Nuveen Missouri Municipal Bond Fund | 1.61% -2.63% | 1.72% -2.53% | 4.67% 3.77% | 4.69% 4.24% | ||||
Lipper Missouri Municipal Debt Funds Category Average1 | 1.19% | 1.07% | 3.92% | 4.44% |
| 6-Month | 1-Year | 5-Year | 10-Year | |||||
Lehman Brothers Missouri Municipal Bond Index2 | 2.79% | 2.86% | 4.74% | 5.24% | ||||
Lehman Brothers Municipal Bond Index3 | 2.40% | 2.71% | 4.68% | 5.30% | ||||
Nuveen Ohio Municipal Bond Fund | 1.98% -2.27% | 1.95% -2.37% | 4.58% 3.70% | 4.58% 4.14% | ||||
Lipper Ohio Municipal Debt Funds Category Average1 | 1.52% | 1.48% | 3.81% | 4.24% | ||||
Lehman Brothers Ohio Municipal Bond Index2 | 2.36% | 2.64% | 4.40% | 5.10% | ||||
Lehman Brothers Municipal Bond Index3 | 2.40% | 2.71% | 4.68% | 5.30% | ||||
Nuveen Wisconsin Municipal Bond Fund | 1.73% -2.55% | 1.60% -2.68% | 4.24% 3.34% | 4.55% 4.11% | ||||
Lipper Other States Municipal Debt Funds Category Average1 | 1.44% | 1.51% | 3.66% | 4.12% | ||||
Lehman Brothers Wisconsin Municipal Bond Index2 | 2.34% | 2.99% | 4.91% | 5.34% | ||||
Lehman Brothers Municipal Bond Index3 | 2.40% | 2.71% | 4.68% | 5.30% |
Returns quoted represent past performance, which is no guarantee of future results. Returns less than one year are cumulative. Returns at NAV would be lower if the sales charge were included. Current performance may be higher or lower than the performance shown. Investment returns and principal value will fluctuate so that when shares are redeemed, they may be worth more or less than their original cost. Class A shares have a 4.2 percent maximum sales charge. Returns do not reflect the deduction of taxes that a shareholder would pay on Fund distributions or the redemption of shares. For the most recent month-end performance, visit www.nuveen.com or call (800) 257-8787.
Please see each Fund’s Spotlight Page later in this report for more complete performance data and expense ratios.
| 1 | The Lipper category averages shown represent the average annualized total return for all reporting funds in the respective categories. The Lipper Kansas Municipal Debt Funds Category Average contained 11, 10, 9 and 8 funds, the Lipper Kentucky Municipal Debt Funds Category Average had 18, 18, 17 and 11 funds, the Lipper Michigan Municipal Debt Funds Category Average had 32, 32, 27 and 24 funds, the Lipper Missouri Municipal Debt Funds Category Average had 18, 18, 17 and 15 funds, the Lipper Ohio Municipal Debt Funds Category Average had 46, 46, 41 and 34 funds, and the Lipper Other States Municipal Debt Funds Category Average had 76, 76, 70 and 54 funds for the six-month, one-year, five-year and ten-year periods ended November 30, 2007, respectively. The returns account for the effects of management fees and assume reinvestment of dividends, but do not reflect any applicable sales charges. You cannot invest directly in a Lipper Category. |
| 2 | The Lehman Brothers Kansas Municipal Bond Index is an unmanaged index comprised of investment grade, tax-exempt Kansas bonds with maturities of two years or greater. The Lehman Brothers Kentucky Municipal Bond Index is an unmanaged index comprised of investment grade, tax-exempt Kentucky bonds with maturities of two years or greater. The Lehman Brothers Michigan Municipal Bond Index is an unmanaged index comprised of investment grade, tax-exempt Michigan bonds with maturities of two years or greater. The Lehman Brothers Missouri Municipal Bond Index is an unmanaged index comprised of investment grade, tax-exempt Missouri bonds with maturities of two years or greater. The Lehman Brothers Ohio Municipal Bond Index is an unmanaged index comprised of investment grade, tax-exempt Ohio bonds with maturities of two years or greater. The Lehman Brothers Wisconsin Municipal Bond Index is an unmanaged index comprised of investment grade, tax-exempt Wisconsin bonds with maturities of two years or greater. The indexes do not reflect any initial or ongoing expenses and are not available for direct investment. |
| 3 | The Lehman Brothers Municipal Bond Index is an unmanaged index composed of a broad range of investment-grade municipal bonds and does not reflect any initial or ongoing expenses. An index is not available for direct investment. |
Semi-Annual Report Page 3
Changes to the portfolio were relatively modest, with only three new purchases made during the period. In each case, we took advantage of market conditions to invest in opportunities that we believed provided our shareholders with unusual levels of value. One of these purchases was of a lower-rated hospital bond issue, while the two others were insured by AMBAC, another municipal bond insurer that recently disclosed exposure to subprime loans. These AMBAC-insured bonds were offering nearly a half-percentage point of additional yield compared to the benchmark AAA-rated Municipal Market Data (MMD) curve – a very rare situation. After careful research, we remained confident in these securities’ underlying financial strength and believed they provided excellent future total return potential for shareholders.
To fund these purchases, most of our selling activity during the period focused on high-quality bonds purchased during the much-lower market-rate environment of the past several years. By selling these bonds, we could replace them with newer bonds offering more favorable yields.
Nuveen Kentucky Municipal Bond Fund
Overall, duration positioning helped the Kentucky Fund’s performance. During the period, we were overweighted in the intermediate part of the yield curve, which generally performed well. A relative underweighting in the market’s longest-duration bonds also proved beneficial, although an underweighting in the positive-performing shortest portion of the yield curve was a corresponding negative.
The Fund was modestly overweighted in AAA-rated bonds. This allocation proved helpful as cautious investors preferred higher-quality issues during the last half of the reporting period. Another noteworthy positive was the Fund’s derivative position, which we had implemented to help maintain the portfolio’s duration within target levels. We had invested small portions of the Fund in forward interest-rate swaps tied to two common interest rates: LIBOR (London Inter-bank Offered Rate) and the Securities Industry and Financial Markets (SIFM) Municipal Swap Index (previously known as BMA). With these derivative positions, we were able to reduce the portfolio’s volatility and manage its duration without being forced to sell positions in the portfolios that we believed were attractive. These derivative securities outperformed the municipal market generally and added to the Fund’s total returns.
Not surprisingly, given the challenging market environment of the period, the Fund’s exposure to lower-credit-quality bonds detracted from overall performance. For example, lower-rated health care positions as well as a modest holding in Puerto Rico–issued tobacco-backed bonds provided a negative influence.
Portfolio activity was relatively modest. Recent purchases focused on essential service bonds offering maturities between 20 to 30 years. When selling bonds, we primarily sold shorter-dated bonds. As these securities gained in value, we took advantage of market conditions to sell them at favorable prices. In addition, we were actively selling some of our bonds whose income is subject to the alternative minimum tax, taking advantage of opportunities to sell these positions at what we believed were attractive prices.
Nuveen Michigan Municipal Bond Fund
The Michigan Fund was helped by our duration positioning, with an overweighting in intermediate-maturity bonds adding to results. An underweighting in longer-duration issues was also a relative positive. However, as with the Kentucky Fund, our relative underexposure to very-short-maturity bonds detracted from performance, as these securities benefited the most from investors’ growing risk aversion. That risk aversion also boosted the market’s highest-quality bonds, in which the Fund was overweighted. Nevertheless, the Fund would have benefited from having greater exposure to pre-refunded1 bonds and general obligation/tax-supported debt.
Another source of positive results came from a modest derivative position, which outperformed the municipal market as a whole during the period. As in the Kentucky Fund, this derivative exposure allowed us to limit the portfolio’s volatility as well as keep its duration within target levels.
The Fund’s worst performers overall were lower-quality bonds, which suffered the most as investors engaged in a flight to quality. In particular, we
| 1 | Advance refundings, also known as pre-refundings or refinancings, occur when an issuer sells new bonds and uses the proceeds to fund principal and interest payments of older existing bonds. This process often results in lower borrowing costs for bond issuers. |
Semi-Annual Report Page 4
owned a number of lower-quality hospital bonds – health care issuance represents a significant portion of the Michigan municipal market – many of which performed relatively poorly during the past six months. Our lower-rated industrial development revenue bonds were generally disappointing performers as well.
As municipal investor sentiment weakened, we found periodic opportunities to buy lower-rated bonds at particularly compelling yields. In the health care sector, for example, we took advantage of several BBB-rated hospital bond issues offering what we believed were excellent values. Otherwise, the rest of our purchases were focused on higher-quality essential service general obligation and tax-backed bonds. These included a variety of school district issues with maturities ranging from 2025 to 2037, as well as a water/sewer issue with a 2023 maturity date.
Our sales were primarily of short-dated pre-refunded securities, for which we were able to get what we believed was a good price in return. These sales enabled us to reinvest in longer-dated and higher-rated paper, thus allowing us to accomplish our credit and duration-management objectives.
Nuveen Missouri Municipal Bond Fund
In the Missouri Fund, we saw ample opportunities to add new lower-rated positions to the portfolio. Many of these were in the health care sector. At various points, we were able to buy new uninsured hospital bonds at wider spreads to AAA-rated bonds than we had become used to seeing in recent years. Unfortunately, in August, when credit concerns led to significant municipal market underperformance, our lower-rated bonds – including some that we had added in an earlier round of spread widening prior to the start of the period – were significant overall detractors from the Fund’s return.
The Fund did benefit modestly from its duration positioning. An underweighting in the most interest-rate-sensitive bonds added to results, as these holdings tended to be the worst performers along the yield curve. An additional favorable performance impact came from our pre-refunded bonds which tended to have shorter-dated maturities and thus held their value better as interest rates rose in the second half of the period.
Most of our purchases during the period were of bonds with 20- to 30-year maturities, enabling us to maintain the Fund's duration at desired levels. Bond sales during the period were primarily shorter bonds, as well as longer-dated bonds that had been issued in recent years during substantially lower interest rate environments. We took advantage of the widening of credit spreads in August to add new lower-rated positions when we believed in their underlying financial strength and saw exceptional value opportunities. We also took advantage of market conditions to sell certain underperforming lower-rated holdings, exchanging these bonds for similar ones offering comparable levels of risk but better embedded yields – thus improving the portfolio's income characteristics.
Nuveen Ohio Municipal Bond Fund
The primary positive influence on the Ohio Fund’s performance was favorable security selection, with a number of our higher-rated and shorter-maturity positions enjoying strong results. On the negative side, we were modestly underweighted in the highest-quality segments of the market, which fared relatively well. In addition, we were overweighed in both industrial development revenue bonds and housing bonds – two sectors that underperformed.
We made a number of new purchases. For example, we added four new general obligation or tax-backed bond positions offering maturities ranging from 2028 to 2034. The majority of our purchases had maturities in the 25- to 30-year range – enabling us to keep the Fund’s duration in line with our target. Other purchases included several longer-dated Ginnie Mae housing bond issues that we believed offered attractive value.
In addition, throughout the period, but especially in August following the municipal market’s downturn, we took advantage of available opportunities to add lower-rated bonds providing what we felt were unusually good values. This included a health care bond issue rated BBB- as well as a water/sewer bond issue. Another recent opportunity was to buy Ohio tobacco settlement backed bonds, part of a multibillion dollar issue that took place in October. Because the issuance was during a fairly weak period for tobacco debt, we were able to purchase these securities at attractive prices and provide good future value potential for our shareholders.
Semi-Annual Report Page 5
Nuveen Wisconsin Municipal Bond Fund
Management activity in the Wisconsin Fund was quite limited during the past six months. This is not unusual, in our experience, because the unique tax laws in Wisconsin limit the type of municipal entities which can issue fully-tax-exempt bonds. As a result, we made only two new purchases during the past six months both of which were of Puerto Rico bond issues which led to a modest increase in the portfolio’s allocation to U.S. territorial issues. In a state such as Wisconsin, where appropriate in-state paper can sometimes be difficult to come by, territorial bonds can be extremely useful investment alternatives, as they are generally fully tax-exempt in all 50 states.
Our duration positioning helped the Fund’s performance. The portfolio was significantly exposed to the intermediate part of the yield curve, which outperformed longer-duration bonds. The Fund’s exposure to higher-rated bonds also proved to be beneficial in the risk-averse investment environment. On the negative side, the Fund’s Puerto Rico exposure tended to be both relatively long in duration and offer credit ratings at the lower end of the investment-grade credit spectrum – two factors that detracted from results.
Recent Market Events
Many of the municipal bonds in the portfolios are covered by policies of insurance, issued by one of several municipal bond insurers, under which the insurer guarantees the timely payment of interest and principal on the bonds. Certain of those insurers, including AMBAC, MBIA and FGIC, historically rated AAA (the highest grade), also insure investment vehicles representing interests in subprime mortgages, which suffered severe credit deterioration during the semi-annual period covered by this report. The defaults and/or credit deterioration of the subprime mortgage investments they insured have caused losses to the insurers, which has reduced the insurers’ capital and called into question the insurers’ continued ability to pay interest and principal on insured bonds for the life of those bonds. One rating agency has already reduced the rating for AMBAC-insured bonds to AA, and other rating agencies may follow, and this rating may fall even further. While the major rating agencies continue to give the other affected insurers their highest rating, as of the date this report was written one or more rating agencies have placed each of these insurers on “negative credit watch”, which may presage one or more rating reductions in the future. The value of the insurance associated with bonds held by the Funds in this report (a component of the value of the bond/insurance combination) generally declined during and after the reporting period, and further credit deterioration or rating downgrades of the insurers could cause further declines in the value of the insurance component of an insured bond, although it has not and should not affect the creditworthiness of the municipal issuer of, and the uninsured value of, the underlying bond.
Dividend Information
Throughout the six-month period, all share classes of the Kansas Fund saw a November increase to its monthly tax-free dividend, while the Class C shares of the Kentucky Fund experienced a dividend increase in August. All share classes of the Ohio Fund saw a dividend reduction in August. The Michigan, Missouri, and Wisconsin Funds saw no dividend changes during the past six months.
Each Fund seeks to pay dividends at a rate that reflects the past and projected performance of the Fund. To permit a Fund to maintain a more stable monthly dividend, the Fund may pay dividends at a rate that may be more or less than the amount of net investment income actually earned by the Fund during the period. If the Fund has cumulatively earned more than it has paid in dividends, it will hold the excess in reserve as undistributed net investment income (UNII) as part of the Fund’s net asset value. Conversely, if the Fund has cumulatively paid in dividends more than it has earned, the excess will constitute a negative UNII that will likewise be reflected in the Fund’s net asset value. Each Fund will, over time, pay all its net investment income as dividends to shareholders.
As of November 30, 2007, the Kentucky, Michigan, Missouri, Ohio, and Wisconsin Funds had negative UNII balances for financial statement purposes and positive UNII balances, based upon our best estimate, for tax purposes. The Kansas Fund had a positive UNII balance for financial statement purposes and a positive UNII balance, based upon our best estimate, for tax purposes.
Semi-Annual Report Page 6
Fund Spotlight as of 11/30/07 Nuveen Kansas Municipal Bond Fund
| Quick Facts | ||||||||
| A Shares | B Shares | C Shares | R Shares | |||||
NAV | $10.41 | $10.32 | $10.41 | $10.45 | ||||
Latest Monthly Dividend1 | $0.0355 | $0.0290 | $0.0310 | $0.0375 | ||||
Inception Date | 1/09/92 | 2/19/97 | 2/11/97 | 2/25/97 |
Returns quoted represent past performance which is no guarantee of future results. Returns without sales charges would be lower if the sales charge were included. Current performance may be higher or lower than the performance shown. Investment returns and principal value will fluctuate so that when shares are redeemed, they may be worth more or less than their original cost. Returns do not reflect the deduction of taxes that a shareholder would pay on Fund distributions or the redemption of shares. Income is generally exempt from regular federal income taxes. Some income may be subject to state and local taxes and to the federal alternative minimum tax. Capital gains, if any, are subject to tax. For the most recent month-end performance visit www.nuveen.com or call (800) 257-8787.
Returns reflect differences in sales charges and expenses, which are primarily differences in distribution and service fees. Class A shares have a 4.2% maximum sales charge. Class A Share purchases of $1 million or more are sold at net asset value without an up-front sales charge but may be subject to a contingent deferred sales charge (CDSC), also known as a back-end sales charge, if redeemed within 18 months of purchase. Class B shares have a CDSC that begins at 5% for redemptions during the first year and declines periodically to 0% over the following five years. Class B shares automatically convert to Class A shares eight years after purchase. Class C shares have a 1% CDSC for redemptions within less than one year, which is not reflected in the one-year total return. Class R shares have no sales charge and may be purchased under limited circumstances or by specified classes of investors. Returns reflect an expense limitation by the Fund’s investment adviser.
| Average Annual Total Returns as of 11/30/07 | ||||
| A Shares | NAV | Offer | ||
1-Year | 2.38% | -1.88% | ||
5-Year | 4.45% | 3.56% | ||
10-Year | 4.59% | 4.14% | ||
| B Shares | w/o CDSC | w/CDSC | ||
1-Year | 1.54% | -2.39% | ||
5-Year | 3.67% | 3.49% | ||
10-Year | 3.97% | 3.97% | ||
| C Shares | NAV | |||
1-Year | 1.76% | |||
5-Year | 3.87% | |||
10-Year | 4.03% | |||
| R Shares | NAV | |||
1-Year | 2.51% | |||
5-Year | �� | 4.65% | ||
10-Year | 4.80% | |||
| Tax-Free Yields | ||||
| A Shares | NAV | Offer | ||
Dividend Yield2 | 4.09% | 3.92% | ||
30-Day Yield2 | 3.68% | — | ||
SEC 30-Day Yield2,3 | — | 3.53% | ||
Taxable-Equivalent Yield3,4 | 5.46% | 5.24% | ||
| B Shares | NAV | |||
Dividend Yield2 | 3.37% | |||
30-Day Yield2 | 2.93% | |||
Taxable-Equivalent Yield4 | 4.35% | |||
| C Shares | NAV | |||
Dividend Yield2 | 3.57% | |||
30-Day Yield2 | 3.13% | |||
Taxable-Equivalent Yield4 | 4.64% | |||
| R Shares | NAV | |||
Dividend Yield2 | 4.31% | |||
SEC 30-Day Yield2 | 3.88% | |||
Taxable-Equivalent Yield4 | 5.76% | |||
Average Annual Total Returns as of 12/31/07
| ||||
| A Shares | NAV | Offer | ||
1-Year | 2.63% | -1.68% | ||
5-Year | 3.93% | 3.04% | ||
10-Year | 4.42% | 3.98% | ||
| B Shares | w/o CDSC | w/CDSC | ||
1-Year | 1.88% | -2.06% | ||
5-Year | 3.19% | 3.01% | ||
10-Year | 3.79% | 3.79% | ||
| C Shares | NAV | |||
1-Year | 2.00% | |||
5-Year | 3.37% | |||
10-Year | 3.85% | |||
| R Shares | NAV | |||
1-Year | 2.85% | |||
5-Year | 4.17% | |||
10-Year | 4.63% | |||
| Portfolio Statistics | ||
Net Assets ($000) | $124,262 | |
Average Effective Maturity on Securities (Years) | 18.27 | |
Average Duration | 5.80 |
| Expense Ratios | ||||||
| Share Class | Gross Expense Ratios | Net Expense Ratios | As of Date | |||
Class A | 0.85% | 0.84% | 5/31/07 | |||
Class B | 1.61% | 1.59% | 5/31/07 | |||
Class C | 1.40% | 1.39% | 5/31/07 | |||
Class R | 0.65% | 0.63% | 5/31/07 | |||
The expense ratios shown factor in Annual Fund Operating Expenses including management fees and other fees and expenses. The Net Expense Ratios reflect a custodian fee credit from the custodian bank whereby certain fees and expenses are reduced by credits earned on the Fund’s cash on deposit with the bank. There is no guarantee that the Fund will earn such credits in the future. Absent the credit, the Net Expense Ratios would be higher and total returns would be less. These expense ratios may vary from the expense ratios shown elsewhere in this report.
| 1 | Paid December 3, 2007. This is the latest monthly tax-exempt dividend declared during the period ended November 30, 2007. |
| 2 | Dividend Yield is the most recent dividend per share (annualized) divided by the appropriate price per share. The SEC 30-Day Yield is computed under an SEC standardized formula and is based on the maximum offer price per share. The 30-Day Yield is computed under the same formula but is based on the Net Asset Value (NAV) per share. The Dividend Yield may differ from the SEC 30-Day Yield because the Fund may be paying out more or less than it is earning and it may not include the effect of amortization of bond premium. |
| 3 | The SEC 30-Day Yield and Taxable-Equivalent Yield on A Shares at NAV applies only to A Shares purchased at no-load pursuant to the Fund’s policy permitting waiver of the A Share load in certain specified circumstances. |
| 4 | The Taxable-Equivalent Yield represents the yield that must be earned on a fully taxable investment in order to equal the yield of the Fund on an after-tax basis at a specified tax rate. With respect to investments that generate qualified dividend income that is taxable at a maximum rate of 15%, the Taxable-Equivalent Yield is lower. The Taxable-Equivalent Yield is based on the Fund’s 30-Day Yield on the indicated date and a combined federal and state income tax rate of 32.6%. |
Semi-Annual Report Page 7
Fund Spotlight as of 11/30/07 Nuveen Kansas Municipal Bond Fund
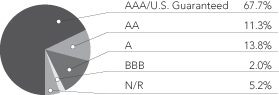
Bond Credit Quality1,2
Industries2
Tax Obligation/Limited | 27.2% | |
Health Care | 22.3% | |
Housing/Single Family | 18.9% | |
Tax Obligation/General | 10.8% | |
Water and Sewer | 6.6% | |
Other | 14.2% |
| 1 | The percentage of AAA ratings shown in the foregoing chart reflects the AAA ratings on certain bonds insured by AMBAC, FGIC or MBIA as of November 30, 2007. As explained earlier in the Portfolio Managers’ Comments section of this report, one rating agency has reduced the rating for AMBAC to AA, and one or more rating agencies have placed each of these insurers on “negative credit watch”, which may presage one or more rating reductions for such insurer or insurers in the future. If one or more insurers’ ratings are reduced below AAA by these rating agencies, it would likely reduce the effective rating of many of the bonds insured by that insurer or insurers, and thereby reduce the percentage of the portfolio rated AAA from the percentage shown in the foregoing chart. |
| 2 | As a percentage of total investments as of November 30, 2007. Holdings are subject to change. |
Expense Example
As a shareholder of the Fund, you incur two types of costs: (1) transaction costs, including front and back end sales charges (loads) or redemption fees, where applicable; and (2) ongoing costs, including management fees; distribution and service (12b-1) fees, where applicable; and other Fund expenses. This Example is intended to help you understand your ongoing costs (in dollars) of investing in the Fund and to compare these costs with the ongoing costs of investing in other mutual funds.
The Example below is based on an investment of $1,000 invested at the beginning of the period and held for the period.
The information under “Actual Performance,” together with the amount you invested, allows you to estimate actual expenses incurred over the reporting period. Simply divide your account value by $1,000 (for example, an $8,600 account value divided by $1,000 = 8.60) and multiply the result by the cost shown for your share class, in the row entitled “Expenses Incurred During Period” to estimate the expenses incurred on your account during this period.
The information under “Hypothetical Performance,” provides information about hypothetical account values and hypothetical expenses based on the Fund’s actual expense ratio and an assumed rate of return of 5% per year before expenses, which is not the Fund’s actual return. The hypothetical account values and expenses may not be used to estimate the actual ending account balance or expense you incurred for the period. You may use this information to compare the ongoing costs of investing in the Fund and other Funds. To do so, compare this 5% hypothetical example with the 5% hypothetical examples that appear in the shareholder reports of the other funds.
Please note that the expenses shown in the table are meant to highlight your ongoing costs only and do not reflect any transactional costs, such as front and back end sales charges (loads) or redemption fees, where applicable. Therefore, the hypothetical information is useful in comparing ongoing costs only, and will not help you determine the relative total costs of owning different funds or share classes. In addition, if these transactional costs were included, your costs would have been higher.
| Hypothetical Performance | ||||||||||||||||||||||||
| Actual Performance | (5% annualized return before expenses) | |||||||||||||||||||||||
| A Shares | B Shares | C Shares | R Shares | A Shares | B Shares | C Shares | R Shares | |||||||||||||||||
Beginning Account Value (6/01/07) | $ | 1,000.00 | $ | 1,000.00 | $ | 1,000.00 | $ | 1,000.00 | $ | 1,000.00 | $ | 1,000.00 | $ | 1,000.00 | $ | 1,000.00 | ||||||||
Ending Account Value (11/30/07) | $ | 1,021.20 | $ | 1,017.50 | $ | 1,018.60 | $ | 1,021.30 | $ | 1,020.76 | $ | 1,017.00 | $ | 1,018.00 | $ | 1,021.76 | ||||||||
Expenses Incurred During Period | $ | 4.36 | $ | 8.14 | $ | 7.14 | $ | 3.34 | $ | 4.36 | $ | 8.14 | $ | 7.13 | $ | 3.35 | ||||||||
For each class of the Fund, expenses are equal to the Fund’s annualized net expense ratio of .86%, 1.61%, 1.41% and ..66% for Classes A, B, C and R, respectively, multiplied by the average account value over the period, multiplied by 183/365 (to reflect the one-half year period).
Semi-Annual Report Page 8
Fund Spotlight as of 11/30/07 Nuveen Kentucky Municipal Bond Fund
| Quick Facts | ||||||||
| A Shares | B Shares | C Shares | R Shares | |||||
NAV | $10.98 | $10.99 | $10.98 | $10.98 | ||||
Latest Monthly Dividend1 | $0.0365 | $0.0295 | $0.0315 | $0.0380 | ||||
Latest Capital Gain Distribution2 | $0.0223 | $0.0223 | $0.0223 | $0.0223 | ||||
Inception Date | 5/04/87 | 2/05/97 | 10/04/93 | 2/07/97 |
Returns quoted represent past performance which is no guarantee of future results. Returns without sales charges would be lower if the sales charge were included. Current performance may be higher or lower than the performance shown. Investment returns and principal value will fluctuate so that when shares are redeemed, they may be worth more or less than their original cost. Returns do not reflect the deduction of taxes that a shareholder would pay on Fund distributions or the redemption of shares. Income is generally exempt from regular federal income taxes. Some income may be subject to state and local taxes and to the federal alternative minimum tax. Capital gains, if any, are subject to tax. For the most recent month-end performance visit www.nuveen.com or call (800) 257-8787.
Returns reflect differences in sales charges and expenses, which are primarily differences in distribution and service fees. Class A shares have a 4.2% maximum sales charge. Class A Share purchases of $1 million or more are sold at net asset value without an up-front sales charge but may be subject to a contingent deferred sales charge (CDSC), also known as a back-end sales charge, if redeemed within 18 months of purchase. Class B shares have a CDSC that begins at 5% for redemptions during the first year and declines periodically to 0% over the following five years. Class B shares automatically convert to Class A shares eight years after purchase. Class C shares have a 1% CDSC for redemptions within less than one year, which is not reflected in the one-year total return. Class R shares have no sales charge and may be purchased under limited circumstances or by specified classes of investors. Returns reflect an expense limitation by the Fund’s investment adviser.
| Average Annual Total Returns as of 11/30/07 | ||||
| A Shares | NAV | Offer | ||
1-Year | 2.25% | -2.04% | ||
5-Year | 4.66% | 3.76% | ||
10-Year | 4.62% | 4.17% | ||
| B Shares | w/o CDSC | w/CDSC | ||
1-Year | 1.56% | -2.36% | ||
5-Year | 3.89% | 3.71% | ||
10-Year | 3.98% | 3.98% | ||
| C Shares | NAV | |||
1-Year | 1.66% | |||
5-Year | 4.08% | |||
10-Year | 4.04% | |||
| R Shares | NAV | |||
1-Year | 2.51% | |||
5-Year | 4.87% | |||
10-Year | 4.82% | |||
| Tax-Free Yields | ||||
| A Shares | NAV | Offer | ||
Dividend Yield3 | 3.99% | 3.82% | ||
30-Day Yield3 | 3.32% | — | ||
SEC 30-Day Yield3,4 | — | 3.18% | ||
Taxable-Equivalent Yield4,5 | 4.90% | 4.70% | ||
| B Shares | NAV | |||
Dividend Yield3 | 3.22% | |||
30-Day Yield3 | 2.57% | |||
Taxable-Equivalent Yield5 | 3.80% | |||
| C Shares | NAV | |||
Dividend Yield3 | 3.44% | |||
30-Day Yield3 | 2.77% | |||
Taxable-Equivalent Yield5 | 4.09% | |||
| R Shares | NAV | |||
Dividend Yield3 | 4.15% | |||
SEC 30-Day Yield3 | 3.52% | |||
Taxable-Equivalent Yield5 | 5.20% | |||
| Average Annual Total Returns as of 12/31/07 | ||||
| A Shares | NAV | Offer | ||
1-Year | 2.62% | -1.72% | ||
5-Year | 4.26% | 3.36% | ||
10-Year | 4.47% | 4.02% | ||
| B Shares | w/o CDSC | w/CDSC | ||
1-Year | 1.93% | -2.01% | ||
5-Year | 3.49% | 3.32% | ||
10-Year | 3.86% | 3.86% | ||
| C Shares | NAV | |||
1-Year | 2.12% | |||
5-Year | 3.69% | |||
10-Year | 3.90% | |||
| R Shares | NAV | |||
1-Year | 2.88% | |||
5-Year | 4.47% | |||
10-Year | 4.68% | |||
| Portfolio Statistics | ||
Net Assets ($000) | $436,932 | |
Average Effective Maturity on Securities (Years) | 13.86 | |
Average Duration | 5.46 |
| Expense Ratios | ||||||
| Share Class | Gross Expense Ratios | Net Expense Ratios | As of Date | |||
Class A | 0.90% | 0.89% | 5/31/07 | |||
Class B | 1.65% | 1.65% | 5/31/07 | |||
Class C | 1.45% | 1.44% | 5/31/07 | |||
Class R | 0.70% | 0.69% | 5/31/07 | |||
The expense ratios shown factor in Annual Fund Operating Expenses including management fees and other fees and expenses. The Net Expense Ratios reflect a custodian fee credit from the custodian bank whereby certain fees and expenses are reduced by credits earned on the Fund’s cash on deposit with the bank. There is no guarantee that the Fund will earn such credits in the future. Absent the credit, the Net Expense Ratios would be higher and total returns would be less. These expense ratios may vary from the expense ratios shown elsewhere in this report.
| 1 | Paid December 3, 2007. This is the latest monthly tax-exempt dividend declared during the period ended November 30, 2007. |
| 2 | Paid December 5, 2006. Capital gains are subject to federal taxation. |
| 3 | Dividend Yield is the most recent dividend per share (annualized) divided by the appropriate price per share. The SEC 30-Day Yield is computed under an SEC standardized formula and is based on the maximum offer price per share. The 30-Day Yield is computed under the same formula but is based on the Net Asset Value (NAV) per share. The Dividend Yield may differ from the SEC 30-Day Yield because the Fund may be paying out more or less than it is earning and it may not include the effect of amortization of bond premium. |
| 4 | The SEC 30-Day Yield and Taxable-Equivalent Yield on A Shares at NAV applies only to A Shares purchased at no-load pursuant to the Fund’s policy permitting waiver of the A Share load in certain specified circumstances. |
| 5 | The Taxable-Equivalent Yield represents the yield that must be earned on a fully taxable investment in order to equal the yield of the Fund on an after-tax basis at a specified tax rate. With respect to investments that generate qualified dividend income that is taxable at a maximum rate of 15%, the Taxable-Equivalent Yield is lower. The Taxable-Equivalent Yield is based on the Fund’s 30-Day Yield on the indicated date and a combined federal and state income tax rate of 32.3%. |
Semi-Annual Report Page 9
Fund Spotlight as of 11/30/07 Nuveen Kentucky Municipal Bond Fund
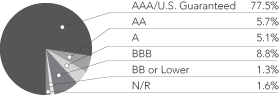
Bond Credit Quality1,2
Industries2
Tax Obligation/Limited | 24.5% | |
U.S. Guaranteed | 18.5% | |
Water and Sewer | 11.5% | |
Health Care | 11.0% | |
Utilities | 10.6% | |
Tax Obligation/General | 7.6% | |
Transportation | 4.8% | |
Other | 11.5% |
| 1 | The percentage of AAA ratings shown in the foregoing chart reflects the AAA ratings on certain bonds insured by AMBAC, FGIC or MBIA as of November 30, 2007. As explained earlier in the Portfolio Managers’ Comments section of this report, one rating agency has reduced the rating for AMBAC to AA, and one or more rating agencies have placed each of these insurers on “negative credit watch”, which may presage one or more rating reductions for such insurer or insurers in the future. If one or more insurers’ ratings are reduced below AAA by these rating agencies, it would likely reduce the effective rating of many of the bonds insured by that insurer or insurers, and thereby reduce the percentage of the portfolio rated AAA from the percentage shown in the foregoing chart. |
| 2 | As a percentage of total investments as of November 30, 2007. Holdings are subject to change. |
Expense Example
As a shareholder of the Fund, you incur two types of costs: (1) transaction costs, including front and back end sales charges (loads) or redemption fees, where applicable; and (2) ongoing costs, including management fees; distribution and service (12b-1) fees, where applicable; and other Fund expenses. This Example is intended to help you understand your ongoing costs (in dollars) of investing in the Fund and to compare these costs with the ongoing costs of investing in other mutual funds.
The Example below is based on an investment of $1,000 invested at the beginning of the period and held for the period.
The information under “Actual Performance,” together with the amount you invested, allows you to estimate actual expenses incurred over the reporting period. Simply divide your account value by $1,000 (for example, an $8,600 account value divided by $1,000 = 8.60) and multiply the result by the cost shown for your share class, in the row entitled “Expenses Incurred During Period” to estimate the expenses incurred on your account during this period.
The information under “Hypothetical Performance,” provides information about hypothetical account values and hypothetical expenses based on the Fund’s actual expense ratio and an assumed rate of return of 5% per year before expenses, which is not the Fund’s actual return. The hypothetical account values and expenses may not be used to estimate the actual ending account balance or expense you incurred for the period. You may use this information to compare the ongoing costs of investing in the Fund and other Funds. To do so, compare this 5% hypothetical example with the 5% hypothetical examples that appear in the shareholder reports of the other funds.
Please note that the expenses shown in the table are meant to highlight your ongoing costs only and do not reflect any transactional costs, such as front and back end sales charges (loads) or redemption fees, where applicable. Therefore, the hypothetical information is useful in comparing ongoing costs only, and will not help you determine the relative total costs of owning different funds or share classes. In addition, if these transactional costs were included, your costs would have been higher.
| Hypothetical Performance | ||||||||||||||||||||||||
| Actual Performance | (5% annualized return before expenses) | |||||||||||||||||||||||
| A Shares | B Shares | C Shares | R Shares | A Shares | B Shares | C Shares | R Shares | |||||||||||||||||
Beginning Account Value (6/01/07) | $ | 1,000.00 | $ | 1,000.00 | $ | 1,000.00 | $ | 1,000.00 | $ | 1,000.00 | $ | 1,000.00 | $ | 1,000.00 | $ | 1,000.00 | ||||||||
Ending Account Value (11/30/07) | $ | 1,022.10 | $ | 1,018.20 | $ | 1,019.20 | $ | 1,022.90 | $ | 1,020.46 | $ | 1,016.75 | $ | 1,017.70 | $ | 1,021.51 | ||||||||
Expenses Incurred During Period | $ | 4.66 | $ | 8.40 | $ | 7.44 | $ | 3.60 | $ | 4.66 | $ | 8.39 | $ | 7.44 | $ | 3.60 | ||||||||
For each class of the Fund, expenses are equal to the Fund’s annualized net expense ratio of .92%, 1.66%, 1.47% and ..71% for Classes A, B, C and R, respectively, multiplied by the average account value over the period, multiplied by 183/365 (to reflect the one-half year period).
Semi-Annual Report Page 10
Fund Spotlight as of 11/30/07 Nuveen Michigan Municipal Bond Fund
| Quick Facts | ||||||||
| A Shares | B Shares | C Shares | R Shares | |||||
NAV | $11.40 | $11.42 | $11.39 | $11.40 | ||||
Latest Monthly Dividend1 | $0.0395 | $0.0325 | $0.0340 | $0.0415 | ||||
Latest Capital Gain and Ordinary Income Distribution2 | $0.0993 | $0.0993 | $0.0993 | $0.0993 | ||||
Inception Date | 6/27/85 | 2/03/97 | 6/22/93 | 2/03/97 |
Returns quoted represent past performance which is no guarantee of future results. Returns without sales charges would be lower if the sales charge were included. Current performance may be higher or lower than the performance shown. Investment returns and principal value will fluctuate so that when shares are redeemed, they may be worth more or less than their original cost. Returns do not reflect the deduction of taxes that a shareholder would pay on Fund distributions or the redemption of shares. Income is generally exempt from regular federal income taxes. Some income may be subject to state and local taxes and to the federal alternative minimum tax. Capital gains, if any, are subject to tax. For the most recent month-end performance visit www.nuveen.com or call (800) 257-8787.
Returns reflect differences in sales charges and expenses, which are primarily differences in distribution and service fees. Class A shares have a 4.2% maximum sales charge. Class A Share purchases of $1 million or more are sold at net asset value without an up-front sales charge but may be subject to a contingent deferred sales charge (CDSC), also known as a back-end sales charge, if redeemed within 18 months of purchase. Class B shares have a CDSC that begins at 5% for redemptions during the first year and declines periodically to 0% over the following five years. Class B shares automatically convert to Class A shares eight years after purchase. Class C shares have a 1% CDSC for redemptions within less than one year, which is not reflected in the one-year total return. Class R shares have no sales charge and may be purchased under limited circumstances or by specified classes of investors. Returns reflect an expense limitation by the Fund’s investment adviser.
| Average Annual Total Returns as of 11/30/07 | ||||
| A Shares | NAV | Offer | ||
1-Year | 2.16% | -2.10% | ||
5-Year | 4.50% | 3.62% | ||
10-Year | 4.72% | 4.26% | ||
| B Shares | w/o CDSC | w/CDSC | ||
1-Year | 1.32% | -2.56% | ||
5-Year | 3.73% | 3.56% | ||
10-Year | 4.10% | 4.10% | ||
| C Shares | NAV | |||
1-Year | 1.49% | |||
5-Year | 3.94% | |||
10-Year | 4.14% | |||
| R Shares | NAV | |||
1-Year | 2.29% | |||
5-Year | 4.72% | |||
10-Year | 4.92% | |||
| Tax-Free Yields | ||||
| A Shares | NAV | Offer | ||
Dividend Yield3 | 4.16% | 3.98% | ||
30-Day Yield3 | 3.51% | — | ||
SEC 30-Day Yield3,4 | — | 3.36% | ||
Taxable-Equivalent Yield4,5 | 5.07% | 4.86% | ||
| B Shares | NAV | |||
Dividend Yield3 | 3.42% | |||
30-Day Yield3 | 2.77% | |||
Taxable-Equivalent Yield5 | 4.00% | |||
| C Shares | NAV | |||
Dividend Yield3 | 3.58% | |||
30-Day Yield3 | 2.96% | |||
Taxable-Equivalent Yield5 | 4.28% | |||
| R Shares | NAV | |||
Dividend Yield3 | 4.37% | |||
SEC 30-Day Yield3 | 3.71% | |||
Taxable-Equivalent Yield5 | 5.36% | |||
| Average Annual Total Returns as of 12/31/07 | ||||
| A Shares | NAV | Offer | ||
1-Year | 2.45% | -1.88% | ||
5-Year | 4.04% | 3.16% | ||
10-Year | 4.57% | 4.12% | ||
| B Shares | w/o CDSC | w/CDSC | ||
1-Year | 1.70% | -2.22% | ||
5-Year | 3.27% | 3.10% | ||
10-Year | 3.95% | 3.95% | ||
| C Shares | NAV | |||
1-Year | 1.86% | |||
5-Year | 3.46% | |||
10-Year | 4.00% | |||
| R Shares | NAV | |||
1-Year | 2.67% | |||
5-Year | 4.25% | |||
10-Year | 4.77% | |||
| Portfolio Statistics | ||
Net Assets ($000) | $225,125 | |
Average Effective Maturity on Securities (Years) | 15.01 | |
Average Duration | 5.69 |
| Expense Ratios | ||||||
| Share Class | Gross Expense Ratios | Net Expense Ratios | As of Date | |||
Class A | 0.91% | 0.90% | 5/31/07 | |||
Class B | 1.67% | 1.65% | 5/31/07 | |||
Class C | 1.46% | 1.45% | 5/31/07 | |||
Class R | 0.71% | 0.70% | 5/31/07 | |||
The expense ratios shown factor in Annual Fund Operating Expenses including management fees and other fees and expenses. The Net Expense Ratios reflect a custodian fee credit from the custodian bank whereby certain fees and expenses are reduced by credits earned on the Fund’s cash on deposit with the bank. There is no guarantee that the Fund will earn such credits in the future. Absent the credit, the Net Expense Ratios would be higher and total returns would be less. These expense ratios may vary from the expense ratios shown elsewhere in this report.
| 1 | Paid December 3, 2007. This is the latest monthly tax-exempt dividend declared during the period ended November 30, 2007. |
| 2 | Paid December 5, 2006. Capital gains and/or ordinary income are subject to federal taxation. |
| 3 | Dividend Yield is the most recent dividend per share (annualized) divided by the appropriate price per share. The SEC 30-Day Yield is computed under an SEC standardized formula and is based on the maximum offer price per share. The 30-Day Yield is computed under the same formula but is based on the Net Asset Value (NAV) per share. The Dividend Yield may differ from the SEC 30-Day Yield because the Fund may be paying out more or less than it is earning and it may not include the effect of amortization of bond premium. |
| 4 | The SEC 30-Day Yield and Taxable-Equivalent Yield on A Shares at NAV applies only to A Shares purchased at no-load pursuant to the Fund’s policy permitting waiver of the A Share load in certain specified circumstances. |
| 5 | The Taxable-Equivalent Yield represents the yield that must be earned on a fully taxable investment in order to equal the yield of the Fund on an after-tax basis at a specified tax rate. With respect to investments that generate qualified dividend income that is taxable at a maximum rate of 15%, the Taxable-Equivalent Yield is lower. The Taxable-Equivalent Yield is based on the Fund’s 30-Day Yield on the indicated date and a combined federal and state income tax rate of 30.8%. |
Semi-Annual Report Page 11
Fund Spotlight as of 11/30/07 Nuveen Michigan Municipal Bond Fund
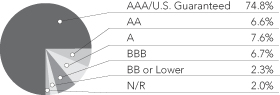
Bond Credit Quality1,2
Industries2
Tax Obligation/General | 35.9% | |
Tax Obligation/Limited | 13.6% | |
U.S. Guaranteed | 12.9% | |
Water and Sewer | 11.7% | |
Health Care | 10.6% | |
Education and Civic Organizations | 4.6% | |
Other | 10.7% |
| 1 | The percentage of AAA ratings shown in the foregoing chart reflects the AAA ratings on certain bonds insured by AMBAC, FGIC or MBIA as of November 30, 2007. As explained earlier in the Portfolio Managers’ Comments section of this report, one rating agency has reduced the rating for AMBAC to AA, and one or more rating agencies have placed each of these insurers on “negative credit watch”, which may presage one or more rating reductions for such insurer or insurers in the future. If one or more insurers’ ratings are reduced below AAA by these rating agencies, it would likely reduce the effective rating of many of the bonds insured by that insurer or insurers, and thereby reduce the percentage of the portfolio rated AAA from the percentage shown in the foregoing chart. |
| 2 | As a percentage of total investments as of November 30 , 2007. Holdings are subject to change. |
Expense Example
As a shareholder of the Fund, you incur two types of costs: (1) transaction costs, including front and back end sales charges (loads) or redemption fees, where applicable; and (2) ongoing costs, including management fees; distribution and service (12b-1) fees, where applicable; and other Fund expenses. This Example is intended to help you understand your ongoing costs (in dollars) of investing in the Fund and to compare these costs with the ongoing costs of investing in other mutual funds.
The Example below is based on an investment of $1,000 invested at the beginning of the period and held for the period.
The information under “Actual Performance,” together with the amount you invested, allows you to estimate actual expenses incurred over the reporting period. Simply divide your account value by $1,000 (for example, an $8,600 account value divided by $1,000 = 8.60) and multiply the result by the cost shown for your share class, in the row entitled “Expenses Incurred During Period” to estimate the expenses incurred on your account during this period.
The information under “Hypothetical Performance,” provides information about hypothetical account values and hypothetical expenses based on the Fund’s actual expense ratio and an assumed rate of return of 5% per year before expenses, which is not the Fund’s actual return. The hypothetical account values and expenses may not be used to estimate the actual ending account balance or expense you incurred for the period. You may use this information to compare the ongoing costs of investing in the Fund and other Funds. To do so, compare this 5% hypothetical example with the 5% hypothetical examples that appear in the shareholder reports of the other funds.
Please note that the expenses shown in the table are meant to highlight your ongoing costs only and do not reflect any transactional costs, such as front and back end sales charges (loads) or redemption fees, where applicable. Therefore, the hypothetical information is useful in comparing ongoing costs only, and will not help you determine the relative total costs of owning different funds or share classes. In addition, if these transactional costs were included, your costs would have been higher.
| Hypothetical Performance | ||||||||||||||||||||||||
| Actual Performance | (5% annualized return before expenses) | |||||||||||||||||||||||
| A Shares | B Shares | C Shares | R Shares | A Shares | B Shares | C Shares | R Shares | |||||||||||||||||
Beginning Account Value (6/01/07) | $ | 1,000.00 | $ | 1,000.00 | $ | 1,000.00 | $ | 1,000.00 | $ | 1,000.00 | $ | 1,000.00 | $ | 1,000.00 | $ | 1,000.00 | ||||||||
Ending Account Value (11/30/07) | $ | 1,020.20 | $ | 1,016.40 | $ | 1,017.20 | $ | 1,021.30 | $ | 1,020.86 | $ | 1,017.10 | $ | 1,018.10 | $ | 1,021.81 | ||||||||
Expenses Incurred During Period | $ | 4.25 | $ | 8.04 | $ | 7.03 | $ | 3.29 | $ | 4.26 | $ | 8.04 | $ | 7.03 | $ | 3.29 | ||||||||
For each class of the Fund, expenses are equal to the Fund’s annualized net expense ratio of .84%, 1.59%, 1.39% and ..65% for Classes A, B, C and R, respectively, multiplied by the average account value over the period, multiplied by 183/365 (to reflect the one-half year period).
Semi-Annual Report Page 12
Fund Spotlight as of 11/30/07 Nuveen Missouri Municipal Bond Fund
| Quick Facts | ||||||||
| A Shares | B Shares | C Shares | R Shares | |||||
NAV | $10.98 | $10.99 | $10.97 | $10.99 | ||||
Latest Monthly Dividend1 | $0.0375 | $0.0305 | $0.0325 | $0.0395 | ||||
Latest Capital Gain Distribution2 | $0.0068 | $0.0068 | $0.0068 | $0.0068 | ||||
Inception Date | 8/03/87 | 2/06/97 | 2/02/94 | 2/19/97 |
Returns quoted represent past performance which is no guarantee of future results. Returns without sales charges would be lower if the sales charge were included. Current performance may be higher or lower than the performance shown. Investment returns and principal value will fluctuate so that when shares are redeemed, they may be worth more or less than their original cost. Returns do not reflect the deduction of taxes that a shareholder would pay on Fund distributions or the redemption of shares. Income is generally exempt from regular federal income taxes. Some income may be subject to state and local taxes and to the federal alternative minimum tax. Capital gains, if any, are subject to tax. For the most recent month-end performance visit www.nuveen.com or call (800) 257-8787.
Returns reflect differences in sales charges and expenses, which are primarily differences in distribution and service fees. Class A shares have a 4.2% maximum sales charge. Class A Share purchases of $1 million or more are sold at net asset value without an up-front sales charge but may be subject to a contingent deferred sales charge (CDSC), also known as a back-end sales charge, if redeemed within 18 months of purchase. Class B shares have a CDSC that begins at 5% for redemptions during the first year and declines periodically to 0% over the following five years. Class B shares automatically convert to Class A shares eight years after purchase. Class C shares have a 1% CDSC for redemptions within less than one year, which is not reflected in the one-year total return. Class R shares have no sales charge and may be purchased under limited circumstances or by specified classes of investors. Returns reflect an expense limitation by the Fund’s investment adviser.
| Average Annual Total Returns as of 11/30/07 | ||||
| A Shares | NAV | Offer | ||
1-Year | 1.72% | -2.53% | ||
5-Year | 4.67% | 3.77% | ||
10-Year | 4.69% | 4.24% | ||
| B Shares | w/o CDSC | w/CDSC | ||
1-Year | 0.95% | -2.96% | ||
5-Year | 3.88% | 3.71% | ||
10-Year | 4.07% | 4.07% | ||
| C Shares | NAV | |||
1-Year | 1.17% | |||
5-Year | 4.09% | |||
10-Year | 4.12% | |||
| R Shares | NAV | |||
1-Year | 1.94% | |||
5-Year | 4.88% | |||
10-Year | 4.90% | |||
| Tax-Free Yields | ||||
| A Shares | NAV | Offer | ||
Dividend Yield3 | 4.10% | 3.93% | ||
30-Day Yield3 | 4.00% | — | ||
SEC 30-Day Yield3,4 | — | 3.83% | ||
Taxable-Equivalent Yield4,5 | 5.91% | 5.66% | ||
| B Shares | NAV | |||
Dividend Yield3 | 3.33% | |||
30-Day Yield3 | 3.25% | |||
Taxable-Equivalent Yield5 | 4.80% | |||
| C Shares | NAV | |||
Dividend Yield3 | 3.56% | |||
30-Day Yield3 | 3.45% | |||
Taxable-Equivalent Yield5 | 5.10% | |||
| R Shares | NAV | |||
Dividend Yield3 | 4.31% | |||
SEC 30-Day Yield3 | 4.19% | |||
Taxable-Equivalent Yield5 | 6.19% | |||
Average Annual Total Returns as of 12/31/07
| ||||
| A Shares | NAV | Offer | ||
1-Year | 1.73% | -2.54% | ||
5-Year | 4.14% | 3.26% | ||
10-Year | 4.49% | 4.04% | ||
| B Shares | w/o CDSC | w/CDSC | ||
1-Year | 0.96% | -2.94% | ||
5-Year | 3.37% | 3.20% | ||
10-Year | 3.88% | 3.88% | ||
| C Shares | NAV | |||
1-Year | 1.18% | |||
5-Year | 3.58% | |||
10-Year | 3.92% | |||
| R Shares | NAV | |||
1-Year | 1.95% | |||
5-Year | 4.35% | |||
10-Year | 4.71% | |||
| Portfolio Statistics | ||
Net Assets ($000) | $247,911 | |
Average Effective Maturity on Securities (Years) | 16.17 | |
Average Duration | 6.66 |
| Expense Ratios | ||||||
| Share Class | Gross Expense Ratios | Net Expense Ratios | As of Date | |||
Class A | 0.88% | 0.87% | 5/31/07 | |||
Class B | 1.63% | 1.61% | 5/31/07 | |||
Class C | 1.43% | 1.42% | 5/31/07 | |||
Class R | 0.68% | 0.67% | 5/31/07 | |||
The expense ratios shown factor in Annual Fund Operating Expenses including management fees and other fees and expenses. The Net Expense Ratios reflect a custodian fee credit from the custodian bank whereby certain fees and expenses are reduced by credits earned on the Fund’s cash on deposit with the bank. There is no guarantee that the Fund will earn such credits in the future. Absent the credit, the Net Expense Ratios would be higher and total returns would be less. These expense ratios may vary from the expense ratios shown elsewhere in this report.
| 1 | Paid December 3, 2007. This is the latest monthly tax-exempt dividend declared during the period ended November 30, 2007. |
| 2 | Paid December 5, 2006. Capital gains are subject to federal taxation. |
| 3 | Dividend Yield is the most recent dividend per share (annualized) divided by the appropriate price per share. The SEC 30-Day Yield is computed under an SEC standardized formula and is based on the maximum offer price per share. The 30-Day Yield is computed under the same formula but is based on the Net Asset Value (NAV) per share. The Dividend Yield may differ from the SEC 30-Day Yield and Taxable-Equivalent Yield because the Fund may be paying out more or less than it is earning and it may not include the effect of amortization of bond premium. |
| 4 | The SEC 30-Day Yield and Taxable-Equivalent Yield on A Shares at NAV applies only to A Shares purchased at no-load pursuant to the Fund’s policy permitting waiver of the A Share load in certain specified circumstances. |
| 5 | The Taxable-Equivalent Yield represents the yield that must be earned on a fully taxable investment in order to equal the yield of the Fund on an after-tax basis at a specified tax rate. With respect to investments that generate qualified dividend income that is taxable at a maximum rate of 15%, the Taxable-Equivalent Yield is lower. The Taxable-Equivalent Yield is based on the Fund’s 30-Day Yield on the indicated date and a combined federal and state income tax rate of 32.3%. |
Semi-Annual Report Page 13
Fund Spotlight as of 11/30/07 Nuveen Missouri Municipal Bond Fund
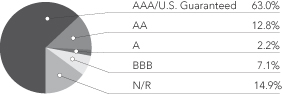
Bond Credit Quality1,2
Industries2
Tax Obligation/Limited | 19.9% | |
Tax Obligation/General | 16.2% | |
Health Care | 12.2% | |
U.S. Guaranteed | 11.3% | |
Water and Sewer | 6.8% | |
Education and Civic Organizations | 5.6% | |
Long-Term Care | 5.6% | |
Housing/Single Family | 5.3% | |
Consumer Staples | 4.9% | |
Other | 12.2% |
| 1 | The percentage of AAA ratings shown in the foregoing chart reflects the AAA ratings on certain bonds insured by AMBAC, FGIC or MBIA as of November 30, 2007. As explained earlier in the Portfolio Managers’ Comments section of this report, one rating agency has reduced the rating for AMBAC to AA, and one or more rating agencies have placed each of these insurers on “negative credit watch”, which may presage one or more rating reductions for such insurer or insurers in the future. If one or more insurers’ ratings are reduced below AAA by these rating agencies, it would likely reduce the effective rating of many of the bonds insured by that insurer or insurers, and thereby reduce the percentage of the portfolio rated AAA from the percentage shown in the foregoing chart. |
| 2 | As a percentage of total investments as of November 30, 2007. Holdings are subject to change. |
Expense Example
As a shareholder of the Fund, you incur two types of costs: (1) transaction costs, including front and back end sales charges (loads) or redemption fees, where applicable; and (2) ongoing costs, including management fees; distribution and service (12b-1) fees, where applicable; and other Fund expenses. This Example is intended to help you understand your ongoing costs (in dollars) of investing in the Fund and to compare these costs with the ongoing costs of investing in other mutual funds.
The Example below is based on an investment of $1,000 invested at the beginning of the period and held for the period.
The information under “Actual Performance,” together with the amount you invested, allows you to estimate actual expenses incurred over the reporting period. Simply divide your account value by $1,000 (for example, an $8,600 account value divided by $1,000 = 8.60) and multiply the result by the cost shown for your share class, in the row entitled “Expenses Incurred During Period” to estimate the expenses incurred on your account during this period.
The information under “Hypothetical Performance,” provides information about hypothetical account values and hypothetical expenses based on the Fund’s actual expense ratio and an assumed rate of return of 5% per year before expenses, which is not the Fund’s actual return. The hypothetical account values and expenses may not be used to estimate the actual ending account balance or expense you incurred for the period. You may use this information to compare the ongoing costs of investing in the Fund and other Funds. To do so, compare this 5% hypothetical example with the 5% hypothetical examples that appear in the shareholder reports of the other funds.
Please note that the expenses shown in the table are meant to highlight your ongoing costs only and do not reflect any transactional costs, such as front and back end sales charges (loads) or redemption fees, where applicable. Therefore, the hypothetical information is useful in comparing ongoing costs only, and will not help you determine the relative total costs of owning different funds or share classes. In addition, if these transactional costs were included, your costs would have been higher.
| Hypothetical Performance | ||||||||||||||||||||||||
| Actual Performance | (5% annualized return before expenses) | |||||||||||||||||||||||
| A Shares | B Shares | C Shares | R Shares | A Shares | B Shares | C Shares | R Shares | |||||||||||||||||
Beginning Account Value (6/01/07) | $ | 1,000.00 | $ | 1,000.00 | $ | 1,000.00 | $ | 1,000.00 | $ | 1,000.00 | $ | 1,000.00 | $ | 1,000.00 | $ | 1,000.00 | ||||||||
Ending Account Value (11/30/07) | $ | 1,016.10 | $ | 1,012.20 | $ | 1,013.30 | $ | 1,018.10 | $ | 1,020.81 | $ | 1,017.05 | $ | 1,018.05 | $ | 1,021.81 | ||||||||
Expenses Incurred During Period | $ | 4.30 | $ | 8.07 | $ | 7.07 | $ | 3.29 | $ | 4.31 | $ | 8.09 | $ | 7.08 | $ | 3.29 | ||||||||
For each class of the Fund, expenses are equal to the Fund’s annualized net expense ratio of .85%, 1.60%, 1.40% and ..65% for Classes A, B, C and R, respectively, multiplied by the average account value over the period, multiplied by 183/365 (to reflect the one-half year period).
Semi-Annual Report Page 14
Fund Spotlight as of 11/30/07 Nuveen Ohio Municipal Bond Fund
| Quick Facts | ||||||||
| A Shares | B Shares | C Shares | R Shares | |||||
NAV | $11.24 | $11.22 | $11.21 | $11.22 | ||||
Latest Monthly Dividend1 | $0.0380 | $0.0310 | $0.0330 | $0.0400 | ||||
Latest Capital Gain Distribution2 | $0.0325 | $0.0325 | $0.0325 | $0.0325 | ||||
Inception Date | 6/27/85 | 2/03/97 | 8/03/93 | 2/03/97 |
Returns quoted represent past performance which is no guarantee of future results. Returns without sales charges would be lower if the sales charge were included. Current performance may be higher or lower than the performance shown. Investment returns and principal value will fluctuate so that when shares are redeemed, they may be worth more or less than their original cost. Returns do not reflect the deduction of taxes that a shareholder would pay on Fund distributions or the redemption of shares. Income is generally exempt from regular federal income taxes. Some income may be subject to state and local taxes and to the federal alternative minimum tax. Capital gains, if any, are subject to tax. For the most recent month-end performance visit www.nuveen.com or call (800) 257-8787.
Returns reflect differences in sales charges and expenses, which are primarily differences in distribution and service fees. Class A shares have a 4.2% maximum sales charge. Class A Share purchases of $1 million or more are sold at net asset value without an up-front sales charge but may be subject to a contingent deferred sales charge (CDSC), also known as a back-end sales charge, if redeemed within 18 months of purchase. Class B shares have a CDSC that begins at 5% for redemptions during the first year and declines periodically to 0% over the following five years. Class B shares automatically convert to Class A shares eight years after purchase. Class C shares have a 1% CDSC for redemptions within less than one year, which is not reflected in the one-year total return. Class R shares have no sales charge and may be purchased under limited circumstances or by specified classes of investors. Returns reflect an expense limitation by the Fund’s investment adviser.
| Average Annual Total Returns as of 11/30/07 | ||||
| A Shares | NAV | Offer | ||
1-Year | 1.95% | -2.37% | ||
5-Year | 4.58% | 3.70% | ||
10-Year | 4.58% | 4.14% | ||
| B Shares | w/o CDSC | w/CDSC | ||
1-Year | 1.11% | -2.79% | ||
5-Year | 3.83% | 3.65% | ||
10-Year | 3.96% | 3.96% | ||
| C Shares | NAV | |||
1-Year | 1.42% | |||
5-Year | 4.03% | |||
10-Year | 4.01% | |||
| R Shares | NAV | |||
1-Year | 2.08% | |||
5-Year | 4.79% | |||
10-Year | 4.79% | |||
| Tax-Free Yields | ||||
| A Shares | NAV | Offer | ||
Dividend Yield3 | 4.06% | 3.89% | ||
30-Day Yield3 | 3.59% | — | ||
SEC 30-Day Yield3,4 | — | 3.44% | ||
Taxable-Equivalent Yield4,5 | 5.30% | 5.08% | ||
| B Shares | NAV | |||
Dividend Yield3 | 3.32% | |||
30-Day Yield3 | 2.84% | |||
Taxable-Equivalent Yield5 | 4.19% | |||
| C Shares | NAV | |||
Dividend Yield3 | 3.53% | |||
30-Day Yield3 | 3.04% | |||
Taxable-Equivalent Yield5 | 4.49% | |||
| R Shares | NAV | |||
Dividend Yield3 | 4.28% | |||
SEC 30-Day Yield3 | 3.79% | |||
Taxable-Equivalent Yield5 | 5.60% | |||
| Average Annual Total Returns as of 12/31/07 | ||||
| A Shares | NAV | Offer | ||
1-Year | 2.30% | -1.99% | ||
5-Year | 4.08% | 3.20% | ||
10-Year | 4.42% | 3.98% | ||
| B Shares | w/o CDSC | w/CDSC | ||
1-Year | 1.55% | -2.35% | ||
5-Year | 3.33% | 3.15% | ||
10-Year | 3.81% | 3.81% | ||
| C Shares | NAV | |||
1-Year | 1.77% | |||
5-Year | 3.53% | |||
10-Year | 3.85% | |||
| R Shares | NAV | |||
1-Year | 2.53% | |||
5-Year | 4.29% | |||
10-Year | 4.63% | |||
| Portfolio Statistics | ||
Net Assets ($000) | $525,223 | |
Average Effective Maturity on Securities (Years) | 15.18 | |
Average Duration | 6.47 |
| Expense Ratios | ||||||
| Share Class | Gross Expense Ratios | Net Expense Ratios | As of Date | |||
Class A | 0.98% | 0.98% | 5/31/07 | |||
Class B | 1.73% | 1.73% | 5/31/07 | |||
Class C | 1.53% | 1.53% | 5/31/07 | |||
Class R | 0.78% | 0.78% | 5/31/07 | |||
The expense ratios shown factor in Annual Fund Operating Expenses including management fees and other fees and expenses. These expense ratios may vary from the expense ratios shown elsewhere in this report.
| 1 | Paid December 3, 2007. This is the latest monthly tax-exempt dividend declared during the period ended November 30, 2007. |
| 2 | Paid December 5, 2006. Capital gains are subject to federal taxation. |
| 3 | Dividend Yield is the most recent dividend per share (annualized) divided by the appropriate price per share. The SEC 30-Day Yield is computed under an SEC standardized formula and is based on the maximum offer price per share. The 30-Day Yield is computed under the same formula but is based on the Net Asset Value (NAV) per share. The Dividend Yield may differ from the SEC 30-Day Yield because the Fund may be paying out more or less than it is earning and it may not include the effect of amortization of bond premium. |
| 4 | The SEC 30-Day Yield and Taxable-Equivalent Yield on A Shares at NAV applies only to A Shares purchased at no-load pursuant to the Fund’s policy permitting waiver of the A Share load in certain specified circumstances. |
| 5 | The Taxable-Equivalent Yield represents the yield that must be earned on a fully taxable investment in order to equal the yield of the Fund on an after-tax basis at a specified tax rate. With respect to investments that generate qualified dividend income that is taxable at a maximum rate of 15%, the Taxable-Equivalent Yield is lower. The Taxable-Equivalent Yield is based on the Fund’s 30-Day Yield on the indicated date and a combined federal and state income tax rate of 32.3%. |
Semi-Annual Report Page 15
Fund Spotlight as of 11/30/07 Nuveen Ohio Municipal Bond Fund
Bond Credit Quality1,2
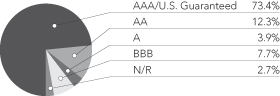
Industries2
U.S. Guaranteed | 23.8% | |
Tax Obligation/General | 20.2% | |
Tax Obligation/Limited | 11.7% | |
Health Care | 9.8% | |
Education and Civic Organizations | 7.7% | |
Utilities | 5.8% | |
Water and Sewer | 5.7% | |
Housing/Multifamily | 4.6% | |
Other | 10.7% |
| 1 | The percentage of AAA ratings shown in the foregoing chart reflects the AAA ratings on certain bonds insured by AMBAC, FGIC or MBIA as of November 30, 2007. As explained earlier in the Portfolio Managers’ Comments section of this report, one rating agency has reduced the rating for AMBAC to AA, and one or more rating agencies have placed each of these insurers on “negative credit watch”, which may presage one or more rating reductions for such insurer or insurers in the future. If one or more insurers’ ratings are reduced below AAA by these rating agencies, it would likely reduce the effective rating of many of the bonds insured by that insurer or insurers, and thereby reduce the percentage of the portfolio rated AAA from the percentage shown in the foregoing chart. |
| 2 | As a percentage of total investments as of November 30, 2007. Holdings are subject to change. |
Expense Example
As a shareholder of the Fund, you incur two types of costs: (1) transaction costs, including front and back end sales charges (loads) or redemption fees, where applicable; and (2) ongoing costs, including management fees; distribution and service (12b-1) fees, where applicable; and other Fund expenses. This Example is intended to help you understand your ongoing costs (in dollars) of investing in the Fund and to compare these costs with the ongoing costs of investing in other mutual funds.
The Example below is based on an investment of $1,000 invested at the beginning of the period and held for the period.
The information under “Actual Performance,” together with the amount you invested, allows you to estimate actual expenses incurred over the reporting period. Simply divide your account value by $1,000 (for example, an $8,600 account value divided by $1,000 = 8.60) and multiply the result by the cost shown for your share class, in the row entitled “Expenses Incurred During Period” to estimate the expenses incurred on your account during this period.
The information under “Hypothetical Performance,” provides information about hypothetical account values and hypothetical expenses based on the Fund’s actual expense ratio and an assumed rate of return of 5% per year before expenses, which is not the Fund’s actual return. The hypothetical account values and expenses may not be used to estimate the actual ending account balance or expense you incurred for the period. You may use this information to compare the ongoing costs of investing in the Fund and other Funds. To do so, compare this 5% hypothetical example with the 5% hypothetical examples that appear in the shareholder reports of the other funds.
Please note that the expenses shown in the table are meant to highlight your ongoing costs only and do not reflect any transactional costs, such as front and back end sales charges (loads) or redemption fees, where applicable. Therefore, the hypothetical information is useful in comparing ongoing costs only, and will not help you determine the relative total costs of owning different funds or share classes. In addition, if these transactional costs were included, your costs would have been higher.
| Hypothetical Performance | ||||||||||||||||||||||||
| Actual Performance | (5% annualized return before expenses) | |||||||||||||||||||||||
| A Shares | B Shares | C Shares | R Shares | A Shares | B Shares | C Shares | R Shares | |||||||||||||||||
Beginning Account Value (6/01/07) | $ | 1,000.00 | $ | 1,000.00 | $ | 1,000.00 | $ | 1,000.00 | $ | 1,000.00 | $ | 1,000.00 | $ | 1,000.00 | $ | 1,000.00 | ||||||||
Ending Account Value (11/30/07) | $ | 1,019.80 | $ | 1,015.10 | $ | 1,017.20 | $ | 1,020.00 | $ | 1,020.31 | $ | 1,016.55 | $ | 1,017.55 | $ | 1,021.31 | ||||||||
Expenses Incurred During Period | $ | 4.81 | $ | 8.59 | $ | 7.59 | $ | 3.80 | $ | 4.81 | $ | 8.59 | $ | 7.59 | $ | 3.80 | ||||||||
For each class of the Fund, expenses are equal to the Fund’s annualized net expense ratio of .95%, 1.70%, 1.50% and ..75% for Classes A, B, C and R, respectively, multiplied by the average account value over the period, multiplied by 183/365 (to reflect the one-half year period).
Semi-Annual Report Page 16
Fund Spotlight as of 11/30/07 Nuveen Wisconsin Municipal Bond Fund
| Quick Facts | ||||||||
| A Shares | B Shares | C Shares | R Shares | |||||
NAV | $10.22 | $10.24 | $10.23 | $10.25 | ||||
Latest Monthly Dividend1 | $0.0325 | $0.0260 | $0.0280 | $0.0345 | ||||
Latest Capital Gain Distribution2 | $0.0218 | $0.0218 | $0.0218 | $0.0218 | ||||
Inception Date | 6/01/94 | 2/25/97 | 2/25/97 | 2/25/97 |
Returns quoted represent past performance which is no guarantee of future results. Returns without sales charges would be lower if the sales charge were included. Current performance may be higher or lower than the performance shown. Investment returns and principal value will fluctuate so that when shares are redeemed, they may be worth more or less than their original cost. Returns do not reflect the deduction of taxes that a shareholder would pay on Fund distributions or the redemption of shares. Income is generally exempt from regular federal income taxes. Some income may be subject to state and local taxes and to the federal alternative minimum tax. Capital gains, if any, are subject to tax. For the most recent month-end performance visit www.nuveen.com or call (800) 257-8787.
Returns reflect differences in sales charges and expenses, which are primarily differences in distribution and service fees. Class A shares have a 4.2% maximum sales charge. Class A Share purchases of $1 million or more are sold at net asset value without an up-front sales charge but may be subject to a contingent deferred sales charge (CDSC), also known as a back-end sales charge, if redeemed within 18 months of purchase. Class B shares have a CDSC that begins at 5% for redemptions during the first year and declines periodically to 0% over the following five years. Class B shares automatically convert to Class A shares eight years after purchase. Class C shares have a 1% CDSC for redemptions within less than one year, which is not reflected in the one-year total return. Class R shares have no sales charge and may be purchased under limited circumstances or by specified classes of investors. Returns reflect an expense limitation by the Fund’s investment adviser.
| Average Annual Total Returns as of 11/30/07 | ||||
| A Shares | NAV | Offer | ||
1-Year | 1.60% | -2.68% | ||
5-Year | 4.24% | 3.34% | ||
10-Year | 4.55% | 4.11% | ||
| B Shares | w/o CDSC | w/CDSC | ||
1-Year | 0.74% | -3.17% | ||
5-Year | 3.45% | 3.28% | ||
10-Year | 3.93% | 3.93% | ||
| C Shares | NAV | |||
1-Year | 0.87% | |||
5-Year | 3.67% | |||
10-Year | 3.98% | |||
| R Shares | NAV | |||
1-Year | 1.93% | |||
5-Year | 4.44% | |||
10-Year | 4.76% | |||
| Tax-Free Yields | ||||
| A Shares | NAV | Offer | ||
Dividend Yield3 | 3.82% | 3.66% | ||
30-Day Yield3 | 3.32% | — | ||
SEC 30-Day Yield3,4 | — | 3.18% | ||
Taxable-Equivalent Yield4,5 | 4.95% | 4.74% | ||
| B Shares | NAV | |||
Dividend Yield3 | 3.05% | |||
30-Day Yield3 | 2.58% | |||
Taxable-Equivalent Yield5 | 3.85% | |||
| C Shares | NAV | |||
Dividend Yield3 | 3.28% | |||
30-Day Yield3 | 2.78% | |||
Taxable-Equivalent Yield5 | 4.14% | |||
| R Shares | NAV | |||
Dividend Yield3 | 4.04% | |||
SEC 30-Day Yield3 | 3.52% | |||
Taxable-Equivalent Yield5 | 5.25% | |||
| Average Annual Total Returns as of 12/31/07 | ||||
| A Shares | NAV | Offer | ||
1-Year | 1.93% | -2.31% | ||
5-Year | 3.70% | 2.81% | ||
10-Year | 4.37% | 3.92% | ||
| B Shares | w/o CDSC | w/CDSC | ||
1-Year | 1.15% | -2.76% | ||
5-Year | 2.92% | 2.74% | ||
10-Year | 3.75% | 3.75% | ||
| C Shares | NAV | |||
1-Year | 1.39% | |||
5-Year | 3.15% | |||
10-Year | 3.81% | |||
| R Shares | NAV | |||
1-Year | 2.26% | |||
5-Year | 3.90% | |||
10-Year | 4.58% | |||
| Portfolio Statistics | ||
Net Assets ($000) | $55,728 | |
Average Effective Maturity on Securities (Years) | 14.84 | |
Average Duration | 6.57 |
| Expense Ratios | ||||||
| Share Class | Gross Expense Ratios | Net Expense Ratios | As of Date | |||
Class A | 0.90% | 0.87% | 5/31/07 | |||
Class B | 1.65% | 1.62% | 5/31/07 | |||
Class C | 1.45% | 1.42% | 5/31/07 | |||
Class R | 0.69% | 0.66% | 5/31/07 | |||
The expense ratios shown factor in Annual Fund Operating Expenses including management fees and other fees and expenses. The Net Expense Ratios reflect a custodian fee credit from the custodian bank whereby certain fees and expenses are reduced by credits earned on the Fund’s cash on deposit with the bank. There is no guarantee that the Fund will earn such credits in the future. Absent the credit, the Net Expense Ratios would be higher and total returns would be less. These expense ratios may vary from the expense ratios shown elsewhere in this report.
| 1 | Paid December 3, 2007. This is the latest monthly tax-exempt dividend declared during the period ended November 30, 2007. |
| 2 | Paid December 5, 2006. Capital gains are subject to federal taxation. |
| 3 | Dividend Yield is the most recent dividend per share (annualized) divided by the appropriate price per share. The SEC 30-Day Yield is computed under an SEC standardized formula and is based on the maximum offer price per share. The 30-Day Yield is computed under the same formula but is based on the Net Asset Value (NAV) per share. The Dividend Yield may differ from the SEC 30-Day Yield because the Fund may be paying out more or less than it is earning and it may not include the effect of amortization of bond premium. |
| 4 | The SEC 30-Day Yield and Taxable-Equivalent Yield on A Shares at NAV applies only to A Shares purchased at no-load pursuant to the Fund’s policy permitting waiver of the A Share load in certain specified circumstances. |
| 5 | The Taxable-Equivalent Yield represents the yield that must be earned on a fully taxable investment in order to equal the yield of the Fund on an after-tax basis at a specified tax rate. With respect to investments that generate qualified dividend income that is taxable at a maximum rate of 15%, the Taxable-Equivalent Yield is lower. The Taxable-Equivalent Yield is based on the Fund’s 30-Day Yield on the indicated date and a combined federal and state income tax rate of 32.9%. |
Semi-Annual Report Page 17
Fund Spotlight as of 11/30/07 Nuveen Wisconsin Municipal Bond Fund
Bond Credit Quality1,2
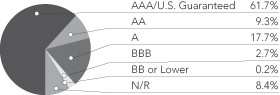
Industries2
Tax Obligation/Limited | 64.3% | |
U.S. Guaranteed | 14.7% | |
Housing/Multifamily | 7.8% | |
Utilities | 6.0% | |
Other | 7.2% |
| 1 | The percentage of AAA ratings shown in the foregoing chart reflects the AAA ratings on certain bonds insured by AMBAC, FGIC or MBIA as of November 30, 2007. As explained earlier in the Portfolio Managers’ Comments section of this report, one rating agency has reduced the rating for AMBAC to AA, and one or more rating agencies have placed each of these insurers on “negative credit watch”, which may presage one or more rating reductions for such insurer or insurers in the future. If one or more insurers’ ratings are reduced below AAA by these rating agencies, it would likely reduce the effective rating of many of the bonds insured by that insurer or insurers, and thereby reduce the percentage of the portfolio rated AAA from the percentage shown in the foregoing chart. |
| 2 | As a percentage of total investments as of November 30, 2007. Holdings are subject to change. |
Expense Example
As a shareholder of the Fund, you incur two types of costs: (1) transaction costs, including front and back end sales charges (loads) or redemption fees, where applicable; and (2) ongoing costs, including management fees; distribution and service (12b-1) fees, where applicable; and other Fund expenses. This Example is intended to help you understand your ongoing costs (in dollars) of investing in the Fund and to compare these costs with the ongoing costs of investing in other mutual funds.
The Example below is based on an investment of $1,000 invested at the beginning of the period and held for the period.
The information under “Actual Performance,” together with the amount you invested, allows you to estimate actual expenses incurred over the reporting period. Simply divide your account value by $1,000 (for example, an $8,600 account value divided by $1,000 = 8.60) and multiply the result by the cost shown for your share class, in the row entitled “Expenses Incurred During Period” to estimate the expenses incurred on your account during this period.
The information under “Hypothetical Performance,” provides information about hypothetical account values and hypothetical expenses based on the Fund’s actual expense ratio and an assumed rate of return of 5% per year before expenses, which is not the Fund’s actual return. The hypothetical account values and expenses may not be used to estimate the actual ending account balance or expense you incurred for the period. You may use this information to compare the ongoing costs of investing in the Fund and other Funds. To do so, compare this 5% hypothetical example with the 5% hypothetical examples that appear in the shareholder reports of the other funds.
Please note that the expenses shown in the table are meant to highlight your ongoing costs only and do not reflect any transactional costs, such as front and back end sales charges (loads) or redemption fees, where applicable. Therefore, the hypothetical information is useful in comparing ongoing costs only, and will not help you determine the relative total costs of owning different funds or share classes. In addition, if these transactional costs were included, your costs would have been higher.
| Hypothetical Performance | ||||||||||||||||||||||||
| Actual Performance | (5% annualized return before expenses) | |||||||||||||||||||||||
| A Shares | B Shares | C Shares | R Shares | A Shares | B Shares | C Shares | R Shares | |||||||||||||||||
Beginning Account Value (6/01/07) | $ | 1,000.00 | $ | 1,000.00 | $ | 1,000.00 | $ | 1,000.00 | $ | 1,000.00 | $ | 1,000.00 | $ | 1,000.00 | $ | 1,000.00 | ||||||||
Ending Account Value (11/30/07) | $ | 1,017.30 | $ | 1,013.40 | $ | 1,013.60 | $ | 1,019.50 | $ | 1,020.71 | $ | 1,016.95 | $ | 1,017.95 | $ | 1,021.71 | ||||||||
Expenses Incurred During Period | $ | 4.40 | $ | 8.18 | $ | 7.17 | $ | 3.39 | $ | 4.41 | $ | 8.19 | $ | 7.18 | $ | 3.40 | ||||||||
For each class of the Fund, expenses are equal to the Fund’s annualized net expense ratio of .87%, 1.62%, 1.42% and ..67% for Classes A, B, C and R, respectively, multiplied by the average account value over the period, multiplied by 183/365 (to reflect the one-half year period).
Semi-Annual Report Page 18
Shareholder
Meeting Report
The special meeting of shareholders was held in the offices of Nuveen Investments on October 12, 2007.
| Nuveen Kansas Municipal Bond Fund | Nuveen Kentucky Municipal Bond Fund | Nuveen Michigan Municipal Bond Fund | Nuveen Missouri Municipal Bond Fund | Nuveen Ohio Municipal Bond Fund | Nuveen Wisconsin Municipal Bond Fund | |||||||
To approve a new investment management agreement: | ||||||||||||
For | 6,186,766 | 21,275,850 | 10,691,793 | 11,824,751 | 26,021,136 | 2,939,308 | ||||||
Against | 119,689 | 498,823 | 382,587 | 684,578 | 971,221 | 79,498 | ||||||
Abstain | 207,526 | 892,484 | 518,633 | 677,765 | 1,504,261 | 87,955 | ||||||
Broker Non-Votes | 2,012,305 | 4,990,762 | 2,391,725 | 3,144,331 | 7,178,442 | 845,762 | ||||||
Total | 8,526,286 | 27,657,919 | 13,984,738 | 16,331,425 | 35,675,060 | 3,952,523 | ||||||
| Approval of the Board Members was reached as follows: | ||||||||||||
Robert P. Bremner | ||||||||||||
For | 8,350,634 | 26,981,872 | 13,604,177 | 14,102,889 | 34,455,167 | 3,836,202 | ||||||
Withhold | 175,652 | 676,047 | 380,561 | 2,228,536 | 1,219,893 | 116,321 | ||||||
Total | 8,526,286 | 27,657,919 | 13,984,738 | 16,331,425 | 35,675,060 | 3,952,523 | ||||||
Jack B. Evans | ||||||||||||
For | 8,351,139 | 26,982,201 | 13,597,259 | 14,114,913 | 34,454,346 | 3,861,579 | ||||||
Withhold | 175,147 | 675,718 | 387,479 | 2,216,512 | 1,220,714 | 90,944 | ||||||
Total | 8,526,286 | 27,657,919 | 13,984,738 | 16,331,425 | 35,675,060 | 3,952,523 | ||||||
William C. Hunter | ||||||||||||
For | 8,351,139 | 26,969,809 | 13,588,188 | 14,113,010 | 34,461,832 | 3,861,579 | ||||||
Withhold | 175,147 | 688,110 | 396,550 | 2,218,415 | 1,213,228 | 90,944 | ||||||
Total | 8,526,286 | 27,657,919 | 13,984,738 | 16,331,425 | 35,675,060 | 3,952,523 | ||||||
David J. Kundert | ||||||||||||
For | 8,367,580 | 26,994,999 | 13,599,355 | 14,119,712 | 34,452,465 | 3,838,890 | ||||||
Withhold | 158,706 | 662,920 | 385,383 | 2,211,713 | 1,222,595 | 113,633 | ||||||
Total | 8,526,286 | 27,657,919 | 13,984,738 | 16,331,425 | 35,675,060 | 3,952,523 | ||||||
William J. Schneider | ||||||||||||
For | 8,368,086 | 26,990,806 | 13,594,852 | 14,108,249 | 34,460,321 | 3,861,579 | ||||||
Withhold | 158,200 | 667,113 | 389,886 | 2,223,176 | 1,214,739 | 90,944 | ||||||
Total | 8,526,286 | 27,657,919 | 13,984,738 | 16,331,425 | 35,675,060 | 3,952,523 | ||||||
Timothy R. Schwertfeger | ||||||||||||
For | 8,366,472 | 26,933,518 | 13,591,631 | 14,118,556 | 34,471,719 | 3,838,890 | ||||||
Withhold | 159,814 | 724,401 | 393,107 | 2,212,869 | 1,203,341 | 113,633 | ||||||
Total | 8,526,286 | 27,657,919 | 13,984,738 | 16,331,425 | 35,675,060 | 3,952,523 | ||||||
Judith M. Stockdale | ||||||||||||
For | 8,366,275 | 26,971,817 | 13,599,522 | 14,099,050 | 34,460,427 | 3,857,891 | ||||||
Withhold | 160,011 | 686,102 | 385,216 | 2,232,375 | 1,214,633 | 94,632 | ||||||
Total | 8,526,286 | 27,657,919 | 13,984,738 | 16,331,425 | 35,675,060 | 3,952,523 | ||||||
19
| Nuveen Kansas Municipal Bond Fund | Nuveen Kentucky Municipal Bond Fund | Nuveen Michigan Municipal Bond Fund | Nuveen Missouri Municipal Bond Fund | Nuveen Ohio Municipal Bond Fund | Nuveen Wisconsin Municipal Bond Fund | |||||||
| Approval of the Board Members was reached as follows: | ||||||||||||
Carole E. Stone | ||||||||||||
For | 8,362,721 | 26,976,975 | 13,593,697 | 14,101,409 | 34,458,183 | 3,859,871 | ||||||
Withhold | 163,565 | 680,944 | 391,041 | 2,230,016 | 1,216,877 | 92,652 | ||||||
Total | 8,526,286 | 27,657,919 | 13,984,738 | 16,331,425 | 35,675,060 | 3,952,523 | ||||||
| To ratify the selection of PricewaterhouseCoopers LLP as the independent registered public accounting firm for the current fiscal year: | ||||||||||||
For | 8,317,113 | 26,540,488 | 13,547,960 | 14,307,515 | 34,461,535 | 3,859,856 | ||||||
Against | 57,488 | 222,974 | 89,484 | 1,599,335 | 384,499 | 39,317 | ||||||
Abstain | 151,685 | 894,457 | 347,294 | 424,575 | 829,026 | 53,350 | ||||||
Total | 8,526,286 | 27,657,919 | 13,984,738 | 16,331,425 | 35,675,060 | 3,952,523 | ||||||
20
Portfolio of Investments (Unaudited)
Nuveen Kansas Municipal Bond Fund
November 30, 2007
| Principal Amount (000) | Description (1) | Optional Call Provisions (2) | Ratings (3) | Value | ||||||
| Education and Civic Organizations – 1.9% | ||||||||||
| $ | 1,000 | Kansas Development Finance Authority, Athletic Facility Revenue Bonds, University of Kansas Athletic Corporation Project, Series 2004K, 5.000%, 6/01/19 | 6/14 at 100.00 | A1 | $ | 1,044,820 | ||||
| 1,200 | Kansas Development Finance Authority, Board of Regents, Revenue Bonds, Kansas State University Housing System, Series 2005A, 5.000%, 4/01/22 – MBIA Insured | 4/15 at 100.00 | AAA | 1,268,304 | ||||||
| 2,200 | Total Education and Civic Organizations | 2,313,124 | ||||||||
| Health Care – 22.2% | ||||||||||
| 1,005 | Coffeyville Public Building Commission, Kansas, Healthcare Facilities Revenue Bonds, Coffeyville Regional Medical Center, Series 2002, 5.000%, 8/01/18 – AMBAC Insured | 8/12 at 100.00 | AAA | 1,041,944 | ||||||
| 2,000 | Colby, Kansas, Health Facilities Revenue Refunding Bonds, Citizens Medical Center Inc., Series 1998, 5.625%, 8/15/16 | 8/08 at 100.00 | N/R | 1,948,180 | ||||||
| 1,680 | Kansas Development Finance Authority, Health Facilities Revenue Bonds, Hays Medical Center Inc., | 11/15 at 100.00 | A2 | 1,730,534 | ||||||
| 4,580 | Kansas Development Finance Authority, Health Facilities Revenue Bonds, Sisters of Charity of Leavenworth Health Services Corporation, Series 2000K, 6.500%, 12/01/16 | 6/10 at 101.00 | AA | 4,943,927 | ||||||
| 2,000 | Kansas Development Finance Authority, Health Facilities Revenue Bonds, Stormont-Vali Health Care Inc., Series 2007L, 4.750%, 11/15/36 – MBIA Insured | 11/17 at 100.00 | Aaa | 1,971,460 | ||||||
| 1,285 | Kansas Development Finance Authority, Hospital Revenue Bonds, Susan B. Allen Memorial Hospital, Series 2002Q, 5.375%, 12/15/16 – RAAI Insured | 12/12 at 100.00 | AA | 1,328,163 | ||||||
| 1,750 | Labette County Medical Center, Kansas, Revenue Bonds, Series 2007A, 5.750%, 9/01/37 | 9/17 at 100.00 | N/R | 1,703,643 | ||||||
| 1,000 | Lawrence, Kansas, Hospital Revenue Bonds, Lawrence Memorial Hospital, Series 2006, 5.125%, 7/01/26 | 7/16 at 100.00 | A3 | 1,020,140 | ||||||
| 1,075 | Manhattan, Kansas, Hospital Revenue Bonds, Mercy Health Center, Series 2001, | 8/11 at 100.00 | AAA | 1,119,656 | ||||||
| Newton, Kansas, Hospital Revenue Refunding Bonds, Newton Healthcare Corporation, Series 1998A: | ||||||||||
| 1,000 | 5.700%, 11/15/18 | 11/08 at 100.00 | N/R | 1,002,640 | ||||||
| 1,750 | 5.750%, 11/15/24 | 11/08 at 100.00 | N/R | 1,750,910 | ||||||
| 100 | Puerto Rico Industrial, Tourist, Educational, Medical and Environmental Control Facilities Financing Authority, Hospital Revenue Bonds, Auxilio Mutuo Hospital, Series 1995A, | 1/08 at 100.00 | AAA | 100,727 | ||||||
| 3,000 | University of Kansas Hospital Authority, Health Facilities Revenue Bonds, KU Health System, Series 2006, 5.000%, 9/01/36 | 9/16 at 100.00 | A | 2,972,640 | ||||||
| 4,780 | Wichita, Kansas, Hospital Facilities Revenue Refunding and Improvement Bonds, Via Christi Health System Inc., Series 1999-XI, 6.250%, 11/15/24 | 11/09 at 101.00 | A+ | 4,999,450 | ||||||
| 27,005 | Total Health Care | 27,634,014 | ||||||||
| Housing/Multifamily – 2.9% | ||||||||||
| Wichita, Kansas, Multifamily Housing Revenue Refunding Bonds, Shores Apartments, Series 1994XI-A: | ||||||||||
| 1,500 | 6.700%, 4/01/19 – RAAI Insured | 4/09 at 102.00 | AA | 1,559,190 | ||||||
| 2,000 | 6.800%, 4/01/24 – RAAI Insured | 4/09 at 102.00 | AA | 2,075,180 | ||||||
| 3,500 | Total Housing/Multifamily | 3,634,370 | ||||||||
| Housing/Single Family – 18.9% | ||||||||||
| 140 | Sedgwick and Shawnee Counties, Kansas, FNMA/GNMA Mortgage-Backed Securities Program Single Family Revenue Bonds, Series 2001A, 6.300%, 12/01/32 (Alternative Minimum Tax) | 12/10 at 105.00 | Aaa | 141,751 | ||||||
| 3,135 | Sedgwick and Shawnee Counties, Kansas, FNMA/GNMA Mortgage-Backed Securities Program Single Family Revenue Bonds, Series 2002B-1, 5.950%, 12/01/33 (Alternative Minimum Tax) | 12/12 at 105.00 | Aaa | 3,319,683 | ||||||
| 190 | Sedgwick and Shawnee Counties, Kansas, GNMA Mortgage-Backed Securities Program Single Family Revenue Bonds, Series 1997A-1, 6.950%, 6/01/29 (Alternative Minimum Tax) | No Opt. Call | Aaa | 199,738 | ||||||
| 180 | Sedgwick and Shawnee Counties, Kansas, GNMA Mortgage-Backed Securities Program Single Family Revenue Bonds, Series 2000A-2, 7.600%, 12/01/31 – MBIA Insured (Alternative Minimum Tax) | 12/09 at 105.00 | Aaa | 183,195 | ||||||
| 4,990 | Sedgwick and Shawnee Counties, Kansas, Mortgage Backed Securities Program Single Family Mortgage Revenue Bonds, Series 2006A1, 5.500%, 12/01/38 (Alternative Minimum Tax) | 12/16 at 104.00 | Aaa | 5,256,715 | ||||||
21
Portfolio of Investments (Unaudited)
Nuveen Kansas Municipal Bond Fund (continued)
November 30, 2007
| Principal Amount (000) | Description (1) | Optional Call Provisions (2) | Ratings (3) | Value | ||||||
| Housing/Single Family (continued) | ||||||||||
| $ | 5,365 | Sedgwick and Shawnee Counties, Kansas, Mortgage Backed Securities Program Single Family Mortgage Revenue Bonds, Series 2006A6, 5.550%, 6/01/38 (Alternative Minimum Tax) | 6/16 at 103.00 | Aaa | $ | 5,691,996 | ||||
| 4,295 | Sedgwick and Shawnee Counties, Kansas, Mortgage Backed Securities Program Single Family Mortgage Revenue Bonds, Series 2006B1, 5.300%, 12/01/38 (Alternative Minimum Tax) | 6/16 at 103.00 | Aaa | 4,485,956 | ||||||
| 3,965 | Sedgwick and Shawnee Counties, Kansas, Mortgage Backed Securities Program Single Family Mortgage Revenue Bonds, Series 2007B4, 5.550%, 12/01/38 (Alternative Minimum Tax) | 12/16 at 104.00 | Aaa | 4,151,910 | ||||||
| 22,260 | Total Housing/Single Family | 23,430,944 | ||||||||
| Industrials – 1.7% | ||||||||||
| 1,025 | Wichita Airport Authority, Kansas, Special Facilities Revenue Bonds, Cessna Citation Service Center, | 6/12 at 101.00 | A– | 1,058,548 | ||||||
| 1,000 | Wichita, Kansas, Industrial Revenue Bonds, NMF America Inc. Series 2000-II, 5.800%, 8/01/15 (Alternative Minimum Tax) | 2/08 at 101.00 | AA | 1,011,290 | ||||||
| 2,025 | Total Industrials | 2,069,838 | ||||||||
| Long-Term Care – 0.3% | ||||||||||
| 500 | Sedgwick County, Kansas, Healthcare Facilities Revenue Bonds, Catholic Care Center Inc., Series 2001, 5.750%, 11/15/23 | 11/09 at 100.00 | A | 509,980 | ||||||
| Materials – 3.0% | ||||||||||
| 3,700 | Ford County, Kansas, Sewage and Solid Waste Disposal Revenue Bonds, Excel Corporation/Cargill Inc. Project, Series 1998, 5.400%, 6/01/28 (Alternative Minimum Tax) | 6/08 at 102.00 | A | 3,761,975 | ||||||
| Tax Obligation/General – 10.8% | ||||||||||
| 2,500 | Butler and Sedgwick Counties Unified School District 385, Andover, Kansas, General Obligation Refunding and Improvement Bonds, Series 2000, 6.000%, 9/01/16 – FSA Insured | No Opt. Call | AAA | 2,932,950 | ||||||
| 65 | Cowley County Unified School District 465, Winfield, Kansas, General Obligation Bonds, Series 2003, 5.250%, 10/01/23 – MBIA Insured | 10/13 at 100.00 | AAA | 69,328 | ||||||
| 1,500 | Douglas County Unified School District 497, Kansas, General Obligation Bonds, Series 2006A, 5.000%, 9/01/25 – MBIA Insured | 9/16 at 100.00 | Aaa | 1,588,725 | ||||||
| 1,100 | Montgomery County Unified School District 445, Coffeyville, Kansas, General Obligation Bonds, Series 2002, 5.000%, 4/01/22 – FGIC Insured | 4/12 at 100.00 | AAA | 1,145,111 | ||||||
| 3,000 | Neosho County Unified School District 413, Kansas, General Obligation Bonds, Series 2006, 5.000%, 9/01/31 – FSA Insured | 9/14 at 100.00 | Aaa | 3,124,440 | ||||||
| Puerto Rico, General Obligation and Public Improvement Bonds, Series 2001A: | ||||||||||
| 1,000 | 5.500%, 7/01/20 – MBIA Insured | No Opt. Call | AAA | 1,128,660 | ||||||
| 330 | 5.375%, 7/01/28 | 7/11 at 100.00 | BBB– | 334,703 | ||||||
| 1,250 | Sedgwick County Unified School District 259, Wichita, Kansas, General Obligation Bonds, Series 2000, 3.500%, 9/01/16 | 9/10 at 100.00 | AA | 1,226,088 | ||||||
| 1,795 | Wichita, Kansas, General Obligation Bonds, Series 2002, 5.000%, 4/01/17 | 4/09 at 101.00 | AA | 1,847,845 | ||||||
| 12,540 | Total Tax Obligation/General | 13,397,850 | ||||||||
| Tax Obligation/Limited – 27.2% | ||||||||||
| 3,000 | Butler County Public Building Commission, Kansas, Improvement Revenue Bonds, Public Facilities Projects, Series 2000, 5.550%, 10/01/21 – MBIA Insured | 10/10 at 100.00 | Aaa | 3,171,600 | ||||||
| Kansas Department of Transportation, Highway Revenue Bonds, Series 2004A: | ||||||||||
| 1,000 | 5.000%, 3/01/20 | 3/14 at 100.00 | AAA | 1,066,170 | ||||||
| 5,000 | 5.000%, 3/01/23 | 3/14 at 100.00 | AAA | 5,255,549 | ||||||
| 5,000 | Kansas Development Finance Authority, Board of Regents, Revenue Bonds, Scientific Research and Development Facilities Projects, Series 2003C, 5.000%, 10/01/23 – AMBAC Insured | 4/13 at 102.00 | AAA | 5,256,949 | ||||||
| 500 | Kansas Development Finance Authority, Lease Revenue Bonds, Department of Administration, State Capitol Restoration Parking Facility Project, Series 2002C, 5.000%, 10/01/21 – FSA Insured | 10/12 at 100.00 | AAA | 526,140 | ||||||
| 1,140 | Kansas Development Finance Authority, Lease Revenue Bonds, Department of Administration, State Capitol Restoration Project, Series 2004G-1, 5.125%, 4/01/21 – MBIA Insured | 4/14 at 100.00 | AAA | 1,215,628 | ||||||
22
| Principal Amount (000) | Description (1) | Optional Call Provisions (2) | Ratings (3) | Value | |||||||
| Tax Obligation/Limited (continued) | |||||||||||
| Kansas Development Finance Authority, Revenue Bonds, Department of Administration, Comprehensive Transportation Program, Series 2006A: | |||||||||||
| $ | 3,900 | 5.000%, 11/01/23 – FGIC Insured | 11/16 at 100.00 | AAA | $ | 4,110,678 | |||||
| 1,000 | 5.000%, 11/01/25 – FGIC Insured | 11/16 at 100.00 | AAA | 1,047,220 | |||||||
| 1,000 | Kansas Development Finance Authority, Revenue Bonds, State Projects, Series 2001W, | 10/11 at 100.00 | AAA | 1,052,630 | |||||||
| 2,355 | Kansas Development Finance Authority, Revenue Bonds, State Projects, Series 2003J, | 8/13 at 100.00 | AAA | 2,526,939 | |||||||
| 1,155 | Kansas Development Finance Authority, Revenue Bonds, State Projects, Series 2004A, | 4/14 at 101.00 | AAA | 1,215,661 | |||||||
| 5,000 | Overland Park Development Corporation, Kansas, First Tier Revenue Bonds, Overland Park Convention Center, Series 2007A, 5.250%, 1/01/32 – AMBAC Insured | 1/17 at 100.00 | AAA | 5,162,050 | |||||||
| 2,000 | Virgin Islands Public Finance Authority, Gross Receipts Taxes Loan Note, Series 1999A, 6.375%, 10/01/19 | 10/10 at 101.00 | BBB+ | 2,156,480 | |||||||
| 32,050 | Total Tax Obligation/Limited | 33,763,694 | |||||||||
| U.S. Guaranteed – 2.6% (4) | |||||||||||
| 1,800 | Overland Park Development Corporation, Kansas, First Tier Revenue Bonds, Overland Park Convention Center, Series 2001A, 7.375%, 1/01/32 (Pre-refunded 1/01/11) | 1/11 at 101.00 | N/R | (4) | 2,027,196 | ||||||
| 1,010 | Wichita, Kansas, Revenue Bonds, CSJ Health System of Wichita, Inc., Series 1985-XXV, 7.200%, 10/01/15 (ETM) | 2/08 at 100.00 | A+ | (4) | 1,192,699 | ||||||
| 2,810 | Total U.S. Guaranteed | 3,219,895 | |||||||||
| Utilities – 1.7% | |||||||||||
| 1,000 | Wyandotte County-Kansas City Unified Government, Kansas, Utility System Revenue Bonds, Series 2004B, 5.000%, 9/01/24 – FSA Insured | 9/14 at 100.00 | AAA | 1,042,070 | |||||||
| 1,000 | Wynadotte County-Kansas City Unified Government, Kansas, Industrial Revenue Bonds, Board of Public Utilities Office Building Complex, Series 2001, 5.000%, 5/01/21 – MBIA Insured | 5/11 at 100.00 | AAA | 1,039,250 | |||||||
| 2,000 | Total Utilities | 2,081,320 | |||||||||
| Water and Sewer – 6.6% | |||||||||||
| 2,300 | Kansas Development Finance Authority, Water Pollution Control Revolving Fund Leveraged Bonds, | 11/12 at 100.00 | AAA | 2,407,686 | |||||||
| 5,500 | Wichita, Kansas, Water and Sewerage Utility Revenue Bonds, Series 2003, | 10/13 at 100.00 | AAA | 5,764,219 | |||||||
| 7,800 | Total Water and Sewer | 8,171,905 | |||||||||
| $ | 118,390 | Total Investments (cost $121,135,707) – 99.8% | 123,988,909 | ||||||||
Other Assets Less Liabilities – 0.2% | 273,516 | ||||||||||
Net Assets – 100% | $ | 124,262,425 | |||||||||
| (1) | All percentages shown in the Portfolio of Investments are based on net assets unless otherwise noted. |
| (2) | Optional Call Provisions: Dates (month and year) and prices of the earliest optional call or redemption. There may be other call provisions at varying prices at later dates. Certain mortgage-backed securities may be subject to periodic principal paydowns. |
| (3) | Ratings: Using the higher of Standard & Poor’s Group (“Standard & Poor’s”) or Moody’s Investor Service, Inc. (“Moody’s”) rating. Ratings below BBB by Standard & Poor’s or Baa by Moody’s are considered to be below investment grade. |
| The AAA ratings shown in the Portfolio of Investments reflects the AAA ratings on certain bonds insured by AMBAC, FGIC or MBIA as of November 30, 2007. As explained earlier in the Portfolio Managers’ Comments section of this report, one rating agency has reduced the rating for AMBAC to AA, and one or more rating agencies have placed each of these insurers on “negative credit watch”, which may presage one or more rating reductions for such insurer or insurers in the future. If one or more insurers’ ratings are reduced below AAA by these rating agencies, it would likely reduce the effective rating of many of the bonds insured by that insurer or insurers. |
| (4) | Backed by an escrow or trust containing sufficient U.S. Government or U.S. Government agency securities which ensure the timely payment of principal and interest. Such investments are normally considered to be equivalent to AAA rated securities. |
| N/R | Not rated. |
| (ETM) | Escrowed to maturity. |
See accompanying notes to financial statements.
23
Portfolio of Investments (Unaudited)
Nuveen Kentucky Municipal Bond Fund
November 30, 2007
| Principal Amount (000) | Description (1) | Optional Call Provisions (2) | Ratings (3) | Value | ||||||
| Consumer Staples – 1.0% | ||||||||||
| $ | 4,685 | Puerto Rico, The Children’s Trust Fund, Tobacco Settlement Asset-Backed Refunding Bonds, Series 2002, 5.375%, 5/15/33 | 5/12 at 100.00 | BBB | $ | 4,576,917 | ||||
| Education and Civic Organizations – 3.2% | ||||||||||
| 1,000 | Campbellsville, Kentucky, Revenue Bonds, Campbellsville University, Series 2005, 5.700%, 3/01/34 | 3/15 at 100.00 | N/R | 1,015,790 | ||||||
| 6,260 | Columbia, Kentucky, Educational Development Revenue Bonds, Lindsey Wilson College Project, | 4/11 at 101.00 | BBB– | 6,584,769 | ||||||
| 1,000 | Kentucky Asset/Liability Commission, General Receipts Revenue Bonds, University of Kentucky, | 10/15 at 100.00 | AAA | 1,086,970 | ||||||
| 2,500 | Puerto Rico Industrial, Tourist, Educational, Medical and Environmental Control Facilities Financing Authority, Higher Education Revenue Bonds, Ana G. Mendez University System, Series 1999, | 2/09 at 101.00 | BBB– | 2,500,525 | ||||||
| 3,000 | Puerto Rico Industrial, Tourist, Educational, Medical and Environmental Control Facilities Financing Authority, Higher Education Revenue Bonds, University of the Sacred Heart, Series 2001, | 9/11 at 100.00 | BBB | 2,965,620 | ||||||
| 13,760 | Total Education and Civic Organizations | 14,153,674 | ||||||||
| Health Care – 11.0% | ||||||||||
| 3,820 | Clark County, Kentucky, Hospital Revenue Refunding and Improvement Bonds, Clark Regional Medical Center Project, Series 1997, 6.200%, 4/01/13 | 3/08 at 101.00 | BBB– | 3,894,872 | ||||||
| 8,880 | Kentucky Economic Development Finance Authority, Health System Revenue Bonds, Norton Healthcare Inc., Series 2000B, 0.000%, 10/01/28 – MBIA Insured | No Opt. Call | AAA | 3,147,694 | ||||||
| 9,500 | Kentucky Economic Development Finance Authority, Hospital Revenue Refunding Bonds, Pikeville, United Methodist Hospital of Kentucky Inc. Project, Series 1997, | 2/08 at 101.00 | AAA | 9,681,070 | ||||||
| Kentucky Economic Development Finance Authority, Hospital System Revenue Refunding and Improvement Bonds, Appalachian Regional Healthcare Inc., Series 1997: | ||||||||||
| 500 | 5.600%, 10/01/08 | 4/08 at 102.00 | BB– | 500,320 | ||||||
| 3,500 | 5.850%, 10/01/17 | 4/08 at 102.00 | BB– | 3,510,255 | ||||||
| 1,500 | 5.875%, 10/01/22 | 4/08 at 102.00 | BB– | 1,500,345 | ||||||
| 6,000 | Murray Hospital Facilities, Kentucky, Revenue Bonds, Murray-Calloway County Public Hospital, | 8/17 at 100.00 | Baa1 | 5,891,820 | ||||||
| 2,195 | Rockcastle County, Kentucky, First Mortgage Revenue Bonds, Rockcastle Hospital and Respiratory Care Center Inc. Project, Series 2005, 5.550%, 6/01/30 | 6/15 at 100.00 | BBB– | 2,202,880 | ||||||
| 16,500 | Russell, Kentucky, Revenue Bonds, Bon Secours Health System, Series 2002A, 5.625%, 11/15/30 | 11/12 at 100.00 | A– | 16,932,960 | ||||||
| 1,000 | Warren County, Kentucky, Hospital Facilities Revenue Bonds, Community Hospital, Series 2007A, | 8/17 at 100.00 | BBB+ | 965,920 | ||||||
| 53,395 | Total Health Care | 48,228,136 | ||||||||
| Housing/Multifamily – 0.8% | ||||||||||
| 3,200 | Henderson, Kentucky, Senior Tax-Exempt Residential Facilities Revenue Bonds, Pleasant Pointe Project, Series 1999A, 6.125%, 5/01/29 | 5/09 at 102.00 | N/R | 3,209,568 | ||||||
| Housing/Single Family – 4.1% | ||||||||||
| 375 | Kentucky Housing Corporation, Housing Revenue Bonds, Series 1998F, 5.000%, 7/01/18 | 1/09 at 101.00 | AAA | 378,878 | ||||||
| 9,480 | Kentucky Housing Corporation, Housing Revenue Bonds, Series 1999A, 5.200%, 1/01/31 | 4/09 at 101.00 | AAA | 9,605,136 | ||||||
| 395 | Kentucky Housing Corporation, Housing Revenue Bonds, Series 1999B, 5.250%, 1/01/28 | 4/09 at 101.00 | AAA | 397,552 | ||||||
| 3,880 | Kentucky Housing Corporation, Housing Revenue Bonds, Series 2004F, 3.900%, 7/01/31 | 1/14 at 100.00 | AAA | 3,883,026 | ||||||
24
| Principal Amount (000) | Description (1) | Optional Call Provisions (2) | Ratings (3) | Value | ||||||
| Housing/Single Family (continued) | ||||||||||
| $ | 1,995 | Kentucky Housing Corporation, Housing Revenue Bonds, Series 2005H, 4.000%, 1/01/33 (Alternative Minimum Tax) | 7/14 at 100.00 | AAA | $ | 1,990,232 | ||||
| 2,000 | Kentucky Housing Corporation, Housing Revenue Bonds, Series 2007, 4.650%, 7/01/37 (Alternative Minimum Tax) | 7/16 at 100.00 | AAA | 1,830,480 | ||||||
| 18,125 | Total Housing/Single Family | 18,085,304 | ||||||||
| Long-Term Care – 1.6% | ||||||||||
| 4,840 | Florence, Kentucky, Housing Facilities Revenue Bonds, Bluegrass RHF Housing Inc., Series 1999, 6.375%, 8/15/29 – ACA Insured | 8/09 at 101.00 | A | 4,934,719 | ||||||
| 2,000 | Kentucky Economic Development Finance Authority, Multifamily Housing Revenue Bonds, Christian Care Communities Projects, Series 2005, 5.250%, 11/20/25 | 11/15 at 103.00 | AAA | 2,118,080 | ||||||
| 6,840 | Total Long-Term Care | 7,052,799 | ||||||||
| Materials – 0.7% | ||||||||||
| 2,820 | Wickliffe, Kentucky, Solid Waste Disposal Facility Revenue Bonds, Westvaco Corporation, Series 1996, 6.375%, 4/01/26 (Alternative Minimum Tax) | 4/08 at 100.00 | BBB | 2,826,148 | ||||||
| Tax Obligation/General – 7.7% | ||||||||||
| Bowling Green, Kentucky, General Obligation and Special Revenue Bonds, Series 2002B: | ||||||||||
| 1,785 | 5.000%, 6/01/23 | 6/12 at 100.00 | Aa2 | 1,860,880 | ||||||
| 1,230 | 5.000%, 6/01/24 | 6/12 at 100.00 | Aa2 | 1,282,287 | ||||||
| 1,700 | 5.000%, 6/01/25 | 6/12 at 100.00 | Aa2 | 1,770,057 | ||||||
| 2,500 | Jefferson County, Kentucky, General Obligation Refunding Bonds, Series 1999C, 6.150%, 5/15/16 | 5/09 at 100.00 | AA+ | 2,572,675 | ||||||
| Louisville and Jefferson County Metropolitan Government, Kentucky, General Obligation Bonds, Series 2004A-B: | ||||||||||
| 1,195 | 5.000%, 11/01/16 – AMBAC Insured | 11/14 at 100.00 | AAA | 1,294,962 | ||||||
| 1,000 | 5.000%, 11/01/17 – AMBAC Insured | 11/14 at 100.00 | AAA | 1,086,450 | ||||||
| 1,175 | Louisville, Kentucky, General Obligation Bonds, Series 2001A, 5.000%, 11/01/21 | 11/11 at 101.00 | AA+ | 1,237,534 | ||||||
| 3,000 | Louisville, Kentucky, General Obligation Bonds, Series 2002A, 5.000%, 10/01/23 – FGIC Insured | 10/12 at 100.00 | AAA | 3,132,990 | ||||||
| 5,000 | Puerto Rico, General Obligation Bonds, Series 2004A, 5.250%, 7/01/21 – MBIA Insured | 7/14 at 100.00 | AAA | 5,433,950 | ||||||
| Puerto Rico, General Obligation and Public Improvement Bonds, Series 2001A: | ||||||||||
| 840 | 5.500%, 7/01/14 – FSA Insured (UB) | No Opt. Call | AAA | 935,155 | ||||||
| 2,550 | 5.500%, 7/01/16 – FSA Insured (UB) | No Opt. Call | AAA | 2,881,934 | ||||||
| 3,000 | 5.500%, 7/01/17 – FSA Insured (UB) | No Opt. Call | AAA | 3,405,150 | ||||||
| 3,440 | 5.500%, 7/01/18 – FSA Insured (UB) | No Opt. Call | AAA | 3,899,137 | ||||||
| 2,250 | 5.500%, 7/01/19 – FSA Insured (UB) | No Opt. Call | AAA | 2,554,830 | ||||||
| 30,665 | Total Tax Obligation/General | 33,347,991 | ||||||||
| Tax Obligation/Limited – 24.5% | ||||||||||
| 1,305 | Ballard County School District Finance Corporation, Kentucky, School Building Revenue Bonds, Series 2004, 5.000%, 6/01/21 – AMBAC Insured | 6/14 at 100.00 | Aaa | 1,384,214 | ||||||
| Boone County School District Finance Corporation, Kentucky, School Building Revenue Bonds, Series 2004B: | ||||||||||
| 1,460 | 5.000%, 5/01/20 – FSA Insured | 5/14 at 100.00 | Aaa | 1,556,360 | ||||||
| 2,580 | 5.000%, 5/01/21 – FSA Insured | 5/14 at 100.00 | Aaa | 2,735,806 | ||||||
| 1,465 | Boone County, Kentucky, Public Properties Corporation, First Mortgage Bonds, AOC Judicial Facility, | 9/12 at 101.00 | Aa3 | 1,568,107 | ||||||
| Butler County School District Finance Corporation, Kentucky, Revenue Bonds, School Buildings, Series 2004C: | ||||||||||
| 1,220 | 5.000%, 6/01/20 | 6/14 at 100.00 | Aa3 | 1,281,049 | ||||||
| 1,255 | 5.000%, 6/01/22 | 6/14 at 100.00 | Aa3 | 1,309,078 | ||||||
| Kenton County School District Finance Corporation, Kentucky, School Building Revenue Bonds, Series 2004: | ||||||||||
| 2,115 | 5.000%, 6/01/17 – MBIA Insured | 6/14 at 100.00 | Aaa | 2,288,620 | ||||||
25
Portfolio of Investments (Unaudited)
Nuveen Kentucky Municipal Bond Fund (continued)
November 30, 2007
| Principal Amount (000) | Description (1) | Optional Call Provisions (2) | Ratings (3) | Value | ||||||
| Tax Obligation/Limited (continued) | ||||||||||
| $ | 3,510 | 5.000%, 6/01/18 – MBIA Insured | 6/14 at 100.00 | Aaa | $ | 3,746,504 | ||||
| 3,690 | 5.000%, 6/01/19 – MBIA Insured | 6/14 at 100.00 | Aaa | 3,938,632 | ||||||
| Kentucky Area Development Districts Financing Trust, Ewing, Lease Acquisition Program Revenue Bonds, Series 2000C: | ||||||||||
| 750 | 5.850%, 6/01/20 | 6/10 at 102.00 | N/R | 785,220 | ||||||
| 1,000 | 6.000%, 6/01/30 | 6/10 at 102.00 | N/R | 1,045,620 | ||||||
| 2,000 | Kentucky Asset/Liability Commission, General Fund Revenue Project Notes, First Series 2005, 5.000%, 5/01/25 – MBIA Insured | 5/15 at 100.00 | AAA | 2,091,300 | ||||||
| 2,365 | Kentucky Local Correctional Facilities Authority, Multi-County Lease Revenue Bonds, Series 2004, | No Opt. Call | AAA | 2,601,760 | ||||||
| Kentucky State Property and Buildings Commission, Revenue Bonds, Project 81, Series 2003: | ||||||||||
| 1,000 | 5.000%, 11/01/19 – AMBAC Insured | 11/13 at 100.00 | AAA | 1,057,340 | ||||||
| 2,845 | 5.000%, 11/01/23 – AMBAC Insured | 11/13 at 100.00 | AAA | 2,965,514 | ||||||
| 2,000 | Kentucky State Property and Buildings Commission, Revenue Bonds, Project 84, Series 2005, 5.000%, 8/01/18 – MBIA Insured | No Opt. Call | AAA | 2,198,660 | ||||||
| 5,000 | Kentucky State Property and Buildings Commission, Revenue Bonds, Project 85, Series 2005, 5.000%, 8/01/15 – FSA Insured | No Opt. Call | AAA | 5,473,300 | ||||||
| 10,000 | Kentucky Turnpike Authority, Economic Development Road Revenue Bonds, Revitalization Project, | 7/15 at 100.00 | AAA | 10,524,700 | ||||||
| Kentucky Turnpike Authority, Economic Development Road Revenue Bonds, Revitalization Project, Series 2006B: | ||||||||||
| 5,095 | 5.000%, 7/01/15 – AMBAC Insured | No Opt. Call | AAA | 5,570,007 | ||||||
| 5,000 | 5.000%, 7/01/24 – AMBAC Insured | 7/16 at 100.00 | AAA | 5,272,750 | ||||||
| 4,000 | Kentucky Turnpike Authority, Economic Development Road Revenue Refunding Bonds, Revitalization Project, Series 2001B, 5.150%, 7/01/19 – FSA Insured | 7/11 at 100.00 | AAA | 4,192,320 | ||||||
| 2,060 | Laurel County, Kentucky, School District Finance Corporation, School Building Revenue Bonds, Series 2007, 5.000%, 6/01/27 – FSA Insured | 6/17 at 100.00 | Aaa | 2,172,332 | ||||||
| Letcher County School District Finance Corporation, Kentucky, School Building Revenue Bonds, Series 2004: | ||||||||||
| 1,430 | 5.000%, 6/01/18 – FSA Insured | 6/14 at 100.00 | Aaa | 1,526,353 | ||||||
| 1,585 | 5.000%, 6/01/20 – FSA Insured | 6/14 at 100.00 | Aaa | 1,690,196 | ||||||
| 1,695 | Louisville and Jefferson County Visitors and Convention Commission, Kentucky, Dedicated Tax Revenue Bonds, Series 2004A, 5.000%, 12/01/15 – FSA Insured | 6/14 at 101.00 | AAA | 1,846,686 | ||||||
| 5,100 | Oldham County School District Finance Corporation, Kentucky, School Building Revenue Bonds, Series 2001A, 5.125%, 4/01/21 | 4/11 at 101.00 | Aa3 | 5,347,197 | ||||||
| Oldham County School District Finance Corporation, Kentucky, School Building Revenue Bonds, Series 2004: | ||||||||||
| 1,230 | 5.000%, 5/01/18 – MBIA Insured | 5/14 at 100.00 | Aaa | 1,311,906 | ||||||
| 1,635 | 5.000%, 5/01/20 – MBIA Insured | 5/14 at 100.00 | Aaa | 1,742,910 | ||||||
| 1,715 | 5.000%, 5/01/21 – MBIA Insured | 5/14 at 100.00 | Aaa | 1,818,569 | ||||||
| 1,360 | Owen County School District Finance Corporation, Kentucky, School Building Revenue Bonds, Series 2001, 5.000%, 4/01/21 | 4/11 at 101.00 | Aa3 | 1,424,138 | ||||||
| 500 | Pendleton County, Kentucky, Leasing Trust Revenue Bonds, Kentucky Association of Counties, Series 1993A, 6.400%, 3/01/19 (5) | No Opt. Call | A | 581,050 | ||||||
| 2,545 | Puerto Rico Highway and Transportation Authority, Highway Revenue Bonds, Series 1998A, 5.500%, 7/01/14 – AMBAC Insured | No Opt. Call | AAA | 2,806,601 | ||||||
| 590 | Puerto Rico Highway and Transportation Authority, Highway Revenue Bonds, Series 2002D, 5.000%, 7/01/32 – FSA Insured | 7/12 at 100.00 | AAA | 605,151 | ||||||
| 3,185 | Puerto Rico Public Buildings Authority, Guaranteed Government Facilities Revenue Bonds, Series 1993L, 5.500%, 7/01/21 – FSA Insured | No Opt. Call | AAA | 3,619,084 | ||||||
| 5,000 | Puerto Rico Public Buildings Authority, Guaranteed Government Facilities Revenue Refunding Bonds, | No Opt. Call | AAA | 5,471,250 | ||||||
26
| Principal Amount (000) | Description (1) | Optional Call Provisions (2) | Ratings (3) | Value | |||||||
| Tax Obligation/Limited (continued) | |||||||||||
| $ | 6,000 | Puerto Rico, Highway Revenue Bonds, Highway and Transportation Authority, Series 2003AA, 5.500%, 7/01/19 – MBIA Insured | No Opt. Call | AAA | $ | 6,759,480 | |||||
| 1,360 | Shelby County School District Finance Corporation, Kentucky, Revenue Bonds, School Buildings, Series 2004, 5.000%, 5/01/21 – MBIA Insured | 5/14 at 100.00 | Aaa | 1,442,130 | |||||||
| 2,185 | Spencer County School District Finance Corporation, Kentucky, Revenue Bonds, School Buildings, Series 2004, 5.000%, 7/01/21 – FSA Insured | 7/14 at 100.00 | Aaa | 2,318,263 | |||||||
| 1,010 | Virgin Islands Public Finance Authority, Gross Receipts Taxes Loan Note, Series 2003, | 10/14 at 100.00 | AAA | 1,100,557 | |||||||
| 99,840 | Total Tax Obligation/Limited | 107,170,714 | |||||||||
| Transportation – 4.8% | |||||||||||
| Guam International Airport Authority, Revenue Bonds, Series 2003C: | |||||||||||
| 5,000 | 5.250%, 10/01/22 – MBIA Insured (Alternative Minimum Tax) | 10/10 at 100.00 | AAA | 5,152,850 | |||||||
| 2,195 | 5.000%, 10/01/23 – MBIA Insured (Alternative Minimum Tax) | 10/13 at 100.00 | AAA | 2,237,100 | |||||||
| 1,250 | Kenton County Airport Board, Kentucky, Airport Revenue Bonds, Cincinnati/Northern Kentucky International Airport, Series 1996B, 5.750%, 3/01/13 – MBIA Insured | 3/08 at 100.00 | AAA | 1,256,350 | |||||||
| 5,090 | Kenton County Airport Board, Kentucky, Airport Revenue Bonds, Cincinnati/Northern Kentucky International Airport, Series 2003B, 5.000%, 3/01/23 – MBIA Insured (Alternative Minimum Tax) | 3/13 at 100.00 | AAA | 5,178,922 | |||||||
| 1,000 | Louisville and Jefferson County Regional Airport Authority, Kentucky, Airport System Revenue Bonds, | 7/13 at 100.00 | AAA | 1,033,150 | |||||||
| 6,000 | Louisville and Jefferson County Regional Airport Authority, Kentucky, Special Facilities Revenue Bonds, Airis Louisville LLC Project, Series 1999A, 5.500%, 3/01/19 (Alternative Minimum Tax) | 3/09 at 101.00 | Baa3 | 6,025,260 | |||||||
| 20,535 | Total Transportation | 20,883,632 | |||||||||
| U.S. Guaranteed – 18.5% (4) | |||||||||||
| 1,875 | Bell County Public Properties Corporation, Kentucky, First Mortgage Revenue Bonds, Judicial Center Project, Series 2000, 5.850%, 9/01/28 (Pre-refunded 3/01/11) – AMBAC Insured | 3/11 at 102.00 | AAA | 2,057,681 | |||||||
| 5,085 | Campbellsville, Kentucky, Industrial Building Revenue Bonds, Campbellsville University Project, Series 1999, 5.500%, 3/01/29 (Pre-refunded 3/01/09) | 3/09 at 102.00 | BBB– | (4) | 5,319,469 | ||||||
| Fayette County School District Finance Corporation, Kentucky, School Building Revenue Bonds, Series 2000: | |||||||||||
| 1,665 | 5.500%, 6/01/18 (Pre-refunded 6/01/10) | 6/10 at 101.00 | AA– | (4) | 1,769,912 | ||||||
| 2,795 | 5.500%, 6/01/20 (Pre-refunded 6/01/10) | 6/10 at 101.00 | AA– | (4) | 2,971,113 | ||||||
| 2,000 | Jefferson County Collegiate Housing Foundation, Kentucky, Student Housing Revenue Bonds, University of Louisville Project, Series 1999A, 7.125%, 9/01/29 (Pre-refunded 9/01/09) | 9/09 at 102.00 | N/R | (4) | 2,162,580 | ||||||
| 5,930 | Jefferson County, Kentucky, College Revenue Bonds, Bellarmine College Project, Series 1999, 5.250%, 5/01/29 (Pre-refunded 5/01/09) | 5/09 at 101.00 | N/R | (4) | 6,136,720 | ||||||
| 4,500 | Kenton County Public Properties Corporation, Kentucky, First Mortgage Revenue Bonds, Courthouse Facilities Project, Series 1998A, 5.000%, 3/01/29 (Pre-refunded 3/01/09) | 3/09 at 101.00 | Aa3 | (4) | 4,638,645 | ||||||
| 1,500 | Kentucky Economic Development Finance Authority, College Revenue Refunding and Improvement Bonds, Centre College Project, Series 2002, 5.000%, 4/01/32 (Pre-refunded 10/01/12) – FSA Insured | 10/12 at 100.00 | AAA | 1,609,245 | |||||||
| Kentucky Economic Development Finance Authority, Mortgage Revenue Bonds, South Central Nursing Homes Inc., Series 1997A: | |||||||||||
| 2,000 | 6.000%, 1/01/27 (Pre-refunded 1/01/08) – MBIA Insured | 1/08 at 105.00 | AAA | 2,104,100 | |||||||
| 3,700 | 6.000%, 1/01/27 (Pre-refunded 1/01/08) – MBIA Insured | 1/08 at 105.00 | AAA | 3,892,585 | |||||||
| 1,000 | Kentucky Economic Development Finance Authority, Revenue Bonds, Catholic Health Initiatives, Series 2001, 5.250%, 9/01/21 (Pre-refunded 9/01/11) | 9/11 at 100.00 | AA | (4) | 1,069,160 | ||||||
| Kentucky Economic Development Finance Authority, Revenue Bonds, Christian Church Homes of Kentucky Inc. Obligated Group, Series 1998: | |||||||||||
| 1,800 | 5.375%, 11/15/23 (Pre-refunded 5/15/08) | 5/08 at 102.00 | BBB | (4) | 1,850,724 | ||||||
| 3,500 | 5.500%, 11/15/30 (Pre-refunded 5/15/08) | 5/08 at 102.00 | BBB | (4) | 3,600,590 | ||||||
27
Portfolio of Investments (Unaudited)
Nuveen Kentucky Municipal Bond Fund (continued)
November 30, 2007
| Principal Amount (000) | Description (1) | Optional Call Provisions (2) | Ratings (3) | Value | |||||||
| U.S. Guaranteed (4) (continued) | |||||||||||
| $ | 6,080 | Kentucky Economic Development Finance Authority, Revenue Refunding and Improvement Bonds, Catholic Health Initiatives, Series 1998A, 5.000%, 12/01/27 (Pre-refunded 6/01/08) | 6/08 at 101.00 | AA | (4) | $ | 6,188,954 | ||||
| 400 | Kentucky State Property and Buildings Commission, Agency Fund Revenue Bonds, Project 66A, Series 2000, 5.750%, 5/01/20 (Pre-refunded 5/01/10) – MBIA Insured | 5/10 at 100.00 | AAA | 423,124 | |||||||
| Kentucky State Property and Buildings Commission, Revenue Bonds, Project 85, Series 2005: | |||||||||||
| 2,795 | 5.000%, 8/01/22 (Pre-refunded 8/01/15) – FSA Insured | 8/15 at 100.00 | AAA | 3,075,730 | |||||||
| 5,085 | 5.000%, 8/01/25 (Pre-refunded 8/01/15) – FSA Insured | 8/15 at 100.00 | AAA | 5,595,737 | |||||||
| 3,860 | Kentucky State Property and Buildings Commission, Revenue Refunding Bonds, Project 72, Series 2001, 5.375%, 10/01/19 (Pre-refunded 10/01/11) – MBIA Insured | 10/11 at 100.00 | AAA | 4,152,704 | |||||||
| 5,000 | Kentucky State Property and Buildings Commission, Revenue Refunding Bonds, Project 79, Series 2003, 5.000%, 10/01/22 (Pre-refunded 10/01/13) – MBIA Insured | 10/13 at 100.00 | AAA | 5,429,700 | |||||||
| 6,000 | Lexington-Fayette Urban County Government, Kentucky, First Mortgage Bonds, Public Facilities Corporation, Series 1998, 5.125%, 10/01/31 (Pre-refunded 7/15/08) – FSA Insured | 7/08 at 102.00 | AAA | 6,183,180 | |||||||
| 650 | Magoffin County School District Finance Corporation, Kentucky, School Building Revenue Bonds, Series 2000, 5.750%, 6/01/20 (Pre-refunded 6/01/10) | 6/10 at 101.00 | Aa3 | (4) | 694,837 | ||||||
| 410 | Puerto Rico Highway and Transportation Authority, Highway Revenue Bonds, Series 2002D, 5.000%, 7/01/32 (Pre-refunded 7/01/12) – FSA Insured | 7/12 at 100.00 | Aaa | 441,144 | |||||||
| Puerto Rico Public Finance Corporation, Commonwealth Appropriation Bonds, Series 2002E: | |||||||||||
| 245 | 6.000%, 8/01/26 – AGC Insured (ETM) | No Opt. Call | AAA | 303,653 | |||||||
| 2,755 | 6.000%, 8/01/26 – AGC Insured (ETM) | No Opt. Call | AAA | 3,414,547 | |||||||
| 2,600 | Puerto Rico, General Obligation and Public Improvement Bonds, Series 2000, 5.750%, 7/01/26 (Pre-refunded 7/01/10) – MBIA Insured | 7/10 at 100.00 | AAA | 2,758,236 | |||||||
| 2,800 | Russell, Kentucky, Health System Revenue Bonds, Franciscan Health Partnership Inc. – Our Lady of Bellefonte Hospital, Series 1997, 5.500%, 7/01/15 (Pre-refunded 1/01/10) | 1/10 at 100.00 | Baa2 | (4) | 2,918,216 | ||||||
| 76,030 | Total U.S. Guaranteed | 80,762,286 | |||||||||
| Utilities – 10.6% | |||||||||||
| 1,175 | Boone County, Kentucky, Collateralized Pollution Control Revenue Bonds, Dayton Power & Light Company, Series 2005A, 4.700%, 1/01/28 – FGIC Insured | 7/15 at 100.00 | AAA | 1,171,769 | |||||||
| 4,000 | Kentucky Municipal Power Agency, Power Supply System Revenue Bonds, Series 2007A, 5.000%, 9/01/37 – MBIA Insured | 9/17 at 100.00 | AAA | 4,170,640 | |||||||
| Owensboro, Kentucky, Electric Light and Power System Revenue Bonds, Series 1991B: | |||||||||||
| 7,100 | 0.000%, 1/01/11 – AMBAC Insured | No Opt. Call | AAA | 6,354,287 | |||||||
| 6,475 | 0.000%, 1/01/12 – AMBAC Insured | No Opt. Call | AAA | 5,574,651 | |||||||
| 5,810 | 0.000%, 1/01/15 – AMBAC Insured | No Opt. Call | AAA | 4,383,994 | |||||||
| 7,900 | 0.000%, 1/01/17 – AMBAC Insured | No Opt. Call | AAA | 5,393,962 | |||||||
| 13,300 | 0.000%, 1/01/18 – AMBAC Insured | No Opt. Call | AAA | 8,604,967 | |||||||
| 3,000 | Puerto Rico Electric Power Authority, Power Revenue Bonds, Series 2003NN, 5.250%, 7/01/23 –MBIA Insured | No Opt. Call | AAA | 3,301,410 | |||||||
| 5,000 | Puerto Rico Electric Power Authority, Power Revenue Bonds, Series 2005RR, 5.000%, 7/01/24 –FGIC Insured | 7/15 at 100.00 | AAA | 5,144,400 | |||||||
| 2,000 | Puerto Rico Electric Power Authority, Power Revenue Bonds, Series 2005SS, 5.000%, 7/01/17 – MBIA Insured | 7/15 at 100.00 | AAA | 2,183,680 | |||||||
| 55,760 | Total Utilities | 46,283,760 | |||||||||
| Water and Sewer – 11.5% | |||||||||||
| 1,405 | Christian County Water District, Kentucky, Waterworks Revenue Bonds, Series 1999, | 10/09 at 101.00 | Aaa | 1,472,089 | |||||||
| 1,000 | Kentucky Rural Water Finance Corporation, Multimodal Public Projects Revenue Bonds, Flexible Term Program, Series 2001A, 5.375%, 2/01/20 | 2/11 at 102.00 | N/R | 1,046,230 | |||||||
| 4,990 | Louisville and Jefferson County Metropolitan Government Board of Water Works, Kentucky, Water System Revenue Bonds, Series 2006, 5.000%, 11/15/29 | 11/16 at 100.00 | AA+ | 5,268,242 | |||||||
28
| Principal Amount (000) | Description (1) | Optional Call Provisions (2) | Ratings (3) | Value | ||||||
| Water and Sewer (continued) | ||||||||||
| Louisville and Jefferson County Metropolitan Sewer District, Kentucky, Sewer and Drainage System Revenue Bonds, Series 1997B: | ||||||||||
| $ | 3,540 | 5.350%, 5/15/22 – MBIA Insured | 5/08 at 101.00 | AAA | $ | 3,579,754 | ||||
| 2,500 | 5.200%, 5/15/25 – MBIA Insured | 5/08 at 101.00 | AAA | 2,527,350 | ||||||
| 3,200 | Louisville and Jefferson County Metropolitan Sewer District, Kentucky, Sewer and Drainage System Revenue Bonds, Series 1998A, 5.000%, 5/15/30 – FGIC Insured | 5/08 at 101.00 | AAA | 3,245,408 | ||||||
| 16,000 | Louisville and Jefferson County Metropolitan Sewer District, Kentucky, Sewer and Drainage System Revenue Bonds, Series 2001A, 5.500%, 5/15/34 – MBIA Insured | 11/11 at 101.00 | AAA | 17,043,356 | ||||||
| Louisville and Jefferson County Metropolitan Sewer District, Kentucky, Sewer and Drainage System Revenue Bonds, Series 2004A: | ||||||||||
| 7,365 | 5.250%, 5/15/37 – FGIC Insured | 5/14 at 101.00 | AAA | 7,761,016 | ||||||
| 750 | 5.000%, 5/15/38 – FGIC Insured | 5/14 at 101.00 | AAA | 777,923 | ||||||
| 7,225 | Northern Kentucky Water District, Revenue Refunding Bonds, Series 2002A, | 2/12 at 100.00 | Aaa | 7,465,087 | ||||||
| 47,975 | Total Water and Sewer | 50,186,455 | ||||||||
| $ | 433,630 | Total Investments (cost $421,441,701) – 100.0% | 436,767,384 | |||||||
Floating Rate Obligations – (1.8)% | (7,680,000) | |||||||||
Other Assets Less Liabilities – 1.8% | 7,844,399 | |||||||||
Net Assets – 100% | $ | 436,931,783 | ||||||||
Forward Swaps outstanding at November 30, 2007:
| Counterparty | Notional Amount | Fund Pay/Receive Floating Rate | Floating Rate Index | Fixed Rate (Annualized) | Fixed Rate Payment Frequency | Effective Date (6) | Termination Date | Unrealized Appreciation (Depreciation) | |||||||||||
| JPMorgan | $ | 9,000,000 | Pay | 3-Month USD-LIBOR | 5.334 | % | Semi-Annually | 2/21/08 | 2/21/35 | $ | 556,749 | ||||||||
| Royal Bank of Canada | 5,300,000 | Pay | SIFM | 4.335 | Quarterly | 8/06/08 | 8/06/37 | �� | 454,682 | ||||||||||
| $ | 1,011,431 | ||||||||||||||||||
| USD-LIBOR | (United States Dollar-London Inter-Bank Offered Rate) |
SIFM – The daily arithmetic average of the weekly SIFM (Securities Industry and Financial Markets) Municipal Swap Index.
| The Fund may invest in “zero coupon” securities. A zero coupon security does not pay a regular interest coupon to its holders during the life of the security. Tax-exempt income to the holder of the security comes from accretion of the difference between the original purchase price of the security at issuance and the par value of the security at maturity and is effectively paid at maturity. Such securities are included in the Portfolio of Investments with a 0.000% coupon rate in their description. The market prices of zero coupon securities generally are more volatile than the market prices of securities that pay interest periodically. |
| (1) | All percentages shown in the Portfolio of Investments are based on net assets unless otherwise noted. |
| (2) | Optional Call Provisions: Dates (month and year) and prices of the earliest optional call or redemption. There may be other call provisions at varying prices at later dates. Certain mortgage-backed securities may be subject to periodic principal paydowns. |
| (3) | Ratings: Using the higher of Standard & Poor’s Group (“Standard & Poor’s”) or Moody’s Investor Service, Inc. (“Moody’s”) rating. Ratings below BBB by Standard & Poor’s or Baa by Moody’s are considered to be below investment grade. |
| The AAA ratings shown in the Portfolio of Investments reflects the AAA ratings on certain bonds insured by AMBAC, FGIC or MBIA as of November 30, 2007. As explained earlier in the Portfolio Managers’ Comments section of this report, one rating agency has reduced the rating for AMBAC to AA, and one or more rating agencies have placed each of these insurers on “negative credit watch”, which may presage one or more rating reductions for such insurer or insurers in the future. If one or more insurers’ ratings are reduced below AAA by these rating agencies, it would likely reduce the effective rating of many of the bonds insured by that insurer or insurers. |
| (4) | Backed by an escrow or trust containing sufficient U.S. Government or U.S. Government agency securities which ensure the timely payment of principal and interest. Such investments are normally considered to be equivalent to AAA rated securities. |
| (5) | The issuer has received a formal adverse determination from the Internal Revenue Service (the “IRS”) regarding the tax-exempt status of the bonds’ coupon payments. The Fund will continue to treat coupon payments as tax-exempt income until such time it is formally determined that the interest on the bonds should be treated as taxable. |
| (6) | Effective date represents the date on which both the Fund and counterparty commence interest payment accruals on each forward swap contract. |
| N/R | Not rated. |
| (ETM) | Escrowed to maturity. |
| (UB) | Underlying bond of an inverse floating rate trust reflected as a financing transaction pursuant to the provisions of SFAS No. 140. |
See accompanying notes to financial statements.
29
Portfolio of Investments (Unaudited)
Nuveen Michigan Municipal Bond Fund
November 30, 2007
| Principal Amount (000) | Description (1) | Optional Call Provisions (2) | Ratings (3) | Value | ||||||
| Consumer Staples – 0.4% | ||||||||||
| $ | 870 | Puerto Rico, The Children’s Trust Fund, Tobacco Settlement Asset-Backed Refunding Bonds, Series 2002, 5.375%, 5/15/33 | 5/12 at 100.00 | BBB | $ | 849,929 | ||||
| Education and Civic Organizations – 4.6% | ||||||||||
| 630 | Chandler Park Academy, Michigan, Public School Academy Charter School Revenue Bonds, Series 2005, 5.125%, 11/01/35 | 11/15 at 100.00 | BBB– | 578,416 | ||||||
| 380 | Grand Traverse Academy, Michigan, Public School Academy Revenue Bonds, Series 2007, 4.750%, 11/01/32 | 11/17 at 100.00 | BBB– | 330,668 | ||||||
| Michigan Technological University, General Revenue Bonds, Series 2004A: | ||||||||||
| 1,230 | 5.000%, 10/01/24 – MBIA Insured | 10/13 at 100.00 | AAA | 1,285,510 | ||||||
| 1,850 | 5.000%, 10/01/29 – MBIA Insured | 10/13 at 100.00 | AAA | 1,906,573 | ||||||
| 6,150 | Wayne State University, Michigan, General Revenue Bonds, Series 1999, | 11/09 at 101.00 | AAA | 6,339,419 | ||||||
| 10,240 | Total Education and Civic Organizations | 10,440,586 | ||||||||
| Health Care – 10.6% | ||||||||||
| 1,440 | Kent Hospital Finance Authority, Michigan, Revenue Bonds, Metropolitan Hospital, Series 2005A, 5.250%, 7/01/30 | 7/15 at 100.00 | BBB | 1,387,382 | ||||||
| 3,530 | Lake View Community Hospital Authority, Michigan, Hospital Revenue Refunding Bonds, Series 1997, 6.250%, 2/15/13 | 2/08 at 100.00 | N/R | 3,536,566 | ||||||
| 2,600 | Michigan Hospital Financing Authority, Revenue Bonds, Oakwood Obligated Group, Series 2007A, 5.000%, 7/15/37 | 7/17 at 100.00 | A | 2,548,650 | ||||||
| 1,000 | Michigan State Hospital Finance Authority, Hospital Revenue Bonds, Michigan Community Hospital, Series 1996, 6.250%, 10/01/27 | 4/08 at 101.00 | BBB– | 1,007,780 | ||||||
| 1,475 | Michigan State Hospital Finance Authority, Hospital Revenue Refunding Bonds, Chelsea Community Hospital, Series 1998, 5.375%, 5/15/19 | 5/08 at 101.00 | BBB | 1,490,502 | ||||||
| 1,000 | Michigan State Hospital Finance Authority, Hospital Revenue Refunding Bonds, Crittenton Hospital, Series 2002A, 5.625%, 3/01/27 | 3/12 at 101.00 | A+ | 1,035,240 | ||||||
| 500 | Michigan State Hospital Finance Authority, Revenue Bonds, Chelsea Community Hospital, Series 2005, 5.000%, 5/15/37 | 5/15 at 100.00 | BBB | 455,270 | ||||||
| 1,400 | Michigan State Hospital Finance Authority, Revenue Bonds, Marquette General Hospital, Series 2005A, 5.000%, 5/15/26 | 5/15 at 100.00 | Baa1 | 1,356,502 | ||||||
| 2,000 | Michigan State Hospital Finance Authority, Revenue Bonds, Sparrow Obligated Group, Series 2005, 5.000%, 11/15/36 – MBIA Insured | 5/15 at 100.00 | AAA | 2,030,420 | ||||||
| 3,755 | Michigan State Hospital Finance Authority, Revenue Refunding Bonds, Detroit Medical Center Obligated Group, Series 1993A, 6.500%, 8/15/18 | 2/08 at 100.00 | BB– | 3,755,864 | ||||||
| 800 | Monroe County Hospital Finance Authority, Michigan, Mercy Memorial Hospital Corporation Revenue Bonds, Series 2006, 5.375%, 6/01/26 | 6/16 at 100.00 | BBB– | 790,768 | ||||||
| 1,600 | Pontiac Hospital Finance Authority, Michigan, Hospital Revenue Refunding Bonds, NOMC Obligated Group, Series 1993, 6.000%, 8/01/23 | 2/08 at 100.00 | B | 1,351,712 | ||||||
| Royal Oak Hospital Finance Authority, Michigan, Hospital Revenue Bonds, William Beaumont Hospital, Series 2001M: | ||||||||||
| 1,000 | 5.250%, 11/15/31 – MBIA Insured | 11/11 at 100.00 | AAA | 1,020,540 | ||||||
| 2,000 | 5.250%, 11/15/35 – MBIA Insured | 11/11 at 100.00 | AAA | 2,036,020 | ||||||
| 24,100 | Total Health Care | 23,803,216 | ||||||||
| Housing/Multifamily – 2.2% | ||||||||||
| 1,200 | Michigan Housing Development Authority, Rental Housing Revenue Bonds, Series 2006D, 5.125%, 4/01/31 – FSA Insured (Alternative Minimum Tax) | 7/15 at 100.00 | AAA | 1,204,656 | ||||||
| 6,000 | Michigan Housing Development Authority, Section 8 Assisted Mortgage Revenue Bonds, Series 1983I, 0.000%, 4/01/14 | No Opt. Call | AA | 3,669,240 | ||||||
| 7,200 | Total Housing/Multifamily | 4,873,896 | ||||||||
30
| Principal Amount (000) | Description (1) | Optional Call Provisions (2) | Ratings (3) | Value | ||||||
| Industrials – 0.9% | ||||||||||
| $ | 2,000 | Michigan Strategic Fund, Solid Waste Disposal Limited Obligation Revenue Bonds, Waste Management Inc., Series 2004, 4.500%, 12/01/13 (Alternative Minimum Tax) | No Opt. Call | BBB | $ | 1,976,920 | ||||
| Long-Term Care – 1.8% | ||||||||||
| 1,000 | Michigan State Hospital Finance Authority, Revenue Bonds, Presbyterian Villages of Michigan Obligated Group, Series 2005, 5.250%, 11/15/25 | 5/15 at 100.00 | N/R | 970,010 | ||||||
| 2,695 | Michigan Strategic Fund, Limited Obligation Revenue Bonds, Clark Retirement Community Inc., Series 1998, 5.250%, 6/01/18 | 6/08 at 100.00 | BBB– | 2,697,183 | ||||||
| Michigan Strategic Fund, Limited Obligation Revenue Refunding Bonds, Porter Hills Presbyterian Village, Series 1998: | ||||||||||
| 140 | 5.300%, 7/01/18 | 7/08 at 101.00 | BBB+ | 140,997 | ||||||
| 260 | 5.375%, 7/01/28 | 7/08 at 101.00 | BBB+ | 260,338 | ||||||
| 4,095 | Total Long-Term Care | 4,068,528 | ||||||||
| Materials – 0.8% | ||||||||||
| 1,750 | Dickinson County Economic Development Corporation, Michigan, Pollution Control Revenue Bonds, International Paper Company, Series 2004A, 4.800%, 11/01/18 | 11/14 at 100.00 | BBB | 1,712,253 | ||||||
| Tax Obligation/General – 35.9% | ||||||||||
| 1,175 | Birmingham, Michigan, General Obligation Bonds, Series 2002, 5.000%, 10/01/21 | 10/12 at 100.50 | AAA | 1,243,197 | ||||||
| 1,220 | Caledonia Community Schools, Kent County, Michigan, General Obligation Bonds, Series 2007, Residuals 1018, 6.598%, 5/01/32 – MBIA Insured (IF) | 5/17 at 100.00 | AAA | 1,279,658 | ||||||
| 1,020 | Caledonia Community Schools, Kent, Allegan and Barry Counties, Michigan, General Obligation Bonds, | 5/13 at 100.00 | AA– | 1,082,557 | ||||||
| Caledonia Community Schools, Kent, Allegan and Barry Counties, Michigan, General Obligation Bonds, Series 2005: | ||||||||||
| 2,000 | 5.000%, 5/01/23 – MBIA Insured | 5/15 at 100.00 | AAA | 2,105,580 | ||||||
| 2,085 | 5.000%, 5/01/24 – MBIA Insured | 5/15 at 100.00 | AAA | 2,188,291 | ||||||
| 1,000 | 5.000%, 5/01/25 – MBIA Insured | 5/15 at 100.00 | AAA | 1,045,650 | ||||||
| 1,850 | Chippewa Valley Schools, Macomb County, Michigan, General Obligation Bonds, Series 2005, 5.000%, 5/01/24 – MBIA Insured | 5/15 at 100.00 | AAA | 1,941,649 | ||||||
| 4,085 | Detroit, Michigan, General Obligation Bonds, Series 2004A-1, 5.250%, 4/01/20 – AMBAC Insured | 4/14 at 100.00 | AAA | 4,352,772 | ||||||
| 11,000 | Detroit-Wayne County Stadium Authority, Michigan, Limited Tax General Obligation Building Authority Stadium Bonds, Series 1997, 5.250%, 2/01/27 – FGIC Insured | 2/08 at 101.00 | AAA | 11,159,936 | ||||||
| 1,245 | Edwardsburg Public School, Cass County, Michigan, General Obligation Bonds, Series 2004, | 5/14 at 100.00 | AAA | 1,301,560 | ||||||
| 4,350 | Hartland Consolidated School District, Livingston County, Michigan, General Obligation Refunding Bonds, Series 2001, 5.125%, 5/01/29 | 5/11 at 100.00 | AA– | 4,456,880 | ||||||
| 1,675 | Hopkins Public Schools, Allegan County, Michigan, General Obligation Bonds, Series 2007, | 5/17 at 100.00 | AAA | 1,768,298 | ||||||
| 2,000 | Howell Public Schools, Livingston County, Michigan, General Obligation Bonds, Series 2003, | 11/13 at 100.00 | AA– | 2,088,880 | ||||||
| 1,000 | Jackson Public Schools, Jackson County, Michigan, General Obligation School Building and Site Bonds, Series 2004, 5.000%, 5/01/22 – FSA Insured | 5/14 at 100.00 | AAA | 1,057,020 | ||||||
| 1,715 | Kalamazoo Public Schools, Michigan, General Obligation Bonds, Series 2006, 5.000%, 5/01/25 – FSA Insured | 5/16 at 100.00 | AAA | 1,808,279 | ||||||
| 1,030 | Kent County, Michigan, General Obligation Bonds, Series 2004A, 5.000%, 12/01/22 | 12/14 at 100.00 | AAA | 1,097,486 | ||||||
| 1,300 | Lansing Community College, Michigan, General Obligation Bonds, Series 2003, 5.000%, 5/01/20 – MBIA Insured | 5/13 at 100.00 | AAA | 1,370,187 | ||||||
| 2,700 | Livonia Public Schools, Wayne County, Michigan, Unlimited Tax General School Building and Site Bonds, Series 1992-II, 0.000%, 5/01/08 – FGIC Insured | No Opt. Call | AAA | 2,661,012 | ||||||
| 500 | Marshall Public Schools, Calhoun County, Michigan, General Obligation Bonds, Series 2007, | 5/17 at 100.00 | AAA | 500,360 | ||||||
31
Portfolio of Investments (Unaudited)
Nuveen Michigan Municipal Bond Fund (continued)
November 30, 2007
| Principal Amount (000) | Description (1) | Optional Call Provisions (2) | Ratings (3) | Value | ||||||
| Tax Obligation/General (continued) | ||||||||||
| $ | 1,500 | Michigan Municipal Bond Authority, General Obligation Bonds, Detroit City School District, Series 2005, 5.000%, 6/01/18 – FSA Insured | 6/15 at 100.00 | AAA | $ | 1,596,495 | ||||
| 2,800 | Michigan Municipal Bond Authority, Local Government Loan Program Revenue Bonds, Pontiac School District, Series 1991C, 0.000%, 6/15/08 – FSA Insured | No Opt. Call | AAA | 2,749,628 | ||||||
| 3,250 | Michigan, General Obligation Bonds, Environmental Protection Program, Series 2003A, 5.250%, 5/01/21 | 5/13 at 100.00 | AA– | 3,481,205 | ||||||
| 2,000 | Muskegon Public Schools, Muskegon County, Michigan, General Obligation Bonds, Series 2004, 5.000%, 5/01/20 – FSA Insured | 5/14 at 100.00 | AAA | 2,132,000 | ||||||
| 545 | Oakland Intermediate School District, Oakland County, Michigan, General Obligation Bonds, Series 2007, 5.000%, 5/01/36 – FSA Insured | 5/17 at 100.00 | AAA | 571,046 | ||||||
| 1,620 | Oakridge Public Schools, Muskegon County, Michigan, General Obligation Bonds, Series 2005, 5.000%, 5/01/24 – MBIA Insured | 5/15 at 100.00 | AAA | 1,700,255 | ||||||
| Okemos Public School District, Ingham County, Michigan, General Obligation Refunding Bonds, Series 1993: | ||||||||||
| 1,000 | 0.000%, 5/01/17 – MBIA Insured | No Opt. Call | AAA | 678,530 | ||||||
| 1,020 | 0.000%, 5/01/18 – MBIA Insured | No Opt. Call | AAA | 656,095 | ||||||
| 4,000 | Ottawa County, Michigan, Water Supply System, General Obligation Bonds, Series 2007, | 8/17 at 100.00 | Aaa | 4,208,040 | ||||||
| 905 | Parchment School District, Kalamazoo County, Michigan, General Obligation Bonds, Series 2007, Residuals 07-1017, 6.597%, 5/01/36 – FSA Insured (IF) | 5/17 at 100.00 | AAA | 945,092 | ||||||
| 1,400 | South Redford School District, Wayne County, Michigan, General Obligation Bonds, Series 2004, 5.000%, 5/01/21 – FGIC Insured | 11/14 at 100.00 | AAA | 1,484,630 | ||||||
| 1,370 | Thornapple Kellogg School District, Barry County, Michigan, General Obligation Bonds, Series 2007, 5.000%, 5/01/32 – MBIA Insured | 5/17 at 100.00 | AAA | 1,437,637 | ||||||
| 1,150 | Wayne Westland Community Schools, Michigan, General Obligation Bonds, Series 2004, | 11/14 at 100.00 | AAA | 1,249,418 | ||||||
| 1,915 | West Bloomfield School District, Oakland County, Michigan, General Obligation Bonds, Series 2005, 5.000%, 5/01/20 – FSA Insured | 5/15 at 100.00 | AAA | 2,041,639 | ||||||
| 3,270 | West Ottawa Public School District, Ottawa County, Michigan, General Obligation Refunding Bonds, Series 1992, 0.000%, 5/01/17 – FGIC Insured | No Opt. Call | AAA | 2,192,339 | ||||||
| 5,175 | Williamston Community School District, Michigan, Unlimited Tax General Obligation QSBLF Bonds, Series 1996, 5.500%, 5/01/25 – MBIA Insured | No Opt. Call | AAA | 5,937,587 | ||||||
| 3,170 | Zeeland Public Schools, Ottawa and Allegan Counties, Michigan, General Obligation Bonds, Series 2005, 5.000%, 5/01/22 – FGIC Insured | 5/15 at 100.00 | AAA | 3,351,229 | ||||||
| 79,040 | Total Tax Obligation/General | 80,922,117 | ||||||||
| Tax Obligation/Limited – 13.6% | ||||||||||
| 1,190 | Detroit, Michigan, Building Authority Revenue Bonds, District Court Madison Center, Series 1996A, 6.150%, 2/01/11 | 2/08 at 100.00 | A | 1,192,368 | ||||||
| Grand Rapids Downtown Development Authority, Michigan, Tax Increment Revenue Bonds, Series 1994: | ||||||||||
| 3,985 | 0.000%, 6/01/17 – MBIA Insured | No Opt. Call | AAA | 2,697,168 | ||||||
| 3,295 | 0.000%, 6/01/18 – MBIA Insured | No Opt. Call | AAA | 2,114,171 | ||||||
| 1,650 | 6.875%, 6/01/24 – MBIA Insured | 12/07 at 100.00 | AAA | 1,717,667 | ||||||
| 3,960 | Michigan Building Authority, Revenue Bonds, Series 2006IA, 5.000%, 10/15/36 – FGIC Insured | 10/16 at 100.00 | AAA | 4,078,523 | ||||||
| 6,000 | Michigan House of Representatives, Certificates of Participation, Series 1998, 0.000%, 8/15/23 – AMBAC Insured | No Opt. Call | AAA | 2,883,300 | ||||||
| 1,230 | Michigan Municipal Bond Authority, AMBAC Insured Bonds, Series 2007B-A, 5.000%, 12/01/34 – AMBAC Insured | 6/17 at 100.00 | AAA | 1,281,476 | ||||||
| Michigan State Building Authority, Revenue Bonds, Facilities Program, Series 2001I: | ||||||||||
| 2,720 | 5.500%, 10/15/19 | 10/11 at 100.00 | A+ | 2,895,630 | ||||||
| 5,000 | 5.000%, 10/15/24 | 10/11 at 100.00 | A+ | 5,175,800 | ||||||
32
| Principal Amount (000) | Description (1) | Optional Call Provisions (2) | Ratings (3) | Value | |||||||
| Tax Obligation/Limited (continued) | |||||||||||
| $ | 4,400 | Michigan State Building Authority, Revenue Bonds, Facilities Program, Series 2005II, | 10/15 at 100.00 | AAA | $ | 4,581,324 | |||||
| 2,000 | Michigan State Building Authority, Revenue Refunding Bonds, Facilities Program, Series 2003II, 5.000%, 10/15/22 – MBIA Insured | 10/13 at 100.00 | AAA | 2,100,720 | |||||||
| 35,430 | Total Tax Obligation/Limited | 30,718,147 | |||||||||
| U.S. Guaranteed – 12.9% (4) | |||||||||||
| 295 | Cedar Springs Public School District, Kent and Newaygo Counties, Michigan, General Obligation Bonds, Series 2003, 5.125%, 5/01/32 (Pre-refunded 5/01/13) | 5/13 at 100.00 | AA– | (4) | 320,562 | ||||||
| 250 | Detroit City School District, Wayne County, Michigan, Unlimited Tax School Building and Site Improvement Bonds, Series 2001A, 5.125%, 5/01/31 (Pre-refunded 5/01/12) – FSA Insured | 5/12 at 100.00 | AAA | 268,880 | |||||||
| 3,000 | Detroit, Michigan, Senior Lien Sewerage Disposal System Revenue Bonds, Series 2001A, 5.125%, 7/01/31 (Pre-refunded 7/01/11) – FGIC Insured | 7/11 at 100.00 | AAA | 3,188,340 | |||||||
| 2,505 | Detroit, Michigan, Senior Lien Water Supply System Revenue Bonds, Series 2003A, 5.000%, 7/01/25 (Pre-refunded 7/01/13) – MBIA Insured | 7/13 at 100.00 | Aaa | 2,709,258 | |||||||
| 3,750 | Kent Hospital Finance Authority, Michigan, Revenue Bonds, Spectrum Health, Series 2001A, 5.500%, 1/15/31 (Pre-refunded 7/15/11) | 7/11 at 101.00 | AA | (4) | 4,062,188 | ||||||
| 1,000 | Livonia Municipal Building Authority, Wayne County, Michigan, General Obligation Bonds, Series 2001, 5.000%, 5/01/27 (Pre-refunded 5/01/10) – FGIC Insured | 5/10 at 100.00 | AAA | 1,040,490 | |||||||
| 75 | Michigan South Central Power Agency, Power Supply System Revenue Bonds, Series 2000, 6.000%, 5/01/12 (ETM) | No Opt. Call | A3 | (4) | 81,246 | ||||||
| 5,000 | Michigan State Hospital Finance Authority, Hospital Revenue Bonds, Ascension Health Credit Group, Series 1999A, 6.125%, 11/15/26 (Pre-refunded 11/15/09) | 11/09 at 101.00 | AAA | 5,311,099 | |||||||
| 2,200 | Michigan State Hospital Finance Authority, Hospital Revenue Bonds, Henry Ford Health System, Series 1999A, 6.000%, 11/15/24 (Pre-refunded 11/15/09) | 11/09 at 101.00 | A1 | (4) | 2,327,820 | ||||||
| 3,000 | Michigan State Hospital Finance Authority, Hospital Revenue Refunding Bonds, Henry Ford Health System, Series 2003A, 5.625%, 3/01/17 (Pre-refunded 3/01/13) | 3/13 at 100.00 | A1 | (4) | 3,305,100 | ||||||
| 605 | Michigan Strategic Fund, Limited Obligation Revenue Bonds, Clark Retirement Community Inc., Series 1998, 5.250%, 6/01/18 (Pre-refunded 6/01/08) | 6/08 at 100.00 | N/R | (4) | 610,457 | ||||||
| 1,500 | Michigan, Certificates of Participation, Series 2000, 5.500%, 6/01/20 | 6/10 at 100.00 | AAA | 1,579,575 | |||||||
| 1,235 | Rochester Community School District, Oakland and Macomb Counties, Michigan, General Obligation Bonds, Series 2000I, 5.750%, 5/01/19 (Pre-refunded 5/01/10) – FGIC Insured | 5/10 at 100.00 | AAA | 1,306,395 | |||||||
| 1,625 | Walled Lake Consolidated School District, Oakland County, Michigan, General Obligation Bonds, Series 2004, 5.250%, 5/01/22 (Pre-refunded 5/01/14) – MBIA Insured | 5/14 at 100.00 | AAA | 1,793,578 | |||||||
| 1,000 | Wayne County, Michigan, Airport Revenue Bonds, Detroit Metropolitan Airport, Series 1998B, 5.000%, 12/01/28 (Pre-refunded 12/01/08) – MBIA Insured | 12/08 at 101.00 | AAA | 1,025,730 | |||||||
| 27,040 | Total U.S. Guaranteed | 28,930,718 | |||||||||
| Utilities – 4.6% | |||||||||||
| 1,000 | Lansing Board of Water and Light, Michigan, Steam and Electric Utility System Revenue Bonds, Series 2003A, 5.000%, 7/01/21 – FSA Insured | 7/13 at 100.00 | AAA | 1,055,470 | |||||||
| 1,000 | Michigan Public Power Agency, Revenue Bonds, Combustion Turbine 1 Project, Series 2001A, 5.250%, 1/01/27 – AMBAC Insured | 1/12 at 100.00 | AAA | 1,045,120 | |||||||
| 925 | Michigan South Central Power Agency, Power Supply System Revenue Bonds, Series 2000, 6.000%, 5/01/12 | No Opt. Call | A3 | 969,252 | |||||||
| 3,300 | Michigan Strategic Fund, Collateralized Limited Obligation Pollution Control Revenue Refunding Bonds, Fixed Rate Conversion, Detroit Edison Company, Series 1999C, 5.650%, 9/01/29 (Alternative | 9/11 at 100.00 | A3 | 3,371,610 | |||||||
| 1,000 | Monroe County Economic Development Corporation, Michigan, Collateralized Limited Obligation Revenue Refunding Bonds, Detroit Edison Company, Series 1992AA, 6.950%, 9/01/22 – FGIC Insured | No Opt. Call | AAA | 1,294,750 | |||||||
33
Portfolio of Investments (Unaudited)
Nuveen Michigan Municipal Bond Fund (continued)
November 30, 2007
| Principal Amount (000) | Description (1) | Optional Call Provisions (2) | Ratings (3) | Value | ||||||
| Utilities (continued) | ||||||||||
| $ | 4,000 | Puerto Rico Electric Power Authority, Power Revenue Refunding Bonds, Series 1989O, | No Opt. Call | AAA | $ | 2,655,360 | ||||
| 11,225 | Total Utilities | 10,391,562 | ||||||||
| Water and Sewer – 11.7% | ||||||||||
| 5,000 | Detroit Water Supply System, Michigan, Water Supply System Revenue Bonds, Series 2006A, 5.000%, 7/01/34 – FSA Insured | 7/16 at 100.00 | AAA | 5,196,099 | ||||||
| 2,500 | Detroit, Michigan, Senior Lien Water Supply System Revenue Bonds, Series 2001A, 5.000%, 7/01/30 – FGIC Insured | 7/11 at 100.00 | AAA | 2,542,950 | ||||||
| 2,495 | Detroit, Michigan, Senior Lien Water Supply System Revenue Bonds, Series 2003A, 5.000%, 7/01/25 – MBIA Insured | 7/13 at 100.00 | AAA | 2,568,952 | ||||||
| 4,455 | Detroit, Michigan, Sewerage Disposal System Revenue Bonds, Series 1999A, 0.000%, 7/01/19 – FGIC Insured | No Opt. Call | AAA | 2,651,260 | ||||||
| 4,000 | Grand Rapids, Michigan, Sanitary Sewer System Revenue Bonds, Series 2005, 5.000%, 1/01/30 – MBIA Insured | 7/15 at 100.00 | AAA | 4,170,240 | ||||||
| 1,625 | Lansing, Michigan, Sewerage Disposal System Revenue Bonds, Series 2003, 5.000%, 5/01/21 – FGIC Insured | 5/14 at 100.00 | AAA | 1,723,134 | ||||||
| 2,075 | Michigan Municipal Bond Authority, Clean Water Revolving Fund Revenue Bonds, Series 2005, 5.000%, 10/01/19 | 10/15 at 100.00 | AAA | 2,231,351 | ||||||
| 4,055 | Michigan Municipal Bond Authority, Drinking Water Revolving Fund Revenue Bonds, Series 2004, 5.000%, 10/01/24 | 10/14 at 100.00 | AAA | 4,274,132 | ||||||
| 1,000 | Michigan Municipal Bond Authority, Water Revolving Fund Revenue Bonds, Series 2007, 5.000%, 10/01/23 | 10/17 at 100.00 | AAA | 1,077,650 | ||||||
| 27,205 | Total Water and Sewer | 26,435,768 | ||||||||
| $ | 230,195 | Total Investments (cost $215,081,854) – 100.0% | 225,123,640 | |||||||
Other Assets Less Liabilities – 0.0% | 1,131 | |||||||||
Net Assets – 100% | $ | 225,124,771 | ||||||||
Forward Swaps outstanding at November 30, 2007:
| Counterparty | Notional Amount | Fund Pay/Receive Floating Rate | Floating Rate Index | Fixed Rate (Annualized) | Fixed Rate Payment Frequency | Effective Date (5) | Termination Date | Unrealized Appreciation (Depreciation) | |||||||||||
| Morgan Stanley | $ | 1,900,000 | Pay | 3-Month USD-LIBOR | 5.335 | % | Semi-Annually | 2/21/08 | 2/21/30 | $ | 111,276 | ||||||||
| Royal Bank of Canada | 2,600,000 | Pay | SIFM | 4.335 | Quarterly | 8/06/08 | 8/06/37 | 223,051 | |||||||||||
| $ | 334,327 | ||||||||||||||||||
| USD-LIBOR | (United States Dollar-London Inter-Bank Offered Rate) |
SIFM – The daily arithmetic average of the weekly SIFM (Securities Industry and Financial Markets) Municipal Swap Index.
| The Fund may invest in “zero coupon” securities. A zero coupon security does not pay a regular interest coupon to its holders during the life of the security. Tax-exempt income to the holder of the security comes from accretion of the difference between the original purchase price of the security at issuance and the par value of the security at maturity and is effectively paid at maturity. Such securities are included in the Portfolio of Investments with a 0.000% coupon rate in their description. The market prices of zero coupon securities generally are more volatile than the market prices of securities that pay interest periodically. |
| (1) | All percentages shown in the Portfolio of Investments are based on net assets unless otherwise noted. |
| (2) | Optional Call Provisions: Dates (month and year) and prices of the earliest optional call or redemption. There may be other call provisions at varying prices at later dates. Certain mortgage-backed securities may be subject to periodic principal paydowns. |
| (3) | Ratings: Using the higher of Standard & Poor’s Group (“Standard & Poor’s”) or Moody’s Investor Service, Inc. (“Moody’s”) rating. Ratings below BBB by Standard & Poor’s or Baa by Moody’s are considered to be below investment grade. |
| The AAA ratings shown in the Portfolio of Investments reflects the AAA ratings on certain bonds insured by AMBAC, FGIC or MBIA as of November 30, 2007. As explained earlier in the Portfolio Managers’ Comments section of this report, one rating agency has reduced the rating for AMBAC to AA, and one or more rating agencies have placed each of these insurers on “negative credit watch”, which may presage one or more rating reductions for such insurer or insurers in the future. If one or more insurers’ ratings are reduced below AAA by these rating agencies, it would likely reduce the effective rating of many of the bonds insured by that insurer or insurers. |
| (4) | Backed by an escrow or trust containing sufficient U.S. Government or U.S. Government agency securities which ensure the timely payment of principal and interest. Such investments are normally considered to be equivalent to AAA rated securities. |
| (5) | Effective date represents the date on which both the Fund and counterparty commence interest payment accruals on each forward swap contract. |
| N/R | Not rated. |
| (ETM) | Escrowed to maturity. |
| (IF) | Inverse floating rate investment. |
See accompanying notes to financial statements.
34
Portfolio of Investments (Unaudited)
Nuveen Missouri Municipal Bond Fund
November 30, 2007
| Principal Amount (000) | Description (1) | Optional Call Provisions (2) | Ratings (3) | Value | ||||||
| Consumer Discretionary – 1.0% | ||||||||||
| $ | 3,225 | St. Louis Industrial Development Authority, Missouri, Senior Lien Revenue Bonds, St. Louis Convention Center Headquarters Hotel, Series 2000A, 0.000%, 7/15/15 – AMBAC Insured | No Opt. Call | AAA | $ | 2,380,824 | ||||
| Consumer Staples – 5.0% | ||||||||||
| 3,000 | Cape Girardeau County Industrial Development Authority, Missouri, Solid Waste Disposal Revenue Bonds, Procter & Gamble Products Company Project, Series 1998, 5.300%, 5/15/28 (Alternative Minimum Tax) | 5/08 at 101.00 | AA– | 3,036,330 | ||||||
| 8,555 | Missouri Development Finance Board, Solid Waste Disposal Revenue Bonds, Procter and Gamble Inc., Series 1999, 5.200%, 3/15/29 (Alternative Minimum Tax) | No Opt. Call | AA– | 9,277,040 | ||||||
| 11,555 | Total Consumer Staples | 12,313,370 | ||||||||
| Education and Civic Organizations – 5.6% | ||||||||||
| 1,000 | Lincoln University, Missouri, Auxillary System Revenue Bonds, Series 2007, 5.125%, 6/01/37 – AGC Insured | 6/17 at 100.00 | AAA | 1,048,450 | ||||||
| 1,100 | Missouri Health and Educational Facilities Authority, Revenue Bonds, Barstow School, Series 1998, 5.250%, 10/01/23 | 10/08 at 100.00 | N/R | 1,100,407 | ||||||
| 900 | Missouri Health and Educational Facilities Authority, Revenue Bonds, Stephens College, Series 1999, 6.000%, 6/01/24 | 6/08 at 102.00 | A1 | 924,012 | ||||||
| 1,000 | Missouri Health and Educational Facilities Authority, Revenue Bonds, Washington University, Series 2001A, 5.500%, 6/15/16 | No Opt. Call | AAA | 1,142,260 | ||||||
| 1,360 | Missouri Health and Educational Facilities Authority, Revenue Bonds, Webster University, Series 2001, 5.500%, 4/01/18 – MBIA Insured | 4/11 at 100.00 | Aaa | 1,439,383 | ||||||
| 3,500 | Missouri Health and Educational Facilities Authority, Washington University Revenue Bonds, Series 2007B, 4.500%, 1/15/36 | 1/17 at 100.00 | AAA | 3,463,985 | ||||||
| 2,590 | Missouri State University, Auxiliary Enterprise System Revenue Bonds, Series 2007A, 5.000%, 4/01/24 – XLCA Insured | 4/17 at 100.00 | AAA | 2,741,334 | ||||||
| 2,060 | Southeast Missouri State University, System Facilities Revenue Refunding and Improvement Bonds, Series 2001, 5.000%, 4/01/26 – MBIA Insured | 4/11 at 100.00 | Aaa | 2,122,336 | ||||||
| 13,510 | Total Education and Civic Organizations | 13,982,167 | ||||||||
| Health Care – 12.2% | ||||||||||
| Cape Girardeau County Industrial Development Authority, Missouri, Health Facilities Revenue Bonds, Southeast Missouri Hospital Association, Series 2007: | ||||||||||
| 1,290 | 5.000%, 6/01/27 | 6/17 at 100.00 | N/R | 1,251,687 | ||||||
| 2,500 | 5.000%, 6/01/36 | 6/17 at 100.00 | N/R | 2,364,050 | ||||||
| 2,520 | Cass County, Missouri, Cass Medical Center Revenue Bonds, Series 2007, 5.625%, 5/01/38 | 11/16 at 100.00 | N/R | 2,522,848 | ||||||
| 2,520 | Clinton County Industrial Development Authority, Missouri, Revenue Bonds, Cameron Regional Medical Center, Series 2007, 5.000%, 12/01/37 | 12/17 at 100.00 | N/R | 2,190,082 | ||||||
| 1,250 | Joplin Industrial Development Authority, Missouri, Health Facilities Revenue Bonds, Freeman Health System, Series 2004, 5.500%, 2/15/29 | 2/15 at 102.00 | BBB+ | 1,272,938 | ||||||
| 1,000 | Missouri Health & Educational Facilities Authority, Saint Lukes Episcopal-Presbyterian Hospitals Revenue Bonds, Series 2001, 5.250%, 12/01/26 – FSA Insured | 6/11 at 101.00 | AAA | 1,029,240 | ||||||
| 1,000 | Missouri Health and Educational Facilities Authority, Revenue Bonds, BJC Health System, Series 2003, 5.125%, 5/15/25 | 5/13 at 100.00 | AA | 1,020,950 | ||||||
| 1,000 | Missouri Health and Educational Facilities Authority, Revenue Bonds, BJC Health System, | 5/15 at 100.00 | AA | 1,026,580 | ||||||
| 500 | Missouri Health and Educational Facilities Authority, Revenue Bonds, Capital Region Medical Center, Series 1998, 5.250%, 11/01/23 | 5/08 at 100.00 | BBB+ | 500,005 | ||||||
| Missouri Health and Educational Facilities Authority, Revenue Bonds, Freeman Health System, Series 1998: | ||||||||||
| 1,500 | 5.250%, 2/15/18 | 2/08 at 102.00 | BBB+ | 1,515,285 | ||||||
| 1,300 | 5.250%, 2/15/28 | 2/08 at 102.00 | BBB+ | 1,299,090 | ||||||
35
Portfolio of Investments (Unaudited)
Nuveen Missouri Municipal Bond Fund (continued)
November 30, 2007
| Principal Amount (000) | Description (1) | Optional Call Provisions (2) | Ratings (3) | Value | ||||||
| Health Care (continued) | ||||||||||
| $ | 2,750 | Missouri Health and Educational Facilities Authority, Revenue Bonds, Lake Regional Health System, Series 2003, 5.700%, 2/15/34 | 2/14 at 100.00 | BBB+ | $ | 2,805,413 | ||||
| Missouri Health and Educational Facilities Authority, Revenue Bonds, Lester E. Cox Medical Center, Series 1992H: | ||||||||||
| 2,650 | 0.000%, 9/01/17 – MBIA Insured | No Opt. Call | AAA | 1,776,984 | ||||||
| 4,740 | 0.000%, 9/01/21 – MBIA Insured | No Opt. Call | AAA | 2,563,392 | ||||||
| 6,300 | 0.000%, 9/01/22 – MBIA Insured | No Opt. Call | AAA | 3,230,010 | ||||||
| 1,000 | New Liberty Hospital District, Missouri, Revenue Bonds, Series 2001, 5.000%, 12/01/21 – AMBAC Insured | 12/11 at 100.00 | AAA | 1,024,570 | ||||||
| 2,880 | Taney County Industrial Development Authority, Missouri, Hospital Revenue Bonds, Skaggs Community Hospital Association, Series 1998, 5.400%, 5/15/28 | 5/08 at 101.00 | BBB | 2,887,603 | ||||||
| 36,700 | Total Health Care | 30,280,727 | ||||||||
| Housing/Multifamily – 2.8% | ||||||||||
| 1,320 | Clay County Industrial Development Authority, Missouri, GNMA Multifamily Housing Revenue Bonds, Oak Creek Apartments, Series 2002, 6.125%, 7/20/25 (Alternative Minimum Tax) | 7/13 at 105.00 | AAA | 1,401,523 | ||||||
| Missouri Housing Development Commission, GNMA Collateralized Multifamily Housing Revenue Bonds, JB Hughes Apartments I and II, Series 2002G: | ||||||||||
| 237 | 6.200%, 5/20/19 | 5/12 at 105.00 | Aaa | 254,289 | ||||||
| 975 | 6.300%, 5/20/37 | 5/12 at 105.00 | Aaa | 1,026,451 | ||||||
| 2,380 | Missouri Housing Development Commission, Multifamily Housing Revenue Bonds, Mansion Apartments II, Series 1999, 6.125%, 4/01/22 (Alternative Minimum Tax) | 4/08 at 102.00 | N/R | 2,410,678 | ||||||
| 1,805 | St. Louis County Industrial Development Authority, Missouri, GNMA Collateralized Subordinate Lien Housing Revenue Refunding Bonds, Southfield and Oak Forest II Apartments, Series 2002A, 5.200%, 1/20/36 | 1/09 at 105.00 | AAA | 1,841,443 | ||||||
| 6,717 | Total Housing/Multifamily | 6,934,384 | ||||||||
| Housing/Single Family – 5.4% | ||||||||||
| Missouri Housing Development Commission, GNMA Single Family Remarketed Mortgage Revenue Bonds, Homeownership Loan Program, Series 1995B: | ||||||||||
| 255 | 6.375%, 9/01/20 (Alternative Minimum Tax) | 3/08 at 101.00 | N/R | 257,841 | ||||||
| 205 | 6.450%, 9/01/27 (Alternative Minimum Tax) | 3/08 at 101.00 | N/R | 207,337 | ||||||
| 90 | Missouri Housing Development Commission, GNMA/FNMA Single Family Mortgage Revenue Bonds, Homeownership Loan Program, Series 1996D, 6.125%, 3/01/28 (Alternative Minimum Tax) | 1/08 at 101.00 | AAA | 91,808 | ||||||
| 55 | Missouri Housing Development Commission, Single Family Mortgage Revenue Bonds, Homeownership Loan Program, Series 1995C, 7.250%, 9/01/26 (Alternative Minimum Tax) | 3/08 at 103.00 | AAA | 55,847 | ||||||
| 100 | Missouri Housing Development Commission, Single Family Mortgage Revenue Bonds, Homeownership Loan Program, Series 1998B-2, 6.400%, 3/01/29 (Alternative Minimum Tax) | 3/08 at 105.00 | AAA | 102,672 | ||||||
| 260 | Missouri Housing Development Commission, Single Family Mortgage Revenue Bonds, Homeownership Loan Program, Series 2000A-1, 6.300%, 9/01/25 (Alternative Minimum Tax) | 9/09 at 100.00 | AAA | 262,850 | ||||||
| 195 | Missouri Housing Development Commission, Single Family Mortgage Revenue Bonds, Homeownership Loan Program, Series 2000B-1, 6.200%, 9/01/25 (Alternative Minimum Tax) | 3/10 at 100.00 | AAA | 201,271 | ||||||
| 2,450 | Missouri Housing Development Commission, Single Family Mortgage Revenue Bonds, Homeownership Loan Program, Series 2005A-1, 5.900%, 9/01/35 (Alternative Minimum Tax) | 9/14 at 100.00 | AAA | 2,599,891 | ||||||
| 4,210 | Missouri Housing Development Commission, Single Family Mortgage Revenue Bonds, Homeownership Loan Program, Series 2006E-1, 5.600%, 3/01/37 (Alternative Minimum Tax) | 3/16 at 104.50 | AAA | 4,593,067 | ||||||
| 2,360 | Missouri Housing Development Commission, Single Family Mortgage Revenue Bonds, Homeownership Loan Program, Series 2007A-1, 4.700%, 9/01/27 (Alternative Minimum Tax) | 9/16 at 100.00 | AAA | 2,264,467 | ||||||
| 2,675 | Missouri Housing Development Commission, Single Family Mortgage Revenue Bonds, Homeownership Loan Program, Series 2007E-1, 5.200%, 9/01/38 (Alternative Minimum Tax) | No Opt. Call | AAA | 2,652,450 | ||||||
| 12,855 | Total Housing/Single Family | 13,289,501 | ||||||||
36
| Principal Amount (000) | Description (1) | Optional Call Provisions (2) | Ratings (3) | Value | ||||||
| Long-Term Care – 5.6% | ||||||||||
| $ | 1,000 | Cole County Industrial Development Authority, Missouri, Revenue Bonds, Lutheran Senior Services – Heisinger Project, Series 2004, 5.500%, 2/01/35 | 2/14 at 100.00 | N/R | $ | 1,007,970 | ||||
| 4,250 | Kansas City Industrial Development Authority, Missouri, Retirement Center Revenue Refunding and Improvement Bonds, Kingswood Project, Series 1998A, 5.875%, 11/15/29 | 11/08 at 102.00 | N/R | 4,092,750 | ||||||
| 2,525 | Lees Summit Industrial Development Authority, Missouri, Revenue Bonds, John Knox Village Obligated Group, Series 2007A, 5.125%, 8/15/32 | 8/17 at 100.00 | N/R | 2,425,692 | ||||||
| 1,285 | Missouri Development Finance Board, Healthcare Facilities Revenue Bonds, Lutheran Home for the Aged, Series 2001A, 5.600%, 11/01/21 | 11/11 at 100.00 | A2 | 1,323,357 | ||||||
| 2,000 | Missouri Health and Educational Facilities Authority, Revenue Bonds, Lutheran Senior Services, | 2/17 at 100.00 | N/R | 1,834,180 | ||||||
| 1,200 | St. Louis County Industrial Development Authority, Missouri, GNMA Collateralized Healthcare Facilities Revenue Bonds, Mary, Queen and Mother Association, Series 2001, 5.400%, 9/20/34 | 3/10 at 102.00 | AAA | 1,229,352 | ||||||
| 2,000 | St. Louis County Industrial Development Authority, Missouri, Revenue Bonds, Friendship Village of West County, Series 2007A, 5.500%, 9/01/28 | 9/17 at 100.00 | N/R | 1,998,580 | ||||||
| 14,260 | Total Long-Term Care | 13,911,881 | ||||||||
| Materials – 0.4% | ||||||||||
| 1,000 | Sugar Creek, Missouri, Industrial Development Revenue Bonds, Lafarge North America Inc., | 6/13 at 101.00 | BBB | 983,500 | ||||||
| Tax Obligation/General – 16.3% | ||||||||||
| 2,000 | Cass County Reorganized School District R-II, Raymore and Peculiar, Missouri, General Obligation Bonds, Series 2002, 5.250%, 3/01/20 – FSA Insured | 3/12 at 100.00 | AAA | 2,140,740 | ||||||
| 540 | Clay County Public School District 53, Liberty, Missouri, General Obligation Bonds, Series 2001C, 5.200%, 3/01/21 | 3/12 at 100.00 | AA+ | 571,244 | ||||||
| 1,280 | Clay County Public School District 53, Liberty, Missouri, General Obligation Bonds, Series 2002B, 5.000%, 3/01/22 – FSA Insured | 3/12 at 100.00 | AAA | 1,331,558 | ||||||
| 1,000 | Greene County Reorganized School District R8, Missouri, General Obligation Bonds, Series 2002, 5.250%, 3/01/20 – FSA Insured | 3/12 at 100.00 | AAA | 1,070,370 | ||||||
| 2,500 | Hickman Mills C-1 School District, Jackson County, Missouri, General Obligation Bonds, Series 2003, 5.000%, 3/01/21 – FSA Insured | 3/13 at 100.00 | AAA | 2,632,375 | ||||||
| 1,450 | Jackson County Reorganized School District R-7, Lees Summit, Missouri, General Obligation Bonds, Series 2004, 5.000%, 3/01/21 – MBIA Insured | 3/14 at 100.00 | Aaa | 1,538,247 | ||||||
| 3,000 | Kansas City, Missouri, General Obligation Bonds, Series 2004F, 5.000%, 2/01/24 | 2/14 at 100.00 | AA | 3,149,880 | ||||||
| 2,000 | Miller County School District R-2, Osage, Missouri, General Obligation Bonds, Series 2006, | 3/16 at 100.00 | AAA | 2,114,060 | ||||||
| Missouri School Boards Association, Lease Participation Certificates, Clay County School District 53 Liberty, Series 2007: | ||||||||||
| 1,070 | 5.250%, 3/01/26 – FSA Insured | 3/17 at 100.00 | AAA | 1,154,905 | ||||||
| 625 | 5.250%, 3/01/27 – FSA Insured | 3/17 at 100.00 | AAA | 673,106 | ||||||
| 1,250 | Nixa Reorganized School District R 02, Missouri, General Obligation Bonds, Series 2006, | 3/16 at 100.00 | AAA | 1,351,075 | ||||||
| 1,240 | North Kansas City School District 74, Clay County, Missouri, General Obligation Bonds, Direct Deposit Program, Series 2007, 5.000%, 3/01/27 | 3/18 at 100.00 | AA+ | 1,316,037 | ||||||
| 4,500 | North Kansas City School District 74, Clay County, Missouri, General Obligation Bonds, Series 2005, 5.000%, 3/01/25 | 3/15 at 100.00 | AA+ | 4,727,114 | ||||||
| 1,000 | Pevely, Missouri, General Obligation Bonds, Series 2004, 5.250%, 3/01/24 – RAAI Insured | 3/13 at 100.00 | AA | 1,021,300 | ||||||
| 2,275 | Platte County Reorganized School District R3, Missouri, General Obligation Bonds, Series 2004, 5.000%, 3/01/20 – MBIA Insured | 3/14 at 100.00 | AAA | 2,424,240 | ||||||
| 750 | Polk County R-1 School District, Bolivar, Missouri, General Obligation Bonds, Missouri Direct Deposit Program, Series 2000, 5.700%, 3/01/20 | 3/10 at 100.00 | AA+ | 786,810 | ||||||
37
Portfolio of Investments (Unaudited)
Nuveen Missouri Municipal Bond Fund (continued)
November 30, 2007
| Principal Amount (000) | Description (1) | Optional Call Provisions (2) | Ratings (3) | Value | ||||||
| Tax Obligation/General (continued) | ||||||||||
| Springfield School District R12, Missouri, General Obligation Bonds, Series 2003: | ||||||||||
| $ | 2,875 | 5.125%, 3/01/20 – FGIC Insured | 3/13 at 100.00 | AAA | $ | 3,051,151 | ||||
| 3,000 | 5.000%, 3/01/22 – FGIC Insured | 3/13 at 100.00 | AAA | 3,136,350 | ||||||
| 1,250 | 5.000%, 3/01/23 – FGIC Insured | 3/13 at 100.00 | AAA | 1,304,100 | ||||||
| 1,605 | St. Louis Board of Education, Missouri, General Obligation Refunding Bonds, Series 2003A, | 4/13 at 100.00 | AAA | 1,691,205 | ||||||
| 1,345 | St. Louis County Pattonville School District R3, Missouri, General Obligation Bonds, Series 2000, 6.500%, 3/01/14 – FGIC Insured | No Opt. Call | AAA | 1,575,358 | ||||||
| 1,450 | St. Louis County Pattonville School District R3, Missouri, General Obligation Bonds, Series 2004, 5.250%, 3/01/20 – FSA Insured | 3/14 at 100.00 | AAA | 1,565,116 | ||||||
| 38,005 | Total Tax Obligation/General | 40,326,341 | ||||||||
| Tax Obligation/Limited – 20.0% | ||||||||||
| 370 | Brentwood, Missouri, Tax Increment Refunding Bonds, Promenade Project, Series 2002, | 4/09 at 100.00 | AA | 375,580 | ||||||
| 1,290 | Cape Girardeau County Building Corporation, Missouri, Leasehold Revenue Bonds, Reorganized School District R-02, Jackson R-II School District High School Project, Series 2005, 5.250%, 3/01/21 – MBIA Insured | 3/16 at 100.00 | AAA | 1,399,005 | ||||||
| 1,875 | Christian County Public Building Corporation, Missouri, Leasehold Revenue Bonds, Justice Center Project, Series 2000, 5.450%, 6/01/15 – RAAI Insured | 6/10 at 100.00 | AA | 1,952,756 | ||||||
| 420 | Cottleville, Missouri, Certificates of Participation, Series 2006, 5.250%, 8/01/31 | 8/14 at 100.00 | N/R | 423,847 | ||||||
| 1,035 | Dunklin County, Missouri, Certificates of Participation, Series 2004, 5.000%, 12/01/19 – FGIC Insured | 12/14 at 100.00 | AAA | 1,114,364 | ||||||
| 2,560 | Fenton, Missouri, Tax Increment Revenue Bonds, Gravois Bluffs Redevelopment Project, Series 2006, 4.500%, 4/01/21 | 4/14 at 100.00 | N/R | 2,572,902 | ||||||
| 1,685 | Fulton, Missouri, Tax Increment Revenue Bonds, Fulton Commons Redevelopment Project, Series 2006, 5.000%, 6/01/28 | 6/16 at 100.00 | N/R | 1,516,163 | ||||||
| 3,000 | Harrisonville, Missouri, Lease Participation Certificates, Series 2003, 5.000%, 12/01/22 – XLCA Insured | 12/13 at 100.00 | AAA | 3,123,750 | ||||||
| 2,525 | Kansas City Tax Increment Financing District, Missouri, Tax Increment Revenue Bonds, Briarcliff West Project, Series 2006A, 5.400%, 6/01/24 | 6/14 at 102.00 | N/R | 2,488,413 | ||||||
| 500 | Kansas City Tax Increment Financing District, Missouri, Tax Increment Revenue Bonds, Maincor Project, Series 2007A, 5.250%, 3/01/18 | No Opt. Call | N/R | 491,985 | ||||||
| 3,885 | Missouri Association of Rural Education, Pulaski County, Certificates of Participation, Waynesville School District R-6, Series 2004, 5.100%, 3/01/24 – MBIA Insured | 3/09 at 100.00 | AAA | 3,945,995 | ||||||
| 2,335 | Missouri Development Finance Board, Independence, Infrastructure Facilities Revenue Bonds, Crackerneck Creek Project, Series 2006C, 5.000%, 3/01/28 | 3/16 at 100.00 | A+ | 2,337,639 | ||||||
| 1,920 | Missouri Development Finance Board, Infrastructure Facilities Revenue Bonds, Branson Landing Project, Series 2005A, 5.000%, 6/01/35 | 6/15 at 100.00 | BBB+ | 1,801,498 | ||||||
| 450 | Monarch-Chesterfield Levee District, St. Louis County, Missouri, Levee District Improvement Bonds, Series 1999, 5.750%, 3/01/19 – MBIA Insured | 3/10 at 101.00 | AAA | 475,133 | ||||||
| 1,705 | O’Fallon, Missouri, Certificates of Participation, Series 2002, 5.250%, 2/01/15 – MBIA Insured | 2/12 at 100.00 | Aaa | 1,822,475 | ||||||
| 1,000 | Osage Beach, Missouri, Tax Increment Revenue Bonds, Prewitts Point Transportation Development District, Series 2006, 5.000%, 5/01/23 | 5/12 at 102.00 | N/R | 947,930 | ||||||
| 7,690 | Pettis County School District 200, Sedalia, Missouri, Certificates of Participation, Missouri Rural Education, Series 2007, 5.000%, 3/01/27 – AGC Insured | 3/17 at 100.00 | AAA | 8,028,205 | ||||||
| 3,000 | Puerto Rico Public Buildings Authority, Guaranteed Government Facilities Revenue Bonds, Series 1993L, 5.500%, 7/01/21 | No Opt. Call | BBB– | 3,351,300 | ||||||
| 1,050 | Riverside Industrial Development Authority, Missouri, Industrial Development Revenue Bonds, Riverside Horizon, Series 2007A, 5.000%, 5/01/27 – ACA Insured | 5/17 at 100.00 | A | 964,530 | ||||||
| 1,170 | Riverside, Missouri, L-385 Levee Redevelopment Plan Tax Increment Revenue Bonds, Series 2004, 5.250%, 5/01/20 | 5/15 at 100.00 | BBB | 1,180,319 | ||||||
38
| Principal Amount (000) | Description (1) | Optional Call Provisions (2) | Ratings (3) | Value | |||||||
| Tax Obligation/Limited (continued) | |||||||||||
| $ | 1,945 | Springfield Center City Development Corporation, Missouri, Lease Revenue Bonds, Jordan Valley Park Exposition Center, Series 2002A, 5.000%, 6/01/27 – AMBAC Insured | 6/12 at 100.00 | Aaa | $ | 1,990,999 | |||||
| 2,950 | Springfield Public Building Corporation, Missouri, Lease Revenue Bonds, Jordan Valley Park Projects, Series 2000A, 6.125%, 6/01/21 – AMBAC Insured | 6/10 at 100.00 | AAA | 3,128,564 | |||||||
| 2,500 | Springfield Public Building Corporation, Missouri, Lease Revenue Bonds, Series 2004, | 3/14 at 100.00 | Aaa | 2,592,800 | |||||||
| 600 | St. Joseph Industrial Development Authority, Missouri, Tax Increment Bonds, Shoppes at North Village Project, Series 2005A, 5.500%, 11/01/27 | 11/14 at 100.00 | N/R | 586,140 | |||||||
| 1,000 | St. Joseph Industrial Development Authority, Missouri, Tax Increment Bonds, Shoppes at North Village Project, Series 2005B, 5.500%, 11/01/27 | 11/14 at 100.00 | N/R | 976,900 | |||||||
| 48,460 | Total Tax Obligation/Limited | 49,589,192 | |||||||||
| Transportation – 4.1% | |||||||||||
| 2,000 | Kansas City, Missouri, Passenger Facility Charge Revenue Bonds, Kansas City International Airport, Series 2001, 5.000%, 4/01/23 – AMBAC Insured (Alternative Minimum Tax) | 4/11 at 101.00 | AAA | 2,030,740 | |||||||
| St. Louis Land Clearance Redevelopment Authority, Missouri, Revenue Refunding and Improvement Bonds, LCRA Parking Facilities, Series 1999C: | |||||||||||
| 1,000 | 7.000%, 9/01/19 | 9/09 at 102.00 | N/R | 1,028,140 | |||||||
| 2,400 | 7.050%, 9/01/24 | 9/09 at 102.00 | N/R | 2,450,592 | |||||||
| St. Louis, Missouri, Airport Revenue Refunding Bonds, Series 2003A: | |||||||||||
| 3,450 | 5.250%, 7/01/16 – FSA Insured | 7/13 at 100.00 | AAA | 3,691,466 | |||||||
| 1,000 | 5.250%, 7/01/18 – FSA Insured | 7/13 at 100.00 | AAA | 1,061,990 | |||||||
| 9,850 | Total Transportation | 10,262,928 | |||||||||
| U.S. Guaranteed – 11.3% (4) | |||||||||||
| 4,500 | Cape Girardeau County, Missouri, Single Family Mortgage Revenue Bonds, Series 1983, 0.000%, 12/01/14 (ETM) | No Opt. Call | Aaa | 3,476,295 | |||||||
| 1,025 | Excelsior Springs School District, Missouri, Leasehold Revenue Bonds, Series 1994, 0.000%, 3/01/14 – FSA Insured (ETM) | No Opt. Call | AAA | 815,019 | |||||||
| 2,500 | Fenton, Missouri, Tax Increment Refunding and Improvement Revenue Bonds, Gravois Bluffs Redevelopment Project, Series 2002, 6.125%, 10/01/21 (Pre-refunded 10/01/12) | 10/12 at 100.00 | N/R | (4) | 2,813,775 | ||||||
| 235 | Greene County, Missouri, Single Family Mortgage Revenue Bonds, Series 1984, 0.000%, 3/01/16 (ETM) | No Opt. Call | Aaa | 170,166 | |||||||
| 1,000 | Jefferson City School District, Missouri, General Obligation Bonds, Series 1991A, 6.700%, 3/01/11 (ETM) | No Opt. Call | Aa2 | (4) | 1,058,070 | ||||||
| 1,000 | Kansas City Metropolitan Community Colleges Building Corporation, Missouri, Leasehold Revenue Bonds, Junior College District of Metropolitan Kansas City, Series 2001, 5.500%, 7/01/18 (Pre-refunded 7/01/11) – FGIC Insured | 7/11 at 100.00 | Aaa | 1,074,330 | |||||||
| 1,500 | Lees Summit Industrial Development Authority, Missouri, Health Facilities Revenue Bonds, John Knox Village, Series 2002, 5.700%, 8/15/22 (Pre-refunded 8/15/12) | 8/12 at 101.00 | N/R | (4) | 1,644,825 | ||||||
| 4,000 | Missouri Development Finance Board, Independence, Infrastructure Facilities Revenue Bonds, Santa Fe Redevelopment Project, Series 2001, 5.250%, 4/01/23 (Pre-refunded 4/01/11) | 4/11 at 100.00 | A+ | (4) | 4,246,280 | ||||||
| 2,000 | Missouri Development Finance Board, Infrastructure Facilities Revenue Bonds, Riverside-Quindaro Bend Levee District L-385, Series 2001, 5.800%, 3/01/20 (Pre-refunded 3/01/10) | 3/10 at 100.00 | N/R | (4) | 2,092,720 | ||||||
| 1,500 | Missouri Development Finance Board, Kansas City, Infrastructure Facilities Revenue Bonds, Midtown Redevelopment Project, Series 2000A, 5.750%, 4/01/22 (Pre-refunded 4/01/10) – MBIA Insured | 4/10 at 100.00 | AAA | 1,583,460 | |||||||
| 2,000 | Missouri Health and Educational Facilities Authority, Revenue Bonds, St. Anthony’s Medical Center, Series 2000, 6.250%, 12/01/30 (Pre-refunded 12/01/10) | 12/10 at 101.00 | A | (4) | 2,184,580 | ||||||
| 500 | Puerto Rico, Highway Revenue Bonds, Highway and Transportation Authority, Series 1996Y, 5.500%, 7/01/36 (Pre-refunded 7/01/16) | 7/16 at 100.00 | Aaa | 572,595 | |||||||
| 5,000 | St. Louis, Missouri, Airport Revenue Bonds, Airport Development Program, Series 2001A, 5.000%, 7/01/26 (Pre-refunded 7/01/11) – MBIA Insured | 7/11 at 100.00 | AAA | 5,291,199 | |||||||
39
Portfolio of Investments (Unaudited)
Nuveen Missouri Municipal Bond Fund (continued)
November 30, 2007
| Principal Amount (000) | Description (1) | Optional Call Provisions (2) | Ratings (3) | Value | |||||||
| U.S. Guaranteed (4) (continued) | |||||||||||
| $ | 950 | Texas County, Missouri, Hospital Revenue Bonds, Texas County Memorial Hospital, Series 2000, 7.250%, 6/15/25 (Pre-refunded 6/15/10) | 6/10 at 100.00 | N/R | (4) | $ | 1,037,714 | ||||
| 27,710 | Total U.S. Guaranteed | 28,061,028 | |||||||||
| Utilities – 3.9% | |||||||||||
| 2,710 | Columbia, Missouri, Water and Electric Revenue Bonds, Series 2002A, 5.000%, 10/01/26 – AMBAC Insured | 10/12 at 100.00 | AAA | 2,809,593 | |||||||
| 1,195 | Nixa, Missouri, Electric System Revenue Bonds, Series 2005, 5.000%, 4/01/25 – XLCA Insured | 4/13 at 100.00 | AAA | 1,228,412 | |||||||
| 2,000 | Puerto Rico Electric Power Authority, Power Revenue Bonds, Series 2003NN, 5.250%, 7/01/23 – MBIA Insured | No Opt. Call | AAA | 2,200,940 | |||||||
| 3,030 | Sikeston, Missouri, Electric System Revenue Refunding Bonds, Series 1996, 6.000%, 6/01/14 – MBIA Insured | No Opt. Call | AAA | 3,478,167 | |||||||
| 8,935 | Total Utilities | 9,717,112 | |||||||||
| Water and Sewer – 6.9% | |||||||||||
| 1,825 | Kansas City, Missouri, Sewerage System Revenue Bonds, Series 2002D-1, 5.375%, 1/01/22 | 1/12 at 100.00 | AA | 1,929,244 | |||||||
| 3,385 | Metropolitan St. Louis Sewerage District, Missouri, Revenue Bonds, Wastewater System, Series 2004A, 5.000%, 5/01/20 – MBIA Insured | 5/14 at 100.00 | AAA | 3,611,592 | |||||||
| 1,600 | Missouri Development Finance Board, Independence, Infrastructure Facilities Revenue Bonds, Water System Improvement Projects, Series 2004, 5.000%, 11/01/24 – AMBAC Insured | 11/14 at 100.00 | AAA | 1,671,712 | |||||||
| 2,965 | Missouri Environmental Improvement and Energy Resources Authority, Water Facility Revenue Bonds, Missouri-American Water Company, Series 2006, 4.600%, 12/01/36 – AMBAC Insured (Alternative Minimum Tax) (UB) | 12/16 at 100.00 | AAA | 2,771,979 | |||||||
| 1,635 | Missouri Environmental Improvement and Energy Resources Authority, Water Facility Revenue Refunding Bonds, Tri-County Water Authority, Series 1999, 6.000%, 4/01/22 – RAAI Insured | 4/09 at 100.00 | AA | 1,666,441 | |||||||
| 1,345 | Missouri Environmental Improvement and Energy Resources Authority, Water Pollution Control and Drinking Water Revenue Bonds, Series 2003B, 5.125%, 1/01/21 | 1/13 at 100.00 | Aaa | 1,425,081 | |||||||
| 1,000 | Missouri Environmental Improvement and Energy Resources Authority, Water Pollution Control and Drinking Water Revenue Bonds, State Revolving Fund Program, Series 2005A, 5.000%, 7/01/25 | 7/15 at 100.00 | Aaa | 1,057,130 | |||||||
| St. Charles County Public Water Supply District 2, Missouri, Certificates of Participation, Series 2002A: | |||||||||||
| 750 | 5.000%, 12/01/26 – MBIA Insured | 12/11 at 100.00 | Aaa | 766,763 | |||||||
| 1,000 | 5.250%, 12/01/28 – MBIA Insured | 12/11 at 100.00 | Aaa | 1,045,060 | |||||||
| 1,000 | West Plains, Missouri, Sewerage System Revenue Bonds, Series 2004, 5.125%, 7/01/24 – FSA Insured | 7/12 at 100.00 | AAA | 1,052,670 | |||||||
| 16,505 | Total Water and Sewer | 16,997,672 | |||||||||
| $ | 249,287 | Total Investments (cost $240,476,019) – 100.5% | 249,030,627 | ||||||||
Floating Rate Obligations – (0.9)% | (2,225,000) | ||||||||||
Other Assets Less Liabilities – 0.4% | 1,104,875 | ||||||||||
Net Assets – 100% | $ | 247,910,502 | |||||||||
| The Fund may invest in “zero coupon” securities. A zero coupon security does not pay a regular interest coupon to its holders during the life of the security. Tax-exempt income to the holder of the security comes from accretion of the difference between the original purchase price of the security at issuance and the par value of the security at maturity and is effectively paid at maturity. Such securities are included in the Portfolio of Investments with a 0.000% coupon rate in their description. The market prices of zero coupon securities generally are more volatile than the market prices of securities that pay interest periodically. |
| (1) | All percentages shown in the Portfolio of Investments are based on net assets unless otherwise noted. |
| (2) | Optional Call Provisions: Dates (month and year) and prices of the earliest optional call or redemption. There may be other call provisions at varying prices at later dates. Certain mortgage-backed securities may be subject to periodic principal paydowns. |
| (3) | Ratings: Using the higher of Standard & Poor’s Group (“Standard & Poor’s”) or Moody’s Investor Service, Inc. (“Moody’s”) rating. Ratings below BBB by Standard & Poor’s or Baa by Moody’s are considered to be below investment grade. |
| The AAA ratings shown in the Portfolio of Investments reflects the AAA ratings on certain bonds insured by AMBAC, FGIC or MBIA as of November 30, 2007. As explained earlier in the Portfolio Managers’ Comments section of this report, one rating agency has reduced the rating for AMBAC to AA, and one or more rating agencies have placed each of these insurers on “negative credit watch”, which may presage one or more rating reductions for such insurer or insurers in the future. If one or more insurers’ ratings are reduced below AAA by these rating agencies, it would likely reduce the effective rating of many of the bonds insured by that insurer or insurers. |
| (4) | Backed by an escrow or trust containing sufficient U.S. Government or U.S. Government agency securities which ensure the timely payment of principal and interest. Such investments are normally considered to be equivalent to AAA rated securities. |
| N/R | Not rated. |
| (ETM) | Escrowed to maturity. |
| (UB) | Underlying bond of an inverse floating rate trust reflected as a financing transaction pursuant to the provisions of SFAS No. 140. |
See accompanying notes to financial statements.
40
Portfolio of Investments (Unaudited)
Nuveen Ohio Municipal Bond Fund
November 30, 2007
| Principal Amount (000) | Description (1) | Optional Call Provisions (2) | Ratings (3) | Value | ||||||
| Consumer Staples – 3.0% | ||||||||||
| $ | 10,000 | Buckeye Tobacco Settlement Financing Authority, Ohio, Tobacco Settlement Asset-Backed Revenue Bonds, Senior Lien, Series 2007A-2, 5.875%, 6/01/47 | 6/17 at 100.00 | BBB | $ | 9,529,800 | ||||
| 6,495 | Puerto Rico, The Children’s Trust Fund, Tobacco Settlement Asset-Backed Refunding Bonds, Series 2002, 5.375%, 5/15/33 | 5/12 at 100.00 | BBB | 6,345,160 | ||||||
| 16,495 | Total Consumer Staples | 15,874,960 | ||||||||
| Education and Civic Organizations – 7.9% | ||||||||||
| 4,090 | Cleveland State University, Ohio, General Receipts Bonds, Series 2003A, 5.000%, 6/01/23 – FGIC Insured | 6/13 at 100.00 | AAA | 4,269,469 | ||||||
| Ohio Higher Education Facilities Commission, General Revenue Bonds, Case Western Reserve University, Series 2004A: | ||||||||||
| 2,310 | 5.000%, 12/01/16 – AMBAC Insured | 12/13 at 100.00 | AAA | 2,467,380 | ||||||
| 2,825 | 5.000%, 12/01/17 – AMBAC Insured | 12/13 at 100.00 | AAA | 3,004,953 | ||||||
| 2,975 | 5.000%, 12/01/18 – AMBAC Insured | 12/13 at 100.00 | AAA | 3,149,633 | ||||||
| 3,850 | Ohio Higher Education Facilities Commission, General Revenue Bonds, Kenyon College, Series 2006, 5.000%, 7/01/41 | 7/16 at 100.00 | A+ | 3,869,866 | ||||||
| 1,750 | Ohio Higher Education Facilities Commission, General Revenue Bonds, Oberlin College, Series 2003, 5.125%, 10/01/24 | 10/13 at 100.00 | AA | 1,825,373 | ||||||
| 910 | Ohio Higher Education Facilities Commission, Revenue Bonds, Case Western Reserve University, Series 1990B, 6.500%, 10/01/20 | No Opt. Call | AA– | 1,102,829 | ||||||
| Ohio Higher Education Facilities Commission, Revenue Bonds, Wittenberg University, Series 2005: | ||||||||||
| 1,000 | 5.000%, 12/01/24 | 12/15 at 100.00 | Baa2 | 984,810 | ||||||
| 1,000 | 5.000%, 12/01/29 | 12/15 at 100.00 | Baa2 | 954,430 | ||||||
| 2,730 | Ohio Higher Educational Facilities Commission, Revenue Bonds, Denison University, Series 2004, 5.000%, 11/01/20 | 11/14 at 100.00 | AA | 2,874,117 | ||||||
| Ohio Higher Educational Facilities Commission, Revenue Bonds, University of Dayton, Series 2004: | ||||||||||
| 1,315 | 5.000%, 12/01/25 – AMBAC Insured | 12/14 at 100.00 | AAA | 1,370,559 | ||||||
| 1,060 | 5.000%, 12/01/27 – AMBAC Insured | 12/14 at 100.00 | AAA | 1,100,884 | ||||||
| Ohio Higher Educational Facilities Commission, Revenue Bonds, Wittenberg University, Series 2001: | ||||||||||
| 1,200 | 5.500%, 12/01/21 | 12/11 at 100.00 | Baa2 | 1,224,348 | ||||||
| 2,075 | 5.000%, 12/01/26 | 12/11 at 100.00 | Baa2 | 2,021,610 | ||||||
| 2,000 | Ohio State Higher Education Facilities, Revenue Bonds, Case Western Reserve University, Series 2006, 5.000%, 12/01/44 – MBIA Insured | 12/16 at 100.00 | AAA | 2,072,600 | ||||||
| Ohio University at Athens, Subordinate Lien General Receipts Bonds, Series 2004: | ||||||||||
| 1,855 | 5.000%, 12/01/21 – MBIA Insured | 6/14 at 100.00 | AAA | 1,970,659 | ||||||
| 1,900 | 5.000%, 12/01/23 – MBIA Insured | 6/14 at 100.00 | AAA | 1,989,566 | ||||||
| 1,675 | University of Cincinnati, Ohio, General Receipts Bonds, Series 2004A, 5.000%, 6/01/21 – AMBAC Insured | 6/14 at 100.00 | AAA | 1,776,673 | ||||||
| University of Cincinnati, Ohio, General Receipts Bonds, Series 2004D: | ||||||||||
| 1,325 | 5.000%, 6/01/24 – AMBAC Insured | 6/14 at 100.00 | AAA | 1,380,557 | ||||||
| 1,005 | 5.000%, 6/01/26 – AMBAC Insured | 6/14 at 100.00 | AAA | 1,043,100 | ||||||
| 1,025 | University of Cincinnati, Ohio, General Receipts Bonds, Series 2004E, 5.000%, 6/01/21 – AMBAC Insured | 12/14 at 100.00 | AAA | 1,087,320 | ||||||
| 39,875 | Total Education and Civic Organizations | 41,540,736 | ||||||||
| Health Care – 10.1% | ||||||||||
| 7,000 | Akron, Bath and Copley Joint Township Hospital District, Ohio, Hospital Facilities Revenue Bonds, Summa Health System, Series 1998A, 5.375%, 11/15/24 | 11/09 at 101.00 | Baa1 | 7,056,840 | ||||||
| 1,065 | Akron, Bath and Copley Joint Township Hospital District, Ohio, Hospital Revenue Bonds, Children’s Hospital Medical Center, Series 2003, 5.250%, 11/15/25 – FSA Insured | 11/13 at 100.00 | Aaa | 1,108,292 | ||||||
| 9,570 | Butler County, Ohio, Hospital Facilities Revenue Bonds, Cincinnati Children’s Medical Center Project, Series 2006K, 4.375%, 5/15/32 – FGIC Insured (UB) | 5/16 at 100.00 | Aaa | 8,757,603 | ||||||
| 1,000 | Cuyahoga County, Ohio, Hospital Revenue Refunding and Improvement Bonds, MetroHealth System, Series 1997, 5.625%, 2/15/17 – MBIA Insured | 2/08 at 101.00 | AAA | 1,021,560 | ||||||
41
Portfolio of Investments (Unaudited)
Nuveen Ohio Municipal Bond Fund (continued)
November 30, 2007
| Principal Amount (000) | Description (1) | Optional Call Provisions (2) | Ratings (3) | Value | ||||||
| Health Care (continued) | ||||||||||
| $ | 4,400 | Cuyahoga County, Ohio, Revenue Refunding Bonds, Cleveland Clinic Health System, Series 2003A, 6.000%, 1/01/32 | 7/13 at 100.00 | AA– | $ | 4,790,544 | ||||
| 6,000 | Erie County, Ohio, Hospital Facilities Revenue Bonds, Firelands Regional Medical Center Project, Series 2006, 5.250%, 8/15/46 | 8/16 at 100.00 | A | 6,088,740 | ||||||
| 2,500 | Erie County, Ohio, Hospital Facilities Revenue Bonds, Firelands Regional Medical Center, Series 2002A, 5.625%, 8/15/32 | 8/12 at 101.00 | A | 2,591,000 | ||||||
| 130 | Franklin County, Ohio, Hospital Revenue Bonds, Holy Cross Health System Corporation, Series 1996, 5.800%, 6/01/16 | 6/08 at 100.00 | Aa2 | 131,099 | ||||||
| 2,000 | Miami County, Ohio, Hospital Facilities Revenue Refunding Bonds, Upper Valley Medical Center Inc., Series 2006, 5.250%, 5/15/26 | 5/16 at 100.00 | A– | 1,991,760 | ||||||
| 4,000 | Middleburg Heights, Ohio, Hospital Improvement Revenue Refunding Bonds, Southwest General Hospital, Series 1995, 5.625%, 8/15/15 – FSA Insured | 8/08 at 102.00 | AAA | 4,133,640 | ||||||
| 7,000 | Montgomery County, Ohio, Hospital Facilities Revenue Refunding and Improvement Bonds, Kettering Medical Center, Series 1996, 6.250%, 4/01/20 – MBIA Insured | No Opt. Call | AAA | 8,366,400 | ||||||
| 2,520 | Montgomery County, Ohio, Revenue Bonds, Catholic Health Initiatives, Series 2004A, 5.000%, 5/01/32 | No Opt. Call | AA | 2,537,086 | ||||||
| 665 | Richland County, Ohio, Hospital Facilities Revenue Improvement Bonds, MedCentral Health System Obligated Group, Series 2000B, 6.375%, 11/15/22 | 11/10 at 101.00 | A– | 703,098 | ||||||
| 2,700 | Richland County, Ohio, Hospital Revenue Bonds, MidCentral Health System Group, Series 2006, 5.250%, 11/15/36 | 11/16 at 100.00 | A– | 2,715,255 | ||||||
| 1,200 | Tuscarawas County, Ohio, Hospital Facilities Revenue Bonds, Union Hospital Project, Series 2001, 5.250%, 10/01/31 – RAAI Insured | 10/11 at 101.00 | AA | 1,195,056 | ||||||
| 51,750 | Total Health Care | 53,187,973 | ||||||||
| Housing/Multifamily – 4.8% | ||||||||||
| 1,035 | Clark County, Ohio, Multifamily Housing Revenue Bonds, Church of God Retirement Home, Series 1998, 6.250%, 11/01/30 (Alternative Minimum Tax) | 11/08 at 103.00 | N/R | 1,002,522 | ||||||
| 3,045 | Franklin County, Ohio, GNMA Collateralized Multifamily Housing Mortgage Revenue Bonds, Carriage House Apartments Project, Series 2002, 5.400%, 3/20/37 | 9/11 at 102.00 | Aaa | 3,132,513 | ||||||
| 2,705 | Henry County, Ohio, GNMA Collateralized Healthcare Facility Revenue Bonds, Alpine Village Project, Series 1999, 6.375%, 2/20/41 | 8/09 at 102.00 | Aaa | 2,826,049 | ||||||
| 1,805 | Montgomery County, Ohio, GNMA Guaranteed Multifamily Housing Revenue Bonds, Canterbury Court Project, Series 2007, 5.500%, 10/20/42 (Alternative Minimum Tax) | 10/18 at 101.00 | Aaa | 1,832,454 | ||||||
| 4,985 | Ohio Capital Corporation for Housing, FHA-Insured Section 8 Assisted Mortgage Loan Revenue Refunding Bonds, Series 1999D, 5.950%, 2/01/23 | 2/09 at 102.00 | Aa2 | 5,156,733 | ||||||
| 2,300 | Ohio Housing Finance Agency, Multifamily Housing Revenue Bonds, Warren Heights Project, GNMA Collateralized, Series 2007, 5.100%, 11/20/48 (Alternative Minimum Tax) | No Opt. Call | Aaa | 2,300,161 | ||||||
| 2,370 | Summit County Port Authority, Ohio, Multifamily Housing Revenue Bonds, CAllis Tower Apartments Project, Series 2007, 5.250%, 9/20/47 (Alternative Minimum Tax) | 9/17 at 102.00 | AAA | 2,329,378 | ||||||
| 4,000 | Summit County Port Authority, Ohio, Multifamily Housing Revenue Bonds, Collinson Apartments, Series 2006A, 4.800%, 3/20/48 (Alternative Minimum Tax) | 3/17 at 102.00 | Aaa | 3,700,560 | ||||||
| 3,000 | Trumbull County, Ohio, Multifamily Housing Revenue Bonds, Royal Mall Apartments, Series 2007, 5.000%, 5/20/49 (Alternative Minimum Tax) | 11/17 at 102.00 | Aaa | 2,867,910 | ||||||
| 25,245 | Total Housing/Multifamily | 25,148,280 | ||||||||
| Housing/Single Family – 0.6% | ||||||||||
| 1,245 | Ohio Housing Finance Agency, GNMA Mortgage-Backed Securities Program Residential Mortgage Revenue Bonds, Series 1998A-1, 5.300%, 9/01/19 – FSA Insured (Alternative Minimum Tax) | 3/08 at 101.50 | Aaa | 1,261,011 | ||||||
| 80 | Ohio Housing Finance Agency, GNMA Mortgage-Backed Securities Program Residential Mortgage Revenue Bonds, Series 1999C, 5.750%, 9/01/30 (Alternative Minimum Tax) | 7/09 at 100.00 | Aaa | 80,670 | ||||||
| 2,000 | Ohio Housing Finance Agency, Single Family Mortgage Revenue Bonds, Series 2006H, 5.000%, 9/01/31 (Alternative Minimum Tax) | 9/15 at 100.00 | Aaa | 1,968,420 | ||||||
| 3,325 | Total Housing/Single Family | 3,310,101 | ||||||||
42
| Principal Amount (000) | Description (1) | Optional Call Provisions (2) | Ratings (3) | Value | ||||||
| Industrials – 2.2% | ||||||||||
| $ | 380 | Cleveland-Cuyahoga County Port Authority, Ohio, Development Revenue Bonds, Bond Fund Program – Columbia National Group Project, Series 2005D, 5.000%, 5/15/20 (Alternative Minimum Tax) | 11/15 at 100.00 | N/R | $ | 373,255 | ||||
| 2,200 | Cleveland-Cuyahoga County Port Authority, Ohio, Development Revenue Bonds, Jergens Inc., Series 1998A, 5.375%, 5/15/18 (Alternative Minimum Tax) | 5/08 at 102.00 | N/R | 2,198,196 | ||||||
| 6,300 | Dayton, Ohio, Special Facilities Revenue Refunding Bonds, Emery Air Freight Corporation and Emery Worldwide Airlines Inc. – Guarantors, Series 1998A, 5.625%, 2/01/18 | 2/08 at 102.00 | AAA | 6,439,545 | ||||||
| Ohio, Economic Development Revenue Bonds, Enterprise Bond Fund Loan Pool, Series 2002-4: | ||||||||||
| 500 | 5.000%, 6/01/15 (Alternative Minimum Tax) | 6/12 at 102.00 | AA– | 523,510 | ||||||
| 675 | 5.450%, 6/01/22 (Alternative Minimum Tax) | 6/12 at 102.00 | AA– | 705,078 | ||||||
| 1,020 | Ohio, Economic Development Revenue Bonds, Enterprise Bond Fund Loan Pool, Series 2002-7, 5.850%, 12/01/22 (Alternative Minimum Tax) | No Opt. Call | AA– | 1,081,067 | ||||||
| 11,075 | Total Industrials | 11,320,651 | ||||||||
| Long-Term Care – 3.0% | ||||||||||
| 3,120 | Franklin County, Ohio, Healthcare Facilities Revenue Bonds, Heinzerling Foundation, Series 1995, 6.200%, 11/01/20 | 5/08 at 100.00 | Aa2 | 3,124,742 | ||||||
| 2,000 | Franklin County, Ohio, Healthcare Facilities Revenue Bonds, Presbyterian Retirement Services, Series 2002A, 5.125%, 7/01/22 – RAAI Insured | 7/12 at 100.00 | AA | 2,012,480 | ||||||
| 9,930 | Hamilton County, Ohio, Health Care Revenue Refunding Bonds, Life Enriching Communities Project, Series 2006A, 5.000%, 1/01/37 | 1/17 at 100.00 | BBB | 9,192,797 | ||||||
| 1,335 | Napoleon, Ohio, FHA-Insured Healthcare Facilities Mortgage Revenue Refunding Bonds, Lutheran Orphans and Old Folks Home Society, Series 1994, 6.875%, 8/01/23 | 2/08 at 100.00 | Aa2 | 1,337,723 | ||||||
| 16,385 | Total Long-Term Care | 15,667,742 | ||||||||
| Materials – 0.5% | ||||||||||
| 1,000 | Toledo-Lucas County Port Authority, Ohio, Port Revenue Bonds, Cargill Inc., Series 2004A, 4.800%, 3/01/22 | 3/14 at 101.00 | A | 1,006,630 | ||||||
| 2,000 | Toledo-Lucas County Port Authority, Ohio, Port Revenue Bonds, Cargill Inc., Series 2004B, 4.500%, 12/01/15 | No Opt. Call | A | 2,065,140 | ||||||
| 3,000 | Total Materials | 3,071,770 | ||||||||
| Tax Obligation/General – 20.9% | ||||||||||
| Adams County Valley School District, Adams and Highland Counties, Ohio, Unlimited Tax School Improvement General Obligation Bonds, Series 1995: | ||||||||||
| 6,000 | 7.000%, 12/01/15 – MBIA Insured | No Opt. Call | AAA | 7,043,640 | ||||||
| 9,500 | 5.250%, 12/01/21 – MBIA Insured | 12/07 at 100.00 | AAA | 9,512,255 | ||||||
| 600 | Anthony Wayne Local School District, Lucas, Wood and Fulton Counties, Ohio, School Facilities Construction and Improvement Bonds, Series 1995, 0.000%, 12/01/13 – FGIC Insured | No Opt. Call | AAA | 477,240 | ||||||
| 2,105 | Buckeye Valley Local School District, Ohio, Unlimited Tax General Obligation Bonds, Series 1995A, 6.850%, 12/01/15 – MBIA Insured | No Opt. Call | AAA | 2,374,798 | ||||||
| 1,000 | Butler County, Hamilton, Ohio, Limited Tax General Obligation Bonds, One Renaissance Center Acquisition, Series 2001, 5.375%, 11/01/17 – AMBAC Insured | 11/11 at 101.00 | Aaa | 1,081,780 | ||||||
| 2,515 | Canton City School District, Stark County, Ohio, General Obligation Bonds, Series 2005, 5.000%, 12/01/19 – MBIA Insured | 6/15 at 100.00 | AAA | 2,691,779 | ||||||
| 2,295 | Central Ohio Solid Waste Authority, General Obligation Bonds, Series 2004A, 5.000%, 12/01/15 – AMBAC Insured | 6/14 at 100.00 | AAA | 2,479,380 | ||||||
| Chesapeake-Union Exempt Village School District, Ohio, General Obligation Bonds, Series 1986: | ||||||||||
| 125 | 8.500%, 12/01/07 | No Opt. Call | N/R | 125,015 | ||||||
| 125 | 8.500%, 12/01/08 | No Opt. Call | N/R | 130,325 | ||||||
| 130 | 8.500%, 12/01/09 | No Opt. Call | N/R | 140,813 | ||||||
| 2,675 | Cuyahoga County, Ohio, General Obligation Bonds, Series 2004, 5.000%, 12/01/22 | 12/14 at 100.00 | AA+ | 2,832,103 | ||||||
| 1,345 | Cuyahoga County, Ohio, Limited Tax General Obligation Bonds, Series 1993, 5.650%, 5/15/18 | No Opt. Call | Aa1 | 1,546,158 | ||||||
43
Portfolio of Investments (Unaudited)
Nuveen Ohio Municipal Bond Fund (continued)
November 30, 2007
| Principal Amount (000) | Description (1) | Optional Call Provisions (2) | Ratings (3) | Value | ||||||
| Tax Obligation/General (continued) | ||||||||||
| $ | 1,000 | Cuyahoga County, Ohio, Limited Tax General Obligation Various Purpose Refunding Bonds, Series 1993B, 5.250%, 10/01/13 | No Opt. Call | AA+ | $ | 1,057,610 | ||||
| Cuyahoga Falls, Ohio, General Obligation Bonds, Series 2004: | ||||||||||
| 1,245 | 5.000%, 12/01/18 – MBIA Insured | 6/14 at 100.00 | Aaa | 1,328,888 | ||||||
| 1,440 | 5.000%, 12/01/21 – MBIA Insured | 6/14 at 100.00 | Aaa | 1,529,784 | ||||||
| 1,170 | Dayton, Ohio, General Obligation Bonds, Series 2004, 5.250%, 12/01/15 – AMBAC Insured | 6/14 at 100.00 | AAA | 1,283,595 | ||||||
| Delaware City School District, Delaware County, Ohio, Unlimited Tax General Obligation School Facilities Construction and Improvement Bonds, Series 1995: | ||||||||||
| 1,000 | 0.000%, 12/01/10 – FGIC Insured | No Opt. Call | AAA | 898,590 | ||||||
| 1,000 | 0.000%, 12/01/11 – FGIC Insured | No Opt. Call | AAA | 864,870 | ||||||
| 1,000 | Fairview Park, Ohio, General Obligation Bonds, Series 2005, 5.000%, 12/01/25 – MBIA Insured | 12/15 at 100.00 | Aaa | 1,054,240 | ||||||
| 1,005 | Findlay, Ohio, General Obligation Bonds, Series 2004, 5.250%, 7/01/15 – MBIA Insured | 7/14 at 100.00 | AAA | 1,103,591 | ||||||
| 3,160 | Franklin County, Ohio, General Obligation Bonds, Series 2007, 5.000%, 12/01/28 | 12/17 at 100.00 | AAA | 3,366,064 | ||||||
| 3,040 | Franklin County, Ohio, Limited Tax General Obligation Refunding Bonds, Series 1993, 5.375%, 12/01/20 | 12/08 at 102.00 | AAA | 3,152,115 | ||||||
| 325 | Geauga County, Ohio, Limited Tax General Obligation, Sewer District Improvement Bonds, Bainbridge Water Project, Series 1995, 6.850%, 12/01/10 | 12/07 at 100.00 | Aa2 | 325,936 | ||||||
| 3,810 | Greater Cleveland Regional Transit Authority, Ohio, General Obligation Bonds, Series 2004, 5.000%, 12/01/17 – MBIA Insured | 12/14 at 100.00 | Aaa | 4,145,204 | ||||||
| 2,425 | Hubbard Exempt Village School District, Trumbull County, Ohio, General Obligation Bonds, Classroom Facilities Improvements, Series 2007, 5.000%, 12/01/34 – CIFG Insured | 6/17 at 100.00 | AAA | 2,528,402 | ||||||
| 1,270 | Kenston Local School District, Geauga County, Ohio, General Obligation Bonds, Series 2003, 5.000%, 12/01/23 – MBIA Insured | 6/13 at 100.00 | Aaa | 1,329,804 | ||||||
| 1,400 | Kent City School District, Portage County, Ohio, General Obligation Library Improvement Bonds, Series 2004, 5.000%, 12/01/20 – FGIC Insured | 12/14 at 100.00 | AAA | 1,495,704 | ||||||
| 1,500 | Kettering City School District, Montgomery County, Ohio, General Obligation Bonds, Series 2007, 5.250%, 12/01/31 – FSA Insured | No Opt. Call | AAA | 1,669,980 | ||||||
| 810 | Kettering, Ohio, Limited Tax General Obligation Bonds, Series 1991, 6.650%, 12/01/12 | 12/07 at 100.00 | Aa3 | 812,122 | ||||||
| Kings Local School District, Warren County, Ohio, General Obligation School Improvement Bonds, Series 2005: | ||||||||||
| 1,000 | 5.000%, 12/01/22 – MBIA Insured | 6/15 at 100.00 | AAA | 1,058,810 | ||||||
| 1,480 | 5.000%, 12/01/24 – MBIA Insured | 6/15 at 100.00 | AAA | 1,559,905 | ||||||
| 555 | Lake County, Ohio, Limited Tax Sewer District Improvement Bonds, Series 2000, 5.600%, 12/01/20 | No Opt. Call | Aa2 | 629,553 | ||||||
| 1,725 | Lakewood City School District, Cuyahoga County, Ohio, General Obligation Bonds, Series 2007, 5.000%, 12/01/30 – FGIC Insured | 12/17 at 100.00 | AAA | 1,813,010 | ||||||
| 2,855 | Marysville Exempted School District, Union County, Ohio, General Obligation Bonds, Series 2006, 5.000%, 12/01/24 – FSA Insured | 12/15 at 100.00 | AAA | 3,017,821 | ||||||
| 1,000 | Mason City School District, Counties of Warren and Butler, Ohio, General Obligation Bonds, Series 2007, 5.000%, 12/01/31 | 6/17 at 100.00 | Aa1 | 1,054,530 | ||||||
| 1,265 | Monroe Local School District, Butler County, Ohio, General Obligation Bonds, Series 2002, 5.750%, 12/01/20 – AMBAC Insured | No Opt. Call | Aaa | 1,484,237 | ||||||
| Oak Hills Local School District, Hamilton County, Ohio, General Obligation Bonds, Series 2005: | ||||||||||
| 3,740 | 5.000%, 12/01/23 – FSA Insured | 12/15 at 100.00 | AAA | 3,955,910 | ||||||
| 1,000 | 5.000%, 12/01/25 – FSA Insured | 12/15 at 100.00 | AAA | 1,051,470 | ||||||
| 1,000 | Ohio, Common Schools Capital Facilities, General Obligation Bonds, Series 2001B, 5.000%, 9/15/21 | 9/11 at 100.00 | AA+ | 1,043,200 | ||||||
| 1,000 | Ohio, Full Faith and Credit General Obligation Infrastructure Improvement Bonds, Series 1994, 6.000%, 8/01/10 | No Opt. Call | AA+ | 1,071,440 | ||||||
| 730 | Ohio, General Obligation Bonds, Common Schools, Series 2004B, 5.000%, 3/15/21 | 3/14 at 100.00 | AA+ | 773,749 | ||||||
| 6,055 | Ohio, General Obligation Bonds, Infrastructure Improvements, Series 2003F, 5.000%, 2/01/22 | 2/13 at 100.00 | AA+ | 6,332,016 | ||||||
| 1,845 | Ohio, General Obligation Bonds, Series 2005A, 5.000%, 9/01/16 | 3/15 at 100.00 | AA+ | 2,007,508 | ||||||
44
| Principal Amount (000) | Description (1) | Optional Call Provisions (2) | Ratings (3) | Value | ||||||
| Tax Obligation/General (continued) | ||||||||||
| $ | 8,140 | Ohio, General Obligation Higher Education Capital Facilities Bonds, Series 2001A, 5.000%, 2/01/20 | 2/11 at 100.00 | AA+ | $ | 8,437,273 | ||||
| 1,000 | Olmsted Falls City School District, Cuyahoga County, Ohio, General Obligation Bonds, Series 2007, 5.000%, 12/01/35 – XLCA Insured | 6/17 at 100.00 | AAA | 1,044,210 | ||||||
| 3,315 | South Point Local School District, Lawrence County, Ohio, General Obligation Bonds, Series 2004, 5.000%, 12/01/24 – FSA Insured | 12/14 at 100.00 | AAA | 3,483,700 | ||||||
| 30 | Strongsville, Ohio, Limited Tax General Obligation Various Purpose Improvement Bonds, Series 1996, 5.950%, 12/01/21 | 12/07 at 101.00 | Aa1 | 30,358 | ||||||
| 2,315 | Summit County, Ohio, General Obligation Bonds, Series 2002R, 5.500%, 12/01/21 – FGIC Insured | No Opt. Call | AAA | 2,659,032 | ||||||
| 3,755 | Toledo City School District, Lucas County, Ohio, General Obligation Bonds, Series 2003B, 5.000%, 12/01/22 – FGIC Insured | 12/13 at 100.00 | Aaa | 3,937,080 | ||||||
| 1,500 | Upper Arlington City School District, Ohio, General Obligation Bonds, Series 2005, 5.000%, 12/01/20 – FSA Insured | 6/15 at 100.00 | AAA | 1,602,720 | ||||||
| West Chester Township, Butler County, Ohio, General Obligation Bonds, Series 2003: | ||||||||||
| 1,365 | 5.250%, 12/01/19 – MBIA Insured | 12/13 at 100.00 | Aaa | 1,471,484 | ||||||
| 1,515 | 5.250%, 12/01/21 – MBIA Insured | 12/13 at 100.00 | Aaa | 1,633,185 | ||||||
| 103,200 | Total Tax Obligation/General | 109,533,986 | ||||||||
| Tax Obligation/Limited – 12.1% | ||||||||||
| 5,690 | Akron, Ohio, Income Tax Revenue Bonds, Community Learning Centers, Series 2004A, 5.000%, 12/01/33 – FGIC Insured | 12/13 at 100.00 | AAA | 5,829,177 | ||||||
| Blue Ash, Ohio, Tax Increment Financing Revenue Bonds, Duke Realty Ohio, Series 2006: | ||||||||||
| 950 | 5.000%, 12/01/25 | 12/16 at 102.00 | N/R | 946,096 | ||||||
| 1,165 | 5.000%, 12/01/30 | 12/16 at 102.00 | N/R | 1,125,611 | ||||||
| 1,850 | Cleveland-Cuyahoga County Port Authority, Ohio, Development Revenue Bonds, R.I.T.A. Project, Series 2004, 5.000%, 11/15/19 – RAAI Insured | 11/14 at 100.00 | AA | 1,870,535 | ||||||
| 1,380 | Columbus, Ohio, Tax Increment Financing Bonds, Easton Project, Series 2004A, 5.000%, 12/01/25 – AMBAC Insured | 6/14 at 100.00 | AAA | 1,429,142 | ||||||
| 5,615 | Franklin County, Ohio, Excise Tax and Lease Revenue Anticipation Bonds, Convention Facilities Authority, Series 2005, 5.000%, 12/01/25 – AMBAC Insured | 12/15 at 100.00 | AAA | 5,872,953 | ||||||
| Franklin County, Ohio, Excise Tax and Lease Revenue Refunding Anticipation Bonds, Convention Facilities Authority, Series 2007: | ||||||||||
| 2,215 | 5.000%, 12/01/26 | 12/17 at 100.00 | Aaa | 2,329,848 | ||||||
| 2,000 | 5.000%, 12/01/27 | 12/17 at 100.00 | Aaa | 2,098,740 | ||||||
| 1,210 | Groveport, Ohio, Special Obligation Income Tax Receipts Bonds, Series 2002, 5.000%, 12/01/22 – MBIA Insured | 12/12 at 100.00 | Aaa | 1,265,491 | ||||||
| Hamilton County Convention Facilities Authority, Ohio, First Lien Revenue Bonds, Series 2004: | ||||||||||
| 2,300 | 5.000%, 12/01/20 – FGIC Insured | 6/14 at 100.00 | AAA | 2,416,449 | ||||||
| 1,000 | 5.000%, 12/01/21 – FGIC Insured | 6/14 at 100.00 | AAA | 1,047,140 | ||||||
| 2,535 | 5.000%, 12/01/22 – FGIC Insured | 6/14 at 100.00 | AAA | 2,645,703 | ||||||
| 11,000 | Hamilton County, Ohio, Sales Tax Bonds, Subordinate Lien, Series 2006, 5.000%, 12/01/32 – AMBAC Insured | 12/16 at 100.00 | Aaa | 11,498,740 | ||||||
| 3,300 | Hamilton County, Ohio, Sales Tax Bonds, Subordinate Series 2000B, 0.000%, 12/01/28 – AMBAC Insured | No Opt. Call | Aaa | 1,203,675 | ||||||
| 1,485 | New Albany Community Authority, Ohio, Community Facilities Revenue Refunding Bonds, Series 2001B, 5.500%, 10/01/16 – AMBAC Insured | 4/12 at 100.00 | AAA | 1,607,171 | ||||||
| 695 | Ohio Department of Transportation, Certificates of Participation, Panhandle Rail Line, Series 1992A, 6.500%, 4/15/12 – FSA Insured | 4/08 at 100.00 | AAA | 696,738 | ||||||
| 1,050 | Ohio State Building Authority, State Facilities Bonds, Administrative Building Fund Projects, Series 2002A, 5.000%, 4/01/22 – FSA Insured | 4/12 at 100.00 | AAA | 1,093,061 | ||||||
| 1,900 | Ohio State Building Authority, State Facilities Bonds, Administrative Building Fund Projects, Series 2005A, 5.000%, 4/01/25 – FSA Insured | 4/15 at 100.00 | AAA | 1,980,389 | ||||||
45
Portfolio of Investments (Unaudited)
Nuveen Ohio Municipal Bond Fund (continued)
November 30, 2007
| Principal Amount (000) | Description (1) | Optional Call Provisions (2) | Ratings (3) | Value | |||||||
| Tax Obligation/Limited (continued) | |||||||||||
| $ | 3,135 | Ohio State Building Authority, State Facilities Bonds, Adult Correctional Building Fund Project, Series 2005A, 5.000%, 4/01/23 – FSA Insured | 4/15 at 100.00 | AAA | $ | 3,298,835 | |||||
| 1,490 | Ohio, State Appropriation Lease Bonds, Mental Health Capital Facilities, Series 2003B-II, 5.000%, 6/01/16 | 6/13 at 100.00 | AA | 1,600,215 | |||||||
| 1,000 | Ohio, State Appropriation Lease Bonds, Parks and Recreation Capital Facilities, Series 2004A-II, 5.000%, 12/01/15 | 12/13 at 100.00 | AA | 1,080,020 | |||||||
| 1,000 | Ohio, State Appropriation Lease Bonds, Parks and Recreation Capital Facilities, Series 2005A-II, 5.250%, 2/01/19 – FSA Insured | 2/15 at 100.00 | AAA | 1,088,500 | |||||||
| 2,700 | Puerto Rico Public Buildings Authority, Guaranteed Government Facilities Revenue Bonds, Series 1993L, 5.500%, 7/01/21 - MBIA Insured (UB) | No Opt. Call | AAA | 3,044,061 | |||||||
| 5,200 | Puerto Rico Public Buildings Authority, Guaranteed Revenue Bonds, Reset Option Long Trust Certificates II-R56, Series 1993L, 7.050%, 7/01/21 – MBIA Insured (IF) | No Opt. Call | AAA | 6,525,220 | |||||||
| 61,865 | Total Tax Obligation/Limited | 63,593,510 | |||||||||
| Transportation – 1.7% | |||||||||||
| 1,000 | Dayton, Ohio, Airport Revenue Bonds, James M. Cox International Airport, Series 2003C, 5.250%, 12/01/27 – RAAI Insured (Alternative Minimum Tax) | 12/13 at 100.00 | AA | 1,003,060 | |||||||
| 1,235 | Dayton, Ohio, Airport Revenue Bonds, James M. Cox International Airport, Series 2005B, 5.000%, 12/01/14 – XLCA Insured | No Opt. Call | AAA | 1,335,381 | |||||||
| 5,000 | Ohio Turnpike Commission, Revenue Refunding Bonds, ROL Series II-R51, Series 1998A, 6.990%, 2/15/24 – FGIC Insured (IF) | No Opt. Call | AAA | 6,433,900 | |||||||
| 7,235 | Total Transportation | 8,772,341 | |||||||||
| U.S. Guaranteed – 24.6% (4) | |||||||||||
| 270 | Athens, Ohio, Sanitary Sewer System Mortgage Revenue Bonds, Series 1989, 7.300%, 12/01/14 (Pre-refunded 12/01/09) | 12/09 at 100.00 | N/R | (4) | 278,170 | ||||||
| 700 | Buckeye Local School District, Medina County, Ohio, General Obligation Bonds, Series 2000, 5.500%, 12/01/25 (Pre-refunded 12/01/10) – FGIC Insured | 12/10 at 100.00 | Aaa | 746,676 | |||||||
| Canal Winchester Local School District, Franklin and Fairfield Counties, Ohio, General Obligation Bonds, Series 2005B: | |||||||||||
| 3,420 | 5.000%, 12/01/26 (Pre-refunded 6/01/15) – MBIA Insured | 6/15 at 100.00 | Aaa | 3,757,109 | |||||||
| 3,590 | 5.000%, 12/01/27 (Pre-refunded 6/01/15) – MBIA Insured | 6/15 at 100.00 | Aaa | 3,943,866 | |||||||
| 1,255 | Cincinnati City School District, Hamilton County, Ohio, General Obligation Bonds, Series 2001, 5.375%, 12/01/17 (Pre-refunded 12/01/11) – MBIA Insured | 12/11 at 100.00 | AAA | 1,354,095 | |||||||
| 7,045 | Columbus, Ohio, General Obligation Bonds, Series 2000, 5.250%, 11/15/17 (Pre-refunded 11/15/10) | 11/10 at 101.00 | Aaa | 7,514,620 | |||||||
| 11,900 | Cuyahoga County, Ohio, Hospital Revenue and Improvement Bonds, MetroHealth System, Series 1999, 6.125%, 2/15/24 (Pre-refunded 2/15/09) | 2/09 at 101.00 | A– | (4) | 12,410,867 | ||||||
| 1,000 | Evergreen Local School District, Ohio, Unlimited Tax General Obligation School Improvement Bonds, Series 1999, 5.625%, 12/01/24 (Pre-refunded 12/01/09) – FGIC Insured | 12/09 at 101.00 | Aaa | 1,055,430 | |||||||
| 1,250 | Hamilton County, Ohio, Healthcare Facilities Revenue Bonds, Twin Towers, Series 1998A, 5.125%, 10/01/23 (Pre-refunded 10/01/08) | 10/08 at 101.00 | BBB | (4) | 1,279,463 | ||||||
| 1,200 | Heath City School District, Licking County, Ohio, Unlimited Tax General Obligation School Improvement Bonds, Series 2000A, 5.500%, 12/01/27 (Pre-refunded 12/01/10) – FGIC Insured | 12/10 at 100.00 | Aaa | 1,278,600 | |||||||
| 3,385 | Lakota Local School District, Butler County, Ohio, Unlimited Tax General Obligation School Improvement and Refunding Bonds, Series 2001, 5.125%, 12/01/26 (Pre-refunded 6/01/11) – FGIC Insured | 6/11 at 100.00 | Aaa | 3,593,313 | |||||||
| 565 | Lebanon, Ohio, Electric System Mortgage Revenue Bonds, Series 2001, 5.500%, 12/01/17 (Pre-refunded 12/01/10) – AMBAC Insured | 12/10 at 101.00 | AAA | 607,143 | |||||||
| 815 | Lorain, Ohio, Hospital Revenue Refunding Bonds, Lakeland Community Hospital Inc., Series 1992, 6.500%, 11/15/12 (ETM) | 2/08 at 100.00 | A1 | (4) | 848,497 | ||||||
| 1,750 | Medina City School District, Medina County, Ohio, Unlimited Tax General Obligation School Building Construction Bonds, Series 1999, 5.250%, 12/01/28 (Pre-refunded 12/01/09) – FGIC Insured | 12/09 at 100.00 | AAA | 1,817,953 | |||||||
| 2,000 | Montgomery County, Ohio, Health System Revenue Bonds, Franciscan Medical Center – Dayton Campus, Series 1997, 5.500%, 7/01/18 (Pre-refunded 1/01/10) | 1/10 at 100.00 | Baa2 | (4) | 2,072,580 | ||||||
46
| Principal Amount (000) | Description (1) | Optional Call Provisions (2) | Ratings (3) | Value | |||||||
| U.S. Guaranteed (4) (continued) | |||||||||||
| $ | 9,500 | Montgomery County, Ohio, Hospital Facilities Revenue Bonds, Kettering Medical Center, Series 1999, 6.750%, 4/01/22 (Pre-refunded 4/01/10) | 4/10 at 101.00 | A | (4) | $ | 10,328,590 | ||||
| 5,610 | Montgomery County, Ohio, Revenue Bonds, Catholic Health Initiatives, Series 2001, 5.375%, 9/01/21 (ETM) | 9/11 at 100.00 | Aa2 | (4) | 5,932,070 | ||||||
| 2,390 | Montgomery County, Ohio, Revenue Bonds, Catholic Health Initiatives, Series 2001, 5.375%, 9/01/21 (Pre-refunded 9/01/11) | 9/11 at 100.00 | Aa2 | (4) | 2,565,761 | ||||||
| North Royalton City School District, Ohio, School Improvement Bonds, Series 1994: | |||||||||||
| 2,200 | 6.000%, 12/01/14 (Pre-refunded 12/01/09) – MBIA Insured | 12/09 at 102.00 | AAA | 2,358,444 | |||||||
| 2,400 | 6.100%, 12/01/19 (Pre-refunded 12/01/09) – MBIA Insured | 12/09 at 102.00 | AAA | 2,577,456 | |||||||
| 1,330 | Ohio Capital Corporation for Housing, FHA-Insured Section 8 Assisted Mortgage Loan Revenue Refunding Bonds, Series 1999D, 5.950%, 2/01/23 (Pre-refunded 2/01/09) | 2/09 at 102.00 | Aa2 | (4) | 1,395,875 | ||||||
| 3,000 | Ohio Higher Education Facilities Commission, Revenue Bonds, Case Western Reserve University, Series 2002B, 5.500%, 10/01/22 (Pre-refunded 10/01/12) | 10/12 at 100.00 | AA– | (4) | 3,293,340 | ||||||
| 1,000 | Ohio Higher Educational Facilities Commission, Revenue Bonds, University of Dayton, Series 2000, 5.500%, 12/01/30 (Pre-refunded 12/01/10) – AMBAC Insured | 12/10 at 101.00 | AAA | 1,074,590 | |||||||
| Ohio Housing Finance Agency, Single Family Mortgage Revenue Bonds, Series 1985B: | |||||||||||
| 6,460 | 0.000%, 1/15/15 (Pre-refunded 1/15/11) – FGIC Insured | 1/11 at 67.04 | AAA | 3,879,876 | |||||||
| 5,700 | 0.000%, 1/15/15 (Pre-refunded 7/15/11) – FGIC Insured | 7/11 at 70.48 | AAA | 3,536,109 | |||||||
| 5,065 | Ohio Water Development Authority, Loan Revenue Bonds, Pure Water Development, Series 1990I, 6.000%, 12/01/16 – AMBAC Insured (ETM) | No Opt. Call | AAA | 5,666,469 | |||||||
| 2,000 | Ohio Water Development Authority, Revenue Bonds, Fresh Water Development, Series 1998, 5.125%, 12/01/23 (Pre-refunded 6/01/08) – FSA Insured | 6/08 at 101.00 | AAA | 2,037,380 | |||||||
| Olentangy Local School District, Delaware and Franklin Counties, Ohio, General Obligation Bonds, Series 2004A: | |||||||||||
| 400 | 5.250%, 12/01/21 (Pre-refunded 6/01/14) – FGIC Insured | 6/14 at 100.00 | AAA | 441,988 | |||||||
| 3,055 | 5.250%, 12/01/22 (Pre-refunded 6/01/14) – FGIC Insured | 6/14 at 100.00 | AAA | 3,375,683 | |||||||
| Olentangy Local School District, Delaware and Franklin Counties, Ohio, Various Purpose Bonds, Series 1999: | |||||||||||
| 1,825 | 5.000%, 12/01/27 (Pre-refunded 12/01/09) | 12/09 at 101.00 | AA | (4) | 1,904,205 | ||||||
| 2,210 | 5.000%, 12/01/27 (Pre-refunded 12/01/09) | 12/09 at 101.00 | AA | (4) | 2,305,914 | ||||||
| 1,495 | Otsego Local School District, Wood, Henry and Lucas Counties, Ohio, General Obligation Bonds, Series 2004, 5.375%, 12/01/22 (Pre-refunded 12/01/14) – FSA Insured | 12/14 at 100.00 | Aaa | 1,674,161 | |||||||
| 1,250 | Parma Community General Hospital Association, Ohio, Hospital Revenue Refunding and Improvement Bonds, Series 1998, 5.350%, 11/01/18 (Pre-refunded 11/01/08) | 11/08 at 101.00 | N/R | (4) | 1,284,050 | ||||||
| 500 | Pickerington Local School District, Fairfield County, Ohio, General Obligation Bonds, Series 1993, 0.000%, 12/01/11 – AMBAC Insured (ETM) | No Opt. Call | AAA | 435,331 | |||||||
| 21,400 | Puerto Rico, Highway Revenue Bonds, Highway and Transportation Authority, Series 1996Y, 5.500%, 7/01/36 (Pre-refunded 7/01/16) – MBIA Insured (UB) | 7/16 at 100.00 | AAA | 24,507,066 | |||||||
| 1,335 | Richland County, Ohio, Hospital Facilities Revenue Improvement Bonds, MedCentral Health System Obligated Group, Series 2000B, 6.375%, 11/15/22 (Pre-refunded 11/15/10) | 11/10 at 101.00 | A– | (4) | 1,463,681 | ||||||
| 1,185 | Sugarcreek Local School District, Athens County, Ohio, General Obligation Bonds, Series 2003, 5.250%, 12/01/24 (Pre-refunded 12/01/13) – MBIA Insured | 12/13 at 100.00 | Aaa | 1,305,503 | |||||||
| University of Cincinnati, Ohio, General Receipts Bonds, Series 2001A: | |||||||||||
| 1,500 | 5.750%, 6/01/18 (Pre-refunded 6/01/11) – FGIC Insured | 6/11 at 101.00 | AAA | 1,636,500 | |||||||
| 1,520 | 5.750%, 6/01/19 (Pre-refunded 6/01/11) – FGIC Insured | 6/11 at 101.00 | AAA | 1,658,320 | |||||||
| 124,475 | Total U.S. Guaranteed | 129,196,744 | |||||||||
| Utilities – 6.0% | |||||||||||
| 1,535 | Cleveland Public Power System, Ohio, First Mortgage Improvement Revenue Bonds, Series 1994A, 0.000%, 11/15/13 – MBIA Insured | No Opt. Call | AAA | 1,233,787 | |||||||
| 5,000 | Ohio Air Quality Development Authority, Revenue Bonds, JMG Funding Limited Partnership Project, Series 1997, 5.625%, 1/01/23 – AMBAC Insured (Alternative Minimum Tax) | 4/08 at 101.00 | Aaa | 5,083,200 | |||||||
47
Portfolio of Investments (Unaudited)
Nuveen Ohio Municipal Bond Fund (continued)
November 30, 2007
| Principal Amount (000) | Description (1) | Optional Call Provisions (2) | Ratings (3) | Value | ||||||
| Utilities (continued) | ||||||||||
| Ohio Municipal Electric Generation Agency, Beneficial Interest Certificates, Belleville Hydroelectric Project – Joint Venture 5, Series 2004: | ||||||||||
| $ | 1,000 | 5.000%, 2/15/20 – AMBAC Insured | 2/14 at 100.00 | AAA | $ | 1,053,030 | ||||
| 5,450 | 5.000%, 2/15/21 – AMBAC Insured | 2/14 at 100.00 | AAA | 5,720,702 | ||||||
| 1,465 | 5.000%, 2/15/22 – AMBAC Insured | 2/14 at 100.00 | AAA | 1,532,038 | ||||||
| 3,295 | 5.000%, 2/15/23 – AMBAC Insured | 2/14 at 100.00 | AAA | 3,436,619 | ||||||
| 7,650 | Ohio Water Development Authority, Solid Waste Disposal Revenue Bonds, Bay Shore Power, Series 1998A, 5.875%, 9/01/20 (Alternative Minimum Tax) | 9/08 at 102.00 | N/R | 7,677,081 | ||||||
| 1,545 | Puerto Rico Electric Power Authority, Power Revenue Refunding Bonds, Series 1989O, 0.000%, 7/01/17 | No Opt. Call | AAA | 1,025,633 | ||||||
| 4,460 | Puerto Rico Industrial, Tourist, Educational, Medical and Environmental Control Facilities Financing Authority, Co-Generation Facility Revenue Bonds, Series 2000A, 6.625%, 6/01/26 (Alternative Minimum Tax) | 6/10 at 101.00 | Baa3 | 4,682,420 | ||||||
| 31,400 | Total Utilities | 31,444,510 | ||||||||
| Water and Sewer – 5.9% | ||||||||||
| 1,730 | Butler County, Ohio, Sewerage System Revenue Bonds, Series 2005, 5.000%, 12/01/23 – FSA Insured | No Opt. Call | Aaa | 1,899,644 | ||||||
| 4,355 | Cincinnati, Ohio, Water System Revenue Bonds, Series 2007B, 5.000%, 12/01/32 | 12/17 at 100.00 | AA+ | 4,584,421 | ||||||
| 865 | City of Marysville, Ohio, Water System Mortgage Revenue Bonds, Series 2007, 5.000%, 12/01/32 – AMBAC Insured | 12/17 at 100.00 | Aaa | 907,705 | ||||||
| 10,000 | Cleveland, Ohio, Waterworks First Mortgage Revenue Refunding and Improvement Bonds, Series 1993G, 5.500%, 1/01/21 – MBIA Insured | No Opt. Call | AAA | 11,412,000 | ||||||
| 1,095 | Hebron, Ohio, Mortgage Revenue Bonds, Waterworks System Improvements, Series 2004, 5.875%, 12/01/25 | 6/14 at 100.00 | N/R | 1,157,897 | ||||||
| 1,260 | Lancaster, Ohio, Wastewater System Improvement Revenue Bonds, Series 2004, 5.000%, 12/01/25 – AMBAC Insured | 12/14 at 100.00 | AAA | 1,313,235 | ||||||
| 4,590 | Marysville, Ohio, Wastewater Treatment System Revenue Bonds, Series 2007, 4.750%, 12/01/47 – XLCA Insured | 12/17 at 100.00 | AAA | 4,599,042 | ||||||
| 1,255 | Ohio Water Development Authority, Revenue Bonds, Fresh Water Development, Series 2004, 5.250%, 12/01/15 | 6/14 at 100.00 | AAA | 1,376,848 | ||||||
| 3,500 | Ohio Water Development Authority, Water Pollution Control Loan Fund Revenue Bonds, Water Quality Project, Series 2005B, 5.000%, 6/01/25 | 6/15 at 100.00 | AAA | 3,695,895 | ||||||
| 28,650 | Total Water and Sewer | 30,946,687 | ||||||||
| $ | 523,975 | Total Investments (cost $522,646,849) – 103.3% | 542,609,991 | |||||||
Floating Rate Obligations – (3.5)% | (18,425,000) | |||||||||
Other Assets Less Liabilities – 0.2% | 1,038,499 | |||||||||
Net Assets – 100% | $ | 525,223,490 | ||||||||
| The Fund may invest in “zero coupon” securities. A zero coupon security does not pay a regular interest coupon to its holders during the life of the security. Tax-exempt income to the holder of the security comes from accretion of the difference between the original purchase price of the security at issuance and the par value of the security at maturity and is effectively paid at maturity. Such securities are included in the Portfolio of Investments with a 0.000% coupon rate in their description. The market prices of zero coupon securities generally are more volatile than the market prices of securities that pay interest periodically. |
| (1) | All percentages shown in the Portfolio of Investments are based on net assets unless otherwise noted. |
| (2) | Optional Call Provisions: Dates (month and year) and prices of the earliest optional call or redemption. There may be other call provisions at varying prices at later dates. Certain mortgage-backed securities may be subject to periodic principal paydowns. |
| (3) | Ratings: Using the higher of Standard & Poor’s Group (“Standard & Poor’s”) or Moody’s Investor Service, Inc. (“Moody’s”) rating. Ratings below BBB by Standard & Poor’s or Baa by Moody’s are considered to be below investment grade. |
| The AAA ratings shown in the Portfolio of Investments reflects the AAA ratings on certain bonds insured by AMBAC, FGIC or MBIA as of November 30, 2007. As explained earlier in the Portfolio Managers’ Comments section of this report, one rating agency has reduced the rating for AMBAC to AA, and one or more rating agencies have placed each of these insurers on “negative credit watch”, which may presage one or more rating reductions for such insurer or insurers in the future. If one or more insurers’ ratings are reduced below AAA by these rating agencies, it would likely reduce the effective rating of many of the bonds insured by that insurer or insurers. |
| (4) | Backed by an escrow or trust containing sufficient U.S. Government or U.S. Government agency securities which ensure the timely payment of principal and interest. Such investments are normally considered to be equivalent to AAA rated securities. |
| N/R | Not rated. |
| (ETM) | Escrowed to maturity. |
| (IF) | Inverse floating rate investment. |
| (UB) | Underlying bond of an inverse floating rate trust reflected as a financing transaction pursuant to the provisions of SFAS No. 140. |
See accompanying notes to financial statements.
48
Portfolio of Investments (Unaudited)
Nuveen Wisconsin Municipal Bond Fund
November 30, 2007
| Principal Amount (000) | Description (1) | Optional Call Provisions (2) | Ratings (3) | Value | ||||||
| Education and Civic Organizations – 3.2% | ||||||||||
| $ | 475 | Ashland Housing Authority, Wisconsin, Student Housing Revenue Bonds, Northland College Project, Series 1998, 5.100%, 4/01/18 | 4/08 at 100.00 | Aaa | $ | 476,577 | ||||
| 500 | Madison Community Development Authority, Wisconsin, Revenue Bonds, Fluno Center Project, Series 1998A, 5.000%, 11/01/20 | 5/08 at 101.00 | AA– | 505,425 | ||||||
| 370 | Puerto Rico Industrial, Tourist, Educational, Medical and Environmental Control Facilities Financing Authority, Higher Education Revenue Bonds, Ana G. Mendez University System, Series 1999, 5.375%, 2/01/29 | 2/09 at 101.00 | BBB– | 370,078 | ||||||
| 200 | Puerto Rico Industrial, Tourist, Educational, Medical and Environmental Control Facilities Financing Authority, Higher Education Revenue Bonds, University of the Sacred Heart, Series 2001, 5.250%, 9/01/21 | 9/11 at 100.00 | BBB | 202,528 | ||||||
| 250 | Puerto Rico Industrial, Tourist, Educational, Medical and Environmental Control Facilities Financing Authority, Higher Education Revenue Refunding Bonds, Ana G. Mendez University System, Series 2002, 5.500%, 12/01/31 | 12/12 at 101.00 | BBB– | 251,330 | ||||||
| 1,795 | Total Education and Civic Organizations | 1,805,938 | ||||||||
| Health Care – 1.6% | ||||||||||
| 385 | Puerto Rico Industrial, Tourist, Educational, Medical and Environmental Control Facilities Financing Authority, FHA-Insured Mortgage Hospital Revenue Bonds, Doctor Pila Hospital, Series 1995A, 5.875%, 8/01/12 | 2/08 at 100.00 | AAA | 385,689 | ||||||
| 500 | Puerto Rico Industrial, Tourist, Educational, Medical and Environmental Control Facilities Financing Authority, Hospital Revenue Bonds, Auxilio Mutuo Hospital, Series 1995A, 6.250%, 7/01/24 – MBIA Insured | 1/08 at 100.00 | AAA | 503,635 | ||||||
| 885 | Total Health Care | 889,324 | ||||||||
| Housing/Multifamily – 7.6% | ||||||||||
| 675 | Kenosha Housing Authority, Wisconsin, GNMA Collateralized Multifamily Housing Revenue Bonds, Villa Ciera Inc., Series 2000A, 5.900%, 11/20/30 | 5/08 at 102.00 | N/R | 690,512 | ||||||
| 570 | Lake Delton Community Development Agency, Wisconsin, GNMA Collateralized Multifamily Housing Revenue Bonds, Woodland Park Project, Series 2001, 5.300%, 2/20/31 (Alternative Minimum Tax) | 1/12 at 102.00 | N/R | 575,426 | ||||||
| 1,000 | Madison Community Development Authority, Wisconsin, GNMA Multifamily Housing Revenue Refunding Bonds, Greentree Glen Apartments, Series 1999A, 5.500%, 9/20/29 (Alternative Minimum Tax) | 3/08 at 101.00 | AAA | 1,002,840 | ||||||
| 200 | Milwaukee Redevelopment Authority, Wisconsin, FHA-Insured Multifamily Housing Revenue Bonds, City Hall Square Apartments, Series 1993, 6.000%, 8/01/22 (Alternative Minimum Tax) | 2/08 at 102.00 | N/R | 202,782 | ||||||
| 500 | Sheboygan Housing Authority, Wisconsin, GNMA Multifamily Revenue Refunding Bonds, Lake Shore Apartments, Series 1998A, 5.100%, 11/20/26 | 5/08 at 100.00 | AAA | 501,155 | ||||||
| 300 | Walworth County Housing Authority, Wisconsin, FHA-Insured Housing Revenue Bonds, Kiwanis Heritage Inc. Senior Apartments, Series 1997, 5.550%, 9/01/22 | 3/08 at 100.00 | N/R | 300,201 | ||||||
| 1,000 | Wisconsin Housing and Economic Development Authority, Housing Revenue Bonds, Series 2006A, 4.550%, 5/01/27 (Alternative Minimum Tax) | 5/16 at 100.00 | AA | 940,070 | ||||||
| 4,245 | Total Housing/Multifamily | 4,212,986 | ||||||||
| Housing/Single Family – 1.9% | ||||||||||
| 50 | Virgin Islands Housing Finance Corporation, GNMA Mortgage-Backed Securities Program Single Family Mortgage Revenue Refunding Bonds, Series 1995A, 6.450%, 3/01/16 (Alternative Minimum Tax) | 3/08 at 100.00 | N/R | 50,564 | ||||||
| 1,000 | Wisconsin Housing and Economic Development Authority, Home Ownership Revenue Bonds, Series 2005E, 4.900%, 11/01/35 | 5/15 at 100.00 | AA | 1,018,700 | ||||||
| 1,050 | Total Housing/Single Family | 1,069,264 | ||||||||
| Tax Obligation/General – 0.2% | ||||||||||
| 95 | Guam, General Obligation Bonds, Series 1993A, 5.400%, 11/15/18 | 5/08 at 100.00 | B | 95,014 | ||||||
| Tax Obligation/Limited – 62.0% | ||||||||||
| 1,500 | Ashwaubenon Community Development Authority, Wisconsin, Lease Revenue Refunding Bonds, Arena Project, Series 2002, 5.150%, 6/01/29 | 6/12 at 100.00 | Aa2 | 1,556,595 | ||||||
49
Portfolio of Investments (Unaudited)
Nuveen Wisconsin Municipal Bond Fund (continued)
November 30, 2007
| Principal Amount (000) | Description (1) | Optional Call Provisions (2) | Ratings (3) | Value | ||||||
| Tax Obligation/Limited (continued) | ||||||||||
| $ | 1,000 | De Forest Redevelopment Authority, Wisconsin, Redevelopment Lease Revenue Bonds, Series 1999B, 5.100%, 2/01/18 | 2/08 at 100.00 | N/R | $ | 1,001,240 | ||||
| 2,000 | Glendale Community Development Authority, Wisconsin, Community Development Lease Revenue Bonds, Bayshore Public Parking Project, Series 2004A, 5.000%, 10/01/24 | 10/14 at 100.00 | A3 | 2,065,900 | ||||||
| 100 | Glendale Community Development Authority, Wisconsin, Community Development Lease Revenue Refunding Bonds, Tax Increment District 6, Series 2001, 5.000%, 10/01/19 | 10/11 at 100.00 | A3 | 102,927 | ||||||
| 350 | Green Bay Brown County Professional Football Stadium District, Wisconsin, Sales Tax Revenue Bonds, Lambeau Field Renovation Project, Series 2001A, 5.000%, 2/01/19 – AMBAC Insured | 2/11 at 100.00 | AAA | 362,572 | ||||||
| 500 | Jackson Community Development Authority, Wisconsin, Revenue Refunding Bonds, Series 1999, 5.100%, 12/01/17 | 12/09 at 100.00 | N/R | 501,120 | ||||||
| 960 | Madison Community Development Authority, Wisconsin, Lease Revenue Refunding Bonds, Monona Terrace, Series 2002, 4.375%, 3/01/20 | 3/12 at 100.00 | Aa2 | 965,866 | ||||||
| 2,000 | Milwaukee Redevelopment Authority, Wisconsin, Lease Revenue Bonds, Neighborhood Public Schools Initiative, Series 2002A, 4.875%, 8/01/21 – AMBAC Insured | 8/12 at 100.00 | AAA | 2,064,720 | ||||||
| 1,000 | Milwaukee Redevelopment Authority, Wisconsin, Lease Revenue Bonds, Neighborhood Public Schools Initiative, Series 2007A, 4.000%, 8/01/23 – AMBAC Insured | 8/17 at 100.00 | Aaa | 985,410 | ||||||
| Milwaukee Redevelopment Authority, Wisconsin, Revenue Bonds, Summerfest Project, Series 2001: | ||||||||||
| 400 | 4.850%, 8/01/17 | 8/11 at 100.00 | A | 412,152 | ||||||
| 1,000 | 4.950%, 8/01/20 | 8/11 at 100.00 | A | 1,022,100 | ||||||
| 1,500 | Neenah Community Development Authority, Wisconsin, Lease Revenue Bonds, Series 2004A, 5.000%, 12/01/26 | 12/14 at 100.00 | A1 | 1,554,195 | ||||||
| 1,000 | Onalaska Community Development Authority, Wisconsin, Community Development Lease Revenue Bonds, Series 2003, 4.875%, 10/01/27 | 10/13 at 100.00 | A2 | 1,037,440 | ||||||
| Puerto Rico Highway and Transportation Authority, Highway Revenue Bonds, Series 2007N: | ||||||||||
| 2,500 | 5.500%, 7/01/25 – AGC Insured | No Opt. Call | AAA | 2,849,075 | ||||||
| 2,000 | 5.250%, 7/01/33 – MBIA Insured | No Opt. Call | AAA | 2,195,840 | ||||||
| 1,000 | Puerto Rico Infrastructure Financing Authority, Special Tax Revenue Bonds, Series 2005C, 5.500%, 7/01/27 – AMBAC Insured | No Opt. Call | AAA | 1,120,160 | ||||||
| Southeast Wisconsin Professional Baseball Park District, Sales Tax Revenue Refunding Bonds, Series 1998A: | ||||||||||
| 850 | 5.500%, 12/15/18 – MBIA Insured | No Opt. Call | AAA | 969,825 | ||||||
| 400 | 5.500%, 12/15/19 – MBIA Insured | No Opt. Call | AAA | 457,504 | ||||||
| 2,195 | 5.500%, 12/15/20 – MBIA Insured | No Opt. Call | AAA | 2,513,758 | ||||||
| 500 | 5.500%, 12/15/26 – MBIA Insured | No Opt. Call | AAA | 573,920 | ||||||
| 1,220 | Sturgeon Bay Waterfront Redevelopment Authority, Wisconsin, Lease Revenue Bonds, Series 2006A, 4.500%, 10/01/21 | 10/16 at 100.00 | N/R | 1,203,249 | ||||||
| 1,305 | Sun Prairie Community Development Authority, Wisconsin, Lease Revenue Bonds, Tax Increment District 8, Series 2006, 4.250%, 8/01/25 | 8/16 at 100.00 | A2 | 1,242,647 | ||||||
| 600 | Virgin Islands Public Finance Authority, Senior Lien Revenue Refunding Bonds, Matching Fund Loan Note, Series 1998A, 5.625%, 10/01/25 | 10/08 at 101.00 | BBB | 610,992 | ||||||
| 1,000 | Weston Community Development Authority, Wisconsin, Lease Revenue Bonds, Series 2004A, 5.250%, 10/01/21 | 10/14 at 100.00 | A3 | 1,053,570 | ||||||
| 1,000 | Weston Community Development Authority, Wisconsin, Lease Revenue Bonds, Series 2005A, 5.000%, 10/01/21 | 10/15 at 100.00 | A3 | 1,046,430 | ||||||
| Wisconsin Center District, Junior Dedicated Tax Revenue Refunding Bonds, Series 1999: | ||||||||||
| 3,400 | 5.250%, 12/15/23 – FSA Insured | No Opt. Call | AAA | 3,797,935 | ||||||
| 500 | 5.250%, 12/15/27 – FSA Insured | No Opt. Call | AAA | 555,355 | ||||||
| 2,000 | Wisconsin Center District, Senior Dedicated Tax Revenue Refunding Bonds, Series 2003A, 0.000%, 12/15/28 – FSA Insured | No Opt. Call | AAA | 754,040 | ||||||
| 33,780 | Total Tax Obligation/Limited | 34,576,537 | ||||||||
50
| Principal Amount (000) | Description (1) | Optional Call Provisions (2) | Ratings (3) | Value | |||||||
| U.S. Guaranteed – 14.2% (4) | |||||||||||
| Ashwaubenon Community Development Authority, Wisconsin, Lease Revenue Bonds, Arena Project, Series 1999A: | |||||||||||
| $ | 1,000 | 5.700%, 6/01/24 (Pre-refunded 6/01/09) | 6/09 at 100.00 | Aa2 | (4) | $ | 1,035,580 | ||||
| 700 | 5.800%, 6/01/29 (Pre-refunded 6/01/09) | 6/09 at 100.00 | Aa2 | (4) | 725,921 | ||||||
| Green Bay Redevelopment Authority, Wisconsin, Lease Revenue Bonds, Convention Center Project, Series 1999A: | |||||||||||
| 1,300 | 5.250%, 6/01/24 (Pre-refunded 6/01/09) | 6/09 at 100.00 | Aa2 | (4) | 1,337,739 | ||||||
| 1,150 | 5.100%, 6/01/29 (Pre-refunded 6/01/09) | 6/09 at 100.00 | Aa2 | (4) | 1,180,878 | ||||||
| Milwaukee Redevelopment Authority, Wisconsin, Lease Revenue Bonds, Public Schools, Series 2003A: | |||||||||||
| 2,000 | 5.125%, 8/01/21 (Pre-refunded 8/01/13) – AMBAC Insured | 8/13 at 100.00 | AAA | 2,174,840 | |||||||
| 1,000 | 5.125%, 8/01/22 (Pre-refunded 8/01/13) – AMBAC Insured | 8/13 at 100.00 | AAA | 1,087,420 | |||||||
| 375 | Sturgeon Bay Waterfront Redevelopment Authority, Wisconsin, Lease Revenue Bonds, Series 1998A, 5.200%, 10/01/21 (Pre-refunded 10/01/08) | 10/08 at 100.00 | N/R | (4) | 380,235 | ||||||
| 7,525 | Total U.S. Guaranteed | 7,922,613 | |||||||||
| Utilities – 5.8% | |||||||||||
| 2,000 | Puerto Rico Electric Power Authority, Power Revenue Bonds, Series 2007TT, 5.000%, 7/01/24 – MBIA Insured | 7/17 at 100.00 | AAA | 2,119,440 | |||||||
| 1,000 | Puerto Rico Electric Power Authority, Power Revenue Bonds, Series 2007VV, 5.250%, 7/01/24 – FGIC Insured | No Opt. Call | AAA | 1,085,120 | |||||||
| 3,000 | Total Utilities | 3,204,560 | |||||||||
| $ | 52,375 | Total Investments (cost $52,803,374) – 96.5% | 53,776,236 | ||||||||
Other Assets Less Liabilities – 3.5% | 1,951,670 | ||||||||||
Net Assets – 100% | $ | 55,727,906 | |||||||||
| The Fund may invest in “zero coupon” securities. A zero coupon security does not pay a regular interest coupon to its holders during the life of the security. Tax-exempt income to the holder of the security comes from accretion of the difference between the original purchase price of the security at issuance and the par value of the security at maturity and is effectively paid at maturity. Such securities are included in the Portfolio of Investments with a 0.000% coupon rate in their description. The market prices of zero coupon securities generally are more volatile than the market prices of securities that pay interest periodically. |
| (1) | All percentages shown in the Portfolio of Investments are based on net assets unless otherwise noted. |
| (2) | Optional Call Provisions: Dates (month and year) and prices of the earliest optional call or redemption. There may be other call provisions at varying prices at later dates. Certain mortgage-backed securities may be subject to periodic principal paydowns. |
| (3) | Ratings: Using the higher of Standard & Poor’s Group (“Standard & Poor’s”) or Moody’s Investor Service, Inc. (“Moody’s”) rating. Ratings below BBB by Standard & Poor’s or Baa by Moody’s are considered to be below investment grade. |
| The AAA ratings shown in the Portfolio of Investments reflects the AAA ratings on certain bonds insured by AMBAC, FGIC or MBIA as of November 30, 2007. As explained earlier in the Portfolio Managers’ Comments section of this report, one rating agency has reduced the rating for AMBAC to AA, and one or more rating agencies have placed each of these insurers on “negative credit watch”, which may presage one or more rating reductions for such insurer or insurers in the future. If one or more insurers’ ratings are reduced below AAA by these rating agencies, it would likely reduce the effective rating of many of the bonds insured by that insurer or insurers. |
| (4) | Backed by an escrow or trust containing sufficient U.S. Government or U.S. Government agency securities which ensure the timely payment of principal and interest. Such investments are normally considered to be equivalent to AAA rated securities. |
| N/R | Not rated. |
See accompanying notes to financial statements.
51
Statement of Assets and Liabilities (Unaudited)
November 30, 2007
| Kansas | Kentucky | Michigan | Missouri | Ohio | Wisconsin | ||||||||||||||||||
Assets | |||||||||||||||||||||||
Investments, at value (cost $121,135,707, $421,441,701, $215,081,854, $240,476,019, $522,646,849 and $52,803,374, respectively) | $ | 123,988,909 | $ | 436,767,384 | $ | 225,123,640 | $ | 249,030,627 | $ | 542,609,991 | $ | 53,776,236 | |||||||||||
Cash | — | 3,811,512 | — | — | — | 371,603 | |||||||||||||||||
Unrealized appreciation on forward swaps | — | 1,011,431 | 334,327 | — | — | — | |||||||||||||||||
Receivables: | |||||||||||||||||||||||
Interest | 1,865,192 | 5,303,675 | 2,188,298 | 3,381,654 | 9,625,525 | 926,989 | |||||||||||||||||
Investments sold | 485,000 | — | — | 10,160 | 7,622,200 | 655,512 | |||||||||||||||||
Shares sold | 23,077 | 299,294 | 223,794 | 45,088 | 606,691 | 247,233 | |||||||||||||||||
Other assets | 169 | 51,563 | 29,275 | 13,882 | 63,916 | 2,358 | |||||||||||||||||
Total assets | 126,362,347 | 447,244,859 | 227,899,334 | 252,481,411 | 560,528,323 | 55,979,931 | |||||||||||||||||
Liabilities | |||||||||||||||||||||||
Cash overdraft | 1,535,536 | — | 1,618,278 | 1,182,904 | 14,493,060 | — | |||||||||||||||||
Floating rate obligations | — | 7,680,000 | — | 2,225,000 | 18,425,000 | — | |||||||||||||||||
Payable for shares redeemed | 27,397 | 784,200 | 157,084 | 99,846 | 113,121 | 25,195 | |||||||||||||||||
Accrued expenses: | |||||||||||||||||||||||
Management fees | 54,772 | 186,182 | 97,859 | 108,505 | 222,313 | 23,922 | |||||||||||||||||
12b-1 distribution and service fees | 32,595 | 98,624 | 52,867 | 54,295 | 96,440 | 12,618 | |||||||||||||||||
Other | 36,242 | 138,631 | 85,253 | 67,202 | 186,914 | 17,307 | |||||||||||||||||
Dividends payable | 413,380 | 1,425,439 | 763,222 | 833,157 | 1,767,985 | 172,983 | |||||||||||||||||
Total liabilities | 2,099,922 | 10,313,076 | 2,774,563 | 4,570,909 | 35,304,833 | 252,025 | |||||||||||||||||
Net assets | $ | 124,262,425 | $ | 436,931,783 | $ | 225,124,771 | $ | 247,910,502 | $ | 525,223,490 | $ | 55,727,906 | |||||||||||
Class A Shares | |||||||||||||||||||||||
Net assets | $ | 95,194,589 | $ | 377,270,808 | $ | 164,506,821 | $ | 217,791,827 | $ | 342,721,613 | $ | 46,071,729 | |||||||||||
Shares outstanding | 9,146,408 | 34,355,000 | 14,435,453 | 19,832,502 | 30,497,602 | 4,508,676 | |||||||||||||||||
Net asset value per share | $ | 10.41 | $ | 10.98 | $ | 11.40 | $ | 10.98 | $ | 11.24 | $ | 10.22 | |||||||||||
Offering price per share (net asset value per share plus | $ | 10.87 | $ | 11.46 | $ | 11.90 | $ | 11.46 | $ | 11.73 | $ | 10.67 | |||||||||||
Class B Shares | |||||||||||||||||||||||
Net assets | $ | 5,068,561 | $ | 10,860,947 | $ | 4,424,145 | $ | 6,720,196 | $ | 13,449,018 | $ | 2,100,909 | |||||||||||
Shares outstanding | 491,165 | 988,305 | 387,359 | 611,301 | 1,198,759 | 205,139 | |||||||||||||||||
Net asset value and offering price per share | $ | 10.32 | $ | 10.99 | $ | 11.42 | $ | 10.99 | $ | 11.22 | $ | 10.24 | |||||||||||
Class C Shares | |||||||||||||||||||||||
Net assets | $ | 20,711,720 | $ | 46,048,571 | $ | 36,527,698 | $ | 21,036,175 | $ | 48,950,569 | $ | 5,973,382 | |||||||||||
Shares outstanding | 1,990,098 | 4,192,610 | 3,206,965 | 1,917,439 | 4,368,403 | 583,661 | |||||||||||||||||
Net asset value and offering price per share | $ | 10.41 | $ | 10.98 | $ | 11.39 | $ | 10.97 | $ | 11.21 | $ | 10.23 | |||||||||||
Class R Shares | |||||||||||||||||||||||
Net assets | $ | 3,287,555 | $ | 2,751,457 | $ | 19,666,107 | $ | 2,362,304 | $ | 120,102,290 | $ | 1,581,886 | |||||||||||
Shares outstanding | 314,550 | 250,562 | 1,725,788 | 214,984 | 10,704,232 | 154,376 | |||||||||||||||||
Net asset value and offering price per share | $ | 10.45 | $ | 10.98 | $ | 11.40 | $ | 10.99 | $ | 11.22 | $ | 10.25 | |||||||||||
Net Assets Consist of: | |||||||||||||||||||||||
Capital paid-in | $ | 121,007,421 | $ | 420,039,889 | $ | 214,447,448 | $ | 238,870,956 | $ | 501,989,484 | $ | 54,724,114 | |||||||||||
Undistributed (Over-distribution of) net investment income | 101,373 | (801,609 | ) | (224,397 | ) | (48,353 | ) | (233,328 | ) | (54,836 | ) | ||||||||||||
Accumulated net realized gain (loss) from investments and derivative transactions | 300,429 | 1,356,389 | 525,607 | 533,291 | 3,504,192 | 85,766 | |||||||||||||||||
Net unrealized appreciation (depreciation) of investments and derivative transactions | 2,853,202 | 16,337,114 | 10,376,113 | 8,554,608 | 19,963,142 | 972,862 | |||||||||||||||||
Net assets | $ | 124,262,425 | $ | 436,931,783 | $ | 225,124,771 | $ | 247,910,502 | $ | 525,223,490 | $ | 55,727,906 | |||||||||||
See accompanying notes to financial statements.
52
Statement of Operations (Unaudited)
Six Months Ended November 30, 2007
| Kansas | Kentucky | Michigan | Missouri | Ohio | Wisconsin | |||||||||||||||||||
Investment Income | $ | 3,131,657 | $ | 10,974,676 | $ | 5,702,160 | $ | 6,334,535 | $ | 13,639,495 | $ | 1,223,551 | ||||||||||||
Expenses | ||||||||||||||||||||||||
Management fees | 334,938 | 1,153,123 | 602,483 | 669,305 | 1,364,802 | 140,383 | ||||||||||||||||||
12b-1 service fees – Class A | 95,669 | 383,212 | 166,608 | 223,526 | 343,116 | 42,911 | ||||||||||||||||||
12b-1 distribution and service fees – Class B | 25,688 | 55,661 | 21,338 | 33,157 | 68,639 | 10,989 | ||||||||||||||||||
12b-1 distribution and service fees – Class C | 78,780 | 172,812 | 138,802 | 78,783 | 180,972 | 22,207 | ||||||||||||||||||
Shareholders’ servicing agent fees and expenses | 31,507 | 99,443 | 61,935 | 49,683 | 138,524 | 13,749 | ||||||||||||||||||
Interest expense on floating rate obligations | — | 170,916 | 11,955 | 37,926 | 365,547 | — | ||||||||||||||||||
Custodian’s fees and expenses | 26,838 | 79,405 | 28,889 | 44,342 | 71,695 | 8,624 | ||||||||||||||||||
Trustees’ fees and expenses | 1,686 | 5,381 | 2,916 | 3,313 | 7,126 | 543 | ||||||||||||||||||
Professional fees | 6,586 | 42,729 | 9,325 | 9,840 | 16,446 | 4,708 | ||||||||||||||||||
Shareholders’ reports – printing and mailing expenses | 8,418 | 27,729 | 19,180 | 12,589 | 37,023 | 4,259 | ||||||||||||||||||
Federal and state registration fees | 8,082 | 8,465 | 10,582 | 10,105 | 8,384 | 8,402 | ||||||||||||||||||
Other expenses | 1,705 | 6,362 | 3,073 | 3,524 | 7,466 | 649 | ||||||||||||||||||
Total expenses before custodian fee credit | 619,897 | 2,205,238 | 1,077,086 | 1,176,093 | 2,609,740 | 257,424 | ||||||||||||||||||
Custodian fee credit | (3,543 | ) | (3,926 | ) | (11,384 | ) | (10,426 | ) | (27,535 | ) | (4,585 | ) | ||||||||||||
Net expenses | 616,354 | 2,201,312 | 1,065,702 | 1,165,667 | 2,582,205 | 252,839 | ||||||||||||||||||
Net investment income | 2,515,303 | 8,773,364 | 4,636,458 | 5,168,868 | 11,057,290 | 970,712 | ||||||||||||||||||
Realized and Unrealized Gain (Loss) | ||||||||||||||||||||||||
Net realized gain (loss) from: | ||||||||||||||||||||||||
Investments | 200,805 | 838,636 | 667,971 | 96,174 | 2,427,300 | 599 | ||||||||||||||||||
Forward swaps | — | — | (149,260 | ) | — | — | — | |||||||||||||||||
Change in net unrealized appreciation (depreciation) of: | ||||||||||||||||||||||||
Investments | (225,179 | ) | (1,625,283 | ) | (1,317,999 | ) | (1,232,691 | ) | (3,529,787 | ) | (82,678 | ) | ||||||||||||
Forward swaps | — | 1,356,444 | 556,502 | — | — | — | ||||||||||||||||||
Net realized and unrealized gain (loss) | (24,374 | ) | 569,797 | (242,786 | ) | (1,136,517 | ) | (1,102,487 | ) | (82,079 | ) | |||||||||||||
Net increase (decrease) in net assets from operations | $ | 2,490,929 | $ | 9,343,161 | $ | 4,393,672 | $ | 4,032,351 | $ | 9,954,803 | $ | 888,633 | ||||||||||||
See accompanying notes to financial statements.
53
Statement of Changes in Net Assets (Unaudited)
| Kansas | Kentucky | |||||||||||||||
| Six Months Ended 11/30/07 | Year Ended | Six Months Ended 11/30/07 | Year Ended | |||||||||||||
Operations | ||||||||||||||||
Net investment income | $ | 2,515,303 | $ | 5,116,315 | $ | 8,773,364 | $ | 18,212,102 | ||||||||
Net realized gain (loss) from: | ||||||||||||||||
Investments | 200,805 | 1,642,173 | 838,636 | 1,028,495 | ||||||||||||
Forward swaps | — | — | — | — | ||||||||||||
Change in net unrealized appreciation (depreciation) of: | ||||||||||||||||
Investments | (225,179 | ) | (1,467,120 | ) | (1,625,283 | ) | 659,410 | |||||||||
Forward swaps | — | — | 1,356,444 | (345,013 | ) | |||||||||||
Net increase (decrease) in net assets from operations | 2,490,929 | 5,291,368 | 9,343,161 | 19,554,994 | ||||||||||||
Distributions to Shareholders | ||||||||||||||||
From net investment income: | ||||||||||||||||
Class A | (1,925,595 | ) | (3,948,267 | ) | (7,719,380 | ) | (16,229,555 | ) | ||||||||
Class B | (88,539 | ) | (216,685 | ) | (190,390 | ) | (516,334 | ) | ||||||||
Class C | (367,380 | ) | (762,069 | ) | (796,184 | ) | (1,622,289 | ) | ||||||||
Class R | (73,250 | ) | (85,404 | ) | (64,853 | ) | (112,352 | ) | ||||||||
From accumulated net realized gains: | ||||||||||||||||
Class A | — | — | — | (804,235 | ) | |||||||||||
Class B | — | — | — | (31,411 | ) | |||||||||||
Class C | — | — | — | (94,175 | ) | |||||||||||
Class R | — | — | — | (5,293 | ) | |||||||||||
Decrease in net assets from distributions to shareholders | (2,454,764 | ) | (5,012,425 | ) | (8,770,807 | ) | (19,415,644 | ) | ||||||||
Fund Share Transactions | ||||||||||||||||
Proceeds from sale of shares | 4,620,068 | 13,983,839 | 12,849,041 | 32,298,305 | ||||||||||||
Proceeds from shares issued to shareholders due | 1,154,031 | 2,398,985 | 4,765,686 | 10,557,770 | ||||||||||||
| 5,774,099 | 16,382,824 | 17,614,727 | 42,856,075 | |||||||||||||
Cost of shares redeemed | (9,896,560 | ) | (20,116,563 | ) | (36,701,211 | ) | (52,943,992 | ) | ||||||||
Net increase (decrease) in net assets from Fund share transactions | (4,122,461 | ) | (3,733,739 | ) | (19,086,484 | ) | (10,087,917 | ) | ||||||||
Net increase (decrease) in net assets | (4,086,296 | ) | (3,454,796 | ) | (18,514,130 | ) | (9,948,567 | ) | ||||||||
Net assets at the beginning of period | 128,348,721 | 131,803,517 | 455,445,913 | 465,394,480 | ||||||||||||
Net assets at the end of period | $ | 124,262,425 | $ | 128,348,721 | $ | 436,931,783 | $ | 455,445,913 | ||||||||
Undistributed (Over-distribution of) net investment income at the | $ | 101,373 | $ | 40,834 | $ | (801,609 | ) | $ | (804,166 | ) | ||||||
See accompanying notes to financial statements.
54
| Michigan | Missouri | |||||||||||||||
| Six Months Ended 11/30/07 | Year Ended | Six Months Ended 11/30/07 | Year Ended | |||||||||||||
Operations | ||||||||||||||||
Net investment income | $ | 4,636,458 | $ | 9,509,739 | $ | 5,168,868 | $ | 10,664,912 | ||||||||
Net realized gain (loss) from: | ||||||||||||||||
Investments | 667,971 | 1,756,860 | 96,174 | 746,850 | ||||||||||||
Forward swaps | (149,260 | ) | — | — | — | |||||||||||
Change in net unrealized appreciation (depreciation) of: | ||||||||||||||||
Investments | (1,317,999 | ) | (423,093 | ) | (1,232,691 | ) | 289,259 | |||||||||
Forward swaps | 556,502 | (222,175 | ) | — | — | |||||||||||
Net increase (decrease) in net assets from operations | 4,393,672 | 10,621,331 | 4,032,351 | 11,701,021 | ||||||||||||
Distributions to Shareholders | ||||||||||||||||
From net investment income: | ||||||||||||||||
Class A | (3,493,545 | ) | (7,050,365 | ) | (4,599,248 | ) | (9,368,335 | ) | ||||||||
Class B | (77,293 | ) | (190,942 | ) | (116,943 | ) | (266,196 | ) | ||||||||
Class C | (668,629 | ) | (1,360,169 | ) | (375,250 | ) | (752,948 | ) | ||||||||
Class R | (440,924 | ) | (938,703 | ) | (51,100 | ) | (56,661 | ) | ||||||||
From accumulated net realized gains: | ||||||||||||||||
Class A | — | (1,448,384 | ) | — | (141,487 | ) | ||||||||||
Class B | — | (47,098 | ) | — | (4,826 | ) | ||||||||||
Class C | — | (322,755 | ) | — | (13,104 | ) | ||||||||||
Class R | — | (184,060 | ) | — | (837 | ) | ||||||||||
Decrease in net assets from distributions to shareholders | (4,680,391 | ) | (11,542,476 | ) | (5,142,541 | ) | (10,604,394 | ) | ||||||||
Fund Share Transactions | ||||||||||||||||
Proceeds from sale of shares | 14,836,834 | 21,356,189 | 5,556,874 | 16,104,993 | ||||||||||||
Proceeds from shares issued to shareholders due | 2,039,621 | 5,074,689 | 2,464,446 | 5,559,873 | ||||||||||||
| 16,876,455 | 26,430,878 | 8,021,320 | 21,664,866 | |||||||||||||
Cost of shares redeemed | (23,835,043 | ) | (30,224,021 | ) | (17,196,472 | ) | (26,794,995 | ) | ||||||||
Net increase (decrease) in net assets from Fund share transactions | (6,958,588 | ) | (3,793,143 | ) | (9,175,152 | ) | (5,130,129 | ) | ||||||||
Net increase (decrease) in net assets | (7,245,307 | ) | (4,714,288 | ) | (10,285,342 | ) | (4,033,502 | ) | ||||||||
Net assets at the beginning of period | 232,370,078 | 237,084,366 | 258,195,844 | 262,229,346 | ||||||||||||
Net assets at the end of period | $ | 225,124,771 | $ | 232,370,078 | $ | 247,910,502 | $ | 258,195,844 | ||||||||
Undistributed (Over-distribution of) net investment income at the | $ | (224,397 | ) | $ | (180,464 | ) | $ | (48,353 | ) | $ | (74,680 | ) | ||||
See accompanying notes to financial statements.
55
Statement of Changes in Net Assets (Unaudited) (continued)
| Ohio | Wisconsin | |||||||||||||||
| Six Months Ended 11/30/07 | Year Ended | Six Months Ended 11/30/07 | Year Ended | |||||||||||||
Operations | ||||||||||||||||
Net investment income | $ | 11,057,290 | $ | 22,190,729 | $ | 970,712 | $ | 1,775,461 | ||||||||
Net realized gain (loss) from: | ||||||||||||||||
Investments | 2,427,300 | 2,589,633 | 599 | 83,300 | ||||||||||||
Forward swaps | — | — | — | — | ||||||||||||
Change in net unrealized appreciation (depreciation) of: | ||||||||||||||||
Investments | (3,529,787 | ) | (1,708,475 | ) | (82,678 | ) | 104,085 | |||||||||
Forward swaps | — | — | — | — | ||||||||||||
Net increase (decrease) in net assets from operations | 9,954,803 | 23,071,887 | 888,633 | 1,962,846 | ||||||||||||
Distributions to Shareholders | ||||||||||||||||
From net investment income: | ||||||||||||||||
Class A | (7,075,831 | ) | (14,370,357 | ) | (824,252 | ) | (1,455,199 | ) | ||||||||
Class B | (243,857 | ) | (621,821 | ) | (35,904 | ) | (88,548 | ) | ||||||||
Class C | (869,049 | ) | (1,721,241 | ) | (98,239 | ) | (186,557 | ) | ||||||||
Class R | (2,656,769 | ) | (5,527,424 | ) | (29,679 | ) | (26,261 | ) | ||||||||
From accumulated net realized gains: | ||||||||||||||||
Class A | — | (994,096 | ) | — | (80,032 | ) | ||||||||||
Class B | — | (52,377 | ) | — | (6,401 | ) | ||||||||||
Class C | — | (137,036 | ) | — | (11,840 | ) | ||||||||||
Class R | — | (363,710 | ) | — | (1,745 | ) | ||||||||||
Decrease in net assets from distributions to shareholders | (10,845,506 | ) | (23,788,062 | ) | (988,074 | ) | (1,856,583 | ) | ||||||||
Fund Share Transactions | ||||||||||||||||
Proceeds from sale of shares | 25,291,856 | 43,834,813 | 6,319,025 | 10,443,529 | ||||||||||||
Proceeds from shares issued to shareholders due | 5,757,094 | 12,663,124 | 565,987 | 1,047,561 | ||||||||||||
| 31,048,950 | 56,497,937 | 6,885,012 | 11,491,090 | |||||||||||||
Cost of shares redeemed | (41,491,378 | ) | (62,384,790 | ) | (2,806,741 | ) | (5,391,370 | ) | ||||||||
Net increase (decrease) in net assets from Fund share transactions | (10,442,428 | ) | (5,886,853 | ) | 4,078,271 | 6,099,720 | ||||||||||
Net increase (decrease) in net assets | (11,333,131 | ) | (6,603,028 | ) | 3,978,830 | 6,205,983 | ||||||||||
Net assets at the beginning of period | 536,556,621 | 543,159,649 | 51,749,076 | 45,543,093 | ||||||||||||
Net assets at the end of period | $ | 525,223,490 | $ | 536,556,621 | $ | 55,727,906 | $ | 51,749,076 | ||||||||
Undistributed (Over-distribution of) net investment income at the | $ | (233,328 | ) | $ | (445,112 | ) | $ | (54,836 | ) | $ | (37,474 | ) | ||||
See accompanying notes to financial statements.
56
Notes to Financial Statements (Unaudited)
1. General Information and Significant Accounting Policies
The Nuveen Multistate Trust IV (the “Trust”) is an open-end investment company registered under the Investment Company Act of 1940, as amended. The Trust is comprised of Nuveen Kansas Municipal Bond Fund (“Kansas”), Nuveen Kentucky Municipal Bond Fund (“Kentucky”), Nuveen Michigan Municipal Bond Fund (“Michigan”), Nuveen Missouri Municipal Bond Fund (“Missouri”), Nuveen Ohio Municipal Bond Fund (“Ohio”) and Nuveen Wisconsin Municipal Bond Fund (“Wisconsin”) (collectively, the “Funds”). The Trust was organized as a Massachusetts business trust on July 1, 1996. The Funds were each organized as a series of predecessor trusts or corporations prior to that date.
The Funds seek to provide high levels of tax-free income and preservation of capital through investments in diversified portfolios of quality municipal bonds. Effective October 31, 2007, each Fund may invest up to 20% of their net assets in below-investment grade (“high yield” or “junk”) municipal bonds.
The following is a summary of significant accounting policies followed by the Funds in the preparation of their financial statements in accordance with accounting principles generally accepted in the United States.
Investment Valuation
The prices of municipal bonds in each Fund’s investment portfolio are provided by a pricing service approved by the Fund’s Board of Trustees. When market price quotes are not readily available (which is usually the case for municipal securities), the pricing service may establish fair value based on yields or prices of municipal bonds of comparable quality, type of issue, coupon, maturity and rating, indications of value from securities dealers, evaluations of anticipated cash flows or collateral and general market conditions. Prices of forward swap contracts are also provided by an independent pricing service approved by each Fund’s Board of Trustees. If the pricing service is unable to supply a price for a municipal bond or forward swap contract, each Fund may use a market price or fair market value quote provided by a major broker/dealer in such investments. If it is determined that the market price or fair market value for an investment or derivative instrument is unavailable or inappropriate, the Board of Trustees of the Funds, or its designee, may establish a fair value for the investment. Temporary investments in securities that have variable rate and demand features qualifying them as short-term investments are valued at amortized cost, which approximates market value.
Investment Transactions
Investment transactions are recorded on a trade date basis. Realized gains and losses from transactions are determined on the specific identification method. Investments purchased on a when-issued/delayed delivery basis may have extended settlement periods. Any investments so purchased are subject to market fluctuation during this period. The Funds have instructed the custodian to segregate assets with a current value at least equal to the amount of the when-issued/delayed delivery purchase commitments. At November 30, 2007, there were no such outstanding purchase commitments in any of the Funds.
Investment Income
Interest income, which includes the amortization of premiums and accretion of discounts for financial reporting purposes, is recorded on an accrual basis. Investment income also includes paydown gains and losses, if any.
Professional Fees
Professional fees presented in the Statement of Operations consist of legal fees incurred in the normal course of operations, audit fees, tax consulting fees and, in some cases, workout expenditures. Workout expenditures are incurred in an attempt to protect or enhance an investment, or to pursue other claims or legal actions on behalf of Fund shareholders.
Income Taxes
Each Fund is a separate taxpayer for federal income tax purposes. Each Fund intends to distribute substantially all net investment income and net capital gains to shareholders and to otherwise comply with the requirements of Subchapter M of the Internal Revenue Code applicable to regulated investment companies. Therefore, no federal income tax provision is required. Furthermore, each Fund intends to satisfy conditions which will enable interest from municipal securities, which is exempt from regular federal and designated state income taxes, to retain such tax-exempt status when distributed to shareholders of the Funds. Net realized capital gains and ordinary income distributions paid by the Funds are subject to federal taxation.
Dividends and Distributions to Shareholders
Tax-exempt net investment income is declared monthly as a dividend. Generally, payment is made or reinvestment is credited to shareholder accounts on the first business day after month-end. Net realized capital gains and/or market discount from investment transactions, if any, are distributed to shareholders not less frequently than annually. Furthermore, capital gains are distributed only to the extent they exceed available capital loss carryforwards.
Distributions to shareholders of tax-exempt net investment income, net realized capital gains and/or market discount, if any, are recorded on the ex-dividend date. The amount and timing of distributions are determined in accordance with federal income tax regulations, which may differ from accounting principles generally accepted in the United States.
Flexible Sales Charge Program
Each Fund offers Class A, B, C and R Shares. Class A Shares are generally sold with an up-front sales charge and incur a .20% annual 12b-1 service fee. Class A Share purchases of $1 million or more are sold at net asset value without an up-front sales charge
57
Notes to Financial Statements (Unaudited) (continued)
but may be subject to a contingent deferred sales charge (“CDSC”) if redeemed within 18 months of purchase. Class B Shares are sold without an up-front sales charge but incur a .75% annual 12b-1 distribution fee and a .20% annual 12b-1 service fee. An investor purchasing Class B Shares agrees to pay a CDSC of up to 5% depending upon the length of time the shares are held by the investor (CDSC is reduced to 0% at the end of six years). Class B Shares convert to Class A Shares eight years after purchase. Class C Shares are sold without an up-front sales charge but incur a .55% annual 12b-1 distribution fee and a .20% annual 12b-1 service fee. An investor purchasing Class C Shares agrees to pay a CDSC of 1% if Class C Shares are redeemed within one year of purchase. Class R Shares are not subject to any sales charge or 12b-1 distribution or service fees. Class R Shares are available only under limited circumstances.
Inverse Floating Rate Securities
Each Fund may invest in inverse floating rate securities. An inverse floating rate security is created by depositing a municipal bond, typically with a fixed interest rate, into a special purpose trust created by a broker-dealer. In turn, this trust (a) issues floating rate certificates, in face amounts equal to some fraction of the deposited bond’s par amount or market value, that typically pay short-term tax-exempt interest rates to third parties, and (b) issues to a long-term investor (such as one of the Funds) an inverse floating rate certificate (sometimes referred to as an “inverse floater”) that represents all remaining or residual interest in the trust. The income received by the inverse floater holder varies inversely with the short-term rate paid to the floating rate certificates’ holders, and in most circumstances the inverse floater holder bears substantially all of the underlying bond’s downside investment risk and also benefits disproportionately from any potential appreciation of the underlying bond’s value. The price of an inverse floating rate security will be more volatile than that of the underlying bond because the interest rate is dependent on not only the fixed coupon rate of the underlying bond but also on the short-term interest paid on the floating rate certificates, and because the inverse floating rate security essentially bears the risk of loss of the greater face value of the underlying bond.
A Fund may purchase an inverse floating rate security in a secondary market transaction without first owning the underlying bond (referred to as an “externally-deposited inverse floater”), or instead by first selling a fixed-rate bond to a broker-dealer for deposit into the special purpose trust and receiving in turn the residual interest in the trust (referred to as a “self-deposited inverse floater”). A Fund may also enter into shortfall and forbearance agreements (sometimes referred to as a “recourse trust” or “credit recovery swap”) with a broker-dealer by which a Fund agrees to reimburse the broker-dealer, in certain circumstances, for the difference between the liquidation value of the fixed-rate bond held by the trust and the liquidation value of the floating rate certificates, as well as any shortfalls in interest cash flows. The inverse floater held by a Fund gives the Fund the right (a) to cause the holders of the floating rate certificates to tender their notes at par, and (b) to have the broker transfer the fixed-rate bond held by the trust to the Fund, thereby collapsing the trust. An investment in an externally-deposited inverse floater is identified in the Portfolio of Investments as an “Inverse floating rate investment”. An investment in a self-deposited inverse floater, recourse trust or credit recovery swap is accounted for as a financing transaction in accordance with Statement of Financial Accounting Standards (SFAS) No. 140 “Accounting for Transfers and Servicing of Financial Assets and Extinguishment of Liabilities”. In such instances, a fixed-rate bond deposited into a special purpose trust is identified in the Portfolio of Investments as an “Underlying bond of an inverse floating rate trust”, with the Fund accounting for the short-term floating rate certificates issued by the trust as “Floating rate obligations” on the Statement of Assets and Liabilities. In addition, the Fund reflects in Investment Income the entire earnings of the underlying bond and accounts for the related interest paid to the holders of the short-term floating rate certificates as “Interest expense on floating rate obligations” in the Statement of Operations.
During the six months ended November 30, 2007, Kentucky, Michigan, Missouri and Ohio invested in externally deposited inverse floaters and/or self-deposited inverse floaters. Kansas and Wisconsin did not invest in any such instruments during the six months ended November 30, 2007.
The average floating rate obligations outstanding and average annual interest rate and fees related to self-deposited inverse floaters during the six months ended November 30, 2007, were as follows:
| Kentucky | Michigan | Missouri | Ohio | |||||||||
Average floating rate obligations | $ | 8,817,978 | $ | 612,022 | $ | 1,988,661 | $ | 18,955,055 | ||||
Average annual interest rate and fees | 3.87% | 3.90% | 3.80% | 3.85% | ||||||||
Forward Swap Transactions
The Funds are authorized to invest in forward interest rate swap transactions. Each Fund’s use of forward interest rate swap transactions is intended to help the Fund manage its overall interest rate sensitivity, either shorter or longer, generally to more closely align the Fund’s interest rate sensitivity with that of the broader municipal market. Forward interest rate swap transactions involve each Fund’s agreement with a counterparty to pay, in the future, a fixed or variable rate payment in exchange for the counterparty paying the Fund a variable or fixed rate payment, the accruals for which would begin at a specified date in the future (the “effective date”). The amount of the payment obligation is based on the notional amount of the forward swap contract and the termination date of the swap (which is akin to a bond’s maturity). The value of the Fund’s swap commitment would increase or decrease based primarily on the extent to which long-term interest rates for bonds having a maturity of the swap’s termination date increases or decreases. The Funds may terminate a swap contract prior to the effective date, at which point a realized gain or loss is recognized. When a forward swap is terminated, it ordinarily does not involve the delivery of securities or other underlying assets or
58
principal, but rather is settled in cash on a net basis. Each Fund intends, but is not obligated, to terminate its forward swaps before the effective date. Accordingly, the risk of loss with respect to the swap counterparty on such transactions is limited to the credit risk associated with a counterparty failing to honor its commitment to pay any realized gain to the Fund upon termination. To reduce such credit risk, all counterparties are required to pledge collateral daily (based on the daily valuation of each swap) on behalf of each Fund with a value approximately equal to the amount of any unrealized gain above a pre-determined threshold. Reciprocally, when any of the Funds have an unrealized loss on a swap contract, the Funds have instructed the custodian to pledge assets of the Funds as collateral with a value approximately equal to the amount of the unrealized loss above a pre-determined threshold. Collateral pledges are monitored and subsequently adjusted if and when the swap valuations fluctuate, either up or down, by at least the predetermined threshold amount. Kentucky and Michigan were the only Funds to invest in forward interest rate swap transactions during the six months ended November 30, 2007.
Expense Allocation
Expenses of the Funds that are not directly attributable to a specific class of shares are prorated among the classes based on the relative net assets of each class. Expenses directly attributable to a class of shares, which presently only include 12b-1 distribution and service fees, are recorded to the specific class.
Custodian Fee Credit
Each Fund has an arrangement with the custodian bank whereby certain custodian fees and expenses are reduced by net credits earned on each Fund’s cash on deposit with the bank. Such deposit arrangements are an alternative to overnight investments. Credits for cash balances may be offset by charges for any days on which the Fund overdraws its account at the custodian bank.
Indemnifications
Under the Trust’s organizational documents, its Officers and Trustees are indemnified against certain liabilities arising out of the performance of their duties to the Trust. In addition, in the normal course of business, the Trust enters into contracts that provide general indemnifications to other parties. The Trust’s maximum exposure under these arrangements is unknown as this would involve future claims that may be made against the Trust that have not yet occurred. However, the Trust has not had prior claims or losses pursuant to these contracts and expects the risk of loss to be remote.
Use of Estimates
The preparation of financial statements in conformity with accounting principles generally accepted in the United States requires management to make estimates and assumptions that affect the reported amounts of assets and liabilities at the date of the financial statements and the reported amounts of increases and decreases in net assets from operations during the reporting period. Actual results may differ from those estimates.
2. Fund Shares
Transactions in Fund shares were as follows:
| Kansas | ||||||||||||||
Six Months Ended 11/30/07 | Year Ended | |||||||||||||
Shares | Amount | Shares | Amount | |||||||||||
Shares sold: | ||||||||||||||
Class A | 294,667 | $ | 3,054,744 | 738,883 | $ | 7,727,761 | ||||||||
Class A – automatic conversion of Class B shares | 22,110 | 228,876 | 137,621 | 1,443,319 | ||||||||||
Class B | 4,058 | 41,675 | 38,040 | 394,448 | ||||||||||
Class C | 84,239 | 872,608 | 257,845 | 2,706,471 | ||||||||||
Class R | 40,704 | 422,165 | 162,706 | 1,711,840 | ||||||||||
Shares issued to shareholders due to reinvestment | ||||||||||||||
Class A | 88,081 | 913,506 | 181,556 | 1,902,123 | ||||||||||
Class B | 4,075 | 41,903 | 9,902 | 102,898 | ||||||||||
Class C | 17,450 | 180,982 | 36,570 | 383,271 | ||||||||||
Class R | 1,694 | 17,640 | 1,016 | 10,693 | ||||||||||
| 557,078 | 5,774,099 | 1,564,139 | 16,382,824 | |||||||||||
Shares redeemed: | ||||||||||||||
Class A | (629,645 | ) | (6,507,291 | ) | (1,333,549 | ) | (13,953,264 | ) | ||||||
Class B | (60,893 | ) | (626,890 | ) | (59,717 | ) | (619,173 | ) | ||||||
Class B – automatic conversion to Class A shares | (22,301 | ) | (228,876 | ) | (138,795 | ) | (1,443,319 | ) | ||||||
Class C | (203,973 | ) | (2,110,797 | ) | (391,534 | ) | (4,090,957 | ) | ||||||
Class R | (40,335 | ) | (422,706 | ) | (936 | ) | (9,850 | ) | ||||||
| (957,147 | ) | (9,896,560 | ) | (1,924,531 | ) | (20,116,563 | ) | |||||||
Net increase (decrease) | (400,069 | ) | $ | (4,122,461 | ) | (360,392 | ) | $ | (3,733,739 | ) | ||||
59
Notes to Financial Statements (Unaudited) (continued)
| Kentucky | ||||||||||||||
Six Months Ended | Year Ended | |||||||||||||
Shares | Amount | Shares | Amount | |||||||||||
Shares sold: | ||||||||||||||
Class A | 858,598 | $ | 9,350,505 | 2,039,116 | $ | 22,523,441 | ||||||||
Class A – automatic conversion of Class B shares | 101,240 | 1,104,462 | 241,274 | 2,668,451 | ||||||||||
Class B | 10,087 | 109,933 | 32,888 | 364,317 | ||||||||||
Class C | 196,064 | 2,135,177 | 552,350 | 6,112,283 | ||||||||||
Class R | 13,763 | 148,964 | 57,059 | 629,813 | ||||||||||
Shares issued to shareholders due to reinvestment of distributions: | ||||||||||||||
Class A | 379,572 | 4,143,403 | 829,319 | 9,183,661 | ||||||||||
Class B | 11,792 | 128,803 | 28,813 | 319,218 | ||||||||||
Class C | 41,504 | 453,140 | 87,326 | 966,833 | ||||||||||
Class R | 3,695 | 40,340 | 7,955 | 88,058 | ||||||||||
| 1,616,315 | 17,614,727 | 3,876,100 | 42,856,075 | |||||||||||
Shares redeemed: | ||||||||||||||
Class A | (2,763,499 | ) | (30,086,539 | ) | (3,696,333 | ) | (40,846,673 | ) | ||||||
Class B | (159,861 | ) | (1,739,491 | ) | (269,743 | ) | (2,975,210 | ) | ||||||
Class B – automatic conversion to Class A shares | (101,220 | ) | (1,104,462 | ) | (241,139 | ) | (2,668,451 | ) | ||||||
Class C | (299,663 | ) | (3,259,701 | ) | (575,593 | ) | (6,356,515 | ) | ||||||
Class R | (46,855 | ) | (511,018 | ) | (8,831 | ) | (97,143 | ) | ||||||
| (3,371,098 | ) | (36,701,211 | ) | (4,791,639 | ) | (52,943,992 | ) | |||||||
Net increase (decrease) | (1,754,783 | ) | $ | (19,086,484 | ) | (915,539 | ) | $ | (10,087,917 | ) | ||||
| Michigan | ||||||||||||||
Six Months Ended | Year Ended 5/31/07 | |||||||||||||
Shares | Amount | Shares | Amount | |||||||||||
Shares sold: | ||||||||||||||
Class A | 1,112,035 | $ | 12,548,688 | 1,330,719 | $ | 15,346,047 | ||||||||
Class A – automatic conversion of Class B shares | 7,443 | 84,688 | 70,452 | 816,002 | ||||||||||
Class B | 10,718 | 121,723 | 27,284 | 316,820 | ||||||||||
Class C | 147,600 | 1,669,669 | 335,428 | 3,867,578 | ||||||||||
Class R | 36,661 | 412,066 | 87,324 | 1,009,742 | ||||||||||
Shares issued to shareholders due to reinvestment of distributions: | ||||||||||||||
Class A | 126,639 | 1,436,248 | 302,979 | 3,507,082 | ||||||||||
Class B | 2,767 | 31,443 | 8,249 | 95,647 | ||||||||||
Class C | 23,990 | 271,917 | 58,027 | 671,298 | ||||||||||
Class R | 26,453 | 300,013 | 69,176 | 800,662 | ||||||||||
| 1,494,306 | 16,876,455 | 2,289,638 | 26,430,878 | |||||||||||
Shares redeemed: | ||||||||||||||
Class A | (1,661,301 | ) | (18,741,407 | ) | (1,723,501 | ) | (19,856,476 | ) | ||||||
Class B | (42,558 | ) | (481,966 | ) | (133,306 | ) | (1,540,545 | ) | ||||||
Class B – automatic conversion to Class A shares | (7,424 | ) | (84,688 | ) | (70,285 | ) | (816,002 | ) | ||||||
Class C | (278,911 | ) | (3,155,890 | ) | (412,809 | ) | (4,755,624 | ) | ||||||
Class R | (121,424 | ) | (1,371,092 | ) | (282,197 | ) | (3,255,374 | ) | ||||||
| (2,111,618 | ) | (23,835,043 | ) | (2,622,098 | ) | (30,224,021 | ) | |||||||
Net increase (decrease) | (617,312 | ) | $ | (6,958,588 | ) | (332,460 | ) | $ | (3,793,143 | ) | ||||
60
| Missouri | ||||||||||||||
Six Months Ended | Year Ended | |||||||||||||
Shares | Amount | Shares | Amount | |||||||||||
Shares sold: | ||||||||||||||
Class A | 342,606 | $ | 3,746,583 | 1,004,766 | $ | 11,149,451 | ||||||||
Class A – automatic conversion of Class B shares | 20,317 | 222,693 | 52,346 | 583,774 | ||||||||||
Class B | 5,799 | 63,404 | 16,927 | 187,643 | ||||||||||
Class C | 97,118 | 1,055,521 | 249,446 | 2,770,206 | ||||||||||
Class R | 42,803 | 468,673 | 127,152 | 1,413,919 | ||||||||||
Shares issued to shareholders due to reinvestment of distributions: | ||||||||||||||
Class A | 203,042 | 2,223,935 | 456,186 | 5,072,942 | ||||||||||
Class B | 6,181 | 67,771 | 13,700 | 152,481 | ||||||||||
Class C | 15,111 | 165,367 | 29,242 | 324,944 | ||||||||||
Class R | 673 | 7,373 | 851 | 9,506 | ||||||||||
| 733,650 | 8,021,320 | 1,950,616 | 21,664,866 | |||||||||||
Shares redeemed: | ||||||||||||||
Class A | (1,356,464 | ) | (14,828,735 | ) | (1,959,287 | ) | (21,743,896 | ) | ||||||
Class B | (46,448 | ) | (507,982 | ) | (92,027 | ) | (1,024,836 | ) | ||||||
Class B – automatic conversion to Class A shares | (20,299 | ) | (222,693 | ) | (52,310 | ) | (583,774 | ) | ||||||
Class C | (124,898 | ) | (1,362,073 | ) | (297,607 | ) | (3,299,155 | ) | ||||||
Class R | (25,042 | ) | (274,989 | ) | (12,855 | ) | (143,334 | ) | ||||||
| (1,573,151 | ) | (17,196,472 | ) | (2,414,086 | ) | (26,794,995 | ) | |||||||
Net increase (decrease) | (839,501 | ) | $ | (9,175,152 | ) | (463,470 | ) | $ | (5,130,129 | ) | ||||
| Ohio | ||||||||||||||
| Six Months Ended 11/30/07 | Year Ended | |||||||||||||
| Shares | Amount | Shares | Amount | |||||||||||
Shares sold: | ||||||||||||||
Class A | 1,807,764 | $ | 20,117,523 | 2,723,205 | $ | 30,926,754 | ||||||||
Class A – automatic conversion of Class B shares | 105,797 | 1,180,630 | 143,718 | 1,640,005 | ||||||||||
Class B | 9,065 | 101,395 | 49,844 | 566,896 | ||||||||||
Class C | 288,826 | 3,219,190 | 723,663 | 8,211,429 | ||||||||||
Class R | 60,690 | 673,118 | 219,836 | 2,489,729 | ||||||||||
Shares issued to shareholders due to reinvestment | ||||||||||||||
Class A | 295,253 | 3,303,861 | 631,048 | 7,181,835 | ||||||||||
Class B | 11,310 | 126,359 | 29,323 | 333,258 | ||||||||||
Class C | 32,474 | 362,242 | 68,970 | 783,102 | ||||||||||
Class R | 175,863 | 1,964,632 | 384,028 | 4,364,929 | ||||||||||
| 2,787,042 | 31,048,950 | 4,973,635 | 56,497,937 | |||||||||||
Shares redeemed: | ||||||||||||||
Class A | (2,479,712 | ) | (27,642,919 | ) | (3,629,878 | ) | (41,190,056 | ) | ||||||
Class B | (150,662 | ) | (1,680,344 | ) | (322,419 | ) | (3,654,426 | ) | ||||||
Class B – automatic conversion to Class A shares | (105,987 | ) | (1,180,630 | ) | (143,960 | ) | (1,640,005 | ) | ||||||
Class C | (325,968 | ) | (3,631,734 | ) | (540,584 | ) | (6,124,905 | ) | ||||||
Class R | (659,218 | ) | (7,355,751 | ) | (862,463 | ) | (9,775,398 | ) | ||||||
| (3,721,547 | ) | (41,491,378 | ) | (5,499,304 | ) | (62,384,790 | ) | |||||||
Net increase (decrease) | (934,505 | ) | $ | (10,442,428 | ) | (525,669 | ) | $ | (5,886,853 | ) | ||||
61
Notes to Financial Statements (Unaudited) (continued)
| Wisconsin | ||||||||||||||
Six Months Ended 11/30/07 | Year Ended | |||||||||||||
Shares | Amount | Shares | Amount | |||||||||||
Shares sold: | ||||||||||||||
Class A | 470,694 | $ | 4,784,054 | 784,243 | $ | 8,107,651 | ||||||||
Class A – automatic conversion of Class B shares | 9,563 | 97,565 | 54,287 | 560,644 | ||||||||||
Class B | 408 | 4,111 | 4,417 | 45,765 | ||||||||||
Class C | 85,504 | 871,774 | 87,112 | 904,057 | ||||||||||
Class R | 55,149 | 561,521 | 79,132 | 825,412 | ||||||||||
Shares issued to shareholders due to reinvestment | ||||||||||||||
Class A | 44,883 | 456,748 | 81,274 | 840,644 | ||||||||||
Class B | 2,161 | 22,038 | 5,445 | 56,427 | ||||||||||
Class C | 5,933 | 60,469 | 12,058 | 124,976 | ||||||||||
Class R | 2,621 | 26,732 | 2,454 | 25,514 | ||||||||||
| 676,916 | 6,885,012 | 1,110,422 | 11,491,090 | |||||||||||
Shares redeemed: | ||||||||||||||
Class A | (144,736 | ) | (1,465,520 | ) | (380,887 | ) | (3,938,916 | ) | ||||||
Class B | (28,007 | ) | (287,520 | ) | (37,804 | ) | (392,419 | ) | ||||||
Class B – automatic conversion to Class A shares | (9,544 | ) | (97,565 | ) | (54,177 | ) | (560,644 | ) | ||||||
Class C | (90,070 | ) | (918,894 | ) | (47,123 | ) | (488,321 | ) | ||||||
Class R | (3,662 | ) | (37,242 | ) | (1,074 | ) | (11,070 | ) | ||||||
| (276,019 | ) | (2,806,741 | ) | (521,065 | ) | (5,391,370 | ) | |||||||
Net increase (decrease) | 400,897 | $ | 4,078,271 | 589,357 | $ | 6,099,720 | ||||||||
3. Investment Transactions
Purchases and sales (including maturities but excluding short-term investments and derivative transactions) during the six months ended November 30, 2007, were as follows:
| Kansas | Kentucky | Michigan | Missouri | Ohio | Wisconsin | |||||||||||||
Purchases | $ | 8,853,565 | $ | 8,607,250 | $ | 14,244,730 | $ | 25,293,560 | $ | 49,154,430 | $ | 3,191,750 | ||||||
Sales and maturities | 13,006,569 | 33,305,908 | 26,194,611 | 34,079,928 | 55,024,485 | 675,000 | ||||||||||||
4. Income Tax Information
The following information is presented on an income tax basis. Differences between amounts for financial statement and federal income tax purposes are primarily due to the treatment of paydown gains and losses, timing differences in recognizing taxable market discount, timing differences in recognizing certain gains and losses on investment transactions and the treatment of investments in inverse floating rate transactions subject to SFAS No. 140. To the extent that differences arise that are permanent in nature, such amounts are reclassified within the capital accounts on the Statement of Assets and Liabilities presented in the annual report, based on their federal tax basis treatment; temporary differences do not require reclassification. Temporary and permanent differences do not impact the net asset values of the Funds.
At November 30, 2007, the cost of investments was as follows:
| Kansas | Kentucky | Michigan | Missouri | Ohio | Wisconsin | |||||||||||||
Cost of investments | $ | 121,134,974 | $ | 413,770,245 | $ | 215,149,874 | $ | 238,227,482 | $ | 503,673,372 | $ | 52,799,216 | ||||||
Gross unrealized appreciation and gross unrealized depreciation of investments at November 30, 2007, were as follows:
| Kansas | Kentucky | Michigan | Missouri | Ohio | Wisconsin | |||||||||||||||||||
Gross unrealized: | ||||||||||||||||||||||||
Appreciation | $ | 3,430,905 | $ | 16,251,974 | $ | 10,829,068 | $ | 10,385,699 | $ | 23,318,736 | $ | 1,311,973 | ||||||||||||
Depreciation | (576,970 | ) | (929,969 | ) | (855,302 | ) | (1,807,229 | ) | (2,808,329 | ) | (334,953 | ) | ||||||||||||
Net unrealized appreciation (depreciation) of investments | $ | 2,853,935 | $ | 15,322,005 | $ | 9,973,766 | $ | 8,578,470 | $ | 20,510,407 | $ | 977,020 | ||||||||||||
62
The tax components of undistributed net tax-exempt income, net ordinary income and net long-term capital gains at May 31, 2007, the Funds’ last tax year end, were as follows:
| Kansas | Kentucky | Michigan | Missouri | Ohio | Wisconsin | |||||||||||||
Undistributed net tax-exempt income* | $ | 435,265 | $ | 652,250 | $ | 480,089 | $ | 743,214 | $ | 893,427 | $ | 118,788 | ||||||
Undistributed net ordinary income** | — | 12,966 | 23,685 | 8,048 | — | 3,401 | ||||||||||||
Undistributed net long-term capital gains | 118,716 | 537,654 | 186,048 | 437,117 | 1,076,892 | 81,767 | ||||||||||||
* Undistributed net tax-exempt income (on a tax basis) has not been reduced for the dividend declared on May 9, 2007, paid on June 1, 2007.
** Net ordinary income consists of taxable market discount income and net short-term capital gains, if any.
The tax character of distributions paid during the Funds’ last tax year ended May 31, 2007, was designated for purposes of the dividends paid deduction as follows:
| Kansas | Kentucky | Michigan | Missouri | Ohio | Wisconsin | |||||||||||||
Distributions from net tax-exempt income | $ | 5,024,864 | $ | 18,597,774 | $ | 9,530,565 | $ | 10,456,421 | $ | 22,291,164 | $ | 1,737,468 | ||||||
Distributions from net ordinary income** | — | — | 19,811 | — | — | — | ||||||||||||
Distributions from net long-term capital gains | — | 935,114 | 2,002,297 | 160,254 | 1,547,219 | 100,018 | ||||||||||||
** Net ordinary income consists of taxable market discount income and net short-term capital gains, if any.
5. Management Fees and Other Transactions with Affiliates
Each Fund’s management fee is separated into two components – a complex-level component, based on the aggregate amount of all fund assets managed by Nuveen Asset Management (the “Adviser”), a wholly owned subsidiary of Nuveen Investments, Inc. (“Nuveen”), and a specific fund-level component, based only on the amount of assets within each individual Fund. This pricing structure enables Nuveen fund shareholders to benefit from growth in the assets within each individual fund as well as from growth in the amount of complex-wide assets managed by the Adviser.
The annual fund-level fee, payable monthly, for each Fund is based upon the average daily net assets of each Fund as follows:
| Average Daily Net Assets | Fund-Level Fee Rate | ||
For the first $125 million | .3500 | % | |
For the next $125 million | .3375 | ||
For the next $250 million | .3250 | ||
For the next $500 million | .3125 | ||
For the next $1 billion | .3000 | ||
For the next $3 billion | .2750 | ||
For net assets over $5 billion | .2500 |
The annual complex-level fee, payable monthly, which is additive to the fund-level fee, for all Nuveen sponsored funds in the U.S., is based on the aggregate amount of total fund assets managed as stated in the table below. As of November 30, 2007, the complex-level fee rate was .1837%.
Effective August 20, 2007, the complex-level fee schedule is as follows:
| Complex-Level Asset Breakpoint Level (1) | Effective Rate at Breakpoint Level | ||
$55 billion | .2000 | % | |
$56 billion | .1996 | ||
$57 billion | .1989 | ||
$60 billion | .1961 | ||
$63 billion | .1931 | ||
$66 billion | .1900 | ||
$71 billion | .1851 | ||
$76 billion | .1806 | ||
$80 billion | .1773 | ||
$91 billion | .1691 | ||
$125 billion | .1599 | ||
$200 billion | .1505 | ||
$250 billion | .1469 | ||
$300 billion | .1445 |
| (1) | The complex-level fee component of the management fee for the funds is calculated based upon the aggregate Managed Assets (“Managed Assets” means the average daily net assets of each fund including assets attributable to preferred stock issued by or borrowings by the Nuveen funds) of Nuveen-sponsored funds in the U.S. |
63
Notes to Financial Statements (Unaudited) (continued)
Prior to August 20, 2007, the complex-level fee schedule was as follows:
| Complex-Level Asset Breakpoint Level (1) | Effective Rate at Breakpoint Level | ||
$55 billion | .2000 | % | |
$56 billion | .1996 | ||
$57 billion | .1989 | ||
$60 billion | .1961 | ||
$63 billion | .1931 | ||
$66 billion | .1900 | ||
$71 billion | .1851 | ||
$76 billion | .1806 | ||
$80 billion | .1773 | ||
$91 billion | .1698 | ||
$125 billion | .1617 | ||
$200 billion | .1536 | ||
$250 billion | .1509 | ||
$300 billion | .1490 |
| (1) | The complex-level fee component of the management fee for the funds is calculated based upon the aggregate Managed Assets (“Managed Assets” means the average daily net assets of each fund including assets attributable to preferred stock issued by or borrowings by the Nuveen funds) of Nuveen-sponsored funds in the U.S. |
The management fee compensates the Adviser for overall investment advisory and administrative services and general office facilities. The Trust pays no compensation directly to those of its Trustees who are affiliated with the Adviser or to its Officers, all of whom receive remuneration for their services to the Trust from the Adviser or its affiliates. The Board of Trustees has adopted a deferred compensation plan for independent Trustees that enables Trustees to elect to defer receipt of all or a portion of the annual compensation they are entitled to receive from certain Nuveen advised funds. Under the plan, deferred amounts are treated as though equal dollar amounts had been invested in shares of select Nuveen advised funds.
The Adviser has agreed to waive part of its management fees or reimburse certain expenses of Ohio in order to limit total expenses (excluding 12b-1 distribution and service fees, interest expense and extraordinary expenses) from exceeding .75% of the average daily net assets. The Adviser may also voluntarily reimburse additional expenses from time to time in any of the Funds. Voluntary reimbursements may be terminated at any time at the Adviser’s discretion.
During the six months ended November 30, 2007, Nuveen Investments, LLC (the “Distributor”), a wholly owned subsidiary of Nuveen, collected sales charges on purchases of Class A Shares, the majority of which were paid out as concessions to financial intermediaries as follows:
| Kansas | Kentucky | Michigan | Missouri | Ohio | Wisconsin | |||||||||||||
Sales charges collected | $ | 51,535 | $ | 174,128 | $ | 67,310 | $ | 93,886 | $ | 107,749 | $ | 62,837 | ||||||
Paid to financial intermediaries | 44,484 | 149,952 | 60,143 | 80,327 | 93,045 | 53,987 | ||||||||||||
The Distributor also received 12b-1 service fees on Class A Shares, substantially all of which were paid to compensate financial intermediaries for providing services to shareholders relating to their investments.
During the six months ended November 30, 2007, the Distributor compensated financial intermediaries directly with commission advances at the time of purchase as follows:
| Kansas | Kentucky | Michigan | Missouri | Ohio | Wisconsin | |||||||||||||
Commission advances | $ | 10,399 | $ | 23,390 | $ | 34,223 | $ | 10,784 | $ | 40,698 | $ | 12,907 | ||||||
To compensate for commissions advanced to financial intermediaries, all 12b-1 service fees collected on Class B Shares during the first year following a purchase, all 12b-1 distribution fees collected on Class B Shares, and all 12b-1 service and distribution fees collected on Class C Shares during the first year following a purchase are retained by the Distributor. During the six months ended November 30, 2007, the Distributor retained such 12b-1 fees as follows:
| Kansas | Kentucky | Michigan | Missouri | Ohio | Wisconsin | |||||||||||||
12b-1 fees retained | $ | 28,512 | $ | 61,735 | $ | 38,414 | $ | 38,380 | $ | 78,455 | $ | 11,915 | ||||||
The remaining 12b-1 fees charged to the Funds were paid to compensate financial intermediaries for providing services to shareholders relating to their investments.
64
The Distributor also collected and retained CDSC on share redemptions during the six months ended November 30, 2007, as follows:
| Kansas | Kentucky | Michigan | Missouri | Ohio | Wisconsin | |||||||||||||
CDSC retained | $ | 6,128 | $ | 17,835 | $ | 8,786 | $ | 7,272 | $ | 27,197 | $ | 865 | ||||||
Agreement and Plan of Merger
On June 20, 2007, Nuveen Investments announced that it had entered into a definitive Agreement and Plan of Merger (“Merger Agreement”) with Windy City Investments, Inc. (“Windy City”), a corporation formed by investors led by Madison Dearborn Partners, LLC (“Madison Dearborn”), pursuant to which Windy City would acquire Nuveen Investments. Madison Dearborn is a private equity investment firm based in Chicago, Illinois. The merger was consummated on November 13, 2007.
The consummation of the merger was deemed to be an “assignment” (as that term is defined in the Investment Company Act of 1940) of the investment management agreement between each Fund and the Adviser, and resulted in the automatic termination of each Fund’s agreement. The Board of Trustees of each Fund considered and approved a new investment management agreement with the Adviser at the same fee rate. The new ongoing agreement was approved by the shareholders of each Fund and took effect on November 13, 2007.
The investors led by Madison Dearborn include an affiliate of Merrill Lynch. As a result, Merrill Lynch is an indirect “affiliated person” (as that term is defined in the Investment Company Act of 1940) of each Fund. Certain conflicts of interest may arise as a result of such indirect affiliation. For example, the Funds are generally prohibited from entering into principal transactions with Merrill Lynch and its affiliates. The Adviser does not believe that any such prohibitions or limitations as a result of Merrill Lynch’s affiliation will significantly impact the ability of the Funds to pursue their investment objectives and policies.
6. New Accounting Pronouncements
Financial Accounting Standards Board Interpretation No. 48
Effective November 30, 2007, the Funds adopted Financial Accounting Standards Board Interpretation No. 48, “Accounting for Uncertainty in Income Taxes” (FIN 48). FIN 48 provides guidance regarding how uncertain tax positions should be recognized, measured, presented and disclosed in the financial statements. FIN 48 requires the evaluation of tax positions taken or expected to be taken in the course of preparing the Funds’ tax returns to determine whether the tax positions are “more-likely-than-not” of being sustained by the applicable tax authority. Tax positions not deemed to meet the more-likely-than-not threshold would be recorded as a tax benefit or expense in the current year. Management of the Funds has concluded that there are no significant uncertain tax positions that require recognition in the Funds’ financial statements. Consequently, the adoption of FIN 48 had no impact on the net assets or results of operations of the Funds.
Financial Accounting Standards Board Statement of Financial Accounting Standards No. 157
In September 2006, the Financial Accounting Standards Board (FASB) issued Statement of Financial Accounting Standards (SFAS) No. 157, “Fair Value Measurements.” This standard establishes a single authoritative definition of fair value, sets out a framework for measuring fair value and requires additional disclosures about fair value measurements. SFAS No. 157 applies to fair value measurements already required or permitted by existing standards. SFAS No. 157 is effective for financial statements issued for fiscal years beginning after November 15, 2007, and interim periods within those fiscal years. The changes to current generally accepted accounting principles from the application of this standard relate to the definition of fair value, the methods used to measure fair value, and the expanded disclosures about fair value measurements. As of November 30, 2007, management does not believe the adoption of SFAS No. 157 will impact the financial statement amounts; however, additional disclosures may be required about the inputs used to develop the measurements and the effect of certain of the measurements included within the Statement of Operations for the period.
7. Subsequent Events
Distributions to Shareholders
The Funds declared dividend distributions from their tax-exempt net investment income which were paid on December 27, 2007, to shareholders of record on December 21, 2007, as follows:
| Kansas | Kentucky | Michigan | Missouri | Ohio | Wisconsin | |||||||||||||
Dividend per share: | ||||||||||||||||||
Class A | $ | .0355 | $ | .0365 | $ | .0395 | $ | .0375 | $ | .0380 | $ | .0325 | ||||||
Class B | .0290 | .0295 | .0325 | .0305 | .0310 | .0260 | ||||||||||||
Class C | .0310 | .0315 | .0340 | .0325 | .0330 | .0280 | ||||||||||||
Class R | .0375 | .0380 | .0415 | .0395 | .0400 | .0345 | ||||||||||||
The following Funds also declared capital gain and/or net ordinary income distributions, for each share class, which were paid on December 5, 2007, to shareholders of record on December 3, 2007, as follows:
| Kansas | Kentucky | Michigan | Missouri | Ohio | Wisconsin | |||||||||||||
Capital gains distribution per share | $ | .0243 | $ | .0242 | $ | .0321 | $ | .0194 | $ | .0735 | $ | .0150 | ||||||
Net ordinary income distribution per share* | — | .0004 | — | .0004 | — | .0006 | ||||||||||||
* Net ordinary income consists of taxable market discount income and net short-term capital gains, if any.
65
Financial Highlights (Unaudited)
Selected data for a share outstanding throughout each period:
| Class (Commencement Date) | |||||||||||||||||||||||||||||||||||||||||||||||||||||||
| Investment Operations | Less Distributions | Ratios/Supplemental Data | |||||||||||||||||||||||||||||||||||||||||||||||||||||
| KANSAS | Ratios to Average Net Assets Before Credit/ Reimbursement | Ratios to Average Net Assets After Reimbursement(c) | Ratios to Average Net Assets After Credit/ Reimbursement(d) | ||||||||||||||||||||||||||||||||||||||||||||||||||||
| Year Ended May 31, | Beginning Net Asset Value | Net Invest- ment Income(a) | Net Realized/ Unrealized Gain (Loss) | Total | Net Invest- ment Income | Capital Gains | Total | Ending Net Asset Value | Total Return(b) | Ending Net Assets (000) | Expenses | Net Invest- ment Income | Expenses | Net Invest- ment Income | Expenses | Net Invest- ment Income | Portfolio Turnover Rate | ||||||||||||||||||||||||||||||||||||||
| Class A (1/92) | |||||||||||||||||||||||||||||||||||||||||||||||||||||||
2008(e) | $ | 10.40 | $ | .21 | $ | .01 | $ | .22 | $ | (.21 | ) | $ | — | $ | (.21 | ) | $ | 10.41 | 2.12 | % | $ | 95,195 | .87 | %* | 4.11 | %* | .87 | %* | 4.11 | %* | .86 | %* | 4.12 | %* | 7 | % | |||||||||||||||||||
2007 | 10.38 | .42 | .01 | .43 | (.41 | ) | — | (.41 | ) | 10.40 | 4.22 | 97,477 | .85 | 4.03 | .85 | 4.03 | .84 | 4.04 | 22 | ||||||||||||||||||||||||||||||||||||
2006 | 10.66 | .42 | (.29 | ) | .13 | (.41 | ) | — | (.41 | ) | 10.38 | 1.28 | 100,128 | .86 | 4.02 | .86 | 4.02 | .84 | 4.03 | 18 | |||||||||||||||||||||||||||||||||||
2005 | 10.20 | .44 | .46 | .90 | (.44 | ) | — | (.44 | ) | 10.66 | 8.95 | 97,861 | .88 | 4.17 | .88 | 4.17 | .87 | 4.18 | 21 | ||||||||||||||||||||||||||||||||||||
2004 | 10.77 | .46 | (.57 | ) | (.11 | ) | (.46 | ) | — | (.46 | ) | 10.20 | (1.02 | ) | 91,744 | .90 | 4.36 | .90 | 4.36 | .89 | 4.37 | 11 | |||||||||||||||||||||||||||||||||
2003 | 10.25 | .48 | .52 | 1.00 | (.48 | ) | — | (.48 | ) | 10.77 | 10.03 | 102,938 | .88 | 4.57 | .88 | 4.57 | .87 | 4.58 | 12 | ||||||||||||||||||||||||||||||||||||
| Class B (2/97) | |||||||||||||||||||||||||||||||||||||||||||||||||||||||
2008(e) | 10.31 | .17 | .01 | .18 | (.17 | ) | — | (.17 | ) | 10.32 | 1.75 | 5,069 | 1.61 | * | 3.36 | * | 1.61 | * | 3.36 | * | 1.61 | * | 3.37 | * | 7 | ||||||||||||||||||||||||||||||
2007 | 10.30 | .34 | .01 | .35 | (.34 | ) | — | (.34 | ) | 10.31 | 3.38 | 5,840 | 1.61 | 3.28 | 1.61 | 3.28 | 1.59 | 3.29 | 22 | ||||||||||||||||||||||||||||||||||||
2006 | 10.58 | .34 | (.28 | ) | .06 | (.34 | ) | — | (.34 | ) | 10.30 | .54 | 7,379 | 1.61 | 3.26 | 1.61 | 3.26 | 1.59 | 3.28 | 18 | |||||||||||||||||||||||||||||||||||
2005 | 10.12 | .36 | .46 | .82 | (.36 | ) | — | (.36 | ) | 10.58 | 8.21 | 10,031 | 1.63 | 3.42 | 1.63 | 3.42 | 1.61 | 3.43 | 21 | ||||||||||||||||||||||||||||||||||||
2004 | 10.69 | .38 | (.57 | ) | (.19 | ) | (.38 | ) | — | (.38 | ) | 10.12 | (1.77 | ) | 11,001 | 1.64 | 3.61 | 1.64 | 3.61 | 1.64 | 3.62 | 11 | |||||||||||||||||||||||||||||||||
2003 | 10.18 | .40 | .52 | .92 | (.41 | ) | — | (.41 | ) | 10.69 | 9.18 | 12,797 | 1.63 | 3.81 | 1.63 | 3.81 | 1.62 | 3.82 | 12 | ||||||||||||||||||||||||||||||||||||
| Class C (2/97) | |||||||||||||||||||||||||||||||||||||||||||||||||||||||
2008(e) | 10.40 | .19 | — | .19 | (.18 | ) | — | (.18 | ) | 10.41 | 1.86 | 20,712 | 1.41 | * | 3.56 | * | 1.41 | * | 3.56 | * | 1.41 | * | 3.57 | * | 7 | ||||||||||||||||||||||||||||||
2007 | 10.38 | .37 | .01 | .38 | (.36 | ) | — | (.36 | ) | 10.40 | 3.69 | 21,767 | 1.40 | 3.48 | 1.40 | 3.48 | 1.39 | 3.50 | 22 | ||||||||||||||||||||||||||||||||||||
2006 | 10.67 | .37 | (.30 | ) | .07 | (.36 | ) | — | (.36 | ) | 10.38 | .67 | 22,736 | 1.41 | 3.47 | 1.41 | 3.47 | 1.39 | 3.48 | 18 | |||||||||||||||||||||||||||||||||||
2005 | 10.21 | .38 | .46 | .84 | (.38 | ) | — | (.38 | ) | 10.67 | 8.39 | 22,836 | 1.43 | 3.62 | 1.43 | 3.62 | 1.42 | 3.63 | 21 | ||||||||||||||||||||||||||||||||||||
2004 | 10.78 | .40 | (.56 | ) | (.16 | ) | (.41 | ) | — | (.41 | ) | 10.21 | (1.53 | ) | 23,656 | 1.45 | 3.81 | 1.45 | 3.81 | 1.44 | 3.82 | 11 | |||||||||||||||||||||||||||||||||
2003 | 10.27 | .42 | .52 | .94 | (.43 | ) | — | (.43 | ) | 10.78 | 9.35 | 25,049 | 1.43 | 4.01 | 1.43 | 4.01 | 1.42 | 4.02 | 12 | ||||||||||||||||||||||||||||||||||||
| Class R (2/97) | |||||||||||||||||||||||||||||||||||||||||||||||||||||||
2008(e) | 10.45 | .22 | — | .22 | (.22 | ) | — | (.22 | ) | 10.45 | 2.13 | 3,288 | .67 | * | 4.31 | * | .67 | * | 4.31 | * | .66 | * | 4.31 | * | 7 | ||||||||||||||||||||||||||||||
2007 | 10.42 | .45 | .02 | .47 | (.44 | ) | — | (.44 | ) | 10.45 | 4.54 | 3,264 | .65 | 4.23 | .65 | 4.23 | .63 | 4.25 | 22 | ||||||||||||||||||||||||||||||||||||
2006 | 10.71 | .45 | (.30 | ) | .15 | (.44 | ) | — | (.44 | ) | 10.42 | 1.41 | 1,560 | .66 | 4.22 | .66 | 4.22 | .64 | 4.23 | 18 | |||||||||||||||||||||||||||||||||||
2005 | 10.24 | .46 | .47 | .93 | (.46 | ) | — | (.46 | ) | 10.71 | 9.26 | 1,449 | .68 | 4.37 | .68 | 4.37 | .67 | 4.38 | 21 | ||||||||||||||||||||||||||||||||||||
2004 | 10.82 | .48 | (.58 | ) | (.10 | ) | (.48 | ) | — | (.48 | ) | 10.24 | (.89 | ) | 1,204 | .70 | 4.56 | .70 | 4.56 | .69 | 4.57 | 11 | |||||||||||||||||||||||||||||||||
2003 | 10.30 | .50 | .53 | 1.03 | (.51 | ) | — | (.51 | ) | 10.82 | 10.23 | 1,310 | .68 | 4.77 | .68 | 4.77 | .67 | 4.78 | 12 | ||||||||||||||||||||||||||||||||||||
| * | Annualized. |
| (a) | Per share Net Investment Income is calculated using the average daily shares method. |
| (b) | Total return is the combination of changes in net asset value, reinvested dividend income at net asset value and reinvested capital gains distributions at net asset value, if any. The last dividend declared in the period, which is typically paid on the first business day of the following month, is assumed to be reinvested at the ending net asset value. The actual reinvest price for the last dividend declared in the period may be different from the price used in the calculation. Total returns are not annualized. |
| (c) | After expense reimbursement from the Adviser, where applicable. |
| (d) | After custodian fee credit and expense reimbursement, where applicable. |
| (e) | For the six months ended November 30, 2007. |
See accompanying notes to financial statements.
66
| Class (Commencement Date) | |||||||||||||||||||||||||||||||||||||||||||||||||||||||
| Investment Operations | Less Distributions | Ratios/Supplemental Data | |||||||||||||||||||||||||||||||||||||||||||||||||||||
| KENTUCKY | Ratios to Average Net Assets Before Credit/ Reimbursement | Ratios to Average Net Assets After Reimbursement(c) | Ratios to Average Net Assets After Credit/ Reimbursement(d) | ||||||||||||||||||||||||||||||||||||||||||||||||||||
| Year Ended May 31, | Beginning Net Asset Value | Net Invest- ment Income(a) | Net Gain | Total | Net | Capital Gains | Total | Ending Net Asset Value | Total Return(b) | Ending Net Assets (000) | Expenses(e) | Net Invest- ment Income | Expenses(e) | Net Invest- ment Income | Expenses(e) | Net Invest- ment Income | Portfolio Turnover Rate | ||||||||||||||||||||||||||||||||||||||
| Class A (5/87) | |||||||||||||||||||||||||||||||||||||||||||||||||||||||
2008(f) | $ | 10.96 | $ | .22 | $ | .02 | $ | .24 | $ | (.22 | ) | $ | — | $ | (.22 | ) | $ | 10.98 | 2.21 | % | $ | 377,271 | .92 | %* | 4.01 | %* | .92 | %* | 4.01 | %* | .92 | %* | 4.02 | %* | 2 | % | |||||||||||||||||||
2007 | 10.96 | .44 | .03 | .47 | (.45 | ) | (.02 | ) | (.47 | ) | 10.96 | 4.35 | 392,262 | .90 | 4.00 | .90 | 4.00 | .89 | 4.01 | 9 | |||||||||||||||||||||||||||||||||||
2006 | 11.30 | .46 | (.30 | ) | .16 | (.46 | ) | (.04 | ) | (.50 | ) | 10.96 | 1.38 | 398,636 | .82 | 4.09 | .82 | 4.09 | .81 | 4.10 | 13 | ||||||||||||||||||||||||||||||||||
2005 | 10.88 | .48 | .43 | .91 | (.48 | ) | (.01 | ) | (.49 | ) | 11.30 | 8.51 | 427,106 | .83 | 4.35 | .83 | 4.35 | .82 | 4.36 | 15 | |||||||||||||||||||||||||||||||||||
2004 | 11.35 | .51 | (.42 | ) | .09 | (.52 | ) | (.04 | ) | (.56 | ) | 10.88 | .90 | 410,109 | .84 | 4.58 | .84 | 4.58 | .83 | 4.58 | 16 | ||||||||||||||||||||||||||||||||||
2003 | 10.92 | .53 | .44 | .97 | (.53 | ) | (.01 | ) | (.54 | ) | 11.35 | 9.03 | 426,782 | .84 | 4.79 | .84 | 4.79 | .83 | 4.79 | 14 | |||||||||||||||||||||||||||||||||||
| Class B (2/97) | |||||||||||||||||||||||||||||||||||||||||||||||||||||||
2008(f) | 10.97 | .18 | .02 | .20 | (.18 | ) | — | (.18 | ) | 10.99 | 1.82 | 10,861 | 1.66 | * | 3.27 | * | 1.66 | * | 3.27 | * | 1.66 | * | 3.27 | * | 2 | ||||||||||||||||||||||||||||||
2007 | 10.97 | .36 | .03 | .39 | (.37 | ) | (.02 | ) | (.39 | ) | 10.97 | 3.56 | 13,466 | 1.65 | 3.26 | 1.65 | 3.26 | 1.65 | 3.26 | 9 | |||||||||||||||||||||||||||||||||||
2006 | 11.31 | .37 | (.30 | ) | .07 | (.37 | ) | (.04 | ) | (.41 | ) | 10.97 | .62 | 18,388 | 1.57 | 3.34 | 1.57 | 3.34 | 1.56 | 3.35 | 13 | ||||||||||||||||||||||||||||||||||
2005 | 10.88 | .40 | .44 | .84 | (.40 | ) | (.01 | ) | (.41 | ) | 11.31 | 7.80 | 21,216 | 1.57 | 3.60 | 1.57 | 3.60 | 1.57 | 3.61 | 15 | |||||||||||||||||||||||||||||||||||
2004 | 11.35 | .43 | (.42 | ) | .01 | (.44 | ) | (.04 | ) | (.48 | ) | 10.88 | .14 | 20,874 | 1.59 | 3.83 | 1.59 | 3.83 | 1.58 | 3.83 | 16 | ||||||||||||||||||||||||||||||||||
2003 | 10.92 | .45 | .44 | .89 | (.45 | ) | (.01 | ) | (.46 | ) | 11.35 | 8.21 | 21,206 | 1.59 | 4.04 | 1.59 | 4.04 | 1.58 | 4.04 | 14 | |||||||||||||||||||||||||||||||||||
| Class C (10/93) | |||||||||||||||||||||||||||||||||||||||||||||||||||||||
2008(f) | 10.96 | .19 | .02 | .21 | (.19 | ) | — | (.19 | ) | 10.98 | 1.92 | 46,049 | 1.47 | * | 3.46 | * | 1.47 | * | 3.46 | * | 1.47 | * | 3.47 | * | 2 | ||||||||||||||||||||||||||||||
2007 | 10.96 | .38 | .02 | .40 | (.38 | ) | (.02 | ) | (.40 | ) | 10.96 | 3.73 | 46,650 | 1.45 | 3.45 | 1.45 | 3.45 | 1.44 | 3.46 | 9 | |||||||||||||||||||||||||||||||||||
2006 | 11.29 | .39 | (.29 | ) | .10 | (.39 | ) | (.04 | ) | (.43 | ) | 10.96 | .88 | 45,919 | 1.37 | 3.54 | 1.37 | 3.54 | 1.36 | 3.55 | 13 | ||||||||||||||||||||||||||||||||||
2005 | 10.87 | .42 | .43 | .85 | (.42 | ) | (.01 | ) | (.43 | ) | 11.29 | 7.91 | 46,160 | 1.37 | 3.80 | 1.37 | 3.80 | 1.37 | 3.81 | 15 | |||||||||||||||||||||||||||||||||||
2004 | 11.34 | .45 | (.42 | ) | .03 | (.46 | ) | (.04 | ) | (.50 | ) | 10.87 | .35 | 45,303 | 1.39 | 4.03 | 1.39 | 4.03 | 1.38 | 4.03 | 16 | ||||||||||||||||||||||||||||||||||
2003 | 10.91 | .47 | .44 | .91 | (.47 | ) | (.01 | ) | (.48 | ) | 11.34 | 8.45 | 50,194 | 1.39 | 4.24 | 1.39 | 4.24 | 1.38 | 4.24 | 14 | |||||||||||||||||||||||||||||||||||
| Class R (2/97) | |||||||||||||||||||||||||||||||||||||||||||||||||||||||
2008(f) | 10.96 | .23 | .02 | .25 | (.23 | ) | — | (.23 | ) | 10.98 | 2.29 | 2,751 | .72 | * | 4.22 | * | .72 | * | 4.22 | * | .71 | * | 4.22 | * | 2 | ||||||||||||||||||||||||||||||
2007 | 10.96 | .47 | .02 | .49 | (.47 | ) | (.02 | ) | (.49 | ) | 10.96 | 4.52 | 3,069 | .70 | 4.20 | .70 | 4.20 | .69 | 4.21 | 9 | |||||||||||||||||||||||||||||||||||
2006 | 11.29 | .48 | (.30 | ) | .18 | (.47 | ) | (.04 | ) | (.51 | ) | 10.96 | 1.64 | 2,451 | .62 | 4.29 | .62 | 4.29 | .61 | 4.30 | 13 | ||||||||||||||||||||||||||||||||||
2005 | 10.87 | .51 | .42 | .93 | (.50 | ) | (.01 | ) | (.51 | ) | 11.29 | 8.70 | 1,581 | .63 | 4.54 | .63 | 4.54 | .62 | 4.55 | 15 | |||||||||||||||||||||||||||||||||||
2004 | 11.33 | .53 | (.41 | ) | .12 | (.54 | ) | (.04 | ) | (.58 | ) | 10.87 | 1.15 | 1,285 | .64 | 4.78 | .64 | 4.78 | .63 | 4.78 | 16 | ||||||||||||||||||||||||||||||||||
2003 | 10.90 | .55 | .44 | .99 | (.55 | ) | (.01 | ) | (.56 | ) | 11.33 | 9.23 | 1,172 | .64 | 4.99 | .64 | 4.99 | .63 | 4.99 | 14 | |||||||||||||||||||||||||||||||||||
| * | Annualized. |
| (a) | Per share Net Investment Income is calculated using the average daily shares method. |
| (b) | Total return is the combination of changes in net asset value, reinvested dividend income at net asset value and reinvested capital gains distributions at net asset value, if any. The last dividend declared in the period, which is typically paid on the first business day of the following month, is assumed to be reinvested at the ending net asset value. The actual reinvest price for the last dividend declared in the period may be different from the price used in the calculation. Total returns are not annualized. |
| (c) | After expense reimbursement from the Adviser, where applicable. |
| (d) | After custodian fee credit and expense reimbursement, where applicable. |
| (e) | The expense ratios in the above table reflect, among other things, the interest expense deemed to have been paid by the Fund on the floating rate certificates issued by the special purpose trusts for the self-deposited inverse floaters held by the Fund, as described in Footnote 1 – Inverse Floating Rate Securities. The amount of this deemed interest expense for such periods expressed as a percentage of average net assets for each share class was as follows: |
Interest Expense | |||
2008(f) | .08 | %* | |
2007 | .08 | ||
2006 | — | ||
2005 | — | ||
2004 | — | ||
2003 | — | ||
| (f) | For the six months ended November 30, 2007. |
See accompanying notes to financial statements.
67
Financial Highlights (Unaudited) (continued)
Selected data for a share outstanding throughout each period:
| Class (Commencement Date) | ||||||||||||||||||||||||||||||||||||||||||||||||||||||||
| Investment Operations | Less Distributions | Ratios/Supplemental Data | ||||||||||||||||||||||||||||||||||||||||||||||||||||||
| MICHIGAN | Ratios to Average Net Assets Before Credit/ Reimbursement | Ratios to Average Net Assets After Reimbursement(c) | Ratios to Average Net Assets After Credit/ Reimbursement(d) | |||||||||||||||||||||||||||||||||||||||||||||||||||||
| Year Ended May 31, | Beginning Net Asset Value | Net Invest- ment Income(a) | Net Realized/ Unrealized Gain (Loss) | Total | Net Invest- ment Income | Capital Gains | Total | Ending Net Asset Value | Total Return(b) | Ending Net Assets (000) | Expenses(e) | Net Invest- ment Income | Expenses(e) | Net Invest- ment Income | Expenses(e) | Net Invest- ment Income | Portfolio Turnover Rate | |||||||||||||||||||||||||||||||||||||||
| Class A (6/85) | ||||||||||||||||||||||||||||||||||||||||||||||||||||||||
2008(f) | $ | 11.41 | $ | .23 | $ | — | ** | $ | .23 | $ | (.24 | ) | $ | — | $ | (.24 | ) | $ | 11.40 | 2.02 | % | $ | 164,507 | .85 | %* | 4.13 | %* | .85 | %* | 4.13 | %* | .84 | %* | 4.14 | %* | 6 | % | |||||||||||||||||||
2007 | 11.45 | .47 | .07 | .54 | (.48 | ) | (.10 | ) | (.58 | ) | 11.41 | 4.70 | 169,395 | .91 | 4.09 | .91 | 4.09 | .90 | 4.10 | 12 | ||||||||||||||||||||||||||||||||||||
2006 | 11.89 | .49 | (.32 | ) | .17 | (.48 | ) | (.13 | ) | (.61 | ) | 11.45 | 1.48 | 170,278 | .86 | 4.16 | .86 | 4.16 | .85 | 4.17 | 11 | |||||||||||||||||||||||||||||||||||
2005 | 11.45 | .51 | .45 | .96 | (.51 | ) | (.01 | ) | (.52 | ) | 11.89 | 8.48 | 181,302 | .86 | 4.32 | .86 | 4.32 | .86 | 4.33 | 16 | ||||||||||||||||||||||||||||||||||||
2004 | 12.16 | .54 | (.58 | ) | (.04 | ) | (.55 | ) | (.12 | ) | (.67 | ) | 11.45 | (.27 | ) | 179,956 | .87 | 4.61 | .87 | 4.61 | .86 | 4.61 | 9 | |||||||||||||||||||||||||||||||||
2003 | 11.55 | .55 | .63 | 1.18 | (.56 | ) | (.01 | ) | (.57 | ) | 12.16 | 10.40 | 204,652 | .86 | 4.67 | .86 | 4.67 | .86 | 4.67 | 10 | ||||||||||||||||||||||||||||||||||||
| Class B (2/97) | ||||||||||||||||||||||||||||||||||||||||||||||||||||||||
2008(f) | 11.43 | .19 | — | .19 | (.20 | ) | — | (.20 | ) | 11.42 | 1.64 | 4,424 | 1.60 | * | 3.38 | * | 1.60 | * | 3.38 | * | 1.59 | * | 3.39 | * | 6 | |||||||||||||||||||||||||||||||
2007 | 11.48 | .39 | .05 | .44 | (.39 | ) | (.10 | ) | (.49 | ) | 11.43 | 3.85 | 4,845 | 1.67 | 3.35 | 1.67 | 3.35 | 1.65 | 3.36 | 12 | ||||||||||||||||||||||||||||||||||||
2006 | 11.92 | .40 | (.32 | ) | .08 | (.39 | ) | (.13 | ) | (.52 | ) | 11.48 | .71 | 6,794 | 1.61 | 3.41 | 1.61 | 3.41 | 1.60 | 3.41 | 11 | |||||||||||||||||||||||||||||||||||
2005 | 11.47 | .42 | .46 | .88 | (.42 | ) | (.01 | ) | (.43 | ) | 11.92 | 7.73 | 8,938 | 1.61 | 3.57 | 1.61 | 3.57 | 1.60 | 3.58 | 16 | ||||||||||||||||||||||||||||||||||||
2004 | 12.18 | .45 | (.58 | ) | (.13 | ) | (.46 | ) | (.12 | ) | (.58 | ) | 11.47 | (1.03 | ) | 10,112 | 1.62 | 3.86 | 1.62 | 3.86 | 1.61 | 3.86 | 9 | |||||||||||||||||||||||||||||||||
2003 | 11.57 | .46 | .63 | 1.09 | (.47 | ) | (.01 | ) | (.48 | ) | 12.18 | 9.56 | 11,179 | 1.61 | 3.91 | 1.61 | 3.91 | 1.61 | 3.92 | 10 | ||||||||||||||||||||||||||||||||||||
| Class C (6/93) | ||||||||||||||||||||||||||||||||||||||||||||||||||||||||
2008(f) | 11.40 | .20 | (.01 | ) | .19 | (.20 | ) | — | (.20 | ) | 11.39 | 1.72 | 36,528 | 1.40 | * | 3.58 | * | 1.40 | * | 3.58 | * | 1.39 | * | 3.59 | * | 6 | ||||||||||||||||||||||||||||||
2007 | 11.44 | .41 | .06 | .47 | (.41 | ) | (.10 | ) | (.51 | ) | 11.40 | 4.11 | 37,779 | 1.46 | 3.54 | 1.46 | 3.54 | 1.45 | 3.56 | 12 | ||||||||||||||||||||||||||||||||||||
2006 | 11.88 | .42 | (.32 | ) | .10 | (.41 | ) | (.13 | ) | (.54 | ) | 11.44 | .91 | 38,141 | 1.41 | 3.61 | 1.41 | 3.61 | 1.40 | 3.62 | 11 | |||||||||||||||||||||||||||||||||||
2005 | 11.43 | .44 | .46 | .90 | (.44 | ) | (.01 | ) | (.45 | ) | 11.88 | 7.98 | 38,386 | 1.41 | 3.77 | 1.41 | 3.77 | 1.40 | 3.78 | 16 | ||||||||||||||||||||||||||||||||||||
2004 | 12.14 | .48 | (.58 | ) | (.10 | ) | (.49 | ) | (.12 | ) | (.61 | ) | 11.43 | (.83 | ) | 36,912 | 1.42 | 4.06 | 1.42 | 4.06 | 1.41 | 4.06 | 9 | |||||||||||||||||||||||||||||||||
2003 | 11.54 | .49 | .61 | 1.10 | (.49 | ) | (.01 | ) | (.50 | ) | 12.14 | 9.71 | 43,693 | 1.41 | 4.12 | 1.41 | 4.12 | 1.41 | 4.12 | 10 | ||||||||||||||||||||||||||||||||||||
| Class R (2/97) | ||||||||||||||||||||||||||||||||||||||||||||||||||||||||
2008(f) | 11.41 | .25 | (.01 | ) | .24 | (.25 | ) | — | (.25 | ) | 11.40 | 2.13 | 19,666 | .66 | * | 4.33 | * | .66 | * | 4.33 | * | .65 | * | 4.34 | * | 6 | ||||||||||||||||||||||||||||||
2007 | 11.45 | .50 | .06 | .56 | (.50 | ) | (.10 | ) | (.60 | ) | 11.41 | 4.92 | 20,351 | .71 | 4.29 | .71 | 4.29 | .70 | 4.30 | 12 | ||||||||||||||||||||||||||||||||||||
2006 | 11.89 | .51 | (.32 | ) | .19 | (.50 | ) | (.13 | ) | (.63 | ) | 11.45 | 1.69 | 21,871 | .66 | 4.36 | .66 | 4.36 | .65 | 4.36 | 11 | |||||||||||||||||||||||||||||||||||
2005 | 11.45 | .53 | .45 | .98 | (.53 | ) | (.01 | ) | (.54 | ) | 11.89 | 8.70 | 23,675 | .66 | 4.52 | .66 | 4.52 | .66 | 4.53 | 16 | ||||||||||||||||||||||||||||||||||||
2004 | 12.16 | .57 | (.58 | ) | (.01 | ) | (.58 | ) | (.12 | ) | (.70 | ) | 11.45 | (.07 | ) | 23,618 | .67 | 4.81 | .67 | 4.81 | .66 | 4.81 | 9 | |||||||||||||||||||||||||||||||||
2003 | 11.56 | .58 | .61 | 1.19 | (.58 | ) | (.01 | ) | (.59 | ) | 12.16 | 10.53 | 24,951 | .66 | 4.87 | .66 | 4.87 | .66 | 4.87 | 10 | ||||||||||||||||||||||||||||||||||||
| * | Annualized. |
| ** | Per share Net Realized/Unrealized Gain (Loss) rounds to less than $.01 per share. |
| (a) | Per share Net Investment Income is calculated using the average daily shares method. |
| (b) | Total return is the combination of changes in net asset value, reinvested dividend income at net asset value and reinvested capital gains distributions at net asset value, if any. The last dividend declared in the period, which is typically paid on the first business day of the following month, is assumed to be reinvested at the ending net asset value. The actual reinvest price for the last dividend declared in the period may be different from the price used in the calculation. Total returns are not annualized. |
| (c) | After expense reimbursement from the Adviser, where applicable. |
| (d) | After custodian fee credit and expense reimbursement, where applicable. |
| (e) | The expense ratios in the above table reflect, among other things, the interest expense deemed to have been paid by the Fund on the floating rate certificates issued by the special purpose trusts for the self-deposited inverse floaters held by the Fund, as described in Footnote 1 – Inverse Floating Rate Securities. The amount of this deemed interest expense for such periods expressed as a percentage of average net assets for each share class was as follows: |
Interest Expense | |||
2008(f) | .01 | %* | |
2007 | .07 | ||
2006 | — | ||
2005 | — | ||
2004 | — | ||
2003 | — | ||
| (f) | For the six months ended November 30, 2007. |
See accompanying notes to financial statements.
68
| Class (Commencement Date) | ||||||||||||||||||||||||||||||||||||||||||||||||||||||||
| Investment Operations | Less Distributions | Ratios/Supplemental Data | ||||||||||||||||||||||||||||||||||||||||||||||||||||||
| MISSOURI | Ratios to Average Net Assets Before Credit/ Reimbursement | Ratios to Average Net Assets After Reimbursement(c) | Ratios to Average Net Assets After Credit/ Reimbursement(d) | |||||||||||||||||||||||||||||||||||||||||||||||||||||
| Year Ended May 31, | Beginning Net Asset Value | Net Invest- ment Income(a) | Net Realized/ Unrealized Gain (Loss) | Total | Net Invest- ment Income | Capital Gains | Total | Ending Net Asset Value | Total Return(b) | Ending Net Assets (000) | Expenses(e) | Net Invest- ment Income | Expenses(e) | Net Invest- ment Income | Expenses(e) | Net Invest- ment Income | Portfolio Turnover Rate | |||||||||||||||||||||||||||||||||||||||
| Class A (8/87) | ||||||||||||||||||||||||||||||||||||||||||||||||||||||||
2008(f) | $ | 11.03 | $ | .23 | $ | (.05 | ) | $ | .18 | $ | (.23 | ) | $ | — | $ | (.23 | ) | $ | 10.98 | 1.61 | % | $ | 217,792 | .86 | %* | 4.12 | %* | .86 | %* | 4.12 | %* | .85 | %* | 4.12 | %* | 10 | % | |||||||||||||||||||
2007 | 10.98 | .46 | .05 | .51 | (.45 | ) | (.01 | ) | (.46 | ) | 11.03 | 4.66 | 227,412 | .88 | 4.13 | .88 | 4.13 | .87 | 4.14 | 16 | ||||||||||||||||||||||||||||||||||||
2006 | 11.25 | .47 | (.26 | ) | .21 | (.48 | ) | — | (.48 | ) | 10.98 | 1.88 | 231,378 | .83 | 4.23 | .83 | 4.23 | .82 | 4.24 | 12 | ||||||||||||||||||||||||||||||||||||
2005 | 10.78 | .48 | .47 | .95 | (.48 | ) | — | (.48 | ) | 11.25 | 8.97 | 232,171 | .84 | 4.35 | .84 | 4.35 | .83 | 4.35 | 16 | |||||||||||||||||||||||||||||||||||||
2004 | 11.30 | .50 | (.53 | ) | (.03 | ) | (.49 | ) | — | (.49 | ) | 10.78 | (.28 | ) | 221,955 | .85 | 4.50 | .85 | 4.50 | .85 | 4.51 | 13 | ||||||||||||||||||||||||||||||||||
2003 | 10.81 | .51 | .51 | 1.02 | (.53 | ) | — | (.53 | ) | 11.30 | 9.63 | 233,996 | .86 | 4.65 | .86 | 4.65 | .85 | 4.66 | 14 | |||||||||||||||||||||||||||||||||||||
| Class B (2/97) | ||||||||||||||||||||||||||||||||||||||||||||||||||||||||
2008(f) | 11.04 | .19 | (.06 | ) | .13 | (.18 | ) | — | (.18 | ) | 10.99 | 1.22 | 6,720 | 1.61 | * | 3.37 | * | 1.61 | * | 3.37 | * | 1.60 | * | 3.38 | * | 10 | ||||||||||||||||||||||||||||||
2007 | 10.99 | .38 | .05 | .43 | (.37 | ) | (.01 | ) | (.38 | ) | 11.04 | 3.87 | 7,351 | 1.63 | 3.38 | 1.63 | 3.38 | 1.61 | 3.39 | 16 | ||||||||||||||||||||||||||||||||||||
2006 | 11.26 | .39 | (.27 | ) | .12 | (.39 | ) | — | (.39 | ) | 10.99 | 1.12 | 8,570 | 1.58 | 3.48 | 1.58 | 3.48 | 1.57 | 3.49 | 12 | ||||||||||||||||||||||||||||||||||||
2005 | 10.79 | .40 | .47 | .87 | (.40 | ) | — | (.40 | ) | 11.26 | 8.15 | 9,197 | 1.58 | 3.60 | 1.58 | 3.60 | 1.58 | 3.60 | 16 | |||||||||||||||||||||||||||||||||||||
2004 | 11.30 | .41 | (.52 | ) | (.11 | ) | (.40 | ) | — | (.40 | ) | 10.79 | (.95 | ) | 9,532 | 1.60 | 3.75 | 1.60 | 3.75 | 1.60 | 3.75 | 13 | ||||||||||||||||||||||||||||||||||
2003 | 10.81 | .43 | .50 | .93 | (.44 | ) | — | (.44 | ) | 11.30 | 8.80 | 11,912 | 1.61 | 3.90 | 1.61 | 3.90 | 1.60 | 3.91 | 14 | |||||||||||||||||||||||||||||||||||||
| Class C (2/94) | ||||||||||||||||||||||||||||||||||||||||||||||||||||||||
2008(f) | 11.02 | .20 | (.05 | ) | .15 | (.20 | ) | — | (.20 | ) | 10.97 | 1.33 | 21,036 | 1.41 | * | 3.57 | * | 1.41 | * | 3.57 | * | 1.40 | * | 3.58 | * | 10 | ||||||||||||||||||||||||||||||
2007 | 10.97 | .40 | .05 | .45 | (.39 | ) | (.01 | ) | (.40 | ) | 11.02 | 4.10 | 21,263 | 1.43 | 3.58 | 1.43 | 3.58 | 1.42 | 3.59 | 16 | ||||||||||||||||||||||||||||||||||||
2006 | 11.24 | .41 | (.26 | ) | .15 | (.42 | ) | — | (.42 | ) | 10.97 | 1.34 | 21,387 | 1.38 | 3.68 | 1.38 | 3.68 | 1.37 | 3.69 | 12 | ||||||||||||||||||||||||||||||||||||
2005 | 10.77 | .42 | .47 | .89 | (.42 | ) | — | (.42 | ) | 11.24 | 8.39 | 19,955 | 1.39 | 3.80 | 1.39 | 3.80 | 1.38 | 3.81 | 16 | |||||||||||||||||||||||||||||||||||||
2004 | 11.29 | .44 | (.53 | ) | (.09 | ) | (.43 | ) | — | (.43 | ) | 10.77 | (.84 | ) | 21,402 | 1.40 | 3.95 | 1.40 | 3.95 | 1.40 | 3.95 | 13 | ||||||||||||||||||||||||||||||||||
2003 | 10.81 | .45 | .49 | .94 | (.46 | ) | — | (.46 | ) | 11.29 | 8.93 | 23,336 | 1.41 | 4.10 | 1.41 | 4.10 | 1.40 | 4.11 | 14 | |||||||||||||||||||||||||||||||||||||
| Class R (2/97) | ||||||||||||||||||||||||||||||||||||||||||||||||||||||||
2008(f) | 11.03 | .24 | (.04 | ) | .20 | (.24 | ) | — | (.24 | ) | 10.99 | 1.81 | 2,362 | .66 | * | 4.31 | * | .66 | * | 4.31 | * | .65 | * | 4.32 | * | 10 | ||||||||||||||||||||||||||||||
2007 | 10.99 | .48 | .04 | .52 | (.47 | ) | (.01 | ) | (.48 | ) | 11.03 | 4.79 | 2,169 | .68 | 4.31 | .68 | 4.31 | .67 | 4.33 | 16 | ||||||||||||||||||||||||||||||||||||
2006 | 11.26 | .49 | (.26 | ) | .23 | (.50 | ) | — | (.50 | ) | 10.99 | 2.10 | 895 | .63 | 4.44 | .63 | 4.44 | .62 | 4.45 | 12 | ||||||||||||||||||||||||||||||||||||
2005 | 10.79 | .50 | .47 | .97 | (.50 | ) | — | (.50 | ) | 11.26 | 9.20 | 561 | .64 | 4.54 | .64 | 4.54 | .64 | 4.55 | 16 | |||||||||||||||||||||||||||||||||||||
2004 | 11.31 | .52 | (.53 | ) | (.01 | ) | (.51 | ) | — | (.51 | ) | 10.79 | (.10 | ) | 483 | .65 | 4.70 | .65 | 4.70 | .65 | 4.71 | 13 | ||||||||||||||||||||||||||||||||||
2003 | 10.82 | .53 | .50 | 1.03 | (.54 | ) | — | (.54 | ) | 11.31 | 9.80 | 534 | .66 | 4.86 | .66 | 4.86 | .65 | 4.86 | 14 | |||||||||||||||||||||||||||||||||||||
| * | Annualized. |
| (a) | Per share Net Investment Income is calculated using the average daily shares method. |
| (b) | Total return is the combination of changes in net asset value, reinvested dividend income at net asset value and reinvested capital gains distributions at net asset value, if any. The last dividend declared in the period, which is typically paid on the first business day of the following month, is assumed to be reinvested at the ending net asset value. The actual reinvest price for the last dividend declared in the period may be different from the price used in the calculation. Total returns are not annualized. |
| (c) | After expense reimbursement from the Adviser, where applicable. |
| (d) | After custodian fee credit and expense reimbursement, where applicable. |
| (e) | The expense ratios in the above table reflect, among other things, the interest expense deemed to have been paid by the Fund on the floating rate certificates issued by the special purpose trusts for the self-deposited inverse floaters held by the Fund, as described in Footnote 1 – Inverse Floating Rate Securities. The amount of this deemed interest expense for such periods expressed as a percentage of average net assets for each share class was as follows: |
Interest Expense | |||
2008(f) | .03 | %* | |
2007 | .04 | ||
2006 | — | ||
2005 | — | ||
2004 | — | ||
2003 | — | ||
| (f) | For the six months ended November 30, 2007. |
See accompanying notes to financial statements.
69
Financial Highlights (Unaudited) (continued)
Selected data for a share outstanding throughout each period:
| Class (Commencement Date) | ||||||||||||||||||||||||||||||||||||||||||||||||||||||||
| Investment Operations | Less Distributions | Ratios/Supplemental Data | ||||||||||||||||||||||||||||||||||||||||||||||||||||||
| OHIO | Ratios to Average Net Assets Before Credit/ Reimbursement | Ratios to Average Net Assets After Reimbursement(c) | Ratios to Average Net Assets After Credit/ Reimbursement(d) | |||||||||||||||||||||||||||||||||||||||||||||||||||||
| Year Ended May 31, | Beginning Net Asset Value | Net Invest- ment Income(a) | Net Realized/ Unrealized Gain (Loss) | Total | Net Invest- ment Income | Capital Gains | Total | Ending Net Asset Value | Total Return(b) | Ending Net Assets (000) | Expenses(e) | Net Invest- ment Income | Expenses(e) | Net Invest- ment Income | Expenses(e) | Net Invest- ment Income | Portfolio Turnover Rate | |||||||||||||||||||||||||||||||||||||||
| Class A (6/85) | ||||||||||||||||||||||||||||||||||||||||||||||||||||||||
2008(f) | $ | 11.25 | $ | .23 | $ | (.01 | ) | $ | .22 | $ | (.23 | ) | $ | — | $ | (.23 | ) | $ | 11.24 | 1.98 | % | $ | 342,722 | .96 | %* | 4.19 | %* | .96 | %* | 4.19 | %* | .95 | %* | 4.20 | %* | 9 | % | |||||||||||||||||||
2007 | 11.27 | .47 | .01 | .48 | (.47 | ) | (.03 | ) | (.50 | ) | 11.25 | 4.30 | 346,298 | .98 | 4.11 | .98 | 4.11 | .98 | 4.12 | 10 | ||||||||||||||||||||||||||||||||||||
2006 | 11.65 | .48 | (.34 | ) | .14 | (.48 | ) | (.04 | ) | (.52 | ) | 11.27 | 1.30 | 348,198 | .83 | 4.21 | .83 | 4.21 | .83 | 4.21 | 13 | |||||||||||||||||||||||||||||||||||
2005 | 11.17 | .51 | .48 | .99 | (.51 | ) | — | (.51 | ) | 11.65 | 9.00 | 358,529 | .84 | 4.43 | .84 | 4.43 | .83 | 4.44 | 11 | |||||||||||||||||||||||||||||||||||||
2004 | 11.78 | .53 | (.60 | ) | (.07 | ) | (.54 | ) | — | (.54 | ) | 11.17 | (.62 | ) | 347,733 | .85 | 4.65 | .85 | 4.65 | .85 | 4.65 | 12 | ||||||||||||||||||||||||||||||||||
2003 | 11.16 | .54 | .62 | 1.16 | (.54 | ) | — | (.54 | ) | 11.78 | 10.65 | 385,619 | .87 | 4.69 | .87 | 4.69 | .87 | 4.69 | 12 | |||||||||||||||||||||||||||||||||||||
| Class B (2/97) | ||||||||||||||||||||||||||||||||||||||||||||||||||||||||
2008(f) | 11.24 | .19 | (.02 | ) | .17 | (.19 | ) | — | (.19 | ) | 11.22 | 1.51 | 13,449 | 1.71 | * | 3.44 | * | 1.71 | * | 3.44 | * | 1.70 | * | 3.45 | * | 9 | ||||||||||||||||||||||||||||||
2007 | 11.25 | .38 | .02 | .40 | (.38 | ) | (.03 | ) | (.41 | ) | 11.24 | 3.64 | 16,125 | 1.73 | 3.36 | 1.73 | 3.36 | 1.73 | 3.37 | 10 | ||||||||||||||||||||||||||||||||||||
2006 | 11.64 | .40 | (.35 | ) | .05 | (.40 | ) | (.04 | ) | (.44 | ) | 11.25 | .47 | 20,504 | 1.58 | 3.45 | 1.58 | 3.45 | 1.58 | 3.46 | 13 | |||||||||||||||||||||||||||||||||||
2005 | 11.16 | .42 | .48 | .90 | (.42 | ) | — | (.42 | ) | 11.64 | 8.22 | 25,621 | 1.58 | 3.69 | 1.58 | 3.69 | 1.58 | 3.69 | 11 | |||||||||||||||||||||||||||||||||||||
2004 | 11.77 | .45 | (.61 | ) | (.16 | ) | (.45 | ) | — | (.45 | ) | 11.16 | (1.34 | ) | 26,057 | 1.60 | 3.90 | 1.60 | 3.90 | 1.60 | 3.90 | 12 | ||||||||||||||||||||||||||||||||||
2003 | 11.15 | .45 | .63 | 1.08 | (.46 | ) | — | (.46 | ) | 11.77 | 9.85 | 28,080 | 1.62 | 3.94 | 1.62 | 3.94 | 1.61 | 3.94 | 12 | |||||||||||||||||||||||||||||||||||||
| Class C (8/93) | ||||||||||||||||||||||||||||||||||||||||||||||||||||||||
2008(f) | 11.22 | .20 | (.01 | ) | .19 | (.20 | ) | — | (.20 | ) | 11.21 | 1.72 | 48,951 | 1.51 | * | 3.64 | * | 1.51 | * | 3.64 | * | 1.50 | * | 3.65 | * | 9 | ||||||||||||||||||||||||||||||
2007 | 11.24 | .40 | .02 | .42 | (.41 | ) | (.03 | ) | (.44 | ) | 11.22 | 3.77 | 49,084 | 1.53 | 3.56 | 1.53 | 3.56 | 1.53 | 3.57 | 10 | ||||||||||||||||||||||||||||||||||||
2006 | 11.63 | .42 | (.35 | ) | .07 | (.42 | ) | (.04 | ) | (.46 | ) | 11.24 | .68 | 46,325 | 1.38 | 3.66 | 1.38 | 3.66 | 1.38 | 3.66 | 13 | |||||||||||||||||||||||||||||||||||
2005 | 11.15 | .45 | .48 | .93 | (.45 | ) | — | (.45 | ) | 11.63 | 8.45 | 45,791 | 1.38 | 3.88 | 1.38 | 3.88 | 1.38 | 3.89 | 11 | |||||||||||||||||||||||||||||||||||||
2004 | 11.76 | .47 | (.60 | ) | (.13 | ) | (.48 | ) | — | (.48 | ) | 11.15 | (1.14 | ) | 44,575 | 1.40 | 4.10 | 1.40 | 4.10 | 1.40 | 4.10 | 12 | ||||||||||||||||||||||||||||||||||
2003 | 11.15 | .47 | .62 | 1.09 | (.48 | ) | — | (.48 | ) | 11.76 | 9.99 | 50,999 | 1.42 | 4.14 | 1.42 | 4.14 | 1.41 | 4.14 | 12 | |||||||||||||||||||||||||||||||||||||
| Class R (2/97) | ||||||||||||||||||||||||||||||||||||||||||||||||||||||||
2008(f) | 11.24 | .25 | (.03 | ) | .22 | (.24 | ) | — | (.24 | ) | 11.22 | 2.00 | 120,102 | .76 | * | 4.39 | * | .76 | * | 4.39 | * | .75 | * | 4.40 | * | 9 | ||||||||||||||||||||||||||||||
2007 | 11.25 | .49 | .02 | .51 | (.49 | ) | (.03 | ) | (.52 | ) | 11.24 | 4.53 | 125,050 | .78 | 4.31 | .78 | 4.31 | .78 | 4.32 | 10 | ||||||||||||||||||||||||||||||||||||
2006 | 11.64 | .50 | (.34 | ) | .16 | (.51 | ) | (.04 | ) | (.55 | ) | 11.25 | 1.51 | 128,133 | .63 | 4.41 | .63 | 4.41 | .63 | 4.41 | 13 | |||||||||||||||||||||||||||||||||||
2005 | 11.16 | .53 | .48 | 1.01 | (.53 | ) | — | (.53 | ) | 11.64 | 9.24 | 139,017 | .64 | 4.64 | .64 | 4.64 | .64 | 4.64 | 11 | |||||||||||||||||||||||||||||||||||||
2004 | 11.77 | .56 | (.61 | ) | (.05 | ) | (.56 | ) | — | (.56 | ) | 11.16 | (.41 | ) | 139,762 | .65 | 4.85 | .65 | 4.85 | .65 | 4.85 | 12 | ||||||||||||||||||||||||||||||||||
2003 | 11.15 | .56 | .62 | 1.18 | (.56 | ) | — | (.56 | ) | 11.77 | 10.89 | 154,781 | .67 | 4.89 | .67 | 4.89 | .67 | 4.89 | 12 | |||||||||||||||||||||||||||||||||||||
| * | Annualized. |
| (a) | Per share Net Investment Income is calculated using the average daily shares method. |
| (b) | Total return is the combination of changes in net asset value, reinvested dividend income at net asset value and reinvested capital gains distributions at net asset value, if any. The last dividend declared in the period, which is typically paid on the first business day of the following month, is assumed to be reinvested at the ending net asset value. The actual reinvest price for the last dividend declared in the period may be different from the price used in the calculation. Total returns are not annualized. |
| (c) | After expense reimbursement from the Adviser, where applicable. |
| (d) | After custodian fee credit and expense reimbursement, where applicable. |
| (e) | The expense ratios in the above table reflect, among other things, the interest expense deemed to have been paid by the Fund on the floating rate certificates issued by the special purpose trusts for the self-deposited inverse floaters held by the Fund, as described in Footnote 1 - Inverse Floating Rate Securities. The amount of this deemed interest expense for such periods expressed as a percentage of average net assets for each share class was as follows: |
Interest Expense | |||
2008(f) | .14 | %* | |
2007 | .15 | ||
2006 | — | ||
2005 | — | ||
2004 | — | ||
2003 | — | ||
| (f) | For the six months ended November 30, 2007. |
See accompanying notes to financial statements.
70
| Class (Commencement Date) | ||||||||||||||||||||||||||||||||||||||||||||||||||||||||
| Investment Operations | Less Distributions | Ratios/Supplemental Data | ||||||||||||||||||||||||||||||||||||||||||||||||||||||
| WISCONSIN | Ratios to Average Net Assets Before Credit/ Reimbursement | Ratios to Average Net Assets After Reimbursement(c) | Ratios to Average Net Assets After Credit/ Reimbursement(d) | |||||||||||||||||||||||||||||||||||||||||||||||||||||
| Year Ended May 31, | Beginning Net Asset Value | Net Invest- ment Income(a) | Net Realized/ Unrealized Gain (Loss) | Total | Net Invest- ment Income | Capital Gains | Total | Ending Net Asset Value | Total Return(b) | Ending Net Assets (000) | Expenses | Net Invest- ment Income | Expenses | Net Invest- ment Income | Expenses | Net Invest- ment Income | Portfolio Turnover Rate | |||||||||||||||||||||||||||||||||||||||
| Class A (6/94) | ||||||||||||||||||||||||||||||||||||||||||||||||||||||||
2008(e) | $ | 10.24 | $ | .19 | $ | (.01 | ) | $ | .18 | $ | (.20 | ) | $ | — | $ | (.20 | ) | $ | 10.22 | 1.73 | % | $ | 46,072 | .89 | %* | 3.75 | %* | .89 | %* | 3.75 | %* | .87 | %* | 3.77 | %* | 1 | % | |||||||||||||||||||
2007 | 10.20 | .39 | .06 | .45 | (.39 | ) | (.02 | ) | (.41 | ) | 10.24 | 4.46 | 42,279 | .90 | 3.78 | .90 | 3.78 | .87 | 3.82 | 10 | ||||||||||||||||||||||||||||||||||||
2006 | 10.54 | .40 | (.28 | ) | .12 | (.41 | ) | (.05 | ) | (.46 | ) | 10.20 | 1.11 | 36,624 | .92 | 3.84 | .92 | 3.84 | .89 | 3.88 | 11 | |||||||||||||||||||||||||||||||||||
2005 | 10.16 | .42 | .37 | .79 | (.41 | ) | — | (.41 | ) | 10.54 | 7.94 | 36,325 | .92 | 3.99 | .92 | 3.99 | .90 | 4.00 | 15 | |||||||||||||||||||||||||||||||||||||
2004 | 10.62 | .43 | (.45 | ) | (.02 | ) | (.44 | ) | — | (.44 | ) | 10.16 | (.33 | ) | 39,033 | .92 | 4.12 | .92 | 4.12 | .91 | 4.13 | 21 | ||||||||||||||||||||||||||||||||||
2003 | 10.14 | .43 | .49 | .92 | (.44 | ) | — | (.44 | ) | 10.62 | 9.41 | 42,360 | .93 | 4.19 | .93 | 4.19 | .91 | 4.20 | 8 | |||||||||||||||||||||||||||||||||||||
| Class B (2/97) | ||||||||||||||||||||||||||||||||||||||||||||||||||||||||
2008(e) | 10.26 | .15 | (.01 | ) | .30 | (.16 | ) | — | (.16 | ) | 10.24 | 1.34 | 2,101 | 1.63 | * | 3.01 | * | 1.63 | * | 3.01 | * | 1.62 | * | 3.03 | * | 1 | ||||||||||||||||||||||||||||||
2007 | 10.22 | .32 | .05 | .37 | (.31 | ) | (.02 | ) | (.33 | ) | 10.26 | 3.67 | 2,464 | 1.65 | 3.04 | 1.65 | 3.04 | 1.62 | 3.07 | 10 | ||||||||||||||||||||||||||||||||||||
2006 | 10.57 | .32 | (.29 | ) | .03 | (.33 | ) | (.05 | ) | (.38 | ) | 10.22 | .26 | 3,295 | 1.67 | 3.09 | 1.67 | 3.09 | 1.64 | 3.12 | 11 | |||||||||||||||||||||||||||||||||||
2005 | 10.18 | .34 | .39 | .73 | (.34 | ) | — | (.34 | ) | 10.57 | 7.25 | 4,600 | 1.67 | 3.24 | 1.67 | 3.24 | 1.66 | 3.25 | 15 | |||||||||||||||||||||||||||||||||||||
2004 | 10.65 | .35 | (.46 | ) | (.11 | ) | (.36 | ) | — | (.36 | ) | 10.18 | (1.01 | ) | 4,568 | 1.67 | 3.37 | 1.67 | 3.37 | 1.66 | 3.38 | 21 | ||||||||||||||||||||||||||||||||||
2003 | 10.17 | .36 | .49 | .85 | (.37 | ) | — | (.37 | ) | 10.65 | 8.53 | 5,960 | 1.67 | 3.44 | 1.67 | 3.44 | 1.66 | 3.45 | 8 | |||||||||||||||||||||||||||||||||||||
| Class C (2/97) | ||||||||||||||||||||||||||||||||||||||||||||||||||||||||
2008(e) | 10.26 | .16 | (.02 | ) | .14 | (.17 | ) | — | (.17 | ) | 10.23 | 1.36 | 5,973 | 1.43 | * | 3.21 | * | 1.43 | * | 3.21 | * | 1.42 | * | 3.23 | * | 1 | ||||||||||||||||||||||||||||||
2007 | 10.23 | .34 | .05 | .39 | (.34 | ) | (.02 | ) | (.36 | ) | 10.26 | 3.91 | 5,975 | 1.45 | 3.24 | 1.45 | 3.24 | 1.42 | 3.27 | 10 | ||||||||||||||||||||||||||||||||||||
2006 | 10.57 | .35 | (.29 | ) | .06 | (.35 | ) | (.05 | ) | (.40 | ) | 10.23 | .49 | 5,422 | 1.47 | 3.29 | 1.47 | 3.29 | 1.44 | 3.33 | 11 | |||||||||||||||||||||||||||||||||||
2005 | 10.18 | .36 | .39 | .75 | (.36 | ) | — | (.36 | ) | 10.57 | 7.47 | 4,797 | 1.47 | 3.44 | 1.47 | 3.44 | 1.45 | 3.45 | 15 | |||||||||||||||||||||||||||||||||||||
2004 | 10.65 | .37 | (.46 | ) | (.09 | ) | (.38 | ) | — | (.38 | ) | 10.18 | (.84 | ) | 4,632 | 1.47 | 3.57 | 1.47 | 3.57 | 1.46 | 3.58 | 21 | ||||||||||||||||||||||||||||||||||
2003 | 10.16 | .38 | .50 | .88 | (.39 | ) | — | (.39 | ) | 10.65 | 8.83 | 4,536 | 1.47 | 3.64 | 1.47 | 3.64 | 1.45 | 3.65 | 8 | |||||||||||||||||||||||||||||||||||||
| Class R (2/97) | ||||||||||||||||||||||||||||||||||||||||||||||||||||||||
2008(e) | 10.28 | .20 | (.02 | ) | .18 | (.21 | ) | — | (.21 | ) | 10.25 | 1.75 | 1,582 | .69 | * | 3.95 | * | .69 | * | 3.95 | * | .67 | * | 3.97 | * | 1 | ||||||||||||||||||||||||||||||
2007 | 10.25 | .42 | .04 | .46 | (.41 | ) | (.02 | ) | (.43 | ) | 10.28 | 4.59 | 1,031 | .69 | 3.97 | .69 | 3.97 | .66 | 4.00 | 10 | ||||||||||||||||||||||||||||||||||||
2006 | 10.59 | .42 | (.28 | ) | .14 | (.43 | ) | (.05 | ) | (.48 | ) | 10.25 | 1.34 | 202 | .72 | 4.04 | .72 | 4.04 | .68 | 4.07 | 11 | |||||||||||||||||||||||||||||||||||
2005 | 10.20 | .44 | .39 | .83 | (.44 | ) | — | (.44 | ) | 10.59 | 8.25 | 63 | .72 | 4.21 | .72 | 4.21 | .71 | 4.22 | 15 | |||||||||||||||||||||||||||||||||||||
2004 | 10.67 | .45 | (.46 | ) | (.01 | ) | (.46 | ) | — | (.46 | ) | 10.20 | (.10 | ) | 177 | .72 | 4.32 | .72 | 4.32 | .71 | 4.33 | 21 | ||||||||||||||||||||||||||||||||||
2003 | 10.18 | .46 | .50 | .96 | (.47 | ) | — | (.47 | ) | 10.67 | 9.62 | 176 | .72 | 4.39 | .72 | 4.39 | .70 | 4.41 | 8 | |||||||||||||||||||||||||||||||||||||
| * | Annualized. |
| (a) | Per share Net Investment Income is calculated using the average daily shares method. |
| (b) | Total return is the combination of changes in net asset value, reinvested dividend income at net asset value and reinvested capital gains distributions at net asset value, if any. The last dividend declared in the period, which is typically paid on the first business day of the following month, is assumed to be reinvested at the ending net asset value. The actual reinvest price for the last dividend declared in the period may be different from the price used in the calculation. Total returns are not annualized. |
| (c) | After expense reimbursement from the Adviser, where applicable. |
| (d) | After custodian fee credit and expense reimbursement, where applicable. |
| (e) | For the six months ended November 30, 2007. |
See accompanying notes to financial statements.
71
Annual Investment Management Agreement Approval Process
The Board Members are responsible for overseeing the performance of the investment adviser to the Funds and determining whether to continue the advisory arrangements. At the annual review meeting held on May 21, 2007 (the “May Meeting”), the Board Members of the Funds, including the Independent Board Members, unanimously approved the continuance of the Investment Management Agreement between each Fund (each, a “Fund”) and Nuveen Asset Management (“NAM”). The foregoing Investment Management Agreements with NAM are hereafter referred to as the “Original Investment Management Agreements.”
Subsequent to the May Meeting, Nuveen Investments, Inc. (“Nuveen”), the parent company of NAM, entered into a merger agreement providing for the acquisition of Nuveen by Windy City Investments, Inc., a corporation formed by investors led by Madison Dearborn Partners, LLC (“MDP”), a private equity investment firm (the “Transaction”). Each Original Investment Management Agreement, as required by Section 15 of the Investment Company Act of 1940 (the “1940 Act”), provides for its automatic termination in the event of its “assignment” (as defined in the 1940 Act). Any change in control of the adviser is deemed to be an assignment. The consummation of the Transaction will result in a change of control of NAM as well as its affiliated sub-advisers and therefore cause the automatic termination of each Original Investment Management Agreement, as required by the 1940 Act. Accordingly, in anticipation of the Transaction, at a meeting held on July 31, 2007 (the “July Meeting”), the Board Members, including the Independent Board Members, unanimously approved new Investment Management Agreements (the “New Investment Management Agreements”) with NAM on behalf of each Fund to take effect immediately after the Transaction or shareholder approval of the new advisory contracts, whichever is later. The 1940 Act also requires that each New Investment Management Agreement be approved by the respective Fund’s shareholders in order for it to become effective. Accordingly, to ensure continuity of advisory services, the Board Members, including the Independent Board Members, unanimously approved Interim Investment Management Agreements to take effect upon the closing of the Transaction if shareholders have not yet approved the New Investment Management Agreements.
Because the information provided and considerations made at the annual review at the May Meeting continue to be relevant with respect to the evaluation of the New Investment Management Agreements, the Board considered the foregoing as part of its deliberations of the New Investment Management Agreements. Accordingly, as indicated, the discussions immediately below outline the materials and information presented to the Board in connection with the Board’s prior annual review and the analysis undertaken and the conclusions reached by the Board Members when determining to continue the Original Investment Management Agreements.
I. Approval of the Original Investment Management Agreements
During the course of the year, the Board received a wide variety of materials relating to the services provided by NAM and the performance of the Funds. At each of its quarterly meetings, the Board reviewed investment performance and various matters relating to the operations of the Funds and other Nuveen funds, including the compliance program, shareholder services, valuation, custody, distribution and other information relating to the nature, extent and quality of services provided by NAM. Between the regularly scheduled quarterly meetings, the Board Members received information on particular matters as the need arose.
In preparation for their considerations at the May Meeting, the Independent Board Members also received extensive materials, well in advance of the meeting, which outlined or are related to, among other things:
| • | the nature, extent and quality of services provided by NAM; |
| • | the organization and business operations of NAM, including the responsibilities of various departments and key personnel; |
| • | each Fund’s past performance as well as the Fund’s performance compared to funds with similar investment objectives based on data and information provided by an independent third party and to customized benchmarks; |
| • | the profitability of Nuveen and certain industry profitability analyses for unaffiliated advisers; |
| • | the expenses of Nuveen in providing the various services; |
| • | the advisory fees and total expense ratios of each Fund, including comparisons of such fees and expenses with those of comparable, unaffiliated funds based on information and data provided by an independent third party (the “Peer Universe”) as well as compared to a subset of funds within the Peer Universe (the “Peer Group”) of the respective Fund (as applicable); |
| • | the advisory fees NAM assesses to other types of investment products or clients; |
| • | the soft dollar practices of NAM, if any; and |
| • | from independent legal counsel, a legal memorandum describing among other things, applicable laws, regulations and duties in reviewing and approving advisory contracts. |
At the May Meeting, NAM made a presentation to, and responded to questions from, the Board. The Independent Board Members also met privately with their legal counsel to review the Board’s duties in reviewing advisory contracts and considering the renewal of the advisory contracts. The Independent Board Members, in consultation with independent counsel, reviewed the factors set out
72
in judicial decisions and Securities and Exchange Commission (“SEC”) directives relating to the renewal of advisory contracts. As outlined in more detail below, the Board Members considered all factors they believed relevant with respect to each Fund, including, but not limited to, the following: (a) the nature, extent and quality of the services to be provided by NAM; (b) the investment performance of the Fund and NAM; (c) the costs of the services to be provided and profits to be realized by Nuveen and its affiliates; (d) the extent to which economies of scale would be realized; and (e) whether fee levels reflect those economies of scale for the benefit of the Fund’s investors. In addition, as noted, the Board Members met regularly throughout the year to oversee the Funds. In evaluating the Original Investment Management Agreements, the Board Members also relied upon their knowledge of NAM, its services and the Funds resulting from their meetings and other interactions throughout the year. It is with this background that the Board Members considered each Original Investment Management Agreement.
A. Nature, Extent and Quality of Services
In considering the renewal of the Original Investment Management Agreements, the Board Members considered the nature, extent and quality of NAM’s services. The Board Members reviewed materials outlining, among other things, Nuveen’s organization and business; the types of services that NAM or its affiliates provide or are expected to provide to the Funds; the performance record of the applicable Fund (as described in further detail below); and at the annual review, any initiatives Nuveen had taken for the municipal fund product line. As noted, the Board Members were already familiar with the organization, operations and personnel of NAM due to the Board Members’ experience in governing the respective Funds and working with NAM on matters relating to the Funds.
At the May Meeting, the Board Members also recognized NAM’s investment in additional qualified personnel throughout the various groups in the organization and recommended to NAM that it continue to review staffing needs as necessary. In addition, the Board Members reviewed materials describing the current status, and, in particular, the developments in 2006 with respect to NAM’s investment process, investment strategies (including additional tools used in executing such strategies), personnel (including portfolio management and research teams), trading process, hedging activities, risk management operations (e.g., reviewing credit quality, duration limits, and derivatives use, as applicable), and investment operations (such as enhancements to trading procedures, pricing procedures, and client services). The Board Members also recognized NAM’s investment of resources and efforts to continue to enhance and refine its investment processes.
In addition to advisory services, the Independent Board Members considered the quality of administrative and non-advisory services provided by NAM and noted that NAM and its affiliates provide the Funds with a wide variety of services and officers and other personnel as are necessary for the operations of the Funds, including:
| • | product management; |
| • | fund administration; |
| • | oversight by shareholder services and other fund service providers; |
| • | administration of Board relations; |
| • | regulatory and portfolio compliance; and |
| • | legal support. |
As the Funds operate in a highly regulated industry and given the importance of compliance, the Board Members considered, in particular, NAM’s compliance activities for the Funds and enhancements thereto. In this regard, the Board Members recognized the quality of NAM’s compliance team. The Board Members further noted NAM’s negotiations with other service providers and the corresponding reduction in certain service providers’ fees at the May Meeting.
Based on their review, the Board Members found that, overall, the nature, extent and quality of services provided (and expected to be provided) to the Funds under the respective Original Investment Management Agreement were satisfactory.
B. The Investment Performance of the Funds and NAM
At the May Meeting, the Board considered the investment performance for each Fund, including the Fund’s historic performance as well as its performance compared to funds with similar investment objectives (the “Performance Peer Group”) based on data provided by an independent third party (as described below). In addition, the Board Members reviewed portfolio level performance (which does not reflect fund level fees and expenses) against customized benchmarks, as described in further detail below.
In evaluating the performance information during the annual review at the May Meeting, in certain instances, the Board Members noted that the closest Performance Peer Group for a fund may not adequately reflect such fund’s investment objectives and strategies, thereby limiting the usefulness of the comparisons of such fund’s performance with that of the Performance Peer Group. These Performance Peer Groups include those for the Nuveen Intermediate Duration Municipal Bond Fund (although such Fund has been reclassified in a more appropriate peer group for 2007).
In addition to the foregoing, with respect to state specific municipal funds, the Board Members also recognized that certain funds do not have a corresponding state specific Performance Peer Group in which case their performance is measured against a more
73
Annual Investment Management Agreement Approval Process (continued)
general municipal category for various states. The open-end state municipal funds that utilize the more general category are the Nuveen New Mexico Municipal Bond Fund and the Nuveen Wisconsin Municipal Bond Fund.
Further, with respect to each Fund, the Board Members reviewed performance information including, among other things, total return information compared with such Fund’s Performance Peer Group for the one-, three- and five-year periods (as applicable) ending December 31, 2006. The Board Members also reviewed each Fund’s portfolio level performance (which does not reflect fund level fees and expenses) compared to customized portfolio level benchmarks for the one- and three-year periods ending December 31, 2006 (as applicable). The analysis was used to assess the efficacy of investment decisions against appropriate measures of risk and total return, within specific market segments. This information supplemented the Fund performance information provided to the Board at each of its quarterly meetings. Based on their review, the Board Members determined that each Fund’s investment performance over time had been satisfactory.
C. Fees, Expenses and Profitability
1. Fees and Expenses
During the annual review, the Board evaluated the management fees and expenses of each Fund reviewing, among other things, such Fund’s advisory fees (net and gross management fees) and total expense ratios (before and after expense reimbursements and/or waivers) in absolute terms as well as comparisons to the gross management fees (before waivers), net management fees (after waivers) and total expense ratios (before and after waivers) of comparable funds in the Peer Universe and the Peer Group. In reviewing the fee schedule for a Fund, the Board Members considered the fund-level and complex-wide breakpoint schedules (described in further detail below) and any fee waivers and reimbursements provided by Nuveen. The Board Members further reviewed data regarding the construction of Peer Groups as well as the methods of measurement for the fee and expense analysis and the performance analysis. In certain cases, due to the small number of peers in the Peer Universe, the Peer Universe and Peer Group had significant overlap or even consisted entirely of the same unaffiliated funds. In reviewing the comparisons of fee and expense information, the Board Members recognized that in certain cases, the size of the fund relative to peers, the small size and odd composition of the Peer Group (including differences in objectives and strategies), expense anomalies, timing of information used or other factors impacting the comparisons thereby limited some of the usefulness of the comparative data. Based on their review of the fee and expense information provided, the Board Members determined that each Fund’s net total expense ratio was within an acceptable range compared to peers.
2. Comparisons with the Fees of Other Clients
At the annual review, the Board Members further reviewed data comparing the advisory fees of NAM with fees NAM charges to other clients. Such clients include NAM’s municipal separately managed accounts. In general, the advisory fees charged for separate accounts are somewhat lower than the advisory fees assessed to the Funds. The Board Members considered the differences in the product types, including, but not limited to, the services provided, the structure and operations, product distribution and costs thereof, portfolio investment policies, investor profiles, account sizes and regulatory requirements. The Board Members noted, in particular, that the range of services provided to the Funds (as discussed above) is much more extensive than that provided to separately managed accounts. As described in further detail above, such additional services include, but are not limited to: product management, fund administration, oversight of third party service providers, administration of Board relations, and legal support. The Board Members noted that the Funds operate in a highly regulated industry requiring extensive compliance functions compared to other investment products. Given the inherent differences in the products, particularly the extensive services provided to the Funds, the Board Members believe such facts justify the different levels of fees.
3. Profitability of Nuveen
In conjunction with its review of fees, the Board Members also considered the profitability of Nuveen for its advisory activities (which incorporated Nuveen’s wholly-owned affiliated sub-advisers) and its financial condition. At the annual review, the Board Members reviewed the revenues and expenses of Nuveen’s advisory activities for the last three years, the allocation methodology used in preparing the profitability data as well as the 2006 Annual Report for Nuveen. The Board Members noted this information supplemented the profitability information requested and received during the year to help keep them apprised of developments affecting profitability (such as changes in fee waivers and expense reimbursement commitments). In this regard, the Board Members noted the enhanced dialogue and information regarding profitability with NAM during the year, including more frequent meetings and updates from Nuveen’s corporate finance group. The Board Members considered Nuveen’s profitability compared with other fund sponsors prepared by three independent third party service providers as well as comparisons of the revenues, expenses and profit margins of various unaffiliated management firms with similar amounts of assets under management prepared by Nuveen.
In reviewing profitability, the Board Members recognized the subjective nature of determining profitability which may be affected by numerous factors including the allocation of expenses. Further, the Board Members recognized the difficulties in making comparisons as the profitability of other advisers generally is not publicly available and the profitability information that is available for certain advisers or management firms may not be representative of the industry and may be affected by, among other things, the adviser’s particular business mix, capital costs, types of funds managed and expense allocations.
Notwithstanding the foregoing, the Board Members reviewed Nuveen’s methodology at the annual review and assumptions for allocating expenses across product lines to determine profitability. Last year, the Board Members also designated an Independent
74
Board Member as a point person for the Board to review the methodology determinations during the year and any refinements thereto, which relevant information produced from such process was reported to the full Board. In reviewing profitability, the Board Members recognized Nuveen’s increased investment in its fund business. Based on its review, the Board Members concluded that Nuveen’s level of profitability for its advisory activities was reasonable in light of the services provided.
In evaluating the reasonableness of the compensation, the Board Members also considered other amounts paid to NAM by the Funds as well as any indirect benefits (such as soft dollar arrangements, if any) NAM and its affiliates receive, or are expected to receive, that are directly attributable to the management of the Funds, if any. See Section E below for additional information on indirect benefits NAM may receive as a result of its relationship with the Funds. Based on their review of the overall fee arrangement of each Fund, the Board Members determined that the advisory fees and expenses were reasonable.
D. Economies of Scale and Whether Fee Levels Reflect These Economies of Scale
With respect to economies of scale, the Board Members recognized the potential benefits resulting from the costs of a Fund being spread over a larger asset base. To help ensure the shareholders share in these benefits, the Board Members reviewed and considered the breakpoints in the advisory fee schedules that reduce advisory fees. In addition to advisory fee breakpoints, the Board also approved a complex-wide fee arrangement in 2004. Pursuant to the complex-wide fee arrangement, the fees of the funds in the Nuveen complex, including the Funds, are reduced as the assets in the fund complex reach certain levels. In evaluating the complex-wide fee arrangement, the Board Members noted that the last complex-wide asset level breakpoint for the complex-wide fee schedule was at $91 billion and that the Board Members anticipated further review and/or negotiations prior to the assets of the Nuveen complex reaching such threshold. Based on their review, the Board Members concluded that the breakpoint schedule and complex-wide fee arrangement were acceptable and desirable in providing benefits from economies of scale to shareholders, subject to further evaluation of the complex-wide fee schedule as assets in the complex increase. See Section II, Paragraph D – “Approval of the New Investment Management Agreements – Economies of Scale and Whether Fee Levels Reflect These Economies of Scale” for information regarding subsequent modifications to the complex-wide fee.
E. Indirect Benefits
In evaluating fees, the Board Members also considered any indirect benefits or profits NAM or its affiliates may receive as a result of its relationship with each Fund. In this regard, during the annual review, the Board Members considered, among other things, any sales charges and distribution fees received and retained by the Funds’ principal underwriter, Nuveen Investments, LLC, an affiliate of NAM. The Board Members also recognized that an affiliate of NAM provides distribution and shareholder services to the Funds and their shareholders for which it may be compensated pursuant to a 12b-1 plan. The Board Members, therefore, considered the 12b-1 fees retained by Nuveen during the last calendar year.
In addition to the above, the Board Members considered whether NAM received any benefits from soft dollar arrangements whereby a portion of the commissions paid by a Fund for brokerage may be used to acquire research that may be useful to NAM in managing the assets of the Funds and other clients. With respect to NAM, the Board Members noted that NAM does not currently have any soft dollar arrangements; however, to the extent certain bona fide agency transactions that occur on markets that traditionally trade on a principal basis and riskless principal transactions are considered as generating “commissions,” NAM intends to comply with the applicable safe harbor provisions.
Based on their review, the Board Members concluded that any indirect benefits received by NAM as a result of its relationship with the Funds were reasonable and within acceptable parameters.
F. Other Considerations
The Board Members did not identify any single factor discussed previously as all-important or controlling in their considerations to continue an advisory contract. The Board Members, including the Independent Board Members, unanimously concluded that the terms of the Original Investment Management Agreements are fair and reasonable, that NAM’s fees are reasonable in light of the services provided to each Fund and that the Original Investment Management Agreements be renewed.
II. Approval of the New Investment Management Agreements
Following the May Meeting, the Board Members were advised of the potential Transaction. As noted above, the completion of the Transaction would terminate each of the Original Investment Management Agreements. Accordingly, at the July Meeting, the Board of each Fund, including the Independent Board Members, unanimously approved the New Investment Management Agreements on behalf of the respective Funds. Leading up to the July Meeting, the Board Members had several meetings and deliberations with and without Nuveen management present, and with the advice of legal counsel, regarding the proposed Transaction as outlined below.
On June 8, 2007, the Board Members held a special telephonic meeting to discuss the proposed Transaction. At that meeting, the Board Members established a special ad hoc committee comprised solely of Independent Board Members to focus on the Transaction and to keep the Independent Board Members updated with developments regarding the Transaction. On June 15, 2007, the ad hoc committee discussed with representatives of NAM the Transaction and modifications to the complex-wide fee schedule that would generate additional fee savings at specified levels of complex-wide asset growth. Following the foregoing meetings and several subsequent telephonic conferences among Independent Board Members and independent counsel, and between
75
Annual Investment Management Agreement Approval Process (continued)
Independent Board Members and representatives of Nuveen, the Board met on June 18, 2007 to further discuss the proposed Transaction. Immediately prior to and then again during the June 18, 2007 meeting, the Independent Board Members met privately with their independent legal counsel. At that meeting, the Board met with representatives of MDP, of Goldman Sachs, Nuveen’s financial adviser in the Transaction, and of the Nuveen Board to discuss, among other things, the history and structure of MDP, the terms of the proposed Transaction (including the financing terms), and MDP’s general plans and intentions with respect to Nuveen (including with respect to management, employees, and future growth prospects). On July 9, 2007, the Board also met to be updated on the Transaction as part of a special telephonic Board meeting. The Board Members were further updated at a special in-person Board meeting held on July 19, 2007 (one Independent Board Member participated telephonically). Subsequently, on July 27, 2007, the ad hoc committee held a telephonic conference with representatives of Nuveen and MDP to further discuss, among other things, the Transaction, the financing of the Transaction, retention and incentive plans for key employees, the effect of regulatory restrictions on transactions with affiliates after the Transaction, and current volatile market conditions and their impact on the Transaction.
In connection with their review of the New Investment Management Agreements, the Independent Board Members, through their independent legal counsel, also requested in writing and received additional information regarding the proposed Transaction and its impact on the provision of services by NAM and its affiliates.
The Independent Board Members received, well in advance of the July Meeting, materials which outlined, among other things:
| • | the structure and terms of the Transaction, including MDP’s co-investor entities and their expected ownership interests, and the financing arrangements that will exist for Nuveen following the closing of the Transaction; |
| • | the strategic plan for Nuveen following the Transaction; |
| • | the governance structure for Nuveen following the Transaction; |
| • | any anticipated changes in the operations of the Nuveen funds following the Transaction, including changes to NAM’s and Nuveen’s day-to-day management, infrastructure and ability to provide advisory, distribution or other applicable services to the Funds; |
| • | any changes to senior management or key personnel who work on Fund related matters (including portfolio management, investment oversight, and legal/compliance) and any retention or incentive arrangements for such persons; |
| • | any anticipated effect on each Fund’s expense ratio (including advisory fees) following the Transaction; |
| • | any benefits or undue burdens imposed on the Funds as a result of the Transaction; |
| • | any legal issues for the Funds as a result of the Transaction; |
| • | the nature, quality and extent of services expected to be provided to the Funds following the Transaction, changes to any existing services and policies affecting the Funds, and cost-cutting efforts, if any, that may impact such services or policies; |
| • | any conflicts of interest that may arise for Nuveen or MDP with respect to the Funds; |
| • | the costs associated with obtaining necessary shareholder approvals and who would bear those costs; and |
| • | from legal counsel, a memorandum describing the applicable laws, regulations and duties in approving advisory contracts, including, in particular, with respect to a change of control. |
Immediately preceding the July Meeting, representatives of MDP met with the Board to further respond to questions regarding the Transaction. After the meeting with MDP, the Independent Board Members met with independent legal counsel in executive session. At the July Meeting, Nuveen also made a presentation and responded to questions. Following the presentations and discussions of the materials presented to the Board, the Independent Board Members met again in executive session with their counsel. As outlined in more detail below, the Independent Board Members considered all factors they believed relevant with respect to each Fund, including the impact that the Transaction could be expected to have on the following: (a) the nature, extent and quality of services to be provided; (b) the investment performance of the Funds; (c) the costs of the services and profits to be realized by Nuveen and its affiliates; (d) the extent to which economies of scale would be realized; and (e) whether fee levels reflect those economies of scale for the benefit of investors. As noted above, during the past year, the Board Members had completed their annual review of the respective Original Investment Management Agreements and many of the factors considered at such reviews were applicable to their evaluation of the New Investment Management Agreements. Accordingly, in evaluating such agreements, the Board Members relied upon their knowledge and experience with NAM and considered the information received and their evaluations and conclusions drawn at the reviews. While the Board reviewed many Nuveen funds at the July Meeting, the Independent Board Members evaluated all information available to them on a fund-by-fund basis, and their determinations were made separately in respect of each Fund.
76
A. Nature, Extent and Quality of Services
In evaluating the nature, quality and extent of the services expected to be provided by NAM under the New Investment Management Agreements, the Independent Board Members considered, among other things, the expected impact, if any, of the Transaction on the operations, facilities, organization and personnel of NAM; the potential implications of regulatory restrictions on the Funds following the Transaction; the ability of NAM and its affiliates to perform their duties after the Transaction; and any anticipated changes to the current investment and other practices of the Funds.
The Board noted that the terms of each New Investment Management Agreement, including the fees payable thereunder, are substantially identical to those of the Original Investment Management Agreement relating to the same Fund (with both reflecting reductions to fee levels in the complex-wide fee schedule for complex-wide assets in excess of $80 billion that have an effective date of August 20, 2007). The Board considered that the services to be provided and the standard of care under the New Investment Management Agreements are the same as the corresponding Original Investment Management Agreements. The Board Members further noted that key personnel of NAM who have responsibility for the Funds in each area, including portfolio management, investment oversight, fund management, fund operations, product management, legal/compliance and board support functions, are expected to be the same following the Transaction. The Board Members considered and are familiar with the qualifications, skills and experience of such personnel. The Board also considered certain information regarding any anticipated retention or incentive plans designed to retain key personnel. Further, the Board Members noted that no changes to Nuveen’s infrastructure or operations as a result of the Transaction were anticipated other than potential enhancements as a result of an expected increase in the level of investment in such infrastructure and personnel. The Board noted MDP’s representations that it does not plan to have a direct role in the management of Nuveen, appointing new management personnel, or directly impacting individual staffing decisions. The Board Members also noted that there were not any planned “cost cutting” measures that could be expected to reduce the nature, extent or quality of services. After consideration of the foregoing, the Board Members concluded that no diminution in the nature, quality and extent of services provided to the Funds and their shareholders by NAM is expected.
In addition to the above, the Board Members considered potential changes in the operations of each Fund. In this regard, the Board Members considered the potential effect of regulatory restrictions on the Funds’ transactions with future affiliated persons. During their deliberations, it was noted that, after the Transaction, a subsidiary of Merrill Lynch is expected to have an ownership interest in Nuveen at a level that will make Merrill Lynch an affiliated person of Nuveen. The Board Members recognized that applicable law would generally prohibit the Funds from engaging in securities transactions with Merrill Lynch as principal, and would also impose restrictions on using Merrill Lynch for agency transactions. They recognized that having MDP and Merrill Lynch as affiliates may restrict the Nuveen funds’ ability to invest in securities of issuers controlled by MDP or issued by Merrill Lynch and its affiliates even if not bought directly from MDP or Merrill Lynch as principal. They also recognized that various regulations may require the Nuveen funds to apply investment limitations on a combined basis with affiliates of Merrill Lynch. The Board Members considered information provided by NAM regarding the potential impact on the Nuveen funds’ operations as a result of these regulatory restrictions. The Board Members considered, in particular, the Nuveen funds that may be impacted most by the restricted access to Merrill Lynch, including: municipal funds (particularly certain state-specific funds), senior loan funds, taxable fixed income funds, preferred security funds and funds that heavily use derivatives. The Board Members considered such funds’ historic use of Merrill Lynch as principal in their transactions and information provided by NAM regarding the expected impact resulting from Merrill Lynch’s affiliation with Nuveen and available measures that could be taken to minimize such impact. NAM informed the Board Members that, although difficult to determine with certainty, its management did not believe that MDP’s or Merrill Lynch’s status as an affiliate of Nuveen would have a material adverse effect on any Nuveen fund’s ability to pursue its investment objectives and policies.
In addition to the regulatory restrictions considered by the Board, the Board Members also considered potential conflicts of interest that could arise between the Nuveen funds and various parties to the Transaction and discussed possible ways of addressing such conflicts.
Based on its review along with its considerations regarding services at the annual review, the Board concluded that the Transaction was not expected to adversely affect the nature, quality or extent of services provided by NAM and that the expected nature, quality and extent of such services supported approval of the New Investment Management Agreements.
B. Performance of the Funds
With respect to the performance of the Funds, the Board considered that the portfolio management personnel responsible for the management of the Funds’ portfolios were expected to continue to manage the portfolios following the completion of the Transaction.
In addition, the Board Members recently reviewed Fund performance at the May Meeting as described above and determined such Funds’ performance was satisfactory or better. The Board Members further noted that the investment policies and strategies were not expected to change as a result of the Transaction.
In light of the foregoing factors, along with the prior findings regarding performance at the annual review, the Board concluded that its findings with respect to performance supported approval of the New Investment Management Agreements.
77
Annual Investment Management Agreement Approval Process (continued)
C. Fees, Expenses and Profitability
As described in more detail above, during the annual review, the Board Members considered, among other things, the management fees and expenses of the Funds, the breakpoint schedules, and comparisons of such fees and expenses with peers. At the annual review, the Board Members determined that the respective Fund’s advisory fees and expenses were reasonable. In evaluating the profitability of Nuveen under the New Investment Management Agreements, the Board Members considered their conclusions at their prior reviews and whether the management fees or other expenses would change as a result of the Transaction. As described above, the investment management fee for NAM is composed of two components – a fund-level component and complex-wide level component. The fee schedule under the New Investment Management Agreements to be paid to NAM is identical to that under the Original Investment Management Agreements, including the modified complex-wide fee schedule. As noted above, the Board recently approved a modified complex-wide fee schedule that would generate additional fee savings on complex-wide assets above $80 billion. The modifications have an effective date of August 20, 2007 and are part of the Original Investment Management Agreements. Accordingly, the terms of the complex-wide component under the New Investment Management Agreements are the same as under the Original Investment Management Agreements. The Board Members also noted that Nuveen has committed for a period of two years from the date of closing of the Transaction that it will not increase gross management fees for any Nuveen fund and will not reduce voluntary expense reimbursement levels for any Nuveen fund from their currently scheduled prospective levels (subject to certain potential adjustments noted below). Based on the information provided, the Board Members did not expect that overall Fund expenses would increase as a result of the Transaction.
In addition, the Board Members considered that additional fund launches were anticipated after the Transaction which would result in an increase in total assets under management in the complex and a corresponding decrease in overall management fees under the complex-wide fee schedule. Taking into consideration the Board’s prior evaluation of fees and expenses at the annual renewal, and the modification to the complex-wide fee schedule, the Board determined that the management fees and expenses were reasonable.
While it is difficult to predict with any degree of certainty the impact of the Transaction on Nuveen’s profitability for its advisory activities, at the recent annual review, the Board Members were satisfied that Nuveen’s level of profitability for its advisory activities was reasonable. During the year, the Board Members had noted the enhanced dialogue regarding profitability and the appointment of an Independent Board Member as a point person to review methodology determinations and refinements in calculating profitability. Given their considerations at the annual review and the modifications to the complex-wide fee schedule, the Board Members were satisfied that Nuveen’s level of profitability for its advisory activities continues to be reasonable.
D. Economies of Scale and Whether Fee Levels Reflect These Economies of Scale
The Board Members have been cognizant of economies of scale and the potential benefits resulting from the costs of a Fund being spread over a larger asset base. To help ensure that shareholders share in the benefits derived from economies of scale, the Board adopted the complex-wide fee arrangement in 2004. At the May Meeting, the Board Members reviewed the complex-wide fee arrangements and noted that additional negotiations may be necessary or appropriate as the assets in the complex approached the $91 billion threshold. In light of this assessment coupled with the upcoming Transaction, at the June 15, 2007 meeting, the ad hoc committee met with representatives of Nuveen to further discuss modifications to the complex-wide fee schedule that would generate additional savings for shareholders as the assets of the complex grow. The proposed terms for the complex-wide fee schedule are expressed in terms of targeted cumulative savings at specified levels of complex-wide assets, rather than in terms of targeted marginal complex-wide fee rates. Under the modified schedule, the schedule would generate additional fee savings beginning at complex-wide assets of $80 billion in order to achieve targeted cumulative annual savings at $91 billion of $28 million on a complex-wide level (approximately $0.6 million higher than those generated under the then current schedule) and generate additional fee savings for asset growth above complex-wide assets of $91 billion in order to achieve targeted annual savings at $125 billion of assets of approximately $50 million on a complex-wide level (approximately $2.2 million higher annually than that generated under the then current schedule). At the July Meeting, the Board approved the modified complex-wide fee schedule for the Original Investment Management Agreements and these same terms will apply to the New Investment Management Agreements. Accordingly, the Board Members believe that the breakpoint schedules and revised complex-wide fee schedule are appropriate and desirable in ensuring that shareholders participate in the benefits derived from economies of scale.
E. Indirect Benefits
During their recent annual review, the Board Members considered any indirect benefits that NAM may receive as a result of its relationship with the Funds, as described above. As the policies and operations of Nuveen are not anticipated to change significantly after the Transaction, such indirect benefits should remain after the Transaction. The Board Members further considered any additional indirect benefits to be received by NAM or its affiliates after the Transaction. The Board Members noted that other than benefits from its ownership interest in Nuveen and indirect benefits from fee revenues paid by the Funds under the management agreements and other Board-approved relationships, it was currently not expected that MDP or its affiliates would derive any benefit from the Funds as a result of the Transaction or transact any business with or on behalf of the Funds (other than perhaps potential Fund acquisitions, in secondary market transactions, of securities issued by MDP portfolio companies); or that Merrill Lynch or its affiliates would derive any benefits from the Funds as a result of the Transaction (noting that, indeed, Merrill Lynch would stand to experience the discontinuation of principal transaction activity with the Nuveen funds and likely would experience a noticeable reduction in the volume of agency transactions with the Nuveen funds).
78
F. Other Considerations
In addition to the factors above, the Board Members also considered the following with respect to the Funds:
| • | Nuveen would rely on the provisions of Section 15(f) of the 1940 Act. Section 15(f) provides, in substance, that when a sale of a controlling interest in an investment adviser occurs, the investment adviser or any of its affiliated persons may receive any amount or benefit in connection with the sale so long as (i) during the three-year period following the consummation of a transaction, at least 75% of the investment company’s board of directors must not be “interested persons” (as defined in the 1940 Act) of the investment adviser or predecessor adviser and (ii) an “unfair burden” (as defined in the 1940 Act, including any interpretations or no-action letters of the SEC) must not be imposed on the investment company as a result of the transaction relating to the sale of such interest, or any express or implied terms, conditions or understanding applicable thereto. In this regard, to help ensure that an unfair burden is not imposed on the Nuveen funds, Nuveen has committed for a period of two years from the date of the closing of the Transaction (i) not to increase gross management fees for any Nuveen fund; (ii) not to reduce voluntary expense reimbursement levels for any Nuveen fund from their currently scheduled prospective levels during that period (such commitment, however, may exclude or be adjusted for the impact of future class-specific expense allocation protocol changes for a particular mutual fund); (iii) that no Nuveen fund whose portfolio is managed by a Nuveen affiliate shall use Merrill Lynch as a broker with respect to portfolio transactions done on an agency basis, except as may be approved in the future by the Compliance Committee of the Board; and (iv) that NAM shall not cause the Funds and other municipal funds that NAM manages, as a whole, to enter into portfolio transactions with or through the other minority owners of Nuveen, on either a principal or an agency basis, to a significantly greater extent than both what one would expect an investment team to use such firm in the normal course of business, and what NAM has historically done, without prior Board or Compliance Committee approval (excluding the impact of proportionally increasing the use of such other “minority owners” to fill the void necessitated by not being able to use Merrill Lynch). |
| • | The Funds would not incur any costs in seeking the necessary shareholder approvals for the New Investment Management Agreements (except for any costs attributed to seeking shareholder approvals of Fund specific matters unrelated to the Transaction, such as approval of Board Members, in which case a portion of such costs will be borne by the applicable Funds). |
| • | The reputation, financial strength and resources of MDP. |
| • | The long-term investment philosophy of MDP and anticipated plans to grow Nuveen’s business to the benefit of the Nuveen funds. |
| • | The benefits to the Nuveen funds as a result of the Transaction including: (i) as a private company, Nuveen may have more flexibility in making additional investments in its business; (ii) as a private company, Nuveen may be better able to structure compensation packages to attract and retain talented personnel; (iii) as certain of Nuveen’s distribution partners are expected to be equity or debt investors in Nuveen, Nuveen may be able to take advantage of new or enhanced distribution arrangements with such partners; and (iv) MDP’s experience, capabilities and resources that may help Nuveen identify and acquire investment teams or firms and finance such acquisitions. |
G. Conclusion
The Board Members did not identify any single factor discussed previously as all-important or controlling. The Board Members, including the Independent Board Members, unanimously concluded that the terms of the New Investment Management Agreements are fair and reasonable, that the fees therein are reasonable in light of the services to be provided to each Fund and that the New Investment Management Agreements should be approved and recommended to shareholders.
III. Approval of Interim Contracts
As noted above, at the July Meeting, the Board Members, including the Independent Board Members, unanimously approved the Interim Investment Management Agreements. If necessary to assure continuity of advisory services, the Interim Investment Management Agreements will take effect upon the closing of the Transaction if shareholders have not yet approved the New Investment Management Agreements. The terms of each Interim Investment Management Agreement are substantially identical to those of the corresponding Original Investment Management Agreement and New Investment Management Agreement, respectively, except for certain term and escrow provisions. In light of the foregoing, the Board Members, including the Independent Board Members, unanimously determined that the scope and quality of services to be provided to the Funds under the respective Interim Investment Management Agreement are at least equivalent to the scope and quality of services provided under the applicable Original Investment Management Agreement.
79
Glossary of Terms Used in this Report
Average Annual Total Return: This is a commonly used method to express an investment’s performance over a particular, usually multi-year time period. It expresses the return that would have been necessary each year to equal the investment’s actual cumulative performance (including change in NAV or offer price and reinvested dividends and capital gains distributions, if any) over the time period being considered.
Average Effective Maturity: The average of the number of years to maturity of the bonds in a Fund’s portfolio, computed by weighting each bond’s time to maturity (the date the security comes due) by the market value of the security. This figure does not account for the likelihood of prepayments or the exercise of call provisions unless an escrow account has been established to redeem the bond before maturity. The market value weighting for an investment in an inverse floating rate security is the value of the portfolio’s residual interest in the inverse floating rate trust, and does not include the value of the floating rate securities issued by the trust.
Average Duration: Duration is a measure of the expected period over which a bond’s principal and interest will be paid, and consequently is a measure of the sensitivity of a bond’s (or bond fund’s) value to changes when market interest rates change. Generally, the longer a bond or Fund’s duration, the more the price of the bond or Fund will change as interest rates change.
Dividend Yield (also known as Market Yield or Current Yield): An investment’s current annualized dividend divided by its current offering price.
Inverse Floaters: Inverse floating rate securities are created by depositing a municipal bond, typically with a fixed interest rate, into a special purpose trust created by a broker-dealer. This trust, in turn, (a) issues floating rate certificates typically paying short-term tax-exempt interest rates to third parties in amounts equal to some fraction of the deposited bond’s par amount or market value, and (b) issues an inverse floating rate certificate (sometimes referred to as an “inverse floater”) to an investor (such as a Fund) interested in gaining investment exposure to a long-term municipal bond. The income received by the holder of the inverse floater varies inversely with the short-term rate paid to the floating rate certificates’ holders, and in most circumstances the holder of the inverse floater bears substantially all of the underlying bond’s downside investment risk. The holder of the inverse floater typically also benefits disproportionately from any potential appreciation of the underlying bond’s value. Hence, an inverse floater essentially represents an investment in the underlying bond on a leveraged basis.
Net Asset Value (NAV): A Fund’s NAV is the dollar value of one share in the Fund. It is calculated by subtracting the liabilities of the Fund from its total assets and then dividing the remainder by the number of shares outstanding. Fund NAVs are calculated at the end of each business day.
SEC 30-Day Yield: A standardized measure of a Fund’s yield that accounts for the future amortization of premiums or discounts of bonds held in the Fund’s portfolio.
Taxable-Equivalent Yield: The yield necessary from a fully taxable investment to equal, on an after-tax basis at a specified assumed tax rate, the yield of a municipal bond investment.
Zero Coupon Bond: A zero coupon bond does not pay a regular interest coupon to its holders during the life of the bond. Tax-exempt income to the holder of the bond comes from accretion of the difference between the original purchase price of the bond at issuance and the par value of the bond at maturity and is effectively paid at maturity. The market prices of zero coupon bonds generally are more volatile than the market prices of bonds that pay interest periodically.
80
Fund Information
Fund Manager Nuveen Asset Management 333 West Wacker Drive Chicago, IL 60606 | Legal Counsel Chapman and Cutler LLP Chicago, IL
Independent Registered Public Accounting Firm PricewaterhouseCoopers LLP Chicago, IL
Custodian State Street Bank & Trust Company Boston, MA | Transfer Agent and Shareholder Services Boston Financial Data Services, Inc.
Nuveen Investor Services P.O. Box 8530 Boston, MA 02266-8530 (800) 257-8787 | ||
Investment Policy Change: On September 19, 2007, the Board of Trustees voted to authorize all of Nuveen’s non-insured open-end municipal bond Funds not already so authorized the capability of investing up to 20% of their net assets in below-investment grade (“high yield” or “junk”) municipal securities. This investment policy change, effective October 31, 2007, will give the Funds’ portfolio managers greater flexibility to enhance: (1) income, (2) potential total return, both absolute and on a risk-adjusted basis, and (3) portfolio diversification.
Quarterly Portfolio of Investments and Proxy Voting information: Each Fund’s (i) quarterly portfolio of investments, (ii) information regarding how the Funds voted proxies relating to portfolio securities held during the most recent 12-month period ended June 30, 2007, and (iii) a description of the policies and procedures that the Funds used to determine how to vote proxies relating to portfolio securities are available without charge, upon request, by calling Nuveen Investments at (800) 257-8787 or on Nuveen’s website at www.nuveen.com.
You may also obtain this and other Fund information directly from the Securities and Exchange Commission (“SEC”). The SEC may charge a copying fee for this information. Visit the SEC on-line at http://www.sec.gov or in person at the SEC’s Public Reference Room in Washington, D.C. Call the SEC at 1-202-942-8090 for room hours and operation. You may also request Fund information by sending an e-mail request to publicinfo@sec.gov or by writing to the SEC’s Public Reference Section at 450 Fifth Street NW, Washington, D.C. 20549.
NASD Regulation, Inc. provides a Public Disclosure Program which supplies certain information regarding the disciplinary history of NASD members and their associated persons in response to either telephone inquiries at (800) 289-9999 or written inquiries at www.nasdr.com. NASD Regulation, Inc. also provides an investor brochure that includes information describing the Public Disclosure Program.
81
Learn more
about Nuveen Funds at
www.nuveen.com/mf
Nuveen Investments:
SERVING Investors
For GENERATIONS
Since 1898, financial advisors and their clients have relied on Nuveen Investments to provide dependable investment solutions. Over this time, Nuveen Investments has adhered to the belief that the best approach to investing is to apply conservative risk-management principles to help minimize volatility.
Building on this tradition, we today offer a range of high quality equity and fixed-income solutions that can be integral parts of a well-diversified core portfolio. Our clients have come to appreciate this diversity, as well as our continued adherence to proven, long-term investing principles.
We offer many different investing solutions for our clients’ different needs.
Managing approximately $170 billion in assets as of September 30, 2007, Nuveen Investments offers access to a number of different asset classes and investing solutions through a variety of products. Nuveen Investments markets its capabilities under six distinct brands: NWQ, specializing in value-style equities; Nuveen, managing fixed-income investments; Santa Barbara, committed to growth equities; Tradewinds, specializing in global value equities; Rittenhouse, focused on “blue-chip” growth equities; and Symphony, with expertise in alternative investments as well as equity and income portfolios.
Find out how we can help you reach your financial goals.
An investor should carefully consider the Fund’s objectives, risks, charges and expenses before investing. For a prospectus containing this and other information about the Fund, please contact your financial advisor or Nuveen Investments at (800) 257-8787. Read the prospectus carefully before you invest or send money.
| • | Share prices |
| • | Fund details |
| • | Daily financial news |
| • | Investor education |
MSA-MS6-1107D
Item 2. Code of Ethics.
Not applicable to this filing.
Item 3. Audit Committee Financial Expert.
Not applicable to this filing.
Item 4. Principal Accountant Fees and Services.
Not applicable to this filing.
Item 5. Audit Committee of Listed Registrants
Not applicable to this registrant.
Item 6. Schedule of Investments
See Portfolio of Investments in Item 1
Item 7. Disclosure of Proxy Voting Policies and Procedures for Closed-End Management Investment Companies
Not applicable to this registrant.
Item 8. Portfolio Managers of Closed-End Management Investment Companies
Not applicable to this registrant.
Item 9. Purchases of Equity Securities by Closed-End Management Investment Company and Affiliated Purchasers
Not applicable to this registrant.
Item 10. Submission of Matters to a Vote of Security Holders
There have been no material changes to the procedures by which shareholders may recommend nominees to the registrant’s Board implemented after the registrant last provided disclosure in response to this Item.
Item 11. Controls and Procedures.
| (a) | The registrant’s principal executive and principal financial officers, or persons performing similar functions, have concluded that the registrant’s disclosure controls and procedures (as defined in Rule 30a-3(c) under the Investment Company Act of 1940, as amended (the “1940 Act”) (17 CFR 270.30a-3(c))) are effective, as of a date within 90 days of the filing date of this report that includes the disclosure required by this paragraph, based on their evaluation of the controls and procedures required by Rule 30a-3(b) under the 1940 Act (17 CFR 270.30a-3(b)) and Rules 13a-15(b) or 15d-15(b) under the Securities Exchange Act of 1934, as amended (the “Exchange Act”) (17 CFR 240.13a-15(b) or 240.15d-15(b)). |
| (b) | There were no changes in the registrant’s internal control over financial reporting (as defined in Rule 30a-3(d) under the 1940 Act (17 CFR 270.30a-3(d)) that occurred during the second fiscal quarter of the period covered by this report that has materially affected, or is reasonably likely to materially affect, the registrant’s internal control over financial reporting. |
Item 12. Exhibits
File the exhibits listed below as part of this Form.
(a)(1) Any code of ethics, or amendment thereto, that is the subject of the disclosure required by Item 2, to the extent that the registrant intends to satisfy the Item 2 requirements through filing of an exhibit: Not applicable to this filing.
(a)(2) A separate certification for each principal executive officer and principal financial officer of the registrant as required by Rule 30a-2(a) under the 1940 Act (17 CFR 270.30a-2(a)) in the exact form set forth below: EX-99.CERT Attached hereto.
(a)(3) Any written solicitation to purchase securities under Rule 23c-1 under the 1940 Act (17 CFR 270.23c-1) sent or given during the period covered by the report by or on behalf of the registrant to 10 or more persons: Not applicable to this registrant.
(b) If the report is filed under Section 13(a) or 15(d) of the Exchange Act, provide the certifications required by Rule 30a-2(b) under the 1940 Act (17 CFR 270.30a-2(b)), Rule 13a-14(b) or Rule 15d-14(b) under the Exchange Act (17 CFR 240.13a-14(b) or 240.15d-14(b)), and Section 1350 of Chapter 63 of Title 18 of the United States Code (18 U.S.C. 1350) as an Exhibit. A certification furnished pursuant to this paragraph will not be deemed “filed” for purposes of Section 18 of the Exchange Act (15 U.S.C. 78r), or otherwise subject to the liability of that section. Such certification will not be deemed to be incorporated by reference into any filing under the Securities Act of 1933 or the Exchange Act, except to the extent that the registration specifically incorporates it by reference. EX-99.906 CERT attached hereto.
SIGNATURES
Pursuant to the requirements of the Securities Exchange Act of 1934 and the Investment Company Act of 1940, the registrant has duly caused this report to be signed on its behalf by the undersigned, thereunto duly authorized.
(Registrant) Nuveen Multistate Trust IV
| By | (Signature and Title)* | /s/ Kevin J. McCarthy | ||||
Kevin J. McCarthy Vice President and Secretary |
Date February 8, 2008
Pursuant to the requirements of the Securities Exchange Act of 1934 and the Investment Company Act of 1940, this report has been signed below by the following persons on behalf of the registrant and in the capacities and on the dates indicated.
| By | (Signature and Title)* | /s/ Gifford R. Zimmerman | ||||
Gifford R. Zimmerman Chief Administrative Officer (principal executive officer) |
Date February 8, 2008
| By | (Signature and Title)* | /s/ Stephen D. Foy | ||||
Stephen D. Foy Vice President and Controller (principal financial officer) |
Date February 8, 2008
| * | Print the name and title of each signing officer under his or her signature. |