Item 1: Report to Shareholders| Financial Services Fund | June 30, 2007 |
The views and opinions in this report were current as of June 30, 2007. They are not guarantees of performance or investment results and should not be taken as investment advice. Investment decisions reflect a variety of factors, and the managers reserve the right to change their views about individual stocks, sectors, and the markets at any time. As a result, the views expressed should not be relied upon as a forecast of the fund’s future investment intent. The report is certified under the Sarbanes-Oxley Act, which requires mutual funds and other public companies to affirm that, to the best of their knowledge, the information in their financial reports is fairly and accurately stated in all material respects.
REPORTS ON THE WEB
Sign up for our E-mail Program, and you can begin to receive updated fund reports and prospectuses online rather than through the mail. Log in to your account at troweprice.com for more information.
Manager’s Letter
Fellow Shareholders
The first half of 2007 was a lackluster period for most financial services investors. While the S&P 500 posted a robust total return of about 7%, the financials sector was the worst-performing sector within the S&P 500, registering a -0.8% loss. Rising long-term interest rates, widening credit spreads, and the long-overdue shakeout in the subprime mortgage industry prompted investors to sell financial stocks while bidding up “real asset” sectors such as energy and materials. The runup in energy and materials shares is particularly noteworthy to us as it could signal signs of incipient inflation and higher long-term interest rates—neither of which bode well for the share prices of many financial companies.
HIGHLIGHTS
• The stock market rose in the first half of the year, but the financials sector was the worst-performing sector within the S&P 500 amid rising long-term interest rates, widening credit spreads, and a shakeout in the subprime mortgage industry.
• The Financial Services Fund strongly outperformed broad measures of the financial sector’s performance in the last six months.
• Avoiding pure-play subprime mortgage lenders, diversified mortgage lenders, and a few of the “mega-cap” banks greatly helped our relative performance. Good stock selection among capital markets companies was also beneficial.
• We remain committed to growing your capital over the long term and think one of the best ways we can accomplish this is by managing the portfolio in a conservative fashion in the current environment.
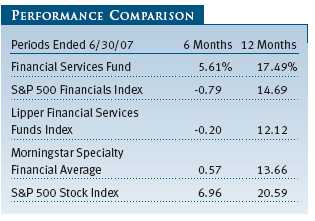
Although financial services investors were dealt a difficult hand in the first half of the year, we are happy to report that your fund managed to post solid absolute and relative returns without taking on outsized risks relative to the peer group. The Financial Services Fund registered a 5.61% gain, whereas the Lipper peer group index posted a modest loss and the Morningstar Specialty Financial Average rose less than 1%.
We are changing the fund’s primary benchmark from the broad S&P 500 Index to the more focused S&P 500 Financials Index. Given that 80% or more of the fund’s assets are normally invested in financial companies, we believe the financials sector of the S&P 500 is a more appropriate benchmark. We will also continue to monitor the portfolio’s performance relative to the Lipper and Morningstar benchmarks shown in the Performance Comparison table.
The fund’s good 6-month results were largely a function of security selection and a somewhat defensive posture. Our defensive positioning is consistent with our circumspect view of the risk/reward trade-off in many financial companies that rely on leverage and a continuation of minimal credit losses and easy borrowing terms to generate earnings growth. Despite our cautious stance, we believe that your fund is full of solid companies with good risk/reward profiles and that we will be able to grow your capital at an acceptable rate over time.
The fund’s long-term relative performance record is favorable. Lipper ranked the fund in the top 15% of its financial services funds universe for the 10-year period ended June 30, 2007. (Based on cumulative total return, Lipper ranked the Financial Services Fund 27 out of 119, 24 out of 95, and 4 out of 26 funds for the 1-, 5-, and 10-year periods ended June 30, 2007, respectively. Results will vary for other time periods. Past performance cannot guarantee future results.)
We intend to continue with a common sense approach to managing the fund, seeking good risk-adjusted returns while avoiding stocks where we do not believe we are being adequately rewarded for assuming the risks inherent in the investment. We also think it is appropriate to remind our current and potential shareholders that this fund is a relatively narrow offering subject to a greater risk of capital losses than more diversified portfolios. We believe that investors should allocate only a relatively small portion of their investment portfolios to this strategy.
MARKET ENVIRONMENT
The economy showed signs of improvement in the last few months following a year-long slowdown that culminated in an anemic 0.7% annualized rate of GDP growth in the first quarter of 2007. While the housing sector remained weak and investors were concerned about problems in the subprime mortgage market, manufacturing and capital spending have showed signs of accelerating. In addition, the national unemployment rate hovered around 4.5%, not far from six-year lows.
Although gasoline prices and other energy costs continued to press higher and inflation remained above the Federal Reserve’s comfort zone, the central bank kept the federal funds target rate at 5.25% during our reporting period—in fact, for the last year—in anticipation that moderate growth would allow inflation pressures to ease over time. Following the Fed’s late-June monetary policy meeting, however, central bank officials acknowledged that “a sustained moderation in inflation pressures has yet to be convincingly demonstrated.” Longer-term interest rates increased as hopes for a Fed rate cut diminished, and the Treasury yield curve, a graphic depiction of the relationship between government bond yields and maturities, steepened late in our reporting period, as long-term rates rose more than short-term rates.
The financials sector substantially underperformed the broad S&P 500 Index in the last six months. Interest rate-sensitive commercial banks and real estate investment trusts (REITs) were among the weakest segments; thrifts and mortgage finance companies were also hurt by continued housing market sluggishness. Stocks of insurers performed well, and capital markets companies, such as asset managers and brokerages, benefited from favorable equity market conditions as well as heightened IPO and merger activity.
INVESTMENT OBJECTIVE & STRATEGY
Our objective is to deliver superior risk-adjusted returns relative to similar financial services-focused offerings over any three-year period. We measure our results against three primary benchmarks: the S&P 500 Financials Index, the Lipper Financial Services Funds Index, and the Morningstar Specialty Financial Average. We employ a bottom-up, fundamental investment process that relies heavily on the work of our team of dedicated investment analysts that collectively follow hundreds of small-, mid-, and large-cap financial companies around the world. We will often hold around 75 securities and employ somewhat of a barbell approach—larger positions (3% to 6% of fund assets) in a handful of names in which we have high confidence, as well as numerous smaller positions (0.25% to 0.75% of assets) where we have determined that the investment risks are higher.
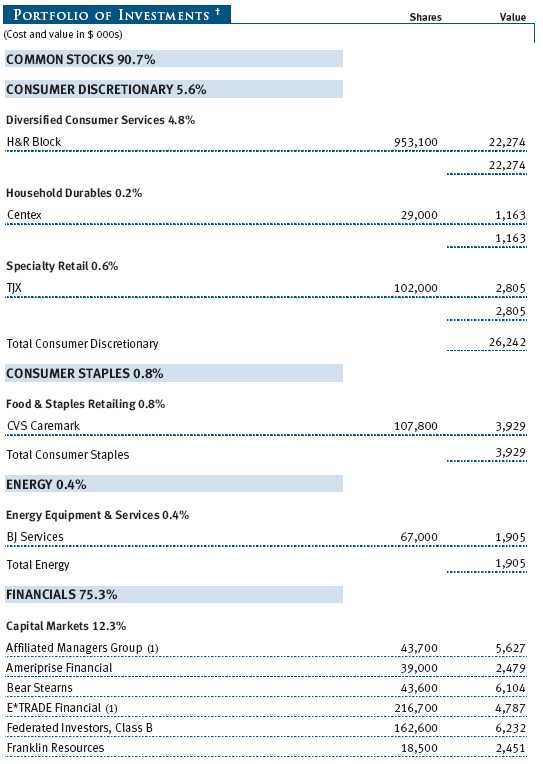
The Financial Services Fund is not a value fund per se, but our investment techniques tend to be more closely associated with value investing than with growth investing. For example, we like stocks with low price/earnings (P/E) and price/book value (P/BV) multiples along with high absolute and relative dividend yields. We tend to like stocks that are out of favor because of temporal issues such as earnings disappointments or missteps in strategy. We tend to focus on asset value, sum-of-parts investments, and special-situation investments. However, we also don’t mind paying a fair price for a higher-quality growth company, as evidenced by our investments in American Express, Franklin Resources, Affiliated Managers Group, and Northern Trust. In summary, our largest positions tend to be in stocks that most observers would classify as value stocks and are often associated with a measure of uncertainty or controversy. As of June 30, our top five holdings certainly fit the value criteria by most investors’ definitions: H&R Block, Citigroup, American International Group, Tyco International, and First Horizon National. (Please refer to the fund’s portfolio of investments for a complete listing of holdings and the amount each represents in the portfolio.)
In an effort to manage risk and generate the best return for each unit of risk we take, we also hold cash, convertible securities, and select non-financial companies that meet a couple of criteria. First, our investments in companies that are not classified as financials offer what we perceive to be an asymmetric risk/reward situation where we calculate a low probability of material permanent loss of capital. Second, we generally make these non-financial investments in securities that we expect to have little correlation with the fund’s broad financial services benchmarks. An example of such a security is Tyco International, one of the better performers in your fund over the past six months. Tyco was a special situation where we saw a large gap between the market price of the stock and the intrinsic value of the company. During the last six months, the company split into three separate publicly traded entities, and the collection of companies traded a bit closer to their intrinsic val ue, aiding performance in a difficult period for pure financial stocks. We have taken some profits in our initial Tyco position but continue to hold all three companies because they still fit our criteria for investment.
In summary, we seek asymmetric risk/reward situations primarily in financial services companies. We often take a contrarian approach and always endeavor to buy assets at a discount to our assessment of their intrinsic value, where the value is not based on aggressive earnings growth assumptions well into the future.
PORTFOLIO REVIEW
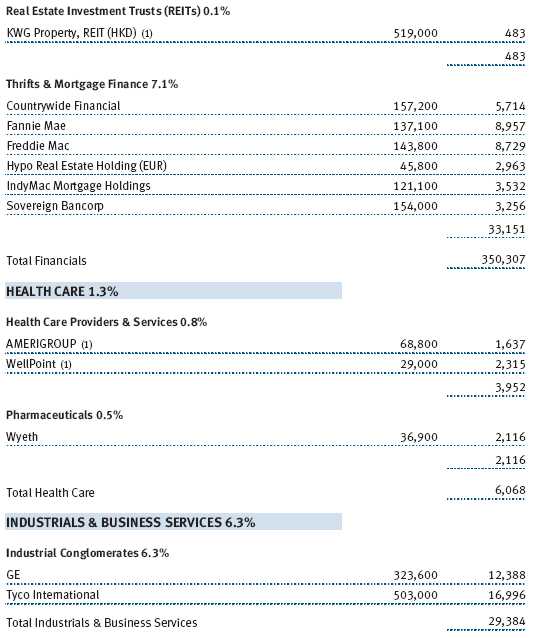
Your fund benefited as much from what it did not own as from what it did own in the first half of our fiscal year. Specifically, avoiding pure-play subprime mortgage lenders, diversified mortgage lenders, and a few of the “mega-cap” banks like Wachovia aided performance. In the last couple of months—and continuing as we write this report—we have started positions in mortgage-related names that we believe will be survivors and generate strong returns over the next two to three years. We now own reasonably sized positions in Bank of America, Countrywide Financial, and Bear Stearns.
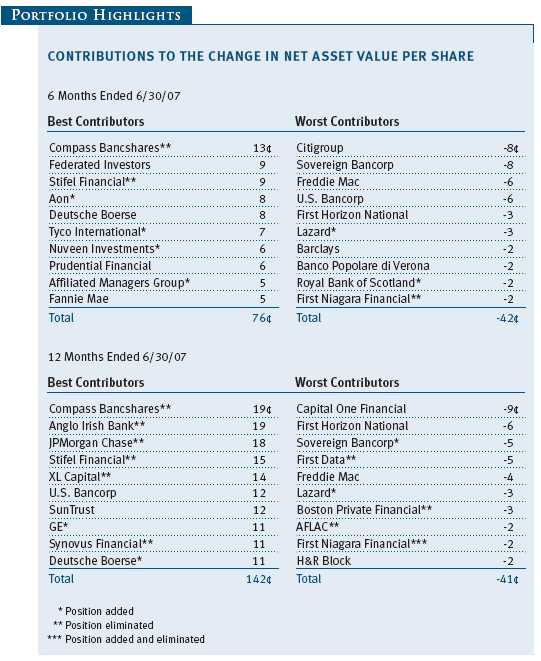
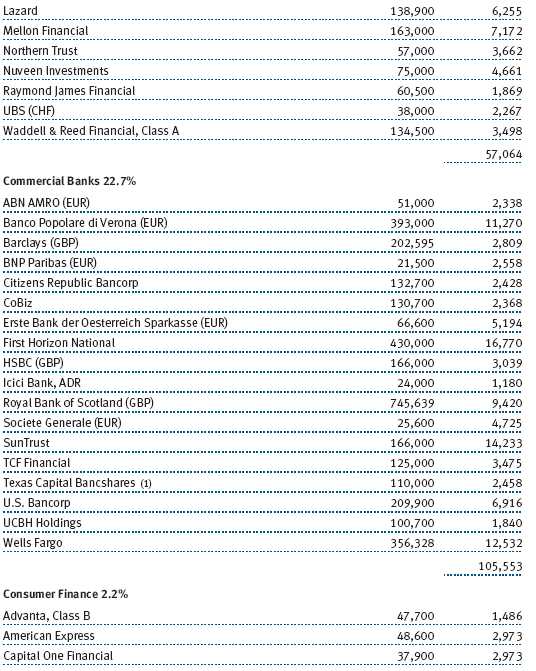
Good stock selection in the capital markets industry also helped performance. Federated Investors, Stifel Financial, Deutsche Boerse, Nuveen Investments, Waddell & Reed Financial, and Affiliated Managers Group were all positive contributors in the period. We maintain a reasonable amount of capital markets exposure in the fund, but choose to do so largely via asset managers and equity-sensitive life insurance companies rather than big positions in Wall Street’s largest investment banks. This positioning is consistent with our view that the market is being a little too generous with its valuation of leading securities firms and financial exchanges, given the risks inherent in these businesses.
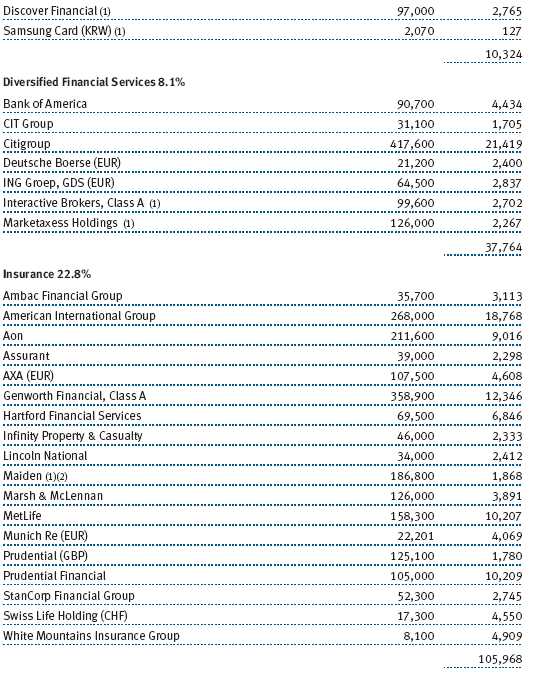
Significant exposure in the property and casualty insurance sector contributed meaningfully to the fund’s first-half results. Insurance broker Aon and underwriters Hartford Financial Services, XL Capital, and AIG registered healthy gains. We trimmed Aon and Hartford and eliminated XL Capital, as the shares are now less attractive following their rapid price appreciation. We have added to our AIG position as we still believe it will be a very attractive investment over a multi-year period.
The fund also benefited from robust merger and acquisition activity, principally driven by unprecedented leveraged buyout (LBO) activity. Companies we held that have either been acquired or have announced their intention to be acquired include Compass Bancshares, Nuveen Investments, Cablevision Systems, Placer Sierra Bancshares, SLM Corp. (Sallie Mae), and ABN Amro. Finally, good stock selection in non-financial companies aided our performance. Tyco was a significant contributor to net asset value, while smaller positions in a number of non-financial securities also were additive.
Our biggest disappointment in the period was Citigroup, a top holding in your fund. We believe Citigroup will fare quite well when its $1.5 trillion asset base reaps the benefit of a positively sloped yield curve. (Long-term interest rates have been equal to or lower than short-term rates for about 18 months; they are usually higher. Banks earn profits when they are able to issue loans at interest rates that are higher than the rates they pay for deposit accounts and CDs.) Further, we believe management and the Board of Directors are now appropriately focused on limiting expense growth to some rate below that of the company’s revenue growth—a simple concept for an organization with the scale and scope of Citigroup, but one that has eluded the company for several years.
Other notable detractors can be chalked up to poor stock selection and the difficult environment for banks and mortgage-related companies, namely Sovereign Bancorp, U.S. Bancorp, First Horizon National, Genworth Financial, and Freddie Mac. We still maintain positions in all of these companies as we believe the valuations reflect much of the fundamental challenges and, in the case of Freddie Mac, the residual impact from numerous regulatory problems.
We are struck by the relative attractiveness of a number of lagging mega-cap financial companies based on their valuation, history of earnings and dividend growth, and potential for future growth. Collectively, Citigroup, AIG, Wells Fargo, and GE accounted for about 14% of your fund at the end of June. Going forward, the performance of these shares could have a significant impact on your fund’s returns.
This table shows the tremendous compression of valuations (i.e., falling P/E ratios and price/book value ratios) that owners of these stocks have experienced over the past seven years. Despite reasonable growth in earnings and dividends, strong balance sheets, dominant market positions, and, with the exception of Wells Fargo, significant exposure to fast-growing non-U.S. countries and regions, these growth stocks have underperformed for a long time. We believe these attractively valued companies currently represent an excellent risk/reward proposition over the next few years.

FUND DISTRIBUTIONS
In mid-December 2007, the fund’s Board of Directors is likely to declare a distribution of dividends as well as short-and long-term capital gains. These distributions will be taxable to investors in nonretirement accounts. Because of a manager change earlier this year coupled with the continuing equity bull market and the heightened takeover activity that has allowed us to realize substantial capital gains from the sale of companies being acquired, investors should expect a significant distribution of capital gains at the end of the year.
OUTLOOK
We are cautious in our outlook for financial services stocks in general but optimistic about the long-term outlook for our current holdings. A history of Wall Street shows us that many financial companies are inherently fragile, doomed to repeat the mistakes of the past, and forgetful that they operate in a highly cyclical industry. The following recent quote by Chuck Prince, CEO of Citigroup, the largest and perhaps the most important financial services company in the world, is a gentle reminder of the time-tested tendency for even the best and the brightest to fall victim to the crowd mentality at market extremes. In a recent interview with the Financial Times, Mr. Prince was asked about the notion of when the “music” might stop as it relates to the cheap financing that is fueling the LBO boom. His reply: “When the music stops, in terms of liquidity, things will be complicated. But as long as the music is playing, you’ve got to get up and dance. We’re still dancing.”
We politely disagree. In our opinion, executives should not and do not have to “get up and dance” just because “the music is playing.” In fact, now is probably a good time to be nervous and rather stingy with new commitments of capital, regardless of the near-term disappointments such restraint might bring. Despite our discomfort with Mr. Prince’s statement, we think Mr. Prince and his talented team of managers are focused on the right remedial efforts. We also think Citigroup is one of the better risk/reward opportunities in our portfolio, and we have made it a top position in the fund.
Looking ahead, we are hopeful that we can avoid the worst of the inevitable downturn in credit markets and financial stocks that will likely follow this enjoyable period of unmatched liquidity, leveraged buyout activity, relaxed lending standards and practices, and “financial innovation.” We are also prepared, in the short term, to make less money for our shareholders than some of our more aggressive peers if the recent emergence of a risk premium in the capital markets turns out to be temporary and investors place aggressive valuations on shares of financial companies. We remain committed to growing your capital over the long term and think one of the best ways we can accomplish this is by managing the portfolio in a conservative fashion in the current environment, given our assessment that risk premiums remain, generally speaking, too low.
Respectfully submitted,

Jeffrey W. Arricale
Chairman of the fund’s Investment Advisory Committee
July 20, 2007
The committee chairman has day-to-day responsibility for managing the portfolio and works with committee members in developing and executing the fund’s investment program.
MANAGER CHANGE
Effective March 1, 2007, Mr. Arricale assumed portfolio management responsibility for the T. Rowe Price Financial Services Fund and became chairman of its Investment Advisory Committee. Michael W. Holton, former portfolio manager of the fund, left the firm on March 9, 2007, after 12 years of service.
RISKS OF INVESTING
As with all equity funds, this fund’s share price can fall because of weakness in the broad market, a particular industry, or specific holdings. The market as a whole can decline for many reasons, including adverse political or economic developments here or abroad, changes in investor psychology, or heavy institutional selling. The prospects for an industry or company may deteriorate because of a variety of factors, including disappointing earnings or changes in the competitive environment. Also, our assessment of companies held in the fund may prove incorrect, resulting in losses or poor performance even in a rising market. In addition, the fund’s investment approach could fall out of favor with the investing public, resulting in lagging performance versus other types of stock funds.
Since the fund will be concentrated in the financial services industry, it will be less diversified than stock funds investing in a broader range of industries and, therefore, could experience significant volatility. Generally, the fund represents greater potential risk than a more diversified fund, although the dividends paid by financial services companies moderate this risk to some extent. Financial services companies may be hurt when interest rates rise sharply, although not all companies are affected equally. The stocks may also be vulnerable to rapidly rising inflation.
Many companies in this field can possess growth characteristics, but the industry is not generally perceived to be dynamic or aggressive, which could dampen fund performance compared with more aggressive funds. The fund’s investments in growth stocks could result in greater volatility because of the generally higher valuations of these stocks. The fund’s use of the value approach carries the risks that the market will not recognize a security’s intrinsic value for a long time or that a stock judged to be undervalued may actually be appropriately priced.
GLOSSARY
Lipper indexes: Fund benchmarks that consist of a small number of the largest mutual funds in a particular category as tracked by Lipper Inc.
Morningstar Specialty Financial Average: A benchmark for the financials sector that comprises mutual funds seeking capital appreciation by investing primarily in stocks of financial services companies.
Price/book value (P/BV) ratio: A ratio used to compare a stock’s market value to its book value. It is calculated by dividing the current closing price of the stock by the latest quarter’s book value.
Price/earnings (P/E) ratio: A ratio shows the “multiple” of earnings at which a stock is selling. It is calculated by dividing a stock’s current price by its current earnings per share. For example, if a stock’s price is $60 per share and the issuing company earns $2 per share, the P/E ratio is $60/$2, or 30.
S&P 500 Financials Index: A subindex of the S&P 500 Stock Index that includes all of the financials sector components of the S&P 500.
S&P 500 Stock Index: An unmanaged index that tracks the stocks of 500 primarily large-cap U.S. companies.

Performance and Expenses
This chart shows the value of a hypothetical $10,000 investment in the fund over the past 10 fiscal year periods or since inception (for funds lacking 10-year records). The result is compared with benchmarks, which may include a broad-based market index and a peer group average or index. Market indexes do not include expenses, which are deducted from fund returns as well as mutual fund averages and indexes.

| AVERAGE ANNUAL COMPOUND TOTAL RETURN |
This table shows how the fund would have performed each year if its actual (or cumulative) returns for the periods shown had been earned at a constant rate.
As a mutual fund shareholder, you may incur two types of costs: (1) transaction costs, such as redemption fees or sales loads, and (2) ongoing costs, including management fees, distribution and service (12b-1) fees, and other fund expenses. The following example is intended to help you understand your ongoing costs (in dollars) of investing in the fund and to compare these costs with the ongoing costs of investing in other mutual funds. The example is based on an investment of $1,000 invested at the beginning of the most recent six-month period and held for the entire period.
Actual Expenses
The first line of the following table (“Actual”) provides information about actual account values and expenses based on the fund’s actual returns. You may use the information in this line, together with your account balance, to estimate the expenses that you paid over the period. Simply divide your account value by $1,000 (for example, an $8,600 account value divided by $1,000 = 8.6), then multiply the result by the number in the first line under the heading “Expenses Paid During Period” to estimate the expenses you paid on your account during this period.
Hypothetical Example for Comparison Purposes
The information on the second line of the table (“Hypothetical”) is based on hypothetical account values and expenses derived from the fund’s actual expense ratio and an assumed 5% per year rate of return before expenses (not the fund’s actual return). You may compare the ongoing costs of investing in the fund with other funds by contrasting this 5% hypothetical example and the 5% hypothetical examples that appear in the shareholder reports of the other funds. The hypothetical account values and expenses may not be used to estimate the actual ending account balance or expenses you paid for the period.
Note: T. Rowe Price charges an annual small-account maintenance fee of $10, generally for accounts with less than $2,000 ($500 for UGMA/UTMA). The fee is waived for any investor whose T. Rowe Price mutual fund accounts total $25,000 or more, accounts employing automatic investing, and IRAs and other retirement plan accounts that utilize a prototype plan sponsored by T. Rowe Price (although a separate custodial or administrative fee may apply to such accounts). This fee is not included in the accompanying table. If you are subject to the fee, keep it in mind when you are estimating the ongoing expenses of investing in the fund and when comparing the expenses of this fund with other funds.
You should also be aware that the expenses shown in the table highlight only your ongoing costs and do not reflect any transaction costs, such as redemption fees or sales loads. Therefore, the second line of the table is useful in comparing ongoing costs only and will not help you determine the relative total costs of owning different funds. To the extent a fund charges transaction costs, however, the total cost of owning that fund is higher.

Unaudited

The accompanying notes are an integral part of these financial statements.
Unaudited

The accompanying notes are an integral part of these financial statements.
Unaudited
The accompanying notes are an integral part of these financial statements.
Unaudited

The accompanying notes are an integral part of these financial statements.
Unaudited

The accompanying notes are an integral part of these financial statements.
Unaudited
| NOTES TO FINANCIAL STATEMENTS |
NOTE 1 - SIGNIFICANT ACCOUNTING POLICIES
T. Rowe Price Financial Services Fund, Inc. (the fund), is registered under the Investment Company Act of 1940 (the 1940 Act) as a diversified, open-end management investment company. The fund commenced operations on September 30, 1996. The fund seeks long-term growth of capital and a modest level of income.
The accompanying financial statements were prepared in accordance with accounting principles generally accepted in the United States of America, which require the use of estimates made by fund management. Fund management believes that estimates and security valuations are appropriate; however, actual results may differ from those estimates, and the security valuations reflected in the financial statements may differ from the value the fund ultimately realizes upon sale of the securities.
Valuation The fund values its investments and computes its net asset value per share at the close of the New York Stock Exchange (NYSE), normally 4 p.m. ET, each day that the NYSE is open for business. Equity securities listed or regularly traded on a securities exchange or in the over-the-counter (OTC) market are valued at the last quoted sale price or, for certain markets, the official closing price at the time the valuations are made, except for OTC Bulletin Board securities, which are valued at the mean of the latest bid and asked prices. A security that is listed or traded on more than one exchange is valued at the quotation on the exchange determined to be the primary market for such security. Listed securities not traded on a particular day are valued at the mean of the latest bid and asked prices for domestic securities and the last quoted sale price for international securities.
Investments in mutual funds are valued at the mutual fund’s closing net asset value per share on the day of valuation.
Other investments, including restricted securities, and those for which the above valuation procedures are inappropriate or are deemed not to reflect fair value are stated at fair value as determined in good faith by the T. Rowe Price Valuation Committee, established by the fund’s Board of Directors.
Most foreign markets close before the close of trading on the NYSE. If the fund determines that developments between the close of a foreign market and the close of the NYSE will, in its judgment, materially affect the value of some or all of its portfolio securities, which in turn will affect the fund’s share price, the fund will adjust the previous closing prices to reflect the fair value of the securities as of the close of the NYSE, as determined in good faith by the T. Rowe Price Valuation Committee, established by the fund’s Board of Directors. A fund may also fair value securities in other situations, such as when a particular foreign market is closed but the fund is open. In deciding whether to make fair value adjustments, the fund reviews a variety of factors, including developments in foreign markets, the performance of U.S. securities markets, and the performance of instruments trading in U.S. markets that represent foreign securities and baskets of foreign securities. The fund uses outside pricing services to provide it with closing market prices and information used for adjusting those prices. The fund cannot predict when and how often it will use closing prices and when it will adjust those prices to reflect fair value. As a means of evaluating its fair value process, the fund routinely compares closing market prices, the next day’s opening prices in the same markets, and adjusted prices.
Currency Translation Assets, including investments, and liabilities denominated in foreign currencies are translated into U.S. dollar values each day at the prevailing exchange rate, using the mean of the bid and asked prices of such currencies against U.S. dollars as quoted by a major bank. Purchases and sales of securities, income, and expenses are translated into U.S. dollars at the prevailing exchange rate on the date of the transaction. The effect of changes in foreign currency exchange rates on realized and unrealized security gains and losses is reflected as a component of security gains and losses.
Rebates Subject to best execution, the fund may direct certain security trades to brokers who have agreed to rebate a portion of the related brokerage commission to the fund in cash. Commission rebates are reflected as realized gain on securities in the accompanying financial statements and totaled $17,000 for the six months ended June 30, 2007.
Investment Transactions, Investment Income, and Distributions Income and expenses are recorded on the accrual basis. Dividends received from mutual fund investments are reflected as dividend income; capital gain distributions are reflected as realized gain/loss. Dividend income and capital gain distributions are recorded on the ex-dividend date. Any income tax-related interest and penalties would be classified as income tax expense. Investment transactions are accounted for on the trade date. Realized gains and losses are reported on the identified cost basis. Distributions to shareholders are recorded on the ex-dividend date. Income distributions are declared and paid on an annual basis. Capital gain distributions, if any, are declared and paid by the fund, typically on an annual basis.
New Accounting Pronouncements Effective June 29, 2007, the fund adopted Financial Accounting Standards Board (“FASB”) Interpretation No. 48 (“FIN 48”), Accounting for Uncertainty in Income Taxes, a clarification of FASB Statement No. 109, Accounting for Income Taxes. FIN 48 establishes financial accounting and disclosure requirements for recognition and measurement of tax positions taken or expected to be taken on an income tax return. The adoption of FIN 48 had no impact on the fund’s net assets or results of operations.
In September 2006, the FASB released the Statement of Financial Accounting Standard No. 157 (“FAS 157”), Fair Value Measurements. FAS 157 clarifies the definition of fair value and establishes the framework for measuring fair value, as well as proper disclosure of this methodology in the financial statements. It will be effective for the fund’s fiscal year beginning January 1, 2008. Management is evaluating the effects of FAS 157; however, it is not expected to have a material impact on the fund’s net assets or results of operations.
NOTE 2 - INVESTMENT TRANSACTIONS
Consistent with its investment objective, the fund engages in the following practices to manage exposure to certain risks or to enhance performance. The investment objective, policies, program, and risk factors of the fund are described more fully in the fund’s prospectus and Statement of Additional Information.
Restricted Securities The fund may invest in securities that are subject to legal or contractual restrictions on resale. Although certain of these securities may be readily sold, for example, under Rule 144A, others may be illiquid, their sale may involve substantial delays and additional costs, and prompt sale at an acceptable price may be difficult.
Purchases and sales of portfolio securities, other than short-term securities, aggregated $344,530,000 and $365,420,000, respectively, for the six months ended June 30, 2007.
NOTE 3 - FEDERAL INCOME TAXES
No provision for federal income taxes is required since the fund intends to continue to qualify as a regulated investment company under Subchapter M of the Internal Revenue Code and distribute to shareholders all of its taxable income and gains. Federal income tax regulations differ from generally accepted accounting principles; therefore, distributions determined in accordance with tax regulations may differ in amount or character from net investment income and realized gains for financial reporting purposes. Financial reporting records are adjusted for permanent book/tax differences to reflect tax character. Financial records are not adjusted for temporary differences. The amount and character of tax-basis distributions and composition of net assets are finalized at fiscal year-end; accordingly, tax-basis balances have not been determined as of June 30, 2007.
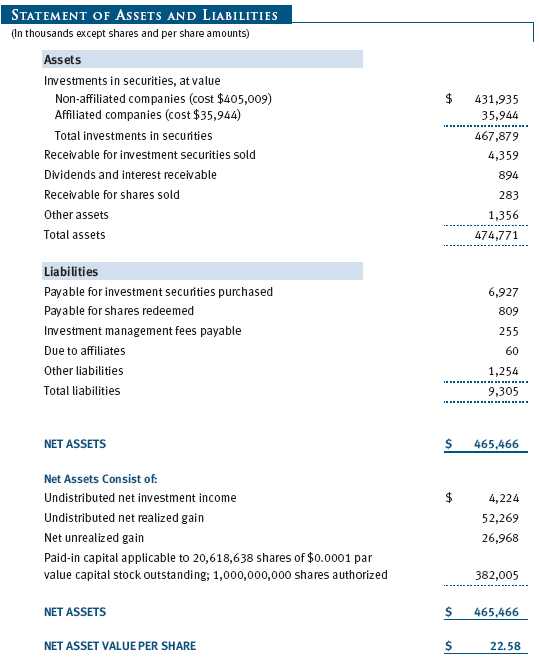
At June 30, 2007, the cost of investments for federal income tax purposes was $440,953,000. Net unrealized gain aggregated $26,968,000 at period-end, of which $31,947,000 related to appreciated investments and $4,979,000 related to depreciated investments.
NOTE 4 - RELATED PARTY TRANSACTIONS
The fund is managed by T. Rowe Price Associates, Inc. (the manager or Price Associates), a wholly owned subsidiary of T. Rowe Price Group, Inc. The investment management agreement between the fund and the manager provides for an annual investment management fee, which is computed daily and paid monthly. The fee consists of an individual fund fee, equal to 0.35% of the fund’s average daily net assets, and a group fee. The group fee rate is calculated based on the combined net assets of certain mutual funds sponsored by Price Associates (the group) applied to a graduated fee schedule, with rates ranging from 0.48% for the first $1 billion of assets to 0.285% for assets in excess of $220 billion. The fund’s group fee is determined by applying the group fee rate to the fund’s average daily net assets. At June 30, 2007, the effective annual group fee rate was 0.30%.
In addition, the fund has entered into service agreements with Price Associates and two wholly owned subsidiaries of Price Associates (collectively, Price). Price Associates computes the daily share price and provides certain other administrative services to the fund. T. Rowe Price Services, Inc., provides shareholder and administrative services in its capacity as the fund’s transfer and dividend disbursing agent. T. Rowe Price Retirement Plan Services, Inc., provides subaccounting and recordkeeping services for certain retirement accounts invested in the fund. For the six months ended June 30, 2007, expenses incurred pursuant to these service agreements were $49,000 for Price Associates, $265,000 for T. Rowe Price Services, Inc., and $30,000 for T. Rowe Price Retirement Plan Services, Inc. The total amount payable at period-end pursuant to these service agreements is reflected as Due to Affiliates in the accompanying financial statements.
Additionally, the fund is one of several mutual funds in which certain college savings plans managed by Price Associates may invest. As approved by the fund’s Board of Directors, shareholder servicing costs associated with each college savings plan are borne by the fund in proportion to the average daily value of its shares owned by the college savings plan. For the six months ended June 30, 2007, the fund was charged $21,000 for shareholder servicing costs related to the college savings plans, of which $16,000 was for services provided by Price. The amount payable at period-end pursuant to this agreement is reflected as Due to Affiliates in the accompanying financial statements. At June 30, 2007, approximately 3% of the outstanding shares of the fund were held by college savings plans.
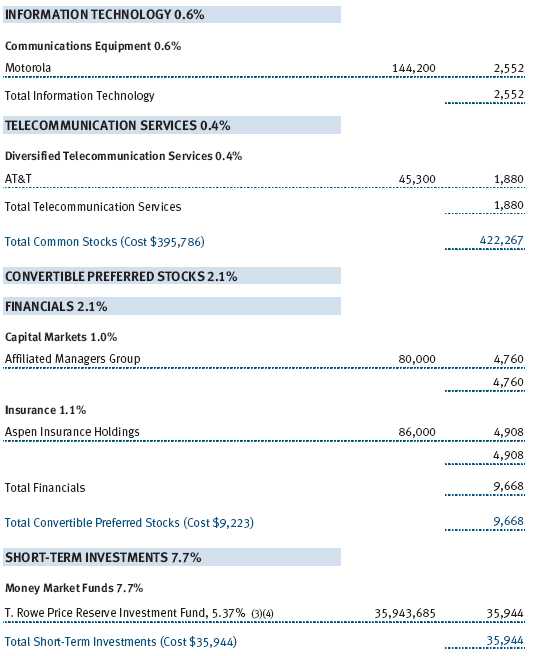
The fund may invest in the T. Rowe Price Reserve Investment Fund and the T. Rowe Price Government Reserve Investment Fund (collectively, the T. Rowe Price Reserve Investment Funds), open-end management investment companies managed by Price Associates and affiliates of the fund. The T. Rowe Price Reserve Investment Funds are offered as cash management options to mutual funds, trusts, and other accounts managed by Price Associates and/or its affiliates, and are not available for direct purchase by members of the public. The T. Rowe Price Reserve Investment Funds pay no investment management fees. During the six months ended June 30, 2007, dividend income from the T. Rowe Price Reserve Investment Funds totaled $702,000, and the value of shares of the T. Rowe Price Reserve Investment Funds held at June 30, 2007, and December 31, 2006, was $35,944,000 and $11,773,000, respectively.
As of June 30, 2007, T. Rowe Price Group, Inc. and/or its wholly owned subsidiaries owned 202,713 shares of the fund, representing 1% of the fund’s net assets.
| INFORMATION ON PROXY VOTING POLICIES, PROCEDURES, AND RECORDS |
A description of the policies and procedures used by T. Rowe Price funds and portfolios to determine how to vote proxies relating to portfolio securities is available in each fund’s Statement of Additional Information, which you may request by calling 1-800-225-5132 or by accessing the SEC’s Web site, www.sec.gov. The description of our proxy voting policies and procedures is also available on our Web site, www.troweprice.com. To access it, click on the words “Company Info” at the top of our homepage for individual investors. Then, in the window that appears, click on the “Proxy Voting Policy” navigation button in the top left corner.
Each fund’s most recent annual proxy voting record is available on our Web site and through the SEC’s Web site. To access it through our Web site, follow the directions above, then click on the words “Proxy Voting Record” at the bottom of the Proxy Voting Policy page.
| HOW TO OBTAIN QUARTERLY PORTFOLIO HOLDINGS |
The fund files a complete schedule of portfolio holdings with the Securities and Exchange Commission for the first and third quarters of each fiscal year on Form N-Q. The fund’s Form N-Q is available electronically on the SEC’s Web site (www.sec.gov); hard copies may be reviewed and copied at the SEC’s Public Reference Room, 450 Fifth St. N.W., Washington, DC 20549. For more information on the Public Reference Room, call 1-800-SEC-0330.
| APPROVAL OF INVESTMENT MANAGEMENT AGREEMENT |
On March 7, 2007, the fund’s Board of Directors (Board) unanimously approved the investment advisory contract (Contract) between the fund and its investment manager, T. Rowe Price Associates, Inc. (Manager). The Board considered a variety of factors in connection with its review of the Contract, also taking into account information provided by the Manager during the course of the year, as discussed below:
Services Provided by the Manager
The Board considered the nature, quality, and extent of the services provided to the fund by the Manager. These services included, but were not limited to, management of the fund’s portfolio and a variety of related activities, as well as financial and administrative services, reporting, and communications. The Board also reviewed the background and experience of the Manager’s senior management team and investment personnel involved in the management of the fund. The Board concluded that it was satisfied with the nature, quality, and extent of the services provided by the Manager.
Investment Performance of the Fund
The Board reviewed the fund’s average annual total return over the 1-, 3-, 5-, and 10-year periods as well as the fund’s year-by-year returns and compared these returns with previously agreed upon comparable performance measures and market data, including those supplied by Lipper and Morningstar, which are independent providers of mutual fund data. On the basis of this evaluation and the Board’s ongoing review of investment results, the Board concluded that the fund’s performance was satisfactory.
Costs, Benefits, Profits, and Economies of Scale
The Board reviewed detailed information regarding the revenues received by the Manager under the Contract and other benefits that the Manager (and its affiliates) may have realized from its relationship with the fund, including research received under “soft dollar” agreements. The Board noted that soft dollars were not used to pay for third-party, non-broker research. The Board also received information on the estimated costs incurred and profits realized by the Manager and its affiliates from advising T. Rowe Price mutual funds, as well as estimates of the gross profits realized from managing the fund in particular. The Board concluded that the Manager’s profits were reasonable in light of the services provided to the fund. The Board also considered whether the fund or other funds benefit under the fee levels set forth in the Contract from any economies of scale realized by the Manager. Under the Contract, the fund pays a fee to the Manager composed of two components—a group fee rate based on the aggregate assets of certain T. Rowe Price mutual funds (including the fund) that declines at certain asset levels and an individual fund fee rate that is assessed on the assets of the fund. The Board concluded that the advisory fee structure for the fund continued to provide for a reasonable sharing of benefits from any economies of scale with the fund’s investors.
Fees
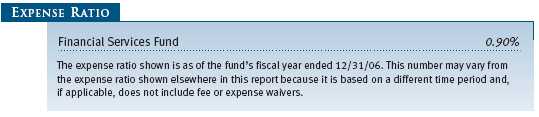
The Board reviewed the fund’s management fee rate, operating expenses, and total expense ratio and compared them with fees and expenses of other comparable funds based on information and data supplied by Lipper. The information provided to the Board indicated that the fund’s management fee rate and expense ratio were generally at or below the median for comparable funds. The Board also reviewed the fee schedules for comparable privately managed accounts of the Manager and its affiliates. Management informed the Board that the Manager’s responsibilities for privately managed accounts are more limited than its responsibilities for the fund and other T. Rowe Price mutual funds that it or its affiliates advise. On the basis of the information provided, the Board concluded that the fees paid by the fund under the Contract were reasonable.
Approval of the Contract
As noted, the Board approved the continuation of the Contract. No single factor was considered in isolation or to be determinative to the decision. Rather, the Board concluded, in light of a weighting and balancing of all factors considered, that it was in the best interests of the fund to approve the continuation of the Contract, including the fees to be charged for services thereunder.
Item 2. Code of Ethics.
A code of ethics, as defined in Item 2 of Form N-CSR, applicable to its principal executive officer, principal financial officer, principal accounting officer or controller, or persons performing similar functions is filed as an exhibit to the registrant’s annual Form N-CSR. No substantive amendments were approved or waivers were granted to this code of ethics during the registrant’s most recent fiscal half-year.
Item 3. Audit Committee Financial Expert.
Disclosure required in registrant’s annual Form N-CSR.
Item 4. Principal Accountant Fees and Services.
Disclosure required in registrant’s annual Form N-CSR.
Item 5. Audit Committee of Listed Registrants.
Not applicable.
Item 6. Schedule of Investments.
Not applicable. The complete schedule of investments is included in Item 1 of this Form N-CSR.
Item 7. Disclosure of Proxy Voting Policies and Procedures for Closed-End Management Investment Companies.
Not applicable.
Item 8. Portfolio Managers of Closed-End Management Investment Companies.
Not applicable.
Item 9. Purchases of Equity Securities by Closed-End Management Investment Company and Affiliated Purchasers.
Not applicable.
Item 10. Submission of Matters to a Vote of Security Holders.
Not applicable.
Item 11. Controls and Procedures.
(a) The registrant’s principal executive officer and principal financial officer have evaluated the registrant’s disclosure controls and procedures within 90 days of this filing and have concluded that the registrant’s disclosure controls and procedures were effective, as of that date, in ensuring that information required to be disclosed by the registrant in this Form N-CSR was recorded, processed, summarized, and reported timely.
(b) The registrant’s principal executive officer and principal financial officer are aware of no change in the registrant’s internal control over financial reporting that occurred during the registrant’s second fiscal quarter covered by this report that has materially affected, or is reasonably likely to materially affect, the registrant’s internal control over financial reporting.
Item 12. Exhibits.(a)(1) The registrant’s code of ethics pursuant to Item 2 of Form N-CSR is filed with the registrant’s annual Form N-CSR.
(2) Separate certifications by the registrant's principal executive officer and principal financial officer, pursuant to Section 302 of the Sarbanes-Oxley Act of 2002 and required by Rule 30a-2(a) under the Investment Company Act of 1940, are attached.
(3) Written solicitation to repurchase securities issued by closed-end companies: not applicable.
(b) A certification by the registrant's principal executive officer and principal financial officer, pursuant to Section 906 of the Sarbanes-Oxley Act of 2002 and required by Rule 30a-2(b) under the Investment Company Act of 1940, is attached.
| |
| | |
SIGNATURES |
| |
| | Pursuant to the requirements of the Securities Exchange Act of 1934 and the Investment |
| Company Act of 1940, the registrant has duly caused this report to be signed on its behalf by the |
| undersigned, thereunto duly authorized. |
| |
| T. Rowe Price Financial Services Fund, Inc. |
| |
| |
| By | /s/ Edward C. Bernard |
| | Edward C. Bernard |
| | Principal Executive Officer |
| |
| Date | August 17, 2007 |
| |
| |
| |
| | Pursuant to the requirements of the Securities Exchange Act of 1934 and the Investment |
| Company Act of 1940, this report has been signed below by the following persons on behalf of |
| the registrant and in the capacities and on the dates indicated. |
| |
| |
| By | /s/ Edward C. Bernard |
| | Edward C. Bernard |
| | Principal Executive Officer |
| |
| Date | August 17, 2007 |
| |
| |
| |
| By | /s/ Joseph A. Carrier |
| | Joseph A. Carrier |
| | Principal Financial Officer |
| |
| Date | August 17, 2007 |