| UNITED STATES |
| SECURITIES AND EXCHANGE COMMISSION |
| Washington, D.C. 20549 |
| |
FORM N-CSR |
| |
CERTIFIED SHAREHOLDER REPORT OF REGISTERED |
MANAGEMENT INVESTMENT COMPANIES |
| |
| |
| |
| Investment Company Act File Number: 811-07749 |
|
| |
| T. Rowe Price Financial Services Fund, Inc. |
|
| (Exact name of registrant as specified in charter) |
| |
| 100 East Pratt Street, Baltimore, MD 21202 |
|
| (Address of principal executive offices) |
| |
| David Oestreicher |
| 100 East Pratt Street, Baltimore, MD 21202 |
|
| (Name and address of agent for service) |
| |
| |
| Registrant’s telephone number, including area code: (410) 345-2000 |
| |
| |
| Date of fiscal year end: December 31 |
| |
| |
| Date of reporting period: June 30, 2010 |
Item 1: Report to Shareholders| Financial Services Fund | June 30, 2010 |

The views and opinions in this report were current as of June 30, 2010. They are not guarantees of performance or investment results and should not be taken as investment advice. Investment decisions reflect a variety of factors, and the managers reserve the right to change their views about individual stocks, sectors, and the markets at any time. As a result, the views expressed should not be relied upon as a forecast of the fund’s future investment intent. The report is certified under the Sarbanes-Oxley Act, which requires mutual funds and other public companies to affirm that, to the best of their knowledge, the information in their financial reports is fairly and accurately stated in all material respects.
REPORTS ON THE WEB
Sign up for our E-mail Program, and you can begin to receive updated fund reports and prospectuses online rather than through the mail. Log in to your account at troweprice.com for more information.
Manager’s Letter
Fellow Shareholders
The U.S. economic recovery continued in the first half of 2010, but a European debt crisis and intense regulatory pressure in major U.S. industries like financial services, health care, and energy have shaken consumer and business confidence and led to a slowdown in the pace of the recovery. Financial services companies declined modestly in the last six months, as strong gains through late April were more than erased by a sharp decline in May and June.
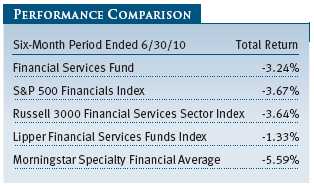
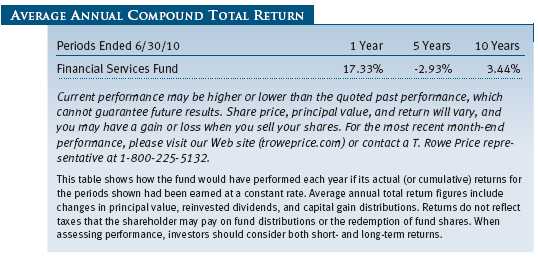
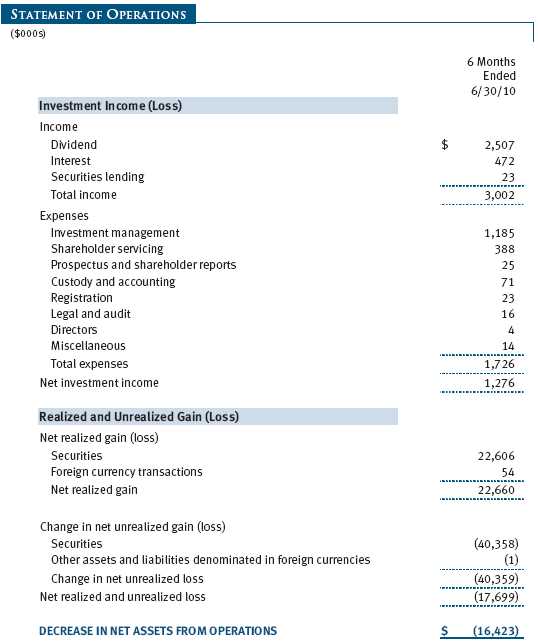
The Financial Services Fund returned -3.24% in the first half of 2010, turning in acceptable performance versus its benchmarks, as shown in the Performance Comparison table. Effective July 1, 2010, we are adding the Russel1 3000 Financial Services Sector Index as a primary benchmark. Given the multi-cap nature of our fund, we think it is appropriate to compare the fund’s performance with that of this Russell index, which includes financials across all market capitalizations.
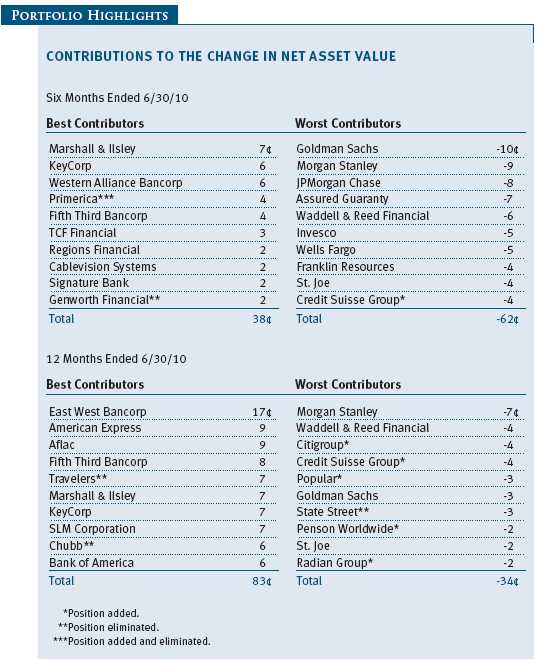
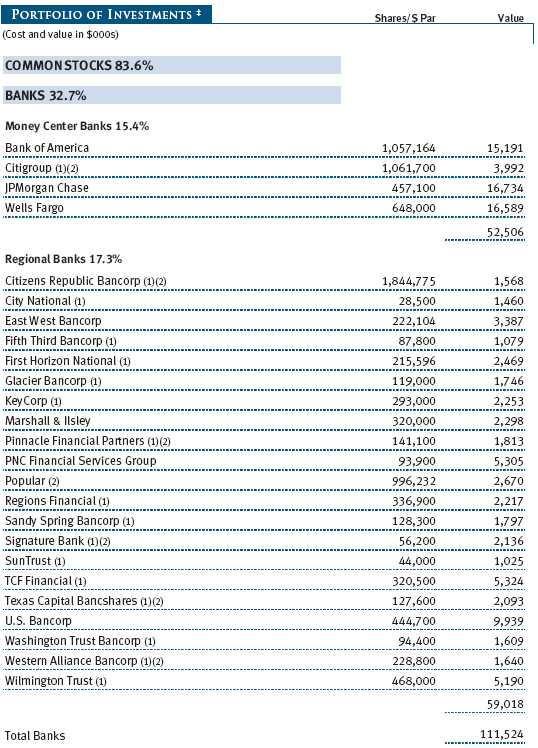
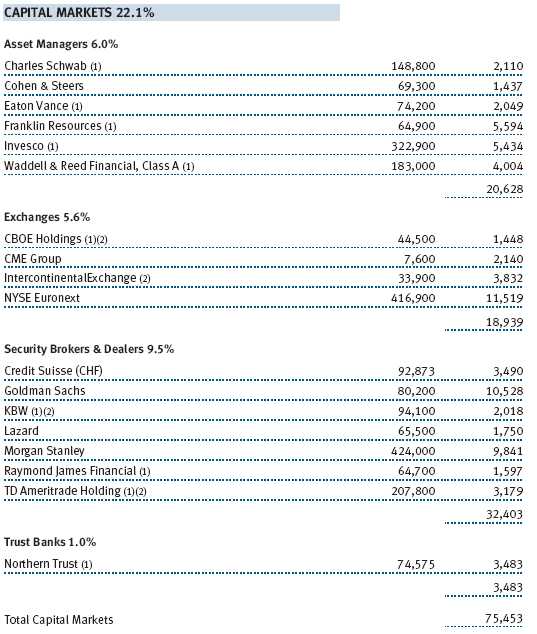
The biggest detractors from performance over the last six months included our large investments in several companies facing substantial business changes stemming from regulatory changes: Goldman Sachs, Morgan Stanley, JPMorgan Chase, and Wells Fargo. Also hurting performance were large positions in asset management companies Franklin Resources and Invesco. We have added to most of these holdings during the period, with Morgan Stanley, Franklin Resources, and Invesco among our largest purchases. (Please refer to the fund’s portfolio of investments for a complete listing of holdings and the amount each represents in the portfolio.)
Regional banks were a bright spot during the period. You may recall that these stocks were among our largest purchases in the first half of 2009 and that, in our opinion, they are less impacted by the regulatory changes facing the industry. Marshall & Ilsley, KeyCorp, Western Alliance Bancorp, Fifth Third Bancorp, Regions Financial, and Signature Bank all helped fund performance. Given the significant appreciation in these securities and our large exposure, we reduced our positions in several regional banks during the period to fund the purchases of the underperformers noted on page 1.
In our last writing, we noted that the securities in the portfolio were trading much closer to their intrinsic value than they were at midyear 2009 but that valuations were still attractive. We did trim selected holdings over the last six months when we felt the price appreciation had unfavorably shifted the risk/reward trade-off. Given the sharp sell-off we have experienced in the last few months coupled with ample evidence of a modest economic recovery, we once again find most of our holdings trading well below our assessment of intrinsic value—as we did in late 2008 and early 2009. As a result, we are optimistic about the potential for above-average returns over the next two to three years and prepared to navigate through the uneven, if not uninspiring, economic recovery that is unfolding in the U.S. and around the world.
As always, we would like to remind our investors that the Financial Services Fund is a relatively narrow offering that is subject to a greater risk of capital losses than more diversified portfolios. We believe that only a relatively small portion of one’s investment portfolio should be allocated to this strategy.
MARKET ENVIRONMENT
There is actually a reasonable amount of good news for investors. With the 10-year Treasury note yielding less than 3% and with large-cap stock returns about the same as investment-grade bond returns over the last 20 years, stocks look like a relative bargain. Cash on corporate balance sheets is at historically high levels. Billions of dollars of government stimulus money has yet to work its way into the economy. Transportation data across trucking, rail, air, and shipping in the U.S. point to a continued economic expansion, and a recovery in many sectors of the economy remains firmly intact. Important metrics at financial institutions like capital ratios, bad debt expense, and nonperforming loan formation continue to improve. Unfortunately, jobless claims remain stubbornly high, and sales across the retail, auto, and housing sectors have fallen off over the last two months. Further, regulatory changes looming in the financials sector are likely to result in less access to credit for consumers and lower returns on equity as companies adjust to higher capital requirements and restrictions on product development and pricing. It seems that for every positive development we see—a global economic recovery, unusually cheap valuations, rapidly improving balance sheets, and strong projected earnings growth in 2011 and 2012—there is an offsetting negative aspect, including regulatory changes that will continue to restrict credit and slow economic growth, a European sovereign debt crisis that will slow the global recovery, and one of the least business-friendly political climates in a generation. If ever there were a “wall of worry” for financial stocks to climb, the current environment with its vast uncertainties fits the bill.
Importantly, when we net the investment risks against the opportunities that currently face us, we believe there are more ways for the patient long-term investor to win than lose. As the share prices of market-leading financial companies have fallen precipitously since late April despite a general improvement in underlying fundamentals, prospective returns have become more attractive. For example, well-positioned companies such as JPMorgan Chase, Bank of America, Prudential Financial, MetLife, and Morgan Stanley are all trading at or below their book value despite ample evidence that these companies will be able to earn returns that are sustainably higher than their cost of capital. We believe the fund is positioned for a resumption of the recovery in share prices that started in March 2009 but began to rapidly reverse in April 2010.
EVOLVING PERSPECTIVES AND FUND POSITIONING
In our report to you six months ago, we noted that asset prices were reflecting the beginning of a global economic recovery, as excessive risk aversion had subsided. We anticipated that governments around the world would begin to remove market support and stimulative fiscal policies while embarking on a series of interest rate hikes to address building inflationary pressures. We now expect stimulative policies to remain in place for a longer period and rate hikes only in selected countries in 2010—namely emerging countries such as China, India, and Brazil, along with developed countries with resource-based economies that supply China, such as Canada and Australia.
Subsequent to our last report, a major sovereign debt crisis unfolded in Europe that called into question the viability of the single-currency European Union (EU). For the first time since the inception of the euro, the EU must take action when member countries—Greece, for example—spend beyond their means to such an extent that the bond market loses confidence and is unwilling to finance the country at affordable rates of interest without explicit EU support. Historically, individual EU countries, particularly those with the biggest social safety nets, have had difficulty implementing unpopular austerity measures required to balance budgets and bring deficits under control. This problem is not new, and it exists in most developed markets around the world (including the U.S.) to varying degrees. What is new is that countries are responding with cuts in spending and contemplating tax increases because the bond market has now effectively “gone on strike,” demanding prohibitively high interest rates on new debt issued by countries on an unsustainable fiscal path, such as Greece, Portugal, and Spain.
So, the stronger EU nations like Germany and France are applying pressure to their colleagues in places like Greece to raise taxes and cut spending at a time when the economy is already shrinking and unemployment is high. The good news is that the bond market is forcing those countries and regions with the least-promising outlooks to implement much-needed structural reform that would otherwise not get done. The bad news is that such actions will slow the global economic recovery. Eventually—perhaps not for a number of years—creditors will apply the same calculus to the U.S. if our elected officials continue to support unsustainable spending habits.
We also noted in our last writing that increased regulation and the potential for damaging legislation would give investors pause, particularly in the financials sector. In fact, we underestimated just how damaging certain aspects of regulation and legislation would become. Now that valuations have declined and we have some visibility into how the changes will impact earnings and returns, we think that “the horse is out of the barn” and that prospective returns are attractive despite the difficult business climate for financial companies.
Finally, we noted that banks looked particularly attractive to us and that we were waiting for the market to price in normalized earnings in 2012 as losses abate and revenues grow from depressed levels. As of this writing, our estimates of 2012 bank earnings are lower than they were six months ago, given regulatory changes and an ultra-low interest rate environment that is likely to persist well into 2011. Normalized earnings for many banks are more likely to be pushed out to 2013 if the low rate environment continues for the next four to six quarters. However, we still find the banks compelling because we think balance sheets are solid and credit losses will continue to decrease. Also, newly emerging pressure on the net interest margin at a number of banks stemming from low interest rates, the impact of implementing new regulations on pricing, and the run-off of higher-yielding consumer loan portfolios will reverse when interest rates rise. Most importantly, valuations are simply too low in our view. We also believe the challenges facing the industry will lead to a significant period of merger and acquisition (M&A) activity in the U.S. banking industry in 2011 and 2012, given the benefits of scale and the large number of banks—over 7,000—that operate in the U.S. Considering the important role banks play in the economy and their prominent weighting in the Financial Services Fund, we believe economic growth in general, and employment growth in particular, will be among the most important drivers of performance of the banks, and thus the fund, in the next 12 to 24 months.
PORTFOLIO REVIEW
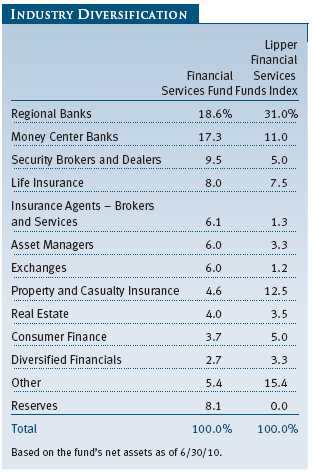
Our fund continues to be well diversified across more than 70 issuers of securities and remains positioned for an economic recovery. The fund is unlikely to perform well if the economy dips back into recession, housing prices fall precipitously, or unemployment increases significantly.
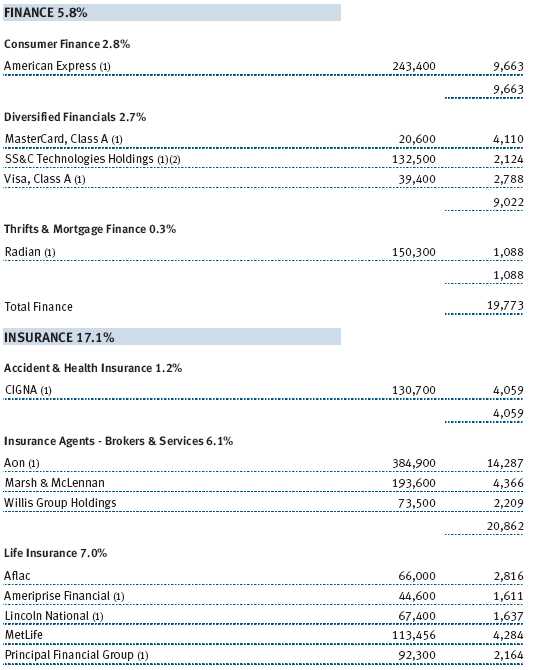
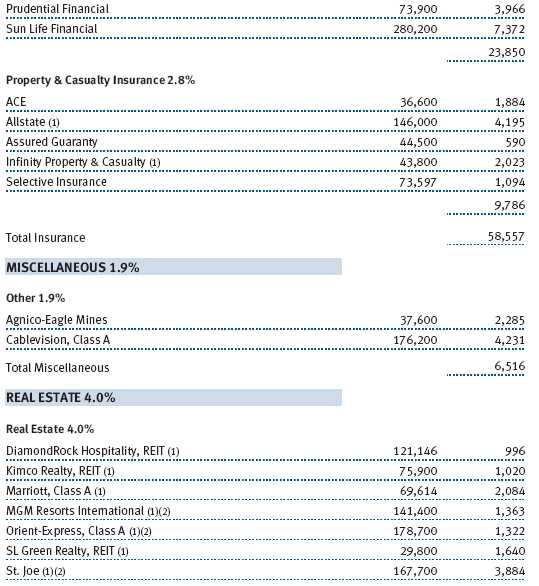
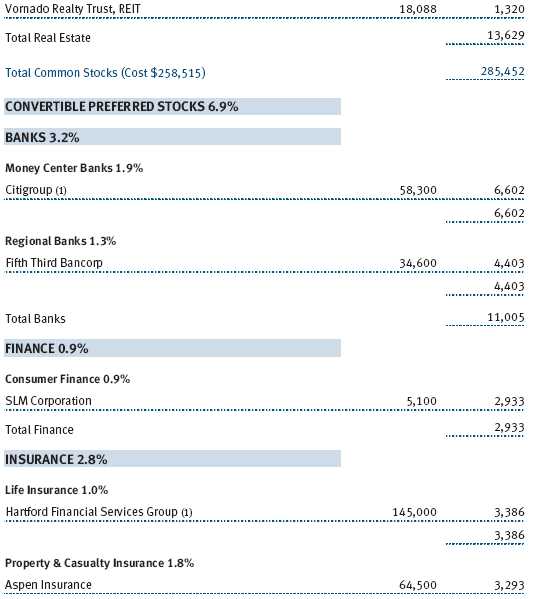
During the last six months, our largest purchases involved banks that tumbled on concerns over regulatory changes and a slowdown in the economy. We bought shares of Citigroup convertible preferred stock that yields over 6% and participates in most of the common stock price’s underlying movement. Citigroup has repaid the federal government, rebuilt its balance sheet to a level that gives it one of the highest regulatory capital ratios in the banking industry, and reduced its portfolio of businesses to a core group of assets that generate more than half of the company’s earnings in attractive emerging markets in Asia and Latin America. At around $4 per share, Citigroup’s common stock is trading below its tangible book value and for about six times what we think the company can earn in a few years. We also made large purchases of the common stocks of Credit Suisse Group, American Express, and Morgan Stanley. Citigroup, Morgan Stanley, and American Express are now top-10 holdings. Other large purchases were focused on asset managers Franklin Resources and Invesco—great businesses that are on sale for 12 to 13 times what we think these companies will earn in 2011. We also continued to add to Canada-based life insurer Sun Life Financial, which was among our largest purchases in the prior six-month period. The company has a 5% dividend yield and an undervalued collection of assets, including U.S.-based money manager MFS.
Our largest sales reflected a number of themes. First, we continued to sell defensive property and casualty insurers that held up well during the downturn. We eliminated long-time holdings Chubb and Travelers as well as niche insurer Assurant. Other large sales reflected profit taking in regional banks where there was no change in our investment thesis, but where we determined that the increase in share price no longer warranted a large position. KeyCorp and Marshall & Ilsley were among the larger such sales in the period. We reduced our positions as both stocks appreciated sharply, garnering valuations 25% to 30% above their tangible book values despite the fact that they face losses for many more quarters as they work through their bad loans toward acceptable levels of profitability in 2012. As of this writing, we have started to rebuild our positions in KeyCorp, Marshall & Ilsley, and other regional banks as they have traded back down to their tangible book values and offer a more favorable risk/reward trade-off.
Other sales were precipitated by a thesis change. We sold two-thirds of our position in supplemental insurer Aflac. It has been a strong performer for the fund, and we are maintaining a core position. However, Aflac has significant investments in the sovereign debt of highly leveraged European nations such as Greece. Given the change in our assessment of risk and return potential, we sold a large portion of our position, locking in significant gains and giving us the flexibility to rebuild the position should the stock decline excessively on balance sheet concerns.
OUTLOOK
Today, the stock prices of many financial companies are discounting significant balance sheet shrinkage and unacceptable returns on capital for years to come. At the end of 2009 and in the first three-and-a-half months of 2010, the stocks were discounting a much more optimistic scenario. Over the last six months, investor sentiment whipsawed from euphoria to despondency, while investor concerns whipsawed from the threat of inflation to the threat of deflation and from the balance sheet to the income statement—in particular, revenue growth. As a result, the market punished those companies that have emerged from the 2008 financial crisis with solid balance sheets but have yet to show evidence that they can grow at acceptable levels over the next 12 to 18 months.
While the economic recovery has clearly lost momentum and regulatory changes are likely to weigh on profits, we believe the fall in stock prices has been excessive as the underlying value of the companies we own has changed little in the last six months. We do anticipate a difficult operating environment for financial companies over the next year or two, as they wrestle with the implementation of new regulations and find it difficult to grow revenues meaningfully with short-term interest rates near 0%. Importantly, we believe clarity on the impact of regulatory change will begin to emerge over the next 12 months. We also believe that the market will eventually see that the difficult revenue growth environment for well-positioned companies, while perhaps having a structural component, is more cyclical in nature and that the companies we own will show ample evidence of an ability to earn acceptable returns—or will be merged with companies that can—in the next couple of years. The risk to this thesis is a reversal in the economic recovery and another round of job losses in the U.S.
In closing, the returns in the first half of 2010 were uninspiring, but the fund remains positioned for an economic recovery. The lack of clarity on three important drivers—the strength of the recovery in the U.S. and Europe, the ultimate impact of regulatory changes on earnings and returns, and the impact of a near-0% interest rate policy on earnings and returns—has prompted investors to move to the sidelines. Our strategy is to embrace the uncertainty and continue to build positions in companies ahead of a turn in fundamentals as long as we are comfortable with each company’s liquidity and balance sheet strength. We believe most of our holdings will be on a path to generate acceptable returns by 2012 as companies adjust their prices and capital allocation strategies to reflect cyclical and structural issues. Industry consolidation would likely have a favorable impact on financials stocks, and we believe changes in the industry will generate significantly more M&A activity in the next two years than we have seen in the last two years. Moreover, we think the Federal Reserve’s current monetary policy will ultimately prove inflationary and that the favorable prospect of a measured rise in rates will eventually be reflected in the shares of financial companies. We look forward to reporting back to you in six months.
Thank you for your confidence in T. Rowe Price.
Respectfully submitted,

Jeffrey W. Arricale
Chairman of the fund’s Investment Advisory Committee
July 23, 2010
The committee chairman has day-to-day responsibility for managing the
portfolio and works with committee members in developing and executing
the fund’s investment program.
RISKS OF INVESTING
The fund’s share price can fall because of weakness in the stock market, a particular industry, or specific holdings. Stock markets can decline for many reasons, including adverse political or economic developments, changes in investor psychology, or heavy institutional selling. The prospects for an industry or company may deteriorate because of a variety of factors, including disappointing earnings or changes in the competitive environment. In addition, the investment manager’s assessment of companies held in a fund may prove incorrect, resulting in losses or poor performance, even in rising markets.
Funds that invest only in specific industries will experience greater volatility than funds investing in a broad range of industries. The banking industry can be significantly affected by legislation that has reduced the separation between commercial and investment banking businesses, changed the laws governing capitalization requirements and the savings and loan industry, and increased competition. In addition, changes in general economic conditions and interest rates can significantly affect the banking industry. Financial services companies may be hurt when interest rates rise sharply, although not all companies are affected equally. The stocks may also be vulnerable to rapidly rising inflation.
GLOSSARY
Lipper indexes: Fund benchmarks that consist of a small number of the largest mutual funds in a particular category as tracked by Lipper Inc.
Morningstar Specialty Financial Average: Tracks the performance of funds that seek capital appreciation by investing primarily in equity securities of financial services companies.
Normalized earnings: What investors should expect financial services companies to earn in a reasonable economic environment, given their business mix and capital requirements.
Price-to-earnings (P/E) ratio - 12 months forward: A valuation measure calculated by dividing the price of a stock by the analysts’ forecast of the next 12 months’ expected earnings. The ratio is a measure of how much investors are willing to pay for the company’s future earnings. The higher the P/E, the more investors are paying for a company’s earnings growth in the next 12 months.
Russell 3000 Financial Services Sector Index: A subindex of the Russell 3000 Index that includes all of the financials sector components of the Russell 3000.
S&P 500 Financials Index: A subindex of the S&P 500 Index that includes all of the financials sector components of the S&P 500.
S&P 500 Index: An unmanaged index that tracks the stocks of 500 primarily large-cap U.S. companies.

Performance and Expenses
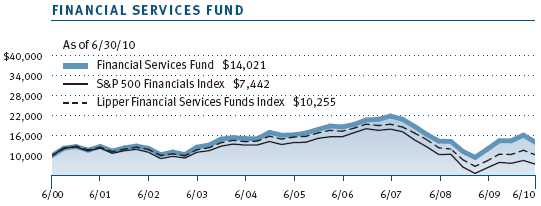
This chart shows the value of a hypothetical $10,000 investment in the fund over the past 10 fiscal year periods or since inception (for funds lacking 10-year records). The result is compared with benchmarks, which may include a broad-based market index and a peer group average or index. Market indexes do not include expenses, which are deducted from fund returns as well as mutual fund averages and indexes.
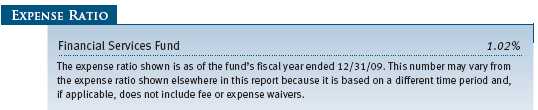
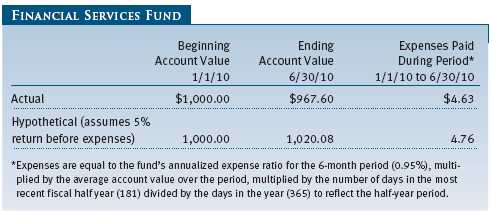
As a mutual fund shareholder, you may incur two types of costs: (1) transaction costs, such as redemption fees or sales loads, and (2) ongoing costs, including management fees, distribution and service (12b-1) fees, and other fund expenses. The following example is intended to help you understand your ongoing costs (in dollars) of investing in the fund and to compare these costs with the ongoing costs of investing in other mutual funds. The example is based on an investment of $1,000 invested at the beginning of the most recent six-month period and held for the entire period.
Actual Expenses
The first line of the following table (“Actual”) provides information about actual account values and expenses based on the fund’s actual returns. You may use the information in this line, together with your account balance, to estimate the expenses that you paid over the period. Simply divide your account value by $1,000 (for example, an $8,600 account value divided by $1,000 = 8.6), then multiply the result by the number in the first line under the heading “Expenses Paid During Period” to estimate the expenses you paid on your account during this period.
Hypothetical Example for Comparison Purposes
The information on the second line of the table (“Hypothetical”) is based on hypothetical account values and expenses derived from the fund’s actual expense ratio and an assumed 5% per year rate of return before expenses (not the fund’s actual return). You may compare the ongoing costs of investing in the fund with other funds by contrasting this 5% hypothetical example and the 5% hypothetical examples that appear in the shareholder reports of the other funds. The hypothetical account values and expenses may not be used to estimate the actual ending account balance or expenses you paid for the period.
Note: T. Rowe Price charges an annual small-account maintenance fee of $10, generally for accounts with less than $2,000 ($500 for UGMA/UTMA). The fee is waived for any investor whose T. Rowe Price mutual fund accounts total $25,000 or more, accounts employing automatic investing, and IRAs and other retirement plan accounts that utilize a prototype plan sponsored by T. Rowe Price (although a separate custodial or administrative fee may apply to such accounts). This fee is not included in the accompanying table. If you are subject to the fee, keep it in mind when you are estimating the ongoing expenses of investing in the fund and when comparing the expenses of this fund with other funds.
You should also be aware that the expenses shown in the table highlight only your ongoing costs and do not reflect any transaction costs, such as redemption fees or sales loads. Therefore, the second line of the table is useful in comparing ongoing costs only and will not help you determine the relative total costs of owning different funds. To the extent a fund charges transaction costs, however, the total cost of owning that fund is higher.
Unaudited
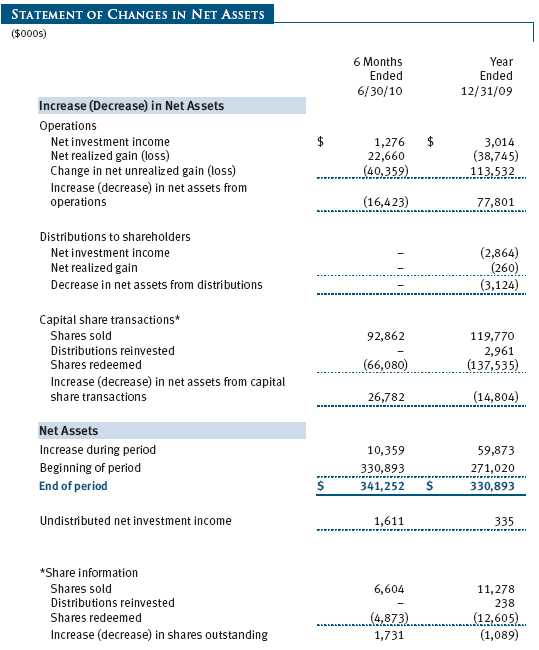
The accompanying notes are an integral part of these financial statements.
Unaudited


The accompanying notes are an integral part of these financial statements.
Unaudited
The accompanying notes are an integral part of these financial statements.
Unaudited
The accompanying notes are an integral part of these financial statements.
Unaudited
The accompanying notes are an integral part of these financial statements.
Unaudited
| NOTES TO FINANCIAL STATEMENTS |
T. Rowe Price Financial Services Fund, Inc. (the fund), is registered under the Investment Company Act of 1940 (the 1940 Act) as a diversified, open-end management investment company. The fund commenced operations on September 30, 1996. The fund seeks long-term growth of capital and a modest level of income.
NOTE 1 - SIGNIFICANT ACCOUNTING POLICIES
Basis of Preparation The accompanying financial statements were prepared in accordance with accounting principles generally accepted in the United States of America (GAAP), which require the use of estimates made by fund management. Fund management believes that estimates and valuations are appropriate; however, actual results may differ from those estimates, and the valuations reflected in the accompanying financial statements may differ from the value ultimately realized upon sale of securities.
Investment Transactions, Investment Income, and Distributions Income and expenses are recorded on the accrual basis. Premiums and discounts on debt securities are amortized for financial reporting purposes. Dividends received from mutual fund investments are reflected as dividend income; capital gain distributions are reflected as realized gain/loss. Dividend income and capital gain distributions are recorded on the ex-dividend date. Income tax-related interest and penalties, if incurred, would be recorded as income tax expense. Investment transactions are accounted for on the trade date. Realized gains and losses are reported on the identified cost basis. Distributions to shareholders are recorded on the ex-dividend date. Income distributions are declared and paid annually. Capital gain distributions, if any, are generally declared and paid by the fund annually.
Currency Translation Assets, including investments, and liabilities denominated in foreign currencies are translated into U.S. dollar values each day at the prevailing exchange rate, using the mean of the bid and asked prices of such currencies against U.S. dollars as quoted by a major bank. Purchases and sales of securities, income, and expenses are translated into U.S. dollars at the prevailing exchange rate on the date of the transaction. The effect of changes in foreign currency exchange rates on realized and unrealized security gains and losses is reflected as a component of security gains and losses.
Rebates and Credits Subject to best execution, the fund may direct certain security trades to brokers who have agreed to rebate a portion of the related brokerage commission to the fund in cash. Commission rebates are reflected as realized gain on securities in the accompanying financial statements and totaled $7,000 for the six months ended June 30, 2010. Additionally, the fund earns credits on temporarily uninvested cash balances held at the custodian, which reduce the fund’s custody charges. Custody expense in the accompanying financial statements is presented before reduction for credits.
New Accounting Pronouncement On January 1, 2010, the fund adopted new accounting guidance that requires enhanced disclosures about fair value measurements in the financial statements. Adoption of this guidance had no impact on the fund’s net assets or results of operations.
NOTE 2 - VALUATION
The fund’s investments are reported at fair value as defined by GAAP. The fund determines the values of its assets and liabilities and computes its net asset value per share at the close of the New York Stock Exchange (NYSE), normally 4 p.m. ET, each day that the NYSE is open for business.
Valuation Methods Equity securities listed or regularly traded on a securities exchange or in the over-the-counter (OTC) market are valued at the last quoted sale price or, for certain markets, the official closing price at the time the valuations are made, except for OTC Bulletin Board securities, which are valued at the mean of the latest bid and asked prices. A security that is listed or traded on more than one exchange is valued at the quotation on the exchange determined to be the primary market for such security. Listed securities not traded on a particular day are valued at the mean of the latest bid and asked prices for domestic securities and the last quoted sale price for international securities.
Debt securities are generally traded in the OTC market. Securities with remaining maturities of one year or more at the time of acquisition are valued at prices furnished by dealers who make markets in such securities or by an independent pricing service, which considers the yield or price of bonds of comparable quality, coupon, maturity, and type, as well as prices quoted by dealers who make markets in such securities. Securities with remaining maturities of less than one year at the time of acquisition generally use amortized cost in local currency to approximate fair value. However, if amortized cost is deemed not to reflect fair value or the fund holds a significant amount of such securities with remaining maturities of more than 60 days, the securities are valued at prices furnished by dealers who make markets in such securities or by an independent pricing service.
Investments in mutual funds are valued at the mutual fund’s closing net asset value per share on the day of valuation.
Other investments, including restricted securities, and those financial instruments for which the above valuation procedures are inappropriate or are deemed not to reflect fair value are stated at fair value as determined in good faith by the T. Rowe Price Valuation Committee, established by the fund’s Board of Directors.
For valuation purposes, the last quoted prices of non-U.S. equity securities may be adjusted under the circumstances described below. If the fund determines that developments between the close of a foreign market and the close of the NYSE will, in its judgment, materially affect the value of some or all of its portfolio securities, the fund will adjust the previous closing prices to reflect what it believes to be the fair value of the securities as of the close of the NYSE. In deciding whether it is necessary to adjust closing prices to reflect fair value, the fund reviews a variety of factors, including developments in foreign markets, the performance of U.S. securities markets, and the performance of instruments trading in U.S. markets that represent foreign securities and baskets of foreign securities. A fund may also fair value securities in other situations, such as when a particular foreign market is closed but the fund is open. The fund uses outside pricing services to provide it with closing prices and information to evaluate and/or adjust those prices. The fund cannot predict how often it will use closing prices and how often it will determine it necessary to adjust those prices to reflect fair value. As a means of evaluating its security valuation process, the fund routinely compares closing prices, the next day’s opening prices in the same markets, and adjusted prices.
Valuation Inputs Various inputs are used to determine the value of the fund’s financial instruments. These inputs are summarized in the three broad levels listed below:
Level 1 – quoted prices in active markets for identical financial instruments
Level 2 – observable inputs other than Level 1 quoted prices (including, but not limited to, quoted prices for similar financial instruments, interest rates, prepayment speeds, and credit risk)
Level 3 – unobservable inputs
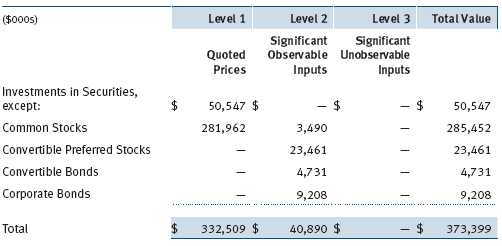
Observable inputs are those based on market data obtained from sources independent of the fund, and unobservable inputs reflect the fund’s own assumptions based on the best information available. The input levels are not necessarily an indication of the risk or liquidity associated with financial instruments at that level. For example, non-U.S. equity securities actively traded in foreign markets generally are reflected in Level 2 despite the availability of closing prices because the fund evaluates and determines whether those closing prices reflect fair value at the close of the NYSE or require adjustment, as described above. The following table summarizes the fund’s financial instruments, based on the inputs used to determine their values on June 30, 2010:
NOTE 3 - OTHER INVESTMENT TRANSACTIONS
Consistent with its investment objective, the fund engages in the following practices to manage exposure to certain risks and/or to enhance performance. The investment objective, policies, program, and risk factors of the fund are described more fully in the fund’s prospectus and Statement of Additional Information.
Restricted Securities The fund may invest in securities that are subject to legal or contractual restrictions on resale. Prompt sale of such securities at an acceptable price may be difficult and may involve substantial delays and additional costs.
Securities Lending The fund lends its securities to approved brokers to earn additional income. It receives as collateral cash and U.S. government securities valued at 102% to 105% of the value of the securities on loan. Cash collateral is invested by the fund’s lending agent(s) in accordance with investment guidelines approved by fund management. Although risk is mitigated by the collateral, the fund could experience a delay in recovering its securities and a possible loss of income or value if the borrower fails to return the securities or if collateral investments decline in value. Securities lending revenue recognized by the fund consists of earnings on invested collateral and borrowing fees, net of any rebates to the borrower and compensation to the lending agent. On June 30, 2010, the value of loaned securities was $31,348,000; aggregate collateral received included U.S. government securities valued at $423,000.
Other Purchases and sales of portfolio securities other than short-term securities aggregated $116,480,000 and $90,338,000, respectively, for the six months ended June 30, 2010.
NOTE 4 - FEDERAL INCOME TAXES
No provision for federal income taxes is required since the fund intends to continue to qualify as a regulated investment company under Subchapter M of the Internal Revenue Code and distribute to shareholders all of its taxable income and gains. Distributions determined in accordance with federal income tax regulations may differ in amount or character from net investment income and realized gains for financial reporting purposes. Financial reporting records are adjusted for permanent book/tax differences to reflect tax character but are not adjusted for temporary differences. The amount and character of tax-basis distributions and composition of net assets are finalized at fiscal year-end; accordingly, tax-basis balances have not been determined as of the date of this report.
The fund intends to retain realized gains to the extent of available capital loss carryforwards. As of December 31, 2009, the fund had $180,365,000 of unused capital loss carryforwards, which expire: $119,942,000 in fiscal 2016 and $60,423,000 in fiscal 2017.
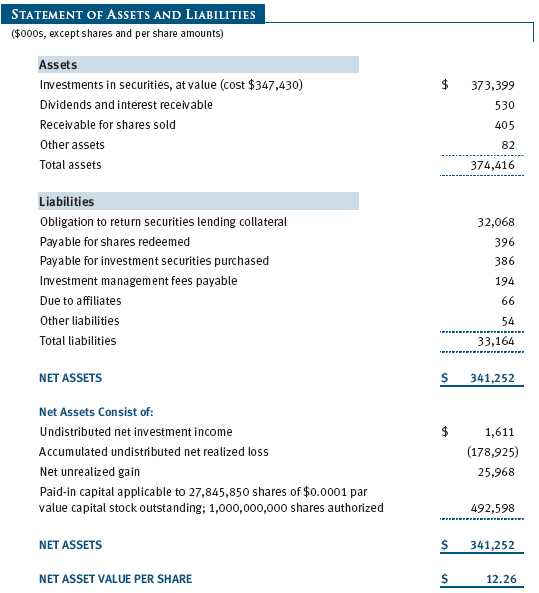
At June 30, 2010, the cost of investments for federal income tax purposes was $347,430,000. Net unrealized gain aggregated $25,968,000 at period-end, of which $39,525,000 related to appreciated investments and $13,557,000 related to depreciated investments.
NOTE 5 - RELATED PARTY TRANSACTIONS
The fund is managed by T. Rowe Price Associates, Inc. (the manager or Price Associates), a wholly owned subsidiary of T. Rowe Price Group, Inc. The investment management agreement between the fund and the manager provides for an annual investment management fee, which is computed daily and paid monthly. The fee consists of an individual fund fee, equal to 0.35% of the fund’s average daily net assets, and a group fee. The group fee rate is calculated based on the combined net assets of certain mutual funds sponsored by Price Associates (the group) applied to a graduated fee schedule, with rates ranging from 0.48% for the first $1 billion of assets to 0.285% for assets in excess of $220 billion. The fund’s group fee is determined by applying the group fee rate to the fund’s average daily net assets. At June 30, 2010, the effective annual group fee rate was 0.30%.
In addition, the fund has entered into service agreements with Price Associates and two wholly owned subsidiaries of Price Associates (collectively, Price). Price Associates computes the daily share price and provides certain other administrative services to the fund. T. Rowe Price Services, Inc., provides shareholder and administrative services in its capacity as the fund’s transfer and dividend disbursing agent. T. Rowe Price Retirement Plan Services, Inc., provides subaccounting and recordkeeping services for certain retirement accounts invested in the fund. For the six months ended June 30, 2010, expenses incurred pursuant to these service agreements were $44,000 for Price Associates; $225,000 for T. Rowe Price Services, Inc.; and $27,000 for T. Rowe Price Retirement Plan Services, Inc. The total amount payable at period-end pursuant to these service agreements is reflected as Due to Affiliates in the accompanying financial statements.
Additionally, the fund is one of several mutual funds in which certain college savings plans managed by Price Associates may invest. As approved by the fund’s Board of Directors, shareholder servicing costs associated with each college savings plan are borne by the fund in proportion to the average daily value of its shares owned by the college savings plan. For the six months ended June 30, 2010, the fund was charged $19,000 for shareholder servicing costs related to the college savings plans, of which $14,000 was for services provided by Price. The amount payable at period-end pursuant to this agreement is reflected as Due to Affiliates in the accompanying financial statements. At June 30, 2010, approximately 3% of the outstanding shares of the fund were held by college savings plans.
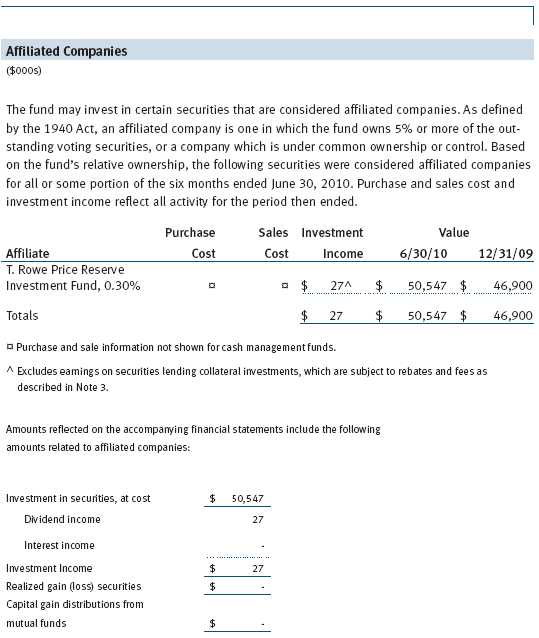
The fund may invest in the T. Rowe Price Reserve Investment Fund and the T. Rowe Price Government Reserve Investment Fund (collectively, the T. Rowe Price Reserve Investment Funds), open-end management investment companies managed by Price Associates and considered affiliates of the fund. The T. Rowe Price Reserve Investment Funds are offered as cash management options to mutual funds, trusts, and other accounts managed by Price Associates and/or its affiliates and are not available for direct purchase by members of the public. The T. Rowe Price Reserve Investment Funds pay no investment management fees.
As of June 30, 2010, T. Rowe Price Group, Inc., and/or its wholly owned subsidiaries owned 225,117 shares of the fund, representing 1% of the fund’s net assets.
| INFORMATION ON PROXY VOTING POLICIES, PROCEDURES, AND RECORDS |
A description of the policies and procedures used by T. Rowe Price funds and portfolios to determine how to vote proxies relating to portfolio securities is available in each fund’s Statement of Additional Information, which you may request by calling 1-800-225-5132 or by accessing the SEC’s Web site, www.sec.gov. The description of our proxy voting policies and procedures is also available on our Web site, www.troweprice.com. To access it, click on the words “Our Company” at the top of our corporate homepage. Then, when the next page appears, click on the words “Proxy Voting Policies” on the left side of the page.
Each fund’s most recent annual proxy voting record is available on our Web site and through the SEC’s Web site. To access it through our Web site, follow the directions above, then click on the words “Proxy Voting Records” on the right side of the Proxy Voting Policies page.
| HOW TO OBTAIN QUARTERLY PORTFOLIO HOLDINGS |
The fund files a complete schedule of portfolio holdings with the Securities and Exchange Commission for the first and third quarters of each fiscal year on Form N-Q. The fund’s Form N-Q is available electronically on the SEC’s Web site (www.sec.gov); hard copies may be reviewed and copied at the SEC’s Public Reference Room, 450 Fifth St. N.W., Washington, DC 20549. For more information on the Public Reference Room, call 1-800-SEC-0330.
| APPROVAL OF INVESTMENT MANAGEMENT AGREEMENT |
On March 9, 2010, the fund’s Board of Directors (Board) unanimously approved the continuation of the investment advisory contract (Contract) between the fund and its investment manager, T. Rowe Price Associates, Inc. (Adviser). The Board considered a variety of factors in connection with its review of the Contract, also taking into account information provided by the Adviser during the course of the year, as discussed below:
Services Provided by the Adviser
The Board considered the nature, quality, and extent of the services provided to the fund by the Adviser. These services included, but were not limited to, management of the fund’s portfolio and a variety of related activities, as well as financial and administrative services, reporting, and communications. The Board also reviewed the background and experience of the Adviser’s senior management team and investment personnel involved in the management of the fund. The Board concluded that it was satisfied with the nature, quality, and extent of the services provided by the Adviser.
Investment Performance of the Fund
The Board reviewed the fund’s average annual total returns over the 1-, 3-, 5-, and 10-year periods, as well as the fund’s year-by-year returns, and compared these returns with a wide variety of previously agreed upon comparable performance measures and market data, including those supplied by Lipper and Morningstar, which are independent providers of mutual fund data. On the basis of this evaluation and the Board’s ongoing review of investment results, and factoring in the severity of the market turmoil during 2008 and 2009, the Board concluded that the fund’s performance was satisfactory.
Costs, Benefits, Profits, and Economies of Scale
The Board reviewed detailed information regarding the revenues received by the Adviser under the Contract and other benefits that the Adviser (and its affiliates) may have realized from its relationship with the fund, including research received under “soft dollar” agreements and commission-sharing arrangements with broker-dealers. The Board considered that the Adviser may receive some benefit from its soft-dollar arrangements pursuant to which it receives research from broker-dealers that execute the applicable fund’s portfolio transactions. The Board also received information on the estimated costs incurred and profits realized by the Adviser and its affiliates from advising T. Rowe Price mutual funds, as well as estimates of the gross profits realized from managing the fund in particular. The Board concluded that the Adviser’s profits were reasonable in light of the services provided to the fund. The Board also considered whether the fund or other funds benefit under the fee levels set forth in the Contract from any economies of scale realized by the Adviser. Under the Contract, the fund pays a fee to the Adviser composed of two components—a group fee rate based on the aggregate assets of certain T. Rowe Price mutual funds (including the fund) that declines at certain asset levels and an individual fund fee rate that is assessed on the assets of the fund. The Board concluded that the advisory fee structure for the fund continued to provide for a reasonable sharing of benefits from any economies of scale with the fund’s investors.
Fees
The Board reviewed the fund’s management fee rate, operating expenses, and total expense ratio and compared them with fees and expenses of other comparable funds based on information and data supplied by Lipper. The information provided to the Board indicated that the fund’s management fee rate was above the median for certain groups of comparable funds but at or below the median for other groups of comparable funds. The information also indicated that the fund’s total expense ratio was above the median for certain groups of comparable funds but below the median for other groups of comparable funds. The Board also reviewed the fee schedules for institutional accounts of the Adviser and its affiliates with smaller mandates. Management informed the Board that the Adviser’s responsibilities for institutional accounts are more limited than its responsibilities for the fund and other T. Rowe Price mutual funds that it or its affiliates advise and that the Adviser performs significant additional services and assumes greater risk for the fund and other T. Rowe Price mutual funds that it advises than it does for institutional accounts. On the basis of the information provided, the Board concluded that the fees paid by the fund under the Contract were reasonable.
Approval of the Contract
As noted, the Board approved the continuation of the Contract. No single factor was considered in isolation or to be determinative to the decision. Rather, the Board was assisted by the advice of independent legal counsel and concluded, in light of a weighting and balancing of all factors considered, that it was in the best interests of the fund to approve the continuation of the Contract, including the fees to be charged for services thereunder.
Item 2. Code of Ethics.A code of ethics, as defined in Item 2 of Form N-CSR, applicable to its principal executive officer, principal financial officer, principal accounting officer or controller, or persons performing similar functions is filed as an exhibit to the registrant’s annual Form N-CSR. No substantive amendments were approved or waivers were granted to this code of ethics during the registrant’s most recent fiscal half-year.
Item 3. Audit Committee Financial Expert.
Disclosure required in registrant’s annual Form N-CSR.
Item 4. Principal Accountant Fees and Services.
Disclosure required in registrant’s annual Form N-CSR.
Item 5. Audit Committee of Listed Registrants.
Not applicable.
Item 6. Investments.
(a) Not applicable. The complete schedule of investments is included in Item 1 of this Form N-CSR.
(b) Not applicable.
Item 7. Disclosure of Proxy Voting Policies and Procedures for Closed-End Management Investment Companies.
Not applicable.
Item 8. Portfolio Managers of Closed-End Management Investment Companies.
Not applicable.
Item 9. Purchases of Equity Securities by Closed-End Management Investment Company and Affiliated Purchasers.
Not applicable.
Item 10. Submission of Matters to a Vote of Security Holders.
Not applicable.
Item 11. Controls and Procedures.
(a) The registrant’s principal executive officer and principal financial officer have evaluated the registrant’s disclosure controls and procedures within 90 days of this filing and have concluded that the registrant’s disclosure controls and procedures were effective, as of that date, in ensuring that information required to be disclosed by the registrant in this Form N-CSR was recorded, processed, summarized, and reported timely.
(b) The registrant’s principal executive officer and principal financial officer are aware of no change in the registrant’s internal control over financial reporting that occurred during the registrant’s second fiscal quarter covered by this report that has materially affected, or is reasonably likely to materially affect, the registrant’s internal control over financial reporting.
Item 12. Exhibits.
(a)(1) The registrant’s code of ethics pursuant to Item 2 of Form N-CSR is filed with the registrant’s annual Form N-CSR.
(2) Separate certifications by the registrant's principal executive officer and principal financial officer, pursuant to Section 302 of the Sarbanes-Oxley Act of 2002 and required by Rule 30a-2(a) under the Investment Company Act of 1940, are attached.
(3) Written solicitation to repurchase securities issued by closed-end companies: not applicable.
(b) A certification by the registrant's principal executive officer and principal financial officer, pursuant to Section 906 of the Sarbanes-Oxley Act of 2002 and required by Rule 30a-2(b) under the Investment Company Act of 1940, is attached.
| | |
SIGNATURES |
| |
| | Pursuant to the requirements of the Securities Exchange Act of 1934 and the Investment |
| Company Act of 1940, the registrant has duly caused this report to be signed on its behalf by the |
| undersigned, thereunto duly authorized. |
| |
| T. Rowe Price Financial Services Fund, Inc. |
| |
| |
| |
| By | /s/ Edward C. Bernard |
| | Edward C. Bernard |
| | Principal Executive Officer |
| |
| Date | August 17, 2010 |
| |
| |
| |
| | Pursuant to the requirements of the Securities Exchange Act of 1934 and the Investment |
| Company Act of 1940, this report has been signed below by the following persons on behalf of |
| the registrant and in the capacities and on the dates indicated. |
| |
| |
| By | /s/ Edward C. Bernard |
| | Edward C. Bernard |
| | Principal Executive Officer |
| |
| Date | August 17, 2010 |
| |
| |
| |
| By | /s/ Gregory K. Hinkle |
| | Gregory K. Hinkle |
| | Principal Financial Officer |
| |
| Date | August 17, 2010 |