| UNITED STATES |
| SECURITIES AND EXCHANGE COMMISSION |
| Washington, D.C. 20549 |
| |
FORM N-CSR |
| |
CERTIFIED SHAREHOLDER REPORT OF REGISTERED |
MANAGEMENT INVESTMENT COMPANIES |
| |
| |
| |
| Investment Company Act File Number: 811-07749 |
|
| |
| T. Rowe Price Financial Services Fund, Inc. |
|
| (Exact name of registrant as specified in charter) |
| |
| 100 East Pratt Street, Baltimore, MD 21202 |
|
| (Address of principal executive offices) |
| |
| David Oestreicher |
| 100 East Pratt Street, Baltimore, MD 21202 |
|
| (Name and address of agent for service) |
| |
| |
| Registrant’s telephone number, including area code: (410) 345-2000 |
| |
| |
| Date of fiscal year end: December 31 |
| |
| |
| Date of reporting period: June 30, 2011 |
Item 1: Report to Shareholders| Financial Services Fund | June 30, 2011 |
The views and opinions in this report were current as of June 30, 2011. They are not guarantees of performance or investment results and should not be taken as investment advice. Investment decisions reflect a variety of factors, and the managers reserve the right to change their views about individual stocks, sectors, and the markets at any time. As a result, the views expressed should not be relied upon as a forecast of the fund’s future investment intent. The report is certified under the Sarbanes-Oxley Act, which requires mutual funds and other public companies to affirm that, to the best of their knowledge, the information in their financial reports is fairly and accurately stated in all material respects.
REPORTS ON THE WEB
Sign up for our E-mail Program, and you can begin to receive updated fund reports and prospectuses online rather than through the mail. Log in to your account at troweprice.com for more information.
Manager’s Letter
Fellow Shareholders
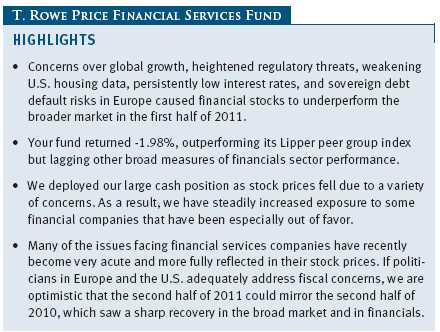
Mark Twain is quoted as saying that “history does not repeat itself, but it does rhyme,” and that almost perfectly summarizes the performance of financial stocks in the first half of 2011. Many of the issues that weighed on financial stocks in the early to middle part of 2010—such as concerns over global growth, heightened regulatory threats, weakening U.S. housing data, persistently low interest rates, and sovereign debt default risks in Europe—came back into the forefront and caused financial stocks to underperform the broader market in the first six months of this year.
PERFORMANCE COMPARISON
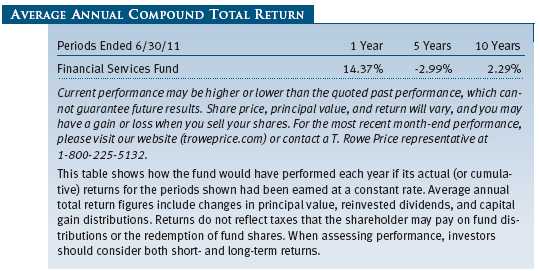
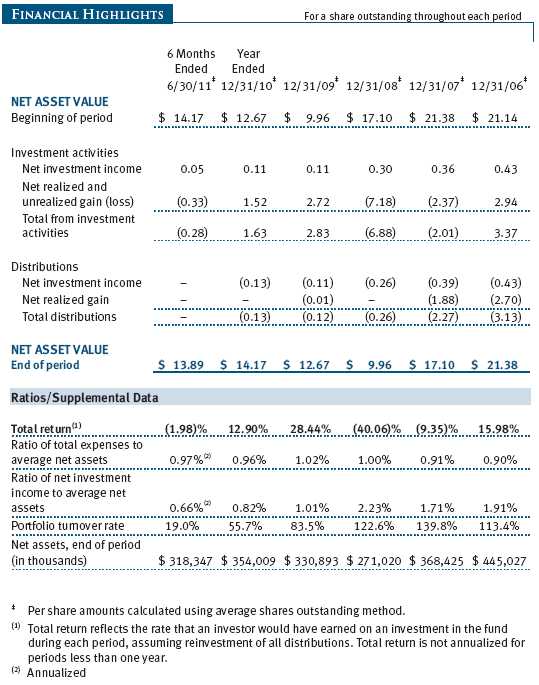
Against this deteriorating macroeconomic backdrop, your fund returned -1.98%, as shown in the Performance Comparison table. The fund outperformed the Lipper Financial Services Funds Index but lagged the Russell 3000 Financial Services Sector Index and the Morningstar Financial Average.

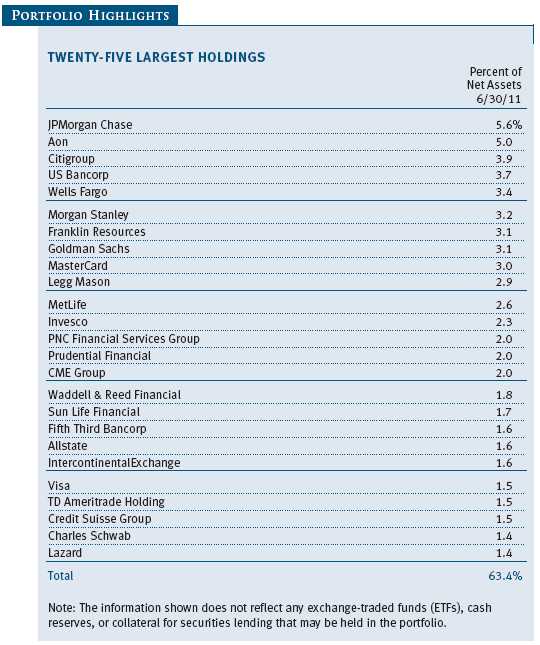
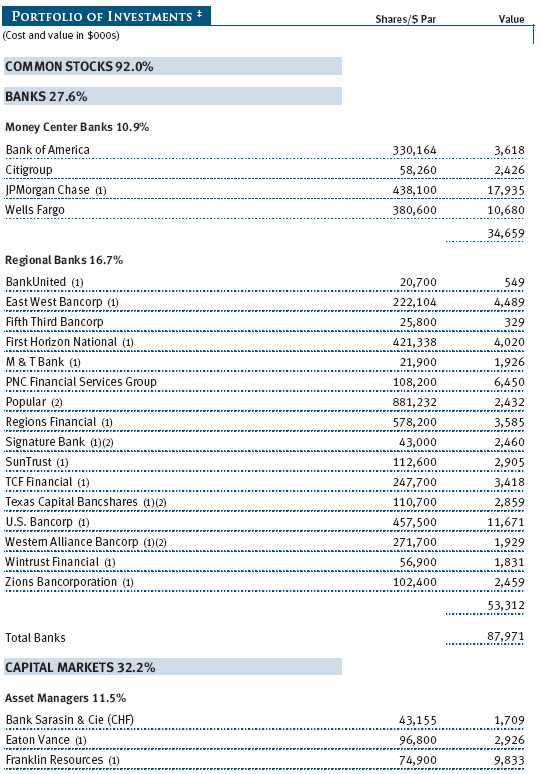
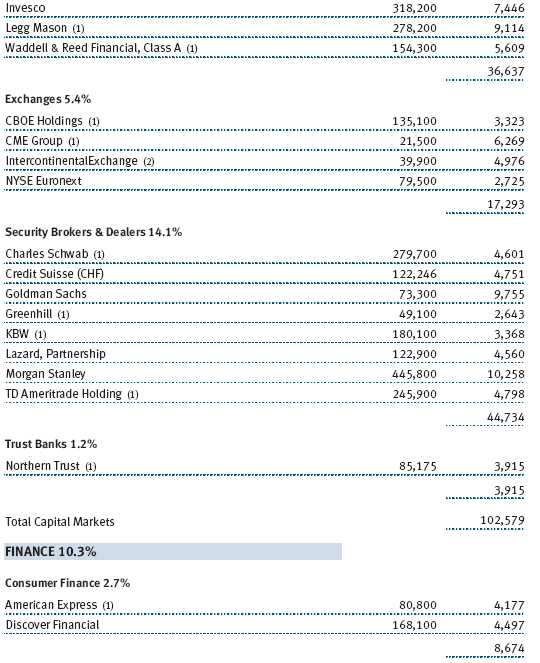
The largest absolute contributors to the fund over the last six months were NYSE Euronext, MasterCard, and insurance broker Aon. These stocks share two common characteristics: They are significantly less affected by the regulatory pressures stemming from the Dodd-Frank Act, and they have no meaningful exposure to the U.S. housing markets or the European sovereign debt crisis. To illustrate just how difficult the first half of the year was for bank stocks due to their exposure to housing and regulatory uncertainty, consider that only one, Texas Capital Bancshares, was a top 10 contributor during the period, even though your fund held over 20 different bank stocks among 66 issuers of securities as of June 30, 2011. (Please refer to the fund’s portfolio of investments for a complete list of holdings and the amount each represents in the portfolio.)
The biggest detractors to fund performance were the companies most exposed to capital markets activity and regulatory uncertainty. Your fund has large positions in Goldman Sachs and Morgan Stanley, both of which were hurt as fixed income trading activity, which represents 25% to 50% of their revenues, was weak, and overall regulatory threats refused to abate. Similarly, a lack of robust capital markets activity, such as mergers and acquisitions and new debt issues, weighed on our investments in KBW and Greenhill, two small investment banks that have been significant disappointments so far this year. We’ve added to several of these positions on weakness as we believe their underperformance is cyclical, not secular, in nature. The sluggish U.S. housing market weighed significantly on our recent purchase of Radian, making it one of the fund’s largest detractors. In an unusual move for us, we reversed course on Radian and eliminated the position after a short holding period (more on this later) as its highly levered balance sheet leaves the company little margin for error.
INVESTMENT OBJECTIVE AND STRATEGY
Before discussing the portfolio in detail, we would like to welcome new shareholders to the fund and thank our longer-term investors for their continuing confidence in T. Rowe Price’s investment management abilities. Given the ongoing challenges of investing in the financials sector, we think it is appropriate to review how we select stocks for the fund and how we structure and manage the portfolio.
Our objective is to deliver superior risk-adjusted returns relative to similar financial services-focused offerings over any three-year period. We measure our results against three benchmarks: the Russell 3000 Financial Services Sector Index, the Lipper Financial Services Funds Index, and the Morningstar Financial Average.
We usually hold approximately 60 to 80 securities. We are comfortable owning several large positions (representing 4% of assets or more) in high-conviction ideas where we believe we have identified significant return potential relative to the risks we are taking. We tend to hold a majority of the fund’s stocks in what we define as “core positions” ranging between 1.25% and 1.75% of assets. These core positions represent the stocks that we view as industry leaders with sustainable business models and attractive valuations. Finally, the fund owns a number of smaller positions (0.5% to 1.0% of assets) in securities that we believe represent higher risk but offer an opportunity for higher returns.
We employ a bottom-up, fundamental investment process that relies heavily on the work of our team of dedicated investment analysts who collectively follow hundreds of small-, mid-, and large-cap financial companies around the world. We also strive to work closely with T. Rowe Price’s fixed income professionals, which we believe is a distinct advantage for us versus other investment firms.
We do not manage the fund with either a traditionally defined “value” or “growth” philosophy. Rather, our style can best be described as one with a heavy “quality” bias. Because commercial banks, investment banks, and insurance companies must employ a high degree of financial leverage to earn satisfactory returns on shareholders’ equity, we are willing to pay higher multiples of earnings or book value for companies with demonstrated track records of successful risk management. We are not risk averse or risk intolerant; rather, we believe that over full economic cycles, we will compound wealth for fund shareholders most effectively by investing in the truly great financial companies of the world, as opposed to always seeking out stocks with the lowest absolute price/earnings (P/E) valuations or with the highest growth rates.
In summary, we seek to invest primarily in financial services companies with defensible business models and best-in-class management teams that have attractive upside potential relative to the risk we are taking. We will occasionally utilize convertible securities, bonds, or common stocks of select nonfinancial companies to achieve this goal, but the vast majority of the fund’s holdings will be common stocks of financial services companies.
PORTFOLIO REVIEW
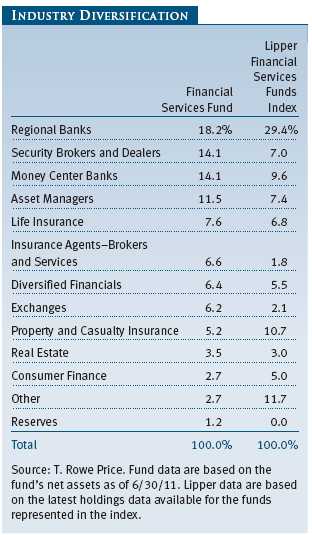
At the end of June, your fund was well diversified across 66 issuers of securities. The fund entered the year positioned for a broad recovery in the U.S. economy and strong capital markets activity, specifically mergers and acquisitions and companies raising capital by issuing equity and debt securities. We deployed our large cash position during the first six months of this year as stock prices fell due to concerns over low interest rates, a stagnating economic recovery, and the negative impact of regulatory reform. As a result, your fund has been steadily increasing exposure to some financial companies that have been especially out of favor.
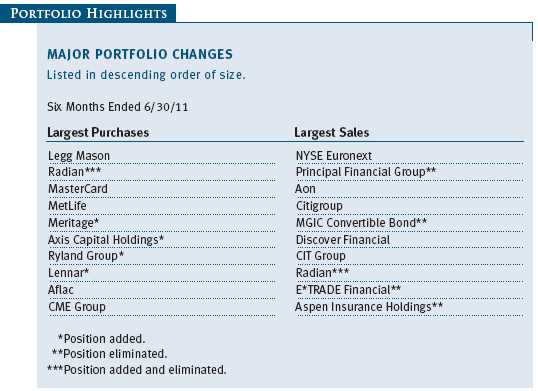
The largest single purchase was Legg Mason, one of the biggest U.S. investment management companies with just under $700 billion in assets under management. This is a turnaround story that appears to be taking two steps forward for every one step backward. The company has improved its balance sheet dramatically, is buying back stock, has streamlined its bloated infrastructure, and is in the process of regaining market share lost during the financial crisis due to underperformance at its largest subsidiary, Western Asset Management. For this to be a good investment, the company must demonstrate consistent margin improvement, which we believe is highly probable. For this to be a great investment, the company needs to have positive net fund inflows again, which we believe is possible given improving investment performance. We believe our investment is protected on the downside because of the significant break-up value in the company and the presence of an increasingly active and engaged Board of Directors.
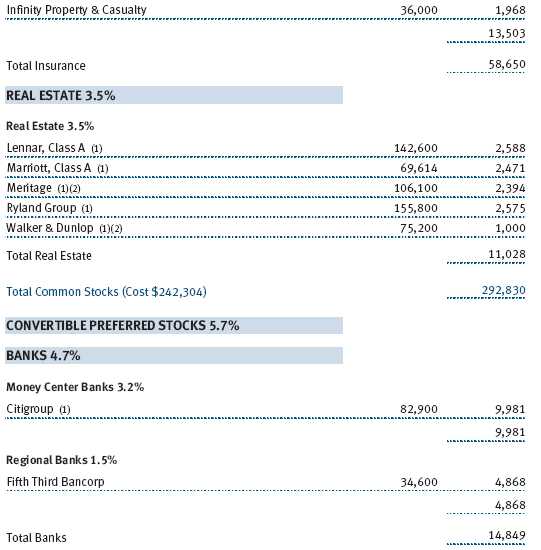
The second-largest purchase was part of a thematic decision to begin increasing our direct exposure to the U.S. housing market. We purchased Radian, a mortgage insurer, along with homebuilders Ryland Group, Meritage, and Lennar. Because of the high risk/reward trade-off of these investments, each represented 1.0% of the fund or less. While U.S. housing continues to be a significantly lagging segment of the economy, all three homebuilders have dramatically improved their balance sheets and adjusted their cost structures to the point where they are operating at or near break-even profitability levels, even with new home sales at unprecedented lows. We believe that, eventually, demand for new homes will increase, and when it does, these homebuilder stocks could have dramatic upside potential. Our purchase of Radian was a less successful investment. Shortly after our purchase, we became concerned that the company’s reserves for future mortgage losses were less adequate than our original analysis suggested. Due to the highly leveraged nature of its balance sheet, we felt the company was in a compromised condition, so we eliminated the position.
Our third-largest individual purchase was MasterCard, which we bought along with Visa in late 2010 and into 2011 as we felt the stock’s decline was excessive when the Federal Reserve presented its proposed rule for interpreting debit interchange rates as part of the Dodd-Frank Act. MasterCard is now a top 10 position in the fund.
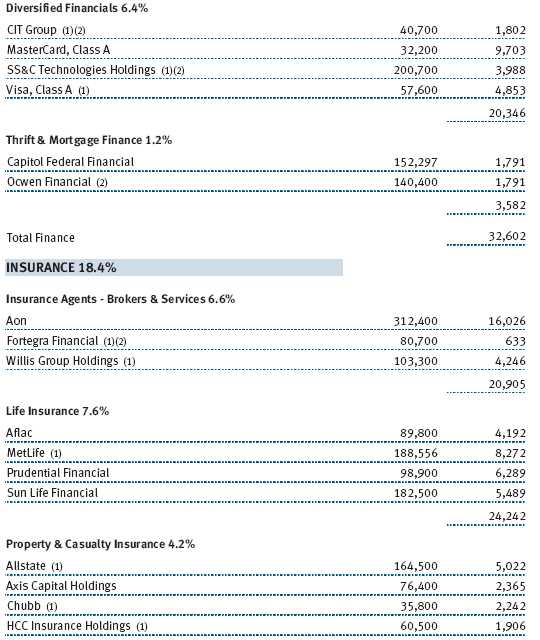
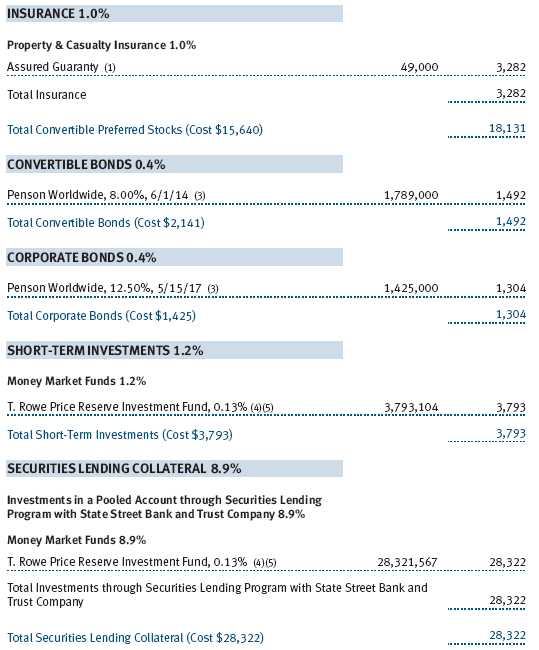
The largest sale during the past six months was NYSE Euronext, which agreed to a merger with Deutsche Boerse but then received a higher bid from rivals Nasdaq OMX Group and IntercontinentalExchange. With the stock’s strong performance thanks to these takeover bids, we reduced what had been the fund’s second-largest holding. We believe a smaller position size is more prudent due to the significant integration risks in this large cross-border transaction. We also eliminated our large holding of a bond issued by insurance broker Hub International Holdings. While the bond remains an attractive investment, we used the proceeds to begin slowly increasing our equity exposure to primary property and casualty (P&C) insurance stocks HCC Insurance Holdings, Chubb, and reinsurer Axis Capital Holdings. Our decision to increase P&C exposure stemmed from our belief that the industry pricing structure is slowly improving due to the tragic earthquake and tsunami in Japan coupled with the earthquake in New Zealand and flooding in Australia.
OUTLOOK
As we discussed in our 2010 annual report, financial companies continue to face a number of real and significant issues. These include the persistently low interest rate environment, the final implementation of U.S. financial reform mandated by the Dodd-Frank Act, ongoing sovereign debt issues both in the U.S. and Europe, the risk of a U.S. double-dip housing recession, and the specter of inflation.
Our views on these issues are mixed. We do not expect an imminent increase in interest rates, but the outlook depends greatly on the pace of the U.S. recovery. Federal Reserve Chairman Ben Bernanke is highly influenced by the mistakes made by the central bank during the Great Depression, especially raising interest rates too soon. As a result, we believe he will err on the side of caution and could keep short-term interest rates “lower for longer.”
We are more optimistic about a reasonable outcome for the final rule-writing and implementation of the Dodd-Frank Act. Predicting regulatory bodies is at best a difficult task and at worst a fool’s game, but we believe that the key issues such as derivatives reform and proprietary trading definitions will be thoughtfully and conservatively finalized in a way that does not significantly disrupt the financial system. This outcome would be good for corporations and individuals, as well as the large brokerage firms and money center banks in which your fund has significant investments.
We do not believe the final chapter has been written yet on the sovereign debt issues in Europe. While the recently passed Greek austerity plan was a positive, it is by no means the final act of the long drama that is the European sovereign debt crisis. Until confidence is restored in the fiscal health of key European Union member countries such as Spain and Italy, it will be difficult for investors to get comfortable with many financial stock holdings, particularly European banks.
Closer to home, Congress is currently engaged in a high-stakes game of political “chicken” over the extension of the U.S. debt ceiling. Failure to reach a compromise could have a disastrous effect on the market in general and financial stocks in particular. By the time you receive this report, a decision about the debt limit probably will have been made, and it could be accompanied by significant changes in fiscal policy. As of this writing, we feel that Congress has the opportunity to steer the U.S. off its currently unsustainable fiscal path (i.e., the U.S. government spends, net of tax receipts, 10% more than the country produces every year) by passing a sensible and comprehensive plan that includes a combination of spending cuts, entitlement reform, and tax increases. Such a move could prove to be a significant long-term positive for U.S. markets, companies, and consumers. Governments—like corporations—with the strongest fiscal position are almost always long-term leaders because they have financial flexibility in difficult times. While we are not optimistic that Congress will agree to sweeping changes by the August 2 deadline for raising the debt ceiling, we have not lost hope. As Sir Winston Churchill reportedly said, “The Americans will always do the right thing... after they have exhausted all the alternatives.” Congress is running out of options, which means it is almost time to do the right thing.
A number of these issues have recently become very acute and more fully reflected in the stock prices of many financial companies. Much is riding on the political resolve of world leaders both here and in Europe. If these politicians get it right, we are optimistic that the second half of 2011 is setting up to mirror the second half of 2010, which saw a sharp recovery in the broad market and in financial stocks. If they fail, the markets have significant downside that could be reminiscent of the 2008 experience. In other words, we believe history is about to rhyme again.
Thank you for your confidence in T. Rowe Price.
Respectfully submitted,

Eric Veiel
Chairman of the fund’s Investment Advisory Committee
July 21, 2011
The committee chairman has day-to-day responsibility for managing the portfolio and works with committee members in developing and executing the fund’s investment program.
RISKS OF INVESTING
The fund’s share price can fall because of weakness in the stock market, a particular industry, or specific holdings. Stock markets can decline for many reasons, including adverse political or economic developments, changes in investor psychology, or heavy institutional selling. The prospects for an industry or company may deteriorate because of a variety of factors, including disappointing earnings or changes in the competitive environment. In addition, the investment manager’s assessment of companies held in a fund may prove incorrect, resulting in losses or poor performance, even in rising markets.
Funds that invest only in specific industries will experience greater volatility than funds investing in a broad range of industries. The banking industry can be significantly affected by legislation that has reduced the separation between commercial and investment banking businesses, changed the laws governing capitalization requirements and the savings and loan industry, and increased competition. In addition, changes in general economic conditions and interest rates can significantly affect the banking industry. Financial services companies may be hurt when interest rates rise sharply, although not all companies are affected equally. The stocks may also be vulnerable to rapidly rising inflation.
GLOSSARY
Lipper indexes: Fund benchmarks that consist of a small number of the largest mutual funds in a particular category as tracked by Lipper Inc.
Morningstar Financial Average: Tracks the performance of funds that seek capital appreciation by investing primarily in equity securities of financial services companies.
Price-to-earnings (P/E) ratio – 12 months forward: A valuation measure calculated by dividing the price of a stock by the analysts’ forecast of the next 12 months’ expected earnings. The ratio is a measure of how much investors are willing to pay for the company’s future earnings. The higher the P/E, the more investors are paying for a company’s earnings growth in the next 12 months.
Return on equity (ROE) – current fiscal year: A valuation measure calculated by dividing the company’s current fiscal year net income by shareholders’ equity (i.e., the company’s book value). ROE measures how much a company earns on each dollar that common stock investors have put into the company. It indicates how effectively and efficiently a company and its management are using stockholder investments.
Russell 3000 Financial Services Sector Index: A subindex of the Russell 3000 Index that includes all of the financials sector components of the Russell 3000.
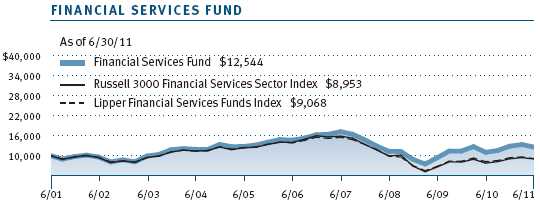
Performance and Expenses
This chart shows the value of a hypothetical $10,000 investment in the fund over the past 10 fiscal year periods or since inception (for funds lacking 10-year records). The result is compared with benchmarks, which may include a broad-based market index and a peer group average or index. Market indexes do not include expenses, which are deducted from fund returns as well as mutual fund averages and indexes.
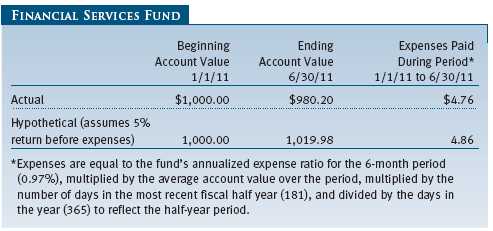
As a mutual fund shareholder, you may incur two types of costs: (1) transaction costs, such as redemption fees or sales loads, and (2) ongoing costs, including management fees, distribution and service (12b-1) fees, and other fund expenses. The following example is intended to help you understand your ongoing costs (in dollars) of investing in the fund and to compare these costs with the ongoing costs of investing in other mutual funds. The example is based on an investment of $1,000 invested at the beginning of the most recent six-month period and held for the entire period.
Actual Expenses
The first line of the following table (“Actual”) provides information about actual account values and expenses based on the fund’s actual returns. You may use the information on this line, together with your account balance, to estimate the expenses that you paid over the period. Simply divide your account value by $1,000 (for example, an $8,600 account value divided by $1,000 = 8.6), then multiply the result by the number on the first line under the heading “Expenses Paid During Period” to estimate the expenses you paid on your account during this period.
Hypothetical Example for Comparison Purposes
The information on the second line of the table (“Hypothetical”) is based on hypothetical account values and expenses derived from the fund’s actual expense ratio and an assumed 5% per year rate of return before expenses (not the fund’s actual return). You may compare the ongoing costs of investing in the fund with other funds by contrasting this 5% hypothetical example and the 5% hypothetical examples that appear in the shareholder reports of the other funds. The hypothetical account values and expenses may not be used to estimate the actual ending account balance or expenses you paid for the period.
Note: T. Rowe Price charges an annual account service fee of $20, generally for accounts with less than $10,000 ($1,000 for UGMA/UTMA). The fee is waived for any investor whose T. Rowe Price mutual fund accounts total $50,000 or more; accounts employing automatic investing; accounts electing to receive electronic delivery of account statements, transaction confirmations, prospectuses, and shareholder reports; accounts of an investor who is a T. Rowe Price Preferred Services, Personal Services, or Enhanced Personal Services client (enrollment in these programs generally requires T. Rowe Price assets of at least $100,000); and IRAs and other retirement plan accounts that utilize a prototype plan sponsored by T. Rowe Price (although a separate custodial or administrative fee may apply to such accounts). This fee is not included in the accompanying table. If you are subject to the fee, keep it in mind when you are estimating the ongoing expenses of investing in the fund and when comparing the expenses of this fund with other funds.
You should also be aware that the expenses shown in the table highlight only your ongoing costs and do not reflect any transaction costs, such as redemption fees or sales loads. Therefore, the second line of the table is useful in comparing ongoing costs only and will not help you determine the relative total costs of owning different funds. To the extent a fund charges transaction costs, however, the total cost of owning that fund is higher.
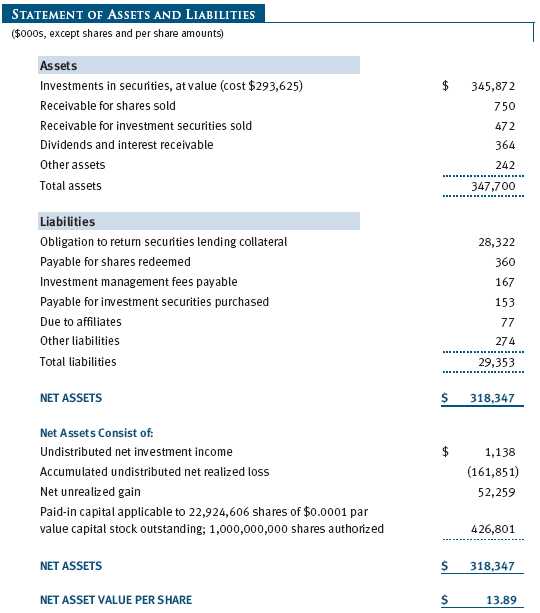
Unaudited
The accompanying notes are an integral part of these financial statements.
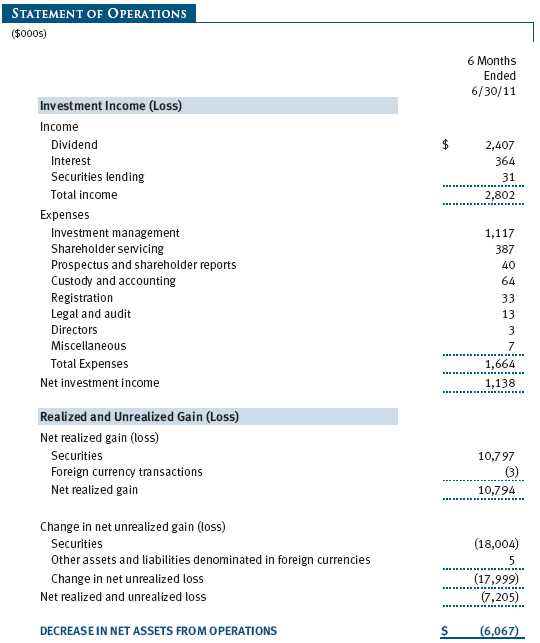
Unaudited
The accompanying notes are an integral part of these financial statements.
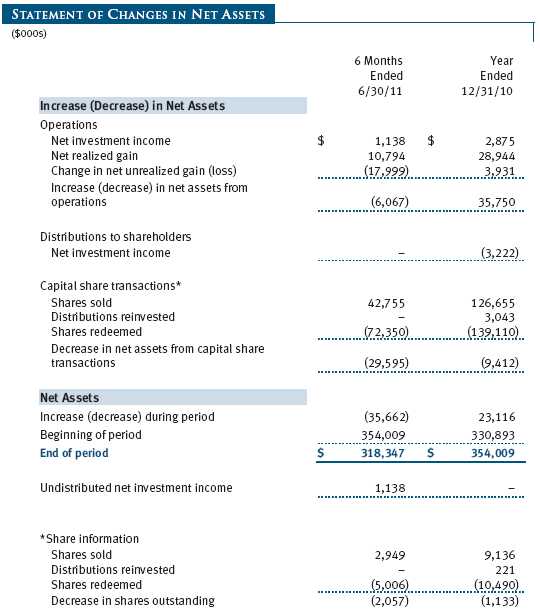
Unaudited
The accompanying notes are an integral part of these financial statements.
Unaudited
The accompanying notes are an integral part of these financial statements.
Unaudited
The accompanying notes are an integral part of these financial statements.
Unaudited
| NOTES TO FINANCIAL STATEMENTS |
T. Rowe Price Financial Services Fund, Inc. (the fund), is registered under the Investment Company Act of 1940 (the 1940 Act) as a diversified, open-end management investment company. The fund commenced operations on September 30, 1996. The fund seeks long-term growth of capital and a modest level of income.
NOTE 1 - SIGNIFICANT ACCOUNTING POLICIES
Basis of Preparation The accompanying financial statements were prepared in accordance with accounting principles generally accepted in the United States of America (GAAP), which require the use of estimates made by management. Management believes that estimates and valuations are appropriate; however, actual results may differ from those estimates, and the valuations reflected in the accompanying financial statements may differ from the value ultimately realized upon sale or maturity.
Investment Transactions, Investment Income, and Distributions Income and expenses are recorded on the accrual basis. Premiums and discounts on debt securities are amortized for financial reporting purposes. Dividends received from mutual fund investments are reflected as dividend income; capital gain distributions are reflected as realized gain/loss. Dividend income and capital gain distributions are recorded on the ex-dividend date. Income tax-related interest and penalties, if incurred, would be recorded as income tax expense. Investment transactions are accounted for on the trade date. Realized gains and losses are reported on the identified cost basis. Distributions to shareholders are recorded on the ex-dividend date. Income distributions are declared and paid annually. Capital gain distributions, if any, are generally declared and paid by the fund annually.
Currency Translation Assets, including investments, and liabilities denominated in foreign currencies are translated into U.S. dollar values each day at the prevailing exchange rate, using the mean of the bid and asked prices of such currencies against U.S. dollars as quoted by a major bank. Purchases and sales of securities, income, and expenses are translated into U.S. dollars at the prevailing exchange rate on the date of the transaction. The effect of changes in foreign currency exchange rates on realized and unrealized security gains and losses is reflected as a component of security gains and losses.
Rebates and Credits Subject to best execution, the fund may direct certain security trades to brokers who have agreed to rebate a portion of the related brokerage commission to the fund in cash. Commission rebates are reflected as realized gain on securities in the accompanying financial statements and totaled $6,000 for the six months ended June 30, 2011. Additionally, the fund earns credits on temporarily uninvested cash balances held at the custodian, which reduce the fund’s custody charges. Custody expense in the accompanying financial statements is presented before reduction for credits.
NOTE 2 - VALUATION
The fund’s financial instruments are reported at fair value as defined by GAAP. The fund determines the values of its assets and liabilities and computes its net asset value per share at the close of the New York Stock Exchange (NYSE), normally 4 p.m. ET, each day that the NYSE is open for business.
Valuation Methods Equity securities listed or regularly traded on a securities exchange or in the over-the-counter (OTC) market are valued at the last quoted sale price or, for certain markets, the official closing price at the time the valuations are made, except for OTC Bulletin Board securities, which are valued at the mean of the latest bid and asked prices. A security that is listed or traded on more than one exchange is valued at the quotation on the exchange determined to be the primary market for such security. Listed securities not traded on a particular day are valued at the mean of the latest bid and asked prices for domestic securities and the last quoted sale price for international securities.
Debt securities are generally traded in the OTC market. Securities with remaining maturities of one year or more at the time of acquisition are valued at prices furnished by dealers who make markets in such securities or by an independent pricing service, which considers the yield or price of bonds of comparable quality, coupon, maturity, and type, as well as prices quoted by dealers who make markets in such securities. Securities with remaining maturities of less than one year at the time of acquisition generally use amortized cost in local currency to approximate fair value. However, if amortized cost is deemed not to reflect fair value or the fund holds a significant amount of such securities with remaining maturities of more than 60 days, the securities are valued at prices furnished by dealers who make markets in such securities or by an independent pricing service.
Investments in mutual funds are valued at the mutual fund’s closing net asset value per share on the day of valuation.
Other investments, including restricted securities, and those financial instruments for which the above valuation procedures are inappropriate or are deemed not to reflect fair value are stated at fair value as determined in good faith by the T. Rowe Price Valuation Committee, established by the fund’s Board of Directors.
For valuation purposes, the last quoted prices of non-U.S. equity securities may be adjusted under the circumstances described below. If the fund determines that developments between the close of a foreign market and the close of the NYSE will, in its judgment, materially affect the value of some or all of its portfolio securities, the fund will adjust the previous closing prices to reflect what it believes to be the fair value of the securities as of the close of the NYSE. In deciding whether it is necessary to adjust closing prices to reflect fair value, the fund reviews a variety of factors, including developments in foreign markets, the performance of U.S. securities markets, and the performance of instruments trading in U.S. markets that represent foreign securities and baskets of foreign securities. A fund may also fair value securities in other situations, such as when a particular foreign market is closed but the fund is open. The fund uses outside pricing services to provide it with closing prices and information to evaluate and/or adjust those prices. The fund cannot predict how often it will use closing prices and how often it will determine it necessary to adjust those prices to reflect fair value. As a means of evaluating its security valuation process, the fund routinely compares closing prices, the next day’s opening prices in the same markets, and adjusted prices.
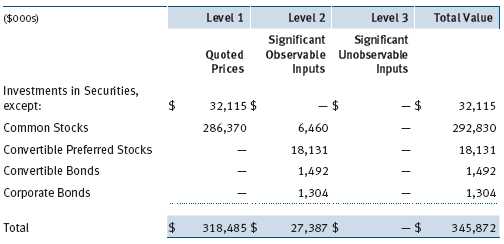
Valuation Inputs Various inputs are used to determine the value of the fund’s financial instruments. These inputs are summarized in the three broad levels listed below:
Level 1 – quoted prices in active markets for identical financial instruments
Level 2 – observable inputs other than Level 1 quoted prices (including, but not limited to, quoted prices for similar financial instruments, interest rates, prepayment speeds, and credit risk)
Level 3 – unobservable inputs
Observable inputs are those based on market data obtained from sources independent of the fund, and unobservable inputs reflect the fund’s own assumptions based on the best information available. The input levels are not necessarily an indication of the risk or liquidity associated with financial instruments at that level. For example, non-U.S. equity securities actively traded in foreign markets generally are reflected in Level 2 despite the availability of closing prices because the fund evaluates and determines whether those closing prices reflect fair value at the close of the NYSE or require adjustment, as described above. The following table summarizes the fund’s financial instruments, based on the inputs used to determine their values on June 30, 2011:
NOTE 3 - OTHER INVESTMENT TRANSACTIONS
Consistent with its investment objective, the fund engages in the following practices to manage exposure to certain risks and/or to enhance performance. The investment objective, policies, program, and risk factors of the fund are described more fully in the fund’s prospectus and Statement of Additional Information.
Restricted Securities The fund may invest in securities that are subject to legal or contractual restrictions on resale. Prompt sale of such securities at an acceptable price may be difficult and may involve substantial delays and additional costs.
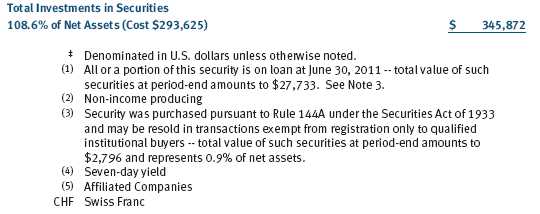
Securities Lending The fund lends its securities to approved brokers to earn additional income. It receives as collateral cash and U.S. government securities valued at 102% to 105% of the value of the securities on loan. Cash collateral is invested by the fund’s lending agent(s) in accordance with investment guidelines approved by management. Although risk is mitigated by the collateral, the fund could experience a delay in recovering its securities and a possible loss of income or value if the borrower fails to return the securities or if collateral investments decline in value. Securities lending revenue recognized by the fund consists of earnings on invested collateral and borrowing fees, net of any rebates to the borrower and compensation to the lending agent. In accordance with GAAP, investments made with cash collateral are reflected in the accompanying financial statements, but collateral received in the form of securities are not. On June 30, 2011, the value of loaned securities was $27,733,000 and cash collateral investments totaled $28,322,000.
Other Purchases and sales of portfolio securities other than short-term securities aggregated $64,129,000 and $76,810,000, respectively, for the six months ended June 30, 2011.
NOTE 4 - FEDERAL INCOME TAXES
No provision for federal income taxes is required since the fund intends to continue to qualify as a regulated investment company under Subchapter M of the Internal Revenue Code and distribute to shareholders all of its taxable income and gains. Distributions determined in accordance with federal income tax regulations may differ in amount or character from net investment income and realized gains for financial reporting purposes. Financial reporting records are adjusted for permanent book/tax differences to reflect tax character but are not adjusted for temporary differences. The amount and character of tax-basis distributions and composition of net assets are finalized at fiscal year-end; accordingly, tax-basis balances have not been determined as of the date of this report.
In accordance with federal tax regulations, the fund recognized capital losses in the current period for tax purposes that had been recognized in the prior fiscal year for financial reporting purposes. Such deferrals relate to net capital losses realized between November 1, 2010 and December 31, 2010, and totaled $260,000. The fund intends to retain realized gains to the extent of available capital loss carryforwards. As of December 31, 2010, the fund had $156,615,000 of unused capital loss carryforwards, which expire: $96,212,000 in fiscal 2016, and $60,403,000 in fiscal 2017.
At June 30, 2011, the cost of investments for federal income tax purposes was $293,625,000. Net unrealized gain aggregated $52,259,000 at period-end, of which $56,283,000 related to appreciated investments and $7,024,000 related to depreciated investments.
NOTE 5 - RELATED PARTY TRANSACTIONS
The fund is managed by T. Rowe Price Associates, Inc. (Price Associates), a wholly owned subsidiary of T. Rowe Price Group, Inc. (Price Group). The investment management agreement between the fund and Price Associates provides for an annual investment management fee, which is computed daily and paid monthly. The fee consists of an individual fund fee, equal to 0.35% of the fund’s average daily net assets, and a group fee. The group fee rate is calculated based on the combined net assets of certain mutual funds sponsored by Price Associates (the group) applied to a graduated fee schedule, with rates ranging from 0.48% for the first $1 billion of assets to 0.28% for assets in excess of $300 billion. The fund’s group fee is determined by applying the group fee rate to the fund’s average daily net assets. At June 30, 2011, the effective annual group fee rate was 0.30%.
In addition, the fund has entered into service agreements with Price Associates and two wholly owned subsidiaries of Price Associates (collectively, Price). Price Associates computes the daily share price and provides certain other administrative services to the fund. T. Rowe Price Services, Inc., provides shareholder and administrative services in its capacity as the fund’s transfer and dividend disbursing agent. T. Rowe Price Retirement Plan Services, Inc., provides subaccounting and recordkeeping services for certain retirement accounts invested in the fund. For the six months ended June 30, 2011, expenses incurred pursuant to these service agreements were $48,000 for Price Associates; $226,000 for T. Rowe Price Services, Inc.; and $29,000 for T. Rowe Price Retirement Plan Services, Inc. The total amount payable at period-end pursuant to these service agreements is reflected as Due to Affiliates in the accompanying financial statements.
Additionally, the fund is one of several mutual funds in which certain college savings plans managed by Price Associates may invest. As approved by the fund’s Board of Directors, shareholder servicing costs associated with each college savings plan are borne by the fund in proportion to the average daily value of its shares owned by the college savings plan. For the six months ended June 30, 2011, the fund was charged $21,000 for shareholder servicing costs related to the college savings plans, of which $14,000 was for services provided by Price. The amount payable at period-end pursuant to this agreement is reflected as Due to Affiliates in the accompanying financial statements. At June 30, 2011, approximately 5% of the outstanding shares of the fund were held by college savings plans.
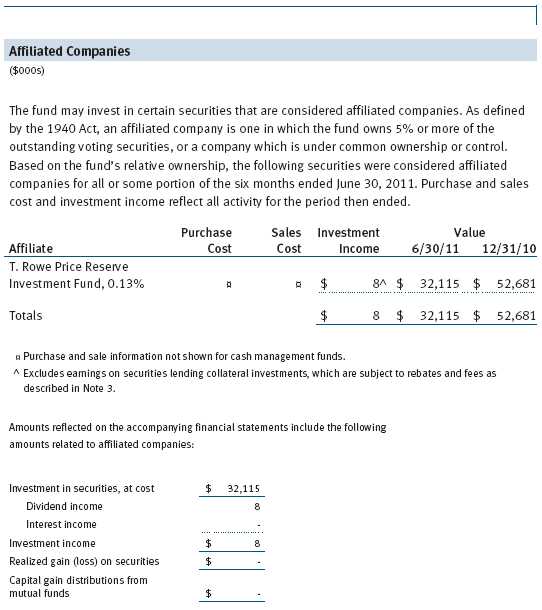
The fund may invest in the T. Rowe Price Reserve Investment Fund and the T. Rowe Price Government Reserve Investment Fund (collectively, the T. Rowe Price Reserve Investment Funds), open-end management investment companies managed by Price Associates and considered affiliates of the fund. The T. Rowe Price Reserve Investment Funds are offered as cash management options to mutual funds, trusts, and other accounts managed by Price Associates and/or its affiliates and are not available for direct purchase by members of the public. The T. Rowe Price Reserve Investment Funds pay no investment management fees.
As of June 30, 2011, T. Rowe Price Group, Inc., and/or its wholly owned subsidiaries owned 225,117 shares of the fund, representing 1% of the fund’s net assets.
| INFORMATION ON PROXY VOTING POLICIES, PROCEDURES, AND RECORDS |
A description of the policies and procedures used by T. Rowe Price funds and portfolios to determine how to vote proxies relating to portfolio securities is available in each fund’s Statement of Additional Information, which you may request by calling 1-800-225-5132 or by accessing the SEC’s website, sec.gov. The description of our proxy voting policies and procedures is also available on our website, troweprice.com. To access it, click on the words “Our Company” at the top of our corporate homepage. Then, when the next page appears, click on the words “Proxy Voting Policies” on the left side of the page.
Each fund’s most recent annual proxy voting record is available on our website and through the SEC’s website. To access it through our website, follow the directions above, then click on the words “Proxy Voting Records” on the right side of the Proxy Voting Policies page.
| HOW TO OBTAIN QUARTERLY PORTFOLIO HOLDINGS |
The fund files a complete schedule of portfolio holdings with the Securities and Exchange Commission for the first and third quarters of each fiscal year on Form N-Q. The fund’s Form N-Q is available electronically on the SEC’s website (sec.gov); hard copies may be reviewed and copied at the SEC’s Public Reference Room, 450 Fifth St. N.W., Washington, DC 20549. For more information on the Public Reference Room, call 1-800-SEC-0330.
| APPROVAL OF INVESTMENT MANAGEMENT AGREEMENT |
On March 9, 2011, the fund’s Board of Directors (Board) unanimously approved the continuation of the investment advisory contract (Contract) between the fund and its investment advisor, T. Rowe Price Associates, Inc. (Advisor). The Board considered a variety of factors in connection with its review of the Contract, also taking into account information provided by the Advisor during the course of the year, as discussed below:
Services Provided by the Advisor
The Board considered the nature, quality, and extent of the services provided to the fund by the Advisor. These services included, but were not limited to, management of the fund’s portfolio and a variety of related activities, as well as financial and administrative services, reporting, and communications. The Board also reviewed the background and experience of the Advisor’s senior management team and investment personnel involved in the management of the fund. The Board concluded that it was satisfied with the nature, quality, and extent of the services provided by the Advisor.
Investment Performance of the Fund
The Board reviewed the fund’s average annual total returns over the 1-, 3-, 5-, and 10-year periods, as well as the fund’s year-by-year returns, and compared these returns with a wide variety of previously agreed upon comparable performance measures and market data, including those supplied by Lipper and Morningstar, which are independent providers of mutual fund data. On the basis of this evaluation and the Board’s ongoing review of investment results, and factoring in the relative market conditions during certain of the performance periods, the Board concluded that the fund’s performance was satisfactory.
Costs, Benefits, Profits, and Economies of Scale
The Board reviewed detailed information regarding the revenues received by the Advisor under the Contract and other benefits that the Advisor (and its affiliates) may have realized from its relationship with the fund, including research received under “soft dollar” agreements and commission-sharing arrangements with broker-dealers. The Board considered that the Advisor may receive some benefit from soft-dollar arrangements pursuant to which research is received from broker-dealers that execute the applicable fund’s portfolio transactions. The Board also received information on the estimated costs incurred and profits realized by the Advisor and its affiliates from advising T. Rowe Price mutual funds, as well as estimates of the gross profits realized from managing the fund in particular. The Board concluded that the Advisor’s profits were reasonable in light of the services provided to the fund. The Board also considered whether the fund or other funds benefit under the fee levels set forth in the Contract from any economies of scale realized by the Advisor. Under the Contract, the fund pays a fee to the Advisor composed of two components—a group fee rate based on the aggregate assets of certain T. Rowe Price mutual funds (including the fund) that declines at certain asset levels and an individual fund fee rate that is assessed on the assets of the fund. The Board determined that it would be appropriate to introduce another breakpoint into the group fee rate, effective May 1, 2011, to allow fund shareholders to participate in additional economies of scale. The Board concluded that the advisory fee structure for the fund continued to provide for a reasonable sharing of benefits from any economies of scale with the fund’s investors.
Fees
The Board reviewed the fund’s management fee rate, operating expenses, and total expense ratio and compared them with fees and expenses of other comparable funds based on information and data supplied by Lipper. The information provided to the Board indicated that the fund’s management fee rate was above the median for certain groups of comparable funds but at or below the median for other groups of comparable funds. The information also indicated that the fund’s total expense ratio was at or below the median for comparable funds. The Board also reviewed the fee schedules for institutional accounts of the Advisor and its affiliates with similar mandates. Management provided the Board with information about the Advisor’s responsibilities and services provided to institutional account clients, which are more limited than its responsibilities for the fund and other T. Rowe Price mutual funds that it advises, and showing that the Advisor performs significant additional services and assumes greater risk for the fund and other T. Rowe Price mutual funds that it advises than it does for institutional account clients. On the basis of the information provided, the Board concluded that the fees paid by the fund under the Contract were reasonable.
Approval of the Contract
As noted, the Board approved the continuation of the Contract. No single factor was considered in isolation or to be determinative to the decision. Rather, the Board was assisted by the advice of independent legal counsel and concluded, in light of a weighting and balancing of all factors considered, that it was in the best interests of the fund to approve the continuation of the Contract (including the fees to be charged for services thereunder).
Item 2. Code of Ethics.
A code of ethics, as defined in Item 2 of Form N-CSR, applicable to its principal executive officer, principal financial officer, principal accounting officer or controller, or persons performing similar functions is filed as an exhibit to the registrant’s annual Form N-CSR. No substantive amendments were approved or waivers were granted to this code of ethics during the registrant’s most recent fiscal half-year.
Item 3. Audit Committee Financial Expert.
Disclosure required in registrant’s annual Form N-CSR.
Item 4. Principal Accountant Fees and Services.
Disclosure required in registrant’s annual Form N-CSR.
Item 5. Audit Committee of Listed Registrants.
Not applicable.
Item 6. Investments.
(a) Not applicable. The complete schedule of investments is included in Item 1 of this Form N-CSR.
(b) Not applicable.
Item 7. Disclosure of Proxy Voting Policies and Procedures for Closed-End Management Investment Companies.
Not applicable.
Item 8. Portfolio Managers of Closed-End Management Investment Companies.
Not applicable.
Item 9. Purchases of Equity Securities by Closed-End Management Investment Company and Affiliated Purchasers.
Not applicable.
Item 10. Submission of Matters to a Vote of Security Holders.
Not applicable.
Item 11. Controls and Procedures.
(a) The registrant’s principal executive officer and principal financial officer have evaluated the registrant’s disclosure controls and procedures within 90 days of this filing and have concluded that the registrant’s disclosure controls and procedures were effective, as of that date, in ensuring that information required to be disclosed by the registrant in this Form N-CSR was recorded, processed, summarized, and reported timely.
(b) The registrant’s principal executive officer and principal financial officer are aware of no change in the registrant’s internal control over financial reporting that occurred during the registrant’s second fiscal quarter covered by this report that has materially affected, or is reasonably likely to materially affect, the registrant’s internal control over financial reporting.
Item 12. Exhibits.
(a)(1) The registrant’s code of ethics pursuant to Item 2 of Form N-CSR is filed with the registrant’s annual Form N-CSR.
(2) Separate certifications by the registrant's principal executive officer and principal financial officer, pursuant to Section 302 of the Sarbanes-Oxley Act of 2002 and required by Rule 30a-2(a) under the Investment Company Act of 1940, are attached.
(3) Written solicitation to repurchase securities issued by closed-end companies: not applicable.
(b) A certification by the registrant's principal executive officer and principal financial officer, pursuant to Section 906 of the Sarbanes-Oxley Act of 2002 and required by Rule 30a-2(b) under the Investment Company Act of 1940, is attached.
| | |
SIGNATURES |
| |
| | Pursuant to the requirements of the Securities Exchange Act of 1934 and the Investment |
| Company Act of 1940, the registrant has duly caused this report to be signed on its behalf by the |
| undersigned, thereunto duly authorized. |
| |
| T. Rowe Price Financial Services Fund, Inc. |
| |
| |
| |
| By | /s/ Edward C. Bernard |
| | Edward C. Bernard |
| | Principal Executive Officer |
| |
| Date | August 17, 2011 |
| |
| |
| |
| | Pursuant to the requirements of the Securities Exchange Act of 1934 and the Investment |
| Company Act of 1940, this report has been signed below by the following persons on behalf of |
| the registrant and in the capacities and on the dates indicated. |
| |
| |
| By | /s/ Edward C. Bernard |
| | Edward C. Bernard |
| | Principal Executive Officer |
| |
| Date | August 17, 2011 |
| |
| |
| |
| By | /s/ Gregory K. Hinkle |
| | Gregory K. Hinkle |
| | Principal Financial Officer |
| |
| Date | August 17, 2011 |