| UNITED STATES |
| SECURITIES AND EXCHANGE COMMISSION |
| Washington, D.C. 20549 |
| |
FORM N-CSR |
| |
CERTIFIED SHAREHOLDER REPORT OF REGISTERED |
MANAGEMENT INVESTMENT COMPANIES |
| |
| |
| |
| Investment Company Act File Number: 811-07749 |
|
| |
| T. Rowe Price Financial Services Fund, Inc. |
|
| (Exact name of registrant as specified in charter) |
| |
| 100 East Pratt Street, Baltimore, MD 21202 |
|
| (Address of principal executive offices) |
| |
| David Oestreicher |
| 100 East Pratt Street, Baltimore, MD 21202 |
|
| (Name and address of agent for service) |
| |
| |
| Registrant’s telephone number, including area code: (410) 345-2000 |
| |
| |
| Date of fiscal year end: December 31 |
| |
| |
| Date of reporting period: June 30, 2009 |
Item 1: Report to Shareholders| Financial Services Fund | June 30, 2009 |
The views and opinions in this report were current as of June 30, 2009. They are not guarantees of performance or investment results and should not be taken as investment advice. Investment decisions reflect a variety of factors, and the managers reserve the right to change their views about individual stocks, sectors, and the markets at any time. As a result, the views expressed should not be relied upon as a forecast of the fund’s future investment intent. The report is certified under the Sarbanes-Oxley Act, which requires mutual funds and other public companies to affirm that, to the best of their knowledge, the information in their financial reports is fairly and accurately stated in all material respects.
REPORTS ON THE WEB
Sign up for our E-mail Program, and you can begin to receive updated fund reports and prospectuses online rather than through the mail. Log in to your account at troweprice.com for more information.
Manager’s Letter
Fellow Shareholders
For the first time in two years, there is some good news to report. First, the epic financial crisis that erupted with the Lehman Brothers bankruptcy in September 2008 and spilled into 2009 is over. Globally coordinated government intervention has taken systemic risk and predictions of another Great Depression off the table. Banks are again lending to one another, spreads on fixed-income securities no longer imply bankruptcy filings at large financial companies, and a significant risk appetite has returned to the capital markets. This is evidenced by nearly $150 billion of fresh equity capital that investors have poured into the financial services sector globally in the last few months.

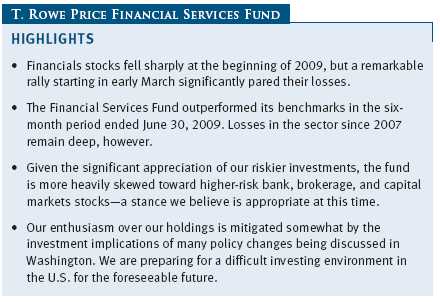
Another piece of good news is that the fund posted a positive return while outpacing its peers on a relative basis for the first six months of 2009, as shown in the Performance Comparison table. We feel that the portfolio is loaded with securities trading comfortably below their intrinsic value, and we see the rate of deterioration in the U.S. economy slowing across many important measures—from home price depreciation to credit card delinquencies to job losses. The economy is still very weak, and while we are confident that our holdings are undervalued and that the economy will grow again before too long, we are not confident about the strength or sustainability of stock price appreciation for the foreseeable future, given the fragile nature of the recovery and the far-reaching implications of proposed policy changes on capital formation, job creation, and consumer spending.
As always, we would like to remind our investors that the Financial Services Fund is a relatively narrow offering that is subject to a greater risk of capital losses than more diversified portfolios. We believe that only a relatively small portion of one’s investment portfolio should be allocated to this strategy.

While the fund has outperformed its benchmarks during the two-year period of unprecedented capital destruction that began with the subprime meltdown in 2007, we have much work to do in order to recover the losses we have incurred. Financials was the worst-performing sector of the market in 2007, 2008, and the first quarter of 2009.
In our last report to you six months ago, we expressed confidence that financial stocks would rise in 2009 or 2010 in anticipation of a cyclical recovery in the global economy. A recovery in share prices indeed has taken hold, but we did not expect the whipsaw impact of investor emotion and government action that resulted in the extraordinary share price movements of the last six months. Specifically, after posting the worst quarterly return in the fund’s 13-year history in the fourth quarter of 2008 (-21.09%), the fund followed up in the first quarter of this year with its third-worst quarterly return ever (-15.66%). Many investors simply gave up on financials, selling shares of good and bad companies indiscriminately, regardless of the fact the prospective returns had soared, given the excessive risk aversion rampant in the market. Then, in early March, just as quickly as investors sold the stocks down to unthinkable lows, greed overtook fear in the minds of investors; the risk of missing out trumped the risk of losing money; and the share prices of many large, established, household-name financial companies doubled, tripled, or even quadrupled in a matter of weeks.
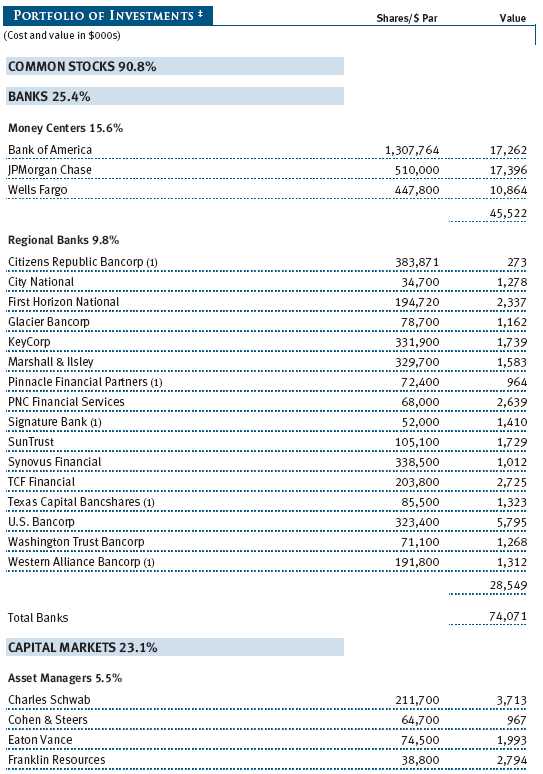
For example, in just eight weeks from the lows in early March, JPMorgan Chase increased over 150%, from $15 to $38; Aflac increased over 175%, from $13.50 to $37.50; and Wells Fargo increased over 200%, from $8.70 to $28; while Bank of America increased over 330%, from $2.53 to $11 in only seven weeks. So, after the biggest six-month decline in the fund’s history, the fund’s net asset value (NAV) increased by nearly two-thirds during this surreal inter-quarter period. For the entire second quarter of 2009, which was characterized by panic buying through early June, the fund ended up posting its best ever quarterly return (25.60%). Going forward, we do not expect a smooth ride, but we do expect less volatility and an absence of the frenetic pace of change in investors’ assessments of the very survivability of systemically important, well-managed financial institutions. (Please refer to the fund’s portfolio of investments for a complete listing of holdings and the amount each represents in the portfolio.)
The past couple of years have been an extraordinarily difficult period for your fund’s management team and our T. Rowe Price colleagues to invest in financial companies and take a long-term view. In a number of situations, fundamental analysis and a seemingly cogent assessment of how events surrounding “too big to fail” companies would unfold mattered little. What mattered more was one’s ability to handicap the government’s arbitrary and inconsistent handling of similar crisis situations (i.e., the tragic decision over the same weekend to support the counterparties of AIG but walk away from the counterparties of Lehman Brothers).
Today, however, we find ourselves able to make what we believe are longer-term investments in many companies based on our estimate of “normal” earnings in a muted economic recovery that is likely to begin later this year. With billions of dollars of fresh capital on the balance sheets and substantial earnings power to absorb the significant future losses that we expect—and readily available liquidity from federal government programs—confidence has been restored and capital markets are funding the majority of companies in the sector. As such, our work is thankfully focused on fundamentals and the lucrative opportunity to look through depressed earnings over the next several quarters and put your capital to work by embracing near-term uncertainty and investing in well-capitalized companies that are gaining customers and have pricing power, yet are trading for six or seven times what we think they can earn in 2011 or 2012. Several banks, brokers, and life insurers we own fit these criteria. Other investments that hold great promise are in the property and casualty (P&C) insurance industry, where we are able to purchase leading companies with strong balance sheets for less than their book value. Our assessment indicates that both the longer-term and near-term earnings could generate significant book value growth and returns well in excess of the cost of capital.

PORTFOLIO REVIEW
Our fund continues to be well diversified across more than 80 issuers of securities and retains the somewhat aggressive posture we adopted in the fourth quarter of 2008 and the first quarter of 2009. We still have a barbell-like structure of defensive and higher-risk investments, but given the significant appreciation of our investments on the riskier end of the barbell during the period and the fact that we put much of our cash to work during the sell-off earlier this year, the fund is now more heavily skewed toward higher-risk bank, brokerage, and capital markets stocks. At the same time, it is less buttressed by cash, convertible securities, and somewhat defensive P&C stocks than it has been in over two years. We believe this positioning is appropriate given our view that systemic risk is largely behind us, the economy will probably return to modest growth in the near term, and most of the companies we own have reasonably strong balance sheets and look attractively valued.
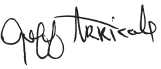
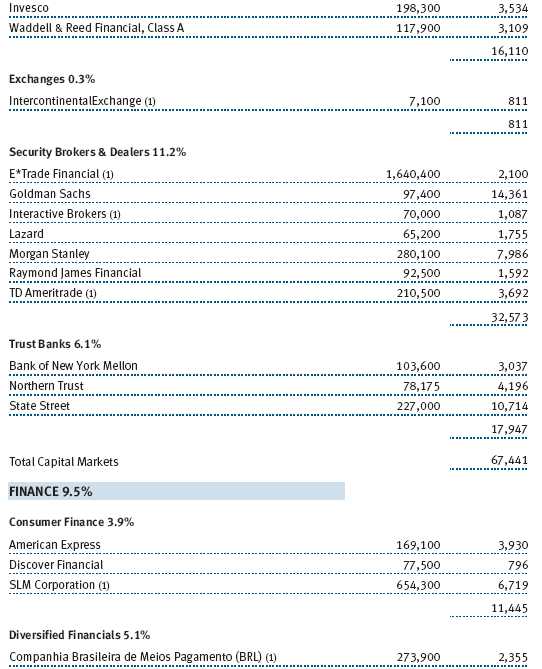
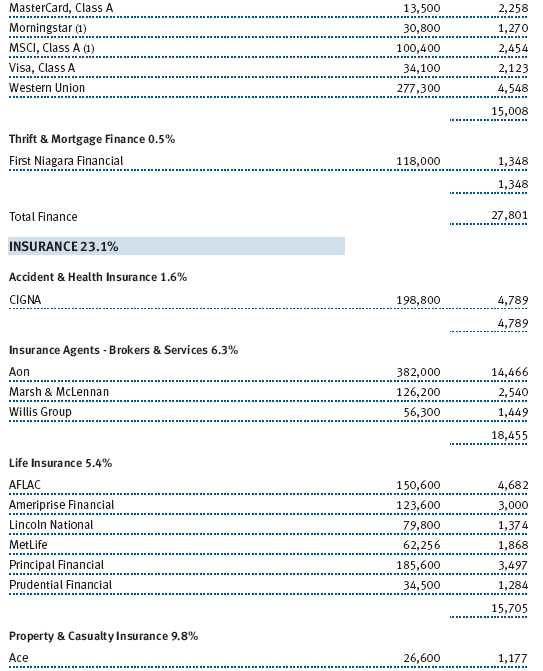
During the period, we significantly increased our ownership of the common stocks in the bank, brokerage, and capital markets industries. Issuers such as Bank of America, JPMorgan Chase, Wells Fargo, U.S. Bancorp, Goldman Sachs, Morgan Stanley, State Street, Northern Trust, E*Trade Financial, Charles Schwab, and TD Ameritrade are top 25 positions in the fund. Securities in these industries represent more than half of the fund’s assets. P&C insurance and related insurance brokers still represent a large position in the fund and include top 25 holdings Aon, Travelers, Chubb, and Aspen Insurance. Despite a favorable long-term view of our P&C investments, our weighting in this relatively defensive sector is naturally less than it was in prior periods given the significant rebound in sectors that bore the brunt of the sell-off in prior periods.
The fund’s outperformance versus its benchmarks in the last six months can be attributed to an underweight position in regional banks and timely increases in exposure to major banks JPMorgan Chase, Bank of America, and Wells Fargo; brokers Goldman Sachs and Morgan Stanley; trust bank State Street; and special situation investments like SLM Corporation (Sallie Mae). These stocks were detractors in prior periods; fortunately, we added to our holdings as we approached the nadir in March and participated in the strong rally that followed.
Absolute returns were acceptable for the period in light of the losses registered by two of the fund’s three benchmarks. We think the Lipper and Morningstar categories are the most representative benchmarks against which to measure our performance. Although our performance versus the S&P 500 Financials Index has been strong over the past few years, that is partially a function of the fact that banks, which represent almost half of the index, have been weak. Investors should expect the fund to be structurally underweighted in banks relative to the S&P 500 Financials Index because we don’t think it is prudent—from a risk-management perspective—to put 50% of our assets in any single industry. As a result, the fund is likely to outperform the S&P 500 Financials Index when banks are weak and underperform when they are strong.
Several of our biggest detractors in the period—Aon, Chubb, and H&R Block—share a common thread: They held up relatively well during the downturn, and investors sold these stocks to fund purchases of beaten-down issuers in other sectors. Other notable detractors can be found in our regional bank holdings. While underweighting regional banks versus our peers softened the blow, investments in Fifth Third Bancorp, Marshall & Ilsley, Synovus Financial, and East West Bancorp hurt performance. We view each of these banks as high risk with high reward potential, and our analysis has led us to place a higher probability on our upside case coming to fruition. We are managing the downside risk by maintaining relatively small positions for the time being and, in some cases, investing higher up in the capital structure.
We plan to add to our regional bank holdings in the coming months because we believe the current valuations do not reflect two important developments. First, we believe that the pace of nonperforming loan formation—the pipeline of future charge-offs—will begin to moderate significantly in the coming months. This would be a strong signal that earnings are likely to be materially higher in 2011–2012 than in 2009–2010. Second, net interest margin (NIM), the spread a bank makes on its assets after the cost of funding, accounts for 80% of the average regional bank’s revenue, and this margin has been declining for many years. With the fed funds target rate effectively at 0% and regional banks now having meaningful pricing power on new loans, we believe the NIM bottomed in the first quarter of 2009 and has nowhere to go but up. The combination of reasonable valuations today and lower charge-offs with higher NIMs in 2011–2012 leads us to believe that regional banks could be one of the better-performing financial industries at some point in the next 12 to 24 months.
Our large positions in Goldman Sachs and JPMorgan Chase—two of the clear long-term winners coming out of this tumultuous period—aided fund performance in the first half of the year. The consensus view of these two firms is that they are the best-managed and best-positioned large financial companies in the world. We agree, which begs the question of why we have around 11% of our assets invested in two well-known stocks where we likely have no major difference of opinion versus the consensus. We maintain large positions in these two institutions because we think they will appreciate materially over the next three years as:
(1) the pipeline of future earnings power that has been built by market share gains during the downturn at the expense of weakened competitors is realized,
(2) management responsibly deploys the significant excess capital currently being hoarded on the balance sheet, and
(3) investors become willing to pay higher price/book value and price/earnings (P/E) multiples for these best-in-class companies with significant earnings power on the other side of this economic cycle.
Holdings in more controversial “value” names in which we generally invest paid off handsomely in the period after fits and starts. Bank of America, Morgan Stanley, Sallie Mae, and State Street all contributed to performance and remain top holdings in the fund. Each of these companies faced balance sheet or funding issues, but we disagreed with the market’s excessively negative assessment of their ability to access capital markets and repair their balance sheets or resolve funding issues. Like Goldman Sachs and JPMorgan Chase, these companies are top 10 holdings in the fund, as we see room for significant appreciation over a two- to three-year period.
Notable purchases in the last six months—aside from increasing positions in the previously mentioned bank and capital markets stocks—include a new position in Aflac, the supplemental insurance benefits company that does most of its business in Japan but is well known in the U.S. because of the “Aflac Duck” commercials. Aflac sells a low-cost supplemental insurance product and invests the premiums in bonds and other securities. The company started the year trading around $46 per share; by March, the stock had fallen to less than $13 per share, as investors feared that Aflac’s investments in European bank fixed-income securities would be wiped out by a wave of defaults and nationalizations. With the help of our domestic life insurance analyst and our European bank and insurance analysts from both our equity and fixed-income departments, we concluded that a small position in Aflac made sense. As we gained confidence that any losses on the investment side would be manageable and that Aflac would likely have access to the capital markets if needed, we made additional investments, and Aflac is now a top 25 position in the fund. As of this writing, the stock is around $32 per share and is trading for just over six times the consensus earnings estimate for 2010 with a dividend yield over 3%. Over the past 20 years, Aflac has averaged a P/E ratio of 15, generated an average annual return on equity exceeding 20%, and compounded earnings and dividends at an annual compounded rate of 18%. The company has managed to avoid cutting its dividend so far during this downturn and, unlike many of our investments, does not face materially depressed operating earnings over the next 12 to 18 months. Our thesis does not require a reversion to anywhere near historic valuation levels in order to generate a significant profit.
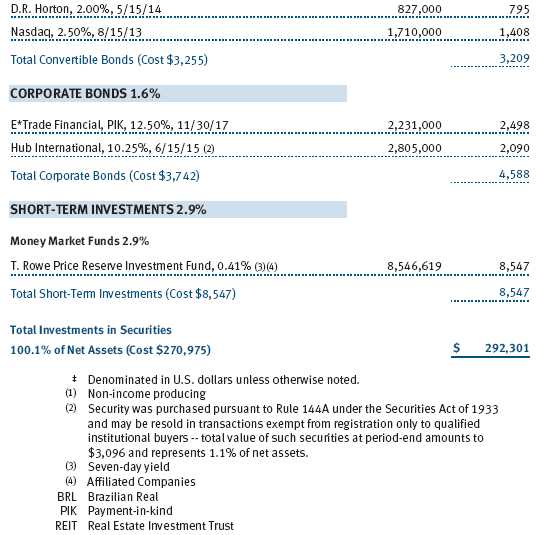
Notable sales in the first half of 2009 include the convertible bonds of Bank of America and Wells Fargo, the proceeds of which we invested in the riskier common equity of each company. For much of this cycle, we have viewed equity as a less attractive part of the capital structure in many financial companies than convertible or fixed-income securities from the same issuer, given the uncertainty of ultimate losses, the first-loss position that equity represents, and the equity-like returns offered by the convertible securities. Staying higher up in the capital structure did not help us make money over the past couple of years, but it did help us lose less money than many of our peers. This swap into equity was consistent with our view late last year that it was time to take more risk in select companies because the prospective returns were enormous and our fundamental work suggested that each company’s balance sheet would be able to absorb future losses while preserving strong earnings power on the other side of the credit cycle.
Another notable sale was H&R Block. After being a solid defensive holding for nearly two years and one of the few bright spots in the portfolio in 2008, H&R Block hurt our performance in the first half of 2009. We were wrong in our assessment of earnings power in 2009 and 2010, as clients proved to be much more price-sensitive in a recession than we and the company had anticipated—there was a meaningful shift to digital tax preparation at the company this past tax season, where H&R Block makes far less money for each client served. Essentially, our investment thesis changed from a view that H&R Block is a defensive holding with a stable and predictable business that is clearly undervalued to one of a well-managed company that is dealing with a “business model in transition,” where the ultimate profitability and defensive characteristics are less clear. We thought H&R Block was not likely to lose us much money over the next year or so, but that it would be a significant underperformer in a recovery. Thus far, this thesis has played out, as the banks and capital markets stocks in which we invested have appreciated considerably.
OUTLOOK
We noted in our last report that we were carefully monitoring housing prices, yield spreads between Treasuries and riskier fixed-income assets, and liquidity as investment guideposts in the financials sector. We informed you that we had started to position the fund more aggressively despite our view that an outright recovery in housing prices and a significant improvement in bank loan portfolios (i.e., the pace of reserve building and the pace of nonperforming loan growth) was probably a 2010 event as we believed financial stocks would advance when the rate of deterioration slowed and before any actual improvement. As of this writing, we have witnessed a strong equity market rally that has been led by financials. Indeed, important metrics like the pace of house price depreciation and the rate of job losses have improved. Credit spreads have continued to narrow in the fixed-income market as investors’ risk appetite has returned. Liquidity remains robust, as the U.S. monetary base reached $1.3 trillion at the end of June, an increase of 23% since the end of last year. We still don’t expect to see significant improvement in bank loan portfolios prior to 2010, but we have more confidence that bank balance sheets can absorb the losses yet to come and that 2010 will be a year of meaningful improvement. A return to “normalized” earnings is most likely a 2012 event, and we are willing to wait for the stocks to trade on these earnings.
What keeps us from getting too comfortable is our concern that equity returns may be below long-term averages for some time. Meaningful and sustainable growth in the weak U.S. economy is going to be challenged by excessive taxation on capital and populist legislation that may further restrict capital formation and prove harmful to the very constituency our elected officials aim to placate. If an economic recovery is stronger than we expect, the fund will participate if financial stocks continue the ascent that started in March. However, our enthusiasm over the bottom-up attractiveness of the stocks we hold is mitigated somewhat by the investment implications of a deficit that is likely to increase faster than gross domestic product and the drag on jobs, profits, and consumer spending that many of the policy changes being discussed in Washington may engender. We can envision a wide range of outcomes as it relates to equity returns over the next several years and lack strong conviction on how investors, small business owners, and consumers will react to a number of plausible environments—higher taxation, higher consumer savings rates, higher inflation, and higher interest rates, to name a few.
In closing, returns for the first half of 2009 are encouraging, and we believe there are solid investment opportunities available to us. We are preparing for a difficult, if not directionless, investing environment in the U.S. for the foreseeable future. While frustrating, it should favor our fund’s and our firm’s patient, fundamentally driven investment approach that emphasizes risk-adjusted returns and benefits from our reservoir of talented research analysts regardless of the external forces that may need to be addressed.
We thank you for your confidence in T. Rowe Price.
Respectfully submitted,
Jeffrey W. Arricale
Chairman of the fund’s Investment Advisory Committee
July 22, 2009
The committee chairman has day-to-day responsibility for managing the portfolio and works with committee members in developing and executing the fund’s investment program.
RISKS OF INVESTING
The fund’s share price can fall because of weakness in the stock market, a particular industry, or specific holdings. Stock markets can decline for many reasons, including adverse political or economic developments, changes in investor psychology, or heavy institutional selling. The prospects for an industry or company may deteriorate because of a variety of factors, including disappointing earnings or changes in the competitive environment. In addition, the investment manager’s assessment of companies held in a fund may prove incorrect, resulting in losses or poor performance, even in rising markets.
Funds that invest only in specific industries will experience greater volatility than funds investing in a broad range of industries. The banking industry can be significantly affected by legislation that has reduced the separation between commercial and investment banking businesses, changed the laws governing capitalization requirements and the savings and loan industry, and increased competition. In addition, changes in general economic conditions and interest rates can significantly affect the banking industry. Financial services companies may be hurt when interest rates rise sharply, although not all companies are affected equally. The stocks may also be vulnerable to rapidly rising inflation.
GLOSSARY
Lipper indexes: Fund benchmarks that consist of a small number of the largest mutual funds in a particular category as tracked by Lipper Inc.
Morningstar Specialty Financial Average: Tracks the performance of funds that seek capital appreciation by investing primarily in equity securities of financial services companies.
Price/book value (P/BV) ratio: A ratio used to compare a stock’s market value to its book value. It is calculated by dividing the current closing price of the stock by the latest quarter’s book value.
Price/earnings (P/E) ratio: A ratio that shows the “multiple” of earnings at which a stock is selling. It is calculated by dividing a stock’s current price by its current earnings per share. For example, if a stock’s price is $60 per share and the issuing company earns $2 per share, the P/E ratio is $60/$2, or 30.
S&P 500 Financials Index: A subindex of the S&P 500 Stock Index that includes all of the financials sector components of the S&P 500.
S&P 500 Stock Index: An unmanaged index that tracks the stocks of 500 primarily large-cap U.S. companies.

Performance and Expenses
This chart shows the value of a hypothetical $10,000 investment in the fund over the past 10 fiscal year periods or since inception (for funds lacking 10-year records). The result is compared with benchmarks, which may include a broad-based market index and a peer group average or index. Market indexes do not include expenses, which are deducted from fund returns as well as mutual fund averages and indexes.

| AVERAGE ANNUAL COMPOUND TOTAL RETURN |
This table shows how the fund would have performed each year if its actual (or cumulative) returns for the periods shown had been earned at a constant rate.

As a mutual fund shareholder, you may incur two types of costs: (1) transaction costs, such as redemption fees or sales loads, and (2) ongoing costs, including management fees, distribution and service (12b-1) fees, and other fund expenses. The following example is intended to help you understand your ongoing costs (in dollars) of investing in the fund and to compare these costs with the ongoing costs of investing in other mutual funds. The example is based on an investment of $1,000 invested at the beginning of the most recent six-month period and held for the entire period.
Actual Expenses
The first line of the following table (“Actual”) provides information about actual account values and expenses based on the fund’s actual returns. You may use the information in this line, together with your account balance, to estimate the expenses that you paid over the period. Simply divide your account value by $1,000 (for example, an $8,600 account value divided by $1,000 = 8.6), then multiply the result by the number in the first line under the heading “Expenses Paid During Period” to estimate the expenses you paid on your account during this period.
Hypothetical Example for Comparison Purposes
The information on the second line of the table (“Hypothetical”) is based on hypothetical account values and expenses derived from the fund’s actual expense ratio and an assumed 5% per year rate of return before expenses (not the fund’s actual return). You may compare the ongoing costs of investing in the fund with other funds by contrasting this 5% hypothetical example and the 5% hypothetical examples that appear in the shareholder reports of the other funds. The hypothetical account values and expenses may not be used to estimate the actual ending account balance or expenses you paid for the period.
Note: T. Rowe Price charges an annual small-account maintenance fee of $10, generally for accounts with less than $2,000 ($500 for UGMA/UTMA). The fee is waived for any investor whose T. Rowe Price mutual fund accounts total $25,000 or more, accounts employing automatic investing, and IRAs and other retirement plan accounts that utilize a prototype plan sponsored by T. Rowe Price (although a separate custodial or administrative fee may apply to such accounts). This fee is not included in the accompanying table. If you are subject to the fee, keep it in mind when you are estimating the ongoing expenses of investing in the fund and when comparing the expenses of this fund with other funds.
You should also be aware that the expenses shown in the table highlight only your ongoing costs and do not reflect any transaction costs, such as redemption fees or sales loads. Therefore, the second line of the table is useful in comparing ongoing costs only and will not help you determine the relative total costs of owning different funds. To the extent a fund charges transaction costs, however, the total cost of owning that fund is higher.

Unaudited

The accompanying notes are an integral part of these financial statements.
Unaudited


The accompanying notes are an integral part of these financial statements.
Unaudited

The accompanying notes are an integral part of these financial statements.
Unaudited
The accompanying notes are an integral part of these financial statements.
Unaudited
The accompanying notes are an integral part of these financial statements.
Unaudited
| NOTES TO FINANCIAL STATEMENTS |
T. Rowe Price Financial Services Fund, Inc. (the fund), is registered under the Investment Company Act of 1940 (the 1940 Act) as a diversified, open-end management investment company. The fund commenced operations on September 30, 1996. The fund seeks long-term growth of capital and a modest level of income.
NOTE 1 - SIGNIFICANT ACCOUNTING POLICIES
Basis of Preparation The accompanying financial statements were prepared in accordance with accounting principles generally accepted in the United States of America, which require the use of estimates made by fund management. Fund management believes that estimates and security valuations are appropriate; however, actual results may differ from those estimates, and the security valuations reflected in the financial statements may differ from the value the fund ultimately realizes upon sale of the securities. Further, fund management believes no events have occurred between June 30, 2009 and August 20, 2009, the date of issuance of the financial statements, that require adjustment of, or disclosure in, the accompanying financial statements.
Investment Transactions, Investment Income, and Distributions Income and expenses are recorded on the accrual basis. Premiums and discounts on debt securities are amortized for financial reporting purposes. Dividends received from mutual fund investments are reflected as dividend income; capital gain distributions are reflected as realized gain/loss. Dividend income and capital gain distributions are recorded on the ex-dividend date. Income tax-related interest and penalties, if incurred, would be recorded as income tax expense. Investment transactions are accounted for on the trade date. Realized gains and losses are reported on the identified cost basis. Distributions to shareholders are recorded on the ex-dividend date. Income distributions are declared and paid an annual basis. Capital gain distributions, if any, are declared and paid by the fund, typically on an annual basis.
Currency Translation Assets, including investments, and liabilities denominated in foreign currencies are translated into U.S. dollar values each day at the prevailing exchange rate, using the mean of the bid and asked prices of such currencies against U.S. dollars as quoted by a major bank. Purchases and sales of securities, income, and expenses are translated into U.S. dollars at the prevailing exchange rate on the date of the transaction. The effect of changes in foreign currency exchange rates on realized and unrealized security gains and losses is reflected as a component of security gains and losses.
Rebates and Credits Subject to best execution, the fund may direct certain security trades to brokers who have agreed to rebate a portion of the related brokerage commission to the fund in cash. Commission rebates are reflected as realized gain on securities in the accompanying financial statements and totaled $4,000 for the six months ended June 30, 2009. Additionally, the fund earns credits on temporarily uninvested cash balances held at the custodian which reduce the fund’s custody charges. Custody expense in the accompanying financial statements is presented before reduction for credits.
New Accounting Pronouncement On January 1, 2009, the fund adopted Statement of Financial Accounting Standards No. 161 (FAS 161), Disclosures about Derivative Instruments and Hedging Activities. FAS 161 requires enhanced disclosures about derivative and hedging activities, including how such activities are accounted for and their effect on financial position, performance and cash flows. Adoption of FAS 161 had no impact on the fund’s net assets or results of operations.
NOTE 2 - VALUATION
The fund’s investments are reported at fair value as defined under Statement of Financial Accounting Standards No. 157 (FAS 157), Fair Value Measurements. The fund values its investments and computes its net asset value per share at the close of the New York Stock Exchange (NYSE), normally 4 p.m. ET, each day that the NYSE is open for business.
Valuation Methods Equity securities listed or regularly traded on a securities exchange or in the over-the-counter (OTC) market are valued at the last quoted sale price or, for certain markets, the official closing price at the time the valuations are made, except for OTC Bulletin Board securities, which are valued at the mean of the latest bid and asked prices. A security that is listed or traded on more than one exchange is valued at the quotation on the exchange determined to be the primary market for such security. Listed securities not traded on a particular day are valued at the mean of the latest bid and asked prices for domestic securities and the last quoted sale price for international securities.
Debt securities are generally traded in the OTC market. Securities with remaining maturities of one year or more at the time of acquisition are valued at prices furnished by dealers who make markets in such securities or by an independent pricing service, which considers the yield or price of bonds of comparable quality, coupon, maturity, and type, as well as prices quoted by dealers who make markets in such securities. Securities with remaining maturities of less than one year at the time of acquisition generally use amortized cost in local currency to approximate fair value. However, if amortized cost is deemed not to reflect fair value or the fund holds a significant amount of such securities with remaining maturities of more than 60 days, the securities are valued at prices furnished by dealers who make markets in such securities or by an independent pricing service.
Investments in mutual funds are valued at the mutual fund’s closing net asset value per share on the day of valuation.
Other investments, including restricted securities, and those for which the above valuation procedures are inappropriate or are deemed not to reflect fair value are stated at fair value as determined in good faith by the T. Rowe Price Valuation Committee, established by the fund’s Board of Directors.
For valuation purposes, the last quoted prices of non-U.S. equity securities may be adjusted under the circumstances described below. If the fund determines that developments between the close of a foreign market and the close of the NYSE will, in its judgment, materially affect the value of some or all of its portfolio securities, the fund will adjust the previous closing prices to reflect what it believes to be the fair value of the securities as of the close of the NYSE. In deciding whether it is necessary to adjust closing prices to reflect fair value, the fund reviews a variety of factors, including developments in foreign markets, the performance of U.S. securities markets, and the performance of instruments trading in U.S. markets that represent foreign securities and baskets of foreign securities. A fund may also fair value securities in other situations, such as when a particular foreign market is closed but the fund is open. The fund uses outside pricing services to provide it with closing prices and information to evaluate and/or adjust those prices. The fund cannot predict how often it will use closing prices and how often it will determine it necessary to adjust those prices to reflect fair value. As a means of evaluating its security valuation process, the fund routinely compares closing prices, the next day’s opening prices in the same markets, and adjusted prices.
Valuation Inputs Various inputs are used to determine the value of the fund’s investments. These inputs are summarized in the three broad levels listed below:
Level 1 – quoted prices in active markets for identical securities
Level 2 – observable inputs other than Level 1 quoted prices (including, but not limited to, quoted prices for similar securities, interest rates, prepayment speeds, credit risk)
Level 3 – unobservable inputs
Observable inputs are those based on market data obtained from sources independent of the fund, and unobservable inputs reflect the fund’s own assumptions based on the best information available. The input levels are not necessarily an indication of the risk or liquidity associated with investments at that level. For example, non-U.S. equity securities actively traded in foreign markets generally are reflected in Level 2 despite the availability of closing prices because the fund evaluates and determines whether those closing prices reflect fair value at the close of the NYSE or require adjustment, as described above. The following table summarizes the fund’s investments, based on the inputs used to determine their values on June 30, 2009:

NOTE 3 - OTHER INVESTMENT TRANSACTIONS
Consistent with its investment objective, the fund engages in the following practices to manage exposure to certain risks or to enhance performance. The investment objective, policies, program, and risk factors of the fund are described more fully in the fund’s prospectus and Statement of Additional Information.
Restricted Securities The fund may invest in securities that are subject to legal or contractual restrictions on resale. Prompt sale of such securities at an acceptable price may be difficult and may involve substantial delays and additional costs.
Other Purchases and sales of portfolio securities other than short-term securities aggregated $149,108,000 and $130,400,000, respectively, for the six months ended June 30, 2009.
NOTE 4 - FEDERAL INCOME TAXES
No provision for federal income taxes is required since the fund intends to continue to qualify as a regulated investment company under Subchapter M of the Internal Revenue Code and distribute to shareholders all of its taxable income and gains. Distributions are determined in accordance with Federal income tax regulations, which differ from generally accepted accounting principles, and, therefore, may differ in amount or character from net investment income and realized gains for financial reporting purposes. Financial reporting records are adjusted for permanent book/tax differences to reflect tax character but are not adjusted for temporary differences. The amount and character of tax-basis distributions and composition of net assets are finalized at fiscal year-end; accordingly, tax-basis balances have not been determined as of June 30, 2009.
In accordance with federal tax regulations, the fund deferred recognition of certain capital loss amounts previously recognized in the prior fiscal year for financial reporting purposes until the current fiscal period for tax purposes. Such deferrals amounted to $21,381,000 and related to net capital losses realized between November 1 and the fund’s fiscal year-end date. Further, the fund intends to retain realized gains to the extent of available capital loss carryforwards. As of December 31, 2008, the fund had $119,942,000 of unused capital loss carryforwards, all of which expire in fiscal 2016.
At June 30, 2009, the cost of investments for federal income tax purposes was $270,975,000. Net unrealized gain aggregated $21,334,000 at period-end, of which $39,520,000 related to appreciated investments and $18,186,000 related to depreciated investments.
NOTE 5 - RELATED PARTY TRANSACTIONS
The fund is managed by T. Rowe Price Associates, Inc. (the manager or Price Associates), a wholly owned subsidiary of T. Rowe Price Group, Inc. The investment management agreement between the fund and the manager provides for an annual investment management fee, which is computed daily and paid monthly. The fee consists of an individual fund fee, equal to 0.35% of the fund’s average daily net assets, and a group fee. The group fee rate is calculated based on the combined net assets of certain mutual funds sponsored by Price Associates (the group) applied to a graduated fee schedule, with rates ranging from 0.48% for the first $1 billion of assets to 0.285% for assets in excess of $220 billion. The fund’s group fee is determined by applying the group fee rate to the fund’s average daily net assets. At June 30, 2009, the effective annual group fee rate was 0.31%.
In addition, the fund has entered into service agreements with Price Associates and two wholly owned subsidiaries of Price Associates (collectively, Price). Price Associates computes the daily share price and provides certain other administrative services to the fund. T. Rowe Price Services, Inc., provides shareholder and administrative services in its capacity as the fund’s transfer and dividend disbursing agent. T. Rowe Price Retirement Plan Services, Inc., provides subaccounting and recordkeeping services for certain retirement accounts invested in the fund. For the six months ended June 30, 2009, expenses incurred pursuant to these service agreements were $49,000 for Price Associates, $239,000 for T. Rowe Price Services, Inc., and $25,000 for T. Rowe Price Retirement Plan Services, Inc. The total amount payable at period-end pursuant to these service agreements is reflected as Due to Affiliates in the accompanying financial statements.
Additionally, the fund is one of several mutual funds in which certain college savings plans managed by Price Associates may invest. As approved by the fund’s Board of Directors, shareholder servicing costs associated with each college savings plan are borne by the fund in proportion to the average daily value of its shares owned by the college savings plan. For the six months ended June 30, 2009, the fund was charged $17,000 for shareholder servicing costs related to the college savings plans, of which $11,000 was for services provided by Price. The amount payable at period-end pursuant to this agreement is reflected as Due to Affiliates in the accompanying financial statements. At June 30, 2009, approximately 3% of the outstanding shares of the fund were held by college savings plans.
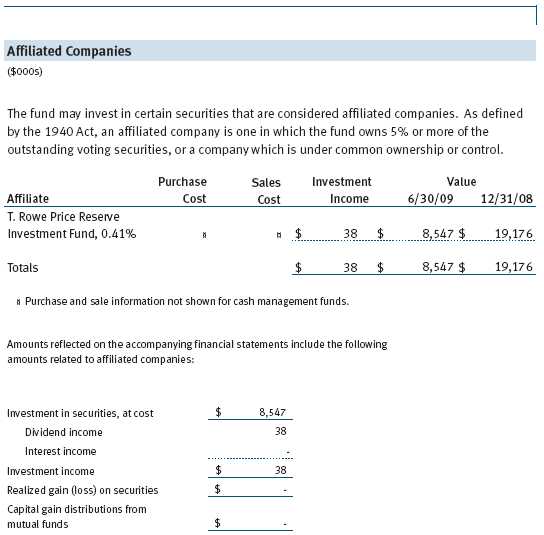
The fund may invest in the T. Rowe Price Reserve Investment Fund and the T. Rowe Price Government Reserve Investment Fund (collectively, the T. Rowe Price Reserve Investment Funds), open-end management investment companies managed by Price Associates and considered affiliates of the fund. The T. Rowe Price Reserve Investment Funds are offered as cash management options to mutual funds, trusts, and other accounts managed by Price Associates and/or its affiliates and are not available for direct purchase by members of the public. The T. Rowe Price Reserve Investment Funds pay no investment management fees.
As of June 30, 2009, T. Rowe Price Group, Inc., and/or its wholly owned subsidiaries owned 225,117 shares of the fund, representing less than 1% of the fund’s net assets.
| INFORMATION ON PROXY VOTING POLICIES, PROCEDURES, AND RECORDS |
A description of the policies and procedures used by T. Rowe Price funds and portfolios to determine how to vote proxies relating to portfolio securities is available in each fund’s Statement of Additional Information, which you may request by calling 1-800-225-5132 or by accessing the SEC’s Web site, www.sec.gov. The description of our proxy voting policies and procedures is also available on our Web site, www.troweprice.com. To access it, click on the words “Our Company” at the top of our corporate homepage. Then, when the next page appears, click on the words “Proxy Voting Policies” on the left side of the page.
Each fund’s most recent annual proxy voting record is available on our Web site and through the SEC’s Web site. To access it through our Web site, follow the directions above, then click on the words “Proxy Voting Records” on the right side of the Proxy Voting Policies page.
| HOW TO OBTAIN QUARTERLY PORTFOLIO HOLDINGS |
The fund files a complete schedule of portfolio holdings with the Securities and Exchange Commission for the first and third quarters of each fiscal year on Form N-Q. The fund’s Form N-Q is available electronically on the SEC’s Web site (www.sec.gov); hard copies may be reviewed and copied at the SEC’s Public Reference Room, 450 Fifth St. N.W., Washington, DC 20549. For more information on the Public Reference Room, call 1-800-SEC-0330.
| APPROVAL OF INVESTMENT MANAGEMENT AGREEMENT |
On March 10, 2009, the fund’s Board of Directors (Board) unanimously approved the investment advisory contract (Contract) between the fund and its investment manager, T. Rowe Price Associates, Inc. (Manager). The Board considered a variety of factors in connection with its review of the Contract, also taking into account information provided by the Manager during the course of the year, as discussed below:
Services Provided by the Manager
The Board considered the nature, quality, and extent of the services provided to the fund by the Manager. These services included, but were not limited to, management of the fund’s portfolio and a variety of related activities, as well as financial and administrative services, reporting, and communications. The Board also reviewed the background and experience of the Manager’s senior management team and investment personnel involved in the management of the fund. The Board concluded that it was satisfied with the nature, quality, and extent of the services provided by the Manager.
Investment Performance of the Fund
The Board reviewed the fund’s average annual total returns over the 1-, 3-, 5-, and 10-year periods as well as the fund’s year-by-year returns and compared these returns with previously agreed upon comparable performance measures and market data, including those supplied by Lipper and Morningstar, which are independent providers of mutual fund data. On the basis of this evaluation and the Board’s ongoing review of investment results, and factoring in the severity of the market turmoil in 2008, the Board concluded that the fund’s performance was satisfactory.
Costs, Benefits, Profits, and Economies of Scale
The Board reviewed detailed information regarding the revenues received by the Manager under the Contract and other benefits that the Manager (and its affiliates) may have realized from its relationship with the fund, including research received under “soft dollar” agreements. The Board noted that soft dollars were not used to pay for third-party, non-broker research during 2008. The Board also received information on the estimated costs incurred and profits realized by the Manager and its affiliates from advising T. Rowe Price mutual funds, as well as estimates of the gross profits realized from managing the fund in particular. The Board concluded that the Manager’s profits were reasonable in light of the services provided to the fund. The Board also considered whether the fund or other funds benefit under the fee levels set forth in the Contract from any economies of scale realized by the Manager. Under the Contract, the fund pays a fee to the Manager composed of two components—a group fee rate based on the aggregate assets of certain T. Rowe Price mutual funds (including the fund) that declines at certain asset levels and an individual fund fee rate that is assessed on the assets of the fund. The Board concluded that the advisory fee structure for the fund continued to provide for a reasonable sharing of benefits from any economies of scale with the fund’s investors.
Fees
The Board reviewed the fund’s management fee rate, operating expenses, and total expense ratio and compared them with fees and expenses of other comparable funds based on information and data supplied by Lipper. The information provided to the Board indicated that the fund’s management fee rate was above the median for certain groups of comparable funds but at or below the median for other groups of comparable funds. The information also indicated that the fund’s expense ratio was above the median for certain groups of comparable funds but below the median for other groups of comparable funds. The Board also reviewed the fee schedules for comparable privately managed accounts of the Manager and its affiliates. Management informed the Board that the Manager’s responsibilities for privately managed accounts are more limited than its responsibilities for the fund and other T. Rowe Price mutual funds that it or its affiliates advise. On the basis of the information provided, the Board concluded that the fees paid by the fund under the Contract were reasonable.
Approval of the Contract
As noted, the Board approved the continuation of the Contract. No single factor was considered in isolation or to be determinative to the decision. Rather, the Board concluded, in light of a weighting and balancing of all factors considered, that it was in the best interests of the fund to approve the continuation of the Contract, including the fees to be charged for services thereunder.
Item 2. Code of Ethics.
A code of ethics, as defined in Item 2 of Form N-CSR, applicable to its principal executive officer, principal financial officer, principal accounting officer or controller, or persons performing similar functions is filed as an exhibit to the registrant’s annual Form N-CSR. No substantive amendments were approved or waivers were granted to this code of ethics during the registrant’s most recent fiscal half-year.
Item 3. Audit Committee Financial Expert.
Disclosure required in registrant’s annual Form N-CSR.
Item 4. Principal Accountant Fees and Services.
Disclosure required in registrant’s annual Form N-CSR.
Item 5. Audit Committee of Listed Registrants.
Not applicable.
Item 6. Investments.
(a) Not applicable. The complete schedule of investments is included in Item 1 of this Form N-CSR.
(b) Not applicable.
Item 7. Disclosure of Proxy Voting Policies and Procedures for Closed-End Management Investment Companies.
Not applicable.
Item 8. Portfolio Managers of Closed-End Management Investment Companies.
Not applicable.
Item 9. Purchases of Equity Securities by Closed-End Management Investment Company and Affiliated Purchasers.
Not applicable.
Item 10. Submission of Matters to a Vote of Security Holders.
Not applicable.
Item 11. Controls and Procedures.
(a) The registrant’s principal executive officer and principal financial officer have evaluated the registrant’s disclosure controls and procedures within 90 days of this filing and have concluded that the registrant’s disclosure controls and procedures were effective, as of that date, in ensuring that information required to be disclosed by the registrant in this Form N-CSR was recorded, processed, summarized, and reported timely.
(b) The registrant’s principal executive officer and principal financial officer are aware of no change in the registrant’s internal control over financial reporting that occurred during the registrant’s second
fiscal quarter covered by this report that has materially affected, or is reasonably likely to materially affect, the registrant’s internal control over financial reporting.
Item 12. Exhibits.
(a)(1) The registrant’s code of ethics pursuant to Item 2 of Form N-CSR is filed with the registrant’s annual Form N-CSR.
(2) Separate certifications by the registrant's principal executive officer and principal financial officer, pursuant to Section 302 of the Sarbanes-Oxley Act of 2002 and required by Rule 30a-2(a) under the Investment Company Act of 1940, are attached.
(3) Written solicitation to repurchase securities issued by closed-end companies: not applicable.
(b) A certification by the registrant's principal executive officer and principal financial officer, pursuant to Section 906 of the Sarbanes-Oxley Act of 2002 and required by Rule 30a-2(b) under the Investment Company Act of 1940, is attached.
| | |
SIGNATURES |
| |
| | Pursuant to the requirements of the Securities Exchange Act of 1934 and the Investment |
| Company Act of 1940, the registrant has duly caused this report to be signed on its behalf by the |
| undersigned, thereunto duly authorized. |
| |
| T. Rowe Price Financial Services Fund, Inc. |
| |
| |
| |
| By | /s/ Edward C. Bernard |
| | Edward C. Bernard |
| | Principal Executive Officer |
| |
| Date | August 20, 2009 |
| |
| |
| |
| | Pursuant to the requirements of the Securities Exchange Act of 1934 and the Investment |
| Company Act of 1940, this report has been signed below by the following persons on behalf of |
| the registrant and in the capacities and on the dates indicated. |
| |
| |
| By | /s/ Edward C. Bernard |
| | Edward C. Bernard |
| | Principal Executive Officer |
| |
| Date | August 20, 2009 |
| |
| |
| |
| By | /s/ Gregory K. Hinkle |
| | Gregory K. Hinkle |
| | Principal Financial Officer |
| |
| Date | August 20, 2009 |