UNITED STATES
SECURITIES AND EXCHANGE COMMISSION
Washington, D.C. 20549
FORM N-CSR
CERTIFIED SHAREHOLDER REPORT OF REGISTERED
MANAGEMENT INVESTMENT COMPANIES
Investment Company Act file number
811-07831
FMI Funds, Inc.
(Exact name of registrant as specified in charter)
100 East Wisconsin Avenue, Suite 2200
Milwaukee, WI 53202
(Address of principal executive offices) (Zip code)
Ted D. Kellner
Fiduciary Management, Inc.
100 East Wisconsin Avenue, Suite 2200
Milwaukee, WI 53202
(Name and address of agent for service)
(414) 226-4555
Registrant's telephone number, including area code:
Date of fiscal year end: September 30
Date of reporting period: March 31, 2009
Item 1. Reports to Stockholders.
SEMIANNUAL REPORT
March 31, 2009
FMI
Focus Fund
A NO-LOAD
MUTUAL FUND
FMI Focus Fund

Ted D. Kellner, CFA
President
April 27, 2009
Dear Fellow Shareholder:
For the first two months of the March quarter, the market continued the downward trend it began in October of 2007. Since then, the markets have advanced 25%+, making this the best rally since 1938. FMI Focus Fund fared much better than most of the indices, declining 7.71% in the first quarter, versus the Russell 2000’s decline of 14.95%. Additionally, as of this writing, with the continued market advance, your Fund is currently in positive territory. Of course, no one can be sure that the current bear market is at an end, but given the significant amount of damage that most stocks have endured, we should be awfully close. According to the Leuthold Group, the Standard & Poor’s 500 10-year total return for the period ending March 6 was a negative 4.4%, or a cumulative loss of 36.3%. This was the worst 10-year stretch in U.S. Stock Market history, including the Great Depression. Additionally, as Leuthold notes, from the valuation levels reached in early March, as well as the returns for the ten years ended March 6, the subsequent 10-year returns, at worst, have been 7.2%, and at best, 15.6%. We are in agreement with Rick’s and Glenn’s views in their management letter. We think we have a terrific group of companies in the FMI Focus Fund portfolio, and we believe the returns will be quite strong over the next three to five years.
Also interesting is a study done by the Security Industry Association ten years ago, surveying 1,500 investors. The expectations for market return back then was a positive 30%. This was after a period of unprecedented returns in the 1990s, accompanied by record-high valuations and unrealistic, lofty expectations. Investor expectations are often guided by the most recent past. We would venture to guess that if the same 1,500 investors were asked the same question today, return expectations would be substantially lower. This, to us, is totally counter-intuitive, given valuations that are at much more attractive levels today. Indeed, in a Barron’s article dated March 8, 2009, institutional investors who were bullish in early March numbered a paltry 17%. This was a 25-year low.
We were extremely pleased with the February 13, 2009 review of the FMI Focus Fund by Morningstar, wherein analyst Andrew Gogerty commented that the FMI Focus Fund’s “research process is impressive in its thoroughness,” and that, “Over time, this management team has executed its strategy well, and … is worth a look.” Morningstar continues to give the FMI Focus Fund a Five Star rating for the past three year period and a Four Star rating for the past five and ten year periods, ending March 31, 2009.
As stated above, no one knows where this bear market will end, but substantial damage has already been done to most securities as detailed by Rick and Glenn in their letter. We look forward to the next several years and we’re very excited about the return prospects for the companies we hold in the FMI Focus Fund.
As always, we thank you very much for your continued support of, and involvement with the FMI Focus Fund.
Sincerely,

Ted D. Kellner, CFA
President
100 E. Wisconsin Ave., Suite 2200 • Milwaukee, WI 53202 • 414-226-4555
www.fmifunds.com
 |  |
| Richard E. Lane | Glenn W. Primack |
| Portfolio Manager | Portfolio Manager |
April 9, 2009
Dear Fellow Shareholders,
Back to Basics
Notwithstanding all of the financial debacles of the past several years, we believe we are in a bottoming process in the stock market. This has been the most gut wrenching period for investors since the 1930s. If indeed the bottom was reached several weeks ago when the S&P 500 Index hit 665, the peak to trough decline this cycle was a staggering 58%. As of today, April 9th, the market has recovered some 1000 points on the Dow Industrial Average. Only time will tell if this ferocious bear market is over.
As we have written in past letters, recessions typically last twelve to fifteen months and the stock market nearly always anticipates upturns by six to nine months. The current recession “officially” started in December of 2007, so this particular downturn is already longer than average with no end in sight. Again, we have
THE VALUE OF A $10,000 INVESTMENT IN THE FMI FOCUS FUND FROM
ITS INCEPTION (12/16/96) TO 3/31/09 AS COMPARED TO THE
RUSSELL 2000(1) AND THE RUSSELL 2000 GROWTH(2)
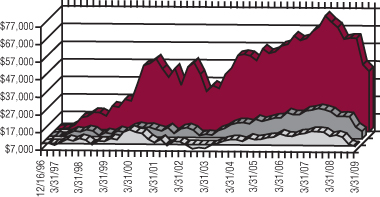
FMI Focus Fund
$44,463
Russell 2000
$14,136
Russell 2000 Growth
$9,738
Results From Fund Inception (12/16/96) Through 3/31/09
| Annualized Total | Annualized Total | Annualized Total Return* | |||
| Total Return* | Total Return* For the | Return* For the 5 | Return* For the 10 | Through 3/31/09 From | |
| Last 3 Months | Year Ended 3/31/09 | Years Ended 3/31/09 | Years Ended 3/31/09 | Fund Inception 12/16/96 | |
| FMI Focus Fund | -7.71% | -29.00% | -3.62% | 6.90% | 12.91% |
| Russell 2000 | -14.95% | -37.50% | -5.24% | 1.93% | 2.86% |
| Russell 2000 Growth | -9.74% | -36.36% | -5.37% | -1.60% | -0.22% |
| (1) | The Russell 2000 Index measures the performance of the 2,000 smallest companies in the Russell 3000 Index which comprises the 3,000 largest U.S. companies based on total market capitalization. |
| (2) | The Russell 2000 Growth Index measures the performance of those Russell 2000 companies with higher price-to-book ratios and higher forecasted growth values. |
| * | Total return includes change in share prices and in each case includes reinvestments of any dividends, interest and capital gain distributions. Performance data quoted represents past performance; past performance does not guarantee future results. Investment return and principal value of an investment will fluctuate so that an investor’s shares, when redeemed, may be worth more or less than their original cost. Current performance of the Fund may be lower or higher than the performance quoted. Performance data current to the most recent month end may be obtained by visiting www.fmifunds.com. The graph and the table do not reflect the deduction of taxes that a shareholder would pay on Fund distributions or the redemption of Fund shares. |
2
profiled ad nauseum that this cycle was destined to be longer and deeper due to the reckless credit bubble and its subsequent unwinding. We have also argued that the rise of lesser developed countries, such as China, India, Brazil, and Eastern European nations, have created a more competitive world economy vis-a-vis U.S. output. This has also created competition for scarce resources manifesting in higher food, energy and material prices. All of these factors have pressured U.S. living standards.
Now an old story, U.S. consumers leveraged themselves in a short-term attempt to maintain prior lifestyles. These past sixteen months the chickens came home to roost. Deleveraging will take time and the competition from newly industrialized economies will not likely diminish. Both of these factors act as governors on the subsequent recovery.
As spring follows winter, recovery will come. Excesses always get purged. That is the brilliance of the free market system. Even if this recession lasts two years, the economy should start to show signs of recovery no later than early 2010. As we said, the stock market will anticipate economic recovery. In the meantime, with the equity market down so substantially, stocks are cheap for the first time in many years.
Your research team at Broadview Advisors is very busy adding attractive, long-term ideas to the portfolio. To use a sports analogy, the offseason work ethic often determines the success of the following season. Clearly, we are in the offseason for investing, but this is precisely the time to be “working” the portfolio, positioning it for the incipient upturn! This is Basic Investing 101. “Buy ‘em when they hate ‘em,” as Warren Buffet likes to say.
In light of the current challenging investment environment, we thought shareholders would appreciate a review of our philosophy as well as some specific examples of companies we are excited about. We consider ourselves special situation investors, combining the best of traditional growth and value investing. We scour the world looking for companies with strong two to three year earnings potential, yet trading at a discount to intrinsic or private market value. We favor strong franchises, strategically positioned in an industry with high barriers to entry. Effective management, properly aligned with investors, is very important. We usually buy when a company’s stock price is under pressure for some identifiable reason (hence opportunistic investors). New opportunities typically fall into one of the three themes illustrated below.
| STRONG | UNDISCOVERED | |||
| CYCLES | FRANCHISES | OPPORTUNITIES | ||
| Sector Specific 2-3 Year Cycle | Currently Out of Favor Misunderstood | Under Followed Overlooked Change IPOs, Spin-Offs Restructurings | ||
| Contrarian Growth | ||||
Cyclical companies fall into the first category. Many industries are cyclical in nature and display powerful earnings coming out of recessions. These stocks often get killed during the end of an economic upturn, giving experienced investors great opportunities. This is clearly an area we differ from traditional growth investors who eschew cyclical stocks and concentrate on pure top-line growth stocks. We are skeptical about the duration
3
of “secular growth.” In their quest for growth, investors often overpay as well, while the opposite is often the case when buying cyclical at the right time in the cycle (in recession).
Rockwell Automation, Inc. (ROK), the Milwaukee-based factory automation company, is an interesting example. Currently, demand is terrible, earnings are under pressure, and the stock has fallen from over eighty dollars into the mid-twenties. Wall Street hates the stock right now while admitting it is a fantastic franchise with dominant market share in the U.S. and high margins and return on investment. The stock trades in the twenties because Rockwell’s businesses are in a serious downturn and unlikely to turn up until late 2010 or 2011. Obviously, there is tremendous value in Rockwell, but investors will have to be patient. Kennametal Inc. (KMT) and Werner Enterprises, Inc. (WERN) are two other “classic” cyclical in the portfolio.
Another example of a cyclical investment we have made is Hexcel Corp. (HXL). Hexcel provides carbon fiber composite material into the aerospace and industrial markets. The aerospace industry was at the beginning of several new product cycles as current fleets are too old. Obviously, the market is concerned with the financing for these new planes due to sluggish credit markets as well as the risk of order cancellation as air traffic plummets. While this cycle was somewhat delayed by both the tough economy and production problems by Boeing Co. (BA) and Airbus (a division of EADS N.V.), it will still happen when the economy begins to recover. Further, the size of the composite opportunity is enormous. Next generation Airbus and Boeing airplane platforms were designed with roughly 10x more composite materials than older platforms such as the 777, and Hexcel has already been specified into the models. We believe the company is uniquely positioned to benefit from this delayed cycle, yet the stock is trading at 9x depressed earnings as investors “discount” the lack of visibility.
The second group, strong franchises currently out of favor, speaks for itself. Most businesses at some point either go through some growing pains, encounter some short-term obstacles or industry dynamic that disrupts growth, or simply stumbles, perhaps due to a management mistake. Investors often make the naïve assumption that companies grow in a straight line and consistently achieve analyst’s estimates. Nothing could be further from the truth and the ups and downs of business, and subsequent overreactions on the part of investors, are what create opportunities.
In our portfolio, Fiserv, Inc. (FISV) is a great example. Fiserv provides processing for banks either on an outsourced basis or selling the software directly to the financial institution to do it themselves. This is a great business with a high level of recurring revenue, three to five year contracts, high margins and strong market share. The stock has been under pressure as investors fear for the health of Fiserv’s customers, the banks. While true, the key consideration is the number of accounts Fiserv processes, which don’t go away even if the bank does. If a bank fails, its accounts will move to a different bank which may well be another Fiserv client. Generally speaking, the company believes its market share is sufficiently high that bank acquisitions and the like are generally neutral to their business over time. This fundamental investor misperception has driven Fiserv’s valuation from a historical P/E ratio of 15-17 times current year earnings to below 10 times current year earnings. As the financial turmoil slowly subsides, Fiserv’s multiple should climb back towards double digits and drive the stock price higher.
We recently took a position in Interpublic Group of Companies, Inc. (IPG), which is a global holding company of advertising agencies. This is the first time we have invested in Interpublic’s equity, but we have followed the company for over 5 years. Interpublic had below industry operating margins, weak internal controls, and a revolving door of managers who failed to restructure the company. Three years ago, the current management team successfully implemented Sarbanes-Oxley and outlined a plan to grow margins from 2% to 8%. Where others failed to resurrect the franchise, CEO Michael Roth and his team succeeded. Organic growth recovered in line with the industry and margins in 2008 expanded to 8.7%, with the potential to reach
4
12% in a normalized economy. Unfortunately, the market rewarded their success by taking the stock from $10 to $3. Fortunately, we were in the position to buy a healthy franchise at a depressed price, as investors anticipate a poor advertising outlook for 2009.
A final example of an out-of-favor strong franchise is NetApp, Inc. (NTAP). For over a decade now NetApp has been recognized as a technology leader in the nearly $40 billion and still growing data storage market. Using an innovative technology called Network Attached Storage or NAS, NetApp has built a formidable franchise against industry giants like International Business Machines Corp. (IBM), Hewlett-Packard Co. (HPQ) and EMC Corp. (EMC), outgrowing them and taking market share consistently since the company’s IPO. During the financial turmoil and market collapse, investors blindly tossed NetApp shares aside on fears over their large exposure to financial services companies. However, even during cyclical downturns, companies generate vast amounts of data that, for often regulatory reasons, must be stored. In other words, spending on storage technology is largely non-discretionary and NetApp’s solution is cheaper and more efficient than its competitor’s pricey offerings. We purchased shares of NetApp and are very excited for the prospects of this highly regarded technology franchise.
Undiscovered opportunities represent the third bucket and again are somewhat self explanatory. The key here is finding good growth but not necessarily paying for it. Initial public offerings, corporate spin-offs, and company restructurings are often good hunting grounds. Undiscovered change can also yield good ideas. Perhaps a new management comes in and invigorates the company as was the case for us in Jos. A. Bank Clothiers, Inc. (JOSB), the menswear retailer which we have discussed in previous shareholder letters.
We view our seasoned investment in Sapient Corp. (SAPE) as one of these undiscovered opportunities. Sapient’s relatively new management ascended through an accounting investigation into options backdating of the previous management. The new team was to improve the margins of this consulting company by improving utilization while continuing to grow the top line by 20%. Wall Street was understandably skeptical regarding management’s margin goals. The company was viewed as a small consulting company in a largely consolidated industry. Margins had historically been low and there was no reason to believe they would rise, given the scale needed to compete against the likes of Accenture Ltd. (ACN). Investors failed to understand that Sapient’s strong growth and rising margins was largely due to its interactive advertising agency and web development business. Through our successful investments in aQuantive, Inc. (purchased by Microsoft Corp. – (MSFT) in May 2007) and Digitas (purchased by French advertising giant Publicis in December 2006), we knew that the interactive agency industry was growing rapidly and provided many higher margin services that traditional agencies could not. Most Wall Street analysts covered Sapient as a consulting business and most advertising agency analysts were unaware the company existed. We believe Sapient has developed a world class interactive advertising agency which should continue to grow through this economic cycle. Finally, the consulting part of Sapient has also held up relatively well and management has done an admirable job of increasing utilization and managing their consultants. Margins reached 12.5% in 2008; and we believe they can sustain mid teen levels when the economic environment stabilizes. This margin profile, combined with double-digit top line growth, implies earnings power of $0.75 on a company currently priced at $5.
Another undiscovered opportunity, Ulta Salon, Cosmetics & Fragrance, Inc. (ULTA), a cosmetics retailer, went public during 2007 at $18 a share. The stock immediately spiked to $36 on what can only be described as investor euphoria! Our meetings with management during the deal road show piqued our interest and we began kicking the tires. We visited several stores not only in Milwaukee, but in the Chicago area, and we spoke with the company’s suppliers, competitors and customers. Although we came away impressed with the format, the management, and the vast growth opportunities in store for this small retailer, we were clearly unimpressed by the valuation the market placed on the shares. The stock was absurdly overvalued and we chose to stay on the sidelines. As we entered 2008 we also entered the now well documented and reported consumer spending
5
meltdown. Although Ulta’s fundamentals fared far better than most retailers, the stock did not. The shares bottomed at an equally staggering $4 per share. A once hot IPO was now a forgotten IPO. Investors abandoned the stock, as did Wall Street, as only a handful of analysts provide research coverage. We, however, had not forgotten. Although this underfollowed company had been left in the dustbin, we continued our research, waiting for an attractive entry point which the turbulent market so graciously handed to us. Although the shares had declined by almost 90%, the long-term outlook was still astounding. Ulta currently has roughly 300 stores with the opportunity to grow to over 1000 locations. Due to all of the retail bankruptcies, real estate opportunities for their locations were now more attractive than ever and developers were eager to court financially sound, stable retailers like Ulta. Furthermore, the department stores, their primary competitors were either going through a wave of store closings or outright going out of business. Although our valuation discipline kept us from participating when the stock was in the $30s the 90% price decline has, in our eyes, handed us an undiscovered gem.
In closing, we hope the preceding discussion was beneficial. We hope you are as excited about the prospects of the companies we highlighted as we are. These are trying times, yet are often the most profitable if one keeps perspective as well as one’s head. Perhaps the bottom has been made, perhaps we may test once more, but equity prices are very attractive on a two to three year basis and we urge you to be patient. The rewards will likely be well worth it. No pain, no gain!
Thank you fellow shareholders and let’s look forward to better times!
Best regards,
 |  |
| Richard E. Lane, CFA | Glenn W. Primack |
| Portfolio Manager | Portfolio Manager |
6
FMI Focus Fund
COST DISCUSSION
As a shareholder of the Fund you incur ongoing costs, including management fees and other Fund expenses. You do not incur transaction costs such as sales charges (loads) on purchase payments, reinvested dividends, or other distributions; redemption fees; and exchange fees because the Fund does not charge these fees. This example is intended to help you understand your ongoing costs (in dollars) of investing in FMI Focus Fund and to compare these costs with the ongoing costs of investing in other mutual funds.
The example is based on an investment of $1,000 invested at the beginning of the period and held for the entire period from October 1, 2008 through March 31, 2009.
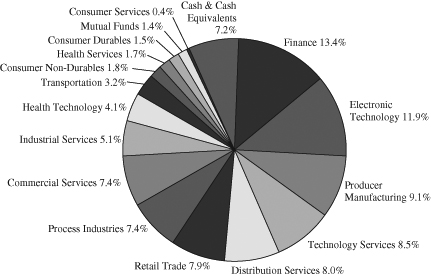
Industry Sectors as of March 31, 2009
Actual Expenses
The first line of the table below provides information about actual account values and actual expenses. You may use the information in this line, together with the amount you invested, to estimate the expenses that you paid over the period. Simply divide your account value by $1,000 (for example, an $8,600 account value divided by $1,000 = 8.6), then multiply the result by the number in the first line under the heading entitled “Expenses Paid During Period” to estimate the expenses you paid on your account during this period.
In addition to the costs highlighted and described below, the only Fund transaction costs you might currently incur would be wire fees ($15 per wire), if you choose to have proceeds from a redemption wired to your bank account instead of receiving a check. Additionally, U.S. Bank charges an annual processing fee ($15) if you maintain an IRA account with the Fund. To determine your total costs of investing in the Fund, you would need to add any applicable wire or IRA processing fees you’ve incurred during the period to the costs provided in the example at the end of this article.
Hypothetical Example for Comparison Purposes
The second line of the table below provides information about hypothetical account values and hypothetical expenses based on the Fund’s actual expense ratio and an assumed rate of return of 5% per year before expenses, which is not the Fund’s actual return. The hypothetical account values and expenses may not be used to estimate the actual ending account balance or expenses you paid for the period. You may use this information to compare the ongoing costs of investing in the Fund and other funds. To do so, compare this 5% hypothetical example with the 5% hypothetical examples that appear in the shareholder reports of the other funds.
Please note that the expenses shown in the table are meant to highlight your ongoing costs only and do not reflect any transactional costs, such as sales charges (loads), redemption fees or exchange fees. Therefore, the second line of the table is useful in comparing ongoing costs only, and will not help you determine the relative total costs of owning different funds. In addition, if these transactional costs were included, your costs would have been higher.
| Beginning | Ending | Expenses Paid | ||||||||||
| Account | Account | During Period* | ||||||||||
| Value 10/01/08 | Value 3/31/09 | 10/01/08-3/31/09 | ||||||||||
| FMI Focus Fund Actual | $ | 1,000.00 | $ | 703.50 | $ | 6.46 | ||||||
| Hypothetical (5% return before expenses) | $ | 1,000.00 | $ | 1,017.40 | $ | 7.64 | ||||||
| * | Expenses are equal to the Fund’s annualized expense ratio of 1.52%, multiplied by the average account value over the period, multiplied by 182/365 (to reflect the one-half year period between October 1, 2008 and March 31, 2009). |
7
FMI Focus Fund
STATEMENT OF ASSETS AND LIABILITIES
March 31, 2009 (Unaudited)
| ASSETS: | ||||
| Investments in securities, at value (cost $406,753,933) | $ | 295,613,810 | ||
| Dividends and interest receivable | 340,344 | |||
| Receivable from investments sold | 338,835 | |||
| Receivable from shareholders for purchases | 159,932 | |||
| Total assets | $ | 296,452,921 | ||
| LIABILITIES: | ||||
| Payable to brokers for securities purchased | $ | 476,470 | ||
| Payable to adviser for management and administrative fees | 251,504 | |||
| Payable to shareholders for redemptions | 222,595 | |||
| Other liabilities | 165,261 | |||
| Total liabilities | 1,115,830 | |||
| NET ASSETS: | ||||
| Capital Stock, $0.0001 par value; 100,000,000 shares authorized; 19,130,165 shares outstanding | 486,375,580 | |||
| Net unrealized depreciation on investments | (111,140,123 | ) | ||
| Accumulated net realized loss on investments | (81,225,640 | ) | ||
| Undistributed net investment income | 1,327,274 | |||
| Net assets | 295,337,091 | |||
| Total liabilities and net assets | $ | 296,452,921 | ||
| CALCULATION OF NET ASSET VALUE PER SHARE: | ||||
| Net asset value, offering and redemption price per share ($295,337,091 ÷ 19,130,165 shares outstanding) | $ | 15.44 | ||
The accompanying notes to financial statements are an integral part of this statement.
8
FMI Focus Fund
SCHEDULE OF INVESTMENTS
March 31, 2009 (Unaudited)
| Shares | Cost | Value | |||||||||
| LONG-TERM INVESTMENTS — 92.8% (a) | |||||||||||
COMMON STOCKS — 91.4% (a) | |||||||||||
COMMERCIAL SERVICES SECTOR — 7.4% | |||||||||||
| Advertising/Marketing Services — 0.9% | |||||||||||
| 624,200 | Interpublic Group of Companies, Inc.* | $ | 2,776,078 | $ | 2,571,704 | ||||||
Miscellaneous Commercial Services — 2.0% | |||||||||||
| 239,400 | Cintas Corp. | 7,218,693 | 5,917,968 | ||||||||
Personnel Services — 4.5% | |||||||||||
| 733,500 | AMN Healthcare Services, Inc.* | 12,552,306 | 3,740,850 | ||||||||
| 171,000 | Manpower Inc. | 8,035,509 | 5,391,630 | ||||||||
| 694,700 | MPS Group, Inc.* | 8,560,623 | 4,133,465 | ||||||||
| 29,148,438 | 13,265,945 | ||||||||||
| CONSUMER DURABLES SECTOR — 1.5% | |||||||||||
| Recreational Products — 1.5% | |||||||||||
| 619,300 | Brunswick Corp. | 4,786,041 | 2,136,585 | ||||||||
| 420,900 | Winnebago Industries, Inc. | 4,205,049 | 2,234,979 | ||||||||
| 8,991,090 | 4,371,564 | ||||||||||
| CONSUMER NON-DURABLES SECTOR — 1.8% | |||||||||||
| Apparel/Footwear — 1.6% | |||||||||||
| 363,100 | Liz Claiborne, Inc. | 12,576,561 | 896,857 | ||||||||
| 412,083 | Volcom, Inc.* | 7,959,460 | 3,997,205 | ||||||||
| 20,536,021 | 4,894,062 | ||||||||||
| Household/Personal Care — 0.2% | |||||||||||
| 135,600 | Bare Escentuals, Inc.* | 1,239,472 | 555,960 | ||||||||
CONSUMER SERVICES SECTOR — 0.4% | |||||||||||
| Hotels/Resorts/Cruiselines — 0.4% | |||||||||||
| 147,700 | Royal Caribbean Cruises Ltd. | 3,103,474 | 1,183,077 | ||||||||
DISTRIBUTION SERVICES SECTOR — 8.0% | |||||||||||
| Electronics Distributors — 5.2% | |||||||||||
| 460,292 | Arrow Electronics, Inc.* | 11,859,366 | 8,773,166 | ||||||||
| 119,200 | Ingram Micro Inc.* | 1,258,312 | 1,506,688 | ||||||||
| 275,254 | ScanSource, Inc.* | 6,887,119 | 5,114,219 | ||||||||
| 20,004,797 | 15,394,073 | ||||||||||
| Food Distributors — 0.9% | |||||||||||
| 138,500 | United Natural Foods, Inc.* | 3,053,052 | 2,627,345 | ||||||||
Medical Distributors — 0.2% | |||||||||||
| 27,500 | Patterson Companies Inc.* | 519,786 | 518,650 | ||||||||
Wholesale Distributors — 1.7% | |||||||||||
| 142,600 | Beacon Roofing Supply, Inc.* | 1,296,929 | 1,909,414 | ||||||||
| 395,200 | Interline Brands, Inc.* | 6,640,373 | 3,331,536 | ||||||||
| 7,937,302 | 5,240,950 | ||||||||||
9
FMI Focus Fund
SCHEDULE OF INVESTMENTS (Continued)
March 31, 2009 (Unaudited)
| Shares | Cost | Value | |||||||||
| LONG-TERM INVESTMENTS — 92.8% (a) (Continued) | |||||||||||
COMMON STOCKS — 91.4% (a) (Continued) | |||||||||||
ELECTRONIC TECHNOLOGY SECTOR — 11.9% | |||||||||||
| Aerospace & Defense — 1.1% | |||||||||||
| 501,870 | Hexcel Corp.* | $ | 3,725,637 | $ | 3,297,286 | ||||||
Computer Peripherals — 2.5% | |||||||||||
| 381,600 | NetApp, Inc.* | 9,076,076 | 5,662,944 | ||||||||
| 91,696 | Zebra Technologies Corp.* | 1,780,196 | 1,744,058 | ||||||||
| 10,856,272 | 7,407,002 | ||||||||||
| Computer Processing Hardware — 0.6% | |||||||||||
| 210,800 | NCR Corp.* | 2,152,601 | 1,675,860 | ||||||||
Electronic Equipment/Instruments — 1.9% | |||||||||||
| 274,100 | Intermec Inc.* | 2,882,143 | 2,850,640 | ||||||||
| 122,700 | Rockwell Automation, Inc. | 3,182,617 | 2,679,768 | ||||||||
| 6,064,760 | 5,530,408 | ||||||||||
| Electronic Production Equipment — 1.8% | |||||||||||
| 372,400 | MKS Instruments, Inc.* | 6,244,889 | 5,463,108 | ||||||||
Semiconductors — 4.0% | |||||||||||
| 676,000 | Altera Corp. | 11,899,061 | 11,863,800 | ||||||||
FINANCE SECTOR — 13.4% | |||||||||||
| Finance/Rental/Leasing — 1.5% | |||||||||||
| 224,800 | Rent-A-Center, Inc.* | 3,461,691 | 4,354,376 | ||||||||
Insurance Brokers/Services — 1.6% | |||||||||||
| 270,000 | Arthur J. Gallagher & Co. | 7,322,292 | 4,590,000 | ||||||||
Life/Health Insurance — 1.7% | |||||||||||
| 234,300 | Genworth Financial Inc. | 3,107,249 | 445,170 | ||||||||
| 146,097 | Reinsurance Group of America, Inc. | 4,530,434 | 4,732,082 | ||||||||
| 7,637,683 | 5,177,252 | ||||||||||
| Multi-Line Insurance — 3.2% | |||||||||||
| 150,383 | PartnerRe Ltd. | 9,181,651 | 9,334,273 | ||||||||
Property/Casualty Insurance — 1.2% | |||||||||||
| 329,780 | Old Republic International Corp. | 4,718,016 | 3,568,220 | ||||||||
Regional Banks — 4.2% | |||||||||||
| 494,214 | Associated Banc-Corp. | 8,482,671 | 7,630,664 | ||||||||
| 182,898 | FirstMerit Corp. | 2,727,909 | 3,328,744 | ||||||||
| 107,000 | TCF Financial Corp. | 1,537,462 | 1,258,320 | ||||||||
| 33,694 | Zions Bancorporation | 836,356 | 331,212 | ||||||||
| 13,584,398 | 12,548,940 | ||||||||||
| HEALTH SERVICES SECTOR — 1.7% | |||||||||||
| Medical/Nursing Services — 1.7% | |||||||||||
| 222,300 | VCA Antech, Inc.* | 6,222,643 | 5,012,865 | ||||||||
10
FMI Focus Fund
SCHEDULE OF INVESTMENTS (Continued)
March 31, 2009 (Unaudited)
| Shares | Cost | Value | |||||||||
| LONG-TERM INVESTMENTS — 92.8% (a) (Continued) | |||||||||||
COMMON STOCKS — 91.4% (a) (Continued) | |||||||||||
HEALTH TECHNOLOGY SECTOR — 4.1% | |||||||||||
| Biotechnology — 1.7% | |||||||||||
| 183,500 | Charles River Laboratories International, Inc.* | $ | 8,738,305 | $ | 4,993,035 | ||||||
Medical Specialties — 2.4% | |||||||||||
| 55,000 | Beckman Coulter, Inc. | 2,733,890 | 2,805,550 | ||||||||
| 117,600 | Hologic, Inc.* | 1,665,072 | 1,539,384 | ||||||||
| 209,778 | Wright Medical Group, Inc.* | 3,433,294 | 2,733,407 | ||||||||
| 7,832,256 | 7,078,341 | ||||||||||
| INDUSTRIAL SERVICES SECTOR — 5.1% | |||||||||||
| Contract Drilling — 0.4% | |||||||||||
| 87,600 | Rowan Companies, Inc. | 2,419,381 | 1,048,572 | ||||||||
Environmental Services — 1.0% | |||||||||||
| 170,800 | Republic Services, Inc. | 3,146,818 | 2,929,220 | ||||||||
Oil & Gas Pipelines — 1.4% | |||||||||||
| 88,400 | Kinder Morgan Energy Partners, L.P. | 3,883,552 | 4,130,048 | ||||||||
Oilfield Services/Equipment — 2.3% | |||||||||||
| 265,300 | Dresser-Rand Group, Inc.* | 5,936,564 | 5,863,130 | ||||||||
| 61,931 | Exterran Holdings Inc.* | 2,547,098 | 992,135 | ||||||||
| 8,483,662 | 6,855,265 | ||||||||||
| PROCESS INDUSTRIES SECTOR — 7.4% | |||||||||||
| Chemicals: Major Diversified — 0.6% | |||||||||||
| 127,600 | Celanese Corp. | 2,794,227 | 1,706,012 | ||||||||
Chemicals: Specialty — 2.4% | |||||||||||
| 312,581 | Cytec Industries Inc. | 14,387,613 | 4,694,967 | ||||||||
| 296,000 | Rockwood Holdings Inc.* | 4,656,862 | 2,350,240 | ||||||||
| 19,044,475 | 7,045,207 | ||||||||||
| Containers/Packaging — 4.4% | |||||||||||
| 108,400 | Bemis Company, Inc. | 2,756,379 | 2,273,148 | ||||||||
| 225,400 | Packaging Corp of America | 4,572,099 | 2,934,708 | ||||||||
| 309,162 | Pactiv Corp.* | 6,071,733 | 4,510,673 | ||||||||
| 251,500 | Sealed Air Corp. | 4,185,538 | 3,470,700 | ||||||||
| 17,585,749 | 13,189,229 | ||||||||||
| PRODUCER MANUFACTURING SECTOR — 9.1% | |||||||||||
| Auto Parts: Original Equipment Manufacturer — 0.5% | |||||||||||
| 67,900 | BorgWarner, Inc. | 1,158,376 | 1,378,370 | ||||||||
Electrical Products — 3.2% | |||||||||||
| 70,000 | Molex Inc. | 1,239,303 | 961,800 | ||||||||
| 684,595 | Molex Inc. Cl A | 17,262,302 | 8,653,281 | ||||||||
| 18,501,605 | 9,615,081 | ||||||||||
11
FMI Focus Fund
SCHEDULE OF INVESTMENTS (Continued)
March 31, 2009 (Unaudited)
| Shares | Cost | Value | |||||||||
| LONG-TERM INVESTMENTS — 92.8% (a) (Continued) | |||||||||||
COMMON STOCKS — 91.4% (a) (Continued) | |||||||||||
PRODUCER MANUFACTURING SECTOR — 9.1% (Continued) | |||||||||||
| Industrial Machinery — 4.2% | |||||||||||
| 147,501 | Kadant Inc.* | $ | 2,224,567 | $ | 1,699,211 | ||||||
| 659,600 | Kennametal Inc. | 12,278,677 | 10,692,116 | ||||||||
| 14,503,244 | 12,391,327 | ||||||||||
| Miscellaneous Manufacturing — 1.2% | |||||||||||
| 198,500 | Brady Corp. | 5,166,416 | 3,499,555 | ||||||||
RETAIL TRADE SECTOR — 7.9% | |||||||||||
| Apparel/Footwear Retail — 1.6% | |||||||||||
| 193,916 | Nordstrom, Inc. | 6,500,737 | 3,248,093 | ||||||||
| 136,006 | Zumiez Inc.* | 1,751,209 | 1,319,258 | ||||||||
| 8,251,946 | 4,567,351 | ||||||||||
| Department Stores — 3.1% | |||||||||||
| 216,300 | Kohl’s Corp.* | 8,602,395 | 9,153,816 | ||||||||
Discount Stores — 1.1% | |||||||||||
| 96,700 | Family Dollar Stores, Inc. | 1,881,745 | 3,226,879 | ||||||||
Specialty Stores — 2.1% | |||||||||||
| 179,800 | PetSmart, Inc. | 3,909,420 | 3,768,608 | ||||||||
| 374,700 | Ulta Salon, Cosmetics & Fragrance, Inc.* | 3,025,348 | 2,480,514 | ||||||||
| 6,934,768 | 6,249,122 | ||||||||||
| TECHNOLOGY SERVICES SECTOR — 8.5% | |||||||||||
| Data Processing Services — 1.6% | |||||||||||
| 129,100 | Fiserv, Inc.* | 4,381,429 | 4,706,986 | ||||||||
Information Technology Services — 3.8% | |||||||||||
| 234,800 | Citrix Systems, Inc.* | 6,117,308 | 5,315,872 | ||||||||
| 1,312,000 | Sapient Corp.* | 9,644,192 | 5,864,640 | ||||||||
| 15,761,500 | 11,180,512 | ||||||||||
| Internet Software/Services — 2.1% | |||||||||||
| 478,900 | Omniture, Inc.* | 7,958,640 | 6,316,691 | ||||||||
Packaged Software — 1.0% | |||||||||||
| 295,400 | Parametric Technology Corp.* | 2,241,313 | 2,948,092 | ||||||||
TRANSPORTATION SECTOR — 3.2% | |||||||||||
| Air Freight/Couriers — 1.3% | |||||||||||
| 304,500 | UTI Worldwide, Inc. | 5,374,680 | 3,638,775 | ||||||||
Trucking — 1.9% | |||||||||||
| 376,600 | Werner Enterprises, Inc. | 6,966,934 | 5,694,192 | ||||||||
| Total common stocks | 379,213,213 | 269,906,366 | |||||||||
12
FMI Focus Fund
SCHEDULE OF INVESTMENTS (Continued)
March 31, 2009 (Unaudited)
| Shares or Principal Amount | Cost | Value | |||||||||
| LONG-TERM INVESTMENTS — 92.8% (a) (Continued) | |||||||||||
MUTUAL FUNDS — 1.4% (a) | |||||||||||
| 210,200 | SPDR KBW Regional Banking ETF | $ | 5,862,558 | $ | 4,040,044 | ||||||
| Total long-term investments | 385,075,771 | 273,946,410 | |||||||||
| SHORT-TERM INVESTMENTS — 7.3% (a) | |||||||||||
| U.S. Treasury Securities — 4.2% | |||||||||||
| $ | 5,000,000 | U.S. Treasury Bills, 0.02%, due 06/04/09 | 4,999,823 | 4,998,294 | |||||||
| 7,500,000 | U.S. Treasury Bills, 0.24%, due 10/22/09 | 7,489,800 | 7,480,567 | ||||||||
| Total U.S. treasury securities | 12,489,623 | 12,478,861 | |||||||||
Variable Rate Demand Note — 3.1% | |||||||||||
| 9,188,539 | U.S. Bank, N.A., 0.00% | 9,188,539 | 9,188,539 | ||||||||
| Total short-term investments | 21,678,162 | 21,667,400 | |||||||||
| Total investments — 100.1% | $ | 406,753,933 | 295,613,810 | ||||||||
Liabilities, less cash and receivables — (0.1%) (a) | (276,719 | ) | |||||||||
| TOTAL NET ASSETS — 100.0% | $ | 295,337,091 | |||||||||
| * | Non-income producing security. |
| (a) | Percentages for the various classifications relate to net assets. |
ETF – Exchange Traded Fund
L.P. – Limited Partnership
The accompanying notes to financial statements are an integral part of this schedule.
13
FMI Focus Fund
STATEMENT OF OPERATIONS
For the Six Month Period Ending March 31, 2009 (Unaudited)
| INCOME: | ||||
| Dividends | $ | 3,874,835 | ||
| Interest | 52,886 | |||
| Total income | 3,927,721 | |||
| EXPENSES: | ||||
| Management fees | 1,953,457 | |||
| Transfer agent fees | 283,176 | |||
| Administrative and accounting services | 127,340 | |||
| Printing and postage expense | 93,583 | |||
| Custodian fees | 40,142 | |||
| Professional fees | 39,682 | |||
| Board of Directors fees | 24,000 | |||
| Registration fees | 22,790 | |||
| Insurance expense | 12,685 | |||
| Other expenses | 3,592 | |||
| Total expenses | 2,600,447 | |||
| NET INVESTMENT GAIN | 1,327,274 | |||
| NET REALIZED LOSS ON INVESTMENTS | (73,587,986 | ) | ||
| NET DECREASE IN UNREALIZED APPRECIATION ON INVESTMENTS | (97,601,761 | ) | ||
| NET LOSS ON INVESTMENTS | (171,189,747 | ) | ||
| NET DECREASE IN NET ASSETS RESULTING FROM OPERATIONS | $ | (169,862,473 | ) | |
For the Six Month Period Ending March 31, 2009 (Unaudited) and For the Year Ended September 30, 2008
| 2009 | 2008 | |||||||
| OPERATIONS: | ||||||||
| Net investment income (loss) | $ | 1,327,274 | $ | (2,873,647 | ) | |||
| Net realized (loss) gain on investments | (73,587,986 | ) | 101,431,267 | |||||
| Net decrease in unrealized appreciation on investments | (97,601,761 | ) | (203,862,755 | ) | ||||
| Net decrease in net assets from operations | (169,862,473 | ) | (105,305,135 | ) | ||||
| DISTRIBUTIONS TO SHAREHOLDERS: | ||||||||
| Distributions from net realized gains ($4.9924 and $2.40297 per share, respectively) | (92,095,117 | ) | (63,183,602 | ) | ||||
| FUND SHARE ACTIVITIES: | ||||||||
| Proceeds from shares issued (1,211,253 and 1,716,362 shares, respectively) | 20,460,470 | 51,589,427 | ||||||
| Net asset value of shares issued in distributions reinvested | ||||||||
| (5,161,593 and 1,885,744 shares, respectively) | 88,469,706 | 61,475,293 | ||||||
| Cost of shares redeemed (8,176,363 and 9,052,799 shares, respectively) | (144,811,265 | ) | (270,256,180 | ) | ||||
| Net decrease in net assets derived from Fund share activities | (35,881,089 | ) | (157,191,460 | ) | ||||
| TOTAL DECREASE | (297,838,679 | ) | (325,680,197 | ) | ||||
| NET ASSETS AT THE BEGINNING OF THE PERIOD | 593,175,770 | 918,855,967 | ||||||
| NET ASSETS AT THE END OF THE PERIOD (Includes undistributed net investment income | ||||||||
| of $1,327,274 and $0, respectively) | $ | 295,337,091 | $ | 593,175,770 | ||||
The accompanying notes to financial statements are an integral part of these statements.
14
FMI Focus Fund
FINANCIAL HIGHLIGHTS
(Selected data for each share of the Fund outstanding throughout each period)
| (Unaudited) | ||||||||||||||||||||||||
| For the Six Month | ||||||||||||||||||||||||
| Period Ending | ||||||||||||||||||||||||
| March 31, | Years Ended September 30, | |||||||||||||||||||||||
| 2009 | 2008 | 2007 | 2006 | 2005 | 2004 | |||||||||||||||||||
| PER SHARE OPERATING PERFORMANCE: | ||||||||||||||||||||||||
| Net asset value, beginning of period | $ | 28.34 | $ | 34.83 | $ | 34.42 | $ | 35.83 | $ | 32.14 | $ | 29.35 | ||||||||||||
| Income from investment operations: | ||||||||||||||||||||||||
| Net investment income (loss) | 0.06 | (0.11 | ) | (0.06 | ) | (0.13 | ) | (0.21 | ) | (0.29 | ) | |||||||||||||
| Net realized and unrealized | ||||||||||||||||||||||||
| (losses) gains on investments | (7.97 | ) | (3.98 | ) | 4.77 | 2.44 | 5.44 | 3.08 | ||||||||||||||||
| Total from investment operations | (7.91 | ) | (4.09 | ) | 4.71 | 2.31 | 5.23 | 2.79 | ||||||||||||||||
| Less distributions: | ||||||||||||||||||||||||
| Distributions from net investment income | — | — | — | — | — | — | ||||||||||||||||||
| Distributions from net realized gains | (4.99 | ) | (2.40 | ) | (4.30 | ) | (3.72 | ) | (1.54 | ) | — | |||||||||||||
| Total from distributions | (4.99 | ) | (2.40 | ) | (4.30 | ) | (3.72 | ) | (1.54 | ) | — | |||||||||||||
| Net asset value, end of period | $ | 15.44 | $ | 28.34 | $ | 34.83 | $ | 34.42 | $ | 35.83 | $ | 32.14 | ||||||||||||
| TOTAL RETURN | (29.65 | %)* | (12.58 | %) | 14.87 | % | 7.75 | % | 16.83 | % | 9.51 | % | ||||||||||||
| RATIOS/SUPPLEMENTAL DATA: | ||||||||||||||||||||||||
| Net assets, end of period (in 000’s $) | 295,337 | 593,176 | 918,856 | 902,646 | 1,053,437 | 1,063,995 | ||||||||||||||||||
| Ratio of expenses to average net assets | 1.52 | %** | 1.53 | % | 1.52 | % | 1.50 | % | 1.48 | % | 1.43 | % | ||||||||||||
| Ratio of net investment income (loss) to | ||||||||||||||||||||||||
| average net assets | 0.78 | %** | (0.37 | %) | (0.17 | %) | (0.38 | %) | (0.61 | %) | (0.87 | %) | ||||||||||||
| Portfolio turnover rate | 37 | % | 72 | % | 41 | % | 49 | % | 63 | % | 64 | % | ||||||||||||
| * | Not Annualized. |
| ** | Annualized. |
The accompanying notes to financial statements are an integral part of this statement.
March 31, 2009 (Unaudited)
| (1) | Summary of Significant Accounting Policies — |
| The following is a summary of significant accounting policies of the FMI Focus Fund (the “Fund”), a series of FMI Funds, Inc. (the “Company”) which is registered as a diversified, open-end management investment company under the Investment Company Act of 1940 (the “1940 Act”), as amended. The Company was incorporated under the laws of Maryland on September 5, 1996 and the Fund commenced operations on December 16, 1996. The assets and liabilities of each Fund in the Company are segregated as a shareholder’s interest is limited to the Fund in which the shareholder owns shares. The investment objective of the Fund is to seek capital appreciation principally through investing in common stocks and warrants, engaging in short sales, investing in foreign securities and effecting transactions in stock index futures contracts, options on stock index futures contracts, and options on securities and stock indexes. |
| (a) | Each security, excluding short-term investments, is valued at the last sale price reported by the principal security exchange on which the issue is traded. Securities that are traded on the Nasdaq Markets are valued at the Nasdaq Official Closing Price or if no sale is reported, at the latest bid price. Securities which are traded over-the-counter are valued at the latest bid price. Securities sold short which are listed on a national securities exchange or the Nasdaq Stock Market but which were not traded on the valuation date are valued at the most recent ask price. Unlisted equity securities for which market quotations are readily available are valued at the most recent bid price. Options purchased or written by the Fund are valued at the average of the most recent bid and ask prices. Securities for which quotations are not readily available are valued at fair value as determined by the investment adviser under the supervision of |
15
FMI Focus Fund
NOTES TO FINANCIAL STATEMENTS (Continued)
March 31, 2009 (Unaudited)
| (1) | Summary of Significant Accounting Policies — (Continued) |
| the Board of Directors. The fair value of a security is the amount which the Fund might reasonably expect to receive upon a current sale. The fair value of a security may differ from the last quoted price and the Fund may not be able to sell a security at the fair value. Market quotations may not be available, for example, if trading in particular securities was halted during the day and not resumed prior to the close of trading on the New York Stock Exchange. Variable rate demand notes are recorded at par value which approximates market value. Short-term investments with maturities of 60 days or less are valued at amortized cost which approximates value. For financial reporting purposes, investment transactions are recorded on the trade date. |
The Fund adopted the provisions of Statement of Financial Accounting Standards No. 157, “Fair Value Measurements” (“SFAS No. 157”), effective October 1, 2008. Under SFAS No. 157, fair value is defined as the price that would be received to sell an asset or paid to transfer a liability (i.e., the “exit price”) in an orderly transaction between market participants at the measurement date. |
| In determining fair value, the Fund uses various valuation approaches. SFAS No. 157 establishes a fair value hierarchy for inputs used in measuring fair value that maximizes the use of observable inputs and minimizes the use of unobservable inputs by requiring that the most observable inputs be used when available. Observable inputs are those that market participants would use in pricing the asset or liability based on market data obtained from sources independent of the Fund. Unobservable inputs reflect the Fund's assumptions about the inputs market participants would use in pricing the asset or liability developed based on the best information available in the circumstances. |
| The fair value hierarchy is categorized into three levels based on the inputs as follows: |
| Level 1 — | Valuations based on unadjusted quoted prices in active markets for identical assets. |
| Level 2 — | Valuations based on quoted prices in markets that are not active or for which all significant inputs are observable, either directly or indirectly. |
| Level 3 — | Valuations based on inputs that are unobservable and significant to the overall fair value measurement. |
| The securities in the Fund that are classified as Level 1 consist of publicly-traded common stock securities. The securities classified as Level 2 consist of short-term treasury securities and demand notes. |
| The following table summarizes the Fund’s investments as of March 31, 2009, based on the inputs used to value them: |
| Valuation Inputs | Investments in Securities | |||
| Level 1 — Quoted prices | $ | 273,946,410 | ||
| Level 2 — Other significant observable inputs | 21,667,400 | |||
| Level 3 — Significant unobservable inputs | — | |||
| Total | $ | 295,613,810 | ||
| (b) | Net realized gains and losses on sales of securities are computed on the identified cost basis. |
| (c) | Dividend income is recorded on the ex-dividend date. Interest income is recorded on an accrual basis. |
| (d) | The Fund has investments in short-term variable rate demand notes, which are unsecured instruments. The Fund may be susceptible to credit risk with respect to these notes to the extent the issuer defaults on its payment obligation. The Fund’s policy is to monitor the creditworthiness of the issuer and nonperformance by these issuers is not anticipated. |
| (e) | Accounting principles generally accepted in the United States of America (“GAAP”) require that permanent differences between income for financial reporting and tax purposes be reclassified in the capital accounts. |
| (f) | The preparation of financial statements in conformity with GAAP requires management to make estimates and assumptions that affect the reported amounts of assets and liabilities and disclosure of contingent assets and liabilities at the date of the financial statements and the reported amounts of revenues and expenses during the reporting period. Actual results could differ from these estimates. |
| (g) | The Fund may sell securities short. For financial statement purposes, an amount equal to the settlement amount would be included in the statement of net assets as a liability. The amount of the liability is subsequently marked-to-market to reflect the current value of the short position. Subsequent fluctuations in the market prices of securities sold, but not yet purchased, may require purchasing the securities at prices which may differ from the market value reflected on the statement of net assets. The Fund is liable for any dividends payable on securities while those securities are in a short position. Under the 1940 Act, the Fund is required to maintain collateral for its short positions consisting of liquid securities. The collateral is required to be adjusted daily to reflect changes in the value of the securities sold short. |
16
FMI Focus Fund
NOTES TO FINANCIAL STATEMENTS (Continued)
March 31, 2009 (Unaudited)
| (1) | Summary of Significant Accounting Policies — (Continued) |
| (h) | The Fund may own certain securities that are restricted. Restricted securities include Section 4(2) commercial paper, securities issued in a private placement, or securities eligible for resale pursuant to Rule 144A under the Securities Act of 1933 (the “Act”). A restricted security cannot be resold to the general public without prior registration under the Act or pursuant to the resale limitations provided by Rule 144A under the Act, or an exemption from the registration requirements of the Act. |
| (i) | No provision has been made for Federal income taxes since the Fund has elected to be taxed as a “regulated investment company” and intends to distribute substantially all net investment company taxable income and net capital gains to its shareholders and otherwise comply with the provisions of the Internal Revenue Code applicable to regulated investment companies. |
| (j) | Effective March 31, 2008, the Fund adopted Financial Accounting Standards Board Interpretation No. 48 (FIN 48), “Accounting for Uncertainty in Income Taxes”. FIN 48 requires the evaluation of tax positions taken on previously filed tax returns or expected to be taken on future returns. These positions must meet a “more-likely-than-not” standard that, based on the technical merits, have a more than fifty percent likelihood of being sustained upon examination. In evaluating whether a tax position has met the recognition threshold, the Fund must presume that the position will be examined by the appropriate taxing authority that has full knowledge of all relevant information. Tax positions not deemed to meet the “more-likely-than-not” threshold are recorded as a tax expense in the current year. |
| FIN 48 requires the Fund to analyze all open tax years, as defined by the Statute of Limitations, for all major jurisdictions. Open tax years are those that are open for exam by taxing authorities. Major jurisdictions for the Fund include Federal and the state of Maryland. As of March 31, 2009, open Federal and Maryland tax years include the tax years ended September 30, 2005 through 2008. The Fund has no examinations in progress. |
| The Fund has reviewed all open tax years and major jurisdictions and concluded that the adoption of FIN 48 resulted in no effect to the Fund’s financial position or results of operations. There is no tax liability resulting from unrecognized tax benefits relating to uncertain income tax positions taken or expected to be taken on the tax return for the fiscal year-end September 30, 2009. The Fund is also not aware of any tax positions for which it is reasonably possible that the total amounts of unrecognized tax benefits will significantly change in the next twelve months. |
| (2) | Investment Adviser and Management Agreement and Transactions With Related Parties — |
| The Fund has a management agreement with Fiduciary Management, Inc. (“FMI”), with whom certain officers and directors of the Fund are affiliated, to serve as investment adviser and manager. Under the terms of the agreement, the Fund will pay FMI a monthly management fee at an annual rate of 1.00% of the daily net assets. Prior to January 1, 2009, the Fund paid FMI a monthly management fee at an annual rate of 1.25% of the daily net assets. The Fund has an administrative agreement with FMI to supervise all aspects of the Fund’s operations except those performed by FMI pursuant to the management agreement. Under the terms of the agreement, the Fund will pay FMI a monthly administrative fee at the annual rate of 0.2% of the daily net assets up to and including $30,000,000, 0.1% on the next $70,000,000 and 0.05% of the daily net assets of the Fund in excess of $100,000,000. |
| FMI entered into a sub-advisory agreement with Broadview Advisors, LLC, with whom a certain director of the Fund is affiliated, to assist it in the day-to-day management of the Fund. Broadview Advisors, LLC, determines which securities will be purchased, retained or sold for the Fund. FMI pays Broadview Advisors, LLC 0.85% of the first $500 million of the average daily net assets of the Fund and 0.80% of the Fund’s average daily net assets in excess of $500 million. Prior to January 1, 2009, FMI paid Broadview Advisors, LLC 76% of the Fund’s management fee of 1.25% of the daily net assets. |
| Under the management agreement, FMI will reimburse the Fund for expenses over 2.75% of the daily net assets of the Fund. No such reimbursements were required for the six month period ending March 31, 2009. |
| The Fund has entered into a Distribution Plan (the “Plan”), pursuant to Rule 12b-1 under the 1940 Act. The Plan provides that the Fund may incur certain costs which may not exceed the lesser of a monthly amount equal to 0.25% of the Fund’s daily net assets or the actual distribution costs incurred during the year. Amounts payable under the Plan are paid monthly for any activities or expenses primarily intended to result in the sale of shares of the Fund. For the six month period ending March 31, 2009, no such expenses were incurred. |
| Under the Fund’s organizational documents, each director, officer, employee or other agent of the Fund (including the Fund’s investment manager) is indemnified, to the extent permitted by the Act, against certain liabilities that may arise out of performance of their duties to the Fund. Additionally, in the normal course of business, the Fund enters into contracts that contain a variety of indemnification clauses. The Fund’s maximum exposure under these arrangements is unknown as this would involve future claims that may be made |
17
FMI Focus Fund
NOTES TO FINANCIAL STATEMENTS (Continued)
March 31, 2009 (Unaudited)
| (2) | Investment Adviser and Management Agreement and Transactions With Related Parties — (Continued) |
| against the Fund that have not yet occurred. However, the Fund has not had prior claims or losses pursuant to these contracts and believes the risk of loss to be remote. |
| At March 31, 2009, one financial intermediary is the record owner of approximately 57% of the Fund’s shares. |
| (3) | Credit Agreement — |
| U.S. Bank, N.A. has made available to the Fund a $60,000,000 credit facility pursuant to a Credit Agreement (“Agreement”) effective November 18, 2002 for the purpose of having cash available to satisfy redemption requests and to purchase portfolio securities. Principal and interest of such loan under the Agreement are due not more than 31 days after the date of the loan. Amounts under the credit facility bear interest at a rate per annum equal to the current prime rate minus one on the amount borrowed. Advances will be collateralized by securities owned by the Fund. During the six month period ending March 31, 2009, the Fund did not borrow against the Agreement. The Credit Agreement expires on June 5, 2009. |
| (4) | Distribution to Shareholders — |
| Net investment income and net realized gains, if any, are distributed to shareholders at least annually. |
| (5) | Investment Transactions — |
| For the six month period ending March 31, 2009, purchases and proceeds of sales of investment securities (excluding short-term investments) were $124,277,181 and $190,439,535, respectively. |
| (6) | Income Tax Information — |
| The following information for the Fund is presented on an income tax basis as of March 31, 2009: |
| Gross | Gross | Net Unrealized | ||||||
| Cost of | Unrealized | Unrealized | Depreciation | |||||
| Investments | Appreciation | Depreciation | on Investments | |||||
| $417,148,611 | $7,525,457 | $129,060,258 | $121,534,801 |
The following information for the Fund is presented on an income tax basis as of September 30, 2008:
| Gross | Gross | Net Unrealized | Distributable | Distributable | ||||||
| Cost of | Unrealized | Unrealized | Depreciation | Ordinary | Long-Term | |||||
| Investments | Appreciation | Depreciation | on Investments | Income | Capital Gains | |||||
| $607,990,193 | $46,576,769 | $67,679,016 | $21,102,247 | $3,914,113 | $88,180,747 |
| The difference between the cost amount for financial statement and federal income tax purposes is due primarily to timing differences in recognizing certain gains and losses in security transactions. For the fiscal year ended September 30, 2008, the Fund had $73,513 of post-30 wash sale loss deferrals that will increase the tax cost basis of securities acquired during the fiscal year ending September 30, 2009. |
| The tax components of dividends paid during the years ended September 30, 2008 and 2007, capital loss carryovers, which may be used to offset future capital gains, subject to Internal Revenue Code limitations, as of September 30, 2008, and tax basis post-October losses as of September 30, 2008, which are not recognized for tax purposes until the first day of the following fiscal year are: |
| September 30, 2008 | September 30, 2007 | |||||||||
| Ordinary | Long-Term | Net Capital | Ordinary | Long-Term | ||||||
| Income | Capital Gains | Loss | Post-October | Income | Capital Gains | |||||
| Distributions | Distributions | Carryovers | Losses | Distributions | Distributions | |||||
| $4,935,599 | $58,248,003 | $— | $— | $22,364,961 | $90,673,743 | |||||
| For corporate shareholders of the Fund, the percentage of dividend income distributed for the year ended September 30, 2008, which is designated as qualifying for the dividends received deduction is 100% (unaudited). |
| For all shareholders of the Fund, the percentage of dividend income distributed for the year ended September 30, 2008, which is designated as qualified dividend income under the Jobs and Growth Tax Relief Act of 2003, is 100% (unaudited). |
18
FMI Focus Fund
ADVISORY AGREEMENT
On December 19, 2008, the Board of Directors of FMI Funds, Inc. (“Directors”) approved the continuation of the FMI Focus Fund’s investment advisory agreement with Fiduciary Management, Inc. and its sub-advisory agreement with Broadview Advisors, LLC. Prior to approving the continuation of the agreements, the Directors considered:
| • | the nature, extent and quality of the services provided by Fiduciary Management, Inc. and Broadview Advisors, LLC |
| • | the investment performance of the Fund |
| • | the cost of the services to be provided and profits to be realized by Fiduciary Management, Inc. and Broadview Advisors, LLC from their relationship with the Fund |
| • | the extent to which economies of scale would be realized as the Fund grew and whether fee levels reflect any economies of scale |
| • | the expense ratio of the Fund |
| • | the manner in which portfolio transactions for the Fund were conducted, including the use of soft dollars |
In considering the nature, extent and quality of the services provided by Fiduciary Management, Inc. and Broadview Advisors, LLC, the Directors reviewed a report describing the portfolio management, shareholder communication and servicing, prospective shareholder assistance and regulatory compliance services provided by Fiduciary Management, Inc. and Broadview Advisors, LLC to the Fund. The Directors concluded that Fiduciary Management, Inc. and Broadview Advisors, LLC were providing essential services to the Fund. In particular, the Directors concluded that Fiduciary Management, Inc. and Broadview Advisors, LLC were preparing reports to shareholders in addition to those required by law, and were providing services to the Fund that were in addition to the services investment advisers typically provided non-mutual fund clients.
The Directors compared the performance of the Fund to benchmark indices over various periods of time and concluded that the performance of the Fund warranted the continuation of the agreements.
A proposed reduction in investment advisory and sub-advisory fees for the Fund was discussed, noting that the decrease in fees would not result in a decrease in services provided by either Fiduciary Management, Inc. or Broadview Advisors, LLC.
In concluding that the advisory fees payable by the Fund were reasonable, the Directors reviewed a report that concluded that the profits Fiduciary Management, Inc. realized with respect to the Fund, expressed as a percentage of pre-tax revenues, was generally less than that of publicly traded investment advisers. The Directors also reviewed reports comparing the Fund’s expense ratio and advisory fees paid by the Fund to those of other comparable mutual funds and concluded that the advisory fee paid by the Fund and the Fund’s expense ratio were within the range of comparable mutual funds. The Directors noted that the investment advisory fee was not adjusted if economies of scale were realized as the Fund grew, but did not consider that factor to be significant in light of the other factors considered.
Finally, the Directors reviewed reports discussing the manner in which portfolio transactions for the Fund were conducted, including the use of soft dollars. Based on these reports, the Directors concluded that the research obtained by Broadview Advisors, LLC was beneficial to the Fund and that Broadview Advisors, LLC was executing the Fund’s portfolio transactions in a manner designated to obtain best execution for the Fund.
ADDITIONAL INFORMATION
For additional information about the Directors and Officers or for a description of the policies and procedures that the Fund uses to determine how to vote proxies relating to portfolio securities, please call (800) 811-5311 and request a Statement of Additional Information. One will be mailed to you free of charge. The Statement of Additional Information is also available on the website of the Securities and Exchange Commission (the “Commission”) at http://www.sec.gov. Information on how the Fund voted proxies relating to portfolio securities is available on the Fund’s website at http://www.fmifunds.com or the website of the Commission no later than August 31 for the prior 12 months ending June 30. The Fund files its complete schedule of portfolio holdings with the Commission for the first and third quarters of each fiscal year on Form N-Q. The Fund’s Form N-Q is available on the Commission’s website. The Fund’s Form N-Q may be reviewed and copied at the Commission’s Public Reference Room in Washington, D.C., and that information on the operation of the Public Reference Room may be obtained by calling 1-800-SEC-0330.
19
FMI Focus Fund
100 East Wisconsin Avenue, Suite 2200
Milwaukee, Wisconsin 53202
www.fmifunds.com
414-226-4555
BOARD OF DIRECTORS
BARRY K. ALLEN
ROBERT C. ARZBAECHER
PATRICK J. ENGLISH
GORDON H. GUNNLAUGSSON
TED D. KELLNER
RICHARD E. LANE
PAUL S. SHAIN
INVESTMENT ADVISER
AND ADMINISTRATOR
FIDUCIARY MANAGEMENT, INC.
100 East Wisconsin Avenue, Suite 2200
Milwaukee, Wisconsin 53202
PORTFOLIO MANAGER
BROADVIEW ADVISORS, LLC
100 East Wisconsin Avenue, Suite 2250
Milwaukee, Wisconsin 53202
TRANSFER AGENT AND
DIVIDEND DISBURSING AGENT
U.S. BANCORP FUND SERVICES, LLC
615 East Michigan Street
Milwaukee, Wisconsin 53202
800-811-5311 or 414-765-4124
CUSTODIAN
U.S. BANK, N.A.
1555 North RiverCenter Drive, Suite 302
Milwaukee, Wisconsin 53212
INDEPENDENT REGISTERED
PUBLIC ACCOUNTING FIRM
PRICEWATERHOUSECOOPERS LLP
100 East Wisconsin Avenue, Suite 1800
Milwaukee, Wisconsin 53202
LEGAL COUNSEL
FOLEY & LARDNER LLP
777 East Wisconsin Avenue
Milwaukee, Wisconsin 53202
This report is not authorized for use as an offer of sale or a solicitation of an offer to buy shares of FMI Focus Fund unless accompanied or preceded by the Fund’s current prospectus.
SEMIANNUAL REPORT
March 31, 2009
FMI
Large Cap
Fund
A NO-LOAD
MUTUAL FUND
FMI
Large Cap
Fund
March 31, 2009
Dear Fellow Shareholders:
The FMI Large Cap Fund declined 8.51% in the March quarter, slightly better than the minus 11.01% of the Standard & Poor’s 500 Index. Finance, Commercial Services and Retail Trade were the three sectors that drove relative performance. Cintas, McGraw-Hill and Best Buy were the standout contributors. On the down side, Electronic Technology and Technology Services, as well as Consumer Non-Durables underperformed. Tyco International, General Electric and Diageo all stumbled in the quarter. We continue to like these stocks and have added to all of them. In fact, we have added to a great many of our investments as prices have fallen and our optimism about their long-term prospects remains unshaken. Energy related stocks were also under severe pressure in the quarter as commodity prices fell and demand declined. This gave us an opportunity to initiate a position in Schlumberger, the leading worldwide oil service enterprise. We’ll have more to say about this investment momentarily.
The stock market continued its mercurial way, recently bouncing 20% off the early March lows. This trough followed an approximate 20% gain in the last six weeks of 2008. We’ve now had four rallies of this magnitude over the past eighteen months, and all of them have buckled to varying degrees so far. There is, of course, no way to know when a bear market will end, but if the amount of damage is any indication, we should be awfully close. According to The Leuthold Group, the S&P 500’s ten-year total return ending March 6 was negative 4.4% per year, or a cumulative loss of 36.3%. It was the worst ten-year stretch in U.S. stock market history, including the Great Depression.
Ten years ago, in the Securities Industry Association’s annual expectations survey, 1,500 investors were asked, “How well do you generally expect your investments to perform?” The average of their responses was plus 30%! It should have come as no surprise that, after a period of unprecedented returns (late 1990s), record high valuations, and unrealistically lofty expectations (as evidenced by this survey), we were on the cusp of a very difficult period. First the tech bubble deflated; then, following a period of easy money and unsustainable credit expansion, the housing bubble popped. Jeremy Grantham, a well-known Wall Street investor, calls the 2003-07 period “the greatest sucker rally in history.” As you can see from the accompanying chart, stocks have given back most of the gains from the 1990s bull market.
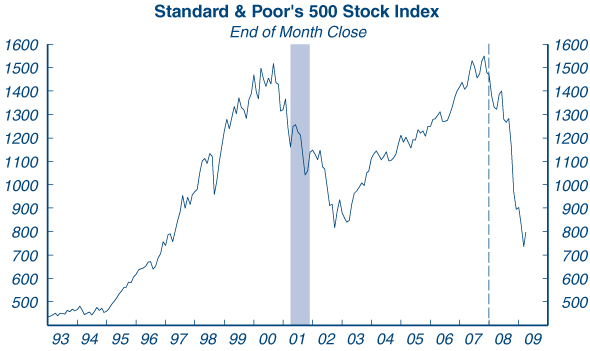
Source: Standard & Poor’s Corporation
Shaded Areas – U.S. Recessions, Dashed Line – Beginning of Latest Recession
We’ve not seen any recent investment surveys but we’re quite sure they would reveal very low expected returns. But talk is cheap. Ten years ago cash levels were near record lows; today cash levels are pushing toward record highs (see chart on following page) and Treasury bill yields are near zero. Fear has metastasized to nearly every sector of the market.
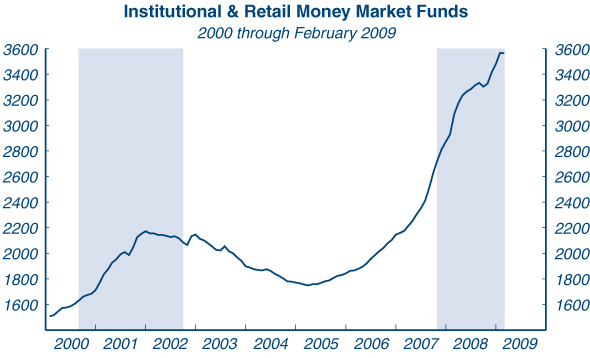
Shaded areas represent Bear Markets. • Data: Billions of Dollars
Source: Federal Reserve Board
Valuations were extremely high ten years ago versus quite low today. Sentiment was very positive in 1999 and today it is near a record low. History shows time and time again that low returns follow high valuations and lofty expectations and high returns follow low valuations and pessimistic expectations. The table below depicts the ten-year annual compound returns for stocks following the fifteen worst ten-year periods in U.S. history. Following these poor returns, the lowest ten-year period compounded at 7.21% and the highest earned a 15.58% return. We believe the next ten years will fall into this range.
No two bear markets are exactly alike, however, and there is a tendency for investors to believe that “this one is really different.” Today, the inability to corral so-called toxic assets, the deterioration of credit quality, a collapse in corporate earnings, growing protectionism, a political assault on business interests, and breathtaking spending initiatives under the guise of “Keynesian Economics” have investors rattled. We’ve analyzed a number of financial panics going back to the beginning of the 19th century; with very few exceptions, panics were characterized by periods of excessive borrowing and over-speculation in real estate, precious metals and stocks (canals, railroads, automobiles, technology). The ensuing bear markets precipitated a raft of damaging governmental actions (unintended consequences) that typically slowed or thwarted corrective market responses. Despite this, the fundamentals eventually recovered and importantly, the stock market anticipated this in advance.
| Past Ten Years | 10 Year ACR | Next Ten Years | Annual Compound | Total Return | ||||||||||||||
| Q2 | 1929 | to | Q2 | 1939 | -3.65 | Q2 | 1939 | to | Q2 | 1949 | 8.62 | 128.54 | ||||||
| Q1 | 1929 | to | Q1 | 1939 | -2.79 | Q1 | 1939 | to | Q1 | 1949 | 9.12 | 139.36 | ||||||
| Q3 | 1929 | to | Q3 | 1939 | -2.74 | Q3 | 1939 | to | Q3 | 1949 | 7.74 | 110.79 | ||||||
| Q1 | 1928 | to | Q1 | 1938 | -2.54 | Q1 | 1938 | to | Q1 | 1948 | 11.76 | 203.87 | ||||||
| Q1 | 1930 | to | Q1 | 1940 | -1.42 | Q1 | 1940 | to | Q1 | 1950 | 9.65 | 151.31 | ||||||
| Q2 | 1930 | to | Q2 | 1940 | -1.42 | Q2 | 1940 | to | Q2 | 1950 | 12.19 | 215.88 | ||||||
| Q4 | 1928 | to | Q4 | 1938 | -0.65 | Q4 | 1938 | to | Q4 | 1948 | 7.21 | 100.63 | « WORST | |||||
| Q3 | 1928 | to | Q3 | 1938 | -0.10 | Q3 | 1938 | to | Q3 | 1948 | 8.12 | 118.31 | ||||||
| Q3 | 1930 | to | Q3 | 1940 | 0.18 | Q3 | 1940 | to | Q3 | 1950 | 12.57 | 226.85 | ||||||
| Q4 | 1927 | to | Q4 | 1937 | 0.20 | Q4 | 1937 | to | Q4 | 1947 | 9.61 | 150.39 | ||||||
| Q4 | 1929 | to | Q4 | 1939 | 0.23 | Q4 | 1939 | to | Q4 | 1949 | 9.09 | 138.67 | ||||||
| Q2 | 1928 | to | Q2 | 1938 | 0.44 | Q2 | 1938 | to | Q2 | 1948 | 9.52 | 148.39 | ||||||
| Q3 | 1964 | to | Q3 | 1974 | 0.49 | Q3 | 1974 | to | Q3 | 1984 | 15.58 | 325.30 | « BEST | |||||
| Q1 | 1931 | to | Q1 | 1941 | 0.71 | Q1 | 1941 | to | Q1 | 1951 | 14.47 | 286.14 | ||||||
| Q4 | 1964 | to | Q4 | 1974 | 1.24 | Q4 | 1974 | to | Q4 | 1984 | 14.76 | 296.23 | ||||||
| Average | 10.67 | 182.71 | ||||||||||||||||
The Leuthold Group – March 2009
Of course we don’t know exactly how this bear market will transpire. Investing is a bit of a faith-based initiative, to borrow a popular phrase. The faith is born out of a belief that capitalism and freedom will ultimately prevail. A strong work ethic and desire to “improve one’s position,” as Adam Smith said, will drive success. The age of the imperial CEO and boards of directors that rubber-stamp ridiculous pay packages are on the run — and should be. Unfortunately, when populism runs too hot, people lose sight of the fact that private sector businesses create the wealth, employment and tax revenue, not the government. What the government gives to Peter, it must take from Paul.
2
Following TARP and TALF, as part of the Financial Stability Plan (and alongside the American Recovery and Reinvestment Act), the Treasury department recently introduced the Public-Private Investment Partnership, or PPIP. Barron’s recently quipped that PPIP should be renamed PIMP because the government is cheaply renting its balance sheet to private investors! Of course it’s easy to take potshots at the confusing myriad of government bailout programs introduced over the past year, but of all of them so far, the PPIP seems to make the most sense. Without getting into the details, we think the program will help the financial system reach price discovery in the troubled assets, an important first step in the recovery process.
For the benefit of new shareholders, the March and September letters deal with companies, and the June and December pieces discuss macro or market related subjects in more detail. Below we have highlighted two of our investments.
GENERAL ELECTRIC CO.
Description
General Electric (GE) is one of the largest and most diversified industrial manufacturing and financial corporations. Products include aircraft engines, locomotives, power generation equipment, transmission and distribution equipment, medical diagnostic devices, bioscience assays, engineered materials, lighting and appliances. Services include engineering, installation and maintenance, repair and overhaul (MRO) activities. GE Capital offers a broad array of financial services including consumer and commercial financing, leasing, real estate financing, asset management and mortgages. GE also owns NBC Universal.
Good Business
| • | The company is number one or number two in nearly all of its businesses. |
| • | GE has unparalleled global breadth and diversification. |
| • | GE has actively increased the recurring revenue (via service contracts) across their business lines. |
| • | Most of GE’s products provide tangible economic value for customers and can generally be described as necessities rather than wants. |
| • | The products and services are relatively easy to understand. |
| • | GE currently has an AA rating with a neutral credit outlook. |
| • | GE’s return on invested capital (ROIC) on their industrial businesses of approximately 16% still comfortably exceeds their cost of capital. |
Valuation
| • | The current valuation reflects an overly-dire outlook. GE has recently cut their dividend and is taking the necessary steps to shore up the balance sheet. |
| • | On a price-to-earnings (P/E) basis, the stock is approximately 10 times highly depressed earnings. The ten-year P/E range is 8.0 - 33.0. |
| • | The book multiple is approximately 1.0, in a ten year range of 0.8 - 7.8. |
| • | The price-to-sales ratio is 0.6 compared to the ten-year range of 0.5 - 3.5x. |
| • | An extremely conservative valuation on GE shares is $16.00 per share. GE Industrial should generate $0.80 of earnings, and using a P/E of 14, is worth approximately $12.00. GE Capital will be approximately $500 billion in assets once downsized. GE Capital has historically generated a 2% return-on-assets (ROA). Given the environment and GE’s higher cost of capital, a 1% ROA is reasonable, or roughly $0.50 in earnings. Assigning a P/E of 8 yields $4.00 per share. |
| • | Longer-term, GE’s earning power should return to $2.00 or more, which should translate into a $25-30 stock. |
Management
| • | Jeffrey Immelt, 52, has been Chairman and CEO since 2001. He has changed the business mix significantly following Jack Welch. Most of the insurance businesses were divested and over $80 billion has been spent on acquisitions. |
3
| • | Despite a history of heavy mergers and acquisitions, there appears to be more focus on internal growth. The company has globalized research and development and divested some inferior businesses. |
| • | GE has a highly regarded management development program. GE business unit leaders are considered to be among the best by analysts, competitors and executive recruiters. |
Investment Thesis
GE’s depressed valuation reflects concerns about their financial exposure plus the impact of the current recession on GE’s Industrial Business. It appears that the company is projecting reserve and loss provisions of approximately $12 billion for 2009. The recent announcement to cut the dividend helps shore up the balance sheet. The biggest risk going forward is that GE may have to raise additional capital if credit quality doesn’t stabilize. We do not believe GE will follow the path of AIG or Citibank (massive bailouts). Some key points on GE Capital that support our viewpoint include:
| • | GE was never involved in financing or underwriting CDOs and does not have any off-balance sheet financing vehicles. |
| • | GE is not engaged in derivatives (other than for hedging purposes). |
| • | GE’s investment portfolio is marked-to-market and is conservatively structured. |
| • | The main areas of concern are in GE’s lending portfolio. |
| • | Over 50% of GE’s lending activities are related to their Industrial and Infrastructure businesses where they have considerable domain knowledge. The underwriting in this area is conservative and the reserving has been appropriate. |
| • | GE’s commercial real estate lending (10% of GE Capital) portfolio is also a concern. Approximately 98% of their real estate lending is in a senior secured position. GE also holds $40 billion in equity interests in commercial real estate holdings. These commercial assets are 100% GE-owned, and diversified by geography and type. We have worked into our assumptions a 10-20% decline in these assets in our capital ratios. |
| • | The size of GE’s consumer lending (40% of GE Capital’s lending) is the area of most concern. The reserving for future losses increased in 2008 and has accelerated this year in areas such as mortgages, auto loans, credit cards, and other installment debt. |
We have gone through GE Capital’s balance sheet in exhaustive detail to estimate potential losses in the consumer and real estate areas. We have worked into our assumptions a difficult economy for both 2009 and 2010. While the financial area has proven to be an enormous disappointment thus far in our ownership tenure, it has resulted in a stock that is significantly undervalued. We believe the stock is trading for less than the value of the industrial businesses, suggesting a negative value for GE Capital. Over the next three to five years, we believe the stock will appreciate significantly.
SCHLUMBERGER LTD.
Description
Schlumberger is the world’s leading supplier of oilfield products and services. The company operates in each of the major oilfield markets, providing products and services that cover the entire life cycle of the reservoir. Europe/CIS/Africa accounts for 34% of revenue, followed by North America at 24%, Middle East & Asia 24%, and Latin America 17%.
Good Business
| • | Schlumberger is the market leader in businesses that represent nearly 60% of its revenue and is number one or number two in segments that make up almost 90% of revenue. Barriers to entry are on the rise due to the increasing complexity of wells and high levels of investment required to compete internationally. |
| • | The company’s products and services are necessities in the exploration and production of oil and gas. |
| • | Schlumberger generates an ROIC north of 20% over a cycle. |
| • | This is an easy business to understand. |
| • | The debt-to-capital ratio, net of cash, is 8.6%. Standard & Poor’s has accorded the company’s bonds a rating of A+/stable outlook. |
4
Valuation
| • | If sales were to contract by a third from the 2008 level and the market were to ascribe the trough EV/sales multiple of 2.0 reached in 2002/2003 on this level of sales, Schlumberger would be valued at $29.00 per share, or downside of 21%. |
| • | Schlumberger trades for 2.61x book. The stock traded down to 2.75x book in 1998 and 2.26x book during the most recent downturn in 2002. The company would be valued at around $32.00 per share if it were to revisit its 2002 low, or downside of 13%. |
| • | We conservatively estimate that the company can earn $3.00 per share by 2012. Investors have typically accorded the stock a P/E multiple in excess of 20. At this valuation, the stock has approximately 70% upside. |
| • | The reward-to-risk ratio is an attractive 3.5-4.0 to 1.0. |
Management
| • | Andrew Gould, 62, has served as Chairman and CEO since February 2003. He previously served as President and COO of the company, and before that was Executive Vice President of Oilfield Services. Gould started his career at Schlumberger in 1975. |
| • | Simon Ayat, 54, has served as CFO since March 2007. He previously served as Treasurer of the company from February 2005 to March 2007, and before that was Controller, from December 2002 to February 2005. Ayat has been with Schlumberger for 24 years. |
| • | Ashok Belani, 50, has served as Chief Technology Officer since March 2006. He joined Schlumberger as a field engineer in 1980. |
Investment Thesis
Schlumberger’s stock price has fallen 67% from its 52-week high due to the significant contraction in oil and gas prices following the onset of the recession. However, we believe this represents a cyclical slowdown rather than an end to the secular upturn. The demand for commodities will increase once global growth resumes, from which Schlumberger stands to benefit as a leading supplier of “picks and shovels” to the energy industry. In addition, an investment in Schlumberger would represent a hedge on inflation, which is a possible byproduct of heavy deficit spending by the government.
* * * * *
Finally, in the aftermath of the Madoff and Stanford Financial Group frauds, among others, some of our shareholders have asked about the safeguards of the FMI Large Cap Fund. Like all mutual funds, it is regulated under the Investment Company Act of 1940. It is a public entity that files regularly with the Securities and Exchange Commission and these documents are available for all to see. Fiduciary Management, Inc., the investment adviser, does not custody the assets; U.S. Bank, N.A. holds the securities. There is complete pricing transparency as the net asset value is calculated and published every day. The securities are liquid and the FMI Large Cap Fund does not use leverage. The Fund has a board with a majority of independent directors and is audited by PricewaterhouseCoopers LLP. The portfolio managers, analysts and employees of Fiduciary Management, Inc. have a significant portion of their net worth invested in the FMI Large Cap Fund and have recently increased that investment.
Thank you for your support of the FMI Large Cap Fund.
Sincerely,
|  |  |
| Ted D. Kellner, CFA | Donald S. Wilson, CFA | Patrick J. English, CFA |
| President and | Vice President | Vice President and |
| Portfolio Manager | Portfolio Manager |
100 E. Wisconsin Ave., Suite 2200 • Milwaukee, WI 53202 • 414-226-4555
www.fmifunds.com
5
FMI Large Cap Fund
COST DISCUSSION
As a shareholder of the Fund you incur ongoing costs, including management fees and other Fund expenses. You do not incur transaction costs such as sales charges (loads) on purchase payments, reinvested dividends, or other distributions; redemption fees; and exchange fees because the Fund does not charge these fees. This example is intended to help you understand your ongoing costs (in dollars) of investing in FMI Large Cap Fund and to compare these costs with the ongoing costs of investing in other mutual funds.
The example is based on an investment of $1,000 invested at the beginning of the period and held for the entire period from October 1, 2008 through March 31, 2009.
Industry Sectors as of March 31, 2009
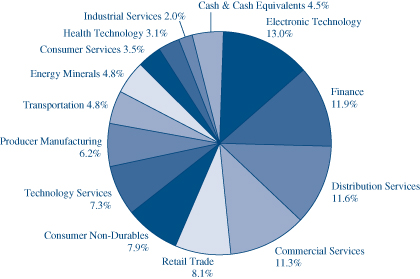
Actual Expenses
The first line of the table below provides information about actual account values and actual expenses. You may use the information in this line, together with the amount you invested, to estimate the expenses that you paid over the period. Simply divide your account value by $1,000 (for example, an $8,600 account value divided by $1,000 = 8.6), then multiply the result by the number in the first line under the heading entitled “Expenses Paid During Period” to estimate the expenses you paid on your account during this period.
In addition to the costs highlighted and described below, the only Fund transaction costs you might currently incur would be wire fees ($15 per wire), if you choose to have proceeds from a redemption wired to your bank account instead of receiving a check. Additionally, U.S. Bank charges an annual processing fee ($15) if you maintain an IRA account with the Fund. To determine your total costs of investing in the Fund, you would need to add any applicable wire or IRA processing fees you’ve incurred during the period to the costs provided in the example at the end of this article.
Hypothetical Example for Comparison Purposes
The second line of the table below provides information about hypothetical account values and hypothetical expenses based on the Fund’s actual expense ratio and an assumed rate of return of 5% per year before expenses, which is not the Fund’s actual return. The hypothetical account values and expenses may not be used to estimate the actual ending account balance or expenses you paid for the period. You may use this information to compare the ongoing costs of investing in the Fund and other funds. To do so, compare this 5% hypothetical example with the 5% hypothetical examples that appear in the shareholder reports of the other funds.
Please note that the expenses shown in the table are meant to highlight your ongoing costs only and do not reflect any transactional costs, such as sales charges (loads), redemption fees or exchange fees. Therefore, the second line of the table is useful in comparing ongoing costs only, and will not help you determine the relative total costs of owning different funds. In addition, if these transactional costs were included, your costs would have been higher.
| Beginning | Ending | Expenses Paid | ||||||||||
| Account | Account | During Period* | ||||||||||
| Value 10/01/08 | Value 3/31/09 | 10/01/08-3/31/09 | ||||||||||
| FMI Large Cap Fund Actual | $ | 1,000.00 | $ | 747.50 | $ | 4.36 | ||||||
| Hypothetical (5% return before expenses) | $ | 1,000.00 | $ | 1,019.90 | $ | 5.04 | ||||||
| * | Expenses are equal to the Fund’s annualized expense ratio of 1.00%, multiplied by the average account value over the period, multiplied by 182/365 (to reflect the one-half year period between October 1, 2008 and March 31, 2009). |
6
FMI Large Cap Fund
STATEMENT OF ASSETS AND LIABILITIES
March 31, 2009 (Unaudited)
| ASSETS: | ||||
| Investments in securities, at value (cost $1,783,043,773) | $ | 1,405,374,639 | ||
| Receivable from shareholders for purchases | 6,766,515 | |||
| Dividends and interest receivable | 5,388,437 | |||
| Cash | 49,365 | |||
| Total assets | $ | 1,417,578,956 | ||
| LIABILITIES: | ||||
| Payable to shareholders for redemptions | $ | 861,922 | ||
| Payable to adviser for management and administrative fees | 769,190 | |||
| Other liabilities | 371,224 | |||
| Total liabilities | 2,002,336 | |||
| NET ASSETS: | ||||
| Capital Stock, $0.0001 par value; 300,000,000 shares authorized; 140,151,265 shares outstanding | 1,857,710,072 | |||
| Net unrealized depreciation on investments | (377,669,134 | ) | ||
| Accumulated net realized loss on investments | (72,816,745 | ) | ||
| Undistributed net investment income | 8,352,427 | |||
| Net assets | 1,415,576,620 | |||
| Total liabilities and net assets | $ | 1,417,578,956 | ||
| CALCULATION OF NET ASSET VALUE PER SHARE: | ||||
| Net asset value, offering and redemption price per share ($1,415,576,620 ÷ 140,151,265 shares outstanding) | $ | 10.10 | ||
The accompanying notes to financial statements are an integral part of this statement.
7
FMI Large Cap Fund
SCHEDULE OF INVESTMENTS
March 31, 2009 (Unaudited)
| Shares | Cost | Value | |||||||||
| COMMON STOCKS — 95.5% (a) | |||||||||||
COMMERCIAL SERVICES SECTOR — 11.3% | |||||||||||
| Financial Publishing/Services — 4.2% | |||||||||||
| 2,606,000 | McGraw-Hill | ||||||||||
| Companies, Inc. | $ | 74,809,148 | $ | 59,599,220 | |||||||
Miscellaneous Commercial Services — 4.9% | |||||||||||
| 2,813,000 | Cintas Corp. | 80,732,429 | 69,537,360 | ||||||||
Personnel Services — 2.2% | |||||||||||
| 1,703,000 | Robert Half | ||||||||||
| International Inc. | 33,640,710 | 30,364,490 | |||||||||
CONSUMER NON-DURABLES SECTOR — 7.9% | |||||||||||
| Beverages: Alcoholic — 4.0% | |||||||||||
| 1,284,000 | Diageo | ||||||||||
| PLC - SP-ADR | 84,145,959 | 57,459,000 | |||||||||
Household/Personal Care — 3.9% | |||||||||||
| 1,188,000 | Kimberly-Clark | ||||||||||
| Corp. | 70,799,931 | 54,778,680 | |||||||||
CONSUMER SERVICES SECTOR — 3.5% | |||||||||||
| Cable/Satellite TV — 0.9% | |||||||||||
| 481,102 | Time Warner | ||||||||||
| Cable, Inc. | 19,826,754 | 11,931,329 | |||||||||
Media Conglomerates — 2.6% | |||||||||||
| 1,916,666 | Time Warner Inc. | 60,175,050 | 36,991,654 | ||||||||
DISTRIBUTION SERVICES SECTOR — 11.6% | |||||||||||
| Food Distributors — 3.8% | |||||||||||
| 2,342,000 | Sysco Corp. | 63,631,701 | 53,397,600 | ||||||||
Medical Distributors — 3.5% | |||||||||||
| 1,593,000 | Cardinal | ||||||||||
| Health, Inc. | 65,409,994 | 50,147,640 | |||||||||
Wholesale Distributors — 4.3% | |||||||||||
| 864,000 | Grainger | ||||||||||
| (W.W.), Inc. | 65,327,720 | 60,635,520 | |||||||||
ELECTRONIC TECHNOLOGY SECTOR — 13.0% | |||||||||||
| Computer Communications — 4.0% | |||||||||||
| 3,334,000 | Cisco | ||||||||||
| Systems, Inc.* | 52,121,774 | 55,911,180 | |||||||||
Electronic Components — 2.6% | |||||||||||
| 3,356,000 | Tyco | ||||||||||
| Electronics Ltd. | 81,521,979 | 37,050,240 | |||||||||
Electronic Equipment/Instruments — 6.4% | |||||||||||
| 1,706,000 | CANON | ||||||||||
| INC. SP-ADR | 66,317,910 | 49,525,180 | |||||||||
| 1,897,000 | Rockwell | ||||||||||
| Automation, Inc. | 51,657,809 | 41,430,480 | |||||||||
| 117,975,719 | 90,955,660 | ||||||||||
| ENERGY MINERALS SECTOR — 4.8% | |||||||||||
| Integrated Oil — 4.8% | |||||||||||
| 1,681,000 | BP PLC - SP-ADR | 87,174,658 | 67,408,100 | ||||||||
FINANCE SECTOR — 11.9% | |||||||||||
| Financial Conglomerates — 2.2% | |||||||||||
| 2,255,000 | American | ||||||||||
| Express Co. | 63,403,304 | 30,735,650 | |||||||||
Major Banks — 5.4% | |||||||||||
| 2,735,000 | Bank of New York | ||||||||||
| Mellon Corp. | 89,709,421 | 77,263,750 | |||||||||
Property/Casualty Insurance — 4.3% | |||||||||||
| 21,600 | Berkshire Hathaway | ||||||||||
| Inc. Cl B* | 67,459,563 | 60,912,000 | |||||||||
HEALTH TECHNOLOGY SECTOR — 3.1% | |||||||||||
| Medical Specialties — 3.1% | |||||||||||
| 1,342,000 | Covidien Ltd. | 57,792,247 | 44,608,080 | ||||||||
INDUSTRIAL SERVICES SECTOR — 2.0% | |||||||||||
| Oilfield Services/Equipment — 2.0% | |||||||||||
| 700,300 | Schlumberger | ||||||||||
| Ltd. | 25,230,759 | 28,446,186 | |||||||||
PRODUCER MANUFACTURING SECTOR — 6.2% | |||||||||||
| Industrial Conglomerates — 6.2% | |||||||||||
| 4,944,000 | General | ||||||||||
| Electric Co.* | 110,561,620 | 49,983,840 | |||||||||
| 1,936,000 | Tyco International | ||||||||||
| Ltd. | 61,470,434 | 37,868,160 | |||||||||
| 172,032,054 | 87,852,000 | ||||||||||
| RETAIL TRADE SECTOR — 8.1% | |||||||||||
| Discount Stores — 4.1% | |||||||||||
| 1,107,000 | Wal-Mart | ||||||||||
| Stores, Inc. | 54,072,298 | 57,674,700 | |||||||||
8
FMI Large Cap Fund
SCHEDULE OF INVESTMENTS (Continued)
March 31, 2009 (Unaudited)
Principal Amount or | |||||||||||
| Shares | Cost | Value | |||||||||
| COMMON STOCKS — 95.5% (a) (Continued) | |||||||||||
RETAIL TRADE SECTOR — 8.1% (Continued) | |||||||||||
| Electronics/Appliance Stores — 4.0% | |||||||||||
| 1,503,500 | Best Buy | ||||||||||
| Co., Inc. | $ | 44,573,030 | $ | 57,072,860 | |||||||
TECHNOLOGY SERVICES SECTOR — 7.3% | |||||||||||
| Data Processing Services — 3.9% | |||||||||||
| 1,563,000 | Automatic Data | ||||||||||
| Processing, Inc. | 60,357,165 | 54,955,080 | |||||||||
Information Technology Services — 3.4% | |||||||||||
| 1,772,000 | Accenture Ltd. | 56,344,027 | 48,712,280 | ||||||||
TRANSPORTATION SECTOR — 4.8% | |||||||||||
| Air Freight/Couriers — 4.8% | |||||||||||
| 1,379,000 | United Parcel | ||||||||||
| Service, Inc. Cl B | 81,676,379 | 67,874,380 | |||||||||
| Total | |||||||||||
| common stocks | 1,729,943,773 | 1,352,274,639 | |||||||||
| SHORT-TERM INVESTMENTS — 3.8% (a) | |||||||||||
| Commercial Paper — 3.8% | |||||||||||
| $ | 53,100,000 | U.S. Bancorp, 0.01%, | |||||||||
| due 4/01/09 | 53,100,000 | 53,100,000 | |||||||||
| Total short-term | |||||||||||
| investments | 53,100,000 | 53,100,000 | |||||||||
Total investments — 99.3% | $ | 1,783,043,773 | 1,405,374,639 | ||||||||
| Cash and | |||||||||||
| receivables, less | |||||||||||
liabilities — 0.7% (a) | 10,201,981 | ||||||||||
TOTAL NET ASSETS — 100.0% | $ | 1,415,576,620 | |||||||||
| * | Non-income producing security. |
| (a) | Percentages for the various classifications relate to net assets. |
ADR – American Depositary Receipts
The accompanying notes to financial statements are an integral part of this schedule.
9
FMI Large Cap Fund
STATEMENT OF OPERATIONS
For the Six Month Period Ending March 31, 2009 (Unaudited)
| INCOME: | ||||
| Dividends | $ | 21,602,006 | ||
| Interest | 262,569 | |||
| Total income | 21,864,575 | |||
| EXPENSES: | ||||
| Management fees | 5,057,860 | |||
| Transfer agent fees | 860,466 | |||
| Administrative and accounting services | 380,280 | |||
| Custodian fees | 156,771 | |||
| Printing and postage expense | 118,467 | |||
| Registration fees | 88,289 | |||
| Professional fees | 31,293 | |||
| Board of Directors fees | 17,000 | |||
| Insurance expense | 9,402 | |||
| Other expenses | 30,325 | |||
| Total expenses | 6,750,153 | |||
| NET INVESTMENT INCOME | 15,114,422 | |||
| NET REALIZED LOSS ON INVESTMENTS | (47,866,278 | ) | ||
| NET DECREASE IN UNREALIZED APPRECIATION ON INVESTMENTS | (303,621,332 | ) | ||
| NET LOSS ON INVESTMENTS | (351,487,610 | ) | ||
| NET DECREASE IN NET ASSETS RESULTING FROM OPERATIONS | $ | (336,373,188 | ) | |
For the Six Month Period Ending March 31, 2009 (Unaudited) and For the Year Ended September 30, 2008
| 2009 | 2008 | |||||||
| OPERATIONS: | ||||||||
| Net investment income | $ | 15,114,422 | $ | 8,594,441 | ||||
| Net realized loss on investments | (47,866,278 | ) | (14,847,464 | ) | ||||
| Net decrease in unrealized appreciation on investments | (303,621,332 | ) | (112,702,435 | ) | ||||
| Net (decrease) in net assets from operations | (336,373,188 | ) | (118,955,458 | ) | ||||
| DISTRIBUTIONS TO SHAREHOLDERS: | ||||||||
| Distributions from net investment income ($0.1143 and $0.1341 per share, respectively) | (13,823,123 | ) | (5,339,265 | ) | ||||
| Distributions from net realized gains ($0.4294 per share) | — | (17,326,247 | ) | |||||
| Total distributions | (13,823,123 | ) | (22,665,512 | ) | ||||
| FUND SHARE ACTIVITIES: | ||||||||
| Proceeds from shares issued (87,872,098 and 58,850,086 shares, respectively) | 947,786,448 | 862,301,900 | ||||||
| Net asset value of shares issued in distributions reinvested | ||||||||
| (816,243 and 1,439,344 shares, respectively) | 9,086,079 | 22,538,745 | ||||||
| Cost of shares redeemed (32,086,181 and 16,236,082 shares, respectively) | (331,299,810 | ) | (241,894,860 | ) | ||||
| Net increase in net assets derived from Fund share activities | 625,572,717 | 642,945,785 | ||||||
| TOTAL INCREASE | 275,376,406 | 501,324,815 | ||||||
| NET ASSETS AT THE BEGINNING OF THE PERIOD | 1,140,200,214 | 638,875,399 | ||||||
| NET ASSETS AT THE END OF THE PERIOD (Includes undistributed | ||||||||
| net investment income of $8,352,427 and $7,061,128, respectively) | $ | 1,415,576,620 | $ | 1,140,200,214 | ||||
The accompanying notes to financial statements are an integral part of these statements.
10
FMI Large Cap Fund
FINANCIAL HIGHLIGHTS
(Selected data for each share of the Fund outstanding throughout each year)
| (Unaudited) | ||||||||||||||||||||||||
| For the Six Month | ||||||||||||||||||||||||
| Period Ending | ||||||||||||||||||||||||
| March 31, | Years Ended September 30, | |||||||||||||||||||||||
| 2009 | 2008 | 2007 | 2006 | 2005 | 2004 | |||||||||||||||||||
| PER SHARE OPERATING PERFORMANCE: | ||||||||||||||||||||||||
| Net asset value, beginning of period | $ | 13.65 | $ | 16.18 | $ | 14.79 | $ | 13.29 | $ | 11.66 | $ | 10.03 | ||||||||||||
| Income from investment operations: | ||||||||||||||||||||||||
| Net investment income | 0.11 | 0.17 | 0.17 | 0.12 | 0.08 | 0.10 | ||||||||||||||||||
| Net realized and unrealized | ||||||||||||||||||||||||
| (losses) gains on investments | (3.55 | ) | (2.14 | ) | 1.65 | 1.78 | 1.82 | 1.68 | ||||||||||||||||
| Total from investment operations | (3.44 | ) | (1.97 | ) | 1.82 | 1.90 | 1.90 | 1.78 | ||||||||||||||||
| Less distributions: | ||||||||||||||||||||||||
| Distributions from net investment income | (0.11 | ) | (0.13 | ) | (0.10 | ) | (0.03 | ) | (0.07 | ) | (0.03 | ) | ||||||||||||
| Distributions from net realized gains | — | (0.43 | ) | (0.33 | ) | (0.37 | ) | (0.20 | ) | (0.12 | ) | |||||||||||||
| Total from distributions | (0.11 | ) | (0.56 | ) | (0.43 | ) | (0.40 | ) | (0.27 | ) | (0.15 | ) | ||||||||||||
| Net asset value, end of period | $ | 10.10 | $ | 13.65 | $ | 16.18 | $ | 14.79 | $ | 13.29 | $ | 11.66 | ||||||||||||
| TOTAL RETURN | (25.25 | %)* | (12.58 | %) | 12.52 | % | 14.82 | % | 16.60 | % | 17.96 | % | ||||||||||||
| RATIOS/SUPPLEMENTAL DATA: | ||||||||||||||||||||||||
| Net assets, end of period (in 000’s $) | 1,415,577 | 1,140,200 | 638,875 | 165,806 | 73,903 | 14,977 | ||||||||||||||||||
| Ratio of expenses (after reimbursement) | ||||||||||||||||||||||||
| to average net assets (a) | 1.00 | %** | 1.00 | % | 1.00 | % | 1.00 | % | 1.00 | % | 1.13 | % | ||||||||||||
| Ratio of net investment income | ||||||||||||||||||||||||
| to average net assets (b) | 2.24 | %** | 1.13 | % | 1.06 | % | 0.88 | % | 0.64 | % | 0.85 | % | ||||||||||||
| Portfolio turnover rate | 13 | % | 30 | % | 19 | % | 29 | % | 40 | % | 38 | % | ||||||||||||
| * | Not Annualized. |
| ** | Annualized. |
| (a) | Computed after giving effect to adviser's expense limitation undertaking. If the Fund had paid all of its expenses for the years ended September 30, 2008, 2007, 2006, 2005 and 2004, the ratios would have been 1.02%, 1.03%, 1.11%, 1.33% and 2.44%, respectively. |
| (b) | If the Fund had paid all of its expenses for the years ended September 30, 2008, 2007, 2006, 2005 and 2004, the ratios would have been 1.11%, 1.03%, 0.77%, 0.31% and (0.46%), respectively. |
The accompanying notes to financial statements are an integral part of this statement.
March 31, 2009 (Unaudited)
| (1) | Summary of Significant Accounting Policies — |
The following is a summary of significant accounting policies of the FMI Large Cap Fund (the “Fund”), a series of FMI Funds, Inc. (the “Company”) which is registered as a non-diversified, open-end management investment company under the Investment Company Act of 1940, as amended. The Company was incorporated under the laws of Maryland on September 5, 1996 and the Fund commenced operations on December 31, 2001. The assets and liabilities of each Fund in the Company are segregated and a shareholder’s interest is limited to the Fund in which the shareholder owns shares. The investment objective of the Fund is to seek long-term capital appreciation principally through investing in a limited number of large capitalization value stocks.
| (a) | Each security, excluding short-term investments, is valued at the last sale price reported by the principal security exchange on which the issue is traded. Securities that are traded on the Nasdaq Markets are valued at the Nasdaq Official Closing Price, or if no sale is |
11
FMI Large Cap Fund
NOTES TO FINANCIAL STATEMENTS (Continued)
March 31, 2009 (Unaudited)
| (1) | Summary of Significant Accounting Policies — (Continued) |
| reported, the latest bid price. Securities that are traded over-the-counter are valued at the latest bid price. Unlisted equity securities for which market quotations are readily available are valued at the most recent bid price. Securities for which quotations are not readily available are valued at fair value as determined by the investment adviser under the supervision of the Board of Directors. The fair value of a security is the amount which the Fund might reasonably expect to receive upon a current sale. The fair value of a security may differ from the last quoted price and the Fund may not be able to sell a security at the fair value. Market quotations may not be available, for example, if trading in particular securities was halted during the day and not resumed prior to the close of trading on the New York Stock Exchange. Variable rate demand notes are recorded at par value which approximates market value. Short-term investments with maturities of 60 days or less are valued at amortized cost which approximates value. For financial reporting purposes, investment transactions are recorded on the trade date. |
| The Fund adopted the provisions of Statement of Financial Accounting Standards No. 157, “Fair Value Measurements” (“SFAS No. 157”), effective October 1, 2008. Under SFAS No. 157, fair value is defined as the price that would be received to sell an asset or paid to transfer a liability (i.e., the “exit price”) in an orderly transaction between market participants at the measurement date. |
| In determining fair value, the Fund uses various valuation approaches. SFAS No. 157 establishes a fair value hierarchy for inputs used in measuring fair value that maximizes the use of observable inputs and minimizes the use of unobservable inputs by requiring that the most observable inputs be used when available. Observable inputs are those that market participants would use in pricing the asset or liability based on market data obtained from sources independent of the Fund. Unobservable inputs reflect the Fund's assumptions about the inputs market participants would use in pricing the asset or liability developed based on the best information available in the circumstances. |
| The fair value hierarchy is categorized into three levels based on the inputs as follows: |
| Level 1 — | Valuations based on unadjusted quoted prices in active markets for identical assets. |
| Level 2 — | Valuations based on quoted prices in markets that are not active or for which all significant inputs are observable, either directly or indirectly. |
| Level 3 — | Valuations based on inputs that are unobservable and significant to the overall fair value measurement. |
| The securities in the Fund that are classified as Level 1 consist of publicly-traded common stock securities. The securities classified as Level 2 consist of short-term commercial paper. |
| The following table summarizes the Fund’s investments as of March 31, 2009, based on the inputs used to value them: |
| Valuation Inputs | Investments in Securities | |||
| Level 1 — Quoted prices | $ | 1,352,274,639 | ||
| Level 2 — Other significant observable inputs | 53,100,000 | |||
| Level 3 — Significant unobservable inputs | — | |||
| Total | $ | 1,405,374,639 | ||
| (b) | Net realized gains and losses on sales of securities are computed on the identified cost basis. |
| (c) | Dividend income is recorded on the ex-dividend date. Interest income is recorded on an accrual basis. |
| (d) | The Fund may own investments in short-term variable rate demand notes, which are unsecured instruments. The Fund may be susceptible to credit risk with respect to these notes to the extent the issuer defaults on its payment obligation. The Fund’s policy is to monitor the creditworthiness of the issuer and nonperformance by these issuers is not anticipated. |
| (e) | Accounting principles generally accepted in the United States of America (“GAAP”) require that permanent differences between income for financial reporting and tax purposes be reclassified in the capital accounts. |
| (f) | The preparation of financial statements in conformity with GAAP requires management to make estimates and assumptions that affect the reported amounts of assets and liabilities and disclosure of contingent assets and liabilities at the date of the financial statements and the reported amounts of revenues and expenses during the reporting period. Actual results could differ from these estimates. |
12
FMI Large Cap Fund
NOTES TO FINANCIAL STATEMENTS (Continued)
March 31, 2009 (Unaudited)
| (1) | Summary of Significant Accounting Policies — (Continued) |
| (g) | The Fund may own certain securities that are restricted. Restricted securities include Section 4(2) commercial paper, securities issued in a private placement, or securities eligible for resale pursuant to Rule 144A under the Securities Act of 1933 (the “Act”). A restricted security cannot be resold to the general public without prior registration under the Act or pursuant to the resale limitations provided by Rule 144A under the Act, or an exemption from the registration requirements of the Act. |
| (h) | No provision has been made for Federal income taxes since the Fund has elected to be taxed as a “regulated investment company” and intends to distribute substantially all net investment company taxable income and net capital gains to its shareholders and otherwise comply with the provisions of the Internal Revenue Code applicable to regulated investment companies. |
| (i) | Effective March 31, 2008, the Fund adopted Financial Accounting Standards Board Interpretation No. 48 (FIN 48), “Accounting for Uncertainty in Income Taxes”. FIN 48 requires the evaluation of tax positions taken on previously filed tax returns or expected to be taken on future returns. These positions must meet a “more-likely-than-not” standard that, based on the technical merits, have a more than fifty percent likelihood of being sustained upon examination. In evaluating whether a tax position has met the recognition threshold, the Fund must presume that the position will be examined by the appropriate taxing authority that has full knowledge of all relevant information. Tax positions not deemed to meet the “more-likely-than-not” threshold are recorded as a tax expense in the current year. |
| FIN 48 requires the Fund to analyze all open tax years, as defined by the Statute of Limitations, for all major jurisdictions. Open tax years are those that are open for exam by taxing authorities. Major jurisdictions for the Fund include Federal and the state of Maryland. As of March 31, 2009, open Federal and Maryland tax years include the tax years ended September 30, 2005 through 2008. The Fund has no examinations in progress. |
| The Fund has reviewed all open tax years and major jurisdictions and concluded that the adoption of FIN 48 resulted in no effect to the Fund’s financial position or results of operations. There is no tax liability resulting from unrecognized tax benefits relating to uncertain income tax positions taken or expected to be taken on the tax return for the fiscal year-end September 30, 2009. The Fund is also not aware of any tax positions for which it is reasonably possible that the total amounts of unrecognized tax benefits will significantly change in the next twelve months. |
| (2) | Investment Adviser and Management Agreement and Transactions With Related Parties — |
The Fund has a management agreement with Fiduciary Management, Inc. (“FMI”), with whom certain officers and directors of the Fund are affiliated, to serve as investment adviser and manager. Under the terms of the agreement, the Fund will pay FMI a monthly management fee at the annual rate of 0.75% of the daily net assets. The Fund has an administrative agreement with FMI to supervise all aspects of the Fund’s operations except those performed by FMI pursuant to the management agreement. Under the terms of the agreement, the Fund will pay FMI a monthly administrative fee at the annual rate of 0.20% of the daily net assets up to and including $30,000,000, 0.10% on the next $70,000,000 and 0.05% of the daily net assets of the Fund in excess of $100,000,000.
Under the management agreement, FMI will reimburse the Fund for expenses over 1.20% of the daily net assets of the Fund. In addition to the reimbursement required under the management agreement, FMI has voluntarily reimbursed the Fund for expenses over 1.00%. For the six month period ending March 31, 2009, there were no contractual or voluntary reimbursements required.
The Fund has entered into a Distribution Plan (the “Plan”), pursuant to Rule 12b-1 under the Investment Company Act of 1940. The Plan provides that the Fund may incur certain costs which may not exceed the lesser of a monthly amount equal to 0.25% of the Fund’s daily net assets or the actual distribution costs incurred during the year. Amounts payable under the Plan are paid monthly for any activities or expenses primarily intended to result in the sale of shares of the Fund. For the six month period ending March 31, 2009, no such expenses were incurred.
Under the Fund’s organizational documents, each Director, officer, employee or other agent of the Fund (including the Fund’s investment manager) is indemnified, to the extent permitted by the Act, against certain liabilities that may arise out of performance of their duties to the Fund. Additionally, in the normal course of business, the Fund enters into contracts that contain a variety of indemnification clauses. The Fund’s maximum exposure under these arrangements is unknown as this would involve future claims that may be made against the Fund that have not yet occurred. However, the Fund has not had prior claims or losses pursuant to these contracts and believes the risk of loss to be remote.
At March 31, 2009, one financial intermediary is the record owner of approximately 40% of the Fund’s shares.
13
FMI Large Cap Fund
NOTES TO FINANCIAL STATEMENTS (Continued)
March 31, 2009 (Unaudited)
| (3) | Credit Agreement — |
U.S. Bank, N.A. has made available to the Fund a $131,700,000 credit facility pursuant to a Credit Agreement (“Agreement”) effective July 14, 2008 for the purposes of having cash available to satisfy redemption requests. Principal and interest of such loan under the Agreement are due not more than 31 days after the date of the loan. Amounts under the credit facility bear interest at a rate per annum equal to the current prime rate minus one on the amount borrowed. Advances will be collateralized by securities owned by the Fund. During the six month period ending March 31, 2009, the Fund did not borrow against the Agreement. The Credit Agreement expires on June 5, 2009.
| (4) | Distribution to Shareholders — |
Net investment income and net realized gains, if any, are distributed to shareholders at least annually.
| (5) | Investment Transactions — |
For the six month period ending March 31, 2009, purchases and proceeds of sales of investment securities (excluding short-term investments) were $846,282,070 and $167,571,179, respectively.
| (6) | Income Tax Information — |
The following information for the Fund is presented on an income tax basis as of March 31, 2009:
| Gross | Gross | Net Unrealized | ||||||
| Cost of | Unrealized | Unrealized | Depreciation | |||||
| Investments | Appreciation | Depreciation | on Investments | |||||
| $1,797,729,943 | $40,331,844 | $432,687,148 | $392,355,304 |
The following information for the Fund is presented on an income tax basis as of September 30, 2008:
| Gross | Gross | Net Unrealized | Distributable | Distributable | ||||||
| Cost of | Unrealized | Unrealized | Depreciation | Ordinary | Long-Term | |||||
| Investments | Appreciation | Depreciation | on Investments | Income | Capital Gains | |||||
| $1,226,907,849 | $44,151,416 | $120,103,221 | $75,951,805 | $7,061,128 | $ — |
The difference, if any, between the cost amounts for financial statement and federal income tax purposes is due primarily to timing differences in recognizing certain gains and losses on security transactions. For the fiscal year ended September 30, 2008, the Fund had $154,302 of post-30 wash sale loss deferrals that will increase the tax cost basis of securities acquired during the fiscal year ending September 30, 2009.
The tax components of dividends paid during the years ended September 30, 2008 and 2007, capital loss carryovers, which may be used to offset future capital gains, subject to Internal Revenue Code limitations, as of September 30, 2008, and tax basis post-October losses as of September 30, 2008, which are not recognized for tax purposes until the first day of the following fiscal year are:
| September 30, 2008 | September 30, 2007 | |||||||||
| Ordinary | Long-Term | Net Capital | Ordinary | Long-Term | ||||||
| Income | Capital Gains | Loss | Post-October | Income | Capital Gains | |||||
| Distributions | Distributions | Carryovers | Losses | Distributions | Distributions | |||||
| $15,034,839 | $7,630,673 | $— | $22,891,906 | $4,022,208 | $2,498,448 | |||||
For corporate shareholders of the Fund, the percentage of dividend income distributed for the year ended September 30, 2008 which is designated as qualifying for the dividends received deduction is 72% (unaudited).
For all shareholders of the Fund, the percentage of dividend income distributed for the year ended September 30, 2008 which is designated as qualified dividend income under the Jobs and Growth Tax Relief Act of 2003, is 72% (unaudited).
14
FMI Large Cap Fund
ADVISORY AGREEMENT
On December 19, 2008, the Board of Directors of FMI Funds, Inc. (“Directors”) approved the continuation of the FMI Large Cap Fund’s investment advisory agreement with Fiduciary Management, Inc. Prior to approving the continuation of the investment advisory agreement, the Directors considered:
| • | the nature, extent and quality of the services provided by Fiduciary Management, Inc. |
| • | the investment performance of the Fund |
| • | the cost of the services to be provided and profits to be realized by Fiduciary Management, Inc. from its relationship with the Fund |
| • | the extent to which economies of scale would be realized as the Fund grew and whether fee levels reflect any economies of scale |
| • | the expense ratio of the Fund |
| • | the manner in which portfolio transactions for the Fund were conducted, including the use of soft dollars |
In considering the nature, extent and quality of the services provided by Fiduciary Management, Inc., the Directors reviewed a report describing the portfolio management, shareholder communication and servicing, prospective shareholder assistance and regulatory compliance services provided by Fiduciary Management, Inc. to the Fund. The Directors concluded that Fiduciary Management, Inc. was providing essential services to the Fund. In particular, the Directors concluded that Fiduciary Management, Inc. was preparing reports to shareholders in addition to those required by law, and was providing services to the Fund that were in addition to the services investment advisers typically provide its non-mutual fund clients.
The Directors compared the performance of the Fund to benchmark indices over various periods of time and concluded that the performance of the Fund warranted the continuation of the advisory agreement.
In concluding that the advisory fees payable by the Fund were reasonable, the Directors reviewed a report that concluded that the profits Fiduciary Management, Inc. realized from its relationship with the Fund, expressed as a percentage of pre-tax revenues, were generally less than that of publicly traded investment advisers. The Directors also reviewed reports comparing the Fund’s expense ratio and advisory fees paid by the Fund to those of other comparable mutual funds and concluded that the advisory fee paid by the Fund and the Fund’s expense ratio, were within the range of comparable mutual funds. The Directors noted that the investment advisory fee was not adjusted if economies of scale were realized as the Fund grew, but did not consider that factor to be significant in light of the other factors considered.
Finally, the Directors reviewed reports discussing the manner in which portfolio transactions for the Fund were conducted, including the use of soft dollars. Based on these reports, the Directors concluded that the research obtained by Fiduciary Management, Inc. was beneficial to the Fund and that Fiduciary Management, Inc. was executing the Fund’s portfolio transactions in a manner designed to obtain best execution for the Fund.
ADDITIONAL INFORMATION
For additional information about the Directors and Officers or for a description of the policies and procedures that the Fund uses to determine how to vote proxies relating to portfolio securities, please call (800) 811-5311 and request a Statement of Additional Information. One will be mailed to you free of charge. The Statement of Additional Information is also available on the website of the Securities and Exchange Commission (the “Commission”) at http://www.sec.gov. Information on how the Fund voted proxies relating to portfolio securities is available on the Fund’s website at http://www.fmifunds.com or the website of the Commission no later than August 31 for the prior 12 months ending June 30. The Fund files its complete schedule of portfolio holdings with the Commission for the first and third quarters of each fiscal year on Form N-Q. The Fund’s Form N-Q is available on the Commission’s website. The Fund’s Form N-Q may be reviewed and copied at the Commission’s Public Reference Room in Washington, D.C., and that information on the operation of the Public Reference Room may be obtained by calling 1-800-SEC-0330.
15
FMI Large Cap Fund
100 East Wisconsin Avenue, Suite 2200
Milwaukee, Wisconsin 53202
www.fmifunds.com
414-226-4555
BOARD OF DIRECTORS
BARRY K. ALLEN
ROBERT C. ARZBAECHER
PATRICK J. ENGLISH
GORDON H. GUNNLAUGSSON
TED D. KELLNER
RICHARD E. LANE
PAUL S. SHAIN
INVESTMENT ADVISER
AND ADMINISTRATOR
FIDUCIARY MANAGEMENT, INC.
100 East Wisconsin Avenue, Suite 2200
Milwaukee, Wisconsin 53202
TRANSFER AGENT AND
DIVIDEND DISBURSING AGENT
U.S. BANCORP FUND SERVICES, LLC
615 East Michigan Street
Milwaukee, Wisconsin 53202
800-811-5311
or
414-765-4124
CUSTODIAN
U.S. BANK, N.A.
1555 North RiverCenter Drive, Suite 302
Milwaukee, Wisconsin 53212
INDEPENDENT REGISTERED
PUBLIC ACCOUNTING FIRM
PRICEWATERHOUSECOOPERS LLP
100 East Wisconsin Avenue
Suite 1800
Milwaukee, Wisconsin 53202
LEGAL COUNSEL
FOLEY & LARDNER LLP
777 East Wisconsin Avenue
Milwaukee, Wisconsin 53202
This report is not authorized for use as an offer of sale or a solicitation of an offer to buy shares of FMI Large Cap Fund unless accompanied or preceded by the Fund’s current prospectus. Performance data quoted represents past performance; past performance does not guarantee future results. The investment return and principal value of an investment will fluctuate so that an investor’s shares, when redeemed, may be worth more or less than their original cost. Current performance of the Fund may be lower or higher than the performance quoted. Performance data current to the most recent month end may be obtained by visiting www.fmifunds.com.
Item 2. Code of Ethics.
Not applicable.
Item 3. Audit Committee Financial Expert.
Not applicable.
Item 4. Principal Accountant Fees and Services.
Not applicable.
Item 5. Audit Committee of Listed Registrants.
Not applicable.
Item 6. Schedule of Investments.
The schedule of investments in securities of unaffiliated issuers is included as part of the report to shareholders filed under Item 1.
Item 7. Disclosure of Proxy Voting Policies and Procedures for Closed-End Management Investment Companies
Not applicable.
Item 8. Portfolio Managers of Closed-End Management Investment Companies.
Not applicable.
Item 9. Purchases of Equity Securities By Closed-End Management Investment Company and Affiliated Purchasers.
Not applicable.
Item 10. Submission of Matters to a Vote of Security Holders.
None.
Item 11. Controls and Procedures.
| (a) | The disclosure controls and procedures of the FMI Funds, Inc. are periodically evaluated. As of March 27, 2009, the date of the last evaluation, we concluded that our disclosure controls and procedures are adequate. |
| (b) | The internal controls of the FMI Funds, Inc. are periodically evaluated. |
There were no changes to FMI Funds’ internal control over financial reporting that occurred during the second fiscal quarter of the period covered by this report that have materially affected, or are reasonably likely to materially affect, such controls.
Item 12. Exhibits.
| (a) | Any code of ethics or amendment thereto. Not applicable. |
| (b) | Certifications pursuant to Section 302 of the Sarbanes-Oxley Act of 2002. Filed herewith. |
| (c) | Certification pursuant to Section 906 of the Sarbanes-Oxley Act of 2002. Filed herewith. |
SIGNATURES
Pursuant to the requirements of the Securities Exchange Act of 1934 and the Investment Company Act of 1940, the registrant has duly caused this report to be signed on its behalf by the undersigned, thereunto duly authorized.
FMI Funds, Inc.
Registrant
By /s/Ted D. Kellner
Ted D. Kellner, Principal Executive Officer
Date May 4, 2009
Pursuant to the requirements of the Securities Exchange Act of 1934 and the Investment Company Act of 1940, this report has been signed below by the following persons on behalf of the registrant and in the capacities and on the dates indicated.
FMI Funds, Inc.
Registrant
By /s/Ted D. Kellner
Ted D. Kellner, Principal Financial Officer
Date May 4, 2009