UNITED STATES
SECURITIES AND EXCHANGE COMMISSION
Washington, D.C. 20549
FORM N-CSR
CERTIFIED SHAREHOLDER REPORT OF REGISTERED
MANAGEMENT INVESTMENT COMPANIES
Investment Company Act file number 811-07831
FMI Funds, Inc.
(Exact name of registrant as specified in charter)
100 East Wisconsin Avenue, Suite 2200
Milwaukee, WI 53202
(Address of principal executive offices) (Zip code)
Ted D. Kellner
Fiduciary Management, Inc.
100 East Wisconsin Avenue, Suite 2200
Milwaukee, WI 53202
(Name and address of agent for service)
(414) 226-4555
Registrant's telephone number, including area code:
Date of fiscal year end: September 30
Date of reporting period: March 31, 2011
Item 1. Reports to Stockholders.
SEMIANNUAL REPORT
March 31, 2011
FMI
Focus Fund
(fmiox)
A NO-LOAD
MUTUAL FUND
FMI Focus Fund
Ted D. Kellner, CFA
April 14, 2011
Dear Fellow Shareholders:
The bull market celebrated its second birthday on March 9, 2011, and threw itself quite a party in the first quarter. Many of the indices have doubled in the past two years, and the first quarter continued the strong trend of the past 24 months. All indices enjoyed robust gains, with the Russell 2000 leading the following indices with an advance of +7.94%, the Dow Jones Industrial Average +7.06%, the Standard & Poor’s 500 +5.92%, and the NASDAQ Index +5.05%. The near 100% gains for most indices in the past two years is the fastest doubling of the averages in over 75 years, and whereas bearishness was rampant in March of 2009, the bulls now outnumber the bears by a margin of better than two-to-one, according to Investors Intelligence.
What has driven this incredibly strong bull market? In our opinion, it stems from three factors. First, corporations have done an incredible job of improving profitability by paring costs and improving productivity, and positioning their companies in a still rather disappointing overall economy. Second, the Fed, led by Chairman Bernanke, has fostered an unprecedented easing of monetary policy. The monetary base has nearly tripled in the last 30 months, from $800 billion to over $2.4 trillion. Many believe that inflation is a monetary phenomenon, and if indeed this is so, increased inflation is not a question of “if,” but “when.” Finally, our government is currently spending approximately $1.60 for every $1.00 in tax revenue it is taking in, an unprecedented level of deficit spending.
Indeed, inflation signs are rearing their ugly heads with many commodities soaring to all-time highs, including the recent run-up in crude oil to $107 per barrel at the end of March. Wholesale food prices spiked at their fastest rate since 1974 in the month of March. Wal-Mart CEO Bill Simon, in a recent USA Today article, said that “inflation is going to be a serious problem soon.” When we look at what is occurring around us on a day-to-day basis, almost all prices are on the rise. Additionally, we remain skeptical, as always, of the economic data we receive from Washington. For example, if the CPI were calculated using methodologies employed by the government in 1990, the reported inflation number for 2010 would have been 4.5%, not the 1.5% actually measured by the Bureau of Labor Statistics. Additionally, it will be interesting to see what path the Fed pursues in the next several months. Currently, it appears that QEII, the $600 billion Fed monetary stimulus package that buys approximately $100 billion of bonds per month, will cease in June. It will be interesting to see the market’s reaction once this opiate is removed. Remember what happened in the spring of 2010, when the housing market’s $8,000 first time buyer credit was removed? Stay tuned!
As indicated above, almost every asset class has been on a tear. We are reminded of the Warren Buffett quote that “the less the prudence with which others conduct their affairs, the greater the prudence with which we should conduct our own affairs.” We are not predicting an end to the extremely strong markets. However, we are of the opinion that prudence and increased selectivity will be increasingly important in the months ahead. As Rick and his team indicate in their attached letter, we like our portfolio very much, and believe it will serve you well, going forward. While sounding a cautious note with some of the above comments, we strongly believe that equities will provide investors with good risk-adjusted investment returns over the next several years. We believe this is particularly true with regard to the FMI Focus Fund portfolio.
As always, we thank you for your continued investment in, and support of, the FMI Focus Fund.
Sincerely,
Ted D. Kellner, CFA
Executive Chairman
Fiduciary Management, Inc. (Adviser)
100 E. Wisconsin Ave., Suite 2200 • Milwaukee, WI 53202 • 414-226-4555
www.fmifunds.com
Richard J. Whiting Richard E. Lane, CFA Aaron J. Garcia, CFA Faraz Farzam, CFA
Investment Management Team
April 4, 2011
Dear Fellow Shareholders,
Lions and Tigers and Bears –
Richard E. Lane, CFA
The first quarter of 2011 was a continuation of the bull trend of late 2010. The FMI Focus Fund was up 8.37% compared to a return of 7.94% for the Russell 2000 Index. The market has been simply amazing in its ability to shrug off bad news and negative events: earthquakes, the tsunamis, and nuclear disasters; monetary tightening in China, India and Brazil; inflationary concerns around the world; revolutions across the Middle East driving oil prices above $100 a barrel; the sinking dollar. Talk about climbing the proverbial “wall of worry!” The bull market continues apace! How come?
THE VALUE OF A $10,000 INVESTMENT IN THE FMI FOCUS FUND FROM
ITS INCEPTION (12/16/96) TO 3/31/11 AS COMPARED TO THE
RUSSELL 2000(1) AND THE RUSSELL 2000 GROWTH(2)
FMI Focus Fund
$94,796
Russell 2000(1)
$28,963
Russell 2000 Growth(2)
$20,763
Results From Fund Inception (12/16/96) Through 3/31/11
| | | | Annualized Total | Annualized Total | Annualized Total Return* |
| | Total Return* | Total Return* For the | Return* For the 5 | Return* For the 10 | Through 3/31/11 From |
| | Last 3 Months | Year Ended 3/31/11 | Years Ended 3/31/11 | Years Ended 3/31/11 | Fund Inception 12/16/96 |
| FMI Focus Fund | 8.37% | 27.05% | 8.10% | 8.98% | 17.05% |
| Russell 2000 | 7.94% | 25.79% | 3.35% | 7.87% | 7.73% |
| Russell 2000 Growth | 9.24% | 31.04% | 4.34% | 6.44% | 5.25% |
| (1) | The Russell 2000 Index measures the performance of the 2,000 smallest companies in the Russell 3000 Index which comprises the 3,000 largest U.S. companies based on total market capitalization. |
| (2) | The Russell 2000 Growth Index measures the performance of those Russell 2000 companies with higher price-to-book ratios and higher forecasted growth values. |
| * | Total return includes change in share prices and in each case includes reinvestments of any dividends, interest and capital gain distributions. Performance data quoted represents past performance; past performance does not guarantee future results. Investment return and principal value of an investment will fluctuate so that an investor’s shares, when redeemed, may be worth more or less than their original cost. Current performance of the Fund may be lower or higher than the performance quoted. Performance data current to the most recent month end may be obtained by visiting www.fmifunds.com. The graph and the table do not reflect the deduction of taxes that a shareholder would pay on Fund distributions or the redemption of Fund shares. |
In our opinion, exceptionally strong corporate profits are driving the market higher, aided and abetted by an asset allocation switch from fixed income to equities. This market has been sneaky in that the economic recovery hasn’t been particularly robust, leaving many investors skeptical and on the sidelines. Now, they are starting to chase the market. This is the inevitable second stage of any bull market. Given the severity of the previous downturn, it is only human nature to be skeptical and fearful that “the shark” will come back. Yet, that is always how it works coming out of a recession. This time is no different.
What is markedly different this time is a relatively weak economic recovery combined with an extraordinarily strong profit cycle. American businesses did an amazing job cutting costs, yielding tremendous productivity improvements and record profit margins. Positive earnings surprises upon positive earnings surprises have given legs to stocks and may well continue. There is no question that the market is overdue for a correction, but the nature of bull markets are that they can go on longer than you think before a correction occurs. As we stated in our previous quarter’s shareholder letter, we believe we are somewhere in the second or third inning of the economic recovery and perhaps the fourth or fifth inning of the bull market. Independent of the market itself, we like our portfolio and see plenty of upside left, volatility notwithstanding.
Aerospace Industry – Aaron J. Garcia, CFA
Over the last two years we have made several investments in the Aerospace industry, a subsector of Industrials. Given our exposure, we thought it might be illuminating to discuss our view of the sector and where we are in this particular cycle. The aerospace OEMs, Boeing and Airbus, are at an inflection point in wide-body aircraft production. The current fleet of wide-body aircraft, which are primarily used for long haul international routes, hasn’t seen a meaningful technological upgrade since the 747. Over the past ten years, both Airbus and Boeing have been designing and testing new aircraft. Key platforms poised to ramp include the much-delayed Boeing 787 (Dreamliner), the Airbus 350, and the Airbus 380. These platforms have been in development for many years and represent a steep change in aircraft technology for long haul routes. We are excited about these planes, as we believe they are well positioned to capitalize on emerging market demand, particularly China. International travel lends itself to these larger aircraft. Due to the longer distances these planes fly, slight improvements in engine efficiency and weight savings through materials science can yield large savings to airlines. We believe the composite manufacturers, Hexcel and Cytec, are well positioned to benefit from these platforms as the new planes use up to ten times the carbon fiber than that of the existing fleet.
In the domestic market, both Airbus and Boeing have ramped production of their narrow-body platforms in response to increasing demand from carriers and a generally aging domestic fleet. We believe this most recent aerospace trough was one of the mildest in several cycles most likely due to the severity of the post-9/11 aerospace downturn. Also, airline metrics have been very positive with strong revenue per seat-miles growth. We believe this bodes well for both the Maintenance Repair and Overhaul segment of the aerospace suppliers as seat-miles increase and more maintenance is needed. Finally, we think there may be a chance that the recent consolidation in airlines, as well as the change in the airline fee structure (baggage fees, meal fees, etc.), could indicate that the airline industry has fundamentally changed and will be less exposed to irrational pricing and oil spikes, which would further decrease the volatility of the aerospace supply.
SPX Corporation (SPW) – Richard J. Whiting
The first stage of recovery, where companies leverage underused capacity and reap the benefits of refined manufacturing footprints; give way to increasing capacity and then to an infrastructure build-out to support the burgeoning need for capacity. SPW, a company with a diverse cadre of business, is skewed toward mid- to late-cycle businesses.
While SPW derives some of its revenue from early cycle business, most notably in the Diagnostic Tools division, the most robust segments serve the build out of industrial capacity in the food and beverage industries, general industrial markets, and the power generation/thermal cooling businesses. We expect to see accelerating revenue in the Flow segment as the solid components business gives way to increased activity in modules and then fully engineered systems for the food and beverage industry. We do not expect the drive to increase capacity in this end market to be purely a North American and European phenomena, but rather a global platform for servicing the dietary needs of maturing economies and an interest in upgrading to more Western standards of quality and safety.
The headlines from Japan, devastating and disheartening as they are, remind us how intrinsic energy, particularly electrical energy, is to all elements of modern life. Electrical power generation is the focus of the Power and Transmission products group of SPW. This segment delivers over half of the company’s revenue. It is a business best measured on a year-over-year basis, rather than quarter-to-quarter, given the lumpy and large project aspects inherent in this market. While it remains early in the cycle for the cooling tower business and particularly the power transmission business, the runway and leverage for these businesses stretch well beyond 2011 and 2012 and potentially as far out as 2015. The replacement cycle in mature economies, coupled with the infrastructure build out in developing economies have set the table for what we expect to be substantial opportunities for SPX Corporation.
Ulta Salon, Cosmetics & Fragrance, Inc. (ULTA) – Faraz Farzam, CFA
Long-time portfolio holding ULTA was our best performing consumer stock during the first quarter, returning 43.62% for the period. The company started the year off with a bang as they pre-announced strong preliminary holiday results. However, they were able to surpass
even those elevated expectations during their formal fourth quarter conference call. They reported strong profits and an even stronger outlook for the balance of 2011 than Wall Street was expecting. Although this investment has already been a huge home run for us, we continue to like the growth prospects and competitive positioning for this category- killing retailer.
MKS Instruments, Inc. (MKSI) – Faraz Farzam, CFA
Semiconductor capital equipment component maker MKSI had a break out first quarter in many ways, making this our standout technology pick for the period. Not only did the company post strong fourth quarter results, but they also announced the first ever dividend payout in the company’s history. The semiconductor capital equipment sector is a highly cyclical, feast or famine industry, not conducive to making regular dividend payouts as companies struggle with cash flow in down cycles. The last down cycle was especially steep and yet MKSI was able to manage through their darkest hour with minimal cash burn. This exceptional performance gave this highly regarded management team the confidence to announce a relatively sizable dividend, attracting the attention of investors that otherwise would never consider investing in this sector. Since the announcement of the dividend the stock has returned 37.0%.
Thank you for continuing to invest alongside us in the FMI Focus Fund.
Sincerely,
 |  |  |  |
| Richard E. Lane, CFA | Faraz Farzam, CFA | Aaron J. Garcia, CFA | Richard J. Witing |
Investment Management Team
As of March 31, 2011, the security holdings mentioned above represented the following percentage of the FMI Focus Fund’s total assets: Cytec Industries Inc. 0.7%; Hexcel Corp. 2.0%; MKS Instruments, Inc. 1.4%; SPX Corporation 2.6%; and Ulta Salon, Cosmetics & Fragrance, Inc. 1.5%. Portfolio holdings are subject to change without notice and are not intended as recommendations of individual securities.
As of the Fund’s Prospectus dated January 31, 2011, the Fund’s annual operating expense ratio is 1.30%.
For more information about the FMI Focus Fund, call (800) 811-5311 for a free prospectus. Please read the prospectus carefully to consider the investment objectives, risks, charges and expenses, before investing or sending money. The prospectus contains this and more information about the FMI Focus Fund. Please read the prospectus carefully before investing.
Distributed by Rafferty Capital Markets, LLC
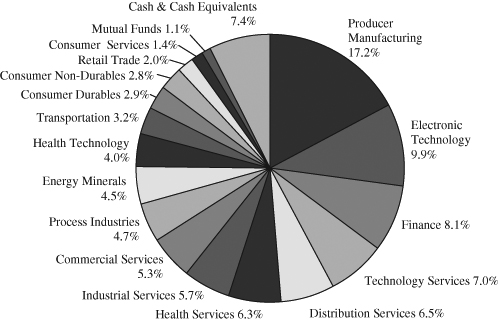
FMI Focus Fund
COST DISCUSSION
Industry Sectors as of March 31, 2011
As a shareholder of the Fund you incur ongoing costs, including management fees and other Fund expenses. You do not incur transaction costs such as sales charges (loads) on purchase payments, reinvested dividends, or other distributions; redemption fees; and exchange fees because the Fund does not charge these fees. This example is intended to help you understand your ongoing costs (in dollars) of investing in FMI Focus Fund and to compare these costs with the ongoing costs of investing in other mutual funds.
The example is based on an investment of $1,000 invested at the beginning of the period and held for the entire period from October 1, 2010 through March 31, 2011.
Actual Expenses
The first line of the table below provides information about actual account values and actual expenses. You may use the information in this line, together with the amount you invested, to estimate the expenses that you paid over the period. Simply divide your account value by $1,000 (for example, an $8,600 account value divided by $1,000 = 8.6), then multiply the result by the number in the first line under the heading entitled “Expenses Paid During Period” to estimate the expenses you paid on your account during this period.
In addition to the costs highlighted and described below, the only Fund transaction costs you might currently incur would be wire fees ($15 per wire), if you choose to have proceeds from a redemption wired to your bank account instead of receiving a check. Additionally, U.S. Bank charges an annual processing fee ($15) if you maintain an IRA account with the Fund. To determine your total costs of investing in the Fund, you would need to add any applicable wire or IRA processing fees you’ve incurred during the period to the costs provided in the example at the end of this article.
Hypothetical Example for Comparison Purposes
The second line of the table below provides information about hypothetical account values and hypothetical expenses based on the Fund’s actual expense ratio and an assumed rate of return of 5% per year before expenses, which is not the Fund’s actual return. The hypothetical account values and expenses may not be used to estimate the actual ending account balance or expenses you paid for the period. You may use this information to compare the ongoing costs of investing in the Fund and other funds. To do so, compare this 5% hypothetical example with the 5% hypothetical examples that appear in the shareholder reports of the other funds.
Please note that the expenses shown in the table are meant to highlight your ongoing costs only and do not reflect any transactional costs, such as sales charges (loads), redemption fees or exchange fees. Therefore, the second line of the table is useful in comparing ongoing costs only, and will not help you determine the relative total costs of owning different funds. In addition, if these transactional costs were included, your costs would have been higher.
| | Beginning | Ending | Expenses Paid |
| | Account | Account | During Period* |
| | Value 10/01/10 | Value 3/31/11 | 10/01/10-3/31/11 |
| FMI Focus Fund Actual | $1,000.00 | $1,246.90 | $7.12 |
| Hypothetical (5% return before expenses) | $1,000.00 | $1,018.60 | $6.39 |
| * | Expenses are equal to the Fund’s annualized expense ratio of 1.27%, multiplied by the average account value over the period, multiplied by 182/365 (to reflect the one-half year period between October 1, 2010 and March 31, 2011). |
FMI Focus Fund
STATEMENT OF ASSETS AND LIABILITIES
March 31, 2011 (Unaudited)
| ASSETS: | | | |
| Investments in securities, at value (cost $426,884,704) | | $ | 561,234,329 | |
| Receivable from shareholders for purchases | | | 900,709 | |
| Dividends receivable | | | 282,583 | |
| Cash | | | 19,846 | |
| Other receivable | | | 226,665 | |
| Total assets | | $ | 562,664,132 | |
| LIABILITIES: | | | | |
| Payable to brokers for investments purchased | | $ | 1,682,781 | |
| Payable to adviser for management fees | | | 428,793 | |
| Payable to shareholders for redemptions | | | 132,035 | |
| Other liabilities | | | 165,777 | |
| Total liabilities | | | 2,409,386 | |
| NET ASSETS: | | | | |
| Capital Stock, $0.0001 par value; 100,000,000 shares authorized; 17,038,506 shares outstanding | | | 444,434,176 | |
| Net unrealized appreciation on investments | | | 134,349,625 | |
| Accumulated net realized loss on investments | | | (18,529,055 | ) |
| Net assets | | | 560,254,746 | |
| Total liabilities and net assets | | $ | 562,664,132 | |
| CALCULATION OF NET ASSET VALUE PER SHARE: | | | | |
| Net asset value, offering and redemption price per share ($560,254,746 ÷ 17,038,506 shares outstanding) | | $ | 32.88 | |
The accompanying notes to financial statements are an integral part of this statement.
SCHEDULE OF INVESTMENTS
March 31, 2011 (Unaudited)
| Shares | | | | Cost | | | Value | |
| LONG-TERM INVESTMENTS — 92.6% (a) | | | | | | |
COMMON STOCKS — 91.5% (a) | | | | | | |
COMMERCIAL SERVICES SECTOR — 5.3% | | | | | | |
| | | Advertising/Marketing Services — 1.6% | | | | | | |
| | 731,400 | | Interpublic Group of Companies, Inc.* | | $ | 3,336,426 | | | $ | 9,193,698 | |
| | | | Miscellaneous Commercial Services — 3.7% | | | | | | | | |
| | 307,230 | | Cardtronics, Inc.* | | | 3,834,148 | | | | 6,252,130 | |
| | 397,800 | | Cintas Corp. | | | 11,397,904 | | | | 12,041,406 | |
| | 174,760 | | Higher One Holdings Inc.* | | | 2,864,713 | | | | 2,525,282 | |
| | | | | | | 18,096,765 | | | | 20,818,818 | |
| CONSUMER DURABLES SECTOR — 2.9% | | | | | | | | |
| | | | Recreational Products — 2.9% | | | | | | | | |
| | 116,900 | | Brunswick Corp. | | | 2,012,926 | | | | 2,972,767 | |
| | 975,000 | | Winnebago Industries, Inc.* | | | 9,935,225 | | | | 13,035,750 | |
| | | | | | | 11,948,151 | | | | 16,008,517 | |
| CONSUMER NON-DURABLES SECTOR — 2.8% | | | | | | | | |
| | | | Apparel/Footwear — 2.8% | | | | | | | | |
| | 499,200 | | Crocs, Inc.* | | | 6,842,949 | | | | 8,905,728 | |
| | 1,307,828 | | Liz Claiborne, Inc.* | | | 8,326,664 | | | | 7,049,193 | |
| | | | | | | 15,169,613 | | | | 15,954,921 | |
FMI Focus Fund
SCHEDULE OF INVESTMENTS (Continued)
March 31, 2011 (Unaudited)
| Shares | | | | Cost | | | Value | |
| LONG-TERM INVESTMENTS — 92.6% (a) (Continued) | | | | | | |
COMMON STOCKS — 91.5% (a) (Continued) | | | | | | |
CONSUMER SERVICES SECTOR — 1.4% | | | | | | |
| | | Hotels/Resorts/Cruiselines — 1.0% | | | | | | |
| | 137,900 | | Royal Caribbean Cruises Ltd.* | | $ | 2,732,860 | | | $ | 5,689,754 | |
| | | | Restaurants — 0.4% | | | | | | | | |
| | 92,800 | | Red Robin Gourmet Burgers Inc.* | | | 2,325,584 | | | | 2,496,320 | |
DISTRIBUTION SERVICES SECTOR — 6.5% | | | | | | | | |
| | | | Electronics Distributors — 4.1% | | | | | | | | |
| | 301,692 | | Arrow Electronics, Inc.* | | | 7,206,109 | | | | 12,634,861 | |
| | 279,200 | | ScanSource, Inc.* | | | 7,419,947 | | | | 10,606,808 | |
| | | | | | | 14,626,056 | | | | 23,241,669 | |
| | | | Medical Distributors — 1.5% | | | | | | | | |
| | 257,948 | | Patterson Companies Inc. | | | 5,964,575 | | | | 8,303,346 | |
| | | | Wholesale Distributors — 0.9% | | | | | | | | |
| | 247,800 | | Beacon Roofing Supply, Inc.* | | | 4,296,926 | | | | 5,072,466 | |
ELECTRONIC TECHNOLOGY SECTOR — 9.9% | | | | | | | | |
| | | | Aerospace & Defense — 2.7% | | | | | | | | |
| | 123,700 | | BE Aerospace, Inc.* | | | 4,341,080 | | | | 4,395,061 | |
| | 557,929 | | Hexcel Corp.* | | | 5,513,212 | | | | 10,985,622 | |
| | | | | | | 9,854,292 | | | | 15,380,683 | |
| | | | Computer Peripherals — 1.0% | | | | | | | | |
| | 245,900 | | Avid Technology, Inc.* | | | 4,018,336 | | | | 5,483,570 | |
| | | | Electronic Components — 1.4% | | | | | | | | |
| | 226,200 | | Plexus Corp.* | | | 6,278,613 | | | | 7,930,572 | |
| | | | Electronic Equipment/Instruments — 0.5% | | | | | | | | |
| | 256,345 | | Intermec Inc.* | | | 2,688,795 | | | | 2,765,963 | |
| | | | Electronic Production Equipment — 1.4% | | | | | | | | |
| | 236,653 | | MKS Instruments, Inc. | | | 3,429,510 | | | | 7,880,545 | |
| | | �� | Semiconductors — 1.9% | | | | | | | | |
| | 863,400 | | PMC-Sierra, Inc.* | | | 6,688,604 | | | | 6,475,500 | |
| | 107,312 | | Power Integrations, Inc. | | | 3,516,218 | | | | 4,113,269 | |
| | | | | | | 10,204,822 | | | | 10,588,769 | |
| | | | Telecommunications Equipment — 1.0% | | | | | | | | |
| | 209,789 | | Ciena Corp.* | | | 3,341,934 | | | | 5,446,122 | |
ENERGY MINERALS SECTOR — 4.5% | | | | | | | | |
| | | | Coal — 1.8% | | | | | | | | |
| | 273,200 | | Arch Coal, Inc. | | | 6,326,356 | | | | 9,846,128 | |
| | | | Oil & Gas Production — 2.7% | | | | | | | | |
| | 482,900 | | Petrohawk Energy Corp.* | | | 9,000,064 | | | | 11,850,366 | |
| | 54,400 | | Unit Corporation* | | | 2,474,047 | | | | 3,370,080 | |
| | | | | | | 11,474,111 | | | | 15,220,446 | |
FMI Focus Fund
SCHEDULE OF INVESTMENTS (Continued)
March 31, 2011 (Unaudited)
| Shares | | | | Cost | | | Value | |
| LONG-TERM INVESTMENTS — 92.6% (a) (Continued) | | | | | | |
COMMON STOCKS — 91.5% (a) (Continued) | | | | | | |
FINANCE SECTOR — 8.1% | | | | | | |
| | | Finance/Rental/Leasing — 1.8% | | | | | | |
| | 97,792 | | CAI International, Inc.* | | $ | 1,711,360 | | | $ | 2,528,901 | |
| | 304,531 | | Mobile Mini, Inc.* | | | 6,007,301 | | | | 7,314,835 | |
| | | | | | | 7,718,661 | | | | 9,843,736 | |
| | | | Insurance Brokers/Services — 0.9% | | | | | | | | |
| | 159,300 | | Arthur J. Gallagher & Co. | | | 4,320,108 | | | | 4,844,313 | |
| | | | Life/Health Insurance — 2.2% | | | | | | | | |
| | 280,300 | | Genworth Financial Inc.* | | | 3,791,420 | | | | 3,772,838 | |
| | 134,700 | | Reinsurance Group of America, Inc. | | | 4,023,673 | | | | 8,456,466 | |
| | | | | | | 7,815,093 | | | | 12,229,304 | |
| | | | Regional Banks — 2.9% | | | | | | | | |
| | 544,986 | | Associated Banc-Corp. | | | 8,031,388 | | | | 8,093,042 | |
| | 63,500 | | First Midwest Bancorp, Inc. | | | 817,243 | | | | 748,665 | |
| | 161,467 | | FirstMerit Corp. | | | 2,679,260 | | | | 2,754,627 | |
| | 249,000 | | Sandy Spring Bancorp, Inc. | | | 3,712,501 | | | | 4,596,540 | |
| | | | | | | 15,240,392 | | | | 16,192,874 | |
| | | | Savings Banks — 0.3% | | | | | | | | |
| | 45,638 | | Columbia Banking System, Inc. | | | 878,062 | | | | 874,880 | |
| | 42,700 | | MB Financial, Inc. | | | 713,136 | | | | 894,992 | |
| | | | | | | 1,591,198 | | | | 1,769,872 | |
| HEALTH SERVICES SECTOR — 6.3% | | | | | | | | |
| | | | Health Industry Services — 4.5% | | | | | | | | |
| | 148,730 | | Covance Inc.* | | | 6,394,142 | | | | 8,138,506 | |
| | 445,700 | | HealthSouth Corp.* | | | 6,302,191 | | | | 11,133,586 | |
| | 242,800 | | PAREXEL International Corporation* | | | 5,553,756 | | | | 6,045,720 | |
| | | | | | | 18,250,089 | | | | 25,317,812 | |
| | | | Medical/Nursing Services — 1.8% | | | | | | | | |
| | 406,094 | | VCA Antech, Inc.* | | | 9,866,159 | | | | 10,225,447 | |
HEALTH TECHNOLOGY SECTOR — 4.0% | | | | | | | | |
| | | | Medical Specialties — 4.0% | | | | | | | | |
| | 73,700 | | Beckman Coulter, Inc. | | | 4,505,088 | | | | 6,122,259 | |
| | 479,000 | | Hologic, Inc.* | | | 6,964,435 | | | | 10,633,800 | |
| | 117,700 | | Thoratec Corporation* | | | 2,813,111 | | | | 3,051,961 | |
| | 161,800 | | Wright Medical Group, Inc.* | | | 2,151,141 | | | | 2,752,218 | |
| | | | | | | 16,433,775 | | | | 22,560,238 | |
| INDUSTRIAL SERVICES SECTOR — 5.7% | | | | | | | | |
| | | | Contract Drilling — 1.3% | | | | | | | | |
| | 165,700 | | Rowan Companies, Inc.* | | | 4,262,690 | | | | 7,320,626 | |
FMI Focus Fund
SCHEDULE OF INVESTMENTS (Continued)
March 31, 2011 (Unaudited)
| Shares | | | | Cost | | | Value | |
| LONG-TERM INVESTMENTS — 92.6% (a) (Continued) | | | | | | |
COMMON STOCKS — 91.5% (a) (Continued) | | | | | | |
INDUSTRIAL SERVICES SECTOR — 5.7% (Continued) | | | | | | |
| | | Engineering & Construction — 3.0% | | | | | | |
| | 419,900 | | Chicago Bridge & Iron Co. N.V. NYS | | $ | 8,497,730 | | | $ | 17,073,134 | |
| | | | Oilfield Services/Equipment — 1.4% | | | | | | | | |
| | 141,600 | | Dresser-Rand Group, Inc.* | | | 3,477,596 | | | | 7,592,592 | |
NON-ENERGY MINERALS SECTOR — 0.0% | | | | | | | | |
| | | | Construction Materials — 0.0% | | | | | | | | |
| | 2,042 | | Trex Company, Inc.* | | | 66,439 | | | | 66,610 | |
PROCESS INDUSTRIES SECTOR — 4.7% | | | | | | | | |
| | | | Chemicals: Major Diversified — 1.6% | | | | | | | | |
| | 206,400 | | Celanese Corp. | | | 6,170,308 | | | | 9,157,968 | |
| | | | Chemicals: Specialty — 1.6% | | | | | | | | |
| | 71,581 | | Cytec Industries Inc. | | | 1,292,623 | | | | 3,891,859 | |
| | 92,100 | | Rockwood Holdings Inc.* | | | 1,174,282 | | | | 4,533,162 | |
| | | | | | | 2,466,905 | | | | 8,425,021 | |
| | | | Containers/Packaging — 1.5% | | | | | | | | |
| | 284,600 | | Owens-Illinois, Inc.* | | | 9,551,527 | | | | 8,592,074 | |
PRODUCER MANUFACTURING SECTOR — 17.2% | | | | | | | | |
| | | Auto Parts: OEM — 1.3% | | | | | | | | |
| | 440,405 | | Modine Manufacturing Company* | | | 6,443,244 | | | | 7,108,137 | |
| | | | Electrical Products — 4.5% | | | | | | | | |
| | 208,200 | | Greatbatch, Inc.* | | | 4,455,137 | | | | 5,508,972 | |
| | 950,995 | | Molex Inc. Cl A | | | 19,920,355 | | | | 19,676,086 | |
| | | | | | | 24,375,492 | | | | 25,185,058 | |
| | | | Industrial Conglomerates — 2.7% | | | | | | | | |
| | 187,100 | | SPX Corporation | | | 12,949,378 | | | | 14,853,869 | |
| | | | Industrial Machinery — 4.1% | | | | | | | | |
| | 398,353 | | Barnes Group Inc. | | | 7,253,721 | | | | 8,317,611 | |
| | 85,218 | | Kadant Inc.* | | | 1,226,587 | | | | 2,231,859 | |
| | 268,853 | | Kennametal Inc. | | | 4,969,119 | | | | 10,485,267 | |
| | 23,400 | | Lincoln Electric Holdings, Inc. | | | 1,369,934 | | | | 1,776,528 | |
| | | | | | | 14,819,361 | | | | 22,811,265 | |
| | | | Metal Fabrication — 0.5% | | | | | | | | |
| | 70,266 | | Kaydon Corp. | | | 2,426,477 | | | | 2,753,725 | |
| | | | Miscellaneous Manufacturing — 3.4% | | | | | | | | |
| | 300,900 | | Brady Corp. | | | 7,853,966 | | | | 10,739,121 | |
| | 169,300 | | Crane Co. | | | 6,526,953 | | | | 8,199,199 | |
| | | | | | | 14,380,919 | | | | 18,938,320 | |
| | | | Trucks/Construction/Farm Machinery — 0.7% | | | | | | | | |
| | 206,728 | | Columbus McKinnon Corp.* | | | 3,596,398 | | | | 3,816,199 | |
FMI Focus Fund
SCHEDULE OF INVESTMENTS (Continued)
March 31, 2011 (Unaudited)
| Shares or Principal Amount | | Cost | | | Value | |
| LONG-TERM INVESTMENTS — 92.6% (a) (Continued) | | | | | | |
COMMON STOCKS — 91.5% (a) (Continued) | | | | | | |
RETAIL TRADE SECTOR — 2.0% | | | | | | |
| | | Specialty Stores — 2.0% | | | | | | |
| | 69,100 | | PetSmart, Inc. | | $ | 1,465,141 | | | $ | 2,829,645 | |
| | 171,000 | | Ulta Salon, Cosmetics & Fragrance, Inc.* | | | 1,059,554 | | | | 8,230,230 | |
| | | | | | | 2,524,695 | | | | 11,059,875 | |
| TECHNOLOGY SERVICES SECTOR — 7.0% | | | | | | | | |
| | | | Data Processing Services — 1.0% | | | | | | | | |
| | 87,700 | | Fiserv, Inc.* | | | 3,583,944 | | | | 5,500,544 | |
| | | | Information Technology Services — 3.0% | | | | | | | | |
| | 226,000 | | Longtop Financial Technologies Limited SP-ADR* | | | 8,465,434 | | | | 7,100,920 | |
| | 839,700 | | Sapient Corp.* | | | 6,396,331 | | | | 9,614,565 | |
| | | | | | | 14,861,765 | | | | 16,715,485 | |
| | | | Internet Software/Services — 1.4% | | | | | | | | |
| | 192,200 | | LogMeIn, Inc.* | | | 7,264,267 | | | | 8,103,152 | |
| | | | Packaged Software — 1.6% | | | | | | | | |
| | 146,600 | | Aspen Technology, Inc.* | | | 2,251,129 | | | | 2,197,534 | |
| | 300,100 | | Parametric Technology Corp.* | | | 2,961,544 | | | | 6,749,249 | |
| | | | | | | 5,212,673 | | | | 8,946,783 | |
| TRANSPORTATION SECTOR — 3.2% | | | | | | | | |
| | | | Air Freight/Couriers — 1.2% | | | | | | | | |
| | 334,300 | | UTI Worldwide, Inc. | | | 5,335,499 | | | | 6,766,232 | |
| | | | Trucking — 2.0% | | | | | | | | |
| | 430,500 | | Werner Enterprises, Inc. | | | 8,252,851 | | | | 11,395,335 | |
| | | | Total common stocks | | | 377,869,358 | | | | 512,487,907 | |
| | | | | | | | | | | | |
| MUTUAL FUNDS — 1.1% (a) | | | | | | | | |
| | 228,000 | | SPDR KBW Regional Banking ETF | | | 6,333,724 | | | | 6,064,800 | |
| | | | Total long-term investments | | | 384,203,082 | | | | 518,552,707 | |
| | | | | | | | | | | | |
| SHORT-TERM INVESTMENTS — 7.6% (a) | | | | | | | | |
| | | | Variable Rate Demand Note — 7.6% | | | | | | | | |
| $ | 42,681,622 | | U.S. Bank, N.A., 0.00% | | | 42,681,622 | | | | 42,681,622 | |
| | | | Total short-term investments | | | 42,681,622 | | | | 42,681,622 | |
| | | | Total investments — 100.2% | | $ | 426,884,704 | | | | 561,234,329 | |
| | | | Liabilities, less other assets — (0.2%) (a) | | | | | | | (979,583 | ) |
| | | | TOTAL NET ASSETS — 100.0% | | | | | | $ | 560,254,746 | |
| * | Non-income producing security. |
| (a) | Percentages for the various classifications relate to net assets. |
ETF – Exchange Traded Fund
N.V. – Netherlands Limited Liability Corp.
NYS – New York Registered Shares
SP-ADR – Sponsored American Depositary Receipt
The accompanying notes to financial statements are an integral part of this schedule.
FMI Focus Fund
STATEMENT OF OPERATIONS
For the Six Month Period Ending March 31, 2011 (Unaudited)
| INCOME: | | | |
| Dividends | | $ | 2,234,964 | |
| Total income | | | 2,234,964 | |
| EXPENSES: | | | | |
| Management fees | | | 2,498,566 | |
| Transfer agent fees | | | 301,550 | |
| Administrative and accounting services | | | 166,813 | |
| Printing and postage expense | | | 64,400 | |
| Custodian fees | | | 39,225 | |
| Registration fees | | | 35,950 | |
| Professional fees | | | 27,870 | |
| Board of Directors fees | | | 20,800 | |
| Insurance expense | | | 5,460 | |
| Other expenses | | | 18,850 | |
| Total expenses | | | 3,179,484 | |
| NET INVESTMENT LOSS | | | (944,520 | ) |
| NET REALIZED GAIN ON INVESTMENTS | | | 30,049,360 | |
| NET INCREASE IN UNREALIZED APPRECIATION ON INVESTMENTS | | | 78,772,325 | |
| NET GAIN ON INVESTMENTS | | | 108,821,685 | |
| NET INCREASE IN NET ASSETS RESULTING FROM OPERATIONS | | $ | 107,877,165 | |
STATEMENTS OF CHANGES IN NET ASSETS
For the Six Month Period Ending March 31, 2011 (Unaudited) and For the Year Ended September 30, 2010
| | | 2011 | | | 2010 | |
| OPERATIONS: | | | | | | |
| Net investment loss | | $ | (944,520 | ) | | $ | (1,901,321 | ) |
| Net realized gain on investments | | | 30,049,360 | | | | 39,192,221 | |
| Net increase in unrealized appreciation on investments | | | 78,772,325 | | | | 21,192,324 | |
| Net increase in net assets from operations | | | 107,877,165 | | | | 58,483,224 | |
| DISTRIBUTIONS TO SHAREHOLDERS: | | | | | | | | |
| Distributions from net investment income ($0.028 per share) | | | — | | | | (430,110 | ) |
| FUND SHARE ACTIVITIES: | | | | | | | | |
| Proceeds from shares issued (3,223,464 and 5,934,341 shares, respectively) | | | 96,927,159 | | | | 145,733,949 | |
| Net asset value of shares issued in distributions reinvested (18,401 shares) | | | — | | | | 411,817 | |
| Cost of shares redeemed (2,267,584 and 7,649,874 shares, respectively) | | | (68,576,711 | ) | | | (184,170,629 | ) |
| Net increase (decrease) in net assets derived from Fund share activities | | | 28,350,448 | | | | (38,024,863 | ) |
| TOTAL INCREASE | | | 136,227,613 | | | | 20,028,251 | |
| NET ASSETS AT THE BEGINNING OF THE PERIOD | | | 424,027,133 | | | | 403,998,882 | |
| NET ASSETS AT THE END OF THE PERIOD (Includes undistributed | | | | | | | | |
| net investment income of $0 and $0, respectively) | | $ | 560,254,746 | | | $ | 424,027,133 | |
The accompanying notes to financial statements are an integral part of these statements.
FMI Focus Fund
FINANCIAL HIGHLIGHTS
(Selected data for each share of the Fund outstanding throughout each period)
| | | (Unaudited) | | | | | | | | | | | | | | | | |
| | | For the Six Month | | | | | | | | | | | | | | | | |
| | | Period Ending | | | | | | | | | | | | | | | | |
| | | March 31, | | | Years Ended September 30, | |
| | | 2011 | | | 2010 | | | 2009 | | | 2008 | | | 2007 | | | 2006 | |
| PER SHARE OPERATING PERFORMANCE: | | | | | | | | | | | | | | | | | | |
| Net asset value, beginning of period | | $ | 26.37 | | | $ | 22.72 | | | $ | 28.34 | | | $ | 34.83 | | | $ | 34.42 | | | $ | 35.83 | |
| Income from investment operations: | | | | | | | | | | | | | | | | | | | | | | | | |
| Net investment (losses) income | | | (0.06 | ) | | | (0.11 | ) | | | 0.02 | | | | (0.11 | ) | | | (0.06 | ) | | | (0.13 | ) |
| Net realized and unrealized | | | | | | | | | | | | | | | | | | | | | | | | |
| gains (losses) on investments | | | 6.57 | | | | 3.79 | | | | (0.65 | ) | | | (3.98 | ) | | | 4.77 | | | | 2.44 | |
| Total from investment operations | | | 6.51 | | | | 3.68 | | | | (0.63 | ) | | | (4.09 | ) | | | 4.71 | | | | 2.31 | |
| Less distributions: | | | | | | | | | | | | | | | | | | | | | | | | |
| Distributions from net investment income | | | — | | | | (0.03 | ) | | | — | | | | — | | | | — | | | | — | |
| Distributions from net realized gains | | | — | | | | — | | | | (4.99 | ) | | | (2.40 | ) | | | (4.30 | ) | | | (3.72 | ) |
| Total from distributions | | | 0.00 | | | | (0.03 | ) | | | (4.99 | ) | | | (2.40 | ) | | | (4.30 | ) | | | (3.72 | ) |
| Net asset value, end of period | | $ | 32.88 | | | $ | 26.37 | | | $ | 22.72 | | | $ | 28.34 | | | $ | 34.83 | | | $ | 34.42 | |
| TOTAL RETURN | | | 24.69 | %* | | | 16.21 | % | | | 3.52 | % | | | (12.58 | %) | | | 14.87 | % | | | 7.75 | % |
| RATIOS/SUPPLEMENTAL DATA: | | | | | | | | | | | | | | | | | | | | | | | | |
| Net assets, end of period (in 000’s $) | | | 560,255 | | | | 424,027 | | | | 403,999 | | | | 593,176 | | | | 918,856 | | | | 902,646 | |
| Ratio of expenses to average net assets | | | 1.27 | %** | | | 1.30 | % | | | 1.40 | % | | | 1.53 | % | | | 1.52 | % | | | 1.50 | % |
| Ratio of net investment (loss) income | | | | | | | | | | | | | | | | | | | | | | | | |
| to average net assets | | | (0.38 | %)** | | | (0.47 | %) | | | 0.12 | % | | | (0.37 | %) | | | (0.17 | %) | | | (0.38 | %) |
| Portfolio turnover rate | | | 34 | % | | | 59 | % | | | 58 | % | | | 72 | % | | | 41 | % | | | 49 | % |
The accompanying notes to financial statements are an integral part of this statement.
NOTES TO FINANCIAL STATEMENTS
March 31, 2011 (Unaudited)
| (1) | Summary of Significant Accounting Policies — |
| | | The following is a summary of significant accounting policies of the FMI Focus Fund (the “Fund”), a series of FMI Funds, Inc. (the “Company”) which is registered as a diversified, open-end management investment company under the Investment Company Act of 1940 (the “Act”), as amended. The Company was incorporated under the laws of Maryland on September 5, 1996 and the Fund commenced operations on December 16, 1996. The assets and liabilities of each Fund in the Company are segregated as a shareholder’s interest is limited to the Fund in which the shareholder owns shares. The investment objective of the Fund is to seek capital appreciation principally through investing in common stock. |
| | (a) | Each security, excluding short-term investments, is valued at the last sale price reported by the principal security exchange on which the issue is traded. Securities that are traded on the Nasdaq Markets are valued at the Nasdaq Official Closing Price or if no sale is reported, at the latest bid price. Securities which are traded over-the-counter are valued at the latest bid price. Securities sold short which are listed on a national securities exchange or the Nasdaq Stock Market but which were not traded on the valuation date are valued at the most recent ask price. Unlisted equity securities for which market quotations are readily available are valued at the most recent bid price. Options purchased or written by the Fund are valued at the average of the most recent bid and ask prices. Securities for which quotations are not readily available are valued at fair value as determined by the investment adviser under the supervision of the Board of Directors. The fair value of a security is the amount which the Fund might reasonably expect to receive upon a current sale. The fair value of a security may differ from the last quoted price and the Fund may not be able to sell a security at the estimated fair value. Market quotations may not be available, for example, if trading in particular securities was halted during the day and not resumed prior to the close of trading on the New York Stock Exchange. As of March 31, 2011 there were no securities that were internally fair valued. Variable rate demand notes are recorded at par value which approximates market value. Short-term investments |
FMI Focus Fund
NOTES TO FINANCIAL STATEMENTS (Continued)
March 31, 2011 (Unaudited)
| (1) | Summary of Significant Accounting Policies — (Continued) |
| | | with maturities of 60 days or less are valued at amortized cost which approximates value. For financial reporting purposes, investment transactions are recorded on the trade date. |
| | | The Fund applies the provisions of the Financial Accounting Standards Board (“FASB”) Accounting Standards Codification “Fair Value Measurements and Disclosures” Topic 820 (“ASC 820”), which defines fair value as the price that would be received to sell an asset or paid to transfer a liability (i.e., the “exit price”) in an orderly transaction between market participants at the measurement date. |
| | | In determining fair value, the Fund uses various valuation approaches. ASC 820 establishes a fair value hierarchy for inputs used in measuring fair value that maximizes the use of observable inputs and minimizes the use of unobservable inputs by generally requiring that the most observable inputs be used when available. Observable inputs are those that market participants would use in pricing the asset or liability based on market data obtained from sources independent of the Fund. Unobservable inputs reflect the Fund’s assumptions about the inputs market participants would use in pricing the asset or liability developed based on the best information available in the circumstances. The inputs or methodologies used for valuing securities are not necessarily an indication of the risks associated with investing in those securities. |
The fair value hierarchy is categorized into three levels based on the inputs as follows:
| | Level 1 — | Valuations based on unadjusted quoted prices in active markets for identical assets. |
| | Level 2 — | Valuations based on quoted prices for similar securities or in markets that are not active or for which all significant inputs are observable, either directly or indirectly. |
| | Level 3 — | Valuations based on inputs that are unobservable and significant to the overall fair value measurement. |
The following table summarizes the Fund’s investments as of March 31, 2011, based on the inputs used to value them:
| Valuation Inputs | | Investments in Securities | |
| Level 1 — Common Stocks | | $ | 512,487,907 | |
| Mutual Funds | | | 6,064,800 | |
| Total Level 1 | | | 518,552,707 | |
| Level 2 — Variable Rate Demand Note | | | 42,681,622 | |
| Level 3 — | | | — | |
| Total | | $ | 561,234,329 | |
| | | It is the Fund’s policy to recognize transfers between levels at the end of the quarterly reporting period. There were no transfers between levels during the six month period ending March 31, 2011. |
See the Schedule of Investments for investments detailed by industry classification.
| | (b) | Net realized gains and losses on sales of securities are computed on the identified cost basis. |
| | (c) | Dividend income is recorded on the ex-dividend date. Interest income is recorded on an accrual basis. |
| | (d) | The Fund has investments in short-term variable rate demand notes, which are unsecured instruments. The Fund may be susceptible to credit risk with respect to these notes to the extent the issuer defaults on its payment obligation. The Fund’s policy is to monitor the creditworthiness of the issuer and nonperformance by these issuers is not anticipated. |
| | (e) | Accounting principles generally accepted in the United States of America (“GAAP”) require that permanent differences between income for financial reporting and tax purposes be reclassified in the capital accounts. |
| | (f) | The preparation of financial statements in conformity with GAAP requires management to make estimates and assumptions that affect the reported amounts of assets and liabilities and disclosure of contingent assets and liabilities at the date of the financial statements and the reported amounts of revenues and expenses during the reporting period. Actual results could differ from these estimates. |
| | (g) | No provision has been made for Federal income taxes since the Fund has elected to be taxed as a “regulated investment company” and intends to distribute substantially all net investment company taxable income and net capital gains to its shareholders and otherwise comply with the provisions of the Internal Revenue Code applicable to regulated investment companies. |
| | (h) | The Fund has reviewed all open tax years and major jurisdictions, which include Federal and the state of Maryland, and concluded that there are no significant uncertain tax positions that would require recognition in the financial statements. Open tax years are those that are open for exam by taxing authorities and, as of March 31, 2011, open Federal tax years include the tax years ended September 30, 2007 through 2010. The Fund has no examinations in progress and is also not aware of any tax positions for which it is reasonably possible that the total amounts of unrecognized tax benefits will significantly change in the next twelve months. |
FMI Focus Fund
NOTES TO FINANCIAL STATEMENTS (Continued)
March 31, 2011 (Unaudited)
| (2) | Investment Adviser and Management Agreement and Transactions With Related Parties — |
| | The Fund has a management agreement with Fiduciary Management, Inc. (“FMI”), with whom certain officers and directors of the Fund are affiliated, to serve as investment adviser and manager. Prior to January 1, 2009, the Fund paid FMI a monthly management fee at an annual rate of 1.25% of the daily net assets. Under the terms of the current agreement, the Fund will pay FMI a monthly management fee at an annual rate of 1.00% of the daily net assets. The Fund is responsible for paying its proportionate share of the compensation, benefits and expenses of its Chief Compliance Officer. For administrative convenience, FMI initially makes these payments and is later reimbursed by the Fund. |
| | | FMI entered into a sub-advisory agreement with Broadview Advisors, LLC, with whom a certain director of the Fund is affiliated, to assist it in the day-to-day management of the Fund. Broadview Advisors, LLC, determines which securities will be purchased, retained or sold for the Fund. FMI pays Broadview Advisors, LLC 0.85% of the first $500 million of the average daily net assets of the Fund and 0.80% of the Fund’s average daily net assets in excess of $500 million. Prior to January 1, 2009, FMI paid Broadview Advisors, LLC 0.76% of the Fund’s management fee of 1.25% of the daily net assets. |
| | | Under the management agreement, FMI will reimburse the Fund for expenses over 2.75% of the daily net assets of the Fund. No such reimbursements were required for the six month period ending March 31, 2011. |
| | | The Fund has entered into a Distribution Plan (the “Plan”), pursuant to Rule 12b-1 under the Act. The Plan provides that the Fund may incur certain costs which may not exceed the lesser of a monthly amount equal to 0.25% of the Fund’s daily net assets or the actual distribution costs incurred during the year. Amounts payable under the Plan are paid monthly for any activities or expenses primarily intended to result in the sale of shares of the Fund. For the six month period ending March 31, 2011, no such expenses were incurred. |
| | | Under the Fund’s organizational documents, each director, officer, employee or other agent of the Fund (including the Fund’s investment manager) is indemnified, to the extent permitted by the Act, against certain liabilities that may arise out of performance of their duties to the Fund. Additionally, in the normal course of business, the Fund enters into contracts that contain a variety of indemnification clauses. The Fund’s maximum exposure under these arrangements is unknown as this would involve future claims that may be made against the Fund that have not yet occurred. However, the Fund has not had prior claims or losses pursuant to these contracts and believes the risk of loss to be remote. |
At March 31, 2011, one financial intermediary is the record owner of approximately 24% of the Fund’s shares.
| | U.S. Bank, N.A. has made available to the Fund a $66,000,000 credit facility pursuant to a Credit Agreement (“Agreement”) effective November 18, 2002 for the purpose of having cash available to satisfy redemption requests and to purchase portfolio securities. Principal and interest of such loan under the Agreement are due not more than 31 days after the date of the loan. Amounts under the credit facility bear interest at a rate per annum equal to the current prime rate minus one percent on the amount borrowed. Advances will be collateralized by securities owned by the Fund. During the six month period ending March 31, 2011, the Fund did not borrow against the Agreement. The Credit Agreement is renewable annually on June 5. |
| (4) | Distribution to Shareholders — |
| | Net investment income and net realized gains, if any, are distributed to shareholders at least annually. |
| (5) | Investment Transactions — |
| | For the six month period ending March 31, 2011, purchases and proceeds of sales of investment securities (excluding short-term investments) were $172,667,167 and $152,107,040, respectively. |
| (6) | Income Tax Information — |
The following information for the Fund is presented on an income tax basis as of September 30, 2010:
| | Gross | Gross | Net Unrealized | Distributable | Distributable |
| Cost of | Unrealized | Unrealized | Appreciation | Ordinary | Long-Term |
| Investments | Appreciation | Depreciation | on Investments | Income | Capital Gains |
| $377,244,353 | $80,791,472 | $32,652,065 | $48,139,407 | $— | $— |
The difference between the cost amount for financial statement and federal income tax purposes is due primarily to timing differences in recognizing certain gains and losses in security transactions.
The tax components of dividends paid during the years ended September 30, 2010 and 2009, capital loss carryovers, which may be used to offset future capital gains, subject to Internal Revenue Code limitations (expiring in 2017 and 2018), as of September 30, 2010, and tax basis post-October losses as of September 30, 2010, which are not recognized for tax purposes until the first day of the following fiscal year are:
FMI Focus Fund
NOTES TO FINANCIAL STATEMENTS (Continued)
March 31, 2011 (Unaudited)
| (6) | Income Tax Information — (Continued) |
| September 30, 2010 | | September 30, 2009 |
| Ordinary | | Long-Term | | Net Capital | | | | Ordinary | | Long-Term |
| Income | | Capital Gains | | Loss | | Post-October | | Income | | Capital Gains |
| Distributions | | Distributions | | Carryovers | | Losses | | Distributions | | Distributions |
| $430,069 | | $— | | $41,140,522 | | $— | | $3,914,370 | | $88,180,747 |
For corporate shareholders of the Fund, the percentage of dividend income distributed for the year ended September 30, 2010, which is designated as qualifying for the dividends received deduction is 96% (unaudited).
For all shareholders of the Fund, the percentage of dividend income distributed for the year ended September 30, 2010, which is designated as qualified dividend income under the Jobs and Growth Tax Relief Act of 2003, is 96% (unaudited).
On December 17, 2010, the Board of Directors of FMI Funds, Inc. (“Directors”) approved the continuation of the FMI Focus Fund’s investment advisory agreement with Fiduciary Management, Inc. (“FMI”) and its sub-advisory agreement with Broadview Advisors, LLC (“Broadview”). Prior to approving the continuation of the agreements, the Directors considered:
| | • | the nature, extent and quality of the services provided by FMI and Broadview |
| | • | the investment performance of the Fund |
| | • | the cost of the services to be provided and profits to be realized by FMI and Broadview from their relationship with the Fund |
| | • | the extent to which economies of scale would be realized as the Fund grew and whether fee levels reflect any economies of scale |
| | • | the expense ratio of the Fund |
| | • | the manner in which portfolio transactions for the Fund were conducted, including the use of soft dollars |
In considering the nature, extent and quality of the services provided by FMI and Broadview, the Directors reviewed a report describing the portfolio management, shareholder communication and servicing, prospective shareholder assistance and regulatory compliance services provided by FMI and Broadview to the Fund. The Directors concluded that FMI and Broadview were providing essential services to the Fund. In particular, the Directors concluded that FMI and Broadview were, or will be, preparing reports to shareholders in addition to those required by law, and were providing services to the Fund that were in addition to the services investment advisers typically provided non-mutual fund clients.
The Directors compared the performance of the Fund to benchmark indices over various periods of time and concluded that the performance of the Fund warranted the continuation of the agreements.
In concluding that the advisory fees payable by the Fund were reasonable, the Directors reviewed a report that concluded that the profits FMI realized with respect to the Fund, expressed as a percentage of pre-tax revenues, were generally comparable to that of publicly traded investment advisers. The Directors also reviewed reports comparing the Fund’s expense ratio and advisory fee paid by the Fund to those of other comparable mutual funds and concluded that the advisory fee paid by the Fund and the Fund’s expense ratio were within the range of comparable mutual funds. The Directors noted that the investment advisory fee was not adjusted if the Fund grew, but did not consider that factor to be significant because of the other factors considered.
Finally, the Directors reviewed reports discussing the manner in which portfolio transactions for the Fund were conducted, including the use of soft dollars. Based on these reports, the Directors concluded that the research obtained by Broadview was beneficial to the Fund and that Broadview was executing the Fund’s portfolio transactions in a manner designed to obtain best execution for the Fund.
For additional information about the Directors and Officers or for a description of the policies and procedures that the Fund uses to determine how to vote proxies relating to portfolio securities, please call (800) 811-5311 and request a Statement of Additional Information. One will be mailed to you free of charge. The Statement of Additional Information is also available on the website of the Securities and Exchange Commission (the “Commission”) at http://www.sec.gov. Information on how the Fund voted proxies relating to portfolio securities is available on the Fund’s website at http://www.fmifunds.com or the website of the Commission no later than August 31 for the prior 12 months ending June 30. The Fund files its complete schedule of portfolio holdings with the Commission for the first and third quarters of each fiscal year on Form N-Q. The Fund’s Form N-Q is available on the Commission’s website. The Fund’s Form N-Q may be reviewed and copied at the Commission’s Public Reference Room in Washington, D.C., and that information on the operation of the Public Reference Room may be obtained by calling 1-800-SEC-0330.
FMI Focus Fund
100 East Wisconsin Avenue, Suite 2200
Milwaukee, Wisconsin 53202
www.fmifunds.com
414-226-4555
BOARD OF DIRECTORS
BARRY K. ALLEN
ROBERT C. ARZBAECHER
PATRICK J. ENGLISH
GORDON H. GUNNLAUGSSON
TED D. KELLNER
RICHARD E. LANE
PAUL S. SHAIN
INVESTMENT ADVISER
FIDUCIARY MANAGEMENT, INC.
100 East Wisconsin Avenue, Suite 2200
Milwaukee, Wisconsin 53202
PORTFOLIO MANAGER
BROADVIEW ADVISORS, LLC
330 East Kilbourn Avenue, Suite 1475
Milwaukee, Wisconsin 53202
ADMINISTRATOR, ACCOUNTANT, TRANSFER
AGENT AND DIVIDEND DISBURSING AGENT
U.S. BANCORP FUND SERVICES, LLC
615 East Michigan Street
Milwaukee, Wisconsin 53202
800-811-5311 or 414-765-4124
CUSTODIAN
U.S. BANK, N.A.
1555 North RiverCenter Drive, Suite 302
Milwaukee, Wisconsin 53212
DISTRIBUTOR
RAFFERTY CAPITAL MARKETS, LLC
59 Hilton Avenue
Garden City, New York 11530
INDEPENDENT REGISTERED
PUBLIC ACCOUNTING FIRM
PRICEWATERHOUSECOOPERS LLP
100 East Wisconsin Avenue, Suite 1800
Milwaukee, Wisconsin 53202
LEGAL COUNSEL
FOLEY & LARDNER LLP
777 East Wisconsin Avenue
Milwaukee, Wisconsin 53202
This report is not authorized for use as an offer of sale or a solicitation of an offer to buy shares of FMI Focus Fund unless accompanied or preceded by the Fund’s current prospectus.
SEMIANNUAL REPORT
March 31, 2011
FMI
Large Cap
Fund
(FMIHX)
A NO-LOAD
MUTUAL FUND
FMI
Large Cap
Fund
March 31, 2011
Dear Fellow Shareholders:
The FMI Large Cap Fund gained 4.74%(1) in the quarter compared to 5.92%(2) for the Standard & Poor’s 500 Index. The first two months of the quarter were similar to last year in that commodity-oriented, levered cyclical and energy-related stocks did well. More defensive stocks continued to underperform. With Middle East conflicts escalating and the terrible tragedy in Japan unfolding, there was some flight back to perceived safety. We were pleased to have not lost too much ground given our conservative, defensive posture. Overall, we have been surprised at the magnitude and duration of the equity rally, now over two years old. Valuations are once again stretched for the market as a whole, particularly given the grave nature of developed country finances.
Easy Solutions?
If you ask the proverbial average American how many people in the U.S. make over $1 million per year, the number would likely be a lot greater than 321,294. Yet that is indeed the figure.(3) The IRS shows adjusted gross income for this group of $1.076 trillion. They paid federal income taxes of $260 billion. So, think about the math. One could increase taxes on this group of people by 50% and assume they do not take any mitigating actions (defer income, hide income, delay capital gains, opt for leisure, etc.), and the additional income generated would be $130 billion. That is less than 10% of this year’s budget deficit of $1.5 trillion. Forget about the $14.3 trillion of debt and any hope of chipping away at that.
4,376,000 filers make more than $200,000 per year. Their adjusted gross income in 2008 was $2.462 trillion. They paid $544 billion in taxes. Again, we could raise tax rates by 50%, assume they take no mitigating actions, and only $272 billion more in taxes would be raised. This is 18% of the current budget deficit. Incidentally, these 4.4 million filers, 1.5% of the population, paid 50% of the total federal income taxes.
There are certainly some high income filers who have found or exploited ways to avoid paying statutory rates (all the more reason to reform the tax code), but odd as it may seem, even doubling their tax rate barely dents the deficit. 13,000 filers made more than $10 million in 2008, generating taxable income of $348 billion and paying $88 billion in federal income tax. Double their tax rate, assume there is no leakage and it would generate just 6% of this year’s deficit.
Some say the answer is to just tax corporations at a higher rate. There are all sorts of issues with this idea, not the least of which is that corporate taxes bring in less than $200 billion annually, just 13% of this year’s deficit, and the U.S. corporate tax rate of 35% is already the second highest amongst the 30 OECD (Organisation for Economic Co-operation & Development) countries. Many companies have moved operations or headquarters overseas to avoid getting taxed at the U.S. rate for income they do not generate in the U.S. Armies of tax lawyers and lobbyists are employed to reduce corporate taxes and this has the effect of favoring
__________
| (1) | The Fund’s one-year and annualized 5-year and since inception (12-31-01) returns through March 31, 2011 were: 10.45%, 5.23% and 7.35%, respectively. |
| (2) | The S&P 500 one-year and annualized 5-year and since inception (12-31-01) returns through March 31, 2011 were 15.65%, 2.62% and 3.57%, respectively. |
| (3) | The IRS data is for 2008, the most recent available. Actual millionaires may be slightly higher in the cases where both spouses earn over $1 million and are filing jointly. |
not only certain types of businesses over others, but large corporations over small. President Obama seems open to reducing corporate tax rates to make the U.S. more competitive. Reducing or eliminating the corporate tax, combined with a much flatter individual tax and the elimination of tax breaks, would also be more equitable and could generate more income over time. In a sense, corporations really don’t pay taxes; they simply pass the burden onto consumers. Raising the corporate tax rate doesn’t affect the CEO’s income at all, but it does hurt the little guy, who pays more for a loaf of bread or possibly loses his job because his unit is moved offshore. Corporations are not living citizens. They are owned by living citizens who pay taxes on distributed corporate income and capital gains. If tax rates on dividends and capital gains migrated toward a broad-based flat tax rate, income would accrue to the owners, suppliers and employees and very possibly tax revenue would rise, in addition to being less regressive.
“We know what it will take for America to win the future. We need to out-innovate, we need to out-educate, we need to out-build our competitors. We need an economy that’s based not on what we consume and borrow from other nations, but what we make and what we sell around the world. We need to make America the best place on Earth to do business… Another barrier government can remove is a burdensome corporate tax code with one of the highest rates in the world.”
— President Barack Obama (February 7, 2011)
No discussion of the budget deficit can progress unless people understand this basic math: approximately 58% of the budget is Medicare, Federal Medicaid, Social Security, and unemployment entitlements. Defense is 20%. If a budget discussion fails to address 78% of the budget, it fails.
According to a recent survey by the Tarrance Group, a majority of voters (63%) incorrectly believes the federal government spends more on defense than it does on Medicare and Social Security. The hard reality is that there are no easy solutions. No sound bite call to tax the rich or stick it to corporations really addresses the problem at all. The issue has been and continues to be excessive government spending.
As this letter is being written, Congress is haggling back and forth about whether federal spending growth will be reduced by $62 billion or $10 billion (1.7% or 0.4% of the total budget, respectively). With little recognition or admission of the underlying fiscal realities, and almost nothing of substance being done about it (in fact, large protests against spending cuts are now commonplace), our macro outlook continues to be guarded. Stock valuations have moved considerably higher over the past year and the combo platter of a fiscal mess, an untenable monetary policy and a stretched market translates into a more cautious investment outlook. Of course, experience tells us there will always be interesting investment ideas, regardless of the big picture. Below we have highlighted two. Additionally, at http://www.fiduciarymgt.com/institutional-investors/additional-resources, we have posted the support work for this letter as well as some other interesting data. We thank one of our team members, Dan Sievers, for compiling this information.
INGERSOLL-RAND PLC
Analyst: Karl Poehls
Business Description
Ingersoll-Rand (IR) is a diversified, global company that provides products, services and solutions to enhance the quality and comfort of air in homes and buildings, transport and protect food and perishables, secure homes and commercial properties, and enhance industrial productivity and efficiency. Its primary operating segments are: Climate Solutions (40% of 2009 EBIT), Security Technologies (31%), Industrial Technologies (17%), and Residential Solutions (12%).
Good Business
| | • | IR’s climate control and security products are critical for maintaining high standards of living. |
| | • | In 2009, approximately 75% of the company’s $13.2 billion in revenue was generated from the sale of parts and services or from the replacement/retrofit market, and can be considered recurring in nature. |
| | • | IR occupies the #1 or #2 market share position in businesses that account for 80% of total sales. |
| | • | Over the past decade, IR has generated returns slightly above its cost of capital. For the trailing 5- and 10-year periods, the company’s ROIC has averaged 8.8% and 9.0%, respectively. Going forward, we expect IR to generate incremental return on invested capital (ROIC) exceeding 15%. |
| | • | The company generates excess free cash flow (FCF) of approximately $1.0 billion. We expect the majority of FCF to be returned to shareholders via dividends and share repurchases. |
| | • | IR has a solid balance sheet with net debt of $2.9 billion. The company’s long-term debt is rated BBB+ at S&P and Baa1 at Moody’s. The interest coverage ratio is 4.4x. |
Valuation
| | • | At the current price, IR’s stock is approximately 30% below its all-time high achieved in 2007. |
| | • | IR currently trades for 1.2x EV/Sales. This is slightly below its trailing 5- and 10-year average EV/Sales multiple of 1.3x. |
| | • | Over the past ten years, IR’s operating margin has averaged 10.1%. We estimate the company’s normalized operating margin run-rate is 13-14% based on its current business mix. This implies earnings power of between $4-5 per share. The stock trades for 8-10x this range. |
| | • | Since 1990, IR’s P/E multiple has averaged 16.8x. This compares to the company’s current P/E multiple of 17.0x, which is based on what we consider to be depressed margins and earnings. |
| | • | In 2011, we expect IR to pay approximately 25% of earnings through an annual dividend of $0.75 per share. This implies a dividend yield of 2%. |
Management
| | • | Michael Lamach has been IR’s CEO since February 2010. Prior to joining IR in 2004, Lamach was employed by Johnson Controls for 18 years and held various management positions. |
| | • | Going forward, we expect IR’s management will be focused on driving internal growth, improving productivity, and installing a high-performance operating culture. This is in sharp contrast to the company’s historical focus under previous leadership. |
| | • | Over the next 3-5 years, we expect management to return a significant percentage of FCF to shareholders through dividends and share buybacks while limiting acquisition activity. |
Investment Thesis
Due to struggles with past acquisitions and currently depressed end markets, IR’s operating margin is meaningfully below its long-term potential. Also, investors are skeptical of management’s ability to meet lofty internal margin targets and are waiting on the sidelines. We believe this presents an attractive opportunity to invest in a global industrial company with highly recurring revenue, leading market share positions, and significant operating leverage to an improved economy.
MICROSOFT CORPORATION
Analyst: Dan Sievers
Description
Microsoft develops, manufactures, licenses, and supports software for computing devices worldwide. In 2010, the company’s Windows & Windows Live Division, which is responsible for the Windows Operating System, Windows Live services, and Internet Explorer, generated 42% of the positive segment level operating profit. Microsoft Business Division, which is responsible for the front-end Microsoft Office products (Word, Excel, PowerPoint, Outlook, etc.) generated another 38% of the positive segment operating profit. Servers and Tools contributed 18% of segment operating profit, and the Entertainment and Devices Division contributed the remaining 2% of operating profit. Separately, Online Services Division, which is responsible for the Bing search engine and MSN, booked an operating loss of $2.4 billion in 2010.
Good Business
| | • | The Windows Operating System and Microsoft Office are entrenched in the workflow of millions of businesses and are used by millions more consumers globally. Traditional PC sales drive revenue and both new software versions and the PC hardware cycle drive recurring purchases. |
| | • | The operating margins and ROIC at Microsoft are phenomenal. Windows OS gross margin is 95%. |
| | • | Microsoft spent $8-9 billion in R&D in each of the past three years, turning out a number of significant new products. In 2009, Apple spent $1.7 billion, and Google spent $2.8 billion in R&D. |
| | • | Microsoft’s balance sheet is bulletproof with net cash of $31 billion (the vast majority is overseas). |
Valuation
| | • | Microsoft trades for 13.0x P/E, 9.2x P/CF, 7.1x EV/EBITDA, and 3.2x EV/Sales vs. 5-year average multiples of 17.6x P/E, 14.1x P/CF, 10.0x EV/EBITDA, and 4.1x EV/Sales. |
| | • | Microsoft offers a 10% FCF yield. |
Management
| | • | CEO Steve Ballmer, 54, was Microsoft’s 30th employee and currently holds $8.5 billion in Microsoft stock (Bill Gates holds $14.9 billion). |
| | • | Microsoft has not granted stock options since 2003. Gates and Ballmer receive no stock awards. |
| | • | 2010 management departures (Ray Ozzie, Robbie Bach & Bob Muglia) have raised eyebrows, but Microsoft is widely thought to possess a deep bench of executive talent. |
| | • | Microsoft has returned an astonishing $126 billion to shareholders over the past six fiscal years through dividends and share repurchases. |
Investment Thesis
Microsoft is out of favor in the market, viewed as a sleepy tech giant that is neither cutting edge nor fashionable. However, a wide range of Microsoft products is deeply and increasingly entrenched in the workflow of global business. Further, there are roughly 1 billion PCs in the world vs. a potential addressable market of 2-4 billion people. Quietly, Microsoft’s forward-thinking R&D efforts have made it the world’s premier cloud computing company. Almost silently, the Windows loaded notebook PC has become the lowest-cost and best-performing internet-connected device available. The targeted strategies of Apple and Google present specific risks, but we are being paid to take this risk at just 10x FCF. Even if Microsoft were to achieve
little or no profit growth in the future (a highly unlikely scenario), the company is likely to deliver solid returns to investors through repurchases and growing dividends. Microsoft is a high-quality cash machine.
Thank you for your support of the FMI Large Cap Fund.
 |  |
| Ted D. Kellner, CFA | Patrick J. English, CFA |
| Executive Chairman | CEO and Chief Investment Officer |
The returns do not reflect the deduction of taxes that a shareholder would pay on Fund distributions or the redemption of Fund shares. Performance data quoted represents past performance; past performance does not guarantee future results. The investment return and principal value of an investment will fluctuate so that an investor’s shares, when redeemed, may be worth more or less than their original cost. Current performance since the above time period may be lower or higher than the performance quoted. Performance data current to the most recent month-end may be obtained by visiting www.fmifunds.com or by calling 1-800-811-5311. As of the Fund’s Prospectus dated January 31, 2011, the Fund’s annual operating expense ratio is 0.97%.
As of March 31, 2011, the security holdings mentioned above represented the following percentage of the Fund’s total assets: Ingersoll-Rand PLC 2.0%; Microsoft Corporation 2.2%. Portfolio holdings are subject to change without notice and are not intended as recommendations of individual securities.
For more information about the FMI Large Cap Fund, call (800) 811-5311 for a free prospectus. Please read the prospectus carefully to consider the investment objectives, risks, charges and expenses, before investing or sending money. The prospectus contains this and more information about the FMI Large Cap Fund. Please read the prospectus carefully before investing.
Distributed by Rafferty Capital Markets, LLC
100 E. Wisconsin Ave., Suite 2200 • Milwaukee, WI 53202 • 414-226-4555
www.fmifunds.com
FMI Large Cap Fund
Industry Sectors as of March 31, 2011
As a shareholder of the Fund you incur ongoing costs, including management fees and other Fund expenses. You do not incur transaction costs such as sales charges (loads) on purchase payments, reinvested dividends, or other distributions; redemption fees; and exchange fees because the Fund does not charge these fees. This example is intended to help you understand your ongoing costs (in dollars) of investing in FMI Large Cap Fund and to compare these costs with the ongoing costs of investing in other mutual funds.
The example is based on an investment of $1,000 invested at the beginning of the period and held for the entire period from October 1, 2010 through March 31, 2011.
Actual Expenses
The first line of the table below provides information about actual account values and actual expenses. You may use the information in this line, together with the amount you invested, to estimate the expenses that you paid over the period. Simply divide your account value by $1,000 (for example, an $8,600 account value divided by $1,000 = 8.6), then multiply the result by the number in the first line under the heading entitled “Expenses Paid During Period” to estimate the expenses you paid on your account during this period.
In addition to the costs highlighted and described below, the only Fund transaction costs you might currently incur would be wire fees ($15 per wire), if you choose to have proceeds from a redemption wired to your bank account instead of receiving a check. Additionally, U.S. Bank charges an annual processing fee ($15) if you maintain an IRA account with the Fund. To determine your total costs of investing in the Fund, you would need to add any applicable wire or IRA processing fees you’ve incurred during the period to the costs provided in the example at the end of this article.
Hypothetical Example for Comparison Purposes
The second line of the table below provides information about hypothetical account values and hypothetical expenses based on the Fund’s actual expense ratio and an assumed rate of return of 5% per year before expenses, which is not the Fund’s actual return. The hypothetical account values and expenses may not be used to estimate the actual ending account balance or expenses you paid for the period. You may use this information to compare the ongoing costs of investing in the Fund and other funds. To do so, compare this 5% hypothetical example with the 5% hypothetical examples that appear in the shareholder reports of the other funds.
Please note that the expenses shown in the table are meant to highlight your ongoing costs only and do not reflect any transactional costs, such as sales charges (loads), redemption fees or exchange fees. Therefore, the second line of the table is useful in comparing ongoing costs only, and will not help you determine the relative total costs of owning different funds. In addition, if these transactional costs were included, your costs would have been higher.
| | Beginning | Ending | Expenses Paid |
| | Account | Account | During Period* |
| | Value 10/01/10 | Value 3/31/11 | 10/01/10-3/31/11 |
| FMI Large Cap Fund Actual | $1,000.00 | $1,141.10 | $5.18 |
| Hypothetical (5% return before expenses) | $1,000.00 | $1,020.10 | $4.89 |
| * | Expenses are equal to the Fund’s annualized expense ratio of 0.97%, multiplied by the average account value over the period, multiplied by 182/365 (to reflect the one-half year period between October 1, 2010 and March 31, 2011). |
FMI Large Cap Fund
STATEMENT OF ASSETS AND LIABILITIES
March 31, 2011 (Unaudited)
| ASSETS: | | | |
| Investments in securities, at value (cost $3,446,071,882) | | $ | 4,150,053,558 | |
| Receivable from shareholders for purchases | | | 11,435,942 | |
| Dividends receivable | | | 8,167,392 | |
| Cash | | | 86,425 | |
| Total assets | | $ | 4,169,743,317 | |
| LIABILITIES: | | | | |
| Payable to adviser for management fees | | $ | 2,043,552 | |
| Payable to shareholders for redemptions | | | 2,013,497 | |
| Other liabilities | | | 800,870 | |
| Total liabilities | | | 4,857,919 | |
| NET ASSETS: | | | | |
| Capital Stock, $0.0001 par value; 400,000,000 shares authorized; 254,723,368 shares outstanding | | | 3,494,793,414 | |
| Net unrealized appreciation on investments | | | 703,981,676 | |
| Accumulated net realized loss on investments | | | (42,732,462 | ) |
| Undistributed net investment income | | | 8,842,770 | |
| Net assets | | | 4,164,885,398 | |
| Total liabilities and net assets | | $ | 4,169,743,317 | |
| CALCULATION OF NET ASSET VALUE PER SHARE: | | | | |
| Net asset value, offering and redemption price per share ($4,164,885,398 ÷ 254,723,368 shares outstanding) | | $ | 16.35 | |
The accompanying notes to financial statements are an integral part of this statement.
FMI Large Cap Fund
SCHEDULE OF INVESTMENTS
March 31, 2011 (Unaudited)
| Shares | | | | Cost | | | Value | |
| COMMON STOCKS — 94.5% (a) | | | | | | |
COMMERCIAL SERVICES SECTOR — 6.6% | | | | | | |
| | | Financial Publishing/Services — 3.1% | | | | | | |
| | 3,245,000 | | McGraw-Hill | | | | | | |
| | | | Companies, Inc. | | $ | 88,077,740 | | | $ | 127,853,000 | |
| | | | Miscellaneous Commercial Services — 3.5% | | | | | | | | |
| | 4,848,000 | | Cintas Corp. | | | 135,887,997 | | | | 146,748,960 | |
CONSUMER NON-DURABLES SECTOR — 10.7% | | | | | | | | |
| | | | Beverages: Alcoholic — 2.8% | | | | | | | | |
| | 1,515,000 | | Diageo | | | | | | | | |
| | | | PLC - SP-ADR | | | 94,337,564 | | | | 115,473,300 | |
| | | | Food: Major Diversified — 4.6% | | | | | | | | |
| | 3,309,000 | | Nestlé | | | | | | | | |
| | | | S.A. - SP-ADR | | | 151,193,867 | | | | 190,201,320 | |
| | | | Household/Personal Care — 3.3% | | | | | | | | |
| | 2,078,000 | | Kimberly-Clark | | | | | | | | |
| | | | Corp. | | | 126,184,234 | | | | 135,631,060 | |
CONSUMER SERVICES SECTOR — 3.9% | | | | | | | | |
| | | | Media Conglomerates — 3.9% | | | | | | | | |
| | 4,573,000 | | Time Warner Inc. | | | 134,463,323 | | | | 163,256,100 | |
DISTRIBUTION SERVICES SECTOR — 7.6% | | | | | | | | |
| | | | Food Distributors — 3.5% | | | | | | | | |
| | 5,223,000 | | Sysco Corp. | | | 143,295,329 | | | | 144,677,100 | |
| | | | Medical Distributors — 4.1% | | | | | | | | |
| | 4,368,000 | | AmerisourceBergen | | | | | | | | |
| | | | Corp. | | | 129,297,282 | | | | 172,798,080 | |
ELECTRONIC TECHNOLOGY SECTOR — 3.1% | | | | | | | | |
| | | | Electronic Components — 3.1% | | | | | | | | |
| | 3,693,000 | | TE Connectivity | | | | | | | | |
| | | | Limited | | | 79,413,941 | | | | 128,590,260 | |
ENERGY MINERALS SECTOR — 3.1% | | | | | | | | |
| | | | Oil & Gas Production — 3.1% | | | | | | | | |
| | 1,389,000 | | Devon Energy | | | | | | | | |
| | | | Corporation | | | 89,983,706 | | | | 127,468,530 | |
FINANCE SECTOR — 12.6% | | | | | | | | |
| | | | Financial Conglomerates — 2.6% | | | | | | | | |
| | 2,438,000 | | American Express Co. | | | 73,564,122 | | | | 110,197,600 | |
| | | | Insurance Brokers/Services — 1.3% | | | | | | | | |
| | 1,387,050 | | Willis Group | | | | | | | | |
| | | | Holdings PLC | | | 49,737,608 | | | | 55,981,338 | |
| | | | Major Banks — 4.6% | | | | | | | | |
| | 6,444,000 | | Bank of New York | | | | | | | | |
| | | | Mellon Corp. | | | 192,340,559 | | | | 192,482,280 | |
| | | | Property/Casualty Insurance — 4.1% | | | | | | | | |
| | 2,068,000 | | Berkshire Hathaway | | | | | | | | |
| | | | Inc. - Cl B* | | | 137,316,607 | | | | 172,946,840 | |
HEALTH TECHNOLOGY SECTOR — 7.6% | | | | | | | | |
| | | | Medical Specialties — 7.6% | | | | | | | | |
| | 2,643,000 | | Coviden PLC | | | 113,800,297 | | | | 137,277,420 | |
| | 4,805,000 | | DENTSPLY | | | | | | | | |
| | | | International Inc. | | | 151,761,483 | | | | 177,736,950 | |
| | | | | | | 265,561,780 | | | | 315,014,370 | |
| INDUSTRIAL SERVICES SECTOR — 2.7% | | | | | | | | |
| | | | Oilfield Services/Equipment — 2.7% | | | | | | | | |
| | 1,210,000 | | Schlumberger | | | | | | | | |
| | | | Limited | | | 59,470,212 | | | | 112,844,600 | |
PROCESS INDUSTRIES SECTOR — 2.9% | | | | | | | | |
| | | Chemicals: Agricultural — 2.9% | | | | | | | | |
| | 1,659,000 | | Monsanto Co. | | | 94,185,352 | | | | 119,879,340 | |
PRODUCER MANUFACTURING SECTOR — 11.1% | | | | | | | | |
| | | | Industrial Conglomerates — 11.1% | | | | | | | | |
| | 2,271,000 | | 3M Co. | | | 162,628,862 | | | | 212,338,500 | |
| | 1,749,000 | | Ingersoll-Rand | | | | | | | | |
| | | | PLC | | | 82,123,802 | | | | 84,494,190 | |
| | 3,703,000 | | Tyco | | | | | | | | |
| | | | International Ltd. | | | 116,108,477 | | | | 165,783,310 | |
| | | | | | | 360,861,141 | | | | 462,616,000 | |
| RETAIL TRADE SECTOR — 7.5% | | | | | | | | |
| | | | Discount Stores — 4.0% | | | | | | | | |
| | 3,219,000 | | Wal-Mart | | | | | | | | |
| | | | Stores, Inc. | | | 162,436,809 | | | | 167,548,950 | |
| | | | Specialty Stores — 3.5% | | | | | | | | |
| | 7,417,000 | | Staples, Inc. | | | 161,890,075 | | | | 144,038,140 | |
FMI Large Cap Fund
SCHEDULE OF INVESTMENTS (Continued)
March 31, 2011 (Unaudited)
| Shares or | | | | | | | | |
| Principal | | | | | | | | |
| Amount | | | | Cost | | | Value | |
| COMMON STOCKS — 94.5% (a) (Continued) | | | | | | |
TECHNOLOGY SERVICES SECTOR — 11.2% | | | | | | |
| | | Data Processing Services — 4.4% | | | | | | |
| | 3,601,000 | | Automatic Data | | | | | | |
| | | | Processing, Inc. | | $ | 146,711,010 | | | $ | 184,767,310 | |
| | | | Information Technology Services — 4.6% | | | | | | | | |
| | 3,516,000 | | Accenture PLC | | | 124,983,108 | | | | 193,274,520 | |
| | | | Packaged Software — 2.2% | | | | | | | | |
| | 3,640,000 | | Microsoft | | | | | | | | |
| | | | Corporation | | | 102,593,585 | | | | 92,310,400 | |
TRANSPORTATION SECTOR — 3.9% | | | | | | | | |
| | | | Air Freight/Couriers — 3.9% | | | | | | | | |
| | 2,163,000 | | United Parcel | | | | | | | | |
| | | | Service, Inc. - Cl B | | | 129,584,931 | | | | 160,754,160 | |
| | | | Total common | | | | | | | | |
| | | | stocks | | | 3,233,371,882 | | | | 3,937,353,558 | |
SHORT-TERM INVESTMENTS — 5.1% (a) | | | | | | | | |
| | | | Commercial Paper — 5.1% | | | | | | | | |
| $ | 212,700,000 | | U.S. Bank, N.A., | | | | | | | | |
| | | | | | | 212,700,000 | | | | 212,700,000 | |
| | | | Total short-term | | | | | | | | |
| | | | investments | | | 212,700,000 | | | | 212,700,000 | |
| | | | Total investments — 99.6% | | $ | 3,446,071,882 | | | | 4,150,053,558 | |
| | | | Cash and | | | | | | | | |
| | | | receivables, | | | | | | | | |
| | | | less liabilities — 0.4% (a) | | | | | | | 14,831,840 | |
| | | | TOTAL NET ASSETS — 100.0% | | | | | | $ | 4,164,885,398 | |
| * | Non-income producing security. |
| (a) | Percentages for the various classifications relate to net assets. |
PLC – Public Limited Company
SP-ADR – Sponsored American Depositary Receipt
The accompanying notes to financial statements are an integral part of this schedule.
FMI Large Cap Fund
STATEMENT OF OPERATIONS
For the Six Month Period Ending March 31, 2011 (Unaudited)
| INCOME: | | | |
| Dividends | | $ | 33,431,543 | |
| Interest | | | 163,961 | |
| Total income | | | 33,595,504 | |
| EXPENSES: | | | | |
| Management fees | | | 13,836,866 | |
| Transfer agent fees | | | 2,358,500 | |
| Administrative and accounting services | | | 964,343 | |
| Custodian fees | | | 267,000 | |
| Printing and postage expense | | | 203,475 | |
| Registration fees | | | 113,200 | |
| Insurance expense | | | 33,150 | |
| Professional fees | | | 28,210 | |
| Board of Directors fees | | | 19,400 | |
| Other expenses | | | 77,350 | |
| Total expenses | | | 17,901,494 | |
| NET INVESTMENT INCOME | | | 15,694,010 | |
| NET REALIZED GAIN ON INVESTMENTS | | | 37,941,806 | |
| NET INCREASE IN UNREALIZED APPRECIATION ON INVESTMENTS | | | 420,905,314 | |
| NET GAIN ON INVESTMENTS | | | 458,847,120 | |
| NET INCREASE IN NET ASSETS RESULTING FROM OPERATIONS | | $ | 474,541,130 | |
STATEMENTS OF CHANGES IN NET ASSETSFor the Six Month Period Ending March 31, 2011 (Unaudited) and For the Year Ended September 30, 2010
| | | 2011 | | | 2010 | |
| OPERATIONS: | | | | | | |
| Net investment income | | $ | 15,694,010 | | | $ | 31,292,948 | |
| Net realized gain on investments | | | 37,941,806 | | | | 40,599,018 | |
| Net increase in unrealized appreciation on investments | | | 420,905,314 | | | | 159,780,424 | |
| Net increase in net assets from operations | | | 474,541,130 | | | | 231,672,390 | |
| DISTRIBUTIONS TO SHAREHOLDERS: | | | | | | | | |
| Distributions from net investment income ($0.1373 and $0.1709 per share, respectively) | | | (31,698,426 | ) | | | (28,040,866 | ) |
| FUND SHARE ACTIVITIES: | | | | | | | | |
| Proceeds from shares issued (54,955,650 and 118,199,701 shares, respectively) | | | 867,849,039 | | | | 1,676,212,878 | |
| Net asset value of shares issued in distributions reinvested | | | | | | | | |
| (1,765,679 and 1,505,339 shares, respectively) | | | 26,370,979 | | | | 20,593,916 | |
| Cost of shares redeemed (31,445,519 and 44,841,197 shares, respectively) | | | (490,541,498 | ) | | | (633,775,155 | ) |
| Net increase in net assets derived from Fund share activities | | | 403,678,520 | | | | 1,063,031,639 | |
| TOTAL INCREASE | | | 846,521,224 | | | | 1,266,663,163 | |
| NET ASSETS AT THE BEGINNING OF THE PERIOD | | | 3,318,364,174 | | | | 2,051,701,011 | |
| NET ASSETS AT THE END OF THE PERIOD (Includes undistributed | | | | | | | | |
| net investment income of $8,842,770 and $24,847,186, respectively) | | $ | 4,164,885,398 | | | $ | 3,318,364,174 | |
The accompanying notes to financial statements are an integral part of these statements.
FMI Large Cap Fund
FINANCIAL HIGHLIGHTS
(Selected data for each share of the Fund outstanding throughout each period)
| | | (Unaudited) | | | | | | | | | | | | | | | | |
| | | For the Six Month | | | | | | | | | | | | | | | | |
| | | Period Ending | | | | | | | | | | | | | | | | |
| | | March 31, | | | Years Ended September 30, | |
| | | 2011 | | | 2010 | | | 2009 | | | 2008 | | | 2007 | | | 2006 | |
| PER SHARE OPERATING PERFORMANCE: | | | | | | | | | | | | | | | | | | |
| Net asset value, beginning of period | | $ | 14.46 | | | $ | 13.27 | | | $ | 13.65 | | | $ | 16.18 | | | $ | 14.79 | | | $ | 13.29 | |
| Income from investment operations: | | | | | | | | | | | | | | | | | | | | | | | | |
| Net investment income | | | 0.07 | | | | 0.17 | | | | 0.20 | | | | 0.17 | | | | 0.17 | | | | 0.12 | |
| Net realized and unrealized | | | | | | | | | | | | | | | | | | | | | | | | |
| gains (losses) on investments | | | 1.96 | | | | 1.19 | | | | (0.47 | )* | | | (2.14 | ) | | | 1.65 | | | | 1.78 | |
| Total from investment operations | | | 2.03 | | | | 1.36 | | | | (0.27 | ) | | | (1.97 | ) | | | 1.82 | | | | 1.90 | |
| Less distributions: | | | | | | | | | | | | | | | | | | | | | | | | |
| Distributions from net investment income | | | (0.14 | ) | | | (0.17 | ) | | | (0.11 | ) | | | (0.13 | ) | | | (0.10 | ) | | | (0.03 | ) |
| Distributions from net realized gains | | | — | | | | — | | | | — | | | | (0.43 | ) | | | (0.33 | ) | | | (0.37 | ) |
| Total from distributions | | | (0.14 | ) | | | (0.17 | ) | | | (0.11 | ) | | | (0.56 | ) | | | (0.43 | ) | | | (0.40 | ) |
| Net asset value, end of period | | $ | 16.35 | | | $ | 14.46 | | | $ | 13.27 | | | $ | 13.65 | | | $ | 16.18 | | | $ | 14.79 | |
| TOTAL RETURN | | | 14.11 | %(1) | | | 10.33 | % | | | (1.79 | %) | | | (12.58 | %) | | | 12.52 | % | | | 14.82 | % |
| | | | | | | | | | | | | | | | | | | | | | | | | |
| RATIOS/SUPPLEMENTAL DATA: | | | | | | | | | | | | | | | | | | | | | | | | |
| Net assets, end of period (in 000’s $) | | | 4,164,885 | | | | 3,318,364 | | | | 2,051,701 | | | | 1,140,200 | | | | 638,875 | | | | 165,806 | |
| Ratio of expenses (after reimbursement) | | | | | | | | | | | | | | | | | | | | | | | | |
| to average net assets (a) | | | 0.97 | %(2) | | | 0.97 | % | | | 0.97 | % | | | 1.00 | % | | | 1.00 | % | | | 1.00 | % |
| Ratio of net investment income | | | | | | | | | | | | | | | | | | | | | | | | |
| to average net assets (b) | | | 0.85 | %(2) | | | 1.18 | % | | | 1.80 | % | | | 1.13 | % | | | 1.06 | % | | | 0.88 | % |
| Portfolio turnover rate | | | 9 | % | | | 20 | % | | | 32 | % | | | 30 | % | | | 19 | % | | | 29 | % |
| * | The amount shown may not correlate with the aggregate gains and losses of portfolio securities due to the timing of subscriptions and redemptions of Fund shares. |
| (a) | Computed after giving effect to adviser’s expense limitation undertaking. If the Fund had paid all of its expenses for the years ended September 30, 2008, 2007 and 2006, the ratios would have been 1.02%, 1.03% and 1.11%, respectively. |
| (b) | If the Fund had paid all of its expenses for the years ended September 30, 2008, 2007 and 2006, the ratios would have been 1.11%, 1.03% and 0.77%, respectively. |
The accompanying notes to financial statements are an integral part of this statement.
FMI Large Cap Fund
NOTES TO FINANCIAL STATEMENTS
March 31, 2011 (Unaudited)
| (1) | Summary of Significant Accounting Policies — |
The following is a summary of significant accounting policies of the FMI Large Cap Fund (the “Fund”), a series of FMI Funds, Inc. (the “Company”) which is registered as a non-diversified, open-end management investment company under the Investment Company Act of 1940 (the “Act”), as amended. The Company was incorporated under the laws of Maryland on September 5, 1996 and the Fund commenced operations on December 31, 2001. The assets and liabilities of each Fund in the Company are segregated and a shareholder’s interest is limited to the Fund in which the shareholder owns shares. The investment objective of the Fund is to seek long-term capital appreciation principally through investing in a limited number of large capitalization value stocks.
| | (a) | Each security, excluding short-term investments, is valued at the last sale price reported by the principal security exchange on which the issue is traded. Securities that are traded on the Nasdaq Markets are valued at the Nasdaq Official Closing Price, or if no sale is reported, the latest bid price. Securities that are traded over-the-counter are valued at the latest bid price. Unlisted equity securities for which market quotations are readily available are valued at the most recent bid price. Securities for which quotations are not readily available are valued at fair value as determined by the investment adviser under the supervision of the Board of Directors. The fair value of a security is the amount which the Fund might reasonably expect to receive upon a current sale. The fair value of a security may differ from the last quoted price and the Fund may not be able to sell a security at the estimated fair value. Market quotations may not be available, for example, if trading in particular securities was halted during the day and not resumed prior to the close of trading on the New York Stock Exchange. As of March 31, 2011, there were no securities that were internally fair valued. Variable rate demand notes are recorded at par value which approximates market value. Short-term investments with maturities of 60 days or less are valued at amortized cost which approximates value. For financial reporting purposes, investment transactions are recorded on the trade date. |
| | | The Fund applies the provisions of the Financial Accounting Standards Board (“FASB”) Accounting Standards Codification “Fair Value Measurements and Disclosures” Topic 820 (“ASC 820”), which defines fair value as the price that would be received to sell an asset or paid to transfer a liability (i.e., the “exit price”) in an orderly transaction between market participants at the measurement date. |
| | | In determining fair value, the Fund uses various valuation approaches. ASC 820 establishes a fair value hierarchy for inputs used in measuring fair value that maximizes the use of observable inputs and minimizes the use of unobservable inputs by generally requiring that the most observable inputs be used when available. Observable inputs are those that market participants would use in pricing the asset or liability based on market data obtained from sources independent of the Fund. Unobservable inputs reflect the Fund’s assumptions about the inputs market participants would use in pricing the asset or liability developed based on the best information available in the circumstances. The inputs or methodologies used for valuing securities are not necessarily an indication of the risks associated with investing in those securities. |
| | | The fair value hierarchy is categorized into three levels based on the inputs as follows: |
| | Level 1 — | Valuations based on unadjusted quoted prices in active markets for identical assets. |
| | Level 2 — | Valuations based on quoted prices for similar securities or in markets that are not active or for which all significant inputs are observable, either directly or indirectly. |
| | Level 3 — | Valuations based on inputs that are unobservable and significant to the overall fair value measurement. |
| | | The following table summarizes the Fund’s investments as of March 31, 2011, based on the inputs used to value them: |
| Valuation Inputs | | Investments in Securities | |
| Level 1 — Common Stocks | | $ | 3,937,353,558 | |
| Level 2 — Short-Term Commercial Paper | | | 212,700,000 | |
| Level 3 — | | | — | |
| Total | | $ | 4,150,053,558 | |
| | | It is the Fund’s policy to recognize transfers between levels at the end of the quarterly reporting period. There were no transfers between levels during the six month period ending March 31, 2011. |
| | | See the Schedule of Investments for investments detailed by industry classifications. |
FMI Large Cap Fund
NOTES TO FINANCIAL STATEMENTS (Continued)
March 31, 2011 (Unaudited)
(1) Summary of Significant Accounting Policies — (Continued)
| | (b) | Net realized gains and losses on sales of securities are computed on the identified cost basis. |
| | (c) | Dividend income is recorded on the ex-dividend date. Interest income is recorded on an accrual basis. |
| | (d) | The Fund may have investments in short-term variable rate demand notes, which are unsecured instruments. The Fund may be susceptible to credit risk with respect to these notes to the extent the issuer defaults on its payment obligation. The Fund’s policy is to monitor the creditworthiness of the issuer and nonperformance by these issuers is not anticipated. |
| | (e) | Accounting principles generally accepted in the United States of America (“GAAP”) require that permanent differences between income for financial reporting and tax purposes be reclassified in the capital accounts. |
| | (f) | The preparation of financial statements in conformity with GAAP requires management to make estimates and assumptions that affect the reported amounts of assets and liabilities and disclosure of contingent assets and liabilities at the date of the financial statements and the reported amounts of revenues and expenses during the reporting period. Actual results could differ from these estimates. |
| | (g) | The Fund may own certain securities that are restricted. Restricted securities include Section 4(2) commercial paper, securities issued in a private placement, or securities eligible for resale pursuant to Rule 144A under the Securities Act of 1933 (the “1933 Act”). A restricted security cannot be resold to the general public without prior registration under the 1933 Act or pursuant to the resale limitations provided by Rule 144A under the 1933 Act, or an exemption from the registration requirements of the 1933 Act. |
| | (h) | No provision has been made for Federal income taxes since the Fund has elected to be taxed as a “regulated investment company” and intends to distribute substantially all net investment company taxable income and net capital gains to its shareholders and otherwise comply with the provisions of the Internal Revenue Code applicable to regulated investment companies. |
| | (i) | The Fund has reviewed all open tax years and major jurisdictions, which include Federal and the state of Maryland, and concluded that there are no significant uncertain tax positions that would require recognition in the financial statements. Open tax years are those that are open for exam by taxing authorities and, as of March 31, 2011, open Federal tax years include the tax years ended September 30, 2007 through 2010. The Fund has no examinations in progress and is also not aware of any tax positions for which it is reasonably possible that the total amounts of unrecognized tax benefits will significantly change in the next twelve months. |
| (2) | Investment Adviser and Management Agreement and Transactions With Related Parties — |
The Fund has a management agreement with Fiduciary Management, Inc. (“FMI”), with whom certain officers and directors of the Fund are affiliated, to serve as investment adviser and manager. Under the terms of the agreement, the Fund will pay FMI a monthly management fee at the annual rate of 0.75% of the daily net assets. The Fund is responsible for paying its proportionate share of the compensation, benefits and expenses of its Chief Compliance Officer. For administrative convenience, FMI initially makes these payments and is later reimbursed by the Fund.
Under the management agreement, FMI will reimburse the Fund for expenses over 1.20% of the daily net assets of the Fund. In addition to the reimbursement required under the management agreement, FMI will voluntarily reimburse the Fund for expenses over 1.00%. For the six month period ending March 31, 2011 there were no contractual or voluntary reimbursements required.
The Fund has entered into a Distribution Plan (the “Plan”), pursuant to Rule 12b-1 under the Act. The Plan provides that the Fund may incur certain costs which may not exceed the lesser of a monthly amount equal to 0.25% of the Fund’s daily net assets or the actual distribution costs incurred during the year. Amounts payable under the Plan are paid monthly for any activities or expenses primarily intended to result in the sale of shares of the Fund. For the six month period ending March 31, 2011, no such expenses were incurred.
Under the Fund’s organizational documents, each director, officer, employee or other agent of the Fund (including the Fund’s investment manager) is indemnified, to the extent permitted by the Act, against certain liabilities that may arise out of performance of their duties to the Fund. Additionally, in the normal course of business, the Fund enters into contracts that contain a variety of indemnification clauses. The Fund’s maximum exposure under these arrangements is unknown as this would involve future claims that may be made against the Fund that have not yet occurred. However, the Fund has not had prior claims or losses pursuant to these contracts and believes the risk of loss to be remote.
At March 31, 2011, one financial intermediary is the record owner of approximately 16% of the Fund’s shares.
FMI Large Cap Fund
NOTES TO FINANCIAL STATEMENTS (Continued)
March 31, 2011 (Unaudited)
(3) Credit Agreement —
U.S. Bank, N.A. has made available to the Fund a $400,000,000 credit facility pursuant to a Credit Agreement (“Agreement”) effective July 14, 2008 for the purposes of having cash available to satisfy redemption requests. Principal and interest of such loan under the Agreement are due not more than 31 days after the date of the loan. Amounts under the credit facility bear interest at a rate per annum equal to the current prime rate minus one percent on the amount borrowed. Advances will be collateralized by securities owned by the Fund. During the six month period ending March 31, 2011, the Fund did not borrow against the Agreement. The Credit Agreement is renewable annually on June 5.
| (4) | Distribution to Shareholders — |
Net investment income and net realized gains, if any, are distributed to shareholders at least annually.
| (5) | Investment Transactions — |
For the six month period ending March 31, 2011, purchases and proceeds of sales of investment securities (excluding short-term investments) were $602,962,409 and $300,733,197, respectively.
| (6) | Income Tax Information — |
The following information for the Fund is presented on an income tax basis as of September 30, 2010:
| | | Gross | | Gross | | Net Unrealized | | Distributable | | Distributable |
| Cost of | | Unrealized | | Unrealized | | Appreciation | | Ordinary | | Long-Term |
| Investments | | Appreciation | | Depreciation | | on Investments | | Income | | Capital Gains |
| $3,074,478,866 | | $391,948,730 | | $124,349,779 | | $267,598,951 | | $24,847,186 | | $— |
The difference, if any, between the cost amounts for financial statement and federal income tax purposes is due primarily to timing differences in recognizing certain gains and losses on security transactions.
The tax components of dividends paid during the years ended September 30, 2010 and 2009, capital loss carryovers, which may be used to offset future capital gains, subject to Internal Revenue Code limitations (expiring in 2017 and 2018), as of September 30, 2010, and tax basis post-October losses as of September 30, 2010, which are not recognized for tax purposes until the first day of the following fiscal year are:
| September 30, 2010 | | September 30, 2009 |
| Ordinary | | Long-Term | | Net Capital | | | | Ordinary | | Long-Term |
| Income | | Capital Gains | | Loss | | Post-October | | Income | | Capital Gains |
| Distributions | | Distributions | | Carryovers | | Losses | | Distributions | | Distributions |
| $28,040,866 | | $— | | $65,196,857 | | $— | | $13,823,123 | | $— |
For corporate shareholders of the Fund, the percentage of dividend income distributed for the year ended September 30, 2010 which is designated as qualifying for the dividends received deduction is 100% (unaudited).
For all shareholders of the Fund, the percentage of dividend income distributed for the year ended September 30, 2010 which is designated as qualified dividend income under the Jobs and Growth Tax Relief Act of 2003, is 100% (unaudited).
FMI Large Cap Fund
On December 17, 2010, the Board of Directors of FMI Funds, Inc. (“Directors”) approved the continuation of the FMI Large Cap Fund’s investment advisory agreement with Fiduciary Management, Inc. (“FMI”). Prior to approving the continuation of the investment advisory agreement, the Directors considered:
| | • | the nature, extent and quality of the services provided by FMI |
| | • | the investment performance of the Fund |
| | • | the cost of the services to be provided and profits to be realized by FMI from its relationship with the Fund |
| | • | the extent to which economies of scale would be realized as the Fund grew and whether fee levels reflect any economies of scale |
| | • | the expense ratio of the Fund |
| | • | the manner in which portfolio transactions for the Fund were conducted, including the use of soft dollars |
In considering the nature, extent and quality of the services provided by FMI, the Directors reviewed a report describing the portfolio management, shareholder communication and servicing, prospective shareholder assistance and regulatory compliance services provided by FMI to the Fund. The Directors concluded that FMI was providing essential services to the Fund. In particular, the Directors concluded that FMI was, or will be, preparing reports to shareholders in addition to those required by law, and was providing services to the Fund that were in addition to the services investment advisers typically provide its non-mutual fund clients.
The Directors compared the performance of the Fund to the benchmark index over various periods of time and concluded that the performance of the Fund warranted the continuation of the advisory agreement.
In concluding that the advisory fees payable by the Fund were reasonable, the Directors reviewed a report that concluded that the profits FMI realized from its relationship with the Fund, expressed as a percentage of pre-tax revenues, were generally comparable to that of publicly traded investment advisers. The Directors also reviewed reports comparing the Fund’s expense ratio and advisory fees paid by the Fund to those of other comparable mutual funds and concluded that the advisory fee paid by the Fund and the Fund’s expense ratio, were within the range of comparable mutual funds. The Directors noted that the investment advisory fee was not adjusted if the Fund grew, but did not consider that factor to be significant because of the other factors considered.
Finally, the Directors reviewed reports discussing the manner in which portfolio transactions for the Fund were conducted, including the use of soft dollars. Based on these reports, the Directors concluded that the research obtained by FMI was beneficial to the Fund and that FMI was executing the Fund’s portfolio transactions in a manner designed to obtain best execution for the Fund.
ADDITIONAL INFORMATION
For additional information about the Directors and Officers or for a description of the policies and procedures that the Fund uses to determine how to vote proxies relating to portfolio securities, please call (800) 811-5311 and request a Statement of Additional Information. One will be mailed to you free of charge. The Statement of Additional Information is also available on the website of the Securities and Exchange Commission (the “Commission”) at http://www.sec.gov. Information on how the Fund voted proxies relating to portfolio securities is available on the Fund’s website at http://www.fmifunds.com or the website of the Commission no later than August 31 for the prior 12 months ending June 30. The Fund files its complete schedule of portfolio holdings with the Commission for the first and third quarters of each fiscal year on Form N-Q. The Fund’s Form N-Q is available on the Commission’s website. The Fund’s Form N-Q may be reviewed and copied at the Commission’s Public Reference Room in Washington, D.C., and that information on the operation of the Public Reference Room may be obtained by calling 1-800-SEC-0330.
FMI Large Cap Fund
100 East Wisconsin Avenue, Suite 2200
Milwaukee, Wisconsin 53202
www.fmifunds.com
414-226-4555
BOARD OF DIRECTORS
BARRY K. ALLEN
ROBERT C. ARZBAECHER
PATRICK J. ENGLISH
GORDON H. GUNNLAUGSSON
TED D. KELLNER
RICHARD E. LANE
PAUL S. SHAIN
INVESTMENT ADVISER
FIDUCIARY MANAGEMENT, INC.
100 East Wisconsin Avenue, Suite 2200
Milwaukee, Wisconsin 53202
ADMINISTRATOR, ACCOUNTANT, TRANSFER
AGENT AND DIVIDEND DISBURSING AGENT
U.S. BANCORP FUND SERVICES, LLC
615 East Michigan Street
Milwaukee, Wisconsin 53202
800-811-5311
or
414-765-4124
CUSTODIAN
U.S. BANK, N.A.
1555 North RiverCenter Drive, Suite 302
Milwaukee, Wisconsin 53212
DISTRIBUTOR
RAFFERTY CAPITAL MARKETS, LLC
59 Hilton Avenue
Garden City, New York 11530
INDEPENDENT REGISTERED
PUBLIC ACCOUNTING FIRM
PRICEWATERHOUSECOOPERS LLP
100 East Wisconsin Avenue, Suite 1800
Milwaukee, Wisconsin 53202
LEGAL COUNSEL
FOLEY & LARDNER LLP
777 East Wisconsin Avenue
Milwaukee, Wisconsin 53202
This report is not authorized for use as an offer of sale or a solicitation of an offer to buy shares of FMI Large Cap Fund unless accompanied or preceded by the Fund’s current prospectus. Performance data quoted represents past performance; past performance does not guarantee future results. The investment return and principal value of an investment will fluctuate so that an investor’s shares, when redeemed, may be worth more or less than their original cost. Current performance of the Fund may be lower or higher than the performance quoted. Performance data current to the most recent month end may be obtained by visiting www.fmifunds.com.
SEMIANNUAL REPORT
March 31, 2011
FMI
International
Fund
(FMIJX)
A NO-LOAD
MUTUAL FUND
FMI
International
Fund
March 31, 2011
Dear Fellow Shareholders:
The FMI International Fund gained 0.75%(1) in the quarter ending March 31. The Technology Services, Producer Manufacturing, and Health Technology sectors were the strongest contributors to the Fund’s overall performance, while Retail Trade, Finance, and Electronic Technology lagged. Solid performance by Accenture and CRH was partially offset by underperformance from Tesco and Shin-Etsu Chemical. During the period, the MSCI EAFE Indexi returned 0.99% in local currency and 3.36% in U.S. Dollars (USD). Since the FMI International Fund is essentially fully hedged against foreign currency exposure, the most relevant benchmark for comparison is the 0.99% return in local currency. Please note that we include a mention of the MSCI EAFE Index only insofar as international investors have grown accustomed to seeing this benchmark. We do not consider the benchmark in the management of the Fund and we would expect significant divergence in performance over quarterly periods. Our long-term goal is to achieve returns that comfortably exceed inflation.
This being the inaugural shareholder letter for the FMI International Fund, we want to briefly explain our investment philosophy and objectives for FMIJX. For over 30 years, the Fund’s advisor has endeavored to purchase strong, durable business franchises at a discount valuation. This discount may be due to company or industry-specific issues and our research attempts to not only get a full grasp of the business, but also to determine whether the problems are temporary or permanent, and whether management is capable. Our outlook is long-term; investors should expect relatively low turnover.
Many outstanding businesses are domiciled outside of the United States. Increasingly, U.S. companies are moving headquarters and operations offshore. Our investment philosophy, strategy and research tactics can be applied in many locales and this ability will be increasingly important as the world shrinks. The lack of good data, transparency and trust with respect to management strategy, return on invested capital, governance and a host of other factors make it impossible to look at many international companies in a way that is comparable to how we operate domestically. While there may be a few good Chinese and Russian companies, for example, we cannot conduct our customary due diligence and therefore, for the time being, choose not to risk our shareholder’s money there. FMIJX will have broad exposure to major economic sectors and industries, however, a company’s country of origin is not a major consideration. The vast majority of investments will be in firms that are global in nature. The Fund will have exposure to emerging markets, but only as it relates to the global footprint of the businesses in which we invest.
___________________
| (1) | The inception date of the FMI International Fund is December 31, 2010. Therefore, the 1- year and annualized 5- year returns are N/A and since inception through March 31, 2011 is 3.08% annualized. |
| i | The MSCI EAFE Index (Europe, Australasia, Far East) is a free float-adjusted market capitalization index that is designed to measure the equity market performance of developed markets, excluding the U.S. & Canada. As of May 27, 2010 the MSCI EAFE Index consisted of the following 22 developed market country indices: Australia, Austria, Belgium, Denmark, Finland, France, Germany, Greece, Hong Kong, Ireland, Israel, Italy, Japan, the Netherlands, New Zealand, Norway, Portugal, Singapore, Spain, Sweden, Switzerland, and the United Kingdom. The MSCI EAFE Index is unmanaged and investors cannot invest directly in the Index. Index results are inclusive of dividends and net of foreign withholding taxes. The reported figures include reinvestment of dividends and capital gains distributions and do not reflect any fees or expenses. |
Since launching the Fund, we have initiated four investments in Japan: SMC Corporation, SHIMANO, SECOM, and Shin-Etsu Chemical. We were originally drawn to these companies because the valuations were low, the balance sheets were robust, and the underlying businesses featured dominant global franchises with top market positions. Excluding SECOM, the vast majority of revenues were generated overseas, reducing the dependence on domestic Japanese demand. In addition, while many Japanese companies do not focus on return on capital and shareholder returns, we believe our collection of businesses are among the exceptions to the rule. Even though Japan faces many challenges in the wake of the tragic earthquake and tsunami, we do not believe these four businesses have been permanently impaired, and we expect them to continue to thrive in the years to come. In fact, during the panic selling in the days following the tsunami, we took advantage of the opportunity and increased certain holdings.
Listed below is a brief summary of SHIMANO, which is provided as an example of a snapshot of our investment process. Please note that in featuring SHIMANO we are not suggesting this stock is better than other holdings in the portfolio.
SHIMANO Inc.
(Analyst: Jonathan Bloom)
Description
SHIMANO is the world’s leading manufacturer of bicycle components, with an estimated market share of over 50% in the mid- and high-end segments of the market. Key bicycle components include derailleurs, brakes, shifters, pedals, cranksets, chains, hubs, cassettes, wheels, et al. Over the past five years, bicycle components have accounted for 77% of total sales and 92% of operating profits. SHIMANO is also the world’s leading manufacturer of fishing tackle, representing 22% of total sales and 8% of operating profits. While the company is based in Japan, approximately 87% of total sales (96% of bicycle component sales) come from overseas, with a geographic distribution as follows – Japan: 13.1%, North America: 12.4%, Europe: 38.3%, Asia: 32.5%, Australia & South America: 3.7%.
Good Business
| | • | Attractive returns: 5- and 10-year average return on invested capital (ROIC) of approximately 16% and 14% respectively, comfortably exceeding the company’s cost of capital. |
| | • | Economies of scale: At over 2x the size of its closest competitor (SRAM), SHIMANO benefits from economies of scale related to manufacturing, R&D spending, sales & marketing, global distribution, etc. |
| | • | Barriers to entry: Patents and advanced performance requirements make entry into the mid- and high-end of the market difficult, as illustrated by a three-player oligopoly (SHIMANO, SRAM and Campagnolo). |
| | • | Robust balance sheet: Virtually no debt. Total debt/capital of < 1%. Net cash of ¥71.5 billion ($863 million). |
| | • | Easy to understand, reasonable ability to control destiny: Narrow focus with two core competencies. |
Valuation
| | • | Currently trading at EV/Sales of 1.50x and EV/ EBITDA of 7.55x, below 5-year historical averages of 1.63x and 9.16x respectively. This compares with a normalized operating margin of 15-16%. |
| | • | P/E 2011E = 17.8x, which is below its 5-year historical average. P/E 2011E (excluding cash) is 14.5x. |
| | • | Currently trading at a 6.8% free cash flow (FCF) yield, based on a 3-year average of FCF. |
| | • | Dividend yield is 1.5%. P/B is 2.3x, which is roughly in line with its 5-year historical average. |
Management
| | • | SHIMANO is family owned and operated, with Mr. Yoshizo Shimano and Mr. Yozo Shimano serving as the Chairman and President of the company, respectively. They have significant skin in the game, with ownership interests of approximately $170 million (3.6% of shares outstanding) between the two of them. |
| | • | Management returns a significant amount of cash to shareholders, having bought back nearly a third of the company’s total shares outstanding over the past decade, in addition to paying a 1% dividend. |
Investment Thesis
SHIMANO is the dominant player in a niche market, operating in a global oligopoly with more than a 50% market share. The company benefits from economies of scale and barriers to entry, and as a result has steadily earned a return above its cost of capital. Management has a strong long-term track record, returns a significant amount of cash to shareholders, and has a meaningful position in the stock. The industry has benefited from long-term structural growth, and with a rise in global income and increased awareness for the importance of exercise and healthy living, demand for mid- and high-end bicycles is expected to continue to increase. The stock is trading near a standard deviation below several key historical valuation metrics, and is attractively priced for a high-quality global franchise with a sizeable moat.
v v v v v
In the context of the current global economic environment, we remain more defensive than most funds, especially in light of the underlying macro risks faced by the developed world. Whether it be the sovereign debt crisis in Europe, unrest in the Middle East, the aftermath of the tsunami in Japan (not to mention the country’s mountain of debt and shrinking population), or a looming real estate bubble in China, there are plenty of big picture issues which need to be closely monitored. Until markets properly discount these risks, or we start to see some meaningful stabilization in the global economic environment, we will continue to be more cautious than usual.
Our investors should know that the advisor is invested alongside of them in the Fund, as with all of our investment products. We will always “eat our own cooking!”
Thank you for your confidence in the FMI International Fund.
| |
| Ted D. Kellner, CFA | Patrick J. English, CFA |
| Executive Chairman | CEO and Chief Investment Officer |
The MSCI EAFE Index is calculated in local currency as well as in USD. The concept of a local currency calculation excludes the impact of currency fluctuations. All currencies of listing are considered in the Index calculation in local currency where current prices (t) and previous day prices (t-1) are converted into USD using the same exchange rate (exchange rate t-1) in the numerator and denominator. As a consequence, the FX factor drops out of the equation. The USD calculation includes exchange rates at t and t-1. Therefore, the local currency calculation only represents the price appreciation or depreciation of the securities, whereas the USD calculation also accounts for the performance of the currency (or currencies) relative to the USD.
MSCI EAFE is a service mark of MSCI Barra.
The returns do not reflect the deduction of taxes that a shareholder would pay on Fund distributions or the redemption of Fund shares. Performance data quoted represents past performance; past performance does not guarantee future results. The investment return and principal value of an investment will fluctuate so that an investor’s shares, when redeemed, may be worth more or less than their original cost. Current performance since the above time period may be lower or higher than the performance quoted. Performance data current to the most recent month-end may be obtained by visiting www.fmifunds.com or by calling 1-800-811-5311. As of the Fund’s Prospectus dated December 31, 2010, the Fund’s annual operating expense ratio is 1.00%
As of March 31, 2011, the security holdings mentioned above represented the following percentage of the Fund’s total assets: Accenture PLC 4.6%; CRH PLC 4.2%; SECOM Co., Ltd. 3.7%; SHIMANO Inc. 3.9%; Shin-Etsu Chemical Co., Ltd. 3.7%; SMC Corporation 3.8%; and Tesco PLC 3.7%. Portfolio holdings are subject to change without notice and are not intended as recommendations of individual securities.
For more information about the FMI International Fund, call (800) 811-5311 for a free prospectus. Please read the prospectus carefully to consider the investment objectives, risks, charges and expenses, before investing or sending money. The prospectus contains this and more information about the FMI International Fund. Please read the prospectus carefully before investing.
Distributed by Rafferty Capital Markets, LLC
100 E. Wisconsin Ave., Suite 2200 • Milwaukee, WI 53202 • 414-226-4555
www.fmifunds.com
FMI International Fund
As a shareholder of the Fund you incur ongoing costs, including management fees and other Fund expenses. You do not incur transaction costs such as sales charges (loads) on purchase payments, reinvested dividends, or other distributions; redemption fees; and exchange fees because the Fund does not charge these fees. This example is intended to help you understand your ongoing costs (in dollars) of investing in FMI International Fund and to compare these costs with the ongoing costs of investing in other mutual funds.
The example is based on an investment of $1,000 invested at the beginning of the period and held for the entire period from December 31, 2010 (Commencement of Operations) through March 31, 2011.
Actual Expenses
The first line of the table below provides information about actual account values and actual expenses. You may use the information in this line, together with the amount you invested, to estimate the expenses that you paid over the period. Simply divide your account value by $1,000 (for example, an $8,600 account value divided by $1,000 = 8.6), then multiply the result by the number in the first line under the heading entitled “Expenses Paid During Period” to estimate the expenses you paid on your account during this period.
In addition to the costs highlighted and described below, the only Fund transaction costs you might currently incur would be wire fees ($15 per wire), if you choose to have proceeds from a redemption wired to your bank account instead of receiving a check. Additionally, U.S. Bank charges an annual processing fee ($15) if you maintain an IRA account with the Fund. To determine your total costs of investing in the Fund, you would need to add any applicable wire or IRA processing fees you’ve incurred during the period to the costs provided in the example at the end of this article.
Hypothetical Example for Comparison Purposes
The example is based on an investment of $1,000 invested at the beginning of the period and held for the entire six month period from October 1, 2010 through March 31, 2011.
The second line of the table below provides information about hypothetical account values and hypothetical expenses based on the Fund’s actual expense ratio and an assumed rate of return of 5% per year before expenses, which is not the Fund’s actual return. The hypothetical account values and expenses may not be used to estimate the actual ending account balance or expenses you paid for the period. You may use this information to compare the ongoing costs of investing in the Fund and other funds. To do so, compare this 5% hypothetical example with the 5% hypothetical examples that appear in the shareholder reports of the other funds.
Please note that the expenses shown in the table are meant to highlight your ongoing costs only and do not reflect any transactional costs, such as sales charges (loads), redemption fees or exchange fees. Therefore, the second line of the table is useful in comparing ongoing costs only, and will not help you determine the relative total costs of owning different funds. In addition, if these transactional costs were included, your costs would have been higher.
| | Beginning | Ending | Expenses Paid |
| | Account | Account | During Period |
| | Value 12/31/10* | Value 3/31/11 | 12/31/10*-3/31/11 |
| FMI International Fund Actual | $1,000.00 | $1,007.50 | $2.50** |
| | | | |
| | Beginning | Ending | Expenses Paid |
| | Account | Account | During Period |
| | Value 10/1/10 | Value 3/31/11 | 10/1/10-3/31/11 |
| Hypothetical (5% return before expenses) | $1,000.00 | $1,019.90 | $5.04*** |
| * | Commencement of Operations. |
| ** | Expenses are equal to the Fund’s annualized expense ratio of 1.00%, multiplied by the average account value over the period, multiplied by 91/365 (to reflect the period between December 31, 2010 (commencement of operations) and March 31, 2011). |
| *** | Expenses are equal to the Fund’s annualized expense ratio of 1.00%, multiplied by the average account value over the period, multiplied by 182/365 (to reflect the assumed six month period between October 1, 2010 and March 31, 2011). |
FMI International Fund
INDUSTRY SECTORS
March 31, 2011 (Unaudited)
FMI International Fund
STATEMENT OF ASSETS AND LIABILITIES
March 31, 2011 (Unaudited)
| ASSETS: | | | |
| Investments in securities, at value (cost $11,175,649) | | $ | 11,278,236 | |
| Dividends receivable | | | 38,698 | |
| Receivable from shareholders for purchases | | | 22,000 | |
| Receivable for forward currency contracts | | | 19,661 | |
| Cash | | | 12,763 | |
| Total assets | | $ | 11,371,358 | |
| | | | | |
| LIABILITIES: | | | | |
| Payable for forward currency contracts | | $ | 109,152 | |
| Payable to adviser for management fees | | | 1,555 | |
| Other liabilities | | | 19,476 | |
| Total liabilities | | | 130,183 | |
| | | | | |
| NET ASSETS: | | | | |
| Capital Stock, $0.0001 par value; 300,000,000 shares authorized; 557,827 shares outstanding | | | 11,178,223 | |
| Net unrealized appreciation on investments | | | 102,587 | |
| Net unrealized depreciation on forward currency contracts | | | (89,491 | ) |
| Net unrealized depreciation on foreign currency transactions | | | (167 | ) |
| Accumulated net realized loss on foreign currency transactions | | | (3,132 | ) |
| Undistributed net investment income | | | 53,155 | |
| Net assets | | | 11,241,175 | |
| Total liabilities and net assets | | $ | 11,371,358 | |
| | | | | |
| CALCULATION OF NET ASSET VALUE PER SHARE: | | | | |
| Net asset value, offering and redemption price per share ($11,241,175 ÷ 557,827 shares outstanding) | | $ | 20.15 | |
The accompanying notes to financial statements are an integral part of this statement.
FMI International Fund
SCHEDULE OF INVESTMENTS
March 31, 2011 (Unaudited)
| Shares | | | | Cost | | | Value | |
| COMMON STOCKS — 83.4% (a) | | | | | | |
COMMERCIAL SERVICES SECTOR — 5.7% | | | | | | |
| | | Miscellaneous Commercial Services — 5.7% | | | | | | |
| | 9,000 | | SECOM Co., | | | | | | |
| | | | Ltd. (Japan) | | $ | 424,438 | | | $ | 418,483 | |
| | 125 | | SGS S.A. (Switzerland) | | | 210,584 | | | | 222,287 | |
| | | | | | | 635,022 | | | | 640,770 | |
| CONSUMER DURABLES SECTOR — 4.0% | | | | | | | | |
| | | | Recreational Products — 4.0% | | | | | | | | |
| | 8,900 | | SHIMANO Inc. (Japan) | | | 451,665 | | | | 445,483 | |
CONSUMER NON-DURABLES SECTOR — 8.4% | | | | | | | | |
| | | | Beverages: Alcoholic — 4.0% | | | | | | | | |
| | 23,450 | | Diageo PLC | | | | | | | | |
| | | | (United Kingdom) | | | 449,429 | | | | 445,747 | |
| | | | Food: Major Diversified — 4.4% | | | | | | | | |
| | 8,725 | | Nestlé S.A. | | | | | | | | |
| | | | (Switzerland) | | | 495,644 | | | | 499,638 | |
CONSUMER SERVICES SECTOR — 4.4% | | | | | | | | |
| | | Restaurants — 4.4% | | | | | | | | |
| | 55,550 | | Compass Group PLC | | | | | | | | |
| | | | (United Kingdom) | | | 500,313 | | | | 499,333 | |
ELECTRONIC TECHNOLOGY SECTOR — 8.0% | | | | | | | | |
| | | | Aerospace & Defense — 4.1% | | | | | | | | |
| | 46,775 | | Rolls-Royce Group PLC | | | | | | | | |
| | | | (United Kingdom)* | | | 468,542 | | | | 463,804 | |
| | | | Electronic Components — 3.9% | | | | | | | | |
| | 12,500 | | TE Connectivity Limited | | | | | | | | |
| | | | (Switzerland) | | | 447,862 | | | | 435,250 | |
FINANCE SECTOR — 9.7% | | | | | | | | |
| | | | Financial Conglomerates — 3.5% | | | | | | | | |
| | 11,950 | | Brookfield Asset | | | | | | | | |
| | | | Management Inc. | | | | | | | | |
| | | | (Canada) | | | 392,754 | | | | 388,390 | |
| | | | Insurance Brokers/Services — 1.8% | | | | | | | | |
| | 5,000 | | Willis Group Holdings | | | | | | | | |
| | | | PLC (Ireland) | | | 181,840 | | | | 201,800 | |
| | | | Property/Casualty Insurance — 4.4% | | | | | | | | |
| | 1,300 | | Fairfax Financial Holdings | | | | | | | | |
| | | | Limited (Canada)* | | | 523,298 | | | | 491,439 | |
HEALTH TECHNOLOGY SECTOR — 4.1% | | | | | | | | |
| | | | Medical Specialties — 4.1% | | | | | | | | |
| | 8,950 | | Coviden PLC (Ireland) | | | 415,957 | | | | 464,863 | |
INDUSTRIAL SERVICES SECTOR — 2.2% | | | | | | | | |
| | | | Oilfield Services/Equipment — 2.2% | | | | | | | | |
| | 2,625 | | Schlumberger Limited | | | | | | | | |
| | | | (Netherlands) | | | 221,921 | | | | 244,807 | |
NON-ENERGY MINERALS SECTOR — 4.2% | | | | | | | | |
| | | | Construction Materials — 4.2% | | | | | | | | |
| | 20,650 | | CRH PLC (Ireland) | | | 425,456 | | | | 474,017 | |
PROCESS INDUSTRIES SECTOR — 5.8% | | | | | | | | |
| | | | Chemicals: Agricultural — 2.0% | | | | | | | | |
| | 700 | | Syngenta AG | | | | | | | | |
| | | | (Switzerland) | | | 212,339 | | | | 227,728 | |
| | | | Chemicals: Specialty — 3.8% | | | | | | | | |
| | 8,500 | | Shin-Etsu Chemical | | | | | | | | |
| | | | Co., Ltd. (Japan) | | | 466,797 | | | | 423,048 | |
PRODUCER MANUFACTURING SECTOR — 15.3% | | | | | | | | |
| | | | Industrial Conglomerates — 7.8% | | | | | | | | |
| | 8,525 | | Ingersoll-Rand | | | | | | | | |
| | | | PLC (Ireland) | | | 399,021 | | | | 411,843 | |
| | 10,475 | | Tyco International | | | | | | | | |
| | | | Ltd. (Switzerland) | | | 451,383 | | | | 468,966 | |
| | | | | | | 850,404 | | | | 880,809 | |
| | | | Industrial Machinery — 7.5% | | | | | | | | |
| | 3,475 | | Schindler Holding AG | | | | | | | | |
| | | | (Switzerland) | | | 392,571 | | | | 417,602 | |
| | 2,600 | | SMC Corporation | | | | | | | | |
| | | | (Japan) | | | 447,067 | | | | 427,942 | |
| | | | | | | 839,638 | | | | 845,544 | |
| RETAIL TRADE SECTOR — 3.7% | | | | | | | | |
| | | | Food Retail — 3.7% | | | | | | | | |
| | 68,400 | | Tesco PLC | | | | | | | | |
| | | | (United Kingdom) | | | 453,883 | | | | 417,835 | |
TECHNOLOGY SERVICES SECTOR — 4.6% | | | | | | | | |
| | | | Information Technology Services — 4.6% | | | | | | | | |
| | 9,450 | | Accenture PLC | | | | | | | | |
| | | | (Ireland) | | | 468,808 | | | | 519,466 | |
FMI International Fund
SCHEDULE OF INVESTMENTS (Continued)
March 31, 2011 (Unaudited)
| Shares or | | | | | | | | |
| Principal | | | | | | | | |
| Amount | | | | Cost | | | Value | |
| COMMON STOCKS — 83.4% (a) (Continued) | | | | | | |
TRANSPORTATION SECTOR — 3.3% | | | | | | |
| | | Air Freight/Couriers — 3.3% | | | | | | |
| | 14,350 | | TNT N.V. (Netherlands) | | $ | 374,077 | | | $ | 368,465 | |
| | | | Total common stocks | | | 9,275,649 | | | | 9,378,236 | |
| | | | | | | | | | | | |
| SHORT-TERM INVESTMENTS — 16.9% (a) | | | | | | | | |
| | | | Commercial Paper — 16.9% | | | | | | | | |
| $ | 1,900,000 | | U.S. Bank, N.A., 0.02%, | | | | | | | | |
| | | | due 04/01/11 | | | 1,900,000 | | | | 1,900,000 | |
| | | | Total short-term | | | | | | | | |
| | | | investments | | | 1,900,000 | | | | 1,900,000 | |
| | | | Total investments — 100.3% | | $ | 11,175,649 | | | | 11,278,236 | |
| | | | Liabilities, less cash | | | | | | | | |
| | | | and receivables — (0.3%) (a) | | | | | | | (37,061 | ) |
| | | | TOTAL NET | | | | | | | | |
| | | | ASSETS — 100.0% | | | | | | $ | 11,241,175 | |
| * | Non-income producing security. |
| (a) | Percentages for the various classifications relate to net assets. |
PLC – Public Limited Company
SCHEDULE OF FORWARD CURRENCY CONTRACTS
| | | | | | | | | | | | Unrealized | |
| Settlement | | Currency to | | U.S. $ Value at | | Currency to | | U.S. $ Value at | | | Appreciation | |
| Date | Counterparty | be Delivered | | March 31, 2011 | | be Received | | March 31, 2011 | | | (Depreciation) | |
| 6/30/11 | U.S. Bank, N.A. | 600,002 Canadian Dollars | | $ | 617,558 | | 599,659 U.S. Dollars | | $ | 599,659 | | | $ | (17,899 | ) |
| 6/30/11 | U.S. Bank, N.A. | 790,000 Swiss Franc | | | 860,661 | | 836,610 U.S. Dollars | | | 836,610 | | | | (24,051 | ) |
| 6/30/11 | U.S. Bank, N.A. | 455,000 Euro | | | 643,621 | | 605,376 U.S. Dollars | | | 605,376 | | | | (38,245 | ) |
| 6/30/11 | U.S. Bank, N.A. | 945,000 British Pound | | | 1,514,006 | | 1,485,049 U.S. Dollars | | | 1,485,049 | | | | (28,957 | ) |
| 6/30/11 | U.S. Bank, N.A. | 123,194,926 Japanese Yen | | | 1,481,977 | | 1,501,638 U.S. Dollars | | | 1,501,638 | | | | 19,661 | |
| | | | | $ | 5,117,823 | | | | $ | 5,028,332 | | | $ | (89,491 | ) |
The accompanying notes to financial statements are an integral part of these schedules.
FMI International Fund
STATEMENT OF OPERATIONS
For the Period from December 31, 2010 (Commencement of Operations) to March 31, 2011 (Unaudited)
| INCOME: | | | |
| Dividends | | $ | 77,939 | |
| Interest | | | 39 | |
| Total income | | | 77,978 | |
| EXPENSES: | | | | |
| Management fees | | | 18,617 | |
| Professional fees | | | 11,660 | |
| Transfer agent fees | | | 6,275 | |
| Custodian fees | | | 5,810 | |
| Administrative and accounting services | | | 5,469 | |
| Registration fees | | | 4,286 | |
| Board of Directors fees | | | 2,000 | |
| Printing and postage expense | | | 95 | |
| Other expenses | | | 7,695 | |
| Total expenses before reimbursement | | | 61,907 | |
| Less expenses reimbursed by adviser | | | (37,084 | ) |
| Net expenses | | | 24,823 | |
| NET INVESTMENT INCOME | | | 53,155 | |
| NET REALIZED GAIN (LOSS) ON INVESTMENTS: | | | | |
| Foreign currency transactions | | | (3,132 | ) |
| Forward currency contracts | | | — | |
| NET REALIZED LOSS ON INVESTMENTS | | | (3,132 | ) |
| NET CHANGE IN UNREALIZED APPRECIATION OF: | | | | |
| Investments | | | 102,587 | |
| Forward currency contracts | | | (89,491 | ) |
| Foreign currency transactions | | | (167 | ) |
| NET CHANGE IN UNREALIZED APPRECIATION | | | 12,929 | |
| NET GAIN ON INVESTMENTS | | | 9,797 | |
| NET INCREASE IN NET ASSETS RESULTING FROM OPERATIONS | | $ | 62,952 | |
The accompanying notes to financial statements are an integral part of this statement.
FMI International Fund
STATEMENT OF CHANGES IN NET ASSETS
For the Period from December 31, 2010 (Commencement of Operations) to March 31, 2011 (Unaudited)
| | | 2011 | |
| OPERATIONS: | | | |
| Net investment income | | $ | 53,155 | |
| Net realized loss on foreign currency transactions | | | (3,132 | ) |
| Net increase in unrealized appreciation on investments | | | 102,587 | |
| Net decrease in unrealized appreciation on forward currency contracts | | | (89,491 | ) |
| Net decrease in unrealized appreciation on foreign currency transactions | | | (167 | ) |
| Net increase in net assets from operations | | | 62,952 | |
| FUND SHARE ACTIVITIES: | | | | |
| Proceeds from shares issued (557,837 shares) | | | 11,178,424 | |
| Cost of shares redeemed (10 shares) | | | (201 | ) |
| Net increase in net assets derived from Fund share activities | | | 11,178,223 | |
| TOTAL INCREASE | | | 11,241,175 | |
| NET ASSETS AT THE BEGINNING OF THE PERIOD | | | 0 | |
| NET ASSETS AT THE END OF THE PERIOD (Includes undistributed net investment income of $53,155) | | $ | 11,241,175 | |
(Selected data for each share of the Fund outstanding throughout the period)
| | | (Unaudited) | |
| | | For the Period from | |
| | | December 31, 2010* | |
| | | to March 31, 2011 | |
| PER SHARE OPERATING PERFORMANCE: | | | |
| Net asset value, beginning of period | | $ | 20.00 | |
| Income from investment operations: | | | | |
| Net investment income | | | 0.11 | |
| Net realized and unrealized gains on investments | | | 0.04 | |
| Total from investment operations | | | 0.15 | |
| Less distributions: | | | | |
| Distributions from net investment income | | | — | |
| Distributions from net realized gains | | | — | |
| Total from distributions | | | — | |
| Net asset value, end of period | | $ | 20.15 | |
| TOTAL RETURN | | | 0.75 | %(1) |
| RATIOS/SUPPLEMENTAL DATA: | | | | |
| Net assets, end of period (in 000’s $) | | | 11,241 | |
| Ratio of expenses (after reimbursement) to average net assets (a) | | | 1.00 | %(2) |
| Ratio of net investment income to average net assets (b) | | | 2.14 | %(2) |
| Portfolio turnover rate | | | 0 | % |
| * | Commencement of Operations |
| (a) | Computed after giving effect to adviser’s expense limitation undertaking. If the Fund had paid all of its expenses for the period from December 31, 2010* to March 31, 2011, the ratio would have been 2.49%(2). |
| (b) | If the Fund had paid all of its expenses for the period December 31, 2010* to March 31, 2011, the ratio would have been 0.65%(2). |
The accompanying notes to financial statements are an integral part of these statements.
FMI International Fund
NOTES TO FINANCIAL STATEMENTS
March 31, 2011 (Unaudited)
| (1) | Summary of Significant Accounting Policies — |
The following is a summary of significant accounting policies of the FMI International Fund (the “Fund”), a series of FMI Funds, Inc. (the “Company”) which is registered as a non-diversified, open-end management investment company under the Investment Company Act of 1940 (the “Act”), as amended. The Company was incorporated under the laws of Maryland on September 5, 1996 and the Fund commenced operations on December 31, 2010. The assets and liabilities of each Fund in the Company are segregated as a shareholder’s interest is limited to the Fund in which the shareholder owns shares. The investment objective of the Fund is to seek capital appreciation principally through investing in non-U.S. common stock.
| | (a) | Each security, excluding short-term investments, is valued at the last sale price reported by the principal security exchange on which the issue is traded. Securities that are traded on the Nasdaq Markets are valued at the Nasdaq Official Closing Price or if no sale is reported, at the latest bid price. Securities which are traded over-the-counter are valued at the latest bid price. Securities sold short which are listed on a national securities exchange or the Nasdaq Stock Market but which were not traded on the valuation date are valued at the most recent ask price. Unlisted equity securities for which market quotations are readily available are valued at the most recent bid price. Options purchased or written by the Fund are valued at the average of the most recent bid and ask prices. Securities for which quotations are not readily available are valued at fair value as determined by the investment adviser under the supervision of the Board of Directors. The fair value of a security is the amount which the Fund might reasonably expect to receive upon a current sale. The fair value of a security may differ from the last quoted price and the Fund may not be able to sell a security at the estimated fair value. Market quotations may not be available, for example, if trading in particular securities was halted during the day and not resumed prior to the close of trading on the New York Stock Exchange. For securities that do not trade during New York Stock Exchange hours, fair value determinations are based on analyses of market movements after the close of those securities’ primary markets, and may include reviews of developments in foreign markets, the performance of U.S. securities markets, and the performance of instruments trading in U.S. markets that represent foreign securities and baskets of foreign securities. The Board may also utilize a service provided by an independent third party to assist in fair valuation of certain securities. As of March 31, 2011 there were no securities that were internally fair valued. Variable rate demand notes are recorded at par value which approximates market value. Short-term investments with maturities of 60 days or less are valued at amortized cost which approximates value. For financial reporting purposes, investment transactions are recorded on the trade date. |
| | | The Fund applies the provisions of the Financial Accounting Standards Board (“FASB”) Accounting Standards Codification “Fair Value Measurements and Disclosures” Topic 820 (“ASC 820”), which defines fair value as the price that would be received to sell an asset or paid to transfer a liability (i.e., the “exit price”) in an orderly transaction between market participants at the measurement date. |
In determining fair value, the Fund uses various valuation approaches. ASC 820 establishes a fair value hierarchy for inputs used in measuring fair value that maximizes the use of observable inputs and minimizes the use of unobservable inputs by generally requiring that the most observable inputs be used when available. Observable inputs are those that market participants would use in pricing the asset or liability based on market data obtained from sources independent of the Fund. Unobservable inputs reflect the Fund’s assumptions about the inputs market participants would use in pricing the asset or liability developed based on the best information available in the circumstances. The inputs or methodologies used for valuing securities are not necessarily an indication of the risks associated with investing in those securities. Over the counter derivatives such as forward currency contracts may be valued using quantitative models. These models may use pricing curves based on market inputs including current exchange rates or indices. These curves are combined with volatility factors to value the overall positions. The market inputs are generally significant and can be corroborated with observable market data and therefore are classified in level 2.
The fair value hierarchy is categorized into three levels based on the inputs as follows:
| | Level 1 — | Valuations based on unadjusted quoted prices in active markets for identical assets. |
| | Level 2 — | Valuations based on quoted prices for similar securities or in markets that are not active or for which all significant inputs are observable, either directly or indirectly. |
| | Level 3 — | Valuations based on inputs that are unobservable and significant to the overall fair value measurement. |
FMI International Fund
NOTES TO FINANCIAL STATEMENTS (Continued)
March 31, 2011 (Unaudited)
| (1) | Summary of Significant Accounting Policies — (Continued) |
| | | The following table summarizes the Fund’s investments as of March 31, 2011, based on the inputs used to value them: |
| Valuation Inputs | | Investments in Securities | |
| Level 1 — Common Stocks | | $ | 9,378,236 | |
| Level 2 — Short-Term Commercial Paper | | | 1,900,000 | |
| Forward currency contracts | | | (89,491 | ) |
| Total Level 2 | | | 1,810,509 | |
| Level 3 — | | | — | |
| Total | | $ | 11,188,745 | |
| | | It is the Fund’s policy to recognize transfers between levels at the end of the quarterly reporting period. There were no transfers between levels during the period ending March 31, 2011. |
See the Schedule of Investments for investments detailed by industry classification.
| | (b) | Net realized gains and losses on sales of securities are computed on the identified cost basis. |
| | (c) | Dividend income is recorded on the ex-dividend date. Interest income is recorded on an accrual basis. |
| | (d) | The Fund may have investments in short-term variable rate demand notes, which are unsecured instruments. The Fund may be susceptible to credit risk with respect to these notes to the extent the issuer defaults on its payment obligation. The Fund’s policy is to monitor the creditworthiness of the issuer and nonperformance by these issuers is not anticipated. |
| | (e) | The Fund may enter into forward currency contracts in order to hedge its exposure to changes in foreign currency rates on its foreign portfolio holdings or to hedge certain purchase and sale commitments denominated in foreign currencies. A forward currency contract is a commitment to purchase or sell a foreign currency at a future date at a negotiated rate. These contracts are valued daily and the asset or liability therein represents unrealized gain or loss on the contracts as measured by the difference between the forward foreign exchange rates at the dates of entry into the contracts and the forward rates at the reporting date. There were on average five forward currency contracts outstanding during the period December 31, 2010 (Commencement of Operations) to March 31, 2011. |
| | | The fair value of the forward currency contracts as of March 31, 2011 is included in the following locations on the statement of assets and liabilities: |
| | | Fair Value of | | Fair Value of |
| | | Asset Forward | | Liability Forward |
| | Location | Currency Contracts | Location | Currency Contracts |
| Forward currency | Receivable for | $19,661 | Payable for | $109,152 |
| contracts | forward currency | | forward currency | |
| | contracts | | contracts | |
| | | Realized and unrealized gains and losses on forward currency contracts entered into during the period December 31, 2010 (Commencement of Operations) to March 31, 2011 by the Fund are recorded in the following locations on the statement of operations: |
| | | Realized | | Unrealized |
| | Location | Gain/Loss | Location | Gain/Loss |
| Forward currency | Net realized loss on forward | $0 | Net change in unrealized | $(89,491) |
| contracts | currency contracts | | depreciation on forward | |
| | | | currency contracts | |
| | | These instruments involve market risk, credit risk, or both kinds of risks, in excess of the amount recognized in the statement of assets and liabilities. Risks arise from the possible inability of counterparties to meet the terms of their contracts and from movement in currency and securities values and interest rates. |
FMI International Fund
NOTES TO FINANCIAL STATEMENTS (Continued)
March 31, 2011 (Unaudited)
| (1) | Summary of Significant Accounting Policies — (Continued) |
| | (f) | Accounting principles generally accepted in the United States of America (“GAAP”) require that permanent differences between income for financial reporting and tax purposes be reclassified in the capital accounts. |
| | (g) | The preparation of financial statements in conformity with GAAP requires management to make estimates and assumptions that affect the reported amounts of assets and liabilities and disclosure of contingent assets and liabilities at the date of the financial statements and the reported amounts of revenues and expenses during the reporting period. Actual results could differ from these estimates. |
| | (h) | No provision has been made for Federal income taxes since the Fund will elect to be taxed as a “regulated investment company” and intends to distribute substantially all net investment company taxable income and net capital gains to its shareholders and otherwise comply with the provisions of the Internal Revenue Code applicable to regulated investment companies. |
| | (i) | The Fund has reviewed the current tax year ending September 30, 2011 and major jurisdictions, which include Federal and the state of Maryland, and concluded that there are no significant uncertain tax positions that would require recognition in the financial statements. The Fund has no examinations in progress and is also not aware of any tax positions for which it is reasonably possible that the total amounts of unrecognized tax benefits will significantly change in the next twelve months. |
| (2) | Investment Adviser and Management Agreement and Transactions With Related Parties — |
The Fund has a management agreement with Fiduciary Management, Inc. (“FMI”), with whom certain officers and directors of the Fund are affiliated, to serve as investment adviser and manager. Under the terms of the current agreement, the Fund will pay FMI a monthly management fee at an annual rate of 0.75% of the daily net assets. The Fund is responsible for paying its proportionate share of the compensation, benefits and expenses of its Chief Compliance Officer. For administrative convenience, FMI initially makes these payments and is later reimbursed by the Fund.
FMI is contractually obligated to reimburse the Fund for expenses over 1.75% of the daily net assets of the Fund. In addition to the reimbursement required under the management agreement, FMI has voluntarily reimbursed the Fund for expenses over 1.00% of the Fund’s daily net assets. All such reimbursements amounted to $37,084 for the period December 31, 2010 (Commencement of Operations) to March 31, 2011.
The Fund has entered into a Distribution Plan (the “Plan”), pursuant to Rule 12b-1 under the Act. The Plan provides that the Fund may incur certain costs which may not exceed the lesser of a monthly amount equal to 0.25% of the Fund’s daily net assets or the actual distribution costs incurred during the year. Amounts payable under the Plan are paid monthly for any activities or expenses primarily intended to result in the sale of shares of the Fund. For the period December 31, 2010 (Commencement of Operations) to March 31, 2011, no such expenses were incurred.
Under the Fund’s organizational documents, each director, officer, employee or other agent of the Fund (including the Fund’s investment manager) is indemnified, to the extent permitted by the Act, against certain liabilities that may arise out of performance of their duties to the Fund. Additionally, in the normal course of business, the Fund enters into contracts that contain a variety of indemnification clauses. The Fund’s maximum exposure under these arrangements is unknown as this would involve future claims that may be made against the Fund that have not yet occurred. However, the Fund has not had prior claims or losses pursuant to these contracts and believes the risk of loss to be remote.
At March 31, 2011, one of the Fund’s Directors owned directly and indirectly approximately 60% of the Fund’s shares and another Director owned approximately 9% of the Fund’s shares.
| (3) | Distribution to Shareholders — |
Net investment income and net realized gains, if any, are distributed to shareholders at least annually.
| (4) | Investment Transactions — |
For the period December 31, 2010 (Commencement of Operations) to March 31, 2011, purchases and proceeds of sales of investment securities (excluding short-term investments) were $9,275,649 and $0, respectively.
FMI International Fund
On December 17, 2010, the Board of Directors of FMI Funds, Inc. (the “Directors”), evaluated such information as is necessary for the Directors to make an informed determination that the Investment Advisory Agreement with Fiduciary Management, Inc. (the “Adviser”) for the FMI International Fund, a new series of FMI Funds, Inc. (the “New Fund”), be approved. Prior to approving the adoption of the Investment Advisory Agreement, the Directors considered:
| | • | the advisory services to be provided by the Adviser are services required for the operation of the New Fund; |
| | • | the Adviser can provide advisory services, the nature and quality of which are at least equal to those provided by others offering the same or similar services; |
| | • | that the fees for the advisory services to be rendered by the Adviser are fair and reasonable in light of the usual and customary charges made by others offering the same or similar services; and |
| | • | the terms of the Investment Advisory Agreement are fair and reasonable; |
Based upon its review, the Directors determined that the Adviser has the capabilities, resources and personnel necessary to manage the New Fund effectively, and that, based on the services the Adviser is required to render under the Investment Advisory Agreement, the compensation to be paid to the Adviser is fair and reasonable and the terms of the Investment Advisory Agreement are fair and reasonable.
The Directors concluded that it would be in the best interests of the New Fund and its shareholders to enter into the Investment Advisory Agreement with the Adviser and therefore, the Investment Advisory Agreement and the fees provided for were approved.
For additional information about the Directors and Officers or for a description of the policies and procedures that the Fund uses to determine how to vote proxies relating to portfolio securities, please call (800) 811-5311 and request a Statement of Additional Information. One will be mailed to you free of charge. The Statement of Additional Information is also available on the website of the Securities and Exchange Commission (the “Commission”) at http://www.sec.gov. Information on how the Fund voted proxies relating to portfolio securities will be available on the Fund’s website at http://www.fmifunds.com or the website of the Commission no later than August 31 for the prior 12 months ending June 30. The Fund files its complete schedule of portfolio holdings with the Commission for the first and third quarters of each fiscal year on Form N-Q. The Fund’s Form N-Q is available on the Commission’s website. The Fund’s Form N-Q may be reviewed and copied at the Commission’s Public Reference Room in Washington, D.C., and that information on the operation of the Public Reference Room may be obtained by calling 1-800-SEC-0330.
FMI International Fund
100 East Wisconsin Avenue, Suite 2200
Milwaukee, Wisconsin 53202
www.fmifunds.com
414-226-4555
BOARD OF DIRECTORS
BARRY K. ALLEN
ROBERT C. ARZBAECHER
PATRICK J. ENGLISH
GORDON H. GUNNLAUGSSON
TED D. KELLNER
RICHARD E. LANE
PAUL S. SHAIN
INVESTMENT ADVISER
FIDUCIARY MANAGEMENT, INC.
100 East Wisconsin Avenue, Suite 2200
Milwaukee, Wisconsin 53202
ADMINISTRATOR, ACCOUNTANT, TRANSFER
AGENT AND DIVIDEND DISBURSING AGENT
U.S. BANCORP FUND SERVICES, LLC
615 East Michigan Street
Milwaukee, Wisconsin 53202
800-811-5311
or
414-765-4124
CUSTODIAN
U.S. BANK, N.A.
1555 North RiverCenter Drive, Suite 302
Milwaukee, Wisconsin 53212
DISTRIBUTOR
RAFFERTY CAPITAL MARKETS, LLC
59 Hilton Avenue
Garden City, New York 11530
INDEPENDENT REGISTERED
PUBLIC ACCOUNTING FIRM
PRICEWATERHOUSECOOPERS LLP
100 East Wisconsin Avenue, Suite 1800
Milwaukee, Wisconsin 53202
LEGAL COUNSEL
FOLEY & LARDNER LLP
777 East Wisconsin Avenue
Milwaukee, Wisconsin 53202
This report is not authorized for use as an offer of sale or a solicitation of an offer to buy shares of FMI International Fund unless accompanied or preceded by the Fund’s current prospectus. Performance data quoted represents past performance; past performance does not guarantee future results. The investment return and principal value of an investment will fluctuate so that an investor’s shares, when redeemed, may be worth more or less than their original cost. Current performance of the Fund may be lower or higher than the performance quoted. Performance data current to the most recent month end may be obtained by visiting www.fmifunds.com.
Item 2. Code of Ethics.
Not applicable for semi-annual reports.
Item 3. Audit Committee Financial Expert.
Not applicable for semi-annual reports.
Item 4. Principal Accountant Fees and Services.
Not applicable for semi-annual reports
Item 5. Audit Committee of Listed Registrants.
Not applicable to registrants who are not listed issuers (as defined in Rule 10A-3 under the Securities Exchange Act of 1934).
Item 6. Schedule of Investments.
| (a) | The Schedules of Investments in securities of unaffiliated issuers are included as part of the report to shareholders filed under Item 1 of this Form. |
Item 7. Disclosure of Proxy Voting Policies and Procedures for Closed-End Management Investment Companies
Not applicable.
Item 8. Portfolio Managers of Closed-End Management Investment Companies.
Not applicable.
Item 9. Purchases of Equity Securities By Closed-End Management Investment Company and Affiliated Purchasers.
Not applicable.
Item 10. Submission of Matters to a Vote of Security Holders.
None.
Item 11. Controls and Procedures.
| (a) | The Registrant’s disclosure controls and procedures are periodically evaluated. As of April 15, 2011, the date of the last evaluation, the Registrant’s officers have concluded that the Registrant’s disclosure controls and procedures are adequate. |
| (b) | The Registrant’s internal controls are periodically evaluated. There were no changes in the Registrant’s internal control over financial reporting that occurred during the second fiscal quarter of the period covered by this report that have materially affected, or are reasonably likely to materially affect, such controls. |
Item 12. Exhibits.
| (a) | (1) Any code of ethics or amendment thereto. Not applicable. |
| | (2) Certifications pursuant to Section 302 of the Sarbanes-Oxley Act of 2002. Filed herewith. |
| (3) | Any written solicitation to purchase securities under Rule 23c-1 under the Act sent or given during the period covered by the report by or on behalf of the Registrant to 10 or more persons. Not applicable to open-end investment companies. |
| (b) | Certification pursuant to Section 906 of the Sarbanes-Oxley Act of 2002. Furnished herewith. |
SIGNATURES
Pursuant to the requirements of the Securities Exchange Act of 1934 and the Investment Company Act of 1940, the registrant has duly caused this report to be signed on its behalf by the undersigned, thereunto duly authorized.
FMI Funds, Inc.
Registrant
By /s/Ted D. Kellner
Ted D. Kellner, President, Principal Executive Officer
Date May 12, 2011
Pursuant to the requirements of the Securities Exchange Act of 1934 and the Investment Company Act of 1940, this report has been signed below by the following persons on behalf of the registrant and in the capacities and on the dates indicated.
FMI Funds, Inc.
Registrant
By /s/Ted D. Kellner
Ted D. Kellner, President, Principal Executive Officer
FMI Funds, Inc.
Registrant
By /s/Ted D. Kellner
Ted D. Kellner, Treasurer, Principal Financial Officer