UNITED STATES
SECURITIES AND EXCHANGE COMMISSION
Washington, D.C. 20549
FORM N-CSR
CERTIFIED SHAREHOLDER REPORT OF REGISTERED
MANAGEMENT INVESTMENT COMPANIES
Investment Company Act file number 811-07831
FMI Funds, Inc.
(Exact name of registrant as specified in charter)
100 East Wisconsin Avenue
Suite 2200
Milwaukee, WI 53202
(Address of principal executive offices) (Zip code)
Ted D. Kellner
Fiduciary Management, Inc.
100 East Wisconsin Avenue
Suite 2200
Milwaukee, WI 53202
(Name and address of agent for service)
(414) 226-4555
(Registrant's telephone number, including area code)
Date of fiscal year end: September 30
Date of reporting period: September 30, 2014
Item 1. Reports to Stockholders.
ANNUAL REPORT
September 30, 2014
FMI Large Cap Fund
(FMIHX)
FMI Common Stock Fund
(FMIMX)
FMI International Fund
(FMIJX)
 | |
| |
| |
| FMI Funds |
| Advised by Fiduciary Management, Inc. |
| www.fmifunds.com |
FMI Funds
TABLE OF CONTENTS
| FMI Large Cap Fund | | |
| | | |
| Shareholder Letter | | | 2 |
| | | | |
| Management’s Discussion of Fund Performance | | | 8 |
| | | | |
| Schedule of Investments | | | 9 |
| | | | |
| Industry Sectors | | | 10 |
| | | | |
| | | | |
| | | | |
| FMI Common Stock Fund | | | |
| | | | |
| Shareholder Letter | | | 11 |
| | | | |
| Management’s Discussion of Fund Performance | | | 17 |
| | | | |
| Schedule of Investments | | | 18 |
| | | | |
| Industry Sectors | | | 20 |
| | | | |
| | | | |
| FMI International Fund | | | |
| | | | |
| Shareholder Letter | | | 21 |
| | | | |
| Management’s Discussion of Fund Performance | | | 27 |
| | | | |
| Schedule of Investments | | | 28 |
| | | | |
| Schedule of Forward Currency Contracts | | | 30 |
| | | | |
| Industry Sectors | | | 30 |
| | | | |
| | | | |
| Financial Statements | | | |
| | | | |
| Statements of Assets and Liabilities | | | 31 |
| | | | |
| Statements of Operations | | | 32 |
| | | | |
| Statements of Changes in Net Assets | | | 33 |
| | | | |
| Financial Highlights | | | 34 |
| | | | |
| Notes to Financial Statements | | | 36 |
| | | | |
| | | | |
| Report of Independent Registered Public Accounting Firm | | | 40 |
| | | | |
| Additional Information | | | 40 |
| | | | |
| Expense Example | | | 41 |
| | | | |
| Directors and Officers | | | 42 |
| | | | |
| Disclosure Information | | | 43 |
| | | | |
| Tax Notice | | | 45 |
| | | | |
| Notice of Privacy Policy | | | 45 |
| | | | |
| Householding Notice | | | 45 |
FMI
Large Cap
Fund
September 30, 2014
Dear Fellow Shareholders:
The FMI Large Cap Fund declined 1.77% in the three months ended September 30 compared to a gain of 1.13% for the benchmark Standard & Poor’s 500 Index (S&P 500). Process Industries, Consumer Non-Durables and Electronic Technology all detracted from performance. Potash, Danone and TE Connectivity were all down in the period. Devon and Schlumberger, both energy-related stocks, declined along with the price of oil. GlaxoSmithKline, which has been a disappointing investment, was sold in the quarter, as our thesis that both the industry and the company had changed proved not to be the case. On the flip side, Consumer Services, Distribution Services and Producer Manufacturing were positive contributors. Time Warner, AmerisourceBergen and Berkshire Hathaway gained in the quarter. The bid by Twenty-First Century Fox for Time Warner gave us the opportunity to exit this stock. Despite a few tough days, the market overall has continued its remarkable and almost uninterrupted run, now exceeding 66 months. We haven’t been willing to pay up for stocks… at least not the ones the market favors today. Gilead, Amgen, and Facebook, all very expensive momentum stocks, were among the top ten contributors to the benchmark this quarter. Our research team continues to scour the landscape for good values but these remain fairly rare. We are finding a few special situations and relative values to tide us over until a deeper turbulence surfaces.
As this bull market stretches on, we are encountering some common questions from our shareholders, clients and consultants. Below we take our best shot at addressing them before reviewing a couple of investments.
At what rate should the stock market appreciate?
Before answering this, let’s look at what stocks have achieved over the long term. According to the most reliable data from Ibbotson Associates, from 1926-2013 large company stocks have had a compound annual return of approximately 10%, with price appreciation constituting roughly 6%, and 4% coming from the dividend yield.
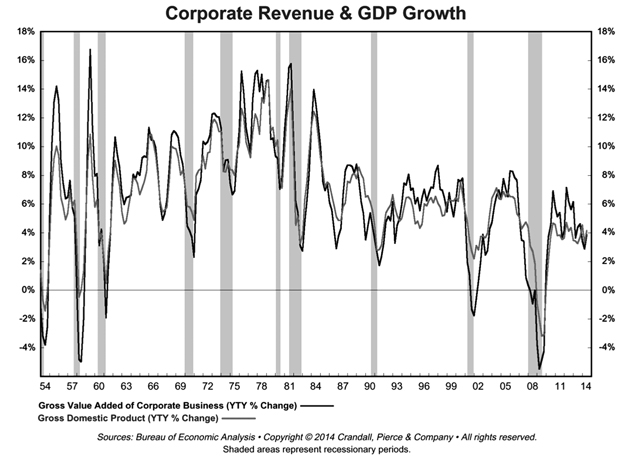
If one views the stock market as a proxy for the growth of corporations (sales and earnings), it is logical to expect the market to appreciate at roughly the rate of corporate sales and earnings growth. It just so happens that sales and earnings for the S&P 500 and broader measures of corporate earnings have, over long periods of time, grown at approximately the same rate of about 6%, although the figure is highly volatile over short time frames. Margins have also gone through years of expansion and contraction, which of course influences the growth rate of earnings compared to sales. In recent years margins have reached all-time highs so it wouldn’t be surprising to see them contract, causing earnings growth to lag sales growth.
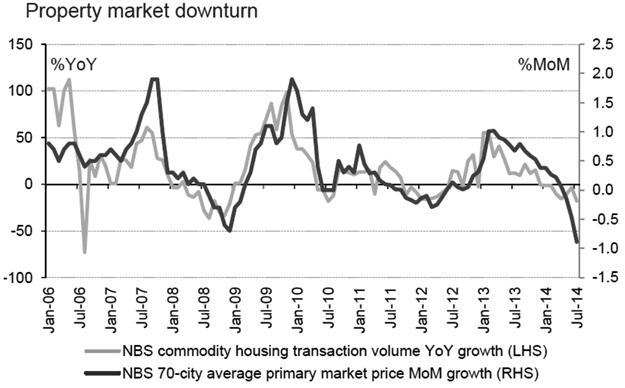
Since the S&P 500 total sales typically make up about two-thirds of the economy’s gross domestic product (GDP), and Bureau of Economic Analysis (BEA) compiled corporate revenue figures are an even larger percentage of GDP, it is not surprising that the growth rates for both corporate sales and the economy, as measured by GDP, have been roughly similar over long periods of time. Nearby is a chart of corporate revenue compared to nominal GDP and it is easy to see the high correlation. From 1926 through June of 2014, the nominal GDP growth rate has been 6.1%, although recently it has been much less.
So, the logical or natural rate at which stock prices “should” appreciate appears to be about 6% (total return would include the dividend yield), but of course investors and speculators sometimes do not have long-term time horizons and also, perhaps do not have a deep appreciation of where we are on the valuation-growth rate spectrum. Investor perceptions, manifested in valuations, tend to dominate short-to-intermediate performance of the stock market. Interest rates, inflation, and a whole host of factors play into valuations. If we go back in time, we find some very interesting data. In some sense, we can look at the modern investment world in two phases, post WWII (we’ll start with 1947) up to 1982, and from that period through today. From June of 1947 through June of 1982 the S&P 500 had a total price change of 620%, or 5.8% compounded annually (the total return was 10.6% with dividends… those were the years of big dividends!). S&P 500 earnings grew 6.3% from 1947-1982. In that same period, nominal GDP gained 1238.5%, or 7.7% compounded annually. So, stock market price returns lagged both nominal GDP and corporate earnings.
In the second period, from June of 1982 through June of 2014, the S&P 500 had a total price change of 1688.4%, or 9.2% compounded annually (12.2% with dividends). The S&P 500 earnings grew at roughly the same rate as they did in the prior period. Nominal GDP, on the other hand, gained 417.5%, or just 5.3% compounded. Obviously, the stock market trounced both the economy and earnings in this time frame. Over the last five and a half years alone, the total price change of the S&P 500 was 191.5% (21.5% compounded) compared to nominal GDP growth of just 23.7%1 (3.9% compounded).
In summary, stocks should (over time) roughly match the underlying growth of the economy and the fundamentals of the corporations that constitute the economy. Historically this rate of growth has been approximately 6%. The last few years have been characterized by a significant increase in stock prices relative to the growth in the economy and the underlying performance of U.S. corporations. The result is a stock market that is very expensive. The Leuthold Group data of 48 different valuation measures (most series exceed 60 years) that we tally every quarter puts the average current market valuation in the 9th decile (10 being the most expensive).
_______________
| 1 | Nominal GDP estimated using 3% for the September 2014 quarter. |
Why can’t valuations remain high?
The simple answer is they can… for a while. And a “while” can be pretty long, as we have seen over the last several years. The Fed has had an “emergency” policy in place for six years and while we will spare the reader a rehashing of prior letters which articulate the damaging short- and long-term elements of this approach, it certainly has helped drive stocks higher and make valuations expensive. Each time reported data is weaker than expected it fuels the market to go higher as investors gain confidence that interest rate policies will remain loose. The prevailing sentiment today is that the “Fed has investors’ backs.” Thus, issues that would normally cause the stock market to correct remain at bay. Subpar economic growth, rather than being a negative, is actually the opposite in today’s market. Modest inflation and low interest rates are taken as a given for the future. It is ironic how opposite the sentiment is today from what it was in 1982. This was a period of very high interest and inflation rates and very low valuations. Sentiment was awful. Today, on the other hand, investors are presented with conditions that are essentially the opposite: low inflation, rock bottom interest rates and sky-high valuations. 1982 turned out to be one of the greatest buying opportunities of all time. Logically, how could 2014 also be a great buying opportunity? Yet that is the Wall Street pitch.�� It should come as no surprise that we do not believe it!
Valuations are unlikely to remain high forever. Aside from being tied to the fundamentals of the economy and the companies that make up the economy (and being completely out of sync there) they are tied to sentiment and emotion. Right now the sentiment is that nothing will derail the equity train. Our experience tells us something will. History suggests the same. The fact that so far this market has shrugged off massive destabilization in the Middle East; a new terrorist threat in ISIS (Islamic State in Iraq and Syria); a renewed Cold War; an economic U-turn in Europe, Japan, Brazil and Russia; the failure of Fed Policy; and the lack of any nod to business or free market principles in Washington, should worry rather than embolden investors. Deep down people know that things are not right. How can an economy be right if nearly 37% of the working-age citizens are not working? Real household incomes, except for those at the top, have been stagnant to declining for over a decade. More people than ever are living off the taxpayer. Companies are not investing enough in capital. The past ten years have seen one of the lowest capital investment relative to GDP since records have been kept. Companies are underinvesting in people. New healthcare mandates, higher taxes and a mountain of new regulations all thwart the effort. Instead, companies borrow at manipulated rates and buy back stock, lifting earnings per share (EPS) for Wall Street while fattening management and board paydays. CEOs make nearly ten times what they made 30 years ago relative to the average hourly worker. This income disparity is translated to great wealth disparity by the Fed’s interest rate policies, which make financial asset owners even wealthier. Will this fuel class animosity and a deepened political crisis? What will happen to stock multiples if labor unrest grows? Minorities, particularly African-Americans, have fallen further behind despite all the subsidies, food stamps and other government help. Our answer to this issue is to throw more money over the wall instead of addressing cause and effect. How will stock markets react to the next Ferguson, Missouri? The market sees through all of this until it doesn’t. We don’t have any idea when this will happen, and frankly, we wouldn’t be that worried about it (from a stock market perspective) were it not for the high valuation levels. Low valuations favor the optimist; high valuations favor the skeptic.
Why are cash levels elevated?
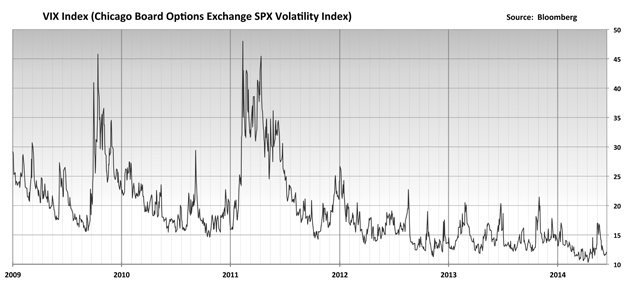
Cash levels are elevated because a number of stocks have reached full value and have been sold, and a number of others have been trimmed as they approach full value. The difference between today and other points in FMI’s history is that just about every sector of the market is elevated and very few companies are trading at significant discounts to fair value. This bull market has seen almost no corrections, and in recent years has not delivered the sort of industry or sector declines that are normal even in an overall rising market. This has prevented us from reloading and staying fully invested. Volatility has been below-average in recent years as can be seen by the nearby chart.
What would it take for you to have a stronger period of outperformance?
To expect stocks to appreciate at 15-20% when the “natural” growth rate of the economy and earnings is around 6% is completely unrealistic. When a market phase is extended (this bull run is now over 66 months old, making it one of the longest on record) people believe it is a new paradigm. But it never is, because humans will always be susceptible to the emotions of greed and fear. We are very confident that opportunities will eventually present themselves through a general market decline or increased sector volatility. In the meantime, we are relegated to special situations or relative value ideas. It is unlikely we would outperform in a market that continues to rise uninterruptedly. Historically, we have performed very well in choppy and down markets. Nobody cheers for poor markets, but these periods are inevitable and we would be surprised if they weren’t a source of outperformance. So, we need to be patient and avoid the temptation to play somebody else’s game.
Why not just invest in an index fund?
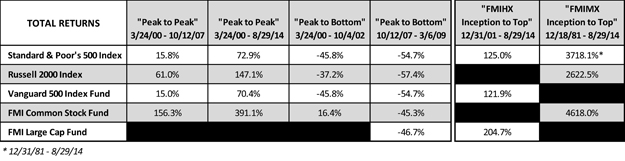
There are times and circumstances that may make sense for this approach. If you don’t have the time, mindset or wherewithal to identify truly talented active managers, then buying an index fund might be a reasonable approach. After a market has been crushed, when nearly all stocks are cheap, is often an advantageous time. There is a tendency, however, for investors to believe it is less risky to buy an index fund. As with any asset, an index fund can become overvalued when the underlying stocks become overvalued. These types of funds are particularly risky at cycle highs, which we believe we are near today. We remember like it was yesterday when John Bogle, Chairman and CEO of Vanguard and the unofficial spokesman for passive investing, stood on the proverbial mountaintop in 1999 telling everyone they should index. Let’s look at what that did for investors: From the peak in March of 2000 to the trough in October of 2002, the S&P 500 (and the Vanguard 500) declined approximately 45.8%. The Russell 2000 Index, a benchmark for smaller capitalization stocks, fell by 37.2%. The FMI Large Cap Fund had not yet begun in early 2000, but the FMI Common Stock Fund was well-established. The FMI Common Stock Fund gained 16.4% during this time frame. If we go “peak to peak” (March of 2000 to October of 2007) the S&P 500 gained 15.8% and the Russell 2000 advanced 61.0%. The FMI Common Stock Fund was up 156.3%. Below is a table looking at returns following peaks, as well as columns for the FMI Large Cap Fund and FMI Common Stock Fund since their respective inception dates.
As is our custom in September, we highlight a couple of investments.
Progressive Corporation (PGR)
(Analyst: Matthew Goetzinger)
Description
Progressive is one of the largest U.S. auto insurers with approximately 9% market share. The company writes personal auto insurance (90% of net premiums written) on both an agency and direct basis, and has consistently achieved an industry-leading low 90% combined ratio. The residual 10% of net premiums written is accounted for by the company’s small commercial auto book. A.M. Best gives Progressive an A+ rating.
Good Business
| | • | Progressive operates in a consolidated and rational market where the top five companies control over 50% of industry premiums. Consistent, time-proven pricing and reserving methodologies, as well as scale, enable the larger and more sophisticated industry players to grow faster than the broader market. |
| | • | Auto insurance is a mandatory consumer coverage which results in predictable and recurring premium volumes. Progressive achieves a solid customer retention rate given the company’s mix of business. |
| | • | Industry-leading policy growth and a low-cost distribution model outpace marketing and advertising spending to generate a high-teens underwriting return on investment (ROI). |
| | • | Progressive has one of the industry’s strongest balance sheets. The company has over $1 billion of excess capital and generates close to $2 billion of operating cash flow annually. The free cash flow yield is in excess of 10%. |
Valuation
| | • | Progressive’s normalized return on equity (ROE) should be in the 18-20% range, implying a target price-to-book multiple (P/B) of close to 3.0 times. On this basis, the stock’s fair value is approximately 50% higher than today’s price. |
| | • | Over the past five years, Progressive has held a median P/B of 2.2 times, ranging from a low of 1.8 times to a high of 2.6 times. Presently the shares trade at 2.0 times book value. |
| | • | The stock’s current price-to-earnings (P/E) multiple is slightly higher than the 5-year range, but earnings are relatively depressed. |
| | • | Excluding excess balance sheet capital, Progressive trades for less than 10.0 times normalized earnings. |
| | • | The 2011 acquisition of Esurance by Allstate, and the 1996 consolidation of GEICO by Berkshire Hathaway, both indicate a private market value of at least 2.5 times book value for Progressive. |
Management
| | • | Consistent with the overall conservative posture of the company, the executive team is incentivized by a sensible compensation plan. |
| | • | The company’s “Gainsharing” program measures performance of the underwriting business, and uses the same performance criteria for all employee bonuses as well as the company’s annual variable dividend. |
| | • | Progressive’s CEO, Glenn Renwick, has 25 years of experience at the company including a variety of operating and leadership roles such as President of a number of operating units, head of the consumer marketing group, and Chief Information Officer. Mr. Renwick has been CEO since 2000. |
Investment Thesis
Measured by underwriting profits, Progressive is the second largest U.S. auto insurer. The company is also a high-quality, technological innovator that has historically grown in a consistent manner. We expect this to continue due to significant scale, a low-cost direct business model, and tremendous pricing analytics which should enable Progressive to earn predictable underwriting profits. The stock is trading at a discount to its historical book multiple, and where it could trade, provided the business develops as we envision.
Honeywell International Inc. (HON)
(Analyst: Andy Ramer)
Description
Honeywell is a diversified global technology and manufacturing company organized into three strategic business groups: Aerospace (avionics, power, turbochargers) – 39% of sales and 43% of profit; Automation & Control Solutions (control products and services) – 44% and 38%; and Performance Materials & Technologies (catalysts, absorbents, refrigerants) – 17% and 19%.
Good Business
| | • | Honeywell has established market-leading positions due to their innovative technology and excellent support and service network. The company has consequently developed a large installed base of equipment. |
| | • | This installed base of equipment is mission-critical and creates the opportunity for follow-on sales in the aftermarket. Recurring revenue and revenues in backlog account for approximately 50% of sales. |
| | • | Honeywell’s return on invested capital (ROIC) is greater than 20%. |
| | • | The businesses are generally easy to understand. |
| | • | Operating and financial performance has been turned around by focusing on factors that they can control rather than relying on significant end market tailwinds or below-the-line items. |
| | • | The long-term debt-to-capital ratio net of cash is only 13% and the leverage ratio is a modest 0.4 times. The pension plan is fully funded. Honeywell is a strong cash generator. |
Valuation
| | • | This is an above-average business, with ROIC greater than that of the S&P 500, and net debt-to-capital less than that of the S&P 500. It trades at an average valuation in line with, or at a slight discount to, the S&P 500. |
| | • | Shares are valued at 16.8 times the fiscal year 1 earnings per share estimate, which is slightly above their 10-year average multiple of 15.8 times. Other high quality industrials like 3M, Danaher, Emerson, ITW, and Rockwell Automation trade for 19.0-20.0 times. |
| | • | The enterprise value-to-2014 (estimate) sales multiple is 1.9 times, relative to a forecast operating margin of 15.5%. Margins are several hundred basis points below peers, and should rise significantly. |
| | • | If Honeywell can grow earnings per share at a 12% compound annual rate over the next five years (which would be at the mid-point of their target range) and the market re-rates the company to 18.0 times, then the shares offer 14% compound annual appreciation potential. The dividend yields 1.9%. |
Management
| | • | Since joining Honeywell in July of 2002, Chairman & CEO Dave Cote has reinvigorated the new product pipeline, shed assets that he deemed were non-core, made acquisitions that strengthened the core, and addressed legacy liabilities. |
| | • | The company has a strong and deep management and an excellent corporate culture. They are conservatively managed from a business, accounting, and balance sheet perspective. |
| | • | Honeywell is an example of where behavior follows incentives. Compensation is tied to ROI, working capital turnover, free cash flow, margin expansion, and revenue. |
Investment Thesis
Honeywell’s product and service offerings are aligned with important global macro trends – energy efficiency, clean energy generation, safety and security, urbanization/High Growth Region development, and customer productivity. The portfolio is balanced between short, mid-range and long, when viewed from a business cycle standpoint. Successful execution should drive organic growth above the multi-industrial average and the valuation is reasonable in a very expensive market.
Thank you for your support of the FMI Large Cap Fund.
100 E. Wisconsin Ave., Suite 2200 • Milwaukee, WI 53202 • 414-226-4555
www.fmifunds.com
This shareholder letter is unaudited.
FMI Large Cap Fund
MANAGEMENT’S DISCUSSION OF FUND PERFORMANCE
During the fiscal year ended September 30, 2014, the FMI Large Cap Fund (the “Fund”) had a total return of 15.77%. The benchmark S&P 500 returned 19.73% in the same period. From a sector standpoint, Electronic Technology, Consumer Non-Durables and Transportation all hurt relative performance. The primary reason Electronic Technology underperformed was our underweighting. The lagging performance of the Consumer Non-Durable sector was largely due to stock selection, particularly Danone, which was down over the year. Expeditors International performed poorly over the past twelve months, hurting the Transportation sector. A higher-than-normal cash levels also hurt performance. Cash has been elevated due to the lack of attractive new ideas and this has been a significant drag on performance over the past two years. On the positive side, Consumer Services, Finance and Energy Minerals all aided relative results. Time Warner, benefitting from a bid by Twenty-First Century Fox, performed strongly for the Consumer Services sector. Bank of New York drove the outperformance in the Finance area. Strong performance by Devon and an underweighted position in Energy contributed to the positive sector results in Energy. Over the past twelve months a number of stocks were sold: Sysco, Willis Group, Wal-Mart, Covidien, Illinois Tool Works, Time Warner and GlaxoSmithKline. Sysco, Willis Group, Wal-Mart and GlaxoSmithKline were sold primarily because of a reassessment of the long term fundamentals. The others were due to valuation. Investments added in the period included Unilever, Progressive Corp., Ross Stores, Omnicom Group, Honeywell, Comcast Corp. and eBay. At September 30, 2014, significantly overweighted sectors included Producer Manufacturing, Commercial Services and Distribution Services. Heavily underweighted areas included Electronic Technology, Health Technology and Utilities.
Strong performance across a number of sectors but particularly in some of the more speculative technology and biotechnology areas helped drive another outstanding year in the S&P 500. The market has gone five and a half years without a meaningful correction. Valuations are near the upper end of historical parameters. Easy monetary policy appears to have been a significant driver of stock market performance in recent years. The economy seems to be somewhat better but has grown at less than half of its long term historical rate. The unemployment rate has also improved, but the labor participation rate remains at a very low level and an extraordinarily high number of citizens are dependent on government support. Companies have been restrained with respect to investing in both capital equipment and labor, which has resulted in less than satisfactory internal growth rates. The economies in Europe, China, Brazil, Japan and Russia have all weakened. Debt levels remain very high in all of these economies as well as in the United States. Geopolitical problems have escalated over the past year. This, combined with less than average growth and very high valuations makes us cautious on the stock market in the short run. We continue to believe, however, that stocks have the best chance to adjust to a dynamic environment over the long run. The Fund sells at a discount to the S&P 500 on most valuation measures.
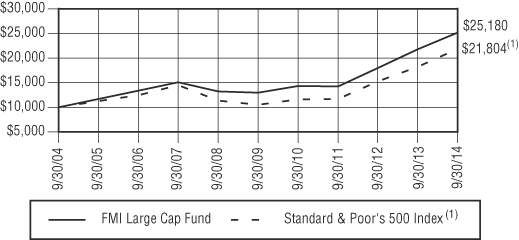
COMPARISON OF CHANGE IN VALUE OF $10,000 INVESTMENT IN
FMILARGE CAP FUND AND STANDARD & POOR’S 500 INDEX(1)
AVERAGE ANNUALIZED TOTAL RETURN
| | | | | Since |
| | | | | Inception |
| | 1-Year | 5-Year | 10-Year | 12/31/01 |
| FMI Large Cap Fund | 15.77% | 14.25% | 9.67% | 8.94% |
| S&P 500 Index | 19.73% | 15.70% | 8.11% | 6.45% |
The graph and the table do not reflect the deduction of taxes that a shareholder would pay on Fund distributions or the redemption of Fund shares. Performance data quoted represents past performance; past performance does not guarantee future results. Investment return and principal value of an investment will fluctuate so that an investor’s shares, when redeemed, may be worth more or less than their original cost. Current performance of a Fund may be lower or higher than the performance quoted. The total returns do not reflect the deduction of taxes that a shareholder would pay on Fund distributions or the redemption of Fund shares. Total return includes change in share prices and in each case includes reinvestments of any dividends, interest and capital gain distributions. Performance data current to the most recent month-end may be obtained by visiting www.fmifunds.com or by calling 1-800-811-5311.
| (1) | The Standard & Poor’s 500 Index consists of 500 selected common stocks, most of which are listed on the New York Stock Exchange. The Standard & Poor’s Ratings Group designates the stocks to be included in the Index on a statistical basis. A particular stock’s weighting in the Index is based on its relative total market value (i.e., its market price per share times the number of shares outstanding). Stocks may be added or deleted from the Index from time to time. |
An investment cannot be made directly into an index.
This page is unaudited.
FMI Large Cap Fund
SCHEDULE OF INVESTMENTS
| Shares | | | | Cost | | | Value | |
| | | | | | | | | |
| COMMON STOCKS — 91.6% (a) | | | | | | |
| | | | | | | |
| COMMERCIAL SERVICES SECTOR — 5.2% | | | | | | |
| | | Advertising/Marketing Services — 3.0% | | | | | | |
| | 3,966,000 | | Omnicom Group Inc. | | $ | 277,353,255 | | | $ | 273,098,760 | |
| | | | Miscellaneous Commercial Services — 2.2% | | | | | | | | |
| | 2,890,000 | | Cintas Corp. | | | 72,227,745 | | | | 204,005,100 | |
| | | | | | | | | |
| CONSUMER NON-DURABLES SECTOR — 9.7% | | | | | | | | |
| | | | Food: Major Diversified — 7.3% | | | | | | | | |
| | 27,475,000 | | Danone S.A. - SP-ADR | | | 388,621,919 | | | | 368,165,000 | |
| | 4,150,000 | | Nestle’ S.A. - SP-ADR | | | 222,649,146 | | | | 305,564,500 | |
| | | | | | | 611,271,065 | | | | 673,729,500 | |
| | | | Household/Personal Care — 2.4% | | | | | | | | |
| | 5,287,000 | | Unilever PLC - SP-ADR | | | 212,079,561 | | | | 221,525,300 | |
| | | | | | | | | |
| CONSUMER SERVICES SECTOR — 5.1% | | | | | | | | |
| | | | Cable/Satellite TV — 3.0% | | | | | | | | |
| | 5,200,000 | | Comcast Corp. - Class A | | | 284,589,282 | | | | 279,656,000 | |
| | | | Other Consumer Services - 2.1% | | | | | | | | |
| | 3,460,000 | | eBay Inc.* | | | 184,248,517 | | | | 195,939,800 | |
| | | | | | | | | |
| DISTRIBUTION SERVICES SECTOR — 4.0% | | | | | | | | |
| | | | Medical Distributors — 4.0% | | | | | | | | |
| | 4,815,000 | | AmerisourceBergen Corp. | | | 161,061,013 | | | | 372,199,500 | |
| | | | | | | | | |
| ELECTRONIC TECHNOLOGY SECTOR — 2.8% | | | | | | | | |
| | | | Electronic Components — 2.8% | | | | | | | | |
| | 4,705,000 | | TE Connectivity Ltd. | | | 107,496,842 | | | | 260,139,450 | |
| | | | | | | | | |
| ENERGY MINERALS SECTOR — 4.3% | | | | | | | | |
| | | | Oil & Gas Production — 4.3% | | | | | | | | |
| | 5,840,000 | | Devon Energy Corp. | | | 355,441,165 | | | | 398,171,200 | |
| | | | | | | | | |
| FINANCE SECTOR — 15.6% | | | | | | | | |
| | | | Financial Conglomerates — 3.7% | | | | | | | | |
| | 3,909,000 | | American Express Co. | | | 167,357,366 | | | | 342,193,860 | |
| | | | Major Banks — 8.9% | | | | | | | | |
| | 12,010,000 | | Bank of New York Mellon Corp. | | | 291,634,831 | | | | 465,147,300 | |
| | 7,010,000 | | Comerica Inc. | | | 216,460,410 | | | | 349,518,600 | |
| | | | | | | 508,095,241 | | | | 814,665,900 | |
| | | | Property/Casualty Insurance — 3.0% | | | | | | | | |
| | 10,830,000 | | Progressive Corp. | | | 269,585,441 | | | | 273,782,400 | |
| | | | | | | | | |
| HEALTH SERVICES SECTOR — 5.1% | | | | | | | | |
| | | | Managed Health Care — 5.1% | | | | | | | | |
| | 5,421,000 | | UnitedHealth Group Inc. | | | 395,782,179 | | | | 467,561,250 | |
| | | | | | | | | |
| INDUSTRIAL SERVICES SECTOR — 4.4% | | | | | | | | |
| | | | Oilfield Services/Equipment — 4.4% | | | | | | | | |
| | 3,950,000 | | Schlumberger | | | 260,767,543 | | | | 401,675,500 | |
| | | | | | | | | |
| PROCESS INDUSTRIES SECTOR — 5.9% | | | | | | | | |
| | | | Chemicals: Agricultural — 5.9% | | | | | | | | |
| | 15,640,000 | | Potash Corp. of Saskatchewan Inc. | | | 586,668,893 | | | | 540,518,400 | |
| | | | | | | | | |
| PRODUCER MANUFACTURING SECTOR — 15.1% | | | | | | | | |
| | | | Industrial Conglomerates — 12.2% | | | | | | | | |
| | 2,500,000 | | 3M Co. | | | 178,166,900 | | | | 354,200,000 | |
| | 3,402,000 | | Berkshire Hathaway Inc. - Cl B* | | | 243,591,013 | | | | 469,952,280 | |
| | 3,230,000 | | Honeywell International Inc. | | | 307,340,217 | | | | 300,777,600 | |
| | | | | | | 729,098,130 | | | | 1,124,929,880 | |
SCHEDULE OF INVESTMENTS (Continued)
| Shares or Principal Amount | | Cost | | | Value | |
| | | | | | | |
| COMMON STOCKS — 91.6% (a) (Continued) | | | | | | |
| | | Trucks/Construction/Farm Machinery — 2.9% | | | | | | |
| | 4,675,000 | | PACCAR Inc. | | $ | 213,920,376 | | | $ | 265,890,625 | |
| | | | | | | | | |
| RETAIL TRADE SECTOR — 2.8% | | | | | | | | |
| | | | Apparel/Footwear Retail — 2.8% | | | | | | | | |
| | 3,430,000 | | Ross Stores Inc. | | | 232,823,199 | | | | 259,239,400 | |
| | | | | | | | | |
| TECHNOLOGY SERVICES SECTOR — 8.9% | | | | | | | | |
| | | | Information Technology Services — 5.2% | | | | | | | | |
| | 5,870,000 | | Accenture PLC | | | 307,651,961 | | | | 477,348,400 | |
| | | | Packaged Software — 3.7% | | | | | | | | |
| | 7,430,000 | | Microsoft Corp. | | | 222,830,276 | | | | 344,454,800 | |
| | | | | | | | | |
| TRANSPORTATION SECTOR — 2.7% | | | | | | | | |
| | | | Air Freight/Couriers — 2.7% | | | | | | | | |
| | 6,150,000 | | Expeditors International of Washington Inc. | | | 231,833,459 | | | | 249,567,000 | |
| | | | Total common stocks | | | 6,392,182,509 | | | | 8,440,292,025 | |
| | | | | | | | | | | | |
| | | | | | | | | |
| SHORT-TERM INVESTMENTS — 8.3% (a) | | | | | | | | |
| | | | Commercial Paper — 8.3% | | | | | | | | |
| $ | 766,900,000 | | U.S. Bank N.A., 0.03%, due 10/01/14 | | | 766,900,000 | | | | 766,900,000 | |
| | | | Total investments — 99.9% | | $ | 7,159,082,509 | | | | 9,207,192,025 | |
| | | | Other assets, less liabilities — 0.1% (a) | | | | | | | 10,206,497 | |
| | | | TOTAL NET ASSETS — 100.0% | | | | | | $ | 9,217,398,522 | |
| * | Non-income producing security. |
| (a) | Percentages for the various classifications relate to net assets. |
PLC – Public Limited Company
SP-ADR – Sponsored American Depositary Receipt
The accompanying notes to financial statements are an integral part of this schedule.
INDUSTRY SECTORS
as of September 30, 2014 (Unaudited)
FMI
Common Stock
Fund
September 30, 2014
Dear Fellow Shareholders:
The FMI Common Stock Fund declined 4.90% in the three months ended September 30 compared to a fall of 7.36% for the benchmark Russell 2000 Index. Health Services, Process Industries, and Health Technology all detracted from performance. Hanger, H.B. Fuller, Lindsay and Valmont Industries were all down in the period. On the positive side, Industrial Services, Energy Minerals and Finance all aided relative performance, primarily because of our underweighting and stock selection. Individual securities that did relatively well in the period included Dresser–Rand Group, MKS Instruments and Dun & Bradstreet. Small cap stocks underperformed larger cap stocks in the quarter and while down, have yet to experience a significant correction. The market has continued its remarkable and almost uninterrupted run, now exceeding 66 months. We haven’t been willing to pay up for stocks… at least not the ones the market favors today. Puma Biotechology, InterMune, Inc., and Avanir Pharmaceuticals were the top three contributors to the benchmark this quarter. Each one has years of losses, a high cash burn rate and is not projected to make money any time soon. It is an indication of the speculative nature of this market. Our research team continues to scour the landscape for good values but these are still fairly rare. We are finding a few special situations and relative values to tide us over until turbulence resurfaces. Perhaps a continuation of the weakness present at the end of the quarter will give us more attractive opportunities.
The longer the market goes without a large correction, the more we encounter some common questions from our shareholders, clients and consultants. Below we take our best shot at addressing them before reviewing a couple of investments.
At what rate should the stock market appreciate?
Before answering this, let’s look at what stocks have achieved over the long term. According to the most reliable data from Ibbotson Associates, from 1926-2013 large company stocks have had a compound annual return of approximately 10%, with price appreciation constituting roughly 6%, and 4% coming from the dividend yield.
If one views the stock market as a proxy for the growth of corporations (sales and earnings), it is logical to expect the market to appreciate at roughly the rate of corporate sales and earnings growth. It just so happens that sales and earnings for the S&P 500 and broader measures of corporate earnings have, over long periods of time, grown at approximately the same rate of about 6%, although the figure is highly volatile over short time frames. Margins have also gone through years of expansion and contraction, which of course influences the growth rate of earnings compared to sales. In recent years margins have reached all-time highs so it wouldn’t be surprising to see them contract, causing earnings growth to lag sales growth.
Since the S&P 500 total sales typically make up about two-thirds of the economy’s gross domestic product (GDP), and Bureau of Economic Analysis (BEA) compiled corporate revenue figures are an even larger percentage of GDP, it is not surprising that the growth rates for both corporate sales and the economy, as measured by GDP, have been roughly similar over long periods of time. Nearby is a chart of corporate revenue compared to nominal GDP and it is easy to see the high correlation. From 1926 through June of 2014, the nominal GDP growth rate has been 6.1%, although recently it has been much less.
So, the logical or natural rate at which stock prices “should” appreciate appears to be about 6% (total return would include the dividend yield), but of course investors and speculators sometimes do not have long-term time horizons and also, perhaps do not have a deep appreciation of where we are on the valuation-growth rate spectrum. Investor perceptions, manifested in valuations, tend to dominate short-to-intermediate performance of the stock market. Interest rates, inflation, and a whole host of factors play into valuations. If we go back in time, we find some very interesting data. In some sense, we can look at the modern investment world in two phases, post WWII (we’ll start with 1947) up to 1982, and from that period through today. From June of 1947 through June of 1982 the S&P 500 had a total price change of 620%, or 5.8% compounded annually (the total return was 10.6% with dividends… those were the years of big dividends!). S&P 500 earnings grew 6.3% from 1947-1982. In that same period, nominal GDP gained 1238.5%, or 7.7% compounded annually. So, stock market price returns lagged both nominal GDP and corporate earnings.
In the second period, from June of 1982 through June of 2014, the S&P 500 had a total price change of 1688.4%, or 9.2% compounded annually (12.2% with dividends). The S&P 500 earnings grew at roughly the same rate as they did in the prior period. Nominal GDP, on the other hand, gained 417.5%, or just 5.3% compounded. Obviously, the stock market trounced both the economy and earnings in this time frame. Over the last five and a half years alone, the total price change of the S&P 500 was 191.5% (21.5% compounded) compared to nominal GDP growth of just 23.7%1 (3.9% compounded).
In summary, stocks should (over time) roughly match the underlying growth of the economy and the fundamentals of the corporations that constitute the economy. Historically this rate of growth has been approximately 6%. The last few years have been characterized by a significant increase in stock prices relative to the growth in the economy and the underlying performance of U.S. corporations. The result is a stock market that is very expensive. The Leuthold Group data of 48 different valuation measures (most series exceed 60 years) that we tally every quarter puts the average current market valuation in the 9th decile (10 being the most expensive).
_______________
| 1 | Nominal GDP estimated using 3% for the September 2014 quarter. |
Why can’t valuations remain high?
The simple answer is they can… for a while. And a “while” can be pretty long, as we have seen over the last several years. The Fed has had an “emergency” policy in place for six years and while we will spare the reader a rehashing of prior letters which articulate the damaging short- and long-term elements of this approach, it certainly has helped drive stocks higher and make valuations expensive. Each time reported data is weaker than expected it fuels the market to go higher as investors gain confidence that interest rate policies will remain loose. The prevailing sentiment today is that the “Fed has investors’ backs.” Thus, issues that would normally cause the stock market to correct remain at bay. Subpar economic growth, rather than being a negative, is actually the opposite in today’s market. Modest inflation and low interest rates are taken as a given for the future. It is ironic how opposite the sentiment is today from what it was in 1982. This was a period of very high interest and inflation rates and very low valuations. Sentiment was awful. Today, on the other hand, investors are presented with conditions that are essentially the opposite: low inflation, rock bottom interest rates and sky-high valuations. 1982 turned out to be one of the greatest buying opportunities of all time. Logically, how could 2014 also be a great buying opportunity? Yet that is the Wall Street pitch. It should come as no surprise that we do not believe it!
Valuations are unlikely to remain high forever. Aside from being tied to the fundamentals of the economy and the companies that make up the economy (and being completely out of sync there) they are tied to sentiment and emotion. Right now the sentiment is that nothing will derail the equity train. Our experience tells us something will. History suggests the same. The fact that so far this market has shrugged off massive destabilization in the Middle East; a new terrorist threat in ISIS (Islamic State in Iraq and Syria); a renewed Cold War; an economic U-turn in Europe, Japan, Brazil and Russia; the failure of Fed Policy; and the lack of any nod to business or free market principles in Washington, should worry rather than embolden investors. Deep down people know that things are not right. How can an economy be right if nearly 37% of the working-age citizens are not working? Real household incomes, except for those at the top, have been stagnant to declining for over a decade. More people than ever are living off the taxpayer. Companies are not investing enough in capital. The past ten years have seen the lowest capital investment relative to GDP since records have been kept. Companies are underinvesting in people. New healthcare mandates, higher taxes and a mountain of new regulations all thwart the effort. Instead, companies borrow at manipulated rates and buy back stock, lifting earnings per share (EPS) for Wall Street while fattening management and board paydays. CEOs make nearly ten times what they made 30 years ago relative to the average hourly worker. This income disparity is translated to great wealth disparity by the Fed’s interest rate policies, which make financial asset owners even wealthier. Will this fuel class animosity and a deepened political crisis? What will happen to stock multiples if labor unrest grows? Minorities, particularly African-Americans, have fallen further behind despite all the subsidies, food stamps and other government help. Our answer to this issue is to throw more money over the wall instead of addressing cause and effect. How will stock markets react to the next Ferguson, Missouri? The market sees through all of this until it doesn’t. We don’t have any idea when this will happen, and frankly, we wouldn’t be that worried about it (from a stock market perspective) were it not for the high valuation levels. Low valuations favor the optimist; high valuations favor the skeptic.
Why are cash levels elevated?
Cash levels are elevated because a number of stocks have reached full value and have been sold, and a number of others have been trimmed as they approach full value. The difference between today and other points in FMI’s history is that just about every sector of the market is elevated and very few companies are trading at significant discounts to fair value. This bull market has seen almost no corrections, and in recent years has not delivered the sort of industry or sector declines that are normal even in an overall rising market. This has prevented us from reloading and staying fully invested. Volatility has been below-average in recent years as can be seen by the nearby chart.
What would it take for you to have a stronger period of outperformance?
To expect stocks to appreciate at 15-20% when the “natural” growth rate of the economy and earnings is around 6% is completely unrealistic. When a market phase is extended (this bull run is now over 66 months old, making it one of the longest on record) people believe it is a new paradigm. But it never is, because humans will always be susceptible to the emotions of greed and fear. We are very confident that opportunities will eventually present themselves through a general market decline or increased sector volatility. In the meantime, we are relegated to special situations or relative value ideas. It is unlikely we would outperform in a market that continues to rise uninterruptedly. Historically, we have performed very well in choppy and down markets. Nobody cheers for poor markets, but these periods are inevitable and we would be surprised if they weren’t a source of outperformance. So, we need to be patient and avoid the temptation to play somebody else’s game.
Why not just invest in an index fund?
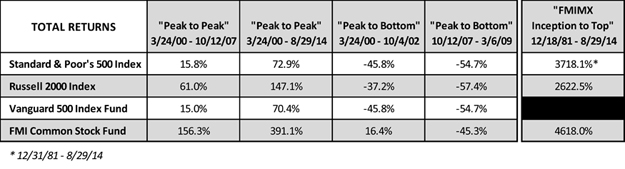
There are times and circumstances that may make sense for this approach. If you don’t have the time, mindset or wherewithal to identify truly talented active managers, then buying an index fund might be a reasonable approach. After a market has been crushed, when nearly all stocks are cheap, it is often an advantageous time. There is a tendency, however, for investors to believe it is less risky to buy an index fund. As with any asset, an index fund can become overvalued when the underlying stocks become overvalued. These types of funds are particularly risky at cycle highs, which we believe we are near today. We remember like it was yesterday when John Bogle, Chairman and CEO of Vanguard and the unofficial spokesman for passive investing, stood on the proverbial mountaintop in 1999 telling everyone they should index. Let’s look at what that did for investors: From the peak in March of 2000 to the trough in October of 2002, the S&P 500 (and the Vanguard 500) declined approximately 45.8%. The Russell 2000, a benchmark for smaller capitalization stocks, fell by 37.2%. The FMI Common Stock Fund gained 16.4% during this time frame. If we go “peak to peak” (March of 2000 to October of 2007) the S&P 500 gained 15.8% and the Russell 2000 advanced 61.0%. The FMI Common Stock Fund was up 156.3%. Below is a table looking at returns following peaks, as well as a column for the FMI Common Stock Fund since its inception.
As is our custom in September, we highlight a couple of investments.
UniFirst Corporation (UNF)
(Analyst: Rob Helf)
Description
Boston-based UniFirst is the third largest uniform rental provider in North America with approximately 8% of market share in a $16 billion market. The company’s primary business is to design, manufacture and market company uniforms for rental, and then clean, maintain and repair them on a weekly basis.
Good Business
| | • | The largest four participants control less than 50% of the industry; there is plenty of room for consolidation. UniFirst has demonstrated skill in making tuck-in acquisitions. |
| | • | The industry has historically grown faster than GDP. |
| | • | The revenue model is generally recurring, with 5-year contracts and price escalators. |
| | • | The company has no customers comprising greater than 1% of overall revenues. |
| | • | The economics of a rental program are profitable for both UniFirst and the customer when compared to an in-house uniform program. |
| | • | Over the past ten years, revenues and earnings per share (EPS) have grown at 8% and 14%, respectively. We expect approximately 9-10% earnings growth over the next five years. |
| | • | Excluding unneeded cash ($6.50 per share), UniFirst generates a low double-digit return on invested capital (ROIC). |
| | • | The company has historically generated free cash flow at 90% of net income. |
Valuation
| | • | UniFirst trades at 16.3 times and 15.0 times fiscal 2015 (August) and 2016 EPS estimates, respectively. Excluding excess cash, the multiple is about 6% cheaper. |
| | • | Historically, the company has traded at 15.0 times next 12 months earnings, in a range of 12.6 to 17.4 times. |
| | • | On an enterprise value-to-sales basis, the company is valued at 1.3 times, which is above its historical average of 1.1 times; however, it is attractive relative to the 13-14% margins it currently generates. |
| | • | UniFirst trades at a discount to its competitors. |
Management
| | • | Ron Croatti is Chairman, President and CEO. He has been part of UniFirst since 1965. He became CEO in 1991 and President in 1995. Ron’s family started the company in 1936 as an industrial laundry/delivery company. He and his family have a 25% ownership interest in the company. |
| | • | Steven Sintros has been VP and CFO since 2009. He has been with the company since February of 2004 and served as its Corporate Controller until January 13, 2009. He previously served as manager with Ernst & Young LLP and Arthur Andersen LLP. |
| | • | Bruce P. Boynton is Senior VP, Operations and is also COO of the Canadian operations. |
Investment Thesis
UniFirst is one of the most profitable participants in the uniform rental industry, primarily by focusing on the details of this simple but necessary business. Most companies that have a margin structure and growth profile like UniFirst trade at a significant premium to the company. The premium is nonexistent in UniFirst because it is unlikely to be bought out, given its high insider control. When interest rates and market sentiment changes, takeover premiums will fall and UniFirst should experience strong relative performance.
Genpact Ltd. (G)
(Analyst: Karl Poehls)
Description
Genpact is a global leader in business process management (BPM) and information technology (IT) outsourcing services. The company executes its strategy according to its proprietary Smart Enterprise Processes (SEP) framework. Genpact was spun off from General Electric (GE) in 2007 and continues to operate with an intense focus on Lean and Six Sigma. The company has broad exposure across a number of industry verticals, employs over 60,000 professionals around the globe, delivers services to more than 700 clients from a network of more than 70 delivery centers, and competes in 18 countries while supporting more than 30 languages.
Good Business
| | • | Genpact is a leading provider of BPM and IT outsourcing services with the majority of its revenues derived from Fortune Global 500 and Fortune 1000 companies. |
| | • | The company estimates that more than 80% of its revenues can be considered recurring in nature and organic growth has averaged 11% over the past five years. |
| | • | In 2012, customer satisfaction scores reached an all-time high. |
| | • | The company’s products and services provide customers with a tangible return on investment (ROI). |
| | • | Genpact has a strong balance sheet with net debt-to-earnings before interest taxes depreciation and amortization (EBITDA) and interest coverage ratios of 1.2 and 9.6 times, respectively. |
| | • | Over the past five years, the company’s return on invested capital (ROIC) has averaged 10.0%, which exceeds its cost of capital. We expect Genpact’s ROIC will approach 13.0-15.0% over the next few years. |
Valuation
| | • | Since the spin-off from GE in August of 2007, Genpact’s stock price has significantly underperformed the Standard & Poor’s 500 and Russell 2000 indices by 30% and 45%, respectively. |
| | • | The stock trades for 1.8 times revenue, which compares to an expected operating margin (EBIT) of 14.0% in 2014 and a trailing 5-year average of 15.3%. |
| | • | Genpact’s trailing price-to-earnings (P/E) multiple is 16.3 times. Over the trailing 5-year period, the company’s stock has traded for an average P/E of 17.5 times. |
| | • | Acquisitions of comparable companies in the IT services, business processing outsourcing (BPO), enterprise software, and financial processing industries typically occur at 10-16 times EBITDA. Genpact’s shares trade for approximately 11 times EBITDA. |
Management
| | • | Current CEO, N.V. “Tiger” Tyagarajan, has led the company since June of 2011. He is considered a pioneer of the BPO industry and has a deep knowledge of Lean and Six Sigma. Mr. Tyagarajan owns 450,000 shares of Genpact’s common stock. |
| | • | Bain Capital has approximately $1 billion invested in the company, which represents 27% of the outstanding shares. Further, representatives of Bain occupy four seats on Genpact’s board of directors. We believe this significant ownership interest will help to drive future shareholder value creation. |
Investment Thesis
In February, Genpact issued 2014 financial guidance that was below expectations and the stock sold off 17%. Management is taking the hard step of driving short-term profit margins down by investing in the business to accelerate future top-line growth. This appears to be the correct path for the long term and has given us the opportunity to invest in a relatively high-growth franchise, with a sticky customer base and strong balance sheet, at a reasonable price.
Thank you for your support of the FMI Common Stock Fund.
100 E. Wisconsin Ave., Suite 2200 • Milwaukee, WI 53202 • 414-226-4555
www.fmifunds.com
This shareholder letter is unaudited.
FMI Common Stock Fund
MANAGEMENT’S DISCUSSION OF FUND PERFORMANCE
During the fiscal year ended September 30, 2014, the FMI Common Stock Fund (the “Fund”) had a total return of 10.44%. The benchmark Russell 2000 returned 3.93% in the same period. Sectors that aided relative performance included Finance, Commercial Services and Distribution Services. The buyout of Protective Life along with strong performance in most of the other financial holdings accounted for the positive results in the Finance sector. Cintas and Robert Half International were the two primary drivers of the positive Commercial Services sector. Arrow was behind the good performance in Distribution Services. On the negative side, Health Services, Process Industries and Health Technology pulled down relative performance, along with higher-than-normal cash levels. Hanger was down significantly in the period, hurting the Health Services sector performance. Process Industries were affected by negative returns from H.B. Fuller. Our underweighted position in Health Technology accounted for the relative performance in that group. Selling fully priced stocks and the inability to replace them with good businesses at attractive valuations caused cash levels to rise. Stocks sold in the period included Kaydon, Molex, Owens & Minor, AptarGroup, A.J. Gallagher, World Fuel, Protective Life, Family Dollar and Dresser-Rand. Kaydon, Molex, Protective Life, Family Dollar and Dresser-Rand were all either taken over or were the subject of buy-out offers. AptarGroup and A.J. Gallagher were sold due to valuation and World Fuel and Owens & Minor were sold because of fundamental concerns. A number of new additions were made over the past twelve months, including Flir Systems, Lindsay Corp., MSC Industrial, Woodward, NVR Corp., Valmont, Genpact, Dresser-Rand, Progress Software, Hanger, Interpublic Group, UniFirst and Sturm, Ruger. At September 30, 2014, the Fund was significantly overweighted in Distribution Services, Commercial Services and Process Industries and meaningfully underweighted in Health Technology, Finance and Electronic Technology.
Good performance across a number of sectors but particularly in some of the more speculative technology and biotechnology areas helped drive positive results for the Russell 2000. While the last three months of the fiscal year exhibited moderately negative results, the market has gone five and a half years without a significant correction. Smaller capitalization stocks have recently underperformed larger capitalization issues. Valuations remain near the upper end of historical parameters. Easy monetary policy appears to have been a significant driver of stock market performance in recent years. The economy seems to be somewhat better but has grown at less than half of its long term historical rate. The unemployment rate has also improved, but the labor participation rate remains at a very low level and an extraordinarily high number of citizens are dependent on government support. Companies have been restrained with respect to investing in both capital equipment and labor, which has resulted in less than satisfactory internal growth rates. The economies in Europe, China, Brazil, Japan and Russia have all weakened. Debt levels remain very high in all of these economies as well as in the United States. Geopolitical problems have escalated over the past year. This, combined with less than average growth and very high valuations makes us cautious on the stock market in the short run. We continue to believe, however, that stocks have the best chance to adjust to a dynamic environment over the long run. The Fund sells at a discount to the Russell 2000 on most valuation measures.
COMPARISON OF CHANGE IN VALUE OF $10,000 INVESTMENT IN
FMI COMMON STOCK FUND AND THE RUSSELL 2000 INDEX(1)
AVERAGE ANNUALIZED TOTAL RETURN
| | | | | Since |
| | | | | Inception |
| | 1-Year | 5-Year | 10-Year | 12/18/81 |
| FMI Common | | | | |
| Stock Fund | 10.44% | 13.80% | 10.75% | 12.34% |
| Russell 2000 Index | 3.93% | 14.29% | 8.19% | 10.39% |
The graph and the table do not reflect the deduction of taxes that a shareholder would pay on Fund distributions or the redemption of Fund shares. Performance data quoted represents past performance; past performance does not guarantee future results. Investment return and principal value of an investment will fluctuate so that an investor’s shares, when redeemed, may be worth more or less than their original cost. Current performance of a Fund may be lower or higher than the performance quoted. The total returns do not reflect the deduction of taxes that a shareholder would pay on Fund distributions or the redemption of Fund shares. Total return includes change in share prices and in each case includes reinvestments of any dividends, interest and capital gain distributions. Performance data current to the most recent month-end may be obtained by visiting www.fmifunds.com or by calling 1-800-811-5311.
| (1) | The Russell 2000 Index measures the performance of the 2,000 smallest companies in the Russell 3000 Index, which comprises the 3,000 largest U.S. companies based on total market capitalization. |
An investment cannot be made directly into an index.
This page is unaudited.
FMI Common Stock Fund
SCHEDULE OF INVESTMENTS
| Shares | | | | Cost | | | Value | |
| | | | | | | |
| COMMON STOCKS — 86.5% (a) | | | | | | |
| | | | | | | |
| COMMERCIAL SERVICES SECTOR — 16.0% | | | | | | |
| | | Advertising/Marketing Services — 3.0% | | | | | | |
| | 2,305,000 | | Interpublic Group of Cos. Inc. | | $ | 41,246,565 | | | $ | 42,227,600 | |
| | | | Financial Publishing/Services — 2.3% | | | | | | | | |
| | 272,000 | | Dun & Bradstreet Corp. | | | 18,520,002 | | | | 31,951,840 | |
| | | | Miscellaneous Commercial Services — 9.2% | | | | | | | | |
| | 467,000 | | Cintas Corp. | | | 10,992,977 | | | | 32,965,530 | |
| | 3,182,000 | | Genpact Ltd.* | | | 54,527,385 | | | | 51,930,240 | |
| | 30,000 | | Graham Holdings Co. | | | 21,383,963 | | | | 20,987,700 | |
| | 1,708,000 | | RPX Corp.* | | | 28,639,896 | | | | 23,450,840 | |
| | | | | | | 115,544,221 | | | | 129,334,310 | |
| | | | Personnel Services — 1.5% | | | | | | | | |
| | 425,000 | | Robert Half International Inc. | | | 11,128,001 | | | | 20,825,000 | |
| | | | | | | | | |
| CONSUMER DURABLES SECTOR — 3.1% | | | | | | | | |
| | | | Homebuilding — 2.0% | | | | | | | | |
| | 25,000 | | NVR Inc.* | | | 25,402,257 | | | | 28,250,500 | |
| | | | Recreational Products — 1.1% | | | | | | | | |
| | 305,000 | | Sturm, Ruger & Co. Inc. | | | 15,271,532 | | | | 14,850,450 | |
| | | | | | | | | |
| CONSUMER SERVICES SECTOR — 1.0% | | | | | | | | |
| | | | Other Consumer Services — 1.0% | | | | | | | | |
| | 150,000 | | UniFirst Corp. | | | 15,331,988 | | | | 14,488,500 | |
| | | | | | | | | |
| DISTRIBUTION SERVICES SECTOR — 13.8% | | | | | | | | |
| | | | Electronics Distributors — 9.0% | | | | | | | | |
| | 503,000 | | Anixter International Inc. | | | 33,236,071 | | | | 42,674,520 | |
| | 987,000 | | Arrow Electronics Inc.* | | | 17,585,961 | | | | 54,630,450 | |
| | 857,000 | | ScanSource Inc.* | | | 22,062,384 | | | | 29,643,630 | |
| | | | | | | 72,884,416 | | | | 126,948,600 | |
| | | | Medical Distributors — 3.2% | | | | | | | | |
| | 1,078,000 | | Patterson Cos. Inc. | | | 23,705,261 | | | | 44,661,540 | |
| | | | Wholesale Distributors — 1.6% | | | | | | | | |
| | 258,000 | | MSC Industrial Direct Co. Inc. | | | 20,681,595 | | | | 22,048,680 | |
| | | | | | | | | |
| ELECTRONIC TECHNOLOGY SECTOR — 3.4% | | | | | | | | |
| | | | Aerospace & Defense — 1.5% | | | | | | | | |
| | 693,000 | | FLIR Systems Inc. | | | 20,964,815 | | | | 21,718,620 | |
| | | | Electronic Production Equipment — 1.9% | | | | | | | | |
| | 823,000 | | MKS Instruments Inc. | | | 22,350,717 | | | | 27,471,740 | |
| | | | | | | | | |
| ENERGY MINERALS SECTOR — 2.0% | | | | | | | | |
| | | | Oil & Gas Production — 2.0% | | | | | | | | |
| | 219,000 | | Cimarex Energy Co. | | | 11,689,715 | | | | 27,710,070 | |
| | | | | | | | | |
| FINANCE SECTOR — 11.4% | | | | | | | | |
| | | | Finance/Rental/Leasing — 2.1% | | | | | | | | |
| | 332,000 | | Ryder System Inc. | | | 13,831,912 | | | | 29,870,040 | |
| | | | Property/Casualty Insurance — 4.7% | | | | | | | | |
| | 804,000 | | Greenlight Capital Re Ltd.* | | | 19,808,449 | | | | 26,057,640 | |
| | 840,000 | | W.R. Berkley Corp. | | | 20,975,570 | | | | 40,152,000 | |
| | | | | | | 40,784,019 | | | | 66,209,640 | |
| | | | Regional Banks — 4.6% | | | | | | | | |
| | 590,000 | | Cullen/Frost Bankers Inc. | | | 34,252,169 | | | | 45,140,900 | |
| | 700,000 | | Zions Bancorporation | | | 16,735,687 | | | | 20,342,000 | |
| | | | | | | 50,987,856 | | | | 65,482,900 | |
FMI Common Stock Fund
SCHEDULE OF INVESTMENTS (Continued)
September 30, 2014
| Shares or Principal Amount | | Cost | | | Value | |
| | | | | | | |
| COMMON STOCKS — 86.5% (a) (Continued) | | | | | | |
| | | | | | | |
| HEALTH SERVICES SECTOR — 0.6% | | | | | | |
| | | Medical/Nursing Services — 0.6% | | | | | | |
| | 418,000 | | Hanger Inc.* | | $ | 14,191,926 | | | $ | 8,577,360 | |
| | | | | | | | | |
| HEALTH TECHNOLOGY SECTOR — 3.1% | | | | | | | | |
| | | | Medical Specialties — 3.1% | | | | | | | | |
| | 537,000 | | Varian Medical Systems Inc.* | | | 40,211,151 | | | | 43,024,440 | |
| | | | | | | | | |
| PROCESS INDUSTRIES SECTOR — 12.3% | | | | | | | | |
| | | | Chemicals: Agricultural — 2.7% | | | | | | | | |
| | 1,460,000 | | Sociedad Quimica y Minera de Chile SA - SP-ADR | | | 43,860,775 | | | | 38,164,400 | |
| | | | Chemicals: Specialty — 4.0% | | | | | | | | |
| | 380,000 | | Compass Minerals International Inc. | | | 27,626,318 | | | | 32,026,400 | |
| | 446,000 | | Innophos Holdings Inc. | | | 22,106,900 | | | | 24,570,140 | |
| | | | | | | 49,733,218 | | | | 56,596,540 | |
| | | | Containers/Packaging — 2.4% | | | | | | | | |
| | 756,000 | | Avery Dennison Corp. | | | 21,521,769 | | | | 33,755,400 | |
| | | | Industrial Specialties — 3.2% | | | | | | | | |
| | 1,133,700 | | H.B. Fuller Co. | | | 43,073,563 | | | | 45,007,890 | |
| | | | | | | | | |
| PRODUCER MANUFACTURING SECTOR — 10.1% | | | | | | | | |
| | | | Industrial Machinery — 4.2% | | | | | | | | |
| | 584,500 | | Kennametal Inc. | | | 22,649,686 | | | | 24,145,695 | |
| | 726,800 | | Woodward Inc. | | | 31,188,890 | | | | 34,610,216 | |
| | | | | | | 53,838,576 | | | | 58,755,911 | |
| | | | Miscellaneous Manufacturing — 4.1% | | | | | | | | |
| | 351,000 | | Carlisle Cos. Inc. | | | 8,802,944 | | | | 28,213,380 | |
| | 220,500 | | Valmont Industries Inc. | | | 32,862,955 | | | | 29,752,065 | |
| | | | | | | 41,665,899 | | | | 57,965,445 | |
| | | | Trucks/Construction/Farm Machinery — 1.8% | | | | | | | | |
| | 337,000 | | Lindsay Corp. | | | 27,007,889 | | | | 25,190,750 | |
| | | | | | | | | |
| TECHNOLOGY SERVICES SECTOR — 6.2% | | | | | | | | |
| | | | Data Processing Services — 4.6% | | | | | | | | |
| | 1,558,000 | | Broadridge Financial Solutions Inc. | | | 34,988,238 | | | | 64,859,540 | |
| | | | Internet Software/Services — 1.6% | | | | | | | | |
| | 955,000 | | Progress Software Corp.* | | | 21,329,244 | | | | 22,834,050 | |
| | | | | | | | | |
| TRANSPORTATION SECTOR — 3.5% | | | | | | | | |
| | | | Air Freight/Couriers — 1.1% | | | | | | | | |
| | 352,000 | | Forward Air Corp. | | | 11,267,415 | | | | 15,780,160 | |
| | | | Marine Shipping — 2.4% | | | | | | | | |
| | 283,000 | | Kirby Corp.* | | | 11,134,976 | | | | 33,351,550 | |
| | | | Total common stocks | | | 934,149,511 | | | | 1,217,913,466 | |
| | | | | | | | | |
| SHORT-TERM INVESTMENTS — 14.0% (a) | | | | | | | | |
| | | | Commercial Paper — 14.0% | | | | | | | | |
| $ | 196,600,000 | | U.S. Bank N.A., 0.03%, due 10/01/14 | | | 196,600,000 | | | | 196,600,000 | |
| | | | Total investments — 100.5% | | $ | 1,130,749,511 | | | | 1,414,513,466 | |
| | | | Liabilities, less other assets — (0.5%) (a) | | | | | | | (6,673,199 | ) |
| | | | TOTAL NET ASSETS — 100.0% | | | | | | $ | 1,407,840,267 | |
| * | Non-income producing security. |
| (a) | Percentages for the various classifications relate to net assets. |
SP-ADR – Sponsored American Depositary Receipt
The accompanying notes to financial statements are an integral part of this schedule.
FMI Common Stock Fund
INDUSTRY SECTORS
as of September 30, 2014 (Unaudited)
FMI
International
Fund
September 30, 2014
Dear Fellow Shareholders:
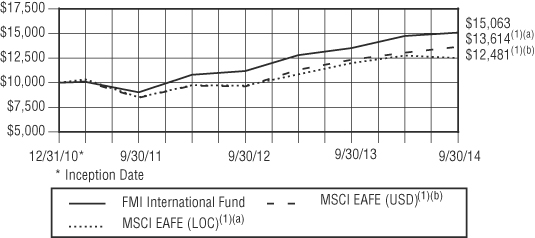
The third quarter of 2014 yielded mixed results for global equity markets, with stock indices in Japan and France advancing by 5.71% and 0.04%, respectively, while German and the U.K. stocks fell by 3.65% and 0.90%, respectively1, as weak economic data (including a 0.2% decline in Germany’s second quarter GDP2) weighed on investor sentiment. The FMI International Fund (FMIJX) fell by 1.38% in the period, which compares with an MSCI EAFE Index gain of 0.93% in local currency and a decline of 5.88% in U.S. Dollars (USD). The relative performance of FMIJX was aided by the Consumer Non-Durables, Retail Trade, and Energy Minerals sectors, while Electronic Technology, Health Technology and Finance sectors were a drag on results. Amorepacific Corp., LG Household & Health Care, and Taiwan Secom generated strong individual returns, while Electrocomponents, Admiral Group, and Adecco each fell in value. The USD strengthened by over 5% against the Japanese Yen, Euro and British Pound. As a reminder, we have chosen to hedge currency risk so that the Fund’s performance is predominantly driven by stock selection, not movements in foreign exchange rates.
To avoid sounding like a broken record, we will spare our readers the reiteration of our view that stock markets are expensive, growth is weak, macro risks abound, and fiscal and monetary policies are misguided and reckless (see our previous shareholder letters for reference). We thought a little change of pace might be refreshing, so instead we will share a few takeaways from our recent research trip to Asia, where two of our analysts visited Japan, South Korea, and Hong Kong. FMI met with over 60 companies, a handful of industry analysts, a Chinese economist, and a member of the Ministry of Finance in Japan. There were a number of interesting observations from the trip:
Japan: Perceptions & Reality
Consistent with our prior meetings in Japan, it remains clear that a vast majority of companies do not have a grasp of return on invested capital (ROIC). It’s all too common for businesses in Japan to fail to earn their cost of capital. During our recent travels, we often came across businesses with long-term (beyond 2020) aspirational targets for return on equity (ROE) that were at or below 10%… far from inspiring. Sometimes this can be a result of an inefficient balance sheet (i.e. hoarding cash and investments), and at other times, an outcome of a low-quality business, poor management, or a lack of focus on profitability (i.e. margins well below global peers). Some companies are slowly starting to talk more about returning additional cash to shareholders, with an increase in dividends and buybacks appearing to be a more realistic consideration. In terms of management quality, we do not expect this to improve overnight, as it will take a long time to change the business culture in Japan. In the meantime, we strive to find the exceptions to the rule, which we believe we have found in FMIJX’s existing Japanese holdings: SMC Corp., Secom, and Shin-Etsu Chemical. Each is a high-quality, dominant business with strong profitability and significant barriers to entry. Their balance sheet efficiency (flush with cash), on the other hand, still has room for improvement.
While we do not believe “Abenomics” will ultimately be successful in rescuing Japan from its mountain of debt, demographic headwinds, and weak economic growth, the policy does appear to be making some initial progress on the inflation front (we would note, however, that printing money is a dangerous game, as modest inflation can quickly turn into hyperinflation). After over fifteen years of deflation, Japan’s inflation rate is now over 1% (with a 2% target), and consumers and companies alike appear to be embracing the reality that prices can actually go up. Companies have long tried to creatively “raise prices” by offering new services and/or technologies, innovative new products, new packaging, reduced product count at the same price, etc. If inflation sticks, companies might actually look to change prices the old fashioned way – simply raise them. This could have a profound impact on a company such as Secom, which provides electronic security services to commercial and residential buildings (think ADT in the U.S., but with its own nationwide security force). Due to low penetration rates in Japan, Secom’s volume growth has been strong for many years, but pricing pressure has held back
_______________
| 1 | The following market indexes are being referred to above: Japan TOPIX, U.K. FTSE All-Share, France CAC-40, and Germany DAX. |
| 2 | Germany’s GDP (gross domestic product) declined 0.2% in the second quarter of 2014, on a quarter-over-quarter basis. |
topline growth. Pricing has started to stabilize in recent years, and our discussions with the company suggest there may be an opportunity to start increasing prices down the road. This could change the company’s growth profile dramatically, and potentially lead to a re-rating of the stock. Inflation in Japan was never baked into our original investment assumptions, but could end up being a positive catalyst nonetheless.
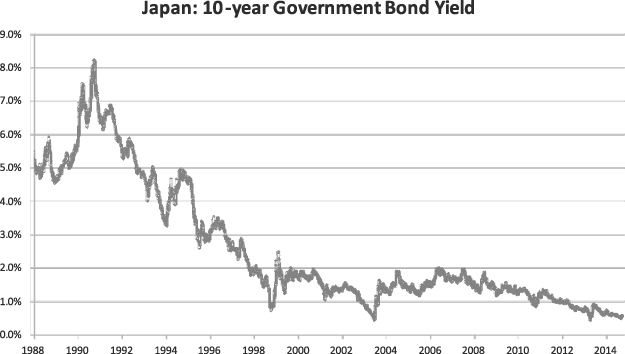
During our time in Japan, we also sat in on a presentation and Q&A session presented by the Ministry of Finance’s new investor relations (IR) department for Japanese Government Bonds (JGBs). The IR people will have their work cut out for them trying to drum up support for JGBs; why any rational international investor would be interested in buying 10-year bonds from the most indebted (not to mention economically-challenged) developed country in the world at a paltry yield of 0.53% is beyond our comprehension. As it stands today, Japan’s national debt service accounts for 24% of the 2014 annual budget and 46% of the tax revenues, despite unsustainably low financing costs. To calm investor fears that a rise in interest rates would cripple the country, IR presented a sensitivity table assuming interest rates could go as high as 4.4% by 2017 (our worst-case would be far higher). Under this scenario, debt service would increase to ¥37.5 trillion from ¥23.3 trillion today (+61%), held down by the duration of the existing portfolio. The further you go out, however, the worse the interest burden will become. According to the speaker, as long as their economic recovery continues (they assume 3% nominal growth), “everything will be okay.” When asked what would happen if rates rose but the economy went into a recession, there was basically no response. It appears there is a blind trust that the government will know just what to do. To our amazement, a comment was made that interest rates “never” really go up above 2%.3 The chart below (with a slightly longer memory) might beg to differ:
Source: Bloomberg
South Korea: Opportunities & Pitfalls
South Korea remains intriguing, as valuations are among the lowest in the developed world (we do not consider it an emerging market4), and a number of inefficiencies still remain, creating attractive investment opportunities. We were pleasantly surprised by a handful of our company meetings. While English filings and language skills can be limited in some cases, financial statements are often available in far more detail than is provided elsewhere in the world. A prime example of the inefficiencies in Korea is the discount placed on the preferred share class, a mispricing that is not economically justified. In Korea, preferred shares typically have the same economic interest as the common shares and pay a higher dividend, but are less liquid and do not have voting rights. As many of the companies are family-controlled, voting rights are of less
_______________
| 3 | “The Japanese Economy and Debt Management,” presentation published by Financial Bureau, Ministry of Finance, Japan, September 2014. |
| 4 | Please see shareholder letter from March 31, 2013 for an in-depth discussion. |
significance, so the discount is mainly attributed to liquidity. As recently as last year, preferred shares traded at discounts as wide as 60% to 80% versus the common shares, an anomaly that simply did not make sense. We have been able to exploit this opportunity through our investments in Amorepacific Corp. and LG Household & Health Care Ltd. (LG H&H), which were purchased at single-digit multiples of earnings — a significant margin of safety for the L’Oreal and Procter & Gamble equivalents of Korea. Over time, we had expected the discount to narrow, to be more in line with what we see in Europe where similar preferred shares trade much closer to par. This has started to play out, as AmorePacific and LG H&H’s preferred shares now trade at a 52% and 46% discount, respectively, from 67% and 70% at the time of purchase. Both stocks remain attractive from an absolute valuation perspective, which we view as far more important than the nominal spread.
The two biggest takeaways from our trip to Korea were the major pitfalls we need to avoid: government involvement and poor corporate governance. While we were already aware from prior research that the government can influence certain industries with a heavy hand, we were surprised to hear from as many companies as we did that they were being adversely affected. The government is a champion for the consumer, so industries that provide basic necessities appear to be the most at risk. The government’s influence is not always through official policy, and in some cases may be through direct communication with an industry and an expectation of compliance. For example, one of the country’s leading instant noodle makers had not been able to raise prices for years, as they were not permitted to by the government. One of the leading discount hypermarket chains was forced to close two days per month so that small- and medium-size enterprises would have a better chance at success. Wireless telecom providers are told one day to cut tariffs, and to cap subsidies another. The list goes on. When a company cannot control its own destiny, we will simply pass and move on to the next.
While corporate governance in Korea is slowly improving, we also witnessed a few examples that suggest that there is still a long way to go. Chaebol conglomerates with multiple cross-holdings of affiliated operating companies must be watched closely. We saw cash-rich operating companies making expensive non-core acquisitions on behalf of their holding companies, less attractive assets being shifted from one operating company to another, and inefficient balance sheets due to equity investments at the operating company level. Before making investments in Korea, we are careful to analyze the corporate structures, aligning ourselves with the controlling family’s direct ownership interests. Being aligned with those who have skin in the game is paramount, and should help to mitigate the risk of being caught on the wrong side of the value equation.
Hong Kong: Further Insights Into China
As most people are aware, the rule of law is much stronger in Hong Kong than it is in China and contracts are viewed similarly to those in the United States. Additionally, the taxes are low and there is a free flow of money, with companies able to transfer billions of dollars in and out of Hong Kong with ease. Hong Kong also has an excellent proximity to China, with Beijing two hours away and Shanghai, just three. International businesses have relocated to Hong Kong because they are close to the action in China and Southeast Asia, but have the aforementioned advantages of being based in Hong Kong. Though Hong Kong’s future political situation is becoming increasingly uncertain as tensions have recently risen with China, historically, it has served these companies quite well. The ongoing political developments will be closely monitored going forward.
Key to success is a company’s ability to build a deep knowledge base in the region, and longstanding contacts and relationships in the countries in which they operate, as is the case with our investment in Jardine Strategic Holdings. A case in point: it has become abundantly clear that China is interested in building local champions, and has, in many cases, made it extremely difficult for multinational players to succeed (just ask retailers Wal-Mart, Tesco, and Kingfisher). One of Korea’s leading hypermarket retailers told us of their failed efforts to enter China. They blamed the Chinese government for refusing to grant them access to prime real estate while local players were given these rights, as well as other subsidies. In discussing Jardine’s recent investment in Zhongsheng Group, an automobile dealership group in China, management described a multi-year due diligence process where they were able to meet with all of the top thirty local Chinese dealers at least once or twice, in order to narrow down the list to a few companies with which they felt comfortable working. Before reaching a final decision, they spoke with top executives at both Toyota and Daimler who communicated that Zhongsheng was the best dealership group in China, especially when it came to integrity and quality. Jardine chose a careful entry point, investing when the stock came under pressure in both equity and convertible debt, to help protect their downside. By partnering with Jardine Strategic, FMIJX has the ability to participate in growth in Greater China and Southeast Asia, thanks to the family-owned investment holding company’s 175+ years of experience and impressive long-term track record of creating shareholder value.
Finally, during our travels we were also surprised to hear a local economist and a number of companies in Hong Kong downplay the risks associated with a potential real estate bubble and credit crisis in China. There was a positive spin for every negative data point we presented. It is clear a lot of people are still “drinking the Kool-Aid.” From our perspective, the facts are overwhelmingly negative, and as a result we are going to err on the side of caution. We would rather be wrong and
miss out on some of the upside, than try to play a speculative game. While the long-term secular outlook in China may be positive, the near-term risk is substantial, as we have articulated in a number of prior letters. With the real estate market starting to turn down, it might not be long before we find out who is right.
Source: BofA Merrill Lynch Global Research
Europe: More of the Same
Unfortunately, not much has changed in Europe, as economic growth continues to languish. The Organisation for Economic Cooperation and Development (OECD) is now forecasting 0.8% growth in the eurozone in 2014 and 1.1% in 2015, a considerable downgrade from earlier expectations in May of 1.2% and 1.7%, respectively.5 Capital investment remains low and unemployment high, a debilitating recipe which is likely to continue to impede economic growth. European Central Bank (ECB) President Mario Draghi is trying to pull out (almost) all the stops, unexpectedly cutting all three major interest rates by an additional 10 basis points to new record lows (the deposit rate is now -0.2%), and signaling that approximately €700 billion of fresh stimulus will be on the way through an asset-buying program of covered bank bonds and asset-backed securities. While coming up short of the full-blown quantitative easing programs championed by the U.S., U.K. and Japan, the ECB is targeting to expand its balance sheet from €2 trillion today to €2.7 trillion, the same level it achieved at the beginning of 2012.6,7 As outlined in prior letters, we have argued that printing money is not a viable economic solution, and our view has not changed.
While this remains a particularly challenging environment to navigate — with high stock valuations, weak business and economic fundamentals, and macro concerns across the globe — listed below are two recent additions to the portfolio that meet our eye with regard to quality and long-term value:
Jardine Strategic Holdings Ltd. (JS-SP)
(Analyst: Jonathan Bloom)
Description
Jardine Strategic Holdings is a family-controlled investment holding company with a focus on Greater China and Southeast Asia. Key assets include controlling positions in Dairy Farm International (DFI-SP), Hongkong Land Holdings
_______________
| 5 | Thomas, Leigh. “OECD slashes growth forecasts, urges aggressive ECB action.” Reuters, September 15, 2014. |
| 6 | Riecher, Stefan. “ECB unexpectedly cuts interest rates as outlook darkens.” Bloomberg, September 4, 2014. |
| 7 | Black, Jeff and Bosley, Catherine. “ECB readying asset-backed purchases after rate cut, Draghi says.” Bloomberg, September 4, 2014. |
(HKL-SP), Astra International (ASII-IJ), and a cross-holding in Jardine Matheson (JM-SP). Key industry exposures include retail store operation (supermarket, convenience store, drug store, home furnishings), restaurant management, real estate investment and development, motor vehicle sales, manufacturing and financing activities, mining, agribusiness, luxury hotel management, engineering, and construction, among others. In 2013, underlying profits by geography were as follows: Southeast Asia (55%), Greater China (40%), U.K. (2%), and Rest of the World (3%).
Good Business
| | • | Dairy Farm International, Astra International and Hongkong Land Holdings all generate a return in excess of their cost of capital, creating economic value. |
| | • | Jardine’s history dates back to the 1830s, as it has established a proven long-term track record in its allocation of capital. Part of the company’s competitive advantage lies in its very deep knowledge base of the region, and long-standing contacts and relationships in the countries in which it operates. |
| | • | Jardine Strategic’s holdings include several businesses and assets with local incumbent advantages and market share positions that would be very difficult and costly to replicate. |
| | • | The company generates various sources of recurring revenue including rent from prominent Hong Kong commercial buildings (Hongkong Land Holdings), automobile service and components (Astra International), and the purchase of consumer staples at various retail formats (Dairy Farm International). |
| | • | Commercial real estate leasing, automobile dealerships, supermarket and drug store operation, and hotel operation are all easy to understand. |
| | • | The company has a solid balance sheet; net debt (excluding net debt of financial services companies) to equity is 5.4%. Interest coverage exclusive of financial services companies is strong at approximately 34 times. |
Valuation
| | • | The company trades at fiscal year 1 and 2 price-to-earnings (P/E) ratios of 12.6 and 11.5 times, respectively. This is roughly in line with 5-year averages of 12.5 and 11.4 times, respectively. |
| | • | Jardine Strategic is trading at an approximately 39% discount to its sum of the parts (SOTP) valuation, which is based on the public market values of its listed investment holdings. This compares with a 10-year average discount of approximately 35%. |
| | • | Applying the Jardine Strategic conglomerate discount allows us to purchase its underlying holdings in Astra International, Hongkong Land Holdings, and Dairy Farm International at implied fiscal year 1 P/E ratios of 8.2, 11.0 and 15.8 times, respectively. |
| | • | The company’s current dividend yield is 0.7%. This compares with a 5- and 10-year average of 0.8% and 1.1%, respectively. |
Management
| | • | The Keswick family has successfully navigated Southeast Asia and Greater China for over 175 years. |
| | • | Management has a proven track record of creating value for themselves and shareholders (significant 10- and 20-year outperformance vs. the MSCI EAFE Index), a long-term investment horizon, and conservative financial management. |
| | • | Management possesses a contrarian mentality; Jardine invested in Astra International in 2000 when others were heading for the exits after the 1997 Asian financial crisis. They had followed the company for 15+ years and seizedthe opportunity. |
Investment Thesis
Owning Jardine Strategic will allow FMIJX to participate in geographic areas (Indonesia, Malaysia, Greater China) where we might otherwise struggle to navigate, while creating diversification across several industries. It is an opportunity to invest alongside a family-run organization that has navigated the region for over 175 years, while creating significant shareholder value through a conservative, long-term approach to capital allocation. At an approximately 39% discount to net asset value, Jardine Strategic offers us a sizeable margin of safety and an attractive investment opportunity.
Smiths Group PLC (SMIN-LN)
(Analyst: Karl Poehls)
Description
Smiths Group is an industrial conglomerate based in the U.K. and has five separate operating businesses, including John Crane (39% of 2013 EBITA), Smiths Medical (32%), Smiths Detection (10%), Smiths Interconnect (12%), and Flex-Tek (7%). In total, the company provides products and services to a diverse range of end markets: transportation and security; oil, gas, and petrochemicals; hospitals and pharmaceuticals; telecommunications; construction; as well as manufacturers in a variety of sectors globally.
Good Business
| | • | A number of products within Smiths Group’s portfolio hold market leading positions. For example, John Crane is the global leader in mechanical seals with 30% market share, and the Medical unit’s Medfusion brand occupies the leading position in neonatal drug delivery. |
| | • | The company estimates that 48% of its revenues can be considered recurring in nature. Approximately two-thirds of John Crane’s sales are generated from the aftermarket and nearly 85% of Smiths Medical’s sales are single-use consumables. |
| | • | Smiths Group has a strong balance sheet with net debt-to-EBITDA and interest coverage ratios of 1.3 and 9.3, respectively. |
| | • | Over the past five years, the company’s ROIC has averaged 13%, which exceeds its cost of capital. We estimate Smiths Group’s ROIC could approach 16-18% over the next few years. |
Valuation
| | • | Smiths Group’s common stock price has underperformed the MSCI EAFE Index over the trailing 1-year and 2-year periods by approximately 5%. |
| | • | Over the past four to five years, sell-side analysts have become increasingly frustrated with the company’s organic growth rate, and roughly half of them assign the shares a Sell or Underweight rating. This suggests there is quite a bit of pessimism built into the current valuation. |
| | • | The company’s trailing P/E multiple is 14.5 times. Over the past ten years, Smiths Group’s stock has traded for an average P/E of 16.3 times. |
| | • | Based on comparable peer takeout and trading multiples, our sum-of-the-parts analysis suggests a fair market value of £17-£18 per share, which is approximately 20-25% above the current market price. We believe this is a valid approach to valuing the company given the odds of future portfolio divestitures. |
Management
| | • | In 2007, Philip Bowman became CEO of Smiths Group. Since this time, he has made a number of positive strategic decisions (e.g., several enterprise resource planning [ERP]) implementations, executive leadership changes, and increased research and development investments) to improve the underlying franchise value of the company’s core operating units. |
| | • | Under Mr. Bowman’s leadership, Smiths Group’s EBITA margin improved from 15.3% in 2008 to 18.0% in 2013. |
| | • | Prior to joining Smiths Group, Mr. Bowman was involved in the sale of Allied Domecq in 2005 as well as the sale of Scottish Power in 2007; he has a strong track record of maximizing value for shareholders. |
Investment Thesis
Smiths Group owns a collection of valuable franchises, and Phil Bowman has taken a number of difficult actions to improve their cost positions as well as their executive talent over the past six years. Due to lackluster organic sales growth in the Medical and Detection businesses, the stock has lagged the equity markets over the past two years. This has provided us with an opportunity to invest in a relatively defensive global industrial company with a solid balance sheet, at an attractive valuation.
Thank you for your support of the FMI International Fund.
100 E. Wisconsin Ave., Suite 2200 • Milwaukee, WI 53202 • 414-226-4555
www.fmifunds.com
This shareholder letter is unaudited.
FMI International Fund
MANAGEMENT’S DISCUSSION OF FUND PERFORMANCE
The FMI International Fund (the “Fund”) gained 11.74% in the fiscal year ended September 30, 2014. This compares to 10.70% return of the benchmark MSCI EAFE Index (local currency) and the 4.25% gain in the MSCI EAFE index (U.S. Dollars). Strong relative performance occurred in Consumer Non-Durables, Consumer Durables and Process Industries. Stocks that helped in each of these sectors included AmorePacific in Consumer Non-Durables, Pirelli in Consumer Durables and Potash in Process Industries. On the negative side, Health Technology, Electronic Technology and Distribution Services all hurt relative performance. Our underweighted position in Health Technology and poor relative performance from GlaxoSmithKline caused this group to lag the benchmark. A decline in Rolls Royce caused the underperformance in Electronic Technology. Poor performance from Electrocomponents caused the Distribution Services to deliver weak results. Stocks added during the fiscal year included Taiwan Secom, Sociedad Quimica y Minera de Chile, Smiths Group PLC, Jardine Strategic and Admiral Group. Stocks sold included CRH PLC, Samsonite, Willis Group, Covidien, and GlaxoSmithKline. Covidien was the subject of a takeover and was sold due to valuation. CRH PLC and Samsonite were also sold due to valuation. Willis Group and GlaxoSmithKline were sold due to fundamental concerns. As of September 30, 2014, sectors that were significantly overweighted relative to the benchmark included Commercial Services, Consumer Non-Durables and Process Industries. Industry sectors that were significantly underweighted included Health Technology, Finance and Communications. Cash levels are elevated due to difficulty finding high quality undervalued securities.
Similar to 2013, stock markets around the globe were generally strong over the fiscal year, perhaps driven by easy monetary policies nearly everywhere. The last three months of the fiscal year were, however, generally flat to negative across the globe. Europe, China, Brazil, Japan and Russia all showed weakening economic growth. The U.S. economy seems to be somewhat better from a year ago but has grown at less than half of its long term historical rate. The U.S. unemployment rate has also improved, but the labor participation rate remains at a very low level and an extraordinarily high number of citizens are dependent on government support. Many global companies have been restrained with respect to investing in both capital equipment and labor, which has resulted in less than satisfactory internal growth rates. Debt levels remain very high in the U.S. as well as many of the major developed and developing countries. Geopolitical problems have escalated over the past year. This, combined with less than average growth and generally high valuations makes us cautious in the short run. We continue to believe, however, that stocks have the best chance to adjust to a dynamic environment over the long run. The Fund sells at a discount to the benchmark on most valuation measures.
COMPARISON OF CHANGE IN VALUE OF $10,000 INVESTMENT IN
FMI INTERNATIONAL FUND AND MSCI EAFE(1)
AVERAGE ANNUALIZED TOTAL RETURN
| | | | | Since |
| | | | | Inception |
| | 1-Year | 3-Year | 5-Year | 12/31/10 |
| FMI International | | | | |
| Fund | 11.74% | 18.60% | N/A | 11.55% |
| MSCI | | | | |
EAFE (LOC)(1)(a) | 10.70% | 17.27% | 8.08% | 8.58% |
| MSCI | | | | |
EAFE (USD)(1)(b) | 4.25% | 13.65% | 6.56% | 6.09% |
The graph and the table do not reflect the deduction of taxes that a shareholder would pay on Fund distributions or the redemption of Fund shares. Performance data quoted represents past performance; past performance does not guarantee future results. Investment return and principal value of an investment will fluctuate so that an investor’s shares, when redeemed, may be worth more or less than their original cost. Current performance of a Fund may be lower or higher than the performance quoted. The total returns do not reflect the deduction of taxes that a shareholder would pay on Fund distributions or the redemption of Fund shares. Total return includes change in share prices and in each case includes reinvestments of any dividends, interest and capital gain distributions. Performance data current to the most recent month-end may be obtained by visiting www.fmifunds.com or by calling 1-800-811-5311.
| (1) | The MSCI EAFE Index (Europe, Australasia, Far East) is a free float-adjusted market capitalization index that is designed to measure the equity market performance of developed markets, excluding the U.S. and Canada. As of May 27, 2010 the MSCI EAFE Index consisted of the following 22 developed market country indices: Australia, Austria, Belgium, Denmark, Finland, France, Germany, Greece, Hong Kong, Ireland, Israel, Italy, Japan, the Netherlands, New Zealand, Norway, Portugal, Singapore, Spain, Sweden, Switzerland and the United Kingdom. The MSCI EAFE Index is unmanaged and investors cannot invest directly in the Index. Index results are inclusive of dividends and net of foreign withholding taxes. The reported figures include reinvestment of dividends and capital gains distributions and do not reflect any fees or expenses. |
| | The MSCI EAFE Index is calculated in local currency as well as in U.S. dollars (USD). The concept of a local currency calculation excludes the impact of currency fluctuations. All currencies of listing are considered in the Index calculation in local currency where current prices (t) and previous day prices (t-1) are converted into USD using the same exchange rate (exchange rate t-1) in the numerator and denominator. As a consequence, the FX factor drops out of the equation. The USD calculation includes exchange rates at t and t-1. Therefore, the local currency calculation only represents the price appreciation or depreciation of the securities, whereas the USD calculation also accounts for the performance of the currency (or currencies) relative to the USD. MSCI EAFE is a service mark of MSCI Barra. |
An investment cannot be made directly into an index.
This page is unaudited.
FMI International Fund
SCHEDULE OF INVESTMENTS
| Shares | | | | Cost | | | Value | |
| | | | | | | |
| LONG-TERM INVESTMENTS — 80.1% (a) | | | | | | |
| COMMON STOCKS — 75.0% (a) | | | | | | |
| | | | | | | |
| COMMERCIAL SERVICES SECTOR — 9.9% | | | | | | |
| | | Advertising/Marketing Services — 3.4% | | | | | | |
| | 798,000 | | WPP PLC (Jersey) (b) | | $ | 15,058,578 | | | $ | 15,986,648 | |
| | | | Miscellaneous Commercial Services — 4.2% | | | | | | | | |
| | 203,000 | | Secom Co. Ltd. (Japan) (b) | | | 11,450,905 | | | | 12,093,612 | |
| | 2,899,740 | | Taiwan Secom (Taiwan) (b) | | | 7,234,019 | | | | 8,005,277 | |
| | | | | | | 18,684,924 | | | | 20,098,889 | |
| | | | Personnel Services — 2.3% | | | | | | | | |
| | 161,000 | | Adecco S.A. (Switzerland) (b) | | | 10,717,342 | | | | 10,883,752 | |
| | | | | | | | | |
| CONSUMER DURABLES SECTOR — 2.5% | | | | | | | | |
| | | | Automotive Aftermarket — 2.5% | | | | | | | | |
| | 843,000 | | Pirelli & C. SpA (Italy) (b) | | | 11,521,809 | | | | 11,624,235 | |
| | | | | | | | | |
| CONSUMER NON-DURABLES SECTOR — 10.9% | | | | | | | | |
| | | | Food: Major Diversified — 5.7% | | | | | | | | |
| | 254,000 | | Danone S.A. (France) (b) | | | 17,979,597 | | | | 17,009,438 | |
| | 133,000 | | Nestle’ S.A. (Switzerland) (b) | | | 9,370,903 | | | | 9,774,307 | |
| | | | | | | 27,350,500 | | | | 26,783,745 | |
| | | | Household/Personal Care — 5.2% | | | | | | | | |
| | 112,000 | | Henkel AG & Co. KGaA (Germany) (b) | | | 8,912,936 | | | | 10,444,452 | |
| | 345,000 | | Unilever PLC (Britain) (b) | | | 14,258,302 | | | | 14,440,897 | |
| | | | | | | 23,171,238 | | | | 24,885,349 | |
| | | | | | | | | |
| CONSUMER SERVICES SECTOR — 3.9% | | | | | | | | |
| | | | Hotels/Resorts/Cruiselines — 2.0% | | | | | | | | |
| | 7,365,000 | | Genting Malaysia Berhad (Malaysia) (b) | | | 9,456,681 | | | | 9,382,256 | |
| | | | Restaurants — 1.9% | | | | | | | | |
| | 568,000 | | Compass Group PLC (Britain) (b) | | | 7,865,167 | | | | 9,161,329 | |
| | | | | | | | | |
| DISTRIBUTION SERVICES SECTOR — 2.2% | | | | | | | | |
| | | | Wholesale Distributors — 2.2% | | | | | | | | |
| | 2,828,000 | | Electrocomponents PLC (Britain) (b) | | | 11,409,855 | | | | 10,181,813 | |
| | | | | | | | | |
| ELECTRONIC TECHNOLOGY SECTOR — 6.3% | | | | | | | | |
| | | | Aerospace & Defense — 4.0% | | | | | | | | |
| | 1,212,000 | | Rolls-Royce Holdings PLC (Britain)*(b) | | | 19,929,517 | | | | 18,863,029 | |
| | | | Electronic Components — 2.3% | | | | | | | | |
| | 197,000 | | TE Connectivity Ltd. (Switzerland) | | | 9,638,291 | | | | 10,892,130 | |
| | | | | | | | | |
| ENERGY MINERALS SECTOR — 2.3% | | | | | | | | |
| | | | Integrated Oil — 2.3% | | | | | | | | |
| | 291,000 | | Royal Dutch Shell PLC (Britain) (b) | | | 10,858,798 | | | | 11,122,068 | |
| | | | | | | | | |
| FINANCE SECTOR — 6.3% | | | | | | | | |
| | | | Property/Casualty Insurance — 6.3% | | | | | | | | |
| | 537,000 | | Admiral Group PLC (Britain) (b) | | | 13,301,776 | | | | 11,136,596 | |
| | 42,000 | | Fairfax Financial Holdings Ltd. (Canada) | | | 17,852,099 | | | | 18,817,965 | |
| | | | | | | 31,153,875 | | | | 29,954,561 | |
| | | | | | | | | |
| INDUSTRIAL SERVICES SECTOR — 3.5% | | | | | | | | |
| | | | Oilfield Services/Equipment — 3.5% | | | | | | | | |
| | 161,000 | | Schlumberger (Curacao) | | | 14,676,589 | | | | 16,372,090 | |
| | | | | | | | | |
| PROCESS INDUSTRIES SECTOR — 10.3% | | | | | | | | |
| | | | Chemicals: Agricultural — 6.9% | | | | | | | | |
| | 712,000 | | Potash Corp. of Saskatchewan Inc. (Canada) | | | 25,440,995 | | | | 24,606,720 | |
FMI International Fund
SCHEDULE OF INVESTMENTS (Continued)
| Shares or Principal Amount | | Cost | | | Value | |
| | | | | | | |
| LONG-TERM INVESTMENTS — 80.1% (a) (Continued) | | | | | | |
| COMMON STOCKS — 75.0% (a) (Continued) | | | | | | |
| | | | | | | |
| PROCESS INDUSTRIES SECTOR — 10.3% (Continued) | | | | | | |
| | | Chemicals: Agricultural — 6.9% (Continued) | | | | | | |
| | 320,000 | | Sociedad Quimica y Minera de Chile S.A. (Chile) (b) | | $ | 8,911,625 | | | $ | 8,298,072 | |
| | | | | | | 34,352,620 | | | | 32,904,792 | |
| | | | Chemicals: Specialty — 1.1% | | | | | | | | |
| | 80,000 | | Shin-Etsu Chemical Co. Ltd. (Japan) (b) | | | 4,639,896 | | | | 5,241,534 | |
| | | | Industrial Specialties — 2.3% | | | | | | | | |
| | 159,000 | | Akzo Nobel N.V. (Netherlands) (b) | | | 10,639,379 | | | | 10,879,032 | |
| | | | | | | | | | | | |
| PRODUCER MANUFACTURING SECTOR — 9.1% | | | | | | | | |
| | | | Industrial Conglomerates — 6.1% | | | | | | | | |
| | 399,000 | | Jardine Strategic Holdings Ltd. (Singapore) | | | 14,467,573 | | | | 13,905,150 | |
| | 735,000 | | Smiths Group PLC (Britain) (b) | | | 16,272,044 | | | | 15,022,605 | |
| | | | | | | 30,739,617 | | | | 28,927,755 | |
| | | | Industrial Machinery — 3.0% | | | | | | | | |
| | 30,000 | | Schindler Holding AG (Switzerland) (b) | | | 4,131,796 | | | | 4,063,650 | |
| | 37,000 | | SMC Corp. (Japan) (b) | | | 8,675,410 | | | | 10,202,417 | |
| | | | | | | 12,807,206 | | | | 14,266,067 | |
| | | | | | | | | | | | |
| RETAIL TRADE SECTOR — 2.8% | | | | | | | | |
| | | | Department Stores — 2.8% | | | | | | | | |
| | 676,500 | | Hyundai Green Food Co. Ltd. (South Korea) (b) | | | 10,936,324 | | | | 13,323,180 | |
| | | | | | | | | | | | |
| TECHNOLOGY SERVICES SECTOR — 5.0% | | | | | | | | |
| | | | Information Technology Services — 5.0% | | | | | | | | |
| | 293,000 | | Accenture PLC (Ireland) | | | 22,230,514 | | | | 23,826,760 | |
| | | | Total common stocks | | | 347,838,720 | | | | 355,561,014 | |
| | | | | | | | | | | | |
| PREFERRED STOCKS — 3.8% (a) | | | | | | | | |
| | | | | | | | | | | | |
| CONSUMER NON-DURABLES SECTOR — 3.8% | | | | | | | | |
| | | | Household/Personal Care — 3.8% | | | | | | | | |
| | 8,500 | | Amorepacific Corp. (South Korea) (b) | | | 2,834,065 | | | | 9,153,745 | |
| | 34,000 | | LG Household & Health Care Ltd. (South Korea) (b) | | | 7,332,607 | | | | 8,819,493 | |
| | | | Total preferred stocks | | | 10,166,672 | | | | 17,973,238 | |
| | | | | | | | | | | | |
| SAVINGS SHARES — 1.3% (a) | | | | | | | | |
| | | | | | | | | | | | |
| CONSUMER DURABLES SECTOR — 1.3% | | | | | | | | |
| | | | Automotive Aftermarket — 1.3% | | | | | | | | |
| | 486,000 | | Pirelli & C. SpA - RSP (Italy) (b) | | | 6,068,426 | | | | 6,295,085 | |
| | | | Total savings shares | | | 6,068,426 | | | | 6,295,085 | |
| | | | Total long-term investments | | | 364,073,818 | | | | 379,829,337 | |
| | | | | | | | | | | | |
| SHORT-TERM INVESTMENTS — 17.7% (a) | | | | | | | | |
| | | | Commercial Paper — 17.7% | | | | | | | | |
| $ | 84,100,000 | | U.S. Bank N.A., 0.03%, due 10/01/14 | | | 84,100,000 | | | | 84,100,000 | |
| | | | Total investments — 97.8% | | $ | 448,173,818 | | | | 463,929,337 | |
| | | | Other assets, less liabilities — 2.2% (a) | | | | | | | 10,428,563 | |
| | | | TOTAL NET ASSETS — 100.0% | | | | | | $ | 474,357,900 | |
| * | Non-income producing security. |
| (a) | Percentages for the various classifications relate to net assets. |
| (b) | Security does not trade during New York Stock Exchange hours and has been valued in accordance with the procedures discussed in Note 1(a) to the financial statements and has been classified as Level 2. As of September 30, 2014 the aggregate value of these securities was $271,408,522. |
PLC – Public Limited Company
RSP – Risparmio (Savings)
SP-ADR – Sponsored American Depositary Receipt
The accompanying notes to financial statements are an integral part of this schedule.
FMI International Fund
SCHEDULE OF FORWARD CURRENCY CONTRACTS
| | | | | | | | U.S. $ Value on | | | | | | | U.S. $ Value on | | | | |
| | | | | | | | September 30, 2014 | | | | | | | September 30, 2014 | | | Unrealized | |
| Settlement | | | Currency to | | of Currency to | | | Currency to | | of Currency to | | | Appreciation | |
| Date | Counterparty | | be Delivered | | be Delivered | | | be Received | | be Received | | | (Depreciation) | |
| 10/24/14 | Bank of Montreal M.C.S. | | | 3,200,000 | | British Pound | | $ | 5,186,576 | | | | 5,340,608 | | U.S. Dollar | | $ | 5,340,608 | | | $ | 154,032 | |
| 10/24/14 | State Street Global | | | | | | | | | | | | | | | | | | | | | | |
| | Markets, LLC | | | 42,500,000 | | British Pound | | | 68,884,210 | | | | 72,346,900 | | U.S. Dollar | | | 72,346,900 | | | | 3,462,690 | |
| 10/24/14 | U.S. Bank N.A. | | | 7,200,000 | | British Pound | | | 11,669,795 | | | | 11,927,628 | | U.S. Dollar | | | 11,927,628 | | | | 257,833 | |
| 10/24/14 | Bank of New York | | | 1,600,000 | | Canadian Dollar | | | 1,427,749 | | | | 1,461,720 | | U.S. Dollar | | | 1,461,720 | | | | 33,971 | |
| 10/24/14 | State Street Global | | | | | | | | | | | | | | | | | | | | | | |
| | Markets, LLC | | | 14,000,000 | | Canadian Dollar | | | 12,492,805 | | | | 13,011,273 | | U.S. Dollar | | | 13,011,273 | | | | 518,468 | |
| 10/24/14 | U.S. Bank N.A. | | | 1,900,000 | | Canadian Dollar | | | 1,695,452 | | | | 1,748,388 | | U.S. Dollar | | | 1,748,388 | | | | 52,936 | |
| 10/24/14 | Bank of New York | | | 650,000,000 | | Chilean Peso | | | 1,084,329 | | | | 1,081,351 | | U.S. Dollar | | | 1,081,351 | | | | (2,978 | ) |
| 10/24/14 | Bank of New York | | | 800,000,000 | | Chilean Peso | | | 1,334,559 | | | | 1,358,069 | | U.S. Dollar | | | 1,358,069 | | | | 23,510 | |
| 10/24/14 | U.S. Bank N.A. | | | 3,200,000,000 | | Chilean Peso | | | 5,338,236 | | | | 5,620,839 | | U.S. Dollar | | | 5,620,839 | | | | 282,603 | |
| 10/24/14 | State Street Global | | | | | | | | | | | | | | | | | | | | | | |
| | Markets, LLC | | | 36,800,000 | | Euro | | | 46,487,896 | | | | 49,377,232 | | U.S. Dollar | | | 49,377,232 | | | | 2,889,336 | |
| 10/24/14 | State Street Global | | | | | | | | | | | | | | | | | | | | | | |
| | Markets, LLC | | | 2,700,000,000 | | Japanese Yen | | | 24,622,474 | | | | 26,268,839 | | U.S. Dollar | | | 26,268,839 | | | | 1,646,365 | |
| 10/24/14 | Bank of New York | | | 9,600,000 | | Malaysian Ringgit | | | 2,921,282 | | | | 3,014,098 | | U.S. Dollar | | | 3,014,098 | | | | 92,816 | |
| 10/24/14 | U.S. Bank N.A. | | | 36,200,000 | | Malaysian Ringgit | | | 11,015,668 | | | | 11,341,563 | | U.S. Dollar | | | 11,341,563 | | | | 325,895 | |
| 10/24/14 | Bank of New York | | | 1,500,000,000 | | South Korean Won | | | 1,419,796 | | | | 1,470,588 | | U.S. Dollar | | | 1,470,588 | | | | 50,792 | |
| 10/24/14 | U.S. Bank N.A. | | | 26,700,000,000 | | South Korean Won | | | 25,272,375 | | | | 25,840,052 | | U.S. Dollar | | | 25,840,052 | | | | 567,677 | |
| 10/24/14 | Bank of | | | | | | | | | | | | | | | | | | | | | | |
| | Montreal M.C.S. | | | 14,500,000 | | Swiss Franc | | | 15,190,926 | | | | 16,075,477 | | U.S. Dollar | | | 16,075,477 | | | | 884,551 | |
| 10/24/14 | Bank of New York | | | 1,200,000 | | Swiss Franc | | | 1,257,180 | | | | 1,322,941 | | U.S. Dollar | | | 1,322,941 | | | | 65,761 | |
| 10/24/14 | State Street Global | | | | | | | | | | | | | | | | | | | | | | |
| | Markets, LLC | | | 3,800,000 | | Swiss Franc | | | 3,981,071 | | | | 4,154,141 | | U.S. Dollar | | | 4,154,141 | | | | 173,070 | |
| 10/24/14 | Bank of New York | | | 28,000,000 | | Taiwan Dollar | | | 920,594 | | | | 934,179 | | U.S. Dollar | | | 934,179 | | | | 13,585 | |
| 10/24/14 | U.S. Bank N.A. | | | 162,000,000 | | Taiwan Dollar | | | 5,326,296 | | | | 5,408,112 | | U.S. Dollar | | | 5,408,112 | | | | 81,816 | |
| | | | | | | | | $ | 247,529,269 | | | | | | | | $ | 259,103,998 | | | $ | 11,574,729 | |
| 10/24/14 | U.S. Bank N.A. | | | 6,220,546 | | U.S. Dollar | | | | | | | 19,800,000 | | Malaysian | | | | | | | | |
| | | | | | | | | | 6,220,546 | | | | | | Ringgit | | | 6,025,144 | | | | (195,402 | ) |
| | | | | | | | | $ | 253,749,815 | | | | | | | | $ | 265,129,142 | | | $ | 11,379,327 | |
The accompanying notes to financial statements are an integral part of these schedules.
INDUSTRY SECTORS
as of September 30, 2014 (Unaudited)
FMI Funds
STATEMENTS OF ASSETS AND LIABILITIES
| | | | FMI | | | FMI | | | FMI | |
| | | | Large Cap | | | Common Stock | | | International | |
| | | | Fund | | | Fund | | | Fund | |
| | | | | | | | | | | |
| ASSETS: | | | | | | | | | | |
| Investments in securities, at value | (a) | | $ | 9,207,192,025 | | | $ | 1,414,513,466 | | | $ | 463,929,337 | |
| Receivables from shareholders for purchases | | | | 7,916,770 | | | | 363,878 | | | | 4,029,222 | |
| Dividends and interest receivable | | | | 11,803,707 | | | | 601,373 | | | | 1,079,460 | |
| Receivable for forward currency contracts | | | | — | | | | — | | | | 11,577,707 | |
| Prepaid expenses | | | | 113,516 | | | | 35,088 | | | | 24,920 | |
| Cash | | | | 74,055 | | | | 102,100 | | | | 72,748 | |
| Total assets | | | $ | 9,227,100,073 | | | $ | 1,415,615,905 | | | $ | 480,713,394 | |
| LIABILITIES: | | | | | | | | | | | | | |
| Payable to brokers for investments purchased | | | $ | — | | | $ | 5,941,432 | | | $ | 5,788,548 | |
| Payable to shareholders for redemptions | | | | 3,821,503 | | | | 557,692 | | | | 79,869 | |
| Payable to adviser for management fees | | | | 4,275,037 | | | | 1,010,674 | | | | 164,073 | |
| Payable for forward currency contracts | | | | — | | | | — | | | | 198,380 | |
| Other liabilities | | | | 1,605,011 | | | | 265,840 | | | | 124,624 | |
| Total liabilities | | | | 9,701,551 | | | | 7,775,638 | | | | 6,355,494 | |
| Net assets | | | $ | 9,217,398,522 | | | $ | 1,407,840,267 | | | $ | 474,357,900 | |
| NET ASSETS: | | | | | | | | | | | | | |
| Capital Stock | (b) | | $ | 6,261,205,654 | | | $ | 968,559,083 | | | $ | 438,063,024 | |
| Net unrealized appreciation (depreciation) on investments: | | | | | | | | | | | | | |
| Securities | | | | 2,048,109,516 | | | | 283,763,955 | | | | 15,755,519 | |
| Forward currency contracts | | | | — | | | | — | | | | 11,379,327 | |
| Foreign currency transactions | | | | — | | | | — | | | | (14,579 | ) |
| Accumulated net realized gain | | | | 855,059,333 | | | | 156,113,923 | | | | 9,177,466 | |
| Undistributed net investment income (loss) | | | | 53,024,019 | | | | (596,694 | ) | | | (2,857 | ) |
| Net assets | | | $ | 9,217,398,522 | | | $ | 1,407,840,267 | | | $ | 474,357,900 | |
| CALCULATION OF NET ASSET VALUE PER SHARE: | | | | | | | | | | | | | |
| Net asset value, offering and redemption price per share | | | | | | | | | | | | | |
| (Net assets ÷ shares outstanding) | | | $ | 22.21 | | | $ | 29.12 | | | $ | 28.64 | |
| | | | | | | | | | | | | | |
| (a) Identified cost of investments | | | $ | 7,159,082,509 | | | $ | 1,130,749,511 | | | $ | 448,173,818 | |
| (b) Par value | | | $ | 0.0001 | | | $ | 0.0001 | | | $ | 0.0001 | |
| Shares authorized | | | | 500,000,000 | | | | 400,000,000 | | | | 400,000,000 | |
| Shares outstanding | | | | 414,936,343 | | | | 48,353,978 | | | | 16,560,802 | |
The accompanying notes to financial statements are an integral part of these statements.
FMI Funds
STATEMENTS OF OPERATIONS
For the Year Ended September 30, 2014
| | | FMI | | | FMI | | | FMI | |
| | | Large Cap | | | Common Stock | | | International | |
| | | Fund | | | Fund | | | Fund | |
| | | | | | | | | | |
| INCOME: | | | | | | | | | |
| Dividends | | $ | 159,633,634 | | | $ | 18,091,106 | | | $ | 5,191,570 | * |
| Interest | | | 227,196 | | | | 63,463 | | | | 13,690 | |
| Total income | | | 159,860,830 | | | | 18,154,569 | | | | 5,205,260 | |
| EXPENSES: | | | | | | | | | | | | |
| Management fees | | | 66,171,584 | | | | 13,813,543 | | | | 1,881,240 | |
| Transfer agent fees | | | 11,664,399 | | | | 1,507,649 | | | | 282,233 | |
| Administration and accounting services | | | 3,502,601 | | | | 547,728 | | | | 121,094 | |
| Printing and postage expense | | | 891,495 | | | | 81,820 | | | | 15,967 | |
| Custodian fees | | | 330,354 | | | | 55,423 | | | | 88,747 | |
| Registration fees | | | 217,184 | | | | 80,368 | | | | 85,530 | |
| Professional fees | | | 63,356 | | | | 44,045 | | | | 41,322 | |
| Board of Directors fees | | | 48,400 | | | | 43,600 | | | | 10,000 | |
| Other expenses | | | 247,903 | | | | 88,668 | | | | 49,740 | |
| Total expenses before reimbursement | | | 83,137,276 | | | | 16,262,844 | | | | 2,575,873 | |
| Less expenses reimbursed by adviser | | | — | | | | — | | | | (69,061 | ) |
| Net expenses | | | 83,137,276 | | | | 16,262,844 | | | | 2,506,812 | |
| NET INVESTMENT INCOME | | | 76,723,554 | | | | 1,891,725 | | | | 2,698,448 | |
| NET REALIZED GAIN (LOSS) ON INVESTMENTS: | | | | | | | | | | | | |
| Securities | | | 888,647,365 | | | | 168,273,295 | | | | 9,666,617 | |
| Forward currency contracts | | | — | | | | — | | | | (5,112,619 | ) |
| Foreign currency transactions | | | — | | | | — | | | | 115,899 | |
| NET REALIZED GAIN (LOSS) ON INVESTMENTS | | | 888,647,365 | | | | 168,273,295 | | | | 4,669,897 | |
| NET CHANGE IN UNREALIZED | | | | | | | | | | | | |
| APPRECIATION (DEPRECIATION) ON INVESTMENTS: | | | | | | | | | | | | |
| Securities | | | 303,314,155 | | | | (39,487,662 | ) | | | (2,479,412 | ) |
| Forward currency contracts | | | — | | | | — | | | | 13,914,237 | |
| Foreign currency transactions | | | — | | | | — | | | | (17,526 | ) |
| NET CHANGE IN UNREALIZED | | | | | | | | | | | | |
| APPRECIATION (DEPRECIATION) ON INVESTMENTS | | | 303,314,155 | | | | (39,487,662 | ) | | | 11,417,299 | |
| NET GAIN ON INVESTMENTS | | | 1,191,961,520 | | | | 128,785,633 | | | | 16,087,196 | |
| NET INCREASE IN NET ASSETS RESULTING FROM OPERATIONS | | $ | 1,268,685,074 | | | $ | 130,677,358 | | | $ | 18,785,644 | |
| * | Net withholding taxes of $672,430. |
The accompanying notes to financial statements are an integral part of these statements.
FMI Funds
STATEMENTS OF CHANGES IN NET ASSETS
For the Years Ended September 30, 2014 and 2013
| | | FMI | | | FMI | | | FMI | |
| | | Large Cap | | | Common Stock | | | International | |
| | | Fund | | | Fund | | | Fund | |
| | | | | | | | | | | | | | | | | | | |
| | | 2014 | | | 2013 | | | 2014 | | | 2013 | | | 2014 | | | 2013 | |
| | | | | | | | | | | | | | | | | | | |
| OPERATIONS: | | | | | | | | | | | | | | | | | | |
| Net investment income | | $ | 76,723,554 | | | $ | 68,382,619 | | | $ | 1,891,725 | | | $ | 2,998,759 | | | $ | 2,698,448 | | | $ | 1,045,058 | |
| Net realized gain on investments | | | 888,647,365 | | | | 470,091,161 | | | | 168,273,295 | | | | 118,919,635 | | | | 4,669,897 | | | | 4,005,804 | |
| Net change in unrealized | | | | | | | | | | | | | | | | | | | | | | | | |
| appreciation (depreciation) | | | | | | | | | | | | | | | | | | | | | | | | |
| on investments | | | 303,314,155 | | | | 803,855,501 | | | | (39,487,662 | ) | | | 157,041,927 | | | | 11,417,299 | | | | 12,779,543 | |
| Net increase in net assets | | | | | | | | | | | | | | | | | | | | | | | | |
| from operations | | | 1,268,685,074 | | | | 1,342,329,281 | | | | 130,677,358 | | | | 278,960,321 | | | | 18,785,644 | | | | 17,830,405 | |
| DISTRIBUTIONS TO SHAREHOLDERS: | | | | | | | | | | | | | | | | | | | | | | | | |
| Distributions from | | | | | | | | | | | | | | | | | | | | | | | | |
| net investment income | | | (69,871,376 | ) | | | (70,248,746 | ) | | | (5,487,178 | ) | | | (3,755,898 | ) | | | (1,132,520 | ) | | | (276,470 | ) |
| Distributions from net realized gains | | | (491,574,928 | ) | | | (76,074,311 | ) | | | (116,981,550 | ) | | | (104,459,853 | ) | | | (3,162,197 | ) | | | (780,403 | ) |
| Total distributions | | | (561,446,304 | ) | | | (146,323,057 | ) | | | (122,468,728 | ) | | | (108,215,751 | ) | | | (4,294,717 | ) | | | (1,056,873 | ) |
| FUND SHARE ACTIVITIES: | | | | | | | | | | | | | | | | | | | | | | | | |
| Proceeds from shares issued | | | 1,645,568,671 | | | | 2,042,367,387 | | | | 237,849,041 | | | | 156,410,362 | | | | 338,231,239 | | | | 59,962,904 | |
| Net asset value of shares issued | | | | | | | | | | | | | | | | | | | | | | | | |
| in distributions reinvested | | | 523,640,012 | | | | 134,676,458 | | | | 119,367,345 | | | | 105,591,665 | | | | 4,287,436 | | | | 1,034,508 | |
| Cost of shares redeemed | | | (1,781,064,687 | ) | | | (1,418,847,676 | ) | | | (216,743,240 | ) | | | (292,088,719 | ) | | | (20,557,903 | ) | | | (7,180,587 | ) |
| Net increase (decrease) in net assets | | | | | | | | | | | | | | | | | | | | | | | | |
| derived from Fund share activities | | | 388,143,996 | | | | 758,196,169 | | | | 140,473,146 | | | | (30,086,692 | ) | | | 321,960,772 | | | | 53,816,825 | |
| TOTAL INCREASE | | | 1,095,382,766 | | | | 1,954,202,393 | | | | 148,681,776 | | | | 140,657,878 | | | | 336,451,699 | | | | 70,590,357 | |
| NET ASSETS AT THE | | | | | | | | | | | | | | | | | | | | | | | | |
| BEGINNING OF THE YEAR | | | 8,122,015,756 | | | | 6,167,813,363 | | | | 1,259,158,491 | | | | 1,118,500,613 | | | | 137,906,201 | | | | 67,315,844 | |
| NET ASSETS AT THE | | | | | | | | | | | | | | | | | | | | | | | | |
| END OF THE YEAR | | $ | 9,217,398,522 | | | $ | 8,122,015,756 | | | $ | 1,407,840,267 | | | $ | 1,259,158,491 | | | $ | 474,357,900 | | | $ | 137,906,201 | |
| Undistributed net investment | | | | | | | | | | | | | | | | | | | | | | | | |
| income (loss) | | $ | 53,024,019 | | | $ | 46,171,841 | | | $ | (596,694 | ) | | $ | 2,998,759 | | | $ | (2,857 | ) | | $ | 3,101,609 | |
| FUND SHARE TRANSACTIONS: | | | | | | | | | | | | | | | | | | | | | | | | |
| Shares sold | | | 76,598,917 | | | | 108,297,779 | | | | 8,151,853 | | | | 6,051,371 | | | | 11,895,853 | | | | 2,432,360 | |
| Shares issued in | | | | | | | | | | | | | | | | | | | | | | | | |
| distributions reinvested | | | 25,656,051 | | | | 8,008,684 | | | | 4,223,898 | | | | 4,598,940 | | | | 159,148 | | | | 47,537 | |
| Less shares redeemed | | | (83,155,053 | ) | | | (75,281,300 | ) | | | (7,373,410 | ) | | | (11,290,353 | ) | | | (729,756 | ) | | | (287,112 | ) |
| Net increase (decrease) | | | | | | | | | | | | | | | | | | | | | | | | |
| in shares outstanding | | | 19,099,915 | | | | 41,025,163 | | | | 5,002,341 | | | | (640,042 | ) | | | 11,325,245 | | | | 2,192,785 | |
The accompanying notes to financial statements are an integral part of these statements.
FMI Large Cap Fund
FINANCIAL HIGHLIGHTS
(Selected data for each share of the Fund outstanding throughout each year)
| | | Years Ended September 30, | |
| | | 2014 | | | 2013 | | | 2012 | | | 2011 | | | 2010 | |
| PER SHARE OPERATING PERFORMANCE: | | | | | | | | | | | | | | | |
| Net asset value, beginning of year | | $ | 20.52 | | | $ | 17.38 | | | $ | 14.31 | | | $ | 14.46 | | | $ | 13.27 | |
| Income from investment operations: | | | | | | | | | | | | | | | | | | | | |
| Net investment income | | | 0.19 | | | | 0.18 | | | | 0.20 | | | | 0.16 | | | | 0.17 | |
| Net realized and unrealized gains (loss) on investments | | | 2.92 | | | | 3.37 | | | | 3.46 | | | | (0.17 | ) | | | 1.19 | |
| Total from investment operations | | | 3.11 | | | | 3.55 | | | | 3.66 | | | | (0.01 | ) | | | 1.36 | |
| | | | | | | | | | | | | | | | | | | | | |
| Less distributions: | | | | | | | | | | | | | | | | | | | | |
| Distributions from net investment income | | | (0.18 | ) | | | (0.20 | ) | | | (0.17 | ) | | | (0.14 | ) | | | (0.17 | ) |
| Distributions from net realized gains | | | (1.24 | ) | | | (0.21 | ) | | | (0.42 | ) | | | — | | | | — | |
| Total from distributions | | | (1.42 | ) | | | (0.41 | ) | | | (0.59 | ) | | | (0.14 | ) | | | (0.17 | ) |
| Net asset value, end of year | | $ | 22.21 | | | $ | 20.52 | | | $ | 17.38 | | | $ | 14.31 | | | $ | 14.46 | |
| | | | | | | | | | | | | | | | | | | | | |
| TOTAL RETURN | | | 15.77 | % | | | 20.94 | % | | | 26.17 | % | | | (0.13 | %) | | | 10.33 | % |
| RATIOS/SUPPLEMENTAL DATA: | | | | | | | | | | | | | | | | | | | | |
| Net assets, end of year (in 000’s $) | | | 9,217,399 | | | | 8,122,016 | | | | 6,167,813 | | | | 4,008,758 | | | | 3,318,364 | |
| Ratio of expenses to average net assets | | | 0.94 | % | | | 0.96 | % | | | 0.96 | % | | | 0.97 | % | | | 0.97 | % |
| Ratio of net investment income to average net assets | | | 0.87 | % | | | 0.95 | % | | | 1.25 | % | | | 1.03 | % | | | 1.18 | % |
| Portfolio turnover rate | | | 31 | % | | | 30 | % | | | 21 | % | | | 28 | % | | | 20 | % |
FINANCIAL HIGHLIGHTS
(Selected data for each share of the Fund outstanding throughout each year)
| | | Years Ended September 30, | |
| | | 2014 | | | 2013 | | | 2012 | | | 2011 | | | 2010 | |
| PER SHARE OPERATING PERFORMANCE: | | | | | | | | | | | | | | | |
| Net asset value, beginning of year | | $ | 29.05 | | | $ | 25.43 | | | $ | 22.63 | | | $ | 22.98 | | | $ | 21.07 | |
| Income from investment operations: | | | | | | | | | | | | | | | | | | | | |
| Net investment income (loss) | | | 0.04 | | | | 0.07 | | | | 0.09 | | | | 0.03 | | | | (0.00 | )* |
| Net realized and unrealized gains on investments | | | 2.91 | | | | 6.05 | | | | 4.79 | | | | 0.44 | | | | 1.96 | |
| Total from investment operations | | | 2.95 | | | | 6.12 | | | | 4.88 | | | | 0.47 | | | | 1.96 | |
| | | | | | | | | | | | | | | | | | | | | |
| Less distributions: | | | | | | | | | | | | | | | | | | | | |
| Distributions from net investment income | | | (0.13 | ) | | | (0.09 | ) | | | (0.04 | ) | | | — | | | | (0.04 | ) |
| Distributions from net realized gains | | | (2.75 | ) | | | (2.41 | ) | | | (2.04 | ) | | | (0.82 | ) | | | (0.01 | ) |
| Total from distributions | | | (2.88 | ) | | | (2.50 | ) | | | (2.08 | ) | | | (0.82 | ) | | | (0.05 | ) |
| Net asset value, end of year | | $ | 29.12 | | | $ | 29.05 | | | $ | 25.43 | | | $ | 22.63 | | | $ | 22.98 | |
| | | | | | | | | | | | | | | | | | | | | |
| TOTAL RETURN | | | 10.44 | % | | | 26.63 | % | | | 22.38 | % | | | 2.03 | % | | | 9.30 | % |
| RATIOS/SUPPLEMENTAL DATA: | | | | | | | | | | | | | | | | | | | | |
| Net assets, end of year (in 000’s $) | | | 1,407,840 | | | | 1,259,158 | | | | 1,118,501 | | | | 945,991 | | | | 925,630 | |
| Ratio of expenses to average net assets | | | 1.18 | % | | | 1.19 | % | | | 1.20 | % | | | 1.21 | % | | | 1.24 | % |
| Ratio of net investment income (loss) to average net assets | | | 0.14 | % | | | 0.26 | % | | | 0.38 | % | | | 0.13 | % | | | (0.01 | %) |
| Portfolio turnover rate | | | 33 | % | | | 24 | % | | | 43 | % | | | 26 | % | | | 30 | % |
| * | Amount is less than $0.005 per share. |
The accompanying notes to financial statements are an integral part of these statements.
FMI International Fund
FINANCIAL HIGHLIGHTS
(Selected data for each share of the Fund outstanding throughout each period)
| | | | | | | | | | | | For the Period from | |
| | | | | | | | | | | | December 31, | |
| | | | | | | | | | | | 2010* to | |
| | | Years Ended September 30, | | | September 30, | |
| | | 2014 | | | 2013 | | | 2012 | | | 2011 | |
| PER SHARE OPERATING PERFORMANCE: | | | | | | | | | | | | |
| Net asset value, beginning of period | | $ | 26.34 | | | $ | 22.12 | | | $ | 18.06 | | | $ | 20.00 | |
| Income from investment operations: | | | | | | | | | | | | | | | | |
| Net investment income | | | 0.30 | | | | 0.25 | | | | 0.22 | | | | 0.16 | |
| Net realized and unrealized gains (loss) on investments | | | 2.74 | | | | 4.29 | | | | 4.00 | | | | (2.10 | ) |
| Total from investment operations | | | 3.04 | | | | 4.54 | | | | 4.22 | | | | (1.94 | ) |
| | | | | | | | | | | | | | | | | |
| Less distributions: | | | | | | | | | | | | | | | | |
| Distributions from net investment income | | | (0.19 | ) | | | (0.08 | ) | | | (0.16 | ) | | | — | |
| Distributions from net realized gains | | | (0.55 | ) | | | (0.24 | ) | | | — | | | | — | |
| Total from distributions | | | (0.74 | ) | | | (0.32 | ) | | | (0.16 | ) | | | — | |
| Net asset value, end of period | | $ | 28.64 | | | $ | 26.34 | | | $ | 22.12 | | | $ | 18.06 | |
| | | | | | | | | | | | | | | | | |
| TOTAL RETURN | | | 11.74 | % | | | 20.87 | % | | | 23.52 | % | | | (9.70 | %)(1) |
| RATIOS/SUPPLEMENTAL DATA: | | | | | | | | | | | | | | | | |
| Net assets, end of period (in 000’s $) | | | 474,358 | | | | 137,906 | | | | 67,316 | | | | 13,514 | |
| Ratio of expense to average net assets: | | | | | | | | | | | | | | | | |
| Before expense reimbursement | | | 1.03 | % | | | 1.15 | % | | | 1.45 | % | | | 2.91 | %(2) |
| After expense reimbursement | | | 1.00 | % | | | 1.00 | % | | | 1.00 | % | | | 1.00 | %(2) |
| Ratio of net investment income (loss) to average net assets: | | | | | | | | | | | | | | | | |
| Before expense reimbursement | | | 1.05 | % | | | 0.89 | % | | | 0.62 | % | | | (0.86 | )%(2) |
| After expense reimbursement | | | 1.08 | % | | | 1.04 | % | | | 1.07 | % | | | 1.05 | %(2) |
| Portfolio turnover rate | | | 22 | % | | | 21 | % | | | 20 | % | | | 12 | %(1) |
| | | | | | | | | | | | | | | | | |
| * | Commencement of Operations. |
The accompanying notes to financial statements are an integral part of this statement.
FMI Funds
NOTES TO FINANCIAL STATEMENTS
| (1) | Summary of Significant Accounting Policies — |
The following is a summary of significant accounting policies of the FMI Large Cap Fund, the FMI Common Stock Fund, and the FMI International Fund (collectively, the “Funds” or, individually, a “Fund”). The FMI Large Cap Fund (the “Large Cap Fund”), the FMI Common Stock Fund (the “Common Stock Fund”), and the FMI International Fund (the “International Fund”) are each a series of FMI Funds, Inc. (the “Company”). The Company was incorporated under the laws of Maryland on September 5, 1996. The Large Cap Fund commenced operations on December 31, 2001 and the International Fund commenced operations on December 31, 2010. The Common Stock Fund is the successor to the FMI Common Stock Fund, the sole series of FMI Common Stock Fund, Inc. (the “Predecessor Common Stock Fund”). The reorganization was effective as of January 31, 2014, and the Common Stock Fund is the accounting survivor of the reorganization. The Predecessor Common Stock Fund was incorporated under the laws of Wisconsin on July 29, 1981. Both the Large Cap Fund and the International Fund are registered as non-diversified, open-end management investment companies under the Investment Company Act of 1940 (the “Act”), as amended. The Common Stock Fund is registered as a diversified open-end management investment company under the Act. The assets and liabilities of each Fund in the Company are segregated and a shareholder’s interest is limited to the Fund in which the shareholder owns shares. The investment objective of the Large Cap Fund is to seek long-term capital appreciation by investing mainly in a limited number of large capitalization value stocks. The investment objective of the Common Stock Fund is to seek long-term capital appreciation by investing mainly in small to medium capitalization value stocks. The investment objective of the International Fund is to seek capital appreciation by investing mainly in a limited number of large capitalization value stocks of non-U.S. companies. The Large Cap Fund and Common Stock Fund are both currently closed to new investors.
| | (a) | Each security, excluding short-term investments, is valued at the last sale price reported by the principal security exchange on which the issue is traded. Securities that are traded on the Nasdaq Markets are valued at the Nasdaq Official Closing Price, or if no sale is reported, the latest bid price. Securities that are traded over-the-counter are valued at the latest bid price. Unlisted equity securities for which market quotations are readily available are valued at the most recent bid price. For the International Fund only, options purchased or written by the Fund are valued at the average of the most recent bid and ask prices. Securities for which quotations are not readily available are valued at fair value as determined by the investment adviser in accordance with procedures approved by the Board of Directors (“Board”). The fair value of a security is the amount which a Fund might reasonably expect to receive upon a current sale. The fair value of a security may differ from the last quoted price and a Fund may not be able to sell a security at the fair value. Market quotations may not be available, for example, if trading in particular securities was halted during the day and not resumed prior to the close of trading on the New York Stock Exchange. For the International Fund only, for securities that do not trade during New York Stock Exchange hours, fair value determinations are based on analyses of market movements after the close of those securities’ primary markets, and may include reviews of developments in foreign markets, the performance of U.S. securities markets, and the performance of instruments trading in U.S. markets that represent foreign securities and baskets of foreign securities. The Board utilizes a service provided by an independent third party to assist in fair valuation of certain securities for the International Fund. As of September 30, 2014, there were no securities that were internally fair valued. Short-term investments with maturities of 60 days or less were valued at amortized cost which approximates value. For financial reporting purposes, investment transactions are recorded on the trade date. |
| | | The Funds apply the provisions of the Financial Accounting Standards Board (“FASB”) Accounting Standards Codification “Fair Value Measurements and Disclosures” Topic 820 (“ASC 820”), which defines fair value as the price that would be received to sell an asset or paid to transfer a liability (i.e., the “exit price”) in an orderly transaction between market participants at the measurement date. |
In determining fair value, the Funds use various valuation approaches. ASC 820 establishes a fair value hierarchy for inputs used in measuring fair value that maximizes the use of observable inputs and minimizes the use of unobservable inputs by generally requiring that the most observable inputs be used when available. Observable inputs are those that market participants would use in pricing the asset or liability based on market data obtained from sources independent of the Funds. Unobservable inputs reflect the Funds’ assumptions about the inputs market participants would use in pricing the asset or liability developed based on the best information available in the circumstances. The inputs or methodologies used for valuing securities are not necessarily an indication of the risks associated with investing in those securities. For the International Fund only, over the counter derivatives such as forward currency contracts may be valued using quantitative models. These models may use pricing curves based on market inputs including current exchange rates or indices. These curves are combined with volatility factors to value the overall positions. The market inputs are generally significant and can be corroborated with observable market data and therefore are classified in level 2.
The fair value hierarchy is categorized into three levels based on the inputs as follows:
| | Level 1 — | Valuations based on unadjusted quoted prices in active markets for identical assets. |
| | Level 2 — | Valuations based on quoted prices for similar securities or in markets that are not active or for which all significant inputs are observable, either directly or indirectly. |
| | | Valuations based on inputs that are unobservable and significant to the overall fair value measurement. |
FMI Funds
NOTES TO FINANCIAL STATEMENTS (Continued)
| (1) | Summary of Significant Accounting Policies — (Continued) |
The following table summarizes the Funds’ investments as of September 30, 2014, based on the inputs used to value them:
| | | | Large Cap Fund | | | Common Stock Fund | | | International Fund | | | International Fund | |
| | | | Investments | | | Investments | | | Investments | | | Other Financial | |
| Valuation Inputs | | in Securities | | | in Securities | | | in Securities | | | Instruments* | |
| Assets: | | | | | | | | | | | | | |
| Level 1 — | Common Stocks | | $ | 8,440,292,025 | | | $ | 1,217,913,466 | | | $ | 108,420,815 | | | $ | — | |
| Level 2 — | Common Stocks | | | — | | | | — | | | | 247,140,199 | | | | — | |
| | Preferred Stocks | | | — | | | | — | | | | 17,973,238 | | | | — | |
| | Savings Shares | | | — | | | | — | | | | 6,295,085 | | | | — | |
| | Short-Term Commercial Paper | | | 766,900,000 | | | | 196,600,000 | | | | 84,100,000 | | | | — | |
| | Forward Currency Contracts | | | — | | | | — | | | | — | | | | 11,577,707 | |
| | Total Level 2 | | | 9,207,192,025 | | | | 1,414,513,466 | | | | 463,929,337 | | | | 11,577,707 | |
| Level 3 — | | | | — | | | | — | | | | — | | | | — | |
| Liabilities: | | | | | | | | | | | | | | | | | |
| Level 2 — Forward Currency Contracts | | | — | | | | — | | | | — | | | | (198,380 | ) |
| Total | | $ | 9,207,192,025 | | | $ | 1,414,513,466 | | | $ | 463,929,337 | | | $ | 11,379,327 | |
| | * | Other financial instruments are derivative instruments, specifically forward currency contracts, which are valued at the unrealized appreciation/(depreciation) on the instrument. |
It is the Funds’ policy to recognize transfers between levels at the end of the reporting period. There were no transfers between levels during the fiscal year ended September 30, 2014.
See the Schedules of Investments for investments detailed by industry classifications.
| | (b) | Net realized gains and losses on sales of securities are computed on the identified cost basis. |
| | (c) | Dividend income is recorded on the ex-dividend date. Interest income is recorded on an accrual basis. |
| | (d) | The International Fund may enter into forward currency contracts in order to hedge its exposure to changes in foreign currency rates on its foreign portfolio holdings or to hedge certain purchase and sale commitments denominated in foreign currencies. A forward currency contract is a commitment to purchase or sell a foreign currency at a future date at a negotiated rate. These contracts are valued daily and the asset or liability therein represents unrealized gain or loss on the contracts as measured by the difference between the forward foreign exchange rates at the dates of entry into the contracts and the forward rates at the reporting date. There were on average thirteen forward currency contracts outstanding during the year ended September 30, 2014. These contracts are not subject to master netting agreements. |
The fair value of the forward currency contracts as of September 30, 2014 is included in the following locations on the International Fund’s statement of assets and liabilities:
| | | | | Fair Value of |
| | | | | (Liability) Forward |
| | Location | Currency Contracts | Location | Currency Contracts |
| Forward currency | Receivable for | $11,577,707 | Payable for | $(198,380) |
| contracts | forward currency | | forward currency | |
| | contracts | | contracts | |
Realized and unrealized gains and losses on forward currency contracts entered into during the year ended September 30, 2014 by the International Fund are recorded in the following locations on the statement of operations:
| | | | | Unrealized |
| | Location | (Loss) | Location | Gain |
| Forward currency | Net realized loss on forward | $(5,112,619) | Net change in unrealized | $13,914,237 |
| contracts | currency contracts | | appreciation on forward | |
| | | | currency contracts | |
These instruments involve market risk, credit risk, or both kinds of risks, in excess of the amount recognized in the International Fund’s statement of assets and liabilities. Risks arise from the possible inability of counterparties to meet the terms of their contracts and from movement in currency and securities values and interest rates.
FMI Funds
NOTES TO FINANCIAL STATEMENTS (Continued)
| (1) | Summary of Significant Accounting Policies — (Continued) |
| | (e) | The preparation of financial statements in conformity with accounting principles generally accepted in the United States of America (“GAAP”) requires management to make estimates and assumptions that affect the reported amounts of assets and liabilities and disclosure of contingent assets and liabilities at the date of the financial statements and the reported amounts of revenues and expenses during the reporting period. Actual results could differ from these estimates. |
| | (f) | The Funds may own certain securities that are restricted. Restricted securities include Section 4(2) commercial paper, securities issued in a private placement, or securities eligible for resale pursuant to Rule 144A under the Securities Act of 1933 (the “1933 Act”). A restricted security cannot be resold to the general public without prior registration under the 1933 Act or pursuant to the resale limitations provided by Rule 144A under the 1933 Act, or an exemption from the registration requirements of the 1933 Act. The Funds did not hold any restricted securities as of September 30, 2014. |
| | (g) | No provision has been made for Federal income taxes since the Funds have elected to be taxed as “regulated investment companies.” The Funds intend to distribute substantially all net investment company taxable income and net capital gains to their respective shareholders and otherwise comply with the provisions of the Internal Revenue Code applicable to regulated investment companies. |
| | (h) | The Funds have reviewed all open tax years and major jurisdictions, which include Federal and the state of Maryland for the Large Cap Fund and International Fund and Federal and the state of Wisconsin for the Predecessor Common Stock Fund, and concluded that there are no significant uncertain tax positions that would require recognition in the financial statements. Open tax years are those that are open for exam by taxing authorities and, as of September 30, 2014, open Federal tax years include the prior three fiscal tax years ended September 30, 2014. The Funds have no examinations in progress and are also not aware of any tax positions for which it is reasonably possible that the total amounts of unrecognized tax benefits will significantly change in the next twelve months. |
| | (i) | GAAP requires that permanent differences between income for financial reporting and tax purposes be reclassified in the capital accounts. During the fiscal year ended September 30, 2014, the reclassifications were as follows: |
| | | Undistributed | | | Accumulated Net | | | | |
| | | Net Investment Income | | | Realized Gain/(Loss) | | | Paid In Capital | |
| Large Cap Fund | | $ | — | | | $ | — | | | $ | — | |
| Common Stock Fund | | $ | — | | | $ | (10,087,759 | ) | | $ | 10,087,759 | |
| International Fund | | $ | (4,670,394 | ) | | $ | 4,670,394 | | | $ | — | |
| (2) | Investment Adviser and Management Agreements and Transactions With Related Parties — |
The Funds each have a management agreement with Fiduciary Management, Inc. (“FMI”), with whom certain officers and directors of the Funds are affiliated, to serve as investment adviser and manager. Under the terms of the agreements, the Large Cap Fund and International Fund will each pay FMI a monthly management fee at the annual rate of 0.75% of the daily net assets of such Fund and the Common Stock Fund will pay a monthly management fee at the annual rate of 1% of the daily net assets of such Fund. The Funds are responsible for paying their proportionate share of the compensation, benefits and expenses of the Funds’ Chief Compliance Officer. For administrative convenience, FMI initially makes these payments and is later reimbursed by the Funds.
Under the respective management agreements, FMI will reimburse the Large Cap Fund for expenses over 1.20% of the daily net assets of such Fund, 1.30% for the Common Stock Fund and 1.75% for the International Fund. In addition to the reimbursement required under each management agreement, FMI will voluntarily reimburse the Large Cap Fund and the International Fund for expenses over 1.00% of such Fund’s daily net assets. For the year ended September 30, 2014 there were no contractual or voluntary reimbursements required for the Large Cap Fund or the Common Stock Fund. For the International Fund, all such reimbursements amounted to $69,061 for the year ended September 30, 2014.
The Large Cap Fund and the International Fund have each entered into a Distribution Plan (the “Plan”), pursuant to Rule 12b-1 under the Act. Each Plan provides that such Fund may incur certain costs which may not exceed the lesser of a monthly amount equal to 0.25% of such Fund’s daily net assets or the actual distribution costs incurred during the year. Amounts payable under each Plan are paid monthly for any activities or expenses primarily intended to result in the sale of shares of such Fund. For the year ended September 30, 2014, no such expenses were incurred by either Fund.
Under the Funds’ organizational documents, each director, officer, employee or other agent of any Fund (including the Funds’ investment manager) is indemnified, to the extent permitted by the Act, against certain liabilities that may arise out of performance of their duties to the Funds. Additionally, in the normal course of business, the Funds enter into contracts that contain a variety of indemnification clauses. The Funds’ maximum exposure under these arrangements is unknown as this would involve future claims that may be made against such Fund that have not yet occurred. However, the Funds have not had prior claims or losses pursuant to these contracts and believe the risk of loss to be remote.
FMI Funds
NOTES TO FINANCIAL STATEMENTS (Continued)
| (2) | Investment Adviser and Management Agreements and Transactions With Related Parties — (Continued) |
At September 30, 2014, two financial intermediaries are the record owners of approximately 8% and 6% of the Large Cap Fund’s shares and one financial intermediary is record owner of approximately 20% of the Common Stock Fund’s shares.
U.S. Bank, N.A. has made available to the Company a combined $675,000,000 credit facility, pursuant to a Loan Agreement (“Agreement”) effective June 4, 2014 for the FMI Funds, Inc. for the purposes of having cash available to satisfy redemption requests. Principal and interest of such loans under the Agreement are due not more than 45 days after the date of the loan. Amounts under the credit facility bear interest at a rate per annum equal to the current prime rate minus one percent on the amount borrowed. Advances will be collateralized by securities owned by such Fund. During the year ended September 30, 2014, none of the Funds borrowed against the Agreement. The Credit Agreement is renewable annually on June 4.
| (4) | Distribution to Shareholders — |
Net investment income and net realized gains, if any, are distributed to shareholders at least annually.
| (5) | Investment Transactions — |
For the year ended September 30, 2014, purchases and proceeds of sales of investment securities (excluding short-term investments) were as follows:
| | | Large Cap Fund | | | Common Stock Fund | | | International Fund | |
| Purchases | | $ | 2,661,738,569 | | | $ | 464,973,130 | | | $ | 292,864,117 | |
| Sales | | | 2,478,436,293 | | | | 388,300,419 | | | | 47,468,592 | |
| (6) | Income Tax Information — |
The following information for the Funds is presented on an income tax basis as of September 30, 2014:
| | | | | | Gross | | | Gross | | | Net Unrealized | | | Distributable | | | Distributable | | | Other | |
| | | Cost of | | | Unrealized | | | Unrealized | | | Appreciation on | | | Ordinary | | | Long-Term | | | Accumulated | |
| | | Investments | | | Appreciation | | | Depreciation | | | Investments | | | Income | | | Capital Gains | | | Gain/Loss | |
| Large Cap Fund | | $ | 7,164,314,754 | | | $ | 2,169,261,691 | | | $ | (126,384,420 | ) | | $ | 2,042,877,271 | | | $ | 96,136,541 | | | $ | 817,179,056 | | | $ | — | |
| Common Stock Fund | | | 1,132,395,551 | | | | 316,133,253 | | | | (34,015,338 | ) | | | 282,117,915 | | | | 16,928,708 | | | | 140,831,255 | | | | (596,694 | ) |
| International Fund | | | 448,212,063 | | | | 32,707,096 | | | | (16,989,822 | ) | | | 15,717,274 | | | | 15,051,808 | | | | 4,989,825 | | | | 535,969 | |
The difference between the cost amounts for financial statement and federal income tax purposes is due primarily to timing differences in recognizing certain gains and losses on security transactions.
The tax components of dividends paid during the years ended September 30, 2014 and 2013, capital loss carryovers, which may be used to offset future capital gains, subject to Internal Revenue Code limitations, as of September 30, 2014, and tax basis post-October losses and late year losses as of September 30, 2014, which are not recognized for tax purposes until the first day of the following fiscal year are:
| | | September 30, 2014 | | | September 30, 2013 | |
| | | Ordinary | | | Long-Term | | | Net | | | | | | Late | | | Ordinary | | | Long-Term | |
| | | Income | | | Capital Gains | | | Capital Loss | | | Post-October | | | Year | | | Income | | | Capital Gains | |
| | | Distributions | | | Distributions | | | Carryovers | | | Losses | | | Losses | | | Distributions | | | Distributions | |
| Large Cap Fund | | $ | 126,787,834 | | | $ | 434,658,470 | | | $ | — | | | $ | — | | | $ | — | | | $ | 103,929,009 | | | $ | 42,394,048 | |
| Common Stock Fund | | | 22,416,039 | | | | 100,052,689 | | | | — | | | | — | | | | (596,694 | ) | | | 16,078,830 | | | | 92,136,921 | |
| International Fund | | | 2,523,215 | | | | 1,771,502 | | | | — | | | | — | | | | — | | | | 787,842 | | | | 269,031 | |
On September 19, 2014, the Board approved the year-end distributions for the Funds. Cash dividends in the aggregate amounts equal to each of the Fund’s net investment income and short-term capital gains, if any, which will be treated as ordinary income, and long-term capital gains, to be payable on December 19, 2014 to outstanding shares of record at the close of business on December 18, 2014.
FMI Funds
REPORT OF INDEPENDENT REGISTERED PUBLIC ACCOUNTING FIRM
To the Board of Directors and Shareholders of FMI Funds, Inc.:
In our opinion, the accompanying statements of assets and liabilities, including the schedules of investments, and the related statements of operations and of changes in net assets and the financial highlights present fairly, in all material respects, the financial position of FMI Funds, Inc. (comprised of FMI Large Cap Fund, FMI Common Stock Fund and FMI International Fund, hereinafter collectively referred to as the “Funds”) at September 30, 2014, the results of each of their operations for the year then ended, the changes in each of their net assets for each of the two years in the period then ended and the financial highlights for each of the periods presented, in conformity with accounting principles generally accepted in the United States of America. These financial statements and financial highlights (hereafter referred to as “financial statements”) are the responsibility of the Funds’ management; our responsibility is to express an opinion on these financial statements based on our audits. We conducted our audits of these financial statements in accordance with the standards of the Public Company Accounting Oversight Board (United States). Those standards require that we plan and perform the audit to obtain reasonable assurance about whether the financial statements are free of material misstatement. An audit includes examining, on a test basis, evidence supporting the amounts and disclosures in the financial statements, assessing the accounting principles used and significant estimates made by management, and evaluating the overall financial statement presentation. We believe that our audits, which included confirmation of securities at September 30, 2014 by correspondence with the custodian and brokers, provide a reasonable basis for our opinion.
Milwaukee, Wisconsin
October 28, 2014
For additional information about the Directors and Officers or for a description of the policies and procedures that the Funds use to determine how to vote proxies relating to portfolio securities, please call (800) 811-5311 and request a Statement of Additional Information. It will be mailed to you free of charge. The Statement of Additional Information is also available on the website of the Securities and Exchange Commission (the “Commission”) at http://www.sec.gov. Information on how each of the Funds voted proxies relating to portfolio securities is available on the Funds’ website at http://www.fmifunds.com or the website of the Commission no later than August 31 for the prior 12 months ending June 30. The Funds file their complete schedules of portfolio holdings with the Commission for the first and third quarters of each fiscal year on Form N-Q. The Funds’ Forms N-Q are available on the Commission’s website. The Funds’ Forms N-Q may be reviewed and copied at the Commission’s Public Reference Room in Washington, D.C., and that information on the operation of the Public Reference Room may be obtained by calling 1-800-SEC-0330.
FMI Funds
EXPENSE EXAMPLE
As a shareholder of the FMI Funds you incur ongoing costs, including management fees and other Fund expenses. You do not incur transaction costs such as sales charges (loads) on purchase payments, reinvested dividends, or other distributions; redemption fees; and exchange fees because the Funds do not charge these fees. This example is intended to help you understand your ongoing costs (in dollars) of investing in each Fund and to compare these costs with the ongoing costs of investing in other mutual funds. The example is based on an investment of $1,000 invested at the beginning of the period and held for the entire period from April 1, 2014 through September 30, 2014.
Actual Expenses
The table below provides information about actual account values and actual expenses. You may use the information in these lines, together with the amount you invested, to estimate the expenses that you paid over the period. Simply divide your account value by $1,000 (for example, an $8,600 account value divided by $1,000 = 8.6), then multiply the result by the number in the line under the heading entitled “Actual Expenses Paid During Period” to estimate the expenses you paid on your account during this period.
In addition to the costs highlighted and described below, the only Fund transaction costs you might currently incur would be wire fees ($15 per wire), if you choose to have proceeds from a redemption wired to your bank account instead of receiving a check. Additionally, U.S. Bank charges an annual processing fee ($15) if you maintain an IRA account with the Fund. To determine your total costs of investing in a Fund, you would need to add any applicable wire or IRA processing fees you’ve incurred during the period to the costs provided in the example at the end of this article.
Hypothetical Example for Comparison Purposes
The table below provides information about hypothetical account values and hypothetical expenses based on each Fund’s actual expense ratio and an assumed rate of return of 5% per year before expenses, which is not the Fund’s actual return. The hypothetical account values and expenses may not be used to estimate the actual ending account balance or expenses you paid for the period. You may use this information to compare the ongoing costs of investing in a Fund and other funds. To do so, compare this 5% hypothetical example with the 5% hypothetical examples that appear in the shareholder reports of the other funds.
Please note that the expenses shown in the table are meant to highlight your ongoing costs only and do not reflect any transactional costs, such as sales charges (loads), redemption fees or exchange fees. Therefore, the hypothetical line of the table is useful in comparing ongoing costs only, and will not help you determine the relative total costs of owning different funds. In addition, if these transactional costs were included, your costs would have been higher.
| | | FMI | | | FMI | | | FMI | |
| | | Large Cap | | | Common Stock | | | International | |
| | | Fund | | | Fund | | | Fund | |
| | | | | | | | | | |
| Actual Beginning Account Value 4/01/14 | | $ | 1,000.00 | | | $ | 1,000.00 | | | $ | 1,000.00 | |
| | | | | | | | | | | | | |
| Actual Ending Account Value 9/30/14 | | $ | 1,038.80 | | | $ | 997.90 | | | $ | 1,022.50 | |
| | | | | | | | | | | | | |
| Actual Expenses Paid During Period* 4/01/14-9/30/14 | | $ | 4.80 | | | $ | 5.91 | | | $ | 5.07 | |
| | | | | | | | | | | | | |
| Hypothetical Beginning Account Value 4/01/14 | | $ | 1,000.00 | | | $ | 1,000.00 | | | $ | 1,000.00 | |
| | | | | | | | | | | | | |
| Hypothetical Ending Account Value 9/30/14 | | $ | 1,020.36 | | | $ | 1,019.15 | | | $ | 1,020.05 | |
| | | | | | | | | | | | | |
| Hypothetical Expenses Paid During Period* 4/01/14-9/30/14 | | $ | 4.76 | | | $ | 5.97 | | | $ | 5.06 | |
| | | | | | | | | | | | | |
| Annualized Expense Ratio* | | | 0.94 | % | | | 1.18 | % | | | 1.00 | % |
| * | Expenses are equal to the Fund’s annualized expense ratio, multiplied by the average account value over the period, multiplied by 183/365 (to reflect the one-half year period between April 1, 2014 and September 30, 2014). |
FMI Funds
DIRECTORS AND OFFICERS
| | | Term of | Principal | # of Funds | Other |
| | Positions | Office and | Occupation(s) | in Complex | Directorships |
| Name, Age | Held with | Length of | During Past | Overseen | Held by |
| and Address* | the Funds | Time Served | Five Years | by Director | Director or Officer |
| | | | | | |
| Non-Interested Directors | | | | |
| | | | | | |
| Barry K. Allen, 65 | Director | Indefinite Term | Mr. Allen is President of Allen Enterprises, LLC | 3 | BCE, Inc. (Bell |
| | | Since 2001 | (Boca Grande, FL) a private equity investments | | Canada Enterprise), |
| | | | and management company, and Operating Partner | | CDW Corp. and |
| | | | for Providence Equity Partners (Providence, RI) | | Harley-Davidson, |
| | | | since September, 2007. | | Inc. |
| | | | | | |
| Robert C. Arzbaecher, 54 | Director | Indefinite Term | Mr. Arzbaecher retired from Actuant Corporation | 3 | Actuant Corporation |
| | | Since 2007 | (Menomonee Falls, WI) in January, 2014. He remains | | and CF Industries |
| | | | Chairman of the Board of Directors. | | Holdings, Inc. |
| | | | | | |
| Gordon H. | Director | Indefinite Term | Mr. Gunnlaugsson retired from M&I Corporation | 3 | None |
| Gunnlaugsson, 70 | Since 2001 | (Milwaukee, WI) in December, 2000. | | |
| | | | | | |
| Paul S. Shain, 51 | Director | Indefinite Term | Mr. Shain is President and Chief Executive Officer | 3 | None |
| | | Since 2001 | of Singlewire Software, LLC (Madison, WI), a | | |
| | | | provider of IP-based paging and emergency | | |
| | | | notification systems, since April, 2009. | | |
| | | | | | |
| Interested Directors | | | | |
| | | | | | |
| John S. Brandser,** 52 | Director | Indefinite Term | Mr. Brandser is President, Secretary, Chief | 3 | None |
| | | Since 2009 | Operating Officer, and Chief Compliance Officer | | |
| | Vice | One Year Term | of Fiduciary Management, Inc. and has been | | |
| | President | Since 2008 | employed by the Adviser in various capacities | | |
| | and | One Year Term | since March, 1995. | | |
| | Secretary | Since 2009 | | | |
| | | | | | |
| Patrick J. English,** 53 | Director | Indefinite Term | Mr. English is Chief Executive Officer, Chief | 3 | None |
| | | Since 2001 | Investment Officer and Treasurer of Fiduciary | | |
| | Vice | One Year Term | Management, Inc. and has been employed by the | | |
| | President | Since 2001 | Adviser in various capacities since December, 1986. | | |
| | | | | | |
| Ted D. Kellner,** 68 | Director | Indefinite Term | Mr. Kellner is Executive Chairman of Fiduciary | 3 | None |
| | | Since 2001 | Management, Inc. which he co-founded in 1980. | | |
| | President | One Year Term | | | |
| | and | Since 2001 | | | |
| | Treasurer | | | | |
| | | | | | |
| Other Officer | | | | |
| | | | | | |
| Kathleen M. Lauters, 62 | Chief | At Discretion | Ms. Lauters has been the Fund’s Chief Compliance | N/A | None |
| | Compliance | of Board | Officer since September, 2004. | | |
| | Officer | Since 2004 | | | |
| | | | | | |
__________
| * | The address of each Director and Officer is c/o Fiduciary Management, Inc., 100 E. Wisconsin Ave., Suite 2200, Milwaukee, WI 53202. |
| ** | Messrs. Brandser, English and Kellner are interested directors of the Funds because they are officers of the Funds and the Adviser. |
FMI Funds
DISCLOSURE INFORMATION
Securities named in the Letters to Shareholders, but not listed in the Schedules of Investments are not held in the Funds as of the date of this disclosure. Portfolio holdings are subject to change without notice and are not intended as recommendations of individual securities.
As of the Funds’ Prospectuses dated January 31, 2014, the FMI Large Cap Fund, FMI Common Stock Fund and FMI International Fund’s annual operating expense ratios are 0.96%, 1.19% and 1.00%, respectively. FMI International Fund’s (“FMIJX”) annual operating expense ratio is 1.15%, less an expense reimbursement of 0.15% for a net operating expense ratio of 1.00%. Fiduciary Management, Inc. (“FMI”) has contractually agreed to waive its advisory fee to the extent necessary to ensure that net expenses of FMIJX do not exceed 1.75% of the average daily net assets. In addition to the reimbursement required under the FMIJX investment advisory agreement, FMI will reimburse FMIJX for expenses in excess of 1.00% of the daily net assets. FMI will not terminate this reimbursement prior to January 31, 2015.
Risks associated with investing in the Funds are as follows:
FMI Large Cap Fund: Stock Market Risk, Medium and Large Capitalization Companies Risk, Non-Diversification Risk (Non-Diversified Funds are subject to higher volatility than funds that are invested more broadly), Value Investing Risk, and Foreign Securities Risk (fluctuation of currency, different financial standards, and political instability).
FMI Common Stock Fund: Stock Market Risk, Small & Medium Capitalization Companies Risks (which includes the potential for greater volatility and less financial resources than Large-Cap Companies), Value Investing Risk and Foreign Securities Risk (fluctuation of currency, different financial standards, and political instability).
FMI International Fund: Stock Market Risk, Non-Diversification Risk (Non-Diversified Funds are subject to higher volatility than funds that are invested more broadly), Value Investing Risk, Foreign Securities Risk (fluctuation of currency, different financial standards, and political instability), Geographic Concentration Risk, Currency Hedging Risk, and Large Capitalization Companies Risk.
For details regarding these risks, please refer to the Funds’ Prospectuses or Summary Prospectuses dated January 31, 2014.
Please note the FMI Common Stock Fund and the FMI Large Cap Fund are currently closed to new investors.
This report is not authorized for use as an offer of sale or a solicitation of an offer to buy shares of the Fund unless accompanied or preceded by the Fund’s current prospectus.
For more information about the FMI Funds, call 1-800-811-5311 for a free Prospectus or Summary Prospectus. Please read these Prospectuses carefully to consider the investment objectives, risks, charges and expenses, before investing or sending money. These Prospectuses contain this and more information about the FMI Funds. Please read the Prospectuses or Summary Prospectuses carefully before investing.
The Standard and Poor’s 500 Index consists of 500 selected common stocks, most of which are listed on the New York Stock Exchange. The Standard & Poor’s Ratings Group designates the stock to be included in the Index on a statistical basis. A particular stock’s weighting in the Index is based on its relative total market value (i.e., its market price per share times the number of shares outstanding). Stocks may be added or deleted from the Index from time to time.
The Russell 2000 Index measures the performance of the 2,000 smallest companies in the Russell 3000 Index which comprises the 3,000 largest U.S. companies based on total market capitalization.
The MSCI EFE Index (Europe, Australasia, Far East) is a free float-adjusted market capitalization index that is designed to measure the equity market performance of developed markets, excluding the U.S. and Canada. As of May 27, 2010 the MSCI EAFE Index consisted of the following 22 developed market country indices: Australia, Austria, Belgium, Denmark, Finland, France, Germany, Greece, Hong Kong, Ireland, Israel, Italy, Japan, the Netherlands, New Zealand, Norway, Portugal, Singapore, Spain, Sweden, Switzerland and the United Kingdom. The MSCI EAFE Index is unmanaged and investors cannot invest directly in the Index. Index results are inclusive of dividends and net of foreign withholding taxes. The reported figures include reinvestment of dividends and capital gains distributions and do not reflect any fees or expenses.
The MSCI EAFE Index is calculated in local currency as well as in U.S. Dollars (USD). The concept of a local currency calculation excludes the impact of currency fluctuations. All currencies of listing are considered in the Index calculation in local currency where current prices (t) and previous day prices (t-1) are converted into USD using the same exchange rate (exchange rate t-1) in the numerator and denominator. As a consequence, the FX factor drops out of the equation. The USD calculation includes exchange rates at t and t-1. Therefore, the local currency calculation only represents the price appreciation or depreciation of the securities, whereas the USD calculation also accounts for the performance of the currency (or currencies) relative to the USD.
MSCI EAFE is a service mark of MSCI Barra.
FMI Funds
DISCLOSURE INFORMATION (Continued)
The CAC 40 is the French stock market index that tracks the 40 largest French stocks based on market capitalization on the Paris Bourse (stock exchange).
The DAX Index is a stock index that represents 30 of the largest and most liquid German companies that trade on the Frankfurt Exchange. The prices used to calculate the DAX Index come through Xetra, an electronic trading system. A free-float methodology is used to calculate the index weightings along with a measure of average trading volume.
The FTSE 100 Index is a capitalization-weighted index of the 100 most highly capitalized companies traded on the London Stock Exchange. The equities use an investibility weighting in the index calculation. The index was developed with a base level of 1000 as of January 3, 1984. The index is maintained by the FTSE Group, a subsidiary of the London Stock Exchange Group.
The TOPIX, also known as the Tokyo Stock Price Index, is a capitalization weighted index of all companies listed on the First Section of the Tokyo Stock Exchange. The index is supplemented by the sub-indices of the 33 industry sectors. The index calculation excludes temporary issues and preferred stocks, and has a base value of 100 as of January 4, 1968.
An investment cannot be made directly into an index.
The Vanguard 500 Index Fund is the industry’s first index fund for individual investors and has diversified exposure to the U.S. equity market. The fund invests in 500 of the largest U.S. companies, which span many different industries. Risks associated with the fund include: Stock market risk, which is the chance that stock prices overall will decline; and Investment style risk, which is the chance that returns from large-capitalization stocks will trail returns from the overall stock market. As of 4-28-14 the expense ratio is 0.17%. As of 9-30-14, the 1-5- and 10-year returns were 19.54%, 15.53% and 7.99%, respectively.
Reference definitions found at Investopedia.com
EPS – Earnings per Share – The portion of a company’s profit allocated to each outstanding share of common stock. Earnings per share serves as an indicator of a company’s profitability.
P/E ratio (forward 4 quarters) – Price to Earnings ratio (forward 4 quarters) is a measure of the price-to-earnings ratio (P/E) using forecasted earnings for the P/E calculation. While the earnings used are just an estimate and are not as reliable as current earnings data, there is still a benefit in estimated P/E analysis. The forecasted earnings used in the formula can either be for the next 12 months or for the next full-year fiscal period.
EBIT – Earnings Before Interest & Tax – An indicator of a company’s profitability, calculated as revenue minus expenses, excluding tax and interest.
EBITDA – Earnings Before Interest Taxes Depreciation and Amortization is essentially net income with interest, taxes, depreciation, and amortization added back to it, and can be used to analyze and compare profitability between companies and industries because it eliminates the effects of financing and accounting decisions.
EV/EBITDA – Enterprise Value to Earnings Before Interest Taxes Depreciation and Amortization is a measure of the value of a stock that compares a company’s enterprise value (market cap plus debt, minority interest and preferred shares, minus total cash and cash equivalents) to its earnings before interest taxes depreciation and amortization. EV/EBITDA is one of several fundamental indicators that investors use to determine whether a stock is priced well. The EV/EBITDA multiple is also often used to determine a company’s valuation in the case of a potential acquisition.
EV/Sales – Enterprise-Value-To-Sales – A valuation measure that compares the enterprise value of a company to the company’s sales. EV/sales gives investors an idea of how much it costs to buy the company’s sales.
P/B – Price to Book – A ratio used to compare a stock’s market value to its book value.
ROE – Return on Equity – The amount of net income returned as a percentage of shareholders equity. Return on equity measures a corporation’s profitability by revealing how much profit a company generates with the money shareholders have invested.
ROI – Return on Investment – A performance measure used to evaluate the efficiency of an investment or to compare the efficiency of a number of different investments.
ROIC – Return on Invested Capital – A calculation used to assess a company’s efficiency at allocating the capital under its control to profitable investments. The return on invested capital measure gives a sense of how well a company is using its money to generate returns.
SOTP – Sum of the Parts – Valuing a company by determining what its divisions would be worth if it was broken up and spun off or acquired by another company.
Distributed by Rafferty Capital Markets, LLC
FMI Funds
TAX NOTICE
For corporate shareholders of the Large Cap Fund, the Common Stock Fund and the International Fund, the percentage of dividend income distributed for the year ended September 30, 2014 which is designated as qualifying for the dividends received deduction is 43.86%, 84.91% and 0%, respectively (unaudited). The International Fund intends to elect to pass-through to shareholders the income tax credit for taxes paid to foreign countries. For the year ended September 30, 2014, the foreign source income was $5,985,137 (unaudited) and the foreign tax expense was $467,889 (unaudited). The pass-through of the foreign tax credit will only affect those persons who are shareholders on the dividend record dates.
For all shareholders of the Large Cap Fund, the Common Stock Fund and the International Fund, the percentage of dividend income distributed for the year ended September 30, 2014 which is designated as qualified dividend income under the Jobs and Growth Tax Relief Act of 2003, is 100%, 86.31% and 71.89%, respectively (unaudited).
Protecting the privacy of our shareholders is important to us. This notice describes the practices and policies through which we maintain the confidentiality and protect the security of your non-public personal information.
What Information We Collect
In the course of providing services to you, we may collect the following types of “non-public personal information” about you:
| • | Information we receive from you on applications or other forms, such as your name, address and social security number, the types and amounts of investments and bank account information, and |
| • | Information about your transactions with us, our affiliates and others, as well as other account data. |
What Information We Disclose
We do not disclose any nonpublic personal information about our current or former shareholders to anyone, except as permitted by law. For example, we are permitted by law to disclose all of the information we collect, as described above, to our transfer agent to process your transactions. Furthermore, we restrict access to your nonpublic personal information to those persons who require such information to provide products or services to you. We maintain physical, electronic and procedural safeguards that comply with federal standards to guard your nonpublic personal information.
In the event that you hold shares of any Fund through a financial intermediary, including, but not limited to, a broker-dealer, bank or trust company, the privacy policy of your financial intermediary may govern how your nonpublic personal information would be shared with nonaffiliated third parties.
IMPORTANT NOTICE REGARDING DELIVERY OF SHAREHOLDER DOCUMENTS
In order to reduce expenses, we will deliver a single copy of prospectuses, proxies, financial reports, and other communication to shareholders with the same residential address, provided they have the same last name or we reasonably believe them to be members of the same family. Unless we are notified otherwise, we will continue to send you only one copy of these materials for as long as you remain a shareholder of the Funds. If you would like to receive individual mailings, please call (800) 811-5311 and we will begin sending you separate copies of these materials within 30 days after we receive your request.
Thank you for allowing us to serve your investment needs.
| FMI Large Cap Fund | FMI Common Stock Fund | FMI International Fund |
100 East Wisconsin Avenue, Suite 2200
Milwaukee, Wisconsin 53202
www.fmifunds.com
414-226-4555
BOARD OF DIRECTORS
| BARRY K. ALLEN | GORDON H. GUNNLAUGSSON |
| ROBERT C. ARZBAECHER | TED D. KELLNER |
| JOHN S. BRANDSER | PAUL S. SHAIN |
| PATRICK J. ENGLISH | |
INVESTMENT ADVISER
FIDUCIARY MANAGEMENT, INC.
100 East Wisconsin Avenue, Suite 2200
Milwaukee, Wisconsin 53202
ADMINISTRATOR, ACCOUNTANT, TRANSFER
AGENT AND DIVIDEND DISBURSING AGENT
U.S. BANCORP FUND SERVICES, LLC
615 East Michigan Street
Milwaukee, Wisconsin 53202
800-811-5311 or 414-765-4124
| CUSTODIAN | INDEPENDENT REGISTERED |
| U.S. BANK, N.A. | PUBLIC ACCOUNTING FIRM |
| | PRICEWATERHOUSECOOPERS LLP |
| DISTRIBUTOR | |
| RAFFERTY CAPITAL MARKETS, LLC | LEGAL COUNSEL |
| | FOLEY & LARDNER LLP |
| |
| |
| |
| FMI Funds |
| 1-800-811-5311 |
| www.fmifunds.com |
Item 2. Code of Ethics.
Registrant has adopted a code of ethics. See attached Exhibit 12 (a) (1).
Item 3. Audit Committee Financial Expert.
Registrant’s Board of Directors has determined that Mr. Gordon Gunnlaugsson, a member of its audit committee, is an audit committee financial expert. Mr. Gunnlaugsson is “independent” as such term is defined in Form N-CSR.
Item 4. Principal Accountant Fees and Services.
(a) Audit Fees
$73,800 (FY 2014) and $66,011 (FY 2013) are the aggregate fees billed for each of the last two fiscal years for professional services rendered by the principal accountant to the registrant for the audit of the registrant’s annual financial statements or services that are normally provided by the accountant in connection with statutory and regulatory filings or engagements for those fiscal years.
(b) Audit-Related Fees
There were no fees billed in the last two fiscal years for Audit-Related Fees.
(c) Tax Fees
There were no other fees billed in the last two fiscal years for professional services rendered by the principal accountant to the registrant for tax compliance, tax advice, tax planning and tax return preparation.
There were no fees billed in the last two fiscal years for professional services rendered by the principal accountant to registrant’s investment adviser for tax compliance, tax advice and tax planning that were required to be approved by the audit committee pursuant to paragraph (c)(7)(ii) of Rule 2-01 of Regulation S-X.
(d) All Other Fees
The registrant paid $6,470 (FY 2014) and $0 (FY 2013) for products and services provided by the principal accountant to the registrant, the principal accountant was engaged to assist the registrant in the establishment of a trading arrangement in a foreign jurisdiction, as services reported in addition to paragraphs (a) – (c) of this Item 4.
There were no fees billed in the last two fiscal years for products and services provided by the principal accountant to registrant’s investment adviser, which were required to be approved by the audit committee pursuant to paragraph (c)(7)(ii) or Rule 2-01 or Regulation S-X.
(e) (1) None
(e) (2) None
(f) Not applicable.
(g) See the tax fees disclosed in paragraph (c) of this Item 4.
(h) Not applicable, as no non-audit services were provided to registrant’s investment adviser.
Item 5. Audit Committee of Listed Registrants.
Not applicable to registrants who are not listed issuers (as defined in Rule 10A-3 under the Securities Exchange Act of 1934).
Item 6. Schedule of Investments.
| (a) | The Schedule of Investments in securities of unaffiliated issuers is included as part of the report to shareholders filed under Item 1 of this Form. |
Item 7. Disclosure of Proxy Voting Policies and Procedures for Closed-End Management Investment Companies
Not applicable.
Item 8. Portfolio Managers of Closed-End Management Investment Companies.
Not applicable.
Item 9. Purchases of Equity Securities by Closed-End Management Investment Company and Affiliated Purchasers.
Not applicable.
Item 10. Submission of Matters to a Vote of Security Holders.
None.
Item 11. Controls and Procedures.
| (a) | The Registrant’s disclosure controls and procedures are periodically evaluated. As of October 15, 2014, the date of the last evaluation, the Registrant’s officers have concluded that the Registrant’s disclosure controls and procedures are adequate. |
| (b) | The Registrant’s internal controls are periodically evaluated. There were no changes in the Registrant’s internal control over financial reporting that occurred during the second fiscal quarter of the period covered by this report that have materially affected, or are reasonably likely to materially affect, such controls. |
Item 12. Exhibits.
| (a) | (1) Any code of ethics or amendment thereto. Filed herewith. |
| | (2) Certifications pursuant to Section 302 of the Sarbanes-Oxley Act of 2002. Filed herewith. |
| | (3) Any written solicitation to purchase securities under Rule 23c-1 under the Act sent or given during the period covered by the report by or on behalf of the Registrant to 10 or more persons. Not applicable to open-end investment companies. |
| (b) | Certification pursuant to Section 906 of the Sarbanes-Oxley Act of 2002. Furnished herewith. |
SIGNATURES
Pursuant to the requirements of the Securities Exchange Act of 1934 and the Investment Company Act of 1940, the registrant has duly caused this report to be signed on its behalf by the undersigned, thereunto duly authorized.
FMI Funds, Inc.
Registrant
By /s/ Ted D. Kellner
Ted D. Kellner, Principal Executive Officer
Date October 29, 2014
Pursuant to the requirements of the Securities Exchange Act of 1934 and the Investment Company Act of 1940, this report has been signed below by the following persons on behalf of the registrant and in the capacities and on the dates indicated.
FMI Funds, Inc.
Registrant
By /s/ Ted D. Kellner
Ted D. Kellner, Principal Financial Officer