Ted D. Kellner
Fiduciary Management, Inc.
ANNUAL REPORT
September 30, 2016
FMI Large Cap Fund
(FMIHX)
FMI Common Stock Fund
(FMIMX)
FMI International Fund
(FMIJX)
| |
| |
|
| |
| |
| FMI Funds, Inc. |
| |
| Advised by Fiduciary Management, Inc. |
| |
| www.fmifunds.com |
| |
| |
| |
| | |
FMI Funds, Inc.
TABLE OF CONTENTS
| FMI Large Cap Fund |
| Shareholder Letter | | | 1 |
| Management’s Discussion of Fund Performance | | | 7 |
| Schedule of Investments | | | 9 |
| Industry Sectors | | | 12 |
| | | | |
| FMI Common Stock Fund |
| Shareholder Letter | | | 13 |
| Management’s Discussion of Fund Performance | | | 19 |
| Schedule of Investments | | | 21 |
| Industry Sectors | | | 24 |
| | | | |
| FMI International Fund |
| Shareholder Letter | | | 25 |
| Management’s Discussion of Fund Performance | | | 32 |
| Schedule of Investments | | | 34 |
| Schedule of Forward Currency Contracts | | | 37 |
| Industry Sectors | | | 38 |
| | | | |
| Financial Statements |
| Statements of Assets and Liabilities | | | 39 |
| Statements of Operations | | | 40 |
| Statements of Changes in Net Assets | | | 41 |
| Financial Highlights | | | 44 |
| Notes to Financial Statements | | | 47 |
| | | | |
| Report of Independent Registered Public Accounting Firm | | | 54 |
| Expense Example | | | 55 |
| Directors and Officers | | | 57 |
| Disclosure Information | | | 59 |
| Matters Submitted for Shareholder Vote | | | 62 |
| Additional Information | | | 62 |
| New Share Class Announcement | | | 63 |
| Tax Notice | | | 63 |
| Notice of Privacy Policy | | | 64 |
| Householding Notice | | | 64 |
FMI
Large Cap
Fund
September 30, 2016
Dear Fellow Shareholders:
The FMI Large Cap Fund (Fund) returned 3.06% in the September quarter compared to 3.85% for the Standard & Poor’s 500 Index (S&P 500). Sectors that aided performance included Energy Minerals, Consumer Services and Consumer Non-Durables. Those that hurt performance included Retail Trade, Electronic Technology and Finance. Stocks that aided results in the period included Devon Energy, eBay and Comerica. We took advantage of the move in Comerica to swap it with JPMorgan, which we believe is a superior franchise trading at a similar multiple. Underperformers included Dollar General, Progressive Corp. and Twenty-First Century Fox. The market worries of January and February, which were bringing some sanity back to equity valuations, ameliorated through the second and third calendar quarters, keeping the bull alive. Our underweighted positions in financial, technology and health care related industries were a drag in the quarter. We are comfortable being underweighted these sectors given the levered, opaque nature of most financials, and the high valuations in technology and health care. The top five, and eight of the top ten contributors to the S&P 500 this quarter were technology-related companies, which gives some insight into the speculative hue of this market. Rumors that Twitter was in play caused its stock to surge over 35% in the quarter. Twitter carries a $17 billion market cap, has never turned a profit (and has lost over $400 million in the last twelve months), and trades for over 5 times revenue. Further evidence comes from a corner of the private equity world with the impending offering of Yeti (coolers, coffee mugs, etc.) rumored at a $5 billion valuation, which is over 10 times 2015 revenue, and 36 times 2015 earnings before interest, taxes, depreciation and amortization (EBITDA).
There is somewhat of a surreal nature to the economic and stock market dialogue today. If one listens to the administration, the economy is a well-oiled jobs machine that delivers steady growth without inflation. Janet Yellen and other Federal Reserve (Fed) board members tell us the economy
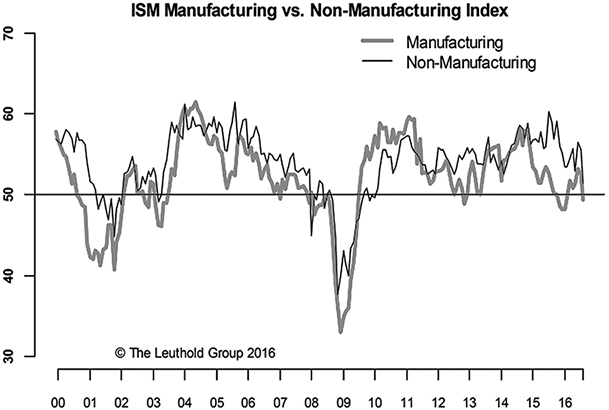
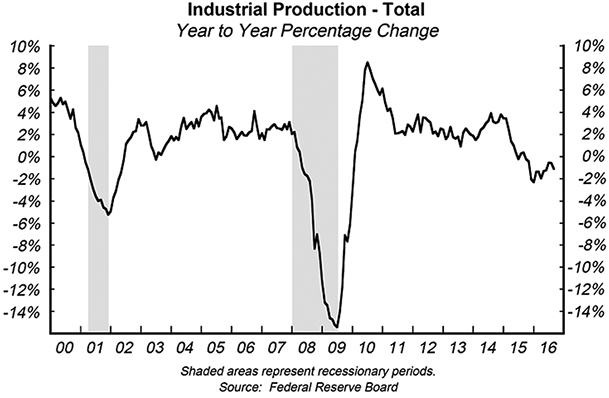
is sound, and that interest rates will soon be normalized (although year after year goes by with little action). The bull market recently passed 7½ years, and people with financial assets — essentially the top 5% — seem pleased. It’s hard to reconcile this against the backdrop of persistently weak gross domestic product (GDP) growth of roughly 1.0-1.5%, and corporate sales and earnings growth that has been negative for five quarters (with a sixth decline expected in the September quarter). If the market reflected just the decline in earnings so far, according to David Rosenberg of Gluskin Sheff, the S&P 500 would be down 20%. The combined Manufacturing and Non-Manufacturing ISM Composite Index (see graph on previous page) recently dropped to 51.2% (the weakest in over six years), industrial production remains soft, retail sales have sputtered, and the Fed’s own broad Labor Market Conditions Index dropped 0.7% in August. The employment-to-population ratio for the U.S. remains mired below 60% and real incomes are lower today than a decade ago, although they rose last year for the first time in years. The average American is running in place, at best.
Consumer health care, rent/housing, and educational expenses are swamping the small increases or declines in other consumer items. Perhaps someone should tell the Fed that the Consumer Price Index (excluding food and energy) was up 2.3% year-over-year in August. Health care and entitlement spending are out of control and are being funded with unsustainable increases in debt. Most people believe the real damage to balance sheets took place in 2008-09, yet over just the past five years the federal government has added $4.8 trillion of debt (bringing the total debt to $19.5 trillion), the Federal Reserve pumped up its balance sheet by $1.7 trillion to $4.5 trillion, and corporations have layered on an estimated $2.2 trillion of new borrowings. The most dangerous aspect is that debt is growing faster than GDP.
These stories, however, are old news. We’ve lost the ability to be surprised or moved by quarter after quarter of the same combination of runaway government spending, easy money and relatively weak economic growth. On the corporate side, financial engineering remains the go-to strategy, but this has proven to be no substitute for organic investment in people and projects. The Fed seems to think one more quarter, or one more year, of extremely low rates is all that is needed to jump-start the economy. If low rates induce capital formation, however, wouldn’t we have seen explosive business investment after eight years of a nearly zero percent Fed Funds rate? Instead, it has been one of the weakest periods of fixed business investment on record.
Moreover, despite a curious but enduring belief in Keynesian economic theories, government spending doesn’t seem likely to cure the growth problem. If deficit spending was the answer, wouldn’t the economy be screaming after more than a decade of nonstop stimulus? It is astonishing
that some pundits are calling for even more fiscal stimulus today. Few consider that there is a wide body of evidence showing that government debt accumulation (deficit spending) steals from overall economic growth. That government spending has a negative multiplier effect on the economy should not come as a startling revelation. Just look around and see where governments spend money and compare that to private capital projects and research and development expansion, and it is easy to see why the economy has underperformed.
Stocks remain elevated by just about all traditional valuation measures. Asset inflation and high valuations are also not confined to the equity markets. Bonds, private equity, real estate and other alternatives are all expensive by historical standards. Paul Singer, the highly regarded leader of Elliott Management, recently called long-term bonds the “biggest bond bubble in world history,” although the 10-Year Treasury has recently backed up a bit. A relatively weak economy, negative earnings growth and high valuations wouldn’t seem to be the ticket to higher stock prices. As we asked in our last letter, what are investors supposed to do? The best option is to take the long view and own quality franchises trading at relative discounts, and recognize that while nobody will be immune to a stock market downturn, this strategy offers the best chance to preserve, and eventually grow, capital. The public continues to pour money into index funds, which have beaten approximately 90% of active U.S. equity managers over the past five years. The money flows are a self-fulfilling feedback loop in the short run that will eventually collapse, as they have in the past. The last time index funds outperformed like this was in the five years ending in early 2000. The S&P 500 proceeded to drop nearly 50% and it took over seven years to recover to the prior peak.
While speculation is alive and well in the stock market, there may be a few markets beginning to crack. The high end of the Canadian and New York City real estate bubbles may be beginning to deflate. Additionally, recall our discussion in the June of 2014 letter of the tremendous excesses in the contemporary art market. In recent months the bottom has begun to fall out of this market, with a number of pieces dropping over 90% or failing to sell at auction. In a recent Bloomberg story, the author mentioned the work of one Lucien Smith: “Smith saw a painting he made while an undergraduate at New York’s Cooper Union fetch $389,000 at Phillips in 2013, two years after it was purchased for $10,000. This week, estimates for three Smith pieces are as low as $7,000. One (to the right), from the series he made by spraying more than 200 canvases with paint from a fire extinguisher, is estimated at $12,000 to $18,000. A bigger spray work sold for $372,120 two years ago.” To each his own, but we know some third graders with ball point pens who would take a dollar and an ice cream cone for similar work.

It takes fortitude to avoid playing someone else’s game, i.e., chasing after what is currently working even though these investments may lack true value. Using professional golf as an analogy, the best players focus not on the results, but the process. They do everything in their power to choose the right club, envision the right shot shape and put themselves in a mental mindset that will deliver a positive swing. If they can execute the process consistently, most, but not all shots will come off well. If they let their minds race after a bad shot or a bad hole and fret about the
results, they are likely to compound their difficulties. You can’t wish the ball into the hole, but instead, must keep your discipline and process. It is strikingly similar with investing. Fortunately, the Fund’s adviser has a great culture that places a lot of faith in being intellectually honest and in staying true to the process. We can’t control the fact that over the past few years, investors have been willing, for example, to buy utility stocks that barely earn their cost of capital, have little to no growth, are highly regulated, and are heavily indebted and expensive. Our process would not translate into a purchase decision in this sector even though, looking in the rear view mirror, it has been rewarding. We are highly confident that in the fullness of time, this group will reflect its underlying fundamentals. Over the years, we have seen this same dynamic in many popular stocks; with few exceptions, these equities ultimately reflected the intrinsic value of their respective businesses. As Ben Graham famously said over eighty years ago, “…the market is a voting machine [popularity contest] in the short run but a weighing machine in the long run.”
Below are a couple of investments we think will eventually register well on the weighing machine.
Bank of New York Mellon Corp. (BK)
(Analyst: Matthew Goetzinger)
Description
The Bank of New York Mellon (BK) is the world’s largest custodian bank, with over $29.5 trillion in assets under custody. The company has the most diverse service offering within the trust bank industry. Asset-based fee businesses drive 80% of the firm’s revenue. 20% comes from net interest income. The company’s Investment Services business accounts for 70% of the fee-based revenue and includes core custody, back and middle office outsourcing, securities clearing, execution, debt issuance and trust services. The company’s multi-manager boutique Investment Management business generates the remaining 30% of fee revenues.
Good Business
| • | BK operates within a rational oligopoly industry structure. The company commands a leading market share in each of its diversified businesses. |
| | |
| • | Scale, long-standing client relationships, deeply intertwined technology platforms, and a global resource base all represent significant durable competitive advantages. |
| | |
| • | Recurring fee-based businesses contribute 80% of the company’s total revenues. |
| | |
| • | The company’s long-term average return on equity exceeds its cost of equity capital; the last twelve months’ return on tangible equity is 20.4%. |
| | |
| • | BK is securely financed with a Basel III capital ratio of 10.2%. Management remains committed to returning substantially all of net income to shareholders through dividends and share repurchases. |
Valuation
| • | Trust banks have historically traded in line with the S&P 500 on a price-to-earnings (P/E) basis. Presently BK trades at a several multiple point discount to the market’s long-term median P/E ratio. |
| | |
| • | Giving effect to a normalization in interest rates, BK’s earnings power is in excess of $4.00 per share. At a P/E multiple of 17, BK’s fair value is approximately 50-75% higher. |
| | |
| • | A sum-of-the-parts valuation places an alternative market value far in excess of the current market price of the stock. |
Management
| • | Gerald Hassell has been the company’s Chief Executive Officer since September 2011. Since joining BK over 30 years ago, Hassell has had direct management responsibility for a broad range of the company’s Investment Services businesses, including asset servicing and issuer, broker-dealer, treasury and clearing services. Hassel owns roughly 0.8 million shares outright. |
| | |
| • | Todd Gibbons is the company’s current Chief Financial Officer. Previously Gibbons served as the company’s Chief Risk Officer. |
| | |
| • | Management is focused on driving organic growth, improving margins, and returns on capital, while at the same time returning excess capital to shareholders. |
Investment Thesis
Bank of New York Mellon’s numerous capital light financial processor franchises are underappreciated by the market. Despite operating with significant scale as the market leader in many recurring fee-based businesses, BK’s valuation is comparable to that of a conventional bank. Over the next three to five years, BK’s earnings growth rate and valuation multiple will improve due to stronger organic revenue growth, further operating leverage, movements toward a more normal interest rate environment, and growth in the global capital markets.
Omnicom Group Inc. (OMC)
(Analyst: Rob Helf)
Description
Omnicom Group is a strategic holding company of advertising and marketing firms that operate in more than 100 countries with more than 5,000 clients. Its business emphasizes traditional media advertising as well as more than 30 marketing services, including customer relationship management, public relations and specialty communications. Additionally, the company provides strategic media planning, buying and digital and interactive marketing.
Good Business
| • | Omnicom is one of the world’s largest advertising and marketing services companies. Approximately 60% of its revenue comes from the U.S., while the balance comes from Europe and the rest of world. |
| | |
| • | The company offers a diversified mix of fee-based services. Omnicom should benefit from the current and anticipated growth in digital advertising expenditures. |
| | |
| • | Agencies have taken on a consultative role in the age of new media, as changes are rapid. |
| | |
| • | Omnicom’s largest client represents less than 4% of overall revenues. |
| | |
| • | The integrated relationship between client and agency results in high switching costs. |
| | |
| • | Over the past decade, the stock has generated a return on invested capital greater than its cost of capital every year, and has averaged 13%. |
| | |
| • | The company’s balance sheet is in excellent shape, with net debt about 1.0 times EBITDA. |
| | |
| • | Omnicom recently increased its quarterly dividend to $0.55 per share, which implies an annual yield of 2.6%. The dividend has grown at over 20% per annum over the past five years as the company has focused on returning cash to shareholders. |
| | |
| • | On average, the company has repurchased over $850 million worth of its equity annually over the past decade. |
Valuation
| • | The stock trades at approximately 1.4 times enterprise value-to-revenues, 9.6 times EBITDA, and 16 times 2017 earnings per share (EPS) estimates. |
| | |
| • | Over the past 10 years, Omnicom has traded at 1.1-1.7 times enterprise value-to-revenues, 8-11.5 times EBITDA, and 13-21 times EPS. The shares trade at their long-term (15 year) averages on most valuation measures, compared to the stock market, which is trading near the peak of its long-term average. |
Management
| • | Bruce Crawford, 87, is Chairman of Omnicom. He began his career in advertising in 1956 and joined BBDO in 1963. He has previously held the positions of President and CEO at Omnicom. |
| | |
| • | John Wren has been President and CEO since 1997. He has been in advertising since 1984, and joined Omnicom in 1986. |
| | |
| • | Phil Angelastro is Executive Vice President and CFO. He has been in this position for two years, and has been with Omnicom since 1997. Previously, he was a partner with Coopers & Lybrand. |
Investment Thesis
Omnicom is attractively valued in a generally expensive market. The company should deliver organic growth at or above GDP with stable margins, strong returns and cash flow. As marketing dollars rapidly move to digital/mobile, corporate marketers should continue to utilize the agencies due to their consultative and non-biased role in the changing landscape. Management has proven to be disciplined since the failed merger with Publicis, and should continue to return a significant amount of capital to shareholders via hefty share repurchases and a healthy dividend.
Thank you for your confidence in the FMI Large Cap Fund.
This shareholder letter is unaudited.
FMI Large Cap Fund
MANAGEMENT’S DISCUSSION OF FUND PERFORMANCE (Unaudited)
During the fiscal year ended September 30, 2016, the FMI Large Cap Fund (Fund) had a total return of 12.36%. The benchmark S&P 500 Index returned 15.43% in the same period. Sectors that aided relative performance included Health Services, Commercial Services, and Consumer Durables. UnitedHealth Group had good performance within the Health Services sector as they reestablished solid growth and announced they were getting out of the exchanges. Omnicom drove the performance of the Commercial Services sector, as they continued to demonstrate steady mid-single digit growth in revenue with improved margins. In the Consumer Durables arena, Stanley Black & Decker gained significantly. On the negative side of sector performance, Process Industries, Electronic Technology and Finance all detracted. The Fund’s relatively high Cash level was also a drag on performance. Potash Corporation declined again this fiscal year, hurting the Process Industries sector. Continued low crop prices, adverse currency impacts and ongoing worries about excess capacity hurt Potash’s stock. Late in the fiscal year Potash and Agrium announced intentions to merge. The Fund’s adviser feels this is a good strategic move, and continues to believe that Potash is significantly undervalued. The Fund’s underweighted position in Electronic Technology detracted from relative results and TE Connectivity, while up in the period, underperformed the sector. The Fund’s adviser believes this sector is significantly overvalued. In the Finance group, Bank of New York and American Express both underperformed. American Express continues to battle increased competition and is taking steps to lower its cost structure.
Other stocks that helped performance included Ross Stores, Honeywell and Accenture. AmerisourceBergen, Dollar General and Twenty-First Century Fox detracted from relative results.
New additions to the Fund over the past twelve months included Twenty-First Century Fox, JPMorgan and Level 3 Communications. 3M and Comerica were sold during the fiscal year. At September 30, 2016, the Fund was significantly overweighted in Producer Manufacturing, Consumer Services and Distribution Services and meaningfully underweighted in Health Technology, Utilities and Electronic Technology.
Good performance across many so-called “defensive” sectors and some speculative groups like Electronic Technology and Health Technology helped drive the results for the S&P 500 Index. While the market corrected about 10% in December, January and into early February, it rallied through the rest of the fiscal year. The “character” of the market hasn’t seemed to change a great deal yet. The bull market is seven and a half years old and valuations remain near the upper end of historical parameters. Easy monetary policy appears to have been a significant driver of stock market performance in recent years. Many economies around the world have weakened and while the U.S. economy has had positive real GDP growth, the rate over the past year has been below average. The unemployment rate has also improved, but the labor participation rate remains at a very low level and an extraordinarily high number of citizens are dependent on government support. Companies have been restrained with respect to investing in both capital equipment and labor, which has resulted in less than satisfactory internal growth rates. Geopolitical problems have seemingly escalated over the past year. This, combined with less than average growth and high valuations makes us cautious on the stock market in the short run. The Fund’s adviser continues to believe, however, that stocks have the best chance to adjust to a dynamic environment over the long run. The Fund sells at discount to the S&P 500 Index on most valuation measures.
FMI Large Cap Fund
MANAGEMENT’S DISCUSSION OF FUND PERFORMANCE (Unaudited)
(Continued)
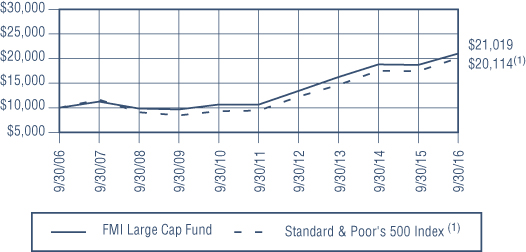
COMPARISON OF CHANGE IN VALUE OF $10,000 INVESTMENT IN
FMI LARGE CAP FUND AND STANDARD & POOR’S 500 INDEX(1)
AVERAGE ANNUALIZED TOTAL RETURN
| | | | | Since Inception |
| | 1-Year | 5-Year | 10-Year | 12/31/01 |
| FMI Large Cap Fund | 12.36% | 14.57% | 7.71% | 8.50% |
| Standard & Poor’s 500 Index | 15.43% | 16.37% | 7.24% | 6.54% |
The graph and the table do not reflect the deduction of taxes that a shareholder would pay on Fund distributions or the redemption of Fund shares. Performance data quoted represents past performance; past performance does not guarantee future results. Investment return and principal value of an investment will fluctuate so that an investor’s shares, when redeemed, may be worth more or less than their original cost. Current performance of a Fund may be lower or higher than the performance quoted. The total returns do not reflect the deduction of taxes that a shareholder would pay on Fund distributions or the redemption of Fund shares. Total return includes change in share prices and in each case includes reinvestments of any dividends, interest and capital gain distributions. Performance data current to the most recent month-end may be obtained by visiting www.fmifunds.com or by calling 1-800-811-5311.
| (1) | The Standard & Poor’s 500 Index consists of 500 selected common stocks, most of which are listed on the New York Stock Exchange. The Standard & Poor’s Ratings Group designates the stocks to be included in the Index on a statistical basis. A particular stock’s weighting in the Index is based on its relative total market value (i.e., its market price per share times the number of shares outstanding). Stocks may be added or deleted from the Index from time to time. |
An investment cannot be made directly into an index.
FMI Large Cap Fund
SCHEDULE OF INVESTMENTS
September 30, 2016
| Shares | | | | Cost | | | Value | |
| | | | | |
| COMMON STOCKS — 90.6% (a) | | | | |
| | | | | |
COMMERCIAL SERVICES SECTOR — 3.5% | | | | |
| | | | | | | | | |
| | | Advertising/Marketing Services — 3.5% | | | | | | |
| | 2,669,000 | | Omnicom Group Inc. | | $ | 183,505,224 | | | $ | 226,865,000 | |
| | | | | | |
COMMUNICATIONS SECTOR — 1.9% | | | | | |
| | | | | | | | | | | | |
| | | | Specialty Telecommunications — 1.9% | | | | | | | | |
| | 2,650,000 | | Level 3 Communications Inc.* | | | 129,768,754 | | | | 122,907,000 | |
| | |
CONSUMER DURABLES SECTOR — 3.4% | |
| | | | | | | | | | | | |
| | | | Tools & Hardware — 3.4% | | | | | | | | |
| | 1,835,000 | | Stanley Black & Decker Inc. | | | 180,437,919 | | | | 225,668,300 | |
| | | | | | |
CONSUMER NON-DURABLES SECTOR — 7.2% | | | | | |
| | | | | | | | | | | | |
| | | | Food: Major Diversified — 4.7% | | | | | | | | |
| | 6,966,000 | | Danone S.A. – SP-ADR | | | 92,079,728 | | | | 103,445,100 | |
| | 2,616,000 | | Nestle’ S.A. – SP-ADR | | | 114,853,710 | | | | 206,716,320 | |
| | | | | | | 206,933,438 | | | | 310,161,420 | |
| | | | | | | | | | | | |
| | | | Household/Personal Care — 2.5% | | | | | | | | |
| | 3,407,000 | | Unilever PLC – SP-ADR | | | 135,625,648 | | | | 161,491,800 | |
| | | | | | |
CONSUMER SERVICES SECTOR — 12.8% | | | | | |
| | | | | | | | | | | | |
| | | | Cable/Satellite TV — 4.9% | | | | | | | | |
| | 4,842,000 | | Comcast Corp. – Cl A | | | 264,787,583 | | | | 321,218,280 | |
| | | | | | | | | | | | |
| | | | Media Conglomerates — 3.9% | | | | | | | | |
| | 3,352,000 | | Twenty-First Century Fox Inc. – Cl A | | | 88,134,377 | | | | 81,185,440 | |
| | 7,106,000 | | Twenty-First Century Fox Inc. – Cl B | | | 196,387,661 | | | | 175,802,440 | |
| | | | | | | 284,522,038 | | | | 256,987,880 | |
| | | | | | | | | | | | |
| | | | Other Consumer Services — 4.0% | | | | | | | | |
| | 7,986,000 | | eBay Inc.* | | | 180,752,341 | | | | 262,739,400 | |
| | | | | | |
DISTRIBUTION SERVICES SECTOR — 3.3% | | | | | |
| | | | | | | | | | | | |
| | | | Medical Distributors — 3.3% | | | | | | | | |
| | 2,718,000 | | AmerisourceBergen Corp. | | | 147,394,531 | | | | 219,560,040 | |
| | | | | | |
ELECTRONIC TECHNOLOGY SECTOR — 3.4% | | | | | |
| | | | | | | | | | | | |
| | | | Electronic Components — 3.4% | | | | | | | | |
| | 3,478,000 | | TE Connectivity Ltd. | | | 71,101,826 | | | | 223,913,640 | |
| | | | | | |
ENERGY MINERALS SECTOR — 3.0% | | | | | |
| | | | | | | | | | | | |
| | | | Oil & Gas Production — 3.0% | | | | | | | | |
| | 4,525,000 | | Devon Energy Corp. | | | 152,819,047 | | | | 199,597,750 | |
| | | | | | |
FINANCE SECTOR — 11.7% | | | | | |
| | | | | | | | | | | | |
| | | | Financial Conglomerates — 5.6% | | | | | | | | |
| | 2,474,000 | | American Express Co. | | | 75,195,045 | | | | 158,434,960 | |
| | 3,168,000 | | JPMorgan Chase & Co. | | | 205,137,819 | | | | 210,957,120 | |
| | | | | | | 280,332,864 | | | | 369,392,080 | |
| | | | | | | | | | | | |
| | | | Major Banks — 3.2% | | | | | | | | |
| | 5,180,000 | | Bank of New York Mellon Corp. | | | 111,145,244 | | | | 206,578,400 | |
FMI Large Cap Fund
SCHEDULE OF INVESTMENTS (Continued)
September 30, 2016
| Shares | | | | Cost | | | Value | |
| | | | | |
| COMMON STOCKS — 90.6% (a) (Continued) | | | | |
| | | | | |
FINANCE SECTOR — 11.7% (Continued) | | | | |
| | | | | | | | | |
| | | Property/Casualty Insurance — 2.9% | | | | | | |
| | 5,962,000 | | Progressive Corp. | | $ | 145,870,519 | | | $ | 187,803,000 | |
| | | | | | |
HEALTH SERVICES SECTOR — 4.1% | | | | | |
| | | | | | | | | | | | |
| | | | Managed Health Care — 4.1% | | | | | | | | |
| | 1,920,000 | | UnitedHealth Group Inc. | | | 137,390,385 | | | | 268,800,000 | |
| | | | | | |
INDUSTRIAL SERVICES SECTOR — 3.9% | | | | | |
| | | | | | | | | | | | |
| | | | Oilfield Services/Equipment — 3.9% | | | | | | | | |
| | 3,247,000 | | Schlumberger Ltd. | | | 208,615,346 | | | | 255,344,080 | |
| | | | | | |
PROCESS INDUSTRIES SECTOR — 3.1% | | | | | |
| | | | | | | | | | | | |
| | | | Chemicals: Agricultural — 3.1% | | | | | | | | |
| | 12,622,000 | | Potash Corp. of Saskatchewan Inc. | | | 276,283,416 | | | | 205,991,040 | |
| | | | | | |
PRODUCER MANUFACTURING SECTOR — 11.6% | | | | | |
| | | | | | | | | | | | |
| | | | Industrial Conglomerates — 7.2% | | | | | | | | |
| | 2,132,000 | | Berkshire Hathaway Inc. – Cl B* | | | 140,389,265 | | | | 308,010,040 | |
| | 1,439,000 | | Honeywell International Inc. | | | 135,736,875 | | | | 167,773,010 | |
| | | | | | | 276,126,140 | | | | 475,783,050 | |
| | | | | | | | | | | | |
| | | | Industrial Machinery — 1.2% | | | | | | | | |
| | 650,000 | | Rockwell Automation Inc. | | | 68,167,231 | | | | 79,521,000 | |
| | | | | | | | | | | | |
| | | | Trucks/Construction/Farm Machinery — 3.2% | | | | | | | | |
| | 3,583,000 | | PACCAR Inc. | | | 149,663,302 | | | | 210,608,740 | |
| | | | | | |
RETAIL TRADE SECTOR — 7.3% | | | | | |
| | | | | | | | | | | | |
| | | | Apparel/Footwear Retail — 3.1% | | | | | | | | |
| | 3,204,000 | | Ross Stores Inc. | | | 108,159,538 | | | | 206,017,200 | |
| | | | | | | | | | | | |
| | | | Discount Stores — 4.2% | | | | | | | | |
| | 3,983,000 | | Dollar General Corp. | | | 292,985,290 | | | | 278,770,170 | |
| | | | | | |
TECHNOLOGY SERVICES SECTOR — 6.9% | | | | | |
| | | | | | | | | | | | |
| | | | Information Technology Services — 4.4% | | | | | | | | |
| | 2,341,000 | | Accenture PLC | | | 76,791,507 | | | | 285,999,970 | |
| | | | | | | | | | | | |
| | | | Packaged Software — 2.5% | | | | | | | | |
| | 2,888,000 | | Microsoft Corp. | | | 79,174,786 | | | | 166,348,800 | |
| | | | | | |
TRANSPORTATION SECTOR — 3.5% | | | | | |
| | | | | | | | | | | | |
| | | | Air Freight/Couriers — 3.5% | | | | | | | | |
| | 4,477,000 | | Expeditors International of Washington Inc. | | | 167,338,527 | | | | 230,655,040 | |
| | | | Total common stocks | | | 4,315,692,444 | | | | 5,958,723,080 | |
| | | | | | | | | | | | |
FMI Large Cap Fund
SCHEDULE OF INVESTMENTS (Continued)
September 30, 2016
| Principal Amount | | | | Cost | | | Value | |
| | |
| SHORT-TERM INVESTMENTS — 9.8% (a) | |
| | | | | | | | | |
| | | Money Market Deposit Account — 7.5% | | | | | | |
| $ | 494,668,761 | | U.S. Bank, N.A., 0.25% | | $ | 494,668,761 | | | $ | 494,668,761 | |
| | | | | | | | | | | | |
| | | | U.S. Treasury Securities — 2.3% | | | | | | | | |
| | 150,000,000 | | U.S. Treasury Bills, 0.115%, due 10/20/16 | | | 149,990,896 | | | | 149,990,400 | |
| | | | Total short-term investments | | | 644,659,657 | | | | 644,659,161 | |
| | | | Total investments — 100.4% | | $ | 4,960,352,101 | | | | 6,603,382,241 | |
| | | | Other assets, less liabilities — (0.4%) (a) | | | | | | | (27,273,252 | ) |
| | | | TOTAL NET ASSETS — 100.0% | | | | | | $ | 6,576,108,989 | |
| * | Non-income producing security. |
| (a) | Percentages for the various classifications relate to net assets. |
| PLC | Public Limited Company |
| SP-ADR | Sponsored American Depositary Receipt |
The accompanying notes to financial statements are an integral part of this schedule.
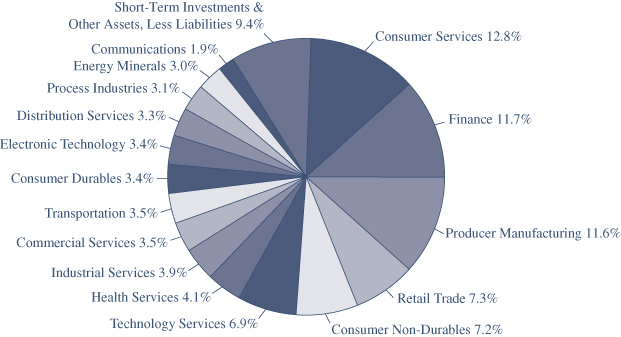
FMI Large Cap Fund
INDUSTRY SECTORS
as of September 30, 2016 (Unaudited)
FMI
Common Stock
Fund
September 30, 2016
Dear Fellow Shareholders:
The FMI Common Stock Fund (Fund) returned 4.95% in the September quarter compared to 9.05% for the Russell 2000 Index (Russell 2000). Sectors that aided performance included Retail Trade, Consumer Services and Health Services. Those that hurt performance included Commercial Services, Producer Manufacturing and Health Technology. Stocks that aided results included Penske Automotive, Anixter International and Zions Bancorporation. Underperformers included Genpact Ltd., Interpublic Group and Valmont Industries. The market worries of January and February, which were bringing some sanity back to equity valuations, ameliorated through the second and the third calendar quarters, keeping the bull alive. The Fund had a tough relative quarter, with some of the more economically sensitive stocks taking it on the chin and the elevated cash position hurting as well. Being underweighted Health Technology and Electronic Technology also hurt relative performance. Investors seemed more emboldened as the quarter unfolded. Health Technology and Electronic Technology sectors are both very expensive. Additionally, we are underweight Finance, which generally performs poorly in difficult markets. To give some color on the degree to which speculative fervor drove the Russell 2000 this quarter, nine of the top ten contributors to that Index were biotech or technology companies. For example, Sarepta Therapeutics gained 222%, Exelixis advanced 64%, and Cepheid appreciated 71%; all three generate huge losses. Rumors that Twitter was in play caused its stock to surge over 35% in the quarter. Twitter carries a $17 billion market cap, has never turned a profit (and has lost over $400 million in the last twelve months), and trades for over 5 times revenue. Further evidence comes from a corner of the private equity world with the impending offering of Yeti (coolers, coffee mugs, etc.) rumored at a $5 billion valuation, which is over 10 times 2015 revenue, and 36 times 2015 earnings before interest, taxes, depreciation and amortization (EBITDA).
There is somewhat of a surreal nature to the economic and stock market dialogue today. If one listens to the administration, the economy is a well-oiled jobs machine that delivers steady growth
without inflation. Janet Yellen and other Federal Reserve (Fed) board members tell us the economy is sound, and that interest rates will soon be normalized (although year after year goes by with little action). The bull market recently passed 7½ years, and people with financial assets — essentially the top 5% — seem pleased. It’s hard to reconcile this against the backdrop of persistently weak gross domestic product (GDP) growth of roughly 1.0-1.5%, and corporate sales and earnings growth that has been negative for five quarters (with a sixth decline expected in the September quarter). If the market reflected just the decline in earnings so far, according to David Rosenberg of Gluskin Sheff, the S&P 500 would be down 20%. The combined Manufacturing and Non-Manufacturing ISM Composite Index (see graph on previous page) recently dropped to 51.2% (the weakest in over six years), industrial production remains soft, retail sales have sputtered, and the Fed’s own broad Labor Market Conditions Index dropped 0.7% in August. The employment-to-population ratio for the U.S. remains mired below 60% and real incomes are lower today than a decade ago, although they rose last year for the first time in years. The average American is running in place, at best.
Consumer health care, rent/housing, and educational expenses are swamping the small increases or declines in other consumer items. Perhaps someone should tell the Fed that the Consumer Price Index (excluding food and energy) was up 2.3% year-over-year in August. Health care and entitlement spending are out of control and are being funded with unsustainable increases in debt. Most people believe the real damage to balance sheets took place in 2008-09, yet over just the past five years the federal government has added $4.8 trillion of debt (bringing the total debt to $19.5 trillion), the Federal Reserve pumped up its balance sheet by $1.7 trillion to $4.5 trillion, and corporations have layered on an estimated $2.2 trillion of new borrowings. The most dangerous aspect is that debt is growing faster than GDP.
These stories, however, are old news. We’ve lost the ability to be surprised or moved by quarter after quarter of the same combination of runaway government spending, easy money and relatively weak economic growth. On the corporate side, financial engineering remains the go-to strategy, but this has proven to be no substitute for organic investment in people and projects. The Fed seems to think one more quarter, or one more year, of extremely low rates is all that is needed to jump-start the economy. If low rates induce capital formation, however, wouldn’t we have seen explosive business investment after eight years of a nearly zero percent Fed Funds rate? Instead, it has been one of the weakest periods of fixed business investment on record.
Moreover, despite a curious but enduring belief in Keynesian economic theories, government spending doesn’t seem likely to cure the growth problem. If deficit spending was the answer,
wouldn’t the economy be screaming after more than a decade of nonstop stimulus? It is astonishing that some pundits are calling for even more fiscal stimulus today. Few consider that there is a wide body of evidence showing that government debt accumulation (deficit spending) steals from overall economic growth. That government spending has a negative multiplier effect on the economy should not come as a startling revelation. Just look around and see where governments spend money and compare that to private capital projects and research and development expansion, and it is easy to see why the economy has underperformed.
Stocks remain elevated by just about all traditional valuation measures. Asset inflation and high valuations are also not confined to the equity markets. Bonds, private equity, real estate and other alternatives are all expensive by historical standards. Paul Singer, the highly regarded leader of Elliott Management, recently called long-term bonds the “biggest bond bubble in world history,” although the 10-Year Treasury has recently backed up a bit. A relatively weak economy, negative earnings growth and high valuations wouldn’t seem to be the ticket to higher stock prices. As we asked in our last letter, what are investors supposed to do? The best option is to take the long view and own quality franchises trading at relative discounts, and recognize that while nobody will be immune to a stock market downturn, this strategy offers the best chance to preserve, and eventually grow, capital. The public continues to pour money into index funds, which have beaten approximately 90% of active U.S. equity managers over the past five years. The money flows are a self-fulfilling feedback loop in the short run that will eventually collapse, as they have in the past. The last time index funds outperformed like this was in the five years ending in early 2000. The S&P 500 proceeded to drop nearly 50% and it took over seven years to recover to the prior peak.
While speculation is alive and well in the stock market, there may be a few markets beginning to crack. The high end of the Canadian and New York City real estate bubbles may be beginning to deflate. Additionally, recall our discussion in the June of 2014 letter of the tremendous excesses in the contemporary art market. In recent months the bottom has begun to fall out of this market, with a number of pieces dropping over 90% or failing to sell at auction. In a recent Bloomberg story, the author mentioned the work of one Lucien Smith: “Smith saw a painting he made while an undergraduate at New York’s Cooper Union fetch $389,000 at Phillips in 2013, two years after it was purchased for $10,000. This week, estimates for three Smith pieces are as low as $7,000. One (to the right), from the series he made by spraying more than 200 canvases with paint from a fire extinguisher, is estimated at $12,000 to $18,000. A bigger spray work sold for $372,120 two years ago.” To each his own, but we know some third graders with ball point pens who would take a dollar and an ice cream cone for similar work.
It takes fortitude to avoid playing someone else’s game, i.e., chasing after what is currently working even though these investments may lack true value. Using professional golf as an analogy, the best players focus not on the results, but the process. They do everything in their power to choose the right club, envision the right shot shape and put themselves in a mental mindset that will deliver a positive swing. If they can execute the process consistently, most, but not all shots
will come off well. If they let their minds race after a bad shot or a bad hole and fret about the results, they are likely to compound their difficulties. You can’t wish the ball into the hole, but instead, must keep your discipline and process. It is strikingly similar with investing. Fortunately, the Fund’s adviser has a great culture that places a lot of faith in being intellectually honest and in staying true to the process. We can’t control the fact that over the past few years, investors have been willing, for example, to buy utility stocks that barely earn their cost of capital, have little to no growth, are highly regulated, and are heavily indebted and expensive. Our process would not translate into a purchase decision in this sector even though, looking in the rear view mirror, it has been rewarding. We are highly confident that in the fullness of time, this group will reflect its underlying fundamentals. Over the years, we have seen this same dynamic in many popular stocks; with few exceptions, these equities ultimately reflected the intrinsic value of their respective businesses. As Ben Graham famously said over eighty years ago, “…the market is a voting machine [popularity contest] in the short run but a weighing machine in the long run.”
Below are a couple of investments we think will eventually register well on the weighing machine.
Arrow Electronics Inc. (ARW)
(Analyst: Matt Sullivan)
Description
Arrow Electronics is a leading global distributor of semiconductors, passive and other electronic components, and enterprise computing solutions. The company also offers a variety of value-added services including programming, system training and certification, solutions testing, and inventory and supply chain management. Arrow distributes these products and services to over 100,000 industrial and commercial customers spanning across 85 different countries.
Good Business
| • | As a distributor of electronics and technology systems, Arrow benefits from global growth in high technology without being exposed to the same obsolescence risk as technology manufacturers. |
| | |
| • | Arrow is one of the world’s largest global information technology distributors, and controls a large market share position in the industry. It has stood the test of time, having incorporated in 1946. |
| | |
| • | The company has a diversified set of vendors, customers, and end markets. Arrow serves over 100,000 customers in 85 countries, including 12,000 value-added resellers. No single supplier accounts for more than 7% of overall revenues, and no single customer accounts for more than 2% of overall revenues. |
| | |
| • | Arrow’s size and expertise in its product offerings create a competitive advantage that translates into better margins than most of its smaller competitors. |
| | |
| • | Over time, the company has proven its ability to consistently earn a return on capital that exceeds its cost of capital. |
| | |
| • | The balance sheet is modestly levered with a debt-to-total capital ratio of approximately 37%. |
Valuation
| • | Arrow is valued at 9.7 times the 2016 consensus earnings per share (EPS) estimate, and 0.34 times enterprise value-to-sales (EV/Sales). This is a significant discount to most market indices, including the Russell 2000. |
| | |
| • | While Arrow has historically traded at a discount to most market indices, the valuation gap has widened significantly in recent years. |
| • | Based on a sum-of-the-parts analysis, we believe Arrow should be trading at least 50% higher. Our confidence in this analysis grew recently when Arrow’s closest competitor, Avnet, sold part of its business at an attractive multiple. |
Management
| • | Michael Long is Chairman, President, and Chief Executive Officer. He has been CEO since 2009, and has been with the company since 1991. Prior to working at Arrow Electronics, Long worked at Schweber Electronics from 1983 until Schweber merged with Arrow in 1991. |
| | |
| • | Management has become more focused on return on invested capital (ROIC) over time. ROIC is one of the key performance metrics used to evaluate and compensate management. |
Investment Thesis
Arrow Electronics is one of the world’s largest distributors of electronic components and enterprise computing solutions. As a distributor of electronics, the company is in the advantageous position of benefitting from global technology growth without being directly exposed to the short product cycles and cutthroat competition that exist for the innovators of technology. Arrow trades at a significant discount to most market indices, despite having a solid track record of earnings per share growth and an above-average ROIC profile. Concerns about Arrow’s role as cloud computing grows have also impacted the multiple. We feel Arrow will continue to thrive in the environment we see existing over the next decade, which, for the vast majority of companies, will be a combination of pure cloud services, traditional networks and hybrid public/private deployments. The large discount in Arrow’s multiple is unwarranted.
Robert Half International Inc. (RHI)
(Analyst: Rob Helf)
Description
Headquartered in Menlo Park, California, Robert Half is the world’s largest specialized staffing company. The company’s revenues are generated in the fields of accounting and finance (Accountemps), Robert Half Technology, Legal and Protiviti, a well-regarded business consulting and internal audit operation.
Good Business
| • | Robert Half is the world’s largest specialized staffing company, with a particular strength in the field of finance/accounting. The company has successfully levered its powerful brand name into other specialty staffing services, including information technology. |
| | |
| • | The increased regulatory burden on permanent employment provides a tailwind for the company. |
| | |
| • | Robert Half has a diverse set of small to mid-size customers, which have traditionally been less price-sensitive and stickier than larger, national account clients. |
| | |
| • | Flexible staffing has strong secular appeal, given the changes in how work is conducted. |
| | |
| • | The company has been expanding its international presence. |
| | |
| • | The company has generated a low double-digit ROIC, on average, over the last decade. |
| | |
| • | Robert Half’s balance sheet is in excellent shape with approximately $2 per share in net cash. |
| | |
| • | The company has consistently generated strong free cash flow and has returned over 100% of this to shareholders via dividends and repurchases. |
| | |
| • | The company currently pays a $0.88 annual dividend, yielding 2.4%. |
Valuation
| • | On a cash-adjusted basis, Robert Half trades at 12.8 times EPS, 8.0 times earnings before interest and taxes (EBIT) and 0.85 times sales. |
| | |
| • | Over the past ten years, the stock, on average, has traded for over 25 times EPS, 15 times EBIT and 1.1 times sales. |
| | |
| • | The shares are approaching one standard deviation below its 10-year EV/Sales average. |
Management
| • | Harold Messmer, 70, is Chairman and CEO; he has served in these roles for over 20 years. From 1985-2004, he served as President. Mr. Messmer beneficially owns more than 1.2 million shares at a value of $68 million. |
| | |
| • | Keith Waddell, 59, is Vice Chairman (since 1999), President (since 2004) and Chief Financial Officer (since 1988). He owns over 1.3 million shares. |
| | |
| • | Paul Gentzkow, 60, is President and Chief Operating Officer-Staffing Services. |
| | |
| • | Management has created an enterprise that has among the highest margins and returns in the staffing industry, and they have been good capital allocators. |
Investment Thesis
The shares of Robert Half have underperformed the overall market in 2016, as growth has slowed for this growing/cyclical leader in specialized staffing. In the most recent quarter, organic growth was a very healthy +8%, and this compared to 15% in the prior year. The shares are discounting an economic recession with an EV/Sales ratio approaching one standard deviation below their 10-year average in the context of an overall stock market that is just the opposite, trading near the upper end of its historical range. The stock appears to be largely discounting a recession and a severe earnings decline. We believe any additional decline in the stock will be temporary. The long-term outlook for Robert Half appears to be strong.
Thank you for your confidence in the FMI Common Stock Fund.
This shareholder letter is unaudited.
FMI Common Stock Fund
MANAGEMENT’S DISCUSSION OF FUND PERFORMANCE (Unaudited)
During the fiscal year ended September 30, 2016, the FMI Common Stock Fund (Fund) had a total return of 12.61%. The benchmark Russell 2000 Index (Russell 2000) returned 15.47% in the same period. Sectors that aided relative performance included Health Technology, Retail Trade and Process Industries. Varian Medical Systems gained in the period as new products began to sell better and they announced plans to spin off a division. The Retail Trade sector was weak for the market but the Fund’s investment in Penske Automotive Group gained. Both H.B. Fuller and Avery Dennison aided performance in the Process Industries sector. On the flipside, Commercial Services, Finance, Electronic Technology and Cash all pulled down performance. Robert Half and ManpowerGroup, both temporary help companies, significantly lagged the market as economic growth continued to disappoint. Finance was a strong sector for the benchmark and the Fund’s underweighted position hurt. Additionally, Greenlight Capital and Ryder System had negative contributions. Similarly, a strong move for the market in Electronic Technology hurt the Fund on a relative basis because of its underweighting. The Fund also underperformed because of its lack of exposure to the Utilities sector, which the Fund’s adviser believes is highly overvalued.
Stocks sold in the period included Kennametal, Armstrong World, Cullen/Frost and Lindsay Corp. Stocks added included ePlus, Penske Automotive Group, and Kennedy-Wilson. At September 30, 2016, the Fund was significantly overweighted in Distribution Services, Process Industries and Producer Manufacturing and meaningfully underweighted in Finance, Electronic Technology and Utilities.
Performance was very mixed by sector over the fiscal year. Oddly, some aggressive groups like Electronic Technology and traditionally defensive groups like Utilities both outperformed the benchmark return. Speculation appears to be solidly in vogue again but so does so-called “yield chasing.” With a few exceptions, both of these themes generally look unattractive. The Russell 2000 dropped approximately 20% from early December of 2015 to mid-February of 2016, technically ending a seven year bull market (<20%> being the widely recognized definition of a bear market) in the small cap arena, although large caps remain in a bull market. Valuations began to get more interesting in this period but still remained well above historical averages. The market then quickly rebounded, bringing valuations back to the upper end of their long-term historical ranges.
Easy monetary policy appears to have been a significant driver of stock market performance in recent years. Many economies around the world have weakened and while the U.S. economy has had positive real GDP growth, the rate over the past year has been below average. The unemployment rate has also improved, but the labor participation rate remains at a very low level and an extraordinarily high number of citizens are dependent on government support. Companies have been restrained with respect to investing in both capital equipment and labor, which has resulted in less than satisfactory internal growth rates. Geopolitical problems have seemingly escalated over the past year. This, combined with less than average growth and high valuations makes the Fund’s adviser cautious on the stock market in the short run. The Fund’s adviser continues to believe, however, that stocks have the best chance to adjust to a dynamic environment over the long run. The Fund sells at discount to the Russell 2000 on most valuation measures.
FMI Common Stock Fund
MANAGEMENT’S DISCUSSION OF FUND PERFORMANCE (Unaudited)
(Continued)
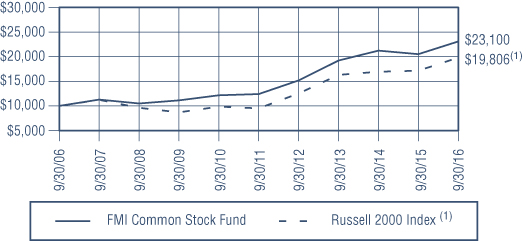
COMPARISON OF CHANGE IN VALUE OF $10,000 INVESTMENT IN
FMI COMMON STOCK FUND AND THE RUSSELL 2000 INDEX(1)
AVERAGE ANNUALIZED TOTAL RETURN
| | | | | Since Inception |
| | 1-Year | 5-Year | 10-Year | 12/18/81 |
| FMI Common Stock Fund | 12.61% | 13.24% | 8.73% | 11.86% |
| Russell 2000 Index | 15.47% | 15.82% | 7.07% | 10.26% |
The graph and the table do not reflect the deduction of taxes that a shareholder would pay on Fund distributions or the redemption of Fund shares. Performance data quoted represents past performance; past performance does not guarantee future results. Investment return and principal value of an investment will fluctuate so that an investor’s shares, when redeemed, may be worth more or less than their original cost. Current performance of a Fund may be lower or higher than the performance quoted. The total returns do not reflect the deduction of taxes that a shareholder would pay on Fund distributions or the redemption of Fund shares. Total return includes change in share prices and in each case includes reinvestments of any dividends, interest and capital gain distributions. Performance data current to the most recent month-end may be obtained by visiting www.fmifunds.com or by calling 1-800-811-5311.
| (1) | The Russell 2000 Index measures the performance of the 2,000 smallest companies in the Russell 3000 Index, which comprises the 3,000 largest U.S. companies based on total market capitalization. |
An investment cannot be made directly into an index.
FMI Common Stock Fund
SCHEDULE OF INVESTMENTS
September 30, 2016
| Shares | | | | Cost | | | Value | |
| | | | | |
| COMMON STOCKS — 88.4% (a) | | | | |
| | | | | |
COMMERCIAL SERVICES SECTOR — 13.8% | | | | |
| | | | | | | | | |
| | | Advertising/Marketing Services — 2.7% | | | | | | |
| | 1,150,000 | | Interpublic Group of Cos. Inc. | | $ | 19,666,148 | | | $ | 25,702,500 | |
| | | | | | | | | | | | |
| | | | Financial Publishing/Services — 1.4% | | | | | | | | |
| | 100,000 | | Dun & Bradstreet Corp. | | | 6,577,926 | | | | 13,662,000 | |
| | | | | | | | | | | | |
| | | | Miscellaneous Commercial Services — 4.5% | | | | | | | | |
| | 1,375,000 | | Genpact Ltd.* | | | 23,005,945 | | | | 32,931,250 | |
| | 883,000 | | RPX Corp.* | | | 13,508,006 | | | | 9,439,270 | |
| | | | | | | 36,513,951 | | | | 42,370,520 | |
| | | | Personnel Services — 5.2% | | | | | | | | |
| | 408,000 | | ManpowerGroup Inc. | | | 27,182,240 | | | | 29,482,080 | |
| | 516,000 | | Robert Half International Inc. | | | 15,719,859 | | | | 19,535,760 | |
| | | | | | | 42,902,099 | | | | 49,017,840 | |
| | | | | | |
CONSUMER DURABLES SECTOR — 1.0% | | | | | |
| | | | | | | | | | | | |
| | | | Homebuilding — 1.0% | | | | | | | | |
| | 6,000 | | NVR Inc.* | | | 5,780,230 | | | | 9,839,220 | |
| | | | | | |
CONSUMER SERVICES SECTOR — 7.0% | | | | | |
| | | | | | | | | | | | |
| | | | Cable/Satellite TV — 2.3% | | | | | | | | |
| | 38,000 | | Cable One Inc. | | | 11,315,190 | | | | 22,192,000 | |
| | | | | | | | | | | | |
| | | | Other Consumer Services — 4.7% | | | | | | | | |
| | 51,000 | | Graham Holdings Co. | | | 23,883,902 | | | | 24,549,870 | |
| | 147,000 | | UniFirst Corp. | | | 14,887,732 | | | | 19,383,420 | |
| | | | | | | 38,771,634 | | | | 43,933,290 | |
| | | | | | |
DISTRIBUTION SERVICES SECTOR — 11.7% | | | | | |
| | | | | | | | | | | | |
| | | | Electronics Distributors — 4.1% | | | | | | | | |
| | 475,000 | | Arrow Electronics Inc.* | | | 9,683,372 | | | | 30,385,750 | |
| | 236,000 | | ScanSource Inc.* | | | 5,005,446 | | | | 8,614,000 | |
| | | | | | | 14,688,818 | | | | 38,999,750 | |
| | | | | | | | | | | | |
| | | | Wholesale Distributors — 7.6% | | | | | | | | |
| | 342,000 | | Anixter International Inc.* | | | 22,052,994 | | | | 22,059,000 | |
| | 507,000 | | Applied Industrial Technologies Inc. | | | 20,998,745 | | | | 23,697,180 | |
| | 361,000 | | MSC Industrial Direct Co. Inc. | | | 25,065,457 | | | | 26,501,010 | |
| | | | | | | 68,117,196 | | | | 72,257,190 | |
| | | | | | |
ELECTRONIC TECHNOLOGY SECTOR — 6.0% | | | | | |
| | | | | | | | | | | | |
| | | | Aerospace & Defense — 4.1% | | | | | | | | |
| | 265,000 | | Esterline Technologies Corp.* | | | 24,727,951 | | | | 20,150,600 | |
| | 581,000 | | FLIR Systems Inc. | | | 16,615,792 | | | | 18,255,020 | |
| | | | | | | 41,343,743 | | | | 38,405,620 | |
| | | | | | | | | | | | |
| | | | Electronic Production Equipment — 1.9% | | | | | | | | |
| | 368,000 | | MKS Instruments Inc. | | | 9,738,799 | | | | 18,300,640 | |
FMI Common Stock Fund
SCHEDULE OF INVESTMENTS (Continued)
September 30, 2016
| Shares | | | | Cost | | | Value | |
| | | | | |
| COMMON STOCKS — 88.4% (a) (Continued) | | | | |
| | |
FINANCE SECTOR — 13.9% | |
| | | | | | | | | |
| | | Finance/Rental/Leasing — 7.9% | | | | | | |
| | 156,000 | | ePlus Inc.* | | $ | 14,009,047 | | | $ | 14,727,960 | |
| | 781,800 | | FirstCash Inc. | | | 27,477,148 | | | | 36,807,144 | |
| | 356,000 | | Ryder System Inc. | | | 15,419,508 | | | | 23,478,200 | |
| | | | | | | 56,905,703 | | | | 75,013,304 | |
| | | | | | | | | | | | |
| | | | Property/Casualty Insurance — 3.5% | | | | | | | | |
| | 687,000 | | Greenlight Capital Re Ltd.* | | | 15,908,848 | | | | 14,042,280 | |
| | 327,000 | | W.R. Berkley Corp. | | | 7,992,588 | | | | 18,887,520 | |
| | | | | | | 23,901,436 | | | | 32,929,800 | |
| | | | | | | | | | | | |
| | | | Real Estate Development — 1.1% | | | | | | | | |
| | 465,750 | | Kennedy-Wilson Holdings Inc. | | | 10,212,395 | | | | 10,502,662 | |
| | | | | | | | | | | | |
| | | | Regional Banks — 1.4% | | | | | | | | |
| | 430,000 | | Zions Bancorporation | | | 9,376,971 | | | | 13,338,600 | |
| | | | | | |
HEALTH SERVICES SECTOR — 1.9% | | | | | |
| | | | | | | | | | | | |
| | | | Health Industry Services — 1.9% | | | | | | | | |
| | 1,349,000 | | Allscripts Healthcare Solutions Inc.* | | | 16,774,790 | | | | 17,766,330 | |
| | | | | | |
HEALTH TECHNOLOGY SECTOR — 2.3% | | | | | |
| | | | | | | | | | | | |
| | | | Medical Specialties — 2.3% | | | | | | | | |
| | 215,000 | | Varian Medical Systems Inc.* | | | 15,467,253 | | | | 21,398,950 | |
| | | | | | |
PROCESS INDUSTRIES SECTOR — 9.1% | | | | | |
| | | | | | | | | | | | |
| | | | Chemicals: Specialty — 1.8% | | | | | | | | |
| | 225,000 | | Compass Minerals International Inc. | | | 16,042,584 | | | | 16,582,500 | |
| | | | | | | | | | | | |
| | | | Containers/Packaging — 2.2% | | | | | | | | |
| | 272,000 | | Avery Dennison Corp. | | | 7,082,809 | | | | 21,158,880 | |
| | | | | | | | | | | | |
| | | | Industrial Specialties — 5.1% | | | | | | | | |
| | 336,400 | | Donaldson Co. Inc. | | | 9,688,204 | | | | 12,557,812 | |
| | 759,000 | | H.B. Fuller Co. | | | 23,536,650 | | | | 35,270,730 | |
| | | | | | | 33,224,854 | | | | 47,828,542 | |
| | | | | | |
PRODUCER MANUFACTURING SECTOR — 11.6% | | | | | |
| | | | | | | | | | | | |
| | | | Building Products — 2.5% | | | | | | | | |
| | 569,000 | | Armstrong World Industries Inc.* | | | 25,004,632 | | | | 23,511,080 | |
| | | | | | | | | | | | |
| | | | Industrial Machinery — 4.5% | | | | | | | | |
| | 681,000 | | Woodward Inc. | | | 28,725,484 | | | | 42,548,880 | |
| | | | | | | | | | | | |
| | | | Miscellaneous Manufacturing — 4.6% | | | | | | | | |
| | 97,000 | | Carlisle Cos. Inc. | | | 1,986,225 | | | | 9,949,290 | |
| | 836,000 | | TriMas Corp.* | | | 18,249,897 | | | | 15,557,960 | |
| | 130,000 | | Valmont Industries Inc. | | | 19,120,992 | | | | 17,494,100 | |
| | | | | | | 39,357,114 | | | | 43,001,350 | |
| | | | | | |
RETAIL TRADE SECTOR — 2.3% | | | | | |
| | | | | | | | | | | | |
| | | | Specialty Stores — 2.3% | | | | | | | | |
| | 448,450 | | Penske Automotive Group Inc. | | | 15,709,458 | | | | 21,606,321 | |
FMI Common Stock Fund
SCHEDULE OF INVESTMENTS (Continued)
September 30, 2016
Shares or Principal Amount | | Cost | | | Value | |
| | | | | |
| COMMON STOCKS — 88.4% (a) (Continued) | | | | |
| | | | | |
TECHNOLOGY SERVICES SECTOR — 4.9% | | | | |
| | | | | | | | | |
| | | Data Processing Services — 3.3% | | | | | | |
| | 455,000 | | Broadridge Financial Solutions Inc. | | $ | 9,493,259 | | | $ | 30,844,450 | |
| | | | | | | | | | | | |
| | | | Packaged Software — 1.6% | | | | | | | | |
| | 570,000 | | Progress Software Corp.* | | | 12,368,726 | | | | 15,504,000 | |
| | | | | | |
TRANSPORTATION SECTOR — 2.9% | | | | | |
| | | | | | | | | | | | |
| | | | Marine Shipping — 2.9% | | | | | | | | |
| | 436,000 | | Kirby Corp.* | | | 20,866,866 | | | | 27,101,760 | |
| | | | Total common stocks | | | 635,930,068 | | | | 835,317,979 | |
| | | | | | |
| SHORT-TERM INVESTMENTS — 11.1% (a) | | | | | |
| | | | | | | | | | | | |
| | | | Money Market Deposit Account — 8.5% | | | | | | | | |
| $ | 79,947,556 | | U.S. Bank, N.A., 0.25% | | | 79,947,556 | | | | 79,947,556 | |
| | | | | | | | | | | | |
| | | | U.S. Treasury Securities — 2.6% | | | | | | | | |
| | 25,000,000 | | U.S. Treasury Bills, 0.115%, due 10/20/16 | | | 24,998,483 | | | | 24,998,400 | |
| | | | Total short-term investments | | | 104,946,039 | | | | 104,945,956 | |
| | | | Total investments — 99.5% | | $ | 740,876,107 | | | | 940,263,935 | |
| | | | Other assets, less liabilities — 0.5% (a) | | | | | | | 4,389,599 | |
| | | | TOTAL NET ASSETS — 100.0% | | | | | | $ | 944,653,534 | |
| * | Non-income producing security. |
| (a) | Percentages for the various classifications relate to net assets. |
The accompanying notes to financial statements are an integral part of this schedule.
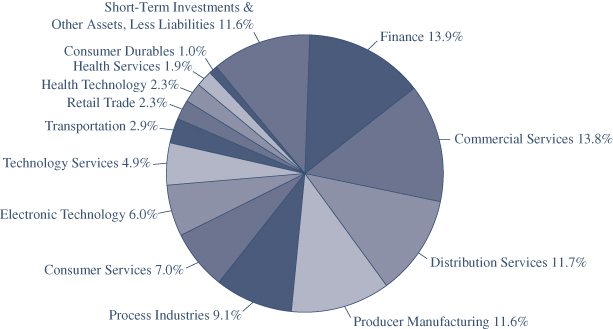
FMI Common Stock Fund
INDUSTRY SECTORS
as of September 30, 2016 (Unaudited)
FMI
International
Fund
September 30, 2016
Dear Fellow Shareholders:
Global stock markets rallied in the third quarter as Brexit fears eased. Fortunately, the sky didn’t fall as some economists had predicted. The FMI International Fund (FMIJX) captured most of the upside, advancing 5.40% in the quarter, while the MSCI EAFE Index gained 6.04% in local currency and 6.43% in U.S. Dollars (USD). Strong relative performance by Producer Manufacturing, Distribution Services, and Commercial Services sectors was partially offset by weaker results in Finance, Consumer Durables, and Consumer Non-Durables. Top performing stocks were Smiths Group, Electrocomponents, and SMC Corp., while LG Household & Health Care, SCA Group, Hyundai GreenFood each declined in value.
With each passing quarter, we do our best to avoid sounding like a broken record. Unfortunately, the story hasn’t changed a whole lot, and if anything, risk has increased. Experimental central bank monetary policies are dangerous (and ineffective), economic and business growth continues to falter, debt is high and on the rise, and stock valuations remain elevated. While negative interest rates and quantitative easing (QE) have pumped up financial asset prices, to believe that printing money out of thin air and artificially suppressing rates will solve the world’s problems is beyond our comprehension. In our view, markets are upside down, and with each passing day we venture further into uncharted territory. At some point there will be a day of reckoning, at which time we will be eagerly waiting to sift through the bargain bin. In the meantime, we remain cautious and highly skeptical, with a continued focus on downside protection.
Return-Free Risk
The negative interest rate frenzy is reaching new heights. In Europe, Henkel and Sanofi were added to the list of corporations to issue bonds at a negative yield. The Wall Street Journal reports that “Roughly €706 billion of eurozone investment-grade corporate bonds traded at negative yields as of Sept. 5, or over 30% of the entire market, according to trading platform Tradeweb, up from roughly 5% of the market in early January.”1 The global figure for negative-yielding debt (primarily government bonds in Europe and Japan) is staggering, topping $13.4 trillion in the period (from close to zero at the start of 2014).2 It is remarkable (and quite alarming) that we’ve gone from a world where sovereign debt once provided a supposed “risk-free return,” to today, when investors are lining up in droves for corporate bonds offering “return-free risk.” According to Richard Sylla (co-author of A History of Interest Rates in 2005), there is no such precedent (for negative interest rates) in at least 5,000 years of banking history.3 For good reason.
To make matters worse, central banks are running out of things to buy. In Europe, despite expanding the €1.6 trillion QE program into corporate bonds, some analysts believe the European Central Bank (ECB) could run out of bonds by year end.4 Reports are surfacing that companies
_______________
1 | Christopher Whittall. “Now Companies Are Getting Paid to Borrow.” The Wall Street Journal, September 6, 2016. |
2 | Robin Wigglesworth and Eric Platt. “Value of negative-yielding bonds hits $13.4tn.” Financial Times, August 12, 2016. |
3 | James Grant. “Hostage to a Bull Market.” The Wall Street Journal, September 9, 2016. |
4 | Elaine Moore. “When will the ECB run out of bonds to buy?” Financial Times, September 8, 2016. |
are creating bonds to sell to the ECB through private placement, which is troubling.5 While the ECB has yet to buy equities, we wouldn’t be surprised if it happens. In Japan, the Bank of Japan (BOJ) holds around a third of Japan’s government bonds, and analysts estimate that it could reach 60% by the end of 2018. They are currently buying bonds at roughly twice the pace at which the government is issuing them.6 The BOJ is also well down the path of acquiring equities, as it is already a top ten shareholder in around 90% of the Nikkei 225 index,7 and is on course to become the number one shareholder in 55 of those companies by the end of 2017.8 This is not normal.

Since the 2008 financial crisis, central banks have printed more than $12 trillion and cut interest rates more than 650 times,9 yet, “global economic output growth is about to enter a sixth year below the average rate since 1990, marking one of the longest eras of weak output in decades,” per The Wall Street Journal.10 In addition, McKinsey Global Institute writes, “Between 65 and 70 percent of households in 25 advanced economies, the equivalent of 540 million to 580 million people, were in segments of the income distribution whose real market incomes—their wages and income from capital—were flat or had fallen in 2014 compared with 2005. This compared with less than 2 percent, or fewer than ten million people, who experienced this phenomenon between 1993 and 2005.”11 The conventional wisdom was that low interest rates and inflated asset prices would help spur demand, with an increase in business and household spending. But the reverse has transpired, as business investment has been anemic and households have padded their savings. Despite a plethora of evidence suggesting that monetary policies have failed, central bankers continue to plow
_______________
5 | Christopher Whittall. “Seller’s Paradise: Companies Build Bonds for European Central Bank to Buy.” The Wall Street Journal, August 21, 2016. |
6 | Rachel Rosenthal and Suryatapa Bhattacharya. “Bank of Japan Risk: Running Out of Bonds to Buy.” The Wall Street Journal, September 9, 2016. |
7 | Yuji Nakamura, Anna Kitanaka and Nao Sano. “The Tokyo Whale Is Quietly Buying Up Huge Stakes in Japan Inc.” Bloomberg, April 24, 2016. |
8 | Anna Kitanaka, Yuji Nakamura and Toshiro Hasegawa. “The Bank of Japan’s Unstoppable Rise to Shareholder No. 1.” Bloomberg, August 14, 2016. |
9 | Jeff Cox. “$12 trillion of QE and the lowest rates in 5,000 years...for this?” CNBC, June 13, 2016. |
10 | Ian Talley. “IMF Signals Another Downgrade to Global Growth.” The Wall Street Journal, September 1, 2016. |
11 | “Poorer Than Their Parents?” McKinsey Global Institute, July 2016. |
ahead with more of the same. This is very unlikely to create a path to prosperity, in our view. Money is not supposed to be free. Our children and grandchildren will likely look back at this period with bewilderment as the economic textbooks are re-written. When policies and valuations get stretched to the extreme, so too will the inevitable consequences.
In Banks We Trust
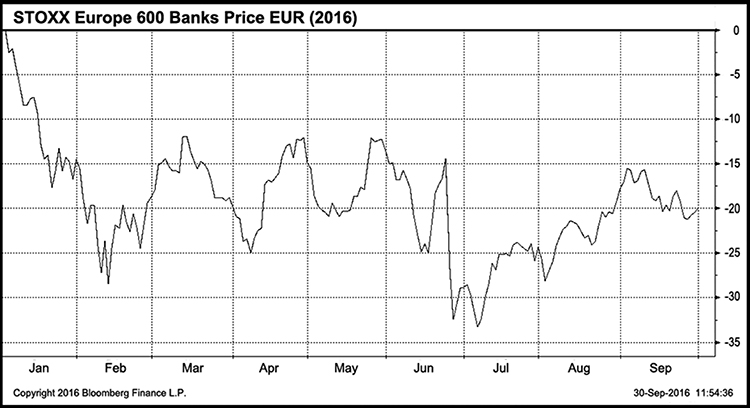
In doing “whatever it takes” to preserve the eurozone and resurrect growth, ECB President Mario Draghi has put a major squeeze on one of his most troubled sectors: European banks. Negative interest rates are debilitating to bank margins and profitability, and earnings have suffered as a result. Furthermore, European banks are lugging around approximately €900 billion ($1 trillion) of bad debt, with Southern Europe being the most heavily weighted to these distressed loans12 (which is not a big surprise). Meanwhile, banks have recently been increasing their exposure to sovereign debt, as it is treated as “risk-free” and does not incur capital charges. As the European sovereign debt crisis should have demonstrated, Europe’s government bonds are hardly “risk-free.” Regulators have (rightly) expressed an interest in introducing capital charges on these holdings, but Fitch Ratings has warned that a policy shift could result in banks having to raise as much as €170 billion in extra capital, or sell €500 billion in debt.13 In reality, European bank balance sheets are likely far worse than meets the eye, and regulators’ softball “stress tests” do little to create comfort.
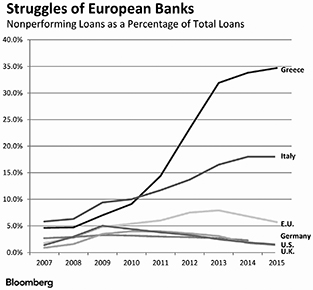
Absent Greece, the Italian banks are clearly in the worst shape, as 17% of total loans have gone sour. This equates to over €360 billion, quadruple the level reached in 2008.14 As articulated by Mauldin Economics, “Italian GDP [gross domestic product] is around $2 trillion. At today’s exchange rate, Italy’s nonperforming bank loans total roughly 25% of GDP. Compare Italy to the U.S., where nonperforming loans amount to only 1.2% of GDP, or $128 billion. If nonperforming loans in the U.S. were 25% of U.S. GDP, they would amount to an astronomical $4.5 trillion. Italy is one good global recession away from a major crisis.”15 While the eurozone was barely able to manage through the contagion risks associated with the Greece debacle, a bank and/or sovereign debt crisis in Italy, at ten times the size of the Greek economy, would be a whole different animal. Needless to say, time is of the essence in terms of putting forth a credible path to sustainability.
_______________
12 | Tom Fairless and Todd Buell. “ECB Proposals Aim to Clear Europe’s Bad Debt Mountain.” The Wall Street Journal, September 12, 2016. |
13 | “European banks raise government debt holdings.” Financial Times, June 21, 2016. |
14 | Giovanni Legorano. “Bad Debt Piled in Italian Banks Looms as Next Crisis.” The Wall Street Journal, July 4, 2016. |
15 | John Mauldin. “Brexit Doesn’t Change the Sad Reality of Europe.” Mauldin Economics, July 8, 2016. |
Despite the stock price decline in European banks earlier this year, we will continue to keep our distance and watch from the sidelines. The black box nature of the businesses, highly-levered balance sheets, and concerns around solvency keep us at bay. Permanent impairment of capital is a material risk.
Fiscal Stimulus To Save The Day?
With monetary policy failing to deliver, some are hoping fiscal stimulus will come to the rescue. In the U.S., Japan and United Kingdom, budget deficits are set to be larger this year than last year, or larger than originally planned.16 As a reminder, with rising deficits comes rising debt. When interest rates inevitably start to normalize (increase), perhaps the cost of debt will come back into focus. Like monetary policy, fiscal stimulus is no magic bullet. If that was the case, Japan’s economy would be on top of the world. Since 1990, Japan has delivered 25 economic stimulus packages,17 and what do they have to show for it? Lackluster growth and the world’s largest accumulation of government debt (as a percentage of GDP).
Mind The Gap
Speaking of profligate spending, the Chinese government continues to prop up its economy as the private sector wanes. Fixed-asset investment, the key driver of China’s growth engine in recent years, hit a 17-year low (8.1%) through August. Investments made by state-run companies were up a massive 21.4%, but investment by private companies, which account for 60% of the total, rose by only 2.1%.18,19 In June, private investment fell for the first time since China started tracking the data in 2004. This is quite a slowdown, considering that it had grown by nearly 30% on average over the prior decade (10.1% in 2015).20 While fixed investment has driven exceptional headline GDP growth, a significant portion of capital appears to have been poorly allocated. A recent Oxford Review of Economic Policy study writes, “Evidence suggests that over half the infrastructure investments in China made in the last three decades have been NPV [net present value] negative.
_______________
16 | Greg Ip. “Fiscal Policy Makes a Quiet Turn Toward Stimulus.” The Wall Street Journal, September 15, 2016. |
17 | Issaku Harada. “Japan Strategy Views.” Goldman Sachs, July 26, 2016. |
18 | “China’s fixed-asset investment hits 17-year low through July.” Nikkei News, August 12, 2016. |
19 | “China retail, industrial production beat expectations in August.” Financial Times, September 12, 2016. |
20 | Mark Magnier. “The Private Pain of China’s Economy.” The Wall Street Journal, August 9, 2016. |
Far from being an engine of economic growth, a typical infrastructure investment has destroyed economic value in China due to poor management of risks that impact cost, time, and benefits.” They also note that “The majority of the investments China has made since 2000 have been debt-fueled,”21 which further compounds the problem.
As we have highlighted in a number of our prior letters, China’s debt levels are of great concern. New data from the Bank for International Settlements (BIS) and Standard & Poor’s (S&P) Global Ratings further reinforce our trepidation. The BIS publishes a quarterly “Credit-to-GDP gap,” which tracks the buildup of excessive credit and is defined as “the difference between the credit-to-GDP ratio and its long-run trend.” It has “been found to be a useful early warning indicator of financial crises.” Typically, a reading over 10% is a cause for concern, indicating an elevated risk to the country’s banking sector. In March, China logged in at 30.1%, the highest level of any nation on record (from 1995).22,23 In addition, S&P reports that China’s total outstanding corporate debt has reached $17.8 trillion, or 171% of GDP. Per the Financial Times, this makes “China’s corporate debt mountain by far the world’s largest in both absolute and relative terms. Not only is the ratio of Chinese company debt-to-GDP more than double that in the U.S. and eurozone, it is projected to grow far more quickly as an increasing number of heavily-indebted corporations ramp up their borrowing simply to repay debts that are coming due. By 2020, China’s outstanding corporate debt will be $32.6 trillion, while its share of global company borrowings will have risen to 43 per cent from 35 per cent last year, according to S&P estimates.”24 Buyers beware. A credit crisis in China would have significant global ramifications.
As we attempt to navigate through some of the potential landmines in the world economy, below are a couple stocks where we see an attractive risk versus reward. In the months ahead, our clients can expect us to remain defensively postured, as we continue to search for high-quality, durable businesses trading at a discount to their intrinsic values.
TE Connectivity Ltd. (TEL)
(Analyst: Jordan Teschendorf)
Description
TE Connectivity (TE) is the global leader in connectors and sensors, with the broadest portfolio of products in this $170 billion market. Transportation is the company’s largest end market, at over 50% and 60% of sales and operating profit, respectively.
Good Business
| • | Approximately 90% of the portfolio provides leading connectivity and sensor solutions. A focus on providing increasingly complex, application-specific solutions raises the barriers to entry; 80% of sales are generated from harsh environment applications that require highly-engineered solutions. |
| | |
| • | Connectors and sensors are a ubiquitous feature in electronic devices. The proliferation of electronics and increasing content penetration is driving demand for TE’s products, which represent a low single-digit percentage of the bill of materials. |
| | |
| • | Return on invested capital (ROIC) was 9.6% in fiscal year 2015. Returns have averaged 11.4%, 10.9%, and 9.7% over the last 3, 5, and 10-year periods, respectively. |
_______________
21 | Atif Ansar, Bent Flyvbjerg, Alexander Budzier and Daniel Lunn (2016). “Does infrastructure investment lead to economic growth or economic fragility? Evidence from China.” Oxford Review of Economic Policy, Volume 32 (Number 3), 360–390. |
22 | Gabriel Wildau. “Global watchdog warns over China’s debt levels.” Financial Times, September 19, 2016. |
23 | Paul Panckhurst. “Warning Indicator for China Banking Stress Climbs to Record.” Bloomberg, September 18, 2016. |
24 | James Kynge. “China: the former EM darling.” Financial Times, September 2, 2016. |
| • | The balance sheet is strong and the company generates a prodigious amount of free cash. |
| | |
| • | This business is easy to understand. |
Valuation
| • | TE trades for 16 times fiscal year 2016 earnings per share forecasts, a significant discount to the S&P 500 multiple, as well as its closest peer Amphenol, which trades for 24.9 times. |
| | |
| • | Koch Industries announced the acquisition of competitor Molex in September 2013 for 22 times consensus calendar year 2014 earnings per share (EPS) estimates. Ascribing a similar multiple to TE would represent upside of around 35%. |
| | |
| • | Free cash flow approximates net income, and thus yields 6.4% on fiscal year 2017 forecasts. |
Management
| • | Tom Lynch has served as Chief Executive Officer since January 2006, and was elected Chairman in January 2013. Terrence Curtin serves as President, and is responsible for all of the Connectivity and Sensors businesses, and merger and acquisition activities. Heath Mitts joined as Chief Financial Officer in September 2016. |
| | |
| • | Since being spun off from Tyco International in June 2007, management has worked to reposition TE as a faster-growing, more profitable enterprise. In January of 2015, the company announced the sale of its volatile and underperforming BNS business to CommScope for $3.0 billion, or 10 times earnings before interest, taxes, depreciation and amortization (EBITDA), with the majority of the sale proceeds used for share repurchases. |
| | |
| • | TE expects to continue to return roughly two-thirds of free cash flow to shareholders over time, with the remaining one-third dedicated to making small and mid-sized acquisitions. |
Investment Thesis
TE Connectivity is well positioned to benefit from the trend towards hybrid, electric, and autonomous vehicles, which carry rising connector and sensor content. Increasing electronic content and design wins are expected to result in organic sales growth of 5-7% per year over the long term, which, in turn, should drive 50 basis points of annual operating margin expansion. Combined with stock buybacks, EPS should grow at a double-digit compounded annual rate. TE is an above-average company that is trading at a well-below-average multiple.
Isuzu Motors (7202 JP)
(Analyst: Dan Sievers)
Description
Isuzu Motors, founded in 1916 and headquartered in Tokyo, is the number five global producer of commercial vehicles by units. The company manufactures and sells heavy, medium, and light-duty commercial vehicles, pickup trucks, sport utility vehicles (SUVs), truck parts, buses, and industrial diesel engines. In fiscal year 2016, Isuzu sold 319,000 heavy duty/medium duty commercial vehicles (CVs), and additionally, sold 349,000 light commercial vehicles (LCVs), and 70,000 separate industrial diesel engines. CVs (more than twice as expensive as LCVs) were 47% of revenues and LCVs were 25% of revenues, such that “vehicles” represented 72% of revenues. The remaining 28% of revenues can be expressed as either, (1) 5% parts & components, 5% parts for overseas production, and 18% other, or as, (2) 5% parts & components, 23% knock-down kits (KD sets) and parts. In 2016, geographic revenue was 36% Japan, 28% Asia, 7% North America, and 29% Other.
Good Business
| • | Isuzu vehicles hold at least one number one category position in 37 countries. In Japan (81,000 units in fiscal year 2016), the CV market is a rational duopoly (with Hino). In Thailand (130,000 units), Isuzu is number one in most CV and LCV categories. Isuzu should |
| | experience secular growth in CV overseas (238,000 units) and LCV export (183,000 units). Demand for CVs is likely to grow throughout the Association of Southeast Asian Nations (ASEAN) block, where Isuzu is strong. |
| | |
| • | In the early 2000s, Isuzu set out to restructure operations, rationalize and realign capacity, and de-lever. Isuzu increased emphasis on a narrow set of products as well as plant efficiency, profitability, and returns. Five-year average margins of earnings before interest and taxes (EBIT) have been 8.8% and 12.7% for ROIC. Isuzu lacks a large financing subsidiary. |
| | |
| • | Isuzu’s balance sheet is in a net cash position, though capital expenditure was high in fiscal 2016, and will be in fiscal 2017, due to manufacturing investments in India (mainly) and China. |
| | |
| • | Isuzu is focused on growing its profitable parts business, which will be aided by its strength in diesel engines. |
Valuation
| • | At headline multiples of 1.4 times price to book value, 0.6 times enterprise value-to-sales (EV/Sales), 5.3 times enterprise value-to-EBITDA (EV/EBITDA), and 8.8 times 2017 estimated price-to-earnings, Isuzu is inexpensive and trades at or below its 5-year average multiples of 1.8 times, 0.6 times, 5.8 times, and 10 times, respectively. Adjusting for Isuzu’s 60 million shares in treasury, its EV/EBITDA multiple drops to 5 times. The multiple would be lower still if we adjusted for Isuzu’s minority investments in Qingling Motors (1122-HK) and others. |
| | |
| • | Isuzu trades at a wide discount to leading Western truck companies (PACCAR, Daimler, Volvo, MAN Truck & Bus) and quality domestic vehicles manufactures like Toyota, each of whom trade in excess of 1.0 times EV/Sales. Only PACCAR has a lower (efficiency) ratio of selling, general and administrative expenses-to-sales. |
Management
| • | Chairman Susumu Hosoi (67), along with prior Chairman Yoshinori Ida, enacted difficult reforms while President of Isuzu, reorienting the company around profitability, utilization, and efficiency. |
| | |
| • | President (as of June 15) Masanori Katayama (62) began as an engineer with Isuzu 37 years ago. |
| | |
| • | Isuzu promotes continuity of strategy via its 3-year mid-term business plans. |
| | |
| • | Isuzu has not grown through acquisition, and uses return on equity as one of four key financial indicators. |
Investment Thesis
Investors overstate Isuzu’s dependence on its domestic Japanese market (somewhat cyclically strong at present), where Isuzu sells just 12% of total vehicle units (25% of CV units) and generates 36% of sales. Isuzu is a strong, efficient, and well-capitalized diesel truck manufacturer with strong market positions throughout the growing ASEAN block (35% of units) and parts of the Middle East & Africa (24% of units). We further expect the company to grow in China and in India, where they are building a new LCV plant. We view the current valuation as attractive, and are encouraged by the fact that Isuzu repurchased 45 million shares in fiscal year 2016 (5.3% of total shares).
Thank you for your support of the FMI International Fund.
This shareholder letter is unaudited.
FMI International Fund
MANAGEMENT’S DISCUSSION OF FUND PERFORMANCE (Unaudited)
During the fiscal year ended September 30, 2016, the FMI International Fund (Fund) had a total return of 13.07%. Over the same period, the MSCI EAFE Index (Index) returned 4.62% in local currency and 6.52% in U.S. Dollars (USD). Sectors that aided the Fund’s relative performance included Finance, Consumer Non-Durables and Distribution Services. In the Finance sector, Admiral Group and Fairfax were up meaningfully. Additionally, the Fund’s significant underweighting in Finance added to performance, as the Index return in this sector was down. Unilever, Henkel, Amorepacific and LG Household all helped the Consumer Non-Durable sector outperform. Position sizes were trimmed in Henkel, Amorepacific and LG Household. Electrocomponents drove the outperformance in the Distribution Services sector. On the negative side, Transportation, Process Industries and Energy Minerals all weighed on relative performance. Bolloré was down significantly on worries about African trade activity and elevated capital expenditures in both African rail infrastructure and battery technologies. The Fund’s adviser remains optimistic about the long-term prospects at Bolloré. Potash Corporation hurt the Fund’s performance as persistently low crop prices, adverse currency and worries about excess capacity continued. The Fund’s adviser continues to believe that Potash is significantly undervalued. The Fund’s underperformance in the Energy sector was caused by its low relative weighting. Cash levels remain higher than normal due to difficulty in finding high-quality undervalued securities. Currency hedging has been a meaningful tailwind versus the USD Index, as the dollar has strengthened considerably over the period. While there was some trimming of various positions, the only position sold outright during the fiscal year was Pirelli. New additions to the Fund included DKSH Holding, Wolseley, Samsung Electronics, Hyundai Motor, Vivendi, Electrolux and Dufry AG. At September 30, 2016, the Fund was overweighted in Process Industries, Producer Manufacturing, Consumer Services and Distribution Services and considerably underweighted in Finance, Health Technology, Communications, and Energy Minerals.
In general, stocks rose in the first quarter before sliding in December, January and the first half of February. Concerns about economic growth and excessive debt, among other issues, seem to be behind the significant correction. But just as quickly markets recovered, despite continued weak fundamentals. Easy money from central bankers and an enduring belief that somehow stocks can rise regardless of the fundamentals appear to be the prevailing wisdom. Some of the factors that are cause for concern include relatively high valuations, slow economic growth and significant increases in debt, particularly in China. China remains one of the Fund’s top worries as it continues to pump credit into the economy at an alarming rate. In most geographics, companies have been reluctant to invest in both capital equipment and labor, which has resulted in less than satisfactory internal growth rates. Global economic growth forecasts have been consistently reduced and geopolitical risks appear to have escalated. Combining subpar growth with high valuations makes the Fund’s adviser cautious on stock markets in the short run. The Fund’s adviser continues to believe, however, that stocks have the best chance to adjust to a dynamic environment over the long run. The Fund sells at discount to the MSCI EAFE Index on most valuation measures.
FMI International Fund
MANAGEMENT’S DISCUSSION OF FUND PERFORMANCE (Unaudited)
(Continued)
COMPARISON OF CHANGE IN VALUE OF $10,000 INVESTMENT IN
FMI INTERNATIONAL FUND AND MSCI EAFE(1)
AVERAGE ANNUALIZED TOTAL RETURN
| | | | | Since Inception |
| | 1-Year | 5-Year | 10-Year | 12/31/10 |
| FMI International Fund | 13.07% | 13.49% | N/A | 9.67% |
MSCI EAFE (LOC)1 | 4.62% | 11.21% | 2.20% | 6.50% |
MSCI EAFE (USD)1 | 6.52% | 7.39% | 1.82% | 3.44% |
The graph and the table do not reflect the deduction of taxes that a shareholder would pay on Fund distributions or the redemption of Fund shares. Performance data quoted represents past performance; past performance does not guarantee future results. Investment return and principal value of an investment will fluctuate so that an investor’s shares, when redeemed, may be worth more or less than their original cost. Current performance of a Fund may be lower or higher than the performance quoted. The total returns do not reflect the deduction of taxes that a shareholder would pay on Fund distributions or the redemption of Fund shares. Total return includes change in share prices and in each case includes reinvestments of any dividends, interest and capital gain distributions. Performance data current to the most recent month-end may be obtained by visiting www.fmifunds.com or by calling 1-800-811-5311.
| (1) | The MSCI EAFE Index (Europe, Australasia, Far East) is a free float-adjusted market capitalization index that is designed to measure the equity market performance of developed markets, excluding the U.S. and Canada. The MSCI EAFE Index consists of the following 21 developed market country indices: Australia, Austria, Belgium, Denmark, Finland, France, Germany, Hong Kong, Ireland, Israel, Italy, Japan, the Netherlands, New Zealand, Norway, Portugal, Singapore, Spain, Sweden, Switzerland and the United Kingdom. The MSCI EAFE Index is unmanaged and investors cannot invest directly in the Index. Index results are inclusive of dividends and net of foreign withholding taxes. The reported figures include reinvestment of dividends and capital gains distributions and do not reflect any fees or expenses. |
| | |
| | The MSCI EAFE Index is calculated in local currency (LOC) as well as in U.S. dollars (USD). The concept of a LOC calculation excludes the impact of currency fluctuations. All currencies of listing are considered in the Index calculation in LOC where current prices (t) and previous day prices (t-1) are converted into USD using the same exchange rate (exchange rate t-1) in the numerator and denominator. As a consequence, the FX factor drops out of the equation. The USD calculation includes exchange rates at t and t-1. Therefore, the LOC calculation only represents the price appreciation or depreciation of the securities, whereas the USD calculation also accounts for the performance of the currency (or currencies) relative to the USD. MSCI EAFE is a service mark of MSCI Barra. |
An investment cannot be made directly into an index.
FMI International Fund
SCHEDULE OF INVESTMENTS
September 30, 2016
| Shares | | | | Cost | | | Value | |
| | |
| LONG-TERM INVESTMENTS — 84.9% (a) | |
| | |
| COMMON STOCKS — 79.2% (a) | |
| | |
COMMERCIAL SERVICES SECTOR — 8.7% | |
| | | | | | | | | |
| | | Advertising/Marketing Services — 2.3% | | | | | | |
| | 5,003,000 | | WPP PLC (Jersey) (b) | | $ | 107,704,080 | | | $ | 117,598,014 | |
| | | | | | | | | | | | |
| | | | Miscellaneous Commercial Services — 3.3% | | | | | | | | |
| | 875,000 | | DKSH Holding AG (Switzerland) (b) | | | 54,911,049 | | | | 64,367,996 | |
| | 1,348,000 | | Secom Co. Ltd. (Japan) (b) | | | 89,687,368 | | | | 100,660,985 | |
| | | | | | | 144,598,417 | | | | 165,028,981 | |
| | | | | | | | | | | | |
| | | | Personnel Services — 3.1% | | | | | | | | |
| | 2,757,000 | | Adecco S.A. (Switzerland) (b) | | | 178,043,531 | | | | 155,400,267 | |
| | |
COMMUNICATIONS SECTOR — 2.0% | |
| | | | | | | | | | | | |
| | | | Wireless Telecommunications — 2.0% | | | | | | | | |
| | 4,935,000 | | Vivendi S.A. (France) (b) | | | 94,459,114 | | | | 99,601,044 | |
| | |
CONSUMER DURABLES SECTOR — 7.7% | |
| | | | | | | | | | | | |
| | | | Electronics/Appliances — 1.9% | | | | | | | | |
| | 3,750,000 | | Electrolux AB — Series B (Sweden) (b) | | | 98,622,073 | | | | 93,925,496 | |
| | | | | | | | | | | | |
| | | | Motor Vehicles — 1.5% | | | | | | | | |
| | 6,585,000 | | Isuzu Motors Ltd. (Japan) (b) | | | 72,678,128 | | | | 77,512,514 | |
| | | | | | | | | | | | |
| | | | Other Consumer Specialties — 1.1% | | | | | | | | |
| | 17,824,900 | | Samsonite International S.A. | | | | | | | | |
| | | | (Luxembourg) (b) | | | 53,667,411 | | | | 57,473,277 | |
| | | | | | | | | | | | |
| | | | Tools & Hardware — 3.2% | | | | | | | | |
| | 2,230,000 | | Makita Corp. (Japan) (b) | | | 125,298,263 | | | | 158,887,098 | |
| | |
CONSUMER NON-DURABLES SECTOR — 12.3% | |
| | | | | | | | | | | | |
| | | | Food: Major Diversified — 3.7% | | | | | | | | |
| | 1,000,000 | | Danone S.A. (France) (b) | | | 66,846,387 | | | | 74,253,217 | |
| | 1,426,000 | | Nestle’ S.A. (Switzerland) (b) | | | 107,332,746 | | | | 112,602,777 | |
| | | | | | | 174,179,133 | | | | 186,855,994 | |
| | | | | | | | | | | | |
| | | | Household/Personal Care — 8.6% | | | | | | | | |
| | 1,374,000 | | Henkel AG & Co. KGaA (Germany) (b) | | | 131,733,013 | | | | 160,255,912 | |
| | 3,942,000 | | Svenska Cellulosa AB | | | | | | | | |
| | | | (SCA Group) (Sweden) (b) | | | 113,684,009 | | | | 117,002,062 | |
| | 3,261,000 | | Unilever PLC (Britain) (b) | | | 143,069,800 | | | | 154,309,998 | |
| | | | | | | 388,486,822 | | | | 431,567,972 | |
| | |
CONSUMER SERVICES SECTOR — 4.8% | |
| | | | | | | | | | | | |
| | | | Cable/Satellite TV — 1.9% | | | | | | | | |
| | 4,743,000 | | Shaw Communications Inc. (Canada) | | | 93,020,564 | | | | 97,068,905 | |
| | | | | | | | | | | | |
| | | | Casinos/Gaming — 1.4% | | | | | | | | |
| | 64,180,000 | | Genting Malaysia Berhad (Malaysia) (b) | | | 70,721,223 | | | | 70,654,832 | |
| | | | | | | | | | | | |
| | | | Restaurants — 1.5% | | | | | | | | |
| | 4,000,000 | | Compass Group PLC (Britain) (b) | | | 65,165,942 | | | | 77,466,176 | |
FMI International Fund
SCHEDULE OF INVESTMENTS (Continued)
September 30, 2016
| Shares | | | | Cost | | | Value | |
| | |
| LONG-TERM INVESTMENTS — 84.9% (a) (Continued) | |
| | |
| COMMON STOCKS — 79.2% (a) (Continued) | |
| | |
DISTRIBUTION SERVICES SECTOR — 3.5% | |
| | | | | | | | | |
| | | Wholesale Distributors — 3.5% | | | | | | |
| | 8,342,500 | | Electrocomponents PLC (Britain) (b) | | $ | 26,394,150 | | | $ | 36,732,540 | |
| | 2,436,000 | | Wolseley PLC (Jersey) (b) | | | 128,038,172 | | | | 137,006,043 | |
| | | | | | | 154,432,322 | | | | 173,738,583 | |
| | |
ELECTRONIC TECHNOLOGY SECTOR — 5.8% | |
| | | | | | | | | | | | |
| | | | Aerospace & Defense — 3.3% | | | | | | | | |
| | 17,671,000 | | Rolls-Royce Holdings PLC (Britain)*(b) | | | 200,639,476 | | | | 164,864,232 | |
| | | | | | | | | | | | |
| | | | Electronic Components — 2.5% | | | | | | | | |
| | 1,971,000 | | TE Connectivity Ltd. (Switzerland) | | | 122,811,040 | | | | 126,892,980 | |
| | |
FINANCE SECTOR — 4.6% | |
| | | | | | | | | | | | |
| | | | Property/Casualty Insurance — 4.6% | | | | | | | | |
| | 1,950,000 | | Admiral Group PLC (Britain) (b) | | | 43,075,577 | | | | 51,754,797 | |
| | 302,000 | | Fairfax Financial Holdings Ltd. (Canada) | | | 152,988,287 | | | | 176,952,963 | |
| | | | | | | 196,063,864 | | | | 228,707,760 | |
| | |
INDUSTRIAL SERVICES SECTOR — 3.7% | |
| | | | | | | | | | | | |
| | | | Oilfield Services/Equipment — 3.7% | | | | | | | | |
| | 2,379,000 | | Schlumberger Ltd. (Curacao) | | | 190,465,737 | | | | 187,084,560 | |
| | |
PROCESS INDUSTRIES SECTOR — 7.0% | |
| | | | | | | | | | | | |
| | | | Chemicals: Agricultural — 3.0% | | | | | | | | |
| | 9,338,000 | | Potash Corp. of Saskatchewan Inc. (Canada) | | | 219,867,666 | | | | 152,396,160 | |
| | | | | | | | | | | | |
| | | | Chemicals: Specialty — 1.5% | | | | | | | | |
| | 1,070,000 | | Shin-Etsu Chemical Co. Ltd. (Japan) (b) | | | 61,048,401 | | | | 74,656,949 | |
| | | | | | | | | | | | |
| | | | Industrial Specialties — 2.5% | | | | | | | | |
| | 1,882,000 | | Akzo Nobel N.V. (Netherlands) (b) | | | 128,847,634 | | | | 127,298,997 | |
| | |
PRODUCER MANUFACTURING SECTOR — 10.2% | |
| | | | | | | | | | | | |
| | | | Industrial Conglomerates — 6.3% | | | | | | | | |
| | 4,135,000 | | Jardine Strategic Holdings Ltd. (Bermuda) (b) | | | 129,104,767 | | | | 135,542,815 | |
| | 9,580,000 | | Smiths Group PLC (Britain) (b) | | | 162,762,727 | | | | 181,850,284 | |
| | | | | | | 291,867,494 | | | | 317,393,099 | |
| | | | | | | | | | | | |
| | | | Industrial Machinery — 3.9% | | | | | | | | |
| | 678,000 | | SMC Corp. (Japan) (b) | | | 169,590,823 | | | | 195,760,815 | |
| | |
RETAIL TRADE SECTOR — 2.0% | |
| | | | | | | | | | | | |
| | | | Department Stores — 0.9% | | | | | | | | |
| | 3,072,500 | | Hyundai GreenFood Co. Ltd. (South Korea) (b) | | | 52,904,932 | | | | 45,056,254 | |
| | | | | | | | | | | | |
| | | | Specialty Stores — 1.1% | | | | | | | | |
| | 425,000 | | Dufry AG (Switzerland)*(b) | | | 50,050,738 | | | | 53,282,655 | |
| | |
TECHNOLOGY SERVICES SECTOR — 4.2% | |
| | | | | | | | | | | | |
| | | | Information Technology Services — 4.2% | | | | | | | | |
| | 1,712,000 | | Accenture PLC (Ireland) | | | 164,764,312 | | | | 209,155,040 | |
FMI International Fund
SCHEDULE OF INVESTMENTS (Continued)
September 30, 2016
Shares or Principal Amount | | Cost | | | Value | |
| | | | | |
| LONG-TERM INVESTMENTS — 84.9% (a) (Continued) | | | | |
| | | | | |
| COMMON STOCKS — 79.2% (a) (Continued) | | | | |
| | | | | |
TRANSPORTATION SECTOR — 2.7% | | | | |
| | | | | | | | | |
| | | Other Transportation — 2.7% | | | | | | |
| | 39,694,000 | | Bolloré (France) (b) | | $ | 173,439,346 | | | $ | 138,183,893 | |
| | | | Total common stocks | | | 3,843,438,486 | | | | 3,983,512,547 | |
| | | | | | |
| PREFERRED STOCKS — 5.7% (a) | | | | | |
| | | | | | |
CONSUMER DURABLES SECTOR — 1.6% | | | | | |
| | | | | | | | | | | | |
| | | | Motor Vehicles — 1.6% | | | | | | | | |
| | 845,000 | | Hyundai Motor Co. (South Korea) (b) | | | 73,273,716 | | | | 81,224,741 | |
| | | | | | |
CONSUMER NON-DURABLES SECTOR — 1.8% | | | | | |
| | | | | | | | | | | | |
| | | | Household/Personal Care — 1.8% | | | | | | | | |
| | 236,000 | | Amorepacific Corp. (South Korea) (b) | | | 24,067,494 | | | | 45,584,933 | |
| | 97,000 | | LG Household & Health Care Ltd. | | | | | | | | |
| | | | (South Korea) (b) | | | 29,646,152 | | | | 45,461,468 | |
| | | | | | | 53,713,646 | | | | 91,046,401 | |
ELECTRONIC TECHNOLOGY SECTOR — 2.3% | | | | | |
| | | | | | | | | | | | |
| | | | Telecommunications Equipment — 2.3% | | | | | | | | |
| | 96,000 | | Samsung Electronics Co. Ltd. | | | | | | | | |
| | | | (South Korea) (b) | | | 92,225,398 | | | | 112,780,914 | |
| | | | Total preferred stocks | | | 219,212,760 | | | | 285,052,056 | |
| | | | Total long-term investments | | | 4,062,651,246 | | | | 4,268,564,603 | |
| | | | | | |
| SHORT-TERM INVESTMENTS — 15.3% (a) | | | | | |
| | | | | | | | | | | | |
| | | | Money Market Deposit Account — 7.8% | | | | | | | | |
| $ | 391,782,169 | | U.S. Bank, N.A., 0.25% | | | 391,782,169 | | | | 391,782,169 | |
| | | | | | | | | | | | |
| | | | U.S. Treasury Securities — 7.5% | | | | | | | | |
| | 375,000,000 | | U.S. Treasury Bills, 0.115%, due 10/20/16 | | | 374,977,240 | | | | 374,976,000 | |
| | | | Total short-term investments | | | 766,759,409 | | | | 766,758,169 | |
| | | | Total investments — 100.2% | | $ | 4,829,410,655 | | | | 5,035,322,772 | |
| | | | Other assets, less liabilities — (0.2%) (a) | | | | | | | (9,580,748 | ) |
| | | | TOTAL NET ASSETS — 100.0% | | | | | | $ | 5,025,742,024 | |
| * | Non-income producing security. |
| (a) | Percentages for the various classifications relate to net assets. |
| (b) | Security does not trade during New York Stock Exchange hours and has been valued in accordance with the procedures discussed in Note 1(a) to the financial statements and has been classified as Level 2. As of |
| | September 30, 2016 the aggregate value of these securities was $3,319,013,995. |
| PLC | Public Limited Company |
The accompanying notes to financial statements are an integral part of this schedule.
FMI International Fund
SCHEDULE OF FORWARD CURRENCY CONTRACTS
September 30, 2016
| | | | | | | U.S. $ Value on | | | | | | U.S. $ Value on | | | | |
| | | | | | | September 30, | | | | | | September 30, | | | | |
| | | | | | | 2016 | | | | | | 2016 | | | Unrealized | |
| Settlement | | | Currency to | | | of Currency to | | | Currency to | | | of Currency to | | | Appreciation | |
Date | Counterparty | | be Delivered | | | be Delivered | | | be Received | | | be Received | | | (Depreciation) | |
| 10/21/16 | Bank of New | | | 595,000,000 | | | $ | 771,557,085 | | | | 784,924,000 | | | $ | 784,924,000 | | | $ | 13,366,915 | |
| | York Mellon | | British Pound | | | | | | | U.S. Dollar | | | | | | | | | |
| | | | | | | | | | | | | | | | | | | | | | |
| 10/21/16 | State Street Global | | | 45,000,000 | | | | 58,353,057 | | | | 58,609,575 | | | | 58,609,575 | | | | 256,518 | |
| | Markets, LLC | | British Pound | | | | | | | U.S. Dollar | | | | | | | | | |
| | | | | | | | | | | | | | | | | | | | | | |
| 10/21/16 | Goldman | | | 30,000,000 | | | | 22,870,575 | | | | 22,929,995 | | | | 22,929,995 | | | | 59,420 | |
| | Sachs & Co. | | Canadian Dollar | | | | | | | U.S. Dollar | | | | | | | | | |
| | | | | | | | | | | | | | | | | | | | | | |
| 10/21/16 | State Street | | | 270,000,000 | | | | 205,835,179 | | | | 206,696,168 | | | | 206,696,168 | | | | 860,989 | |
| | Global Markets, | | Canadian Dollar | | | | | | | U.S. Dollar | | | | | | | | | |
| | LLC | | | | | | | | | | | | | | | | | | | | |
| | | | | | | | | | | | | | | | | | | | | | |
| 10/21/16 | Goldman | | | 43,000,000 | | | | 48,352,507 | | | | 48,328,990 | | | | 48,328,990 | | | | (23,517 | ) |
| | Sachs & Co. | | Euro | | | | | | | U.S. Dollar | | | | | | | | | |
| | | | | | | | | | | | | | | | | | | | | | |
| 10/21/16 | JPMorgan | | | 412,000,000 | | | | 463,284,484 | | | | 455,728,320 | | | | 455,728,320 | | | | (7,556,164 | ) |
| | Chase | | Euro | | | | | | | U.S. Dollar | | | | | | | | | |
| | | | | | | | | | | | | | | | | | | | | | |
| 10/21/16 | JPMorgan | | | 4,000,000,000 | | | | 39,480,762 | | | | 39,592,200 | | | | 39,592,200 | | | | 111,438 | |
| | Chase | | Japanese Yen | | | | | | | U.S. Dollar | | | | | | | | | |
| | | | | | | | | | | | | | | | | | | | | | |
| 10/21/16 | JPMorgan | | | 47,000,000,000 | | | | 463,898,952 | | | | 442,350,859 | | | | 442,350,859 | | | | (21,548,093 | ) |
| | Chase | | Japanese Yen | | | | | | | U.S. Dollar | | | | | | | | | |
| | | | | | | | | | | | | | | | | | | | | | |
| 10/21/16 | State Street | | | 245,000,000 | | | | 59,171,038 | | | | 60,382,009 | | | | 60,382,009 | | | | 1,210,971 | |
| | Global Markets, | | Malaysian | | | | | | | U.S. Dollar | | | | | | | | | |
| | LLC | | Ringgit | | | | | | | | | | | | | | | | | |
| | | | | | | | | | | | | | | | | | | | | | |
| 10/21/16 | State Street | | | 305,000,000,000 | | | | 276,889,678 | | | | 267,226,599 | | | | 267,226,599 | | | | (9,663,079 | ) |
| | Global Markets, | | South Korean | | | | | | | U.S. Dollar | | | | | | | | | |
| | LLC | | Won | | | | | | | | | | | | | | | | | |
| | | | | | | | | | | | | | | | | | | | | | |
| 10/21/16 | Bank of New | | | 745,000,000 | | | | 86,936,655 | | | | 86,931,155 | | | | 86,931,155 | | | | (5,500 | ) |
| | York Mellon | | Swedish Krona | | | | | | | U.S. Dollar | | | | | | | | | |
| | | | | | | | | | | | | | | | | | | | | | |
| 10/21/16 | Bank of New | | | 345,000,000 | | | | 40,259,256 | | | | 40,496,760 | | | | 40,496,760 | | | | 237,504 | |
| | York Mellon | | Swedish Krona | | | | | | | U.S. Dollar | | | | | | | | | |
| | | | | | | | | | | | | | | | | | | | | | |
| 10/21/16 | Goldman | | | 440,000,000 | | | | 51,345,139 | | | | 51,596,259 | | | | 51,596,259 | | | | 251,120 | |
| | Sachs & Co. | | Swedish Krona | | | | | | | U.S. Dollar | | | | | | | | | |
| | | | | | | | | | | | | | | | | | | | | | |
| 10/21/16 | Goldman | | | 25,000,000 | | | | 25,766,878 | | | | 25,493,295 | | | | 25,493,295 | | | | (273,583 | ) |
| | Sachs & Co. | | Swiss Franc | | | | | | | U.S. Dollar | | | | | | | | | |
| | | | | | | | | | | | | | | | | | | | | | |
| 10/21/16 | State Street Global | | | 280,000,000 | | | | 288,589,038 | | | | 285,579,015 | | | | 285,579,015 | | | | (3,010,023 | ) |
| | Markets, LLC | | Swiss Franc | | | | | | | U.S. Dollar | | | | | | | | | |
| | | | | | | | $ | 2,902,590,283 | | | | | | | $ | 2,876,865,199 | | | $ | (25,725,084 | ) |
| 10/21/16 | State Street Global | | | 65,211,500 | | | | | | | | 50,000,000 | | | | | | | | | |
| | Markets, LLC | | U.S. Dollar | | | | 65,211,500 | | | British Pound | | | | 64,836,730 | | | | (374,770 | ) |
| | | | | | | | $ | 2,967,801,783 | | | | | | | $ | 2,941,701,929 | | | $ | (26,099,854 | ) |
The accompanying notes to financial statements are an integral part of this schedule.
FMI International Fund
INDUSTRY SECTORS
as of September 30, 2016 (Unaudited)
FMI Funds, Inc.
STATEMENTS OF ASSETS AND LIABILITIES
September 30, 2016
| | | FMI | | | FMI | | | FMI | |
| | | Large Cap | | | Common Stock | | | International | |
| | | Fund | | | Fund | | | Fund | |
| ASSETS: | | | | | | | | | |
| Investments in securities, at value (a) | | $ | 6,603,382,241 | | | $ | 940,263,935 | | | $ | 5,035,322,772 | |
| Receivables from shareholders for purchases | | | 5,013,098 | | | | 330,833 | | | | 22,704,242 | |
| Dividends and interest receivable | | | 9,574,814 | | | | 476,895 | | | | 9,465,000 | |
| Receivable for investments sold | | | — | | | | 5,373,710 | | | | 663,733 | |
| Unrealized appreciation on | | | | | | | | | | | | |
| forward currency contracts | | | — | | | | — | | | | 16,354,875 | |
| Prepaid expenses | | | 95,009 | | | | 28,327 | | | | 127,202 | |
| Total assets | | $ | 6,618,065,162 | | | $ | 946,473,700 | | | $ | 5,084,637,824 | |
| LIABILITIES: | | | | | | | | | | | | |
| Payable to brokers for investments purchased | | $ | — | | | $ | 547,064 | | | $ | 7,724,080 | |
| Payable to shareholders for redemptions | | | 37,927,951 | | | | 518,808 | | | | 5,764,147 | |
| Payable to adviser for management fees | | | 2,894,614 | | | | 614,517 | | | | 2,092,053 | |
| Payable for foreign currency transaction | | | — | | | | — | | | | 56,582 | |
| Unrealized depreciation on | | | | | | | | | | | | |
| forward currency contracts | | | — | | | | — | | | | 42,454,729 | |
| Other liabilities | | | 1,133,608 | | | | 139,777 | | | | 804,209 | |
| Total liabilities | | | 41,956,173 | | | | 1,820,166 | | | | 58,895,800 | |
| Net Assets | | $ | 6,576,108,989 | | | $ | 944,653,534 | | | $ | 5,025,742,024 | |
| NET ASSETS: | | | | | | | | | | | | |
| Capital Stock (b) | | $ | 4,551,108,383 | | | $ | 702,705,200 | | | $ | 4,737,437,671 | |
| Net unrealized appreciation (depreciation) | | | | | | | | | | | | |
| on investments: | | | | | | | | | | | | |
| Securities | | | 1,643,030,140 | | | | 199,387,828 | | | | 205,912,117 | |
| Forward currency contracts | | | — | | | | — | | | | (26,099,854 | ) |
| Foreign currency transactions | | | — | | | | — | | | | (107,485 | ) |
| Accumulated net realized gain (loss) | | | 322,899,915 | | | | 42,727,115 | | | | 27,357,303 | |
| Undistributed net investment income (loss) | | | 59,070,551 | | | | (166,609 | ) | | | 81,242,272 | |
| Net assets | | $ | 6,576,108,989 | | | $ | 944,653,534 | | | $ | 5,025,742,024 | |
| CALCULATION OF NET ASSET VALUE PER SHARE: | | | | | | | | | | | | |
| Net asset value, offering and redemption price | | | | | | | | | | | | |
| per share (Net assets ÷ shares outstanding) | | $ | 20.20 | | | $ | 25.42 | | | $ | 30.67 | |
| | | | | | | | | | | | | |
| (a) Identified cost of investments | | $ | 4,960,352,101 | | | $ | 740,876,107 | | | $ | 4,829,410,655 | |
| (b) Par value | | $ | 0.0001 | | | $ | 0.0001 | | | $ | 0.0001 | |
| Shares authorized | | | 500,000,000 | | | | 400,000,000 | | | | 400,000,000 | |
| Shares outstanding | | | 325,607,243 | | | | 37,165,988 | | | | 163,890,249 | |
The accompanying notes to financial statements are an integral part of these statements.
FMI Funds, Inc.
STATEMENTS OF OPERATIONS
For the Year Ended September 30, 2016
| | | FMI | | | FMI | | | FMI | |
| | | Large Cap | | | Common Stock | | | International | |
| | | Fund | | | Fund | | | Fund | |
| INCOME: | | | | | | | | | |
| Dividends* | | $ | 154,332,450 | | | $ | 11,262,077 | | | $ | 66,297,707 | |
| Interest | | | 1,262,593 | | | | 195,372 | | | | 1,149,405 | |
| Total income | | | 155,595,043 | | | | 11,457,449 | | | | 67,447,112 | |
| EXPENSES: | | | | | | | | | | | | |
| Management fees | | | 55,833,473 | | | | 10,222,885 | | | | 25,493,266 | |
| Transfer agent fees | | | 10,129,952 | | | | 1,157,067 | | | | 4,800,226 | |
| Administration and accounting services | | | 2,280,244 | | | | 315,322 | | | | 1,013,380 | |
| Printing and postage expense | | | 1,161,816 | | | | 89,225 | | | | 412,262 | |
| Custodian fees | | | 273,080 | | | | 41,307 | | | | 531,990 | |
| Registration fees | | | 113,866 | | | | 41,112 | | | | 164,995 | |
| Professional fees | | | 78,079 | | | | 59,030 | | | | 58,950 | |
| Board of Directors fees | | | 65,333 | | | | 58,239 | | | | 44,500 | |
| Other expenses | | | 236,766 | | | | 80,641 | | | | 124,568 | |
| Total expenses | | | 70,172,609 | | | | 12,064,828 | | | | 32,644,137 | |
| NET INVESTMENT INCOME (LOSS) | | | 85,422,434 | | | | (607,379 | ) | | | 34,802,975 | |
| NET REALIZED GAIN (LOSS) ON INVESTMENTS: | | | | | | | | | | | | |
| Securities | | | 444,975,000 | | | | 59,697,294 | | | | 43,311,804 | |
| Forward currency contracts | | | — | | | | — | | | | 68,217,335 | |
| Foreign currency transactions | | | — | | | | — | | | | (14,667,137 | ) |
| NET REALIZED GAIN (LOSS) ON INVESTMENTS | | | 444,975,000 | | | | 59,697,294 | | | | 96,862,002 | |
| NET CHANGE IN UNREALIZED | | | | | | | | | | | | |
| APPRECIATION (DEPRECIATION) ON INVESTMENTS: | | | | | | | | | | | | |
| Securities | | | 368,090,908 | | | | 64,237,052 | | | | 346,620,252 | |
| Forward currency contracts | | | — | | | | — | | | | (35,247,869 | ) |
| Foreign currency transactions | | | — | | | | — | | | | (65,698 | ) |
| NET CHANGE IN UNREALIZED | | | | | | | | | | | | |
| APPRECIATION (DEPRECIATION) | | | | | | | | | | | | |
| ON INVESTMENTS | | | 368,090,908 | | | | 64,237,052 | | | | 311,306,685 | |
| NET GAIN ON INVESTMENTS | | | 813,065,908 | | | | 123,934,346 | | | | 408,168,687 | |
| NET INCREASE IN NET ASSETS | | | | | | | | | | | | |
| RESULTING FROM OPERATIONS | | $ | 898,488,342 | | | $ | 123,326,967 | | | $ | 442,971,662 | |
| | | | | | | | | | | | | |
| * Net withholding taxes | | $ | 6,007,258 | | | $ | — | | | $ | 5,998,136 | |
| | | | | | | | | | | | | |
The accompanying notes to financial statements are an integral part of these statements.
FMI Large Cap Fund
STATEMENTS OF CHANGES IN NET ASSETS
For the Years Ended September 30, 2016 and 2015
| | | 2016 | | | 2015 | |
| OPERATIONS: | | | | | | |
| Net investment income | | $ | 85,422,434 | | | $ | 82,523,368 | |
| Net realized gain on investments | | | 444,975,000 | | | | 705,590,727 | |
| Net change in unrealized appreciation (depreciation) | | | | | | | | |
| on investments | | | 368,090,908 | | | | (773,170,284 | ) |
| Net increase in net assets from operations | | | 898,488,342 | | | | 14,943,811 | |
| DISTRIBUTIONS TO SHAREHOLDERS: | | | | | | | | |
| Distributions from net investment income | | | (85,598,665 | ) | | | (76,298,972 | ) |
| Distributions from net realized gains | | | (756,814,477 | ) | | | (860,363,566 | ) |
| Total distributions | | | (842,413,142 | ) | | | (936,662,538 | ) |
| FUND SHARE ACTIVITIES: | | | | | | | | |
| Proceeds from shares issued | | | 952,385,108 | | | | 1,299,362,295 | |
| Net asset value of shares issued | | | | | | | | |
| in distributions reinvested | | | 796,897,874 | | | | 879,225,661 | |
| Cost of shares redeemed | | | (3,728,472,826 | ) | | | (1,975,044,118 | ) |
| Net increase (decrease) in net assets | | | | | | | | |
| derived from Fund share activities | | | (1,979,189,844 | ) | | | 203,543,838 | |
| TOTAL (DECREASE) | | | (1,923,114,644 | ) | | | (718,174,889 | ) |
| NET ASSETS AT THE BEGINNING OF THE YEAR | | | 8,499,223,633 | | | | 9,217,398,522 | |
| NET ASSETS AT THE END OF THE YEAR | | $ | 6,576,108,989 | | | $ | 8,499,223,633 | |
| Undistributed net investment income | | $ | 59,070,551 | | | $ | 59,248,415 | |
| FUND SHARE TRANSACTIONS: | | | | | | | | |
| Shares sold | | | 49,558,557 | | | | 59,994,793 | |
| Shares issued in distributions reinvested | | | 43,713,542 | | | | 41,200,828 | |
| Less shares redeemed | | | (192,584,541 | ) | | | (91,212,279 | ) |
| Net increase (decrease) in shares outstanding | | | (99,312,442 | ) | | | 9,983,342 | |
The accompanying notes to financial statements are an integral part of these statements.
FMI Common Stock Fund
STATEMENTS OF CHANGES IN NET ASSETS
For the Years Ended September 30, 2016 and 2015
| | | 2016 | | | 2015 | |
| OPERATIONS: | | | | | | |
| Net investment income (loss) | | $ | (607,379 | ) | | $ | 571,124 | |
| Net realized gain on investments | | | 59,697,294 | | | | 112,651,791 | |
| Net change in unrealized appreciation (depreciation) | | | | | | | | |
| on investments | | | 64,237,052 | | | | (148,613,179 | ) |
| Net increase (decrease) in net assets from operations | | | 123,326,967 | | | | (35,390,264 | ) |
| DISTRIBUTIONS TO SHAREHOLDERS: | | | | | | | | |
| Distributions from net investment income | | | — | | | | (1,053,123 | ) |
| Distributions from net realized gains | | | (118,034,018 | ) | | | (158,049,506 | ) |
| Total distributions | | | (118,034,018 | ) | | | (159,102,629 | ) |
| FUND SHARE ACTIVITIES: | | | | | | | | |
| Proceeds from shares issued | | | 128,194,956 | | | | 118,704,219 | |
| Net asset value of shares issued | | | | | | | | |
| in distributions reinvested | | | 114,904,447 | | | | 154,854,648 | |
| Cost of shares redeemed | | | (547,516,284 | ) | | | (243,128,775 | ) |
| Net increase (decrease) in net assets | | | | | | | | |
| derived from Fund share activities | | | (304,416,881 | ) | | | 30,430,092 | |
| TOTAL (DECREASE) | | | (299,123,932 | ) | | | (164,062,801 | ) |
| NET ASSETS AT THE BEGINNING OF THE YEAR | | | 1,243,777,466 | | | | 1,407,840,267 | |
| NET ASSETS AT THE END OF THE YEAR | | $ | 944,653,534 | | | $ | 1,243,777,466 | |
| Undistributed net investment (loss) | | $ | (166,609 | ) | | $ | (1,078,793 | ) |
| FUND SHARE TRANSACTIONS: | | | | | | | | |
| Shares sold | | | 5,314,334 | | | | 4,371,787 | |
| Shares issued in distributions reinvested | | | 5,129,663 | | | | 5,707,875 | |
| Less shares redeemed | | | (22,924,327 | ) | | | (8,787,322 | ) |
| Net increase (decrease) in shares outstanding | | | (12,480,330 | ) | | | 1,292,340 | |
The accompanying notes to financial statements are an integral part of these statements.
FMI International Fund
STATEMENTS OF CHANGES IN NET ASSETS
For the Years Ended September 30, 2016 and 2015
| | | 2016 | | | 2015 | |
| OPERATIONS: | | | | | | |
| Net investment income | | $ | 34,802,975 | | | $ | 13,075,949 | |
| Net realized gain on investments | | | 96,862,002 | | | | 32,143,596 | |
| Net change in unrealized appreciation (depreciation) | | | | | | | | |
| on investments | | | 311,306,685 | | | | (158,722,174 | ) |
| Net increase (decrease) in net assets from operations | | | 442,971,662 | | | | (113,502,629 | ) |
| DISTRIBUTIONS TO SHAREHOLDERS: | | | | | | | | |
| Distributions from net investment income | | | (48,049,577 | ) | | | (14,639,678 | ) |
| Distributions from net realized gains | | | (536,796 | ) | | | (9,537,976 | ) |
| Total distributions | | | (48,586,373 | ) | | | (24,177,654 | ) |
| FUND SHARE ACTIVITIES: | | | | | | | | |
| Proceeds from shares issued | | | 2,874,668,799 | | | | 2,210,324,773 | |
| Net asset value of shares issued | | | | | | | | |
| in distributions reinvested | | | 47,743,869 | | | | 23,919,735 | |
| Cost of shares redeemed | | | (597,023,706 | ) | | | (264,954,352 | ) |
| Net increase in net assets | | | | | | | | |
| derived from Fund share activities | | | 2,325,388,962 | | | | 1,969,290,156 | |
| TOTAL INCREASE | | | 2,719,774,251 | | | | 1,831,609,873 | |
| NET ASSETS AT THE BEGINNING OF THE YEAR | | | 2,305,967,773 | | | | 474,357,900 | |
| NET ASSETS AT THE END OF THE YEAR | | $ | 5,025,742,024 | | | $ | 2,305,967,773 | |
| Undistributed net investment income | | $ | 81,242,272 | | | $ | 40,938,676 | |
| FUND SHARE TRANSACTIONS: | | | | | | | | |
| Shares sold | | | 99,474,241 | | | | 75,248,377 | |
| Shares issued in distributions reinvested | | | 1,718,023 | | | | 857,338 | |
| Less shares redeemed | | | (20,775,901 | ) | | | (9,192,631 | ) |
| Net increase in shares outstanding | | | 80,416,363 | | | | 66,913,084 | |
The accompanying notes to financial statements are an integral part of these statements.
FMI Large Cap Fund
FINANCIAL HIGHLIGHTS
(Selected data for each share of the Fund outstanding throughout each year)
| | | Years Ended September 30, | |
| | | 2016 | | | 2015 | | | 2014 | | | 2013 | | | 2012 | |
| PER SHARE OPERATING PERFORMANCE: | | | | | | | | | | | | | | | |
| Net asset value, beginning of year | | $ | 20.00 | | | $ | 22.21 | | | $ | 20.52 | | | $ | 17.38 | | | $ | 14.31 | |
| Income from investment operations: | | | | | | | | | | | | | | | | | | | | |
Net investment income(1) | | | 0.21 | | | | 0.19 | | | | 0.19 | | | | 0.18 | | | | 0.20 | |
| Net realized and unrealized | | | | | | | | | | | | | | | | | | | | |
| gains (loss) on investments | | | 2.04 | | | | (0.17 | ) | | | 2.92 | | | | 3.37 | | | | 3.46 | |
| Total from investment operations | | | 2.25 | | | | 0.02 | | | | 3.11 | | | | 3.55 | | | | 3.66 | |
| Less distributions: | | | | | | | | | | | | | | | | | | | | |
| Distributions from net investment income | | | (0.21 | ) | | | (0.18 | ) | | | (0.18 | ) | | | (0.20 | ) | | | (0.17 | ) |
| Distributions from net realized gains | | | (1.84 | ) | | | (2.05 | ) | | | (1.24 | ) | | | (0.21 | ) | | | (0.42 | ) |
| Total from distributions | | | (2.05 | ) | | | (2.23 | ) | | | (1.42 | ) | | | (0.41 | ) | | | (0.59 | ) |
| Net asset value, end of year | | $ | 20.20 | | | $ | 20.00 | | | $ | 22.21 | | | $ | 20.52 | | | $ | 17.38 | |
| TOTAL RETURN | | | 12.36 | % | | | (0.54 | %) | | | 15.77 | % | | | 20.94 | % | | | 26.17 | % |
| RATIOS/SUPPLEMENTAL DATA: | | | | | | | | | | | | | | | | | | | | |
| Net assets, end of year (in 000’s $) | | | 6,576,109 | | | | 8,499,224 | | | | 9,217,399 | | | | 8,122,016 | | | | 6,167,813 | |
| Ratio of expenses to average net assets | | | 0.90 | % | | | 0.93 | % | | | 0.94 | % | | | 0.96 | % | | | 0.96 | % |
| Ratio of net investment income | | | | | | | | | | | | | | | | | | | | |
| to average net assets | | | 1.09 | % | | | 0.87 | % | | | 0.87 | % | | | 0.95 | % | | | 1.25 | % |
| Portfolio turnover rate | | | 17 | % | | | 18 | % | | | 31 | % | | | 30 | % | | | 21 | % |
| (1) | Net investment income per share was calculated using average shares outstanding. |
The accompanying notes to financial statements are an integral part of this statement.
FMI Common Stock Fund
FINANCIAL HIGHLIGHTS
(Selected data for each share of the Fund outstanding throughout each year)
| | | Years Ended September 30, | |
| | | 2016 | | | 2015 | | | 2014 | | | 2013 | | | 2012 | |
| PER SHARE OPERATING PERFORMANCE: | | | | | | | | | | | | | | | |
| Net asset value, beginning of year | | $ | 25.05 | | | $ | 29.12 | | | $ | 29.05 | | | $ | 25.43 | | | $ | 22.63 | |
| Income from investment operations: | | | | | | | | | | | | | | | | | | | | |
Net investment income (loss)(1) | | | (0.01 | ) | | | 0.01 | | | | 0.04 | | | | 0.07 | | | | 0.09 | |
| Net realized and unrealized | | | | | | | | | | | | | | | | | | | | |
| gains (loss) on investments | | | 2.84 | | | | (0.74 | ) | | | 2.91 | | | | 6.05 | | | | 4.79 | |
| Total from investment operations | | | 2.83 | | | | (0.73 | ) | | | 2.95 | | | | 6.12 | | | | 4.88 | |
| Less distributions: | | | | | | | | | | | | | | | | | | | | |
| Distributions from net investment income | | | — | | | | (0.02 | ) | | | (0.13 | ) | | | (0.09 | ) | | | (0.04 | ) |
| Distributions from net realized gains | | | (2.46 | ) | | | (3.32 | ) | | | (2.75 | ) | | | (2.41 | ) | | | (2.04 | ) |
| Total from distributions | | | (2.46 | ) | | | (3.34 | ) | | | (2.88 | ) | | | (2.50 | ) | | | (2.08 | ) |
| Net asset value, end of year | | $ | 25.42 | | | $ | 25.05 | | | $ | 29.12 | | | $ | 29.05 | | | $ | 25.43 | |
| TOTAL RETURN | | | 12.61 | % | | | (3.38 | %) | | | 10.44 | % | | | 26.63 | % | | | 22.38 | % |
| RATIOS/SUPPLEMENTAL DATA: | | | | | | | | | | | | | | | | | | | | |
| Net assets, end of year (in 000’s $) | | | 944,654 | | | | 1,243,777 | | | | 1,407,840 | | | | 1,259,158 | | | | 1,118,501 | |
| Ratio of expenses to average net assets | | | 1.12 | % | | | 1.17 | % | | | 1.18 | % | | | 1.19 | % | | | 1.20 | % |
| Ratio of net investment income (loss) | | | | | | | | | | | | | | | | | | | | |
| to average net assets | | | (0.06 | %) | | | 0.04 | % | | | 0.14 | % | | | 0.26 | % | | | 0.38 | % |
| Portfolio turnover rate | | | 17 | % | | | 29 | % | | | 33 | % | | | 24 | % | | | 43 | % |
| (1) | Net investment income (loss) per share was calculated using average shares outstanding. |
The accompanying notes to financial statements are an integral part of this statement.
FMI International Fund
FINANCIAL HIGHLIGHTS
(Selected data for each share of the Fund outstanding throughout each year)
| | | Years Ended September 30, | |
| | | 2016 | | | 2015 | | | 2014 | | | 2013 | | | 2012 | |
| PER SHARE OPERATING PERFORMANCE: | | | | | | | | | | | | | | | |
| Net asset value, beginning of year | | $ | 27.63 | | | $ | 28.64 | | | $ | 26.34 | | | $ | 22.12 | | | $ | 18.06 | |
| Income from investment operations: | | | | | | | | | | | | | | | | | | | | |
Net investment income(1) | | | 0.29 | | | | 0.25 | | | | 0.30 | | | | 0.25 | | | | 0.22 | |
| Net realized and unrealized | | | | | | | | | | | | | | | | | | | | |
| gains (losses) on investments | | | 3.27 | | | | (0.30 | ) | | | 2.74 | | | | 4.29 | | | | 4.00 | |
| Total from investment operations | | | 3.56 | | | | (0.05 | ) | | | 3.04 | | | | 4.54 | | | | 4.22 | |
| Less distributions: | | | | | | | | | | | | | | | | | | | | |
| Distributions from net investment income | | | (0.51 | ) | | | (0.58 | ) | | | (0.19 | ) | | | (0.08 | ) | | | (0.16 | ) |
| Distributions from net realized gains | | | (0.01 | ) | | | (0.38 | ) | | | (0.55 | ) | | | (0.24 | ) | | | — | |
| Total from distributions | | | (0.52 | ) | | | (0.96 | ) | | | (0.74 | ) | | | (0.32 | ) | | | (0.16 | ) |
| Net asset value, end of year | | $ | 30.67 | | | $ | 27.63 | | | $ | 28.64 | | | $ | 26.34 | | | $ | 22.12 | |
| TOTAL RETURN | | | 13.07 | % | | | (0.19 | %) | | | 11.74 | % | | | 20.87 | % | | | 23.52 | % |
| RATIOS/SUPPLEMENTAL DATA: | | | | | | | | | | | | | | | | | | | | |
| Net assets, end of year (in 000’s $) | | | 5,025,742 | | | | 2,305,968 | | | | 474,358 | | | | 137,906 | | | | 67,316 | |
| Ratio of expenses to average net assets: | | | | | | | | | | | | | | | | | | | | |
| Before expense reimbursement | | | 0.94 | % | | | 0.98 | % | | | 1.03 | % | | | 1.15 | % | | | 1.45 | % |
| After expense reimbursement | | | 0.94 | % | | | 0.98 | % | | | 1.00 | % | | | 1.00 | % | | | 1.00 | % |
| Ratio of net investment income | | | | | | | | | | | | | | | | | | | | |
| to average net assets: | | | | | | | | | | | | | | | | | | | | |
| Before expense reimbursement | | | 1.01 | % | | | 0.87 | % | | | 1.05 | % | | | 0.89 | % | | | 0.62 | % |
| After expense reimbursement | | | 1.01 | % | | | 0.87 | % | | | 1.08 | % | | | 1.04 | % | | | 1.07 | % |
| Portfolio turnover rate | | | 16 | % | | | 9 | % | | | 22 | % | | | 21 | % | | | 20 | % |
| (1) | Net investment income per share was calculated using average shares outstanding. |
The accompanying notes to financial statements are an integral part of this statement.
FMI Funds, Inc.
NOTES TO FINANCIAL STATEMENTS
September 30, 2016
| (1) | Summary of Significant Accounting Policies — |
The following is a summary of significant accounting policies of the FMI Large Cap Fund, the FMI Common Stock Fund, and the FMI International Fund (collectively, the “Funds” or, individually, a “Fund”). The FMI Large Cap Fund (the “Large Cap Fund”), the FMI Common Stock Fund (the “Common Stock Fund”), and the FMI International Fund (the “International Fund”) are each a series of FMI Funds, Inc. (the “Company”). The Company was incorporated under the laws of Maryland on September 5, 1996. The Large Cap Fund commenced operations on December 31, 2001 and the International Fund commenced operations on December 31, 2010. The Common Stock Fund is the successor to the FMI Common Stock Fund, the sole series of FMI Common Stock Fund, Inc. (the “Predecessor Common Stock Fund”). The Predecessor Common Stock Fund commenced operations on December 18, 1981. The reorganization was effective as of January 31, 2014, and the Common Stock Fund is the accounting survivor of the reorganization. The Predecessor Common Stock Fund was incorporated under the laws of Wisconsin on July 29, 1981. Both the Large Cap Fund and the International Fund are registered as non-diversified, open-end management investment companies under the Investment Company Act of 1940 (the “Act”), as amended. The Common Stock Fund is registered as a diversified open-end management investment company under the Act. The assets and liabilities of each Fund in the Company are segregated and a shareholder’s interest is limited to the Fund in which the shareholder owns shares. The investment objective of the Large Cap Fund is to seek long-term capital appreciation by investing mainly in a limited number of large capitalization value stocks. The investment objective of the Common Stock Fund is to seek long-term capital appreciation by investing mainly in small to medium capitalization value stocks. The investment objective of the International Fund is to seek capital appreciation by investing mainly in a limited number of large capitalization value stocks of non-U.S. companies.
| | (a) | Each security is valued at the current day last sale price reported by the principal security exchange on which the issue is traded. Securities that are traded on the Nasdaq Markets are valued at the Nasdaq Official Closing Price, or if no sale is reported, the latest bid price. Securities that are traded over-the-counter, including short-term securities are valued at the close price, if not close, then at the latest bid price. Unlisted equity securities for which market quotations are readily available are valued at the close price, if not close, then at the most recent bid price. Foreign securities are valued on a basis of quotations from the primary market in which they are traded, and are converted from the local currency into U.S. dollars using exchange rates as of the close of the New York Stock Exchange. For the International Fund only, options purchased or written by the Fund are valued at the average of the most recent bid and ask prices. Securities for which quotations are not readily available are valued at fair value as determined by the investment adviser in accordance with procedures approved by the Board of Directors (the “Board”). The fair value of a security is the amount which a Fund might reasonably expect to receive upon a current sale. The fair value of a security may differ from the last quoted price and a Fund may not be able to sell a security at the fair value. Market quotations may not be available, for example, if trading in particular securities was halted during the day and not resumed prior to the close of trading on the New York Stock Exchange. For the International Fund only, for securities that do not trade during New York Stock Exchange hours, fair value determinations are based on analyses of market movements after the close of those securities’ primary markets, and may include reviews of developments in foreign markets, the performance of U.S. securities markets, and the performance of |
FMI Funds, Inc.
NOTES TO FINANCIAL STATEMENTS (Continued)
September 30, 2016
| (1) | Summary of Significant Accounting Policies — (Continued) |
| | | |
| | | instruments trading in U.S. markets that represent foreign securities and baskets of foreign securities. The Board utilizes a service provided by an independent third party to assist in fair valuation of certain securities for the International Fund. As of September 30, 2016, there were no securities that were internally fair valued. For financial reporting purposes, investment transactions are recorded on the trade date. |
| | | |
| | | The Funds apply the provisions of the Financial Accounting Standards Board (“FASB”) Accounting Standards Codification “Fair Value Measurements and Disclosures” Topic 820 (“ASC 820”), which defines fair value as the price that would be received to sell an asset or paid to transfer a liability (i.e., the “exit price”) in an orderly transaction between market participants at the measurement date. |
| | | |
| | | In determining fair value, the Funds use various valuation approaches. ASC 820 establishes a fair value hierarchy for inputs used in measuring fair value that maximizes the use of observable inputs and minimizes the use of unobservable inputs by generally requiring that the most observable inputs be used when available. Observable inputs are those that market participants would use in pricing the asset or liability based on market data obtained from sources independent of the Funds. Unobservable inputs reflect the Funds’ assumptions about the inputs market participants would use in pricing the asset or liability developed based on the best information available in the circumstances. The inputs or methodologies used for valuing securities are not necessarily an indication of the risks associated with investing in those securities. For the International Fund only, over the counter derivatives such as forward currency contracts may be valued using quantitative models. These models may use pricing curves based on market inputs including current exchange rates or indices. These curves are combined with volatility factors to value the overall positions. The market inputs are generally significant and can be corroborated with observable market data and therefore are classified in level 2. |
| | | |
| | | The fair value hierarchy is categorized into three levels based on the inputs as follows: |
| | | Level 1 — | Valuations based on unadjusted quoted prices in active markets for identical assets. |
| | | | |
| | | Level 2 — | Valuations based on quoted prices for similar securities or in markets that are not active or for which all significant inputs are observable, either directly or indirectly. |
| | | | |
| | | Level 3 — | Valuations based on inputs that are unobservable and significant to the overall fair value measurement. |
FMI Funds, Inc.
NOTES TO FINANCIAL STATEMENTS (Continued)
September 30, 2016
| (1) | Summary of Significant Accounting Policies — (Continued) |
| | | The following table summarizes the Fund’s investments as of September 30, 2016, based on the inputs used to value them: |
| | | | | | | | | | | | | | | | |
| | | | | | Large Cap | | | Common Stock | | | International | | | International | |
| | | | | | Fund | | | Fund | | | Fund | | | Fund | |
| | | | | | Investments | | | Investments | | | Investments | | | Other Financial | |
| | | Valuations | | | in Securities | | | in Securities | | | in Securities | | | Instruments* | |
| | | Assets: | | | | | | | | | | | | | |
| | | Level 1 — | Common Stocks | | $ | 5,958,723,080 | | | $ | 835,317,979 | | | $ | 949,550,608 | | | $ | — | |
| | | Level 2 — | Common Stocks | | | — | | | | — | | | | 3,033,961,939 | | | | — | |
| | | | Preferred Stocks | | | — | | | | — | | | | 285,052,056 | | | | — | |
| | | | Short-Term | | | | | | | | | | | | | | | | |
| | | | Money Market | | | | | | | | | | | | | | | | |
| | | | Deposit Account | | | 494,668,761 | | | | 79,947,556 | | | | 391,782,169 | | | | — | |
| | | | Short-Term U.S. | | | | | | | | | | | | | | | | |
| | | | Treasury Securities | | | 149,990,400 | | | | 24,998,400 | | | | 374,976,000 | | | | — | |
| | | | Forward Currency | | | | | | | | | | | | | | | | |
| | | | Contracts | | | — | | | | — | | | | — | | | | 16,354,875 | |
| | | | Total Level 2 | | | 644,659,161 | | | | 104,945,956 | | | | 4,085,772,164 | | | | 16,354,875 | |
| | | Level 3 — | | | | — | | | | — | | | | — | | | | — | |
| | | Total Assets | | | | 6,603,382,241 | | | | 940,263,935 | | | | 5,035,322,772 | | | | 16,354,875 | |
| | | Liabilities: | | | | | | | | | | | | | | | | | |
| | | Level 2 — | Forward Currency | | | | | | | | | | | | | | | | |
| | | | Contracts | | | — | | | | — | | | | — | | | | (42,454,729 | ) |
| | | Total | | | $ | 6,603,382,241 | | | $ | 940,263,935 | | | $ | 5,035,322,772 | | | $ | (26,099,854 | ) |
| | | * | Other financial instruments are derivative instruments, specifically forward currency contracts, which are valued at the unrealized appreciation/(depreciation) on the instrument. |
| | | It is the Funds’ policy to recognize transfers between levels at the end of the reporting period. There were no transfers between levels during the fiscal year ended September 30, 2016. |
| | | |
| | | See the Schedules of Investments for investments detailed by industry classifications. |
| | | |
| | (b) | Net realized gains and losses on sales of securities are computed on the identified cost basis. |
| | | |
| | (c) | Dividend income is recorded on the ex-dividend date. Interest income is recorded on an accrual basis. The Fund records the amortization and accretion of discounts and premiums on securities purchased using the effective interest method in accordance with generally accepted accounting principals in the United States of America (“GAAP”). |
| | | |
| | (d) | The International Fund may enter into forward currency contracts in order to hedge its exposure to changes in foreign currency rates on its foreign portfolio holdings or to hedge certain purchase and sale commitments denominated in foreign currencies. A forward currency contract is a commitment to purchase or sell a foreign currency at a future date at a negotiated rate. These contracts are valued daily and the asset or liability therein represents unrealized gain or loss on the contracts as measured by the difference between the forward foreign exchange rates at the dates of entry into the contracts and the forward rates at the reporting date. On a quarterly average there were fourteen forward currency contracts outstanding during the year ended September 30, 2016. These contracts are not subject to master netting agreements. |
FMI Funds, Inc.
NOTES TO FINANCIAL STATEMENTS (Continued)
September 30, 2016
| (1) | Summary of Significant Accounting Policies — (Continued) |
| | | The fair value of the forward currency contracts as of September 30, 2016, is included in the following location on the Statements of Assets and Liabilities for the International Fund: |
| | | | | Fair Value of | | Fair Value of |
| | | | | Asset Forward | | (Liability) Forward |
| | | | Location | Currency Contracts | Location | Currency Contracts |
| | | Forward currency | Unrealized | $16,354,875 | Unrealized | $(42,454,729) |
| | | contracts | appreciation on | | depreciation on | |
| | | | forward currency | | forward currency | |
| | | | contracts | | contracts | |
| | | Realized and unrealized gains and losses on forward currency contracts entered into during the year ended September 30, 2016, are recorded in the following location on the Statements of Operations for the International Fund: |
| | | | | Realized | | Unrealized |
| | | | Location | Gain | Location | (Loss) |
| | | Forward currency | Net realized | $68,217,335 | Net change in | $(35,247,869) |
| | | contracts | gain on forward | | unrealized depreciation | |
| | | | currency contracts | | on forward | |
| | | | | | currency contracts | |
| | | These instruments involve market risk, credit risk, or both kinds of risks, in excess of the amount recognized on the Statements of Assets and Liabilities for the International Fund. Risks arise from the possible inability of counterparties to meet the terms of their contracts and from movement in currency and securities values and interest rates. |
| | | |
| | (e) | The preparation of financial statements in conformity with GAAP requires management to make estimates and assumptions that affect the reported amounts of assets and liabilities and disclosure of contingent assets and liabilities at the date of the financial statements and the reported amounts of revenues and expenses during the reporting period. Actual results could differ from these estimates. |
| | | |
| | (f) | The Funds may own certain securities that are restricted. Restricted securities include Section 4(2) commercial paper, securities issued in a private placement, or securities eligible for resale pursuant to Rule 144A under the Securities Act of 1933 (the “1933 Act”). A restricted security cannot be resold to the general public without prior registration under the 1933 Act or pursuant to the resale limitations provided by Rule 144A under the 1933 Act, or an exemption from the registration requirements of the 1933 Act. The Funds did not hold any restricted securities as of September 30, 2016. |
| | | |
| | (g) | No provision has been made for Federal income taxes since the Funds have elected to be taxed as “regulated investment companies.” The Funds intend to distribute substantially all net investment company taxable income and net capital gains to their respective shareholders and otherwise comply with the provisions of the Internal Revenue Code applicable to regulated investment companies. |
| | | |
| | (h) | The Funds have reviewed all open tax years and major jurisdictions, which include Federal and the state of Maryland for the Large Cap Fund, Common Stock Fund and International |
FMI Funds, Inc.
NOTES TO FINANCIAL STATEMENTS (Continued)
September 30, 2016
| (1) | Summary of Significant Accounting Policies — (Continued) |
| | | Fund and Federal and the state of Wisconsin for the Predecessor Common Stock Fund, and concluded that there are no significant uncertain tax positions that would require recognition in the financial statements. Open tax years are those that are open for exam by taxing authorities and, as of September 30, 2016, open Federal tax years include the four fiscal tax years ended September 30, 2016. The Funds have no examinations in progress and are also not aware of any tax positions for which it is reasonably possible that the total amounts of unrecognized tax benefits will significantly change in the next twelve months. |
| | | |
| | (i) | GAAP requires that permanent differences between income for financial reporting and tax purposes be reclassified in the capital accounts. These differences are caused primarily by differences in the timing of the recognition of certain components of income or realized capital gain for federal income tax purposes. The Fund may utilize earnings and profits distributed to shareholders on redemption of shares as part of the dividends paid deduction. These reclassifications have no effect on net assets, results of operations or net asset value per share. For the International Fund these differences are also due to the tax treatment of forward currency contracts and foreign currency transactions. These reclassifications have no impact on the net asset value of the International Fund and are designed to present the undistributed income and realized gains on a tax basis which is considered to be more informative to shareholders. During the fiscal year ended September 30, 2016, the reclassifications were as follows: |
| | | | | Undistributed Net | | | Accumulated Net | | | | |
| | | | | Investment Income/(Loss) | | | Realized Gain/(Loss) | | | Paid In Capital | |
| | | Large Cap Fund | | $ | (1,633 | ) | | $ | (65,547,102 | ) | | $ | 65,548,735 | |
| | | Common Stock Fund | | $ | 1,519,563 | | | $ | (9,652,469 | ) | | $ | 8,132,906 | |
| | | International Fund | | $ | 53,550,198 | | | $ | (58,245,726 | ) | | $ | 4,695,528 | |
| (2) | Investment Adviser and Management Agreement and Transactions With Related Parties — |
The Funds each have a management agreement with Fiduciary Management, Inc. (“FMI” or the “Adviser”), with whom certain officers and directors of the Funds are affiliated, to serve as investment adviser and manager.
Pursuant to current Investment Advisory agreements, effective as of January 1, 2016, the Adviser is entitled to receive a fee. The fee is computed and payable at the end of each month. The following annual percentages of each Fund’s average daily net assets are used:
| | | • | FMI Large Cap Fund: 0.75% of the assets from $0 - $2.5 billion; 0.70% of the assets from $2.5 - $5.0 billion; 0.65% of the assets from $5.0 - $10.0 billion; and 0.60% of the assets over $10.0 billion. |
| | | | |
| | | • | FMI Common Stock Fund: 0.95% of the assets from $0 - $500 million; 0.90% of the assets from $500 million - $1.0 billion; 0.85% of the assets from $1.0 - $1.5 billion; and 0.80% of the assets over $1.5 billion. |
| | | | |
| | | • | FMI International Fund: 0.75% of the assets from $0 - $2.5 billion; 0.70% of the assets from $2.5 - $5.0 billion; 0.65% of the assets from $5.0 - $10.0 billion; and 0.60% of the assets over $10.0 billion. |
Prior to January 1, 2016, the Adviser was entitled to receive a fee at an annual rate of 0.75% of the average daily net assets of the FMI Large Cap Fund and FMI International Fund, and a fee at an annual rate of 1.00% of the average daily net assets of the FMI Common Stock Fund.
FMI Funds, Inc.
NOTES TO FINANCIAL STATEMENTS (Continued)
September 30, 2016
| (2) | Investment Adviser and Management Agreement and Transactions With Related Parties — (Continued) |
The Funds are responsible for paying their proportionate share of the compensation, benefits and expenses of the Funds’ Chief Compliance Officer. For administrative convenience, FMI initially makes these payments and is later reimbursed by the Funds.
Under the respective management agreements, FMI will reimburse the Large Cap Fund for expenses over 1.20% of the daily net assets of such Fund, 1.30% for the Common Stock Fund and 1.75% for the International Fund. In addition to the reimbursement required under each management agreement, FMI will voluntarily reimburse the Large Cap Fund and the International Fund for expenses over 1.00% of such Fund’s daily net assets. For the year ended September 30, 2016 there were no contractual or voluntary reimbursements required for the Funds.
The Large Cap Fund and the International Fund have each entered into a Distribution Plan (the “Plan”), pursuant to Rule 12b-1 under the Act. Each Plan, if implemented, provides that the applicable Fund may incur certain costs which may not exceed the lesser of a monthly amount equal to 0.25% of such Fund’s daily net assets or the actual distribution costs incurred during the year. Amounts payable under each Plan would be paid monthly for any activities or expenses primarily intended to result in the sale of shares of such Fund. For the year ended September 30, 2016, no such expenses were charged to the shareholders of either Fund as the Funds had not implemented the Plan.
Under the Funds’ organizational documents, each director, officer, employee or other agent of any Fund (including the Funds’ investment manager) is indemnified, to the extent permitted by the Act, against certain liabilities that may arise out of performance of their duties to the Funds. Additionally, in the normal course of business, the Funds enter into contracts that contain a variety of indemnification clauses. The Funds’ maximum exposure under these arrangements is unknown as this would involve future claims that may be made against such Fund that have not yet occurred. However, the Funds have not had prior claims or losses pursuant to these contracts and believe the risk of loss to be remote.
At September 30, 2016, two financial intermediaries are the record owners of approximately 6.7% and 5.9% of the Large Cap Fund’s shares.
U.S. Bank, N.A. (the “Bank”) has made available to the Company a $675,000,000 umbrella credit facility, pursuant to the loan agreement (the “Agreement”) effective June 3, 2016 for the FMI Funds, Inc. for the purposes of having cash available to satisfy redemption requests. Principal is due not more than 45 days after the date of the loan. Amounts under the credit facility bear interest at a rate per annum equal to the Bank’s current prime rate minus one percent on the amount borrowed. Advances will be collateralized by securities owned by the borrowing Fund. During the year ended September 30, 2016, none of the Funds borrowed against the Agreement. The new Agreement is subject to renewal on June 2, 2017.
| (4) | Distribution to Shareholders — |
Net investment income and net realized gains, if any, are distributed to shareholders at least annually.
| (5) | Investment Transactions — |
For the year ended September 30, 2016, purchases and sales of investment securities (excluding short-term investments) were as follows:
FMI Funds, Inc.
NOTES TO FINANCIAL STATEMENTS (Continued)
September 30, 2016
| (5) | Investment Transactions — (Continued) |
| | | | Large Cap Fund | | | Common Stock Fund | | | International Fund | |
| | Purchases | | $ | 1,187,878,482 | | | $ | 168,545,709 | | | $ | 2,461,326,438 | |
| | Sales | | | 4,015,581,736 | | | | 563,607,926 | | | | 477,231,633 | |
| (6) | Income Tax Information — |
The following information for the Funds is presented on an income tax basis as of September 30, 2016:
| | | | | | | | | | | | Net | | | | | | | | | | |
| | | | | | | | | | | | Unrealized | | | | | | Distribu- | | | | |
| | | | | | | | | | | | Appreciation | | | Distribu- | | | table | | | Other | |
| | | | | | Gross | | | Gross | | | (Depreciation) | | | table | | | Long-Term | | | Accum- | |
| | | Cost of | | | Unrealized | | | Unrealized | | | on | | | Ordinary | | | Capital | | | ulated | |
| | | Investments | | | Appreciation | | | Depreciation | | | Investments | | | Income | | | Gains | | | Losses | |
| Large Cap | | | | | | | | | | | | | | | | | | | | | |
| Fund | | $ | 5,004,516,670 | | | $ | 1,766,480,366 | | | $ | (167,614,795 | ) | | $ | 1,598,865,571 | | | $ | 59,070,551 | | | $ | 367,064,484 | | | $ | — | |
| Common | | | | | | | | | | | | | | | | | | | | | | | | | | | | |
| Stock | | | | | | | | | | | | | | | | | | | | | | | | | | | | |
| Fund | | | 744,119,016 | | | | 218,867,589 | | | | (22,722,670 | ) | | | 196,144,919 | | | | — | | | | 45,970,024 | | | | (166,609 | ) |
| International | | | | | | | | | | | | | | | | | | | | | | | | | | | | |
| Fund | | | 4,830,230,412 | | | | 465,144,798 | | | | (260,052,438 | ) | | | 205,092,360 | | | | 65,713,768 | | | | 16,466,037 | | | | 1,032,188 | |
The difference between the cost amounts for financial statement and federal income tax purposes is due primarily to timing differences in recognizing certain gains and losses on security transactions.
The tax components of dividends paid during the years ended September 30, 2016 and 2015, and tax basis late year losses as of September 30, 2016, which are not recognized for tax purposes until the first day of the following fiscal year are:
| | | September 30, 2016 | | | September 30, 2015 | |
| | | Ordinary | | | Long-Term | | | Late | | | Ordinary | | | Long-Term | | | | | | Late | |
| | | Income | | | Capital Gains | | | Year | | | Income | | | Capital Gains | | | Post-October | | | Year | |
| | | Distributions | | | Distributions | | | Losses | | | Distributions | | | Distributions | | | Losses | | | Losses | |
| Large Cap | | | | | | | | | | | | | | | | | | | | | |
| Fund | | $ | 153,479,727 | | | $ | 688,933,415 | | | $ | — | | | $ | 119,478,849 | | | $ | 817,183,689 | | | $ | — | | | $ | — | |
| Common | | | | | | | | | | | | | | | | | | | | | | | | | | | | |
| Stock Fund | | | — | | | | 118,034,018 | | | | (166,609 | ) | | | 17,981,931 | | | | 141,120,698 | | | | — | | | | (1,078,793 | ) |
| International | | | | | | | | | | | | | | | | | | | | | | | | | | | | |
| Fund | | | 48,049,577 | | | | 536,796 | | | | — | | | | 19,187,706 | | | | 4,989,948 | | | | (10,688,240 | ) | | | — | |
On September 16, 2016, the Board approved the year-end distributions for the Funds. Cash dividends in the aggregate amounts equal to each of the Fund’s net investment income and short-term capital gains, if any, which will be treated as ordinary income, and long-term capital gains, to be payable on December 16, 2016 to outstanding shares of record at the close of business on December 15, 2016.
Effective October 31, 2016, existing shareholders of the FMI Funds may exchange their investor class shares for institutional class shares. The institutional class shares will also be open to new investors. Share class requirements apply to existing and new investors.
FMI Funds, Inc.
REPORT OF INDEPENDENT REGISTERED PUBLIC ACCOUNTING FIRM
To the Board of Directors and Shareholders of FMI Funds, Inc.:
In our opinion, the accompanying statements of assets and liabilities, including the schedules of investments, and the related statements of operations and of changes in net assets and the financial highlights present fairly, in all material respects, the financial position of the FMI Funds, Inc. (comprised of FMI Large Cap Fund, FMI Common Stock Fund, and FMI International Fund, hereinafter collectively referred to as the “Funds”) at September 30, 2016, the results of each of their operations for the year then ended, the changes in their net assets for each of the two years in the period then ended and the financial highlights for each of the five years in the period then ended, in conformity with accounting principles generally accepted in the United States of America. These financial statements and financial highlights (hereafter referred to as “financial statements”) are the responsibility of the Funds’ management. Our responsibility is to express an opinion on these financial statements based on our audits. We conducted our audits of these financial statements in accordance with the standards of the Public Company Accounting Oversight Board (United States). Those standards require that we plan and perform the audit to obtain reasonable assurance about whether the financial statements are free of material misstatement. An audit includes examining, on a test basis, evidence supporting the amounts and disclosures in the financial statements, assessing the accounting principles used and significant estimates made by management, and evaluating the overall financial statement presentation. We believe that our audits, which included confirmation of securities at September 30, 2016 by correspondence with the custodian and brokers, provide a reasonable basis for our opinion.
Milwaukee, Wisconsin
October 25, 2016
FMI Funds, Inc.
EXPENSE EXAMPLE (Unaudited)
As a shareholder of the FMI Funds you incur ongoing costs, including management fees and other Fund expenses. You do not incur transaction costs such as sales charges (loads) on purchase payments, reinvested dividends, or other distributions; redemption fees; and exchange fees because the Funds do not charge these fees. This example is intended to help you understand your ongoing costs (in dollars) of investing in each Fund and to compare these costs with the ongoing costs of investing in other mutual funds. The example is based on an investment of $1,000 invested at the beginning of the period and held for the entire period from April 1, 2016 through September 30, 2016.
Actual Expenses
The table below provides information about actual account values and actual expenses. You may use the information in these lines, together with the amount you invested, to estimate the expenses that you paid over the period. Simply divide your account value by $1,000 (for example, an $8,600 account value divided by $1,000 = 8.6), then multiply the result by the number in the line under the heading entitled “Actual Expenses Paid During Period” to estimate the expenses you paid on your account during this period.
In addition to the costs highlighted and described below, the only Fund transaction costs you might currently incur would be wire fees ($15 per wire), if you choose to have proceeds from a redemption wired to your bank account instead of receiving a check. Additionally, U.S. Bank charges an annual processing fee ($15) if you maintain an IRA account with the Fund. To determine your total costs of investing in a Fund, you would need to add any applicable wire or IRA processing fees you’ve incurred during the period to the costs provided in the example at the end of this article.
Hypothetical Example for Comparison Purposes
The table below provides information about hypothetical account values and hypothetical expenses based on each Fund’s actual expense ratio and an assumed rate of return of 5% per year before expenses, which is not the Fund’s actual return. The hypothetical account values and expenses may not be used to estimate the actual ending account balance or expenses you paid for the period. You may use this information to compare the ongoing costs of investing in a Fund and other funds. To do so, compare this 5% hypothetical example with the 5% hypothetical examples that appear in the shareholder reports of the other funds.
Please note that the expenses shown in the table are meant to highlight your ongoing costs only and do not reflect any transactional costs, such as sales charges (loads), redemption fees or exchange fees (the Funds do not currently charge any such fees). Therefore, the hypothetical line of the table is useful in comparing ongoing costs only, and will not help you determine the relative total costs of owning different funds. In addition, if the Funds imposed transactional costs and these transactional costs were included, your costs would have been higher.
FMI Funds, Inc.
EXPENSE EXAMPLE (Unaudited) (Continued)
| | | FMI | | | FMI | | | FMI | |
| | | Large Cap | | | Common Stock | | | International | |
| | | Fund | | | Fund | | | Fund | |
| | | | | | | | | | |
| Actual Beginning | | | | | | | | | |
| Account Value 4/01/16 | | $ | 1,000.00 | | | $ | 1,000.00 | | | $ | 1,000.00 | |
| | | | | | | | | | | | | |
| Actual Ending | | | | | | | | | | | | |
| Account Value 9/30/16 | | $ | 1,049.90 | | | $ | 1,057.00 | | | $ | 1,070.10 | |
| | | | | | | | | | | | | |
| Actual Expenses Paid | | | | | | | | | | | | |
| During Period* 4/01/16-9/30/16 | | $ | 4.51 | | | $ | 5.55 | | | $ | 4.86 | |
| | | | | | | | | | | | | |
| Hypothetical Beginning | | | | | | | | | | | | |
| Account Value 4/01/16 | | $ | 1,000.00 | | | $ | 1,000.00 | | | $ | 1,000.00 | |
| | | | | | | | | | | | | |
| Hypothetical Ending | | | | | | | | | | | | |
| Account Value 9/30/16 | | $ | 1,020.60 | | | $ | 1,019.60 | | | $ | 1,020.30 | |
| | | | | | | | | | | | | |
| Hypothetical Expenses Paid | | | | | | | | | | | | |
| During Period* 4/01/16-9/30/16 | | $ | 4.45 | | | $ | 5.45 | | | $ | 4.75 | |
| | | | | | | | | | | | | |
| Annualized Expense Ratio* | | | 0.88 | % | | | 1.08 | % | | | 0.94 | % |
| * | Expenses are equal to the Fund’s annualized expense ratio, multiplied by the average account value over the period, multiplied by 183/366 (to reflect the one-half year period between April 1, 2016 and September 30, 2016). |
FMI Funds, Inc.
DIRECTORS AND OFFICERS (Unaudited)
| | | Term of | Principal | |
| | Positions | Office and | Occupation(s) | Other |
| Name, Age | Held with | Length of | During Past | Directorships Held by |
and Address*^ | the Funds | Time Served | Five Years | Director or Officer |
| | | | | |
| Non-Interested Directors | | | | |
| | | | | |
| Barry K. Allen, 67 | Director | Indefinite | Mr. Allen is President of | BCE, Inc. |
| | | Term Since | Allen Enterprises, LLC | (Bell Canada |
| | | 2001 | (Boca Grande, FL) a | Enterprise) |
| | | | private equity investments | and CDW |
| | | | and management company, | Corp. |
| | | | and Operating Partner | |
| | | | for Providence Equity | |
| | | | Partners (Providence, RI) | |
| | | | since September, 2007. | |
| | | | | |
| Robert C. | Director | Indefinite | Mr. Arzbaecher retired as | Actuant |
| Arzbaecher, 56 | | Term Since | Chairman and Chief | Corporation |
| | | 2007 | Executive Officer of | and CF |
| | | | Actuant Corporation | Industries |
| | | | (Menomonee Falls, WI) | Holdings, Inc. |
| | | | in March 2016. | |
| | | | | |
| Lawrence J. Burnett, 58 | Director | Indefinite | Mr. Burnett is a shareholder | None |
| | | Term Since | and employee of Reinhart | |
| | | August, 2016 | Boerner Van Deuren s.c. | |
| | | | (Milwaukee, WI), since his | |
| | | | graduation from Cornell | |
| | | | Law School in 1982. | |
| | | | Mr. Burnett is also the Co- | |
| | | | Chair of Reinhart Boerner’s | |
| | | | business law department. | |
| | | | | |
| Gordon H. | Director | Indefinite | Mr. Gunnlaugsson retired | None |
| Gunnlaugsson, 72 | | Term Since | from M&I Corporation | |
| | | 2001 | (Milwaukee, WI) | |
| | | | in December, 2000. | |
| | | | | |
| Paul S. Shain, 53 | Director | Indefinite | Mr. Shain is President and | None |
| | | Term Since | Chief Executive Officer | |
| | | 2001 | of Singlewire Software, | |
| | | | LLC (Madison, WI), a | |
| | | | provider of IP-based | |
| | | | paging and emergency | |
| | | | notification systems, | |
| | | | since April, 2009. | |
FMI Funds, Inc.
DIRECTORS AND OFFICERS (Unaudited) (Continued)
| | | Term of | Principal | |
| | Positions | Office and | Occupation(s) | Other |
| Name, Age | Held with | Length of | During Past | Directorships Held by |
and Address*^ | the Funds | Time Served | Five Years | Director or Officer |
| | | | | |
| Non-Interested Directors | | | | |
| | | | | |
| Robert J. Venable, 52 | Director | Indefinite | Mr. Venable is President of | None |
| | | Term Since | Charter Steel (Milwaukee, | |
| | | August, 2016 | WI), a producer of special | |
| | | | bar quality wire rod, since | |
| | | | July 2013. From January | |
| | | | 2000 to May 2013, Mr. | |
| | | | Venable was a Managing | |
| | | | Director of R.W. Baird, a | |
| | | | middle market investment bank. | |
| | | | | |
| Interested Directors | | | | |
| | | | | |
| John S. Brandser,** 54 | Director | Indefinite | Mr. Brandser is President, | None |
| | | Term Since | Secretary, Chief | |
| | | 2009 | Operating Officer and | |
| | Vice | One Year | Chief Compliance Officer | |
| | President | Term Since | of Fiduciary Management, | |
| | and | 2008 | Inc. and has been | |
| | Secretary | One Year | employed by the Adviser | |
| | | Term Since | in various capacities | |
| | | 2009 | since March, 1995. | |
| | | | | |
| Patrick J. English,** 55 | Director | Indefinite | Mr. English is Chief | None |
| | | Term Since | Executive Officer, Chief | |
| | | 2001 | Investment Officer and | |
| | Vice | One Year | Treasurer of Fiduciary | |
| | President | Term Since | Management, Inc. and has | |
| | | 2001 | been employed by the | |
| | | | Adviser in various capacities | |
| | | | since December, 1986. | |
| | | | | |
| Ted D. Kellner,** 70 | Director | Indefinite | Mr. Kellner is | None |
| | | Term Since | Executive Chairman of | |
| | | 2001 | Fiduciary Management, | |
| | President | One Year | Inc. which he | |
| | and | Term Since | co-founded in 1980. | |
| | Treasurer | 2001 | | |
| | | | | |
| Other Officer | | | | |
| | | | | |
| Kathleen M. Lauters, 64 | Chief | At | Ms. Lauters has | None |
| | Compli- | Discretion | been the Fund’s Chief | |
| | ance | of Board | Compliance Officer since | |
| | Officer | Since 2004 | September, 2004. | |
| * | | The address of each Director and Officer is c/o Fiduciary Management, Inc., 100 E. Wisconsin Ave., Suite 2200, Milwaukee, WI 53202. |
| ** | | Messrs. Brandser, English and Kellner are interested directors of the Funds because they are officers of the Funds and the Adviser. |
| ^ | | Each Non-Interested and Interested Director oversees 3 Funds in the complex. |
FMI Funds, Inc.
DISCLOSURE INFORMATION (Unaudited)
Performance data quoted represents past performance; past performance does not guarantee future results. Investment return and principal value of an investment will fluctuate so that an investor’s shares, when redeemed, may be worth more or less than their original cost. Current performance of a Fund may be lower or higher than the performance quoted. Performance data current to the most recent month end may be obtained by visiting www.fmifunds.com or by calling 1-800-811-5311. The returns do not reflect the deduction of taxes that a shareholder would pay on Fund distributions or the redemption of Fund shares.
Securities named in the Letters to Shareholders, but not listed in the Schedules of Investments are not held in the Funds as of the date of this disclosure. Portfolio holdings are subject to change without notice and are not intended as recommendations of individual securities.
This report is not authorized for use as an offer of sale or a solicitation of an offer to buy shares of the Fund unless accompanied or preceded by the Fund’s current prospectus.
As of the Funds’ Prospectuses dated January 29, 2016, the FMI Large Cap Fund, FMI Common Stock Fund and FMI International Fund’s annual operating expense ratios are 0.87%, 1.07% and 0.98%, respectively.
Please note: Effective June 30, 2016, the FMI Common Stock Fund and the FMI Large Cap Fund were reopened to new investors.
Risks associated with investing in the Funds are as follows:
| | FMI Large Cap Fund: Stock Market Risk, Medium and Large Capitalization Companies Risks, Non-Diversification Risk (Non-Diversified funds are subject to higher volatility than funds that are invested more broadly), Value Investing Risk, Foreign Securities Risk (fluctuation of currency, different financial standards, and political instability) and Liquidity Risk. |
| | |
| | FMI Common Stock Fund: Stock Market Risk, Medium and Small Capitalization Companies Risks (which includes the potential for greater volatility and less financial resources than Large-Cap Companies), Value Investing Risk, Foreign Securities Risk (fluctuation of currency, different financial standards, and political instability) and Liquidity Risk. |
| | |
| | FMI International Fund: Stock Market Risk, Non-Diversification Risk (Non-Diversified funds are subject to higher volatility than funds that are invested more broadly), Value Investing Risk, Foreign Securities Risk (fluctuation of currency, different financial standards, and political instability), Geographic Concentration Risk, Currency Hedging Risk, Large Capitalization Companies Risk and Liquidity Risk. |
For details regarding these risks, please refer to the Funds’ Summary or Statutory Prospectuses dated January 29, 2016.
For more information about the FMI Funds, call 1-800-811-5311 for a free Prospectus or Summary Prospectus. Please read these Prospectuses carefully to consider the investment objectives, risks, charges and expenses, before investing or sending money. These Prospectuses contain this and more information about the FMI Funds. Please read the Prospectus or Summary Prospectuses carefully before investing.
The Standard and Poor’s 500 Index consists of 500 selected common stocks, most of which are listed on the New York Stock Exchange. The Standard & Poor’s Ratings Group designates the stock to be included in the Index on a statistical basis. A particular stock’s weighting in the Index
FMI Funds, Inc.
DISCLOSURE INFORMATION (Unaudited) (Continued)
is based on its relative total market value (i.e., its market price per share times the number of shares outstanding). Stocks may be added or deleted from the Index from time to time.
The Russell 2000 Index measures the performance of the 2,000 smallest companies in the Russell 3000 Index which comprises the 3,000 largest U.S. companies based on total market capitalization.
The MSCI EAFE Index (Europe, Australasia, Far East) is a free float-adjusted market capitalization index that is designed to measure the equity market performance of developed markets, excluding the U.S. and Canada. The MSCI EAFE Index consists of the following 21 developed market country indices: Australia, Austria, Belgium, Denmark, Finland, France, Germany, Hong Kong, Ireland, Israel, Italy, Japan, the Netherlands, New Zealand, Norway, Portugal, Singapore, Spain, Sweden, Switzerland and the United Kingdom. The MSCI EAFE Index is unmanaged and investors cannot invest directly in the Index. Index results are inclusive of dividends and net of foreign withholding taxes. The reported figures include reinvestment of dividends and capital gains distributions and do not reflect any fees or expenses.
The MSCI EAFE Index is calculated in local currency (LOC) as well as in U.S. Dollars (USD). The concept of a LOC calculation excludes the impact of currency fluctuations. All currencies of listing are considered in the Index calculation in LOC where current prices (t) and previous day prices (t-1) are converted into USD using the same exchange rate (exchange rate t-1) in the numerator and denominator. As a consequence, the FX factor drops out of the equation. The USD calculation includes exchange rates at t and t-1. Therefore, the LOC calculation only represents the price appreciation or depreciation of the securities, whereas the USD calculation also accounts for the performance of the currency (or currencies) relative to the USD.
MSCI EAFE is a service mark of MSCI Barra.
The ISM Composite Index is a combination of the ISM Manufacturing and Non-Manufacturing Indices. The ISM Manufacturing Index is based on a monthly survey of more than 300 manufacturing firms by the Institute of Supply Management (ISM) and monitors employment, production, inventories, new orders and supplier deliveries. The ISM Non-Manufacturing Index is an index based on surveys of more than 400 non-manufacturing firms’ purchasing and supply executives, within 60 sectors across the nation, by the Institute of Supply Management (ISM) and monitors economic data. A composite diffusion index is created based on the data from these surveys, that monitors economic conditions of the nation.
The Labor Market Conditions Index tracks changes in the labor market by finding variations from multiple labor indicators. Indicators range from unemployment rates to wages to layoffs to business surveys with the objective of creating a cohesive picture of the labor market.
The Consumer Price Index is a measure that examines the weighted average of prices of a basket of consumer goods and services, such as transportation, food and medical care. It is calculated by taking price changes for each item in the predetermined basket of goods and averaging them. Changes in the CPI are used to assess price changes associated with the cost of living; the CPI is one of the most frequently used statistics for identifying periods of inflation or deflation.
The USD Index is a measure of the value of the U.S. dollar relative to the value of a basket of currencies of the majority of the U.S.’s most significant trading partners.
The Nikkei 225 Index is a price-weighted index comprised of Japan’s top 225 blue-chip companies traded on the Tokyo Stock Exchange.
An investment cannot be made directly into an index.
FMI Funds, Inc.
DISCLOSURE INFORMATION (Unaudited) (Continued)
Reference definitions found at Investopedia.com
EBIT – Earnings Before Interest & Tax – An indicator of a company’s profitability, calculated as revenue minus expenses, excluding tax and interest.
EBITDA – Earnings Before Interest Taxes Depreciation and Amortization is essentially net income with interest, taxes, depreciation, and amortization added back to it, and can be used to analyze and compare profitability between companies and industries because it eliminates the effects of financing and accounting decisions.
EPS – Earnings per Share – The portion of a company’s profit allocated to each outstanding share of common stock. Earnings per share serves as an indicator of a company’s profitability.
EV/EBITDA – Enterprise Value to Earnings Before Interest Taxes Depreciation and Amortization is a measure of the value of a stock that compares a company’s enterprise value (market cap plus debt, minority interest and preferred shares, minus total cash and cash equivalents) to its earnings before interest taxes depreciation and amortization. EV/EBITDA is one of several fundamental indicators that investors use to determine whether a stock is priced well. The EV/EBITDA multiple is also often used to determine a company’s valuation in the case of a potential acquisition.
EV/Revenue – Enterprise Value To Revenue is a measure that compares the enterprise value of a company to the company’s revenues. EV/Revenue is one of several fundamental indicators that investors use to determine whether a stock is priced well.
EV/Sales – Enterprise-Value-To-Sales – A valuation measure that compares the enterprise value of a company to the company’s sales. EV/sales gives investors an idea of how much it costs to buy the company’s sales.
Employment-to-Population Ratio – a macroeconomic statistic that indicates the ratio of the labor force currently employed to the total working-age population of a region, municipality or country. It is calculated by dividing the number of people employed by the total number of people of working age.
NPV – Net Present Value – The difference between the present value of cash inflows and the present value of cash outflows. NPV is used in capital budgeting to analyze the profitability of a projected investment or project.
P/B – Price to Book –A ratio used to compare a stock’s market value to its book value.
P/E ratio (forward 4 quarters) – Price to Earnings ratio (forward 4 quarters) is a measure of the price-to-earnings ratio (P/E) using forecasted earnings for the P/E calculation. While the earnings used are just an estimate and are not as reliable as current earnings data, there is still a benefit in estimated P/E analysis. The forecasted earnings used in the formula can either be for the next 12 months or for the next full-year fiscal period.
ROIC – Return on Invested Capital – A calculation used to assess a company’s efficiency at allocating the capital under its control to profitable investments. The return on invested capital measure gives a sense of how well a company is using its money to generate returns.
SOTP – Sum of the Parts – Valuing a company by determining what its divisions would be worth if it was broken up and spun off or acquired by another company.
FMI Funds, Inc.
MATTERS SUBMITTED FOR SHAREHOLDER VOTE (Unaudited)
A special meeting of the shareholders of the FMI Funds, Inc. (the “Corporation”), consisting of three series: FMI Large Cap Fund, FMI Common Stock Fund and FMI International Fund, was held on August 18, 2016. At the meeting, the shareholders elected nine Directors to the Corporation’s Board of Directors. The results of the shareholder vote are as follows (there were no broker non-votes and no abstentions):
| | For | Withheld |
FMI Funds, Inc. | | |
| John S. Brandser | 411,801,622 | 68,420,256 |
| Patrick J. English | 411,779,102 | 68,442,776 |
| Ted D. Kellner | 411,293,651 | 68,928,227 |
| Barry K. Allen | 410,790,110 | 69,431,769 |
| Robert C. Arzbaecher | 472,520,968 | 7,700,911 |
| Gordon H. Gunnlaugsson | 472,104,805 | 8,117,074 |
| Paul S. Shain | 472,716,462 | 7,505,416 |
| Robert J. Venable | 472,528,841 | 7,693,038 |
| Lawrence J. Burnett | 472,389,935 | 7,831,944 |
ADDITIONAL INFORMATION (Unaudited)
For additional information about the Directors and Officers or for a description of the policies and procedures that the Funds use to determine how to vote proxies relating to portfolio securities, please call (800) 811-5311 and request a Statement of Additional Information. It will be mailed to you free of charge. The Statement of Additional Information is also available on the website of the Securities and Exchange Commission (the “Commission”) at http://www.sec.gov. Information on how each of the Funds voted proxies relating to portfolio securities is available on the Funds’ website at http://www.fmifunds.com or the website of the Commission no later than August 31 for the prior 12 months ending June 30. The Funds file their complete schedules of portfolio holdings with the Commission for the first and third quarters of each fiscal year on Form N-Q. The Funds’ Forms N-Q are available on the Commission’s website. The Funds’ Forms N-Q may be reviewed and copied at the Commission’s Public Reference Room in Washington, D.C., and that information on the operation of the Public Reference Room may be obtained by calling 1-800-SEC-0330.
FMI Funds, Inc.
NEW SHARE CLASS ANNOUNCEMENT (Unaudited)
We are pleased to announce that each of FMI Large Cap Fund, FMI Common Stock Fund, and FMI International Fund, (collectively, the “Funds”) has established a new Institutional Class of shares, (the “Institutional Class”) to be effective as of October 31, 2016. This message is not a prospectus and does not purport to contain all information an investor may require to form an investment decision. Please read the Prospectus for the Funds dated as of October 31, 2016 when it becomes available, as it will contain important information about the Institutional Class. Please read the Prospectus carefully to consider the investment objectives, risks, charges and expenses, before investing or sending money. The Prospectus contains this and more information about the FMI Funds. Please read the Prospectus and Summary Prospectuses carefully before investing. A copy of the Prospectus as well as other relevant documents (when available) may be obtained free of charge from the Securities and Exchange Commission’s website at www.sec.gov or by calling the FMI Funds at 1-800-811-5311.
TAX NOTICE (Unaudited)
For corporate shareholders of the Large Cap Fund, the Common Stock Fund and the International Fund, the percentage of dividend income distributed for the year ended September 30, 2016 which is designated as qualifying for the dividends received deduction is 100%, 0% and 0%, respectively. The International Fund intends to elect to pass-through to shareholders the income tax credit for taxes paid to foreign countries. For the year ended September 30, 2016, the foreign source income was $72,295,843 and the foreign tax expense was $5,380,543. The pass-through of the foreign tax credit will only affect those persons who are shareholders on the dividend record dates. For all shareholders of the Large Cap Fund, the Common Stock Fund and the International Fund, the percentage of dividend income distributed for the year ended September 30, 2016 which is designated as qualified dividend income under the Jobs and Growth Tax Relief Act of 2003, is 100%, 0% and 52.98%, respectively.
FMI Funds, Inc.
NOTICE OF PRIVACY POLICY (Unaudited)
Protecting the privacy of our shareholders is important to us. This notice describes the practices and policies through which we maintain the confidentiality and protect the security of your non-public personal information.
What Information We Collect
In the course of providing services to you, we may collect the following types of “non-public personal information” about you:
| • | Information we receive from you on applications or other forms, such as your name, address and social security number, the types and amounts of investments and bank account information, and |
| | |
| • | Information about your transactions with us, our affiliates and others, as well as other account data. |
What Information We Disclose
We do not disclose any nonpublic personal information about our current or former shareholders to anyone, except as permitted by law. For example, we are permitted by law to disclose all of the information we collect, as described above, to our transfer agent to process your transactions. Furthermore, we restrict access to your nonpublic personal information to those persons who require such information to provide products or services to you. We maintain physical, electronic and procedural safeguards that comply with federal standards to guard your nonpublic personal information. In the event that you hold shares of any Fund through a financial intermediary, including, but not limited to, a broker-dealer, bank or trust company, the privacy policy of your financial intermediary may govern how your nonpublic personal information would be shared with nonaffiliated third parties.
IMPORTANT NOTICE REGARDING DELIVERY OF SHAREHOLDER DOCUMENTS (Unaudited)
In order to reduce expenses, we will deliver a single copy of prospectuses, proxies, financial reports, and other communication to shareholders with the same residential address, provided they have the same last name or we reasonably believe them to be members of the same family. Unless we are notified otherwise, we will continue to send you only one copy of these materials for as long as you remain a shareholder of the Funds. If you would like to receive individual mailings, please call (800) 811-5311 and we will begin sending you separate copies of these materials within 30 days after we receive your request.
Thank you for allowing us to serve your investment needs.
(This Page Intentionally Left Blank.)
| FMI Large Cap Fund | FMI Common Stock Fund | FMI International Fund |
100 East Wisconsin Avenue, Suite 2200
Milwaukee, Wisconsin 53202
www.fmifunds.com
414-226-4555
BOARD OF DIRECTORS
| | BARRY K. ALLEN | GORDON H. GUNNLAUGSSON | |
| | ROBERT C. ARZBAECHER | TED D. KELLNER | |
| | JOHN S. BRANDSER | PAUL S. SHAIN | |
| | LAWRENCE J. BURNETT | ROBERT J. VENABLE | |
| | PATRICK J. ENGLISH | | |
INVESTMENT ADVISER
FIDUCIARY MANAGEMENT, INC.
100 East Wisconsin Avenue, Suite 2200
Milwaukee, Wisconsin 53202
ADMINISTRATOR, ACCOUNTANT, TRANSFER
AGENT AND DIVIDEND DISBURSING AGENT
U.S. BANCORP FUND SERVICES, LLC
615 East Michigan Street
Milwaukee, Wisconsin 53202
800-811-5311 or 414-765-4124
| CUSTODIAN | INDEPENDENT REGISTERED |
| U.S. BANK, N.A. | PUBLIC ACCOUNTING FIRM |
| Milwaukee, Wisconsin | PRICEWATERHOUSECOOPERS LLP |
| | Milwaukee, Wisconsin |
| DISTRIBUTOR | |
| RAFFERTY CAPITAL MARKETS, LLC | LEGAL COUNSEL |
| Garden City, New York | FOLEY & LARDNER LLP |
| | Milwaukee, Wisconsin |
| | |
| |
| |
|
| |
| |
| FMI Funds, Inc. |
| |
| 1-800-811-5311 |
| |
| www.fmifunds.com |
| |
| |
| |
| | |