ANNUAL REPORT
September 30, 2018
FMI Large Cap Fund
Investor Class (FMIHX)
Institutional Class (FMIQX)
FMI Common Stock Fund
Investor Class (FMIMX)
Institutional Class (FMIUX)
FMI International Fund
Investor Class (FMIJX)
Institutional Class (FMIYX)
| | | |
 | | |
| | |
| | |
| | |
| | |
| | |
| FMI Funds, Inc. | |
| | |
| Advised by Fiduciary Management, Inc. | |
| www.fmifunds.com | |
| | |
| | |
| | |
| | | |
FMI Funds, Inc.
TABLE OF CONTENTS
| FMI Large Cap Fund | |
| Shareholder Letter | 1 |
| Management’s Discussion of Fund Performance | 8 |
| Schedule of Investments | 10 |
| Industry Sectors | 12 |
| | |
| FMI Common Stock Fund | |
| Shareholder Letter | 13 |
| Management’s Discussion of Fund Performance | 20 |
| Schedule of Investments | 22 |
| Industry Sectors | 24 |
| | |
| FMI International Fund | |
| Shareholder Letter | 25 |
| Management’s Discussion of Fund Performance | 33 |
| Schedule of Investments | 36 |
| Schedule of Forward Currency Contracts | 40 |
| Industry Sectors | 41 |
| | |
| Financial Statements | |
| Statements of Assets and Liabilities | 42 |
| Statements of Operations | 43 |
| Statements of Changes in Net Assets | 44 |
| Financial Highlights | 47 |
| Notes to Financial Statements | 53 |
| | |
| Report of Independent Registered Public Accounting Firm | 63 |
| Expense Example | 64 |
| Directors and Officers | 66 |
| Disclosure Information | 69 |
| Additional Information | 72 |
| Tax Notice | 72 |
| Notice of Privacy Policy | 73 |
| Householding Notice | 73 |
FMI
Large Cap
Fund
September 30, 2018
Dear Fellow Shareholders:
The FMI Large Cap Fund returned 4.05%1 in the September quarter compared to 7.71% for the Standard & Poor’s 500 Index. Growth stocks continued to outperform value stocks, leaving us in the proverbial penalty box. Sectors that contributed positively to results included Finance, Consumer Durables and Producer Manufacturing. On the negative side of the sector ledger were Consumer Services, Health Technology and Electronic Technology. Cash was an additional drag. Positive performers included Berkshire Hathaway, Honeywell and TJX Companies. On the flip side, eBay, Schlumberger and Twenty-First Century Fox underperformed. We eliminated Progressive from the portfolio and added Dollar Tree and Chubb.
The seeds of any bust are inherent in the boom that outstrips the pace of whatever solid factors gave it its impetus in the first place. There are no safeguards that can protect the emotional investor from himself. – J. Paul Getty
The bull market stretched into uncharted territory in the third calendar quarter, reaching its longest duration and one of its strongest up-cycle performances on record. Investors continued to focus on the good news -- the U.S. economy, Wall Street’s version of earnings and rising stock prices…while ignoring danger signals -- overconfidence (as reflected in valuations), rising rates and inflation, unbridled debt accumulation, a burgeoning trade war and perhaps some signs of fatigue in the economy. Faith in index funds and exchange-traded funds (ETFs) continued unabated, despite the “crowded trade” nature of many of these products. High confidence in technology shares harkens back to the 1990s, with exceptionally optimistic valuations for both established and startup companies. Private equity transactions, in all but a small minority of cases, are taking place at record-high valuations and debt leverage. So-called “covenant-lite” conditions have returned to the high yield arena. Across the board there appears to be little regard for safety and downside protection.
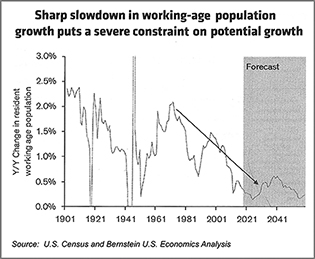
According to Bloomberg’s weekly survey, U.S. real GDP grew at an estimated rate of 3.0% in Q3 and is predicted to grow 2.8% in the December quarter. While the unemployment rate is low, the work force participation rate of 62.7% remained well below its 67% peak, and today, hovers near a 40-year low. Working age population growth continued to be soft (see chart on the right) and unless birth rates or immigration pick up, will be a source of future weakness.
____________
1 | The FMI Large Cap Fund Investor Class (FMIHX) and FMI Large Cap Fund Institutional Class (FMIQX) had a return of 4.05% and 4.10%, respectively, for the third quarter of 2018. |
The large number of working-age people who lost jobs in the last recession and were supposed to be returning to the labor force this cycle appear to be mostly idle. The evidence of this is rising wage rates (recently exceeding 3% according to the Atlanta Fed). With wages being the largest cost for most companies, margins may be at risk. Productivity gains, which have been meaningfully below long-term averages (see chart below) may not provide the offset to wage pressures unless there is a sustained increase in business improvement spending.
The benefit from lower tax rates and fewer regulations is a positive, although the lack of fiscal discipline threatens long-term prosperity. The market seems unconcerned with the potential of an economic downturn. While we are not economists, we do recognize that recessions often come out of the blue. A yield curve that is near inversion doesn’t bolster confidence that fair weather is a foregone conclusion. The CRB Metals Index is off over 15% from its recent peak. Pending home sales declined for the eighth straight month in August, down 2.3% from last year. Auto sales, at a recently annualized rate of 16.6 million, are down nearly 1.9 million units from the peak. Many technology companies are seeing inventories grow much faster than sales. Overseas economies, buyers of U.S. products, have softened, particularly in the emerging markets. Currency weakness in many of these countries is of particular concern, given high levels of dollar-denominated debt.
Across the globe, debt levels are rising significantly. The sovereign debt load has approximately doubled, and debt of all kinds is up 75% over the past decade, even though excessive debt was at the root of the last crisis. Worldwide debt-to-GDP is at a record 318%. The U.S. annual budget deficit as a percent of GDP is running at a 4.2% rate...the kind of figure one would normally see in the throes of a recession. Interestingly, it
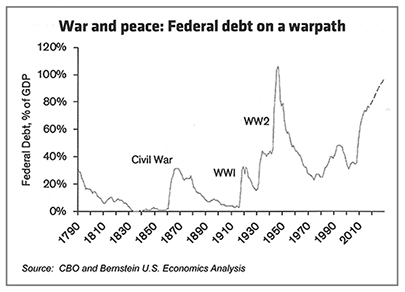
wasn’t that long ago that U.S. leaders chastised Eurozone countries for exceeding the 3% deficit-to-GDP mandate. It is highly unusual for debt ratios to be rising at this point in the economic cycle. The U.S. national debt is $21.5 trillion, an astonishing figure relative to our $20.5 trillion economy and unprecedented in non-war times (see chart from Bernstein on previous page). Unfunded welfare benefits are a multiple of our debt obligations.
Much has been made of the strong earnings performance in recent quarters. Everyone’s skepticism meter ought to be blinking yellow when Wall Street says earnings growth is 20% while the economy is growing 5% nominally and sales growth is in the single digits. We are, of course, experiencing a one-time positive year-over-year benefit from lower corporate tax rates but once those lap, long-term earnings growth rates will likely fall significantly. Wall Street, with an assist from corporate managements, has embraced the concept of “adjusted earnings,” as discussed in previous letters. The abuse of this measurement has reached alarming levels. Based partly on our inquiry, the Leuthold Group studied actual GAAP (generally accepted accounting principles) reported, operating and “adjusted” S&P 500 earnings over a long-term (30-year) time frame. The spread between these figures has become wide. Even excluding the credit crisis quarters, the spread between reported GAAP earnings and Wall Street earnings is 23.6% (Wall Street’s version is always higher). Proponents of adjusted earnings presentation say that amortization of intangibles, stock compensation and other one-time items justify this measure. Leuthold, among other findings, determined that more than 40% of the amount companies spent on mergers & acquisitions activity ended up in the scrap heap (written off). Additionally, many companies that claim “one-time” charges often have these write-offs with great frequency. Excluding the real cost of stock options seems dubious. There may be some justification for adding back a portion of amortization to GAAP earnings, but it seems managements and Wall Street have overplayed this hand.
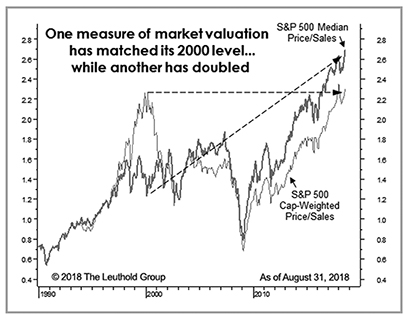
Using the long-term, oft-cited valuation data provided by Leuthold, stocks today are in the 9th decile on a median basis (10th being the most expensive). We regularly review 46 different valuation series, including several price-to-earnings (P/E) data sets. It would be odd, to say the least, to have most of these measures registering in the 9th or 10th deciles, while at the same time having Wall Street’s version of P/E ratios be “reasonable” or even “attractive,” as proponents like to tout. Somebody is wrong. Using a much harder-to-manipulate series, price-to-sales, tells a different story. Leuthold recently called the above chart “the scariest chart in the world.” Of course, investor sentiment usually reflects the current trajectory of stock prices. “Markets make opinions,” as the old bromide goes.
Ten years after the last financial and stock market crisis, the media has engaged in a lengthy rehash and post mortem of what transpired. It’s ironic and quite surprising to us at least, given how fresh the crisis still is in our minds, that many of the same mistakes are being repeated by investors today. A decade ago most investors scoffed at the notion that home prices could fall. A house was a surefire investment, and the proof of that was the willingness of banks to loan 95% or more against
it. Investors believed in Wall Street’s products (credit default options, mortgage-backed securities, collateralized loan obligations, etc.) and high-yield bonds. The economy was seemingly healthy, and the market saw little reason to worry about high valuations. They believed in central bankers. Today, investors have the same lofty confidence in high-flying social media, technology and med-tech shares. Many of the same aforementioned derivative investment vehicles are back in vogue, along with a cornucopia of ETFs and index products. Many mistakenly believe that these products carry not only low fees, but low risk. Do investors in the iShares U.S. Energy ETF, iShares Technology ETF or iShares Telecom ETF, for example, know that far from investing in diversified portfolios, they are putting over half their money behind just five stocks? A little over a year ago we discussed the potential liquidity issues facing many of the most popular ETFs. With turnover in many of these ETFs vastly greater than even the most liquid underlying constituent stocks, trading activity could be very interesting when markets get shaky. Junk bond spreads recently hit 315 basis points over treasuries -- half the level of two years ago and a figure not seen since 2007, according to economist David Rosenberg. The faith in central bankers seems unshaken. Finally, just like a decade ago, perception that the economy is strong appears to be overriding any concern about high valuations or other potential troublesome developments.
What we have seen as excessive and unsustainable has persisted far longer than we thought possible. On one level that makes us “wrong,” but of course that doesn’t change the reality of the aforementioned conditions. We would rather give up some of the upside than to be remorseful in hindsight. Greed usually ends in regret. That means being more cautious with our investments and expectations today. Is there a way around another crisis and lousy stock market? Anything is possible when it comes to markets and human behavior. Earnings...the good and sustainable kind...could advance at a healthy rate and inflation could stay within earshot of 2%. The big one, interest rates, though significantly higher than two years ago, could stay well below normal for an extended period. Wages and other escalating costs could recede. The political crisis between the left and right could ameliorate. The nascent trade war with China could resolve. Externalities such as terrorism, wars, natural disasters, etc., could be benign. In other words, a lot must go right and not much can go wrong given today’s valuations. We continue to hunt for attractive investments but acknowledge the environment is far from ideal. We are working diligently, with a focus on the long term. Additionally, we have our own money invested right alongside yours. Our confidence in achieving good full cycle returns remains high.
Below we highlight a couple of investments:
Dollar Tree Inc. (DLTR)
(Analyst: Matt Sullivan)
Description
Dollar Tree is a leading discount retailer in the United States and Canada, operating over 15,000 total stores. 6,812 stores, or 45%, are operated under the Dollar Tree and Dollar Tree Canada (225 stores) banners. The other 8,261 stores are operated under the Family Dollar banner, which was acquired in July of 2015. The Dollar Tree brand accounts for 51% of the combined company’s revenue, 58% of gross profit, and 67% of EBITDA (earnings before interest, taxes, depreciation, and amortization). The Family Dollar franchise accounts for the remaining 49% of revenue, 42% of gross profit, and 33% of EBITDA.
Good Business
| | • | The Dollar Tree banner has one of the best margin and return profiles in the physical retail industry. Family Dollar’s return on invested capital (ROIC) is lower but has ample opportunity to improve. Its closest competitor, Dollar General, earns very high returns on capital. We believe Family Dollar can at least partially close the ROIC gap with Dollar General. |
| | • | Dollar Tree has grown its same store sales for 41 consecutive quarters. Family Dollar’s comparable same-store sales have been less impressive, particularly recently, yet Dollar General’s comps have been positive for 28 straight years. Both the dollar and discount store business models, respectively, have proven to be defensive and should hold up well in a more difficult economic environment. |
| | | |
| | • | The customer profile, low average ticket, and types of products sold protect the business from online competition. |
| | | |
| | • | The Dollar Tree business model is unique within the retail landscape. The $1 price point and constantly changing inventory provides the customer with a differentiated, treasure hunt shopping experience. The ever-changing merchandise in the store also provides management with the ability to control the company’s gross margin. |
| | | |
| | • | Both Dollar Tree and Family Dollar are difficult to replicate. |
| | | |
| | • | The balance sheet is in good shape with net debt-to-EBITDA of approximately 1.7 times. |
| | | |
| | • | The business is easy to understand. |
Valuation
| | • | Dollar Tree shares are down by more than 20% this year. This compares to the S&P 500, which is up approximately 10% year-to-date. |
| | | |
| | • | Dollar Tree is trading at 1.1 times enterprise value-to-sales, which is about one standard deviation below its 3- and 5-year averages. |
| | | |
| | • | Dollar Tree is trading at 9.5 times enterprise value-to-EBITDA (EV/EBITDA), which is a discount to other high-quality retailers as well as the S&P 500. |
| | | |
| | • | On a sum of the parts basis using 2018 estimates, if we ascribe a 12 times EV/EBITDA multiple to the Dollar Tree banner, we believe we’re paying less than 5 times EV/EBITDA for Family Dollar. For reference, Dollar General trades at 12 times EV/EBITDA. |
| | | |
| | • | The stock is trading at approximately 14 times next year’s consensus earnings per share estimate. |
Management
| | • | Bob Sasser became Executive Chairman of the Board on September 18, 2017. He was previously Chief Executive Officer from 2004 to September 2017. From 1993 to 2003, he was Dollar Tree’s Chief Operating Officer. |
| | | |
| | • | Gary Philbin became President and Chief Executive Officer of Dollar Tree and was appointed to the board of directors on September 18, 2017. He was previously Enterprise President of Dollar Tree from December 2016 to September 2017. From July 2015 to December 2016, he served as President and Chief Operating Officer of Family Dollar. From March 2007 to July 2015, he was Chief Operating Officer of Dollar Tree. |
Investment Thesis
We believe Dollar Tree is an excellent business with a good operational management team. The Family Dollar business that was acquired in July 2015 is still a work in progress. The turnaround is taking much longer than management or Wall Street originally expected. Some analysts are beginning to lose faith that the business will ever be successfully turned around. This has created a drag on the stock price.
The stock is now much cheaper than other discount retailers as well as the market. While we’re not convinced that the Family Dollar turnaround will work, we believe the market is ascribing an excessively low multiple to the asset. This leads us to believe that there are multiple ways to win
in the stock, including a potential separation or sale of Family Dollar. A number of sell-side analysts have already started calling for a spin or sale of Family Dollar. This could be an excellent outcome if it happens relatively quickly, as opposed to later, after further struggles. If management does successfully turn Family Dollar around, the stock should do well, considering its relatively modest valuation.
Chubb Ltd. (CB)
(Analyst: Matthew Goetzinger)
Description
Chubb is one of the largest publicly traded property and casualty insurance companies globally. In aggregate, the company has operations in 54 countries and territories. Chubb provides commercial, personal property, casualty, personal accident, and supplemental health insurance to a diverse group of clients. A.M. Best rates the company as an A++ (stable) insurer, and Standard & Poor’s carries it at a AA (stable) rating. Approximately 63% of premiums are from the U.S., 13% from Europe/Eurasia & Africa, 11% from Asia, 8% from Latin America, and 5% from Bermuda and Canada.
Good Business
| | • | Chubb is a durable, differentiated multi-line insurer with an attractive small and middle market commercial book of business, as well as a highly attractive high net worth personal lines customer base. |
| | | |
| | • | For medium-to-larger-sized commercial enterprises, casualty insurance is a necessary coverage. This non-discretionary attribute, along with Chubb’s emphasis on high service levels, results in strong customer retention and predictable revenues. The company’s renewal retention ratio generally ranges between 85 to 90%. |
| | | |
| | • | The company’s disciplined risk selection and cycle management have led to consistently conservative initial loss picks, underwriting stability, and a low volatility return on equity (ROE). The company presently generates a 16% return on total capital. Incremental returns on capital are attractive. |
| | | |
| | • | Chubb currently maintains industry-low balance sheet leverage metrics across the three most important indicators of net premiums-to-shareholders’ equity (0.67 times), invested assets-to-shareholders’ equity (2.4 times), and debt-to-total capital (20%). Approximately 55% of net premiums are from shorter tail lines. |
Valuation
| | • | Over the past 25 years, Chubb’s price-to-book multiple has averaged approximately 1.5 times, ranging from a low of around 1 times to a high of over 2 times. The stock presently trades at multi-year lows. |
| | | |
| | • | Over the past 13 years, Chubb has grown book value per share at a 10% cumulative annual growth rate. |
| | | |
| | • | Downside margin of safety is supported by the company’s current low valuation multiple, excess capital, loss reserve cushion, and significant franchise value. |
Management
| | • | Chubb has a diverse and highly-respected management team, led by Evan Greenberg as Chairman and CEO. The top five executives own approximately $400 million of stock. |
| | | |
| | • | Management is compensated based upon key financial metrics (75% overall weight) of tangible book value per share growth, core operating ROE, core operating income, and the property & casualty (P&C) combined ratio. The residual quarter of incentive compensation is determined by operational and strategic goals. |
| | • | Mr. Greenberg’s management team has been a cohesive group, with backgrounds tying back to legacy ACE and supplemented by key individuals staying on from the Chubb organization. |
| | | |
| | • | Philip Bancroft has been the Chief Financial Officer of Chubb Ltd. since January of 2002. |
Investment Thesis
Chubb is a defensive and diversified P&C company serving attractive commercial and personal lines. The franchise is run by one of the industry’s most respected management teams, who are expected to continue operating the company with a disciplined focus on underwriting cycle management and maintaining a conservative balance sheet. Gradual deployment of the company’s excess capital into organic premium growth, small complimentary tuck-in acquisitions outside the U.S., and repurchases at an attractive discount to intrinsic value should continue the company’s 15-year track record of 10% compound annual growth in book value per share. Chubb’s current multi-year low valuation provides a unique opportunity to invest in one of the best businesses in property and casualty insurance.
Thank you for your confidence in the FMI Large Cap Fund.
This shareholder letter is unaudited.
FMI Large Cap Fund
MANAGEMENT’S DISCUSSION OF FUND PERFORMANCE (Unaudited)
During the fiscal year ended September 30, 2018, the FMI Large Cap Fund the “Fund” had a total return of 12.67%1. The benchmark S&P 500 returned 17.91% in the same period. Sectors that aided relative performance included Finance, Health Services and Process Industries. Progressive Corp. drove the performance within the Finance sector, likely due to continued good earnings and underwriting performance. UnitedHealth Group appreciated strongly during the year on very solid earnings. The Nutrien/Potash combination recovered somewhat in 2018, helping the Process Industries sector. On the negative side of sector performance, Technology Services, Electronic Technology, and Industrial Services all detracted. The Fund’s cash level was also a drag on performance. The benchmark’s exposure to technology related stocks and sectors has been a major driver of performance and the Fund’s underweighting has been the opposite. The stocks that make up these sectors are generally considered growth stocks rather than value stocks. These equities are valued at extraordinary levels today. Additionally, one of our holdings in Technology Services, Cerner Corp., underperformed. Revenue growth has perhaps been slightly less than the market expected. Schlumberger declined during the period and hurt the Industrial Services sector performance. Despite higher oil prices, Schlumberger’s fundamentals have lagged. Deep water and more complex work has not come on as rapidly as anticipated, pushing back the earnings recovery.
Other stocks that helped performance included the Level 3/CenturyLink merged company, TJX Companies, JPMorgan Chase and Twenty-First Century Fox. eBay, Stanley Black & Decker, Omnicom, PACCAR and Bank of New York Mellon all detracted from relative results.
Some new additions to the Fund over the past twelve months included Quest Diagnostics, Smith & Nephew, Masco Corp., PepsiCo, Chubb Ltd. and Dollar Tree. Some stocks sold during the year included AmerisourceBergen, Devon Energy, Microsoft, Comcast and Progressive Corp. As of September 30, 2018, the Fund was significantly overweighted in Producer Manufacturing, Health Services and Commercial Services and meaningfully underweighted in Health Technology, Utilities and Electronic Technology.
Strong performance across most technology and biotechnology related sectors and retail trade (Amazon) characterized the S&P 500 over the past year. Passive investment strategies continued to see heavy inflows of money, at the expense of active strategies. Stocks generally appear overvalued and the S&P 500 index, on many valuation measures, is even more expensive than it was in the late 1990s. The growing use of “adjusted earnings” rather than GAAP earnings by Wall Street and corporate management gives a misleading P/E ratio. The current bull market is nine and a half years old and the longest on record.
The Federal Reserve has moved slowly to normalize interest rates but the price of money remains unusually cheap by historical standards. Economic growth has improved over the past twelve months but at great cost to both government and corporate balance sheets. Total debt relative to U.S. GDP is near 100% and the deficit to GDP is now 4.2%. Corporate leverage by some measures is at a fifty-year high. The unemployment rate is low but the labor force participation rate continues to be depressed. Wage rates and inflation are rising. Domestic and international political risks remain elevated.
While the conventional wisdom is that stock market risk is low because the economy is stronger, we believe valuations are so high that it leaves little room for error. We remain cautious on the stock market’s prospects over the near term. The Fund continues to sell at a discount to the S&P 500 on most valuation measures.
____________
1 | The FMI Large Cap Fund Investor Class (FMIHX) and the FMI Large Cap Fund Institutional Class (FMIQX) had a return of 12.67% and 12.82%, respectively, for the fiscal year ended September 30, 2018. |
FMI Large Cap Fund
MANAGEMENT’S DISCUSSION OF FUND PERFORMANCE (Unaudited)
(Continued)
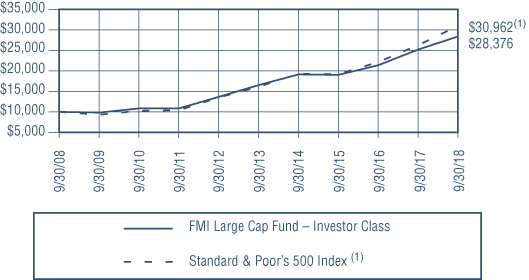
COMPARISON OF CHANGE IN VALUE OF $10,000 INVESTMENT IN
FMI LARGE CAP FUND – INVESTOR CLASS AND STANDARD & POOR’S 500 INDEX(1)
AVERAGE ANNUALIZED TOTAL RETURN
| | | | | | Inception |
| | | | | | through |
| | Inception Date | 1-Year | 5-Year | 10-Year | 9/30/2018 |
| FMI Large Cap Fund – Investor Class | 12/31/01 | 12.67% | 11.43% | 10.99% | 9.28% |
| FMI Large Cap Fund – Institutional Class | 10/31/16 | 12.82% | N/A | N/A | 17.53% |
Standard & Poor’s 500 Index(1)* | | 17.91% | 13.95% | 11.97% | 7.88% |
The graph and the table do not reflect the deduction of taxes that a shareholder would pay on Fund distributions or the redemption of Fund shares. Performance data quoted represents past performance; past performance does not guarantee future results. Investment return and principal value of an investment will fluctuate so that an investor’s shares, when redeemed, may be worth more or less than their original cost. Current performance of a Fund may be lower or higher than the performance quoted. The total returns do not reflect the deduction of taxes that a shareholder would pay on Fund distributions or the redemption of Fund shares. Total return includes change in share prices and in each case includes reinvestments of any dividends, interest and capital gain distributions. Performance data current to the most recent month-end may be obtained by visiting www.fmifunds.com or by calling 1-800-811-5311.
| (1) | The Standard & Poor’s 500 Index consists of 500 selected common stocks, most of which are listed on the New York Stock Exchange. The Standard & Poor’s Ratings Group designates the stocks to be included in the Index on a statistical basis. A particular stock’s weighting in the Index is based on its relative total market value (i.e., its market price per share times the number of shares outstanding). Stocks may be added or deleted from the Index from time to time. |
| * | The benchmark since inception returns are calculated since inception of the Investor Class, December 31, 2001 to September 30, 2018. |
An investment cannot be made directly into an index.
FMI Large Cap Fund
SCHEDULE OF INVESTMENTS
September 30, 2018
| Shares | | | | Cost | | | Value | |
| COMMON STOCKS — 92.6% (a) | | | | | | |
| | | | | | | |
COMMERCIAL SERVICES SECTOR — 2.4% | | | | | | |
| | | Advertising/Marketing Services — 2.4% | | | | | | |
| | 2,135,000 | | Omnicom Group Inc. | | $ | 144,720,073 | | | $ | 145,222,700 | |
| | | | | | | | | |
COMMUNICATIONS SECTOR — 2.7% | | | | | | | | |
| | | | Specialty Telecommunications — 2.7% | | | | | | | | |
| | 7,687,000 | | CenturyLink Inc. | | | 156,339,767 | | | | 162,964,400 | |
| | | | | | | | | |
CONSUMER DURABLES SECTOR — 3.0% | | | | | | | | |
| | | | Tools & Hardware — 3.0% | | | | | | | | |
| | 1,245,000 | | Stanley Black & Decker Inc. | | | 121,553,431 | | | | 182,317,800 | |
| | | | | | | | | |
CONSUMER NON-DURABLES SECTOR — 8.5% | | | | | | | | |
| | | | Beverages: Non-Alcoholic — 2.7% | | | | | | | | |
| | 1,455,000 | | PepsiCo Inc. | | | 146,874,516 | | | | 162,669,000 | |
| | | | | | | | | | | | |
| | | | Food: Major Diversified — 3.0% | | | | | | | | |
| | 2,190,000 | | Nestlé S.A. — SP-ADR | | | 112,268,922 | | | | 182,208,000 | |
| | | | | | | | | | | | |
| | | | Household/Personal Care — 2.8% | | | | | | | | |
| | 3,090,000 | | Unilever PLC — SP-ADR | | | 136,645,902 | | | | 169,857,300 | |
| | | | | | | | | |
CONSUMER SERVICES SECTOR — 7.4% | | | | | | | | |
| | | | Movies/Entertainment — 4.1% | | | | | | | | |
| | 5,440,000 | | Twenty-First Century Fox Inc. – Cl B | | | 158,230,155 | | | | 249,260,800 | |
| | | | | | | | | | | | |
| | | | Other Consumer Services — 3.3% | | | | | | | | |
| | 5,965,000 | | eBay Inc.* | | | 124,808,363 | | | | 196,964,300 | |
| | | | | | | | | |
ELECTRONIC TECHNOLOGY SECTOR — 1.8% | | | | | | | | |
| | | | Electronic Components — 1.8% | | | | | | | | |
| | 1,210,000 | | TE Connectivity Ltd. | | | 18,936,165 | | | | 106,395,300 | |
| | | | | | | | | |
FINANCE SECTOR — 15.5% | | | | | | | | |
| | | | Investment Managers — 1.0% | | | | | | | | |
| | 1,930,000 | | Franklin Resources Inc. | | | 62,018,367 | | | | 58,691,300 | |
| | | | | | | | | | | | |
| | | | Major Banks — 6.8% | | | | | | | | |
| | 3,325,000 | | Bank of New York Mellon Corp. | | | 68,080,743 | | | | 169,541,750 | |
| | 2,148,000 | | JPMorgan Chase & Co. | | | 137,905,665 | | | | 242,380,320 | |
| | | | | | | 205,986,408 | | | | 411,922,070 | |
| | | | Multi-Line Insurance — 5.2% | | | | | | | | |
| | 1,460,000 | | Berkshire Hathaway Inc. – Cl B* | | | 88,501,453 | | | | 312,600,600 | |
| | | | | | | | | | | | |
| | | | Property/Casualty Insurance — 2.5% | | | | | | | | |
| | 1,125,000 | | Chubb Ltd. | | | 151,747,628 | | | | 150,345,000 | |
| | | | | | | | | |
HEALTH SERVICES SECTOR — 10.4% | | | | | | | | |
| | | | Health Industry Services — 3.4% | | | | | | | | |
| | 1,890,000 | | Quest Diagnostics Inc. | | | 190,864,071 | | | | 203,949,900 | |
The accompanying notes to financial statements are an integral part of this schedule.
FMI Large Cap Fund
SCHEDULE OF INVESTMENTS (Continued)
September 30, 2018
| Shares | | | | Cost | | | Value | |
| COMMON STOCKS — 92.6% (a) (Continued) | | | | | | |
| | | | | | | |
HEALTH SERVICES SECTOR — 10.4% (Continued) | | | | | | |
| | | Managed Health Care — 7.0% | | | | | | |
| | 675,000 | | Aetna Inc. | | $ | 114,835,883 | | | $ | 136,923,750 | |
| | 1,070,000 | | UnitedHealth Group Inc. | | | 76,504,985 | | | | 284,662,800 | |
| | | | | | | 191,340,868 | | | | 421,586,550 | |
HEALTH TECHNOLOGY SECTOR — 2.5% | | | | | | | | |
| | | | Medical Specialties — 2.5% | | | | | | | | |
| | 3,995,000 | | Smith & Nephew PLC — SP-ADR | | | 148,560,577 | | | | 148,174,550 | |
| | | | | | | | | |
INDUSTRIAL SERVICES SECTOR — 2.7% | | | | | | | | |
| | | | Oilfield Services/Equipment — 2.7% | | | | | | | | |
| | 2,630,000 | | Schlumberger Ltd. | | | 162,455,964 | | | | 160,219,600 | |
| | | | | | | | | |
PROCESS INDUSTRIES SECTOR — 3.4% | | | | | | | | |
| | | | Chemicals: Agricultural — 3.4% | | | | | | | | |
| | 3,521,000 | | Nutrien Ltd. | | | 159,602,854 | | | | 203,161,700 | |
| | | | | | | | | |
PRODUCER MANUFACTURING SECTOR — 8.8% | | | | | | | | |
| | | | Building Products — 1.9% | | | | | | | | |
| | 3,160,000 | | Masco Corp. | | | 119,891,733 | | | | 115,656,000 | |
| | | | | | | | | | | | |
| | | | Industrial Conglomerates — 4.7% | | | | | | | | |
| | 1,700,000 | | Honeywell International Inc. | | | 162,566,838 | | | | 282,880,000 | |
| | | | | | | | | | | | |
| | | | Trucks/Construction/Farm Machinery — 2.2% | | | | | | | | |
| | 1,965,000 | | PACCAR Inc. | | | 79,213,329 | | | | 133,993,350 | |
| | | | | | | | | |
RETAIL TRADE SECTOR — 11.3% | | | | | | | | |
| | | | Apparel/Footwear Retail — 4.3% | | | | | | | | |
| | 2,325,000 | | The TJX Companies Inc. | | | 163,877,055 | | | | 260,446,500 | |
| | | | | | | | | | | | |
| | | | Discount Stores — 7.0% | | | | | | | | |
| | 2,713,000 | | Dollar General Corp. | | | 198,620,238 | | | | 296,530,900 | |
| | 1,510,000 | | Dollar Tree Inc.* | | | 133,944,252 | | | | 123,140,500 | |
| | | | | | | 332,564,490 | | | | 419,671,400 | |
TECHNOLOGY SERVICES SECTOR — 9.4% | | | | | | | | |
| | | | Information Technology Services — 6.6% | | | | | | | | |
| | 1,270,000 | | Accenture PLC | | | 37,265,546 | | | | 216,154,000 | |
| | 2,814,000 | | Cerner Corp.* | | | 146,339,969 | | | | 181,249,740 | |
| | | | | | | 183,605,515 | | | | 397,403,740 | |
| | | | Packaged Software — 2.8% | | | | | | | | |
| | 3,214,000 | | Oracle Corp. | | | 128,504,605 | | | | 165,713,840 | |
| | | | | | | | | |
TRANSPORTATION SECTOR — 2.8% | | | | | | | | |
| | | | Air Freight/Couriers — 2.8% | | | | | | | | |
| | 2,250,000 | | Expeditors International of Washington Inc. | | | 83,243,577 | | | | 165,442,500 | |
| | | | Total common stocks | | | 3,734,922,626 | | | | 5,569,718,200 | |
The accompanying notes to financial statements are an integral part of this schedule.
FMI Large Cap Fund
SCHEDULE OF INVESTMENTS (Continued)
September 30, 2018
| Principal Amount | | | Cost | | | Value | |
| SHORT-TERM INVESTMENTS — 7.4% (a) | | | | | | |
| | | Bank Deposit Account — 3.3% | | | | | | |
| $ | 196,701,727 | | U.S. Bank N.A., 2.05%^ | | $ | 196,701,727 | | | $ | 196,701,727 | |
| | | | | | | | | | | | |
| | | | U.S. Treasury Securities — 4.1% | | | | | | | | |
| | 50,000,000 | | U.S. Treasury Bills, 1.953%, due 10/18/18^ | | | 49,953,840 | | | | 49,951,184 | |
| | 50,000,000 | | U.S. Treasury Bills, 2.070%, due 11/23/18^ | | | 49,850,938 | | | | 49,844,773 | |
| | 150,000,000 | | U.S. Treasury Bills, 2.098%, due 12/13/18^ | | | 149,362,770 | | | | 149,353,266 | |
| | | | Total U.S. treasury securities | | | 249,167,548 | | | | 249,149,223 | |
| | | | Total short-term investments | | | 445,869,275 | | | | 445,850,950 | |
| | | | Total investments — 100.0% | | $ | 4,180,791,901 | | | | 6,015,569,150 | |
| | | | Other assets, less liabilities — 0.0% (a) | | | | | | | 2,003,535 | |
| | | | TOTAL NET ASSETS — 100.0% | | | | | | $ | 6,017,572,685 | |
| * | Non-income producing security. |
| ^ | The rate shown is as of September 30, 2018. |
| (a) | Percentages for the various classifications relate to total net assets. |
| PLC | Public Limited Company |
| SP-ADR | Sponsored American Depositary Receipt |
The accompanying notes to financial statements are an integral part of this schedule.
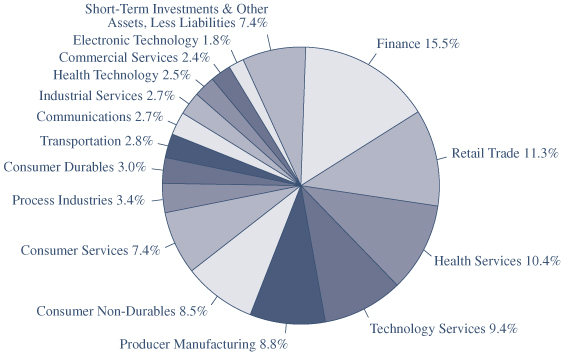
INDUSTRY SECTORSas of September 30, 2018 (Unaudited)
FMI
Common Stock
Fund
September 30, 2018
Dear Fellow Shareholders:
The FMI Common Stock Fund returned 2.88%1 in the September quarter compared to 3.58% for the Russell 2000 Index. Growth stocks continued to outperform value stocks, although not to the same degree as recent quarters or years. Equities of money-losing companies continued to outpace the moneymakers. As of September 25, 2018, of the top 50 performers (year-to-date) in the Russell 2000 benchmark, not a single one would pass our quality or valuation criteria. 35 of the top 50 Russell 2000 performers lost money over the past twelve months. These 50 companies, on a median basis, trade at 9.6 times revenue. The benchmark trades at or near record-high multiples of just about any valuation characteristic one can conjure. Given the heavy flows toward passive index investing, including the Russell 2000, it’s not an exaggeration to say that investors simply don’t seem to care what they are buying. They believe the Russell 2000 is a proxy for small cap or growth stock investing, and that’s about the extent of it. The median Russell 2000 stock has significantly lagged the Index, suggesting performance has been driven by the higher-valued and heavier-weighted stocks. Interestingly, $1 invested in the FMI Common Stock Fund at the beginning of 2009 (roughly coinciding with the start of this bull market) would be worth $3.50 today, compared to $2.38 for the median Russell 2000 stock, and $3.88 for the Russell 2000 Index. In a down market, it is likely that the movie will play in reverse, with the benchmark underperforming the median. Sectors that contributed positively to the Fund’s results in the quarter included Producer Manufacturing, Finance, and Commercial Services. On the negative side of the ledger were Health Technology, Technology Services and Consumer Non-Durable sectors. Cash continued to be a drag. Carlisle Companies, Armstrong World Industries and W.R. Berkeley were positive performers, while FirstCash, Hain Celestial Group and ViaSat detracted.
The seeds of any bust are inherent in the boom that outstrips the pace of whatever solid factors gave it its impetus in the first place. There are no safeguards that can protect the emotional investor from himself. – J. Paul Getty
The bull market stretched into uncharted territory in the third calendar quarter, reaching its longest duration and one of its strongest up-cycle performances on record. Investors continued to focus on the good news -- the U.S. economy, Wall Street’s version of earnings and rising stock prices...while ignoring danger signals -- overconfidence (as reflected in valuations), rising rates and inflation, unbridled debt accumulation, a burgeoning trade war and perhaps some signs of fatigue in the economy. Faith in index funds and exchange-traded funds (ETFs) continued unabated, despite the “crowded trade” nature of many of these products. High confidence in technology shares harkens back to the 1990s, with exceptionally optimistic valuations for both established and startup companies. Private equity transactions, in all but a small minority of cases, are taking place at record-high valuations and debt leverage. So-called “covenant-lite” conditions have returned to the high yield arena. Across the board there appears to be little regard for safety and downside protection.
____________
1 | The FMI Common Stock Fund Investor Class (FMIMX) and the FMI Common Stock Fund Institutional Class (FMIUX) had a return of 2.88% and 2.91%, respectively, for the third quarter of 2018. |
According to Bloomberg’s weekly survey, U.S. real GDP grew at an estimated rate of 3.0% in Q3 and is predicted to grow 2.8% in the December quarter. While the unemployment rate is low, the work force participation rate of 62.7% remained well below its 67% peak, and today, hovers near a 40-year low. Working age population growth continued to be soft (see chart on the right) and unless birth rates or immigration pick up, will be a source of future weakness.
The large number of working-age people who lost jobs in the last recession and were supposed to be returning to the labor force this cycle appear to be mostly idle. The evidence of this is rising wage rates (recently exceeding 3% according to the Atlanta Fed). With wages being the largest cost for most companies, margins may be at risk. Productivity gains, which have been meaningfully below long-term averages (see chart below) may not provide the offset to wage pressures unless there is a sustained increase in business improvement spending.
The benefit from lower tax rates and fewer regulations is a positive, although the lack of fiscal discipline threatens long-term prosperity. The market seems unconcerned with the potential of an economic downturn. While we are not economists, we do recognize that recessions often come out of the blue. A yield curve that is near inversion doesn’t bolster confidence that fair weather is a foregone conclusion. The CRB Metals Index is off over 15% from its recent peak. Pending home sales declined for the eighth straight month in August, down 2.3% from last year. Auto sales, at a recently annualized rate of 16.6 million, are down nearly 1.9 million units from the peak. Many technology companies are seeing inventories grow much faster than sales. Overseas economies, buyers of U.S. products, have softened, particularly in the emerging markets. Currency weakness in many of these countries is of particular concern, given high levels of dollar-denominated debt.
Across the globe, debt levels are rising significantly. The sovereign debt load has approximately doubled, and debt of all kinds is up 75% over the past decade, even though excessive debt was at the root of the last crisis. Worldwide debt-to-GDP is at a record 318%. The U.S. annual budget deficit as a percent of GDP is running at a 4.2% rate...the kind of figure one would normally see in the throes of a recession. Interestingly, it wasn’t that long ago that U.S. leaders chastised Eurozone countries for exceeding the 3% deficit-to-GDP mandate. It is highly unusual for debt ratios to be rising at this point in the economic cycle. The U.S. national debt is $21.5 trillion, an astonishing figure relative to our $20.5 trillion economy and unprecedented in non-war times (see above chart from Bernstein). Unfunded welfare benefits are a multiple of our debt obligations.
Much has been made of the strong earnings performance in recent quarters. Everyone’s skepticism meter ought to be blinking yellow when Wall Street says earnings growth is 20% while the economy is growing 5% nominally and sales growth is in the single digits. We are, of course, experiencing a one-time positive year-over-year benefit from lower corporate tax rates but once those lap, long-term earnings growth rates will likely fall significantly. Wall Street, with an assist from corporate managements, has embraced the concept of “adjusted earnings,” as discussed in previous letters. The abuse of this measurement has reached alarming levels. Based partly on our inquiry, the Leuthold Group studied actual GAAP (generally accepted accounting principles) reported, operating and “adjusted” S&P 500 earnings over a long-term (30-year) time frame. The spread between these figures has become wide. Even excluding the credit crisis quarters, the spread between reported GAAP earnings and Wall Street earnings is 23.6% (Wall Street’s version is always higher). Proponents of adjusted earnings presentation say that amortization of intangibles, stock compensation and other one-time items justify this measure. Leuthold, among other findings, determined that more than 40% of the amount companies spent on mergers & acquisitions activity ended up in the scrap heap (written off). Additionally, many companies that claim “one-time” charges often have these write-offs with great frequency. Excluding the real cost of stock options seems dubious. There may be some justification for adding back a portion of amortization to GAAP earnings, but it seems managements and Wall Street have overplayed this hand.
Using the long-term, oft-cited valuation data provided by Leuthold, stocks today are in the 9th decile on a median basis (10th being the most expensive). We regularly review 46 different valuation series, including several price-to-earnings (P/E) data sets. It would be odd, to say the least, to have most of these measures registering in the 9th or 10th deciles, while at the same time having Wall Street’s version of P/E ratios be “reasonable” or even “attractive,” as proponents like to tout. Somebody is wrong. Using a much harder-to-manipulate series, price-to-sales, tells a different story. Leuthold recently called the above chart “the scariest chart in the world.” Of course, investor sentiment usually reflects the current trajectory of stock prices. “Markets make opinions,” as the old bromide goes.
Ten years after the last financial and stock market crisis, the media has engaged in a lengthy rehash and post mortem of what transpired. It’s ironic and quite surprising to us at least, given how fresh the crisis still is in our minds, that many of the same mistakes are being repeated by investors today. A decade ago most investors scoffed at the notion that home prices could fall. A house was a surefire investment, and the proof of that was the willingness of banks to loan 95% or more against it. Investors believed in Wall Street’s products (credit default options, mortgage-backed securities, collateralized loan obligations, etc.) and high-yield bonds. The economy was seemingly healthy, and the market saw little reason to worry about high valuations. They believed in central bankers. Today, investors have the same lofty confidence in high-flying social media, technology and med-tech shares. Many of the same aforementioned derivative investment vehicles are back in vogue, along with a cornucopia of ETFs and index products. Many mistakenly believe that these products carry not only low fees, but low risk. Do investors in the iShares U.S. Energy ETF, iShares Technology ETF or iShares Telecom ETF, for example, know that far from investing in diversified portfolios, they are putting over half their money behind just five stocks? A little over a year ago we discussed the potential liquidity issues facing many of the most popular ETFs. With turnover in many of these ETFs vastly greater than even the most liquid underlying constituent stocks, trading activity could be very interesting when markets get shaky. Junk bond spreads recently hit 315 basis points over treasuries -- half the level of two years ago and a figure not seen since 2007, according to economist David Rosenberg. The faith in central bankers seems unshaken. Finally, just like a decade ago, perception that the economy is strong appears to be overriding any concern about high valuations or other potential troublesome developments.
What we have seen as excessive and unsustainable has persisted far longer than we thought possible. On one level that makes us “wrong,” but of course that doesn’t change the reality of the aforementioned conditions. We would rather give up some of the upside than to be remorseful in hindsight. Greed usually ends in regret. That means being more cautious with our investments and expectations today. Is there a way around another crisis and lousy stock market? Anything is possible when it comes to markets and human behavior. Earnings...the good and sustainable kind...could advance at a healthy rate and inflation could stay within earshot of 2%. The big one, interest rates, though significantly higher than two years ago, could stay well below normal for an extended period. Wages and other escalating costs could recede. The political crisis between the
left and right could ameliorate. The nascent trade war with China could resolve. Externalities such as terrorism, wars, natural disasters, etc., could be benign. In other words, a lot must go right and not much can go wrong given today’s valuations. We continue to hunt for attractive investments but acknowledge the environment is far from ideal. We are working diligently, with a focus on the long term. Additionally, we have our own money invested right alongside yours. Our confidence in achieving good full cycle returns remains high.
Below we highlight a couple of investments:
Argo Group International Holdings Ltd. (ARGO)
(Analyst: Matthew Goetzinger)
Description
Argo Group International is a diversified specialty insurance company focusing on small-to-mid-sized commercial risks. Specialty Excess and Surplus lines (35% of gross written premiums), niche Commercial Specialty (30%), and International Specialty (15%) together constitute Argo’s property and casualty business. Argo’s Lloyd’s franchise, Syndicate 1200, comprises the remaining mix of premiums written. Reinsurance accounts for 12% of the premium mix. Argo is A rated by A.M. Best.
Good Business
| | • | Argo is a durable, differentiated, and diversified specialty insurer with an attractive small-to-middle market account focus. |
| | | |
| | • | The company has significant scarcity value as one of the few remaining independent scale players in the specialty market with a top five market share. |
| | | |
| | • | Property and casualty insurance is a necessary coverage. This non-discretionary attribute, along with the company’s emphasis on high service levels, results in strong customer retention and predictable revenues. |
| | | |
| | • | Argo’s focus on safety and good risk-adjusted returns leads the company to maintain conservative customer exposures and excess reserves. Management targets 10% annual growth in book value of equity per share. |
| | | |
| | • | The company is managed with conservative leverage parameters. |
| | | |
| | • | Argo is A rated by A.M. Best and Standard & Poor’s, with a risk-based capital ratio of 200%. |
Valuation
| | • | Argo trades at just over 1 times estimated year-end book value per share. |
| | | |
| | • | The 20-year industry average property & casualty insurance book value multiple is 1.2 times, with speciality insurers typically trading at a strong valuation premium to the group. |
| | | |
| | • | Recent private market values for strong specialty insurers have been north of 1.7 times book value. |
Management
| | • | Mark Watson was named Argo’s Chief Executive Officer in January of 2000. He previously had a leadership role at a smaller niche insurer who ultimately sold to the USF&G Corp. |
| | | |
| | • | As a group, Argo’s executive management team and corporate board own 4.9% of the company’s shares outstanding. CEO Mark Watson individually holds approximately 3.3% of the shares. |
| | | |
| | • | The company’s incentive compensation plans appropriately target growth in book value per share as a key metric. |
| | | |
| | • | During the past several years Argo has capitalized on industry changes and hired key talent from larger firms like AIG and Travelers. |
Investment Thesis
Argo is a durable, differentiated specialty insurer with an attractive small-to-middle market account focus. Capitalizing on a continuation of the company’s strong underwriting track record, incremental improvements to overhead costs, and steady investment performance should result in Argo achieving a 10% return on equity, and a higher level once interest rates normalize. The stock trades at an attractive valuation.
Graham Holdings Co. (GHC)
(Analyst: Dan Sievers)
Description
Graham Holdings, formerly the Washington Post Company, is a decentralized family-controlled holding company, and the owner of Kaplan International, Test Prep, and Professional education businesses (55% of second quarter 2018 revenue); seven broadcast television stations (17% of revenues); a manufacturing division (19% of revenues); a home healthcare division (6% of revenues); a digital marketing firm called Social Code (2% of revenues); and other assets (1% of revenues).
Good Business
| | • | Following an almost decade-long restructuring, Kaplan no longer owns or operates a for-profit college. We believe that Kaplan’s education services business (International, Test Prep, and Professional/Schweser) will be able to grow over time, and we should see potential for margin improvement. |
| | | |
| | • | Graham Holdings’ seven broadcast television stations continue to exhibit durability and good profitability, adding value through local news programming while benefiting from growth in retransmission fees and political advertising in even-numbered years. |
| | | |
| | • | For Graham’s Kaplan, broadcast, home healthcare, and Social Code divisions, we believe incremental growth can be achieved with very limited incremental capital investment, leading to attractive returns on invested capital and free cash flow that can be utilized opportunistically by the corporate office to repurchase undervalued shares, or for reasonably-priced acquisitions. |
| | | |
| | • | Graham Holdings is conservatively capitalized with over $400 million in net balance sheet cash. In addition, its pension plans are overfunded by $1 billion. The value of this pension surplus to shareholders is certainly limited but may still be quite significant. |
Valuation
| | • | The company is not covered by any sell-side analysts, but based on our estimates for 2018, the company trades at a modest 6.0 times enterprise value-to-EBITDA (earnings before interest, taxes, depreciation, and amortization) multiple. |
| | | |
| | • | Based on these same near-term 2018 estimates, we estimate a sum-of-the-parts value that offers over 35% upside. We note that Graham has an exemplary long-term record of repurchasing its shares aggressively only when the shares trade at a wide discount to their estimate of net asset value. |
Management
| | • | CEO Tim O’Shaughnessy (age 36) has, in his 4 years at Graham, exhibited financial conservatism and a long-term focus. In August of 2018, he made a $2 million open-market purchase of Graham shares at $550. Mr. O’Shaughnessy is the son-in-law to controlling shareholder and Chairman Donald Graham (age 73), who has more than 18% economic ownership in the company. |
| | | |
| | • | We note the presence (and influence) of reputable value-focused investors such as Chris Davis and Tom Gayner on the board of directors. |
Investment Thesis
Graham Holdings is covered by zero sell-side analysts and has been largely ignored by investors during a nearly decade-long restructuring at Kaplan and a period of difficult -- but necessary -- divestiture decisions, including the 2013 sale of The Washington Post, the spin-off of the very valuable Cable One (CABO) division, and the recent March 2018 divestiture of Kaplan University (now part of Purdue University Global). Today, we believe the restructuring at Kaplan is largely complete, and that the remaining set of Kaplan businesses are attractive. We believe results from this new, stronger and simpler Kaplan are likely to lead some investors to rediscover the stock in due course. In the meantime, the company is run with a long-term focus and has a fortress-like balance sheet, which provides optionality to either repurchase shares at an attractive valuation, or wait for moderately-priced acquisition opportunities to present themselves.
Thank you for your confidence in the FMI Common Stock Fund.
This shareholder letter is unaudited.
FMI Common Stock Fund
MANAGEMENT’S DISCUSSION OF FUND PERFORMANCE (Unaudited)
During the fiscal year ended September 30, 2018, the FMI Common Stock Fund the “Fund” had a total return of 6.92%1. The benchmark Russell 2000 returned 15.24% in the same period. Sectors that aided relative performance included Finance, Producer Manufacturing, and Utilities. FirstCash and Kennedy-Wilson were notable positive contributors within the Finance sector, both likely due to fundamental results being somewhat better than the market anticipated. Armstrong World Industries and Carlisle Cos. reported solid progress and the stocks responded, aiding performance in the Producer Manufacturing sector. The zero exposure to Utilities drove the outperformance of that sector. On the detractor side of the ledger, Technology Services, Distribution Services and Consumer Services, along with elevated cash, pulled down performance. TiVo Corp. and Allscripts Healthcare Solutions, all within Technology Services, underperformed over the past year. TiVo’s stock remained under a cloud due to the ongoing lawsuit with Comcast and a management change. Allscripts seemed to perform reasonably well fundamentally but the company’s complexity and uneven order rate has been off-putting to investors. Recent announcements should make the story much simpler in the future. In the Distribution Service sector, Anixter International declined in the period because of inconsistent quarterly performance. A new CEO was recently installed. Graham Holdings was off slightly during the year so it was a detractor on a relative basis to the Consumer Services sector. Technology related sectors and higher than normal cash were by far the two biggest factors in the underperformance of the Fund during the trailing 12 months.
Some stocks sold in the period include Greenlight Capital, Applied Industrial Technologies, MEDNAX, Kirby Corp., Esterline Technologies and Casey’s General Stores. Stocks added include Cars.com, Howard Hughes, Trinity Industries, Argo Group, TiVo, EnPro Industries, Hain Celestial and WABCO. As of September 30, 2018, the Fund was significantly overweighted in Distribution Services, Commercial Services and Producer Manufacturing and meaningfully underweighted in Finance, Electronic Technology and Health Technology.
The fiscal year was very similar to the prior with respect to the benchmark. Strong performance across most sectors characterized the Russell 2000 over the past year. Highly speculative companies, such as biotechnology and technology stocks, were particularly strong. Despite the Russell 2000’s strong returns, approximately one third of the companies in the index lost money over the past year. Passive investment strategies continued to see heavy inflows of money, at the expense of active strategies. Stocks generally appear overvalued and the Russell 2000 index, on many valuation measures, is even more expensive than it was in the late 1990s. The bull market in small cap stocks, with one interruption, has extended to nine and a half years, one of the longest on record and is up over 450% from the last major trough in March of 2009.
The Federal Reserve has moved slowly to normalize interest rates but the price of money remains unusually cheap by historical standards. Economic growth has improved over the past twelve months but at great cost to both government and corporate balance sheets. Total debt relative to U.S. GDP is near 100% and the deficit to GDP is now 4.2%. Corporate leverage by some measures is at a fifty-year high. The unemployment rate is low but the labor force participation rate continues to be depressed. Wage rates and inflation are rising. Domestic and international political risks remain elevated.
While the conventional wisdom is that stock market risk is low because the economy is stronger, we believe valuations are so high that it leaves little room for error. We remain cautious on the stock market’s prospects over the near term. The Fund continues to sell at a discount to the Russell 2000 on most valuation measures.
____________
1 | The FMI Common Stock Fund Investor Class (FMIMX) and the FMI Common Stock Fund Institutional Class (FMIUX) had a return of 6.92% and 7.02%, respectively, for the fiscal year ended September 30, 2018. |
FMI Common Stock Fund
MANAGEMENT’S DISCUSSION OF FUND PERFORMANCE (Unaudited)
(Continued)
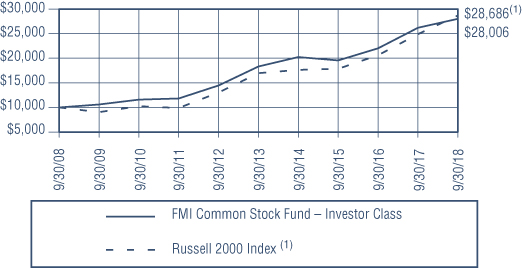
COMPARISON OF CHANGE IN VALUE OF $10,000 INVESTMENT IN
FMI COMMON STOCK FUND – INVESTOR CLASS AND THE RUSSELL 2000 INDEX(1)
AVERAGE ANNUALIZED TOTAL RETURN
| | | | | | Inception |
| | Inception | | | | through |
| | Date | 1-Year | 5-Year | 10-Year | 9/30/2018 |
| FMI Common Stock Fund – | | | | | |
| Investor Class | 12/18/81 | 6.92% | 8.85% | 10.85% | 11.91% |
| FMI Common Stock Fund – | | | | | |
| Institutional Class | 10/31/16 | 7.02% | N/A | N/A | 15.15% |
Russell 2000 Index(1)* | | 15.24% | 11.07% | 11.11% | 10.67% |
The graph and the table do not reflect the deduction of taxes that a shareholder would pay on Fund distributions or the redemption of Fund shares. Performance data quoted represents past performance; past performance does not guarantee future results. Investment return and principal value of an investment will fluctuate so that an investor’s shares, when redeemed, may be worth more or less than their original cost. Current performance of a Fund may be lower or higher than the performance quoted. The total returns do not reflect the deduction of taxes that a shareholder would pay on Fund distributions or the redemption of Fund shares. Total return includes change in share prices and in each case includes reinvestments of any dividends, interest and capital gain distributions. Performance data current to the most recent month-end may be obtained by visiting www.fmifunds.com or by calling 1-800-811-5311.
| (1) | The Russell 2000 Index measures the performance of the 2,000 smallest companies in the Russell 3000 Index, which comprises the 3,000 largest U.S. companies based on total market capitalization. |
| * | The benchmark since inception returns are calculated since inception of the Investor Class, December 18, 1981 to September 30, 2018. |
An investment cannot be made directly into an index.
FMI Common Stock Fund
SCHEDULE OF INVESTMENTS
September 30, 2018
| Shares | | | | Cost | | | Value | |
| COMMON STOCKS — 81.7% (a) | | | | | | |
| | | | | | | |
COMMERCIAL SERVICES SECTOR — 14.4% | | | | | | |
| | | Advertising/Marketing Services — 3.3% | | | | | | |
| | 1,550,000 | | Interpublic Group of Cos. Inc. | | $ | 27,837,296 | | | $ | 35,448,500 | |
| | | | | | | | | | | | |
| | | | Financial Publishing/Services — 1.6% | | | | | | | | |
| | 78,000 | | FactSet Research Systems Inc. | | | 12,516,471 | | | | 17,449,380 | |
| | | | | | | | | | | | |
| | | | Miscellaneous Commercial Services — 5.3% | | | | | | | | |
| | 80,000 | | Broadridge Financial Solutions Inc. | | | 1,629,984 | | | | 10,556,000 | |
| | 1,500,000 | | Genpact Ltd. | | | 27,268,509 | | | | 45,915,000 | |
| | | | | | | 28,898,493 | | | | 56,471,000 | |
| | | | Personnel Services — 4.2% | | | | | | | | |
| | 280,000 | | ManpowerGroup Inc. | | | 19,009,958 | | | | 24,068,800 | |
| | 290,000 | | Robert Half International Inc. | | | 7,557,791 | | | | 20,410,200 | |
| | | | | | | 26,567,749 | | | | 44,479,000 | |
CONSUMER NON-DURABLES SECTOR — 1.3% | | | | | | | | |
| | | | Food: Specialty/Candy — 1.3% | | | | | | | | |
| | 520,000 | | Hain Celestial Group Inc.* | | | 15,815,962 | | | | 14,102,400 | |
| | | | | | | | | |
CONSUMER SERVICES SECTOR — 5.8% | | | | | | | | |
| | | | Cable/Satellite TV — 1.9% | | | | | | | | |
| | 23,000 | | Cable One Inc. | | | 6,979,818 | | | | 20,323,030 | |
| | | | | | | | | | | | |
| | | | Other Consumer Services — 3.9% | | | | | | | | |
| | 73,000 | | Graham Holdings Co. | | | 35,482,299 | | | | 42,288,900 | |
| | | | | | | | | |
DISTRIBUTION SERVICES SECTOR — 7.6% | | | | | | | | |
| | | | Electronics Distributors — 4.4% | | | | | | | | |
| | 280,000 | | Arrow Electronics Inc.* | | | 4,740,467 | | | | 20,641,600 | |
| | 280,000 | | ePlus Inc.* | | | 15,102,514 | | | | 25,956,000 | |
| | | | | | | 19,842,981 | | | | 46,597,600 | |
| | | | Wholesale Distributors — 3.2% | | | | | | | | |
| | 348,000 | | Anixter International Inc.* | | | 22,551,135 | | | | 24,464,400 | |
| | 117,000 | | MSC Industrial Direct Co. Inc. | | | 7,003,921 | | | | 10,308,870 | |
| | | | | | | 29,555,056 | | | | 34,773,270 | |
ELECTRONIC TECHNOLOGY SECTOR — 2.1% | | | | | | | | |
| | | | Telecommunications Equipment — 2.1% | | | | | | | | |
| | 355,000 | | ViaSat Inc.* | | | 24,867,862 | | | | 22,702,250 | |
| | | | | | | | | |
FINANCE SECTOR — 19.6% | | | | | | | | |
| | | | Finance/Rental/Leasing — 6.1% | | | | | | | | |
| | 438,000 | | FirstCash Inc. | | | 13,596,578 | | | | 35,916,000 | |
| | 400,000 | | Ryder System Inc. | | | 18,363,248 | | | | 29,228,000 | |
| | | | | | | 31,959,826 | | | | 65,144,000 | |
| | | | Property/Casualty Insurance — 7.6% | | | | | | | | |
| | 304,750 | | Argo Group International Holdings Ltd. | | | 16,023,541 | | | | 19,214,488 | |
| | 365,000 | | W.R. Berkley Corp. | | | 11,515,238 | | | | 29,174,450 | |
The accompanying notes to financial statements are an integral part of this schedule.
FMI Common Stock Fund
SCHEDULE OF INVESTMENTS (Continued)
September 30, 2018
| Shares | | | | Cost | | | Value | |
| COMMON STOCKS — 81.7% (a) (Continued) | | | | | | |
| | | | | | | |
FINANCE SECTOR — 19.6% (Continued) | | | | | | |
| | | Property/Casualty Insurance — 7.6% (Continued) | | | | | | |
| | 35,000 | | White Mountains Insurance Group Ltd. | | $ | 31,410,325 | | | $ | 32,755,450 | |
| | | | | | | 58,949,104 | | | | 81,144,388 | |
| | | | Real Estate Development — 4.5% | | | | | | | | |
| | 177,000 | | The Howard Hughes Corp.* | | | 22,364,166 | | | | 21,986,940 | |
| | 1,220,000 | | Kennedy-Wilson Holdings Inc. | | | 25,274,389 | | | | 26,230,000 | |
| | | | | | | 47,638,555 | | | | 48,216,940 | |
| | | | Regional Banks — 1.4% | | | | | | | | |
| | 293,000 | | Zions Bancorporation | | | 7,891,512 | | | | 14,693,950 | |
| | | | | | | | | |
PROCESS INDUSTRIES SECTOR — 3.9% | | | | | | | | |
| | | | Containers/Packaging — 3.9% | | | | | | | | |
| | 387,000 | | Avery Dennison Corp. | | | 25,381,510 | | | | 41,931,450 | |
| | | | | | | | | |
PRODUCER MANUFACTURING SECTOR — 19.2% | | | | | | | | |
| | | | Auto Parts: OEM — 1.0% | | | | | | | | |
| | 89,000 | | WABCO Holdings Inc.* | | | 10,947,026 | | | | 10,496,660 | |
| | | | | | | | | | | | |
| | | | Building Products — 3.9% | | | | | | | | |
| | 600,000 | | Armstrong World Industries Inc.* | | | 26,113,541 | | | | 41,760,000 | |
| | | | | | | | | | | | |
| | | | Industrial Machinery — 4.4% | | | | | | | | |
| | 180,000 | | EnPro Industries Inc. | | | 13,414,936 | | | | 13,127,400 | |
| | 414,000 | | Woodward Inc. | | | 17,005,585 | | | | 33,476,040 | |
| | | | | | | 30,420,521 | | | | 46,603,440 | |
| | | | Metal Fabrication — 1.3% | | | | | | | | |
| | 102,000 | | Valmont Industries Inc. | | | 14,934,787 | | | | 14,127,000 | |
| | | | | | | | | | | | |
| | | | Miscellaneous Manufacturing — 6.9% | | | | | | | | |
| | 365,000 | | Carlisle Cos. Inc. | | | 29,135,573 | | | | 44,457,000 | |
| | 965,000 | | TriMas Corp.* | | | 21,230,669 | | | | 29,336,000 | |
| | | | | | | 50,366,242 | | | | 73,793,000 | |
| | | | Trucks/Construction/Farm Machinery — 1.7% | | | | | | | | |
| | 485,000 | | Trinity Industries Inc. | | | 15,852,178 | | | | 17,770,400 | |
| | | | | | | | | |
RETAIL TRADE SECTOR — 2.1% | | | | | | | | |
| | | | Specialty Stores — 2.1% | | | | | | | | |
| | 475,000 | | Penske Automotive Group Inc. | | | 16,842,025 | | | | 22,510,250 | |
| | | | | | | | | |
TECHNOLOGY SERVICES SECTOR — 5.7% | | | | | | | | |
| | | | Information Technology Services — 3.0% | | | | | | | | |
| | 2,260,000 | | Allscripts Healthcare Solutions Inc.* | | | 27,585,536 | | | | 32,205,000 | |
| | | | | | | | | | | | |
| | | | Internet Software/Services — 1.6% | | | | | | | | |
| | 615,000 | | Cars.com Inc.* | | | 16,797,883 | | | | 16,980,150 | |
| | | | | | | | | | | | |
| | | | Packaged Software — 1.1% | | | | | | | | |
| | 920,000 | | TiVo Corp. | | | 12,608,763 | | | | 11,454,000 | |
| | | | Total common stocks | | | 622,652,996 | | | | 873,465,958 | |
The accompanying notes to financial statements are an integral part of this schedule.
FMI Common Stock Fund
SCHEDULE OF INVESTMENTS (Continued)
September 30, 2018
| Principal Amount | | | Cost | | | Value | |
| SHORT-TERM INVESTMENTS — 18.3% (a) | | | | | | |
| | | Bank Deposit Account — 4.3% | | | | | | |
| $ | 45,686,522 | | U.S. Bank N.A., 2.05%^ | | $ | 45,686,522 | | | $ | 45,686,522 | |
| | | | | | | | | | | | |
| | | | U.S. Treasury Securities — 14.0% | | | | | | | | |
| | 25,000,000 | | U.S. Treasury Bills, 1.953%, due 10/18/18^ | | | 24,976,920 | | | | 24,975,592 | |
| | 50,000,000 | | U.S. Treasury Bills, 2.070%, due 11/23/18^ | | | 49,850,937 | | | | 49,844,772 | |
| | 50,000,000 | | U.S. Treasury Bills, 2.098%, due 12/13/18^ | | | 49,787,590 | | | | 49,784,422 | |
| | 25,000,000 | | U.S. Treasury Bills, 2.166%, due 01/17/19^ | | | 24,835,750 | | | | 24,836,031 | |
| | | | Total U.S. treasury securities | | | 149,451,197 | | | | 149,440,817 | |
| | | | Total short-term investments | | | 195,137,719 | | | | 195,127,339 | |
| | | | Total investments — 100.0% | | $ | 817,790,715 | | | | 1,068,593,297 | |
| | | | Other assets, less liabilities — 0.0% (a) | | | | | | | 71,870 | |
| | | | TOTAL NET ASSETS — 100.0% | | | | | | $ | 1,068,665,167 | |
| * | Non-income producing security. |
| ^ | The rate shown is as of September 30, 2018. |
| (a) | Percentages for the various classifications relate to total net assets. |
The accompanying notes to financial statements are an integral part of this schedule.
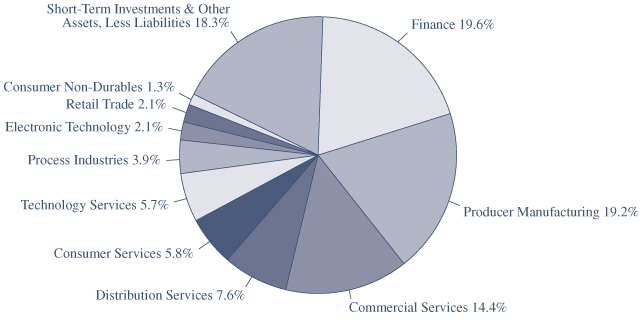
INDUSTRY SECTORS
as of September 30, 2018 (Unaudited)
FMI
International
Fund
September 30, 2018
Dear Fellow Shareholders:
From a macroeconomic standpoint, several negative data points have surfaced: there are signs that global economic growth may have peaked; capital investment disappointed; debt levels continued to rise; trade growth slowed thanks to rising trade tensions and heightened policy uncertainty; housing markets waned; and emerging market currencies and financial markets came under intense pressure. However, after a slow start to the year, developed international stock markets continue their path toward recovery. The FMI International Fund (“Fund”) added 0.51%1 in the quarter, compared with an MSCI EAFE Index return of 2.36% in local currency and 1.35% in U.S. Dollars (USD). The Consumer Services, Electronic Technology and Consumer Durables sectors performed well on a relative basis, partially offset by Producer Manufacturing, Commercial Services, and Distribution Services. Top individual gains were logged by Whitbread, Isuzu Motors and Safran, while Smiths Group, Travis Perkins and Schlumberger each declined in value. Cash detracted from overall returns.
To justify today’s expensive stock valuations, investors need to believe companies will be able to quickly grow into their current multiples. In our view, expectations are lofty and don’t leave much room for error. A number of signposts continue to give us reason for pause.
Structural Growth Challenges
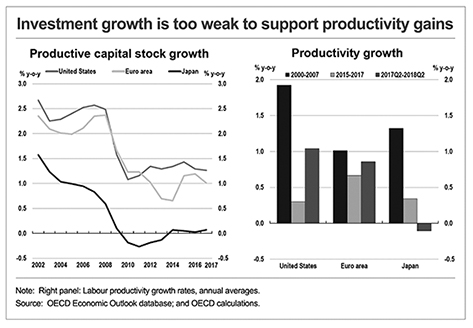
At its core, long-term economic growth is driven by a combination of three key factors: productivity growth, more people working, and people working more hours. Productivity, or the improvement in output per hour worked, can be enhanced by capital investments, as advancements in innovation and technology can help drive efficiency improvements. As capital stock ages, organic investment in property, plant and equipment and research and development (R&D), is paramount in driving future growth. In recent years, however, capital investment and productivity have fallen well short of historical norms, despite an accommodative monetary environment where money was virtually free. Instead, companies have often opted to lever up their balance sheets to acquire businesses or do share buybacks at high valuations, neither of which does much to grow the economic pie. While a momentum and growth-driven stock market might cheer on this form of capital allocation, long-term shareholder value is unlikely to be enhanced by debt-fueled financial engineering. As shown in the chart on the next page from the Organisation for Economic Co-operation and Development (OECD), current “investment growth is too weak to support productivity gains.”2 This is a major problem, and one which requires a significant change in mindset to fix. For the economy to sustainably grow at higher levels, companies must invest organically and improve their productivity.
____________
1 | The FMI International Fund Investor Class (FMIJX) and FMI International Fund Institutional Class (FMIYX) had a return of 0.51% and 0.50%, respectively, for the third quarter of 2018. |
2 | Laurence Boone – OECD Chief Economist, presentation. “OECD Interim Economic Outlook: High uncertainty weighing on global growth.” September 20, 2018. |
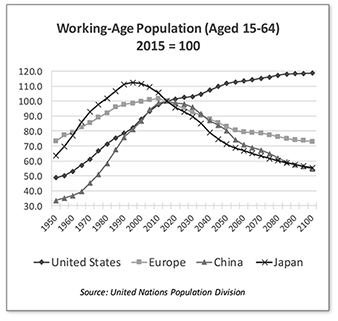
Given that faster growth has not come from productivity, economic output will be more reliant on the number of people working, and number of hours worked. Unfortunately, the outlook on this front is equally challenged. The United Nations Population Division forecasts a steady decline in working-age population in Europe, Japan and China, as illustrated in the chart on the right.3 Despite massive long-term financial implications, this structural challenge gets very little airtime from the financial press.
The Economist aptly describes the problem at hand: “A place with fewer workers must raise productivity even more to keep growing economically. It will struggle to sustain spending on public goods such as defense. The national debt will be borne on fewer shoulders. Fewer people will be around to come up with the sort of brilliant ideas that can enrich a nation. Businesses might be loath to invest. In fast-shrinking Japan, even domestic firms focus on foreign markets. The old will weigh more heavily on society, too. […] In Japan, where young people are few and lives are long, demographers expect there to be 48 people over the age of 65 for every 100 people of working age in 2020. In 1990 there were just 17.” With debt levels rising steadily and more people exiting the workforce, the math starts to break down. The current trajectory is simply not sustainable. Fortunately, there are a number of potential solutions to this predicament: countries can look to increase the number of women in the workforce, push back the retirement age (and related benefits), increase immigration, and improve birth rates. Significant policy changes would be necessary, some of which (such as higher retirement age and immigration) would likely face stiff political opposition.4 Change is never easy, but at some point, tough decisions will have to be made. Ultimately, we see this headwind getting worse before it gets better.
____________
3 | http://www.un.org/en/development/desa/population/ |
4 | “Many countries suffer from shrinking working-age populations,” The Economist, May 5, 2018. |
Corporate Debt: “Tidal Wave”
Coming out of the great financial crisis of 2008-09, the expectation was for significant deleveraging. Quite the opposite has occurred; while households and banks have repaired their balance sheets to some degree, governments, central banks, nonfinancial corporations and shadow banks have more than picked up the slack. In July, the Institute of International Finance (IIF) estimated that total global debt has reached $247 trillion (318% of GDP),5 which compares with $167 trillion in 2007 (287%).6
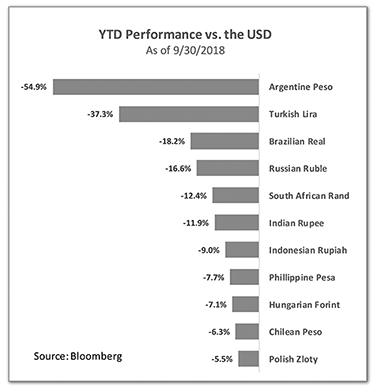
Recent reports by the McKinsey Global Institute (MGI) have studied the corporate debt sector, which often slips under the radar. Thanks to ultra-low interest rates, nonfinancial corporate debt has more than doubled over the last decade, growing by $37 trillion to reach $66 trillion in mid-2017, according to MGI. Approximately two thirds of the growth in corporate debt has come from developing countries, which comes with heightened risk, especially when loans are issued in USD.7 Turkey and Argentina are feeling this pain (see above chart), as their currencies have outright collapsed, with a significant share of debt in foreign currencies, large external financing needs and high domestic inflation, among other factors. Contagion has been limited to emerging markets thus far, and the hope is that it will remain contained.
Not surprisingly, China has accounted for more than half of the growth in global corporate debt, and now has one of the highest corporate debt ratios in the world. Approximately 30% to 35% of corporate debt in China is associated with construction and real estate,8 which we view as a major risk point. Even though a housing and/or credit crisis in China has yet to come to bear, that doesn’t mean it eventually won’t.
Globally, corporate borrowers have shifted toward bond financing instead of bank loans, as demand has been strong, with bond investors starved for yield. Unfortunately, over the past decade there has been a deterioration in credit quality. According to PIMCO, the net leverage ratio for investment grade BBB issuers has risen from 1.7 times in 2000 to 2.9 times in 2017, a significant increase. The debt rating agencies’ willingness to move the goal posts is a troubling development. Meanwhile, loan covenant quality has recently hit record lows, according to Moody’s,9 while corporate defaults are already above their 30-year average, despite an extraordinarily low interest-rate environment.10
____________
5 | “Global Debt Monitor – July 2018.” Institute of International Finance, July 19, 2018. |
6 | “IIF Quarterly Global Debt Monitor – May 2018.” Institute of International Finance, May, 2018. GDP data taken from IMF database (https://www.imf.org/external/datamapper/datasets/WEO/1). |
7 | McKinsey Global Institute discussion paper, “Rising Corporate Debt: Peril or Promise?” June 2018. “A decade after the Global Financial Crisis: What has (and hasn’t) changed?” McKinsey Global Institute briefing note. September 2018, 2. |
8 | McKinsey, 2. |
9 | Alexandra Scaggs. “Loan covenant quality hits record low, says Moody’s.” Financial Times, July 24, 2018. |
10 | McKinsey, 13. |
MGI warns that “a tidal wave of corporate bond refinancing is coming.” They estimate that, “From 2018 to 2022, a record amount of bonds – between $1.6 trillion and $2.1 trillion annually – will mature. […] as much as $10 trillion of bonds will come due over the next five years.” Rising interest rates complicate the situation, and can make refinancing more difficult and expensive, increase the risk of default (i.e., lower interest coverage ratios), and in some cases can make debt burdens unsustainable.11 If we get a recession or a bear market during this period, the risks will be magnified. Investing in companies with strong balance sheets -- a key tenant of FMI’s investment process -- is as important today as it has ever been. Balance sheets don’t seem to matter…until they do.
International Discount: Misunderstood
As we have articulated in prior letters, stock valuations are elevated, both in domestic (U.S.) and international markets. Through quantitative easing (QE) and artificially-low interest rates, global central banks have achieved at least one of their key policy objectives: to increase asset prices. The subsequent wealth effect, which they predicted would trickle down and drive faster growth…? Don’t hold your breath. Domestic stocks are now trading in the 9th or 10th decile of historical valuation, one of the more expensive stock markets on record.12 That said, there is a commonly-held view among investors that developed international stocks are significantly cheaper than their domestic counterparts.
We believe this notion is misguided, especially relating to the high-quality types of businesses we look to own. To start, sector weightings play a significant role in aggregate index valuations. Looking at the U.S. versus Europe, according to Bloomberg (as of 9/24/18) the Standard & Poor’s 500 Index has a whopping 25.8% weighting in technology, one of the most expensive high-flying sectors in the economy, compared to the STOXX 600 Index at a 5.9% weighting. Conversely, the STOXX 600 has a higher weighting in financials (19.8% vs. the S&P 500 at 13.8%), one of the cheapest sectors, but also one which is fraught with risk (i.e., European banks). To improve comparability, JPMorgan tracks a “sector neutral” price-to-earnings (P/E) ratio of the Eurozone vs. the U.S., where they look at sector multiples assuming the same weights. On this basis (see above chart), the Eurozone trades at a slight discount (single-digit percentage) to the U.S., and above its historical average.13
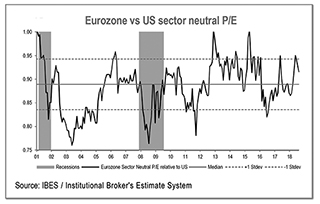
From a bottom-up perspective, our company research in the trenches tells a similar story. While international stocks might appear to be marginally cheaper on the surface, finding great businesses at reasonable (or better yet, inexpensive) prices today is about as difficult overseas as it is in the U.S. The current environment is the most challenging period for new idea generation in FMI’s 37+ year history. As investors gravitate up the business-quality spectrum, the concept of an “international quality international companies (see table on the next page), each of which has a comparable peer trading on
____________
11 | McKinsey, 13. |
12 | Leuthold valuation data. |
13 | Mislav Matejka, Prabhav Bhadani, and Nitya Saldanha. “Equity Strategy: Keep OW US versus Eurozone…” J.P. Morgan Cazenove, August 28, 2018. |
U.S. stock exchanges. Of course, there are idiosyncratic factors at each of these businesses, and there will never be a perfect match in terms of the comps. That said, we think this sample gives a reasonable approximation of the respective opportunity sets. In aggregate, the international basket trades at a slight premium to the domestic, not the wide discount some industry pundits would have you believe.
At the end of the day, stocks are expensive virtually everywhere (in developed markets), not just in the U.S. Central bankers’ money-printing machines have juiced asset classes far and wide.
Glass Half Full
To summarize: Expectations seem high? Check. Leverage is abundant? Check. Risks appear to be intensifying? Check. Growth stocks are outperforming value stocks? Check. Stocks are expensive? Check. Yet we are encouraged? How can that be? Well… for the first time in a long time, fear is starting to creep back into the investor psyche. While some complacency still remains, stock markets are actually going down with regularity, which is how markets are supposed to work. When companies miss earnings, management has a misstep, or when negative macro news hits the wires, stocks are reacting. This is all good news. With volatility come buying opportunities. Great businesses don’t typically go on sale for no reason – but when they do, investors need to be ready to capitalize.
In mid-September, Bank of America Merrill Lynch estimated that global stocks, excluding U.S. technology stocks, were down 7% year-to-date (YTD).14 The emerging market pullback is a big part of this, but the MSCI EAFE Index (USD) is down over 1% YTD as well. Markets move in cycles, and when the next downdraft comes we plan to make the most of it.
Below we highlight a couple of our international investments:
Merlin Entertainments PLC (MERL-LN)
(Analyst: Jordan Teschendorf)
Description
Merlin is the second largest theme park operator in the world by attendance, operating 122 primarily family-focused attractions and over 4,000 themed hotel rooms in 25 countries across three
____________
14 | Michael Hartnett. “The Thundering Word: The Long View.” Bank of America Merrill Lynch, September 16, 2018. |
divisions, with 2017 sales/profit exposure as follows: Midway: 41%/42%, LEGOLAND Parks: 38%/44%, Resort Theme Parks: 21%/14%. Attractions include LEGOLAND Parks (LLP), LEGOLAND Discovery Centers (LDC), Madame Tussauds, SEA LIFE, The Dungeons, The Eye Brand, Little Big City, Peppa Pig and Bear Grylls branded attractions, and branded resort theme parks (RST: Alton Towers, Thorpe Park, Chessington World of Adventures, Warwick Castle, Gardaland and Heide Park). Midway Attractions are predominantly indoor attractions located in city centers or resorts and providing visits of shorter duration, while theme parks are outdoor attractions offering accommodations, rides, shows, and interactive experiences across a central theme. Approximately 66 million visitors came through Merlin’s attractions in 2017, with an average spend per visitor of approximately £20.
Good Business
| | • | Merlin’s return on invested capital is well above its cost of capital, averaging 12.6% over the past five years. |
| | | |
| | • | The business is easy to understand, faces limited risk of disruption, and benefits from increasing spend on experiences. |
| | | |
| | • | The company has an impressive track record of defensive growth, evident in part by positive visitation, revenue, and EBITDA (earnings before interest, taxes, depreciation, and amortization) growth through the global financial crisis. Most attractions are highly differentiated and modestly priced, enforcing strong value. |
| | | |
| | • | Merlin’s licensing and co-operation agreement with LEGO A/S confers global exclusivity to operate existing LEGOLAND parks in perpetuity and global exclusivity to open further parks until beyond 2050 (with extensions thereafter). LEGO is the world’s largest toy company, and one of most valuable global consumer brands. This intellectual property further differentiates Merlin and is key to LEGOLAND Parks’ financial record of double-digit growth with attractive returns on capital. |
| | | |
| | • | We view the company’s opportunity to add themed accommodations to its parks as capable of generating £10-£20 million of annual EBITDA at high incremental returns over the next five years and beyond. |
| | | |
| | • | Merlin’s business is increasingly diversified by geography, with the UK representing 31% of 2017 sales, down from 43% in 2011 and 49% in 2008. We expect this trend to continue, contributing to a higher valuation over time. |
| | | |
| | • | The balance sheet is appropriately financed with 2.4 times net leverage. |
Valuation
| | • | Merlin’s stock price is up only modestly from its closing price the day it came public in late 2013, despite growing earnings per share by nearly 20%. Total return has lagged the FTSE All-Share Index by 17% — the entirety of this underperformance due to price movement following its fiscal third quarter 2017 results. |
| | | |
| | • | The company trades at approximately 17.7 times forward earnings estimates, which have recently been reset to account for a more challenging external environment. This is near the lowest valuation for Merlin since it has been publicly traded and compares to an average multiple of 20 times forward earnings. |
| | | |
| | • | On an enterprise value basis, shares currently yield nearly 6% on trailing underlying free cash flow, which we expect to grow at a mid-to-high single-digit rate over the next several years. |
Management
| | • | CEO Nick Varney (54) led a management buyout of Vardon Attractions in 1999 to form Merlin. He beneficially owned 6.681 million shares at the end of last year, worth £26 million at the current price. |
| | • | The LEGO family office (KIRKBI) holds an approximately 30% ownership in Merlin, keeping them invested in the company’s long-term success. |
| | | |
| | • | Our initial view of management is that of highly disciplined capital allocators, willing to invest for the long term in the group’s highest returning projects. Management aims to earn 20% EBITDA return on capital employed (ROCE) on all capital expenditure (CapEx). Long-term compensation is tied to earnings per share (EPS) growth and ROCE (after-tax and includes all intangible assets) over a three-year period. No awards are earned if ROCE does not exceed 8.0%. |
Investment Thesis
Merlin’s like-for-like revenue and margins have come under pressure over the last few years as a result of slower underlying market growth and adverse external factors, including poor weather, foreign exchange volatility, and terror attacks in markets important to the group (London, Manchester, Munich and Berlin). Elevated uncertainty associated with Britain’s exit from the EU, and potential for prolonged pressure on consumer spending in the important UK market (approximately 30% of EBITDA) have further weighed on sentiment. While there is limited visibility today, we believe that over time, the market will look past these external factors and apply a higher multiple to the company’s growing earnings stream. Notwithstanding near-term pressure that could persist within Midway, we think Merlin can grow earnings at a reasonable rate over the next several years, given its significant opportunity to expand LEGO-themed attractions and accommodations, which hold global appeal and represent approximately half of group EBITDA. Across consumer-facing businesses, we view the company’s global and perpetual exclusivity to operate and expand LEGO’s physical and tangible presence as a unique and irreplaceable asset not fully reflected in the group’s valuation.
Samsung Electronics Co. Ltd. (005935-KS)
(Analyst: Dan Sievers)
Description
Samsung Electronics was founded in 1969 and is headquartered 45 minutes south of Seoul. It is broadly organized as a Components Business (75% of 2017 operating profit), which includes semiconductor production (DRAM, NAND, and System LSI) and display panels (OLED, LED, and LCD technologies); and a Sets Business (25% of 2017 operating profit), which includes mobile computing products (smartphones, tablets, laptops, and telecom equipment), consumer electronics (televisions, monitors, and home appliances), and medical equipment. Sales to external customers in 2017 were 34% Americas, 19% Europe, 18% Asia & Africa, 16% China, and 13% Korea.
Good Business
| | • | Samsung Electronics has established leadership positions in most of its key Components Businesses. It is the global #1 producer of both DRAM and NAND memory and #1 in OLED display technology. In the Sets Businesses, the company remains #1 in total global smartphone units and television display units. Samsung has been gaining some global share in semiconductor foundry, home appliances, and medical and telecom equipment. |
| | | |
| | • | The value of Samsung’s franchise resides principally in its leading Components Businesses, where components go into both Samsung and other manufacturers’ products worldwide. Even so, some observers continue to overstate the importance of the company’s mobile smartphone business (22% of 2017 operating income). |
| | | |
| | • | In 2017, Samsung ranked #2 on the list of U.S. patent recipients, and Interbrand ranked it the #6 best global brand. |
| | | |
| | • | Barriers to entry continue to rise in the global semiconductor production industry. Samsung has the resources and technology to invest for the long term and has indeed led the global |
| | | semiconductor industry in CapEx spending in eight of the last ten years. In 2017, the company spent KW 28 trillion ($25 billion) on semiconductor CapEx and another KW 14 trillion ($12 billion) on display CapEx, with additional company-wide R&D investment of KW 16 trillion ($14 billion). |
| | | |
| | • | Samsung reported a return on equity of 21% in 2017, despite a drag from an inefficient over-capitalized balance sheet. As of the second quarter of 2018, the company had KW 70 trillion ($62 billion) in net cash on the balance sheet. |
Valuation
| | • | The company remains a very cheap enterprise at 4.4 times 2017 enterprise value-to-earnings before interest and taxes (EV/EBIT), 2.6 times 2017 EV/EBITDA, and 1.2 times book value. Samsung Electronics can be owned at an even more attractive valuation via the preferred shares (3.7% dividend yield) which trade at a 19% discount to the common shares (3.0% dividend yield) and sport an undemanding 5.7 times price-to-earnings (trailing 12 months). |
| | | |
| | • | Despite significant increases in direct returns of capital to shareholders (through dividends and buybacks), net cash continues to build on the company’s balance sheet (which increases future optionality). |
Management
| | • | Samsung’s founding family continues to hold significant influence through high-single-digit economic ownership of the company’s shares and much higher (although well short of majority) voting control. We expect Samsung heir Jae Yong Lee (48) to have a visible role, but do not view his role as critical to Samsung’s success. Historically, South Korean corporate governance has been lacking, but the company’s governance has shown improvement in recent years, exemplified by the 2017 separation of the Chairman and CEO roles. Samsung Electronics is largely unencumbered by Samsung Group cross-holdings. |
| | | |
| | • | In the third quarter of 2017, an orderly management transition occurred amongst Samsung’s CEO with 36-year Samsung veteran Dr. Ki-nam Kim (UCLA PhD) being elevated to lead the Components Businesses. |
| | | |
| | • | Over the past five years, dividends have grown at a 40% compound annual growth rate (CAGR) and shares outstanding have shrunk at a 2% CAGR. |
Investment Thesis
Samsung has produced strong results over the past three years, but investors are currently concerned about the very high level of profitability in its leading global memory business (DRAM and NAND), where profit margins are expected to decline over the next few years. Despite this expected decline in memory profitability, the company’s leading competitive position in memory is unlikely to be threatened over the next several years as capacity additions have become more difficult (rising entry barriers) and established competitors have become more rational (partly due to consolidation). We see the potential for both revenue growth and margin improvement in a variety of Samsung Electronics’ other businesses such as System LSI (semiconductor components & foundry), Display (OLED components), and Consumer Electronics. When taken together, we think Samsung’s preferred shares are very cheap at 5.4 times estimated 2018 earnings.
Thank you for your confidence in the FMI International Fund.
This shareholder letter is unaudited.
FMI International Fund
MANAGEMENT’S DISCUSSION OF FUND PERFORMANCE (Unaudited)
During the fiscal year ended September 30, 2018, the FMI International Fund (FMIJX) the “Fund” had a total return of 2.27%1. Over the same period, the MSCI EAFE Index the “Index” returned 5.09% in local currency and 2.74% in U.S. Dollars (USD). Sectors that aided the Fund’s relative performance included Finance, Consumer Services, and Process Industries. In Finance, our underweighting to this underperforming sector added to performance. Whitbread helped drive performance in the Consumer Services sector, as Coca-Cola’s acquisition of Whitbread’s Costa Coffee business was a catalyst for value creation. In Process Industries, Nutrien performed well on the back of merger synergies, rising potash and nitrogen prices, and the sale of equity stakes, driving outperformance in the space. On the negative side of the ledger, Commercial Services, Energy Minerals, and Retail Trade all weighed on relative performance. In Commercial Services, Adecco’s temporary staffing growth started to slow, and the market punished the stock over fears that the cycle may have peaked. Our long-term thesis, through a full cycle, remains intact. Not having exposure to Energy Minerals hurt, as it was the strongest performing sector in the Index. The quality of the businesses driving the returns in Energy Minerals is suspect, however. In Retail Trade, skepticism around Dufry’s margin trajectory have weighed on the stock; we have a more optimistic outlook. Other stocks that helped performance included Ferguson, Accenture and Safran. Electrolux, Travis Perkins, and Jardine Strategic detracted from relative results. An underweight exposure to Japan, which was among the strongest performing stock markets, weighed on the relative performance, as did an elevated cash position. Currency hedging helped, as the USD strengthened over the period.
New additions to the Fund over the past twelve months included Bureau Veritas, Merlin Entertainments, CK Hutchison Holdings, Expeditors International of Washington, Smith & Nephew, Safran, Grupo Televisa, and Chubb Ltd. Makita Corp, Genting Malaysia, Admiral Group, Rolls-Royce Holdings, Samsonite International, and Liberty Latin America were sold during the fiscal year. A number of holdings were either boosted or trimmed. As of September 30, 2018, the Fund was significantly overweighted in Consumer Services, Commercial Services, and Distribution Services and underweighted in Finance, Health Technology, and Energy Minerals. The Fund is notably overweighted in Canada and South Korea and underweighted in Japan.
Despite a rough March quarter, where rising interest rates, a spike in volatility, and talk of a potential trade war temporarily shook investor confidence, stocks powered through and rose modestly in the most recent fiscal year. Markets continue to shrug off a slew of negative macro-economic data points: signs that global economic growth may have peaked, disappointing levels of capital investment, increasing debt levels, slowing trade growth thanks to rising trade tensions and heightened policy uncertainty, weakening housing markets, and the collapse of several emerging market currencies and financial markets. Despite all the talk last year of a “synchronized” global economic recovery, economic growth remains below historical averages. Productivity has lagged, and China, Europe and Japan face a structural challenge of declining working age populations. The central bank monetary experiment continues, with money printing, massive asset-buying programs (quantitative easing or QE) and negative interest rates still prevalent; encouragingly these policies should start to wind down in the coming years. Stock valuations continue to be elevated, both in the U.S. and abroad, providing investors with less margin of safety. With risks abound, we remain cautious and will continue to focus on downside protection. The Fund continues to sell at a discount to the MSCI EAFE on most valuation measures.
____________
1 | The FMI International Fund Investor Class (FMIJX) and FMI International Fund Institutional Class (FMIYX) had a return of 2.27% and 2.40%, respectively, for the fiscal year ended September 30, 2018. |
FMI International Fund
MANAGEMENT’S DISCUSSION OF FUND PERFORMANCE (Unaudited)
(Continued)
COMPARISON OF CHANGE IN VALUE OF $10,000 INVESTMENT IN
FMI INTERNATIONAL FUND – INVESTOR CLASS AND MSCI EAFE(1)
AVERAGE ANNUALIZED TOTAL RETURN
| | | | | | Inception |
| | Inception | | | | through |
| | Date | 1-Year | 5-Year | 10-Year | 9/30/2018 |
| FMI International Fund – Investor Class | 12/31/10 | 2.27% | 7.95% | N/A | 9.19% |
| FMI International Fund – Institutional Class | 10/31/16 | 2.40% | N/A | N/A | 8.88% |
MSCI EAFE Net (LOC)(1)* | | 5.09% | 7.87% | 6.70% | 7.85% |
MSCI EAFE Net (USD)(1)* | | 2.74% | 4.42% | 5.38% | 5.24% |
The graph and the table do not reflect the deduction of taxes that a shareholder would pay on Fund distributions or the redemption of Fund shares. Performance data quoted represents past performance; past performance does not guarantee future results. Investment return and principal value of an investment will fluctuate so that an investor’s shares, when redeemed, may be worth more or less than their original cost. Current performance of a Fund may be lower or higher than the performance quoted. The total returns do not reflect the deduction of taxes that a shareholder would pay on Fund distributions or the redemption of Fund shares. Total return includes change in share prices and in each case includes reinvestments of any dividends, interest and capital gain distributions. Performance data current to the most recent month-end may be obtained by visiting www.fmifunds.com or by calling 1-800-811-5311.
FMI International Fund
MANAGEMENT’S DISCUSSION OF FUND PERFORMANCE (Unaudited)
(Continued)
| (1) | The MSCI EAFE Index (Europe, Australasia, Far East) is a free float-adjusted market capitalization index that is designed to measure the equity market performance of developed markets, excluding the U.S. and Canada. The MSCI EAFE Index consists of the following 21 developed market country indices: Australia, Austria, Belgium, Denmark, Finland, France, Germany, Hong Kong, Ireland, Israel, Italy, Japan, the Netherlands, New Zealand, Norway, Portugal, Singapore, Spain, Sweden, Switzerland and the United Kingdom. The MSCI EAFE Index is unmanaged and investors cannot invest directly in the Index. Index results are inclusive of dividends and net of foreign withholding taxes. The reported figures include reinvestment of dividends and capital gains distributions and do not reflect any fees or expenses. |
| | The MSCI EAFE Index is calculated in local currency (LOC) as well as in U.S. dollars (USD). The concept of a LOC calculation excludes the impact of currency fluctuations. All currencies of listing are considered in the Index calculation in LOC where current prices (t) and previous day prices (t-1) are converted into USD using the same exchange rate (exchange rate t-1) in the numerator and denominator. As a consequence, the FX factor drops out of the equation. The USD calculation includes exchange rates at t and t-1. Therefore, the LOC calculation only represents the price appreciation or depreciation of the securities, whereas the USD calculation also accounts for the performance of the currency (or currencies) relative to the USD. MSCI EAFE is a service mark of MSCI Barra. |
| * | The benchmark since inception returns are calculated since inception of the Investor Class, December 31, 2010 to September 30, 2018. |
An investment cannot be made directly into an index.
FMI International Fund
SCHEDULE OF INVESTMENTS
September 30, 2018
| Shares | | | | Cost | | | Value | |
| LONG-TERM INVESTMENTS — 86.2% (a) | | | | | | |
| COMMON STOCKS — 78.9% (a) | | | | | | |
| | | | | | | |
COMMERCIAL SERVICES SECTOR — 10.0% | | | | | | |
| | | Advertising/Marketing Services — 1.9% | | | | | | |
| | 9,400,000 | | WPP PLC (Jersey) (b) | | $ | 189,321,479 | | | $ | 137,659,718 | |
| | | | | | | | | | | | |
| | | | Miscellaneous Commercial Services — 5.9% | | | | | | | | |
| | 3,600,000 | | Bureau Veritas S.A. (France) (b) | | | 90,760,709 | | | | 92,960,026 | |
| | 1,515,000 | | DKSH Holding AG (Switzerland) (b) | | | 99,220,292 | | | | 103,151,566 | |
| | 2,878,000 | | Secom Co. Ltd. (Japan) (b) | | | 202,201,654 | | | | 234,533,116 | |
| | | | | | | 392,182,655 | | | | 430,644,708 | |
| | | | Personnel Services — 2.2% | | | | | | | | |
| | 3,080,000 | | Adecco Group AG (Switzerland) (b) | | | 187,540,039 | | | | 161,907,469 | |
| | | | | | | | | |
COMMUNICATIONS SECTOR — 2.2% | | | | | | | | |
| | | | Wireless Telecommunications — 2.2% | | | | | | | | |
| | 2,864,000 | | Millicom International | | | | | | | | |
| | | | Cellular S.A. (Luxembourg) (b) | | | 152,399,219 | | | | 164,253,131 | |
| | | | | | | | | |
CONSUMER DURABLES SECTOR — 3.9% | | | | | | | | |
| | | | Electronics/Appliances — 2.0% | | | | | | | | |
| | 6,570,000 | | Electrolux AB — Series B (Sweden) (b) | | | 166,088,889 | | | | 144,731,967 | |
| | | | | | | | | | | | |
| | | | Motor Vehicles — 1.9% | | | | | | | | |
| | 8,824,000 | | Isuzu Motors Ltd. (Japan) (b) | | | 101,263,672 | | | | 139,106,264 | |
| | | | | | | | | |
CONSUMER NON-DURABLES SECTOR — 8.2% | | | | | | | | |
| | | | Food: Major Diversified — 2.8% | | | | | | | | |
| | 2,450,000 | | Nestlé S.A. (Switzerland) (b) | | | 185,117,597 | | | | 203,929,734 | |
| | | | | | | | | | | | |
| | | | Household/Personal Care — 5.4% | | | | | | | | |
| | 2,200,000 | | Henkel AG & Co. KGaA (Germany) (b) | | | 223,562,609 | | | | 233,393,108 | |
| | 2,900,000 | | Unilever PLC (Britain) (b) | | | 123,443,909 | | | | 159,309,872 | |
| | | | | | | 347,006,518 | | | | 392,702,980 | |
CONSUMER SERVICES SECTOR — 13.5% | | | | | | | | |
| | | | Broadcasting — 1.5% | | | | | | | | |
| | 6,152,000 | | Grupo Televisa S.A.B. — SP-ADR (Mexico) | | | 100,730,407 | | | | 109,136,480 | |
| | | | | | | | | | | | |
| | | | Cable/Satellite TV — 0.9% | | | | | | | | |
| | 3,410,000 | | Shaw Communications Inc. (Canada) | | | 65,146,896 | | | | 66,449,657 | |
| | | | | | | | | | | | |
| | | | Movies/Entertainment — 4.2% | | | | | | | | |
| | 30,000,000 | | Merlin Entertainments PLC (Britain) (b) | | | 147,047,745 | | | | 156,455,815 | |
| | 5,800,000 | | Vivendi S.A. (France) (b) | | | 108,513,337 | | | | 149,158,836 | |
| | | | | | | 255,561,082 | | | | 305,614,651 | |
| | | | Restaurants — 6.9% | | | | | | | | |
| | 7,650,000 | | Compass Group PLC (Britain) (b) | | | 142,723,033 | | | | 170,085,828 | |
| | 5,400,000 | | Whitbread PLC (Britain) (b) | | | 251,459,757 | | | | 331,895,908 | |
| | | | | | | 394,182,790 | | | | 501,981,736 | |
The accompanying notes to financial statements are an integral part of this schedule.
FMI International Fund
SCHEDULE OF INVESTMENTS (Continued)
September 30, 2018
| Shares | | | | Cost | | | Value | |
| LONG-TERM INVESTMENTS — 86.2% (a) (Continued) | | | | | | |
| COMMON STOCKS — 78.9% (a) (Continued) | | | | | | |
| | | | | | | |
DISTRIBUTION SERVICES SECTOR — 6.0% | | | | | | |
| | | Wholesale Distributors — 6.0% | | | | | | |
| | 4,026,315 | | Ferguson PLC (Jersey) (b) | | $ | 237,262,647 | | | $ | 341,521,498 | |
| | 7,025,000 | | Travis Perkins PLC (Britain) (b) | | | 133,822,456 | | | | 97,486,823 | |
| | | | | | | 371,085,103 | | | | 439,008,321 | |
ELECTRONIC TECHNOLOGY SECTOR — 4.1% | | | | | | | | |
| | | | Aerospace & Defense — 2.7% | | | | | | | | |
| | 1,400,000 | | Safran S.A. (France) (b) | | | 153,404,423 | | | | 196,033,535 | |
| | | | | | | | | | | | |
| | | | Electronic Components — 1.4% | | | | | | | | |
| | 1,180,000 | | TE Connectivity Ltd. (Switzerland) | | | 68,369,824 | | | | 103,757,400 | |
| | | | | | | | | |
FINANCE SECTOR — 5.6% | | | | | | | | |
| | | | Property/Casualty Insurance — 5.6% | | | | | | | | |
| | 1,100,000 | | Chubb Ltd. (Switzerland) | | | 148,633,408 | | | | 147,004,000 | |
| | 487,000 | | Fairfax Financial Holdings Ltd. (Canada) | | | 230,880,600 | | | | 264,582,031 | |
| | | | | | | 379,514,008 | | | | 411,586,031 | |
HEALTH TECHNOLOGY SECTOR — 2.1% | | | | | | | | |
| | | | Medical Specialties — 2.1% | | | | | | | | |
| | 8,600,000 | | Smith & Nephew PLC (Britain) (b) | | | 158,712,650 | | | | 156,904,871 | |
| | | | | | | | | |
INDUSTRIAL SERVICES SECTOR — 2.7% | | | | | | | | |
| | | | Oilfield Services/Equipment — 2.7% | | | | | | | | |
| | 3,225,000 | | Schlumberger Ltd. (Curacao) | | | 249,738,271 | | | | 196,467,000 | |
| | | | | | | | | |
PROCESS INDUSTRIES SECTOR — 3.8% | | | | | | | | |
| | | | Chemicals: Agricultural — 3.8% | | | | | | | | |
| | 4,793,000 | | Nutrien Ltd. (Canada) | | | 236,563,252 | | | | 276,556,100 | |
| | | | | | | | | |
PRODUCER MANUFACTURING SECTOR — 8.2% | | | | | | | | |
| | | | Industrial Conglomerates — 8.2% | | | | | | | | |
| | 14,560,000 | | CK Hutchison Holdings Ltd. | | | | | | | | |
| | | | (Cayman Islands) (b) | | | 187,020,334 | | | | 167,596,385 | |
| | 4,890,000 | | Jardine Strategic Holdings Ltd. (Bermuda) (b) | | | 156,258,471 | | | | 177,478,315 | |
| | 13,225,000 | | Smiths Group PLC (Britain) (b) | | | 229,254,640 | | | | 257,494,828 | |
| | | | | | | 572,533,445 | | | | 602,569,528 | |
RETAIL TRADE SECTOR — 1.4% | | | | | | | | |
| | | | Specialty Stores — 1.4% | | | | | | | | |
| | 905,000 | | Dufry AG (Switzerland) (b) | | | 112,246,049 | | | | 102,250,194 | |
| | | | | | | | | |
TECHNOLOGY SERVICES SECTOR — 3.5% | | | | | | | | |
| | | | Information Technology Services — 3.5% | | | | | | | | |
| | 1,505,000 | | Accenture PLC (Ireland) | | | 140,609,017 | | | | 256,151,000 | |
The accompanying notes to financial statements are an integral part of this schedule.
FMI International Fund
SCHEDULE OF INVESTMENTS (Continued)
September 30, 2018
| Shares | | | | Cost | | | Value | |
| LONG-TERM INVESTMENTS — 86.2% (a) (Continued) | | | | | | |
| COMMON STOCKS — 78.9% (a) (Continued) | | | | | | |
| | | | | | | |
TRANSPORTATION SECTOR — 3.7% | | | | | | |
| | | Air Freight/Couriers — 1.4% | | | | | | |
| | 1,365,000 | | Expeditors International of Washington Inc. | | | | | | |
| | | | (United States) | | $ | 85,921,045 | | | $ | 100,368,450 | |
| | | | | | | | | | | | |
| | | | Other Transportation — 2.3% | | | | | | | | |
| | 38,413,000 | | Bolloré (France) (b) | | | 154,813,277 | | | | 165,922,137 | |
| | | | Total common stocks | | | 5,220,051,607 | | | | 5,765,693,062 | |
| | | | | | | | | | | | |
| PREFERRED STOCKS — 7.3% (a) | | | | | | | | |
| | | | | | | | | |
CONSUMER DURABLES SECTOR — 1.3% | | | | | | | | |
| | | | Motor Vehicles — 1.3% | | | | | | | | |
| | 1,210,000 | | Hyundai Motor Co. (South Korea) (b) | | | 104,818,794 | | | | 92,421,829 | |
| | | | | | | | | |
CONSUMER NON-DURABLES SECTOR — 2.8% | | | | | | | | |
| | | | Household/Personal Care — 2.8% | | | | | | | | |
| | 671,000 | | Amorepacific Corp. (South Korea) (b) | | | 90,071,227 | | | | 83,163,417 | |
| | 171,000 | | LG Household & Health Care Ltd. | | | | | | | | |
| | | | (South Korea) (b) | | | 62,411,759 | | | | 123,930,389 | |
| | | | | | | 152,482,986 | | | | 207,093,806 | |
ELECTRONIC TECHNOLOGY SECTOR — 3.2% | | | | | | | | |
| | | | Telecommunications Equipment — 3.2% | | | | | | | | |
| | 6,950,000 | | Samsung Electronics Co. Ltd. | | | | | | | | |
| | | | (South Korea) (b) | | | 144,738,652 | | | | 237,045,412 | |
| | | | Total preferred stocks | | | 402,040,432 | | | | 536,561,047 | |
| | | | Total long-term investments | | | 5,622,092,039 | | | | 6,302,254,109 | |
The accompanying notes to financial statements are an integral part of this schedule.
FMI International Fund
SCHEDULE OF INVESTMENTS (Continued)
September 30, 2018
| Principal Amount | | | Cost | | | Value | |
| SHORT-TERM INVESTMENTS — 13.2% (a) | | | | | | |
| | | Bank Deposit Account — 4.3% | | | | | | |
| $ | 316,215,164 | | U.S. Bank N.A., 2.05%^(c) | | $ | 316,215,164 | | | $ | 316,215,164 | |
| | | | | | | | | | | | |
| | | | U.S. Treasury Securities — 8.9% | | | | | | | | |
| | 300,000,000 | | U.S. Treasury Bills, 2.070%, due 11/23/18^ | | | 299,105,625 | | | | 299,068,635 | |
| | 250,000,000 | | U.S. Treasury Bills, 2.098%, due 12/13/18^ | | | 248,937,951 | | | | 248,922,110 | |
| | 100,000,000 | | U.S. Treasury Bills, 2.166%, due 01/17/19^ | | | 99,343,000 | | | | 99,344,125 | |
| | | | Total U.S. treasury securities | | | 647,386,576 | | | | 647,334,870 | |
| | | | Total short-term investments | | | 963,601,740 | | | | 963,550,034 | |
| | | | Total investments — 99.4% | | $ | 6,585,693,779 | | | | 7,265,804,143 | |
| | | | Other assets, less liabilities — 0.6% (a) | | | | | | | 47,397,736 | |
| | | | TOTAL NET ASSETS — 100.0% | | | | | | $ | 7,313,201,879 | |
| ^ | The rate shown is as of September 30, 2018. |
| (a) | Percentages for the various classifications relate to total net assets. |
| (b) | Security does not trade during New York Stock Exchange hours and has been valued in accordance with the procedures discussed in Note 1(a) to the financial statements and has been classified as Level 2. |
| | As of September 30, 2018 the aggregate value of these securities was $4,781,781,991. |
| (c) | As of September 30, 2018, $3,490,000 of this security is held as collateral for certain forward currency contracts. |
| PLC | Public Limited Company |
| SP-ADR | Sponsored American Depositary Receipt |
The accompanying notes to financial statements are an integral part of this schedule.
FMI International Fund
SCHEDULE OF FORWARD CURRENCY CONTRACTS
September 30, 2018
| | | | | | | | | U.S. $ Value on | | | | | | U.S. $ Value on | | | | |
| | | | | | | | | September 30, | | | | | | September 30, | | | | |
| | | | | | | | | 2018 | | | | | | 2018 | | | Unrealized | |
| Settlement | | | | Currency to | | | of Currency to | | | Currency to | | | of Currency to | | | Appreciation | |
| Date | | Counterparty | | be Delivered | | | be Delivered | | | be Received | | | be Received | | | (Depreciation) | |
| 10/26/18 | | The Bank of New | | 1,220,000,000 | | | $ | 1,592,178,240 | | | 1,610,491,500 | | | $ | 1,610,491,500 | | | $ | 18,313,260 | |
| | | | York Mellon | | British Pound | | | | | | | U.S. Dollar | | | | | | | | | |
| | | | | | | | | | | | | | | | | | | | | | |
| 10/26/18 | | JPMorgan Chase | | 395,000,000 | | | | 306,004,612 | | | 301,995,617 | | | | 301,995,617 | | | | (4,008,995 | ) |
| | | | Bank, N.A. | | Canadian Dollar | | | | | | | U.S. Dollar | | | | | | | | | |
| | | | | | | | | | | | | | | | | | | | | | |
| 10/26/18 | | State Street Bank | | 630,000,000 | | | | 733,108,712 | | | 741,761,370 | | | | 741,761,370 | | | | 8,652,658 | |
| | | | and Trust Co. | | Euro | | | | | | | U.S. Dollar | | | | | | | | | |
| | | | | | | | | | | | | | | | | | | | | | |
| 10/26/18 | | The Bank of New | | 34,000,000,000 | | | | 299,868,058 | | | 307,888,743 | | | | 307,888,743 | | | | 8,020,685 | |
| | | | York Mellon | | Japanese Yen | | | | | | | U.S. Dollar | | | | | | | | | |
| | | | | | | | | | | | | | | | | | | | | | |
| 10/26/18 | | Goldman | | 1,100,000,000 | | | | 58,490,050 | | | 57,607,723 | | | | 57,607,723 | | | | (882,327 | ) |
| | | | Sachs & Co. LLC | | Mexican Peso | | | | | | | U.S. Dollar | | | | | | | | | |
| | | | | | | | | | | | | | | | | | | | | | |
| 10/26/18 | | State Street | | 520,000,000,000 | | | | 469,063,571 | | | 463,619,262 | | | | 463,619,262 | | | | (5,444,309 | ) |
| | | | Bank and | | South Korea Won | | | | | | | U.S. Dollar | | | | | | | | | |
| | | | Trust Co. | | | | | | | | | | | | | | | | | | |
| | | | | | | | | | | | | | | | | | | | | | |
| 10/26/18 | | Goldman | | 1,200,000,000 | | | | 135,339,881 | | | 137,113,272 | | | | 137,113,272 | | | | 1,773,391 | |
| | | | Sachs & Co. LLC | | Swedish Krona | | | | | | | U.S. Dollar | | | | | | | | | |
| | | | | | | | | | | | | | | | | | | | | | |
| 10/26/18 | | JPMorgan | | 545,000,000 | | | | 556,760,600 | | | 552,797,205 | | | | 552,797,205 | | | | (3,963,395 | ) |
| | | | Chase Bank, N.A. | | Swiss Franc | | | | | | | U.S. Dollar | | | | | | | | | |
| | | | | | | | | $ | 4,150,813,724 | | | | | | $ | 4,173,274,692 | | | $ | 22,460,968 | |
The accompanying notes to financial statements are an integral part of this schedule.
FMI International Fund
INDUSTRY SECTORS
as of September 30, 2018 (Unaudited)
FMI Funds, Inc.
STATEMENTS OF ASSETS AND LIABILITIES
September 30, 2018
| | | FMI | | | FMI | | | FMI | |
| | | Large Cap | | | Common Stock | | | International | |
| | | Fund | | | Fund | | | Fund | |
| ASSETS: | | | | | | | | | |
| Investments in securities, at value (a) | | $ | 6,015,569,150 | | | $ | 1,068,593,297 | | | $ | 7,265,804,143 | |
| Receivables from shareholders for purchases | | | 3,111,319 | | | | 577,259 | | | | 13,786,071 | |
| Dividends and interest receivable | | | 6,345,998 | | | | 627,071 | | | | 19,644,016 | |
| Unrealized appreciation on | | | | | | | | | | | | |
| forward currency contracts | | | — | | | | — | | | | 36,759,994 | |
| Prepaid expenses | | | 81,750 | | | | 45,599 | | | | 176,482 | |
| Total assets | | $ | 6,025,108,217 | | | $ | 1,069,843,226 | | | $ | 7,336,170,706 | |
| LIABILITIES: | | | | | | | | | | | | |
| Payable to shareholders for redemptions | | $ | 4,273,697 | | | $ | 361,516 | | | $ | 4,427,131 | |
| Payable to adviser for management fees | | | 2,551,261 | | | | 670,692 | | | | 3,359,741 | |
| Unrealized depreciation on | | | | | | | | | | | | |
| forward currency contracts | | | — | | | | — | | | | 14,299,026 | |
| Other liabilities | | | 710,574 | | | | 145,851 | | | | 882,929 | |
| Total liabilities | | | 7,535,532 | | | | 1,178,059 | | | | 22,968,827 | |
| Net assets | | $ | 6,017,572,685 | | | $ | 1,068,665,167 | | | $ | 7,313,201,879 | |
| NET ASSETS: | | | | | | | | | | | | |
| Capital Stock | | $ | 3,418,578,521 | | | $ | 758,527,525 | | | $ | 6,297,961,756 | |
| Net unrealized appreciation/(depreciation) | | | | | | | | | | | | |
| on investments: | | | | | | | | | | | | |
| Securities | | | 1,834,777,249 | | | | 250,802,582 | | | | 680,110,364 | |
| Forward currency contracts | | | — | | | | — | | | | 22,460,968 | |
| Foreign currency transactions | | | — | | | | — | | | | 7,666 | |
| Accumulated undistributed net | | | | | | | | | | | | |
| realized gain (loss) | | | 710,139,908 | | | | 56,717,443 | | | | 167,791,959 | |
| Undistributed net investment income (loss) | | | 54,077,007 | | | | 2,617,617 | | | | 144,869,166 | |
| Net assets | | $ | 6,017,572,685 | | | $ | 1,068,665,167 | | | $ | 7,313,201,879 | |
| CALCULATION OF NET ASSET VALUE PER SHARE: | | | | | | | | | | | | |
| Investor Class shares: | | | | | | | | | | | | |
| Net assets | | $ | 3,155,817,799 | | | $ | 635,174,365 | | | $ | 3,267,841,411 | |
| Shares outstanding | | | 138,111,329 | | | | 23,057,804 | | | | 96,682,763 | |
| Shares authorized ($0.0001 par value) | | | 400,000,000 | | | | 200,000,000 | | | | 300,000,000 | |
| Net asset value, offering and | | | | | | | | | | | | |
| redemption price per share | | $ | 22.85 | | | $ | 27.55 | | | $ | 33.80 | |
| Institutional Class shares: | | | | | | | | | | | | |
| Net assets | | $ | 2,861,754,886 | | | $ | 433,490,802 | | | $ | 4,045,360,468 | |
| Shares outstanding | | | 125,252,098 | | | | 15,712,653 | | | | 119,461,745 | |
| Shares authorized ($0.0001 par value) | | | 200,000,000 | | | | 100,000,000 | | | | 200,000,000 | |
| Net asset value, offering and | | | | | | | | | | | | |
| redemption price per share | | $ | 22.85 | | | $ | 27.59 | | | $ | 33.86 | |
| (a) Identified cost of investments | | $ | 4,180,791,901 | | | $ | 817,790,715 | | | $ | 6,585,693,779 | |
The accompanying notes to financial statements are an integral part of these statements.
FMI Funds, Inc.
STATEMENTS OF OPERATIONS
For the Year Ended September 30, 2018
| | | FMI | | | FMI | | | FMI | |
| | | Large Cap | | | Common Stock | | | International | |
| | | Fund | | | Fund | | | Fund | |
| INCOME: | | | | | | | | | |
| Dividends* | | $ | 112,639,778 | | | $ | 10,587,196 | | | $ | 158,680,378 | |
| Interest | | | 9,013,610 | | | | 3,174,183 | | | | 15,200,210 | |
| Total investment income | | | 121,653,388 | | | | 13,761,379 | | | | 173,880,588 | |
| EXPENSES: | | | | | | | | | | | | |
| Management fees | | | 41,837,176 | | | | 9,305,820 | | | | 53,445,595 | |
| Shareholder servicing fees (Investor Class) | | | 4,892,615 | | | | 744,944 | | | | 6,246,494 | |
| Administration and accounting services | | | 1,725,899 | | | | 321,154 | | | | 2,078,198 | |
| Printing and postage expense | | | 396,076 | | | | 50,413 | | | | 571,156 | |
| Transfer agent fees | | | 306,113 | | | | 79,023 | | | | 256,481 | |
| Custodian fees | | | 212,875 | | | | 38,049 | | | | 1,114,983 | |
| Registration fees | | | 170,054 | | | | 103,696 | | | | 242,667 | |
| Board of Directors fees | | | 100,200 | | | | 100,200 | | | | 100,200 | |
| Professional fees | | | 45,955 | | | | 40,863 | | | | 43,038 | |
| Other expenses | | | 150,226 | | | | 60,181 | | | | 169,794 | |
| Total expenses | | | 49,837,189 | | | | 10,844,343 | | | | 64,268,606 | |
| NET INVESTMENT INCOME (LOSS) | | | 71,816,199 | | | | 2,917,036 | | | | 109,611,982 | |
| NET REALIZED GAIN (LOSS) ON INVESTMENTS: | | | | | | | | | | | | |
| Securities | | | 909,162,450 | | | | 92,598,386 | | | | 225,771,571 | |
| Forward currency contracts | | | — | | | | — | | | | 113,914,249 | |
| Foreign currency transactions | | | — | | | | — | | | | (41,865,640 | ) |
| NET REALIZED GAIN (LOSS) ON INVESTMENTS | | | 909,162,450 | | | | 92,598,386 | | | | 297,820,180 | |
| NET CHANGE IN UNREALIZED APPRECIATION/ | | | | | | | | | | | | |
| DEPRECIATION ON INVESTMENTS: | | | | | | | | | | | | |
| Securities | | | (207,350,232 | ) | | | (23,746,718 | ) | | | (281,529,560 | ) |
| Forward currency contracts | | | — | | | | — | | | | 59,727,400 | |
| Foreign currency transactions | | | — | | | | — | | | | (142,726 | ) |
| NET CHANGE IN UNREALIZED APPRECIATION/ | | | | | | | | | | | | |
| DEPRECIATION ON INVESTMENTS | | | (207,350,232 | ) | | | (23,746,718 | ) | | | (221,944,886 | ) |
| NET GAIN (LOSS) ON INVESTMENTS | | | 701,812,218 | | | | 68,851,668 | | | | 75,875,294 | |
| NET INCREASE (DECREASE) IN NET ASSETS | | | | | | | | | | | | |
| RESULTING FROM OPERATIONS | | $ | 773,628,417 | | | $ | 71,768,704 | | | $ | 185,487,276 | |
| | | | | | | | | | | | | |
| * Net withholding taxes | | $ | 1,671,553 | | | $ | — | | | $ | 11,647,613 | |
The accompanying notes to financial statements are an integral part of these statements.
FMI Large Cap Fund
STATEMENTS OF CHANGES IN NET ASSETS
For the Years Ended September 30, 2018 and 2017
| | | 2018 | | | 2017 | |
| OPERATIONS: | | | | | | |
| Net investment income (loss) | | $ | 71,816,199 | | | $ | 47,895,618 | |
| Net realized gain (loss) on investments | | | 909,162,450 | | | | 625,075,612 | |
| Net change in unrealized | | | | | | | | |
| appreciation/depreciation on investments | | | (207,350,232 | ) | | | 399,097,341 | |
| Net increase (decrease) in net assets from operations | | | 773,628,417 | | | | 1,072,068,571 | |
| DISTRIBUTIONS TO SHAREHOLDERS FROM: | | | | | | | | |
| Net investment income (Investor Class) | | | (27,598,884 | ) | | | (54,156,552 | ) |
| Net investment income (Institutional Class) | | | (25,132,954 | ) | | | (17,815,881 | ) |
| Net realized gains (Investor Class) | | | (298,319,215 | ) | | | (295,164,433 | ) |
| Net realized gains (Institutional Class) | | | (219,767,111 | ) | | | (94,830,701 | ) |
| Total distributions | | | (570,818,164 | ) | | | (461,967,567 | ) |
| FUND SHARE ACTIVITIES: | | | | | | | | |
| Net increase (decrease) in net assets | | | | | | | | |
| derived from Fund share activities (Note 8) | | | (562,456,405 | ) | | | (808,991,156 | ) |
| TOTAL INCREASE (DECREASE) | | | (359,646,152 | ) | | | (198,890,152 | ) |
| NET ASSETS AT THE BEGINNING OF THE YEAR | | | 6,377,218,837 | | | | 6,576,108,989 | |
| NET ASSETS AT THE END OF THE YEAR | | $ | 6,017,572,685 | | | $ | 6,377,218,837 | |
| Undistributed net investment income (loss) | | $ | 54,077,007 | | | $ | 34,993,736 | |
| | | | | | | | | |
| FUND SHARE TRANSACTIONS: | | | | | | | | |
| Net increase (decrease) in shares outstanding (Note 8) | | | (24,275,711 | ) | | | (37,968,105 | ) |
The accompanying notes to financial statements are an integral part of these statements.
FMI Common Stock Fund
STATEMENTS OF CHANGES IN NET ASSETS
For the Years Ended September 30, 2018 and 2017
| | | 2018 | | | 2017 | |
| OPERATIONS: | | | | | | |
| Net investment income (loss) | | $ | 2,917,036 | | | $ | 238,848 | |
| Net realized gain (loss) on investments | | | 92,598,386 | | | | 101,191,857 | |
| Net change in unrealized | | | | | | | | |
| appreciation/depreciation on investments | | | (23,746,718 | ) | | | 75,161,472 | |
| Net increase (decrease) in net assets from operations | | | 71,768,704 | | | | 176,592,177 | |
| DISTRIBUTIONS TO SHAREHOLDERS FROM: | | | | | | | | |
| Net investment income (Investor Class) | | | (159,486 | ) | | | (42,282 | ) |
| Net investment income (Institutional Class) | | | (141,628 | ) | | | (28,262 | ) |
| Net realized gains (Investor Class) | | | (83,468,635 | ) | | | (40,682,135 | ) |
| Net realized gains (Institutional Class) | | | (31,775,805 | ) | | | (6,638,215 | ) |
| Total distributions | | | (115,545,554 | ) | | | (47,390,894 | ) |
| FUND SHARE ACTIVITIES: | | | | | | | | |
| Net increase (decrease) in net assets | | | | | | | | |
| derived from Fund share activities (Note 8) | | | 9,091,805 | | | | 29,495,395 | |
| TOTAL INCREASE (DECREASE) | | | (34,685,045 | ) | | | 158,696,678 | |
| NET ASSETS AT THE BEGINNING OF THE YEAR | | | 1,103,350,212 | | | | 944,653,534 | |
| NET ASSETS AT THE END OF THE YEAR | | $ | 1,068,665,167 | | | $ | 1,103,350,212 | |
| Undistributed net investment income (loss) | | $ | 2,617,617 | | | $ | 1,695 | |
| | | | | | | | | |
| FUND SHARE TRANSACTIONS: | | | | | | | | |
| Net increase (decrease) in shares outstanding (Note 8) | | | 512,025 | | | | 1,092,444 | |
The accompanying notes to financial statements are an integral part of these statements.
FMI International Fund
STATEMENTS OF CHANGES IN NET ASSETS
For the Years Ended September 30, 2018 and 2017
| | | 2018 | | | 2017 | |
| OPERATIONS: | | | | | | |
| Net investment income (loss) | | $ | 109,611,982 | | | $ | 73,912,826 | |
| Net realized gain (loss) on investments | | | 297,820,180 | | | | 96,982,036 | |
| Net change in unrealized appreciation/ | | | | | | | | |
| depreciation on investments | | | (221,944,886 | ) | | | 744,819,106 | |
| Net increase (decrease) in net assets from operations | | | 185,487,276 | | | | 915,713,968 | |
| DISTRIBUTIONS TO SHAREHOLDERS FROM: | | | | | | | | |
| Net investment income (Investor Class) | | | (14,619,661 | ) | | | (146,718,193 | ) |
| Net investment income (Institutional Class) | | | (8,859,217 | ) | | | (21,606,217 | ) |
| Net realized gains (Investor Class) | | | (70,501,237 | ) | | | (34,095,065 | ) |
| Net realized gains (Institutional Class) | | | (37,554,047 | ) | | | (4,989,390 | ) |
| Total distributions | | | (131,534,162 | ) | | | (207,408,865 | ) |
| FUND SHARE ACTIVITIES: | | | | | | | | |
| Net increase (decrease) in net assets | | | | | | | | |
| derived from Fund share activities (Note 8) | | | (847,004,361 | ) | | | 2,372,205,999 | |
| TOTAL INCREASE (DECREASE) | | | (793,051,247 | ) | | | 3,080,511,102 | |
| NET ASSETS AT THE BEGINNING OF THE YEAR | | | 8,106,253,126 | | | | 5,025,742,024 | |
| NET ASSETS AT THE END OF THE YEAR | | $ | 7,313,201,879 | | | $ | 8,106,253,126 | |
| Undistributed net investment income (loss) | | $ | 144,869,166 | | | $ | (13,329,029 | ) |
| | | | | | | | | |
| FUND SHARE TRANSACTIONS: | | | | | | | | |
| Net increase (decrease) in shares outstanding (Note 8) | | | (25,144,360 | ) | | | 77,398,619 | |
The accompanying notes to financial statements are an integral part of these statements.
FMI Large Cap Fund
FINANCIAL HIGHLIGHTS
(Selected data for each share of the Fund outstanding throughout each year)
Investor Class
| | | Years Ended September 30, | |
| | | 2018 | | | 2017 | | | 2016 | | | 2015 | | | 2014 | |
| PER SHARE OPERATING PERFORMANCE: | | | | | | | | | | | | | | | |
| Net asset value, beginning of year | | $ | 22.17 | | | $ | 20.20 | | | $ | 20.00 | | | $ | 22.21 | | | $ | 20.52 | |
| Income from investment operations: | | | | | | | | | | | | | | | | | | | | |
Net investment income (loss)(1) | | | 0.24 | | | | 0.15 | | | | 0.21 | | | | 0.19 | | | | 0.19 | |
| Net realized and unrealized | | | | | | | | | | | | | | | | | | | | |
| gain (loss) on investments | | | 2.43 | | | | 3.30 | | | | 2.04 | | | | (0.17 | ) | | | 2.92 | |
| Total from investment operations | | | 2.67 | | | | 3.45 | | | | 2.25 | | | | 0.02 | | | | 3.11 | |
| Less distributions: | | | | | | | | | | | | | | | | | | | | |
| Distributions from net investment income | | | (0.17 | ) | | | (0.23 | ) | | | (0.21 | ) | | | (0.18 | ) | | | (0.18 | ) |
| Distributions from net realized gains | | | (1.82 | ) | | | (1.25 | ) | | | (1.84 | ) | | | (2.05 | ) | | | (1.24 | ) |
| Total from distributions | | | (1.99 | ) | | | (1.48 | ) | | | (2.05 | ) | | | (2.23 | ) | | | (1.42 | ) |
| Net asset value, end of year | | $ | 22.85 | | | $ | 22.17 | | | $ | 20.20 | | | $ | 20.00 | | | $ | 22.21 | |
| TOTAL RETURN | | | 12.67 | % | | | 17.86 | % | | | 12.36 | % | | | (0.54 | %) | | | 15.77 | % |
| RATIOS/SUPPLEMENTAL DATA: | | | | | | | | | | | | | | | | | | | | |
| Net assets, end of year (in 000’s $) | | | 3,155,818 | | | | 3,856,953 | | | | 6,576,109 | | | | 8,499,224 | | | | 9,217,399 | |
| Ratio of expenses to average net assets | | | 0.85 | % | | | 0.86 | % | | | 0.90 | % | | | 0.93 | % | | | 0.94 | % |
| Ratio of net investment income (loss) | | | | | | | | | | | | | | | | | | | | |
| to average net assets | | | 1.07 | % | | | 0.71 | % | | | 1.09 | % | | | 0.87 | % | | | 0.87 | % |
| Portfolio turnover rate | | | 25 | %(2) | | | 16 | %(2) | | | 17 | % | | | 18 | % | | | 31 | % |
| (1) | Net investment income (loss) per share was calculated using average shares outstanding. |
| (2) | Portfolio turnover rate is disclosed for the Fund as a whole. |
The accompanying notes to financial statements are an integral part of this statement.
FMI Large Cap Fund
FINANCIAL HIGHLIGHTS
(Selected data for each share of the Fund outstanding throughout each period)
Institutional Class
| | | | | | For the Period | |
| | | Year Ended | | | from October 31, 2016* | |
| | | September 30, 2018 | | | to September 30, 2017 | |
| PER SHARE OPERATING PERFORMANCE: | | | | | | |
| Net asset value, beginning of period | | $ | 22.18 | | | $ | 19.73 | |
| Income from investment operations: | | | | | | | | |
Net investment income (loss)(1) | | | 0.27 | | | | 0.16 | |
| Net realized and unrealized gain (loss) on investments | | | 2.43 | | | | 3.77 | |
| Total from investment operations | | | 2.70 | | | | 3.93 | |
| Less distributions: | | | | | | | | |
| Distributions from net investment income | | | (0.21 | ) | | | (0.23 | ) |
| Distributions from net realized gains | | | (1.82 | ) | | | (1.25 | ) |
| Total from distributions | | | (2.03 | ) | | | (1.48 | ) |
| Net asset value, end of period | | $ | 22.85 | | | $ | 22.18 | |
| TOTAL RETURN | | | 12.82 | % | | | 20.76 | %(2) |
| RATIOS/SUPPLEMENTAL DATA: | | | | | | | | |
| Net assets, end of period (in 000’s $) | | | 2,861,755 | | | | 2,520,266 | |
| Ratio of expenses to average net assets | | | 0.71 | % | | | 0.72 | %(3) |
| Ratio of net investment income (loss) to average net assets | | | 1.20 | % | | | 0.81 | %(3) |
| Portfolio turnover rate | | | 25 | %(4) | | | 16 | %(4) |
| * | | Inception date. |
| (1) | | Net investment income (loss) per share was calculated using average shares outstanding. |
| (2) | | Not annualized. |
| (3) | | Annualized. |
| (4) | | Portfolio turnover rate is disclosed for the Fund as a whole. |
The accompanying notes to financial statements are an integral part of this statement.
FMI Common Stock Fund
FINANCIAL HIGHLIGHTS
(Selected data for each share of the Fund outstanding throughout each year)
Investor Class
| | | Years Ended September 30, | |
| | | 2018 | | | 2017 | | | 2016 | | | 2015 | | | 2014 | |
| PER SHARE OPERATING PERFORMANCE: | | | | | | | | | | | | | | | |
| Net asset value, beginning of year | | $ | 28.83 | | | $ | 25.42 | | | $ | 25.05 | | | $ | 29.12 | | | $ | 29.05 | |
| Income from investment operations: | | | | | | | | | | | | | | | | | | | | |
Net investment income (loss)(1) | | | 0.06 | | | | 0.00 | * | | | (0.01 | ) | | | 0.01 | | | | 0.04 | |
| Net realized and unrealized | | | | | | | | | | | | | | | | | | | | |
| gains (loss) on investments | | | 1.80 | | | | 4.69 | | | | 2.84 | | | | (0.74 | ) | | | 2.91 | |
| Total from investment operations | | | 1.86 | | | | 4.69 | | | | 2.83 | | | | (0.73 | ) | | | 2.95 | |
| Less distributions: | | | | | | | | | | | | | | | | | | | | |
| Distributions from net investment income | | | (0.01 | ) | | | 0.00 | * | | | — | | | | (0.02 | ) | | | (0.13 | ) |
| Distributions from net realized gains | | | (3.13 | ) | | | (1.28 | ) | | | (2.46 | ) | | | (3.32 | ) | | | (2.75 | ) |
| Total from distributions | | | (3.14 | ) | | | (1.28 | ) | | | (2.46 | ) | | | (3.34 | ) | | | (2.88 | ) |
| Net asset value, end of year | | $ | 27.55 | | | $ | 28.83 | | | $ | 25.42 | | | $ | 25.05 | | | $ | 29.12 | |
| TOTAL RETURN | | | 6.92 | % | | | 18.96 | % | | | 12.61 | % | | | (3.38 | %) | | | 10.44 | % |
| RATIOS/SUPPLEMENTAL DATA: | | | | | | | | | | | | | | | | | | | | |
| Net assets, end of year (in 000’s $) | | | 635,174 | | | | 825,176 | | | | 944,654 | | | | 1,243,777 | | | | 1,407,840 | |
| Ratio of expenses to average net assets | | | 1.04 | % | | | 1.06 | % | | | 1.12 | % | | | 1.17 | % | | | 1.18 | % |
| Ratio of net investment income (loss) | | | | | | | | | | | | | | | | | | | | |
| to average net assets | | | 0.23 | % | | | 0.00 | % | | | (0.06 | %) | | | 0.04 | % | | | 0.14 | % |
| Portfolio turnover rate | | | 26 | %(2) | | | 26 | %(2) | | | 17 | % | | | 29 | % | | | 33 | % |
| * | | Amount is less than $0.005. |
| (1) | | Net investment income (loss) per share was calculated using average shares outstanding. |
| (2) | | Portfolio turnover rate is disclosed for the Fund as a whole. |
The accompanying notes to financial statements are an integral part of this statement.
FMI Common Stock Fund
FINANCIAL HIGHLIGHTS
(Selected data for each share of the Fund outstanding throughout each period)
Institutional Class
| | | | | | For the Period | |
| | | Year Ended | | | from October 31, 2016* | |
| | | September 30, 2018 | | | to September 30, 2017 | |
| PER SHARE OPERATING PERFORMANCE: | | | | | | |
| Net asset value, beginning of period | | $ | 28.85 | | | $ | 24.72 | |
| Income from investment operations: | | | | | | | | |
Net investment income (loss)(1) | | | 0.10 | | | | 0.03 | |
| Net realized and unrealized gain (loss) on investments | | | 1.79 | | | | 5.39 | |
| Total from investment operations | | | 1.89 | | | | 5.42 | |
| Less distributions: | | | | | | | | |
| Distributions from net investment income | | | (0.02 | ) | | | (0.01 | ) |
| Distributions from net realized gains | | | (3.13 | ) | | | (1.28 | ) |
| Total from distributions | | | (3.15 | ) | | | (1.29 | ) |
| Net asset value, end of period | | $ | 27.59 | | | $ | 28.85 | |
| TOTAL RETURN | | | 7.02 | % | | | 22.43 | %(2) |
| RATIOS/SUPPLEMENTAL DATA: | | | | | | | | |
| Net assets, end of period (in 000’s $) | | | 433,491 | | | | 278,174 | |
| Ratio of expenses to average net assets | | | 0.94 | % | | | 0.97 | %(3) |
| Ratio of net investment income (loss) to average net assets | | | 0.37 | % | | | 0.12 | %(3) |
| Portfolio turnover rate | | | 26 | %(4) | | | 26 | %(4) |
| * | | Inception date. |
| (1) | | Net investment income (loss) per share was calculated using average shares outstanding. |
| (2) | | Not annualized. |
| (3) | | Annualized. |
| (4) | | Portfolio turnover rate is disclosed for the Fund as a whole. |
The accompanying notes to financial statements are an integral part of this statement.
FMI International Fund
FINANCIAL HIGHLIGHTS
(Selected data for each share of the Fund outstanding throughout each year)
Investor Class
| | | Years Ended September 30, | |
| | | 2018 | | | 2017 | | | 2016 | | | 2015 | | | 2014 | |
| PER SHARE OPERATING PERFORMANCE: | | | | | | | | | | | | | | | |
| Net asset value, beginning of year | | $ | 33.59 | | | $ | 30.67 | | | $ | 27.63 | | | $ | 28.64 | | | $ | 26.34 | |
| Income from investment operations: | | | | | | | | | | | | | | | | | | | | |
Net investment income (loss)(1) | | | 0.48 | | | | 0.32 | | | | 0.29 | | | | 0.25 | | | | 0.30 | |
| Net realized and unrealized | | | | | | | | | | | | | | | | | | | | |
| gain (loss) on investments | | | 0.28 | | | | 3.72 | | | | 3.27 | | | | (0.30 | ) | | | 2.74 | |
| Total from investment operations | | | 0.76 | | | | 4.04 | | | | 3.56 | | | | (0.05 | ) | | | 3.04 | |
| Less distributions: | | | | | | | | | | | | | | | | | | | | |
| Distributions from net investment income | | | (0.10 | ) | | | (0.91 | ) | | | (0.51 | ) | | | (0.58 | ) | | | (0.19 | ) |
| Distributions from net realized gains | | | (0.45 | ) | | | (0.21 | ) | | | (0.01 | ) | | | (0.38 | ) | | | (0.55 | ) |
| Total from distributions | | | (0.55 | ) | | | (1.12 | ) | | | (0.52 | ) | | | (0.96 | ) | | | (0.74 | ) |
| Net asset value, end of year | | $ | 33.80 | | | $ | 33.59 | | | $ | 30.67 | | | $ | 27.63 | | | $ | 28.64 | |
| TOTAL RETURN | | | 2.27 | % | | | 13.66 | % | | | 13.07 | % | | | (0.19 | %) | | | 11.74 | % |
| RATIOS/SUPPLEMENTAL DATA: | | | | | | | | | | | | | | | | | | | | |
| Net assets, end of year (in 000’s $) | | | 3,267,841 | | | | 5,369,580 | | | | 5,025,742 | | | | 2,305,968 | | | | 474,358 | |
| Ratio of expenses to average net assets: | | | | | | | | | | | | | | | | | | | | |
| Before expense reimbursement | | | 0.90 | % | | | 0.91 | % | | | 0.94 | % | | | 0.98 | % | | | 1.03 | % |
| After expense reimbursement | | | 0.90 | % | | | 0.91 | % | | | 0.94 | % | | | 0.98 | % | | | 1.00 | % |
| Ratio of net investment income (loss) | | | | | | | | | | | | | | | | | | | | |
| to average net assets: | | | | | | | | | | | | | | | | | | | | |
| Before expense reimbursement | | | 1.43 | % | | | 1.02 | % | | | 1.01 | % | | | 0.87 | % | | | 1.05 | % |
| After expense reimbursement | | | 1.43 | % | | | 1.02 | % | | | 1.01 | % | | | 0.87 | % | | | 1.08 | % |
| Portfolio turnover rate | | | 21 | %(2) | | | 26 | %(2) | | | 16 | % | | | 9 | % | | | 22 | % |
| (1) | Net investment income (loss) per share was calculated using average shares outstanding. |
| (2) | Portfolio turnover rate is disclosed for the Fund as a whole. |
The accompanying notes to financial statements are an integral part of this statement.
FMI International Fund
FINANCIAL HIGHLIGHTS
(Selected data for each share of the Fund outstanding throughout each period)
Institutional Class
| | | | | | For the Period | |
| | | Year Ended | | | from October 31, 2016* | |
| | | September 30, 2018 | | | to September 30, 2017 | |
| PER SHARE OPERATING PERFORMANCE: | | | | | | |
| Net asset value, beginning of period | | $ | 33.62 | | | $ | 30.36 | |
| Income from investment operations: | | | | | | | | |
Net investment income (loss)(1) | | | 0.49 | | | | 0.35 | |
| Net realized and unrealized gain (loss) on investments | | | 0.31 | | | | 4.04 | |
| Total from investment operations | | | 0.80 | | | | 4.39 | |
| Less distributions: | | | | | | | | |
| Distributions from net investment income | | | (0.11 | ) | | | (0.92 | ) |
| Distributions from net realized gains | | | (0.45 | ) | | | (0.21 | ) |
| Total from distributions | | | (0.56 | ) | | | (1.13 | ) |
| Net asset value, end of period | | $ | 33.86 | | | $ | 33.62 | |
| TOTAL RETURN | | | 2.40 | % | | | 14.95 | %(2) |
| RATIOS/SUPPLEMENTAL DATA: | | | | | | | | |
| Net assets, end of period (in 000’s $) | | | 4,045,361 | | | | 2,736,673 | |
| Ratio of expenses to average net assets | | | 0.76 | % | | | 0.77 | %(3) |
| Ratio of net investment income (loss) to average net assets | | | 1.44 | % | | | 1.19 | %(3) |
| Portfolio turnover rate | | | 21 | %(4) | | | 26 | %(4) |
| * | | Inception date. |
| (1) | | Net investment income (loss) per share was calculated using average shares outstanding. |
| (2) | | Not annualized. |
| (3) | | Annualized. |
| (4) | | Portfolio turnover rate is disclosed for the Fund as a whole. |
The accompanying notes to financial statements are an integral part of this statement.
FMI Funds, Inc.
NOTES TO FINANCIAL STATEMENTS
September 30, 2018
(1) Summary of Significant Accounting Policies — |
The following is a summary of significant accounting policies of the FMI Large Cap Fund, the FMI Common Stock Fund, and the FMI International Fund (collectively, the “Funds” or, individually, a “Fund”). The FMI Large Cap Fund (the “Large Cap Fund”), the FMI Common Stock Fund (the “Common Stock Fund”), and the FMI International Fund (the “International Fund”) are each a series of FMI Funds, Inc. (the “Company”). The Company was incorporated under the laws of Maryland on September 5, 1996. The Large Cap Fund commenced operations on December 31, 2001 and the International Fund commenced operations on December 31, 2010. The Common Stock Fund is the successor to the FMI Common Stock Fund, the sole series of FMI Common Stock Fund, Inc. (the “Predecessor Common Stock Fund”). The Predecessor Common Stock Fund commenced operations on December 18, 1981. The reorganization was effective as of January 31, 2014, and the Common Stock Fund is the accounting survivor of the reorganization. The Predecessor Common Stock Fund was incorporated under the laws of Wisconsin on July 29, 1981.
Effective October 31, 2016, the Funds offer two classes of shares (Investor and Institutional). The Institutional Class has the same management fee as the Investor Class and does not have a shareholder servicing plan. A higher investment minimum is required for the Institutional Class than the Investor Class. Each class of shares has exclusive voting rights with respect to matters that affect just that class. Income, expenses (other than expenses attributable to a specific class) and realized and unrealized gains or losses on investments are allocated to each class of shares on its relative net assets. The Board of Directors (the “Board”) may elect to have certain expenses specific to the Investor Class shares or Institutional Class shares be borne solely by the Class to which such expenses are attributable, but any expenses not specifically allocated to the Investor Class shares or Institutional Class shares are generally allocated to each such Class proportionately (after any applicable base fee to be paid by a class of shares of a Fund attributable to such expense) on the basis of the net asset value of that Class in relation to the net asset value of the applicable Fund.
Both the Large Cap Fund and the International Fund are registered as non-diversified, open-end management investment companies under the Investment Company Act of 1940 (the “Act”), as amended. The Common Stock Fund is registered as a diversified open-end management investment company under the Act. The Funds follow the investment company accounting and financial reporting guidance under Financial Accounting Standards Board (“FASB”) Accounting Standards Codification “Financial Services – Investment Companies” Topic 946 (“ASC 946”). The assets and liabilities of each Fund in the Company are segregated and a shareholder’s interest is limited to the Fund in which the shareholder owns shares. The investment objective of the Large Cap Fund is to seek long-term capital appreciation by investing mainly in a limited number of large capitalization value stocks. The investment objective of the Common Stock Fund is to seek long-term capital appreciation by investing mainly in small to medium capitalization value stocks. The investment objective of the International Fund is to seek capital appreciation by investing mainly in a limited number of large capitalization value stocks of non-U.S. companies. The International Fund re-opened to all investors effective April 2, 2018, as announced in the prospectus supplement filed March 19, 2018. The International Fund had been closed to new investors since April 30, 2017.
FMI Funds, Inc.
NOTES TO FINANCIAL STATEMENTS (Continued)
September 30, 2018
(1) Summary of Significant Accounting Policies — (Continued) |
| | (a) | Each security is valued at the current day last sale price reported by the principal security exchange on which the issue is traded. Securities that are traded on the Nasdaq Markets are valued at the Nasdaq Official Closing Price, or if no sale is reported, the latest bid price. Securities that are traded over-the-counter, including U.S. Treasury securities are valued at the close price, if not close, then at the latest bid price. Bank deposits are valued at acquisition cost which approximates fair value. Unlisted equity securities for which market quotations are readily available are valued at the close price, if not close, then at the most recent bid price. Foreign securities are valued on a basis of quotations from the primary market in which they are traded, and are converted from the local currency into U.S. dollars using exchange rates as of the close of the New York Stock Exchange. For the International Fund only, options purchased or written by the Fund are valued at the average of the most recent bid and ask prices. Securities for which quotations are not readily available are valued at fair value as determined by the investment adviser in accordance with procedures approved by the Board. The fair value of a security is the amount which a Fund might reasonably expect to receive upon a current sale. The fair value of a security may differ from the last quoted price and a Fund may not be able to sell a security at the fair value. Market quotations may not be available, for example, if trading in particular securities was halted during the day and not resumed prior to the close of trading on the New York Stock Exchange. The foreign markets in which the International Fund may invest are sometimes open on days when the New York Stock Exchange is not open and the International Fund does not calculate its net asset value. For securities that do not trade during New York Stock Exchange hours, fair value determinations are based on analyses of market movements after the close of those securities’ primary markets, and may include reviews of developments in foreign markets, the performance of U.S. securities markets, and the performance of instruments trading in U.S. markets that represent foreign securities and baskets of foreign securities. The Board utilizes a service provided by an independent third party to assist in fair valuation of certain securities for the International Fund. As of September 30, 2018, there were no securities that were internally fair valued. |
| | | |
| | | The Funds apply the provisions of the FASB Accounting Standards Codification “Fair Value Measurement” Topic 820 (“ASC 820”), which defines fair value as the price that would be received to sell an asset or paid to transfer a liability (i.e., the “exit price”) in an orderly transaction between market participants at the measurement date. |
| | | |
| | | In determining fair value, the Funds use various valuation approaches. ASC 820 establishes a fair value hierarchy for inputs used in measuring fair value that maximizes the use of observable inputs and minimizes the use of unobservable inputs by generally requiring that the most observable inputs be used when available. Observable inputs are those that market participants would use in pricing the asset or liability based on market data obtained from sources independent of the Funds. Unobservable inputs reflect the Funds’ assumptions about the inputs market participants would use in pricing the asset or liability developed based on the best information available in the circumstances. The inputs or methodologies used for valuing securities are not necessarily an indication of the risks associated with investing in those securities. For the International Fund only, over the counter derivatives such as forward currency contracts may be valued using quantitative models. These models may use pricing curves based |
FMI Funds, Inc.
NOTES TO FINANCIAL STATEMENTS (Continued)
September 30, 2018
(1) Summary of Significant Accounting Policies — (Continued)
| | on market inputs including current exchange rates or indices. These curves are combined with volatility factors to value the overall positions. The market inputs are generally significant and can be corroborated with observable market data and therefore are classified in level 2. |
| | |
| | The fair value hierarchy is categorized into three levels based on the inputs as follows: |
| | Level 1 — | Valuations based on unadjusted quoted prices in active markets for identical assets. |
| | | |
| | Level 2 — | Valuations based on quoted prices for similar securities or in markets that are not active or for which all significant inputs are observable, either directly or indirectly. |
| | | |
| | Level 3 — | Valuations based on inputs that are unobservable and significant to the overall fair value measurement. |
| | The following table summarizes the Funds’ investments as of September 30, 2018, based on the inputs used to value them: |
| | | | | | Large Cap | | | Common Stock | | | International | | | International | |
| | | | | | Fund | | | Fund | | | Fund | | | Fund | |
| | | | | | Investments | | | Investments | | | Investments | | | Other Financial | |
| | Valuations | | in Securities | | | in Securities | | | in Securities | | | Instruments* | |
| | Assets: | | | | | | | | | | | | |
| | Level 1 — | Common Stocks | | $ | 5,569,718,200 | | | $ | 873,465,958 | | | $ | 1,520,472,118 | | | $ | — | |
| | Level 2 — | Common Stocks | | | — | | | | — | | | | 4,245,220,944 | | | | — | |
| | | | Preferred Stocks | | | — | | | | — | | | | 536,561,047 | | | | — | |
| | | | Short-Term Bank | | | | | | | | | | | | | | | | |
| | | | Deposit Account | | | 196,701,727 | | | | 45,686,522 | | | | 316,215,164 | | | | — | |
| | | | Short-Term U.S. | | | | | | | | | | | | | | | | |
| | | | Treasury Securities | | | 249,149,223 | | | | 149,440,817 | | | | 647,334,870 | | | | — | |
| | | | Forward Currency | | | | | | | | | | | | | | | | |
| | | | Contracts | | | — | | | | — | | | | — | | | | 36,759,994 | |
| | | | Total Level 2 | | | 445,850,950 | | | | 195,127,339 | | | | 5,745,332,025 | | | | 36,759,994 | |
| | Level 3 — | | | — | | | | — | | | | — | | | | — | |
| | Total Assets | | | 6,015,569,150 | | | | 1,068,593,297 | | | | 7,265,804,143 | | | | 36,759,994 | |
| | Liabilities: | | | | | | | | | | | | | | | | |
| | Level 2 — | Forward Currency | | | | | | | | | | | | | | | | |
| | | | Contracts | | | — | | | | — | | | | — | | | | (14,299,026 | ) |
| | Total | | | $ | 6,015,569,150 | | | $ | 1,068,593,297 | | | $ | 7,265,804,143 | | | $ | 22,460,968 | |
| | * | Other financial instruments are derivative instruments, specifically forward currency contracts, which are valued at the unrealized appreciation/(depreciation) on the instrument. |
| | | For the fiscal year ended September 30, 2018, there were no transfers between levels. |
| | | |
| | | See the Schedules of Investments for investments detailed by industry classifications. |
| | | |
| | (b) | Net realized gains and losses on sales of securities are computed on the identified cost basis. For financial reporting purposes, investment transactions are recorded on the trade date. |
FMI Funds, Inc.
NOTES TO FINANCIAL STATEMENTS (Continued)
September 30, 2018
(1) Summary of Significant Accounting Policies — (Continued)
| | (c) | Investment securities and other assets and liabilities denominated in foreign currencies are translated into U.S. dollar amounts at the date of valuation. Purchases and sales of investment securities and income and expense items denominated in foreign currencies are translated into U.S. dollar amounts on the respective date of such transactions. The Company does not isolate that portion of the results of operations resulting from changes in foreign exchange rates on investments from the fluctuations arising from changes in market prices of securities held. Such fluctuations are included with the net realized and unrealized gain or loss from investments. Reported net realized foreign exchange gains or losses arise from sales of foreign currencies, currency gains or losses realized between the trade and settlement dates on securities transactions, and the difference between the amounts of dividends, interest, and foreign withholding taxes recorded on the Company’s books and the U.S. dollar equivalent of the amounts actually received or paid. Net unrealized foreign exchange gains and losses arise from changes in the fair values of assets and liabilities, other than investments in securities at fiscal period-end, resulting from changes in exchange rates. |
| | | |
| | (d) | Dividend income is recorded on the ex-dividend date. Interest income is recorded on an accrual basis. The Funds record the amortization and accretion of discounts and premiums on securities purchased using the effective interest method in accordance with generally accepted accounting principles in the United States of America (“GAAP”). Withholding taxes on foreign dividends have been provided for in accordance with the Funds’ understanding of the applicable country’s tax rules and regulations. |
| | | |
| | (e) | The International Fund may enter into forward currency contracts in order to hedge its exposure to changes in foreign currency rates on its foreign portfolio holdings or to hedge certain purchase and sale commitments denominated in foreign currencies. A forward currency contract is a commitment to purchase or sell a foreign currency at a future date at a negotiated rate. These contracts are valued daily and the asset or liability therein represents unrealized gain or loss on the contracts as measured by the difference between the forward foreign exchange rates at the dates of entry into the contracts and the forward rates at the reporting date. On a quarterly average there were nine forward currency contracts outstanding during the year ended September 30, 2018. These contracts are not subject to master netting agreements. For Non-Deliverable Forward Currency Contracts (“Contract”) the International Fund posts collateral, in the form of cash or cash equivalents to a segregated account at the custodian when the Contract is in an unrealized loss position. When the Contract is in an unrealized gain position, the counterparty posts collateral to a segregated account at the custodian. |
| | | |
| | | The fair value of the forward currency contracts as of September 30, 2018, is included in the following location on the Statements of Assets and Liabilities for the International Fund: |
| | | | Fair Value of | | Fair Value of | |
| | | | Asset Forward | | (Liability) Forward | |
| | | Location | Currency Contracts | Location | Currency Contracts | |
| | Forward currency | Unrealized | $36,759,994 | Unrealized | $(14,299,026) | |
| | contracts | appreciation on | | depreciation on | | |
| | | forward currency | | forward currency | | |
| | | contracts | | contracts | | |
FMI Funds, Inc.
NOTES TO FINANCIAL STATEMENTS (Continued)
September 30, 2018
(1) Summary of Significant Accounting Policies — (Continued)
| | Realized and unrealized gains and losses on forward currency contracts entered into during the year ended September 30, 2018, are recorded in the following location on the Statements of Operations for the International Fund: |
| | | | Realized | | Unrealized | |
| | | Location | Gain | Location | Appreciation | |
| | Forward currency | Net realized | $113,914,249 | Net change in | $59,727,400 | |
| | contracts | gain (loss) on | | unrealized appreciation/ | | |
| | | forward currency | | depreciation on | | |
| | | contracts | | forward currency | | |
| | | | | contracts | | |
| | | These instruments involve market risk, credit risk, or both kinds of risks, in excess of the amount recognized on the Statements of Assets and Liabilities for the International Fund. Risks arise from the possible inability of counterparties to meet the terms of their contracts and from movement in currency and securities values and interest rates. |
| | | |
| | (f) | The preparation of financial statements in conformity with GAAP requires management to make estimates and assumptions that affect the reported amounts of assets and liabilities and disclosure of contingent assets and liabilities at the date of the financial statements and the reported amounts of revenues and expenses during the reporting period. Actual results could differ from these estimates. |
| | | |
| | (g) | The Funds may own certain securities that are restricted. Restricted securities include Section 4(2) commercial paper or securities issued in a private placement. The Funds did not hold any restricted securities as of September 30, 2018. |
| | | |
| | (h) | No provision has been made for Federal income taxes since the Funds have elected to be taxed as “regulated investment companies.” The Funds intend to distribute substantially all net investment company taxable income and net capital gains to their respective shareholders and otherwise comply with the provisions of the Internal Revenue Code applicable to regulated investment companies. |
| | | |
| | (i) | The Funds have reviewed all open tax years and major jurisdictions, which include Federal and the state of Maryland for the Large Cap Fund, Common Stock Fund and International Fund and concluded that there are no significant uncertain tax positions that would require recognition in the financial statements. The Funds recognize interest and penalties, if any, related to unrecognized tax benefits on certain tax benefits on uncertain tax positions as income tax expense in the Statements of Operations. During the year ended September 30, 2018, the Funds did not incur any interest or penalties. Open tax years are those that are open for exam by taxing authorities and, as of September 30, 2018, open Federal tax years include the prior four fiscal tax years ended September 30, 2018. The Funds have no examinations in progress and are also not aware of any tax positions for which it is reasonably possible that the total amounts of unrecognized tax benefits will significantly change in the next twelve months. |
| | | |
| | (j) | GAAP requires that permanent differences between income for financial reporting and tax purposes be reclassified in the capital accounts. These differences are caused primarily by differences in the treatment of certain components of income or realized capital gain for federal income tax purposes. Each Fund may utilize earnings and profits distributed to shareholders |
FMI Funds, Inc.
NOTES TO FINANCIAL STATEMENTS (Continued)
September 30, 2018
(1) Summary of Significant Accounting Policies — (Continued)
| | on redemption of shares as part of the dividends paid deduction. These reclassifications have no effect on net assets, results of operations or net asset value per share. For the International Fund these differences are also due to the tax treatment of forward currency contracts and foreign currency transactions. During the fiscal year ended September 30, 2018, the reclassifications were as follows: |
| | | | Undistributed Net | | | Accumulated Net | | | | |
| | | | Investment Income (Loss) | | | Realized Gain (Loss) | | | Capital Stock | |
| | Large Cap Fund | | $ | (1,090 | ) | | $ | (132,955,586 | ) | | $ | 132,956,676 | |
| | Common Stock Fund | | $ | — | | | $ | (10,208,554 | ) | | $ | 10,208,554 | |
| | International Fund | | $ | 72,065,091 | | | $ | (89,180,330 | ) | | $ | 17,115,239 | |
| | (k) | Common Company expenses are typically allocated evenly between the Funds of the Company, or by other equitable means. |
(2) Investment Adviser and Management Agreement and Transactions With Related Parties —
The Funds each have a management agreement with Fiduciary Management, Inc. (“FMI” or the “Adviser”), with whom certain officers and directors of the Funds are affiliated, to serve as investment adviser and manager. Under the terms of the agreements, the Adviser is entitled to receive a fee. The fee is computed and payable at the end of each month. The following annual percentages of each Fund’s average daily net assets are used:
| | • | Large Cap Fund: 0.70% of the assets from $0 - $2.5 billion; 0.65% of the assets from $2.5 - $5.0 billion; and 0.60% of the assets over $5.0 billion. |
| | | |
| | • | Common Stock Fund: 0.90% of the assets from $0 - $500 million; 0.85% of the assets from $500 million - $1.0 billion; 0.80% of the assets over $1.0 billion. |
| | | |
| | • | International Fund: 0.75% of the assets from $0 - $2.5 billion; 0.70% of the assets from $2.5 - $5.0 billion; 0.65% of the assets from $5.0 – $10.0 billion; and 0.60% of the assets over $10.0 billion. |
The Funds are responsible for paying their proportionate share of the compensation, benefits and expenses of the Funds’ Chief Compliance Officer. For administrative convenience, FMI initially makes these payments and is later reimbursed by the Funds.
Under the respective Investment Advisory or operating expenses limitation agreements, FMI will reimburse the Funds for expenses as follows:
| | | Investor Class Expense Cap | Institutional Class Expense Cap |
| | Large Cap Fund | 1.20% | 1.10% |
| | Common Stock Fund | 1.30% | 1.20% |
| | International Fund | 1.75% | 1.65% |
For the year ended September 30, 2018, there were no contractual or voluntary reimbursements required for the Funds.
The Large Cap Fund and the International Fund have each entered into a Distribution Plan (the “Plan”), pursuant to Rule 12b-1 under the Act. Each Plan, if implemented, provides that the applicable Fund may incur certain costs which may not exceed the lesser of a monthly amount equal to 0.25% of such Fund’s daily net assets or the actual distribution costs incurred during
FMI Funds, Inc.
NOTES TO FINANCIAL STATEMENTS (Continued)
September 30, 2018
(2) Investment Adviser and Management Agreement and Transactions With Related Parties — (Continued)
the year. Amounts payable under each Plan would be paid monthly for any activities or expenses primarily intended to result in the sale of shares of such Fund. For the year ended September 30, 2018, no such expenses were charged to the shareholders of either Fund as the Funds had not implemented the Plan.
Under the Funds’ organizational documents, each director, officer, employee or other agent of any Fund (including the Funds’ investment manager) is indemnified, to the extent permitted by the Act, against certain liabilities that may arise out of performance of their duties to the Funds. Additionally, in the normal course of business, the Funds enter into contracts that contain a variety of indemnification clauses. The Funds’ maximum exposure under these arrangements is unknown as this would involve future claims that may be made against such Fund that have not yet occurred. However, the Funds have not had prior claims or losses pursuant to these contracts and believe the risk of loss to be remote.
At September 30, 2018, no person is deemed to “control” a Fund, as that term is defined in the Act, because the Funds do not know of any person who owns beneficially or through controlled companies more than 25% of a Fund’s Investor Class and Institutional Class shares, on a combined basis, or who acknowledges the existence of control.
(3) Shareholder Servicing Plan —
The Funds have adopted a Shareholder Servicing Plan pursuant to which Investor Class shares may pay financial intermediaries for assets maintained in an omnibus account at an annual rate of up to 0.15% of the average daily net assets, or an annual per account rate approved by the Board. The Board may also authorize the Funds to pay for shareholder services outside of the plan.
For the year ended September 30, 2018, shareholder servicing fees incurred are disclosed on the Statements of Operations.
(4) Loan Agreements —
U.S. Bank, N.A. (the “Bank”) has made available to the Company a $725,000,000 umbrella credit facility, pursuant to the loan agreement (the “Agreement”) effective May 31, 2018 for the FMI Funds, Inc. for the purposes of having cash available to satisfy redemption requests and is subject to certain restrictions and covenants. For the period October 1, 2017 through May 30, 2018, the umbrella credit facility was $675,000,000. Principal is due not more than 45 days after the date of the loan. Amounts under the credit facility bear interest at a rate per annum equal to the Bank’s current prime rate minus one percent on the amount borrowed. Advances will be collateralized by securities owned by the borrowing Fund. During the year ended September 30, 2018, none of the Funds borrowed against the Agreement. The Agreement is subject to renewal on May 30, 2019.
(5) Distribution to Shareholders —
Net investment income and net realized gains, if any, are distributed to shareholders at least annually. Distributions to shareholders are recorded on the ex-dividend date.
FMI Funds, Inc.
NOTES TO FINANCIAL STATEMENTS (Continued)
September 30, 2018
(6) Investment Transactions —
For the year ended September 30, 2018, purchases and sales of investment securities (excluding short-term investments) were as follows:
| | | | Large Cap Fund | | | Common Stock Fund | | | International Fund | |
| | Purchases | | $ | 1,445,493,625 | | | $ | 225,735,584 | | | $ | 1,354,785,767 | |
| | Sales | | | 2,393,921,996 | | | | 302,022,846 | | | | 1,679,457,968 | |
(7) Income Tax Information —
The following information for the Funds is presented on an income tax basis as of September 30, 2018:
| | | | | | | | | | | | Net | | | | | | | |
| | | | | | | | | | | | Unrealized | | | | | | Distribu- | |
| | | | | | | | | | | | Appreciation | | | Distribu- | | | table | |
| | | | | | Gross | | | Gross | | | (Depreciation) | | | table | | | Long-Term | |
| | | Cost of | | | Unrealized | | | Unrealized | | | on | | | Ordinary | | | Capital | |
| | | Investments | | | Appreciation(1) | | | Depreciation(1) | | | Investments(1) | | | Income | | | Gains | |
| Large Cap | | | | | | | | | | | | | | | | | | |
| Fund | | $ | 4,224,709,461 | | | $ | 1,873,678,531 | | | $ | (82,818,842 | ) | | $ | 1,790,859,689 | | | $ | 54,077,007 | | | $ | 754,057,468 | |
| Common | | | | | | | | | | | | | | | | | | | | | | | | |
| Stock Fund | | | 819,468,183 | | | | 259,364,979 | | | | (10,239,865 | ) | | | 249,125,114 | | | | 5,531,385 | | | | 55,481,143 | |
| International | | | | | | | | | | | | | | | | | | | | | | | | |
| Fund | | | 6,588,653,341 | | | | 966,043,404 | | | | (288,884,936 | ) | | | 677,158,468 | | | | 215,600,865 | | | | 122,480,790 | |
| (1) | Represents amounts of investments in securities, forward currency contracts and foreign currency transactions. |
The difference between the cost amounts for financial statement and federal income tax purposes is due primarily to timing differences in recognizing certain gains and losses on security transactions.
The tax components of dividends paid during the years ended September 30, 2018 and 2017 are as follows:
| | | | September 30, 2018 | | | September 30, 2017 | |
| | | | Ordinary | | | Long-Term | | | Ordinary | | | Long-Term | |
| | | | Income | | | Capital Gains | | | Income | | | Capital Gains | |
| | | | Distributions* | | | Distributions | | | Distributions* | | | Distributions | |
| | Large Cap Fund | | $ | 114,435,755 | | | $ | 456,382,409 | | | $ | 71,972,433 | | | $ | 389,995,134 | |
| | Common Stock Fund | | | 7,371,196 | | | | 108,174,358 | | | | 628,667 | | | | 46,762,227 | |
| | International Fund | | | 77,844,252 | | | | 53,689,910 | | | | 184,023,852 | | | | 23,385,013 | |
* For federal income tax purposes, distributions on short-term capital gains are treated as ordinary income distributions.
FMI Funds, Inc.
NOTES TO FINANCIAL STATEMENTS (Continued)
September 30, 2018
(8) Fund Share Transactions —
| | | | Year Ended | | | Year Ended | |
| | | | September 30, 2018 | | | September 30, 2017 | |
| | Large Cap Fund | | Shares | | | Amount | | | Shares | | | Amount | |
| | Sales | | | | | | | | | | | | |
| | Investor Class | | | 15,959,831 | | | $ | 351,482,480 | | | | 21,655,099 | | | $ | 448,604,812 | |
| | Institutional Class | | | 43,371,692 | | | | 959,561,391 | | | | 136,146,705 | | | | 2,847,096,672 | |
| | Reinvestment of dividends | | | | | | | | | | | | | | | | |
| | and distributions | | | | | | | | | | | | | | | | |
| | Investor Class | | | 14,976,434 | | | | 320,345,924 | | | | 17,228,386 | | | | 343,878,586 | |
| | Institutional Class | | | 9,580,898 | | | | 204,743,793 | | | | 4,373,527 | | | | 87,208,121 | |
| | Redemptions | | | | | | | | | | | | | | | | |
| | Investor Class | | | (66,813,081 | ) | | | (1,477,547,863 | ) | | | (190,502,583 | ) | | | (3,974,081,352 | ) |
| | Institutional Class | | | (41,351,485 | ) | | | (921,042,130 | ) | | | (26,869,239 | ) | | | (561,697,995 | ) |
| | Total Investor Class | | | (35,876,816 | ) | | | (805,719,459 | ) | | | (151,619,098 | ) | | | (3,181,597,954 | ) |
| | Total Institutional Class | | | 11,601,105 | | | | 243,263,054 | | | | 113,650,993 | | | | 2,372,606,798 | |
| | Net increase (decrease) | | | (24,275,711 | ) | | $ | (562,456,405 | ) | | | (37,968,105 | ) | | $ | (808,991,156 | ) |
| | | | | | | | | | | | | | | | | | |
| | | | Year Ended | | | Year Ended | |
| | | | September 30, 2018 | | | September 30, 2017 | |
| | Common Stock Fund | | Shares | | | Amount | | | Shares | | | Amount | |
| | Sales | | | | | | | | | | | | | | | | |
| | Investor Class | | | 2,467,515 | | | $ | 67,536,887 | | | | 4,060,207 | | | $ | 109,556,600 | |
| | Institutional Class | | | 6,454,683 | | | | 176,730,909 | | | | 10,006,334 | | | | 268,595,468 | |
| | Reinvestment of dividends | | | | | | | | | | | | | | | | |
| | and distributions | | | | | | | | | | | | | | | | |
| | Investor Class | | | 3,065,085 | | | | 80,979,549 | | | | 1,488,053 | | | | 39,165,565 | |
| | Institutional Class | | | 1,200,184 | | | | 31,732,855 | | | | 251,636 | | | | 6,623,050 | |
| | Redemptions | | | | | | | | | | | | | | | | |
| | Investor Class | | | (11,092,470 | ) | | | (304,874,594 | ) | | | (14,096,574 | ) | | | (377,610,214 | ) |
| | Institutional Class | | | (1,582,972 | ) | | | (43,013,801 | ) | | | (617,212 | ) | | | (16,835,074 | ) |
| | Total Investor Class | | | (5,559,870 | ) | | | (156,358,158 | ) | | | (8,548,314 | ) | | | (228,888,049 | ) |
| | Total Institutional Class | | | 6,071,895 | | | | 165,449,963 | | | | 9,640,758 | | | | 258,383,444 | |
| | Net increase (decrease) | | | 512,025 | | | $ | 9,091,805 | | | | 1,092,444 | | | $ | 29,495,395 | |
FMI Funds, Inc.
NOTES TO FINANCIAL STATEMENTS (Continued)
September 30, 2018
(8) Fund Share Transactions — (Continued)
| | | | Year Ended | | | Year Ended | |
| | | | September 30, 2018 | | | September 30, 2017 | |
| | International Fund | | Shares | | | Amount | | | Shares | | | Amount | |
| | Sales | | | | | | | | | | | | |
| | Investor Class | | | 19,281,104 | | | $ | 652,780,810 | | | | 89,860,897 | | | $ | 2,793,637,875 | |
| | Institutional Class | | | 61,141,653 | | | | 2,074,033,083 | | | | 90,816,851 | | | | 2,840,643,850 | |
| | Reinvestment of dividends | | | | | | | | | | | | | | | | |
| | and distributions | | | | | | | | | | | | | | | | |
| | Investor Class | | | 2,493,933 | | | | 83,646,506 | | | | 5,915,278 | | | | 175,802,061 | |
| | Institutional Class | | | 1,335,977 | | | | 44,848,765 | | | | 894,973 | | | | 26,589,641 | |
| | Redemptions | | | | | | | | | | | | | | | | |
| | Investor Class | | | (84,969,353 | ) | | | (2,875,792,372 | ) | | | (99,789,345 | ) | | | (3,131,105,701 | ) |
| | Institutional Class | | | (24,427,674 | ) | | | (826,521,153 | ) | | | (10,300,035 | ) | | | (333,361,727 | ) |
| | Total Investor Class | | | (63,194,316 | ) | | | (2,139,365,056 | ) | | | (4,013,170 | ) | | | (161,665,765 | ) |
| | Total Institutional Class | | | 38,049,956 | | | | 1,292,360,695 | | | | 81,411,789 | | | | 2,533,871,764 | |
| | Net increase (decrease) | | | (25,144,360 | ) | | $ | (847,004,361 | ) | | | 77,398,619 | | | $ | 2,372,205,999 | |
(9) Subsequent Events —
On September 14, 2018, the Board approved the year-end distributions for the Funds. Cash dividends in the aggregate amounts equal to each of the Fund’s net investment income and short-term capital gains, if any, which will be treated as ordinary income, and long-term capital gains, to be payable on December 14, 2018 to outstanding shares of record at the close of business on December 13, 2018.
FMI Funds, Inc.
REPORT OF INDEPENDENT REGISTERED PUBLIC ACCOUNTING FIRM
To the Shareholders and Board of Directors of FMI Funds, Inc.
Opinion on the Financial Statements
We have audited the accompanying statements of assets and liabilities, including the schedules of investments and forward currency contracts, of FMI Funds, Inc. comprising FMI Large Cap Fund, FMI Common Stock Fund, and FMI International Fund (the “Funds”), as of September 30, 2018, and the related statements of operations for the year then ended, the statements of changes in net assets for each of the two years in the period then ended, including the related notes, and the financial highlights for each of the two years in the period then ended (collectively referred to as the “financial statements”). In our opinion, the financial statements present fairly, in all material respects, the financial position of each of the Funds as of September 30, 2018, the results of their operations for the year then ended, and the changes in their net assets and the financial highlights for each of the two years in the period then ended, in conformity with accounting principles generally accepted in the United States of America.
The Funds’ financial highlights for the periods ended September 30, 2016, and prior, were audited by other auditors whose report dated October 25, 2016, expressed an unqualified opinion on those financial statements and financial highlights.
Basis for Opinion
These financial statements are the responsibility of the Funds’ management. Our responsibility is to express an opinion on the Funds’ financial statements based on our audits. We are a public accounting firm registered with the Public Company Accounting Oversight Board (United States) (“PCAOB”) and are required to be independent with respect to the Funds in accordance with the U.S. federal securities laws and the applicable rules and regulations of the Securities and Exchange Commission and the PCAOB.
We conducted our audits in accordance with the standards of the PCAOB. Those standards require that we plan and perform the audit to obtain reasonable assurance about whether the financial statements are free of material misstatement, whether due to error or fraud.
Our audits included performing procedures to assess the risks of material misstatement of the financial statements, whether due to error or fraud, and performing procedures that respond to those risks. Such procedures included examining, on a test basis, evidence regarding the amounts and disclosures in the financial statements and confirmation of securities owned as of September 30, 2018, by correspondence with the custodian and brokers. Our audits also included evaluating the accounting principles used and significant estimates made by management, as well as evaluating the overall presentation of the financial statements. We believe that our audits provide a reasonable basis for our opinion.
We have served as the Funds’ auditor since 2016.
COHEN & COMPANY, LTD.
Milwaukee, Wisconsin
October 26, 2018
FMI Funds, Inc.
EXPENSE EXAMPLE (Unaudited)
As a shareholder of the FMI Funds you incur ongoing costs, including management fees and other Fund expenses. You do not incur transaction costs such as sales charges (loads) on purchase payments, reinvested dividends, or other distributions; redemption fees; and exchange fees because the Funds do not charge these fees. This example is intended to help you understand your ongoing costs (in dollars) of investing in each Fund and to compare these costs with the ongoing costs of investing in other mutual funds. The example is based on an investment of $1,000 invested at the beginning of the period and held for the entire period from April 1, 2018 through September 30, 2018.
Actual Expenses
The table below provides information about actual account values and actual expenses. You may use the information in these lines, together with the amount you invested, to estimate the expenses that you paid over the period. Simply divide your account value by $1,000 (for example, an $8,600 account value divided by $1,000 = 8.6), then multiply the result by the number in the line under the row entitled “Actual Expenses Paid During Period” to estimate the expenses you paid on your account during this period.
In addition to the costs highlighted and described below, the only Fund transaction costs you might currently incur would be wire fees ($15 per wire), if you choose to have proceeds from a redemption wired to your bank account instead of receiving a check. Additionally, U.S. Bank charges an annual processing fee ($15) if you maintain an IRA account with the Fund. To determine your total costs of investing in a Fund, you would need to add any applicable wire or IRA processing fees you’ve incurred during the period to the costs provided in the example at the end of this article.
Hypothetical Example for Comparison Purposes
The table below provides information about hypothetical account values and hypothetical expenses based on each Fund’s actual expense ratio and an assumed rate of return of 5% per year before expenses, which is not the Fund’s actual return. The hypothetical account values and expenses may not be used to estimate the actual ending account balance or expenses you paid for the period. You may use this information to compare the ongoing costs of investing in a Fund and other funds. To do so, compare this 5% hypothetical example with the 5% hypothetical examples that appear in the shareholder reports of the other funds.
Please note that the expenses shown in the table are meant to highlight your ongoing costs only and do not reflect any transactional costs, as described above. Therefore, the hypothetical line of the table is useful in comparing ongoing costs only, and will not help you determine the relative total costs of owning different funds. In addition, if these transactional costs were included, your costs would have been higher.
FMI Funds, Inc.
EXPENSE EXAMPLE (Unaudited) (Continued)
| | | FMI | | | FMI | | | FMI | |
| | | Large Cap | | | Common Stock | | | International | |
| | | Fund | | | Fund | | | Fund | |
| Investor Class | | | | | | | | | |
| Actual Beginning Account Value 4/01/18 | | $ | 1,000.00 | | | $ | 1,000.00 | | | $ | 1,000.00 | |
| Actual Ending Account Value 9/30/18 | | $ | 1,075.30 | | | $ | 1,039.20 | | | $ | 1,029.90 | |
| Actual Expenses Paid | | | | | | | | | | | | |
| During Period* 4/01/18-9/30/18 | | $ | 4.37 | | | $ | 5.32 | | | $ | 4.48 | |
| Hypothetical Beginning | | | | | | | | | | | | |
| Account Value 4/01/18 | | $ | 1,000.00 | | | $ | 1,000.00 | | | $ | 1,000.00 | |
| Hypothetical Ending | | | | | | | | | | | | |
| Account Value 9/30/18 | | $ | 1,020.86 | | | $ | 1,019.85 | | | $ | 1,020.66 | |
| Hypothetical Expenses Paid | | | | | | | | | | | | |
| During Period* 4/01/18-9/30/18 | | $ | 4.26 | | | $ | 5.27 | | | $ | 4.46 | |
| Annualized Expense Ratio* | | | 0.84% | | | | 1.04% | | | | 0.88% | |
| Institutional Class | | | | | | | | | | | | |
| Actual Beginning Account Value 4/01/18 | | $ | 1,000.00 | | | $ | 1,000.00 | | | $ | 1,000.00 | |
| Actual Ending Account Value 9/30/18 | | $ | 1,076.30 | | | $ | 1,039.60 | | | $ | 1,030.40 | |
| Actual Expenses Paid | | | | | | | | | | | | |
| During Period* 4/01/18-9/30/18 | | $ | 3.70 | | | $ | 4.81 | | | $ | 3.87 | |
| Hypothetical Beginning | | | | | | | | | | | | |
| Account Value 4/01/18 | | $ | 1,000.00 | | | $ | 1,000.00 | | | $ | 1,000.00 | |
| Hypothetical Ending | | | | | | | | | | | | |
| Account Value 9/30/18 | | $ | 1,021.51 | | | $ | 1,020.36 | | | $ | 1,021.26 | |
| Hypothetical Expenses Paid | | | | | | | | | | | | |
| During Period* 4/01/18-9/30/18 | | $ | 3.60 | | | $ | 4.76 | | | $ | 3.85 | |
| Annualized Expense Ratio* | | | 0.71% | | | | 0.94% | | | | 0.76% | |
| * | Expenses are equal to the Fund’s annualized expense ratio, multiplied by the average account value over the period, multiplied by 183/365 (to reflect the one-half year period between April 1, 2018 and September 30, 2018). |
FMI Funds, Inc.
DIRECTORS AND OFFICERS (Unaudited)
| | | Term of | Principal | | |
| | Positions | Office and | Occupation(s) | Other | |
| Name, Age | Held with | Length of | During Past | Directorships Held by | |
and Address*^ | the Funds | Time Served | Five Years | Director or Officer | |
| Non-Interested Directors | | | | | |
| Barry K. Allen, 69 | Director | Indefinite | Mr. Allen is President of | BCE, Inc. | |
| | | Term Since | Allen Enterprises, LLC | (Bell Canada | |
| | | 2001 | (Boca Grande, FL) a | Enterprise) | |
| | | | private equity investments | and CDW | |
| | | | and management company, | Corp. | |
| | | | and Operating Partner | | |
| | | | for Providence Equity | | |
| | | | Partners (Providence, RI) | | |
| | | | since September, 2007. | | |
| | | | | | |
| Robert C. | Director | Indefinite | Mr. Arzbaecher retired as | CF Industries | |
| Arzbaecher, 58 | | Term Since | Chairman and Chief | Holdings, Inc. | |
| | | 2007 | Executive Officer of | | |
| | | | Actuant Corporation | | |
| | | | (Menomonee Falls, WI) | | |
| | | | in March, 2016. | | |
| | | | | | |
| Lawrence J. Burnett, 60 | Director | Indefinite | Mr. Burnett is a shareholder | None | |
| | | Term Since | and employee of Reinhart | | |
| | | 2016 | Boerner Van Deuren s.c. | | |
| | | | (Milwaukee, WI), since his | | |
| | | | graduation from Cornell | | |
| | | | Law School in 1982. | | |
| | | | Mr. Burnett is also the Co- | | |
| | | | Chair of Reinhart Boerner’s | | |
| | | | business law department. | | |
| | | | | | |
| Rebecca W. House, 45 | Director | Indefinite | Ms. House is Senior Vice | None | |
| | | Term Since | President, General Counsel | | |
| | | 2017 | and Secretary at Rockwell | | |
| | | | Automation, Inc., an | | |
| | | | industrial automation | | |
| | | | company, since January | | |
| | | | 2017. From October 2010 to | | |
| | | | December 2016, Ms. House | | |
| | | | was Assistant General | | |
| | | | Counsel at Harley-Davidson, | | |
| | | | Inc., a motorcycle manufacturer. | | |
FMI Funds, Inc.
DIRECTORS AND OFFICERS (Unaudited) (Continued)
| | | Term of | Principal | | |
| | Positions | Office and | Occupation(s) | Other | |
| Name, Age | Held with | Length of | During Past | Directorships Held by | |
and Address*^ | the Funds | Time Served | Five Years | Director or Officer | |
| Non-Interested Directors | | | | | |
| Paul S. Shain, 55 | Director | Indefinite | Mr. Shain is President and | None | |
| | | Term Since | Chief Executive Officer | | |
| | | 2001 | of Singlewire Software, | | |
| | | | LLC (Madison, WI), a | | |
| | | | provider of IP-based | | |
| | | | paging and emergency | | |
| | | | notification systems, | | |
| | | | since April, 2009. | | |
| | | | | | |
| Robert J. Venable, 54 | Director | Indefinite | Mr. Venable is President of | None | |
| | | Term Since | Charter Manufacturing, a | | |
| | | 2016 | Wisconsin-based company | | |
| | | | with operations in a range | | |
| | | | of industrial markets. He | | |
| | | | has served with Charter in | | |
| | | | this and other roles | | |
| | | | since 2013. | | |
| Interested Directors | | | | | |
| John S. Brandser,** 56 | Director | Indefinite | Mr. Brandser is President, | None | |
| | | Term Since | Secretary, Chief | | |
| | | 2009 | Operating Officer and | | |
| | President | One Year | Chief Compliance Officer | | |
| | and | Term Since | of Fiduciary Management, | | |
| | Treasurer | 2017 | Inc. and has been | | |
| | | One Year | employed by the Adviser | | |
| | | Term Since | in various capacities | | |
| | | 2017 | since March, 1995. | | |
| | | | | | |
| Patrick J. English,** 57 | Director | Indefinite | Mr. English is Chief | None | |
| | | Term Since | Executive Officer, Chief | | |
| | | 2001 | Investment Officer and | | |
| | Vice | One Year | Treasurer of Fiduciary | | |
| | President | Term Since | Management, Inc. and has | | |
| | and | 2001 | been employed by the | | |
| | Secretary | One Year | Adviser in various capacities | | |
| | | Term Since | since December, 1986. | | |
| | | 2017 | | | |
FMI Funds, Inc.
DIRECTORS AND OFFICERS (Unaudited) (Continued)
| | | Term of | Principal | | |
| | Positions | Office and | Occupation(s) | Other | |
| Name, Age | Held with | Length of | During Past | Directorships Held by | |
and Address* | the Funds | Time Served | Five Years | Director or Officer | |
| Other Officer | | | | | |
| Lauren A. Grebe, 31 | Chief | At | Ms. Grebe is Chief | None | |
| | Compli- | Discretion | Compliance Officer of | | |
| | ance | of Board | the Funds since March, | | |
| | Officer | Since 2017 | 2017, and was previously a | | |
| | | | Compliance Officer of the | | |
| | | | Funds since June, 2016. From | | |
| | | | August, 2009 to June, 2016, | | |
| | | | Ms. Grebe was employed by | | |
| | | | PricewaterhouseCoopers LLP, | | |
| | | | auditing clients in the asset | | |
| | | | management industry. | | |
____________
| * | | The address of each Director and Officer is c/o Fiduciary Management, Inc., 100 E. Wisconsin Ave., Suite 2200, Milwaukee, WI 53202. |
| ** | | Messrs. Brandser and English are interested directors of the Funds because they are officers of the Funds and/or affiliated persons of the Adviser. |
| ^ | | Each Non-Interested and Interested Director oversees 3 Funds in the complex. |
FMI Funds, Inc.
DISCLOSURE INFORMATION (Unaudited)
Performance data quoted represents past performance; past performance does not guarantee future results. Investment return and principal value of an investment will fluctuate so that an investor’s shares, when redeemed, may be worth more or less than their original cost. Current performance of a Fund may be lower or higher than the performance quoted. Performance data current to the most recent month end may be obtained by visiting www.fmifunds.com or by calling 1-800-811-5311. The returns do not reflect the deduction of taxes that a shareholder would pay on Fund distributions or the redemption of Fund shares.
Securities named in the Letters to Shareholders, but not listed in the Schedules of Investments are not held in the Funds as of the date of this disclosure. Portfolio holdings are subject to change without notice and are not intended as recommendations of individual securities.
This report is not authorized for use as an offer of sale or a solicitation of an offer to buy shares of the Funds unless accompanied or preceded by the Funds’ current prospectus.
As of the Funds’ Prospectus dated January 31, 2018 and supplemented on March 19, 2018, the FMI Large Cap Fund, FMI Common Stock Fund and FMI International Funds’ Investor Class annual operating expense ratios are: 0.85%, 1.04% and 0.91%, respectively. The FMI Large Cap Fund, FMI Common Stock Fund and FMI International Funds’ Institutional Class annual operating expense ratios are: 0.71%, 0.95%, and 0.77%, respectively.
Risks associated with investing in the Funds are as follows:
FMI Large Cap Fund: Stock Market Risk, Medium and Large Capitalization Companies Risks, Non-Diversification Risk (Non-Diversified funds are subject to higher volatility than funds that are invested more broadly), Value Investing Risk, Foreign Securities Risk (fluctuation of currency, different financial standards, and political instability) and Liquidity Risk.
FMI Common Stock Fund: Stock Market Risk, Medium and Small Capitalization Companies Risks (which includes the potential for greater volatility and less financial resources than Large-Cap Companies), Value Investing Risk, Foreign Securities Risk (fluctuation of currency, different financial standards, and political instability) and Liquidity Risk.
FMI International Fund: Stock Market Risk, Non-Diversification Risk (Non-Diversified funds are subject to higher volatility than funds that are invested more broadly), Value Investing Risk, Foreign Securities Risk (fluctuation of currency, different financial standards, and political instability), Geographic Concentration Risk, Currency Hedging Risk, Large Capitalization Companies Risk and Liquidity Risk.
For details regarding these risks, please refer to the Funds’ Summary or Statutory Prospectuses dated January 31, 2018, each supplemented on March 19, 2018.
For more information about the FMI Funds, call 1-800-811-5311 for a free Prospectus or Summary Prospectus. Please read these Prospectuses carefully to consider the investment objectives, risks, charges and expenses, before investing or sending money. These Prospectuses contain this and more information about the FMI Funds. Please read the Prospectuses or Summary Prospectuses carefully before investing.
The Standard and Poor’s 500 Index (S&P 500) measures the large-cap segment of the U.S. equity market using a market-capitalization-weighted index composed of 500 constituent companies. Individual companies may change over time.
The Russell 2000 Index measures the performance of the 2,000 smallest companies in the Russell 3000 Index which comprises the 3,000 largest U.S. companies based on total market capitalization. The Russell 2000 Value Index includes equities that exhibit value characteristics and the Russell 2000 Growth Index includes equities that exhibit growth characteristics.
The MSCI EAFE Index (Europe, Australasia, Far East) is a free float-adjusted market capitalization index that is designed to measure the equity market performance of developed markets, excluding the U.S. and Canada. The MSCI EAFE Index consists of the following 21 developed market country indices: Australia, Austria, Belgium, Denmark, Finland, France, Germany, Hong Kong, Ireland, Israel, Italy, Japan, the Netherlands, New
FMI Funds, Inc.
DISCLOSURE INFORMATION (Unaudited) (Continued)
Zealand, Norway, Portugal, Singapore, Spain, Sweden, Switzerland and the United Kingdom. The MSCI EAFE Index is unmanaged and investors cannot invest directly in the Index. Index results are inclusive of dividends and net of foreign withholding taxes. The reported figures include reinvestment of dividends and capital gains distributions and do not reflect any fees or expenses.
The MSCI EAFE Index is calculated in local currency (LOC) as well as in U.S. Dollars (USD). The concept of a LOC calculation excludes the impact of currency fluctuations. All currencies of listing are considered in the Index calculation in LOC where current prices (t) and previous day prices (t-1) are converted into USD using the same exchange rate (exchange rate t-1) in the numerator and denominator. As a consequence, the FX factor drops out of the equation. The USD calculation includes exchange rates at t and t-1. Therefore, the LOC calculation only represents the price appreciation or depreciation of the securities, whereas the USD calculation also accounts for the performance of the currency (or currencies) relative to the USD.
MSCI EAFE is a service mark of MSCI Barra.
The CRB Metals Index acts as a representative indicator of the global metal commodity market.
The FTSE All-Share Index, originally known as the FTSE Actuaries All Share Index, is a capitalization-weighted index, comprised of approximately 642 companies traded on the London Stock Exchange and captures 98% of the UK’s market capitalization.
The STOXX 600 is an index of 600 companies that represents large, mid, and small cap companies across seventeen countries of the European region: Austria, Belgium, Czech Republic, Denmark, Finland, France, Germany, Ireland, Italy, Luxembourg, the Netherlands, Norway, Portugal, Spain, Sweden, Switzerland and the United Kingdom.
All indices are unmanaged. It is not possible to invest directly into an index.
GLOSSARY
CAGR – Compound Annual Growth Rate – the mean annual growth rate of an investment over a specified period.
Capital Expenditure – funds used by a company to acquire, upgrade, and maintain physical assets and is often used to undertake new projects or investments by the firm. The cost of a capital expenditure is spread over the useful life of the asset.
EBIT – Earnings Before Interest & Tax – an indicator of a company’s profitability, calculated as revenue minus expenses, excluding tax and interest.
EBITDA – Earnings Before Interest Taxes Depreciation and Amortization is essentially net income with interest, taxes, depreciation, and amortization added back to it, and can be used to analyze and compare profitability between companies and industries because it eliminates the effects of financing and accounting decisions.
EPS – Earnings per Share – The portion of a company’s profit allocated to each outstanding share of common stock. Earnings per share serves as an indicator of a company’s profitability.
EV/EBITDA – Enterprise Value to Earnings Before Interest Taxes Depreciation and Amortization is a measure of the value of a stock that compares a company’s enterprise value (market cap plus debt, minority interest and preferred shares, minus total cash and cash equivalents) to its earnings before interest taxes depreciation and amortization. EV/EBITDA is one of several fundamental indicators that investors use to determine whether a stock is priced well. The EV/EBITDA multiple is also often used to determine a company’s valuation in the case of a potential acquisition.
EV/Sales – Enterprise-Value-To-Sales – a valuation measure that compares the enterprise value of a company to the company’s sales. EV/sales gives investors an idea of how much it costs to buy the company’s sales.
FMI Funds, Inc.
DISCLOSURE INFORMATION (Unaudited) (Continued)
Free cash flow – a measure of a company’s financial performance, calculated as operating cash flow minus capital expenditures, Free cash flow represents the cash that a company is able to generate after spending the money required to maintain or expand its asset base.
GDP – Gross Domestic Product is the monetary value of all finished goods and services produced within a country’s borders in a specific time period.
Price-to-book – The price-to-book ratio is the ratio for valuing a company that measures its current share price relative to its book value of equity.
Price-to-earnings ratio – The price-earnings ratio (P/E Ratio) is the ratio for valuing a company that measures its current share price relative to its per-share earnings.
Price-to-sales ratio – Price-to-sales ratio is a valuation ratio that compares a company’s stock price to its revenues. The price-to-sales ratio is an indicator of the value placed on each dollar of a company’s sales or revenues. It can be calculated either by dividing the company’s market capitalization by its total sales over a 12-month period, or on a per-share basis by dividing the stock price by sales per share for a 12-month period.
ROCE – Return on Capital Employed – Return on capital employed is a financial ratio that measures a company’s profitability and efficiency with which its capital is employed.
ROE – Return on Equity – Return on equity is the amount of net income returned as a percentage of shareholders’ equity and measures a company’s profitability by revealing how much profit a company generates with the money shareholders have invested.
ROIC – Return on Invested Capital – a calculation used to assess a company’s efficiency at allocating the capital under its control to profitable investments. The return on invested capital measure gives a sense of how well a company is using its money to generate returns.
Reference definitions found at Investopedia.com
Distributed by Rafferty Capital Markets, LLC, 1010 Franklin Avenue, Garden City, NY 11530
FMI Funds, Inc.
ADDITIONAL INFORMATION (Unaudited)
For additional information about the Directors and Officers or for a description of the policies and procedures that the Funds use to determine how to vote proxies relating to portfolio securities, please call (800) 811-5311 and request a Statement of Additional Information. It will be mailed to you free of charge. The Statement of Additional Information is also available on the website of the Securities and Exchange Commission (the “Commission”) at http://www.sec.gov. Information on how each of the Funds voted proxies relating to portfolio securities is available on the Funds’ website at http://www.fmifunds.com or the website of the Commission no later than August 31 for the prior 12 months ending June 30. The Funds file their complete schedules of portfolio holdings with the Commission for the first and third quarters of each fiscal year on Form N-Q. The Funds’ Forms N-Q are available on the Commission’s website. The Funds’ Forms N-Q may be reviewed and copied at the Commission’s Public Reference Room in Washington, D.C., and that information on the operation of the Public Reference Room may be obtained by calling 1-800-SEC-0330.
TAX NOTICE (Unaudited)
For corporate shareholders of the Large Cap Fund, the Common Stock Fund and the International Fund, the percentage of dividend income distributed for the year ended September 30, 2018 which is designated as qualifying for the dividends received deduction is 64.14%, 100% and 0.30%, respectively. The International Fund intends to elect to pass-through to shareholders the income tax credit for taxes paid to foreign countries. For the year ended September 30, 2018, the foreign source income was $169,093,532 and the foreign tax expense was $11,647,613. The pass-through of the foreign tax credit will only affect those persons who are shareholders on the dividend record dates. For all shareholders of the Large Cap Fund, the Common Stock Fund and the International Fund, the percentage of dividend income distributed for the year ended September 30, 2018 which is designated as qualified dividend income under the Jobs and Growth Tax Relief Act of 2003, is 87.05%, 100% and 59.21%, respectively. For all shareholders of the Large Cap Fund, the Common Stock Fund and the International Fund, the percentage of taxable ordinary income distributions that are designated as short-term capital gain distributions under Internal Revenue Section 871(k)(2)(c) is 0%, 0% and 69.84%, respectively.
FMI Funds, Inc.
NOTICE OF PRIVACY POLICY (Unaudited)
Protecting the privacy of our shareholders is important to us. This notice describes the practices and policies through which we maintain the confidentiality and protect the security of your non-public personal information.
What Information We Collect
In the course of providing services to you, we may collect the following types of “non-public personal information” about you:
| • | Information we receive from you on applications or other forms, such as your name, address and social security number, the types and amounts of investments and bank account information, and |
| • | Information about your transactions with us, our affiliates and others, as well as other account data. |
What Information We Disclose
We do not disclose any nonpublic personal information about our current or former shareholders to anyone, except as permitted by law. For example, we are permitted by law to disclose all of the information we collect, as described above, to our transfer agent to process your transactions. Furthermore, we restrict access to your nonpublic personal information to those persons who require such information to provide products or services to you. We maintain physical, electronic and procedural safeguards that comply with federal standards to guard your nonpublic personal information. In the event that you hold shares of any Fund through a financial intermediary, including, but not limited to, a broker-dealer, bank or trust company, the privacy policy of your financial intermediary may govern how your nonpublic personal information would be shared with nonaffiliated third parties.
IMPORTANT NOTICE REGARDING DELIVERY OF SHAREHOLDER DOCUMENTS (Unaudited)
In order to reduce expenses, we will deliver a single copy of prospectuses, proxies, financial reports, and other communication to shareholders with the same residential address, provided they have the same last name or we reasonably believe them to be members of the same family. Unless we are notified otherwise, we will continue to send you only one copy of these materials for as long as you remain a shareholder of the Funds. If you would like to receive individual mailings, please call (800) 811-5311 and we will begin sending you separate copies of these materials within 30 days after we receive your request.
Thank you for allowing us to serve your investment needs.
| FMI Large Cap Fund | FMI Common Stock Fund | FMI International Fund |
100 East Wisconsin Avenue, Suite 2200
Milwaukee, Wisconsin 53202
www.fmifunds.com
414-226-4555
BOARD OF DIRECTORS
| | BARRY K. ALLEN | PATRICK J. ENGLISH | |
| | ROBERT C. ARZBAECHER | REBECCA W. HOUSE | |
| | JOHN S. BRANDSER | PAUL S. SHAIN | |
| | LAWRENCE J. BURNETT | ROBERT J. VENABLE | |
INVESTMENT ADVISER
FIDUCIARY MANAGEMENT, INC.
100 East Wisconsin Avenue, Suite 2200
Milwaukee, Wisconsin 53202
ADMINISTRATOR, ACCOUNTANT, TRANSFER
AGENT AND DIVIDEND DISBURSING AGENT
U.S. BANCORP FUND SERVICES, LLC
615 East Michigan Street
Milwaukee, Wisconsin 53202
800-811-5311 or 414-765-4124
| | CUSTODIAN | INDEPENDENT REGISTERED | |
| | U.S. BANK, N.A. | PUBLIC ACCOUNTING FIRM | |
| | Milwaukee, Wisconsin | COHEN & COMPANY, LTD. | |
| | | Milwaukee, Wisconsin | |
| | DISTRIBUTOR | | |
| | RAFFERTY CAPITAL MARKETS, LLC | LEGAL COUNSEL | |
| | Garden City, New York | FOLEY & LARDNER LLP | |
| | | Milwaukee, Wisconsin | |
| | | |
| | | |
| | |
| | |
| | |
| | |
| FMI Funds, Inc. | |
| | |
| 1-800-811-5311 | |
| www.fmifunds.com | |
| | |
| | |
| | |
| | | |
| | | |
| | | |
Item 2. Code of Ethics.
The registrant has adopted a code of ethics that applies to the registrant’s principal executive officer and principal financial officer. The registrant has not made any amendments to its code of ethics during the period covered by this report. The registrant has not granted any waivers from any provisions of the code of ethics during the period covered by this report. A copy of the registrant’s Code of Ethics is filed herewith.
The registrant has adopted a code of ethics that applies to the registrant’s principal executive officer and principal financial officer. The registrant has not made any substantive amendments to its code of ethics during the period covered by this report. The registrant has not granted any waivers from any provisions of the code of ethics during the period covered by this report.
Item 3. Audit Committee Financial Expert.
The registrant’s Board of Directors has determined that Mr. Robert C. Arzbaecher, a member of its audit committee, is an audit committee financial expert. Mr. Arzbaecher is “independent” as such term is defined in Form N-CSR.
Item 4. Principal Accountant Fees and Services.
(a) Audit Service Fees
$60,000 (FY 2018) and $60,000 (FY 2017) are the aggregate fees billed for each of the last two fiscal years for professional services rendered by the principal accountant to the registrant for the audit of the registrant’s annual financial statements or services that are normally provided by the accountant in connection with statutory and regulatory filings or engagements for those fiscal years.
(b) Audit-Related Service Fees
There were no fees billed in the last two fiscal years for Audit-Related Fees.
(c) Tax Service Fees
$15,000 (FY 2018) and $15,000 (FY 2017) are the aggregate fees billed in the last two fiscal years for professional services rendered by the principal accountant to the registrant for tax compliance, tax advice, tax planning and tax return preparation.
There were no fees billed in the last two fiscal years for professional services rendered by the principal accountant to registrant’s investment adviser for tax compliance, tax advice and tax planning that were required to be approved by the audit committee pursuant to paragraph (c)(7)(ii) of Rule 2-01 of Regulation S-X.
(d) All Other Service Fees
There were no fees billed in the last two fiscal years for products and services provided by the principal accountant to the registrant, other than the services reported in paragraphs (a) – (c) of this Item 4.
The audit committee has adopted pre-approval policies and procedures that require the audit committee to pre‑approve all audit and non‑audit services of the registrant, including services provided to any entity affiliated with the registrant.
(e) (1) None
(e) (2) None
(f) Not applicable.
(g) See the tax fees disclosed in paragraph (c) of this Item 4.
(h) Not applicable, as no non-audit services were provided to registrant’s investment adviser.
Item 5. Audit Committee of Listed Registrants.
Not applicable to registrants who are not listed issuers (as defined in Rule 10A-3 under the Securities Exchange Act of 1934).
Item 6. Investments.
| (a) | The Schedule of Investments in securities of unaffiliated issuers is included as part of the report to shareholders filed under Item 1 of this Form. |
(b) Not Applicable.
Item 7. Disclosure of Proxy Voting Policies and Procedures for Closed-End Management Investment Companies.
Not applicable to open-end investment companies.
Item 8. Portfolio Managers of Closed-End Management Investment Companies.
Not applicable to open-end investment companies.
Item 9. Purchases of Equity Securities by Closed‑End Management Investment Company and Affiliated Purchasers.
Not applicable to open-end investment companies.
Item 10. Submission of Matters to a Vote of Security Holders.
Not Applicable.
Item 11. Controls and Procedures.
| (a) | The Registrant’s principal executive and principal financial officers have concluded that the Registrant’s disclosure controls and procedures are effective, as of a date within 90 days of the filing of this report, based on their evaluation of the Registrant’s disclosure controls and procedures. |
| (b) | There were no changes in the Registrant’s internal control over financial reporting during the Registrant’s fourth fiscal quarter of the period covered by this report that have materially affected, or are reasonably likely to materially affect, the Registrant’s internal control over financial reporting. |
Item 12. Disclosure of Securities Lending Activities for Closed-End Management Investment Companies
Not applicable to open-end investment companies.
Item 13. Exhibits.
| (a) | (1) Any code of ethics or amendment thereto, that is the subject of the disclosure required by Item 2, to the extent that the registrant intends to satisfy Item 2 requirements through filing an exhibit. Filed herewith. |
(2) Certifications pursuant to Section 302 of the Sarbanes-Oxley Act of 2002. Filed herewith.
| (3) | Any written solicitation to purchase securities under Rule 23c-1 under the Act sent or given during the period covered by the report by or on behalf of the Registrant to 10 or more persons. Not applicable to open-end investment companies. |
| (4) | There was no change in registrant’s independent public accountant for the period covered by this report. |
| (b) | Certifications pursuant to Section 906 of the Sarbanes‑Oxley Act of 2002. Furnished herewith. |
SIGNATURES
Pursuant to the requirements of the Securities Exchange Act of 1934 and the Investment Company Act of 1940, the registrant has duly caused this report to be signed on its behalf by the undersigned, thereunto duly authorized.
(Registrant) FMI Funds, Inc.
By (Signature and Title) /s/John S. Brandser
John S. Brandser, President/Principal Executive Officer
Date November 5, 2018
Pursuant to the requirements of the Securities Exchange Act of 1934 and the Investment Company Act of 1940, this report has been signed below by the following persons on behalf of the registrant and in the capacities and on the dates indicated.
By (Signature and Title) /s/John S. Brandser
John S. Brandser, President/Principal Executive Officer
Date November 5, 2018
By (Signature and Title) /s/John S. Brandser
John S. Brandser, Treasurer/Principal Financial Officer
Date November 5, 2018