UNITED STATES
SECURITIES AND EXCHANGE COMMISSION
Washington, D.C. 20549
FORM N-CSR
CERTIFIED SHAREHOLDER REPORT OF REGISTERED
MANAGEMENT INVESTMENT COMPANIES
Investment Company Act file number 811-07831
FMI Funds, Inc.
(Exact name of registrant as specified in charter)
100 East Wisconsin Avenue
Suite 2200
Milwaukee, WI 53202
(Address of principal executive offices) (Zip code)
John S. Brandser
Fiduciary Management, Inc.
100 East Wisconsin Avenue
Suite 2200
Milwaukee, WI 53202
(Name and address of agent for service)
(414) 226-4555
Registrant’s telephone number, including area code
Date of fiscal year end: September 30
Date of reporting period: September 30, 2020
Item 1. Reports to Stockholders.
ANNUAL REPORT
September 30, 2020
FMI Large Cap Fund Investor Class (Ticker Symbol: FMIHX) Institutional Class (Ticker Symbol: FMIQX) | FMI International Fund Investor Class (Ticker Symbol: FMIJX) Institutional Class (Ticker Symbol: FMIYX) |
| | |
FMI Common Stock Fund Investor Class (Ticker Symbol: FMIMX) Institutional Class (Ticker Symbol: FMIUX) | FMI International Fund II – Currency Unhedged Investor Class (Not Available For Sale) Institutional Class (Ticker Symbol: FMIFX) |
| | |
 | FMI Funds, Inc. Advised by Fiduciary Management, Inc.
www.fmifunds.com |
Beginning on January 1, 2021, as permitted by regulations adopted by the U.S. Securities and Exchange Commission, paper copies of the Funds’ annual and semi-annual shareholder reports will no longer be sent by mail, unless you specifically request paper copies of the reports from the Funds or from your financial intermediary (such as a broker-dealer or a bank). Instead, the reports will be made available on the Funds’ website www.fmifunds.com, and you will be notified by mail each time a report is posted and provided with a website link to access the report.
If you already elected to receive shareholder reports electronically, you will not be affected by this change and you need not take any action. You may elect to receive shareholder reports and other communications from the Funds electronically anytime by contacting your financial intermediary (such as a broker-dealer or a bank) or, if you are a direct investor, by calling 1-800-811-5311.
You may elect to receive all future reports in paper free of charge. If you invest through a financial intermediary, you can contact your financial intermediary to request that you continue to receive paper copies of your shareholder reports. If you invest directly with the Funds, you can call 1-800-811-5311 to let the Funds know you wish to continue receiving paper copies of your shareholder reports. Your election to receive reports in paper will apply to all Funds held in your account if you invest through your financial intermediary or all Funds held within the fund complex if you invest directly with the Funds.
FMI Funds, Inc.
TABLE OF CONTENTS
FMI
Large Cap
Fund
(unaudited)
September 30, 2020
Dear Fellow Shareholders:
The FMI Large Cap Fund (“Fund”) returned 7.67%1 in the quarter compared to 8.93% for the Standard & Poor’s 500 Index (“S&P 500”), and 5.59% for the Russell 1000 Value Index (“Russell 1000 Value”). While not changing much in the most recent quarter, the spread between value-oriented strategies like the FMI Large Cap Fund and growth stock-dominated indices like the S&P 500, Russell 1000 Index and Russell 1000 Growth Index has widened significantly in recent years. The year-to-date gap between the Russell 1000 Value and Russell 1000 Growth Indices was an astonishing 35.90%. The Fund has handily outperformed the value benchmarks and most of its value peers over 3, 5, and 10-year time frames. With much of the investing world capitulating to the siren song of growth stocks, FMI remains steadfast in our belief that ultimately, fundamentals and good values will trump high valuations and unsustainable growth expectations. We are starting to see some investors call “timeout” on the mad dash to growth stocks, hedging against the idea that the most popular names and the best-looking stock charts can continue to beat value equities. In the quarter, sectors that helped the Fund’s relative performance included Producer Manufacturing, Finance, and Distribution Services. Sectors detracting included Electronic Technology, Retail Trade, and Commercial Services. Eaton Corp. PLC, Berkshire Hathaway Inc., and HD Supply Holdings Inc. were positive relative contributors, while Dollar Tree Inc., Omnicom Group Inc., and Schlumberger Ltd. hurt.
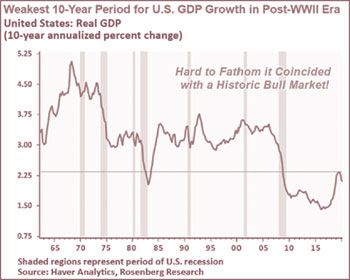
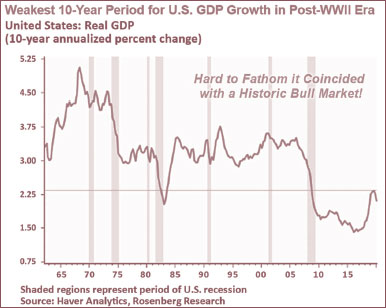
Over several missives prior to the pandemic, we articulated the strange juxtaposition of relative weak U.S. corporate sales and earnings growth compared to high valuations. The S&P 500 (iShares Core S&P 500 ETF as a proxy), grew revenue and operating earnings at 3.4% and 3.6%, respectively, over the 10-year period ending 2019; this includes acquisitions and a record increase in balance sheet leverage. With the S&P 500 constituting such a large swath of the U.S. economy, it is perhaps not surprising that the last ten years has been the slowest decade of economic growth since WWII (see chart to the right). GDP growth had been so weak pundits began talking about using a different measurement for gauging economic well-being.
| 1 | The FMI Large Cap Fund Investor Class (FMIHX) and the FMI Large Cap Fund Institutional Class (FMIQX) had a return of 7.67% and 7.74%, respectively, for the third quarter of 2020. |
The onset of COVID-19 sent the 2020 fundamentals for the economy and most companies down further, yet the market endured just a very short 23 trading days of trouble before resurging to an all-time high. Growth stocks, including most highly speculative ventures, have continued to dominate the landscape, creating the widest performance spread to value stocks in memory. Although the popular and financial media doesn’t describe it as such, it is truly a mania for many equities. Investors have seemingly thrown caution to the wind in their effort to participate. Despite a few short market contractions, to include the fourth quarter of 2018 (66 trading days) and earlier this year, the bull market that began in March of 2009 has the illusion of permanency. Many feel we are in a new, higher-growth paradigm, driven mostly by technology. If that were the case, why is economic growth so slow? Why is productivity over the past decade so weak? It doesn’t add up. Perhaps it is merely the belief that a few companies will have secular growth and the remaining “old economy” companies will struggle. While acknowledging the superior growth of some of the big cap tech names, we think any stock can get too expensive and any trade can be overcrowded. Every frothy market in history has its earmarks; following are a few recent observations:
| ● | The total market value of the NASDAQ Composite stocks recently became larger than the combined value of the developed world stock markets, ex-U.S. (MSCI World ex USA Index). |
| ● | Four tech names – Apple Inc., Amazon.com Inc., Microsoft Corp., and Alphabet Inc. – became bigger than the entire Japanese market, as well as the combined China/Hong Kong stock market. |
| ● | Tesla Inc., barely profitable after 17 years and competing in a highly competitive industry, saw its market cap go up over tenfold (from $38 billion to over $400 billion) in the 12 months ended 8/26/20, including a 75% gain in the three weeks following the 8/10/20 stock split announcement, which has zero fundamental meaning. |
| ● | Apple, whose operating earnings peaked five years ago at $71.2 billion, saw its market capitalization go from about $600 billion five years ago to over $2 trillion recently, including a 40% gain in a little over a month after their stock split was announced on 7/30/20. |
| ● | In Q3 2020, Apple’s market cap became larger than the entire Russell 2000 Index, and also overtook the FTSE 100 Index for the first time. |
| ● | The IPO market is likely to set a record in 2020, and recently Snowflake Inc., a company that had $264 million in sales and lost over $350 million in fiscal 2020, came public with a $33 billion value. On the first day of trading the market value reached $89 billion, larger than Autodesk Inc. and Cerner Corp. combined, which together have approximately $9 billion of highly recurring software revenue. Palantir Technologies Inc., a secretive big data company that has been rumored as an IPO for years, finally pulled the trigger on the last day of the September quarter. This company was founded in 2003 and as far as we can tell, has never turned a profit. In 2019, the company had $742 million in revenue and lost about $580 million. Its market cap on day one stretched to $18 billion. Asana Inc., one of many emerging software-as-a-service companies, also came public on the last day of the quarter and traded to $4.6 billion. It was valued at $1.5 billion in December of 2018; it had fiscal 2020 revenue of approximately $143 million and lost about $119 million. |
| ● | Nikola Corp., a development-stage hydrogen truck company with no revenue, reached a $27 billion market cap this summer before a short seller exposed potential serious flaws. |
| ● | Workhorse Group Inc., a company that for years has been trying to develop electric vehicles, has never made money, and managed to garner less than a half million dollars in 2019 sales, recently sported a market cap of over $3 billion. |
| ● | Gilead Sciences Inc. announced the $21 billion acquisition of Immunomedics Inc., an emerging biotech company with minimal sales and over $300 million of losses last year. Illumina Inc. announced they were buying Grail Inc., a development stage company, for a valuation of $7.1 billion and a 12-year earn-out. Johnson & Johnson announced the purchase of Momenta Pharmaceuticals Inc. for roughly $6.5 billion. It has $30 million in sales for the trailing 12 months ending 6/30/20. |
| ● | As of 9/30/20 there were 415 Health Technology sector stocks in the iShares Russell 2000, and 371 were money-losing. In nearly all cases the companies have never made money. They have been some of the best performing stocks in 2020. |
| ● | Mirati Therapeutics Inc., a company with $3.3 million in revenue and losing over $200 million, has an approximate market value of $7.4 billion and was up 1,319% over the past three years. The CEO makes more than two times the annual revenue of the company. For over 20 years this company has been on the verge of hitting it big! |
| ● | Special Purpose Acquisition Companies (SPAC), empty shell corporations set up to buy companies, have received over $50 billion so far this year. SPAC managers typically get 20% of the SPAC shares. Billy Beane (of Oakland Athletics and Moneyball fame) and Paul Ryan (former congressman from Wisconsin) are in on the action. |
| ● | The High-Tech Strategist reported in September that the top five holdings of Vanguard’s Total Stock Market ETF and SPDR S&P 500 ETF were Apple Inc., Microsoft Corp., Amazon.com Inc., Alphabet Inc., and Facebook Inc. These same five stocks were the largest holdings of the iShares Russell 1000 ETF, iShares Russell 3000 ETF and Vanguard Growth ETF. While this is not surprising, one of Vanguard’s largest international ETFs, the Vanguard Total World Stock ETF, had the same top five holdings. Ditto for the Vanguard ESG U.S. Stock ETF. As of 8/31/20, the Fidelity Magellan Fund had these same five in their top six holdings, along with Visa Inc. (trading at nearly 20 times revenue). Same for the Fidelity Independence Equity Fund. The Fidelity Trend Fund had the same five plus Mastercard Inc. (21 times revenue). Fidelity Growth Discovery Fund had the same five, as did the Fidelity Disciplined Equity Fund. We surmise many of the largest fund families look similar. |
| ● | The S&P 500 is more concentrated in the top names than at the peak of the 2000 market. |
| ● | In June, Deutsche Bank estimated that roughly 19% of U.S. companies are “zombie” companies, i.e., their debt servicing costs are greater than their earnings. |
| ● | Since 1947, the median number of hours of work required to purchase one unit of the S&P 500 was 30. As of early July, it is over 140 hours. |
| ● | According to The Leuthold Group, as of 7/10/20, stocks were in the highest decile (10th) of valuations based on the median decile of approximately 50 different valuation measures. |
| ● | Robinhood Financial LLC has added over 3 million customers since the beginning of the year. Measures of retail investor speculation are near their highest ever, including small-sized option trading that now exceeds the trading volume of individual stocks. |
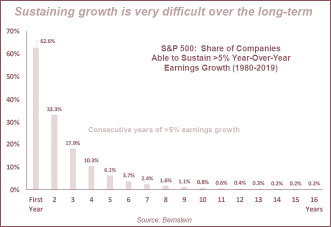
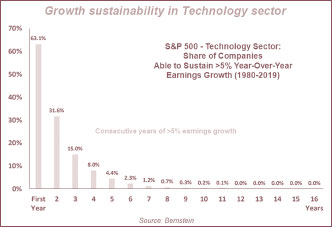
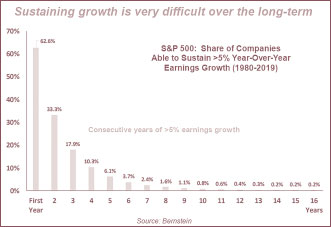
We are not ignorant to the excitement and promise of some of the emerging software companies, and other concepts that essentially defer profits on the income statement in order to grow the top line rapidly and lock in a future stream of profit. Establishing what is perceived to be an unassailable position in the market is easier in the digital world compared to the physical world. Many companies will win with this strategy. Many more will try and fail. Our issue is that most of these companies are being priced as the eventual winners. They can’t all win! Sustaining even 5% growth for more than a few years is difficult (even for the Technology sector), as evidenced by the following charts. The stocks that have captured the imagination of investors depend on sustained success over a very long time horizon. Valuations leave little room for error.
 |  |
Growth stocks in particular are sensitive to discount rate changes. This is because so much of the present value depends on compounding higher earnings well into the future. Following is a table from Credit Suisse HOLT, outlining possible return outcomes in different classes of stocks as a result of changes in sector discount rates. This table reveals some interesting scenarios. For example, if sector discount rates went back to just the 3-year median, U.S. Hyper Growth stocks would fall 32% and U.S. cyclical value stocks would decline 7%. If rates went back to their 20-year median, U.S. Tech Large Cap would fall 44% and U.S. Financials would gain 46%. Realize, these are just mathematical calculations, but they inform the possibilities. Our portfolios are far less dependent on the maintenance of historically low interest rates. We are finding excellent values in the cyclicals such as Schlumberger Ltd. and Emerson Electric Co., and in financials, particularly Northern Trust Corp., JPMorgan Chase & Co., and The Charles Schwab Corp.
Probability-weighted valuation upside/downsides for various HOLT Styles, regions
and sectors based on observed discount rates in a given economic regime
| | Warranted Valuation Upside/Downside % |
Scenario per Fig 4
(probability weighting) | US Hyper
Growth | US Tech
Large Cap | US Quality
Defensives | US Quality
Growth | US | Europe Ex
UK | UK | Developing
Countries | US
Cyclical
Value | Top 25%
Value
Developed
Markets | Developed
Energy
Large Cap | Developing Financials | UK
Financials | Europe
Financials | US
Financials |
Goldilocks (35%):
discount rate@20-year min | 6% | 23% | 4% | 11% | 4% | 0% | 7% | 13% | 19% | 18% | 43% | 72% | 96% | 90% | 84% |
Normalization (35%):
discount rate@3-year median | -32% | -38% | -17% | -21% | -10% | -7% | -10% | -8% | -7% | -5% | 15% | 14% | 8% | 20% | 28% |
Status Quo (27%):
no change in discount rate | 0% | 0% | 0% | 0% | 0% | 0% | 0% | 0% | 0% | 0% | 0% | 0% | 0% | 0% | 0% |
Stagflation (3%):
discount rate@20-yr median | -83% | -44% | -43% | -36% | -19% | -27% | -18% | -13% | -8% | -4% | 21% | 21% | 38% | 35% | 46% |
| Weighted Upside/Downside | -12% | -7% | -6% | -4% | -3% | -3% | -2% | 1% | 4% | 4% | 21% | 31% | 38% | 40% | 41% |
Source: Credit Suisse HOLT®, HOLT Global Viewpoint, September 28, 2020
Two additional investments we highlight this quarter are Comcast Corp. and Dollar Tree Inc.
Comcast Corp. – Cl A (CMCSA)
(Analyst: Dan Sievers)
Description
Comcast Corp. is the combination of Comcast Cable, NBC Universal (NBCU), and Sky PLC (Sky). Comcast Cable is the #1 provider of fixed broadband service in the United States (26 million residential subscribers) with an advantaged top-quality network and a strong and growing business services offering. NBCU and Sky are leading multinational media conglomerates that own strong libraries of existing content and together, invest over $23 billion in content annually. In 2019, revenue contributions were as follows: Cable (53%), NBC Cable Networks (11%), NBC Broadcast Television (9%), NBCU Filmed Entertainment (6%), Universal Studios Theme Parks (5%), Sky (18%), and Corporate & Eliminations (-2%).
Good Business
| ● | Most of Comcast Cable’s cash flow comes from recurring high-margin Residential Broadband and Business Services (not from Video). In 2019, these lines of business each reported over 9% revenue growth and combined for $24.3 billion in revenue. Second quarter 2020 residential net subscriber additions (+232,000) were the strongest 2Q net additions in thirteen years. For the fifteenth consecutive year, in 2020, Comcast is on pace to add more than 1 million broadband subscribers. Comcast Cable’s broadband-centric growth is roughly composed of >4% customer volume, 2-3% price and tiering, and 2% of lost discounts due to unbundling. Comcast’s broadband network is top-quality (soon to be 100% DOCSIS 3.1) and we expect broadband subscriber additions to continue to be strong despite regional investments in 5G fixed wireless (a limited value proposition), as Comcast takes further share from disadvantaged DSL-like competition (25 million subscribers nationally), benefits from demographic tailwinds (younger households have higher broadband penetration), and continues to grow its network footprint (which is over-indexed to growing population centers) beyond 58 million homes passed. Comcast cable is likely to continue to win because its similarly-priced product really is superior (better speed, better reliability, and better extras like xFi WiFi management, Xfinity Flex, and the soon-to-be launched Peacock AVOD service). Comcast’s Wireless business (>2 million subscribers) should reach profitability in 2021. Underlying Cable returns on invested capital are rising. |
| ● | In 2019, Charter Communications Inc. (Comcast competitor) reported typical monthly consumption for broadband-only subscribers surpassed 450GB, which compared to about 8GB of typical monthly consumption of cellular wireless data. 5G mobile networks are likely to remain too capacity-constrained to offer suitable alternatives to cable broadband. Gradual build out of 5G fixed wireless may present a suitable alternative to cable broadband, but will suffer from difficult-to-solve technical challenges (range and reliability issues), will only be available in limited locations, will require huge fiber-centric investment on the part of carriers, and these build outs face similarly daunting overbuilder economics akin to U-verse, FiOS, Google Fiber, or others. |
| ● | NBCU and Sky are likely to face real challenges in parts of their respective businesses due to a changing media landscape, but they also possess real advantages, like strong libraries of existing content, significant annual content investment, a meaningful focus on live sports and news content, and the premiere #2 global theme parks business in Universal Studios. |
| ● | Comcast’s net debt-to-EBITDA (ND/EBITDA) leverage at year-end 2018 was above 3.3 times, but has now fallen below 2.7 times, on its way to Comcast’s traditional 2.0-2.25 times target leverage range (lower than peers) by early 2021. |
Valuation
| ● | At $43.50, Comcast trades at 13.9 times 2019 price-to-earnings (P/E) and 8.8 times enterprise value-to-EBITDA (2019). On a P/E basis, this appears attractive in absolute terms, is well below Comcast’s historical P/E multiple, and represents a substantial discount to the S&P 500. |
| ● | Bernstein recently estimated that $36 is the price investors are paying for Cable & Theme Parks while receiving the rest of NBCU & Sky for free. Additionally, at year-end 2019, noting significant value in Comcast’s investment portfolio (from Hulu, Atairos, and more), Morgan Stanley also recognized the strong enduring value (and growth) in NBCU’s Parks & Films divisions an investor receives at a significant discount to peers. |
Management
| ● | Brian Roberts, son of the late founder Ralph Roberts, became President in 1990, CEO in 2002, and Chairman in 2004. The Roberts family controls one-third voting interest in Comcast through non-traded B shares. Setting the Sky acquisition aside, we view the long-run Roberts track record as very good. |
| ● | Comcast’s divisional performance stacks up well against direct peers in most cases, supporting our view that Comcast possesses a deep bench of strong (though excessively compensated) executive leadership. |
Investment Thesis
Over the past three completed years, pure-play Cable broadband providers (including Charter Communications and Cable One Inc.) have trounced the S&P 500, reflecting strong and durable growth in subscribers, rising margins, and declining capital intensity. Though all industry observers agree that Comcast’s Cable broadband business is top quality (#1), Comcast’s shares lagged the S&P 500 due to investor concerns over its media businesses and its acquisition of Sky. While we take no out-of-consensus positive view of NBC Broadcast and NBC Cable Networks, we see enduring value in the catalog at Universal Studios Film & Television, Universal Studios Theme Parks, and some of Sky’s true direct-to-consumer offerings. Comcast’s customers, content, and brands increase the likelihood of success of its streaming service, Peacock (which just passed 15 million sign-ups). Though the pandemic has pressured Comcast’s media businesses (weaker advertising, paused sports, and delayed film releases) and temporarily closed Comcast’s Theme Parks, its Cable broadband business has strengthened, and continues to grow and drive the bulk of Comcast’s value. As Comcast nears its target 2.0-2.25 times ND/EBITDA leverage range in early 2021 and restarts their share buyback, investor interest is likely to increase.
Dollar Tree Inc. (DLTR)
(Analyst: Matt Sullivan)
Description
Dollar Tree is a leading discount retailer in the United States and Canada, operating over 15,400 total stores, 7,652 (or 49%) of which are operated under the Dollar Tree banner. The other 7,827 stores are operated under the banner of Family Dollar, which was acquired in July 2015. The Dollar Tree banner accounts for around 52% of the combined company revenue and 78% of profits. The Family Dollar banner accounts for the remaining 48% of revenue and 22% of profits.
Good Business
| ● | The Dollar Tree business model is unique within the retail landscape. The $1 price point and constantly changing inventory provide the customer with a differentiated, treasure hunt shopping experience. The ever-changing merchandise in the stores also provides management with the ability to control the company’s gross margin. |
| ● | The Family Dollar banner sells a limited number of necessary consumable products and other general merchandise items at highly attractive prices. The company’s scale, concentrated purchasing, and low-cost locations allows it to sell products at prices well below those of competitors. |
| ● | Both business models are defensive and perform well in most economic environments. The consolidated company has had positive same store sales growth in each of the past fourteen years. |
| ● | The business generates attractive returns on tangible capital that exceed the company’s cost of capital. |
| ● | The customer profile, low average ticket, and types of products sold protect the business from online competition. |
| ● | Both Dollar Tree and Family Dollar possess scale advantages that make them difficult to replicate. |
| ● | The balance sheet is in good shape with ND/EBITDA of approximately 1.1 times. |
| ● | The business is easy to understand. |
Valuation
| ● | Dollar Tree is trading at a valuation discount to the S&P 500 even though it’s a better-than-average company. |
| ● | The stock trades for 15.8 times the next 12-month earnings per share (EPS) forecast, which is a standard deviation below its 5-year average of 17.9 times. |
| ● | The shares are also trading at 0.95 times enterprise value-to-sales, which is about one standard deviation below its 5-year average of 1.33 times. |
Management
| ● | Bob Sasser became Executive Chairman of the Board in September 2017. He was previously CEO from 2004 to September 2017. Prior to that he was Dollar Tree’s COO from 1999 to 2003. |
| ● | Mike Witynski joined the company in 2010 and became President and CEO in July 2020. He was previously COO from July 2015 until December 2019, and Enterprise President from December 2019 until July 2020. |
Investment Thesis
Dollar Tree is a high-quality, defensive business that performs well in most economic environments. While the pandemic has negatively impacted customer traffic at the stores and has increased costs throughout the organization, the business is holding up reasonably well this year; same store sales and EPS are both expected to grow in 2020. We believe that over the next few years, the company will expand its store base and continue to grow its same store sales, and that margins will improve. When including stock buybacks, EPS are expected to grow at a double-digit compound annual rate. The company’s stock is attractively valued, trading at 15.8 times the next 12-months EPS estimate in a very expensive market.
Thank you for your confidence in the FMI Large Cap Fund.
This shareholder letter is unaudited.
FMI Large Cap Fund
MANAGEMENT’S DISCUSSION OF FUND PERFORMANCE (Unaudited)
During the fiscal year ended September 30, 2020, the FMI Large Cap Fund (FMIHX) the “Fund” had a total return of 0.71%(1). The benchmark S&P 500 returned 15.15% in the same period. The Russell 1000 Value Index declined 5.03% in the same period. Relative to the S&P 500, sectors that aided relative performance included Energy Minerals (underweight), Health Services, Utilities (underweight) and Producer Manufacturing. The Fund had little direct exposure to Energy Minerals, an area of weakness due to low hydrocarbon prices and slower demand because of COVID-19. UnitedHealth Group drove the results in Health Services as they grew earnings steadily over the past year. Masco Corp. performed well prior to and during the COVID-19 curtailments, as consumers engaged in more home improvement. Utilities attracted less attention in the S&P 500 because of their slow underlying growth; the Fund had no exposure to Utilities. On the negative side of sector performance, Electronic Technology, Retail Trade, Technology Services and Industrial Services all detracted. The Fund’s cash level also hurt results. TE Connectivity, Dollar Tree, Omnicom Group and Schlumberger were disrupted and impacted by COVID-19 concerns. Additionally, TE Connectivity declined, perhaps due to fears about auto manufacturing volumes, and Schlumberger declined precipitously due to weak energy prices and demand concerns. The oil services related areas of the economy have been extremely difficult in recent years. The Fund’s thesis remains that Schlumberger is one of the strongest players in a necessary business and that it is exceptionally undervalued.
Other stocks that helped performance included Accenture, Dollar General and Progressive Corp. These stocks all benefitted from good earnings growth in an environment where that was difficult to achieve. Southwest Airlines, JPMorgan and Chubb all detracted from relative results. COVID-19 severely disrupted air travel, hurting Southwest Airlines. The market turned against Financials during the period, with additional pressure on JPMorgan because of net interest margin compression, and reserve building related to the economic environment, while Chubb performed well fundamentally in the period, investors feared COVID-19 related claims.
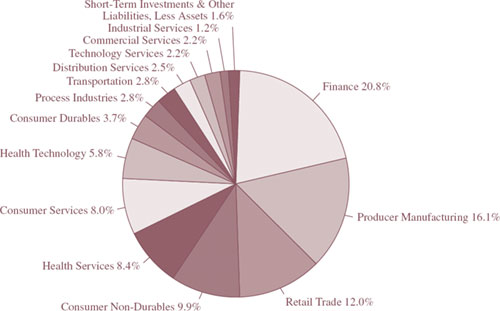
New additions to the Fund over the past twelve months included Comcast Corp., Eaton Corp., Koninklijke Philips, Emerson Electric, Sony and Progressive Corp. Stocks sold during the year included Fox Corp., eBay Inc., Stanley Black & Decker, Cerner Corp., Nutrien, TE Connectivity and Southwest Airlines. As of September 30, 2020, the Fund was significantly overweighted in Producer Manufacturing, Health Services and Finance and meaningfully underweighted in Technology Services, Electronic Technology and Health Technology.
The S&P 500 has been dominated by the largest growth companies, particularly those in the technology sphere. This has driven a wide performance differential between the S&P 500 and funds such as the FMI Large Cap Fund, which are value oriented. The so-called FAAANM stocks (Facebook, Apple, Amazon, Alphabet {Google}, Netflix, and Microsoft), along with other perceived growth stocks, were exceptionally strong over the past year. The S&P 500’s weighting in the top ten names rivals the concentration last seen in the 2000 market peak. Stocks perceived to be in the “growth” camp continued to outperform so called “value” stocks during the year by a very wide margin. Passive investment strategies also continued to see heavy inflows of money, at the expense of active strategies. Many stocks appear overvalued and the S&P 500 index, on most valuation measures, is more expensive than it was at the peak in 2000. The growing use of “adjusted earnings” rather than GAAP earnings by Wall Street and corporate management gives a misleading P/E ratio. With the exception of the fourth calendar quarter of 2018 and a brief period in February and March of 2020, the market has been an in a up phase, driven by growth stocks, since March of 2009. This is extremely long by historical standards.
The Federal Reserve (“Fed”) has undertaken an unprecedented policy of monetary accommodation, both prior to and after COVID-19 became widespread. The Fed’s balance sheet has roughly doubled over the past twelve months. The price of money remains unusually low by historical standards and the Fund managers believe many negative effects, including potential high inflation and currency debasement, are being ignored by the market. The economy went into a sharp recession in February of 2020, primarily due to COVID-19. Debt at both the corporate and government levels has grown significantly. Recent additions to the government debt totals are extraordinary by historical standards. U.S. total federal debt-to-GDP is well over 100% and the highest in the WWII era. Corporate leverage by some measures is at a fifty-year high.
| (1) | The FMI Large Cap Fund Institutional Class (FMIQX) returned 0.84% for the fiscal year ended 9/30/20. |
FMI Large Cap Fund
MANAGEMENT’S DISCUSSION OF FUND PERFORMANCE (Unaudited)(Continued)
With valuations high and speculative fervor present in the IPO and private equity areas, along with an overwhelming belief that interest rates will stay low for years, the Fund managers feel growth stocks are particularly vulnerable to a change in conditions. The outlook for strong relative performance from value-oriented stocks, while contrarian in nature, is positive.
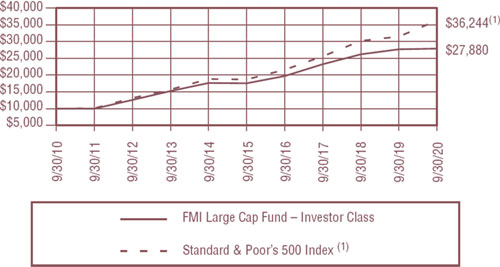
COMPARISON OF CHANGE IN VALUE OF $10,000 INVESTMENT IN
FMI LARGE CAP FUND – INVESTOR CLASS AND STANDARD & POOR’S 500 INDEX(1)
| AVERAGE ANNUALIZED TOTAL RETURN |
| | | | | | Inception |
| | | | | | through |
| | Inception Date | 1-Year | 5-Year | 10-Year | 9/30/2020 |
| FMI Large Cap Fund – Investor Class | 12/31/01 | 0.71% | 9.70% | 10.80% | 8.61% |
| FMI Large Cap Fund – Institutional Class | 10/31/16 | 0.84% | N/A | N/A | 10.05% |
| Standard & Poor’s 500 Index(1)* | | 15.15% | 14.15% | 13.74% | 8.06% |
The graph and the table do not reflect the deduction of taxes that a shareholder would pay on Fund distributions or the redemption of Fund shares. Performance data quoted represents past performance; past performance does not guarantee future results. Investment return and principal value of an investment will fluctuate so that an investor’s shares, when redeemed, may be worth more or less than their original cost. Current performance of a Fund may be lower or higher than the performance quoted. The total returns do not reflect the deduction of taxes that a shareholder would pay on Fund distributions or the redemption of Fund shares. Total return includes change in share prices and in each case includes reinvestments of any dividends, interest and capital gain distributions. Performance data current to the most recent month-end may be obtained by visiting www.fmifunds.com or by calling 1-800-811-5311.
| (1) | The Standard & Poor’s 500 Index consists of 500 selected common stocks, most of which are listed on the New York Stock Exchange. The Standard & Poor’s Ratings Group designates the stocks to be included in the Index on a statistical basis. A particular stock’s weighting in the Index is based on its relative total market value (i.e., its market price per share times the number of shares outstanding). Stocks may be added or deleted from the Index from time to time. |
| * | The benchmark since inception returns are calculated since inception of the Investor Class, December 31, 2001 to September 30, 2020. |
An investment cannot be made directly into an index.
FMI Large Cap Fund
SCHEDULE OF INVESTMENTS
September 30, 2020
| Shares | | | | | Cost | | | Value | |
| COMMON STOCKS — 98.4% (a) | | | | | | |
| COMMERCIAL SERVICES SECTOR — 2.2% | | | | | | | | |
| | | | | Advertising/Marketing Services — 2.2% | | | | | | | | |
| | 1,520,000 | | | Omnicom Group Inc. | | $ | 101,534,567 | | | $ | 75,240,000 | |
| CONSUMER DURABLES SECTOR — 3.7% | | | | | | | | |
| | | | | Electronics/Appliances — 3.7% | | | | | | | | |
| | 1,650,000 | | | Sony Corp. — SP-ADR* | | | 104,693,897 | | | | 126,637,500 | |
| CONSUMER NON-DURABLES SECTOR — 9.9% | | | | | | | | |
| | | | | Beverages: Non-Alcoholic — 2.8% | | | | | | | | |
| | 700,000 | | | PepsiCo Inc. | | | 70,012,365 | | | | 97,020,000 | |
| | | | | Food: Major Diversified — 2.9% | | | | | | | | |
| | 825,000 | | | Nestlé S.A. — SP-ADR | | | 34,040,394 | | | | 98,385,375 | |
| | | | | Household/Personal Care — 4.2% | | | | | | | | |
| | 2,305,000 | | | Unilever PLC — SP-ADR | | | 93,152,573 | | | | 142,172,400 | |
| CONSUMER SERVICES SECTOR — 8.0% | | | | | | | | |
| | | | | Cable/Satellite TV — 4.0% | | | | | | | | |
| | 2,910,000 | | | Comcast Corp. — Cl A | | | 128,510,595 | | | | 134,616,600 | |
| | | | | Other Consumer Services — 4.0% | | | | | | | | |
| | 79,000 | | | Booking Holdings Inc.* | | | 140,665,297 | | | | 135,143,720 | |
| DISTRIBUTION SERVICES SECTOR — 2.5% | | | | | | | | |
| | | | | Wholesale Distributors — 2.5% | | | | | | | | |
| | 2,100,000 | | | HD Supply Holdings Inc.* | | | 83,461,960 | | | | 86,604,000 | |
| FINANCE SECTOR — 20.8% | | | | | | | | |
| | | | | Investment Banks/Brokers — 2.8% | | | | | | | | |
| | 2,595,000 | | | The Charles Schwab Corp. | | | 94,952,055 | | | | 94,016,850 | |
| | | | | Major Banks — 2.8% | | | | | | | | |
| | 975,000 | | | JPMorgan Chase & Co. | | | 62,197,660 | | | | 93,863,250 | |
| | | | | Multi-Line Insurance — 6.7% | | | | | | | | |
| | 1,065,000 | | | Berkshire Hathaway Inc. — Cl B* | | | 60,364,576 | | | | 226,781,100 | |
| | | | | Property/Casualty Insurance — 6.0% | | | | | | | | |
| | 960,000 | | | Chubb Ltd. | | | 128,277,883 | | | | 111,475,200 | |
| | 975,000 | | | Progressive Corp. | | | 74,036,038 | | | | 92,303,250 | |
| | | | | | | | 202,313,921 | | | | 203,778,450 | |
| | | | | Regional Banks — 2.5% | | | | | | | | |
| | 1,115,000 | | | Northern Trust Corp. | | | 96,605,324 | | | | 86,936,550 | |
| HEALTH SERVICES SECTOR — 8.4% | | | | | | | | |
| | | | | Health Industry Services — 4.6% | | | | | | | | |
| | 1,370,000 | | | Quest Diagnostics Inc. | | | 134,810,438 | | | | 156,851,300 | |
| | | | | Managed Health Care — 3.8% | | | | | | | | |
| | 415,000 | | | UnitedHealth Group Inc. | | | 29,634,444 | | | | 129,384,550 | |
The accompanying notes to financial statements are an integral part of this schedule.
FMI Large Cap Fund
SCHEDULE OF INVESTMENTS (Continued)
September 30, 2020
| Shares | | | | | Cost | | | Value | |
| COMMON STOCKS — 98.4% (a) (Continued) | | | | | | |
| HEALTH TECHNOLOGY SECTOR — 5.8% | | | | | | | | |
| | | | | Medical Specialties — 5.8% | | | | | | | | |
| | 2,420,000 | | | Koninklijke Philips N.V. — SP-ADR* | | $ | 113,229,127 | | | $ | 114,103,000 | |
| | 2,105,000 | | | Smith & Nephew PLC — SP-ADR | | | 77,331,297 | | | | 82,305,500 | |
| | | | | | | | 190,560,424 | | | | 196,408,500 | |
| INDUSTRIAL SERVICES SECTOR — 1.2% | | | | | | | | |
| | | | | Oilfield Services/Equipment — 1.2% | | | | | | | | |
| | 2,635,000 | | | Schlumberger Ltd. | | | 51,030,292 | | | | 41,000,600 | |
| PROCESS INDUSTRIES SECTOR — 2.8% | | | | | | | | |
| | | | | Industrial Specialties — 2.8% | | | | | | | | |
| | 780,000 | | | PPG Industries Inc. | | | 77,397,847 | | | | 95,222,400 | |
| PRODUCER MANUFACTURING SECTOR — 16.1% | | | | | | | | |
| | | | | Building Products — 5.3% | | | | | | | | |
| | 3,255,000 | | | Masco Corp. | | | 113,114,263 | | | | 179,448,150 | |
| | | | | Electrical Products — 4.5% | | | | | | | | |
| | 1,060,000 | | | Eaton Corp. PLC | | | 97,893,785 | | | | 108,151,800 | |
| | 675,000 | | | Emerson Electric Co. | | | 31,678,272 | | | | 44,259,750 | |
| | | | | | | | 129,572,057 | | | | 152,411,550 | |
| | | | | Industrial Conglomerates — 3.2% | | | | | | | | |
| | 670,000 | | | Honeywell International Inc. | | | 60,115,461 | | | | 110,288,700 | |
| | | | | Trucks/Construction/Farm Machinery — 3.1% | | | | | | | | |
| | 1,220,000 | | | PACCAR Inc. | | | 48,890,312 | | | | 104,041,600 | |
| RETAIL TRADE SECTOR — 12.0% | | | | | | | | |
| | | | | Apparel/Footwear Retail — 3.1% | | | | | | | | |
| | 1,875,000 | | | The TJX Companies Inc. | | | 64,193,895 | | | | 104,343,750 | |
| | | | | Discount Stores — 8.9% | | | | | | | | |
| | 840,000 | | | Dollar General Corp. | | | 60,480,464 | | | | 176,080,800 | |
| | 1,400,000 | | | Dollar Tree Inc.* | | | 124,501,378 | | | | 127,876,000 | |
| | | | | | | | 184,981,842 | | | | 303,956,800 | |
| TECHNOLOGY SERVICES SECTOR — 2.2% | | | | | | | | |
| | | | | Information Technology Services — 2.2% | | | | | | | | |
| | 335,000 | | | Accenture PLC | | | 8,645,057 | | | | 75,706,650 | |
| TRANSPORTATION SECTOR — 2.8% | | | | | | | | |
| | | | | Air Freight/Couriers — 2.8% | | | | | | | | |
| | 1,050,000 | | | Expeditors International of Washington Inc. | | | 38,553,785 | | | | 95,046,000 | |
| | | | | Total common stocks | | | 2,404,005,301 | | | | 3,345,306,345 | |
The accompanying notes to financial statements are an integral part of this schedule.
FMI Large Cap Fund
SCHEDULE OF INVESTMENTS (Continued)
September 30, 2020
| Principal Amount | | | | | Cost | | | Value | |
| SHORT-TERM INVESTMENTS — 1.6% (a) | | | | | | | | |
| | | | | Bank Deposit Account — 1.6% | | | | | | | | |
| | $55,074,261 | | | U.S. Bank N.A., 0.04%^ | | $ | 55,074,261 | | | $ | 55,074,261 | |
| | | | | Total short-term investments | | | 55,074,261 | | | | 55,074,261 | |
| | | | | Total investments — 100.0% | | $ | 2,459,079,562 | | | | 3,400,380,606 | |
| | | | | Other liabilities, less assets — (0.0%) (a) | | | | | | | (592,530 | ) |
| | | | | TOTAL NET ASSETS — 100.0% | | | | | | $ | 3,399,788,076 | |
| | | | | | | | | | | | | |
| * | Non-income producing security. |
| ^ | The rate shown is as of September 30, 2020. |
| (a) | Percentages for the various classifications relate to total net assets. |
| PLC | Public Limited Company |
| SP-ADR | Sponsored American Depositary Receipt |
The accompanying notes to financial statements are an integral part of this schedule.
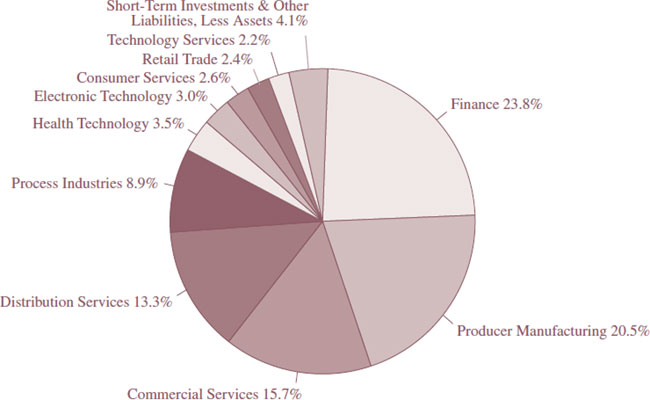
INDUSTRY SECTORS as a percentage of net assets
as of September 30, 2020 (Unaudited)
| | FMI Common Stock Fund (unaudited) | September 30, 2020 |
Dear Fellow Shareholders:
The FMI Common Stock Fund (“Fund”) returned 1.60%1 in the quarter compared to 4.93% for the Russell 2000 Index (“Russell 2000”), and 2.56% for the Russell 2000 Value Index (“Russell 2000 Value”). While not changing much in the most recent quarter, the spread between value-oriented strategies like the FMI Common Stock Fund and growth stock-dominated indices like the Russell 2000 or Russell 2000 Growth Index has widened significantly in recent years. The year-to-date gap between the Russell 2000 Value and Russell 2000 Growth Indices was 25.42%. The Fund has handily outperformed the value benchmarks and most of its value peers over 3, 5, and 10-year time frames. With much of the investing world capitulating to the siren song of growth stocks, FMI remains steadfast in our belief that ultimately, fundamentals and good values will trump high valuations and unsustainable growth expectations. We are starting to see some investors call “timeout” on the mad dash to growth stocks, hedging against the idea that the most popular names and the best-looking stock charts can continue to beat value equities. In the quarter, sectors that helped the Fund’s relative performance included Process Industries, Technology Services, and the absence of meaningful exposure to Energy Minerals. Sectors detracting included Producer Manufacturing, Finance, and Commercial Services. Avery Dennison Corp., Insight Enterprises Inc., and Arrow Electronics Inc. were positive relative contributors, while Armstrong World Industries Inc., Zions Bancorporation, and White Mountains Insurance Group Ltd. hurt.
Over several missives prior to the pandemic, we articulated the strange juxtaposition of relative weak U.S. corporate sales and earnings growth compared to high valuations. The S&P 500 (iShares Core S&P 500 ETF as a proxy), grew revenue and operating earnings at 3.4% and 3.6%, respectively, over the 10-year period ending 2019; this includes acquisitions and a record increase in balance sheet leverage. With the S&P 500 constituting such a large swath of the U.S. economy, it is perhaps not surprising that the last ten years has been the slowest decade of economic growth since WWII (see chart to the right). GDP growth had been so weak pundits began talking about using a different measurement for gauging economic well-being.
| 1 | The FMI Common Stock Fund Investor Class (FMIMX) and the FMI Common Stock Fund Institutional Class (FMIUX) both had a return of 1.60% for the third quarter of 2020. |
The onset of COVID-19 sent the 2020 fundamentals for the economy and most companies down further, yet the market endured just a very short 23 trading days of trouble before resurging to an all-time high. Growth stocks, including most highly speculative ventures, have continued to dominate the landscape, creating the widest performance spread to value stocks in memory. Although the popular and financial media doesn’t describe it as such, it is truly a mania for many equities. Investors have seemingly thrown caution to the wind in their effort to participate. Despite a few short market contractions, to include the fourth quarter of 2018 (66 trading days) and earlier this year, the bull market that began in March of 2009 has the illusion of permanency. Many feel we are in a new, higher-growth paradigm, driven mostly by technology. If that were the case, why is economic growth so slow? Why is productivity over the past decade so weak? It doesn’t add up. Perhaps it is merely the belief that a few companies will have secular growth and the remaining “old economy” companies will struggle. While acknowledging the superior growth of some of the big cap tech names, we think any stock can get too expensive and any trade can be overcrowded. Every frothy market in history has its earmarks; following are a few recent observations:
| ● | The total market value of the NASDAQ Composite stocks recently became larger than the combined value of the developed world stock markets, ex-U.S. (MSCI World ex USA Index). |
| ● | Four tech names – Apple Inc., Amazon.com Inc., Microsoft Corp., and Alphabet Inc. – became bigger than the entire Japanese market, as well as the combined China/Hong Kong stock market. |
| ● | Tesla Inc., barely profitable after 17 years and competing in a highly competitive industry, saw its market cap go up over tenfold (from $38 billion to over $400 billion) in the 12 months ended 8/26/20, including a 75% gain in the three weeks following the 8/10/20 stock split announcement, which has zero fundamental meaning. |
| ● | Apple, whose operating earnings peaked five years ago at $71.2 billion, saw its market capitalization go from about $600 billion five years ago to over $2 trillion recently, including a 40% gain in a little over a month after their stock split was announced on 7/30/20. |
| ● | In Q3 2020, Apple’s market cap became larger than the entire Russell 2000 Index, and also overtook the FTSE 100 Index for the first time. |
| ● | The IPO market is likely to set a record in 2020, and recently Snowflake Inc., a company that had $264 million in sales and lost over $350 million in fiscal 2020, came public with a $33 billion value. On the first day of trading the market value reached $89 billion, larger than Autodesk Inc. and Cerner Corp. combined, which together have approximately $9 billion of highly recurring software revenue. Palantir Technologies Inc., a secretive big data company that has been rumored as an IPO for years, finally pulled the trigger on the last day of the September quarter. This company was founded in 2003 and as far as we can tell, has never turned a profit. In 2019, the company had $742 million in revenue and lost about $580 million. Its market cap on day one stretched to $18 billion. Asana Inc., one of many emerging software-as-a-service companies, also came public on the last day of the quarter and traded to $4.6 billion. It was valued at $1.5 billion in December of 2018; it had fiscal 2020 revenue of approximately $143 million and lost about $119 million. |
| ● | Nikola Corp., a development-stage hydrogen truck company with no revenue, reached a $27 billion market cap this summer before a short seller exposed potential serious flaws. |
| ● | Workhorse Group Inc., a company that for years has been trying to develop electric vehicles, has never made money, and managed to garner less than a half million dollars in 2019 sales, recently sported a market cap of over $3 billion. |
| ● | Gilead Sciences Inc. announced the $21 billion acquisition of Immunomedics Inc., an emerging biotech company with minimal sales and over $300 million of losses last year. Illumina Inc. announced they were buying Grail Inc., a development stage company, for a valuation of $7.1 billion and a 12-year earn-out. Johnson & Johnson announced the purchase of Momenta Pharmaceuticals Inc. for roughly $6.5 billion. It has $30 million in sales for the trailing 12 months ending 6/30/20. |
| ● | As of 9/30/20 there were 415 Health Technology sector stocks in the iShares Russell 2000, and 371 were money-losing. In nearly all cases the companies have never made money. They have been some of the best performing stocks in 2020. |
| ● | Mirati Therapeutics Inc., a company with $3.3 million in revenue and losing over $200 million, has an approximate market value of $7.4 billion and was up 1,319% over the past three years. The CEO makes more than two times the annual revenue of the company. For over 20 years this company has been on the verge of hitting it big! |
| ● | Special Purpose Acquisition Companies (SPAC), empty shell corporations set up to buy companies, have received over $50 billion so far this year. SPAC managers typically get 20% of the SPAC shares. Billy Beane (of Oakland Athletics and Moneyball fame) and Paul Ryan (former congressman from Wisconsin) are in on the action. |
| ● | The High-Tech Strategist reported in September that the top five holdings of Vanguard’s Total Stock Market ETF and SPDR S&P 500 ETF were Apple Inc., Microsoft Corp., Amazon.com Inc., Alphabet Inc., and Facebook Inc. These same five stocks were the largest holdings of the iShares Russell 1000 ETF, iShares Russell 3000 ETF and Vanguard Growth ETF. While this is not surprising, one of Vanguard’s largest international ETFs, the Vanguard Total World Stock ETF, had the same top five holdings. Ditto for the Vanguard ESG U.S. Stock ETF. As of 8/31/20, the Fidelity Magellan Fund had these same five in their top six holdings, along with Visa Inc. (trading at nearly 20 times revenue). Same for the Fidelity Independence Equity Fund. The Fidelity Trend Fund had the same five plus Mastercard Inc. (21 times revenue). Fidelity Growth Discovery Fund had the same five, as did the Fidelity Disciplined Equity Fund. We surmise many of the largest fund families look similar. |
| ● | The S&P 500 is more concentrated in the top names than at the peak of the 2000 market. |
| ● | In June, Deutsche Bank estimated that roughly 19% of U.S. companies are “zombie” companies, i.e., their debt servicing costs are greater than their earnings. |
| ● | Since 1947, the median number of hours of work required to purchase one unit of the S&P 500 was 30. As of early July, it is over 140 hours. |
| ● | According to The Leuthold Group, as of 7/10/20, stocks were in the highest decile (10th) of valuations based on the median decile of approximately 50 different valuation measures. |
| ● | Robinhood Financial LLC has added over 3 million customers since the beginning of the year. Measures of retail investor speculation are near their highest ever, including small-sized option trading that now exceeds the trading volume of individual stocks. |
We are not ignorant to the excitement and promise of some of the emerging software companies, and other concepts that essentially defer profits on the income statement in order to grow the top line rapidly and lock in a future stream of profit. Establishing what is perceived to be an unassailable position in the market is easier in the digital world compared to the physical world. Many companies will win with this strategy. Many more will try and fail. Our issue is that most of these companies are being priced as the eventual winners. They can’t all win! Sustaining even 5% growth for more than a few years is difficult (even for the Technology sector), as evidenced by the following charts. The stocks that have captured the imagination of investors depend on sustained success over a very long time horizon. Valuations leave little room for error.
 |  |
Growth stocks in particular are sensitive to discount rate changes. This is because so much of the present value depends on compounding higher earnings well into the future. Following is a table from Credit Suisse HOLT, outlining possible return outcomes in different classes of stocks as a result of changes in sector discount rates. This table reveals some interesting scenarios. For example, if sector discount rates went back to just the 3-year median, U.S. Hyper Growth stocks would fall 32% and U.S. cyclical value stocks would decline 7%. If rates went back to their 20-year median, U.S. Tech Large Cap would fall 44% and U.S. Financials would gain 46%. Realize, these are just mathematical calculations, but they inform the possibilities. Our portfolios are far less dependent on the maintenance of historically low interest rates. We are finding excellent values in the cyclicals, such as Flowserve Corp. and Applied Industrial Technologies Inc., and in financials, particularly Ryder System Inc., Kennedy-Wilson Holdings Inc., and Howard Hughes Corp.
Probability-weighted valuation upside/downsides for various HOLT Styles, regions
and sectors based on observed discount rates in a given economic regime
| | Warranted Valuation Upside/Downside % |
Scenario per Fig 4
(probability weighting) | US Hyper
Growth | US Tech
Large Cap | US Quality
Defensives | US Quality
Growth | US | Europe Ex UK | UK | Developing Countries | US
Cyclical | Top 25% Value Developed: Markets | Developed Energy Large Cap | Developing Financials | UK
Financials | Europe Financials | US
Financials |
Goldilocks (35%):
discount rate@20-year min | 6% | 23% | 4% | 11% | 4% | 0% | 7% | 13% | 19% | 18% | 43% | 72% | 96% | 90% | 84% |
Normalization (35%):
discount rate@3-year median | -32% | -38% | -17% | -21% | -10% | -7% | -10% | -8% | -7% | -5% | 15% | 14% | 8% | 20% | 28% |
Status Quo (27%):
no change in discount rate | 0% | 0% | 0% | 0% | 0% | 0% | 0% | 0% | 0% | 0% | 0% | 0% | 0% | 0% | 0% |
Stagflation (3%):
discount rate @ 20-yr median | -83% | -44% | -43% | -36% | -19% | -27% | -18% | -13% | -8% | -4% | 21% | 21% | 38% | 35% | 46% |
| Weighted Upside/Downside | -12% | -7% | -6% | -4% | -3% | -3% | -2% | 1% | 4% | 4% | 21% | 31% | 38% | 40% | 41% |
Source: Credit Suisse HOLT ®, HOLT Global Viewpoint, September 28, 2020
Two additional investments we highlight this quarter are Plexus Corp. and TriMas Corp.
Plexus Corp. (PLXS)
(Analyst: Julia Jensen)
Description
Plexus provides electronic manufacturing services (EMS). The firm partners with companies to transform concepts into branded products and delivers them to the market. It operates in four different market sectors: Healthcare and Life Sciences (39% of revenues), Industrial and Commercial (37%), Communications (8%), and Aerospace and Defense (16%). Plexus’ focus is on winning contracts in niche markets that involve high-complexity/low-volume products. The company operates mainly in Malaysia and the U.S., but also in China, Mexico, Scotland, Germany, and Romania.
Good Business
| ● | We consider Plexus to be best-in-class due to its superior margins and returns relative to peers, which have been driven by shifting product mix from low-complexity/high-volume products to high-complexity/low-volume products. |
| ● | Plexus has differentiated itself from peers with its top-notch design team and regulatory expertise. Much of this differentiation is within the Healthcare/Life Sciences sector, where projects with high engineering involvement and regulatory barriers predominate. |
| ● | The company’s business model has a more defensive business mix relative to peers, which has been proven by its relative outperformance in the Great Financial Crisis and the current pandemic-related recession. |
| ● | Plexus is regarded as having higher service levels relative to peers, and has a net promoter score of 84%, which is high relative to the industry benchmark of ~56%. |
| ● | Management is organically focused and does not believe in mergers and acquisitions. We expect 9-12% annual revenue growth for the next five years now that management is largely finished with pruning its networking and communications portfolio. |
| ● | The company has a strong balance sheet with a net debt-to-EBITDA ratio of 0.4 times and $650 million of liquidity. |
Valuation
| ● | Plexus trades at a forward price-to-earnings multiple (P/E) of 16.2 times and a trailing P/E of 17.9 times, which are approximately 50% lower than the weighted average Russell 3000 P/E multiples. |
| ● | Despite performing much better fundamentally throughout the pandemic than the average U.S. business, the shares are still down ~20% from their pre-pandemic high, while the U.S. stock market in aggregate is almost on par with pre-pandemic highs. |
Management
| ● | Plexus’ management team is regarded as one of the best in the industry. The team takes a disciplined approach when selecting new projects, only taking on those that fit their strategy. |
| ● | CEO Todd Kelsey and COO Steven Frisch have been with the company for over 25 years and have held their positions since 2016. All other executives have held their positions for over five years. |
| ● | Management is well-aligned with shareholder interests and focused on growing return on invested capital (ROIC), which comprises 40% of incentive-based compensation. The other compensation is based on revenue growth (40%) and individual goals (20%). Notably, this compensation plan runs deep in the organization and includes all managers. |
Investment Thesis
The EMS industry has historically been a tough one; it has been earmarked by little differentiation and low returns. However, Plexus has been an exception to this characterization due to its disciplined, niche strategy. Over the past decade, management has had an emphasis on shifting to a high-complexity/low-volume product mix. This has transitioned the company’s high-complexity product mix to 93% of the business from 47% in 2008. This change has brought superior design team capabilities, sticky relationships, advanced regulatory knowledge, lower cyclicality, and higher returns. We particularly like that roughly 40% of the business now comes from Healthcare/Life Sciences, given its defensiveness and long product lifecycles. The protective nature of the business mix has been demonstrated throughout the pandemic. We expect continued strong demand for Plexus’ services because recessions tend to drive manufacturing outsourcing, as many businesses lack the capital to manufacture in-house. We think the company will achieve strong growth over the long run, and it is an attractive relative value with a mid-teens earnings multiple potential.
TriMas Corp. (TRS)
(Analyst: Matt Sullivan)
Description
TriMas is a global designer, manufacturer and distributor of engineered products for commercial, industrial, and consumer markets. The company operates in three business segments: Packaging (58% of sales), Aerospace (26%), and Specialty Products (16%). The Packaging business makes specialty closures and dispensers for consumer and industrial products that are sold to a variety of end markets. The Aerospace business is a leading supplier of highly engineered fasteners to the aerospace industry. The Specialty Products business manufactures high and low-pressure steel cylinders, natural gas-powered wellhead engines and compressors, as well as other products. In total, approximately 82% of the company’s consolidated sales come from the U.S., 12% from Europe, 5% from Asia-Pacific, and 1% from Latin America.
Good Business
| ● | We estimate that TriMas’ ROIC is approximately 12%, which exceeds the company’s cost of capital. |
| ● | TriMas’ products typically constitute a small portion of a customer’s total production costs, but are critically important to the end product. |
| ● | The company’s businesses have relatively high barriers to entry. Each business segment exhibits one or more of the following characteristics: the products are highly engineered, patent-protected, sold into industries with stringent regulatory requirements, sold under long-term contracts, have well established and highly regarded brands, and/or the businesses have longstanding relationships with customers. |
| ● | The Packaging and Aerospace businesses are defensive, have the highest barriers to entry, contribute the vast majority of the company’s earnings, and should drive earnings growth going forward. |
| ● | The Packaging business’ dispensers and closures are mainly used in consumer non-durable products, and the Aerospace business sells its products to customers under long-term contracts. |
| ● | The company has a strong balance sheet and is easy to understand. |
Valuation
| ● | The stock trades at 15.0 times our next 12-months earnings per share (EPS) estimate, which is below the company’s 5-year average and is a significant discount to the Russell 2000 as well as other comparable companies serving similar end markets. |
| ● | The stock is trading at 1.6 times enterprise value-to-sales, which is below the company’s 5-year average of 1.7 times. |
Management
| ● | Tom Amato became President and CEO in July 2016. He has more than 25 years of broad industrial experience, having served in several leadership positions at global, multi-billion-dollar businesses, and as a CEO for companies owned by notable private equity firms, including The Carlyle Group Inc. and American Securities LLC. |
| ● | CFO Bob Zalupski joined TriMas in 2002. He has more than 30 years of business and financial management experience. Prior to being named CFO in 2015, he was Vice President, Finance, Corporate Development and Treasurer. |
Investment Thesis
TriMas is a collection of above-average businesses. COVID-19 has negatively impacted two of the company’s three business segments, causing the stock to come under pressure. Offsetting these challenges, the Packaging business (dispensers and closures for cleaning and hygiene products) has experienced a strong increase in demand as a result of the pandemic. We believe the strength in the Packaging business will more than offset weakness in the company’s other segments. Given the fairly resilient fundamental profile during this difficult time, we view the current valuation, at only 15.0 times the next 12-months EPS estimate, as attractive.
Thank you for your confidence in the FMI Common Stock Fund.
This shareholder letter is unaudited.
| FMI Common Stock Fund |
MANAGEMENT’S DISCUSSION OF FUND PERFORMANCE (Unaudited) |
During the fiscal year ended September 30, 2020, the FMI Common Stock Fund (FMIMX) the “Fund” had a total return of negative 11.51%(1). The benchmark Russell 2000 Index returned positive return of 0.39% in the same period. The Russell 2000 Value Index declined 14.88% in the same period. Relative to the Russell 2000, sectors that aided performance included Energy Minerals and Utilities (both underweight), Process Industries and Distribution Services. The Fund had little direct exposure to Energy Minerals, an area of weakness due to low hydrocarbon prices and slower demand because of COVID-19. Utilities attracted less attention in the Russell 2000 because of their slow underlying growth; the Fund had no exposure to Utilities. Avery Dennison Corp. drove the results in Process Industries as most of their pressure sensitive products benefitted from COVID-19. Arrow Electronics and HD Supply performed relatively well as their earnings weren’t dramatically impacted by COVID-19. On the negative side of sector performance, Health Technology, Producer Manufacturing and Electronic Technology all detracted. In Health Technology, Phibro Animal Health Corp. fell due to African Swine Flu and poor execution. Several stocks suffered in the Producer Manufacturing area because of COVID-19, including Carlisle Cos., TriMas Corp., Armstrong World Industries and Woodward Inc. ViaSat declined due to concerns about the balance sheet.
Other stocks that helped relative performance included Penske Automotive, ePlus Corp. and Insight Enterprises. Penske’s results, while not spectacular, were better than the market expected. ePlus and Insight both grew earnings significantly ahead of market expectations in the period. Other stocks that detracted from results included Graham Holdings, FirstCash Inc., Howard Hughes Corp., Zions Bancorporation and other names in finance. Graham reported mixed results throughout the year and investors struggled to grasp the near-term outlook. Almost every stock in the finance arena declined significantly. Worries about low economic growth, interest rates and reserves escalated after COVID-19. The outlook for companies in the finance sector looks positive to the Fund managers. Balance sheets are strong, and expectations are low.
New additions to the Fund over the past twelve months included Houlihan Lokey, Applied Industrial Technologies, Insight Enterprises, A.O Smith, Henry Schein and Flowserve. Stocks sold during the year included Argo Group, ePlus, Watsco, WABCO and ViaSat. As of September 30, 2020, the Fund was significantly overweighted in Producer Manufacturing, Commercial Services, and Distribution Services and meaningfully underweighted in Heath Technology, Technology Services and Electronic Technology.
The Russell 2000 has been driven by Health Technology, Technology Services and Electronic Technology over the past twelve months. The FMI Common Stock Fund managers believe these sectors have the greatest number of speculative stocks anywhere in the stock market. More than three quarters of the nearly 400 Russell 2000 Health Technology companies are money losing, yet that sector gained 34% in the period compared to an increase of 0.39% for the overall Russell 2000. The Technology Services and Electronic Technology areas are also up significantly in a weak market, largely driven by stocks with the highest valuations. On most valuation measures, the Russell 2000 is in the highest decile of historical measures. Passive investment strategies also continued to see heavy inflows of money, at the expense of active strategies. The growing use of “adjusted earnings” rather than GAAP earnings by Wall Street and corporate management gives a misleading P/E ratio.
The Federal Reserve (“Fed”) has undertaken an unprecedented policy of monetary accommodation, both prior to and after COVID-19 became widespread. The Fed’s balance sheet has roughly doubled over the past twelve months. The price of money remains unusually low by historical standards and the Fund managers believe many negative effects, including potential high inflation and currency debasement, are being ignored by the market. The economy went into a sharp recession in February of 2020, primarily due to COVID-19. Debt at both the corporate and government levels has grown significantly. Recent additions to the government debt totals are extraordinary by historical standards. U.S. total federal debt-to-GDP is well over 100% and the highest in the WWII era. Corporate leverage by some measures is at a fifty-year high.
With valuations high and speculative fervor present in the IPO and private equity areas, along with an overwhelming belief that interest rates will stay low for years, the Fund managers feel growth stocks are particularly vulnerable to a change in conditions. The outlook for strong relative performance from value-oriented stocks, while contrarian in nature, is positive.
(1) The FMI Common Stock Fund Institutional Class (FMIUX) returned -11.41% for the fiscal year ending 9/30/20.
| FMI Common Stock Fund |
| MANAGEMENT’S DISCUSSION OF FUND PERFORMANCE (Unaudited) (Continued) |
|
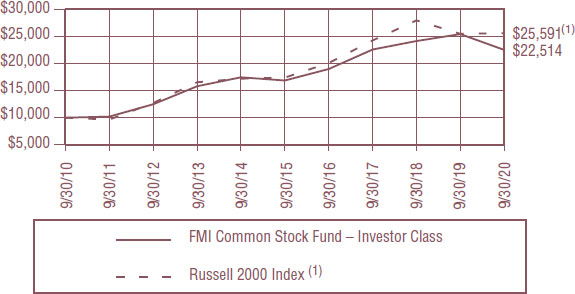
COMPARISON OF CHANGE IN VALUE OF $10,000 INVESTMENT IN
FMI COMMON STOCK FUND – INVESTOR CLASS AND THE RUSSELL 2000 INDEX(1)
| AVERAGE ANNUALIZED TOTAL RETURN |
| | Inception Date | 1-Year | 5-Year | 10-Year | Inception through 9/30/2020 |
| FMI Common Stock Fund –Investor Class | 12/18/81 | -11.51% | 5.94% | 8.45% | 11.06% |
| FMI Common Stock Fund –Institutional Class | 10/31/16 | -11.41% | N/A | N/A | 5.29% |
| Russell 2000 Index(1)* | | 0.39% | 8.00% | 9.85% | 9.84% |
The graph and the table do not reflect the deduction of taxes that a shareholder would pay on Fund distributions or the redemption of Fund shares. Performance data quoted represents past performance; past performance does not guarantee future results. Investment return and principal value of an investment will fluctuate so that an investor’s shares, when redeemed, may be worth more or less than their original cost. Current performance of a Fund may be lower or higher than the performance quoted. The total returns do not reflect the deduction of taxes that a shareholder would pay on Fund distributions or the redemption of Fund shares. Total return includes change in share prices and in each case includes reinvestments of any dividends, interest and capital gain distributions. Performance data current to the most recent month-end may be obtained by visiting www.fmifunds.com or by calling 1-800-811-5311.
| (1) | The Russell 2000 Index measures the performance of the 2,000 smallest companies in the Russell 3000 Index, which comprises the 3,000 largest U.S. companies based on total market capitalization. |
| * | The benchmark since inception returns are calculated since inception of the Investor Class, December 18, 1981 to September 30, 2020. |
An investment cannot be made directly into an index.
FMI Common Stock Fund
SCHEDULE OF INVESTMENTS
September 30, 2020
| Shares | | | | | Cost | | | Value | |
| COMMON STOCKS — 95.9% (a) | | | | | | | | |
| COMMERCIAL SERVICES SECTOR — 15.7% | | | | | | | | |
| | | | | Advertising/Marketing Services — 3.1% | | | | | | | | |
| | 1,275,000 | | | Interpublic Group of Cos. Inc. | | $ | 22,046,035 | | | $ | 21,254,250 | |
| | | | | Miscellaneous Commercial Services — 7.1% | | | | | | | | |
| | 143,450 | | | FTI Consulting Inc.* | | | 16,248,500 | | | | 15,201,396 | |
| | 875,000 | | | Genpact Ltd. | | | 14,508,365 | | | | 34,081,250 | |
| | | | | | | | 30,756,865 | | | | 49,282,646 | |
| | | | | Personnel Services — 5.5% | | | | | | | | |
| | 160,000 | | | ManpowerGroup Inc. | | | 10,005,094 | | | | 11,732,800 | |
| | 490,000 | | | Robert Half International Inc. | | | 21,555,688 | | | | 25,940,600 | |
| | | | | | | | 31,560,782 | | | | 37,673,400 | |
| CONSUMER SERVICES SECTOR — 2.6% | | | | | | | | |
| | | | | Other Consumer Services — 2.6% | | | | | | | | |
| | 45,000 | | | Graham Holdings Co. | | | 20,557,975 | | | | 18,184,950 | |
| DISTRIBUTION SERVICES SECTOR — 13.3% | | | | | | | | |
| | | | | Electronics Distributors — 3.4% | | | | | | | | |
| | 300,000 | | | Arrow Electronics Inc.* | | | 9,893,291 | | | | 23,598,000 | |
| | | | | Medical Distributors — 2.2% | | | | | | | | |
| | 260,000 | | | Henry Schein Inc.* | | | 13,293,217 | | | | 15,282,800 | |
| | | | | Wholesale Distributors — 7.7% | | | | | | | | |
| | 200,000 | | | Applied Industrial Technologies Inc. | | | 11,992,135 | | | | 11,020,000 | |
| | 850,000 | | | HD Supply Holdings Inc.* | | | 33,475,208 | | | | 35,054,000 | |
| | 110,000 | | | MSC Industrial Direct Co. Inc. | | | 6,582,555 | | | | 6,960,800 | |
| | | | | | | | 52,049,898 | | | | 53,034,800 | |
| ELECTRONIC TECHNOLOGY SECTOR — 3.0% | | | | | | | | |
| | | | | Aerospace & Defense — 1.0% | | | | | | | | |
| | 48,000 | | | Huntington Ingalls Industries Inc. | | | 8,075,176 | | | | 6,756,000 | |
| | | | | Electronic Components — 2.0% | | | | | | | | |
| | 200,000 | | | Plexus Corp.* | | | 13,910,503 | | | | 14,126,000 | |
| FINANCE SECTOR — 23.8% | | | | | | | | |
| | | | | Finance/Rental/Leasing — 6.8% | | | | | | | | |
| | 495,000 | | | FirstCash Inc. | | | 23,620,089 | | | | 28,318,950 | |
| | 440,000 | | | Ryder System Inc. | | | 19,888,760 | | | | 18,585,600 | |
| | | | | | | | 43,508,849 | | | | 46,904,550 | |
| | | | | Investment Banks/Brokers — 3.5% | | | | | | | | |
| | 403,840 | | | Houlihan Lokey Inc. | | | 20,222,031 | | | | 23,846,752 | |
| | | | | Life/Health Insurance — 1.0% | | | | | | | | |
| | 58,000 | | | Primerica Inc. | | | 7,036,706 | | | | 6,562,120 | |
| | | | | Multi-Line Insurance — 2.2% | | | | | | | | |
| | 19,371 | | | White Mountains Insurance Group Ltd. | | | 16,933,458 | | | | 15,090,009 | |
| | | | | Property/Casualty Insurance — 2.8% | | | | | | | | |
| | 315,000 | | | W.R. Berkley Corp. | | | 5,117,323 | | | | 19,262,250 | |
The accompanying notes to financial statements are an integral part of this schedule.
FMI Common Stock Fund
SCHEDULE OF INVESTMENTS (Continued)
September 30, 2020
| Shares | | | | | Cost | | | Value | |
| COMMON STOCKS — 95.9% (a) (Continued) | | | | | | | | |
| FINANCE SECTOR — 23.8% (Continued) | | | | | | | | |
| | | | | Real Estate Development — 4.6% | | | | | | | | |
| | 250,000 | | | The Howard Hughes Corp.* | | $ | 25,365,386 | | | $ | 14,400,000 | |
| | 1,175,000 | | | Kennedy-Wilson Holdings Inc. | | | 22,407,305 | | | | 17,061,000 | |
| | | | | | | | 47,772,691 | | | | 31,461,000 | |
| | | | | Regional Banks — 2.9% | | | | | | | | |
| | 695,000 | | | Zions Bancorporation | | | 22,072,253 | | | | 20,307,900 | |
| HEALTH TECHNOLOGY SECTOR — 3.5% | | | | | | | | |
| | | | | Medical Specialties — 2.8% | | | | | | | | |
| | 440,000 | | | Dentsply Sirona Inc. | | | 14,747,639 | | | | 19,241,200 | |
| | | | | Pharmaceuticals: Major — 0.7% | | | | | | | | |
| | 290,000 | | | Phibro Animal Health Corp. | | | 8,136,930 | | | | 5,046,000 | |
| PROCESS INDUSTRIES SECTOR — 8.9% | | | | | | | | |
| | | | | Containers/Packaging — 6.5% | | | | | | | | |
| | 350,000 | | | Avery Dennison Corp. | | | 19,892,257 | | | | 44,744,000 | |
| | | | | Industrial Specialties — 2.4% | | | | | | | | |
| | 350,000 | | | Donaldson Co. Inc. | | | 14,991,016 | | | | 16,247,000 | |
| PRODUCER MANUFACTURING SECTOR — 20.5% | | | | | | | | |
| | | | | Building Products — 4.8% | | | | | | | | |
| | 375,000 | | | A.O. Smith Corp. | | | 14,503,877 | | | | 19,800,000 | |
| | 190,000 | | | Armstrong World Industries Inc. | | | 7,834,094 | | | | 13,073,900 | |
| | | | | | | | 22,337,971 | | | | 32,873,900 | |
| | | | | Industrial Machinery — 5.0% | | | | | | | | |
| | 175,000 | | | EnPro Industries Inc. | | | 12,542,480 | | | | 9,871,750 | |
| | 400,000 | | | Flowserve Corp. | | | 9,204,782 | | | | 10,916,000 | |
| | 175,000 | | | Woodward Inc. | | | 7,110,989 | | | | 14,028,000 | |
| | | | | | | | 28,858,251 | | | | 34,815,750 | |
| | | | | Miscellaneous Manufacturing — 8.1% | | | | | | | | |
| | 275,000 | | | Carlisle Cos. Inc. | | | 19,562,984 | | | | 33,651,750 | |
| | 990,000 | | | TriMas Corp.* | | | 21,908,123 | | | | 22,572,000 | |
| | | | | | | | 41,471,107 | | | | 56,223,750 | |
| | | | | Trucks/Construction/Farm Machinery — 2.6% | | | | | | | | |
| | 915,000 | | | Trinity Industries Inc. | | | 17,733,771 | | | | 17,842,500 | |
| RETAIL TRADE SECTOR — 2.4% | | | | | | | | |
| | | | | Specialty Stores — 2.4% | | | | | | | | |
| | 350,000 | | | Penske Automotive Group Inc. | | | 11,953,975 | | | | 16,681,000 | |
| TECHNOLOGY SERVICES SECTOR — 2.2% | | | | | | | | |
| | | | | Information Technology Services — 2.2% | | | | | | | | |
| | 270,000 | | | Insight Enterprises Inc.* | | | 15,266,119 | | | | 15,276,600 | |
| | | | | Total common stocks | | | 560,196,089 | | | | 661,619,127 | |
The accompanying notes to financial statements are an integral part of this schedule.
FMI Common Stock Fund
SCHEDULE OF INVESTMENTS (Continued)
September 30, 2020
| Principal Amount | | | Cost | | | Value | |
| SHORT-TERM INVESTMENTS — 4.2% (a) | | | | | | | | |
| | | | | Bank Deposit Account — 4.2% | | | | | | | | |
| $ | 29,227,320 | | | U.S. Bank N.A., 0.04%^ | | $ | 29,227,320 | | | $ | 29,227,320 | |
| | | | | Total short-term investments | | | 29,227,320 | | | | 29,227,320 | |
| | | | | Total investments — 100.1% | | $ | 589,423,409 | | | | 690,846,447 | |
| | | | | Other liabilities, less assets —(0.1%) (a) | | | | | | | (607,514 | ) |
| | | | | TOTAL NET ASSETS — 100.0% | | | | | | $ | 690,238,933 | |
| * | Non-income producing security. |
| ^ | The rate shown is as of September 30, 2020. |
| (a) | Percentages for the various classifications relate to total net assets. |
The accompanying notes to financial statements are an integral part of this schedule.
INDUSTRY SECTORS as a percentage of net assets
as of September 30, 2020 (Unaudited)
FMI International Fund
and
FMI International Fund II – Currency Unhedged
September 30, 2020
Dear Fellow Shareholders:
Being a value investor in a growth and momentum-driven stock market is a lonely existence, but one that can be quite rewarding through a full cycle. As Warren Buffett once said, it is wise to “be fearful when others are greedy, and greedy when others are fearful.” Today, we are seeing an abundance of greed, notwithstanding a few pockets of fear (hint: international value equities). We have continued to remain true to our research process and value orientation despite the challenging backdrop.
In the third quarter, the FMI International Funds (“Funds”) continued to rebound, advancing 4.53% (currency hedged)1 and 6.62% (currency unhedged)2, which compares with an MSCI EAFE Index gain of 1.22% in local currency (LOC) and 4.80% in U.S. Dollars (USD). Unfortunately, value stocks have continued to fall out of favor, as the MSCI EAFE Value Index declined 2.34% in LOC and gained 1.19% in USD in the period, each lagging their comparable MSCI EAFE Growth Index by over 7%. Performance in the Funds was led by Ferguson PLC, B&M European Value Retail S.A., and Hyundai Motor Co. Preferred, as Amorepacific Corp. Preferred, Chubb Ltd., and Jardine Strategic Holdings Ltd. each detracted. The Consumer Services, Distribution Services, and Consumer Durables sectors were positive contributors, while Producer Manufacturing, Technology Services, and Industrial Services lagged. A weak USD hurt FMI’s currency hedged performance.
In 2020, the Funds have been especially hard-hit by COVID-related headwinds. We look forward to a rebound in several companies where we believe the long-term prospects are far more attractive than they are currently being given credit for. We think we have a number of “coiled springs” in the portfolio, poised to outperform once business starts to normalize. If, for example, our holdings were simply to return to their 52-week highs, the portfolios would be up over 27%, and in our opinion, still be undervalued.
Given the litany of risks investors should be trying to carefully navigate (global pandemic, deep recession, elevated valuations, central bank profligacy, leverage, geopolitical risks, and inflation, to name just a few), there is no better time to own a collection of high-quality companies. Our portfolios are filled with what we feel are durable, competitively advantaged businesses with strong balance sheets and skilled management teams. Not only do these companies have the wherewithal to make it through these tough times, but most should come out even stronger on the other side. The portfolios trade at a significant discount to our benchmarks, which should bode well for future returns.
| 1 | The FMI International Fund [currency hedged] Investor Class (FMIJX) and the FMI International Fund [currency hedged] Institutional Class (FMIYX) had a return of 4.53% and 4.52%, respectively, for the third quarter of 2020. |
| 2 | The FMI International Fund (unhedged) Institutional Class (FMIFX) had a return of 6.62% for the third quarter of 2020. |
Everything but the Kitchen Sink
To prop up the global economy, policymakers have responded with unprecedented force, throwing anything and everything at the problem. Collectively, global central banks and governments have tallied $21 trillion in monetary and fiscal stimulus, a truly remarkable sum (~24% of 2019 GDP).3 At the same time, world debt has soared to a record high 331% of GDP ($258 trillion).4 While economic growth has come in a bit better than originally feared (with Organisation for Economic Co-operation and Development [OECD] estimates for 2020 global Real GDP growth of -4.5% in September versus -6.0% in June), the recovery is starting to lose some steam, and growth is now expected to be $7 trillion lower than pre-COVID estimates for 2021 (see chart to the right).5 Following a period of widespread lockdowns, the early gains are starting to moderate, with a recent surge in COVID-19 cases dampening the reopening process. Growth may slow further as employment subsidy programs wind down and layoffs ensue. While we are hopeful that rapid antigen testing and vaccines will be important steps toward returning to more “normal” levels of business activity, it is unclear how quickly these will be approved and made available to the masses. We expect to see some permanent changes in human behavior as a result of the pandemic, but the magnitude remains unclear. We are living through times for which there is no real historical precedent.
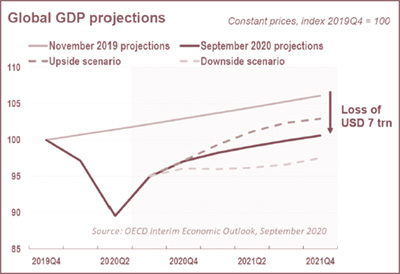
Despite tremendous economic uncertainty, speculation continues to run rampant in financial asset markets. Unfortunately, normal price discovery has been all but lost, as massive asset purchasing programs (quantitative easing) have continued to distort the market’s pricing mechanisms. Interest rates are artificially low, which has inflated asset prices and valuations, especially on the more speculative end of the risk spectrum, i.e., long-duration growth stocks. Low or negative-yielding debt is pushing investors into riskier assets in search for yield and returns.
Consider your UK retiree who has GBP 1.5 million in savings, for example. In the decade leading up to the great financial crisis, they would have been able to generate at least a 5% yield on a 10-year UK government bond, netting GBP 75,000 of interest income. Today, with a 10-year yield of 0.23%, one would need almost $33 million in savings to generate the same GBP 75,000. To generate a 5% return, the retiree would likely have to venture out into junk bonds or equities, where the risk profile is far greater. According to the Financial Times, “Just 3 percent of the investable bond world today yields more than 5 percent — a share that is close to an all-time low and represents a precipitous drop from levels seen roughly two decades ago. In the late 1990s, nearly 75 percent of bonds traded with yields above 5 percent, while sub-2 percent yields comprised well under 10 percent of the market [vs. 86% today].”6 To describe today’s interest rate environment as extraordinary would be a massive understatement.
| 3 | Michael Hartnett, David Jones, and Shirley Wu. “The Thundering Word: The Hitchhiker’s Guide to the Investment Universe.” BofA Global Research, September 3, 2020. |
| 4 | Emre Tiftik, Khadija Mahmood, and Sonja Gibbs. “Global Debt Monitor.” Institute of International Finance. July 16, 2020. |
| 5 | Laurence Boone. “OECD Interim Economic Outlook: Living with Uncertainty.” September 16, 2020. |
| 6 | Colby Smith. “Hard times yield-squeezed bond investors follow the path into ‘extreme risk’ territory.” Financial Times, July 26, 2020. |
To that point, $15+ trillion of negative-yielding bonds globally is extremely worrisome, as the mere thought of investors buying Greek or Italian bonds trading at a guaranteed loss (if held to maturity), defies logic. In our view, central banks have gone too far, too fast, and will find themselves in a very difficult situation in the years to come. The Bank of Japan has been so aggressive printing money and gobbling up assets that it could soon own around 50% of Japanese government bonds, 50% of the country’s commercial paper, one-sixth of corporate bonds,7 and 75% of its exchange-traded funds (ETFs).8 Meanwhile, The Wall Street Journal reports that “The European Central Bank is vacuuming up sovereign bonds faster than governments can pump them out,” and that “UBS expects the net supply of European government bonds to be minus € 73 billion in 2020 […] compared with € 182 billion last year. This means that the central bank is projected to buy more bonds this year than governments sell, after factoring out bonds that are repaid.”9 With price-insensitive buyers of this scale moving markets, it’s no wonder asset prices have become disconnected from the fundamentals. Printing money may be the oldest trick in the book, but there is no historical precedent where it has actually worked.
Relative Value Overseas
Thinking about Warren Buffett’s message about greed and fear in the context of the global investment landscape is informative. In looking at equity performance over the past ten years, we have seen a remarkable divergence between U.S. and international stock markets. Over the last decade, the Standard & Poor’s 500 Index generated a return of 262.44% (13.74% per annum), trouncing the MSCI EAFE Index gain of 83.50% (6.26%) in LOC and 57.06% (4.62%) in USD.
Not surprisingly, the U.S. stock market is littered with signs of excess, as we have outlined in our Large Cap Fund and Common Stock Fund shareholder letters. The geographic bifurcation recently became so extreme that the market cap for U.S. tech stocks exceeded that of the entire European stock market (which had been four times larger than U.S. tech back in 2007).10 The market cap for the top four tech names (Apple, Amazon, Microsoft and Alphabet) was greater than the Japanese stock market in total – as well as the combined China and Hong Kong stock markets! Apple’s market cap alone exceeded the size of the FTSE 100 Index, a basket of the largest companies in the UK.11 Ironically, Apple’s operating profits are expected to be lower in 2020 than they were in 2015. And yet, somehow the stock has gained 354.54% over the past five years, going from a market cap of $629 billion to $1.98 trillion. Today, it trades for 35 times trailing price-to-earnings (versus a 10-year average of 16 times), despite underwhelming growth prospects. The greed alarm bell doth toll, and loudly!
As the following chart illustrates, the valuation premium for U.S. versus foreign stocks (in developed markets) is at the highest level it has been in over 40 years, and by a significant margin.
| 7 | Leo Lewis. “Bank of Japan to tighten grip on corporate bond market.” Financial Times, April 27, 2020. |
| 8 | Min Jeong Lee and Toshiro Hasegawa. “When Will BOJ Slow ETF Buying? Some Say When Nikkei Tops 20,000.” Bloomberg, April 6, 2020. |
| 9 | Anna Hirtenstein. “European Central Bank Smothers Government Bond Market.” The Wall Street Journal, September 11, 2020. |
| 10 | Jesse Pound. “U.S. tech stocks are now worth more than the entire European stock market.” CNBC, August 28, 2020. |
| 11 | Daren Fonda. “4 Big Tech Companies Are Larger Than Japan’s Stock Market. Why Investors Should Be Cautious.” Barron’s, August 28, 2020. |
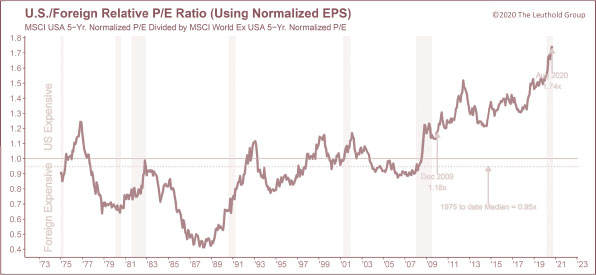
While sector mix tells some of the story, with more tech exposure in the U.S. and financial exposure in Europe, even on a sector-neutral basis the price-to-earnings premium is well above historical averages.12 As we look out across the globe, we see attractive opportunities in international markets (a couple of which we highlight at the end of this letter), with better absolute values than are currently available in most of the U.S. Given the valuation disparity, we expect to see strong relative performance in foreign markets in the years ahead.
The Tide Will Turn
Growth investing has benefited from low interest rates (see our discussion in the June letter), a shift from active to passive investing (fueling momentum strategies), and economic fragility (sectors and industries that were most impacted by COVID-19 have been in the value camp), among other factors. Predictably, investors are chasing recent performance and buying what has been working, regardless of the valuations. As in every other market cycle, speculation will be generously rewarded… until it isn’t.
Over the past decade, the MSCI EAFE Growth Index (USD) has gained 96.75% (7.00% per annum), over four times the 23.07% (2.10% per annum) return of the MSCI EAFE Value Index (USD). At some point investors will wake up to the reality that value stocks have been vastly oversold and growth stocks bid too high. Eventually, mean reversion will kick in and run its course. In Europe, value stocks trade at a record discount to growth of nearly 60% (see chart below),13 so those that lean into the wind will be doing so with what appears to be a sizeable margin of safety.
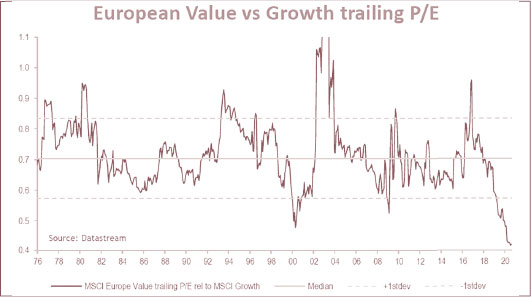
| 12 | Mislav Matejka, Prabhav Bhadani, and Nitya Saldanha. “Global Equity Strategy.” Page 86. J.P. Morgan Cazenove. September 1, 2020. |
While it has been a trying time for value investors, with history as our guide we are confident that better days lie ahead. Eventually the global economy will recover, rates will normalize, and fundamentals and valuation will start to re-enter the conversation. In the meantime, we will keep our heads down, trying to find the next compelling value in an overvalued world. Below are a couple of stocks we believe fit the bill.
Jardine Strategic Holdings Ltd. (JS SP)
(Analyst: Dain Tofson)
Description
Jardine Strategic is a family-controlled investment holding company with a focus on Greater China and Southeast Asia. Key holdings include controlling positions in Dairy Farm, Hongkong Land, Jardine Cycle & Carriage, Mandarin Oriental, and a cross holding in Jardine Matheson. Key industry exposures include retail store operations (grocery, convenience store, drug store, home furnishings), real estate investment and development, automobile dealerships, luxury hotel management, restaurant management, manufacturing and financing activities, mining, agribusiness, and engineering and construction, among others. In 2019, underlying profits were split 54% Greater China, 44% Southeast Asia, and 2% Rest of World. Mainland China specifically contributed 20% of underlying profits.
Good Business
| ● | The key holdings generate a return in excess of cost of capital over an economic cycle. |
| ● | The company’s competitive advantage lies in its very deep knowledge base of Greater China and Southeast Asia and long-standing contacts and relationships in the countries in which it operates. |
| ● | Jardine Strategic’s holdings include several businesses with local incumbent advantages and market share positions that would be very difficult and costly to replicate. |
| ● | The company generates various sources of recurring revenue including rent on commercial buildings (Hongkong Land), automobile service and components (Jardine Cycle & Carriage through its controlling interest in Astra), and purchase of consumer staples (Dairy Farm). |
| ● | As of 1Q 2020, Jardine Strategic Corporate had a net cash balance of $2.3 billion. Consolidated net debt excluding financial services companies as a percentage of equity was 10%. |
Valuation
| ● | The company trades at 8.0 times 2021 earnings per share versus a 10-year average of 11.3 times. |
| ● | The shares also trade at a price-to-book ratio of 0.3 times, close to an all-time low. |
| ● | Jardine Strategic is trading around a 50% discount to NAV based on the public market value of its listed holdings, versus a historical average discount of 35%. |
| ● | The key holdings are inexpensive on a standalone basis – Hongkong Land trades at 8.4 times 2021 earnings per share or 0.2 times price-to-book; and Jardine Cycle & Carriage trades at 7.8 times 2021 earnings per share; Dairy Farm trades at 17.0 times 2021 earnings per share – and, if you apply Jardine Strategic’s NAV discount, our implied earnings per share multiple on the key holdings is roughly half of the standalone multiple. |
Management
| ● | The family has successfully navigated Southeast Asia and Greater China for over 180 years and has a proven track record of creating shareholder value (20-year outperformance vs. the MSCI EAFE Index.) |
| ● | Management takes a long-term view and is known for being contrarian. As an example, they invested in Astra in 2000 after the Asian Financial Crisis when others were still skittish. |
Investment Thesis
Jardine Strategic has an impressive long-term track record in part due to its very deep knowledge base of the Greater China and Southeast Asia region, and long-standing contacts and relationships in the countries in which it operates. As such, Jardine Strategic allows us to participate in a region that we might otherwise struggle to navigate. The stock trades at a very low 8.0 times 2021 earnings per share, and at a sizeable discount to its NAV. The valuation offers a large margin of safety. At the same time, the $2.3 billion of net cash gives management a lot of firepower to capitalize on opportunities that arise during the COVID-19 downturn.
Chubb Ltd. (CB)
(Analyst: Ben Karek)
Description
Chubb is one of the largest publicly traded property and casualty (P&C) insurance companies globally. In aggregate, the company has operations in 54 countries and territories. Chubb provides commercial, personal property, casualty, personal accident, and supplemental health insurance to a diverse group of clients. Approximately 63% of premiums are from the U.S., 13% from Europe/Eurasia and Africa, 11% from Asia, 7% from Latin America, and 6% from Bermuda and Canada. By product, the mix is Commercial P&C 55%, Personal Lines 21%, Accident & Health/Life 17%, Agriculture 5%, and Reinsurance 2%. The Chubb brand is probably best known as the leading provider of insurance to high net worth individuals.
Good Business
| ● | Chubb is a durable, differentiated multi-line insurer with an attractive small and middle market commercial book of business, as well as a respected high net worth personal lines customer base. |
| ● | For medium to larger-sized commercial enterprises, casualty insurance is a necessity coverage. This non-discretionary attribute, along with Chubb’s emphasis on high service levels, results in strong customer retention and predictable revenues. The company’s renewal retention ratio generally ranges between 85 to 90% (it was 95% in 2019 for major accounts). |
| ● | Chubb’s disciplined risk selection and cycle management has led to conservative initial loss picks, underwriting stability, and a consistent return on equity (ROE). |
| ● | Over the past ten years the company’s underwriting combined ratio is 7.6% better than the industry. |
| ● | Operating expenses are over 4% lower than large cap peers. |
| ● | The company presently generates a 14% return on tangible equity. Incremental returns on invested capital are attractive. |
| ● | Chubb currently maintains industry-low balance sheet leverage metrics across the three most important indicators of net premiums to shareholder’s equity (0.6 times), invested assets to shareholder’s equity (2.0 times), and debt-to-total capital (22%). The company’s investment portfolio is purposefully “plain vanilla.” |
| ● | The investment portfolio duration is four years with an average credit quality of A/Aa. |
Valuation
| ● | Over the past 25 years, Chubb’s price-to-book multiple has averaged close to 1.5 times, ranging from a low of 1.0 times to a high of over 2.0 times, and it currently trades below book value. At 1.5 times book value per share, the stock would be valued at $182 per share. |
| ● | Over the past ten years, Chubb has grown book value per share at a 6% compound annual growth rate. The dividend yield is 2.7%. |
Management
| ● | Chubb has a diverse and highly respected management team led by Chairman and CEO Evan Greenberg, who personally owns $122 million in stock. |
| ● | Management is compensated based upon key financial metrics (75% overall weight) of tangible book value per share growth, core operating ROE, core operating income, and the P&C combined ratio. The residual quarter of incentive compensation is determined by operational and strategic goals. |
| ● | Mr. Greenberg’s management team has been a cohesive group with backgrounds tying back to legacy ACE Limited and supplemented by key individuals staying on from the legacy Chubb organization. |
| ● | Philip Bancroft has been the CFO of Chubb Limited since January 2002. |
Investment Thesis
Chubb is one of the largest P&C insurers globally and has a specialty in high net worth personal lines. Chubb has industry-leading combined ratios and is led by one of the best insurance CEOs in the industry. The company is benefitting from the industry underpricing risks the last few years, which has led to firming pricing without the reserve charges taken by many of its peers. This has driven the best premium growth in many years. With regard to COVID specifically, there is talk about regulators or governments forcing insurance companies to pay business interruption claims even though the policies specifically exclude viruses and pandemics. There is no court ruling or other precedent for this complete disregard for contract law, and we view the probability that this intervention holds up in court as very low.
Thank you for your support of the FMI International Funds.
This shareholder letter is unaudited.
| FMI International Fund and FMI International Fund II – Currency Unhedged |
| MANAGEMENT’S DISCUSSION OF FUND PERFORMANCE (Unaudited) |
During the fiscal year (FY) ended September 30, 2020, the FMI International Fund (FMIJX), the “currency hedged Fund,” declined 10.06%(1). Over the same period, the MSCI EAFE Index, the “Index,” fell 4.74% in local currency (LOC) and gained 0.49% in U.S. Dollars (USD), while the MSCI EAFE Value Index, the “Value Index,” dropped 16.46% in LOC and 11.93% in USD.
The FMI International Fund II – Currency Unhedged (FMIFX), the “currency unhedged Fund,” was launched on December 31, 2019, so has less than a full year of operating performance. Year-to-date (YTD), the currency unhedged Fund declined by 13.80%. Meanwhile, the Index decreased by 7.09% in USD, while the Value Index sank by 18.31% in USD.
In both time periods (YTD and FY), the currency hedged Fund and currency unhedged Fund, the “Funds”, underperformed the Index and outperformed the Value Index, in LOC and USD. The Funds value-orientation has been a meaningful headwind to performance, as growth stocks have been driving the market. The Value Index has lagged the comparable MSCI EAFE Growth Index by an extraordinary 21.81% in LOC and 22.91% in USD in the YTD, and 23.91% and 25.37% during the FY, respectively.
The Funds’ relative performance was aided by the Distribution Services, Finance, and Transportation sectors. Not having exposure to Energy Minerals also helped, as it was the weakest performing sector in the Index. Ferguson led the performance in the Distribution Services sector, as the plumbing and heating distributor has been gaining market share across all its end markets and managing its cost base well, expanding margins. Our underweight in Finance was beneficial as the sector declined on concerns over falling interest rates and rising credit risks, among others. In Transportation, Expeditors’ fundamentals and pricing in the air freight forwarding market have benefitted from extreme capacity imbalances due to stronger demand for certain products during the pandemic (technology, medical products, etc.), coupled with constrained supply due to limited passenger flights and belly space for cargo.
Conversely, the Consumer Services, Producer Manufacturing, and Health Technology sectors all weighed on the Funds’ relative performance. In Consumer Services, our travel and hospitality exposure (Whitbread, Compass Group, and Booking Holdings) was especially hard hit during the pandemic, as demand fell precipitously. In Producer Manufacturing, CNH Industrial’s previous management team was too slow to respond to the COVID-induced slowdown. Over the long-term we are optimistic about the company’s self-help initiatives, margin opportunity, and portfolio optionality. Our Health Technology exposure hurt, as it was one of the best-performing sectors, but we were underweight, and did not own big pharma and biotechnology. One of our holdings, Smith & Nephew, relied heavily on elective procedures (70% of the mix) which were temporarily postponed.
Additional stocks that performed well included B&M European Value Retail, Sony Corp., and DKSH, while Schlumberger, Jardine Strategic, and Safran each detracted. An underweight exposure to Japan (outperforming market) and overweight exposure to the United Kingdom (underperforming market) hurt our relative performance. An overweight exposure to South Korea and Switzerland helped. Weakening of the USD was a headwind for the currency hedged Fund.
New additions to the Funds included Yokogawa Electric, Lloyds Banking, Akzo Nobel and Howden Joinery. We moved on from several of our lower-conviction ideas, as we sold our positions in Nutrien, Electrolux, TE Connectivity, and Isuzu Motors, and upgraded the quality of the portfolio when the market became dislocated. A number of additional holdings were boosted or trimmed in the period.
As of September 30, 2020, the Funds were significantly overweight in Consumer Services, Commercial Services, and Retail Trade versus the Index, and underweight in Finance, Health Technology, and Utilities. The Fund is overweight the United Kingdom, South Korea and Canada, and underweight Japan, Germany and Australia.
| (1) | The FMI International Fund Institutional Class (FMIYX) had a total return of -9.95% for the fiscal year ended 9/30/20. |
FMI International Fund and FMI International Fund II – Currency Unhedged
MANAGEMENT’S DISCUSSION OF FUND PERFORMANCE (Unaudited) (Continued)
After a strong start to the fiscal year, where global stock markets rallied in the December 2019 quarter, the Coronavirus (COVID-19) pandemic took the world by storm in the first quarter of 2020 and beyond. Unfortunately, COVID-19 has hurt value investors much more than their growth counterparts, as there is seemingly no price too high for defensive or growth companies, and no price too low for cyclical or out-of-favor value names. Valuation has become an afterthought, as fiscal and monetary stimulus (i.e. money printing) and low/negative rates has led to aggressive speculation on the growth side of the equation. Valuation-conscious investors with a focus on business quality and balance sheet strength have not been rewarded. Many sectors and industries in the value camp, such as financials, energy, industrials, travel and hospitality, have been the hardest hit by the virus. Overall, we continue to have great confidence in our portfolio over the long run. Owning a collection of high-quality, durable businesses with solid balance sheets, which trade at a significant discount to their intrinsic values, our benchmarks, and our value-oriented peers should be a winning combination.
COMPARISON OF CHANGE IN VALUE OF $10,000 INVESTMENT IN
FMI INTERNATIONAL FUND – INVESTOR CLASS AND MSCI EAFE(1)
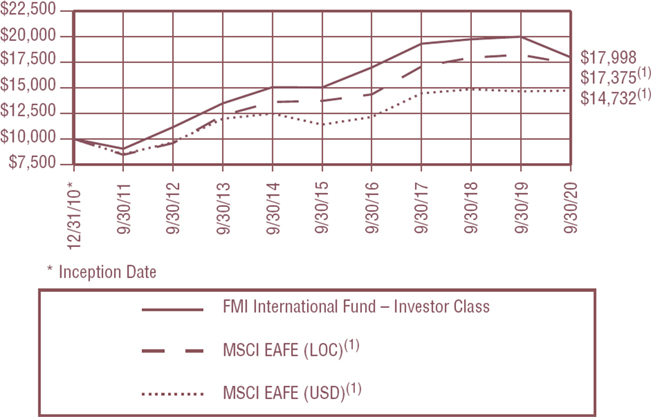
AVERAGE ANNUALIZED TOTAL RETURN
| | | Inception Date | | 1-Year | | | 5-Year | | | 10-Year | | | Inception
through
9/30/2020 | |
| FMI International Fund – Investor Class | | 12/31/10 | | | -10.06 | % | | | 3.66% | | | | N/A | | | | 6.21% | |
| FMI International Fund – Institutional Class | | 10/31/16 | | | -9.95 | % | | | N/A | | | | N/A | | | | 1.87% | |
| MSCI EAFE Net (LOC)(1)* | | | | | -4.74 | % | | | 4.83% | | | | 6.26% | | | | 5.83% | |
| MSCI EAFE Net (USD)(1)* | | | | | 0.49 | % | | | 5.26% | | | | 4.62% | | | | 4.05% | |
The graph and the table do not reflect the deduction of taxes that a shareholder would pay on Fund distributions or the redemption of Fund shares. Performance data quoted represents past performance; past performance does not guarantee future results. Investment return and principal value of an investment will fluctuate so that an investor’s shares, when redeemed, may be worth more or less than their original cost. Current performance of a Fund may be lower or higher than the performance quoted.
FMI International Fund and FMI International Fund II – Currency Unhedged
MANAGEMENT’S DISCUSSION OF FUND PERFORMANCE (Unaudited) (Continued)
The total returns do not reflect the deduction of taxes that a shareholder would pay on Fund distributions or the redemption of Fund shares. Total return includes change in share prices and in each case includes reinvestments of any dividends, interest and capital gain distributions. Performance data current to the most recent month-end may be obtained by visiting www.fmifunds.com or by calling 1-800-811-5311.
| (1) | The MSCI EAFE Index (Europe, Australasia, Far East) is a free float-adjusted market capitalization index that is designed to measure the equity market performance of developed markets, excluding the U.S. and Canada. The MSCI EAFE Index consists of the following 21 developed market country indices: Australia, Austria, Belgium, Denmark, Finland, France, Germany, Hong Kong, Ireland, Israel, Italy, Japan, the Netherlands, New Zealand, Norway, Portugal, Singapore, Spain, Sweden, Switzerland and the United Kingdom. The MSCI EAFE Index is unmanaged and investors cannot invest directly in the Index. Index results are inclusive of dividends and net of foreign withholding taxes. The reported figures include reinvestment of dividends and capital gains distributions and do not reflect any fees or expenses. |
The MSCI EAFE Index is calculated in local currency (LOC) as well as in U.S. dollars (USD). The concept of a LOC calculation excludes the impact of currency fluctuations. All currencies of listing are considered in the Index calculation in LOC where current prices (t) and previous day prices (t-1) are converted into USD using the same exchange rate (exchange rate t-1) in the numerator and denominator. As a consequence, the FX factor drops out of the equation. The USD calculation includes exchange rates at t and t-1. Therefore, the LOC calculation only represents the price appreciation or depreciation of the securities, whereas the USD calculation also accounts for the performance of the currency (or currencies) relative to the USD. MSCI EAFE is a service mark of MSCI Barra.
| * | The benchmark since inception returns are calculated since inception of the Investor Class, December 31, 2010 to September 30, 2020. |
An investment cannot be made directly into an index.
FMI International Fund and FMI International Fund II – Currency Unhedged
MANAGEMENT’S DISCUSSION OF FUND PERFORMANCE (Unaudited) (Continued)
COMPARISON OF CHANGE IN VALUE OF $10,000 INVESTMENT IN
FMI INTERNATIONAL FUND II - CURRENCY UNHEDGED –
INSTITUTIONAL CLASS AND MSCI EAFE(1)
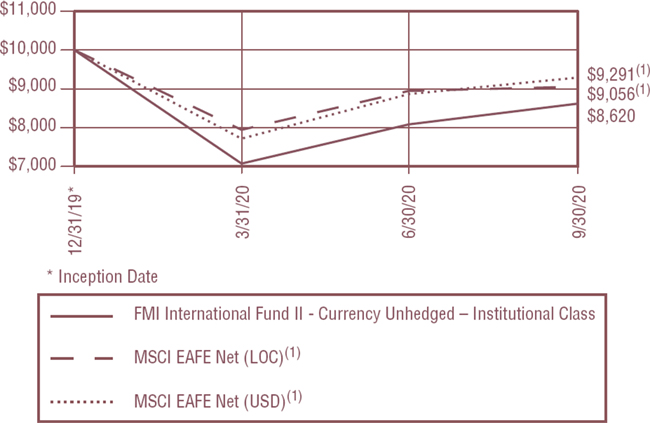
AVERAGE TOTAL RETURN – NOT ANNUALIZED
| | | Inception Date | | 3 Months | | | Inception
through
9/30/2020 |
| FMI International Fund II – Currency Unhedged – Institutional Class | | 12/31/19 | | | 6.62% | | | | -13.80 | % |
| MSCI EAFE Net (LOC)(1)* | | | | | 1.22% | | | | -9.44 | % |
| MSCI EAFE Net (USD)(1)* | | | | | 4.80% | | | | -7.09 | % |
The graph and the table do not reflect the deduction of taxes that a shareholder would pay on Fund distributions or the redemption of Fund shares. Performance data quoted represents past performance; past performance does not guarantee future results. Investment return and principal value of an investment will fluctuate so that an investor’s shares, when redeemed, may be worth more or less than their original cost. Current performance of a Fund may be lower or higher than the performance quoted. The total returns do not reflect the deduction of taxes that a shareholder would pay on Fund distributions or the redemption of Fund shares. Total return includes change in share prices and in each case includes reinvestments of any dividends, interest and capital gain distributions. Performance data current to the most recent month-end may be obtained by visiting www.fmifunds.com or by calling 1-800-811-5311.
| (1) | The MSCI EAFE Index (Europe, Australasia, Far East) is a free float-adjusted market capitalization index that is designed to measure the equity market performance of developed markets, excluding the U.S. and Canada. The MSCI EAFE Index consists of the following 21 developed market country indices: Australia, Austria, Belgium, Denmark, Finland, France, Germany, Hong Kong, Ireland, Israel, Italy, Japan, the Netherlands, New Zealand, Norway, Portugal, Singapore, Spain, Sweden, Switzerland and the United Kingdom. The MSCI EAFE Index is unmanaged and investors cannot invest directly in the Index. Index results are inclusive of dividends and net of foreign withholding taxes. The reported figures include reinvestment of dividends and capital gains distributions and do not reflect any fees or expenses. |
FMI International Fund and FMI International Fund II – Currency Unhedged
MANAGEMENT’S DISCUSSION OF FUND PERFORMANCE (Unaudited) (Continued)
The MSCI EAFE Index is calculated in local currency (LOC) as well as in U.S. dollars (USD). The concept of a LOC calculation excludes the impact of currency fluctuations. All currencies of listing are considered in the Index calculation in LOC where current prices (t) and previous day prices (t-1) are converted into USD using the same exchange rate (exchange rate t-1) in the numerator and denominator. As a consequence, the FX factor drops out of the equation. The USD calculation includes exchange rates at t and t-1. Therefore, the LOC calculation only represents the price appreciation or depreciation of the securities, whereas the USD calculation also accounts for the performance of the currency (or currencies) relative to the USD. MSCI EAFE is a service mark of MSCI Barra.
| * | The benchmark since inception returns are calculated since inception of the Institutional Class, December 31, 2019 to September 30, 2020. |
An investment cannot be made directly into an index.
FMI International Fund
SCHEDULE OF INVESTMENTS
September 30, 2020
| Shares | | | | | Cost | | | Value | |
| LONG-TERM INVESTMENTS — 98.5% (a) | | | | | | | | |
| COMMON STOCKS — 88.6% (a) | | | | | | | | |
| COMMERCIAL SERVICES SECTOR — 9.9% | | | | | | | | |
| | | | | Advertising/Marketing Services — 1.8% | | | | | | | | |
| | 7,625,000 | | | WPP PLC (Jersey) (b) | | $ | 106,579,623 | | | $ | 59,886,692 | |
| | | | | Miscellaneous Commercial Services — 6.7% | | | | | | | | |
| | 2,350,000 | | | Bureau Veritas S.A. (France) (b)* | | | 57,366,729 | | | | 52,972,421 | |
| | 1,550,000 | | | DKSH Holding AG (Switzerland) (b) | | | 86,853,367 | | | | 107,980,453 | |
| | 700,000 | | | Secom Co. Ltd. (Japan) (b) | | | 41,940,279 | | | | 64,060,863 | |
| | | | | | | | 186,160,375 | | | | 225,013,737 | |
| | | | | Personnel Services — 1.4% | | | | | | | | |
| | 925,000 | | | Adecco Group AG (Switzerland) (b) | | | 48,318,534 | | | | 48,807,945 | |
| COMMUNICATIONS SECTOR — 1.7% | | | | | | | | |
| | | | | Wireless Telecommunications — 1.7% | | | | | | | | |
| | 1,850,000 | | | Millicom International | | | | | | | | |
| | | | | Cellular S.A. (Luxembourg) | | | 89,470,193 | | | | 56,018,000 | |
| CONSUMER DURABLES SECTOR — 4.4% | | | | | | | | |
| | | | | Electronics/Appliances — 4.4% | | | | | | | | |
| | 1,925,000 | | | Sony Corp. (Japan) (b) | | | 104,582,351 | | | | 147,535,917 | |
| CONSUMER NON-DURABLES SECTOR — 10.3% | | | | | | | | |
| | | | | Food: Major Diversified — 1.6% | | | | | | | | |
| | 450,000 | | | Nestlé S.A. (Switzerland) (b) | | | 31,425,151 | | | | 53,555,418 | |
| | | | | Home Furnishings — 1.0% | | | | | | | | |
| | 4,500,000 | | | Howden Joinery Group PLC (Britain) (b) | | | 33,633,224 | | | | 34,250,117 | |
| | | | | Household/Personal Care — 7.7% | | | | | | | | |
| | 1,320,000 | | | Henkel AG & Co. KGaA (Germany) (b) | | | 124,755,680 | | | | 123,457,880 | |
| | 2,175,000 | | | Unilever PLC (Britain) (b) | | | 88,554,409 | | | | 134,096,406 | |
| | | | | | | | 213,310,089 | | | | 257,554,286 | |
| CONSUMER SERVICES SECTOR — 14.4% | | | | | | | | |
| | | | | Broadcasting — 0.8% | | | | | | | | |
| | 4,550,000 | | | Grupo Televisa S.A.B. — SP-ADR (Mexico)* | | | 54,716,089 | | | | 28,119,000 | |
| | | | | Cable/Satellite TV — 1.4% | | | | | | | | |
| | 2,665,000 | | | Shaw Communications Inc. (Canada) | | | 50,167,412 | | | | 48,634,674 | |
| | | | | Media Conglomerates — 3.4% | | | | | | | | |
| | 4,075,000 | | | Vivendi S.A. (France) (b) | | | 77,019,905 | | | | 113,810,821 | |
| | | | | Movies/Entertainment — 2.2% | | | | | | | | |
| | 19,500,000 | | | Bolloré (France) (b) | | | 68,596,300 | | | | 72,634,031 | |
| | | | | Other Consumer Services — 4.1% | | | | | | | | |
| | 80,000 | | | Booking Holdings Inc. (United States)* | | | 140,700,731 | | | | 136,854,400 | |
The accompanying notes to financial statements are an integral part of this schedule.
FMI International Fund
SCHEDULE OF INVESTMENTS (Continued)
September 30, 2020
| Shares | | | | | Cost | | | Value | |
| LONG-TERM INVESTMENTS — 98.5% (a) (Continued) | | | | | | | | |
| COMMON STOCKS — 88.6% (a) (Continued) | | | | | | | | |
| CONSUMER SERVICES SECTOR — 14.4% (Continued) | | | | | | | | |
| | | | | Restaurants — 2.5% | | | | | | | | |
| | 2,325,000 | | | Compass Group PLC (Britain) (b) | | $ | 34,975,310 | | | $ | 34,925,782 | |
| | 1,750,000 | | | Whitbread PLC (Britain) (b) | | | 65,429,957 | | | | 47,814,973 | |
| | | | | | | | 100,405,267 | | | | 82,740,755 | |
| DISTRIBUTION SERVICES SECTOR — 6.6% | | | | | | | | |
| | | | | Wholesale Distributors — 6.6% | | | | | | | | |
| | 2,200,000 | | | Ferguson PLC (Jersey) (b) | | | 120,887,172 | | | | 221,388,077 | |
| ELECTRONIC TECHNOLOGY SECTOR — 4.8% | | | | | | | | |
| | | | | Aerospace & Defense — 2.8% | | | | | | | | |
| | 950,000 | | | Safran S.A. (France) (b)* | | | 103,001,338 | | | | 93,468,308 | |
| | | | | Electronic Equipment/Instruments — 2.0% | | | | | | | | |
| | 4,150,000 | | | Yokogawa Electric Corp. (Japan) (b) | | | 74,118,661 | | | | 65,908,434 | |
| FINANCE SECTOR — 6.8% | | | | | | | | |
| | | | | Major Banks — 1.4% | | | | | | | | |
| | 136,000,000 | | | Lloyds Banking Group PLC (Britain) (b)* | | | 70,168,887 | | | | 46,169,770 | |
| | | | | Property/Casualty Insurance — 5.4% | | | | | | | | |
| | 925,000 | | | Chubb Ltd. (Switzerland) | | | 123,602,753 | | | | 107,411,000 | |
| | 250,000 | | | Fairfax Financial Holdings Ltd. (Canada) | | | 111,210,543 | | | | 73,617,213 | |
| | | | | | | | 234,813,296 | | | | 181,028,213 | |
| HEALTH TECHNOLOGY SECTOR — 5.6% | | | | | | | | |
| | | | | Medical Specialties — 5.6% | | | | | | | | |
| | 2,375,000 | | | Koninklijke Philips N.V. (Netherlands) (b)* | | | 107,659,207 | | | | 112,146,102 | |
| | 3,825,000 | | | Smith & Nephew PLC (Britain) (b) | | | 69,367,312 | | | | 74,929,577 | |
| | | | | | | | 177,026,519 | | | | 187,075,679 | |
| INDUSTRIAL SERVICES SECTOR — 1.4% | | | | | | | | |
| | | | | Oilfield Services/Equipment — 1.4% | | | | | | | | |
| | 3,000,000 | | | Schlumberger Ltd. (Curacao) | | | 131,228,330 | | | | 46,680,000 | |
| PROCESS INDUSTRIES SECTOR — 2.7% | | | | | | | | |
| | | | | Industrial Specialties — 2.7% | | | | | | | | |
| | 900,000 | | | Akzo Nobel N.V. (Netherlands) (b) | | | 59,828,314 | | | | 90,963,975 | |
| PRODUCER MANUFACTURING SECTOR — 5.2% | | | | | | | | |
| | | | | Industrial Conglomerates — 3.5% | | | | | | | | |
| | 6,600,000 | | | Smiths Group PLC (Britain) (b) | | | 105,183,748 | | | | 116,752,125 | |
| | | | | Trucks/Construction/Farm Machinery — 1.7% | | | | | | | | |
| | 7,375,000 | | | CNH Industrial N.V. (Netherlands) (b)* | | | 73,516,346 | | | | 57,041,147 | |
The accompanying notes to financial statements are an integral part of this schedule.
FMI International Fund
SCHEDULE OF INVESTMENTS (Continued)
September 30, 2020
| Shares | | | | | Cost | | | Value | |
| LONG-TERM INVESTMENTS — 98.5% (a) (Continued) | | | | | | | | |
| COMMON STOCKS — 88.6% (a) (Continued) | | | | | | | | |
| RETAIL TRADE SECTOR — 11.0% | | | | | | | | |
| | | | | Department Stores — 5.7% | | | | | | | | |
| | 30,000,000 | | | B&M European Value | | | | | | | | |
| | | | | Retail S.A. (Luxembourg) (b) | | $ | 121,766,821 | | | $ | 191,256,832 | |
| | | | | Specialty Stores — 5.3% | | | | | | | | |
| | 14,625,000 | | | CK Hutchison Holdings Ltd. | | | | | | | | |
| | | | | (Cayman Islands) (b) | | | 158,534,276 | | | | 88,623,911 | |
| | 4,510,000 | | | Jardine Strategic Holdings Ltd. (Bermuda) (b) | | | 137,476,446 | | | | 89,418,990 | |
| | | | | | | | 296,010,722 | | | | 178,042,901 | |
| TECHNOLOGY SERVICES SECTOR — 2.1% | | | | | | | | |
| | | | | Information Technology Services — 2.1% | | | | | | | | |
| | 310,000 | | | Accenture PLC (Ireland) | | | 23,504,323 | | | | 70,056,900 | |
| | | | | | | | | | | | | |
| TRANSPORTATION SECTOR — 1.7% | | | | | | | | |
| | | | | Air Freight/Couriers — 1.7% | | | | | | | | |
| | 625,000 | | | Expeditors International of | | | | | | | | |
| | | | | Washington Inc. (United States) | | | 39,139,824 | | | | 56,575,000 | |
| | | | | Total common stocks | | | 2,935,279,545 | | | | 2,967,823,154 | |
| | | | | | | | | | | | | |
| PREFERRED STOCKS — 9.9% (a) | | | | | | | | |
| CONSUMER DURABLES SECTOR — 1.3% | | | | | | | | |
| | | | | Motor Vehicles — 1.3% | | | | | | | | |
| | 600,000 | | | Hyundai Motor Co. (South Korea) (b) | | | 48,300,378 | | | | 45,283,637 | |
| CONSUMER NON-DURABLES SECTOR — 3.3% | | | | | | | | |
| | | | | Household/Personal Care — 3.3% | | | | | | | | |
| | 875,000 | | | Amorepacific Corp. (South Korea) (b) | | | 59,564,288 | | | | 43,081,519 | |
| | 110,989 | | | LG Household & Health | | | | | | | | |
| | | | | Care Ltd. (South Korea) (b) | | | 33,482,187 | | | | 67,062,147 | |
| | | | | | | | 93,046,475 | | | | 110,143,666 | |
| ELECTRONIC TECHNOLOGY SECTOR — 5.3% | | | | | | | | |
| | | | | Telecommunications Equipment — 5.3% | | | | | | | | |
| | 4,125,000 | | | Samsung Electronics Co. Ltd. | | | | | | | | |
| | | | | (South Korea) (b) | | | 76,598,437 | | | | 177,544,165 | |
| | | | | Total preferred stocks | | | 217,945,290 | | | | 332,971,468 | |
| | | | | Total long-term investments | | | 3,153,224,835 | | | | 3,300,794,622 | |
The accompanying notes to financial statements are an integral part of this schedule.
FMI International Fund
SCHEDULE OF INVESTMENTS (Continued)
September 30, 2020
| Principal Amount | | | | | Cost | | | Value | |
| SHORT-TERM INVESTMENTS — 3.1% (a) | | | | | | | | |
| | | | | Bank Deposit Account — 3.1% | | | | | | | | |
| $ | 102,183,693 | | | U.S. Bank N.A., 0.04%^(c) | | $ | 102,183,693 | | | $ | 102,183,693 | |
| | | | | Total short-term investments | | | 102,183,693 | | | | 102,183,693 | |
| | | | | Total investments — 101.6% | | $ | 3,255,408,528 | | | | 3,402,978,315 | |
| | | | | Other liabilities, less assets — (1.6%) (a) | | | | | | | (53,347,640 | ) |
| | | | | TOTAL NET ASSETS — 100.0% | | | | | | $ | 3,349,630,675 | |
* | Non-income producing security. |
| ^ | The rate shown is as of September 30, 2020. |
| (a) | Percentages for the various classifications relate to net assets. |
| (b) | Security does not trade during New York Stock Exchange hours, provided that certain foreign exchanges may trade during a portion of the New York Stock Exchange hours, and has been valued in accordance with the procedures discussed in Note 1(a) to the financial statements and has been classified as Level 2. As of September 30, 2020 the aggregate value of these securities was $2,676,828,435. |
| (c) | $9,041,901 of this security is held as collateral for certain forward currency contracts. |
| PLC | Public Limited Company |
| SP-ADR | Sponsored American Depositary Receipt |
The accompanying notes to financial statements are an integral part of this schedule.
FMI International Fund
SCHEDULE OF FORWARD CURRENCY CONTRACTS
September 30, 2020
Settlement
Date | | Counterparty | | Currency to
be Delivered | | | U.S. $ Value on
September 30,
2020
of Currency to
be Delivered | | Currency to
be Received | | | U.S. $ Value on
September 30,
2020
of Currency to
be Received | | | Unrealized
Appreciation
(Depreciation) | |
| 10/16/20 | | State Street Bank | | 750,000,000 | | $ | 967,840,755 | | 946,066,500 | | $ | 946,066,500 | | $ | (21,774,255 | ) |
| | | and Trust Co. | | British Pound | | | | | U.S. Dollar | | | | | | | |
| | | | | | | | | | | | | | | | | |
| 10/16/20 | | JPMorgan Chase | | 165,000,000 | | | 123,921,888 | | 121,661,229 | | | 121,661,229 | | | (2,260,659 | ) |
| | | Bank, N.A. | | Canadian Dollar | | | | | U.S. Dollar | | | | | | | |
| | | | | | | | | | | | | | | | | |
| 10/16/20 | | The Bank of New | | 630,000,000 | | | 738,889,692 | | 720,940,500 | | | 720,940,500 | | | (17,949,192 | ) |
| | | York Mellon | | Euro | | | | | U.S. Dollar | | | | | | | |
| | | | | | | | | | | | | | | | | |
| 10/16/20 | | The Bank of New | | 730,000,000 | | | 94,188,629 | | 94,144,958 | | | 94,144,958 | | | (43,671 | ) |
| | | York Mellon | | Hong Kong Dollar | | | | | U.S. Dollar | | | | | | | |
| | | | | | | | | | | | | | | | | |
| 10/16/20 | | The Bank of New | | 30,000,000,000 | | | 284,505,262 | | 281,478,701 | | | 281,478,701 | | | (3,026,561 | ) |
| | | York Mellon | | Japanese Yen | | | | | U.S. Dollar | | | | | | | |
| | | | | | | | | | | | | | | | | |
| 10/16/20 | | JPMorgan Chase | | 380,000,000 | | | 17,152,154 | | 16,814,159 | | | 16,814,159 | | | (337,995 | ) |
| | | Bank, N.A. | | Mexican Peso | | | | | U.S. Dollar | | | | | | | |
| | | | | | | | | | | | | | | | | |
| 10/16/20 | | State Street | | 380,000,000,000 | | | 324,920,108 | | 316,260,799 | | | 316,260,799 | | | (8,659,309 | ) |
| | | Bank and | | South Korea Won | | | | | U.S. Dollar | | | | | | | |
| | | Trust Co. | | | | | | | | | | | | | | |
| | | | | | | | | | | | | | | | | |
| 10/16/20 | | JPMorgan Chase | | 195,000,000 | | | 211,816,929 | | 207,585,935 | | | 207,585,935 | | | (4,230,994 | ) |
| | | Bank, N.A. | | Swiss Franc | | | | | U.S. Dollar | | | | | | | |
| | | | | | | $ | 2,763,235,417 | | | | $ | 2,704,952,781 | | $ | (58,282,636 | ) |
| | | | | | | | | | | | | | | | | |
| | | | | | | | | | | | | | | | | |
| 10/16/20 | | State Street | | 96,370,500 | | $ | 96,370,500 | | 75,000,000 | | $ | 96,784,076 | | $ | 413,576 | |
| | | Bank and | | U.S. Dollar | | | | | British Pound | | | | | | | |
| | | Trust Co. | | | | | | | | | | | | | | |
| | | | | | | | | | | | | | | | | |
| 10/16/20 | | JPMorgan Chase | | 14,934,657 | | | 14,934,657 | | 20,000,000 | | | 15,020,835 | | | 86,178 | |
| | | Bank, N.A. | | U.S. Dollar | | | | | Canadian Dollar | | | | | | | |
| | | | | | | | | | | | | | | | | |
| 10/16/20 | | The Bank of New | | 93,952,000 | | | 93,952,000 | | 80,000,000 | | | 93,827,262 | | | (124,738 | ) |
| | | York Mellon | | U.S. Dollar | | | | | Euro | | | | | | | |
| | | | | | | | | | | | | | | | | |
| 10/16/20 | | The Bank of New | | 15,483,871 | | | 15,483,871 | | 120,000,000 | | | 15,483,062 | | | (809 | ) |
| | | York Mellon | | U.S. Dollar | | | | | Hong Kong Dollar | | | | | | | |
| | | | | | | | | | | | | | | | | |
| 10/16/20 | | The Bank of New | | 28,422,548 | | | 28,422,548 | | 3,000,000,000 | | | 28,450,526 | | | 27,978 | |
| | | York Mellon | | U.S. Dollar | | | | | Japanese Yen | | | | | | | |
The accompanying notes to financial statements are an integral part of this schedule.
FMI International Fund
SCHEDULE OF FORWARD CURRENCY CONTRACTS (Continued)
September 30, 2020
Settlement
Date | | Counterparty | | Currency to
be Delivered | | | U.S. $ Value on
September 30,
2020
of Currency to
be Delivered | | Currency to
be Received | | | U.S. $ Value on
September 30,
2020
of Currency to
be Received | | | Unrealized
Appreciation
(Depreciation) | |
| 10/16/20 | | JPMorgan Chase | | 3,126,820 | | $ | 3,126,820 | | 70,000,000 | | $ | 3,159,607 | | $ | 32,787 | |
| | | Bank, N.A. | | U.S. Dollar | | | | | Mexican Peso | | | | | | | |
| | | | | | | | | | | | | | | | | |
| 10/16/20 | | State Street | | | | | | | | | | | | | | |
| | | Bank and | | 25,695,931 | | | 25,695,931 | | 30,000,000,000 | | | 25,651,587 | | | (44,344 | ) |
| | | Trust Co. | | U.S. Dollar | | | | | South Korea Won | | | | | | | |
| | | | | | | | | | | | | | | | | |
| 10/16/20 | | JPMorgan Chase | | 21,717,484 | | | 21,717,484 | | 20,000,000 | | | 21,724,813 | | | 7,329 | |
| | | Bank, N.A. | | U.S. Dollar | | | | | Swiss Franc | | | | | | | |
| | | | | | | $ | 299,703,811 | | | | $ | 300,101,768 | | $ | 397,957 | |
| | | | | | | $ | 3,062,939,228 | | | | $ | 3,005,054,549 | | $ | (57,884,679 | ) |
| | | | | | | | | | | | | | | | | |
The accompanying notes to financial statements are an integral part of this schedule.
FMI International Fund
INDUSTRY SECTORS as a percentage of net assets
as of September 30, 2020 (Unaudited)
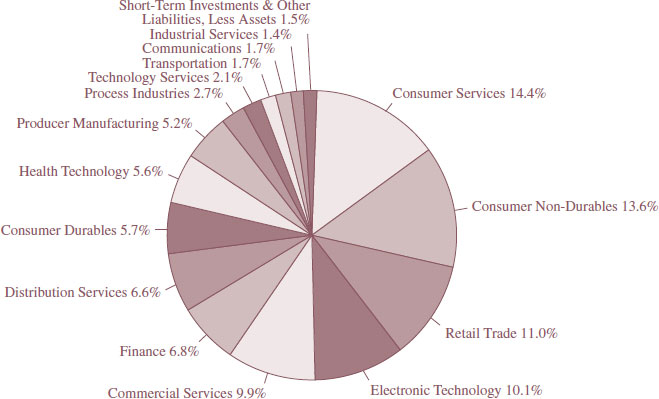
CONCENTRATION BY COUNTRY based on domicile of issuer as a percentage of long-term investments only
as of September 30, 2020 (Unaudited)
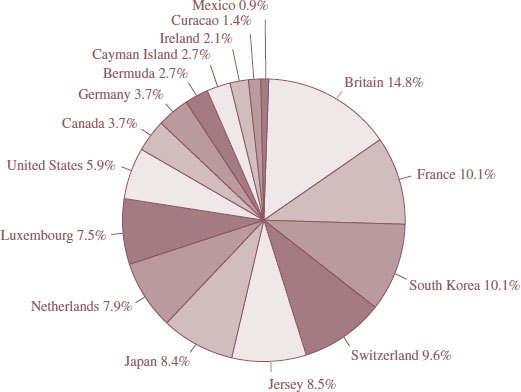
| FMI International Fund II – Currency Unhedged |
| SCHEDULE OF INVESTMENTS |
| September 30, 2020 |
| Shares | | | | | Cost | | | Value | |
| LONG-TERM INVESTMENTS — 95.0% (a) | | | | | | |
| COMMON STOCKS — 85.6% (a) | | | | | | |
| COMMERCIAL SERVICES SECTOR — 9.6% | | | | | | | | |
| | | | | Advertising/Marketing Services — 1.7% | | | | | | | | |
| | 101,500 | | | WPP PLC (Jersey) (b) | | $ | 1,078,536 | | | $ | 797,180 | |
| | | | | Miscellaneous Commercial Services — 6.5% | | | | | | | | |
| | 31,900 | | | Bureau Veritas S.A. (France) (b)* | | | 756,137 | | | | 719,072 | |
| | 21,300 | | | DKSH Holding AG (Switzerland) (b) | | | 1,239,129 | | | | 1,483,860 | |
| | 9,600 | | | Secom Co. Ltd. (Japan) (b) | | | 843,285 | | | | 878,549 | |
| | | | | | | | 2,838,551 | | | | 3,081,481 | |
| | | | | Personnel Services — 1.4% | | | | | | | | |
| | 12,300 | | | Adecco Group AG (Switzerland) (b) | | | 612,721 | | | | 649,014 | |
| COMMUNICATIONS SECTOR — 1.7% | | | | | | | | |
| | | | | Wireless Telecommunications — 1.7% | | | | | | | | |
| | 26,000 | | | Millicom International | | | | | | | | |
| | | | | Cellular S.A. (Luxembourg) | | | 964,469 | | | | 787,280 | |
| CONSUMER DURABLES SECTOR — 4.2% | | | | | | | | |
| | | | | Electronics/Appliances — 4.2% | | | | | | | | |
| | 26,300 | | | Sony Corp. (Japan) (b) | | | 1,851,428 | | | | 2,015,686 | |
| CONSUMER NON-DURABLES SECTOR — 9.9% | | | | | | | | |
| | | | | Food: Major Diversified — 1.5% | | | | | | | | |
| | 6,000 | | | Nestlé S.A. (Switzerland) (b) | | | 660,430 | | | | 714,072 | |
| | | | | Home Furnishings — 1.1% | | | | | | | | |
| | 67,000 | | | Howden Joinery Group PLC (Britain) (b) | | | 500,761 | | | | 509,946 | |
| | | | | Household/Personal Care — 7.3% | | | | | | | | |
| | 17,800 | | | Henkel AG & Co. KGaA (Germany) (b) | | | 1,554,293 | | | | 1,664,811 | |
| | 29,700 | | | Unilever PLC (Britain) (b) | | | 1,664,090 | | | | 1,831,110 | |
| | | | | | | | 3,218,383 | | | | 3,495,921 | |
| CONSUMER SERVICES SECTOR — 14.7% | | | | | | | | |
| | | | | Broadcasting — 0.9% | | | | | | | | |
| | 71,400 | | | Grupo Televisa S.A.B. — SP-ADR (Mexico)* | | | 655,455 | | | | 441,252 | |
| | | | | Cable/Satellite TV — 1.5% | | | | | | | | |
| | 38,600 | | | Shaw Communications Inc. (Canada) | | | 720,391 | | | | 704,427 | |
| | | | | Media Conglomerates — 3.2% | | | | | | | | |
| | 55,400 | | | Vivendi S.A. (France) (b) | | | 1,445,668 | | | | 1,547,269 | |
| | | | | Movies/Entertainment — 2.1% | | | | | | | | |
| | 264,700 | | | Bolloré (France) (b) | | | 1,013,524 | | | | 985,960 | |
| | | | | Other Consumer Services — 4.0% | | | | | | | | |
| | 1,100 | | | Booking Holdings Inc. (United States)* | | | 1,958,024 | | | | 1,881,748 | |
The accompanying notes to financial statements are an integral part of this schedule.
| FMI International Fund II – Currency Unhedged |
| SCHEDULE OF INVESTMENTS (Continued) |
| September 30, 2020 |
| Shares | | | | | Cost | | | Value | |
| LONG-TERM INVESTMENTS — 95.0% (a) (Continued) | | | | | | |
| COMMON STOCKS — 85.6% (a) (Continued) | | | | | | |
| CONSUMER SERVICES SECTOR — 14.7% (Continued) | | | | | | | | |
| | | | | Restaurants — 3.0% | | | | | | | | |
| | 42,600 | | | Compass Group PLC (Britain) (b) | | $ | 731,514 | | | $ | 639,930 | |
| | 28,500 | | | Whitbread PLC (Britain) (b) | | | 1,114,137 | | | | 778,701 | |
| | | | | | | | 1,845,651 | | | | 1,418,631 | |
| DISTRIBUTION SERVICES SECTOR — 6.4% | | | | | | | | |
| | | | | Wholesale Distributors — 6.4% | | | | | | | | |
| | 30,300 | | | Ferguson PLC (Jersey) (b) | | | 2,626,844 | | | | 3,049,118 | |
| ELECTRONIC TECHNOLOGY SECTOR — 4.6% | | | | | | | | |
| | | | | Aerospace & Defense — 2.7% | | | | | | | | |
| | 13,000 | | | Safran S.A. (France) (b)* | | | 1,484,080 | | | | 1,279,040 | |
| | | | | Electronic Equipment/Instruments — 1.9% | | | | | | | | |
| | 55,900 | | | Yokogawa Electric Corp. (Japan) (b) | | | 874,862 | | | | 887,779 | |
| FINANCE SECTOR — 6.5% | | | | | | | | |
| | | | | Major Banks — 1.3% | | | | | | | | |
| | 1,801,000 | | | Lloyds Banking Group PLC (Britain) (b)* | | | 811,474 | | | | 611,410 | |
| | | | | Property/Casualty Insurance — 5.2% | | | | | | | | |
| | 12,700 | | | Chubb Ltd. (Switzerland) | | | 1,723,836 | | | | 1,474,724 | |
| | 3,400 | | | Fairfax Financial Holdings Ltd. (Canada) | | | 1,329,741 | | | | 1,001,194 | |
| | | | | | | | 3,053,577 | | | | 2,475,918 | |
| HEALTH TECHNOLOGY SECTOR — 5.3% | | | | | | | | |
| | | | | Medical Specialties — 5.3% | | | | | | | | |
| | 32,200 | | | Koninklijke Philips N.V. (Netherlands) (b)* | | | 1,502,481 | | | | 1,520,465 | |
| | 52,200 | | | Smith & Nephew PLC (Britain) (b) | | | 1,113,091 | | | | 1,022,568 | |
| | | | | | | | 2,615,572 | | | | 2,543,033 | |
| INDUSTRIAL SERVICES SECTOR — 1.3% | | | | | | | | |
| | | | | Oilfield Services/Equipment — 1.3% | | | | | | | | |
| | 40,000 | | | Schlumberger Ltd. (Curacao) | | | 1,146,964 | | | | 622,400 | |
| PROCESS INDUSTRIES SECTOR — 2.6% | | | | | | | | |
| | | | | Industrial Specialties — 2.6% | | | | | | | | |
| | 12,400 | | | Akzo Nobel N.V. (Netherlands) (b) | | | 927,522 | | | | 1,253,281 | |
| PRODUCER MANUFACTURING SECTOR — 4.9% | | | | | | | | |
| | | | | Industrial Conglomerates — 3.3% | | | | | | | | |
| | 89,100 | | | Smiths Group PLC (Britain) (b) | | | 1,749,326 | | | | 1,576,154 | |
| | | | | Trucks/Construction/Farm Machinery — 1.6% | | | | | | | | |
| | 99,200 | | | CNH Industrial N.V. (Netherlands) (b)* | | | 875,055 | | | | 767,252 | |
The accompanying notes to financial statements are an integral part of this schedule.
| FMI International Fund II – Currency Unhedged |
| SCHEDULE OF INVESTMENTS (Continued) |
| September 30, 2020 |
| Shares | | | | | Cost | | | Value | |
| LONG-TERM INVESTMENTS — 95.0% (a) (Continued) | | | | | | |
| COMMON STOCKS — 85.6% (a) (Continued) | | | | | | |
| RETAIL TRADE SECTOR — 10.3% | | | | | | | | |
| | | | | Department Stores — 5.4% | | | | | | | | |
| | 401,600 | | | B&M European Value | | | | | | | | |
| | | | | Retail S.A. (Luxembourg) (b) | | $ | 2,094,045 | | | $ | 2,560,292 | |
| | | | | Specialty Stores — 4.9% | | | | | | | | |
| | 195,000 | | | CK Hutchison Holdings Ltd. | | | | | | | | |
| | | | | (Cayman Islands) (b) | | | 1,509,066 | | | | 1,181,652 | |
| | 58,700 | | | Jardine Strategic Holdings Ltd. (Bermuda) (b) | | | 1,480,958 | | | | 1,163,835 | |
| | | | | | | | 2,990,024 | | | | 2,345,487 | |
| TECHNOLOGY SERVICES SECTOR — 2.0% | | | | | | | | |
| | | | | Information Technology Services — 2.0% | | | | | | | | |
| | 4,200 | | | Accenture PLC (Ireland) | | | 872,069 | | | | 949,158 | |
| TRANSPORTATION SECTOR — 1.6% | | | | | | | | |
| | | | | Air Freight/Couriers — 1.6% | | | | | | | | |
| | 8,400 | | | Expeditors International of | | | | | | | | |
| | | | | Washington Inc. (United States) | | | 646,258 | | | | 760,368 | |
| | | | | Total common stocks | | | 42,131,664 | | | | 40,710,557 | |
| | | | | | | | | | | | | |
| PREFERRED STOCKS — 9.4% (a) | | | | | | | | |
| CONSUMER DURABLES SECTOR — 1.3% | | | | | | | | |
| | | | | Motor Vehicles — 1.3% | | | | | | | | |
| | 8,000 | | | Hyundai Motor Co. (South Korea) (b) | | | 535,999 | | | | 603,782 | |
| CONSUMER NON-DURABLES SECTOR — 3.1% | | | | | | | | |
| | | | | Household/Personal Care — 3.1% | | | | | | | | |
| | 11,300 | | | Amorepacific Corp. (South Korea) (b) | | | 766,071 | | | | 556,367 | |
| | 1,500 | | | LG Household & Health | | | | | | | | |
| | | | | Care Ltd. (South Korea) (b) | | | 962,265 | | | | 906,335 | |
| | | | | | | | 1,728,336 | | | | 1,462,702 | |
| ELECTRONIC TECHNOLOGY SECTOR — 5.0% | | | | | | | | |
| | | | | Telecommunications Equipment — 5.0% | | | | | | | | |
| | 55,700 | | | Samsung Electronics Co. Ltd. | | | | | | | | |
| | | | | (South Korea) (b) | | | 2,238,863 | | | | 2,397,384 | |
| | | | | Total preferred stocks | | | 4,503,198 | | | | 4,463,868 | |
| | | | | Total long-term investments | | | 46,634,862 | | | | 45,174,425 | |
The accompanying notes to financial statements are an integral part of this schedule.
| FMI International Fund II – Currency Unhedged |
| SCHEDULE OF INVESTMENTS (Continued) |
| September 30, 2020 |
| Principal Amount | | | | | Cost | | | Value | |
| SHORT-TERM INVESTMENTS — 4.8% (a) | | | | | | | | |
| | | | Bank Deposit Account — 4.8% | | | | | | | | |
| $ | 2,260,715 | | | U.S. Bank N.A., 0.04%^ | | $ | 2,260,715 | | | $ | 2,260,715 | |
| | | | | Total short-term investments | | | 2,260,715 | | | | 2,260,715 | |
| | | | | Total investments — 99.8% | | $ | 48,895,577 | | | | 47,435,140 | |
| | | | | Other liabilities, less assets — 0.2% (a) | | | | | | | 119,634 | |
| | | | | TOTAL NET ASSETS — 100.0% | | | | | | $ | 47,554,774 | |
| * | Non-income producing security. |
| ^ | The rate shown is as of September 30, 2020. |
| (a) | Percentages for the various classifications relate to net assets. |
| (b) | Security does not trade during New York Stock Exchange hours, provided that certain foreign exchanges may trade during a portion of the New York Stock Exchange hours, and has been valued in accordance with the procedures discussed in Note 1(a) to the financial statements and has been classified as Level 2. As of September 30, 2020 the aggregate value of these securities was $36,551,874. |
| PLC | Public Limited Company |
| SP-ADR | Sponsored American Depositary Receipt |
The accompanying notes to financial statements are an integral part of this schedule.
FMI International Fund II – Currency Unhedged
INDUSTRY SECTORS as a percentage of net assets
as of September 30, 2020 (Unaudited)
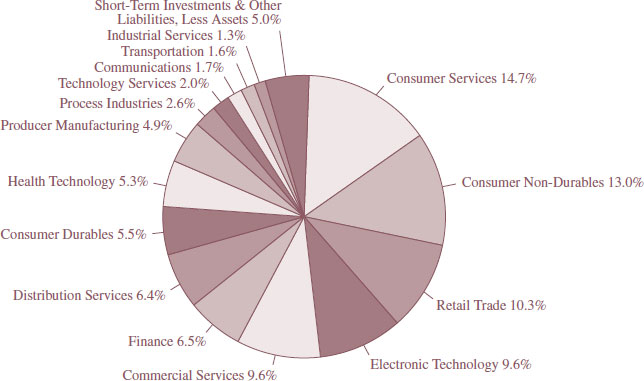
CONCENTRATION BY COUNTRY based on domicile of issuer as a percentage of long-term investments only
as of September 30, 2020 (Unaudited)
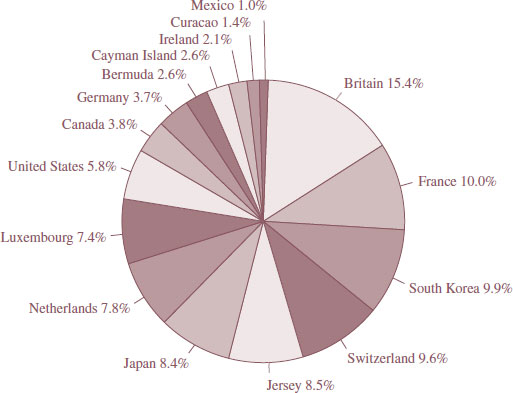
FMI Funds, Inc.
STATEMENTS OF ASSETS AND LIABILITIES
September 30, 2020
| | | FMI
Large Cap
Fund | | | FMI
Common Stock
Fund | | | FMI
International
Fund | | | FMI
International
Fund II–Currency
Unhedged | |
| ASSETS: | | | | | | | | | | | | |
| Investments in securities, at value (a) | | $ | 3,400,380,606 | | | $ | 690,846,447 | | | $ | 3,402,978,315 | | | $ | 47,435,140 | |
| Receivable for investments sold | | | — | | | | 1,987,842 | | | | — | | | | — | |
| Receivables from shareholders for purchases | | | 3,238,225 | | | | 1,027,344 | | | | 3,615,825 | | | | 113,686 | |
| Dividends and interest receivable | | | 3,326,317 | | | | 383,329 | | | | 11,798,090 | | | | 63,282 | |
| Unrealized appreciation on forward currency contracts | | | — | | | | — | | | | 567,848 | | | | — | |
| Prepaid expenses | | | 62,910 | | | | 50,565 | | | | 104,793 | | | | 4,638 | |
| Total assets | | $ | 3,407,008,058 | | | $ | 694,295,527 | | | $ | 3,419,064,871 | | | $ | 47,616,746 | |
| LIABILITIES: | | | | | | | | | | | | | | | | |
| Payable to brokers for investments purchased | | $ | — | | | $ | 655,196 | | | $ | — | | | $ | — | |
| Payable to shareholders for redemptions | | | 5,414,913 | | | | 2,878,071 | | | | 8,761,269 | | | | 1,241 | |
| Payable to adviser for management fees | | | 1,396,246 | | | | 415,274 | | | | 1,740,981 | | | | 35,649 | |
| Unrealized depreciation on forward currency contracts | | | — | | | | — | | | | 58,452,527 | | | | — | |
| Other liabilities | | | 408,823 | | | | 108,053 | | | | 479,419 | | | | 25,082 | |
| Total liabilities | | | 7,219,982 | | | | 4,056,594 | | | | 69,434,196 | | | | 61,9 72 | |
| Net assets | | $ | 3,399,788,076 | | | $ | 690,238,933 | | | $ | 3,349,630,675 | | | $ | 47,554,774 | |
| NET ASSETS: | | | | | | | | | | | | | | | | |
| Capital Stock | | $ | 2,134,657,660 | | | $ | 603,565,293 | | | $ | 3,884,040,822 | | | $ | 50,002,445 | |
| Total distributable earnings | | | 1,265,130,416 | | | | 86,673,640 | | | | (534,410,147) | | | | (2,44 7,671) | |
| Net assets | | $ | 3,399,788,076 | | | $ | 690,238,933 | | | $ | 3,349,630,675 | | | $ | 47,554,774 | |
The accompanying notes to financial statements are an integral part of these statements.
FMI Funds, Inc.
STATEMENTS OF ASSETS AND LIABILITIES (Continued)
September 30, 2020
| | | FMI
Large Cap
Fund | | | FMI
Common Stock
Fund | | | FMI
International
Fund | | | FMI
International
Fund II – Currency
Unhedged | |
| CALCULATION OF NET ASSET VALUE PER SHARE: | | | | | | | | | | | | |
| Investor Class shares: | | | | | | | | | | | | |
| Net assets | | $ | 1,475,503,870 | | | $ | 345,427,730 | | | $ | 1,207,016,209 | | | $ | — | |
| Shares outstanding | | | 78,447,310 | | | | 15,528,065 | | | | 43,589,878 | | | | — | |
| Shares authorized ($0.0001 par value) | | | 300,000,000 | | | | 300,000,000 | | | | 300,000,000 | | | | 300,000,000 | |
| Net asset value, offering and redemption price per share | | $ | 18.81 | | | $ | 22.25 | | | $ | 27.69 | | | $ | — | |
| Institutional Class shares: | | | | | | | | | | | | | | | | |
| Net assets | | $ | 1,924,284,206 | | | $ | 344,811,203 | | | $ | 2,142,614,466 | | | $ | 47,554,774 | |
| Shares outstanding | | | 102,380,293 | | | | 15,477,283 | | | | 77,261,675 | | | | 2,757,730 | |
| Shares authorized ($0.0001 par value) | | | 300,000,000 | | | | 300,000,000 | | | | 300,000,000 | | | | 300,000,000 | |
| Net asset value, offering and redemption price per share | | $ | 18.80 | | | $ | 22.28 | | | $ | 27.73 | | | $ | 17.24 | |
| | | | | | | | | | | | | | | | |
| (a) Identified cost of investments | | $ | 2,459,079,562 | | | $ | 589,423,409 | | | $ | 3,255,408,528 | | | $ | 48,895,577 | |
The accompanying notes to financial statements are an integral part of these statements.
FMI Funds, Inc.
STATEMENTS OF OPERATIONS
For the Year Ended September 30, 2020
| | | FMI
Large Cap
Fund | | | FMI
Common
Stock Fund | | | FMI
International
Fund | | | FMI
International
Fund II – Currency
Unhedged^ | |
| INCOME: | | | | | | | | | | | | |
| Dividends* | | $ | 72,598,536 | | | $ | 13,307,960 | | | $ | 95,615,645 | | | $ | 436,015 | |
| Dividends from affiliates | | | — | | | | — | | | | 12,448,685 | | | | — | |
| Interest | | | 2,214,803 | | | | 1,434,350 | | | | 4,328,023 | | | | 12,073 | |
| Total income | | | 74,813,339 | | | | 14,742,310 | | | | 112,392,353 | | | | 448,088 | |
| EXPENSES: | | | | | | | | | | | | | | | | |
| Management fees | | | 26,110,221 | | | | 7,047,112 | | | | 38,403,326 | | | | 174,705 | |
| Shareholder servicing fees (Investor Class) | | | 2,611,228 | | | | 476,934 | | | | 2,886,652 | | | | — | |
| Administration and accounting services | | | 766,629 | | | | 194,710 | | | | 977,966 | | | | 18,821 | |
| Printing and postage expense | | | 314,555 | | | | 52,683 | | | | 606,228 | | | | 2,412 | |
| Transfer agent fees | | | 171,954 | | | | 70,742 | | | | 200,244 | | | | 13,339 | |
| Custodian fees | | | 136,412 | | | | 29,651 | | | | 671,808 | | | | 19,654 | |
| Registration fees | | | 130,749 | | | | 113,432 | | | | 146,035 | | | | 2,085 | |
| Board of Directors fees | | | 81,562 | | | | 81,562 | | | | 81,562 | | | | 45,263 | |
| Professional fees | | | 48,586 | | | | 36,602 | | | | 52,189 | | | | 29,500 | |
| Interest expense | | | — | | | | — | | | | 9,990 | | | | — | |
| Other expenses | | | 143,667 | | | | 64,782 | | | | 179,833 | | | | 27,102 | |
| Total expenses before reimbursement | | | 30,515,563 | | | | 8,168,210 | | | | 44,215,833 | | | | 332,881 | |
| Less expenses reimbursed by adviser | | | — | | | | — | | | | — | | | | (123,250 | ) |
| Net expenses | | | 30,515,563 | | | | 8,168,210 | | | | 44,215,833 | | | | 209,631 | |
| NET INVESTMENT INCOME | | | 44,297,776 | | | | 6,574,100 | | | | 68,176,520 | | | | 238,457 | |
The accompanying notes to financial statements are an integral part of these statements.
FMI Funds, Inc.
STATEMENTS OF OPERATIONS (Continued)
For the Year Ended September 30, 2020
| | | FMI
Large Cap
Fund | | | FMI
Common
Stock Fund | | | FMI
International
Fund | | | FMI
International
Fund II – Currency
Unhedged^ | |
| NET REALIZED GAIN (LOSS) ON INVESTMENTS: | | | | | | | | | | | | | | | | |
| Securities | | $ | 472,389,104 | | | $ | (14,339,788 | ) | | $ | (674,870,415 | ) | | $ | (1,222,417 | ) |
| Affiliated securities | | | — | | | | — | | | | (4,629,705 | ) | | | — | |
| Forward currency contracts | | | — | | | | — | | | | 59,818,649 | | | | — | |
| Foreign currency transactions | | | — | | | | — | | | | (12,431,179 | ) | | | (4,453 | ) |
| NET REALIZED GAIN (LOSS) ON INVESTMENTS | | | 472,389,104 | | | | (14,339,788 | ) | | | (632,112,650 | ) | | | (1,226,870 | ) |
| NET CHANGE IN UNREALIZED APPRECIATION/DEPRECIATION ON INVESTMENTS: | | | | | | | | | | | | | | | | |
| Securities | | | (588,845,221 | ) | | | (119,130,686 | ) | | | (201,468,277 | ) | | | (1,460,437 | ) |
| Forward currency contracts | | | — | | | | — | | | | (138,033,284 | ) | | | — | |
| Foreign currency transactions | | | — | | | | — | | | | 719,944 | | | | 1,179 | |
| NET CHANGE IN UNREALIZED APPRECIATION/DEPRECIATION ON INVESTMENTS | | | (588,845,221 | ) | | | (119,130,686 | ) | | | (338,781,617 | ) | | | (1,459,258 | ) |
| NET GAIN (LOSS) ON INVESTMENTS | | | (116,456,117 | ) | | | (133,470,474 | ) | | | (970,894,267 | ) | | | (2,686,128 | ) |
| NET DECREASE IN NET ASSETS RESULTING FROM OPERATIONS | | $ | (72,158,341 | ) | | $ | (126,896,374 | ) | | $ | (902,717,747 | ) | | $ | (2,447,671 | ) |
| | | | | | | | | | | | | | | | | |
| * Net withholding taxes | | $ | 640,229 | | | $ | 14,063 | | | $ | 10,449,717 | | | $ | 46,917 | |
| ^ | For the Period from December 31, 2019 (inception date) to September 30, 2020. |
The accompanying notes to financial statements are an integral part of these statements.
FMI Large Cap Fund
STATEMENTS OF CHANGES IN NET ASSETS
For the Years Ended September 30, 2020 and 2019
| | | 2020 | | | 2019 | |
| OPERATIONS: | | | | | | |
| Net investment income | | $ | 44,297,776 | | | $ | 64,859,923 | |
| Net realized gain (loss) on investments | | | 472,389,104 | | | | 472,577,450 | |
| Net change in unrealized appreciation/depreciation on investments | | | (588,845,221 | ) | | | (304,630,984 | ) |
| Net increase (decrease) in net assets from operations | | | (72,158,341 | ) | | | 232,806,389 | |
| DISTRIBUTIONS TO SHAREHOLDERS FROM: | | | | | | | | |
| Investor Class | | | (166,160,881 | ) | | | (454,904,568 | ) |
| Institutional Class | | | (206,048,278 | ) | | | (417,831,240 | ) |
| Total distributions (Note 8) | | | (372,209,159 | ) | | | (872,735,808 | ) |
| FUND SHARE ACTIVITIES: | | | | | | | | |
| Net increase (decrease) in net assets derived from Fund share activities (Note 9) | | | (1,145,745,468 | ) | | | (387,742,222 | ) |
| TOTAL INCREASE (DECREASE) | | | (1,590,112,968 | ) | | | (1,027,671,641 | ) |
| NET ASSETS AT THE BEGINNING OF THE YEAR | | | 4,989,901,044 | | | | 6,017,572,685 | |
| NET ASSETS AT THE END OF THE YEAR | | $ | 3,399,788,076 | | | $ | 4,989,901,044 | |
| FUND SHARE TRANSACTIONS: | | | | | | | | |
| Net increase (decrease) in shares outstanding (Note 9) | | | (67,005,235 | ) | | | (15,530,589 | ) |
The accompanying notes to financial statements are an integral part of these statements.
FMI Common Stock Fund
STATEMENTS OF CHANGES IN NET ASSETS
For the Years Ended September 30, 2020 and 2019
| | | 2020 | | | 2019 | |
| OPERATIONS: | | | | | | |
| Net investment income | | $ | 6,574,100 | | | $ | 6,119,163 | |
| Net realized gain (loss) on investments | | | (14,339,788 | ) | | | 66,411,449 | |
| Net change in unrealized appreciation/depreciation on investments | | | (119,130,686 | ) | | | (30,248,858 | ) |
| Net increase (decrease) in net assets from operations | | | (126,896,374 | ) | | | 42,281,754 | |
| DISTRIBUTIONS TO SHAREHOLDERS FROM: | | | | | | | | |
| Investor Class | | | (25,060,595 | ) | | | (48,819,988 | ) |
| Institutional Class | | | (23,991,070 | ) | | | (32,122,690 | ) |
| Total distributions (Note 8) | | | (49,051,665 | ) | | | (80,942,678 | ) |
| FUND SHARE ACTIVITIES: | | | | | | | | |
| Net increase (decrease) in net assets derived from Fund share activities (Note 9) | | | (111,309,384 | ) | | | (52,507,887 | ) |
| TOTAL INCREASE (DECREASE) | | | (287,257,423 | ) | | | (91,168,811 | ) |
| NET ASSETS AT THE BEGINNING OF THE YEAR | | | 977,496,356 | | | | 1,068,665,167 | |
| NET ASSETS AT THE END OF THE YEAR | | $ | 690,238,933 | | | $ | 977,496,356 | |
| FUND SHARE TRANSACTIONS: | | | | | | | | |
| Net increase (decrease) in shares outstanding (Note 9) | | | (6,020,804 | ) | | | (1,744,305 | ) |
The accompanying notes to financial statements are an integral part of these statements.
FMI International Fund
STATEMENTS OF CHANGES IN NET ASSETS
For the Years Ended September 30, 2020 and 2019
| | | 2020 | | | 2019 | |
| OPERATIONS: | | | | | | |
| Net investment income | | $ | 68,176,520 | | | $ | 113,350,522 | |
| Net realized gain (loss) on investments | | | (632,112,650 | ) | | | 233,693,869 | |
| Net change in unrealized appreciation/depreciation on investments | | | (338,781,617 | ) | | | (273,588,045 | ) |
| Net increase (decrease) in net assets from operations | | | (902,717,747 | ) | | | 73,456,346 | |
| DISTRIBUTIONS TO SHAREHOLDERS FROM: | | | | | | | | |
| Investor Class | | | (97,089,683 | ) | | | (197,796,066 | ) |
| Institutional Class | | | (167,806,435 | ) | | | (258,555,391 | ) |
| Total distributions (Note 8) | | | (264,896,118 | ) | | | (456,351,457 | ) |
| FUND SHARE ACTIVITIES: | | | | | | | | |
| Net increase (decrease) in net assets derived from Fund share activities (Note 9) | | | (2,761,603,041 | ) | | | 348,540,813 | |
| TOTAL INCREASE (DECREASE) | | | (3,929,216,906 | ) | | | (34,354,298 | ) |
| NET ASSETS AT THE BEGINNING OF THE YEAR | | | 7,278,847,581 | | | | 7,313,201,879 | |
| NET ASSETS AT THE END OF THE YEAR | | $ | 3,349,630,675 | | | $ | 7,278,847,581 | |
| FUND SHARE TRANSACTIONS: | | | | | | | | |
| Net increase (decrease) in shares outstanding (Note 9) | | | (107,212,437 | ) | | | 11,919,482 | |
The accompanying notes to financial statements are an integral part of these statements.
FMI International Fund II – Currency Unhedged
STATEMENT OF CHANGES IN NET ASSETS
For the Period from December 31, 2019 (Inception date) to September 30, 2020
| | | For the Period from December 31, 2019*to September 30, 2020 |
| OPERATIONS: | | | | |
| Net investment income | | | $ | 238,457 | |
| Net realized gain (loss) on investments | | | | (1,226,870 | ) |
| Net change in unrealized appreciation/depreciation on investments | | | | (1,459,258 | ) |
| Net increase (decrease) in net assets from operations | | | | (2,447,671 | ) |
| DISTRIBUTIONS TO SHAREHOLDERS FROM: | | | | | |
| Investor Class | | | | — | |
| Institutional Class | | | | — | |
| Total distributions (Note 8) | | | | — | |
| FUND SHARE ACTIVITIES: | | | | | |
| Net increase (decrease) in net assets derived from Fund share activities (Note 9) | | | | 50,002,445 | |
| TOTAL INCREASE (DECREASE) | | | | 47,554,774 | |
| NET ASSETS AT THE BEGINNING OF THE PERIOD | | | | — | |
| NET ASSETS AT THE END OF THE PERIOD | | | $ | 47,554,774 | |
| FUND SHARE TRANSACTIONS: | | | | | |
| Net increase (decrease) in shares outstanding (Note 9) | | | | 2,757,730 | |
* Inception date.
The accompanying notes to financial statements are an integral part of this statement.
FMI Large Cap Fund
FINANCIAL HIGHLIGHTS
(Selected data for each share of the Fund outstanding throughout each year)
| Investor Class | | | | | | | | | | |
| | | Years Ended September 30, | |
| | | 2020 | | | 2019 | | | 2018 | | | 2017 | | | 2016 | |
| PER SHARE OPERATING PERFORMANCE: | | | | | | | | | | |
| Net asset value, beginning of year | | $20.14 | | | $22.85 | | | $22.17 | | | $20.20 | | | $20.00 | |
| Income from investment operations: | | | | | | | | | | | | | | | |
| Net investment income (loss)(1) | | 0.18 | | | 0.25 | | | 0.24 | | | 0.15 | | | 0.21 | |
| Net realized and unrealized gain (loss) on investments | | 0.03 | (2) | | 0.55 | | | 2.43 | | | 3.30 | | | 2.04 | |
| Total from investment operations | | 0.21 | | | 0.80 | | | 2.67 | | | 3.45 | | | 2.25 | |
| Less distributions: | | | | | | | | | | | | | | | |
| Distributions from net investment income | | (0.17 | ) | | (0.28 | ) | | (0.17 | ) | | (0.23 | ) | | (0.21 | ) |
| Distributions from net realized gains | | (1.37 | ) | | (3.23 | ) | | (1.82 | ) | | (1.25 | ) | | (1.84 | ) |
| Total from distributions | | (1.54 | ) | | (3.51 | ) | | (1.99 | ) | | (1.48 | ) | | (2.05 | ) |
| Net asset value, end of year | | $18.81 | | | $20.14 | | | $22.85 | | | $22.17 | | | $20.20 | |
| TOTAL RETURN | | 0.71% | | | 5.72% | | | 12.67% | | | 17.86% | | | 12.36% | |
| RATIOS/SUPPLEMENTAL DATA: | | | | | | | | | | | | | | | |
| Net assets, end of year (in 000’s $) | | 1,475,504 | | | 2,337,118 | | | 3,155,818 | | | 3,856,953 | | | 6,576,109 | |
| Ratio of expenses to average net assets | | 0.81% | | | 0.82% | | | 0.85% | | | 0.86% | | | 0.90% | |
| Ratio of net investment income (loss) to average net assets | | 0.99% | | | 1.25% | | | 1.07% | | | 0.71% | | | 1.09% | |
| Portfolio turnover rate | | 28% | (3) | | 20% | (3) | | 25% | (3) | | 16% | (3) | | 17% | |
| (1) | Net investment income (loss) per share was calculated using average shares outstanding. |
| (2) | Realized and unrealized gain (loss) per share in this caption are balancing amounts necessary to reconcile the change in net asset value per share for the year, and may not reconcile with the aggregate gains on the Statement of Operations due to share transactions for the year. |
| (3) | Portfolio turnover rate is disclosed for the Fund as a whole. |
The accompanying notes to financial statements are an integral part of this statement.
FMI Large Cap Fund
FINANCIAL HIGHLIGHTS
(Selected data for each share of the Fund outstanding throughout each period)
Institutional Class
| | | | | | | | | For the Period from |
| | | Years Ended September 30, | | | October 31, 2016* to |
| | | 2020 | | | 2019 | | | 2018 | | | September 30, 2017 |
| PER SHARE OPERATING PERFORMANCE: | | | | | | | | | |
| Net asset value, beginning of period | | $20.13 | | | $22.85 | | | $22.18 | | | | $19.73 | |
| Income from investment operations: | | | | | | | | | | | | | |
| Net investment income (loss)(1) | | 0.21 | | | 0.25 | | | 0.27 | | | | 0.16 | |
| Net realized and unrealized gain (loss) on investments | | 0.02 | (2) | | 0.58 | | | 2.43 | | | | 3.77 | |
| Total from investment operations | | 0.23 | | | 0.83 | | | 2.70 | | | | 3.93 | |
| Less distributions: | | | | | | | | | | | | | |
| Distributions from net investment income | | (0.19 | ) | | (0.32 | ) | | (0.21 | ) | | | (0.23 | ) |
| Distributions from net realized gains | | (1.37 | ) | | (3.23 | ) | | (1.82 | ) | | | (1.25 | ) |
| Total from distributions. | | (1.56 | ) | | (3.55 | ) | | (2.03 | ) | | | (1.48 | ) |
| Net asset value, end of period | | $18.80 | | | $20.13 | | | $22.85 | | | | $22.18 | |
| TOTAL RETURN | | 0.84% | | | 5.89% | | | 12.82% | | | | 20.76% | (3) |
| RATIOS/SUPPLEMENTAL DATA: | | | | | | | | | | | | | |
| Net assets, end of period (in 000’s $) | | 1,924,284 | | | 2,652,783 | | | 2,861,755 | | | | 2,520,266 | |
| Ratio of expenses to average net assets | | 0.67% | | | 0.68% | | | 0.71% | | | | 0.72% | (4) |
| Ratio of net investment income (loss) to average net assets | | 1.13% | | | 1.26% | | | 1.20% | | | | 0.81% | (4) |
| Portfolio turnover rate(5) | | 28% | | | 20% | | | 25% | | | | 16% | |
| (1) | Net investment income (loss) per share was calculated using average shares outstanding. |
| (2) | Realized and unrealized gain (loss) per share in this caption are balancing amounts necessary to reconcile the change in net asset value per share for the year, and may not reconcile with the aggregate gains on the Statement of Operations due to share transactions for the year. |
| (5) | Portfolio turnover rate is disclosed for the Fund as a whole. |
The accompanying notes to financial statements are an integral part of this statement.
FMI Common Stock Fund
FINANCIAL HIGHLIGHTS
(Selected data for each share of the Fund outstanding throughout each year)
Investor Class
| | | Years Ended September 30, | |
| | | 2020 | | | 2019 | | | 2018 | | | 2017 | | | 2016 | |
| PER SHARE OPERATING PERFORMANCE: | | | | | | | | | | |
| Net asset value, beginning of year | | $26.39 | | | $27.55 | | | $28.83 | | | $25.42 | | | $25.05 | |
| Income from investment operations: | | | | | | | | | | | | | | | |
| Net investment income (loss)(1) | | 0.17 | | | 0.15 | | | 0.06 | | | 0.00 | * | | (0.01 | ) |
| Net realized and unrealized gain (loss) on investments | | (3.02 | ) | | 0.94 | | | 1.80 | | | 4.69 | | | 2.84 | |
| Total from investment operations | | (2.85 | ) | | 1.09 | | | 1.86 | | | 4.69 | | | 2.83 | |
| Less distributions: | | | | | | | | | | | | | | | |
| Distributions from net investment income | | (0.11 | ) | | (0.10 | ) | | (0.01 | ) | | 0.00 | * | | — | |
| Distributions from net realized gains | | (1.18 | ) | | (2.15 | ) | | (3.13 | ) | | (1.28 | ) | | (2.46 | ) |
| Total from distributions | | (1.29 | ) | | (2.25 | ) | | (3.14 | ) | | (1.28 | ) | | (2.46 | ) |
| Net asset value, end of year | | $22.25 | | | $26.39 | | | $27.55 | | | $28.83 | | | $25.42 | |
| TOTAL RETURN | | (11.51% | ) | | 5.28% | | | 6.92% | | | 18.96% | | | 12.61% | |
| RATIOS/SUPPLEMENTAL DATA: | | | | | | | | | | | | | | | |
| Net assets, end of year (in 000’s $) | | 345,428 | | | 529,234 | | | 635,174 | | | 825,176 | | | 944,654 | |
| Ratio of expenses to average net assets | | 1.02% | | | 1.02% | | | 1.04% | | | 1.06% | | | 1.12% | |
| Ratio of net investment income (loss) to average net assets | | 0.71% | | | 0.59% | | | 0.23% | | | 0.00% | | | (0.06% | ) |
| Portfolio turnover rate | | 32% | (2) | | 28% | (2) | | 26% | (2) | | 26% | (2) | | 17% | |
| * | Amount is less than $0.005. |
| (1) | Net investment income (loss) per share was calculated using average shares outstanding. |
| (2) | Portfolio turnover rate is disclosed for the Fund as a whole. |
The accompanying notes to financial statements are an integral part of this statement.
FMI Common Stock Fund
FINANCIAL HIGHLIGHTS
(Selected data for each share of the Fund outstanding throughout each period)
Institutional Class
| | | | | | | | | For the Period from |
| | | Years Ended September 30, | | | October 31, 2016* to |
| | | 2020 | | | 2019 | | | 2018 | | | September 30, 2017 |
| PER SHARE OPERATING PERFORMANCE: | | | | | | | | | |
| Net asset value, beginning of period | | $26.42 | | | $27.59 | | | $28.85 | | | | $24.72 | |
| Income from investment operations: | | | | | | | | | | | | | |
| Net investment income (loss)(1) | | 0.20 | | | 0.18 | | | 0.10 | | | | 0.03 | |
| Net realized and unrealized gain (loss) on investments | | (3.02 | ) | | 0.93 | | | 1.79 | | | | 5.39 | |
| Total from investment operations | | (2.82 | ) | | 1.11 | | | 1.89 | | | | 5.42 | |
| Less distributions: | | | | | | | | | | | | | |
| Distributions from net investment income | | (0.14 | ) | | (0.13 | ) | | (0.02 | ) | | | (0.01 | ) |
| Distributions from net realized gains | | (1.18 | ) | | (2.15 | ) | | (3.13 | ) | | | (1.28 | ) |
| Total from distributions | | (1.32 | ) | | (2.28 | ) | | (3.15 | ) | | | (1.29 | ) |
| Net asset value, end of period | | $22.28 | | | $26.42 | | | $27.59 | | | | $28.85 | |
| TOTAL RETURN | | (11.41% | ) | | 5.40% | | | 7.02% | | | | 22.43% | (2) |
| RATIOS/SUPPLEMENTAL DATA: | | | | | | | | | | | | | |
| Net assets, end of period (in 000’s $) | | 344,811 | | | 448,262 | | | 433,491 | | | | 278,174 | |
| Ratio of expenses to average net assets | | 0.90% | | | 0.91% | | | 0.94% | | | | 0.97% | (3) |
| Ratio of net investment income (loss) to average net assets | | 0.84% | | | 0.71% | | | 0.37% | | | | 0.12% | (3) |
| Portfolio turnover rate(4) | | 32% | | | 28% | | | 26% | | | | 26% | |
| (1) | Net investment income (loss) per share was calculated using average shares outstanding. |
| (4) | Portfolio turnover rate is disclosed for the Fund as a whole. |
The accompanying notes to financial statements are an integral part of this statement.
FMI International Fund
FINANCIAL HIGHLIGHTS
(Selected data for each share of the Fund outstanding throughout each year)
Investor Class
| | | Years Ended September 30, | |
| | | 2020 | | | 2019 | | | 2018 | | | 2017 | | | 2016 | |
| PER SHARE OPERATING PERFORMANCE: | | | | | | | | | | |
| Net asset value, beginning of year | | $31.89 | | | $33.80 | | | $33.59 | | | $30.67 | | | $27.63 | |
| Income from investment operations: | | | | | | | | | | | | | | | |
| Net investment income (loss)(1) | | 0.35 | | | 0.48 | | | 0.48 | | | 0.32 | | | 0.29 | |
| Net realized and unrealized gain (loss) on investments | | (3.40 | ) | | (0.26 | ) | | 0.28 | | | 3.72 | | | 3.27 | |
| Total from investment operations | | (3.05 | ) | | 0.22 | | | 0.76 | | | 4.04 | | | 3.56 | |
| Less distributions: | | | | | | | | | | | | | | | |
| Distributions from net investment income | | (1.15 | ) | | (1.32 | ) | | (0.10 | ) | | (0.91 | ) | | (0.51 | ) |
| Distributions from net realized gains | | — | | | (0.81 | ) | | (0.45 | ) | | (0.21 | ) | | (0.01 | ) |
| Total from distributions | | (1.15 | ) | | (2.13 | ) | | (0.55 | ) | | (1.12 | ) | | (0.52 | ) |
| Net asset value, end of year | | $27.69 | | | $31.89 | | | $33.80 | | | $33.59 | | | $30.67 | |
| TOTAL RETURN | | (10.06% | ) | | 1.27% | | | 2.27% | | | 13.66% | | | 13.07% | |
| RATIOS/SUPPLEMENTAL DATA: | | | | | | | | | | | | | | | |
| Net assets, end of year (in 000’s $) | | 1,207,016 | | | 2,798,739 | | | 3,267,841 | | | 5,369,580 | | | 5,025,742 | |
| Ratio of expenses to average net assets | | 0.91% | | | 0.90% | | | 0.90% | | | 0.91% | | | 0.94% | |
| Ratio of net investment income (loss) to average net assets | | 1.19% | | | 1.55% | | | 1.43% | | | 1.02% | | | 1.01% | |
| Portfolio turnover rate | | 23% | (2) | | 13% | (2) | | 21% | (2) | | 26% | (2) | | 16% | |
| (1) | Net investment income (loss) per share was calculated using average shares outstanding. |
| (2) | Portfolio turnover rate is disclosed for the Fund as a whole. |
The accompanying notes to financial statements are an integral part of this statement.
FMI International Fund
FINANCIAL HIGHLIGHTS
(Selected data for each share of the Fund outstanding throughout each period)
Institutional Class
| | | | | | | | | For the Period from |
| | | Years Ended September 30, | | | October 31, 2016* to |
| | | 2020 | | | 2019 | | | 2018 | | | September 30, 2017 |
| PER SHARE OPERATING PERFORMANCE: | | | | | | | | | |
| Net asset value, beginning of period | | $31.93 | | | $33.86 | | | $33.62 | | | | $30.36 | |
| Income from investment operations: | | | | | | | | | | | | | |
| Net investment income (loss)(1) | | 0.38 | | | 0.53 | | | 0.49 | | | | 0.35 | |
| Net realized and unrealized gain (loss) on investments | | (3.39 | ) | | (0.27 | ) | | 0.31 | | | | 4.04 | |
| Total from investment operations | | (3.01 | ) | | 0.26 | | | 0.80 | | | | 4.39 | |
| Less distributions: | | | | | | | | | | | | | |
| Distributions from net investment income | | (1.19 | ) | | (1.38 | ) | | (0.11 | ) | | | (0.92 | ) |
| Distributions from net realized gains | | — | | | (0.81 | ) | | (0.45 | ) | | | (0.21 | ) |
| Total from distributions | | (1.19 | ) | | (2.19 | ) | | (0.56 | ) | | | (1.13 | ) |
| Net asset value, end of period | | $27.73 | | | $31.93 | | | $33.86 | | | | $33.62 | |
| TOTAL RETURN | | (9.95% | ) | | 1.42% | | | 2.40% | | | | 14.95% | (2) |
| RATIOS/SUPPLEMENTAL DATA: | | | | | | | | | | | | | |
| Net assets, end of period (in 000’s $) | | 2,142,615 | | | 4,480,109 | | | 4,045,361 | | | | 2,736,673 | |
| Ratio of expenses to average net assets | | 0.77% | | | 0.76% | | | 0.76% | | | | 0.77% | (3) |
| Ratio of net investment income (loss) to average net assets | | 1.31% | | | 1.69% | | | 1.44% | | | | 1.19% | (3) |
| Portfolio turnover rate(4) | | 23% | | | 13% | | | 21% | | | | 26% | |
| (1) | Net investment income (loss) per share was calculated using average shares outstanding. |
| (4) | Portfolio turnover rate is disclosed for the Fund as a whole. |
The accompanying notes to financial statements are an integral part of this statement.
FMI International Fund II – Currency Unhedged
FINANCIAL HIGHLIGHTS
(Selected data for each share of the Fund outstanding throughout the period)
Institutional Class
| | | For the Period from December 31, 2019* to September 30, 2020 |
| PER SHARE OPERATING PERFORMANCE: | | | | |
| Net asset value, beginning of period | | | $20.00 | |
| Income from investment operations: | | | | |
| Net investment income (loss)(1) | | | 0.13 | |
| Net realized and unrealized gain (loss) on investments | | | (2.89 | ) |
| Total from investment operations | | | (2.76 | ) |
| Less distributions: | | | | |
| Distributions from net investment income | | | — | |
| Distributions from net realized gains | | | — | |
| Total from distributions | | | — | |
| Net asset value, end of period | | | $17.24 | |
| TOTAL RETURN | | | (13.80% | )(2) |
| RATIOS/SUPPLEMENTAL DATA: | | | | |
| Net assets, end of period (in 000’s $) | | | 47,555 | |
| Ratio of expenses to average net assets: | | | | |
| Before expense reimbursement | | | 1.43% | (3) |
| After expense reimbursement | | | 0.90% | (3) |
| Ratio of net investment income (loss) to average net assets: | | | | |
| Before expense reimbursement | | | 0.49% | (3) |
| After expense reimbursement | | | 1.02% | (3) |
| Portfolio turnover rate | | | 15% | |
| (1) | Net investment income (loss) per share was calculated using average shares outstanding. |
The accompanying notes to financial statements are an integral part of this statement.
FMI Funds, Inc.
NOTES TO FINANCIAL STATEMENTS
September 30, 2020
The following is a summary of significant accounting policies of the FMI Large Cap Fund, the FMI Common Stock Fund, the FMI International Fund, and the FMI International Fund II – Currency Unhedged (collectively, the “Funds” or, individually, a “Fund”). The FMI Large Cap Fund (the “Large Cap Fund”), the FMI Common Stock Fund (the “Common Stock Fund”), the FMI International Fund (the “International Fund”), and the FMI International Fund II – Currency Unhedged (the “International Currency Unhedged Fund”) are each a series of FMI Funds, Inc. (the “Company”). The Company was incorporated under the laws of Maryland on September 5, 1996. The Large Cap Fund commenced operations on December 31, 2001 and the International Fund commenced operations on December 31, 2010. The Common Stock Fund is the successor to the FMI Common Stock Fund, the sole series of FMI Common Stock Fund, Inc. (the “Predecessor Common Stock Fund”). The Predecessor Common Stock Fund commenced operations on December 18, 1981. The reorganization was effective as of January 31, 2014, and the Common Stock Fund is the accounting survivor of the reorganization. The Predecessor Common Stock Fund was incorporated under the laws of Wisconsin on July 29, 1981. The International Currency Unhedged Fund commenced operations on December 31, 2019. Organizational and offering costs, which consist of costs incurred to establish the International Currency Unhedged Fund and enable the Fund to legally do business, including the legal fees incurred in the registration of the Fund, were borne by the Adviser and are not subject to reimbursement by the Fund.
Effective October 31, 2016, the Large Cap Fund, Common Stock Fund, and International Fund offer two classes of shares (Investor and Institutional). The International Currency Unhedged Fund currently only offers Institutional Class shares. The Institutional Class has the same management fee as the Investor Class and does not have a shareholder servicing plan. A higher investment minimum is required for the Institutional Class than the Investor Class. Each class of shares has exclusive voting rights with respect to matters that affect just that class. Income, expenses (other than expenses attributable to a specific class) and realized and unrealized gains or losses on investments are allocated to each class of shares on its relative net assets. The Board of Directors (the “Board”) may elect to have certain expenses specific to the Investor Class shares or Institutional Class shares be borne solely by the Class to which such expenses are attributable, but any expenses not specifically allocated to the Investor Class shares or Institutional Class shares are generally allocated to each such Class proportionately (after any applicable base fee to be paid by a class of shares of a Fund attributable to such expense) on the basis of the net asset value of that Class in relation to the net asset value of the applicable Fund.
FMI Funds, Inc.
NOTES TO FINANCIAL STATEMENTS (Continued)
September 30, 2020
| (1) | Organization — (Continued) |
The Large Cap Fund and the International Currency Unhedged Fund are non-diversified, open-end management investment companies under the Investment Company Act of 1940 (the “Act”), as amended. The Common Stock Fund and the International Fund are diversified open-end management investment companies under the Act. The financial statements are prepared in accordance with accounting principles generally accepted in the United States of America (“GAAP”). The Funds follow the investment company accounting and financial reporting guidance under Financial Accounting Standards Board (“FASB”) Accounting Standards Codification “Financial Services – Investment Companies” Topic 946 (“ASC 946”). The assets and liabilities of each Fund in the Company are segregated and a shareholder’s interest is limited to the Fund in which the shareholder owns shares. The investment objective of the Large Cap Fund is to seek long-term capital appreciation by investing mainly in limited a number of large capitalization value stocks. The investment objective of the Common Stock Fund is to seek long-term capital appreciation by investing mainly in small to medium capitalization value stocks. The investment objective of the International Fund and International Currency Unhedged Fund is to seek capital appreciation by investing mainly in a limited number of large capitalization value stocks of non-U.S. companies.
| (2) | Summary of Significant Accounting Policies and Other Information — |
| a) | The Funds apply the provisions of the FASB Accounting Standards Codification “Fair Value Measurement” Topic 820 (“ASC 820”), which defines fair value as the price that would be received to sell an asset or paid to transfer a liability (i.e., the “exit price”) in an orderly transaction between market participants at the measurement date. |
Each security is valued at the current day last sale price reported by the principal security exchange on which the issue is traded. Securities that are traded on the Nasdaq Markets are valued at the Nasdaq Official Closing Price, or if no sale is reported, the latest bid price. Securities that are traded over-the-counter, including U.S. Treasury securities are valued at the close price, if not close, then at the latest bid price. Bank deposits are valued at acquisition cost which approximates fair value. Unlisted equity securities for which market quotations are readily available are valued at the close price, if not close, then at the most recent bid price. Foreign securities are valued on a basis of quotations from the primary market in which they are traded, and are converted from the local currency into U.S. dollars using exchange rates as of the close of the New York Stock Exchange. For the International Fund and International Currency Unhedged Fund only, options purchased or written by each of the Funds’ are valued at the average of the most recent bid and ask prices. Securities for which quotations are not readily available are valued at fair value as determined by the investment adviser in accordance with procedures approved by the Board. The fair value of a security is the amount which a Fund might reasonably expect to receive upon a current sale. The fair value of a security may differ from the last quoted price and a Fund may not be able to sell a security at the fair value. Market quotations may not be available, for example, if trading in particular securities was halted during the day and not resumed prior to the close of trading on the New York Stock Exchange. The foreign markets in which the International Fund and International Currency Unhedged Fund may invest are sometimes open on days when the New York Stock Exchange is not open and the International Fund and International Currency Unhedged Fund do not calculate their net asset value. For securities that do not trade during New York Stock Exchange hours, fair value determinations are based on analyses of market movements after the close of those securities’ primary markets, and may include reviews of developments in foreign markets, the performance of U.S. securities markets, and the performance of instruments trading in U.S. markets that represent foreign securities and baskets of foreign securities. The Board utilizes a service provided by an independent third party to assist in fair valuation of certain securities for the International Fund and the International Currency Unhedged Fund. As of September 30, 2020, there were no securities that were internally fair valued.
FMI Funds, Inc.
NOTES TO FINANCIAL STATEMENTS (Continued)
September 30, 2020
| (2) | Summary of Significant Accounting Policies and Other Information — (Continued) |
In determining fair value, the Funds use various valuation approaches. ASC 820 establishes a fair value hierarchy for inputs used in measuring fair value that maximizes the use of observable inputs and minimizes the use of unobservable inputs by generally requiring that the most observable inputs be used when available. Observable inputs are those that market participants would use in pricing the asset or liability based on market data obtained from sources independent of the Funds. Unobservable inputs reflect the Funds’ assumptions about the inputs market participants would use in pricing the asset or liability developed based on the best information available in the circumstances. The inputs or methodologies used for valuing securities are not necessarily an indication of the risks associated with investing in those securities. Over the counter derivatives such as forward currency contracts may be valued using quantitative models. These models may use pricing curves based on market inputs including current exchange rates or indices. These curves are combined with volatility factors to value the overall positions. The market inputs are generally significant and can be corroborated with observable market data and therefore are classified in level 2.
The fair value hierarchy is categorized into three levels based on the inputs as follows:
| Level 1 — | Valuations based on unadjusted quoted prices in active markets for identical assets. |
| Level 2 — | Valuations based on quoted prices for similar securities or in markets that are not active or for which all significant inputs are observable, either directly or indirectly. |
| Level 3 — | Valuations based on inputs that are unobservable and significant to the overall fair value measurement. |
The following table summarizes the Funds’ investments as of September 30, 2020, based on the inputs used to value them:
| | | | | | | | | | | | |
| Valuations | | | Large Cap Fund Investments in Securities | | Common Stock Fund Investments in Securities |
| Assets: | | | | | | | | |
| Level 1 — Common Stocks | | | $ | 3,345,306,345 | | | | $ | 661,619,127 | |
| Bank Deposit Account | | | | 55,074,261 | | | | | 29,227,320 | |
| Total Level 1 | | | | 3,400,380,606 | | | | | 690,846,447 | |
| Level 2 — Common Stocks | | | | — | | | | | — | |
| Preferred Stocks | | | | — | | | | | — | |
| Forward Currency Contracts | | | | — | | | | | — | |
| Total Level 2 | | | | — | | | | | — | |
| Level 3 — | | | | — | | | | | — | |
| Total Assets | | | | 3,400,380,606 | | | | | 690,846,447 | |
| Liabilities: | | | | | | | | | | |
| Level 2 — Forward Currency Contracts | | | | — | | | | | — | |
| Total | | | $ | 3,400,380,606 | | | | $ | 690,846,447 | |
FMI Funds, Inc.
NOTES TO FINANCIAL STATEMENTS (Continued)
September 30, 2020
(2) Summary of Significant Accounting Policies and Other Information — (Continued)
| | | | | | | | | | | | | | | | | |
| Valuations | | | International Fund Investments in Securities | | International Fund Other Financial Instruments* | | International Currency Unhedged Fund Investments in Securities |
| Assets: | | | | | | | | | | | | |
| Level 1 — Common Stocks | | | $ | 623,966,187 | | | | $ | — | | | | $ | 8,622,551 | |
| Bank Deposit Account | | | | 102,183,693 | | | | | — | | | | | 2,260,715 | |
| Total Level 1 | | | | 726,149,880 | | | | | — | | | | | 10,883,266 | |
| Level 2 — Common Stocks | | | | 2,343,856,967 | | | | | — | | | | | 32,088,006 | |
| Preferred Stocks | | | | 332,971,468 | | | | | — | | | | | 4,463,868 | |
| Forward Currency Contracts | | | | — | | | | | 567,848 | | | | | — | |
| Total Level 2 | | | | 2,676,828,435 | | | | | 567,848 | | | | | 36,551,874 | |
| Level 3 — | | | | — | | | | | — | | | | | — | |
| Total Assets | | | | 3,402,978,315 | | | | | 567,848 | | | | | 47,435,140 | |
| Liabilities: | | | | | | | | | | | | | | | |
| Level 2 — Forward Currency Contracts | | | | — | | | | | (58,452,527 | ) | | | | — | |
| Total | | | $ | 3,402,978,315 | | | | $ | (57,884,679 | ) | | | $ | 47,435,140 | |
| * | Other financial instruments are derivative instruments, specifically forward currency contracts, which are valued at the unrealized appreciation/(depreciation) on the instrument. |
See the Schedules of Investments for investments detailed by industry classifications.
| (b) | Net realized gains and losses on sales of securities are computed on the identified cost basis. For financial reporting purposes, investment transactions are recorded on the trade date. |
| (c) | Investment securities and other assets and liabilities denominated in foreign currencies are translated into U.S. dollar amounts at the date of valuation. Purchases and sales of investment securities and income and expense items denominated in foreign currencies are translated into U.S. dollar amounts on the respective date of such transactions. The Company does not isolate that portion of the results of operations resulting from changes in foreign exchange rates on investments from the fluctuations arising from changes in market prices of securities held. Such fluctuations are included with the net realized and unrealized gain or loss from investments. Reported net realized foreign exchange gains or losses arise from sales of foreign currencies, currency gains or losses realized between the trade and settlement dates on securities transactions, and the difference between the amounts of dividends, interest, and foreign withholding taxes recorded on the Company’s books and the U.S. dollar equivalent of the amounts actually received or paid. Net unrealized foreign exchange gains and losses arise from changes in the fair values of assets and liabilities, other than investments in securities at fiscal period-end, resulting from changes in exchange rates. |
| (d) | Dividend income is recorded on the ex-dividend date. Interest income is recorded on an accrual basis. The Funds record the amortization and accretion of discounts and premiums on securities purchased using the effective interest method in accordance with GAAP. Withholding taxes on foreign dividends have been provided for in accordance with the Funds’ understanding of the applicable country’s tax rules and regulations. |
FMI Funds, Inc.
NOTES TO FINANCIAL STATEMENTS (Continued)
September 30, 2020
| (2) | Summary of Significant Accounting Policies and Other Information — (Continued) |
| (e) | The International Fund may enter into forward currency contracts in order to hedge its exposure to changes in foreign currency rates on its foreign portfolio holdings or to hedge certain purchase and sale commitments denominated in foreign currencies The International Currency Unhedged Fund normally does not seek to reduce currency risk by hedging its perceived foreign currency exposure back into the U.S. dollar and will generally not be exposed to currency fluctuations. However, the investment adviser reserves the right to temporarily hedge all or a portion of the Funds currency exposure. A forward currency contract is a commitment to purchase or sell a foreign currency at a future date at a negotiated rate. These contracts are valued daily and the asset or liability therein represents unrealized gain or loss on the contracts as measured by the difference between the forward foreign exchange rates at the dates of entry into the contracts and the forward rates at the reporting date. On a quarterly average there were fourteen forward currency contracts with an average quarterly value of $4,337,918,495 outstanding during the year ended September 30, 2020. These contracts are not subject to master netting agreements. For Non-Deliverable Forward Currency Contracts (“Contract”) the Fund posts collateral, in the form of cash or cash equivalents to a segregated account at the custodian when the Contract is in an unrealized loss position. When the Contract is in an unrealized gain position, the counterparty posts collateral to a segregated account at the custodian. |
The fair value of the forward currency contracts as of September 30, 2020, is included in the following location on the Statements of Assets and Liabilities for the International Fund:
| | | Location | | Fair Value of Asset Forward Currency Contracts | | Location | | Fair Value of (Liability) Forward Currency Contracts |
Forward currency contracts | | Unrealized appreciation on forward currency contracts | | $567,848 | | Unrealized depreciation on forward currency contracts | | $(58,452,527) |
Realized and unrealized gains and losses on forward currency contracts entered into during the year ended September 30, 2020, are recorded in the following location on the Statements of Operations for the International Fund:
| | | Location | | Realized Gain | | Location | | Unrealized Depreciation |
Forward currency contracts | | Net realized gain (loss) on forward currency contracts | | $59,818,649 | | Net change in unrealized appreciation/ depreciation on forward currency contracts | | $138,033,284 |
These instruments involve market risk, credit risk, or both kinds of risks, in excess of the amount recognized on the Statements of Assets and Liabilities for the International Fund. Risks arise from the possible inability of counterparties to meet the terms of their contracts and from movement in currency and securities values and interest rates.
| (f) | The preparation of financial statements in conformity with GAAP requires management to make estimates and assumptions that affect the reported amounts of assets and liabilities and disclosure of contingent assets and liabilities at the date of the financial statements and the reported amounts of income and expenses during the reporting period. Actual results could differ from these estimates. |
FMI Funds, Inc.
NOTES TO FINANCIAL STATEMENTS (Continued)
September 30, 2020
| (2) | Summary of Significant Accounting Policies and Other Information — (Continued) |
| (g) | The Funds may own certain securities that are restricted. Restricted securities include Section 4(2) commercial paper or securities issued in a private placement. The Funds did not hold any restricted securities as of September 30, 2020. |
| (h) | No provision has been made for Federal income taxes since the Funds have elected to be taxed as “regulated investment companies.” The Funds intend to distribute substantially all net investment company taxable income and net capital gains to their respective shareholders and otherwise comply with the provisions of the Internal Revenue Code applicable to regulated investment companies. |
| (i) | The Funds have reviewed all open tax years and major jurisdictions, which include Federal and the state of Maryland for the Funds and concluded that there are no significant uncertain tax positions that would require recognition in the financial statements. The Funds recognize interest and penalties, if any, related to unrecognized tax benefits on certain tax benefits on uncertain tax positions as income tax expense in the Statements of Operations. During the year or period ended September 30, 2020, the Funds did not incur any interest or penalties. Open tax years are those that are open for exam by taxing authorities and, as of September 30, 2020, open Federal tax years include the prior four fiscal tax years ended September 30, 2020. The Funds have no examinations in progress and are also not aware of any tax positions for which it is reasonably possible that the total amounts of unrecognized tax benefits will significantly change in the next twelve months. |
| (j) | GAAP requires that permanent differences between income for financial reporting and tax purposes be reclassified in the capital accounts. These differences are caused primarily by differences in the treatment of certain components of income or realized capital gain for federal income tax purposes. Each Fund may utilize earnings and profits distributed to shareholders on redemption of shares as part of the dividends paid deduction. These reclassifications have no effect on net assets, results of operations or net asset value per share. For the International Fund these differences relate to net operating losses. During the fiscal year ended September 30, 2020, the reclassifications were as follows: |
| | | Total Distributable Earnings | | Capital Stock | |
| Large Cap Fund | | | $ | (146,854,096 | ) | | $ | 146,854,096 | |
| Common Stock Fund | | | $ | — | | | $ | — | |
| International Fund | | | $ | 22,555,757 | | | $ | (22,555,757 | ) |
| International Currency Unhedged Fund | | | $ | — | | | $ | — | |
| (k) | Net investment income and net realized gains, if any, are distributed to shareholders at least annually. Distributions to shareholders are recorded on the ex-dividend date. |
| (l) | Common Company expenses are typically allocated evenly between the Funds of the Company, or by other equitable means. |
FMI Funds, Inc.
NOTES TO FINANCIAL STATEMENTS (Continued)
September 30, 2020
| (3) | Investment Adviser and Management Agreement and Transactions With Related Parties — |
The Funds each have a management agreement with Fiduciary Management, Inc. (“FMI” or the “Adviser”), with whom certain officers and directors of the Funds are affiliated, to serve as investment adviser and manager.
Under the terms of the current Advisory agreements, effective as of December 31, 2019, the Adviser is entitled to receive a fee. The fee is computed daily and payable at the end of each month. The following annual percentages of the International Currency Unhedged Fund’s average daily net assets are used:
| ● | 0.75% of the assets from $0 - $2.5 billion; 0.70% of the assets from $2.5 - $5.0 billion; 0.65% of the assets from $5.0 - $10.0 billion; and 0.60% of the assets over $10.0 billion. |
Under the terms of the current Advisory agreements, effective as of January 1, 2019, the Adviser is entitled to receive a fee. The fee is computed daily and payable at the end of each month. The following annual percentages of each Fund’s average daily net assets are used:
| ● | Large Cap Fund: 0.65% of the assets from $0 - $2.5 billion; 0.60% of the assets from $2.5 - $5.0 billion; and 0.55% of the assets over $5.0 billion. |
| ● | Common Stock Fund: 0.85% of the assets from $0 - $500 million; 0.80% of the assets from $500 million - $1.0 billion; 0.75% of the assets over $1.0 billion. |
| ● | International Fund: 0.75% of the assets from $0 - $2.5 billion; 0.70% of the assets from $2.5 - $5.0 billion; 0.65% of the assets from $5.0 - $10.0 billion; and 0.60% of the assets over $10.0 billion. |
The Funds are responsible for paying their proportionate share of the compensation, benefits and expenses of the Funds’ Chief Compliance Officer. For administrative convenience, FMI initially makes these payments and is later reimbursed by the Funds.
Under the respective Investment Advisory or operating expenses limitation agreements, FMI will reimburse the Funds for expenses (excluding federal, state and local taxes, interest, brokerage commissions and extraordinary items) as follows:
| | | Investor Class Expense Cap | | Institutional Class Expense Cap |
| Large Cap Fund | | 1.20% | | 1.10% |
| Common Stock Fund | | 1.30% | | 1.20% |
| International Fund | | 1.75% | | 1.65% |
| International Currency Unhedged Fund | | N/A | | 1.65% |
For the year ended September 30, 2020, there were no contractual or voluntary reimbursements required for the Large Cap Fund, Common Stock Fund or International Fund. For the International Currency Unhedged Fund, from inception (December 31, 2019) to September 30, 2020 there is no contractual reimbursement and the voluntary reimbursement is $123,250. The voluntary 0.90% expense cap/reimbursement agreement for the International Currency Unhedged Fund will continue in effect until January 31, 2021, with successive renewal terms of one year unless terminated by the Adviser prior to any such renewal. The Adviser is entitled to recoup such amounts for a one year period from the date the Adviser reduced its compensation and/or assumed expenses for the International Currency Unhedged Fund. The Adviser does not intend to recoup this $123,250.
FMI Funds, Inc.
NOTES TO FINANCIAL STATEMENTS (Continued)
September 30, 2020
| (3) | Investment Adviser and Management Agreement and Transactions With Related Parties — (Continued) |
The Large Cap Fund, the International Fund and the International Currency Unhedged Fund have each entered into a Distribution Plan (the “Plan”), pursuant to Rule 12b-1 under the Act. Each Plan, if implemented, provides that the applicable Fund may incur certain costs which may not exceed the lesser of a monthly amount equal to 0.25% of such Fund’s daily net assets or the actual distribution costs incurred during the year. Amounts payable under each Plan would be paid monthly for any activities or expenses primarily intended to result in the sale of shares of such Fund. For the year ended September 30, 2020, no such expenses were charged to the shareholders of any Fund as the Funds had not implemented the Plan.
Under the Funds’ organizational documents, each director, officer, employee or other agent of any Fund (including the Funds’ investment manager) is indemnified, to the extent permitted by the Act, against certain liabilities that may arise out of performance of their duties to the Funds. Additionally, in the normal course of business, the Funds enter into contracts that contain a variety of indemnification clauses. The Funds’ maximum exposure under these arrangements is unknown as this would involve future claims that may be made against such Fund that have not yet occurred. However, the Funds have not had prior claims or losses pursuant to these contracts and believe the risk of loss to be remote.
At September 30, 2020, no person is deemed to “control” a Fund, as that term is defined in the Act, because the Funds do not know of any person who owns beneficially or through controlled companies more than 25% of a Fund’s Investor Class and Institutional Class shares, on a combined basis, or who acknowledges the existence of control.
| (4) | Investments in Affiliated Issuers — |
An issuer in which a Fund’s holdings represent 5% or more of the outstanding voting securities of an issuer is an “affiliated” issuer as defined in the 1940 Act. The International Fund is the only Fund with an investment in a security of an affiliated issuer held during the year ended September 30, 2020 as set forth below:
Name of Issuer: B&M European Value Retail S.A. (Luxembourg)+
Fair Value as of 09/30/2019 | | | Gross Additions | | | Gross Reductions | | | Realized Gain/(Loss) | | | Change in Unrealized Gain/(Loss) | | | Fair Value as of 09/30/2020 | | | Dividend Income | | | Share Balance as of 9/30/2020 | |
| $ | 186,544,095 | | | $ | 69,331,963 | | | $ | (107,078,438 | ) | | $ | (4,629,705 | ) | | $ | 47,088,917 | | | $ | 191,256,832 | | | $ | 12,448,685 | | | | 30,000,000 | |
| $ | 186,544,095 | | | $ | 69,331,963 | | | $ | (107,078,438 | ) | | $ | (4,629,705 | ) | | $ | 47,088,917 | | | $ | 191,256,832 | | | $ | 12,448,685 | | | | 30,000,000 | |
| + | Issuer was not an affiliate as of September 30, 2020. |
| (5) | Shareholder Servicing Plan — |
The Funds have adopted a Shareholder Servicing Plan pursuant to which Investor Class shares, (if available), may pay financial intermediaries for assets maintained in an omnibus account at an annual rate of up to 0.15% of the average daily net assets, or an annual per account rate approved by the Board. The Board may also authorize the Funds to pay for shareholder services outside of the plan.
FMI Funds, Inc.
NOTES TO FINANCIAL STATEMENTS (Continued)
September 30, 2020
| (5) | Shareholder Servicing Plan — (Continued) |
For the year ended September 30, 2020, shareholder servicing fees incurred are disclosed on the Statements of Operations.
U.S. Bank, N.A. (the “Bank”) has made available to the Company a $650,000,000 umbrella credit facility, pursuant to the loan agreement (the “Agreement”) effective May 29, 2020 for the FMI Funds, Inc. (consisting of Large Cap Fund, Common Stock Fund, International Fund and International Currency Unhedged Fund) for the purposes of having cash available to satisfy redemption requests and is subject to certain restrictions and covenants. For the period October 1, 2019 through May 28, 2020, the umbrella credit facility was $725,000,000. Effective December 31, 2019 the Bank and FMI Funds, Inc., amended the agreements to include the International Currency Unhedged Fund. Principal is due not more than 45 days after the date of the loan. Amounts under the credit facility bear interest at a rate per annum equal to the Bank’s current prime rate minus one percent on the amount borrowed. Advances will be collateralized by securities owned by the borrowing Fund. The Agreement is subject to renewal on May 28, 2021. During the year ended September 30, 2020, the International Fund is the only Fund that borrowed, at a rate of 2.25%, against the Agreement as follows:
Average Borrowings | | Amount Outstanding as of September 30, 2020 | | Interest Expense | | Maximum Borrowing | | Maximum Borrowing Date |
| $436,702 | | $ — | | $9,990 | | $83,312,000 | | 03/17/2020 |
| (7) | Investment Transactions — |
For the year ended September 30, 2020, purchases and sales of investment securities (excluding short-term investments) were as follows:
| | | | Large Cap Fund | | | Common Stock Fund | | International Fund |
| Purchases | | | $ | 1,103,513,802 | | | | $ | 241,403,405 | | | | $ | 1,152,625,919 | |
| Sales | | | | 2,279,081,764 | | | | | 252,950,453 | | | | | 3,312,074,585 | |
For the International Currency Unhedged Fund the since inception (December 31, 2019) to the period ended September 30, 2020, purchases and sales of investment securities (excluding short-term investments) were as follows:
| Purchases | | |
| $52,471,427 | | | | | | | | | | | |
| Sales | | | | 4,461,734 | | | | | | | | | | | |
FMI Funds, Inc.
NOTES TO FINANCIAL STATEMENTS (Continued)
September 30, 2020
| (8) | Income Tax Information — |
The following information for the Funds is presented on an income tax basis as of September 30, 2020:
| | | Cost of Investments | | | Gross Unrealized Appreciation(1) | | | Gross Unrealized Depreciation(1) | | | Net Unrealized Appreciation (Depreciation) on Investments(1) | |
| Large Cap Fund | | $ | 2,467,745,093 | | | $ | 1,014,299,476 | | | $ | (81,663,963 | ) | | | $932,635,513 | |
| Common Stock Fund | | | 591,307,001 | | | | 145,010,312 | | | | (45,470,866 | ) | | | 99,539,446 | |
| International Fund | | | 3,303,132,037 | | | | 675,998,282 | | | | (575,672,256 | ) | | | 100,326,026 | |
| International Currency Unhedged Fund | | | 49,052,713 | | | | 2,586,374 | | | | (4,202,768 | ) | | | (1,616,394 | ) |
| (1) | Represents amounts of investments in securities, forward currency contracts and foreign currency transactions. |
The difference between the cost amounts for financial statement and federal income tax purposes is due primarily to timing differences in recognizing certain gains and losses on security transactions. The International Fund and International Currency Unhedged Fund are the only Funds with temporary mark to market differences. The components of accumulated earnings (deficit) on a tax-basis are as follows:
| | | Net Unrealized Appreciation (Depreciation) | | | Undistributed Ordinary Income | | | Undistributed Long-Term Capital Gains | | | Other Accumulated (Losses) | | | Total Distributable Earnings/ (Accumulated Losses) | |
| Large Cap Fund | | $ | 932,635,513 | | | $ | 44,297,775 | | | $ | 288,197,128 | | | $ | — | | | $ | 1,265,130,416 | |
| Common Stock Fund | | | 99,539,446 | | | | 6,574,021 | | | | — | | | | (19,439,827 | ) | | | 86,673,640 | |
| International Fund | | | 100,326,026 | | | | — | | | | — | | | | (634,736,173 | ) | | | (534,410,147 | ) |
| International Currency Unhedged Fund | | | (1,616,394 | ) | | | 234,004 | | | | — | | | | (1,065,281 | ) | | | (2,447,671 | ) |
The other accumulated losses above are all capital loss carryovers, which may be used indefinitely to offset future gains as follows:
| | | Short-Term Capital Loss Carryovers | | Long-Term Capital Loss Carryovers | | Total Capital Loss Carryovers |
| Large Cap Fund | | | $ | — | | | | $ | — | | | | $ | — | |
| Common Stock Fund | | | | 16,540,493 | | | | | 2,899,334 | | | | | 19,439,827 | |
| International Fund | | | | 53,953,841 | | | | | 580,782,332 | | | | | 634,736,173 | |
| International Currency Unhedged Fund | | | | 1,065,281 | | | | | — | | | | | 1,065,281 | |
The tax components of dividends paid during the years ended September 30, 2020 and 2019 are as follows:
| | | | September 30, 2020 | | | September 30, 2019 | |
| | | | Ordinary Income Distributions | | | Long-Term Capital Gains Distributions | | | Ordinary Income Distributions* | | | Long-Term Capital Gains Distributions | |
| Large Cap Fund | | | $ | 43,982,413 | | | $ | 328,226,746 | | | $ | 97,113,804 | | | $ | 775,622,004 | |
| Common Stock Fund | | | | 4,710,556 | | | | 44,341,109 | | | | 7,231,614 | | | | 73,711,064 | |
| International Fund | | | | 264,896,118 | | | | — | | | | 333,870,849 | | | | 122,480,608 | |
| * | For federal income tax purposes, distributions on short-term capital gains are treated as ordinary income distributions. |
FMI Funds, Inc.
NOTES TO FINANCIAL STATEMENTS (Continued)
September 30, 2020
| (9) | Fund Share Transactions — |
| | | Year Ended September 30, 2020 | | | Year Ended September 30, 2019 | |
| Large Cap Fund | | Shares | | | Amount | | | Shares | | | Amount | |
| Sales | | | | | | | | | | | | |
| Investor Class | | | 6,949,510 | | | $ | 122,473,700 | | | | 10,683,401 | | | $ | 203,464,338 | |
| Institutional Class | | | 27,651,702 | | | | 494,035,656 | | | | 36,948,528 | | | | 705,524,921 | |
| Reinvestment of dividends and distributions | | | | | | | | | | | | | | | | |
| Investor Class | | | 8,295,454 | | | | 162,673,843 | | | | 25,191,103 | | | | 443,363,404 | |
| Institutional Class | | | 10,281,091 | | | | 201,200,945 | | | | 23,563,684 | | | | 414,013,932 | |
| Redemptions | | | | | | | | | | | | | | | | |
| Investor Class | | | (52,825,286 | ) | | | (948,242,497 | ) | | | (57,958,201 | ) | | | (1,120,763,243 | ) |
| Institutional Class | | | (67,357,706 | ) | | | (1,177,887,115 | ) | | | (53,959,104 | ) | | | (1,033,345,574 | ) |
| Total Investor Class | | | (37,580,322 | ) | | | (663,094,954 | ) | | | (22,083,697 | ) | | | (473,935,501 | ) |
| Total Institutional Class | | | (29,424,913 | ) | | | (482,650,514 | ) | | | 6,553,108 | | | | 86,193,279 | |
| Net increase (decrease) | | | (67,005,235 | ) | | $ | (1,145,745,468 | ) | | | (15,530,589 | ) | | $ | (387,742,222 | ) |
| | | | | | | | | | | | | | | | | |
| | | Year Ended September 30, 2020 | | | Year Ended September 30, 2019 | |
| Common Stock Fund | | Shares | | | Amount | | | Shares | | | Amount | |
| Sales | | | | | | | | | | | | | | | | |
| Investor Class | | | 2,116,906 | | | $ | 48,600,753 | | | | 2,252,913 | | | $ | 56,983,108 | |
| Institutional Class | | | 7,136,020 | | | | 163,844,506 | | | | 5,113,386 | | | | 129,259,588 | |
| Reinvestment of dividends and distributions | | | | | | | | | | | | | | | | |
| Investor Class | | | 922,566 | | | | 24,078,967 | | | | 2,098,189 | | | | 47,544,954 | |
| Institutional Class | | | 899,124 | | | | 23,476,124 | | | | 1,387,411 | | | | 31,452,601 | |
| Redemptions | | | | | | | | | | | | | | | | |
| Investor Class | | | (7,568,853 | ) | | | (172,591,759 | ) | | | (7,351,460 | ) | | | (182,641,412 | ) |
| Institutional Class | | | (9,526,567 | ) | | | (198,717,975 | ) | | | (5,244,744 | ) | | | (135,106,726 | ) |
| Total Investor Class | | | (4,529,381 | ) | | | (99,912,039 | ) | | | (3,000,358 | ) | | | (78,113,350 | ) |
| Total Institutional Class | | | (1,491,423 | ) | | | (11,397,345 | ) | | | 1,256,053 | | | | 25,605,463 | |
| Net increase (decrease) | | | (6,020,804 | ) | | $ | (111,309,384 | ) | | | (1,744,305 | ) | | $ | (52,507,887 | ) |
FMI Funds, Inc.
NOTES TO FINANCIAL STATEMENTS (Continued)
September 30, 2020
| (9) | Fund Share Transactions — (Continued) |
| | | Year Ended September 30, 2020 | | | Year Ended September 30, 2019 | |
| International Fund | | Shares | | | Amount | | | Shares | | | Amount | |
| Sales | | | | | | | | | | | | |
| Investor Class | | | 6,775,232 | | | $ | 198,701,774 | | | | 21,049,815 | | | $ | 648,605,477 | |
| Institutional Class | | | 34,097,366 | | | | 963,338,176 | | | | 52,123,592 | | | | 1,612,621,764 | |
| Reinvestment of dividends and distributions | | | | | | | | | | | | | | | | |
| Investor Class | | | 2,958,802 | | | | 95,036,724 | | | | 6,716,995 | | | | 194,725,691 | |
| Institutional Class | | | 4,954,564 | | | | 159,239,678 | | | | 8,632,709 | | | | 250,348,567 | |
| Redemptions | | | | | | | | | | | | | | | | |
| Investor Class | | | (53,901,852 | ) | | | (1,457,347,271 | ) | | | (36,691,877 | ) | | | (1,128,462,232 | ) |
| Institutional Class | | | (102,096,549 | ) | | | (2,720,572,122 | ) | | | (39,911,752 | ) | | | (1,229,298,454 | ) |
| Total Investor Class | | | (44,167,818 | ) | | | (1,163,608,773 | ) | | | (8,925,067 | ) | | | (285,131,064 | ) |
| Total Institutional Class | | | (63,044,619 | ) | | | (1,597,994,268 | ) | | | 20,844,549 | | | | 633,671,877 | |
| Net increase (decrease) | | | (107,212,437 | ) | | $ | (2,761,603,041 | ) | | | 11,919,482 | | | $ | 348,540,813 | |
| | | | | | | | | | | | | | | | | | |
| | | | For the Period December 31, 2019 | | | | | | | | | |
| International Currency | | to September 30, 2020 | | | | | | | | | |
| Unhedged Fund | | | Shares | | | Amount | | | | | | | | | |
| Sales | | | | | | | | | | | | | | | | |
| Institutional Class | | | 2,828,036 | | | $ | 51,142,790 | | | | | | | | | |
| Redemptions | | | | | | | | | | | | | | | | |
| Institutional Class | | | (70,306 | ) | | | (1,140,345 | ) | | | | | | | | |
| Total Institutional Class | | | 2,757,730 | | | | 50,002,445 | | | | | | | | | |
| Net increase (decrease) | | | 2,757,730 | | | $ | 50,002,445 | | | | | | | | | |
On September 18, 2020, the Board approved the year-end distributions for the Funds. Cash dividends in the aggregate amounts equal to each of the Fund’s net Investment Income and short-term capital gains, if any, which will be treated as ordinary income, and long-term capital gains, to be payable on December 18, 2020, to outstanding shares of record at the close of business on December 17, 2020.
FMI Funds, Inc.
REPORT OF INDEPENDENT REGISTERED PUBLIC ACCOUNTING FIRM
To the Shareholders and Board of Directors of FMI Funds, Inc.
Opinion on the Financial Statements
We have audited the accompanying statements of assets and liabilities, including the schedules of investments and forward currency contracts, of FMI Funds, Inc. comprising FMI Large Cap Fund, FMI Common Stock Fund, FMI International Fund, and FMI International Fund II – Currency Unhedged (the “Funds”), as of September 30, 2020, and the related statements of operations and changes in net assets, including the related notes, and the financial highlights for the period December 31, 2019 (commencement of operations) through September 30, 2020, for FMI International Fund II – Currency Unhedged, and the related statements of operations for the year then ended, the statements of changes in net assets for each of the two years in the period then ended, including the related notes, and the financial highlights for each of the four years in the period then ended for FMI Large Cap Fund, FMI Common Stock Fund, and FMI International Fund (collectively referred to as the “financial statements”). In our opinion, the financial statements present fairly, in all material respects, the financial position of each of the Funds as of September 30, 2020, the results of their operations, the changes in their net assets, and the financial highlights for each of the periods indicated above, in conformity with accounting principles generally accepted in the United States of America.
The Funds’ financial highlights for the year ended September 30, 2016, were audited by other auditors whose report dated October 25, 2016, expressed an unqualified opinion on those financial highlights.
Basis for Opinion
These financial statements are the responsibility of the Funds’ management. Our responsibility is to express an opinion on the Funds’ financial statements based on our audits. We are a public accounting firm registered with the Public Company Accounting Oversight Board (United States) (“PCAOB”) and are required to be independent with respect to the Funds in accordance with the U.S. federal securities laws and the applicable rules and regulations of the Securities and Exchange Commission and the PCAOB.
We conducted our audits in accordance with the standards of the PCAOB. Those standards require that we plan and perform the audit to obtain reasonable assurance about whether the financial statements are free of material misstatement, whether due to error or fraud.
Our audits included performing procedures to assess the risks of material misstatement of the financial statements, whether due to error or fraud, and performing procedures that respond to those risks. Such procedures included examining, on a test basis, evidence regarding the amounts and disclosures in the financial statements. Our procedures included confirmation of securities owned as of September 30, 2020, by correspondence with the custodian and brokers. Our audits also included evaluating the accounting principles used and significant estimates made by management, as well as evaluating the overall presentation of the financial statements. We believe that our audits provide a reasonable basis for our opinion.
We have served as the Funds’ auditor since 2016.

COHEN & COMPANY, LTD.
Milwaukee, Wisconsin
October 28, 2020
FMI Funds, Inc.
EXPENSE EXAMPLE (Unaudited)
As a shareholder of the FMI Funds you incur ongoing costs, including management fees and other Fund expenses. You do not incur transaction costs such as sales charges (loads) on purchase payments, reinvested dividends, or other distributions; redemption fees; and exchange fees because the Funds do not charge these fees. This example is intended to help you understand your ongoing costs (in dollars) of investing in each Fund and to compare these costs with the ongoing costs of investing in other mutual funds. The example is based on an investment of $1,000 invested at the beginning of the period and held for the entire period from April 1, 2020 through September 30, 2020.
Actual Expenses
The table below provides information about actual account values and actual expenses. You may use the information in these lines, together with the amount you invested, to estimate the expenses that you paid over the period. Simply divide your account value by $1,000 (for example, an $8,600 account value divided by $1,000 = 8.6), then multiply the result by the number in the line under the heading entitled “Actual Expenses Paid During Period” to estimate the expenses you paid on your account during this period.
In addition to the costs highlighted and described below, the only Fund transaction costs you might currently incur would be wire fees ($15 per wire), if you choose to have proceeds from a redemption wired to your bank account instead of receiving a check. Additionally, U.S. Bank charges an annual processing fee ($15) if you maintain an IRA account with the Fund. To determine your total costs of investing in a Fund, you would need to add any applicable wire or IRA processing fees you’ve incurred during the period to the costs provided in the example at the end of this article.
Hypothetical Example for Comparison Purposes
The table below provides information about hypothetical account values and hypothetical expenses based on each Fund’s actual expense ratio and an assumed rate of return of 5% per year before expenses, which is not the Fund’s actual return. The hypothetical account values and expenses may not be used to estimate the actual ending account balance or expenses you paid for the period. You may use this information to compare the ongoing costs of investing in a Fund and other funds. To do so, compare this 5% hypothetical example with the 5% hypothetical examples that appear in the shareholder reports of the other funds.
Please note that the expenses shown in the table are meant to highlight your ongoing costs only and do not reflect any transactional costs, such as sales charges (loads), redemption fees or exchange fees. Therefore, the hypothetical line of the table is useful in comparing ongoing costs only, and will not help you determine the relative total costs of owning different funds. In addition, if these transactional costs were included, your costs would have been higher.
FMI Funds, Inc.
EXPENSE EXAMPLE (Unaudited) (Continued)
| | | | | | | | | | | | | | | | | | | | | | |
| | | FMI
Large Cap
Fund | | FMI
Common
Stock Fund | | FMI
International
Fund | | FMI International
Fund II – Currency
Unhedged | |
| Investor Class | | | | | | | | | | | | | |
| Actual Beginning | | | | | | | | | | | | | |
| Account Value 4/01/20 | | | $ | 1,000.00 | | | | $ | 1,000.00 | | | | $ | 1,000.00 | | | | $ | — | | |
| Actual Ending | | | | | | | | | | | | | | | | | | | | | |
| Account Value 9/30/20 | | | $ | 1,243.20 | | | | $ | 1,162.50 | | | | $ | 1,192.50 | | | | $ | — | | |
| Actual Expenses Paid | | | | | | | | | | | | | | | | | | | | | |
| During Period* 4/01/20-9/30/20 | | | $ | 4.54 | | | | $ | 5.51 | | | | $ | 5.04 | | | | $ | — | | |
| Hypothetical Beginning | | | | | | | | | | | | | | | | | | | | | |
| Account Value 4/01/20 | | | $ | 1,000.00 | | | | $ | 1,000.00 | | | | $ | 1,000.00 | | | | $ | — | | |
| Hypothetical Ending | | | | | | | | | | | | | | | | | | | | | |
| Account Value 9/30/20 | | | $ | 1,020.95 | | | | $ | 1,019.90 | | | | $ | 1,020.40 | | | | $ | — | | |
| Hypothetical Expenses Paid | | | | | | | | | | | | | | | | | | | | | |
| During Period* 4/01/20-9/30/20 | | | $ | 4.09 | | | | $ | 5.15 | | | | $ | 4.65 | | | | $ | — | | |
| Annualized Expense Ratio* | | | | 0.81 | % | | | | 1.02 | % | | | | 0.92 | % | | | | — | | |
| Institutional Class | | | | | | | | | | | | | | | | | | | | | |
| Actual Beginning | | | | | | | | | | | | | | | | | | | | | |
| Account Value 4/01/20 | | | $ | 1,000.00 | | | | $ | 1,000.00 | | | | $ | 1,000.00 | | | | $ | 1,000.00 | | |
| Actual Ending | | | | | | | | | | | | | | | | | | | | | |
| Account Value 9/30/20 | | | $ | 1,244.20 | | | | $ | 1,163.40 | | | | $ | 1,192.70 | | | | $ | 1,218.40 | | |
| Actual Expenses Paid | | | | | | | | | | | | | | | | | | | | | |
| During Period* 4/01/20-9/30/20 | | | $ | 3.82 | | | | $ | 4.92 | | | | $ | 4.39 | | | | $ | 4.99 | | |
| Hypothetical Beginning | | | | | | | | | | | | | | | | | | | | | |
| Account Value 4/01/20 | | | $ | 1,000.00 | | | | $ | 1,000.00 | | | | $ | 1,000.00 | | | | $ | 1,000.00 | | |
| Hypothetical Ending | | | | | | | | | | | | | | | | | | | | | |
| Account Value 9/30/20 | | | $ | 1,021.60 | | | | $ | 1,020.45 | | | | $ | 1,021.00 | | | | $ | 1,020.50 | | |
| Hypothetical Expenses Paid | | | | | | | | | | | | | | | | | | | | | |
| During Period* 4/01/20-9/30/20 | | | $ | 3.44 | | | | $ | 4.60 | | | | $ | 4.04 | | | | $ | 4.55 | | |
| Annualized Expense Ratio* | | | | 0.68 | % | | | | 0.91 | % | | | | 0.80 | % | | | | 0.90 | % | |
* | Expenses are equal to the Fund’s annualized expense ratio, multiplied by the average account value over the period, multiplied by 183/366 (to reflect the one-half year period between April 1, 2020 and September 30, 2020). |
FMI Funds, Inc.
DIRECTORS AND OFFICERS (Unaudited)
| | | | | | | | | |
Name, Age
and Address*^ | | Positions
Held with
the Funds | | Term of
Office and
Length of
Time Served | | Principal
Occupation(s)
During Past
Five Years | | Other
Directorships Held by
Director or Officer |
| Non-Interested Directors | | | | | | | | |
| Robert C. Arzbaecher, 60 | | Director | | Indefinite Term Since 2007 | | Mr. Arzbaecher retired as Chairman and Chief Executive Officer of Actuant Corporation (Menomonee Falls, WI) in March, 2016. | | CF Industries Holdings, Inc. |
| | | | | | | | | |
| Lawrence J. Burnett, 62 | | Director | | Indefinite Term Since 2016 | | Mr. Burnett is a shareholder and employee of Reinhart Boerner Van Deuren s.c. (Milwaukee, WI), since his graduation from Cornell Law School in 1982. Mr. Burnett is also the Co- Chair of Reinhart Boerner’s business law department. | | None |
| | | | | | | | | |
| Rebecca W. House, 47 | | Director | | Indefinite Term Since 2017 | | Ms. House is Chief Administrative & Legal Officer at Rockwell Automation, Inc., an industrial automation company, since July 2020, and was previously General Counsel and Secretary since January 2017. From October 2010 to December 2016, Ms. House was Assistant General Counsel at Harley-Davidson, Inc., a motorcycle manufacturer. | | None |
| | | | | | | | | |
| Paul S. Shain, 57 | | Director | | Indefinite Term Since 2001 | | Mr. Shain is President and Chief Executive Officer of Singlewire Software, LLC (Madison, WI), a provider of IP-based paging and emergency notification systems, since April, 2009. | | None |
| | | | | | | | | |
| Robert J. Venable, 56 | | Director | | Indefinite Term Since 2016 | | Mr. Venable is President of Charter Manufacturing, a Wisconsin-based company with operations in a range of industrial markets. He has served with Charter in this and other roles since 2013. | | None |
FMI Funds, Inc.
DIRECTORS AND OFFICERS (Unaudited) (Continued)
| | | | | | | | | |
Name, Age
and Address*^ | | Positions
Held with
the Funds | | Term of
Office and
Length of
Time Served | | Principal
Occupation(s)
During Past
Five Years | | Other
Directorships Held by
Director or Officer |
| Interested Directors | | | | | | | | |
| John S. Brandser,** 58 | | Director
President and Treasurer | | Indefinite Term Since 2009 One Year Term Since 2017 One Year Term Since 2017 | | Mr. Brandser is President, Secretary, Chief Operating Officer and Chief Compliance Officer of Fiduciary Management, Inc. and has been employed by the Adviser in various capacities since March, 1995. | | None |
| | | | | | | | | |
| Patrick J. English,** 59 | | Director
Vice President and Secretary | | Indefinite Term Since 2001 One Year Term Since 2001 One Year Term Since 2017 | | Mr. English is Chief Executive Officer, Chief Investment Officer and Treasurer of Fiduciary Management, Inc. and has been employed by the Adviser in various capacities since December, 1986. | | None |
| | | | | | | | | |
| Other Officer | | | | | | | | |
| Lauren A. Grebe, 33 | | Chief Compliance Officer | | At Discretion of Board Since 2017 | | Ms. Grebe is Chief Compliance Officer of the Funds since March, 2017, and was previously a Compliance Officer of the Funds since June, 2016. From August, 2009 to June, 2016, Ms. Grebe was employed by PricewaterhouseCoopers LLP, auditing clients in the asset management industry. | | None |
| * | The address of each Director and Officer is c/o Fiduciary Management, Inc., 100 E. Wisconsin Ave., Suite 2200, Milwaukee, WI 53202. |
| ** | Messrs. Brandser and English are interested directors of the Funds because they are officers of the Funds and/or affiliated persons of the Adviser. |
| ^ | Each Non-Interested and Interested Director oversees 4 Funds in the complex. |
FMI Funds, Inc.
LIQUIDITY RISK MANAGEMENT PROGRAM (Unaudited)
On June 26, 2020 the Directors of FMI Funds, Inc., and its series the FMI Common Stock Fund, FMI Large Cap Fund, FMI International Fund an FMI International Fund II – Currency Unhedged (collectively, the “Funds”), reviewed and considered a written report prepared by the program administrator of the Funds’ Liquidity Risk Management Program (the “Program”), the Funds’ Trading Practices Committee (the “Program Administrator”), which addressed the operation of the Program and assessed the Program’s adequacy and effectiveness of implementation. In considering the report, the Directors noted that the Program Administrator has determined that all of the Funds primarily hold assets that are highly liquid investments, and thus may rely on the exclusion from the requirements to determine and review a highly liquid investment minimum and to adopt shortfall policies and procedures. They then confirmed with the Program Administrator that no material changes were made to the Program, and reviewed all of the material features of the Program to ensure that they understand how the Program is designed to assess and manage the risk that the Funds could not meet requests to redeem shares issued by the Funds without significant dilution of remaining investors in the Funds. Following this review and discussion, the Directors determined that they believe the disclosures in the report, taken as a whole, provide the information necessary for the Directors to effectively assess the Program and its implementation, and that they are comfortable with the report’s conclusion that the Program is reasonably designed to assess and manage the Funds’ liquidity risk and is operating as intended.
FMI Funds, Inc.
DISCLOSURE INFORMATION (Unaudited)
Performance data quoted represents past performance; past performance does not guarantee future results. Investment return and principal value of an investment will fluctuate so that an investor’s shares, when redeemed, may be worth more or less than their original cost. Current performance of a Fund may be lower or higher than the performance quoted. Performance data current to the most recent month end may be obtained by visiting www.fmifunds.com or by calling 1-800-811-5311. The returns do not reflect the deduction of taxes that a shareholder would pay on Fund distributions or the redemption of Fund shares.
Securities named in the Letters to Shareholders, but not listed in the Schedules of Investments are not held in the Funds as of the date of this disclosure. Portfolio holdings are subject to change without notice and are not intended as recommendations of individual securities.
This report is not authorized for use as an offer of sale or a solicitation of an offer to buy shares of the Funds unless accompanied or preceded by the Funds’ current prospectus.
As of the Funds’ Prospectus dated January 31, 2020, the annual operating expense ratios for the Investor Class of FMI Large Cap Fund, FMI Common Stock Fund and FMI International Fund are: 0.80%, 1.01% and 0.90%, respectively. The annual operating expense ratios for the Institutional Class of FMI Large Cap Fund, FMI Common Stock Fund, FMI International Fund and FMI International Fund II – Currency Unhedged are: 0.67%, 0.90%, 0.76% and 0.90%*, respectively.
| * | Note that the annual operating expenses for the Institutional Class of FMI International Fund II – Currency Unhedged are 1.80% before the investment adviser’s voluntary reimbursement such that annual fund operating expenses do not exceed 0.90%, which will continue at least through January 31, 2021. |
Risks associated with investing in the Funds are as follows:
FMI Large Cap Fund: Stock Market Risk, Medium and Large Capitalization Companies Risks, Non-Diversification Risk (Non-Diversified funds are subject to higher volatility than funds that are invested more broadly), Value Investing Risk, Foreign Securities Risk (fluctuation of currency, different financial standards, and political instability) and Liquidity Risk.
FMI Common Stock Fund: Stock Market Risk, Medium and Small Capitalization Companies Risks (which includes the potential for greater volatility and less financial resources than Large-Cap Companies), Value Investing Risk, Foreign Securities Risk (fluctuation of currency, different financial standards, and political instability) and Liquidity Risk.
FMI International Fund: Stock Market Risk, Value Investing Risk, Foreign Securities Risk (fluctuation of currency, different financial standards, and political instability), Geographic Concentration Risk, Currency Hedging Risk, Large Capitalization Companies Risk and Liquidity Risk.
FMI International Fund II – Currency Unhedged: Stock Market Risk, Non-Diversified Risk (Non-Diversified Funds are subject to higher volatility than funds that are invested more broadly). Value Investing Risk, Foreign Securities Risk (fluctuation of currency, different financial standards, and political instability), Geographic Concentration Risk, Large Capitalization Companies Risk, and Liquidity Risk.
For details regarding these risks, please refer to the Funds’ Summary or Statutory Prospectuses dated January 31, 2020.
For more information about the FMI Funds, call 1-800-811-5311 for a free Prospectus or Summary Prospectus. Please read these Prospectuses carefully to consider the investment objectives, risks, charges and expenses, before investing or sending money. These Prospectuses contain this and more information about the FMI Funds. Please read the Prospectuses or Summary Prospectuses carefully before investing.
FMI Funds, Inc.
DISCLOSURE INFORMATION (Unaudited) (Continued)
The Standard and Poor’s 500 Index (S&P 500) consists of 500 selected common stocks, most of which are listed on the New York Stock Exchange. The S&P’s Ratings Group designates the stocks to be included in the Index on a statistical basis. A particular stock’s weighting in the Index is based on its relative total market value (i.e., its market price per share times the number of shares outstanding). Stocks may be added or deleted from the Index from time to time. The S&P 500 Energy Sector Index, S&P 500 Financial Sector Index, and S&P Industrials Sector Index are comprised of the S&P 500 companies with a corresponding GICS sector classification.
The Russell 1000 Index measures the performance of the 1,000 largest companies in the Russell 3000 Index which comprises the 3,000 largest U.S. companies based on total market capitalization. The Russell 1000 Value Index includes equities that exhibit value characteristics and the Russell 1000 Growth Index includes equities that exhibit growth characteristics.
The Russell 2000 Index measures the performance of the 2,000 smallest companies in the Russell 3000 Index. The Russell 2000 Value Index includes equities that exhibit value characteristics and the Russell 2000 Growth Index includes equities that exhibit growth characteristics.
The Russell 3000 Index measures performance of the 3,000 largest U.S. companies based on total market capitalization.
The MSCI EAFE Index (Europe, Australasia, Far East) is a free float-adjusted market capitalization index that is designed to measure the equity market performance of developed markets, excluding the U.S. and Canada. The MSCI EAFE Index consists of the following 21 developed market country indices: Australia, Austria, Belgium, Denmark, Finland, France, Germany, Hong Kong, Ireland, Israel, Italy, Japan, the Netherlands, New Zealand, Norway, Portugal, Singapore, Spain, Sweden, Switzerland and the United Kingdom. Index results are inclusive of dividends and net of foreign withholding taxes. The reported figures include reinvestment of dividends and capital gains distributions and do not reflect any fees or expenses.
The MSCI EAFE Value Index captures large and mid cap securities exhibiting overall value style characteristics across Developed Markets countries around the world, excluding the U.S. and Canada. The value investment style characteristics for index construction are defined using three variables: book value to price, 12-month forward earnings to price and dividend yield.
The MSCI EAFE Index and MSCI EAFE Value Index are calculated in local currency (LOC) as well as in U.S. Dollars (USD). The concept of a LOC calculation excludes the impact of currency fluctuations. All currencies of listing are considered in the Index calculation in LOC where current prices (t) and previous day prices (t-1) are converted into USD using the same exchange rate (exchange rate t-1) in the numerator and denominator. As a consequence, the FX factor drops out of the equation. The USD calculation includes exchange rates at t and t-1. Therefore, the LOC calculation only represents the price appreciation or depreciation of the securities, whereas the USD calculation also accounts for the performance of the currency (or currencies) relative to the USD.
The MSCI EAFE Growth Index captures large and mid cap securities exhibiting overall growth style characteristics across Developed Markets countries around the world, excluding the U.S. and Canada. The growth investment style characteristics for index construction are defined using five variables: long-term forward EPS growth rate, short-term forward EPS growth rate, current internal growth rate and long-term historical EPS growth trend and long-term historical sales per share growth trend.
The MSCI World ex USA Index captures large and mid cap representation across 22 of 23 developed market countries, excluding the United States. The index covers approximately 85% of the free float-adjusted market capitalization of each country.
MSCI EAFE is a service mark of MSCI Barra.
The NASDAQ Composite Index measures all domestic and international based stocks listed on the NASDAQ Stock Market, comprised of over 2,500 companies.
The FTSE 100 Index captures the 100 most highly capitalized companies traded on the London Stock Exchange.
All indices are unmanaged. These indices are used herein for comparative purposes in accordance with the Securities and Exchange Commission regulations. It is not possible to invest directly into an index.
FMI Funds, Inc.
DISCLOSURE INFORMATION (Unaudited) (Continued)
GLOSSARY
EBITDA – Earnings Before Interest Taxes Depreciation and Amortization is essentially net income with interest, taxes, depreciation, and amortization added back to it, and can be used to analyze and compare profitability between companies and industries because it eliminates the effects of financing and accounting decisions.
EPS – Earnings per Share – The portion of a company’s profit allocated to each outstanding share of common stock. Earnings per share serves as an indicator of a company’s profitability.
EV/EBITDA – Enterprise Value to Earnings Before Interest Taxes Depreciation and Amortization is a measure of the value of a stock that compares a company’s enterprise value (market cap plus debt, minority interest and preferred shares, minus total cash and cash equivalents) to its earnings before interest taxes depreciation and amortization. EV/EBITDA is one of several fundamental indicators that investors use to determine whether a stock is priced well. The EV/EBITDA multiple is also often used to determine a company’s valuation in the case of a potential acquisition.
EV/Sales – Enterprise-Value-To-Sales is a valuation measure that compares the enterprise value of a company to the company’s sales. EV/sales gives investors an idea of how much it costs to buy the company’s sales.
GDP – Gross Domestic Product – Gross Domestic Product is the monetary value of all finished goods and services produced within a country’s borders in a specific time period.
ND/EBITDA – Net debt-to-EBITDA is a measurement of the total amount of outstanding company debt as a percentage of EBITDA. The ratio is an indicator of the company’s ability to pay its debt.
Price-to-book – The price-to-book ratio is the ratio for valuing a company that measures its current share price relative to its book value of equity.
Price-to-earnings ratio – The price-earnings ratio (P/E Ratio) is the ratio for valuing a company that measures its current share price relative to its per-share earnings. The trailing P/E ratio is calculated by dividing the current share price by per-share earnings over the previous 12 months and the forward P/E ratio estimates likely per-share earnings over the next 12 months.
ROE – Return on Equity – Return on equity is the amount of net income returned as a percentage of shareholders’ equity and measures a company’s profitability by revealing how much profit a company generates with the money shareholders have invested.
Return on Tangible Equity – Return on tangible equity is the amount of net income returned as a percentage of shareholders’ equity, excluding intangible elements such as goodwill, debt that can be converted to common stock, and preferred stock.
ROIC – Return on Invested Capital – a calculation used to assess a company’s efficiency at allocating the capital under its control to profitable investments. The return on invested capital measure gives a sense of how well a company is using its money to generate returns.
Reference definitions found at Investopedia.com
Distributed by Rafferty Capital Markets, LLC, 1010 Franklin Avenue, Garden City, NY 11530
FMI Funds, Inc.
ADDITIONAL INFORMATION (Unaudited)
For additional information about the Directors and Officers or for a description of the policies and procedures that the Funds use to determine how to vote proxies relating to portfolio securities, please call (800) 811-5311 and request a Statement of Additional Information. It will be mailed to you free of charge. The Statement of Additional Information is also available on the website of the Securities and Exchange Commission (the “Commission”) at http://www.sec.gov. Information on how each of the Funds voted proxies relating to portfolio securities is available on the Funds’ website at http://www.fmifunds.com or the website of the Commission no later than August 31 for the prior 12 months ending June 30. The Funds file their complete schedules of portfolio holdings with the Commission for the first and third quarters of each fiscal year as an exhibit to its reports on Form N-PORT. The Funds’ Forms N-PORT are available on the Commission’s website.
TAX NOTICE (Unaudited)
For corporate shareholders of the Large Cap Fund, the Common Stock Fund, the International Fund and the International Currency Unhedged Fund, the percentage of dividend income distributed for the year ended September 30, 2020 which is designated as qualifying for the dividends received deduction is 76.02%, 100%, 0.33% and 0%, respectively. The International Fund and the International Currency Unhedged Fund intend to elect to pass-through to shareholders the income tax credit for taxes paid to foreign countries. For the year ended September 30, 2020, only the International Currency Unhedged Fund had foreign source income of $480,126 and foreign tax expense of $45,305. The pass-through of the foreign tax credit will only affect those persons who are shareholders on the dividend record dates. For all shareholders of the Large Cap Fund, the Common Stock Fund, the International Fund and the International Currency Unhedged Fund, the percentage of dividend income distributed for the year ended September 30, 2020 which is designated as qualified dividend income under the Jobs and Growth Tax Relief Act of 2003, is 100%, 100%, 33.07% and 0%, respectively. For all shareholders of the Large Cap Fund, the Common Stock Fund, the International Fund and the International Currency Unhedged Fund, the percentage of taxable ordinary income distributions that are designated as short-term capital gain distributions under Internal Revenue Section 871(k)(2)(c) is 0%, 0%, 0% and 0%, respectively.
FMI Funds, Inc.
NOTICE OF PRIVACY POLICY (Unaudited)
Protecting the privacy of our shareholders is important to us. This notice describes the practices and policies through which we maintain the confidentiality and protect the security of your non-public personal information.
What Information We Collect
In the course of providing services to you, we may collect the following types of “non-public personal information” about you:
| ● | Information we receive from you on applications or other forms, such as your name, address and social security number, the types and amounts of investments and bank account information, and |
| ● | Information about your transactions with us, our affiliates and others, as well as other account data. |
What Information We Disclose
We do not disclose any nonpublic personal information about our current or former shareholders to anyone, except as permitted by law. For example, we are permitted by law to disclose all of the information we collect, as described above, to our transfer agent to process your transactions. Furthermore, we restrict access to your nonpublic personal information to those persons who require such information to provide products or services to you. We maintain physical, electronic and procedural safeguards that comply with federal standards to guard your nonpublic personal information. In the event that you hold shares of any Fund through a financial intermediary, including, but not limited to, a broker-dealer, bank or trust company, the privacy policy of your financial intermediary may govern how your nonpublic personal information would be shared with nonaffiliated third parties.
IMPORTANT NOTICE REGARDING DELIVERY OF SHAREHOLDER DOCUMENTS (Unaudited)
In order to reduce expenses, we will deliver a single copy of prospectuses, proxies, financial reports, and other communication to shareholders with the same residential address, provided they have the same last name or we reasonably believe them to be members of the same family. Unless we are notified otherwise, we will continue to send you only one copy of these materials for as long as you remain a shareholder of the Funds. If you would like to receive individual mailings, please call (800) 811-5311 and we will begin sending you separate copies of these materials within 30 days after we receive your request.
Thank you for allowing us to serve your investment needs.
| FMI Large Cap Fund | FMI Common Stock Fund | FMI International Fund | FMI International Fund II –
Currency Unhedged |
100 East Wisconsin Avenue, Suite 2200
Milwaukee, Wisconsin 53202
www.fmifunds.com
414-226-4555
| BOARD OF DIRECTORS |
| ROBERT C. ARZBAECHER | REBECCA W. HOUSE |
| JOHN S. BRANDSER | PAUL S. SHAIN |
| LAWRENCE J. BURNETT | ROBERT J. VENABLE |
| PATRICK J. ENGLISH | |
INVESTMENT ADVISER
FIDUCIARY MANAGEMENT, INC.
100 East Wisconsin Avenue, Suite 2200
Milwaukee, Wisconsin 53202
ADMINISTRATOR, ACCOUNTANT, TRANSFER AGENT AND
DIVIDEND DISBURSING AGENT
U.S. BANCORP FUND SERVICES, LLC
615 East Michigan Street
Milwaukee, Wisconsin 53202
800-811-5311 or 414-765-4124
| CUSTODIAN | INDEPENDENT REGISTERED |
| U.S. BANK, N.A. | PUBLIC ACCOUNTING FIRM |
| Milwaukee, Wisconsin | COHEN & COMPANY, LTD. |
| | Milwaukee, Wisconsin |
| DISTRIBUTOR | |
| RAFFERTY CAPITAL MARKETS, LLC | LEGAL COUNSEL |
| Garden City, New York | FOLEY & LARDNER LLP |
| | Milwaukee, Wisconsin |
| | |
 | FMI Funds, Inc.
1-800-811-5311
www.fmifunds.com |
Item 2. Code of Ethics.
The registrant has adopted a code of ethics that applies to the registrant’s principal executive officer and principal financial officer. The registrant has not made any amendments to its code of ethics during the period covered by this report. The registrant has not granted any waivers from any provisions of the code of ethics during the period covered by this report. A copy of the registrant’s Code of Ethics is filed herewith.
The registrant has adopted a code of ethics that applies to the registrant’s principal executive officer and principal financial officer. The registrant has not made any substantive amendments to its code of ethics during the period covered by this report. The registrant has not granted any waivers from any provisions of the code of ethics during the period covered by this report.
Item 3. Audit Committee Financial Expert.
The registrant’s Board of Directors has determined that Mr. Robert C. Arzbaecher, a member of its audit committee, is an audit committee financial expert. Mr. Arzbaecher is “independent” as such term is defined in Form N-CSR.
Item 4. Principal Accountant Fees and Services.
(a) Audit Service Fees
$80,000 (FY 2020) and $60,000 (FY 2019) are the aggregate fees billed for each of the last two fiscal years for professional services rendered by the principal accountant to the registrant for the audit of the registrant’s annual financial statements or services that are normally provided by the accountant in connection with statutory and regulatory filings or engagements for those fiscal years. The increase in fees billed is due primarily to the increase from 3 portfolios to 4 portfolios in the Fund Complex.
(b) Audit-Related Service Fees
There were no fees billed in the last two fiscal years for Audit-Related Fees.
(c) Tax Service Fees
$20,500 (FY 2020) and $15,000 (FY 2019) are the aggregate fees billed in the last two fiscal years for professional services rendered by the principal accountant to the registrant for tax compliance, tax advice, tax planning and tax return preparation. The increase in fees billed is due primarily to the increase from 3 portfolios to 4 portfolios in the Fund Complex plus an initial review of the new portfolio.
There were no fees billed in the last two fiscal years for professional services rendered by the principal accountant to registrant’s investment adviser for tax compliance, tax advice and tax planning that were required to be approved by the audit committee pursuant to paragraph (c)(7)(ii) of Rule 2-01 of Regulation S-X.
(d) All Other Service Fees
There were no fees billed in the last two fiscal years for products and services provided by the principal accountant to the registrant, other than the services reported in paragraphs (a) – (c) of this Item 4.
The audit committee has adopted pre-approval policies and procedures that require the audit committee to pre‑approve all audit and non‑audit services of the registrant, including services provided to any entity affiliated with the registrant.
(e) (1) None
(e) (2) None
(f) Not applicable.
(g) See the tax fees disclosed in paragraph (c) of this Item 4.
(h) Not applicable, as no non-audit services were provided to registrant’s investment adviser.
Item 5. Audit Committee of Listed Registrants.
Not applicable to registrants who are not listed issuers (as defined in Rule 10A-3 under the Securities Exchange Act of 1934).
Item 6. Investments.
(a) | The Schedule of Investments in securities of unaffiliated issuers is included as part of the report to shareholders filed under Item 1 of this Form. |
(b) Not Applicable.
Item 7. Disclosure of Proxy Voting Policies and Procedures for Closed-End Management Investment Companies.
Not applicable to open-end investment companies.
Item 8. Portfolio Managers of Closed-End Management Investment Companies.
Not applicable to open-end investment companies.
Item 9. Purchases of Equity Securities by Closed‑End Management Investment Company and Affiliated Purchasers.
Not applicable to open-end investment companies.
Item 10. Submission of Matters to a Vote of Security Holders.
Not applicable.
Item 11. Controls and Procedures.
(a) | The Registrant’s principal executive and principal financial officers have concluded that the Registrant’s disclosure controls and procedures are effective, as of a date within 90 days of the filing of this report, based on their evaluation of the Registrant’s disclosure controls and procedures. |
(b) | There were no changes in the Registrant’s internal control over financial reporting during the Registrant’s period covered by this report that have materially affected, or are reasonably likely to materially affect, the Registrant’s internal control over financial reporting. |
Item 12. Disclosure of Securities Lending Activities for Closed-End Management Investment Companies
Not applicable to open-end investment companies.
Item 13. Exhibits.
(3) Any written solicitation to purchase securities under Rule 23c‑1 under the Act sent or given during the period covered by the report by or on behalf of the registrant to 10 or more persons. Not applicable to open-end investment companies.
(4) There was no change in registrant’s independent public accountant for the period covered by this report.
SIGNATURES
Pursuant to the requirements of the Securities Exchange Act of 1934 and the Investment Company Act of 1940, the registrant has duly caused this report to be signed on its behalf by the undersigned, thereunto duly authorized.
FMI Funds, Inc.
Registrant
By /s/ John S. Brandser
John S. Brandser, President/Principal Executive Officer
Date 11/5/20
Pursuant to the requirements of the Securities Exchange Act of 1934 and the Investment Company Act of 1940, this report has been signed below by the following persons on behalf of the registrant and in the capacities and on the dates indicated.
By /s/ John S. Brandser
John S. Brandser, President/Principal Executive Officer
Date 11/5/20
By /s/ John S. Brandser
John S. Brandser, Treasurer/Principal Financial Officer
Date 11/5/20