SECURITIES AND EXCHANGE COMMISSION
Washington, D.C. 20549
(Exact name of registrant as specified in charter)
| (a) | Annual Report |
ANNUAL REPORT
September 30, 2022
FMI Large Cap Fund
Investor Class (Ticker Symbol: FMIHX)
Institutional Class (Ticker Symbol: FMIQX)
FMI Common Stock Fund
Investor Class (Ticker Symbol: FMIMX)
Institutional Class (Ticker Symbol: FMIUX)
FMI International Fund
Investor Class (Ticker Symbol: FMIJX)
Institutional Class (Ticker Symbol: FMIYX)
FMI International Fund II – Currency Unhedged
Investor Class (Not Available For Sale)
Institutional Class (Ticker Symbol: FMIFX)
 | FMI Funds, Inc. Advised by Fiduciary Management, Inc. www.fmifunds.com |
FMI Funds, Inc.
TABLE OF CONTENTS
Large Cap
Fund
| (unaudited) | September 30, 2022 |
The FMI Large Cap Fund (“Fund”) declined 6.43%1 in the September quarter compared to a 4.88% decline in the S&P 500 Index and a 5.56% decline in the iShares Russell 1000 Value ETF2. Relative to the S&P 500 Index, sectors that helped included Producer Manufacturing, Finance, and Process Industries. Underperforming sectors included Electronic Technology, Health Services, and Retail Trade. Carlisle Cos. Inc., The Charles Schwab Corp., and Avery Dennison Corp. aided performance while Fresenius Medical Care AG & Co. KGaA-SP-ADR (Fresenius), Koninklijke Philips N.V.-SP-ADR (Philips), and Sony Group Corp.-SP-ADR all detracted. Both stocks and bonds entered bear market territory this year on multiple concerns, some of which will be addressed shortly.
While the markets have been difficult, the team has not been this optimistic about future performance in many years, perhaps not since the Great Financial Crisis. There are several factors that give us optimism:
| ● | Valuations are attractive on both an absolute and relative basis. |
| ● | The sentiment of the market is negative, which is a contrarian’s delight. |
| ● | The strength and durability of the current portfolio has rarely been stronger. |
| ● | The full cycle return on invested capital of the constituents is very good. |
| ● | Many current holdings are significantly depressed, and we view them as coiled springs. |
| ● | The era of ultra-low interest rates appears to be over. This should favor our approach. |
Many of the worrisome issues and themes we have discussed in recent years are coming to pass. Rates have escalated rapidly. Reckless, and even feckless, monetary policies have been revealed. The bond market has suffered steep declines. Stocks are in disarray. The private equity and leverage bubbles have started to burst. Inflation is much higher. A “black swan” geopolitical event (Russia’s war on Ukraine) has transpired. Many of the risk items that sky-high valuations suggested would not occur are now happening. But the time to be “negative” has passed. These worries are out in the open and recognized, and now fear is the prevailing sentiment. History suggests this is the time to be more constructive. We are positive about the future and feel the set up for stocks is the best it has been in years.
We will delve into this theme shortly. Before that, we want to address some issues that have held back the performance in recent periods. Although the FMI Large Cap Fund has a greater percentage of its holdings’ revenue in the U.S. than the S&P 500, about 15% of the Fund, on average, in recent years has been in American Depositary Receipts (ADRs). We felt these franchises were better values than their U.S. counterparts, as depicted in the nearby table.
| 1 | The FMI Large Cap Fund Investor Class (FMIHX) and the FMI Large Cap Fund Institutional Class (FMIQX) had a return of -6.43% and -6.44%, respectively, for the third quarter of 2022. |
| 2 | Source: Bloomberg – returns do not reflect management fees, transaction costs or expenses. Performance is based on market price returns. Beginning 8/10/2020, market price returns are calculated using closing price. Prior to 8/10/2020, market price returns were calculated using midpoint bid/ask spread at 4:00 PM ET. |
| Sponsored ADR’s | EV/EBITDA NTM | U.S. Stock | EV/EBITDA NTM | Discount |
| SAP SE | 11.1x | Salesforce Inc. Workday Inc. | 13.6x 20.4x | -18% -46% |
| Unilever PLC | 12.4x | Procter & Gamble Co. Colgate-Palmolive Co. | 15.2x 14.7x | -18% -16% |
| Sony Group Corp. | 6.6x | Electronic Arts Inc. Warner Music Group Corp. | 10.8x 12.8x | -39% -48% |
| Smith & Nephew PLC | 9.3x | Stryker Corp. Zimmer Biomet Holdings Inc. | 17.4x 11.5x | -47% -19% |
| Koninklijke Philips N.V. | 7.0x | Boston Scientific Corp. Medtronic PLC | 16.4x 12.6x | -57% -44% |
| Fresenius Medical Care AG & Co. KGaA | 7.0x | Da Vita Inc. | 8.6x | -19% |
| Source: FactSet - EV/EBITDA NTM as of 9/30/2022 | ||||
Unfortunately, the unprecedented strength of the U.S. Dollar (USD) has hurt performance of these shares (which can easily reverse), but significant idiosyncratic factors have been more impactful. Philips, for example, has declined dramatically in response to issues surrounding their respiratory business, including a product recall and FDA letter. While this is less than 10% of Philip’s revenue and earnings, the impact on the market capitalization has been severe. Fear of a large legal settlement and negative news flow has, in our opinion, far exceeded the likely outcome. Fresenius, which provides dialysis care, was hurt by excess mortality during COVID. Post-COVID inflation has taken a much greater-than-expected bite out of earnings (and the stock price). Smith & Nephew PLC-SP-ADR has suffered disproportionately from COVID (deferred elective procedures), supply chain problems, and mismanagement in their orthopedic franchise. We probably should have anticipated the inflation issue at Fresenius, and we could have better understood the management issues at Smith & Nephew, but when we re-underwrote these investments, we felt the stock’s long-term upside potential was high. The decline in SAP SE-SP-ADR is related to market fears about the success of their efforts to transition the software business from a site license model to a cloud-based recurring revenue construct. Based on our research, we believe the company is on a positive cloud development path and that better stock performance is likely. Finally, the Fund has been hurt by very little exposure to energy and commodity related businesses. We feel these types of companies can periodically be great “trading” stocks, but over long periods of time, they generally underperform due to their low business quality attributes.
The team’s optimism starts with valuations. The portfolio trades at a modest 14.0 times projected 2023 earnings, 2.1 times the latest twelve month’s revenue and 12.9 times the trailing year’s EV/EBITDA. On these metrics that is about a 34% discount to the iShares S&P 500 ETF, as illustrated by the nearby table. The Fund also trades at a discount to the large cap value benchmark.
| September 30, 2022 Weighted Average | FMI Large Cap Fund | iShares S&P 500 | Discount to S&P 500 |
| P/E (1 Year Trailing) | 21.1x | 29.3x | 28% |
| FY2 P/E | 14.0x | 19.4x | 28% |
| P/S | 2.1x | 4.5x | 53% |
| EV/EBITDA | 12.9x | 18.1x | 29% |
| Average Discount | 34% | ||
| *Estimated valuations for FMI and the iShares are weighted average valuation calculations, not reweighted to exclude cash, and financial companies are excluded from the EV/EBITDA calculation. Valuations for both the portfolio and the ETF are modified based on criteria identified by FMI. For more detailed information regarding these valuations, please contact FMI. | |||
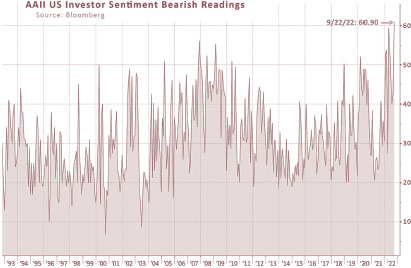
Bearish sentiment indicators (see chart below) are high. We view this as a positive. It is very difficult to avoid dwelling on “losses,” but there is nothing we can do about the past. If the business is sound and the balance sheet is solid, then the stock is likely to recover. Unfortunately, most investors react to the past rather than looking forward. The current Fund constituents are characterized by good balance sheets, solid return structures, and competitive strengths. Strong companies on sale for reasonable prices are a source of optimism, not pessimism.
Financial markets are apoplectic about interest rates. The overwhelming consensus opinion is that higher rates will crush the economy for an extended period. We think the fear that has been fanned by the rate move may indeed result in a temporary hit to the economy or a recession, but at FMI, we like to turn our analysis 180 degrees. Did the move from “normal” interest rates, prior to the Great Financial Crisis, to zero percent rates for years afterwards cause the economy to boom? No! Economic growth was historically weak over the past 15 years. Abnormally low rates boosted asset prices and set the mergers and acquisitions (M&A) and private equity markets aflame, but it did very little for organic economic growth. We had a boom in financial engineering. So why will economic growth be terrible when the reverse conditions prevail? We think economic growth will be much better over the next decade than it has been over the last. Price to earnings (P/E) multiples, however, will likely be lower. Inflation is obviously very elevated but appears to finally be on a downward path. We don’t know if the inflation rate will get back to 2% anytime soon but feel it will be significantly lower than it has been over the past year. Earning an outsized spread over inflation in stocks, like we have seen for many years, is probably not in the cards, but we believe quality, value-oriented equities, especially our stocks, have the best chance of beating inflation over a three-to-five-year time horizon.
Before delving into a couple of portfolio companies in greater detail, we want to illustrate what’s happened since our January investment in CarMax Inc., a stock highlighted in the March letter. It illustrates our investment approach. CarMax is currently out-of-favor, yet it has a winning business model, and a leading share of the used car market. With just 4% of a $270 billion market, it has a long runway for growth. Over the past few years, the bears believed that Carvana Co. and other “online” car resellers were going to take the used car market by storm, leaving CarMax in the dust. Carvana’s stock was a rocket and at one point carried a market valuation in excess of $40 billion, despite the company losing money hand over fist. Our research indicated that customers wanted multiple ways to purchase used cars (not just online like Carvana) and that CarMax offered not only the more traditional car lot sale, but also a full online and delivered-to-the-home model. CarMax was (and remains) profitable and has a good balance sheet. Carvana was chewing through cash and relied on capital markets to fund its growth-at-all-cost approach. Carvana’s stock is down roughly 90% year-to-date; they’ve had to raise equity, and some question their viability. CarMax is also down significantly, reflecting recession fears, higher borrowing rates, and tough earnings comparisons, which we discussed in March. So, while the stock has been difficult, we feel CarMax is actually stronger from a competitive standpoint. It looks like we will have to wait out a downturn, but from today’s valuation, we feel the next several years hold a lot of promise for the stock.
Below are two more examples of good business franchises trading at attractive values.
Avery Dennison Corp. (AVY)
Analyst: Ben Karek
Description
Avery Dennison is a vertically integrated manufacturer of pressure sensitive labels and assorted tickets and tags. Pressure sensitive labels are used on products such as beverages, shampoo, shipping packages, pharmaceuticals, etc. Avery reports in three segments: Pressure Sensitive Materials (65% of sales), Retail Branding & Information Solutions (26%), and Industrial & Healthcare Materials (9%). Avery primarily manufactures locally and operates 200 manufacturing and distribution facilities in over 50 countries.
Good Business
| ● | Avery is the global leader in its main product lines and is 2.5 times larger than its next largest competitor in pressure sensitive labels. This confers scale benefits that allow it to earn best-in-class margins while still leading on innovation. |
| ● | Avery is minimally cyclical. Fast turning product lines, including consumer goods, retail, and logistics/shipping account for ~80% of sales. Avery has proven adept at cost management in periods of lower demand. |
| ● | Avery’s product usage is not impacted by the shift to private label and/or start up brands, a perennial challenge in home and personal care/consumer packaged goods categories. |
| ● | Avery’s products are low-cost relative to the total product, yet they convey high value information to the consumer (brand image, product quality, etc.). |
| ● | Avery has 50%+ market share in ultra-high frequency radio frequency identification (UHF RFID) tags, which are undergoing secular growth in the +15-20% range. |
| ● | Avery’s historical and incremental returns on capital are high. ROIC was 18% in 2021, up from 9% in 2012, driven by both capital discipline and operating profit growth. |
| ● | Avery’s balance sheet is appropriately levered. |
Valuation
| ● | With high-single-digit long term earnings growth expectations and a 20% return on invested capital, 16 times forward earnings and 11.4 times forward EBITDA are reasonable absolute multiples. |
| ● | Prior to this period of raw material inflation and a potential macro slow down, Avery traded at 25 times forward earnings and 16 times forward EBITDA. The P/E is below the 5-year average and EV/EBITDA is equal to the 5-year average. |
| ● | RFID is 8% of sales and continues to grow well above the company average. We believe that this could structurally increase Avery’s trading multiple in the next 3-5 years. |
Management
| ● | CEO Mitch Butier was a chief architect of Avery’s Economic Value Added (EVA) strategy. He has previously served as COO and CFO for Avery Dennison. His track record since becoming CEO in 2016 is very strong. Mitch owns 270 thousand shares, worth $50 million at today’s prices. |
| ● | Avery’s incentives are aligned with shareholders. Short term incentives are based on organic sales, adjusted earnings per share (EPS), and free cash flow. Long term incentives are driven by total shareholder return and EVA. |
Investment Thesis
Avery has two key drivers that allow them to grow organic revenue above GDP: high value categories and emerging markets. 60% of sales are now exposed to one or both categories. Of note within high value products, Avery is by far the market leader in UHF RFID tags used in end markets like apparel, aviation, and food. This business is growing 15-20% and has a long runway in both existing and yet to be tapped end markets. These factors allow for long run volume growth in the 4% range. This story is simple to understand and, in more benign times, generates a lot of interest from investors. Combined with a long running cost efficiency program and share buybacks, we expect a reasonably stable high single digit percentage earnings growth profile. This is particularly valuable as Avery is run on EVA and thus consistently balances growth, margins, and returns on capital (i.e. they are not growing for growth’s sake). Avery has run into a few headwinds that are giving us an opportunity to invest. First, Avery’s commodity raw materials are derived from paper and oil, both of which have seen significant spikes driven by supply and demand factors. This has put pressure on Avery’s margins as it takes one to two quarters to catch up to cost inflation. Given the magnitude and duration of the inflation, there is concern around when they will recapture price/cost neutrality. Second, inflation combined with other macro challenges (like the war in Ukraine), have led to concerns about a global recession. Although Avery is much less cyclical than average, it is more cyclical than some other packaging companies and thus is sold quickly when macro fears emerge. We believe all these factors to be transitory, and thus believe that the valuation is attractive.
Ferguson PLC (FERG)
Analyst: Jordan Teschendorf
Description
Ferguson is the world’s largest distributor of plumbing and heating products to trade professionals with sales and trading profit of $22.8 billion and $2.1 billion, respectively. Following disposals of lower quality international businesses over more than a decade, concluding with the recent sale of the UK business in January 2021, Ferguson’s operations are now entirely focused on the attractive North American market. Ferguson’s sales exposure by end market is split Residential (54%), Commercial (32%), Civil/Infrastructure (7%), and Industrial (7%), with sales further split 60%/40% remodel, maintenance, and improvement (RMI) versus new construction. Ferguson’s U.S. headquarters is in Newport News, Virginia.
Good Business
| ● | Ferguson has exited many unprofitable or low-returning businesses over the last decade and reoriented towards organic growth and selective bolt-on acquisitions, driving improved margins and returns on capital. |
| ● | The business is easy to understand, occupies a critical role between fragmented suppliers (over 37 thousand) and customers (over 1 million), and consistently grows 3-4% ahead of the end markets that it serves. |
| ● | The company’s scale, branch density, and distribution footprint provide it with a competitive advantage in terms of purchasing, fulfillment, contractor relationships, and superior service levels versus its fragmented competition. |
| ● | In 2021, approximately 60% of Ferguson’s sales were related to RMI work, which is less cyclical and typically carries higher margins than sales to the new build market. This mix compares favorably with the group’s 31% RMI exposure in 2008. |
| ● | Ferguson’s U.S. business has a terrific long-term track record, with operating profit growing in the double-digits over the trailing 10, 20, and 30-year periods. We believe the customer value proposition and franchise continue to strengthen with scale, which should flow through to improving economics for shareowners. |
Ferguson maintains a solid balance sheet, and is a strong free cash flow generator, with total cash returns exceeding $9.0 billion over the last decade.
Valuation
| ● | The stock trades at 11.3 times forward EPS estimates, approximately two standard deviations below its long-term average and a double-digit discount to its closest U.S. peers. |
| ● | The below average valuation does not adequately reflect the company’s increasingly attractive business mix as well as the continued strengthening of Ferguson’s competitive positioning. |
| ● | Ferguson pays regular and special dividends and recently restarted its share repurchase program (repurchased more than $500 million in the third quarter of fiscal year 2022 alone). |
Management
| ● | Over the last decade, management has focused on organic growth and returns, strengthening its already market leading U.S. business and divesting operations in several less attractive geographies. |
| ● | Kevin Murphy was elevated to group CEO in 2019, previously serving as CEO of Ferguson (U.S.A.) and COO. He has built a solid track record of profitable and disciplined growth through prioritizing data/analytics, digital capability, and talent management to position Ferguson closer to its trade customers. He joined Ferguson decades ago through the acquisition of his family’s business. |
| ● | Operating profit/EPS growth and cash conversion are components of the compensation plan, capturing the essence of value creation for a physical distribution business. |
| ● | We believe Ferguson has a strong corporate culture. |
Investment Thesis
Ferguson provides the Fund exposure to the building, repair, and replacement of critical components, touching virtually every modern physical structure and piece of infrastructure in North America. Given its advantages, including its scale, branch density, distribution footprint, and technology and service superiority, we expect Ferguson will continue to take share in its markets over time. Concerns over rising interest rates, consumer confidence, and normalizing demand patterns in residential end markets (~55% of sales) have recently weighed on sentiment. We acknowledge these concerns, but note the company’s track record of managing through cycles, stronger outlook in several non-residential markets, and significantly improved business mix this cycle (U.S. pure play, higher repair & replacement, network density, etc.). Assuming reasonably supportive end markets and continued strong execution, Ferguson should be capable of growing underlying EPS at a double-digit annual rate through the cycle while maintaining 20%+ returns on capital and balance sheet strength. The stock is attractively valued on an absolute and relative basis. Additionally, we think it is likely that Ferguson will be added to S&P 500 and other U.S. indices within the next year.
Thank you for your confidence in The FMI Large Cap Fund.
This shareholder letter is unaudited.
FMI Large Cap Fund
MANAGEMENT’S DISCUSSION OF FUND PERFORMANCE (Unaudited)
During the fiscal year ended September 30, 2022, the FMI Large Cap Fund (“Fund”) had a total return of minus 15.86%1. The benchmark S&P 500 Index returned minus 15.47% in the same period. The trailing 12-month return for the iShares Russell 1000 Value ETF2 was minus 11.40%. Relative to the S&P 500, sectors that aided performance included Finance, Retail Trade, and Producer Manufacturing. Progressive Corp., The Charles Schwab Corp., Arch Capital Group Ltd., and Chubb Ltd. drove the results in the Finance sector, as all continued to grow earnings and benefit from higher interest rates or solid underwriting. In Retail Trade, Dollar Tree Inc. and Dollar General Corp. gained significantly in the period, with the former benefitting from a new management team and the latter from efficient execution. In Producer Manufacturing, Carlisle Cos. Inc. had strong results as the commercial roofing business grew significantly. On the negative side of sector performance, Health Technology, Health Services, and Electronic Technology all detracted. Koninklijke Philips N.V.-SP-ADR continued to decline due to ongoing fallout from a product recall in the sleep apnea area and an FDA letter. Smith & Nephew PLC-SP-ADR also underperformed, as missteps in the orthopedic area combined with supply chain problems derailed the earnings recovery from COVID related trading conditions. Fresenius Medical Care AG & Co. KGaA-SP-ADR, which has suffered from excess mortality related to COVID, also missed earnings expectations because of their inability to quickly pass on inflationary costs. In all three of these health care related stocks, the Fund managers believe the problems are fixable and short-term in nature. In the Electronic Technology sector, Micron Technology Inc. dropped significantly in the second half of the fiscal year as a downturn beset the memory market. Sony Group Corp.-SP-ADR also hurt performance, primarily due to supply chain issues and currency. The Fund managers believe the problems at Micron and Sony are temporary. The Fund managers seek to own high quality, value-oriented stocks. Sometimes the market wants stocks in areas that we believe are lower quality in nature, such as energy and commodities. The Fund had no direct exposure to Energy Minerals, which significantly detracted from the relative results compared to both the S&P 500 and the iShares Russell 1000 Value ETF.
Other stocks that helped performance included Berkshire Hathaway Inc. – Cl B, PACCAR Inc., and The TJX Cos. Inc. Berkshire benefitted from solid underwriting results and good performance in the operating units. PACCAR and TJX managed their respective businesses well in the face of choppy end markets. Other detractors included Meta Platforms Inc. – Cl A, Alphabet Inc. – Cl A, and SAP SE-SP-ADR. Meta and Alphabet experienced a slowdown in their digital advertising businesses. Additionally, Meta faced stronger competition from TikTok. The market has been skeptical of SAP’s transition from a software site license business to a cloud-based revenue model. New additions to the Fund over the past twelve months included SAP, CarMax Inc., Carlisle, CDW Corp., Avery Dennison Corp., Ferguson PLC, and BlackRock Inc. Stocks sold during the year included Expeditors International of Washington Inc., Emerson Electric Co., Quest Diagnostics Inc., PPG Industries Inc., Dover Corp., Chubb Ltd., and Comcast Corp. – Cl A. As of September 30, 2022, the Fund was significantly overweighted in Producer Manufacturing, Retail Trade, and Finance. The Fund was meaningfully underweighted in Technology Services, Electronic Technology, and Health Technology.
The S&P 500 entered a traditionally defined bear market in fiscal 2022 (down 20%). Earnings growth has remained relatively robust over the year, so valuations have come down significantly. Worries about high inflation, rising interest rates, and an economic slowdown permeate the landscape. Geopolitical issues, particularly the Russian war with Ukraine and the saber rattling by China over Taiwan, have further spooked investors.
| 1 | The FMI Large Cap Fund Investor Class (FMIHX) and the FMI Large Cap Fund Institutional Class (FMIQX) had a return of -15.86% and -15.73%, respectively, for the fiscal year ended 09/30/2022. |
| 2 | Source: Bloomberg – returns do not reflect management fees, transaction costs or expenses. Performance is based on market price returns. Beginning 8/10/2020, market price returns are calculated using closing price. Prior to 8/10/2020, market price returns were calculated using midpoint bid/ask spread at 4:00 PM ET. |
FMI Large Cap Fund
MANAGEMENT’S DISCUSSION OF FUND PERFORMANCE (Unaudited) (Continued)
The Fund managers have become more optimistic about future performance now that many potential worries have become visible realities. The Federal Reserve is no longer printing money, but instead is engaging in quantitative tightening. This should help control inflation and engender a more normal interest rate environment. A realistic cost of capital helps move the economy from one driven by financial engineering to one driven by fundamental investment. Companies with solid balance sheets that make money stand a better chance of outperforming compared to the previous environment, where more speculative businesses outperformed. The Fund trades at a meaningful discount to the S&P 500, and the managers believe the quality of the underlying companies is better than the benchmark.
COMPARISON OF CHANGE IN VALUE OF $10,000 INVESTMENT IN
FMI LARGE CAP FUND – INVESTOR CLASS — STANDARD & POOR’S 500 INDEX(1)
AND THE ISHARES RUSSELL 1000 VALUE ETF(2)
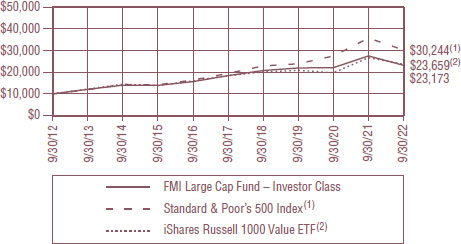
Source: Bloomberg – returns do not reflect management fees, transaction costs or expenses. Performance is based on market price returns. Beginning 8/10/2020, market price returns are calculated using closing price. Prior to 8/10/2020, market price returns were calculated using midpoint bid/ask spread at 4:00 PM ET.
AVERAGE ANNUALIZED TOTAL RETURN
| Inception Date | 1-Year | 5-Year | 10-Year | Inception through 9/30/2022 | |
| FMI Large Cap Fund – Investor Class | 12/31/01 | -15.86% | 4.67% | 8.77% | 7.99% |
| FMI Large Cap Fund – Institutional Class | 10/31/16 | -15.73% | 4.82% | N/A | 7.43% |
| Standard & Poor’s 500 Index(1)* | -15.47% | 9.24% | 11.70% | 7.74% | |
| iShares Russell 1000 Value ETF(2)* | -11.40% | 5.15% | 8.99% | 6.85% |
The graph and the table do not reflect the deduction of taxes that a shareholder would pay on Fund distributions or the redemption of Fund shares. Performance data quoted represents past performance; past performance does not guarantee future results. Investment return and principal value of an investment will fluctuate so that an investor’s shares, when redeemed, may be worth more or less than their original cost. Current performance of a Fund may be lower or higher than the performance quoted. The total returns do not reflect the deduction of taxes that a shareholder would pay on Fund distributions or the redemption of Fund shares. Total return includes change in share prices and in each case includes reinvestments of any dividends, interest and capital gain distributions. Performance data current to the most recent month-end may be obtained by visiting www.fmifunds.com or by calling 1-800-811-5311.
FMI Large Cap Fund
MANAGEMENT’S DISCUSSION OF FUND PERFORMANCE (Unaudited) (Continued)
| (1) | The Standard & Poor’s 500 Index consists of 500 selected common stocks, most of which are listed on the New York Stock Exchange. The Standard & Poor’s Ratings Group designates the stocks to be included in the Index on a statistical basis. A particular stock’s weighting in the Index is based on its relative total market value (i.e., its market price per share times the number of shares outstanding). Stocks may be added or deleted from the Index from time to time. |
| (2) | The iShares Russell 1000 Value ETF seeks to track investment results of an index composed of large- and mid-capitalization U.S. equities that exhibit value characteristics. Performance is compared to the iShares Russell 1000 Value (“ETF”) for illustrative purposes only. The metrics regarding the comparative ETF have been obtained from Bloomberg and the returns do not reflect management fees, transaction costs or expenses. Performance is based on market price returns. Beginning 8/10/2020, market price returns are calculated using closing price. Prior to 8/10/2020, market price returns were calculated using midpoint bid/ask spread at 4:00 PM ET. The ETF is not subject to the same fees or expenses as the Fund. The Fund is not restricted to investing in those securities which comprise the ETF. The Fund’s performance may or may not correlate to the ETF, and it should not be considered a proxy for the ETF. |
| * | The benchmark since inception returns are calculated since inception of the Investor Class, December 31, 2001 to September 30, 2022. |
An investment cannot be made directly into an index.
FMI Large Cap Fund
September 30, 2022
| Shares | Cost | Value | ||||||||||
| COMMON STOCKS — 99.0% (a) | ||||||||||||
| COMMERCIAL SERVICES SECTOR — 2.9% | ||||||||||||
| Advertising/Marketing Services — 2.9% | ||||||||||||
| 935,000 | Omnicom Group Inc. | $ | 62,185,448 | $ | 58,989,150 | |||||||
| CONSUMER NON-DURABLES SECTOR — 3.7% | ||||||||||||
| Household/Personal Care — 3.7% | ||||||||||||
| 1,755,000 | Unilever PLC — SP-ADR | 69,516,156 | 76,939,200 | |||||||||
| CONSUMER SERVICES SECTOR — 3.7% | ||||||||||||
| Other Consumer Services — 3.7% | ||||||||||||
| 47,000 | Booking Holdings Inc.* | 81,939,448 | 77,230,870 | |||||||||
| DISTRIBUTION SERVICES SECTOR — 2.9% | ||||||||||||
| Wholesale Distributors — 2.9% | ||||||||||||
| 580,000 | Ferguson PLC | 74,726,132 | 59,699,400 | |||||||||
| ELECTRONIC TECHNOLOGY SECTOR — 6.5% | ||||||||||||
| Computer Processing Hardware — 3.3% | ||||||||||||
| 1,060,000 | Sony Group Corp. — SP-ADR | 66,875,744 | 67,893,000 | |||||||||
| Semiconductors — 3.2% | ||||||||||||
| 1,330,000 | Micron Technology Inc. | 69,772,589 | 66,633,000 | |||||||||
| FINANCE SECTOR — 23.2% | ||||||||||||
| Investment Banks/Brokers — 5.5% | ||||||||||||
| 1,565,000 | The Charles Schwab Corp. | 64,239,804 | 112,476,550 | |||||||||
| Investment Managers — 1.7% | ||||||||||||
| 65,000 | BlackRock Inc. | 38,281,392 | 35,768,200 | |||||||||
| Major Banks — 2.2% | ||||||||||||
| 435,000 | JPMorgan Chase & Co. | 27,689,577 | 45,457,500 | |||||||||
| Multi-Line Insurance — 8.5% | ||||||||||||
| 1,210,000 | Arch Capital Group Ltd.* | 44,658,577 | 55,103,400 | |||||||||
| 450,000 | Berkshire Hathaway Inc. — Cl B* | 22,426,305 | 120,159,000 | |||||||||
| 67,084,882 | 175,262,400 | |||||||||||
| Property/Casualty Insurance — 2.0% | ||||||||||||
| 360,000 | Progressive Corp. | 26,875,563 | 41,835,600 | |||||||||
| Regional Banks — 3.3% | ||||||||||||
| 805,000 | Northern Trust Corp. | 69,526,301 | 68,875,800 | |||||||||
| HEALTH SERVICES SECTOR — 5.7% | ||||||||||||
| Managed Health Care — 4.4% | ||||||||||||
| 180,000 | UnitedHealth Group Inc. | 12,853,494 | 90,907,200 | |||||||||
| Medical/Nursing Services — 1.3% | ||||||||||||
| 1,955,000 | Fresenius Medical Care | |||||||||||
| AG & Co. KGaA — SP-ADR | 78,587,312 | 27,448,200 | ||||||||||
The accompanying notes to financial statements are an integral part of this schedule.
FMI Large Cap Fund
SCHEDULE OF INVESTMENTS (Continued)
September 30, 2022
| Shares | Cost | Value | ||||||||||
| COMMON STOCKS — 99.0% (a) (Continued) | ||||||||||||
| HEALTH TECHNOLOGY SECTOR — 4.0% | ||||||||||||
| Medical Specialties — 4.0% | ||||||||||||
| 2,135,000 | Koninklijke Philips N.V. — SP-ADR | $ | 95,584,258 | $ | 32,857,650 | |||||||
| 2,165,000 | Smith & Nephew PLC — SP-ADR | 78,055,967 | 50,271,300 | |||||||||
| 173,640,225 | 83,128,950 | |||||||||||
| INDUSTRIAL SERVICES SECTOR — 1.6% | ||||||||||||
| Oilfield Services/Equipment — 1.6% | ||||||||||||
| 945,000 | Schlumberger Ltd. | 18,181,044 | 33,925,500 | |||||||||
| PROCESS INDUSTRIES SECTOR — 3.3% | ||||||||||||
| Containers/Packaging — 3.3% | ||||||||||||
| 420,000 | Avery Dennison Corp. | 72,915,271 | 68,334,000 | |||||||||
| PRODUCER MANUFACTURING SECTOR — 13.8% | ||||||||||||
| Building Products — 7.6% | ||||||||||||
| 266,000 | Carlisle Cos. Inc. | 64,210,810 | 74,589,060 | |||||||||
| 1,785,000 | Masco Corp. | 58,390,770 | 83,341,650 | |||||||||
| 122,601,580 | 157,930,710 | |||||||||||
| Electrical Products — 2.4% | ||||||||||||
| 375,000 | Eaton Corp. PLC | 35,556,027 | 50,010,000 | |||||||||
| Trucks/Construction/Farm Machinery — 3.8% | ||||||||||||
| 945,000 | PACCAR Inc. | 44,973,544 | 79,087,050 | |||||||||
| RETAIL TRADE SECTOR — 15.8% | ||||||||||||
| Apparel/Footwear Retail — 2.5% | ||||||||||||
| 835,000 | The TJX Cos. Inc. | 33,029,932 | 51,870,200 | |||||||||
| Discount Stores — 10.8% | ||||||||||||
| 560,000 | Dollar General Corp. | 39,984,997 | 134,321,600 | |||||||||
| 655,000 | Dollar Tree Inc.* | 56,883,492 | 89,145,500 | |||||||||
| 96,868,489 | 223,467,100 | |||||||||||
| Specialty Stores — 2.5% | ||||||||||||
| 770,000 | CarMax Inc.* | 79,041,953 | 50,835,400 | |||||||||
| TECHNOLOGY SERVICES SECTOR — 11.9% | ||||||||||||
| Information Technology Services — 3.8% | ||||||||||||
| 500,000 | CDW Corp. | 88,032,215 | 78,040,000 | |||||||||
| Internet Software/Services — 5.3% | ||||||||||||
| 865,000 | Alphabet Inc. — Cl A* | 100,993,814 | 82,737,250 | |||||||||
| 205,000 | Meta Platforms Inc. — Cl A | |||||||||||
| (formerly Facebook Inc.)* | 64,934,226 | 27,814,400 | ||||||||||
| 165,928,040 | 110,551,650 | |||||||||||
| Packaged Software — 2.8% | ||||||||||||
| 725,000 | SAP SE — SP-ADR | 86,680,260 | 58,906,250 | |||||||||
| Total common stocks | 1,827,602,422 | 2,051,502,880 | ||||||||||
The accompanying notes to financial statements are an integral part of this schedule.
FMI Large Cap Fund
SCHEDULE OF INVESTMENTS (Continued)
September 30, 2022
| Principal Amount | Cost | Value | ||||||||||
| SHORT-TERM INVESTMENTS — 0.9% (a) | ||||||||||||
| Bank Deposit Account — 0.9% | ||||||||||||
| $ | 19,135,997 | U.S. Bank N.A., 2.65%^ | $ | 19,135,997 | $ | 19,135,997 | ||||||
| Total short-term investments | 19,135,997 | 19,135,997 | ||||||||||
| Total investments — 99.9% | $ | 1,846,738,419 | 2,070,638,877 | |||||||||
| Other assets, less liabilities — 0.1% (a) | 1,534,469 | |||||||||||
| TOTAL NET ASSETS — 100.0% | $ | 2,072,173,346 | ||||||||||
| * | Non-income producing security. |
| ^ | The rate shown is as of September 30, 2022. |
| (a) | Percentages for the various classifications relate to total net assets. |
| PLC | Public Limited Company |
| SP-ADR | Sponsored American Depositary Receipt |
The accompanying notes to financial statements are an integral part of this schedule.
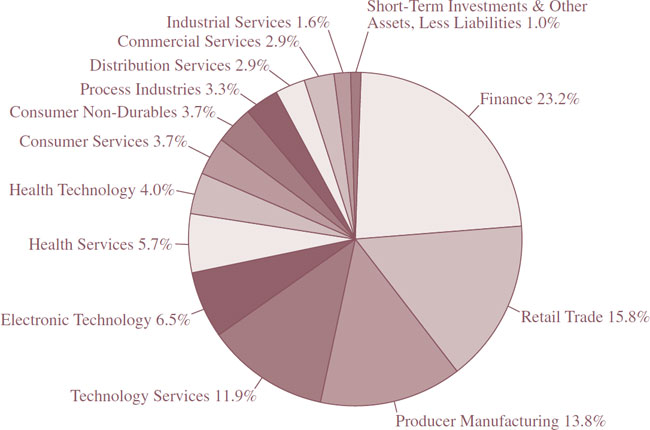
INDUSTRY SECTORS as a percentage of net assets
as of September 30, 2022 (Unaudited)
| FMI | ||
| Common Stock | ||
| Fund | ||
| (unaudited) | September 30, 2022 |
The FMI Common Stock Fund (“Fund”) declined 1.22%1 in the September quarter compared to a 2.19% decline in the Russell 2000 Index (“Russell 2000”) and a 4.61% loss in the Russell 2000 Value Index (“Russell 2000 Value”). Relative to the Russell 2000, sectors that helped included Retail Trade, Finance, and Electronic Technology. Underperforming sectors included Health Technology, Distribution Services, and Commercial Services. BJ’s Wholesale Club Holdings Inc., FirstCash Holdings Inc., and Plexus Corp. aided performance while Simpson Manufacturing Co. Inc., Arrow Electronics Inc., and Concentrix Corp. all detracted. Both stocks and bonds entered bear market territory this year on multiple concerns, some of which will be addressed shortly.
While the markets have been difficult, the team has not been this optimistic about future performance in many years, perhaps not since the Great Financial Crisis. There are several factors that give us optimism:
| ● | Valuations are attractive on both an absolute and relative basis. |
| ● | The sentiment of the market is negative, which is a contrarian’s delight. |
| ● | The strength and durability of the current portfolio has rarely been stronger. |
| ● | The full cycle return on invested capital of the constituents is very good. |
| ● | Many current holdings are significantly depressed, and we view them as coiled springs. |
| ● | The era of ultra-low interest rates appears to be over. This should favor our approach. |
Many of the worrisome issues and themes we have discussed in recent years are coming to pass. Rates have escalated rapidly. Reckless, and even feckless, monetary policies have been revealed. The bond market has suffered steep declines. Stocks are in disarray. The private equity and leverage bubbles have started to burst. Inflation is much higher. A “black swan” geopolitical event (Russia’s war on Ukraine) has transpired. Many of the risk items that sky-high valuations suggested would not occur are now happening. But the time to be “negative” has passed. These worries are out in the open and recognized and now fear is the prevailing sentiment. History suggests this is the time to be more constructive. We are positive about the future and feel the set up for stocks is the best it has been in years.
We will delve into this theme shortly. Before that, we want to address some stocks that have lagged recently and why we have decided to stick with them or cut them loose. Arrow Electronics has been a long-term holding for the Fund. The stock is much more volatile than the underlying fundamentals. Arrow distributes semiconductors and technology hardware, and those end markets are in a cyclical downturn, taking the stock with them. Arrow has proven its ability to adjust to the cycles and ultimately thrive, and with the valuation low, our current plan is to stick with it. Henry Schein Inc., like Arrow, is a distributor, primarily in the dental arena, but also in medical supplies. Fears about slowing dental markets and tough comparisons have hurt the stock in the short run. We do not think Henry Schein’s competitive position has diminished. With a reasonable valuation for a high-quality defensive company, we’ve increased our investment. On the flipside, we exited Phibro Animal Health Corp. – Cl A, the animal health products producer. Inconsistent execution doomed this idea. It was a small holding that was proving more trouble than it was worth. Concentrix, which had been a good stock initially, fell significantly since the last quarter. The market was spooked by a modest slowing of growth. We were more concerned about a ramping up of the mergers and acquisitions (M&A) rhetoric and decided to move to the sidelines.
| 1 | The FMI Common Stock Fund Investor Class (FMIMX) and the FMI Common Stock Fund Institutional Class (FMIUX) had a return of -1.22% and -1.22%, respectively, for the third quarter of 2022. |
The team’s optimism starts with valuations. The Fund trades at a modest 12.9 times projected 2023 earnings, 1.3 times the latest twelve month’s revenue and 10.3 times the trailing year’s EV/EBITDA. On these metrics that is about a 54% discount to the iShares Russell 2000 ETF, as illustrated by the nearby table. The Fund also trades at a discount to the small cap value benchmark.
| September 30, 2022 Weighted Average | FMI Common Stock Fund | iShares Russell 2000 | Discount to Russell 2000 |
| P/E (1Year Trailing) | 15.9x | 29.4x | 46% |
| FY2 P/E | 12.9x | 23.5x | 45% |
| P/S | 1.3x | 5.3x | 75% |
| EV/EBITDA | 10.3x | 20.6x | 50% |
| Average Discount | 54% | ||
| *Estimated valuations for FMI and the iShares are weighted average valuation calculations, not reweighted to exclude cash, and financial companies are excluded from the EV/EBITDA calculation. Valuations for both the portfolio and the ETF are modified based on criteria identified by FMI. For more detailed information regarding these valuations, please contact FMI. | |||
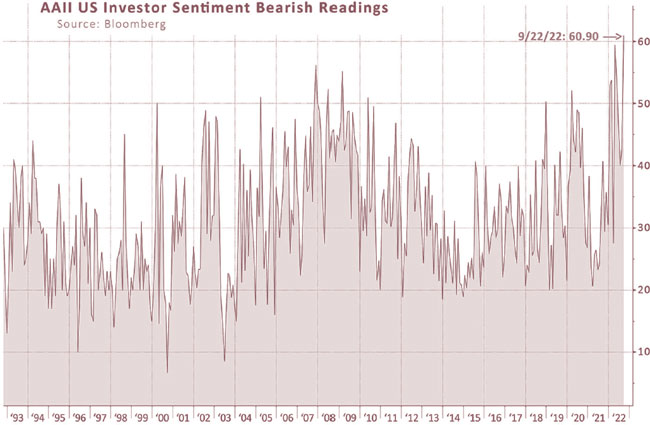
Bearish sentiment indicators (see chart below) are high. We view this as a positive. It is very difficult to avoid dwelling on “losses,” but there is nothing anyone can do about the past. If the business is sound and the balance sheet is solid, then the stock is likely to recover. Unfortunately, most investors react to the past rather than look forward. The current Fund constituents are characterized by good balance sheets, solid return structures, and competitive strengths. Strong companies on sale for reasonable prices are a source of optimism, not pessimism.
Financial markets are apoplectic about interest rates. The overwhelming consensus opinion is that higher rates will crush the economy for an extended period. We think the fear that has been fanned by the rate move may indeed result in a temporary hit to the economy or a recession, but at FMI, we like to turn our analysis 180 degrees. Did the move from “normal” interest rates prior to the Great Financial Crisis, to zero percent rates for years afterwards cause the economy to boom? No! Economic growth was historically weak over the past 15 years. Abnormally low rates boosted asset prices and set the mergers and acquisitions (M&A) and private equity markets aflame, but it did very little for organic economic growth. We had a boom in financial engineering. So why will economic growth be terrible when the reverse conditions prevail? We think economic growth will be better over the next decade than it has been over the last. Price to earnings (P/E) multiples, however, will likely be lower. Inflation is obviously very elevated but appears to finally be on a downward path. We don’t know if the inflation rate will get back to 2% anytime soon, but feel it will be significantly lower than it has been over the past year. Earning an outsized spread over inflation in stocks, like we have seen for many years, is probably not in the cards, but we believe quality, value-oriented equities, especially our stocks, have the best chance of beating inflation over a three-to-five-year time horizon.
Before delving into a couple of portfolio companies in greater detail, we want to discuss what’s happened since our late 2021 investment in Skechers U.S.A. Inc. – Cl A, a stock highlighted in the March letter. It illustrates our investment approach. Skechers has performed about in line with the small cap benchmarks since purchase but is down approximately 30% in absolute terms. Earnings estimates for 2022 are only down about 11% since we bought it. China lockdown issues and European exposure have been cited as factors. We expect some of these pressures to continue for a few months or quarters, but the franchise remains strong, and we’ve added to the stock. Management has performed admirably for decades at Skechers and we think the odds favor the stock at today’s attractive valuation.
Below are two more examples of good business franchises trading at attractive values.
Simpson Manufacturing Co. Inc. (SSD)
Analyst: Rob Helf
Description
Simpson Manufacturing Co. Inc., designs, engineers, and manufactures wood and concrete construction products. These include connectors, truss plates, and fasteners/fastening systems, as well as concrete construction products (adhesives, specialty chemicals, mechanical anchors, powder actuated tools, and reinforcing fiber materials). Structural connectors are typically steel devices used to strengthen, support, and connect load-bearing elements within a building. We estimate that wood connector products are 80% of both revenue and gross profits for the company. Importantly, most of the wood products are for new home construction (50%), with the balance being multi-family construction and repair and remodel (30%).
Good Business
| ● | Simpson is a leader in structural connector manufacturing with a solid track record of organic growth and profitability. Management estimates that the company has over 75% of market share in the connector industry. |
| ● | The company’s competitive advantages are built on the Strong-Tie brand, engineering excellence, and superior customer service. This has led to strong pricing power and increasing profitability and cash flow. Simpson maintains significant scale as it manufactures over 15,000 wood products and 1,000 concrete products. |
| ● | Simpson’s products enhance structural integrity in the event of natural disasters (hurricanes, earthquakes, fires). The company actively works with state and local code writers to improve construction practices, which leads to mandating the use of structural connectors. |
| ● | Much of the country’s population growth is occurring in the Western and Southern regions, which have home building codes that often require greater use of structural connectors in construction. |
| ● | The company generates mid-to-high teens margins and returns on invested capital (ROIC). Since 2018, ROIC has become an important part of management compensation. |
| ● | Free cash flow has approximated 90% of net income over the past 6 years. |
| ● | Simpson has $275 million of net cash and anticipates deploying about 50% of operating cash flow towards dividends and share repurchases. |
Valuation
| ● | Simpson trades for 11.4 times trailing twelve-month earnings per share (EPS) and 12 times 2023 estimated EPS. Historically, Simpson has traded between 21-34 times trailing EPS and 20-30 times projected earnings. |
| ● | In the last 5 years, the company has focused the business on profitability and ROIC. We argue that this should result in a higher multiple going forward. |
| ● | The shares traded at 11 times forward EPS in 2009, the worst housing crisis in recent times. |
Management
| ● | Karen Colonias is the current CEO and has been with Simpson since 2004. She will retire as CEO on December 31, 2022. |
| ● | Michael Olosky has been President and COO since 2020 and will replace Colonias as CEO at the end of the year. Prior to Simpson, Olosky spent 22 years in numerous leadership positions at Henkel, most recently as Regional President North America/Head of the Electronics and Industrial Division. Olosky has a BS in Mechanical Engineering from Michigan Tech and an MBA from Michigan State. |
| ● | Brian Magstadt has served as CFO since 2012. Magstadt has served in numerous financial positions at Simpson since 2004. He is a CPA and has an MBA from Santa Clara University. |
| ● | Since 2018, a significant portion of executive compensation has been tied to ROIC. |
Investment Thesis
Simpson is a leading producer in a very good, but cyclical business. The company’s highly engineered and patented Strong-Tie connectors provide robust architectural integrity for a modest price and are the industry standard. The high-margin products are specified and mandated in the design of new homes, especially in the South and West where natural disasters have increased the importance of the products. The recent share performance reflects a market that is focused on short-term new housing activity. Additionally, earnings comparisons are difficult as the company raised prices last year ahead of higher steel costs. Management has been transparent with this price/cost dynamic. We believe these concerns are embedded in the valuation which is near all-time lows. This is a high-quality company trading at a low valuation due to near-term macro worries and tough comparisons.
Genpact Ltd. (G)
Analyst: Julia Ramon
Description
Genpact is a global business process management and outsourcing provider that works with clients to help them design, transform, and run business-critical operations. Genpact reports under two segments: Data-Tech-AI (~45% of revenue) and Digital Operations (~55% of revenue). Data-Tech-AI consists of client projects where Genpact is designing, building, and transforming businesses using technology. Digital Operations consists of more traditional business process outsourcing work such as operating and streamlining workflows and processes. The company has broad exposure across a number of industry verticals, employs over 114,000 professionals around the globe, and operates in over 30 countries.
Good Business
| ● | Genpact is an industry-leading provider of business process outsourcing and digital transformational services and has experience running thousands of processes for hundreds of Fortune Global 500 clients. Its process excellence and proprietary methodologies of delivery have been developed and fine-tuned over its two decades+ of operations. |
| ● | The company estimates that more than 80% of its revenues are somewhat recurring in nature, with average deal length around 3 years and annual client retention in the high-90 percentage range. |
| ● | Over the trailing 3, 5, and 10-year periods, Genpact has grown revenue at an average rate of 10.1%, 9.5%, and 9.6%, respectively. The company expects organic growth to exceed 10% per year over the next several years, along with accelerated margin expansion through scale efficiencies. |
| ● | Genpact’s solutions provide customers with a tangible return on investment primarily by helping customers decrease costs, drive growth, and reduce risks. |
| ● | The company estimates its current total addressable market opportunity is approximately $750 billion and growing in the high single digit percent range annually. |
| ● | Over the trailing 5-year period, the company’s ROIC has averaged approximately 12%, which exceeds its cost of capital. |
| ● | Genpact has a good balance sheet with a net debt-to-EBITDA ratio of 1.7 times. |
Valuation
| ● | Genpact trades (on a GAAP basis) at a forward price-to-earnings multiple of 17.4 times and a price-to-sales multiple of 1.9 times, both of which are roughly a standard deviation below the 10-year average. |
| ● | Our expectation for accelerating organic growth and margin expansion over the next several years supports a valuation multiple above the company’s historical average. |
| ● | The stock trades at a significant discount to the Russell 2000, despite having above-average business quality and a higher expected EPS growth rate. |
Management
| ● | Current CEO, N.V. “Tiger” Tyagarajan, has led the company since June 2011. He is considered a pioneer of the industry and has a deep knowledge of Lean and Six Sigma. He beneficially owns 3.05 million shares. |
| ● | Genpact has an experienced management team, and its average named executive officer tenure is greater than 10 years. |
Investment Thesis
Genpact is a global leader in the business process outsourcing industry. Over the past decade, Genpact has significantly diversified its client base away from its former parent company (General Electric Company) by aggressively growing other client revenue and winning new customers. General Electric is now just ~9% of revenue. Additionally, over the last several years, management has invested significantly to add vertical expertise, enhance its brand image, and grow its digital transformation offerings. As a result, Genpact is winning large new deals with blue-chip companies and continues to gain share in a market that is already secularly growing. We think Genpact is well positioned for 10%+ organic sales growth with margin expansion over the next 3-5 years and expect the business to perform well in most economic environments (revenue and operating income grew at double-digit rates through the Great Financial Crisis). Overall, we think Genpact’s strong growth profile, defensive business aspects, solid balance sheet, and attractive valuation make for a good outlook.
Thank you for your confidence in The FMI Common Stock Fund.
This shareholder letter is unaudited.
FMI Common Stock Fund
MANAGEMENT’S DISCUSSION OF FUND PERFORMANCE (Unaudited)
During the fiscal year ended September 30, 2022, the FMI Common Stock Fund (“Fund”) had a total return of minus 9.10%1. The benchmark Russell 2000 Index (“Russell 2000”) returned minus 23.50% in the same period. The trailing 12-month return for the Russell 2000 Value Index (“Russell 2000 Value”) was minus 17.69%. Relative to the Russell 2000, sectors that aided relative performance included Technology Services, Producer Manufacturing, and Retail Trade. CDK Global Inc., KBR Inc., and Insight Enterprises Inc. drove the results in the Technology Services sector, as all three continued to grow earnings and CDK was bought out. In Producer Manufacturing, Carlisle Cos. Inc. had strong results as the commercial roofing business grew significantly. In Retail Trade, BJ’s Wholesale Club Holdings Inc. performed strongly as consumers sought better values for food. On the negative side of sector performance, Energy Minerals, Utilities, and Industrial Services detracted. The Fund managers seek to own high quality, value-oriented stocks. Sometimes the market wants stocks in areas that we believe are lower quality in nature, such as energy and commodities. The Fund had no direct exposures to these three sectors that outperformed. Stocks that detracted from performance included Concentrix Corp., Gates Industrial Corp. PLC, ManpowerGroup Inc., Herbalife Nutrition Ltd., Dentsply Sirona Inc., LGI Homes Inc., and Skechers U.S.A. Inc. – Cl A. Nearly all of these companies experienced a slowdown in demand. Better opportunities surfaced and the Fund managers removed Concentrix, Herbalife, and Dentsply Sirona.
Other stocks that helped performance included FTI Consulting Inc., Beacon Roofing Supply Inc., and nVent Electric PLC. FTI experienced solid underlying demand and efficient execution. Beacon’s business is somewhat weather driven, which helped, but there is also underlying secular demand growth. nVent has benefited from secular growth in electric products and electricity management. New additions to the Fund over the past twelve months included Skechers, Gates Industrial, Triton International Ltd., Five Below Inc., AptarGroup Inc., and The AZEK Co. Inc. Stocks sold during the year included Ryder Systems Inc., EnPro Industries Inc., Trinity Industries Inc., A.O. Smith Corp., Huntington Ingalls Industries Inc., Phibro Animal Health Corp. – Cl A, Flowserve Corp., Dentsply Sirona, Herbalife Nutrition, Brady Corp. – Cl A, CDK Global, and Concentrix. As of September 30, 2022, the Fund was significantly overweighted in Producer Manufacturing, Distribution Services, and Commercial Services. The Fund was meaningfully underweighted in Finance, Health Technology, and Energy Minerals.
The Russell 2000 entered a traditionally defined bear market in fiscal 2022 (down 20%). Earnings growth has remained relatively robust over the year, so valuations have come down significantly. Worries about high inflation, rising interest rates, and an economic slowdown permeate the landscape. Geopolitical issues, particularly the Russian war with Ukraine and the saber rattling by China over Taiwan, have further spooked investors.
The Fund managers have become more optimistic about future performance now that many potential worries have become visible realities. The Federal Reserve is no longer printing money, but instead is engaging in quantitative tightening. This should help control inflation and engender a more normal interest rate environment. A realistic cost of capital helps move the economy from one driven by financial engineering to one driven by fundamental investment. Companies with solid balance sheets that make money stand a better chance of outperforming compared to the previous environment, where more speculative businesses outperformed. The Fund trades at a meaningful discount to the Russell 2000, and the managers believe the quality of the underlying companies is better than the benchmark.
| 1 | The FMI Common Stock Fund Investor Class (FMIMX) and the FMI Common Stock Fund Institutional Class (FMIUX) had a return of -9.10% and -8.99%, respectively, for the fiscal year ended 09/30/2022. |
FMI Common Stock Fund
MANAGEMENT’S DISCUSSION OF FUND PERFORMANCE (Unaudited) (Continued)
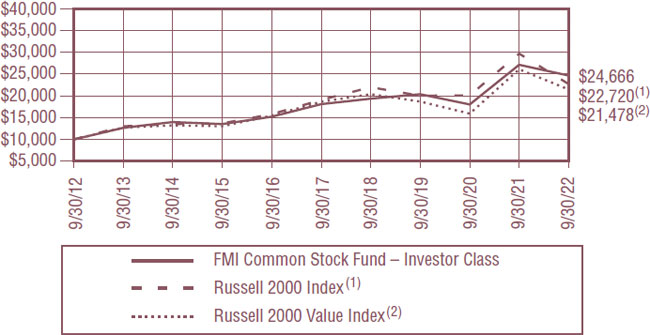
COMPARISON OF CHANGE IN VALUE OF $10,000 INVESTMENT IN FMI COMMON STOCK FUND – INVESTOR CLASS — THE RUSSELL 2000© INDEX(1) AND THE RUSSELL 2000© VALUE INDEX(2)
AVERAGE ANNUALIZED TOTAL RETURN
| Inception | ||||||||||||||||||
| through | ||||||||||||||||||
| Inception Date | 1-Year | 5-Year | 10-Year | 9/30/2022 | ||||||||||||||
| FMI Common Stock Fund – | ||||||||||||||||||
| Investor Class | 12/18/81 | -9.10% | 6.39% | 9.45% | 11.34% | |||||||||||||
| FMI Common Stock Fund – | ||||||||||||||||||
| Institutional Class | 10/31/16 | -8.99% | 6.51% | N/A | 9.14% | |||||||||||||
| Russell 2000 Index(1)* | -23.50% | 3.55% | 8.55% | 9.66% | ||||||||||||||
| Russell 2000 Value Index(2)* | -17.69% | 2.87% | 7.94% | 11.06% | ||||||||||||||
The graph and the table do not reflect the deduction of taxes that a shareholder would pay on Fund distributions or the redemption of Fund shares. Performance data quoted represents past performance; past performance does not guarantee future results. Investment return and principal value of an investment will fluctuate so that an investor’s shares, when redeemed, may be worth more or less than their original cost. Current performance of a Fund may be lower or higher than the performance quoted. The total returns do not reflect the deduction of taxes that a shareholder would pay on Fund distributions or the redemption of Fund shares. Total return includes change in share prices and in each case includes reinvestments of any dividends, interest and capital gain distributions. Performance data current to the most recent month-end may be obtained by visiting www.fmifunds.com or by calling 1-800-811-5311.
| (1) | The Russell 2000 Index measures the performance of the 2,000 smallest companies in the Russell 3000 Index, which comprises the 3,000 largest U.S. companies based on total market capitalization. |
| (2) | The Russell 2000 Value Index includes equities that exhibit value characteristics and the Russell 2000 Growth Index includes equities that exhibit growth characteristics. |
| * | The benchmark since inception returns are calculated since inception of the Investor Class, December 18, 1981 to September 30, 2022. |
An investment cannot be made directly into an index.
FMI Common Stock Fund
September 30, 2022
| Shares | Cost | Value | ||||||||||
| COMMON STOCKS — 93.8% (a) | ||||||||||||
| COMMERCIAL SERVICES SECTOR — 14.8% | ||||||||||||
| Advertising/Marketing Services — 4.0% | ||||||||||||
| 1,498,000 | Interpublic Group of Cos. Inc. | $ | 30,126,593 | $ | 38,348,800 | |||||||
| Miscellaneous Commercial Services — 6.0% | ||||||||||||
| 52,000 | FTI Consulting Inc.* | 5,764,039 | 8,616,920 | |||||||||
| 1,098,000 | Genpact Ltd. | 24,384,380 | 48,059,460 | |||||||||
| 30,148,419 | 56,676,380 | |||||||||||
| Personnel Services — 4.8% | ||||||||||||
| 164,000 | ManpowerGroup Inc. | 10,836,641 | 10,609,160 | |||||||||
| 450,000 | Robert Half International Inc. | 23,718,963 | 34,425,000 | |||||||||
| 34,555,604 | 45,034,160 | |||||||||||
| CONSUMER DURABLES SECTOR — 1.9% | ||||||||||||
| Homebuilding — 1.9% | ||||||||||||
| 219,000 | LGI Homes Inc.* | 26,779,990 | 17,820,030 | |||||||||
| CONSUMER NON-DURABLES SECTOR — 2.9% | ||||||||||||
| Apparel/Footwear — 2.9% | ||||||||||||
| 863,000 | Skechers U.S.A. Inc. — Cl A* | 38,551,158 | 27,374,360 | |||||||||
| DISTRIBUTION SERVICES SECTOR — 13.9% | ||||||||||||
| Electronics Distributors — 2.5% | ||||||||||||
| 255,000 | Arrow Electronics Inc.* | 8,631,673 | 23,508,450 | |||||||||
| Medical Distributors — 4.9% | ||||||||||||
| 707,000 | Henry Schein Inc.* | 45,894,406 | 46,499,390 | |||||||||
| Wholesale Distributors — 6.5% | ||||||||||||
| 246,000 | Applied Industrial Technologies Inc. | 16,206,081 | 25,283,880 | |||||||||
| 664,000 | Beacon Roofing Supply Inc.* | 36,010,377 | 36,334,080 | |||||||||
| 52,216,458 | 61,617,960 | |||||||||||
| ELECTRONIC TECHNOLOGY SECTOR — 7.4% | ||||||||||||
| Electronic Components — 3.5% | ||||||||||||
| 1,044,000 | nVent Electric PLC | 23,635,972 | 33,000,840 | |||||||||
| Electronic Production Equipment — 3.9% | ||||||||||||
| 424,000 | Plexus Corp.* | 32,624,637 | 37,125,440 | |||||||||
| FINANCE SECTOR — 18.6% | ||||||||||||
| Finance/Rental/Leasing — 5.2% | ||||||||||||
| 533,000 | FirstCash Holdings Inc. | 24,856,958 | 39,095,550 | |||||||||
| 188,000 | Triton International Ltd. | 11,759,611 | 10,289,240 | |||||||||
| 36,616,569 | 49,384,790 | |||||||||||
| Investment Banks/Brokers — 2.8% | ||||||||||||
| 348,000 | Houlihan Lokey Inc. — Cl A | 17,591,157 | 26,232,240 | |||||||||
| Life/Health Insurance — 3.3% | ||||||||||||
| 251,000 | Primerica Inc. | 33,827,635 | 30,985,950 | |||||||||
The accompanying notes to financial statements are an integral part of this schedule.
FMI Common Stock Fund
SCHEDULE OF INVESTMENTS (Continued)
September 30, 2022
| Shares | Cost | Value | ||||||||||
| COMMON STOCKS — 93.8% (a) (Continued) | ||||||||||||
| FINANCE SECTOR — 18.6% (Continued) | ||||||||||||
| Multi-Line Insurance — 1.8% | ||||||||||||
| 13,000 | White Mountains Insurance Group Ltd. | $ | 11,806,982 | $ | 16,939,260 | |||||||
| Real Estate Development — 2.4% | ||||||||||||
| 82,930 | The Howard Hughes Corp.* | 4,440,207 | 4,593,493 | |||||||||
| 1,203,000 | Kennedy-Wilson Holdings Inc. | 21,324,408 | 18,598,380 | |||||||||
| 25,764,615 | 23,191,873 | |||||||||||
| Regional Banks — 3.1% | ||||||||||||
| 586,000 | Zions Bancorporation N.A | 17,456,925 | 29,803,960 | |||||||||
| PROCESS INDUSTRIES SECTOR — 1.9% | ||||||||||||
| Containers/Packaging — 1.9% | ||||||||||||
| 194,000 | AptarGroup Inc. | 20,138,347 | 18,435,820 | |||||||||
| PRODUCER MANUFACTURING SECTOR — 17.7% | ||||||||||||
| Auto Parts: OEM — 3.2% | ||||||||||||
| 610,000 | Donaldson Co. Inc. | 28,541,421 | 29,896,100 | |||||||||
| Building Products — 7.6% | ||||||||||||
| 541,000 | The AZEK Co. Inc.* | 9,864,261 | 8,991,420 | |||||||||
| 132,000 | Carlisle Cos. Inc. | 5,740,764 | 37,014,120 | |||||||||
| 335,000 | Simpson Manufacturing Co. Inc. | 35,161,477 | 26,264,000 | |||||||||
| 50,766,502 | 72,269,540 | |||||||||||
| Industrial Machinery — 2.0% | ||||||||||||
| 1,062,000 | Gates Industrial Corp. PLC* | 16,347,995 | 10,365,120 | |||||||||
| 112,000 | Woodward Inc. | 4,866,634 | 8,989,120 | |||||||||
| 21,214,629 | 19,354,240 | |||||||||||
| Miscellaneous Manufacturing — 4.9% | ||||||||||||
| 176,000 | LCI Industries | 24,111,382 | 17,856,960 | |||||||||
| 1,126,000 | TriMas Corp. | 26,149,035 | 28,228,820 | |||||||||
| 50,260,417 | 46,085,780 | |||||||||||
| RETAIL TRADE SECTOR — 8.4% | ||||||||||||
| Discount Stores — 2.9% | ||||||||||||
| 197,000 | Five Below Inc.* | 25,641,331 | 27,120,990 | |||||||||
| Specialty Stores — 5.5% | ||||||||||||
| 714,000 | BJ’s Wholesale Club Holdings Inc.* | 41,256,609 | 51,986,340 | |||||||||
| TECHNOLOGY SERVICES SECTOR — 6.3% | ||||||||||||
| Information Technology Services — 6.3% | ||||||||||||
| 446,000 | Insight Enterprises Inc.* | 32,283,044 | 36,754,860 | |||||||||
| 521,000 | KBR Inc. | 20,610,805 | 22,517,620 | |||||||||
| 52,893,849 | 59,272,480 | |||||||||||
| Total common stocks | 756,941,898 | 887,965,173 | ||||||||||
The accompanying notes to financial statements are an integral part of this schedule.
FMI Common Stock Fund
SCHEDULE OF INVESTMENTS (Continued)
September 30, 2022
| Principal Amount | Cost | Value | ||||||||||
| SHORT-TERM INVESTMENTS — 6.2% (a) | ||||||||||||
| Bank Deposit Account — 6.2% | ||||||||||||
| $ | 58,652,586 | U.S. Bank N.A., 2.65%^ | $ | 58,652,586 | $ | 58,652,586 | ||||||
| Total short-term investments | 58,652,586 | 58,652,586 | ||||||||||
| Total investments — 100.0% | $ | 815,594,484 | 946,617,759 | |||||||||
| Other assets, less liabilities — 0.0% (a) | 324,847 | |||||||||||
| TOTAL NET ASSETS — 100.0% | $ | 946,942,606 | ||||||||||
| * | Non-income producing security. |
| ^ | The rate shown is as of September 30, 2022. |
| (a) | Percentages for the various classifications relate to total net assets. |
| PLC | Public Limited Company |
The accompanying notes to financial statements are an integral part of this schedule.
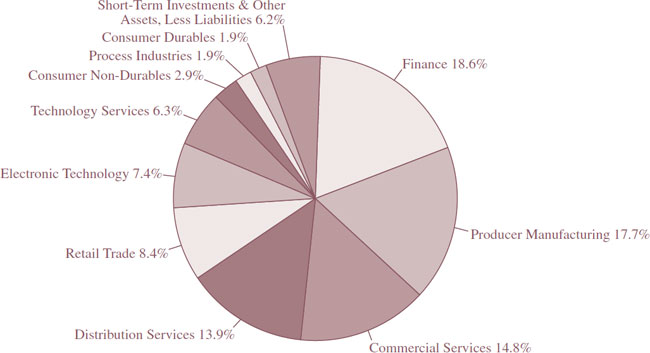
INDUSTRY SECTORS as a percentage of net assets
as of September 30, 2022 (Unaudited)
and
FMI International Fund II – Currency Unhedged
| (unaudited) | September 30, 2022 |
International stock markets continued their descent in the September quarter, with the Ukraine war weighing on economic growth and fueling inflation, particularly in food and energy. World GDP growth is slowing, and most major central banks are tightening monetary policy to stem the persistent upward pressure on prices. Economic indicators point to an outlook that may get worse before it gets better, and several stock and bond markets are in bear market territory. Amidst the carnage lies opportunities.
For the quarter, the FMI International Funds (“Funds”) fell by 5.04%1 on a currency hedged basis and 10.53%2 currency unhedged, compared with the MSCI EAFE Index’s decline of 3.59% in local currency (LOC) and 9.36% in U.S. Dollars (USD). The MSCI EAFE Value Index dropped 4.23% (LOC) and 10.21% (USD). FMI’s currency hedged performance benefited from a very strong USD. The Consumer Services, Producer Manufacturing, and Distribution Services sectors were additive to performance, while Retail Trade, Health Services, and Electronic Technology detracted. Sodexo S.A., DBS Group Holdings Ltd., and Unilever PLC performed well individually, as Fresenius Medical Care AG & Co. KGaA, B&M European Value Retail S.A., and Koninklijke Philips N.V. each lagged the market. The Funds’ UK consumer exposure has weighed on our relative performance, but we remain constructive over the long-term which we will discuss below.
While global stock markets have been challenging, we are as optimistic about our future performance as we have been in years, for several reasons: valuations are attractive, both on an absolute and relative basis. The sentiment of the market is overwhelmingly negative, which can create exciting prospects for those that are contrarian. The strength and durability of our companies are robust, yet many of our stocks are depressed; we believe we own several coiled springs. Lastly, the era of ultra-low interest rates appears to be ending (Japan is still holding out), which should bode well for our investment approach. We see brighter days ahead for the portfolios and will continue to stay the course during these tough times.
| 1 | The FMI International Fund [currency hedged] Investor Class (FMIJX) and the FMI International Fund [currency hedged] Institutional Class (FMIYX) had a return of -5.04% and -4.96%, respectively, for the third quarter of 2022. |
| 2 | The FMI International Fund [currency unhedged] Investor Class (FMIFX) had a return of -10.53% for the third quarter of 2022. |
Long in the Tooth?
Stock markets move in cycles, and today we are in an especially painful one for international investors. As illustrated in the chart on the following page, we are in the throes of the longest (14.2 years) and widest period of underperformance (239%) for developed international markets versus the U.S. in over 50 years:
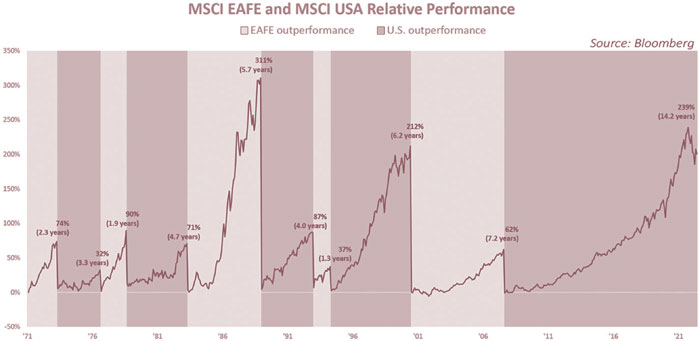
Several headwinds have impacted overseas markets during the period, including the European sovereign debt crisis, Brexit, Europe’s proximity to the Ukraine war (and resulting energy crisis), and USD strength, to name a few. Additionally, international stock markets have had more exposure to the financial sector, while U.S. markets are over-indexed to big tech, which has not helped the comparison. Today, Europe is in the eye of the storm, facing higher inflation and weaker economic growth than the U.S., in addition to being well behind the curve in terms of tightening monetary policy. Headline inflation is expected to soon peak in most major economies, but to date has remained stubbornly high. Meanwhile, Japan is still playing with fire, continuing to embrace negative interest rates and quantitative easing, while intervening to prop up the Yen for the first time since 1998.3 There is no shortage of macro risks.
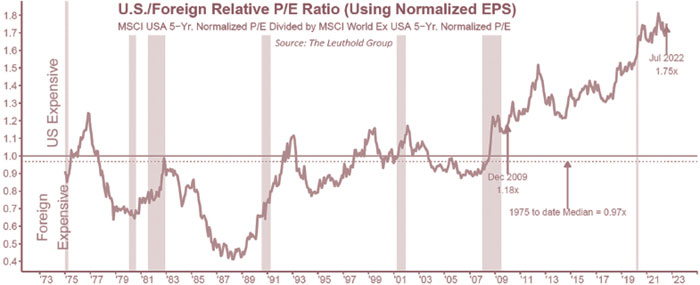
That said, valuations finally appear to be incorporating a lot of bad news, which is consistent with stock market history. In times of excess fear, investors predictably take the prevailing sentiment to the extreme, selling individual stocks to levels far below their intrinsic value. This is the nature of bear markets, and we find ourselves in one today. The opposite is certainly true during periods of market exuberance. Encouragingly, the normalized valuation spread between U.S. and foreign stocks is near an all-time high, as depicted below. This may create an attractive relative opportunity for those investing internationally, as a simple reversion to the mean could work wonders over time.
| 3 | Kana Inagaki and Leo Lewis. “Japan intervenes to prop up yen for first time since 1998.” Financial Times, September 22, 2022. |
When markets fall indiscriminately, stock picking becomes paramount. The FMI International portfolios are discerning. Not only does FMI focus on high-quality businesses (compounders) with strong balance sheets, but we remain disciplined on valuation, looking for companies being sold at significant discounts. Today, the portfolios’ valuation is compelling, trading at less than 12 times consensus estimates for 2023 earnings, approximately a 25% discount to the iShares MSCI EAFE ETF. The set-up appears attractive. While it is easy to dwell on recent mark-to-market “losses” in the portfolios, if the businesses and balance sheets are sound, the stocks are likely to recover. When companies with strong competitive positions temporarily go on sale, it is reason to be optimistic.
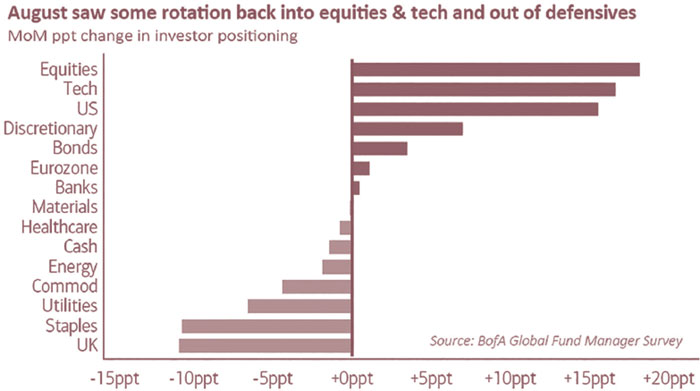
House on Fire
Investors are vacating the UK in droves, as depicted by the Bank of America chart below, pulled from their recent “Global Fund Manager Survey.”4 Consumer-related stocks, in particular, have been left for dead. Among the 56 European macro themes that Goldman Sachs tracks, UK Consumption ranks second-to-last in terms of year-to-date stock performance, with the representative basket of stocks down ~54%. For comparison, the EU Consumption basket is down ~29%.5 Are the prospects in the UK that much worse? We have our doubts, and at the very least, believe there are diamonds in the rough.
According to OECD economic forecasts from just last week, the UK economy is expected to outperform the Eurozone this year (3.4% versus 3.1%), but lag by a similar amount in 2023 (0% verus 0.3%).6 Inflation in the UK was running a bit higher than the Eurozone in August, at 9.9% versus 9.1%. The official statistics at the end of the first quarter showed government debt-to-GDP (UK: 99.6%, Eurozone: 95.6%) and deficit levels (2.6%, 2.3%) within striking distance of one another.7 So why such an extreme stock price divergence?
| 4 | Michael Hartnett and Myung-Jee Jung. “Global Fund Manager Survey: Bulls Wanted.” BofA Global Research, August 16, 2022. |
| 5 | Source: Bloomberg. |
| 6 | Mathias Cormann and Alvaro Santos Pereira. “OECD Economic Outlook: Paying the Price of War.” September 26, 2022. |
| 7 | https://www.ons.gov.uk/ |
https://ec.europa.eu/eurostat
New UK Prime Minister, Liz Truss, played a role by spooking markets with a sweeping fiscal proposal of tax cuts (household and corporate), reduced regulations, and emergency energy subsidies, among other measures. The fiscal package would be largely funded with debt. UK stock and bond markets came under intense selling pressure, as did the pound, which touched a record low versus the USD. The Bank of England intervened in the long-dated bond market to ensure stability. Critics voiced concerns around fueling inflation, an increasing government debt burden, and the need to raise rates significantly, while supporters touted improved economic growth prospects and debt falling as a percentage of GDP over the medium term.8 While the plethora of macro crosscurrents is nearly impossible to predict, we have a more favorable viewpoint than the naysayers. In the early 1980s, after a period of high inflation, many believed that U.S. tax cuts would be catastrophic – yet an economic revival ensued. Lower taxes and regulations have a long history of being quite good for business activity.
We are also skeptical about the fear factor around higher interest rates, given we remain well below historical levels. As we explain in our domestic shareholder letters (and it applies to the UK as well): “Financial markets are apoplectic about interest rates. The overwhelming consensus opinion is that higher rates will crush the economy for an extended period. We think the fear that has been fanned by the rate move may indeed result in a temporary hit to the economy or a recession, but at FMI we like to turn our analysis 180 degrees. Did the move from ”normal“ interest rates prior to the Great Financial Crisis to zero percent rates for years afterwards cause the economy to boom? No! Economic growth was historically weak over the past 15 years. Abnormally low rates boosted asset prices and set the mergers and acquisitions (M&A) and private equity markets aflame, but it did very little for organic economic growth. We had a boom in financial engineering. So why will economic growth be terrible when the reverse conditions prevail? We think economic growth will be much better over the next decade than it has been over the last.”
Furthermore, if higher rates and inflation are sustained, we believe the portfolios are well-positioned. Our quality businesses have inherent pricing power given their competitive advantages and barriers to entry, their balance sheets are built for difficult times, and the valuations embed a significant margin of safety. The portfolios have not benefited from ultra-low interest rates like many of the high-flying growth stocks.
As UK consumer stocks have come under extreme pressure, we have been leaning into the wind, adding to each of our related holdings: Greggs PLC (featured in the March shareholder letter), B&M Value European Retail, and Howden Joinery Group PLC (both featured on the following pages). We believe their respective stock moves are overblown, as these are strong, durable franchises that will be able to weather the storm. We do not view the sell-off as a permanent impairment of capital. Quite the opposite: we see tremendous upside potential and a very attractive risk/reward from current depressed levels. This is what we have been trained to do ... go against the grain and take advantage of mispricing in the market. This is the essence of value investing.
----
FMI will continue to hold true to our core principles, as we believe wholeheartedly in our investment process. Investors can take comfort knowing that our team “eats our own cooking,” and is invested right alongside our shareholders in each of our strategies. Our net worth is tied to the very same stocks our shareholders own.
| 8 | Philip Aldrick. “UK’s Biggest Tax Cuts Since 1972 Trigger Crash in Pound, Bonds” Bloomberg, September 23, 2022. |
As promised, a summary of the aforementioned investments is provided below:
B&M European Value Retail S.A. (BME LN)
Analyst: Jordan Teschendorf
Description
B&M European Value Retail is the largest general merchandise discount retailer in the UK, operating 1,119 stores under the B&M (701 stores; 91% EBITDA) and Heron Foods (311 stores; 4% EBITDA) banners (fiscal year 2022), primarily outside of Southeastern England. The company operates 107 stores in France under the Babou banner (5% EBITDA) and recently sold its German operations (Jawoll). It’s core B&M franchise operates low-cost store formats, offering a variety of branded consumables (grocery and fast-moving consumer goods products) and private label general merchandise at “everyday low prices” (typically 20-30% cheaper).
Good Business
| ● | B&M stores perform well in a variety of economic environments, evidenced by consistently growing same store sales over the last decade. B&M generated positive comparisons through the financial crisis (+10.4% average on fiscal years 2008-2010). |
| ● | A simple and low-cost operating model (rents, labor, overhead), direct sourcing, and concentrated SKU’s allow B&M to offer products at very low prices, while a rotating assortment of seasonal merchandise adds newness and excitement to the offer (“treasure hunt”). B&M’s average basket size of ~£13 makes online selling and delivery uneconomic. |
| ● | We estimate approximately 75% of B&M’s products are priced below £5 and the store’s core customers are working class. B&M has progressively broadened its appeal socioeconomically and geographically. |
| ● | B&M has consistently gained share in the growing UK discount general merchandise industry and has established itself as a dominant player. Discount retail in the UK remains underpenetrated relative to many other developed markets, including the U.S. |
| ● | B&M’s five-year average lease-adjusted return on invested capital (ROIC) is in the high-teens, well above the company’s cost of capital. B&M stores have cash payback periods of less than 15 months. |
| ● | The balance sheet is conservatively capitalized (1.3 times net debt/EBITDA) and the business generates strong cash flow. |
| ● | The business is easy to understand. |
Valuation
| ● | B&M trades at 9 times forward earnings per share (EPS) estimates, over two standard deviations below its historical average of 18 times. |
| ● | The stock trades at less than 1 times EV/Sales, over a standard deviation below its historical average. |
| ● | B&M pays an annual dividend targeted at 30-40% of earnings as well as special dividends with excess cash. |
Management
| ● | Simon Arora has been CEO of the company since December 2004, following the acquisition of B&M jointly with his family. In April 2022, he announced his intention to retire over the coming year, though he will remain on the board through April 2023. The Arora family owns 7% of the common stock (currently worth £225 million), aligning interests with long-term shareholder value creation. |
| ● | Alex Russo, CFO, was recently promoted to CEO. We view Alex as a capable leader with strong retail experience (previous roles at Wilko, Kingfisher PLC, Tesco PLC, Asda) and expect minimal strategic change. |
| ● | Compensation for executive officers is modest. Long-term incentives are based on absolute EPS growth (50%) and relative total shareholder return (50%). The company pays an ordinary dividend and aims to return surplus cash to shareholders. Capital returned to shareholders through special dividends alone has totaled £850 million over the last three years. |
Investment Thesis
B&M is a relatively defensive and growing business that performs well in most economic environments. Since we established our initial position in late 2018, B&M’s fundamentals have been strong (growing sales and profits over 40% and over 85%, respectively) as they have solidified their leading position in UK discount retailing. B&M’s stores performed exceptionally well through the pandemic (same store sales +20%), presenting a challenging near-term setup for the stock as it laps these results, while at the same time, the economic backdrop has become more uncertain. These dual concerns have pressured the stock. We think the company will navigate this period better than most, and longer-term, will continue to grow its core B&M banner in the UK at attractive returns on capital for many years to come. The balance sheet is in great shape liquidity is strong, and B&M has been increasing cash returns to shareholders. Valuation is attractive at 9 times forward EPS estimates and 10-12 times our estimate of EPS in a recessionary environment.
Howden Joinery Group PLC (HWDN LN)
Analyst: Ben Karek
Description
Howdens is the UK’s largest supplier of fitted kitchens and assorted products. They operate primarily in the UK (788 depots), but also in France/Belgium (42 depots), and Ireland (1 depot). They sell exclusively to tradesmen. The product mix is roughly 80% cabinets/counters/frontals, 10% appliances, and 10% floors/doors. They have 10,000 employees and are headquartered in London.
Good Business
| ● | Howden has a leading 30% market share for kitchens in the UK. This drives economies of scale in purchasing, manufacturing, and distribution. It allows them to offer similar or lower prices than competitors at a better all-in value proposition. This has driven long-term market share gains. |
| ● | Howden’s business model is built around using their best-in-class service to engender loyalty/stickiness from their mom-and-pop tradesmen customers. They are a one-stop-shop for everything you could need in a kitchen. |
| ● | Effectively all of Howden’s business is retrofit/refurbishment. They do not work with the large homebuilders. |
| ● | Infrequent end-customer purchases (usually once every 15 years, at a minimum), individually negotiated prices, a cost advantage, and the aforementioned tradesman loyalty has allowed for ~2-3% annual price increases over the last 15 years. |
| ● | Although new depot growth will run out in the UK over the next ~5 years, Howden is in the early stages of rolling out depots in France after testing the concept for over a decade. The concept is performing well and should have a long runway. |
| ● | Depot staff are incentivized with 5% of depot profits as a bonus. This aligns shareholders and depot managers, yet gives them latitude to manage the business locally. Depot managers choose what product to stock, what price to sell it at, how many employees to hire, etc. This is a unique and finely tuned model. |
| ● | The balance sheet has no financial debt and £250 million in cash. Including leases, net debt/EBITDA is 0.7 times. |
| ● | ROIC is 25%, fully burdened for leases. After a series of investments over the last 3 years, we expect incremental returns to improve from here. |
Valuation
| ● | Howden trades at 10 times estimated earnings, two standard deviations below its 10-year average. On pre-COVID EPS (below what we believe to be normalized) the shares trade at 16 times earnings, which approximates its 10-year average. |
| ● | With a net cash balance sheet, greater than a 25% incremental ROIC, 5-7% revenue growth, and slightly faster EPS growth, we believe the valuation is attractive in absolute terms. |
Management
| ● | CEO Andrew Livingston comes with a strong track record from Screwfix, where he executed a strategy similar to what he’s executing at Howdens. Andrew owns ~£1 million in Howden stock. |
| ● | The CFO and COO both have long tenures with Howdens. The COO was a founding member of Howden Joinery and owns ~£4 million in stock. |
| ● | Howdens’ executive compensation program heavily incentivizes growth in pretax profit. Given Howdens’ high returns on capital, this is the best lever to create value. |
Investment Thesis
Howden Joinery is a high-quality company that exhibits many of the characteristics we look for: no debt, organic reinvestment focus, a differentiated/hard to replicate business model, and aligned management. This is a simple (but not easy) business model that we understand well through ownership of businesses like Watsco Inc. and Ferguson PLC. The reasons we hadn’t invested in the company previously were concerns about UK depot penetration, trading liquidity, and cyclicality due to the product’s discretionary nature. In the years we’ve followed it, the company has continued to demonstrate their ability to execute and take market share from competitors, all while modernizing the business and solidifying plans for an expansion into France. The shares began to reflect that, and the P/E multiple approached 20 times. Howden Joinery came out of COVID much stronger, but we are now in a period of record inflation and recession fears are high, causing the stock to sell off. Although we are cautious on the near-term fundamentals, we think the mid-to-long term outlook for the business is as good or better than it has been in recent history. We think Howden can compound revenue and pretax profit at mid-to-high single digits while earning returns significantly in excess of their cost capital. With no financial debt, and an attractive valuation, we believe Howden Joinery is a strong addition to the FMI International Funds.
Thank you for your continued confidence in The FMI International Funds.
This shareholder letter is unaudited.
FMI International Fund and FMI International Fund II – Currency Unhedged
MANAGEMENT’S DISCUSSION OF FUND PERFORMANCE (Unaudited)
During the fiscal year ended September 30, 2022, the FMI International Funds declined 17.24%1 (“currency hedged”) and 28.71%2 (“currency unhedged”). Over the same period, the MSCI EAFE Index (“Index”) fell by 11.11% in local currency (LOC) and 25.13% in U.S. Dollars (USD), while the MSCI EAFE Value Index (“Value Index”) dropped by 4.79% in LOC and 20.16% in USD. FMI’s currency hedged performance was aided by a strong USD, but to a lesser extent than the spread (LOC vs. USD) of the Index and Value Index (“Indices”).
The Funds’ relative performance was aided by the Finance, Industrial Services, and Transportation sectors. DBS Group Holdings Ltd. led the performance in the Finance sector, as net interest income benefited from rising interest rates and provisions remained low due to resilient asset quality. The Industrial Services sector was boosted by Schlumberger Ltd., as international markets (over 80% of profits) showed further signs of a recovery, and a spike in energy prices was a tailwind to investor sentiment. Expeditors International of Washington Inc. drove the performance in Transportation, benefiting from disrupted supply chains, strong pricing, and tight capacity.
Conversely, the Consumer Non-Durables, Health Technology, and Retail Trade sectors all weighed on the Funds’ relative performance. Not having direct exposure to Energy Minerals and Non-Energy Minerals also hurt, as these sectors outperformed the Indices significantly after a significant boost from the Ukraine war. A tough UK retail environment weighed on Greggs PLC (in Consumer Non-Durables) and B&M European Value Retail S.A. (in Retail Trade). As we discuss in our shareholder letter, we believe these are strong, durable franchises that will be able to weather the storm. We do not view the sell-off as a permanent impairment of capital, as we see tremendous upside potential and a very attractive risk/reward from current depressed levels. In Health Technology, Koninklijke Philips N.V. (“Philips”) declined significantly in response to issues surrounding their respiratory business, including a product recall and FDA letter. While this accounts for less than 10% of Philip’s revenue and earnings, the impact on the market capitalization has been severe. We believe negative news flow and the fear of a large legal settlement has led to a mark-to-market that far exceeds the likely outcome.
Additional stocks that performed well included Arch Capital Group Ltd., Chubb Ltd., Yokogawa Electric Corp., and Smiths Group PLC, while Fresenius Medical Care AG & Co. KGaA, Samsung Electronics Co. Ltd., Booking Holdings Inc., and Sony Group Corp. each detracted.
Amidst the volatility, we have been consolidating to our highest conviction ideas, as we added 1 new position to each portfolio, while selling 8. We purchased Sodexo S.A., a leading caterer, facilities manager, and benefits and rewards services provider, which has solid growth prospects, relatively defensive fundamental performance, mid-teens return on capital, a solid balance sheet, and a discounted valuation. We sold Expeditors, Universal Music Group N.V., Secom Co. Ltd., Bollore, and Chubb, among others. Several holdings were boosted or trimmed during the period.
As of September 30, 2022, the Funds were significantly overweight in Distribution Services, Consumer Services, and Electronic Technology versus the Indices, and underweight in Finance, Energy Minerals, and Non-Energy Minerals. In terms of geographic revenue exposure, the Funds are overweight the UK and South Korea, and underweight Japan and Australia. Our exposure to the UK consumer and South Korea weighed on our relative performance versus the Indices.
The fiscal year started off on a strong footing, as global economic growth was recovering from the pandemic and international stock markets were on the rise. Unfortunately, the Ukraine war derailed the upturn, weighing on economic growth and fueling inflation. World GDP growth is slowing, and most major central banks are tightening monetary policy to stem the persistent upward pressure on prices. Economic indicators point to an outlook that may get worse before it gets better, and several stock and bond markets are in bear market territory.
The Funds were outperforming the Index up until the eve of the war, then gave up meaningful ground in the subsequent months, as deeper value and lower quality (i.e. energy, commodities, weak balance sheets, etc.) shined. As a reminder, FMI strives to invest in high-quality businesses that are well-run, have strong balance sheets, and trade at discount valuations. The opposite end of the spectrum has been rewarded in calendar year 2022, as illustrated by the following European Macro/Thematic performance tracked by Goldman Sachs – among the stronger performers: EU Defense (+40.1%), Oil Majors (+16.0%), Commodity Exposed (+0.0%), EU Miners (-6.2%), and High Pension Liabilities (-14.5%); among the weaker performers: EU High Pricing Power (-31.4%), EU Strong Balance Sheet (-32.3%), and UK Consumption (-54.0%).
| 1 | The FMI International Fund [currency hedged] Investor Class (FMIJX) and the FMI International Fund [currency hedged] Institutional Class (FMIYX) had a return of -17.24% and -17.10%, respectively, for the fiscal year ended 9/30/2022. |
| 2 | The FMI International Fund [currency unhedged] Institutional Class (FMIFX) had a return of -28.71% for the fiscal year ended 9/30/2022. |
FMI International Fund and FMI International Fund II – Currency Unhedged
MANAGEMENT’S DISCUSSION OF FUND PERFORMANCE (Unaudited) (Continued)
While the portfolios have been out of sync with what’s been currently “working,” we have great confidence in our companies and believe they are well-positioned for higher inflation and interest rates. Our quality businesses have inherent pricing power given their competitive advantages and barriers to entry, their balance sheets are built for difficult times, and the valuations embed a significant margin of safety. We intentionally limit our exposure to energy and commodities (even though they can be great trading stocks over short-term periods), as they do not fit our process in terms of business quality and historical long-term value creation.
While global stock markets have been difficult, we are optimistic about our future performance for several reasons. Valuations are attractive, both on an absolute and relative basis. The era of ultra-low interest rates appears to be ending. The sentiment of the market is overwhelmingly negative, which can create exciting prospects for those that are contrarian in nature. The strength and durability of our companies are robust, yet many of our stocks are depressed. We see brighter days ahead as we believe we own several coiled springs in quality companies.
COMPARISON OF CHANGE IN VALUE OF $10,000 INVESTMENT IN
FMI INTERNATIONAL FUND – INVESTOR CLASS — MSCI EAFE(1) AND MSCI EAFE VALUE(2)
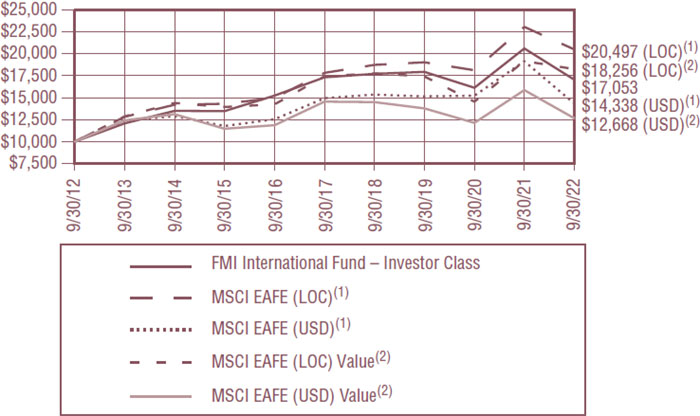
AVERAGE ANNUALIZED TOTAL RETURN
| Inception Date | 1-Year | 5-Year | 10-Year | Inception through 9/30/2022 | ||||||||||
| FMI International Fund – Investor Class | 12/31/10 | -17.24 | % | -0.31 | % | 5.48 | % | 5.63 | % | |||||
| FMI International Fund – Institutional Class | 10/31/16 | -17.10 | % | -0.17 | % | N/A | 2.23 | % | ||||||
| MSCI EAFE Net (LOC)(1)* | -11.11 | % | 2.83 | % | 7.44 | % | 5.92 | % | ||||||
| MSCI EAFE Net (LOC) Value(2)* | -4.79 | % | 0.93 | % | 6.20 | % | 4.83 | % | ||||||
| MSCI EAFE Net (USD)(1)* | -25.13 | % | -0.84 | % | 3.67 | % | 2.82 | % | ||||||
| MSCI EAFE Net (USD) Value(2)* | -20.16 | % | -2.74 | % | 2.39 | % | 1.70 | % | ||||||
FMI International Fund and FMI International Fund II – Currency Unhedged
MANAGEMENT’S DISCUSSION OF FUND PERFORMANCE (Unaudited) (Continued)
The graph and the table do not reflect the deduction of taxes that a shareholder would pay on Fund distributions or the redemption of Fund shares. Performance data quoted represents past performance; past performance does not guarantee future results. Investment return and principal value of an investment will fluctuate so that an investor’s shares, when redeemed, may be worth more or less than their original cost. Current performance of a Fund may be lower or higher than the performance quoted. The total returns do not reflect the deduction of taxes that a shareholder would pay on Fund distributions or the redemption of Fund shares. Total return includes change in share prices and in each case includes reinvestments of any dividends, interest and capital gain distributions. Performance data current to the most recent month-end may be obtained by visiting www.fmifunds.com or by calling 1-800-811-5311.
| (1) | The MSCI EAFE Index (Europe, Australasia, Far East) is a free float-adjusted market capitalization index that is designed to measure the equity market performance of developed markets, excluding the U.S. and Canada. The MSCI EAFE Index consists of the following 21 developed market country indices: Australia, Austria, Belgium, Denmark, Finland, France, Germany, Hong Kong, Ireland, Israel, Italy, Japan, the Netherlands, New Zealand, Norway, Portugal, Singapore, Spain, Sweden, Switzerland and the United Kingdom. The MSCI EAFE Index is unmanaged and investors cannot invest directly in the Index. Index results are inclusive of dividends and net of foreign withholding taxes. The reported figures include reinvestment of dividends and capital gains distributions and do not reflect any fees or expenses. |
| (2) | The MSCI EAFE Value Index captures large and mid cap securities exhibiting overall value style characteristics across Developed Markets countries around the world, excluding the U.S. and Canada. The value Investment style characteristics for index construction are defined using three variables: book value to price, 12-month forward earnings to price and dividend yield. |
The MSCI EAFE and MSCI EAFE Value Index are calculated in local currency (LOC) as well as in U.S. dollars (USD). The concept of a LOC calculation excludes the impact of currency fluctuations. All currencies of listing are considered in the Index calculation in LOC where current prices (t) and previous day prices (t-1) are converted into USD using the same exchange rate (exchange rate t-1) in the numerator and denominator. As a consequence, the FX factor drops out of the equation. The USD calculation includes exchange rates at t and t-1. Therefore, the LOC calculation only represents the price appreciation or depreciation of the securities, whereas the USD calculation also accounts for the performance of the currency (or currencies) relative to the USD. MSCI EAFE is a service mark of MSCI Barra.
| * | The benchmark since inception returns are calculated since inception of the Investor Class, December 31, 2010 to September 30, 2022. |
An investment cannot be made directly into an index.
FMI International Fund and FMI International Fund II – Currency Unhedged
MANAGEMENT’S DISCUSSION OF FUND PERFORMANCE (Unaudited) (Continued)
COMPARISON OF CHANGE IN VALUE OF $10,000 INVESTMENT IN
FMI INTERNATIONAL FUND II — CURRENCY UNHEDGED –
INSTITUTIONAL CLASS AND MSCI EAFE(1) AND MSCI EAFE VALUE(2)

| AVERAGE ANNUALIZED TOTAL RETURN | |||||||||||
| Inception Date | 3 Months | 1-Year | Inception through 9/30/2022 | ||||||||
| FMI International Fund II – Currency Unhedged – Institutional Class | 12/31/19 | -10.53 | % | -28.71 | % | -8.63 | % | ||||
| MSCI EAFE Net (USD)(1)* | -9.36 | % | -25.13 | % | -4.76 | % | |||||
| MSCI EAFE Net (USD) Value(1)* | -10.21 | % | -20.16 | % | -5.65 | % | |||||
The graph and the table do not reflect the deduction of taxes that a shareholder would pay on Fund distributions or the redemption of Fund shares. Performance data quoted represents past performance; past performance does not guarantee future results. Investment return and principal value of an investment will fluctuate so that an investor’s shares, when redeemed, may be worth more or less than their original cost. Current performance of a Fund may be lower or higher than the performance quoted. The total returns do not reflect the deduction of taxes that a shareholder would pay on Fund distributions or the redemption of Fund shares. Total return includes change in share prices and in each case includes reinvestments of any dividends, interest and capital gain distributions. Performance data current to the most recent month-end may be obtained by visiting www.fmifunds.com or by calling 1-800-811-5311.
| (1) | The MSCI EAFE Index (Europe, Australasia, Far East) is a free float-adjusted market capitalization index that is designed to measure the equity market performance of developed markets, excluding the U.S. and Canada. The MSCI EAFE Index consists of the following 21 developed market country indices: Australia, Austria, Belgium, Denmark, Finland, France, Germany, Hong Kong, Ireland, Israel, Italy, Japan, the Netherlands, New Zealand, Norway, Portugal, Singapore, Spain, Sweden, Switzerland and the United Kingdom. The MSCI EAFE Index is unmanaged and investors cannot invest directly in the Index. Index results are inclusive of dividends and net of foreign withholding taxes. The reported figures include reinvestment of dividends and capital gains distributions and do not reflect any fees or expenses. |
FMI International Fund and FMI International Fund II – Currency Unhedged
MANAGEMENT’S DISCUSSION OF FUND PERFORMANCE (Unaudited) (Continued)
| (2) | The MSCI EAFE Value Index captures large and mid cap securities exhibiting overall value style characteristics across Developed Markets countries around the world, excluding the U.S. and Canada. The value Investment style characteristics for index construction are defined using three variables: book value to price, 12-month forward earnings to price and dividend yield. MSCI EAFE is a service mark of MSCI Barra. |
| * | The benchmark since inception returns are calculated since inception of the Institutional Class, December 31, 2019 to September 30, 2022. |
An investment cannot be made directly into an index.
September 30, 2022
| Shares | Cost | Value | ||||||||||
| LONG-TERM INVESTMENTS — 87.7% (a) | ||||||||||||
| COMMON STOCKS — 82.1% (a) | ||||||||||||
| COMMERCIAL SERVICES SECTOR — 1.7% | ||||||||||||
| Advertising/Marketing Services — 1.7% | ||||||||||||
| 6,200,000 | WPP PLC (Jersey) (b) | $ | 79,326,987 | $ | 51,181,975 | |||||||
| CONSUMER DURABLES SECTOR — 1.9% | ||||||||||||
| Electronics/Appliances — 1.9% | ||||||||||||
| 10,190,000 | Howden Joinery Group PLC (Britain) (b) | 75,465,968 | 56,926,616 | |||||||||
| CONSUMER NON-DURABLES SECTOR — 8.4% | ||||||||||||
| Food: Specialty/Candy — 2.5% | ||||||||||||
| 3,951,000 | Greggs PLC (Britain) (b) | 106,048,047 | 74,634,408 | |||||||||
| Household/Personal Care — 5.9% | ||||||||||||
| 1,200,000 | Henkel AG & Co. KGaA (Germany) (b) | 111,159,535 | 68,007,591 | |||||||||
| 2,425,000 | Unilever PLC (Britain) (b) | 104,781,163 | 106,553,664 | |||||||||
| 215,940,698 | 174,561,255 | |||||||||||
| CONSUMER SERVICES SECTOR — 9.7% | ||||||||||||
| Media Conglomerates — 0.7% | ||||||||||||
| 2,535,000 | Vivendi (France) (b) | 46,556,730 | 19,662,841 | |||||||||
| Other Consumer Services — 4.1% | ||||||||||||
| 75,000 | Booking Holdings Inc. (United States)* | 137,732,575 | 123,240,750 | |||||||||
| Restaurants — 4.9% | ||||||||||||
| 1,935,000 | Sodexo S.A. (France) (b) | 157,266,344 | 145,318,680 | |||||||||
| DISTRIBUTION SERVICES SECTOR — 11.4% | ||||||||||||
| Medical Distributors — 3.2% | ||||||||||||
| 1,325,000 | DKSH Holding AG (Switzerland) (b) | 75,162,258 | 96,137,605 | |||||||||
| Wholesale Distributors — 8.2% | ||||||||||||
| 1,480,000 | Ferguson PLC (Jersey) (b) | 86,694,503 | 153,518,565 | |||||||||
| 6,000,000 | Rexel S.A. (France) (b) | 111,615,531 | 89,920,222 | |||||||||
| 198,310,034 | 243,438,787 | |||||||||||
| ELECTRONIC TECHNOLOGY SECTOR — 9.7% | ||||||||||||
| Aerospace & Defense — 3.8% | ||||||||||||
| 1,250,000 | Safran S.A. (France) (b) | 133,685,296 | 113,736,762 | |||||||||
| Computer Processing Hardware — 4.1% | ||||||||||||
| 1,885,000 | Sony Group Corp. (Japan) (b) | 113,528,161 | 121,421,269 | |||||||||
| Electronic Equipment/Instruments — 1.8% | ||||||||||||
| 3,340,000 | Yokogawa Electric Corp. (Japan) (b) | 59,113,396 | 52,618,896 | |||||||||
| FINANCE SECTOR — 9.4% | ||||||||||||
| Major Banks — 5.8% | ||||||||||||
| 4,905,000 | DBS Group Holdings Ltd. (Singapore) (b) | 110,134,877 | 113,469,171 | |||||||||
| 133,700,000 | Lloyds Banking Group PLC (Britain) (b) | 67,687,515 | 60,430,573 | |||||||||
| 177,822,392 | 173,899,744 | |||||||||||
The accompanying notes to financial statements are an integral part of this schedule.
FMI International Fund
SCHEDULE OF INVESTMENTS (Continued)
September 30, 2022
| Shares | Cost | Value | ||||||||||
| LONG-TERM INVESTMENTS — 87.7% (a) (Continued) | ||||||||||||
| COMMON STOCKS — 82.1% (a) (Continued) | ||||||||||||
| FINANCE SECTOR — 9.4% (Continued) | ||||||||||||
| Multi-Line Insurance — 3.6% | ||||||||||||
| 2,365,000 | Arch Capital Group Ltd. (Bermuda)* | $ | 102,070,707 | $ | 107,702,100 | |||||||
| HEALTH SERVICES SECTOR — 1.3% | ||||||||||||
| Medical/Nursing Services — 1.3% | ||||||||||||
| 1,330,000 | Fresenius Medical Care | |||||||||||
| AG & Co. KGaA (Germany) (b) | 106,670,311 | 37,469,974 | ||||||||||
| HEALTH TECHNOLOGY SECTOR — 8.6% | ||||||||||||
| Medical Specialties — 4.3% | ||||||||||||
| 3,065,000 | Koninklijke Philips N.V. (Netherlands) (b) | 129,527,256 | 47,190,099 | |||||||||
| 6,965,000 | Smith & Nephew PLC (Britain) (b) | 123,938,486 | 80,395,147 | |||||||||
| 253,465,742 | 127,585,246 | |||||||||||
| Pharmaceuticals: Major — 4.3% | ||||||||||||
| 390,000 | Roche Holding AG (Switzerland) (b) | 136,403,011 | 126,957,781 | |||||||||
| INDUSTRIAL SERVICES SECTOR — 2.0% | ||||||||||||
| Oilfield Services/Equipment — 2.0% | ||||||||||||
| 1,660,000 | Schlumberger Ltd. (Curacao) | 60,183,575 | 59,594,000 | |||||||||
| PROCESS INDUSTRIES SECTOR — 1.7% | ||||||||||||
| Chemicals: Specialty — 1.7% | ||||||||||||
| 1,415,000 | NOF Corp. (Japan) (b) | 74,286,266 | 51,113,058 | |||||||||
| PRODUCER MANUFACTURING SECTOR — 6.8% | ||||||||||||
| Building Products — 1.7% | ||||||||||||
| 6,050,000 | Sanwa Holdings Corp. (Japan) (b) | 76,000,029 | 51,961,492 | |||||||||
| Electrical Products — 2.0% | ||||||||||||
| 3,560,000 | Smiths Group PLC (Britain) (b) | 54,129,056 | 59,298,601 | |||||||||
| Industrial Conglomerates — 1.8% | ||||||||||||
| 1,035,000 | Jardine Matheson | |||||||||||
| Holdings Ltd. (Bermuda) (b) | 68,461,836 | 52,327,502 | ||||||||||
| Industrial Machinery — 1.3% | ||||||||||||
| 1,877,000 | Nabtesco Corp. (Japan) (b) | 67,961,048 | 38,396,907 | |||||||||
| RETAIL TRADE SECTOR — 6.1% | ||||||||||||
| Discount Stores — 3.5% | ||||||||||||
| 30,700,000 | B&M European Value | |||||||||||
| Retail S.A. (Luxembourg) (b) | 128,134,995 | 104,417,500 | ||||||||||
| Specialty Stores — 2.6% | ||||||||||||
| 13,825,000 | CK Hutchison Holdings Ltd. | |||||||||||
| (Cayman Islands) (b) | 128,000,076 | 76,123,888 | ||||||||||
The accompanying notes to financial statements are an integral part of this schedule.
FMI International Fund
SCHEDULE OF INVESTMENTS (Continued)
September 30, 2022
| Shares | Cost | Value | ||||||||||
| LONG-TERM INVESTMENTS — 87.7% (a) (Continued) | ||||||||||||
| COMMON STOCKS — 82.1% (a) (Continued) | ||||||||||||
| TECHNOLOGY SERVICES SECTOR — 3.4% | ||||||||||||
| Packaged Software — 3.4% | ||||||||||||
| 1,237,000 | SAP SE (Germany) (b) | $ | 141,644,145 | $ | 100,809,138 | |||||||
| Total common stocks | 2,973,369,683 | 2,440,536,775 | ||||||||||
| PREFERRED STOCKS — 5.6% (a) | ||||||||||||
| CONSUMER NON-DURABLES SECTOR — 1.7% | ||||||||||||
| Household/Personal Care — 1.7% | ||||||||||||
| 850,000 | Amorepacific Corp. (South Korea) (b) | 56,985,599 | 24,790,649 | |||||||||
| 110,000 | LG Household & Health | |||||||||||
| Care Ltd. (South Korea) (b) | 33,028,463 | 25,201,417 | ||||||||||
| 90,014,062 | 49,992,066 | |||||||||||
| ELECTRONIC TECHNOLOGY SECTOR — 3.9% | ||||||||||||
| Telecommunications Equipment — 3.9% | ||||||||||||
| 3,555,000 | Samsung Electronics Co. | |||||||||||
| Ltd. (South Korea) (b) | 82,238,693 | 115,476,698 | ||||||||||
| Total preferred stocks | 172,252,755 | 165,468,764 | ||||||||||
| Total long-term investments | 3,145,622,438 | 2,606,005,539 | ||||||||||
| Principal Amount | ||||||||||||
| SHORT-TERM INVESTMENTS — 5.0% (a) | ||||||||||||
| Bank Deposit Account — 5.0% | ||||||||||||
| $148,803,086 | U.S. Bank N.A., 2.65%^ | 148,803,086 | 148,803,086 | |||||||||
| Total short-term investments | 148,803,086 | 148,803,086 | ||||||||||
| Total investments — 92.7% | $ | 3,294,425,524 | 2,754,808,625 | |||||||||
| Other assets, less liabilities — 7.3% (a) | 215,951,959 | |||||||||||
| TOTAL NET ASSETS — 100.0% | $ | 2,970,760,584 | ||||||||||
| * | Non-income producing security. |
| ^ | The rate shown is as of September 30, 2022. |
| (a) | Percentages for the various classifications relate to total net assets. |
| (b) | Security does not trade during New York Stock Exchange hours, provided that certain foreign exchanges may trade during a portion of the New York Stock Exchange hours, and has been valued in accordance with the procedures discussed in Note 2(a) to the financial statements and has been classified as Level 2. As of September 30, 2022 the aggregate value of these securities was $2,315,468,689. |
| PLC | Public Limited Company |
The accompanying notes to financial statements are an integral part of this schedule.
FMI International Fund
SCHEDULE OF FORWARD CURRENCY CONTRACTS
September 30, 2022
Settlement Date | Counterparty | Currency to be Delivered | U.S. $ Value on September 30, 2022 of Currency to be Delivered | Currency to be Received | U.S. $ Value on September 30, 2022 of Currency to be Received | Unrealized Appreciation | ||||||||||||
| 10/14/22 | State Street Bank and Trust Co. | 570,000,000 British Pound | $ | 636,630,742 | 716,484,870 U.S. Dollar | $ | 716,484,870 | $ | 79,854,128 | |||||||||
| 10/14/22 | The Bank of New York Mellon | 635,000,000 Euro | 622,941,611 | 687,019,200 U.S. Dollar | 687,019,200 | 64,077,589 | ||||||||||||
| 10/14/22 | JPMorgan Chase Bank, N.A. | 680,000,000 Hong Kong Dollar | 86,658,910 | 86,920,953 U.S. Dollar | 86,920,953 | 262,043 | ||||||||||||
| 10/14/22 | The Bank of New York Mellon | 42,500,000,000 Japanese Yen | 294,037,076 | 319,532,055 U.S. Dollar | 319,532,055 | 25,494,979 | ||||||||||||
| 10/14/22 | JPMorgan Chase Bank, N.A. | 115,000,000 Singapore Dollar | 80,080,300 | 83,668,310 U.S. Dollar | 83,668,310 | 3,588,010 | ||||||||||||
| 10/14/22 | State Street Bank and Trust Co. | 265,000,000,000 South Korea Won | 185,269,058 | 210,824,443 U.S. Dollar | 210,824,443 | 25,555,385 | ||||||||||||
| 10/14/22 | JPMorgan Chase Bank, N.A. | 180,000,000 Swiss Franc | 182,655,010 | 186,230,914 U.S. Dollar | 186,230,914 | 3,575,904 | ||||||||||||
| $ | 2,088,272,707 | $ | 2,290,680,745 | $ | 202,408,038 | |||||||||||||
The accompanying notes to financial statements are an integral part of this schedule.
FMI International Fund
INDUSTRY SECTORS as a percentage of net assets
as of September 30, 2022 (Unaudited)
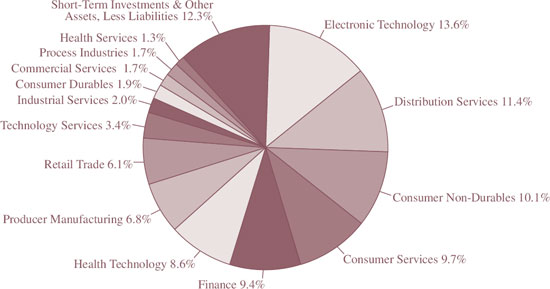
CONCENTRATION BY COUNTRY based on domicile of issuer as
a percentage of long-term investments only
as of September 30, 2022 (Unaudited)
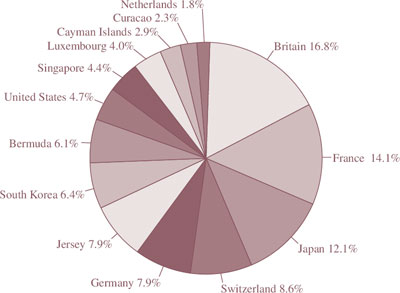
FMI International Fund II – Currency Unhedged
September 30, 2022
| Shares | Cost | Value | ||||||||||
| LONG-TERM INVESTMENTS — 94.9% (a) | ||||||||||||
| COMMON STOCKS — 88.7% (a) | ||||||||||||
| COMMERCIAL SERVICES SECTOR — 1.9% | ||||||||||||
| Advertising/Marketing Services — 1.9% | ||||||||||||
| 113,600 | WPP PLC (Jersey) (b) | $ | 1,204,487 | $ | 937,786 | |||||||
| CONSUMER DURABLES SECTOR — 2.0% | ||||||||||||
| Electronics/Appliances — 2.0% | ||||||||||||
| 172,000 | Howden Joinery Group PLC (Britain) (b) | 1,340,062 | 960,881 | |||||||||
| CONSUMER NON-DURABLES SECTOR — 9.2% | ||||||||||||
| Food: Specialty/Candy — 2.6% | ||||||||||||
| 68,500 | Greggs PLC (Britain) (b) | 1,848,246 | 1,293,965 | |||||||||
| Household/Personal Care — 6.6% | ||||||||||||
| 22,350 | Henkel AG & Co. KGaA (Germany) (b) | 1,946,388 | 1,266,641 | |||||||||
| 44,300 | Unilever PLC (Britain) (b) | 2,426,213 | 1,946,527 | |||||||||
| 4,372,601 | 3,213,168 | |||||||||||
| CONSUMER SERVICES SECTOR — 9.9% | ||||||||||||
| Media Conglomerates — 0.8% | ||||||||||||
| 52,425 | Vivendi (France) (b) | 1,313,385 | 406,637 | |||||||||
| Other Consumer Services — 4.2% | ||||||||||||
| 1,250 | Booking Holdings Inc. (United States)* | 2,278,638 | 2,054,013 | |||||||||
| Restaurants — 4.9% | ||||||||||||
| 32,000 | Sodexo S.A. (France) (b) | 2,630,530 | 2,403,203 | |||||||||
| DISTRIBUTION SERVICES SECTOR — 12.5% | ||||||||||||
| Medical Distributors — 3.6% | ||||||||||||
| 24,275 | DKSH Holding AG (Switzerland) (b) | 1,473,143 | 1,761,313 | |||||||||
| Wholesale Distributors — 8.9% | ||||||||||||
| 27,075 | Ferguson PLC (Jersey) (b) | 2,440,886 | 2,808,456 | |||||||||
| 103,000 | Rexel S.A. (France) (b) | 1,926,791 | 1,543,630 | |||||||||
| 4,367,677 | 4,352,086 | |||||||||||
| ELECTRONIC TECHNOLOGY SECTOR — 10.3% | ||||||||||||
| Aerospace & Defense — 4.2% | ||||||||||||
| 22,775 | Safran S.A. (France) (b) | 2,513,296 | 2,072,284 | |||||||||
| Computer Processing Hardware — 4.1% | ||||||||||||
| 31,000 | Sony Group Corp. (Japan) (b) | 2,266,929 | 1,996,848 | |||||||||
| Electronic Equipment/Instruments — 2.0% | ||||||||||||
| 61,500 | Yokogawa Electric Corp. (Japan) (b) | 959,592 | 968,881 | |||||||||
| FINANCE SECTOR — 10.1% | ||||||||||||
| Major Banks — 6.2% | ||||||||||||
| 81,800 | DBS Group Holdings Ltd. (Singapore) (b) | 1,834,172 | 1,892,310 | |||||||||
| 2,504,750 | Lloyds Banking Group PLC (Britain) (b) | 1,177,882 | 1,132,113 | |||||||||
| 3,012,054 | 3,024,423 | |||||||||||
The accompanying notes to financial statements are an integral part of this schedule.
FMI International Fund II – Currency Unhedged
SCHEDULE OF INVESTMENTS (Continued)
September 30, 2022
| Shares | Cost | Value | ||||||||||
| LONG-TERM INVESTMENTS — 94.9% (a) (Continued) | ||||||||||||
| COMMON STOCKS — 88.7% (a) (Continued) | ||||||||||||
| FINANCE SECTOR — 10.1% (Continued) | ||||||||||||
| Multi-Line Insurance — 3.9% | ||||||||||||
| 41,500 | Arch Capital Group Ltd. (Bermuda)* | $ | 1,765,833 | $ | 1,889,910 | |||||||
| HEALTH SERVICES SECTOR — 1.4% | ||||||||||||
| Medical/Nursing Services — 1.4% | ||||||||||||
| 24,650 | Fresenius Medical Care | |||||||||||
| AG & Co. KGaA (Germany) (b) | 1,942,395 | 694,462 | ||||||||||
| HEALTH TECHNOLOGY SECTOR — 9.2% | ||||||||||||
| Medical Specialties — 4.8% | ||||||||||||
| 56,325 | Koninklijke Philips N.V. (Netherlands) (b) | 2,536,493 | 867,205 | |||||||||
| 128,250 | Smith & Nephew PLC (Britain) (b) | 2,424,212 | 1,480,356 | |||||||||
| 4,960,705 | 2,347,561 | |||||||||||
| Pharmaceuticals: Major — 4.4% | ||||||||||||
| 6,700 | Roche Holding AG (Switzerland) (b) | 2,316,156 | 2,181,070 | |||||||||
| INDUSTRIAL SERVICES SECTOR — 2.3% | ||||||||||||
| Oilfield Services/Equipment — 2.3% | ||||||||||||
| 30,800 | Schlumberger Ltd. (Curacao) | 650,062 | 1,105,720 | |||||||||
| PROCESS INDUSTRIES SECTOR — 1.9% | ||||||||||||
| Chemicals: Specialty — 1.9% | ||||||||||||
| 26,100 | NOF Corp. (Japan) (b) | 1,345,687 | 942,792 | |||||||||
| PRODUCER MANUFACTURING SECTOR — 7.6% | ||||||||||||
| Building Products — 2.0% | ||||||||||||
| 111,500 | Sanwa Holdings Corp. (Japan) (b) | 1,379,833 | 957,637 | |||||||||
| Electrical Products — 2.2% | ||||||||||||
| 66,250 | Smiths Group PLC (Britain) (b) | 1,173,854 | 1,103,520 | |||||||||
| Industrial Conglomerates — 2.0% | ||||||||||||
| 19,250 | Jardine Matheson | |||||||||||
| Holdings Ltd. (Bermuda) (b) | 1,261,360 | 973,241 | ||||||||||
| Industrial Machinery — 1.4% | ||||||||||||
| 34,600 | Nabtesco Corp. (Japan) (b) | 1,226,858 | 707,796 | |||||||||
| RETAIL TRADE SECTOR — 6.7% | ||||||||||||
| Discount Stores — 3.8% | ||||||||||||
| 555,000 | B&M European Value Retail S.A. (Luxembourg) (b) | 3,013,239 | 1,887,678 | |||||||||
| Specialty Stores — 2.9% | ||||||||||||
| 256,175 | CK Hutchison Holdings Ltd. (Cayman Islands) (b) | 1,758,321 | 1,410,563 | |||||||||
The accompanying notes to financial statements are an integral part of this schedule.
FMI International Fund II – Currency Unhedged
SCHEDULE OF INVESTMENTS (Continued)
September 30, 2022
| Shares | Cost | Value | ||||||||||
| LONG-TERM INVESTMENTS — 94.9% (a) (Continued) | ||||||||||||
| COMMON STOCKS — 88.7% (a) (Continued) | ||||||||||||
| TECHNOLOGY SERVICES SECTOR — 3.7% | ||||||||||||
| Packaged Software — 3.7% | ||||||||||||
| 22,300 | SAP SE (Germany) (b) | $ | 2,568,499 | $ | 1,817,335 | |||||||
| Total common stocks | 54,943,442 | 43,464,773 | ||||||||||
| PREFERRED STOCKS — 6.2% (a) | ||||||||||||
| CONSUMER NON-DURABLES SECTOR — 1.9% | ||||||||||||
| Household/Personal Care — 1.9% | ||||||||||||
| 15,700 | Amorepacific Corp. (South Korea) (b) | 978,888 | 457,898 | |||||||||
| 2,050 | LG Household & Health Care Ltd. (South Korea) (b) | 1,274,010 | 469,663 | |||||||||
| 2,252,898 | 927,561 | |||||||||||
| ELECTRONIC TECHNOLOGY SECTOR — 4.3% | ||||||||||||
| Telecommunications Equipment — 4.3% | ||||||||||||
| 65,000 | Samsung Electronics Co. Ltd. (South Korea) (b) | 2,831,198 | 2,111,388 | |||||||||
| Total preferred stocks | 5,084,096 | 3,038,949 | ||||||||||
| Total long-term investments | 60,027,538 | 46,503,722 | ||||||||||
| Principal Amount | ||||||||||||
| SHORT-TERM INVESTMENTS — 4.3% (a) | ||||||||||||
| Bank Deposit Account — 4.3% | ||||||||||||
| $ | 2,113,015 | U.S. Bank N.A., 2.65%^ | 2,113,015 | 2,113,015 | ||||||||
| Total short-term investments | 2,113,015 | 2,113,015 | ||||||||||
| Total investments — 99.2% | $ | 62,140,553 | 48,616,737 | |||||||||
| Other assets, less liabilities — 0.8% (a) | 368,990 | |||||||||||
| TOTAL NET ASSETS — 100.0% | $ | 48,985,727 | ||||||||||
| * | Non-income producing security. |
| ^ | The rate shown is as of September 30, 2022. |
| (a) | Percentages for the various classifications relate to total net assets. |
| (b) | Security does not trade during New York Stock Exchange hours, provided that certain foreign exchanges may trade during a portion of the New York Stock Exchange hours, and has been valued in accordance with the procedures discussed in Note 2(a) to the financial statements and has been classified as Level 2. As of September 30, 2022, the aggregate value of these securities was $41,454,079. |
| PLC | Public Limited Company |
The accompanying notes to financial statements are an integral part of this schedule.
FMI International Fund II – Currency Unhedged
INDUSTRY SECTORS as a percentage of net assets
as of September 30, 2022 (Unaudited)
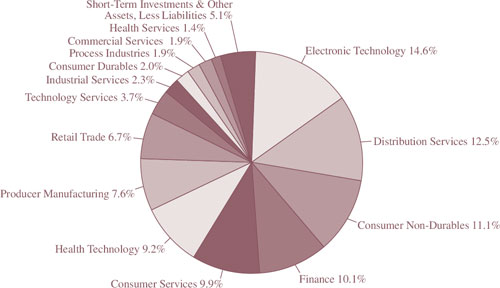
CONCENTRATION BY COUNTRY based on domicile of issuer as
a percentage of long-term investments only
as of September 30, 2022 (Unaudited)
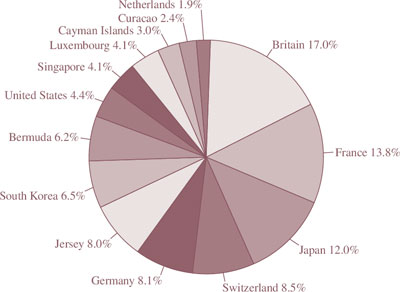
STATEMENTS OF ASSETS AND LIABILITIES
September 30, 2022
| FMI Large Cap Fund | FMI Common Stock Fund | FMI International Fund | FMI International Fund II – Currency Unhedged | |||||||||||||
| ASSETS: | ||||||||||||||||
| Investments in securities, at value (a) | $ | 2,070,638,877 | $ | 946,617,759 | $ | 2,754,808,625 | $ | 48,616,737 | ||||||||
| Foreign cash, at value (b) | — | — | 2,574,666 | — | ||||||||||||
| Restricted cash | — | — | 25,310,000 | — | ||||||||||||
| Receivable from shareholders for purchases | 2,341,113 | 1,011,468 | 5,032,045 | 39,620 | ||||||||||||
| Dividends, interest and other receivables | 3,572,824 | 452,772 | 13,129,482 | 363,343 | ||||||||||||
| Unrealized appreciation on forward currency contracts | — | — | 202,408,038 | — | ||||||||||||
| Prepaid expenses | 75,758 | 80,436 | 86,289 | 9,446 | ||||||||||||
| Total assets | $ | 2,076,628,572 | $ | 948,162,435 | $ | 3,003,349,145 | $ | 49,029,146 | ||||||||
| LIABILITIES: | ||||||||||||||||
| Payable to brokers for collateral received | $ | — | $ | — | $ | 25,310,000 | $ | — | ||||||||
| Payable to shareholders for redemptions | 3,207,918 | 512,092 | 5,226,883 | — | ||||||||||||
| Payable to adviser for management fees | 938,798 | 583,956 | 1,686,557 | 13,081 | ||||||||||||
| Payable for professional fees | 17,746 | 16,379 | 23,561 | 14,216 | ||||||||||||
| Payable to custodian | 15,154 | 6,134 | 70,425 | 6,825 | ||||||||||||
| Other liabilities | 275,610 | 101,268 | 271,135 | 9,297 | ||||||||||||
| Total liabilities | 4,455,226 | 1,219,829 | 32,588,561 | 43,419 | ||||||||||||
| Net assets | $ | 2,072,173,346 | $ | 946,942,606 | $ | 2,970,760,584 | $ | 48,985,727 | ||||||||
| NET ASSETS: | ||||||||||||||||
| Capital Stock | $ | 1,517,162,639 | $ | 754,987,205 | $ | 3,378,158,246 | $ | 63,782,620 | ||||||||
| Total distributable earnings/(accumulated losses) | 555,010,707 | 191,955,401 | (407,397,662 | ) | (14,796,893 | ) | ||||||||||
| Net assets | $ | 2,072,173,346 | $ | 946,942,606 | $ | 2,970,760,584 | $ | 48,985,727 | ||||||||
The accompanying notes to financial statements are an integral part of these financial statements.
FMI Funds, Inc.
STATEMENTS OF ASSETS AND LIABILITIES (Continued)
September 30, 2022
| FMI Large Cap Fund | FMI Common Stock Fund | FMI International Fund | FMI International Fund II – Currency Unhedged | |||||||||||||
| CALCULATION OF NET | ||||||||||||||||
| ASSET VALUE PER SHARE: | ||||||||||||||||
| Investor Class Shares: | ||||||||||||||||
| Net assets | $ | 1,001,681,960 | $ | 357,946,333 | $ | 792,420,526 | $ | — | ||||||||
| Shares outstanding | 66,864,543 | 13,393,840 | 28,045,838 | — | ||||||||||||
| Shares authorized ($0.0001 par value) | 300,000,000 | 300,000,000 | 300,000,000 | — | ||||||||||||
| Net asset value, offering and redemption price per share | $ | 14.98 | $ | 26.72 | $ | 28.25 | $ | — | ||||||||
| Institutional Class shares: | ||||||||||||||||
| Net assets | $ | 1,070,491,386 | $ | 588,996,273 | $ | 2,178,340,058 | $ | 48,985,727 | ||||||||
| Shares outstanding | 71,562,382 | 21,998,375 | 76,848,537 | 3,311,422 | ||||||||||||
| Shares authorized ($0.0001 par value) | 300,000,000 | 300,000,000 | 300,000,000 | 300,000,000 | ||||||||||||
| Net asset value, offering and redemption price per share | $ | 14.96 | $ | 26.77 | $ | 28.35 | $ | 14.79 | ||||||||
| (a) Identified cost of investments | $ | 1,846,738,419 | $ | 815,594,484 | $ | 3,294,425,524 | $ | 62,140,553 | ||||||||
| (b) Identified cost of foreign cash | $ | — | $ | — | $ | 2,692,639 | $ | — | ||||||||
The accompanying notes to financial statements are an integral part of these financial statements.
FMI Funds, Inc.
For the Year Ended September 30, 2022
| FMI Large Cap Fund | FMI Common Stock Fund | FMI International Fund | FMI International Fund II – Currency Unhedged | |||||||||||||
| INCOME: | ||||||||||||||||
| Dividends* | $ | 40,590,841 | $ | 10,590,662 | $ | 71,841,817 | $ | 1,497,315 | ||||||||
| Interest | 174,397 | 264,968 | 1,121,162 | 11,931 | ||||||||||||
| Total income | 40,765,238 | 10,855,630 | 72,962,979 | 1,509,246 | ||||||||||||
| EXPENSES: | ||||||||||||||||
| Management fees | 18,366,378 | 8,145,262 | 24,729,610 | 508,906 | ||||||||||||
| Shareholder servicing fees (Investor Class) | 1,782,998 | 445,176 | 1,412,655 | — | ||||||||||||
| Administration and accounting services | 591,705 | 235,023 | 692,672 | 33,339 | ||||||||||||
| Printing and postage expense | 225,572 | 57,714 | 593,893 | 5,744 | ||||||||||||
| Transfer agent fees | 115,316 | 67,046 | 108,322 | 18,311 | ||||||||||||
| Custodian fees | 104,157 | 38,038 | 446,066 | 31,777 | ||||||||||||
| Registration fees | 87,070 | 64,544 | 100,018 | 29,762 | ||||||||||||
| Board of Directors fees | 72,500 | 72,500 | 72,500 | 72,500 | ||||||||||||
| Professional fees | 45,202 | 41,658 | 50,156 | 39,912 | ||||||||||||
| Interest expense | 9,112 | 517 | — | 1,451 | ||||||||||||
| Other expenses | 210,274 | 78,563 | 207,928 | 36,868 | ||||||||||||
| Total expenses before reimbursement | 21,610,284 | 9,246,041 | 28,413,820 | 778,570 | ||||||||||||
| Less expenses reimbursed by adviser | — | — | — | (166,011 | ) | |||||||||||
| Net expenses | 21,610,284 | 9,246,041 | 28,413,820 | 612,559 | ||||||||||||
| NET INVESTMENT INCOME | 19,154,954 | 1,609,589 | 44,549,159 | 896,687 | ||||||||||||
The accompanying notes to financial statements are an integral part of these financial statements.
FMI Funds, Inc.
STATEMENTS OF OPERATIONS (Continued)
For the Year Ended September 30, 2022
| FMI Large Cap Fund | FMI Common Stock Fund | FMI International Fund | FMI International Fund II – Currency Unhedged | |||||||||||||
| NET REALIZED GAIN (LOSS) ON INVESTMENTS: | ||||||||||||||||
| Securities | $ | 435,120,201 | $ | 69,318,084 | $ | 79,917,330 | $ | (1,741,823 | ) | |||||||
| Forward currency contracts | — | — | 273,710,418 | — | ||||||||||||
| Foreign currency transactions | — | — | (8,234,282 | ) | (22,968 | ) | ||||||||||
| NET REALIZED GAIN (LOSS) ON INVESTMENTS | 435,120,201 | 69,318,084 | 345,393,466 | (1,764,791 | ) | |||||||||||
| NET CHANGE IN UNREALIZED APPRECIATION/DEPRECIATION ON INVESTMENTS: | ||||||||||||||||
| Securities | (841,127,660 | ) | (165,647,805 | ) | (1,136,622,249 | ) | (19,726,641 | ) | ||||||||
| Forward currency contracts | — | — | 141,273,528 | — | ||||||||||||
| Foreign currency transactions | — | — | (1,204,719 | ) | (40,178 | ) | ||||||||||
| NET CHANGE IN UNREALIZED APPRECIATION/DEPRECIATION ON INVESTMENTS | (841,127,660 | ) | (165,647,805 | ) | (996,553,440 | ) | (19,766,819 | ) | ||||||||
| NET GAIN (LOSS) ON INVESTMENTS | (406,007,459 | ) | (96,329,721 | ) | (651,159,974 | ) | (21,531,610 | ) | ||||||||
| NET INCREASE (DECREASE) IN NET ASSETS RESULTING FROM OPERATIONS | $ | (386,852,505 | ) | $ | (94,720,132 | ) | $ | (606,610,815 | ) | $ | (20,634,923 | ) | ||||
| * Net withholding taxes | $ | 843,494 | $ | — | $ | 6,134,068 | $ | 135,353 | ||||||||
The accompanying notes to financial statements are an integral part of these financial statements.
FMI Large Cap Fund
STATEMENTS OF CHANGES IN NET ASSETS
For the Years Ended September 30, 2022 and 2021
| 2022 | 2021 | |||||||
| OPERATIONS: | ||||||||
| Net investment income | $ | 19,154,954 | $ | 27,038,378 | ||||
| Net realized gain (loss) on investments | 435,120,201 | 605,957,266 | ||||||
| Net change in unrealized appreciation/depreciation on investments | (841,127,660 | ) | 123,727,074 | |||||
| Net increase (decrease) in net assets from operations | (386,852,505 | ) | 756,722,718 | |||||
| DISTRIBUTIONS TO SHAREHOLDERS FROM: | ||||||||
| Investor Class | (220,026,036 | ) | (167,535,731 | ) | ||||
| Institutional Class | (278,028,660 | ) | (196,110,923 | ) | ||||
| Total distributions (Note 8) | (498,054,696 | ) | (363,646,654 | ) | ||||
| FUND SHARE ACTIVITIES: | ||||||||
| Net increase (decrease) in net assets derived from Fund share activities (Note 9) | (254,087,896 | ) | (581,695,697 | ) | ||||
| TOTAL INCREASE (DECREASE) | (1,138,995,097 | ) | (188,619,633 | ) | ||||
| NET ASSETS AT THE BEGINNING OF THE YEAR | 3,211,168,443 | 3,399,788,076 | ||||||
| NET ASSETS AT THE END OF THE YEAR | $ | 2,072,173,346 | $ | 3,211,168,443 | ||||
| FUND SHARE TRANSACTIONS: | ||||||||
| Net increase (decrease) in shares outstanding (Note 9) | (14,849,295 | ) | (27,551,383 | ) | ||||
The accompanying notes to financial statements are an integral part of these financial statements.
FMI Common Stock Fund
STATEMENTS OF CHANGES IN NET ASSETS
For the Years Ended September 30, 2022 and 2021
| 2022 | 2021 | |||||||
| OPERATIONS: | ||||||||
| Net investment income | $ | 1,609,589 | $ | 2,992,669 | ||||
| Net realized gain (loss) on investments | 69,318,084 | 136,275,567 | ||||||
| Net change in unrealized appreciation/depreciation on investments | (165,647,805 | ) | 195,248,042 | |||||
| Net increase (decrease) in net assets from operations | (94,720,132 | ) | 334,516,278 | |||||
| DISTRIBUTIONS TO SHAREHOLDERS FROM: | ||||||||
| Investor Class | (49,540,457 | ) | (3,085,944 | ) | ||||
| Institutional Class | (62,187,565 | ) | (3,488,077 | ) | ||||
| Total distributions (Note 8) | (111,728,022 | ) | (6,574,021 | ) | ||||
| FUND SHARE ACTIVITIES: | ||||||||
| Net increase (decrease) in net assets derived from Fund share activities (Note 9) | 213,119,547 | (77,909,977 | ) | |||||
| TOTAL INCREASE (DECREASE) | 6,671,393 | 250,032,280 | ||||||
| NET ASSETS AT THE BEGINNING OF THE YEAR | 940,271,213 | 690,238,933 | ||||||
| NET ASSETS AT THE END OF THE YEAR | $ | 946,942,606 | $ | 940,271,213 | ||||
| FUND SHARE TRANSACTIONS: | ||||||||
| Net increase (decrease) in shares outstanding (Note 9) | 7,123,584 | (2,736,717 | ) | |||||
The accompanying notes to financial statements are an integral part of these financial statements.
FMI International Fund
STATEMENTS OF CHANGES IN NET ASSETS
For the Years Ended September 30, 2022 and 2021
| 2022 | 2021 | |||||||
| OPERATIONS: | ||||||||
| Net investment income | $ | 44,549,159 | $ | 122,132,223 | ||||
| Net realized gain (loss) on investments | 345,393,466 | 165,224,047 | ||||||
| Net change in unrealized appreciation/depreciation on investments | (996,553,440 | ) | 568,298,485 | |||||
| Net increase (decrease) in net assets from operations | (606,610,815 | ) | 855,654,755 | |||||
| DISTRIBUTIONS TO SHAREHOLDERS FROM: | ||||||||
| Investor Class | (36,245,422 | ) | — | |||||
| Institutional Class | (85,786,033 | ) | — | |||||
| Total distributions (Note 8) | (122,031,455 | ) | — | |||||
| FUND SHARE ACTIVITIES: | ||||||||
| Net increase (decrease) in net assets derived from Fund share activities (Note 9) | 281,706,526 | (787,589,102 | ) | |||||
| TOTAL INCREASE (DECREASE) | (446,935,744 | ) | 68,065,653 | |||||
| NET ASSETS AT THE BEGINNING OF THE YEAR | 3,417,696,328 | 3,349,630,675 | ||||||
| NET ASSETS AT THE END OF THE YEAR | $ | 2,970,760,584 | $ | 3,417,696,328 | ||||
| FUND SHARE TRANSACTIONS: | ||||||||
| Net increase (decrease) in shares outstanding (Note 9) | 8,435,897 | (24,393,075 | ) | |||||
The accompanying notes to financial statements are an integral part of these financial statements.
FMI International Fund II – Currency Unhedged
STATEMENTS OF CHANGES IN NET ASSETS
For the Years Ended September 30, 2022 and 2021
| 2022 | 2021 | |||||||
| OPERATIONS: | ||||||||
| Net investment income | $ | 896,687 | $ | 2,381,692 | ||||
| Net realized gain (loss) on investments | (1,764,791 | ) | 2,272,074 | |||||
| Net change in unrealized appreciation/depreciation on investments | (19,766,819 | ) | 7,661,699 | |||||
| Net increase (decrease) in net assets from operations | (20,634,923 | ) | 12,315,465 | |||||
| DISTRIBUTIONS TO SHAREHOLDERS FROM: | ||||||||
| Institutional Class | (3,350,974 | ) | (478,518 | ) | ||||
| Total distributions (Note 8) | (3,350,974 | ) | (478,518 | ) | ||||
| FUND SHARE ACTIVITIES: | ||||||||
| Net increase (decrease) in net assets derived from Fund share activities (Note 9) | 974,406 | 12,605,497 | ||||||
| TOTAL INCREASE (DECREASE) | (23,011,491 | ) | 24,442,444 | |||||
| NET ASSETS AT THE BEGINNING OF THE YEAR | 71,997,218 | 47,554,774 | ||||||
| NET ASSETS AT THE END OF THE YEAR | $ | 48,985,727 | $ | 71,997,218 | ||||
| FUND SHARE TRANSACTIONS: | ||||||||
| Net increase (decrease) in shares outstanding (Note 9) | (6,004 | ) | 559,696 | |||||
The accompanying notes to financial statements are an integral part of these financial statements.
FMI Large Cap Fund
(Selected data for each share of the Fund outstanding throughout each year)
| Investor Class | |||||||||||||||
| Years Ended September 30, | |||||||||||||||
| 2022 | 2021 | 2020 | 2019 | 2018 | |||||||||||
| PER SHARE OPERATING PERFORMANCE: | |||||||||||||||
| Net asset value, beginning of year | $ | 20.96 | $ | 18.81 | $ | 20.14 | $ | 22.85 | $ | 22.17 | |||||
| Income from investment operations: | |||||||||||||||
| Net investment income (loss)(1) | 0.11 | 0.15 | 0.18 | 0.25 | 0.24 | ||||||||||
| Net realized and unrealized gain (loss) on investments | (2.73 | ) | 4.25 | 0.03 | (2) | 0.55 | 2.43 | ||||||||
| Total from investment operations | (2.62 | ) | 4.40 | 0.21 | 0.80 | 2.67 | |||||||||
| Less distributions: | |||||||||||||||
| Distributions from net investment income | (0.16 | ) | (0.30 | ) | (0.17 | ) | (0.28 | ) | (0.17 | ) | |||||
| Distributions from net realized gains | (3.20 | ) | (1.95 | ) | (1.37 | ) | (3.23 | ) | (1.82 | ) | |||||
| Total from distributions | (3.36 | ) | (2.25 | ) | (1.54 | ) | (3.51 | ) | (1.99 | ) | |||||
| Net asset value, end of year | $ | 14.98 | $ | 20.96 | $ | 18.81 | $ | 20.14 | $ | 22.85 | |||||
| TOTAL RETURN | (15.86 | %) | 24.48 | % | 0.71 | % | 5.72 | % | 12.67 | % | |||||
| RATIOS/SUPPLEMENTAL DATA: | |||||||||||||||
| Net assets, end of year (in 000’s $) | 1,001,682 | 1,422,451 | 1,475,504 | 2,337,118 | 3,155,818 | ||||||||||
| Ratio of expenses to average net assets | 0.83 | % | 0.82 | % | 0.81 | % | 0.82 | % | 0.85 | % | |||||
| Ratio of net investment income (loss) to average net assets | 0.60 | % | 0.72 | % | 0.99 | % | 1.25 | % | 1.07 | % | |||||
| Portfolio turnover rate(3) | 25 | % | 17 | % | 28 | % | 20 | % | 25 | % | |||||
| (1) | Net investment income (loss) per share was calculated using average shares outstanding. |
| (2) | Realized and unrealized gain (loss) per share in this caption are balancing amounts necessary to reconcile the change in net asset value per share for the year, and may not reconcile with the aggregate gains on the Statement of Operations due to share transactions for the year. |
| (3) | Portfolio turnover rate is disclosed for the Fund as a whole. |
The accompanying notes to financial statements are an integral part of these financial statements.
FMI Large Cap Fund
FINANCIAL HIGHLIGHTS
(Selected data for each share of the Fund outstanding throughout each year)
| Institutional Class | |||||||||||||||
| Years Ended September 30, | |||||||||||||||
| 2022 | 2021 | 2020 | 2019 | 2018 | |||||||||||
| PER SHARE OPERATING PERFORMANCE: | |||||||||||||||
| Net asset value, beginning of year | $ | 20.94 | $ | 18.80 | $ | 20.13 | $ | 22.85 | $ | 22.18 | |||||
| Income from investment operations: | |||||||||||||||
| Net investment income (loss)(1) | 0.14 | 0.18 | 0.21 | 0.25 | 0.27 | ||||||||||
| Net realized and unrealized gain (loss) on investments | (2.73 | ) | 4.24 | 0.02 | (2) | 0.58 | 2.43 | ||||||||
| Total from investment operations | (2.59 | ) | 4.42 | 0.23 | 0.83 | 2.70 | |||||||||
| Less distributions: | |||||||||||||||
| Distributions from net investment income | (0.19 | ) | (0.33 | ) | (0.19 | ) | (0.32 | ) | (0.21 | ) | |||||
| Distributions from net realized gains | (3.20 | ) | (1.95 | ) | (1.37 | ) | (3.23 | ) | (1.82 | ) | |||||
| Total from distributions | (3.39 | ) | (2.28 | ) | (1.56 | ) | (3.55 | ) | (2.03 | ) | |||||
| Net asset value, end of year | $ | 14.96 | $ | 20.94 | $ | 18.80 | $ | 20.13 | $ | 22.85 | |||||
| TOTAL RETURN | (15.73 | %) | 24.63 | % | 0.84 | % | 5.89 | % | 12.82 | % | |||||
| RATIOS/SUPPLEMENTAL DATA: | |||||||||||||||
| Net assets, end of year (in 000’s $) | 1,070,491 | 1,788,717 | 1,924,284 | 2,652,783 | 2,861,755 | ||||||||||
| Ratio of expenses to average net assets | 0.69 | % | 0.68 | % | 0.67 | % | 0.68 | % | 0.71 | % | |||||
| Ratio of net investment income (loss) to average net assets | 0.73 | % | 0.85 | % | 1.13 | % | 1.26 | % | 1.20 | % | |||||
| Portfolio turnover rate(3) | 25 | % | 17 | % | 28 | % | 20 | % | 25 | % | |||||
| (1) | Net investment income (loss) per share was calculated using average shares outstanding. |
| (2) | Realized and unrealized gain (loss) per share in this caption are balancing amounts necessary to reconcile the change in net asset value per share for the year, and may not reconcile with the aggregate gains on the Statement of Operations due to share transactions for the year. |
| (3) | Portfolio turnover rate is disclosed for the Fund as a whole. |
The accompanying notes to financial statements are an integral part of these financial statements.
FMI Common Stock Fund
FINANCIAL HIGHLIGHTS
(Selected data for each share of the Fund outstanding throughout each year)
| Investor Class | |||||||||||||||
| Years Ended September 30, | |||||||||||||||
| 2022 | 2021 | 2020 | 2019 | 2018 | |||||||||||
| PER SHARE OPERATING PERFORMANCE: | |||||||||||||||
| Net asset value, beginning of year | $ | 33.23 | $ | 22.25 | $ | 26.39 | $ | 27.55 | $ | 28.83 | |||||
| Income from investment operations: | |||||||||||||||
| Net investment income (loss)(1) | 0.03 | 0.08 | 0.17 | 0.15 | 0.06 | ||||||||||
| Net realized and unrealized gain (loss) on investments | (2.57 | ) | 11.11 | (3.02 | ) | 0.94 | 1.80 | ||||||||
| Total from investment operations | (2.54 | ) | 11.19 | (2.85 | ) | 1.09 | 1.86 | ||||||||
| Less distributions: | |||||||||||||||
| Distributions from net investment income | (0.11 | ) | (0.21 | ) | (0.11 | ) | (0.10 | ) | (0.01 | ) | |||||
| Distributions from net realized gains | (3.86 | ) | — | (1.18 | ) | (2.15 | ) | (3.13 | ) | ||||||
| Total from distributions | (3.97 | ) | (0.21 | ) | (1.29 | ) | (2.25 | ) | (3.14 | ) | |||||
| Net asset value, end of year | $ | 26.72 | $ | 33.23 | $ | 22.25 | $ | 26.39 | $ | 27.55 | |||||
| TOTAL RETURN | (9.10 | %) | 50.49 | % | (11.51 | %) | 5.28 | % | 6.92 | % | |||||
| RATIOS/SUPPLEMENTAL DATA: | |||||||||||||||
| Net assets, end of year (in 000’s $) | 357,946 | 423,286 | 345,428 | 529,234 | 635,174 | ||||||||||
| Ratio of expenses to average net assets | 1.00 | % | 1.01 | % | 1.02 | % | 1.02 | % | 1.04 | % | |||||
| Ratio of net investment income (loss) to average net assets | 0.09 | % | 0.28 | % | 0.71 | % | 0.59 | % | 0.23 | % | |||||
| Portfolio turnover rate(2) | 36 | % | 29 | % | 32 | % | 28 | % | 26 | % | |||||
| (1) | Net investment income (loss) per share was calculated using average shares outstanding. |
| (2) | Portfolio turnover rate is disclosed for the Fund as a whole. |
The accompanying notes to financial statements are an integral part of these financial statements.
FMI Common Stock Fund
FINANCIAL HIGHLIGHTS
(Selected data for each share of the Fund outstanding throughout each year)
| Institutional Class | |||||||||||||||
| Years Ended September 30, | |||||||||||||||
| 2022 | 2021 | 2020 | 2019 | 2018 | |||||||||||
| PER SHARE OPERATING PERFORMANCE: | |||||||||||||||
| Net asset value, beginning of year | $ | 33.29 | $ | 22.28 | $ | 26.42 | $ | 27.59 | $ | 28.85 | |||||
| Income from investment operations: | |||||||||||||||
| Net investment income (loss)(1) | 0.07 | 0.12 | 0.20 | 0.18 | 0.10 | ||||||||||
| Net realized and unrealized gain (loss) on investments | (2.58 | ) | 11.12 | (3.02 | ) | 0.93 | 1.79 | ||||||||
| Total from investment operations | (2.51 | ) | 11.24 | (2.82 | ) | 1.11 | 1.89 | ||||||||
| Less distributions: | |||||||||||||||
| Distributions from net investment income | (0.15 | ) | (0.23 | ) | (0.14 | ) | (0.13 | ) | (0.02 | ) | |||||
| Distributions from net realized gains | (3.86 | ) | — | (1.18 | ) | (2.15 | ) | (3.13 | ) | ||||||
| Total from distributions | (4.01 | ) | (0.23 | ) | (1.32 | ) | (2.28 | ) | (3.15 | ) | |||||
| Net asset value, end of year | $ | 26.77 | $ | 33.29 | $ | 22.28 | $ | 26.42 | $ | 27.59 | |||||
| TOTAL RETURN | (8.99 | %) | 50.68 | % | (11.41 | %) | 5.40 | % | 7.02 | % | |||||
| RATIOS/SUPPLEMENTAL DATA: | |||||||||||||||
| Net assets, end of year (in 000’s $) | 588,996 | 516,985 | 344,811 | 448,262 | 433,491 | ||||||||||
| Ratio of expenses to average net assets | 0.89 | % | 0.90 | % | 0.90 | % | 0.91 | % | 0.94 | % | |||||
| Ratio of net investment income (loss) to average net assets | 0.22 | % | 0.39 | % | 0.84 | % | 0.71 | % | 0.37 | % | |||||
| Portfolio turnover rate(2) | 36 | % | 29 | % | 32 | % | 28 | % | 26 | % | |||||
| (1) | Net investment income (loss) per share was calculated using average shares outstanding. |
| (2) | Portfolio turnover rate is disclosed for the Fund as a whole. |
The accompanying notes to financial statements are an integral part of these financial statements.
FMI International Fund
FINANCIAL HIGHLIGHTS
(Selected data for each share of the Fund outstanding throughout each year)
| Investor Class | |||||||||||||||
| Years Ended September 30, | |||||||||||||||
| 2022 | 2021 | 2020 | 2019 | 2018 | |||||||||||
| PER SHARE OPERATING PERFORMANCE: | |||||||||||||||
| Net asset value, beginning of year | $ | 35.36 | $ | 27.69 | $ | 31.89 | $ | 33.80 | $ | 33.59 | |||||
| Income from investment operations: | |||||||||||||||
| Net investment income (loss)(1) | 0.41 | 1.10 | 0.35 | 0.48 | 0.48 | ||||||||||
| Net realized and unrealized gain (loss) on investments | (6.29 | ) | 6.57 | (3.40 | ) | (0.26 | ) | 0.28 | |||||||
| Total from investment operations | (5.88 | ) | 7.67 | (3.05 | ) | 0.22 | 0.76 | ||||||||
| Less distributions: | |||||||||||||||
| Distributions from net investment income | (1.23 | ) | — | (1.15 | ) | (1.32 | ) | (0.10 | ) | ||||||
| Distributions from net realized gains | — | — | — | (0.81 | ) | (0.45 | ) | ||||||||
| Total from distributions | (1.23 | ) | — | (1.15 | ) | (2.13 | ) | (0.55 | ) | ||||||
| Net asset value, end of year | $ | 28.25 | $ | 35.36 | $ | 27.69 | $ | 31.89 | $ | 33.80 | |||||
| TOTAL RETURN | (17.24 | %) | 27.70 | % | (10.06 | %) | 1.27 | % | 2.27 | % | |||||
| RATIOS/SUPPLEMENTAL DATA: | |||||||||||||||
| Net assets, end of year (in 000’s $) | 792,421 | 1,066,600 | 1,207,016 | 2,798,739 | 3,267,841 | ||||||||||
| Ratio of expenses to average net assets | 0.94 | % | 0.94 | % | 0.91 | % | 0.90 | % | 0.90 | % | |||||
| Ratio of net investment income (loss) to average net assets | 1.22 | % | 3.29 | % | 1.19 | % | 1.55 | % | 1.43 | % | |||||
| Portfolio turnover rate(2) | 20 | % | 27 | % | 23 | % | 13 | % | 21 | % | |||||
| (1) | Net investment income (loss) per share was calculated using average shares outstanding. |
| (2) | Portfolio turnover rate is disclosed for the Fund as a whole. |
The accompanying notes to financial statements are an integral part of these financial statements.
FMI International Fund
FINANCIAL HIGHLIGHTS
(Selected data for each share of the Fund outstanding throughout each year)
| Institutional Class | |||||||||||||||
| Years Ended September 30, | |||||||||||||||
| 2022 | 2021 | 2020 | 2019 | 2018 | |||||||||||
| PER SHARE OPERATING PERFORMANCE: | |||||||||||||||
| Net asset value, beginning of year | $ | 35.46 | $ | 27.73 | $ | 31.93 | $ | 33.86 | $ | 33.62 | |||||
| Income from investment operations: | |||||||||||||||
| Net investment income (loss)(1) | 0.45 | 1.18 | 0.38 | 0.53 | 0.49 | ||||||||||
| Net realized and unrealized gain (loss) on investments | (6.29 | ) | 6.55 | (3.39 | ) | (0.27 | ) | 0.31 | |||||||
| Total from investment operations | (5.84 | ) | 7.73 | (3.01 | ) | 0.26 | 0.80 | ||||||||
| Less distributions: | |||||||||||||||
| Distributions from net investment income | (1.27 | ) | — | (1.19 | ) | (1.38 | ) | (0.11 | ) | ||||||
| Distributions from net realized gains | — | — | — | (0.81 | ) | (0.45 | ) | ||||||||
| Total from distributions | (1.27 | ) | — | (1.19 | ) | (2.19 | ) | (0.56 | ) | ||||||
| Net asset value, end of year | $ | 28.35 | $ | 35.46 | $ | 27.73 | $ | 31.93 | $ | 33.86 | |||||
| TOTAL RETURN | (17.10 | %) | 27.88 | % | (9.95 | %) | 1.42 | % | 2.40 | % | |||||
| RATIOS/SUPPLEMENTAL DATA: | |||||||||||||||
| Net assets, end of year (in 000’s $) | 2,178,340 | 2,351,096 | 2,142,615 | 4,480,109 | 4,045,361 | ||||||||||
| Ratio of expenses to average net assets | 0.81 | % | 0.80 | % | 0.77 | % | 0.76 | % | 0.76 | % | |||||
| Ratio of net investment income (loss) to average net assets | 1.37 | % | 3.48 | % | 1.31 | % | 1.69 | % | 1.44 | % | |||||
| Portfolio turnover rate(2) | 20 | % | 27 | % | 23 | % | 13 | % | 21 | % | |||||
| (1) | Net investment income (loss) per share was calculated using average shares outstanding. |
| (2) | Portfolio turnover rate is disclosed for the Fund as a whole. |
The accompanying notes to financial statements are an integral part of these financial statements.
FMI International Fund II – Currency Unhedged
FINANCIAL HIGHLIGHTS
(Selected data for each share of the Fund outstanding throughout each period)
Institutional Class
| Years Ended September 30, | For the Period from December 31, 2019* to September 30, | ||||||||
| 2022 | 2021 | 2020 | |||||||
| PER SHARE OPERATING PERFORMANCE: | |||||||||
| Net asset value, beginning of period | $ | 21.70 | $ | 17.24 | $ | 20.00 | |||
| Income from investment operations: | |||||||||
| Net investment income (loss)(1) | 0.26 | 0.77 | 0.13 | ||||||
| Net realized and unrealized gain (loss) on investments | (6.22 | ) | 3.87 | (2.89 | ) | ||||
| Total from investment operations | (5.96 | ) | 4.64 | (2.76 | ) | ||||
| Less distributions: | |||||||||
| Distributions from net investment income | (0.66 | ) | (0.18 | ) | — | ||||
| Distributions from net realized gains | (0.29 | ) | — | — | |||||
| Total from distributions | (0.95 | ) | (0.18 | ) | — | ||||
| Net asset value, end of period | $ | 14.79 | $ | 21.70 | $ | 17.24 | |||
| TOTAL RETURN | (28.71 | %) | 26.96 | % | (13.80 | %)(2) | |||
| RATIOS/SUPPLEMENTAL DATA: | |||||||||
| Net assets, end of period (in 000’s $) | 48,986 | 71,997 | 47,555 | ||||||
| Ratio of expenses to average net assets: | |||||||||
| Before expense reimbursement | 1.15 | % | 1.16 | % | 1.43 | %(3) | |||
| After expense reimbursement | 0.90 | % | 0.90 | % | 0.90 | %(3) | |||
| Ratio of net investment income (loss) to average net assets | |||||||||
| Before expense reimbursement | 1.07 | % | 3.35 | % | 0.49 | %(3) | |||
| After expense reimbursement | 1.32 | % | 3.61 | % | 1.02 | %(3) | |||
| Portfolio turnover rate | 27 | % | 31 | % | 15 | %(2) | |||
| * | Inception date. |
| (1) | Net investment income (loss) per share was calculated using average shares outstanding. |
| (2) | Not annualized. |
| (3) | Annualized. |
The accompanying notes to financial statements are an integral part of these financial statements.
FMI Funds, Inc.
September 30, 2022
| (1) | Organization — |
The following is a summary of significant accounting policies of the FMI Large Cap Fund, the FMI Common Stock Fund, the FMI International Fund, and the FMI International Fund II – Currency Unhedged (collectively, the “Funds” or, individually, a “Fund”). The FMI Large Cap Fund (the “Large Cap Fund”), the FMI Common Stock Fund (the “Common Stock Fund”), the FMI International Fund (the “International Fund”), and the FMI International Fund II – Currency Unhedged (the “International Currency Unhedged Fund”) are each a series of FMI Funds, Inc. (the “Company”). The Company was incorporated under the laws of Maryland on September 5, 1996. The Large Cap Fund commenced operations on December 31, 2001 and the International Fund commenced operations on December 31, 2010. The Common Stock Fund is the successor to the FMI Common Stock Fund, the sole series of FMI Common Stock Fund, Inc. (the “Predecessor Common Stock Fund”). The Predecessor Common Stock Fund commenced operations on December 18, 1981. The reorganization was effective as of January 31, 2014, and the Common Stock Fund is the accounting survivor of the reorganization. As the accounting survivor of the reorganization, the Common Stock Fund adopted the Financial Statements of the Predecessor Common Stock Fund. The Predecessor Common Stock Fund was incorporated under the laws of Wisconsin on July 29, 1981. The International Currency Unhedged Fund commenced operations on December 31, 2019.
Effective October 31, 2016, the Large Cap Fund, Common Stock Fund, and International Fund offer two classes of shares (Investor and Institutional). The International Currency Unhedged Fund currently only offers Institutional Class shares. The Institutional Class has the same management fee as the Investor Class and does not have a shareholder servicing plan. A higher investment minimum is required for the Institutional Class than the Investor Class. Each class of shares has exclusive voting rights with respect to matters that affect just that class. Income, expenses (other than expenses attributable to a specific class) and realized and unrealized gains or losses on investments are allocated to each class of shares on its relative net assets. The Company’s Board of Directors (the “Board”) may elect to have certain expenses specific to the Investor Class shares or Institutional Class shares be borne solely by the Class to which such expenses are attributable, but any expenses not specifically allocated to the Investor Class shares or Institutional Class shares are generally allocated to each such Class proportionately (after any applicable base fee to be paid by a class of shares of a Fund attributable to such expense) on the basis of the net asset value of that Class in relation to the net asset value of the applicable Fund.
The Large Cap Fund and the International Currency Unhedged Fund are non-diversified, open-end management investment companies under the Investment Company Act of 1940 (the “Act”), as amended. The Common Stock Fund and the International Fund are diversified open-end management investment companies under the Act. The financial statements are prepared in accordance with accounting principles generally accepted in the United States of America (“GAAP”). The Funds follow the investment company accounting and financial reporting guidance under Financial Accounting Standards Board (“FASB”) Accounting Standards Codification “Financial Services – Investment Companies” Topic 946 (“ASC 946”). The assets and liabilities of each Fund in the Company are segregated and a shareholder’s interest is limited to the Fund in which the shareholder owns shares. The investment objective of the Large Cap Fund is to seek long-term capital appreciation by investing mainly in limited a number of large capitalization value stocks. The investment objective of the Common Stock Fund is to seek long-term capital appreciation by investing mainly in small to medium capitalization value stocks. The investment objective of the International Fund and International Currency Unhedged Fund is to seek capital appreciation by investing mainly in a limited number of large capitalization value stocks of non-U.S. companies.
FMI Funds, Inc.
NOTES TO FINANCIAL STATEMENTS (Continued)
September 30, 2022
| (2) | Summary of Significant Accounting Policies and Other Information — |
| (a) | The Funds apply the provisions of the FASB Accounting Standards Codification “Fair Value Measurement” Topic 820 (“ASC 820”), which defines fair value as the price that would be received to sell an asset or paid to transfer a liability (i.e., the “exit price”) in an orderly transaction between market participants at the measurement date. |
Each security is valued at the current day last sale price reported by the principal security exchange on which the issue is traded. Securities that are traded on the Nasdaq Markets are valued at the Nasdaq Official Closing Price, or if no sale is reported, the latest bid price. Securities that are traded over-the-counter, including U.S. Treasury securities are valued at the close price, if not close, then at the latest bid price. Bank deposits are valued at acquisition cost which approximates fair value. Unlisted equity securities for which market quotations are readily available are valued at the close price, if not close, then at the most recent bid price. Foreign securities are valued on a basis of quotations from the primary market in which they are traded, and are converted from the local currency into U.S. dollars using exchange rates as of the close of the New York Stock Exchange. For the International Fund and International Currency Unhedged Fund only, options purchased or written by each of the Funds’ are valued at the average of the most recent bid and ask prices. Securities for which quotations are not readily available are valued at fair value as determined by the investment adviser as the Board appointed valuation designee, in accordance with procedures approved by the Board. The fair value of a security is the amount which a Fund might reasonably expect to receive upon a current sale. The fair value of a security may differ from the last quoted price and a Fund may not be able to sell a security at the fair value. Market quotations may not be available, for example, if trading in particular securities was halted during the day and not resumed prior to the close of trading on the New York Stock Exchange. The foreign markets in which the International Fund and International Currency Unhedged Fund may invest are sometimes open on days when the New York Stock Exchange is not open and the International Fund and International Currency Unhedged Fund do not calculate their net asset value. For securities that do not trade during New York Stock Exchange hours, fair value determinations are based on analyses of market movements after the close of those securities’ primary markets, and may include reviews of developments in foreign markets, the performance of U.S. securities markets, and the performance of instruments trading in U.S. markets that represent foreign securities and baskets of foreign securities. The investment adviser utilizes a service provided by an independent third party to assist in fair valuation of certain securities for the International Fund and the International Currency Unhedged Fund. As of September 30, 2022, there were no securities that were internally fair valued.
FMI Funds, Inc.
NOTES TO FINANCIAL STATEMENTS (Continued)
September 30, 2022
| (2) | Summary of Significant Accounting Policies and Other Information — (Continued) |
In determining fair value, the Funds use various valuation approaches. ASC 820 establishes a fair value hierarchy for inputs used in measuring fair value that maximizes the use of observable inputs and minimizes the use of unobservable inputs by generally requiring that the most observable inputs be used when available. Observable inputs are those that market participants would use in pricing the asset or liability based on market data obtained from sources independent of the Funds. Unobservable inputs reflect the Funds’ assumptions about the inputs market participants would use in pricing the asset or liability developed based on the best information available in the circumstances. The inputs or methodologies used for valuing securities are not necessarily an indication of the risks associated with investing in those securities. Over the counter derivatives such as forward currency contracts may be valued using quantitative models. These models may use pricing curves based on market inputs including current exchange rates or indices. These curves are combined with volatility factors to value the overall positions. The market inputs are generally significant and can be corroborated with observable market data and therefore are classified in level 2.
The fair value hierarchy is categorized into three levels based on the inputs as follows:
Level 1 — Valuations based on unadjusted quoted prices in active markets for identical assets.
Level 2 — Valuations based on quoted prices for similar securities or in markets that are not active or for which all significant inputs are observable, either directly or indirectly.
Level 3 — Valuations based on inputs that are unobservable and significant to the overall fair value measurement.
The following table summarizes the Funds’ investments as of September 30, 2022, based on the inputs used to value them:
| Valuations | Large Cap Fund Investments in Securities | Common Stock Fund Investments in Securities | ||||||
| Assets: | ||||||||
| Level 1 — Common Stocks | $ | 2,051,502,880 | $ | 887,965,173 | ||||
| Bank Deposit Account | 19,135,997 | 58,652,586 | ||||||
| Total Level 1 | 2,070,638,877 | 946,617,759 | ||||||
| Level 2 — Common Stocks | — | — | ||||||
| Preferred Stocks | — | — | ||||||
| Forward Currency Contracts | — | — | ||||||
| Total Level 2 | — | — | ||||||
| Level 3 — | — | — | ||||||
| Total Assets | 2,070,638,877 | 946,617,759 | ||||||
| Liabilities: | ||||||||
| Level 2 — Forward Currency Contracts | — | — | ||||||
| Total | $ | 2,070,638,877 | $ | 946,617,759 | ||||
FMI Funds, Inc.
NOTES TO FINANCIAL STATEMENTS (Continued)
September 30, 2022
| (2) | Summary of Significant Accounting Policies and Other Information — (Continued) |
| Valuations | International Fund Investments in Securities | International Fund Other Financial Instruments* | International Currency Unhedged Fund Investments in Securities | |||||||||
| Assets: | ||||||||||||
| Level 1 — Common Stocks | $ | 290,536,850 | $ | — | $ | 5,049,643 | ||||||
| Bank Deposit Account | 148,803,086 | — | 2,113,015 | |||||||||
| Total Level 1 | 439,339,936 | — | 7,162,658 | |||||||||
| Level 2 — Common Stocks | 2,149,999,925 | — | 38,415,130 | |||||||||
| Preferred Stocks | 165,468,764 | — | 3,038,949 | |||||||||
| Forward Currency Contracts | — | 202,408,038 | — | |||||||||
| Total Level 2 | 2,315,468,689 | 202,408,038 | 41,454,079 | |||||||||
| Level 3 — | — | — | — | |||||||||
| Total Assets | 2,754,808,625 | 202,408,038 | 48,616,737 | |||||||||
| Liabilities: | ||||||||||||
| Level 2 — Forward Currency Contracts | — | — | — | |||||||||
| Total | $ | 2,754,808,625 | $ | 202,408,038 | $ | 48,616,737 | ||||||
| * | Other financial instruments are derivative instruments, specifically forward currency contracts, which are valued at the unrealized appreciation/(depreciation) on the instrument. |
See the Schedules of Investments for investments detailed by industry classifications.
| (b) | Net realized gains and losses on sales of securities are computed on the identified cost basis. For financial reporting purposes, investment transactions are recorded on the trade date. |
| (c) | Investment securities and other assets and liabilities denominated in foreign currencies are translated into U.S. dollar amounts at the date of valuation. Purchases and sales of investment securities and income and expense items denominated in foreign currencies are translated into U.S. dollar amounts on the respective date of such transactions. The Company does not isolate that portion of the results of operations resulting from changes in foreign exchange rates on investments from the fluctuations arising from changes in market prices of securities held. Such fluctuations are included with the net realized and unrealized gain or loss from investments. Reported net realized foreign exchange gains or losses arise from sales of foreign currencies, currency gains or losses realized between the trade and settlement dates on securities transactions, and the difference between the amounts of dividends, interest, and foreign withholding taxes recorded on the Company’s books and the U.S. dollar equivalent of the amounts actually received or paid. Net unrealized foreign exchange gains and losses arise from changes in the fair values of assets and liabilities, other than investments in securities at fiscal period-end, resulting from changes in exchange rates. |
| (d) | Dividend income is recorded on the ex-dividend date. Interest income is recorded on an accrual basis. The Funds record the amortization and accretion of discounts and premiums on securities purchased using the effective interest method. Withholding taxes on foreign dividends have been provided for in accordance with the Funds’ understanding of the applicable country’s tax rules and regulations. |
FMI Funds, Inc.
NOTES TO FINANCIAL STATEMENTS (Continued)
September 30, 2022
| (2) | Summary of Significant Accounting Policies and Other Information — (Continued) |
| (e) | The International Fund may enter into forward currency contracts in order to hedge its exposure to changes in foreign currency rates on its foreign portfolio holdings or to hedge certain purchase and sale commitments denominated in foreign currencies. The International Currency Unhedged Fund normally does not seek to reduce currency risk by hedging its perceived foreign currency exposure back into the U.S. dollar and will generally not be exposed to currency fluctuations. However, the investment adviser reserves the right to temporarily hedge all or a portion of the International Currency Unhedged Fund’s currency exposure. A forward currency contract is a commitment to purchase or sell a foreign currency at a future date at a negotiated rate. These contracts are valued daily and the asset or liability therein represents unrealized gain or loss on the contracts as measured by the difference between the forward foreign exchange rates at the dates of entry into the contracts and the forward rates at the reporting date. On a quarterly average there were seven forward currency contracts with an average quarterly value of $2,522,281,451 outstanding during the year ended September 30, 2022. These contracts are not subject to master netting agreements. For Non-Deliverable Forward Currency Contracts (“Contract”), the International Fund posts collateral, in the form of cash or cash equivalents, to a segregated account at the custodian when the Contract is in an unrealized loss position. When the Contract is in an unrealized gain position, the counterparty posts collateral to a segregated account at the custodian. |
The fair value of the forward currency contracts as of September 30, 2022, is included in the following location on the Statements of Assets and Liabilities for the International Fund:
| Fair Value of | Fair Value of | |||||||||||
| Asset Forward | (Liability) Forward | |||||||||||
| Location | Currency Contracts | Location | Currency Contracts | |||||||||
| Forward currency | Unrealized | $ | 202,408,038 | Unrealized | $ | — | ||||||
| contracts | appreciation on | depreciation on | ||||||||||
| forward currency | forward currency | |||||||||||
| contracts | contracts | |||||||||||
Realized and unrealized gains and losses on forward currency contracts entered into during the year ended September 30, 2022, are recorded in the following location on the Statements of Operations for the International Fund:
| Realized | Unrealized | |||||||||||
| Location | Gain (Loss) | Location | Appreciation | |||||||||
| Forward currency contracts | Net realized gain (loss) on forward currency contracts | $ | 273,710,418 | Net change in unrealized appreciation/ depreciation on forward currency contracts | $ | 141,273,528 | ||||||
These instruments involve market risk, credit risk, or both kinds of risks, in excess of the amount recognized on the Statements of Assets and Liabilities for the International Fund. Risks arise from the possible inability of counterparties to meet the terms of their contracts and from movement in currency and securities values and interest rates.
FMI Funds, Inc.
NOTES TO FINANCIAL STATEMENTS (Continued)
September 30, 2022
| (2) | Summary of Significant Accounting Policies and Other Information — (Continued) |
| (f) | The preparation of financial statements in conformity with GAAP requires management to make estimates and assumptions that affect the reported amounts of assets and liabilities and disclosure of contingent assets and liabilities at the date of the financial statements and the reported amounts of income and expenses during the reporting period. Actual results could differ from these estimates. |
| (g) | The Funds may own certain securities that are restricted. Restricted securities include Section 4(a)(2) commercial paper or securities issued in a private placement. The Funds did not hold any restricted securities as of September 30, 2022. |
| (h) | No provision has been made for Federal income taxes since the Funds have elected to be taxed as “regulated investment companies.” The Funds intend to distribute substantially all net investment company taxable income and net capital gains to their respective shareholders and otherwise comply with the provisions of the Internal Revenue Code of 1986, as amended, applicable to regulated investment companies. |
| (i) | The Funds have reviewed all open tax years and major jurisdictions, which include Federal and the state of Maryland for the Funds and concluded that there are no significant uncertain tax positions that would require recognition in the financial statements. The Funds recognize interest and penalties, if any, related to unrecognized tax benefits on certain tax benefits on uncertain tax positions as income tax expense in the Statements of Operations. During the year ended September 30, 2022, the Funds did not incur any interest or penalties. Open tax years are those that are open for exam by taxing authorities and, as of September 30, 2022, open Federal tax years include the prior four fiscal tax years ended September 30, 2022. The Funds have no examinations in progress and are also not aware of any tax positions for which it is reasonably possible that the total amounts of unrecognized tax benefits will significantly change in the next twelve months. |
| (j) | GAAP requires that permanent differences between income for financial reporting and tax purposes be reclassified in the capital accounts. These differences are caused primarily by differences in the treatment of certain components of income or realized capital gain for federal income tax purposes. Each Fund may utilize earnings and profits distributed to shareholders on redemption of shares as part of the dividends paid deduction. These reclassifications have no effect on net assets, results of operations or net asset value per share. During the fiscal year ended September 30, 2022, the reclassifications were as follows: |
| Total Distributable Earnings/ | ||||||||
| (Accumulated Losses) | Capital Stock | |||||||
| Large Cap Fund | $ | (97,032,451 | ) | $ | 97,032,451 | |||
| Common Stock Fund | $ | (8,816,017 | ) | $ | 8,816,017 | |||
| International Fund | $ | — | $ | �� | ||||
| International Currency Unhedged Fund | $ | — | $ | — | ||||
| (k) | Net investment income and net realized gains, if any, are distributed to shareholders at least annually. Distributions to shareholders are recorded on the ex-dividend date. |
| (l) | Common Company expenses are typically allocated evenly between the Funds of the Company, or by other equitable means. |
FMI Funds, Inc.
NOTES TO FINANCIAL STATEMENTS (Continued)
September 30, 2022
| (3) | Investment Adviser and Advisory Agreement and Transactions With Related Parties — |
The Funds each have an investment advisory agreement with Fiduciary Management, Inc. (“FMI” or the “Adviser”), with whom certain officers and directors of the Funds are affiliated, to serve as investment adviser and manager.
Under the terms of the current advisory agreements, effective as of December 31, 2019, the Adviser is entitled to receive a fee. The fee is computed daily and payable at the end of each month. The following annual percentages of the International Currency Unhedged Fund’s average daily net assets are used:
| ● | 0.75% of the assets from $0 – $2.5 billion; 0.70% of the assets from $2.5 – $5.0 billion; 0.65% of the assets from $5.0 – $10.0 billion; and 0.60% of the assets over $10.0 billion. |
Under the terms of the current advisory agreements, effective as of January 1, 2019, the Adviser is entitled to receive a fee. The fee is computed daily and payable at the end of each month. The following annual percentages of each Fund’s average daily net assets are used:
| ● | Large Cap Fund: 0.65% of the assets from $0 – $2.5 billion; 0.60% of the assets from $2.5 – $5.0 billion; and 0.55% of the assets over $5.0 billion. |
| ● | Common Stock Fund: 0.85% of the assets from $0 – $500 million; 0.80% of the assets from $500 million – $1.0 billion; 0.75% of the assets over $1.0 billion. |
| ● | International Fund: 0.75% of the assets from $0 – $2.5 billion; 0.70% of the assets from $2.5 – $5.0 billion; 0.65% of the assets from $5.0 – $10.0 billion; and 0.60% of the assets over $10.0 billion. |
The Funds are responsible for paying their proportionate share of the compensation, benefits and expenses of the Funds’ Chief Compliance Officer. For administrative convenience, FMI initially makes these payments and is later reimbursed by the Funds.
Under the respective advisory agreement or operating expenses limitation agreements, FMI will reimburse the Funds for expenses (excluding federal, state and local taxes, interest, brokerage commissions and extraordinary items) as follows:
| Investor Class | Institutional Class | |||
| Expense Cap | Expense Cap | |||
| Large Cap Fund | 1.20% | 1.10% | ||
| Common Stock Fund | 1.30% | 1.20% | ||
| International Fund | 1.75% | 1.65% | ||
| International Currency Unhedged Fund | 1.75% | 1.65% |
For the year ended September 30, 2022, there were no contractual or voluntary reimbursements required for the Large Cap Fund, Common Stock Fund or International Fund. For the International Currency Unhedged Fund, there is no contractual reimbursement and the voluntary reimbursement is $166,011. The voluntary 0.90% expense cap/reimbursement agreement for the International Currency Unhedged Fund will continue in effect until January 31, 2023, with successive renewal terms of one year unless terminated by the Adviser prior to any such renewal. The Adviser is entitled to recoup such amounts for a one year period from the date the Adviser reduced its compensation and/or assumed expenses for the International Currency Unhedged Fund. The Adviser does not intend to recoup this $166,011.
FMI Funds, Inc.
NOTES TO FINANCIAL STATEMENTS (Continued)
September 30, 2022
| (3) | Investment Adviser and Advisory Agreement and Transactions With Related Parties — (Continued) |
The Large Cap Fund, the International Fund and the International Currency Unhedged Fund have each entered into a Distribution Plan (the “Plan”), pursuant to Rule 12b-1 under the Act. Each Plan, if implemented, provides that the applicable Fund may incur certain costs which may not exceed the lesser of a monthly amount equal to 0.25% of such Fund’s daily net assets or the actual distribution costs incurred during the year. Amounts payable under each Plan would be paid monthly for any activities or expenses primarily intended to result in the sale of shares of such Fund. For the year ended September 30, 2022, no such expenses were charged to the shareholders of any Fund as the Funds had not implemented the Plan.
Under the Funds’ organizational documents, each director, officer, employee or other agent of any Fund (including the Adviser) is indemnified, to the extent permitted by the Act, against certain liabilities that may arise out of performance of their duties to the Funds. Additionally, in the normal course of business, the Funds enter into contracts that contain a variety of indemnification clauses. The Funds’ maximum exposure under these arrangements is unknown as this would involve future claims that may be made against such Fund that have not yet occurred. However, the Funds have not had prior claims or losses pursuant to these contracts and believe the risk of loss to be remote.
At September 30, 2022, other than with regard to the International Currency Unhedged Fund, no person is deemed to “control” a Fund, as that term is defined in the Act, because the Funds do not know of any person who owns beneficially or through controlled companies more than 25% of a Fund’s Investor Class and Institutional Class shares, on a combined basis, or who acknowledges the existence of control. With regard to the International Currency Unhedged Fund, the known holdings of the Adviser and its affiliates are 25.81% of the Institutional Class shares of the Currency Unhedged Fund as of September 20, 2022 (Investor Class shares are not currently available for sale).
| (4) | Investments in Affiliated Issuers — |
An issuer in which a Fund’s holdings represent 5% or more of the outstanding voting securities of an issuer is an “affiliated” issuer as defined in the 1940 Act. For the year ended September 30, 2022 there were no Funds with an investment in a security of an affiliated issuer.
| (5) | Shareholder Servicing Plan — |
The Funds have adopted a Shareholder Servicing Plan pursuant to which Investor Class shares, (if available), may pay financial intermediaries for assets maintained in an omnibus account at an annual rate of up to 0.15% of the average daily net assets, or an annual per account rate approved by the Board. The Board may also authorize the Funds to pay for shareholder services outside of the plan.
For the year ended September 30, 2022, shareholder servicing fees incurred are disclosed on the Statements of Operations.
FMI Funds, Inc.
NOTES TO FINANCIAL STATEMENTS (Continued)
September 30, 2022
| (6) | Loan Agreements — |
U.S. Bank, N.A. (the “Bank”) has made available to the Company a $600,000,000 umbrella credit facility, pursuant to the loan agreement (the “Agreement”) effective May 27, 2022 for the FMI Funds, Inc. (consisting of Large Cap Fund, Common Stock Fund, International Fund and International Currency Unhedged Fund), for the purposes of having cash available to satisfy redemption requests and is subject to certain restrictions and covenants. For the period October 1, 2021 through May 26, 2022, the umbrella credit facility was $600,000,000. Principal is due not more than 45 days after the date of the loan. Amounts under the credit facility bear interest at a rate per annum equal to the Bank’s current prime rate minus one percent on the amount borrowed. Advances will be collateralized by securities owned by the borrowing Fund. The Agreement is subject to renewal on May 26, 2023. During the year ended September 30, 2022, the International Fund is the only Fund that did not borrow against the loan agreement. The Large Cap Fund, Common Stock Fund and International Currency Unhedged Fund borrowed, at an interest rate in the range of 2.25% - 5.25%, against the Agreement as follows:
| Amount | Outstanding as | |||||||||||||||||
| Average | of September 30, | Interest | Maximum | Maximum | ||||||||||||||
| Borrowings | 2022 | Expense | Borrowing | Borrowing Date | ||||||||||||||
| Large Cap Fund | $ | 192,992 | $ | — | $ | 9,112 | $ | 29,030,000 | 09/27/2022 | |||||||||
| Common Stock Fund | 22,649 | — | 517 | 4,641,000 | 12/21/2021 | |||||||||||||
| International Currency Unhedged Fund | 49,014 | — | 1,451 | 2,688,000 | 06/28/2022 | |||||||||||||
| (7) | Investment Transactions — |
For the year ended September 30, 2022, purchases and sales of investment securities (excluding short-term investments) were as follows:
| International | |||||||||||||||||
| Currency | |||||||||||||||||
| Large Cap Fund | Common Stock Fund | International Fund | Unhedged Fund | ||||||||||||||
| Purchases | $ | 708,115,134 | $ | 400,122,498 | $ | 1,002,414,445 | $ | 17,233,110 | |||||||||
| Sales | 1,443,207,156 | 338,850,582 | 630,875,396 | 21,936,974 | |||||||||||||
| (8) | Income Tax Information — |
The following information for the Funds is presented on an income tax basis as of September 30, 2022:
| Net Unrealized | ||||||||||||||||
| Gross | Gross | Appreciation | ||||||||||||||
| Cost of | Unrealized | Unrealized | (Depreciation) | |||||||||||||
| Investments | Appreciation(1) | Depreciation(1) | on Investments(1) | |||||||||||||
| Large Cap Fund | $ | 1,853,000,120 | $ | 524,105,325 | $ | (306,466,568 | ) | $ | 217,638,757 | |||||||
| Common Stock Fund | 816,596,223 | 198,536,901 | (68,515,365 | ) | 130,021,536 | |||||||||||
| International Fund | 3,322,786,589 | 347,246,292 | (912,210,961 | ) | (564,964,669 | ) | ||||||||||
| International Currency Unhedged Fund | 63,253,894 | 1,937,861 | (16,615,580 | ) | (14,677,719 | ) | ||||||||||
(1) Represents amounts of investments in securities, forward currency contracts and foreign currency transactions.
FMI Funds, Inc.
NOTES TO FINANCIAL STATEMENTS (Continued)
September 30, 2022
| (8) | Income Tax Information — (Continued) |
The difference between the cost amounts for financial statement and federal income tax purposes is due primarily to timing differences in recognizing certain gains and losses on security transactions. The International Funds are the only Funds with temporary mark to market differences. The components of accumulated earnings (deficit) on a tax-basis are as follows:
| Total | ||||||||||||||||||||
| Net | Distributable | |||||||||||||||||||
| Unrealized | Undistributed | Undistributed | Other | Earnings/ | ||||||||||||||||
| Appreciation | Ordinary | Long-Term | Accumulated | (Accumulated | ||||||||||||||||
| (Depreciation) | Income | Capital Gains | (Losses) | Losses) | ||||||||||||||||
| Large Cap Fund | $ | 217,638,757 | $ | 13,332,676 | $ | 324,039,274 | $ | — | $ | 555,010,707 | ||||||||||
| Common Stock Fund | 130,021,536 | 1,029,632 | 60,904,233 | — | 191,955,401 | |||||||||||||||
| International Fund | (564,964,669 | ) | 447,852,464 | — | (290,285,457 | ) | (407,397,662 | ) | ||||||||||||
| International Currency Unhedged Fund | (14,677,719 | ) | 684,384 | — | (803,558 | ) | (14,796,893 | ) | ||||||||||||
The International Fund utilized $64,601,667 of prior year capital loss carryovers.
The other accumulated losses above for the International Fund and International Currency Unhedged Fund are all capital loss carryovers, which may be used indefinitely to offset future gains as follows:
| Short-Term Capital | Long-Term Capital | Total Capital | ||||||||||
| Loss Carryovers | Loss Carryovers | Loss Carryovers | ||||||||||
| International Fund | $ | 52,750,194 | $ | 237,535,263 | $ | 290,285,457 | ||||||
| International Currency Unhedged Fund | 517,956 | 285,602 | 803,558 | |||||||||
The tax components of dividends paid during the years ended September 30, 2022 and 2021 are as follows:
| September 30, 2022 | September 30, 2021 | |||||||||||||||
| Ordinary | Long-Term | Ordinary | Long-Term | |||||||||||||
| Income | Capital Gains | Income | Capital Gains | |||||||||||||
| Distributions* | Distributions | Distributions* | Distributions | |||||||||||||
| Large Cap Fund | $ | 49,296,828 | $ | 448,757,868 | $ | 51,615,076 | $ | 312,031,578 | ||||||||
| Common Stock Fund | 3,572,626 | 108,155,396 | 6,574,021 | — | ||||||||||||
| International Fund | 122,031,455 | — | — | — | ||||||||||||
| International Fund Currency Unhedged | 2,556,915 | 794,059 | 478,518 | — | ||||||||||||
| * | For federal income tax purposes, distributions on short-term capital gains are treated as ordinary income distributions. |
FMI Funds, Inc.
NOTES TO FINANCIAL STATEMENTS (Continued)
September 30, 2022
| (9) | Fund Share Transactions — |
| Year Ended | Year Ended | |||||||||||||||
| September 30, 2022 | September 30, 2021 | |||||||||||||||
| Large Cap Fund | Shares | Amount | Shares | Amount | ||||||||||||
| Sales | ||||||||||||||||
| Investor Class | 4,339,661 | $ | 78,378,013 | 4,107,617 | $ | 84,115,258 | ||||||||||
| Institutional Class | 9,846,281 | 180,623,327 | 15,411,571 | 317,662,390 | ||||||||||||
| Reinvestment of dividends and distributions | ||||||||||||||||
| Investor Class | 11,559,346 | 219,049,619 | 8,627,384 | 166,077,149 | ||||||||||||
| Institutional Class | 14,610,684 | 276,141,925 | 10,113,907 | 194,288,146 | ||||||||||||
| Redemptions | ||||||||||||||||
| Investor Class | (16,894,122 | ) | (310,952,388 | ) | (23,322,653 | ) | (476,766,459 | ) | ||||||||
| Institutional Class | (38,311,145 | ) | (697,328,392 | ) | (42,489,209 | ) | (867,072,181 | ) | ||||||||
| Total Investor Class | (995,115 | ) | (13,524,756 | ) | (10,587,652 | ) | (226,574,052 | ) | ||||||||
| Total Institutional Class | (13,854,180 | ) | (240,563,140 | ) | (16,963,731 | ) | (355,121,645 | ) | ||||||||
| Net increase (decrease) | (14,849,295 | ) | $ | (254,087,896 | ) | (27,551,383 | ) | $ | (581,695,697 | ) | ||||||
| Year Ended | Year Ended | |||||||||||||||
| September 30, 2022 | September 30, 2021 | |||||||||||||||
| Common Stock Fund | Shares | Amount | Shares | Amount | ||||||||||||
| Sales | ||||||||||||||||
| Investor Class | 1,136,942 | $ | 34,957,499 | 1,358,888 | $ | 40,468,948 | ||||||||||
| Institutional Class | 7,467,492 | 223,727,902 | 3,246,842 | 98,202,692 | ||||||||||||
| Reinvestment of dividends and distributions | ||||||||||||||||
| Investor Class | 1,606,701 | 48,811,581 | 109,266 | 3,009,192 | ||||||||||||
| Institutional Class | 2,016,282 | 61,315,144 | 125,236 | 3,451,515 | ||||||||||||
| Redemptions | ||||||||||||||||
| Investor Class | (2,088,297 | ) | (64,365,803 | ) | (4,257,725 | ) | (126,034,802 | ) | ||||||||
| Institutional Class | (3,015,536 | ) | (91,326,776 | ) | (3,319,224 | ) | (97,007,522 | ) | ||||||||
| Total Investor Class | 655,346 | 19,403,277 | (2,789,571 | ) | (82,556,662 | ) | ||||||||||
| Total Institutional Class | 6,468,238 | 193,716,270 | 52,854 | 4,646,685 | ||||||||||||
| Net increase (decrease) | 7,123,584 | $ | 213,119,547 | (2,736,717 | ) | $ | (77,909,977 | ) | ||||||||
FMI Funds, Inc.
NOTES TO FINANCIAL STATEMENTS (Continued)
September 30, 2022
| Year Ended | Year Ended | |||||||||||||||
| September 30, 2022 | September 30, 2021 | |||||||||||||||
| International Fund | Shares | Amount | Shares | Amount | ||||||||||||
| Sales | ||||||||||||||||
| Investor Class | 2,361,842 | $ | 78,578,721 | 1,977,475 | $ | 66,993,021 | ||||||||||
| Institutional Class | 21,475,543 | 710,562,881 | 16,940,301 | 577,800,531 | ||||||||||||
| Reinvestment of dividends and distributions | ||||||||||||||||
| Investor Class | 1,044,980 | 35,895,075 | — | — | ||||||||||||
| Institutional Class | 2,269,865 | 78,151,463 | — | — | ||||||||||||
| Redemptions | ||||||||||||||||
| Investor Class | (5,523,380 | ) | (183,656,096 | ) | (15,404,957 | ) | (499,915,121 | ) | ||||||||
| Institutional Class | (13,192,953 | ) | (437,825,518 | ) | (27,905,894 | ) | (932,467,533 | ) | ||||||||
| Total Investor Class | (2,116,558 | ) | (69,182,300 | ) | (13,427,482 | ) | (432,922,100 | ) | ||||||||
| Total Institutional Class | 10,552,455 | 350,888,826 | (10,965,593 | ) | (354,667,002 | ) | ||||||||||
| Net increase (decrease) | 8,435,897 | $ | 281,706,526 | (24,393,075 | ) | $ | (787,589,102 | ) | ||||||||
| Year Ended | Year Ended | |||||||||||||||
| International Currency | September 30, 2022 | September 30, 2021 | ||||||||||||||
| Unhedged Fund | Shares | Amount | Shares | Amount | ||||||||||||
| Sales | ||||||||||||||||
| Institutional Class | 759,339 | $ | 14,921,914 | 956,205 | $ | 20,663,931 | ||||||||||
| Reinvestment of dividends and distributions | ||||||||||||||||
| Institutional Class | 152,788 | 3,152,021 | 21,853 | 444,942 | ||||||||||||
| Redemptions | ||||||||||||||||
| Institutional Class | (918,131 | ) | (17,099,529 | ) | (418,362 | ) | (8,503,376 | ) | ||||||||
| Total Institutional Class | (6,004 | ) | 974,406 | 559,696 | 12,605,497 | |||||||||||
| Net increase (decrease) | (6,004 | ) | $ | 974,406 | 559,696 | $ | 12,605,497 | |||||||||
| (10) | Subsequent Events — |
On September 16, 2022, the Board approved the year-end distributions for the Funds. Cash dividends in the aggregate amounts equal to each of the Fund’s net Investment Income and short-term capital gains, if any, which will be treated as ordinary income, and long-term capital gains, to be payable on December 16, 2022, to outstanding shares of record at the close of business on December 15, 2022.
REPORT OF INDEPENDENT REGISTERED PUBLIC ACCOUNTING FIRM
To the Shareholders and Board of Directors of FMI Funds, Inc.
Opinion on the Financial Statements
We have audited the accompanying statements of assets and liabilities, including the schedule of forward currency contracts for FMI International Fund and the schedules of investments, of FMI Funds, Inc. comprising the funds listed below (the “Funds”) as of September 30, 2022, the related statements of operations, the statements of changes in net assets, the related notes, and the financial highlights for each of the periods indicated below (collectively referred to as the “financial statements”). In our opinion, the financial statements present fairly, in all material respects, the financial position of each of the Funds as of September 30, 2022, the results of their operations, the changes in net assets, and the financial highlights for each of the periods indicated below, in conformity with accounting principles generally accepted in the United States of America.
| Fund Name | Statements of Operations | Statements of Changes in Net Assets | Financial Highlights |
| FMI Large Cap Fund | For the year ended 2022 | For the years ended 2022 and 2021 | For the years ended 2022, 2021, 2020, 2019, and 2018 |
| FMI Common Stock Fund | For the year ended 2022 | For the years ended 2022 and 2021 | For the years ended 2022, 2021, 2020, 2019, and 2018 |
| FMI International Fund | For the year ended 2022 | For the years ended 2022 and 2021 | For the years ended 2022, 2021, 2020, 2019, and 2018 |
| FMI International Fund II – Currency Unhedged | For the year ended 2022 | For the years ended 2022 and 2021 | For the years ended 2022 and 2021 and for the period from December 31, 2019 (commencement of operations) through September 30, 2020 |
Basis for Opinion
These financial statements are the responsibility of the Funds’ management. Our responsibility is to express an opinion on the Funds’ financial statements based on our audits. We are a public accounting firm registered with the Public Company Accounting Oversight Board (United States) (“PCAOB”) and are required to be independent with respect to the Funds in accordance with the U.S. federal securities laws and the applicable rules and regulations of the Securities and Exchange Commission and the PCAOB.
We conducted our audits in accordance with the standards of the PCAOB. Those standards require that we plan and perform the audit to obtain reasonable assurance about whether the financial statements are free of material misstatement whether due to error or fraud.
Our audits included performing procedures to assess the risks of material misstatement of the financial statements, whether due to error or fraud, and performing procedures that respond to those risks. Such procedures included examining, on a test basis, evidence regarding the amounts and disclosures in the financial statements. Our procedures included confirmation of securities owned as of September 30, 2022, by correspondence with the custodian and brokers. Our audits also included evaluating the accounting principles used and significant estimates made by management, as well as evaluating the overall presentation of the financial statements. We believe that our audits provide a reasonable basis for our opinion.
We have served as the Funds’ auditor since 2016.

COHEN & COMPANY, LTD.
Milwaukee, Wisconsin
November 8, 2022
EXPENSE EXAMPLE (Unaudited)
As a shareholder of the FMI Funds you incur ongoing costs, including management fees and other Fund expenses. You do not incur transaction costs such as sales charges (loads) on purchase payments, reinvested dividends, or other distributions; redemption fees; or exchange fees because the Funds do not charge these fees. This example is intended to help you understand your ongoing costs (in dollars) of investing in each Fund and to compare these costs with the ongoing costs of investing in other mutual funds. The example is based on an investment of $1,000 invested at the beginning of the period and held for the entire period from April 1, 2022 through September 30, 2022.
Actual Expenses
The table below provides information about actual account values and actual expenses. You may use the information in these lines, together with the amount you invested, to estimate the expenses that you paid over the period. Simply divide your account value by $1,000 (for example, an $8,600 account value divided by $1,000 = 8.6), then multiply the result by the number in the line under the heading entitled “Actual Expenses Paid During Period” to estimate the expenses you paid on your account during this period.
In addition to the costs highlighted and described below, the only Fund transaction costs you might currently incur would be wire fees ($15 per wire), if you choose to have proceeds from a redemption wired to your bank account instead of receiving a check. Additionally, U.S. Bank charges an annual processing fee ($15) if you maintain an IRA account with a Fund. To determine your total costs of investing in a Fund, you would need to add any applicable wire or IRA processing fees you’ve incurred during the period to the costs provided in the example at the end of this article.
Hypothetical Example for Comparison Purposes
The table below provides information about hypothetical account values and hypothetical expenses based on each Fund’s actual expense ratio and an assumed rate of return of 5% per year before expenses, which is not the Fund’s actual return. The hypothetical account values and expenses may not be used to estimate the actual ending account balance or expenses you paid for the period. You may use this information to compare the ongoing costs of investing in a Fund and other funds. To do so, compare this 5% hypothetical example with the 5% hypothetical examples that appear in the shareholder reports of the other funds.
Please note that the expenses shown in the table are meant to highlight your ongoing costs only and do not reflect any transactional costs, such as sales charges (loads), redemption fees or exchange fees. Therefore, the hypothetical line of the table is useful in comparing ongoing costs only, and will not help you determine the relative total costs of owning different funds. In addition, if these transactional costs were included, your costs would have been higher.
FMI Funds, Inc.
EXPENSE EXAMPLE (Unaudited) (Continued)
FMI | FMI Common Stock Fund | FMI | FMI International | |||||||||||||
| Investor Class | ||||||||||||||||
| Actual Beginning | ||||||||||||||||
| Account Value 4/01/22 | $ | 1,000.00 | $ | 1,000.00 | $ | 1,000.00 | $ | — | ||||||||
| Actual Ending | ||||||||||||||||
| Account Value 9/30/22 | $ | 812.40 | $ | 878.70 | $ | 844.30 | $ | — | ||||||||
| Actual Expenses Paid | ||||||||||||||||
| During Period* 4/01/22-9/30/22 | $ | 3.77 | $ | 4.71 | $ | 4.35 | $ | — | ||||||||
| Hypothetical Beginning | ||||||||||||||||
| Account Value 4/01/22 | $ | 1,000.00 | $ | 1,000.00 | $ | 1,000.00 | $ | — | ||||||||
| Hypothetical Ending | ||||||||||||||||
| Account Value 9/30/22 | $ | 1,020.91 | $ | 1,020.05 | $ | 1,020.36 | $ | — | ||||||||
| Hypothetical Expenses Paid | ||||||||||||||||
| During Period* 4/01/22-9/30/22 | $ | 4.20 | $ | 5.06 | $ | 4.76 | $ | — | ||||||||
| Annualized Expense Ratio* | 0.83% | 1.00% | 0.94% | — | ||||||||||||
| Institutional Class | ||||||||||||||||
| Actual Beginning | ||||||||||||||||
| Account Value 4/01/22 | $ | 1,000.00 | $ | 1,000.00 | $ | 1,000.00 | $ | 1,000.00 | ||||||||
| Actual Ending | ||||||||||||||||
| Account Value 9/30/22 | $ | 813.00 | $ | 879.10 | $ | 845.00 | $ | 749.60 | ||||||||
| Actual Expenses Paid | ||||||||||||||||
| During Period* 4/01/22-9/30/22 | $ | 3.18 | $ | 4.19 | $ | 3.75 | $ | 3.95 | ||||||||
| Hypothetical Beginning | ||||||||||||||||
| Account Value 4/01/22 | $ | 1,000.00 | $ | 1,000.00 | $ | 1,000.00 | $ | 1,000.00 | ||||||||
| Hypothetical Ending | ||||||||||||||||
| Account Value 9/30/22 | $ | 1,021.56 | $ | 1,020.61 | $ | 1,021.01 | $ | 1,020.56 | ||||||||
| Hypothetical Expenses Paid | ||||||||||||||||
| During Period* 4/01/22-9/30/22 | $ | 3.55 | $ | 4.51 | $ | 4.10 | $ | 4.56 | ||||||||
| Annualized Expense Ratio* | 0.70% | 0.89% | 0.81% | 0.90% | ||||||||||||
| * | Expenses are equal to the Fund’s annualized expense ratio, multiplied by the average account value over the period, multiplied by 183/365 (to reflect the one-half year period between April 1, 2022 and September 30, 2022). |
DIRECTORS AND OFFICERS (Unaudited)
| Name, Age and Address*^ | Positions Held with the Funds | Term of Office and Length of Time Served | Principal Occupation(s) During Past Five Years | Other Directorships Held by Director or Officer | ||||
| Non-Interested Directors | ||||||||
| Robert C. Arzbaecher, 62 | Director | Indefinite Term Since 2007 | Mr. Arzbaecher retired as Chairman and Chief Executive Officer of Actuant Corporation (Menomonee Falls, WI) in March 2016. | CF Industries Holdings, Inc. | ||||
| Lawrence J. Burnett, 64 | Director | Indefinite Term Since 2016 | Mr. Burnett is a shareholder and employee of Reinhart Boerner Van Deuren s.c. (Milwaukee, WI), a law firm since 1982. Mr. Burnett is also the Co-Chair of Reinhart Boerner’s business law department. | None | ||||
| Rebecca W. House, 49 | Director | Indefinite Term Since 2017 | Ms. House is Chief People and Legal Officer and Corporate Secretary at Rockwell Automation, Inc., an industrial automation company, since July 2020, and was previously General Counsel and Secretary since January 2017. | Marvell Technology, Inc. | ||||
| Paul S. Shain, 59 | Director | Indefinite Term Since 2001 | Mr. Shain is President and Chief Executive Officer of Singlewire Software, LLC (Madison, WI), a provider of IP-based paging and emergency notification systems, since April 2009. | None | ||||
| Robert J. Venable, 58 | Director | Indefinite Term Since 2016 | Mr. Venable previously was President and COO of Charter Manufacturing (Mequon, WI) a privately held steel and iron manufacturing company, where he has been employed since July 2013. | None | ||||
FMI Funds, Inc.
DIRECTORS AND OFFICERS (Unaudited) (Continued)
| Name, Age and Address*^ | Positions Held with the Funds | Term of Office and Length of Time Served | Principal Occupation(s) During Past Five Years | Other Directorships Held by Director or Officer | ||||
| Interested Directors | ||||||||
| John S. Brandser,** 60 | Director President and Treasurer | Indefinite Term Since 2013 One Year Term Since 2017 One Year Term Since 2017 | Mr. Brandser is President, Secretary, Chief Operating Officer and Chief Compliance Officer of Fiduciary Management, Inc. and has been employed by the Adviser in various capacities since March 1995. | None | ||||
| Patrick J. English,** 61 | Director Vice President and Secretary | Indefinite Term Since 2001 One Year Term Since 2001 One Year Term Since 2017 | Mr. English is Chairman, Chief Executive Officer, Chief Investment Officer and Treasurer of Fiduciary Management, Inc. and has been employed by the Adviser in various capacities since December 1986. | None | ||||
| Other Officer | ||||||||
| Ryan J. Ladwig, 35 | Chief Compliance Officer | At the Discretion of Board since 2021 | Mr. Ladwig is Chief Compliance Officer of the Funds since November 2021 and was previously a Compliance & Operations Officer of the Adviser since December 2017. From June 2014 to December 2017, Mr. Ladwig was employed by PricewaterhouseCoopers, LLP, auditing clients in the asset management industry. | None |
| * | The address of each Director and Officer is c/o Fiduciary Management, Inc., 100 E. Wisconsin Ave., Suite 2200, Milwaukee, WI 53202. |
| ** | Messrs. Brandser and English are interested directors of the Funds because they are officers of the Funds and/or affiliated persons of the Adviser. |
| ^ | Each Non-Interested and Interested Director oversees each of the four Funds in the complex. |
FMI Funds, Inc.
LIQUIDITY RISK MANAGEMENT PROGRAM (Unaudited)
On June 24, 2022 the Directors of FMI Funds, Inc., and its series the FMI Common Stock Fund, FMI Large Cap Fund, FMI International Fund and FMI International Fund II – Currency Unhedged (collectively, the “Funds”), reviewed and considered a written report prepared by the program administrator of the Funds’ Liquidity Risk Management Program (the “Program”), the Funds’ Trading Practices Committee (the “Program Administrator”), which addressed the operation of the Program and assessed the Program’s adequacy and effectiveness of implementation. In considering the report, the Directors noted that the Program Administrator has determined that all of the Funds primarily hold assets that are highly liquid investments, and thus may rely on the exclusion from the requirements to determine and review a highly liquid investment minimum and to adopt shortfall policies and procedures. They then confirmed with the Program Administrator that no material changes were made to the Program, and reviewed all of the material features of the Program to ensure that they understand how the Program is designed to assess and manage the risk that the Funds could not meet requests to redeem shares issued by the Funds without significant dilution of remaining investors in the Funds. Following this review and discussion, the Directors determined that they believe the disclosures in the report, taken as a whole, provide the information necessary for the Directors to effectively assess the Program and its implementation, and that they are comfortable with the report’s conclusion that the Program is reasonably designed to assess and manage the Funds’ liquidity risk and is operating as intended.
DISCLOSURE INFORMATION (Unaudited)
Performance data quoted represents past performance; past performance does not guarantee future results. Investment return and principal value of an investment will fluctuate so that an investor’s shares, when redeemed, may be worth more or less than their original cost. Current performance of a Fund may be lower or higher than the performance quoted. Performance data current to the most recent month end may be obtained by visiting www.fmifunds.com or by calling 1-800-811-5311. The returns do not reflect the deduction of taxes that a shareholder would pay on Fund distributions or the redemption of Fund shares.
Securities named in the Letters to Shareholders, but not listed in the Schedules of Investments are not held in the Funds as of the date of this disclosure. Portfolio holdings are subject to change without notice and are not intended as recommendations of individual securities.
This report is not authorized for use as an offer of sale or a solicitation of an offer to buy shares of the Funds unless accompanied or preceded by the Funds’ current prospectus.
As of the Funds’ Prospectus dated January 31, 2022, the annual operating expense ratios for the Investor Class of FMI Large Cap Fund, FMI Common Stock Fund and FMI International Fund are: 0.82%, 1.01% and 0.94%, respectively. The annual operating expense ratios for the Institutional Class of FMI Large Cap Fund, FMI Common Stock Fund, FMI International Fund and FMI International Fund II – Currency Unhedged are: 0.68%, 0.90%, 0.80% and 0.90%*, respectively.
| * | Note that the annual operating expenses for the Institutional Class of FMI International Fund II – Currency Unhedged are 1.16% before the investment adviser’s voluntary reimbursement such that annual fund operating expenses do not exceed 0.90%, which will continue at least through January 31, 2023. |
Risks associated with investing in the Funds are as follows:
FMI Large Cap Fund: Stock Market Risk, Medium and Large Capitalization Companies Risks, Non-Diversification Risk (Non-Diversified funds are subject to higher volatility than funds that are invested more broadly), Value Investing Risk, Foreign Securities Risk (fluctuation of currency, different financial standards, and political instability), Liquidity Risk, and Tax Law Change Risk.
FMI Funds, Inc.
DISCLOSURE INFORMATION (Unaudited) (Continued)
FMI Common Stock Fund: Stock Market Risk, Medium and Small Capitalization Companies Risks (which includes the potential for greater volatility and less financial resources than Large-Cap Companies), Value Investing Risk, Foreign Securities Risk (fluctuation of currency, different financial standards, and political instability), Liquidity Risk, and Tax Law Change Risk.
FMI International Fund: Stock Market Risk, Value Investing Risk, Foreign Securities Risk (fluctuation of currency, different financial standards, and political instability), Geographic Concentration Risk, Currency Hedging Risk, Large Capitalization Companies Risk, Liquidity Risk, and Tax Law Change Risk.
FMI International Fund II – Currency Unhedged: Stock Market Risk, Non-Diversified Risk (Non-Diversified Funds are subject to higher volatility than funds that are invested more broadly), Value Investing Risk, Foreign Securities Risk (fluctuation of currency, different financial standards, and political instability), Geographic Concentration Risk, Large Capitalization Companies Risk, Liquidity Risk, and Tax Law Change Risk.
For details regarding these risks, please refer to the Funds’ Summary or Statutory Prospectuses dated January 31, 2022.
For more information about the FMI Funds, call 1-800-811-5311 for a free Prospectus or Summary Prospectus. Please read these Prospectuses carefully to consider the investment objectives, risks, charges and expenses, before investing or sending money. These Prospectuses contain this and more information about the FMI Funds. Please read the Prospectuses or Summary Prospectuses carefully before investing.
The Standard and Poor’s 500 Index (S&P 500) consists of 500 selected common stocks, most of which are listed on the New York Stock Exchange. The S&P’s Ratings Group designates the stocks to be included in the Index on a statistical basis. A particular stock’s weighting in the Index is based on its relative total market value (i.e., its market price per share times the number of shares outstanding). Stocks may be added or deleted from the Index from time to time.
The iShares S&P 500 ETF seeks to track investment results of an index composed of large-capitalization U.S. equities. Performance is compared to the ETF for illustrative purposes only. The metrics regarding the comparative ETF have been obtained from Bloomberg and the returns are calculated assuming all dividends are reinvested. The ETF is not subject to the same fees or expenses as the Fund. The Fund is not restricted to investing in those securities which comprise the ETF. The Fund’s performance may or may not correlate to the ETF, and it should not be considered a proxy for the ETF.
The iShares Russell 1000 Value ETF seeks to track investment results of an index composed of large- and mid-capitalization U.S. equities that exhibit value characteristics. Performance is compared to the iShares Russell 1000 Value ETF for illustrative purposes only. The metrics regarding the comparative ETF have been obtained from Bloomberg and the returns are calculated assuming all dividends are reinvested. The ETF is not subject to the same fees or expenses as the Fund. The Fund is not restricted to investing in those securities which comprise the ETF. The Fund’s performance may or may not correlate to the ETF, and it should not be considered a proxy for the ETF.
The Russell 2000 Index measures the performance of the 2,000 smallest companies in the Russell 3000 Index. The Russell 2000 Value Index includes equities that exhibit value characteristics and the Russell 2000 Growth Index includes equities that exhibit growth characteristics.
The MSCI EAFE Index (Europe, Australasia, Far East) is a free float-adjusted market capitalization index that is designed to measure the equity market performance of developed markets, excluding the U.S. and Canada. The MSCI EAFE Index consists of the following 21 developed market country indices: Australia, Austria, Belgium, Denmark, Finland, France, Germany, Hong Kong, Ireland, Israel, Italy, Japan, the Netherlands, New Zealand, Norway, Portugal, Singapore, Spain, Sweden, Switzerland and the United Kingdom. Index results are inclusive of dividends and net of foreign withholding taxes. The reported figures include reinvestment of dividends and capital gains distributions and do not reflect any fees or expenses.
FMI Funds, Inc.
DISCLOSURE INFORMATION (Unaudited) (Continued)
The iShares MSCI EAFE ETF seeks to track the investment results of an index composed of large- and mid-capitalization developed market equities, excluding the U.S. and Canada. Performance is compared to the ETF for illustrative purposes only. The metrics regarding the comparative ETF have been obtained from Bloomberg and the returns are calculated assuming all dividends are reinvested. The ETF is not subject to the same fees or expenses as the Fund. The Fund is not restricted to investing in those securities which comprise the ETF. The Fund’s performance may or may not correlate to the ETF, and it should not be considered a proxy for the ETF.
The MSCI EAFE Value Index captures large and mid cap securities exhibiting overall value style characteristics across Developed Markets countries around the world, excluding the U.S. and Canada. The value investment style characteristics for index construction are defined using three variables: book value to price, 12-month forward earnings to price and dividend yield.
The MSCI EAFE Index and MSCI EAFE Value Index are calculated in local currency (LOC) as well as in U.S. Dollars (USD). The concept of a LOC calculation excludes the impact of currency fluctuations. All currencies of listing are considered in the Index calculation in LOC where current prices (t) and previous day prices (t-1) are converted into USD using the same exchange rate (exchange rate t-1) in the numerator and denominator. As a consequence, the FX factor drops out of the equation. The USD calculation includes exchange rates at t and t-1. Therefore, the LOC calculation only represents the price appreciation or depreciation of the securities, whereas the USD calculation also accounts for the performance of the currency (or currencies) relative to the USD.
The MSCI EAFE Growth Index captures large and mid cap securities exhibiting overall growth style characteristics across Developed Markets countries around the world, excluding the U.S. and Canada. The growth investment style characteristics for index construction are defined using five variables: long-term forward EPS growth rate, short-term forward EPS growth rate, current internal growth rate and long-term historical EPS growth trend and long-term historical sales per share growth trend.
The MSCI USA Index captures large and mid cap segments of the US market. The index consists of 626 constituents that cover approximately 85% of the free float-adjusted market capitalization in the US.
MSCI EAFE is a service mark of MSCI Barra.
All indices are unmanaged. These indices are used herein for comparative purposes in accordance with the Securities and Exchange Commission regulations. It is not possible to invest directly into an index.
GLOSSARY
ADR – American Depositary Receipt refer to a negotiable certificate issued by a U.S. depository bank representing a specified number of shares, usually one share, of a foreign company’s stock. The ADR trades on U.S. stock markets as any domestic shares would.
Cost of Capital is a company’s calculation of the minimum return that would be necessary in order to justify undertaking a capital budgeting project. Investors may also use the term to refer to an evaluation of an investment’s potential return in relation to its costs and risks.
Debt-to-GDP is a ratio of a country’s public debt to its gross domestic product and is an indicator of a country’s ability to pay back its debts.
EBITDA – Earnings Before Interest Taxes Depreciation and Amortization is net income with interest, taxes, depreciation, and amortization added back to it, and can be used to analyze and compare profitability between companies and industries because it eliminates the effects of financing and accounting decisions.
EV – Enterprise Value measures a company’s total value, often used as a more comprehensive alternative to equity market capitalization. EV includes in its calculation the market capitalization of a company but also short-term and long-term debt and any cash or cash equivalents on the company’s balance sheet.
EPS – Earnings per share is calculated as a company’s profit divided by the outstanding shares of its common stock. The resulting number serves as an indicator of a company’s profitability.
EV/EBITDA – Enterprise Value to Earnings Before Interest Taxes Depreciation and Amortization is a measure of the value of a stock that compares a company’s enterprise value (market cap plus debt, minority interest and preferred shares, minus total cash and cash equivalents) to its earnings before interest taxes depreciation and amortization. EV/EBITDA is one of several fundamental indicators that investors use to determine whether a stock is priced well. The EV/EBITDA multiple is also often used to determine a company’s valuation in the case of a potential acquisition.
FMI Funds, Inc.
DISCLOSURE INFORMATION (Unaudited) (Continued)
EV/Sales – Enterprise value to Sales is a financial valuation measure that compares the enterprise value of a company to its total sales. The EV/sales multiple gives investors a quantifiable metric of how to value a company based on its sales while taking account of both the company’s equity and debt.
EVA – Economic Value Added, also known as economic profit, is a measure of a company’s or project’s financial success based on residual wealth, calculated as subtracting the cost of capital from operating profits. The purpose of EVA is to determine the value a company generates from the capital invested into it with the overall goal of improving the returns generated for shareholders.
Free Cash Flow represents the cash a company generates after accounting for cash outflows to support operations and maintain its capital assets. Unlike earnings or net income, free cash flow is a measure of profitability that excludes the non-cash expenses of the income statement and includes spending on equipment and assets as well as changes in working capital from the balance sheet.
GDP – Gross Domestic Product – Gross Domestic Product is the monetary value of all finished goods and services produced within a country’s borders in a specific time period.
Mark-to-Market is a method of measuring the fair value of accounts that can fluctuate over time, such as assets and liabilities. Mark to market aims to provide a realistic appraisal of an institution’s or company’s current financial situation based on current market conditions.
Market Capitalization refers to the total dollar market value of a company’s outstanding shares of stock. The investment community uses this figure to determine a company’s size instead of sales or total asset figures. In an acquisition, the market cap is used to determine whether a takeover candidate represents a good value or not to the acquirer.
NTM – Next Twelve Months refers to a financial measure such as revenue, EBITDA or net income that is being forecasted for the immediate next twelve months from a current date.
Debt-to-EBITDA – Net debt-to-EBITDA is a measurement of the total amount of outstanding company debt as a percentage of EBITDA. The ratio is an indicator of the company’s ability to pay its debt.
P/E ratio – Price-to-earnings ratio is the ratio for valuing a company that measures its current share price relative to its per-share earnings. The trailing P/E ratio is calculated by dividing the current share price by per-share earnings over the previous 12 months and the forward P/E ratio estimates likely per-share earnings over the next 12 months.
P/S ratio – Price-to-sales ratio is a valuation ratio that compares a company’s stock price to its revenues. The price-to-sales ratio is an indicator of the value placed on each dollar of a company’s sales or revenues. It can be calculated either by dividing the company’s market capitalization by its total sales over a 12-month period, or on a per-share basis by dividing the stock price by sales per share for a 12-month period.
ROC – Return on Capital is a financial ratio that can be used to assess a company’s profitability and capital efficiency. In other words, this ratio can help to understand how well a company is generating profits from its capital.
ROIC – Return on Invested Capital is a calculation used to assess a company’s efficiency at allocating the capital under its control to profitable investments. The return on invested capital measure gives a sense of how well a company is using its money to generate returns.
Reference definitions found at Investopedia.com
Distributed by Foreside Financial Services, LLC, Three Canal Plaza, Suite 100, Portland, ME 04101
FMI Funds, Inc.
ADDITIONAL INFORMATION (Unaudited)
For additional information about the Directors and Officers or for a description of the policies and procedures that the Funds use to determine how to vote proxies relating to portfolio securities, please review the Statement of Additional Information. You may call (800) 811-5311 and request a Statement of Additional Information, and it will be mailed to you free of charge. The Statement of Additional Information is also available on the website of the Securities and Exchange Commission (the “Commission”) at http://www.sec.gov. Information on how each of the Funds voted proxies relating to portfolio securities during the most recent 12-month period ended June 30 is available on the Funds’ website at http://www.fmifunds.com or the website of the Commission no later than August 31 for the prior 12 months ended June 30. The Funds file their complete schedules of portfolio holdings with the Commission for the first and third quarters of each fiscal year as exhibits to their reports on Form N-PORT. The Funds’ Form N-PORT reports are available on the Commission’s website provided above.
For corporate shareholders of the Large Cap Fund, the Common Stock Fund, the International Fund and the International Currency Unhedged Fund, the percentage of dividend income distributed for the year ended September 30, 2022 which is designated as qualifying for the dividends received deduction is 73.17%, 100%, 0% and 0.24%, respectively. The International Fund and the International Currency Unhedged Fund intend to elect to pass-through to shareholders the income tax credit for taxes paid to foreign countries. For the year ended September 30, 2022, only the International Fund and International Currency Unhedged Fund had foreign source income of $77,975,886 and $1,632,668, respectively and foreign tax expense of $6,134,068 and $135,353, respectively. The pass-through of the foreign tax credit will only affect those persons who are shareholders on the dividend record dates. For all shareholders of the Large Cap Fund, the Common Stock Fund, the International Fund and the International Currency Unhedged Fund, the percentage of dividend income distributed for the year ended September 30, 2022 which is designated as qualified dividend income under the Jobs and Growth Tax Relief Act of 2003, is 100%, 100%, 100% and 100%, respectively. For all shareholders of the Large Cap Fund, the Common Stock Fund, the International Fund and the International Currency Unhedged Fund, the percentage of taxable ordinary income distributions that are designated as short-term capital gain distributions under Internal Revenue Section 871(k)(2)(c) is 47.42%, 0%, 0% and 9.11%, respectively.
FMI Funds, Inc.
NOTICE OF PRIVACY POLICY (Unaudited)
Protecting the privacy of our shareholders is important to us. This notice describes the practices and policies through which we maintain the confidentiality and protect the security of your non-public personal information.
What Information We Collect
In the course of providing services to you, we may collect the following types of “non-public personal information” about you:
| ● | Information we receive from you on applications or other forms, such as your name, address and social security number, the types and amounts of investments and bank account information, and |
| ● | Information about your transactions with us, our affiliates and others, as well as other account data. |
What Information We Disclose
We do not disclose any nonpublic personal information about our current or former shareholders to anyone, except as permitted by law. For example, we are permitted by law to disclose all of the information we collect, as described above, to our transfer agent to process your transactions. Furthermore, we restrict access to your nonpublic personal information to those persons who require such information to provide products or services to you. Since we have adopted policies and procedures to ensure we only share information required for our normal business operations, we do not provide a means for opting out of this limited sharing of your information. We maintain physical, electronic and procedural safeguards that comply with federal standards to guard your nonpublic personal information. In the event that you hold shares of any Fund through a financial intermediary, including, but not limited to, a broker-dealer, bank or trust company, the privacy policy of your financial intermediary may govern how your nonpublic personal information would be shared with nonaffiliated third parties.
IMPORTANT NOTICE REGARDING DELIVERY OF SHAREHOLDER DOCUMENTS (Unaudited)
In order to reduce expenses, we will deliver a single copy of prospectuses, proxies, financial reports, and other communication to shareholders with the same residential address, provided they have the same last name or we reasonably believe them to be members of the same family. Unless we are notified otherwise, we will continue to send you only one copy of these materials for as long as you remain a shareholder of the Funds. If you would like to receive individual mailings, please call (800) 811-5311 and we will begin sending you separate copies of these materials within 30 days after we receive your request.
Thank you for allowing us to serve your investment needs.
| FMI Large Cap Fund | FMI Common Stock Fund | FMI International Fund | FMI International Fund II – Currency Unhedged |
100 East Wisconsin Avenue, Suite 2200
Milwaukee, Wisconsin 53202
www.fmifunds.com
414-226-4555
| BOARD OF DIRECTORS | |
| ROBERT C. ARZBAECHER | REBECCA W. HOUSE |
| JOHN S. BRANDSER | PAUL S. SHAIN |
| LAWRENCE J. BURNETT | ROBERT J. VENABLE |
| PATRICK J. ENGLISH | |
INVESTMENT ADVISER
FIDUCIARY MANAGEMENT, INC.
100 East Wisconsin Avenue, Suite 2200
Milwaukee, Wisconsin 53202
ADMINISTRATOR, ACCOUNTANT, TRANSFER
AGENT AND DIVIDEND DISBURSING AGENT
U.S. BANCORP FUND SERVICES, LLC
615 East Michigan Street
Milwaukee, Wisconsin 53202
800-811-5311 or 414-765-4124
| CUSTODIAN | INDEPENDENT REGISTERED |
| U.S. BANK, N.A. | PUBLIC ACCOUNTING FIRM |
| Milwaukee, Wisconsin | COHEN & COMPANY, LTD. |
| Milwaukee, Wisconsin |
| DISTRIBUTOR | LEGAL COUNSEL |
| FORESIDE FINANCIAL SERVICES, LLC | FOLEY & LARDNER LLP |
| Portland, Maine | Milwaukee, Wisconsin |
 | FMI Funds, Inc.
1-800-811-5311
www.fmifunds.com
|
| (b) | Not applicable. |
| (a) | Schedule of Investments is included as part of the report to shareholders filed under Item 1 of this Form. |
| (b) | Not applicable. |
| (a) | The Registrant’s principal executive and principal financial officers have concluded that the Registrant’s disclosure controls and procedures are effective, as of a date within 90 days of the filing of this report, based on their evaluation of the Registrant’s disclosure controls and procedures. |
| (b) | There were no changes in the Registrant's internal control over financial reporting (as defined in Rule 30a-3(d) under the Act) that occurred during the period covered by this report that have materially affected, or are reasonably likely to materially affect, the Registrant's internal control over financial reporting. |