UNITED STATES
SECURITIES AND EXCHANGE COMMISSION
Washington, D.C. 20549
SECURITIES AND EXCHANGE COMMISSION
Washington, D.C. 20549
FORM N-CSR
CERTIFIED SHAREHOLDER REPORT OF REGISTERED
MANAGEMENT INVESTMENT COMPANIES
Investment Company Act file number 811-07831
FMI Funds, Inc.
(Exact name of registrant as specified in charter)
(Exact name of registrant as specified in charter)
790 North Water Street, Suite 2100
Milwaukee, WI 53202
(Address of principal executive offices) (Zip code)
John S. Brandser
Fiduciary Management, Inc.
790 North Water Street
Suite 2100
Milwaukee, WI 53202
(Name and address of agent for service)
(414) 226-4545
Registrant's telephone number, including area code
Date of fiscal year end: September 30
Date of reporting period: September 30, 2023
Item 1. Reports to Stockholders.
| (a) |
ANNUAL REPORT
September 30, 2023
FMI Common Stock Fund
Investor Class (Ticker Symbol: FMIMX)
Institutional Class (Ticker Symbol: FMIUX)
FMI Large Cap Fund
Investor Class (Ticker Symbol: FMIHX)
Institutional Class (Ticker Symbol: FMIQX)
FMI International Fund
Investor Class (Ticker Symbol: FMIJX)
Institutional Class (Ticker Symbol: FMIYX)
FMI International Fund II – Currency Unhedged
Investor Class (Not Available For Purchase)
Institutional Class (Ticker Symbol: FMIFX)
 | |
| FMI Funds, Inc. | |
| Advised by Fiduciary Management, Inc. | |
| www.fmifunds.com | |
FMI Funds, Inc.
TABLE OF CONTENTS
| Shareholder Letter | 1 | ||
| FMI Common Stock Fund | |||
| Management’s Discussion of Fund Performance | 8 | ||
| Schedule of Investments | 11 | ||
| Industry Sectors | 13 | ||
| FMI Large Cap Fund | |||
| Management’s Discussion of Fund Performance | 14 | ||
| Schedule of Investments | 18 | ||
| Industry Sectors | 20 | ||
| FMI International Fund and FMI International Fund II – Currency Unhedged | |||
| Management’s Discussion of Fund Performance | 21 | ||
| FMI International Fund | |||
| Schedule of Investments | 27 | ||
| Schedule of Forward Currency Contracts | 30 | ||
| Industry Sectors | 31 | ||
| FMI International Fund II – Currency Unhedged | |||
| Schedule of Investments | 32 | ||
| Industry Sectors | 35 | ||
| Financial Statements | |||
| Statements of Assets and Liabilities | 36 | ||
| Statements of Operations | 38 | ||
| Statements of Changes in Net Assets | 40 | ||
| Financial Highlights | 44 | ||
| Notes to Financial Statements | 51 | ||
Report of Independent Registered Public Accounting Firm | 63 | ||
| Expense Example | 64 | ||
| Directors and Officers | 66 | ||
| Liquidity Risk Management Program | 68 | ||
| Disclosure Information | 69 | ||
| Additional Information | 72 | ||
| Tax Notice | 72 | ||
| Notice of Privacy Policy | 73 | ||
| Householding Notice | 73 |
FMI Funds, Inc.
Shareholder Letter
(Unaudited)
September 30, 2023
Dear Fellow Shareholders:
After a strong start to the year, global equity markets gave up some ground in the September quarter. Fortunately, the speculative appetite we saw from investors in the first two quarters started to lose some steam. Value benchmarks began clawing back some relative performance, which was encouraging. Stock valuations are stretched and continue to prove more favorable in the U.S. Small Cap and International arenas. U.S. Large Caps remain exceedingly top-heavy with performance being dominated by a handful of mega-cap companies that trade at significant premiums. Across geographies, cyclical stocks have been outperforming their more defensive counterparts; we are finding incremental opportunities in the latter.
While economic growth in the U.S. has been resilient, both Europe and China have come under mounting pressure. Inflation has been falling but remains elevated. Debt levels and borrowing costs have increased, which combined with higher labor and input costs, have weighed on corporate margins and earnings. Over the long-term, we remain optimistic and are excited to see a more normal interest rate environment. This should bode well for organic growth, stock picking, and value investing. With global value stocks trading near a historically wide discount to growth, the current set-up looks attractive from here. Any reversion to the mean would result in brighter days for those with a value orientation. We’ve got our sunglasses ready.
To that end, each of the FMI Funds gained on their respective primary benchmark in the period. The third quarter performance commentary is outlined below:
FMI Common Stock Fund: Performance
The FMI Common Stock Fund (“Common Stock Fund”) declined 1.91%1, compared to a fall of 5.13% and 2.96% in the Russell 2000 Index (“Russell 2000”) and Russell 2000 Value Index (“Russell 2000 Value”), respectively. Relative to the Russell 2000, sectors that contributed to the performance included Finance, Electronic Technology, and Retail Trade, while Commercial Services, Consumer Durables, and Distribution Services lagged. Not having exposure to Health Technology—which is littered with money-losing bio-technology companies—was also additive in the period. Some top individual performers included BJ’s Wholesale Club Holdings Inc., Zions Bancorporation N.A., and Houlihan Lokey Inc. Cl A, while Interpublic Group of Cos. Inc., LGI Homes Inc., and Fortune Brands Innovations Inc. weighed. Over 40% of the companies in the Russell 2000 and Russell 2000 Value lose money…not an area we typically look to invest. Our business quality focus has been a key to our outperformance in recent years.
FMI Large Cap Fund: Performance
The FMI Large Cap Fund (“Large Cap Fund”) dropped 2.60%2, compared to a decrease of 3.27% and 3.19% in the S&P 500 Index (“S&P 500”) and iShares Russell 1000 Value ETF3,
_______________
1 | The FMI Common Stock Fund Investor Class (FMIMX) and the FMI Common Stock Fund Institutional Class (FMIUX) had a return of -1.91% and -1.88%, respectively, for the third quarter of 2023. |
2 | The FMI Large Cap Fund Investor Class (FMIHX) and the FMI Large Cap Fund Institutional Class (FMIQX) had a return of -2.60% and -2.54%, respectively, for the third quarter of 2023. |
3 | Source: Bloomberg – returns do not reflect management fees, transaction costs or expenses. Performance is based on market price returns. Beginning 8/10/20, market price returns are calculated using closing price. Prior to 8/10/20, market price returns were calculated using midpoint bid/ask spread at 4:00 PM ET. |
1
respectively. Relative to the S&P 500, our Electronic Technology, Consumer Services, and Finance sector exposures boosted our performance, while Retail Trade, Commercial Services, and Health Technology lagged. Booking Holdings Inc., CDW Corp., and Micron Technology Inc. outperformed, while Dollar General Corp., Dollar Tree Inc., and Omnicom Group Inc. detracted. Year-to-date (YTD), the Large Cap Fund’s performance has fallen squarely between the S&P 500 and iShares Russell 1000 Value ETF. As each day passes, the S&P 500 looks progressively more like a concentrated growth index (additional color to follow). The S&P 500 Equal Weight index has lagged the S&P 500 by over 11% YTD, as the S&P 500 returns are being driven by a select few stocks. Despite higher interest rates, the Russell 1000 Value has underperformed the Russell 1000 Growth Index by ~23% YTD, an extreme gap by historical standards; we don’t think the market’s lurch back to growth this year will persist.
FMI International Fund & FMI International Fund II – Currency Unhedged: Performance
The FMI International Funds (“International Funds”) fell 1.09%4 on a currency hedged basis and 4.08%5 currency unhedged, compared with the MSCI EAFE Index’s decline of 1.27% in local currency (LOC) and 4.11% in U.S. Dollars (USD). The MSCI EAFE Value Index gained 3.64% in LOC and 0.59% in USD. Relative to the MSCI EAFE Index, top contributing sectors included Producer Manufacturing, Consumer Services, and Industrial Services, while Health Technology, Finance, and a lack of exposure to Energy Minerals weighed. Strong individual contributions came from Schlumberger Ltd., Booking Holdings Inc., and Howden Joinery Group PLC, while Smith & Nephew PLC, Samsung Electronics Co. Ltd. Preferred, and Barry Callebaut AG gave up some ground. The MSCI EAFE Value outperformed significantly in the period, with the “deeper value” Energy and Finance sectors leading the way. FMI is typically under-weight these sectors due to business quality and balance sheet concerns. A strong USD was a tailwind for FMI’s currency hedged portfolio in the quarter.
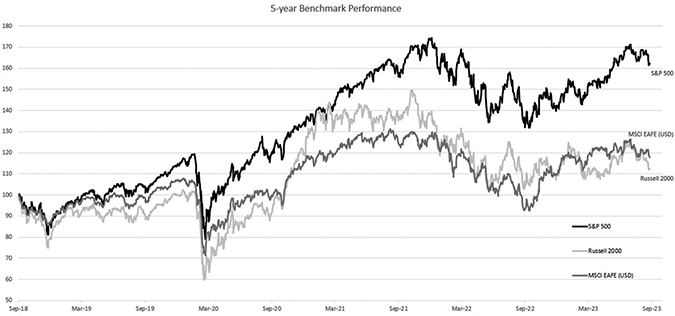
The Bigger You Are The Harder You Fall
As illustrated in the chart below, the last five years have created a windfall for investors in the S&P 500 (U.S. Large Cap stocks), as it has trounced other asset class benchmarks, including the Russell 2000 (U.S. Small Cap stocks) and the MSCI EAFE (International Large Cap stocks). The performance gap has blown out again in 2023, and now stands at approximately 48% and 43%, respectively, over the full five-year period.
_______________
4 | The FMI International Fund [currency hedged] Investor Class (FMIJX) and the FMI International Fund [currency hedged] Institutional Class (FMIYX) had a return of -1.09% and -1.02%, respectively, for the third quarter of 2023. |
5 | The FMI International Fund [currency unhedged] Institutional Class (FMIFX) had a return of -4.08% for the third quarter of 2023. |
2
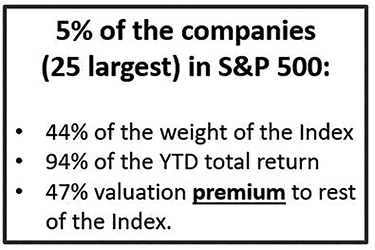
With this divergence comes risk. The concentration in the S&P 500 is truly extraordinary. The top 5% of the companies (25 largest) account for around 44% of the weight of the index, 94% of the YTD total return, and trade at an average valuation premium of 47%6 to the rest of the index. Expectations remain high for those chosen few. As illustrated in last quarter’s letter, leaders rise and fall, and this is consistent across business cycles (only one of the top ten companies in the S&P 500 in 2000 was in the top ten in 2020). Today’s exuberance has some earmarks of the “Nifty Fifty” in the 1970s, where investors crowded like lemmings into 50 indisputable companies, pushing valuations to extremes. The speculative fever eventually broke between 1973-74, when the Dow fell ~42%, while the “Nifty Fifty” dropped ~59%! Unfortunately, investors appear to have very short memories, and most were not alive through this painful experience. While market cycles are never identical, from the top they do have a long history of transitioning from overvalued to undervalued, as human nature doesn’t change (fear and greed). As we highlighted last quarter, the lion’s share of the top performing themes in the U.S. fell in the speculative camp, and for that we feel that caution is warranted today.
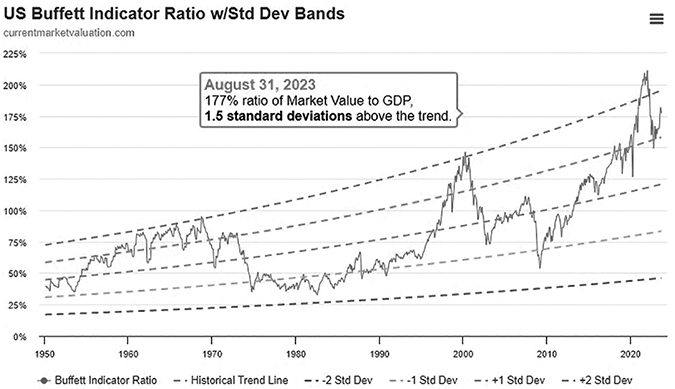
Valuations in the U.S. have ballooned, with numerous warning signals now flashing red. Through The Leuthold Group, we track 46 different valuation metrics, dating as far back as 1926. On a median basis, we are currently in the 10th decile of historical valuation – one of the most expensive stock markets in U.S. history. The widely referenced Buffett Indicator, measuring market value to GDP, tells a similar story of overvaluation (see chart on the following page). JPMorgan writes, “Equities are up YTD on multiple expansion while real rates and cost of capital are moving deeper into restrictive territory. History suggests this relationship is becoming increasingly unsustainable, with the S&P 500 multiple over-valued by 3-4x vs. real rates, posing risk to valuations, especially since earnings expectations already face a high hurdle for 2024.”
_______________
6 | Estimated Valuations are for the iShares S&P 500 ETF, calculations are based on the average discount to the average valuations as of September 30, 2023 for the trailing 1-year Price-to-Earnings Ratio, Fiscal Year One Price-to-Earnings Ratio, Fiscal Year Two Price-to-Earnings Ratio, Price-to-Sales Ratio, and Price-to-Book Ratio. Valuations for the ETF are scrubbed and adjusted based on criteria identified by FMI. For more detailed information regarding these valuations, please contact FMI. |
3
Fortunately, there are attractive relative values outside of the mega-cap companies in the S&P 500. As we pointed out last quarter, the discount for U.S. Small Caps vs. U.S. Large Caps is near an all-time high, as are European valuations vs. domestic. All of FMI’s portfolios trade at a significant discount to the core benchmarks, and we invest in above-average businesses with strong balance sheets. We see compelling opportunities across our holdings, with a collection of all-weather vehicles that can withstand these tough and unpredictable times.
China’s House of Cards
The macro environment features numerous headwinds, including waning global growth, record debt levels, elevated inflation, rising interest rates, and heightened geopolitical risks. On the growth front, the U.S. has been the most robust developed economy, with a strong labor market and a resilient consumer. That said, the Organisation for Economic Co-operation and Development (“OECD”) expects U.S. real GDP to slow to a “soft landing” from 2.2% in 2023 to 1.3% in 2024. European growth has already hit the skids, falling to 0.6% in 2023 with 1.1% expected in 2024. High food and energy inflation has weighed, business activity and bank lending has slowed, and a higher cost of borrowing is impacting investment, among other factors.
China, which just months ago was expected to account for almost 35% of global growth this year, has run into significant challenges. The property sector, which we have long described as a dangerous and a speculative bubble, has finally popped. In recent years, housing accounted for as much as 25% of China’s GDP. The property sector, which holds 70% of China’s households’ wealth, is ailing. Property sales are down nearly 40% from their 2021 peak, housing starts have fallen 60%, and prices have dropped 33%. Developer defaults and business losses are commonplace, and more strain may be on the horizon. Leverage in China is up dramatically, with total credit up 8.5 times since 2008, even as GDP is up less than half that (3.9 times).
China’s problems don’t end there. Their demographics are poor, with a working age population in decline since 2011 and a total population that started to shrink in 2022. Productivity growth is slowing, exports are weak, youth unemployment is high, and tensions with the West are rising. The glory days for the world’s second largest economy may be behind them. Unfortunately, additional weakness in China would be felt worldwide. Risks abound.
4
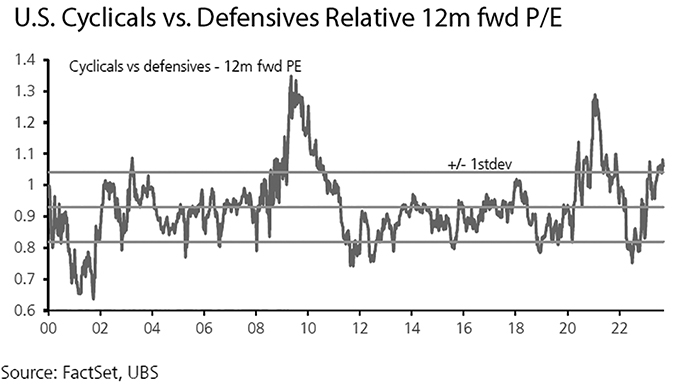
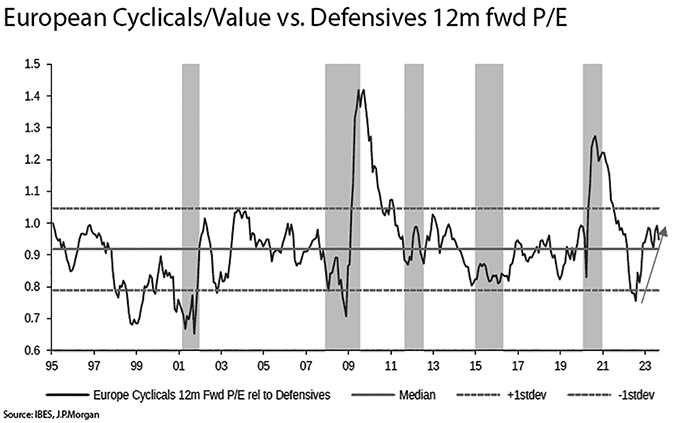
Not So Expensive Defensives
Despite the weakening economic backdrop described above, cyclical stocks have surprisingly outperformed “defensives” (steady, less-cyclical businesses) in both the U.S. and Europe over the past year. As illustrated below, valuations are looking more attractive on the defensive side of the equation. In the U.S., cyclicals are trading around a standard deviation above historical levels from a relative price-to-earnings standpoint, while in Europe they are trading above the historical median, but are not quite as extended.
5
We have found some interesting opportunities among the defensives that have been left behind. In the third quarter, we added a new position to each of our portfolios which fit the description. The idiosyncratic investment case for these new purchases is outlined below:
Valvoline Inc. (VVV) – FMI Common Stock Fund
After a long history of underinvestment under Ashland and a messy seven years as a standalone public company, Valvoline is finally a pure-play quick lube retailer, having sold their motor oil business earlier this year. We like the business model for its stability, growth potential, pricing power, and high returns on capital. The business offers customers a better oil change experience relative to the alternatives. Going forward, the story will be simpler to understand, the analyst coverage will be uniform, and it should get reclassified as retail. In the current environment, Valvoline has the added benefit of having a tight store-level culture that helps minimize labor turnover, and has effectively no shrink, which is currently a major thorn in the side of retailers. Given Valvoline’s choppy history (thanks to the divested motor oil business), we believe investors are in a wait and see mode as the company proves out its standalone financial results and accelerates its organic store expansion. Increased penetration in a fragmented market, expanded usage of synthetic oils, and a consistent experience as consumers continue to shift to do-it-for-me, should drive strong earnings per share growth at high incremental returns. Although we believe we can get an attractive return from just the growth, there is the chance for a higher valuation as Valvoline puts up its first year of (nearly) clean financials in Fiscal Year 2024. We also believe the short- to medium-term threat of electric vehicles is manageable. If our growth expectations are achieved, the downside is modest even if the multiple compresses meaningfully over our five-year investment horizon. We hope investors will increasingly appreciate Valvoline’s simple, high return model after a long period of being obfuscated by inferior businesses.
Sysco Corp. (SYY) – FMI Large Cap Fund
Sysco Corp. is the largest global distributor of food and related products to the foodservice or food-away-from-home industry. Sales in the U.S. account for approximately 82% of the company’s consolidated revenue, with the remainder mainly coming from Canada, Latin America, and Europe (18%). The company provides products and related services from thousands of suppliers to over 725,000 customer locations including restaurants (~62% of sales), education and government facilities (~8%), travel and leisure establishments (~8%), healthcare facilities (~7%), and other foodservice customers (15%). Sysco possesses many business characteristics that FMI finds attractive. The company has a dominant market position in a large, growing, resilient industry. They sell necessary, consumable products. Economies of scale allow Sysco to provide a better offering than peers while also allowing them to operate with higher margins. These advantages have helped Sysco take market share over time and earn a return on capital that consistently exceeds its cost of capital. We believe that Sysco will continue to grow its market share in the large and fragmented foodservice distribution market and should be able to generate mid-single-digit EBIT growth over time. When combined with share repurchases and dividend yield, the company should generate a high-single-digit to low-double-digit total return to investors without multiple expansion. The shares are trading at a depressed valuation relative to the S&P 500 and relative to the company’s history, which we believe provides us downside protection and could generate additional upside should it revert to the historical levels.
Coca-Cola Europacific Partners PLC (CCEP) – FMI International Funds
Coca-Cola Europacific Partners (CCEP) is the largest Coca-Cola bottling franchise, accounting for an estimated one-third of Coca-Cola System profits. CCEP sells whatever it deems to be the optimal mix of The Coca-Cola Company’s (TCCC) 200+ brands in its 30 countries (from its owned bottling plants and coolers) and CCEP sets all prices. Over the last decade plus, alignment has been structurally enhanced between TCCC and the top bottling groups through incidence-based pricing
6
(sales value rather than volume) and through direct ownership. Bottlers are increasingly benefiting from TCCC’s innovation and overall “total beverage” strategy (including TCCC’s acquired and licensed brands in energy drinks and ready-to-drink coffee, alcohol, and more). By year-end 2023, CCEP should also generate 28% of sales from the faster growing Asia-Pacific region (with no sales in China). CCEP is inexpensive compared to other global staples, with nearly 2x the average free cash flow yield. Compared to its own seven-year history, it trades at a significant discount on a price-to-earnings basis. It offers attractive defensive growth potential and predictable capital allocation.
Thank you for your continued support of FMI Funds, Inc.
Please see page 69 for important disclosures.
This shareholder letter is unaudited.
7
FMI Common Stock Fund
MANAGEMENT’S DISCUSSION OF FUND PERFORMANCE (Unaudited)
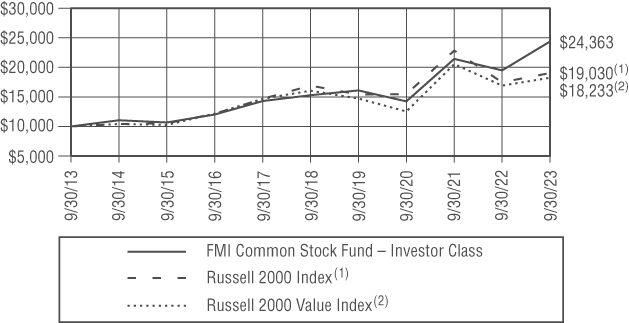
During the fiscal year ended September 30, 2023, the FMI Common Stock Fund (“Fund”) had a total return of 25.08%1. The benchmark Russell 2000 Index (“Russell 2000”) returned 8.93% in the same period. The trailing 12-month return for the Russell 2000 Value Index (“Russell 2000 Value”) was 7.84%.
Relative to the Russell 2000, sectors that aided relative performance included Finance, Technology Services, and Distribution Services. Primerica Inc., Houlihan Lokey Inc. – Cl A, FirstCash Holdings Inc., and Triton International Ltd. – Cl A, drove the results in the Finance sector. Triton International was acquired at a premium, while the others demonstrated strong business fundamentals. In Technology Services, Insight Enterprises Inc. outperformed, as investors were nervous about the impacts of a slowing macro environment, but the company’s fundamentals have thus far proved to be fairly resilient. In Distribution Services, despite a softening housing outlook, Beacon Roofing Supply Inc.’s ~80% replacement-centric business had a stronger-than-expected outlook, while Applied Industrial Technologies Inc. executed well as demand remained strong. Other stocks that helped performance included nVent Electric PLC, Skechers U.S.A. Inc. – Cl A, and Five Below Inc. nVent’s margin performance has been outstanding, and excitement over their fast-growing data solutions offerings, which benefits from AI adoption, has driven multiple expansion. Last year, Skechers’ fundamentals were negatively impacted by supply chain challenges and COVID-19 related lockdowns in China. Those headwinds have improved so far this year and the market has responded by re-rating the shares higher. Five Below performed strong fundamentally, but we sold the shares after the valuation no longer demonstrated a discount to our estimate of intrinsic value.
On the negative side of sector performance, Industrial Services, Energy Minerals, and Commercial Services detracted. The Fund had no direct exposures to the first two sectors that outperformed, as business quality concerns typically limits our investments in energy and commodities. In Commercial Services, Genpact Ltd. lagged, as negative sentiment around generative artificial intelligence (AI) has impacted the stock, but is believed to be significantly overblown. Additional stocks that detracted from performance included Zions Bancorporation N.A., BJ’s Wholesale Club Holdings Inc., and Robert Half International Inc. Zions got caught up in the first quarter 2023 contagion fear around Silicon Valley Bank’s collapse due to some optical similarities between their balance sheets (namely bonds carried at mark-to-market losses), and Zions being a West Coast regional bank. We believe the similarities largely end there. Softening consumer spending, particularly for higher margin discretionary merchandise, and lower year-over-year gas gross profits have caused analysts to anticipate a down earnings year for BJ’s Wholesale. Robert Half experienced a cyclical slowdown which was worse than expected.
New additions to the Fund over the past twelve months included Core & Main Inc. – Cl A, Timken Co., Valvoline Inc., Fabrinet, CTS Corp., ITT Inc., and Fortune Brands Innovations Inc. Stocks sold during the year included ManpowerGroup Inc., KBR Inc., Woodward Inc., Five Below Inc., AZEK Co. Inc. – Cl A, Kennedy-Wilson Holdings Inc., and FTI Consulting Inc.
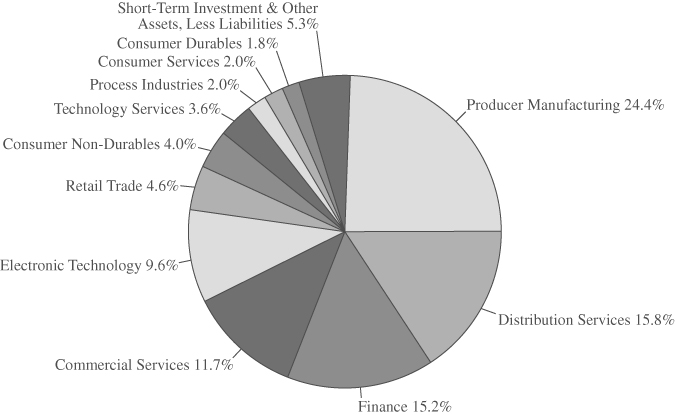
As of September 30, 2023, the Fund was significantly overweight in Producer Manufacturing, Distribution Services, and Commercial Services sectors. The Fund was meaningfully underweight in Health Technology, Technology Services, Energy Minerals and Finance sectors.
After a tough fiscal year 2022, U.S. stocks rebounded strongly in fiscal year 2023, despite concerns around a regional banking crisis, waning global growth, record debt levels, elevated inflation, rising interest rates, and heightened geopolitical risks. Furthermore, corporate earnings growth in the U.S. has slowed, as higher borrowing, labor and input costs have weighed. Growth stocks outperformed value stocks in the period, but much more significantly in the U.S. Large Cap arena, which remains exceedingly top-heavy with performance being dominated by a handful of mega-cap companies that trade at significant valuation premiums (see recent shareholder letters for further discussion). Speculation appears to be plentiful. Stock valuations in the U.S. have ballooned, as the market is currently trading in the 10th decile of historical valuation – one of the most expensive stock markets in U.S. history (on a median basis, tracking 46 different valuation metrics dating as far back as 1926). There are attractive relative values outside many of the anointed mega-cap companies in the S&P 500. For example, profitable U.S. Small Caps are now trading near an all-time high discount vs. U.S. Large Caps.
_______________
1 | The FMI Common Stock Fund Investor Class (FMIMX) and the FMI Common Stock Fund Institutional Class (FMIUX) had a return of 25.08% and 25.22%, respectively, for the fiscal year ending September 30, 2023. |
8
FMI Common Stock Fund
MANAGEMENT’S DISCUSSION OF FUND PERFORMANCE (Unaudited)
(Continued)
Given the backdrop, the Fund portfolio managers were pleased to outperform the Russell 2000 and Russell 2000 Value by a wide margin during the current fiscal year. Over 40% of the companies in the Russell 2000 and Russell 2000 Value lose money…not an area they typically look to invest. The managers business quality focus has been a key to outperformance in recent years. Over the long-term, they are optimistic and excited to see a more normal interest rate environment. This should bode well for organic growth, stock picking, and value investing. With global value stocks trading near a historically wide discount to growth, the current set-up looks attractive from here. Any reversion to the mean should result in brighter days for those with a value orientation. The Fund trades at a significant discount to the Russell 2000, the businesses have strong balance sheets, and management believes the companies are above average. Management sees opportunities across the Fund, with what they feel is a collection of all-weather vehicles that can withstand tough and unpredictable times.
COMPARISON OF CHANGE IN VALUE OF $10,000 INVESTMENT IN FMI COMMON STOCK FUND –
INVESTOR CLASS — THE RUSSELL 2000© INDEX(1) AND THE RUSSELL 2000© VALUE INDEX(2)
AVERAGE ANNUALIZED TOTAL RETURN
| Inception | |||||
| through | |||||
| Inception Date | 1-Year | 5-Year | 10-Year | 9/30/2023 | |
FMI Common Stock Fund – | |||||
Investor Class | 12/18/81 | 25.08% | 9.78% | 9.31% | 11.65% |
FMI Common Stock Fund – | |||||
Institutional Class | 10/31/16 | 25.22% | 9.90% | N/A | 11.33% |
Russell 2000 Index(1)* | 8.93% | 2.40% | 6.65% | 9.64% | |
Russell 2000 Value Index(2)* | 7.84% | 2.59% | 6.19% | 10.98% |
The graph and the table do not reflect the deduction of taxes that a shareholder would pay on Fund distributions or the redemption of Fund shares. Performance data quoted represents past performance; past performance does not guarantee future results. Investment return and principal value of an investment will fluctuate so that an investor’s shares, when redeemed, may be worth more or less than their original cost. Current performance of a Fund may be lower or higher than the performance quoted. The total returns do not reflect the deduction of taxes that a shareholder would pay on Fund distributions or the redemption of Fund shares. Total return includes change in share prices and in each case includes reinvestments of any dividends, interest and capital gain distributions. Performance data current to the most recent month-end may be obtained by visiting www.fmifunds.com or by calling 1-800-811-5311.
9
FMI Common Stock Fund
MANAGEMENT’S DISCUSSION OF FUND PERFORMANCE (Unaudited)
(Continued)
| (1) | The Russell 2000 Index measures the performance of the 2,000 smallest companies in the Russell 3000 Index, which comprises the 3,000 largest U.S. companies based on total market capitalization. |
| (2) | The Russell 2000 Value Index includes equities that exhibit value characteristics and the Russell 2000 Growth Index includes equities that exhibit growth characteristics. |
| * | The benchmark since inception returns are calculated since inception of the Investor Class, December 18, 1981 to September 30, 2023. |
An investment cannot be made directly into an index.
10
FMI Common Stock Fund
SCHEDULE OF INVESTMENTS
September 30, 2023
| Shares | Cost | Value | |||||||||
COMMON STOCKS — 94.7%(1) | |||||||||||
COMMERCIAL SERVICES SECTOR — 11.7% | |||||||||||
| Advertising/Marketing Services — 3.3% | |||||||||||
1,660,000 | Interpublic Group of Cos. Inc. | $ | 35,407,016 | $ | 47,575,600 | ||||||
| Miscellaneous Commercial Services — 4.3% | |||||||||||
1,730,000 | Genpact Ltd. | 48,941,893 | 62,626,000 | ||||||||
| Personnel Services — 4.1% | |||||||||||
810,000 | Robert Half International Inc. | 50,876,453 | 59,356,800 | ||||||||
CONSUMER DURABLES SECTOR — 1.8% | |||||||||||
| Homebuilding — 1.8% | |||||||||||
267,000 | LGI Homes Inc.(2) | 32,458,963 | 26,563,830 | ||||||||
CONSUMER NON-DURABLES SECTOR — 4.0% | |||||||||||
| Apparel/Footwear — 4.0% | |||||||||||
1,183,000 | Skechers U.S.A. Inc. — Cl A(2) | 51,328,336 | 57,907,850 | ||||||||
CONSUMER SERVICES SECTOR — 2.0% | |||||||||||
| Other Consumer Services — 2.0% | |||||||||||
925,000 | Valvoline Inc. | 29,882,920 | 29,822,000 | ||||||||
DISTRIBUTION SERVICES SECTOR — 15.8% | |||||||||||
| Electronics Distributors — 2.6% | |||||||||||
309,000 | Arrow Electronics Inc.(2) | 15,554,791 | 38,699,160 | ||||||||
| Medical Distributors — 4.4% | |||||||||||
868,000 | Henry Schein Inc.(2) | 58,568,643 | 64,449,000 | ||||||||
| Wholesale Distributors — 8.8% | |||||||||||
235,000 | Applied Industrial Technologies Inc. | 15,033,348 | 36,333,350 | ||||||||
805,000 | Beacon Roofing Supply Inc.(2) | 45,952,730 | 62,121,850 | ||||||||
1,035,000 | Core & Main Inc. — Cl A(2) | 29,674,788 | 29,859,750 | ||||||||
90,660,866 | 128,314,950 | ||||||||||
ELECTRONIC TECHNOLOGY SECTOR — 9.6% | |||||||||||
| Electronic Components — 3.0% | |||||||||||
815,000 | nVent Electric PLC | 16,132,830 | 43,186,850 | ||||||||
| Electronic Production Equipment — 4.9% | |||||||||||
530,000 | CTS Corp. | 23,419,856 | 22,122,200 | ||||||||
523,000 | Plexus Corp.(2) | 42,104,151 | 48,628,540 | ||||||||
65,524,007 | 70,750,740 | ||||||||||
| Semiconductors — 1.7% | |||||||||||
145,000 | Fabrinet(2) | 13,771,658 | 24,159,900 | ||||||||
FINANCE SECTOR — 15.2% | |||||||||||
| Finance/Rental/Leasing — 3.7% | |||||||||||
533,000 | FirstCash Holdings Inc. | 26,908,468 | 53,502,540 | ||||||||
| Investment Banks/Brokers — 3.7% | |||||||||||
500,000 | Houlihan Lokey Inc. — Cl A | 31,228,156 | 53,560,000 | ||||||||
The accompanying notes to financial statements are an integral part of this schedule.
11
FMI Common Stock Fund
SCHEDULE OF INVESTMENTS (Continued)
September 30, 2023
| Shares | Cost | Value | |||||||||
COMMON STOCKS — 94.7%(1) (Continued) | |||||||||||
FINANCE SECTOR — 15.2% (Continued) | |||||||||||
| Life/Health Insurance — 3.8% | |||||||||||
282,874 | Primerica Inc. | $ | 39,281,082 | $ | 54,880,385 | ||||||
| Major Banks — 2.4% | |||||||||||
1,005,000 | Zions Bancorporation N.A. | 34,857,723 | 35,064,450 | ||||||||
| Multi-Line Insurance — 1.6% | |||||||||||
16,000 | White Mountains Insurance Group Ltd. | 16,123,980 | 23,931,040 | ||||||||
PROCESS INDUSTRIES SECTOR — 2.0% | |||||||||||
| Containers/Packaging — 2.0% | |||||||||||
237,000 | AptarGroup Inc. | 25,254,240 | 29,634,480 | ||||||||
PRODUCER MANUFACTURING SECTOR — 24.4% | |||||||||||
| Auto Parts: OEM — 3.1% | |||||||||||
765,000 | Donaldson Co. Inc. | 37,298,150 | 45,624,600 | ||||||||
| Building Products — 11.9% | |||||||||||
251,000 | Carlisle Cos. Inc. | 32,713,079 | 65,074,260 | ||||||||
770,000 | Fortune Brands Innovations Inc. | 45,401,719 | 47,863,200 | ||||||||
406,000 | Simpson Manufacturing Co. Inc. | 44,384,951 | 60,822,860 | ||||||||
122,499,749 | 173,760,320 | ||||||||||
| Industrial Machinery — 5.4% | |||||||||||
2,480,000 | Gates Industrial Corp. PLC(2) | 33,542,797 | 28,792,800 | ||||||||
330,000 | ITT Inc. | 27,234,245 | 32,310,300 | ||||||||
236,751 | Timken Co. | 17,247,965 | 17,398,831 | ||||||||
78,025,007 | 78,501,931 | ||||||||||
| Miscellaneous Manufacturing — 4.0% | |||||||||||
215,000 | LCI Industries | 28,646,678 | 25,245,300 | ||||||||
1,365,000 | TriMas Corp. | 32,750,235 | 33,797,400 | ||||||||
61,396,913 | 59,042,700 | ||||||||||
RETAIL TRADE SECTOR — 4.6% | |||||||||||
| Specialty Stores — 4.6% | |||||||||||
930,000 | BJ’s Wholesale Club Holdings Inc.(2) | 57,006,070 | 66,374,100 | ||||||||
TECHNOLOGY SERVICES SECTOR — 3.6% | |||||||||||
| Information Technology Services — 3.6% | |||||||||||
360,000 | Insight Enterprises Inc.(2) | 23,482,552 | 52,380,000 | ||||||||
Total common stocks | 1,062,470,466 | 1,379,669,226 | |||||||||
The accompanying notes to financial statements are an integral part of this schedule.
12
FMI Common Stock Fund
SCHEDULE OF INVESTMENTS (Continued)
September 30, 2023
| Shares | Cost | Value | |||||||||
SHORT-TERM INVESTMENT — 3.1%(1) | |||||||||||
| Money Market Fund — 3.1% | |||||||||||
44,431,688 | First American Treasury | ||||||||||
Obligations Fund, Cl X, 5.264%(3) | $ | 44,431,688 | $ | 44,431,688 | |||||||
Total short-term investment | 44,431,688 | 44,431,688 | |||||||||
Total investments — 97.8% | $ | 1,106,902,154 | 1,424,100,914 | ||||||||
Other assets, less liabilities — 2.2%(1) | 32,280,118 | ||||||||||
| TOTAL NET ASSETS — 100.0% | $ | 1,456,381,032 | |||||||||
| (1) | Percentages for the various classifications relate to total net assets. |
| (2) | Non-Income producing security. |
| (3) | The rate quoted is the annualized 7-day yield as of September 30, 2023. |
| PLC | Public Limited Company |
The accompanying notes to financial statements are an integral part of this schedule.
INDUSTRY SECTORS as a percentage of net assets
as of September 30, 2023 (Unaudited)
13
FMI Large Cap Fund
MANAGEMENT’S DISCUSSION OF FUND PERFORMANCE (Unaudited)
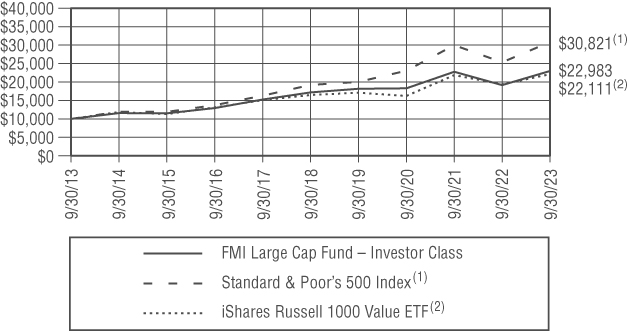
During the fiscal year ended September 30, 2023, the FMI Large Cap Fund (“Fund”) had a total return of 19.95%1. The benchmark Standard & Poor’s 500 Index returned 21.62% in the same period. The trailing 12-month return for the iShares Russell 1000 Value ETF2 was 14.13%.
Relative to the S&P 500, sectors that aided performance included Consumer Services, Health Technology, and Distribution Services. Booking Holdings Inc. drove the results in the Consumer Services sector, as travel continues to recover, with particular improvement in Europe, and Booking is taking market share from competitors. In Health Technology, Koninklijke Philips N.V.-SP-ADR recovered from a tough 2022, as business fundamentals improved. Ferguson PLC aided the relative performance in Distribution Services, as the business outperformed its respective end-markets which were challenging. Other stocks that helped performance included Arch Capital Group Ltd., SAP SE-SP-ADR, and Eaton Corp. PLC. Arch Capital has executed well, while benefiting from a hardening of the property catastrophic reinsurance and property and casualty insurance markets. SAP has been performing resiliently and tracking ahead of schedule on their cloud transition despite a tougher macro backdrop. Eaton has re-rated after strong execution and a successful portfolio transformation. The company is poised to benefit from big secular growth drivers including electrification and energy transition.
On the negative side of sector performance, Retail Trade, Electronic Technology, and Technology Services all detracted. In Retail Trade, Dollar General Corp. and Dollar Tree Inc. both underperformed. Macro conditions, such as persistent inflation, lower tax refunds, a reduction in SNAP benefits, high shrink, and a decline in spending on more profitable discretionary merchandise, have slowed Dollar General’s same store sales growth and negatively impacted gross margins. In addition, competitive pressures have ramped up and the company’s new management team has made some uncharacteristic operational missteps that now require re-investment in price, labor, and processes to correct. At Dollar Tree, while the top-line performance has been encouraging, the turnaround is proving to be larger and more costly than initially expected. In Technology Services and Electronic Technology, our under-weight exposure to mega-cap tech hurt significantly given their relative outperformance. Meta Platforms Inc. – Cl A hurt, as we sold the position at a loss after losing confidence in management and the Metaverse expense trajectory. Other detractors included The Charles Schwab Corp., Northern Trust Corp., and Carlisle Cos. Inc. Charles Schwab is seeing yield-seeking deposits move from the bank to money market funds. They’re staying within Schwab, but they’ll be monetized at a lower rate and are requiring some higher cost funding to temporarily replace them. This “cash sorting” was expected and happens every cycle, although the pace and magnitude of the rate increases were worse than initially expected. Northern Trust’s expense and net interest income guidance disappointed, but they are starting to focus more on expenses. Destocking and margin normalization has weighed on Carlisle.
New additions to the Fund over the past twelve months included Sysco Corp. and Carrier Global Corp. Stocks sold during the year included PACCAR Inc., JPMorgan Chase & Co., and Meta Platforms Inc. Cl A.
As of September 30, 2023, the Fund was significantly overweight in Producer Manufacturing, Finance, and Distribution Services. The Fund was meaningfully underweight in Technology Services, Electronic Technology, and Health Technology.
After a tough fiscal year 2022, U.S. stocks rebounded strongly in fiscal year 2023, despite concerns around a regional banking crisis, waning global growth, record debt levels, elevated inflation, rising interest rates, and heightened geopolitical risks. Furthermore, corporate earnings growth in the U.S. has slowed, as higher borrowing, labor and input costs have weighed. Growth stocks outperformed value stocks in the period, but much more significantly in the U.S. Large Cap arena, which remains exceedingly top-heavy with performance being dominated by a handful of mega-cap companies that trade at significant valuation premiums (see recent shareholder letters for further discussion). Speculation appears to be plentiful. Stock valuations in the U.S. have
_______________
1 | The Large Cap Fund Investor Class (FMIHX) and the FMI Large Cap Fund Institutional Class (FMIQX) had a return of 19.95% and 20.07%, respectively, for the fiscal year ending September 30, 2023. |
2 | Source: Bloomberg – returns do not reflect management fees, transaction costs or expenses. Performance is based on market price returns. Beginning 8/10/20, market price returns are calculated using closing price. Prior to 8/10/20, market price returns were calculated using midpoint bid/ask spread at 4:00 PM ET. |
14
FMI Large Cap Fund
MANAGEMENT’S DISCUSSION OF FUND PERFORMANCE (Unaudited)
(Continued)
ballooned, as the market is currently trading in the 10th decile of historical valuation – one of the most expensive stock markets in U.S. history (on a median basis, tracking 46 different valuation metrics dating as far back as 1926). There are attractive relative values outside many of the anointed mega-cap companies in the S&P 500.
Given the backdrop, the Fund portfolio managers were pleased to capture most of the upside of the S&P 500 during the current fiscal year, while outperforming the iShares Russell 1000 Value ETF by a wide margin. Over the long-term, they are optimistic and are excited to see a more normal interest rate environment. This should bode well for organic growth, stock picking, and value investing. With global value stocks trading near a historically wide discount to growth, the current set-up looks attractive from here. Any reversion to the mean should result in brighter days for those with a value orientation. The Fund trades at a significant discount to the S&P 500, the businesses have strong balance sheets, and management believes the companies are above average. Management sees opportunities across the Fund, with what they feel is a collection of all-weather vehicles that can withstand tough and unpredictable times.
15
FMI Large Cap Fund
MANAGEMENT’S DISCUSSION OF FUND PERFORMANCE (Unaudited)
(Continued)
COMPARISON OF CHANGE IN VALUE OF $10,000 INVESTMENT IN
FMI LARGE CAP FUND – INVESTOR CLASS — STANDARD & POOR’S 500 INDEX(1)
AND THE ISHARES RUSSELL 1000 VALUE ETF(2)
AVERAGE ANNUALIZED TOTAL RETURN
| Inception | |||||
| through | |||||
| Inception Date | 1-Year | 5-Year | 10-Year | 9/30/2023 | |
FMI Large Cap Fund – Investor Class | 12/31/01 | 19.95% | 5.99% | 8.68% | 8.52% |
FMI Large Cap Fund – Institutional Class | 10/31/16 | 20.07% | 6.13% | N/A | 9.17% |
Standard & Poor’s 500 Index(1)* | 21.62% | 9.92% | 11.91% | 8.34% | |
iShares Russell 1000 Value ETF(2)* | 14.13% | 6.06% | 8.26% | 7.18% |
The graph and the table do not reflect the deduction of taxes that a shareholder would pay on Fund distributions or the redemption of Fund shares. Performance data quoted represents past performance; past performance does not guarantee future results. Investment return and principal value of an investment will fluctuate so that an investor’s shares, when redeemed, may be worth more or less than their original cost. Current performance of a Fund may be lower or higher than the performance quoted. The total returns do not reflect the deduction of taxes that a shareholder would pay on Fund distributions or the redemption of Fund shares. Total return includes change in share prices and in each case includes reinvestments of any dividends, interest and capital gain distributions. Performance data current to the most recent month-end may be obtained by visiting www.fmifunds.com or by calling 1-800-811-5311.
| (1) | The Standard & Poor’s 500 Index consists of 500 selected common stocks, most of which are listed on the New York Stock Exchange. The Standard & Poor’s Ratings Group designates the stocks to be included in the Index on a statistical basis. A particular stock’s weighting in the Index is based on its relative total market value (i.e., its market price per share times the number of shares outstanding). Stocks may be added or deleted from the Index from time to time. |
| (2) | The iShares Russell 1000 Value ETF seeks to track investment results of an index composed of large- and mid-capitalization U.S. equities that exhibit value characteristics. Performance is compared to the iShares Russell 1000 Value ETF (“ETF”) for illustrative purposes only. The metrics regarding the comparative ETF have been obtained from Bloomberg and the returns do not reflect management fees, transaction costs or |
16
FMI Large Cap Fund
MANAGEMENT’S DISCUSSION OF FUND PERFORMANCE (Unaudited)
(Continued)
| expenses. Performance is based on market price returns. Beginning 8/10/2020, market price returns are calculated using closing price. Prior to 8/10/2020, market price returns were calculated using midpoint bid/ask spread at 4:00 PM ET. The ETF is not subject to the same fees or expenses as the Fund. The Fund is not restricted to investing in those securities which comprise the ETF. The Fund’s performance may or may not correlate to the ETF, and it should not be considered a proxy for the ETF. | |
| * | The benchmark since inception returns are calculated since inception of the Investor Class, December 31, 2001 to September 30, 2023. |
An investment cannot be made directly into an index.
17
FMI Large Cap Fund
SCHEDULE OF INVESTMENTS
September 30, 2023
| Shares | Cost | Value | |||||||||
COMMON STOCKS — 98.3%(1) | |||||||||||
COMMERCIAL SERVICES SECTOR — 2.7% | |||||||||||
| Advertising/Marketing Services — 2.7% | |||||||||||
595,000 | Omnicom Group Inc. | $ | 39,572,557 | $ | 44,315,600 | ||||||
CONSUMER NON-DURABLES SECTOR — 3.0% | |||||||||||
| Household/Personal Care — 3.0% | |||||||||||
975,000 | Unilever PLC — SP-ADR | 38,480,544 | 48,165,000 | ||||||||
CONSUMER SERVICES SECTOR — 4.4% | |||||||||||
| Other Consumer Services — 4.4% | |||||||||||
23,000 | Booking Holdings Inc.(2) | 39,082,089 | 70,930,850 | ||||||||
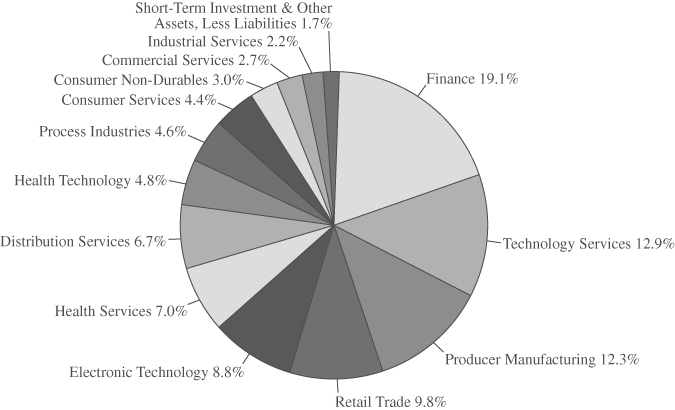
DISTRIBUTION SERVICES SECTOR — 6.7% | |||||||||||
| Food Distributors — 1.4% | |||||||||||
350,000 | Sysco Corp. | 24,310,111 | 23,117,500 | ||||||||
| Wholesale Distributors — 5.3% | |||||||||||
520,000 | Ferguson PLC | 63,831,481 | 85,524,400 | ||||||||
ELECTRONIC TECHNOLOGY SECTOR — 8.8% | |||||||||||
| Computer Processing Hardware — 4.6% | |||||||||||
895,000 | Sony Group Corp. — SP-ADR | 55,884,978 | 73,756,950 | ||||||||
| Semiconductors — 4.2% | |||||||||||
1,005,000 | Micron Technology Inc. | 48,491,332 | 68,370,150 | ||||||||
FINANCE SECTOR — 19.1% | |||||||||||
| Investment Banks/Brokers — 4.3% | |||||||||||
1,275,000 | The Charles Schwab Corp. | 48,781,741 | 69,997,500 | ||||||||
| Investment Managers — 4.6% | |||||||||||
50,000 | BlackRock Inc. | 29,447,225 | 32,324,500 | ||||||||
615,000 | Northern Trust Corp. | 52,294,960 | 42,730,200 | ||||||||
81,742,185 | 75,054,700 | ||||||||||
| Multi-Line Insurance — 5.1% | |||||||||||
500,000 | Arch Capital Group Ltd.(2) | 18,047,650 | 39,855,000 | ||||||||
310,000 | Progressive Corp. | 25,601,757 | 43,183,000 | ||||||||
43,649,407 | 83,038,000 | ||||||||||
| Property/Casualty Insurance — 5.1% | |||||||||||
235,000 | Berkshire Hathaway Inc. Cl B(2) | 11,176,060 | 82,320,500 | ||||||||
HEALTH SERVICES SECTOR — 7.0% | |||||||||||
| Managed Health Care — 4.8% | |||||||||||
155,000 | UnitedHealth Group Inc. | 19,074,375 | 78,149,450 | ||||||||
| Medical/Nursing Services — 2.2% | |||||||||||
1,680,000 | Fresenius Medical | ||||||||||
Care AG & Co. KGaA — SP-ADR | 60,898,713 | 36,187,200 | |||||||||
The accompanying notes to financial statements are an integral part of this schedule.
18
FMI Large Cap Fund
SCHEDULE OF INVESTMENTS (Continued)
September 30, 2023
| Shares | Cost | Value | |||||||||
COMMON STOCKS — 98.3%(1) (Continued) | |||||||||||
HEALTH TECHNOLOGY SECTOR — 4.8% | |||||||||||
| Medical Specialties — 4.8% | |||||||||||
2,090,000 | Koninklijke Philips N.V. — SP-ADR(2) | $ | 74,431,031 | $ | 41,674,600 | ||||||
1,435,000 | Smith & Nephew PLC — SP-ADR | 50,892,058 | 35,544,950 | ||||||||
125,323,089 | 77,219,550 | ||||||||||
INDUSTRIAL SERVICES SECTOR — 2.2% | |||||||||||
| Contract Drilling — 2.2% | |||||||||||
605,000 | Schlumberger Ltd. | 11,639,716 | 35,271,500 | ||||||||
PROCESS INDUSTRIES SECTOR — 4.6% | |||||||||||
| Containers/Packaging — 4.6% | |||||||||||
405,000 | Avery Dennison Corp. | 69,607,906 | 73,981,350 | ||||||||
PRODUCER MANUFACTURING SECTOR — 12.3% | |||||||||||
| Building Products — 7.1% | |||||||||||
210,000 | Carlisle Cos. Inc. | 49,379,260 | 54,444,600 | ||||||||
1,145,000 | Masco Corp. | 35,821,692 | 61,200,250 | ||||||||
85,200,952 | 115,644,850 | ||||||||||
| Electrical Products — 1.4% | |||||||||||
106,000 | Eaton Corp. PLC | 9,606,292 | 22,607,680 | ||||||||
| Industrial Machinery — 3.8% | |||||||||||
1,110,000 | Carrier Global Corp. | 49,210,177 | 61,272,000 | ||||||||
RETAIL TRADE SECTOR — 9.8% | |||||||||||
| Apparel/Footwear Retail — 1.4% | |||||||||||
250,000 | The TJX Cos. Inc. | 8,458,463 | 22,220,000 | ||||||||
| Discount Stores — 5.2% | |||||||||||
415,000 | Dollar General Corp. | 38,033,546 | 43,907,000 | ||||||||
380,000 | Dollar Tree Inc.(2) | 32,487,797 | 40,451,000 | ||||||||
70,521,343 | 84,358,000 | ||||||||||
| Specialty Stores — 3.2% | |||||||||||
730,000 | CarMax Inc.(2) | 63,044,613 | 51,632,900 | ||||||||
TECHNOLOGY SERVICES SECTOR — 12.9% | |||||||||||
| Information Technology Services — 4.1% | |||||||||||
325,000 | CDW Corp. | 56,455,379 | 65,572,000 | ||||||||
| Internet Software/Services — 5.6% | |||||||||||
690,000 | Alphabet Inc. — Cl A(2) | 76,097,068 | 90,293,400 | ||||||||
| Packaged Software — 3.2% | |||||||||||
395,000 | SAP SE — SP-ADR | 42,748,166 | 51,081,400 | ||||||||
Total common stocks | 1,242,888,737 | 1,590,082,430 | |||||||||
The accompanying notes to financial statements are an integral part of this schedule.
19
FMI Large Cap Fund
SCHEDULE OF INVESTMENTS (Continued)
September 30, 2023
| Shares | Cost | Value | |||||||||
SHORT-TERM INVESTMENT — 1.6%(1) | |||||||||||
| Money Market Fund — 1.6% | |||||||||||
26,580,969 | First American Treasury | ||||||||||
Obligations Fund, Cl X, 5.264%(3) | $ | 26,580,969 | $ | 26,580,969 | |||||||
Total short-term investment | 26,580,969 | 26,580,969 | |||||||||
Total investments — 99.9% | $ | 1,269,469,706 | 1,616,663,399 | ||||||||
Other assets, less liabilities — 0.1%(1) | 1,741,757 | ||||||||||
| TOTAL NET ASSETS — 100.0% | $ | 1,618,405,156 | |||||||||
| (1) | Percentages for the various classifications relate to total net assets. |
| (2) | Non-Income producing security. |
| (3) | The rate quoted is the annualized 7-day yield as of September 30, 2023. |
| PLC | Public Limited Company |
| SP-ADR | Sponsored American Depositary Receipt |
The accompanying notes to financial statements are an integral part of this schedule.
INDUSTRY SECTORS as a percentage of net assets
as of September 30, 2023 (Unaudited)
20
FMI International Fund and FMI International Fund II – Currency Unhedged
MANAGEMENT’S DISCUSSION OF FUND PERFORMANCE (Unaudited)
During the fiscal year ended September 30, 2023, the FMI International Funds gained 30.14%1 (“currency hedged”) and 33.78%2 (“currency unhedged”). Over the same period, the MSCI EAFE Index (“Index”) increased 20.32% in local currency (LOC) and 25.65% in U.S. Dollars (USD), while the MSCI EAFE Value Index (“Value Index”) added 25.89% in LOC and 31.51% in USD. FMI’s currency hedged performance was negatively impacted by a weak USD.
The Funds’ relative performance was aided by the Retail Trade, Consumer Services and Electronic Technology sectors. B&M European Value Retail S.A. drove the Retail Trade performance after a tough 2022 when UK consumer stocks were under extreme pressure. The stock recovered in 2023 as the business model proved resilient. Consumer Services was led by Booking Holdings Inc., as travel continues to recover, with particular improvement in Europe, and Booking is taking market share from competitors. In Electronic Technology, Safran S.A. performed well as they benefitted from rebounding global air travel while successfully navigating supply chain challenges and inflation, leading to an outlook for multiyear double-digit earnings growth. Additional stocks that performed well included Arch Capital Group Ltd., Ferguson PLC, and SAP SE. Arch Capital has executed well, while benefiting from a hardening of the property catastrophic reinsurance and property and casualty insurance markets. Ferguson’s business has outperformed its respective end-markets which were challenging. SAP has been performing resiliently and tracking ahead of schedule on their cloud transition despite a tougher macro backdrop.
Conversely, the Health Technology, Commercial Services, and Producer Manufacturing sectors all weighed on the Funds’ relative performance. In Health Technology, Roche Holdings AG declined, as an Alzheimer’s pipeline drug failure in late 2022 and weaker than expected 2023 guidance disappointed. In Commercial Services, Genpact Ltd. lagged, as negative sentiment around generative artificial intelligence (AI) has impacted the stock, but is believed to be significantly overblown. In Producer Manufacturing, Nabtesco Corp. lagged as cyclical pressure and operational execution weighed on the stock. Additional stocks that detracted from performance included DKSH Holdings AG, Barry Callebaut AG, and Smith & Nephew PLC. DKSH underperformed, as a sluggish recovery coming out of COVID-19 in China and other Asian countries has weighed on topline growth. For Barry Callebaut, rising chocolate prices and slowing economic growth have hurt global chocolate consumption this year. Additionally, last year’s Salmonella outbreak in one of Barry Callebaut’s plants is proving to be more impactful than initially expected. With Smith & Nephew, improving sales growth in Orthopedics did not yet translate into improving margins, which disappointed (despite margin targets being reiterated for 2023 and 2025).
New additions to the Fund over the past twelve months included Ryanair Holdings PLC-SP-ADR, Coca-Cola Europacific Partners PLC, Weir Group PLC, Barry Callebaut AG, Diageo PLC, Genpact Ltd. and Ashtead Group PLC. Stocks sold during the year included WPP PLC, CK Hutchison Holdings Ltd., Nabtesco Corp., Vivendi, Henkel AG & Co. KGaA, LG Household & Health Care Ltd. Pfd., and Amorepacific Corp. Pfd.
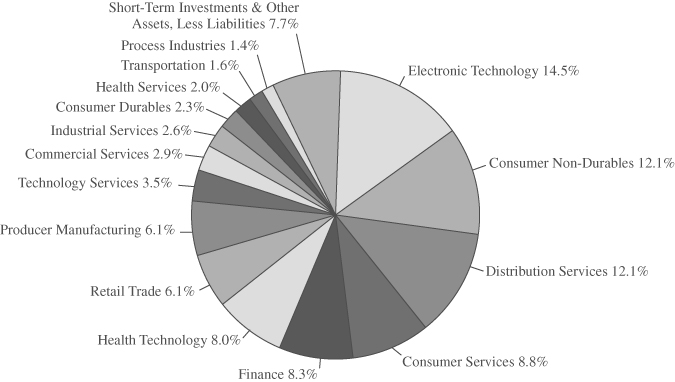
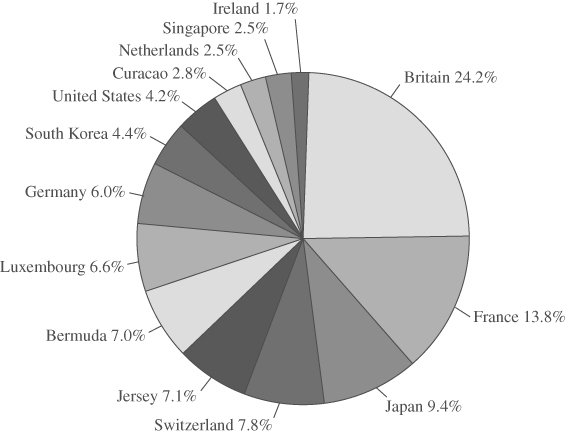
As of September 30, 2023, the Funds were significantly overweight in Distribution Services, Electronic Technology, and Consumer Services versus the Index, and underweight in Finance, Health Technology, and Energy Minerals. In terms of geographic revenue exposure, the Funds are overweight the United Kingdom and United States and underweight Japan and China.
After a tough fiscal year 2022, international stock markets rebounded strongly in fiscal year 2023, despite concerns around waning global growth, record debt levels, elevated inflation, rising interest rates, and heightened geopolitical risks. In the international arena, value stocks outperformed growth stocks in the period, with the “deeper value” Energy and Finance sectors performing strongly. FMI is typically under-weight these sectors due to business quality and balance sheet concerns. International stocks currently trade near an all-time high
_______________
1 | The FMI International Fund [currency hedged] Investor Class (FMIJX) and the FMI International Fund [currency hedged] Institutional Class (FMIYX) had a return of 30.14% and 30.30%, respectively, for the fiscal year ending September 30, 2023. |
2 | The FMI International Fund [currency unhedged] Institutional Class (FMIFX) had a return of 33.78% for the fiscal year ending September 30, 2023. |
21
FMI International Fund and FMI International Fund II – Currency Unhedged
MANAGEMENT’S DISCUSSION OF FUND PERFORMANCE (Unaudited)
(Continued)
discount to the U.S., which should provide some margin of safety. Some of the discount is warranted, as Europe is facing high food and energy inflation, business activity and bank lending has slowed, and a higher cost of borrowing is impacting investment. In China, the property sector, which we have long described as a dangerous and a speculative bubble, has finally popped. Furthermore, China’s demographics are poor, productivity growth is slowing, exports are weak, youth unemployment is high, and tensions with the West are rising.
Given the challenging backdrop, the Fund portfolio managers were pleased to outperform both the Index and Value Index in a rapidly rising stock market. Over the long-term, they remain optimistic and are excited to see a more normal interest rate environment. This should bode well for organic growth, stock picking, and value investing. With global value stocks currently trading near a historically wide discount to growth, the current set-up looks attractive from here. Any reversion to the mean should result in brighter days for those with a value orientation. The Funds trade at a significant discount to the Index, the businesses have strong balance sheets, and management believes the companies are above average. Management sees compelling opportunities across the Funds, with what they feel is a collection of all-weather vehicles that can withstand tough and unpredictable times.
22
FMI International Fund and FMI International Fund II – Currency Unhedged
MANAGEMENT’S DISCUSSION OF FUND PERFORMANCE (Unaudited)
(Continued)
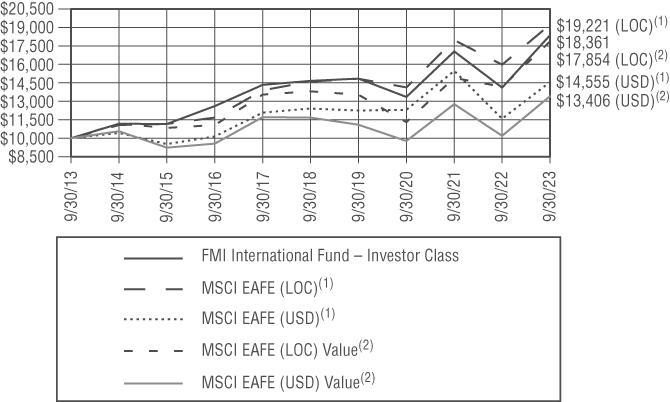
COMPARISON OF CHANGE IN VALUE OF $10,000 INVESTMENT IN
FMI INTERNATIONAL FUND – INVESTOR CLASS — MSCI EAFE(1) AND MSCI EAFE VALUE(2)
AVERAGE ANNUALIZED TOTAL RETURN
| Inception | |||||
| through | |||||
| Inception Date | 1-Year | 5-Year | 10-Year | 9/30/2023 | |
FMI International Fund – Investor Class | 12/31/10 | 30.14% | 4.61% | 6.27% | 7.37% |
FMI International Fund – Institutional Class | 10/31/16 | 30.30% | 4.76% | N/A | 5.88% |
MSCI EAFE Net (LOC)(1)* | 20.32% | 5.65% | 6.75% | 6.98% | |
MSCI EAFE Net (LOC) Value(2)* | 25.89% | 5.27% | 5.97% | 6.35% | |
MSCI EAFE Net (USD)(1)* | 25.65% | 3.24% | 3.82% | 4.45% | |
MSCI EAFE Net (USD) Value(2)* | 31.51% | 2.81% | 2.97% | 3.77% |
The graph and the table do not reflect the deduction of taxes that a shareholder would pay on Fund distributions or the redemption of Fund shares. Performance data quoted represents past performance; past performance does not guarantee future results. Investment return and principal value of an investment will fluctuate so that an investor’s shares, when redeemed, may be worth more or less than their original cost. Current performance of a Fund may be lower or higher than the performance quoted. The total returns do not reflect the deduction of taxes that a shareholder would pay on Fund distributions or the redemption of Fund shares. Total return includes change in share prices and in each case includes reinvestments of any dividends, interest and capital gain distributions. Performance data current to the most recent month-end may be obtained by visiting www.fmifunds.com or by calling 1-800-811-5311.
| (1) | The MSCI EAFE Index (Europe, Australasia, Far East) is a free float-adjusted market capitalization index that is designed to measure the equity market performance of developed markets, excluding the U.S. and Canada. The MSCI EAFE Index consists of the following 21 developed market country indices: Australia, Austria, Belgium, Denmark, Finland, France, Germany, Hong Kong, Ireland, Israel, Italy, Japan, the Netherlands, New |
23
FMI International Fund and FMI International Fund II – Currency Unhedged
MANAGEMENT’S DISCUSSION OF FUND PERFORMANCE (Unaudited)
(Continued)
| Zealand, Norway, Portugal, Singapore, Spain, Sweden, Switzerland and the United Kingdom. The MSCI EAFE Index is unmanaged and investors cannot invest directly in the Index. Index results are inclusive of dividends and net of foreign withholding taxes. The reported figures include reinvestment of dividends and capital gains distributions and do not reflect any fees or expenses. | |
| (2) | The MSCI EAFE Value Index captures large and mid cap securities exhibiting overall value style characteristics across Developed Markets countries around the world, excluding the U.S. and Canada. The value Investment style characteristics for index construction are defined using three variables: book value to price, 12-month forward earnings to price and dividend yield. |
| The MSCI EAFE and MSCI EAFE Value Index are calculated in local currency (LOC) as well as in U.S. dollars (USD). The concept of a LOC calculation excludes the impact of currency fluctuations. All currencies of listing are considered in the Index calculation in LOC where current prices (t) and previous day prices (t-1) are converted into USD using the same exchange rate (exchange rate t-1) in the numerator and denominator. As a consequence, the FX factor drops out of the equation. The USD calculation includes exchange rates at t and t-1. Therefore, the LOC calculation only represents the price appreciation or depreciation of the securities, whereas the USD calculation also accounts for the performance of the currency (or currencies) relative to the USD. MSCI EAFE is a service mark of MSCI Barra. | |
| * | The benchmark since inception returns are calculated since inception of the Investor Class, December 31, 2010 to September 30, 2023. |
An investment cannot be made directly into an index.
24
FMI International Fund and FMI International Fund II – Currency Unhedged
MANAGEMENT’S DISCUSSION OF FUND PERFORMANCE (Unaudited)
(Continued)
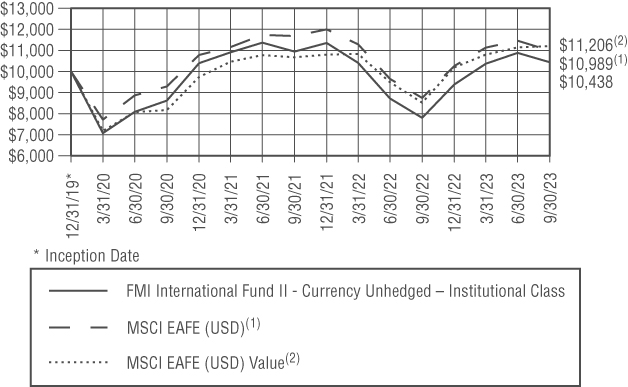
COMPARISON OF CHANGE IN VALUE OF $10,000 INVESTMENT IN
FMI INTERNATIONAL FUND II — CURRENCY UNHEDGED –
INSTITUTIONAL CLASS AND MSCI EAFE(1) AND MSCI EAFE VALUE(2)
AVERAGE ANNUALIZED TOTAL RETURN
| Inception | ||||
| through | ||||
| Inception Date | 1-Year | 3-Year | 9/30/2023 | |
FMI International Fund II – Currency Unhedged – | ||||
Institutional Class | 12/31/19 | 33.78% | 6.59% | 1.15% |
MSCI EAFE Net (USD)(1)* | 25.65% | 5.75% | 2.55% | |
MSCI EAFE Net (USD) Value(2)* | 31.51% | 11.11% | 3.08% |
The graph and the table do not reflect the deduction of taxes that a shareholder would pay on Fund distributions or the redemption of Fund shares. Performance data quoted represents past performance; past performance does not guarantee future results. Investment return and principal value of an investment will fluctuate so that an investor’s shares, when redeemed, may be worth more or less than their original cost. Current performance of a Fund may be lower or higher than the performance quoted. The total returns do not reflect the deduction of taxes that a shareholder would pay on Fund distributions or the redemption of Fund shares. Total return includes change in share prices and in each case includes reinvestments of any dividends, interest and capital gain distributions. Performance data current to the most recent month-end may be obtained by visiting www.fmifunds.com or by calling 1-800-811-5311.
| (1) | The MSCI EAFE Index (Europe, Australasia, Far East) is a free float-adjusted market capitalization index that is designed to measure the equity market performance of developed markets, excluding the U.S. and Canada. The MSCI EAFE Index consists of the following 21 developed market country indices: Australia, Austria, Belgium, Denmark, Finland, France, Germany, Hong Kong, Ireland, Israel, Italy, Japan, the Netherlands, New Zealand, Norway, Portugal, Singapore, Spain, Sweden, Switzerland and the United Kingdom. The MSCI EAFE |
25
FMI International Fund and FMI International Fund II – Currency Unhedged
MANAGEMENT’S DISCUSSION OF FUND PERFORMANCE (Unaudited)
(Continued)
| Index is unmanaged and investors cannot invest directly in the Index. Index results are inclusive of dividends and net of foreign withholding taxes. The reported figures include reinvestment of dividends and capital gains distributions and do not reflect any fees or expenses. | |
| (2) | The MSCI EAFE Value Index captures large and mid cap securities exhibiting overall value style characteristics across Developed Markets countries around the world, excluding the U.S. and Canada. The value Investment style characteristics for index construction are defined using three variables: book value to price, 12-month forward earnings to price and dividend yield. MSCI EAFE is a service mark of MSCI Barra. |
| * | The benchmark since inception returns are calculated since inception of the Institutional Class, December 31, 2019 to September 30, 2023. |
An investment cannot be made directly into an index.
26
FMI International Fund
SCHEDULE OF INVESTMENTS
September 30, 2023
| Shares | Cost | Value | |||||||||
LONG-TERM INVESTMENTS — 92.3%(1) | |||||||||||
COMMON STOCKS — 88.2%(1) | |||||||||||
COMMERCIAL SERVICES SECTOR — 2.9% | |||||||||||
| Miscellaneous Commercial Services — 2.9% | |||||||||||
3,325,000 | Genpact Ltd. (Bermuda) | $ | 140,202,262 | $ | 120,365,000 | ||||||
CONSUMER DURABLES SECTOR — 2.3% | |||||||||||
| Electronics/Appliances — 2.3% | |||||||||||
10,340,000 | Howden Joinery Group PLC (Britain)(4) | 76,308,220 | 92,518,147 | ||||||||
CONSUMER NON-DURABLES SECTOR — 12.1% | |||||||||||
| Beverages: Alcoholic — 2.1% | |||||||||||
2,320,000 | Diageo PLC (Britain)(4) | 100,448,240 | 85,534,562 | ||||||||
| Beverages: Non-Alcoholic — 2.1% | |||||||||||
1,385,000 | Coca-Cola Europacific Partners PLC (Britain) | 87,198,706 | 86,534,800 | ||||||||
| Food: Specialty/Candy — 4.7% | |||||||||||
38,000 | Barry Callebaut AG (Switzerland)(4) | 82,668,815 | 60,429,255 | ||||||||
4,425,000 | Greggs PLC (Britain)(4) | 119,945,004 | 131,736,110 | ||||||||
202,613,819 | 192,165,365 | ||||||||||
| Household/Personal Care — 3.2% | |||||||||||
2,625,000 | Unilever PLC (Britain)(4) | 112,240,154 | 129,851,140 | ||||||||
CONSUMER SERVICES SECTOR — 8.8% | |||||||||||
| Other Consumer Services — 3.9% | |||||||||||
52,000 | Booking Holdings Inc. (United States)(2) | 89,513,766 | 160,365,400 | ||||||||
| Restaurants — 4.9% | |||||||||||
1,935,000 | Sodexo S.A. (France)(4) | 157,266,344 | 199,203,548 | ||||||||
DISTRIBUTION SERVICES SECTOR — 12.1% | |||||||||||
| Medical Distributors — 2.2% | |||||||||||
1,325,000 | DKSH Holding AG (Switzerland)(4) | 75,162,258 | 89,625,755 | ||||||||
| Wholesale Distributors — 9.9% | |||||||||||
1,620,000 | Ferguson PLC (Jersey)(4) | 101,715,903 | 266,605,299 | ||||||||
6,115,000 | Rexel S.A. (France)(4) | 113,118,225 | 137,012,547 | ||||||||
214,834,128 | 403,617,846 | ||||||||||
ELECTRONIC TECHNOLOGY SECTOR — 10.4% | |||||||||||
| Aerospace & Defense — 4.5% | |||||||||||
1,175,000 | Safran S.A. (France)(4) | 123,160,730 | 184,133,359 | ||||||||
| Computer Processing Hardware — 4.3% | |||||||||||
2,130,000 | Sony Group Corp. (Japan)(4) | 134,755,032 | 174,181,994 | ||||||||
| Electronic Equipment/Instruments — 1.6% | |||||||||||
3,340,000 | Yokogawa Electric Corp. (Japan)(4) | 59,113,396 | 64,464,378 | ||||||||
FINANCE SECTOR — 8.3% | |||||||||||
| Finance/Rental/Leasing — 1.9% | |||||||||||
1,300,000 | Ashtead Group PLC (Britain)(4) | 63,126,241 | 78,835,892 | ||||||||
The accompanying notes to financial statements are an integral part of this schedule.
27
FMI International Fund
SCHEDULE OF INVESTMENTS (Continued)
September 30, 2023
| Shares | Cost | Value | |||||||||
LONG-TERM INVESTMENTS — 92.3%(1) (Continued) | |||||||||||
COMMON STOCKS — 88.2%(1) (Continued) | |||||||||||
FINANCE SECTOR — 8.3% (Continued) | |||||||||||
| Major Banks — 4.2% | |||||||||||
3,790,000 | DBS Group Holdings Ltd. (Singapore)(4) | $ | 84,316,013 | $ | 93,081,086 | ||||||
148,400,000 | Lloyds Banking Group PLC (Britain)(4) | 73,863,493 | 79,749,790 | ||||||||
158,179,506 | 172,830,876 | ||||||||||
| Multi-Line Insurance — 2.2% | |||||||||||
1,110,000 | Arch Capital Group Ltd. (Bermuda)(2) | 45,974,299 | 88,478,100 | ||||||||
HEALTH SERVICES SECTOR — 2.0% | |||||||||||
| Medical/Nursing Services — 2.0% | |||||||||||
| 1,885,000 | Fresenius Medical Care | ||||||||||
AG & Co. KGaA (Germany)(4) | 129,797,693 | 81,039,880 | |||||||||
HEALTH TECHNOLOGY SECTOR — 8.0% | |||||||||||
| Medical Specialties — 4.5% | |||||||||||
4,694,999 | Koninklijke Philips N.V. (Netherlands)(2)(4) | 151,535,337 | 93,675,820 | ||||||||
7,190,000 | Smith & Nephew PLC (Britain)(4) | 126,451,258 | 89,232,576 | ||||||||
277,986,595 | 182,908,396 | ||||||||||
| Pharmaceuticals: Major — 3.5% | |||||||||||
530,000 | Roche Holding AG (Switzerland)(4) | 180,660,334 | 144,690,592 | ||||||||
INDUSTRIAL SERVICES SECTOR — 2.6% | |||||||||||
| Contract Drilling — 2.6% | |||||||||||
1,845,000 | Schlumberger Ltd. (Curacao) | 68,316,952 | 107,563,500 | ||||||||
PROCESS INDUSTRIES SECTOR — 1.4% | |||||||||||
| Chemicals: Specialty — 1.4% | |||||||||||
1,415,000 | NOF Corp. (Japan)(4) | 74,286,266 | 56,489,256 | ||||||||
PRODUCER MANUFACTURING SECTOR — 6.1% | |||||||||||
| Building Products — 1.4% | |||||||||||
4,400,000 | Sanwa Holdings Corp. (Japan)(4) | 54,508,279 | 58,397,253 | ||||||||
| Electrical Products — 1.3% | |||||||||||
2,650,000 | Smiths Group PLC (Britain)(4) | 39,232,605 | 52,173,443 | ||||||||
| Industrial Conglomerates — 1.3% | |||||||||||
1,155,000 | Jardine Matheson Holdings Ltd. (Bermuda)(4) | 74,573,963 | 53,524,442 | ||||||||
| Trucks/Construction/Farm Machinery — 2.1% | |||||||||||
3,650,000 | Weir Group PLC (Britain)(4) | 82,013,006 | 84,333,766 | ||||||||
RETAIL TRADE SECTOR — 6.1% | |||||||||||
| Discount Stores — 6.1% | |||||||||||
35,000,000 | B&M European Value | ||||||||||
Retail S.A. (Luxembourg)(4) | 138,493,167 | 249,650,695 | |||||||||
The accompanying notes to financial statements are an integral part of this schedule.
28
FMI International Fund
SCHEDULE OF INVESTMENTS (Continued)
September 30, 2023
| Shares | Cost | Value | |||||||||
LONG-TERM INVESTMENTS — 92.3%(1) (Continued) | |||||||||||
COMMON STOCKS — 88.2%(1) (Continued) | |||||||||||
TECHNOLOGY SERVICES SECTOR — 3.5% | |||||||||||
| Packaged Software — 3.5% | |||||||||||
1,110,000 | SAP SE (Germany)(4) | $ | 119,105,141 | $ | 143,680,659 | ||||||
TRANSPORTATION SECTOR — 1.6% | |||||||||||
| Airlines — 1.6% | |||||||||||
655,000 | Ryanair Holdings PLC — SP-ADR (Ireland)(2) | 65,231,864 | 63,672,550 | ||||||||
Total common stocks | 3,144,302,966 | 3,600,830,594 | |||||||||
PREFERRED STOCK — 4.1%(1) | |||||||||||
ELECTRONIC TECHNOLOGY SECTOR — 4.1% | |||||||||||
| Telecommunications Equipment — 4.1% | |||||||||||
4,170,000 | Samsung Electronics Co. Ltd. (South Korea)(4) | 106,839,392 | 167,994,578 | ||||||||
Total preferred stock | 106,839,392 | 167,994,578 | |||||||||
Total long-term investments | 3,251,142,358 | 3,768,825,172 | |||||||||
SHORT-TERM INVESTMENTS — 2.7%(1) | |||||||||||
| Money Market Fund — 2.7% | |||||||||||
111,310,355 | First American Treasury | ||||||||||
Obligations Fund, Cl X, 5.264%(3) | 111,310,355 | 111,310,355 | |||||||||
Principal Amount | |||||||||||
| Bank Deposit Account — 0.0% | |||||||||||
$ | 144,349 | U.S. Bank N.A., 5.200%(5)(6) | 144,349 | 144,349 | |||||||
Total short-term investments | 111,454,704 | 111,454,704 | |||||||||
Total investments — 95.0% | $ | 3,362,597,062 | 3,880,279,876 | ||||||||
Other assets, less liabilities — 5.0%(1) | 205,289,584 | ||||||||||
| TOTAL NET ASSETS — 100.0% | $ | 4,085,569,460 | |||||||||
| (1) | Percentages for the various classifications relate to total net assets. |
| (2) | Non-Income producing security. |
| (3) | The rate quoted is the annualized 7-day yield as of September 30, 2023. |
| (4) | Security does not trade during New York Stock Exchange hours, provided that certain foreign exchanges may trade during a portion of the New York Stock Exchange hours, and has been valued in accordance with the Funds pricing procedures discussed in Note 2(a) to the financial statements and has been classified as level 2. As of September 30, 2023 the aggregate value of these securities was $3,141,845,822. |
| (5) | The rate shown is as of September 30, 2023. |
| (6) | This $144,349 security is held as collateral for certain forward currency contracts. |
| PLC | Public Limited Company |
| SP-ADR | Sponsored American Depositary Receipt |
The accompanying notes to financial statements are an integral part of this schedule.
29
FMI International Fund
SCHEDULE OF FORWARD CURRENCY CONTRACTS
September 30, 2023
| U.S. $Value on | U.S. $Value on | ||||||||||||||||||||
| September 30, | September 30, | ||||||||||||||||||||
| 2023 | 2023 | Unrealized | |||||||||||||||||||
| Settlement | Currency to | of Currency to | Currency to | of Currency to | Appreciation | ||||||||||||||||
| Date | Counterparty | be Delivered | be Delivered | be Received | be Received | (Depreciation) | |||||||||||||||
| 10/20/23 | State Street Bank | 1,050,000,000 | $ | 1,281,278,583 | 1,354,494,750 | $ | 1,354,494,750 | $ | 73,216,167 | ||||||||||||
| and Trust Co. | British Pound | U.S. Dollar | |||||||||||||||||||
| 10/20/23 | The Bank of | 760,000,000 | 804,220,964 | 856,390,800 | 856,390,800 | 52,169,836 | |||||||||||||||
| New York Mellon | Euro | U.S. Dollar | |||||||||||||||||||
| 10/20/23 | JPMorgan Chase | 585,000,000 | 74,739,759 | 75,007,308 | 75,007,308 | 267,549 | |||||||||||||||
| Bank, N.A. | Hong Kong Dollar | U.S. Dollar | |||||||||||||||||||
| 10/20/23 | The Bank of | 51,000,000,000 | 342,551,612 | 370,249,374 | 370,249,374 | 27,697,762 | |||||||||||||||
| New York Mellon | Japanese Yen | U.S. Dollar | |||||||||||||||||||
| 10/20/23 | JPMorgan Chase | 115,000,000 | 84,205,379 | 87,025,616 | 87,025,616 | 2,820,237 | |||||||||||||||
| Bank, N.A. | Singapore Dollar | U.S. Dollar | |||||||||||||||||||
| 10/20/23 | State Street Bank | 225,000,000,000 | 166,934,407 | 178,076,771 | 178,076,771 | 11,142,364 | |||||||||||||||
| and Trust Co. | South Korea Won | U.S. Dollar | |||||||||||||||||||
| 10/20/23 | JPMorgan Chase | 270,000,000 | 295,643,965 | 317,664,138 | 317,664,138 | 22,020,173 | |||||||||||||||
| Bank, N.A. | Swiss Franc | U.S. Dollar | |||||||||||||||||||
$ | 3,049,574,669 | $ | 3,238,908,757 | 189,334,088 | |||||||||||||||||
| 10/20/23 | JPMorgan Chase | 74,788,100 | $ | 74,788,100 | 585,000,000 | $ | 74,739,758 | $ | (48,342 | ) | |||||||||||
| Bank, N.A. | U.S. Dollar | Hong Kong Dollar | |||||||||||||||||||
$ | 74,788,100 | $ | 74,739,758 | $ | (48,342 | ) | |||||||||||||||
$ | 3,124,362,769 | $ | 3,313,648,515 | $ | 189,285,746 | ||||||||||||||||
The accompanying notes to financial statements are an integral part of this schedule.
30
FMI International Fund
INDUSTRY SECTORS as a percentage of net assets
as of September 30, 2023 (Unaudited)
CONCENTRATION BY COUNTRY based on domicile of issuer as
a percentage of long-term investments only
as of September 30, 2023 (Unaudited)
31
FMI International Fund II – Currency Unhedged
SCHEDULE OF INVESTMENTS
September 30, 2023
| Shares | Cost | Value | |||||||||
LONG-TERM INVESTMENTS — 95.9%(1) | |||||||||||
COMMON STOCKS — 91.6%(1) | |||||||||||
COMMERCIAL SERVICES SECTOR — 3.0% | |||||||||||
| Miscellaneous Commercial Services — 3.0% | |||||||||||
58,100 | Genpact Ltd. (Bermuda) | $ | 2,455,443 | $ | 2,103,220 | ||||||
CONSUMER DURABLES SECTOR — 2.3% | |||||||||||
| Electronics/Appliances — 2.3% | |||||||||||
182,700 | Howden Joinery Group PLC (Britain)(4) | 1,436,350 | 1,634,726 | ||||||||
CONSUMER NON-DURABLES SECTOR — 12.5% | |||||||||||
| Beverages: Alcoholic — 2.2% | |||||||||||
41,750 | Diageo PLC (Britain)(4) | 1,806,230 | 1,539,253 | ||||||||
| Beverages: Non-Alcoholic — 2.1% | |||||||||||
24,000 | Coca-Cola Europacific Partners PLC (Britain) | 1,511,066 | 1,499,520 | ||||||||
| Food: Specialty/Candy — 4.9% | |||||||||||
675 | Barry Callebaut AG (Switzerland)(4) | 1,459,800 | 1,073,414 | ||||||||
81,000 | Greggs PLC (Britain)(4) | 2,232,684 | 2,411,441 | ||||||||
3,692,484 | 3,484,855 | ||||||||||
| Household/Personal Care — 3.3% | |||||||||||
48,100 | Unilever PLC (Britain)(4) | 2,620,042 | 2,379,368 | ||||||||
CONSUMER SERVICES SECTOR — 9.0% | |||||||||||
| Other Consumer Services — 4.1% | |||||||||||
950 | Booking Holdings Inc. (United States)(2) | 1,656,672 | 2,929,753 | ||||||||
| Restaurants — 4.9% | |||||||||||
34,000 | Sodexo S.A. (France)(4) | 2,840,854 | 3,500,217 | ||||||||
DISTRIBUTION SERVICES SECTOR — 12.9% | |||||||||||
| Medical Distributors — 2.3% | |||||||||||
24,150 | DKSH Holding AG (Switzerland)(4) | 1,463,052 | 1,633,556 | ||||||||
| Wholesale Distributors — 10.6% | |||||||||||
30,475 | Ferguson PLC (Jersey)(4) | 2,929,829 | 5,015,307 | ||||||||
111,950 | Rexel S.A. (France)(4) | 2,131,918 | 2,508,349 | ||||||||
5,061,747 | 7,523,656 | ||||||||||
ELECTRONIC TECHNOLOGY SECTOR — 11.1% | |||||||||||
| Aerospace & Defense — 4.8% | |||||||||||
21,625 | Safran S.A. (France)(4) | 2,326,250 | 3,388,837 | ||||||||
| Computer Processing Hardware — 4.7% | |||||||||||
40,700 | Sony Group Corp. (Japan)(4) | 3,070,730 | 3,328,266 | ||||||||
| Electronic Equipment/Instruments — 1.6% | |||||||||||
61,000 | Yokogawa Electric Corp. (Japan)(4) | 950,064 | 1,177,343 | ||||||||
FINANCE SECTOR — 8.6% | |||||||||||
| Finance/Rental/Leasing — 1.9% | |||||||||||
22,450 | Ashtead Group PLC (Britain)(4) | 1,107,427 | 1,361,435 | ||||||||
The accompanying notes to financial statements are an integral part of this schedule.
32
FMI International Fund II – Currency Unhedged
SCHEDULE OF INVESTMENTS (Continued)
September 30, 2023
| Shares | Cost | Value | |||||||||
LONG-TERM INVESTMENTS — 95.9%(1) (Continued) | |||||||||||
COMMON STOCKS — 91.6%(1) (Continued) | |||||||||||
FINANCE SECTOR — 8.6% (Continued) | |||||||||||
| Major Banks — 4.4% | |||||||||||
68,200 | DBS Group Holdings Ltd. (Singapore)(4) | $ | 1,524,728 | $ | 1,674,968 | ||||||
2,675,800 | Lloyds Banking Group PLC (Britain)(4) | 1,273,283 | 1,437,968 | ||||||||
2,798,011 | 3,112,936 | ||||||||||
| Multi-Line Insurance — 2.3% | |||||||||||
20,450 | Arch Capital Group Ltd. (Bermuda)(2) | 850,757 | 1,630,070 | ||||||||
HEALTH SERVICES SECTOR — 2.1% | |||||||||||
| Medical/Nursing Services — 2.1% | |||||||||||
34,675 | Fresenius Medical Care | ||||||||||
AG & Co. KGaA (Germany)(4) | 2,411,047 | 1,490,747 | |||||||||
HEALTH TECHNOLOGY SECTOR — 8.4% | |||||||||||
| Medical Specialties — 4.6% | |||||||||||
85,400 | Koninklijke Philips N.V. (Netherlands)(2)(4) | 2,943,500 | 1,703,923 | ||||||||
128,100 | Smith & Nephew PLC (Britain)(4) | 2,341,850 | 1,589,804 | ||||||||
5,285,350 | 3,293,727 | ||||||||||
| Pharmaceuticals: Major — 3.8% | |||||||||||
9,850 | Roche Holding AG (Switzerland)(4) | 3,300,124 | 2,689,061 | ||||||||
INDUSTRIAL SERVICES SECTOR — 2.7% | |||||||||||
| Contract Drilling — 2.7% | |||||||||||
33,100 | Schlumberger Ltd. (Curacao) | 779,863 | 1,929,730 | ||||||||
PROCESS INDUSTRIES SECTOR — 1.5% | |||||||||||
| Chemicals: Specialty — 1.5% | |||||||||||
26,700 | NOF Corp. (Japan)(4) | 1,338,788 | 1,065,910 | ||||||||
PRODUCER MANUFACTURING SECTOR — 6.1% | |||||||||||
| Building Products — 1.4% | |||||||||||
77,000 | Sanwa Holdings Corp. (Japan)(4) | 930,849 | 1,021,952 | ||||||||
| Electrical Products — 1.3% | |||||||||||
46,700 | Smiths Group PLC (Britain)(4) | 770,934 | 919,434 | ||||||||
| Industrial Conglomerates — 1.3% | |||||||||||
19,650 | Jardine Matheson Holdings Ltd. (Bermuda)(4) | 1,279,665 | 910,611 | ||||||||
| Trucks/Construction/Farm Machinery — 2.1% | |||||||||||
66,500 | Weir Group PLC (Britain)(4) | 1,495,178 | 1,536,492 | ||||||||
RETAIL TRADE SECTOR — 6.3% | |||||||||||
| Discount Stores — 6.3% | |||||||||||
627,700 | B&M European Value | ||||||||||
Retail S.A. (Luxembourg)(4) | 3,161,317 | 4,477,307 | |||||||||
The accompanying notes to financial statements are an integral part of this schedule.
33
FMI International Fund II – Currency Unhedged
SCHEDULE OF INVESTMENTS (Continued)
September 30, 2023
| Shares | Cost | Value | |||||||||
LONG-TERM INVESTMENTS — 95.9%(1) (Continued) | |||||||||||
COMMON STOCKS — 91.6%(1) (Continued) | |||||||||||
TECHNOLOGY SERVICES SECTOR — 3.5% | |||||||||||
| Packaged Software — 3.5% | |||||||||||
19,500 | SAP SE (Germany)(4) | $ | 2,182,342 | $ | 2,524,120 | ||||||
TRANSPORTATION SECTOR — 1.6% | |||||||||||
| Airlines — 1.6% | |||||||||||
11,500 | Ryanair Holdings PLC — SP-ADR (Ireland)(2) | 1,145,439 | 1,117,915 | ||||||||
Total common stocks | 59,728,075 | 65,204,017 | |||||||||
PREFERRED STOCK — 4.3%(1) | |||||||||||
ELECTRONIC TECHNOLOGY SECTOR — 4.3% | |||||||||||
| Telecommunications Equipment — 4.3% | |||||||||||
76,000 | Samsung Electronics Co. Ltd. (South Korea)(4) | 3,294,592 | 3,061,772 | ||||||||
Total preferred stock | 3,294,592 | 3,061,772 | |||||||||
Total long-term investments | 63,022,667 | 68,265,789 | |||||||||
SHORT-TERM INVESTMENT — 3.8%(1) | |||||||||||
| Money Market Fund — 3.8% | |||||||||||
| 2,708,539 | First American Treasury | ||||||||||
Obligations Fund, Cl X, 5.264%(3) | 2,708,539 | 2,708,539 | |||||||||
Total short-term investment | 2,708,539 | 2,708,539 | |||||||||
Total investments — 99.7% | $ | 65,731,206 | 70,974,328 | ||||||||
Other assets, less liabilities — 0.3%(1) | 214,083 | ||||||||||
| TOTAL NET ASSETS — 100.0% | $ | 71,188,411 | |||||||||
| (1) | Percentages for the various classifications relate to total net assets. |
| (2) | Non-Income producing security. |
| (3) | The rate quoted is the annualized 7-day yield as of September 30, 2023. |
| (4) | Security does not trade during New York Stock Exchange hours, provided that certain foreign exchanges may trade during a portion of the New York Stock Exchange hours, and has been valued in accordance with the Funds pricing procedures discussed in Note 2(a) to the financial statements and has been classified as level 2. As of September 30, 2023 the aggregate value of these securities was $57,055,581. |
| PLC | Public Limited Company |
| SP-ADR | Sponsored American Depositary Receipt |
The accompanying notes to financial statements are an integral part of this schedule.
34
FMI International Fund II – Currency Unhedged
INDUSTRY SECTORS as a percentage of net assets
as of September 30, 2023 (Unaudited)
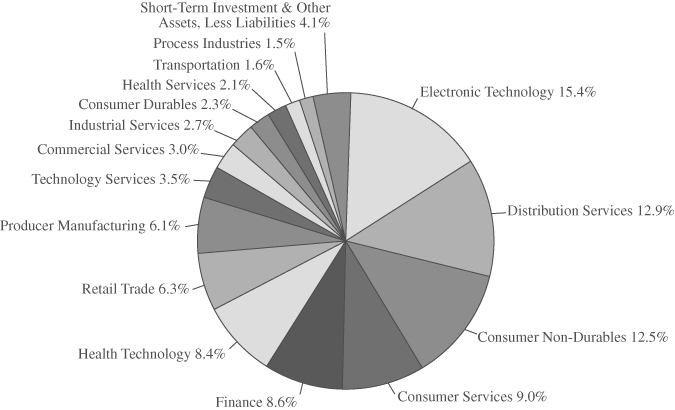
CONCENTRATION BY COUNTRY based on domicile of issuer as
a percentage of long-term investments only
as of September 30, 2023 (Unaudited)

35
FMI Funds, Inc.
STATEMENTS OF ASSETS AND LIABILITIES
September 30, 2023
| FMI | ||||||||||||||||
| FMI | FMI | FMI | International | |||||||||||||
| Common Stock | Large Cap | International | Fund II – Currency | |||||||||||||
| Fund | Fund | Fund | Unhedged | |||||||||||||
| ASSETS: | ||||||||||||||||
| Investments in securities, | ||||||||||||||||
at value(1) | $ | 1,424,100,914 | $ | 1,616,663,399 | $ | 3,880,279,876 | $ | 70,974,328 | ||||||||
| Restricted cash | — | — | 11,370,000 | — | ||||||||||||
| Receivable from shareholders | ||||||||||||||||
| for purchases | 2,556,946 | 456,911 | 5,749,419 | 262 | ||||||||||||
| Dividends, interest and | ||||||||||||||||
| other receivables | 430,837 | 2,846,223 | 14,532,664 | 261,957 | ||||||||||||
| Receivable for | ||||||||||||||||
| investments sold | 39,406,557 | — | 8,108,295 | 143,882 | ||||||||||||
| Unrealized appreciation on | ||||||||||||||||
| forward currency contracts | — | — | 189,334,088 | — | ||||||||||||
| Prepaid expenses | 62,232 | 45,855 | 110,865 | 8,102 | ||||||||||||
| Total assets | $ | 1,466,557,486 | $ | 1,620,012,388 | $ | 4,109,485,207 | $ | 71,388,531 | ||||||||
| LIABILITIES: | ||||||||||||||||
| Payable to brokers | ||||||||||||||||
| for collateral received | $ | — | $ | — | $ | 11,370,000 | $ | — | ||||||||
| Payable to brokers | ||||||||||||||||
| for investments purchased | 8,671,036 | — | 8,138,567 | 147,260 | ||||||||||||
| Payable to shareholders | ||||||||||||||||
| for redemptions | 549,188 | 724,561 | 1,799,479 | 970 | ||||||||||||
| Payable for foreign | ||||||||||||||||
| currency transactions | — | — | 8,491 | 151 | ||||||||||||
| Payable to adviser | ||||||||||||||||
| for management fees | 839,574 | 684,596 | 2,246,495 | 28,169 | ||||||||||||
| Unrealized depreciation on | ||||||||||||||||
| forward currency contracts | — | — | 48,342 | — | ||||||||||||
| Other liabilities | 116,656 | 198,075 | 304,373 | 23,570 | ||||||||||||
| Total liabilities | 10,176,454 | 1,607,232 | 23,915,747 | 200,120 | ||||||||||||
| Net assets | $ | 1,456,381,032 | $ | 1,618,405,156 | $ | 4,085,569,460 | $ | 71,188,411 | ||||||||
| NET ASSETS: | ||||||||||||||||
| Capital stock | $ | 1,095,257,017 | $ | 1,133,260,769 | $ | 4,043,264,324 | $ | 70,152,721 | ||||||||
| Total distributable | ||||||||||||||||
| earnings/(accumulated | ||||||||||||||||
| deficit) | 361,124,015 | 485,144,387 | 42,305,136 | 1,035,690 | ||||||||||||
| Net assets | $ | 1,456,381,032 | $ | 1,618,405,156 | $ | 4,085,569,460 | $ | 71,188,411 | ||||||||
The accompanying notes to financial statements are an integral part of these financial statements.
36
FMI Funds, Inc.
STATEMENTS OF ASSETS AND LIABILITIES (Continued)
September 30, 2023
| FMI | ||||||||||||||||
| FMI | FMI | FMI | International | |||||||||||||
| Common Stock | Large Cap | International | Fund II – Currency | |||||||||||||
| Fund | Fund | Fund | Unhedged | |||||||||||||
| CALCULATION OF NET | ||||||||||||||||
| ASSET VALUE PER SHARE: | ||||||||||||||||
| Investor Class Shares: | ||||||||||||||||
| Net assets | $ | 531,534,732 | $ | 919,253,206 | $ | 1,028,427,978 | $ | — | ||||||||
| Shares outstanding | 16,976,454 | 62,890,388 | 32,234,766 | — | ||||||||||||
| Shares authorized | ||||||||||||||||
| ($0.0001 par value) | 300,000,000 | 300,000,000 | 300,000,000 | — | ||||||||||||
| Net asset value, offering and | ||||||||||||||||
| redemption price per share | $ | 31.31 | $ | 14.62 | $ | 31.90 | $ | — | ||||||||
| Institutional Class Shares: | ||||||||||||||||
| Net assets | $ | 924,846,300 | $ | 699,151,950 | $ | 3,057,141,482 | $ | 71,188,411 | ||||||||
| Shares outstanding | 29,480,599 | 47,919,958 | 95,449,957 | 3,648,096 | ||||||||||||
| Shares authorized | ||||||||||||||||
| ($0.0001 par value) | 300,000,000 | 300,000,000 | 300,000,000 | 300,000,000 | ||||||||||||
| Net asset value, offering and | ||||||||||||||||
| redemption price per share | $ | 31.37 | $ | 14.59 | $ | 32.03 | $ | 19.51 | ||||||||
(1) Identified cost of investments | $ | 1,106,902,154 | $ | 1,269,469,706 | $ | 3,362,597,062 | $ | 65,731,206 | ||||||||
The accompanying notes to financial statements are an integral part of these financial statements.
37
FMI Funds, Inc.
STATEMENTS OF OPERATIONS
For the Year Ended September 30, 2023
| FMI | ||||||||||||||||
| FMI | FMI | FMI | International | |||||||||||||
| Common Stock | Large Cap | International | Fund II – Currency | |||||||||||||
| Fund | Fund | Fund | Unhedged | |||||||||||||
| INCOME: | ||||||||||||||||
Dividends(1) | $ | 12,937,742 | $ | 25,501,242 | $ | 93,281,507 | $ | 1,623,031 | ||||||||
| Interest | 3,635,631 | 1,039,539 | 6,915,799 | 133,554 | ||||||||||||
| Total income | 16,573,373 | 26,540,781 | 100,197,306 | 1,756,585 | ||||||||||||
| EXPENSES: | ||||||||||||||||
| Management fees | 9,948,255 | 11,710,936 | 27,431,677 | 491,372 | ||||||||||||
| Shareholder servicing fees | ||||||||||||||||
| (Investor Class) | 511,706 | 1,376,063 | 1,374,084 | — | ||||||||||||
| Administration and | ||||||||||||||||
| accounting services | 282,911 | 394,312 | 773,029 | 32,526 | ||||||||||||
| Printing and postage expense | 61,793 | 118,854 | 611,247 | 5,517 | ||||||||||||
| Transfer agent fees | 73,268 | 80,148 | 104,649 | 18,413 | ||||||||||||
| Custodian fees | 47,280 | 68,643 | 469,327 | 24,114 | ||||||||||||
| Registration fees | 106,627 | 85,470 | 111,747 | 29,218 | ||||||||||||
| Board of Directors fees | 72,500 | 72,500 | 72,500 | 72,500 | ||||||||||||
| Professional fees | 41,245 | 45,278 | 48,647 | 39,986 | ||||||||||||
| Interest expense | — | 41,306 | — | — | ||||||||||||
| Other expenses | 89,125 | 122,608 | 233,533 | 36,433 | ||||||||||||
| Total expenses | ||||||||||||||||
| before reimbursement | 11,234,710 | 14,116,118 | 31,230,440 | 750,079 | ||||||||||||
| Less expenses | ||||||||||||||||
| reimbursed by adviser | — | — | — | (159,934 | ) | |||||||||||
| Net expenses | 11,234,710 | 14,116,118 | 31,230,440 | 590,145 | ||||||||||||
| NET INVESTMENT INCOME | 5,338,663 | 12,424,663 | 68,966,866 | 1,166,440 | ||||||||||||
The accompanying notes to financial statements are an integral part of these financial statements.
38
FMI Funds, Inc.
STATEMENTS OF OPERATIONS (Continued)
For the Year Ended September 30, 2023
| FMI | ||||||||||||||||
| FMI | FMI | FMI | International | |||||||||||||
| Common Stock | Large Cap | International | Fund II – Currency | |||||||||||||
| Fund | Fund | Fund | Unhedged | |||||||||||||
| NET REALIZED GAIN (LOSS) | ||||||||||||||||
| ON INVESTMENTS: | ||||||||||||||||
| Securities | $ | 49,844,575 | $ | 224,712,914 | $ | (149,031,282 | ) | $ | (3,289,024 | ) | ||||||
| Forward currency contracts | — | — | (105,078,506 | ) | — | |||||||||||
| Foreign currency transactions | — | — | 37,955,057 | (16,465 | ) | |||||||||||
| NET REALIZED GAIN (LOSS) | ||||||||||||||||
| ON INVESTMENTS | 49,844,575 | 224,712,914 | (216,154,731 | ) | (3,305,489 | ) | ||||||||||
| NET CHANGE IN UNREALIZED | ||||||||||||||||
| APPRECIATION/DEPRECIATION | ||||||||||||||||
| ON INVESTMENTS: | ||||||||||||||||
| Securities | 186,175,485 | 123,293,235 | 1,057,299,713 | 18,766,938 | ||||||||||||
| Forward currency contracts | — | — | (13,122,292 | ) | — | |||||||||||
| Foreign currency transactions | — | — | 565,706 | 34,949 | ||||||||||||
| NET CHANGE IN UNREALIZED | ||||||||||||||||
| APPRECIATION/DEPRECIATION | ||||||||||||||||
| ON INVESTMENTS | 186,175,485 | 123,293,235 | 1,044,743,127 | 18,801,887 | ||||||||||||
| NET GAIN (LOSS) | ||||||||||||||||
| ON INVESTMENTS | 236,020,060 | 348,006,149 | 828,588,396 | 15,496,398 | ||||||||||||
| NET INCREASE (DECREASE) IN | ||||||||||||||||
| NET ASSETS RESULTING | ||||||||||||||||
| FROM OPERATIONS | $ | 241,358,723 | $ | 360,430,812 | $ | 897,555,262 | $ | 16,662,838 | ||||||||
(1) Net withholding taxes | $ | — | $ | (364,741 | ) | $ | (6,643,388 | ) | $ | (120,020 | ) | |||||
The accompanying notes to financial statements are an integral part of these financial statements.
39
FMI Common Stock Fund
STATEMENTS OF CHANGES IN NET ASSETS
For the Years Ended September 30, 2023 and 2022
| 2023 | 2022 | |||||||
| OPERATIONS: | ||||||||
| Net investment income | $ | 5,338,663 | $ | 1,609,589 | ||||
| Net realized gain (loss) on investments | 49,844,575 | 69,318,084 | ||||||
| Net change in unrealized appreciation/depreciation | ||||||||
| on investments | 186,175,485 | (165,647,805 | ) | |||||
| Net increase (decrease) in net assets from operations | 241,358,723 | (94,720,132 | ) | |||||
| DISTRIBUTIONS TO SHAREHOLDERS FROM: | ||||||||
| Investor Class | (24,761,425 | ) | (49,540,457 | ) | ||||
| Institutional Class | (43,252,225 | ) | (62,187,565 | ) | ||||
| Total distributions (Note 8) | (68,013,650 | ) | (111,728,022 | ) | ||||
| FUND SHARE ACTIVITIES: | ||||||||
| Net increase (decrease) in net assets | ||||||||
| derived from Fund share activities (Note 9) | 336,093,353 | 213,119,547 | ||||||
| TOTAL INCREASE (DECREASE) | 509,438,426 | 6,671,393 | ||||||
NET ASSETS AT THE BEGINNING OF THE YEAR | 946,942,606 | 940,271,213 | ||||||
NET ASSETS AT THE END OF THE YEAR | $ | 1,456,381,032 | $ | 946,942,606 | ||||
| FUND SHARE TRANSACTIONS: | ||||||||
| Net increase (decrease) in shares outstanding (Note 9) | 11,064,838 | 7,123,584 | ||||||
The accompanying notes to financial statements are an integral part of these financial statements.
40
FMI Large Cap Fund
STATEMENTS OF CHANGES IN NET ASSETS
For the Years Ended September 30, 2023 and 2022
| 2023 | 2022 | |||||||
| OPERATIONS: | ||||||||
| Net investment income | $ | 12,424,663 | $ | 19,154,954 | ||||
| Net realized gain (loss) on investments | 224,712,914 | 435,120,201 | ||||||
| Net change in unrealized appreciation/depreciation | ||||||||
| on investments | 123,293,235 | (841,127,660 | ) | |||||
| Net increase (decrease) in net assets from operations | 360,430,812 | (386,852,505 | ) | |||||
| DISTRIBUTIONS TO SHAREHOLDERS FROM: | ||||||||
| Investor Class | (195,562,163 | ) | (220,026,036 | ) | ||||
| Institutional Class | (141,809,940 | ) | (278,028,660 | ) | ||||
| Total distributions (Note 8) | (337,372,103 | ) | (498,054,696 | ) | ||||
| FUND SHARE ACTIVITIES: | ||||||||
| Net increase (decrease) in net assets | ||||||||
| derived from Fund share activities (Note 9) | (476,826,899 | ) | (254,087,896 | ) | ||||
| TOTAL INCREASE (DECREASE) | (453,768,190 | ) | (1,138,995,097 | ) | ||||
NET ASSETS AT THE BEGINNING OF THE YEAR | 2,072,173,346 | 3,211,168,443 | ||||||
NET ASSETS AT THE END OF THE YEAR | $ | 1,618,405,156 | $ | 2,072,173,346 | ||||
| FUND SHARE TRANSACTIONS: | ||||||||
| Net increase (decrease) in shares outstanding (Note 9) | (27,616,579 | ) | (14,849,295 | ) | ||||
The accompanying notes to financial statements are an integral part of these financial statements.
41
FMI International Fund
STATEMENTS OF CHANGES IN NET ASSETS
For the Years Ended September 30, 2023 and 2022
| 2023 | 2022 | |||||||
| OPERATIONS: | ||||||||
| Net investment income | $ | 68,966,866 | $ | 44,549,159 | ||||
| Net realized gain (loss) on investments | (216,154,731 | ) | 345,393,466 | |||||
| Net change in unrealized appreciation/depreciation | ||||||||
| on investments | 1,044,743,127 | (996,553,440 | ) | |||||
| Net increase (decrease) in net assets from operations | 897,555,262 | (606,610,815 | ) | |||||
| DISTRIBUTIONS TO SHAREHOLDERS FROM: | ||||||||
| Investor Class | (116,170,330 | ) | (36,245,422 | ) | ||||
| Institutional Class | (331,682,134 | ) | (85,786,033 | ) | ||||
| Total distributions (Note 8) | (447,852,464 | ) | (122,031,455 | ) | ||||
| FUND SHARE ACTIVITIES: | ||||||||
| Net increase (decrease) in net assets | ||||||||
| derived from Fund share activities (Note 9) | 665,106,078 | 281,706,526 | ||||||
| TOTAL INCREASE (DECREASE) | 1,114,808,876 | (446,935,744 | ) | |||||
| NET ASSETS AT THE BEGINNING OF THE YEAR | 2,970,760,584 | 3,417,696,328 | ||||||
| NET ASSETS AT THE END OF THE YEAR | $ | 4,085,569,460 | $ | 2,970,760,584 | ||||
| FUND SHARE TRANSACTIONS: | ||||||||
| Net increase (decrease) in shares outstanding (Note 9) | 22,790,348 | 8,435,897 | ||||||
The accompanying notes to financial statements are an integral part of these financial statements
42
FMI International Fund II – Currency Unhedged
STATEMENTS OF CHANGES IN NET ASSETS
For the Years Ended September 30, 2023 and 2022
| 2023 | 2022 | |||||||
| OPERATIONS: | ||||||||
| Net investment income | $ | 1,166,440 | $ | 896,687 | ||||
| Net realized gain (loss) on investments | (3,305,489 | ) | (1,764,791 | ) | ||||
| Net change in unrealized appreciation/depreciation | ||||||||
| on investments | 18,801,887 | (19,766,819 | ) | |||||
| Net increase (decrease) in net assets from operations | 16,662,838 | (20,634,923 | ) | |||||
| DISTRIBUTIONS TO SHAREHOLDERS FROM: | ||||||||
| Institutional Class | (830,255 | ) | (3,350,974 | ) | ||||
| Total distributions (Note 8) | (830,255 | ) | (3,350,974 | ) | ||||
| FUND SHARE ACTIVITIES: | ||||||||
| Net increase (decrease) in net assets | ||||||||
| derived from Fund share activities (Note 9) | 6,370,101 | 974,406 | ||||||
| TOTAL INCREASE (DECREASE) | 22,202,684 | (23,011,491 | ) | |||||
NET ASSETS AT THE BEGINNING OF THE YEAR | 48,985,727 | 71,997,218 | ||||||
NET ASSETS AT THE END OF THE YEAR | $ | 71,188,411 | $ | 48,985,727 | ||||
| FUND SHARE TRANSACTIONS: | ||||||||
| Net increase (decrease) in shares outstanding (Note 9) | 336,674 | (6,004 | ) | |||||
The accompanying notes to financial statements are an integral part of these financial statements.
43
FMI Common Stock Fund
FINANCIAL HIGHLIGHTS
(Selected data for each share of the Fund outstanding throughout each year)
Investor Class
| Years Ended September 30, | ||||||||||||||||||||
| 2023 | 2022 | 2021 | 2020 | 2019 | ||||||||||||||||
| PER SHARE OPERATING PERFORMANCE: | ||||||||||||||||||||
| Net asset value, beginning of year | $ | 26.72 | $ | 33.23 | $ | 22.25 | $ | 26.39 | $ | 27.55 | ||||||||||
| Income from investment operations: | ||||||||||||||||||||
Net investment income (loss)(1) | 0.11 | 0.03 | 0.08 | 0.17 | 0.15 | |||||||||||||||
| Net realized and unrealized | ||||||||||||||||||||
| gain (loss) on investments | 6.35 | (2.57 | ) | 11.11 | (3.02 | ) | 0.94 | |||||||||||||
| Total from investment operations | 6.46 | (2.54 | ) | 11.19 | (2.85 | ) | 1.09 | |||||||||||||
| Less distributions: | ||||||||||||||||||||
| Distributions from net investment income | (0.04 | ) | (0.11 | ) | (0.21 | ) | (0.11 | ) | (0.10 | ) | ||||||||||
| Distributions from net realized gains | (1.83 | ) | (3.86 | ) | — | (1.18 | ) | (2.15 | ) | |||||||||||
| Total from distributions | (1.87 | ) | (3.97 | ) | (0.21 | ) | (1.29 | ) | (2.25 | ) | ||||||||||
| Net asset value, end of year | $ | 31.31 | $ | 26.72 | $ | 33.23 | $ | 22.25 | $ | 26.39 | ||||||||||
| TOTAL RETURN | 25.08 | % | (9.10 | %) | 50.49 | % | (11.51 | %) | 5.28 | % | ||||||||||
| RATIOS/SUPPLEMENTAL DATA: | ||||||||||||||||||||
| Net assets, end of year (in 000’s $) | 531,535 | 357,946 | 423,286 | 345,428 | 529,234 | |||||||||||||||
| Ratio of expenses to average net assets | 0.99 | % | 1.00 | % | 1.01 | % | 1.02 | % | 1.02 | % | ||||||||||
| Ratio of net investment income (loss) | ||||||||||||||||||||
| to average net assets | 0.35 | % | 0.09 | % | 0.28 | % | 0.71 | % | 0.59 | % | ||||||||||
Portfolio turnover rate(2) | 23 | % | 36 | % | 29 | % | 32 | % | 28 | % | ||||||||||
(1) | Net investment income (loss) per share was calculated using average shares outstanding. |
(2) | Portfolio turnover rate is disclosed for the Fund as a whole. |
The accompanying notes to financial statements are an integral part of these financial statements.
44
FMI Common Stock Fund
FINANCIAL HIGHLIGHTS
(Selected data for each share of the Fund outstanding throughout each year)
| Institutional Class | ||||||||||||||||||||
| Years Ended September 30, | ||||||||||||||||||||
| 2023 | 2022 | 2021 | 2020 | 2019 | ||||||||||||||||
| PER SHARE OPERATING PERFORMANCE: | ||||||||||||||||||||
Net asset value, beginning of year | $ | 26.77 | $ | 33.29 | $ | 22.28 | $ | 26.42 | $ | 27.59 | ||||||||||
Income from investment operations: | ||||||||||||||||||||
Net investment income (loss)(1) | 0.15 | 0.07 | 0.12 | 0.20 | 0.18 | |||||||||||||||
| Net realized and unrealized | ||||||||||||||||||||
| gain (loss) on investments | 6.35 | (2.58 | ) | 11.12 | (3.02 | ) | 0.93 | |||||||||||||
Total from investment operations | 6.50 | (2.51 | ) | 11.24 | (2.82 | ) | 1.11 | |||||||||||||
Less distributions: | ||||||||||||||||||||
| Distributions from net investment income | (0.07 | ) | (0.15 | ) | (0.23 | ) | (0.14 | ) | (0.13 | ) | ||||||||||
| Distributions from net realized gains | (1.83 | ) | (3.86 | ) | — | (1.18 | ) | (2.15 | ) | |||||||||||
Total from distributions | (1.90 | ) | (4.01 | ) | (0.23 | ) | (1.32 | ) | (2.28 | ) | ||||||||||
Net asset value, end of year | $ | 31.37 | $ | 26.77 | $ | 33.29 | $ | 22.28 | $ | 26.42 | ||||||||||
| TOTAL RETURN | 25.22 | % | (8.99 | %) | 50.68 | % | (11.41 | %) | 5.40 | % | ||||||||||
| RATIOS/SUPPLEMENTAL DATA: | ||||||||||||||||||||
Net assets, end of year (in 000’s $) | 924,846 | 588,996 | 516,985 | 344,811 | 448,262 | |||||||||||||||
Ratio of expenses to average net assets | 0.87 | % | 0.89 | % | 0.90 | % | 0.90 | % | 0.91 | % | ||||||||||
Ratio of net investment income (loss) | ||||||||||||||||||||
to average net assets | 0.48 | % | 0.22 | % | 0.39 | % | 0.84 | % | 0.71 | % | ||||||||||
Portfolio turnover rate(2) | 23 | % | 36 | % | 29 | % | 32 | % | 28 | % | ||||||||||
(1) | Net investment income (loss) per share was calculated using average shares outstanding. |
(2) | Portfolio turnover rate is disclosed for the Fund as a whole. |
The accompanying notes to financial statements are an integral part of these financial statements.
45
FMI Large Cap Fund
FINANCIAL HIGHLIGHTS
(Selected data for each share of the Fund outstanding throughout each year)
| Investor Class | ||||||||||||||||||||
| Years Ended September 30, | ||||||||||||||||||||
| 2023 | 2022 | 2021 | 2020 | 2019 | ||||||||||||||||
| PER SHARE OPERATING PERFORMANCE: | ||||||||||||||||||||
Net asset value, beginning of year | $ | 14.98 | $ | 20.96 | $ | 18.81 | $ | 20.14 | $ | 22.85 | ||||||||||
Income from investment operations: | ||||||||||||||||||||
Net investment income (loss)(1) | 0.09 | 0.11 | 0.15 | 0.18 | 0.25 | |||||||||||||||
| Net realized and unrealized | ||||||||||||||||||||
| gain (loss) on investments | 2.64 | (2.73 | ) | 4.25 | 0.03 | (2) | 0.55 | |||||||||||||
Total from investment operations | 2.73 | (2.62 | ) | 4.40 | 0.21 | 0.80 | ||||||||||||||
Less distributions: | ||||||||||||||||||||
| Distributions from net investment income | (0.11 | ) | (0.16 | ) | (0.30 | ) | (0.17 | ) | (0.28 | ) | ||||||||||
| Distributions from net realized gains | (2.98 | ) | (3.20 | ) | (1.95 | ) | (1.37 | ) | (3.23 | ) | ||||||||||
Total from distributions | (3.09 | ) | (3.36 | ) | (2.25 | ) | (1.54 | ) | (3.51 | ) | ||||||||||
Net asset value, end of year | $ | 14.62 | $ | 14.98 | $ | 20.96 | $ | 18.81 | $ | 20.14 | ||||||||||
| TOTAL RETURN | 19.95 | % | (15.86 | %) | 24.48 | % | 0.71 | % | 5.72 | % | ||||||||||
| RATIOS/SUPPLEMENTAL DATA: | ||||||||||||||||||||
Net assets, end of year (in 000’s $) | 919,253 | 1,001,682 | 1,422,451 | 1,475,504 | 2,337,118 | |||||||||||||||
Ratio of expenses to average net assets | 0.84 | % | 0.83 | % | 0.82 | % | 0.81 | % | 0.82 | % | ||||||||||
Ratio of net investment income (loss) | ||||||||||||||||||||
to average net assets | 0.63 | % | 0.60 | % | 0.72 | % | 0.99 | % | 1.25 | % | ||||||||||
Portfolio turnover rate(3) | 14 | % | 25 | % | 17 | % | 28 | % | 20 | % | ||||||||||
| (1) | Net investment income (loss) per share was calculated using average shares outstanding. |
| (2) | Realized and unrealized gain (loss) per share in this caption are balancing amounts necessary to reconcile the change in net asset value per share for the year, and may not reconcile with the aggregate gains on the Statement of Operations due to share transactions for the year. |
| (3) | Portfolio turnover rate is disclosed for the Fund as a whole. |
The accompanying notes to financial statements are an integral part of these financial statements.
46
FMI Large Cap Fund
FINANCIAL HIGHLIGHTS
(Selected data for each share of the Fund outstanding throughout each year)
Institutional Class
| Years Ended September 30, | ||||||||||||||||||||
| 2023 | 2022 | 2021 | 2020 | 2019 | ||||||||||||||||
| PER SHARE OPERATING PERFORMANCE: | ||||||||||||||||||||
Net asset value, beginning of year | $ | 14.96 | $ | 20.94 | $ | 18.80 | $ | 20.13 | $ | 22.85 | ||||||||||
Income from investment operations: | ||||||||||||||||||||
Net investment income (loss)(1) | 0.11 | 0.14 | 0.18 | 0.21 | 0.25 | |||||||||||||||
| Net realized and unrealized | ||||||||||||||||||||
| gain (loss) on investments | 2.63 | (2.73 | ) | 4.24 | 0.02 | (2) | 0.58 | |||||||||||||
Total from investment operations | 2.74 | (2.59 | ) | 4.42 | 0.23 | 0.83 | ||||||||||||||
Less distributions: | ||||||||||||||||||||
| Distributions from net investment income | (0.13 | ) | (0.19 | ) | (0.33 | ) | (0.19 | ) | (0.32 | ) | ||||||||||
| Distributions from net realized gains | (2.98 | ) | (3.20 | ) | (1.95 | ) | (1.37 | ) | (3.23 | ) | ||||||||||
Total from distributions | (3.11 | ) | (3.39 | ) | (2.28 | ) | (1.56 | ) | (3.55 | ) | ||||||||||
Net asset value, end of year | $ | 14.59 | $ | 14.96 | $ | 20.94 | $ | 18.80 | $ | 20.13 | ||||||||||
| TOTAL RETURN | 20.07 | % | (15.73 | %) | 24.63 | % | 0.84 | % | 5.89 | % | ||||||||||
| RATIOS/SUPPLEMENTAL DATA: | ||||||||||||||||||||
Net assets, end of year (in 000’s $) | 699,152 | 1,070,491 | 1,788,717 | 1,924,284 | 2,652,783 | |||||||||||||||
Ratio of expenses to average net assets | 0.71 | % | 0.69 | % | 0.68 | % | 0.67 | % | 0.68 | % | ||||||||||
Ratio of net investment income (loss) | ||||||||||||||||||||
to average net assets | 0.77 | % | 0.73 | % | 0.85 | % | 1.13 | % | 1.26 | % | ||||||||||
Portfolio turnover rate(3) | 14 | % | 25 | % | 17 | % | 28 | % | 20 | % | ||||||||||
| (1) | Net investment income (loss) per share was calculated using average shares outstanding. |
| (2) | Realized and unrealized gain (loss) per share in this caption are balancing amounts necessary to reconcile the change in net asset value per share for the year, and may not reconcile with the aggregate gains on the Statement of Operations due to share transactions for the year. |
| (3) | Portfolio turnover rate is disclosed for the Fund as a whole. |
The accompanying notes to financial statements are an integral part of these financial statements.
47
FMI International Fund
FINANCIAL HIGHLIGHTS
(Selected data for each share of the Fund outstanding throughout each year)
Investor Class
| Years Ended September 30, | ||||||||||||||||||||
| 2023 | 2022 | 2021 | 2020 | 2019 | ||||||||||||||||
| PER SHARE OPERATING PERFORMANCE: | ||||||||||||||||||||
Net asset value, beginning of year | $ | 28.25 | $ | 35.36 | $ | 27.69 | $ | 31.89 | $ | 33.80 | ||||||||||
Income from investment operations: | ||||||||||||||||||||
Net investment income (loss)(1) | 0.54 | 0.41 | 1.10 | 0.35 | 0.48 | |||||||||||||||
| Net realized and unrealized | ||||||||||||||||||||
| gain (loss) on investments | 7.35 | (6.29 | ) | 6.57 | (3.40 | ) | (0.26 | ) | ||||||||||||
Total from investment operations | 7.89 | (5.88 | ) | 7.67 | (3.05 | ) | 0.22 | |||||||||||||
Less distributions: | ||||||||||||||||||||
| Distributions from net investment income | (4.24 | ) | (1.23 | ) | — | (1.15 | ) | (1.32 | ) | |||||||||||
| Distributions from net realized gains | — | — | — | — | (0.81 | ) | ||||||||||||||
Total from distributions | (4.24 | ) | (1.23 | ) | — | (1.15 | ) | (2.13 | ) | |||||||||||
Net asset value, end of year | $ | 31.90 | $ | 28.25 | $ | 35.36 | $ | 27.69 | $ | 31.89 | ||||||||||
| TOTAL RETURN | 30.14 | % | (17.24 | %) | 27.70 | % | (10.06 | %) | 1.27 | % | ||||||||||
| RATIOS/SUPPLEMENTAL DATA: | ||||||||||||||||||||
Net assets, end of year (in 000’s $) | 1,028,428 | 792,421 | 1,066,600 | 1,207,016 | 2,798,739 | |||||||||||||||
Ratio of expenses to average net assets | 0.94 | % | 0.94 | % | 0.94 | % | 0.91 | % | 0.90 | % | ||||||||||
Ratio of net investment income (loss) | ||||||||||||||||||||
to average net assets | 1.73 | % | 1.22 | % | 3.29 | % | 1.19 | % | 1.55 | % | ||||||||||
Portfolio turnover rate(2) | 21 | % | 20 | % | 27 | % | 23 | % | 13 | % | ||||||||||
(1) | Net investment income (loss) per share was calculated using average shares outstanding. |
(2) | Portfolio turnover rate is disclosed for the Fund as a whole. |
The accompanying notes to financial statements are an integral part of these financial statements.
48
FMI International Fund
FINANCIAL HIGHLIGHTS
(Selected data for each share of the Fund outstanding throughout each year)
Institutional Class
| Years Ended September 30, | ||||||||||||||||||||
| 2023 | 2022 | 2021 | 2020 | 2019 | ||||||||||||||||
| PER SHARE OPERATING PERFORMANCE: | ||||||||||||||||||||
Net asset value, beginning of year | $ | 28.35 | $ | 35.46 | $ | 27.73 | $ | 31.93 | $ | 33.86 | ||||||||||
Income from investment operations: | ||||||||||||||||||||
Net investment income (loss)(1) | 0.59 | 0.45 | 1.18 | 0.38 | 0.53 | |||||||||||||||
| Net realized and unrealized | ||||||||||||||||||||
| gain (loss) on investments | 7.36 | (6.29 | ) | 6.55 | (3.39 | ) | (0.27 | ) | ||||||||||||
Total from investment operations | 7.95 | (5.84 | ) | 7.73 | (3.01 | ) | 0.26 | |||||||||||||
Less distributions: | ||||||||||||||||||||
| Distributions from net investment income | (4.27 | ) | (1.27 | ) | — | (1.19 | ) | (1.38 | ) | |||||||||||
| Distributions from net realized gains | — | — | — | — | (0.81 | ) | ||||||||||||||
Total from distributions | (4.27 | ) | (1.27 | ) | — | (1.19 | ) | (2.19 | ) | |||||||||||
Net asset value, end of year | $ | 32.03 | $ | 28.35 | $ | 35.46 | $ | 27.73 | $ | 31.93 | ||||||||||
| TOTAL RETURN | 30.30 | % | (17.10 | %) | 27.88 | % | (9.95 | %) | 1.42 | % | ||||||||||
| RATIOS/SUPPLEMENTAL DATA: | ||||||||||||||||||||
Net assets, end of year (in 000’s $) | 3,057,141 | 2,178,340 | 2,351,096 | 2,142,615 | 4,480,109 | |||||||||||||||
Ratio of expenses to average net assets | 0.80 | % | 0.81 | % | 0.80 | % | 0.77 | % | 0.76 | % | ||||||||||
Ratio of net investment income (loss) | ||||||||||||||||||||
to average net assets | 1.88 | % | 1.37 | % | 3.48 | % | 1.31 | % | 1.69 | % | ||||||||||
Portfolio turnover rate(2) | 21 | % | 20 | % | 27 | % | 23 | % | 13 | % | ||||||||||
(1) | Net investment income (loss) per share was calculated using average shares outstanding. |
(2) | Portfolio turnover rate is disclosed for the Fund as a whole. |
The accompanying notes to financial statements are an integral part of these financial statements.
49
FMI International Fund II – Currency Unhedged
FINANCIAL HIGHLIGHTS
(Selected data for each share of the Fund outstanding throughout each period)
Institutional Class
| For the | ||||||||||||||||
| Period from | ||||||||||||||||
| December 31, | ||||||||||||||||
2019(1) to | ||||||||||||||||
| Years Ended September 30, | September 30, | |||||||||||||||
| 2023 | 2022 | 2021 | 2020 | |||||||||||||
| PER SHARE OPERATING PERFORMANCE: | ||||||||||||||||
Net asset value, beginning of period | $ | 14.79 | $ | 21.70 | $ | 17.24 | $ | 20.00 | ||||||||
Income from investment operations: | ||||||||||||||||
Net investment income (loss)(2) | 0.34 | 0.26 | 0.77 | 0.13 | ||||||||||||
| Net realized and unrealized | ||||||||||||||||
| gain (loss) on investments | 4.63 | (6.22 | ) | 3.87 | (2.89 | ) | ||||||||||
Total from investment operations | 4.97 | (5.96 | ) | 4.64 | (2.76 | ) | ||||||||||
Less distributions: | ||||||||||||||||
| Distributions from net investment income | (0.25 | ) | (0.66 | ) | (0.18 | ) | — | |||||||||
| Distributions from net realized gains | — | (0.29 | ) | — | — | |||||||||||
Total from distributions | (0.25 | ) | (0.95 | ) | (0.18 | ) | — | |||||||||
Net asset value, end of period | $ | 19.51 | $ | 14.79 | $ | 21.70 | $ | 17.24 | ||||||||
| TOTAL RETURN | 33.78 | % | (28.71 | %) | 26.96 | % | (13.80 | %)(3) | ||||||||
| RATIOS/SUPPLEMENTAL DATA: | ||||||||||||||||
Net assets, end of period (in 000’s $) | 71,188 | 48,986 | 71,997 | 47,555 | ||||||||||||
Ratio of expenses to average net assets: | ||||||||||||||||
| Before expense reimbursement | 1.14 | % | 1.15 | % | 1.16 | % | 1.43 | %(4) | ||||||||
| After expense reimbursement | 0.90 | % | 0.90 | % | 0.90 | % | 0.90 | %(4) | ||||||||
Ratio of net investment income (loss) | ||||||||||||||||
to average net assets | ||||||||||||||||
| Before expense reimbursement | 1.54 | % | 1.07 | % | 3.35 | % | 0.49 | %(4) | ||||||||
| After expense reimbursement | 1.78 | % | 1.32 | % | 3.61 | % | 1.02 | %(4) | ||||||||
Portfolio turnover rate | 21 | % | 27 | % | 31 | % | 15 | %(3) | ||||||||
| (1) | Inception date. |
| (2) | Net investment income (loss) per share was calculated using average shares outstanding. |
| (3) | Not annualized. |
| (4) | Annualized. |
The accompanying notes to financial statements are an integral part of these financial statements.
50
FMI Funds, Inc.
NOTES TO FINANCIAL STATEMENTS
September 30, 2023
| (1) | Organization — |
| The following is a summary of significant accounting policies of the FMI Common Stock Fund, the FMI Large Cap Fund, the FMI International Fund, and the FMI International Fund II – Currency Unhedged (collectively, the “Funds” or, individually, a “Fund”). The FMI Common Stock Fund (the “Common Stock Fund”), the FMI Large Cap Fund (the “Large Cap Fund”), the FMI International Fund (the “International Fund”), and the FMI International Fund II – Currency Unhedged (the “International Currency Unhedged Fund”) are each a series of FMI Funds, Inc. (the “Company”). The Company was incorporated under the laws of Maryland on September 5, 1996. The Common Stock Fund is the successor to the FMI Common Stock Fund, the sole series of FMI Common Stock Fund, Inc. (the “Predecessor Common Stock Fund”). The Predecessor Common Stock Fund commenced operations on December 18, 1981. The reorganization was effective as of January 31, 2014, and the Common Stock Fund is the accounting survivor of the reorganization. As the accounting survivor of the reorganization, the Common Stock Fund adopted the Financial Statements of the Predecessor Common Stock Fund. The Predecessor Common Stock Fund was incorporated under the laws of Wisconsin on July 29, 1981. The Large Cap Fund commenced operations on December 31, 2001, and the International Fund commenced operations on December 31, 2010. The International Currency Unhedged Fund commenced operations on December 31, 2019. | |
| Effective October 31, 2016, the Common Stock Fund, Large Cap Fund, and International Fund offer two classes of shares (Investor and Institutional). The International Currency Unhedged Fund currently only offers Institutional Class shares. The Institutional Class has the same management fee as the Investor Class and does not have a shareholder servicing plan. A higher investment minimum is required for the Institutional Class than the Investor Class. Each class of shares has exclusive voting rights with respect to matters that affect just that class. Income, expenses (other than expenses attributable to a specific class) and realized and unrealized gains or losses on investments are allocated to each class of shares based on its relative net assets. The Company’s Board of Directors (the “Board”) may elect to have certain expenses specific to the Investor Class shares or Institutional Class shares be borne solely by the Class to which such expenses are attributable, but any expenses not specifically allocated to the Investor Class shares or Institutional Class shares are generally allocated to each such Class proportionately (after any applicable base fee to be paid by a class of shares of a Fund attributable to such expense) on the basis of the net asset value of that Class in relation to the net asset value of the applicable Fund. | |
| The Funds are diversified, open-end management investment companies under the Investment Company Act of 1940 (the “1940 Act”), as amended. The financial statements are prepared in accordance with accounting principles generally accepted in the United States of America (“GAAP”). The Funds follow the investment company accounting and financial reporting guidance under Financial Accounting Standards Board (“FASB”) Accounting Standards Codification “Financial Services – Investment Companies” Topic 946 (“ASC 946”). The assets and liabilities of each Fund in the Company are segregated, and a shareholder’s interest is limited to the Fund in which the shareholder owns shares. The investment objective of the Common Stock Fund is to seek long-term capital appreciation by investing mainly in small- to medium capitalization value stocks. The investment objective of the Large Cap Fund is to seek long-term capital appreciation by investing mainly in a limited number of large capitalization value stocks. |
51
FMI Funds, Inc.
NOTES TO FINANCIAL STATEMENTS (Continued)
September 30, 2023
| (1) | Organization — (Continued) | |
| The investment objective of the International Fund and International Currency Unhedged Fund is to seek capital appreciation by investing mainly in a limited number of large capitalization value stocks of non-U.S. companies. | ||
| (2) | Summary of Significant Accounting Policies and Other Information — | |
| (a) | The Funds apply the provisions of the FASB Accounting Standards Codification “Fair Value Measurement” Topic 820 (“ASC 820”), which defines fair value as the price that would be received to sell an asset or paid to transfer a liability (i.e., the “exit price”) in an orderly transaction between market participants at the measurement date. | |
| Each security is valued at the current day last sale price reported by the principal security exchange on which the issue is traded. Securities that are traded on the Nasdaq Markets are valued at the Nasdaq Official Closing Price, or if no sale is reported, the latest bid price. Securities that are traded over-the-counter, including U.S. Treasury securities are valued at the close price, if not close, then at the latest bid price. Money market funds are valued at net asset value per share. Bank deposits are valued at acquisition cost which approximates fair value. Unlisted equity securities for which market quotations are readily available are valued at the close price, if not close, then at the most recent bid price. Foreign securities are valued on a basis of quotations from the primary market in which they are traded and are converted from the local currency into U.S. dollars using exchange rates as of the close of the New York Stock Exchange. For the International Fund and International Currency Unhedged Fund only, options purchased or written by each of the Funds are valued at the average of the most recent bid and ask prices. Securities for which quotations are not readily available are valued at fair value as determined by the investment adviser as the Board appointed valuation designee, in accordance with procedures approved by the Board. The fair value of a security is the amount which a Fund might reasonably expect to receive upon a current sale. The fair value of a security may differ from the last quoted price and a Fund may not be able to sell a security at the fair value. Market quotations may not be available, for example, if trading in particular securities was halted during the day and not resumed prior to the close of trading on the New York Stock Exchange. The foreign markets in which the International Fund and International Currency Unhedged Fund may invest are sometimes open on days when the New York Stock Exchange is not open, and the International Fund and International Currency Unhedged Fund do not calculate their net asset value. For securities that do not trade during New York Stock Exchange hours, fair value determinations are based on analyses of market movements after the close of those securities’ primary markets, and may include reviews of developments in foreign markets, the performance of U.S. securities markets, and the performance of instruments trading in U.S. markets that represent foreign securities and baskets of foreign securities. The investment adviser utilizes a service provided by an independent third party to assist in fair valuation of certain securities for the International Fund and the International Currency Unhedged Fund. As of September 30, 2023, there were no securities that were internally fair valued. | ||
| In determining fair value, the Funds use various valuation approaches. ASC 820 establishes a fair value hierarchy for inputs used in measuring fair value that maximizes the use of | ||
52
FMI Funds, Inc.
NOTES TO FINANCIAL STATEMENTS (Continued)
September 30, 2023
| (2) | Summary of Significant Accounting Policies and Other Information — (Continued) | |
| observable inputs and minimizes the use of unobservable inputs by generally requiring that the most observable inputs be used when available. Observable inputs are those that market participants would use in pricing the asset or liability based on market data obtained from sources independent of the Funds. Unobservable inputs reflect the Funds’ assumptions about the inputs market participants would use in pricing the asset or liability developed based on the best information available in the circumstances. The inputs or methodologies used for valuing securities are not necessarily an indication of the risks associated with investing in those securities. Over the counter derivatives such as forward currency contracts may be valued using quantitative models. These models may use pricing curves based on market inputs including current exchange rates or indices. These curves are combined with volatility factors to value the overall positions. The market inputs are generally significant and can be corroborated with observable market data and therefore are classified in level 2. | ||
| The fair value hierarchy is categorized into three levels based on the inputs as follows: |
| Level 1 — | Quoted prices (unadjusted) in active markets for identical assets or liabilities that the reporting entity can access at the measurement date. | ||
| Level 2 — | Inputs other than quoted prices included within Level 1 that are observable for the asset or liability, either directly or indirectly. | ||
| Level 3 — | Unobservable inputs for the asset or liability. | ||
| The following table summarizes the Funds’ investments as of September 30, 2023, based on the inputs used to value them: | |||
| Common Stock Fund | Large Cap Fund | ||||||||||
| Investments | Investments | ||||||||||
Valuations | in Securities | in Securities | |||||||||
| Assets: | |||||||||||
Level 1 — | Common Stocks(1) | $ | 1,379,669,226 | $ | 1,590,082,430 | ||||||
| Money Market Fund | 44,431,688 | 26,580,969 | |||||||||
| Total Level 1 | 1,424,100,914 | 1,616,663,399 | |||||||||
Level 2 — | Common Stocks(1) | — | — | ||||||||
Preferred Stocks(1) | — | — | |||||||||
| Forward Currency Contracts | — | — | |||||||||
| Total Level 2 | — | — | |||||||||
Level 3 — | None | — | — | ||||||||
| Total Assets | 1,424,100,914 | 1,616,663,399 | |||||||||
| Liabilities: | |||||||||||
| Level 2 — | Forward Currency Contracts | — | — | ||||||||
| Total | $ | 1,424,100,914 | $ | 1,616,663,399 | |||||||
53
FMI Funds, Inc.
NOTES TO FINANCIAL STATEMENTS (Continued)
September 30, 2023
| (2) | Summary of Significant Accounting Policies and Other Information — (Continued) |
| International | |||||||||||||||
| International | International | Currency | |||||||||||||
| Fund | Fund | Unhedged Fund | |||||||||||||
| Investments | Other Financial | Investments | |||||||||||||
Valuations | in Securities | Instruments(2) | in Securities | ||||||||||||
| Assets: | |||||||||||||||
Level 1 — | Common Stocks(1) | $ | 626,979,350 | $ | — | $ | 11,210,208 | ||||||||
Money Market Fund | 111,310,355 | — | 2,708,539 | ||||||||||||
Bank Deposit Account | 144,349 | — | — | ||||||||||||
Total Level 1 | 738,434,054 | — | 13,918,747 | ||||||||||||
Level 2 — | Common Stocks(1) | 2,973,851,244 | — | 53,993,809 | |||||||||||
Preferred Stocks(1) | 167,994,578 | — | 3,061,772 | ||||||||||||
Forward Currency Contracts | — | 189,334,088 | — | ||||||||||||
Total Level 2 | 3,141,845,822 | 189,334,088 | 57,055,581 | ||||||||||||
Level 3 — | None | — | — | — | |||||||||||
| Total Assets | 3,880,279,876 | 189,334,088 | 70,974,328 | ||||||||||||
| Liabilities: | |||||||||||||||
Level 2 — | Forward Currency Contracts | — | (48,342 | ) | — | ||||||||||
| Total | $ | 3,880,279,876 | $ | 189,285,746 | $ | 70,974,328 | |||||||||
(1) | See the Schedules of Investments for investments detailed by industry classifications. | ||
(2) | Other financial instruments are derivative instruments, specifically forward currency contracts, which are valued at the unrealized appreciation/(depreciation) on the instrument. |
| (b) | Net realized gains and losses on sales of securities are computed on the identified cost basis. For financial reporting purposes, investment transactions are recorded on the trade date. | |
| (c) | Investment securities and other assets and liabilities denominated in foreign currencies are translated into U.S. dollar amounts at the date of valuation. Purchases and sales of investment securities and income and expense items denominated in foreign currencies are translated into U.S. dollar amounts on the respective date of such transactions. The Company does not isolate that portion of the results of operations resulting from changes in foreign exchange rates on investments from the fluctuations arising from changes in market prices of securities held. Such fluctuations are included with the net realized and unrealized gain or loss from investments. Reported net realized foreign exchange gains or losses arise from sales of foreign currencies, currency gains or losses realized between the trade and settlement dates on securities transactions, and the difference between the amounts of dividends, interest, and foreign withholding taxes recorded on the Company’s books and the U.S. dollar equivalent of the amounts actually received or paid. Net unrealized foreign exchange gains and losses arise from changes in the fair values of assets and liabilities, other than investments in securities at fiscal period end, resulting from changes in exchange rates. | |
| (d) | Dividend income is recorded on the ex-dividend date. Interest income is recorded on an accrual basis. The Funds record the amortization and accretion of premiums and discounts on securities purchased using the effective interest method. Withholding taxes on foreign dividends have been provided for in accordance with the Funds’ understanding of the applicable country’s tax rules and regulations. |
54
FMI Funds, Inc.
NOTES TO FINANCIAL STATEMENTS (Continued)
September 30, 2023
| (2) | Summary of Significant Accounting Policies and Other Information — (Continued) |
| (e) | The International Fund may enter into forward currency contracts in order to hedge its exposure to changes in foreign currency rates on its foreign portfolio holdings or to hedge certain purchase and sale commitments denominated in foreign currencies. The International Currency Unhedged Fund normally does not seek to reduce currency risk by hedging its perceived foreign currency exposure back into the U.S. dollar and will generally not be exposed to currency fluctuations. However, the investment adviser reserves the right to temporarily hedge all or a portion of the International Currency Unhedged Fund’s currency exposure. A forward currency contract is a commitment to purchase or sell a foreign currency at a future date at a negotiated rate. These contracts are valued daily and the asset or liability therein represents unrealized gain or loss on the contracts as measured by the difference between the forward foreign exchange rates at the dates of entry into the contracts and the forward rates at the reporting date. The International Fund and International Currency Unhedged Fund have made an election under Section 988 of the Internal Revenue Code of 1986, as amended (the “Code”), which provides special rules for certain transactions in foreign currency other than the taxpayer’s functional currency (i.e. unless certain special rules apply, currencies other than the U.S. dollar). Certain section 988 gains or losses will increase or decrease the amount of a Fund’s investment company taxable income available to be distributed to shareholders as net capital gain, rather than increasing or decreasing the amount of a Fund’s ordinary income. On a quarterly average there were seven forward currency contracts with an average quarterly value of $2,740,718,267 outstanding during the year ended September 30, 2023. These contracts are not subject to master netting agreements. For Non-Deliverable Forward Currency Contracts (“Contract”), the International Fund posts collateral, in the form of cash or cash equivalents, to a segregated account at the custodian when the Contract is in an unrealized loss position. When the Contract is in an unrealized gain position, the counterparty posts collateral to a segregated account at the custodian. | |
| The fair value of the forward currency contracts as of September 30, 2023, is included in the following location on the Statements of Assets and Liabilities for the International Fund: |
| Fair Value of | Fair Value of | ||||
| Asset Forward | (Liability) Forward | ||||
Location | Currency Contracts | Location | Currency Contracts | ||
Forward currency | Unrealized | $189,334,088 | Unrealized | $48,342 | |
contracts | appreciation on | depreciation on | |||
| forward currency | forward currency | ||||
| contracts | contracts |
| Realized and unrealized gains and losses on forward currency contracts entered into during the year ended September 30, 2023, are recorded in the following location on the Statements of Operations for the International Fund: |
| Realized | Unrealized | ||||
Location | Gain (Loss) | Location | Depreciation | ||
| Forward currency | Net realized | $(105,078,506) | Net change in | $(13,122,292) | |
| contracts | gain (loss) on | unrealized appreciation/ | |||
| forward currency | (depreciation) on | ||||
| contracts | forward currency | ||||
| contracts |
55
FMI Funds, Inc.
NOTES TO FINANCIAL STATEMENTS (Continued)
September 30, 2023
| (2) | Summary of Significant Accounting Policies and Other Information — (Continued) |
| These instruments involve market risk, credit risk, or both kinds of risks, in excess of the amount recognized on the Statements of Assets and Liabilities for the International Fund. Risks arise from the possible inability of counterparties to meet the terms of their contracts and from movement in currency and securities values and interest rates. | ||
| (f) | The preparation of financial statements in conformity with GAAP requires management to make estimates and assumptions that affect the reported amounts of assets and liabilities and disclosure of contingent assets and liabilities at the date of the financial statements and the reported amounts of income and expenses during the reporting period. Actual results could differ from these estimates. | |
| (g) | The Funds may own certain securities that are restricted. Restricted securities include Section 4(a)(2) commercial paper or securities issued in a private placement. The Funds did not hold any restricted securities as of September 30, 2023. | |
| (h) | No provision has been made for Federal income taxes since the Funds have elected to be taxed as “regulated investment companies.” The Funds intend to distribute substantially all net investment company taxable income and net capital gains to their respective shareholders and otherwise comply with the provisions of the Code, applicable to regulated investment companies. | |
| (i) | The Funds have reviewed all open tax years and major jurisdictions, which include Federal and the state of Maryland for the Funds and concluded that there are no significant uncertain tax positions that would require recognition in the financial statements. The Funds recognize interest and penalties, if any, related to unrecognized tax benefits on certain tax benefits on uncertain tax positions as income tax expense in the Statements of Operations. During the year ended September 30, 2023, the Funds did not incur any interest or penalties. Open tax years are those that are open for exam by taxing authorities and, as of September 30, 2023, open Federal tax years include the prior four fiscal tax years ended September 30, 2023. The Funds have no examinations in progress and are also not aware of any tax positions for which it is reasonably possible that the total amounts of unrecognized tax benefits will significantly change in the next twelve months. | |
| (j) | GAAP requires that permanent differences between income for financial reporting and tax purposes be reclassified in the capital accounts. These differences are caused primarily by differences in the treatment of certain components of income or realized capital gain for federal income tax purposes. Each Fund may utilize earnings and profits distributed to shareholders on redemption of shares as part of the dividends paid deduction. These reclassifications have no effect on net assets, results of operations or net asset value per share. During the fiscal year ended September 30, 2023, the reclassifications were as follows: |
| Total Distributable Earnings/ | ||||||||||
| (Accumulated Deficit) | Capital Stock | |||||||||
| Common Stock Fund | $ | (4,176,459 | ) | $ | 4,176,459 | |||||
| Large Cap Fund | $ | (92,925,029 | ) | $ | 92,925,029 | |||||
| International Fund | $ | — | $ | — | ||||||
| International Currency Unhedged Fund | $ | — | $ | — | ||||||
56
FMI Funds, Inc.
NOTES TO FINANCIAL STATEMENTS (Continued)
September 30, 2023
| (2) | Summary of Significant Accounting Policies and Other Information — (Continued) |
| (k) | Net investment income and net realized gains, if any, are distributed to shareholders at least annually. Distributions to shareholders are recorded on the ex-dividend date. | |
| (l) | Common Company expenses are typically allocated evenly between the Funds of the Company, or by other equitable means. | |
| (m) | In October 2022, the Securities and Exchange Commission (the “SEC”) adopted a final rule relating to Tailored Shareholder Reports for Mutual Funds and Exchange-Traded Funds; Fee Information in Investment Company Advertisements. The rule and form amendments will, among other things, require the Fund to transmit concise and visually engaging shareholder reports that highlight key information. The amendments will require that funds tag information in a structured data format and that certain more in-depth information be made available online and available for delivery free of charge to investors on request. The amendments became effective January 24, 2023. There is an 18-month transition period after the effective date of the amendment. |
| (3) | Investment Adviser and Advisory Agreement and Transactions With Related Parties — |
The Funds each have an investment advisory agreement with Fiduciary Management, Inc. (“FMI” or the “Adviser”), with whom certain officers and directors of the Funds are affiliated, to serve as investment adviser and manager. | |
| Under the terms of the current advisory agreement for the International Currency Unhedged Fund, effective as of December 31, 2019, the Adviser is entitled to receive a fee. The fee is computed daily and payable at the end of each month. The following annual percentages of the International Currency Unhedged Fund’s average daily net assets are used: |
| • | 0.75% of the assets from $0 – $2.5 billion; 0.70% of the assets from $2.5 – $5.0 billion; 0.65% of the assets from $5.0 – $10.0 billion; and 0.60% of the assets over $10.0 billion. |
| Under the terms of the current advisory agreements for the Common Stock Fund, Large Cap Fund and International Fund, effective as of January 1, 2019, the Adviser is entitled to receive a fee. The fee is computed daily and payable at the end of each month. The following annual percentages of each Fund’s average daily net assets are used: |
| • | Common Stock Fund: 0.85% of the assets from $0 – $500 million; 0.80% of the assets from $500 million – $1.0 billion; 0.75% of the assets over $1.0 billion. | |
| • | Large Cap Fund: 0.65% of the assets from $0 – $2.5 billion; 0.60% of the assets from $2.5 – $5.0 billion; and 0.55% of the assets over $5.0 billion. | |
| • | International Fund: 0.75% of the assets from $0 – $2.5 billion; 0.70% of the assets from $2.5 – $5.0 billion; 0.65% of the assets from $5.0 – $10.0 billion; and 0.60% of the assets over $10.0 billion. |
| The Funds are responsible for paying their proportionate share of the compensation, benefits and expenses of the Funds’ Chief Compliance Officer. For administrative convenience, FMI initially makes these payments and is later reimbursed by the Funds. | |
| Under the respective advisory agreement or operating expenses limitation agreements, FMI will reimburse the Funds for expenses (excluding federal, state and local taxes, interest, brokerage commissions and extraordinary items) as follows: |
57
FMI Funds, Inc.
NOTES TO FINANCIAL STATEMENTS (Continued)
September 30, 2023
| (3) | Investment Adviser and Advisory Agreement and Transactions With Related Parties — |
| (Continued) |
| Investor Class | Institutional Class | ||
Expense Cap | Expense Cap | ||
| Common Stock Fund | 1.30% | 1.20% | |
| Large Cap Fund | 1.20% | 1.10% | |
| International Fund | 1.75% | 1.65% | |
| International Currency Unhedged Fund | 1.75% | 1.65% |
| For the year ended September 30, 2023, there were no contractual or voluntary reimbursements required for the Common Stock Fund, Large Cap Fund or International Fund. For the year ended September 30, 2023, for the International Currency Unhedged Fund, there is no contractual reimbursement and the voluntary reimbursement is $159,934. The voluntary 0.90% expense cap/reimbursement agreement for the International Currency Unhedged Fund will continue in effect until January 31, 2024, with successive renewal terms of one year unless terminated by the Adviser prior to any such renewal. The Adviser is entitled to recoup such amounts for a one-year period from the date the Adviser reduced its compensation and/or assumed expenses for the International Currency Unhedged Fund. The Adviser does not intend to recoup this $159,934. | |
| The Large Cap Fund, the International Fund and the International Currency Unhedged Fund have each entered into a Distribution Plan (the “Plan”), pursuant to Rule 12b-1 under the 1940 Act. Each Plan, if implemented, provides that the applicable Fund may incur certain costs which may not exceed the lesser of a monthly amount equal to 0.25% of such Fund’s daily net assets or the actual distribution costs incurred during the year. Amounts payable under each Plan would be paid monthly for any activities or expenses primarily intended to result in the sale of shares of such Fund. For the year ended September 30, 2023, no such expenses were charged to the shareholders of any Fund as the Funds had not implemented the Plan. | |
| Under the Funds’ organizational documents, each director, officer, employee or other agent of any Fund (including the Adviser) is indemnified, to the extent permitted by the Act, against certain liabilities that may arise out of performance of their duties to the Funds. Additionally, in the normal course of business, the Funds enter into contracts that contain a variety of indemnification clauses. The Funds’ maximum exposure under these arrangements is unknown as this would involve future claims that may be made against such Fund that have not yet occurred. However, the Funds have not had prior claims or losses pursuant to these contracts and believe the risk of loss to be remote. | |
| At September 30, 2023, no person is deemed to “control” a Fund, as that term is defined in the Act, because the Funds do not know of any person who owns beneficially or through controlled companies more than 25% of a Fund’s Investor Class and Institutional Class shares, on a combined basis, or who acknowledges the existence of control. | |
| (4) | Investments in Affiliated Issuers — |
| An issuer in which a Fund’s holdings represent 5% or more of the outstanding voting securities of an issuer is an “affiliated” issuer as defined in the 1940 Act. For the year ended September 30, 2023, there were no Funds with an investment in a security of an affiliated issuer. |
58
FMI Funds, Inc.
NOTES TO FINANCIAL STATEMENTS (Continued)
September 30, 2023
| (5) | Shareholder Servicing Plan — |
| The Funds have adopted a Shareholder Servicing Plan pursuant to which Investor Class shares, (if available), may pay financial intermediaries for assets maintained in an omnibus account at an annual rate of up to 0.15% of the average daily net assets of such Fund, or an annual per account rate approved by the Board. The Board may also authorize the Funds to pay for shareholder services outside of the plan. | |
| For the year ended September 30, 2023, shareholder servicing fees incurred are disclosed on the Statements of Operations. | |
| (6) | Loan Agreements — |
| U.S. Bank, N.A. (the “Bank”) has made available to the Company a $600,000,000 umbrella credit facility, pursuant to the loan agreement (the “Agreement”) effective May 26, 2023 for the FMI Funds, Inc. (consisting of Common Stock Fund, Large Cap Fund, International Fund and International Currency Unhedged Fund), for the purposes of having cash available to satisfy redemption requests and is subject to certain restrictions and covenants. For the period October 1, 2022 through May 25, 2023, the umbrella credit facility was $600,000,000. Principal is due not more than 45 days after the date of the loan. Amounts under the credit facility bear interest at a rate per annum equal to the Bank’s current prime rate minus one percent on the amount borrowed. Advances will be collateralized by securities owned by the borrowing Fund. The Agreement is subject to renewal on May 25, 2024. During the year ended September 30, 2023, the Large Cap Fund is the only Fund that borrowed against the loan agreement, at an interest rate in the range of 5.25% – 6.50%, as follows: |
| Amount | ||||||
| Average | Outstanding as of | Interest | Maximum | Maximum | ||
Borrowings | September 30, 2023 | Expense | Borrowing | Borrowing Date | ||
Large Cap Fund | $738,795 | $ — | $41,306 | $182,055,000 | 10/05/2022 |
| (7) | Investment Transactions — |
| For the year ended September 30, 2023, purchases and sales of investment securities (excluding short-term investments) were as follows: |
| International | ||||||||||||||||||||
| Currency | ||||||||||||||||||||
| Common Stock Fund | Large Cap Fund | International Fund | Unhedged Fund | |||||||||||||||||
| Purchases | $ | 522,221,435 | $ | 244,483,946 | $ | 979,421,172 | $ | 19,498,040 | ||||||||||||
| Sales | 265,853,901 | 1,053,511,757 | 724,869,680 | 13,213,829 | ||||||||||||||||
59
FMI Funds, Inc.
NOTES TO FINANCIAL STATEMENTS (Continued)
September 30, 2023
| (8) | Income Tax Information — |
| The following information for the Funds is presented on an income tax basis as of September 30, 2023: |
| Net Unrealized | |||||||||||||||||
| Gross | Gross | Appreciation | |||||||||||||||
| Cost of | Unrealized | Unrealized | (Depreciation) | ||||||||||||||
| Investments | Appreciation(1) | Depreciation(1) | on Investments(1) | ||||||||||||||
Common Stock Fund | $ | 1,107,254,595 | $ 362,076,969 | $ | (45,230,650 | ) | $ | 316,846,319 | |||||||||
Large Cap Fund | 1,283,827,414 | 453,517,766 | (120,681,781 | ) | 332,835,985 | ||||||||||||
International Fund | 3,384,441,170 | 1,204,450,263 | (705,843,165 | ) | 498,607,098 | ||||||||||||
International Currency | |||||||||||||||||
Unhedged Fund | 66,574,710 | 11,429,445 | (7,035,440 | ) | 4,394,005 | ||||||||||||
(1) | Represents amounts of investments in securities, forward currency contracts and foreign currency transactions. |
| The difference between the cost amounts for financial statement and federal income tax purposes is due primarily to timing differences in recognizing certain gains and losses on security transactions. The International Fund is the only Fund with temporary mark to market differences. The components of accumulated earnings (deficit) on a tax-basis are as follows: |
| Total | |||||||||||||||||||||
| Net | Distributable | ||||||||||||||||||||
| Unrealized | Undistributed | Undistributed | Other | Earnings/ | |||||||||||||||||
| Appreciation | Ordinary | Long-Term | Accumulated | (Accumulated | |||||||||||||||||
| (Depreciation) | Income | Capital Gains | (Deficit) | Deficit) | |||||||||||||||||
Common Stock Fund | $ | 316,846,319 | $ | 23,805,718 | $ | 20,471,978 | $ | — | $ | 361,124,015 | |||||||||||
Large Cap Fund | 332,835,985 | 12,424,663 | 139,883,739 | — | 485,144,387 | ||||||||||||||||
International Fund | 498,607,098 | — | — | (456,301,962 | ) | 42,305,136 | |||||||||||||||
International Currency | |||||||||||||||||||||
Unhedged Fund | 4,394,005 | 1,004,104 | — | (4,362,419 | ) | 1,035,690 | |||||||||||||||
| The International Fund and International Currency Unhedged Fund utilized $52,750,194 and $196,557, respectively, of prior year short-term capital loss carryovers. | |
| The other accumulated deficit above includes $119,190,880 of late-year losses for the International Fund only. For the International Fund and International Currency Unhedged Fund all capital loss carryovers may be used indefinitely to offset future gains as follows: |
| Short-Term Capital | Long-Term Capital | Total Capital | |||||||||||||
| Loss Carryovers | Loss Carryovers | Loss Carryovers | |||||||||||||
International Fund | $ | — | $ | 337,111,082 | $ | 337,111,082 | |||||||||
International Currency | |||||||||||||||
Unhedged Fund | 321,399 | 4,041,020 | 4,362,419 | ||||||||||||
60
FMI Funds, Inc.
NOTES TO FINANCIAL STATEMENTS (Continued)
September 30, 2023
| (8) | Income Tax Information — (Continued) |
| The tax components of dividends paid during the years ended September 30, 2023 and 2022 are as follows: |
| Year Ended | Year Ended | ||||||||||||||||
| September 30, 2023 | September 30, 2022 | ||||||||||||||||
| Ordinary | Long-Term | Ordinary | Long-Term | ||||||||||||||
| Income | Capital Gains | Income | Capital Gains | ||||||||||||||
| Distributions* | Distributions | Distributions* | Distributions | ||||||||||||||
Common Stock Fund | $ | 3,566,548 | $ | 64,447,102 | $ | 3,572,626 | $ | 108,155,396 | |||||||||
Large Cap Fund | 13,332,676 | 324,039,427 | 49,296,828 | 448,757,868 | |||||||||||||
International Fund | 447,852,464 | — | 122,031,455 | — | |||||||||||||
International Fund | |||||||||||||||||
Currency Unhedged | 830,255 | — | 2,556,915 | 794,059 | |||||||||||||
| * | For federal income tax purposes, distributions on short-term capital gains are treated as ordinary income distributions. |
| (9) | Fund Share Transactions — |
| Year Ended | Year Ended | ||||||||||||||||
| September 30, 2023 | September 30, 2022 | ||||||||||||||||
Common Stock Fund | Shares | Amount | Shares | Amount | |||||||||||||
| Sales | |||||||||||||||||
Investor Class | 6,228,283 | $ | 192,408,466 | 1,136,942 | $ | 34,957,499 | |||||||||||
Institutional Class | 10,041,791 | 308,599,109 | 7,467,492 | 223,727,902 | |||||||||||||
| Reinvestment of dividends | |||||||||||||||||
| and distributions | |||||||||||||||||
Investor Class | 862,363 | 24,146,161 | 1,606,701 | 48,811,581 | |||||||||||||
Institutional Class | 1,527,952 | 42,813,205 | 2,016,282 | 61,315,144 | |||||||||||||
| Redemptions | |||||||||||||||||
Investor Class | (3,508,032 | ) | (106,952,699 | ) | (2,088,297 | ) | (64,365,803 | ) | |||||||||
Institutional Class | (4,087,519 | ) | (124,920,889 | ) | (3,015,536 | ) | (91,326,776 | ) | |||||||||
Total Investor Class | 3,582,614 | 109,601,928 | 655,346 | 19,403,277 | |||||||||||||
Total Institutional Class | 7,482,224 | 226,491,425 | 6,468,238 | 193,716,270 | |||||||||||||
| Net increase (decrease) | 11,064,838 | $ | 336,093,353 | 7,123,584 | $ | 213,119,547 | |||||||||||
| Year Ended | Year Ended | ||||||||||||||||
| September 30, 2023 | September 30, 2022 | ||||||||||||||||
Large Cap Fund | Shares | Amount | Shares | Amount | |||||||||||||
| Sales | |||||||||||||||||
Investor Class | 2,705,696 | $ | 40,863,349 | 4,339,661 | $ | 78,378,013 | |||||||||||
Institutional Class | 9,390,128 | 136,250,495 | 9,846,281 | 180,623,327 | |||||||||||||
| Reinvestment of dividends | |||||||||||||||||
| and distributions | |||||||||||||||||
Investor Class | 14,439,158 | 194,784,241 | 11,559,346 | 219,049,619 | |||||||||||||
Institutional Class | 10,425,358 | 140,221,056 | 14,610,684 | 276,141,925 | |||||||||||||
| Redemptions | |||||||||||||||||
Investor Class | (21,119,009 | ) | (314,911,197 | ) | (16,894,122 | ) | (310,952,388 | ) | |||||||||
Institutional Class | (43,457,910 | ) | (674,034,843 | ) | (38,311,145 | ) | (697,328,392 | ) | |||||||||
Total Investor Class | (3,974,155 | ) | (79,263,607 | ) | (995,115 | ) | (13,524,756 | ) | |||||||||
Total Institutional Class | (23,642,424 | ) | (397,563,292 | ) | (13,854,180 | ) | (240,563,140 | ) | |||||||||
| Net increase (decrease) | (27,616,579 | ) | $ | (476,826,899 | ) | (14,849,295 | ) | $ | (254,087,896 | ) | |||||||
61
FMI Funds, Inc.
NOTES TO FINANCIAL STATEMENTS (Continued)
September 30, 2023
| (9) | Fund Share Transactions — (Continued) |
| Year Ended | Year Ended | ||||||||||||||||
| September 30, 2023 | September 30, 2022 | ||||||||||||||||
International Fund | Shares | Amount | Shares | Amount | |||||||||||||
| Sales | |||||||||||||||||
Investor Class | 6,361,817 | $ | 199,563,117 | 2,361,842 | $ | 78,578,721 | |||||||||||
Institutional Class | 25,248,383 | 784,774,621 | 21,475,543 | 710,562,881 | |||||||||||||
| Reinvestment of dividends | |||||||||||||||||
| and distributions | |||||||||||||||||
Investor Class | 4,125,604 | 114,691,779 | 1,044,980 | 35,895,075 | |||||||||||||
Institutional Class | 11,174,269 | 311,538,626 | 2,269,865 | 78,151,463 | |||||||||||||
| Redemptions | |||||||||||||||||
Investor Class | (6,298,493 | ) | (193,666,671 | ) | (5,523,380 | ) | (183,656,096 | ) | |||||||||
Institutional Class | (17,821,232 | ) | (551,795,394 | ) | (13,192,953 | ) | (437,825,518 | ) | |||||||||
Total Investor Class | 4,188,928 | 120,588,225 | (2,116,558 | ) | (69,182,300 | ) | |||||||||||
Total Institutional Class | 18,601,420 | 544,517,853 | 10,552,455 | 350,888,826 | |||||||||||||
| Net increase (decrease) | 22,790,348 | $ | 665,106,078 | 8,435,897 | $ | 281,706,526 | |||||||||||
| Year Ended | Year Ended | ||||||||||||||||
| International Currency | September 30, 2023 | September 30, 2022 | |||||||||||||||
Unhedged Fund | Shares | Amount | Shares | Amount | |||||||||||||
| Sales | |||||||||||||||||
Institutional Class | 520,897 | $ | 9,997,541 | 759,339 | $ | 14,921,914 | |||||||||||
| Reinvestment of dividends | |||||||||||||||||
| and distributions | |||||||||||||||||
Institutional Class | 47,688 | 830,255 | 152,788 | 3,152,021 | |||||||||||||
| Redemptions | |||||||||||||||||
Institutional Class | (231,911 | ) | (4,457,695 | ) | (918,131 | ) | (17,099,529 | ) | |||||||||
Total Institutional Class | 336,674 | 6,370,101 | (6,004 | ) | 974,406 | ||||||||||||
| Net increase (decrease) | 336,674 | $ | 6,370,101 | (6,004 | ) | $ | 974,406 | ||||||||||
| (10) | Subsequent Events — |
| On September 22, 2023, the Board approved the year-end distributions for the Funds. Cash dividends in the aggregate amounts equal to each of the Fund’s net Investment Income and short-term capital gains, if any, which will be treated as ordinary income, and long-term capital gains, to be payable on December 15, 2023, to outstanding shares of record at the close of business on December 14, 2023. |
62
FMI Funds, Inc.
REPORT OF INDEPENDENT REGISTERED PUBLIC ACCOUNTING FIRM
To the Shareholders and Board of Directors of FMI Funds, Inc.
Opinion on the Financial Statements
We have audited the accompanying statements of assets and liabilities, including the schedule of forward currency contracts for FMI International Fund and the schedules of investments, of FMI Funds, Inc. comprising the funds listed below (the “Funds”) as of September 30, 2023, the related statements of operations, the statements of changes in net assets, the related notes, and the financial highlights for each of the periods indicated below (collectively referred to as the “financial statements”). In our opinion, the financial statements present fairly, in all material respects, the financial position of each of the Funds as of September 30, 2023, the results of their operations, the changes in net assets, and the financial highlights for each of the periods indicated below in conformity with accounting principles generally accepted in the United States of America.
| Statements of | Statements of | ||
| Fund Name | Operations | Changes in Net Assets | Financial Highlights |
| FMI Common Stock Fund, | For the year | For the years ended | For the years ended 2023, 2022, 2021, |
| FMI Large Cap Fund, and | ended 2023 | 2023 and 2022 | 2020, and 2019 |
| FMI International Fund | |||
| FMI International Fund II – | For the year | For the years ended | For the years ended 2023, 2022, and 2021 |
| Currency Unhedged | ended 2023 | 2023 and 2022 | and for the period from December 31, |
| 2019 (commencement of operations) | |||
| through September 30, 2020 |
Basis for Opinion
These financial statements are the responsibility of the Funds’ management. Our responsibility is to express an opinion on the Funds’ financial statements based on our audits. We are a public accounting firm registered with the Public Company Accounting Oversight Board (United States) (“PCAOB”) and are required to be independent with respect to the Funds in accordance with the U.S. federal securities laws and the applicable rules and regulations of the Securities and Exchange Commission and the PCAOB.
We conducted our audits in accordance with the standards of the PCAOB. Those standards require that we plan and perform the audit to obtain reasonable assurance about whether the financial statements are free of material misstatement whether due to error or fraud.
Our audits included performing procedures to assess the risks of material misstatement of the financial statements, whether due to error or fraud, and performing procedures that respond to those risks. Such procedures included examining, on a test basis, evidence regarding the amounts and disclosures in the financial statements. Our procedures included confirmation of securities owned as of September 30, 2023, by correspondence with the custodian and brokers. Our audits also included evaluating the accounting principles used and significant estimates made by management, as well as evaluating the overall presentation of the financial statements. We believe that our audits provide a reasonable basis for our opinion.
We have served as the Funds’ auditor since 2016.

COHEN & COMPANY, LTD.
Milwaukee, Wisconsin
November 14, 2023
63
FMI Funds, Inc.
EXPENSE EXAMPLE (Unaudited)
As a shareholder of the FMI Funds you incur ongoing costs, including management fees and other Fund expenses. You do not incur transaction costs such as sales charges (loads) on purchase payments, reinvested dividends, or other distributions; redemption fees; and exchange fees because the Funds do not charge these fees. This example is intended to help you understand your ongoing costs (in dollars) of investing in each Fund and to compare these costs with the ongoing costs of investing in other mutual funds. The example is based on an investment of $1,000 invested at the beginning of the period and held for the entire period from April 1, 2023, through September 30, 2023.
Actual Expenses
The table below provides information about actual account values and actual expenses. You may use the information in these lines, together with the amount you invested, to estimate the expenses that you paid over the period. Simply divide your account value by $1,000 (for example, an $8,600 account value divided by $1,000 = 8.6), then multiply the result by the number in the line under the heading entitled “Actual Expenses Paid During Period” to estimate the expenses you paid on your account during this period.
In addition to the costs highlighted and described below, the only Fund transaction costs you might currently incur would be wire fees ($15 per wire), if you choose to have proceeds from a redemption wired to your bank account instead of receiving a check. Additionally, U.S. Bank charges an annual processing fee ($15) if you maintain an IRA account with a Fund. To determine your total costs of investing in a Fund, you would need to add any applicable wire or IRA processing fees you’ve incurred during the period to the costs provided in the example at the end of this article.
Hypothetical Example for Comparison Purposes
The table below provides information about hypothetical account values and hypothetical expenses based on each Fund’s actual expense ratio and an assumed rate of return of 5% per year before expenses, which is not the Fund’s actual return. The hypothetical account values and expenses may not be used to estimate the actual ending account balance or expenses you paid for the period. You may use this information to compare the ongoing costs of investing in a Fund and other funds. To do so, compare this 5% hypothetical example with the 5% hypothetical examples that appear in the shareholder reports of the other funds.
Please note that the expenses shown in the table are meant to highlight your ongoing costs only and do not reflect any transactional costs, such as sales charges (loads), redemption fees or exchange fees. Therefore, the hypothetical line of the table is useful in comparing ongoing costs only, and will not help you determine the relative total costs of owning different funds. In addition, if these transactional costs were included, your costs would have been higher.
64
FMI Funds, Inc.
EXPENSE EXAMPLE (Unaudited) (Continued)
| FMI | FMI | FMI | FMI International | |||||||||||||
| Common | Large Cap | International | Fund II – Currency | |||||||||||||
| Stock Fund | Fund | Fund | Unhedged | |||||||||||||
| Investor Class | ||||||||||||||||
Actual Beginning | ||||||||||||||||
Account Value 4/1/23 | $ | 1,000.00 | $ | 1,000.00 | $ | 1,000.00 | $ | — | ||||||||
Actual Ending | ||||||||||||||||
Account Value 9/30/23 | $ | 1,036.70 | $ | 1,029.60 | $ | 1,039.40 | $ | — | ||||||||
Actual Expenses Paid | ||||||||||||||||
During Period(1) 4/1/23-9/30/23 | $ | 5.05 | $ | 4.22 | $ | 4.81 | $ | — | ||||||||
Hypothetical Beginning | ||||||||||||||||
Account Value 4/1/23 | $ | 1,000.00 | $ | 1,000.00 | $ | 1,000.00 | $ | — | ||||||||
Hypothetical Ending | ||||||||||||||||
Account Value 9/30/23 | $ | 1,020.10 | $ | 1,020.91 | $ | 1,020.36 | $ | — | ||||||||
Hypothetical Expenses Paid | ||||||||||||||||
During Period(1) 4/1/23-9/30/23 | $ | 5.01 | $ | 4.20 | $ | 4.76 | $ | — | ||||||||
Annualized Expense Ratio(1) | 0.99 | % | 0.83 | % | 0.94 | % | — | |||||||||
| Institutional Class | ||||||||||||||||
Actual Beginning | ||||||||||||||||
Account Value 4/1/23 | $ | 1,000.00 | $ | 1,000.00 | $ | 1,000.00 | $ | 1,000.00 | ||||||||
Actual Ending | ||||||||||||||||
Account Value 9/30/23 | $ | 1,037.30 | $ | 1,029.60 | $ | 1,040.30 | $ | 1,006.70 | ||||||||
Actual Expenses Paid | ||||||||||||||||
During Period(1) 4/1/23-9/30/23 | $ | 4.39 | $ | 3.51 | $ | 4.09 | $ | 4.53 | ||||||||
Hypothetical Beginning | ||||||||||||||||
Account Value 4/1/23 | $ | 1,000.00 | $ | 1,000.00 | $ | 1,000.00 | $ | 1,000.00 | ||||||||
Hypothetical Ending | ||||||||||||||||
Account Value 9/30/23 | $ | 1,020.76 | $ | 1,021.61 | $ | 1,021.06 | $ | 1,020.56 | ||||||||
Hypothetical Expenses Paid | ||||||||||||||||
During Period(1) 4/1/23-9/30/23 | $ | 4.36 | $ | 3.50 | $ | 4.05 | $ | 4.56 | ||||||||
Annualized Expense Ratio(1) | 0.86 | % | 0.69 | % | 0.80 | % | 0.90 | % | ||||||||
(1) | Expenses are equal to the Fund’s annualized net expense ratio, multiplied by the average account value over the period, multiplied by 183/365 (to reflect the one-half year period between April 1, 2023, and September 30, 2023). |
65
FMI Funds, Inc.
DIRECTORS AND OFFICERS (Unaudited)
| Term of | Principal | |||
| Positions | Office and | Occupation(s) | Other | |
| Name, Age | Held with | Length of | During Past | Directorships Held by |
and Address*^ | the Funds | Time Served | Five Years | Director or Officer |
| Non-Interested Directors | ||||
Robert C. | Director | Indefinite | Mr. Arzbaecher retired as | CF Industries |
Arzbaecher, 63 | Term Since | Chairman and Chief | Holdings, Inc. | |
2007 | Executive Officer of | |||
Actuant Corporation | ||||
(Menomonee Falls, WI) | ||||
in March 2016. | ||||
Lawrence J. Burnett, 65 | Director | Indefinite | Mr. Burnett is a shareholder | None |
Term Since | and employee of Reinhart | |||
2016 | Boerner Van Deuren s.c. | |||
(Milwaukee, WI), a law firm | ||||
since 1982. | ||||
Rebecca W. House, 50 | Director | Indefinite | Ms. House is Chief People | Marvell |
Term Since | and Legal Officer and | Technology, Inc. | ||
2017 | Corporate Secretary at | |||
Rockwell Automation, Inc., | ||||
an industrial automation | ||||
company, since July 2020, | ||||
and was previously General | ||||
Counsel and Secretary since | ||||
January 2017. | ||||
Paul S. Shain, 60 | Director | Indefinite | Mr. Shain is President and | None |
Term Since | Chief Executive Officer | |||
2001 | of Singlewire Software, | |||
LLC (Madison, WI), a | ||||
provider of IP-based | ||||
paging and emergency | ||||
notification systems, | ||||
since April 2009. | ||||
Robert J. Venable, 59 | Director | Indefinite | Mr. Venable is President and | None |
Term Since | Chief Executive Officer | |||
2016 | of Miami Corporation | |||
Management, LLC | ||||
(Chicago, IL), a family | ||||
office and family holding | ||||
company, since January 2023, | ||||
and was previously President | ||||
and Chief Operating Officer | ||||
of Charter Manufacturing | ||||
(Mequon, WI), since | ||||
July 2013. |
66
FMI Funds, Inc.
DIRECTORS AND OFFICERS (Unaudited) (Continued)
| Term of | Principal | |||
| Positions | Office and | Occupation(s) | Other | |
| Name, Age | Held with | Length of | During Past | Directorships Held by |
and Address*^ | the Funds | Time Served | Five Years | Director or Officer |
| Interested Directors | ||||
Jonathan T. Bloom,** 42 | Director | Indefinite | Mr. Bloom is Co-Chief | None |
Term since | Investment Officer | |||
2023 | of Fiduciary Management, | |||
Vice | One Year | Inc. and has been | ||
President | term since | employed by the Adviser | ||
2023 | in various capacities | |||
Since March 2010. | ||||
John S. Brandser,** 61 | Director | Indefinite | Mr. Brandser is President, | None |
Term Since | Secretary and Chief | |||
2013 | Executive Officer | |||
President | One Year | of Fiduciary Management, | ||
and | Term Since | Inc. and has been | ||
Treasurer | 2017 | employed by the Adviser | ||
One Year | in various capacities | |||
Term Since | since March 1995. | |||
2017 | ||||
Patrick J. English,** 62 | Director | Indefinite | Mr. English is Executive | None |
Term Since | Chairman, Co-Chief | |||
2001 | Investment Officer | |||
Vice | One Year | and Treasurer of Fiduciary | ||
President | Term Since | Management, Inc. and has | ||
and | 2001 | been employed by the | ||
Secretary | One Year | Adviser in various capacities | ||
Term Since | since December 1986. | |||
2017 | ||||
| Other Officer | ||||
Ryan J. Ladwig, 36 | Chief | At the | Mr. Ladwig is Chief | None |
Compli- | Discretion of | Compliance Officer of the | ||
ance | Board since | Funds since November 2021 | ||
Officer | 2021 | and was previously a | ||
Compliance & Operations | ||||
Officer of the Adviser since | ||||
December 2017. |
__________
* | The address of each Director and Officer is c/o Fiduciary Management, Inc., 790 North Water Street, Suite 2100, Milwaukee, WI 53202. | |
** | Messrs. Bloom, Brandser and English are interested directors of the Funds because they are officers of the Funds and/or affiliated persons of the Adviser. | |
^ | Each Non-Interested and Interested Director oversees each of the four Funds in the complex. |
67
FMI Funds, Inc.
LIQUIDITY RISK MANAGEMENT PROGRAM (Unaudited)
On June 23, 2023 the Directors of FMI Funds, Inc., and its series the FMI Common Stock Fund, FMI Large Cap Fund, FMI International Fund and FMI International Fund II – Currency Unhedged (collectively, the “Funds”), reviewed and considered a written report prepared by the program administrator of the Funds’ Liquidity Risk Management Program (the “Program”), the Funds’ Trading Practices Committee (the “Program Administrator”), which addressed the operation of the Program and assessed the Program’s adequacy and effectiveness of implementation. In considering the report, the Directors noted that the Program Administrator has determined that all of the Funds primarily hold assets that are highly liquid investments, and thus may rely on the exclusion from the requirements to determine and review a highly liquid investment minimum and to adopt shortfall policies and procedures. They then confirmed with the Program Administrator that no material changes were made to the Program, and reviewed all of the material features of the Program to ensure that they understand how the Program is designed to assess and manage the risk that the Funds could not meet requests to redeem shares issued by the Funds without significant dilution of remaining investors in the Funds. Following this review and discussion, the Directors determined that they believe the disclosures in the report, taken as a whole, provide the information necessary for the Directors to effectively assess the Program and its implementation, and that they are comfortable with the report’s conclusion that the Program is reasonably designed to assess and manage the Funds’ liquidity risk and is operating as intended.
68
FMI Funds, Inc.
DISCLOSURE INFORMATION (Unaudited)
Performance data quoted represents past performance; past performance does not guarantee future results. Investment return and principal value of an investment will fluctuate so that an investor’s shares, when redeemed, may be worth more or less than their original cost. Current performance of a Fund may be lower or higher than the performance quoted. Performance data current to the most recent month end may be obtained by visiting www.fmifunds.com or by calling 1-800-811-5311. The returns do not reflect the deduction of taxes that a shareholder would pay on Fund distributions or the redemption of Fund shares.
Securities named in the Letter to Shareholders, but not listed in the Statement of Net Assets are not held in the Funds as of the date of this disclosure. Portfolio holdings are subject to change without notice and are not intended as recommendations of individual securities.
This report is not authorized for use as an offer of sale or a solicitation of an offer to buy shares of the Funds unless accompanied or preceded by the Funds’ current prospectus.
As of the Funds’ Prospectus dated January 31, 2023, the annual operating expense ratios for the Investor Class of FMI Common Stock Fund, FMI Large Cap Fund and FMI International Fund are: 1.00%, 0.84% and 0.94%, respectively. The annual operating expense ratios for the Institutional Class of FMI Common Stock Fund, FMI Large Cap Fund, FMI International Fund and FMI International Fund II – Currency Unhedged are: 0.89%, 0.70%, 0.81% and 0.90%*, respectively.
| * | Note that the annual operating expenses for the Institutional Class of FMI International Fund II – Currency Unhedged are 1.15% before the investment adviser’s voluntary reimbursement such that annual fund operating expenses do not exceed 0.90%, which will continue at least through January 31, 2024. |
Risks associated with investing in the Funds are as follows:
FMI Common Stock Fund: Stock Market Risk, Medium and Small Capitalization Companies Risks (which includes the potential for greater volatility and less financial resources than Large-Cap Companies), Value Investing Risk, Foreign Securities Risk (fluctuation of currency, different financial standards, and political instability), Liquidity Risk, and Tax Law Change Risk.
FMI Large Cap Fund: Stock Market Risk, Medium and Large Capitalization Companies Risks, Value Investing Risk, Foreign Securities Risk (fluctuation of currency, different financial standards, and political instability), Liquidity Risk, and Tax Law Change Risk.
FMI International Fund: Stock Market Risk, Value Investing Risk, Foreign Securities Risk (fluctuation of currency, different financial standards, and political instability), Geographic Concentration Risk, Currency Hedging Risk, Large Capitalization Companies Risk, Liquidity Risk, and Tax Law Change Risk.
FMI International Fund II – Currency Unhedged: Stock Market Risk, Value Investing Risk, Foreign Securities Risk (fluctuation of currency, different financial standards, and political instability), Geographic Concentration Risk, Large Capitalization Companies Risk, Liquidity Risk, and Tax Law Change Risk.
For details regarding these risks, please refer to the Funds’ Summary or Statutory Prospectuses dated January 31, 2023.
The Standard and Poor’s 500 Index (S&P 500) consists of 500 selected common stocks, most of which are listed on the New York Stock Exchange. The S&P’s Ratings Group designates the stocks to be included in the Index on a statistical basis. A particular stock’s weighting in the Index is based on its relative total market value (i.e., its market price per share times the number of shares outstanding). Stocks may be added or deleted from the Index from time to time.
The Standard and Poors 500 Equal Weight Index (EWI) is the equal-weight version of the widely-used S&P 500. The index includes the same constituents as the capitalization weighted S&P 500, but each company in the S&P 500 EWI is allocated a fixed weight – or 0.2% of the index total at each quarterly rebalance.
69
FMI Funds, Inc.
DISCLOSURE INFORMATION (Unaudited) (Continued)
The iShares Russell 1000 Value ETF seeks to track investment results of an index composed of large- and mid-capitalization U.S. equities that exhibit value characteristics. Performance is compared to the iShares Russell 1000 Value ETF for illustrative purposes only. The metrics regarding the comparative ETF have been obtained from Bloomberg and the returns are calculated assuming all dividends are reinvested. The ETF is not subject to the same fees or expenses as the Fund. The Fund is not restricted to investing in those securities which comprise the ETF. The Fund’s performance may or may not correlate to the ETF, and it should not be considered a proxy for the ETF.
The Russell 1000 Growth Index seeks to track the investment results of an index composed of large- and mid-capitalization U.S. equities that exhibit growth characteristics.
The Russell 2000 Index measures the performance of the 2,000 smallest companies in the Russell 3000 Index. The Russell 2000 Value Index includes equities that exhibit value characteristics and the Russell 2000 Growth Index includes equities that exhibit growth characteristics.
The MSCI EAFE Index (Europe, Australasia, Far East) is a free float-adjusted market capitalization index that is designed to measure the equity market performance of developed markets, excluding the U.S. and Canada. The MSCI EAFE Index consists of the following 21 developed market country indices: Australia, Austria, Belgium, Denmark, Finland, France, Germany, Hong Kong, Ireland, Israel, Italy, Japan, the Netherlands, New Zealand, Norway, Portugal, Singapore, Spain, Sweden, Switzerland and the United Kingdom. Index results are inclusive of dividends and net of foreign withholding taxes. The reported figures include reinvestment of dividends and capital gains distributions and do not reflect any fees or expenses.
The MSCI EAFE Value Index captures large and mid cap securities exhibiting overall value style characteristics across Developed Markets countries around the world, excluding the U.S. and Canada. The value investment style characteristics for index construction are defined using three variables: book value to price, 12-month forward earnings to price and dividend yield.
The MSCI EAFE Index and MSCI EAFE Value Index are calculated in local currency (LOC) as well as in U.S. Dollars (USD). The concept of a LOC calculation excludes the impact of currency fluctuations. All currencies of listing are considered in the Index calculation in LOC where current prices (t) and previous day prices (t-1) are converted into USD using the same exchange rate (exchange rate t-1) in the numerator and denominator. As a consequence, the FX factor drops out of the equation. The USD calculation includes exchange rates at t and t-1. Therefore, the LOC calculation only represents the price appreciation or depreciation of the securities, whereas the USD calculation also accounts for the performance of the currency (or currencies) relative to the USD.
MSCI EAFE is a service mark of MSCI Barra.
All indices are unmanaged. These indices are used herein for comparative purposes in accordance with the Securities and Exchange Commission regulations. It is not possible to invest directly into an index.
GLOSSARY
Cost of Capital is a company’s calculation of the minimum return that would be necessary in order to justify undertaking a capital budgeting project. Investors may also use the term to refer to an evaluation of an investment’s potential return in relation to its costs and risks.
EBIT – Earnings Before Interest and Taxes is calculated as revenue minus expenses excluding tax and interest. EBIT is also called operating earnings, operating profit, and profit before interest and taxes and indicates a company’s profitability.
EPS – Earnings Per Share is calculated as a company’s profit divided by the outstanding shares of its common stock. The resulting number serves as an indicator of a company’s profitability. It is common for a company to report EPS that is adjusted for extraordinary items and potential share dilution. The higher a company’s EPS, the more profitable it is considered to be.
70
FMI Funds, Inc.
DISCLOSURE INFORMATION (Unaudited) (Continued)
Free Cash Flow represents the cash a company generates after accounting for cash outflows to support operations and maintain its capital assets. Unlike earnings or net income, free cash flow is a measure of profitability that excludes the non-cash expenses of the income statement and includes spending on equipment and assets as well as changes in working capital from the balance sheet.
GDP – Gross Domestic Product is the monetary value of all finished goods and services produced within a country’s borders in a specific time period.
P/E ratio – Price-to-earnings ratio is the ratio for valuing a company that measures its current share price relative to its per-share earnings. The trailing P/E ratio is calculated by dividing the current share price by per-share earnings over the previous 12 months and the forward P/E ratio estimates likely per-share earnings over the next 12 months.
ROC – Return on Capital is a financial ratio that can be used to assess a company’s profitability and capital efficiency. In other words, this ratio can help to understand how well a company is generating profits from its capital.
Standard Deviation is a basic mathematical concept that measures volatility in the market or the average amount by which individual data points differ from the mean. Simply put, standard deviation helps determine the spread of asset prices from their average price.
US Buffett Indicator Ratio, also known as the Stock Market Capitalization-GDP- Ratio, is a ratio used to determine whether an overall market is undervalued or overvalued compared to a historical average. The ratio can be used to focus on specific markets, such as the U.S. market, or it can be applied to the global market, depending on what values are used in the calculation. It is calculated by dividing the stock market cap by gross domestic product (GDP).
Reference definitions found at Investopedia.com
Distributed by Foreside Financial Services, LLC, Three Canal Plaza, Suite 100, Portland, ME 04101
71
FMI Funds, Inc.
ADDITIONAL INFORMATION (Unaudited)
For additional information about the Directors and Officers or for a description of the policies and procedures that the Funds use to determine how to vote proxies relating to portfolio securities, please review the Statement of Additional Information. You may call (800) 811-5311 and request a Statement of Additional Information, and it will be mailed to you free of charge. The Statement of Additional Information is also available on the website of the Securities and Exchange Commission (the “Commission”) at http://www.sec.gov. Information on how each of the Funds voted proxies relating to portfolio securities during the most recent 12-month period ended June 30 is available on the Funds’ website at http://www.fmifunds.com or the website of the Commission no later than August 31 for the prior 12 months ended June 30. The Funds file their complete schedules of portfolio holdings with the Commission for the first and third quarters of each fiscal year as exhibits to their reports on Form N-PORT. The Funds’ Form N-PORT reports are available on the Commission’s website provided above.
TAX NOTICE (Unaudited)
For corporate shareholders of the Common Stock Fund, the Large Cap Fund, the International Fund, and the International Currency Unhedged Fund, the percentage of dividend income distributed for the year ended September 30, 2023 that is designated as qualifying for the dividends received deduction is 57.59%, 100%, 0%, and 0%, respectively. The International Fund and the International Currency Unhedged Fund intend to elect to pass-through to shareholders the income tax credit for taxes paid to foreign countries. For the year ended September 30, 2023, only the International Fund and International Currency Unhedged Fund had foreign source income of $99,924,895 and $1,742,853, respectively and foreign tax expense of $6,643,388 and $120,020, respectively. The pass-through of the foreign tax credit will only affect those persons who are shareholders on the dividend record dates. For all shareholders of the Common Stock Fund, the Large Cap Fund, the International Fund, and the International Currency Unhedged Fund, the percentage of dividend income distributed for the September 30, 2023 that is designated as qualified dividend income under the Jobs and Growth Tax Relief Act of 2003, is 59.43%, 100%, 13.40%, and 100%, respectively. For all shareholders of the Common Stock Fund, the Large Cap Fund, the International Fund, and the International Currency Unhedged Fund, the percentage of taxable ordinary income distributions that are designated as short-term capital gain distributions under Internal Revenue Section 871(k)(2)(c) is 37.67%, 0%, 0%, and 0%, respectively.
72
FMI Funds, Inc.
NOTICE OF PRIVACY POLICY (Unaudited)
Protecting the privacy of our shareholders is important to us. This notice describes the practices and policies through which we maintain the confidentiality and protect the security of your non-public personal information.
What Information We Collect
In the course of providing services to you, we may collect the following types of “non-public personal information” about you:
| • | Information we receive from you on applications or other forms, such as your name, address and social security number, the types and amounts of investments and bank account information, and |
| • | Information about your transactions with us, our affiliates and others, as well as other account data. |
What Information We Disclose
We do not disclose any nonpublic personal information about our current or former shareholders to anyone, except as permitted by law. For example, we are permitted by law to disclose all of the information we collect, as described above, to our transfer agent to process your transactions. Furthermore, we restrict access to your nonpublic personal information to those persons who require such information to provide products or services to you. Since we have adopted policies and procedures to ensure we only share information required for our normal business operations, we do not provide a means for opting out of this limited sharing of your information. We maintain physical, electronic and procedural safeguards that comply with federal standards to guard your nonpublic personal information. In the event that you hold shares of any Fund through a financial intermediary, including, but not limited to, a broker-dealer, bank or trust company, the privacy policy of your financial intermediary may govern how your nonpublic personal information would be shared with nonaffiliated third parties.
IMPORTANT NOTICE REGARDING DELIVERY OF SHAREHOLDER DOCUMENTS (Unaudited)
In order to reduce expenses, we will deliver a single copy of prospectuses, proxies, financial reports, and other communication to shareholders with the same residential address, provided they have the same last name or we reasonably believe them to be members of the same family. Unless we are notified otherwise, we will continue to send you only one copy of these materials for as long as you remain a shareholder of the Funds. If you would like to receive individual mailings, please call (800) 811-5311 and we will begin sending you separate copies of these materials within 30 days after we receive your request.
Thank you for allowing us to serve your investment needs.
73
| FMI Common Stock Fund | FMI Large Cap Fund | FMI International Fund | FMI International Fund II – |
| Currency Unhedged |
790 North Water Street, Suite 2100
Milwaukee, Wisconsin 53202
www.fmifunds.com
414-226-4555
BOARD OF DIRECTORS
ROBERT C. ARZBAECHER | PATRICK J. ENGLISH | ||
JONATHAN T. BLOOM | REBECCA W. HOUSE | ||
JOHN S. BRANDSER | PAUL S. SHAIN | ||
LAWRENCE J. BURNETT | ROBERT J. VENABLE |
INVESTMENT ADVISER
FIDUCIARY MANAGEMENT, INC.
790 North Water Street, Suite 2100
Milwaukee, Wisconsin 53202
ADMINISTRATOR, ACCOUNTANT, TRANSFER
AGENT AND DIVIDEND DISBURSING AGENT
U.S. BANCORP FUND SERVICES, LLC
615 East Michigan Street
Milwaukee, Wisconsin 53202
800-811-5311 or 414-765-4124
| CUSTODIAN | INDEPENDENT REGISTERED |
| U.S. BANK, N.A. | PUBLIC ACCOUNTING FIRM |
| Milwaukee, Wisconsin | COHEN & COMPANY, LTD. |
| Milwaukee, Wisconsin | |
| DISTRIBUTOR | LEGAL COUNSEL |
| FORESIDE FINANCIAL SERVICES, LLC | FOLEY & LARDNER LLP |
| Portland, Maine | Milwaukee, Wisconsin |
| | |
| FMI Funds, Inc. | |
1-800-811-5311 | |
www.fmifunds.com | |
| (b) | Not applicable. |
Item 2. Code of Ethics.
The registrant has adopted a code of ethics that applies to the registrant’s principal executive officer and principal financial officer. The registrant has not made any substantive amendments to its code of ethics during the period covered by this report. The registrant has not granted any waivers from any provisions of the code of ethics during the period covered by this report. A copy of the registrant’s Code of Ethics is filed herewith.
Item 3. Audit Committee Financial Expert.
The registrant’s Board of Directors has determined that Mr. Robert C. Arzbaecher, a member of its audit committee, is an audit committee financial expert. Mr. Arzbaecher is “independent” as such term is defined in Form N-CSR.
Item 4. Principal Accountant Fees and Services.
(a) Audit Fees
$75,000 (FY 2023) and $70,000 (FY 2022) are the aggregate fees billed for each of the last two fiscal years for professional services rendered by the principal accountant to the registrant for the audit of the registrant’s annual financial statements or services that are normally provided by the accountant in connection with statutory and regulatory filings or engagements for those fiscal years.
(b) Audit-Related Fees
There were no fees billed in the last two fiscal years for Audit-Related Fees.
(c) Tax Fees
$20,000 (FY 2023) and $20,000 (FY 2022) are the aggregate fees billed in the last two fiscal years for professional services rendered by the principal accountant to the registrant for tax compliance, tax advice, tax planning and tax return preparation.
There were no fees billed in the last two fiscal years for professional services rendered by the principal accountant to registrant’s investment adviser for tax compliance, tax advice and tax planning that were required to be approved by the audit committee pursuant to paragraph (c)(7)(ii) of Rule 2-01 of Regulation S-X.
(d) All Other Fees
There were no fees billed in the last two fiscal years for products and services provided by the principal accountant to the registrant, other than the services reported in paragraphs (a) – (c) of this Item 4.
(e) (1) The audit committee has adopted pre-approval policies and procedures that require the audit committee to pre‑approve all audit and non‑audit services of the registrant, including services provided to any entity affiliated with the registrant.
(e) (2) None.
(f) Not applicable.
(g) See the tax fees disclosed in paragraph (c) of this Item 4.
(h) Not applicable, as no non-audit services were provided to registrant’s investment adviser or any entity controlling, controlled by, or under common control with the investment adviser.
(i) Not applicable, as the registrant has not been identified by the U.S. Securities and Exchange Commission as having filed an annual report issued by a registered public accounting firm branch or office that is located in a foreign jurisdiction where the Public Company Accounting Oversight Board is unable to inspect or completely investigate because of a position taken by an authority in that jurisdiction.
(j) Not applicable, as the registrant is not a foreign issuer.
Item 5. Audit Committee of Listed Registrants.
Not applicable to registrants who are not listed issuers (as defined in Rule 10A-3 under the Securities Exchange Act of 1934).
Item 6. Investments.
| (a) | Schedule of Investments is included as part of the report to shareholders filed under Item 1 of this Form. |
| (b) | Not applicable. |
Item 7. Disclosure of Proxy Voting Policies and Procedures for Closed-End Management Investment Companies.
Not applicable to open-end investment companies.
Item 8. Portfolio Managers of Closed-End Management Investment Companies.
Not applicable to open-end investment companies.
Item 9. Purchases of Equity Securities by Closed‑End Management Investment Company and Affiliated Purchasers.
Not applicable to open-end investment companies.
Item 10. Submission of Matters to a Vote of Security Holders.
Not applicable.
Item 11. Controls and Procedures.
| (a) | The registrant’s principal executive and principal financial officers have concluded that the registrant’s disclosure controls and procedures are effective, as of a date within 90 days of the filing of this report, based on their evaluation of the registrant’s disclosure controls and procedures. |
| (b) | There were no changes in the registrant's internal control over financial reporting (as defined in Rule 30a-3(d) under the Act) that occurred during the period covered by this report that have materially affected, or are reasonably likely to materially affect, the registrant's internal control over financial reporting. |
Item 12. Disclosure of Securities Lending Activities for Closed-End Management Investment Companies
Not applicable to open-end investment companies.
Item 13. Exhibits.
(3) Any written solicitation to purchase securities under Rule 23c‑1 under the Act sent or given during the period covered by the report by or on behalf of the registrant to 10 or more persons. Not applicable to open-end investment companies.
(4) Change in the registrant’s independent public accountant. There was no change in the registrant’s independent public accountant for the period covered by this report.
SIGNATURES
Pursuant to the requirements of the Securities Exchange Act of 1934 and the Investment Company Act of 1940, the registrant has duly caused this report to be signed on its behalf by the undersigned, thereunto duly authorized.
(Registrant) FMI Funds, Inc.
By /s/John S. Brandser
John S. Brandser, President/Principal Executive Officer
Date November 21, 2023
Pursuant to the requirements of the Securities Exchange Act of 1934 and the Investment Company Act of 1940, this report has been signed below by the following persons on behalf of the registrant and in the capacities and on the dates indicated.
By /s/John S. Brandser
John S. Brandser, President/Principal Executive Officer
Date November 21, 2023
By /s/John S. Brandser
John S. Brandser, Treasurer/Principal Financial Officer
Date November 21, 2023