TABLE OF CONTENTS
CNI Charter Funds Annual Report
| 2 | Letter to Our Shareholders |
| 4 | Money Market Funds Investment Adviser's Report |
| 6 | Fixed Income and Blended Funds Investment Adviser's Report |
| 9 | Fixed Income and Blended Funds Overview |
| 16 | Equity Funds Investment Adviser's Report |
| 19 | Equity Funds Overview |
| 24 | Schedule of Investments |
| 78 | Statements of Assets and Liabilities |
| 82 | Statements of Operations |
| 86 | Statements of Changes in Net Assets |
| 92 | Financial Highlights |
| 96 | Notes to Financial Statements |
| 106 | Report of Independent Registered Public Accounting Firm |
| 107 | Trustees and Officers |
| 109 | Notice to Shareholders |
| 110 | Disclosure of Fund Expenses |
| 112 | Board Approval of Advisory and Sub-Advisory Agreements |
The Funds file their complete schedules of portfolio holdings with the Securities and Exchange Commission for the first and third quarters of each fiscal year on Form N-Q within 60 days after the end of the period. The Funds’ Form N-Q filings are available on the Commission’s website at http://www.sec.gov, and may be reviewed and copied at the Commission’s Public Reference Room in Washington, DC. Information on the operation of the Public Reference Room may be obtained by calling 1-800-SEC-0330. The most current Form N-Q filing is also available on the Funds’ website at www.cnicharterfunds.com and without charge, upon request, by calling 1-888-889-0799.
A description of the policies and procedures that the Funds use to determine how to vote proxies relating to the Funds’ portfolio securities, and information on how the Funds voted proxies relating to portfolio securities during the most recent 12-month period ending June 30 is available (1) without charge, upon request, by calling 1-888-889-0799, (2) on the Funds’ website at www.cnicharterfunds.com, and (3) on the Securities and Exchange Commission’s website at www.sec.gov.
CNI CHARTER FUNDS | PAGE 1
letter to our shareholders
ECONOMIC AND MARKET OVERVIEW
When this fiscal year started in October 2010, the Federal Open Market Committee (FOMC) had just announced plans for stimulating sluggish U.S. economic growth by acquiring Treasury debt on the open market in order to drive interest rates lower. The stimulus seemed to have had the desired effect, and by January, economic forecasts for the 2011 U.S. Gross Domestic Product’s growth were in the 3.5% range. Unfortunately, higher inflation (due mainly to food and energy prices), which cut into real consumer spending, along with supply chain disruptions caused by the Japanese tsunami in March caused the economy to weaken in the second quarter. By mid-summer, the gridlock in Washington over the debt ceiling debate, the credit downgrade of U.S. government bonds, and the steadily deteriorating situation in Europe caused a sharp pullback in equity prices. Since then, economic conditions in the United States have improved, but with the situation in Europe still highly volatile, we have actively repositioned the CNI Charter Fund portfolios for a slow growth economy and a more defensive stance.
The U.S. economy faces three important challenges ahead: 1) dealing with the overhang of excessive debt, at both the household and government levels; 2) a sticky unemployment rate of about 9%, which will decrease only when the rate of economic expansion picks up; and 3) the potential spillover from a possible recession in Europe.
Equity markets started the fiscal year with an encouraging upward slope of increasing returns in the December and March quarters. Most of those gains were wiped out by the sharp selloff towards the end of our fiscal year. For the fiscal year ended September 30, 2011, the S&P 500 Index remained in positive territory with returns of 1.14%.
Despite the downgrade, investors continued to flock to the perceived safety of U.S. government debt, and by late September the yield on the bellweather 10-year maturity U.S. Treasury note had fallen to a six decade low. Overall, the bond market outperformed stocks, with the Barclays Capital U.S. Intermediate Government/Credit Index up 3.40% for the fiscal year.
Related to the worldwide flight to the safety of the U.S. Treasury bond, the dollar rose versus many foreign currencies during the fourth quarter. This foreign exchange movement dampened the returns of foreign securities to U.S. investors. Outside the United States, many emerging market countries were tightening monetary policy in order to restrain inflationary pressures. As a result, this was a fiscal year that favored domestic investment over international: the international developed equity markets, measured by EAFE (the Europe, Australasia and Far East Index) declined by 9.36%, while the MSCI Emerging Markets Index fell by 16.15% for the fiscal year.
The Federal Reserve Bank continued to keep short term interest rates near zero in an effort to stimulate investment in the domestic economy. This has caused money market fund yields to fall to historically low rates. Late in the quarter, the Fed also began “Operation Twist” designed to lower mortgage rates in order to boost the moribund housing market. That, along with the heavy buying of Treasuries during the recent turmoil, succeeded in lowering rates further at the longer maturity end of the yield curve.
ORGANIZATIONAL CHANGES
Previously the CNI Charter Funds were advised by two advisory groups, City National Asset Management, Inc. (“CNAM”) and CCM Advisors, LLC (“CCMA”), both fully owned subsidiaries of the same parent, City National Corporation. On January 1, 2011, the business activities of CCMA were combined into CNAM, as a means of streamlining administration, research and software, and bringing the entire CNI Charter Fund family under one roof. The former CCMA team continues its advisory practice as CNAM’s Chicago office and is responsible for the oversight of all the sub-advised CNI Charter Funds.
CNI CHARTER FUNDS | PAGE 2
FEE WAIVERS FOR MONEY MARKET FUNDS
CNAM is very focused on the needs of the Funds’ shareholders. As stated above, the Federal Reserve Bank’s strategy is to maintain short-term interest rates at very low levels to stimulate the economy and the housing market. The Fed has announced that it intends to maintain short-term rates near zero until mid-2013. In order to protect the interests and preserve the capital of the CNI Charter Money Market Fund investors, CNAM has waived a substantial amount of its fees on these Funds since the financial crisis began in late 2008. The three Funds subject to this policy are the Prime, Government and California Tax Exempt Money Market Funds. This has enabled all three Funds to produce positive, albeit modest, returns throughout this period.
This marks my first fiscal year end as the Chief Investment Officer of CNAM and the CNI Charter Funds. As the investment adviser to the Funds, CNAM continues to follow its investment discipline throughout periods of market turmoil. CNAM seeks to meet each of our mutual funds’ distinct investment objectives through intensive security research, continuous monitoring of financial data, re-evaluation of portfolio holdings and weightings during changing circumstances, and maintenance of high compliance standards.
Please read the following pages carefully as they contain important information on the assets and financial condition of the Funds. If you have any questions about this report or CNI Charter Funds, please call your investment professional or (888) 889-0799.
Thank you for the confidence you place in the CNI Charter Funds.
Sincerely,
Bruce Simon
Chief Investment Officer
CNI Charter Funds
Past performance is no guarantee of future results. Certain shareholders may be subject to the Alternative Minimum Tax (AMT). Federal income tax rules apply to any capital gain distributions.
Fund expenses have been waived during the period on which the performance is based. Without waivers, performance would be lower.
This information must be preceded or accompanied by a current prospectus. Please read the prospectus carefully before investing.
CNI CHARTER FUNDS | PAGE 3
investment adviser’s report
Money Market Funds
The last twelve months have been very challenging for the short-term markets. The continued disruptions in the European crisis saga, a U.S. Government downgrade by Standard & Poor’s and continued low interest rates top the list of issues that made it such a challenging period.
The European sovereign debt crisis became more pronounced as the year progressed. The European Central Bank, European Union officials and participant countries attempted to offer solutions to prevent the default of Greek debt and avoid any contagion to other countries and financial institutions. The most recent discussions appear to have provided solutions that could solve the problem, but most market participants continue to hold reduced exposure to European debt.
In early August, the credit rating agency Standard & Poor’s downgraded its credit rating of the U.S. Federal government from AAA to AA+. This was the first time that the U.S. Government has been given a rating below AAA. The market reacted with very little fanfare at the announcement and has actually traded higher due to continued global economic weakness and flight to quality trades caused by the Euro crisis. Both Fitch and Moody’s maintained their credit ratings of the U.S. Federal government at AAA.
Historically low interest rates continue to beleaguer short-term markets and money market fund managers. The effective Fed Funds target rate has remained at 0.00% to 0.25% since late 2008. In August, the Federal Reserve Bank (the “Fed”) pledged to keep the benchmark rate at a record low level at least through mid-2013. The average money market fund continues to offer yields at or near 0.00%. As a result of this ultra low yield environment, 98.4% of all funds are waiving fees and absorbing a portion of expenses, according to iMoneyNet.
FUND COMMENTARY
All returns listed below relate to the 12-month period ended September 30, 2011 and are net of expenses. CNI Charter Funds’ returns refer to Institutional Class Shares. Other classes would have different returns.
| | • | The Government Money Market Fund was positioned properly for changes, or lack thereof, in Fed policy and the lower economic growth environment. The Fund has maintained a maturity profile of approximately 50 days average life in order to benefit from higher yielding securities in the face of continued low interest rates. CNAM waived the majority of its fees to produce a positive return of 0.02%. |
| | • | The Prime Money Market Fund continues to focus on a well diversified strategy of high quality, liquid issuers. Due to continued pressure on European financial institutions with exposure to the sovereign debt crisis, out of an abundance of caution, the Fund will not acquire any additional debt securities issued by European financial institutions until we believe the market has stabilized. CNAM waived the majority of its fees to produce a positive return of 0.06%. |
| | • | Our objective for the California Tax Exempt Money Market Fund continues to focus on the fundamental objective of principal preservation and liquidity. The yield curve for allowable money market securities remains relatively flat, with the risk of extending generally outweighing the benefit gained, and thus the average maturity of the portfolio remains short at 27 days. We continue to carefully watch credit developments in California and while the state has strengthened its liquidity position, we have been very selective of other municipalities. Over the course of the year, we have also eliminated or nearly eliminated exposure to European bank liquidity providers for our variable rate demand notes as the European credit crisis deepened. CNAM waived the majority of its fees to produce a return of 0.02%. |
CNI CHARTER FUNDS | PAGE 4
STRATEGIC OUTLOOK
As mentioned, due to the continued slow pace of the economic recovery and high levels of unemployment the Fed has pledged to keep rates at historically low levels for an extended period of time. We consider our Money Market Funds to be appropriately positioned for the low and slow economic growth that is expected. As always, CNAM continues to monitor the objectives of the Funds very closely and seek opportunities in the markets to best serve the Funds’ shareholders.
Sincerely,
|  |
| Gregory Kaplan | William Miller |
Paul Single
Directors of Fixed Income Investments
City National Asset Management, Inc.
This material represents the managers’ assessment of the portfolios and market environment at a specific point in time and should not be relied upon by the reader as research or investment advice.
CNI CHARTER FUNDS | PAGE 5
investment adviser’s report
Fixed Income and Blended Funds
For the first half of 2011, risk assets performed well with equities and bonds showing positive year over year gains. However, the European sovereign debt crisis, which has dominated international headlines throughout the year, and the accompanying worry peaked in late third-quarter 2011, as the inability of the European leaders to quell the market’s desire for action contributed to downtrodden consumer sentiment and a buildup of fear as seen with the VIX Index (a measure of stock market volatility) more than tripling, from 14.6 to 48.0 (versus an average of 18.6 over the last year). This dramatic uptick in fear created a flight to quality with investors fleeing into Treasuries and out of risk assets, resulting in a total return of 5.97% for the Barclays Capital U.S. Treasury Index over the fiscal year ending September 30, 2011.
In late September, the Federal Reserve Bank (the “Fed”) engaged in another easing program dubbed “Operation Twist.” Operation Twist’s intent is to spur economic growth and investment by flattening the yield curve. This will be done by selling short-term securities and buying long-term securities to bring down longer term interest rates. Furthermore, the Fed stated plainly that its goal is to keep rates low through mid-2013. With rates remaining near historic lows, the Fed is hoping to encourage investors to move out of low risk assets (Treasuries) and into higher risk assets (mainly corporate bonds and equities). A massive flow of capital out of Treasuries and into higher risk assets would positively impact asset prices and in turn, consumer sentiment.
The flight to quality during August and September in particular, benefitted Treasuries and agency-backed debt, while the yield on corporate bonds increased from 1.54% to 2.41% per Barclays Capital U.S. Corporate Investment Grade Index. The back-up in yields has made for very attractive entry points across the corporate credit space.
Similarly municipal bonds have benefitted from the Fed's commitment to low interest rates and the flight to quality during August and September, during which muni 10-year yields fell by 42 basis points. The municipal yield curve remained quite steep over the period encouraging investors to extend at the margin and avoid negligible rates in cash and short-term securities. The commonly watched value barometer of municipal yields relative to Treasury yields has remained well above historical averages. This has encouraged cross-over buyers to shift assets from government markets into high grade municipal debt supporting additional issuance late in the year.
All returns listed below relate to the 12-month period ended September 30, 2011 and are net of expenses. CNI Charter Funds’ returns refer to Institutional Class Shares. Other classes would have different returns.
LIMITED MATURITY FIXED INCOME FUND
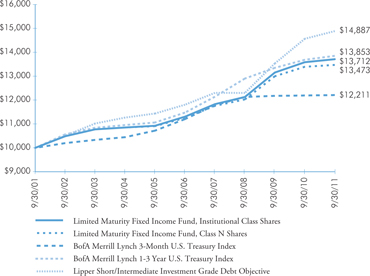
The Limited Maturity Fixed Income Fund follows the multi-portfolio style of combining complementary core + alpha portfolios to blend returns over interest rate and sector cycles. The portfolio managers met the objectives of the Fund, which are to preserve capital, maintain liquidity and maximize income in a high credit quality fund. The barbelled portfolios which create this Fund are benchmarked to the BofA/Merrill Lynch 3-Month U.S. Treasury Bill Index and the BofA/Merrill Lynch 1-3 Year Treasury Index. For the fiscal year the Fund returned 0.92% versus 1.20% for the BofA/Merrill Lynch 1-3 Year Treasury Index and 0.14% for the BofA/Merrill Lynch 3-Month U.S. Treasury Bill Index.
For income oriented investors, the Fund’s 30-day SEC yield at September 30, 2011 was 1.16%, compared to 0.30% for the BofA/Merrill Lynch 1-3 Year Treasury Index and 0.02% for BofA/Merrill Lynch U.S. Treasury Bills Index. The Fund maintained an income advantage over both indices over the year, because it was diversified in both high grade corporate and agency securities. The largest sector allocation, Agencies, comprised 40.1% of the Fund at year end, while Treasuries were 11.7% and Corporate Bonds were 31.3%. The Fund’s performance year-to-date primarily stems from the allocation to corporate bonds which had performed well in the first half of the year, but experienced negative price performance over the third quarter, while the diversification to government bonds aided performance at the end of the year during the bond market turmoil.
CNI CHARTER FUNDS | PAGE 6
GOVERNMENT BOND FUND
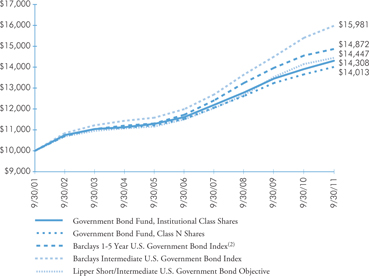
The Government Bond Fund produced a return of 2.86%. By comparison, the Barclays Capital U.S. 1-5 Year Government Bond Index returned 2.16%. The Fund outperformed the benchmark due to the Funds’ overweight in agency-backed debt and collateralized mortgage obligations. In addition, the Fund maintained a somewhat shorter duration versus the benchmark in order to keep liquidity higher than normal to support shareholder activity.
CORPORATE BOND FUND
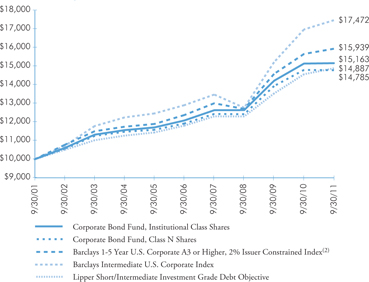
The Corporate Bond Fund produced a total annual net return of 0.15%, while the Barclays Capital U.S. Corporate 1-5 A3 or Higher, 2% Issuer Constrained Index returned 1.79%. The Fund maintained its positive stance on corporate credit quality while its overweight in lower quality (BBB) issues contributed to poor relative performance over the very volatile third quarter.
Continued positive (albeit slow) domestic GDP growth, and tentatively positive news from Europe are both supportive of credit quality. In addition, credit is expected to perform well in the near term given the relative values created with the sell-off in August and September.
CALIFORNIA TAX EXEMPT BOND FUND
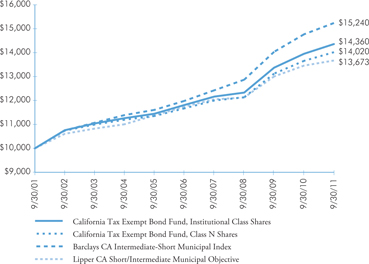
The California Tax Exempt Bond Fund produced a total return of 2.92%, while the Barclays Capital CA Intermediate-Short Municipal Index returned 3.19%. By comparison the Lipper CA Short/Intermediate Muni Debt Objective median return was 1.59%. The first quarter of the fiscal year experienced a significant increase in market volatility due to the expiration of the Build America Bond Program combined with heightened credit fears. This set the market up for good returns late in the second fiscal quarter. Very limited bond supply and improving economic outlook helped to more than offset earlier weakness. This was followed by further strength in high quality bond markets due to the debt ceiling debate and ultimate downgrade of U.S. Treasury debt by Standand & Poor’s (“S&P”) in August. The fiscal year wrapped up on a very strong note for the Fund as its high quality intermediate structure benefited from the acute concern of an imminent Greek default.
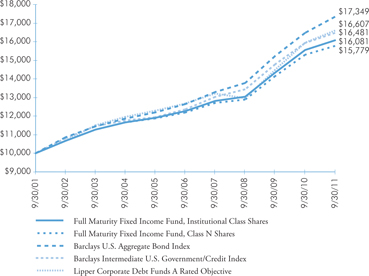
FULL MATURITY FIXED INCOME
The Full Maturity Fixed Income Fund combines two portfolios designed to complement each other in the core + alpha strategy and to provide a “full” maturity spectrum. The sub-advisers are:
| | • | Boyd Watterson Asset Management, the alpha sub-adviser, manages to the Barclays Capital U.S. Intermediate Government/Credit Bond Index, and will more aggressively move duration above or below the index by up to 20%; |
| | • | Baird Advisors, the core sub-adviser, manages to the Barclays Capital U.S. Aggregate Bond Index, and is always duration neutral to the index and seeks to add value by sector selection. |
Following its investment objectives of preserving capital and seeking investment income, the Fund is broadly diversified in government and investment grade securities. The Fund’s sub-advisers began the fiscal year with a 45.4% tilt towards corporate bonds, which was the favored sector in the first three quarters of the fiscal year and benefitted performance. Despite S&P’s downgrade, U.S. Treasury prices rose sharply in the final fiscal quarter (ended September 30) as a response to the flight from European Union debt problems with Greece. The Fund ended the fiscal year with a 27.5% weighting in Treasuries and 6.3% in Agencies; these Government bond weightings benefitted investors in the Treasury rally. The diversification among sectors for this Fund serves to protect investors from any one sector’s risk, while maintaining a steady cashflow stream from the fixed income payments. The Fund invests in investment grade bonds only and has maintained an overall portfolio AA investment quality rating.
The Fund’s total return was 3.36% for the fiscal year. This was in line with the Barclays Capital U.S. Intermediate Government/Credit Bond Index return of 3.40% for the period. The Lipper Corporate Debt Funds A-Rated Objective, which includes bond funds that are 100% weighted towards corporate bonds, returned 4.11% for the fiscal year.
CNI CHARTER FUNDS | PAGE 7
investment adviser’s report
Fixed Income and Blended Funds (continued)
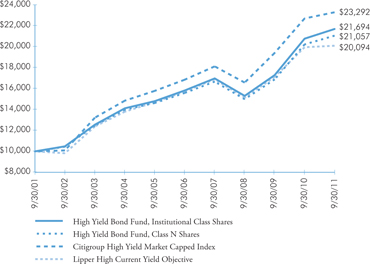
HIGH YIELD BOND FUND
The High Yield Bond Fund, sub-advised by Guggenheim Partners LLC, was in the select few of below investment grade bond managers able to produce positive returns for the fiscal year. In the first three fiscal quarters, when Industrial sector returns were still generally on the upswing, the Fund participated in this sector, ending the fiscal year with 71.6% weight, even as the Fund’s sub-adviser forecast slower economic growth in the period. The Fund underweighted the riskier Financials sector, minimizing bank sector bonds, having an 8.2% allocation at fiscal year end. During the flight to high quality bonds in the final fiscal quarter, when below investment grade bonds were down sharply, the Fund’s portfolio was down less, providing investors with a twelve-month return of 4.45%. By comparison, the Fund’s primary benchmark, the Citigroup High Yield Market Capped Index, was up 2.59% for the year (the “Market Capped” refers to the fact that no one security can be more than 2% weighting of the index). The Lipper High Current Yield Objective return for this category was 0.71% for the same period.
The Fund’s sub-adviser has followed a strategy of buying the high yielding bonds of mid-sized companies, rather than those of the very large capitalized companies because they generally yield at a higher rate and there are more potential holdings (263 at fiscal year end), which enables the Fund to spread risk. The sub-adviser also buys intermediate maturity bonds in the higher credit range, in an effort to avoid defaults in this category. The sub-adviser has been successful in meeting the Fund’s objective of maximizing return in the high yield market.
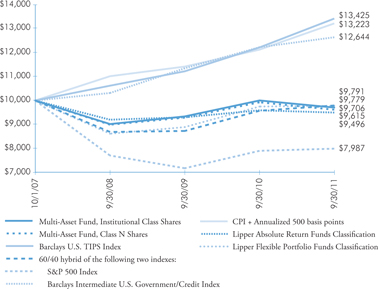
MULTI-ASSET FUND
For the fiscal year, the Multi Asset Fund returned -2.97%, compared to -0.98% median return for the Lipper Absolute Return Objective peer group. Fund returns were negatively impacted during the flight from risky assets that occurred as a result of the flare up of the European sovereign debt crisis in August and September. The Fund’s cash and fixed income allocations increased significantly as allocations to riskier assets were aggressively reduced due to heightened market volatility.
Additionally, the Fund’s remaining equity allocations were shifted to be more defensive, with biases to domestic, large cap and dividend-paying stocks. Heightened volatility and potentially weaker economic growth also led us to reduce the Fund’s real estate and commodity allocations. We increased the Fund’s allocation to high yield debt towards the end of the fiscal year, as valuations became very attractive due to the risk averse environment.
The following pages provide an overview of each of the Fixed Income and Blended Funds managed by CNAM. Please visit cnicharterfunds.com for the most current returns.
Sincerely,
| |
| Gregory Kaplan | William Miller |
 Paul Single
Directors of Fixed Income Investments
City National Asset Management, Inc.
Timothy G. Solberg, CFA
Director of Sub-advised Funds
City National Asset Management, Inc.
This material represents the managers’ assessment of the portfolios and market environment at a specific point in time and should not be relied upon by the reader as research or investment advice.
CNI CHARTER FUNDS | PAGE 8
fund overview
Limited Maturity Fixed Income Fund
The Fund seeks to provide a high level of current income, consistent with the preservation of capital and liquidity by investing primarily in fixed income securities either issued or guaranteed by the U.S. Government or its agencies or instrumentalities, money market instruments and non-convertible fixed income securities of U.S. companies.
Comparison of Change in the Value of a $10,000 Investment in the Limited Maturity Fixed Income Fund, Institutional Class Shares and Class N Shares, versus the BofA Merrill Lynch 3-Month U.S. Treasury Index and the BofA Merrill Lynch 1-3 Year U.S. Treasury Index, and the Lipper Short/Intermediate Investment Grade Debt Objective(1)
| (1) | The performance in the above graph does not reflect the deduction of taxes the shareholder will pay on Fund distributions or the redemptions of Fund shares. Investment performance reflects fee waivers in effect. In the absence of such waivers, total return would be reduced. |
Past performance is no indication of future performance.
The Fund’s comparative benchmarks do not include the annual operating expenses incurred by the Fund. Please note that one cannot invest directly in an unmanaged index.
AVERAGE ANNUAL TOTAL RETURNS |
| | | | | | |
| | | | | | |
| | | | | | |
Bofa Merrill Lynch 3-Month U.S. Treasury Index | | | | | | |
Bofa Merrill Lynch 1-3 Year U.S. Treasury Index | | | | | | |
Lipper Short/Intermediate Investment Grade Debt Objective | | | | | | |
| (1) | Class I Shares of the predecessor to the Limited Maturity Fixed Income Fund (the “Predecessor Fund”) commenced operations on October 22, 1988. On September 30, 2005, the Predecessor Fund reorganized into the Fund. The performance results for Institutional Class Shares of the Fund for the period of October 22, 1988 to September 29, 2005, reflects the performance of the Predecessor Fund’s Class I Shares. |
| (2) | Class I Shares of the predecessor to the Limited Maturity Fixed Income Fund (the “Predecessor Fund”) commenced operations on October 22, 1988. Class A Shares of the Predecessor Fund, the predecessor to the Class N Shares of the Fund, commenced operations on October 22, 2004. On September 30, 2005, the Predecessor Fund reorganized into the Fund. The performance results for Class N Shares of the Fund for the period of October 22, 2004, to September 29, 2005, reflects the performance of the Predecessor Fund’s Class A Shares. The performance results for Class N Shares of the Fund for the period of October 22, 1988 to October 21, 2004, reflects the performance of the Predecessor Fund’s Class I Shares. The performance of the Predecessor Fund’s Class I Shares has not been adjusted to reflect the higher Rule 12b-1 fees and expenses applicable to the Fund’s Class N Shares. If it had, the performance of the Fund’s Class N Shares would have been lower than that shown. |
| TOP TEN HOLDINGS |
| % OF PORTFOLIO |
| U.S. Treasury Notes | |
| 4.250%, 08/15/15 | 9.0 |
| FHLB | |
| 0.875%, 08/22/12 | 5.3 |
| FNMA | |
| 0.500%, 08/09/13 | 5.3 |
| FHLB | |
| 5.750%, 05/15/12 | 4.8 |
| FHLMC | |
| 2.125%, 09/21/12 | 4.7 |
| FHLMC | |
| 4.375%, 07/17/15 | 3.9 |
| Southern California Public Power Authority, Sub-Ser B, AGM | |
| 6.930%, 05/15/17 | 3.4 |
| FNMA | |
| 5.000%, 02/13/17 | 3.1 |
| FNMA | |
| 5.250%, 08/01/12 | 2.7 |
| U.S. Treasury Notes | |
| 4.125%, 08/31/12 | 2.7 |
CNI CHARTER FUNDS | PAGE 9
fund overview
Government Bond Fund
The Fund seeks to provide current income (as the primary component of a total return intermediate duration strategy) by investing primarily in U.S. Government securities either issued or guaranteed by the U.S. Government or its agencies or instrumentalities.
Comparison of Change in the Value of a $10,000 Investment in the Government Bond Fund, Institutional Class or Class N Shares, versus the Barclays Capital U.S. 1-5 Year Government Bond Index, Barclays Capital U.S. Intermediate U.S. Government Bond Index, and the Lipper Short/Intermediate U.S. Government Bond Objective(1)
| (1) | The performance in the above graph does not reflect the deduction of taxes the shareholder will pay on Fund distributions or the redemptions of Fund shares. Investment performance reflects fee waivers in effect. In the absence of such waivers, total return would be reduced. |
| (2) | The Fund’s adviser has elected to compare the Fund's performance to the Barclays Capital U.S. 1-5 Year Government Bond Index as it believes this is the most appropriate index for comparison to the Fund's performance. |
Past performance is no indication of future performance.
The Fund’s comparative benchmarks do not include the annual operating expenses incurred by the Fund. Please note that one cannot invest directly in an unmanaged index.
AVERAGE ANNUAL TOTAL RETURNS |
| | | | | | |
| | | | | | |
| | | | | | |
Barclays Capital U.S. 1-5 Year Government Bond Index | | | | | | |
Barclays Capital U.S. Intermediate Government Bond Index | | | | | | |
Lipper Short/Intermediate U.S. Government Bond Objective | | | | | | |
| (1) | Commenced operations on January 14, 2000. |
| (2) | Commenced operations on April 13, 2000. |
| ^ | The Fund’s Institutional Class Shares are currently offered only to accounts for which City National Bank serves as trustee or in a fiduciary capacity. |
| † | Class N Shares’ performance for the period of January 14, 2000 to April 13, 2000 was calculated using the performance of the Institutional Class Shares adjusted to reflect the expenses of the Class N Shares. If performance of the Institutional Class Shares had not been adjusted, the performance of the Class N Shares for that period would have been higher because the expenses of the Class N Shares are higher than those of the Institutional Class Shares. |
| TOP TEN HOLDINGS |
| % OF PORTFOLIO |
| Israel Government AID Bond | |
| 3.962%, 05/15/20 | 7.2 |
| Tennessee Valley Authority, Ser E | |
| 6.250%, 12/15/17 | 5.6 |
| Egypt Government AID Bond | |
| 4.450%, 09/15/15 | 5.1 |
| FHLMC REMIC, Ser 2011-3806, Cl UP | |
| 4.500%, 02/15/41 | 4.8 |
| U.S. Treasury Note | |
| 1.375%, 11/30/15 | 4.6 |
| FFCB | |
| 1.875%, 12/07/12 | 4.6 |
| FHLB | |
| 0.393%, 04/08/14 | 4.5 |
| FHLMC | |
| 1.050%, 06/27/14 | 4.5 |
| FFCB | |
| 0.600%, 08/01/13 | 4.5 |
| FHLMC REMIC, Ser 2010-3680, Cl VA | |
| 4.500%, 07/15/21 | 4.4 |
CNI CHARTER FUNDS | PAGE 10
fund overview
Corporate Bond Fund
The Fund seeks to provide current income (as the primary component of a total return intermediate duration strategy) by investing in a diversified portfolio of investment grade fixed income securities, primarily corporate bonds issued by domestic and international companies denominated in U.S. dollars.
Comparison of Change in the Value of a $10,000 Investment in the Corporate Bond Fund, Institutional Class or Class N Shares, versus the Barclays Capital U.S. Corporate 1-5 A3 or Higher, 2% Issuer Constrained Index, the Barclays Capital U.S. Intermediate Corporate Bond Index, and the Lipper Short/Intermediate Investment Grade Debt Objective(1)
| (1) | The performance in the above graph does not reflect the deduction of taxes the shareholder will pay on Fund distributions or the redemptions of Fund shares. Investment performance reflects fee waivers in effect. In the absence of such waivers, total return would be reduced. |
| (2) | The Fund’s adviser has elected to compare the Fund's performance to the Barclays Capital U.S. Corporate 1-5 A3 or Higher, 2% Issuer Constrained Index as it believes this is the most appropriate index for comparison to the Fund's performance. |
Past performance is no indication of future performance.
The Fund’s comparative benchmarks do not include the annual operating expenses incurred by the Fund. Please note that one cannot invest directly in an unmanaged index.
AVERAGE ANNUAL TOTAL RETURNS |
| | | | | | |
| | | | | | |
| | | | | | |
Barclays Capital U.S. Corporate 1-5 A3 or Higher, 2% Issuer Constrained Index | | | | | | |
Barclays Capital U.S. Intermediate Corporate Bond Index | | | | | | |
Lipper Short/Intermediate Investment Grade Debt Objective | | | | | | |
| (1) | Commenced operations on January 14, 2000. |
| (2) | Commenced operations on April 13, 2000. |
| ^ | The Fund’s Institutional Class Shares are currently offered only to accounts for which City National Bank serves as trustee or in a fiduciary capacity. |
| † | Class N Shares’ performance for the period of January 14, 2000 to April 13, 2000 was calculated using the performance of the Institutional Class Shares adjusted to reflect the expenses of the Class N Shares. If performance of the Institutional Class Shares had not been adjusted, the performance of the Class N Shares for that period would have been higher because the expenses of the Class N Shares are higher than those of the Institutional Class Shares. |
| TOP TEN HOLDINGS* |
| % OF PORTFOLIO |
| Wachovia Bank | |
| 4.800%, 11/01/14 | 3.1 |
| General Electric Capital | |
| 5.900%, 05/13/14 | 2.9 |
| Caisse Centrale Desjardins du Quebec | |
| 2.650%, 09/16/15 | 2.7 |
| Kingdom of Denmark | |
| 2.750%, 11/15/11 | 2.7 |
| General Electric Capital, FDIC Insured |
| 2.625%, 12/28/12 | 2.5 |
| Ally Financial, FDIC Insured | |
| 2.200%, 12/19/12 | 2.3 |
| JPMorgan Chase, FDIC Insured | |
| 2.125%, 12/26/12 | 2.3 |
| Citigroup Funding, FDIC Insured | |
| 2.250%, 12/10/12 | 2.3 |
| Verizon Communications | |
| 5.550%, 02/15/16 | 2.2 |
| ConocoPhillips Canada Funding I | |
| 5.625%, 10/15/16 | 2.1 |
| * | Excludes Cash Equivalents |
CNI CHARTER FUNDS | PAGE 11
fund overview
California Tax Exempt Bond Fund
The Fund seeks to provide current income exempt from Federal and California state income tax (as the primary component of a total return strategy) by investing primarily in California municipal bonds and notes.
Comparison of Change in the Value of a $10,000 Investment in the California Tax Exempt Bond Fund, Institutional Class or Class N Shares, versus the Barclays Capital CA Intermediate-Short Municipal Index, and the Lipper CA Short/Intermediate Municipal Objective(1)
| (1) | The performance in the above graph does not reflect the deduction of taxes the shareholder will pay on Fund distributions or the redemptions of Fund shares. Investment performance reflects fee waivers in effect. In the absence of such waivers, total return would be reduced. |
Past performance is no indication of future performance.
The Fund’s comparative benchmarks do not include the annual operating expenses incurred by the Fund. Please note that one cannot invest directly in an unmanaged index.
AVERAGE ANNUAL TOTAL RETURNS |
| | | | | | |
| | | | | | |
| | | | | | |
Barclays Capital CA Intermediate-Short Municipal Index | | | | | | |
Lipper CA Short/Intermediate Municipal Objective | | | | | | |
| (1) | Commenced operations on January 14, 2000. |
| (2) | Commenced operations on April 13, 2000. |
| ^ | The Fund’s Institutional Class Shares are currently offered only to accounts for which City National Bank serves as trustee or in a fiduciary capacity. |
| † | Class N Shares’ performance for the period of January 14, 2000 to April 13, 2000 was calculated using the performance of the Institutional Class Shares adjusted to reflect the expenses of the Class N Shares. If performance of the Institutional Class Shares had not been adjusted, the performance of the Class N Shares for that period would have been higher because the expenses of the Class N Shares are higher than those of the Institutional Class Shares. |
| TOP TEN HOLDINGS* |
| % OF PORTFOLIO |
| California Statewide Communities Development Authority, Proposition 1A Receivables, Ser PG, RB | |
| 5.000%, 06/15/13 | 4.6 |
| County of Riverside California, Ser A, COP, AMBAC | |
| 5.000%, 11/01/17 | 3.0 |
| California State, GO | |
| Callable 3/1/2015 @ 100 | |
| 5.000%, 03/01/16 | 2.9 |
| Southern California, Public Power Authority, Subordinated Southern Transmission Project, Ser A, RB | |
| 5.000%, 07/01/17 | 2.5 |
| Orange County, Public Financing Authority, RB, NATL-RE | |
| 5.000%, 07/01/17 | 2.1 |
| Imperial Irrigation District, RB | |
| Callable 7/1/2021 @ 100 | |
| 5.250%, 07/01/23 | 2.1 |
| California State, GO | |
| Callable 11/1/2020 @ 100 | |
| 5.000%, 11/01/22 | 2.1 |
| Modesto Irrigation District, Ser A, RB | |
| 5.000%, 07/01/17 | 2.0 |
| California State, GO | |
| 5.000%, 09/01/20 | 2.0 |
| California State, Public Works Board, University of California Research Project, Ser L, RB, NATL-RE | |
| Callable 11/1/2015 @ 100 | |
| 5.250%, 11/01/16 | 2.0 |
| * | Excludes Cash Equivalents |
CNI CHARTER FUNDS | PAGE 12
fund overview
Full Maturity Fixed Income Fund
The Fund seeks to provide a high level of current income, consistent with the preservation of capital by investing primarily in fixed income securities either issued or guaranteed by the U.S. Government or its agencies or instrumentalities, money market instruments, non-convertible fixed income securities of U.S. companies and U.S. dollar-denominated debt obligations issued by foreign governments and corporations.
Comparison of Change in the Value of a $10,000 Investment in the Full Maturity Fixed Income Fund, Institutional Class Shares and Class N Shares, versus the Barclays Capital U.S. Aggregate Bond Index, the Barclays Capital U.S. Intermediate Government/Credit Bond Index, and the Lipper Corporate Debt Funds A-Rated Objective (1)
| (1) | The performance in the above graph does not reflect the deduction of taxes the shareholder will pay on Fund distributions or the redemptions of Fund shares. Investment performance reflects fee waivers in effect. In the absence of such waivers, total return would be reduced. |
Past performance is no indication of future performance.
The Fund’s comparative benchmarks do not include the annual operating expenses incurred by the Fund. Please note that one cannot invest directly in an unmanaged index.
AVERAGE ANNUAL TOTAL RETURNS |
| | | | | | |
| | | | | | |
| | | | | | |
Barclays Capital U.S. Aggregate Bond Index | | | | | | |
Barclays Capital U.S. Intermediate Government/Credit Bond Index | | | | | | |
Lipper Corporate Debt Funds A-Rated Objective | | | | | | |
| (1) | Class I Shares of the predecessor to the Full Maturity Fixed Income Fund (the “Predecessor Fund”) commenced operations on October 20, 1988. On September 30, 2005, the Predecessor Fund reorganized into the Fund. The performance results for Institutional Class Shares of the Fund for the period of October 20, 1988 to September 29, 2005, reflects the performance of the Predecessor Fund’s Class I Shares. |
| (2) | Class I Shares of the predecessor to the Full Maturity Fixed Income Fund (the “Predecessor Fund”) commenced operations on October 20, 1988. Class A Shares of the Predecessor Fund, the predecessor to the Class N Shares of the Fund, commenced operations on May 11, 2004. On September 30, 2005, the Predecessor Fund reorganized into the Fund. The performance results for Class N Shares of the Fund for the period of May 11, 2004, to September 29, 2005, reflects the performance of the Predecessor Fund’s Class A Shares. The performance results for Class N Shares of the Fund for the period of October 20, 1988 to May 11, 2004, reflects the performance of the Predecessor Fund’s Class I Shares. The performance of the Predecessor Fund’s Class I Shares has not been adjusted to reflect the higher Rule 12b-1 fees and expenses applicable to the Fund’s Class N Shares. If it had, the performance of the Fund’s Class N Shares would have been lower than that shown. |
| TOP TEN HOLDINGS* |
| % OF PORTFOLIO |
| U.S. Treasury Note | |
| 2.375%, 07/31/17 | 6.3 |
| U.S. Treasury Bond | |
| 6.250%, 08/15/23 | 4.1 |
| U.S. Treasury Note | |
| 2.625%, 11/15/20 | 3.0 |
| U.S. Treasury Note | |
| 1.750%, 07/31/15 | 2.3 |
| FNMA | |
| 4.625%, 10/15/13 | 2.3 |
| U.S. Treasury Note | |
| 2.375%, 09/30/14 | 2.0 |
| U.S. Treasury Note | |
| 4.750%, 05/15/14 | 1.8 |
| FNMA | |
| 5.500%, 04/01/36 | 1.5 |
| U.S. Treasury Note | |
| 2.375%, 03/31/16 | 1.4 |
| U.S. Treasury Bond | |
| 4.375%, 02/15/38 | 1.4 |
| * | Excludes Cash Equivalents |
CNI CHARTER FUNDS | PAGE 13
fund overview
High Yield Bond Fund
The Fund seeks to maximize total return by investing primarily in fixed income securities rated below investment grade including corporate bonds and debentures, convertible and preferred securities, zero coupon obligations and debt securities that are issued by U.S. and foreign governments and their agencies.
Comparison of Change in the Value of a $10,000 Investment in the High Yield Bond Fund, Institutional Class or Class N Shares, versus the Citigroup High Yield Market Capped Index, and the Lipper High Current Yield Objective(1)
| (1) | The performance in the above graph does not reflect the deduction of taxes the shareholder will pay on Fund distributions or the redemptions of Fund shares. Investment performance reflects fee waivers in effect. In the absence of such waivers, total return would be reduced. |
Past performance is no indication of future performance.
The Fund’s comparative benchmarks do not include the annual operating expenses incurred by the Fund. Please note that one cannot invest directly in an unmanaged index.
AVERAGE ANNUAL TOTAL RETURNS |
| | | | | | |
| | | | | | |
| | | | | | |
Citigroup High Yield Market Capped Index | | | | | | |
Lipper High Current Yield Objective | | | | | | |
| (1) | Commenced operations on January 14, 2000. |
| ^ | The Fund’s Institutional Class Shares are currently offered only to accounts for which City National Bank serves as trustee or in a fiduciary capacity. |
| TOP TEN HOLDINGS* |
| % OF PORTFOLIO |
| CIT Group | |
| 7.000%, 05/02/17 | 1.0 |
| Ironshore Holdings US | |
| 8.500%, 05/15/20 | 0.9 |
| Marquette Transportation | |
| 10.875%, 01/15/17 | 0.9 |
| Coleman Cable | |
| 9.000%, 02/15/18 | 0.9 |
| United Maritime Group | |
| 11.750%, 06/15/15 | 0.8 |
| CKE Restaurants | |
| 11.375%, 07/15/18 | 0.8 |
| AES | |
| 7.375%, 07/01/21 | 0.8 |
| Kratos Defense & Security Solutions | |
| 10.000%, 06/01/17 | 0.8 |
| iGate | |
| 9.000%, 05/01/16 | 0.8 |
| Quadra FNX Mining | |
| 7.750%, 06/15/19 | 0.8 |
| * | Excludes Cash Equivalents |
CNI CHARTER FUNDS | PAGE 14
fund overview
Multi-Asset Fund
The Fund seeks to generate a positive total return in excess of inflation in a manner consistent with capital preservation in all market environments by investing all or a substantial portion of its assets in other mutual funds or other types of funds like exchange-traded funds.
Comparison of Change in the Value of a $10,000 Investment in the Multi-Asset Fund, Institutional Class or Class N Shares, versus the Barclays Capital U.S. TIPS Index; a 60/40 hybrid of the following two indexes: the S&P 500 Index and the Barclays Capital U.S. Intermediate Government/Credit Index; the CPI + Annualized 500 basis points; the Lipper Absolute Return Funds Classification; and the Lipper Flexible Portfolio Funds Classification(1)
| (1) | The performance in the above graph does not reflect the deduction of taxes the shareholder will pay on Fund distributions or the redemptions of Fund shares. Investment performance reflects fee waivers in effect. In the absence of such waivers, total return would be reduced. |
Past performance is no indication of future performance.
The Fund’s comparative benchmarks do not include the annual operating expenses incurred by the Fund. Please note that one cannot invest directly in an unmanaged index.
AVERAGE ANNUAL TOTAL RETURNS |
| | | | | | |
| | | | | | |
| | | | | | |
Barclays Capital U.S. TIPS Index | | | | |
60/40 hybrid of the following two indexes: S&P 500 Index Barclays Capital U.S. Intermediate Government/Credit Index | | | | |
CPI + Annualized 500 basis points | | | | |
Lipper Absolute Return Funds Classification | | | | |
Lipper Flexible Portfolio Funds Classification | | | | |
| (1) | Commenced operations on October 1, 2007. |
| ^ | The Fund’s Institutional Class Shares are currently offered only to accounts for which City National Bank serves as trustee or in a fiduciary capacity. |
| TOP TEN HOLDINGS* |
| % OF PORTFOLIO |
| SPDR S&P 500 Fund | 8.4 |
| Oppenheimer International Bond Fund, Class A | 6.4 |
| CNI High Yield Bond Fund, Institutional Class | 5.8 |
| Vanguard Short-Term Bond Index Fund | 5.1 |
| Principal Preferred Securities Fund | 5.0 |
| Fidelity Floating Rate High Income Fund | 4.5 |
| CNI Corporate Bond Fund, Institutional Class | 4.3 |
| CNI Government Bond Fund, Institutional Class | 3.5 |
| Cohen & Steers International Realty Fund, Inc. | 3.1 |
| PIMCO Emerging Markets Bond Fund | 3.1 |
| * | Excludes Cash Equivalents |
CNI CHARTER FUNDS | PAGE 15
investment adviser’s report
Equity Funds
The fiscal year ended September 30, 2011 was really a tale of two markets. First, we experienced the continuation of a bull market that had begun in March of 2009. This market showed robust price appreciation and was accompanied by improving economic fundamentals. From September 30, 2010 through April 29, 2011, the S&P 500 Index returned 20.79% and the Nasdaq Composite Index returned 21.99%. This period was brought to an end by two major events. First, the Japanese earthquake and corresponding tsunami on March 11 brought the world’s fourth largest exporter (the United States is third) to its knees overnight. It took a while for this disaster’s economic effects to be felt but, within 30 to 60 days, the world’s industrial companies were feeling the full force of this disaster. The second market event was the sovereign debt issues being experienced by Greece, Ireland, Portugal, Italy and Spain. As the debate on how to resolve these issues became more public, it would not take long to adversely affect asset prices across the world.
The second half of the fiscal year was much more difficult and most of the gains achieved through the first half of the year were lost. From April 29, 2011 through September 30, 2011, the S&P 500 Index was down 16.26% while the Nasdaq Composite Index declined 15.57%. In addition to the lingering effects of the Japanese disaster and the raging debate on how to resolve the sovereign debt issues in Europe, there was a contentious debate on the home grown budget deficits here in the United States. While Japan’s economy is improving as the country continues to repair the damage brought by the earthquake, European and U.S. debt issues promise to be in the headlines for the foreseeable future.
So, at the end of the day, the Fund’s returns essentially were flat for the fiscal year ended September 30, 2011 with the S&P 500 Index returning 1.14% and the Nasdaq Composite Index returning 2.99% for the same period. Looking forward, we believe the equity market is inexpensive based on most valuation measures. However, we do not see tremendous upside in the equity market until there is some political resolution on how to address the U.S. and European fiscal problems.
All returns listed below relate to the 12-month period ended September 30, 2011 and are net of expenses. CNI Charter Funds’ returns refer to Institutional Class Shares. Other classes would have different returns.
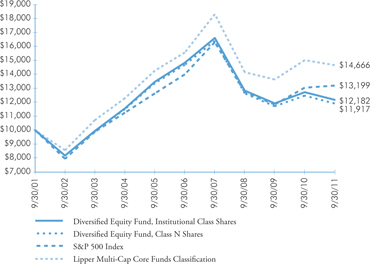
DIVERSIFIED EQUITY FUND
As with other equity funds, this was a volatile year for the Diversified Equity Fund. The Fund began the fiscal year with a lead on the S&P 500 Index at quarters ended December 31 and March 31, due in part to weightings in Energy, which saw oil prices spike during the Arab spring revolts, and Industrials and Materials as the economy was expanding. The markets slowed dramatically as the economic recovery looked like it may be stalled, and then went into a slide during the summer months when oil prices and industrial production dropped. The Information Technology sector split between those that were gaining by the new “cloud” technology and those being outpaced by recent developments. During the last fiscal quarter’s steep market drop, the Fund’s underweight in defensive sectors such as Consumer Staples, and no holdings in Utilities were a disadvantage relative to the Index.
The Fund produced a return of -4.27% for this fiscal year. Lipper Analytics compares this Fund to its Multi-Cap Core Funds Classification, which had a return of -2.36% for the same period. The S&P 500 Index was up 1.14% for the same period. At the beginning of September 2011, we terminated an equity portfolio manager which had contributed to the Fund’s underperformance versus the S&P 500 Index benchmark. We decided to allocate 60% of the Fund to the higher dividend paying stocks of the value oriented sub-adviser, SKBA Capital Management, LLC, with 40% allocated to the growth style sub-adviser, Turner Investment Partners, Inc.
At fiscal year end, the Fund is selectively allocated to Information Technology companies that seek to take advantage of the most recent advances in cloud computing, while poised for a slower economy, with the largest weightings in non-money center bank Financial sector equities (insurance companies and regional
CNI CHARTER FUNDS | PAGE 16
banks), and Healthcare sector corporations set to benefit from the current market. Consumer Discretionary holdings round out the fourth largest weighting, as the Fed continues to hold interest rates low to stimulate consumer spending on larger items that need to be financed by the average consumer.
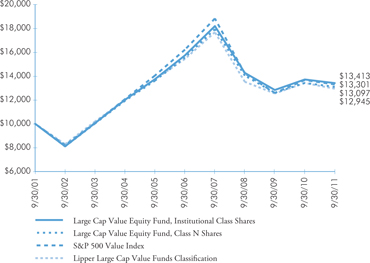
LARGE CAP VALUE EQUITY FUND
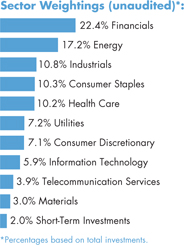
While all stocks experienced the downswing in markets during the final fiscal quarter, value oriented stocks in this Fund did relatively better than their peers. The strategy of seeking out of favor companies at attractive prices while keeping a focus on quality of financials has served the Fund well. Gains in Telecommunications and Information Technology aided returns, as did judicious selling of certain Energy related stocks before a dramatic downturn in oil prices caused the sector to decline significantly. While the overall Finance sector, which at year-end held the largest allocation at 22.4% of the portfolio, aided the Fund’s return for the year, a money center bank and insurance company were laggards in the portfolio. Other sectors contributing to returns were Industrials and Information Technology.
The Large Cap Value Equity Fund produced a return of -2.20%. The return was 46 basis points ahead of its primary benchmark, the S&P 500 Value Index, for the fiscal year. The Fund’s returns compared favorably to the Lipper Large-Cap Value Funds Classification median return of -3.54%.
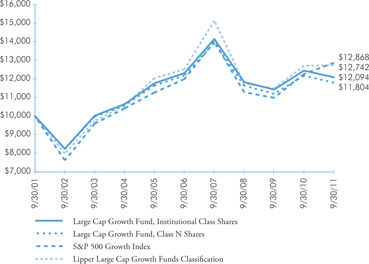
LARGE CAP GROWTH EQUITY FUND
While growth oriented stocks generally were in favor this year, they experienced a drawback in returns and the consensus was that the period of more aggressive expansion was over. During the final fiscal quarter, all growth style sectors experienced a slide in returns as investors reassessed the economic recovery. This Fund was no exception, and saw a retraction in results. The Large Cap Growth Equity Fund returns for the fiscal year were -2.86%, compared to 4.85% for the S&P 500 Growth Index. By comparison, the Lipper Large-Cap Growth Funds Classification median return was 0.27%.
The Fund did well during the first half of the year and underperformed during the second half of the year, mainly due to taking a more aggressive stance regarding the prospects for economic growth. As the likelihood of recession increased owing to concerns surrounding deteriorating U.S. economic growth and European sovereign debt issues, positions within economically sensitive sectors underperformed. This was particularly true for Consumer Discretionary, the second largest weighting in the portfolio at 13.3%, and smaller weightings in Materials and Energy sectors, where stocks in the Index performed better than those owned in the Fund. Holdings in Information Technology, which comprised the largest allocation of the Fund at 34.3%, produced mixed results. As part of the re-evaluation of overall growth prospects in the economy, the portfolio managers continue to employ a disciplined investment process focusing on higher quality companies with good earnings growth prospects and reasonable valuations.
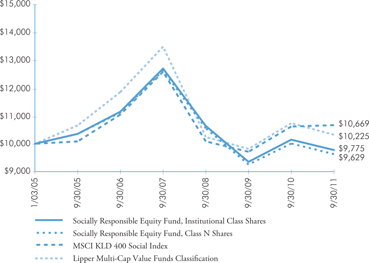
SOCIALLY RESPONSIBLE EQUITY FUND
The Socially Responsible Equity Fund seeks to invest in companies that follow “ESG” or environmental, social and governance guidelines. It is sub-advised by SKBA Capital Management, LLC, a value style equity manager with long-term experience in ESG responsible investing. Besides seeking companies with sound financial ratios and social worth, the Fund restricts investment in certain companies which are deemed not socially responsible, including tobacco and nuclear power companies. The avoidance of nuclear power worked to this Fund’s advantage earlier in 2011 after the Japanese tsunami and power plant crisis, as stocks of U.S. nuclear power generators dropped in a spillover effect.
For the fiscal year, this Fund was down 3.67%. Lipper classifies this Fund in the Multi-Cap Value category, as it follows a large cap bias but holds up to 20% in mid-sized capitalization companies.
At September 30, the 45 holdings in this portfolio were diversified towards dividend paying companies that will produce yields even in a slower economy. The heaviest sector weights were tilted towards non-money center
CNI CHARTER FUNDS | PAGE 17
investment adviser’s report
Equity Funds (continued)
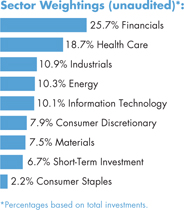
bank Financials, including insurance companies, at 25.7%; Healthcare companies set to benefit from current health testing and pharmaceutical market, 18.7%; and about 10% each in Industrials, Information Technology and Energy.
CSC SMALL CAP VALUE FUND (FORMERLY, “RCB SMALL CAP VALUE FUND”)
On July 1, 2011, the portfolio management team that has sub-advised the Fund since inception established Cove Street Capital, LLC, and the CNI Charter Funds elected to hire Cove Street Capital to serve as the Fund’s sub-adviser with the same portfolio team and renamed this Fund from “RCB” to “CSC” to reflect the sub-adviser change. During this fiscal year, the Fund experienced wider volatility which is common for smaller capitalized stocks in a market downturn compared with large capitalized stocks. Although the Fund lagged its Lipper category during the first three fiscal quarters, the sub-adviser had increased the Fund’s cash position to 16% in mid-July, which proved beneficial at the beginning of the market downturn in the final fiscal quarter and helped mitigate overall returns for the year. Despite a strong showing in the final fiscal quarter, returns for the fiscal year for the Fund were -7.38% compared to the median Lipper Small-Cap Core Funds Classification return of -2.88%.
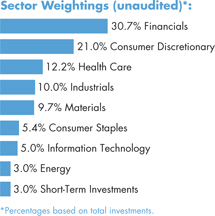
The Fund held a concentrated portfolio, consisting of 29 stocks at year end. Therefore, selection of stocks is more important than in a broadly diversified portfolio. Several detractors from performance for the year were in the Materials and Energy sectors, somewhat countered by gains in the Financial (insurance) and both Consumer sectors: Staples and Discretionary.
The following pages provide an overview of each of the Equity Funds managed by CNAM. Please visit cnicharterfunds.com for the most current returns.
Sincerely,
 | |
| Oliver Campbell | Otis “Tres” Heald |
Directors of Equity Investments
City National Asset Management, Inc.
Timothy G. Solberg, CFA
Director of Sub-advised Funds
City National Asset Management, Inc.
This material represents the managers’ assessment of the portfolios and market environment at a specific point in time and should not be relied upon by the reader as research or investment advice.
CNI CHARTER FUNDS | PAGE 18
fund overview
Diversified Equity Fund
The Fund seeks to provide long-term capital growth by investing primarily in common stocks of large-capitalization U.S. companies that are diversified among various industries and market sectors.
Comparison of Change in the Value of a $10,000 Investment in the Diversified Equity Fund, Institutional Class Shares and Class N Shares, versus the S&P 500 Index, and the Lipper Multi-Cap Core Funds Classification(1)
| (1) | The performance in the above graph does not reflect the deduction of taxes the shareholder will pay on Fund distributions or the redemptions of Fund shares. Investment performance reflects fee waivers in effect. In the absence of such waivers, total return would be reduced. |
Past performance is no indication of future performance.
The Fund’s comparative benchmarks do not include the annual operating expenses incurred by the Fund. Please note that one cannot invest directly in an unmanaged index.
AVERAGE ANNUAL TOTAL RETURNS |
| | | | | | |
| | | | | | |
| | | | | | |
| | | | | | |
Lipper Multi-Cap Core Funds Classification | | | | | | |
| (1) | Class I Shares of the predecessor to the Diversified Equity Fund (the “Predecessor Fund”) commenced operations on October 20, 1988. On September 30, 2005, the Predecessor Fund reorganized into the Fund. The performance results for Institutional Class Shares of the Fund for the period of October 20, 1988 to September 29, 2005, reflects the performance of the Predecessor Fund’s Class I Shares. |
| (2) | Class I Shares of the predecessor to the Diversified Equity Fund (the “Predecessor Fund”) commenced operations on October 20, 1988. Class A Shares of the Predecessor Fund, the predecessor to the Class N Shares of the Fund, commenced operations on December 30, 2002. On September 30, 2005, the Predecessor Fund reorganized into the Fund. The performance results for Class N Shares of the Fund for the period of December 30, 2002, to September 29, 2005, reflects the performance of the Predecessor Fund’s Class A Shares. The performance results for Class N Shares of the Fund for the period of October 20, 1988 to December 30, 2002, reflects the performance of the Predecessor Fund’s Class I Shares. The performance of the Predecessor Fund’s Class I Shares has not been adjusted to reflect the higher Rule 12b-1 fees and expenses applicable to the Fund’s Class N Shares. If it had, the performance of the Fund’s Class N Shares would have been lower than that shown. |
| TOP TEN HOLDINGS* |
| % OF PORTFOLIO |
| Apple | 2.8 |
| Brookfield Asset Management, Cl A | 2.3 |
| Tyco International | 2.1 |
| PepsiCo | 1.9 |
| IBM | 1.9 |
| Berkshire Hathaway, Cl B | 1.8 |
| BB&T | 1.8 |
| CareFusion | 1.7 |
| HCC Insurance Holdings | 1.7 |
| Covidien | 1.7 |
| * | Excludes Cash Equivalents |
CNI CHARTER FUNDS | PAGE 19
fund overview
Large Cap Value Equity Fund
The Fund seeks to provide capital appreciation and moderate income consistent with current returns available in the marketplace by investing in large U.S. corporations and U.S. dollar denominated American Depositary Receipts of large foreign corporations which are undervalued.
Comparison of Change in the Value of a $10,000 Investment in the Large Cap Value Equity Fund, Institutional Class or Class N Shares, versus the S&P 500 Value Index, and the Lipper Large Cap Value Funds Classification(1)
| (1) | The performance in the above graph does not reflect the deduction of taxes the shareholder will pay on Fund distributions or the redemptions of Fund shares. Investment performance reflects fee waivers in effect. In the absence of such waivers, total return would be reduced. |
Past performance is no indication of future performance.
The Fund’s comparative benchmarks do not include the annual operating expenses incurred by the Fund. Please note that one cannot invest directly in an unmanaged index.
AVERAGE ANNUAL TOTAL RETURNS |
| | | | | | |
| | | | | | |
| | | | | | |
| | | | | | |
Lipper Large Cap Value Funds Classification | | | | | | |
| (1) | Commenced operations on January 14, 2000. |
| (2) | Commenced operations on April 13, 2000. |
| ^ | The Fund’s Institutional Class Shares are currently offered only to accounts for which City National Bank serves as trustee or in a fiduciary capacity. |
| † | Class N Shares’ performance for the period of January 14, 2000 to April 13, 2000 was calculated using the performance of the Institutional Class Shares adjusted to reflect the expenses of the Class N Shares. If performance of the Institutional Class Shares had not been adjusted, the performance of the Class N Shares for that period would have been higher because the expenses of the Class N Shares are higher than those of the Institutional Class Shares. |
| TOP TEN HOLDINGS |
| % OF PORTFOLIO |
| Exxon Mobil | 3.7 |
| Chevron | 3.6 |
| ConocoPhillips | 3.2 |
| Berkshire Hathaway, Cl B | 2.5 |
| JPMorgan Chase | 2.5 |
| Wal-Mart Stores | 2.5 |
| General Electric | 2.5 |
| Wells Fargo | 2.4 |
| Procter & Gamble | 2.2 |
| Comcast, Cl A | 2.0 |
CNI CHARTER FUNDS | PAGE 20
fund overview
Large Cap Growth Equity Fund
The Fund seeks to provide capital appreciation by investing in large U.S. corporations and U.S. dollar denominated American Depositary Receipts of large foreign corporations with the potential for growth.
Comparison of Change in the Value of a $10,000 Investment in the Large Cap Growth Equity Fund, Institutional Class or Class N Shares, versus the S&P 500 Growth Index, and the Lipper Large Cap Growth Funds Classification(1)
| (1) | The performance in the above graph does not reflect the deduction of taxes the shareholder will pay on Fund distributions or the redemptions of Fund shares. Investment performance reflects fee waivers in effect. In the absence of such waivers, total return would be reduced. |
Past performance is no indication of future performance.
The Fund’s comparative benchmarks do not include the annual operating expenses incurred by the Fund. Please note that one cannot invest directly in an unmanaged index.
AVERAGE ANNUAL TOTAL RETURNS |
| | | | | | |
| | | | | | |
| | | | | | |
| | | | | | |
Lipper Large Cap Growth Funds Classification | | | | | | |
| (1) | Commenced operations on January 14, 2000. |
| (2) | Commenced operations on March 28, 2000. |
| ^ | The Fund’s Institutional Class Shares are currently offered only to accounts for which City National Bank serves as trustee or in a fiduciary capacity. |
| † | Class N Shares’ performance for the period of January 14, 2000 to March 28, 2000 was calculated using the performance of the Institutional Class Shares adjusted to reflect the expenses of the Class N Shares. If performance of the Institutional Class Shares had not been adjusted, the performance of the Class N Shares for that period would have been higher because the expenses of the Class N Shares are higher than those of the Institutional Class Shares. |
| TOP TEN HOLDINGS |
| % OF PORTFOLIO |
| Apple | 9.5 |
| Google, Cl A | 4.5 |
| IBM | 4.3 |
| Celgene | 3.3 |
| Qualcomm | 3.3 |
| Mastercard, Cl A | 2.7 |
| EMC | 2.6 |
| Oracle | 2.5 |
| Gilead Sciences | 2.4 |
| Cummins | 2.3 |
CNI CHARTER FUNDS | PAGE 21
fund overview
September 30, 2011
Socially Responsible Equity Fund
The Fund seeks to provide long-term capital growth by investing primarily in common stocks of U.S. issuers that meet certain socially responsible criteria.
Comparison of Change in the Value of a $10,000 Investment in the Socially Responsible Equity Fund, Institutional Class Shares and Class N Shares, versus the MSCI KLD 400 Social Index and the Lipper Multi-Cap Value Funds Classification(1)
| (1) | The performance in the above graph does not reflect the deduction of taxes the shareholder will pay on Fund distributions or the redemptions of Fund shares. Investment performance reflects fee waivers in effect. In the absence of such waivers, total return would be reduced. |
Past performance is no indication of future performance.
The Fund’s comparative benchmarks do not include the annual operating expenses incurred by the Fund. Please note that one cannot invest directly in an unmanaged index.
AVERAGE ANNUAL TOTAL RETURNS |
| | | | | | |
| | | | | | |
| | | | | | |
MSCI KLD 400 Social Index | | | | | |
Lipper Multi-Cap Value Funds Classification | | | | | |
| (1) | Class I Shares of the predecessor to the Socially Responsible Equity Fund (the “Predecessor Fund”) commenced operations on January 3, 2005. On September 30, 2005, the Predecessor Fund reorganized into the Fund. The performance results for Institutional Class Shares of the Fund for the period of January 3, 2005 to September 29, 2005, reflects the performance of the Predecessor Fund’s Class I Shares. |
| (2) | Class I Shares of the predecessor to the Socially Responsible Equity Fund (the “Predecessor Fund”) commenced operations on January 3, 2005. Class A Shares of the Predecessor Fund, the predecessor to the Class N Shares of the Fund, commenced operations on August 12, 2005. On September 30, 2005, the Predecessor Fund reorganized into the Fund. The performance results for Class N Shares of the Fund for the period of August 12, 2005, to September 29, 2005, reflects the performance of the Predecessor Fund’s Class A Shares. The performance results for Class N Shares of the Fund for the period of January 3, 2005 to August 12, 2005, reflects the performance of the Predecessor Fund’s Class I Shares. The performance of the Predecessor Fund’s Class I Shares has not been adjusted to reflect the higher Rule 12b-1 fees and expenses applicable to the Fund’s Class N Shares. If it had, the performance of the Fund’s Class N Shares would have been lower than that shown. |
| TOP TEN HOLDINGS* |
| % OF PORTFOLIO |
| Chubb | 3.5 |
| Spectra Energy | 3.4 |
| Brookfield Asset Management, Cl A | 3.4 |
| Bristol-Myers Squibb | 3.2 |
| Berkshire Hathaway, Cl B | 3.0 |
| ConocoPhillips | 3.0 |
| Abbott Laboratories | 2.9 |
| Automatic Data Processing | 2.8 |
| Patterson | 2.8 |
| Analog Devices | 2.8 |
| * | Excludes Cash Equivalents |
CNI CHARTER FUNDS | PAGE 22
fund overview
CSC Small Cap Value Fund††
The Fund seeks to provide capital appreciation by investing primarily in smaller U.S. corporations which are considered undervalued.
Comparison of Change in the Value of a $10,000 Investment in the CSC Small Cap Value Fund, Institutional Class, Class N Shares, or Class R Shares, versus the Russell 2500 Value Index, the Russell 2000 Index, the Russell 2000 Value Index, the Lipper Small Cap Value Funds Classification, and the Lipper Small Cap Core Funds Classification(1)
| (1) | The performance in the above graph does not reflect the deduction of taxes the shareholder will pay on Fund distributions or the redemptions of Fund shares. Investment performance reflects fee waivers in effect. In the absence of such waivers, total return would be reduced. |
Past performance is no indication of future performance.
The Fund’s comparative benchmarks do not include the annual operating expenses incurred by the Fund. Please note that one cannot invest directly in an unmanaged index.
AVERAGE ANNUAL TOTAL RETURNS |
| | | | | | |
Institutional Class (1)^† | | | | | | |
| | | | | | |
| | | | | | |
| | | | | | |
| | | | | | |
| | | | | | |
| | | | | | |
Lipper Small Cap Value Funds Classification | | | | | | |
Lipper Small Cap Core Funds Classification | | | | | | |
| (1) | Commenced operations on October 3, 2001. |
| (2) | The Fund’s predecessor commenced operations on September 30, 1998, and reorganized into Class R shares of the Fund on October 1, 2001. |
| ^ | The Fund’s Institutional Class Shares are currently offered only to accounts for which City National Bank serves as trustee or in a fiduciary capacity. |
| † | The performance of the Institutional Class and Class N Shares for October 1, 2001, and October 2, 2001, reflects the performance of the Fund’s Class R shares. The performance of all share classes for the period prior to October 1, 2001, reflects the performance of the Class R Shares of the Fund’s predecessor, which commenced operations on September 30, 1998, and reorganized into the Fund’s Class R Shares on October 1, 2001. The performance of the predecessor fund’s Class R Shares has not been adjusted to reflect the expenses applicable to Institutional and Class N Shares. If performance of the predecessor fund’s Class R Shares had been adjusted, the performance of the Institutional Class and Class N Shares would have been higher because the expenses of the predecessor fund’s Class R Shares are higher than those of the Fund's Institutional Class and Class N Shares. |
| †† | See Note 1 in Notes to Financial Statements. |
| TOP TEN HOLDINGS |
| % OF PORTFOLIO |
| White Mountains Insurance Group | 7.3 |
| HSN | 5.7 |
| Alleghany | 5.5 |
| Central Garden & Pet, Cl A | 5.4 |
| Teleflex | 5.4 |
| Wendy's | 5.1 |
| Coinstar | 4.9 |
| PerkinElmer | 4.3 |
| Symetra Financial | 4.1 |
| Hallmark Financial Services | 3.6 |
CNI CHARTER FUNDS | PAGE 23
schedule of investments
Government Money Market Fund
| | | | | |
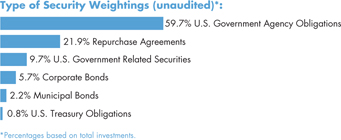
| U.S. Government Agency Obligations [59.7%] | | | | |
| FAMC DN (A) | | | | | | |
| 0.020%, 10/06/11 | | $ | 15,000 | | | $ | 15,000 | |
| 0.060%, 10/07/11 | | | 23,000 | | | | 23,000 | |
| 0.060%, 10/24/11 | | | 31,750 | | | | 31,749 | |
| 0.050%, 12/01/11 | | | 19,000 | | | | 18,998 | |
| 0.120%, 02/03/12 | | | 30,000 | | | | 29,988 | |
| 0.140%, 04/25/12 | | | 27,000 | | | | 26,978 | |
| FFCB | | | | | | | | |
| 0.154%, 12/14/11(B) | | | 50,000 | | | | 50,000 | |
| 0.250%, 07/02/12 | | | 24,400 | | | | 24,397 | |
| FFCB DN | | | | | | | | |
| 0.010%, 10/24/11(A) | | | 10,000 | | | | 10,000 | |
| FHLB | | | | | | | | |
| 0.216%, 10/13/11(B) | | | 50,000 | | | | 50,003 | |
| 0.230%, 10/21/11 | | | 47,000 | | | | 47,001 | |
| 0.132%, 10/27/11(B) | | | 40,000 | | | | 40,000 | |
| 0.300%, 11/08/11 | | | 50,000 | | | | 50,000 | |
| 0.260%, 11/23/11 | | | 50,000 | | | | 49,998 | |
| 0.750%, 12/21/11 | | | 55,000 | | | | 55,058 | |
| 0.370%, 01/04/12 | | | 10,440 | | | | 10,447 | |
| 0.100%, 01/18/12 | | | 20,000 | | | | 19,999 | |
| 0.180%, 01/24/12(B) | | | 30,000 | | | | 30,003 | |
| 0.250%, 04/04/12 | | | 17,100 | | | | 17,099 | |
| 0.130%, 05/15/12 | | | 15,000 | | | | 14,998 | |
| 0.260%, 07/06/12 | | | 25,000 | | | | 24,999 | |
| 0.330%, 07/16/12 | | | 25,000 | | | | 25,000 | |
| 0.130%, 07/18/12(B) | | | 20,000 | | | | 20,000 | |
| 0.330%, 08/08/12 | | | 20,000 | | | | 20,000 | |
| 0.450%, 09/24/12 | | | 10,000 | | | | 10,001 | |
| FHLB DN (A) | | | | | | | | |
| 0.009%, 10/07/11 | | | 36,827 | | | | 36,827 | |
| 0.030%, 10/17/11 | | | 25,000 | | | | 25,000 | |
| 0.025%, 10/19/11 | | | 25,000 | | | | 25,000 | |
| 0.080%, 10/21/11 | | | 50,000 | | | | 49,998 | |
| 0.012%, 10/28/11 | | | 21,350 | | | | 21,350 | |
| 0.020%, 11/02/11 | | | 20,000 | | | | 20,000 | |
| 0.050%, 11/04/11 | | | 35,246 | | | | 35,244 | |
| 0.030%, 11/25/11 | | | 45,000 | | | | 44,998 | |
| 0.100%, 01/18/12 | | | 33,000 | | | | 32,990 | |
| FHLMC | | | | | | | | |
| 0.185%, 08/10/12(B) | | | 20,000 | | | | 20,002 | |
| FHLMC DN (A) | | | | | | | | |
| 0.134%, 10/03/11 | | $ | 60,626 | | | $ | 60,625 | |
| 0.001%, 10/06/11 | | | 25,000 | | | | 25,000 | |
| 0.001%, 10/13/11 | | | 15,960 | | | | 15,960 | |
| 0.001%, 10/18/11 | | | 10,068 | | | | 10,068 | |
| 0.001%, 10/24/11 | | | 50,000 | | | | 50,000 | |
| 0.001%, 10/31/11 | | | 23,811 | | | | 23,811 | |
| 0.180%, 12/13/11 | | | 50,000 | | | | 49,982 | |
| 0.120%, 01/03/12 | | | 30,000 | | | | 29,991 | |
| 0.060%, 01/09/12 | | | 44,000 | | | | 43,993 | |
| 0.090%, 02/07/12 | | | 28,712 | | | | 28,703 | |
| 0.100%, 02/13/12 | | | 15,887 | | | | 15,881 | |
| 0.110%, 03/13/12 | | | 25,000 | | | | 24,987 | |
| 0.140%, 08/06/12 | | | 25,000 | | | | 24,970 | |
| FICO STRIP PO (A) | | | | | | | | |
| 0.080%, 10/05/11 | | | 10,000 | | | | 10,000 | |
| 0.190%, 04/05/12 | | | 14,445 | | | | 14,431 | |
| FNMA | | | | | | | | |
| 2.000%, 01/09/12 | | | 45,000 | | | | 45,229 | |
| 0.875%, 01/12/12 | | | 25,000 | | | | 25,042 | |
| FNMA DN (A) | | | | | | | | |
| 0.100%, 10/03/11 | | | 100,000 | | | | 99,999 | |
| 0.060%, 10/19/11 | | | 30,000 | | | | 29,999 | |
| 0.080%, 11/02/11 | | | 50,000 | | | | 49,996 | |
| 0.110%, 11/14/11 | | | 50,000 | | | | 49,993 | |
| 0.190%, 12/01/11 | | | 50,000 | | | | 49,984 | |
| 0.140%, 12/19/11 | | | 30,000 | | | | 29,991 | |
| 0.020%, 12/28/11 | | | 50,000 | | | | 49,998 | |
| 0.090%, 01/03/12 | | | 50,000 | | | | 49,988 | |
| 0.180%, 05/01/12 | | | 17,000 | | | | 16,982 | |
Total U.S. Government Agency Obligations (Cost $1,951,728) | | | | 1,951,728 | |
| U.S. Government Related Securities [9.7%] | | | | | |
| Straight-A Funding (A) | | | | | | | | |
| 0.190%, 11/01/11 | | | 40,000 | | | | 39,994 | |
| 0.190%, 11/14/11 | | | 40,000 | | | | 39,991 | |
| 0.190%, 12/19/11 | | | 59,191 | | | | 59,166 | |
| 0.190%, 12/20/11 | | | 25,000 | | | | 24,989 | |
| 0.180%, 11/02/11 | | | 24,000 | | | | 23,996 | |
| 0.170%, 12/12/11 | | | 50,000 | | | | 49,983 | |
| 0.160%, 10/26/11 | | | 27,300 | | | | 27,297 | |
| 0.120%, 10/04/11 | | | 46,044 | | | | 46,044 | |
| 0.090%, 10/05/11 | | | 5,400 | | | | 5,400 | |
Total U.S. Government Related Securities (Cost $316,860) | | | | 316,860 | |
See accompanying notes to financial statements.
CNI CHARTER FUNDS | PAGE 24
schedule of investments
Government Money Market Fund (continued)
| Corporate Bonds [5.6%] | | | | | | | | |
| Banks [2.6%] | | | | | | | | |
| American Express Bank, FDIC Insured, MTN | | | | | | | | |
| 3.150%, 12/09/11 | | $ | 22,250 | | | $ | 22,379 | |
| Bank of America, FDIC Insured, MTN | | | | | | | | |
| 2.100%, 04/30/12 | | | 20,000 | | | | 20,224 | |
| 0.555%, 06/22/12(B) | | | 9,100 | | | | 9,123 | |
| Regions Bank, FDIC Insured, MTN | | | | | | | | |
| 3.250%, 12/09/11 | | | 28,063 | | | | 28,229 | |
| US Central Federal Credit Union | | | | | | | | |
| 1.250%, 10/19/11 | | | 6,249 | | | | 6,252 | |
| | | | 86,207 | |
| Financial Services [1.7%] | | | | | |
| Citigroup, FDIC Insured | | | | | | | | |
| 2.875%, 12/09/11 | | | 42,000 | | | | 42,221 | |
| General Electric Capital, FDIC Insured, MTN | | | | | | | | |
| 2.250%, 03/12/12 | | | 12,940 | | | | 13,061 | |
| | | | 55,282 | |
| Investment Banker/Broker Dealer [1.3%] | | | | | |
| Goldman Sachs Group | | | | | | | | |
| 0.522%, 11/09/11(B) | | | 13,420 | | | | 13,427 | |
| Morgan Stanley, FDIC Insured | | | | | | | | |
| 3.250%, 12/01/11 | | | 25,000 | | | | 25,130 | |
| 1.176%, 12/01/11(B) | | | 5,400 | | | | 5,410 | |
Total Investment Banker/Broker Dealer | | | | 43,967 | |
Total Corporate Bonds (Cost $185,456) | | | | 185,456 | |
| | | | | | | | | |
| Municipal Bonds [2.2%] | | | | | | | | |
| California [0.5%] | | | | | | | | |
| California Statewide, Communities Development Authority, Fairway Family Apartments Project, Ser PP, RB, FNMA (B) (C) | | | | | | | | |
| 0.170%, 10/06/11 | | | 8,000 | | | | 8,000 | |
| Sacramento County, Housing Authority, Ashford Heights Apartments Project, Ser H, RB, FNMA (B) (C) | | | | | | | | |
| 0.180%, 10/06/11 | | | 9,000 | | | | 9,000 | |
| | | | 17,000 | |
| Nevada [0.6%] | | | | | | | | |
| Nevada, Housing Division, Vista Creek Project, RB, FNMA (B) (C) | | | | | | | | |
| | $ | 21,000 | | | $ | 21,000 | |
| Texas [0.9%] | | | | | | | | |
| Houston, Housing Finance, Regency Park Apartments Project, RB, FNMA (B) (C) | | | | | | | | |
| 0.210%, 10/6/11 | | | 13,900 | | | | 13,900 | |
| Texas State, Department of Housing & Community Affairs, Idlewilde Apartments Project, RB, FNMA (B) (C) | | | | | | | | |
| 0.180%, 10/06/11 | | | 13,935 | | | | 13,935 | |
| | | | 27,835 | |
| Washington [0.2%] | | | | | | | | |
| Washington State, Housing Finance Commission, Vintage Spokane Project, Ser A, RB, FNMA (B) (C) | | | | | | | | |
| | | 8,000 | | | | 8,000 | |
Total Municipal Bonds (Cost $73,835) | | | | | | | 73,835 | |
| | | | | | | | | |
| U.S. Treasury Obligation [0.8%] | | | | | | | | |
| U.S. Treasury Note | | | | | | | | |
| 0.875%, 01/31/12 | | | 25,000 | | | | 25,068 | |
Total U.S. Treasury Obligation (Cost $25,068) | | | | 25,068 | |
| Repurchase Agreements(D) [21.9%] | | | | | |
| Bank of America | | | | | | | | |
| 0.030%, dated 09/30/11, repurchased on 10/03/11, repurchase price $337,000,843 (collateralized by various U.S. Government obligations, ranging in par value $1,161,000-$54,667,000, 0.000%-5.625%, 08/01/12-11/23/35; with total market value $343,740,632) | | | 337,000 | | | | 337,000 | |
See accompanying notes to financial statements.
CNI CHARTER FUNDS | PAGE 25
schedule of investments
Government Money Market Fund (concluded)
| Barclays | | | | | | | | |
| 0.050%, dated 09/30/11, repurchased on 10/03/11, repurchase price $62,300,260 (collateralized by a FHLB and FNMA obligation, ranging in par value $3,315,000-$56,789,000, 2.750%-3.625%, 03/13/14-03/12/21; with total market value $63,549,235) | | $ | 62,300 | | | $ | 62,300 | |
| Deutsche Bank | | | | | | | | |
| 0.050%, dated 09/30/11, repurchased on 10/03/11, repurchase price $265,001,104 (collateralized by various U.S. Government obligations, ranging in par value $28,317,000-$90,065,000, 0.000%-6.030%, 08/01/12-01/15/37; with total market value $270,300,538) | | | 265,000 | | | | 265,000 | |
| Goldman Sachs | | | | | | | | |
| 0.040%, dated 09/30/11, repurchased on 10/03/11, repurchase price $50,000,167 (collateralized by various U.S. Government obligations, ranging in par value $5,447,000-$9,642,000, 0.000%-5.000%, 03/14/12-09/03/30; with total market value $51,000,033) | | | 50,000 | | | | 50,000 | |
Total Repurchase Agreements (Cost $714,300) | | | | 714,300 | |
Total Investments [99.9%] (Cost $3,267,247) | | | $ | 3,267,247 | |
Percentages are based on Net Assets of $3,269,019 ($ Thousands).
| (A) | Zero coupon security. The rate reported is the effective yield at time of purchase. |
| (B) | Floating Rate Security — The rate reported is the rate in effect on September 30, 2011. |
| (C) | Put and Demand Feature — The date reported is the next reset date or put date. |
| (D) | Tri-Party Repurchase Agreement. |
DN — Discount Note
FAMC — Federal Agriculture Mortgage Corporation
FDIC Insured — Federal Depositary Insurance Corporation
FFCB — Federal Farm Credit Bank
FHLB — Federal Home Loan Bank
FHLMC — Federal Home Loan Mortgage Corporation
FICO — Financing Corporation
FNMA — Federal National Mortgage Association
MTN — Medium Term Note
PO — Principal Only
RB — Revenue Bond
Ser — Series
STRIP — Separate trading of registered interest and principal of securities.
As of September 30, 2011, all of the Fund’s investments are Level 2.
For the year ended September 30, 2011, there have been no transfers between Level 1 and Level 2 assets and liabilities. Transfers between Levels are recognized at period end.
For more information on valuation inputs, see Note 2 — Significant Accounting Policies in the Notes to Financial Statements.
See accompanying notes to financial statements.
CNI CHARTER FUNDS | PAGE 26
schedule of investments
Prime Money Market Fund
| | | | | |
| Commercial Paper [62.5%] | | | | | | |
| Banks [20.5%] | | | | | | |
| Australia & New Zealand Banking Group (A) | | | | | | |
| 0.230%, 12/07/11 | | $ | 15,000 | | | $ | 14,993 | |
| Bank of America | | | | | | | | |
| 0.240%, 10/31/11 | | | 15,000 | | | | 14,997 | |
| Bank of Nova Scotia | | | | | | | | |
| 0.075%, 10/12/11 | | | 15,000 | | | | 15,000 | |
| 0.070%, 10/03/11 | | | 15,000 | | | | 15,000 | |
| BNZ International Funding (A) | | | | | | | | |
| 0.382%, 05/22/12 | | | 20,000 | | | | 20,002 | |
| 0.260%, 11/23/11 | | | 10,000 | | | | 9,996 | |
| 0.250%, 10/06/11 | | | 10,750 | | | | 10,750 | |
| Commonwealth Bank of Australia (A) | | | | | | | | |
| 0.398%, 06/22/12 | | | 10,000 | | | | 9,996 | |
| Korea Development Bank | | | | | | | | |
| 0.410%, 10/24/11 | | | 15,000 | | | | 14,996 | |
| 0.350%, 10/14/11 | | | 10,000 | | | | 9,999 | |
| 0.300%, 10/07/11 | | | 10,000 | | | | 9,999 | |
| Manhattan Asset Funding (A) | | | | | | | | |
| 0.240%, 10/24/11 | | | 10,000 | | | | 9,998 | |
| National Australia Funding Delaware (A) | | | | | | | | |
| 0.250%, 11/01/11 | | | 15,000 | | | | 14,997 | |
| Sumitomo Corp of America | | | | | | | | |
| 0.320%, 12/12/11 | | | 10,000 | | | | 9,994 | |
| 0.270%, 11/07/11 | | | 15,000 | | | | 14,996 | |
| 0.220%, 10/18/11 | | | 15,000 | | | | 14,998 | |
| Sumitomo Mitsui Banking (A) | | | | | | | | |
| 0.270%, 11/01/11 | | | 15,000 | | | | 14,996 | |
| 0.180%, 10/04/11 | | | 15,000 | | | | 15,000 | |
| Toronto-Dominion Holdings USA (A) | | | | | | | | |
| 0.090%, 11/22/11 | | | 15,000 | | | | 14,998 | |
| 0.040%, 10/27/11 | | | 10,000 | | | | 10,000 | |
| Westpac Securities NZ (A) | | | | | | | | |
| 0.340%, 12/16/11 | | | 10,000 | | | | 9,993 | |
| | | | 275,698 | |
| Computer System Design & Services [1.1%] | | | | | |
| Hewlett-Packard (A) | | | | | | | | |
| | $ | 15,000 | | | $ | 15,000 | |
| Financial Services [17.0%] | | | | | | | | |
| American Honda Finance | | | | | | | | |
| 0.160%, 11/15/11 | | | 10,000 | | | | 9,998 | |
| BTM Capital (A) | | | | | | | | |
| 0.350%, 10/03/11 | | | 15,000 | | | | 15,000 | |
| CAFCO (A) | | | | | | | | |
| 0.150%, 10/03/11 | | | 15,000 | | | | 15,000 | |
| Caisse Centrale Desjardins du Quebec (A) | | | | | | | | |
| 0.290%, 12/28/11 | | | 15,000 | | | | 14,989 | |
| 0.140%, 10/03/11 | | | 15,000 | | | | 15,000 | |
| General Electric Capital | | | | | | | | |
| 0.130%, 10/14/11 | | | 10,000 | | | | 10,000 | |
| Gotham Funding (A) | | | | | | | | |
| 0.220%, 10/06/11 | | | 14,000 | | | | 14,000 | |
| 0.220%, 10/26/11 | | | 10,000 | | | | 9,998 | |
| John Deere Credit (A) | | | | | | | | |
| 0.090%, 10/19/11 | | | 15,000 | | | | 14,999 | |
| 0.070%, 10/13/11 | | | 19,000 | | | | 18,999 | |
| 0.060%, 10/06/11 | | | 5,000 | | | | 5,000 | |
| MetLife Short Term Funding (A) | | | | | | | | |
| 0.180%, 10/17/11 | | | 6,200 | | | | 6,199 | |
| 0.180%, 10/31/11 | | | 15,000 | | | | 14,998 | |
| 0.160%, 10/04/11 | | | 13,647 | | | | 13,647 | |
| Old Line Funding (A) | | | | | | | | |
| 0.160%, 10/21/11 | | | 15,750 | | | | 15,749 | |
| Toyota Financial Services de Puerto Rico | | | | | | | | |
| 0.080%, 10/07/11 | | | 10,000 | | | | 10,000 | |
| Toyota Motor Credit | | | | | | | | |
| 0.250%, 12/23/11 | | | 15,000 | | | | 14,991 | |
| 0.180%, 11/10/11 | | | 10,000 | | | | 9,998 | |
| | | | 228,565 | |
| Food, Beverage & Tobacco [1.5%] | | | | | |
| Nestle Capital (A) | | | | | | | | |
| 0.030%, 10/11/11 | | | 10,000 | | | | 10,000 | |
| PepsiCo (A) | | | | | | | | |
| 0.050%, 11/01/11 | | | 10,000 | | | | 9,999 | |
Total Food, Beverage & Tobacco | | | | 19,999 | |
| Household Products [0.7%] | | | | | | | | |
| Procter & Gamble (A) | | | | | | | | |
| | | 10,000 | | | | 10,000 | |
See accompanying notes to financial statements.
CNI CHARTER FUNDS | PAGE 27
schedule of investments
Prime Money Market Fund (continued)
| Import/Export [1.9%] | | | | | | | | |
| Mitsui & USA | | | | | | | | |
| 0.220%, 11/16/11 | | $ | 10,000 | | | $ | 9,997 | |
| 0.190%, 10/11/11 | | | 15,000 | | | | 14,999 | |
| | | | 24,996 | |
| Investment Banker/Broker Dealer [6.7%] | | | | | |
| AllianceBernstein (A) | | | | | | | | |
| 0.150%, 10/17/11 | | | 25,000 | | | | 24,998 | |
| 0.100%, 10/11/11 | | | 15,000 | | | | 15,000 | |
| Citigroup Funding | | | | | | | | |
| 0.370%, 12/07/11 | | | 10,000 | | | | 9,993 | |
| Macquarie Bank (A) | | | | | | | | |
| 0.290%, 10/17/11 | | | 20,000 | | | | 19,998 | |
| 0.260%, 10/28/11 | | | 20,000 | | | | 19,996 | |
Total Investment Banker/Broker Dealer | | | | 89,985 | |
| Miscellaneous Manufacturing [5.2%] | | | | | |
| Chariot Funding (A) | | | | | | | | |
| 0.150%, 10/19/11 | | | 10,000 | | | | 9,999 | |
| Danske (A) | | | | | | | | |
| 0.250%, 10/03/11 | | | 15,000 | | | | 15,000 | |
| Fairway Finance (A) | | | | | | | | |
| 0.160%, 10/05/11 | | | 10,000 | | | | 10,000 | |
| Falcon Asset Securitization (A) | | | | | | | | |
| 0.140%, 10/24/11 | | | 20,000 | | | | 19,998 | |
| Variable Funding Capital (A) | | | | | | | | |
| 0.130%, 10/12/11 | | | 15,000 | | | | 14,999 | |
Total Miscellaneous Manufacturing | | | | 69,996 | |
| Petroleum & Fuel Products [1.1%] | | | | | |
| Shell International Finance BV (A) | | | | | | | | |
| | | 15,000 | | | | 14,999 | |
| Retail [4.6%] | | | | | | | | |
| Target | | | | | | | | |
| 0.070%, 10/24/11 | | | 10,000 | | | | 10,000 | |
| 0.050%, 10/03/11 | | | 17,500 | | | | 17,500 | |
| Wal-Mart Stores (A) | | | | | | | | |
| 0.080%, 11/07/11 | | | 10,000 | | | | 9,999 | |
| 0.070%, 10/04/11 | | | 10,000 | | | | 10,000 | |
| 0.060%, 10/12/11 | | | 15,000 | | | | 15,000 | |
| | | | 62,499 | |
| Schools [2.2%] | | | | | | | | |
| University of California | | | | | | | | |
| 0.200%, 10/13/11 | | $ | 15,000 | | | $ | 14,999 | |
| 0.150%, 11/08/11 | | | 15,000 | | | | 14,998 | |
| | | | 29,997 | |
Total Commercial Paper (Cost $841,734) | | | | 841,734 | |
| Corporate Bonds [4.2%] | | | | | | | | |
| Banks [3.1%] | | | | | | | | |
| IADB DN (C) | | | | | | | | |
| 0.015%, 10/04/11 | | | 21,200 | | | | 21,200 | |
| Wachovia | | | | | | | | |
| 5.300%, 10/15/11 | | | 20,000 | | | | 20,038 | |
| | | | 41,238 | |
| Security Brokers & Dealers [1.1%] | | | | | |
| Morgan Stanley, MTN | | | | | | | | |
| | | 15,000 | | | | 14,996 | |
Total Corporate Bonds (Cost $56,234) | | | | 56,234 | |
| U.S. Government Agency Obligations [3.0%] | | | | | |
| FHLB | | | | | | | | |
| 0.132%, 10/27/11(B) | | | 10,000 | | | | 10,000 | |
| 0.330%, 07/16/12 | | | 10,000 | | | | 10,000 | |
| FHLMC | | | | | | | | |
| 0.185%, 08/10/12(B) | | | 10,000 | | | | 10,001 | |
| FNMA DN | | | | | | | | |
| 0.100%, 11/30/11(C) | | | 10,000 | | | | 9,998 | |
Total U.S. Government Agency Obligations (Cost $39,999) | | | | 39,999 | |
| Municipal Bonds [2.6%] | | | | | | | | |
| California [1.5%] | | | | | | | | |
| California State, Ser A-1, GO (B) (D) (E) | | | | | | | | |
| 0.040%, 10/01/11 | | | 4,800 | | | | 4,800 | |
| California State, Ser A-2, RB | | | | | | | | |
| 2.000%, 06/26/12 | | | 15,000 | | | | 15,176 | |
| | | | 19,976 | |
See accompanying notes to financial statements.
CNI CHARTER FUNDS | PAGE 28
schedule of investments
Prime Money Market Fund (continued)
| | | | | |
| Illinois [1.1%] | | | | | | |
| Chicago, Midway Airport Authority, RB (B) (D) (E) | | | | | | |
| | $ | 14,500 | | | $ | 14,500 | |
Total Municipal Bonds (Cost $34,476) | | | | | | | 34,476 | |
| U.S. Government Related Securities [1.9%] | | | | | |
| Straight-A Funding | | | | | | | | |
| 0.190%, 11/17/11 | | | 15,000 | | | | 14,996 | |
| 0.190%, 11/28/11 | | | 10,000 | | | | 9,997 | |
Total U.S. Government Related Securities (Cost $24,993) | | | | 24,993 | |
| Certificates of Deposit [11.9%] | | | | | | | | |
| Banco Del Estado De Chile | | | | | | | | |
| 0.190%, 10/04/11 | | | 20,000 | | | | 20,000 | |
| 0.240%, 10/17/11 | | | 15,000 | | | | 15,000 | |
| Bank of America | | | | | | | | |
| 0.190%, 10/03/11 | | | 10,000 | | | | 10,000 | |
| 0.230%, 10/28/11 | | | 10,000 | | | | 10,000 | |
| Bank of Montreal Chicago | | | | | | | | |
| 0.329%, 10/31/11 | | | 25,000 | | | | 25,000 | |
| Bank of Nova Scotia | | | | | | | | |
| 0.290%, 12/28/11 | | | 10,000 | | | | 10,000 | |
| Norinchukin Bank | | | | | | | | |
| 0.290%, 10/28/11 | | | 15,000 | | | | 15,000 | |
| 0.350%, 11/30/11 | | | 10,000 | | | | 10,000 | |
| Skandinaviska Enskilda Banken NY | | | | | | | | |
| 0.220%, 10/03/11 | | | 15,000 | | | | 15,000 | |
| Westpac Banking | | | | | | | | |
| 0.290%, 11/02/11 | | | 10,000 | | | | 10,002 | |
| 0.319%, 06/15/12 | | | 20,000 | | | | 20,000 | |
Total Certificates of Deposit (Cost $160,002) | | | | 160,002 | |
| Short-Term Investment [0.5%] | | | | | | |
| Goldman Sachs Financial Square Funds - Government Fund, 0.006%* | | | 7,290,680 | | | | 7,291 | |
Total Short-Term Investment (Cost $7,291) | | | | 7,291 | |
| | | | | |
| Repurchase Agreements(F) [13.4%] | | | | |
| Bank of America | | | | | | |
| 0.030%, dated 09/30/11, repurchased on 10/03/11, repurchase price $125,000,313 (collateralized by a FHLB and FNMA obligation, ranging in par value $40,635,000-$59,934,000, 0.044%-6.250%, 08/28/12-07/15/32; with total market value $127,500,799) | | $ | 125,000 | | | $ | 125,000 | |
| Barclays | | | | | | | | |
| 0.050%, dated 09/30/11, repurchased on 10/03/11, repurchase price $5,600,023 (collateralized by a FNMA obligation, par value $5,688,000, 0.625%, 09/24/12; with total market value $5,712,311) | | | 5,600 | | | | 5,600 | |
| Deutsche Bank | | | | | | | | |
| 0.050%, dated 09/30/11, repurchased on 10/03/11, repurchase price $50,000,208 (collateralized by a FNMA obligation, par value $44,749,000, 4.625%, 10/15/14; with total market value $51,000,790) | | | 50,000 | | | | 50,000 | |
Total Repurchase Agreements (Cost $180,600) | | | | 180,600 | |
Total Investments [100.0%] (Cost $1,345,329) | | | $ | 1,345,329 | |
Percentages are based on Net Assets of $1,345,648 ($ Thousands).
| * | The rate reported is the 7-day effective yield as of September 30, 2011. |
| (A) | Security exempt from registration under Rule 144A of the Securities Act of 1933. These securities may be resold in transactions exempt from registration normally to qualified institutions. On September 30, 2011, the value of these securities amounted to $574,282 (000), representing 42.7% of the net assets of the Fund. |
| (B) | Floating Rate Security — The rate reported is the rate in effect on September 30, 2011. |
| (C) | Zero coupon security. The rate reported is the effective yield at time of purchase. |
| (D) | Put and Demand Feature — The date reported is the next reset date or put date. |
| (E) | Securities are held in conjunction with a letter of credit from a major bank or financial institution. |
| (F) | Tri-Party Repurchase Agreement. |
See accompanying notes to financial statements.
CNI CHARTER FUNDS | PAGE 29
schedule of investments
Prime Money Market Fund (concluded)
DN — Discount Note
FHLB — Federal Home Loan Bank
FHLMC — Federal Home Loan Mortgage Corporation
FNMA — Federal National Mortgage Association
GO — General Obligation
IADB — Inter-American Development Bank
MTN — Medium Term Note
RB — Revenue Bond
Ser — Series
The following is a summary of the inputs used as of September 30, 2011 in valuing the Fund’s investments carried at value ($ Thousands) in accordance with ASC 820:
| Investments in Securities | | | | | | | | | | | | |
| Commercial Paper | | $ | — | | | $ | 841,734 | | | $ | — | | | $ | 841,734 | |
| Corporate Bonds | | | — | | | | 56,234 | | | | — | | | | 56,234 | |
| U.S. Government Agency Obligations | | | — | | | | 39,999 | | | | — | | | | 39,999 | |
| Municipal Bonds | | | — | | | | 34,476 | | | | — | | | | 34,476 | |
| U.S. Government Related Securities | | | — | | | | 24,993 | | | | — | | | | 24,993 | |
| Certificates of Deposit | | | — | | | | 160,002 | | | | — | | | | 160,002 | |
| Short-Term Investment | | | 7,291 | | | | — | | | | — | | | | 7,291 | |
| Repurchase Agreements | | | — | | | | 180,600 | | | | — | | | | 180,600 | |
| Total Investments in Securities | | $ | 7,291 | | | $ | 1,338,038 | | | $ | — | | | $ | 1,345,329 | |
For the year ended September 30, 2011, there have been no transfers between Level 1 and Level 2 assets and liabilities. Transfers between Levels are recognized at period end.
For more information on valuation inputs, see Note 2 — Significant Accounting Policies in the Notes to Financial Statements.
See accompanying notes to financial statements.
CNI CHARTER FUNDS | PAGE 30
schedule of investments
California Tax Exempt Money Market Fund
| | | | | |
| Municipal Bonds [96.2%] | | | | | | |
| California [96.2%] | | | | | | |
| Bay Area Toll Authority, Ser A-2, RB (A) (B) (C) | | | | | | |
| 0.080%, 10/06/11 | | $ | 5,000 | | | $ | 5,000 | |
| Bay Area Toll Authority, Ser C-1, RB (A) (B) (C) | | | | | | | | |
| 0.080%, 10/06/11 | | | 23,050 | | | | 23,050 | |
| Bay Area Toll Authority, Ser C-1, RB (A) (B) (C) | | | | | | | | |
| 0.080%, 10/06/11 | | | 19,445 | | | | 19,445 | |
| Bay Area Toll Authority, Ser C-2, RB (A) (B) (C) | | | | | | | | |
| 0.080%, 10/06/11 | | | 4,190 | | | | 4,190 | |
| California State Department of Water Resources, Ser A, RB (D) | | | | | | | | |
| Pre-Refunded @ 101 | | | | | | | | |
| 5.375%, 05/01/12 | | | 10,000 | | | | 10,400 | |
| California State, Economic Recovery Project, Ser C-1, GO (A) (B) (C) | | | | | | | | |
| 0.080%, 10/01/11 | | | 5,750 | | | | 5,750 | |
| California State, Health Facilities Financing Authority, Luvile Salter Project, Ser B, RB (A) (C) | | | | | | | | |
| 0.110%, 10/06/11 | | | 11,700 | | | | 11,700 | |
| California State, Health Facilities Financing Authority, Ser A, RB (A) (B) (C) | | | | | | | | |
| 0.110%, 10/05/11 | | | 1,800 | | | | 1,800 | |
| California State, Health Facilities Financing Authority, Ser B, RB (A) (B) (C) | | | | | | | | |
| 0.130%, 10/05/11 | | | 22,250 | | | | 22,250 | |
| California State, Health Facilities Financing Authority, Ser C, RB (A) (B) (C) | | | | | | | | |
| 0.140%, 10/05/11 | | $ | 9,475 | | | $ | 9,475 | |
| California State, Health Facilities Financing Authority, Ser C, RB (A) (B) (C) | | | | | | | | |
| 0.090%, 10/06/11 | | | 8,500 | | | | 8,500 | |
| California State, Infrastructure & Economic Development Authority, J Paul Getty Trust Project, Ser B, RB (A) (C) | | | | | | | | |
| 0.040%, 10/01/11 | | | 10,215 | | | | 10,215 | |
| California State, Infrastructure & Economic Development Authority, J Paul Getty Trust Project, Ser B, RB (A) (C) | | | | | | | | |
| 0.030%, 10/01/11 | | | 5,990 | | | | 5,990 | |
| California State, Infrastructure & Economic Development Authority, J Paul Getty Trust Project, Ser D, RB (A) (C) | | | | | | | | |
| 0.040%, 10/01/11 | | | 1,955 | | | | 1,955 | |
| California State, Infrastructure & Economic Development Authority, Pacific Gas & Electric Project, Ser D, RB (A) (B) (C) | | | | | | | | |
| 0.010%, 10/01/11 | | | 10,400 | | | | 10,400 | |
| California State, Infrastructure & Economic Development Bank, Ser A, RB (C) | | | | | | | | |
| 3.900%, 10/02/11 | | | 4,675 | | | | 4,704 | |
| California State, Kindergarten Project, Ser A-2, GO (A) (B) (C) | | | | | | | | |
| 0.060%, 10/01/11 | | | 24,550 | | | | 24,550 | |
| California State, Kindergarten Project, Ser A-3, GO (A) (B) (C) | | | | | | | | |
| 0.040%, 10/01/11 | | | 7,600 | | | | 7,600 | |
| California State, Kindergarten Project, Ser A-8, GO (A) (B) (C) | | | | | | | | |
| 0.140%, 10/06/11 | | | 29,400 | | | | 29,400 | |
| California State, Kindergarten Project, Ser B-2, GO (A) (B) (C) | | | | | | | | |
| 0.060%, 10/01/11 | | | 5,300 | | | | 5,300 | |
| California State, Kindergarten Project, Ser B-5, GO (A) (B) (C) | | | | | | | | |
| 0.130%, 10/06/11 | | | 9,200 | | | | 9,200 | |
| California State, Ser A-2, GO (A) (B) (C) | | | | | | | | |
| 0.040%, 10/01/11 | | | 4,275 | | | | 4,275 | |
See accompanying notes to financial statements.
CNI CHARTER FUNDS | PAGE 31
schedule of investments
California Tax Exempt Money Market Fund (continued)
| California State, Ser A-2, RB | | | | | | | | |
| 2.000%, 06/26/12 | | $ | 21,000 | | | $ | 21,247 | |
| California State, Ser B-1, GO (A) (B) (C) | | | | | | | | |
| 0.040%, 10/01/11 | | | 8,400 | | | | 8,400 | |
| California State, Ser B-4, GO (A) (B) (C) | | | | | | | | |
| 0.130%, 10/05/11 | | | 15,000 | | | | 15,000 | |
| California State, Sub-Ser A-1, GO (A) (B) (C) | | | | | | | | |
| 0.100%, 10/05/11 | | | 5,000 | | | | 5,000 | |
| California State, Sub-Ser A-2, GO (A) (B) (C) | | | | | | | | |
| 0.100%, 10/05/11 | | | 7,000 | | | | 7,000 | |
| California Statewide, Communities Development Authority, John Muir Health Project, Ser A, RB (A) (B) (C) | | | | | | | | |
| 0.010%, 10/01/11 | | | 10,000 | | | | 10,000 | |
| California Statewide, Communities Development Authority, Masters College Project, Ser A, RB (A) (B) (C) | | | | | | | | |
| 0.130%, 10/06/11 | | | 3,000 | | | | 3,000 | |
| California Statewide, Communities Development Authority, Ser D, RB (A) (C) | | | | | | | | |
| 0.110%, 10/05/11 | | | 21,500 | | | | 21,500 | |
| East Bay, Municipal Utility District, Ser A-2, RB (A) (C) | | | | | | | | |
| 0.070%, 10/05/11 | | | 14,900 | | | | 14,900 | |
| East Bay, Municipal Utility District, Sub-Ser A-1, RB (A) (C) | | | | | | | | |
| 0.090%, 10/05/11 | | | 11,885 | | | | 11,885 | |
| Eastern Municipal Water District, Ser B, COP (A) (C) | | | | | | | | |
| 0.100%, 10/05/11 | | | 17,600 | | | | 17,600 | |
| Eastern Municipal Water District, Ser D, COP (A) (C) | | | | | | | | |
| 0.130%, 10/05/11 | | | 14,375 | | | | 14,375 | |
| Elsinore Valley, Municipal Water District, Ser A, COP (A) (B) (C) | | | | | | | | |
| 0.150%, 10/05/11 | | | 3,485 | | | | 3,485 | |
| Elsinore Valley, Municipal Water District, Ser B, COP (A) (B) (C) | | | | | | | | |
| 0.130%, 10/06/11 | | | 14,700 | | | | 14,700 | |
| Glendale, Police Building Project, COP (A) (C) | | | | | | | | |
| 0.150%, 10/06/11 | | | 17,300 | | | | 17,300 | |
| Irvine, Improvement Board, Act 1915 Project, District #05-21, Ser A, COP (A) (B) (C) | | | | | | | | |
| 0.200%, 10/01/11 | | | 10,000 | | | | 10,000 | |
| Irvine, Improvement Board, Act 1915 Project, District #97-16, COP (A) (B) (C) | | | | | | | | |
| 0.200%, 10/01/11 | | $ | 3,500 | | | $ | 3,500 | |
| Irvine, Improvement Board, Act 1915 Project, District #97-17, SAB (A) (B) (C) | | | | | | | | |
| 0.200%, 10/01/11 | | | 7,150 | | | | 7,150 | |
| Long Beach, TRAN | | | | | | | | |
| 2.000%, 09/28/12 | | | 7,000 | | | | 7,118 | |
| Los Angeles County, TRAN | | | | | | | | |
| 2.500%, 02/29/12 | | | 3,000 | | | | 3,027 | |
| Los Angeles County, TRAN | | | | | | | | |
| 2.500%, 03/30/12 | | | 2,500 | | | | 2,527 | |
| Los Angeles County, Metropolitan Transportation Authority, RB (A) (B) (C) | | | | | | | | |
| 0.100%, 10/06/11 | | | 2,000 | | | | 2,000 | |
| Los Angeles County, Metropolitan Transportation Authority, Ser A1, RB (A) (C) | | | | | | | | |
| 0.080%, 10/01/11 | | | 3,100 | | | | 3,100 | |
| Los Angeles County, Metropolitan Transportation Authority, Ser A1, RB (A) (C) | | | | | | | | |
| 0.160%, 10/06/11 | | | 12,785 | | | | 12,785 | |
| Los Angeles County, Metropolitan Transportation Authority, Ser A2, RB (A) (C) | | | | | | | | |
| 0.080%, 10/01/11 | | | 9,200 | | | | 9,200 | |
| Los Angeles County, Metropolitan Transportation Authority, Ser C2, RB (A) (B) (C) | | | | | | | | |
| 0.100%, 10/06/11 | | | 9,325 | | | | 9,325 | |
| Los Angeles County, Metropolitan Transportation Authority, Ser C4, RB, FGIC (A) (B) (C) | | | | | | | | |
| 0.100%, 10/06/11 | | | 2,400 | | | | 2,400 | |
| Los Angeles County, Ser A, TRAN | | | | | | | | |
| 2.500%, 02/29/12 | | | 3,000 | | | | 3,027 | |
| Los Angeles, Department of Water & Power, Sub-Ser A-3, RB (A) (C) | | | | | | | | |
| 0.110%, 10/06/11 | | | 2,500 | | | | 2,500 | |
| Los Angeles, Department of Water & Power, Sub-Ser B-1, RB (A) (C) | | | | | | | | |
| 0.110%, 10/06/11 | | | 5,350 | | | | 5,350 | |
| Los Angeles, Department of Water & Power, Sub-Ser B-2, RB (A) (C) | | | | | | | | |
| 0.030%, 10/01/11 | | | 30,000 | | | | 30,000 | |
See accompanying notes to financial statements.
CNI CHARTER FUNDS | PAGE 32
schedule of investments
California Tax Exempt Money Market Fund (continued)
| Los Angeles, Department of Water & Power, Sub-Ser B-2, RB (A) (C) | | | | | | | | |
| 0.100%, 10/06/11 | | $ | 12,600 | | | $ | 12,600 | |
| Los Angeles, Department of Water & Power, Sub-Ser B-3, RB (A) (C) | | | | | | | | |
| 0.100%, 10/01/11 | | | 14,360 | | | | 14,360 | |
| Los Angeles, Department of Water & Power, Sub-Ser B-4, RB (A) (C) | | | | | | | | |
| 0.110%, 10/06/11 | | | 9,000 | | | | 9,000 | |
| Los Angeles, Department of Water & Power, Sub-Ser B-5, RB (A) (C) | | | | | | | | |
| 0.160%, 10/06/11 | | | 5,400 | | | | 5,400 | |
| Los Angeles, Unified School District, Administration Building III Project, Ser B, COP (A) (B) (C) | | | | | | | | |
| 0.160%, 10/05/11 | | | 12,265 | | | | 12,265 | |
| Los Angeles, Wastewater Systems Authority, Sub-Ser B, RB (A) (B) (C) | | | | | | | | |
| 0.110%, 10/06/11 | | | 9,720 | | | | 9,720 | |
| Metropolitan Water District of Southern California, Ser A-2, RB (A) (C) | | | | | | | | |
| 0.160%, 10/06/11 | | | 11,000 | | | | 11,000 | |
| Modesto California, Ser A, RB (A) (B) (C) | | | | | | | | |
| 0.120%, 10/06/11 | | | 4,900 | | | | 4,900 | |
| Newport Beach, Hoag Memorial Hospital Project, Ser C, RB (A) (C) | | | | | | | | |
| 0.110%, 10/05/11 | | | 14,200 | | | | 14,200 | |
| Oakland-Alameda County, Coliseum Authority, Ser C-1, RB (A) (B) (C) | | | | | | | | |
| 0.150%, 10/05/11 | | | 14,400 | | | | 14,400 | |
| Oakland-Alameda County, Coliseum Authority, Ser C-2, RB (A) (B) (C) | | | | | | | | |
| 0.120%, 10/05/11 | | | 3,500 | | | | 3,500 | |
| Orange County, TECP | | | | | | | | |
| 0.130%, 10/03/11 | | | 15,000 | | | | 15,000 | |
| Orange County, Water District Authority, Ser A, COP (A) (B) (C) | | | | | | | | |
| 0.130%, 10/05/11 | | | 16,850 | | | | 16,850 | |
| Riverside County, Public Facilities Authority, Ser C, COP (A) (B) (C) | | | | | | | | |
| 0.130%, 10/05/11 | | | 9,600 | | | | 9,600 | |
| Riverside County, Ser A, TRAN | | | | | | | | |
| 2.000%, 03/30/12 | | | 5,000 | | | | 5,043 | |
| Riverside, Water Authority, Ser A, RB (A) (C) | | | | | | | | |
| 0.230%, 10/06/11 | | $ | 5,000 | | | $ | 5,000 | |
| Sacramento County, Sanitation District Financing Authority, Sub-Ser D, RB (A) (B) (C) | | | | | | | | |
| 0.080%, 10/01/11 | | | 17,000 | | | | 17,000 | |
| Sacramento County, Sanitation District Financing Authority, Sub-Ser E, RB (A) (B) (C) | | | | | | | | |
| 0.140%, 10/05/11 | | | 11,700 | | | | 11,700 | |
| San Diego County, Regional Transportation Commission, Ser B, RB (A) (C) | | | | | | | | |
| 0.130%, 10/06/11 | | | 12,980 | | | | 12,980 | |
| San Diego, Water Authority, TECP | | | | | | | | |
| 0.140%, 10/06/11 | | | 3,000 | | | | 3,000 | |
| San Diego, Water Authority, TECP | | | | | | | | |
| 0.160%, 12/01/11 | | | 13,100 | | | | 13,100 | |
| San Francisco City & County Airports Commission, Ser 37C, RB (A) (B) (C) | | | | | | | | |
| 0.130%, 10/05/11 | | | 10,000 | | | | 10,000 | |
| Santa Clara County, Financing Authority, Multiple Facilities Projects, Ser M, RB (A) (B) (C) | | | | | | | | |
| 0.170%, 10/05/11 | | | 10,105 | | | | 10,105 | |
| Santa Clara County, Financing Authority, VMC Facility Replacement Project, Ser B, RB (A) (C) | | | | | | | | |
| 0.140%, 10/05/11 | | | 14,820 | | | | 14,820 | |
| Santa Clara Valley Transportation Authority, Ser C, RB (A) (C) | | | | | | | | |
| 0.100%, 10/06/11 | | | 995 | | | | 995 | |
| Santa Clara Valley, Transportation Authority, Ser C, RB (A) (C) | | | | | | | | |
| 0.120%, 10/06/11 | | | 12,000 | | | | 12,000 | |
| Santa Clara Valley, Transportation Authority, Ser D, RB (A) (C) | | | | | | | | |
| 0.100%, 10/06/11 | | | 20,800 | | | | 20,800 | |
| Southern California Public Power Authority, RB (A) (B) (C) | | | | | | | | |
| 0.180%, 10/05/11 | | | 7,000 | | | | 7,000 | |
| Southern California, Metropolitan Water District, Ser A-1, RB (A) (C) | | | | | | | | |
| 0.180%, 10/06/11 | | | 2,440 | | | | 2,440 | |
See accompanying notes to financial statements.
CNI CHARTER FUNDS | PAGE 33
schedule of investments
California Tax Exempt Money Market Fund (concluded)
| University of California, Regents Medical Center, Ser B-1, RB (A) (C) | | | | | | | | |
| 0.030%, 10/01/11 | | $ | 10,450 | | | $ | 10,450 | |
| | | | 842,778 | |
Total Municipal Bonds (Cost $842,778) | | | | 842,778 | |
| Commercial Paper [1.7%] | | | | | | | | |
| California [1.7%] | | | | | | | | |
| Regent of the University of California | | | | | | | | |
| | | 15,000 | | | | 15,000 | |
Total Commercial Paper (Cost $15,000) | | | | 15,000 | |
Total Investments [97.9%] (Cost $857,778) | | | $ | 857,778 | |
Percentages are based on Net Assets of $876,316 ($ Thousands).
| (A) | Put and Demand Feature — The date reported is the next reset or put date. |
| (B) | Securities are held in conjunction with a letter of credit from a major bank or financial institution. |
| (C) | Floating Rate Security — The rate reported is the rate in effect on September 30, 2011. |
| (D) | Pre-Refunded Security — The maturity date shown is the pre-refunded date. |
COP — Certificate of Participation
FGIC — Financial Guaranty Insurance Company
GO — General Obligation
RB — Revenue Bond
SAB — Special Assessment Board
Ser — Series
TECP — Tax-Exempt Commercial Paper
TRAN — Tax and Revenue Anticipation Note
As September 30, 2011, all of the Fund’s investments are Level 2.
For the year ended September 30, 2011, there have been no transfers between Level 1 and Level 2 assets and liabilities. Transfers between Levels are recognized at period end.
For more information on valuation inputs, see Note 2 — Significant Accounting Policies in the Notes to Financial Statements.
See accompanying notes to financial statements.
CNI CHARTER FUNDS | PAGE 34
schedule of investments
Limited Maturity Fixed Income Fund
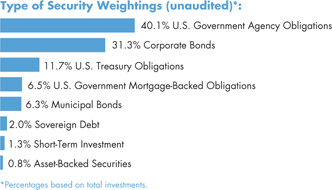
| | | | | |
| U.S. Government Agency Obligations [39.8%] | | | | |
| FHLB | | | | | | |
| 5.750%, 05/15/12 | | $ | 1,750 | | | $ | 1,809 | |
| 0.875%, 08/22/12 | | | 2,000 | | | | 2,011 | |
| FHLMC | | | | | | | | |
| 4.750%, 03/05/12 | | | 1,000 | | | | 1,020 | |
| 4.375%, 07/17/15 | | | 1,300 | | | | 1,468 | |
| 2.125%, 09/21/12 | | | 1,750 | | | | 1,781 | |
| FNMA | | | | | | | | |
| 6.125%, 03/15/12 | | | 600 | | | | 616 | |
| 5.375%, 11/15/11 | | | 1,000 | | | | 1,006 | |
| 5.250%, 08/01/12 | | | 1,000 | | | | 1,041 | |
| 5.000%, 03/15/16 | | | 600 | | | | 701 | |
| 5.000%, 02/13/17 | | | 1,000 | | | | 1,185 | |
| 0.700%, 09/19/14 | | | 545 | | | | 542 | |
| 0.500%, 08/09/13 | | | 2,000 | | | | 2,002 | |
Total U.S. Government Agency Obligations (Cost $15,038) | | | | 15,182 | |
| Corporate Bonds [31.1%] | | | | | | | | |
| Banks [16.3%] | | | | | | | | |
| ANZ National International | | | | | | | | |
| 6.200%, 07/19/13 | | | 625 | | | | 668 | |
| Bank of America | | | | | | | | |
| 4.875%, 01/15/13 | | | 150 | | | | 150 | |
| Bank of New York Mellon, MTN | | | | | | | | |
| 5.000%, 03/23/12 | | | 150 | | | | 153 | |
| Barclays Bank, MTN | | | | | | | | |
| 4.500%, 03/10/17(A) | | | 545 | | | | 510 | |
| Citigroup | | | | | | | | |
| 6.375%, 08/12/14 | | | 600 | | | | 635 | |
| Credit Suisse NY, MTN | | | | | | | | |
| 5.000%, 05/15/13 | | | 600 | | | | 620 | |
| Goldman Sachs Group | | | | | | | | |
| 5.125%, 01/15/15 | | | 600 | | | | 619 | |
| JPMorgan Chase, MTN | | | | | | | | |
| 2.050%, 01/24/14 | | | 600 | | | | 606 | |
| Morgan Stanley | | | | | | | | |
| 5.375%, 10/15/15 | | $ | 600 | | | $ | 595 | |
| 3.250%, 12/01/11 | | | 1,000 | | | | 1,005 | |
| Wachovia, MTN | | | | | | | | |
| 5.500%, 05/01/13 | | | 600 | | | | 638 | |
| | | | 6,199 | |
| Computer System Design & Services [1.5%] | | | | | |
| Hewlett-Packard | | | | | | | | |
| 4.250%, 02/24/12 | | | 150 | | | | 152 | |
| 2.950%, 08/15/12 | | | 120 | | | | 122 | |
| IBM | | | | | | | | |
| 4.750%, 11/29/12 | | | 165 | | | | 172 | |
| 2.100%, 05/06/13 | | | 140 | | | | 143 | |
Total Computer System Design & Services | | | | 589 | |
| Drugs [0.5%] | | | | | | | | |
| Pfizer | | | | | | | | |
| | | 170 | | | | 173 | |
| Financial Services [8.7%] | | | | | | | | |
| Boeing Capital | | | | | | | | |
| 6.500%, 02/15/12 | | | 150 | | | | 153 | |
| Caterpillar Financial Services, MTN | | | | | | | | |
| 5.750%, 02/15/12 | | | 150 | | | | 153 | |
| CME Group | | | | | | | | |
| 5.400%, 08/01/13 | | | 625 | | | | 669 | |
| General Electric Capital, MTN | | | | | | | | |
| 2.950%, 05/09/16 | | | 545 | | | | 546 | |
| 2.000%, 09/28/12 | | | 1,000 | | | | 1,017 | |
| HSBC Finance | | | | | | | | |
| 5.500%, 01/19/16 | | | 600 | | | | 627 | |
| John Deere Capital, MTN | | | | | | | | |
| 5.250%, 10/01/12 | | | 150 | | | | 156 | |
| | | | 3,321 | |
| Food, Beverage & Tobacco [0.6%] | | | | | |
| Coca-Cola Refreshments USA | | | | | | | | |
| 3.750%, 03/01/12 | | | 170 | | | | 172 | |
| PepsiCo | | | | | | | | |
| 5.150%, 05/15/12 | | | 60 | | | | 62 | |
Total Food, Beverage & Tobacco | | | | 234 | |
| Investment Banker/Broker Dealer [2.2%] | | | | | |
| Goldman Sachs Group | | | | | | | | |
| 6.600%, 01/15/12 | | | 115 | | | | 117 | |
See accompanying notes to financial statements.
CNI CHARTER FUNDS | PAGE 35
schedule of investments
Limited Maturity Fixed Income Fund (continued)
| Merrill Lynch, MTN | | | | | | | | |
| 5.000%, 01/15/15 | | $ | 600 | | | $ | 580 | |
| Morgan Stanley | | | | | | | | |
| 6.600%, 04/01/12 | | | 150 | | | | 153 | |
Total Investment Banker/Broker Dealer | | | | 850 | |
| Retail [0.4%] | | | | | | | | |
| Wal-Mart Stores | | | | | | | | |
| | | 170 | | | | 174 | |
| Telephones & Telecommunications [0.4%] | | | | | |
| AT&T | | | | | | | | |
| | | 150 | | | | 151 | |
| Transport-Rail [0.5%] | | | | | | | | |
| Canadian National Railway | | | | | | | | |
| | | 175 | | | | 175 | |
Total Corporate Bonds (Cost $11,950) | | | | 11,866 | |
| U.S. Treasury Obligations [11.7%] | | | | | | | | |
| U.S. Treasury Notes | | | | | | | | |
| 4.250%, 08/15/15 | | | 3,000 | | | | 3,410 | |
| 4.125%, 08/31/12 | | | 1,000 | | | | 1,036 | |
Total U.S. Treasury Obligations (Cost $4,226) | | | | 4,446 | |
| U.S. Government Mortgage-Backed Obligations [6.4%] | |
| FHLMC, Pool G12806 | | | | | | | | |
| 5.500%, 09/01/22 | | | 158 | | | | 171 | |
| FHLMC, Pool G18247 | | | | | | | | |
| 5.000%, 04/01/23 | | | 112 | | | | 121 | |
| FHLMC, Pool G18251 | | | | | | | | |
| 5.000%, 05/01/23 | | | 167 | | | | 179 | |
| FHLMC, Pool G18321 | | | | | | | | |
| 4.500%, 08/01/24 | | | 96 | | | | 102 | |
| FHLMC, Pool J04241 | | | | | | | | |
| 5.500%, 01/01/22 | | | 96 | | | | 103 | |
| FHLMC, Pool J04459 | | | | | | | | |
| 5.000%, 03/01/22 | | | 79 | | | | 85 | |
| FHLMC, Pool J04508 | | | | | | | | |
| 5.000%, 03/01/22 | | | 86 | | | | 93 | |
| FHLMC, Pool J07575 | | | | | | | | |
| 5.000%, 04/01/23 | | | 100 | | | | 108 | |
| FNMA, Pool 541946 | | | | | | | | |
| 7.500%, 07/01/30 | | | — | | | | 1 | |
| FNMA, Pool 837196 | | | | | | | | |
| 5.500%, 02/01/21 | | | 199 | | | | 216 | |
| FNMA, Pool 933915 | | | | | | | | |
| 4.500%, 06/01/23 | | $ | 196 | | | $ | 209 | |
| FNMA, Pool 961783 | | | | | | | | |
| 4.500%, 02/01/23 | | | 180 | | | | 192 | |
| FNMA REMIC, Ser 2011-79, Cl GC | | | | | | | | |
| 2.000%, 12/25/22 | | | 853 | | | | 868 | |
Total U.S. Government Mortgage-Backed Obligations (Cost $2,327) | | | | 2,448 | |
| Municipal Bonds [6.3%] | | | | | | | | |
| California [6.3%] | | | | | | | | |
| Southern California Public Power Authority, Sub-Ser B, RB, AGM, ETM | | | | | | | | |
| 6.930%, 05/15/17 | | | 1,000 | | | | 1,273 | |
| State of California, Ser A2, RB | | | | | | | | |
| 2.000%, 06/26/12 | | | 545 | | | | 552 | |
| University of California, RB (A) | | | | | | | | |
| 1.988%, 05/15/50 | | | 545 | | | | 554 | |
| | | | 2,379 | |
Total Municipal Bonds (Cost $2,293) | | | | 2,379 | |
| Sovereign Debt [2.0%] | | | | | | | | |
| Province of Ontario Canada | | | | | | | | |
| 4.100%, 06/16/14 | | | 600 | | | | 649 | |
| 1.875%, 11/19/12 | | | 125 | | | | 127 | |
Total Sovereign Debt (Cost $767) | | | | 776 | |
| Asset-Backed Securities [0.8%] | | | | | | | | |
| Mercedes-Benz Auto Receivables Trust, Ser 2009-1, Cl A4 | | | | | | | | |
| 2.430%, 03/15/16 | | | 165 | | | | 169 | |
| USAA Auto Owner Trust, Ser 2009-2, Cl A4 | | | | | | | | |
| 2.530%, 07/15/15 | | | 135 | | | | 138 | |
Total Asset-Backed Securities (Cost $300) | | | | 307 | |
See accompanying notes to financial statements.
CNI CHARTER FUNDS | PAGE 36
schedule of investments
Limited Maturity Fixed Income Fund (concluded)
| | | | | |
| Short-Term Investment [1.3%] | | | | | | |
| AIM STIT-Treasury Portfolio, 0.020%* | | | 494,082 | | | $ | 494 | |
Total Short-Term Investment (Cost $494) | | | | 494 | |
Total Investments [99.4%] (Cost $37,395) | | | | | | $ | 37,898 | |
Percentages are based on Net Assets of $38,145 ($ Thousands).
| * | The rate reported is the 7-day effective yield as of September 30, 2011. |
| (A) | Floating Rate Security — The rate reflected is the rate in effect on September 30, 2011. |
AGM — Assured Guarantee Municipal
Cl — Class
ETM — Escrowed to Maturity
FHLB — Federal Home Loan Bank
FHLMC — Federal Home Loan Mortgage Corporation
FNMA — Federal National Mortgage Association
MTN — Medium Term Note
RB — Revenue Bond
REMIC — Real Estate Mortgage Investment Conduit
Ser — Series
Amounts designated as “—” are either $0 or have been rounded to $0.
The following is a summary of the inputs used as of September 30, 2011 in valuing the Fund’s investments carried at value ($ Thousands) in accordance with ASC 820:
| Investments in Securities | | | | | | | | | | | | |
| U.S. Government Agency Obligations | | $ | — | | | $ | 15,182 | | | $ | — | | | $ | 15,182 | |
| Corporate Bonds | | | — | | | | 11,866 | | | | — | | | | 11,866 | |
| U.S. Treasury Obligations | | | — | | | | 4,446 | | | | — | | | | 4,446 | |
| U.S. Government Mortgage-Backed Obligations | | | — | | | | 2,448 | | | | — | | | | 2,448 | |
| Municipal Bonds | | | — | | | | 2,379 | | | | — | | | | 2,379 | |
| Sovereign Debt | | | — | | | | 776 | | | | — | | | | 776 | |
| Asset-Backed Securities | | | — | | | | 307 | | | | — | | | | 307 | |
| Short-Term Investment | | | 494 | | | | — | | | | — | | | | 494 | |
| Total Investments in Securities | | $ | 494 | | | $ | 37,404 | | | $ | — | | | $ | 37,898 | |
For the year ended September 30, 2011, there have been no transfers between Level 1 and Level 2 assets and liabilities. Transfers between Levels are recognized at period end.
For more information on the valuation inputs, see Note 2 — Significant Accounting Policies in the Notes to Financial Statements.
See accompanying notes to financial statements.
CNI CHARTER FUNDS | PAGE 37
schedule of investments
Government Bond Fund
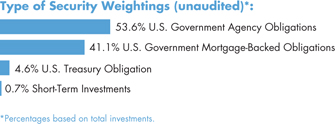
| | | | | |
| U.S. Government Agency Obligations [53.6%] | | | | |
| Egypt Government AID Bond | | | | | | |
| 4.450%, 09/15/15 | | $ | 8,000 | | | $ | 9,045 | |
| FAMC, MTN | | | | | | | | |
| 3.250%, 06/25/14 | | | 7,000 | | | | 7,465 | |
| FFCB | | | | | | | | |
| 1.875%, 12/07/12 | | | 8,000 | | | | 8,145 | |
| 0.600%, 08/01/13 | | | 8,000 | | | | 8,007 | |
| FHLB | | | | | | | | |
| 3.250%, 09/12/14 | | | 3,000 | | | | 3,210 | |
| 0.393%, 04/08/14(A) | | | 8,000 | | | | 8,016 | |
| FHLMC, MTN | | | | | | | | |
| 4.375%, 07/17/15 | | | 5,000 | | | | 5,648 | |
| 1.050%, 06/27/14 | | | 8,000 | | | | 8,012 | |
| FNMA | | | | | | | | |
| 4.750%, 11/19/12 | | | 7,000 | | | | 7,349 | |
| 3.100%, 03/22/16 | | | 4,000 | | | | 4,052 | |
| 0.700%, 09/19/14 | | | 4,000 | | | | 3,982 | |
| Israel Government AID Bond | | | | | | | | |
| 3.962%, 05/15/20(B) | | | 15,528 | | | | 12,782 | |
| Tennessee Valley Authority, Ser E | | | | | | | | |
| 6.250%, 12/15/17 | | | 8,000 | | | | 10,084 | |
Total U.S. Government Agency Obligations (Cost $92,994) | | | | 95,797 | |
| U.S. Government Mortgage-Backed Obligations [41.0%] | |
| FHLB CMO, Ser 2008-1239, Cl I | | | | | | | | |
| 4.805%, 08/20/15 | | | 5,498 | | | | 6,013 | |
| FHLMC REMIC, Ser 2006-R005, Cl AB | | | | | | | | |
| 5.500%, 12/15/18 | | | 1,680 | | | | 1,720 | |
| FHLMC REMIC, Ser 2007-R010, Cl AB | | | | | | | | |
| 5.500%, 12/15/19 | | | 3,024 | | | | 3,134 | |
| FHLMC REMIC, Ser 2007-R011, Cl AB | | | | | | | | |
| 5.500%, 12/15/20 | | | 4,847 | | | | 5,048 | |
| FHLMC REMIC, Ser 2007-R012, Cl AB | | | | | | | | |
| 5.500%, 12/15/20 | | | 1,752 | | | | 1,802 | |
| FHLMC REMIC, Ser 2007-R013, Cl AB | | | | | | | | |
| 6.000%, 12/15/21 | | | 192 | | | | 197 | |
| FHLMC REMIC, Ser 2010-3680, Cl VA | | | | | | | | |
| 4.500%, 07/15/21 | | $ | 7,278 | | | $ | 7,785 | |
| FHLMC REMIC, Ser 2011-3805, Cl EK | | | | | | | | |
| 4.000%, 06/15/40 | | | 7,359 | | | | 7,756 | |
| FHLMC REMIC, Ser 2011-3806, Cl UP | | | | | | | | |
| 4.500%, 02/15/41 | | | 7,792 | | | | 8,603 | |
| FNMA ARM | | | | | | | | |
| 2.375%, 03/01/34(A) | | | 305 | | | | 321 | |
| FNMA REMIC, Ser 2005-25, Cl VH | | | | | | | | |
| 5.000%, 04/25/16 | | | 3,151 | | | | 3,320 | |
| FNMA REMIC, Ser 2006-R009, Cl AJ | | | | | | | | |
| 5.750%, 12/15/18 | | | 4,185 | | | | 4,307 | |
| FNMA REMIC, Ser 2011-17, Cl EK | | | | | | | | |
| 4.000%, 07/25/25 | | | 6,993 | | | | 7,367 | |
| FNMA REMIC, Ser 2011-79, Cl GC | | | | | | | | |
| 2.000%, 12/25/22 | | | 7,582 | | | | 7,712 | |
| GNMA | | | | | | | | |
| 8.000%, 08/15/22 | | | 10 | | | | 12 | |
| 7.500%, 06/15/24 | | | 3 | | | | 4 | |
| 7.500%, 05/15/26 | | | 3 | | | | 3 | |
| 7.500%, 04/15/32 | | | 30 | | | | 35 | |
| 7.000%, 12/15/16 | | | 8 | | | | 9 | |
| 6.000%, 01/15/29 | | | 5 | | | | 6 | |
| GNMA ARM | | | | | | | | |
| 2.000%, 08/20/35(A) | | | 83 | | | | 86 | |
| 1.750%, 04/20/35(A) | | | 431 | | | | 445 | |
| GNMA CMO, Ser 2010-87, Cl NE | | | | | | | | |
| 3.000%, 09/20/38 | | | 7,407 | | | | 7,696 | |
Total U.S. Government Mortgage-Backed Obligations (Cost $72,453) | | | | 73,381 | |
| U.S. Treasury Obligation [4.6%] | | | | | | | | |
| U.S. Treasury Note | | | | | | | | |
| 1.375%, 11/30/15 | | | 8,000 | | | | 8,208 | |
Total U.S. Treasury Obligation (Cost $7,859) | | | | 8,208 | |
See accompanying notes to financial statements.
CNI CHARTER FUNDS | PAGE 38
schedule of investments
Government Bond Fund (concluded)
| | | | | |
| Short-Term Investment [0.7%] | | | | | | |
| Goldman Sachs Financial Square Funds - Government Fund, 0.006%* | | | 1,242,015 | | | $ | 1,242 | |
Total Short-Term Investment (Cost $1,242) | | | | 1,242 | |
Total Investments [99.9%] (Cost $174,548) | | | $ | 178,628 | |
Percentages are based on Net Assets of $178,806 ($ Thousands).
| * | The rate reported is the 7-day effective yield as of September 30, 2011. |
| (A) | Floating Rate Security — The rate reported is the rate in effect on September 30, 2011. |
| (B) | Zero coupon security. The rate reported is the effective yield at time of purchase. |
AID — Agency for International Development
ARM — Adjustable Rate Mortgage
Cl — Class
CMO — Collateralized Mortgage Obligation
FAMC — Federal Agriculture Mortgage Corporation
FFCB — Federal Farm Credit Bank
FHLB — Federal Home Loan Bank
FHLMC — Federal Home Loan Mortgage Corporation
FNMA — Federal National Mortgage Association
GNMA — Government National Mortgage Association
MTN — Medium Term Note
REMIC — Real Estate Mortgage Investment Conduit
Ser — Series
The following is a summary of the inputs used as of September 30, 2011 in valuing the Fund’s investments carried at value ($ Thousands) in accordance with ASC 820:
| Investments in Securities | | | | | | | | | | | | |
| U.S. Government Agency Obligations | | $ | — | | | $ | 95,797 | | | $ | — | | | $ | 95,797 | |
| U.S. Government Mortgage-Backed Obligations | | | — | | | | 73,381 | | | | — | | | | 73,381 | |
| U.S. Treasury Obligation | | | — | | | | 8,208 | | | | — | | | | 8,208 | |
| Short-Term Investment | | | 1,242 | | | | — | | | | — | | | | 1,242 | |
| Total Investments in Securities | | $ | 1,242 | | | $ | 177,386 | | | $ | — | | | $ | 178,628 | |
For the year ended September 30, 2011, there have been no transfers between Level 1 and Level 2 assets and liabilities. Transfers between Levels are recognized at period end.
For more information on valuation inputs, see Note 2 — Significant Accounting Policies in the Notes to Financial Statements.
See accompanying notes to financial statements.
CNI CHARTER FUNDS | PAGE 39
schedule of investments
Corporate Bond Fund
| | | | | |
| Corporate Bonds [87.9%] | | | | | | |
| Automotive [0.9%] | | | | | | |
| Daimler Finance North America | | | | | | |
| | $ | 1,000 | | | $ | 987 | |
| Banks [15.2%] | | | | | | | | |
| ANZ National Int'l | | | | | | | | |
| 3.250%, 04/02/12(A) | | | 2,000 | | | | 2,022 | |
| Bank of America, FDIC Insured, MTN | | | | | | | | |
| 3.125%, 06/15/12 | | | 1,500 | | | | 1,531 | |
| Bank of Scotland | | | | | | | | |
| 5.000%, 11/21/11(A) | | | 1,000 | | | | 1,005 | |
| Barclays Bank | | | | | | | | |
| 6.050%, 12/04/17(A) | | | 1,000 | | | | 918 | |
| Barclays Bank, MTN | | | | | | | | |
| 4.500%, 03/10/17(B) | | | 1,950 | | | | 1,823 | |
| Deutsche Bank | | | | | | | | |
| 7.250%, 10/15/11 | | | 500 | | | | 501 | |
| Deutsche Bank, MTN | | | | | | | | |
| 3.875%, 08/18/14 | | | 853 | | | | 870 | |
| JPMorgan Chase | | | | | | | | |
| 6.000%, 10/01/17 | | | 1,890 | | | | 1,987 | |
| JPMorgan Chase, FDIC Insured | | | | | | | | |
| 2.125%, 12/26/12 | | | 2,500 | | | | 2,555 | |
| Wachovia Bank, MTN | | | | | | | | |
| 4.800%, 11/01/14 | | | 3,240 | | | | 3,457 | |
| Wells Fargo, FDIC Insured | | | | | | | | |
| 3.000%, 12/09/11 | | $ | 700 | | | $ | 703 | |
| | | | 17,372 | |
| Chemicals [1.0%] | | | | | | | | |
| Dow Chemical | | | | | | | | |
| | | 1,000 | | | | 1,104 | |
| Communication & Media [2.2%] | | | | | |
| CBS | | | | | | | | |
| 8.875%, 05/15/19 | | | 1,000 | | | | 1,277 | |
| Comcast Cable Communications Holdings | | | | | | | | |
| 8.375%, 03/15/13 | | | 160 | | | | 176 | |
| Time Warner Cable | | | | | | | | |
| 5.850%, 05/01/17 | | | 1,000 | | | | 1,111 | |
Total Communication & Media | | | | 2,564 | |
| Computer System Design & Services [3.6%] | | | | | |
| Cisco Systems | | | | | | | | |
| 5.500%, 02/22/16 | | | 1,250 | | | | 1,441 | |
| Dell | | | | | | | | |
| 5.625%, 04/15/14 | | | 1,000 | | | | 1,088 | |
| Hewlett-Packard | | | | | | | | |
| 6.125%, 03/01/14 | | | 1,470 | | | | 1,607 | |
Total Computer System Design & Services | | | | 4,136 | |
| Diversified Operations [0.5%] | | | | | | | | |
| 3M, MTN | | | | | | | | |
| | | 500 | | | | 536 | |
| Electrical Services [2.2%] | | | | | | | | |
| Alabama Power | | | | | | | | |
| 4.850%, 12/15/12 | | | 1,380 | | | | 1,444 | |
| American Electric Power | | | | | | | | |
| 5.250%, 06/01/15 | | | 986 | | | | 1,093 | |
Total Electrical Services | | | | 2,537 | |
| Finance Auto Loans [0.9%] | | | | | | | | |
| Harley-Davidson Financial Services, MTN | | | | | | | | |
| | | 1,000 | | | | 1,029 | |
| Financial Services [15.7%] | | | | | | | | |
| Ally Financial, FDIC Insured | | | | | | | | |
| 2.200%, 12/19/12 | | | 2,500 | | | | 2,555 | |
See accompanying notes to financial statements.
CNI CHARTER FUNDS | PAGE 40
schedule of investments
Corporate Bond Fund (continued)
| American Express Credit, MTN | | | | | | | | |
| 2.800%, 09/19/16 | | $ | 1,100 | | | $ | 1,095 | |
| Boeing Capital | | | | | | | | |
| 6.500%, 02/15/12 | | | 930 | | | | 949 | |
| Caisse Centrale Desjardins du Quebec | | | | | | | | |
| 2.650%, 09/16/15(A) | | | 3,000 | | | | 3,083 | |
| CME Group | | | | | | | | |
| 5.400%, 08/01/13 | | | 95 | | | | 102 | |
| General Electric Capital | | | | | | | | |
| 5.900%, 05/13/14 | | | 3,000 | | | | 3,280 | |
| General Electric Capital, FDIC Insured, MTN | | | | | | | | |
| 2.625%, 12/28/12 | | | 2,770 | | | | 2,848 | |
| HSBC Finance | | | | | | | | |
| 5.250%, 04/15/15 | | | 1,250 | | | | 1,294 | |
| National Rural Utilities, Ser C, MTN | | | | | | | | |
| 7.250%, 03/01/12 | | | 833 | | | | 855 | |
| Societe Generale | | | | | | | | |
| 2.200%, 09/14/13(A) | | | 2,000 | | | | 1,885 | |
| | | | 17,946 | |
| Food, Beverage & Tobacco [4.4%] | | | | | |
| Anheuser-Busch InBev Worldwide | | | | | | | | |
| 5.375%, 11/15/14 | | | 1,195 | | | | 1,335 | |
| Bottling Group | | | | | | | | |
| 5.500%, 04/01/16 | | | 1,000 | | | | 1,164 | |
| 4.625%, 11/15/12 | | | 1,435 | | | | 1,499 | |
| Dr Pepper Snapple Group | | | | | | | | |
| 2.900%, 01/15/16 | | | 1,000 | | | | 1,032 | |
Total Food, Beverage & Tobacco | | | | 5,030 | |
| Internet Security [0.9%] | | | | | | | | |
| Symantec | | | | | | | | |
| | | 1,000 | | | | 1,013 | |
| Investment Banker/Broker Dealer [12.9%] | | | | | |
| Citigroup | | | | | | | | |
| 5.850%, 08/02/16 | | | 980 | | | | 1,048 | |
| 5.500%, 02/15/17 | | | 250 | | | | 249 | |
| Citigroup Funding, FDIC Insured | | | | | | | | |
| 2.250%, 12/10/12 | | | 2,500 | | | | 2,555 | |
| Credit Suisse | | | | | | | | |
| 5.500%, 08/15/13 | | | 1,250 | | | | 1,307 | |
| Goldman Sachs Group | | | | | | | | |
| 5.625%, 01/15/17 | | | 1,700 | | | | 1,649 | |
| Jefferies Group | | | | | | | | |
| 8.500%, 07/15/19 | | $ | 870 | | | $ | 968 | |
| Macquarie Group | | | | | | | | |
| 6.000%, 01/14/20(A) | | | 2,000 | | | | 1,896 | |
| Merrill Lynch | | | | | | | | |
| 6.050%, 05/16/16 | | | 2,025 | | | | 1,822 | |
| Morgan Stanley, MTN | | | | | | | | |
| 6.250%, 08/28/17 | | | 2,000 | | | | 1,975 | |
| Nomura Holdings, MTN | | | | | | | | |
| 4.125%, 01/19/16 | | | 1,200 | | | | 1,218 | |
Total Investment Banker/Broker Dealer | | | | 14,687 | |
| Multi-line Insurance [1.5%] | | | | | | | | |
| MetLife | | | | | | | | |
| | | 1,430 | | | | 1,753 | |
| Petroleum & Fuel Products [7.8%] | | | | | |
| BP Capital Markets | | | | | | | | |
| 5.250%, 11/07/13 | | | 2,000 | | | | 2,154 | |
| ConocoPhillips Canada Funding I | | | | | | | | |
| 5.625%, 10/15/16 | | | 2,000 | | | | 2,322 | |
| Duke Capital | | | | | | | | |
| 5.500%, 03/01/14 | | | 615 | | | | 663 | |
| Kinder Morgan Energy Partners | | | | | | | | |
| 6.000%, 02/01/17 | | | 1,000 | | | | 1,132 | |
| Shell International Finance | | | | | | | | |
| 3.250%, 09/22/15 | | | 1,500 | | | | 1,599 | |
| Transocean | | | | | | | | |
| 6.000%, 03/15/18 | | | 1,000 | | | | 1,065 | |
Total Petroleum & Fuel Products | | | | 8,935 | |
| Real Estate Investment Trusts [4.9%] | | | | | |
| HCP | | | | | | | | |
| 5.650%, 12/15/13 | | | 500 | | | | 525 | |
| 5.625%, 05/01/17 | | | 500 | | | | 519 | |
| Health Care REIT | | | | | | | | |
| 4.700%, 09/15/17 | | | 1,000 | | | | 1,002 | |
| Kimco Realty | | | | | | | | |
| 6.875%, 10/01/19 | | | 1,080 | | | | 1,233 | |
| Simon Property Group | | | | | | | | |
| 6.100%, 05/01/16 | | | 2,000 | | | | 2,268 | |
Total Real Estate Investment Trusts | | | | 5,547 | |
| Retail [5.2%] | | | | | | | | |
| CVS Caremark | | | | | | | | |
| 6.125%, 08/15/16 | | | 1,000 | | | | 1,157 | |
| Kroger | | | | | | | | |
| 5.500%, 02/01/13 | | | 450 | | | | 474 | |
See accompanying notes to financial statements.
CNI CHARTER FUNDS | PAGE 41
schedule of investments
Corporate Bond Fund (continued)
| Target | | | | | | | | |
| 6.000%, 01/15/18 | | $ | 1,770 | | | $ | 2,144 | |
| Wal-Mart Stores | | | | | | | | |
| 2.875%, 04/01/15 | | | 2,000 | | | | 2,110 | |
| | | | 5,885 | |
| Telephones & Telecommunications [8.1%] | | | | | |
| AT&T | | | | | | | | |
| 5.100%, 09/15/14 | | | 2,000 | | | | 2,197 | |
| 2.400%, 08/15/16 | | | 1,870 | | | | 1,887 | |
| Deutsche Telekom International Finance | | | | | | | | |
| 5.250%, 07/22/13 | | | 475 | | | | 502 | |
| Motorola Solutions | | | | | | | | |
| 6.000%, 11/15/17 | | | 1,000 | | | | 1,107 | |
| Telefonica Emisiones SAU | | | | | | | | |
| 6.421%, 06/20/16 | | | 1,000 | | | | 1,025 | |
| Verizon Communications | | | | | | | | |
| 5.550%, 02/15/16 | | | 2,195 | | | | 2,504 | |
Total Telephones & Telecommunications | | | | 9,222 | |
Total Corporate Bonds (Cost $98,377) | | | | 100,283 | |
| Sovereign Debt [3.9%] | | | | | | | | |
| Kingdom of Denmark | | | | | | | | |
| 2.750%, 11/15/11 | | | 3,000 | | | | 3,008 | |
| Korea National Oil | | | | | | | | |
| 2.875%, 11/09/15(A) | | | 1,000 | | | | 967 | |
| United Mexican States, MTN | | | | | | | | |
| 5.875%, 01/15/14 | | | 450 | | | | 486 | |
Total Sovereign Debt (Cost $4,459) | | | | 4,461 | |
| Municipal Bonds [3.7%] | | | | | | | | |
| California [2.8%] | | | | | | | | |
California State, City of Industry, Sales Tax Project, RB, NATL-RE | | | | | |
| 5.000%, 01/01/12 | | | 955 | | | | 960 | |
| California State, GO | | | | | | | | |
| 5.700%, 11/01/21 | | | 185 | | | | 200 | |
| California State, Ser A-2, RB | | | | | | | | |
| 2.000%, 06/26/12 | | | 2,000 | | | | 2,024 | |
| | | | 3,184 | |
| | | | | |
| Wisconsin [0.9%] | | | | | | |
| De Pere, Unified School District, GO, FGIC (C) | | | | | | |
| Pre-Refunded @ 100 | | | | | | |
| | $ | 995 | | | $ | 995 | |
Total Municipal Bonds (Cost $4,163) | | | | 4,179 | |
| U.S. Treasury Obligation [0.6%] | | | | | | | | |
| U.S. Treasury Inflation Protection Security | | | | | | | | |
| 2.000%, 01/15/14 | | | 611 | | | | 649 | |
Total U.S. Treasury Obligation (Cost $617) | | | | 649 | |
| U.S. Government Mortgage-Backed Obligations [0.3%] | |
| FHLMC REMIC, Ser 2005-2982, Cl NB | | | | | | | | |
| 5.500%, 02/15/29 | | | 32 | | | | 32 | |
| FNMA REMIC, Ser 2002-56, Cl MC | | | | | | | | |
| 5.500%, 09/25/17 | | | 318 | | | | 338 | |
Total U.S. Government Mortgage-Backed Obligations (Cost $350) | | | | 370 | |
| Short-Term Investment [2.7%] | | | | | | | | |
| Fidelity Institutional Domestic Money Market Portfolio, Cl I, 0.116%* | | | 3,051,571 | | | | 3,052 | |
Total Short-Term Investment (Cost $3,052) | | | | 3,052 | |
Total Investments [99.1%] (Cost $111,018) | | | $ | 112,994 | |
Percentages are based on Net Assets of $114,044 ($ Thousands).
| * | The rate reported is the 7-day effective yield as of September 30, 2011. |
| (A) | Security exempt from registration under Rule 144A of the Securities Act of 1933. These securities may be resold in transactions exempt from registration normally to qualified institutions. On September 30, 2011, the value of these securities amounted to $13,792 (000), representing 12.1% of the net assets of the Fund. |
| (B) | Floating Rate Security — The rate reported is the rate in effect on September 30, 2011. |
| (C) | Pre-Refunded Security — The maturity date shown is the pre-refunded date. |
See accompanying notes to financial statements.
CNI CHARTER FUNDS | PAGE 42
schedule of investments
Corporate Bond Fund (concluded)
Cl — Class
FDIC Insured — Federal Depositary Insurance Corporation
FGIC — Financial Guaranty Insurance Company
FHLMC — Federal Home Loan Mortgage Corporation
FNMA — Federal National Mortgage Association
GO — General Obligation
MTN — Medium Term Note
NATL-RE — National Public Finance Guarantee Corporation
RB — Revenue Bond
REIT — Real Estate Investment Trust
REMIC — Real Estate Mortgage Investment Conduit
Ser — Series
The following is a summary of the inputs used as of September 30, 2011 in valuing the Fund’s investments carried at value ($ Thousands) in accordance with ASC 820:
| Investments in Securities | | | | | | | | | | | | |
| Corporate Bonds | | $ | — | | | $ | 100,283 | | | $ | — | | | $ | 100,283 | |
| Sovereign Debt | | | — | | | | 4,461 | | | | — | | | | 4,461 | |
| Municipal Bonds | | | — | | | | 4,179 | | | | — | | | | 4,179 | |
| U.S. Treasury Obligation | | | — | | | | 649 | | | | — | | | | 649 | |
| U.S. Government Mortgage-Backed Obligations | | | — | | | | 370 | | | | — | | | | 370 | |
| Short-Term Investment | | | 3,052 | | | | — | | | | — | | | | 3,052 | |
| Total Investments in Securities | | $ | 3,052 | | | $ | 109,942 | | | $ | — | | | $ | 112,994 | |
For the year ended September 30, 2011, there have been no transfers between Level 1 and Level 2 assets and liabilities. Transfers between Levels are recognized at period end.
For more information on valuation inputs, see Note 2 — Significant Accounting Policies in the Notes to Financial Statements.
See accompanying notes to financial statements.
CNI CHARTER FUNDS | PAGE 43
schedule of investments
California Tax Exempt Bond Fund
| | | | | |
| Municipal Bonds [95.4%] | | | | | | |
| Arizona [1.4%] | | | | | | |
| Arizona State, School Facilities Board, Ser C, COP, AGM | | | | | | |
| Callable 09/01/14 @ 100 | | | | | | |
| | $ | 750 | | | $ | 813 | |
| California [86.5%] | | | | | | | | |
| Atwater, Elementary School District, Ser A, GO, NATL-RE FGIC | | | | | | | | |
| Callable 08/01/13 @ 100 | | | | | | | | |
| 5.000%, 08/01/22 | | | 660 | | | | 680 | |
| Azusa, Redevelopment Agency, Mortgage-Backed Securities Program, Ser A, RB, FNMA, ETM | | | | | | | | |
| 6.875%, 10/01/12 | | | 200 | | | | 213 | |
| Bay Area, Infrastructure Financing Authority, State Payment Acceleration Project, RB, NATL-RE FGIC | | | | | | | | |
| Callable 08/01/14 @ 100 | | | | | | | | |
| 5.000%, 08/01/17 | | | 600 | | | | 638 | |
| California Health Facilities Financing Authority, Ser A, RB | | | | | | | | |
| Callable 11/15/13 @ 100 | | | | | | | | |
| 5.000%, 11/15/23 | | | 1,000 | | | | 1,062 | |
| California State, Department of Water Resources, Water Systems Project, Ser Y, RB, NATL-RE FGIC | | | | | | | | |
| Callable 06/01/13 @ 100 | | | | | | | | |
| 5.250%, 12/01/19 | | | 515 | | | | 557 | |
| California State, Economic Recovery Authority, Ser A, GO, NATL-RE | | | | | | | | |
| Callable 07/01/14 @ 100 | | | | | | | | |
| 5.000%, 07/01/15 | | $ | 965 | | | $ | 1,067 | |
| California State, Economic Recovery Authority, Ser B, GO (A) | | | | | | | | |
| 4.000%, 07/01/23 | | | 750 | | | | 807 | |
| California State, Educational Facilities Authority, Stanford University Project, Ser T-4, RB | | | | | | | | |
| 5.000%, 03/15/14 | | | 350 | | | | 389 | |
| California State, GO | | | | | | | | |
| Callable 03/01/15 @ 100 | | | | | | | | |
| 5.000%, 03/01/16 | | | 1,500 | | | | 1,666 | |
| California State, GO | | | | | | | | |
| Callable 02/01/12 @ 100 | | | | | | | | |
| 5.000%, 02/01/18 | | | 175 | | | | 177 | |
| California State, GO | | | | | | | | |
| 5.000%, 09/01/20 | | | 1,000 | | | | 1,152 | |
| California State, GO | | | | | | | | |
| Callable 11/01/20 @ 100 | | | | | | | | |
| 5.000%, 11/01/22 | | | 1,025 | | | | 1,170 | |
| California State, Infrastructure & Economic Authority, Bay Area Toll Bridges Project, Ser A, RB, AGM (B) | | | | | | | | |
| Pre-Refunded @ 100 | | | | | | | | |
| 5.250%, 07/01/13 | | | 125 | | | | 136 | |
| California State, Public Works Board Lease, Department of Corrections-Administration Project, Ser A, RB, AMBAC | | | | | | | | |
| Callable 03/01/12 @ 100 | | | | | | | | |
| 5.250%, 03/01/18 | | | 155 | | | | 157 | |
| California State, Public Works Board, Department of Mental Health Project, Ser A, RB | | | | | | | | |
| 5.250%, 06/01/13 | | | 200 | | | | 212 | |
| California State, Public Works Board, Regents University, Ser C, RB, NATL-RE FGIC | | | | | | | | |
| 5.000%, 09/01/20 | | | 825 | | | | 964 | |
| California State, Public Works Board, University of California Project, Ser C-1, RB | | | | | | | | |
| Callable 03/01/20 @ 100 | | | | | | | | |
| 5.000%, 03/01/21 | | | 660 | | | | 758 | |
| California State, Public Works Board, University of California Research Project, Ser L, RB, NATL-RE | | | | | | | | |
| Callable 11/01/15 @ 100 | | | | | | | | |
| 5.250%, 11/01/16 | | | 1,000 | | | | 1,146 | |
See accompanying notes to financial statements.
CNI CHARTER FUNDS | PAGE 44
schedule of investments
California Tax Exempt Bond Fund (continued)
| California Statewide Communities Development Authority, Kaiser Permanente, Ser A, RB | | | | | | | | |
| 5.000%, 04/01/19 | | $ | 200 | | | $ | 231 | |
| California Statewide Communities Development Authority, Kaiser Permanente, Ser B, RB (A) | | | | | | | | |
| 3.900%, 08/01/31 | | | 625 | | | | 673 | |
| California Statewide Communities Development Authority, Proposition 1A Receivables, Ser PG, RB | | | | | | | | |
| 5.000%, 06/15/13 | | | 2,460 | | | | 2,627 | |
| Carlsbad, Public Financing Authority, Municipal Golf Course Project, Ser A, RB, AMBAC | | | | | | | | |
| 4.500%, 09/01/16 | | | 350 | | | | 396 | |
| Castaic Lake, Water Agency, 1999 Project, Ser A, COP, AMBAC | | | | | | | | |
| Callable 08/01/16 @ 100 | | | | | | | | |
| 5.000%, 08/01/22 | | | 275 | | | | 300 | |
| Castaic Lake, Water Agency, Water Systems Improvement Project, Ser A, COP, NATL-RE | | | | | | | | |
| 7.000%, 08/01/13 | | | 300 | | | | 332 | |
| Clovis, Public Financing Authority, Ser A, TA, NATL-RE | | | | | | | | |
| 3.250%, 08/01/13 | | | 400 | | | | 397 | |
| County of Riverside, Ser A, COP, AMBAC | | | | | | | | |
| 5.000%, 11/01/17 | | | 1,500 | | | | 1,681 | |
| El Camino, Hospital District, GO, NATL-RE | | | | | | | | |
| Callable 02/01/17 @ 100 | | | | | | | | |
| 5.000%, 08/01/20 | | | 500 | | | | 548 | |
| Escondido, Union School District, Refunding & Financing Project, COP, NATL-RE | | | | | | | | |
| 4.750%, 07/01/19 | | | 735 | | | | 766 | |
| Fresno, Unified School District, Election 2001 Project, Ser D, GO, NATL-RE (B) | | | | | | | | |
| Pre-Refunded @ 102 | | | | | | | | |
| 5.000%, 08/01/13 | | | 200 | | | | 221 | |
| Gilroy, Unified School District, GO (C) | | | | | | | | |
| 3.506%, 04/01/13 | | | 500 | | | | 486 | |
| Gilroy, Unified School District, GO, NATL-RE FGIC | | | | | | | | |
| Callable 08/01/13 @ 100 | | | | | | | | |
| 5.250%, 08/01/19 | | $ | 800 | | | $ | 841 | |
| Golden State, Tobacco Settlement, Enhanced-Asset Backed, Ser A, RB, AMBAC | | | | | | | | |
| Callable 10/20/11 @ 100 | | | | | | | | |
| 5.000%, 06/01/20 | | | 500 | | | | 500 | |
| Golden State, Tobacco Settlement, Ser A-1, RB (B) | | | | | | | | |
| Pre-Refunded @ 100 | | | | | | | | |
| 6.750%, 06/01/13 | | | 920 | | | | 1,015 | |
| Imperial Irrigation District, RB | | | | | | | | |
| Callable 07/01/21 @ 100 | | | | | | | | |
| 5.250%, 07/01/23 | | | 1,000 | | | | 1,174 | |
| Jefferson, Unified High School District, Ser A, GO, NATL-RE FGIC | | | | | | | | |
| 5.000%, 08/01/14 | | | 200 | | | | 218 | |
| Long Beach, Community College District, Ser A, GO | | | | | | | | |
| 9.850%, 01/15/13 | | | 500 | | | | 559 | |
| Los Angeles County, Metropolitan Transportation Authority, Proposition A, Ser B, RB, AGM | | | | | | | | |
| Callable 11/04/11 @ 101 | | | | | | | | |
| 5.250%, 07/01/15 | | | 250 | | | | 253 | |
| Los Angeles County, Metropolitan Transportation Authority, Proposition C, Ser A, RB, NATL-RE | | | | | | | | |
| Callable 07/01/14 @ 100 | | | | | | | | |
| 5.000%, 07/01/16 | | | 200 | | | | 221 | |
| Los Angeles County, Sanitation Districts Financing Authority, Capital Projects (District #14), Sub-Ser B, RB, NATL-RE FGIC | | | | | | | | |
| 3.750%, 10/01/14 | | | 175 | | | | 185 | |
| Los Angeles, Department of Water & Power, Power Systems Project, Sub-Ser A-2, RB, AGM | | | | | | | | |
| Callable 07/01/15 @ 100 | | | | | | | | |
| 5.000%, 07/01/25 | | | 1,000 | | | | 1,079 | |
| Los Angeles, Municipal Improvement Authority, Central Library Project, Ser A, RB, NATL-RE | | | | | | | | |
| 5.250%, 06/01/12 | | | 300 | | | | 308 | |
| Los Angeles, Municipal Improvement Authority, Central Library Project, Ser A, RB, NATL-RE | | | | | | | | |
| Callable 06/01/12 @ 100 | | | | | | | | |
| 5.500%, 06/01/18 | | | 500 | | | | 513 | |
See accompanying notes to financial statements.
CNI CHARTER FUNDS | PAGE 45
schedule of investments
California Tax Exempt Bond Fund (continued)
| Los Angeles, Municipal Improvement Authority, Real Property, Ser E, RB | | | | | | | | |
| 5.000%, 09/01/15 | | $ | 275 | | | $ | 306 | |
| Los Angeles, Municipal Improvement Authority, Ser A, RB | | | | | | | | |
| 4.000%, 11/01/19 | | | 475 | | | | 484 | |
| Los Angeles, Municipal Improvement Authority, Ser C, RB | | | | | | | | |
| 4.000%, 09/01/16 | | | 500 | | | | 540 | |
| Los Angeles, Ser A, GO, AGM (B) | | | | | | | | |
| Pre-Refunded @ 100 | | | | | | | | |
| 5.000%, 09/01/12 | | | 750 | | | | 782 | |
| Los Angeles, Unified School District, COP, AMBAC | | | | | | | | |
| 5.000%, 10/01/12 | | | 750 | | | | 780 | |
| Los Angeles, Unified School District, Ser A-1, GO, NATL-RE | | | | | | | | |
| Callable 07/01/14 @ 100 | | | | | | | | |
| 5.000%, 07/01/17 | | | 165 | | | | 180 | |
| Los Angeles, Unified School District, Ser I, GO | | | | | | | | |
| Callable 07/01/19 @ 100 | | | | | | | | |
| 5.250%, 07/01/23 | | | 1,000 | | | | 1,132 | |
| Los Angeles, Wastewater Systems Authority, Ser A, RB | | | | | | | | |
| 5.000%, 06/01/14 | | | 825 | | | | 918 | |
| Modesto Irrigation District, Ser A, RB | | | | | | | | |
| 5.000%, 07/01/17 | | | 1,000 | | | | 1,158 | |
| Mount San Antonio, Community College District, GO (C) | | | | | | | | |
| 3.857%, 05/01/15 | | | 500 | | | | 459 | |
| Oakley, Civic Center Project, COP | | | | | | | | |
| 4.000%, 05/01/12 | | | 230 | | | | 234 | |
| Orange County, Public Financing Authority, RB, NATL-RE | | | | | | | | |
| 5.000%, 07/01/17 | | | 1,050 | | | | 1,215 | |
| Orange County, Sanitation District, Ser A, COP | | | | | | | | |
| 3.000%, 02/01/17 | | | 500 | | | | 534 | |
| Port of Oakland, Ser B, RB, NATL-RE | | | | | | | | |
| Callable 11/01/17 @ 100 | | | | | | | | |
| 5.000%, 11/01/23 | | | 500 | | | | 526 | |
| Port of Oakland, Ser C, RB, NATL-RE | | | | | | | | |
| 5.000%, 11/01/15 | | | 450 | | | | 503 | |
| Sacramento, Area Flood Control Agency, Ser A, SAB, NATL-RE FGIC | | | | | | | | |
| Callable 10/01/17 @ 100 | | | | | | | | |
| 5.000%, 10/01/21 | | $ | 400 | | | $ | 447 | |
| Sacramento, City Financing Authority, EPA Building Project, Ser A, RB, AMBAC | | | | | | | | |
| Callable 11/04/11 @ 100 | | | | | | | | |
| 4.750%, 05/01/17 | | | 525 | | | | 526 | |
| Sacramento, Municipal Utility District, Ser T, RB, NATL-RE FGIC | | | | | | | | |
| Callable 05/15/14 @ 100 | | | | | | | | |
| 5.250%, 05/15/22 | | | 805 | | | | 856 | |
| Sacramento, Unified School District, Election of 2002, GO, NATL-RE | | | | | | | | |
| Callable 07/01/15 @ 100 | | | | | | | | |
| 5.000%, 07/01/18 | | | 300 | | | | 334 | |
| San Diego, Public Facilities Financing Authority, Ser B, RB | | | | | | | | |
| 5.000%, 05/15/14 | | | 750 | | | | 823 | |
| San Diego, Unified School District, Election 1998 Project, Ser E, GO, AGM | | | | | | | | |
| Callable 07/01/13 @ 101 | | | | | | | | |
| 5.250%, 07/01/16 | | | 100 | | | | 109 | |
| San Francisco City & County Finance, RB, NATL-RE | | | | | | | | |
| Callable 07/01/14 @ 100 | | | | | | | | |
| 3.750%, 07/01/18 | | | 500 | | | | 509 | |
| San Francisco City & County, Airports Commission, Ser B, RB | | | | | | | | |
| 5.000%, 05/01/17 | | | 495 | | | | 570 | |
| San Francisco City & County, Multiple Capital Improvement Projects, Ser B, COP | | | | | | | | |
| Callable 04/01/19 @ 100 | | | | | | | | |
| 5.000%, 04/01/22 | | | 735 | | | | 800 | |
| San Francisco City & County, Redevelopment Agency, Redevelopment Projects, Ser B, TA | | | | | | | | |
| 5.000%, 08/01/17 | | | 540 | | | | 593 | |
| San Francisco City & County, Redevelopment Agency, Redevelopment Projects, Ser B, TA, NATL-RE | | | | | | | | |
| 5.000%, 08/01/15 | | | 300 | | | | 324 | |
| San Francisco City & County, Redevelopment Agency, Redevelopment Projects, Ser B, TA, NATL-RE FGIC | | | | | | | | |
| 5.250%, 08/01/13 | | | 500 | | | | 529 | |
See accompanying notes to financial statements.
CNI CHARTER FUNDS | PAGE 46
schedule of investments
California Tax Exempt Bond Fund (continued)
| San Francisco City & County, Redevelopment Agency, Redevelopment Projects, Ser B, TA, NATL-RE FGIC | | | | | | | | |
| Callable 08/01/13 @ 100 | | | | | | | | |
| 5.250%, 08/01/18 | | $ | 600 | | | $ | 625 | |
| San Francisco, Bay Area Transit Financing Authority, Ser A, RB, NATL-RE | | | | | | | | |
| Callable 07/01/15 @ 100 | | | | | | | | |
| 5.000%, 07/01/24 | | | 550 | | | | 592 | |
| Santa Margarita, Dana Point Authority, Improvement Districts 3-3A-4-4A, Ser A, RB, AMBAC | | | | | | | | |
| Callable 08/01/14 @ 100 | | | | | | | | |
| 5.000%, 08/01/15 | | | 290 | | | | 327 | |
| Solano County, COP, NATL-RE (B) | | | | | | | | |
| Pre-Refunded @ 100 | | | | | | | | |
| 5.250%, 11/01/12 | | | 100 | | | | 105 | |
| Southern California, Metropolitan Water District Authority, Ser A, RB | | | | | | | | |
| 5.750%, 07/01/21 | | | 280 | | | | 343 | |
| Southern California, Public Power Authority, Subordinated Southern Transmission Project, Ser A, RB | | | | | | | | |
| 5.000%, 07/01/17 | | | 1,200 | | | | 1,423 | |
| University of California, Regents Medical Center, Ser E, RB | | | | | | | | |
| Callable 05/15/17 @ 101 | | | | | | | | |
| 5.000%, 05/15/21 | | | 250 | | | | 281 | |
| University of California, Revenues Limited Project, Ser A, RB, NATL-RE | | | | | | | | |
| Callable 05/15/12 @ 101 | | | | | | | | |
| 4.750%, 05/15/23 | | | 500 | | | | 513 | |
| University of California, Revenues Limited Project, Ser B, RB, AGM (B) | | | | | | | | |
| Pre-Refunded @ 101 | | | | | | | | |
| 5.000%, 05/15/13 | | | 765 | | | | 828 | |
| University of California, Revenues Unrefunded Balance General, Ser A, RB, AMBAC | | | | | | | | |
| Callable 05/15/13 @ 100 | | | | | | | | |
| 5.125%, 05/15/15 | | | 510 | | | | 546 | |
| | | | 50,229 | |
| Illinois [0.6%] | | | | | | | | |
| Cook County, Forest Preservation District, GO, AMBAC | | | | | | | | |
| Callable 11/15/14 @ 100 | | | | | | | | |
| | $ | 300 | | | $ | 331 | |
| New York [1.9%] | | | | | | | | |
| New York City, Housing Development, Ser F, RB | | | | | | | | |
| Callable 11/04/11 @ 100 | | | | | | | | |
| 1.950%, 11/01/12 | | | 500 | | | | 500 | |
| New York State, Local Assistance Correction Authority, Ser E, RB | | | | | | | | |
| 6.000%, 04/01/14 | | | 540 | | | | 581 | |
| | | | 1,081 | |
| South Carolina [1.4%] | | | | | | | | |
| Columbia, Tourism Development Fee Pledge Project, COP, AMBAC | | | | | | | | |
| Callable 06/01/13 @ 100 | | | | | | | | |
| 5.250%, 06/01/16 | | | 350 | | | | 368 | |
| South Carolina State, Jobs & Economic Development Authority, Palmetto Health Project, Ser C, RB (B) | | | | | | | | |
| Pre-Refunded @ 100 | | | | | | | | |
| 6.875%, 08/01/13 | | | 400 | | | | 446 | |
| | | | 814 | |
| Washington [2.5%] | | | | | | | | |
| Central Puget Sound, Regional Transit Authority, Ser A, RB, AMBAC | | | | | | | | |
| Callable 05/01/15 @ 100 | | | | | | | | |
| 5.000%, 11/01/21 | | | 1,000 | | | | 1,102 | |
| King County, NJB Properties Project, Ser A, RB | | | | | | | | |
| 5.000%, 12/01/14 | | | 325 | | | | 365 | |
| | | | 1,467 | |
| Puerto Rico [1.1%] | | | | | | | | |
| Puerto Rico, Sales Tax Financing, Sub-Ser A, RB | | | | | | | | |
| | | 605 | | | | 656 | |
Total Municipal Bonds (Cost $53,836) | | | | 55,391 | |
See accompanying notes to financial statements.
CNI CHARTER FUNDS | PAGE 47
schedule of investments
California Tax Exempt Bond Fund (concluded)
| | | | | |
| Short-Term Investment [2.1%] | | | | | | |
| Federated California Municipal Money Market Fund, Cl I, 0.020%* | | | 1,193,729 | | | $ | 1,194 | |
Total Short-Term Investment (Cost $1,194) | | | | 1,194 | |
Total Investments [97.5%] (Cost $55,030) | | | $ | 56,585 | |
Percentages are based on Net Assets of $58,027 ($ Thousands).
| * | The rate reported is the 7-day effective yield as of September 30, 2011. |
| (A) | Floating Rate Security — The rate reported is the rate in effect on September 30, 2011. |
| (B) | Pre-Refunded Security — The maturity date shown is the pre-refunded date. |
| (C) | Zero coupon security. The rate reported is the effective yield at time of purchase. |
AGM — Assured Guarantee Municipal
AMBAC — American Municipal Bond Assurance Company
Cl — Class
COP — Certificate of Participation
ETM — Escrowed to Maturity
FGIC — Financial Guaranty Insurance Company
FNMA — Federal National Mortgage Association
GO — General Obligation
NATL-RE — National Public Finance Guarantee Corporation
RB — Revenue Bond
SAB — Special Assessment Board
Ser — Series
TA — Tax Allocation
The following is a summary of the inputs used as of September 30, 2011 in valuing the Fund’s investments carried at value ($ Thousands) in accordance with ASC 820:
| Investments in Securities | | | | | | | | | | | | |
| Municipal Bonds | | $ | — | | | $ | 55,391 | | | $ | — | | | $ | 55,391 | |
| Short-Term Investment | | | 1,194 | | | | — | | | | — | | | | 1,194 | |
| Total Investments in Securities | | $ | 1,194 | | | $ | 55,391 | | | $ | — | | | $ | 56,585 | |
For the year ended September 30, 2011, there have been no transfers between Level 1 and Level 2 assets and liabilities. Transfers between Levels are recognized at period end.
For more information on valuation inputs, see Note 2 — Significant Accounting Policies in the Notes to Financial Statements.
See accompanying notes to financial statements.
CNI CHARTER FUNDS | PAGE 48
schedule of investments
Full Maturity Fixed Income Fund
| | | | | |
| Corporate Bonds [41.9%] | | | | | | |
| Agriculture [0.2%] | | | | | | |
| Bunge NA Finance | | | | | | |
| | $ | 100 | | | $ | 109 | |
| Automotive [0.3%] | | | | | | | | |
| Johnson Controls | | | | | | | | |
| | | 100 | | | | 112 | |
| Banks [11.3%] | | | | | | | | |
| Bank of America | | | | | | | | |
| 10.200%, 07/15/15 | | | 100 | | | | 111 | |
| Bank of America, MTN | | | | | | | | |
| 7.375%, 05/15/14 | | | 355 | | | | 366 | |
| Bank of Nova Scotia | | | | | | | | |
| 2.250%, 01/22/13 | | | 375 | | | | 382 | |
| Barclays Bank | | | | | | | | |
| 5.125%, 01/08/20 | | | 100 | | | | 98 | |
| BB&T, MTN | | | | | | | | |
| 3.375%, 09/25/13 | | | 360 | | | | 373 | |
| Canadian Imperial Bank of Commerce | | | | | | | | |
| 2.350%, 12/11/15 | | | 385 | | | | 390 | |
| Citigroup | | | | | | | | |
| 6.375%, 08/12/14 | | | 430 | | | | 455 | |
| Deutsche Bank, MTN | | | | | | | | |
| 3.450%, 03/30/15 | | | 100 | | | | 100 | |
| Deutsche Bank Trust | | | | | | | | |
| 7.250%, 10/15/11 | | | 46 | | | | 46 | |
| Dresdner Bank - New York | | | | | | | | |
| 7.250%, 09/15/15 | | | 150 | | | | 140 | |
| Goldman Sachs Group | | | | | | | | |
| 3.625%, 02/07/16 | | | 475 | | | | 462 | |
| JPMorgan Chase | | | | | | | | |
| 4.650%, 06/01/14 | | | 445 | | | | 471 | |
| 4.250%, 10/15/20 | | | 150 | | | | 150 | |
| KeyCorp, MTN | | | | | | | | |
| 3.750%, 08/13/15 | | $ | 245 | | | $ | 252 | |
| Kookmin Bank | | | | | | | | |
| 7.250%, 05/14/14(A) | | | 100 | | | | 111 | |
| PNC Funding | | | | | | | | |
| 4.250%, 09/21/15 | | | 360 | | | | 389 | |
| 3.000%, 05/19/14 | | | 125 | | | | 129 | |
| SunTrust Banks | | | | | | | | |
| 3.600%, 04/15/16 | | | 250 | | | | 254 | |
| Wachovia, MTN | | | | | | | | |
| 5.500%, 05/01/13 | | | 200 | | | | 213 | |
| Wells Fargo | | | | | | | | |
| 3.625%, 04/15/15 | | | 125 | | | | 130 | |
| | | | 5,022 | |
| Cable/Media [2.0%] | | | | | | | | |
| Comcast | | | | | | | | |
| 4.950%, 06/15/16 | | | 230 | | | | 255 | |
| DIRECTV Holdings | | | | | | | | |
| 3.500%, 03/01/16 | | | 245 | | | | 253 | |
| TCI Communications | | | | | | | | |
| 7.875%, 08/01/13 | | | 75 | | | | 83 | |
| Time Warner Cable | | | | | | | | |
| 4.125%, 02/15/21 | | | 305 | | | | 304 | |
| | | | 895 | |
| Chemicals [0.9%] | | | | | | | | |
| Dow Chemical | | | | | | | | |
| 2.500%, 02/15/16 | | | 255 | | | | 251 | |
| PPG Industries | | | | | | | | |
| 1.900%, 01/15/16 | | | 160 | | | | 159 | |
| | | | 410 | |
| Computer System Design & Services [0.9%] | | | | | |
| Hewlett-Packard | | | | | | | | |
| | | 415 | | | | 411 | |
| Drugs [1.1%] | | | | | | | | |
| McKesson | | | | | | | | |
| 3.250%, 03/01/16 | | | 135 | | | | 142 | |
| Teva Pharmaceutical | | | | | | | | |
| 5.550%, 02/01/16 | | | 75 | | | | 86 | |
| Wyeth | | | | | | | | |
| 5.500%, 02/15/16 | | | 220 | | | | 253 | |
| | | | 481 | |
See accompanying notes to financial statements.
CNI CHARTER FUNDS | PAGE 49
schedule of investments
Full Maturity Fixed Income Fund (continued)
| Energy [1.7%] | | | | | | | | |
| Baltimore Gas & Electric | | | | | | | | |
| 6.125%, 07/01/13 | | $ | 210 | | | $ | 226 | |
| Carolina Power & Light | | | | | | | | |
| 5.150%, 04/01/15 | | | 80 | | | | 90 | |
| Exelon | | | | | | | | |
| 5.625%, 06/15/35 | | | 75 | | | | 78 | |
| Korea Electric Power | | | | | | | | |
| 7.750%, 04/01/13 | | | 95 | | | | 102 | |
| 6.750%, 08/01/27 | | | 75 | | | | 88 | |
| PPL Energy Supply, Ser A | | | | | | | | |
| 5.700%, 10/15/15 | | | 75 | | | | 81 | |
| Trans-Allegheny Interstate Line | | | | | | | | |
| 4.000%, 01/15/15(A) | | | 100 | | | | 105 | |
| | | | 770 | |
| Finance Auto Loans [0.2%] | | | | | | | | |
| Toyota Motor Credit, MTN | | | | | | | | |
| | | 100 | | | | 100 | |
| Financial Services [4.1%] | | | | | | | | |
| American Express Credit, MTN | | | | | | | | |
| 7.300%, 08/20/13 | | | 285 | | | | 312 | |
| Bank of New York Mellon, MTN | | | | | | | | |
| 3.100%, 01/15/15 | | | 265 | | | | 275 | |
| Caterpillar Financial Services, MTN | | | | | | | | |
| 6.200%, 09/30/13 | | | 225 | | | | 247 | |
| 1.375%, 05/20/14 | | | 180 | | | | 181 | |
| General Electric Capital, MTN | | | | | | | | |
| 6.000%, 08/07/19 | | | 125 | | | | 141 | |
| 2.250%, 11/09/15 | | | 250 | | | | 247 | |
| HSBC Finance | | | | | | | | |
| 6.676%, 01/15/21(A) | | | 83 | | | | 82 | |
| National Rural Utilities Cooperative Finance | | | | | | | | |
| 10.375%, 11/01/18 | | | 125 | | | | 180 | |
| UFJ Finance Aruba | | | | | | | | |
| 6.750%, 07/15/13 | | | 125 | | | | 134 | |
| | | | 1,799 | |
| Food, Beverage & Tobacco [1.9%] | | | | | |
| Cia de Bebidas das Americas | | | | | | | | |
| 8.750%, 09/15/13 | | | 175 | | | | 198 | |
| General Mills | | | | | | | | |
| 5.650%, 02/15/19 | | | 120 | | | | 142 | |
| Kellogg | | | | | | | | |
| 4.450%, 05/30/16 | | | 210 | | | | 234 | |
| Kraft Foods | | | | | | | | |
| 6.500%, 08/11/17 | | $ | 215 | | | $ | 255 | |
Total Food, Beverage & Tobacco | | | | 829 | |
| Insurance [2.4%] | | | | | | | | |
| Berkshire Hathaway | | | | | | | | |
| 3.200%, 02/11/15 | | | 265 | | | | 279 | |
| MetLife | | | | | | | | |
| 5.000%, 06/15/15 | | | 230 | | | | 252 | |
| Protective Life | | | | | | | | |
| 4.300%, 06/01/13 | | | 100 | | | | 103 | |
| Prudential Financial, MTN | | | | | | | | |
| 5.375%, 06/21/20 | | | 165 | | | | 173 | |
| 2.750%, 01/14/13 | | | 100 | | | | 101 | |
| Travelers | | | | | | | | |
| 3.900%, 11/01/20 | | | 170 | | | | 174 | |
| | | | 1,082 | |
| Invest Mgmnt/Advis Serv [0.6%] | | | | | |
| BlackRock | | | | | | | | |
| | | 260 | | | | 276 | |
| Investment Banker/Broker Dealer [2.3%] | | | | | |
| Goldman Sachs Group | | | | | | | | |
| 5.150%, 01/15/14 | | | 75 | | | | 78 | |
| Jefferies Group | | | | | | | | |
| 6.450%, 06/08/27 | | | 100 | | | | 96 | |
| Morgan Stanley | | | | | | | | |
| 5.300%, 03/01/13 | | | 450 | | | | 454 | |
| 4.750%, 04/01/14 | | | 75 | | | | 71 | |
| Morgan Stanley, MTN | | | | | | | | |
| 6.625%, 04/01/18 | | | 100 | | | | 99 | |
| TD Ameritrade Holding | | | | | | | | |
| 4.150%, 12/01/14 | | | 200 | | | | 213 | |
Total Investment Banker/Broker Dealer | | | | 1,011 | |
| Manufacturing [1.1%] | | | | | | | | |
| General Electric | | | | | | | | |
| 5.000%, 02/01/13 | | | 225 | | | | 236 | |
| Tyco International Finance | | | | | | | | |
| 4.125%, 10/15/14 | | | 230 | | | | 244 | |
| | | | 480 | |
| Medical Products [0.3%] | | | | | | | | |
| Zimmer Holdings | | | | | | | | |
| | | 115 | | | | 127 | |
See accompanying notes to financial statements.
CNI CHARTER FUNDS | PAGE 50
schedule of investments
Full Maturity Fixed Income Fund (continued)
| Medical-HMO [0.5%] | | | | | | | | |
| UnitedHealth Group | | | | | | | | |
| 4.750%, 02/10/14 | | $ | 40 | | | $ | 43 | |
| 4.700%, 02/15/21 | | | 165 | | | | 182 | |
| | | | 225 | |
| Metals & Mining [0.5%] | | | | | | | | |
| Rio Tinto Finance USA | | | | | | | | |
| 6.500%, 07/15/18 | | | 100 | | | | 120 | |
| Vale Overseas | | | | | | | | |
| 6.875%, 11/21/36 | | | 100 | | | | 108 | |
| | | | 228 | |
| Multi-Media [1.0%] | | | | | | | | |
| Time Warner | | | | | | | | |
| 5.875%, 11/15/16 | | | 270 | | | | 305 | |
| Viacom | | | | | | | | |
| 6.250%, 04/30/16 | | | 125 | | | | 144 | |
| | | | 449 | |
| Networking Products [0.3%] | | | | | | | | |
| Cisco Systems | | | | | | | | |
| | | 100 | | | | 115 | |
| Oil, Gas & Consumable Fuels [1.5%] | | | | | |
| BP Capital Markets | | | | | | | | |
| 3.200%, 03/11/16 | | | 100 | | | | 104 | |
| 3.125%, 10/01/15 | | | 200 | | | | 207 | |
| Petrobras International Finance | | | | | | | | |
| 3.875%, 01/27/16 | | | 100 | | | | 99 | |
| Total Capital | | | | | | | | |
| 3.125%, 10/02/15 | | | 250 | | | | 265 | |
Total Oil, Gas & Consumable Fuels | | | | 675 | |
| Petroleum & Fuel Products [0.8%] | | | | | |
| Energy Transfer Partners | | | | | | | | |
| 6.625%, 10/15/36 | | | 75 | | | | 77 | |
| Enterprise Products Operating | | | | | | | | |
| 3.700%, 06/01/15 | | | 125 | | | | 131 | |
| Kinder Morgan Energy Partners | | | | | | | | |
| 5.300%, 09/15/20 | | | 125 | | | | 135 | |
Total Petroleum & Fuel Products | | | | 343 | |
| REITS-Health Care [0.6%] | | | | | | | | |
| Health Care REIT | | | | | | | | |
| | $ | 260 | | | $ | 250 | |
| REITS-Office Property [0.6%] | | | | | | | | |
| Boston Properties | | | | | | | | |
| | | 245 | | | | 269 | |
| Retail [0.7%] | | | | | | | | |
| Home Depot | | | | | | | | |
| | | 280 | | | | 317 | |
| Retail-Drug Store [0.6%] | | | | | | | | |
| CVS Caremark | | | | | | | | |
| | | 220 | | | | 253 | |
| Telephones & Telecommunications [3.2%] | | | | | |
| AT&T | | | | | | | | |
| 5.600%, 05/15/18 | | | 285 | | | | 330 | |
| British Telecommunications | | | | | | | | |
| 9.875%, 12/15/30 | | | 100 | | | | 145 | |
| Deutsche Telekom International Finance | | | | | | | | |
| 8.750%, 06/15/30 | | | 75 | | | | 100 | |
| 6.000%, 07/08/19 | | | 50 | | | | 58 | |
| GTE | | | | | | | | |
| 6.840%, 04/15/18 | | | 100 | | | | 120 | |
| New Cingular Wireless Services | | | | | | | | |
| 8.750%, 03/01/31 | | | 75 | | | | 112 | |
| Telecom Italia Capital | | | | | | | | |
| 7.200%, 07/18/36 | | | 75 | | | | 68 | |
| Telefonica Emisiones | | | | | | | | |
| 6.421%, 06/20/16 | | | 75 | | | | 77 | |
| Verizon Communications | | | | | | | | |
| 3.000%, 04/01/16 | | | 385 | | | | 403 | |
Total Telephones & Telecommunications | | | | 1,413 | |
| Waste Disposal [0.3%] | | | | | | | | |
| Waste Management | | | | | | | | |
| | | 130 | | | | 130 | |
Total Corporate Bonds (Cost $17,824) | | | | 18,581 | |
| U.S. Treasury Obligations [27.4%] | | | | | | | | |
| U.S. Treasury Bonds | | | | | | | | |
| 6.250%, 08/15/23 | | | 1,275 | | | | 1,817 | |
| 5.250%, 11/15/28 | | | 450 | | | | 613 | |
| 4.375%, 02/15/38 | | | 500 | | | | 639 | |
See accompanying notes to financial statements.
CNI CHARTER FUNDS | PAGE 51
schedule of investments
Full Maturity Fixed Income Fund (continued)
| U.S. Treasury Notes | | | | | | | | |
| 4.750%, 05/15/14 | | $ | 710 | | | $ | 791 | |
| 2.750%, 02/15/19 | | | 450 | | | | 489 | |
| 2.625%, 04/30/16 | | | 565 | | | | 610 | |
| 2.625%, 11/15/20 | | | 1,235 | | | | 1,321 | |
| 2.375%, 09/30/14 | | | 840 | | | | 888 | |
| 2.375%, 03/31/16 | | | 600 | | | | 641 | |
| 2.375%, 07/31/17 | | | 2,630 | | | | 2,809 | |
| 2.125%, 08/15/21 | | | 530 | | | | 539 | |
| 1.750%, 07/31/15 | | | 985 | | | | 1,027 | |
Total U.S. Treasury Obligations (Cost $11,303) | | | | 12,184 | |
| U.S. Government Mortgage-Backed Obligations [15.8%] | |
| FHLMC, Pool 1B2677 | | | | | | | | |
| 2.650%, 01/01/35(B) | | | 13 | | | | 14 | |
| FHLMC, Pool 1B2683 | | | | | | | | |
| 2.657%, 01/01/35(B) | | | 9 | | | | 10 | |
| FHLMC, Pool 1B2692 | | | | | | | | |
| 2.506%, 12/01/34(B) | | | 27 | | | | 28 | |
| FHLMC, Pool A93996 | | | | | | | | |
| 4.500%, 09/01/40 | | | 180 | | | | 190 | |
| FHLMC, Pool C20300 | | | | | | | | |
| 6.500%, 01/01/29 | | | 7 | | | | 8 | |
| FHLMC, Pool E01280 | | | | | | | | |
| 5.000%, 12/01/17 | | | 18 | | | | 19 | |
| FHLMC, Pool G03490 | | | | | | | | |
| 4.500%, 08/01/40 | | | 496 | | | | 525 | |
| FHLMC, Pool G04222 | | | | | | | | |
| 5.500%, 04/01/38 | | | 115 | | | | 125 | |
| FHLMC, Pool G08003 | | | | | | | | |
| 6.000%, 07/01/34 | | | 64 | | | | 70 | |
| FHLMC, Pool G11431 | | | | | | | | |
| 6.000%, 02/01/18 | | | 11 | | | | 12 | |
| FHLMC, Pool G11880 | | | | | | | | |
| 5.000%, 12/01/20 | | | 53 | | | | 57 | |
| FHLMC, Pool G11911 | | | | | | | | |
| 5.000%, 02/01/21 | | | 122 | | | | 132 | |
| FHLMC, Pool G13767 | | | | | | | | |
| 4.000%, 03/01/25 | | | 479 | | | | 505 | |
| FHLMC, Pool G18124 | | | | | | | | |
| 6.000%, 06/01/21 | | | 37 | | | | 40 | |
| FHLMC REMIC, Ser 2007-R010, Cl VA | | | | | | | | |
| 5.500%, 04/15/17 | | | 92 | | | | 99 | |
| FHLMC REMIC, Ser 2009-3540, Cl CD | | | | | | | | |
| 2.000%, 06/15/14 | | | 120 | | | | 121 | |
| FHLMC REMIC, Ser 2730, Cl PD | | | | | | | | |
| 5.000%, 05/15/21 | | | 64 | | | | 65 | |
| FHLMC REMIC, Ser 2804, Cl VC | | | | | | | | |
| 5.000%, 07/15/21 | | $ | 135 | | | $ | 153 | |
| FHLMC REMIC, Ser 3122, Cl VA | | | | | | | | |
| 6.000%, 01/15/17 | | | 86 | | | | 88 | |
| FHLMC REMIC, Ser 3132, Cl MA | | | | | | | | |
| 5.500%, 12/15/23 | | | 22 | | | | 22 | |
| FHLMC REMIC, Ser R003, Cl VA | | | | | | | | |
| 5.500%, 08/15/16 | | | 105 | | | | 111 | |
| FHLMC REMIC, Ser R009, Cl AJ | | | | | | | | |
| 5.750%, 12/15/18 | | | 25 | | | | 25 | |
| FHLMC REMIC, Ser R010, Cl AB | | | | | | | | |
| 5.500%, 12/15/19 | | | 85 | | | | 89 | |
| FNMA, Pool 252570 | | | | | | | | |
| 6.500%, 07/01/29 | | | 14 | | | | 16 | |
| FNMA, Pool 253183 | | | | | | | | |
| 7.500%, 04/01/30 | | | 1 | | | | 2 | |
| FNMA, Pool 253398 | | | | | | | | |
| 8.000%, 08/01/30 | | | 5 | | | | 5 | |
| FNMA, Pool 254510 | | | | | | | | |
| 5.000%, 11/01/17 | | | 24 | | | | 26 | |
| FNMA, Pool 254545 | | | | | | | | |
| 5.000%, 12/01/17 | | | 47 | | | | 51 | |
| FNMA, Pool 254685 | | | | | | | | |
| 5.000%, 04/01/18 | | | 38 | | | | 41 | |
| FNMA, Pool 254949 | | | | | | | | |
| 5.000%, 11/01/33 | | | 45 | | | | 49 | |
| FNMA, Pool 255814 | | | | | | | | |
| 5.500%, 08/01/35 | | | 112 | | | | 122 | |
| FNMA, Pool 303168 | | | | | | | | |
| 9.500%, 02/01/25 | | | 4 | | | | 4 | |
| FNMA, Pool 725424 | | | | | | | | |
| 5.500%, 04/01/34 | | | 82 | | | | 90 | |
| FNMA, Pool 735060 | | | | | | | | |
| 6.000%, 11/01/34 | | | 47 | | | | 52 | |
| FNMA, Pool 735228 | | | | | | | | |
| 5.500%, 02/01/35 | | | 44 | | | | 48 | |
| FNMA, Pool 735230 | | | | | | | | |
| 5.500%, 02/01/35 | | | 104 | | | | 114 | |
| FNMA, Pool 745275 | | | | | | | | |
| 5.000%, 02/01/36 | | | 503 | | | | 543 | |
| FNMA, Pool 745418 | | | | | | | | |
| 5.500%, 04/01/36 | | | 605 | | | | 661 | |
| FNMA, Pool 827223 | | | | | | | | |
| 2.215%, 04/01/35(B) | | | 103 | | | | 107 | |
| FNMA, Pool 844809 | | | | | | | | |
| 5.000%, 11/01/35 | | | 332 | | | | 358 | |
See accompanying notes to financial statements.
CNI CHARTER FUNDS | PAGE 52
schedule of investments
Full Maturity Fixed Income Fund (continued)
| FNMA, Pool 995865 | | | | | | | | |
| 4.500%, 07/01/24 | | $ | 433 | | | $ | 462 | |
| FNMA, Pool AD0454 | | | | | | | | |
| 5.000%, 11/01/21 | | | 115 | | | | 124 | |
| FNMA, Pool AD8522 | | | | | | | | |
| 4.000%, 08/01/40 | | | 169 | | | | 177 | |
| FNMA, Pool AE0949 | | | | | | | | |
| 4.000%, 02/01/41 | | | 171 | | | | 179 | |
| FNMA REMIC, Ser 136, Cl PK | | | | | | | | |
| 6.000%, 08/25/22 | | | 14 | | | | 16 | |
| FNMA REMIC, Ser 33, Cl LD | | | | | | | | |
| 4.250%, 09/25/22 | | | 52 | | | | 54 | |
| FNMA REMIC, Ser W6, Cl 1A6 | | | | | | | | |
| 5.500%, 07/25/34 | | | 46 | | | | 49 | |
| GNMA, Pool 4696 | | | | | | | | |
| 4.500%, 05/20/40 | | | 369 | | | | 400 | |
| GNMA, Pool 4747 | | | | | | | | |
| 5.000%, 07/20/40 | | | 156 | | | | 172 | |
| GNMA, Pool 479168 | | | | | | | | |
| 8.000%, 02/15/30 | | | 8 | | | | 9 | |
| GNMA, Pool 4923 | | | | | | | | |
| 4.500%, 01/20/41 | | | 191 | | | | 208 | |
| GNMA, Pool 780315 | | | | | | | | |
| 9.500%, 12/15/17 | | | 7 | | | | 9 | |
| NCUA Guaranteed Notes, Ser 2010-C1, Cl A2 | | | | | | | | |
| 2.900%, 10/29/20 | | | 225 | | | | 236 | |
| NCUA Guaranteed Notes, Ser 2010-R1, Cl 2A | | | | | | | | |
| 1.840%, 10/07/20 | | | 132 | | | | 133 | |
Total U.S. Government Mortgage-Backed Obligations (Cost $6,693) | | | | 7,025 | |
| U.S. Government Agency Obligations [6.3%] | | | | | |
| FHLMC | | | | | | | | |
| 2.500%, 01/07/14 | | | 510 | | | | 533 | |
| FNMA | | | | | | | | |
| 4.625%, 10/15/13 | | | 930 | | | | 1,008 | |
| 2.875%, 12/11/13 | | | 475 | | | | 500 | |
| 2.375%, 07/28/15 | | | 385 | | | | 405 | |
| 1.750%, 02/22/13 | | | 325 | | | | 331 | |
Total U.S. Government Agency Obligations (Cost $2,668) | | | | 2,777 | |
| Commercial Mortgage-Backed Obligations [2.4%] | |
| Citigroup, Ser 2005-CD1 | | | | | | | | |
| 5.398%, 07/15/44(B) | | | 200 | | | | 217 | |
| Citigroup, Ser 2007-CD4, Cl A2B | | | | | | | | |
| 5.205%, 12/11/49 | | | 150 | | | | 151 | |
| Commercial Mortgage, Ser 2005-C5, Cl A5A | | | | | | | | |
| 5.116%, 06/10/44(B) | | $ | 200 | | | $ | 217 | |
| JPMorgan Chase, Ser 2006-CB17, Cl ASB | | | | | | | | |
| 5.415%, 12/12/43 | | | 200 | | | | 211 | |
| Wachovia Bank Commercial Mortgage Trust, Ser 2005-C22 | | | | | | | | |
| 5.444%, 12/15/44(B) | | | 250 | | | | 272 | |
Total Commercial Mortgage-Backed Obligations (Cost $1,023) | | | | 1,068 | |
| Mortgage-Backed Securities [2.0%] | | | | | | | | |
| American Express Credit Account Master Trust, Ser 2008-5, Cl A | | | | | | | | |
| 1.029%, 03/15/16(B) | | | 200 | | | | 203 | |
| Banc of America Alternative Loan Trust, Ser 2004-2, Cl 5A1 | | | | | | | | |
| 5.500%, 03/25/19 | | | 66 | | | | 69 | |
| Chase Mortgage Finance, Ser 2003-S13, Cl A11 | | | | | | | | |
| 5.500%, 11/25/33 | | | 51 | | | | 52 | |
| GE Capital Credit Card Master Note Trust, Ser 2007-4, Cl A | | | | | | | | |
| 0.279%, 06/15/15(B) | | | 375 | | | | 375 | |
| Residential Accredit Loans, Ser 2004-QS5, Cl A5 | | | | | | | | |
| 4.750%, 04/25/34 | | | 23 | | | | 23 | |
| Residential Accredit Loans, Ser 2004-QS6, Cl A1 | | | | | | | | |
| 5.000%, 05/25/19 | | | 38 | | | | 38 | |
| WaMu Mortgage Pass Through Certificates, Ser 2004-CB2, Cl 5A | | | | | | | | |
| 5.000%, 07/25/19 | | | 105 | | | | 109 | |
Total Mortgage-Backed Securities (Cost $860) | | | | 869 | |
| Asset-Backed Securities [1.5%] | | | | | | | | |
| Bayview Financial Acquisition Trust, Ser 2007-A, Cl 1A2 | | | | | | | | |
| 6.205%, 05/28/37 | | | 200 | | | | 193 | |
| Cityscape Home Equity Loan Trust, Ser 1997-C, Cl A4 | | | | | | | | |
| 7.000%, 07/25/28 | | | 5 | | | | 4 | |
| Contimortgage Home Equity Loan Trust, Ser 1997-2, Cl A9 | | | | | | | | |
| 7.090%, 04/15/28 | | | 1 | | | | 1 | |
| Discover Card Master Trust, Ser 2010-A1, Cl A1 | | | | | | | | |
| 0.879%, 09/15/15(B) | | | 200 | | | | 202 | |
See accompanying notes to financial statements.
CNI CHARTER FUNDS | PAGE 53
schedule of investments
Full Maturity Fixed Income Fund (concluded)
| | | | | |
| GMAC Mortgage Corporation Loan Trust, Ser 2004-GH1, Cl A6 | | | | | | |
| 4.810%, 07/25/35 | | $ | 89 | | | $ | 86 | |
| Green Tree Financial, Ser 1997-7, Cl A6 | | | | | | | | |
| 6.760%, 07/15/29 | | | 59 | | | | 64 | |
| GSAA Home Equity Trust, Ser 2005-1, Cl AF2 | | | | | | | | |
| 4.316%, 11/25/34(B) | | | 5 | | | | 5 | |
| RAAC, Ser 2004-SP1, Cl AI4 | | | | | | | | |
| 5.285%, 08/25/27(B) | | | 66 | | | | 66 | |
| Residential Asset Mortgage Products, Ser 2002-RS3, Cl AI5 | | | | | | | | |
| 5.572%, 06/25/32(B) | | | 45 | | | | 36 | |
Total Asset-Backed Securities (Cost $672) | | | | 657 | |
| Sovereign Debt [0.4%] | | | | | | | | |
| National Bank of Hungary | | | | | | | | |
| 8.875%, 11/01/13 | | | 75 | | | | 82 | |
| United Mexican States, MTN | | | | | | | | |
| 5.125%, 01/15/20 | | | 100 | | | | 108 | |
Total Sovereign Debt (Cost $176) | | | | 190 | |
| Municipal Bond [0.2%] | | | | | | | | |
| Puerto Rico [0.2%] | | | | | | | | |
| Government Development Bank for Puerto Rico, Ser Senior B, RB | | | | | | | | |
| | | 100 | | | | 105 | |
Total Municipal Bond (Cost $100) | | | | 105 | |
| Short-Term Investment [1.9%] | | | | | | | | |
| AIM STIT-Treasury Portfolio, 0.020%* | | | 836,426 | | | | 836 | |
Total Short-Term Investment (Cost $836) | | | | 836 | |
Total Investments [99.8%] (Cost $42,155) | | | $ | 44,292 | |
Percentages are based on Net Assets of $44,391 ($ Thousands).
| * | The rate reported is the 7-day effective yield as of September 30, 2011. |
| (A) | Security exempt from registration under Rule 144A of the Securities Act of 1933. These securities may be resold in transactions exempt from registration normally to qualified institutions. On September 30, 2011, the value of these securities amounted to $298 (000), representing 0.7% of the net assets of the Fund. |
| (B) | Floating Rate Security — The rate reported is the rate in effect on September 30, 2011. |
| (C) | Step Bond — The rate reflected on the Schedule of Investments is the rate in effect on September 30, 2011. |
Cl — Class
FHLMC — Federal Home Loan Mortgage Corporation
FNMA — Federal National Mortgage Association
GNMA — Government National Mortgage Association
MTN — Medium Term Note
NA — National Association
NCUA — National Credit Union Administration
RB — Revenue Bond
REIT — Real Estate Investment Trust
REMIC — Real Estate Mortgage Investment Conduit
Ser — Series
The following is a summary of the inputs used as of September 30, 2011 in valuing the Fund’s investments carried at value ($ Thousands) in accordance with ASC 820:
| Investments in Securities | | | | | | | | | | | | |
| Corporate Bonds | | $ | — | | | $ | 18,581 | | | $ | — | | | $ | 18,581 | |
| U.S. Treasury Obligations | | | — | | | | 12,184 | | | | — | | | | 12,184 | |
| U.S. Government Mortgage-Backed Obligations | | | — | | | | 7,025 | | | | — | | | | 7,025 | |
| U.S. Government Agency Obligations | | | — | | | | 2,777 | | | | — | | | | 2,777 | |
| Commercial Mortgage-Backed Obligations | | | — | | | | 1,068 | | | | — | | | | 1,068 | |
| Mortgage-Backed Securities | | | — | | | | 869 | | | | — | | | | 869 | |
| Asset-Backed Securities | | | — | | | | 657 | | | | — | | | | 657 | |
| Sovereign Debt | | | — | | | | 190 | | | | — | | | | 190 | |
| Municipal Bond | | | — | | | | 105 | | | | — | | | | 105 | |
| Short-Term Investment | | | 836 | | | | — | | | | — | | | | 836 | |
| Total Investments in Securities | | $ | 836 | | | $ | 43,456 | | | $ | — | | | $ | 44,292 | |
For the year ended September 30, 2011, there have been no transfers between Level 1 and Level 2 assets and liabilities. Transfers between Levels are recognized at period end.
For more information on valuation inputs, see Note 2 — Significant Accounting Policies in Notes to Financial Statements.
See accompanying notes to financial statements.
CNI CHARTER FUNDS | PAGE 54
schedule of investments
High Yield Bond Fund
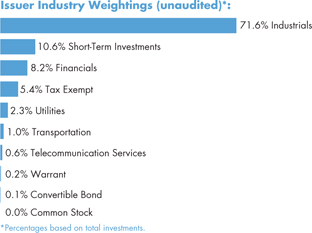
| | | | | |
| Corporate Bonds [91.0%] | | | | | | |
| Advertising Agencies [0.7%] | | | | | | |
| MDC Partners | | | | | | |
| | $ | 600 | | | $ | 648 | |
| Aerospace & Defense [2.1%] | | | | | | | | |
| Global Aviation Holdings | | | | | | | | |
| 14.000%, 08/15/13 | | | 558 | | | | 385 | |
| Kratos Defense & Security Solutions | | | | | | | | |
| 10.000%, 06/01/17 | | | 800 | | | | 796 | |
| L-3 Communications | | | | | | | | |
| 10.000%, 02/01/18 | | | 250 | | | | 240 | |
| Sequa | | | | | | | | |
| 13.500%, 12/01/15(A) | | | 101 | | | | 107 | |
| 11.750%, 12/01/15(A) | | | 400 | | | | 420 | |
Total Aerospace & Defense | | | | 1,948 | |
| Airlines [1.3%] | | | | | | | | |
| American Airlines 2011-2 Class A Pass Through Trust | | | | | | | | |
| 8.625%, 10/15/21 | | | 400 | | | | 398 | |
| Continental Airlines, Ser 2007-1, Cl C | | | | | | | | |
| 7.339%, 04/19/14 | | | 395 | | | | 385 | |
| DAE Aviation Holdings | | | | | | | | |
| 11.250%, 08/01/15(A) | | | 150 | | | | 152 | |
| Delta Airlines | | | | | | | | |
| 12.250%, 03/15/15(A) | | | 250 | | | | 266 | |
| | | | 1,201 | |
| Auto Rent & Lease [0.2%] | | | | | | | | |
| Avis Budget Car Rental | | | | | | | | |
| 7.750%, 05/15/16 | | | 100 | | | | 97 | |
| H&E Equipment Services | | | | | | | | |
| 8.375%, 07/15/16 | | $ | 100 | | | $ | 96 | |
| | | | 193 | |
| Autoparts [1.5%] | | | | | | | | |
| Asbury Automotive Group | | | | | | | | |
| 7.625%, 03/15/17 | | | 100 | | | | 95 | |
| Exide Technologies | | | | | | | | |
| 8.625%, 02/01/18 | | | 750 | | | | 697 | |
| Stanadyne | | | | | | | | |
| 10.000%, 08/15/14 | | | 650 | | | | 611 | |
| | | | 1,403 | |
| Banks [1.0%] | | | | | | | | |
| CIT Group | | | | | | | | |
| | | 1,000 | | | | 970 | |
| Broadcasting & Cable [3.3%] | | | | | | | | |
| Atlantic Broadband Finance | | | | | | | | |
| 9.375%, 01/15/14 | | | 100 | | | | 99 | |
| Barrington Broadcasting Group | | | | | | | | |
| 10.500%, 08/15/14 | | | 100 | | | | 94 | |
| Bonten Media Acquisition | | | | | | | | |
| 9.000%, 06/01/15(A) | | | 190 | | | | 141 | |
| Bresnan Broadband Holdings | | | | | | | | |
| 8.000%, 12/15/18(A) | | | 750 | | | | 756 | |
| Cablevision Systems | | | | | | | | |
| 8.000%, 04/15/20 | | | 400 | | | | 407 | |
| CCO Holdings | | | | | | | | |
| 8.125%, 04/30/20 | | | 250 | | | | 260 | |
| CSC Holdings | | | | | | | | |
| 7.625%, 07/15/18 | | | 100 | | | | 105 | |
| DCP | | | | | | | | |
| 10.750%, 08/15/15(A) | | | 500 | | | | 415 | |
| Fisher Communications | | | | | | | | |
| 8.625%, 09/15/14 | | | 111 | | | | 111 | |
| Kabel BW Erste Beteiligungs | | | | | | | | |
| 7.500%, 03/15/19(A) | | | 500 | | | | 486 | |
| Local TV Finance | | | | | | | | |
| 9.250%, 06/15/15(A) | | | 122 | | | | 112 | |
| Newport Television | | | | | | | | |
| 13.000%, 03/15/17(A) | | | 139 | | | | 131 | |
Total Broadcasting & Cable | | | | 3,117 | |
| Building & Construction [1.8%] | | | | | |
| APERAM | | | | | | | | |
| 7.375%, 04/01/16(A) | | | 400 | | | | 352 | |
See accompanying notes to financial statements.
CNI CHARTER FUNDS | PAGE 55
schedule of investments
High Yield Bond Fund (continued)
| Building Materials Corp of America | | | | | | | | |
| 6.750%, 05/01/21(A) | | $ | 400 | | | $ | 380 | |
| Cemex | | | | | | | | |
| 9.000%, 01/11/18(A) | | | 500 | | | | 339 | |
| Columbus McKinnon | | | | | | | | |
| 7.875%, 02/01/19 | | | 200 | | | | 194 | |
| Dycom Investments | | | | | | | | |
| 7.125%, 01/15/21 | | | 300 | | | | 289 | |
| Interline Brands | | | | | | | | |
| 7.000%, 11/15/18 | | | 190 | | | | 186 | |
Total Building & Construction | | | | 1,740 | |
| Chemicals [0.7%] | | | | | | | | |
| Nalco | | | | | | | | |
| 6.625%, 01/15/19(A) | | | 250 | | | | 274 | |
| Nexeo Solutions | | | | | | | | |
| 8.375%, 03/01/18(A) | | | 250 | | | | 247 | |
| Polymer Group | | | | | | | | |
| 7.750%, 02/01/19(A) | | | 130 | | | | 129 | |
| | | | 650 | |
| Coal Mining [0.4%] | | | | | | | | |
| Consol Energy | | | | | | | | |
| | | 400 | | | | 421 | |
| Commercial Services [2.9%] | | | | | | | | |
| ARAMARK | | | | | | | | |
| 8.500%, 02/01/15 | | | 500 | | | | 506 | |
| Bankrate | | | | | | | | |
| 11.750%, 07/15/15 | | | 162 | | | | 182 | |
| DynCorp International | | | | | | | | |
| 10.375%, 07/01/17 | | | 750 | | | | 654 | |
| Iron Mountain | | | | | | | | |
| 8.750%, 07/15/18 | | | 150 | | | | 153 | |
| NCO Group | | | | | | | | |
| 11.875%, 11/15/14 | | | 800 | | | | 728 | |
| Tube City IMS | | | | | | | | |
| 9.750%, 02/01/15 | | | 575 | | | | 549 | |
Total Commercial Services | | | | 2,772 | |
| Communications Software [0.6%] | | | | | |
| Aspect Software | | | | | | | | |
| | | 600 | | | | 603 | |
| Computer Graphics [0.4%] | | | | | | | | |
| Eagle Parent | | | | | | | | |
| | | 400 | | | | 362 | |
| Computer System Design & Services [2.3%] | | | | | |
| Compucom Systems | | | | | | | | |
| 12.500%, 10/01/15(A) | | $ | 750 | | | $ | 754 | |
| iGate | | | | | | | | |
| 9.000%, 05/01/16(A) | | | 850 | | | | 790 | |
| Stratus Technologies Bermuda | | | | | | | | |
| 12.000%, 03/29/15 | | | 708 | | | | 619 | |
Total Computer System Design & Services | | | | 2,163 | |
| Consumer Products & Services [3.5%] | | | | | |
| American Achievement | | | | | | | | |
| 10.875%, 04/15/16(A) | | | 500 | | | | 380 | |
| American Standard Americas | | | | | | | | |
| 10.750%, 01/15/16(A) | | | 250 | | | | 190 | |
| Amscan Holdings | | | | | | | | |
| 8.750%, 05/01/14 | | | 500 | | | | 491 | |
| MSX International | | | | | | | | |
| 12.500%, 04/01/12(A) | | | 100 | | | | 82 | |
| Prestige Brands | | | | | | | | |
| 8.250%, 04/01/18 | | | 250 | | | | 255 | |
| Scotts Miracle-Gro | | | | | | | | |
| 6.625%, 12/15/20(A) | | | 350 | | | | 343 | |
| Spectrum Brands Holdings | | | | | | | | |
| 9.500%, 06/15/18 | | | 450 | | | | 479 | |
| Steinway Musical Instruments | | | | | | | | |
| 7.000%, 03/01/14(A) | | | 44 | | | | 44 | |
| WMG Acquisition | | | | | | | | |
| 11.500%, 10/01/18(A) | | | 400 | | | | 368 | |
| 9.500%, 06/15/16 | | | 200 | | | | 203 | |
| Yankee Acquisition, Ser B | | | | | | | | |
| 9.750%, 02/15/17 | | | 50 | | | | 46 | |
| YCC Holdings | | | | | | | | |
| 10.250%, 02/15/16 | | | 400 | | | | 340 | |
Total Consumer Products & Services | | | | 3,221 | |
| Containers & Packaging [2.8%] | | | | | |
| Graphic Packaging International | | | | | | | | |
| 7.875%, 10/01/18 | | | 145 | | | | 149 | |
| Intertape Polymer US | | | | | | | | |
| 8.500%, 08/01/14 | | | 100 | | | | 89 | |
| Pregis | | | | | | | | |
| 12.375%, 10/15/13 | | | 650 | | | | 592 | |
| Pretium Packaging | | | | | | | | |
| 11.500%, 04/01/16(A) | | | 350 | | | | 343 | |
| Sealed Air | | | | | | | | |
| 8.125%, 09/15/19(A) | | | 750 | | | | 758 | |
| Solo Cup | | | | | | | | |
| 10.500%, 11/01/13 | | | 550 | | | | 544 | |
| 8.500%, 02/15/14 | | | 200 | | | | 174 | |
Total Containers & Packaging | | | | 2,649 | |
See accompanying notes to financial statements.
CNI CHARTER FUNDS | PAGE 56
schedule of investments
High Yield Bond Fund (continued)
| Data Processing/Mgmt [0.8%] | | | | | | | | |
| First Data | | | | | | | | |
| 10.550%, 09/24/15(B) | | $ | 633 | | | $ | 527 | |
| 8.875%, 08/15/20(A) | | | 150 | | | | 141 | |
Total Data Processing/Mgmt | | | | 668 | |
| Distribution/Wholesale [1.6%] | | | | | | | | |
| Baker & Taylor | | | | | | | | |
| 11.500%, 07/01/13(A) | | | 500 | | | | 378 | |
| Intcomex | | | | | | | | |
| 13.250%, 12/15/14 | | | 750 | | | | 729 | |
| VWR Funding | | | | | | | | |
| 10.250%, 07/15/15(B) | | | 423 | | | | 418 | |
Total Distribution/Wholesale | | | | 1,525 | |
| Diversified Operations [1.0%] | | | | | | | | |
| Amsted Industries | | | | | | | | |
| 8.125%, 03/15/18(A) | | | 450 | | | | 466 | |
| Griffon | | | | | | | | |
| 7.125%, 04/01/18 | | | 500 | | | | 441 | |
Total Diversified Operations | | | | 907 | |
| Drugs [0.7%] | | | | | | | | |
| Endo Pharmaceuticals Holdings | | | | | | | | |
| 7.000%, 07/15/19(A) | | | 400 | | | | 402 | |
| Giant Funding | | | | | | | | |
| 8.250%, 02/01/18(A) | | | 300 | | | | 300 | |
| | | | 702 | |
| E-Commerce/Products [0.7%] | | | | | | | | |
| GXS Worldwide | | | | | | | | |
| | | 650 | | | | 624 | |
| Electric Utilities [1.6%] | | | | | | | | |
| AES | | | | | | | | |
| 8.000%, 10/15/17 | | | 100 | | | | 101 | |
| 8.000%, 06/01/20 | | | 50 | | | | 50 | |
| 7.375%, 07/01/21(A) | | | 850 | | | | 803 | |
| CMS Energy | | | | | | | | |
| 8.750%, 06/15/19 | | | 50 | | | | 58 | |
| 6.875%, 12/15/15 | | | 150 | | | | 161 | |
| PNM Resources | | | | | | | | |
| 9.250%, 05/15/15 | | | 100 | | | | 110 | |
| RRI Energy | | | | | | | | |
| 7.625%, 06/15/14 | | | 200 | | | | 196 | |
| | | | 1,479 | |
| Engines-Internal Combust [0.5%] | | | | | |
| Briggs & Stratton | | | | | | | | |
| | $ | 500 | | | $ | 505 | |
| Enterprise Software/Serv [0.4%] | | | | | |
| JDA Software Group | | | | | | | | |
| | | 375 | | | | 396 | |
| Entertainment & Gaming [9.6%] | | | | | |
| Boyd Gaming | | | | | | | | |
| 6.750%, 04/15/14 | | | 500 | | | | 430 | |
| Buffalo Thunder Development Authority | | | | | | | | |
| 9.375%, 12/15/14(A) (D) | | | 75 | | | | 27 | |
| Caesars Entertainment Operating | | | | | | | | |
| 12.750%, 04/15/18 | | | 100 | | | | 68 | |
| 11.250%, 06/01/17 | | | 250 | | | | 252 | |
| 10.000%, 12/15/18 | | | 350 | | | | 208 | |
| CCM Merger | | | | | | | | |
| 8.000%, 08/01/13(A) | | | 175 | | | | 165 | |
| Choctaw Resort Development Enterprise | | | | | | | | |
| 7.250%, 11/15/19(A) | | | 175 | | | | 106 | |
| Chukchansi Economic Development Authority | | | | | | | | |
| 8.000%, 11/15/13(A) | | | 250 | | | | 169 | |
| 3.917%, 11/15/12(A) (C) | | | 250 | | | | 170 | |
| Circus & Eldorado Joint Venture/Silver Legacy Capital | | | | | | | | |
| 10.125%, 03/01/12 | | | 150 | | | | 116 | |
| Diamond Resorts | | | | | | | | |
| 12.000%, 08/15/18 | | | 750 | | | | 703 | |
| Inn of the Mountain Gods Resort & Casino | | | | | | | | |
| 8.750%, 11/30/20(A) | | | 41 | | | | 39 | |
| 1.250%, 11/30/20(A) | | | 102 | | | | 56 | |
| Jacobs Entertainment | | | | | | | | |
| 9.750%, 06/15/14 | | | 75 | | | | 73 | |
| Lions Gate Entertainment | | | | | | | | |
| 10.250%, 11/01/16(A) | | | 750 | | | | 720 | |
| Mashantucket Western Pequot Tribe | | | | | | | | |
| 8.500%, 11/15/15(A) (D) | | | 170 | | | | 9 | |
| MGM Resorts International | | | | | | | | |
| 11.375%, 03/01/18 | | | 400 | | | | 400 | |
| Mohegan Tribal Gaming Authority | | | | | | | | |
| 7.125%, 08/15/14 | | | 100 | | | | 50 | |
| NAI Entertainment Holdings | | | | | | | | |
| 8.250%, 12/15/17(A) | | | 500 | | | | 515 | |
| Penn National Gaming | | | | | | | | |
| 8.750%, 08/15/19 | | | 250 | | | | 265 | |
See accompanying notes to financial statements.
CNI CHARTER FUNDS | PAGE 57
schedule of investments
High Yield Bond Fund (continued)
| Regal Entertainment Group | | | | | | | | |
| 9.125%, 08/15/18 | | $ | 225 | | | $ | 223 | |
| River Rock Entertainment Authority | | | | | | | | |
| 9.750%, 11/01/11 | | | 800 | | | | 586 | |
| San Pasqual Casino | | | | | | | | |
| 8.000%, 09/15/13(A) | | | 100 | | | | 98 | |
| Scientific Games | | | | | | | | |
| 8.125%, 09/15/18 | | | 325 | | | | 319 | |
| Seminole Indian Tribe of Florida | | | | | | | | |
| 7.750%, 10/01/17(A) | | | 360 | | | | 362 | |
| Shingle Springs Tribal Gaming Authority | | | | | | | | |
| 9.375%, 06/15/15(A) | | | 100 | | | | 59 | |
| Snoqualmie Entertainment Authority | | | | | | | | |
| 9.125%, 02/01/15(A) | | | 300 | | | | 289 | |
| 4.179%, 02/01/14(A) (C) | | | 450 | | | | 394 | |
| Speedway Motorsports | | | | | | | | |
| 6.750%, 02/01/19 | | | 250 | | | | 238 | |
| Sugarhouse HSP Gaming Prop Mezz | | | | | | | | |
| 8.625%, 04/15/16(A) | | | 700 | | | | 690 | |
| Tunica-Biloxi Gaming Authority | | | | | | | | |
| 9.000%, 11/15/15(A) | | | 125 | | | | 125 | |
| Vail Resorts | | | | | | | | |
| 6.500%, 05/01/19(A) | | | 500 | | | | 493 | |
| Waterford Gaming | | | | | | | | |
| 8.625%, 09/15/14(A) (F) | | | 59 | | | | 28 | |
| Wynn Las Vegas | | | | | | | | |
| 7.875%, 05/01/20 | | | 175 | | | | 183 | |
| 7.750%, 08/15/20 | | | 400 | | | | 420 | |
Total Entertainment & Gaming | | | | 9,048 | |
| Financial Services [1.6%] | | | | | | | | |
| CDRT Merger Sub | | | | | | | | |
| 8.125%, 06/01/19(A) | | | 650 | | | | 601 | |
| Icahn Enterprises | | | | | | | | |
| 7.750%, 01/15/16 | | | 650 | | | | 649 | |
| National Rural Utility Co-op | | | | | | | | |
| 10.125%, 07/15/19(A) | | | 300 | | | | 285 | |
| | | | 1,535 | |
| Food, Beverage & Tobacco [3.0%] | | | | | |
| B&G Foods | | | | | | | | |
| 7.625%, 01/15/18 | | | 200 | | | | 207 | |
| Beverages & More | | | | | | | | |
| 9.625%, 10/01/14(A) | | | 400 | | | | 397 | |
| Bumble Bee Acquisition | | | | | | | | |
| 9.000%, 12/15/17(A) | | | 700 | | | | 658 | |
| Bumble Bee Holdco SCA | | | | | | | | |
| 9.625%, 03/15/18(A) (B) | | $ | 250 | | | $ | 200 | |
| Darling International | | | | | | | | |
| 8.500%, 12/15/18 | | | 350 | | | | 377 | |
| Le-Nature's | | | | | | | | |
| 9.000%, 06/15/13(A) (D) (F) | | | 150 | | | | 20 | |
| US Foodservice | | | | | | | | |
| 8.500%, 06/30/19(A) | | | 750 | | | | 677 | |
| Vector Group | | | | | | | | |
| 11.000%, 08/15/15 | | | 250 | | | | 251 | |
Total Food, Beverage & Tobacco | | | | 2,787 | |
| Insurance [2.3%] | | | | | | | | |
| CNO Financial Group | | | | | | | | |
| 9.000%, 01/15/18(A) | | | 500 | | | | 517 | |
| Ironshore Holdings US | | | | | | | | |
| 8.500%, 05/15/20(A) | | | 800 | | | | 878 | |
| National Life Insurance | | | | | | | | |
| 10.500%, 09/15/39(A) | | | 150 | | | | 204 | |
| USI Holdings | | | | | | | | |
| 9.750%, 05/15/15(A) | | | 507 | | | | 456 | |
| 4.161%, 11/15/14(A) (C) | | | 125 | | | | 109 | |
| | | | 2,164 | |
| Investment Banker/Broker Dealer [1.5%] | | | | | |
| E*Trade Financial | | | | | | | | |
| 7.875%, 12/01/15 | | | 750 | | | | 728 | |
| Nuveen Investments | | | | | | | | |
| 10.500%, 11/15/15 | | | 750 | | | | 692 | |
Total Investment Banker/Broker Dealer | | | | 1,420 | |
| Investment Companies [1.2%] | | | | | | | | |
| American Capital | | | | | | | | |
| 7.960%, 12/31/13(A) | | | 505 | | | | 498 | |
| Offshore Group Investments | | | | | | | | |
| 11.500%, 08/01/15(A) | | | 620 | | | | 639 | |
Total Investment Companies | | | | 1,137 | |
| Machinery [1.6%] | | | | | | | | |
| Case New Holland | | | | | | | | |
| 7.875%, 12/01/17 | | | 150 | | | | 160 | |
| CPM Holdings | | | | | | | | |
| 10.625%, 09/01/14 | | | 500 | | | | 529 | |
| Tempel Steel | | | | | | | | |
| 12.000%, 08/15/16(A) | | | 500 | | | | 480 | |
| Thermadyne Holdings | | | | | | | | |
| 9.000%, 12/15/17 | | | 350 | | | | 343 | |
| | | | 1,512 | |
See accompanying notes to financial statements.
CNI CHARTER FUNDS | PAGE 58
schedule of investments
High Yield Bond Fund (continued)
| Marine Services [0.5%] | | | | | | | | |
| Great Lakes Dredge & Dock | | | | | | | | |
| | $ | 500 | | | $ | 460 | |
| Medical Products & Services [2.8%] | | | | | |
| Apria Healthcare Group | | | | | | | | |
| 12.375%, 11/01/14 | | | 400 | | | | 368 | |
| 11.250%, 11/01/14 | | | 100 | | | | 96 | |
| BioScrip | | | | | | | | |
| 10.250%, 10/01/15 | | | 600 | | | | 600 | |
| DJO Finance | | | | | | | | |
| 9.750%, 10/15/17(A) | | | 210 | | | | 175 | |
| Omnicare | | | | | | | | |
| 7.750%, 06/01/20 | | | 350 | | | | 357 | |
| OnCure Holdings | | | | | | | | |
| 11.750%, 05/15/17 | | | 500 | | | | 443 | |
| STHI Holding | | | | | | | | |
| 8.000%, 03/15/18(A) | | | 200 | | | | 193 | |
| Symbion | | | | | | | | |
| 11.000%, 08/23/15(B) | | | 418 | | | | 411 | |
Total Medical Products & Services | | | | 2,643 | |
| Metal-Copper [0.8%] | | | | | | | | |
| Quadra FNX Mining | | | | | | | | |
| | | 800 | | | | 774 | |
| Metals & Mining [2.6%] | | | | | | | | |
| Aleris International | | | | | | | | |
| 7.625%, 02/15/18(A) | | | 250 | | | | 224 | |
| Atkore International | | | | | | | | |
| 9.875%, 01/01/18(A) | | | 500 | | | | 453 | |
| Midwest Vanadium Pty | | | | | | | | |
| 11.500%, 02/15/18(A) | | | 500 | | | | 395 | |
| Mirabela Nickel | | | | | | | | |
| 8.750%, 04/15/18(A) | | | 330 | | | | 267 | |
| Noranda Aluminum Acquisition | | | | | | | | |
| 4.417%, 05/15/15(B) (C) | | | 673 | | | | 606 | |
| Novelis | | | | | | | | |
| 8.375%, 12/15/17 | | | 500 | | | | 495 | |
| | | | 2,440 | |
| Miscellaneous Business Services [0.4%] | | | | | |
| Affinion Group | | | | | | | | |
| 11.500%, 10/15/15 | | | 100 | | | | 78 | |
| Carriage Services | | | | | | | | |
| 7.875%, 01/15/15 | | | 200 | | | | 196 | |
| Lamar Media | | | | | | | | |
| 6.625%, 08/15/15 | | | 100 | | | | 98 | |
| MCBC Holdings | | | | | | | | |
| 6.817%, 10/15/14(A) (F) | | $ | 50 | | | $ | 28 | |
Total Miscellaneous Business Services | | | | 400 | |
| Miscellaneous Manufacturing [1.8%] | | | | | |
| AGY Holding | | | | | | | | |
| 11.000%, 11/15/14 | | | 100 | | | | 72 | |
| CEVA Group | | | | | | | | |
| 11.625%, 10/01/16(A) | | | 250 | | | | 244 | |
| 11.500%, 04/01/18(A) | | | 100 | | | | 92 | |
| 8.375%, 12/01/17(A) | | | 300 | | | | 278 | |
| Coleman Cable | | | | | | | | |
| 9.000%, 02/15/18 | | | 850 | | | | 829 | |
| Thermon Industries | | | | | | | | |
| 9.500%, 05/01/17 | | | 205 | | | | 213 | |
Total Miscellaneous Manufacturing | | | | 1,728 | |
| Multi-line Insurance [0.2%] | | | | | | | | |
| Kemper | | | | | | | | |
| | | 195 | | | | 201 | |
| Office Automation and Equip [0.4%] | | | | | |
| CDW | | | | | | | | |
| | | 400 | | | | 392 | |
| Paper & Related Products [0.2%] | | | | | |
| Verso Paper Holdings | | | | | | | | |
| | | 300 | | | | 207 | |
| Petroleum & Fuel Products [6.2%] | | | | | |
| Bill Barrett | | | | | | | | |
| 9.875%, 07/15/16 | | | 250 | | | | 273 | |
| 7.625%, 10/01/19 | | | 525 | | | | 516 | |
| Continental Resources | | | | | | | | |
| 7.375%, 10/01/20 | | | 500 | | | | 517 | |
| Copano Energy | | | | | | | | |
| 7.750%, 06/01/18 | | | 100 | | | | 102 | |
| Crestwood Midstream Partners | | | | | | | | |
| 7.750%, 04/01/19(A) | | | 400 | | | | 388 | |
| Denbury Resources | | | | | | | | |
| 8.250%, 02/15/20 | | | 500 | | | | 525 | |
| Eagle Rock Energy Partners | | | | | | | | |
| 8.375%, 06/01/19(A) | | | 750 | | | | 720 | |
| Energy Transfer Equity | | | | | | | | |
| 7.500%, 10/15/20 | | | 400 | | | | 411 | |
| Ferrellgas | | | | | | | | |
| 6.500%, 05/01/21 | | | 130 | | | | 110 | |
| Helix Energy Solutions Group | | | | | | | | |
| 9.500%, 01/15/16(A) | | | 100 | | | | 102 | |
See accompanying notes to financial statements.
CNI CHARTER FUNDS | PAGE 59
schedule of investments
High Yield Bond Fund (continued)
| Milagro Oil & Gas | | | | | | | | |
| 10.500%, 05/15/16(A) | | $ | 400 | | | $ | 320 | |
| Newfield Exploration | | | | | | | | |
| 6.625%, 09/01/14 | | | 150 | | | | 151 | |
| Plains Exploration & Production | | | | | | | | |
| 7.750%, 06/15/15 | | | 150 | | | | 154 | |
| 7.625%, 06/01/18 | | | 100 | | | | 102 | |
| Precision Drilling | | | | | | | | |
| 6.500%, 12/15/21(A) | | | 400 | | | | 394 | |
| Quicksilver Resources | | | | | | | | |
| 7.125%, 04/01/16 | | | 400 | | | | 352 | |
| SandRidge Energy | | | | | | | | |
| 8.000%, 06/01/18(A) | | | 150 | | | | 141 | |
| 7.500%, 03/15/21(A) | | | 250 | | | | 230 | |
| SESI | | | | | | | | |
| 6.375%, 05/01/19(A) | | | 300 | | | | 290 | |
| Southern Star Central | | | | | | | | |
| 6.750%, 03/01/16 | | | 100 | | | | 99 | |
Total Petroleum & Fuel Products | | | | 5,897 | |
| Printing & Publishing [1.0%] | | | | | | | | |
| Houghton Mifflin Harcourt Publishers | | | | | | | | |
| 10.500%, 06/01/19(A) | | | 400 | | | | 284 | |
| inVentiv Health | | | | | | | | |
| 10.000%, 08/15/18(A) | | | 800 | | | | 704 | |
Total Printing & Publishing | | | | 988 | |
| Real Estate [0.6%] | | | | | | | | |
| Kennedy-Wilson | | | | | | | | |
| | | 600 | | | | 559 | |
| Research and Development [1.4%] | | | | | |
| Alion Science and Technology | | | | | | | | |
| 12.000%, 11/01/14(B) | | | 590 | | | | 520 | |
| 10.250%, 02/01/15 | | | 330 | | | | 201 | |
| Catalent Pharma Solutions | | | | | | | | |
| 9.500%, 04/15/15(B) | | | 695 | | | | 634 | |
Total Research and Development | | | | 1,355 | |
| Retail [6.5%] | | | | | | | | |
| Academy | | | | | | | | |
| 9.250%, 08/01/19(A) | | | 550 | | | | 512 | |
| ACE Hardware | | | | | | | | |
| 9.125%, 06/01/16(A) | | | 100 | | | | 104 | |
| BI-LO | | | | | | | | |
| 9.250%, 02/15/19(A) | | | 450 | | | | 437 | |
| Burlington Coat Factory Warehouse | | | | | | | | |
| 10.000%, 02/15/19(A) | | $ | 500 | | | $ | 425 | |
| CKE Restaurants | | | | | | | | |
| 11.375%, 07/15/18 | | | 773 | | | | 804 | |
| Claire's Stores | | | | | | | | |
| 9.625%, 06/01/15 | | | 135 | | | | 104 | |
| Easton-Bell Sports | | | | | | | | |
| 9.750%, 12/01/16 | | | 500 | | | | 522 | |
| Liz Claiborne | | | | | | | | |
| 10.500%, 04/15/19(A) | | | 400 | | | | 400 | |
| Mobile Mini | | | | | | | | |
| 7.875%, 12/01/20 | | | 725 | | | | 696 | |
| Pantry | | | | | | | | |
| 7.750%, 02/15/14 | | | 750 | | | | 735 | |
| Penske Automotive Group | | | | | | | | |
| 7.750%, 12/15/16 | | | 100 | | | | 99 | |
| RadioShack | | | | | | | | |
| 6.750%, 05/15/19(A) | | | 300 | | | | 281 | |
| Rare Restaurant Group | | | | | | | | |
| 9.250%, 05/15/14(A) | | | 100 | | | | 71 | |
| Rite Aid | | | | | | | | |
| 9.500%, 06/15/17 | | | 750 | | | | 593 | |
| Sbarro | | | | | | | | |
| 10.375%, 02/01/15(D) (F) | | | 50 | | | | 4 | |
| Sonic Automotive | | | | | | | | |
| 9.000%, 03/15/18 | | | 70 | | | | 70 | |
| Susser Holdings | | | | | | | | |
| 8.500%, 05/15/16 | | | 250 | | | | 260 | |
| | | | 6,117 | |
| Rubber & Plastic [0.1%] | | | | | | | | |
| Cooper Tire & Rubber | | | | | | | | |
| | | 100 | | | | 97 | |
| Schools-Day Care [0.4%] | | | | | | | | |
| Knowledge Learning | | | | | | | | |
| | | 400 | | | | 380 | |
| Semi-Conductors [0.8%] | | | | | | | | |
| Freescale Semiconductor | | | | | | | | |
| 9.250%, 04/15/18(A) | | | 500 | | | | 514 | |
| Stoneridge | | | | | | | | |
| 9.500%, 10/15/17(A) | | | 200 | | | | 204 | |
| | | | 718 | |
See accompanying notes to financial statements.
CNI CHARTER FUNDS | PAGE 60
schedule of investments
High Yield Bond Fund (continued)
| Shipbuilding [0.5%] | | | | | | | | |
| Huntington Ingalls Industries | | | | | | | | |
| 7.125%, 03/15/21(A) | | $ | 250 | | | $ | 232 | |
| 6.875%, 03/15/18(A) | | | 250 | | | | 232 | |
| | | | 464 | |
| Steel & Steel Works [0.8%] | | | | | | | | |
| Ryerson | | | | | | | | |
| 12.000%, 11/01/15 | | | 75 | | | | 75 | |
| Standard Steel | | | | | | | | |
| 12.000%, 05/01/15(A) | | | 600 | | | | 694 | |
Total Steel & Steel Works | | | | 769 | |
| Telephones & Telecommunications [3.1%] | | | | | |
| Avaya | | | | | | | | |
| 9.750%, 11/01/15 | | | 250 | | | | 183 | |
| 7.000%, 04/01/19(A) | | | 750 | | | | 637 | |
| Clearwire Communications | | | | | | | | |
| 12.000%, 12/01/15(A) | | | 650 | | | | 550 | |
| CommScope | | | | | | | | |
| 8.250%, 01/15/19(A) | | | 500 | | | | 487 | |
| GeoEye | | | | | | | | |
| 8.625%, 10/01/16 | | | 345 | | | | 348 | |
| Syniverse Holdings | | | | | | | | |
| 9.125%, 01/15/19 | | | 750 | | | | 735 | |
Total Telephones & Telecommunications | | | | 2,940 | |
| Textile-Home Furnishings [0.2%] | | | | | |
| Empire Today | | | | | | | | |
| | | 250 | | | | 229 | |
| Transactional Software [0.3%] | | | | | | | | |
| Open Solutions | | | | | | | | |
| | | 600 | | | | 309 | |
| Transportation Services [5.0%] | | | | | | | | |
| ACL I | | | | | | | | |
| 10.625%, 02/15/16(A) (B) | | | 634 | | | | 495 | |
| Commercial Barge Line | | | | | | | | |
| 12.500%, 07/15/17 | | | 250 | | | | 266 | |
| Florida East Coast Railway | | | | | | | | |
| 8.125%, 02/01/17 | | | 750 | | | | 727 | |
| Marquette Transportation | | | | | | | | |
| 10.875%, 01/15/17 | | | 900 | | | | 867 | |
| Pegasus Solutions | | | | | | | | |
| 10.500%, 04/15/15(A) | | | 100 | | | | 36 | |
| Quality Distribution | | | | | | | | |
| 9.875%, 11/01/18 | | | 800 | | | | 772 | |
| | | | | |
| Sabre Holdings | | | | | | |
| 8.350%, 03/15/16 | | $ | 495 | | | $ | 405 | |
| Stena | | | | | | | | |
| 7.000%, 12/01/16 | | | 150 | | | | 130 | |
| Travelport | | | | | | | | |
| 11.875%, 09/01/16 | | | 90 | | | | 36 | |
| 9.875%, 09/01/14 | | | 300 | | | | 196 | |
| United Maritime Group | | | | | | | | |
| 11.750%, 06/15/15 | | | 800 | | | | 808 | |
Total Transportation Services | | | | 4,738 | |
| Waste Disposal [0.5%] | | | | | | | | |
| WCA Waste | | | | | | | | |
| | | 500 | | | | 475 | |
| Web Hosting/Design [0.3%] | | | | | | | | |
| Equinix | | | | | | | | |
| | | 250 | | | | 249 | |
Total Corporate Bonds (Cost $90,642) | | | | 85,999 | |
| Warrants [0.2%] | | | | | | | | |
| Alion Science and Technology, | | | | | | | | |
| Expires 03/15/17 (F) * | | | 380 | | | | — | |
| CUI Acquisition (E)(F)(G) * | | | 2,756 | | | | 171 | |
Total Warrants (Cost $250) | | | | 171 | |
| Convertible Bond [0.1%] | | | | | | | | |
| Food, Beverage & Tobacco [0.1%] | | | | | |
| Vector Group | | | | | | | | |
| | | 54 | | | | 62 | |
Total Convertible Bond (Cost $57) | | | | 62 | |
| Special Stock [0.0%] | | | | | | | | |
| Broadcasting & Cable [0.0%] | | | | | | | | |
| | | 8,500 | | | | 7 | |
Total Special Stock (Cost $9) | | | | 7 | |
See accompanying notes to financial statements.
CNI CHARTER FUNDS | PAGE 61
schedule of investments
High Yield Bond Fund (concluded)
| | | | | | |
| Short-Term Investments [10.8%] | | | | | | |
| Fidelity Institutional Domestic Money Market Portfolio, Cl I, 0.062%** | | | 5,114,330 | | | $ | 5,114 | |
| SEI Daily Income Trust, Prime Obligation Fund, Cl A, 0.010%** | | | 5,114,330 | | | | 5,114 | |
Total Short-Term Investments (Cost $10,228) | | | | 10,228 | |
Total Investments [102.1%] (Cost $101,186) | | | $ | 96,467 | |
Percentages are based on Net Assets of $94,501 ($ Thousands).
| * | Non-income producing security. |
| ** | The rate reported is the 7-day effective yield as of September 30, 2011. |
| (A) | Security exempt from registration under Rule 144A of the Securities Act of 1933. These securities may be resold in transactions exempt from registration normally to qualified institutions. On September 30, 2011, the value of these securities amounted to $38,604 (000), representing 40.8% of the net assets of the Fund. |
| (C) | Floating Rate Security — The rate reported is the rate in effect on September 30, 2011. |
| (D) | In default on interest payments. Rate shown represents the last coupon rate prior to default. |
| (E) | This warrant is a result of the restructuring of Cleveland Unlimited, has an exercise price of $0.0001 per share of common stock and does not have an expiration date. |
| (F) | Security is considered illiquid. |
| (G) | Security is fair valued. |
Cl — Class
CVV — Contingent Value Vehicle
Ser — Series
Amounts designated as “—” are either $0 or have been rounded to $0.
The following is a summary of the inputs used as of September 30, 2011 in valuing the Fund’s investments carried at value ($ Thousands) in accordance with ASC 820:
| Investments in Securities | | | | | | | | | | | | |
| Corporate Bonds | | $ | — | | | $ | 85,952 | | | $ | 47 | | | $ | 85,999 | |
| Warrants | | | — | | | | — | | | | 171 | | | | 171 | |
| Convertible Bond | | | — | | | | 62 | | | | — | | | | 62 | |
| Special Stock | | | — | | | | — | | | | 7 | | | | 7 | |
| Short-Term Investments | | | 10,228 | | | | — | | | | — | | | | 10,228 | |
| Total Investments in Securities | | $ | 10,228 | | | $ | 86,014 | | | $ | 225 | | | $ | 96,467 | |
The following is a reconciliation of investments in which significant unobservable inputs (Level 3) were used in determining value:
| | | Investments in Corporate Bonds ($Thousands) | | | Investments in Warrants ($Thousands) | | | Investments in Special Stock ($Thousands) | |
| Beginning balance as of October 1, 2010 | | $ | 278 | | | $ | — | | | $ | 10 | |
| Accrued discounts/premiums | | | — | | | | — | | | | — | |
| Realized gain/(loss) | | | (34 | ) | | | — | | | | 2 | |
| Change in unrealized appreciation/ (depreciation) | | | 31 | | | | (79 | ) | | | (2 | ) |
| Net purchases/sales | | | (256 | ) | | | 250 | | | | (3 | ) |
| Net transfer in and/or out of Level 3 | | | 28 | | | | — | | | | — | |
| Ending balance as of September 30, 2011 | | $ | 47 | | | $ | 171 | | | $ | 7 | |
| Changes in unrealized gains (losses) included in earnings related to securities held at reporting date | | $ | (26 | ) | | $ | (79 | ) | | $ | (2 | ) |
For the year ended September 30, 2011, there have been no transfers between Level 1 and Level 2 assets and liabilities. For the year ended September 30, 2011, there were transfers of $28 (000)s from Level 2 to Level 3. Transfers between Levels are recognized at period end.
For more information on valuation inputs, see Note 2 — Significant Accounting Policies in the Notes to Financial Statements.
See accompanying notes to financial statements.
CNI CHARTER FUNDS | PAGE 62
schedule of investments
Multi-Asset Fund
| | | | | | |
| Exchange-Traded Funds [29.9%] | | | | | | |
| Guggenheim Timber Fund | | | 23,552 | | | $ | 375 | |
| iShares MSCI EAFE Index Fund | | | 21,699 | | | | 1,036 | |
| iShares S&P Global Timber Fund | | | 10,919 | | | | 376 | |
| iShares S&P MidCap 400 Index Fund | | | 17,786 | | | | 1,387 | |
| Powershares DB Agricultural Fund | | | 29,925 | | | | 887 | |
| SPDR Barclays Capital High Yield Bond Fund | | | 35,741 | | | | 1,294 | |
| SPDR S&P 500 Fund | | | 33,481 | | | | 3,789 | |
| Vanguard Dividend Appreciation | | | 25,645 | | | | 1,250 | |
| Vanguard Emerging Markets | | | 25,124 | | | | 902 | |
| Vanguard Short-Term Bond Index Fund | | | 216,367 | | | | 2,307 | |
Total Exchange-Traded Funds (Cost $14,840) | | | | 13,603 | |
| Affiliated Registered Investment Companies [13.7%] | |
| CNI Corporate Bond Fund, Institutional Class | | | 184,401 | | | | 1,951 | |
| CNI Government Bond Fund, Institutional Class | | | 149,068 | | | | 1,602 | |
| CNI High Yield Bond Fund, Institutional Class | | | 331,419 | | | | 2,645 | |
Total Affiliated Registered Investment Companies (Cost $6,222) | | | | 6,198 | |
| Unaffiliated Registered Investment Companies [26.5%] | |
| Alpine International Real Estate Equity Fund | | | 30,305 | | | | 562 | |
| Cohen & Steers International Realty Fund, Inc. | | | 160,697 | | | | 1,421 | |
| Direxion Commodity Trends Strategy Fund | | | 33,163 | | | | 759 | |
| Fidelity Floating Rate High Income Fund | | | 213,639 | | | | 2,021 | |
| | | | | |
| Oppenheimer International Bond Fund, Class A | | | 457,383 | | | $ | 2,877 | |
| PIMCO Emerging Markets Bond Fund | | | 139,887 | | | | 1,399 | |
| PIMCO Emerging Markets Bond Fund, Institutional Class | | | 70,869 | | | | 768 | |
| Principal Preferred Securities Fund | | | 239,534 | | | | 2,247 | |
Total Unaffiliated Registered Investment Companies (Cost $13,047) | | | | 12,054 | |
| Corporate Bonds [9.0%] | | | | | | | | |
| Financial Services [9.0%] | | | | | | | | |
| Citigroup | | | | | | | | |
| 5.500%, 08/27/12 | | $ | 1,000 | | | | 1,026 | |
| HSBC Finance | | | | | | | | |
| 7.000%, 05/15/12 | | | 1,000 | | | | 1,029 | |
| Merrill Lynch, MTN | | | | | | | | |
| 6.050%, 08/15/12 | | | 1,000 | | | | 1,009 | |
| Morgan Stanley | | | | | | | | |
| 6.600%, 04/01/12 | | | 1,000 | | | | 1,022 | |
| | | | 4,086 | |
Total Corporate Bonds (Cost $4,107) | | | | 4,086 | |
| Municipal Bond [2.2%] | | | | | | | | |
| California [2.2%] | | | | | | | | |
| California State, Ser A-2, RAN | | | | | | | | |
| | | 1,000 | | | | 1,012 | |
Total Municipal Bond (Cost $1,012) | | | | 1,012 | |
| Certificate of Deposit [2.2%] | | | | | | | | |
| Cooperatieve Centrale Raiffeisen-Boerenleenbank BA | | | | | | | | |
| | | 1,000 | | | | 1,000 | |
Total Certificate of Deposit (Cost $1,000) | | | | 1,000 | |
See accompanying notes to financial statements.
CNI CHARTER FUNDS | PAGE 63
schedule of investments
Multi-Asset Fund (concluded)
| | | | | | |
| Short-Term Investment [16.1%] | | | | | | |
| Fidelity Institutional Domestic Money Market Portfolio, Cl I, 0.116%* | | | 7,338,711 | | | $ | 7,339 | |
Total Short-Term Investment (Cost $7,339) | | | | 7,339 | |
Total Investments [99.6%] (Cost $47,567) | | | $ | 45,292 | |
Percentages are based on Net Assets of $45,461 ($ Thousands).
| * | The rate reported is the 7-day effective yield as of September 30, 2011. |
EAFE —Europe Australiasia and the Far East
MSCI — Morgan Stanley Capital International
RAN — Revenue Anticipation Note
SPDR — Standard & Poor’s Depository Receipts
The following is a summary of the inputs used as of September 30, 2011 in valuing the Fund’s investments carried at value ($ Thousands):
| Investments in Securities | | | | | | | | | | | | |
| Exchange-Traded Funds | | $ | 13,603 | | | $ | — | | | $ | — | | | $ | 13,603 | |
| Affiliated Registered Investment Companies | | | 6,198 | | | | — | | | | — | | | | 6,198 | |
| Unaffiliated Registered Investment Companies | | | 12,054 | | | | — | | | | — | | | | 12,054 | |
| Corporate Bonds | | | — | | | | 4,086 | | | | — | | | | 4,086 | |
| Municipal Bond | | | — | | | | 1,012 | | | | — | | | | 1,012 | |
| Certificate of Deposit | | | — | | | | 1,000 | | | | — | | | | 1,000 | |
| Short-Term Investment | | | 7,339 | | | | — | | | | — | | | | 7,339 | |
| Total Investments in Securities | | $ | 39,194 | | | $ | 6,098 | | | $ | — | | | $ | 45,292 | |
For the year ended September 30, 2011, there have been no transfers between Level 1 and Level 2 assets and liabilities. Transfers between Levels are recognized at period end.
For more information on valuation inputs, see note 2 — Significant Accounting Policies in the Notes to Financial Statements.
See accompanying notes to financial statements.
CNI CHARTER FUNDS | PAGE 64
schedule of investments
Diversified Equity Fund
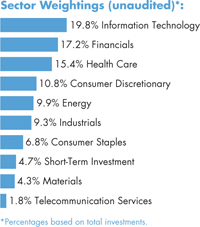
| | | | | | |
| Common Stock [95.6%] | | | | | | |
| Aerospace & Defense [2.3%] | | | | | | |
| Boeing | | | 6,080 | | | $ | 368 | |
| Precision Castparts | | | 1,560 | | | | 242 | |
| Raytheon | | | 16,115 | | | | 659 | |
Total Aerospace & Defense | | | | 1,269 | |
| Airlines [0.3%] | | | | | | | | |
United Continental Holdings * | | | 7,640 | | | | 148 | |
| Apparel/Textiles [1.0%] | | | | | | | | |
| Coach | | | 5,480 | | | | 284 | |
| Lululemon Athletica * | | | 2,730 | | | | 133 | |
| Ralph Lauren, Cl A | | | 1,090 | | | | 141 | |
| | | | 558 | |
| Auto Components [0.1%] | | | | | | | | |
TRW Automotive Holdings * | | | 2,540 | | | | 83 | |
| Automotive [2.0%] | | | | | | | | |
| Ford Motor * | | | 47,600 | | | | 460 | |
| Honda Motor ADR | | | 11,300 | | | | 330 | |
| Paccar | | | 9,200 | | | | 311 | |
| | | | 1,101 | |
| Banks [3.1%] | | | | | | | | |
| CIT Group * | | | 18,900 | | | | 574 | |
| M&T Bank | | | 6,800 | | | | 475 | |
| MSCI, Cl A * | | | 5,550 | | | | 169 | |
| US Bancorp | | | 21,100 | | | | 497 | |
| | | | 1,715 | |
| Beauty Products [0.3%] | | | | | | | | |
| | | 1,810 | | | $ | 159 | |
| Biomedical Research & Products [0.6%] | | | | | |
| | | 4,970 | | | | 308 | |
| Biotechnology [0.3%] | | | | | | | | |
Alexion Pharmaceuticals * | | | 2,900 | | | | 186 | |
| Broadcasting & Cable [3.5%] | | | | | | | | |
| Acme Packet * | | | 3,830 | | | | 163 | |
| Cisco Systems | | | 46,600 | | | | 722 | |
| F5 Networks * | | | 1,890 | | | | 135 | |
| Finisar * | | | 4,460 | | | | 78 | |
| Qualcomm | | | 16,620 | | | | 808 | |
Total Broadcasting & Cable | | | | 1,906 | |
| Building & Construction [1.0%] | | | | | |
| | | 25,200 | | | | 546 | |
| Business Services [2.6%] | | | | | | | | |
| eBay * | | | 22,620 | | | | 667 | |
| Mastercard, Cl A | | | 1,620 | | | | 514 | |
| VeriFone Systems * | | | 7,230 | | | | 253 | |
| | | | 1,434 | |
| Chemicals [1.0%] | | | | | | | | |
| Mosaic | | | 2,780 | | | | 136 | |
| Potash Corp of Saskatchewan | | | 9,800 | | | | 424 | |
| | | | 560 | |
| Commercial Banks [1.8%] | | | | | | | | |
| | | 46,600 | | | | 994 | |
| Communication & Media [1.9%] | | | | | |
| Comcast, Cl A | | | 17,700 | | | | 370 | |
| Time Warner | | | 21,866 | | | | 655 | |
Total Communication & Media | | | | 1,025 | |
| Computer Software [1.4%] | | | | | | | | |
| | | 30,471 | | | | 758 | |
| Computer System Design & Services [6.2%] | |
| Apple * | | | 4,079 | | | | 1,555 | |
| Dell * | | | 46,529 | | | | 658 | |
See accompanying notes to financial statements.
CNI CHARTER FUNDS | PAGE 65
schedule of investments
Diversified Equity Fund (continued)
| IBM | | | 5,860 | | | $ | 1,026 | |
| SanDisk * | | | 4,560 | | | | 184 | |
Total Computer System Design & Services | | | | 3,423 | |
| Consumer Products & Services [0.6%] | | | | | |
| | | 12,600 | | | | 326 | |
| Containers & Packaging [1.2%] | | | | | |
| | | 21,600 | | | | 661 | |
| Diversified Metals & Mining [0.6%] | | | | | |
| | | 7,030 | | | | 321 | |
| Drugs [3.8%] | | | | | | | | |
| Allergan | | | 3,680 | | | | 303 | |
| Bristol-Myers Squibb | | | 13,700 | | | | 430 | |
| Mylan * | | | 36,300 | | | | 617 | |
| Shire ADR | | | 4,540 | | | | 427 | |
| Watson Pharmaceuticals * | | | 4,590 | | | | 313 | |
| | | | 2,090 | |
| Electrical Services [0.2%] | | | | | | | | |
| | | 3,250 | | | | 107 | |
| Entertainment [3.3%] | | | | | | | | |
| Chipotle Mexican Grill, Cl A * | | | 830 | | | | 251 | |
| Las Vegas Sands * | | | 14,760 | | | | 566 | |
| Starbucks | | | 8,760 | | | | 327 | |
| Starwood Hotels & Resorts Worldwide | | | 4,430 | | | | 172 | |
| Wendy's | | | 103,000 | | | | 473 | |
| | | | 1,789 | |
| Financial Services [1.9%] | | | | | | | | |
| American Express | | | 12,000 | | | | 539 | |
| Capital One Financial | | | 13,000 | | | | 515 | |
| | | | 1,054 | |
| Food, Beverage & Tobacco [3.4%] | | | | | |
| Coca-Cola | | | 11,270 | | | | 761 | |
| Hansen Natural * | | | 900 | | | | 79 | |
| PepsiCo | | | 16,609 | | | | 1,028 | |
Total Food, Beverage & Tobacco | | | | 1,868 | |
| Health Care Technology [0.4%] | | | | | |
| | | 3,240 | | | $ | 222 | |
| Healthcare Products & Services [2.2%] | | | | | |
| McKesson | | | 8,562 | | | | 622 | |
| Pharmaceutical Product Development | | | 22,800 | | | | 585 | |
Total Healthcare Products & Services | | | | 1,207 | |
| Household Furniture & Fixtures [0.3%] | | | | | |
Tempur-Pedic International * | | | 2,720 | | | | 143 | |
| Insurance [7.7%] | | | | | | | | |
| Aetna | | | 6,200 | | | | 225 | |
| Berkshire Hathaway, Cl B * | | | 14,322 | | | | 1,018 | |
| Chubb | | | 10,200 | | | | 612 | |
| HCC Insurance Holdings | | | 35,000 | | | | 947 | |
| Loews | | | 18,100 | | | | 625 | |
| Unum Group | | | 37,800 | | | | 792 | |
| | | | 4,219 | |
| Internet & Catalog Retail [0.5%] | | | | | |
| | | 580 | | | | 261 | |
| Investment Banker/Broker Dealer [0.5%] | | | | | |
Affiliated Managers Group * | | | 3,540 | | | | 276 | |
| Machinery [2.3%] | | | | | | | | |
| AGCO * | | | 19,300 | | | | 667 | |
| Caterpillar | | | 4,100 | | | | 303 | |
| Cummins | | | 3,665 | | | | 299 | |
| | | | 1,269 | |
| Manufacturing [2.1%] | | | | | | | | |
| | | 28,650 | | | | 1,168 | |
| Medical Products & Services [7.7%] | | | | | |
| Baxter International | | | 2,770 | | | | 156 | |
| CareFusion * | | | 40,042 | | | | 959 | |
| Cooper | | | 2,300 | | | | 182 | |
| Covidien | | | 20,940 | | | | 924 | |
| Laboratory Corp of America Holdings * | | | 8,100 | | | | 640 | |
| Patterson | | | 24,100 | | | | 690 | |
| Quest Diagnostics | | | 13,600 | | | | 671 | |
Total Medical Products & Services | | | | 4,222 | |
See accompanying notes to financial statements.
CNI CHARTER FUNDS | PAGE 66
schedule of investments
Diversified Equity Fund (concluded)
| Office Furniture & Fixtures [2.1%] | | | | | |
| Fortinet * | | | 5,370 | | | $ | 90 | |
| QLIK Technologies * | | | 3,680 | | | | 80 | |
| Salesforce.com * | | | 2,490 | | | | 284 | |
| Synopsys * | | | 19,500 | | | | 475 | |
| VMware, Cl A * | | | 2,920 | | | | 235 | |
Total Office Furniture & Fixtures | | | | 1,164 | |
| Paper & Related Products [1.5%] | | | | | |
| Packaging Corp of America | | | 21,500 | | | | 501 | |
| Sealed Air | | | 18,700 | | | | 312 | |
Total Paper & Related Products | | | | 813 | |
| Petroleum & Fuel Products [10.0%] | | | | | |
| Anadarko Petroleum | | | 7,320 | | | | 462 | |
| Cabot Oil & Gas | | | 2,950 | | | | 183 | |
| Cameron International * | | | 3,600 | | | | 150 | |
| Concho Resources * | | | 3,920 | | | | 279 | |
| ConocoPhillips | | | 8,200 | | | | 519 | |
| Equities | | | 4,000 | | | | 213 | |
| Newfield Exploration * | | | 16,000 | | | | 635 | |
| Noble | | | 28,700 | | | | 842 | |
| Patterson-UTI Energy | | | 22,800 | | | | 395 | |
| Schlumberger | | | 6,760 | | | | 404 | |
| Southwestern Energy * | | | 17,900 | | | | 597 | |
| Spectra Energy | | | 32,300 | | | | 792 | |
Total Petroleum & Fuel Products | | | | 5,471 | |
| Real Estate Investment Trust [0.3%] | | | | | |
| | | 1,300 | | | | 148 | |
| Real Estate Management & Development [2.3%] | |
Brookfield Asset Management, Cl A | | | 46,100 | | | | 1,270 | |
| Retail [2.2%] | | | | | | | | |
| Bed Bath & Beyond * | | | 4,250 | | | | 243 | |
| Walgreen | | | 23,100 | | | | 760 | |
| Whole Foods Market | | | 2,850 | | | | 186 | |
| | | | 1,189 | |
| Semi-Conductors [3.2%] | | | | | | | | |
| Altera | | | 7,550 | | | | 238 | |
| Applied Materials | | | 59,000 | | | | 611 | |
| ARM Holdings ADR | | | 9,490 | | | | 242 | |
| ASML Holding, Cl G | | | 7,560 | | | | 261 | |
| Broadcom, Cl A | | | 8,670 | | | | 288 | |
| Cypress Semiconductor | | | 7,150 | | | $ | 107 | |
| | | | 1,747 | |
| Telephones & Telecommunications [1.8%] | | | | | |
| AT&T | | | 17,800 | | | | 508 | |
| Vodafone Group ADR | | | 18,700 | | | | 479 | |
Total Telephones & Telecommunications | | | | 987 | |
| Transportation Services [0.5%] | | | | | |
| | | 3,680 | | | | 301 | |
| Web Portals/ISP [2.2%] | | | | | | | | |
| Amazon.com * | | | 3,380 | | | | 731 | |
| Google, Cl A * | | | 950 | | | | 489 | |
| | | | 1,220 | |
| Wholesale [1.4%] | | | | | | | | |
| Green Mountain Coffee Roasters * | | | 1,300 | | | | 121 | |
| Hershey | | | 4,420 | | | | 262 | |
| Mead Johnson Nutrition, Cl A | | | 5,960 | | | | 410 | |
| | | | 793 | |
Total Common Stock (Cost $55,248) | | | | 52,479 | |
| Short-Term Investment [4.7%] | | | | | | | | |
| AIM STIT-Treasury Portfolio, 0.020%** | | | 2,556,189 | | | | 2,556 | |
Total Short-Term Investment (Cost $2,556) | | | | 2,556 | |
Total Investments [100.3%] (Cost $57,804) | | | $ | 55,035 | |
Percentages are based on Net Assets of $54,871 ($ Thousands).
| * | Non-income producing security. |
| ** | The rate reported is the 7-day effective yield as of September 30, 2011. |
ADR — American Depositary Receipt
Cl — Class
As of September 30, 2011, all of the Fund’s investments are Level 1.
For the year ended September 30, 2011, there have been no transfers between Level 1 and Level 2 assets and liabilities. Transfers between Levels are recognized at period end.
For more information on valuation inputs, see Note 2 – Significant Accounting Policies in the Notes to Financial Statements.
See accompanying notes to financial statements.
CNI CHARTER FUNDS | PAGE 67
schedule of investments
Large Cap Value Equity Fund
| | | | | | |
| Common Stock [98.3%] | | | | | | |
| Aerospace & Defense [1.5%] | | | | | | |
| General Dynamics | | | 9,000 | | | $ | 512 | |
| L-3 Communications Holdings, Cl 3 | | | 15,600 | | | | 967 | |
Total Aerospace & Defense | | | | 1,479 | |
| Beverages [1.2%] | | | | | | | | |
| Molson Coors Brewing, Cl B | | | 15,400 | | | | 610 | |
| PepsiCo | | | 10,200 | | | | 632 | |
| | | | 1,242 | |
| Biotechnology [1.2%] | | | | | | | | |
| | | 31,600 | | | | 1,226 | |
| Capital Markets [3.2%] | | | | | | | | |
| Bank of New York Mellon | | | 52,900 | | | | 984 | |
| Goldman Sachs Group | | | 11,200 | | | | 1,059 | |
| State Street | | | 34,800 | | | | 1,119 | |
| | | | 3,162 | |
| Commercial Banks [4.2%] | | | | | | | | |
| US Bancorp | | | 74,500 | | | | 1,754 | |
| Wells Fargo | | | 98,960 | | | | 2,387 | |
| | | | 4,141 | |
| Commercial Services & Supplies [2.4%] | | | | | |
| Iron Mountain | | | 42,500 | | | | 1,344 | |
| Waste Management | | | 30,500 | | | | 993 | |
Total Commercial Services & Supplies | �� | | | 2,337 | |
| Communications Equipment [1.6%] | | | | | |
| | | 101,500 | | | $ | 1,572 | |
| Consumer Finance [1.8%] | | | | | | | | |
| | | 40,200 | | | | 1,805 | |
| Containers & Packaging [0.9%] | | | | | |
| | | 52,100 | | | | 870 | |
| Diversified Financial Services [4.3%] | | | | | |
| Citigroup | | | 69,300 | | | | 1,775 | |
| JPMorgan Chase | | | 83,200 | | | | 2,506 | |
Total Diversified Financial Services | | | | 4,281 | |
| Diversified Telecommunication Services [3.1%] | |
| AT&T | | | 60,317 | | | | 1,720 | |
| Verizon Communications | | | 37,600 | | | | 1,384 | |
Total Diversified Telecommunication Services | | | | 3,104 | |
| Electric Utilities [2.4%] | | | | | | | | |
| American Electric Power | | | 13,100 | | | | 498 | |
| Edison International | | | 35,500 | | | | 1,358 | |
| NextEra Energy | | | 10,200 | | | | 551 | |
| | | | 2,407 | |
| Energy Equipment & Services [1.1%] | | | | | |
Diamond Offshore Drilling | | | 19,800 | | | | 1,084 | |
| Food & Staples Retailing [5.1%] | | | | | |
| CVS | | | 52,400 | | | | 1,760 | |
| SUPERVALU | | | 124,500 | | | | 829 | |
| Wal-Mart Stores | | | 48,200 | | | | 2,501 | |
Total Food & Staples Retailing | | | | 5,090 | |
| Food Products [1.7%] | | | | | | | | |
| Archer-Daniels-Midland | | | 36,900 | | | | 916 | |
| Dean Foods * | | | 90,000 | | | | 798 | |
| | | | 1,714 | |
| Health Care Equipment & Supplies [1.2%] | | | | | |
| Baxter International | | | 12,500 | | | | 702 | |
| Becton Dickinson | | | 6,900 | | | | 506 | |
Total Health Care Equipment & Supplies | | | | 1,208 | |
See accompanying notes to financial statements.
CNI CHARTER FUNDS | PAGE 68
schedule of investments
Large Cap Value Equity Fund (continued)
| Health Care Providers & Services [2.5%] | | | | | |
| Aetna | | | 34,200 | | | $ | 1,243 | |
| Cigna | | | 18,500 | | | | 776 | |
| UnitedHealth Group | | | 9,500 | | | | 438 | |
Total Health Care Providers & Services | | | | 2,457 | |
| Household Products [2.2%] | | | | | | | | |
| | | 34,700 | | | | 2,192 | |
| Industrial Conglomerates [3.0%] | | | | | |
| General Electric | | | 160,700 | | | | 2,449 | |
| Tyco International | | | 13,600 | | | | 554 | |
Total Industrial Conglomerates | | | | 3,003 | |
| Insurance [7.4%] | | | | | | | | |
| Aflac | | | 45,200 | | | | 1,580 | |
| Berkshire Hathaway, Cl B * | | | 35,400 | | | | 2,515 | |
| Marsh & McLennan | | | 63,100 | | | | 1,674 | |
| Travelers | | | 31,700 | | | | 1,545 | |
| | | | 7,314 | |
| Leisure Equipment & Products [1.7%] | | | | | |
| | | 63,800 | | | | 1,652 | |
| Machinery [0.9%] | | | | | | | | |
| | | 25,700 | | | | 888 | |
| Media [2.6%] | | | | | | | | |
| Comcast, Cl A | | | 96,800 | | | | 2,023 | |
| Time Warner | | | 17,933 | | | | 538 | |
| | | | 2,561 | |
| Metals & Mining [2.2%] | | | | | | | | |
| Barrick Gold | | | 19,100 | | | | 891 | |
| Newmont Mining | | | 19,800 | | | | 1,245 | |
| | | | 2,136 | |
| Multiline Retail [1.9%] | | | | | | | | |
| | | 39,100 | | | | 1,917 | |
| Multi-Utilities [4.8%] | | | | | | | | |
| Consolidated Edison | | | 7,000 | | | | 399 | |
| National Grid ADR | | | 27,200 | | | | 1,349 | |
| PG&E | | | 42,000 | | | | 1,777 | |
| Public Service Enterprise Group | | | 22,100 | | | | 738 | |
| Sempra Energy | | | 10,000 | | | $ | 515 | |
| | | | 4,778 | |
| Oil, Gas & Consumable Fuels [16.2%] | | | | | |
| Apache | | | 14,000 | | | | 1,123 | |
| BP ADR | | | 40,900 | | | | 1,475 | |
| Chevron | | | 38,240 | | | | 3,538 | |
| ConocoPhillips | | | 50,080 | | | | 3,171 | |
| Devon Energy | | | 20,100 | | | | 1,114 | |
| Exxon Mobil | | | 50,500 | | | | 3,668 | |
| Hess | | | 26,000 | | | | 1,364 | |
| Marathon Oil | | | 30,000 | | | | 648 | |
Total Oil, Gas & Consumable Fuels | | | | 16,101 | |
| Pharmaceuticals [5.3%] | | | | | |
| Abbott Laboratories | | | 21,700 | | | | 1,110 | |
| Merck | | | 23,100 | | | | 756 | |
| Pfizer | | | 104,000 | | | | 1,839 | |
| Teva Pharmaceutical Industries ADR | | | 23,300 | | | | 867 | |
| Warner Chilcott, Cl A * | | | 46,400 | | | | 663 | |
| | | | 5,235 | |
| Real Estate Management & Development [1.6%] | |
Brookfield Asset Management, Cl A | | | 58,200 | | | | 1,603 | |
| Road & Rail [3.0%] | | | | | |
| CSX | | | 60,000 | | | | 1,120 | |
| Union Pacific | | | 23,000 | | | | 1,879 | |
| | | | 2,999 | |
| Semiconductors & Semiconductor Equipment [2.5%] | |
| Intel | | | 72,200 | | | | 1,540 | |
| Texas Instruments | | | 34,900 | | | | 930 | |
Total Semiconductors & Semiconductor Equipment | | | | 2,470 | |
| Software [1.8%] | | | | | | | | |
| | | 73,500 | | | | 1,830 | |
| Specialty Retail [1.0%] | | | | | |
| Best Buy | | | 22,700 | | | | 529 | |
| Lowe's | | | 22,500 | | | | 435 | |
| | | | 964 | |
See accompanying notes to financial statements.
CNI CHARTER FUNDS | PAGE 69
schedule of investments
Large Cap Value Equity Fund (concluded)
| Wireless Telecommunication Services [0.8%] | |
| | | 260,000 | | | $ | 790 | |
Total Common Stock (Cost $106,958) | | | | 97,612 | |
| Short-Term Investments [2.0%] | | | | | | | | |
| Fidelity Institutional Domestic Money Market Portfolio, Cl I, 0.062%** | | | 1,517,643 | | | | 1,517 | |
| Goldman Sachs Financial Square Funds - Government Fund, 0.006%** | | | 509,703 | | | | 510 | |
Total Short-Term Investments (Cost $2,027) | | | | 2,027 | |
Total Investments [100.3%] (Cost $108,985) | | | $ | 99,639 | |
Percentages are based on Net Assets of $99,369 ($ Thousands).
| * | Non-income producing security. |
| ** | The rate reported is the 7-day effective yield as of September 30, 2011. |
ADR — American Depositary Receipt
Cl — Class
As of September 30, 2011, all of the Fund’s investments are Level 1.
For the year ended September 30, 2011, there have been no transfers between Level 1 and Level 2 assets and liabilities. Transfers between Levels are recognized at period end.
For more information on valuation inputs, see note 2 — Significant Accounting Policies in the Notes to Financial Statements.
See accompanying notes to financial statements.
CNI CHARTER FUNDS | PAGE 70
schedule of investments
Large Cap Growth Equity Fund
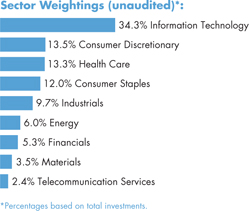
| | | | | | |
| Common Stock [99.8%] | | | | | | |
| Aerospace & Defense [1.5%] | | | | | | |
| | | 10,700 | | | $ | 647 | |
| Air Freight & Logistics [1.3%] | | | | | |
| | | 8,700 | | | | 589 | |
| Beverages [4.0%] | | | | | | | | |
| Dr Pepper Snapple Group | | | 24,100 | | | | 934 | |
| Fomento Economico Mexicano ADR | | | 12,800 | | | | 830 | |
| | | | 1,764 | |
| Biotechnology [6.6%] | | | | | | | | |
| Celgene * | | | 23,400 | | | | 1,449 | |
| Gilead Sciences * | | | 26,500 | | | | 1,028 | |
| United Therapeutics * | | | 11,100 | | | | 416 | |
| | | | 2,893 | |
| Capital Markets [1.0%] | | | | | | | | |
| | | 4,600 | | | | 440 | |
| Chemicals [1.0%] | | | | | | | | |
| | | 9,200 | | | | 451 | |
| Communications Equipment [5.4%] | | | | | |
| F5 Networks * | | | 6,900 | | | | 490 | |
| Finisar * | | | 24,900 | | | | 437 | |
| Qualcomm | | | 29,300 | | | | 1,425 | |
Total Communications Equipment | | | | 2,352 | |
| Computers & Peripherals [12.1%] | | | | | |
| Apple * | | | 10,900 | | | $ | 4,155 | |
| EMC * | | | 54,000 | | | | 1,133 | |
Total Computers & Peripherals | | | | 5,288 | |
| Diversified Financial Services [1.2%] | | | | | |
| | | 16,900 | | | | 509 | |
| Diversified Telecommunication Services [1.4%] | |
| | | 16,100 | | | | 593 | |
| Electronic Equipment [1.5%] | | | | | | | | |
| | | 53,300 | | | | 659 | |
| Energy Equipment & Services [4.7%] | | | | | |
| Baker Hughes | | | 15,100 | | | | 697 | |
| National Oilwell Varco | | | 8,600 | | | | 440 | |
| Schlumberger | | | 15,200 | | | | 908 | |
Total Energy Equipment & Services | | | | 2,045 | |
| Food & Staples Retailing [4.8%] | | | | | |
| CVS | | | 29,300 | | | | 984 | |
| Tesco ADR | | | 32,400 | | | | 576 | |
| Wal-Mart Stores | | | 10,100 | | | | 524 | |
Total Food & Staples Retailing | | | | 2,084 | |
| Food Products [1.7%] | | | | | | | | |
| | | 13,100 | | | | 764 | |
| Health Care Equipment & Supplies [3.4%] | | | | | |
| Baxter International | | | 15,900 | | | | 892 | |
| Intuitive Surgical * | | | 1,600 | | | | 583 | |
Total Health Care Equipment & Supplies | | | | 1,475 | |
| Hotels, Restaurants & Leisure [1.6%] | | | | | |
| | | 18,300 | | | | 682 | |
| Insurance [1.7%] | | | | | |
| | | 16,200 | | | | 759 | |
| Internet & Catalog Retail [1.9%] | | | | | |
| | | 1,800 | | | | 809 | |
See accompanying notes to financial statements.
CNI CHARTER FUNDS | PAGE 71
schedule of investments
Large Cap Growth Equity Fund (concluded)
| Internet Software & Services [4.5%] | | | | | |
| | | 3,800 | | | $ | 1,955 | |
| IT Services [6.9%] | | | | | |
| IBM | | | 10,600 | | | | 1,855 | |
| Mastercard, Cl A | | | 3,700 | | | | 1,174 | |
| | | | 3,029 | |
| Machinery [5.3%] | | | | | | | | |
| Caterpillar | | | 7,700 | | | | 569 | |
| Cummins | | | 12,300 | | | | 1,004 | |
| Danaher | | | 17,300 | | | | 725 | |
| | | | 2,298 | |
| Media [6.8%] | | | | | | | | |
| Comcast, Cl A | | | 32,500 | | | | 679 | |
| DIRECTV, Cl A * | | | 23,400 | | | | 989 | |
| Omnicom Group | | | 17,400 | | | | 641 | |
| Time Warner Cable, Cl A | | | 10,700 | | | | 671 | |
| | | | 2,980 | |
| Metals & Mining [2.5%] | | | | | | | | |
| Allegheny Technologies | | | 14,300 | | | | 529 | |
| Worthington Industries | | | 39,800 | | | | 556 | |
| | | | 1,085 | |
| Multiline Retail [3.2%] | | | | | | | | |
| Kohl's | | | 14,200 | | | | 697 | |
| Target | | | 14,100 | | | | 692 | |
| | | | 1,389 | |
| Oil, Gas & Consumable Fuels [1.3%] | | | | | |
| | | 16,600 | | | | 563 | |
| Personal Products [1.4%] | | | | | | | | |
| | | 32,400 | | | | 635 | |
| Pharmaceuticals [3.3%] | | | | | | | | |
| Mylan * | | | 47,000 | | | | 799 | |
| Shire ADR | | | 6,800 | | | | 639 | |
| | | | 1,438 | |
| Real Estate Investment Trusts [1.3%] | | | | | |
| | | 5,300 | | | $ | 590 | |
| Road & Rail [1.6%] | | | | | | | | |
| | | 11,400 | | | | 696 | |
| Semiconductors & Semiconductor Equipment [1.3%] | |
| | | 18,400 | | | | 580 | |
| Software [2.5%] | | | | | | | | |
| | | 38,500 | | | | 1,106 | |
| Wireless Telecommunication Services [1.1%] | |
MetroPCS Communications * | | | 53,400 | | | | 465 | |
Total Common Stock (Cost $44,683) | | | | 43,612 | |
Total Investments [99.8%] (Cost $44,683) | | | $ | 43,612 | |
Percentages are based on Net Assets of $43,690 ($ Thousands).
| * | Non-income producing security. |
ADR — American Depositary Receipt
Cl — Class
As of September 30, 2011, all of the Fund’s investments are Level 1.
For the year ended September 30, 2011, there have been no transfers between Level 1 and Level 2 assets and liabilities. Transfers between Levels are recognized at period end.
For more information on valuation inputs, see note 2 — Significant Accounting Policies in the Notes to Financial Statements.
See accompanying notes to financial statements.
CNI CHARTER FUNDS | PAGE 72
schedule of investments
Socially Responsible Equity Fund
| | | | | | |
| Common Stock [94.9%] | | | | | | |
| Automotive [2.3%] | | | | | | |
| Ford Motor * | | | 90,000 | | | $ | 871 | |
| Honda Motor ADR | | | 21,000 | | | | 612 | |
| | | | 1,483 | |
| Banks [7.4%] | | | | | | | | |
| CIT Group * | | | 30,300 | | | | 920 | |
| Cullen | | | 27,500 | | | | 1,261 | |
| M&T Bank | | | 17,000 | | | | 1,188 | |
| US Bancorp | | | 61,400 | | | | 1,446 | |
| | | | 4,815 | |
| Broadcasting & Cable [1.4%] | | | | | | | | |
| | | 61,000 | | | | 945 | |
| Building & Construction [1.6%] | | | | | |
| | | 47,800 | | | | 1,036 | |
| Business Services [2.9%] | | | | | | | | |
Automatic Data Processing | | | 40,000 | | | | 1,886 | |
| Chemicals [2.1%] | | | | | | | | |
| | | 35,000 | | | | 1,399 | |
| Communication & Media [3.4%] | | | | | |
| Thomson Reuters | | | 37,000 | | | | 1,000 | |
| Time Warner | | | 42,000 | | | | 1,259 | |
Total Communication & Media | | | | 2,259 | |
| Computer Software [1.5%] | | | | | | | | |
| | | 40,500 | | | $ | 1,008 | |
| Distributors [2.3%] | | | | | | | | |
| | | 29,000 | | | | 1,473 | |
| Drugs [6.2%] | | | | | | | | |
| Abbott Laboratories | | | 38,000 | | | | 1,943 | |
| Bristol-Myers Squibb | | | 66,700 | | | | 2,093 | |
| | | | 4,036 | |
| Electrical Equipment [1.8%] | | | | | | | | |
| | | 29,000 | | | | 1,198 | |
| Financial Services [3.6%] | | | | | | | | |
| American Express | | | 30,000 | | | | 1,347 | |
| NYSE Euronext | | | 42,500 | | | | 988 | |
| | | | 2,335 | |
| Healthcare Products & Services [6.1%] | | | | | |
| Cardinal Health | | | 32,000 | | | | 1,340 | |
| McKesson | | | 17,000 | | | | 1,236 | |
| Pharmaceutical Product Development | | | 55,700 | | | | 1,429 | |
Total Healthcare Products & Services | | | | 4,005 | |
| Insurance [11.8%] | | | | | | | | |
| Berkshire Hathaway, Cl B * | | | 28,000 | | | | 1,989 | |
| Chubb | | | 39,000 | | | | 2,339 | |
| HCC Insurance Holdings | | | 34,200 | | | | 925 | |
| Loews | | | 36,000 | | | | 1,244 | |
| Mercury General | | | 31,000 | | | | 1,189 | |
| | | | 7,686 | |
| Machinery [1.1%] | | | | | | | | |
| | | 20,000 | | | | 692 | |
| Manufacturing [1.9%] | | | | | | | | |
| | | 29,875 | | | | 1,218 | |
See accompanying notes to financial statements.
CNI CHARTER FUNDS | PAGE 73
schedule of investments
Socially Responsible Equity Fund (concluded)
| Medical Products & Services [6.7%] | | | | | |
| Laboratory Corp of America Holdings * | | | 16,000 | | | $ | 1,265 | |
| Patterson | | | 65,000 | | | | 1,861 | |
| Quest Diagnostics | | | 25,000 | | | | 1,234 | |
Total Medical Products & Services | | | | 4,360 | |
| Paper & Related Products [2.8%] | | | | | |
| Packaging Corp of America | | | 53,500 | | | | 1,247 | |
| Sealed Air | | | 34,600 | | | | 578 | |
Total Paper & Related Products | | | | 1,825 | |
| Petroleum & Fuel Products [10.5%] | | | | | |
| ConocoPhillips | | | 31,000 | | | | 1,963 | |
| Encana | | | 77,300 | | | | 1,485 | |
| Southwestern Energy * | | | 34,700 | | | | 1,157 | |
| Spectra Energy | | | 91,500 | | | | 2,244 | |
Total Petroleum & Fuel Products | | | | 6,849 | |
| Real Estate Management & Development [3.4%] | |
Brookfield Asset Management, Cl A | | | 81,000 | | | | 2,232 | |
| Retail [2.3%] | | | | | | | | |
| | | 45,000 | | | | 1,480 | |
| Semi-Conductors [4.4%] | | | | | | | | |
| Analog Devices | | | 59,000 | | | | 1,844 | |
| Intel | | | 49,000 | | | | 1,045 | |
| | | | 2,889 | |
| Steel & Steel Works [2.7%] | | | | | | | | |
| | | 55,000 | | | | 1,740 | |
| Transportation Services [1.9%] | | | | | |
United Parcel Service, Cl B | | | 20,100 | | | | 1,269 | |
| Waste Management Services [2.8%] | | | | | |
| | | 56,000 | | | | 1,823 | |
Total Common Stock (Cost $61,946) | | | | 61,941 | |
| Short-Term Investment [6.8%] | | | | | | | | |
| AIM STIT-Government TaxAdvantage Portfolio, 0.020%** | | | 4,472,412 | | | $ | 4,472 | |
Total Short-Term Investment (Cost $4,472) | | | | 4,472 | |
Total Investments [101.7%] (Cost $66,418) | | | $ | 66,413 | |
Percentages are based on Net Assets of $65,325 ($ Thousands).
| * | Non-income producing security. |
| ** | The rate reported is the 7-day effective yield as of September 30, 2011. |
ADR — American Depositary Receipt
Cl — Class
As of September 30, 2011, all of the Fund’s investments are Level 1.
For the year ended September 30, 2011, there have been no transfers between Level 1 and Level 2 assets and liabilities. Transfers between Levels are recognized at period end.
For more information on valuation inputs, see note 2 — Significant Accounting Policies in the Notes to Financial Statements.
See accompanying notes to financial statements.
CNI CHARTER FUNDS | PAGE 74
schedule of investments
CSC Small Cap Value Fund†
| | | | | | |
| Common Stock [97.5%] | | | | | | |
| Capital Markets [5.8%] | | | | | | |
| Duff & Phelps, Cl A | | | 50,900 | | | $ | 543 | |
| Federated Investors, Cl B | | | 27,555 | | | | 483 | |
| | | | 1,026 | |
| Chemicals [4.7%] | | | | | | | | |
| KMG Chemicals | | | 34,102 | | | | 420 | |
| Spartech * | | | 132,105 | | | | 423 | |
| | | | 843 | |
| Commercial Banks [2.5%] | | | | | | | | |
| | | 32,450 | | | | 448 | |
| Construction Materials [2.4%] | | | | | | | | |
| | | 25,900 | | | | 431 | |
| Diversified Consumer Services [4.9%] | | | | | |
| | | 21,965 | | | | 879 | |
| Electrical Equipment [2.9%] | | | | | |
| | | 18,500 | | | | 507 | |
| Health Care Equipment & Supplies [5.4%] | | | | | |
| | | 17,900 | | | | 963 | |
| Health Care Providers & Services [2.5%] | | | | | |
| | | 28,064 | | | | 448 | |
| Hotels, Restaurants & Leisure [7.8%] | | | | | |
| International Speedway, Cl A | | | 20,500 | | | $ | 468 | |
| Wendy's | | | 200,000 | | | | 918 | |
Total Hotels, Restaurants & Leisure | | | | 1,386 | |
| Household Products [8.0%] | | | | | | | | |
| Central Garden & Pet, Cl A * | | | 136,400 | | | | 966 | |
| Scotts Miracle-Gro, Cl A | | | 10,350 | | | | 462 | |
| | | | 1,428 | |
| Insurance [22.6%] | | | | | | | | |
| Alleghany * | | | 3,379 | | | | 975 | |
| Hallmark Financial Services * | | | 87,786 | | | | 647 | |
| Hilltop Holdings * | | | 49,200 | | | | 355 | |
| Symetra Financial | | | 90,600 | | | | 738 | |
| White Mountains Insurance Group | | | 3,232 | | | | 1,311 | |
| | | | 4,026 | |
| Internet & Catalog Retail [5.7%] | | | | | |
| | | 30,600 | | | | 1,014 | |
| IT Services [2.9%] | | | | | | | | |
Global Cash Access Holdings * | | | 200,000 | | | | 512 | |
| Life Sciences Tools & Services [4.3%] | | | | | |
| | | 40,000 | | | | 768 | |
| Machinery [5.0%] | | | | | | | | |
| Altra Holdings * | | | 37,650 | | | | 436 | |
| IDEX | | | 14,300 | | | | 445 | |
| | | | 881 | |
| Media [2.7%] | | | | | | | | |
| | | 7,202 | | | | 476 | |
| Oil, Gas & Consumable Fuels [3.0%] | | | | | |
| | | 31,300 | | | | 532 | |
| Professional Services [2.2%] | | | | | | | | |
| | | 39,700 | | | | 396 | |
See accompanying notes to financial statements.
CNI CHARTER FUNDS | PAGE 75
schedule of investments
CSC Small Cap Value Fund† (concluded)
| | | | | |
| Software [2.2%] | | | | | | |
| | | 17,700 | | | $ | 386 | |
Total Common Stock (Cost $16,877) | | | | 17,350 | |
| Repurchase Agreement(A) [3.0%] | | | | | |
| Morgan Stanley | | | | | | | | |
| 0.060%, dated 09/30/11, repurchased on 10/03/11, repurchase price $530,131 (collateralized by a U.S. Treasury Bond, par value $532,402, 6.125%, 11/15/27; with total market value $540,732) | | $ | 530 | | | | 530 | |
Total Repurchase Agreement (Cost $530) | | | | 530 | |
Total Investments [100.5%] (Cost $17,407) | | | $ | 17,880 | |
Percentages are based on Net Assets of $17,784 ($ Thousands).
| * | Non-income producing security. |
| † | See Note 1 in Notes to Financial Statements. |
| (A) | Tri-Party Repurchase Agreement. |
Cl — Class
The following is a summary of the inputs used as of September 30, 2011 in valuing the Fund’s investments carried at value ($ Thousands):
| Investments in Securities | | | | | | | | | | | | |
| Common Stock | | $ | 17,350 | | | $ | — | | | $ | — | | | $ | 17,350 | |
| Repurchase Agreement | | | — | | | | 530 | | | | — | | | | 530 | |
| Total Investments in Securities | | $ | 17,350 | | | $ | 530 | | | $ | — | | | $ | 17,880 | |
For the year ended September 30, 2011, there have been no transfers between Level 1 and Level 2 assets and liabilities. Transfers between Levels are recognized at period end.
For more information on valuation inputs, see Note 2 — Significant Accounting Policies in the Notes to Financial Statements.
See accompanying notes to financial statements.
CNI CHARTER FUNDS | PAGE 76
This page intentionally left blank.
CNI CHARTER FUNDS | PAGE 77
statements of assets and liabilities (000)
September 30, 2011
| | | Government Money Market Fund | | | | | | California Tax Exempt Money Market Fund | |
| ASSETS: | | | | | | | | | |
Cost of securities (including repurchase agreements) | | $ | 3,267,247 | | | $ | 1,345,329 | | | $ | 857,778 | |
| Investments in securities, at value | | $ | 2,552,947 | | | $ | 1,164,729 | | | $ | 857,778 | |
| Repurchase agreements, at value | | | 714,300 | | | | 180,600 | | | | — | |
| Cash | | | 98 | | | | — | | | | 3,777 | |
| Receivable for investment securities sold | | | — | | | | — | | | | 21,510 | |
| Dividend and interest receivable | | | 2,080 | | | | 562 | | | | 485 | |
| Receivable for capital shares sold | | | — | | | | — | | | | 6 | |
| | | 49 | | | | 22 | | | | 15 | |
| | | 3,269,474 | | | | 1,345,913 | | | | 883,571 | |
| | | | | | | | | | | | | |
| LIABILITIES: | | | | | | | | | | | | |
| Payable for income distributions | | | 8 | | | | 13 | | | | 8 | |
| Payable for investment securities purchased | | | — | | | | — | | | | 7,118 | |
| Investment adviser fees payable | | | 68 | | | | 84 | | | | 26 | |
| Shareholder servicing & distribution fees payable | | | — | | | | 6 | | | | — | |
| Administrative fees payable | | | 113 | | | | 46 | | | | 32 | |
| Trustees' fees payable | | | 2 | | | | 1 | | | | — | |
| | | 264 | | | | 115 | | | | 71 | |
| | | 455 | | | | 265 | | | | 7,255 | |
| | $ | 3,269,019 | | | $ | 1,345,648 | | | $ | 876,316 | |
| | | | | | | | | | | | | |
| NET ASSETS: | | | | | | | | | | | | |
| Paid-in Capital (unlimited authorization — $0.01 par value) | | $ | 3,269,024 | | | $ | 1,345,660 | | | $ | 876,314 | |
Accumulated net realized gain (loss) on investments | | | (5 | ) | | | (12 | ) | | | 2 | |
| | $ | 3,269,019 | | | $ | 1,345,648 | | | $ | 876,316 | |
| | | | | | | | | | | | | |
| Institutional Class Shares ($Dollars): | | | | | | | | | | | | |
| Net Assets | | $ | 51,704,935 | | | $ | 630,249,629 | | | $ | 169,931,407 | |
| Total shares outstanding at end of year | | | 51,706,423 | | | | 630,327,912 | | | | 169,933,000 | |
| Net asset value, offering and redemption price per share | | | | | | | | | | | | |
| (net assets ÷ shares outstanding) | | $ | 1.00 | | | $ | 1.00 | | | $ | 1.00 | |
| | | | | | | | | | | | | |
| Class N Shares ($Dollars): | | | | | | | | | | | | |
| Net Assets | | $ | 2,926,119,637 | | | $ | 450,281,815 | | | $ | 628,163,321 | |
| Total shares outstanding at end of year | | | 2,926,121,487 | | | | 450,343,244 | | | | 628,164,240 | |
| Net asset value, offering and redemption price per share | | | | | | | | | | | | |
| (net assets ÷ shares outstanding) | | $ | 1.00 | | | $ | 1.00 | | | $ | 1.00 | |
| | | | | | | | | | | | | |
| Class S Shares ($Dollars): | | | | | | | | | | | | |
| Net Assets | | $ | 291,194,136 | | | $ | 265,116,183 | | | $ | 78,221,145 | |
| Total shares outstanding at end of year | | | 291,195,793 | | | | 265,081,127 | | | | 78,217,383 | |
| Net asset value, offering and redemption price per share | | | | | | | | | | | | |
| (net assets ÷ shares outstanding) | | $ | 1.00 | | | $ | 1.00 | | | $ | 1.00 | |
Amounts designated as “—” are either $0 or have been rounded to $0.
See accompanying notes to financial statements.
CNI CHARTER FUNDS | PAGE 78
statements of assets and liabilities (000)
September 30, 2011
| | | Limited Maturity Fixed Income Fund | | | | | | | | | California Tax Exempt Bond Fund | |
| ASSETS: | | | | | | | | | | | | |
| | $ | 37,395 | | | $ | 174,548 | | | $ | 111,018 | | | $ | 55,030 | |
| Investments in securities, at value | | $ | 37,898 | | | $ | 178,628 | | | $ | 112,994 | | | $ | 56,585 | |
| Receivable for investment securities sold | | | — | | | | — | | | | — | | | | 811 | |
| Dividend and income receivable | | | 297 | | | | 754 | | | | 1,304 | | | | 708 | |
| Receivable for capital shares sold | | | 6 | | | | 174 | | | | — | | | | 20 | |
| | | 1 | | | | 3 | | | | 2 | | | | 1 | |
| | | 38,202 | | | | 179,559 | | | | 114,300 | | | | 58,125 | |
| | | | | | | | | | | | | | | | | |
| LIABILITIES: | | | | | | | | | | | | | | | | |
| Payable for income distributions | | | 13 | | | | 59 | | | | 172 | | | | 64 | |
| Payable for capital shares redeemed | | | 6 | | | | 577 | | | | 5 | | | | 7 | |
| Investment adviser fees payable | | | 16 | | | | 55 | | | | 37 | | | | 7 | |
| Shareholder servicing & distribution fees payable | | | 4 | | | | 39 | | | | 24 | | | | 13 | |
| Administrative fees payable | | | 2 | | | | 7 | | | | 4 | | | | 2 | |
| | | 16 | | | | 16 | | | | 14 | | | | 5 | |
| | | 57 | | | | 753 | | | | 256 | | | | 98 | |
| | $ | 38,145 | | | $ | 178,806 | | | $ | 114,044 | | | $ | 58,027 | |
| | | | | | | | | | | | | | | | | |
| NET ASSETS: | | | | | | | | | | | | | | | | |
| Paid-in Capital (unlimited authorization — $0.01 par value) | | $ | 40,098 | | | $ | 174,582 | | | $ | 111,530 | | | $ | 56,111 | |
| Accumulated net realized gain (loss) on investments | | | (2,456 | ) | | | 144 | | | | 538 | | | | 361 | |
Net unrealized appreciation on investments | | | 503 | | | | 4,080 | | | | 1,976 | | | | 1,555 | |
| | $ | 38,145 | | | $ | 178,806 | | | $ | 114,044 | | | $ | 58,027 | |
| | | | | | | | | | | | | | | | | |
| Institutional Class Shares ($Dollars): | | | | | | | | | | | | | | | | |
| Net Assets | | $ | 31,742,780 | | | $ | 175,865,927 | | | $ | 111,563,578 | | | $ | 53,463,539 | |
| Total shares outstanding at end of year | | | 2,847,979 | | | | 16,359,635 | | | | 10,542,327 | | | | 5,009,847 | |
| Net asset value, offering and redemption price per share | | | | | | | | | | | | | | | | |
| (net assets ÷ shares outstanding) | | $ | 11.15 | | | $ | 10.75 | | | $ | 10.58 | | | $ | 10.67 | |
| | | | | | | | | | | | | | | | | |
| Class N Shares ($Dollars): | | | | | | | | | | | | | | | | |
| Net Assets | | $ | 6,402,686 | | | $ | 2,939,986 | | | $ | 2,480,817 | | | $ | 4,563,424 | |
| Total shares outstanding at end of year | | | 574,114 | | | | 272,969 | | | | 234,152 | | | | 426,386 | |
| Net asset value, offering and redemption price per share | | | | | | | | | | | | | | | | |
| (net assets ÷ shares outstanding) | | $ | 11.15 | | | $ | 10.77 | | | $ | 10.59 | | | $ | 10.70 | |
Amounts designated as “—” are either $0 or have been rounded to $0.
See accompanying notes to financial statements.
CNI CHARTER FUNDS | PAGE 79
statements of assets and liabilities (000)
September 30, 2011
| | | Full Maturity Fixed Income Fund | | | | | | | | | | |
| ASSETS: | | | | | | | | | | | | |
Cost of securities (including affiliated investments and repurchase agreements) | | $ | 42,155 | | | $ | 101,186 | | | $ | 47,567 | | | $ | 57,804 | |
| Investments in securities, at value | | $ | 44,292 | | | $ | 96,467 | | | $ | 39,094 | | | $ | 55,035 | |
| Affiliated investments, at value | | | — | | | | — | | | | 6,198 | | | | — | |
| Cash | | | — | | | | — | | | | 5 | | | | — | |
| Dividend and income receivable | | | 344 | | | | 2,327 | | | | 158 | | | | 35 | |
| Receivable for investment securities sold | | | 51 | | | | — | | | | — | | | | 1,751 | |
| Receivable for capital shares sold | | | 82 | | | | 229 | | | | 79 | | | | 3 | |
| | | 1 | | | | 1 | | | | 1 | | | | 1 | |
| | | 44,770 | | | | 99,024 | | | | 45,535 | | | | 56,825 | |
| | | | | | | | | | | | | | | | | |
| LIABILITIES: | | | | | | | | | | | | | | | | |
| Payable for income distributions | | | 100 | | | | 386 | | | | 35 | | | | 8 | |
| Payable for capital shares redeemed | | | 1 | | | | — | | | | — | | | | — | |
| Payable for investment securities purchased | | | 240 | | | | 4,050 | | | | — | | | | 1,889 | |
| Investment adviser fees payable | | | 18 | | | | 49 | | | | 19 | | | | 36 | |
| Shareholder servicing & distribution fees payable | | | 1 | | | | 27 | | | | 15 | | | | — | |
| Administrative fees payable | | | 2 | | | | 4 | | | | 2 | | | | 2 | |
| | | 17 | | | | 7 | | | | 3 | | | | 19 | |
| | | 379 | | | | 4,523 | | | | 74 | | | | 1,954 | |
| | $ | 44,391 | | | $ | 94,501 | | | $ | 45,461 | | | $ | 54,871 | |
| | | | | | | | | | | | | | | | | |
| NET ASSETS: | | | | | | | | | | | | | | | | |
| Paid-in Capital (unlimited authorization — $0.01 par value) | | $ | 41,780 | | | $ | 101,228 | | | $ | 49,752 | | | $ | 77,703 | |
| Undistributed net investment income | | | — | | | | — | | | | 15 | | | | — | |
| Accumulated net realized gain (loss) on investments | | | 474 | | | | (2,008 | ) | | | (2,031 | ) | | | (20,063 | ) |
Net unrealized appreciation (depreciation) on investments | | | 2,137 | | | | (4,719 | ) | | | (2,275 | ) | | | (2,769 | ) |
| | $ | 44,391 | | | $ | 94,501 | | | $ | 45,461 | | | $ | 54,871 | |
| | | | | | | | | | | | | | | | | |
| Institutional Class Shares ($Dollars): | | | | | | | | | | | | | | | | |
| Net Assets | | $ | 43,894,029 | | | $ | 65,829,448 | | | $ | 19,084,494 | | | $ | 50,029,037 | |
| Total shares outstanding at end of year | | | 4,023,736 | | | | 8,252,982 | | | | 1,932,078 | | | | 4,414,577 | |
| Net asset value, offering and redemption price per share | | | | | | | | | | | | | | | | |
| (net assets ÷ shares outstanding) | | $ | 10.91 | | | $ | 7.98 | | | $ | 9.88 | | | $ | 11.33 | |
| | | | | | | | | | | | | | | | | |
| Class N Shares ($Dollars): | | | | | | | | | | | | | | | | |
| Net Assets | | $ | 496,891 | | | $ | 28,671,817 | | | $ | 26,376,671 | | | $ | 4,842,226 | |
| Total shares outstanding at end of year | | | 45,576 | | | | 3,594,089 | | | | 2,670,591 | | | | 426,049 | |
| Net asset value, offering and redemption price per share | | | | | | | | | | | | | | | | |
| (net assets ÷ shares outstanding) | | $ | 10.90 | | | $ | 7.98 | | | $ | 9.88 | | | $ | 11.37 | |
Amounts designated as “—” are either $0 or have been rounded to $0.
See accompanying notes to financial statements.
CNI CHARTER FUNDS | PAGE 80
statements of assets and liabilities (000)
September 30, 2011
| | | Large Cap Value Equity Fund | | | Large Cap Growth Equity Fund | | | Socially Responsible Equity Fund | | | CSC Small Cap Value Fund† | |
| ASSETS: | | | | | | | | | | | | |
Cost of securities (including repurchase agreements) | | $ | 108,985 | | | $ | 44,683 | | | $ | 66,418 | | | $ | 17,407 | |
| Investments in securities, at value | | $ | 99,639 | | | $ | 43,612 | | | $ | 66,413 | | | $ | 17,350 | |
| Repurchase agreements, at value | | | — | | | | — | | | | — | | | | 530 | |
| Cash | | | — | | | | — | | | | 13 | | | | — | |
| Dividend and income receivable | | | 113 | | | | 22 | | | | 96 | | | | 8 | |
| Receivable for investment securities sold | | | — | | | | 111 | | | | — | | | | — | |
| Receivable for capital shares sold | | | 124 | | | | 66 | | | | 70 | | | | 2 | |
| | | 2 | | | | 1 | | | | 1 | | | | — | |
| | | 99,878 | | | | 43,812 | | | | 66,593 | | | | 17,890 | |
| | | | | | | | | | | | | | | | | |
| LIABILITIES: | | | | | | | | | | | | | | | | |
| Payable for income distributions | | | 93 | | | | — | | | | — | | | | — | |
| Payable for capital shares redeemed | | | 328 | | | | 3 | | | | 19 | | | | 22 | |
| Payable for investment securities purchased | | | — | | | | — | | | | 1,182 | | | | 55 | |
| Investment adviser fees payable | | | 53 | | | | 25 | | | | 42 | | | | 13 | |
| Shareholder servicing & distribution fees payable | | | 24 | | | | 12 | | | | 2 | | | | 5 | |
| Administrative fees payable | | | 4 | | | | 2 | | | | 3 | | | | 1 | |
| Payable to custodian | | | — | | | | 77 | | | | — | | | | — | |
| | | 7 | | | | 3 | | | | 20 | | | | 10 | |
| | | 509 | | | | 122 | | | | 1,268 | | | | 106 | |
| | $ | 99,369 | | | $ | 43,690 | | | $ | 65,325 | | | $ | 17,784 | |
| | | | | | | | | | | | | | | | | |
| NET ASSETS: | | | | | | | | | | | | | | | | |
| Paid-in Capital (unlimited authorization — $0.01 par value) | | $ | 112,539 | | | $ | 46,058 | | | $ | 77,030 | | | $ | 21,545 | |
| Accumulated net realized loss on investments | | | (3,824 | ) | | | (1,297 | ) | | | (11,700 | ) | | | (4,234 | ) |
Net unrealized appreciation (depreciation) on investments | | | (9,346 | ) | | | (1,071 | ) | | | (5 | ) | | | 473 | |
| | $ | 99,369 | | | $ | 43,690 | | | $ | 65,325 | | | $ | 17,784 | |
| | | | | | | | | | | | | | | | | |
| Institutional Class Shares ($Dollars): | | | | | | | | | | | | | | | | |
| Net Assets | | $ | 90,304,591 | | | $ | 34,387,359 | | | $ | 62,193,012 | | | $ | 1,660,149 | |
| Total shares outstanding at end of year | | | 12,183,286 | | | | 4,622,148 | | | | 7,421,237 | | | | 86,572 | |
| Net asset value, offering and redemption price per share | | | | | | | | | | | | | | | | |
| (net assets ÷ shares outstanding) | | $ | 7.41 | | | $ | 7.44 | | | $ | 8.38 | | | $ | 19.18 | |
| | | | | | | | | | | | | | | | | |
| Class N Shares ($Dollars): | | | | | | | | | | | | | | | | |
| Net Assets | | $ | 9,063,932 | | | $ | 9,302,723 | | | $ | 3,132,057 | | | $ | 4,048,197 | |
| Total shares outstanding at end of year | | | 1,224,947 | | | | 1,265,769 | | | | 374,325 | | | | 215,643 | |
| Net asset value, offering and redemption price per share | | | | | | | | | | | | | | | | |
| (net assets ÷ shares outstanding) | | $ | 7.40 | | | $ | 7.35 | | | $ | 8.37 | | | $ | 18.77 | |
| | | | | | | | | | | | | | | | | |
| Class R Shares ($Dollars): | | | | | | | | | | | | | | | | |
| Net Assets | | $ | — | | | $ | — | | | $ | — | | | $ | 12,075,411 | |
| Total shares outstanding at end of year | | | — | | | | — | | | | — | | | | 642,682 | |
| Net asset value, offering and redemption price per share | | | | | | | | | | | | | | | | |
| (net assets ÷ shares outstanding) | | $ | — | | | $ | — | | | $ | — | | | $ | 18.79 | |
| Maximum offering price per share | | | | | | | | | | | | | | | | |
| (net asset value ÷ 96.50%) | | $ | — | | | $ | — | | | $ | — | | | $ | 19.47 | |
| † | See Note 1 in Notes to Financial Statements. |
Amounts designated as “—” are either $0 or have been rounded to $0.
See accompanying notes to financial statements.
CNI CHARTER FUNDS | PAGE 81
statements of operations
For the year ended September 30, 2011
| | | Government Money Market Fund (000) | | | Prime Money Market Fund (000) | | | California Tax Exempt Money Market Fund (000) | |
| INCOME: | | | | | | | | | |
| Interest Income | | $ | 4,857 | | | $ | 3,762 | | | $ | 1,715 | |
| | | — | | | | 1 | | | | — | |
| | | 4,857 | | | | 3,763 | | | | 1,715 | |
| | | | | | | | | | | | | |
| EXPENSES: | | | | | | | | | | | | |
| Investment Advisory Fees | | | 7,987 | | | | 3,388 | | | | 2,490 | |
| Shareholder Servicing Fees — Institutional Class | | | 185 | | | | 1,462 | | | | 376 | |
Shareholder Servicing Fees — Class N (1) | | | 20,053 | | | | 3,349 | | | | 5,282 | |
Shareholder Servicing Fees — Class S (1) | | | 2,431 | | | | 2,429 | | | | 506 | |
| Administration Fees | | | 1,509 | | | | 666 | | | | 453 | |
| Transfer Agent Fees | | | 252 | | | | 111 | | | | 76 | |
| Trustee Fees | | | 164 | | | | 75 | | | | 50 | |
| Professional Fees | | | 487 | | | | 214 | | | | 144 | |
| Custody Fees | | | 141 | | | | 63 | | | | 32 | |
| Registration Fees | | | 112 | | | | 51 | | | | 35 | |
| Printing Fees | | | 111 | | | | 49 | | | | 33 | |
Insurance and Other Expenses | | | 313 | | | | 150 | | | | 102 | |
| | | 33,745 | | | | 12,007 | | | | 9,579 | |
| Less, Waivers of: | | | | | | | | | | | | |
| Investment Advisory Fees | | | (6,470 | ) | | | (1,533 | ) | | | (1,775 | ) |
| Shareholder Servicing Fees — Institutional Class | | | (185 | ) | | | (1,462 | ) | | | (376 | ) |
Shareholder Servicing Fees — Class N (1) | | | (19,862 | ) | | | (3,236 | ) | | | (5,236 | ) |
Shareholder Servicing Fees — Class S (1) | | | (2,382 | ) | | | (2,297 | ) | | | (497 | ) |
| Administration Fees | | | (226 | ) | | | (100 | ) | | | (68 | ) |
| | | (252 | ) | | | (111 | ) | | | (76 | ) |
| | | 4,368 | | | | 3,268 | | | | 1,551 | |
| | | | | | | | | | | | | |
| | | 489 | | | | 495 | | | | 164 | |
Net Realized Loss From Securities Transactions | | | — | | | | (12 | ) | | | — | |
Net Increase in Net Assets Resulting from Operations | | $ | 489 | | | $ | 483 | | | $ | 164 | |
| (1) | Includes class specific distribution expenses. |
Amounts designated as “—” are either $0 or have been rounded to $0.
See accompanying notes to financial statements.
CNI CHARTER FUNDS | PAGE 82
statements of operations
For the year ended September 30, 2011
| | | Limited Maturity Fixed Income Fund (000) | | | Government Bond Fund (000) | | | Corporate Bond Fund (000) | | | California Tax Exempt Bond Fund (000) | |
| INCOME: | | | | | | | | | | | | |
| Interest Income | | $ | 875 | | | $ | 3,582 | | | $ | 4,248 | | | $ | 1,621 | |
| Dividend Income | | | — | | | | — | | | | 3 | | | | — | |
Less: Foreign Taxes Withheld | | | — | | | | — | | | | (1 | ) | | | — | |
| | | 875 | | | | 3,582 | | | | 4,250 | | | | 1,621 | |
| | | | | | | | | | | | | | | | | |
| EXPENSES: | | | | | | | | | | | | | | | | |
| Investment Advisory Fees | | | 206 | | | | 734 | | | | 462 | | | | 136 | |
| Shareholder Servicing Fees — Institutional Class | | | — | | | | 419 | | | | 283 | | | | 116 | |
Shareholder Servicing Fees — Class N (1) | | | 44 | | | | 15 | | | | 12 | | | | 19 | |
| Administration Fees | | | 20 | | | | 84 | | | | 57 | | | | 25 | |
| Transfer Agent Fees | | | 42 | | | | 14 | | | | 9 | | | | 4 | |
| Trustee Fees | | | 2 | | | | 9 | | | | 6 | | | | 3 | |
| Professional Fees | | | 6 | | | | 27 | | | | 18 | | | | 8 | |
| Custody Fees | | | 2 | | | | 8 | | | | 5 | | | | 2 | |
| Registration Fees | | | 1 | | | | 6 | | | | 4 | | | | 2 | |
| Printing Fees | | | (6 | ) | | | 6 | | | | 4 | | | | 2 | |
Insurance and Other Expenses | | | 4 | | | | 16 | | | | 14 | | | | 4 | |
| | | 321 | | | | 1,338 | | | | 874 | | | | 321 | |
Recovery of Investment Advisory Fees Previously Waived (2) | | | — | | | | — | | | | 1 | | | | — | |
| Less, Waivers of: | | | | | | | | | | | | | | | | |
| Investment Advisory Fees | | | — | | | | (122 | ) | | | — | | | | (56 | ) |
| Shareholder Servicing Fees — Class N | | | (22 | ) | | | — | | | | — | | | | — | |
| | | (3 | ) | | | (14 | ) | | | (9 | ) | | | (4 | ) |
| | | 296 | | | | 1,202 | | | | 866 | | | | 261 | |
| | | | | | | | | | | | | | | | | |
| | | 579 | | | | 2,380 | | | | 3,384 | | | | 1,360 | |
| Net Realized Gain From Securities Transactions | | | 359 | | | | 1,609 | | | | 1,063 | | | | 362 | |
Net Change in Unrealized Appreciation/(Depreciation) on Investments | | | (607 | ) | | | 1,187 | | | | (3,970 | ) | | | (50 | ) |
Net Increase in Net Assets Resulting From Operations | | $ | 331 | | | $ | 5,176 | | | $ | 477 | | | $ | 1,672 | |
| (1) | Includes class specific distribution expenses. |
| (2) | See Note 4 for Advisory Fees recovered. |
Amounts designated as “—” are either $0 or have been rounded to $0.
See accompanying notes to financial statements.
CNI CHARTER FUNDS | PAGE 83
statements of operations
For the year ended September 30, 2011
| | | Full Maturity Fixed Income Fund (000) | | | High Yield Bond Fund (000) | | | | | | Diversified Equity Fund (000) | |
| INCOME: | | | | | | | | | | | | |
| Dividend Income | | $ | — | | | $ | 2 | | | $ | 827 | | | $ | 855 | |
| Interest Income | | | 1,569 | | | | 6,853 | | | | 33 | | | | — | |
| Income from Affiliated Investments | | | — | | | | — | | | | 225 | | | | — | |
Less: Foreign Taxes Withheld | | | — | | | | — | | | | — | | | | (4 | ) |
| | | 1,569 | | | | 6,855 | | | | 1,085 | | | | 851 | |
| | | | | | | | | | | | | | | | | |
| EXPENSES: | | | | | | | | | | | | | | | | |
| Investment Advisory Fees | | | 234 | | | | 546 | | | | 206 | | | | 509 | |
| Shareholder Servicing Fees — Institutional Class | | | — | | | | 113 | | | | 38 | | | | — | |
Shareholder Servicing Fees — Class N (1) | | | 17 | | | | 151 | | | | 129 | | | | 34 | |
| Administration Fees | | | 23 | | | | 36 | | | | 20 | | | | 34 | |
| Transfer Agent Fees | | | 44 | | | | 6 | | | | 3 | | | | 48 | |
| Trustee Fees | | | 3 | | | | 4 | | | | 2 | | | | 4 | |
| Professional Fees | | | 7 | | | | 12 | | | | 7 | | | | 10 | |
| Custody Fees | | | 2 | | | | 3 | | | | 2 | | | | 3 | |
| Registration Fees | | | 2 | | | | 2 | | | | 1 | | | | 3 | |
| Printing Fees | | | (8 | ) | | | 3 | | | | 2 | | | | (9 | ) |
Insurance and Other Expenses | | | 5 | | | | 7 | | | | 3 | | | | 6 | |
| | | 329 | | | | 883 | | | | 413 | | | | 642 | |
| Less, Waiver of: | | | | | | | | | | | | | | | | |
| Investment Advisory Fees | | | — | | | | (67 | ) | | | — | | | | — | |
Shareholder Servicing Fees — Class N (1) | | | (8 | ) | | | — | | | | — | | | | (17 | ) |
| | | (4 | ) | | | (6 | ) | | | (3 | ) | | | (6 | ) |
| | | 317 | | | | 810 | | | | 410 | | | | 619 | |
| | | | | | | | | | | | | | | | | |
| | | 1,252 | | | | 6,045 | | | | 675 | | | | 232 | |
| Net Realized Gain From Securities Transactions | | | 609 | | | | 1,560 | | | | 1,865 | | | | 4,639 | |
| Net Realized Gain From Affiliated Investments | | | — | | | | — | | | | 49 | | | | — | |
| Net Change in Unrealized Depreciation on Investments | | | (395 | ) | | | (5,656 | ) | | | (4,638 | ) | | | (6,927 | ) |
Net Change in Unrealized Depreciation on Affiliated Investments | | | — | | | | — | | | | (24 | ) | | | — | |
Net Increase/(Decrease) in Net Assets Resulting From Operations | | $ | 1,466 | | | $ | 1,949 | | | $ | (2,073 | ) | | $ | (2,056 | ) |
| (1) | Includes class specific distribution expenses. |
Amounts designated as “—” are either $0 or have been rounded to $0.
See accompanying notes to financial statements.
CNI CHARTER FUNDS | PAGE 84
statements of operations
For the year ended September 30, 2011
| | | Large Cap Value Equity Fund (000) | | | Large Cap Growth Equity Fund (000) | | | Socially Responsible Equity Fund (000) | | | CSC Small Cap Value Fund† (000) | |
| INCOME: | | | | | | | | | | | | |
| Dividend Income | | $ | 2,591 | | | $ | 586 | | | $ | 1,567 | | | $ | 226 | |
| Interest Income | | | — | | | | — | | | | — | | | | 1 | |
Less: Foreign Taxes Withheld | | | (4 | ) | | | — | | | | (26 | ) | | | — | |
| | | 2,587 | | | | 586 | | | | 1,541 | | | | 227 | |
| | | | | | | | | | | | | | | | | |
| EXPENSES: | | | | | | | | | | | | | | | | |
| Investment Advisory Fees | | | 698 | | | | 337 | | | | 536 | | | | 203 | |
| Shareholder Servicing Fees — Institutional Class | | | 255 | | | | 103 | | | | — | | | | 7 | |
Shareholder Servicing Fees — Class N (1) | | | 53 | | | | 53 | | | | 16 | | | | 25 | |
Shareholder Servicing Fees — Class R (1) | | | — | | | | — | | | | — | | | | 80 | |
| Administration Fees | | | 55 | | | | 25 | | | | 35 | | | | 12 | |
| Transfer Agent Fees | | | 9 | | | | 4 | | | | 49 | | | | 27 | |
| Trustee Fees | | | 6 | | | | 3 | | | | 4 | | | | 1 | |
| Professional Fees | | | 17 | | | | 8 | | | | 11 | | | | 3 | |
| Printing Fees | | | 4 | | | | 2 | | | | (8 | ) | | | 1 | |
| Custody Fees | | | 5 | | | | 2 | | | | 3 | | | | 1 | |
| Registration Fees | | | 4 | | | | 2 | | | | 2 | | | | 1 | |
Insurance and Other Expenses | | | 10 | | | | 4 | | | | 6 | | | | 2 | |
| | | 1,116 | | | | 543 | | | | 654 | | | | 363 | |
| Less, Waiver of: | | | | | | | | | | | | | | | | |
Shareholder Servicing Fees — Class N (1) | | | — | | | | — | | | | (8 | ) | | | — | |
Shareholder Servicing Fees — Class R (1) | | | — | | | | — | | | | — | | | | (64 | ) |
| | | (9 | ) | | | (4 | ) | | | (6 | ) | | | (2 | ) |
| | | 1,107 | | | | 539 | | | | 640 | | | | 297 | |
| | | | | | | | | | | | | | | | | |
| | | 1,480 | | | | 47 | | | | 901 | | | | (70 | ) |
| Net Realized Gain/(Loss) From Securities Transactions | | | 4,640 | | | | 3,717 | | | | (1,057 | ) | | | 1,944 | |
Net Change in Unrealized Depreciation on Investments | | | (8,528 | ) | | | (5,911 | ) | | | (2,820 | ) | | | (2,867 | ) |
Net Decrease in Net Assets Resulting from Operations | | $ | (2,408 | ) | | $ | (2,147 | ) | | $ | (2,976 | ) | | $ | (993 | ) |
| (1) | Includes class specific distribution expenses. |
| † | See Note 1 in Notes to Financial Statements. |
Amounts designated as “—” are either $0 or have been rounded to $0.
See accompanying notes to financial statements.
CNI CHARTER FUNDS | PAGE 85
statements of changes in net assets
For the years ended September 30
| | | Government Money Market Fund (000) | | | Prime Money Market Fund (000) | |
| | | | | | | | | | | | |
| OPERATIONS: | | | | | | | | | | | | |
| Net Investment Income | | $ | 489 | | | $ | 679 | | | $ | 495 | | | $ | 755 | |
| Net Realized Gain (Loss) from Security Transactions | | | — | | | | (5 | ) | | | (12 | ) | | | — | |
Net Change in Unrealized Appreciation (Depreciation) on Investments | | | — | | | | — | | | | — | | | | — | |
Net Increase in Net Assets Resulting from Operations | | | 489 | | | | 674 | | | | 483 | | | | 755 | |
| | | | | | | | | | | | | | | | | |
| DIVIDENDS AND DISTRIBUTIONS FROM: | | | | | | | | | | | | | | | | |
| Net Investment Income: | | | | | | | | | | | | | | | | |
| Institutional Class | | | (19 | ) | | | (38 | ) | | | (330 | ) | | | (430 | ) |
| Class N | | | (458 | ) | | | (613 | ) | | | (146 | ) | | | (240 | ) |
| Class S | | | (32 | ) | | | (29 | ) | | | (57 | ) | | | (85 | ) |
| Realized Capital Gains: | | | | | | | | | | | | | | | | |
| Institutional Class | | | — | | | | — | | | | — | | | | (58 | ) |
| Class N | | | — | | | | — | | | | — | | | | (68 | ) |
| | | — | | | | — | | | | — | | | | (40 | ) |
Total Dividends & Distributions | | | (509 | ) | | | (680 | ) | | | (533 | ) | | | (921 | ) |
| | | | | | | | | | | | | | | | | |
CAPITAL SHARE TRANSACTIONS:(1) | | | | | | | | | | | | | | | | |
| Institutional Class: | | | | | | | | | | | | | | | | |
| Shares Issued | | | 468,707 | | | | 618,772 | | | | 2,567,876 | | | | 1,322,472 | |
| Shares Issued in Lieu of Dividends and Distributions | | | — | | | | 1 | | | | 51 | | | | 83 | |
| | | (498,052 | ) | | | (661,586 | ) | | | (2,427,636 | ) | | | (1,375,843 | ) |
Increase (Decrease) in Net Assets From Institutional Class Share Transactions | | | (29,345 | ) | | | (42,813 | ) | | | 140,291 | | | | (53,288 | ) |
| | | | | | | | | | | | | | | | | |
| Class N: | | | | | | | | | | | | | | | | |
| Shares Issued | | | 6,046,915 | | | | 4,589,006 | | | | 1,236,194 | | | | 1,396,173 | |
| Shares Issued in Lieu of Dividends and Distributions | | | 374 | | | | 504 | | | | 93 | | | | 195 | |
| | | (5,719,187 | ) | | | (4,540,616 | ) | | | (1,218,312 | ) | | | (1,620,744 | ) |
Increase (Decrease) in Net Assets from Class N Share Transactions | | | 328,102 | | | | 48,894 | | | | 17,975 | | | | (224,376 | ) |
| | | | | | | | | | | | | | | | | |
| Class S: | | | | | | | | | | | | | | | | |
| Shares Issued | | | 849,467 | | | | 990,276 | | | | 1,490,167 | | | | 1,102,036 | |
| Shares Issued in Lieu of Dividends and Distributions | | | — | | | | — | | | | — | | | | — | |
| | | (906,968 | ) | | | (940,420 | ) | | | (1,577,615 | ) | | | (1,122,183 | ) |
Increase/(Decrease) in Net Assets from Class S Share Transactions | | | (57,501 | ) | | | 49,856 | | | | (87,448 | ) | | | (20,147 | ) |
| | | | | | | | | | | | | | | | | |
Net Increase (Decrease) in Net Assets From Share Transactions | | | 241,256 | | | | 55,937 | | | | 70,818 | | | | (297,811 | ) |
Total Increase (Decrease) in Net Assets | | | 241,236 | | | | 55,931 | | | | 70,768 | | | | (297,977 | ) |
| | | | | | | | | | | | | | | | | |
| NET ASSETS: | | | | | | | | | | | | | | | | |
| | | 3,027,783 | | | | 2,971,852 | | | | 1,274,880 | | | | 1,572,857 | |
| | $ | 3,269,019 | | | $ | 3,027,783 | | | $ | 1,345,648 | | | $ | 1,274,880 | |
Undistributed (Distribution in Excess of) Net Investment Income | | $ | — | | | $ | 20 | | | $ | — | | | $ | 38 | |
| (1) | See Note 8 for shares issued and redeemed. |
Amounts designated as “—” are either $0 or have been rounded to $0.
See accompanying notes to financial statements.
CNI CHARTER FUNDS | PAGE 86
California Tax Exempt Money Market Fund (000) | | | Limited Maturity Fixed Income Fund (000) | | | Government Bond Fund (000) | | | Corporate Bond Fund (000) | |
| | | | | | | | | | | | | | | | | | | | | | |
| | | | | | | | | | | | | | | | | | | | | | | |
| $ | 164 | | | $ | 246 | | | $ | 579 | | | $ | 806 | | | $ | 2,380 | | | $ | 2,534 | | | $ | 3,384 | | | $ | 3,304 | |
| | — | | | | 10 | | | | 359 | | | | 216 | | | | 1,609 | | | | 654 | | | | 1,063 | | | | 699 | |
| | — | | | | — | | | | (607 | ) | | | 317 | | | | 1,187 | | | | 1,657 | | | | (3,970 | ) | | | 2,293 | |
| | 164 | | | | 256 | | | | 331 | | | | 1,339 | | | | 5,176 | | | | 4,845 | | | | 477 | | | | 6,296 | |
| | | | | | | | | | | | | | | | | | | | | | | | | | | | | | | |
| | | | | | | | | | | | | | | | | | | | | | | | | | | | | | | |
| | | | | | | | | | | | | | | | | | | | | | | | | | | | | | | |
| | (36 | ) | | | (62 | ) | | | (471 | ) | | | (751 | ) | | | (3,304 | ) | | | (3,484 | ) | | | (3,327 | ) | | | (3,259 | ) |
| | (121 | ) | | | (179 | ) | | | (108 | ) | | | (97 | ) | | | (52 | ) | | | (80 | ) | | | (63 | ) | | | (48 | ) |
| | (7 | ) | | | (5 | ) | | | — | | | | — | | | | — | | | | — | | | | — | | | | — | |
| | | | | | | | | | | | | | | | | | | | | | | | | | | | | | | |
| | — | | | | (1 | ) | | | — | | | | — | | | | — | | | | — | | | | — | | | | — | |
| | — | | | | (7 | ) | | | — | | | | — | | | | — | | | | — | | | | — | | | | — | |
| | — | | | | (1 | ) | | | — | | | | — | | | | — | | | | — | | | | — | | | | — | |
| | (164 | ) | | | (255 | ) | | | (579 | ) | | | (848 | ) | | | (3,356 | ) | | | (3,564 | ) | | | (3,390 | ) | | | (3,307 | ) |
| | | | | | | | | | | | | | | | | | | | | | | | | | | | | | | |
| | | | | | | | | | | | | | | | | | | | | | | | | | | | | | | |
| | | | | | | | | | | | | | | | | | | | | | | | | | | | | | | |
| | 1,057,959 | | | | 1,024,504 | | | | 2,339 | | | | 26,702 | | | | 56,798 | | | | 118,193 | | | | 40,990 | | | | 35,743 | |
| | — | | | | — | | | | 306 | | | | 535 | | | | 2,397 | | | | 2,306 | | | | 1,062 | | | | 892 | |
| | (1,028,266 | ) | | | (1,025,845 | ) | | | (3,982 | ) | | | (31,618 | ) | | | (40,511 | ) | | | (38,343 | ) | | | (33,215 | ) | | | (22,899 | ) |
| | 29,693 | | | | (1,341 | ) | | | (1,337 | ) | | | (4,381 | ) | | | 18,684 | | | | 82,156 | | | | 8,837 | | | | 13,736 | |
| | | | | | | | | | | | | | | | | | | | | | | | | | | | | | | |
| | | | | | | | | | | | | | | | | | | | | | | | | | | | | | | |
| | 1,294,708 | | | | 1,197,782 | | | | 8,524 | | | | 10,788 | | | | 529 | | | | 1,787 | | | | 1,077 | | | | 2,426 | |
| | 117 | | | | 178 | | | | 76 | | | | 97 | | | | 29 | | | | 33 | | | | 33 | | | | 19 | |
| | (1,305,501 | ) | | | (1,263,962 | ) | | | (11,411 | ) | | | (3,180 | ) | | | (883 | ) | | | (1,705 | ) | | | (945 | ) | | | (1,107 | ) |
| | (10,676 | ) | | | (66,002 | ) | | | (2,811 | ) | | | 7,705 | | | | (325 | ) | | | 115 | | | | 165 | | | | 1,338 | |
| | | | | | | | | | | | | | | | | | | | | | | | | | | | | | | |
| | | | | | | | | | | | | | | | | | | | | | | | | | | | | | | |
| | 301,856 | | | | 145,553 | | | | — | | | | — | | | | — | | | | — | | | | — | | | | — | |
| | — | | | | — | | | | — | | | | — | | | | — | | | | — | | | | — | | | | — | |
| | (271,899 | ) | | | (171,684 | ) | | | — | | | | — | | | | — | | | | — | | | | — | | | | — | |
| | 29,957 | | | | (26,131 | ) | | | — | | | | — | | | | — | | | | — | | | | — | | | | — | |
| | | | | | | | | | | | | | | | | | | | | | | | | | | | | | | |
| | 48,974 | | | | (93,474 | ) | | | (4,148 | ) | | | 3,324 | | | | 18,359 | | | | 82,271 | | | | 9,002 | | | | 15,074 | |
| | 48,974 | | | | (93,473 | ) | | | (4,396 | ) | | | 3,815 | | | | 20,179 | | | | 83,552 | | | | 6,089 | | | | 18,063 | |
| | | | | | | | | | | | | | | | | | | | | | | | | | | | | | | |
| | | | | | | | | | | | | | | | | | | | | | | | | | | | | | | |
| | 827,342 | | | | 920,815 | | | | 42,541 | | | | 38,726 | | | | 158,627 | | | | 75,075 | | | | 107,955 | | | | 89,892 | |
| $ | 876,316 | | | $ | 827,342 | | | $ | 38,145 | | | $ | 42,541 | | | $ | 178,806 | | | $ | 158,627 | | | $ | 114,044 | | | $ | 107,955 | |
| $ | — | | | $ | — | | | $ | — | | | $ | (1 | ) | | $ | — | | | $ | — | | | $ | — | | | $ | — | |
See accompanying notes to financial statements.
CNI CHARTER FUNDS | PAGE 87
statements of changes in net assets
For the years ended September 30
| | | California Tax Exempt Bond Fund (000) | | | Full Maturity Fixed Income Fund (000) | |
| | | | | | | | | | | | |
| OPERATIONS: | | | | | | | | | | | | |
| Net Investment Income | | $ | 1,360 | | | $ | 1,235 | | | $ | 1,252 | | | $ | 1,511 | |
| Net Realized Gain from Security Transactions | | | 362 | | | | 373 | | | | 609 | | | | 189 | |
Net Change in Unrealized Appreciation (Depreciation) on Investments | | | (50 | ) | | | 173 | | | | (395 | ) | | | 2,017 | |
Increase (Decrease) in Net Assets Resulting from Operations | | | 1,672 | | | | 1,781 | | | | 1,466 | | | | 3,717 | |
| | | | | | | | | | | | | | | | | |
| DIVIDENDS AND DISTRIBUTIONS FROM: | | | | | | | | | | | | | | | | |
| Net Investment Income: | | | | | | | | | | | | | | | | |
| Institutional Class | | | (1,267 | ) | | | (1,175 | ) | | | (1,204 | ) | | | (1,464 | ) |
| Class N | | | (93 | ) | | | (60 | ) | | | (86 | ) | | | (71 | ) |
| Realized Capital Gains: | | | | | | | | | | | | | | | | |
| Institutional Class | | | (173 | ) | | | — | | | | (225 | ) | | | (195 | ) |
| Class N | | | (14 | ) | | | — | | | | (22 | ) | | | (9 | ) |
| Return of Capital: | | | | | | | | | | | | | | | | |
| Institutional Class | | | — | | | | — | | | | — | | | | — | |
| | | — | | | | — | | | | — | | | | — | |
Total Dividends and Distributions | | | (1,547 | ) | | | (1,235 | ) | | | (1,537 | ) | | | (1,739 | ) |
| | | | | | | | | | | | | | | | | |
| CAPITAL SHARE TRANSACTIONS: | | | | | | | | | | | | | | | | |
| Institutional Class: | | | | | | | | | | | | | | | | |
| Shares Issued | | | 26,410 | | | | 12,067 | | | | 1,116 | | | | 4,362 | (2) |
| Shares Issued in Lieu of Dividends and Distributions | | | 691 | | | | 500 | | | | 1,207 | | | | 1,366 | |
| | | (14,210 | ) | | | (11,199 | ) | | | (4,147 | ) | | | (1,339 | ) |
Increase (Decrease) in Net Assets From Institutional Class Share Transactions | | | 12,891 | | | | 1,368 | | | | (1,824 | ) | | | 4,389 | |
| | | | | | | | | | | | | | | | | |
| Class N: | | | | | | | | | | | | | | | | |
| Shares Issued | | | 1,527 | | | | 2,974 | | | | 2,493 | | | | 3,308 | |
| Shares Issued in Lieu of Dividends and Distributions | | | 67 | | | | 29 | | | | 66 | | | | 89 | |
| | | (349 | ) | | | (1,634 | ) | | | (5,847 | ) | | | (771 | ) |
Increase (Decrease) in Net Assets from Class N Share Transactions | | | 1,245 | | | | 1,369 | | | | (3,288 | ) | | | 2,626 | |
| | | | | | | | | | | | | | | | | |
Net Increase (Decrease) in Net Assets From Share Transactions | | | 14,136 | | | | 2,737 | | | | (5,112 | ) | | | 7,015 | |
Total Increase (Decrease) in Net Assets | | | 14,261 | | | | 3,283 | | | | (5,183 | ) | | | 8,993 | |
| | | | | | | | | | | | | | | | | |
| NET ASSETS: | | | | | | | | | | | | | | | | |
| | | 43,766 | | | | 40,483 | | | | 49,574 | | | | 40,581 | |
| | $ | 58,027 | | | $ | 43,766 | | | $ | 44,391 | | | $ | 49,574 | |
Undistributed (Distribution in Excess of) Net Investment Income | | $ | — | | | $ | — | | | $ | — | | | $ | 1 | |
| (1) | See Note 8 for shares issued and redeemed. |
| (2) | Includes subscriptions as a result of an in-kind transfer of securities (see Note 9). |
Amounts designated as “—” are either $0 or have been rounded to $0.
See accompanying notes to financial statements.
CNI CHARTER FUNDS | PAGE 88
High Yield Bond Fund (000) | | | | | | Diversified Equity Fund (000) | |
| | | | | | | | | | | | | | | | |
| | | | | | | | | | | | | | | | | |
| $ | 6,045 | | | $ | 4,049 | | | $ | 675 | | | $ | 512 | | | $ | 232 | | | $ | 301 | |
| | 1,560 | | | | 989 | | | | 1,914 | | | | 290 | | | | 4,639 | | | | 1,377 | |
| | (5,656 | ) | | | 2,994 | | | | (4,662 | ) | | | 1,230 | | | | (6,927 | ) | | | 1,658 | |
| | 1,949 | | | | 8,032 | | | | (2,073 | ) | | | 2,032 | | | | (2,056 | ) | | | 3,336 | |
| | | | | | | | | | | | | | | | | | | | | | | |
| | | | | | | | | | | | | | | | | | | | | | | |
| | | | | | | | | | | | | | | | | | | | | | | |
| | (3,817 | ) | | | (2,138 | ) | | | (270 | ) | | | (187 | ) | | | (224 | ) | | | (287 | ) |
| | (2,228 | ) | | | (1,911 | ) | | | (392 | ) | | | (334 | ) | | | (7 | ) | | | (17 | ) |
| | | | | | | | | | | | | | | | | | | | | | | |
| | — | | | | — | | | | — | | | | — | | | | — | | | | — | |
| | — | | | | — | | | | — | | | | — | | | | — | | | | — | |
| | | | | | | | | | | | | | | | | | | | | | | |
| | — | | | | — | | | | — | | | | — | | | | — | | | | (2 | ) |
| | — | | | | — | | | | — | | | | — | | | | — | | | | — | |
| | (6,045 | ) | | | (4,049 | ) | | | (662 | ) | | | (521 | ) | | | (231 | ) | | | (306 | ) |
| | | | | | | | | | | | | | | | | | | | | | | |
| | | | | | | | | | | | | | | | | | | | | | | |
| | | | | | | | | | | | | | | | | | | | | | | |
| | 50,134 | | | | 23,442 | | | | 10,915 | | | | 5,018 | | | | 3,691 | | | | 8,841 | (2) |
| | 1,254 | | | | 1,010 | | | | 225 | | | | 152 | | | | 134 | | | | 250 | |
| | (16,681 | ) | | | (8,902 | ) | | | (2,124 | ) | | | (2,817 | ) | | | (8,556 | ) | | | (5,387 | ) |
| | 34,707 | | | | 15,550 | | | | 9,016 | | | | 2,353 | | | | (4,731 | ) | | | 3,704 | |
| | | | | | | | | | | | | | | | | | | | | | | |
| | | | | | | | | | | | | | | | | | | | | | | |
| | 8,503 | | | | 4,077 | | | | 10,429 | | | | 7,196 | | | | 526 | | | | 1,605 | |
| | 1,349 | | | | 1,233 | | | | 228 | | | | 180 | | | | 4 | | | | 17 | |
| | (3,817 | ) | | | (2,980 | ) | | | (4,754 | ) | | | (3,223 | ) | | | (2,060 | ) | | | (922 | ) |
| | 6,035 | | | | 2,330 | | | | 5,903 | | | | 4,153 | | | | (1,530 | ) | | | 700 | |
| | | | | | | | | | | | | | | | | | | | | | | |
| | 40,742 | | | | 17,880 | | | | 14,919 | | | | 6,506 | | | | (6,261 | ) | | | 4,404 | |
| | 36,646 | | | | 21,863 | | | | 12,184 | | | | 8,017 | | | | (8,548 | ) | | | 7,434 | |
| | | | | | | | | | | | | | | | | | | | | �� | | |
| | | | | | | | | | | | | | | | | | | | | | | |
| | 57,855 | | | | 35,992 | | | | 33,277 | | | | 25,260 | | | | 63,419 | | | | 55,985 | |
| $ | 94,501 | | | $ | 57,855 | | | $ | 45,461 | | | $ | 33,277 | | | $ | 54,871 | | | $ | 63,419 | |
| $ | — | | | $ | — | | | $ | 15 | | | $ | 2 | | | $ | — | | | $ | (1 | ) |
See accompanying notes to financial statements.
CNI CHARTER FUNDS | PAGE 89
statements of changes in net assets
For the years ended September 30
| | | Large Cap Value Equity Fund (000) | | | Large Cap Growth Equity Fund (000) | |
| | | | | | | | | | | | |
| OPERATIONS: | | | | | | | | | | | | |
| Net Investment Income | | $ | 1,480 | | | $ | 1,233 | | | $ | 47 | | | $ | 164 | |
| Net Realized Gain (Loss) from Security Transactions | | | 4,640 | | | | 2,188 | | | | 3,717 | | | | (1,035 | ) |
Net Change in Unrealized Appreciation (Depreciation) on Investments | | | (8,528 | ) | | | 2,901 | | | | (5,911 | ) | | | 4,167 | |
Increase (Decrease) in Net Assets Resulting from Operations | | | (2,408 | ) | | | 6,322 | | | | (2,147 | ) | | | 3,296 | |
| | | | | | | | | | | | | | | | | |
| DIVIDENDS AND DISTRIBUTIONS FROM: | | | | | | | | | | | | | | | | |
| Net Investment Income: | | | | | | | | | | | | | | | | |
| Institutional Class | | | (1,364 | ) | | | (1,133 | ) | | | (56 | ) | | | (139 | ) |
| Class N | | | (114 | ) | | | (101 | ) | | | (6 | ) | | | (25 | ) |
| | | — | | | | — | | | | — | | | | — | |
Total Dividends and Distributions | | | (1,478 | ) | | | (1,234 | ) | | | (62 | ) | | | (164 | ) |
| | | | | | | | | | | | | | | | | |
CAPITAL SHARE TRANSACTIONS:(1) | | | | | | | | | | | | | | | | |
| Institutional Class: | | | | | | | | | | | | | | | | |
| Shares Issued | | | 24,244 | | | | 22,677 | | | | 18,340 | | | | 8,758 | |
| Shares Issued in Lieu of Dividends and Distributions | | | 1,032 | | | | 812 | | | | 22 | | | | 48 | |
| | | (26,063 | ) | | | (14,669 | ) | | | (13,444 | ) | | | (7,928 | ) |
Increase (Decrease) in Net Assets From Institutional Class Share Transactions | | | (787 | ) | | | 8,820 | | | | 4,918 | | | | 878 | |
| | | | | | | | | | | | | | | | | |
| Class N: | | | | | | | | | | | | | | | | |
| Shares Issued | | | 615 | | | | 1,648 | | | | 1,461 | | | | 710 | |
| Shares Issued in Lieu of Dividends and Distributions | | | 76 | | | | 67 | | | | 4 | | | | 15 | |
| | | (1,463 | ) | | | (1,077 | ) | | | (1,072 | ) | | | (1,317 | ) |
Increase (Decrease) in Net Assets From Class N Share Transactions | | | (772 | ) | | | 638 | | | | 393 | | | | (592 | ) |
| | | | | | | | | | | | | | | | | |
| Class R: | | | | | | | | | | | | | | | | |
| Shares Issued | | | — | | | | — | | | | — | | | | — | |
| Shares Issued in Lieu of Dividends and Distributions | | | — | | | | — | | | | — | | | | — | |
| | | — | | | | — | | | | — | | | | — | |
Decrease in Net Assets From Class R Share Transactions | | | — | | | | — | | | | — | | | | — | |
| | | | | | | | | | | | | | | | | |
Net Increase (Decrease) in Net Assets from Share Transactions | | | (1,559 | ) | | | 9,458 | | | | 5,311 | | | | 286 | |
Total Increase (Decrease) in Net Assets | | | (5,445 | ) | | | 14,546 | | | | 3,102 | | | | 3,418 | |
| | | | | | | | | | | | | | | | | |
| NET ASSETS: | | | | | | | | | | | | | | | | |
| | | 104,814 | | | | 90,268 | | | | 40,588 | | | | 37,170 | |
| | $ | 99,369 | | | $ | 104,814 | | | $ | 43,690 | | | $ | 40,588 | |
Undistributed (Distribution in Excess Of) Net Investment Income | | $ | — | | | $ | (2 | ) | | $ | — | | | $ | — | |
| (1) | See Note 8 for shares issued and redeemed. |
| † | See Note 1 in Notes to Financial Statements. |
Amounts designated as “—” are either $0 or have been rounded to $0.
See accompanying notes to financial statements.
See accompanying notes to financial statements.
CNI CHARTER FUNDS | PAGE 90
Socially Responsible Equity Fund (000) | | | CSC Small Cap Value Fund† (000) | |
| | | | | | | | | | |
| | | | | | | | | | | |
| $ | 901 | | | $ | 587 | | | $ | (70 | ) | | $ | 53 | |
| | (1,057 | ) | | | (1,862 | ) | | | 1,944 | | | | 3,169 | |
| | (2,820 | ) | | | 5,910 | | | | (2,867 | ) | | | (503 | ) |
| | (2,976 | ) | | | 4,635 | | | | (993 | ) | | | 2,719 | |
| | | | | | | | | | | | | | | |
| | | | | | | | | | | | | | | |
| | | | | | | | | | | | | | | |
| | (867 | ) | | | (575 | ) | | | (10 | ) | | | — | |
| | (35 | ) | | | (14 | ) | | | (4 | ) | | | — | |
| | — | | | | — | | | | (77 | ) | | | (14 | ) |
| | (902 | ) | | | (589 | ) | | | (91 | ) | | | (14 | ) |
| | | | | | | | | | | | | | | |
| | | | | | | | | | | | | | | |
| | | | | | | | | | | | | | | |
| | 16,039 | | | | 11,228 | | | | 487 | | | | 1,236 | |
| | 867 | | | | 575 | | | | 10 | | | | — | |
| | (10,863 | ) | | | (8,409 | ) | | | (2,095 | ) | | | (491 | ) |
| | 6,043 | | | | 3,394 | | | | (1,598 | ) | | | 745 | |
| | | | | | | | | | | | | | | |
| | | | | | | | | | | | | | | |
| | 1,850 | | | | 1,491 | | | | 106 | | | | 369 | |
| | 34 | | | | 14 | | | | 3 | | | | — | |
| | (894 | ) | | | (282 | ) | | | (499 | ) | | | (346 | ) |
| | 990 | | | | 1,223 | | | | (390 | ) | | | 23 | |
| | | | | | | | | | | | | | | |
| | | | | | | | | | | | | | | |
| | — | | | | — | | | | 418 | | | | 704 | |
| | — | | | | — | | | | 74 | | | | 14 | |
| | — | | | | — | | | | (4,235 | ) | | | (2,890 | ) |
| | — | | | | — | | | | (3,743 | ) | | | (2,172 | ) |
| | | | | | | | | | | | | | | |
| | 7,033 | | | | 4,617 | | | | (5,731 | ) | | | (1,404 | ) |
| | 3,155 | | | | 8,663 | | | | (6,815 | ) | | | 1,301 | |
| | | | | | | | | | | | | | | |
| | | | | | | | | | | | | | | |
| | 62,170 | | | | 53,507 | | | | 24,599 | | | | 23,298 | |
| $ | 65,325 | | | $ | 62,170 | | | $ | 17,784 | | | $ | 24,599 | |
| $ | — | | | $ | 1 | | | $ | — | | | $ | 88 | |
See accompanying notes to financial statements.
CNI CHARTER FUNDS | PAGE 91
financial highlights
For a Share Outstanding Throughout Each Period
For the year ended September 30,
| | Net Asset Value Beginning of Period | | | | | | Dividends from Net Investment Income | | | Net Asset Value End of Period | | | | | | Net Assets End of Period (000) | | | Ratio of Expenses to Average Net Assets(1)(2) | | | Ratio of Net Investment Income to Average Net Assets(1) | | | Ratio of Expenses to Average Net Assets (Excluding Waivers & Recovered Fees)(1) | |
| Government Money Market Fund | |
| Institutional Class (commenced operations on April 3, 2000) | |
| 2011 | | $ | 1.00 | | | $ | 0.000 | ^ | | $ | (0.000 | )^ | | $ | 1.00 | | | | 0.02 | % | | $ | 51,705 | | | | 0.14 | % | | | 0.03 | % | | | 0.61 | % |
| 2010 | | | 1.00 | | | | 0.000 | ^ | | | (0.000 | )^ | | | 1.00 | | | | 0.04 | | | | 81,050 | | | | 0.17 | | | | 0.04 | | | | 0.62 | |
| 2009 | | | 1.00 | | | | 0.003 | | | | (0.003 | ) | | | 1.00 | | | | 0.27 | | | | 123,863 | | | | 0.36 | | | | 0.26 | | | | 0.65 | |
| 2008 | | | 1.00 | | | | 0.027 | | | | (0.027 | ) | | | 1.00 | | | | 2.72 | | | | 100,674 | | | | 0.59 | | | | 2.62 | | | | 0.59 | |
| 2007 | | | 1.00 | | | | 0.047 | | | | (0.047 | ) | | | 1.00 | | | | 4.77 | | | | 47,858 | | | | 0.60 | | | | 4.67 | | | | 0.61 | |
| Class N (commenced operations on June 21, 1999) | |
| 2011 | | $ | 1.00 | | | $ | 0.000 | ^ | | $ | (0.000 | )^ | | $ | 1.00 | | | | 0.02 | % | | $ | 2,926,120 | | | | 0.14 | % | | | 0.02 | % | | | 1.11 | % |
| 2010 | | | 1.00 | | | | 0.000 | ^ | | | (0.000 | )^ | | | 1.00 | | | | 0.02 | | | | 2,598,035 | | | | 0.19 | | | | 0.02 | | | | 1.12 | |
| 2009 | | | 1.00 | | | | 0.002 | | | | (0.002 | ) | | | 1.00 | | | | 0.19 | | | | 2,549,147 | | | | 0.47 | | | | 0.21 | | | | 1.13 | |
| 2008 | | | 1.00 | | | | 0.025 | | | | (0.025 | ) | | | 1.00 | | | | 2.49 | | | | 3,006,935 | | | | 0.81 | | | | 2.40 | | | | 1.09 | |
| 2007 | | | 1.00 | | | | 0.044 | | | | (0.044 | ) | | | 1.00 | | | | 4.54 | | | | 2,291,138 | | | | 0.82 | | | | 4.45 | | | | 1.11 | |
| Class S (commenced operations on October 6, 1999) | |
| 2011 | | $ | 1.00 | | | $ | 0.000 | ^ | | $ | (0.000 | )^ | | $ | 1.00 | | | | 0.01 | % | | $ | 291,194 | | | | 0.15 | % | | | 0.01 | % | | | 1.11 | % |
| 2010 | | | 1.00 | | | | 0.000 | ^ | | | (0.000 | )^ | | | 1.00 | | | | 0.01 | | | | 348,698 | | | | 0.20 | | | | 0.01 | | | | 1.12 | |
| 2009 | | | 1.00 | | | | 0.001 | | | | (0.001 | ) | | | 1.00 | | | | 0.12 | | | | 298,842 | | | | 0.54 | | | | 0.13 | | | | 1.13 | |
| 2008 | | | 1.00 | | | | 0.023 | | | | (0.023 | ) | | | 1.00 | | | | 2.29 | | | | 408,747 | | | | 1.02 | | | | 2.23 | | | | 1.09 | |
| 2007 | | | 1.00 | | | | 0.042 | | | | (0.042 | ) | | | 1.00 | | | | 4.33 | | | | 321,061 | | | | 1.02 | | | | 4.24 | | | | 1.11 | |
| |
| Institutional Class (commenced operations on March 23, 1998) | |
| 2011 | | $ | 1.00 | | | $ | 0.001 | | | $ | (0.001 | ) | | $ | 1.00 | | | | 0.06 | % | | $ | 630,250 | | | | 0.22 | % | | | 0.05 | % | | | 0.60 | % |
| 2010 | | | 1.00 | | | | 0.001 | | | | (0.001 | )* | | | 1.00 | | | | 0.09 | | | | 489,980 | | | | 0.24 | | | | 0.08 | | | | 0.60 | |
| 2009 | | | 1.00 | | | | 0.005 | | | | (0.005 | ) | | | 1.00 | | | | 0.46 | | | | 543,326 | | | | 0.44 | | | | 0.46 | | | | 0.65 | |
| 2008 | | | 1.00 | | | | 0.030 | | | | (0.030 | ) | | | 1.00 | | | | 3.01 | | | | 532,931 | | | | 0.58 | | | | 2.90 | | | | 0.58 | |
| 2007 | | | 1.00 | | | | 0.047 | | | | (0.047 | ) | | | 1.00 | | | | 4.85 | | | | 438,639 | | | | 0.59 | | | | 4.74 | | | | 0.60 | |
| Class N (commenced operations on October 18, 1999) | |
| 2011 | | $ | 1.00 | | | $ | 0.000 | ^ | | $ | (0.000 | )^ | | $ | 1.00 | | | | 0.03 | % | | $ | 450,282 | | | | 0.25 | % | | | 0.03 | % | | | 1.10 | % |
| 2010 | | | 1.00 | | | | 0.000 | ^ | | | (0.000 | )*^ | | | 1.00 | | | | 0.06 | | | | 432,235 | | | | 0.28 | | | | 0.04 | | | | 1.10 | |
| 2009 | | | 1.00 | | | | 0.003 | | | | (0.003 | ) | | | 1.00 | | | | 0.33 | | | | 656,769 | | | | 0.61 | | | | 0.39 | | | | 1.15 | |
| 2008 | | | 1.00 | | | | 0.027 | | | | (0.027 | ) | | | 1.00 | | | | 2.78 | | | | 1,123,900 | | | | 0.80 | | | | 2.65 | | | | 1.08 | |
| 2007 | | | 1.00 | | | | 0.045 | | | | (0.045 | ) | | | 1.00 | | | | 4.62 | | | | 870,537 | | | | 0.81 | | | | 4.52 | | | | 1.10 | |
| Class S (commenced operations on October 26, 1999) | |
| 2011 | | $ | 1.00 | | | $ | 0.000 | ^ | | $ | 0.000 | ^ | | $ | 1.00 | | | | 0.02 | % | | $ | 265,116 | | | | 0.27 | % | | | 0.01 | % | | | 1.10 | % |
| 2010 | | | 1.00 | | | | 0.000 | ^ | | | (0.000 | )*^ | | | 1.00 | | | | 0.04 | | | | 352,575 | | | | 0.30 | | | | 0.02 | | | | 1.10 | |
| 2009 | | | 1.00 | | | | 0.002 | | | | (0.002 | ) | | | 1.00 | | | | 0.23 | | | | 372,762 | | | | 0.73 | | | | 0.28 | | | | 1.15 | |
| 2008 | | | 1.00 | | | | 0.025 | | | | (0.025 | ) | | | 1.00 | | | | 2.57 | | | | 633,815 | | | | 1.00 | | | | 2.54 | | | | 1.08 | |
| 2007 | | | 1.00 | | | | 0.043 | | | | (0.043 | ) | | | 1.00 | | | | 4.41 | | | | 620,195 | | | | 1.01 | | | | 4.32 | | | | 1.10 | |
California Tax Exempt Money Market Fund | |
| Institutional Class (commenced operations on April 3, 2000) | |
| 2011 | | $ | 1.00 | | | $ | 0.000 | ^ | | $ | (0.000 | )^ | | $ | 1.00 | | | | 0.02 | % | | $ | 169,932 | | | | 0.16 | % | | | 0.02 | % | | | 0.62 | % |
| 2010 | | | 1.00 | | | | 0.000 | ^ | | | (0.000 | )*^ | | | 1.00 | | | | 0.04 | | | | 140,238 | | | | 0.19 | | | | 0.04 | | | | 0.63 | |
| 2009 | | | 1.00 | | | | 0.003 | | | | (0.003 | ) | | | 1.00 | | | | 0.33 | | | | 141,579 | | | | 0.30 | | | | 0.31 | | | | 0.65 | |
| 2008 | | | 1.00 | | | | 0.018 | | | | (0.018 | ) | | | 1.00 | | | | 1.80 | | | | 157,427 | | | | 0.55 | | | | 1.69 | | | | 0.61 | |
| 2007 | | | 1.00 | | | | 0.030 | | | | (0.030 | ) | | | 1.00 | | | | 3.01 | | | | 89,237 | | | | 0.55 | | | | 2.97 | | | | 0.62 | |
| Class N (commenced operations on June 21, 1999) | |
| 2011 | | $ | 1.00 | | | $ | 0.000 | ^ | | $ | (0.000 | )^ | | $ | 1.00 | | | | 0.02 | % | | $ | 628,163 | | | | 0.17 | % | | | 0.02 | % | | | 1.12 | % |
| 2010 | | | 1.00 | | | | 0.000 | ^ | | | (0.000 | )*^ | | | 1.00 | | | | 0.03 | | | | 638,839 | | | | 0.20 | | | | 0.02 | | | | 1.12 | |
| 2009 | | | 1.00 | | | | 0.002 | | | | (0.002 | ) | | | 1.00 | | | | 0.23 | | | | 704,840 | | | | 0.41 | | | | 0.25 | | | | 1.16 | |
| 2008 | | | 1.00 | | | | 0.016 | | | | (0.016 | ) | | | 1.00 | | | | 1.57 | | | | 880,794 | | | | 0.78 | | | | 1.47 | | | | 1.11 | |
| 2007 | | | 1.00 | | | | 0.027 | | | | (0.027 | ) | | | 1.00 | | | | 2.78 | | | | 695,318 | | | | 0.78 | | | | 2.73 | | | | 1.12 | |
| Class S (commenced operations on November 12, 1999) | |
| 2011 | | $ | 1.00 | | | $ | 0.000 | ^ | | $ | (0.000 | )^ | | $ | 1.00 | | | | 0.01 | % | | $ | 78,221 | | | | 0.17 | % | | | 0.01 | % | | | 1.12 | % |
| 2010 | | | 1.00 | | | | 0.000 | ^ | | | (0.000 | )*^ | | | 1.00 | | | | 0.01 | | | | 48,265 | | | | 0.22 | | | | 0.01 | | | | 1.12 | |
| 2009 | | | 1.00 | | | | 0.002 | | | | (0.002 | ) | | | 1.00 | | | | 0.17 | | | | 74,396 | | | | 0.54 | | | | 0.26 | | | | 1.16 | |
| 2008 | | | 1.00 | | | | 0.014 | | | | (0.014 | ) | | | 1.00 | | | | 1.37 | | | | 141,757 | | | | 0.98 | | | | 1.40 | | | | 1.11 | |
| 2007 | | | 1.00 | | | | 0.025 | | | | (0.025 | ) | | | 1.00 | | | | 2.57 | | | | 178,918 | | | | 0.98 | | | | 2.55 | | | | 1.12 | |
| † | Per share calculations are based on Average Shares outstanding throughout the period. |
| ‡ | Returns are for the period indicated and have not been annualized. Fee waivers are in effect; if they had not been in effect, performance would have been lower. Returns shown do not reflect the deduction of taxes that a shareholder would pay on fund distributions or the redemption of fund shares. |
| ^ | Amount represents less than $0.001. |
| * | Includes a realized capital gain distribution of less than $0.001. |
| (1) | Annualized for periods less than one year. |
| (2) | Ratio includes waivers and previously waived investment advisory fees recovered. The impact of the recovered fees may cause a higher net expense ratio. |
See accompanying notes to financial statements.
CNI CHARTER FUNDS | PAGE 92
| | Net Asset Value Beginning of Period | | | | | | Net Realized and Unrealized Gains (Losses) on Securities† | | | Dividends from Net Investment Income | | | Distri- butions from Realized Capital Gains | | | Net Asset Value End of Period | | | | | | Net Assets End of Period (000) | | | Ratio of Expenses to Average Net Assets(1)(2) | | | Ratio of Net Investment Income to Average Net Assets(1) | | | Ratio of Expenses to Average Net Assets (Excluding Waivers & Recovered Fees)(1) | | | | |
| Limited Maturity Fixed Income Fund | |
| Institutional Class (commenced operations on October 22,1988) | |
| 2011 | | $ | 11.21 | | | $ | 0.16 | | | $ | (0.06 | ) | | $ | (0.16 | ) | | $ | — | | | $ | 11.15 | | | | 0.92 | % | | $ | 31,743 | | | | 0.66 | % | | | 1.46 | % | | | 0.67 | % | | | 50 | % |
| 2010 | | | 11.06 | | | | 0.20 | | | | 0.16 | | | | (0.21 | ) | | | — | | | | 11.21 | | | | 3.28 | | | | 33,279 | | | | 0.73 | | | | 1.82 | | | | 0.71 | | | | 118 | |
| 2009 | | | 10.49 | | | | 0.30 | | | | 0.57 | | | | (0.30 | ) | | | — | | | | 11.06 | | | | 8.44 | | | | 37,255 | | | | 0.75 | | | | 2.66 | | | | 0.76 | | | | 98 | |
| 2008 | | | 10.59 | | | | 0.37 | | | | (0.10 | ) | | | (0.37 | ) | | | — | | | | 10.49 | | | | 2.54 | | | | 92,681 | | | | 0.76 | | | | 3.44 | | | | 0.67 | | | | 79 | |
| 2007 | | | 10.56 | | | | 0.45 | | | | 0.03 | | | | (0.45 | ) | | | — | | | | 10.59 | | | | 4.63 | | | | 44,365 | | | | 0.76 | | | | 4.25 | | | | 0.77 | | | | 76 | |
| Class N (commenced operations on October 22, 2004) | |
| 2011 | | $ | 11.22 | | | $ | 0.14 | | | $ | (0.08 | ) | | $ | (0.13 | ) | | $ | — | | | $ | 11.15 | | | | 0.58 | % | | $ | 6,402 | | | | 0.91 | % | | | 1.21 | % | | | 1.17 | % | | | 50 | % |
| 2010 | | | 11.07 | | | | 0.16 | | | | 0.17 | | | | (0.18 | ) | | | — | | | | 11.22 | | | | 3.04 | | | | 9,262 | | | | 0.98 | | | | 1.48 | | | | 1.22 | | | | 118 | |
| 2009 | | | 10.51 | | | | 0.27 | | | | 0.57 | | | | (0.28 | ) | | | — | | | | 11.07 | | | | 8.07 | | | | 1,471 | | | | 1.00 | | | | 2.29 | | | | 1.24 | | | | 98 | |
| 2008 | | | 10.61 | | | | 0.35 | | | | (0.10 | ) | | | (0.35 | ) | | | — | | | | 10.51 | | | | 2.29 | | | | 432 | | | | 1.00 | | | | 3.24 | | | | 0.92 | | | | 79 | |
| 2007 | | | 10.57 | | | | 0.42 | | | | 0.04 | | | | (0.42 | ) | | | — | | | | 10.61 | | | | 4.47 | | | | 310 | | | | 1.00 | | | | 3.99 | | | | 1.02 | | | | 76 | |
| |
| Institutional Class (commenced operations on January 14, 2000) | |
| 2011 | | $ | 10.66 | | | $ | 0.15 | | | $ | 0.15 | | | $ | (0.21 | ) | | $ | — | | | $ | 10.75 | | | | 2.86 | % | | $ | 175,866 | | | | 0.70 | % | | | 1.40 | % | | | 0.78 | % | | | 86 | % |
| 2010 | | | 10.58 | | | | 0.19 | | | | 0.16 | | | | (0.27 | ) | | | — | | | | 10.66 | | | | 3.37 | | | | 155,376 | | | | 0.70 | | | | 1.81 | | | | 0.78 | | | | 93 | |
| 2009 | | | 10.40 | | | | 0.35 | | | | 0.18 | | | | (0.35 | ) | | | — | | | | 10.58 | | | | 5.18 | | | | 71,966 | | | | 0.70 | | | | 3.29 | | | | 0.77 | | | | 85 | |
| 2008 | | | 10.33 | | | | 0.42 | | | | 0.08 | | | | (0.43 | ) | | | — | | | | 10.40 | | | | 4.87 | | | | 66,097 | | | | 0.70 | | | | 4.05 | | | | 0.77 | | | | 36 | |
| 2007 | | | 10.28 | | | | 0.46 | | | | 0.05 | | | | (0.46 | ) | | | — | | | | 10.33 | | | | 5.04 | | | | 52,606 | | | | 0.70 | | | | 4.50 | | | | 0.77 | | | | 83 | |
| Class N (commenced operations on April 13, 2000) | |
| 2011 | | $ | 10.68 | | | $ | 0.12 | | | $ | 0.15 | | | $ | (0.18 | ) | | $ | — | | | $ | 10.77 | | | | 2.60 | % | | $ | 2,940 | | | | 0.95 | % | | | 1.17 | % | | | 1.03 | % | | | 86 | % |
| 2010 | | | 10.60 | | | | 0.16 | | | | 0.16 | | | | (0.24 | ) | | | — | | | | 10.68 | | | | 3.10 | | | | 3,251 | | | | 0.95 | | | | 1.57 | | | | 1.03 | | | | 93 | |
| 2009 | | | 10.42 | | | | 0.32 | | | | 0.18 | | | | (0.32 | ) | | | — | | | | 10.60 | | | | 4.91 | | | | 3,109 | | | | 0.95 | | | | 3.04 | | | | 1.02 | | | | 85 | |
| 2008 | | | 10.35 | | | | 0.40 | | | | 0.07 | | | | (0.40 | ) | | | — | | | | 10.42 | | | | 4.59 | | | | 2,761 | | | | 0.95 | | | | 3.80 | | | | 1.02 | | | | 36 | |
| 2007 | | | 10.30 | | | | 0.44 | | | | 0.04 | | | | (0.43 | ) | | | — | | | | 10.35 | | | | 4.77 | | | | 2,632 | | | | 0.95 | | | | 4.25 | | | | 1.02 | | | | 83 | |
| |
| Institutional Class (commenced operations on January 14, 2000) | |
| 2011 | | $ | 10.88 | | | $ | 0.32 | | | $ | (0.30 | ) | | $ | (0.32 | ) | | $ | — | | | $ | 10.58 | | | | 0.15 | % | | $ | 111,563 | | | | 0.75 | % | | | 2.94 | % | | | 0.75 | % | | | 40 | % |
| 2010 | | | 10.56 | | | | 0.35 | | | | 0.32 | | | | (0.35 | ) | | | — | | | | 10.88 | | | | 6.50 | | | | 105,571 | | | | 0.74 | | | | 3.32 | | | | 0.75 | | | | 28 | |
| 2009 | | | 9.76 | | | | 0.39 | | | | 0.80 | | | | (0.39 | ) | | | — | | | | 10.56 | | | | 12.48 | | | | 88,897 | | | | 0.74 | | | | 3.88 | | | | 0.75 | | | | 30 | |
| 2008 | | | 10.18 | | | | 0.43 | | | | (0.41 | ) | | | (0.44 | ) | | | — | | | | 9.76 | | | | 0.04 | | | | 69,709 | | | | 0.73 | | | | 4.25 | | | | 0.74 | | | | 12 | |
| 2007 | | | 10.17 | | | | 0.45 | | | | — | | | | (0.44 | ) | | | — | | | | 10.18 | | | | 4.57 | | | | 62,210 | | | | 0.74 | | | | 4.39 | | | | 0.75 | | | | 30 | |
| Class N (commenced operations on April 13, 2000) | |
| 2011 | | $ | 10.89 | | | $ | 0.29 | | | $ | (0.30 | ) | | $ | (0.29 | ) | | $ | — | | | $ | 10.59 | | | | (0.10 | )% | | $ | 2,481 | | | | 1.00 | % | | | 2.69 | % | | | 1.00 | % | | | 40 | % |
| 2010 | | | 10.57 | | | | 0.33 | | | | 0.32 | | | | (0.33 | ) | | | — | | | | 10.89 | | | | 6.23 | | | | 2,384 | | | | 0.99 | | | | 3.05 | | | | 1.00 | | | | 28 | |
| 2009 | | | 9.77 | | | | 0.36 | | | | 0.81 | | | | (0.37 | ) | | | — | | | | 10.57 | | | | 12.19 | | | | 995 | | | | 0.99 | | | | 3.59 | | | | 1.00 | | | | 30 | |
| 2008 | | | 10.18 | | | | 0.41 | | | | (0.41 | ) | | | (0.41 | ) | | | — | | | | 9.77 | | | | (0.11 | ) | | | 608 | | | | 0.98 | | | | 4.02 | | | | 0.99 | | | | 12 | |
| 2007 | | | 10.17 | | | | 0.42 | | | | 0.01 | | | | (0.42 | ) | | | — | | | | 10.18 | | | | 4.30 | | | | 1,043 | | | | 0.99 | | | | 4.13 | | | | 1.00 | | | | 30 | |
California Tax Exempt Bond Fund | |
| Institutional Class (commenced operations on January 14, 2000) | |
| 2011 | | $ | 10.70 | | | $ | 0.29 | | | $ | 0.01 | | | $ | (0.29 | ) | | $ | (0.04 | ) | | $ | 10.67 | | | | 2.92 | % | | $ | 53,464 | | | | 0.50 | % | | | 2.73 | % | | | 0.62 | % | | | 26 | % |
| 2010 | | | 10.57 | | | | 0.32 | | | | 0.13 | | | | (0.32 | ) | | | — | | | | 10.70 | | | | 4.34 | | | | 40,457 | | | | 0.50 | | | | 3.03 | | | | 0.62 | | | | 28 | |
| 2009 | | | 10.06 | | | | 0.33 | | | | 0.51 | | | | (0.33 | ) | | | — | | | | 10.57 | | | | 8.45 | | | | 38,581 | | | | 0.50 | | | | 3.18 | | | | 0.61 | | | | 50 | |
| 2008 | | | 10.24 | | | | 0.32 | | | | (0.18 | ) | | | (0.32 | ) | | | — | | | | 10.06 | | | | 1.38 | | | | 34,262 | | | | 0.50 | | | | 3.13 | | | | 0.61 | | | | 55 | |
| 2007 | | | 10.25 | | | | 0.31 | | | | (0.01 | ) | | | (0.31 | ) | | | — | | | | 10.24 | | | | 2.98 | | | | 33,802 | | | | 0.50 | | | | 3.04 | | | | 0.62 | | | | 43 | |
| Class N (commenced operations on April 13, 2000) | |
| 2011 | | $ | 10.73 | | | $ | 0.26 | | | $ | 0.01 | | | $ | (0.26 | ) | | $ | (0.04 | ) | | $ | 10.70 | | | | 2.65 | % | | $ | 4,563 | | | | 0.75 | % | | | 2.46 | % | | | 0.87 | % | | | 26 | % |
| 2010 | | | 10.60 | | | | 0.29 | | | | 0.13 | | | | (0.29 | ) | | | — | | | | 10.73 | | | | 4.06 | | | | 3,309 | | | | 0.75 | | | | 2.75 | | | | 0.87 | | | | 28 | |
| 2009 | | | 10.09 | | | | 0.30 | | | | 0.51 | | | | (0.30 | ) | | | — | | | | 10.60 | | | | 8.15 | | | | 1,902 | | | | 0.75 | | | | 2.92 | | | | 0.87 | | | | 50 | |
| 2008 | | | 10.27 | | | | 0.30 | | | | (0.18 | ) | | | (0.30 | ) | | | — | | | | 10.09 | | | | 1.12 | | | | 1,049 | | | | 0.75 | | | | 2.87 | | | | 0.86 | | | | 55 | |
| 2007 | | | 10.27 | | | | 0.28 | | | | — | | | | (0.28 | ) | | | — | | | | 10.27 | | | | 2.82 | | | | 922 | | | | 0.75 | | | | 2.78 | | | | 0.87 | | | | 43 | |
| † | Per share calculations are based on Average Shares outstanding throughout the period. |
| ‡ | Returns are for the period indicated and have not been annualized. Fee waivers are in effect; if they had not been in effect, performance would have been lower. Returns shown do not reflect the deduction of taxes that a shareholder would pay on fund distributions or the redemption of fund shares. |
| (1) | Annualized for periods less than one year. |
| (2) | Ratio includes waivers and previously waived investment advisory fees recovered. The impact of the recovered fees may cause a higher net expense ratio. |
Amounts designated as “—” are either $0 or have been rounded to $0.
See accompanying notes to financial statements.
CNI CHARTER FUNDS | PAGE 93
financial highlights
For a Share Outstanding Throughout Each Period
For the year/period ended September 30,
| | Net Asset Value Beginning of Period | | | | | | Net Realized and Unrealized Gains (Losses) on Securities† | | | Dividends from Net Investment Income | | | Distrib- utions from Realized Capital Gains | | | Net Asset Value End of Period | | | | | | Net Assets End of Period (000) | | | Ratio of Expenses to Average Net Assets(1)(2) | | | Ratio of Net Investment Income to Average Net Assets(1) | | | Ratio of Expenses to Average Net Assets (Excluding Waivers & Recovered Fees)(1) | | | | |
| Full Maturity Fixed Income Fund | |
| Institutional Class (commenced operations on October 20, 1988) | |
| 2011 | | $ | 10.91 | | | $ | 0.29 | | | $ | 0.07 | | | $ | (0.30 | ) | | $ | (0.06 | ) | | $ | 10.91 | | | | 3.36 | % | | $ | 43,894 | | | | 0.66 | % | | | 2.70 | % | | | 0.67 | % | | | 43 | % |
| 2010 | | | 10.46 | | | | 0.36 | | | | 0.50 | | | | (0.36 | ) | | | (0.05 | ) | | | 10.91 | | | | 8.48 | | | | 45,756 | | | | 0.70 | | | | 3.40 | | | | 0.71 | | | | 63 | |
| 2009 | | | 9.90 | | | | 0.40 | | | | 0.56 | | | | (0.40 | ) | | | — | | | | 10.46 | | | | 9.95 | | | | 39,495 | | | | 0.75 | | | | 3.97 | | | | 0.75 | | | | 56 | |
| 2008 | | | 10.16 | | | | 0.44 | | | | (0.26 | ) | | | (0.44 | ) | | | — | | | | 9.90 | | | | 1.76 | | | | 42,579 | | | | 0.64 | | | | 4.32 | | | | 0.64 | | | | 34 | |
| 2007 | | | 10.16 | | | | 0.45 | | | | — | | | | (0.45 | ) | | | — | | | | 10.16 | | | | 4.48 | | | | 42,096 | | | | 0.79 | | | | 4.48 | | | | 0.73 | | | | 55 | |
| Class N (commenced operations on May 11, 2004) | |
| 2011 | | $ | 10.90 | | | $ | 0.26 | | | $ | 0.07 | | | $ | (0.27 | ) | | $ | (0.06 | ) | | $ | 10.90 | | | | 3.10 | % | | $ | 497 | | | | 0.91 | % | | | 2.46 | % | | | 1.17 | % | | | 43 | % |
| 2010 | | | 10.46 | | | | 0.33 | | | | 0.50 | | | | (0.34 | ) | | | (0.05 | ) | | | 10.90 | | | | 8.12 | | | | 3,818 | | | | 0.95 | | | | 3.08 | | | | 1.21 | | | | 63 | |
| 2009 | | | 9.89 | | | | 0.39 | | | | 0.56 | | | | (0.38 | ) | | | — | | | | 10.46 | | | | 9.79 | | | | 1,086 | | | | 1.00 | | | | 3.70 | | | | 1.26 | | | | 56 | |
| 2008 | | | 10.16 | | | | 0.42 | | | | (0.27 | ) | | | (0.42 | ) | | | — | | | | 9.89 | | | | 1.42 | | | | 687 | | | | 0.89 | | | | 4.02 | | | | 0.89 | | | | 34 | |
| 2007 | | | 10.16 | | | | 0.42 | | | | — | | | | (0.42 | ) | | | — | | | | 10.16 | | | | 4.23 | | | | 235 | | | | 1.04 | | | | 4.23 | | | | 0.99 | | | | 55 | |
| |
| Institutional Class (commenced operations on January 14, 2000) | |
| 2011 | | $ | 8.31 | | | $ | 0.72 | | | $ | (0.33 | ) | | $ | (0.72 | ) | | $ | — | | | $ | 7.98 | | | | 4.45 | % | | $ | 65,829 | | | | 1.00 | % | | | 8.43 | % | | | 1.10 | % | | | 56 | % |
| 2010 | | | 7.56 | | | | 0.72 | | | | 0.75 | | | | (0.72 | ) | | | — | | | | 8.31 | | | | 20.17 | | | | 33,845 | | | | 1.00 | | | | 8.89 | | | | 1.10 | | | | 87 | |
| 2009 | | | 7.40 | | | | 0.62 | | | | 0.18 | | | | (0.64 | ) | | | — | | | | 7.56 | | | | 12.94 | | | | 16,355 | | | | 1.00 | | | | 9.75 | | | | 1.10 | | | | 59 | |
| 2008 | | | 8.91 | | | | 0.64 | | | | (1.47 | ) | | | (0.68 | ) | | | — | | | | 7.40 | | | | (9.83 | ) | | | 13,926 | | | | 1.00 | | | | 7.72 | | | | 1.09 | | | | 20 | |
| 2007 | | | 8.96 | | | | 0.70 | | | | (0.06 | ) | | | (0.69 | ) | | | — | | | | 8.91 | | | | 7.27 | | | | 17,137 | | | | 1.00 | | | | 7.73 | | | | 1.10 | | | | 26 | |
| Class N (commenced operations on January 14, 2000) | |
| 2011 | | $ | 8.31 | | | $ | 0.69 | | | $ | (0.33 | ) | | $ | (0.69 | ) | | $ | — | | | $ | 7.98 | | | | 4.14 | % | | $ | 28,672 | | | | 1.30 | % | | | 8.12 | % | | | 1.40 | % | | | 56 | % |
| 2010 | | | 7.56 | | | | 0.70 | | | | 0.74 | | | | (0.69 | ) | | | — | | | | 8.31 | | | | 19.81 | | | | 24,010 | | | | 1.30 | | | | 8.68 | | | | 1.40 | | | | 87 | |
| 2009 | | | 7.40 | | | | 0.60 | | | | 0.18 | | | | (0.62 | ) | | | — | | | | 7.56 | | | | 12.61 | | | | 19,637 | | | | 1.30 | | | | 9.43 | | | | 1.40 | | | | 59 | |
| 2008 | | | 8.91 | | | | 0.62 | | | | (1.47 | ) | | | (0.66 | ) | | | — | | | | 7.40 | | | | (10.10 | ) | | | 17,521 | | | | 1.30 | | | | 7.43 | | | | 1.39 | | | | 20 | |
| 2007 | | | 8.96 | | | | 0.68 | | | | (0.07 | ) | | | (0.66 | ) | | | — | | | | 8.91 | | | | 6.95 | | | | 20,121 | | | | 1.30 | | | | 7.44 | | | | 1.40 | | | | 26 | |
| |
| Institutional Class (commenced operations on October 1, 2007) | |
| 2011 | | $ | 10.37 | | | $ | 0.19 | | | $ | (0.48 | ) | | $ | (0.20 | ) | | $ | — | | | $ | 9.88 | | | | (2.97 | )% | | $ | 19,084 | | | | 0.84 | % | | | 1.76 | % | | | 0.85 | % | | | 67 | % |
| 2010 | | | 9.87 | | | | 0.20 | | | | 0.50 | | | | (0.20 | ) | | | — | | | | 10.37 | | | | 7.15 | | | | 11,258 | | | | 0.84 | | | | 1.96 | | | | 0.85 | | | | 76 | |
| 2009 | | | 9.70 | | | | 0.15 | | | | 0.18 | | | | (0.16 | ) | | | — | | | | 9.87 | | | | 3.54 | | | | 8,423 | | | | 0.83 | | | | 1.71 | | | | 0.84 | | | | 94 | |
| 2008 | | | 11.00 | | | | 0.25 | | | | (1.32 | ) | | | (0.23 | ) | | | — | | | | 9.70 | | | | (9.84 | ) | | | 10,741 | | | | 1.29 | | | | 2.37 | | | | 1.30 | | | | 141 | |
| Class N (commenced operations on October 1, 2007) | |
| 2011 | | $ | 10.36 | | | $ | 0.17 | | | $ | (0.48 | ) | | $ | (0.17 | ) | | $ | — | | | $ | 9.88 | | | | (3.11 | )% | | $ | 26,377 | | | | 1.09 | % | | | 1.57 | % | | | 1.10 | % | | | 67 | % |
| 2010 | | | 9.86 | | | | 0.17 | | | | 0.50 | | | | (0.17 | ) | | | — | | | | 10.36 | | | | 6.89 | | | | 22,019 | | | | 1.09 | | | | 1.69 | | | | 1.10 | | | | 76 | |
| 2009 | | | 9.69 | | | | 0.13 | | | | 0.18 | | | | (0.14 | ) | | | — | | | | 9.86 | | | | 3.29 | | | | 16,837 | | | | 1.09 | | | | 1.46 | | | | 1.10 | | | | 94 | |
| 2008 | | | 11.00 | | | | 0.23 | | | | (1.33 | ) | | | (0.21 | ) | | | — | | | | 9.69 | | | | (10.12 | ) | | | 16,708 | | | | 1.53 | | | | 2.22 | | | | 1.54 | | | | 141 | |
| |
| Institutional Class (commenced operations on October 20, 1988) | |
| 2011 | | $ | 11.88 | | | $ | 0.05 | | | $ | (0.55 | ) | | $ | (0.05 | ) | | $ | — | | | $ | 11.33 | | | | (4.27 | )% | | $ | 50,029 | | | | 0.89 | % | | | 0.37 | % | | | 0.90 | % | | | 112 | % |
| 2010 | | | 11.19 | | | | 0.06 | | | | 0.69 | | | | (0.06 | )* | | | — | | | | 11.88 | | | | 6.69 | | | | 56,809 | | | | 0.94 | | | | 0.51 | | | | 0.95 | | | | 105 | |
| 2009 | | | 12.19 | | | | 0.11 | | | | (1.00 | ) | | | (0.11 | )** | | | — | | | | 11.19 | | | | (7.08 | ) | | | 50,425 | | | | 0.98 | | | | 1.15 | | | | 0.99 | | | | 93 | |
| 2008 | | | 18.48 | | | | 0.14 | | | | (3.84 | ) | | | (0.14 | ) | | | (2.45 | ) | | | 12.19 | | | | (22.73 | ) | | | 74,997 | | | | 0.97 | | | | 0.98 | | | | 0.94 | | | | 143 | |
| 2007 | | | 18.17 | | | | 0.18 | | | | 1.89 | | | | (0.18 | ) | | | (1.58 | ) | | | 18.48 | | | | 11.93 | | | | 102,232 | | | | 0.99 | | | | 0.98 | | | | 1.02 | | | | 116 | |
| Class N (commenced operations on December 30, 2002) | |
| 2011 | | $ | 11.92 | | | $ | 0.02 | | | $ | (0.56 | ) | | $ | (0.01 | ) | | $ | — | | | $ | 11.37 | | | | (4.50 | )% | | $ | 4,842 | | | | 1.14 | % | | | 0.11 | % | | | 1.40 | % | | | 112 | % |
| 2010 | | | 11.22 | | | | 0.03 | | | | 0.70 | | | | (0.03 | ) | | | — | | | | 11.92 | | | | 6.50 | | | | 6,610 | | | | 1.19 | | | | 0.26 | | | | 1.45 | | | | 105 | |
| 2009 | | | 12.22 | | | | 0.09 | | | | (1.00 | ) | | | (0.09 | ) | | | — | | | | 11.22 | | | | (7.30 | ) | | | 5,560 | | | | 1.23 | | | | 0.91 | | | | 1.49 | | | | 93 | |
| 2008 | | | 18.52 | | | | 0.11 | | | | (3.85 | ) | | | (0.11 | ) | | | (2.45 | ) | | | 12.22 | | | | (22.93 | ) | | | 7,102 | | | | 1.22 | | | | 0.74 | | | | 1.19 | | | | 143 | |
| 2007 | | | 18.21 | | | | 0.13 | | | | 1.89 | | | | (0.13 | ) | | | (1.58 | ) | | | 18.52 | | | | 11.62 | | | | 10,400 | | | | 1.27 | | | | 0.73 | | | | 1.24 | | | | 116 | |
| † | Per share calculations are based on Average Shares outstanding throughout the period. |
| ‡ | Returns are for the period indicated and have not been annualized. Fee waivers are in effect; if they had not been in effect, performance would have been lower. Returns shown do not reflect the deduction of taxes that a shareholder would pay on fund distributions or the redemption of fund shares. |
| * | Includes return of capital less than $0.01 per share. |
| ** | Includes return of capital of $0.01 per share. |
| (1) | Annualized for periods less than one year. |
| (2) | Ratio includes waivers and previously waived investment advisory fees recovered. The impact of the recovered fees may cause a higher net expense ratio. |
Amounts designated as “—” are either $0 or have been rounded to $0.
See accompanying notes to financial statements.
CNI CHARTER FUNDS | PAGE 94
| | Net Asset Value Beginning of Period | | | Net Investment Income (Loss)† | | | Net Realized and Unrealized Gains (Losses) on Securities† | | | Dividends from Net Investment Income | | | Distri- butions from Realized Capital Gains | | | Net Asset Value End of Period | | | | | | Net Assets End of Period (000) | | | Ratio of Expenses to Average Net Assets (1)(2) | | | Ratio of Net Investment Income (Loss) to Average Net Assets(1) | | | Ratio of Expenses to Average Net Assets (Excluding Waivers & Recovered Fees)(1) | | | | |
| Large Cap Value Equity Fund | |
| Institutional Class (commenced operations on January 14, 2000) | |
| 2011 | | $ | 7.68 | | | $ | 0.11 | | | $ | (0.27 | ) | | $ | (0.11 | ) | | $ | — | | | $ | 7.41 | | | | (2.20 | )% | | $ | 90,305 | | | | 0.96 | % | | | 1.34 | % | | | 0.97 | % | | | 43 | % |
| 2010 | | | 7.28 | | | | 0.10 | | | | 0.40 | | | | (0.10 | ) | | | — | | | | 7.68 | | | | 6.85 | | | | 94,725 | | | | 0.96 | | | | 1.29 | | | | 0.97 | | | | 26 | |
| 2009 | | | 8.25 | | | | 0.13 | | | | (0.98 | ) | | | (0.12 | ) | | | — | | | | 7.28 | | | | (10.03 | ) | | | 81,308 | | | | 0.96 | | | | 2.11 | | | | 0.97 | | | | 18 | |
| 2008 | | | 11.21 | | | | 0.16 | | | | (2.48 | ) | | | (0.15 | ) | | | (0.49 | ) | | | 8.25 | | | | (21.57 | ) | | | 88,361 | | | | 0.95 | | | | 1.64 | | | | 0.96 | | | | 36 | |
| 2007 | | | 10.36 | | | | 0.19 | | | | 1.38 | | | | (0.19 | ) | | | (0.53 | ) | | | 11.21 | | | | 15.60 | | | | 110,024 | | | | 0.96 | | | | 1.73 | | | | 0.97 | | | | 24 | |
| Class N (commenced operations on April 13, 2000) | |
| 2011 | | $ | 7.67 | | | $ | 0.09 | | | $ | (0.27 | ) | | $ | (0.09 | ) | | $ | — | | | $ | 7.40 | | | | (2.45 | )% | | $ | 9,064 | | | | 1.21 | % | | | 1.09 | % | | | 1.22 | % | | | 43 | % |
| 2010 | | | 7.27 | | | | 0.08 | | | | 0.40 | | | | (0.08 | ) | | | — | | | | 7.67 | | | | 6.59 | | | | 10,089 | | | | 1.21 | | | | 1.03 | | | | 1.22 | | | | 26 | |
| 2009 | | | 8.24 | | | | 0.12 | | | | (0.98 | ) | | | (0.11 | ) | | | — | | | | 7.27 | | | | (10.27 | ) | | | 8,960 | | | | 1.21 | | | | 1.89 | | | | 1.22 | | | | 18 | |
| 2008 | | | 11.19 | | | | 0.13 | | | | (2.46 | ) | | | (0.13 | ) | | | (0.49 | ) | | | 8.24 | | | | (21.72 | ) | | | 11,712 | | | | 1.20 | | | | 1.38 | | | | 1.21 | | | | 36 | |
| 2007 | | | 10.35 | | | | 0.16 | | | | 1.37 | | | | (0.16 | ) | | | (0.53 | ) | | | 11.19 | | | | 15.24 | | | | 17,190 | | | | 1.21 | | | | 1.47 | | | | 1.22 | | | | 24 | |
Large Cap Growth Equity Fund | |
| Institutional Class (commenced operations on January 14, 2000) | |
| 2011 | | $ | 7.67 | | | $ | 0.01 | | | $ | (0.23 | ) | | $ | (0.01 | ) | | $ | — | | | $ | 7.44 | | | | (2.86 | )% | | $ | 34,387 | | | | 0.99 | % | | | 0.14 | % | | | 1.00 | % | | | 82 | % |
| 2010 | | | 7.08 | | | | 0.04 | | | | 0.59 | | | | (0.04 | ) | | | — | | | | 7.67 | | | | 8.89 | | | | 31,317 | | | | 0.99 | | | | 0.52 | | | | 1.00 | | | | 61 | |
| 2009 | | | 7.38 | | | | 0.04 | | | | (0.30 | ) | | | (0.04 | ) | | | — | | | | 7.08 | | | | (3.36 | ) | | | 28,050 | | | | 0.99 | | | | 0.70 | | | | 1.00 | | | | 12 | |
| 2008 | | | 8.86 | | | | 0.03 | | | | (1.48 | ) | | | (0.03 | ) | | | — | | | | 7.38 | | | | (16.40 | ) | | | 31,074 | | | | 0.98 | | | | 0.35 | | | | 0.99 | | | | 26 | |
| 2007 | | | 7.75 | | | | 0.05 | | | | 1.10 | | | | (0.04 | ) | | | — | | | | 8.86 | | | | 14.91 | | | | 45,784 | | | | 0.99 | | | | 0.52 | | | | 1.00 | | | | 30 | |
| Class N (commenced operations on March 28, 2000) | |
| 2011 | | $ | 7.59 | | | $ | (0.01 | ) | | $ | (0.23 | ) | | $ | (0.00 | )^ | | $ | — | | | $ | 7.35 | | | | (3.11 | )% | | $ | 9,303 | | | | 1.24 | % | | | (0.10 | )% | | | 1.25 | % | | | 82 | % |
| 2010 | | | 7.00 | | | | 0.02 | | | | 0.59 | | | | (0.02 | ) | | | — | | | | 7.59 | | | | 8.72 | | | | 9,271 | | | | 1.24 | | | | 0.27 | | | | 1.25 | | | | 61 | |
| 2009 | | | 7.31 | | | | 0.03 | | | | (0.31 | ) | | | (0.03 | ) | | | — | | | | 7.00 | | | | (3.77 | ) | | | 9,120 | | | | 1.24 | | | | 0.45 | | | | 1.25 | | | | 12 | |
| 2008 | | | 8.77 | | | | 0.01 | | | | (1.46 | ) | | | (0.01 | ) | | | — | | | | 7.31 | | | | (16.55 | ) | | | 11,341 | | | | 1.23 | | | | 0.11 | | | | 1.24 | | | | 26 | |
| 2007 | | | 7.68 | | | | 0.01 | | | | 1.10 | | | | (0.02 | ) | | | — | | | | 8.77 | | | | 14.51 | | | | 15,063 | | | | 1.24 | | | | 0.28 | | | | 1.25 | | | | 30 | |
Socially Responsible Equity Fund | |
| Institutional Class (commenced operations on January 3, 2005) | |
| 2011 | | $ | 8.81 | | | $ | 0.12 | | | $ | (0.43 | ) | | $ | (0.12 | ) | | $ | — | | | $ | 8.38 | | | | (3.67 | )% | | $ | 62,193 | | | | 0.88 | % | | | 1.27 | % | | | 0.89 | % | | | 22 | % |
| 2010 | | | 8.20 | | | | 0.09 | | | | 0.61 | | | | (0.09 | )* | | | — | | | | 8.81 | | | | 8.51 | | | | 59,746 | | | | 0.95 | | | | 1.01 | | | | 0.96 | | | | 36 | |
| 2009 | | | 9.51 | | | | 0.12 | | | | (1.30 | ) | | | (0.13 | ) | | | — | | | | 8.20 | | | | (12.11 | ) | | | 52,406 | | | | 0.97 | | | | 1.74 | | | | 0.98 | | | | 48 | |
| 2008 | | | 12.12 | | | | 0.16 | | | | (2.04 | ) | | | (0.15 | ) | | | (0.58 | ) | | | 9.51 | | | | (16.24 | ) | | | 53,256 | | | | 0.99 | | | | 1.51 | | | | 0.90 | | | | 41 | |
| 2007 | | | 10.91 | | | | 0.14 | | | | 1.36 | | | | (0.14 | ) | | | (0.15 | ) | | | 12.12 | | | | 13.89 | | | | 56,490 | | | | 0.94 | | | | 1.19 | | | | 1.00 | | | | 29 | |
| Class N (commenced operations on August 12, 2005) | |
| 2011 | | $ | 8.79 | | | $ | 0.10 | | | $ | (0.42 | ) | | $ | (0.10 | ) | | $ | — | | | $ | 8.37 | | | | (3.80 | )% | | $ | 3,132 | | | | 1.13 | % | | | 1.05 | % | | | 1.39 | % | | | 22 | % |
| 2010 | | | 8.19 | | | | 0.07 | | | | 0.60 | | | | (0.07 | ) | | | — | | | | 8.79 | | | | 8.15 | | | | 2,424 | | | | 1.20 | | | | 0.81 | | | | 1.46 | | | | 36 | |
| 2009 | | | 9.50 | | | | 0.11 | | | | (1.31 | ) | | | (0.11 | ) | | | — | | | | 8.19 | | | | (12.34 | ) | | | 1,101 | | | | 1.22 | | | | 1.49 | | | | 1.48 | | | | 48 | |
| 2008 | | | 12.11 | | | | 0.14 | | | | (2.05 | ) | | | (0.12 | ) | | | (0.58 | ) | | | 9.50 | | | | (16.46 | ) | | | 885 | | | | 1.24 | | | | 1.26 | | | | 1.15 | | | | 41 | |
| 2007 | | | 10.90 | | | | 0.12 | | | | 1.36 | | | | (0.11 | ) | | | (0.16 | ) | | | 12.11 | | | | 13.64 | | | | 741 | | | | 1.19 | | | | 0.94 | | | | 1.25 | | | | 29 | |
CSC Small Cap Value Fund(3) | |
| Institutional Class (commenced operations on October 3, 2001) | |
| 2011 | | $ | 20.77 | | | $ | (0.05 | ) | | $ | (1.47 | ) | | $ | (0.07 | ) | | $ | — | | | $ | 19.18 | | | | (7.38 | )% | | $ | 1,660 | | | | 1.19 | % | | | (0.23 | )% | | | 1.20 | % | | | 50 | % |
| 2010 | | | 18.46 | | | | 0.08 | | | | 2.23 | | | | — | | | | — | | | | 20.77 | | | | 12.51 | | | | 3,331 | | | | 1.20 | | | | 0.40 | | | | 1.21 | | | | 48 | |
| 2009 | | | 16.42 | | | | (0.02 | ) | | | 2.35 | | | | (0.29 | ) | | | — | | | | 18.46 | | | | 15.20 | | | | 2,317 | | | | 1.19 | | | | (0.13 | ) | | | 1.20 | | | | 62 | |
| 2008 | | | 30.79 | | | | 0.19 | | | | (9.57 | ) | | | — | | | | (4.99 | ) | | | 16.42 | | | | (35.01 | ) | | | 1,742 | | | | 1.19 | | | | 0.85 | | | | 1.20 | | | | 78 | |
| 2007 | | | 28.25 | | | | 0.02 | | | | 3.00 | | | | (0.01 | ) | | | (0.47 | ) | | | 30.79 | | | | 10.65 | | | | 9,062 | | | | 1.19 | | | | 0.08 | | | | 1.20 | | | | 57 | |
| Class N (commenced operations on October 3, 2001) | |
| 2011 | | $ | 20.33 | | | $ | (0.11 | ) | | $ | (1.43 | ) | | $ | (0.02 | ) | | $ | — | | | $ | 18.77 | | | | (7.61 | )% | | $ | 4,048 | | | | 1.44 | % | | | (0.49 | )% | | | 1.45 | % | | | 50 | % |
| 2010 | | | 18.12 | | | | 0.02 | | | | 2.19 | | | | — | | | | — | | | | 20.33 | | | | 12.20 | | | | 4,760 | | | | 1.45 | | | | 0.12 | | | | 1.46 | | | | 48 | |
| 2009 | | | 16.14 | | | | (0.05 | ) | | | 2.30 | | | | (0.27 | ) | | | — | | | | 18.12 | | | | 14.91 | | | | 4,226 | | | | 1.44 | | | | (0.37 | ) | | | 1.45 | | | | 62 | |
| 2008 | | | 30.42 | | | | 0.15 | | | | (9.44 | ) | | | — | | | | (4.99 | ) | | | 16.14 | | | | (35.16 | ) | | | 4,262 | | | | 1.44 | | | | 0.70 | | | | 1.45 | | | | 78 | |
| 2007 | | | 27.98 | | | | (0.05 | ) | | | 2.96 | | | | — | | | | (0.47 | ) | | | 30.42 | | | | 10.37 | | | | 9,753 | | | | 1.44 | | | | (0.16 | ) | | | 1.45 | | | | 57 | |
| Class R (commenced operations on September 30, 1998) | |
| 2011 | | $ | 20.37 | | | $ | (0.05 | ) | | $ | (1.43 | ) | | $ | (0.10 | ) | | $ | — | | | $ | 18.79 | | | | (7.35 | )% | | $ | 12,076 | | | | 1.20 | % | | | (0.25 | )% | | | 1.60 | % | | | 50 | % |
| 2010 | | | 18.15 | | | | 0.04 | | | | 2.20 | | | | (0.02 | ) | | | — | | | | 20.37 | | | | 12.33 | | | | 16,508 | | | | 1.33 | | | | 0.23 | | | | 1.73 | | | | 48 | |
| 2009 | | | 16.15 | | | | 0.01 | | | | 2.31 | | | | (0.32 | ) | | | — | | | | 18.15 | | | | 15.50 | | | | 16,755 | | | | 0.97 | | | | 0.08 | | | | 1.55 | | | | 62 | |
| 2008 | | | 30.38 | | | | 0.20 | | | | (9.44 | ) | | | — | | | | (4.99 | ) | | | 16.15 | | | | (35.02 | ) | | | 19,183 | | | | 1.23 | | | | 0.92 | | | | 1.55 | | | | 78 | |
| 2007 | | | 27.93 | | | | (0.05 | ) | | | 2.97 | | | | — | | | | (0.47 | ) | | | 30.38 | | | | 10.43 | | | | 40,944 | | | | 1.44 | | | | (0.17 | ) | | | 1.45 | | | | 57 | |
| † | Per share calculations are based on Average Shares outstanding throughout the period. |
| ‡ | Returns are for the period indicated and have not been annualized. Fee waivers are in effect; if they had not been in effect, performance would have been lower. Total return figures do not include applicable sales loads. Returns shown do not reflect the deduction of taxes that a shareholder would pay on fund distributions or the redemption of fund shares. |
| * | Includes return of capital less than $0.01 per share. |
| ^ | Amount represents less than $0.01 per share. |
| (1) | Annualized for periods less than one year. |
| (2) | Ratio includes waivers and previously waived investment advisory fees recovered. The impact of the recovered fees may cause a higher net expense ratio. |
| (3) | See Note 1 in Notes to Financial Statements. |
Amounts designated as “—” are either $0 or have been rounded to $0.
See accompanying notes to financial statements.
CNI CHARTER FUNDS | PAGE 95
notes to financial statements
CNI Charter Funds, a Delaware statutory trust (the “Trust”), is registered under the Investment Company Act of 1940, as amended (the “1940 Act”), as an open-end management investment company currently offering the following 15 series (each a “Fund” and collectively, the “Funds”): Government Money Market Fund, Prime Money Market Fund, California Tax Exempt Money Market Fund (collectively, the “Money Market Funds”); Limited Maturity Fixed Income Fund, Government Bond Fund, Corporate Bond Fund, California Tax Exempt Bond Fund, Full Maturity Fixed Income Fund, High Yield Bond Fund (collectively, the “Fixed Income Funds”); Multi-Asset Fund; and Diversified Equity Fund, Large Cap Value Equity Fund, Large Cap Growth Equity Fund, Socially Responsible Equity Fund and CSC Small Cap Value Fund (collectively, the “Equity Funds”). The Money Market Funds are registered to offer Institutional, Class N and Class S Shares. The Fixed Income Funds, Equity Funds and Multi-Asset Fund offer Institutional and Class N Shares; in addition, the CSC Small Cap Value Fund offers Class R Shares.
City National Asset Management, Inc. (“CNAM”) serves as the investment manager of the Funds. Prior to January 1, 2011, CCM Advisors, LLC (“CCMA”), an affiliate of CNAM, served as the investment manager to the Limited Maturity Fixed Income Fund (the “Limited Maturity Fund”), Full Maturity Fixed Income Fund (the “Full Maturity Fund”), Diversified Equity Fund (the “Diversified Fund”) and Socially Responsible Equity Fund (the “Socially Responsible Fund”). Effective January 1, 2011, CCMA combined its business with CNAM and CNAM became the investment manager to these Funds.
The assets of each Fund are segregated, and a shareholder’s interest is limited to the Fund in which shares are held. Each Fund is diversified with the exception of the California Tax Exempt Bond Fund, which is non-diversified. The Funds’ prospectus provides descriptions of each Fund’s investment objectives, policies and strategies.
Effective July 1, 2011, Cove Street Capital, LLC (“Cove Street”) serves as the investment sub-adviser to the CSC Small Cap Value Fund. On May 19, 2011, the Board of Trustees of the Trust, including the trustees of the Trust (each a “Trustee”) who are not “interested persons” of the Trust, as defined in the 1940 Act, unanimously approved the appointment of Cove Street to serve as sub-adviser to the RCB Small Cap Value Fund following a change in control of the previous sub-adviser, Reed, Conner & Birdwell, LLC, that resulted in the automatic termination of the sub-advisory agreement with Reed, Conner & Birdwell, LLC. As a result of the change in sub-adviser, the Board of Trustees approved the change in name of the RCB Small Cap Value Fund to the CSC Small Cap Value Fund.
| 2. | SIGNIFICANT ACCOUNTING POLICIES: |
The following is a summary of significant accounting policies followed by the Funds.
Use of Estimates – The preparation of financial statements in conformity with U.S. generally accepted accounting principles requires management to make estimates and assumptions that affect the reported amounts of assets and liabilities and disclosure of contingent assets and liabilities at the date of the financial statements and the reported amounts of increases and decreases in net assets from operations during the reporting period. Actual results could differ from those estimates.
Security Valuation – Securities listed on a securities exchange, market or automated quotation system for which quotations are readily available (except for securities traded on NASDAQ) are valued at the last quoted sale price on the primary exchange or market (foreign or domestic) on which they are traded, or, if there is no such reported sale, at the most recent quoted bid price. For securities traded on NASDAQ, the NASDAQ Official Closing Price is used. If available, debt securities are priced based upon valuations provided by independent, third-party pricing agents. Such values generally reflect the last reported sales price if the security is actively traded. The third-party pricing agents may also value debt securities at an evaluated bid price by employing methodologies that utilize actual market transactions, broker-supplied valuations, or other methodologies designed to identify the market value for such securities. Debt obligations, including money market funds, with remaining maturities of 60 days or less may be valued at their amortized cost, which approximates market value. The prices for foreign securities are reported in local currency and converted to U.S. dollars using currency exchange rates. Investments in registered investment companies are priced at their daily net asset values. Prices for most securities held in the Funds are provided daily by recognized independent pricing agents. If a security price cannot be obtained from an independent, third-party pricing agent, the Funds seek to obtain a bid price from at least one independent broker.
Securities for which market prices are not “readily available” are valued in accordance with Fair Value Procedures established by the Trust’s Board of Trustees. The Funds’ Fair Value Procedures are implemented through a Fair Value Committee (the “Committee”) designated by the Trust’s Board of Trustees. Some of the more common reasons that may necessitate that a security be valued using Fair Value Procedures include: the security’s trading has been halted or suspended; the security has been de-
CNI CHARTER FUNDS | PAGE 96
listed from a national exchange; the security’s primary trading market is temporarily closed at a time when under normal conditions it would be open; for international securities, market events occur after the close of the foreign markets that make closing prices not representative of fair value; or the security’s primary pricing source is not able or willing to provide a price. When a security is valued in accordance with the Fair Value Procedures, the Committee will determine the value after taking into consideration relevant information reasonably available to the Committee.
In accordance with U.S. generally accepted accounting principles, the objective of a fair value measurement is to determine the price that would be received to sell an asset or paid to transfer a liability in an orderly transaction between market participants at the measurement date (an exit price). Accordingly, the fair value hierarchy gives the highest priority to quoted prices (unadjusted) in active markets for identical assets or liabilities (Level 1) and the lowest priority to unobservable inputs (Level 3). The three levels of the fair value hierarchy are described below:
| | • | Level 1 — Unadjusted quoted prices in active markets for identical, unrestricted assets or liabilities that the Funds have the ability to access at the measurement date; |
| | • | Level 2 — Quoted prices which are not active, or inputs that are observable (either directly or indirectly) for substantially the full term of the asset or liability; and |
| | • | Level 3 — Prices, inputs or exotic modeling techniques which are both significant to the fair value measurement and unobservable (supported by little or no market activity). |
Investments are classified within the level of the lowest significant input considered in determining fair value. Investments classified within Level 3 whose fair value measurement considers several inputs may include Level 1 or Level 2 inputs as components of the overall fair value measurement.
In May 2011, the FASB issued ASU No. 2011-04 “Amendments to Achieve Common Fair Value Measurement and Disclosure Requirements in U.S. GAAP and International Financial Reporting Standards (“IFRS”)”. ASU 2011-04 includes common requirements for measurement of and disclosure about fair value between U.S. GAAP and IFRS. ASU 2011-04 will require reporting entities to disclose the following information for fair value measurements categorized within Level 3 of the fair value hierarchy: quantitative information about the unobservable inputs used in the fair value measurement, the valuation processes used by the reporting entity, and a narrative description of the sensitivity of the fair value measurement to changes in unobservable inputs and the interrelationships between those unobservable inputs. In addition, ASU 2011-04 will require reporting entities to make disclosures about amounts and reasons for all transfers in and out of Level 1 and Level 2 fair value measurements. The new and revised disclosures are effective for interim and annual reporting periods beginning after December 15, 2011. At this time, management is evaluating the implications of ASU 2011-04 and its impact on the financial statements.
For the year ended September 30, 2011, there have been no significant changes to the Funds’ fair valuation methodologies.
Security Transactions and Related Income – Security transactions are accounted for on the trade date of the security purchase or sale. Costs used in determining net realized capital gains and losses on the sale of securities are those of the specific securities sold. Interest income is recognized on an accrual basis and dividend income is recognized on the ex-dividend date. Purchase discounts and premiums on securities held by the Funds are accreted and amortized to maturity using the scientific method, which approximates the effective interest method over the holding period of a security, except for the Money Market Funds, which use a straight line basis which is not materially different from the scientific method.
Repurchase Agreements – Securities pledged as collateral for repurchase agreements are held by each Fund’s custodian bank, U.S. Bank, N.A., until maturity of the repurchase agreements. Provisions of the agreements and procedures adopted by the investment adviser require that the market value of the collateral, including accrued interest thereon, is sufficient in the event of default by the counterparty. The Funds also invest in tri-party repurchase agreements. Securities held as collateral for tri-party repurchase agreements are maintained by the broker’s custodian bank in a segregated account until maturity of the repurchase agreement. Provisions of the agreements require that the market value of the collateral, including accrued interest thereon, is sufficient in the event of default. If the counterparty defaults and the value of the collateral declines or if the counterparty enters into an insolvency proceeding, realization of the collateral by the Fund may be delayed or limited.
TBA Transactions – The Funds may engage in “to be announced” (“TBA”) security transactions. Such transactions involve a commitment by a Fund to purchase or sell securities for a predetermined price or yield, with payment and delivery taking place beyond the customary settlement period. The Funds record TBA securities on the trade date and maintain security positions such that sufficient liquid assets will be available to make payments for the securities purchased.
CNI CHARTER FUNDS | PAGE 97
notes to financial statements
Expense Allocation – Common expenses incurred by the Funds are allocated among the Funds (i) based upon relative average daily net assets, (ii) as incurred on a specific identification basis, or (iii) equally among the Funds, depending on the nature of the expenditure.
Classes – Class-specific expenses are borne by that class. Income, non class-specific expenses, and realized and unrealized gains/losses are allocated to the respective class on the basis of relative net asset value each day.
Dividends and Distributions to Shareholders – Dividends from net investment income are declared daily and paid to shareholders monthly for the Money Market Funds and Fixed Income Funds. Dividends from net investment income are declared and paid quarterly for the Multi-Asset Fund and Equity Funds, except that dividends from net investment income are declared and paid annually for the CSC Small Cap Value Fund. Distributions from net realized capital gains are distributed to shareholders at least annually.
| 3. | ADMINISTRATION, TRANSFER AGENT, DISTRIBUTION AND SHAREHOLDER SERVICES AGREEMENTS: |
Pursuant to an administration agreement dated April 1, 1999, as amended April 1, 2008, January 1, 2009, January 1, 2010 and January 1, 2011 (the “Agreement”), SEI Investments Global Funds Services (the “Administrator”), a wholly owned subsidiary of SEI Investments Company, acts as the Trust’s administrator. Under the terms of the Agreement, the Administrator is entitled to receive an annual fee of 0.065% of aggregate average daily net assets of the Trust not exceeding $2.5 billion, 0.045% of aggregate average daily net assets of the Trust exceeding $2.5 billion but not exceeding $5 billion, 0.025% of aggregate average daily net assets of the Trust exceeding $5 billion but not exceeding $7.5 billion, and 0.02% of aggregate average daily net assets of the Trust exceeding $7.5 billion. Each Fund is subject to a minimum annual fee of $90,000, which may be reduced at the sole discretion of the Administrator.
The Trust has adopted a Rule 12b-1 Distribution Plan (“the Plan”) with respect to Class N, Class S and Class R Shares that allows each Fund to pay distribution and servicing fees. Pursuant to the Plan, SEI Investments Distribution Co. (the “Distributor”) receives a distribution fee, computed daily and paid monthly, at the annual rate of 0.50% of the average daily net assets of the Class N Shares and Class S Shares of the Money Market Funds and 0.25% of the Class N Shares of the Fixed Income Funds, Multi-Asset Fund and Equity Funds and the Class R Shares of the CSC Small Cap Value Fund, with the exception of 0.30% charged to the Class N Shares of the High Yield Bond Fund, which may be used by the Distributor to provide compensation for sales support and distribution-related activities.
Effective October 1, 2009, the CSC Small Cap Value Fund Class R shares voluntarily began waiving 0.14% in 12b-1 fees.
SEI Institutional Transfer Agency, a division of SEI Investments Fund Management Corporation (the “Transfer Agent”), serves as transfer agent for the Trust and provides services at an annual rate of $15,000 per share class. The Transfer Agent has agreed to waive these fees.
As of May 24, 2010, UMB Fund Services serves as sub-transfer agent for Class R shares of the CSC Small Cap Value Fund and all share classes of the Limited Maturity Fund, Full Maturity Fund, Diversified Fund and Socially Responsible Fund, and provides services at an annual rate of $14,000 per share class plus other transaction based fees and out of pocket expenses.
The Trust has entered into Shareholder Servicing Agreements that permit payment of compensation to City National Bank (“CNB”) and its affiliates (including CNAM) which provide certain shareholder support for their customers who own Institutional Class (except for Institutional Class Shares of the Limited Maturity Fixed Income Fund, Full Maturity Fixed Income Fund, Diversified Equity Fund and Socially Responsible Equity Fund), Class N, Class S or Class R Shares. In consideration for such services, a shareholder servicing fee is charged at the annual rate of up to 0.25% of each Fund’s average daily net assets. CNB and CNAM have both agreed to voluntarily waive portions of their shareholder servicing fees with respect to certain Funds. For the year ended September 30, 2011, CNB and CNAM received Shareholder Servicing fees from the Trust in the amounts of $6,563,706 and $5,105, respectively.
Certain officers of the Trust are also officers of CNAM or the Administrator. Such officers are paid no fees by the Trust for serving as officers of the Trust.
CNI CHARTER FUNDS | PAGE 98
| 4. | INVESTMENT ADVISORY FEES AND OTHER AGREEMENTS: |
Under the terms of the current investment management agreements, CNAM receives an annual fee equal to a percentage of the average daily net assets of the Funds, as follows:
| |
| Government Money Market Fund | 0.26% |
| Prime Money Market Fund | 0.25 |
| California Tax Exempt Money Market Fund | 0.27 |
| Limited Maturity Fund | 0.50 |
| Government Bond Fund | 0.43 |
| Corporate Bond Fund | 0.40 |
| California Tax Exempt Bond Fund | 0.27 |
| Full Maturity Fund | 0.50 |
| High Yield Bond Fund | 0.75 |
| Multi-Asset Fund | 0.50 |
| Diversified Fund | 0.75 |
| Large Cap Value Equity Fund | 0.62 |
| Large Cap Growth Equity Fund | 0.65 |
| Socially Responsible Fund | 0.75 |
| |
Robert W. Baird & Co., Incorporated and Boyd Watterson Asset Management, LLC act as the investment sub-advisers with respect to the Full Maturity Fund.
Guggenheim Investment Management, LLC acts as the investment sub-adviser with respect to the High Yield Bond Fund.
SKBA Capital Management, LLC and Turner Investment Partners, Inc. act as the investment sub-advisers with respect to the Diversified Fund.
SKBA Capital Management, LLC acts as the investment sub-adviser with respect to the Socially Responsible Fund.
Cove Street Capital, LLC acts as the investment sub-adviser with respect to the CSC Small Cap Value Fund.
Sub-adviser fees are paid by CNAM.
CNAM has agreed to limit its fees or reimburse expenses to the extent necessary to keep operating expenses at or below certain percentages of certain of the Funds’ respective average daily net assets. For the Limited Maturity Fixed Income Fund, Full Maturity Fixed Income Fund, Diversified Equity Fund and Socially Responsible Equity Fund the expense limitations are contractual and for the other funds they are voluntary. In the case of the CSC Small Cap Value Fund, the Fund’s sub-adviser has contractually agreed to limit its fees or reimburse expenses to meet the expense limitations. The expense limitations (expressed as percentages of average daily net assets) are as follows:
| Government Money Market Fund | | California Tax Exempt Money Market Fund | |
| Institutional Class | 0.63% | 0.63% | 0.55% | |
| Class N | 0.85% | 0.85% | 0.78% | |
| | | | |
| Limited Maturity Fixed Income Fund | | | California Tax Exempt Bond Fund |
| Institutional Class | 1.00% | 0.80% | 0.80% | 0.60% |
| | | | |
| Full Maturity Fixed Income Fund | | | |
| Institutional Class | 1.00% | 1.10% | 1.50% | 1.25% |
| | | | |
| Large Cap Value Equity Fund | Large Cap Growth Equity Fund | Socially Responsible Equity Fund | |
| Institutional Class | 1.00% | 1.05% | 1.25% | 1.24% |
| Class N | 1.25% | 1.30% | 1.50% | 1.49% |
| | | | |
Any fee reductions or expense reimbursements may be repaid by a Fund to CNAM or the CSC Small Cap Value Fund’s sub-adviser, as applicable, within three years after occurrence, subject to certain restrictions and only if such repayments do not cause the Fund’s expense ratios, at the time of repayment, to exceed the applicable amount shown in the preceding table.
During the year ended September 30, 2011, the Board of Trustees approved the reimbursement to CNAM of fees previously waived by CNAM in the amount of $595 with respect to the Corporate Bond Fund.
CNI CHARTER FUNDS | PAGE 99
notes to financial statements
As of September 30, 2011, fees which were previously waived by CNAM which may be subject to possible future reimbursement were as follows:
| Potential Amount of Recovery (000) | |
| Government Money Market Fund | $2,210 | | 2012 |
| | 5,102 | | 2013 |
| | 6,470 | | 2014 |
| Prime Money Market Fund | 880 | | 2012 |
| | 1,372 | | 2013 |
| | 1,533 | | 2014 |
| California Tax Exempt Money Market Fund | 1,568 | | 2012 |
| | 1,560 | | 2013 |
| | 1,775 | | 2014 |
| Government Bond Fund | 49 | | 2012 |
| | 101 | | 2013 |
| | 122 | | 2014 |
| California Tax Exempt Bond Fund | 39 | | 2012 |
| | 46 | | 2013 |
| | 56 | | 2014 |
| High Yield Bond Fund | 25 | | 2012 |
| | 43 | | 2013 |
| | 67 | | 2014 |
CNAM, CNB and the Administrator have voluntarily agreed to further waive and reduce their fees and/or reimburse certain expenses of the Money Market Funds in order to maintain a one-day net income yield (yield floor) of each Fund of not less than 0.01% of the Fund’s average daily net assets. The following table shows waivers, with respect to such yield floor, by class for the year ended September 30, 2011:
| | | Shareholder Servicing Fee Waiver (000) | | | Investment Advisory Fee Waiver (000) | | | Administration Fee Waiver (000) | |
| Government Money Market Fund | | | | | | | |
| Institutional | | $ | 184 | | | $ | 153 | | | $ | 5 | |
| Class N | | | 12,911 | (1) | | | 5,641 | | | | 197 | |
| | | 2,187 | (1) | | | 676 | | | | 24 | |
| | | | | | | | | | | | | |
| Prime Money Market Fund | | | | | | | | | | | | |
| Institutional | | | 1,462 | | | | 687 | | | | 43 | |
| Class N | | | 2,075 | (1) | | | 492 | | | | 33 | |
| | | 2,103 | (1) | | | 354 | | | | 24 | |
| | | | | | | | | | | | | |
| California Tax Exempt Money Market Fund | | | | | | | | | |
| Institutional | | | 376 | | | | 200 | | | | 11 | |
| Class N | | | 3,335 | (1) | | | 908 | | | | 52 | |
| | | 450 | (1) | | | 94 | | | | 5 | |
| (1) | Includes class specific distribution expenses. |
| 5. | INVESTMENT TRANSACTIONS: |
The cost of security purchases and proceeds from the sale and maturities of securities, other than temporary investments in short-term securities for the year ended September 30, 2011, were as follows for the Fixed Income Funds, Multi-Asset Fund and Equity Funds:
| | | | | | |
| | | | | | | | | | | | |
| Limited Maturity Fixed Income Fund | | $ | 11,411 | | | $ | 6,919 | | | $ | 11,156 | | | $ | 10,163 | |
| Government Bond Fund | | | 126,006 | | | | 16,285 | | | | 119,524 | | | | 4,276 | |
| Corporate Bond Fund | | | — | | | | 49,040 | | | | 602 | | | | 42,792 | |
| California Tax Exempt Bond Fund | | | — | | | | 26,112 | | | | — | | | | 12,487 | |
| Full Maturity Fixed Income Fund | | | 12,252 | | | | 6,862 | | | | 12,234 | | | | 11,529 | |
| High Yield Bond Fund | | | — | | | | 71,443 | | | | — | | | | 37,942 | |
| Multi-Asset Fund | | | — | | | | 30,517 | * | | | — | | | | 21,866 | * |
| Diversified Equity Fund | | | — | | | | 73,418 | | | | — | | | | 82,687 | |
| Large Cap Value Equity Fund | | | — | | | | 48,003 | | | | — | | | | 46,535 | |
| Large Cap Growth Equity Fund | | | — | | | | 47,723 | | | | — | | | | 41,394 | |
| Socially Responsible Equity Fund | | | — | | | | 21,962 | | | | — | | | | 14,752 | |
| | | — | | | | 11,156 | | | | — | | | | 16,325 | |
| * | Includes $2,665(000) and $888(000) of purchases and sales, respectively, of affiliated registered investment companies. |
| 6. | FEDERAL TAX INFORMATION: |
It is each Fund’s intention to continue to qualify as a regulated investment company for Federal income tax purposes and distribute all of its taxable income and net capital gains. Accordingly, no provisions for Federal income taxes are required.
Management has analyzed the Funds’ tax position taken on federal income tax returns for all open tax years and has concluded that as of September 30, 2011, no provision for income tax would be required in the Funds’ financial statements. The Funds’ federal and state income and federal excise tax returns for tax years for which the applicable statutes of limitations have not expired are subject to examination by the Internal Revenue Service and state departments of revenue.
The Funds may be subject to taxes imposed by countries in which they invest, with respect to their investments in issuers existing or operating in such countries. Such taxes are generally based on income earned. The Funds accrue such taxes when the related income is earned.
CNI CHARTER FUNDS | PAGE 100
The timing and characterization of certain income and capital gains distributions are determined annually in accordance with Federal tax regulations, which may differ from accounting principles generally accepted in the United States of America. As a result, net investment income (loss) and net realized gain (loss) on investment transactions for a reporting period may differ significantly from distributions during such period. These book/tax differences may be temporary or permanent. To the extent these differences are permanent in nature, they are charged or credited to undistributed net investment income (loss), accumulated net realized gain (loss), or paid-in capital, as appropriate, in the period that the differences arise.
Accordingly, the following permanent differences, primarily attributable to REIT adjustments, corporate action adjustments, realized gains (losses) on paydowns and timing of distributions and investments in partnerships, were reclassified to/from the following accounts as of September 30, 2011:
| | Increase (Decrease) Undistributed Net Investment Income (Loss) (000) | | | Increase (Decrease) Accumulated Net Realized Gain (Loss) (000) | | | Decrease Paid in Capital (000) | |
| Limited Maturity Fixed Income Fund | | $ | 1 | | | $ | (1 | ) | | $ | — | |
| Government Bond Fund | | | 976 | | | | (976 | ) | | | — | |
| Corporate Bond Fund | | | 6 | | | | (6 | ) | | | — | |
| Full Maturity Fixed Income Fund | | | 37 | | | | (37 | ) | | | — | |
| Large Cap Growth Equity Fund | | | 15 | | | | — | | | | (15 | ) |
| CSC Small Cap Value Fund | | | 73 | | | | (18 | ) | | | (55 | ) |
These reclassifications had no effect on net assets or net asset value per share.
The tax character of dividends and distributions paid during the years ended September 30, 2011 and September 30, 2010 were as follows:
| | | | | | | | Long-Term Capital Gain (000) | | | | | | | |
| Government Money Market Fund | |
| 2011 | | $ | — | | | $ | 509 | | | $ | — | | | $ | — | | | $ | 509 | |
| 2010 | | | — | | | | 680 | | | | — | | | | — | | | | 680 | |
| Prime Money Market Fund | |
| 2011 | | | — | | | | 533 | | | | — | | | | — | | | | 533 | |
| 2010 | | | — | | | | 921 | | | | — | | | | — | | | | 921 | |
| California Tax Exempt Money Market Fund | |
| 2011 | | | 163 | | | | 1 | | | | — | | | | — | | | | 164 | |
| 2010 | | | 246 | | | | 9 | | | | — | | | | — | | | | 255 | |
| Limited Maturity Fixed Income Fund | |
| 2011 | | | — | | | | 579 | | | | — | | | | — | | | | 579 | |
| 2010 | | | — | | | | 848 | | | | — | | | | — | | | | 848 | |
| Government Bond Fund | |
| 2011 | | | — | | | | 3,356 | | | | — | | | | — | | | | 3,356 | |
| 2010 | | | — | | | | 3,564 | | | | — | | | | — | | | | 3,564 | |
| Corporate Bond Fund | |
| 2011 | | | — | | | | 3,390 | | | | — | | | | — | | | | 3,390 | |
| 2010 | | | — | | | | 3,307 | | | | — | | | | — | | | | 3,307 | |
| California Tax Exempt Bond Fund | |
| 2011 | | | 1,360 | | | | — | | | | 187 | | | | — | | | | 1,547 | |
| 2010 | | | 1,234 | | | | 1 | | | | — | | | | — | | | | 1,235 | |
| Full Maturity Fixed Income Fund | |
| 2011 | | | — | | | | 1,427 | | | | 110 | | | | — | | | | 1,537 | |
| 2010 | | | — | | | | 1,544 | | | | 195 | | | | — | | | | 1,739 | |
| High Yield Bond Fund | |
| 2011 | | | — | | | | 6,045 | | | | — | | | | — | | | | 6,045 | |
| 2010 | | | — | | | | 4,049 | | | | — | | | | — | | | | 4,049 | |
| Multi-Asset Fund | |
| 2011 | | | — | | | | 662 | | | | — | | | | — | | | | 662 | |
| 2010 | | | — | | | | 521 | | | | — | | | | — | | | | 521 | |
| Diversified Equity Fund | |
| 2011 | | | — | | | | 231 | | | | — | | | | — | | | | 231 | |
| 2010 | | | — | | | | 304 | | | | — | | | | 2 | | | | 306 | |
| Large Cap Value Equity Fund | |
| 2011 | | | — | | | | 1,478 | | | | — | | | | — | | | | 1,478 | |
| 2010 | | | — | | | | 1,234 | | | | — | | | | — | | | | 1,234 | |
| Large Cap Growth Equity Fund | |
| 2011 | | | — | | | | 62 | | | | — | | | | — | | | | 62 | |
| 2010 | | | — | | | | 164 | | | | — | | | | — | | | | 164 | |
| Socially Responsible Equity Fund | |
| 2011 | | | — | | | | 902 | | | | — | | | | — | | | | 902 | |
| 2010 | | | — | | | | 589 | | | | — | | | | — | | | | 589 | |
| CSC Small Cap Value Fund | |
| 2011 | | | — | | | | 91 | | | | — | | | | — | | | | 91 | |
| 2010 | | | — | | | | 14 | | | | — | | | | — | | | | 14 | |
CNI CHARTER FUNDS | PAGE 101
notes to financial statements
As of September 30, 2011, the components of Distributable Earnings/(Accumulated Losses) on a tax basis were as follows:
| | Undistributed Tax-Exempt Income (000) | | | Undistributed Ordinary Income (000) | | | Undistributed Long-Term Capital Gain (000) | | | Capital Loss Carryforwards (000) | | | | | | Unrealized Appreciation (Depreciation) (000) | | | Other Temporary Differences (000) | | | Total Distributable Earnings (Accumulated Losses) (000) | |
| Government Money Market Fund | | $ | — | | | $ | 28 | | | $ | — | | | $ | (5 | ) | | $ | — | | | $ | — | | | $ | (28 | ) | | $ | (5 | ) |
| Prime Money Market Fund | | | — | | | | 17 | | | | — | | | | — | | | | (12 | ) | | | — | | | | (17 | ) | | | (12 | ) |
| California Tax Exempt Money Market Fund | | | 9 | | | | — | | | | — | | | | — | | | | — | | | | — | | | | (7 | ) | | | 2 | |
| Limited Maturity Fixed Income Fund | | | — | | | | 41 | | | | — | | | | (2,456 | ) | | | — | | | | 503 | | | | (41 | ) | | | (1,953 | ) |
| Government Bond Fund | | | — | | | | 213 | | | | 143 | | | | — | | | | — | | | | 4,080 | | | | (212 | ) | | | 4,224 | |
| Corporate Bond Fund | | | — | | | | 256 | | | | 538 | | | | — | | | | — | | | | 1,976 | | | | (256 | ) | | | 2,514 | |
| California Tax Exempt Bond Fund | | | 62 | | | | 120 | | | | 299 | | | | — | | | | — | | | | 1,555 | | | | (120 | ) | | | 1,916 | |
| Full Maturity Fixed Income Fund | | | — | | | | 157 | | | | 432 | | | | — | | | | — | | | | 2,121 | | | | (99 | ) | | | 2,611 | |
| High Yield Bond Fund | | | — | | | | 621 | | | | — | | | | (1,998 | ) | | | — | | | | (4,729 | ) | | | (621 | ) | | | (6,727 | ) |
| Multi-Asset Fund | | | — | | | | 145 | | | | — | | | | (2,014 | ) | | | — | | | | (2,291 | ) | | | (131 | ) | | | (4,291 | ) |
| Diversified Equity Fund | | | — | | | | 62 | | | | — | | | | (19,423 | ) | | | — | | | | (3,409 | ) | | | (62 | ) | | | (22,832 | ) |
| Large Cap Value Equity Fund | | | — | | | | 383 | | | | — | | | | (3,824 | ) | | | — | | | | (9,346 | ) | | | (383 | ) | | | (13,170 | ) |
| Large Cap Growth Equity Fund | | | — | | | | — | | | | — | | | | (1,195 | ) | | | — | | | | (1,173 | ) | | | — | | | | (2,368 | ) |
| Socially Responsible Equity Fund | | | — | | | | 235 | | | | — | | | | (11,097 | ) | | | (589 | ) | | | (19 | ) | | | (235 | ) | | | (11,705 | ) |
| CSC Small Cap Value Fund | | | — | | | | — | | | | — | | | | (4,233 | ) | | | — | | | | 473 | | | | (1 | ) | | | (3,761 | ) |
For tax purposes, the losses in the Funds can be carried forward for a maximum of eight years to offset any future net realized capital gains. As of September 30, 2011, the breakdown of capital loss carryforwards was as follows:
| Government Money Market Fund | | $ | — | | | $ | — | | | $ | — | | | $ | — | | | $ | — | | | $ | — | | | $ | — | | | $ | 5 | |
| Limited Maturity Fixed Income Fund | | | — | | | | 502 | | | | 132 | | | | 1,415 | | | | — | | | | 81 | | | | 326 | | | | — | |
| High Yield Bond Fund | | | — | | | | — | | | | — | | | | — | | | | — | | | | 257 | | | | 1,741 | | | | — | |
| Multi-Asset Fund | | | — | | | | — | | | | — | | | | — | | | | — | | | | 686 | | | | 1,328 | | | | — | |
| Diversified Equity Fund | | | — | | | | — | | | | — | | | | — | | | | — | | | | 6,090 | | | | 13,333 | | | | — | |
| Large Cap Value Equity Fund | | | — | | | | — | | | | — | | | | — | | | | — | | | | — | | | | 3,824 | | | | — | |
| Large Cap Growth Equity Fund | | | 67 | | | | — | | | | — | | | | — | | | | — | | | | — | | | | 1,128 | | | | — | |
| Socially Responsible Equity Fund | | | — | | | | — | | | | — | | | | — | | | | 81 | | | | 2,161 | | | | 7,193 | | | | 1,662 | |
| CSC Small Cap Value Fund | | | — | | | | — | | | | — | | | | — | | | | — | | | | — | | | | 4,233 | | | | — | |
During the year ended September 30, 2011, the following Funds had utilized capital loss carryforwards to offset capital gains amounting to:
| |
| Limited Maturity Fund | $358 | |
| Government Bond Fund | 26 | |
| Corporate Bond Fund | 519 | |
| High Yield Bond Fund | 1,364 | |
| Multi-Asset Fund Fund | 1,623 | |
| Diversified Equity Fund | 4,494 | |
| Large Cap Value Equity Fund | 4,641 | |
| Large Cap Growth Equity Fund | 2,812 | |
| | |
Under the recently enacted Regulated Investment Company Modernization Act of 2010, Funds will be permitted to carry forward capital losses incurred in taxable years beginning after December 22, 2010 for an unlimited period. However, any losses incurred during those future taxable years will be required to be utilized prior to the losses incurred in pre-enactment taxable years. As a result of this ordering rule, pre-enactment capital loss carryforwards may be more likely to expire unused. Additionally, post-enactment capital losses that are carried forward will retain their character as either short-term or long-term capital losses rather than being considered all short-term as under previous law.
CNI CHARTER FUNDS | PAGE 102
Post-October losses represent losses realized on investments and foreign currency transactions from November 1, 2010, through September 30, 2011, that, in accordance with Federal income tax regulations, the Funds have elected to defer and treat as having arisen in the following fiscal year.
The aggregate gross unrealized appreciation on securities, the aggregate gross unrealized depreciation on securities and the net unrealized appreciation/ (depreciation) for tax purposes at September 30, 2011, for each of the Fixed Income Funds, Equity Funds and Multi-Asset Fund were as follows:
| | | | | Aggregate Gross Unrealized Appreciation (000) | | | Aggregate Gross Unrealized Depreciation (000) | | | Net Unrealized Appreciation (Deprecation) (000) | |
| Limited Maturity Fixed Income Fund | | $ | 37,395 | | | $ | 693 | | | $ | (190 | ) | | $ | 503 | |
| Government Bond Fund | | | 174,548 | | | | 4,262 | | | | (182 | ) | | | 4,080 | |
| Corporate Bond Fund | | | 111,018 | | | | 3,008 | | | | (1,032 | ) | | | 1,976 | |
| California Tax Exempt Bond Fund | | | 55,030 | | | | 1,634 | | | | (79 | ) | | | 1,555 | |
| Full Maturity Fixed Income Fund | | | 42,171 | | | | 2,236 | | | | (115 | ) | | | 2,121 | |
| High Yield Bond Fund | | | 101,196 | | | | 1,145 | | | | (5,874 | ) | | | (4,729 | ) |
| Multi Asset Fund | | | 47,583 | | | | 72 | | | | (2,363 | ) | | | (2,291 | ) |
| Diversified Equity Fund | | | 58,444 | | | | 2,571 | | | | (5,980 | ) | | | (3,409 | ) |
| Large Cap Value Equity Fund | | | 108,985 | | | | 6,090 | | | | (15,436 | ) | | | (9,346 | ) |
| Large Cap Growth Equity Fund | | | 44,785 | | | | 4,986 | | | | (6,159 | ) | | | (1,173 | ) |
| Socially Responsible Equity Fund | | | 66,432 | | | | 5,888 | | | | (5,907 | ) | | | (19 | ) |
| CSC Small Cap Value Fund | | | 17,407 | | | | 3,258 | | | | (2,785 | ) | | | 473 | |
At September 30, 2011, the Money Market Funds’ cost of securities for Federal income tax purposes approximates the cost disclosed in the Schedule of Investments.
| 7. | CONCENTRATION OF CREDIT RISK |
In the normal course of business, the Funds enter into contracts that provide general indemnifications. The Funds’ maximum exposure under these arrangements is dependent on future claims that may be made against the Funds and, therefore, cannot be established; however, based on experience, the risk of loss from such claims is considered remote.
The Multi-Asset Fund may invest in exchange-traded notes (“ETNs”) as a non-principal investment strategy. ETNs are unsecured debt obligations of investment banks which are traded on exchanges and the returns of which are linked to the performance of market indexes. In addition to trading ETNs on exchanges, investors may redeem ETNs directly with the issuer on a weekly basis, typically in a minimum amount of 50,000 units, or hold the ETNs until maturity. ETNs are riskier than ordinary unsecured debt securities and have no principal protection. The Fund will generally invest in ETNs which are linked to commodities indexes. The Fund’s investment in an ETN may be influenced by many unpredictable factors, including highly volatile commodities prices, changes in supply and demand relationships, weather, agriculture, trade, changes in interest rates, and monetary and other governmental policies, action and inaction. Investing in ETNs is not equivalent to investing directly in index components or the relevant index itself. Because ETNs are debt securities, they possess credit risk; if the issuer has financial difficulties or goes bankrupt, the investor may not receive the return it was promised.
California Tax Exempt Funds – Specific Risks
The ability of issuers to pay interest on, and repay principal of, California municipal securities may be affected by economic and political developments in the State of California.
Certain securities are backed by letters of credit from various financial institutions and financial guaranty assurance agencies. These letters of credit enhance the credit quality of the individual securities; however, if any of the financial institutions or financial guaranty assurance agencies’ credit quality should deteriorate, it could cause the individual security’s credit quality to change. Additionally, if any of the Funds concentrate their letters of credit in any one financial institution, the risk of credit quality deterioration increases.
CNI CHARTER FUNDS | PAGE 103
notes to financial statements
| 8. | CAPITAL SHARES ISSUED AND REDEEMED: |
Capital share activity for the years ended September 30, were as follows:
| | | Government Money Market Fund (000) | | | Prime Money Market Fund (000) | | | California Tax Exempt Money Market Fund (000) | |
| | | | | | | | | | | | | | | | | | | |
| CAPITAL SHARES ISSUED AND REDEEMED: | | | | | | | | | | | | | | | | |
| Institutional Class: | | | | | | | | | | | | | | | | | | |
| Shares issued | | | 468,707 | | | | 618,772 | | | | 2,567,876 | | | | 1,322,472 | | | | 1,057,959 | | | | 1,024,504 | |
Shares issued in Lieu of Dividends and Distributions | | | — | | | | 1 | | | | 51 | | | | 83 | | | | — | | | | — | |
| | | (498,052 | ) | | | (661,586 | ) | | | (2,427,636 | ) | | | (1,375,843 | ) | | | (1,028,266 | ) | | | (1,025,845 | ) |
Net Institutional Class transactions | | | (29,345 | ) | | | (42,813 | ) | | | 140,291 | | | | (53,288 | ) | | | 29,693 | | | | (1,341 | ) |
| Class N: | | | | | | | | | | | | | | | | | | | | | | | | |
| Shares issued | | | 6,046,915 | | | | 4,589,006 | | | | 1,236,194 | | | | 1,396,173 | | | | 1,294,708 | | | | 1,197,782 | |
Shares issued in Lieu of Dividends and Distributions | | | 374 | | | | 504 | | | | 93 | | | | 195 | | | | 117 | | | | 178 | |
| | | (5,719,187 | ) | | | (4,540,616 | ) | | | (1,218,312 | ) | | | (1,620,744 | ) | | | (1,305,501 | ) | | | (1,263,962 | ) |
| | | 328,102 | | | | 48,894 | | | | 17,975 | | | | (224,376 | ) | | | (10,676 | ) | | | (66,002 | ) |
| Class S: | | | | | | | | | | | | | | | | | | | | | | | | |
| Shares issued | | | 849,467 | | | | 990,276 | | | | 1,490,167 | | | | 1,102,036 | | | | 301,856 | | | | 145,553 | |
Shares issued in Lieu of Dividends and Distributions | | | — | | | | — | | | | — | | | | — | | | | — | | | | — | |
| | | (906,968 | ) | | | (940,420 | ) | | | (1,577,615 | ) | | | (1,122,183 | ) | | | (271,899 | ) | | | (171,685 | ) |
| | | (57,501 | ) | | | 49,856 | | | | (87,448 | ) | | | (20,147 | ) | | | 29,957 | | | | (26,132 | ) |
| | | Limited Maturity Fixed Income Fund (000) | | | Government Bond Fund (000) | | | | | | California Tax Exempt Bond Fund (000) | |
| | | | | | | | | | | | | | | | | | | | | | | | | |
| CAPITAL SHARES ISSUED AND REDEEMED: | | | | | | | | | | | | | | | | | | | |
| Institutional Class: | | | | | | | | | | | | | | | | | | | | | | | | |
| Shares issued | | | 210 | | | | 2,399 | | | | 5,375 | | | | 11,176 | | | | 3,825 | | | | 3,350 | | | | 2,513 | | | | 1,143 | |
| Shares issued in Lieu of Dividends and Distributions | | | 28 | | | | 48 | | | | 227 | | | | 217 | | | | 99 | | | | 84 | | | | 66 | | | | 47 | |
| | | (358 | ) | | | (2,846 | ) | | | (3,818 | ) | | | (3,622 | ) | | | (3,090 | ) | | | (2,143 | ) | | | (1,349 | ) | | | (1,061 | ) |
Net Institutional Class transactions | | | (120 | ) | | | (399 | ) | | | 1,784 | | | | 7,771 | | | | 834 | | | | 1,291 | | | | 1,230 | | | | 129 | |
| Class N: | | | | | | | | | | | | | | | | | | | | | | | | | | | | | | | | |
| Shares issued | | | 763 | | | | 970 | | | | 50 | | | | 168 | | | | 100 | | | | 227 | | | | 145 | | | | 282 | |
| Shares issued in Lieu of Dividends and Distributions | | | 5 | | | | 9 | | | | 3 | | | | 3 | | | | 3 | | | | 2 | | | | 6 | | | | 3 | |
| | | (1,021 | ) | | | (286 | ) | | | (84 | ) | | | (160 | ) | | | (88 | ) | | | (104 | ) | | | (33 | ) | | | (156 | ) |
| | | (253 | ) | | | 693 | | | | (31 | ) | | | 11 | | | | 15 | | | | 125 | | | | 118 | | | | 129 | |
CNI CHARTER FUNDS | PAGE 104
| 8. | CAPITAL SHARES ISSUED AND REDEEMED (CONTINUED): |
| | | Full Maturity Fixed Income Fund (000) | | | High Yield Bond Fund (000) | | | | | | Diversified Equity Fund (000) | |
| | | | | | | | | | | | | | | | | | | | | | | | | |
| CAPITAL SHARES ISSUED AND REDEEMED: | | | | | | | | | | | | | | | | | | | |
| Institutional Class: | | | | | | | | | | | | | | | | | | | | | | | | |
| Shares issued | | | 103 | | | | 415 | | | | 6,022 | | | | 2,887 | | | | 1,023 | | | | 499 | | | | 271 | | | | 725 | |
| Shares issued in Lieu of Dividends and Distributions | | | 113 | | | | 129 | | | | 147 | | | | 126 | | | | 21 | | | | 15 | | | | 11 | | | | 21 | |
| | | (385 | ) | | | (126 | ) | | | (1,989 | ) | | | (1,103 | ) | | | (198 | ) | | | (282 | ) | | | (647 | ) | | | (471 | ) |
Net Institutional Class transactions | | | (169 | ) | | | 418 | | | | 4,180 | | | | 1,910 | | | | 846 | | | | 232 | | | | (365 | ) | | | 275 | |
| Class N: | | | | | | | | | | | | | | | | | | | | | | | | | | | | | | | | |
| Shares issued | | | 233 | | | | 311 | | | | 992 | | | | 511 | | | | 964 | | | | 720 | | | | 39 | | | | 136 | |
| Shares issued in Lieu of Dividends and Distributions | | | 6 | | | | 8 | | | | 159 | | | | 153 | | | | 21 | | | | 18 | | | | — | | | | 1 | |
| | | (544 | ) | | | (73 | ) | | | (446 | ) | | | (372 | ) | | | (439 | ) | | | (320 | ) | | | (168 | ) | | | (78 | ) |
| | | (305 | ) | | | 246 | | | | 705 | | | | 292 | | | | 546 | | | | 418 | | | | (129 | ) | | | 59 | |
| | | Large Cap Value Equity Fund (000) | | | Large Cap Growth Equity Fund (000) | | | Socially Responsible Equity Fund (000) | | | CSC Small Cap Value Fund (000) | |
| | | | | | | | | | | | | | | | | | | | | | | | | |
| CAPITAL SHARES ISSUED AND REDEEMED: | | | | | | | | | | | | | | | | | | |
| Institutional Class: | | | | | | | | | | | | | | | | | | | | | | | | |
| Shares issued | | | 2,893 | | | | 3,000 | | | | 2,163 | | | | 1,180 | | | | 1,674 | | | | 1,303 | | | | 22 | | | | 60 | |
| Shares issued in Lieu of Dividends and Distributions | | | 124 | | | | 108 | | | | 3 | | | | 6 | | | | 91 | | | | 66 | | | | — | | | | — | |
| | | (3,161 | ) | | | (1,944 | ) | | | (1,627 | ) | | | (1,066 | ) | | | (1,127 | ) | | | (974 | ) | | | (96 | ) | | | (25 | ) |
Net Institutional Class transactions | | | (144 | ) | | | 1,164 | | | | 539 | | | | 120 | | | | 638 | | | | 395 | | | | (74 | ) | | | 35 | |
| Class N: | | | | | | | | | | | | | | | | | | | | | | | | | | | | | | | | |
| Shares issued | | | 73 | | | | 214 | | | | 172 | | | | 96 | | | | 189 | | | | 172 | | | | 5 | | | | 18 | |
| Shares issued in Lieu of Dividends and Distributions | | | 9 | | | | 9 | | | | — | | | | 2 | | | | 4 | | | | 2 | | | | — | | | | — | |
| | | (172 | ) | | | (140 | ) | | | (128 | ) | | | (178 | ) | | | (95 | ) | | | (33 | ) | | | (23 | ) | | | (17 | ) |
| | | (90 | ) | | | 83 | | | | 44 | | | | (80 | ) | | | 98 | | | | 141 | | | | (18 | ) | | | 1 | |
| Class R: | | | | | | | | | | | | | | | | | | | | | | | | | | | | | | | | |
| Shares issued | | | — | | | | — | | | | — | | | | — | | | | — | | | | — | | | | 19 | | | | 36 | |
| Shares issued in Lieu of Dividends and Distributions | | | — | | | | — | | | | — | | | | — | | | | — | | | | — | | | | 3 | | | | 1 | |
| | | — | | | | — | | | | — | | | | — | | | | — | | | | — | | | | (190 | ) | | | (150 | ) |
| | | — | | | | — | | | | — | | | | — | | | | — | | | | — | | | | (168 | ) | | | (113 | ) |
During the year ended September 30, 2010, the Full Maturity Fund and Diversified Fund issued shares of beneficial interest in exchange for securities. The securities were transferred at their fair value on March 19, 2010, as follows:
| | |
| Full Maturity Fixed Income Fund | 411,798 | $4,332 |
| Diversified Equity Fund | 584,035 | $7,189 |
The Trust has evaluated the need for additional disclosures and/or adjustments resulting from subsequent events. Based on this evaluation, no adjustments were required to the financial statements as of September 30, 2011.
At meetings of the Board of Trustees of the Trust held on August 25, 2011 and October 18, 2011, the Board approved, after the recommendation of Cove Street, a plan to reorganize the CSC Small Cap Value Fund (the “Fund”), a series of the Trust, into the CSC Small Cap Value Fund, a newly created series of Managed Portfolio Series (“MPS”), subject to shareholder approval. Shareholders of the Fund will be asked to approve the reorganization at a Special Shareholder Meeting in January, 2012.
CNI CHARTER FUNDS | PAGE 105
report of independent registered public accounting firm
To the Shareholders and Board of Trustees ofCNI Charter Funds:
We have audited the accompanying statements of assets and liabilities of the Government Money Market Fund, Prime Money Market Fund, California Tax Exempt Money Market Fund, Limited Maturity Fixed Income Fund, Government Bond Fund, Corporate Bond Fund, California Tax Exempt Bond Fund, Full Maturity Fixed Income Fund, High Yield Bond Fund, Multi-Asset Fund, Diversified Equity Fund, Large Cap Value Equity Fund, Large Cap Growth Equity Fund, Socially Responsible Equity Fund and CSC Small Cap Value Fund (collectively, the “Funds”), including the schedules of investments, as of September 30, 2011, and the related statements of operations for the year then ended, the statements of changes in net assets for each of the years in the two-year period then ended, and the financial highlights for each of the years or periods in the five-year period then ended. These financial statements and financial highlights are the responsibility of the Funds’ management. Our responsibility is to express an opinion on these financial statements and financial highlights based on our audits.
We conducted our audits in accordance with the standards of the Public Company Accounting Oversight Board (United States). Those standards require that we plan and perform the audit to obtain reasonable assurance about whether the financial statements and financial highlights are free of material misstatement. An audit includes examining, on a test basis, evidence supporting the amounts and disclosures in the financial statements. Our procedures included confirmation of securities owned as of September 30, 2011, by correspondence with the custodian and brokers, or other appropriate auditing procedures when replies from brokers were not received. An audit also includes assessing the accounting principles used and significant estimates made by management, as well as evaluating the overall financial statement presentation. We believe that our audits provide a reasonable basis for our opinion.
In our opinion, the financial statements and financial highlights referred to above present fairly, in all material respects, the financial position of each of the aforementioned funds of the CNI Charter Funds as of September 30, 2011, the results of their operations for the year then ended, changes in their net assets for each of the years in the two-year period then ended, and the financial highlights for each of the years or periods in the five-year period then ended, in conformity with U.S. generally accepted accounting principles.
Philadelphia, Pennsylvania
November 23, 2011
CNI CHARTER FUNDS | PAGE 106
trustees and officers (Unaudited)
Information pertaining to the Trustees and Officers of the Trust is set forth below as of September 30, 2011. Trustees who are not deemed to be “interested persons” of the Trust as defined in the Investment Company Act of 1940 are referred to as “Independent Trustees.” The Trust’s Statement of Additional Information (“SAI”) includes additional information about the Trustees and Officers. The SAI may be obtained without charge by calling 1-888-889-0799.
| | Term of Office(1) and Length of Time Served | Principal Occupation for the Past Five Years | Number of Portfolios in Fund Complex(2) Overseen by Trustee | Other Directorships Held by Trustee |
|
Irwin G. Barnet, Esq. CNI Charter Funds 400 North Roxbury Drive Beverly Hills, California 90210 Age: 73 | Trustee | Since 1999 | Attorney and of counsel, Reed Smith LLP, a law firm (2009-present). Partner, Reed Smith LLP (2003-2008). Attorney and principal, Crosby, Heafey, Roach & May P.C., a law firm (2000-2002). Attorney and principal, Sanders, Barnet, Goldman, Simons & Mosk, a law firm (1980-2000). | 15 | None |
Vernon C. Kozlen CNI Charter Funds 400 N. Roxbury Drive Beverly Hills, California 90210 Age: 68 | Trustee | Since 2007 | Retired (2007-present). President and Chief Executive Officer, CNI Charter Funds (2000-2007). Executive Vice President and Director of Asset Management Development, CNB (1996-2007). Director, Reed, Conner & Birdwell LLC (2000-2007), and Convergent Capital Management, LLC (2003-2007). Chairman of the Board, CNAM, Inc. (2001-2005). Chairman of the Board, City National Securities, Inc. (1999-2005). Director, CNAM, Inc. (2001-2006), and City National Securities, Inc. (1999-2006). | 15 | Windermere Jupiter Fund, LLC. CMS/Ironwood Multi-Strategy Fund LLC. CMS/Barlow Long-Short Equity Fund, LLC. |
Victor Meschures CNI Charter Funds 400 North Roxbury Drive Beverly Hills, California 90210 Age: 73 | Trustee | Since 1999 | Certified Public Accountant, Meschures, Campeas, Thompson, Snyder, Pocras & Levin LLP, an accounting firm (1964-present). | 15 | None |
William R. Sweet CNI Charter Funds 400 North Roxbury Drive Beverly Hills, California 90210 Age: 74 | Trustee | Since 1999 | Retired. Executive Vice President, Union Bank of California (1985-1996). | 15 | None |
James Wolford CNI Charter Funds 400 North Roxbury Drive Beverly Hills, California 90210 Age: 57 | Trustee | Since 1999 | Chief Financial Officer, Pacific Office Properties, a real estate investment trust (April 2010-present). Chief Financial Officer, Bixby Land Company, a real estate company (2004-March 2010). Regional Financial Officer, AIMCO, a real estate investment trust (2004). Chief Financial Officer, DBM Group, a direct mail marketing company (2001-2004). Senior Vice President and Chief Operating Officer, Forecast Commercial Real Estate Service, Inc. (2000-2001). Senior Vice President and Chief Financial Officer, Bixby Ranch Company (1985-2000). | 15 | None |
| (1) | Each Trustee serves until the next meeting of shareholders, if any, called for the purpose of electing trustees and until the election and qualification of his or her successor or until death, resignation, declaration of bankruptcy or incompetence by a court of competent jurisdiction, or removal by a majority vote of the Trustees or the shares entitled to vote. |
| (2) | “Fund complex” is defined as two or more registered investment companies that hold themselves out to investors as related companies or have a common investment adviser or affiliated investment advisers. |
CNI CHARTER FUNDS | PAGE 107
trustees and officers (Unaudited) (Continued)
| | Term of Office(1) and Length of Time Served | Principal Occupation for the Past Five Years |
|
Richard Gershen City National Bank 400 N. Roxbury Drive Beverly Hills, California 90210 Age: 57 | President and Chief Executive Officer | Since May 2010 | Executive Vice President, Wealth Management Division, CNB (2009-present). Executive Managing Director, Business Management and Strategy, Evergreen Investments, a division of Wachovia (2000-2009). |
Eric Kleinschmidt SEI Investments One Freedom Valley Drive Oaks, Pennsylvania 19456 Age: 43 | Controller and Chief Operating Officer | Since 2005 | Director of Fund Accounting, SEI Investments (2004-present). Manager of Fund Accounting, SEI Investments (1999-2004). |
Kelly Schmalhausen City National Bank 400 N. Roxbury Drive Beverly Hills, California 90210 Age: 48 | Senior Vice President and Chief Compliance Officer | Since May 2011 | Senior Vice President and Chief Compliance Officer, Wealth Management Division, CNB (April 2011-present). Chief Compliance Officer, CNAM, Inc. (May 2011-present). Senior Vice President, Corporate Compliance Manager - Investments & Trust, Zions Bancorporation (2005-2010). Senior Vice President - Investment Compliance Manager, Amegy Bank of Texas (acquired by Zions Bancorporation) (2002-2005). |
Carolyn Mead SEI Investments One Freedom Valley Drive Oaks, Pennsylvania 19456 Age: 54 | Vice President and Secretary | Since February 2010 | Attorney, SEI Investments Company (2007-present). Associate, Stradley, Ronon, Stevens & Young (2004-2007). Counsel, ING Variable Annuities (1999-2002). |
Susan S. Rudzinski Convergent Capital Management LLC 190 S. LaSalle Street Suite 2800 Chicago, Illinois 60603 Age: 48 | Vice President | Since 2007 | Compliance Director, Convergent Capital Management, LLC (2006-present). Chief Compliance Officer, CCM Advisors, LLC (2006-2010). Self-employed Investment Advisory Compliance and Operations Consultant (2005-2006). Manager, Affiliate Contracts, The Burridge Group LLC (2003-2004). |
Timothy G. Solberg City National Bank 190 S. LaSalle Street Suite 2800 Chicago, Illinois 60603 Age: 58 | Vice President and Assistant Secretary | Since 2005 | Senior Vice President and Director – Sub-Advised Funds, City National Bank (2011-Present). Managing Director and Chief Investment Officer, CCM Advisors, LLC (2002-2010). |
Bernadette Sparling SEI Investments One Freedom Valley Drive Oaks, Pennsylvania 19456 Age: 34 | Vice President and Assistant Secretary | Since February 2010 | Attorney, SEI Investments Company (2005-present). Associate, Blank Rome LLP (2001-2005). |
Brent Vasher SEI Investments One Freedom Valley Drive Oaks, Pennsylvania 19456 Age: 28 | Vice President and Assistant Secretary | Since February 2010 | Attorney, SEI Investments Company (2008-present). Associate, Law Office of Lloyd Z. Remick (2006-2008). |
| (1) | Each officer serves until removed by the Board or the principal executive officer of the Trust, or until such officer resigns. |
CNI CHARTER FUNDS | PAGE 108
notice to shareholders (Unaudited)
For shareholders that do not have a September 30, 2011 taxable year end, this notice is for informational purposes only. For shareholders with a September 30, 2011 taxable year end, please consult your tax advisor as to the pertinence of this notice.
For California income tax purposes, for the fiscal year ended September 30, 2011, each of the California Tax Exempt Bond Fund and California Tax Exempt Money Market Fund is designating 88.96% and 96.84%, respectively, of its distributions paid from net investment income as exempt-interest dividends under Section 17145 of the California Revenue and Taxation Code.
For Federal income tax purposes, for the fiscal year ended September 30, 2011 each Fund is designating the following items with regard to distributions paid during the year:
| (A) Long Term Capital Gain Distributions | | (C) Ordinary Income Distributions | | | (F) Dividends Qualifying for Corporate Dividends Rec. Deduction (1) | (G) Qualifying Dividend Income (2) | (H) U.S. Government Interest (3) | (I) Interest Related Dividends (4) | (J) Qualified Short-Term Capital Gain Dividends (5) |
| Government Money Market Fund | 0.00% | 0.00% | 100.00% | 0.00% | 100.00% | 0.00% | 0.00% | 8.71% | 99.70% | 0.00% |
| Prime Money Market Fund | 0.00% | 0.00% | 100.00% | 0.00% | 100.00% | 0.00% | 0.00% | 0.37% | 99.73% | 0.00% |
| California Tax Exempt Money Market Fund | 0.00% | 0.00% | 0.47% | 99.53% | 100.00% | 0.00% | 0.00% | 0.00% | 0.00% | 0.00% |
| Limited Maturity Fixed Income Fund | 0.00% | 0.00% | 100.00% | 0.00% | 100.00% | 0.00% | 0.00% | 12.94% | 96.56% | 0.00% |
| Government Bond Fund | 0.00% | 0.00% | 100.00% | 0.00% | 100.00% | 0.00% | 0.00% | 9.49% | 100.00% | 0.00% |
| Corporate Bond Fund | 0.00% | 0.00% | 100.00% | 0.00% | 100.00% | 0.00% | 0.00% | 0.72% | 94.39% | 0.00% |
| California Tax Exempt Bond Fund | 12.29% | 0.00% | 0.00% | 87.71% | 100.00% | 0.00% | 0.00% | 0.00% | 0.00% | 0.00% |
| Full Maturity Fixed Income Fund | 7.10% | 0.00% | 92.90% | 0.00% | 100.00% | 0.00% | 0.00% | 13.99% | 93.79% | 100.00% |
| High Yield Bond Fund | 0.00% | 0.00% | 100.00% | 0.00% | 100.00% | 0.00% | 0.00% | 0.00% | 99.59% | 0.00% |
| Multi-Asset Fund | 0.00% | 0.00% | 100.00% | 0.00% | 100.00% | 13.73% | 29.13% | 0.03% | 2.61% | 0.00% |
| Diversified Equity Fund | 0.00% | 0.00% | 100.00% | 0.00% | 100.00% | 100.00% | 100.00% | 0.00% | 0.00% | 0.00% |
| Large Cap Value Equity Fund | 0.00% | 0.00% | 100.00% | 0.00% | 100.00% | 100.00% | 100.00% | 0.00% | 0.00% | 0.00% |
| Large Cap Growth Equity Fund | 0.00% | 0.00% | 100.00% | 0.00% | 100.00% | 100.00% | 100.00% | 0.00% | 0.00% | 0.00% |
| Socially Responsible Equity Fund | 0.00% | 0.00% | 100.00% | 0.00% | 100.00% | 100.00% | 100.00% | 0.00% | 0.00% | 0.00% |
| 0.00% | 0.00% | 100.00% | 0.00% | 100.00% | 100.00% | 100.00% | 0.00% | 0.00% | 0.00% |
| (1) | “Dividends Received Deduction” represent dividends which qualify for the corporate dividends received deduction. |
| (2) | “Qualifying Dividend Income” represent qualifying dividends as created by the Jobs and Growth Tax Relief Reconciliation Act of 2003. The Fund intends to designate the maximum amount permitted by law. |
| (3) | “U.S. Government Interest” represent the amount of interest that was derived from direct U.S. Government obligations and distributed during the fiscal year. This amount is reflected as a percentage of ordinary income. Generally, interest from direct U.S. Government obligations is exempt from state income tax. However, for shareholders who are residents of California, Connecticut or New York, the statutory threshold requirements were not satisfied to permit exemption of these amounts from state income. |
| (4) | “Interest Related Dividends” represent qualifying interest that is exempt from U.S. withholding tax when paid to foreign investors as created by the American Jobs Creation Act of 2004. |
| (5) | “Short-Term Capital Gain Dividends” represent qualifying short-term capital gain that is exempt from U.S. withholding tax when paid to foreign investors as created by the American Jobs Creation Act of 2004. |
Items (A), (B), (C), (D) and (E) are based on the percentage of each fund’s total distribution.
Items (F) and (G) are based on the percentage of “Ordinary Income Distributions.”
Item (H) is based on the percentage of gross income of each Fund.
Item (I) is based on the percentage of net investment income distributions.
Item (J) is based on the percentage of short-term capital gain distributions.
CNI CHARTER FUNDS | PAGE 109
disclosure of fund expenses (Unaudited)
All mutual funds have operating expenses. As a shareholder of a Fund, your investment is affected by these ongoing costs, which include (among others) costs for portfolio management, administrative services, class-specific distribution fees and shareholder reports like this one. It is important for you to understand the impact of these costs on your investment returns.
Operating expenses such as these are deducted from the Fund’s gross income and directly reduce your final investment return. These expenses are expressed as a percentage of the Fund’s average net assets; this percentage is known as the Fund’s expense ratio.
The following examples use the expense ratio and are intended to help you understand the ongoing costs (in dollars) of investing in your Fund and to compare these costs with those of other mutual funds. The examples are based on an investment of $1,000 made at the beginning of the period shown and held for the entire period.
The table below illustrates your Fund’s costs in two ways:
Actual Fund Return. This section helps you to estimate the actual expenses that your Fund incurred over the period. The “Expenses Paid During Period” column shows the actual dollar expense cost incurred by a $1,000 investment in the Fund, and the “Ending Account Value” number is derived from deducting that expense cost from the Fund’s gross investment return.
You can use this information, together with the actual amount you invested in the Fund, to estimate the expenses you paid over that period. Simply divide your actual account value by $1,000 to arrive at a ratio (for example, an $8,600 account value divided by $1,000 = 8.6), then multiply that ratio by the number shown for your Fund under “Expenses Paid During Period.”
Hypothetical 5% Return. This section helps you compare your Fund’s costs with those of other mutual funds. It assumes that the Fund had an annual 5% return before expenses during the year, but that the expense ratio (Column 3) for the period is unchanged. This example is useful in making comparisons because the Securities and Exchange Commission requires all mutual funds to make this 5% calculation. You can assess your Fund’s comparative cost by comparing the hypothetical result for your Fund in the “Expenses Paid During Period” column with those that appear in the same charts in the shareholder reports for other funds.
NOTE: Because the return is set at 5% for comparison purposes – NOT your Fund’s actual return – the account values shown do not apply to your specific investment.
| | | Beginning Account Value 4/1/2011 | | | Ending Account Value 9/30/2011 | | | Annualized Expense Ratios | | | Expense Paid During Period* | |
Government Money Market Fund | |
| Actual Fund Return | |
| Institutional Class | | $ | 1,000.00 | | | $ | 1,000.20 | | | | 0.09 | % | | $ | 0.45 | |
| Class N | | | 1,000.00 | | | | 1,000.20 | | | | 0.10 | | | | 0.50 | |
| Class S | | | 1,000.00 | | | | 1,000.10 | | | | 0.10 | | | | 0.50 | |
| | | | | | | | | | | | | | | | | |
| Hypothetical 5% Return | |
| Institutional Class | | $ | 1,000.00 | | | $ | 1,024.62 | | | | 0.09 | % | | $ | 0.46 | |
| Class N | | | 1,000.00 | | | | 1,024.57 | | | | 0.10 | | | | 0.51 | |
| Class S | | | 1,000.00 | | | | 1,024.57 | | | | 0.10 | | | | 0.51 | |
| | |
| |
| Actual Fund Return | |
| Institutional Class | | $ | 1,000.00 | | | $ | 1,000.60 | | | | 0.17 | % | | $ | 0.85 | |
| Class N | | | 1,000.00 | | | | 1,000.30 | | | | 0.19 | | | | 0.95 | |
| Class S | | | 1,000.00 | | | | 1,000.20 | | | | 0.21 | | | | 1.05 | |
| | | | | | | | | | | | | | | | | |
| Hypothetical 5% Return | |
| Institutional Class | | $ | 1,000.00 | | | $ | 1,024.22 | | | | 0.17 | % | | $ | 0.86 | |
| Class N | | | 1,000.00 | | | | 1,024.12 | | | | 0.19 | | | | 0.96 | |
| Class S | | | 1,000.00 | | | | 1,024.02 | | | | 0.21 | | | | 1.07 | |
| | | Beginning Account Value 4/1/2011 | | | Ending Account Value 9/30/2011 | | | Annualized Expense Ratios | | | Expense Paid During Period* | |
California Tax Exempt Money Market Fund | |
| Actual Fund Return | |
| Institutional Class | | $ | 1,000.00 | | | $ | 1,000.20 | | | | 0.11 | % | | $ | 0.55 | |
| Class N | | | 1,000.00 | | | | 1,000.20 | | | | 0.11 | | | | 0.55 | |
| Class S | | | 1,000.00 | | | | 1,000.10 | | | | 0.12 | | | | 0.60 | |
| | | | | | | | | | | | | | | | | |
| Hypothetical 5% Return | |
| Institutional Class | | $ | 1,000.00 | | | $ | 1,024.52 | | | | 0.11 | % | | $ | 0.56 | |
| Class N | | | 1,000.00 | | | | 1,024.47 | | | | 0.11 | | | | 0.56 | |
| Class S | | | 1,000.00 | | | | 1,024.47 | | | | 0.12 | | | | 0.61 | |
| | |
Limited Maturity Fixed Income Fund | |
| Actual Fund Return | |
| Institutional Class | | $ | 1,000.00 | | | $ | 1,009.20 | | | | 0.64 | % | | $ | 3.22 | |
| Class N | | | 1,000.00 | | | | 1,005.80 | | | | 0.88 | | | | 4.42 | |
| | | | | | | | | | | | | | | | | |
| Hypothetical 5% Return | |
| Institutional Class | | $ | 1,000.00 | | | $ | 1,021.86 | | | | 0.64 | % | | $ | 3.24 | |
| Class N | | | 1,000.00 | | | | 1,020.66 | | | | 0.88 | | | | 4.46 | |
| * | Expenses are equal to the Fund’s annualized expense ratio multiplied by the average account value over the period, multiplied by 183/365 (to reflect the one-half year period). |
CNI CHARTER FUNDS | PAGE 110
| | | Beginning Account Value 4/1/2011 | | | Ending Account Value 9/30/2011 | | | Annualized Expense Ratios | | | Expense Paid During Period* | |
| |
| Actual Fund Return | |
| Institutional Class | | $ | 1,000.00 | | | $ | 1,028.60 | | | | 0.70 | % | | $ | 3.56 | |
| Class N | | | 1,000.00 | | | | 1,026.00 | | | | 0.95 | | | | 4.82 | |
| | | | | | | | | | | | | | | | | |
| Hypothetical 5% Return | |
| Institutional Class | | $ | 1,000.00 | | | $ | 1,021.56 | | | | 0.70 | % | | $ | 3.55 | |
| Class N | | | 1,000.00 | | | | 1,020.31 | | | | 0.95 | | | | 4.81 | |
| | | | | | | | | | | | | | | | | |
| |
| Actual Fund Return | |
| Institutional Class | | $ | 1,000.00 | | | $ | 1,001.50 | | | | 0.75 | % | | $ | 3.76 | |
| Class N | | | 1,000.00 | | | | 999.00 | | | | 1.00 | | | | 5.01 | |
| | | | | | | | | | | | | | | | | |
| Hypothetical 5% Return | |
| Institutional Class | | $ | 1,000.00 | | | $ | 1,021.31 | | | | 0.75 | % | | $ | 3.80 | |
| Class N | | | 1,000.00 | | | | 1,020.05 | | | | 1.00 | | | | 5.06 | |
| | |
California Tax-Exempt Bond Fund | |
| Actual Fund Return | |
| Institutional Class | | $ | 1,000.00 | | | $ | 1,029.20 | | | | 0.50 | % | | $ | 2.54 | |
| Class N | | | 1,000.00 | | | | 1,026.50 | | | | 0.75 | | | | 3.81 | |
| | | | | | | | | | | | | | | | | |
| Hypothetical 5% Return | |
| Institutional Class | | $ | 1,000.00 | | | $ | 1,022.56 | | | | 0.50 | % | | $ | 2.54 | |
| Class N | | | 1,000.00 | | | | 1,021.31 | | | | 0.75 | | | | 3.80 | |
| | | | | | | | | | | | | | | | | |
Full Maturity Fixed Income Fund | |
| Actual Fund Return | |
| Institutional Class | | $ | 1,000.00 | | | $ | 1,033.60 | | | | 0.63 | % | | $ | 3.21 | |
| Class N | | | 1,000.00 | | | | 1,031.00 | | | | 0.88 | | | | 4.48 | |
| | | | | | | | | | | | | | | | | |
| Hypothetical 5% Return | |
| Institutional Class | | $ | 1,000.00 | | | $ | 1,021.91 | | | | 0.63 | % | | $ | 3.19 | |
| Class N | | | 1,000.00 | | | | 1,020.66 | | | | 0.88 | | | | 4.46 | |
| | |
| |
| Actual Fund Return | |
| Institutional Class | | $ | 1,000.00 | | | $ | 1,044.50 | | | | 1.00 | % | | $ | 5.13 | |
| Class N | | | 1,000.00 | | | | 1,041.40 | | | | 1.30 | | | | 6.65 | |
| | | | | | | | | | | | | | | | | |
| Hypothetical 5% Return | |
| Institutional Class | | $ | 1,000.00 | | | $ | 1,020.05 | | | | 1.00 | % | | $ | 5.06 | |
| Class N | | | 1,000.00 | | | | 1,018.55 | | | | 1.30 | | | | 6.58 | |
| | | | | | | | | | | | | | | | | |
| |
| Actual Fund Return | |
| Institutional Class | | $ | 1,000.00 | | | $ | 970.30 | | | | 0.84 | % | | $ | 4.15 | |
| Class N | | | 1,000.00 | | | | 968.90 | | | | 1.09 | | | | 5.38 | |
| | | | | | | | | | | | | | | | | |
| Hypothetical 5% Return | |
| Institutional Class | | $ | 1,000.00 | | | $ | 1,020.86 | | | | 0.84 | % | | $ | 4.26 | |
| Class N | | | 1,000.00 | | | | 1,019.60 | | | | 1.09 | | | | 5.52 | |
| | | Beginning Account Value 4/1/2011 | | | Ending Account Value 9/30/2011 | | | Annualized Expense Ratios | | | Expense Paid During Period* | |
| |
| Actual Fund Return | |
| Institutional Class | | $ | 1,000.00 | | | $ | 957.30 | | | | 0.85 | % | | $ | 4.17 | |
| Class N | | | 1,000.00 | | | | 955.00 | | | | 1.10 | | | | 5.39 | |
| | | | | | | | | | | | | | | | | |
| Hypothetical 5% Return | |
| Institutional Class | | $ | 1,000.00 | | | $ | 1,020.81 | | | | 0.85 | % | | $ | 4.31 | |
| Class N | | | 1,000.00 | | | | 1,019.55 | | | | 1.10 | | | | 5.57 | |
| | |
| |
| Actual Fund Return | |
| Institutional Class | | $ | 1,000.00 | | | $ | 978.00 | | | | 0.96 | % | | $ | 4.76 | |
| Class N | | | 1,000.00 | | | | 975.50 | | | | 1.21 | | | | 5.99 | |
| | | | | | | | | | | | | | | | | |
| Hypothetical 5% Return | |
| Institutional Class | | $ | 1,000.00 | | | $ | 1,020.26 | | | | 0.96 | % | | $ | 4.86 | |
| Class N | | | 1,000.00 | | | | 1,019.00 | | | | 1.21 | | | | 6.12 | |
| | | | | | | | | | | | | | | | | |
| |
| Actual Fund Return | |
| Institutional Class | | $ | 1,000.00 | | | $ | 971.40 | | | | 0.99 | % | | $ | 4.89 | |
| Class N | | | 1,000.00 | | | | 968.90 | | | | 1.24 | | | | 6.12 | |
| | | | | | | | | | | | | | | | | |
| Hypothetical 5% Return | |
| Institutional Class | | $ | 1,000.00 | | | $ | 1,020.10 | | | | 0.99 | % | | $ | 5.01 | |
| Class N | | | 1,000.00 | | | | 1,018.85 | | | | 1.24 | | | | 6.28 | |
| | |
Socially Responsible Equity Fund | |
| Actual Fund Return | |
| Institutional Class | | $ | 1,000.00 | | | $ | 963.30 | | | | 0.86 | % | | $ | 4.23 | |
| Class N | | | 1,000.00 | | | | 962.00 | | | | 1.11 | | | | 5.46 | |
| | | | | | | | | | | | | | | | | |
| Hypothetical 5% Return | |
| Institutional Class | | $ | 1,000.00 | | | $ | 1,020.76 | | | | 0.86 | % | | $ | 4.36 | |
| Class N | | | 1,000.00 | | | | 1,019.50 | | | | 1.11 | | | | 5.62 | |
| | |
| |
| Actual Fund Return | |
| Institutional Class | | $ | 1,000.00 | | | $ | 926.20 | | | | 1.19 | % | | $ | 5.75 | |
| Class N | | | 1,000.00 | | | | 923.90 | | | | 1.44 | | | | 6.95 | |
| Class R | | | 1,000.00 | | | | 926.50 | | | | 1.16 | | | | 5.60 | |
| | | | | | | | | | | | | | | | | |
| Hypothetical 5% Return | |
| Institutional Class | | $ | 1,000.00 | | | $ | 1,019.10 | | | | 1.19 | % | | $ | 6.02 | |
| Class N | | | 1,000.00 | | | | 1,017.85 | | | | 1.44 | | | | 7.28 | |
| Class R | | | 1,000.00 | | | | 1,019.25 | | | | 1.16 | | | | 5.87 | |
| * | Expenses are equal to the Fund’s annualized expense ratio multiplied by the average account value over the period, multiplied by 183/365 (to reflect the one-half year period). |
CNI CHARTER FUNDS | PAGE 111
board approval of advisory and sub-advisory agreements
(Unaudited)
The Board of Trustees (the “Board”) of CNI Charter Funds (the “Trust”) is comprised of five Trustees, each of whom is independent of the Trust’s investment adviser and sub-advisers (the “Independent Trustees”). During the six months ended September 30, 2011, the Board and the Independent Trustees approved renewal of the Trust’s advisory agreement with City National Asset Management, Inc. (“CNAM”) with respect to each series of the Trust (each a “Fund and collectively the “Funds”). They also approved renewal of the following agreements with the sub-advisers to certain of the Funds (collectively the “Sub-Advisers”):
| | • | CNAM’s sub-advisory agreement with Robert W. Baird & Co. Incorporated (“Baird”) with respect to the Full Maturity Fixed Income Fund; |
| | • | CNAM’s sub-advisory agreement with Boyd Watterson Asset Management, LLC (“Boyd Watterson”) with respect to the Full Maturity Fixed Income Fund; |
| | • | CNAM’s sub-advisory agreement with Guggenheim Investment Management, LLC (“Guggenheim”) with respect to the High Yield Bond Fund; |
| | • | CNAM’s sub-advisory agreements with SKBA Capital Management, LLC (“SKBA”) with respect to the Socially Responsible Equity Fund and the Diversified Equity Fund; and |
| | • | CNAM’s sub-advisory agreement with Turner Investment Partners, Inc. (“Turner”) with respect to the Diversified Equity Fund. |
In addition, the Board approved a new sub-advisory agreement (the “CSC Agreement”) between CNAM and Cove Street Capital, LLC (“Cove Street”) with respect to the CSC Small Cap Value Fund (formerly the RCB Small Cap Value Fund).
The advisory and sub-advisory agreements listed above are collectively referred to below as the “Agreements.”
GENERAL INFORMATION
The following information summarizes the Board’s considerations associated with its review of the Agreements. In connection with their deliberations, the Board considered such information and factors as they believed, in light of the legal advice furnished to them and their own business judgment, to be relevant. The Agreements were considered separately for each Fund, although the Board took into account the common interests of the Funds in its review. As described below, the Board considered the nature, quality and extent of the various investment advisory and administrative services performed by CNAM and each sub-adviser. In considering these matters, the Independent Trustees discussed the approval of the Agreements with management and in private sessions with counsel at which no representatives of CNAM, the Sub-Advisers or Cove Street were present.
The Board reviewed extensive materials regarding investment results of CNAM, each Sub-Adviser, and Cove Street, advisory fee and expense comparisons, financial information with respect to each entity, descriptions of various functions such as compliance monitoring and portfolio trading practices, and information about the personnel providing investment management and administrative services to the Funds. They also took into account information they received at past meetings of the Board and its committees with respect to these matters.
In deciding to approve the Agreements, the Board and the Independent Trustees did not identify a single factor as controlling and this summary does not describe all of the matters considered. However, the Board and the Independent Trustees concluded that each of the various factors referred to below favored such approval.
CITY NATIONAL ASSET MANAGEMENT, INC.
Nature, Extent and Quality of Services
In reviewing the services provided by CNAM, the Board considered a variety of matters, including the background, education and experience of its key portfolio management and operational personnel; its overall financial strength and stability; its resources and efforts to retain, attract and motivate capable personnel to serve the Funds; and the overall general quality and depth of its organization. The Board also took into account the experience, capability and integrity of CNAM’s senior management; its investment philosophy and processes, including sub-adviser oversight processes; its brokerage, trading and soft dollar practices; its disaster recovery and contingency planning; and its commitment and systems in place with regard to compliance with applicable laws and regulations. The Board found all of these matters to be satisfactory.
Investment Performance
The Board assessed the performance of each Fund compared with its respective benchmark index or indexes and the average of all funds in its respective peer group category (each a “universe”) selected by Lipper, Inc. and iMoneyNet, Inc. (for the money market funds only) for the one-, three-, five- and ten-year and since inception periods ended June 30, 2011, as applicable. The Board also reviewed the performance of each Fund (other than the Limited Maturity Fixed Income Fund, Full Maturity Fixed Income Fund, Diversified Equity Fund and Socially Responsible Equity Fund, which are distributed through retail channels) compared with the average performance of all funds
CNI CHARTER FUNDS | PAGE 112
in its respective “bank channel” universe, which includes only those funds in the Fund’s Lipper universe that are distributed through institutional and retail bank channels. In addition, the Board reviewed the performance of each Fund compared to a select group of comparable funds determined by CNAM to have investment objectives similar to that of the Fund.
The Board’s observations with respect to the annualized total returns of the Funds’ Institutional Class shares were as follows:
| | • | The returns of the Government Money Market Fund were above the returns of the relevant Lipper institutional money market fund universe and bank channel universe for the one-year period, and above the returns of the iMoneyNet institutional fund universe for the one-year, three-year and five-year periods. They were below the average returns of the Lipper universe and bank channel universe for all other periods. |
| | • | The returns of the Prime Money Market Fund and California Tax Exempt Money Market Fund were above or very close to the returns of the relevant Lipper institutional money market fund universes, iMoneyNet institutional fund universes, and bank channel universes for the one-year period, and below those measures for all other periods. |
| | • | The returns of the Limited Maturity Fixed Income Fund were above the BofA Merrill Lynch 3-Month U.S. Treasury Index returns for all periods and above the BofA Merrill Lynch 1-3 Year U.S. Treasury Index returns for all periods except the ten-year and since inception periods. They were below the returns of the Lipper short/intermediate investment grade debt funds universe for all periods. |
| | • | The returns of the Government Bond Fund were above the returns of the Barclays Capital U.S. 1-5 Year Government Bond Index, Lipper short/intermediate U.S. government universe and bank channel universe for the one-year period. They were below those measures for all other periods and below the returns of the Barclays Capital U.S. Intermediate Government Bond Index for all periods. |
| | • | The returns of the Corporate Bond Fund were above the returns of the Lipper short/intermediate investment-grade universe for the five-year, ten-year and since-inception periods, above the returns for the bank channel universe for the since inception period, and below those measures for all other periods. They were below the returns of the Barclays Capital U.S. Corporate 1-5A3 or Higher, 2% Issuer Constrained Index and the Barclays Capital U.S. Intermediate Corporate Bond Index for all periods. |
| | • | The returns of the California Tax Exempt Bond Fund were above the returns of the Lipper California short/intermediate municipal debt universe for all periods, and above the returns of the bank channel universe for the one-year, ten-year and since inception periods. They were below the Barclays Capital CA Intermediate-Short Municipal Index returns for all periods. |
| | • | The returns of the Full Maturity Fixed Income Fund were above the returns of the Barclays Capital Intermediate U.S. Government/Credit Index for the three-year period. They were below the returns of that Index for the other periods, and below the returns of the Barclays Capital U.S. Aggregate Bond Index and the Lipper corporate A-rated debt funds universe for all periods. |
| | • | The returns of the High Yield Bond Fund were above the returns of the Lipper high current yield fund universe for all periods, and above the returns of the Citigroup High-Yield Market Index returns for the five-year and ten-year periods. They were above the returns of the bank channel universe for the one-year and three-year periods and below for the other periods. |
| | • | The returns of the Multi-Asset Fund were above the returns of the Barclays Capital U.S. TIPS Index for the one-year period, above the returns of a blended index comprised 60% of the S&P 500 Index and 40% of the Barclays Capital Intermediate Government/Credit Index for the since inception period, and above the returns of the CPI plus 500 basis points benchmark for the one-year period. They were above the returns of the Lipper flexible portfolio funds universe for the since inception period, and above the returns of the bank channel universe for all periods. |
| | • | The returns of the Diversified Equity Fund were close to the returns of the S&P 500 Index for the ten-year and since inception periods, but below the returns of the Lipper multi-cap core funds universe for all periods. |
| | • | The returns of the Large Cap Value Equity Fund were above or the same as the S&P 500 Value Index returns for the three-, five- and ten-year periods, and above the returns of the Lipper large cap value funds universe for the three-year period. They were below the returns of the bank channel universe for all periods. |
| | • | The returns of the Large Cap Growth Equity Fund were above or the same as the returns of the Lipper large cap growth fund universe for the three-, five- and ten-year periods, and above or the same as the returns for the bank |
CNI CHARTER FUNDS | PAGE 113
board approval of advisory and sub-advisory agreements
(Unaudited) (Continued)
channel universe for the ten-year and since inception periods. They were above the returns of the S&P 500 Growth Index for the ten-year period.
| | • | The returns of the Socially Responsible Equity Fund were above returns of the Russell 1000 Value Index for the five-year period. They were below the returns of the MSCI KLD 400 Social Index and the Lipper Multi-Cap Value fund universe for all periods. |
| | • | The returns of the CSC Small Cap Value Fund were above the returns of the Russell 2000 Index, Russell 2000 Value Index and Russell 2500 Value Index, and the returns of the Lipper Small Cap Core funds universe and bank channel universe, for the three-year and since-inception periods. They were below those measures for all other periods. |
The Board concluded that CNAM continued to provide satisfactory management and oversight services to the Funds. They noted that the investment results of the Funds over the long term were generally competitive; that the results for the Money Market Funds compared to their peer groups were acceptable given the special services and investment focuses of those Funds and the unusual market conditions applicable to the money market fund industry in recent years; and that consideration of returns of market indexes needed to take into account that indexes do not reflect the expenses of operating mutual funds.
Advisory Fees and Fund Expenses
The Board reviewed information regarding the advisory fees charged by CNAM and the total expenses of the Institutional Class of each Fund (as percentages of their respective average annual net assets) compared to those of the funds included in the relevant Lipper and bank channel universes, as applicable, and concluded that the advisory fees and expenses of the Funds continued to be reasonable.
The Board observed that the actual investment advisory fees (net of fee waivers) paid by the Funds generally were at or above the relevant Lipper and bank channel averages, but were within or below the middle 60% range for the relevant Lipper universes (except for the Prime Money Market Fund, the Limited Maturity Fixed Income Fund and the High Yield Bond Fund). In considering the information about advisory fees, the Board noted the relatively small sizes of the Funds compared to the average sizes of the funds in the relevant Lipper and bank channel universes. The Board considered that other than the Trust CNAM has only one discretionary, investment advisory client, which is a cash management account. The Board noted that although the advisory fees paid by the cash management account to CNAM are lower than the fees paid by the Trust’s Money Market Funds to CNAM, the Money Market Funds are required to comply with Rule 2a-7 and other regulations and restrictions under the 1940 Act, and that such compliance requires significantly more work and resources than management of separate accounts.
The Board considered that the total expense ratios of the Money Market Funds (net of fee waivers) were below the relevant Lipper universe and bank channel averages and were in the lowest 20% of the relevant Lipper universes, and that the total expense ratios for all other Funds (net of fee waivers) were below the relevant Lipper universe averages and above the bank channel averages, as applicable (except for the expense ratios of the Government Bond Fund, California Tax Exempt Bond Fund, the Multi-Asset Fund, and the Large Cap Growth Equity Fund, which were below both measures). They further noted that the expense ratios of all Funds were within the middle 60% range for the relevant Lipper universes (except for the Multi-Asset Fund and Socially Responsible Equity Fund, which were in the lowest 20% of the relevant Lipper universes).
The Board considered information prepared by CNAM relating to its costs and profits with respect to the Funds. The Board also considered the benefits received by CNAM and its affiliates as a result of CNAM’s relationship with the Funds, including investment advisory fees paid to CNAM, fees paid to City National Bank and City National Securities, Inc. for providing certain shareholder servicing and sub-distribution services to the Trust, and the intangible benefits of any favorable publicity arising in connection with the Funds’ performance. They also noted that although there were no advisory fee breakpoints, based on CNAM’s operations significant economies of scale were not likely to be realized until the asset levels of most of the Funds were significantly higher than their current levels.
Conclusions
Based on their review, including their consideration of each of the factors referred to above, the Board and the Independent Trustees concluded that the compensation payable to CNAM with respect to each of the Funds pursuant to its advisory agreement with the Trust is fair and reasonable in light of the nature and quality of the services being provided by CNAM to the respective Funds and their shareholders, and that renewal of the agreement was in the best interest of the Funds and their shareholders.
CNI CHARTER FUNDS | PAGE 114
SUB-ADVISERS
Nature, Extent and Quality of Services
In reviewing the services provided by each of the Sub-Advisers, the Board considered a variety of matters, including the background, education and experience of the Sub-Adviser’s key portfolio management and operational personnel; its overall financial strength and stability; its resources and related efforts to retain, attract and motivate capable personnel to serve the relevant Funds; and the overall general quality and depth of its organization. The Board also reviewed each Sub-Adviser’s investment philosophy and processes as well as its brokerage and trading practices, its disaster recovery and contingency planning, and its commitment and systems in place with regard to compliance with applicable laws and regulations. The Board found all of these matters to be satisfactory.
Investment Performance
The Board’s observations regarding the performance of the Full Maturity Fixed Income Fund, High Yield Bond Fund, Diversified Equity Fund and Socially Responsible Equity Fund are described above. In addition, the Board assessed the performance of each of Baird’s and Boyd Watterson’s portions of the Full Maturity Fixed Income Fund, and SKBA’s and Turner’s portions of the Diversified Equity Fund, compared with the Sub-Adviser’s respective benchmark for various periods ended June 30, 2011. The Board made the following additional observations in reviewing the annualized total returns of each Sub-Adviser:
| | • | The returns for Baird’s portion of the Full Maturity Fixed Income Fund were above the returns of the Barclays Capital U.S. Aggregate Bond Index for the one- and two-year periods, and were below but close to the returns of the Index for the ten-year period. |
| | • | The returns for Boyd Watterson’s portion of the Full Maturity Fixed Income Fund were above the returns of the Barclays Capital Intermediate U.S. Government/Credit Index for all periods measured (up to and including the five-year period). |
| | • | The returns for SKBA’s portion of the Diversified Equity Fund were above the returns of the Russell 1000 Value Index for the three-year period, and were below but close to the returns of the Index for the two-year period. |
| | • | The returns for Turner’s portion of the Diversified Equity Fund were below the returns of the Russell 1000 Growth Index for all periods (up to and including the three-year period). In considering this information, the Board noted that Turner began serving as a sub-adviser to the Fund in March 2008, at a time when the growth style was not in favor, but that Turner had been assessed as the Fund’s best performing sub-adviser in 2009. |
The Board concluded that each Sub-Adviser continued to provide satisfactory services to the Funds.
Advisory Fees and Fund Expenses
The Board reviewed information regarding the advisory fees charged by each Sub-Adviser and observed that the fees charged by each Sub-Adviser were generally low compared to the fees it charged to its other institutional clients. The Board noted that Guggenheim’s advisory fee with respect to the Fund was higher than its fees with respect to other mutual funds for which it serves as sub-adviser, but also noted that each of those other funds was significantly larger than the High Yield Bond Fund. Similarly, the Board observed that Turner’s advisory fee with respect to the Diversified Equity Fund was higher than its fees with respect to another mutual fund for which it serves as sub-adviser, but noted that the other fund was larger than the Fund and was an “earlier adopter” of Turner’s strategy. The Trustees noted that CNAM pays all sub-advisory fees out of CNAM’s advisory fee.
The Board considered information prepared by each Sub-Adviser relating to its revenues and profits with respect to the Fund or Funds for which it serves as sub-adviser. The Board also considered the benefits received by each Sub-Adviser and its affiliates as a result of its relationship with the Funds, including the sub-advisory fees paid to the Sub-Adviser, the intangible benefits of its association with the Funds generally and any favorable publicity arising in connection with the Funds’ performance.
Conclusions
Based on their review, including their consideration of each of the factors referred to above, the Board and the Independent Trustees concluded that the compensation payable to each Sub-Adviser pursuant to its respective sub-advisory agreement is fair and reasonable in light of the nature and quality of the services being provided by each Sub-Adviser to the respective Funds and their shareholders, and that renewal of each sub-advisory agreement was in the best interest of the Funds and their shareholders.
CNI CHARTER FUNDS | PAGE 115
board approval of advisory and sub-advisory agreements
(Unaudited) (Continued)
COVE STREET CAPITAL, LLC SUB-ADVISORY AGREEMENT
In May 2011, the Board of Trustees approved Cove Street as the new sub-adviser to the RCB Small Cap Value Fund, and the change of the Fund’s name to CSC Small Cap Value Fund, effective upon the closing of the sale of CNC’s ownership interests in Reed, Conner & Birdwell LLC (the then-current sub-adviser to the Fund). As part of that sale transaction Jeffrey Bronchick, the Fund’s portfolio manager, left RCB and organized Cove Street as a new investment adviser. The Board noted that the proposed sub-advisory agreement with Cove Street would be substantially the same as the current sub-advisory agreement, except for its term.
Nature, Extent and Quality of Services
In reviewing the services proposed to be provided by Cove Street to the Fund, the Board considered a variety of matters, including the background, education and experience of Cove Street’s key portfolio management and operational personnel; the fact that Mr. Bronchick, who had served as a portfolio manager for the Fund since the inception of its predecessor in 1998, would continue to manage the Fund on behalf of Cove Street; Cove Street’s financial and other resources and related efforts to retain, attract and motivate other capable personnel to serve the Fund; and the overall general quality and depth of its organization. The Board also reviewed Cove Street’s investment philosophy and processes as well as its brokerage and trading practices, its disaster recovery and contingency planning, and its commitment and systems in place with regard to compliance with applicable laws and regulations.
Investment Performance
The Board reviewed the performance of the Fund for the one-year, three-year, five-year and since inception periods ended March 31, 2011, compared with its benchmark, the Russell 2000 Index; the average of all funds in its peer group category selected by Lipper, Inc. (Lipper small-cap core funds); and the average of all funds in the Lipper small-cap core funds universe distributed through institutional bank channels. The Board noted that although the returns for the Fund were below all of those measures for the one-, three-, and five-year periods (except for the bank channel universe average for the three-year period), the Fund’s returns were above all of those measures for the since-inception period, as expected for a fund with a value-oriented focus on preservation of capital over the long term.
Advisory Fees and Fund Expenses
The Board reviewed information regarding the sub-advisory fees proposed to be charged by Cove Street and observed that at the Fund’s current asset level Cove Street’s fees would be below its standard fees for its small cap strategy. The Board also observed that although the Fund’s proposed advisory fees were above the average of funds in the Lipper small-cap core funds universe, the Fund’s anticipated total expenses would be below the Lipper universe average and the Fund’s advisory fees and total expenses would be in the middle 60% of all funds in the Lipper universe. The Board also considered that Cove Street would be entering into an agreement to limit the Fund’s total expenses, as RCB had done in the past. The Board observed that the asset levels of the Fund were relatively small and were not currently likely to lead to significant economies of scale in the near future.
The Board also considered the information prepared by Cove Street relating to the revenues it expects to receive from the Fund, as well as the benefits to be received by Cove Street as a result of its relationship with the Fund, including the intangible benefits of any favorable publicity arising in connection with the Fund’s performance.
Conclusions
Based on their review, including their consideration of each of the factors referred to above, the Board and the Independent Trustees concluded that the terms of the proposed sub-advisory agreement with Cove Street are fair and reasonable, and that approval of the CSC Agreement was in the best interests of the Fund and its shareholders.
CNI CHARTER FUNDS | PAGE 116
| | THANK YOU for your investment with CNI Charter Funds. We value the trust you have placed in us to help you achieve your financial goals. |
For more information on CNI Charter Funds, including charges
and expenses, please call 1-888-889-0799 or go to cnicharterfunds.com
for a free prospectus. Read it carefully before you invest or send money.

CNI -AR- 001- 1000
Item 2. Code of Ethics.
The registrant has adopted a code of ethics that applies to the registrant’s principal executive officer, principal financial officer and principal accounting officer.
Item 3. Audit Committee Financial Expert.
(a)(1) The registrant’s board of trustees has determined that the registrant has at least one audit committee financial expert serving on the audit committee.
(a)(2) The audit committee financial experts are William R. Sweet and James R. Wolford. Messrs. Sweet and Wolford are independent as defined in Form N-CSR Item 3(a)(2).
Item 4. Principal Accountant Fees and Services.
Fees billed by KPMG LLP Related to the Trust
KPMG LLP billed the Trust aggregate fees for services rendered to the Trust for the last two fiscal years as follows:
| | 2011 | 2010 |
| | | All fees and services to the Trust that were pre-approved | All fees and services to service affiliates that were pre-approved | All other fees and services to service affiliates that did not require pre-approval | All fees and services to the Trust that were pre-approved | All fees and services to service affiliates that were pre-approved | All other fees and services to service affiliates that did not require pre-approval |
| (a) | Audit Fees(1) | $309,500 | N/A | N/A | $300,000 | N/A | N/A |
| (b) | Audit-Related Fees | N/A | N/A | N/A | N/A | N/A | N/A |
| (c) | Tax Fees | $61,875 | N/A | N/A | $67,125 | N/A | N/A |
| (d) | All Other Fees | N/A | N/A | N/A | N/A | N/A | N/A |
Notes:
| | (1) | Audit fees include amounts related to the audit of the registrant’s annual financial statements and services normally provided by the accountant in connection with statutory and regulatory filings. |
| (e)(2) | Percentage of fees billed applicable to non-audit services pursuant to waiver of pre-approval requirement were as follows: |
| | 2011 | 2010 |
| Audit-Related Fees | N/A | N/A |
| Tax Fees | N/A | N/A |
| All Other Fees | N/A | N/A |
| (g) | The aggregate non-audit fees and services billed by KPMG LLP for the last two fiscal years were $61,875 and $67,125 for 2011 and 2010, respectively. |
Item 5. Audit Committee of Listed Registrants.
Not applicable to open-end management investment companies.
Item 6. Schedule of Investments
Not applicable.
Item 7. Disclosure of Proxy Voting Policies and Procedures for Closed-End Management Investment Companies.
Not applicable to open-end management investment companies.
Item 8. Portfolio Managers of Closed-End Management Investment Companies
Not applicable. Effective for closed-end management investment companies for fiscal years ending on or after December 31, 2005
Item 9. Purchases of Equity Securities by Closed-End Management Company and Affiliated Purchasers.
Not applicable to open-end management investment companies.
Item 10. Submission of Matters to a Vote of Security Holders.
CNI Charter Funds (the "Fund") has adopted the following procedures by which shareholders may recommend nominees to the Fund's Board of Trustees. The Fund has a Nominating Committee comprised solely of persons who are not considered "interested persons" of the Fund within the meaning of the Investment Company Act of 1940. The Committee periodically reviews such issues as the Board's composition, responsibilities, committees, compensation and other relevant issues, and recommends any appropriate changes to the full Board of Trustees. While the Committee normally is able to identify from its own resources an ample number of qualified candidates, it will consider shareholder suggestions of persons to be considered as nominees to fill future vacancies on the Board, so long as the shareholder or shareholder group submitting a proposed nominee: (a) beneficially owns more than 5% of the Fund's voting shares and has held such shares continuously for two years, and (b) is not an adverse holder. No eligible shareholder or shareholder group may submit more than one independent Board member nominee each year. Such suggestions must be sent in writing to the Fund 's Secretary, and must be accompanied by the shareholder's contact information, the nominee's contact information and number of Fund shares owned by the nominee, all information regarding the nominee that would be required to be disclosed in solicitations of proxies for elections of directors required under the Securities Exchange Act of 1934, and a notarized letter from the nominee stating his or her intention to serve as a nominee and be named in the Fund's proxy statement, if so designated by the Committee and the Board of Trustees.
Item 11. Controls and Procedures.
(a) The certifying officers, whose certifications are included herewith, have evaluated the registrant’s disclosure controls and procedures within 90 days of the filing date of this report. In their opinion, based on their evaluation, the registrant’s disclosure controls and procedures are adequately designed, and are operating effectively to ensure, that information required to be disclosed by the registrant in the reports it files or submits under the Securities Exchange Act of 1934 is recorded, processed, summarized and reported within the time periods specified in the Securities and Exchange Commission’s rules and forms.
(b) There were no significant changes in the registrant’s internal control over financial reporting that occurred during the registrant’s last fiscal half-year that has materially affected, or is reasonably likely to materially affect, the registrant’s internal control over financial reporting.
Items 12. Exhibits.
(a)(1) Code of Ethics attached hereto.
(a)(2) A separate certification for the principal executive officer and the principal financial officer of the registrant as required by Rule 30a-2(a) under the Investment Company Act of 1940, as amended (17 CFR 270.30a-2(a)), are filed herewith.
(b) Officer certifications as required by Rule 30a-2(b) under the Investment Company Act of 1940, as amended (17 CFR 270.30a-2(b)) also accompany this filing as an Exhibit.
SIGNATURES
Pursuant to the requirements of the securities Exchange Act of 1934 and the Investment Company Act of 1940, the registrant has duly caused this report to be signed on its behalf by the undersigned, thereunto duly authorized.
| (Registrant) | CNI Charter Funds | |
| | | |
| By (Signature and Title) | /s/ Rich Gershen | |
| | Rich Gershen, President & CEO | |
| | | |
| Date: December 1, 2011 | | |
Pursuant to the requirements of the Securities Exchange Act of 1934 and the Investment Company Act of 1940, this report has been signed below by the following persons on behalf of the registrant and in the capacities and on the dates indicated.
| By (Signature and Title) | /s/ Rich Gershen | |
| | Rich Gershen, President & CEO | |
| Date: December 1, 2011 | | |
| | | |
| By (Signature and Title) | /s/ Eric Kleinschmidt | |
| | Eric Kleinschmidt, Controller and COO | |
| Date: December 1, 2011 | | |