File No. 333-215584
AS FILED WITH THE SECURITIES AND EXCHANGE COMMISSION ON February 22, 2017
SECURITIES AND EXCHANGE COMMISSION
WASHINGTON, D.C. 20549
FORM N-14
| | | | |
| | REGISTRATION STATEMENT | | |
| | UNDER | | |
| | THE SECURITIES ACT OF 1933 | | ☐ |
| | Pre-Effective Amendment No.2 | | ☒ |
| | Post-Effective Amendment No. | | ☐ |
EQ Advisors Trust
(Exact Name of Registrant as Specified in Charter)
1290 Avenue of the Americas
New York, New York 10104
(Address of Principal Executive Offices)
(212) 554-1234
(Registrant’s Area Code and Telephone Number)
STEVEN M. JOENK
AXA Equitable Funds Management Group, LLC
1290 Avenue of the Americas
New York, New York 10104
(Name and Address of Agent for Service)
With copies to:
| | |
PATRICIA LOUIE, ESQ. AXA Equitable Funds Management Group, LLC 1290 Avenue of the Americas New York, New York 10104 | | MARK C. AMOROSI, ESQ. K&L Gates LLP 1601 K Street, N.W. Washington, DC 20006 |
Approximate Date of Proposed Public Offering:
As soon as practicable after this Registration Statement becomes effective.
The Registrant hereby amends this Registration Statement on such date or dates as may be necessary to delay its effective date until the Registrant shall file a further amendment which specifically states this Registration Statement shall thereafter become effective in accordance with Section 8(a) of the Securities Act of 1933 or until the Registration Statement shall become effective on such dates as the Securities and Exchange Commission, acting pursuant to said Section 8(a), may determine.
Title of securities being registered: Class IB and Class K shares of beneficial interest in the series of the Registrant designated as the All Asset Growth-Alt 20 Portfolio, AXA/Horizon Small Cap Value Portfolio, AXA/DoubleLine Opportunistic Core Plus Bond Portfolio, and EQ/PIMCO Global Real Return Portfolio
No filing fee is required because the registrant is relying on Section 24(f) of the Investment Company Act of 1940, as amended, pursuant to which it has previously registered an indefinite number of shares (File Nos. 333-17217 and 811-07953).
EQ ADVISORS TRUST
CONTENTS OF REGISTRATION STATEMENT
This Registration Statement contains the following papers and documents:
Cover Sheet
Contents of Registration Statement
Letter to Shareholders
Notice of Special Meeting
Contractholder Voting Instructions
Part A - Proxy Statement/Prospectus
Part B - Statement of Additional Information
Part C - Other Information
Signature Page
Exhibit Index
AXA EQUITABLE LIFE INSURANCE COMPANY
1290 Avenue of the Americas
New York, New York 10104
February 28, 2017
Dear Contractholder:
Enclosed is a notice and Combined Proxy Statement and Prospectus relating to a Joint Special Meeting of Shareholders of each of the following Portfolios:
| | • | | All Asset Aggressive-Alt 25 Portfolio (“Alt 25 Portfolio”) |
| | • | | All Asset Aggressive-Alt 50 Portfolio (“Alt 50 Portfolio”) |
| | • | | All Asset Aggressive-Alt 75 Portfolio (“Alt 75 Portfolio”) |
| | • | | CharterSM Alternative 100 Moderate Portfolio (“Alternative 100 Moderate Portfolio”) |
| | • | | CharterSM Income Strategies Portfolio (“Income Strategies Portfolio”) |
| | • | | CharterSM Interest Rate Strategies Portfolio (“Interest Rate Strategies Portfolio”) |
| | • | | CharterSM International Moderate Portfolio (“International Moderate Portfolio”) |
| | • | | CharterSM Real Assets Portfolio (“Real Assets Portfolio”) |
| | • | | AXA/Pacific Global Small Cap Value Portfolio (“Pac Global Portfolio”) |
(each an “Acquired Portfolio” and together the “Acquired Portfolios”)
The Alt 25 Portfolio, Alt 50 Portfolio, Alt 75 Portfolio, and Pac Global Portfolio are series of EQ Advisors Trust (“EQ Trust”). The Alternative 100 Moderate Portfolio, Income Strategies Portfolio, Interest Rate Strategies Portfolio, International Moderate Portfolio, and Real Assets Portfolio are series of AXA Premier VIP Trust (“VIP Trust” and together with EQ Trust, the “Trusts”). The Joint Special Meeting of Shareholders of the Acquired Portfolios is scheduled to be held at the Trusts’ offices, 1290 Avenue of the Americas, New York, New York 10104, on March 28, 2017, at 2:30 p.m., Eastern time (the “Meeting”). At the Meeting, the shareholders of the Acquired Portfolios who are entitled to vote at the Meeting, with shareholders of each Acquired Portfolio voting separately, will be asked to approve the proposals described below.
As an owner of a variable life insurance policy and/or a variable annuity contract or certificate (a “Contract”) that participates in an Acquired Portfolio through the investment divisions of a separate account or accounts established by AXA Equitable Life Insurance Company (“AXA Equitable”) or another insurance company (each, an “Insurance Company) you (a “Contractholder”) are entitled to instruct the Insurance Company that issued your Contract how to vote the Acquired Portfolio shares related to your interest in those accounts as of the close of business on December 31, 2016. The Insurance Company that issued your Contract is the record owner of the Portfolio shares related to your interest in those accounts and is sometimes referred to as a “shareholder.” The attached Notice of Joint Special Meeting of Shareholders and Combined Proxy Statement and Prospectus concerning the Meeting describe the matters to be considered at the Meeting. You should read the Combined Proxy Statement and Prospectus prior to completing your voting instruction card.
Each Trust’s Board of Trustees (the “Board”) has called the Meeting to request shareholder approval of the reorganization of each Acquired Portfolio into a corresponding series of EQ Trust or VIP Trust (an “Acquiring Portfolio”) (each, a “Reorganization”) as set forth below:
| | • | | the Alt 25 Portfolio, Alt 50 Portfolio, Alt 75 Portfolio into the All Asset Growth-Alt 20 Portfolio, a series of EQ Trust; |
| | • | | the Alternative 100 Moderate Portfolio into the All Asset Growth-Alt 20 Portfolio, a series of EQ Trust; |
| | • | | the Income Strategies Portfolio and Interest Rate Strategies Portfolio into the AXA/DoubleLine Opportunistic Core Plus Bond Portfolio, a series of EQ Trust; |
| | • | | the International Moderate Portfolio into the CharterSM Moderate Portfolio, a series of VIP Trust; |
| | • | | the Real Assets Portfolio into the EQ/PIMCO Global Real Return Portfolio, a series of EQ Trust; and |
| | • | | the Pac Global Portfolio into the AXA/Horizon Small Cap Value Portfolio, a series of EQ Trust. |
The Board of each Trust has approved the proposals and recommends that you vote “FOR” the proposal relating to the Acquired Portfolio in which you own shares. Although each Board has determined that a vote “FOR” the proposal is in the best interest of each Portfolio and its shareholders, the final decision is yours.
Each Acquired Portfolio and Acquiring Portfolio is managed by AXA Equitable Funds Management Group, LLC. Each of AXA/DoubleLine Opportunistic Core Plus Bond Portfolio, EQ/PIMCO Global Real Return Portfolio, Pac Global Portfolio, and AXA/Horizon Small Cap Value Portfolio is sub-advised by an investment sub-adviser. In each case, if the Reorganization involving an Acquired Portfolio is approved and implemented, each Contractholder that invests indirectly in the Acquired Portfolio will automatically become a Contractholder that invests indirectly in the corresponding Acquiring Portfolio.
You are cordially invited to attend the Meeting. Since it is important that your vote be represented whether or not you are able to attend, you are urged to consider these matters and to exercise your voting instructions by completing, dating, and signing the enclosed voting instruction card and returning it in the accompanying return envelope at your earliest convenience or by relaying your voting instructions via telephone or the Internet by following the enclosed instructions. For further information on how to instruct AXA Equitable, please see the Contractholder Voting Instructions included herein. Of course, we hope that you will be able to attend the Meeting, and if you wish, you may provide voting instructions in person, even though you may have already returned a voting instruction card or submitted your voting instructions via telephone or the Internet. Please respond promptly in order to save additional costs of proxy solicitation and in order to make sure you are represented.
|
| Very truly yours, |
|
| Steven M. Joenk |
| Managing Director |
| AXA Equitable Life Insurance Company |
EQ ADVISORS TRUST
All Asset Aggressive-Alt 25 Portfolio
All Asset Aggressive-Alt 50 Portfolio
All Asset Aggressive-Alt 75 Portfolio
AXA/Pacific Global Small Cap Value Portfolio
AXA PREMIER VIP TRUST
CharterSM Alternative 100 Moderate Portfolio
CharterSM Income Strategies Portfolio
CharterSM Interest Rate Strategies Portfolio
CharterSM International Moderate Portfolio
CharterSM Real Assets Portfolio
1290 Avenue of the Americas
New York, New York 10104
NOTICE OF JOINT SPECIAL MEETING OF SHAREHOLDERS
TO BE HELD ON
March 28, 2017
To the Shareholders:
NOTICE IS HEREBY GIVEN that a Joint Special Meeting of Shareholders of each of the following Portfolios, each of which is a series of EQ Advisors Trust (“EQ Trust”) or AXA Premier VIP Trust (“VIP Trust,” and together with EQ Trust, the “Trusts”), as indicated above, will be held on March 28, 2017 at 2:30 p.m., Eastern time, at the offices of the Trust, located at 1290 Avenue of the Americas, New York, New York 10104 (the “Meeting”):
| | • | | All Asset Aggressive-Alt 25 Portfolio (“Alt 25 Portfolio”) |
| | • | | All Asset Aggressive-Alt 50 Portfolio (“Alt 50 Portfolio”) |
| | • | | All Asset Aggressive-Alt 75 Portfolio (“Alt 75 Portfolio”) |
| | • | | CharterSM Alternative 100 Moderate Portfolio (“Alternative 100 Moderate Portfolio”) |
| | • | | CharterSM Income Strategies Portfolio (“Income Strategies Portfolio”) |
| | • | | CharterSM Interest Rate Strategies Portfolio (“Interest Rate Strategies Portfolio”) |
| | • | | CharterSM International Moderate Portfolio (“International Moderate Portfolio”) |
| | • | | CharterSM Real Assets Portfolio (“Real Assets Portfolio”) |
| | • | | AXA/Pacific Global Small Cap Value Portfolio (“Pac Global Portfolio”) |
(each an “Acquired Portfolio” and together the “Acquired Portfolios”).
The Meeting will be held to act on the following proposals:
For shareholders of the Alt 25 Portfolio, Alt 50 Portfolio, and Alt 75 Portfolio, only:
| | 1. | | To approve the Plan of Reorganization and Termination with respect to the reorganization of the Alt 25 Portfolio, Alt 50 Portfolio, and Alt 75 Portfolio, each a series of EQ Trust, each into the All Asset Growth-Alt 20 Portfolio, a series of EQ Trust. |
For shareholders of the Alternative 100 Moderate Portfolio only:
| | 1d. | | To approve the Agreement and Plan of Reorganization with respect to the reorganization of the Alternative 100 Moderate Portfolio into the All Asset Growth-Alt 20 Portfolio, a series of EQ Trust. |
i
For shareholders of the Income Strategies Portfolio and Interest Rate Strategies Portfolio only:
| | 2. | | To approve the Agreement and Plan of Reorganization and Termination with respect to the reorganization of the Income Strategies Portfolio and Interest Rate Strategies Portfolio, each a series of VIP Trust, each into the AXA/DoubleLine Opportunistic Core Plus Bond Portfolio, a series of EQ Trust. |
For shareholders of the International Moderate Portfolio only:
| | 3. | | To approve the Plan of Reorganization and Termination with respect to the reorganization of the International Moderate Portfolio, a series of VIP Trust, into the CharterSM Moderate Portfolio, a series of VIP Trust. |
For shareholders of the Real Assets Portfolio only:
| | 4. | | To approve the Agreement and Plan of Reorganization and Termination with respect to the reorganization of the Real Assets Portfolio, a series of VIP Trust, into the EQ/PIMCO Global Real Return Portfolio, a series of EQ Trust. |
For shareholders of the Pac Global Portfolio only:
| | 5. | | To approve the Plan of Reorganization and Termination with respect to the reorganization of the Pac Global Portfolio, a series of EQ Trust, into the AXA/Horizon Small Cap Value Portfolio, a series of EQ Trust. |
For shareholders of each Acquired Portfolio:
| | 6. | | To transact other business that may properly come before the Meeting or any adjournments thereof. |
The Board of Trustees of each respective Trust (the “Board”) unanimously recommends that you vote in favor of the relevant proposal(s).
Please note that owners of variable life insurance policies and/or variable annuity contracts or certificates (the “Contractholders”) issued by AXA Equitable Life Insurance Company (“AXA Equitable”), who have invested in shares of an Acquired Portfolio through the investment divisions of a separate account or accounts of AXA Equitable will be given the opportunity to provide voting instructions on the above proposals.
You should read the Combined Proxy Statement and Prospectus attached to this notice prior to completing your proxy or voting instruction card. The record date for determining the number of shares outstanding, the shareholders entitled to vote and the Contractholders entitled to provide voting instructions at the Meeting and any adjournments or postponements thereof has been fixed as the close of business on December 31, 2016. If you attend the Meeting, you may vote or provide your voting instructions in person.
YOUR VOTE IS IMPORTANT
PLEASE RETURN YOUR PROXY OR VOTING INSTRUCTION CARD PROMPTLY
Regardless of whether you plan to attend the Meeting, you should vote or provide voting instructions by promptly completing, dating, and signing the enclosed proxy or voting instruction card and returning it in the enclosed postage-paid envelope. You also can vote or provide voting instructions through the Internet or by telephone using the 12-digit control number that appears on the enclosed proxy or voting instruction card and following the simple instructions. If you are present at the Meeting, you may change your vote or voting instructions, if desired, at that time. The Board of each Trust recommends that you vote or provide voting instructions to vote “FOR” each proposal.
|
By order of the Boards of EQ Trust and VIP Trust, Patricia Louie Secretary |
Dated: February 28, 2017
New York, New York
ii
AXA EQUITABLE LIFE INSURANCE COMPANY
CONTRACTHOLDER VOTING INSTRUCTIONS
REGARDING A JOINT SPECIAL MEETING OF SHAREHOLDERS OF
ALL ASSET AGGRESSIVE-ALT 25 PORTFOLIO
ALL ASSET AGGRESSIVE-ALT 50 PORTFOLIO
ALL ASSET AGGRESSIVE-ALT 75 PORTFOLIO
AXA/PACIFIC GLOBAL SMALL CAP VALUE PORTFOLIO
EACH A SERIES OF EQ ADVISORS TRUST
CHARTERSM ALTERNATIVE 100 MODERATE PORTFOLIO
CHARTERSM INCOME STRATEGIES PORTFOLIO
CHARTERSM INTEREST RATE STRATEGIES PORTFOLIO
CHARTERSM INTERNATIONAL MODERATE PORTFOLIO
CHARTERSM REAL ASSETS PORTFOLIO
EACH A SERIES OF AXA PREMIER VIP TRUST
TO BE HELD ON March 28, 2017
Dated: February 22, 2017
GENERAL
These Contractholder Voting Instructions are being furnished by AXA Equitable Life Insurance Company (“AXA Equitable”) to owners of its variable life insurance policies or variable annuity contracts or certificates (the “Contracts”) (the “Contractholders”) who, as of December 31, 2016 (the “Record Date”), had net premiums or contributions allocated to the investment divisions of its separate account or accounts (the “Separate Accounts”) that are invested in shares of one or more of the following Portfolios, each of which is a series of EQ Advisors Trust (“EQ Trust”) or AXA Premier VIP Trust (“VIP Trust,” and together with EQ Trust, the “Trusts”), as indicated above:
| | • | | All Asset Aggressive-Alt 25 Portfolio (“Alt 25 Portfolio”) |
| | • | | All Asset Aggressive-Alt 50 Portfolio (“Alt 50 Portfolio”) |
| | • | | All Asset Aggressive-Alt 75 Portfolio (“Alt 75 Portfolio”) |
| | • | | CharterSM Alternative 100 Moderate Portfolio (“Alternative 100 Moderate Portfolio”) |
| | • | | CharterSM Income Strategies Portfolio (“Income Strategies Portfolio”) |
| | • | | CharterSM Interest Rate Strategies Portfolio (“Interest Rate Strategies Portfolio”) |
| | • | | CharterSM International Moderate Portfolio (“International Moderate Portfolio”) |
| | • | | CharterSM Real Assets Portfolio (“Real Assets Portfolio”) |
| | • | | AXA/Pacific Global Small Cap Value Portfolio (“Pac Global Portfolio”) |
(each an “Acquired Portfolio” and together the “Acquired Portfolios”).
The Alt 25 Portfolio, Alt 50 Portfolio, Alt 75 Portfolio, and Pac Global Portfolio are series of EQ Trust, a Delaware statutory trust that is registered with the Securities and Exchange Commission (“SEC”) as an open-end management investment company. The Alternative 100 Moderate Portfolio, Income Strategies Portfolio, Interest Rate Strategies Portfolio, International Moderate Portfolio, and Real Assets Portfolio are series of VIP Trust, a Delaware statutory trust that is registered with the SEC as an open-end management investment company.
AXA Equitable will offer Contractholders the opportunity to instruct it, as the record owner of all of the shares of beneficial interest in an Acquired Portfolio (the “Shares”) held by the Separate Accounts, as to how it should vote on the respective reorganization proposals (the “Proposals”) that will be considered at the Joint
i
Special Meeting of Shareholders of the Acquired Portfolios referred to in the preceding Notice and at any adjournments or postponements (the “Meeting”). The enclosed Combined Proxy Statement and Prospectus, which you should read and retain for future reference, sets forth concisely information about the proposed reorganization involving each Acquired Portfolio and the corresponding acquiring series of EQ Trust or VIP Trust that a Contractholder should know before completing the enclosed voting instruction card.
AXA Equitable Financial Services Company, LLC, a wholly owned subsidiary of AXA Financial, Inc., is the parent company of AXA Equitable. AXA Financial, Inc. is a wholly owned subsidiary of AXA, a French insurance holding company. The principal executive offices of AXA Equitable Financial Services Company, LLC and AXA Financial, Inc. are located at 1290 Avenue of the Americas, New York, New York 10104.
These Contractholder Voting Instructions and the accompanying voting instruction card, together with the enclosed proxy materials, are being mailed to Contractholders on or about February 28, 2017.
HOW TO INSTRUCT AXA EQUITABLE
To instruct AXA Equitable as to how to vote the Shares held in the investment divisions of its Separate Accounts, Contractholders are asked to promptly complete their voting instructions on the enclosed voting instruction card(s), sign and date the voting instruction card(s), and mail the voting instruction card(s) in the accompanying postage-paid envelope. Contractholders also may provide voting instructions by telephone at 1-800-690-6903 or by Internet at our website at www.proxyvote.com.
If a voting instruction card is not marked to indicate voting instructions but is signed and timely returned, it will be treated as an instruction to vote the Shares “For” the applicable Proposal.
The number of Shares held in the investment division of a Separate Account corresponding to the Acquired Portfolio for which a Contractholder may provide voting instructions was determined as of the Record Date by dividing (i) a Contract’s account value allocable to that investment division by (ii) the net asset value of one Share of the Acquired Portfolio. Each whole Share of an Acquired Portfolio is entitled to one vote as to each matter with respect to which it is entitled to vote and each fractional Share is entitled to a proportionate fractional vote. At any time prior to AXA Equitable’s voting at the Meeting, a Contractholder may revoke his or her voting instructions with respect to that investment division by providing AXA Equitable with a properly executed written revocation of such voting instructions, properly executing later-dated voting instructions by a voting instruction card, telephone or the Internet, or appearing and providing voting instructions in person at the Meeting.
HOW AXA EQUITABLE WILL VOTE
AXA Equitable will vote the Shares for which it receives timely voting instructions from Contractholders in accordance with those instructions. Shares in each investment division of a Separate Account for which AXA Equitable receives a voting instruction card that is signed and timely returned but is not marked to indicate voting instructions will be treated as an instruction to vote the Shares “FOR” a Proposal. Shares in each investment division of a Separate Account for which AXA Equitable receives no timely voting instructions from Contractholders, or that are attributable to amounts retained by AXA Equitable as surplus or seed money, will be voted by AXA Equitable either “FOR” or “AGAINST” a Proposal, or as an abstention, in the same proportion as the Shares for which Contractholders have provided voting instructions to AXA Equitable. As a result of such proportional voting by AXA Equitable, it is possible that a small number of Contractholders could determine whether a Proposal is approved.
OTHER MATTERS
AXA Equitable is not aware of any matters, other than the specified Proposals, to be acted on at the Meeting. If any other matters come before the Meeting, AXA Equitable will vote the Shares upon such matters in its discretion. Voting instruction cards may be solicited by directors, officers and employees of AXA Equitable Funds Management Group, LLC, the investment manager of each Trust, or its affiliates as well as officers and
ii
agents of the Trust. The principal solicitation will be by mail, but voting instructions may also be solicited by telephone, fax, personal interview, the Internet or other permissible means.
If the quorum necessary to transact business at the Meeting is not established with respect to an Acquired Portfolio, or the vote required to approve a Proposal is not obtained at the Meeting, the persons named as proxies may propose one or more adjournments or postponements of the Meeting in accordance with applicable law to permit further solicitation of voting instructions. The persons named as proxies will vote in their discretion on any such adjournment or postponement.
It is important that your Contract be represented. Please promptly mark your voting instructions on the enclosed voting instruction card; then sign and date the voting instruction card and mail it in the accompanying postage-paid envelope. You may also provide your voting instructions by telephone at 1-800-690-6903 or by Internet at our website at www.proxyvote.com.
iii
COMBINED PROXY STATEMENT
for
All Asset Aggressive-Alt 25 Portfolio
All Asset Aggressive-Alt 50 Portfolio
All Asset Aggressive-Alt 75 Portfolio
AXA/Pacific Global Small Cap Value Portfolio,
each a series of EQ Advisors Trust and
CharterSM Alternative 100 Moderate Portfolio
CharterSM Income Strategies Portfolio
CharterSM Interest Rate Strategies Portfolio
CharterSM International Moderate Portfolio
CharterSM Real Assets Portfolio,
each a series of AXA Premier VIP Trust and
PROSPECTUS
for
All Asset Growth-Alt 20 Portfolio
AXA/Horizon Small Cap Value Portfolio
AXA/DoubleLine Opportunistic Core Plus Bond Portfolio
EQ/PIMCO Global Real Return Portfolio,
each a series of EQ Advisors Trust and
CharterSM Moderate Portfolio,
a series of AXA Premier VIP Trust
Dated February 22, 2017
1290 Avenue of the Americas
New York, New York 10104
1-877-222-2144
This Combined Proxy Statement and Prospectus (the “Combined Proxy Statement/Prospectus”) is being furnished to owners (the “Contractholders”) of variable life insurance policies and/or variable annuity contracts or certificates (the “Contracts”) issued by AXA Equitable Life Insurance Company (“AXA Equitable”) who, as of December 31, 2016, had net premiums or contributions allocated to the investment divisions of its separate account or accounts (the “Separate Accounts”) that are invested in shares of beneficial interest in one or more the following Portfolios, each of which is a series of EQ Advisors Trust (“EQ Trust”) or AXA Premier VIP Trust (“VIP Trust,” and together with EQ Trust, the “Trusts”), as indicated above:
| | • | | All Asset Aggressive-Alt 25 Portfolio (“Alt 25 Portfolio”) |
| | • | | All Asset Aggressive-Alt 50 Portfolio (“Alt 50 Portfolio”) |
| | • | | All Asset Aggressive-Alt 75 Portfolio (“Alt 75 Portfolio”) |
| | • | | CharterSM Alternative 100 Moderate Portfolio (“Alternative 100 Moderate Portfolio”) |
| | • | | CharterSM Income Strategies Portfolio (“Income Strategies Portfolio”) |
| | • | | CharterSM Interest Rate Strategies Portfolio (“Interest Rate Strategies Portfolio”) |
| | • | | CharterSM International Moderate Portfolio (“International Moderate Portfolio”) |
| | • | | CharterSM Real Assets Portfolio (“Real Assets Portfolio”) |
| | • | | AXA/Pacific Global Small Cap Value Portfolio (“Pac Global Portfolio”) |
| | | | (each an “Acquired Portfolio” and together the “Acquired Portfolios”) |
The Alt 25 Portfolio, Alt 50 Portfolio, Alt 75 Portfolio, and Pac Global Portfolio are series of EQ Trust. The Alternative 100 Moderate Portfolio, Income Strategies Portfolio, Interest Rate Strategies Portfolio, International Moderate Portfolio, and Real Assets Portfolio are series of VIP Trust. The Trusts are open-end management investment companies registered with the Securities and Exchange Commission (“SEC”).
|
THE SECURITIES AND EXCHANGE COMMISSION HAS NOT APPROVED OR DISAPPROVED THESE SECURITIES OR PASSED UPON THE ADEQUACY OF THIS COMBINED PROXY STATEMENT/PROSPECTUS. ANY REPRESENTATION TO THE CONTRARY IS A CRIMINAL OFFENSE. |
This Combined Proxy Statement/Prospectus also is being furnished to AXA Equitable as the record owner of shares and to other shareholders that were invested in the Acquired Portfolios as of December 31, 2016. Contractholders are being provided the opportunity to instruct AXA Equitable to approve or disapprove the proposals contained in this Combined Proxy Statement/Prospectus (each, a “Proposal”) in connection with the solicitation by the Board of Trustees of each Trust (the “Board”) of proxies to be used at the Joint Special Meeting of Shareholders of the Acquired Portfolios to be held at 1290 Avenue of the Americas, New York, New York 10104, on March 28, 2017, at 2:30 p.m., Eastern time, or any adjournment or postponement thereof (the “Meeting”).
The shareholders of each Acquired Portfolio will vote separately on its reorganization. The consummation of any one reorganization described in any of the below Proposals is not contingent on the consummation of any other reorganization in that Proposal. The Proposals described in this Combined Proxy Statement/Prospectus are as follows:
| | |
| Proposal | | Shareholders Entitled to Vote on the Proposal |
1. To approve the Plan of Reorganization and Termination with respect to the reorganization of the: A. Alt 25 Portfolio, a series of EQ Trust, B. Alt 50 Portfolio, a series of EQ Trust, and C. Alt 75 Portfolio, a series of EQ Trust, into the All Asset Growth-Alt 20 Portfolio, a series of EQ Trust. | | Shareholders of the Alt 25 Portfolio, Alt 50 Portfolio, and Alt 75 Portfolio, voting separately with respect to the Reorganization of their Portfolio(s). |
| 1.D. To approve the Agreement and Plan of Reorganization and Termination with respect to the reorganization of the Alternative 100 Moderate Portfolio, a series of VIP Trust, into the All Asset Growth-Alt 20 Portfolio, a series of EQ Trust. | | Shareholders of the Alternative 100 Moderate Portfolio, voting separately with respect to the Reorganization of their Portfolio. |
2. To approve the Agreement and Plan of Reorganization and Termination with respect to the reorganization of the: A. Income Strategies Portfolio, a series of VIP Trust, and B. Interest Rate Strategies Portfolio, a series of VIP Trust, into the AXA/DoubleLine Opportunistic Core Plus Bond Portfolio, a series of EQ Trust. | | Shareholders of the Income Strategies Portfolio and Interest Rate Strategies Portfolio, voting separately with respect to the Reorganization of their Portfolio(s). |
| 3. To approve the Plan of Reorganization and Termination with respect to the reorganization of the International Moderate Portfolio, a series of VIP Trust, into the CharterSM Moderate Portfolio, also a series of VIP Trust. | | Shareholders of the International Moderate Portfolio. |
| 4. To approve the Agreement and Plan of Reorganization and Termination with respect to the reorganization of the Real Assets Portfolio, a series of VIP Trust, into the EQ/PIMCO Global Real Return Portfolio, a series of EQ Trust. | | Shareholders of the Real Assets Portfolio. |
ii
| | |
| Proposal | | Shareholders Entitled to Vote on the Proposal |
5. To approve the Plan of Reorganization and Termination with respect to the reorganization of the: Pac Global Portfolio, a series of EQ Trust, into the AXA/Horizon Small Cap Value Portfolio, a series of EQ Trust. | | Shareholders of the AXA/Horizon Small Cap Value Portfolio. |
| 6. To transact other business that may properly come before the Meeting or any adjournments thereof. | | Shareholders of each Acquired Portfolio, as applicable. |
Each reorganization referred to in Proposals 1-5 above is referred to herein as a “Reorganization” and together as the “Reorganizations.” Each of the All Asset Growth-Alt 20 Portfolio, AXA/DoubleLine Opportunistic Core Plus Bond Portfolio, CharterSM Moderate Portfolio, EQ/PIMCO Global Real Return Portfolio, and AXA/Horizon Small Cap Value Portfolio is referred to herein as an “Acquiring Portfolio” and together as the “Acquiring Portfolios.”
This Combined Proxy Statement/Prospectus, which you should retain for future reference, contains important information regarding the Proposals that you should know before voting or providing voting instructions. Additional information about each Trust has been filed with the SEC and is available, without charge, upon oral or written request. This Combined Proxy Statement/Prospectus is being provided to AXA Equitable and mailed to Contractholders and other shareholders on or about February 28, 2017. This Combined Proxy Statement/Prospectus and a proxy or voting instruction card also will be available at www.proxyvote.com on or about February 28, 2017. It is expected that one or more representatives of AXA Equitable will attend the Meeting in person or by proxy and will vote shares held by AXA Equitable in accordance with voting instructions received from its Contractholders and in accordance with voting procedures established by each Trust.
The following documents have been filed with the SEC and are incorporated by reference into this Combined Proxy Statement/Prospectus:
| | 1. | | The Statement of Additional Information dated February 22, 2017, relating the Reorganizations of Alt 25 Portfolio, Alt 50 Portfolio, Alt 75 Portfolio, Alternative 100 Moderate Portfolio, Income Strategies Portfolio, Interest Rate Strategies Portfolio, Real Assets Portfolio and Pac Global Portfolio (File No. 333-215584) which includes the financial statements for the fiscal year ended December 31, 2016 for these Acquired Portfolios and each of their corresponding Acquiring Portfolios; and |
| | 2. | | The Statement of Additional Information dated February 22, 2017, relating the Reorganization of International Moderate Portfolio (File No. 333-215585) which includes the financial statements for the fiscal year ended December 31, 2016 for this Acquired Portfolio and its corresponding Acquiring Portfolio. |
For a free copy of any of these documents, please call 1-877-222-2144 or write the Trusts at the address above.
Each Trust is subject to the informational requirements of the Securities Exchange Act of 1934, as amended. Accordingly, each Trust must file certain reports and other information with the SEC. You can copy and review information about each Trust, including proxy materials and proxy and information statements, at the SEC’s Public Reference Room in Washington, DC, and at certain of the following SEC Regional Offices: New York Regional Office, 3 World Financial Center, Suite 400, New York, New York 10281; Miami Regional Office, 801 Brickell Avenue, Suite 1800, Miami, Florida 33131; Chicago Regional Office, 175 W. Jackson Boulevard, Suite 900, Chicago, Illinois 60604; Denver Regional Office, 1801 California Street, Suite 1500, Denver, Colorado 80202; Los Angeles Regional Office, 5670 Wilshire Boulevard, 11th Floor, Los Angeles, California 90036; Boston Regional Office, 33 Arch Street, 23rd Floor, Boston, MA 02110; Philadelphia Regional Office, The Mellon Independence Center, 701 Market Street, Philadelphia, PA 19106; Atlanta Regional Office, 3475 Lenox Road, N.E., Suite 1000, Atlanta, GA 30326; Fort Worth Regional Office, Burnett Plaza, Suite 1900, 801 Cherry Street, Unit 18, Fort Worth, TX 76102; Salt Lake Regional Office, 15 W. South Temple Street, Suite 1800, Salt Lake City, UT 84101; and San Francisco Regional Office,
iii
44 Montgomery Street, Suite 2600, San Francisco, CA 94104. You may obtain information on the operation of the Public Reference Room by calling the SEC at (202) 551-8090. Reports and other information about each Trust are available on the EDGAR Database on the SEC’s Internet site at http://www.sec.gov. You may obtain copies of this information from the SEC’s Public Reference Branch, Office of Consumer Affairs and Information Services, Washington, DC 20549, at prescribed rates.
Copies of EQ Trust’s and VIP Trust’s most recent annual and semi-annual reports, including financial statements, previously have been delivered to Contractholders. Contractholders may request additional copies of each Trust’s annual or semi-annual reports, free of charge, by writing to the respective Trust at 1290 Avenue of the Americas, New York, New York 10104 or by calling 1-877-222-2144.
iv
TABLE OF CONTENTS
| | | | |
| | | Page | |
SUMMARY | | | 1 | |
PROPOSAL 1: TO APPROVE THE PLAN OF REORGANIZATION AND TERMINATION WITH RESPECT TO THE REORGANIZATION OF THE ALT 25 PORTFOLIO, ALT 50 PORTFOLIO, AND ALT 75 PORTFOLIO, EACH A SERIES OF EQ TRUST, AND THE AGREEMENT AND PLAN OF REORGANIZATION AND TERMINATION WITH RESPECT TO THE REORGANIZATION OF THE ALTERNATIVE 100 MODERATE PORTFOLIO, A SERIES OF VIP TRUST, EACH INTO THE ALL ASSET GROWTH-ALT 20 PORTFOLIO, A SERIES OF EQ TRUST. | | | 2 | |
Proposal 1.A. | | | 3 | |
Proposal 1.B. | | | 6 | |
Proposal 1.C. | | | 9 | |
Proposal 1.D. | | | 12 | |
Comparative Fee and Expense Tables | | | 16 | |
Example of Portfolio Expenses | | | 18 | |
Portfolio Turnover | | | 20 | |
Comparison of Investment Objectives, Policies and Strategies | | | 20 | |
Comparison of Principal Risk Factors | | | 24 | |
Comparative Performance Information | | | 25 | |
Capitalization | | | 28 | |
PROPOSAL 2: TO APPROVE THE AGREEMENT AND PLAN OF REORGANIZATION AND TERMINATION WITH RESPECT TO THE REORGANIZATION OF THE INCOME STRATEGIES PORTFOLIO AND INTEREST RATE STRATEGIES PORTFOLIO, EACH A SERIES OF VIP TRUST, EACH INTO THE AXA/DOUBLELINE OPPORTUNISTIC CORE PLUS BOND PORTFOLIO, A SERIES OF EQ TRUST. | | | 29 | |
Proposal 2.A. | | | 29 | |
Proposal 2.B. | | | 32 | |
Comparative Fee and Expense Tables | | | 36 | |
Example of Portfolio Expenses | | | 38 | |
Portfolio Turnover | | | 39 | |
Comparison of Investment Objectives, Policies and Strategies | | | 39 | |
Comparison of Principal Risk Factors | | | 44 | |
Comparative Performance Information | | | 45 | |
Capitalization | | | 46 | |
PROPOSAL 3: TO APPROVE THE PLAN OF REORGANIZATION AND TERMINATION WITH RESPECT TO THE REORGANIZATION OF THE INTERNATIONAL MODERATE PORTFOLIO, A SERIES OF VIP TRUST, INTO THE CHARTERSM MODERATE PORTFOLIO, ALSO A SERIES OF VIP TRUST. | | | 47 | |
Comparative Fee and Expense Tables | | | 50 | |
Example of Portfolio Expenses | | | 51 | |
Portfolio Turnover | | | 51 | |
Comparison of Investment Objectives, Policies and Strategies | | | 51 | |
Comparison of Principal Risk Factors | | | 53 | |
Comparative Performance Information | | | 54 | |
Capitalization | | | 55 | |
PROPOSAL 4: TO APPROVE THE AGREEMENT AND PLAN OF REORGANIZATION AND TERMINATION WITH RESPECT TO THE REORGANIZATION OF THE REAL ASSETS PORTFOLIO, A SERIES OF VIP TRUST, INTO THE EQ/PIMCO GLOBAL REAL RETURN PORTFOLIO, A SERIES OF EQ TRUST. | | | 56 | |
Comparative Fee and Expense Tables | | | 59 | |
Example of Portfolio Expenses | | | 60 | |
i
ii
SUMMARY
You should read this entire Combined Proxy Statement/Prospectus carefully. For additional information, you should consult the applicable Agreement and Plan of Reorganization and Termination or Plan of Reorganization and Termination (collectively, the “Reorganization Plans”), copies of the forms of which are attached hereto as Appendix A.
The Proposed Reorganizations
This Combined Proxy Statement/Prospectus is soliciting shareholders with amounts invested in one or more Acquired Portfolios as of December 31, 2016, to approve the Reorganization Plan (with respect to the Acquired Portfolio in which they are invested), whereby each Acquired Portfolio will be reorganized into a corresponding Acquiring Portfolio, as described below. (Each Acquired Portfolio and Acquiring Portfolio is sometimes referred to herein as a “Portfolio,” and together, the “Portfolios.”)
Among the Acquired Portfolios’ shares, each of Alt 25 Portfolio, Alt 50 Portfolio, Alt 75 Portfolio, and Pac Global Portfolio has two classes of shares, designated Class IB and Class K shares; and each of Alternative 100 Moderate Portfolio, Income Strategies Portfolio, Interest Rate Strategies Portfolio, International Moderate Portfolio, and Real Assets Portfolio has one class of shares, designated Class B shares (together, the “Acquired Portfolio Shares”).
Among the Acquiring Portfolios’ shares, the All Asset Growth-Alt 20 Portfolio has three classes of shares, designated Class IA, Class IB, and Class K shares; each of AXA/DoubleLine Opportunistic Core Plus Bond Portfolio, EQ/PIMCO Global Real Return Portfolio, and AXA/Horizon Small Cap Value Portfolio has two classes, designated Class IB and Class K shares; and CharterSM Moderate Portfolio has one class of shares, designated Class B shares (together, the “Acquiring Portfolio Shares”). The rights and preferences of each class of Acquiring Portfolio Shares are substantially similar in all material respects to the rights and preferences of the corresponding class of Acquired Portfolio Shares.
Each Reorganization Plan provides, with respect to each Reorganization, for:
| | • | | the transfer of all the assets of the Acquired Portfolio to the corresponding Acquiring Portfolio in exchange solely for Acquiring Portfolio Shares having an aggregate net asset value equal to the Acquired Portfolio’s net assets and the Acquiring Portfolio’s assumption of all the liabilities of the Acquired Portfolio; |
| | • | | the distribution to the shareholders (for the benefit of the Separate Accounts, as applicable, and thus the Contractholders) of those Acquiring Portfolio Shares; and |
| | • | | the complete termination of the Acquired Portfolio. |
The Board of each Trust is proposing the Reorganizations because it believes that each Reorganization will permit shareholders invested in the Acquired Portfolios, which are small and have limited prospects for future growth and therefore a limited ability to achieve economies of scale, to invest in the corresponding Acquiring Portfolios, which in each case will result in a larger combined portfolio with a similar investment objective that invests in a similar asset class or asset classes and has better prospects for attracting additional assets and lowering expenses. The total annual operating expense ratios of the Class IB and Class K shares of the All Asset Growth-Alt 20 Portfolio, AXA/DoubleLine Opportunistic Core Plus Bond Portfolio, EQ/PIMCO Global Real Return Portfolio and AXA/Horizon Small Cap Value Portfolio are expected to be lower than those of the corresponding classes of shares of the corresponding Acquired Portfolios for the one year after the proposed Reorganizations. The total annual operating expense ratio of the Class B shares of the CharterSM Moderate Portfolio are expected to be the same as those of the Class B shares of the corresponding Acquired Portfolio for the one year after the Reorganization. There is no assurance that fees and expenses will not increase after April 30, 2018, when the expense limitations for the Acquiring Portfolios will terminate if they are not renewed by the Boards. All of the Acquiring Portfolios, except for the CharterSM Moderate Portfolio and the AXA/Horizon Small Cap Value Portfolio, have lower total operating expenses than their corresponding Acquired Portfolios, regardless of whether the expense limitation is in effect. As further described in “Potential Benefits of the Reorganization to FMG LLC and its Affiliates” below, the Portfolios’ investment manager may realize benefits in connection with the Reorganizations, such as the reduction of elimination of its obligations to waive or reimburse fees and expenses if an Acquiring Portfolio is below its expense limit or has a lower expense ratio. For a detailed description of the Boards’ reasons for proposing the Reorganizations, see “Additional Information about the Reorganizations — Board Considerations” below.
1
A comparison of the investment objectives, policies, strategies and principal risks of each Acquired Portfolio and its corresponding Acquiring Portfolio is included in “Comparison of Investment Objectives, Policies and Strategies” and “Comparison of Principal Risk Factors” below. The Portfolios have identical distribution procedures, purchase procedures, exchange rights and redemption procedures, which are discussed in the “Additional Information about the Portfolios” section below. Each Portfolio offers its shares to Separate Accounts and certain other eligible investors. Shares of each Portfolio are offered and redeemed at their net asset value without any sales load. You will not incur any sales loads or similar transaction charges as a result of a Reorganization.
Subject to shareholder approval, the Reorganizations are expected to be effective at the close of business on May 19, 2017, or on a later date each Trust decides upon (the “Closing Date”). As a result of each Reorganization, each shareholder that owns shares of an Acquired Portfolio would become an owner of shares of the corresponding Acquiring Portfolio. Each such shareholder would hold, immediately after the Closing Date, Class IB, Class K, or Class B shares of the applicable Acquiring Portfolio having an aggregate value equal to the aggregate value of the Class IB, Class K, or Class B shares of the Acquired Portfolio that were held by the shareholder as of the Closing Date. Shareholders of Acquired Portfolios that are series of VIP Trust (that is, shareholders of Alternative 100 Moderate Portfolio, Income Strategies Portfolio, Interest Rate Strategies Portfolio, and Real Assets Portfolio) will receive Class IB shares of the corresponding Acquiring Portfolio in exchange for their Class B shares. Similarly, each Contractholder whose Contract values are invested in shares of an Acquired Portfolio would become an indirect owner of shares of the corresponding Acquiring Portfolio. Each such Contractholder would indirectly hold, immediately after the Closing Date, Class IB, Class K, or Class B shares of the applicable Acquiring Portfolio having an aggregate value equal to the aggregate value of the Class IB, Class K, or Class B shares of the Acquired Portfolio that were indirectly held by the Contractholder as of the Closing Date. The Reorganizations of the Alt 50 Portfolio and Alt 75 Portfolio into the All Asset Growth-Alt 20 Portfolio, the Income Strategies Portfolio and Interest Rate Strategies Portfolio into the AXA/DoubleLine Opportunistic Core Plus Bond Portfolio, the International Moderate Portfolio into the CharterSM Moderate Portfolio, and the Real Assets Portfolio into the EQ/PIMCO Global Real Return Portfolio, will not qualify, for federal income tax purposes, as tax-free reorganizations, and each such Reorganization will be treated as a taxable transaction. The Reorganizations of the Alt 25 Portfolio and the Alternative 100 Moderate Portfolio into the All Asset Growth-Alt 20 Portfolio and the Reorganization of the Pac Global Portfolio into the AXA/Horizon Small Cap Value Portfolio each is intended to qualify for federal income tax purposes as a tax-free reorganization.
Please see “Additional Information about the Reorganizations — Federal Income Tax Consequences of the Reorganizations” below for further information.
The Board of each respective Trust has unanimously approved the Reorganization Plan with respect to each Acquired Portfolio and each Acquiring Portfolio, respectively. Accordingly, the Board of each respective Trust is submitting each Reorganization Plan for approval by each Acquired Portfolio’s shareholders. In considering whether to approve the Proposals, you should review the discussion of the Proposals set forth below. In addition, you should review the information in this Combined Proxy Statement/Prospectus that relates to each Proposal and Reorganization Plan generally. The Board of each Trust recommends that you vote “FOR” the relevant Proposal(s) to approve the Plan(s) of Reorganization.
PROPOSAL 1: TO APPROVE THE PLAN OF REORGANIZATION AND TERMINATION WITH RESPECT TO THE REORGANIZATION OF THE ALT 25 PORTFOLIO, ALT 50 PORTFOLIO, AND ALT 75 PORTFOLIO, EACH A SERIES OF EQ TRUST, AND THE AGREEMENT AND PLAN OF REORGANIZATION AND TERMINATION WITH RESPECT TO THE REORGANIZATION OF THE ALTERNATIVE 100 MODERATE PORTFOLIO, A SERIES OF VIP TRUST, EACH INTO THE ALL ASSET GROWTH-ALT 20 PORTFOLIO, A SERIES OF EQ TRUST.
This Proposal 1 requests your approval of each Reorganization Plan pursuant to which the Alt 25 Portfolio, Alt 50 Portfolio, Alt 75 Portfolio, and Alternative 100 Moderate Portfolio will be reorganized into the All Asset Growth-Alt 20 Portfolio. The shareholders of each Acquired Portfolio will vote separately on its Reorganization. The consummation of any one Reorganization described in this Proposal is not contingent on the consummation of any other Reorganization.
2
Proposal 1.A.: This Proposal 1.A. requests your approval of the Reorganization Plan pursuant to which the Alt 25 Portfolio will be reorganized into the All Asset Growth-Alt 20 Portfolio. In considering whether you should approve the Proposal, you should note that:
| | • | | The Alt 25 Portfolio and the All Asset Growth-Alt 20 Portfolio have similar investment objectives. The Alt 25 Portfolio seeks long-term capital appreciation and current income, with a greater emphasis on capital appreciation; while the All Asset Growth-Alt 20 Portfolio seeks long-term capital appreciation and current income. Below is a summary comparison of the two Portfolios. For a detailed comparison of the Portfolios’ investment policies and strategies, see “Comparisons of Investment Objectives, Policies and Strategies” below. |
| | • | | The Portfolios have similar investment policies. Each Portfolio invests in other mutual funds managed by AXA Equitable Funds Management Group, LLC (“FMG LLC” or the “Manager”) (“Underlying Portfolios”) and exchange-traded funds (“Underlying ETFs”) and provides diversified exposure to equity securities, fixed income securities, and alternative investments (“asset classes”). Each Portfolio invests according to an “asset allocation target,” which is established by the Manager and represents an approximate percentage of the Portfolio’s assets that are invested in each asset class. Each Portfolio’s alternative investments may include convertible securities, investments in certain industries or sectors (e.g., infrastructure), Underlying ETFs that invest in commodities and other instruments that derive their value from natural resources, the AXA Natural Resources Portfolio, the AXA Real Estate Portfolio and other instruments that derive their value from real estate, and the EQ/GAMCO Mergers and Acquisitions Portfolio. |
| | • | | There are, however, differences between the two Portfolios’ principal investment policies and strategies of which you should be aware. The Portfolios’ asset allocation targets differ, as described immediately below. |
| | • | | The Alt 25 Portfolio’s current asset allocation target is to invest approximately 65% of its assets in equity investments, 10% of its assets in fixed income investments, and 25% of its assets in alternative investments through investments in Underlying Portfolios and Underlying ETFs. |
| | • | | The All Asset Growth-Alt 20 Portfolio’s current asset allocation target is to invest approximately 55% of its assets in equity investments, 25% of its assets in fixed income investments, and 20% of its assets in alternative investments through investments in Underlying Portfolios and Underlying ETFs. |
| | • | | In addition to the asset allocation targets discussed above, the Manager also has established target investment percentages for each “asset category” in which each Portfolio invests. Each target investment percentage is an approximate percentage of the Portfolio’s assets that is invested in a particular asset category through investments in Underlying Portfolios or Underlying ETFs whose individual holdings fall within such asset category. The term “asset category” refers to specific types of securities or other instruments within each asset class (e.g., large cap equity securities, micro/small/mid cap equity securities, foreign/emerging markets securities, Real Estate Investment Trusts (“REITs”), investment grade bonds and high yield bonds (also known as “junk bonds”)). The Portfolios have different current target investment percentages. Below is a chart that compares the Portfolios’ current target investment percentages. |
| | | | | | | | |
Asset Class | | Alt 25 Portfolio | | | All Asset Growth-
Alt 20 Portfolio | |
Range of Equity | | | 65% | | | | 55% | |
Large Cap Equity Securities | | | 25% | | | | 20% | |
Micro/Small/Mid Cap Equity Securities | | | 20% | | | | 15% | |
Foreign/Emerging Markets Securities | | | 20% | | | | 20% | |
Range of Alternative Investments | | | 25% | | | | 20% | |
REITS | | | 5% | | | | 5% | |
Other Alternatives | | | 20% | | | | 15% | |
Range of Fixed Income | | | 10% | | | | 25% | |
Investment Grade Bonds | | | 9% | | | | 23% | |
High Yield Bonds | | | 1% | | | | 2% | |
3
| | • | | Each Portfolio’s principal risks are the same and include affiliated portfolio risk, alternative investment risk, commodity price volatility risk, convertible securities risk, credit risk, energy sector risk, equity risk, foreign securities risk, currency risk, depositary receipts risk, emerging markets risk, infrastructure sector risk, interest rate risk, investment grade securities risk, large-cap company risk, mid-cap, small-cap and micro-cap company risk, natural resources sector risk, non-investment grade securities risk, real estate investing risk, risks related to investments in Underlying Portfolios and Underlying ETFs, securities lending risk, and special situations risk. To the extent the All Asset Growth-Alt 20 Portfolio generally will invest a greater percentage of its assets in fixed income investments and a lesser percentage of its assets in equity investments and in non-traditional (alternative) investments than the Alt 25 Portfolio, its risk profile will differ from that of the Alt 25 Portfolio with respect to the degree of risk associated with those investments. For a detailed comparison of the Portfolios’ principal risks, see “Comparison of Principal Risk Factors” below. |
| | • | | FMG LLC serves as the investment manager and administrator for each Portfolio, and it is anticipated that FMG LLC will continue to manage and administer the All Asset Growth-Alt 20 Portfolio after the Reorganization. For a detailed description of FMG LLC, please see “Additional Information about the Portfolios — The Manager” below. |
| | • | | The Alt 25 Portfolio and the All Asset Growth-Alt 20 Portfolio had net assets of approximately $32.4 million and $277.6 million, respectively, as of January 31, 2017. Thus, if the Reorganization had been in effect on that date, the combined Portfolio would have had net assets of approximately $310.0 million. In addition, as discussed in connection with Proposal 1.B., 1.C., and 1.D., it is also proposed that the Alt 50 Portfolio, Alt 75 Portfolio, and Alternative 100 Moderate Portfolio be reorganized into the All Asset Growth-Alt 20 Portfolio. These Portfolios’ approximate net assets as of January 31, 2017 were as follows: |
| | | | |
Acquired Portfolios | | Net Assets | |
Alt 50 Portfolio | | $ | 2.9 million | |
Alt 75 Portfolio | | $ | 3.1 million | |
Alternative 100 Moderate Portfolio | | $ | 8.3 million | |
| | • | | Thus, if the Reorganizations of the Alt 25 Portfolio and each of the Portfolios as provided in Proposal 1.B., 1.C., and 1.D. had been in effect on that date, the combined Portfolio would have had net assets of approximately $324.3 million. |
| | • | | The shareholders of the Alt 25 Portfolio will receive shares of the All Asset Growth-Alt 20 Portfolio pursuant to the Reorganization. Shareholders will not pay any sales charges in connection with the Reorganization. Please see “Comparative Fee and Expense Tables,” “Additional Information about the Reorganizations” and “Additional Information about the Portfolios” below for more information. |
| | • | | It is estimated that the total annual operating expense ratio (including acquired fund fees and expenses) for the All Asset Growth-Alt 20 Portfolio Class IB shares and Class K shares, for the fiscal year following the Reorganization, will be 1.33% and 1.08%, respectively, which are lower than those of the Alt 25 Portfolio Class IB and Class K shares for the fiscal year ended December 31, 2016, which were 1.42% and 1.17%, respectively. This assumes that only the Reorganization of the Alt 25 Portfolio into the All Asset Growth-Alt 20 Portfolio is consummated. If all four of the proposed Reorganizations into the All Asset Growth-Alt 20 Portfolio are consummated then it is estimated that the total annual operating expense ratio (including acquired fund fees and expenses) for the All Asset Growth-Alt 20 Portfolio Class IB and Class K shares for the fiscal year following the Reorganization will be 1.32% and 1.07%, respectively. For a more detailed comparison of the fees and expenses of the Portfolios, please see “Comparative Fee and Expense Tables” and “Additional Information about the Portfolios” below. |
| | • | | The Portfolios are subject to the same management fee schedule. The management fee for each Portfolio is equal to an annual rate of 0.10% of its average daily net assets. |
4
| | • | | The Portfolios are subject to the same administration fee schedule. In addition to the management fee, each Portfolio also pays FMG LLC its proportionate share of an asset-based administration fee, subject to a minimum annual fee of $32,500. For purposes of calculating the asset-based administration fee, the assets of the Portfolios are aggregated with those of the other portfolios of VIP Trust (“VIP Trust Portfolios”) and the AXA Strategic Allocation Series Portfolios, AXA All Asset Allocation Series Portfolios, and AXA/Franklin Templeton Allocation Managed Volatility Portfolio of EQ Trust (the “EQ Trust Fund-of-Funds Portfolios”), which are also managed by FMG LLC. The asset-based administration fee is equal to an annual rate of 0.15% of the first $35 billion of the aggregate average daily net assets of the Portfolios, VIP Trust Portfolios, and EQ Trust Fund-of-Funds Portfolios; 0.11% on the next $10 billion; 0.10% on the next $5 billion; and 0.095% thereafter. For a more detailed description of the fees and expenses of the Portfolios, please see “Comparative Fee and Expense Tables” and “Additional Information about the Portfolios” below. |
| | • | | Each Portfolio is subject to an expense limitation arrangement. |
| | • | | Pursuant to a contract, FMG LLC has agreed to make payments or waive its management, administrative or other fees to limit the expenses of the Alt 25 Portfolio through April 30, 2017 (unless the Board of Trustees consents to an earlier revision or termination of this arrangement), so that the annual operating expenses of the Portfolio (other than interest, taxes, brokerage commissions, dividend and interest expenses on securities sold short, expenses of Underlying Portfolios and Underlying ETFs, other expenditures that are capitalized in accordance with generally accepted accounting principles and other extraordinary expenses not incurred in the ordinary course of the Portfolio’s business) do not exceed an annual rate of average daily net assets of 0.65% for Class IB shares and 0.40% for Class K shares of the Alt 25 Portfolio. |
| | • | | Pursuant to a contract, FMG LLC has agreed to make payments or waive its management, administrative or other fees to limit the expenses of the All Asset Growth-Alt 20 Portfolio through April 30, 2018 (unless the Board of Trustees consents to an earlier revision or termination of this arrangement), so that the annual operating expenses (including acquired fund fees and expenses) of the All Asset Growth-Alt 20 Portfolio (other than interest, taxes, brokerage commissions, dividend and interest expenses on securities sold short, other expenditures that are capitalized in accordance with generally accepted accounting principles and other extraordinary expenses not incurred in the ordinary course of the Portfolio’s business) do not exceed an annual rate of average daily net assets of 1.35% for Class IB shares and 1.10% for Class K shares of the All Asset Growth-Alt 20 Portfolio. |
| | • | | The Class IB shares of the All Asset Growth-Alt 20 Portfolio and Alt 25 Portfolio are each subject to a 0.25% Rule 12b-1 fee. |
| | • | | The Class IB shares and Class K shares of All Asset Growth-Alt 20 Portfolio underperformed compared to the Class IB shares and Class K shares of the Alt 25 Portfolio for the one-year period ended December 31, 2016 and for the period since inception. Please see “Comparative Performance Information” below. |
| | • | | Following the Reorganization, it is anticipated that FMG LLC will redeem shares that it holds in the combined Portfolio representing seed capital it has previously invested. The withdrawal of such seed capital is not expected to have a material effect on the annual operating expenses of the combined Portfolio. |
| | • | | Following the Reorganization, the combined Portfolio will be managed in accordance with the investment objective, policies and strategies of the All Asset Growth-Alt 20 Portfolio. It is not expected that the All Asset Growth-Alt 20 Portfolio will revise any of its investment policies following the Reorganization to reflect those of the Alt 25 Portfolio. FMG LLC has reviewed the Alt 25 Portfolio’s current portfolio holdings and determined that the holdings generally are compatible with the All Asset Growth-Alt 20 Portfolio’s investment objective and policies. Thus, FMG LLC believes that, if the Reorganization is approved, all or a substantial portion of the holdings of the Alt 25 Portfolio could be |
5
| | transferred to and held by the All Asset Growth-Alt 20 Portfolio. However, it is expected that some of those holdings may not remain at the time of the Reorganization due to normal portfolio turnover. It is also expected that, if the Reorganization is approved, the holdings of the Alt 25 Portfolio involved therein that are not compatible with the All Asset Growth-Alt 20 Portfolio’s investment objective and policies will be liquidated in an orderly manner in connection with the Reorganization, and the proceeds of these sales held in temporary investments or reinvested in assets that are consistent with All Asset Growth-Alt 20 Portfolio’s investment objective and policies. The portion of the Alt 25 Portfolio’s assets that will be liquidated in connection with the Reorganization will depend on market conditions and on the assessment by FMG LLC of the compatibility of those holdings with the All Asset Growth-Alt 20 Portfolio’s portfolio composition and investment objective and policies. The need for the Alt 25 Portfolio to sell investments in connection with the Reorganization may result in its selling securities at a disadvantageous time and price and could result in its realizing gains (or losses) that would not otherwise have been realized and incurring transaction costs that would not otherwise have been incurred. It is estimated that the Alt 25 Portfolio will not sell any of its holdings in connection with its Reorganization, and therefore no portfolio transaction costs are expected to be incurred. This estimate is subject to change depending on the factors outlined above. Contractholders will not recognize any gain or loss for federal income tax purposes as a result of the Reorganizations. |
| | • | | FMG LLC has voluntarily agreed to pay expenses of the Reorganization that exceed the Alt 25 Portfolio’s expense limitation set forth in its expense limitation agreement. The Reorganization expenses for the Alt 25 Portfolio, which are estimated to be $33,333, exceed the expense limit and will be paid by FMG LLC. |
Proposal 1.B.: This Proposal 1.B. requests your approval of the Reorganization Plan pursuant to which the Alt 50 Portfolio will be reorganized into the All Asset Growth-Alt 20 Portfolio. In considering whether you should approve the Proposal, you should note that:
| | • | | The Alt 50 Portfolio and the All Asset Growth-Alt 20 Portfolio have similar investment objectives. The Alt 50 Portfolio seeks long-term capital appreciation. The All Asset Growth-Alt 20 Portfolio also seeks long-term capital appreciation, but seeks current income as well. Below is a summary comparison of the two Portfolios. For a detailed comparison of the Portfolios’ investment policies and strategies, see “Comparisons of Investment Objectives, Policies and Strategies” below. |
| | • | | The Portfolios have similar investment policies. Each Portfolio invests in Underlying Portfolios and Underlying ETFs and provides diversified exposure to equity securities, fixed income securities, and alternative investments (“asset classes”). Each Portfolio invests according to an “asset allocation target,” which is established by the Manager and represents an approximate percentage of the Portfolio’s assets that are invested in each asset class. Each Portfolio may invest in alternative investments, which include convertible securities, investments in certain industries or sectors (e.g., infrastructure), Underlying ETFs that invest in commodities and other instruments that derive their value from natural resources, the AXA Natural Resources Portfolio, the AXA Real Estate Portfolio and other instruments that derive their value from real estate, and the EQ/GAMCO Mergers and Acquisitions Portfolio. |
| | • | | There are, however, differences between the two Portfolios’ principal investment policies and strategies of which you should be aware. The Portfolios’ asset allocation targets differ, as described below. |
| | • | | The Alt 50 Portfolio’s current asset allocation target is to invest approximately 45% of its assets in equity investments, 5% of its assets in fixed income investments, and 50% of its assets in alternative investments through investments in Underlying Portfolios and Underlying ETFs. |
| | • | | The All Asset Growth-Alt 20 Portfolio’s current asset allocation target is to invest approximately 55% of its assets in equity investments, 25% of its assets in fixed income investments, and 20% of its assets in alternative investments through investments in Underlying Portfolios and Underlying ETFs. |
6
| | • | | In addition to the asset allocation targets discussed above, the Manager also has established target investment percentages for each “asset category” in which each Portfolio invests. Each target investment percentage is an approximate percentage of the Portfolio’s assets that is invested in a particular asset category through investments in Underlying Portfolios or Underlying ETFs whose individual holdings fall within such asset category. The term “asset category” refers to specific types of securities or other instruments within each asset class (e.g., large cap equity securities, micro/small/mid cap equity securities, foreign/emerging markets securities, REITs, investment grade bonds and high yield bonds (also known as “junk bonds”)). The Portfolios have different current target investment percentages. Below is a chart that compares the Portfolios’ current target investment percentages. |
| | | | | | | | |
Asset Class | | Alt 50 Portfolio | | | All Asset Growth-
Alt 20 Portfolio | |
Range of Equity | | | 45% | | | | 55% | |
Large Cap Equity Securities | | | 20% | | | | 20% | |
Micro/Small/Mid Cap Equity Securities | | | 10% | | | | 15% | |
Foreign/Emerging Markets Securities | | | 15% | | | | 20% | |
Range of Alternative Investments | | | 50% | | | | 20% | |
REITS | | | 15% | | | | 5% | |
Other Alternatives | | | 35% | | | | 15% | |
Range of Fixed Income | | | 5% | | | | 25% | |
Investment Grade Bonds | | | 4% | | | | 23% | |
High Yield Bonds | | | 1% | | | | 2% | |
| | • | | Each Portfolio’s principal risks are the same and include affiliated portfolio risk, alternative investment risk, commodity price volatility risk, convertible securities risk, credit risk, energy sector risk, equity risk, foreign securities risk, currency risk, depositary receipts risk, emerging markets risk, infrastructure sector risk, interest rate risk, investment grade securities risk, large-cap company risk, mid-cap, small-cap and micro-cap company risk, natural resources sector risk, non-investment grade securities risk, real estate investing risk, risks related to investments in Underlying Portfolios and Underlying ETFs, securities lending risk, and special situations risk. To the extent the All Asset Growth-Alt 20 Portfolio generally will invest a greater percentage of its assets in fixed income investments and equity securities and a lesser percentage of its assets in non-traditional (alternative) investments than the Alt 50 Portfolio, its risk profile will differ from that of the Alt 50 Portfolio with respect to the degree of risk associated with those investments. For a detailed comparison of the Portfolios’ principal risks, see “Comparison of Principal Risk Factors” below. |
| | • | | FMG LLC serves as the investment manager and administrator for each Portfolio and it is anticipated that FMG LLC will continue to manage and administer the All Asset Growth-Alt 20 Portfolio after the Reorganization. For a detailed description of FMG LLC, please see “Additional Information about the Portfolios — The Manager” below. |
| | • | | The Alt 50 Portfolio and the All Asset Growth-Alt 20 Portfolio had net assets of approximately $2.9 million and $277.6 million, respectively, as of January 31, 2017. Thus, if the Reorganization had been in effect on that date, the combined Portfolio would have had net assets of approximately $280.5 million. In addition, as discussed in connection with Proposal 1.A., 1.C., and 1.D., it is also proposed that the Alt 25 Portfolio, Alt 75 Portfolio, and Alternative 100 Moderate Portfolio be reorganized into the All Asset Growth-Alt 20 Portfolio. These Portfolios’ approximate net assets as of January 31, 2017 were as follows: |
| | | | |
Acquired Portfolios | | Net Assets | |
Alt 25 Portfolio | | $ | 32.4 million | |
Alt 75 Portfolio | | $ | 3.1 million | |
Alternative 100 Moderate Portfolio | | $ | 8.3 million | |
Thus, if the Reorganizations of the Alt 50 Portfolio and each of the Portfolios as provided in Proposal 1.A., 1.C., and 1.D. had been in effect on that date, the combined Portfolio would have had net assets of approximately $324.3 million.
7
| | • | | The shareholders of the Alt 50 Portfolio will receive shares of the All Asset Growth-Alt 20 Portfolio pursuant to the Reorganization. Shareholders will not pay any sales charges in connection with the Reorganization. Please see “Comparative Fee and Expense Tables,” “Additional Information about the Reorganizations” and “Additional Information about the Portfolios” below for more information. |
| | • | | It is estimated that the total annual operating expense ratio (including acquired fund fees and expenses) for the All Asset Growth-Alt 20 Portfolio Class IB shares for the fiscal year following the Reorganization will be 1.33%, which is lower than that of the Alt 50 Portfolio Class IB shares for the fiscal year ended December 31, 2016, which was 1.42%. This assumes that only the Reorganization of the Alt 50 Portfolio into the All Asset Growth-Alt 20 Portfolio is consummated. If all four of the proposed Reorganizations into the All Asset Growth-Alt 20 Portfolio are consummated then it is estimated that the total annual operating expense ratio (including acquired fund fees and expenses) for the All Asset Growth-Alt 20 Portfolio Class IB and Class K shares for the fiscal year following the Reorganization will be 1.32% and 1.07%, respectively. For a more detailed comparison of the fees and expenses of the Portfolios, please see “Comparative Fee and Expense Tables” and “Additional Information about the Portfolios” below. |
| | • | | The Portfolios are subject to the same management fee schedule. The management fee for each Portfolio is equal to an annual rate of 0.10% of its average daily net assets. |
| | • | | The Portfolios are subject to the same administration fee schedule. In addition to the management fee, each Portfolio also pays FMG LLC its proportionate share of an asset-based administration fee, subject to a minimum annual fee of $32,500. For purposes of calculating the asset-based administration fee, the assets of the Portfolios are aggregated with those of the other portfolios of VIP Trust (“VIP Trust Portfolios”) and the AXA Strategic Allocation Series Portfolios, AXA All Asset Allocation Series Portfolios, and AXA/Franklin Templeton Allocation Managed Volatility Portfolio of EQ Trust (the “EQ Trust Fund-of-Funds Portfolios”), which are also managed by FMG LLC. The asset-based administration fee is equal to an annual rate of 0.15% of the first $35 billion of the aggregate average daily net assets of the Portfolios, VIP Trust Portfolios, and EQ Trust Fund-of-Funds Portfolios; 0.11% on the next $10 billion; 0.10% on the next $5 billion; and 0.095% thereafter. For a more detailed description of the fees and expenses of the Portfolios, please see “Comparative Fee and Expense Tables” and “Additional Information about the Portfolios” below. |
| | • | | Each Portfolio is subject to an expense limitation arrangement. |
| | • | | Pursuant to a contract, FMG LLC has agreed to make payments or waive its management, administrative or other fees to limit the expenses of the Alt 50 Portfolio through April 30, 2017 (unless the Board of Trustees consents to an earlier revision or termination of this arrangement), so that the annual operating expenses of the Portfolio (other than interest, taxes, brokerage commissions, dividend and interest expenses on securities sold short, expenses of Underlying Portfolios and Underlying ETFs, other expenditures that are capitalized in accordance with generally accepted accounting principles and other extraordinary expenses not incurred in the ordinary course of the Portfolio’s business) do not exceed an annual rate of average daily net assets of 0.65% for Class IB shares and 0.40% for Class K shares of the Alt 50 Portfolio. |
| | • | | Pursuant to a contract, FMG LLC has agreed to make payments or waive its management, administrative or other fees to limit the expenses of the All Asset Growth-Alt 20 Portfolio through April 30, 2018 (unless the Board of Trustees consents to an earlier revision or termination of this arrangement), so that the annual operating expenses (including acquired fund fees and expenses) of the All Asset Growth-Alt 20 Portfolio (other than interest, taxes, brokerage commissions, dividend and interest expenses on securities sold short, other expenditures that are capitalized in accordance with generally accepted accounting principles and other extraordinary expenses not incurred in the ordinary course of the Portfolio’s business) do not exceed an annual rate of average daily net assets of 1.35% for Class IB shares and 1.10% for Class K shares of the All Asset Growth-Alt 20 Portfolio. |
| | • | | The Class IB shares of the All Asset Growth-Alt 20 Portfolio and Alt 50 Portfolio are each subject to a 0.25% Rule 12b-1 fee. |
8
| | • | | The Class IB shares of All Asset Growth-Alt 20 Portfolio underperformed compared to the Class IB shares of the Alt 50 Portfolio for the one-year period ended December 31, 2016 and outperformed the Alt 50 Portfolio for the period since inception. Please see “Comparative Performance Information” below. |
| | • | | Following the Reorganization, it is anticipated that FMG LLC will redeem shares that it holds in the combined Portfolio representing seed capital it has previously invested. The withdrawal of such seed capital is not expected to have a material effect on the annual operating expenses of the combined Portfolio. |
| | • | | Following the Reorganization, the combined Portfolio will be managed in accordance with the investment objective, policies and strategies of the All Asset Growth-Alt 20 Portfolio. It is not expected that the All Asset Growth-Alt 20 Portfolio will revise any of its investment policies following the Reorganization to reflect those of the Alt 50 Portfolio. FMG LLC has reviewed the Alt 50 Portfolio’s current portfolio holdings and determined that the holdings generally are compatible with the All Asset Growth-Alt 20 Portfolio’s investment objective and policies. Thus, FMG LLC believes that, if the Reorganization is approved, all or a substantial portion of the holdings of the Alt 50 Portfolio could be transferred to and held by the All Asset Growth-Alt 20 Portfolio. However, it is expected that some of those holdings may not remain at the time of the Reorganization due to normal portfolio turnover. It is also expected that, if the Reorganization is approved, the holdings of the Alt 50 Portfolio involved therein that are not compatible with the All Asset Growth-Alt 20 Portfolio’s investment objective and policies will be liquidated in an orderly manner in connection with the Reorganization, and the proceeds of these sales held in temporary investments or reinvested in assets that are consistent with All Asset Growth-Alt 20 Portfolio’s investment objective and policies. The portion of the Alt 50 Portfolio’s assets that will be liquidated in connection with the Reorganization will depend on market conditions and on the assessment by FMG LLC of the compatibility of those holdings with the All Asset Growth-Alt 20 Portfolio’s portfolio composition and investment objective and policies. The need for the Alt 50 Portfolio to sell investments in connection with the Reorganization may result in its selling securities at a disadvantageous time and price and could result in its realizing gains (or losses) that would not otherwise have been realized and incurring transaction costs that would not otherwise have been incurred. It is estimated that the Alt 50 Portfolio will not sell any of its holdings in connection with its Reorganization, and therefore no portfolio transaction costs are expected to be incurred. This estimate is subject to change depending on the factors outlined above. Contractholders will not recognize any gain or loss for federal income tax purposes as a result of the Reorganizations. |
| | • | | FMG LLC has voluntarily agreed to pay expenses of the Reorganization that exceed the Alt 50 Portfolio’s expense limitation set forth in its expense limitation agreement. The Reorganization expenses for the Alt 50 Portfolio, which are estimated to be $33,333, exceed the expense limit and will be paid by FMG LLC. |
Proposal 1.C.: This Proposal 1.C. requests your approval of the Reorganization Plan pursuant to which the Alt 75 Portfolio will be reorganized into the All Asset Growth-Alt 20 Portfolio. In considering whether you should approve the Proposal, you should note that:
| | • | | The Alt 75 Portfolio and the All Asset Growth-Alt 20 Portfolio have similar investment objectives. The Alt 75 Portfolio seeks long-term capital appreciation. The All Asset Growth-Alt 20 Portfolio also seeks long-term capital appreciation, but seeks current income as well. Below is a summary comparison of the two Portfolios. For a detailed comparison of the Portfolios’ investment policies and strategies, see “Comparisons of Investment Objectives, Policies and Strategies” below. |
| | • | | The Portfolios have similar investment policies. Each Portfolio invests in Underlying Portfolios and Underlying ETFs and provides diversified exposure to equity securities, fixed income securities, and alternative investments (“asset classes”). Each Portfolio invests according to an “asset allocation target,” which is established by the Manager and represents an approximate percentage of the Portfolio’s assets that are invested in each asset class. Each Portfolio may invest in alternative investments, which include convertible securities, investments in certain industries or sectors (e.g., infrastructure), Underlying ETFs that invest in commodities and other instruments that derive their value from natural |
9
| | resources, the AXA Natural Resources Portfolio, the AXA Real Estate Portfolio and other instruments that derive their value from real estate, and the EQ/GAMCO Mergers and Acquisitions Portfolio. |
| | • | | There are, however, differences between the two Portfolios’ principal investment policies and strategies of which you should be aware. The Portfolios’ asset allocation targets differ, as described below: |
| | • | | The Alt 75 Portfolio’s current asset allocation target is to invest approximately 20% of its assets in equity investments, 5% of its assets in fixed income investments, and 75% of its assets in alternative investments through investments in Underlying Portfolios and Underlying ETFs. |
| | • | | The All Asset Growth-Alt 20 Portfolio’s current asset allocation target is to invest approximately 55% of its assets in equity investments, 25% of its assets in fixed income investments, and 20% of its assets in alternative investments through investments in Underlying Portfolios and Underlying ETFs. |
| | • | | In addition to the asset allocation targets discussed above, the Manager also has established target investment percentages for each “asset category” in which each Portfolio invests. Each target investment percentage is an approximate percentage of the Portfolio’s assets that is invested in a particular asset category through investments in Underlying Portfolios or Underlying ETFs whose individual holdings fall within such asset category. The term “asset category” refers to specific types of securities or other instruments within each asset class (e.g., large cap equity securities, micro/small/mid cap equity securities, foreign/emerging markets securities, REITs, investment grade bonds and high yield bonds (also known as “junk bonds”)). The Portfolios have different current target investment percentages. Below is a chart that compares the Portfolios’ current target investment percentages. |
| | | | | | | | |
Asset Class | | Alt 75 Portfolio | | | All Asset Growth-
Alt 20 Portfolio | |
Range of Equity | | | 20% | | | | 55% | |
Large Cap Equity Securities | | | 10% | | | | 20% | |
Micro/Small/Mid Cap Equity Securities | | | 5% | | | | 15% | |
Foreign/Emerging Markets Securities | | | 5% | | | | 20% | |
Range of Alternative Investments | | | 75% | | | | 20% | |
REITS | | | 20% | | | | 5% | |
Other Alternatives | | | 55% | | | | 15% | |
Range of Fixed Income | | | 5% | | | | 25% | |
Investment Grade Bonds | | | 4% | | | | 23% | |
High Yield Bonds | | | 1% | | | | 2% | |
| | • | | Each Portfolio’s principal risks are the same and include affiliated portfolio risk, alternative investment risk, commodity price volatility risk, convertible securities risk, credit risk, energy sector risk, equity risk, foreign securities risk, currency risk, depositary receipts risk, emerging markets risk, infrastructure sector risk, interest rate risk, investment grade securities risk, large-cap company risk, mid-cap, small-cap and micro-cap company risk, natural resources sector risk, non-investment grade securities risk, real estate investing risk, risks related to investments in Underlying Portfolios and Underlying ETFs, securities lending risk, and special situations risk. To the extent the All Asset Growth-Alt 20 Portfolio generally will invest a greater percentage of its assets in fixed income investments and equity securities and a lesser percentage of its assets in non-traditional (alternative) investments than the Alt 75 Portfolio, its risk profile will differ from that of the Alt 75 Portfolio with respect to the degree of risk associated with those investments. For a detailed comparison of the Portfolios’ principal risks, see “Comparison of Principal Risk Factors” below. |
| | • | | FMG LLC serves as the investment manager and administrator for each Portfolio and it is anticipated that FMG LLC will continue to manage and administer the All Asset Growth-Alt 20 Portfolio after the Reorganization. For a detailed description of FMG LLC, please see “Additional Information about the Portfolios — The Manager” below. |
| | • | | The Alt 75 Portfolio and the All Asset Growth-Alt 20 Portfolio had net assets of approximately $3.1 million and $277.6 million, respectively, as of January 31, 2017. Thus, if the Reorganization had been in effect on that date, the combined Portfolio would have had net assets of approximately $280.7 million. In addition, as discussed in connection with Proposal 1.A., 1.B., and 1.D., it is also proposed that the Alt 25 |
10
| | Portfolio, Alt 50 Portfolio, and Alternative 100 Moderate Portfolio be reorganized into the All Asset Growth-Alt 20 Portfolio. These Portfolios’ approximate net assets as of January 31, 2017 were as follows: |
| | | | |
Acquired Portfolios | | Net Assets | |
Alt 25 Portfolio | | $ | 32.4 million | |
Alt 50 Portfolio | | $ | 2.9 million | |
Alternative 100 Moderate Portfolio | | $ | 8.3 million | |
Thus, if the Reorganizations of the Alt 75 Portfolio and each of the Portfolios as provided in Proposal 1.A., 1.B., and 1.D. had been in effect on that date, the combined Portfolio would have had net assets of approximately $324.3 million.
| | • | | The shareholders of the Alt 75 Portfolio will receive shares of the All Asset Growth-Alt 20 Portfolio pursuant to the Reorganization. Shareholders will not pay any sales charges in connection with the Reorganization. Please see “Comparative Fee and Expense Tables,” “Additional Information about the Reorganizations” and “Additional Information about the Portfolios” below for more information. |
| | • | | It is estimated that the total annual operating expense ratio (including acquired fund fees and expenses) for the All Asset Growth-Alt 20 Portfolio Class IB shares for the fiscal year following the Reorganization will be 1.33%, which is lower than that of the Alt 75 Portfolio Class IB shares for the fiscal year ended December 31, 2016, which was 1.43%. This assumes that only the Reorganization of the Alt 75 Portfolio into the All Asset Growth-Alt 20 Portfolio is consummated. If all four of the proposed Reorganizations into the All Asset Growth-Alt 20 Portfolio are consummated then it is estimated that the total annual operating expense ratio (including acquired fund fees and expenses) for the All Asset Growth-Alt 20 Portfolio Class IB and Class K shares for the fiscal year following the Reorganization will be 1.32% and 1.07%, respectively. For a more detailed comparison of the fees and expenses of the Portfolios, please see “Comparative Fee and Expense Tables” and “Additional Information about the Portfolios” below. |
| | • | | The Portfolios are subject to the same management fee schedule. The management fee for each Portfolio is equal to an annual rate of 0.10% of its average daily net assets. |
| | • | | The Portfolios are subject to the same administration fee schedule. In addition to the management fee, each Portfolio also pays FMG LLC its proportionate share of an asset-based administration fee, subject to a minimum annual fee of $32,500. For purposes of calculating the asset-based administration fee, the assets of the Portfolios are aggregated with those of the other portfolios of VIP Trust (“VIP Trust Portfolios”) and the AXA Strategic Allocation Series Portfolios, AXA All Asset Allocation Series Portfolios, and AXA/Franklin Templeton Allocation Managed Volatility Portfolio of EQ Trust (the “EQ Trust Fund-of-Funds Portfolios”), which are also managed by FMG LLC. The asset-based administration fee is equal to an annual rate of 0.15% of the first $35 billion of the aggregate average daily net assets of the Portfolios, VIP Trust Portfolios, and EQ Trust Fund-of-Funds Portfolios; 0.11% on the next $10 billion; 0.10% on the next $5 billion; and 0.095% thereafter. For a more detailed description of the fees and expenses of the Portfolios, please see “Comparative Fee and Expense Tables” and “Additional Information about the Portfolios” below. |
| | • | | Each Portfolio is subject to an expense limitation arrangement. |
| | • | | Pursuant to a contract, FMG LLC has agreed to make payments or waive its management, administrative or other fees to limit the expenses of the Alt 75 Portfolio through April 30, 2017 (unless the Board of Trustees consents to an earlier revision or termination of this arrangement), so that the annual operating expenses of the Portfolio (other than interest, taxes, brokerage commissions, dividend and interest expenses on securities sold short, expenses of Underlying Portfolios and Underlying ETFs, other expenditures that are capitalized in accordance with generally accepted accounting principles and other extraordinary expenses not incurred in the ordinary course of the Portfolio’s business) do not exceed an annual rate of average daily net assets of 0.65% for Class IB shares and 0.40% for Class K shares of the Alt 75 Portfolio. |
| | • | | Pursuant to a contract, FMG LLC has agreed to make payments or waive its management, administrative or other fees to limit the expenses of the All Asset Growth-Alt 20 Portfolio through |
11
| | April 30, 2018 (unless the Board of Trustees consents to an earlier revision or termination of this arrangement), so that the annual operating expenses (including acquired fund fees and expenses) of the All Asset Growth-Alt 20 Portfolio (other than interest, taxes, brokerage commissions, dividend and interest expenses on securities sold short, other expenditures that are capitalized in accordance with generally accepted accounting principles and other extraordinary expenses not incurred in the ordinary course of the Portfolio’s business) do not exceed an annual rate of average daily net assets of 1.35% for Class IB shares and 1.10% for Class K shares of the of the All Asset Growth-Alt 20 Portfolio. |
| | • | | The Class IB shares of the All Asset Growth-Alt 20 Portfolio and Alt 75 Portfolio are each subject to a 0.25% Rule 12b-1 fee. |
| | • | | The Class IB shares of All Asset Growth-Alt 20 Portfolio underperformed compared to the Class IB shares of the Alt 75 Portfolio for the one-year period ended December 31, 2016 and outperformed the Alt 75 Portfolio for the period since inception. Please see “Comparative Performance Information” below. |
| | • | | Following the Reorganization, it is anticipated that FMG LLC will redeem shares that it holds in the combined Portfolio representing seed capital it has previously invested. The withdrawal of such seed capital is not expected to have a material effect on the annual operating expenses of the combined Portfolio. |
| | • | | Following the Reorganization, the combined Portfolio will be managed in accordance with the investment objective, policies and strategies of the All Asset Growth-Alt 20 Portfolio. It is not expected that the All Asset Growth-Alt 20 Portfolio will revise any of its investment policies following the Reorganization to reflect those of the Alt 75 Portfolio. FMG LLC has reviewed the Alt 75 Portfolio’s current portfolio holdings and determined that the holdings generally are compatible with the All Asset Growth-Alt 20 Portfolio’s investment objective and policies. Thus, FMG LLC believes that, if the Reorganization is approved, all or a substantial portion of the holdings of the Alt 75 Portfolio could be transferred to and held by the All Asset Growth-Alt 20 Portfolio. However, it is expected that some of those holdings may not remain at the time of the Reorganization due to normal portfolio turnover. It is also expected that, if the Reorganization is approved, the holdings of the Alt 75 Portfolio involved therein that are not compatible with the All Asset Growth-Alt 20 Portfolio’s investment objective and policies will be liquidated in an orderly manner in connection with the Reorganization, and the proceeds of these sales held in temporary investments or reinvested in assets that are consistent with All Asset Growth-Alt 20 Portfolio investment objective and policies. The portion of the Alt 75 Portfolio’s assets that will be liquidated in connection with the Reorganization will depend on market conditions and on the assessment by FMG LLC of the compatibility of those holdings with the All Asset Growth-Alt 20 Portfolio’s portfolio composition and investment objective and policies. The need for the Alt 75 Portfolio to sell investments in connection with the Reorganization may result in its selling securities at a disadvantageous time and price and could result in its realizing gains (or losses) that would not otherwise have been realized and incurring transaction costs that would not otherwise have been incurred. It is estimated that the Alt 75 Portfolio will not sell any of its holdings in connection with its Reorganization, and therefore no portfolio transaction costs are expected to be incurred. This estimate is subject to change depending on the factors outlined above. Contractholders will not recognize any gain or loss for federal income tax purposes as a result of the Reorganizations. |
| | • | | FMG LLC has voluntarily agreed to pay expenses of the Reorganization that exceed the Alt 75 Portfolio’s expense limitation set forth in its expense limitation agreement. The Reorganization expenses for the Alt 75 Portfolio, which are estimated to be $33,333, exceed the expense limit and will be paid by FMG LLC. |
Proposal 1.D.: This Proposal 1.D. requests your approval of the Reorganization Plan pursuant to which the Alternative 100 Moderate Portfolio will be reorganized into the All Asset Growth-Alt 20 Portfolio. In considering whether you should approve the Proposal, you should note that:
| | • | | The Portfolios are series of separate Trusts. The Alternative 100 Moderate Portfolio is a series of VIP Trust and the All Asset Growth-Alt 20 Portfolio is a series of EQ Trust. |
12
| | • | | The Alternative 100 Moderate Portfolio and the All Asset Growth-Alt 20 Portfolio have similar investment objectives. The Alternative 100 Moderate Portfolio seeks long-term capital appreciation. The All Asset Growth-Alt 20 Portfolio also seeks long-term capital appreciation, but seeks current income as well. Below is a summary comparison of the two Portfolios. For a detailed comparison of the Portfolios’ investment policies and strategies, see “Comparisons of Investment Objectives, Policies and Strategies” below. |
| | • | | The Portfolios have similar investment policies. Each Portfolio invests in Underlying Portfolios and Underlying ETFs. There are, however, differences between the Portfolios’ principal investment policies and strategies of which you should be aware. One primary difference between the Portfolios is their asset allocation targets. The Alternative 100 Moderate Portfolio invests substantially all of its assets in nontraditional (alternative) asset categories and strategies, while the All Asset Growth-Alt 20 Portfolio provides diversified exposure to equity securities, fixed income securities, and alternative investments (“asset classes”). In particular, the All Asset Growth-Alt 20 Portfolio’s current asset allocation target is to invest approximately 55% of its assets in equity investments, 25% of its assets in fixed income investments, and 20% of its assets in alternative investments through investments in Underlying Portfolios and Underlying ETFs. |
| | • | | The Alternative 100 Moderate Portfolio invests substantially all of its assets in Underlying Portfolios and Underlying ETFs that invest primarily in nontraditional (alternative) asset categories and strategies. The non-traditional (alternative) asset categories and strategies of the Underlying Portfolios and Underlying ETFs in which the Portfolio invests include absolute return/multi strategies, commodities, convertible securities, currency, global infrastructure, global real estate, listed private equity, long/short credit, managed futures, merger arbitrage, natural resources, and precious and base metals. In addition, the Portfolio may invest in Underlying Portfolios and Underlying ETFs that employ derivatives (including futures contracts) for a variety of purposes, including to reduce risk, to seek enhanced returns from certain asset classes, and to leverage exposure to certain asset classes. In selecting Underlying Portfolios and Underlying ETFs, the Manager utilizes a proprietary investment process that may take into consideration a number of factors including, as appropriate and applicable, fund performance, management team, investment style, correlations, asset class exposure, industry classification, benchmark, risk adjusted return, volatility, expense ratio, asset size and portfolio turnover. For purposes of asset class and asset category target allocations, where an Underlying Portfolio or Underlying ETF could be assigned to more than one asset class (e.g., equity and alternative asset classes) or category (e.g., international bond and global bond asset categories), the Manager may, in its discretion, assign an Underlying Portfolio or Underlying ETF to one or more asset classes or categories. |
| | • | | The All Asset Growth-Alt 20 Portfolio’s current asset allocation target is to invest approximately 55% of its assets in equity investments, 25% of its assets in fixed income investments, and 20% of its assets in alternative investments through investments in Underlying Portfolios and Underlying ETFs. The All Asset Growth-Alt 20 Portfolio also invests according to target investment percentages for each “asset category.” Each target investment percentage is an approximate percentage of the Portfolio’s assets that is invested in a particular asset category through investments in Underlying Portfolios or Underlying ETFs whose individual holdings fall within such asset category. The term “asset category” refers to specific types of securities or other instruments within each asset class (e.g., large cap equity securities, micro/small/mid cap equity securities, foreign/emerging markets securities, REITs, investment grade bonds and high yield bonds (also known as “junk bonds”)). |
| | • | | Each Portfolio is subject to affiliated portfolio risk, convertible securities risk, credit risk, equity risk, foreign securities risk, currency risk, emerging markets risk, infrastructure sector risk, interest rate risk, investment grade securities risk, large-cap company risk, mid-cap, small-cap and micro-cap company risk, natural resources sector risk, non-investment grade securities risk, real estate investing risk, risks related to investments in Underlying Portfolios and Underlying ETFs, and special situations risk. The Alternative 100 Moderate Portfolio also is subject to non-traditional (alternative) investment risk, commodity risk, derivatives risk, |
13
| | futures contract risk, leveraging risk, listed private equity company risk, market risk, and portfolio management, while the All Asset Growth-Alt 20 Portfolio generally is not. In addition, the principal risks of investing in the All Asset Growth-Alt 20 Portfolio also include alternative investment risk, commodity price volatility risk, depositary receipts risk, energy sector risk, and securities lending risk. To the extent the All Asset Growth-Alt 20 Portfolio generally will invest a greater percentage of its assets in fixed income investments and equity securities and a lesser percentage of its assets in non-traditional (alternative) investments than the Alternative 100 Moderate Portfolio, its risk profile will differ from that of the Alternative 100 Moderate Portfolio with respect to the degree of risk associated with those investments. For a detailed comparison of the Portfolios’ principal risks, see “Comparisons of Principal Risk Factors” below. |
| | • | | FMG LLC serves as the investment manager and administrator for each Portfolio and it is anticipated that FMG LLC will continue to manage and administer the All Asset Growth-Alt 20 Portfolio after the Reorganization. For a detailed description of FMG LLC, please see “Additional Information about the Portfolios — The Manager” below. |
| | • | | The Alternative 100 Moderate Portfolio and the All Asset Growth-Alt 20 Portfolio had net assets of approximately $8.3 million and $277.6 million, respectively, as of January 31, 2017. Thus, if the Reorganization had been in effect on that date, the combined Portfolio would have had net assets of approximately $285.9 million. In addition, as discussed in connection with Proposal 1.A., 1.B., and 1.C., it is also proposed that the Alt 25 Portfolio, Alt 50 Portfolio, and Alt 75 Portfolio be reorganized into the All Asset Growth-Alt 20 Portfolio. These Portfolios’ approximate net assets as of January 31, 2017 were as follows: |
| | | | |
Acquired Portfolios | | Net Assets | |
Alt 25 Portfolio | | $ | 32.4 million | |
Alt 50 Portfolio | | $ | 2.9 million | |
Alt 75 Portfolio | | $ | 3.1 million | |
Thus, if the Reorganizations of the Alternative 100 Moderate Portfolio and each of the Portfolios as provided in Proposal 1.A., 1.B., and 1.C. had been in effect on that date, the combined Portfolio would have had net assets of approximately $324.3 million.
| | • | | The shareholders of the Alternative 100 Moderate Portfolio will receive shares of the All Asset Growth-Alt 20 Portfolio pursuant to the Reorganization. Shareholders will not pay any sales charges in connection with the Reorganization. Please see “Comparative Fee and Expense Tables,” “Additional Information about the Reorganizations” and “Additional Information about the Portfolios” below for more information. |
| | • | | It is estimated that the total annual operating expense ratio (including acquired fund fees and expenses) for the All Asset Growth-Alt 20 Portfolio Class IB shares, for the fiscal year following the Reorganization, will be 1.33%, which is lower than that of the Alternative 100 Moderate Portfolio Class B shares for the fiscal year ended December 31, 2016, which was 1.55%. This assumes that only the Reorganization of the Alternative 100 Moderate Portfolio into the All Asset Growth-Alt 20 Portfolio is consummated. If all four of the proposed Reorganizations into the All Asset Growth-Alt 20 Portfolio are consummated then it is estimated that the total annual operating expense ratio (including acquired fund fees and expenses) for the All Asset Growth-Alt 20 Portfolio Class IB shares, for the fiscal year following the Reorganization will be 1.32%. For a more detailed comparison of the fees and expenses of the Portfolios, please see “Comparative Fee and Expense Tables” and “Additional Information about the Portfolios” below. |
| | • | | The All Asset Growth-Alt 20 Portfolio has a lower management fee than the Alternative 100 Moderate Portfolio. The management fee for the Alternative 100 Moderate Portfolio is equal to an annual rate of 0.15% of its average daily net assets; while the maximum management fee for the All Asset Growth-Alt 20 Portfolio is equal to an annual rate of 0.10% of its average daily net assets. |
| | • | | The Portfolios are subject to the same administration fee schedule. In addition to the management fee, each Portfolio also pays FMG LLC its proportionate share of an asset-based administration fee, subject |
14
| | to a minimum annual fee of $32,500. For purposes of calculating the asset-based administration fee, the assets of the Portfolios are aggregated with those of the other portfolios of VIP Trust (“VIP Trust Portfolios”) and the AXA Strategic Allocation Series Portfolios, AXA All Asset Allocation Series Portfolios, and AXA/Franklin Templeton Allocation Managed Volatility Portfolio of EQ Trust (the “EQ Trust Fund-of-Funds Portfolios”), which are also managed by FMG LLC. The asset-based administration fee is equal to an annual rate of 0.15% of the first $35 billion of the aggregate average daily net assets of the Portfolios, VIP Trust Portfolios, and EQ Trust Fund-of-Funds Portfolios; 0.11% on the next $10 billion; 0.10% on the next $5 billion; and 0.095% thereafter. For a more detailed description of the fees and expenses of the Portfolios, please see “Comparative Fee and Expense Tables” and “Additional Information about the Portfolios” below. |
| | • | | Each Portfolio is subject to an expense limitation arrangement. |
| | • | | Pursuant to a contract, FMG LLC has agreed to make payments or waive its management, administrative or other fees to limit the expenses of the Alternative 100 Moderate Portfolio through April 30, 2017 (unless the Board of Trustees consents to an earlier revision or termination of this arrangement), so that the annual operating expenses (including acquired fund fees and expenses) of the Alternative 100 Moderate Portfolio (exclusive of taxes, interest, brokerage commissions, dividend and interest expenses on securities sold short, capitalized expenses, and extraordinary expenses) do not exceed an annual rate of average daily net assets of 1.55% for Class B shares of the Alternative 100 Moderate Portfolio. |
| | • | | Pursuant to a contract, FMG LLC has agreed to make payments or waive its management, administrative or other fees to limit the expenses of the All Asset Growth-Alt 20 Portfolio through April 30, 2018 (unless the Board of Trustees consents to an earlier revision or termination of this arrangement), so that the annual operating expenses (including acquired fund fees and expenses) of the All Asset Growth-Alt 20 Portfolio (other than interest, taxes, brokerage commissions, dividend and interest expenses on securities sold short, other expenditures that are capitalized in accordance with generally accepted accounting principles and other extraordinary expenses not incurred in the ordinary course of the Portfolio’s business) do not exceed an annual rate of average daily net assets of 1.35% for Class IB shares of the All Asset Growth-Alt 20 Portfolio. |
| | • | | The Class IB shares of the All Asset Growth-Alt 20 Portfolio and the Class B shares of the Alternative 100 Moderate Portfolio are each subject to a 0.25% Rule 12b-1 fee. |
| | • | | The Class IB shares of the All Asset Growth-Alt 20 Portfolio underperformed compared to the Class B shares of the Alternative 100 Moderate Portfolio for the one-year period ended December 31, 2016 and outperformed the Alternative 100 Moderate Portfolio for the period since inception. Please see “Comparative Performance Information” below. |
| | • | | Following the Reorganization, it is anticipated that FMG LLC will redeem shares that it holds in the combined Portfolio representing seed capital it has previously invested. The withdrawal of such seed capital is not expected to have a material effect on the annual operating expenses of the combined Portfolio. |
| | • | | Following the Reorganization, the combined Portfolio will be managed in accordance with the investment objective, policies and strategies of the All Asset Growth-Alt 20 Portfolio. If the Reorganization is approved, all of the Alternative 100 Moderate Portfolio’s assets (“Transferred Assets”) on the Closing Date will be transferred to the All Asset Growth-Alt 20 Portfolio. It is anticipated that immediately prior to the Closing Date, the Alternative 100 Moderate Portfolio will liquidate substantially all of its securities holdings and hold cash. Therefore, it is anticipated that the Transferred Assets will consist of cash. The sale of portfolio holdings by the Alternative 100 Moderate Portfolio in connection with the Reorganization may result in the Alternative 100 Moderate Portfolio selling securities at a disadvantageous time and price and could result in it realizing gains (or losses) that would not otherwise have been realized and incurring transaction costs that would not otherwise have been incurred. It is also expected that, over time, the All Asset Growth-Alt 20 Portfolio will use the Transferred Assets to invest in Underlying |
15
| | Portfolios and Underlying ETFs, as well as other investments, consistent with its principal investment strategy. The estimated portfolio transaction costs of the Reorganization of the Alternative 100 Moderate Portfolio are $1,200. This amount is an estimate and is subject to change. The actual amount could be higher or lower depending on the factors outlined above. Contractholders will not recognize any gain or loss for federal income tax purposes as a result of the Reorganizations. |
| | • | | FMG LLC has voluntarily agreed to pay expenses of the Reorganization that exceed the Alternative 100 Moderate Portfolio’s expense limitation set forth in its expense limitation agreement. The Reorganization expenses for the Alternative 100 Moderate Portfolio, which are estimated to be $33,333, exceed the expense limit and will be paid by FMG LLC. |
Comparative Fee and Expense Tables
The following tables show the fees and expenses of the Class IB Shares and Class K Shares of the Alt 25 Portfolio, Alt 50 Portfolio, and Alt 75 Portfolio, Class B Shares of the Alternative 100 Moderate Portfolio, and the Class IB Shares and Class K Shares of the All Asset Growth-Alt 20 Portfolio and the estimated pro forma fees and expenses of the Class IB Shares and Class K Shares of the All Asset Growth-Alt 20 Portfolio after giving effect to the proposed Reorganizations. Fees and expenses for each Portfolio are based on those incurred by the relevant class of its shares for the fiscal year ended December 31, 2016. The pro forma fees and expenses of the All Asset Growth-Alt 20 Portfolio shares assume that each Reorganization was in effect for the year ended December 31, 2016. The tables below do not reflect any Contract-related fees and expenses, which would increase overall fees and expenses. See a Contract prospectus for a description of those fees and expenses.
Shareholder Fees
(fees paid directly from your investment)
| | | | | | | | |
Alt 25 Portfolio | | Alt 50 Portfolio | | Alt 75 Portfolio | | Alternative 100 Moderate Portfolio | | Pro Forma All Asset Growth-Alt 20 Portfolio
(assuming the Reorganization is approved) |
Not Applicable. | | Not Applicable. | | Not Applicable. | | Not Applicable. | | Not Applicable. |
Annual Operating Expenses
(expenses that you may pay each year as a percentage of the value of your investment)
| | | | | | | | | | | | | | | | | | | | | | | | |
| | | Alt 25 Portfolio | | | All Asset Growth-Alt 20
Portfolio | | | Pro Forma All Asset
Growth-Alt 20 Portfolio
(assuming only the
Reorganization with the
Alt 25 Portfolio
is approved) | |
| | | Class IB | | | Class K | | | Class IB | | | Class K | | | Class IB | | | Class K | |
Management Fee | | | 0.10 | % | | | 0.10 | % | | | 0.10 | % | | | 0.10 | % | | | 0.10 | % | | | 0.10 | % |
Distribution and/or Service Fees (12b-1 fees) | | | 0.25 | % | | | 0.00 | % | | | 0.25 | % | | | 0.00 | % | | | 0.25 | % | | | 0.00 | % |
Other Expenses | | | 0.75 | % | | | 0.75 | % | | | 0.24 | % | | | 0.24 | % | | | 0.23 | % | | | 0.23 | % |
Acquired Fund Fees and Expenses | | | 0.77 | % | | | 0.77 | % | | | 0.75 | % | | | 0.75 | % | | | 0.75 | % | | | 0.75 | % |
Total Annual Portfolio Operating Expenses | | | 1.87 | % | | | 1.62 | % | | | 1.34 | % | | | 1.09 | % | | | 1.33 | % | | | 1.08 | % |
Fee Waiver and/or Expense Reimbursement† | | | (0.45 | )% | | | (0.45 | )% | | | N/A | | | | N/A | | | | N/A | | | | N/A | |
Total Annual Portfolio Operating Expenses After Fee Waiver and/or Expense Reimbursement | | | 1.42 | % | | | 1.17 | % | | | 1.34 | % | | | 1.09 | % | | | 1.33 | % | | | 1.08 | % |
| † | | Pursuant to a contract, FMG LLC has agreed to make payments or waive its management, administrative or other fees to limit the expenses of the Alt 25 Portfolio through April 30, 2017 (unless the Board of Trustees consents to an earlier revision or termination of this arrangement), so that the annual operating expenses of the Portfolio (other than interest, taxes, brokerage commissions, dividend and interest expenses on securities sold short, expenses of Underlying Portfolios and Underlying ETFs, other expenditures that are capitalized in accordance with generally accepted accounting principles and other extraordinary expenses not incurred in the ordinary course of the Portfolio’s business) do not exceed an annual rate of average daily net assets of 0.65% for Class IB shares and 0.40% for Class K shares of the Alt 25 Portfolio. |
16
Annual Operating Expenses
(expenses that you may pay each year as a percentage of the value of your investment)
| | | | | | | | | | | | | | | | | | | | |
| | | Alt 50 Portfolio | | | All Asset Growth-Alt 20
Portfolio | | | Pro Forma All Asset
Growth-Alt 20 Portfolio
(assuming only the
Reorganization with the
Alt 50 Portfolio
is approved) | |
| | | Class IB | | | Class IB | | | Class K | | | Class IB | | | Class K | |
Management Fee | | | 0.10 | % | | | 0.10 | % | | | 0.10 | % | | | 0.10 | % | | | 0.10 | % |
Distribution and/or Service Fees (12b-1 fees) | | | 0.25 | % | | | 0.25 | % | | | 0.00 | % | | | 0.25 | % | | | 0.00 | % |
Other Expenses | | | 5.04 | % | | | 0.24 | % | | | 0.24 | % | | | 0.23 | % | | | 0.23 | % |
Acquired Fund Fees and Expenses | | | 0.77 | % | | | 0.75 | % | | | 0.75 | % | | | 0.75 | % | | | 0.75 | % |
Total Annual Portfolio Operating Expenses | | | 6.16 | % | | | 1.34 | % | | | 1.09 | % | | | 1.33 | % | | | 1.08 | % |
Fee Waiver and/or Expense Reimbursement† | | | (4.74 | )% | | | N/A | | | | N/A | | | | N/A | | | | N/A | |
Total Annual Portfolio Operating Expenses After Fee Waiver and/or Expense Reimbursement | | | 1.42 | % | | | 1.34 | % | | | 1.09 | % | | | 1.33 | % | | | 1.08 | % |
| † | | Pursuant to a contract, FMG LLC has agreed to make payments or waive its management, administrative or other fees to limit the expenses of the Alt 50 Portfolio through April 30, 2017 (unless the Board of Trustees consents to an earlier revision or termination of this arrangement), so that the annual operating expenses of the Portfolio (other than interest, taxes, brokerage commissions, dividend and interest expenses on securities sold short, expenses of Underlying Portfolios and Underlying ETFs, other expenditures that are capitalized in accordance with generally accepted accounting principles and other extraordinary expenses not incurred in the ordinary course of the Portfolio’s business) do not exceed an annual rate of average daily net assets of 0.65% for Class IB shares of the Alt 50 Portfolio. |
Annual Operating Expenses
(expenses that you may pay each year as a percentage of the value of your investment)
| | | | | | | | | | | | | | | | | | | | |
| | | Alt 75 Portfolio | | | All Asset Growth-Alt 20
Portfolio | | | Pro Forma All Asset
Growth-Alt 20 Portfolio
(assuming only the
Reorganization with the
Alt 75 Portfolio
is approved) | |
| | | Class IB | | | Class IB | | | Class K | | | Class IB | | | Class K | |
Management Fee | | | 0.10 | % | | | 0.10 | % | | | 0.10 | % | | | 0.10 | % | | | 0.10 | % |
Distribution and/or Service Fees (12b-1 fees) | | | 0.25 | % | | | 0.25 | % | | | 0.00 | % | | | 0.25 | % | | | 0.00 | % |
Other Expenses | | | 4.81 | % | | | 0.24 | % | | | 0.24 | % | | | 0.23 | % | | | 0.23 | % |
Acquired Fund Fees and Expenses | | | 0.78 | % | | | 0.75 | % | | | 0.75 | % | | | 0.75 | % | | | 0.75 | % |
Total Annual Portfolio Operating Expenses | | | 5.94 | % | | | 1.34 | % | | | 1.09 | % | | | 1.33 | % | | | 1.08 | % |
Fee Waiver and/or Expense Reimbursement† | | | (4.51 | )% | | | N/A | | | | N/A | | | | 0.00 | % | | | 0.00 | % |
Total Annual Portfolio Operating Expenses After Fee Waiver and/or Expense Reimbursement | | | 1.43 | % | | | 1.34 | % | | | 1.09 | % | | | 1.33 | % | | | 1.08 | % |
| † | | Pursuant to a contract, FMG LLC has agreed to make payments or waive its management, administrative or other fees to limit the expenses of the Alt 75 Portfolio through April 30, 2017 (unless the Board of Trustees consents to an earlier revision or termination of this arrangement), so that the annual operating expenses of the Portfolio (other than interest, taxes, brokerage commissions, dividend and interest expenses on securities sold short, expenses of Underlying Portfolios and Underlying ETFs, other expenditures that are capitalized in accordance with generally accepted accounting principles and other extraordinary expenses not incurred in the ordinary course of the Portfolio’s business) do not exceed an annual rate of average daily net assets of 0.65% for Class IB shares of the Alt 75 Portfolio. |
17
Annual Operating Expenses
(expenses that you may pay each year as a percentage of the value of your investment)
| | | | | | | | | | | | |
| | | Alternative 100 Moderate
Portfolio | | | All Asset Growth-Alt 20
Portfolio | | | Pro Forma All Asset Growth-
Alt 20 Portfolio (assuming
only the Reorganization with
the Alternative 100 Moderate
Portfolio is approved) | |
| | | Class B | | | Class IB | | | Class IB | |
Management Fee | | | 0.15 | % | | | 0.10 | % | | | 0.10 | % |
Distribution and/or Service Fees (12b-1 fees) | | | 0.25 | % | | | 0.25 | % | | | 0.25 | % |
Other Expenses | | | 1.08 | % | | | 0.24 | % | | | 0.23 | % |
Acquired Fund Fees and Expenses | | | 0.90 | % | | | 0.75 | % | | | 0.75 | % |
Total Annual Portfolio Operating Expenses | | | 2.38 | % | | | 1.34 | % | | | 1.33 | % |
Fee Waiver and/or Expense Reimbursement | | | (0.83 | )%†* | | | N/A | | | | N/A | |
Total Annual Portfolio Operating Expenses After Fee Waiver and/or Expense Reimbursement | | | 1.55 | % | | | 1.34 | % | | | 1.33 | % |
| † | | Pursuant to a contract, FMG LLC has agreed to make payments or waive its management, administrative or other fees to limit the expenses of the Alternative 100 Moderate Portfolio through April 30, 2017 (unless the Board of Trustees consents to an earlier revision or termination of this arrangement) so that the annual operating expenses (including Acquired Fund Fees and Expenses) of the Alternative 100 Moderate Portfolio (exclusive of taxes, interest, brokerage commissions, dividend and interest expenses on securities sold short, capitalized expenses and extraordinary expenses) do not exceed an annual rate of average daily net assets of 1.55% for Class B shares of the Alternative 100 Moderate Portfolio. |
| * | | Fee Waiver and/or Expense Reimbursement information has been restated to reflect the current expense limitation arrangement noted above. |
Pro Forma Annual Operating Expenses
(assuming all Reorganizations are approved)
(expenses that you may pay each year as a percentage of the value of your investment)
| | | | | | | | |
| | | Pro Forma All Asset Growth-Alt 20
Portfolio (assuming all
Reorganizations are approved)* | | | Pro Forma All Asset Growth-Alt 20
Portfolio (assuming all
Reorganizations are approved)* | |
| | | Class IB | | | Class K | |
Management Fee | | | 0.10% | | | | 0.10% | |
Distribution and/or Service Fees (12b-1 fees) | | | 0.25% | | | | 0.00% | |
Other Expenses | | | 0.22% | | | | 0.22% | |
Acquired Fund Fees and Expenses | | | 0.75% | | | | 0.75% | |
Total Annual Portfolio Operating Expenses | | | 1.32% | | | | 1.07% | |
| * | | Pro forma annual operating expenses have been adjusted to reflect the anticipated withdrawal of seed capital by FMG LLC and/or its affiliates from the combined Portfolio subsequent to the Reorganization. The total operating expenses for the combined Portfolio on a pro forma basis, assuming all the Reorganizations are approved, represents the lowest total operating expenses resulting from each possible combination of the proposed Reorganizations. The highest total operating expenses on a pro forma basis would result if less than all the Acquired Portfolios approved the Reorganizations. |
Example of Portfolio Expenses
This example is intended to help you compare the costs of investing in the Portfolios with the cost of investing in other investment options. The example assumes that:
| | • | | You invest $10,000 in a Portfolio for the time periods indicated; |
| | • | | Your investment has a 5% return each year; |
| | • | | The Portfolio’s operating expenses remain the same; and |
| | • | | The Expense Limitation Arrangement with respect to the Portfolios is not renewed. |
18
This example does not reflect any Contract-related fees and expenses, including redemption fees (if any) at the Contract level. If such fees and expenses were reflected, the total expenses would be higher. Although your actual costs may be higher or lower, based on these assumptions your costs would be:
| | | | | | | | | | | | | | | | |
| | | 1 Year | | | 3 Years | | | 5 Years | | | 10 Years | |
Alt 25 Portfolio | | | | | | | | | | | | | | | | |
Class IB | | $ | 145 | | | $ | 544 | | | $ | 969 | | | $ | 2,154 | |
Class K | | $ | 119 | | | $ | 467 | | | $ | 839 | | | $ | 1,884 | |
All Asset Growth-Alt 20 Portfolio | | | | | | | | | | | | | | | | |
Class IB | | $ | 136 | | | $ | 425 | | | $ | 734 | | | $ | 1,613 | |
Class K | | $ | 111 | | | $ | 347 | | | $ | 601 | | | $ | 1,329 | |
Pro Forma All Asset Growth-Alt 20 Portfolio (assuming only the Reorganization with the Alt 20 Portfolio is approved) | | | | | | | | | | | | | | | | |
Class IB | | $ | 135 | | | $ | 421 | | | $ | 729 | | | $ | 1,601 | |
Class K | | $ | 110 | | | $ | 343 | | | $ | 595 | | | $ | 1,317 | |
| | | | |
| | | 1 Year | | | 3 Years | | | 5 Years | | | 10 Years | |
Alt 50 Portfolio | | | | | | | | | | | | | | | | |
Class IB | | $ | 145 | | | $ | 1,406 | | | $ | 2,638 | | | $ | 5,596 | |
All Asset Growth-Alt 20 Portfolio | | | | | | | | | | | | | | | | |
Class IB | | $ | 136 | | | $ | 425 | | | $ | 734 | | | $ | 1,613 | |
Class K | | $ | 111 | | | $ | 347 | | | $ | 601 | | | $ | 1,329 | |
Pro Forma All Asset Growth-Alt 20 Portfolio (assuming only the Reorganization with the Alt 50 Portfolio is approved) | | | | | | | | | | | | | | | | |
Class IB | | $ | 135 | | | $ | 421 | | | $ | 729 | | | $ | 1,601 | |
Class K | | $ | 110 | | | $ | 343 | | | $ | 595 | | | $ | 1,317 | |
| | | | |
| | | 1 Year | | | 3 Years | | | 5 Years | | | 10 Years | |
Alt 75 Portfolio | | | | | | | | | | | | | | | | |
Class IB | | $ | 146 | | | $ | 1,364 | | | $ | 2,560 | | | $ | 5,454 | |
All Asset Growth-Alt 20 Portfolio | | | | | | | | | | | | | | | | |
Class IB | | $ | 136 | | | $ | 425 | | | $ | 734 | | | $ | 1,613 | |
Class K | | $ | 111 | | | $ | 347 | | | $ | 601 | | | $ | 1,329 | |
Pro Forma All Asset Growth-Alt 20 Portfolio (assuming only the Reorganization with the Alt 75 Portfolio is approved) | | | | | | | | | | | | | | | | |
Class IB | | $ | 135 | | | $ | 421 | | | $ | 729 | | | $ | 1,601 | |
Class K | | $ | 110 | | | $ | 343 | | | $ | 595 | | | $ | 1,317 | |
| | | | |
| | | 1 Year | | | 3 Years | | | 5 Years | | | 10 Years | |
Alternative 100 Moderate Portfolio | | | | | | | | | | | | | | | | |
Class B | | $ | 158 | | | $ | 663 | | | $ | 1,195 | | | $ | 2,653 | |
All Asset Growth-Alt 20 Portfolio | | | | | | | | | | | | | | | | |
Class IB | | $ | 136 | | | $ | 425 | | | $ | 734 | | | $ | 1,613 | |
Pro Forma All Asset Growth-Alt 20 Portfolio (assuming only the Reorganization with the Alternative 100 Moderate Portfolio is approved) | | | | | | | | | | | | | | | | |
Class IB | | $ | 135 | | | $ | 421 | | | $ | 729 | | | $ | 1,601 | |
| | | | |
| | | 1 Year | | | 3 Years | | | 5 Years | | | 10 Years | |
Pro Forma All Asset Growth-Alt 20 Portfolio | | | | | | | | | | | | | | | | |
(assuming all Reorganizations are approved) Class IB | | $ | 134 | | | $ | 418 | | | $ | 723 | | | $ | 1,590 | |
(assuming all Reorganizations are approved) Class K | | $ | 109 | | | $ | 340 | | | $ | 590 | | | $ | 1,306 | |
19
Portfolio Turnover
Each Portfolio pays transaction costs, such as commissions, when it buys and sells securities (or “turns over” its portfolio). A higher portfolio turnover rate may indicate higher transaction costs. These costs, which are not reflected in annual fund operating expenses or in the example, affect a Portfolio’s performance. During the fiscal year ended December 31, 2016, the portfolio turnover rates for each of the Alt 25 Portfolio, Alt 50 Portfolio, Alt 75 Portfolio, and Alternative 100 Moderate Portfolio were 18%, 17%, 30% and 16%, respectively, of the average value of the Portfolio; while the portfolio turnover rate for the All Asset Growth-Alt 20 Portfolio was 11% of the average value of the Portfolio.
Comparison of Investment Objectives, Policies and Strategies
The following table compares the investment objectives and principal investment policies and strategies of the Acquired Portfolio with those of the Acquiring Portfolio. The Board of each Trust may change the investment objective of a respective Portfolio without a vote of that Portfolio’s shareholders. For more detailed information about each Portfolio’s investment strategies and risks, see Appendix B.
| | | | | | | | |
Acquiring Portfolio | | Acquired Portfolio |
All Asset Growth-Alt 20 Portfolio | | Alt 25 Portfolio | | Alt 50 Portfolio | | Alt 75 Portfolio | | Alternative 100
Moderate Portfolio |
Investment Objective | | Investment Objective | | Investment Objective | | Investment Objective | | Investment Objective |
| | | | |
| Seeks long-term capital appreciation and current income. | | Seeks long-term capital appreciation and current income, with a greater emphasis on capital appreciation. | | Seeks long-term capital appreciation. | | Seeks long-term capital appreciation. | | Seeks long-term capital appreciation. |
| | | | |
Principal Investment Strategies | | Principal Investment Strategies | | Principal Investment Strategies | | Principal Investment Strategies | | Principal Investment Strategies |
| | | | |
| The Portfolio pursues its investment objective by investing in Underlying Portfolios managed by the Manager and Underlying ETFs. | | Same. | | Same. | | Same. | | Same. The Portfolio may also invest in investment companies managed by investment managers other than the Manager (affiliated and unaffiliated Underlying Portfolios) that comprise various asset categories and strategies. In addition, the Portfolio may invest in Underlying Portfolios and Underlying ETFs that employ derivatives. |
| | | | |
| The Manager, under the oversight of the Trust’s Board of Trustees, has established an asset allocation target for the Portfolio. This target is the approximate percentage of the Portfolio’s assets that will be invested in equity investments, fixed income investments or alternative investments (referred to herein as “asset classes”) as represented by the holdings of the Underlying Portfolios and Underlying ETFs in which the Portfolio invests. | | Same | | Same | | Same | | No corresponding strategy. |
20
| | | | | | | | |
Acquiring Portfolio | | Acquired Portfolio |
All Asset Growth-Alt 20 Portfolio | | Alt 25 Portfolio | | Alt 50 Portfolio | | Alt 75 Portfolio | | Alternative 100
Moderate Portfolio |
| The Portfolio’s current asset allocation target is to invest approximately 55% of its assets in equity investments, 25% of its assets in fixed income investments and 20% of its assets in alternative investments through investments in Underlying Portfolios and Underlying ETFs. | | The Portfolio’s current asset allocation target is to invest approximately 65% of its assets in equity investments, 10% of its assets in fixed income investments and 25% of its assets in alternative investments through investments in Underlying Portfolios and Underlying ETFs. | | The Portfolio’s current asset allocation target is to invest approximately 45% of its assets in equity investments, 5% of its assets in fixed income investments and 50% of its assets in alternative investments through investments in Underlying Portfolios and Underlying ETFs. | | The Portfolio’s current asset allocation target is to invest approximately 20% of its assets in equity investments, 5% of its assets in fixed income investments and 75% of its assets in alternative investments through investments in Underlying Portfolios and Underlying ETFs. | | Under normal market conditions, the Portfolio allocates substantially all of its assets to Underlying Portfolios and Underlying ETFs that invest primarily in nontraditional (alternative) asset categories and strategies. |
| | | | |
| Alternative investments are different than traditional equity or fixed income investments. Alternative investments have the potential to enhance portfolio diversification and reduce overall portfolio volatility because these investments may not have a strong correlation (relationship) to one another or to traditional market indexes. Alternative investments may include, for example, convertible securities, investments in certain industries or sectors (e.g., infrastructure), exchange-traded funds (“ETFs”) that invest in commodities and other instruments that derive their value from natural resources, the AXA Natural Resources Portfolio, the AXA Real Estate Portfolio and other instruments that derive their value from real estate, and the EQ/GAMCO Mergers and Acquisitions Portfolio. | | Same. | | Same. | | Same. | | No corresponding strategy. |
| | | | |
| This asset allocation target may be changed by the Manager and the Trust’s Board of Trustees without shareholder approval. | | Same. | | Same. | | Same. | | No corresponding strategy. |
| | | | |
| The non-traditional (alternative) asset categories and strategies of the Underlying Portfolios and Underlying ETFs in which the Portfolio invests are as follows: absolute return/multi strategies, commodities, convertible securities, currency, global infrastructure, global real estate, listed private equity, long/short credit, managed futures, merger arbitrage, natural resources, and precious and base metals. | | Same. | | Same. | | Same. | | No corresponding strategy. |
21
| | | | | | | | |
Acquiring Portfolio | | Acquired Portfolio |
All Asset Growth-Alt 20 Portfolio | | Alt 25 Portfolio | | Alt 50 Portfolio | | Alt 75 Portfolio | | Alternative 100
Moderate Portfolio |
| Non-traditional (alternative) investments are alternatives to traditional equity (stocks) or fixed income (bonds and cash) investments. Non-traditional (alternative) investments have the potential to enhance portfolio diversification and reduce overall portfolio volatility because these investments may not have a strong correlation (relationship) to one another or to traditional market indexes. Non-traditional (alternative) investments use a different approach to investing than do traditional investments. This approach may involve, for example, holding both long and short positions in securities or using derivatives or hedging strategies. Many nontraditional (alternative) investment strategies are designed to help reduce the role of overall market direction in determining return. | | Same. | | Same. | | Same. | | No corresponding strategy. |
| | | | |
| Subject to the asset allocation target set forth above, the Manager also has established target investment percentages for each asset category in which the Portfolio invests. As used in this Prospectus, the term “asset category” refers to specific types of securities or other instruments within each asset class (e.g., large cap equity securities, micro/small/mid cap equity securities, foreign/emerging markets securities, Real Estate Investment Trusts (“REITs”), investment grade bonds and high yield bonds (also known as “junk bonds”)). | | Same. | | Same. | | Same. | | For purposes of asset class and asset category target allocations, where an Underlying Portfolio or Underlying ETF could be assigned to more than one asset class (e.g., equity and alternative asset classes) or category (e.g., international bond and global bond asset categories), the Manager may, in its discretion, assign an Underlying Portfolio or Underlying ETF to one or more asset classes or categories. |
| | | | |
| Each target investment percentage is an approximate percentage of the Portfolio’s assets that is invested in a particular asset category through investments in Underlying Portfolios or Underlying ETFs whose individual holdings fall within such asset category. | | Same. | | Same. | | Same. | | No corresponding strategy. |
22
| | | | | | | | |
Acquiring Portfolio | | Acquired Portfolio |
All Asset Growth-Alt 20 Portfolio | | Alt 25 Portfolio | | Alt 50 Portfolio | | Alt 75 Portfolio | | Alternative 100
Moderate Portfolio |
| Under the Portfolio’s current target investment percentages, it generally invests its assets in a combination of Underlying Portfolios or Underlying ETFs that results in the Portfolio being invested in the following asset categories in the approximate percentages shown in the table below. | | Same. | | Same. | | Same. | | In selecting Underlying Portfolios and Underlying ETFs, the Manager will utilize a proprietary investment process that may take into consideration a number of factors including, as appropriate and applicable, fund performance, management team, investment style, correlations, asset class exposure, industry classification, benchmark, risk adjusted return, volatility, expense ratio, asset size and portfolio turnover. |
| | | | |
| The Manager may change these targets from time to time. Actual allocations can deviate from the amounts shown below by up to 15% for each asset class and asset category. | | Same. | | Same. | | Same. | | No corresponding strategy. |
| | | | |
| The REITs, other alternative investments, investment grade and high yield bond categories may include both U.S. and foreign issuers. | | Same. | | Same. | | Same. | | No corresponding strategy. |
| | | | |
Asset Class Equity: 55% Large Cap Equity Securities: 20% Micro/Small/Mid Cap Equity Securities: 15% Foreign/Emerging Markets Securities: 20% Alternatives: 20% REITs: 5% Other Alternatives: 15% Fixed Income: 25% Investment Grade: 23% High Yield: 2% | | Asset Class Equity: 65% Large Cap Equity Securities: 25% Micro/Small/Mid Cap Equity Securities: 20% Foreign/Emerging Markets Securities: 20% Alternatives: 25% REITS: 5% Other Alternatives: 20% Fixed Income: 10% Investment Grade: 9% High Yield: 1% | | Asset Class Equity: 45% Large Cap Equity Securities: 20% Micro/Small/Mid Cap Equity Securities: 10% Foreign/Emerging Markets Securities: 15% Alternatives: 50% REITS: 15% Other Alternatives: 35% Fixed Income: 5% Investment Grades: 4% High Yields: 1% | | Asset Class Equity: 20% Large Cap Equity Securities: 10% Micro/Small/Mid Cap Equity Securities: 5% Foreign/Emerging Markets Securities: 5% Alternatives: 75% REITS: 20% Other Alternatives: 55% Fixed Income: 5% Investment Grades: 4% High Yield: 1% | | No corresponding strategy. |
| | | | |
| The Manager selects the Underlying Portfolios and Underlying ETFs in which to invest the Portfolio’s assets. The Manager may add new Underlying Portfolios and Underlying ETFs or replace or eliminate existing Underlying Portfolios and Underlying ETFs without shareholder approval. The Underlying Portfolios and Underlying ETFs have been selected to represent a reasonable spectrum of investment options for the Portfolio. | | Same. | | Same. | | Same. | | Same. |
23
| | | | | | | | |
Acquiring Portfolio | | Acquired Portfolio |
All Asset Growth-Alt 20 Portfolio | | Alt 25 Portfolio | | Alt 50 Portfolio | | Alt 75 Portfolio | | Alternative 100
Moderate Portfolio |
| The Manager has based the asset allocation target and target investment percentages for the Portfolio on the degree to which it believes the Underlying Portfolios and Underlying ETFs, in combination, are appropriate for the Portfolio’s investment objective. | | Same. | | Same. | | Same. | | No corresponding strategy. |
| | | | |
| The Manager may sell the Portfolio’s holdings for a variety of reasons, including to invest in an Underlying Portfolio or Underlying ETF believed to offer superior investment opportunities. | | Same. | | Same. | | Same. | | Same. |
| | | | |
| The Portfolio also may lend its portfolio securities to earn additional income. | | Same. | | Same. | | Same. | | No corresponding strategy. |
Comparison of Principal Risk Factors
An investment in a Portfolio is not a deposit of a bank and is not insured or guaranteed by the Federal Deposit Insurance Corporation or any other government agency. You may lose money by investing in a Portfolio. The following table compares the principal risks of an investment in each Portfolio. For an explanation of each such risk, see “Additional Information about the Reorganizations — Descriptions of Risk Factors” below.
| | | | | | | | | | |
Risks | | Alt 25 Portfolio | | Alt 50 Portfolio | | Alt 75 Portfolio | | Alternative 100
Moderate
Portfolio | | All Asset
Growth-Alt 20
Portfolio |
Affiliated Portfolio Risk | | X | | X | | X | | X | | X |
Alternative Investment Risk | | X | | X | | X | | | | X |
Commodity Risk | | | | | | | | X | | |
Commodity Price Volatility Risk | | X | | X | | X | | | | X |
Convertible Securities Risk | | X | | X | | X | | X | | X |
Credit Risk | | X | | X | | X | | X | | X |
Derivatives Risk | | | | | | | | X | | |
Energy Sector Risk | | X | | X | | X | | | | X |
Equity Risk | | X | | X | | X | | X | | X |
Foreign Securities Risk | | X | | X | | X | | X | | X |
Currency Risk | | X | | X | | X | | X | | X |
Depositary Receipts Risk | | X | | X | | X | | | | X |
Emerging Markets Risk | | X | | X | | X | | X | | X |
Futures Contract Risk | | | | | | | | X | | |
Infrastructure Sector Risk | | X | | X | | X | | X | | X |
Interest Rate Risk | | X | | X | | X | | X | | X |
Investment Grade Securities Risk | | X | | X | | X | | X | | X |
Large-Cap Company Risk | | X | | X | | X | | X | | X |
Leveraging Risk | | | | | | | | X | | |
Listed Private Equity Company Risk | | | | | | | | X | | |
Market Risk | | | | | | | | X | | |
Mid-Cap and Small-Cap Company Risk | | X | | X | | X | | X | | X |
Natural Resources Sector Risk | | X | | X | | X | | X | | X |
Non-Investment Grade Securities Risk | | X | | X | | X | | X | | X |
Non-Traditional (Alternative) Investment Risk | | | | | | | | X | | |
Portfolio Management Risk | | | | | | | | X | | |
Real Estate Investing Risk | | X | | X | | X | | X | | X |
Risks Related to Investments in Underlying Portfolios and Underlying ETFs | | X | | X | | X | | X | | X |
Securities Lending Risk | | X | | X | | X | | | | X |
Special Situations Risk | | X | | X | | X | | X | | X |
24
In addition to the risks noted above, as noted in the prospectuses for the affiliated Underlying Portfolios, FMG LLC and, in certain cases, an affiliate, serve as investment manager, investment sub-adviser and/or administrator for the Underlying Portfolios and earn fees for providing services in these capacities, which are in addition to the fees directly associated with a Portfolio. In this connection, the Manager’s selection of Underlying Portfolios and Underlying ETFs may have a positive or negative effect on its revenues and/or profits.
Comparative Performance Information
The bar charts and tables below provide some indication of the risks of investing in each Portfolio by showing changes in each Portfolio’s performance from year to year and by showing how each Acquired Portfolio’s average annual total returns for the past year and since inception, and the Acquiring Portfolio’s average annual total returns for the past one-, five- and ten-years, through December 31, 2016, compared to the returns of a broad-based securities market index. The additional broad-based securities market index shows how each Portfolio’s performance compared with the returns of other asset classes in which the Portfolio may invest. The return of the broad-based securities market index (and any additional comparative index) shown in the right hand column below is the return of the index for the last 10 years or, if shorter, since the inception of the share class with the longest history. Past performance is not an indication of future performance.
The performance results do not reflect any Contract-related fees and expenses, which would reduce the performance results.
Alt 25 Portfolio - Calendar Year Total Returns (Class IB)
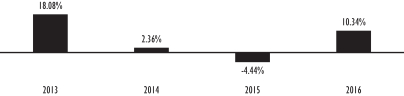
| | |
Best quarter (% and time period)
7.47% (2013 3rd Quarter) | | Worst quarter (% and time period)
-8.46% (2015 3rd Quarter) |
Alt 50 Portfolio - Calendar Year Total Returns (Class IB)
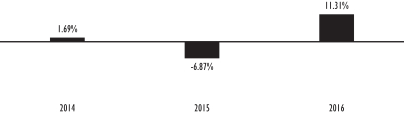
| | |
Best quarter (% and time period) 5.48% (2014 2nd Quarter) | | Worst quarter (% and time period)
-9.04% (2015 3rd Quarter) |
25
Alt 75 Portfolio - Calendar Year Total Returns (Class IB)
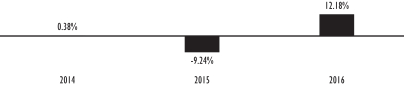
| | |
Best quarter (% and time period) 6.66% (2014 2nd Quarter) | | Worst quarter (% and time period)
-9.03% (2015 3rd Quarter) |
Alternative 100 Moderate Portfolio - Calendar Year Total Returns (Class B)
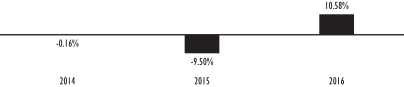
| | |
Best quarter (% and time period) 5.03% (2014 2nd Quarter) | | Worst quarter (% and time period)
-7.85% (2015 3rd Quarter) |
All Asset Growth-Alt 20 Portfolio - Calendar Year Total Returns (Class IB)
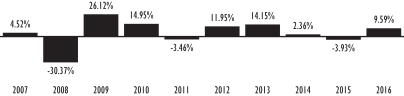
| | |
Best quarter (% and time period) 15.31% (2009 2nd Quarter) | | Worst quarter (% and time period)
-16.47% (2008 4th Quarter) |
Alt 25 Portfolio Average Annual Total Returns (For the periods ended December 31, 2016)
| | | | | | | | |
| | | One Year | | | Since Inception | |
Alt 25 Portfolio — Class IB Shares (Inception Date: August 29, 2012) | | | 10.34% | | | | 6.74% | |
Alt 25 Portfolio — Class K Shares (Inception Date: August 29, 2012) | | | 10.53% | | | | 6.99% | |
S&P 500® Index (reflects no deduction for fees, expenses, or taxes) | | | 11.96% | | | | 13.63% | |
Bloomberg Barclays U.S. Intermediate Government/Credit Bond Index
(reflects no deduction for fees, expenses, or taxes) | | | 2.08% | | | | 1.45% | |
All Asset Aggressive-Alt 25 Index (reflects no deduction for fees, expenses, or taxes) | | | 7.99% | | | | 8.09% | |
26
Alt 50 Portfolio Average Annual Total Returns (For the periods ended December 31, 2016)
| | | | | | | | |
| | | One Year | | | Since
Inception | |
Alt 50 Portfolio — Class IB Shares (Inception Date: October 28, 2013) | | | 11.31% | | | | 1.52% | |
S&P 500® Index (reflects no deduction for fees, expenses, or taxes) | | | 11.96% | | | | 10.15% | |
Bloomberg Barclays U.S. Intermediate Government/Credit Bond Index
(reflects no deduction for fees, expenses, or taxes) | | | 2.08% | | | | 1.76% | |
All Asset Aggressive-Alt 50 Index (reflects no deduction for fees, expenses, or taxes) | | | 6.26% | | | | 4.55% | |
Alt 75 Portfolio Average Annual Total Returns (For the periods ended December 31, 2016)
| | | | | | | | |
| | | One Year | | | Since
Inception | |
Alt 75 Portfolio — Class IB Shares (Inception Date: October 28, 2013) | | | 12.18% | | | | 0.16% | |
S&P 500® Index (reflects no deduction for fees, expenses, or taxes) | | | 11.96% | | | | 10.15% | |
Bloomberg Barclays U.S. Intermediate Government/Credit Bond Index
(reflects no deduction for fees, expenses, or taxes) | | | 2.08% | | | | 1.76% | |
All Asset Aggressive-Alt 75 Index (reflects no deduction for fees, expenses, or taxes) | | | 4.45% | | | | 3.67% | |
Alternative 100 Moderate Portfolio Average Annual Total Returns
(For the periods ended December 31, 2016)
| | | | | | | | |
| | | One Year | | | Since
Inception | |
Alternative 100 Moderate Portfolio — Class B Shares (Inception Date: October 30, 2013) | | | 10.58% | | | | -0.35% | |
BofA Merrill Lynch 3-Month U.S. Treasury Bill Index (reflects no deduction for fees, expenses, or taxes) | | | 0.33% | | | | 0.14% | |
S&P 500® Index (reflects no deduction for fees, expenses, or taxes) | | | 11.96% | | | | 10.14% | |
CharterSM Alternative 100 Moderate Composite Index* (reflects no deduction for fees, expenses, or taxes) | | | 9.71% | | | | -0.76% | |
| * | | The inception date for the Composite Index is October 31, 2013 |
All Asset Growth-Alt 20 Portfolio Average Annual Total Returns
(For the periods ended December 31, 2016)
| | | | | | | | | | | | |
| | | One Year | | | Five Years | | | Ten Years/ Since
Inception | |
All Asset Growth-Alt 20 Portfolio — Class IB Shares | | | 9.59% | | | | 6.61% | | | | 3.44% | |
All Asset Growth-Alt 20 Portfolio — Class K Shares (Inception Date: August 29, 2012) | | | 9.84% | | | | N/A | | | | 6.04% | |
S&P 500® Index (reflects no deduction for fees and expenses) | | | 11.96% | | | | 14.66% | | | | 6.95% | |
Bloomberg Barclays U.S. Intermediate Government/Credit Bond Index
(reflects no deduction for fees, expenses, or taxes) | | | 2.08% | | | | 1.85% | | | | 3.84% | |
All Asset Growth-Alt 20 Index (reflects no deduction for fees, expenses, or taxes) | | | 7.08% | | | | 7.69% | | | | 4.65% | |
27
Capitalization
The following table shows the capitalization of each Portfolio as of December 31, 2016 and of the All Asset Growth-Alt 20 Portfolio on a pro forma combined basis as of December 31, 2016, after giving effect to the proposed Reorganizations. Pro forma capitalization of the combined Portfolio has been adjusted to reflect the anticipated withdrawal of seed capital by FMG LLC and/or its affiliates from the combined Portfolio subsequent to the Reorganization. Pro forma net assets may not total and net asset values per share may not recalculate due to rounding of net assets.
| | | | | | | | | | | | |
| | | Net Assets
(in millions) | | | Net Asset Value
Per Share | | | Shares
Outstanding | |
Alt 25 Portfolio — Class IB Shares | | $ | 29.0 | | | $ | 12.00 | | | | 2,417,144 | |
All Asset Growth — Alt 20 Portfolio — Class IB Shares | | $ | 254.0 | | | $ | 18.95 | | | | 13,405,347 | |
Adjustments* | | | — | | | | — | | | | (886,606 | ) |
| Pro forma All Asset Growth — Alt 20 Portfolio — Class IB Shares (assuming the Reorganization is approved) | | $ | 283.0 | | | $ | 18.95 | | | | 14,935,885 | |
| | | |
Alt 25 Portfolio — Class K Shares | | $ | 1.7 | | | $ | 11.99 | | | | 140,735 | |
All Asset Growth — Alt 20 Portfolio — Class K Shares | | $ | 1.5 | | | $ | 18.86 | | | | 77,963 | |
Adjustments* | | | — | | | | — | | | | (51,236 | ) |
| Pro forma All Asset Growth — Alt 20 Portfolio — Class K (assuming the Reorganization is approved) | | $ | 3.2 | | | $ | 18.86 | | | | 167,462 | |
| | | |
| Alt 50 Portfolio — Class IB Shares | | $ | 2.8 | | | $ | 9.29 | | | | 305,172 | |
| All Asset Growth — Alt 20 Portfolio — Class IB Shares | | $ | 254.0 | | | $ | 18.95 | | | | 13,405,347 | |
| Adjustments* | | | (2.1 | ) | | | — | | | | (266,278 | ) |
| Pro forma All Asset Growth — Alt 20 Portfolio — Class IB Shares (assuming the Reorganization is approved) | | $ | 254.7 | | | $ | 18.95 | | | | 13,444,241 | |
| | | |
| Alt 75 Portfolio — Class IB Shares | | $ | 3.0 | | | $ | 8.95 | | | | 338,896 | |
| All Asset Growth — Alt 20 Portfolio — Class IB | | $ | 254.0 | | | $ | 18.95 | | | | 13,405,347 | |
| Adjustments* | | | (2.0 | ) | | | — | | | | (284,910 | ) |
| Pro forma All Asset Growth — Alt 20 Portfolio — Class IB Shares (assuming the Reorganization is approved) | | $ | 255.0 | | | $ | 18.95 | | | | 13,459,333 | |
| | | |
| CharterSM Alternative 100 Moderate Portfolio | | $ | 8.2 | | | $ | 9.12 | | | | 898,592 | |
| All Asset Growth — Alt 20 Portfolio — Class IB Shares | | $ | 254.0 | | | $ | 18.95 | | | | 13,405,347 | |
| Adjustments* | | | — | | | | — | | | | (466,095 | ) |
| Pro forma All Asset Growth — Alt 20 Portfolio — Class IB Shares (assuming the Reorganization is approved) | | $ | 262.2 | | | $ | 18.95 | | | | 13,837,844 | |
| | | |
| Pro forma All Asset Growth-Alt 20 Portfolio — Class IB Shares (assuming all Reorganizations are approved) | | $ | 292.9 | | | $ | 18.95 | | | | 15,461,262 | |
| Pro forma All Asset Growth-Alt 20 Portfolio — Class K Shares (assuming all Reorganizations are approved) | | $ | 3.2 | | | $ | 18.86 | | | | 167,462 | |
AFTER CAREFUL CONSIDERATION, THE BOARD OF EACH TRUST UNANIMOUSLY APPROVED THE REORGANIZATION PLAN WITH RESPECT TO THE ALT 25 PORTFOLIO, ALT 50 PORTFOLIO, ALT 75 PORTFOLIO, AND ALTERNATIVE 100 MODERATE PORTFOLIO. ACCORDINGLY, THE BOARD OF EACH TRUST HAS SUBMITTED THE REORGANIZATION PLAN FOR APPROVAL BY THESE PORTFOLIOS’ SHAREHOLDERS. THE BOARD OF EACH TRUST RECOMMENDS THAT YOU VOTE “FOR” PROPOSAL 1.
28
PROPOSAL 2: TO APPROVE THE AGREEMENT AND PLAN OF REORGANIZATION AND TERMINATION WITH RESPECT TO THE REORGANIZATION OF THE INCOME STRATEGIES PORTFOLIO AND INTEREST RATE STRATEGIES PORTFOLIO, EACH A SERIES OF VIP TRUST, EACH INTO THE AXA/DOUBLELINE OPPORTUNISTIC CORE PLUS BOND PORTFOLIO, A SERIES OF EQ TRUST.
This Proposal 2 requests your approval of a Reorganization Plan pursuant to which the Income Strategies Portfolio and Interest Rate Strategies Portfolio will be reorganized into the AXA/DoubleLine Opportunistic Core Plus Bond Portfolio. The shareholders of each Acquired Portfolio will vote separately on its Reorganization. The consummation of any one Reorganization described in this Proposal is not contingent on the consummation of any other Reorganization.
Proposal 2.A.: This Proposal 2.A. requests your approval of the Reorganization Plan pursuant to which the Income Strategies Portfolio will be reorganized into the AXA/DoubleLine Opportunistic Core Plus Bond Portfolio. In considering whether you should approve the Proposal, you should note that:
| | • | | The Portfolios are series of separate Trusts. The Income Strategies Portfolio is a series of VIP Trust and the AXA/DoubleLine Opportunistic Core Plus Bond Portfolio is a series of EQ Trust. |
| | • | | The Income Strategies Portfolio and the AXA/DoubleLine Opportunistic Core Plus Bond Portfolio have similar but distinct investment objectives. The Income Strategies Portfolio seeks a high level of current income. The AXA/DoubleLine Opportunistic Core Plus Bond Portfolio seeks to maximize current income and total return. While the Portfolios’ objectives are stated differently, each Portfolio focuses on current income and provides exposure to fixed income securities, and thus the objectives do not differ materially. |
| | • | | Both Portfolios provide diversified exposure to fixed income securities. There are, however, differences in the Portfolios’ principal investment policies and strategies of which you should be aware. These are set forth immediately below. For a detailed comparison of the Portfolios’ investment policies and strategies, see “Comparisons of Investment Objectives, Policies and Strategies” below. |
| | • | | The Income Strategies Portfolio utilizes a fund-of-funds structure and invests in other investment companies, while the AXA/DoubleLine Opportunistic Core Plus Bond Portfolio is sub-advised by an investment sub-adviser that actively manages the Portfolio’s assets and invests directly in securities and other investments. |
| | • | | The Income Strategies Portfolio invests in securities of Underlying Portfolios and Underlying ETFs comprising various asset categories and strategies. The Income Strategies Portfolio’s current asset allocation target is to invest approximately 25% of its assets in equity investments, 50% of its assets in fixed income investments, and 25% of its assets in non-traditional (alternative) investments. The asset categories and strategies of the Underlying Portfolios and Underlying ETFs in which the Income Strategies Portfolio may invest are as follows (asset categories and strategies that the Manager considers to be non-traditional (alternative) are indicated with an asterisk*): covered call writing*, global infrastructure*, global real estate*, long/short credit*, natural resources*, domestic/international preferred, domestic large cap equity, international equity income, bank loans, emerging markets debt, floating rate securities, global bond, high yield bond, inflation linked securities, international bond, and US investment grade bond. |
| | • | | The AXA/DoubleLine Opportunistic Core Plus Bond Portfolio invests at least 80% of its net assets in fixed income securities including through investments in other investment companies and financial instruments that derive their value from such securities. The AXA/DoubleLine Opportunistic Core Plus Bond Portfolio’s investments in fixed income securities include securities issued or guaranteed by the U.S. government or its agencies, instrumentalities or sponsored corporations; mortgage-backed securities; asset-backed securities; foreign and domestic corporate bonds; floating or variable rate obligations (including inverse floater collateralized mortgage obligations); bank loans and assignments; fixed income securities issued by corporations and governments in foreign countries including emerging |
29
| | markets issuers and U.S. dollar-denominated securities or non-U.S. issuers; securities issued by municipalities; collateralized loan obligations and other securities bearing fixed interest rates of any maturity; and inverse floaters, interest-only and principal-only securities. The AXA/DoubleLine Opportunistic Core Plus Bond Portfolio may invest up to 40% of its assets in below investment grade securities (commonly known as “junk bonds”). |
| | • | | Each Portfolio’s principal risks include credit risk, emerging markets risk, foreign securities risk, interest rate risk, investment grade securities risk, liquidity risk, loan risk, non-investment grade and securities risk. The Income Strategies Portfolio also is subject to affiliated portfolio risk, currency risk, derivatives risk, equity risk, floating rate loan risk, inflation-indexed bonds risk, infrastructure sector risk, large-cap company risk, market risk, natural resources sector risk, non-traditional (alternative) investment risk, portfolio management risk, real estate investing risk, and risks related to investments in Underlying Portfolios and Underlying ETFs as principal risks, while the AXA/DoubleLine Opportunistic Core Plus Bond Portfolio is not. The AXA/DoubleLine Opportunistic Core Plus Bond Portfolio is subject to collateralized loan obligations risk, distressed companies risk, geographic concentration risk, inverse floaters risk, mortgage-backed and asset-backed securities risk, political/economic risk, portfolio turnover risk, redemption risk, regulatory risk, risks of investing in other investment companies, securities lending risk, settlement risk, transaction costs risk, and U.S. government securities risk as principal risks, while the Income Strategies Portfolio generally is not. For a detailed comparison of the Portfolios’ principal risks, see “Comparison of Principal Risk Factors” below. |
| | • | | FMG LLC serves as the investment manager and administrator for both Portfolios. FMG LLC has selected DoubleLine Capital LP (“DoubleLine”) as the sub-adviser (“Sub-Adviser”) to sub-advise the assets of the AXA/DoubleLine Opportunistic Core Plus Bond Portfolio. It is anticipated that FMG LLC will continue to manage and administer, and that DoubleLine will continue to sub-advise, the AXA/DoubleLine Opportunistic Core Plus Bond Portfolio after the Reorganization. |
| | • | | The Manager has been granted relief by the SEC to hire, terminate and replace sub-advisers and amend sub-advisory agreements subject to the approval of the Board of Trustees and without obtaining shareholder approval. However, FMG LLC may not enter into a sub-advisory agreement on behalf of a Portfolio with an “affiliated person” of the Manager, unless the sub-advisory agreement, including compensation, is approved by the Portfolio’s shareholders. For a detailed description of the Manager and the Sub-Adviser to the AXA/DoubleLine Opportunistic Core Plus Bond Portfolio, please see “Additional Information about the Portfolios — The Manager” and “ — The Sub-Advisers” below. |
| | • | | The Income Strategies Portfolio and the AXA/DoubleLine Opportunistic Core Plus Bond Portfolio had net assets of approximately $4.6 million and $ 72.7 million, respectively, as of January 31, 2017. Thus, if the Reorganization had been in effect on that date, the combined Portfolio would have had net assets of approximately $77.3 million. In addition, as discussed in connection with Proposal 2.B. below, it is also proposed that the Interest Rate Strategies Portfolio be reorganized into the AXA/DoubleLine Opportunistic Core Plus Bond Portfolio. The Interest Rate Strategies Portfolio had net assets of approximately $4.3 million as of January 31, 2017. Thus, if the Reorganizations of both the Income Strategies Portfolio and Interest Rate Strategies Portfolio into the AXA/DoubleLine Opportunistic Core Plus Bond Portfolio had been in effect on that date, the combined Portfolio would have had net assets of approximately $81.6 million. |
| | • | | The shareholders of the Income Strategies Portfolio will receive shares of the AXA/DoubleLine Opportunistic Core Plus Bond Portfolio pursuant to the Reorganization. Shareholders will not pay any sales charges in connection with the Reorganization. Please see “Comparative Fee and Expense Tables,” “Additional Information about the Reorganizations” and “Additional Information about the Portfolios” below for more information. |
| | • | | It is estimated that the total annual operating expense ratio (including acquired fund fees and expenses, if any) for the AXA/DoubleLine Opportunistic Core Plus Bond Portfolio’s Class IB shares, for the fiscal year following the Reorganization, will be 1.06%, which is lower than that of the Income Strategies Portfolio’s Class B shares for the fiscal year ended December 31, 2016, which was 1.20%. This assumes |
30
| | that only the Reorganization of the Income Strategies Portfolio into the AXA/DoubleLine Opportunistic Core Plus Bond Portfolio is consummated. If both of the proposed Reorganizations into the AXA/DoubleLine Opportunistic Core Plus Bond Portfolio are consummated then it is estimated that the total annual operating expense ratio (including acquired fund fees and expenses, if any) for the AXA/DoubleLine Opportunistic Core Plus Bond Portfolio’s Class IB shares for the fiscal year following the Reorganization, will be 1.06%. For a more detailed comparison of the fees and expenses of the Portfolios, please see “Comparative Fee and Expense Tables” and “Additional Information about the Portfolios” below. |
| | • | | The AXA/DoubleLine Opportunistic Core Plus Bond Portfolio has a higher management fee than the Income Strategies Portfolio because it invests directly in securities and other instruments rather than operating as a fund-of-funds. The management fee for the Income Strategies Portfolio is equal to an annual rate of 0.15% of its average daily net assets; while the management fee for the AXA/DoubleLine Opportunistic Core Plus Bond Portfolio is equal to an annual rate of 0.60% of its average daily net assets. However, as discussed below, the AXA/DoubleLine Opportunistic Core Plus Bond Portfolio currently has a lower expense limitation agreement in place than that for the Income Strategies Portfolio. |
| | • | | The Portfolios pay different administration fees. |
| | • | | The Income Strategies Portfolio pays FMG LLC its proportionate share of an asset-based administration fee, subject to a minimum annual fee of $32,500. For purposes of calculating the asset-based administration fee, the assets of the Income Strategies Portfolio are aggregated with those of the other VIP Trust Portfolios (“VIP Trust Portfolios”) and the AXA Strategic Allocation Series Portfolios, AXA All Asset Allocation Series Portfolios, and AXA/Franklin Templeton Allocation Managed Volatility Portfolio of EQ Trust (the “EQ Trust Fund-of-Funds Portfolios”), which are also managed by FMG LLC. The asset-based administration fee is equal to an annual rate of 0.15% of the first $35 billion of the aggregate average daily net assets of the Portfolios, VIP Trust Portfolios, and EQ Trust Fund-of-Funds Portfolios; 0.11% on the next $10 billion; 0.10% on the next $5 billion; and 0.095% thereafter. |
| | • | | The AXA/DoubleLine Opportunistic Core Plus Bond Portfolio pays FMG LLC its proportionate share of an asset-based administration fee for the other portfolios of EQ Trust that are advised by a single investment sub-adviser (“Single-Advised Portfolios”), which is equal to an annual rate of 0.10% of the first $30 billion of the aggregate average daily net assets of the Single-Advised Portfolios; 0.0975% of the next $10 billion; 0.0950% of the next $5 billion; and 0.0925% thereafter, subject to a minimum annual fee of $30,000. For a more detailed description of the fees and expenses of the Portfolios, including a description of the Single-Advised Portfolios, please see “Additional Information about the Portfolios” below. |
| | • | | Each Portfolio is subject to an expense limitation arrangement. |
| | • | | Pursuant to a contract, FMG LLC has agreed to make payments or waive its management, administrative and other fees to limit the expenses of the Income Strategies Portfolio through April 30, 2017 (unless the Board of Trustees consents to an earlier revision or termination of this arrangement) so that the annual operating expenses (including acquired fund fees and expenses) of the Income Strategies Portfolio (other than interest, taxes, brokerage commissions, dividend and interest expenses on securities sold short, other expenditures that are capitalized in accordance with generally accepted accounting principles and other extraordinary expenses not incurred in the ordinary course of the Portfolio’s business) do not exceed an annual rate of average daily net assets of 1.20% for Class B shares of the Income Strategies Portfolio. |
| | • | | Pursuant to a contract, FMG LLC has agreed to make payments or waive its management, administrative and other fees to limit the expenses of the AXA/DoubleLine Opportunistic Core Plus Bond Portfolio through April 30, 2018 (unless the Board of Trustees consents to an earlier revision or termination of this arrangement) so that the annual operating expenses of the AXA/DoubleLine Opportunistic Core Plus Bond Portfolio (other than interest, taxes, brokerage commissions, fees and |
31
| | expenses of other investment companies in which the Portfolio invests, dividend and interest expenses on securities sold short, other expenditures that are capitalized in accordance with generally accepted accounting principles and other extraordinary expenses not incurred in the ordinary course of the Portfolio’s business) do not exceed an annual rate of average daily net assets of 1.05% for Class IB shares of the AXA/DoubleLine Opportunistic Core Plus Bond Portfolio. |
| | • | | The Class IB shares of the AXA/DoubleLine Opportunistic Core Plus Bond Portfolio and the Class B shares of the Income Strategies Portfolio are each subject to a 0.25% Rule 12b-1 fee. |
| | • | | The Class IB shares of the AXA/DoubleLine Opportunistic Core Plus Bond Portfolio underperformed compared to the Class B shares of the Income Strategies Portfolio for the one-year period ended December 31, 2016 and for the period since inception. Please see “Comparative Performance Information” below. |
| | • | | Following the Reorganization, it is anticipated that FMG LLC will redeem shares that it holds in the combined Portfolio representing seed capital it has previously invested. The withdrawal of such seed capital is not expected to have a material effect on the annual operating expenses of the combined Portfolio. |
| | • | | Following the Reorganization, the combined Portfolio will be managed in accordance with the investment objective, policies and strategies of the AXA/DoubleLine Opportunistic Core Plus Bond Portfolio. It is not expected that the AXA/DoubleLine Opportunistic Core Plus Bond Portfolio will revise any of its investment policies following the Reorganization to reflect those of the Income Strategies Portfolio. If the Reorganization is approved, all of the Income Strategies Portfolio’s assets (“Transferred Assets”) on the Closing Date will be transferred to the AXA/DoubleLine Opportunistic Core Plus Bond Portfolio. It is anticipated that immediately prior to the Closing Date, the Income Strategies Portfolio will liquidate substantially all of its securities holdings and hold cash. Therefore, it is anticipated that the Transferred Assets will consist of cash. The sale of portfolio holdings by the Income Strategies Portfolio in connection with the Reorganization may result in the Income Strategies Portfolio selling securities at a disadvantageous time and price and could result in it realizing gains (or losses) that would not otherwise have been realized and incurring transaction costs that would not otherwise have been incurred. It is also expected that, over time, the AXA/DoubleLine Opportunistic Core Plus Bond Portfolio will use the Transferred Assets to invest in fixed income securities consistent with its principal investment strategy. The estimated portfolio transaction costs of the Reorganization of the Income Strategies Portfolio are $500. This amount is an estimate and is subject to change. The actual amount could be higher or lower depending on the factors outlined above. Contractholders will not recognize any gain or loss for federal income tax purposes as a result of the Reorganizations. |
| | • | | FMG LLC has voluntarily agreed to pay expenses of the Reorganization that exceed the Income Strategies Portfolio’s expense limitation set forth in its expense limitation agreement. The Reorganization expenses for the Income Strategies Portfolio, which are estimated to be $33,333, exceed the expense limit and will be paid by FMG LLC. |
Proposal 2.B.: This Proposal 2.B. requests your approval of the Reorganization Plan pursuant to which the Interest Rate Strategies Portfolio will be reorganized into the AXA/DoubleLine Opportunistic Core Plus Bond Portfolio. In considering whether you should approve the Proposal, you should note that:
| | • | | The Portfolios are series of separate Trusts. The Interest Rate Strategies Portfolio is a series of VIP Trust and the AXA/DoubleLine Opportunistic Core Plus Bond Portfolio is a series of EQ Trust. |
| | • | | The Interest Rate Strategies Portfolio and the AXA/DoubleLine Opportunistic Core Plus Bond Portfolio have similar but distinct investment objectives. The Interest Rate Strategies Portfolio seeks to achieve long-term total return, consistent with the preservation of capital and prudent investment management. The AXA/DoubleLine Opportunistic Core Plus Bond Portfolio seeks to maximize current income and total return. |
| | • | | Both Portfolios provide diversified exposure to fixed income securities. There are, however, differences in the Portfolios’ principal investment policies and strategies of which you should be aware. These are |
32
| | set forth immediately below. For a detailed comparison of the Portfolios’ investment policies and strategies, see “Comparisons of Investment Objectives, Policies and Strategies” below. |
| | • | | The Interest Rate Strategies Portfolio utilizes a fund-of-funds structure and invests in other investment companies, while the AXA/DoubleLine Opportunistic Core Plus Bond Portfolio is sub-advised by an investment sub-adviser that actively manages the Portfolio’s assets and invests directly in securities and other investments. |
| | • | | The Interest Rate Strategies Portfolio invests in securities of Underlying Portfolios and Underlying ETFs comprising various asset categories and strategies. The Interest Rate Strategies Portfolio’s current asset allocation target is to invest approximately 25% of its assets in equity investments, 50% of its assets in fixed income investments, and 25% of its assets in nontraditional (alternative) investments. The asset categories and strategies of the Underlying Portfolios and Underlying ETFs in which the Interest Rate Strategies Portfolio may invest are as follows (asset categories and strategies that the Manager considers to be non-traditional (alternative) are indicated with an asterisk*): absolute return/multi strategies*, convertible securities*, covered call writing*, global infrastructure*, global real estate*, long/short credit*, natural resources*, domestic large cap equity, global equity, international equity, income, bank loans, emerging markets debt, floating rate securities, global bond, high yield bond, inflation linked securities, international bond, money market, unconstrained bond, US investment grade bond, and US short term investment grade bond. |
| | • | | The AXA/DoubleLine Opportunistic Core Plus Bond Portfolio invests at least 80% of its net assets in fixed income securities, including through investments in other investment companies and financial instruments that drive their value from such securities. The AXA/DoubleLine Opportunistic Core Plus Bond Portfolio’s investments in fixed income securities include securities issued or guaranteed by the U.S. government or its agencies, instrumentalities or sponsored corporations; mortgage-backed securities; asset-backed securities; foreign and domestic corporate bonds; floating or variable rate obligations (including inverse floater collateralized mortgage obligations); bank loans and assignments; fixed income securities issued by corporations and governments in foreign countries including emerging markets issuers and U.S. dollar-denominated securities or non-U.S. issuers; securities issued by municipalities; collateralized loan obligations and other securities bearing fixed interest rates of any maturity; and inverse floaters, interest-only and principal-only securities. The AXA/DoubleLine Opportunistic Core Plus Bond Portfolio may invest up to 40% of its assets in below investment grade securities (commonly known as “junk bonds”). |
| | • | | Each Portfolio’s principal risks include credit risk, emerging markets risk, foreign securities risk, interest rate risk, investment grade securities risk, liquidity risk, loan risk, non-investment grade and securities risk. The Interest Rate Strategies Portfolio also is subject to affiliated portfolio risk, currency risk, derivatives risk equity risk, floating rate loan risk, inflation-indexed bonds risk, infrastructure sector risk, large-cap company risk, market risk, natural resources sector risk, non-traditional (alternative) investment risk, portfolio management risk, real estate investing risk, and risks related to investments in Underlying Portfolios and Underlying ETFs as principal risks, while the AXA/DoubleLine Opportunistic Core Plus Bond Portfolio is not. The AXA/DoubleLine Opportunistic Core Plus Bond Portfolio is subject to collateralized loan obligations risk, distressed companies risk, geographic concentration risk, inverse floaters risk, mortgage-backed and asset-backed securities risk, political/economic risk, portfolio turnover risk, redemption risk, regulatory risk, risks of investing in other investment companies, securities lending risk, settlement risk, transaction costs risk, and U.S. government securities risk; while the Interest Rate Strategies Portfolio generally is not. For a detailed comparison of the Portfolios’ principal risks, see “Comparison of Principal Risk Factors” below. |
| | • | | FMG LLC serves as the investment manager and administrator for both Portfolios. FMG LLC has selected DoubleLine Capital LP (“DoubleLine”) as the sub-adviser (“Sub-Adviser”) to manage the assets of the AXA/DoubleLine Opportunistic Core Plus Bond Portfolio. It is anticipated that FMG LLC will continue to manage and administer, and that DoubleLine will continue to sub-advise, the AXA/DoubleLine Opportunistic Core Plus Bond Portfolio after the Reorganization. |
33
| | • | | The Manager has been granted relief by the SEC to hire, terminate and replace Sub-Advisers and amend sub-advisory agreements subject to the approval of the Board of Trustees and without obtaining shareholder approval. However, FMG LLC may not enter into a sub-advisory agreement on behalf of a Portfolio with an “affiliated person” of the Manager, unless the sub-advisory agreement, including compensation, is approved by the Portfolio’s shareholders. For a detailed description of the Manager and the Sub-Adviser to the AXA/DoubleLine Opportunistic Core Plus Bond Portfolio, please see “Additional Information about the Portfolios — The Manager” and “ — The Sub-Advisers” below. |
| | • | | The Interest Rate Strategies Portfolio and the AXA/DoubleLine Opportunistic Core Plus Bond Portfolio had net assets of approximately $4.3 million and $72.7 million, respectively, as of January 31, 2017. Thus, if the Reorganization had been in effect on that date, the combined Portfolio would have had net assets of approximately $77.0 million. In addition, as discussed in connection with Proposal 2.A. above, it is also proposed that the Income Strategies Portfolio be reorganized into the AXA/DoubleLine Opportunistic Core Plus Bond Portfolio. The Income Strategies Portfolio had net assets of approximately $4.6 million as of January 31, 2017. Thus, if the Reorganizations of both the Interest Rate Strategies Portfolio and Income Strategies Portfolio into the AXA/DoubleLine Opportunistic Core Plus Bond Portfolio had been in effect on that date, the combined Portfolio would have had net assets of approximately $81.6 million. |
| | • | | The shareholders of the Interest Rate Strategies Portfolio will receive shares of the AXA/DoubleLine Opportunistic Core Plus Bond Portfolio pursuant to the Reorganization. Shareholders will not pay any sales charges in connection with the Reorganization. Please see “Comparative Fee and Expense Tables,” “Additional Information about the Reorganizations” and “Additional Information about the Portfolios” below for more information. |
| | • | | It is estimated that the total annual operating expense ratio (including acquired fund fees and expenses, if any) for the AXA/DoubleLine Opportunistic Core Plus Bond Portfolio’s Class IB shares, for the fiscal year following the Reorganization, will be 1.06%, which is lower than that of the Interest Rate Strategies Portfolio’s Class B shares for the fiscal year ended December 31, 2016, which was 1.20%. This is assuming that only the Reorganization of the Interest Rate Strategies Portfolio is consummated. If both of the proposed Reorganizations into the AXA/DoubleLine Opportunistic Core Plus Bond Portfolio are consummated then it is estimated that the total annual operating expense ratio (including acquired fund fees and expenses, if any) for the AXA/DoubleLine Opportunistic Core Plus Bond Portfolio’s Class IB shares for the fiscal year following the Reorganization, will be 1.06%. For a more detailed comparison of the fees and expenses of the Portfolios, please see “Comparative Fee and Expense Tables” and “Additional Information about the Portfolios” below. |
| | • | | The AXA/DoubleLine Opportunistic Core Plus Bond Portfolio has a higher management fee than the Interest Rate Strategies Portfolio because it invests directly in securities and other instruments rather than operating as a fund-of-funds. The management fee for the Interest Rate Strategies Portfolio is equal to an annual rate of 0.15% of its average daily net assets, while the management fee for the AXA/DoubleLine Opportunistic Core Plus Bond Portfolio is equal to an annual rate of 0.60% of its average daily net assets. However, as discussed below, the AXA/DoubleLine Opportunistic Core Plus Bond Portfolio currently has a lower expense limitation agreement in place than that for the Interest Rate Strategies Portfolio. |
| | • | | The Portfolios pay different administration fees. |
| | • | | The Interest Rate Strategies Portfolio pays FMG LLC its proportionate share of an asset-based administration fee, subject to a minimum annual fee of $32,500. For purposes of calculating the asset-based administration fee, the assets of the Interest Rate Strategies Portfolio are aggregated with those of the other VIP Trust Portfolios (“VIP Trust Portfolios”) and the AXA Strategic Allocation Series Portfolios, AXA All Asset Allocation Series Portfolios, and AXA/Franklin Templeton Allocation Managed Volatility Portfolio of EQ Trust (the “EQ Trust Fund-of-Funds Portfolios”), which are also managed by FMG LLC. The asset-based administration fee is equal to an annual rate of 0.15% of the first |
34
| | $35 billion of the aggregate average daily net assets of the Portfolios, VIP Trust Portfolios, and EQ Trust Fund-of-Funds Portfolios; 0.11% on the next $10 billion; 0.10% on the next $5 billion; and 0.095% thereafter. |
| | • | | The AXA/DoubleLine Opportunistic Core Plus Bond Portfolio pays FMG LLC its proportionate share of an asset-based administration fee for the other portfolios of EQ Trust that are advised by a single investment sub-adviser (“Single-Advised Portfolios”), which is equal to an annual rate of 0.10% of the first $30 billion of the aggregate average daily net assets of the Single-Advised Portfolios; 0.0975% of the next $10 billion; 0.0950% of the next $5 billion; and 0.0925% thereafter, subject to a minimum annual fee of $30,000. For a more detailed description of the fees and expenses of the Portfolios, including a description of the Single-Advised Portfolios, please see “Additional Information about the Portfolios” below. |
| | • | | Each Portfolio is subject to an expense limitation arrangement. |
| | • | | Pursuant to a contract, FMG LLC has agreed to make payments or waive its management, administrative and other fees to limit the expenses of the Interest Rate Strategies Portfolio through April 30, 2017 (unless the Board of Trustees consents to an earlier revision or termination of this arrangement) so that the annual operating expenses (including acquired fund fees and expenses) of the Interest Rate Strategies Portfolio (other than interest, taxes, brokerage commissions, dividend and interest expenses on securities sold short, other expenditures that are capitalized in accordance with generally accepted accounting principles and other extraordinary expenses not incurred in the ordinary course of the Portfolio’s business) do not exceed an annual rate of average daily net assets of 1.20% for Class B shares of the Interest Rate Strategies Portfolio. |
| | • | | Pursuant to a contract, FMG LLC has agreed to make payments or waive its management, administrative and other fees to limit the expenses of the AXA/DoubleLine Opportunistic Core Plus Bond Portfolio through April 30, 2018 (unless the Board of Trustees consents to an earlier revision or termination of this arrangement) so that the annual operating expenses of the AXA/DoubleLine Opportunistic Core Plus Bond Portfolio (other than interest, taxes, brokerage commissions, fees and expenses of other investment companies in which the Portfolio invests, dividend and interest expenses on securities sold short, other expenditures that are capitalized in accordance with generally accepted accounting principles and other extraordinary expenses not incurred in the ordinary course of the Portfolio’s business) do not exceed an annual rate of average daily net assets of 1.05% for Class IB shares of the AXA/DoubleLine Opportunistic Core Plus Bond Portfolio. |
| | • | | The Class IB shares of the AXA/DoubleLine Opportunistic Core Plus Bond Portfolio and the Class B shares of the Interest Rate Strategies Portfolio are each subject to a 0.25% Rule 12b-1 fee. |
| | • | | The Class IB shares of the AXA/DoubleLine Opportunistic Core Plus Bond Portfolio underperformed compared to the Class B shares of the Interest Rate Strategies Portfolio for the one-year period ended December 31, 2016 and for the period since inception. Please see “Comparative Performance Information” below. |
| | • | | Following the Reorganization, it is anticipated that FMG LLC will redeem shares that it holds in the combined Portfolio representing seed capital it has previously invested. The withdrawal of such seed capital is not expected to have a material effect on the annual operating expenses of the combined Portfolio. |
| | • | | Following the Reorganization, the combined Portfolio will be managed in accordance with the investment objective, policies and strategies of the AXA/DoubleLine Opportunistic Core Plus Bond Portfolio. It is not expected that the AXA/DoubleLine Opportunistic Core Plus Bond Portfolio will revise any of its investment policies following the Reorganization to reflect those of the Interest Rate Strategies Portfolio. If the Reorganization is approved, all of the Income Strategies Portfolio’s assets (“Transferred Assets”) on the Closing Date will be transferred to the AXA/DoubleLine Opportunistic Core Plus Bond Portfolio. |
35
| | It is anticipated that immediately prior to the Closing Date, the Interest Rate Strategies Portfolio will liquidate substantially all of its securities holdings and hold cash. Therefore, it is anticipated that the Transferred Assets will consist of cash. The sale of portfolio holdings by the Income Strategies Portfolio in connection with the Reorganization may result in the Interest Rate Strategies Portfolio selling securities at a disadvantageous time and price and could result in it realizing gains (or losses) that would not otherwise have been realized and incurring transaction costs that would not otherwise have been incurred. It is also expected that, over time, the AXA/DoubleLine Opportunistic Core Plus Bond Portfolio will use the Transferred Assets to invest in fixed income securities consistent with its principal investment strategy. The estimated portfolio transaction costs of the Reorganization of the Interest Rate Strategies Portfolio are $400. This amount is an estimate and is subject to change. The actual amount could be higher or lower depending on the factors outlined above. Contractholders will not recognize any gain or loss for federal income tax purposes as a result of the Reorganizations. |
| | • | | FMG LLC has voluntarily agreed to pay expenses of the Reorganization that exceed the Interest Rate Strategies Portfolio’s expense limitation set forth in its expense limitation agreement. The Reorganization expenses for the Interest Rate Strategies Portfolio, which are estimated to be $33,333, exceed the expense limit and will be paid by FMG LLC. |
Comparative Fee and Expense Tables
The following tables show the fees and expenses of the Class B Shares of the Income Strategies Portfolio and Interest Rate Strategies Portfolio and the Class IB Shares of the AXA/DoubleLine Opportunistic Core Plus Bond Portfolio and the estimated pro forma fees and expenses of the Class IB Shares of the AXA/DoubleLine Opportunistic Core Plus Bond Portfolio after giving effect to the proposed Reorganizations. Fees and expenses for each Portfolio are based on those incurred by the relevant class of its shares for the fiscal year ended December 31, 2016. The pro forma fees and expenses of the AXA/DoubleLine Opportunistic Core Plus Bond Portfolio Shares assume that each Reorganization was in effect for the year ended December 31, 2016. The tables below do not reflect any Contract-related fees and expenses, which would increase overall fees and expenses. See a Contract prospectus for a description of those fees and expenses.
Shareholder Fees
(fees paid directly from your investment)
| | | | | | |
Income Strategies Portfolio | | Interest Rate Strategies Portfolio | | AXA/DoubleLine Opportunistic
Core Plus Bond Portfolio | | Pro Forma
AXA/DoubleLine Opportunistic
Core Plus Bond (assuming both the
Reorganizations are approved) |
Not Applicable. | | Not Applicable. | | Not Applicable. | | Not Applicable. |
Annual Operating Expenses
(expenses that you may pay each year as a percentage of the value of your investment)
| | | | | | | | | | | | |
| | | Income Strategies Portfolio | | | AXA/DoubleLine Opportunistic
Core Plus Bond Portfolio | | | Pro Forma AXA/DoubleLine
Opportunistic Core Plus Bond
Portfolio (assuming only the
Reorganization of the Income
Strategies Portfolio is approved)** | |
| | | Class B | | | Class IB | | | Class IB | |
Management Fee | | | 0.15 | % | | | 0.60 | % | | | 0.60 | % |
Distribution and/or Service Fees (12b-1 fees) | | | 0.25 | % | | | 0.25 | % | | | 0.25 | % |
Other Expenses | | | 2.89 | % | | | 0.26 | % | | | 0.25 | % |
Acquired Fund Fees and Expenses | | | 0.64 | % | | | 0.01 | % | | | 0.01 | % |
Total Annual Portfolio Operating Expenses | | | 3.93 | % | | | 1.12 | % | | | 1.11 | % |
Fee Waiver and/or Expense Reimbursement†* | | | (2.73 | )% | | | (0.06 | )% | | | (0.05 | )% |
36
| | | | | | | | | | | | |
| | | Income Strategies Portfolio | | | AXA/DoubleLine Opportunistic
Core Plus Bond Portfolio | | | Pro Forma AXA/DoubleLine
Opportunistic Core Plus Bond
Portfolio (assuming only the
Reorganization of the Income
Strategies Portfolio is approved)** | |
| | | Class B | | | Class IB | | | Class IB | |
Total Annual Portfolio Operating Expenses After Fee Waiver and/or Expense Reimbursement | | | 1.20% | | | | 1.06% | | | | 1.06% | |
| † | | Pursuant to a contract, FMG LLC has agreed to make payments or waive its management, administrative or other fees to limit the expenses of (1) the Income Strategies Portfolio through April 30, 2017 (unless the Board of Trustees consents to an earlier revision or termination of this arrangement) so that the annual operating expenses (including Acquired Fund Fees and Expenses) of the Portfolio (exclusive of taxes, interest, brokerage commissions, dividend and interest expenses on securities sold short, capitalized expenses, and extraordinary expenses) do not exceed an annual rate of average daily net assets of 1.20% for Class B shares of the Portfolio, and (2) the EQ/DoubleLine Opportunistic Core Plus Bond Portfolio through April 30, 2018 (unless the Board of Trustees consents to an earlier revision or termination of this arrangement) so that the annual operating expenses of the Portfolio (exclusive of taxes, interest, brokerage commissions, fees and expenses of other investment companies in which the Portfolio invests, dividend and interest expenses on securities sold short, capitalized expenses and extraordinary expenses) do not exceed an annual rate of average daily net assets of 1.05% for Class IB shares of the Portfolio. |
| * | | Fee Waiver and/or Expense Reimbursement information has been restated to reflect the current expense limitation arrangements noted above. |
| ** | | Pro forma annual operating expenses have been adjusted to reflect the anticipated withdrawal of seed capital by FMG LLC and/or its affiliates from the combined Portfolio subsequent to the Reorganization. |
Annual Operating Expenses
(expenses that you may pay each year as a percentage of the value of your investment)
| | | | | | | | | | | | |
| | | Interest Rate Strategies Portfolio | | | AXA/DoubleLine Opportunistic
Core Plus Bond Portfolio | | | Pro Forma AXA/DoubleLine
Opportunistic Core Plus Bond
Portfolio (assuming only the
Reorganization of the Interest
Rate Strategies Portfolio is
approved)** | |
| | | Class B | | | Class IB | | | Class IB | |
Management Fee | | | 0.15 | % | | | 0.60 | % | | | 0.60 | % |
Distribution and/or Service Fees (12b-1 fees) | | | 0.25 | % | | | 0.25 | % | | | 0.25 | % |
Other Expenses | | | 2.84 | % | | | 0.26 | % | | | 0.25 | % |
Acquired Fund Fees and Expenses | | | 0.67 | % | | | 0.01 | % | | | 0.01 | % |
Total Annual Portfolio Operating Expenses | | | 3.91 | % | | | 1.12 | % | | | 1.11 | % |
Fee Waiver and/or Expense Reimbursement†* | | | (2.71 | )% | | | (0.06 | )% | | | (0.05 | )% |
Total Annual Portfolio Operating Expenses After Fee Waiver and/or Expense Reimbursement | | | 1.20 | % | | | 1.06 | % | | | 1.06 | % |
| † | | Pursuant to a contract, FMG LLC has agreed to make payments or waive its management, administrative or other fees to limit the expenses of (1) the Interest Rate Strategies Portfolio through April 30, 2017 (unless the Board of Trustees consents to an earlier revision or termination of this arrangement) so that the annual operating expenses (including Acquired Fund Fees and Expenses) of the Portfolio (exclusive of taxes, interest, brokerage commissions, dividend and interest expenses on securities sold short, capitalized expenses, and extraordinary expenses) do not exceed an annual rate of average daily net assets of 1.20% for Class B shares of the Portfolio, and (2) the EQ/DoubleLine Opportunistic Core Plus Bond Portfolio through April 30, 2018 (unless the Board of Trustees consents to an earlier revision or termination of this arrangement) so that the annual operating expenses of the Portfolio (exclusive of taxes, interest, brokerage commissions, fees and expenses of other investment companies in which the Portfolio invests, dividend and interest expenses on securities sold short, capitalized expenses and extraordinary expenses) do not exceed an annual rate of average daily net assets of 1.05% for Class IB shares of the Portfolio. |
37
| * | | Fee Waiver and/or Expense Reimbursement information has been restated to reflect the current expense limitation arrangements noted above. |
| ** | | Pro forma annual operating expenses have been adjusted to reflect the anticipated withdrawal of seed capital by FMG LLC and/or its affiliates from the combined Portfolio subsequent to the Reorganization. |
Pro Forma Annual Operating Expenses
(assuming both Reorganizations are approved)
(expenses that you may pay each year as a percentage of the value of your investment)
| | | | |
| | | Pro Forma AXA/DoubleLine Opportunistic Core Plus Bond Portfolio
(assuming both the Reorganizations of the Income Strategies
Portfolio and Interest Rate Strategies Portfolio are approved)** | |
| | Class IB | |
Management Fee | | | 0.60 | % |
Distribution and/or Service Fees (12b-1 fees) | | | 0.25 | % |
Other Expenses | | | 0.24 | % |
Acquired Fund Fees and Expenses | | | 0.01 | % |
Total Annual Portfolio Operating Expenses | | | 1.10 | % |
Fee Waiver and/or Expense Reimbursement† | | | (0.04 | )% |
Total Annual Portfolio Operating Expenses After Fee Waiver and/or Expense Reimbursement | | | 1.06 | % |
| † | | Pursuant to a contract, FMG LLC has agreed to make payments or waive its management, administrative or other fees to limit the expenses of the EQ/DoubleLine Opportunistic Core Plus Bond Portfolio through April 30, 2018 (unless the Board of Trustees consents to an earlier revision or termination of this arrangement) so that the annual operating expenses of the Portfolio (exclusive of taxes, interest, brokerage commissions, dividend and interest expenses on securities sold short, capitalized expenses, fees and expenses of other investment companies in which the Portfolio invests, and extraordinary expenses) do not exceed an annual rate of average daily net assets of 1.05% for Class IB shares of the Portfolio. |
| ** | | Pro forma annual operating expenses have been adjusted to reflect the anticipated withdrawal of seed capital by FMG LLC and/or its affiliates from the combined Portfolio subsequent to the Reorganization. |
Example of Portfolio Expenses
This example is intended to help you compare the costs of investing in the Portfolios with the cost of investing in other investment options. The example assumes that:
| | • | | You invest $10,000 in a Portfolio for the time periods indicated; |
| | • | | Your investment has a 5% return each year; |
| | • | | The Portfolio’s operating expenses remain the same; and |
| | • | | The Expense Limitation Arrangement with respect to the Portfolios is not renewed. |
This example does not reflect any Contract-related fees and expenses, including redemption fees (if any) at the Contract level. If such fees and expenses were reflected, the total expenses would be higher. Although your actual costs may be higher or lower, based on these assumptions your costs would be:
| | | | | | | | | | | | | | | | |
| | | 1 Year | | | 3 Years | | | 5 Years | | | 10 Years | |
Income Strategies Portfolio | | | | | | | | | | | | | | | | |
Class B | | $ | 122 | | | $ | 947 | | | $ | 1,789 | | | $ | 3,975 | |
AXA/DoubleLine Opportunistic Core Plus Bond Portfolio | | | | | | | | | | | | | | | | |
Class IB | | $ | 108 | | | $ | 350 | | | $ | 611 | | | $ | 1,358 | |
Pro Forma AXA/DoubleLine Opportunistic Core Plus Bond Portfolio (assuming only the Reorganization of the Income Strategies Portfolio is approved) | | | | | | | | | | | | | | | | |
Class IB | | $ | 108 | | | $ | 348 | | | $ | 607 | | | $ | 1,347 | |
38
| | | | | | | | | | | | | | | | |
| | | 1 Year | | | 3 Years | | | 5 Years | | | 10 Years | |
Interest Rate Strategies Portfolio | | | | | | | | | | | | | | | | |
Class B | | $ | 122 | | | $ | 943 | | | $ | 1,781 | | | $ | 3,959 | |
AXA/DoubleLine Opportunistic Core Plus Bond Portfolio | | | | | | | | | | | | | | | | |
Class IB | | $ | 108 | | | $ | 350 | | | $ | 611 | | | $ | 1,358 | |
Pro Forma AXA/DoubleLine Opportunistic Core Plus Bond Portfolio (assuming only the Reorganization of the Interest Rate Strategies Portfolio is approved) | | | | | | | | | | | | | | | | |
Class IB | | $ | 108 | | | $ | 348 | | | $ | 607 | | | $ | 1,347 | |
| | | | |
| | | 1 Year | | | 3 Years | | | 5 Years | | | 10 Years | |
Pro Forma AXA/DoubleLine Opportunistic Core Plus Bond Portfolio (assuming both the Reorganizations are approved) | | | | | | | | | | | | | | | | |
Class IB | | $ | 108 | | | $ | 346 | | | $ | 602 | | | $ | 1,337 | |
Portfolio Turnover
Each Portfolio pays transaction costs, such as commissions, when it buys and sells securities (or “turns over” its portfolio). A higher portfolio turnover rate may indicate higher transaction costs. These costs, which are not reflected in annual fund operating expenses or in the example, affect a Portfolio’s performance. During the fiscal year ended December 31, 2016, the portfolio turnover rates for each of the Income Strategies Portfolio, Interest Rate Strategies Portfolio, and the AXA/DoubleLine Opportunistic Core Plus Bond Portfolio were 22%, 13%, and 76%, respectively, of the average value of each Portfolio.
Comparison of Investment Objectives, Policies and Strategies
The following table compares the investment objectives and principal investment policies and strategies of the Income Strategies Portfolio and Interest Rate Strategies Portfolio with those of the AXA/DoubleLine Opportunistic Core Plus Bond Portfolio. The Board of each Trust may change the investment objective of a respective Portfolio without a vote of that Portfolio’s shareholders. For more detailed information about each Portfolio’s investment strategies and risks, see Appendix B.
| | | | |
Acquiring Portfolio | | Acquired Portfolio |
AXA/DoubleLine Opportunistic Core Plus Bond Portfolio | | Income Strategies Portfolio | | Interest Rate Strategies Portfolio |
Investment Objective: Seeks to maximize current income and total return. | | Investment Objective: Seeks a high level of current income. | | Investment Objective Seeks to achieve long-term total return, consistent with the preservation of capital and prudent investment management. |
39
| | | | |
Acquiring Portfolio | | Acquired Portfolio |
AXA/DoubleLine Opportunistic Core Plus Bond Portfolio | | Income Strategies Portfolio | | Interest Rate Strategies Portfolio |
Principal Investment Strategies Under normal circumstances, the Portfolio invests at least 80% of its net assets, plus any borrowings for investment purposes, in fixed income securities. For purposes of this investment policy, fixed income securities include direct and indirect investments in fixed income securities and investments in other investment companies and financial instruments that drive their value from such securities. | | Principal Investment Strategies The Portfolio pursues its investment objective by investing in other mutual funds managed by AXA Equitable Funds Management Group, LLC (“FMG LLC” or “Manager”) and in investment companies managed by investment managers other than FMG LLC (affiliated and unaffiliated “Underlying Portfolios”) and in exchange traded securities of other investment companies or investment vehicles (“Underlying ETFs”) comprising various asset categories and strategies. The Manager, under the oversight of the Trust’s Board of Trustees, has established an asset allocation target for the Portfolio. This target is the approximate percentage of the Portfolio’s assets that will be invested in equity investments, fixed income investments or nontraditional (alternative) investments (referred to herein as “asset classes”) as represented by the primary holdings (as described in the prospectuses) of the Underlying Portfolios and Underlying ETFs in which the Portfolio invests. The Portfolio’s current asset allocation target is to invest approximately 25% of its assets in equity investments, 50% of its assets in fixed income investments and 25% of its assets in nontraditional (alternative) investments through investments in Underlying Portfolios and Underlying ETFs. | | Principal Investment Strategies The Portfolio pursues its investment objective by investing in other mutual funds managed by AXA Equitable Funds Management Group, LLC (“FMG LLC” or “Manager”) and in investment companies managed by investment managers other than FMG LLC (affiliated and unaffiliated “Underlying Portfolios”) and in exchange traded securities of other investment companies or investment vehicles (“Underlying ETFs”) comprising various asset categories and strategies. The Manager, under the oversight of the Trust’s Board of Trustees, has established an asset allocation target for the Portfolio. This target is the approximate percentage of the Portfolio’s assets that will be invested in equity investments, fixed income investments or nontraditional (alternative) investments (referred to herein as “asset classes”) as represented by the primary holdings (as described in the prospectuses) of the Underlying Portfolios and Underlying ETFs in which the Portfolio invests. The Portfolio’s current asset allocation target is to invest approximately 25% of its assets in equity investments, 50% of its assets in fixed income investments and 25% of its assets in nontraditional (alternative) investments through investments in Underlying Portfolios and Underlying ETFs. |
| | |
| The Portfolio’s investments in fixed income securities include, but are not limited to, securities issued or guaranteed by the U.S. government or its agencies, instrumentalities or sponsored corporations; mortgage-backed securities; asset-backed securities; foreign and domestic corporate bonds; floating or variable rate obligations (including inverse floater collateralized mortgage obligations); bank loans; fixed income securities issued by corporations and governments in foreign countries including emerging markets issuers and U.S. dollar denominated securities or non-U.S. issuers; securities issued by municipalities; collateralized loan obligations and other securities bearing fixed interest rates of any maturity. | | No corresponding strategy. | | No corresponding strategy. |
40
| | | | |
Acquiring Portfolio | | Acquired Portfolio |
AXA/DoubleLine Opportunistic Core Plus Bond Portfolio | | Income Strategies Portfolio | | Interest Rate Strategies Portfolio |
| The Portfolio may invest up to 40% of its assets in below investment grade securities (commonly known as “junk bonds”). Such investments may include debt obligations of distressed companies, including companies that are close to or in default. The Sub-Adviser allocates investments in below investment grade securities broadly by industry and issuer in an attempt to reduce the impact on the Portfolio of negative events affecting an industry or issuer. Securities below investment grade include those securities rated Ba1 or lower by Moody’s Investors Service, Inc. (“Moody’s”) or BB+ or lower by Fitch Ratings Ltd. (“Fitch”) or by Standard & Poor’s Ratings Services (“S&P”) or, if unrated, deemed to be of comparable quality by the Manager or Sub-Adviser. | | No corresponding strategy. | | No corresponding strategy. |
| | |
| The Portfolio may invest in mortgage-backed or other asset-backed securities of any credit rating or credit quality without regard to the 40% limitation described above. | | No corresponding strategy. | | No corresponding strategy. |
| | |
| The Portfolio may also invest in inverse floaters, interest-only and principal-only securities. In addition, the Portfolio may invest in senior bank loans and assignments, including through investments in other investment companies advised by the Sub-Adviser. | | No corresponding strategy. | | No corresponding strategy. |
| | |
| No corresponding strategy. | | The asset allocation target may be changed by the Manager and the Trust’s Board of Trustees without shareholder approval. Actual allocations can deviate by up to 15% for each asset class. | | The asset allocation target may be changed by the Manager and the Trust’s Board of Trustees without shareholder approval. Actual allocations can deviate by up to 15% for each asset class. |
| | |
| No corresponding strategy. | | As used in this Prospectus, the term “asset category” refers to specific types of securities or other instruments within each asset class. The traditional and nontraditional (alternative) asset categories and strategies of the Underlying Portfolios and Underlying ETFs in which the Portfolio invests are as follows (asset categories and strategies that the Manager considers to be nontraditional (alternative) are indicated with an asterisk*): covered call writing*, global infrastructure*, global real Estate*, long/short credit*, natural resources*, domestic/international, preferred, domestic large cap Equity, international equity, income, bank loans, emerging markets debt, floating rate securities, global bond, high yield bond, inflation linked securities, international bond, and US investment grade bond. | | As used in this Prospectus, the term “asset category” refers to specific types of securities or other instruments within each asset class. The traditional and nontraditional (alternative) asset categories and strategies of the Underlying Portfolios and Underlying ETFs in which the Portfolio invests are as follows (asset categories and strategies that the Manager considers to be nontraditional (alternative) are indicated with an asterisk*): absolute return/multi strategies*, convertible securities*, covered call writing*, global infrastructure*, global real Estate*, long/short credit*, natural resources*, domestic large cap equity, global equity, international equity, income, bank loans, emerging markets debt, floating rate securities, global bond, high yield bond, inflation linked securities, international bond, money market, unconstrained bond, US investment grade bond, US short term investment grade bond. |
41
| | | | |
Acquiring Portfolio | | Acquired Portfolio |
AXA/DoubleLine Opportunistic Core Plus Bond Portfolio | | Income Strategies Portfolio | | Interest Rate Strategies Portfolio |
| No corresponding strategy. | | Nontraditional (alternative) investments are alternatives to traditional equity (stocks) or fixed income (bonds and cash) investments. Nontraditional (alternative) investments have the potential to enhance portfolio diversification and reduce overall portfolio volatility because these investments may not have a strong correlation (relationship) to one another or to traditional market indexes. Nontraditional (alternative) investments use a different approach to investing than do traditional investments. This approach may involve, for example, holding both long and short positions in securities or using derivatives or hedging strategies. Many nontraditional (alternative) investment strategies are designed to help reduce the role of overall market direction in determining return. | | Nontraditional (alternative) investments are alternatives to traditional equity (stocks) or fixed income (bonds and cash) investments. Nontraditional (alternative) investments have the potential to enhance portfolio diversification and reduce overall portfolio volatility because these investments may not have a strong correlation (relationship) to one another or to traditional market indexes. Nontraditional (alternative) investments use a different approach to investing than do traditional investments. This approach may involve, for example, holding both long and short positions in securities or using derivatives or hedging strategies. Many nontraditional (alternative) investment strategies are designed to help reduce the role of overall market direction in determining return. |
| | |
| No corresponding strategy. | | In addition, the Portfolio may invest in Underlying Portfolios and Underlying ETFs that employ derivatives (including futures contracts) for a variety of purposes, including to reduce risk, to seek enhanced returns from certain asset classes, and to leverage exposure to certain asset classes. | | In addition, the Portfolio may invest in Underlying Portfolios and Underlying ETFs that employ derivatives (including futures contracts) for a variety of purposes, including to reduce risk, to seek enhanced returns from certain asset classes, and to leverage exposure to certain asset classes. |
| | |
| The Sub-Adviser actively manages the Portfolio’s asset class exposure using a top-down approach, which involves using fundamental research regarding the investment characteristics of each sector (such as risk, volatility, relative valve, and the potential for growth and income), as well as the Sub-Adviser’s outlook for the economy and financial markets as a whole. Primary sectors include government/municipals, high yield, global developed credit, international sovereign debt, emerging markets, and mortgage and asset-backed. The Sub-Adviser will gradually rotate portfolio assets among sectors in various markets using a long term approach to attempt to maximize return. Individual securities within asset classes are selected using a bottom up approach, which involves an analysis of each individual issuer’s creditworthiness. | | The Manager selects the Underlying Portfolios and Underlying ETFs in which to invest the Portfolio’s assets. In selecting Underlying Portfolios and Underlying ETFs, the Manager will utilize a proprietary investment process that may take into consideration a number of factors including, as appropriate and applicable, fund performance, management team, investment style, correlations, asset class exposure, industry classification, benchmark, risk adjusted return, volatility, expense ratio, asset size and portfolio turnover. For purposes of asset class and asset category target allocations, where an Underlying Portfolio or Underlying ETF could be assigned to more than one asset class (e.g., equity and alternative asset classes) or category (e.g., international bond and global bond asset categories), the Manager may, in its discretion, assign an Underlying Portfolio or Underlying ETF to one or more asset classes or categories. | | The Manager selects the Underlying Portfolios and Underlying ETFs in which to invest the Portfolio’s assets. In selecting Underlying Portfolios and Underlying ETFs, the Manager will utilize a proprietary investment process that may take into consideration a number of factors including, as appropriate and applicable, fund performance, management team, investment style, correlations, asset class exposure, industry classification, benchmark, risk adjusted return, volatility, expense ratio, asset size and portfolio turnover. For purposes of asset class and asset category target allocations, where an Underlying Portfolio or Underlying ETF could be assigned to more than one asset class (e.g., equity and alternative asset classes) or category (e.g., international bond and global bond asset categories), the Manager may, in its discretion, assign an Underlying Portfolio or Underlying ETF to one or more asset classes or categories. |
42
| | | | |
Acquiring Portfolio | | Acquired Portfolio |
AXA/DoubleLine Opportunistic Core Plus Bond Portfolio | | Income Strategies Portfolio | | Interest Rate Strategies Portfolio |
| The Sub-Adviser uses a controlled risk approach in managing the Portfolio, which includes consideration of: Security selection within a given asset class; Relative performance of the various market sectors and asset classes; The rates offered by bonds at different maturities; Fluctuations in the overall level of interest rates. | | The Manager may add new Underlying Portfolios and Underlying ETFs or replace or eliminate existing Underlying Portfolios and Underlying ETFs without shareholder approval. The Underlying Portfolios and Underlying ETFs have been selected to represent a reasonable spectrum of investment options for the Portfolio. The Manager has based the asset allocation target percentages for the Portfolio on the degree to which it believes the Underlying Portfolios and Underlying ETFs, in combination, are appropriate for the Portfolio’s investment objective. | | The Manager may add new Underlying Portfolios and Underlying ETFs or replace or eliminate existing Underlying Portfolios and Underlying ETFs without shareholder approval. The Underlying Portfolios and Underlying ETFs have been selected to represent a reasonable spectrum of investment options for the Portfolio. The Manager has based the asset allocation target percentages for the Portfolio on the degree to which it believes the Underlying Portfolios and Underlying ETFs, in combination, are appropriate for the Portfolio’s investment objective. |
| | |
| The Sub-Adviser also monitors the duration of the securities held by the Portfolio to seek to mitigate exposure to interest rate risk. Duration is a measure used to determine the sensitivity of a security’s price to interest rates. Typically, a bond portfolio with a low (short) duration means that its value is less sensitive to interest rate changes, while a bond portfolio with a high (long) duration is more sensitive. Under normal circumstances, the Sub-Adviser seeks to maintain an investment portfolio with a weighted average effective duration of no less than two years and no more than eight years. The duration of the Portfolio’s investments may vary materially from its target, from time to time, and there is no assurance that the duration of the Portfolio’s investments will meet its target. | | No corresponding strategy. | | No corresponding strategy. |
| | |
| Portfolio securities may be sold at any time. Sales may occur when the Sub-Adviser perceives deterioration in the credit fundamentals of the issuer, believes there are negative macro political considerations that may affect the issuer, determines to take advantage of a better investment opportunity, or the individual security has reached the Sub-Adviser’s sell target. | | The Manager may sell the Portfolio’s holdings for a variety of reasons, including to invest in an Underlying Portfolio or Underlying ETF believed to offer superior investment opportunities. | | The Manager may sell the Portfolio’s holdings for a variety of reasons, including to invest in an Underlying Portfolio or Underlying ETF believed to offer superior investment opportunities. |
| | |
| The Portfolio may engage in active and frequent trading of portfolio securities to achieve its investment objective. | | No corresponding strategy. | | No corresponding strategy. |
| | |
| The Portfolio also may lend its portfolio securities to earn additional income. | | No corresponding strategy. | | No corresponding strategy. |
43
Comparison of Principal Risk Factors
An investment in a Portfolio is not a deposit of a bank and is not insured or guaranteed by the Federal Deposit Insurance Corporation or any other government agency. You may lose money by investing in each Portfolio. The following table compares the principal risks of an investment in each Portfolio. For an explanation of each such risk, see “Additional Information about the Reorganizations — Descriptions of Risk Factors” below.
| | | | | | | | | | | | |
Risks | | Income Strategies
Portfolio | | | Interest Rate Strategies
Portfolio | | | AXA/DoubleLine
Opportunistic Core Plus
Bond Portfolio | |
Affiliated Portfolio Risk | | | X | | | | X | | | | | |
Collateralized Loan Obligations Risk | | | | | | | | | | | X | |
Convertible Securities Risk | | | | | | | X | | | | | |
Credit Risk | | | X | | | | X | | | | X | |
Derivatives Risk | | | X | | | | X | | | | | |
Distressed Companies Risk | | | | | | | | | | | X | |
Equity Risk | | | X | | | | X | | | | | |
Floating Rate Loan Risk | | | X | | | | X | | | | | |
Foreign Securities Risk | | | X | | | | X | | | | X | |
Currency Risk | | | X | | | | X | | | | | |
Emerging Markets Risk | | | X | | | | X | | | | X | |
Geographic Concentration Risk | | | | | | | | | | | X | |
Inflation-Indexed Bonds Risk | | | X | | | | X | | | | | |
Infrastructure Sector Risk | | | X | | | | X | | | | | |
Interest Rate Risk | | | X | | | | X | | | | X | |
Inverse Floaters Risk | | | | | | | | | | | X | |
Investment Grade Securities Risk | | | X | | | | X | | | | X | |
Large-Cap Company Risk | | | X | | | | X | | | | | |
Liquidity Risk | | | X | | | | X | | | | X | |
Loan Risk | | | X | | | | X | | | | X | |
Market Risk | | | X | | | | X | | | | | |
Money Market Risk | | | | | | | X | | | | | |
Mortgage-Backed and Asset-Backed Securities Risk | | | | | | | | | | | X | |
Natural Resources Sector Risk | | | X | | | | X | | | | | |
Non-Investment Grade Risk | | | X | | | | X | | | | X | |
Non-Traditional (Alternative) Investment Risk | | | X | | | | X | | | | | |
Political/Economic Risk | | | | | | | | | | | X | |
Portfolio Management Risk | | | X | | | | X | | | | | |
Portfolio Turnover Risk | | | | | | | | | | | X | |
Real Estate Investing Risk | | | X | | | | X | | | | | |
Redemption Risk | | | | | | | | | | | X | |
Regulatory Risk | | | | | | | | | | | X | |
Risks of Investing in Other Investment Companies | | | | | | | | | | | X | |
Risks Related to Investments in Underlying Portfolios and Underlying ETFs | | | X | | | | X | | | | | |
Securities Lending Risk | | | | | | | | | | | X | |
Settlement Risk | | | | | | | | | | | X | |
Transaction Costs Risk | | | | | | | | | | | X | |
U.S. Government Securities Risk | | | | | | | | | | | X | |
In addition to the risks described above, as noted in the prospectuses for the affiliated Underlying Portfolios, FMG LLC and, in certain cases, an affiliate, serve as investment manager, investment sub-adviser and/or administrator for those Underlying Portfolios and earn fees for providing services in these capacities, which are in addition to the fees directly associated with a Portfolio. In this connection, the Manager’s selection of Underlying Portfolios and Underlying ETFs may have a positive or negative effect on its revenues and/or profits.
44
Comparative Performance Information
The bar charts and tables below provide some indication of the risks of investing in each Portfolio by showing changes in the Portfolio’s performance from year to year (or, in the case of the AXA/DoubleLine Opportunistic Core Plus Bond Portfolio, the Portfolio’s performance for the past year), and by showing how each Portfolio’s average annual total returns for one year and since inception through December 31, 2016 compared to the returns of a broad-based market index. The return of the broad-based market index (and any additional comparative index) shown in the right hand columns below for each Portfolio is the return of the index since inception of the share class with the longest history. Past performance is not an indication of future performance.
The performance results do not reflect any Contract-related fees and expenses, which would reduce the performance results.
Income Strategies Portfolio - Calendar Year Total Returns (Class B)
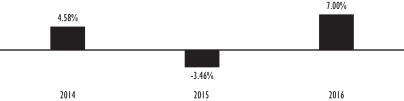
| | |
Best quarter (% and time period) 3.70% (2014 2nd Quarter) | | Worst quarter (% and time period)
-3.68% (2015 3rd Quarter) |
Interest Rate Strategies Portfolio - Calendar Year Total Returns (Class B)
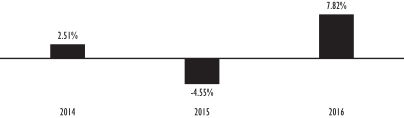
| | |
Best quarter (% and time period) 3.79% (2014 2nd Quarter) | | Worst quarter (% and time period)
-4.77% (2015 3rd Quarter) |
AXA/DoubleLine Opportunistic Core Plus Bond Portfolio - Calendar Year Total Returns (Class IB)

| | |
Best quarter (% and time period) 2.64% (2016 2nd Quarter) | | Worst quarter (% and time period)
-2.00% (2016 4th Quarter) |
45
Income Strategies Portfolio Average Annual Total Returns (For the periods ended December 31, 2016)
| | | | | | | | |
| | | One Year | | | Since
Inception | |
Income Strategies Portfolio — Class B Shares
(Inception Date: October 30, 2013) | | | 7.00% | | | | 2.43% | |
Bloomberg Barclays U.S. Aggregate Bond Index (reflects no Deduction for fees, expenses, or taxes) | | | 2.65% | | | | 2.55% | |
25% MSCI AC World (Net) Index / 50% Bloomberg Barclays U.S. Aggregate Bond Index / 25% BofA Merrill Lynch3-Month U.S. Treasury Bill Index (reflects no deduction for fees, expenses, or taxes) | | | 3.47% | | | | 2.37% | |
Interest Rate Strategies Portfolio Average Annual Total Returns (For the periods ended December 31, 2016)
| | | | | | | | |
| | | One Year | | | Since
Inception | |
Interest Rate Strategies Portfolio — Class B Shares
(Inception Date: October 30, 2013) | | | 7.82% | | | | 1.70% | |
Bloomberg Barclays U.S. Aggregate Bond Index (reflects no Deduction for fees, expenses, or taxes) | | | 2.65% | | | | 2.55% | |
25% MSCI AC World (Net) Index / 50% Bloomberg Barclays U.S. Aggregate Bond Index / 25% BofA Merrill Lynch3-Month U.S. Treasury Bill Index (reflects no deduction for fees, expenses, or taxes) | | | 3.47% | | | | 2.37% | |
AXA/DoubleLine Opportunistic Core Plus Bond Portfolio Average Annual Total Returns (For the periods ended December 31, 2016)
| | | | | | | | |
| | | One Year | | | Since
Inception | |
AXA/DoubleLine Opportunistic Core Plus Bond Portfolio — Class B Shares
(Inception Date: May 1, 2015) | | | 4.83% | | | | 1.50% | |
Bloomberg Barclays U.S. Aggregate Bond Index (reflects no Deduction for fees, expenses, or taxes) | | | 2.65% | | | | 1.16% | |
Capitalization
The following table shows the capitalization of each Portfolio as of December 31, 2016 and of the AXA/DoubleLine Opportunistic Core Plus Bond Portfolio on a pro forma combined basis as of December 31, 2016, after giving effect to each proposed Reorganization. Pro forma capitalization of the combined Portfolio has been adjusted to reflect the anticipated withdrawal of seed capital by FMG LLC and/or its affiliates from the combined Portfolio subsequent to the Reorganization. Pro forma net assets may not total and net asset values per share may not recalculate due to rounding of net assets.
| | | | | | | | | | | | |
| | | Net Assets
(in millions) | | | Net Asset Value
Per Share | | | Shares
Outstanding | |
Income Strategies Portfolio — Class B Shares | | $ | 4.6 | | | $ | 9.40 | | | | 484,237 | |
AXA/DoubleLine Opportunistic Core Plus Bond Portfolio — Class IB Shares | | $ | 10.3 | | | $ | 9.81 | | | | 1,049,975 | |
Adjustments | | $ | (1.3 | ) | | $ | — | | | | (150,778 | ) |
Pro forma AXA/DoubleLine Opportunistic Core Plus Bond Portfolio — Class IB Shares
(assuming only the Reorganization of the Income Strategies Portfolio approved) | | $ | 13.6 | | | $ | 9.81 | | | | 1,383,434 | |
Interest Rate Strategies Portfolio — Class B Shares | | $ | 4.2 | | | $ | 9.45 | | | | 446,404 | |
AXA/DoubleLine Opportunistic Core Plus Bond Portfolio — Class IB Shares | | $ | 10.3 | | | $ | 9.81 | | | | 1,049,975 | |
Adjustments | | $ | (0.6 | ) | | $ | — | | | | (74,276 | ) |
Pro forma AXA/DoubleLine Opportunistic Core Plus Bond Portfolio — Class IB Shares
(assuming only the Reorganization of the Interest Rate Strategies Portfolio is approved) | | $ | 13.9 | | | $ | 9.81 | | | | 1,422,103 | |
Pro forma AXA/DoubleLine Opportunistic Core Plus Bond Portfolio — Class IB Shares
(assuming both Reorganizations are approved) | | $ | 17.2 | | | $ | 9.81 | | | | 1,755,562 | |
46
AFTER CAREFUL CONSIDERATION, THE BOARD OF VIP TRUST UNANIMOUSLY APPROVED THE REORGANIZATION PLAN WITH RESPECT TO THE INCOME STRATEGIES PORTFOLIO AND THE INTEREST RATE STRATEGIES PORTFOLIO. ACCORDINGLY, THE BOARD HAS SUBMITTED THE REORGANIZATION PLAN FOR APPROVAL BY EACH PORTFOLIO’S SHAREHOLDERS. THE BOARD RECOMMENDS THAT YOU VOTE “FOR” PROPOSAL 2.
PROPOSAL 3: TO APPROVE THE PLAN OF REORGANIZATION AND TERMINATION WITH RESPECT TO THE REORGANIZATION OF THE INTERNATIONAL MODERATE PORTFOLIO, A SERIES OF VIP TRUST, INTO THE CHARTERSM MODERATE PORTFOLIO, ALSO A SERIES OF VIP TRUST.
This Proposal 3 requests your approval of a Reorganization Plan pursuant to which the International Moderate Portfolio will be reorganized into the CharterSM Moderate Portfolio. In considering whether you should approve the Proposal, you should note that:
| | • | | The Portfolios have identical investment objectives. The Portfolios seek long-term capital appreciation and current income, with a greater emphasis on current income. |
| | • | | Each Portfolio pursues its investment objective by investing in other mutual funds managed by FMG LLC and in investment companies managed by investment managers other than FMG LLC (for purposes of this proposal, affiliated and unaffiliated “Underlying Portfolios”) and in exchange traded securities of other investment companies or investment vehicles (“Underlying ETFs”) comprising various asset categories and strategies. Each Portfolio invests approximately 35% of its assets in equity investments, 55% of its assets in fixed income investments and 10% of its assets in nontraditional (alternative) investments through investments in Underlying Portfolios and Underlying ETFs. Each Portfolio also may invest in Underlying Portfolios and Underlying ETFs that employ derivatives (including futures contracts) for a variety of purposes, including to reduce risk, to seek enhanced returns from certain asset classes, and to leverage exposure to certain asset classes. |
| | • | | There are, however, differences in the Portfolios’ principal investment policies and strategies of which you should be aware. These are set forth immediately below. For a detailed comparison of the Portfolios’ investment policies and strategies, see “Comparisons of Investment Objectives, Policies and Strategies” below. |
| | • | | The International Moderate Portfolio invests at least 65% of its total assets in Underlying Portfolios and Underlying ETFs that invest primarily in securities of foreign companies (securities of companies organized outside of the U.S. and that are traded in markets outside the U.S.) or in currencies. The asset categories and strategies of the Underlying Portfolios and Underlying ETFs in which the International Moderate Portfolio may invest are as follows (asset categories and strategies that the Manager considers to be non-traditional (alternative) are indicated with an asterisk*): currency*, global infrastructure*, global real estate*, emerging markets equity, emerging markets , small cap, frontier markets, global equity, international developed equity, international equity, income, international/global small cap equity, emerging markets debt, high yield bond, inflation linked securities, and international bond. |
| | • | | The CharterSM Moderate Portfolio does not have an investment policy to invest at least 65% of its total assets in Underlying Portfolios and Underlying ETFs that invest primarily in securities of foreign companies. The CharterSM Moderate Portfolio invests in Underlying Portfolios and Underlying ETFs that utilize asset categories and strategies as follows (asset categories and strategies that the Manager considers to be non-traditional (alternative) are indicated with an asterisk*): absolute return/multi, strategies*, commodities*, convertible securities*, covered call writing*, currency*, global infrastructure*, global real estate*, listed private equity*, long/short credit*, managed futures*, merger arbitrage*, natural resources*, precious and base metals*, domestic large cap equity, domestic mid cap equity, domestic small cap equity, domestic micro cap equity, emerging markets equity, |
47
| | emerging markets small cap, frontier markets, global equity, international developed equity, international/global small cap equity, bank loans, emerging markets debt, floating rate securities, global bond, high yield bond, inflation linked securities, international bond, money market, US government bond, US investment grade bond, and US short term investment grade bond. |
| | • | | Each Portfolio’s principal risks include affiliated portfolio risk, credit risk, currency risk, derivatives risk, emerging markets risk, equity risk, foreign securities risk, futures contract risk, inflation-indexed bonds risk, interest rate risk, investment grade securities risk, large-cap company risk, liquidity risk, market risk, mid-cap, small-cap company risk, non-investment grade securities risk, non-traditional (alternative) investment risk, portfolio management risk, real estate investing risk, and risk related to investments in Underlying Portfolios and Underlying ETFs. In addition, the International Moderate Portfolio is subject to infrastructure sector risk and real estate investing risk as principal risks, while the CharterSM Moderate Portfolio generally is not. The CharterSM Moderate Portfolio also is subject to convertible securities risk, floating rate loan risk, loan risk, micro-cap company risk, money market risk, sector concentration risk, and U.S. government securities risk as principal risks, while the International Moderate Portfolio is not. To the extent the CharterSM Moderate Portfolio generally will invest a lesser percentage of its assets in foreign investments than the International Moderate Portfolio, its risk profile will differ from that of the International Moderate Portfolio with respect to the degree of risk associated with those investments. For a detailed comparison of the Portfolios’ principal risks, see “Comparison of Principal Risk Factors” below. |
| | • | | FMG LLC serves as the investment manager and administrator for each Portfolio. It is anticipated that FMG LLC will continue to serve as the investment manager and administrator for the CharterSM Moderate Portfolio after the Reorganization. |
| | • | | The International Moderate Portfolio and the CharterSM Moderate Portfolio had net assets of approximately $8.4 million and $24.0 million, respectively, as of January 31, 2017. Thus, if the Reorganization had been in effect on that date, the combined Portfolio would have had net assets of approximately $32.4 million. |
| | • | | The Class B shareholders of the International Moderate Portfolio will receive Class B shares of the CharterSM Moderate Portfolio pursuant to the Reorganization. Shareholders will not pay any sales charges in connection with the Reorganization. Please see “Comparative Fee and Expense Tables,” “Additional Information about the Reorganization” and “Additional Information about the Portfolios” below for more information. |
| | • | | It is estimated that the total annual operating expense ratio (including acquired fund fees and expenses, if any) for the CharterSM Moderate Portfolio’s Class B shares, for the fiscal year following the Reorganization, will be 1.25%, which is the same as that of the International Moderate Portfolio’s Class B shares for the fiscal year ended December 31, 2016. |
| | • | | The Portfolios are subject to the same management fee schedule. The management fee for each Portfolio is equal to an annual rate of 0.15% of its average daily net assets. |
| | • | | The Portfolios are subject to the same administration fee schedule. In addition to the management fee, each Portfolio also pay FMG LLC its proportionate share of an asset-based administration fee, subject to a minimum annual fee of $32,500. For purposes of calculating the asset-based administration fee, the assets of the International Moderate Portfolio and CharterSM Moderate Portfolio are aggregated with those of the other VIP Trust Portfolios (“VIP Trust Portfolios”) and the AXA Strategic Allocation Series Portfolios, AXA All Asset Allocation Series Portfolios, and AXA/Franklin Templeton Allocation Managed Volatility Portfolio of EQ Trust (the “EQ Trust Fund-of-Funds Portfolios”), which are also managed by FMG LLC. The asset-based administration fee is equal to an annual rate of 0.15% of the first $35 billion of the aggregate average daily net assets of the Portfolios, VIP Trust Portfolios, and EQ Trust Fund-of-Funds Portfolios; 0.11% on the next $10 billion; 0.10% on the next $5 billion; and 0.095% thereafter. |
48
| | • | | Each Portfolio is subject to an expense limitation arrangement. |
| | • | | FMG LLC has entered into an Expense Limitation Arrangement pursuant to which FMG LLC has agreed to make payments or waive its management, administrative or other fees to limit the expenses of the International Moderate Portfolio through April 30, 2017 (unless the Board of the VIP Trust consents to an earlier revision or termination of this arrangement) so that the annual operating expenses (including acquired fund fees and expenses) of the International Moderate Portfolio (exclusive of taxes, interest, brokerage commissions, dividend and interest expenses on securities sold short, capitalized expenses, and extraordinary expenses) do not exceed an annual rate of average daily net assets of 1.25% for Class B shares of the International Moderate Portfolio. |
| | • | | FMG LLC has entered into an Expense Limitation Arrangement pursuant to which FMG LLC has agreed to make payments or waive its management, administrative or other fees to limit the expenses of the CharterSM Moderate Portfolio through April 30, 2018 (unless the Board of the VIP Trust consents to an earlier revision or termination of this arrangement) so that the annual operating expenses (including acquired fund fees and expenses) of the CharterSM Moderate Portfolio (exclusive of taxes, interest, brokerage commissions, dividend and interest expenses on securities sold short, capitalized expenses, and extraordinary expenses) do not exceed an annual rate of average daily net assets of 1.25% for Class B shares of the CharterSM Moderate Portfolio. |
| | • | | Class B shares of the CharterSM Moderate Portfolio and Class B shares of the International Moderate Portfolio are each subject to a 0.25% Rule 12b-1 fee. |
| | • | | The Class B shares of the CharterSM Moderate Portfolio outperformed compared to the Class B shares of the International Moderate Portfolio for the one-year period ended December 31, 2016 and for the period since inception. Please see “Comparative Performance Information” below. |
| | • | | Following the Reorganization, it is anticipated that FMG LLC will redeem shares that it holds in the combined Portfolio representing seed capital it has previously invested. The withdrawal of such seed capital is not expected to have a material effect on the annual operating expenses of the combined Portfolio. |
| | • | | Following the Reorganization, the combined Portfolio will be managed in accordance with the investment objective, policies and strategies of the CharterSM Moderate Portfolio. It is not expected that the CharterSM Moderate Portfolio will revise any of its investment policies following the Reorganization to reflect those of the International Moderate Portfolio. If the Reorganization is approved, all of the International Moderate Portfolio’s assets (“Transferred Assets”) on the Closing Date will be transferred to the CharterSM Moderate Portfolio. It is anticipated that immediately prior to the Closing Date, the International Moderate Portfolio will liquidate substantially all of its securities holdings and hold cash. Therefore, it is anticipated that the Transferred Assets will consist of cash. The sale of portfolio holdings by the International Moderate Portfolio in connection with the Reorganization may result in the International Moderate Portfolio selling securities at a disadvantageous time and price and could result in it realizing gains (or losses) that would not otherwise have been realized and incurring transaction costs that would not otherwise have been incurred. It is also expected that, over time, the CharterSM Moderate Portfolio will use the Transferred Assets to invest in other investment companies consistent with its principal investment strategy. The estimated portfolio transaction costs of the Reorganization of the International Moderate Portfolio are $700. This amount is an estimate and is subject to change. The actual amount could be higher or lower depending on the factors outlined above. Contractholders will not recognize any gain or loss for federal income tax purposes as a result of the Reorganization. |
| | • | | FMG LLC has voluntarily agreed to pay expenses of the Reorganization that exceed the International Moderate Portfolio’s expense limitation set forth in its expense limitation agreement. The Reorganization expenses for the International Moderate Portfolio, which are estimated to be $33,333, exceed the expense limit and will be paid by FMG LLC. |
49
COMPARATIVE FEE AND EXPENSE TABLES
The following tables show the fees and expenses of the Class B Shares of the International Moderate Portfolio and the CharterSM Moderate Portfolio and the estimated pro forma fees and expenses of the Class B Shares of the CharterSM Moderate Portfolio after giving effect to the proposed Reorganization. Fees and expenses for each Portfolio are based on those incurred by the relevant class of its shares for the fiscal year ended December 31, 2016. The pro forma fees and expenses of the CharterSM Moderate Portfolio shares assume that the Reorganization was in effect for the year ended December 31, 2016. The tables below do not reflect any Contract-related fees and expenses, which would increase overall fees and expenses. See a Contract prospectus for a description of those fees and expenses.
Shareholder Fees
(fees paid directly from your investment)
| | | | |
International Moderate Portfolio | | CharterSM Moderate Portfolio | | Pro Forma CharterSM Moderate Portfolio (assuming the Reorganization is approved) |
| Not Applicable. | | Not Applicable. | | Not Applicable. |
Annual Operating Expenses
(expenses that you may pay each year as a percentage of the value of your investment)
| | | | | | | | | | | | |
| | | International Moderate Portfolio | | | CharterSM Moderate Portfolio | | | Pro Forma CharterSM Moderate
Portfolio (assuming the
Reorganization is approved)** | |
| | | Class B | | | Class B | | | Class B | |
Management Fee | | | 0.15 | % | | | 0.15 | % | | | 0.15 | % |
Distribution and/or Service Fees (12b-1 fees) | | | 0.25 | % | | | 0.25 | % | | | 0.25 | % |
Other Expenses | | | 1.14 | % | | | 1.12 | % | | | 0.94 | % |
Acquired Fund Fees and Expenses | | | 0.65 | % | | | 0.73 | % | | | 0.73 | % |
Total Annual Portfolio Operating Expenses | | | 2.19 | % | | | 2.25 | % | | | 2.07 | % |
Fee Waiver and/or Expense Reimbursement†* | | | (0.94 | )% | | | (1.00 | )% | | | (0.82 | )% |
Total Annual Portfolio Operating Expenses After Fee Waiver and/or Expense Reimbursement | | | 1.25 | % | | | 1.25 | % | | | 1.25 | % |
| † | | Pursuant to a contract, FMG LLC has agreed to make payments or waive its management, administrative and other fees to limit the expenses of (1) the International Moderate Portfolio through April 30, 2017 (unless the Board of Trustees consents to an earlier revision or termination of this arrangement) so that the annual operating expenses (including Acquired Fund Fees and Expenses) of the Portfolio (exclusive of taxes, interest, brokerage commissions, dividend and interest expenses on securities sold short, capitalized expenses, and extraordinary expenses) do not exceed an annual rate of average daily net assets of 1.25% for Class B shares of the International Moderate Portfolio and (2) the CharterSM Moderate Portfolio through April 30, 2018 (unless the Board of Trustees consents to an earlier revision or termination of this arrangement) so that the annual operating expenses (including Acquired Fund Fees and Expenses) of the Portfolio (exclusive of taxes, interest, brokerage commissions, dividend and interest expenses on securities sold short, capitalized expenses, and extraordinary expenses) do not exceed an annual rate of average daily net assets of 1.25% for Class B shares of the CharterSM Moderate Portfolio. |
| * | | Fee Waiver and/or Expense Reimbursement information has been restated to reflect the current expense limitation arrangement noted above. |
| ** | | Pro forma annual operating expenses have been adjusted to reflect the anticipated withdrawal of seed capital by FMG LLC and/or its affiliates from the combined Portfolio subsequent to the Reorganization. |
50
Example of Portfolio Expenses
This example is intended to help you compare the costs of investing in the Portfolios with the cost of investing in other investment options. The example assumes that:
| | • | | You invest $10,000 in a Portfolio for the time periods indicated; |
| | • | | Your investment has a 5% return each year; |
| | • | | The Portfolio’s operating expenses remain the same; and |
| | • | | The Expense Limitation Arrangement with respect to the Portfolios is not renewed. |
This example does not reflect any Contract-related fees and expenses, including redemption fees (if any) at the Contract level. If such fees and expenses were reflected, the total expenses would be higher. Although your actual costs may be higher or lower, based on these assumptions your costs would be:
| | | | | | | | | | | | | | | | |
| | | 1 Year | | | 3 Years | | | 5 Years | | | 10 Years | |
International Moderate Portfolio | | | | | | | | | | | | | | | | |
Class B | | $ | 127 | | | $ | 595 | | | $ | 1,089 | | | $ | 2,450 | |
CharterSM Moderate Portfolio | | | | | | | | | | | | | | | | |
Class B | | $ | 127 | | | $ | 607 | | | $ | 1,114 | | | $ | 2,507 | |
Pro Forma CharterSM Moderate Portfolio (assuming the Reorganization is approved) | | | | | | | | | | | | | | | | |
Class B | | $ | 127 | | | $ | 570 | | | $ | 1,038 | | | $ | 2,335 | |
Portfolio Turnover
Each Portfolio pays transaction costs, such as commissions, when it buys and sells securities (or “turns over” its portfolio). A higher portfolio turnover rate may indicate higher transaction costs. These costs, which are not reflected in annual fund operating expenses or in the example, affect a Portfolio’s performance. During the fiscal year ended December 31, 2016, the portfolio turnover rates for each of the International Moderate Portfolio and the CharterSM Moderate Portfolio were 9% and 13%, respectively, of the average value of each Portfolio.
Comparison of Investment Objectives, Policies and Strategies
The following table compares the investment objectives and principal investment policies and strategies of the International Moderate Portfolio with those of the CharterSM Moderate Portfolio. The Board of VIP Trust may change the investment objective of a respective Portfolio without a vote of that Portfolio’s shareholders. For more detailed information about each Portfolio’s investment strategies and risks, see Appendix B.
| | |
Acquiring Portfolio | | Acquired Portfolio |
CharterSM Moderate Portfolio | | International Moderate Portfolio |
| Investment Objective | | Investment Objective |
| |
| Seeks long-term capital appreciation and current income, with a greater emphasis on current income. | | Same. |
| |
| Principal Investment Strategies | | Principal Investment Strategies |
| |
| The Portfolio pursues its investment objective by investing in other mutual funds managed by AXA Equitable Funds Management Group, LLC (“FMG LLC” or “Manager”) and in investment companies managed by investment managers other than FMG LLC (affiliated and unaffiliated “Underlying Portfolios”) and in exchange traded securities of other investment companies or investment vehicles (“Underlying ETFs”) comprising various asset categories and strategies. | | Same. |
51
| | |
Acquiring Portfolio | | Acquired Portfolio |
CharterSM Moderate Portfolio | | International Moderate Portfolio |
| The Manager, under the oversight of the Trust’s Board of Trustees, has established an asset allocation target for the Portfolio. This target is the approximate percentage of the Portfolio’s assets that will be invested in equity investments, fixed income investments or nontraditional (alternative) investments (referred to herein as “asset classes”) as represented by the primary holdings (as described in the prospectuses) of the Underlying Portfolios and Underlying ETFs in which the Portfolio invests. | | Same. |
| |
| The Portfolio’s current asset allocation target is to invest approximately 35% of its assets in equity investments, 55% of its assets in fixed income investments and 10% of its assets in nontraditional (alternative) investments through investments in Underlying Portfolios and Underlying ETFs. | | Same. |
| |
| This asset allocation target may be changed by the Manager and the Trust’s Board of Trustees without shareholder approval. Actual allocations can deviate by up to 15% for each asset class. | | Same. |
| |
| No corresponding strategy. | | The Portfolio invests at least 65% of its total assets in Underlying Portfolios and Underlying ETFs that invest primarily in securities of foreign companies (securities of companies organized outside of the U.S. and that are traded in markets outside the U.S.) or in currencies. |
| |
| As used in this Prospectus, the term “asset category” refers to specific types of securities or other instruments within each asset class. The traditional and nontraditional (alternative) asset categories and strategies of the Underlying Portfolios and Underlying ETFs in which the Portfolio invests are as follows (asset categories and strategies that the Manager considers to be nontraditional (alternative) are indicated with an asterisk*): absolute return/multi strategies*, commodities*, convertible securities*, covered call writing*, currency*, global infrastructure*, global real estate*, listed private equity*, long/short credit*, managed futures*, merger arbitrage*, natural resources*, precious and base metals*, domestic large cap equity, domestic mid cap equity, domestic small cap equity, domestic micro cap equity, emerging markets equity, emerging markets small cap, frontier markets, global equity, international developed equity, international/global small cap equity, bank loans, emerging markets debt, floating rate securities, global bond, high yield bond, inflation linked securities, international bond, money market, US government bond, US investment grade bond, and US short term investment grade bond. | | As used in this Prospectus, the term “asset category” refers to specific types of securities or other instruments within each asset class. The traditional and nontraditional (alternative) asset categories and strategies of the Underlying Portfolios and Underlying ETFs in which the Portfolio invests are as follows (asset categories and strategies that the Manager considers to be nontraditional (alternative) are indicated with an asterisk*): currency*, global infrastructure*, global real estate*, emerging markets equity, emerging markets , small cap, frontier markets, global equity, international developed equity, international equity, income, international/global small cap equity, emerging markets debt, high yield bond, inflation linked securities, and international bond. |
| |
| Nontraditional (alternative) investments are alternatives to traditional equity (stocks) or fixed income (bonds and cash) investments. Nontraditional (alternative) investments have the potential to enhance portfolio diversification and reduce overall portfolio volatility because these investments may not have a strong correlation (relationship) to one another or to traditional market indexes. Nontraditional (alternative) investments use a different approach to investing than do traditional investments. This approach may involve, for example, holding both long and short positions in securities or using derivatives or hedging strategies. Many nontraditional (alternative) investment strategies are designed to help reduce the role of overall market direction in determining return. | | Same. |
| |
| In addition, the Portfolio may invest in Underlying Portfolios and Underlying ETFs that employ derivatives (including futures contracts) for a variety of purposes, including to reduce risk, to seek enhanced returns from certain asset classes, and to leverage exposure to certain asset classes. | | Same. |
52
| | |
Acquiring Portfolio | | Acquired Portfolio |
CharterSM Moderate Portfolio | | International Moderate Portfolio |
| The Manager selects the Underlying Portfolios and Underlying ETFs in which to invest the Portfolio’s assets. In selecting Underlying Portfolios and Underlying ETFs, the Manager will utilize a proprietary investment process that may take into consideration a number of factors including, as appropriate and applicable, fund performance, management team, investment style, correlations, asset class exposure, industry classification, benchmark, risk adjusted return, volatility, expense ratio, asset size and portfolio turnover. | | Same. |
| |
| No corresponding strategy. | | For purposes of complying with the 65% policy identified above, the Manager will identify Underlying Portfolios and Unaffiliated Underlying ETFs in which to invest by reference to such Underlying Portfolio’s or Underlying ETF’s name and investment policies at the time of investment. An Underlying Portfolio or Underlying ETF that changes its name or investment policies subsequent to the time of the Portfolio’s investment may continue to be considered an appropriate investment for purposes of the 65% policy. |
| |
| For purposes of asset class and asset category target allocations, where an Underlying Portfolio or Underlying ETF could be assigned to more than one asset class (e.g., equity and alternative asset classes) or category (e.g., international bond and global bond asset categories), the Manager may, in its discretion, assign an Underlying Portfolio or Underlying ETF to one or more asset classes or categories. | | Same. |
| |
| The Manager may add new Underlying Portfolios and Underlying ETFs or replace or eliminate existing Underlying Portfolios and Underlying ETFs without shareholder approval. The Underlying Portfolios and Underlying ETFs have been selected to represent a reasonable spectrum of investment options for the Portfolio. | | Same. |
| |
| The Manager has based the asset allocation target percentages for the Portfolio on the degree to which it believes the Underlying Portfolios and Underlying ETFs, in combination, are appropriate for the Portfolio’s investment objective. The Manager may sell the Portfolio’s holdings for a variety of reasons, including to invest in an Underlying Portfolio or Underlying ETF believed to offer superior investment opportunities. | | Same. |
Comparison of Principal Risk Factors
An investment in a Portfolio is not a deposit of a bank and is not insured or guaranteed by the Federal Deposit Insurance Corporation or any other government agency. You may lose money by investing in a Portfolio. The following table compares the principal risks of an investment in each Portfolio. For an explanation of each such risk, see “Additional Information about the Reorganizations — Descriptions of Risk Factors” below.
| | | | |
Risks | | CharterSM Moderate Portfolio | | International Moderate Portfolio |
Affiliated Portfolio Risk | | X | | X |
Convertible Securities Risk | | X | | |
Credit Risk | | X | | X |
Derivatives Risk | | X | | X |
Equity Risk | | X | | X |
Floating Rate Loan Risk | | X | | |
Foreign Securities Risk | | X | | X |
Currency Risk | | X | | X |
Emerging Markets Risk | | X | | X |
Future Contract Risk | | X | | X |
Inflation-Indexed Bonds Risk | | X | | X |
53
| | | | |
Risks | | CharterSM Moderate Portfolio | | International Moderate Portfolio |
Interest Rate Risk | | X | | X |
Investment Grade Securities Risk | | X | | X |
Large-Cap Company Risk | | X | | X |
Liquidity Risk | | X | | X |
Market Risk | | X | | X |
Loan Risk | | X | | |
Mid-Cap and Small-Cap Company Risk | | X | | X |
Money Market Risk | | X | | |
Non-Investment Grade Risk | | X | | X |
Non-Traditional (Alternative) Investment Risk | | X | | X |
Portfolio Management Risk | | X | | X |
Real Estate Investing Risk | | | | X |
Risks Related to Investments in Underlying Portfolios and Underlying ETFs | | X | | X |
Sector Concentration Risk | | X | | |
U.S. Government Securities Risk | | X | | |
Comparative Performance Information
The bar charts and tables below provide some indication of the risks of investing in each Portfolio by showing changes in the Portfolio’s performance from year to year and by showing how each Portfolio’s average annual total returns for one year and since inception through December 31, 2016 compared to the returns of a broad-based market index. The return of the broad-based market index (and any additional comparative index) shown in the right hand columns below for each Portfolio is the return of the index since inception of the share class with the longest history. Past performance is not an indication of future performance.
The performance results do not reflect any Contract-related fees and expenses, which would reduce the performance results.
International Moderate Portfolio - Calendar Year Total Returns (Class B)
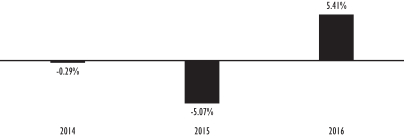
| | |
Best quarter (% and time period) 3.85% (2016 3rd Quarter) | | Worst quarter (% and time period) -4.90% (2015 3rd Quarter) |
CharterSM Moderate Portfolio - Calendar Year Total Returns (Class B)
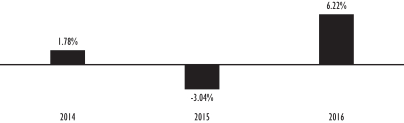
| | |
Best quarter (% and time period) 3.48% (2016 3rd Quarter) | | Worst quarter (% and time period) -4.70% (2015 3rd Quarter) |
54
International Moderate Portfolio Average Annual Total Returns (For the periods ended December 31, 2016)
| | | | | | | | |
| | | One Year | | | Since Inception | |
International Moderate Portfolio — Class B Shares (Inception Date: October 30, 2013) | | | 5.41% | | | | -0.33% | |
BofA Merrill Lynch Global Broad Market ex. U.S. Index (reflects no deduction for fees, expenses, or taxes) | | | 1.69% | | | | -3.12% | |
35% MSCI AC World ex. U.S. (Net) Index / 55% BofA Merrill Lynch Global Broad Market ex. U.S. Index /10% BofA Merrill Lynch 3-Month U.S. Treasury Bill Index (reflects no deduction for fees, expenses, or taxes) | | | 2.76% | | | | -2.09% | |
CharterSM Moderate Portfolio Average Annual Total Returns (For the periods ended December 31, 2016)
| | | | | | | | |
| | | One Year | | | Since
Inception | |
CharterSM Moderate Portfolio — Class B Shares (Inception Date: October 30, 2013) | | | 6.22% | | | | 1.76% | |
Dow Jones Moderately Conservative Portfolio Index (reflects no deduction for fees, expenses, or taxes) | | | 5.65% | | | | 3.00% | |
35% MSCI AC World (Net) Index / 37% Bloomberg Barclays U.S. Intermediate Government/Credit Bond Index / 18% BofA Merrill Lynch Global Broad Market ex U.S. Index / 10% BofA Merrill Lynch 3-Month U.S. Treasury Bill Index (reflects no deduction for fees, expenses, or taxes) | | | 4.02% | | | | 1.57% | |
Capitalization
The following table shows the capitalization of each Portfolio as of December 31, 2016 and of the CharterSM Moderate Portfolio on a pro forma combined basis as of December 31, 2016, after giving effect to the proposed Reorganization. Pro forma capitalization of the combined Portfolio has been adjusted to reflect the anticipated withdrawal of seed capital by FMG LLC and/or its affiliates from the combined Portfolio subsequent to the Reorganization. Pro forma net assets may not total and net asset values per share may not recalculate due to rounding of net assets.
| | | | | | | | | | | | |
| | | Net Assets
(in millions) | | | Net Asset Value
Per Share | | | Shares
Outstanding | |
International Moderate Portfolio — Class B Share | | $ | 8.2 | | | $ | 9.09 | | | | 906,792 | |
CharterSM Moderate Portfolio — Class B Shares | | $ | 23.6 | | | $ | 9.80 | | | | 2,408,733 | |
Adjustments | | | (5.9 | ) | | | — | | | | (655,769 | ) |
Pro forma CharterSM Moderate Portfolio — Class IB Shares (assuming the Reorganization is approved) | | $ | 25.9 | | | $ | 9.80 | | | | 2,649,756 | |
AFTER CAREFUL CONSIDERATION, THE BOARD OF VIP TRUST UNANIMOUSLY APPROVED THE REORGANIZATION PLAN WITH RESPECT TO THE INTERNATIONAL MODERATE PORTFOLIO. ACCORDINGLY, THE BOARD HAS SUBMITTED THE REORGANIZATION PLAN FOR APPROVAL BY THIS PORTFOLIO’S SHAREHOLDERS. THE BOARD RECOMMENDS THAT YOU VOTE “FOR” PROPOSAL 3.
55
PROPOSAL 4: TO APPROVE THE AGREEMENT AND PLAN OF REORGANIZATION AND TERMINATION WITH RESPECT TO THE REORGANIZATION OF THE REAL ASSETS PORTFOLIO, A SERIES OF VIP TRUST, INTO THE EQ/PIMCO GLOBAL REAL RETURN PORTFOLIO, A SERIES OF EQ TRUST.
This Proposal 4 requests your approval of a Reorganization Plan pursuant to which the Real Assets Portfolio will be reorganized into the EQ/PIMCO Global Real Return Portfolio. In considering whether you should approve the Proposal, you should note that:
| | • | | The Portfolios are series of separate Trusts. The Real Assets Portfolio is a series of VIP Trust and the EQ/PIMCO Global Real Return Portfolio is a series of EQ Trust. |
| | • | | The Portfolios have similar investment objectives. The Real Assets Portfolio seeks to achieve maximum real return. The EQ/PIMCO Global Real Return Portfolio seeks to achieve maximum real return, consistent with preservation of capital and prudent investment management. |
| | • | | Both Portfolios seek maximum real return by investing in assets that are affected directly or indirectly by the level of and changes in the rate of inflation and, therefore, provide real returns. There are, however, differences in the Portfolios’ principal investment policies and strategies of which you should be aware. These are set forth immediately below. For a detailed comparison of the Portfolios’ investment policies and strategies, see “Comparisons of Investment Objectives, Policies and Strategies” below. |
| | • | | The Real Assets Portfolio utilizes a fund-of-funds structure and invests in other investment companies, while the EQ/PIMCO Global Real Return Portfolio is sub-advised by an investment sub-adviser that actively manages the Portfolio’s assets and invests directly in securities and other investments. |
| | • | | The Real Assets Portfolio invests in securities of other mutual funds managed by FMG LLC and in investment companies managed by investment managers other than FMG LLC (for purposes of this proposal, affiliated and unaffiliated “Underlying Portfolios”) and in exchange traded securities of other investment companies or investment vehicles (“Underlying ETFs”) comprising various asset categories and strategies. The Real Assets Portfolio’s current asset allocation target is to invest approximately 30% of its assets in fixed income investments and 70% of its assets in nontraditional (alternative) investments through investments in Underlying Portfolios and Underlying ETFs. Under normal circumstances, the Fund will invest at least 80% of its assets (plus borrowings for investment purposes) in real assets, which include equity and fixed income securities and other investments among seven general asset categories: commodities, currency, global infrastructure, global real estate, natural resources, precious and base metals, and inflation-linked securities. The traditional and nontraditional (alternative) asset categories and strategies of the Underlying Portfolios and Underlying ETFs in which the Portfolio invests are as follows (asset categories and strategies that the Manager considers to be nontraditional (alternative) are indicated with an asterisk*): commodities*, global real estate*, precious and base metals*, currency*, natural resources*, inflation linked securities, and global infrastructure*. |
| | • | | The EQ/PIMCO Global Real Return Portfolio invests at least 80% of its net assets, plus borrowings for investment purposes, in inflation-indexed bonds of varying maturities issued by the U.S. (e.g., Treasury Inflation Protected Securities (“TIPS”)) and non-U.S. governments, their agencies or instrumentalities, and corporations, which may be represented by forwards or derivatives such as options, futures contracts or swap agreements. Subject to applicable law, the EQ/PIMCO Global Real Return Portfolio may invest all of its assets in derivative instruments, such as options, futures contracts or swap agreements, or in mortgage or asset backed securities. The EQ/PIMCO Global Real Return Portfolio invests a significant portion of its net assets in instruments that are economically tied to foreign (non-U.S.) countries, including emerging market countries. The EQ/PIMCO Global Real Return Portfolio may invest up to 10% of its total assets in high yield securities, also known as “junk bonds,” and also may invest up to 10% of its total assets in preferred stocks. Unlike the Real Assets Portfolio, the EQ/PIMCO Global Real Return Portfolio is non-diversified, which means that it may invest its assets in a smaller number of issuers than a diversified portfolio. |
56
| | • | | Each Portfolio’s principal risks include credit risk, currency risk, derivatives risk, emerging markets risk, foreign securities risk, inflation-indexed bonds risk, interest rate risk, investment grade securities risk, and liquidity risk. The Real Assets Portfolio also is subject to affiliated portfolio risk, commodity risk, infrastructure risk, market risk, natural resources sector risk, non-traditional (alternative) investment risk, portfolio management risk, real estate investing risk, and risks related to investments in underlying portfolios as principal risks, while the EQ/PIMCO Global Real Return Portfolio is not. The EQ/PIMCO Global Real Return Portfolio is subject to equity risk, focused portfolio risk, leveraging risk, mortgage- and asset- backed securities risk, non-investment grade securities risk, portfolio turnover risk, redemption risk, securities lending risk, and US government securities risk as principal risks, while the Real Assets Portfolio is not. To the extent the EQ/PIMCO Global Real Return Portfolio generally will invest a lesser percentage of its assets in alternative investments than the Real Assets Portfolio and more of its assets in TIPS, its risk profile will differ from that of the Real Assets Portfolio with respect to the degree of risk associated with those investments. For a detailed comparison of the Portfolios’ principal risks, see “Comparison of Principal Risk Factors” below. |
| | • | | FMG LLC serves as the investment manager and administrator for each Portfolio. FMG LLC has selected Pacific Investment Management Company LLC (“PIMCO”) as the sub-adviser (“Sub-Adviser”) to sub-advise the assets of the EQ/PIMCO Global Real Return Portfolio. It is anticipated that FMG LLC will continue to manage and administer, and that PIMCO will continue to sub-advise, the EQ/PIMCO Global Real Return Portfolio after the Reorganization. |
| | • | | The Manager has been granted relief by the SEC to hire, terminate and replace Sub-Advisers and amend sub-advisory agreements subject to the approval of the Board of Trustees and without obtaining shareholder approval. However, FMG LLC may not enter into a sub-advisory agreement on behalf of a Portfolio with an “affiliated person” of the Manager, unless the sub-advisory agreement, including compensation, is approved by the Portfolio’s shareholders. For a detailed description of the Manager and the Sub-Adviser to the EQ/PIMCO Global Real Return Portfolio, please see “Additional Information about the Portfolios — The Manager” and “— The Sub-Advisers” below. |
| | • | | The Real Assets Portfolio and the EQ/PIMCO Global Real Return Portfolio had net assets of approximately $4.9 million and $71.8 million, respectively, as of January 31, 2017. Thus, if the Reorganization had been in effect on that date, the combined Portfolio would have had net assets of approximately $74.8 million. |
| | • | | The Class B shareholders of the Real Assets Portfolio will receive Class IB shares of the EQ/PIMCO Global Real Return Portfolio pursuant to the Reorganization. The Class K shares of the EQ/PIMCO Global Real Return Portfolio are not subject to the Reorganization. Shareholders will not pay any sales charges in connection with the Reorganization. Please see “Comparative Fee and Expense Tables,” “Additional Information about the Reorganization” and “Additional Information about the Portfolios” below for more information. |
| | • | | It is estimated that the total annual operating expense ratio (including acquired fund fees and expenses, if any) for the EQ/PIMCO Global Real Return Portfolio’s Class IB shares, for the fiscal year following the Reorganization, will be 1.31%, which is lower than that of the Real Assets Portfolio’s Class B shares for the fiscal year ended December 31, 2016, which was 1.40%. For a more detailed comparison of the fees and expenses of the Portfolios, please see “Comparative Fee and Expense Tables” and “Additional Information about the Portfolios” below. |
| | • | | The EQ/PIMCO Global Real Return Portfolio has a higher management fee than the Real Assets Portfolio because it invests directly in securities and other instruments rather than operating as a fund-of-funds. The management fee for the Real Assets Portfolio is equal to an annual rate of 0.15% of its average daily net assets, while the management fee for the EQ/PIMCO Global Real Return Portfolio is equal to an annual rate of 0.60% of its average daily net assets. However, as discussed below, the EQ/PIMCO Global Real Return Portfolio currently has a lower expense limitation agreement in place than that for the Real Assets Portfolio. |
| | • | | The Portfolios pay different administration fees. |
57
| | • | | The Real Assets Portfolio pays FMG LLC its proportionate share of an asset-based administration fee, subject to a minimum annual fee of $32,500. For purposes of calculating the asset-based administration fee, the assets of the Real Assets Portfolio are aggregated with those of the other VIP Trust Portfolios (“VIP Trust Portfolios”) and the AXA Strategic Allocation Series Portfolios, AXA All Asset Allocation Series Portfolios, and AXA/Franklin Templeton Allocation Managed Volatility Portfolio of EQ Trust (the “EQ Trust Fund-of-Funds Portfolios”), which are also managed by FMG LLC. The asset-based administration fee is equal to an annual rate of 0.15% of the first $35 billion of the aggregate average daily net assets of the Portfolios, VIP Trust Portfolios, and EQ Trust Fund-of-Funds Portfolios; 0.11% on the next $10 billion; 0.10% on the next $5 billion; and 0.095% thereafter. |
| | • | | The EQ/PIMCO Global Real Return Portfolio pays FMG LLC its proportionate share of an asset-based administration fee for the other portfolios of EQ Trust that are advised by a single investment sub-adviser (“Single-Advised Portfolios”), which is equal to an annual rate of 0.10% of the first $30 billion of the aggregate average daily net assets of the Single-Advised Portfolios; 0.0975% of the next $10 billion; 0.0950% of the next $5 billion; and 0.0925% thereafter, subject to a minimum annual fee of $30,000. For a more detailed description of the fees and expenses of the Portfolios, including a description of the Single-Advised Portfolios, please see “Additional Information about the Portfolios” below. |
| | • | | Each Portfolio is subject to an expense limitation arrangement. |
| | • | | FMG LLC has entered into an expense limitation arrangement with VIP Trust pursuant to which FMG LLC has agreed to make payments or waive its management, administrative or other fees to limit the expenses of the Real Assets Portfolio through April 30, 2017 (unless the Board of Trustees consents to an earlier revision or termination of this arrangement) so that the annual operating expenses (including acquired fund fees and expenses) of the Real Assets Portfolio (exclusive of taxes, interest, brokerage commissions, dividend and interest expenses on securities sold short, capitalized expenses, and extraordinary expenses) do not exceed an annual rate of average daily net assets of 1.40% for Class B shares of the Real Assets Portfolio. |
| | • | | FMG LLC has entered into an expense limitation arrangement with EQ Trust pursuant to which FMG LLC has agreed to make payments or waive its management, administrative or other fees to limit the expenses of the EQ/PIMCO Global Real Return Portfolio through April 30, 2018 (unless the Board of Trustees consents to an earlier revision or termination of this arrangement) so that the annual operating expenses of the EQ/PIMCO Global Real Return Portfolio (exclusive of taxes, interest, brokerage commissions, dividend and interest expenses on securities sold short, capitalized expenses, fees and expenses of other investment companies in which the Portfolio invests, and extraordinary expenses) do not exceed an annual rate of average daily net assets of 1.00% for Class IB shares of the EQ/PIMCO Global Real Return Portfolio. |
| | • | | The Class IB shares of the EQ/PIMCO Global Real Return Portfolio and the Class B shares of the Real Assets Portfolio are each subject to the 0.25% Rule 12b-1 fee. |
| | • | | The Class IB shares of the EQ/PIMCO Global Real Return Portfolio underperformed compared to the Class B shares of the Real Assets Portfolio for the one-year period ended December 31, 2016 and outperformed the Real Assets Portfolio for the period since inception. Please see “Comparative Performance Information” below. |
| | • | | Following the Reorganization, it is anticipated that FMG LLC will redeem shares that it holds in the combined Portfolio representing seed capital it has previously invested. The withdrawal of such seed capital is not expected to have a material effect on the annual operating expenses of the combined Portfolio. |
| | • | | Following the Reorganization, the combined Portfolio will be managed in accordance with the investment objective, policies and strategies of the EQ/PIMCO Global Real Return Portfolio. It is not expected |
58
| | that the EQ/PIMCO Global Real Return Portfolio will revise any of its investment policies following the Reorganization to reflect those of the Real Assets Portfolio. If the Reorganization is approved, all of the Real Assets Portfolio’s assets (“Transferred Assets”) on the Closing Date will be transferred to the EQ/PIMCO Global Real Return Portfolio. It is anticipated that immediately prior to the Closing Date, the Real Assets Portfolio will liquidate substantially all of its securities holdings and hold cash. Therefore, it is anticipated that the Transferred Assets will consist of cash. The sale of portfolio holdings by the Real Assets Portfolio in connection with the Reorganization may result in the Real Assets Portfolio selling securities at a disadvantageous time and price and could result in it realizing gains (or losses) that would not otherwise have been realized and incurring transaction costs that would not otherwise have been incurred. It is also expected that, over time, the EQ/PIMCO Global Real Return Portfolio will use the Transferred Assets to invest in Treasury Inflation Protected Securities consistent with its principal investment strategy. The estimated portfolio transaction costs of the Reorganization of the Real Assets Portfolio are $600. This amount is an estimate and is subject to change. The actual amount could be higher or lower depending on the factors outlined above. Contractholders will not recognize any gain or loss for federal income tax purposes as a result of the Reorganizations. |
| | • | | FMG LLC has voluntarily agreed to pay expenses of the Reorganization that exceed the Real Assets Portfolio’s expense limitation set forth in its expense limitation agreement. The Reorganization expenses for the Real Assets Portfolio, which are estimated to be $33,333, exceed the expense limit and will be paid by FMG LLC. |
Comparative Fee and Expense Tables
The following tables show the fees and expenses of the Class B Shares of the Real Assets Portfolio and the Class IB Shares of the EQ/PIMCO Global Real Return Portfolio and the estimated pro forma fees and expenses of the Class IB Shares of the EQ/PIMCO Global Real Return Portfolio after giving effect to the proposed Reorganization. Fees and expenses for each Portfolio are based on those incurred by the relevant class of its shares for the fiscal year ended December 31, 2016. The pro forma fees and expenses of the EQ/PIMCO Global Real Return Portfolio shares assume that the Reorganization was in effect for the year ended December 31, 2016. The tables below do not reflect any Contract-related fees and expenses, which would increase overall fees and expenses. See a Contract prospectus for a description of those fees and expenses.
Shareholder Fees
(fees paid directly from your investment)
| | | | |
Real Assets Portfolio | | EQ/PIMCO Global Real Return
Portfolio | | Pro Forma EQ/PIMCO Global
Real Return Portfolio (assuming the Reorganization is approved) |
| Not Applicable. | | Not Applicable. | | Not Applicable. |
59
Annual Operating Expenses
(expenses that you may pay each year as a percentage of the value of your investment)
| | | | | | | | | | | | |
| | | Real Assets Portfolio | | | EQ/PIMCO Global Real
Return Portfolio | | | Pro Forma EQ/PIMCO Global
Real Return Portfolio (assuming
the Reorganization is
approved)*** | |
| | | Class B | | | Class IB | | | Class IB | |
Management Fee | | | 0.15 | % | | | 0.60 | % | | | 0.60 | % |
Distribution and/or Service Fees (12b-1 fees) | | | 0.25 | % | | | 0.25 | % | | | 0.25 | % |
Other Expenses | | | 2.25 | % | | | 0.64 | ** | | | 0.61 | %** |
Acquired Fund Fees and Expenses | | | 0.74 | % | | | N/A | | | | N/A | |
Total Annual Portfolio Operating Expenses | | | 3.39 | % | | | 1.49 | % | | | 1.46 | % |
Fee Waiver and/or Expense Reimbursement† | | | (1.99 | )%* | | | (0.18 | )% | | | (0.15 | )% |
Total Annual Portfolio Operating Expenses After Fee Waiver and/ or Expense Reimbursement | | | 1.40 | % | | | 1.31 | % | | | 1.31 | % |
| † | | Pursuant to a contract, FMG LLC has agreed to make payments or waive its management, administrative or other fees to limit the expenses of (1) the Real Assets Portfolio through April 30, 2017] (unless the Board of Trustees consents to an earlier revision or termination of this arrangement) so that the annual operating expenses (including Acquired Fund Fees and Expenses) of the Portfolio (exclusive of taxes, interest, brokerage commissions, dividend and interest expenses on securities sold short, capitalized expenses, and extraordinary expenses) do not exceed an annual rate of average daily net assets of 1.40% for Class B shares of the Portfolio, and (2) the EQ/PIMCO Global Real Return Portfolio through April 30, 2018 (unless the Board of Trustees consents to an earlier revision or termination of this arrangement) so that the annual operating expenses of the Portfolio (exclusive of taxes, interest, brokerage commissions, dividend and interest expenses on securities sold short, capitalized expenses, fees and expenses of other investment companies in which the Portfolio invests, and extraordinary expenses) do not exceed an annual rate of average daily net assets of 1.00% for Class IB shares of the Portfolio. |
| * | | Fee Waiver and/or Expense Reimbursement information has been restated to reflect the current expense limitation arrangement noted above. |
| ** | | Includes interest expense of 0.31%. |
| *** | | Pro forma annual operating expenses have been adjusted to reflect the anticipated withdrawal of seed capital by FMG LLC and/or its affiliates from the combined Portfolio subsequent to the Reorganization. |
Example of Portfolio Expenses
This example is intended to help you compare the costs of investing in the Portfolios with the cost of investing in other investment options. The example assumes that:
| | • | | You invest $10,000 in a Portfolio for the time periods indicated; |
| | • | | Your investment has a 5% return each year; |
| | • | | The Portfolio’s operating expenses remain the same; and |
| | • | | The Expense Limitation Arrangement with respect to the Portfolios is not renewed. |
This example does not reflect any Contract-related fees and expenses, including redemption fees (if any) at the Contract level. If such fees and expenses were reflected, the total expenses would be higher. Although your actual costs may be higher or lower, based on these assumptions your costs would be:
| | | | | | | | | | | | | | | | |
| | | 1 Year | | | 3 Years | | | 5 Years | | | 10 Years | |
Real Assets Portfolio | | | | | | | | | | | | | | | | |
Class B | | $ | 143 | | | $ | 856 | | | $ | 1,593 | | | $ | 3,542 | |
EQ/PIMCO Global Real Return Portfolio | | | | | | | | | | | | | | | | |
Class IB | | $ | 133 | | | $ | 453 | | | $ | 796 | | | $ | 1,764 | |
Pro Forma EQ/PIMCO Global Real Return Portfolio (assuming the Reorganization is approved) | | | | | | | | | | | | | | | | |
Class IB | | $ | 133 | | | $ | 447 | | | $ | 783 | | | $ | 1,733 | |
60
Portfolio Turnover
Each Portfolio pays transaction costs, such as commissions, when it buys and sells securities (or “turns over” its portfolio). A higher portfolio turnover rate may indicate higher transaction costs. These costs, which are not reflected in annual fund operating expenses or in the example, affect a Portfolio’s performance. During the fiscal year ended December 31, 2016, the portfolio turnover rates for each of the Real Assets Portfolio and the EQ/PIMCO Global Real Return Portfolio were 21% and 108%, respectively, of the average value of each Portfolio.
Comparison of Investment Objectives, Policies and Strategies
The following table compares the investment objectives and principal investment policies and strategies of the Real Assets Portfolio with those of the EQ/PIMCO Global Real Return Portfolio. The Board of each Trust may change the investment objective of a respective Portfolio without a vote of that Portfolio’s shareholders. For more detailed information about each Portfolio’s investment strategies and risks, see Appendix B.
| | |
Acquiring Portfolio | | Acquired Portfolio |
EQ/PIMCO Global Real Return Portfolio | | Real Assets Portfolio |
| Investment Objective | | Investment Objective |
| |
| Seeks to achieve maximum real return. | | Seeks to achieve maximum real return, consistent with preservation of capital and prudent investment management. |
| |
| Principal Investment Strategies | | Principal Investment Strategies |
| |
| Under normal circumstances, the Portfolio invests at least 80% of its net assets, plus borrowings for investment purposes, in inflation-indexed bonds of varying maturities issued by the U.S. (e.g., Treasury Inflation Protected Securities (“TIPS”)) and non-U.S. governments, their agencies or instrumentalities, and corporations, which may be represented by forwards or derivatives such as options, futures contracts or swap agreements. Inflation-indexed bonds are fixed income securities that are structured to provide protection against inflation. | | The Portfolio expects to invest principally in investments that the Manager believes are affected directly or indirectly by the level of and changes in the rate of inflation and, therefore, provide real returns (such investments are “real assets”). Under normal circumstances, the Fund will invest at least 80% of its assets (plus borrowings for investment purposes) in real assets. |
| |
| No corresponding strategy. | | The Portfolio pursues its investment objective by investing in other mutual funds managed by AXA Equitable Funds Management Group, LLC (“FMG LLC” or “Manager”) and in investment companies managed by investment managers other than FMG LLC (affiliated and unaffiliated “Underlying Portfolios”) and in exchange traded securities of other investment companies or investment vehicles (“Underlying ETFs”) comprising various asset categories and strategies. |
| |
| Assets not invested in inflation-indexed bonds may be invested in other types of fixed income instruments, including bonds, debt securities and other similar instruments issued by various U.S. and non-U.S. public or private-sector entities. The value of the bond’s principal or the interest income paid on the bond is adjusted to track changes in an official inflation measure. | | No corresponding strategy. |
61
| | |
Acquiring Portfolio | | Acquired Portfolio |
EQ/PIMCO Global Real Return Portfolio | | Real Assets Portfolio |
| No corresponding strategy. | | The Manager, under the oversight of the Trust’s Board of Trustees, has established an asset allocation target for the Portfolio. This target is the approximate percentage of the Portfolio’s assets that will be invested in fixed income investments or nontraditional (alternative) investments (referred to herein as “asset classes”) as represented by the primary holdings (as described in the prospectuses) of the Underlying Portfolios and Underlying ETFs in which the Portfolio invests. The Portfolio’s current asset allocation target is to invest approximately 30% of its assets in fixed income investments and 70% of its assets in nontraditional (alternative) investments through investments in Underlying Portfolios and Underlying ETFs. This asset allocation target may be changed by the Manager and the Trust’s Board of Trustees without shareholder approval. Actual allocations can deviate by up to 15% for each asset class. |
| |
| No corresponding strategy. | | Real assets include equity and fixed income securities and other investments among seven general asset categories: commodities, currency, global infrastructure, global real estate, natural resources, precious and base metals, and inflation-linked securities. For purposes of the Portfolio, real return is defined as the rate of return after adjusting for inflation. The term “asset category” refers to specific types of securities or other instruments within each asset class. The traditional and nontraditional (alternative) asset categories and strategies of the Underlying Portfolios and Underlying ETFs in which the Portfolio invests are as follows (asset categories and strategies that the Manager considers to be nontraditional (alternative) are indicated with an asterisk*): commodities*, global real estate*, precious and base metals*, currency*, natural resources*, inflation linked securities, and global infrastructure*. |
| |
| No corresponding strategy. | | Nontraditional (alternative) investments are alternatives to traditional equity (stocks) or fixed income (bonds and cash) investments. Nontraditional (alternative) investments have the potential to enhance portfolio diversification and reduce overall portfolio volatility because these investments may not have a strong correlation (relationship) to one another or to traditional market indexes. Nontraditional (alternative) investments use a different approach to investing than do traditional investments. This approach may involve, for example, holding both long and short positions in securities or using derivatives or hedging strategies. Many nontraditional (alternative) investment strategies are designed to help reduce the role of overall market direction in determining return. |
| |
| The Portfolio invests primarily in investment grade securities, but may invest up to 10% of its total assets in high yield securities, also known as “junk bonds” rated B or higher by Moody’s Investors Service, Inc. (“Moody’s”), or equivalently rated by Standard & Poor’s Rating Services (“S&P”) or Fitch, Inc. (“Fitch”), or, if unrated, determined by the Manager or Sub-Adviser to be of comparable quality. | | No corresponding strategy. |
| |
| The Portfolio normally invests a significant portion of its net assets in instruments that are economically tied to foreign (non-U.S.) countries. The Portfolio may invest, without limitation, in securities that are economically tied to emerging market countries. The Portfolio may also invest without limitation in foreign currency transactions, including currency forward transactions. | | No corresponding strategy. |
62
| | |
Acquiring Portfolio | | Acquired Portfolio |
EQ/PIMCO Global Real Return Portfolio | | Real Assets Portfolio |
| The Portfolio is non-diversified, which means that it may in vest its assets in a smaller number of issuers than a diversified portfolio. | | No corresponding strategy. |
| |
| Subject to applicable law and any other restrictions described in the Portfolio’s Prospectus or Statement of Additional Information, the Portfolio may invest all of its assets in derivative instruments, such as options, futures contracts or swap agreements, or in mortgage or asset backed securities. The Portfolio’s investments in derivatives may be deemed to involve the use of leverage because the Portfolio is not required to invest the full market value of the contract upon entering into the contract but participates in gains and losses on the full contract price. The use of derivatives also may be deemed to involve the use of leverage because the heightened price sensitivity of some derivatives to market changes may magnify the Portfolio’s gain or loss. | | In addition, the Portfolio may invest in Underlying Portfolios and Underlying ETFs that employ derivatives (including futures contracts) for a variety of purposes, including to reduce risk, to seek enhanced returns from certain asset classes, and to leverage exposure to certain asset classes. |
| |
| The Portfolio may, without limitation, seek to obtain market exposure to the securities in which it primarily invests by entering into a series of purchase and sale contracts (such as contracts for derivative instruments) or by using other investment techniques (such as buy backs or dollar rolls). The Portfolio may purchase or sell securities on a when issued, delayed delivery or forward commitment basis. | | No corresponding strategy. |
| |
| The Portfolio may also invest up to 10% of its total assets in preferred stocks. The Portfolio may also invest, to a limited extent, in loan participations. The Portfolio may engage in active and frequent trading of portfolio securities to achieve its investment objective. | | No corresponding strategy. |
| |
| The Sub-Adviser manages the Portfolio’s duration based on the Sub-Adviser’s view of the market and interest rates. The Portfolio may invest in securities of any maturity. Duration also measures the sensitivity of the value of a bond or bond portfolio to changes in interest rates. Typically, a bond portfolio with a low (short) duration means that its value is less sensitive to interest rate changes, while a bond portfolio with a high (long) duration is more sensitive. Effective duration takes into account that for certain bonds expected cash flows will fluctuate as interest rates change and is defined in nominal yield terms, which is market convention for most bond investors and managers. The Sub-Adviser may sell a security for a variety of reasons, such as to make other investments believed to offer superior investment opportunities. The effective duration of this Portfolio normally varies within three years (plus or minus) of the effective portfolio duration of the securities comprising the Bloomberg Barclays World Government Inflation-Linked Index (hedged), as calculated by the Sub-Adviser, which as of December 31, 2016, as converted, was 12.08 years. | | No corresponding strategy. |
63
| | |
Acquiring Portfolio | | Acquired Portfolio |
EQ/PIMCO Global Real Return Portfolio | | Real Assets Portfolio |
| | The Manager selects the Underlying Portfolios and Underlying ETFs in which to invest the Portfolio’s assets. In selecting Underlying Portfolios and Underlying ETFs, the Manager will utilize a proprietary investment process that may take into consideration a number of factors including, as appropriate and applicable, fund performance, management team, investment style, correlations, asset class exposure, industry classification, benchmark, risk adjusted return, volatility, expense ratio, asset size and portfolio turnover. For purposes of complying with the 80% policy identified above, the Manager will identify Underlying Portfolios and Unaffiliated Underlying ETFs in which to invest by reference to such Underlying Portfolio’s or Underlying ETF’s name and investment policies at the time of investment. An Underlying Portfolio or Underlying ETF that changes its name or investment policies subsequent to the time of the Portfolio’s investment may continue to be considered an appropriate investment for purposes of the 80% policy. For purposes of asset class and asset category target allocations, where an Underlying Portfolio or Underlying ETF could be assigned to more than one asset class (e.g., equity and alternative asset classes) or category (e.g., international bond and global bond asset categories), the Manager may, in its discretion, assign an Underlying Portfolio or Underlying ETF to one or more asset classes or categories. The Manager may add new Underlying Portfolios and Underlying ETFs or replace or eliminate existing Underlying Portfolios and Underlying ETFs without shareholder approval. The Underlying Portfolios and Underlying ETFs have been selected to represent a reasonable spectrum of investment options for the Portfolio. The Manager has based the asset allocation target percentages for the Portfolio on the degree to which it believes the Underlying Portfolios and Underlying ETFs, in combination, are appropriate for the Portfolio’s investment objective. The Manager may sell the Portfolio’s holdings for a variety of reasons, including to invest in an Underlying Portfolio or Underlying ETF believed to offer superior investment opportunities. |
| |
| The Portfolio also may lend its portfolio securities to earn additional income. | | No corresponding strategy. |
Comparison of Principal Risk Factors
An investment in a Portfolio is not a deposit of a bank and is not insured or guaranteed by the Federal Deposit Insurance Corporation or any other government agency. You may lose money by investing in a Portfolio. The following table compares the principal risks of an investment in each Portfolio. For an explanation of each such risk, see “Additional Information about the Reorganizations — Descriptions of Risk Factors” below.
| | | | | | | | |
Risks | | EQ/PIMCO Global Real Return Portfolio | | | Real Assets Portfolio | |
Affiliated Portfolio Risk | | | | | | | X | |
Commodity Risk | | | | | | | X | |
Credit Risk | | | X | | | | X | |
Derivatives Risk | | | X | | | | X | |
Equity Risk | | | X | | | | | |
Focused Portfolio Risk | | | X | | | | | |
Foreign Securities Risk | | | X | | | | X | |
Currency Risk | | | X | | | | X | |
Emerging Markets Risk | | | X | | | | X | |
Inflation-Indexed Bonds Risk | | | X | | | | X | |
64
| | | | | | | | |
Risks | | EQ/PIMCO Global Real Return Portfolio | | | Real Assets Portfolio | |
Infrastructure Sector Risk | | | | | | | X | |
Interest Rate Risk | | | X | | | | X | |
Investment Grade Securities Risk | | | X | | | | X | |
Leveraging Risk | | | X | | | | | |
Liquidity Risk | | | X | | | | X | |
Market Risk | | | | | | | X | |
Mortgage-Backed and Asset-Backed Securities Risk | | | X | | | | | |
Natural Resources Sector Risk | | | | | | | X | |
Non-Investment Grade Securities Risk | | | X | | | | | |
Non-Traditional (Alternative) Investment Risk | | | | | | | X | |
Portfolio Management Risk | | | | | | | | |
Portfolio Turnover Risk | | | X | | | | X | |
Redemption Risk | | | X | | | | | |
Real Estate Investing Risk | | | | | | | X | |
Risks Related to Investments in Underlying Portfolios and Underlying ETFs | | | | | | | X | |
Securities Lending Risk | | | X | | | | | |
U.S. Government Securities Risk | | | X | | | | | |
In addition to the risks described above, as noted in the prospectuses for the affiliated Underlying Portfolios, FMG LLC and, in certain cases, an affiliate, serve as investment manager, investment sub-adviser and/or administrator for those Underlying Portfolios and earn fees for providing services in these capacities, which are in addition to the fees directly associated with a Portfolio. In this connection, the Manager’s selection of Underlying Portfolios and Underlying ETFs may have a positive or negative effect on its revenues and/or profits.
Comparative Performance Information
The bar charts and tables below provide some indication of the risks of investing in each Portfolio by showing changes in the Portfolio’s performance from year to year and by showing how each Portfolio’s average annual total returns for one year and since inception through December 31, 2016 compared to the returns of a broad-based market index. The return of the broad-based market index (and any additional comparative index) shown in the right hand columns below for each Portfolio is the return of the index since inception of the share class with the longest history. Past performance is not an indication of future performance.
The performance results do not reflect any Contract-related fees and expenses, which would reduce the performance results.
Real Assets Portfolio - Calendar Year Total Returns (Class B)
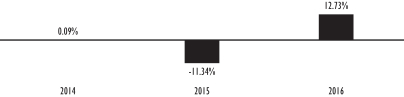
| | |
Best quarter (% and time period)
6.23% (2016 2nd Quarter) | | Worst quarter (% and time period)
-7.79% (2015 3rd Quarter) |
65
EQ/PIMCO Global Real Return Portfolio - Calendar Year Total Returns (Class IB)
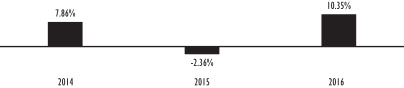
| | |
Best quarter (% and time period)
4.15% (2016 3rd quarter) | | Worst quarter (% and time period)
-2.73% (2015 2nd Quarter) |
Real Assets Portfolio Average Annual Total Returns (For the periods ended December 31, 2016)
| | | | | | | | |
| | | One Year | | | Since
Inception | |
Real Assets Portfolio — Class B Shares
(Inception Date: October 30, 2013) | | | 12.73% | | | | -0.91% | |
Bloomberg Barclays World Government Inflation-Linked Bond Index (reflects no deduction for fees, expenses, or taxes) | | | 10.22% | | | | 4.71% | |
30% Bloomberg Barclays World Government Inflation-Linked Bond Index/70% BofA Merrill Lynch 3-Month U.S. Treasury Bill Index (reflects no deduction for fees, expenses, or taxes) | | | 3.24% | | | | 1.52% | |
EQ/PIMCO Global Real Return Portfolio Average Annual Total Returns (For the periods ended December 31, 2016)
| | | | | | | | |
| | | One Year | | | Since
Inception | |
EQ/PIMCO Global Real Return Portfolio — Class IB Shares (Inception Date: February 8, 2013) | | | 10.35% | | | | 2.32% | |
Bloomberg Barclays World Government Inflation-Linked Bond Index (reflects no deduction for fees, expenses, or taxes) | | | 10.22% | | | | 2.97% | |
Capitalization
The following table shows the capitalization of each Portfolio as of December 31, 2016 and of the EQ/PIMCO Global Real Return Portfolio on a pro forma combined basis as of December 31, 2016, after giving effect to the proposed Reorganization. Pro forma capitalization of the combined Portfolio has been adjusted to reflect the anticipated withdrawal of seed capital by FMG LLC and/or its affiliates from the combined Portfolio subsequent to the Reorganization. Pro forma net assets may not total and net asset values per share may not recalculate due to rounding of net assets.
| | | | | | | | | | | | |
| | | Net Assets
(in millions) | | | Net Asset Value
Per Share | | | Shares
Outstanding | |
Real Assets Portfolio — Class B Share | | $ | 4.8 | | | $ | 9.09 | | | | 529,533 | |
EQ/PIMCO Global Real Return Portfolio — Class IB Shares | | $ | 38.7 | | | $ | 9.69 | | | | 3,997,385 | |
Adjustments | | | — | | | | — | | | | (32,877 | ) |
Pro forma EQ/PIMCO Global Real Return Portfolio — Class IB Shares (assuming the Reorganization is approved) | | $ | 43.5 | | | $ | 9.69 | | | | 4,494,041 | |
AFTER CAREFUL CONSIDERATION, THE BOARD OF VIP TRUST UNANIMOUSLY APPROVED THE REORGANIZATION PLAN WITH RESPECT TO THE REAL ASSETS PORTFOLIO. ACCORDINGLY, THE BOARD HAS SUBMITTED THE REORGANIZATION PLAN FOR APPROVAL BY THIS PORTFOLIO’S SHAREHOLDERS. THE BOARD RECOMMENDS THAT YOU VOTE “FOR” PROPOSAL 4.
66
PROPOSAL 5: TO APPROVE THE PLAN OF REORGANIZATION AND TERMINATION WITH RESPECT TO THE REORGANIZATION OF THE PAC GLOBAL PORTFOLIO, A SERIES OF EQ TRUST, INTO THE AXA/HORIZON SMALL CAP VALUE PORTFOLIO, ALSO A SERIES OF EQ TRUST.
This Proposal 5 requests your approval of a Reorganization Plan pursuant to which the Pac Global Portfolio will be reorganized into the AXA/Horizon Small Cap Value Portfolio. In considering whether you should approve the Proposal, you should note that:
| | • | | The Portfolios have identical investment objectives. The Portfolios seek to achieve long-term growth of capital. Below is a summary comparison of the two Portfolios. For a detailed comparison of the Portfolios’ investment policies and strategies, see “Comparisons of Investment Objectives, Policies and Strategies” below. |
| | • | | The Portfolios have substantially the same investment policies. Each Portfolio, under normal circumstances, invests at least 80% of its net assets in securities of companies with small market capitalizations (or other financial instruments that derive their value from the securities of such companies). Each Portfolio is structured so that approximately 50% of its assets are actively managed by a sub-adviser (“Active Allocated Portion”) and approximately 50% of its assets are allocated to a passive sub-adviser that seeks to track the performance of the Russell 2000 Value Index (“Index Allocated Portion”). Each Portfolio invests primarily in common stocks, but may invest in other securities that a sub-adviser believes provide opportunities for capital growth. The Portfolios also may invest in foreign securities, including securities of companies based in developing countries and depositary receipts of foreign-based companies. |
| | • | | The Pac Global Portfolio’s Active Allocated Portion is sub-advised by Pacific Global Investment Management Company (“Pac Global”) while the AXA/Horizon Small Cap Value Portfolio’s Active Allocated Portion is sub-advised by Horizon Asset Management LLC (“Horizon). Each Portfolio’s Index Allocated Portion is sub-advised by BlackRock Investment Management, LLC (“BlackRock”). |
| | • | | Each Portfolio’s principal risks include currency risk, depository receipts risk, equity risk, emerging markets risk, foreign securities risk, index strategy risk, investment style risk, multiple adviser risk, portfolio turnover risk, securities lending risk, and small-cap company risk. The Pac Global Portfolio is subject to micro-cap company risk as a principal risk, while the AXA/Horizon Small Cap Value Portfolio generally is not. The AXA/Horizon Small Cap Value Portfolio also is subject to ETF risk, non-investment grade securities risk, and special situations risk, while the Pac Global Portfolio generally is not. For a detailed comparison of the Portfolios’ principal risks, see “Comparison of Principal Risk Factors” below. |
| | • | | FMG LLC serves as the investment manager and administrator for each Portfolio. FMG LLC has selected Pac Global as the sub-adviser to the Pac Global Portfolio’s Active Allocated Portion. FMG LLC has selected Horizon as the sub-adviser to the AXA/Horizon Small Cap Value Portfolio’s Active Allocated Portion. FMG LLC has selected BlackRock as the sub-adviser to each Portfolio’s Index Allocated Portion. It is anticipated that FMG LLC will continue to manage and administer, and Horizon and BlackRock will continue to sub-advise, the AXA/Horizon Small Cap Value Portfolio after the Reorganization. |
| | • | | The Manager has been granted relief by the SEC to hire, terminate and replace sub-advisers and amend sub-advisory agreements subject to the approval of the Board of Trustees and without obtaining shareholder approval. However, FMG LLC may not enter into a sub-advisory agreement on behalf of a Portfolio with an “affiliated person” of the Manager, unless the sub-advisory agreement, including compensation, is approved by the Portfolio’s shareholders. For a detailed description of the Manager and the sub-adviser to the AXA/Horizon Small Cap Value Portfolio, please see “Additional Information about the Portfolios — The Manager” and “— The Sub-Advisers” below. |
67
| | • | | The Pac Global Portfolio and the AXA/Horizon Small Cap Value Portfolio had net assets of approximately $161.9 million and $173.6 million, respectively, as of January 31, 2017. Thus, if the Reorganization had been in effect on that date, the combined Portfolio would have had net assets of approximately $335.5 million. |
| | • | | The shareholders of the Pac Global Portfolio will receive shares of the AXA/Horizon Small Cap Value Portfolio pursuant to the Reorganization. Shareholders will not pay any sales charges in connection with the Reorganization. Please see “Comparative Fee and Expense Tables,” “Additional Information about the Reorganizations” and “Additional Information about the Portfolios” below for more information. |
| | • | | It is estimated that the total annual operating expense ratio (including acquired fund fees and expenses, if any) for the AXA/Horizon Small Cap Value Portfolio Class IB shares and Class K shares, for the fiscal year following the Reorganization, will be 1.16% and 0.91%, respectively, which is lower than those of the Pac Global Portfolio Class IB shares and Class K shares for the fiscal year ended December 31, 2016, which were 1.20% and 0.95%, respectively. For a more detailed comparison of the fees and expenses of the Portfolios, please see “Comparative Fee and Expense Tables” and “Additional Information about the Portfolios” below. |
| | • | | The Portfolios are subject to the same management fee schedule. The management fee for each Portfolio is equal to an annual rate of 0.80% of its average daily net assets. |
| | • | | The Portfolios are subject to the same administration fee schedule. In addition to the management fee, each Portfolio also pays FMG LLC its proportionate share of an asset-based administration fee, subject to a minimum annual fee of $32,500. For purposes of calculating the asset-based administration fee, the assets of the Portfolios are aggregated with those of each “Hybrid Portfolio” (defined below), and the AXA/AB Dynamic Growth Portfolio, AXA/AB Dynamic Moderate Growth Portfolio, AXA/Goldman Sachs Strategic Allocation Portfolio, AXA/Invesco Strategic Allocation Portfolio, AXA/Legg Mason Strategic Allocation Portfolio, and the ATM Portfolios, which are also managed by FMG LLC. The asset-based administration fee is equal to an annual rate of 0.15% of the first $25 billion of the aggregate average daily net assets of the Portfolios, Hybrid Portfolio, AXA/AB Dynamic Growth Portfolio, AXA/AB Dynamic Moderate Growth Portfolio, AXA/Goldman Sachs Strategic Allocation Portfolio, AXA/Invesco Strategic Allocation Portfolio, AXA/Legg Mason Strategic Allocation Portfolio, and the ATM Portfolios; 0.11% on the next $10 billion; 0.10% on the next $5 billion; and 0.095% thereafter. For a more detailed description of the fees and expenses of the Portfolios, please see “Comparative Fee and Expense Tables” and “Additional Information about the Portfolios” below. |
| | • | | Each Portfolio is subject to an expense limitation arrangement. |
| | • | | Pursuant to a contract, FMG LLC has agreed to make payments or waive its management, administrative or other fees to limit the expenses of the Pac Global Portfolio through April 30, 2017 (unless the Board of Trustees consents to an earlier revision or termination of this arrangement), so that the annual operating expenses of the Portfolio (exclusive of taxes, interest, brokerage commissions, dividend and interest expenses on securities sold short, capitalized expenses, fees and expenses of other investment companies and exchange-traded investment vehicles in which the Portfolio invests and extraordinary expenses) do not exceed an annual rate of average daily net assets of 1.20% for Class IB shares and 0.95% for Class K shares of the Pac Global Portfolio. |
| | • | | Pursuant to a contract, FMG LLC has agreed to make payments or waive its management, administrative or other fees to limit the expenses of the AXA/Horizon Small Cap Value Portfolio through April 30, 2018 (unless the Board of Trustees consents to an earlier revision or termination of this arrangement), so that the annual operating expenses of the AXA/Horizon Small Cap Value Portfolio (exclusive of taxes, interest, brokerage commissions, dividend and interest expenses on securities sold short, capitalized expenses, fees and expenses of other investment companies and |
68
| | exchange-traded investment vehicles in which the Portfolio invests and extraordinary expenses) do not exceed an annual rate of average daily net assets of 1.15% for Class IB shares and 0.90% for Class K shares of the AXA/Horizon Small Cap Value Portfolio. |
| | • | | The Class IB shares of the AXA/Horizon Small Cap Value Portfolio and Pac Global Portfolio are each subject to a 0.25% Rule 12b-1 fee. |
| | • | | The Class IB shares of the AXA/Horizon Small Cap Value Portfolio underperformed compared to the Class IB shares of the Pac Global Portfolio for the one-year period ended December 31, 2016 and outperformed the Pac Global Portfolio for the period since inception. Please see “Comparative Performance Information” below. |
| | • | | Following the Reorganization, the combined Portfolio will be managed in accordance with the investment objective, policies and strategies of the AXA/Horizon Small Cap Value Portfolio. It is not expected that the AXA/Horizon Small Cap Value Portfolio will revise any of its investment policies following the Reorganization to reflect those of the Pac Global Portfolio. FMG LLC has reviewed the Pac Global Portfolio’s current portfolio holdings and determined that the holdings generally are compatible with the AXA/Horizon Small Cap Value Portfolio’s investment objective and policies. Thus, FMG LLC believes that, if the Reorganization is approved, all or a substantial portion of the holdings of the Pac Global Portfolio could be transferred to and held by the AXA/Horizon Small Cap Value Portfolio. However, it is expected that some of those holdings may not remain at the time of the Reorganization due to normal portfolio turnover. It is also expected that, if the Reorganization is approved, the holdings of the Pac Global Portfolio involved therein that are not compatible with the AXA/Horizon Small Cap Value Portfolio’s investment objective and policies will be liquidated in an orderly manner in connection with the Reorganization, and the proceeds of these sales held in temporary investments or reinvested in assets that are consistent with AXA/Horizon Small Cap Value Portfolio’s investment objective and policies. The portion of the Pac Global Portfolio’s assets that will be liquidated in connection with the Reorganization will depend on market conditions and on the assessment by FMG LLC of the compatibility of those holdings with the AXA/Horizon Small Cap Value Portfolio’s portfolio composition and investment objective and policies. The need for the Pac Global Portfolio to sell investments in connection with the Reorganization may result in its selling securities at a disadvantageous time and price and could result in its realizing gains (or losses) that would not otherwise have been realized and incurring transaction costs that would not otherwise have been incurred. The estimated percentage of the holdings of the Pac Global Portfolio that will be sold in connection with its Reorganization is 2.3%. The estimated portfolio transaction costs of the Reorganization of the Pac Global Portfolio are $44,505. These are estimated amounts and are subject to change. The actual amounts could be higher or lower depending on the factors outlined above. Contractholders will not recognize any gain or loss for federal income tax purposes as a result of the Reorganizations. |
| | • | | FMG LLC has voluntarily agreed to pay expenses of the Reorganization that exceed the Pac Global Portfolio’s expense limitation set forth in its expense limitation agreement. The Reorganization expenses for the Pac Global Portfolio, which are estimated to be $33,333, exceed the expense limit and will be paid by FMG LLC. |
Comparative Fee and Expense Tables
The following tables show the fees and expenses of the Class IB Shares and Class K Shares of the Pac Global Portfolio and the Class IB Shares and Class K Shares of the AXA/Horizon Small Cap Value Portfolio and the estimated pro forma fees and expenses of the Class IB Shares and Class K Shares of the AXA/Horizon Small Cap Value Portfolio after giving effect to the proposed Reorganization. Fees and expenses for each Portfolio are based on those incurred by the relevant class of its shares for the fiscal year ended December 31, 2016. The pro forma fees and expenses of the AXA/Horizon Small Cap Value Portfolio shares assume that the Reorganization was in effect for the year ended December 31, 2016. The tables below do not reflect any Contract-related fees and expenses, which would increase overall fees and expenses. See a Contract prospectus for a description of those fees and expenses.
69
Shareholder Fees
(fees paid directly from your investment)
| | | | |
Pac Global Portfolio | | AXA/Horizon Small Cap Value Portfolio | | Pro Forma AXA/Horizon Small
Cap Value Portfolio (assuming the
Reorganization is approved) |
| Not Applicable. | | Not Applicable. | | Not Applicable. |
Annual Operating Expenses
(expenses that you may pay each year as a percentage of the value of your investment)
| | | | | | | | | | | | | | | | | | | | | | | | |
| | | Pac Global Portfolio | | | AXA/Horizon Small Cap Value
Portfolio | | | Pro Forma AXA/Horizon Small
Cap Value Portfolio (assuming the
Reorganization is approved) | |
| | | Class IB | | | Class K | | | Class IB | | | Class K | | | Class IB | | | Class K | |
Management Fee | | | 0.80 | % | | | 0.80 | % | | | 0.80 | % | | | 0.80 | % | | | 0.80 | % | | | 0.80 | % |
Distribution and/or Service Fees (12b-1 fees) | | | 0.25 | % | | | 0.00 | % | | | 0.25 | % | | | 0.00 | % | | | 0.25 | % | | | 0.00 | % |
Other Expenses | | | 0.23 | % | | | 0.23 | % | | | 0.22 | % | | | 0.22 | % | | | 0.18 | % | | | 0.18 | % |
Acquired Fund Fees and Expenses | | | N/A | | | | N/A | | | | 0.01 | % | | | 0.01 | % | | | 0.01 | % | | | 0.01 | % |
Total Annual Portfolio Operating Expenses | | | 1.28 | % | | | 1.03 | % | | | 1.28 | % | | | 1.03 | % | | | 1.24 | % | | | 0.99 | % |
Fee Waiver and/or Expense Reimbursement†* | | | (0.08 | )% | | | (0.08 | )% | | | (0.12 | )% | | | (0.12 | )% | | | (0.08 | )% | | | (0.08 | )% |
Total Annual Portfolio Operating Expenses After Fee Waiver and/ or Expense Reimbursement | | | 1.20 | % | | | 0.95 | % | | | 1.16 | % | | | 0.91 | % | | | 1.16 | % | | | 0.91 | % |
| † | | Pursuant to a contract, FMG LLC has agreed to make payments or waive its management, administrative or other fees to limit the expenses of (1) the Pac Global Portfolio through April 30, 2017 (unless the Board of Trustees consents to an earlier revision or termination of this arrangement) so that the annual operating expenses (exclusive of taxes, interest, brokerage commissions, dividend and interest expenses on securities sold short, capitalized expenses, fees and expenses of other investment companies and exchange-traded investment vehicles in which the Portfolio invests and extraordinary expenses) do not exceed an annual rate of average daily net assets of 1.20% for Class IB shares and 0.95% for Class K shares of the Portfolio, and (2) the AXA/Horizon Small Cap Value Portfolio through April 30, 2018 (unless the Board of Trustees consents to an earlier revision or termination of this arrangement) so that the annual operating expenses of the Portfolio (exclusive of taxes, interest, brokerage commissions, dividend and interest expenses on securities sold short, capitalized expenses, fees and expenses of other investment companies and exchange-traded investment vehicles in which the Portfolio invests and extraordinary expenses) do not exceed an annual rate of average daily net assets of 1.15% for Class IB shares and 0.90% for Class K shares of the Portfolio. |
| * | | Fee Waiver and/or Expense Reimbursement information has been restated to reflect the current expense limitation arrangement noted above. |
Example of Portfolio Expenses
This example is intended to help you compare the costs of investing in the Portfolios with the cost of investing in other investment options. The example assumes that:
| | • | | You invest $10,000 in a Portfolio for the time periods indicated; |
| | • | | Your investment has a 5% return each year; |
| | • | | The Portfolio’s operating expenses remain the same; and |
| | • | | The Expense Limitation Arrangement with respect to the Portfolios is not renewed. |
70
This example does not reflect any Contract-related fees and expenses, including redemption fees (if any) at the Contract level. If such fees and expenses were reflected, the total expenses would be higher. Although your actual costs may be higher or lower, based on these assumptions your costs would be:
| | | | | | | | | | | | | | | | |
| | | 1 Year | | | 3 Years | | | 5 Years | | | 10 Years | |
Pac Global Portfolio | | | | | | | | | | | | | | | | |
Class IB | | $ | 122 | | | $ | 398 | | | $ | 695 | | | $ | 1,538 | |
Class K | | $ | 97 | | | $ | 320 | | | $ | 561 | | | $ | 1,252 | |
AXA/Horizon Small Cap Value Portfolio | | | | | | | | | | | | | | | | |
Class IB | | $ | 118 | | | $ | 394 | | | $ | 691 | | | $ | 1,535 | |
Class K | | $ | 93 | | | $ | 316 | | | $ | 557 | | | $ | 1,249 | |
Pro Forma AXA/Horizon Small Cap Value Portfolio (assuming the Reorganization is approved) | | | | | | | | | | | | | | | | |
Class IB | | $ | 118 | | | $ | 386 | | | $ | 673 | | | $ | 1,493 | |
Class K | | $ | 93 | | | $ | 307 | | | $ | 539 | | | $ | 1,206 | |
Portfolio Turnover
Each Portfolio pays transaction costs, such as commissions, when it buys and sells securities (or “turns over” its portfolio). A higher portfolio turnover rate may indicate higher transaction costs. These costs, which are not reflected in annual fund operating expenses or in the example, affect a Portfolio’s performance. During the fiscal year ended December 31, 2016, the portfolio turnover rates for each of the Pac Global Portfolio and the AXA/Horizon Small Cap Value Portfolio were 26% and 23%, respectively, of the average value of each Portfolio.
Comparison of Investment Objectives, Policies and Strategies
The following table compares the investment objectives and principal investment policies and strategies of the Pac Global Portfolio with those of the AXA/Horizon Small Cap Value Portfolio. The Board of each Trust may change the investment objective of a respective Portfolio without a vote of that Portfolio’s shareholders. For more detailed information about each Portfolio’s investment strategies and risks, see Appendix B.
| | |
Acquiring Portfolio | | Acquired Portfolio |
AXA/Horizon Small Cap Value Portfolio | | Pac Global Portfolio |
| Investment Objective | | Investment Objective |
| |
| Seeks to achieve long-term growth of capital. | | Seeks to achieve long-term growth of capital. |
| |
| Principal Investment Strategies | | Principal Investment Strategies |
| |
| Under normal circumstances, the Portfolio invests at least 80% of its net assets, plus borrowings for investment purposes, in securities of companies with small market capitalizations (or other financial instruments that derive their value from the securities of such companies). | | Same. |
| |
| For purposes of this Portfolio, small market capitalization companies are those companies with market capitalizations within the range of companies in the Russell 2000® Index (“Russell 2000”) at the time of investment (as of December 31, 2016, the market capitalization of the companies in the Russell 2000 was between $21.1 million and $10.5 billion). The size of companies in the Russell 2000 changes with market conditions, which can result in changes to the market capitalization range of companies in the index. | | Same. |
| |
| The Portfolio intends to invest primarily in common stocks, but it may also invest in other securities that a Sub-Adviser believes provide opportunities for capital growth. The Portfolio may invest up to 20% of its assets in foreign securities, including securities of companies based in developing countries and depositary receipts of foreign-based companies. | | Same. |
71
| | |
Acquiring Portfolio | | Acquired Portfolio |
AXA/Horizon Small Cap Value Portfolio | | Pac Global Portfolio |
| The Portfolio’s assets normally are allocated among two or more investment managers, each of which manages its portion of the Portfolio using a different but complementary investment strategy. | | Same. |
| |
| One portion of the Portfolio is actively managed (“Active Allocated Portion”) and one portion of the Portfolio seeks to track the performance of a particular index (“Index Allocated Portion”). | | Same. |
| |
| Under normal circumstances, the Active Allocated Portion consists of approximately 50% of the Portfolio’s net assets and the Index Allocated Portion consists of approximately 50% of the Portfolio’s net assets. | | Same. |
| |
| The Sub-Adviser to the Active Allocated Portion of the Portfolio believes that favorable investment opportunities are available through companies that exhibit a number of the following characteristics: are selling below their perceived intrinsic value, have limited or no institutional ownership, have had short-term earnings shortfalls, have had a recent initial public offering but have not attracted significant analyst coverage, are selling at or below book or replacement value, and have price to earnings ratios that are less than one half of their projected growth rate. | | The Active Allocated Portion of the Portfolio typically invests in companies that are at the time of purchase, within the range of companies in the Russell 2000, and generally invests a significant portion of its assets in companies with market capitalizations that are, at the time of purchase, not greater than the highest market capitalization of companies in the Russell Microcap® Index which are often referred to as “microcap stocks”). |
| |
| The Sub-Adviser focuses on undervalued and special situation small capitalization equities (including common stocks, convertible securities, warrants and other equity securities having the characteristics of common stocks, such as depositary receipts) that the Sub-Adviser believes have the potential for rewarding long-term investment results. | | The Sub-Adviser to the Active Allocated Portion follows a value-based investment approach focusing on the long-term market cycle to select investments. |
| |
| The Sub-Adviser also may invest in exchange traded funds (“ETFs”) and may invest in convertible and nonconvertible debt securities rated below investment grade (also known as “junk bonds”) or unrated securities that the Sub-Adviser has determined to be of comparable quality. | | None. |
| |
| The Sub-Adviser selects securities from companies that are engaged in a number of industries, including the media, financial services, retailing, manufacturing and consumer products, and utilities industries. The Sub-Adviser considers a company’s fundamentals by reviewing its balance sheets, corporate revenues, earnings and dividends. The Sub-Adviser also looks at the amount of capital a company spends on research and development. | | The Sub-Adviser to the Active Allocated Portion attempts to identify growing companies with unique or proprietary advantages in their industries and strong potential for earnings growth. |
| |
| Sell decisions are generally triggered by either adequate value being achieved, as determined by the Sub- Adviser, or by an adverse change in a company’s operating performance or a deterioration of the company’s business model. A sell trigger also may occur if the Sub-Adviser discovers a new investment opportunity that it believes is more compelling and represents a better risk reward profile than other investments held by the Active Allocated Portion. The Active Allocated Portion may engage in active and frequent trading to achieve the Portfolio’s investment objective. | | None. |
| |
| The Index Allocated Portion of the Portfolio seeks to track the performance (before fees and expenses) of the Russell 2000® Value Index with minimal tracking error. This strategy is commonly referred to as an indexing strategy. The Index Allocated Portion may use a full replication technique or a sampling approach in pursuing its indexing strategy. | | Same. |
| |
| The Portfolio also may lend its portfolio securities to earn additional income. | | Same. |
72
Comparison of Principal Risk Factors
An investment in a Portfolio is not a deposit of a bank and is not insured or guaranteed by the Federal Deposit Insurance Corporation or any other government agency. You may lose money by investing in a Portfolio. The following table compares the principal risks of an investment in each Portfolio. For an explanation of each such risk, see “Additional Information about the Reorganizations — Descriptions of Risk Factors” below.
| | | | | | | | |
Risks | | AXA/Horizon Small Cap Value Portfolio | | | Pac Global Portfolio | |
ETF risk | | | X | | | | | |
Equity Risk | | | X | | | | X | |
Foreign Securities Risk | | | X | | | | X | |
Currency Risk | | | X | | | | X | |
Depository Receipts Risk | | | X | | | | X | |
Emerging Markets Risk | | | X | | | | X | |
Indexed Strategy Risk | | | X | | | | X | |
Investment Style Risk | | | X | | | | X | |
Multiple Adviser Risk | | | X | | | | X | |
Non-Investment Grade Securities Risk | | | X | | | | | |
Portfolio Turnover Risk | | | X | | | | X | |
Securities Lending Risk | | | X | | | | X | |
Small-Cap Company Risk | | | X | | | | | |
Small-cap and Micro-Cap Company Risk | | | | | | | X | |
Special Situations Risk | | | X | | | | | |
Comparative Performance Information
The bar charts and tables below provide some indication of the risks of investing in each Portfolio by showing changes in the Portfolio’s performance from year to year and by showing how each Portfolio’s average annual total returns for one year and since inception through December 31, 2016 compared to the returns of a broad-based market index. The return of the broad-based market index (and any additional comparative index) shown in the right hand columns below for each Portfolio is the return of the index since inception of the share class with the longest history. Past performance is not an indication of future performance.
The performance results do not reflect any Contract-related fees and expenses, which would reduce the performance results.
Pac Global Portfolio - Calendar Year Total Returns (Class IB)
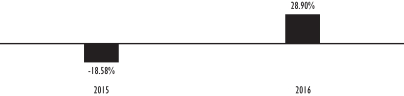
| | |
Best quarter (% and time period) 15.66% (2016 4th Quarter) | | Worst quarter (% and time period)
-15.93% (2015 3rd Quarter) |
73
AXA/Horizon Small Cap Value Portfolio - Calendar Year Total Returns (Class IB)
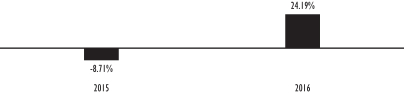
| | |
Best quarter (% and time period) 9.81% (2016 4th quarter) | | Worst quarter (% and time period)
-12.47% (2015 3rd Quarter) |
Pac Global Portfolio Average Annual Total Returns
(For the periods ended December 31, 2016)
| | | | | | | | |
| | | One Year | | | Since
Inception | |
AXA/Pacific Global Small Cap Value Portfolio — Class IB Shares (Inception Date: April 21, 2014) | | | 28.90% | | | | -1.28% | |
Russell 2000® Value Index (reflects no deduction for fees, expenses, or taxes) | | | 31.74% | | | | 9.25% | |
AXA/Horizon Small Cap Value Portfolio Average Annual Total Returns (For the periods ended December 31, 2016)
| | | | | | | | |
| | | One Year | | | Since
Inception | |
AXA/Horizon Small Cap Value — Class IB Shares (Inception Date: April 21, 2014) | | | 24.19% | | | | 5.04% | |
Russell 2000 Value Index (reflects no deduction for fees, expenses, or taxes) | | | 31.74% | | | | 9.25% | |
Capitalization
The following table shows the capitalization of each Portfolio as of December 31, 2016 and of the AXA/Horizon Small Cap Value Portfolio on a pro forma combined basis as of December 31, 2016, after giving effect to the proposed Reorganization. Pro forma net assets may not total and net asset values per share may not recalculate due to rounding of net assets.
| | | | | | | | | | | | |
| | | Net Assets
(in millions) | | | Net Asset Value
Per Share | | | Shares
Outstanding | |
AXA/Pacific Global Small Cap Value Portfolio — Class IB Shares | | $ | 0.5 | | | $ | 9.18 | | | | 55,631 | |
AXA/Horizon Small Cap Value Portfolio — Class IB Shares | | $ | 0.4 | | | $ | 9.84 | | | | 42,423 | |
Adjustments | | | — | | | | — | | | | (3,750 | ) |
Pro forma AXA/DoubleLine Opportunistic Core Plus Bond Portfolio — Class IB Shares (assuming the Reorganization is approved) | | $ | 0.9 | | | $ | 9.84 | | | | 94,304 | |
AXA/Pacific Global Small Cap Value Portfolio — Class K Shares | | $ | 161.4 | | | $ | 9.17 | | | | 17,604,560 | |
AXA/Horizon Small Cap Value Portfolio — Class K Shares | | $ | 173.3 | | | $ | 9.83 | | | | 17,621,220 | |
Adjustments | | | — | | | | — | | | | (1,184,936 | ) |
Pro forma AXA/DoubleLine Opportunistic Core Plus Bond Portfolio — Class IB Shares (assuming the Reorganization is approved) | | $ | 334.7 | | | $ | 9.83 | | | | 34,040,844 | |
AFTER CAREFUL CONSIDERATION, THE BOARD OF VIP TRUST UNANIMOUSLY APPROVED THE REORGANIZATION PLAN WITH RESPECT TO THE PAC GLOBAL PORTFOLIO. ACCORDINGLY, THE BOARD HAS SUBMITTED THE REORGANIZATION PLAN FOR APPROVAL BY THIS PORTFOLIO’S SHAREHOLDERS. THE BOARD RECOMMENDS THAT YOU VOTE “FOR” PROPOSAL 5.
74
ADDITIONAL INFORMATION ABOUT THE REORGANIZATIONS
Terms of the Agreements and/or Plans of Reorganization
The terms and conditions under which the Reorganizations would be completed are contained in the Reorganization Plan. The following is a summary of the Reorganization Plans. For additional information, please refer to the copies of the forms of the Reorganization Plans, which are attached to this Combined Proxy Statement/Prospectus as Appendix A.
Each Reorganization will involve the Acquiring Portfolio acquiring all the assets of the corresponding Acquired Portfolio in exchange solely for Acquiring Portfolio Shares and the Acquiring Portfolio’s assumption of all of the Acquired Portfolio’s liabilities. Each Reorganization Plan further provides that, on or as promptly as reasonably practicable after the Closing Date, each Acquired Portfolio will distribute the Acquiring Portfolio Shares it receives in its Reorganization to its shareholders (for the benefit of the Separate Accounts, as applicable, and thus the Contractholders). The number of full and fractional Acquiring Portfolio Shares each shareholder will receive will be equal in net asset value (as determined in accordance with the Trusts’ normal valuation procedures), as of immediately after the close of business (generally 4:00 p.m., Eastern time) on the Closing Date, to the Acquired Portfolio Shares the shareholder holds at that time. After that distribution to an Acquired Portfolio’s shareholders, the applicable Trust, on behalf of the Acquired Portfolio, will take all necessary steps under its Agreement and Declaration of Trust, as amended (the “Declaration of Trust”), and Delaware and any other applicable law to effect a complete termination of the Acquired Portfolio.
The Board of a Portfolio involved in a Reorganization may terminate or delay a Reorganization Plan with respect to, and abandon or postpone, the Reorganization at any time prior to the Closing Date, before or after approval by the relevant Acquired Portfolio’s shareholders, if circumstances develop that, in the Board’s opinion, make proceeding with a Reorganization inadvisable for a Portfolio. The consummation of each Reorganization also is subject to various conditions, including approval of the Reorganization by the applicable Acquired Portfolio’s shareholders, completion of all filings with, and receipt of all necessary approvals, if any, from the SEC, and other customary corporate and securities matters. Subject to the satisfaction of those conditions, each Reorganization will take place immediately after the close of business on its Closing Date.
The Board of each Acquired Portfolio, including the Trustees who are not “interested persons” (as defined in the Investment Company Act of 1940, as amended (the “1940 Act”)) of the relevant Trust (the “Independent Trustees”), has determined, with respect to each Acquired Portfolio, that the interests of the Acquired Portfolio’s existing shareholders will not be diluted as a result of the Reorganization and that participation in the Reorganization is in the best interests of the Acquired Portfolio. Similarly, the Board of each Acquiring Portfolio, including the Independent Trustees, has determined, with respect to each Acquiring Portfolio, that the interests of the Acquiring Portfolio’s existing shareholders will not be diluted as a result of the Reorganization and that the participation in the Reorganization is in the best interests of the Acquiring Portfolio.
The Acquired Portfolios involved in a Reorganization will bear the expenses of each Reorganization described in this Combined Proxy Statement/Prospectus. However, FMG LLC has voluntarily agreed to pay expenses of each Reorganization that exceed the Portfolio’s expense limitation set forth in its expense limitation agreement.
Approval of the Reorganization Plan with respect to an Acquired Portfolio will require a majority vote of that Acquired Portfolio’s shareholders. Such majority is defined in the 1940 Act as the lesser of (1) 67% or more of the voting securities of the Acquired Portfolio present at a meeting, if the holders of more than 50% of its outstanding voting securities are present or represented by proxy, or (2) more than 50% of its outstanding voting securities. If the Reorganization Plan is not approved by an Acquired Portfolio’s shareholders or a Reorganization is not consummated for any other reason, the Board of the Acquired Portfolio will consider other possible courses of action. Please see “Voting Information” below for more information.
75
Description of the Securities to Be Issued
The shareholders of each Acquired Portfolio will receive Class IB, Class K, or Class B shares of the corresponding Acquiring Portfolio in accordance with the procedures provided for in the applicable Reorganization Plan. Each such share will be fully paid and non-assessable by the relevant Trust, as appropriate, when issued and will have no preemptive or conversion rights.
Each Acquiring Portfolio is a series of VIP Trust or EQ Trust, as applicable. The Trusts may issue an unlimited number of authorized shares of beneficial interest, par value $0.001 per share. The Second Amended and Restated Agreement and Declaration of Trust of EQ Trust (the “EQ Trust DoT”) and the Agreement and Declaration of Trust of VIP Trust (the “VIP Trust DoT”) authorize each respective Board to issue shares in different series and classes. In addition, the EQ Trust DoT and VIP Trust DoT authorize each respective Board to create new series and to name the rights and preferences of the shareholders of each series. Each respective Board does not need additional shareholder action to divide the shares into separate series or classes or to name the shareholders’ rights and preferences.
EQ Trust currently offers three classes of shares of All Asset Growth-Alt 20 Portfolio — Class IA, Class IB and Class K shares, and two classes of shares of AXA/DoubleLine Opportunistic Core Plus Bond Portfolio, EQ/PIMCO Global Real Return Portfolio, and AXA/Horizon Small Cap Value Portfolio — Class IB and Class K shares. VIP Trust currently offers one class of shares of CharterSM Moderate Portfolio — Class B shares.
Each Trust has adopted, in the manner prescribed under Rule 12b-1 under the 1940 Act, a plan of distribution pertaining to the Class IA, Class IB, and Class B shares of the Acquiring Portfolios, as applicable. The maximum distribution and/or service (12b-1) fee for each Acquiring Portfolio’s Class IA, Class IB, and Class B shares is equal to an annual rate of 0.25% of the average daily net assets attributable to such share class. Because these distribution/service fees are paid out of each Acquiring Portfolio’s assets on an ongoing basis, over time these fees will increase your cost of investing and may cost more than paying other types of charges. The Class IA shares of the Acquiring Portfolios are not subject to the Reorganizations.
Board Considerations
Acquired Portfolios of EQ Trust. At a meeting of the Board of the EQ Trust held on November 30-December 1, 2016, FMG LLC recommended that: (1) each of All Asset Aggressive-Alt 25 Portfolio (“Alt 25 Portfolio”), All Asset Aggressive-Alt 50 Portfolio (“Alt 50 Portfolio”), and All Asset Aggressive-Alt 75 Portfolio (“Alt 75 Portfolio”), each a series of EQ Trust, be reorganized into the All Asset Growth-Alt 20 Portfolio, also a series of EQ Trust; and (2) the Pacific Global Small Cap Value Portfolio (“Pac Global”), a series of EQ Trust, be reorganized into the AXA/Horizon Small Cap Value Portfolio, also a series of EQ Trust.
FMG LLC noted that, in addition to regularly evaluating the performance of each portfolio of EQ Trust, it continually reviews the overall line-up of investment options and conducts in-depth analysis of its entire fund complex to provide recommendations to the Board to strengthen the fund complex’s line-up. FMG LLC stated that it was recommending the Reorganizations to streamline and strengthen the fund complex’s line-up and to address certain other developments with respect to each Acquired Portfolio, including the failure of each Acquired Portfolio to attract sufficient Contractholder interest and thus achieve a more sustainable asset base as well as prospects for future growth.
FMG LLC noted that each Acquired Portfolio has a similar investment objective as its corresponding Acquiring Portfolio. FMG LLC also noted that: (1) each of the Alt 25 Portfolio, Alt 50 Portfolio, and Alt 75 Portfolio provides diversified exposure to equity securities, fixed income securities, and alternative investments through investments in other mutual funds managed by FMG LLC and exchange-traded funds, similar to the All Asset Growth- Alt 20 Portfolio; and (2) Pac Global provides exposure to securities of companies with small market capitalizations and is structured so that approximately 50% of its assets are actively managed by a sub-adviser and approximately 50% of its assets are allocated to a passive sub-adviser that seeks to track the performance of the Russell 2000 Value Index, similar to the AXA/Horizon Small Cap Value Portfolio. FMG LLC noted that, given each Acquired Portfolio’s failure to attract sufficient Contractholder interest as well as limited prospects
76
for future growth, FMG LLC believes that it would be appropriate to reorganize each Acquired Portfolio into its corresponding Acquiring Portfolio. FMG LLC also noted that it believes the Reorganizations would be beneficial to the shareholders invested in the Acquired Portfolios because the Reorganizations would provide a means by which Contractholders with amounts allocated to an Acquired Portfolio could pursue a similar investment objective in the context of a larger fund with better growth prospects and lower expenses.
In determining whether to approve the Reorganization Plan with respect to each Acquired Portfolio and recommend its approval to shareholders, the Board, including the Independent Trustees, with the advice and assistance of independent legal counsel, inquired into a number of matters and considered the following factors, among others: (1) the potential benefits of each Reorganization to shareholders, including estimated lower total annual operating expenses (including acquired fund fees and expenses) for the fiscal year following the Reorganization by reorganizing each Acquired Portfolio into a corresponding Acquiring Portfolio with lower total annual operating expenses (including acquired fund fees and expenses) than each Acquired Portfolio and greater potential to increase assets and thereby realize economies of scale in the Portfolio’s expenses and portfolio management fees as a result of asset growth; (2) comparisons of each Acquired Portfolio’s and Acquiring Portfolio’s investment objectives, policies, strategies, restrictions, and risks; (3) the experience and qualifications of the Manager and key personnel managing each Acquiring Portfolio; (4) the effect of the Reorganization on an Acquired Portfolio’s annual operating expenses and shareholder fees and services, including a comparison of each Acquired Portfolio’s and its corresponding Acquiring Portfolio’s management fee and administration fee; (5) the relative historical performance records of the Portfolios; (6) any change in shareholder rights; (7) the direct or indirect federal income tax consequences of the Reorganizations to shareholders and Contractholders; (8) any fees or expenses that will be borne directly or indirectly by an Acquired Portfolio in connection with its respective Reorganization; (9) the terms and conditions of the Reorganization Plan and whether a Reorganization would result in dilution of shareholder interests; (10) the potential benefits of the Reorganizations to other persons, including FMG LLC and its affiliates, as discussed below in the section entitled “Potential Benefits of the Reorganizations to FMG LLC and its Affiliates” and (11) possible alternatives to the Reorganizations, including the potential benefits and detriments of maintaining the current structure.
In connection with the Board’s consideration of the proposed Reorganizations, FMG LLC provided to the Board information regarding the factors set forth above as well as other information relating to the Reorganizations.
In reaching the decision to recommend approval of the Reorganizations, the Board, including the Independent Trustees, concluded that each Acquired Portfolio’s participation in its respective Reorganization is in its best interests and that the interests of existing shareholders of the Acquired Portfolios would not be diluted as a result of the Reorganizations. The Board of the EQ Trust’s conclusion was based on a number of factors, including the following:
| | • | | The Reorganizations will permit shareholders invested in each Acquired Portfolio to allocate amounts to a larger combined Portfolio that pursues an identical or similar investment objective, provides comparable exposure to the same or similar asset classes and/or strategies, and has better prospects for attracting additional assets and realizing a lower total annual operating expense ratio than the relevant Acquired Portfolio (including acquired fund fees and expenses). |
| | • | | The total annual operating expense ratios for the Class IB and Class K shares of each Acquiring Portfolio are expected to be lower than those of the corresponding classes of shares of the corresponding Acquired Portfolio for the last fiscal year (restated to reflect current fees). |
| | • | | Each Portfolio is subject to an expense limitation agreement and in each case the expense limitation for the Acquiring Portfolio’s Class IB or Class K shares is the same as or lower than that for the corresponding Acquired Portfolio’s Class IB or Class K shares. |
| | • | | Following the Reorganizations, FMG LLC will continue to serve as the investment manager and administrator of each Acquiring Portfolio. |
77
| | • | | As a result of each Reorganization, each shareholder of Class IB and Class K shares of an Acquired Portfolio would hold, immediately after the Closing Date, Class IB or Class K shares, respectively, of the Acquiring Portfolio having an aggregate value equal to the aggregate value of the Acquired Portfolio shares that such shareholder holds as of the Closing Date. |
| | • | | Each Reorganization will be effected on the basis of each participating Portfolio’s net asset value, which will be determined in connection with each Reorganization in accordance with EQ Trust’s normal valuation procedures, which are identical for all of the Portfolios. |
| | • | | Shareholders will not pay sales charges in connection with the Reorganizations. |
| | • | | The Reorganizations are not expected to have any adverse tax results to Contractholders, as discussed further below under “Additional Information about the Reorganizations — Federal Income Tax Consequences of the Reorganizations.” |
| | • | | Each Portfolio has identical distribution, purchase and redemption procedures and identical exchange rights. |
| | • | | Any costs to the Acquired Portfolio in repositioning its portfolio in anticipation of the Reorganizations is expected to be de-minimis. |
| | • | | Potential conflicts of interest of FMG LLC in proposing the Reorganizations, as discussed further below under “Potential Benefits of the Reorganizations to FMG LLC and its Affiliates.” |
| | • | | The Acquired Portfolio involved in each Reorganization will bear the expenses of the Reorganization. However, FMG LLC has voluntarily agreed to pay expenses of each Reorganization that exceed an Acquired Portfolio’s expense limitation set forth in its expense limitation agreement. |
On the basis of the information provided to it and its evaluation of that information, the Board of the EQ Trust, including the Independent Trustees, voted unanimously to approve the Reorganization Plan and to recommend that the shareholders of each Acquired Portfolio also approve, respectively, the Reorganization Plan.
Acquired Portfolios of VIP Trust. At a meeting of the Board of the VIP Trust held on December 5, 2016, FMG LLC recommended that the: (1) CharterSM Alternative 100 Moderate Portfolio (“Alternative 100 Moderate Portfolio”), a series of VIP Trust, be reorganized into the All Asset Growth- Alt 20 Portfolio, a series of EQ Advisors Trust (“EQ Trust”); (2) the CharterSM Income Strategies Portfolio (“Income Strategies Portfolio”) and CharterSM Interest Rate Strategies Portfolio (“Interest Rate Strategies Portfolio”), each a series of VIP Trust, be reorganized into the AXA/DoubleLine Opportunistic Core Plus Bond Portfolio, a series of EQ Trust; (3) the CharterSM International Moderate Portfolio (“International Moderate Portfolio”), a series of VIP Trust, be reorganized into the CharterSM Moderate Portfolio (“Moderate Portfolio”), also a series of VIP Trust; and (4) the CharterSM Real Assets Portfolio (“Real Assets Portfolio”), a series of VIP Trust, be reorganized into the EQ/PIMCO Global Real Return Portfolio, a series of EQ Trust.
FMG LLC noted that, in addition to regularly evaluating the performance of each portfolio of the VIP Trust, it continually reviews the overall line-up of investment options and conducts in-depth analysis of its entire fund complex to provide recommendations to the Board to strengthen the fund complex’s line-up. FMG LLC stated that it was recommending the Reorganizations to streamline and strengthen the VIP Trust’s line-up and to address certain other developments with respect to each Acquired Portfolio, including the failure of each Acquired Portfolio to attract sufficient Contractholder interest and thus achieve a more sustainable asset base as well as prospects for future growth.
FMG LLC noted that each Acquired Portfolio has a similar investment objective as its corresponding Acquiring Portfolio. FMG LLC also noted that the Alternative 100 Moderate Portfolio and All Asset Growth- Alt 20 Portfolio provide exposure to various asset categories and strategies including alternative investments through investments in other mutual funds managed by FMG LLC and exchange-traded funds; that the Real Assets Portfolio and EQ/PIMCO Global Real Return Portfolio seek to maximum real return by investing in assets that are affected directly or indirectly by the level of and changes in the rate of inflation and, therefore, provide real
78
returns; that the Income Strategies, Income Rate Strategies Portfolio, and AXA/DoubleLine Opportunistic Core Plus Bond Portfolio provide diversified exposure to fixed income securities; and that the International Moderate Portfolio and Moderate Portfolio provide diversified exposure to equity securities, fixed income securities, and alternative investments through investments in other mutual funds managed by FMG LLC and exchange-traded funds. FMG LLC noted that, given each Acquired Portfolio’s failure to attract sufficient Contractholder interest as well as limited prospects for future growth, FMG LLC believes it would be appropriate to reorganize each Acquired Portfolio into the corresponding Acquiring Portfolio. FMG LLC also noted that it believes the Reorganizations would be beneficial to the shareholders invested in the Acquired Portfolios because the Reorganizations would provide a means by which Contractholders with amounts allocated to an Acquired Portfolio could pursue a similar investment objective in the context of a larger fund with better growth prospects and lower expenses.
In determining whether to approve the Reorganization Plan with respect to each Acquired Portfolio and recommend its approval to shareholders, the Board of the VIP Trust, including the Independent Trustees, with the advice and assistance of independent legal counsel, inquired into a number of matters and considered the following factors, among others: (1) the potential benefits of each Reorganization to shareholders, including estimated lower total annual operating expenses (including acquired fund fees and expenses) for the fiscal year following the Reorganization by reorganizing each Acquired Portfolio into a corresponding Acquiring Portfolio with lower total annual operating expenses (including acquired fund fees and expenses) (with the exception of the Reorganization of the International Moderate Portfolio into the Moderate Portfolio which is estimated to have the same total annual operating expense (including acquired fund fees and expenses), and greater potential to increase assets and thereby realize economies of scale in the Portfolio’s expenses and portfolio management fees as a result of asset growth; (2) comparisons of each Acquired Portfolio’s and its corresponding Acquiring Portfolio’s investment objectives, policies, strategies, restrictions, and risks; (3) the experience and qualifications of the Manager and key personnel managing each Acquiring Portfolio; (4) the effect of the Reorganization on an Acquired Portfolio’s annual operating expenses and shareholder fees and services, including a comparison of each Acquired Portfolio’s and its corresponding Acquiring Portfolio’s management fee and administration fee; (5) the relative historical performance records of the Portfolios; (6) any change in shareholder rights; (7) the direct or indirect federal income tax consequences of the Reorganizations to shareholders and Contractholders; (8) any fees or expenses that will be borne directly or indirectly by an Acquired Portfolio in connection with its respective Reorganization; (9) the terms and conditions of the Reorganization Plan and whether a Reorganization would result in dilution of shareholder interests; (10) the potential benefits of the Reorganizations to other persons, including FMG LLC and its affiliates, as discussed below in the section entitled “Potential Benefits of the Reorganizations to FMG LLC and its Affiliates” and (11) possible alternatives to the Reorganizations, including the potential benefits and detriments of maintaining the current structure.
In connection with the Board’s consideration of the proposed Reorganizations, the Independent Trustees requested, and FMG LLC provided to the Board, information regarding the factors set forth above as well as other information relating to the Reorganizations.
In reaching the decision to recommend approval of the Reorganizations, the Board, including the Independent Trustees, concluded that each Acquired Portfolio’s participation in its respective Reorganization is in its best interests and that the interests of existing shareholders of the Acquired Portfolio would not be diluted as a result of the Reorganizations. The Board’s conclusion was based on a number of factors, including the following:
| | • | | The Reorganizations will permit shareholders invested in each Acquired Portfolio to allocate amounts to a larger combined Portfolio that pursues an identical or similar investment objective, provides comparable exposure to the same or similar asset classes and/or strategies, and has better prospects for attracting additional assets and realizing a lower total annual operating expense ratio than the relevant Acquired Portfolio (including acquired fund fees and expenses). |
| | • | | The total annual operating expense ratios for the Class IB or Class B shares, as appropriate, of an Acquiring Portfolio are expected to be the same as, or lower than, those of the corresponding class of shares of an Acquired Portfolio for the last fiscal year (restated to reflect current fees). |
79
| | • | | Each Portfolio is subject to an expense limitation agreement and in each case the expense limitation for the Acquiring Portfolio’s Class IB or Class B shares is the same as or lower than that for the corresponding Acquired Portfolio’s Class B shares. |
| | • | | Following the Reorganizations, FMG LLC will continue to serve as the investment manager and administrator of each Acquiring Portfolio. |
| | • | | As a result of the Reorganization, each shareholder of Class B shares of an Acquired Portfolio would hold, immediately after the Closing Date, Class IB or Class B shares, as appropriate, of the corresponding Acquiring Portfolio having an aggregate value equal to the aggregate value of the Acquired Portfolio shares that such shareholder holds as of the Closing Date. |
| | • | | Each Reorganization will be effected on the basis of each participating Portfolio’s net asset value, which will be determined in connection with each Reorganization in accordance with each Trust’s normal valuation procedures, as applicable, which are identical for all of the Portfolios. |
| | • | | Shareholders will not pay sales charges in connection with the Reorganizations. |
| | • | | The Reorganizations are not expected to have any adverse tax results to Contractholders, as discussed further below under “Additional Information about the Reorganizations — Federal Income Tax Consequences of the Reorganizations.” |
| | • | | Each Portfolio has identical distribution, purchase and redemption procedures and identical exchange rights. |
| | • | | Any costs to the Acquired Portfolio in repositioning its portfolio in anticipation of the Reorganizations is expected to be de-minimus. |
| | • | | Potential conflicts of interest of FMG LLC in proposing the Reorganizations, as discussed further below under “Potential Benefits of the Reorganizations to FMG LLC and its Affiliates.” |
| | • | | The Acquired Portfolio involved in each Reorganization will bear the expenses of the Reorganization. However, FMG LLC has voluntarily agreed to pay expenses of each Reorganization that exceed an Acquired Portfolio’s expense limitation set forth in its expense limitation agreement. |
On the basis of the information provided to it and its evaluation of that information, the Board of the VIP Trust, including the Independent Trustees, voted unanimously to approve each Reorganization Plan and to recommend that the shareholders of each Acquired Portfolio also approve, respectively, the Reorganization Plan.
Potential Benefits of the Reorganizations to FMG LLC and its Affiliates
FMG LLC may realize benefits in connection with the Reorganizations. For example, the profitability from the fees payable to FMG LLC by an Acquiring Portfolio may be higher than the profits derived from the fees paid by the corresponding Acquired Portfolio. FMG LLC may further benefit to the extent a Reorganization would eliminate or reduce FMG LLC’s obligations under an expense limitation arrangement currently in effect for an Acquired Portfolio by reorganizing the Acquired Portfolio into a corresponding Acquiring Portfolio which is operating below its expense limitation or has a lower total expense ratio. In addition, in certain cases, FMG LLC owns a significant amount of shares of the Acquired or Acquiring Portfolios representing investment of seed money by FMG LLC to facilitate the operations of an Acquired or Acquiring Portfolio. A Reorganization may increase the size of a Portfolio such that FMG LLC could redeem shares that it holds in a Portfolio representing such seed money investments. Redeeming seed money from an Acquired or Acquiring Portfolio may enable FMG LLC to reduce its costs associated with providing seed capital and/or use the proceeds to provide seed money for other funds and products that it manages or is developing or realize other benefits. Furthermore, FMG is expected to experience and benefit from a number of efficiencies associated with the streamlining of the fund family. In considering whether to approve the proposed Reorganizations, the Boards recognized these potential benefits to and conflicts of interest of FMG LLC and its affiliates, and concluded that the potential benefits of the proposed Reorganizations, including achieving lower or the same total operating expenses with improved prospects for attracting additional assets and lowering expenses, supported a decision to approve the Reorganizations.
80
Descriptions of Risk Factors
A Portfolio’s performance may be affected by one or more of the following risks, which are described in detail in Appendix B “More Information on Strategies and Risk Factors.”
| | | | | | | | | | |
Risks | | Alt 25 Portfolio | | Alt 50 Portfolio | | Alt 75 Portfolio | | Alternative 100
Moderate
Portfolio | | All Asset
Growth-Alt
20 Portfolio |
Affiliated Portfolio Risk | | X | | X | | X | | X | | X |
Alternative Investment Risk | | X | | X | | X | | | | X |
Commodity Price Volatility Risk | | X | | X | | X | | | | X |
Commodity Risk | | | | | | | | X | | |
Convertible Securities Risk | | X | | X | | X | | X | | X |
Credit Risk | | X | | X | | X | | X | | X |
Derivatives Risk | | | | | | | | X | | |
Energy Sector Risk | | X | | X | | X | | | | X |
Equity Risk | | X | | X | | X | | X | | X |
Floating Rate Loan Risk | | | | | | | | | | |
Foreign Securities Risk | | X | | X | | X | | X | | X |
Currency Risk | | X | | X | | X | | X | | X |
Depositary Receipts Risk | | X | | X | | X | | | | X |
Emerging Markets Risk | | X | | X | | X | | X | | X |
Futures Contract Risk | | | | | | | | X | | |
Infrastructure Sector Risk | | X | | X | | X | | X | | X |
Interest Rate Risk | | X | | X | | X | | X | | X |
Investment Grade Securities Risk | | X | | X | | X | | X | | X |
Large-Cap Company Risk | | X | | X | | X | | X | | X |
Leveraging Risk | | | | | | | | X | | |
Listed Private Equity Company Risk | | | | | | | | X | | |
Market Risk | | | | | | | | X | | |
Mid-Cap and Small-Cap Company Risk | | X | | X | | X | | X | | X |
Natural Resources Sector Risk | | X | | X | | X | | X | | X |
Non-Investment Grade Securities Risk | | X | | X | | X | | X | | X |
Non-Traditional (Alternative) Investment Risk | | | | | | | | X | | |
Portfolio Management Risk | | | | | | | | X | | |
Real Estate Investing Risk | | X | | X | | X | | X | | X |
Risks Related to Investments in Underlying Portfolios and Underlying ETFs | | X | | X | | X | | X | | X |
Securities Lending Risk | | X | | X | | X | | | | X |
Special Situations Risk | | X | | X | | X | | X | | X |
| | | | | | |
Risks | | Income Strategies
Portfolio | | Interest Rate Strategies
Portfolio | | AXA/DoubleLine
Opportunistic Core Plus
Bond Portfolio |
Affiliated Portfolio Risk | | X | | X | | |
Collateralized Loan Obligations Risk | | | | | | X |
Convertible Securities Risk | | | | X | | |
Credit Risk | | X | | X | | X |
Derivatives Risk | | X | | X | | |
Distressed Companies Risk | | | | | | X |
Equity Risk | | X | | X | | |
Floating Rate Loan Risk | | X | | X | | |
Foreign Securities Risk | | X | | X | | X |
Currency Risk | | X | | X | | |
Emerging Markets Risk | | X | | X | | X |
Geographic Concentration Risk | | | | | | X |
Inflation-Indexed Bonds Risk | | X | | X | | |
Infrastructure Sector Risk | | X | | X | | |
Interest Rate Risk | | X | | X | | X |
Inverse Floaters Risk | | | | | | X |
81
| | | | | | |
Risks | | Income Strategies
Portfolio | | Interest Rate Strategies
Portfolio | | AXA/DoubleLine
Opportunistic Core Plus
Bond Portfolio |
Investment Grade Securities Risk | | X | | X | | X |
Large-Cap Company Risk | | X | | X | | |
Liquidity Risk | | X | | X | | X |
Loan Risk | | X | | X | | X |
Market Risk | | X | | X | | |
Money Market Risk | | | | X | | |
Mortgage-Backed and Asset- Backed Securities Risk | | | | | | X |
Natural Resources Sector Risk | | X | | X | | |
Non-Investment Grade Securities Risk | | X | | X | | X |
Non-Traditional (Alternative) Investment Risk | | X | | X | | |
Political/Economic Risk | | | | | | X |
Portfolio Management Risk | | X | | X | | |
Portfolio Turnover Risk | | | | | | X |
Real Estate Investing Risk | | X | | X | | |
Redemption Risk | | | | | | X |
Regulatory Risk | | | | | | X |
Risks Related to Investments in Underlying Portfolios and Underlying ETFs | | X | | X | | |
Risks Related to Investing in Other Investment Companies | | | | | | X |
Securities Lending Risk | | | | | | X |
Settlement Risk | | | | | | X |
Transaction Costs Risk | | | | | | X |
U.S. Government Securities Risk | | | | | | X |
| | | | |
Risks | | International Moderate Portfolio | | Moderate Portfolio |
Affiliated Portfolio Risk | | X | | X |
Convertible Securities Risk | | | | X |
Credit Risk | | X | | X |
Derivatives Risk | | X | | X |
Equity Risk | | X | | X |
Floating Rate Loan Risk | | | | X |
Foreign Securities Risk | | X | | X |
Currency Risk | | X | | X |
Emerging Markets Risk | | X | | X |
Futures Contract Risk | | X | | X |
Inflation-Indexed Bonds Risk | | X | | X |
Infrastructure Sector Risk | | X | | |
Interest Rate Risk | | X | | X |
Investment Grade Securities Risk | | X | | X |
Large-Cap Company Risk | | X | | X |
Leveraging Risk | | | | |
Liquidity Risk | | X | | X |
Loan Risk | | | | X |
Market Risk | | X | | X |
Mid-Cap and Small-Cap Company Risk | | X | | X |
Money Market Risk | | | | X |
Non-Investment Grade Securities Risk | | X | | X |
Non-Traditional (Alternative) Investment Risk | | X | | |
Portfolio Management Risk | | X | | X |
Real Estate Investing Risk | | X | | |
Risks Related to Investments in Underlying Portfolios and Underlying ETFs | | X | | X |
Sector Concentration Risk | | | | X |
U.S. Government Securities Risk | | | | X |
82
| | | | |
Risks | | Real Assets Portfolio | | EQ/PIMCO Global Real Return Portfolio |
Affiliated Portfolio Risk | | X | | |
Commodity Risk | | X | | |
Credit Risk | | X | | X |
Derivatives Risk | | X | | X |
Equity Risk | | | | X |
Foreign Securities Risk | | X | | X |
Currency Risk | | X | | X |
Emerging Markets Risk | | X | | X |
Inflation-Indexed Bonds Risk | | X | | X |
Infrastructure Sector Risk | | X | | |
Interest Rate Risk | | X | | X |
Investment Grade Securities Risk | | X | | X |
Leveraging Risk | | | | X |
Liquidity Risk | | X | | X |
Market Risk | | X | | |
Mortgage-Backed and Asset-Backed Securities Risk | | | | X |
Natural Resources Sector Risk | | X | | |
Non-Investment Grade Securities Risk | | X | | X |
Portfolio Management Risk | | X | | |
Portfolio Turnover Risk | | | | X |
Real Estate Investing Risk | | X | | |
Redemption Risk | | | | X |
Securities Lending Risk | | | | X |
U.S. Government Securities Risk | | | | X |
| | |
Risks | | AXA/Horizon Small Cap Value Portfolio | | Pac Global Portfolio |
ETF risk | | X | | |
Equity Risk | | X | | X |
Foreign Securities Risk | | X | | X |
Currency Risk | | X | | X |
Depository Receipts Risk | | X | | X |
Emerging Markets Risk | | X | | X |
Indexed Strategy Risk | | X | | X |
Investment Style Risk | | X | | X |
Multiple Adviser Risk | | X | | X |
Non-Investment Grade Securities Risk | | X | | |
Portfolio Turnover Risk | | X | | X |
Securities Lending Risk | | X | | X |
Small-Cap Company Risk | | X | | |
Small-cap and Micro-Cap Company Risk | | | | X |
Special Situations Risk | | X | | |
Affiliated Portfolio Risk: In managing a Portfolio that invests in Underlying Portfolios, the Manager will have the authority to select and substitute the Underlying Portfolios. The Manager may be subject to potential conflicts of interest in allocating a Portfolio’s assets among the various Underlying Portfolios because the fees payable to it by some of the Underlying Portfolios are higher than the fees payable by other Underlying Portfolios and because the Manager is also responsible for managing, administering, and with respect to certain Underlying Portfolios, its affiliates are responsible for sub-advising, the Underlying Portfolios.
Alternative Investment Risk: To the extent a Portfolio invests in Underlying Portfolios and Underlying ETFs that invest in alternative investments, it will be subject to the risks associated with such investments. Alternative investments may use a different approach to investing than do traditional investments (such as equity or fixed income investments) and the performance of alternative investments is not expected to correlate closely with more traditional investments; however, it is possible that alternative investments will decline in value along with equity or fixed income markets, or both, or that they may not otherwise perform in accordance with expectation. Alternative investments may have different characteristics and risks than do traditional investments, can be highly volatile, may be less liquid, particularly in periods of stress, and may be more complex and less transparent than traditional investments. Alternative investments also may have more complicated tax profiles than traditional investments. The use of alternative investments may not achieve the desired effect.
83
Collateralized Loan Obligations Risk: In addition to the typical risks associated with fixed income securities discussed elsewhere in this Prospectus (e.g., interest rate risk and credit risk), collateralized loan obligations (“CLOs”) carry additional risks including, but are not limited to: (a) the possibility that distributions from collateral securities will not be adequate to make interest or other payments; (b) the quality of the collateral may decline in value or default; (c) the risk that a Portfolio may invest in CLOs that are subordinate to other classes; and (d) the complex structure of the security may not be fully understood at the time of investment and may produce disputes with the issuer or unexpected investment results.
Commodity Price Volatility Risk: Because the value of the shares of an Underlying ETF that is based on a particular commodity depends on the price of that commodity, the value of those shares is subject to fluctuations similar to those affecting the commodity.
Commodity Risk: Investments in certain issuers, especially resource extraction and production companies, are sensitive to fluctuations in certain commodity markets, and changes in those markets may cause a Portfolio’s holdings to lose value. The commodities markets may fluctuate widely based on a variety of factors including changes in overall market movements, domestic and foreign political and economic events and policies, war, acts of terrorism, changes in exchange rates, domestic or foreign interest rates or inflation rates and/or investor expectations concerning such rates, and trading activities in commodities. Prices of various commodities may also be affected by factors such as drought, floods and weather, livestock disease and embargoes, tariffs and other regulatory developments. The prices of commodities can also fluctuate widely due to supply and demand disruptions in major producing or consuming regions. Certain commodities may be produced in a limited number of countries and may be controlled by a small number of producers. As a result, political, economic and supply related events in such countries could have a disproportionate impact on the prices of such commodities. Securities of companies that are dependent on a single commodity, or are concentrated in a single commodity sector, may exhibit even higher volatility attributable to commodity prices.
Convertible Securities Risk: The value of convertible securities fluctuates in relation to changes in interest rates and the credit quality of the issuer and, in addition, fluctuates in relation to the underlying common stock. A convertible security may be subject to redemption at the option of the issuer at a price established in the convertible security’s governing instrument, which may be different than the current market price of the security. If a convertible security held by a Portfolio is called for redemption, the Portfolio will be required to permit the issuer to redeem the security, convert it into underlying common stock or sell it to a third party. Investments by a Portfolio in convertible debt securities may not be subject to any ratings restrictions, although in such cases a Portfolio’s Adviser will consider such ratings, and any changes in such ratings, in its determination of whether a portfolio should invest in and/or continue to hold the securities. Convertible securities are subject to equity risk, interest rate risk and credit risk and are often lower-quality securities, which mean that they are subject to the same risks as an investment in lower rated debt securities. Since it derives a portion of its value from the common stock into which it may be converted, a convertible security is also subject to the same types of market and issuer-specific risks that apply to the underlying common stock. Convertible securities are normally “junior” securities, which mean an issuer usually must pay interest on its nonconvertible debt before it can make payments on its convertible securities. If an issuer stops making interest or principal payments, these securities may become worthless and a Portfolio could lose its entire investment. In the event of a liquidation of the issuing company, holders of convertible securities may be paid before the company’s common stock holders but after holders of any senior debt obligations of the company.
Credit Risk: The risk that the issuer or the guarantor (or other obligor, such as a party providing insurance or other credit enhancement) of a fixed income security, or the counterparty to a derivatives contract, repurchase agreement, loan of portfolio securities or other transaction, is unable or unwilling, or is perceived (whether by market participants, ratings agencies, pricing services or otherwise) as unable or unwilling, to make timely principal and/or interest payments, or otherwise honor its obligations. Securities are subject to varying degrees of credit risk, which are often reflected in their credit ratings. The downgrade of the credit rating of a security may decrease its value.
84
Currency Risk: Investments in foreign currencies and in securities that trade in, or receive revenues in, or in derivatives that provide exposure to foreign currencies are subject to the risk that those currencies will decline in value relative to the U.S. dollar, or, in the case of hedging positions, that the U.S. dollar will decline in value relative to the currency being hedged. Any such decline may erode or reverse any potential gains from an investment in securities denominated in foreign currency or may widen existing loss. Currency rates may fluctuate significantly over short periods of time for a number of reasons, including changes in interest rates, intervention (or the failure to intervene) by governments, central banks or supranational entities, or by the imposition of currency controls or other political developments in the U.S. or abroad.
Depositary Receipts Risk: Investments in depositary receipts (including American Depositary Receipts, European Depositary Receipts and Global Depositary Receipts) are generally subject to the same risks of investing in the foreign securities that they evidence or into which they may be converted. In addition, issuers underlying unsponsored depositary receipts may not provide as much information as U.S. issuers and issuers underlying sponsored depositary receipts. Unsponsored depositary receipts also may not carry the same voting privileges as sponsored depositary receipts.
Derivatives Risk: A Portfolio’s investments in derivatives may rise or fall in value more rapidly than other investments. Changes in the value of a derivative may not correlate perfectly or at all with the underlying asset, rate or index, and a Portfolio could lose more than the principal amount invested. In addition, it may be difficult or impossible for a Portfolio to purchase or sell certain derivatives in sufficient amounts to achieve the desired level of exposure, which may result in a loss or may be costly to a portfolio. Derivatives also may be subject to certain other risks such as leveraging risk, interest rate risk, credit risk, the risk that a counterparty may be unable or unwilling to honor its obligations, and the risk of mispricing or improper valuation. Derivatives also may not behave as anticipated by a Portfolio, especially in abnormal market conditions. Changing regulation may make derivatives more costly, limit their availability, disrupt markets, or otherwise adversely affect their value or performance.
Distressed Companies Risk: Debt obligations of distressed companies typically are unrated, lower-rated or close to default. Securities of distressed companies may be less liquid and are generally more likely to become worthless than the securities of more financially stable companies. If the issuer of a security held by a Portfolio defaults, a Portfolio may experience significant losses on the security, which may lower a Portfolio’s net asset value. Securities tend to lose much of their value before the issuer defaults.
Emerging Markets Risk: There are greater risks involved in investing in emerging market countries and/or their securities markets. Investments in these countries and/or markets may present market, credit, currency, liquidity, legal, political, technical and other risks different from, or greater than, the risks of investing in developed countries. Investments in emerging markets are more susceptible to loss than investments in developed markets. In addition, the risks associated with investing in a narrowly defined geographic area are generally more pronounced with respect to investments in emerging market countries.
Energy Sector Risk: The energy sector is cyclical and highly dependent on commodities prices. The market values of companies in the energy sector could be adversely affected by, among other factors, levels and volatility of global energy prices, commodity price volatility, energy supply and demand, changes in exchange rates and interest rates, imposition of import controls, increased competition, capital expenditures on and the success of exploration and production, depletion of resources, development of alternative energy sources and energy conservation efforts, technological developments, tax treatment and labor relations. Companies in this sector are subject to substantial government regulation and contractual fixed pricing, which may increase the cost of business and limit these companies’ earnings, and a significant portion of their revenues depends on a relatively small number of customers, including governmental entities and utilities. Energy companies may also operate in or engage in transactions involving countries with less developed regulatory regimes or a history of expropriation, nationalization or other adverse policies. Energy companies also face a significant risk of civil liability from accidents resulting in injury or loss of life or property, pollution or other environmental mishaps, equipment malfunctions or mishandling of materials and a risk of loss from terrorism, political strife and natural disasters.
85
Equity Risk: In general, stocks and other equity security values fluctuate, and sometimes widely fluctuate, in response to changes in a company’s financial condition as well as general market, economic and political conditions and other factors.
Floating Rate Loan Risk: Floating rate loans generally are subject to restrictions on resale. The liquidity of floating rate loans, including the volume and frequency of secondary market trading in such loans, varies significantly over time and among individual floating rate loans. For example, if the credit quality of a floating rate loan unexpectedly declines significantly, secondary market trading in that floating rate loan can also decline. During periods of infrequent trading, valuing a floating rate loan can be more difficult, and buying and selling a floating rate loan at an acceptable price can be more difficult and delayed. Difficulty in selling a floating rate loan can result in a loss. The value of the collateral securing a floating rate loan can decline, be insufficient to meet the obligations of the borrower, or be difficult to liquidate. As a result, a floating rate loan may not be fully collateralized, and can decline significantly in value.
Focused Portfolio Risk: A Portfolio may employ a strategy of investing in the securities of a limited number of companies, some of which may be in the same industry, sector or geographic region. As a result, a Portfolio may incur more risk because changes in the value of a single security may have a more significant effect, either positive or negative, on a Portfolio’s net asset value. Further, a Portfolio may be more sensitive to events affecting a single industry, sector or geographic region. The use of such a focused investment strategy may increase the volatility of a Portfolio’s investment performance, as a Portfolio may be more susceptible to risks associated with a single economic, political or regulatory event than a portfolio that is more broadly invested.
Foreign Securities Risk: Investments in foreign securities, including depositary receipts, involve risks not associated with investing in U.S. securities. Foreign markets, particularly emerging markets, may be less liquid, more volatile and subject to less government supervision than U.S. markets. Security values also may be negatively affected by changes in the exchange rates between the U.S. dollar and foreign currencies. Differences between U.S. and foreign legal, political and economic systems, regulatory regimes and market practices also may impact security values and it may take more time to clear and settle trades involving foreign securities.
Futures Contract Risk: The primary risks associated with the use of futures contracts are (a) the imperfect correlation between the change in market value of the instruments held by a Portfolio and the price of the futures contract; (b) liquidity risks, including the possible absence of a liquid secondary market for a futures contract and the resulting inability to close a futures contract when desired; (c) losses (potentially unlimited) caused by unanticipated market movements; (d) a sub-adviser’s inability to predict correctly the direction of securities prices, interest rates, currency exchange rates and other economic factors; (e) the possibility that a counterparty, clearing member or clearinghouse will default in the performance of its obligations; (f) if a Portfolio has insufficient cash, it may have to sell securities from its portfolio to meet daily variation margin requirements, and a Portfolio may have to sell securities at a time when it may be disadvantageous to do so; and (g) transaction costs associated with investments in futures contracts may be significant, which could cause or increase losses or reduce gains. Futures contracts are also subject to the same risks as the underlying investments to which they provide exposure. In addition, futures contracts may subject a Portfolio to leveraging risk.
Geographic Concentration Risk: To the extent the Portfolio invests a significant portion of its assets in securities of companies domiciled, or exercising the predominant part of their economic activity, in one country or geographic region, it assumes the risk that economic, political, social and environmental conditions in that particular country or region will have a significant impact on a Portfolio’s investment performance and that a Portfolio’s performance will be more volatile than the performance of more geographically diversified funds. The economies and financial markets of certain regions can be highly interdependent and may decline all at the same time. In addition, certain areas are prone to natural disasters such as earthquakes, volcanoes, droughts or tsunamis and are economically sensitive to environmental events.
Index Strategy Risk: A Portfolio that employs an index strategy generally invests in the securities included in the relevant index or a representative sample of such securities regardless of market trends. The Portfolio generally will not modify its index strategy to respond to changes in the economy, which means that it may be particularly susceptible to a general decline in the market segment relating to the relevant index. In addition, although the
86
index strategy attempts to closely track its benchmark index, the Portfolio may not invest in all of the securities in the index. Also, the Portfolio’s fees and expenses will reduce the Portfolio’s returns, unlike those of the benchmark index. Cash flow into and out of the Portfolio, portfolio transaction costs, changes in the securities that comprise the index, and the Portfolio’s valuation procedures also may affect the Portfolio’s performance. Therefore, there can be no assurance that the performance of the index strategy will match that of the benchmark index.
Inflation-Indexed Bonds Risk: Inflation-indexed bonds are fixed income securities whose principal value is periodically adjusted according to inflation. Inflation-indexed bonds, including Treasury Inflation-Protected Securities (“TIPS”), decline in value when real interest rates rise. In certain interest rate environments, such as when real interest rates are rising faster than nominal interest rates, inflation-indexed bonds may experience greater losses than other fixed income securities with similar durations. Interest payments on inflation-linked debt securities may be difficult to predict and may vary as the principal and/or interest is adjusted for inflation. In periods of deflation, a Portfolio may have no income at all from such investments.
Infrastructure Sector Risk: Companies in the infrastructure sector may be subject to a variety of factors that could adversely affect their business or operations, including high interest costs in connection with capital construction programs, high degrees of leverage, costs associated with governmental, environmental and other regulations, the effects of economic slowdowns, increased competition from other providers of services, uncertainties concerning costs, the level of government spending on infrastructure projects, and other factors. Infrastructure companies may be adversely affected by commodity price volatility, changes in exchange rates, import controls, depletion of resources, technological developments, and labor relations.
Interest Rate Risk: The risk that fixed income securities will decline in value because of changes in interest rates. When interest rates decline, the value of a Portfolio’s debt securities generally rises. Conversely, when interest rates rise, the value of a Portfolio’s debt securities generally declines. A Portfolio with a longer average duration will be more sensitive to changes in interest rates, usually making it more volatile than a fund with a shorter average duration. As of the date of this Prospectus, interest rates in the United States are at or near historic lows, but may rise significantly or rapidly, potentially resulting in losses to a Portfolio.
Inverse Floaters Risk: Inverse floaters are fixed income securities with a floating or variable rate of interest. Inverse floaters have interest rates that tend to move in the opposite direction as the specified market rates or indices, and may exhibit substantially greater price volatility than fixed rate obligations having similar credit quality, redemption provisions and maturity. Inverse floater collateralized mortgage obligations (“CMOs”) exhibit greater price volatility than the majority of mortgage-related securities. In addition, some inverse floater CMOs exhibit extreme sensitivity to changes in prepayments. As a result, the yield to maturity of an inverse floater CMO is sensitive not only to changes in interest rates but also to changes in prepayment rates on the related underlying mortgage assets.
Investment Grade Securities Risk: Debt securities commonly are rated by national bond ratings agencies. Investment grade securities are securities rated BBB or higher by Standard & Poor’s Ratings Services (“S&P”) or Fitch Ratings Ltd. (“Fitch”) or Baa or higher by Moody’s Investors Service, Inc. (“Moody’s”), or, if unrated, determined by the Manager or the Sub-Adviser to be of comparable quality. Securities rated in the lower investment grade rating categories (e.g., BBB or Baa) are considered investment grade securities, but are somewhat riskier than higher rated obligations because they are regarded as having only an adequate capacity to pay principal and interest, and are considered to lack outstanding investment characteristics.
Investment Style Risk: The Portfolio may use a particular style or set of styles — in this case “value” styles — to select investments. Those styles may be out of favor or may not produce the best results over short or longer time periods. Value stocks are subject to the risks that notwithstanding that a stock is selling at a discount to its perceived true worth, the market will never fully recognize its intrinsic value. In addition, there is the risk that a stock judged to be undervalued may actually be appropriately priced. Value stocks may also increase the volatility of the Portfolio’s share price.
87
Large-Cap Company Risk: Larger more established companies may be unable to respond quickly to new competitive challenges such as changes in technology and consumer tastes. Many larger companies also may not be able to attain the high growth rate of successful smaller companies, especially during extended periods of economic expansion.
Leveraging Risk: When a Portfolio leverages its holdings, the value of an investment in a Portfolio will be more volatile and all other risks will tend to be compounded. For example, a Portfolio may take on leveraging risk when it engages in derivatives transactions (such as futures and options investments), invests collateral from securities loans or borrows money. A Portfolio may experience leveraging risk in connection with investments in derivatives because its investments in derivatives may be small relative to the investment exposure assumed, leaving more assets to be invested in other investments. Such investments may have the effect of leveraging a Portfolio because a Portfolio may experience gains or losses not only on its investments in derivatives, but also on the investments purchased with the remainder of the assets. If the value of a Portfolio’s investments in derivatives is increasing, this could be offset by declining values of a Portfolio’s other investments. Conversely, it is possible that the rise in the value of a Portfolio’s non-derivative investments could be offset by a decline in the value of a Portfolio’s investments in derivatives. In either scenario, a Portfolio may experience losses. In a market where the value of a Portfolio’s investments in derivatives is declining and the value of its other investments is declining, a Portfolio may experience substantial losses.
Liquidity Risk: The risk that certain investments may be difficult or impossible for a Portfolio to purchase or sell at an advantageous time or price or in sufficient amounts to achieve the desired level of exposure. A Portfolio may be required to dispose of other investments at unfavorable times or prices to satisfy obligations, which may result in a loss or may be costly to a Portfolio.
Listed Private Equity Company Risk: Listed private equity companies include publicly traded vehicles whose purpose is to invest in privately held companies. Generally, little public information exists for privately held companies, and there is a risk that investors may not be able to make a fully informed investment decision. Investing in less mature privately held companies involves greater risk than investing in well-established, publicly-traded companies.
Loan Risk: Loan interests are subject to liquidity risk, prepayment risk (the risk that when interest rates fall, debt securities may be repaid more quickly than expected and a Portfolio may be required to reinvest in securities with a lower yield), extension risk (the risk that when interest rates rise, debt securities may be repaid more slowly than expected and the value of a Portfolio’s holdings may decrease), the risk of subordination to other creditors, restrictions on resale, and the lack of a regular trading market and publicly available information. Loan interests may be difficult to value and may have extended trade settlement periods. Accordingly, the proceeds from the sale of a loan may not be available to make additional investments or to meet redemption obligations until potentially a substantial period after the sale of the loan. The extended trade settlement periods could force a Portfolio to liquidate other securities to meet redemptions and may present a risk that a Portfolio may incur losses in order to timely honor redemptions. There is a risk that the value of any collateral securing a loan in which a Portfolio has an interest may decline and that the collateral may not be sufficient to cover the amount owed on the loan. In the event the borrower defaults, a Portfolio’s access to the collateral may be limited or delayed by bankruptcy or other insolvency laws. To the extent that a Portfolio invests in loan participations and assignments, it is subject to the risk that the financial institution acting as agent for all interests in a loan might fail financially. It is also possible that a Portfolio could be held liable, or may be called upon to fulfill other obligations, as a co-lender.
Market Risk: The risk that the securities markets will move down, sometimes rapidly and unpredictably based on overall economic conditions and other factors. Changes in the financial condition of a single issuer can impact a market as a whole.
Mid-Cap, Small-Cap and Micro-Cap Company Risk: A Portfolio’s investments in mid-, small-cap and micro-cap companies may involve greater risks than investments in larger, more established issuers because they generally are more vulnerable than larger companies to adverse business or economic developments. Such companies generally have narrower product lines, more limited financial and management resources and more
88
limited markets for their stock as compared with larger companies. As a result, the value of such securities may be more volatile than the securities of larger companies, and a Portfolio may experience difficulty in purchasing or selling such securities at the desired time and price or in the desired amount. In general, these risks are greater for small- and microcap companies than for mid-cap companies.
Money Market Risk: Although a money market fund is designed to be a relatively low risk investment, it is not free of risk. Despite the short maturities and high credit quality of a money market fund’s investments, increases in interest rates and deteriorations in the credit quality of the instruments the money market fund has purchased may reduce the money market fund’s yield and can cause the price of a money market security to decrease. In addition, a money market fund is subject to the risk that the value of an investment may be eroded over time by inflation. The Securities and Exchange Commission recently adopted changes to the rules that govern money market funds. These changes may affect a money market fund’s investment strategies, operations and/or return potential.
Mortgage-Backed and Asset-Backed Securities Risk: The risk that the principal on mortgage- and asset-backed securities held by a Portfolio will be prepaid, which generally will reduce the yield and market value of these securities. If interest rates fall, the rate of prepayments tends to increase as borrowers are motivate to pay off debt and refinance at new lower rates. Rising interest rates may increase the risk of default by borrowers and tend to extend the duration of these securities, making them more sensitive to changes in interest rates. As a result, in a period of rising interest rates, a Portfolio that holds these types of securities may experience additional volatility and losses. This is known as extension risk. Moreover, declines in the credit quality of the issuers of mortgage- and asset-backed securities or instability in the markets for such securities may affect the value and liquidity of such securities, which could result in losses to a Portfolio. In addition, certain mortgage- and asset-backed securities may include securities backed by pools of loans made to “subprime” borrowers or borrowers with blemished credit histories; the risk of defaults is generally higher in the case of mortgage pools that include such subprime mortgages.
Multiple Adviser Risk: The Manager allocates the Portfolio’s assets among multiple Sub-Advisers, each of which is responsible for investing its allocated portion of the Portfolio’s assets. To a significant extent, the Portfolio’s performance will depend on the success of the Manager in allocating the Portfolio’s assets to Sub-Advisers and its selection and oversight of the Sub-Advisers. Because each Sub-Adviser manages its allocated portion of the Portfolio independently from another Sub-Adviser, the same security may be held in different portions of the Portfolio, or may be acquired for one portion of the Portfolio at a time when a Sub-Adviser to another portion deems it appropriate to dispose of the security from that other portion. Similarly, under some market conditions, one Sub-Adviser may believe that temporary, defensive investments in short-term instruments or cash are appropriate when another Sub-Adviser believes continued exposure to the equity or debt markets is appropriate for its allocated portion of the Portfolio. Because each Sub-Adviser directs the trading for its own portion of the Portfolio, and does not aggregate its transactions with those of the other Sub-Adviser, the Portfolio may incur higher brokerage costs than would be the case if a single Sub-Adviser were managing the entire Portfolio. In addition, while the Manager seeks to allocate the Portfolio’s assets among the Portfolio’s Sub-Advisers in a manner that it believes is consistent with achieving the Portfolio’s investment objective(s), the Manager may be subject to potential conflicts of interest in allocating the Portfolio’s assets among Sub-Advisers, including affiliated Sub-Advisers, because the Manager pays different fees to the Sub-Advisers and due to other factors that could impact the Manager’s revenues and profits.
Natural Resources Sector Risk: The profitability of companies in the natural resources sector can be adversely affected by worldwide energy prices and other world events, limits on and the success of exploration projects, and production spending. Companies in the natural resources sector also could be adversely affected by commodity price volatility, changes in exchange rates, interest rates or inflation rates and/ or investor expectations concerning such rates, changes in the supply of, or the demand for, natural resources, imposition of import controls, government regulation and intervention, civil conflict, economic conditions, increased competition, technological developments, and labor relations. In addition, companies in the natural resources sector may be subject to the risks generally associated with extraction of natural resources, such as the risks of mining and oil drilling, and the risks of the hazards associated with natural resources, such as natural or man-made disasters,
89
fire, drought, liability for environmental damage claims, and increased regulatory and environmental costs. Prices of precious metals and of precious metal related securities have historically been very volatile due to various economic, financial, social and political factors and may adversely affect the financial condition of companies involved with precious metals.
Non-Investment Grade Securities Risk: Bonds rated below investment grade (i.e., BB or lower by S&P or Fitch or Ba or lower by Moody’s or, if unrated, deemed to be of comparable quality by the Manager or Sub-Adviser) are speculative in nature and are subject to additional risk factors such as increased possibility of default, illiquidity of the security, and changes in value based on changes in interest rates. Non-investment grade bonds, sometimes referred to as “junk bonds,” are usually issued by companies without long track records of sales and earnings, or by those companies with questionable credit strength.
Non-Traditional (Alternative) Investment Risk: To the extent a Portfolio invests in Underlying Portfolios and Underlying ETFs that invest in non-traditional (alternative) investments, the Portfolio will be subject to the risks associated with such investments. Nontraditional (alternative) investments may use a different approach to investing than do traditional investments (stocks, bonds, and cash) and the performance of alternative investments is not expected to correlate closely with more traditional investments; however, it is possible that alternative investments will decline in value along with equity or fixed income markets, or both, or that they may not otherwise perform in accordance with expectations. Non-traditional (alternative) investments may have different characteristics and risks than do traditional investments. Non-traditional (alternative) investments can be highly volatile, are often less liquid, particularly in periods of stress, are generally more complex and less transparent, and may have more complicated tax profiles than traditional investments. In addition, the performance of non-traditional (alternative) investments may be more dependent on investment manager experience and skill than traditional investments. The use of non-traditional (alternative) investments may not achieve the desired effect.
Political/Economic Risk: Changes in economic and tax policies, government instability, war or other political or economic actions or factors may have an adverse effect on a Portfolio’s foreign investments.
Portfolio Management Risk: The risk that strategies used by the Manager or a Sub-Adviser(s) and their securities selections fails to produce the intended results.
Portfolio Turnover Risk: High portfolio turnover (generally, turnover, in excess of 100% in any given fiscal year) may result in increased transaction costs to a Portfolio, which may result in higher fund expenses and lower total return.
Real Estate Investing Risk: Real estate-related investments may decline in value as a result of factors affecting the real estate industry. Real estate is a cyclical business, highly sensitive to supply and demand, general and local economic developments and characterized by intense competition and periodic overbuilding. Real estate income and values also may be greatly affected by demographic trends, such as population shifts or changing tastes and values. Losses may occur from casualty or condemnation and government actions, such as tax increases, zoning law changes, regulatory limitations on rents, or environmental regulations, also may have a major impact on real estate. The availability of mortgages and changes in interest rates may also affect real estate values. Changing interest rates and credit quality requirements also will affect the cash flow of real estate companies and their ability to meet capital needs. REITs generally invest directly in real estate (equity REITs), in mortgages secured by interests in real estate (mortgage REITs) or in some combination of the two (hybrid REITs). Investing in REITs exposes investors to the risks of owning real estate directly, as well as to risks that relate specifically to the way in which REITs are organized and operated. Equity REITs may be affected by changes in the value of the underlying property owned by the REIT, while mortgage REITs may be affected by the quality of any credit extended. Equity and mortgage REITs are also subject to heavy cash flow dependency, defaults by borrowers, and self-liquidations. Individual REITs may own a limited number of properties and may concentrate in a particular region or property type. REITs also must satisfy specific Internal Revenue Code requirements to qualify for the tax-free pass-through of taxable income and net realized gains. Failure to meet these requirements may have adverse consequences on a Portfolio. In addition, even the larger REITs in the industry tend to be small- to medium-sized companies in relation to the equity markets as a whole. Moreover, shares of REITs may trade less frequently and, therefore, are subject to more erratic price movements than securities of larger issuers.
90
Redemption Risk: A Portfolio may experience periods of heavy redemptions that could cause a Portfolio to sell assets at inopportune times or at a loss or depressed value. Redemption risk is heightened during periods of declining or illiquid markets. Heavy redemptions could hurt a Portfolio’s performance. Market developments and other factors, including a general rise in interest rates, have the potential to cause investors to move out of fixed income securities on a large scale, which may increase redemptions from mutual funds that hold large amounts of fixed income securities. Such a move, coupled with a reduction in the ability or willingness of dealers and other institutional investors to buy or hold fixed income securities, may result in decreased liquidity and increased volatility in the fixed income markets.
Regulatory Risk: Less information may be available about foreign companies. In general, foreign companies are not subject to uniform accounting, auditing and financial reporting standards or to other regulatory practices and requirements as are U.S. companies. Many foreign governments do not supervise and regulate stock exchanges, brokers and the sale of securities to the same extent as does the United States and may not have laws to protect investors that are comparable to U.S. securities laws. In addition, some countries may have legal systems that may make it difficult for a Portfolio to vote proxies, exercise shareholder rights, and pursue legal remedies with respect to its foreign investments.
Risks Related to Investments in Underlying Portfolios and Underlying ETFs: A Portfolio that invests in other investment companies will indirectly bear fees and expenses charged by those investment companies, in addition to a Portfolio’s direct fees and expenses. The cost of investing in a Portfolio, therefore, may be higher than the cost of investing in a mutual fund that exclusively invests directly in individual stocks and bonds. In addition, a Portfolio’s net asset value is subject to fluctuations in the net asset values of the other investment companies in which it invests. A Portfolio is also subject to the risks associated with the securities in which the other investment companies invest and the ability of a Portfolio to meet its investment objective will depend, to a significant degree, on the ability of the other investment companies to meet their investment objectives. A Portfolio and the other investment companies are subject to certain general investment risks, including market risk, issuer-specific risk, investment style risk and portfolio management risk. In addition, to the extent a Portfolio invests in other investment companies that invest in equity securities, fixed income securities and/or foreign securities, a Portfolio is subject to the risks associated with investing in such securities. The extent to which the investment performance and risks associated with a Portfolio correlate to those of a particular other investment company will depend upon the extent to which a Portfolio’s assets are allocated from time to time for investment in the other investment company, which will vary.
Securities Lending Risk: A Portfolio may lend its portfolio securities to seek income. There is a risk that a borrower may default on its obligations to return loaned securities, however, a Portfolio’s securities lending agent may indemnify a Portfolio against that risk, and the loans will be collateralized at least 100%, which collateral may be applied to repurchase or reacquire the lent securities in the event of a borrower’s default. A Portfolio will be responsible for the risks associated with the investment of cash collateral, including any collateral invested in an affiliated money market fund. A Portfolio may lose money on its investment of cash collateral or may fail to earn sufficient income on its investment to meet obligations to the borrower. In addition, delays may occur in the recovery of securities from borrowers, which could interfere with a Portfolio’s ability to vote proxies or to settle transactions.
Settlement Risk: Settlement and clearance procedures in certain foreign markets differ significantly from those in the United States. Foreign settlement and clearance procedures and trade regulations also may involve certain risks (such as delays in payment for or delivery of securities) not typically associated with the settlement of U.S. investments. At times, settlements in certain foreign countries have not kept pace with the number of securities transactions. These problems may make it difficult for a Portfolio to carry out transactions. If a Portfolio cannot settle or is delayed in settling a purchase of securities, it may miss attractive investment opportunities and certain of its assets may be un-invested with no return earned thereon for some period. If a Portfolio cannot settle or is delayed in settling a sale of securities, it may lose money if the value of the security then declines or, if it has contracted to sell the security to another party, a Portfolio could be liable for any losses incurred.
Small-Cap and Micro-Cap Company Risk: The Portfolio’s investments in small-cap and micro-cap companies may involve greater risks than investments in larger, more established issuers because they generally
91
are more vulnerable than larger companies to adverse business or economic developments. Such companies generally have narrower product lines, more limited financial and management resources, and more limited markets for their stock as compared with larger companies, and may have less experienced management and unproven track records. They may depend on a more limited management group than larger capitalized companies. In addition, it is more difficult to get information on smaller companies, which tend to be less well known, have shorter operating histories, do not have significant ownership by large investors and are followed by relatively few securities analysts. As a result, the value of such securities may be more volatile than the securities of larger companies, and because the securities generally trade in lower volumes than larger cap securities, the Portfolio may experience difficulty in purchasing or selling such securities at the desired time and price or in the desired amount. In general, these risks are greater for micro-cap companies than for small-cap companies.
Small-Cap Company Risk: The Portfolio’s investments in small-cap companies may involve greater risks than investments in larger, more established issuers because they generally are more vulnerable than larger companies to adverse business or economic developments. Such companies generally have narrower product lines, more limited financial and management resources, and more limited markets for their stock as compared with larger companies. They may depend on a more limited management group than larger capitalized companies. In addition, it is more difficult to get information on smaller companies, which tend to be less well known, have shorter operating histories, do not have significant ownership by large investors and are followed by relatively few securities analysts. As a result, the value of such securities may be more volatile than the securities of larger companies, and because the securities generally trade in lower volumes than larger cap securities, the Portfolio may experience difficulty in purchasing or selling such securities at the desired time and price or in the desired amount.
Special Situations Risk: The Portfolio may seek to benefit from “special situations,” such as mergers, consolidations, bankruptcies, liquidations, reorganizations, restructurings, tender or exchange offers or other unusual events expected to affect a particular issuer. In general, securities of companies which are the subject of a tender or exchange offer or a merger, consolidation, liquidation, restructuring, bankruptcy or reorganization proposal sell at a premium to their historic market price immediately prior to the announcement of the transaction. However, it is possible that the value of securities of a company involved in such a transaction will not rise and in fact may fall, in which case the Portfolio would lose money. It is also possible that the transaction may not be completed as anticipated or may take an excessive amount of time to be completed, in which case the Portfolio may not realize any premium on its investment and could lose money if the value of the securities declines during the Portfolio’s holding period. In some circumstances, the securities purchased may be illiquid making it difficult for the Portfolio to dispose of them at an advantageous price.
Federal Income Tax Consequences of the Reorganizations
Taxable Reorganizations. It is anticipated that the Reorganizations of the Alt 50 Portfolio and the Alt 75 Portfolio into the All Asset Growth-Alt 20 Portfolio, the Income Strategies Portfolio and the Interest Rate Strategies Portfolio into the AXA/DoubleLine Opportunistic Core Plus Bond Portfolio, the Real Assets Portfolio into the EQ/PIMCO Global Real Return Portfolio, and the International Moderate Portfolio into the CharterSM Moderate Portfolio will not qualify, for federal income tax purposes, as tax-free reorganizations. As a result, gain or loss will be recognized by each of those Acquired Portfolios on the transfer of its assets to the corresponding Acquiring Portfolio (or, in the cases of certain of those Acquired Portfolios, on the disposition of its securities holdings) and its shareholders, but no gain or loss will be recognized by the Contractholders who had premiums or contributions allocated to the investment divisions of the Separate Accounts that are invested in shares of those Acquired Portfolios. In addition, pursuant to each such Reorganization, (1) each such shareholder’s (a) adjusted basis for federal income tax purposes (“basis”) in the Acquiring Portfolio Shares it receives in the Reorganization will be the fair market value thereof at the time the Reorganization is consummated (“Effective Time”) and (b) holding period for those Acquiring Portfolio Shares will begin on the following day, and (2) the Acquiring Portfolio’s (a) basis in the Transferred Assets it receives will be the fair market value thereof at the Effective Time and (b) holding period for those Transferred Assets will begin on the following day.
92
Tax-free Reorganizations. The Reorganizations of the Alt 25 Portfolio and the Alternative 100 Moderate Portfolio into the All Asset Growth-Alt 20 Portfolio and the Reorganization of the Pac Global Portfolio into the AXA/Horizon Small Cap Value Portfolio each is intended to qualify for federal income tax purposes as a tax-free reorganization under section 368(a)(1)(D) of the Code. As a condition to consummation of each such Reorganization, the Trust will receive an opinion from K&L Gates LLP (“Counsel”), with respect to the Reorganization and the Portfolios participating therein and their shareholders, substantially to the effect that — based on the facts and assumptions stated therein and conditioned on certain representations of the Trust being true and complete at the Effective Time and consummation of the Reorganization in accordance with the applicable Reorganization Plan and applicable Reorganization Agreement (without the waiver or modification of any terms or conditions thereof and without taking into account any amendment thereof that Counsel has not approved) — for federal income tax purposes:
(1) the Reorganization will qualify as a “reorganization” (as defined in section 368(a)(1)(D) of the Code), and each Portfolio will be a “party to a reorganization” (within the meaning of section 368(b) of the Code);
(2) neither Portfolio will recognize any gain or loss on the Reorganization;
(3) an Acquired Portfolio shareholder will not recognize any gain or loss on the exchange of its Acquired Portfolio Shares for Acquiring Portfolio Shares;
(4) an Acquired Portfolio shareholder’s aggregate basis in the Acquiring Portfolio Shares it receives in the Reorganization will be the same as the aggregate basis in its Acquired Portfolio Shares it actually or constructively surrenders in exchange for those Acquiring Portfolio Shares, and its holding period for those Acquiring Portfolio Shares will include, in each instance, its holding period for those Acquired Portfolio Shares, provided the shareholder holds the latter as capital assets at the Effective Time; and
(5) the Acquiring Portfolio’s basis in each Transferred Asset the Acquired Portfolio transfers to it will be the same as the Acquired Portfolio’s basis therein immediately before the Reorganization, and the Acquiring Portfolio’s holding period for each such asset will include the Acquired Portfolio’s holding period therefor (except where the Acquiring Portfolio’s investment activities have the effect of reducing or eliminating an asset’s holding period).
Notwithstanding clauses (2) and (5), such opinion may state that no opinion is expressed as to the effect of a Reorganization on the Portfolios participating therein or the participating Acquired Portfolio’s shareholders with respect to any Transferred Asset as to which any unrealized gain or loss is required to be recognized for federal income tax purposes at the end of a taxable year (or on the termination or transfer thereof) under a mark-to-market system of accounting.
Notwithstanding that the Reorganization of the Alternative 100 Moderate Portfolio into the All Asset Growth-Alt 20 Portfolio will qualify for the federal income tax treatment described in the preceding paragraph, because (as mentioned above) that Acquired Portfolio will liquidate all its securities holdings before the Effective Time, it will realize all unrealized gain in those assets on their disposition, which gain must be distributed to its shareholders at or before the Effective Time. In addition, because the Transferred Assets in that Reorganization will be cash, clause (5) will be irrelevant.
As a result of a tax-free Reorganization, the participating Acquiring Portfolio will succeed to certain tax attributes of the corresponding Acquired Portfolio, except that the amount of the latter’s accumulated capital loss carryovers that the former may use to offset capital gains it recognizes after its Reorganization will be subject to an annual limitation under sections 382 and 383 of the Code. An Acquiring Portfolio may carry over to (and use in, subject to the sections 382/383 limitation) subsequent taxable years capital losses the corresponding Acquired Portfolio incurred, including any net capital loss that Acquired Portfolio sustains during its taxable year ending at the Effective Time and any net unrealized built-in loss that Acquired Portfolio has on that date, for an unlimited period. Additionally, capital losses that are carried forward will retain their character as either short-term or long-term capital losses rather than being considered all short-term (as under previous law).
93
In general, the sections 382/383 limitation applicable to an Acquiring Portfolio for each taxable year will equal the sum of (1) the product of the net asset value of the corresponding Acquired Portfolio as of the Effective Time multiplied by the “long-term tax-exempt rate” (which is a market-based rate published by the Internal Revenue Service (“Service”) each month, currently 2.04%) for the month in which the Effective Time occurs plus (2) the amount of any net unrealized built-in gain of that Acquired Portfolio as of the Effective Time that it recognizes in any taxable year all or part of which is in the period through the fifth anniversary of the Effective Time (as long as the amount of that net unrealized built-in gain is greater than the lesser of (i) 15% of that net asset value or (ii) $10,000,000). The annual limitation will be proportionately reduced for the portion of an Acquiring Portfolio’s current taxable year after the Effective Time and for any subsequent short taxable year.
Both Reorganizations. Contractholders who had premiums or contributions allocated to the investment divisions of the Separate Accounts that are invested in Acquired Portfolio Shares will not recognize any gain or loss as a result of the Reorganizations. If an Acquired Portfolio sells securities before its Reorganization, it may recognize gains or losses (which losses could be significant) on those sales. Any net gains recognized on those sales would increase the amount of any distribution the Acquired Portfolio must make to its shareholders before consummating its Reorganization.
If a Reorganization fails to meet the requirements of Code section 368(a)(1)(D), a Separate Account that is invested in shares of the Acquired Portfolio involved therein could realize a gain or loss on the transaction equal to the difference between its basis in those shares and the fair market value of the Acquiring Portfolio Shares it receives.
The Trust has not sought a tax ruling from the Service but instead is acting in reliance on the opinion of Counsel discussed above. That opinion is not binding on the Service or the courts and does not preclude the Service from adopting a contrary position. Contractholders are urged to consult their tax advisers as to the specific consequences to them of the Reorganizations, including the applicability and effect of state, local, foreign and other taxes.
ADDITIONAL INFORMATION ABOUT THE PORTFOLIOS
Management of EQ Trust and VIP Trust
This section provides information about the Trusts, the Manager, and the Sub-Advisers for the Portfolios of the Trusts involved in the Reorganizations.
EQ Trust
EQ Trust is organized as a Delaware statutory trust and is registered with the SEC as an open-end management investment company. The Trust’s Board of Trustees is responsible for the overall management of EQ Trust and its Portfolios. EQ Trust issues shares of beneficial interest that are currently divided among eighty-six (86) Portfolios, sixty-one (61) of which have authorized Class IA, Class IB and Class K shares, twenty-five (25) of which are only authorized to issue Class IB and Class K shares. This Combined Proxy Statement/Prospectus describes the Class IB and Class K shares of the Alt 25 Portfolio, Alt 50 Portfolio, Alt 75 Portfolio, All Asset Growth- Alt 20 Portfolio, EQ/PIMCO Global Real Return Portfolio, AXA/DoubleLine Opportunistic Core Plus Bond Portfolio, AXA/Horizon Small Cap Value Portfolio, and Pac Global.
VIP Trust
VIP Trust is organized as a Delaware statutory trust and is registered with the SEC as an open-end management investment company. The Trust’s Board is responsible for the overall management of VIP Trust and its Portfolios. VIP Trust issues shares of beneficial interest that are currently divided among twenty-three (23) distinct mutual funds, each with its own investment strategy and risk/reward profile. This Combined Proxy Statement/Prospectus describes the Class B shares of the Alt 100 Moderate Portfolio, Real Assets Portfolio, Income Strategies Portfolio, Interest Rate Strategies Portfolio, International Moderate Portfolio, and CharterSM Moderate Portfolio.
94
The Manager
FMG LLC, 1290 Avenue of the Americas, New York, New York 10104, is the Manager to each Acquired Portfolio and each Acquiring Portfolio. FMG LLC is registered with the SEC as an investment adviser under the Investment Advisers Act of 1940, as amended. FMG LLC also is registered with the Commodity Futures Trading Commission (“CFTC”) as a commodity pool operator (“CPO”) under the Commodity Exchange Act, as amended, and serves as a CPO with respect to certain portfolios of EQ Trust; however, FMG LLC currently claims an exclusion (under CFTC Rule 4.5) from registration as a CPO with respect to each Acquired Portfolio and Acquiring Portfolio. Being subject to dual regulation by the SEC and the CFTC may increase compliance costs and may affect Portfolio returns. FMG LLC is a wholly owned subsidiary of AXA Equitable Life Insurance Company (“AXA Equitable”). AXA Equitable is an indirect wholly owned subsidiary of AXA Financial, Inc., a subsidiary of AXA, a French insurance holding company. FMG LLC serves as the investment manager to mutual funds and other pooled investment vehicles and, as of December 31, 2016, had approximately $101.5 billion in assets under management.
The Manager has a variety of responsibilities for the general management and administration of the Trusts and the Portfolios. With respect to the Alt 25 Portfolio, Alt 50 Portfolio, Alt 75 Portfolio, All Asset Growth- Alt 20 Portfolio, Alt 100 Moderate Portfolio, Real Assets Portfolio, Income Strategies Portfolio, Interest Rate Strategies Portfolio, International Moderate Portfolio, and CharterSM Moderate Portfolio, the Manager is responsible for determining the asset allocation range for these Portfolios and ensuring that the allocations are consistent with the guidelines that have been approved by the applicable Board. The Manager also periodically establishes specific percentage targets for each asset category and identifies each Underlying Portfolio and Underlying ETF to be held by these Portfolios using the Manager’s proprietary investment process, based on fundamental research regarding the investment characteristics of the asset classes, asset categories and Underlying Portfolios and Underlying ETFs, as well as its outlook for the economy and financial markets. The Manager also rebalances these Portfolios’ holdings through its selection of Underlying Portfolios and Underlying ETFs as deemed necessary to bring the asset allocation of each Portfolio back into alignment with its asset allocation range and target investment percentages.
The Manager may be subject to potential conflicts of interest in selecting Underlying Portfolios and Underlying ETFs because it (and in certain cases its affiliates) earn fees for managing and administering the affiliated Underlying Portfolios, but not the unaffiliated Underlying Portfolios or Underlying ETFs. In addition, the Manager may be subject to potential conflicts of interest in selecting affiliated Underlying Portfolios because the fees paid to it by some of the affiliated Underlying Portfolios are higher than the fees paid by other affiliated Underlying Portfolios.
With respect to the AXA/DoubleLine Opportunistic Core Plus Bond Portfolio, EQ/PIMCO Global Real Return Portfolio, AXA/Horizon Small Cap Value Portfolio, and Pac Global Portfolio, the Manager provides or oversees the provision of all investment advisory, portfolio management, and administrative services to these Portfolios. The Manager has supervisory responsibility for the management and investment of these Portfolios’ assets and develops overall investment strategies for the Portfolios. The Manager also has discretion to make all determinations with respect to the investment of these Portfolio’s assets. As further discussed below, the Manager’s management responsibilities include the selection and monitoring of Sub-Advisers.
With respect to the AXA/Horizon Small Cap Value Portfolio and Pac Global Portfolio (“Hybrid Portfolios”), each of which consists of an Index Allocated Portion and an Active Allocated Portion, the Manager is responsible for, among other things, determining the asset allocation range for the Portfolios, selecting and monitoring the Sub-Advisers for the Portfolios, advising the ETF Allocated Portions of the Portfolios (including selecting Underlying ETFs in which the Portfolios invest) and ensuring that asset allocations are consistent with the guidelines that have been approved by the Board. With respect to certain of the Hybrid Portfolios, the Manager also is responsible for developing and overseeing the proprietary research model used to manage the equity exposure of each Portfolio.
The Manager plays an active role in monitoring each portfolio and Sub-Adviser and uses portfolio analytics systems to strengthen its evaluation of performance, style, risk levels, diversification and other criteria. The
95
Manager also monitors each Sub-Adviser’s portfolio management team to determine whether its investment activities remain consistent with the portfolios’ (or portion thereof) investment style and objectives.
Beyond performance analysis, the Manager monitors significant changes that may impact a Sub-Adviser’s overall business. The Manager monitors continuity in a Sub-Adviser’s operations and changes in investment personnel and senior management. The Manager performs due diligence reviews with each Sub-Adviser no less frequently than annually. The Manager obtains detailed, comprehensive information concerning portfolio and Sub-Adviser performance and portfolio operations that is used to supervise and monitor a Sub-Adviser and the portfolio operations. A team is responsible for conducting ongoing investment reviews with each Sub-Adviser and for developing the criteria by which portfolio performance is measured.
The Manager selects Sub-Advisers from a pool of candidates, including its affiliates, to manage the portfolio (or portions thereof). The Manager may appoint, dismiss and replace Sub-Advisers and amend sub-advisory agreements subject to the approval of the EQ Trust’s Board. The Manager also may allocate a portfolio’s assets to additional Sub-Advisers subject to the approval of the Board and has discretion to allocate a portfolio’s assets among a portfolio’s current Sub-Advisers. The Manager recommends Sub-Advisers for a portfolio to the Board based upon its continuing quantitative and qualitative evaluation of each Sub-Adviser’s skills in managing assets pursuant to specific investment styles and strategies. Short-term investment performance, by itself, is not a significant factor in selecting or terminating a Sub-Adviser, and the Manager does not expect to recommend frequent changes of Sub-Advisers.
If the Manager appoints, dismisses or replaces a Sub-Adviser to a portfolio or adjusts the asset allocation among Sub-Advisers in a portfolio the affected portfolio may experience a period of transition during which the securities held in the portfolio may be repositioned in connection with the change in Sub-Adviser(s). A portfolio may not pursue its principal investment strategies during such a transition period and may incur increased brokerage commissions and other transaction costs in connection with the change(s). Generally, transitions may be implemented before or after the effective date of the new Sub-Adviser’s appointment as an adviser to the portfolio, and may be completed in several days to several weeks, depending on the particular circumstances of the transition. In addition, as described in “Comparative Performance Information” above, the past performance of a portfolio is not necessarily an indication of future performance. This may be particularly true for any portfolios that have undergone Sub-Adviser changes and/or changes to the investment objectives or policies of the portfolio.
The Manager is responsible for overseeing Sub-Advisers and recommending their hiring, termination and replacement to the EQ Trust’s Board. A committee of FMG LLC investment personnel (“Investment Committee”) is primarily responsible for the selection, monitoring and oversight of each Portfolio’s Sub-Adviser(s), as applicable, and performs other duties for portfolios not described in this Combined Proxy Statement/Prospectus.
The Manager has received an exemptive order from the SEC to permit it and the Board to appoint, dismiss and replace Sub-Advisers and to amend the sub-advisory agreements between the Manager and the Sub-Advisers without obtaining shareholder approval. Accordingly, the Manager is able, subject to the approval of the Trusts’ Boards, to appoint, dismiss and replace Sub-Advisers and to amend sub-advisory agreements without obtaining shareholder approval. If a new Sub-Adviser is retained for a Portfolio, shareholders will receive notice of such action. However, the Manager may not enter into a sub-advisory agreement with an “affiliated person” of the Manager (as that term is defined in the 1940 Act) (the “Affiliated Sub-Adviser”), such as AllianceBernstein, AXA Investment Managers, Inc., and AXA Rosenberg Investment Management LLC, unless the sub-advisory agreement with the Affiliated Sub-Adviser, including compensation, is also approved by the affected portfolio’s shareholders. An amendment to an investment management agreement between FMG LLC and the Trust that would result in an increase in the management fee rate specified in that agreement (i.e., the aggregate management fee) charged to a portfolio will also be submitted to shareholders for approval.
The portfolio managers at FMG LLC, 1290 Avenue of the Americas, New York, New York 10104, that are jointly and primarily responsible for the day-to-day management of each Portfolio are: Kenneth T. Kozlowski, CFP®, CLU, ChFC, and Alwi Chan, CFA®.
96
Kenneth T. Kozlowski, CFP®, CHFC, CLU has served as Executive Vice President and Chief Investment Officer of FMG LLC since June 2012 and as Managing Director of AXA Equitable since September 2011. He was Senior Vice President of FMG LLC from May 2011 to June 2012 and a Vice President of AXA Equitable from February 2001 to August 2011. He has served as Vice President of EQ Trust from June 2010 to present. Since 2003, Mr. Kozlowski has had primary responsibility for the asset allocation, fund selection and rebalancing of the funds of funds currently managed by FMG LLC and for the ETF Allocated Portions since May 25, 2007. Mr. Kozlowski served as Chief Financial Officer and Treasurer of EQ Trust from 2002 to 2007. He has been managing the AXA/DoubleLine Opportunistic Core Plus Bond Portfolio since May 2015 and the EQ/PIMCO Global Real Return Portfolio since May 2011.
Alwi Chan, CFA® has served as Senior Vice President and Deputy Chief Investment Officer of FMG LLC since June 2012 and as Lead Director of AXA Equitable since February 2007. He served as Vice President of FMG LLC from May 2011 to June 2012. Prior to that, he served as an Assistant Vice President (2005-2007) and Senior Investment Analyst (2002-2005) of AXA Equitable. He also has served as a Vice President of EQ Trust since 2007. He has been managing the AXA/DoubleLine Opportunistic Core Plus Bond Portfolio since May 2015 and the EQ/PIMCO Global Real Return Portfolio since May 2009.
Management and Administrative Fees
Each Portfolio pays a fee to FMG LLC for management services. The table below shows the annual rate of the management fees (as a percentage of each Portfolio’s average daily net assets) that the Manager received from each Portfolio in 2016 for managing the Portfolio and the rate of the management fees waived by the Manager in 2016 in accordance with the provisions of the Expense Limitation Arrangement, as defined below, with respect to each Portfolio.
| | | | | | | | | | | | | | | | |
Acquiring Portfolio | | Annual Rate
Received
All Classes | | | Rate of Fees Waived and
Expenses Reimbursed | |
| | | Class IB | | | Class K | | | Class B | |
All Asset Growth-Alt 20 Portfolio | | | 0.10% | | | | (0.01 | )% | | | (0.01 | )% | | | N/A | |
AXA/DoubleLine Opportunistic Core Plus Bond Portfolio | | | 0.60% | | | | (0.05 | )% | | | (0.06 | )% | | | N/A | |
CharterSM Moderate Portfolio | | | 0.15% | | | | N/A | | | | N/A | | | | (0.94 | )% |
EQ/PIMCO Global Real Return Portfolio | | | 0.60% | | | | (0.18 | )% | | | (0.17 | )% | | | N/A | |
AXA/Horizon Small Cap Value Portfolio | | | 0.80% | | | | (0.09 | )% | | | (0.09 | )% | | | N/A | |
| | | | | | | | | | | | | | | | |
Acquired Portfolio | | Annual Rate
Received
All Classes | | | Rate of Fees Waived and
Expenses Reimbursed | |
| | | Class IB | | | Class K | | | Class B | |
Alt 25 Portfolio | | | 0.10% | | | | (0.47 | ) | | | (0.47 | ) | | | N/A | |
Alt 50 Portfolio | | | 0.10% | | | | (4.75 | ) | | | (3.01 | )% | | | N/A | |
Alt 75 Portfolio | | | 0.10% | | | | (4.52 | ) | | | (3.00 | )% | | | N/A | |
Alternative 100 Moderate Portfolio | | | 0.15% | | | | N/A | | | | N/A | | | | (0.83 | ) |
Income Strategies Portfolio | | | 0.15% | | | | N/A | | | | N/A | | | | (2.70 | )% |
Interest Rate Strategies Portfolio | | | 0.15% | | | | N/A | | | | N/A | | | | (2.67 | )% |
International Moderate Portfolio | | | 0.15% | | | | N/A | | | | N/A | | | | (0.94 | )% |
Real Assets Portfolio | | | 0.15% | | | | N/A | | | | N/A | | | | (1.94 | )% |
Pac Global Portfolio | | | 0.80% | | | | (0.10 | )% | | | (0.10 | )% | | | N/A | |
In the interest of limiting through April 30, 2018 (unless the Board of Trustees of the respective Trust consents to an earlier revision or termination of this arrangement) the expenses of certain portfolios, the Manager has entered into an expense limitation agreement with each Trust with respect to each Acquiring Portfolio (“Expense Limitation Arrangement”). Pursuant to the Expense Limitation Arrangement, the Manager has agreed to make payments or waive its management, administrative and other fees to limit the expenses of each Acquiring Portfolio so that (1) the annual operating expenses of AXA/DoubleLine Opportunistic Core Plus Bond Portfolio, EQ/PIMCO Global Real Return Portfolio, and AXA/Horizon Small Cap Value Portfolio (exclusive of taxes, interest, brokerage commissions, dividend and interest expenses on securities sold short, capitalized
97
expenses, fees and expenses of other investment companies in which the Acquiring Portfolio invests and extraordinary expenses) do not exceed an annual rate of average daily net assets as set forth in the table below, and (2) the annual operating expenses (including acquired fund fees and expenses) of the All Asset Growth-Alt 20 Portfolio and Moderate Portfolio (exclusive of taxes, interest, brokerage commissions, dividend and interest expenses on securities sold short, capitalized expenses, and extraordinary expenses) do not exceed an annual rate of average daily net assets as set forth in the table below:
| | | | | | | | | | | | |
Acquiring Portfolio | | Total Expenses Limited to
(% of average daily net assets) | |
| | Class IB | | | Class K | | | Class B | |
All Asset Growth-Alt 20 Portfolio | | | 1.35% | | | | 1.10% | | | | N/A | |
AXA/DoubleLine Opportunistic Core Plus Bond Portfolio | | | 1.05% | | | | 0.80% | | | | N/A | |
CharterSM Moderate Portfolio | | | N/A | | | | N/A | | | | 1.30% | |
EQ/PIMCO Global Real Return Portfolio | | | 1.00% | | | | 0.75% | | | | N/A | |
AXA/Horizon Small Cap Value Portfolio | | | 1.15% | | | | 0.90% | | | | N/A | |
The Expense Limitation Arrangement may be terminated by AXA Equitable Funds Management Group, LLC at any time after April 30, 2018. The All Asset Growth-Alt 20 Portfolio offers Class IA shares and the AXA/DoubleLine Opportunistic Core Plus Bond Portfolio and EQ/PIMCO Global Real Return Portfolio each offer Class K shares, which are subject to the Expense Limitation Arrangement but are not subject to the Reorganization. The Manager may be reimbursed the amount of any such payments and waivers in the future provided that the payments or waivers are reimbursed within three years of the payment or waiver being made and the combination of the Acquiring Portfolio’s expense ratio and such reimbursements do not exceed the Acquiring Portfolio’s expense cap at the time of the waiver and/or reimbursement. If the actual expense ratio is less than the expense cap and the Manager has recouped any eligible previous payments made, the Acquiring Portfolio will be charged such lower expenses.
In the interest of limiting through April 30, 2017 (unless the Board of Trustees of the respective Trust consents to an earlier revision or termination of this arrangement) the expenses of certain portfolios, the Manager has entered into an expense limitation agreement with each Trust with respect to each Acquired Portfolio (“Expense Limitation Arrangement”). Pursuant to the Expense Limitation Arrangement, the Manager has agreed to make payments or waive its management, administrative and other fees to limit the expenses of each Acquired Portfolio so that (1) the annual operating expenses of the Alt 25 Portfolio, Alt 50 Portfolio, and Alt 75 Portfolio (exclusive of taxes, interest, brokerage commissions, dividend and interest expenses on securities sold short, capitalized expenses, fees and expenses of other investment companies and investment vehicles in which the Portfolio invests and extraordinary expenses) do not exceed an annual rate of average daily net assets as set forth in the table below; (2) the annual operating expenses (including acquired fund fees and expenses) of the Alternative 100 Moderate Portfolio, Income Strategies Portfolio, Interest Rate Strategies Portfolio, International Moderate Portfolio, and Real Assets Portfolio (exclusive of taxes, interest, brokerage commissions, dividend and interest expenses on securities sold short, capitalized expenses, and extraordinary expenses) do not exceed an annual rate of average daily net assets as set forth in the table below; and (3) the annual operating expenses of the Pac Global Portfolio (exclusive of taxes, interest, brokerage commissions, dividend and interest expenses on securities sold short, capitalized expenses, fees and expenses of other investment companies and exchange-traded investment vehicles in which the Portfolio invests and extraordinary expenses) as a percentage of average daily net assets do not exceed the following respective expense ratios:
| | | | | | | | | | | | |
Acquired Portfolio | | Total Expenses Limited to
(% of average daily net assets) | |
| | Class IB | | | Class K | | | Class B | |
Alt 25 Portfolio | | | 0.65% | | | | 0.40% | | | | N/A | |
Alt 50 Portfolio | | | 0.65% | | | | 0.40% | | | | N/A | |
Alt 75 Portfolio | | | 0.65% | | | | 0.40% | | | | N/A | |
Alternative 100 Moderate Portfolio | | | N/A | | | | N/A | | | | 1.55% | |
Income Strategies Portfolio | | | N/A | | | | N/A | | | | 1.20% | |
98
| | | | | | | | | | | | |
Acquired Portfolio | | Total Expenses Limited to
(% of average daily net assets) | |
| | Class IB | | | Class K | | | Class B | |
Interest Rate Strategies Portfolio | | | N/A | | | | N/A | | | | 1.20% | |
International Moderate Portfolio | | | N/A | | | | N/A | | | | 1.25% | |
Real Assets Portfolio | | | N/A | | | | N/A | | | | 1.40% | |
Pac Global Portfolio | | | 1.20% | | | | 0.95% | | | | N/A | |
The Manager has voluntarily agreed to make payments or waive all or a portion of its management, administrative and other fees to limit the expenses of the Pac Global Portfolio so that the annual operating expenses of the Portfolio (exclusive of interest, taxes, brokerage commissions, fees and expenses of other investment companies in which the Portfolio invests, dividend and interest expenses on securities sold short, other expenditures that are capitalized in accordance with generally accepted accounting principles, and other extraordinary expenses not incurred in the ordinary course of the Portfolio’s business) as a percentage of average daily net assets do not exceed an annual rate of average daily net assets of 1.15% for Class IB shares and 0.90% for Class K shares of the Portfolio.
The Manager may be reimbursed the amount of any such payments and waivers in the future provided that the payments or waivers are reimbursed within three years of the payment or waiver being made and the combination of a Portfolio’s expense ratio and such reimbursements do not exceed a Portfolio’s expense cap. If the actual expense ratio is less than the expense cap and the Manager has recouped any eligible previous payments or waivers made, a Portfolio will be charged such lower expenses. The Manager’s selection of Underlying Portfolios may positively or negatively impact its obligations under the Expense Limitation Agreement and its ability to recoup previous payments or waivers made under the Expense Limitation Agreement. The expense limitation described above for the Acquired Portfolios is the current arrangement of the Acquired Portfolios and will not continue if their Reorganizations are approved. If the Acquired Portfolios are reorganized, the Manager will forgo the recoupment of any amounts waived or reimbursed with respect to the Acquired Portfolios prior to their Reorganizations.
Each Sub-Adviser to a Portfolio is paid by the Manager. Changes to the advisory fees may be negotiated, which could result in an increase or a decrease in the amount of the management fee retained by the Manager, without shareholder approval. A discussion of the basis for the decision by the Board of each of EQ Trust and VIP Trust to approve the investment management and sub-advisory agreements with respect to each Portfolio is available in each respective Trust’s Semi-Annual or Annual Report to Shareholders.
FMG LLC also currently serves as the Administrator of the Portfolios. The administrative services provided to the Trusts by FMG LLC include, among others, coordination of each Trust’s audit, financial statements and tax returns; expense management and budgeting; legal administrative services and compliance monitoring; portfolio accounting services, including daily net asset value accounting; operational risk management; and oversight of each Trust’’ proxy voting policies and procedures and anti-money laundering program.
For administrative services, in addition to the management fee, each Portfolio pays FMG LLC its proportionate share of an asset-based administration fee.
Each of Alt 25 Portfolio, Alt 50 Portfolio, Alt 75 Portfolio, Alt 100 Moderate Portfolio, Real Assets Portfolio, Income Strategies Portfolio, Interest Rate Strategies Portfolio, International Moderate Portfolio, All Asset Growth-Alt 20 Portfolio, and CharterSM Moderate Portfolio pays FMG LLC its proportionate share of an asset-based administration fee, subject to a minimum annual fee of $32,500. For purposes of calculating the asset-based administration fee, the assets of the All Asset Growth-Alt 20 Portfolio and CharterSM Moderate Portfolio are aggregated with those of EQ Trust’s Strategic Allocation Portfolios and AXA/Franklin Templeton Allocation Managed Volatility Portfolio, and with VIP Trust Portfolios, which are also managed by FMG LLC, each of which are offered in other prospectuses (together with the All Asset Growth-Alt 20 Portfolio and CharterSM Moderate Portfolio, the “Fund-of-Funds Portfolios”). The asset-based administration fee is equal to an annual rate of 0.15% of the first $35 billion of the aggregate average daily net assets of the Fund-of-Funds Portfolios; 0.11% of the next $10 billion; $0.10% of the next 5 billion and 0.095% thereafter.
99
Each of AXA/DoubleLine Opportunistic Core Plus Bond Portfolio and EQ/PIMCO Global Real Return Portfolio pays FMG LLC its proportionate share of an asset-based administration fee for the Single-Advised Portfolios, subject to a minimum annual fee of $30,000. The Single-Advised Portfolios include AXA/DoubleLine Opportunistic Core Plus Bond Portfolio, AXA/AB Short Duration Government Bond Portfolio, AXA/Loomis Sayles Growth Portfolio, AXA Natural Resources Portfolio, AXA Real Estate Portfolio, AXA SmartBeta Equity Portfolio, EQ/BlackRock Basic Value Equity Portfolio, EQ/Boston Advisors Equity Income Portfolio, EQ/Calvert Socially Responsible Portfolio, EQ/Capital Guardian Research Portfolio, EQ/Common Stock Index Portfolio, EQ/Core Bond Index Portfolio, EQ/Equity 500 Index Portfolio, EQ/GAMCO Mergers and Acquisitions Portfolio, EQ/GAMCO Small Company Value Portfolio, EQ/International Equity Index Portfolio, EQ/Intermediate Government Bond Portfolio, EQ/Invesco Comstock Portfolio, EQ/JPMorgan Value Opportunities Portfolio, EQ/Large Cap Growth Index Portfolio, EQ/Large Cap Value Index Portfolio, EQ/MFS International Growth Portfolio, EQ/MidCap Index Portfolio, EQ/Money Market Portfolio, EQ/Morgan Stanley Mid Cap Growth Portfolio, EQ/Oppenheimer Global Portfolio, EQ/PIMCO Global Real Return Portfolio, EQ/PIMCO Ultra Short Bond Portfolio, EQ/Small Company Index Portfolio, EQ/T. Rowe Price Growth Stock Portfolio, EQ/UBS Growth and Income Portfolio, and EQ/Wells Fargo Omega Growth Portfolio, (together with the EQ/Energy ETF Portfolio and EQ/Low Volatility Global ETF Portfolio, which are offered in another prospectus). The Single-Advised Portfolios’ asset based administration fee rates based on aggregate average daily net assets of the Single-Advised Portfolios is equal to an annual rate of: 0.100% of the first $30 billion; 0.0975% of the next $10 billion; 0.0950% of the next $5 billion; and 0.0925% thereafter.
Each of the Pac Global Portfolio and AXA/Horizon Small Cap Value Portfolio pays FMG LLC its proportionate share of an asset-based administration fee, subject to a minimum annual fee of $32,500. For purposes of calculating the asset-based administration fee, the assets of the Portfolios are aggregated with those of the AXA Global Equity Managed Volatility Portfolio, AXA International Core Managed Volatility Portfolio, AXA International Value Managed Volatility Portfolio, AXA Large Cap Core Managed Volatility Portfolio, AXA Large Cap Growth Managed Volatility Portfolio, AXA Large Cap Value Managed Volatility Portfolio, AXA Mid Cap Value Managed Volatility Portfolio, AXA/AB Small Cap Growth Portfolio, AXA/Franklin Balanced Managed Volatility Portfolio, AXA/Franklin Small Cap Value Managed Volatility Portfolio, AXA/Lord Abbett Micro Cap Portfolio, AXA/Morgan Stanley Small Cap Growth Portfolio, AXA/Mutual Large Cap Equity Managed Volatility Portfolio, AXA/Templeton Global Equity Managed Volatility Portfolio, EQ/Convertible Securities Portfolio, EQ/Emerging Markets Equity PLUS Portfolio, EQ/Global Bond PLUS Portfolio, EQ/High Yield Bond Portfolio, EQ/Quality Bond PLUS Portfolio, Multimanager Aggressive Equity Portfolio, Multimanager Core Bond Portfolio, Multimanager Mid Cap Growth Portfolio, Multimanager Mid Cap Value Portfolio, and Multimanager Technology Portfolio (each a “Hybrid Portfolio”), and the AXA/AB Dynamic Growth Portfolio, AXA/AB Dynamic Moderate Growth Portfolio, AXA/Goldman Sachs Strategic Allocation Portfolio, AXA/Invesco Strategic Allocation Portfolio, AXA/Legg Mason Strategic Allocation Portfolio, and the ATM Portfolios (the ATM Portfolios are ATM International Managed Volatility Portfolio, ATM Large Cap Managed Volatility Portfolio, ATM Mid Cap Managed Volatility Portfolio, ATM Small Cap Managed Volatility Portfolio, AXA 2000 Managed Volatility Portfolio, AXA 400 Managed Volatility Portfolio, AXA 500 Managed Volatility Portfolio and AXA International Managed Volatility Portfolio, which are offered in another Prospectus), which are also managed by FMG LLC. The asset-based administration fee is equal to an annual rate of 0.15% of the first $25 billion of the aggregate average daily net assets of the Portfolios, Hybrid Portfolio, AXA/AB Dynamic Growth Portfolio, AXA/AB Dynamic Moderate Growth Portfolio, AXA/Goldman Sachs Strategic Allocation Portfolio, AXA/Invesco Strategic Allocation Portfolio, AXA/Legg Mason Strategic Allocation Portfolio, and the ATM Portfolios; 0.11% on the next $10 billion; 0.10% on the next $5 billion; and 0.095% thereafter.
The Sub-Advisers
Each of the AXA/DoubleLine Opportunistic Core Plus Bond Portfolio, EQ/PIMCO Global Real Return Portfolio, AXA/Horizon Small Cap Value Portfolio, and Pac Global Portfolio’s investments are selected by its Sub-Adviser(s). The following table describes the AXA/DoubleLine Opportunistic Core Plus Bond Portfolio, EQ/PIMCO Global Real Return Portfolio, AXA/Horizon Small Cap Value Portfolio, and Pacific Global Portfolio’s Sub-Adviser(s) and portfolio managers and each portfolio manager’s business experience. Information about the portfolio managers’ compensation, other accounts they manage and their ownership of securities of each Portfolio is available in the EQ Trust and VIP Trust Statement of Additional Information dated May 1, 2016, as supplemented.
100
| | | | |
Portfolio | | Sub-Adviser and Portfolio Managers | | Business Experience |
| | |
| AXA/DoubleLine Opportunistic Core Plus Bond Portfolio | | DoubleLine Capital LP
333 S. Grand Avenue, Suite 1800,
Los Angeles, CA 90071
Portfolio Managers
Jeffrey E. Gundlach | | Jeffrey E. Gundlach is the founder, Chief Executive Officer, and Chief Investment Officer of DoubleLine. Mr. Gundlach has been Chief Executive Officer and Chief Investment Officer of DoubleLine since its inception in December 2009. Mr. Gundlach has a B.A. in Mathematics and Philosophy from Dartmouth College. He has been managing the AXA/DoubleLine Opportunistic Core Plus Bond Portfolio since May 2015. |
| | |
| EQ/PIMCO Global Real Return Portfolio | | Pacific Investment Management
Company LLC
650 Newport Center Drive,
Newport Beach, CA 92660
Portfolio Managers
Mihir P. Worah
Jeremie Banet | | Mihir P. Worah is CIO Asset Allocation and Real Return and a managing director in the Newport Beach office. He is a member of the Investment Committee and the Executive Committee, and oversees portfolio management for the U.S. He is a generalist portfolio manager who manages a variety of fixed income, commodity and multi-asset portfolios. Prior to joining PIMCO in 2001, he was a postdoctoral research associate at the University of California, Berkeley, and the Stanford Linear Accelerator Center, where he built models to explain the difference between matter and anti-matter. In 2012 he co-authored “Intelligent Commodity Indexing,” published by McGraw-Hill. He has 15 years of investment experience and holds a Ph.D. in theoretical physics from the University of Chicago. He has been managing the EQ/PIMCO Global Real Return Portfolio since February 2013. Jeremie Banet is an executive vice president in the Newport Beach office and a portfolio manager on the real return team. Prior to joining PIMCO in 2011, he traded inflation-linked investments at Nomura Fixed Income. Prior to that, he was with BNP Paribas, most recently as head of U.S. inflation trading. He has 15 years of investment and financial services experience and holds a master’s degree in applied economics and an undergraduate degree from Paris IX Dauphine University. He has been managing the EQ/PIMCO Global Real Return Portfolio since May 2015. |
| | |
AXA/Horizon Small
Cap Value Portfolio | | Horizon Asset Management LLC
470 Park Avenue South,
New York, NY 10016
Portfolio Managers
Murray Stahl
Matthew Houk | | Murray Stahl is primarily responsible for the investment decisions for an Active Allocated Portion of the AXA/Horizon Small Cap Value Portfolio. Mr. Stahl currently serves as Chairman and Chief Investment Officer of Horizon. Mr. Stahl, a co-founder of Horizon, has over thirty years of investing experience and, in addition to overseeing the Horizon Research Team, is Chairman of Horizon’s Investment Committee, which is responsible for portfolio management decisions. Mr. Stahl has full authority over all aspects of the an Active Allocated Portion of the AXA/Horizon Small Cap Value Portfolio, including, but not limited to, purchases and sales of individual securities, portfolio risk assessment, and management of daily cash balances in accordance with anticipated investment management requirements. |
101
| | | | |
Portfolio | | Sub-Adviser and Portfolio Managers | | Business Experience |
| | | | Matthew Houk’s primary responsibility is to assist Mr. Stahl in communicating Horizon’s investment strategy and research to clients. In addition, Mr. Houk is responsible for conducting and authoring research and is also a Co-Portfolio Manager of a small-cap fund managed by an affiliate of Horizon. Mr. Houk joined the firm in 2008 and prior to that, was with Goldman, Sachs & Co. from 2005 to 2008. |
| | |
| | BlackRock Investment
Management, LLC
P.O. Box 9011,
Princeton, NJ 08543-9011
Portfolio Managers
Alan Mason
Greg Savage,
Creighton Jue
Rachel M. Aguirre | | Alan Mason, Managing Director of BlackRock since 2009; Managing Director of Barclays Global Investors (“BGI”) from 2008 to 2009; Principal of BGI from 1996 to 2008. Greg Savage, Managing Director of BlackRock since 2010; Director of BlackRock in 2009; Principal of BGI from 2007 to 2009; Associate of BGI from 1999 to 2007. Creighton Jue, CFA, Managing Director of BlackRock since 2011; Director of BlackRock from 2009 to 2011; Principal of BGI from 2000 to 2009. Rachel M. Aguirre, Director of BlackRock since 2012; Vice President of BlackRock from 2009 to 2011; Principal and Portfolio Manager of BGI from 2005 to 2009. |
| | |
AXA/Pacific Global Small Cap Value Portfolio | | Pacific Global Investment
Management Company 101 N. Brand Blvd., Suite 1950
Glendale, CA 91203 Portfolio Managers George A. Henning | | George A. Henning is primarily responsible for the day-to-day management of the Active Allocated Portion of the AXA/Pacific Global Small Cap Value Portfolio. Mr. Henning has been a portfolio manager since 1993. |
Legal Proceedings
A lawsuit was filed in the United States District Court of the District of New Jersey in July 2011, entitled Mary Ann Sivolella v. AXA Equitable Life Insurance Company and AXA Equitable Funds Management Group, LLC (“AXA Equitable FMG”) (“Sivolella Litigation”). The lawsuit was filed derivatively on behalf of eight funds. The lawsuit seeks recovery under Section 36(b) of the Investment Company Act of 1940, as amended (the “Investment Company Act”), for alleged excessive fees paid to AXA Equitable and AXA Equitable FMG for investment management services.
In January 2013, a second lawsuit was filed in the United States District Court of the District of New Jersey entitled Sanford et al. v. AXA Equitable FMG (“Sanford Litigation”). The lawsuit was filed derivatively on behalf of eight funds, four of which are named in the Sivolella lawsuit as well as four new funds, and seeks recovery under Section 36(b) of the Investment Company Act for alleged excessive fees paid to AXA Equitable FMG for investment management services. In light of the similarities of the allegations in the Sivolella and Sanford Litigations, the parties and the Court agreed to consolidate the two lawsuits.
In April 2013, the Plaintiffs in the Sivolella and Sanford Litigations amended the complaints to add additional claims under Section 36(b) of the 1940 Act for recovery of alleged excessive fees paid to FMG LLC in its capacity as the Administrator of EQ Trust. The Plaintiffs seek recovery of the alleged overpayments, or alternatively, rescission of the contract and restitution of the excessive fees paid, interest, costs, and fees. In January 2015, plaintiffs and defendants filed motions for summary judgement, which were denied by the Court.
102
The non-jury trial commenced in January 2016 and testimony concluded in February 2016. Closing arguments occurred in June 2016 following post-trial briefing. In August 2016, the Court issued its decision in favor of AXA Equitable and AXA Equitable FMG, finding that the Plaintiffs had failed to meet their burden to demonstrate that AXA Equitable and AXA Equitable FMG breached their fiduciary duty in violation of Section 36(b) or show any actual damages. In September 2016, the Plaintiffs filed a motion to amend the trial opinion and to amend or make new findings of fact and/or conclusions of law, which was denied by the Court in December 2016. In December 2016, plaintiffs filed a notice to appeal the Court’s decision to the United States Court of Appeals for the Third District.
On November 1, 2010, EQ Trust, and several of its Portfolios, were named as defendants and putative members of the proposed defendant class of contractholders in a lawsuit brought by The Official Committee of Unsecured Creditors of Tribune Company (the “Committee”) in the United States Bankruptcy Court for the District of Delaware regarding Tribune Company’s Chapter 11 bankruptcy proceeding (In re Tribune Company). The lawsuit relates to amounts paid to EQ Trust, and several of its Portfolios, as holders of publicly-traded shares of Tribune Company, which were components of certain broad-based securities market indices, for which there were public tender offers during 2007. The suit seeks return of the share price received by Tribune Company shareholders in the tender offers plus interest and attorneys’ fees and expenses.
On July 1, 2011, retiree participants in certain Tribune-defined compensation plans (the “Retirees”) initiated a lawsuit in the United States District Court for the Southern District of New York against certain Tribune Company shareholders who sold their shares as part of the 2007 public tender offers (the “Retiree Suit”). This Retiree Suit also seeks return of the share price received by Tribune Company shareholders in connection with the tender offers plus interest and attorneys’ fees and expenses.
On August 24, 2011, the trustees of certain trusts that hold notes issued by Tribune Company (the “Noteholders”) initiated a separate lawsuit in the United States District Court for the Southern District of New York against certain Tribune Company shareholders who sold their shares as part of the 2007 public tender offers (the “Noteholder Suit”). This Noteholder Suit also seeks return of the share price received by Tribune Company shareholders in connection with the tender offers plus interest and attorneys’ fees and expenses.
The Committee’s suit, the Retiree Suit, and the Noteholder Suit have each been consolidated with a number of related lawsuits filed by the Noteholders and Retirees around the United States into a single multi-district litigation proceeding now pending in the United States District Court for the Southern District of New York (In re: Tribune Company Fraudulent Conveyance Litigation).
The EQ/Equity 500 Index Portfolio, the EQ/GAMCO Mergers and Acquisitions Portfolio and the AXA Mid Cap Value Managed Volatility Portfolio are named as defendants in the Noteholder Suit and the Retiree Suit. The EQ/Equity 500 Index Portfolio, the EQ/GAMCO Mergers and Acquisitions Portfolio, the AXA Mid Cap Value Managed Volatility Portfolio, the AXA Large Cap Core Managed Volatility Portfolio, the EQ/Small Company Index II Portfolio, the EQ/Common Stock Index II Portfolio, and EQ Advisors Trust are all putative members of the proposed defendant class of shareholders in the Committee’s suit. The EQ/Equity 500 Index Portfolio, the EQ/GAMCO Mergers and Acquisition Portfolio, the AXA Large Cap Core Managed Volatility Portfolio, and EQ Advisors Trust are also named separately in the Committee’s suit, in the event it is not certified as a class action. The amounts paid to the above six Portfolios in connection with the public tender offers were approximately: (i) the EQ/Equity 500 Index Portfolio – $1,740,800; (ii) the EQ/GAMCO Mergers and Acquisitions Portfolio – $1,122,000; (iii) the AXA Mid Cap Value Managed Volatility Portfolio – $2,992,000; (iv) the AXA Large Cap Core Managed Volatility Portfolio – $64,600; (v) the EQ/Small Company Index II Portfolio (now called EQ/Small Company Index) – $61,200; (vi) the EQ/Common Stock Index II Portfolio (now called EQ/Common Stock Index) – $18,360; and (vii) the Multimanager Large Cap Value Portfolio (now called AXA Large Cap Value Managed Volatility Portfolio) – $3,359,200.
The lawsuits do not allege any misconduct by the EQ Trust or its Portfolios. The Noteholders and Retirees’ suits have been dismissed and the United States Court of Appeals for the Second Circuit has affirmed the dismissal of those suits. The Committee Suit remains pending before the United States District Court for the Southern District of New York. The Portfolios cannot predict the outcome of these lawsuits. If the lawsuits were to be
103
decided or settled in a manner adverse to the Portfolios, the payment of such judgments or settlements could have an adverse effect on each Portfolio’s net asset value. However, no liability for litigation relating to this matter has been accrued in the financial statements of the Portfolios, as the Manager believes a loss is not probable.
Portfolio Services
Portfolio Distribution Arrangements
EQ Trust
EQ Trust offers Class IA shares, Class IB shares, and Class K shares on behalf of the All Asset Growth - Alt 20 Portfolio. EQ Trust offers Class IB shares and Class K shares of the Alt 25 Portfolio, Alt 50 Portfolio, Alt 75 Portfolio, All Asset Growth- Alt 20 Portfolio, EQ/PIMCO Global Real Return Portfolio, AXA/DoubleLine Opportunistic Core Plus Bond Portfolio, AXA/Horizon Small Cap Value Portfolio, and Pac Global. AXA Distributors, LLC (“AXA Distributors”) serves as the distributor for the Class IA, Class IB and Class K shares of the Trust. Each class of shares is offered and redeemed at its net asset value without any sales load. AXA Distributors is an affiliate of FMG LLC. AXA Distributors is registered as a broker-dealer under the Securities Exchange Act of 1934, as amended and is a member of the Financial Industry Regulatory Authority, Inc. (“FINRA”).
EQ Trust has adopted a Distribution Plan pursuant to Rule 12b-1 under the 1940 Act for the Trust’s Class IA and Class IB shares (“Distribution Plan”). Under the Distribution Plan, the Class IA and Class IB shares of EQ Trust are charged a distribution and/or service (12b-1) fee to compensate AXA Distributors for promoting, selling and servicing shares of the Portfolios. The distribution and/or service (12b-1) fee may be retained by AXA Distributors or used to pay financial intermediaries for similar services. The maximum distribution and/or service (12b-1) fee for each Portfolio’s Class IA and Class IB shares is equal to an annual rate of 0.25% of the average daily net assets attributable to the Portfolio’s Class IA and Class IB shares. Because these fees are paid out of each Portfolio’s assets on an ongoing basis, over time, the fees for Class IA and Class IB shares will increase your cost of investing and may cost you more than other types of charges. The All Asset Growth - Alt 20 Portfolio’s Class IA shares are not subject to the Reorganizations.
The distributor also may receive payments from certain Sub-Advisers of the Underlying Portfolios or their affiliates to help defray expenses for sales meetings, or seminar sponsorships and similar expenses that may relate to the Contracts and/or the Sub-Advisers’ respective Underlying Portfolios. These sales meetings or seminar sponsorships may provide the Advisers with increased access to persons involved in the distribution of the Contracts. The distributor also may receive marketing support from the Sub-Advisers in connection with the distribution of the Contracts.
VIP Trust
The Alt 100 Moderate Portfolio, Real Assets Portfolio, Income Strategies Portfolio, Interest Rate Strategies Portfolio, International Moderate Portfolio, and CharterSM Moderate Portfolio are distributed by AXA Distributors. AXA Distributors is registered as a broker-dealer under the Securities Exchange Act of 1934, as amended, and is a member of FINRA. VIP Trust has adopted a Distribution Plan under Rule 12b-1 under the 1940 Act for the CharterSM Allocation Portfolios’ Class A and Class B shares. Under the Distribution Plan, Class A and Class B shares are charged a distribution and/or service (12b-1) fee to compensate AXA Distributors for promoting, selling and servicing shares of the CharterSM Allocation Portfolios. The distribution and/or service (12b-1) fee may be retained by AXA Distributors or used to pay financial intermediaries for similar services. The maximum annual distribution and/or service (12b-1) fee for each CharterSM Allocation Portfolio’s Class A and Class B shares is equal to an annual rate of 0.25% of the average daily net assets attributable to Class A and Class B shares. Because these fees are paid out of each CharterSM Allocation Portfolio’s assets on an ongoing basis, over time, these fees for Class A and Class B shares will increase the cost of your investment and may cost you more than paying other types of charges. The CharterSM Allocation Portfolios Class A shares are not subject to the Reorganizations.
104
The distributor may receive payments from certain investment advisers or sub-advisers of the Underlying Portfolios and Underlying ETFs or their affiliates to help defray expenses for sales meetings or seminar sponsorships that may relate to the Contracts and/or the investment advisers or sub-advisers respective Underlying Portfolios and Underlying ETFs. These sales meetings or seminar sponsorships may provide the investment advisers with increased access to persons involved in the distribution of the Contracts. The distributor also may receive other marketing support from the investment advisers or sub-advisers in connection with the distribution of the Contracts.
Payments to Broker-Dealers and Other Financial Intermediaries
The Portfolios are not sold directly to the general public but instead are offered as an underlying investment option for Contracts and retirement plans and to other eligible investors. The Portfolios and their related companies may make payments to a sponsoring insurance company (or its affiliates) or other financial intermediary for distribution and/or other services. These payments may create a conflict of interest by influencing the insurance company or other financial intermediary and your financial adviser to recommend the Portfolio over another investment or by influencing an insurance company to include the Portfolio as an underlying investment option in the Contract. The prospectus (or other offering document) for your Contract may contain additional information about these payments. Ask your financial adviser or visit your financial intermediary’s website for more information.
Buying and Selling Shares
The Portfolios’ shares are currently sold only to insurance company separate accounts in connection with Contracts issued or to be issued by AXA Equitable Life Insurance Company (“AXA Equitable”), or other affiliated or unaffiliated insurance companies and to the AXA Equitable 401(k) Plan. Shares also may be sold to other tax-qualified retirement plans and other investors eligible under applicable federal tax regulations. Class K shares of the Portfolios are sold only to other portfolios of the Trusts and certain group annuity and retirement plans.
The Portfolios do not have minimum initial or subsequent investment requirements. Shares of the Portfolios are redeemable on any business day (normally any day on which the New York Stock Exchange is open) upon receipt of a request. All redemption requests will be processed and payment with respect thereto will normally be made within seven days after tender. Please refer to your Contract prospectus for more information on purchasing and redeeming shares of the Portfolios.
All shares are purchased and sold at their net asset value without any sales load. All redemption requests will be processed and payment with respect thereto will normally be made within seven days after tender. Each Portfolio reserves the right to suspend or change the terms of purchasing or selling shares.
The Trusts may suspend the right of redemption for any period or postpone payment for more than seven days when the New York Stock Exchange (“NYSE”) is closed (other than a weekend or holiday) or when trading is restricted by the SEC or the SEC declares that an emergency exists. Redemptions may also be suspended and payments may be postponed for more than seven days during other periods permitted by the SEC. A Portfolio may pay the redemption price in whole or part by a distribution in kind of readily marketable securities in lieu of cash or may take up to seven days to pay a redemption request in order to raise capital, when it is detrimental for the Portfolio to make cash payments as determined in the sole discretion of FMG LLC.
Frequent transfers or purchases and redemptions of Portfolio shares, including market timing and other program trading or short-term trading strategies, may be disruptive to the Portfolios. Excessive purchases and redemptions of shares of a Portfolio may adversely affect the Portfolios’ performance and the interests of long-term investors by requiring the Portfolios to maintain larger amounts of cash or to liquidate portfolio holdings at a disadvantageous time or price. For example, when market timing occurs, the Portfolios may have to sell its holdings to have the cash necessary to redeem the market timer’s shares. This can happen when it is not advantageous to sell any securities, so the Portfolios’ performance may be hurt. When large dollar amounts are involved, market timing can also make it difficult to use long-term investment strategies because the Portfolio cannot predict how much cash it will have to invest. In addition, disruptive transfers or purchases and redemptions of Portfolio
105
shares may impede efficient portfolio management and impose increased transaction costs, such as brokerage costs, by requiring the portfolio manager to effect more frequent purchases and sales of portfolio securities. Similarly, a Portfolio may bear increased administrative costs as a result of the asset level and investment volatility that accompanies patterns of excessive or short-term trading. To the extent a Portfolio invests in Underlying Portfolios and Underlying ETFs that invest a significant portion of their assets in foreign securities (e.g., EQ/ International Equity Index Portfolio, EQ/MFS International Growth Portfolio, AXA International Value Managed Volatility Portfolio, AXA International Core Managed Volatility Portfolio, iShares MSCI Emerging Markets ETF), the securities of small- and mid-capitalization companies (e.g., Multimanager Mid Cap Growth Portfolio, AXA/AB Small Cap Growth Portfolio and Multimanager Small Cap Value Portfolio,) or high yield securities (e.g. EQ/High Yield Bond Portfolio, SPDR Barclays Capital High Yield Bond ETF), it will tend to be subject to the risks associated with market timing and short-term trading strategies to a greater extent than a portfolio that does not. Securities trading in overseas markets present time zone arbitrage opportunities when events affecting portfolio securities values occur after the close of the overseas market but prior to the close of the U.S. market. Securities of small- and mid-capitalization companies and high-yield securities also present arbitrage opportunities because the market for such securities may be less liquid than the market for the securities of larger companies and higher quality bonds which could result in pricing inefficiencies.
Each Trust’s Board has adopted policies and procedures regarding disruptive transfer activity. The Trusts and the Portfolios discourage frequent purchases and redemptions of portfolio shares by Contractholders and will not make special arrangements to accommodate such transactions in Portfolio shares. As a general matter, each Portfolio and the Trusts reserve the right to reject a transfer that they believe, in their sole discretion is disruptive (or potentially disruptive) to the management of the Portfolio.
Each Trust’s policies and procedures seek to discourage what it considers to be disruptive trading activity. Each Trust seeks to apply its policies and procedures to all Contractholders uniformly, including omnibus accounts. It should be recognized, however, that such policies and procedures are subject to limitations:
| | • | | They do not eliminate the possibility that disruptive transfer activity, including market timing, will occur or that portfolio performance will be affected by such activity. |
| | • | | The design of such policies and procedures involves inherently subjective judgments, which FMG LLC and its affiliates, on behalf of each Trust, seek to make in a fair and reasonable manner consistent with the interests of all Contractholders. |
| | • | | The limits on the ability to monitor certain potentially disruptive transfer activity means that some Contractholders may be treated differently than others, resulting in the risk that some Contractholders may be able to engage in frequent transfer activity while others will bear the effect of that frequent transfer activity. |
If FMG LLC, on behalf of each Trust, determines that a Contractholder’s transfer patterns among a Trust’s portfolios are disruptive to a Trust’s portfolios, FMG LLC or an affiliate may, among other things, restrict the availability of personal telephone requests, facsimile transmissions, automated telephone services, internet services or any electronic transfer services. FMG LLC or an affiliate may also refuse to act on transfer instructions of an agent acting under a power of attorney who is acting on behalf of more than one owner. In making these determinations, FMG LLC or an affiliate may consider the combined transfer activity of Contracts that it believes are under common ownership, control or direction.
Each Trust currently considers transfers into and out of (or vice versa) the same portfolio within a five-business day period as potentially disruptive transfer activity. In order to reduce disruptive activity, it monitors the frequency of transfers, including the size of transfers in relation to portfolio assets, in each portfolio. Each Trust aggregates inflows and outflows for each portfolio on a daily basis. When a potentially disruptive transfer into or out of a portfolio occurs on a day when the portfolio’s net inflows and outflows exceed an established monitoring threshold, FMG LLC or an affiliate sends a letter to the Contractholder explaining that there is a policy against disruptive transfer activity and that if such activity continues, FMG LLC or an affiliate may take action to restrict the availability of voice, fax and automated transaction services. If such Contractholder is
106
identified a second time as engaging in potentially disruptive transfer activity, FMG LLC or an affiliate currently will restrict the availability of voice, fax and automated transaction services. FMG LLC or an affiliate currently will apply such action for the remaining life of each affected Contract. Because FMG LLC or an affiliate exercises discretion in determining whether or not to take the actions discussed above, some Contractholders may be treated differently than others, resulting in the risk that some Contractholders may be able to engage in frequent transfer activity while others will bear the effect of the frequent transfer activity. Although Contractholders who have engaged in disruptive transfer activity currently receive letters notifying them of FMG LLC or an affiliate’s intention to restrict access to communication services, such letters may not continue to be provided in the future. Consistent with seeking to discourage potentially disruptive transfer activity, FMG LLC, or an affiliate thereof or the Trusts also may in its sole discretion and without further notice, change what it considers potentially disruptive transfer activity and its monitoring procedures and thresholds, as well as change its procedures to restrict this activity. You should consult your Contract prospectus for information on other specific limitations on the transfer privilege.
The above policies and procedures with respect to frequent transfers or purchases and redemptions of portfolio shares also apply to retirement plan participants. The above policies and procedures do not apply to transfers, purchases and redemptions of shares of portfolios of each Trust by funds of funds managed by FMG LLC. These transfers, purchases and redemptions are exempt from the above policies and procedures because they are initiated pursuant to asset allocation strategies developed by FMG LLC and its affiliates and, therefore, are not intended to disadvantage the relevant portfolios or their shareholders.
Notwithstanding our efforts, we may be unable to detect or deter market timing activity by certain persons, which can lead to disruption of management of, and excess costs to, the portfolios, including the Portfolios.
How Portfolio Shares Are Priced
“Net asset value” is the price of one share of a portfolio of EQ Trust, including the Portfolios, without a sales charge, and is calculated each business day using the following formula:
| | | | | | | | | | |
| Net Asset Value = | | Total market
value of securities | | + | | Cash and other
assets | | – | | Liabilities |
| | Number of outstanding shares |
The net asset value of portfolio shares is determined according to this schedule:
| | • | | A share’s net asset value is determined as of the close of regular trading on the NYSE on the days it is open for trading. This is normally 4:00 p.m. Eastern time. |
| | • | | The price for purchasing or redeeming a share will be based upon the net asset value next calculated after an order is received and accepted by a portfolio or its designated agent. |
| | • | | A portfolio heavily invested in foreign securities may have net asset value changes on days when shares cannot be purchased or sold because foreign securities sometimes trade on days when a portfolio’s shares are not priced. |
Shares of the Underlying Portfolios held by a Portfolio are valued at their respective net asset values. Generally, other portfolio securities and assets of a Portfolio as well as portfolio securities and other assets held by the Underlying Portfolios are valued as follows:
| | • | | Equity securities (including securities issued by ETFs) — most recent sales price or official closing price or if there is no sale or official closing price, latest available bid price. |
| | • | | Securities traded on foreign exchanges — most recent sales or bid price on the foreign exchange or market, unless a significant event or circumstance occurs after the close of that market or exchange that will materially affect its value. In that case, the security will be valued using the fair value procedures by or under the direction of the Trust’s Board of Trustees at the close of regular trading on the Exchange. Foreign currency is converted into U.S. dollar equivalent daily at current exchange rates. |
107
| | • | | Debt securities — based upon pricing service valuations. Debt securities with original or remaining maturities of 60 days or less may be valued at amortized cost. |
| | • | | Convertible bonds and unlisted convertible preferred stocks — valued at prices obtained from a pricing service for such instruments or, if a pricing service price is not available, at bid prices obtained from one or more of the major dealers in such bonds or stocks. Where there is a discrepancy between dealers, values may be adjusted based on recent premium spreads to the underlying common stocks. Convertible bonds may be matrix-priced based upon the conversion value to the underlying common stocks and market premiums. |
| | • | | Options — for exchange traded options, last sales price or, if not available, previous day’s sales price. If the bid price is higher or the asked price is lower than the last sale price, the higher bid or lower asked price may be used. Options not traded on an exchange or actively traded are valued according to fair value methods. |
| | • | | Futures — last sales price or, if there is no sale, latest available bid price. |
| | • | | Investment Company Securities — shares of open-end mutual funds (other than ETFs) held by a portfolio will be valued at the net asset value of the shares of such funds as described in these funds’ prospectuses. |
| | • | | Swaps—utilize prices provided by approved pricing services. |
Securities and assets for which market quotations are not readily available, for which valuation cannot be provided or for which events or circumstances occurring after the close of the relevant market or exchange materially affect their value are valued pursuant to the fair value procedures in good faith by or under the direction of the Board of Trustees. For example, a security whose trading has been halted during the trading day may be fair valued based on the available information at the time of the close of the trading market. Similarly, securities for which there is no ready market (e.g., securities of certain small capitalization issuers, high yield securities and securities of certain issuers located in emerging markets) also may be fair valued. Some methods for valuing these securities may include: fundamental analysis (earnings multiple, etc.), matrix pricing, discounts from market prices of similar securities, or discounts applied due to the nature and duration of restrictions on the disposition of the securities.
Events or circumstances affecting the values of portfolio securities that occur between the closing of their principal markets and the time the net asset value is determined, such as foreign securities trading on foreign exchanges that close before the time the net asset value of portfolio shares is determined, may be reflected in the Trusts’ calculations of net asset values for each applicable portfolio when each Trust deems that the particular event or circumstance would materially affect such portfolio’s net asset value. Such events or circumstances may be company specific, such as an earning report, country or region specific, such as a natural disaster, or global in nature. Such events or circumstances also may include price movements in the U.S. securities markets.
The effect of fair value pricing as described above is that securities may not be priced on the basis of quotations from the primary market in which they are traded, but rather may be priced by another method that the EQ Trust Board believes will reflect fair value. As such, fair value pricing is based on subjective judgments and it is possible that fair value may differ materially from the value realized on a sale. This policy is intended to assure that the portfolio’s net asset value fairly reflects security values as of the time of pricing. Also, fair valuation of a portfolio’s securities can serve to reduce arbitrage opportunities available to short-term traders, but there is no assurance that fair value pricing policies will prevent dilution of the portfolio’s net asset value by those traders.
Each business day, the portfolios’ net asset values, including the net asset values of any applicable Acquiring Portfolio, are transmitted electronically to insurance companies that use the portfolios as underlying investment options for Contracts.
108
Dividends and Other Distributions
Each Portfolio generally distributes most or all of its net investment income and net realized gains (collectively, “Taxable Income”), if any, annually. Dividends and other distributions by a Portfolio are automatically reinvested at net asset value in shares of the distributing class of the Portfolio.
Federal Income Tax Considerations
The Portfolios currently sell their shares only to insurance company separate accounts, qualified plans and other investors eligible under applicable tax regulations. Accordingly, distributions a Portfolio makes of its investment company taxable income and net capital gain (i.e., the excess of net long-term capital gain over net short-term capital loss) (collectively, “Taxable Income”) and net gains realized on its shareholders’ redemptions or exchanges of Portfolio shares generally will not be taxable to them (or to the holders of underlying Contracts or plan participants or beneficiaries). See the prospectus for your Contract for further tax information.
Each Portfolio is treated as a separate corporation, and intends to continue to qualify each taxable year to be treated as a “regulated investment company” (a “RIC”), for federal tax purposes. Each g Portfolio will be so treated if it meets specified federal income tax rules, including requirements regarding types of investments, diversification limits on investments, types of income, and distributions. To comply with all these requirements may, from time to time, necessitate a Portfolio’s disposition of one or more investments when it might not otherwise do so.
A Portfolio that satisfies the federal tax requirements to be treated as a RIC is not taxed at the entity (portfolio) level to the extent it passes through its Taxable Income to its shareholders by making distributions. Although the Trust intends that each Portfolio will be operated to have no federal tax liability, if a Portfolio does have any federal tax liability, that would hurt its investment performance. Also, to the extent that a Portfolio invests in foreign securities or holds foreign currencies, it could be subject to foreign taxes that would reduce its investment performance.
It is important for each Portfolio to maintain its RIC status (and to satisfy certain other requirements), because each shareholder of the Portfolio that is an insurance company separate account will then be able to use a “look-through” rule in determining whether the account meets federal tax investment diversification rules for those accounts. If a Portfolio failed to meet those diversification rules, owners of non-pension plan Contracts funded through the Portfolio would be taxed immediately on the accumulated investment earnings under their Contracts and would lose any benefit of tax deferral. FMG LLC, in its capacity as the investment manager and the administrator of the Trust, therefore carefully monitors the Portfolios’ compliance with all of the RIC rules and separate account investment diversification rules.
Contractholders seeking to more fully understand the tax consequences of their investment should consult with their tax advisers or the insurance company that issued their Contract or refer to their Contract prospectus.
Portfolio Holdings Disclosure
A description of the Portfolios’ policies and procedures with respect to the disclosure of their portfolio securities holdings is available in the Portfolios’ Statement of Additional Information.
109
FINANCIAL HIGHLIGHTS
The following financial highlights tables are intended to help you understand the financial performance of the Class IB and Class K shares of the All Asset Growth- Alt 20 Portfolio, AXA/DoubleLine Opportunistic Core Plus Bond Portfolio, EQ/PIMCO Global Real Return Portfolio, AXA/Horizon Small Cap Value Portfolio, All Asset Aggressive-Alt 25 Portfolio, All Asset Aggressive-Alt 50 Portfolio, All Asset Aggressive-Alt 75 Portfolio, and AXA/Pacific Global Small Cap Value Portfolio, and the Class B shares of the CharterSM Moderate Portfolio, CharterSM Alternative 100 Moderate Portfolio, CharterSM Income Strategies Portfolio, CharterSM Interest Rate Strategies Portfolio, CharterSM International Moderate Portfolio, and CharterSM Real Assets Portfolio. The financial information in the tables is for the past five years (or, if shorter, the period of operations). The financial information below for the Class IA, Class IB, Class K, and Class B shares, as applicable, of the respective Portfolios has been derived from the financial statements of the Portfolios, which have been audited by PricewaterhouseCoopers LLP (“PwC”), an independent registered public accounting firm. PwC’s report on each Portfolio’s financial statements for the fiscal year ended December 31, 2016, and the financial statements themselves as of December 31, 2016 are included in the Statement of Additional Information relating to this Combined Proxy Statement/Prospectus. The information should be read in conjunction with these financial statement documents.
Certain information reflects financial results for a single share. The total returns in the table represent the rate that a shareholder would have earned (or lost) on an investment in the Portfolio (assuming reinvestment of all dividends and other distributions). The total return figures shown below do not reflect any Separate Account or Contract fees and charges. The total return figures would be lower if they did reflect such fees and charges.
110
All Asset Growth-Alt 20 Portfolio
| | | | | | | | | | | | | | | | | | | | |
| | | Year Ended December 31, | |
Class IA | | 2016 | | | 2015 | | | 2014 | | | 2013 | | | 2012 | |
Net asset value, beginning of year | | $ | 17.84 | | | $ | 19.30 | | | $ | 19.59 | | | $ | 18.42 | | | $ | 17.11 | |
| | | | | | | | | | | | | | | | | | | | |
Income (loss) from investment operations: | | | | | | | | | | | | | | | | | | | | |
Net investment income (loss) (e)(x) | | | 0.23 | | | | 0.14 | | | | 0.24 | | | | 0.21 | | | | 0.25 | |
Net realized and unrealized gain (loss) on investments | | | 1.48 | | | | (0.90 | ) | | | 0.25 | | | | 2.37 | | | | 1.80 | |
| | | | | | | | | | | | | | | | | | | | |
Total from investment operations | | | 1.71 | | | | (0.76 | ) | | | 0.49 | | | | 2.58 | | | | 2.05 | |
| | | | | | | | | | | | | | | | | | | | |
Less distributions: | | | | | | | | | | | | | | | | | | | | |
Dividends from net investment income | | | (0.25 | ) | | | (0.16 | ) | | | (0.28 | ) | | | (0.27 | ) | | | (0.29 | ) |
Distributions from net realized gains | | | (0.40 | ) | | | (0.54 | ) | | | (0.50 | ) | | | (1.14 | ) | | | (0.45 | ) |
| | | | | | | | | | | | | | | | | | | | |
Total dividends and distributions | | | (0.65 | ) | | | (0.70 | ) | | | (0.78 | ) | | | (1.41 | ) | | | (0.74 | ) |
| | | | | | | | | | | | | | | | | | | | |
Net asset value, end of year | | $ | 18.90 | | | $ | 17.84 | | | $ | 19.30 | | | $ | 19.59 | | | $ | 18.42 | |
| | | | | | | | | | | | | | | | | | | | |
Total return | | | 9.55 | % | | | (3.94 | )% | | | 2.42 | % | | | 14.12 | % | | | 11.98 | % |
| | | | | | | | | | | | | | | | | | | | |
Ratios/Supplemental Data: | | | | | | | | | | | | | | | | | | | | |
Net assets, end of year (000’s) | | $ | 18,358 | | | $ | 14,722 | | | $ | 12,546 | | | $ | 9,868 | | | $ | 6,218 | |
| Ratio of expenses to average net assets: | | | | | | | | | | | | | | | | | | | | |
After waivers and reimbursements (f) | | | 0.58 | % | | | 0.57 | % | | | 0.51 | % | | | 0.35 | % | | | 0.35 | % |
Before waivers and reimbursements (f) | | | 0.59 | % | | | 0.57 | % | | | 0.58 | % | | | 0.58 | % | | | 0.62 | % |
| Ratio of net investment income (loss) to average net assets: | | | | | | | | | | | | | | | | | | | | |
After waivers and reimbursements (f)(x) | | | 1.26 | % | | | 0.71 | % | | | 1.21 | % | | | 1.09 | % | | | 1.37 | % |
Before waivers and reimbursements (f)(x) | | | 1.25 | % | | | 0.71 | % | | | 1.14 | % | | | 0.86 | % | | | 1.09 | % |
Portfolio turnover rate^ | | | 11 | % | | | 14 | % | | | 18 | % | | | 43 | % | | | 43 | % |
| |
| | | Year Ended December 31, | |
Class IB | | 2016 | | | 2015 | | | 2014 | | | 2013 | | | 2012 | |
Net asset value, beginning of year | | $ | 17.88 | | | $ | 19.34 | | | $ | 19.64 | | | $ | 18.46 | | | $ | 17.15 | |
| | | | | | | | | | | | | | | | | | | | |
Income (loss) from investment operations: | | | | | | | | | | | | | | | | | | | | |
Net investment income (loss) (e)(x) | | | 0.21 | | | | 0.12 | | | | 0.21 | | | | 0.17 | | | | 0.22 | |
Net realized and unrealized gain (loss) on investments | | | 1.51 | | | | (0.88 | ) | | | 0.27 | | | | 2.42 | | | | 1.83 | |
| | | | | | | | | | | | | | | | | | | | |
Total from investment operations | | | 1.72 | | | | (0.76 | ) | | | 0.48 | | | | 2.59 | | | | 2.05 | |
| | | | | | | | | | | | | | | | | | | | |
Less distributions: | | | | | | | | | | | | | | | | | | | | |
Dividends from net investment income | | | (0.25 | ) | | | (0.16 | ) | | | (0.28 | ) | | | (0.27 | ) | | | (0.29 | ) |
Distributions from net realized gains | | | (0.40 | ) | | | (0.54 | ) | | | (0.50 | ) | | | (1.14 | ) | | | (0.45 | ) |
| | | | | | | | | | | | | | | | | | | | |
Total dividends and distributions | | | (0.65 | ) | | | (0.70 | ) | | | (0.78 | ) | | | (1.41 | ) | | | (0.74 | ) |
| | | | | | | | | | | | | | | | | | | | |
Net asset value, end of year | | $ | 18.95 | | | $ | 17.88 | | | $ | 19.34 | | | $ | 19.64 | | | $ | 18.46 | |
| | | | | | | | | | | | | | | | | | | | |
Total return | | | 9.59 | % | | | (3.93 | )% | | | 2.36 | % | | | 14.15 | % | | | 11.95 | % |
| | | | | | | | | | | | | | | | | | | | |
Ratios/Supplemental Data: | | | | | | | | | | | | | | | | | | | | |
Net assets, end of year (000’s) | | $ | 253,966 | | | $ | 247,650 | | | $ | 276,875 | | | $ | 285,902 | | | $ | 267,515 | |
| Ratio of expenses to average net assets: | | | | | | | | | | | | | | | | | | | | |
After waivers and reimbursements (f) | | | 0.58 | % | | | 0.57 | % | | | 0.50 | % | | | 0.35 | % | | | 0.35 | % |
Before waivers and reimbursements (f) | | | 0.59 | % | | | 0.57 | % | | | 0.58 | % | | | 0.58 | % | | | 0.62 | % |
| Ratio of net investment income (loss) to average net assets: | | | | | | | | | | | | | | | | | | | | |
After waivers and reimbursements (f)(x) | | | 1.11 | % | | | 0.62 | % | | | 1.06 | % | | | 0.88 | % | | | 1.22 | % |
Before waivers and reimbursements (f)(x) | | | 1.10 | % | | | 0.62 | % | | | 0.98 | % | | | 0.65 | % | | | 0.95 | % |
Portfolio turnover rate^ | | | 11 | % | | | 14 | % | | | 18 | % | | | 43 | % | | | 43 | % |
111
All Asset Growth-Alt 20 Portfolio (Continued)
| | | | | | | | | | | | | | | | | | | | |
| | | Year Ended December 31, | | | August 29, 2012* to
December 31, 2012 | |
Class K | | 2016 | | | 2015 | | | 2014 | | | 2013 | | |
Net asset value, beginning of period | | $ | 17.80 | | | $ | 19.26 | | | $ | 19.56 | | | $ | 18.39 | | | $ | 18.34 | |
| | | | | | | | | | | | | | | | | | | | |
Income (loss) from investment operations: | | | | | | | | | | | | | | | | | | | | |
Net investment income (loss) (e)(x) | | | 0.27 | | | | 0.20 | | | | 0.31 | | | | 0.38 | | | | 0.39 | |
Net realized and unrealized gain (loss) on investments | | | 1.48 | | | | (0.92 | ) | | | 0.22 | | | | 2.25 | | | | 0.32 | |
| | | | | | | | | | | | | | | | | | | | |
Total from investment operations | | | 1.75 | | | | (0.72 | ) | | | 0.53 | | | | 2.63 | | | | 0.71 | |
| | | | | | | | | | | | | | | | | | | | |
Less distributions: | | | | | | | | | | | | | | | | | | | | |
Dividends from net investment income | | | (0.29 | ) | | | (0.20 | ) | | | (0.33 | ) | | | (0.32 | ) | | | (0.32 | ) |
Distributions from net realized gains | | | (0.40 | ) | | | (0.54 | ) | | | (0.50 | ) | | | (1.14 | ) | | | (0.34 | ) |
| | | | | | | | | | | | | | | | | | | | |
Total dividends and distributions | | | (0.69 | ) | | | (0.74 | ) | | | (0.83 | ) | | | (1.46 | ) | | | (0.66 | ) |
| | | | | | | | | | | | | | | | | | | | |
Net asset value, end of period | | $ | 18.86 | | | $ | 17.80 | | | $ | 19.26 | | | $ | 19.56 | | | $ | 18.39 | |
| | | | | | | | | | | | | | | | | | | | |
Total return (b) | | | 9.84 | % | | | (3.72 | )% | | | 2.62 | % | | | 14.43 | % | | | 3.86 | % |
| | | | | | | | | | | | | | | | | | | | |
Ratios/Supplemental Data: | | | | | | | | | | | | | | | | | | | | |
Net assets, end of period (000’s) | | $ | 1,470 | | | $ | 1,191 | | | $ | 931 | | | $ | 674 | | | $ | 52 | |
| Ratio of expenses to average net assets: | | | | | | | | | | | | | | | | | | | | |
After waivers and reimbursements (a)(f) | | | 0.33 | % | | | 0.32 | % | | | 0.26 | % | | | 0.10 | % | | | 0.10 | % |
Before waivers and reimbursements (a)(f) | | | 0.34 | % | | | 0.32 | % | | | 0.33 | % | | | 0.33 | % | | | 0.44 | % |
Ratio of net investment income (loss) to average net assets: | | | | | | | | | | | | | | | | | | | | |
After waivers and reimbursements (a)(f)(x) | | | 1.45 | % | | | 1.06 | % | | | 1.56 | % | | | 1.89 | % | | | 6.17 | %(l) |
Before waivers and reimbursements (a)(f)(x) | | | 1.44 | % | | | 1.06 | % | | | 1.49 | % | | | 1.66 | % | | | 5.83 | %(l) |
Portfolio turnover rate^ | | | 11 | % | | | 14 | % | | | 18 | % | | | 43 | % | | | 43 | % |
| * | | Commencement of Operations. |
| ^ | | Portfolio turnover rate excludes derivatives, if any. |
| (a) | | Ratios for periods less than one year are annualized. |
| (b) | | Total returns for periods less than one year are not annualized. |
| (e) | | Net investment income (loss) per share is based on average shares outstanding. |
| (f) | | Expenses do not include the expenses of the underlying funds (“indirect expenses”), if applicable. |
| (l) | | The annualized ratio of net investment income to average net assets may not be indicative of operating results for a full year. |
| (x) | | Recognition of net investment income is affected by the timing of dividend declarations by the underlying funds in which the Portfolio invests. |
112
AXA/DoubleLine Opportunistic Core Plus Bond Portfolio
| | | | | | | | |
Class IB | | Year Ended
December 31, 2016 | | | May 1, 2015* to
December 31, 2015 | |
Net asset value, beginning of period | | $ | 9.61 | | | $ | 10.00 | |
| | | | | | | | |
Income (loss) from investment operations: | | | | | | | | |
Net investment income (loss) (e) | | | 0.25 | | | | 0.17 | |
Net realized and unrealized gain (loss) on investments | | | 0.21 | | | | (0.39 | ) |
| | | | | | | | |
Total from investment operations | | | 0.46 | | | | (0.22 | ) |
| | | | | | | | |
Less distributions: | | | | | | | | |
Dividends from net investment income | | | (0.26 | ) | | | (0.17 | ) |
| | | | | | | | |
Net asset value, end of period | | $ | 9.81 | | | $ | 9.61 | |
| | | | | | | | |
Total return (b) | | | 4.83 | % | | | (2.20 | )% |
| | | | | | | | |
Ratios/Supplemental Data: | | | | | | | | |
Net assets, end of period (000’s) | | $ | 10,304 | | | $ | 2,364 | |
| Ratio of expenses to average net assets: | | | | | | | | |
After waivers (a)(f) | | | 1.06 | % | | | 1.08 | % |
Before waivers (a)(f) | | | 1.11 | % | | | 1.26 | % |
Ratio of net investment income (loss) to average net assets: | | | | | | | | |
After waivers (a)(f) | | | 2.52 | % | | | 2.54 | %(l) |
Before waivers (a)(f) | | | 2.47 | % | | | 2.36 | %(l) |
Portfolio turnover rate (z)^ | | | 76 | % | | | 79 | % |
| | |
Class K | | Year Ended
December 31, 2016 | | | May 1, 2015* to
December 31, 2015 | |
Net asset value, beginning of period | | $ | 9.61 | | | $ | 10.00 | |
| | | | | | | | |
Income (loss) from investment operations: | | | | | | | | |
Net investment income (loss) (e) | | | 0.28 | | | | 0.18 | |
Net realized and unrealized gain (loss) on investments | | | 0.21 | | | | (0.38 | ) |
| | | | | | | | |
Total from investment operations | | | 0.49 | | | | (0.20 | ) |
| | | | | | | | |
Less distributions: | | | | | | | | |
Dividends from net investment income | | | (0.29 | ) | | | (0.19 | ) |
| | | | | | | | |
Net asset value, end of period | | $ | 9.81 | | | $ | 9.61 | |
| | | | | | | | |
Total return (b) | | | 5.10 | % | | | (2.03 | )% |
| | | | | | | | |
Ratios/Supplemental Data: | | | | | | | | |
Net assets, end of period (000’s) | | $ | 60,950 | | | $ | 57,967 | |
| Ratio of expenses to average net assets: | | | | | | | | |
After waivers (a)(f) | | | 0.82 | % | | | 0.84 | % |
Before waivers (a)(f) | | | 0.88 | % | | | 1.04 | % |
Ratio of net investment income (loss) to average net assets: | | | | | | | | |
After waivers (a)(f) | | | 2.84 | % | | | 2.67 | %(l) |
Before waivers (a)(f) | | | 2.78 | % | | | 2.47 | %(l) |
Portfolio turnover rate (z)^ | | | 76 | % | | | 79 | % |
| * | | Commencement of Operations. |
| ^ | | Portfolio turnover rate excludes derivatives, if any. |
| (a) | | Ratios for periods less than one year are annualized. |
| (b) | | Total returns for periods less than one year are not annualized. |
| (e) | | Net investment income (loss) per share is based on average shares outstanding. |
| (f) | | Expenses do not include the expenses of the underlying funds (“indirect expenses”), if applicable. |
| (l) | | The annualized ratio of net investment income to average net assets may not be indicative of operating results for a full year. |
| (z) | | Portfolio turnover rate for periods less than one year is not annualized. |
113
EQ/PIMCO Global Real Return Portfolio
| | | | | | | | | | | | | | | | |
| | | Year Ended December 31, | | | February 8, 2013* to
December 31, 2013 | |
Class IB | | 2016 | | | 2015 | | | 2014 | | |
Net asset value, beginning of period | | $ | 9.26 | | | $ | 9.67 | | | $ | 9.40 | | | $ | 10.00 | |
| | | | | | | | | | | | | | | | |
Income (loss) from investment operations: | | | | | | | | | | | | | | | | |
Net investment income (loss) (e) | | | 0.09 | | | | 0.04 | | | | 0.06 | | | | — | # |
Net realized and unrealized gain (loss) on investments, options written, futures and foreign currency transactions | | | 0.85 | | | | (0.27 | ) | | | 0.68 | | | | (0.59 | ) |
| | | | | | | | | | | | | | | | |
Total from investment operations | | | 0.94 | | | | (0.23 | ) | | | 0.74 | | | | (0.59 | ) |
| | | | | | | | | | | | | | | | |
Less distributions: | | | | | | | | | | | | | | | | |
Dividends from net investment income | | | (0.49 | ) | | | (0.13 | ) | | | (0.47 | ) | | | (0.01 | ) |
Distributions from net realized gains | | | (0.02 | ) | | | (0.05 | ) | | | — | | | | — | |
| | | | | | | | | | | | | | | | |
Total dividends and distributions | | | (0.51 | ) | | | (0.18 | ) | | | (0.47 | ) | | | (0.01 | ) |
| | | | | | | | | | | | | | | | |
Net asset value, end of period | | $ | 9.69 | | | $ | 9.26 | | | $ | 9.67 | | | $ | 9.40 | |
| | | | | | | | | | | | | | | | |
Total return (b) | | | 10.35 | % | | | (2.36 | )% | | | 7.86 | % | | | (5.90 | )% |
| | | | | | | | | | | | | | | | |
Ratios/Supplemental Data: | | | | | | | | | | | | | | | | |
Net assets, end of period (000’s) | | $ | 38,725 | | | $ | 25,420 | | | $ | 13,949 | | | $ | 3,804 | |
| Ratio of expenses to average net assets: | | | | | | | | | | | | | | | | |
After waivers and reimbursements (a)(f) | | | 1.31 | %**** | | | 1.12 | %*** | | | 1.05 | %** | | | 1.00 | % |
Before waivers and reimbursements (a)(f) | | | 1.49 | %**** | | | 1.36 | %*** | | | 1.46 | %** | | | 1.95 | % |
Ratio of net investment income (loss) to average net assets: | | | | | | | | | | | | | | | | |
After waivers and reimbursements (a)(f) | | | 0.92 | % | | | 0.42 | % | | | 0.65 | % | | | — | %(l)‡‡ |
Before waivers and reimbursements (a)(f) | | | 0.74 | % | | | 0.18 | % | | | 0.24 | % | | | (0.97 | )%(l) |
Portfolio turnover rate (z)^ | | | 108 | % | | | 66 | % | | | 92 | % | | | 555 | % |
| | |
| | | Year Ended December 31, | | | February 8, 2013* to
December 31, 2013 | |
Class K | | 2016 | | | 2015 | | | 2014 | | |
Net asset value, beginning of period | | $ | 9.28 | | | $ | 9.67 | | | $ | 9.40 | | | $ | 10.00 | |
| | | | | | | | | | | | | | | | |
Income (loss) from investment operations: | | | | | | | | | | | | | | | | |
Net investment income (loss) (e) | | | 0.12 | | | | 0.05 | | | | 0.10 | | | | 0.05 | |
Net realized and unrealized gain (loss) on investments, options written, futures and foreign currency transactions | | | 0.85 | | | | (0.26 | ) | | | 0.66 | | | | (0.62 | ) |
| | | | | | | | | | | | | | | | |
Total from investment operations | | | 0.97 | | | | (0.21 | ) | | | 0.76 | | | | (0.57 | ) |
| | | | | | | | | | | | | | | | |
Less distributions: | | | | | | | | | | | | | | | | |
Dividends from net investment income | | | (0.52 | ) | | | (0.13 | ) | | | (0.49 | ) | | | (0.03 | ) |
Distributions from net realized gains | | | (0.02 | ) | | | (0.05 | ) | | | — | | | | — | |
| | | | | | | | | | | | | | | | |
Total dividends and distributions | | | (0.54 | ) | | | (0.18 | ) | | | (0.49 | ) | | | (0.03 | ) |
| | | | | | | | | | | | | | | | |
Net asset value, end of period | | $ | 9.71 | | | $ | 9.28 | | | $ | 9.67 | | | $ | 9.40 | |
| | | | | | | | | | | | | | | | |
Total return (b) | | | 10.63 | % | | | (2.15 | )% | | | 8.14 | % | | | (5.69 | )% |
| | | | | | | | | | | | | | | | |
Ratios/Supplemental Data: | | | | | | | | | | | | | | | | |
Net assets, end of period (000’s) | | $ | 31,346 | | | $ | 28,098 | | | $ | 19,350 | | | $ | 15,546 | |
| Ratio of expenses to average net assets: | | | | | | | | | | | | | | | | |
After waivers and reimbursements (a)(f) | | | 1.05 | %***** | | | 0.87 | %*** | | | 0.80 | %** | | | 0.75 | % |
Before waivers and reimbursements (a)(f) | | | 1.22 | %***** | | | 1.11 | %*** | | | 1.18 | %** | | | 1.70 | % |
Ratio of net investment income (loss) to average net assets: | | | | | | | | | | | | | | | | |
After waivers and reimbursements (a)(f) | | | 1.17 | % | | | 0.48 | % | | | 1.00 | % | | | 0.59 | %(l) |
Before waivers and reimbursements (a)(f) | | | 0.99 | % | | | 0.23 | % | | | 0.62 | % | | | (0.37 | )%(l) |
Portfolio turnover rate (z)^ | | | 108 | % | | | 66 | % | | | 92 | % | | | 555 | % |
114
EQ/PIMCO Global Real Return Portfolio (Continued)
| * | | Commencement of Operations. |
| ** | | Includes Interest Expense of 0.05%. |
| *** | | Includes Interest Expense of 0.12%. |
| **** | | Includes Interest Expense of 0.31% |
| ***** | | Includes Interest Expense of 0.30% |
| # | | Per share amount is less than $0.005. |
| ‡‡ | | Amount is less than 0.005%. |
| ^ | | Portfolio turnover rate excludes derivatives, if any. |
| (a) | | Ratios for periods less than one year are annualized. |
| (b) | | Total returns for periods less than one year are not annualized. |
| (e) | | Net investment income (loss) per share is based on average shares outstanding. |
| (f) | | Expenses do not include the expenses of the underlying funds (“indirect expenses”), if applicable. |
| (l) | | The annualized ratio of net investment income to average net assets may not be indicative of operating results for a full year. |
| (z) | | Portfolio turnover rate for periods less than one year is not annualized. |
115
AXA/Horizon Small Cap Value Portfolio
| | | | | | | | | | | | | | | | |
Class IB | | Year Ended
December 31, 2016 | | | May 1, 2015** to December 31, 2015 | | | January 1, 2015 to April 13, 2015‡ | | | April 21, 2014* to
December 31, 2014 | |
Net asset value, beginning of period | | $ | 8.55 | | | $ | 10.00 | | | $ | 9.79 | | | $ | 10.00 | |
| | | | | | | | | | | | | | | | |
Income (loss) from investment operations: | | | | | | | | | | | | | | | | |
Net investment income (loss) (e) | | | 0.06 | | | | 0.03 | | | | — | # | | | 0.02 | |
Net realized and unrealized gain (loss) on investments, futures and foreign currency transactions | | | 2.02 | | | | (1.10 | ) | | | 0.41 | | | | 0.06 | |
| | | | | | | | | | | | | | | | |
Total from investment operations | | | 2.08 | | | | (1.07 | ) | | | 0.41 | | | | 0.08 | |
| | | | | | | | | | | | | | | | |
Less distributions: | | | | | | | | | | | | | | | | |
Dividends from net investment income | | | (0.03 | ) | | | — | | | | — | | | | — | # |
Distributions from net realized gains | | | (0.50 | ) | | | (0.36 | ) | | | — | | | | (0.27 | ) |
Return of capital | | | (0.26 | ) | | | (0.02 | ) | | | — | | | | (0.02 | ) |
| | | | | | | | | | | | | | | | |
Total dividends and distributions | | | (0.79 | ) | | | (0.38 | ) | | | — | | | | (0.29 | ) |
| | | | | | | | | | | | | | | | |
Net asset value, end of period | | $ | 9.84 | | | $ | 8.55 | | | $ | 10.20 | | | $ | 9.79 | |
| | | | | | | | | | | | | | | | |
Total return (b) | | | 24.19 | % | | | (10.63 | )% | | | 4.19 | % | | | 0.73 | % |
| | | | | | | | | | | | | | | | |
Ratios/Supplemental Data: | | | | | | | | | | | | | | | | |
Net assets, end of period (000’s) | | $ | 418 | | | $ | 166 | | | $ | — | | | $ | 25 | |
Ratio of expenses to average net assets: | | | | | | | | | | | | | | | | |
After waivers (a)(f) | | | 1.18 | % | | | 1.22 | % | | | 1.25 | % | | | 1.25 | % |
Before waivers (a)(f) | | | 1.27 | % | | | 1.24 | % | | | 1.25 | % | | | 5.75 | % |
Ratio of net investment income (loss) to average net assets: | | | | | | | | | | | | | | | | |
After waivers (a)(f) | | | 0.61 | % | | | 0.41 | %(l) | | | 0.15 | %(l) | | | 0.30 | %(l) |
Before waivers (a)(f) | | | 0.52 | % | | | 0.39 | %(l) | | | 0.15 | %(l) | | | (4.20 | )%(l) |
Portfolio turnover rate (z)^ | | | 23 | % | | | 17 | % | | | 17 | % | | | 18 | % |
| | | | | | | | | | | | |
| | | Year Ended December 31, | | | April 21, 2014* to
December 31, 2014 | |
Class K | | 2016 | | | 2015 | | |
Net asset value, beginning of period | | $ | 8.54 | | | $ | 9.79 | | | $ | 10.00 | |
| | | | | | | | | | | | |
Income (loss) from investment operations: | | | | | | | | | | | | |
Net investment income (loss) (e) | | | 0.07 | | | | 0.05 | | | | 0.04 | |
Net realized and unrealized gain (loss) on investments, futures and foreign currency transactions | | | 2.03 | | | | (0.90 | ) | | | 0.05 | |
| | | | | | | | | | | | |
Total from investment operations | | | 2.10 | | | | (0.85 | ) | | | 0.09 | |
| | | | | | | | | | | | |
Less distributions: | | | | | | | | | | | | |
Dividends from net investment income | | | (0.04 | ) | | | (0.02 | ) | | | (0.01 | ) |
Distributions from net realized gains | | | (0.50 | ) | | | (0.36 | ) | | | (0.27 | ) |
Return of capital | | | (0.27 | ) | | | (0.02 | ) | | | (0.02 | ) |
| | | | | | | | | | | | |
Total dividends and distributions | | | (0.81 | ) | | | (0.40 | ) | | | (0.30 | ) |
| | | | | | | | | | | | |
Net asset value, end of period | | $ | 9.83 | | | $ | 8.54 | | | $ | 9.79 | |
| | | | | | | | | | | | |
Total return (b) | | | 24.54 | % | | | (8.58 | )% | | | 0.91 | % |
| | | | | | | | | | | | |
Ratios/Supplemental Data: | | | | | | | | | | | | |
Net assets, end of period (000’s) | | $ | 173,256 | | | $ | 149,286 | | | $ | 166,935 | |
Ratio of expenses to average net assets: | | | | | | | | | | | | |
After waivers (a)(f) | | | 0.93 | % | | | 0.98 | % | | | 1.00 | % |
Before waivers (a)(f) | | | 1.02 | % | | | 0.99 | % | | | 1.03 | % |
Ratio of net investment income (loss) to average net assets: | | | | | | | | | | | | |
After waivers (a)(f) | | | 0.82 | % | | | 0.48 | % | | | 0.55 | %(l) |
Before waivers (a)(f) | | | 0.73 | % | | | 0.48 | % | | | 0.52 | %(l) |
Portfolio turnover rate (z)^ | | | 23 | % | | | 17 | % | | | 18 | % |
116
AXA/Horizon Small Cap Value Portfolio (Continued)
| * | | Commencement of Operations. |
| ‡ | | After the close of business on April 13, 2015, operations ceased and shares were fully redeemed. |
| # | | Per share amount is less than $0.005. |
| ^ | | Portfolio turnover rate excludes derivatives, if any. |
| (a) | | Ratios for periods less than one year are annualized. |
| (b) | | Total returns for periods less than one year are not annualized. |
| (e) | | Net investment income (loss) per share is based on average shares outstanding. |
| (f) | | Expenses do not include the expenses of the underlying funds (“indirect expenses”), if applicable. |
| (l) | | The annualized ratio of net investment income to average net assets may not be indicative of operating results for a full year. |
| (z) | | Portfolio turnover rate for periods less than one year is not annualized. |
117
All Asset Aggressive-Alt 25 Portfolio
| | | | | | | | | | | | | | | | | | | | |
| | | Year Ended December 31, | | | August 29, 2012* to
December 31, 2012 | |
Class IB | | 2016 | | | 2015 | | | 2014 | | | 2013 | | |
Net asset value, beginning of period | | $ | 11.10 | | | $ | 11.90 | | | $ | 11.91 | | | $ | 10.29 | | | $ | 10.00 | |
| | | | | | | | | | | | | | | | | | | | |
Income (loss) from investment operations: | | | | | | | | | | | | | | | | | | | | |
Net investment income (loss) (e)(x) | | | 0.11 | | | | 0.08 | | | | 0.18 | | | | 0.27 | | | | 0.11 | |
Net realized and unrealized gain (loss) on investments | | | 1.04 | | | | (0.60 | ) | | | 0.11 | | | | 1.59 | | | | 0.30 | |
| | | | | | | | | | | | | | | | | | | | |
Total from investment operations | | | 1.15 | | | | (0.52 | ) | | | 0.29 | | | | 1.86 | | | | 0.41 | |
| | | | | | | | | | | | | | | | | | | | |
Less distributions: | | | | | | | | | | | | | | | | | | | | |
Dividends from net investment income | | | (0.12 | ) | | | (0.09 | ) | | | (0.17 | ) | | | (0.16 | ) | | | (0.12 | ) |
Distributions from net realized gains | | | (0.13 | ) | | | (0.19 | ) | | | (0.13 | ) | | | (0.08 | ) | | | — | # |
| | | | | | | | | | | | | | | | | | | | |
Total dividends and distributions | | | (0.25 | ) | | | (0.28 | ) | | | (0.30 | ) | | | (0.24 | ) | | | (0.12 | ) |
| | | | | | | | | | | | | | | | | | | | |
Net asset value, end of period | | $ | 12.00 | | | $ | 11.10 | | | $ | 11.90 | | | $ | 11.91 | | | $ | 10.29 | |
| | | | | | | | | | | | | | | | | | | | |
Total return (b) | | | 10.34 | % | | | (4.44 | )% | | | 2.36 | % | | | 18.08 | % | | | 4.14 | % |
| | | | | | | | | | | | | | | | | | | | |
Ratios/Supplemental Data: | | | | | | | | | | | | | | | | | | | | |
Net assets, end of period (000’s) | | $ | 29,004 | | | $ | 22,461 | | | $ | 16,073 | | | $ | 4,911 | | | $ | 262 | |
| Ratio of expenses to average net assets: | | | | | | | | | | | | | | | | | | | | |
After waivers and reimbursements (a)(f) | | | 0.63 | % | | | 0.65 | % | | | 0.59 | % | | | 0.35 | % | | | 0.35 | % |
Before waivers and reimbursements (a)(f) | | | 1.10 | % | | | 1.32 | % | | | 2.20 | % | | | 6.43 | % | | | 36.02 | % |
Ratio of net investment income (loss) to average net assets: | | | | | | | | | | | | | | | | | | | | |
After waivers and reimbursements (a)(f)(x) | | | 0.96 | % | | | 0.65 | % | | | 1.52 | % | | | 2.32 | % | | | 3.08 | %(l) |
Before waivers and reimbursements (a)(f)(x) | | | 0.49 | % | | | (0.02 | )% | | | (0.10 | )% | | | (3.76 | )% | | | (32.59 | )%(l) |
Portfolio turnover rate (z)^ | | | 18 | % | | | 24 | % | | | 34 | % | | | 41 | % | | | 3 | % |
| | |
| | | Year Ended December 31, | | | August 29, 2012* to
December 31, 2012 | |
Class K | | 2016 | | | 2015 | | | 2014 | | | 2013 | | |
Net asset value, beginning of period | | $ | 11.10 | | | $ | 11.89 | | | $ | 11.91 | | | $ | 10.29 | | | $ | 10.00 | |
| | | | | | | | | | | | | | | | | | | | |
Income (loss) from investment operations: | | | | | | | | | | | | | | | | | | | | |
Net investment income (loss) (e)(x) | | | 0.13 | | | | 0.09 | | | | 0.15 | | | | 0.19 | | | | 0.12 | |
Net realized and unrealized gain (loss) on investments | | | 1.04 | | | | (0.57 | ) | | | 0.16 | | | | 1.70 | | | | 0.30 | |
| | | | | | | | | | | | | | | | | | | | |
Total from investment operations | | | 1.17 | | | | (0.48 | ) | | | 0.31 | | | | 1.89 | | | | 0.42 | |
| | | | | | | | | | | | | | | | | | | | |
Less distributions: | | | | | | | | | | | | | | | | | | | | |
Dividends from net investment income | | | (0.15 | ) | | | (0.12 | ) | | | (0.20 | ) | | | (0.19 | ) | | | (0.13 | ) |
Distributions from net realized gains | | | (0.13 | ) | | | (0.19 | ) | | | (0.13 | ) | | | (0.08 | ) | | | — | # |
| | | | | | | | | | | | | | | | | | | | |
Total dividends and distributions | | | (0.28 | ) | | | (0.31 | ) | | | (0.33 | ) | | | (0.27 | ) | | | (0.13 | ) |
| | | | | | | | | | | | | | | | | | | | |
Net asset value, end of period | | $ | 11.99 | | | $ | 11.10 | | | $ | 11.89 | | | $ | 11.91 | | | $ | 10.29 | |
| | | | | | | | | | | | | | | | | | | | |
Total return (b) | | | 10.53 | % | | | (4.11 | )% | | | 2.53 | % | | | 18.38 | % | | | 4.23 | % |
| | | | | | | | | | | | | | | | | | | | |
Ratios/Supplemental Data: | | | | | | | | | | | | | | | | | | | | |
Net assets, end of period (000’s) | | $ | 1,688 | | | $ | 1,348 | | | $ | 1,527 | | | $ | 981 | | | $ | 261 | |
| Ratio of expenses to average net assets: | | | | | | | | | | | | | | | | | | | | |
After waivers and reimbursements (a)(f) | | | 0.38 | % | | | 0.40 | % | | | 0.32 | % | | | 0.10 | % | | | 0.10 | % |
Before waivers and reimbursements (a)(f) | | | 0.85 | % | | | 1.07 | % | | | 2.06 | % | | | 7.74 | % | | | 35.77 | % |
Ratio of net investment income (loss) to average net assets: | | | | | | | | | | | | | | | | | | | | |
After waivers and reimbursements (a)(f)(x) | | | 1.17 | % | | | 0.72 | % | | | 1.27 | % | | | 1.64 | % | | | 3.33 | %(l) |
Before waivers and reimbursements (a)(f)(x) | | | 0.70 | % | | | 0.05 | % | | | (0.47 | )% | | | (6.00 | )% | | | (32.35 | )%(l) |
Portfolio turnover rate (z)^ | | | 18 | % | | | 24 | % | | | 34 | % | | | 41 | % | | | 3 | % |
118
All Asset Aggressive-Alt 25 Portfolio (Continued)
| * | | Commencement of Operations. |
| # | | Per share amount is less than $0.005. |
| ^ | | Portfolio turnover rate excludes derivatives, if any. |
| (a) | | Ratios for periods less than one year are annualized. |
| (b) | | Total returns for periods less than one year are not annualized. |
| (e) | | Net investment income (loss) per share is based on average shares outstanding. |
| (f) | | Expenses do not include the expenses of the underlying funds (“indirect expenses”), if applicable. |
| (l) | | The annualized ratio of net investment income to average net assets may not be indicative of operating results for a full year. |
| (x) | | Recognition of net investment income is affected by the timing of dividend declarations by the underlying funds in which the Portfolio invests. |
| (z) | | Portfolio turnover rate for periods less than one year is not annualized. |
119
All Asset Aggressive-Alt 50 Portfolio
| | | | | | | | | | | | | | | | |
| | | Year Ended December 31, | | | October 28, 2013* to
December 31, 2013 | |
Class IB | | 2016 | | | 2015 | | | 2014 | | |
Net asset value, beginning of period | | $ | 8.49 | | | $ | 9.58 | | | $ | 9.68 | | | $ | 10.00 | |
| | | | | | | | | | | | | | | | |
Income (loss) from investment operations: | | | | | | | | | | | | | | | | |
Net investment income (loss) (e)(x) | | | 0.09 | | | | 0.06 | | | | 0.15 | | | | 0.11 | |
Net realized and unrealized gain (loss) on investments | | | 0.87 | | | | (0.71 | ) | | | 0.01 | † | | | (0.16 | ) |
| | | | | | | | | | | | | | | | |
Total from investment operations | | | 0.96 | | | | (0.65 | ) | | | 0.16 | | | | (0.05 | ) |
| | | | | | | | | | | | | | | | |
Less distributions: | | | | | | | | | | | | | | | | |
Dividends from net investment income | | | (0.10 | ) | | | (0.08 | ) | | | (0.26 | ) | | | (0.17 | ) |
Distributions from net realized gains | | | (0.06 | ) | | | (0.36 | ) | | | — | | | | (0.10 | ) |
| | | | | | | | | | | | | | | | |
Total dividends and distributions | | | (0.16 | ) | | | (0.44 | ) | | | (0.26 | ) | | | (0.27 | ) |
| | | | | | | | | | | | | | | | |
Net asset value, end of period | | $ | 9.29 | | | $ | 8.49 | | | $ | 9.58 | | | $ | 9.68 | |
| | | | | | | | | | | | | | | | |
Total return (b) | �� | | 11.31 | % | | | (6.87 | )% | | | 1.69 | % | | | (0.47 | )% |
| | | | | | | | | | | | | | | | |
Ratios/Supplemental Data: | | | | | | | | | | | | | | | | |
Net assets, end of period (000’s) | | $ | 2,836 | | | $ | 2,299 | | | $ | 2,323 | | | $ | 2,010 | |
| Ratio of expenses to average net assets: | | | | | | | | | | | | | | | | |
After waivers and reimbursements (a)(f) | | | 0.64 | % | | | 0.65 | % | | | 0.56 | % | | | 0.35 | % |
Before waivers and reimbursements (a)(f) | | | 5.39 | % | | | 4.56 | % | | | 5.06 | % | | | 4.16 | % |
Ratio of net investment income (loss) to average net assets: | | | | | | | | | | | | | | | | |
After waivers and reimbursements (a)(f)(x) | | | 0.97 | % | | | 0.67 | % | | | 1.53 | % | | | 6.41 | %(l) |
Before waivers and reimbursements (a)(f)(x) | | | (3.78 | )% | | | (3.24 | )% | | | (2.97 | )% | | | 2.59 | %(l) |
Portfolio turnover rate (z)^ | | | 17 | % | | | 15 | % | | | 12 | % | | | 1 | % |
| | | |
| | | January 1, 2016 to
July 7, 2016‡ | | | Year Ended December 31, | | | October 28, 2013* to
December 31, 2013 | |
Class K | | | 2015 | | | 2014 | | |
Net asset value, beginning of period | | $ | 8.49 | | | $ | 9.58 | | | $ | 9.68 | | | $ | 10.00 | |
| | | | | | | | | | | | | | | | |
Income (loss) from investment operations: | | | | | | | | | | | | | | | | |
Net investment income (loss) (e)(x) | | | (0.01 | ) | | | 0.08 | | | | 0.17 | | | | 0.11 | |
Net realized and unrealized gain (loss) on investments | | | 0.63 | | | | (0.71 | ) | | | 0.02 | † | | | (0.16 | ) |
| | | | | | | | | | | | | | | | |
Total from investment operations | | | 0.62 | | | | (0.63 | ) | | | 0.19 | | | | (0.05 | ) |
| | | | | | | | | | | | | | | | |
Less distributions: | |
Dividends from net investment income | | | — | | | | (0.10 | ) | | | (0.29 | ) | | | (0.17 | ) |
Distributions from net realized gains | | | — | | | | (0.36 | ) | | | — | | | | (0.10 | ) |
| | | | | | | | | | | | | | | | |
Total dividends and distributions | | | — | | | | (0.46 | ) | | | (0.29 | ) | | | (0.27 | ) |
| | | | | | | | | | | | | | | | |
Net asset value, end of period | | $ | 9.11 | | | $ | 8.49 | | | $ | 9.58 | | | $ | 9.68 | |
| | | | | | | | | | | | | | | | |
Total return (b) | | | 7.30 | % | | | (6.65 | )% | | | 1.95 | % | | | (0.43 | )% |
| | | | | | | | | | | | | | | | |
Ratios/Supplemental Data: | | | | | | | | | | | | | | | | |
Net assets, end of period (000’s) | | $ | — | | | $ | 1,895 | | | $ | 2,030 | | | $ | 1,992 | |
| Ratio of expenses to average net assets: | | | | | | | | | | | | | | | | |
After waivers and reimbursements (a)(f) | | | 0.40 | % | | | 0.40 | % | | | 0.30 | % | | | 0.10 | % |
Before waivers and reimbursements (a)(f) | | | 3.41 | % | | | 4.29 | % | | | 4.71 | % | | | 3.89 | % |
Ratio of net investment income (loss) to average net assets: | | | | | | | | | | | | | | | | |
After waivers and reimbursements (a)(f)(x) | | | (0.13 | )% | | | 0.88 | % | | | 1.68 | % | | | 6.62 | %(l) |
Before waivers and reimbursements (a)(f)(x) | | | (3.14 | )% | | | (3.01 | )% | | | (2.73 | )% | | | 2.84 | %(l) |
Portfolio turnover rate^ | | | 17 | % | | | 15 | % | | | 12 | % | | | 1 | %(z) |
120
All Asset Aggressive-Alt 50 Portfolio (Continued)
| * | | Commencement of Operations. |
| ‡ | | After the close of business on July 7, 2016, operations ceased and shares of seed capital were fully redeemed. |
| ^ | | Portfolio turnover rate excludes derivatives, if any. |
| (a) | | Ratios for periods less than one year are annualized. |
| (b) | | Total returns for periods less than one year are not annualized. |
| (e) | | Net investment income (loss) per share is based on average shares outstanding. |
| (f) | | Expenses do not include the expenses of the underlying funds (“indirect expenses”), if applicable. |
| (l) | | The annualized ratio of net investment income to average net assets may not be indicative of operating results for a full year. |
| (x) | | Recognition of net investment income is affected by the timing of dividend declarations by the underlying funds in which the Portfolio invests. |
| (z) | | Portfolio turnover rate for periods less than one year is not annualized. |
121
All Asset Aggressive-Alt 75 Portfolio
| | | | | | | | | | | | | | | | |
| | | Year Ended December 31, | | | October 28, 2013* to
December 31, 2013 | |
Class IB | | 2016 | | | 2015 | | | 2014 | | |
Net asset value, beginning of period | | $ | 8.09 | | | $ | 9.30 | | | $ | 9.56 | | | $ | 10.00 | |
| | | | | | | | | | | | | | | | |
Income (loss) from investment operations: | | | | | | | | | | | | | | | | |
Net investment income (loss) (e)(x) | | | 0.09 | | | | 0.07 | | | | 0.19 | | | | 0.11 | |
Net realized and unrealized gain (loss) on investments | | | 0.90 | | | | (0.92 | ) | | | (0.15 | ) | | | (0.28 | ) |
| | | | | | | | | | | | | | | | |
Total from investment operations | | | 0.99 | | | | (0.85 | ) | | | 0.04 | | | | (0.17 | ) |
| | | | | | | | | | | | | | | | |
Less distributions: | | | | | | | | | | | | | | | | |
Dividends from net investment income | | | (0.13 | ) | | | (0.10 | ) | | | (0.30 | ) | | | (0.17 | ) |
Distributions from net realized gains | | | — | | | | (0.26 | ) | | | — | | | | (0.06 | ) |
Return of capital | | | — | | | | — | | | | — | | | | (0.04 | ) |
| | | | | | | | | | | | | | | | |
Total dividends and distributions | | | (0.13 | ) | | | (0.36 | ) | | | (0.30 | ) | | | (0.27 | ) |
| | | | | | | | | | | | | | | | |
Net asset value, end of period | | $ | 8.95 | | | $ | 8.09 | | | $ | 9.30 | | | $ | 9.56 | |
| | | | | | | | | | | | | | | | |
Total return (b) | | | 12.18 | % | | | (9.24 | )% | | | 0.38 | % | | | (1.66 | )% |
| | | | | | | | | | | | | | | | |
Ratios/Supplemental Data: | | | | | | | | | | | | | | | | |
Net assets, end of period (000’s) | | $ | 3,034 | | | $ | 2,376 | | | $ | 2,432 | | | $ | 1,981 | |
Ratio of expenses to average net assets: | | | | | | | | | | | | | | | | |
After waivers and reimbursements (a)(f) | | | 0.64 | % | | | 0.65 | % | | | 0.56 | % | | | 0.35 | % |
Before waivers and reimbursements (a)(f) | | | 5.16 | % | | | 4.52 | % | | | 5.01 | % | | | 4.20 | % |
Ratio of net investment income (loss) to average net assets: | | | | | | | | | | | | | | | | |
After waivers and reimbursements (a)(f)(x) | | | 1.06 | % | | | 0.80 | % | | | 1.88 | % | | | 6.50 | %(l) |
Before waivers and reimbursements (a)(f)(x) | | | (3.46 | )% | | | (3.07 | )% | | | (2.56 | )% | | | 2.64 | %(l) |
Portfolio turnover rate (z)^ | | | 30 | % | | | 13 | % | | | 11 | % | | | 1 | % |
| | | |
| | | January 1, 2016 to
July 7, 2016‡ | | | Year Ended December 31, | | | October 28, 2013* to
December 31, 2013 | |
Class K | | | 2015 | | | 2014 | | |
Net asset value, beginning of period | | $ | 8.09 | | | $ | 9.30 | | | $ | 9.56 | | | $ | 10.00 | |
| | | | | | | | | | | | | | | | |
Income (loss) from investment operations: | | | | | | | | | | | | | | | | |
Net investment income (loss) (e)(x) | | | — | # | | | 0.09 | | | | 0.19 | | | | 0.11 | |
Net realized and unrealized gain (loss) on investments | | | 0.81 | | | | (0.92 | ) | | | (0.13 | ) | | | (0.27 | ) |
| | | | | | | | | | | | | | | | |
Total from investment operations | | | 0.81 | | | | (0.83 | ) | | | 0.06 | | | | (0.16 | ) |
| | | | | | | | | | | | | | | | |
Less distributions: | | | | | | | | | | | | | | | | |
Dividends from net investment income | | | — | | | | (0.12 | ) | | | (0.32 | ) | | | (0.18 | ) |
Distributions from net realized gains | | | — | | | | (0.26 | ) | | | — | | | | (0.06 | ) |
Return of capital | | | — | | | | — | | | | — | | | | (0.04 | ) |
| | | | | | | | | | | | | | | | |
Total dividends and distributions | | | — | | | | (0.38 | ) | | | (0.32 | ) | | | (0.28 | ) |
| | | | | | | | | | | | | | | | |
Net asset value, end of period | | $ | 8.90 | | | $ | 8.09 | | | $ | 9.30 | | | $ | 9.56 | |
| | | | | | | | | | | | | | | | |
Total return (b) | | | 10.01 | % | | | (9.01 | )% | | | 0.64 | % | | | (1.61 | )% |
| | | | | | | | | | | | | | | | |
Ratios/Supplemental Data: | | | | | | | | | | | | | | | | |
Net assets, end of period (000’s) | | $ | — | | | $ | 1,801 | | | $ | 1,979 | | | $ | 1,967 | |
| Ratio of expenses to average net assets: | | | | | | | | | | | | | | | | |
After waivers and reimbursements (a)(f) | | | 0.40 | % | | | 0.40 | % | | | 0.30 | % | | | 0.10 | % |
Before waivers and reimbursements (a)(f) | | | 3.41 | % | | | 4.24 | % | | | 4.61 | % | | | 3.95 | % |
Ratio of net investment income (loss) to average net assets: | | | | | | | | | | | | | | | | |
After waivers and reimbursements (a)(f)(x) | | | (0.07 | )% | | | 1.01 | % | | | 1.95 | % | | | 6.73 | %(l) |
Before waivers and reimbursements (a)(f)(x) | | | (3.08 | )% | | | (2.83 | )% | | | (2.36 | )% | | | 2.88 | %(l) |
Portfolio turnover rate^ | | | 30 | % | | | 13 | % | | | 11 | % | | | 1 | %(z) |
122
All Asset Aggressive-Alt 75 Portfolio (Continued)
| * | | Commencement of Operations. |
| # | | Per share amount is less than $0.005. |
| ^ | | Portfolio turnover rate excludes derivatives, if any. |
| ‡ | | After the close of business on July 7, 2016, operations for Class K ceased and shares of seed capital were fully redeemed. |
| (a) | | Ratios for periods less than one year are annualized. |
| (b) | | Total returns for periods less than one year are not annualized. |
| (e) | | Net investment income (loss) per share is based on average shares outstanding. |
| (f) | | Expenses do not include the expenses of the underlying funds (“indirect expenses”), if applicable. |
| (l) | | The annualized ratio of net investment income to average net assets may not be indicative of operating results for a full year. |
| (x) | | Recognition of net investment income is affected by the timing of dividend declarations by the underlying funds in which the Portfolio invests. |
| (z) | | Portfolio turnover rate for periods less than one year is not annualized. |
123
AXA/Pacific Global Small Cap Value Portfolio
| | | | | | | | | | | | | | | | |
Class IB | | Year Ended
December 31, 2016 | | | May 1, 2015** to December 31, 2015 | | | January 1, 2015 to
April 13, 2015‡ | | | April 21, 2014* to December 31, 2014 | |
Net asset value, beginning of period | | $ | 7.16 | | | $ | 8.84 | | | $ | 8.97 | | | $ | 10.00 | |
| | | | | | | | | | | | | | | | |
Income (loss) from investment operations: | | | | | | | | | | | | | | | | |
Net investment income (loss) (e) | | | 0.05 | | | | 0.01 | | | | — | # | | | (0.01 | ) |
Net realized and unrealized gain (loss) on investments and futures | | | 2.02 | | | | (1.55 | ) | | | 0.06 | | | | (0.79 | ) |
| | | | | | | | | | | | | | | | |
Total from investment operations | | | 2.07 | | | | (1.54 | ) | | | 0.06 | | | | (0.80 | ) |
| | | | | | | | | | | | | | | | |
Less distributions: | | | | | | | | | | | | | |
Dividends from net investment income | | | (0.04 | ) | | | (0.01 | ) | | | — | | | | — | |
Distributions from net realized gains | | | — | | | | (0.13 | ) | | | — | | | | (0.23 | ) |
Return of capital | | | (0.01 | ) | | | — | # | | | — | | | | — | |
| | | | | | | | | | | | | | | | |
Total dividends and distributions | | | (0.05 | ) | | | (0.14 | ) | | | — | | | | (0.23 | ) |
| | | | | | | | | | | | | | | | |
Net asset value, end of period | | $ | 9.18 | | | $ | 7.16 | | | $ | 9.03 | | | $ | 8.97 | |
| | | | | | | | | | | | | | | | |
Total return (b) | | | 28.90 | % | | | (17.39 | )% | | | 0.67 | % | | | (7.98 | )% |
| | | | | | | | | | | | | | | | |
Ratios/Supplemental Data: | | | | | | | | | | | | | |
Net assets, end of period (000’s) | | $ | 511 | | | $ | 204 | | | $ | — | | | $ | 23 | |
| Ratio of expenses to average net assets: | | | | | | | | | | | | | | | | |
After waivers and reimbursements (a)(f) | | | 1.18 | % | | | 1.22 | % | | | 1.25 | % | | | 1.25 | % |
Before waivers and reimbursements (a)(f) | | | 1.28 | % | | | 1.26 | % | | | 1.25 | % | | | 5.96 | % |
Ratio of net investment income (loss) to average net assets: | | | | | | | | | | | | | | | | |
After waivers and reimbursements (a)(f) | | | 0.62 | % | | | 0.21 | %(l) | | | (0.12 | )%(l) | | | (0.13 | )%(l) |
Before waivers and reimbursements (a)(f) | | | 0.52 | % | | | 0.17 | %(l) | | | (0.12 | )%(l) | | | (4.84 | )%(l) |
Portfolio turnover rate (z)^ | | | 26 | % | | | 26 | % | | | 26 | % | | | 18 | % |
| | | | | | | | | | | | |
| | | Year Ended December 31, | | | April 21, 2014* to
December 31, 2014 | |
Class K | | 2016 | | | 2015 | | |
Net asset value, beginning of period | | $ | 7.15 | | | $ | 8.97 | | | $ | 10.00 | |
| | | | | | | | | | | | |
Income (loss) from investment operations: | | | | | | | | | | | | |
Net investment income (loss) (e) | | | 0.06 | | | | 0.02 | | | | 0.01 | |
Net realized and unrealized gain (loss) on investments and futures | | | 2.03 | | | | (1.69 | ) | | | (0.80 | ) |
| | | | | | | | | | | | |
Total from investment operations | | | 2.09 | | | | (1.67 | ) | | | (0.79 | ) |
| | | | | | | | | | | | |
Less distributions: | |
Dividends from net investment income | | | (0.06 | ) | | | (0.02 | ) | | | (0.01 | ) |
Distributions from net realized gains | | | — | | | | (0.13 | ) | | | (0.23 | ) |
Return of capital | | | (0.01 | ) | | | — | # | | | — | |
| | | | | | | | | | | | |
Total dividends and distributions | | | (0.07 | ) | | | (0.15 | ) | | | (0.24 | ) |
| | | | | | | | | | | | |
Net asset value, end of period | | $ | 9.17 | | | $ | 7.15 | | | $ | 8.97 | |
| | | | | | | | | | | | |
Total return (b) | | | 29.27 | % | | | (18.49 | )% | | | (7.84 | )% |
| | | | | | | | | | | | |
Ratios/Supplemental Data: | |
Net assets, end of period (000’s) | | $ | 161,405 | | | $ | 134,364 | | | $ | 159,905 | |
| Ratio of expenses to average net assets: | | | | | | | | | | | | |
After waivers and reimbursements (a)(f) | | | 0.93 | % | | | 0.98 | % | | | 1.00 | % |
Before waivers and reimbursements (a)(f) | | | 1.03 | % | | | 1.00 | % | | | 1.03 | % |
Ratio of net investment income (loss) to average net assets: | | | | | | | | | | | | |
After waivers and reimbursements (a)(f) | | | 0.80 | % | | | 0.24 | % | | | 0.14 | %(l) |
Before waivers and reimbursements (a)(f) | | | 0.70 | % | | | 0.22 | % | | | 0.11 | %(l) |
Portfolio turnover rate (z)^ | | | 26 | % | | | 26 | % | | | 18 | % |
124
AXA/Pacific Global Small Cap Value Portfolio (Continued)
| * | | Commencement of Operations. |
| ‡ | | After the close of business on April 30, 2015, operations ceased and shares were fully redeemed. |
| # | | Per share amount is less than $0.005. |
| ^ | | Portfolio turnover rate excludes derivatives, if any. |
| (a) | | Ratios for periods less than one year are annualized. |
| (b) | | Total returns for periods less than one year are not annualized. |
| (e) | | Net investment income (loss) per share is based on average shares outstanding. |
| (f) | | Expenses do not include the expenses of the underlying funds (“indirect expenses”), if applicable. |
| (l) | | The annualized ratio of net investment income to average net assets may not be indicative of operating results for a full year. |
| (z) | | Portfolio turnover rate for periods less than one year is not annualized. |
125
CharterSM Moderate Portfolio
| | | | | | | | | | | | | | | | |
| | | Year Ended December 31, | | | October 30, 2013* to
December 31, 2013 | |
Class B | | 2016 | | | 2015 | | | 2014 | | |
Net asset value, beginning of period | | $ | 9.42 | | | $ | 9.93 | | | $ | 9.93 | | | $ | 10.00 | |
| | | | | | | | | | | | | | | | |
Income (loss) from investment operations: | | | | | | | | | | | | | | | | |
Net investment income (loss) (e)(x) | | | 0.16 | | | | 0.12 | | | | 0.19 | | | | 0.08 | |
Net realized and unrealized gain (loss) on investments | | | 0.43 | | | | (0.43 | ) | | | (0.02 | ) | | | — | # |
| | | | | | | | | | | | | | | | |
Total from investment operations | | | 0.59 | | | | (0.31 | ) | | | 0.17 | | | | 0.08 | |
| | | | | | | | | | | | | | | | |
Less distributions: | | | | | | | | | | | | | | | | |
Dividends from net investment income | | | (0.16 | ) | | | (0.13 | ) | | | (0.16 | ) | | | (0.12 | ) |
Distributions from net realized gains | | | (0.05 | ) | | | (0.07 | ) | | | (0.01 | ) | | | (0.03 | ) |
| | | | | | | | | | | | | | | | |
Total dividends and distributions | | | (0.21 | ) | | | (0.20 | ) | | | (0.17 | ) | | | (0.15 | ) |
| | | | | | | | | | | | | | | | |
Net asset value, end of period | | $ | 9.80 | | | $ | 9.42 | | | $ | 9.93 | | | $ | 9.93 | |
| | | | | | | | | | | | | | | | |
Total return (b) | | | 6.22 | % | | | (3.04 | )% | | | 1.78 | % | | | 0.84 | % |
| | | | | | | | | | | | | | | | |
Ratios/Supplemental Data: | | | | | | | | | | | | | | | | |
Net assets, end of period (000’s) | | $ | 23,611 | | | $ | �� 19,789 | | | $ | 17,731 | | | $ | 4,481 | |
| Ratio of expenses to average net assets: | | | | | | | | | | | | | | | | |
After waivers and reimbursements (a)(f) | | | 0.58 | %(j) | | | 0.63 | % | | | 0.65 | % | | | 0.65 | % |
Before waivers and reimbursements (a)(f) | | | 1.52 | % | | | 1.81 | % | | | 2.86 | % | | | 3.78 | % |
Ratio of net investment income (loss) to average net assets: | | | | | | | | | | | | | | | | |
After waivers and reimbursements (a)(f)(x) | | | 1.67 | % | | | 1.24 | % | | | 1.87 | % | | | 4.87 | %(l) |
Before waivers and reimbursements (a)(f)(x) | | | 0.74 | % | | | 0.06 | % | | | (0.35 | )% | | | 1.74 | %(l) |
Portfolio turnover rate (z)^ | | | 13 | % | | | 39 | % | | | 13 | % | | | 15 | % |
| * | | Commencement of Operations. |
| # | | Per share amount is less than $0.005. |
| ^ | | Portfolio turnover rate excludes derivatives, if any. |
| (a) | | Ratios for periods less than one year are annualized. |
| (b) | | Total returns for periods less than one year are not annualized. |
| (e) | | Net investment income (loss) per share is based on average shares outstanding. |
| (f) | | Expenses do not include the expenses of the underlying funds (“indirect expenses”), if applicable. |
| (j) | | Including direct and indirect expenses, the net expense ratio after waivers and reimbursements would be 1.07%. |
| (l) | | The annualized ratio of net investment income to average net assets may not be indicative of operating results for a full year. |
| (x) | | Recognition of net investment income is affected by the timing of dividend declarations by the underlying funds in which the Portfolio invests. |
| (z) | | Portfolio turnover rate for periods less than one year is not annualized. |
126
CharterSM Alternative 100 Moderate Portfolio (ag)
| | | | | | | | | | | | | | | | |
| | | Year Ended December 31, | | | October 30, 2013* to
December 31, 2013 | |
Class B | | 2016 | | | 2015 | | | 2014 | | |
Net asset value, beginning of period | | $ | 8.36 | | | $ | 9.54 | | | $ | 9.73 | | | $ | 10.00 | |
| | | | | | | | | | | | | | | | |
Income (loss) from investment operations: | | | | | | | | | | | | | | | | |
Net investment income (loss) (e)(x) | | | 0.03 | | | | 0.13 | | | | 0.13 | | | | 0.07 | |
Net realized and unrealized gain (loss) on investments | | | 0.85 | | | | (1.04 | ) | | | (0.15 | ) | | | (0.17 | ) |
| | | | | | | | | | | | | | | | |
Total from investment operations | | | 0.88 | | | | (0.91 | ) | | | (0.02 | ) | | | (0.10 | ) |
| | | | | | | | | | | | | | | | |
Less distributions: | | | | | | | | | | | | | | | | |
Dividends from net investment income | | | (0.08 | ) | | | (0.13 | ) | | | (0.17 | ) | | | (0.14 | ) |
Distributions from net realized gains | | | — | | | | (0.14 | ) | | | — | | | | (0.02 | ) |
Return of capital | | | (0.04 | ) | | | — | | | | — | | | | (0.01 | ) |
| | | | | | | | | | | | | | | | |
Total dividends and distributions | | | (0.12 | ) | | | (0.27 | ) | | | (0.17 | ) | | | (0.17 | ) |
| | | | | | | | | | | | | | | | |
Net asset value, end of period | | $ | 9.12 | | | $ | 8.36 | | | $ | 9.54 | | | $ | 9.73 | |
| | | | | | | | | | | | | | | | |
Total return (b) | | | 10.58 | % | | | (9.50 | )% | | | (0.16 | )% | | | (1.01 | )% |
| | | | | | | | | | | | | | | | |
Ratios/Supplemental Data: | | | | | | | | | | | | | | | | |
Net assets, end of period (000’s) | | $ | 8,196 | | | $ | 12,781 | | | $ | 7,734 | | | $ | 4,269 | |
| Ratio of expenses to average net assets: | | | | | | | | | | | | | | | | |
After waivers and reimbursements (a)(f) | | | 0.70 | %(j) | | | 0.66 | %** | | | 0.65 | % | | | 0.65 | % |
Before waivers and reimbursements (a)(f) | | | 1.48 | % | | | 2.36 | % | | | 3.01 | % | | | 3.82 | % |
| Ratio of net investment income (loss) to average net assets: | | | | | | | | | | | | | | | | |
After waivers and reimbursements (a)(f)(x) | | | 0.35 | % | | | 1.40 | % | | | 1.27 | % | | | 4.13 | %(l) |
Before waivers and reimbursements (a)(f)(x) | | | (0.42 | )% | | | (0.31 | )% | | | (1.09 | )% | | | 0.96 | %(l) |
Portfolio turnover rate (z)^ | | | 16 | % | | | 30 | % | | | 13 | % | | | 7 | % |
| * | | Commencement of Operations. |
| ** | | Includes Tax Expense of 0.01%. |
| ^ | | Portfolio turnover rate excludes derivatives, if any. |
| (a) | | Ratios for periods less than one year are annualized. |
| (b) | | Total returns for periods less than one year are not annualized. |
| (e) | | Net investment income (loss) per share is based on average shares outstanding. |
| (f) | | Expenses do not include the expenses of the underlying funds (“indirect expenses”), if applicable. |
| (j) | | Including direct and indirect expenses, the net expense ratio after waivers and reimbursements would be 1.20%. |
| (l) | | The annualized ratio of net investment income to average net assets may not be indicative of operating results for a full year. |
| (x) | | Recognition of net investment income is affected by the timing of dividend declarations by the underlying funds in which the Portfolio invests. |
| (z) | | Portfolio turnover rate for periods less than one year is not annualized. |
| (ag) | | On September 25, 2015, this Portfolio received, through a merger transaction, the assets and liabilities of the CharterSM Alternative 100 Conservative Plus Portfolio and CharterSM Alternative 100 Growth Portfolio that followed the same objectives as this Portfolio. Information prior to the period ended September 25, 2015 represents the results of operations of the CharterSM Alternative 100 Moderate Portfolio. |
127
CharterSM Income Strategies Portfolio
| | | | | | | | | | | | | | | | |
| | | Year Ended December 31, | | | October 30, 2013* to
December 31, 2013 | |
Class B | | 2016 | | | 2015 | | | 2014 | | |
Net asset value, beginning of period | | $ | 9.14 | | | $ | 9.87 | | | $ | 9.76 | | | $ | 10.00 | |
| | | | | | | | | | | | | | | | |
Income (loss) from investment operations: | | | | | | | | | | | | | | | | |
Net investment income (loss) (e)(x) | | | 0.23 | | | | 0.21 | | | | 0.30 | | | | 0.16 | |
Net realized and unrealized gain (loss) on investments | | | 0.41 | | | | (0.55 | ) | | | 0.15 | | | | (0.18 | ) |
| | | | | | | | | | | | | | | | |
Total from investment operations | | | 0.64 | | | | (0.34 | ) | | | 0.45 | | | | (0.02 | ) |
| | | | | | | | | | | | | | | | |
Less distributions: | | | | | | | | | | | | | | | | |
Dividends from net investment income | | | (0.26 | ) | | | (0.24 | ) | | | (0.30 | ) | | | (0.19 | ) |
Distributions from net realized gains | | | (0.12 | ) | | | (0.15 | ) | | | (0.04 | ) | | | (0.03 | ) |
| | | | | | | | | | | | | | | | |
Total dividends and distributions | | | (0.38 | ) | | | (0.39 | ) | | | (0.34 | ) | | | (0.22 | ) |
| | | | | | | | | | | | | | | | |
Net asset value, end of period | | $ | 9.40 | | | $ | 9.14 | | | $ | 9.87 | | | $ | 9.76 | |
| | | | | | | | | | | | | | | | |
Total return (b) | | | 7.00 | % | | | (3.46 | )% | | | 4.58 | % | | | (0.11 | )% |
| | | | | | | | | | | | | | | | |
Ratios/Supplemental Data: | | | | | | | | | | | | | | | | |
Net assets, end of period (000’s) | | $ | 4,551 | | | $ | 5,087 | | | $ | 6,667 | | | $ | 4,017 | |
| Ratio of expenses to average net assets: | | | | | | | | | | | | | | | | |
After waivers and reimbursements (a)(f) | | | 0.59 | %(j) | | | 0.63 | % | | | 0.65 | % | | | 0.65 | % |
Before waivers and reimbursements (a)(f) | | | 3.29 | % | | | 3.46 | % | | | 3.94 | % | | | 3.85 | % |
Ratio of net investment income (loss) to average net assets: | | | | | | | | | | | | | | | | |
After waivers and reimbursements (a)(f)(x) | | | 2.41 | % | | | 2.16 | % | | | 2.94 | % | | | 9.54 | %(l) |
Before waivers and reimbursements (a)(f)(x) | | | (0.30 | )% | | | (0.67 | )% | | | (0.36 | )% | | | 6.33 | %(l) |
Portfolio turnover rate (z)^ | | | 22 | % | | | 25 | % | | | 17 | % | | | 11 | % |
| * | | Commencement of Operations. |
| ^ | | Portfolio turnover rate excludes derivatives, if any. |
| (a) | | Ratios for periods less than one year are annualized. |
| (b) | | Total returns for periods less than one year are not annualized. |
| (e) | | Net investment income (loss) per share is based on average shares outstanding. |
| (f) | | Expenses do not include the expenses of the underlying funds (“indirect expenses”), if applicable. |
| (j) | | Including direct and indirect expenses, the net expense ratio after waivers and reimbursements would be 0.98%. |
| (l) | | The annualized ratio of net investment income to average net assets may not be indicative of operating results for a full year. |
| (x) | | Recognition of net investment income is affected by the timing of dividend declarations by the underlying funds in which the Portfolio invests. |
| (z) | | Portfolio turnover rate for periods less than one year is not annualized. |
128
CharterSM Interest Rate Strategies Portfolio
| | | | | | | | | | | | | | | | |
| | | Year Ended December 31, | | | October 30, 2013* to
December 31, 2013 | |
Class B | | 2016 | | | 2015 | | | 2014 | | |
Net asset value, beginning of period | | $ | 9.10 | | | $ | 9.83 | | | $ | 9.84 | | | $ | 10.00 | |
| | | | | | | | | | | | | | | | |
Income (loss) from investment operations: | | | | | | | | | | | | | | | | |
Net investment income (loss) (e)(x) | | | 0.18 | | | | 0.14 | | | | 0.24 | | | | 0.09 | |
Net realized and unrealized gain (loss) on investments | | | 0.53 | | | | (0.60 | ) | | | 0.01 | † | | | (0.10 | ) |
| | | | | | | | | | | | | | | | |
Total from investment operations | | | 0.71 | | | | (0.46 | ) | | | 0.25 | | | | (0.01 | ) |
| | | | | | | | | | | | | | | | |
Less distributions: | �� | | | | | | | | | | | | | | | |
Dividends from net investment income | | | (0.24 | ) | | | (0.17 | ) | | | (0.25 | ) | | | (0.12 | ) |
Distributions from net realized gains | | | (0.09 | ) | | | (0.10 | ) | | | (0.01 | ) | | | (0.03 | ) |
Return of capital | | | (0.03 | ) | | | — | | | | — | | | | — | |
| | | | | | | | | | | | | | | | |
Total dividends and distributions | | | (0.36 | ) | | | (0.27 | ) | | | (0.26 | ) | | | (0.15 | ) |
| | | | | | | | | | | | | | | | |
Net asset value, end of period | | $ | 9.45 | | | $ | 9.10 | | | $ | 9.83 | | | $ | 9.84 | |
| | | | | | | | | | | | | | | | |
Total return (b) | | | 7.82 | % | | | (4.55 | )% | | | 2.51 | % | | | (0.01 | )% |
| | | | | | | | | | | | | | | | |
Ratios/Supplemental Data: | | | | | | | | | | | | | | | | |
Net assets, end of period (000’s) | | $ | 4,220 | | | $ | 5,951 | | | $ | 8,590 | | | $ | 4,000 | |
| Ratio of expenses to average net assets: | | | | | | | | | | | | | | | | |
After waivers and reimbursements (a)(f) | | | 0.57 | %(j) | | | 0.63 | % | | | 0.65 | % | | | 0.65 | % |
Before waivers and reimbursements (a)(f) | | | 3.24 | % | | | 2.60 | % | | | 3.19 | % | | | 3.86 | % |
Ratio of net investment income (loss) to average net assets: | | | | | | | | | | | | | | | | |
After waivers and reimbursements (a)(f)(x) | | | 1.92 | % | | | 1.46 | % | | | 2.37 | % | | | 5.53 | %(l) |
Before waivers and reimbursements (a)(f)(x) | | | (0.75 | )% | | | (0.51 | )% | | | (0.17 | )% | | | 2.33 | %(l) |
Portfolio turnover rate (z)^ | | | 13 | % | | | 27 | % | | | 26 | % | | | 14 | % |
| * | | Commencement of Operations. |
| † | | The amount shown for a share outstanding throughout the period does not accord with the aggregate net income and/or gain on investments for that period because of the timing of sales and repurchases of the Portfolio shares in relation to fluctuating market value of the investments in the Portfolio. |
| ^ | | Portfolio turnover rate excludes derivatives, if any. |
| (a) | | Ratios for periods less than one year are annualized. |
| (b) | | Total returns for periods less than one year are not annualized. |
| (e) | | Net investment income (loss) per share is based on average shares outstanding. |
| (f) | | Expenses do not include the expenses of the underlying funds (“indirect expenses”), if applicable. |
| (j) | | Including direct and indirect expenses, the net expense ratio after waivers and reimbursements would be 0.96%. |
| (l) | | The annualized ratio of net investment income to average net assets may not be indicative of operating results for a full year. |
| (x) | | Recognition of net investment income is affected by the timing of dividend declarations by the underlying funds in which the Portfolio invests. |
| (z) | | Portfolio turnover rate for periods less than one year is not annualized. |
129
CharterSM International Moderate Portfolio (ag)
| | | | | | | | | | | | | | | | |
| | | Year Ended December 31, | | | October 30, 2013* to
December 31, 2013 | |
Class B | | 2016 | | | 2015 | | | 2014 | | |
Net asset value, beginning of period | | $ | 8.85 | | | $ | 9.46 | | | $ | 9.77 | | | $ | 10.00 | |
| | | | | | | | | | | | | | | | |
Income (loss) from investment operations: | | | | | | | | | | | | | | | | |
Net investment income (loss) (e)(x) | | | 0.15 | | | | 0.18 | | | | 0.26 | | | | 0.09 | |
Net realized and unrealized gain (loss) on investments | | | 0.32 | | | | (0.66 | ) | | | (0.29 | ) | | | (0.17 | ) |
| | | | | | | | | | | | | | | | |
Total from investment operations | | | 0.47 | | | | (0.48 | ) | | | (0.03 | ) | | | (0.08 | ) |
| | | | | | | | | | | | | | | | |
Less distributions: | | | | | | | | | | | | | | | | |
Dividends from net investment income | | | (0.21 | ) | | | (0.10 | ) | | | (0.28 | ) | | | (0.11 | ) |
Distributions from net realized gains | | | — | | | | (0.03 | ) | | | — | | | | (0.01 | ) |
Return of capital | | | (0.02 | ) | | | — | | | | — | | | | (0.03 | ) |
| | | | | | | | | | | | | | | | |
Total dividends and distributions | | | (0.23 | ) | | | (0.13 | ) | | | (0.28 | ) | | | (0.15 | ) |
| | | | | | | | | | | | | | | | |
Net asset value, end of period | | $ | 9.09 | | | $ | 8.85 | | | $ | 9.46 | | | $ | 9.77 | |
| | | | | | | | | | | | | | | | |
Total return (b) | | | 5.41 | % | | | (5.07 | )% | | | (0.29 | )% | | | (0.81 | )% |
| | | | | | | | | | | | | | | | |
Ratios/Supplemental Data: | | | | | | | | | | | | | | | | |
Net assets, end of period (000’s) | | $ | 8,243 | | | $ | 13,516 | | | $ | 4,770 | | | $ | 3,971 | |
| Ratio of expenses to average net assets: | | | | | | | | | | | | | | | | |
After waivers and reimbursements (a)(f) | | | 0.60 | %(j) | | | 0.60 | % | | | 0.65 | % | | | 0.65 | % |
Before waivers and reimbursements (a)(f) | | | 1.54 | % | | | 2.89 | % | | | 4.19 | % | | | 3.88 | % |
| Ratio of net investment income (loss) to average net assets: | | | | | | | | | | | | | | | | |
After waivers and reimbursements (a)(f)(x) | | | 1.62 | % | | | 1.91 | % | | | 2.59 | % | | | 5.14 | %(l) |
Before waivers and reimbursements (a)(f)(x) | | | 0.67 | % | | | (0.37 | )% | | | (0.95 | )% | | | 1.91 | %(l) |
Portfolio turnover rate (z)^ | | | 9 | % | | | 13 | % | | | 12 | % | | | 13 | % |
| * | | Commencement of Operations. |
| ^ | | Portfolio turnover rate excludes derivatives, if any. |
| (a) | | Ratios for periods less than one year are annualized. |
| (b) | | Total returns for periods less than one year are not annualized. |
| (e) | | Net investment income (loss) per share is based on average shares outstanding. |
| (f) | | Expenses do not include the expenses of the underlying funds (“indirect expenses”), if applicable. |
| (j) | | Including direct and indirect expenses, the net expense ratio after waivers and reimbursements would be 0.97%. |
| (l) | | The annualized ratio of net investment income to average net assets may not be indicative of operating results for a full year. |
| (x) | | Recognition of net investment income is affected by the timing of dividend declarations by the underlying funds in which the Portfolio invests. |
| (z) | | Portfolio turnover rate for periods less than one year is not annualized. |
| (ag) | | On September 25, 2015, this Portfolio received, through a merger transaction, the assets and liabilities of the CharterSM International Conservative Portfolio and CharterSM International Growth Portfolio that followed the same objectives as this Portfolio. Information prior to the period ended September 25, 2015 represents the results of operations of the CharterSM International Moderate Portfolio. |
130
CharterSM Real Assets Portfolio
| | | | | | | | | | | | | | | | |
| | | Year Ended December 31, | | | October 30, 2013* to
December 31, 2013 | |
Class B | | 2016 | | | 2015 | | | 2014 | | |
Net asset value, beginning of period | | $ | 8.22 | | | $ | 9.36 | | | $ | 9.60 | | | $ | 10.00 | |
| | | | | | | | | | | | | | | | |
Income (loss) from investment operations: | | | | | | | | | | | | | | | | |
Net investment income (loss) (e)(x) | | | 0.15 | | | | 0.06 | | | | 0.23 | | | | 0.06 | |
Net realized and unrealized gain (loss) on investments | | | 0.90 | | | | (1.12 | ) | | | (0.22 | ) | | | (0.35 | ) |
| | | | | | | | | | | | | | | | |
Total from investment operations | | | 1.05 | | | | (1.06 | ) | | | 0.01 | | | | (0.29 | ) |
| | | | | | | | | | | | | | | | |
Less distributions: | | | | | | | | | | | | | | | | |
Dividends from net investment income | | | (0.16 | ) | | | (0.08 | ) | | | (0.25 | ) | | | (0.07 | ) |
Return of capital | | | (0.02 | ) | | | — | | | | — | | | | (0.04 | ) |
| | | | | | | | | | | | | | | | |
Total dividends and distributions | | | (0.18 | ) | | | (0.08 | ) | | | (0.25 | ) | | | (0.11 | ) |
| | | | | | | | | | | | | | | | |
Net asset value, end of period | | $ | 9.09 | | | $ | 8.22 | | | $ | 9.36 | | | $ | 9.60 | |
| | | | | | | | | | | | | | | | |
Total return (b) | | | 12.73 | % | | | (11.34 | )% | | | 0.09 | % | | | (2.88 | )% |
| | | | | | | | | | | | | | | | |
Ratios/Supplemental Data: | | | | | | | | | | | | | | | | |
Net assets, end of period (000’s) | | $ | 4,813 | | | $ | 4,107 | | | $ | 4,758 | | | $ | 3,886 | |
| Ratio of expenses to average net assets: | | | | | | | | | | | | | | | | |
After waivers and reimbursements (a)(f) | | | 0.71 | %(j) | | | 0.65 | % | | | 0.65 | % | | | 0.65 | % |
Before waivers and reimbursements (a)(f) | | | 2.65 | % | | | 3.22 | % | | | 3.87 | % | | | 3.92 | % |
| Ratio of net investment income (loss) to average net assets: | | | | | | | | | | | | | | | | |
After waivers and reimbursements (a)(f)(x) | | | 1.66 | % | | | 0.70 | % | | | 2.31 | % | | | 3.44 | %(l) |
Before waivers and reimbursements (a)(f)(x) | | | (0.28 | )% | | | (1.88 | )% | | | (0.90 | )% | | | 0.17 | %(l) |
Portfolio turnover rate (z)^ | | | 21 | % | | | 21 | % | | | 14 | % | | | 15 | % |
| * | | Commencement of Operations. |
| ^ | | Portfolio turnover rate excludes derivatives, if any. |
| (a) | | Ratios for periods less than one year are annualized. |
| (b) | | Total returns for periods less than one year are not annualized. |
| (e) | | Net investment income (loss) per share is based on average shares outstanding. |
| (f) | | Expenses do not include the expenses of the underlying funds (“indirect expenses”), if applicable. |
| (j) | | Including direct and indirect expenses, the net expense ratio after waivers and reimbursements would be 1.17% for Class B. |
| (l) | | The annualized ratio of net investment income to average net assets may not be indicative of operating results for a full year. |
| (x) | | Recognition of net investment income is affected by the timing of dividend declarations by the underlying funds in which the Portfolio invests. |
| (z) | | Portfolio turnover rate for periods less than one year is not annualized. |
131
VOTING INFORMATION
The following information applies to the Reorganization of the Acquired Portfolio for which you are entitled to vote.
Voting Rights
Shareholders with amounts invested in shares of an Acquired Portfolio at the close of business on December 31, 2016 (the “Record Date”) will be entitled to be present and vote for the applicable Acquired Portfolio at the Meeting with respect to their shares as of the Record Date.
Each whole share of an Acquired Portfolio is entitled to one vote as to each matter with respect to which it is entitled to vote, as described above, and each fractional share is entitled to a proportionate fractional vote. Votes cast by proxy or in person by a shareholder at the Meeting will be counted by persons appointed as inspectors of election for the Meeting. The table below shows the number of outstanding shares of each Acquired Portfolio as of the Record Date that are entitled to vote at the Meeting. AXA Equitable owned of record more than 95% of those shares.
| | | | | | | | | | | | | | | | |
Acquired Portfolio | | Total
Number | | | Number of
Class IB | | | Number of
Class B | | | Number of
Class K | |
All Asset Aggressive-Alt 25 Portfolio | | | 2,557,656.91 | | | | 2,415,514.57 | | | | N/A | | | | 142,142.34 | |
All Asset Aggressive-Alt 50 Portfolio | | | 305,174.78 | | | | 305,174.78 | | | | N/A | | | | N/A | |
All Asset Aggressive-Alt 75 Portfolio | | | 338,900.17 | | | | 338,900.17 | | | | N/A | | | | N/A | |
CharterSM Alternative 100 Moderate Portfolio | | | 898,603.54 | | | | N/A | | | | 898,603.54 | | | | N/A | |
CharterSM Income Strategies Portfolio | | | 485,220.61 | | | | N/A | | | | 485,220.61 | | | | N/A | |
CharterSM Interest Rate Strategies Portfolio | | | 446,417.13 | | | | N/A | | | | 446,417.13 | | | | N/A | |
CharterSM International Moderate Portfolio | | | 906,780.59 | | | | N/A | | | | 906,780.59 | | | | N/A | |
CharterSM Real Assets Portfolio | | | 532,700.16 | | | | N/A | | | | 532,700.16 | | | | N/A | |
AXA/Pacific Global Small Cap Value Portfolio | | | 17,660,787.31 | | | | 55,588.34 | | | | N/A | | | | 17,605,198.97 | |
All properly executed and unrevoked proxies received in time for the Meeting will be voted as instructed by shareholders. If a shareholder executes a proxy but gives no voting instructions, that shareholder’s shares that are represented by that proxy will be voted “FOR” the respective Proposal and “FOR” or “AGAINST” any other business which may properly arise at the Meeting, in the proxies’ discretion. Any person giving a proxy has the power to revoke it at any time prior to its exercise by executing a superseding proxy or by submitting a written notice of revocation to the Trust. To be effective, such revocation must be received by the respective Trust prior to the Meeting. In addition, although mere attendance at the Meeting will not revoke a proxy, a shareholder present at the Meeting may withdraw his or her proxy by voting in person.
Contractholders with amounts allocated to an Acquired Portfolio on its respective Record Date will be entitled to be present and provide voting instructions for the Portfolio at the Meeting with respect to shares held indirectly as of the Record Date. Voting instructions may be solicited, and such instructions may be provided, in the same manner as proxies as described herein. AXA Equitable will vote the shares for which it receives timely voting instructions from Contractholders in accordance with those instructions. Shares in each investment division of a Separate Account that is invested in an Acquired Portfolio for which AXA Equitable receives a voting instruction card that is signed and timely returned but is not marked to indicate voting instructions will be treated as an instruction to vote the shares “FOR” the respective Proposal, and AXA Equitable may vote in its discretion with respect to other matters not now known that may be presented at the Meeting. AXA Equitable will vote in its discretion on any proposal to adjourn or postpone the Meeting. Shares in each investment division of a Separate Account for which AXA Equitable receives no timely voting instructions from Contractholders, or which are attributable to amounts retained by AXA Equitable as surplus or seed money, will be voted by AXA Equitable “FOR” or “AGAINST” approval of the respective Proposal, or as an abstention, in the same proportion as the shares for which Contractholders have provided voting instructions to AXA Equitable. As a result of such proportional voting by AXA Equitable, it is possible that a small number of Contractholders could determine whether a Proposal is approved.
132
Voting instructions executed by a Contractholder may be revoked at any time prior to AXA Equitable voting the shares represented thereby by the Contractholder providing AXA Equitable with a properly executed written revocation of such voting instructions, or by the Contractholder providing AXA Equitable with proper later-dated voting instructions by voting instruction card, telephone or the Internet. In addition, any Contractholder who attends the Meeting in person may provide voting instructions by a voting instruction card at the Meeting, thereby canceling any voting instruction previously given. Proxies executed by AXA Equitable may be revoked at any time before they are exercised by a written revocation duly received, by properly executing a later-dated proxy or by AXA Equitable representative attending the Meeting and voting in person.
Prompt execution and return of the enclosed voting instruction card is requested. A self-addressed, postage-paid envelope is enclosed for your convenience.
Required Shareholder Vote
Approval of the Reorganization Plan with respect to a Reorganization involving an Acquired Portfolio will require the affirmative vote of (1) 67% or more of the voting securities of the Acquired Portfolio present at the Meeting, if the holders of more than 50% of its outstanding voting securities are present or represented by proxy, or (2) more than 50% of its outstanding voting securities, whichever is less. “Voting securities” refers to the shares of an Acquired Portfolio.
The presence, in person or by proxy, of at least one-third of the shares of an Acquired Portfolio entitled to vote at the Meeting will constitute a quorum for the transaction of business, with respect to that Acquired Portfolio, at the Meeting. A quorum will be reached due to AXA Equitable’s direct or indirect ownership of each Trust’s shares, as described below.
Abstentions are counted as shares present at the Meeting in determining whether a quorum is present but do not count as votes cast for or against a Proposal. Therefore, abstentions will have the same effect as a vote “against” a Proposal because each Proposal requires the affirmative vote of a specified majority of the applicable Acquired Portfolio’s outstanding voting securities.
To each Trust’s knowledge, as of the Record Date, the officers and Trustees owned, as a group, less than 1% of the shares of each Acquired Portfolio.
AXA Equitable may be deemed to be a control person of EQ Trust or VIP Trust by virtue of its direct or indirect ownership of more than 95% of the Trust’s shares. Shareholders owning more than 25% of the outstanding shares of an Acquired Portfolio may be able to determine the outcome of most issues that are submitted to shareholders for a vote. As of the Record Date, except as set forth in Appendix C, to each Trust’s knowledge, (1) no person, other than AXA Equitable, owned beneficially or of record more than 5% of the outstanding Class IB, Class B, or Class K shares, as applicable, of each Acquired Portfolio, and (2) no Contractholder owned Contracts entitling such Contractholder to provide voting instructions regarding more than 5% of the outstanding Class IB, Class B, or Class K shares, as applicable, of each Acquired Portfolio.
Solicitation of Proxies and Voting Instructions
Solicitation of proxies and voting instructions is being made by each Trust primarily by the mailing of this Notice and Combined Proxy Statement/Prospectus with its enclosures on or about December 31, 2016. The principal solicitation will be by mail, but proxies and voting instructions also may be solicited by telephone, fax, personal interview by directors, officers, employees or agents of FMG LLC or its affiliates or each Trust or its affiliates, without additional compensation, through the Internet, or other permissible means. Shareholders can vote proxies: (1) by Internet at our website at www.proxyvote.com; (2) by telephone at 1-800-690-6903; or (3) by mail, with the enclosed proxy card. Contractholders can provide voting instructions: (1) by Internet at our website at www.proxyvote.com; (2) by telephone at 1-800-690-6903; or (3) by mail, with the enclosed voting instruction card. In lieu of executing a proxy card or voting instruction card, you may attend the Meeting in person. The cost of the Meeting, including the cost of solicitation of proxies and the expenses associated with reimbursing brokers or nominees for their reasonable expenses in forwarding solicitation material to beneficial
133
owners, will be borne by each class of each Acquired Portfolio. The cost of the Reorganizations is estimated to be $300,000, which will be allocated equally among the Acquired Portfolios. However, the Manager has voluntarily agreed to pay expenses relating to the Reorganizations that exceed a class’s expense cap.
Adjournment or Postponement
If a quorum is not established at the Meeting or if sufficient votes in favor of a Proposal are not received by the time scheduled for the Meeting, the persons named as proxies may propose one or more adjournments or postponements of the Meeting to permit further solicitation of proxies. Any adjournment or postponement of the Meeting will require the affirmative vote of a majority of the shares represented in person or by proxy at the session of the Meeting to be adjourned. The persons named as proxies will vote in their discretion on any such adjournment or postponement. A shareholder vote may be taken on one or more of the items in this Combined Proxy Statement/Prospectus prior to such adjournment if sufficient votes have been received and it is otherwise appropriate. The costs of any additional solicitation and any adjourned session will be borne as described above.
Submission of Certain Shareholder Proposals
Each Trust is not required to hold regular shareholder meetings and, in order to minimize its costs, does not intend to hold meetings of shareholders unless so required by applicable law, regulation or regulatory policy or if otherwise deemed advisable by each Trust’s management. Therefore, it is not practicable to specify a date by which proposals must be received in order to be incorporated in an upcoming proxy statement for a meeting of shareholders. Shareholders will be given notice of any meeting of shareholders not less than ten days, and not more than ninety days, before the date of the meeting.
Other Matters
Each Trust does not know of any matters to be presented at the Meeting other than those described in this Combined Proxy Statement/Prospectus. If other business properly comes before the Meeting, the proxyholders will vote thereon in accordance with their best judgment.
* * * * *
Copies of EQ Trust’s and VIP Trust’s most recent annual and semi-annual reports, including financial statements, previously have been delivered to Contractholders. Contractholders may request additional copies of each Trust’s annual or semi-annual reports, free of charge, by writing to the respective Trust at 1290 Avenue of the Americas, New York, New York 10104 or by calling 1-877-522-5035.
We need your vote. It is important that you execute and return all of your proxy or voting instruction cards promptly.
134
APPENDIX A.1
FORM OF
AGREEMENT AND PLAN OF REORGANIZATION AND TERMINATION
THIS AGREEMENT AND PLAN OF REORGANIZATION AND TERMINATION (“Agreement”) is made as of [ ], 2017, between EQ ADVISORS TRUST, a Delaware statutory trust (“EQAT”), on behalf of All Asset Aggressive — Alt 50 Portfolio and All Asset Aggressive — Alt 75 Portfolio, each a segregated portfolio of assets (“series”) thereof (each, a “Target”), and All Asset Growth — Alt 20 Portfolio, EQ/PIMCO Global Real Return Portfolio, and AXA/DoubleLine Opportunities Core Plus Bond Portfolio, each also a series thereof (each, an “Acquiring Portfolio”), and AXA PREMIER VIP TRUST, also a Delaware statutory trust (“VIP”), on behalf of CharterSM Real Assets Portfolio, CharterSM Income Strategies Portfolio, and CharterSM Interest Rate Strategies Portfolio, each a series thereof (each, also a “Target”). (Each Target and Acquiring Portfolio is sometimes referred to herein as a “Portfolio,” each of EQAT and VIP is sometimes referred to herein as an “Investment Company,” and the Investment Company of which a Target is a series is sometimes referred to herein as a “Target Investment Company.”) Notwithstanding anything to the contrary contained herein, (1) all agreements, covenants, representations, warranties, actions, and obligations (collectively, “Obligations”) of and by each Portfolio, and of and by each Investment Company, as applicable, on its behalf, contained herein shall be deemed to be the Obligations of that Portfolio only, (2) all rights and benefits created hereunder in favor of a Portfolio shall inure to and be enforceable by the Investment Company of which that Portfolio is a series on that Portfolio’s behalf, and (3) in no event shall any other series of an Investment Company or the assets thereof be held liable with respect to the breach or other default by an obligated Portfolio or Investment Company of its Obligations set forth herein.
Each Investment Company currently sells voting shares of beneficial interest in its Portfolios, $0.001 par value per share (“shares”), to (1) separate accounts of AXA Equitable Life Insurance Company (“AXA Equitable”), AXA Life and Annuity Company (in the case of EQAT), or other affiliated or unaffiliated insurance companies (“Separate Accounts”) in connection with certain variable annuity certificates and contracts and variable life insurance policies (collectively, “Contracts”) issued thereby and (2) The AXA Equitable 401(k) Plan. Shares in each Portfolio also may be sold to (3) other tax-qualified retirement plans and (4) other investors eligible under applicable regulations under the Internal Revenue Code of 1986, as amended (“Code”) (“Regulations”). Class K shares of EQAT and certain series of VIP not involved in the transactions contemplated hereby are sold only to other series thereof and certain group annuity and retirement plans. The Portfolios are underlying investment options for the Separate Accounts to fund Contracts. Under applicable law, the assets of all the Separate Accounts (i.e., the shares in the Portfolios) are the property of AXA Equitable, which is the owner of record of those shares, and are held for the benefit of the Contract holders.
The Investment Companies wish to effect five separate reorganizations, each consisting of (1) the transfer of all of a Target’s assets to the Acquiring Portfolio listed on Schedule A to this Agreement (“Schedule A”) opposite its name (“corresponding Acquiring Portfolio”) in exchange for shares in that Acquiring Portfolio and that Acquiring Portfolio’s assumption of all of that Target’s liabilities, (2) the distribution of those shares pro rata to that Target’s shareholders in exchange for their shares therein and in complete liquidation thereof (for federal tax purposes), and (3) that Target’s termination as a series of the relevant Target Investment Company, all on the terms and conditions set forth herein (all the foregoing transactions involving each Target and its corresponding Acquiring Portfolio being referred to herein collectively as a “Reorganization”). The consummation of one Reorganization is not contingent on the consummation of any other Reorganization. (For convenience, the balance hereof — except the paragraph below describing the Portfolios’ share classes, paragraphs that mention a “VIP Reorganization” or an “EQAT Reorganization” or both, and paragraphs 1.3 and 7.2 — refers only to a single Reorganization, one Target, and one Acquiring Portfolio, but the terms and conditions hereof shall apply separately to each Reorganization and the Portfolios participating therein.)
Each Investment Company’s board of trustees (each, a “Board”), in each case including a majority of its members who are not “interested persons” (as that term is defined in the Investment Company Act of 1940, as amended (“1940 Act”)) of either Investment Company, (1) has duly approved this Agreement and the transactions contemplated hereby and has duly authorized its performance hereof on its Portfolio’s behalf and consummation of
A-1
the Reorganization by all necessary Board action and (2) has determined that participation in the Reorganization is in the best interests of its Portfolio and that the interests of the existing shareholders thereof will not be diluted as a result of the Reorganization.
Each Target that is a series of VIP offers a single class of shares, designated Class B (“Class B Target Shares”); and each Target that is a series of EQAT offers three classes of shares, designated Class IA, Class IB, and Class K shares (“Class IA Target Shares,” “Class IB Target Shares,” and “Class K Target Shares,” respectively, and, together with Class B Target Shares, “Target Shares”). Each Acquiring Portfolio also offers three classes of shares, designated Class IA, Class IB, and Class K shares (“Class IA Acquiring Portfolio Shares,” “Class IB Acquiring Portfolio Shares,” and “Class K Acquiring Portfolio Shares,” respectively, and collectively, “Acquiring Portfolio Shares”). The Portfolios’ similarly designated classes of shares have identical characteristics, rights, and preferences.
In consideration of the mutual promises contained herein, the parties agree as follows:
1. PLAN OF REORGANIZATION AND TERMINATION
1.1. Subject to the requisite approval of Target’s shareholders and the terms and conditions set forth herein, Target shall assign, sell, convey, transfer, and deliver all of its assets described in paragraph 1.2 (“Assets”) to Acquiring Portfolio. In exchange therefor, Acquiring Portfolio shall —
(a) issue and deliver to Target the number of full and fractional (all references herein to “fractional” shares meaning fractions rounded to the eighth decimal place)
(1) in the case of each Reorganization involving a Target that is a series of EQAT (i.e., the Reorganizations involving the Portfolios listed on the first two lines of Schedule A) (each, an “EQAT Reorganization”), (i) Class IA Acquiring Portfolio Shares determined by dividing Target’s net value (computed as set forth in paragraph 2.1) (“Target Value”) attributable to the Class IA Target Shares by the net asset value (computed as set forth in paragraph 2.2) (“NAV”) of a Class IA Acquiring Portfolio Share, (ii) Class IB Acquiring Portfolio Shares determined by dividing the Target Value attributable to the Class IB Target Shares by the NAV of a Class IB Acquiring Portfolio Share, and (iii) Class K Acquiring Portfolio Shares determined by dividing the Target Value attributable to the Class K Target Shares by the NAV of a Class K Acquiring Portfolio Share, and
(2) in the case of each Reorganization involving a Target that is a series of VIP (i.e., the Reorganizations involving the Portfolios listed on the last three lines of Schedule A) (each, a “VIP Reorganization”), Class IB Acquiring Portfolio Shares determined by dividing the Target Value by the NAV of a Class IB Acquiring Portfolio Share, and
(b) assume all of Target’s liabilities described in paragraph 1.3 (“Liabilities”).
Those transactions shall take place at the Closing (as defined in paragraph 3.1).
1.2. The Assets shall consist of all assets and property of every kind and nature — including all cash, cash equivalents, securities, commodities, futures interests, receivables (including interest and dividends receivable), claims and rights of action, rights to register shares under applicable securities laws, goodwill, and books and records — Target owns at the Valuation Time (as defined in paragraph 2.1) and any deferred and prepaid expenses shown as assets on Target’s books at that time; and Target has no unamortized or unpaid organizational fees or expenses that, in the case of each VIP Reorganization, have not previously been disclosed in writing to EQAT.
1.3. The Liabilities shall consist of all of Target’s liabilities, debts, obligations, and duties of whatever kind or nature existing at the Valuation Time, whether absolute, accrued, contingent, or otherwise, whether known or unknown, whether or not arising in the ordinary course of business, whether or not determinable at the Effective Time (as defined in paragraph 3.1), and whether or not specifically referred to herein, except expenses borne by another Target pursuant to paragraph 7.2. Notwithstanding the foregoing, Target shall use its best efforts to discharge all its known liabilities, debts, obligations, and duties before the Effective Time.
A-2
1.4. If the dividends and/or other distributions Target has paid through the Effective Time for its current taxable year do not equal or exceed the sum of its (a) “investment company taxable income” (within the meaning of section 852(b)(2)) (all “section” references are to the Code, unless otherwise noted), computed without regard to any deduction for dividends paid, plus (b) “net capital gain” (as defined in section 1222(11)), after reduction by any capital loss carryovers, for that year through that time (including any such gain realized and recognized pursuant to the transactions comprising the Reorganization), then at or as soon as practicable before that time, Target shall declare and pay to its shareholders of record one or more dividends and/or other distributions so that it will have distributed substantially all of that income and gain — and in no event less than the sum of 98% of its “ordinary income” plus 98.2% of its “capital gain net income,” as those terms are defined in section 4982(e)(1) and (2), respectively — for all federal income and excise tax periods ending at or before the Effective Time, and treating its current taxable year as ending at that time, such that Target will have no tax liability under sections 852 or 4982 for the current and any prior tax periods.
1.5. At the Effective Time (or as soon thereafter as is reasonably practicable), Target shall distribute the Acquiring Portfolio Shares it receives pursuant to paragraph 1.1(a) to the Separate Accounts for which AXA Equitable holds Target Shares of record at the Effective Time (each, a “Shareholder”), in proportion to their Target Shares then so held and in constructive exchange therefor, and shall completely liquidate (which shall be treated as a complete liquidation of Target for federal tax purposes, within the meaning of section 1.368-2(m)(1)(iv) of the Regulations). That distribution shall be accomplished by EQAT’s transfer agent’s opening accounts on Acquiring Portfolio’s shareholder records in the names of the Shareholders (except Shareholders in whose names accounts thereon already exist) and transferring those Acquiring Portfolio Shares to those newly opened and existing accounts. Pursuant to that transfer, each Shareholder’s account shall be credited with the respective pro rata number of full and fractional Acquiring Portfolio Shares due that Shareholder, by class (i.e., the account for each Shareholder that holds Class B Target Shares shall be credited with the respective pro rata number of full and fractional Class IB Acquiring Portfolio Shares due that Shareholder, the account for each Shareholder that holds Class IA Target Shares shall be credited with the respective pro rata number of full and fractional Class IA Acquiring Portfolio Shares due that Shareholder, the account for each Shareholder that holds Class IB Target Shares shall be credited with the respective pro rata number of full and fractional Class IB Acquiring Portfolio Shares due that Shareholder, and the account for each Shareholder that holds Class K Target Shares shall be credited with the respective pro rata number of full and fractional Class K Acquiring Portfolio Shares due that Shareholder). The aggregate NAV of Acquiring Portfolio Shares of each class to be so credited to each Shareholder’s account shall equal the aggregate NAV of the Target Shares of the corresponding class that Shareholder holds at the Effective Time. All issued and outstanding Target Shares, including any represented by certificates, shall simultaneously be canceled on Target’s shareholder records. EQAT shall not issue certificates representing the Acquiring Portfolio Shares issued in connection with the Reorganization.
1.6. Any transfer taxes payable on issuance and transfer of Acquiring Portfolio Shares in a name other than that of the registered holder on Target’s shareholder records of the Target Shares actually or constructively exchanged therefor shall be paid by the transferee thereof, as a condition of that issuance and transfer.
1.7. After the Effective Time, Target shall not conduct any business except in connection with its termination. As soon as reasonably practicable after distribution of the Acquiring Portfolio Shares pursuant to paragraph 1.5 — as provided there, on making that distribution Target’s liquidation shall be complete for federal tax purposes — (a) Target shall be terminated as a series of the Target Investment Company and (b) the Target Investment Company shall make all filings and take all other actions in connection therewith necessary and proper to effect that termination.
1.8. Any reporting responsibility of Target to a public authority, including the responsibility for filing regulatory reports, tax returns, and other documents with the Securities and Exchange Commission (“Commission”), any state securities commission, any federal, state, and local tax authorities, and any other relevant regulatory authority, is and shall remain its responsibility up to and including the date on which it is terminated. In furtherance of the foregoing, after the Effective Time, except as otherwise agreed to by the Investment Companies, the Target Investment Company shall prepare, or shall cause its agents to prepare, any federal, state, and local tax returns required to be filed by it with respect to Target’s final taxable year ending with its complete liquidation and for any prior periods or taxable years and shall cause those tax returns to be duly filed with the appropriate taxing authorities.
A-3
2. VALUATION
2.1. For purposes of paragraph 1.1(a), Target’s net value shall be (a) the value of the Assets computed immediately after the close of regular trading on the New York Stock Exchange (“NYSE”) and Target’s declaration of dividends and/or other distributions, if any, on the date of the Closing (“Valuation Time”), using the valuation procedures set forth in the Target Investment Company’s then-current prospectus and statement of additional information (“Pro/SAI”) including Target and valuation procedures established by its Board (collectively, “Valuation Procedures”), less (b) the amount of the Liabilities at the Valuation Time.
2.2. For purposes of paragraph 1.1(a), the NAV per share of each class of Acquiring Portfolio Shares shall be computed at the Valuation Time, using the Valuation Procedures.
2.3. All computations pursuant to paragraphs 2.1 and 2.2 shall be made (a) by AXA Equitable Funds Management Group, LLC (“FMG LLC”), in its capacity as each Investment Company’s administrator, or (b) in the case of securities subject to fair valuation, in accordance with the respective Valuation Procedures.
3. CLOSING AND EFFECTIVE TIME
3.1. Unless the Investment Companies agree otherwise (or in the case of an EQAT Reorganization EQAT determines otherwise), all acts necessary to consummate the Reorganization (“Closing”) shall be deemed to occur simultaneously as of immediately after the close of business (4:00 p.m., Eastern Time) on May 19, 2017, or a later date as to which they agree (or EQAT determines) (“Effective Time”). If, at or immediately before the Valuation Time, (a) the NYSE or another primary trading market for portfolio securities of either Portfolio (each, an “Exchange”) is closed to trading or trading thereon is restricted or (b) trading or the reporting of trading on an Exchange or elsewhere is disrupted, so that, in either Board’s (or, in the case of an EQAT Reorganization, EQAT’s Board’s) judgment, accurate appraisal of the value of either Portfolio’s net assets and/or the NAV per share of any class of Acquiring Portfolio Shares is impracticable, the date of the Closing (and, therefore, the Valuation Time and the Effective Time) shall be postponed until the first business day on which that Exchange is open for regular trading after the day when that trading has been fully resumed and that reporting has been restored. The Closing shall be held at the Investment Companies’ offices or at another place as to which they agree.
3.2. The Investment Companies shall direct the custodian of the Portfolios’ assets to deliver at the Closing a certificate of an authorized officer (“Certificate”) stating that (a) the Assets it holds will be transferred to Acquiring Portfolio at the Effective Time and (b) all necessary taxes in connection with the delivery of the Assets, including all applicable federal and state stock transfer stamps, if any, have been paid or provision for payment has been made.
3.3. The Target Investment Company shall direct its transfer agent to deliver to EQAT at or immediately after the Closing a Certificate stating that its records contain (a) the name, address, and taxpayer identification number of each Shareholder, (b) the number of full and fractional shares in each outstanding class of Target Shares each Shareholder owns, and (c) the dividend reinvestment elections, if any, applicable to each Shareholder, all at the Effective Time.
3.4. EQAT shall direct its transfer agent to deliver to the Target Investment Company, (a) at the Closing, a confirmation, or other evidence satisfactory to the Target Investment Company, that the Acquiring Portfolio Shares to be issued to Target pursuant to paragraph 1.1(a) have been credited to Target’s account on Acquiring Portfolio’s shareholder records and (b) at or as soon as reasonably practicable after the Closing, a Certificate as to the opening of accounts on those records in the names of the Shareholders (except Shareholders in whose names accounts thereon already exist).
3.5. Each Investment Company in a VIP Reorganization shall deliver to the other at the Closing (a) a Certificate in form and substance satisfactory to the recipient and dated the Effective Time, to the effect that the representations and warranties it made herein are true and correct at the Effective Time except as they may be affected by the transactions contemplated hereby and (b) bills of sale, checks, assignments, share certificates, receipts, and/or other documents the other Investment Company or its counsel reasonably requests.
A-4
4. REPRESENTATIONS AND WARRANTIES
4.1. The Target Investment Company, on Target’s behalf, represents and warrants to EQAT, on Acquiring Portfolio’s behalf, as follows (or, in the case of an EQAT Reorganization, EQAT’s obligation to implement this Agreement on Acquiring Portfolio’s behalf shall be subject to satisfaction of the following conditions at or before, and continuing through, the Effective Time):
4.1.1. The Target Investment Company (a) is a statutory trust that is duly organized, validly existing, and in good standing under the laws of the State of Delaware (a “Delaware Statutory Trust”), and its Certificate of Trust has been duly filed in the office of the Secretary of State thereof, (b) is duly registered under the 1940 Act as an open-end management investment company, which registration is in full force and effect, and (c) has the power to own all its properties and assets and to carry on its business described in its current registration statement on Form N-1A;
4.1.2. Target is a duly established and designated series thereof;
4.1.3. The execution, delivery, and performance hereof have been duly authorized at the date hereof by all necessary action on the part of the Target Investment Company’s Board, which has made the determinations required by Rule 17a-8(a) under the 1940 Act; and this Agreement constitutes a valid and legally binding obligation of the Target Investment Company, with respect to Target, enforceable in accordance with its terms, except as they may be limited by bankruptcy, insolvency, fraudulent transfer, reorganization, receivership, moratorium, and similar laws affecting the rights and remedies of creditors generally and by general principles of equity;
4.1.4. At the Effective Time, the Target Investment Company, on Target’s behalf, will have good and marketable title to the Assets and full right, power, and authority to sell, assign, transfer, and deliver the Assets hereunder free of any liens or other encumbrances (except securities that are subject to “securities loans,” as referred to in section 851(b)(2), or are restricted to resale by their terms); and on delivery and payment for the Assets, EQAT, on Acquiring Portfolio’s behalf, will acquire good and marketable title thereto, subject to no restrictions on the full transfer thereof, including restrictions that might arise under the Securities Act of 1933, as amended (“1933 Act”);
4.1.5. The Target Investment Company, with respect to Target, is not currently engaged in, and its execution, delivery, and performance hereof and consummation of the Reorganization will not result in, (a) a conflict with or material violation of any provision of Delaware law, VIP’s Agreement and Declaration of Trust (“VIP Declaration”) (in the case of a VIP Reorganization) or EQAT’s Amended and Restated Declaration of Trust, as amended (“EQAT Declaration”) (in the case of an EQAT Reorganization) (each, a “Declaration”) or Bylaws, or any agreement, indenture, instrument, contract, lease, or other undertaking (each, an “Undertaking”) to which the Target Investment Company, with respect to Target or on its behalf, is a party or by which it is bound or (b) the acceleration of any obligation, or the imposition of any penalty, under any Undertaking, judgment, or decree to which the Target Investment Company, with respect to Target or on its behalf, is a party or by which it is bound;
4.1.6. At or before the Effective Time, either (a) all material contracts and other commitments of or applicable to Target (other than this Agreement and certain investment contracts, including options, futures, forward contracts, and swap agreements) will terminate or (b) provision for discharge, and/or Acquiring Portfolio’s assumption, of any liabilities of Target thereunder will be made, without either Portfolio’s incurring any liability or penalty with respect thereto and without diminishing or releasing any rights the Target Investment Company, on Target’s behalf, may have had with respect to actions taken or omitted or to be taken by any other party thereto before the Closing;
4.1.7. No litigation, administrative proceeding, action, or investigation of or before any court, governmental body, or arbitrator is presently pending or, to the Target Investment Company’s knowledge, threatened against the Target Investment Company, with respect to Target or any of its properties or assets attributable or allocable to Target, that, if adversely determined, would materially and adversely affect Target’s financial condition or the conduct of its business; and the Target Investment Company, on Target’s
A-5
behalf, knows of no facts that might form the basis for the institution of any such litigation, proceeding, action, or investigation and is not a party to or subject to the provisions of any order, decree, judgment, or award of any court, governmental body, or arbitrator that materially and adversely affects Target’s business or the Target Investment Company’s ability to consummate the transactions contemplated hereby;
4.1.8. Target’s Statement of Assets and Liabilities, Portfolio of Investments, Statement of Operations, and Statement of Changes in Net Assets (each, a “Statement”) at and for the fiscal year (in the case of the last Statement, for the two fiscal years) ended December 31, 2016, have been audited by PricewaterhouseCoopers LLP, an independent registered public accounting firm (“PwC”), and are in accordance with generally accepted accounting principles consistently applied in the United States (“GAAP”); those Statements (copies of which VIP, in the case of a VIP Reorganization, has furnished to EQAT) present fairly, in all material respects, Target’s financial condition at that date in accordance with GAAP and the results of its operations and changes in its net assets for the period(s) then ended; and, to the Target Investment Company’s management’s best knowledge and belief, there are no known contingent liabilities of Target required to be reflected on a balance sheet (including the notes thereto) in accordance with GAAP at that date that are not disclosed therein;
4.1.9. Since December 31, 2016, there has not been any material adverse change in Target’s financial condition, assets, liabilities, or business, other than changes occurring in the ordinary course of business, or any incurrence by Target of indebtedness maturing more than one year from the date that indebtedness was incurred; for purposes of this representation and warranty, a decline in Target’s NAV due to declines in market values of securities Target holds, the discharge of Target’s liabilities, or the redemption of Target Shares by its shareholders will not constitute a material adverse change;
4.1.10. All federal, state, and local tax returns, dividend reporting forms, and other tax-related reports (collectively, “Returns”) of Target required by law to have been filed by the Effective Time (including any properly and timely filed extensions of time to file) will have been timely filed and are or will be correct in all material respects, and all federal and other taxes shown as due or required to be shown as due on those Returns will have been paid or provision will have been made for the payment thereof (except for amounts that alone or in the aggregate would not reasonably be expected to have a material adverse effect); to the best of the Target Investment Company’s knowledge, no such Return is currently under audit and no assessment has been asserted with respect to those Returns; and Target (a) is in compliance in all material respects with all applicable Regulations pertaining to (1) the reporting of dividends and other distributions on and redemptions of its shares, (2) withholding in respect thereof, and (3) shareholder basis reporting, (b) has withheld in respect of dividends and other distributions and paid to the proper taxing authorities all taxes required to be withheld, and (c) is not liable for any material penalties that could be imposed thereunder;
4.1.11. Target is not classified as a partnership, and instead is classified as an association that is taxable as a corporation, for federal tax purposes and either has elected the latter classification by filing Form 8832 with the Internal Revenue Service (“IRS”) or is a “publicly traded partnership” (as defined in section 7704(b)) that is treated as a corporation; Target is an “investment company” (as defined in section 368(a)(2)(F)(iii)) and a “fund” (as defined in section 851(g)(2), eligible for treatment under section 851(g)(1)); Target has elected to be a “regulated investment company” under Part I of Subchapter M of Chapter 1 of Subtitle A of the Code (“Subchapter M”) (“RIC”); for each taxable year of its operation (including the taxable year that will end at the Effective Time (“current year”)), Target has met (and for the current year will meet) the requirements of Subchapter M for qualification and treatment as a RIC and has been (and for the current year will be) eligible to and has computed (and for the current year will compute) its federal income tax under section 852; and Target has no earnings and profits accumulated in any taxable year in which the provisions of Subchapter M did not apply to it;
4.1.12. All issued and outstanding Target Shares are, and at the Effective Time will be, duly and validly issued and outstanding, fully paid, and non-assessable by the Target Investment Company and have been offered and sold in every state and the District of Columbia in compliance in all material respects with applicable registration requirements of the 1933 Act and state securities laws; all issued and outstanding
A-6
Target Shares will, at the Effective Time, be held by the persons and in the amounts set forth on Target’s shareholder records (as provided in the Certificate to be delivered pursuant to paragraph 3.3); and Target does not have outstanding any options, warrants, or other rights to subscribe for or purchase any Target Shares, nor are there outstanding any securities convertible into any Target Shares;
4.1.13. On the effective date of the Registration Statement (as defined in paragraph 4.3.1), at the time of the Shareholders Meeting (as defined in paragraph 5.2), and at the Effective Time, the Target Investment Company’s Pro/SAI including Target will (a) conform in all material respects to the applicable requirements of the 1933 Act and the 1940 Act and the rules and regulations of the Commission thereunder and (b) not contain any untrue statement of a material fact or omit to state a material fact required to be stated therein or necessary to make the statements therein, in light of the circumstances under which they were made, not misleading;
4.1.14. The information to be furnished by the Target Investment Company for use in no-action letters, applications for orders, the Registration Statement, and other documents filed or to be filed with any federal, state, or local regulatory authority (including the Financial Industry Regulatory Authority, Inc. (“FINRA”)) that may be necessary in connection with the transactions contemplated hereby will be accurate and complete in all material respects, will comply in all material respects with federal securities laws and other laws and regulations, and will not contain any untrue statement of a material fact or omit to state a material fact required to be stated therein or necessary to make the statements therein, in light of the circumstances under which they were made, not misleading;
4.1.15. The Acquiring Portfolio Shares to be delivered to Target hereunder are not being acquired for the purpose of making any distribution thereof, other than in accordance with the terms hereof; and
4.1.16. The Declaration permits the Target Investment Company to vary its shareholders’ investment; the Target Investment Company does not have a fixed pool of assets -- each series thereof (including Target) is a managed portfolio of securities, and FMG LLC and each investment sub-adviser thereof have the authority to buy and sell securities for it.
4.2. EQAT, on Acquiring Portfolio’s behalf, represents and warrants to the Target Investment Company, on Target’s behalf, as follows (or, in the case of an EQAT Reorganization, EQAT’s obligation to implement this Agreement on Target’s behalf shall be subject to satisfaction of the following conditions at or before, and continuing through, the Effective Time):
4.2.1. EQAT (a) is a Delaware Statutory Trust, and its Certificate of Trust has been duly filed in the office of the Secretary of State of Delaware, (b) is duly registered under the 1940 Act as an open-end management investment company, which registration is in full force and effect, and (c) has the power to own all its properties and assets and to carry on its business described in its current registration statement on Form N-1A;
4.2.2. Acquiring Portfolio is a duly established and designated series of EQAT;
4.2.3. The execution, delivery, and performance hereof have been duly authorized at the date hereof by all necessary action on the part of EQAT’s Board, which has made the determinations required by Rule 17a-8(a) under the 1940 Act; and this Agreement constitutes a valid and legally binding obligation of EQAT, with respect to Acquiring Portfolio, enforceable in accordance with its terms, except as they may be limited by bankruptcy, insolvency, fraudulent transfer, reorganization, receivership, moratorium, and similar laws affecting the rights and remedies of creditors generally and general principles of equity;
4.2.4. No consideration other than Acquiring Portfolio Shares (and Acquiring Portfolio’s assumption of the Liabilities) will be issued in exchange for the Assets in the Reorganization;
4.2.5. EQAT, with respect to Acquiring Portfolio, is not currently engaged in, and its execution, delivery, and performance hereof and consummation of the Reorganization will not result in, (a) a conflict with or material violation of any provision of Delaware law, the EQAT Declaration or EQAT’s Bylaws, or any Undertaking to which EQAT, with respect to Acquiring Portfolio or on its behalf, is a party or by which it is
A-7
bound or (b) the acceleration of any obligation, or the imposition of any penalty, under any Undertaking, judgment, or decree to which EQAT, with respect to Acquiring Portfolio or on its behalf, is a party or by which it is bound;
4.2.6. No litigation, administrative proceeding, action, or investigation of or before any court, governmental body, or arbitrator is presently pending or, to EQAT’s knowledge, threatened against EQAT, with respect to Acquiring Portfolio or any of its properties or assets attributable or allocable to Acquiring Portfolio, that, if adversely determined, would materially and adversely affect Acquiring Portfolio’s financial condition or the conduct of its business; and EQAT, on Acquiring Portfolio’s behalf, knows of no facts that might form the basis for the institution of any such litigation, proceeding, action, or investigation and is not a party to or subject to the provisions of any order, decree, judgment, or award of any court, governmental body, or arbitrator that materially and adversely affects Acquiring Portfolio’s business or EQAT’s ability to consummate the transactions contemplated hereby;
4.2.7. Acquiring Portfolio’s Statements at and for the fiscal year (in the case of the Statement of Changes in Net Assets, for the two fiscal years) ended December 31, 2016, have been audited by PwC and are in accordance with GAAP; those Statements (copies of which, in the case of a VIP Reorganization, EQAT has furnished to VIP) present fairly, in all material respects, Acquiring Portfolio’s financial condition at that date in accordance with GAAP and the results of its operations and changes in its net assets for the period(s) then ended; and, to EQAT’s management’s best knowledge and belief, there are no known contingent liabilities of Acquiring Portfolio required to be reflected on a balance sheet (including the notes thereto) in accordance with GAAP at that date that are not disclosed therein;
4.2.8. Since December 31, 2016, there has not been any material adverse change in Acquiring Portfolio’s financial condition, assets, liabilities, or business, other than changes occurring in the ordinary course of business, or any incurrence by Acquiring Portfolio of indebtedness maturing more than one year from the date that indebtedness was incurred; for purposes of this representation and warranty, a decline in Acquiring Portfolio’s NAV due to declines in market values of securities Acquiring Portfolio holds, the discharge of Acquiring Portfolio’s liabilities, or the redemption of Acquiring Portfolio Shares by its shareholders will not constitute a material adverse change;
4.2.9. All Returns of Acquiring Portfolio required by law to have been filed by the Effective Time (including any properly and timely filed extensions of time to file) will have been timely filed and are or will be correct in all material respects, and all federal and other taxes shown as due or required to be shown as due on those Returns will have been paid or provision will have been made for the payment thereof except for amounts that alone or in the aggregate would not reasonably be expected to have a material adverse effect; to the best of EQAT’s knowledge, no such Return is currently under audit and no assessment has been asserted with respect to those Returns; and Acquiring Portfolio (a) is in compliance in all material respects with all applicable Regulations pertaining to (1) the reporting of dividends and other distributions on and redemptions of its shares, (2) withholding in respect thereof, and (3) shareholder basis reporting, (b) has withheld in respect of dividends and other distributions and paid to the proper taxing authorities all taxes required to be withheld, and (c) is not liable for any material penalties that could be imposed thereunder;
4.2.10. Acquiring Portfolio is not classified as a partnership, and instead is classified as an association that is taxable as a corporation, for federal tax purposes and either has elected the latter classification by filing Form 8832 with the IRS or is a “publicly traded partnership” (as defined in section 7704(b)) that is treated as a corporation; Acquiring Portfolio is an “investment company” (as defined in section 368(a)(2)(F)(iii)) and a “fund” (as defined in section 851(g)(2), eligible for treatment under section 851(g)(1)); Acquiring Portfolio has elected to be a RIC; for each taxable year of its operation (including the taxable year that includes the Effective Time (“current year”)), Acquiring Portfolio has met (and for the current year will meet) the requirements of Subchapter M for qualification and treatment as a RIC and has been (and for the current year will be) eligible to and has computed (and for the current year will compute) its federal income tax under section 852; Acquiring Portfolio will continue to meet all those requirements for the current year and intends to continue to do so, and to continue to be eligible to and to so compute its federal income tax, for succeeding taxable years; and Acquiring Portfolio has no earnings and profits accumulated in any taxable year in which the provisions of Subchapter M did not apply to it;
A-8
4.2.11. All issued and outstanding Acquiring Portfolio Shares are, and at the Effective Time will be, duly and validly issued and outstanding, fully paid, and non-assessable by EQAT and have been offered and sold in every state and the District of Columbia in compliance in all material respects with applicable registration requirements of the 1933 Act and state securities laws; Acquiring Portfolio does not have outstanding any options, warrants, or other rights to subscribe for or purchase any Acquiring Portfolio Shares, nor are there outstanding any securities convertible into any Acquiring Portfolio Shares; and the Acquiring Portfolio Shares to be issued and delivered to Target, for the Shareholders’ accounts, pursuant to the terms hereof, (a) will have been duly authorized by EQAT and duly registered under the federal securities laws (and appropriate notices respecting them will have been duly filed under applicable state securities laws) at the Effective Time and (b) when so issued and delivered, will be duly and validly issued and outstanding Acquiring Portfolio Shares, fully paid and non-assessable by EQAT;
4.2.12. On the effective date of the Registration Statement, at the time of the Shareholders Meeting, and at the Effective Time, (a) EQAT’s Pro/SAI including Acquiring Portfolio will conform in all material respects to the applicable requirements of the 1933 Act and the 1940 Act and the rules and regulations of the Commission thereunder and (b) that Pro/SAI and the prospectus included in the Registration Statement will not include any untrue statement of a material fact or omit to state a material fact required to be stated therein or necessary to make the statements therein, in light of the circumstances under which they were made, not misleading; provided that the foregoing will not apply to statements in or omissions from that prospectus made in reliance on and in conformity with information furnished by the Target Investment Company for use therein;
4.2.13. The information to be furnished by EQAT for use in no-action letters, applications for orders, the Registration Statement, and other documents filed or to be filed with any federal, state, or local regulatory authority (including FINRA) that may be necessary in connection with the transactions contemplated hereby will be accurate and complete in all material respects, will comply in all material respects with federal securities laws and other laws and regulations, and will not contain any untrue statement of a material fact or omit to state a material fact required to be stated therein or necessary to make the statements therein, in light of the circumstances under which they were made, not misleading; and
4.2.14. The EQAT Declaration permits EQAT to vary its shareholders’ investment; EQAT does not have a fixed pool of assets — each series thereof (including Acquiring Portfolio) is a managed portfolio of securities, and FMG LLC and each investment sub-adviser thereof have the authority to buy and sell securities for it.
4.3. Each Investment Company, on its Portfolio’s behalf, represents and warrants to the other Investment Company, on its Portfolio’s behalf, as follows (or, in the case of an EQAT Reorganization, EQAT’s obligation to implement this Agreement on each Portfolio’s behalf shall be subject to satisfaction of the following conditions at or before, and continuing through, the Effective Time):
4.3.1. No governmental consents, approvals, or authorizations (collectively, “consents”) or filings are required under the 1933 Act, the Securities Exchange Act of 1934, as amended, the 1940 Act, or state securities laws, and no consents or orders of any court are required, for its execution, delivery, and performance hereof on its Portfolio’s behalf, except for (a) EQAT’s filing with the Commission of a registration statement on Form N-14 relating to the Acquiring Portfolio Shares issuable hereunder, and any supplement or amendment thereto, including therein a prospectus and proxy statement (“Registration Statement”), and a post-effective amendment to EQAT’s registration statement on Form N-1A and (b) consents, filings, and orders that have been made or received or may be required after the Effective Time;
4.3.2. The fair market value of the Acquiring Portfolio Shares each Shareholder receives will be approximately equal to the fair market value of its Target Shares it actually or constructively surrenders in exchange therefor; and
4.3.3. There will be no dissenters to the Reorganization under the applicable provisions of Delaware law, and Acquiring Portfolio will not pay cash in lieu of fractional Acquiring Portfolio Shares in connection with the Reorganization.
A-9
5. COVENANTS(1)
5.1. Each Investment Company covenants to operate its Portfolio’s business in the ordinary course between the date hereof and the Closing, it being understood that:
(a) such ordinary course will include declaring and paying customary dividends and other distributions and changes in operations contemplated by each Portfolio’s normal business activities; and
(b) each Portfolio will retain exclusive control of the composition of its portfolio until the Closing.
5.2. The Target Investment Company covenants to call and hold a meeting of Target’s shareholders to consider and act on this Agreement and to take all other action necessary to obtain approval of the transactions contemplated hereby (“Shareholders Meeting”).
| (1) | | This paragraph 5 shall not apply in the case of an EQAT Reorganization. |
5.3. The Target Investment Company covenants that it will assist EQAT in obtaining information EQAT reasonably requests concerning the beneficial ownership of Target Shares.
5.4. The Target Investment Company covenants that it will turn over its books and records regarding Target (including all tax books and records and all books and records required to be maintained under the 1940 Act and the rules and regulations thereunder) to EQAT at the Closing.
5.5. Each Investment Company covenants to cooperate with the other in preparing the Registration Statement in compliance with applicable federal and state securities laws.
5.6. Each Investment Company covenants that it will, from time to time, as and when requested by the other Investment Company, execute and deliver or cause to be executed and delivered all assignments and other instruments, and will take or cause to be taken all further action, the other Investment Company deems necessary or desirable in order to vest in, and confirm to, (a) EQAT, on Acquiring Portfolio’s behalf, title to and possession of all the Assets, and (b) the Target Investment Company, on Target’s behalf, title to and possession of the Acquiring Portfolio Shares to be delivered hereunder, and otherwise to carry out the intent and purpose hereof.
5.7. EQAT covenants to use all reasonable efforts to obtain the consents required by the 1933 Act, the 1940 Act, and applicable state securities laws it deems appropriate to continue Acquiring Portfolio’s operations after the Effective Time.
5.8. The Target Investment Company covenants to distribute all the Acquiring Portfolio Shares it receives in the Reorganization to the Shareholders in complete liquidation of Target.
5.9. Subject to this Agreement, each Investment Company covenants to take or cause to be taken all actions, and to do or cause to be done all things, reasonably necessary, proper, or advisable to consummate and effectuate the transactions contemplated hereby.
6. CONDITIONS PRECEDENT
Each Investment Company’s obligations hereunder shall be subject to (a) the other Investment Company’s performance of all its obligations to be performed hereunder at or before the Closing, (b) all representations and warranties of the other Investment Company contained herein being true and correct in all material respects at the date hereof and, except as they may be affected by the transactions contemplated hereby, at the Effective Time, with the same force and effect as if made at that time (except that clauses (a) and (b) shall not apply in the case of an EQAT Reorganization), and (c) the following further conditions that, at or before that time:
6.1. This Agreement and the transactions contemplated hereby shall have been duly adopted and approved by both Boards and by Target’s shareholders at the Shareholders Meeting (including any adjournments or postponements thereof);
A-10
6.2. All necessary filings shall have been made with the Commission and state securities authorities, and no order or directive shall have been received that any other or further action is required to permit the Investment Companies to carry out the transactions contemplated hereby; the Registration Statement shall have become effective under the 1933 Act, no stop orders suspending the effectiveness thereof shall have been issued, and, to each Investment Company’s best knowledge, no investigation or proceeding for that purpose shall have been instituted or shall be pending, threatened, or contemplated under the 1933 Act or the 1940 Act; the Commission shall not have issued an unfavorable report with respect to the Reorganization under section 25(b) of the 1940 Act nor instituted any proceedings seeking to enjoin consummation of the transactions contemplated hereby under section 25(c) of the 1940 Act; and all consents, orders, and permits of federal, state, and local regulatory authorities (including the Commission and state securities authorities) either Investment Company deems necessary to permit consummation, in all material respects, of the transactions contemplated hereby shall have been obtained, except where failure to obtain same would not involve a risk of a material adverse effect on either Portfolio’s assets or properties, provided that either Investment Company may for itself waive any of those conditions;
6.3. At the Effective Time, no action, suit, or other proceeding shall be pending (or, to either Investment Company’s best knowledge, threatened to be commenced) before any court, governmental agency, or arbitrator in which it is sought to enjoin the performance of, restrain, prohibit, affect the enforceability of, or obtain damages or other relief in connection with, the transactions contemplated hereby;
6.4. EQAT, on Acquiring Portfolio’s behalf, shall have executed and delivered at or before the Closing a Certificate confirming that EQAT, on Acquiring Portfolio’s behalf, assumes all of the Liabilities; and
6.5. At any time before the Closing, either Investment Company may waive any of the foregoing conditions (except that set forth in paragraph 6.1) if, in the judgment of its Board, that waiver will not have a material adverse effect on its Portfolio’s shareholders’ interests.
7. BROKERAGE FEES AND EXPENSES
7.1. Each Investment Company represents and warrants to the other that there are no brokers or finders entitled to receive any payments in connection with the transactions provided for herein.
7.2. The expenses of the Reorganizations shall be borne by all the Targets in proportion to their respective numbers of Contract holder accounts at the Effective Time, except that (a) no Target shall bear any brokerage or similar expenses incurred by or for the benefit of another Portfolio in connection with the Reorganization, which shall be borne by the Portfolio that directly incurs them, and (b) expenses shall be paid by the Portfolio directly incurring them if and to the extent that the payment thereof by another person would result in that Portfolio’s disqualification as a RIC.
8. ENTIRE AGREEMENT; NO SURVIVAL
Neither Investment Company has made any representation, warranty, or covenant not set forth herein, and this Agreement constitutes the entire agreement between the Investment Companies. The representations, warranties, and covenants contained herein or in any document delivered pursuant hereto or in connection herewith shall not survive the Closing.
9. TERMINATION OF AGREEMENT
This Agreement may be terminated at any time at or before the Closing:
9.1. By either Investment Company (a) in the event of the other Investment Company’s material breach of any representation, warranty, or covenant contained herein to be performed at or before the Closing, (b) if a condition to its obligations has not been met and it reasonably appears that that condition will not or cannot be met, (c) if a governmental body issues an order, decree, or ruling having the effect of permanently enjoining, restraining, or otherwise prohibiting consummation of the Reorganization, or (d) if the Closing has not occurred on or before December 31, 2017, or another date to which the Investment Companies agree; or
9.2. By the Investment Companies’ mutual agreement.
A-11
In the event of termination under paragraphs 9.1(c) or (d) or 9.2, neither Investment Company (nor its trustees, officers, or shareholders) shall have any liability to the other Investment Company.
10. AMENDMENTS
In the case of a VIP Reorganization, the Investment Companies may amend, modify, or supplement this Agreement at any time in any manner they mutually agree on in writing, and in the case of an EQAT Reorganization, EQAT’s Board may do so (solely with respect to that EQAT Reorganization), notwithstanding Target’s shareholders’ approval hereof; provided that, following that approval, no such amendment, modification, or supplement shall have a material adverse effect on the Shareholders’ interests.
11. MISCELLANEOUS
11.1. This Agreement shall be governed by and construed in accordance with the internal laws of the State of Delaware, without giving effect to principles of conflicts of laws; provided that, in the case of any conflict between those laws and the federal securities laws, the latter shall govern.
11.2. Nothing expressed or implied herein is intended or shall be construed to confer on or give any person, firm, trust, or corporation other than each Investment Company, on its Portfolio’s behalf, and their respective successors and assigns any rights or remedies under or by reason hereof.
11.3 Notice is hereby given that this instrument is executed and delivered on behalf of each Investment Company’s trustees solely in their capacities as trustees, and not individually, and that each Investment Company’s obligations under this instrument are not binding on or enforceable against any of its trustees, officers, shareholders, or series other than its Portfolio but are only binding on and enforceable against its property attributable to and held for the benefit of its Portfolio (“Portfolio’s Property”) and not its property attributable to and held for the benefit of any other series thereof. Each Investment Company, in asserting any rights or claims hereunder on its or its Portfolio’s behalf, shall look only to the other Portfolio’s Property in settlement of those rights or claims and not to the property of any other series of the other Investment Company or to those trustees, officers, or shareholders.
11.4 Any term or provision hereof that is invalid or unenforceable in any jurisdiction shall, as to that jurisdiction, be ineffective to the extent of that invalidity or unenforceability without rendering invalid or unenforceable the remaining terms and provisions hereof or affecting the validity or enforceability of any of the terms and provisions hereof in any other jurisdiction.
11.5. This Agreement may be executed in one or more counterparts, all of which shall be considered one and the same agreement, and shall become effective when one or more counterparts have been executed by each Investment Company and delivered to the other Investment Company. The headings contained herein are for reference purposes only and shall not affect in any way the meaning or interpretation hereof.
IN WITNESS WHEREOF, each party has caused this Agreement to be executed and delivered by its duly authorized officer as of the day and year first written above.
| | |
EQ ADVISORS TRUST, on behalf of its series listed on Schedule A |
| |
By: | | |
| Name: | | Steven M. Joenk |
| Title: | | President and Chief Executive Officer |
|
AXA PREMIER VIP TRUST, on behalf of its series listed on Schedule A |
| |
By: | | |
| Name: | | Brian E. Walsh |
| Title: | | Chief Financial Officer |
A-12
SCHEDULE A
| | |
TARGETS | | ACQUIRING PORTFOLIOS (All Series of EQAT) |
| (Series of EQAT) | | |
| |
| All Asset Aggressive — Alt 50 Portfolio | | All Asset Growth — Alt 20 Portfolio |
| |
| All Asset Aggressive — Alt 75 Portfolio | | All Asset Growth — Alt 20 Portfolio |
| |
| (Series of VIP) | | |
| |
| CharterSM Real Assets Portfolio | | EQ/PIMCO Global Real Return Portfolio |
| |
| CharterSM Income Strategies Portfolio | | AXA/DoubleLine Opportunities Core Plus Bond Portfolio |
| |
| CharterSM Interest Rate Strategies Portfolio | | AXA/DoubleLine Opportunities Core Plus Bond Portfolio |
A-13
APPENDIX A.2
FORM OF
AGREEMENT AND PLAN OF REORGANIZATION AND TERMINATION
THIS AGREEMENT AND PLAN OF REORGANIZATION AND TERMINATION (“Agreement”) is made as of [ ], 2017, between EQ ADVISORS TRUST, a Delaware statutory trust (“EQAT”), on behalf of All Asset Aggressive - Alt 25 Portfolio, a segregated portfolio of assets (“series”) thereof (“EQAT Target”), and All Asset Growth -Alt 20 Portfolio, also a series thereof (“Acquiring Portfolio”), and AXA PREMIER VIP TRUST, also a Delaware statutory trust (“VIP”), on behalf of CharterSM Alternative 100 Moderate Portfolio, a series thereof (“VIP Target”). (Each of EQAT Target and VIP Target is sometimes referred to herein as a “Target,” each of the Targets and Acquiring Portfolio is sometimes referred to herein as a “Portfolio,” each of EQAT and VIP is sometimes referred to herein as an “Investment Company,” and the Investment Company of which a Target is a series is sometimes referred to herein as a “Target Investment Company.”) Notwithstanding anything to the contrary contained herein, (1) all agreements, covenants, representations, warranties, actions, and obligations (collectively, “Obligations”) of and by each Portfolio, and of and by each Investment Company, as applicable, on its behalf, contained herein shall be deemed to be the Obligations of that Portfolio only, (2) all rights and benefits created hereunder in favor of a Portfolio shall inure to and be enforceable by the Investment Company of which that Portfolio is a series on that Portfolio’s behalf, and (3) in no event shall any other series of an Investment Company or the assets thereof be held liable with respect to the breach or other default by an obligated Portfolio or Investment Company of its Obligations set forth herein.
Each Investment Company currently sells voting shares of beneficial interest in its Portfolios, $0.001 par value per share (“shares”), to (1) separate accounts of AXA Equitable Life Insurance Company (“AXA Equitable”), AXA Life and Annuity Company (in the case of EQAT), or other affiliated or unaffiliated insurance companies in connection with certain variable annuity certificates and contracts and variable life insurance policies (collectively, “Contracts”) issued thereby and (2) The AXA Equitable 401(k) Plan. Shares in each Portfolio also may be sold to (3) other tax-qualified retirement plans and (4) other investors eligible under applicable Regulations (as defined below). Class K shares of EQAT and certain series of VIP not involved in the transactions contemplated hereby are sold only to other series thereof and certain group annuity and retirement plans. The Portfolios are underlying investment options for those separate accounts to fund Contracts. Under applicable law, the assets of all those separate accounts (i.e., the shares in the Portfolios) are the property of AXA Equitable, which is the owner of record of those shares, and are held for the benefit of the Contract holders.
The Investment Companies wish to effect two separate reorganizations, each described in section 368(a)(1)(D) of the Internal Revenue Code of 1986, as amended (“Code”) (all “section” references are to the Code, unless otherwise noted), and intend this Agreement to be, and adopt it as, a “plan of reorganization” (within the meaning of the regulations under the Code (“Regulations”)). Each reorganization will consist of (1) the transfer of all of a Target’s assets to Acquiring Portfolio in exchange solely for shares in Acquiring Portfolio and Acquiring Portfolio’s assumption of all of that Target’s liabilities, (2) the distribution of those shares pro rata to that Target’s shareholders in exchange for their shares therein and in complete liquidation thereof (for federal tax purposes), and (3) that Target’s termination as a series of the relevant Target Investment Company, all on the terms and conditions set forth herein (all the foregoing transactions involving each Target and Acquiring Portfolio being referred to herein collectively as a “Reorganization”). The consummation of one Reorganization is not contingent on the consummation of the other Reorganization. (For convenience, the balance hereof — except the paragraph below describing the Portfolios’ share classes, paragraphs that mention a “VIP Reorganization” or an “EQAT Reorganization” or both, and paragraphs 1.3, 4.3.10, and 7.2 — refers only to a single Reorganization and one Target, but the terms and conditions hereof shall apply separately to each Reorganization and the Portfolios participating therein.)
Each Investment Company’s board of trustees (each, a “Board”), in each case including a majority of its members who are not “interested persons” (as that term is defined in the Investment Company Act of 1940, as amended (“1940 Act”)) of either Investment Company, (1) has duly approved this Agreement and the transactions
A-14
contemplated hereby and has duly authorized its performance hereof on its Portfolio’s behalf and consummation of the Reorganization by all necessary Board action and (2) has determined that participation in the Reorganization is in the best interests of its Portfolio and that the interests of the existing shareholders thereof will not be diluted as a result of the Reorganization.
VIP Target offers a single class of shares, designated Class B (“Class B Target Shares”); and EQAT Target offers three classes of shares, designated Class IA, Class IB, and Class K shares (“Class IA Target Shares,” “Class IB Target Shares,” and “Class K Target Shares,” respectively, and, together with Class B Target Shares, “Target Shares”). Acquiring Portfolio also offers three classes of shares, designated Class IA, Class IB, and Class K shares (“Class IA Acquiring Portfolio Shares,” “Class IB Acquiring Portfolio Shares,” and “Class K Acquiring Portfolio Shares,” respectively, and collectively, “Acquiring Portfolio Shares”). The Portfolios’ similarly designated classes of shares have identical characteristics, rights, and preferences.
In consideration of the mutual promises contained herein, the parties agree as follows:
1. PLAN OF REORGANIZATION AND TERMINATION
1.1. Subject to the requisite approval of Target’s shareholders and the terms and conditions set forth herein, Target shall assign, sell, convey, transfer, and deliver all of its assets described in paragraph 1.2 (“Assets”) to Acquiring Portfolio. In exchange therefor, Acquiring Portfolio shall —
(a) issue and deliver to Target the number of full and fractional (all references herein to “fractional” shares meaning fractions rounded to the eighth decimal place)
(1) in the case of the Reorganization involving EQAT Target (“EQAT Reorganization”), (i) Class IA Acquiring Portfolio Shares determined by dividing Target’s net value (computed as set forth in paragraph 2.1) (“Target Value”) attributable to the Class IA Target Shares by the net asset value (computed as set forth in paragraph 2.2) (“NAV”) of a Class IA Acquiring Portfolio Share, (ii) Class IB Acquiring Portfolio Shares determined by dividing the Target Value attributable to the Class IB Target Shares by the NAV of a Class IB Acquiring Portfolio Share, and (iii) Class K Acquiring Portfolio Shares determined by dividing the Target Value attributable to the Class K Target Shares by the NAV of a Class K Acquiring Portfolio Share, and
(2) in the case of the Reorganization involving VIP Target (“VIP Reorganization”), Class IB Acquiring Portfolio Shares determined by dividing the Target Value by the NAV of a Class IB Acquiring Portfolio Share, and
(b) assume all of Target’s liabilities described in paragraph 1.3 (“Liabilities”).
Those transactions shall take place at the Closing (as defined in paragraph 3.1).
1.2. The Assets shall consist of all assets and property of every kind and nature — including all cash, cash equivalents, securities, commodities, futures interests, receivables (including interest and dividends receivable), claims and rights of action, rights to register shares under applicable securities laws, goodwill, and books and records — Target owns at the Valuation Time (as defined in paragraph 2.1) and any deferred and prepaid expenses shown as assets on Target’s books at that time; and Target has no unamortized or unpaid organizational fees or expenses that, in the case of the VIP Reorganization, have not previously been disclosed in writing to EQAT.
1.3. The Liabilities shall consist of all of Target’s liabilities, debts, obligations, and duties of whatever kind or nature existing at the Valuation Time, whether absolute, accrued, contingent, or otherwise, whether known or unknown, whether or not arising in the ordinary course of business, whether or not determinable at the Effective Time (as defined in paragraph 3.1), and whether or not specifically referred to herein, except Reorganization Expenses (as defined in paragraph 4.3.10) borne by the other Target pursuant to paragraph 7.2. Notwithstanding the foregoing, Target shall use its best efforts to discharge all its known liabilities, debts, obligations, and duties before the Effective Time.
A-15
1.4. If the dividends and/or other distributions Target has paid through the Effective Time for its current taxable year do not equal or exceed the sum of its (a) “investment company taxable income” (within the meaning of section 852(b)(2)), computed without regard to any deduction for dividends paid, plus (b) “net capital gain” (as defined in section 1222(11)), after reduction by any capital loss carryovers, for that year through that time (including any such gain realized and recognized pursuant to the transactions comprising the Reorganization), then at or as soon as practicable before that time, Target shall declare and pay to its shareholders of record one or more dividends and/or other distributions so that it will have distributed substantially all of that income and gain — and in no event less than the sum of 98% of its “ordinary income” plus 98.2% of its “capital gain net income,” as those terms are defined in section 4982(e)(1) and (2), respectively — for all federal income and excise tax periods ending at or before the Effective Time, and treating its current taxable year as ending at that time, such that Target will have no tax liability under sections 852 or 4982 for the current and any prior tax periods.
1.5. At the Effective Time (or as soon thereafter as is reasonably practicable), Target shall distribute the Acquiring Portfolio Shares it receives pursuant to paragraph 1.1(a) to the separate accounts for which AXA Equitable holds Target Shares of record at the Effective Time (each, a “Shareholder”), in proportion to their Target Shares then so held and in constructive exchange therefor, and shall completely liquidate (which shall be treated as a complete liquidation of Target for federal tax purposes, within the meaning of section 1.368-2(m)(1)(iv) of the Regulations). That distribution shall be accomplished by EQAT’s transfer agent’s opening accounts on Acquiring Portfolio’s shareholder records in the names of the Shareholders (except Shareholders in whose names accounts thereon already exist) and transferring those Acquiring Portfolio Shares to those newly opened and existing accounts. Pursuant to that transfer, each Shareholder’s account shall be credited with the respective pro rata number of full and fractional Acquiring Portfolio Shares due that Shareholder, by class (i.e., the account for each Shareholder that holds Class B Target Shares shall be credited with the respective pro rata number of full and fractional Class IB Acquiring Portfolio Shares due that Shareholder, the account for each Shareholder that holds Class IA Target Shares shall be credited with the respective pro rata number of full and fractional Class IA Acquiring Portfolio Shares due that Shareholder, the account for each Shareholder that holds Class IB Target Shares shall be credited with the respective pro rata number of full and fractional Class IB Acquiring Portfolio Shares due that Shareholder, and the account for each Shareholder that holds Class K Target Shares shall be credited with the respective pro rata number of full and fractional Class K Acquiring Portfolio Shares due that Shareholder). The aggregate NAV of Acquiring Portfolio Shares of each class to be so credited to each Shareholder’s account shall equal the aggregate NAV of the Target Shares of the corresponding class that Shareholder holds at the Effective Time. All issued and outstanding Target Shares, including any represented by certificates, shall simultaneously be canceled on Target’s shareholder records. EQAT shall not issue certificates representing the Acquiring Portfolio Shares issued in connection with the Reorganization.
1.6. Any transfer taxes payable on issuance and transfer of Acquiring Portfolio Shares in a name other than that of the registered holder on Target’s shareholder records of the Target Shares actually or constructively exchanged therefor shall be paid by the transferee thereof, as a condition of that issuance and transfer.
1.7. After the Effective Time, Target shall not conduct any business except in connection with its termination. As soon as reasonably practicable after distribution of the Acquiring Portfolio Shares pursuant to paragraph 1.5 — as provided there, on making that distribution Target’s liquidation shall be complete for federal tax purposes — but in all events within six months after the Effective Time, (a) Target shall be terminated as a series of the Target Investment Company, and (b) the Target Investment Company shall make all filings and take all other actions in connection therewith necessary and proper to effect that termination.
1.8. Any reporting responsibility of Target to a public authority, including the responsibility for filing regulatory reports, tax returns, and other documents with the Securities and Exchange Commission (“Commission”), any state securities commission, any federal, state, and local tax authorities, and any other relevant regulatory authority, is and shall remain its responsibility up to and including the date on which it is terminated. In furtherance of the foregoing, after the Effective Time, except as otherwise agreed to by the Investment Companies, the Target Investment Company shall prepare, or shall cause its agents to prepare, any federal, state, and local tax returns required to be filed by it with respect to Target’s final taxable year ending with its complete liquidation and for any prior periods or taxable years and shall cause those tax returns to be duly filed with the appropriate taxing authorities.
A-16
2. VALUATION
2.1. For purposes of paragraph 1.1(a), Target’s net value shall be (a) the value of the Assets computed immediately after the close of regular trading on the New York Stock Exchange (“NYSE”) and Target’s declaration of dividends and/or other distributions, if any, on the date of the Closing (“Valuation Time”), using the valuation procedures set forth in the Target Investment Company’s then-current prospectus and statement of additional information (“Pro/SAI”) including Target and valuation procedures established by its Board (collectively, “Valuation Procedures”), less (b) the amount of the Liabilities at the Valuation Time.
2.2. For purposes of paragraph 1.1(a), the NAV per share of each class of Acquiring Portfolio Shares shall be computed at the Valuation Time, using the Valuation Procedures.
2.3. All computations pursuant to paragraphs 2.1 and 2.2 shall be made (a) by AXA Equitable Funds Management Group, LLC (“FMG LLC”), in its capacity as each Investment Company’s administrator, or (b) in the case of securities subject to fair valuation, in accordance with the respective Valuation Procedures.
3. CLOSING AND EFFECTIVE TIME
3.1. Unless the Investment Companies agree otherwise (or, in the case of the EQAT Reorganization, EQAT determines otherwise), all acts necessary to consummate the Reorganization (“Closing”) shall be deemed to occur simultaneously as of immediately after the close of business (4:00 p.m., Eastern Time) on May 19, 2017, or a later date as to which they agree (or EQAT determines) (“Effective Time”). If, at or immediately before the Valuation Time, (a) the NYSE or another primary trading market for portfolio securities of either Portfolio (each, an “Exchange”) is closed to trading or trading thereon is restricted or (b) trading or the reporting of trading on an Exchange or elsewhere is disrupted, so that, in either Board’s (or, in the case of the EQAT Reorganization, EQAT’s Board’s) judgment, accurate appraisal of the value of either Portfolio’s net assets and/or the NAV per share of any class of Acquiring Portfolio Shares is impracticable, the date of the Closing (and, therefore, the Valuation Time and the Effective Time) shall be postponed until the first business day on which that Exchange is open for regular trading after the day when that trading has been fully resumed and that reporting has been restored. The Closing shall be held at the Investment Companies’ offices or at another place as to which they agree (or, in the case of the EQAT Reorganization, EQAT determines).
3.2. The Investment Companies shall direct the custodian of the Portfolios’ assets to deliver at the Closing a certificate of an authorized officer (“Certificate”) stating that (a) the Assets it holds will be transferred to Acquiring Portfolio at the Effective Time, (b) all necessary taxes in connection with the delivery of the Assets, including all applicable federal and state stock transfer stamps, if any, have been paid or provision for payment has been made, and (c) the information (including adjusted basis and holding period, by lot) concerning the Assets, including all portfolio securities, transferred by Target to Acquiring Portfolio, as reflected on Acquiring Portfolio’s books immediately after the Closing, does or will conform to that information on Target’s books immediately before the Closing.
3.3. The Target Investment Company shall direct its transfer agent to deliver to EQAT at or immediately after the Closing a Certificate stating that its records contain (a) the name, address, and taxpayer identification number of each Shareholder, (b) the number of full and fractional shares in each outstanding class of Target Shares each Shareholder owns, and (c) the dividend reinvestment elections, if any, applicable to each Shareholder, all at the Effective Time.
3.4. EQAT shall direct its transfer agent to deliver to the Target Investment Company, (a) at the Closing, a confirmation, or other evidence satisfactory to the Target Investment Company, that the Acquiring Portfolio Shares to be issued to Target pursuant to paragraph 1.1(a) have been credited to Target’s account on Acquiring Portfolio’s shareholder records and (b) at or as soon as reasonably practicable after the Closing, a Certificate as to the opening of accounts on those records in the names of the Shareholders (except Shareholders in whose names accounts thereon already exist).
3.5. Each Investment Company in the VIP Reorganization shall deliver to the other at the Closing (a) a Certificate in form and substance satisfactory to the recipient and dated the Effective Time, to the effect that the
A-17
representations and warranties it made herein are true and correct at the Effective Time except as they may be affected by the transactions contemplated hereby and (b) bills of sale, checks, assignments, share certificates, receipts, and/or other documents the other Investment Company or its counsel reasonably requests.
4. REPRESENTATIONS AND WARRANTIES
4.1. The Target Investment Company, on Target’s behalf, represents and warrants to EQAT, on Acquiring Portfolio’s behalf, as follows (or, in the case of the EQAT Reorganization, EQAT’s obligation to implement this Agreement on Acquiring Portfolio’s behalf shall be subject to satisfaction of the following conditions at or before, and continuing through, the Effective Time):
4.1.1. The Target Investment Company (a) is a statutory trust that is duly organized, validly existing, and in good standing under the laws of the State of Delaware (a “Delaware Statutory Trust”), and its Certificate of Trust has been duly filed in the office of the Secretary of State thereof, (b) is duly registered under the 1940 Act as an open-end management investment company, which registration is in full force and effect, and (c) has the power to own all its properties and assets and to carry on its business described in its current registration statement on Form N-1A;
4.1.2. Target is a duly established and designated series thereof;
4.1.3. The execution, delivery, and performance hereof have been duly authorized at the date hereof by all necessary action on the part of the Target Investment Company’s Board, which has made the determinations required by Rule 17a-8(a) under the 1940 Act; and this Agreement constitutes a valid and legally binding obligation of the Target Investment Company, with respect to Target, enforceable in accordance with its terms, except as they may be limited by bankruptcy, insolvency, fraudulent transfer, reorganization, receivership, moratorium, and similar laws affecting the rights and remedies of creditors generally and by general principles of equity;
4.1.4. At the Effective Time, the Target Investment Company, on Target’s behalf, will have good and marketable title to the Assets and full right, power, and authority to sell, assign, transfer, and deliver the Assets hereunder free of any liens or other encumbrances (except securities that are subject to “securities loans,” as referred to in section 851(b)(2), or are restricted to resale by their terms); and on delivery and payment for the Assets, EQAT, on Acquiring Portfolio’s behalf, will acquire good and marketable title thereto, subject to no restrictions on the full transfer thereof, including restrictions that might arise under the Securities Act of 1933, as amended (“1933 Act”);
4.1.5. The Target Investment Company, with respect to Target, is not currently engaged in, and its execution, delivery, and performance hereof and consummation of the Reorganization will not result in, (a) a conflict with or material violation of any provision of Delaware law, VIP’s Agreement and Declaration of Trust (“VIP Declaration”) (in the case of the VIP Reorganization) or EQAT’s Amended and Restated Declaration of Trust, as amended (“EQAT Declaration”) (in the case of the EQAT Reorganization) (each, a “Declaration”) or Bylaws, or any agreement, indenture, instrument, contract, lease, or other undertaking (each, an “Undertaking”) to which the Target Investment Company, with respect to Target or on its behalf, is a party or by which it is bound or (b) the acceleration of any obligation, or the imposition of any penalty, under any Undertaking, judgment, or decree to which the Target Investment Company, with respect to Target or on its behalf, is a party or by which it is bound;
4.1.6. At or before the Effective Time, either (a) all material contracts and other commitments of or applicable to Target (other than this Agreement and certain investment contracts, including options, futures, forward contracts, and swap agreements) will terminate or (b) provision for discharge, and/or Acquiring Portfolio’s assumption, of any liabilities of Target thereunder will be made, without either Portfolio’s incurring any liability or penalty with respect thereto and without diminishing or releasing any rights the Target Investment Company, on Target’s behalf, may have had with respect to actions taken or omitted or to be taken by any other party thereto before the Closing;
4.1.7. No litigation, administrative proceeding, action, or investigation of or before any court, governmental body, or arbitrator is presently pending or, to the Target Investment Company’s knowledge,
A-18
threatened against the Target Investment Company, with respect to Target or any of its properties or assets attributable or allocable to Target, that, if adversely determined, would materially and adversely affect Target’s financial condition or the conduct of its business; and the Target Investment Company, on Target’s behalf, knows of no facts that might form the basis for the institution of any such litigation, proceeding, action, or investigation and is not a party to or subject to the provisions of any order, decree, judgment, or award of any court, governmental body, or arbitrator that materially and adversely affects Target’s business or the Target Investment Company’s ability to consummate the transactions contemplated hereby;
4.1.8. Target’s Statement of Assets and Liabilities, Portfolio of Investments, Statement of Operations, and Statement of Changes in Net Assets (each, a “Statement”) at and for the fiscal year (in the case of the last Statement, for the two fiscal years) ended December 31, 2016, have been audited by PricewaterhouseCoopers LLP, an independent registered public accounting firm (“PwC”), and are in accordance with generally accepted accounting principles consistently applied in the United States (“GAAP”); those Statements (copies of which VIP, in the case of the VIP Reorganization, has furnished to EQAT) present fairly, in all material respects, Target’s financial condition at that date in accordance with GAAP and the results of its operations and changes in its net assets for the period(s) then ended; and, to the Target Investment Company’s management’s best knowledge and belief, there are no known contingent liabilities of Target required to be reflected on a balance sheet (including the notes thereto) in accordance with GAAP at that date that are not disclosed therein;
4.1.9. Since December 31, 2016, there has not been any material adverse change in Target’s financial condition, assets, liabilities, or business, other than changes occurring in the ordinary course of business, or any incurrence by Target of indebtedness maturing more than one year from the date that indebtedness was incurred; for purposes of this representation and warranty, a decline in Target’s NAV due to declines in market values of securities Target holds, the discharge of Target’s liabilities, or the redemption of Target Shares by its shareholders will not constitute a material adverse change;
4.1.10. All federal, state, and local tax returns, dividend reporting forms, and other tax-related reports (collectively, “Returns”) of Target required by law to have been filed by the Effective Time (including any properly and timely filed extensions of time to file) will have been timely filed and are or will be correct in all material respects, and all federal and other taxes shown as due or required to be shown as due on those Returns will have been paid or provision will have been made for the payment thereof (except for amounts that alone or in the aggregate would not reasonably be expected to have a material adverse effect); to the best of the Target Investment Company’s knowledge, no such Return is currently under audit and no assessment has been asserted with respect to those Returns; and Target (a) is in compliance in all material respects with all applicable Regulations pertaining to (1) the reporting of dividends and other distributions on and redemptions of its shares, (2) withholding in respect thereof, and (3) shareholder basis reporting, (b) has withheld in respect of dividends and other distributions and paid to the proper taxing authorities all taxes required to be withheld, and (c) is not liable for any material penalties that could be imposed thereunder;
4.1.11. Target is not classified as a partnership, and instead is classified as an association that is taxable as a corporation, for federal tax purposes and either has elected the latter classification by filing Form 8832 with the Internal Revenue Service (“IRS”) or is a “publicly traded partnership” (as defined in section 7704(b)) that is treated as a corporation; Target is an “investment company” (as defined in section 368(a)(2)(F)(iii)) and a “fund” (as defined in section 851(g)(2), eligible for treatment under section 851(g)(1)); Target has elected to be a “regulated investment company” under Part I of Subchapter M of Chapter 1 of Subtitle A of the Code (“Subchapter M”) (“RIC”); for each taxable year of its operation (including the taxable year that will end at the Effective Time (“current year”)), Target has met (and for the current year will meet) the requirements of Subchapter M for qualification and treatment as a RIC and has been (and for the current year will be) eligible to and has computed (and for the current year will compute) its federal income tax under section 852; and Target has no earnings and profits accumulated in any taxable year in which the provisions of Subchapter M did not apply to it;
4.1.12. Target is in the same line of business as Acquiring Portfolio is in, for purposes of section 1.368-1(d)(2) of the Regulations, and did not enter into that line of business as part of the plan of reorganization; from the time the
A-19
Target Investment Company’s Board approved the transactions contemplated hereby (“Approval Time”) through the Effective Time, Target has invested and will invest its assets in a manner that ensures its compliance with the foregoing and paragraph 4.1.11; from the time it commenced operations through the Effective Time, Target has conducted and will conduct its “historic business” (within the meaning of that section) in a substantially unchanged manner; from the Approval Time through the Effective Time, Target has not changed, and will not change, its historic investment policies in connection with the Reorganization; and the Target Investment Company believes, based on its review of each Portfolio’s investment portfolio, that Target’s portfolio holdings are generally consistent and compatible with Acquiring Portfolio’s investment objective and policies and that, as a result, a large majority of Target’s assets can be transferred to and held by Acquiring Portfolio;
4.1.13. At the Effective Time, (a) at least 33 1/3% of Target’s portfolio assets — including, for these purposes, a proportionate share of the portfolio assets of any RIC (including an exchange-traded fund that is a RIC) in which Target invests — will meet Acquiring Portfolio’s investment objective, strategies, policies, risks, and restrictions (collectively, “Investment Criteria”), (b) Target will not have altered its portfolio in connection with the Reorganization to meet that 33 1/3% threshold, and (c) Target will not have modified any of its Investment Criteria as part of the plan of reorganization, for purposes of section 1.368-1(d)(2) of the Regulations;
4.1.14. To the best of the Target Investment Company’s management’s knowledge, there is no plan or intention by its shareholders to redeem, sell, exchange, or otherwise dispose of a number of Target Shares (or Acquiring Portfolio Shares to be received in the Reorganization), in connection with the Reorganization, that would reduce their ownership of the Target Shares (or the equivalent Acquiring Portfolio Shares) to a number of shares that is less than 50% of the current number of Target Shares outstanding;
4.1.15. During the five-year period ending at the Effective Time, neither Target nor any person “related” (within the meaning of section 1.368-1(e)(4) of the Regulations (“Related”) without regard to section 1.368-1(e)(4)(i)(A) thereof) to it will have (a) acquired Target Shares with consideration other than Acquiring Portfolio Shares or Target Shares, except for shares redeemed in the ordinary course of Target’s business as a series of an open-end investment company pursuant to section 22(e) of the 1940 Act, or (b) made distributions with respect to Target Shares except for (1) normal, regular dividend distributions made pursuant to Target’s historic dividend-paying practice and (2) other distributions declared and paid to ensure Target’s continuing qualification as a RIC and to avoid the imposition of fund-level tax;
4.1.16. All issued and outstanding Target Shares are, and at the Effective Time will be, duly and validly issued and outstanding, fully paid, and non-assessable by the Target Investment Company and have been offered and sold in every state and the District of Columbia in compliance in all material respects with applicable registration requirements of the 1933 Act and state securities laws; all issued and outstanding Target Shares will, at the Effective Time, be held by the persons and in the amounts set forth on Target’s shareholder records (as provided in the Certificate to be delivered pursuant to paragraph 3.3); and Target does not have outstanding any options, warrants, or other rights to subscribe for or purchase any Target Shares, nor are there outstanding any securities convertible into any Target Shares;
4.1.17. Target incurred the Liabilities, which are associated with the Assets, in the ordinary course of its business;
4.1.18. Target is not under the jurisdiction of a court in a “title 11 or similar case” (as defined in section 368(a)(3)(A));
4.1.19. Not more than 25% of the value of Target’s total assets (excluding cash, cash items, and Government securities) is invested in the stock and securities of any one issuer, and not more than 50% of the value of those assets is invested in the stock and securities of five or fewer issuers; provided that a proportionate share of the assets of any RIC in which Target invests (and not the securities issued by the RIC itself) shall be taken into account for this purpose;
A-20
4.1.20. On the effective date of the Registration Statement (as defined in paragraph 4.3.1), at the time of the Shareholders Meeting (as defined in paragraph 5.2), and at the Effective Time, the Target Investment Company’s Pro/SAI including Target will (a) conform in all material respects to the applicable requirements of the 1933 Act and the 1940 Act and the rules and regulations of the Commission thereunder and (b) not contain any untrue statement of a material fact or omit to state a material fact required to be stated therein or necessary to make the statements therein, in light of the circumstances under which they were made, not misleading;
4.1.21. The information to be furnished by the Target Investment Company for use in no-action letters, applications for orders, the Registration Statement, and other documents filed or to be filed with any federal, state, or local regulatory authority (including the Financial Industry Regulatory Authority, Inc. (“FINRA”)) that may be necessary in connection with the transactions contemplated hereby will be accurate and complete in all material respects, will comply in all material respects with federal securities laws and other laws and regulations, and will not contain any untrue statement of a material fact or omit to state a material fact required to be stated therein or necessary to make the statements therein, in light of the circumstances under which they were made, not misleading;
4.1.22. The Acquiring Portfolio Shares to be delivered to Target hereunder are not being acquired for the purpose of making any distribution thereof, other than in accordance with the terms hereof; and
4.1.23. The Declaration permits the Target Investment Company to vary its shareholders’ investment; the Target Investment Company does not have a fixed pool of assets — each series thereof (including Target) is a managed portfolio of securities, and FMG LLC and each investment sub-adviser thereof have the authority to buy and sell securities for it.
4.2. EQAT, on Acquiring Portfolio’s behalf, represents and warrants to the Target Investment Company, on Target’s behalf, as follows (or, in the case of the EQAT Reorganization, EQAT’s obligation to implement this Agreement on Target’s behalf shall be subject to satisfaction of the following conditions at or before, and continuing through, the Effective Time):
4.2.1. EQAT (a) is a Delaware Statutory Trust, and its Certificate of Trust has been duly filed in the office of the Secretary of State of Delaware, (b) is duly registered under the 1940 Act as an open-end management investment company, which registration is in full force and effect, and (c) has the power to own all its properties and assets and to carry on its business described in its current registration statement on Form N-1A;
4.2.2. Acquiring Portfolio is a duly established and designated series of EQAT;
4.2.3. The execution, delivery, and performance hereof have been duly authorized at the date hereof by all necessary action on the part of EQAT’s Board, which has made the determinations required by Rule 17a-8(a) under the 1940 Act; and this Agreement constitutes a valid and legally binding obligation of EQAT, with respect to Acquiring Portfolio, enforceable in accordance with its terms, except as they may be limited by bankruptcy, insolvency, fraudulent transfer, reorganization, receivership, moratorium, and similar laws affecting the rights and remedies of creditors generally and general principles of equity;
4.2.4. No consideration other than Acquiring Portfolio Shares (and Acquiring Portfolio’s assumption of the Liabilities) will be issued in exchange for the Assets in the Reorganization;
4.2.5. EQAT, with respect to Acquiring Portfolio, is not currently engaged in, and its execution, delivery, and performance hereof and consummation of the Reorganization will not result in, (a) a conflict with or material violation of any provision of Delaware law, the EQAT Declaration or EQAT’s Bylaws, or any Undertaking to which EQAT, with respect to Acquiring Portfolio or on its behalf, is a party or by which it is bound or (b) the acceleration of any obligation, or the imposition of any penalty, under any Undertaking, judgment, or decree to which EQAT, with respect to Acquiring Portfolio or on its behalf, is a party or by which it is bound;
A-21
4.2.6. No litigation, administrative proceeding, action, or investigation of or before any court, governmental body, or arbitrator is presently pending or, to EQAT’s knowledge, threatened against EQAT, with respect to Acquiring Portfolio or any of its properties or assets attributable or allocable to Acquiring Portfolio, that, if adversely determined, would materially and adversely affect Acquiring Portfolio’s financial condition or the conduct of its business; and EQAT, on Acquiring Portfolio’s behalf, knows of no facts that might form the basis for the institution of any such litigation, proceeding, action, or investigation and is not a party to or subject to the provisions of any order, decree, judgment, or award of any court, governmental body, or arbitrator that materially and adversely affects Acquiring Portfolio’s business or EQAT’s ability to consummate the transactions contemplated hereby;
4.2.7. Acquiring Portfolio’s Statements at and for the fiscal year (in the case of the Statement of Changes in Net Assets, for the two fiscal years) ended December 31, 2016, have been audited by PwC and are in accordance with GAAP; those Statements (copies of which, in the case of the VIP Reorganization, EQAT has furnished to VIP) present fairly, in all material respects, Acquiring Portfolio’s financial condition at that date in accordance with GAAP and the results of its operations and changes in its net assets for the period(s) then ended; and, to EQAT’s management’s best knowledge and belief, there are no known contingent liabilities of Acquiring Portfolio required to be reflected on a balance sheet (including the notes thereto) in accordance with GAAP at that date that are not disclosed therein;
4.2.8. Since December 31, 2016, there has not been any material adverse change in Acquiring Portfolio’s financial condition, assets, liabilities, or business, other than changes occurring in the ordinary course of business, or any incurrence by Acquiring Portfolio of indebtedness maturing more than one year from the date that indebtedness was incurred; for purposes of this representation and warranty, a decline in Acquiring Portfolio’s NAV due to declines in market values of securities Acquiring Portfolio holds, the discharge of Acquiring Portfolio’s liabilities, or the redemption of Acquiring Portfolio Shares by its shareholders will not constitute a material adverse change;
4.2.9. All Returns of Acquiring Portfolio required by law to have been filed by the Effective Time (including any properly and timely filed extensions of time to file) will have been timely filed and are or will be correct in all material respects, and all federal and other taxes shown as due or required to be shown as due on those Returns will have been paid or provision will have been made for the payment thereof except for amounts that alone or in the aggregate would not reasonably be expected to have a material adverse effect; to the best of EQAT’s knowledge, no such Return is currently under audit and no assessment has been asserted with respect to those Returns; and Acquiring Portfolio (a) is in compliance in all material respects with all applicable Regulations pertaining to (1) the reporting of dividends and other distributions on and redemptions of its shares, (2) withholding in respect thereof, and (3) shareholder basis reporting, (b) has withheld in respect of dividends and other distributions and paid to the proper taxing authorities all taxes required to be withheld, and (c) is not liable for any material penalties that could be imposed thereunder;
4.2.10. Acquiring Portfolio is not classified as a partnership, and instead is classified as an association that is taxable as a corporation, for federal tax purposes and either has elected the latter classification by filing Form 8832 with the IRS or is a “publicly traded partnership” (as defined in section 7704(b)) that is treated as a corporation; Acquiring Portfolio is an “investment company” (as defined in section 368(a)(2)(F)(iii)) and a “fund” (as defined in section 851(g)(2), eligible for treatment under section 851(g)(1)); Acquiring Portfolio has elected to be a RIC; for each taxable year of its operation (including the taxable year that includes the Effective Time (“current year”)), Acquiring Portfolio has met (and for the current year will meet) the requirements of Subchapter M for qualification and treatment as a RIC and has been (and for the current year will be) eligible to and has computed (and for the current year will compute) its federal income tax under section 852; Acquiring Portfolio will continue to meet all those requirements for the current year and intends to continue to do so, and to continue to be eligible to and to so compute its federal income tax, for succeeding taxable years; and Acquiring Portfolio has no earnings and profits accumulated in any taxable year in which the provisions of Subchapter M did not apply to it;
A-22
4.2.11. Acquiring Portfolio is in the same line of business as Target was in preceding the Reorganization, for purposes of section 1.368-1(d)(2) of the Regulations, and did not enter into that line of business as part of the plan of reorganization; and following the Reorganization, Acquiring Portfolio will continue, and has no plan or intention to change, that line of business;
4.2.12. At the Effective Time, Acquiring Portfolio (1) will not have modified any of its Investment Criteria as part of the plan of reorganization and (2) will not have any plan or intention to change any of its Investment Criteria after the Reorganization;
4.2.13. Following the Reorganization, Acquiring Portfolio will (a) continue Target’s “historic business” (within the meaning of section 1.368-1(d)(2) of the Regulations) and (b) use a significant portion of Target’s “historic business assets” (within the meaning of section 1.368-1(d)(3) of the Regulations) in a business; moreover, in the case of the EQAT Reorganization, Acquiring Portfolio (c) has no plan or intention to sell or otherwise dispose of a significant part of the Assets, except for dispositions made in the ordinary course of that business and dispositions necessary to maintain its status as a RIC, and (d) expects to retain substantially all the Assets in the same form as it receives them in the Reorganization, unless and until subsequent investment circumstances suggest the desirability of change or it becomes necessary to make dispositions thereof to maintain that status; and EQAT believes, based on its review of each Portfolio’s investment portfolio, that Target’s portfolio holdings are generally consistent and compatible with Acquiring Portfolio’s investment objective and strategies and that, as a result, in the case of the EQAT Reorganization, a large majority of Target’s assets can be transferred to and held by Acquiring Portfolio;
4.2.14. Acquiring Portfolio does not directly or indirectly own, nor at the Effective Time will it directly or indirectly own, nor has it directly or indirectly owned at any time during the past five years, any Target Shares;
4.2.15. Acquiring Portfolio has no plan or intention to issue additional Acquiring Portfolio Shares following the Reorganization except for shares issued in the ordinary course of its business as a series of an open-end investment company; nor will Acquiring Portfolio, or any person Related to it, have any plan or intention at the Effective Time to acquire or redeem any Acquiring Portfolio Shares issued in the Reorganization — either directly or through any transaction, agreement, or arrangement with any other person — except for redemptions Acquiring Portfolio will make as such a series pursuant to section 22(e) of the 1940 Act;
4.2.16. Before or in the Reorganization, neither Acquiring Portfolio nor any person Related to it will have acquired, directly or through any transaction, agreement, or arrangement with any other person, Target Shares with consideration other than Acquiring Portfolio Shares;
4.2.17. Acquiring Portfolio is not under the jurisdiction of a court in a “title 11 or similar case” (as defined in section 368(a)(3)(A));
4.2.18. There is no plan or intention for Acquiring Portfolio to be terminated, dissolved, or merged into another statutory or business trust or a corporation or any “fund” thereof (as defined in section 851(g)(2)) following the Reorganization;
4.2.19. Assuming the truthfulness and correctness of the Target Investment Company’s representation and warranty in paragraph 4.1.19, immediately after the Reorganization (a) not more than 25% of the value of Acquiring Portfolio’s total assets (excluding cash, cash items, and Government securities) will be invested in the stock and securities of any one issuer and (b) not more than 50% of the value of those assets will be invested in the stock and securities of five or fewer issuers; provided that a proportionate share of the assets of any RIC in which Target invests (and not the securities issued by the RIC itself) shall be taken into account for this purpose;
4.2.20. All issued and outstanding Acquiring Portfolio Shares are, and at the Effective Time will be, duly and validly issued and outstanding, fully paid, and non-assessable by EQAT and have been offered and sold in every state and the District of Columbia in compliance in all material respects with applicable registration
A-23
requirements of the 1933 Act and state securities laws; Acquiring Portfolio does not have outstanding any options, warrants, or other rights to subscribe for or purchase any Acquiring Portfolio Shares, nor are there outstanding any securities convertible into any Acquiring Portfolio Shares; and the Acquiring Portfolio Shares to be issued and delivered to Target, for the Shareholders’ accounts, pursuant to the terms hereof, (a) will have been duly authorized by EQAT and duly registered under the federal securities laws (and appropriate notices respecting them will have been duly filed under applicable state securities laws) at the Effective Time and (b) when so issued and delivered, will be duly and validly issued and outstanding Acquiring Portfolio Shares, fully paid and non-assessable by EQAT;
4.2.21. On the effective date of the Registration Statement, at the time of the Shareholders Meeting, and at the Effective Time, (a) EQAT’s Pro/SAI including Acquiring Portfolio will conform in all material respects to the applicable requirements of the 1933 Act and the 1940 Act and the rules and regulations of the Commission thereunder and (b) that Pro/SAI and the prospectus included in the Registration Statement will not include any untrue statement of a material fact or omit to state a material fact required to be stated therein or necessary to make the statements therein, in light of the circumstances under which they were made, not misleading; provided that the foregoing will not apply to statements in or omissions from that prospectus made in reliance on and in conformity with information furnished by the Target Investment Company for use therein;
4.2.22. The information to be furnished by EQAT for use in no-action letters, applications for orders, the Registration Statement, and other documents filed or to be filed with any federal, state, or local regulatory authority (including FINRA) that may be necessary in connection with the transactions contemplated hereby will be accurate and complete in all material respects, will comply in all material respects with federal securities laws and other laws and regulations, and will not contain any untrue statement of a material fact or omit to state a material fact required to be stated therein or necessary to make the statements therein, in light of the circumstances under which they were made, not misleading; and
4.2.23. The EQAT Declaration permits EQAT to vary its shareholders’ investment; EQAT does not have a fixed pool of assets — each series thereof (including Acquiring Portfolio) is a managed portfolio of securities, and FMG LLC and each investment sub-adviser thereof have the authority to buy and sell securities for it.
4.3. Each Investment Company, on its Portfolio’s behalf, represents and warrants to the other Investment Company, on its Portfolio’s behalf, as follows (or, in the case of the EQAT Reorganization, EQAT’s obligation to implement this Agreement on each Portfolio’s behalf shall be subject to satisfaction of the following conditions at or before, and continuing through, the Effective Time):
4.3.1. No governmental consents, approvals, or authorizations (collectively, “consents”) or filings are required under the 1933 Act, the Securities Exchange Act of 1934, as amended, the 1940 Act, or state securities laws, and no consents or orders of any court are required, for its execution, delivery, and performance hereof on its Portfolio’s behalf, except for (a) EQAT’s filing with the Commission of a registration statement on Form N-14 relating to the Acquiring Portfolio Shares issuable hereunder, and any supplement or amendment thereto, including therein a prospectus and proxy statement (“Registration Statement”), and a post-effective amendment to EQAT’s registration statement on Form N-1A and (b) consents, filings, and orders that have been made or received or may be required after the Effective Time;
4.3.2. The fair market value of the Acquiring Portfolio Shares each Shareholder receives will be approximately equal to the fair market value of its Target Shares it actually or constructively surrenders in exchange therefor;
4.3.3. Its management (a) is unaware of any plan or intention of Shareholders to redeem, sell, or otherwise dispose of (1) any portion of their Target Shares before the Reorganization to any person Related to either Portfolio or (2) any portion of the Acquiring Portfolio Shares they receive in the Reorganization to any person Related to Acquiring Portfolio, (b) does not anticipate dispositions of those Acquiring Portfolio Shares at the time of or soon after the Reorganization to exceed the usual rate and frequency of dispositions
A-24
of shares in Target as a series of an open-end investment company, (c) expects that the percentage of shareholder interests, if any, that will be disposed of as a result, or at the time, of the Reorganization will be de minimis, and (d) does not anticipate that there will be extraordinary redemptions of Acquiring Portfolio Shares immediately following the Reorganization;
4.3.4. Target’s shareholders will pay their own expenses (such as fees of personal investment or tax advisers for advice regarding the Reorganization), if any, incurred in connection with the Reorganization;
4.3.5. The fair market value and “adjusted basis” (within the meaning of section 1011) of the Assets will equal or exceed the Liabilities to be assumed by Acquiring Portfolio and those to which the Assets are subject;
4.3.6. At the Effective Time, there will be no intercompany indebtedness existing between the Portfolios that was issued, acquired, or settled at a discount;
4.3.7. Pursuant to the Reorganization, Target will transfer to Acquiring Portfolio, and Acquiring Portfolio will acquire, at least 90% of the fair market value of the net assets, and at least 70% of the fair market value of the gross assets, Target held immediately before the Reorganization; for the purposes of this representation and warranty, any amounts Target uses to pay its Reorganization expenses and to make redemptions and distributions immediately before the Reorganization (except (a) redemptions pursuant to section 22(e) of the 1940 Act and (b) dividends and other distributions declared and paid to ensure Target’s continuing qualification as a RIC and to avoid the imposition of fund-level tax) will be included as assets it held immediately before the Reorganization;
4.3.8. None of the compensation AXA Equitable or any affiliate thereof receives as a service provider to Target will be separate consideration for, or allocable to, any of the Target Shares that AXA Equitable (on any Shareholder’s behalf) holds; none of the Acquiring Portfolio Shares AXA Equitable (on any Shareholder’s behalf) receives in the Reorganization will be separate consideration for, or allocable to, any employment agreement, investment advisory agreement, or other service agreement; and the compensation paid to AXA Equitable or any affiliate thereof will be for services actually rendered and will be commensurate with amounts paid to third parties bargaining at arm’s-length for similar services;
4.3.9. Immediately after the Reorganization, AXA Equitable (through its separate accounts) will own shares constituting “control” (within the meaning of section 368(a)(2)(H)(i), i.e., as defined in section 304(c)) of Acquiring Portfolio;
4.3.10. No expenses incurred by Target or on its behalf in connection with the Reorganization will be paid or assumed by Acquiring Portfolio, the other Target, AXA Equitable or any affiliate thereof (including FMG LLC), or any other third party unless those expenses are solely and directly related to the Reorganization (determined in accordance with the guidelines set forth in Rev. Rul. 73-54, 1973-1 C.B. 187) (“Reorganization Expenses”), and no cash or property other than Acquiring Portfolio Shares will be transferred to Target or any of its shareholders with the intention that such cash or property be used to pay any expenses (even Reorganization Expenses) thereof;
4.3.11. There will be no dissenters to the Reorganization under the applicable provisions of Delaware law, and Acquiring Portfolio will not pay cash in lieu of fractional Acquiring Portfolio Shares in connection with the Reorganization;
4.3.12. The Reorganization is being undertaken for bona fide business purposes (and not a purpose to avoid federal income tax); and
4.3.13. The principal purpose of Acquiring Portfolio’s assumption of the Liabilities is a bona fide business purpose and is not avoidance of federal income tax on the transaction.
A-25
5. COVENANTS (1)
5.1. Each Investment Company covenants to operate its Portfolio’s business in the ordinary course between the date hereof and the Closing, it being understood that:
(a) such ordinary course will include declaring and paying customary dividends and other distributions and changes in operations contemplated by each Portfolio’s normal business activities; and
(b) each Portfolio will retain exclusive control of the composition of its portfolio until the Closing.
5.2. The Target Investment Company covenants to call and hold a meeting of Target’s shareholders to consider and act on this Agreement and to take all other action necessary to obtain approval of the transactions contemplated hereby (“Shareholders Meeting”).
5.3. The Target Investment Company covenants that it will assist EQAT in obtaining information EQAT reasonably requests concerning the beneficial ownership of Target Shares.
5.4. The Target Investment Company covenants that it will turn over its books and records regarding Target (including all tax books and records and all books and records required to be maintained under the 1940 Act and the rules and regulations thereunder) to EQAT at the Closing.
5.5. Each Investment Company covenants to cooperate with the other in preparing the Registration Statement in compliance with applicable federal and state securities laws.
5.6. Each Investment Company covenants that it will, from time to time, as and when requested by the other Investment Company, execute and deliver or cause to be executed and delivered all assignments and other instruments, and will take or cause to be taken all further action, the other Investment Company deems necessary or desirable in order to vest in, and confirm to, (a) EQAT, on Acquiring Portfolio’s behalf, title to and possession of all the Assets, and (b) the Target Investment Company, on Target’s behalf, title to and possession of the Acquiring Portfolio Shares to be delivered hereunder, and otherwise to carry out the intent and purpose hereof.
5.7. EQAT covenants to use all reasonable efforts to obtain the consents required by the 1933 Act, the 1940 Act, and applicable state securities laws it deems appropriate to continue Acquiring Portfolio’s operations after the Effective Time.
5.8. The Target Investment Company covenants to distribute all the Acquiring Portfolio Shares it receives in the Reorganization to the Shareholders in complete liquidation of Target.
| (1) | | This paragraph 5 shall not apply in the case of the EQAT Reorganization. |
5.9. As promptly as practicable, but in any case within sixty days, after the Effective Time, the Target Investment Company shall furnish to EQAT, in a form reasonably satisfactory to EQAT, a Certificate stating the earnings and profits of Target for federal income tax purposes that will be carried over by Acquiring Portfolio as a result of section 381.
5.10. It is the Investment Companies’ intention that the Reorganization will qualify as a reorganization with the meaning of section 368(a)(1)(D). Neither Investment Company shall take any action or cause any action to be taken (including the filing of any tax return) that is inconsistent with that treatment or results in the failure of the Reorganization to qualify as such a reorganization.
5.11. Subject to this Agreement, each Investment Company covenants to take or cause to be taken all actions, and to do or cause to be done all things, reasonably necessary, proper, or advisable to consummate and effectuate the transactions contemplated hereby.
6. CONDITIONS PRECEDENT
Each Investment Company’s obligations hereunder shall be subject to (a) the other Investment Company’s performance of all its obligations to be performed hereunder at or before the Closing, (b) all representations and
A-26
warranties of the other Investment Company contained herein being true and correct in all material respects at the date hereof and, except as they may be affected by the transactions contemplated hereby, at the Effective Time, with the same force and effect as if made at that time (except that clauses (a) and (b) shall not apply in the case of the EQAT Reorganization), and (c) the following further conditions that, at or before that time:
6.1. This Agreement and the transactions contemplated hereby shall have been duly adopted and approved by both Boards (by EQAT’s Board in the case of the EQAT Reorganization) and by Target’s shareholders at the Shareholders Meeting (including any adjournments or postponements thereof);
6.2. All necessary filings shall have been made with the Commission and state securities authorities, and no order or directive shall have been received that any other or further action is required to permit the Investment Companies to carry out the transactions contemplated hereby; the Registration Statement shall have become effective under the 1933 Act, no stop orders suspending the effectiveness thereof shall have been issued, and, to each Investment Company’s best knowledge, no investigation or proceeding for that purpose shall have been instituted or shall be pending, threatened, or contemplated under the 1933 Act or the 1940 Act; the Commission shall not have issued an unfavorable report with respect to the Reorganization under section 25(b) of the 1940 Act nor instituted any proceedings seeking to enjoin consummation of the transactions contemplated hereby under section 25(c) of the 1940 Act; and all consents, orders, and permits of federal, state, and local regulatory authorities (including the Commission and state securities authorities) either Investment Company deems necessary to permit consummation, in all material respects, of the transactions contemplated hereby shall have been obtained, except where failure to obtain same would not involve a risk of a material adverse effect on either Portfolio’s assets or properties, provided that either Investment Company may for itself waive any of those conditions;
6.3. At the Effective Time, no action, suit, or other proceeding shall be pending (or, to either Investment Company’s best knowledge, threatened to be commenced) before any court, governmental agency, or arbitrator in which it is sought to enjoin the performance of, restrain, prohibit, affect the enforceability of, or obtain damages or other relief in connection with, the transactions contemplated hereby;
6.4. The Investment Companies (or, in the case of the EQAT Reorganization, EQAT) shall have received an opinion of K&L Gates LLP (“Counsel”) as to the federal income tax consequences mentioned below (“Tax Opinion”). In rendering the Tax Opinion, Counsel may rely as to factual matters, exclusively and without independent verification, on the representations and warranties made in this Agreement, which Counsel may treat as representations and warranties made to it (that, notwithstanding paragraph 8, shall survive the Closing), and in separate letters, if Counsel requests, addressed to it (collectively, “Representations”) and, in the case of the VIP Reorganization, the Certificates delivered pursuant to paragraph 3.5(a). The Tax Opinion shall be substantially to the effect that — based on the facts and assumptions stated therein and conditioned on the Representations’ being true and complete at the Effective Time and consummation of the Reorganization in accordance herewith (without the waiver or modification of any terms or conditions hereof and without taking into account any amendment hereof that Counsel has not approved) — for federal income tax purposes:
6.4.1. Target’s transfer of the Assets to Acquiring Portfolio in exchange solely for Acquiring Portfolio Shares and Acquiring Portfolio’s assumption of the Liabilities, followed by Target’s distribution of those shares pro rata to the Shareholders actually or constructively in exchange for their Target Shares and in complete liquidation of Target, will qualify as a “reorganization” (as defined in section 368(a)(1)(D)), and each Portfolio will be “a party to a reorganization” within the meaning of section 368(b);
6.4.2. Target will recognize no gain or loss on the transfer of the Assets to Acquiring Portfolio in exchange solely for Acquiring Portfolio Shares and Acquiring Portfolio’s assumption of the Liabilities or on the subsequent distribution of those shares to the Shareholders in exchange for their Target Shares;
6.4.3. Acquiring Portfolio will recognize no gain or loss on its receipt of the Assets in exchange solely for Acquiring Portfolio Shares and its assumption of the Liabilities;
6.4.4. Acquiring Portfolio’s basis in each Asset will be the same as Target’s basis therein immediately before the Reorganization, and Acquiring Portfolio’s holding period for each Asset will include
A-27
Target’s holding period therefor (except where Acquiring Portfolio’s investment activities have the effect of reducing or eliminating an Asset’s holding period);
6.4.5. A Shareholder will recognize no gain or loss on the exchange of all its Target Shares solely for Acquiring Portfolio Shares pursuant to the Reorganization; and
6.4.6. A Shareholder’s aggregate basis in the Acquiring Portfolio Shares it receives in the Reorganization will be the same as the aggregate basis in its Target Shares it actually or constructively surrenders in exchange for those Acquiring Portfolio Shares; and its holding period for those Acquiring Portfolio Shares will include, in each instance, its holding period for those Target Shares, provided the Shareholder holds the latter as capital assets at the Effective Time.
Notwithstanding subparagraphs 6.4.2 and 6.4.4, the Tax Opinion may state that no opinion is expressed as to the effect of the Reorganization on Target or any Shareholder with respect to any Asset as to which any unrealized gain or loss is required to be recognized for federal income tax purposes at the end of a taxable year (or on the termination or transfer thereof) under a mark-to-market system of accounting;
6.5. EQAT, on Acquiring Portfolio’s behalf, shall have executed and delivered at or before the Closing a Certificate confirming that EQAT, on Acquiring Portfolio’s behalf, assumes all of the Liabilities; and
6.6. At any time before the Closing, either Investment Company may waive any of the foregoing conditions (except those set forth in paragraphs 6.1 and 6.4) if, in the judgment of its Board, that waiver will not have a material adverse effect on its Portfolio’s shareholders’ interests.
7. BROKERAGE FEES AND EXPENSES
7.1. Each Investment Company represents and warrants to the other that there are no brokers or finders entitled to receive any payments in connection with the transactions provided for herein.
7.2. Subject to satisfaction of the representation contained in paragraph 4.3.10, the Reorganization Expenses shall be borne by the Targets in proportion to their respective numbers of Contract holder accounts at the Effective Time, except that (a) neither Target shall bear any brokerage or similar expenses incurred by or for the benefit of the other Target or Acquiring Portfolio in connection with the Reorganization, which shall be borne by the Portfolio that directly incurs them, and (b) expenses shall be paid by the Portfolio directly incurring them if and to the extent that the payment thereof by another person would result in that Portfolio’s disqualification as a RIC or would prevent the Reorganization in which it participates from qualifying as a tax-free reorganization.
8. ENTIRE AGREEMENT; NO SURVIVAL
Neither Investment Company has made any representation, warranty, or covenant not set forth herein, and this Agreement constitutes the entire agreement between the Investment Companies. The representations, warranties, and covenants contained herein or in any document delivered pursuant hereto or in connection herewith shall not survive the Closing (except to the extent provided in paragraph 6.4).
9. TERMINATION OF AGREEMENT
9.1. In the case of the VIP Reorganization, this Agreement may be terminated at any time at or before the Closing as follows:
9.1.1. By either Investment Company (a) in the event of the other Investment Company’s material breach of any representation, warranty, or covenant contained herein to be performed at or before the Closing, (b) if a condition to its obligations has not been met and it reasonably appears that that condition will not or cannot be met, (c) if a governmental body issues an order, decree, or ruling having the effect of permanently enjoining, restraining, or otherwise prohibiting consummation of the Reorganization, or (d) if the Closing has not occurred on or before December 31, 2017, or another date to which the Investment Companies agree; or
9.1.2. By the Investment Companies’ mutual agreement.
A-28
9.2. In the event of termination under paragraphs 9.1.1(c) or (d) or 9.1.2, neither Investment Company (nor its trustees, officers, or shareholders) shall have any liability to the other Investment Company.
9.3. In the case of the EQAT Reorganization, EQAT’s Board may terminate or delay this Agreement and abandon or postpone the transactions contemplated hereby, at any time before the Effective Time, if circumstances develop that, in its opinion, make proceeding with the Reorganization inadvisable for either Portfolio.
10. AMENDMENTS
In the case of the VIP Reorganization, the Investment Companies may amend, modify, or supplement this Agreement at any time in any manner they mutually agree on in writing, and in the case of the EQAT Reorganization, EQAT’s Board may do so (solely with respect to the EQAT Reorganization), notwithstanding Target’s shareholders’ approval hereof; provided that, following that approval, no such amendment, modification, or supplement shall have a material adverse effect on the Shareholders’ interests.
11. MISCELLANEOUS
11.1. This Agreement shall be governed by and construed in accordance with the internal laws of the State of Delaware, without giving effect to principles of conflicts of laws; provided that, in the case of any conflict between those laws and the federal securities laws, the latter shall govern.
11.2. Nothing expressed or implied herein is intended or shall be construed to confer on or give any person, firm, trust, or corporation other than each Investment Company, on its Portfolio’s behalf, and their respective successors and assigns any rights or remedies under or by reason hereof.
11.3 Notice is hereby given that this instrument is executed and delivered on behalf of each Investment Company’s trustees solely in their capacities as trustees, and not individually, and that each Investment Company’s obligations under this instrument are not binding on or enforceable against any of its trustees, officers, shareholders, or series other than its Portfolio but are only binding on and enforceable against its property attributable to and held for the benefit of its Portfolio (“Portfolio’s Property”) and not its property attributable to and held for the benefit of any other series thereof. Each Investment Company, in asserting any rights or claims hereunder on its or its Portfolio’s behalf, shall look only to the other Portfolio’s Property in settlement of those rights or claims and not to the property of any other series of the other Investment Company or to those trustees, officers, or shareholders.
11.4 Any term or provision hereof that is invalid or unenforceable in any jurisdiction shall, as to that jurisdiction, be ineffective to the extent of that invalidity or unenforceability without rendering invalid or unenforceable the remaining terms and provisions hereof or affecting the validity or enforceability of any of the terms and provisions hereof in any other jurisdiction.
11.5. This Agreement may be executed in one or more counterparts, all of which shall be considered one and the same agreement, and shall become effective when one or more counterparts have been executed by each Investment Company and delivered to the other Investment Company. The headings contained herein are for reference purposes only and shall not affect in any way the meaning or interpretation hereof.
IN WITNESS WHEREOF, each party has caused this Agreement to be executed and delivered by its duly authorized officer as of the day and year first written above.
| | |
EQ ADVISORS TRUST, on behalf of All Asset Aggressive — Alt 25 Portfolio and All Asset Growth — Alt 20 Portfolio |
| |
By: | | |
| Name: | | Steven M. Joenk |
| Title: | | President and Chief Executive Officer |
|
AXA PREMIER VIP TRUST, on behalf of CharterSM Alternative 100 Moderate Portfolio |
| |
By: | | |
| Name: | | Brian E. Walsh |
| Title: | | Chief Financial Officer |
A-29
APPENDIX A.3
FORM OF PLAN OF REORGANIZATION AND TERMINATION
THIS PLAN OF REORGANIZATION AND TERMINATION (“Plan”) is adopted by AXA PREMIER VIP TRUST, a Delaware statutory trust (“Trust”), on behalf of CharterSM International Moderate Portfolio (“Target”) and CharterSM Moderate Portfolio (“Acquiring Portfolio”), each a segregated portfolio of assets (“series”) thereof. (Each of Target and Acquiring Portfolio is sometimes referred to herein as a “Portfolio.”) Notwithstanding anything to the contrary contained herein, (1) all agreements, covenants, actions, and obligations (collectively, “Obligations”) of and by each Portfolio contained herein shall be deemed to be Obligations of, and all rights and benefits created hereunder in favor of each Portfolio shall inure to and be enforceable by, the Trust acting on its behalf, and (2) in no event shall any other series of the Trust or the assets thereof be held liable with respect to the breach or other default by an obligated Portfolio or the Trust of its Obligations set forth herein.
The Trust (1) is a statutory trust that is duly organized, validly existing, and in good standing under the laws of the State of Delaware, (2) is duly registered under the Investment Company Act of 1940, as amended (“1940 Act”), as an open-end management investment company, which registration is in full force and effect, and (3) has the power to own all its properties and assets and to carry on its business described in its current registration statement on Form N-1A. Each Portfolio is a duly established and designated series thereof.
The Trust currently sells voting shares of beneficial interest in the Portfolios, $0.001 par value per share (“shares”), to (1) separate accounts of AXA Equitable Life Insurance Company (“AXA Equitable”) or other affiliated or unaffiliated insurance companies (“Separate Accounts”) in connection with certain variable annuity certificates and contracts and variable life insurance policies (collectively, “Contracts”) issued thereby and (2) The AXA Equitable 401(k) Plan. Shares in each Portfolio also may be sold to (3) other tax-qualified retirement plans and (4) other investors eligible under applicable regulations under the Internal Revenue Code of 1986, as amended (“Code”) (“Regulations”). The Portfolios are underlying investment options for the Separate Accounts to fund Contracts. Under applicable law, the assets of all the Separate Accounts (i.e., the shares in the Portfolios) are the property of AXA Equitable, which is the owner of record of those shares, and are held for the benefit of the Contract holders.
The Trust wishes to effect a reorganization consisting of (1) the transfer of all of Target’s assets to Acquiring Portfolio in exchange for shares in Acquiring Portfolio and Acquiring Portfolio’s assumption of all of Target’s liabilities, (2) the distribution of those shares pro rata to Target’s shareholders in exchange for their shares therein and in complete liquidation thereof (for federal tax purposes), and (3) Target’s termination as a series of the Trust, all on the terms and conditions set forth herein (collectively, “Reorganization”).
The Trust’s Agreement and Declaration of Trust, as amended (“Declaration”), permits it to vary its shareholders’ investment. The Trust does not have a fixed pool of assets — each series thereof (including each Portfolio) is a managed portfolio of securities, and AXA Equitable Funds Management Group, LLC (“FMG LLC”) and each investment sub-adviser thereof, if any, have the authority to buy and sell securities for it.
The Trust’s Board of Trustees (“Board”), including a majority of its members who are not “interested persons” (as that term is defined in the 1940 Act) thereof, (1) has duly adopted this Plan, approved the transactions contemplated hereby, and duly authorized its performance hereof on each Portfolio’s behalf and consummation of the Reorganization by all necessary Board action and (2) has determined that participation in the Reorganization is in the best interests of each Portfolio and that the interests of the existing shareholders thereof will not be diluted as a result of the Reorganization.
Target offers a single class of shares, designated Class B shares (“Target Shares”). Acquiring Portfolio also offers a single class of shares, also designated Class B shares (“Acquiring Portfolio Shares”). The Portfolios’ shares have identical characteristics, rights, and preferences.
A-30
1. PLAN OF REORGANIZATION AND TERMINATION
1.1 Subject to the requisite approval of Target’s shareholders and the terms and conditions set forth herein, Target shall assign, sell, convey, transfer, and deliver all of its assets described in paragraph 1.2 (“Assets”) to Acquiring Portfolio. In exchange therefor, Acquiring Portfolio shall —
(a) issue and deliver to Target the number of full and fractional (all references herein to “fractional” shares meaning fractions rounded to the eighth decimal place) Acquiring Portfolio Shares determined by dividing Target’s net value (computed as set forth in paragraph 2.1) by the net asset value (computed as set forth in paragraph 2.2) (“NAV”) of an Acquiring Portfolio Share, and
(b) assume all of Target’s liabilities described in paragraph 1.3 (“Liabilities”).
Those transactions shall take place at the Closing (as defined in paragraph 3.1).
1.2 The Assets shall consist of all assets and property of every kind and nature — including all cash, cash equivalents, securities, commodities, futures interests, receivables (including interest and dividends receivable), claims and rights of action, rights to register shares under applicable securities laws, goodwill, and books and records — Target owns at the Valuation Time (as defined in paragraph 2.1) and any deferred and prepaid expenses (other than unamortized organizational expenses) shown as assets on Target’s books at that time.
1.3 The Liabilities shall consist of all of Target’s liabilities, debts, obligations, and duties of whatever kind or nature existing at the Valuation Time, whether absolute, accrued, contingent, or otherwise, whether known or unknown, whether or not arising in the ordinary course of business, whether or not determinable at the Effective Time (as defined in paragraph 3.1), and whether or not specifically referred to herein. Notwithstanding the foregoing, Target shall use its best efforts to discharge all its known liabilities, debts, obligations, and duties before the Effective Time.
1.4 If the dividends and/or other distributions Target has paid through the Effective Time for its current taxable year do not equal or exceed the sum of its (a) “investment company taxable income” (within the meaning of section 852(b)(2)) (all “section” references are to the Code, unless otherwise noted), computed without regard to any deduction for dividends paid, plus (b) “net capital gain” (as defined in section 1222(11)), after reduction by any capital loss carryovers, for that year through that time (including any such gain realized and recognized pursuant to the transactions comprising the Reorganization), then at or as soon as practicable before that time, Target shall declare and pay to its shareholders of record one or more dividends and/or other distributions so that it will have distributed substantially all of that income and gain — and in no event less than the sum of 98% of its “ordinary income” plus 98.2% of its “capital gain net income,” as those terms are defined in section 4982(e)(1) and (2), respectively — for all federal income tax periods ending at or before the Effective Time, and treating its current taxable year as ending at that time, such that Target will have no tax liability under section 852 for the current and any prior tax periods.
1.5 At the Effective Time (or as soon thereafter as is reasonably practicable), Target shall distribute the Acquiring Portfolio Shares it receives pursuant to paragraph 1.1(a) to the Separate Accounts for which AXA Equitable holds Target Shares of record at the Effective Time (each, a “Shareholder”), in proportion to their Target Shares then so held and in constructive exchange therefor, and shall completely liquidate (which shall be treated as a complete liquidation of Target for federal tax purposes, within the meaning of section 1.368-2(m)(1)(iv) of the Regulations). That distribution shall be accomplished by the Trust’s transfer agent’s opening accounts on Acquiring Portfolio’s shareholder records in the names of the Shareholders (except Shareholders in whose names accounts thereon already exist) and transferring those Acquiring Portfolio Shares to those newly opened and existing accounts. Pursuant to that transfer, each Shareholder’s account shall be credited with the respective pro rata number of full and fractional Acquiring Portfolio Shares due that Shareholder. The aggregate NAV of Acquiring Portfolio Shares to be so credited to each Shareholder’s account shall equal the aggregate NAV of the Target Shares that Shareholder holds at the Effective Time. All issued and outstanding Target Shares, including any represented by certificates, shall simultaneously be canceled on Target’s shareholder records. The Trust shall not issue certificates representing the Acquiring Portfolio Shares issued in connection with the Reorganization.
A-31
1.6 Any transfer taxes payable on issuance and transfer of Acquiring Portfolio Shares in a name other than that of the registered holder on Target’s shareholder records of the Target Shares actually or constructively exchanged therefor shall be paid by the transferee thereof, as a condition of that issuance and transfer.
1.7 After the Effective Time, Target shall not conduct any business except in connection with its termination. As soon as reasonably practicable after distribution of the Acquiring Portfolio Shares pursuant to paragraph 1.5 — as provided there, on making that distribution Target’s liquidation shall be complete for federal tax purposes — (a) Target shall be terminated as a series of the Trust and (b) the Trust shall make all filings and take all other actions in connection therewith necessary and proper to effect that termination.
1.8 Any reporting responsibility of Target to a public authority, including the responsibility for filing regulatory reports, tax returns, and other documents with the Securities and Exchange Commission (“Commission”), any state securities commission, any federal, state, and local tax authorities, and any other relevant regulatory authority, is and shall remain its responsibility up to and including the date on which it is terminated. In furtherance of the foregoing, after the Effective Time the Trust shall prepare, or shall cause its agents to prepare, any federal, state, and local tax returns, required to be filed by it with respect to Target’s final taxable year ending with its complete liquidation and for any prior periods or taxable years and shall cause those tax returns to be duly filed with the appropriate taxing authorities.
2. VALUATION
2.1 For purposes of paragraph 1.1(a), Target’s net value shall be (a) the value of the Assets computed immediately after the close of regular trading on the New York Stock Exchange (“NYSE”) and Target’s declaration of dividends and/or other distributions, if any, on the date of the Closing (“Valuation Time”), using the valuation procedures set forth in the Trust’s then-current prospectus and statement of additional information including Target and valuation procedures established by the Board (collectively, “Valuation Procedures”), less (b) the amount of the Liabilities at the Valuation Time.
2.2 For purposes of paragraph 1.1(a), the NAV per Acquiring Portfolio Share shall be computed at the Valuation Time, using the Valuation Procedures.
2.3 All computations pursuant to paragraphs 2.1 and 2.2 shall be made (a) by FMG LLC, in its capacity as the Trust’s administrator, or (b) in the case of securities subject to fair valuation, in accordance with the Valuation Procedures.
3. CLOSING AND EFFECTIVE TIME
3.1 Unless the Trust determines otherwise, all acts necessary to consummate the Reorganization (“Closing”) shall be deemed to occur simultaneously as of immediately after the close of business (4:00 p.m., Eastern Time) on May 19, 2017, or a later date the Trust determines (“Effective Time”). If, at or immediately before the Valuation Time, (a) the NYSE or another primary trading market for portfolio securities of either Portfolio (each, an “Exchange”) is closed to trading or trading thereon is restricted or (b) trading or the reporting of trading on an Exchange or elsewhere is disrupted so that, in the Board’s judgment, accurate appraisal of the value of either Portfolio’s net assets and/or the NAV per Acquiring Portfolio Share is impracticable, the date of the Closing (and, therefore, the Valuation Time and the Effective Time) shall be postponed until the first business day on which that Exchange is open for regular trading after the day when that trading has been fully resumed and that reporting has been restored. The Closing shall be held at the Trust’s offices or at another place the Trust determines.
3.2 The Trust shall direct the custodian of the Portfolios’ assets to deliver at the Closing a certificate of an authorized officer (“Certificate”) stating that (a) the Assets it holds will be transferred to Acquiring Portfolio at the Effective Time and (b) all necessary taxes in connection with the delivery of the Assets, including all applicable federal and state stock transfer stamps, if any, have been paid or provision for payment has been made.
A-32
3.3 The Trust shall direct its transfer agent to deliver at or immediately after the Closing a Certificate stating that its records contain (a) the name, address, and taxpayer identification number of each Shareholder, (b) the number of full and fractional outstanding Target Shares each Shareholder owns, and (c) the dividend reinvestment elections, if any, applicable to each Shareholder, all at the Effective Time.
3.4. The Trust shall direct its transfer agent to deliver (a) at the Closing, a confirmation, or other evidence satisfactory to the Trust, that the Acquiring Portfolio Shares to be issued to Target pursuant to paragraph 1.1(a) have been credited to Target’s account on Acquiring Portfolio’s shareholder records and (b) at or as soon as reasonably practicable after the Closing, a Certificate as to the opening of accounts on those records in the names of the Shareholders (except Shareholders in whose names accounts thereon already exist).
4. CONDITIONS PRECEDENT
4.1 The Trust’s obligation to implement this Plan on Acquiring Portfolio’s behalf shall be subject to satisfaction of the following conditions at or before, and continuing through, the Effective Time:
(a) At the Effective Time, the Trust, on Target’s behalf, will have good and marketable title to the Assets and full right, power, and authority to sell, assign, transfer, and deliver the Assets hereunder free of any liens or other encumbrances (except securities that are subject to “securities loans,” as referred to in section 851(b)(2), or are restricted to resale by their terms); and on delivery and payment for the Assets, the Trust, on Acquiring Portfolio’s behalf, will acquire good and marketable title thereto, subject to no restrictions on the full transfer thereof, including restrictions that might arise under the Securities Act of 1933, as amended (“1933 Act”);
(b) The Trust, with respect to Target, is not currently engaged in, and its adoption and performance hereof and consummation of the Reorganization will not result in, (1) a conflict with or material violation of any provision of Delaware law, the Declaration or the Trust’s By-Laws (collectively, “Governing Documents”), or any agreement, indenture, instrument, contract, lease, or other undertaking (each, an “Undertaking”) to which the Trust, with respect to Target or on its behalf, is a party or by which it is bound or (2) the acceleration of any obligation, or the imposition of any penalty, under any Undertaking, judgment, or decree to which the Trust, with respect to Target or on its behalf, is a party or by which it is bound;
(c) At or before the Effective Time, either (1) all material contracts and other commitments of or applicable to Target (other than this Plan and certain investment contracts, including options, futures, forward contracts, and swap agreements) will terminate or (2) provision for discharge, and/or Acquiring Portfolio’s assumption, of any liabilities of Target thereunder will be made, without either Portfolio’s incurring any liability or penalty with respect thereto and without diminishing or releasing any rights the Trust, on Target’s behalf, may have had with respect to actions taken or omitted or to be taken by any other party thereto before the Closing;
(d) No litigation, administrative proceeding, action, or investigation of or before any court, governmental body, or arbitrator is presently pending or, to the Trust’s knowledge, threatened against the Trust, with respect to Target or any of its properties or assets attributable or allocable to Target, that, if adversely determined, would materially and adversely affect Target’s financial condition or the conduct of its business; and the Trust, on Target’s behalf, knows of no facts that might form the basis for the institution of any such litigation, proceeding, action, or investigation and is not a party to or subject to the provisions of any order, decree, judgment, or award of any court, governmental body, or arbitrator that materially and adversely affects Target’s business or the Trust’s ability to consummate the transactions contemplated hereby;
(e) Target’s Statement of Assets and Liabilities, Portfolio of Investments, Statement of Operations, and Statement of Changes in Net Assets (each, a “Statement”) at and for the fiscal year (in the case of the last Statement, for the two fiscal years) ended December 31, 2016, have been audited by PricewaterhouseCoopers LLP, an independent registered public accounting firm (“PwC”), and are in accordance with generally accepted accounting principles consistently applied in the United States (“GAAP”); those Statements present fairly, in all material respects, Target’s financial condition at that date in accordance with GAAP and the results
A-33
of its operations and changes in its net assets for the period(s) then ended; and, to the Trust’s management’s best knowledge and belief, there are no known contingent liabilities of Target required to be reflected on a balance sheet (including the notes thereto) in accordance with GAAP at that date that are not disclosed therein;
(f) Since December 31, 2016, there has not been any material adverse change in Target’s financial condition, assets, liabilities, or business, other than changes occurring in the ordinary course of business, or any incurrence by Target of indebtedness maturing more than one year from the date that indebtedness was incurred; for purposes of this subparagraph, a decline in Target’s NAV due to declines in market values of securities Target holds, the discharge of Target liabilities, or the redemption of Target Shares by its shareholders will not constitute a material adverse change;
(g) All federal, state, and local tax returns, dividend reporting forms, and other tax-related reports (collectively, “Returns”) of Target required by law to have been filed by the Effective Time (including any properly and timely filed extensions of time to file) will have been timely filed and are or will be correct in all material respects, and all federal and other taxes shown as due or required to be shown as due on those Returns will have been paid or provision will have been made for the payment thereof (except for amounts that alone or in the aggregate would not reasonably be expected to have a material adverse effect); to the best of the Trust’s knowledge, no such Return is currently under audit and no assessment has been asserted with respect to those Returns; and Target (1) is in compliance in all material respects with all applicable Regulations pertaining to (i) the reporting of dividends and other distributions on and redemptions of its shares, (ii) withholding in respect thereof, and (iii) shareholder basis reporting, (2) has withheld in respect of dividends and other distributions and paid to the proper taxing authorities all taxes required to be withheld, and (3) is not liable for any material penalties that could be imposed thereunder;
(h) Target is not classified as a partnership, and instead is classified as an association that is taxable as a corporation, for federal tax purposes and either has elected the latter classification by filing Form 8832 with the Internal Revenue Service (“IRS”) or is a “publicly traded partnership” (as defined in section 7704(b)) that is treated as a corporation; Target is a “fund” (as defined in section 851(g)(2), eligible for treatment under section 851(g)(1)); Target has elected to be a “regulated investment company” under Part I of Subchapter M of Chapter 1 of Subtitle A of the Code (“Subchapter M”) (“RIC”); for each taxable year of its operation (including the taxable year that will end at the Effective Time (“current year”)), Target has met (and for the current year will meet) the requirements of Subchapter M for qualification and treatment as a RIC and has been (and for the current year will be) eligible to and has computed (and for the current year will compute) its federal income tax under section 852; and Target has no earnings and profits accumulated in any taxable year in which the provisions of Subchapter M did not apply to it; and
(i) All issued and outstanding Target Shares are, and at the Effective Time will be, duly and validly issued and outstanding, fully paid, and non-assessable by the Trust and have been offered and sold in every state and the District of Columbia in compliance in all material respects with applicable registration requirements of the 1933 Act and state securities laws; all issued and outstanding Target Shares will, at the Effective Time, be held by the persons and in the amounts set forth on Target’s shareholder records (as provided in the Certificate to be delivered pursuant to paragraph 3.3); and Target does not have outstanding any options, warrants, or other rights to subscribe for or purchase any Target Shares, nor are there outstanding any securities convertible into any Target Shares.
4.2 The Trust’s obligation to implement this Plan on Target’s behalf shall be subject to satisfaction of the following conditions at or before, and continuing through, the Effective Time:
(a) No consideration other than Acquiring Portfolio Shares (and Acquiring Portfolio’s assumption of the Liabilities) will be issued in exchange for the Assets in the Reorganization;
(b) The Trust, with respect to Acquiring Portfolio, is not currently engaged in, and its adoption and performance hereof and consummation of the Reorganization will not result in, (1) a conflict with or material violation of any provision of Delaware law, the Governing Documents, or any Undertaking to which the
A-34
Trust, with respect to Acquiring Portfolio or on its behalf, is a party or by which it is bound or (2) the acceleration of any obligation, or the imposition of any penalty, under any Undertaking, judgment, or decree to which the Trust, with respect to Acquiring Portfolio or on its behalf, is a party or by which it is bound;
(c) No litigation, administrative proceeding, action, or investigation of or before any court, governmental body, or arbitrator is presently pending or, to the Trust’s knowledge, threatened against the Trust, with respect to Acquiring Portfolio or any of its properties or assets attributable or allocable to Acquiring Portfolio, that, if adversely determined, would materially and adversely affect Acquiring Portfolio’s financial condition or the conduct of its business; and the Trust, on Acquiring Portfolio’s behalf, knows of no facts that might form the basis for the institution of any such litigation, proceeding, action, or investigation and is not a party to or subject to the provisions of any order, decree, judgment, or award of any court, governmental body, or arbitrator that materially and adversely affects Acquiring Portfolio’s business or the Trust’s ability to consummate the transactions contemplated hereby;
(d) Acquiring Portfolio’s Statements at and for the fiscal year (in the case of the Statement of Changes in Net Assets, for the two fiscal years) ended December 31, 2016, have been audited by PwC and are in accordance with GAAP; those Statements present fairly, in all material respects, Acquiring Portfolio’s financial condition at that date in accordance with GAAP and the results of its operations and changes in its net assets for the period(s) then ended; and, to the Trust’s management’s best knowledge and belief, there are no known contingent liabilities of Acquiring Portfolio required to be reflected on a balance sheet (including the notes thereto) in accordance with GAAP at that date that are not disclosed therein;
(e) Since December 31, 2016, there has not been any material adverse change in Acquiring Portfolio’s financial condition, assets, liabilities, or business, other than changes occurring in the ordinary course of business, or any incurrence by Acquiring Portfolio of indebtedness maturing more than one year from the date that indebtedness was incurred; for purposes of this subparagraph, a decline in Acquiring Portfolio’s NAV due to declines in market values of securities Acquiring Portfolio holds, the discharge of Acquiring Portfolio’s liabilities, or the redemption of Acquiring Portfolio Shares by its shareholders will not constitute a material adverse change;
(f) All Returns of Acquiring Portfolio required by law to have been filed by the Effective Time (including any properly and timely filed extensions of time to file) will have been timely filed and are or will be correct in all material respects, and all federal and other taxes shown as due or required to be shown as due on those Returns will have been paid or provision will have been made for the payment thereof (except for amounts that alone or in the aggregate would not reasonably be expected to have a material adverse effect); to the best of the Trust’s knowledge, no such Return is currently under audit and no assessment has been asserted with respect to those Returns; and Acquiring Portfolio (1) is in compliance in all material respects with all applicable Regulations pertaining to (i) the reporting of dividends and other distributions on and redemptions of its shares, (ii) withholding in respect thereof, and (iii) shareholder basis reporting, (2) has withheld in respect of dividends and other distributions and paid to the proper taxing authorities all taxes required to be withheld, and (3) is not liable for any material penalties that could be imposed thereunder;
(g) Acquiring Portfolio is not classified as a partnership, and instead is classified as an association that is taxable as a corporation, for federal tax purposes and either has elected the latter classification by filing Form 8832 with the IRS or is a “publicly traded partnership” (as defined in section 7704(b)) that is treated as a corporation; Acquiring Portfolio is a “fund” (as defined in section 851(g)(2), eligible for treatment under section 851(g)(1)); Acquiring Portfolio has elected to be a RIC; for each taxable year of its operation (including the taxable year that includes the Effective Time (“current year”)), Acquiring Portfolio has met (and for the current year will meet) the requirements of Subchapter M for qualification and treatment as a RIC and has been (and for the current year will be) eligible to and has computed (and for the current year will compute) its federal income tax under section 852; Acquiring Portfolio will continue to meet all those requirements for the current year and intends to continue to do so, and to continue to be
A-35
eligible to and to so compute its federal income tax, for succeeding taxable years; and Acquiring Portfolio has no earnings and profits accumulated in any taxable year in which the provisions of Subchapter M did not apply to it; and
(h) All issued and outstanding Acquiring Portfolio Shares are, and at the Effective Time will be, duly and validly issued and outstanding, fully paid, and non-assessable by the Trust and have been offered and sold in every state and the District of Columbia in compliance in all material respects with applicable registration requirements of the 1933 Act and state securities laws; Acquiring Portfolio does not have outstanding any options, warrants, or other rights to subscribe for or purchase any Acquiring Portfolio Shares, nor are there outstanding any securities convertible into any Acquiring Portfolio Shares; and the Acquiring Portfolio Shares to be issued and delivered to Target, for the Shareholders’ accounts, pursuant to the terms hereof, (1) will have been duly authorized by the Trust and duly registered under the federal securities laws (and appropriate notices respecting them will have been duly filed under applicable state securities laws) at the Effective Time and (2) when so issued and delivered, will be duly and validly issued and outstanding Acquiring Portfolio Shares, fully paid and non-assessable by the Trust.
4.3 The Trust’s obligation to implement this Plan on each Portfolio’s behalf shall be subject to satisfaction of the following conditions at or before, and continuing through, the Effective Time:
(a) No governmental consents, approvals, or authorizations (collectively, “consents”) or filings are required under the 1933 Act, the Securities Exchange Act of 1934, as amended, the 1940 Act, or state securities laws, and no consents or orders of any court are required, for the Trust’s adoption and performance hereof, on either Portfolio’s behalf, except for (1) the Trust’s filing with the Commission of a registration statement on Form N-14 relating to the Acquiring Portfolio Shares issuable hereunder, and any supplement or amendment thereto, including therein a prospectus and proxy statement (“Registration Statement”), and a post-effective amendment to its registration statement on Form N-1A and (2) consents, filings, and orders that have been made or received or may be required after the Effective Time;
(b) The fair market value of the Acquiring Portfolio Shares each Shareholder receives will be approximately equal to the fair market value of its Target Shares it actually or constructively surrenders in exchange therefor;
(c) There will be no dissenters to the Reorganization under the applicable provisions of Delaware law, and Acquiring Portfolio will not pay cash in lieu of fractional Acquiring Portfolio Shares in connection with the Reorganization;
(d) The Trust shall have called and held a meeting of Target’s shareholders to consider and act on this Plan and to take all other action necessary to obtain approval of the transactions contemplated hereby (“Shareholders Meeting”); and this Plan shall have been approved at that meeting (including any adjournments or postponements thereof);
(e) All necessary filings shall have been made with the Commission and state securities authorities, and no order or directive shall have been received that any other or further action is required to permit the Trust to carry out the transactions contemplated hereby; the Registration Statement shall have become effective under the 1933 Act, no stop orders suspending the effectiveness thereof shall have been issued, and, to the Trust’s best knowledge, no investigation or proceeding for that purpose shall have been instituted or shall be pending, threatened, or contemplated under the 1933 Act or the 1940 Act; the Commission shall not have issued an unfavorable report with respect to the Reorganization under section 25(b) of the 1940 Act nor instituted any proceedings seeking to enjoin consummation of the transactions contemplated hereby under section 25(c) of the 1940 Act; and all consents, orders, and permits of federal, state, and local regulatory authorities (including the Commission and state securities authorities) the Trust deems necessary to permit consummation, in all material respects, of the transactions contemplated hereby shall have been obtained, except where failure to obtain same would not involve a risk of a material adverse effect on either Portfolio’s assets or properties; and
A-36
(f) At the Effective Time, no action, suit, or other proceeding shall be pending (or, to the Trust’s best knowledge, threatened to be commenced) before any court, governmental agency, or arbitrator in which it is sought to enjoin the performance of, restrain, prohibit, affect the enforceability of, or obtain damages or other relief in connection with, the transactions contemplated hereby.
5. EXPENSES
Target shall bear all the expenses of the Reorganization, except that (a) Target shall not bear any brokerage or similar expenses incurred by or for the benefit of Acquiring Portfolio in connection with the Reorganization, which shall be borne by Acquiring Portfolio, and (b) expenses shall be paid by the Portfolio directly incurring them if and to the extent that the payment thereof by another person would result in that Portfolio’s disqualification as a RIC.
6. TERMINATION
The Board may terminate or delay this Plan and abandon or postpone the transactions contemplated hereby, at any time before the Effective Time, if circumstances develop that, in its opinion, make proceeding with the Reorganization inadvisable for either Portfolio.
7. AMENDMENTS
The Board may amend, modify, or supplement this Plan at any time in any manner, notwithstanding Target’s shareholders’ approval hereof; provided that, following that approval, no such amendment, modification, or supplement shall have a material adverse effect on the Shareholders’ interests.
8. MISCELLANEOUS
8.1 This Plan shall be governed by and construed in accordance with the internal laws of the State of Delaware, without giving effect to principles of conflicts of laws; provided that, in the case of any conflict between those laws and the federal securities laws, the latter shall govern.
8.2 Nothing expressed or implied herein is intended or shall be construed to confer on or give any person, firm, trust, or corporation other than the Trust (on the Portfolios’ behalf) and its successors and assigns any rights or remedies under or by reason hereof.
8.3 Notice is hereby given that this instrument is adopted on behalf of the Trust’s trustees solely in their capacities as trustees, and not individually, and that the Trust’s obligations under this instrument are not binding on or enforceable against any of its trustees, officers, shareholders, or series other than the Portfolios but are only binding on and enforceable against the Trust’s property attributable to and held for the benefit of each respective Portfolio (“Portfolio’s Property”) and not its property attributable to and held for the benefit of any other series thereof. The Trust, in asserting any rights or claims hereunder on either Portfolio’s behalf, shall look only to the other Portfolio’s Property in settlement of those rights or claims and not to the property of any other series of the Trust or to those trustees, officers, or shareholders.
8.4 Any term or provision hereof that is invalid or unenforceable in any jurisdiction shall, as to that jurisdiction, be ineffective to the extent of that invalidity or unenforceability without rendering invalid or unenforceable the remaining terms and provisions hereof or affecting the validity or enforceability of any of the terms and provisions hereof in any other jurisdiction.
Adopted as of December 1, 2016
A-37
APPENDIX A.4
FORM OF PLAN OF
REORGANIZATION AND TERMINATION
THIS PLAN OF REORGANIZATION AND TERMINATION (“Plan”) is adopted by EQ ADVISORS TRUST, a Delaware statutory trust (“Trust”), on behalf of AXA/Pacific Global Small Cap Value Portfolio (“Target”) and AXA/Horizon Small Cap Value Portfolio (“Acquiring Portfolio”), each a segregated portfolio of assets (“series”) thereof. (Each of Target and Acquiring Portfolio is sometimes referred to herein as a “Portfolio.”) Notwithstanding anything to the contrary contained herein, (1) all agreements, covenants, actions, and obligations (collectively, “Obligations”) of and by each Portfolio contained herein shall be deemed to be Obligations of, and all rights and benefits created hereunder in favor of each Portfolio shall inure to and be enforceable by, the Trust acting on its behalf, and (2) in no event shall any other series of the Trust or the assets thereof be held liable with respect to the breach or other default by an obligated Portfolio or the Trust of its Obligations set forth herein.
The Trust (1) is a statutory trust that is duly organized, validly existing, and in good standing under the laws of the State of Delaware, (2) is duly registered under the Investment Company Act of 1940, as amended (“1940 Act”), as an open-end management investment company, which registration is in full force and effect, and (3) has the power to own all its properties and assets and to carry on its business described in its current registration statement on Form N-1A. Each Portfolio is a duly established and designated series thereof.
The Trust currently sells voting shares of beneficial interest in the Portfolios, $0.001 par value per share (“shares”), to (1) separate accounts of AXA Equitable Life Insurance Company (“AXA Equitable”), AXA Life and Annuity Company, or other affiliated or unaffiliated insurance companies (“Separate Accounts”) in connection with certain variable annuity certificates and contracts and variable life insurance policies (collectively, “Contracts”) issued thereby and (2) The AXA Equitable 401(k) Plan. Shares in each Portfolio also may be sold to (3) other tax-qualified retirement plans and (4) other investors eligible under applicable Regulations (as defined below). Class K shares are sold only to other series of the Trust, series of AXA Premier VIP Trust, and certain group annuity and retirement plans. The Portfolios are underlying investment options for the Separate Accounts to fund Contracts. Under applicable law, the assets of all the Separate Accounts (i.e., the shares in the Portfolios) are the property of AXA Equitable, which is the owner of record of those shares, and are held for the benefit of the Contract holders.
The Trust wishes to effect a reorganization described in section 368(a)(1)(D) of the Internal Revenue Code of 1986, as amended (“Code”) (all “section” references are to the Code, unless otherwise noted), and intends this Plan to be, and adopts it as, a “plan of reorganization” (within the meaning of the regulations under the Code (“Regulations”)). The reorganization will consist of (1) the transfer of all of Target’s assets to Acquiring Portfolio in exchange solely for shares in Acquiring Portfolio and Acquiring Portfolio’s assumption of all of Target’s liabilities, (2) the distribution of those shares pro rata to Target’s shareholders in exchange for their shares therein and in complete liquidation thereof (for federal tax purposes), and (3) Target’s termination as a series of the Trust, all on the terms and conditions set forth herein (collectively, “Reorganization”).
The Trust’s Amended and Restated Declaration of Trust, as amended (“Declaration”), permits it to vary its shareholders’ investment. The Trust does not have a fixed pool of assets — each series thereof (including each Portfolio) is a managed portfolio of securities, and AXA Equitable Funds Management Group, LLC (“FMG LLC”) and each investment sub-adviser thereof, if any, have the authority to buy and sell securities for it. The Trust believes, based on its review of each Portfolio’s investment portfolio, that Target’s portfolio holdings are generally consistent and compatible with Acquiring Portfolio’s investment objective, policies, and strategies and that, as a result, a large majority of Target’s assets can be transferred to and held by Acquiring Portfolio.
The Trust’s Board of Trustees (“Board”), including a majority of its members who are not “interested persons” (as that term is defined in the 1940 Act) thereof, (1) has duly adopted this Plan, approved the transactions contemplated hereby, and duly authorized its performance hereof on each Portfolio’s behalf and consummation of the Reorganization by all necessary Board action and (2) has determined that participation in the Reorganization is in the best interests of each Portfolio and that the interests of the existing shareholders thereof will not be diluted as a result of the Reorganization.
A-38
Target offers three classes of shares, designated Class IA, Class IB, and Class K shares (“Class IA Target Shares,” “Class IB Target Shares,” and “Class K Target Shares,” respectively, and collectively, “Target Shares”). Acquiring Portfolio also offers three classes of shares, also designated Class IA, Class IB, and Class K shares (“Class IA Acquiring Portfolio Shares,” “Class IB Acquiring Portfolio Shares,” and “Class K Acquiring Portfolio Shares,” respectively, and collectively, “Acquiring Portfolio Shares”). The Portfolios’ similarly designated classes of shares have identical characteristics, rights, and preferences.
1. PLAN OF REORGANIZATION AND TERMINATION
1.1 Subject to the requisite approval of Target’s shareholders and the terms and conditions set forth herein, Target shall assign, sell, convey, transfer, and deliver all of its assets described in paragraph 1.2 (“Assets”) to Acquiring Portfolio. In exchange therefor, Acquiring Portfolio shall —
(a) issue and deliver to Target the number of full and fractional (all references herein to “fractional” shares meaning fractions rounded to the eighth decimal place) (1) Class IA Acquiring Portfolio Shares determined by dividing Target’s net value (computed as set forth in paragraph 2.1) (“Target Value”) attributable to the Class IA Target Shares by the net asset value (computed as set forth in paragraph 2.2) (“NAV”) of a Class IA Acquiring Portfolio Share, (2) Class IB Acquiring Portfolio Shares determined by dividing the Target Value attributable to the Class IB Target Shares by the NAV of a Class IB Acquiring Portfolio Share, and (3) Class K Acquiring Portfolio Shares determined by dividing the Target Value attributable to the Class K Target Shares by the NAV of a Class K Acquiring Portfolio Share, and
(b) assume all of Target’s liabilities described in paragraph 1.3 (“Liabilities”).
Those transactions shall take place at the Closing (as defined in paragraph 3.1).
1.2 The Assets shall consist of all assets and property of every kind and nature — including all cash, cash equivalents, securities, commodities, futures interests, receivables (including interest and dividends receivable), claims and rights of action, rights to register shares under applicable securities laws, goodwill, and books and records — Target owns at the Valuation Time (as defined in paragraph 2.1) and any deferred and prepaid expenses (other than unamortized organizational expenses) shown as assets on Target’s books at that time.
1.3 The Liabilities shall consist of all of Target’s liabilities, debts, obligations, and duties of whatever kind or nature existing at the Valuation Time, whether absolute, accrued, contingent, or otherwise, whether known or unknown, whether or not arising in the ordinary course of business, whether or not determinable at the Effective Time (as defined in paragraph 3.1), and whether or not specifically referred to herein. Notwithstanding the foregoing, Target shall use its best efforts to discharge all its known liabilities, debts, obligations, and duties before the Effective Time.
1.4 If the dividends and/or other distributions Target has paid through the Effective Time for its current taxable year do not equal or exceed the sum of its (a) “investment company taxable income” (within the meaning of section 852(b)(2)), computed without regard to any deduction for dividends paid, plus (b) “net capital gain” (as defined in section 1222(11)), after reduction by any capital loss carryovers, for that year through that time, then at or as soon as practicable before that time, Target shall declare and pay to its shareholders of record one or more dividends and/or other distributions so that it will have distributed substantially all of that income and gain for all federal income tax periods ending at or before the Effective Time, and treating its current taxable year as ending at that time, such that Target will have no tax liability under section 852 for the current and any prior tax periods.
1.5 At the Effective Time (or as soon thereafter as is reasonably practicable), Target shall distribute the Acquiring Portfolio Shares it receives pursuant to paragraph 1.1(a) to the Separate Accounts for which AXA Equitable holds Target Shares of record at the Effective Time (each, a “Shareholder”), in proportion to their Target Shares then so held and in constructive exchange therefor, and shall completely liquidate (which shall be treated as a complete liquidation of Target for federal tax purposes, within the meaning of section 1.368-2(m)(1)(iv) of the Regulations). That distribution shall be accomplished by the Trust’s transfer agent’s opening accounts on Acquiring Portfolio’s shareholder records in the names of the Shareholders (except Shareholders in whose names accounts thereon already exist) and transferring those Acquiring Portfolio Shares
A-39
to those newly opened and existing accounts. Pursuant to that transfer, each Shareholder’s account shall be credited with the respective pro rata number of full and fractional Acquiring Portfolio Shares due that Shareholder, by class (i.e., the account for each Shareholder that holds Class IA Target Shares shall be credited with the respective pro rata number of full and fractional Class IA Acquiring Portfolio Shares due that Shareholder, the account for each Shareholder that holds Class IB Target Shares shall be credited with the respective pro rata number of full and fractional Class IB Acquiring Portfolio Shares due that Shareholder, and the account for each Shareholder that holds Class K Target Shares shall be credited with the respective pro rata number of full and fractional Class K Acquiring Portfolio Shares due that Shareholder). The aggregate NAV of Acquiring Portfolio Shares to be so credited to each Shareholder’s account shall equal the aggregate NAV of the Target Shares that Shareholder holds at the Effective Time. All issued and outstanding Target Shares, including any represented by certificates, shall simultaneously be canceled on Target’s shareholder records. Acquiring Portfolio shall not issue certificates representing the Acquiring Portfolio Shares issued in connection with the Reorganization.
1.6 Any transfer taxes payable on issuance and transfer of Acquiring Portfolio Shares in a name other than that of the registered holder on Target’s shareholder records of the Target Shares actually or constructively exchanged therefor shall be paid by the transferee thereof, as a condition of that issuance and transfer.
1.7 After the Effective Time, Target shall not conduct any business except in connection with its termination. As soon as reasonably practicable after distribution of the Acquiring Portfolio Shares pursuant to paragraph 1.5 — as provided there, on making that distribution Target’s liquidation shall be complete for federal tax purposes — but in all events within six months after the Effective Time, (a) Target shall be terminated as a series of the Trust and (b) the Trust shall make all filings and take all other actions in connection therewith necessary and proper to effect that termination.
1.8 Any reporting responsibility of Target to a public authority, including the responsibility for filing regulatory reports, tax returns, and other documents with the Securities and Exchange Commission (“Commission”), any state securities commission, any federal, state, and local tax authorities, and any other relevant regulatory authority, is and shall remain its responsibility up to and including the date on which it is terminated. In furtherance of the foregoing, after the Effective Time, the Trust shall prepare, or shall cause its agents to prepare, any federal, state, and local tax returns, required to be filed by it with respect to Target’s final taxable year ending with its complete liquidation and for any prior periods or taxable years and shall cause those tax returns to be duly filed with the appropriate taxing authorities.
2. VALUATION
2.1 For purposes of paragraph 1.1(a), Target’s net value shall be (a) the value of the Assets computed immediately after the close of regular trading on the New York Stock Exchange (“NYSE”) and Target’s declaration of dividends and/or other distributions, if any, on the date of the Closing (“Valuation Time”), using the valuation procedures set forth in the Trust’s then-current prospectus and statement of additional information and valuation procedures established by the Board (collectively, “Valuation Procedures”), less (b) the amount of the Liabilities at the Valuation Time.
2.2 For purposes of paragraph 1.1(a), the NAV per share of each class of Acquiring Portfolio Shares shall be computed at the Valuation Time, using the Valuation Procedures.
2.3 All computations pursuant to paragraphs 2.1 and 2.2 shall be made (a) by FMG LLC, in its capacity as the Trust’s administrator, or (b) in the case of securities subject to fair valuation, in accordance with the Valuation Procedures.
3. CLOSING AND EFFECTIVE TIME
3.1 Unless the Trust determines otherwise, all acts necessary to consummate the Reorganization (“Closing”) shall be deemed to occur simultaneously as of immediately after the close of business (4:00 p.m., Eastern Time) on May 19, 2017, or a later date the Trust determines (“Effective Time”). If, at or immediately before the Valuation Time, (a) the NYSE or another primary trading market for portfolio securities of either
A-40
Portfolio (each, an “Exchange”) is closed to trading or trading thereon is restricted or (b) trading or the reporting of trading on an Exchange or elsewhere is disrupted so that, in the Board’s judgment, accurate appraisal of the value of either Portfolio’s net assets and/or the NAV per share of any class of Acquiring Portfolio Shares is impracticable, the date of the Closing (and, therefore, the Valuation Time and the Effective Time) shall be postponed until the first business day on which that Exchange is open for regular trading after the day when that trading has been fully resumed and that reporting has been restored. The Closing shall be held at the Trust’s offices or at another place the Trust determines.
3.2 The Trust shall direct the custodian of the Portfolios’ assets to deliver at the Closing a certificate of an authorized officer (“Certificate”) stating that (a) the Assets it holds will be transferred to Acquiring Portfolio at the Effective Time, (b) all necessary taxes in connection with the delivery of the Assets, including all applicable federal and state stock transfer stamps, if any, have been paid or provision for payment has been made, and (c) the information (including adjusted basis and holding period, by lot) concerning the Assets, including all portfolio securities, transferred by Target to Acquiring Portfolio, as reflected on Acquiring Portfolio’s books immediately after the Closing, does or will conform to that information on Target’s books immediately before the Closing.
3.3 The Trust shall direct its transfer agent to deliver to it at or immediately after the Closing a Certificate stating that its records contain (a) the name, address, and taxpayer identification number of each Shareholder, (b) the number of full and fractional shares in each outstanding class of Target Shares each Shareholder owns, and (c) the dividend reinvestment elections, if any, applicable to each Shareholder, all at the Effective Time.
3.4. The Trust shall direct its transfer agent to deliver (a) at the Closing, a confirmation, or other evidence satisfactory to the Trust, that the Acquiring Portfolio Shares to be issued to Target pursuant to paragraph 1.1(a) have been credited to Target’s account on Acquiring Portfolio’s shareholder records and (b) at or as soon as reasonably practicable after the Closing, a Certificate as to the opening of accounts on those records in the names of the Shareholders (except Shareholders in whose names accounts thereon already exist).
4. CONDITIONS PRECEDENT
4.1 The Trust’s obligation to implement this Plan on Acquiring Portfolio’s behalf shall be subject to satisfaction of the following conditions at or before (and continuing through) the Effective Time:
(a) At the Effective Time, the Trust, on Target’s behalf, will have good and marketable title to the Assets and full right, power, and authority to sell, assign, transfer, and deliver the Assets hereunder free of any liens or other encumbrances (except securities that are subject to “securities loans,” as referred to in section 851(b)(2), or are restricted to resale by their terms); and on delivery and payment for the Assets, the Trust, on Acquiring Portfolio’s behalf, will acquire good and marketable title thereto, subject to no restrictions on the full transfer thereof, including restrictions that might arise under the Securities Act of 1933, as amended (“1933 Act”);
(b) The Trust, with respect to Target, is not currently engaged in, and its adoption and performance hereof and consummation of the Reorganization will not result in, (1) a conflict with or material violation of any provision of Delaware law, the Declaration or the Trust’s By-Laws (collectively, “Governing Documents”), or any agreement, indenture, instrument, contract, lease, or other undertaking (each, an “Undertaking”) to which the Trust, with respect to Target or on its behalf, is a party or by which it is bound or (2) the acceleration of any obligation, or the imposition of any penalty, under any Undertaking, judgment, or decree to which the Trust, with respect to Target or on its behalf, is a party or by which it is bound;
(c) At or before the Effective Time, either (1) all material contracts and other commitments of or applicable to Target (other than this Plan and certain investment contracts, including options, futures, forward contracts, and swap agreements) will terminate or (2) provision for discharge, and/or Acquiring Portfolio’s assumption, of any liabilities of Target thereunder will be made, without either Portfolio’s incurring any liability or penalty with respect thereto and without diminishing or releasing any rights the Trust, on Target’s behalf, may have had with respect to actions taken or omitted or to be taken by any other party thereto before the Closing;
A-41
(d) No litigation, administrative proceeding, action, or investigation of or before any court, governmental body, or arbitrator is presently pending or, to the Trust’s knowledge, threatened against the Trust, with respect to Target or any of its properties or assets attributable or allocable to Target, that, if adversely determined, would materially and adversely affect Target’s financial condition or the conduct of its business; and the Trust, on Target’s behalf, knows of no facts that might form the basis for the institution of any such litigation, proceeding, action, or investigation and is not a party to or subject to the provisions of any order, decree, judgment, or award of any court, governmental body, or arbitrator that materially and adversely affects Target’s business or the Trust’s ability to consummate the transactions contemplated hereby;
(e) Target’s Statement of Assets and Liabilities, Portfolio of Investments, Statement of Operations, and Statement of Changes in Net Assets (each, a “Statement”) at and for the fiscal year (in the case of the last Statement, for the two fiscal years) ended December 31, 2016, have been audited by PricewaterhouseCoopers LLP, an independent registered public accounting firm (“PwC”), and are in accordance with generally accepted accounting principles consistently applied in the United States (“GAAP”); those Statements present fairly, in all material respects, Target’s financial condition at that date in accordance with GAAP and the results of its operations and changes in its net assets for the period(s) then ended; and, to the Trust’s management’s best knowledge and belief, there are no known contingent liabilities of Target required to be reflected on a balance sheet (including the notes thereto) in accordance with GAAP at that date that are not disclosed therein;
(f) Since December 31, 2016, there has not been any material adverse change in Target’s financial condition, assets, liabilities, or business, other than changes occurring in the ordinary course of business, or any incurrence by Target of indebtedness maturing more than one year from the date that indebtedness was incurred; for purposes of this subparagraph, a decline in Target’s NAV due to declines in market values of securities Target holds, the discharge of Target liabilities, or the redemption of Target Shares by its shareholders will not constitute a material adverse change;
(g) All federal, state, and local tax returns, dividend reporting forms, and other tax-related reports (collectively, “Returns”) of Target required by law to have been filed by the Effective Time (including any properly and timely filed extensions of time to file) will have been timely filed and are or will be correct in all material respects, and all federal and other taxes shown as due or required to be shown as due on those Returns will have been paid or provision will have been made for the payment thereof (except for amounts that alone or in the aggregate would not reasonably be expected to have a material adverse effect); to the best of the Trust’s knowledge, no such Return is currently under audit and no assessment has been asserted with respect to those Returns; and Target (1) is in compliance in all material respects with all applicable Regulations pertaining to (i) the reporting of dividends and other distributions on and redemptions of its shares, (ii) withholding in respect thereof, and (iii) shareholder basis reporting, (2) has withheld in respect of dividends and other distributions and paid to the proper taxing authorities all taxes required to be withheld, and (3) is not liable for any material penalties that could be imposed thereunder;
(h) Target is not classified as a partnership, and instead is classified as an association that is taxable as a corporation, for federal tax purposes and either has elected the latter classification by filing Form 8832 with the Internal Revenue Service (“IRS”) or is a “publicly traded partnership” (as defined in section 7704(b)) that is treated as a corporation; Target is an “investment company” (as defined in section 368(a)(2)(F)(iii)) and a “fund” (as defined in section 851(g)(2), eligible for treatment under section 851(g)(1)); Target has elected to be a “regulated investment company” under Part I of Subchapter M of Chapter 1 of Subtitle A of the Code (“Subchapter M”) (“RIC”); for each taxable year of its operation (including the taxable year that will end at the Effective Time (“current year”)), Target has met (and for the current year will meet) the requirements of Subchapter M for qualification and treatment as a RIC and has been (and for the current year will be) eligible to and has computed (and for the current year will compute) its federal income tax under section 852; Target has declared and paid to its shareholders the dividend(s) and/or other distribution(s), if any, required to be declared and paid pursuant to paragraph 1.4; and Target has no earnings and profits accumulated in any taxable year in which the provisions of Subchapter M did not apply to it;
A-42
(i) Target is in the same line of business as Acquiring Portfolio is in, for purposes of section 1.368-1(d)(2) of the Regulations, and did not enter into that line of business as part of the plan of reorganization; from the time the Board approved the transactions contemplated hereby (“Approval Time”) through the Effective Time, Target has invested and will invest its assets in a manner that ensures its compliance with the foregoing and paragraph 4.1(h); from the time it commenced operations through the Effective Time, Target has conducted and will conduct its “historic business” (within the meaning of that section) in a substantially unchanged manner; and from the Approval Time through the Effective Time, Target (1) has not disposed of and/or acquired, and will not dispose of and/or acquire, any assets (a) for the purpose of satisfying Acquiring Portfolio’s investment objective or policies or (b) for any other reason except in the ordinary course of its business as a RIC and (2) has not changed, and will not change, its historic investment policies in connection with the Reorganization;
(j) At the Effective Time, (1) at least 33 1/3% of Target’s portfolio assets — including, for these purposes, a proportionate share of the portfolio assets of any RIC (including an exchange-traded fund that is a RIC) in which Target invests — will meet Acquiring Portfolio’s investment objective, strategies, policies, risks, and restrictions (collectively, “Investment Criteria”), (2) Target will not have altered its portfolio in connection with the Reorganization to meet that 33 1/3% threshold, and (3) Target will not have modified any of its Investment Criteria as part of the plan of reorganization, for purposes of section 1.368-1(d)(2) of the Regulations;
(k) To the best of the Trust’s management’s knowledge, there is no plan or intention by Target’s shareholders to redeem, sell, exchange, or otherwise dispose of a number of Target Shares (or Acquiring Portfolio Shares to be received in the Reorganization), in connection with the Reorganization, that would reduce their ownership of the Target Shares (or the equivalent Acquiring Portfolio Shares) to a number of shares that is less than 50% of the current number of Target Shares outstanding;
(l) During the five-year period ending at the Effective Time, neither Target nor any person “related” (within the meaning of section 1.368-1(e)(4) of the Regulations (“Related”), without regard to section 1.368-1(e)(4)(i)(A) thereof) to it will have (1) acquired Target Shares with consideration other than Acquiring Portfolio Shares or Target Shares, except for shares redeemed in the ordinary course of Target’s business as a series of an open-end investment company pursuant to section 22(e) of the 1940 Act, or (2) made distributions with respect to Target Shares except for (i) normal, regular dividend distributions made pursuant to Target’s historic dividend-paying practice and (ii) other distributions declared and paid to ensure Target’s continuing qualification as a RIC and to avoid the imposition of fund-level tax;
(m) All issued and outstanding Target Shares are, and at the Effective Time will be, duly and validly issued and outstanding, fully paid, and non-assessable by the Trust and have been offered and sold in every state and the District of Columbia in compliance in all material respects with applicable registration requirements of the 1933 Act and state securities laws; all issued and outstanding Target Shares will, at the Effective Time, be held by the persons and in the amounts set forth on Target’s shareholder records (as provided in the Certificate to be delivered pursuant to paragraph 3.3); and Target does not have outstanding any options, warrants, or other rights to subscribe for or purchase any Target Shares, nor are there outstanding any securities convertible into any Target Shares;
(n) Target incurred the Liabilities, which are associated with the Assets, in the ordinary course of its business;
(o) Target is not under the jurisdiction of a court in a “title 11 or similar case” (as defined in section 368(a)(3)(A)); and
(p) Not more than 25% of the value of Target’s total assets (excluding cash, cash items, and Government securities) is invested in the stock and securities of any one issuer, and not more than 50% of the value of those assets is invested in the stock and securities of five or fewer issuers; provided that a proportionate share of the assets of any RIC in which Target invests (and not the securities issued by the RIC itself) shall be taken into account for this purpose.
A-43
4.2 The Trust’s obligation to implement this Plan on Target’s behalf shall be subject to satisfaction of the following conditions at or before (and continuing through) the Effective Time:
(a) No consideration other than Acquiring Portfolio Shares (and Acquiring Portfolio’s assumption of the Liabilities) will be issued in exchange for the Assets in the Reorganization;
(b) The Trust, with respect to Acquiring Portfolio, is not currently engaged in, and its adoption and performance hereof and consummation of the Reorganization will not result in, (1) a conflict with or material violation of any provision of Delaware law, the Governing Documents, or any Undertaking to which the Trust, with respect to Acquiring Portfolio or on its behalf, is a party or by which it is bound or (2) the acceleration of any obligation, or the imposition of any penalty, under any Undertaking, judgment, or decree to which the Trust, with respect to Acquiring Portfolio or on its behalf, is a party or by which it is bound;
(c) No litigation, administrative proceeding, action, or investigation of or before any court, governmental body, or arbitrator is presently pending or, to the Trust’s knowledge, threatened against the Trust, with respect to Acquiring Portfolio or any of its properties or assets attributable or allocable to Acquiring Portfolio, that, if adversely determined, would materially and adversely affect Acquiring Portfolio’s financial condition or the conduct of its business; and the Trust, on Acquiring Portfolio’s behalf, knows of no facts that might form the basis for the institution of any such litigation, proceeding, action, or investigation and is not a party to or subject to the provisions of any order, decree, judgment, or award of any court, governmental body, or arbitrator that materially and adversely affects Acquiring Portfolio’s business or the Trust’s ability to consummate the transactions contemplated hereby;
(d) Acquiring Portfolio’s Statements at and for the fiscal year (in the case of the Statement of Changes in Net Assets, for the two fiscal years) ended December 31, 2015, have been audited by PwC and are in accordance with GAAP; those Statements present fairly, in all material respects, Acquiring Portfolio’s financial condition at that date in accordance with GAAP and the results of its operations and changes in its net assets for the period(s) then ended; and, to the Trust’s management’s best knowledge and belief, there are no known contingent liabilities of Acquiring Portfolio required to be reflected on a balance sheet (including the notes thereto) in accordance with GAAP at that date that are not disclosed therein;
(e) Since December 31, 2016, there has not been any material adverse change in Acquiring Portfolio’s financial condition, assets, liabilities, or business, other than changes occurring in the ordinary course of business, or any incurrence by Acquiring Portfolio of indebtedness maturing more than one year from the date that indebtedness was incurred; for purposes of this subparagraph, a decline in Acquiring Portfolio’s NAV due to declines in market values of securities Acquiring Portfolio holds, the discharge of Acquiring Portfolio’s liabilities, or the redemption of Acquiring Portfolio Shares by its shareholders will not constitute a material adverse change;
(f) All Returns of Acquiring Portfolio required by law to have been filed by the Effective Time (including any properly and timely filed extensions of time to file) will have been timely filed and are or will be correct in all material respects, and all federal and other taxes shown as due or required to be shown as due on those Returns will have been paid or provision will have been made for the payment thereof (except for amounts that alone or in the aggregate would not reasonably be expected to have a material adverse effect); to the best of the Trust’s knowledge, no such Return is currently under audit and no assessment has been asserted with respect to those Returns; and Acquiring Portfolio (1) is in compliance in all material respects with all applicable Regulations pertaining to (i) the reporting of dividends and other distributions on and redemptions of its shares, (ii) withholding in respect thereof, and (iii) shareholder basis reporting, (2) has withheld in respect of dividends and other distributions and paid to the proper taxing authorities all taxes required to be withheld, and (3) is not liable for any material penalties that could be imposed thereunder;
A-44
(g) Acquiring Portfolio is not classified as a partnership, and instead is classified as an association that is taxable as a corporation, for federal tax purposes and either has elected the latter classification by filing Form 8832 with the IRS or is a “publicly traded partnership” (as defined in section 7704(b)) that is treated as a corporation; Acquiring Portfolio is an “investment company” (as defined in section 368(a)(2)(F)(iii)) and a “fund” (as defined in section 851(g)(2), eligible for treatment under section 851(g)(1)); Acquiring Portfolio has elected to be a RIC; for each taxable year of its operation (including the taxable year that includes the Effective Time (“current year”)), Acquiring Portfolio has met (and for the current year will meet) the requirements of Subchapter M for qualification and treatment as a RIC and has been (and for the current year will be) eligible to and has computed (and for the current year will compute) its federal income tax under section 852; Acquiring Portfolio will continue to meet all those requirements for the current year and intends to continue to do so, and to continue to be eligible to and to so compute its federal income tax, for succeeding taxable years; and Acquiring Portfolio has no earnings and profits accumulated in any taxable year in which the provisions of Subchapter M did not apply to it;
(h) Acquiring Portfolio is in the same line of business as Target was in preceding the Reorganization, for purposes of section 1.368-1(d)(2) of the Regulations, and did not enter into that line of business as part of the plan of reorganization; and following the Reorganization, Acquiring Portfolio will continue, and has no plan or intention to change, that line of business;
(i) At the Effective Time, Acquiring Portfolio (1) will not have modified any of its Investment Criteria as part of the plan of reorganization and (2) will not have any plan or intention to change any of its Investment Criteria after the Reorganization;
(j) Following the Reorganization, Acquiring Portfolio will (1) continue Target’s “historic business” (within the meaning of section 1.368-1(d)(2) of the Regulations) and (2) use a significant portion of Target’s “historic business assets” (within the meaning of section 1.368-1(d)(3) of the Regulations) in a business; moreover, Acquiring Portfolio (3) has no plan or intention to sell or otherwise dispose of a significant part of the Assets, except for dispositions made in the ordinary course of that business and dispositions necessary to maintain its status as a RIC, and (4) expects to retain substantially all the Assets in the same form as it receives them in the Reorganization, unless and until subsequent investment circumstances suggest the desirability of change or it becomes necessary to make dispositions thereof to maintain that status;
(k) Acquiring Portfolio does not directly or indirectly own, nor at the Effective Time will it directly or indirectly own, nor has it directly or indirectly owned at any time during the past five years, any Target Shares;
(l) Acquiring Portfolio has no plan or intention to issue additional Acquiring Portfolio Shares following the Reorganization, except for shares issued in the ordinary course of its business as a series of an open-end investment company; nor will Acquiring Portfolio or any person Related to it have any plan or intention at the Effective Time to acquire or redeem any Acquiring Portfolio Shares issued in the Reorganization — either directly or through any transaction, agreement, or arrangement with any other person — except for redemptions Acquiring Portfolio will make as such a series pursuant to section 22(e) of the 1940 Act;
(m) Before or in the Reorganization, neither Acquiring Portfolio nor any person Related to it will have acquired, directly or through any transaction, agreement, or arrangement with any other person, Target Shares with consideration other than Acquiring Portfolio Shares;
(n) Acquiring Portfolio is not under the jurisdiction of a court in a “title 11 or similar case” (as defined in section 368(a)(3)(A));
(o) There is no plan or intention for Acquiring Portfolio to be terminated, dissolved, or merged into another statutory or business trust or a corporation or any “fund” thereof (as defined in section 851(g)(2)) following the Reorganization;
A-45
(p) Assuming satisfaction of the condition in paragraph 4.1(p), immediately after the Reorganization (1) not more than 25% of the value of Acquiring Portfolio’s total assets (excluding cash, cash items, and Government securities) will be invested in the stock and securities of any one issuer and (2) not more than 50% of the value of those assets will be invested in the stock and securities of five or fewer issuers; provided that a proportionate share of the assets of any RIC in which Acquiring Portfolio invests (and not the securities issued by the RIC itself) shall be taken into account for this purpose; and
(q) All issued and outstanding Acquiring Portfolio Shares are, and at the Effective Time will be, duly and validly issued and outstanding, fully paid, and non-assessable by the Trust and have been offered and sold in every state and the District of Columbia in compliance in all material respects with applicable registration requirements of the 1933 Act and state securities laws; Acquiring Portfolio does not have outstanding any options, warrants, or other rights to subscribe for or purchase any Acquiring Portfolio Shares, nor are there outstanding any securities convertible into any Acquiring Portfolio Shares; and the Acquiring Portfolio Shares to be issued and delivered to Target, for the Shareholders’ accounts, pursuant to the terms hereof, (1) will have been duly authorized by the Trust and duly registered under the federal securities laws (and appropriate notices respecting them will have been duly filed under applicable state securities laws) at the Effective Time and (2) when so issued and delivered, will be duly and validly issued and outstanding Acquiring Portfolio Shares, fully paid and non-assessable by the Trust.
4.3 The Trust’s obligation to implement this Plan on each Portfolio’s behalf shall be subject to satisfaction of the following conditions at or before (and continuing through) the Effective Time:
(a) No governmental consents, approvals, or authorizations (collectively, “consents”) or filings are required under the 1933 Act, the Securities Exchange Act of 1934, as amended, the 1940 Act, or state securities laws, and no consents or orders of any court are required, for the Trust’s adoption and performance hereof, on either Portfolio’s behalf, except for (1) the Trust’s filing with the Commission of a registration statement on Form N-14 relating to the Acquiring Portfolio Shares issuable hereunder, and any supplement or amendment thereto, including therein a prospectus and proxy statement (“Registration Statement”), and a post-effective amendment to its registration statement on Form N-1A and (2) consents, filings, and orders that have been made or received or may be required after the Effective Time;
(b) The fair market value of the Acquiring Portfolio Shares each Shareholder receives will be approximately equal to the fair market value of its Target Shares it actually or constructively surrenders in exchange therefor;
(c) The Trust’s management (1) is unaware of any plan or intention of Shareholders to redeem, sell, or otherwise dispose of (i) any portion of their Target Shares before the Reorganization to any person Related to either Portfolio or (ii) any portion of the Acquiring Portfolio Shares they receive in the Reorganization to any person Related to Acquiring Portfolio, (2) does not anticipate dispositions of those Acquiring Portfolio Shares at the time of or soon after the Reorganization to exceed the usual rate and frequency of dispositions of shares in Target as a series of an open-end investment company, (3) expects that the percentage of shareholder interests, if any, that will be disposed of as a result, or at the time, of the Reorganization will be de minimis, and (4) does not anticipate that there will be extraordinary redemptions of Acquiring Portfolio Shares immediately following the Reorganization;
(d) Target’s shareholders will pay their own expenses (such as fees of personal investment or tax advisers for advice concerning the Reorganization), if any, incurred in connection with the Reorganization;
(e) The fair market value and “adjusted basis” (within the meaning of section 1011) of the Assets will equal or exceed the Liabilities to be assumed by Acquiring Portfolio and those to which the Assets are subject;
(f) At the Effective Time, there will be no intercompany indebtedness existing between the Portfolios that was issued, acquired, or settled at a discount;
(g) Pursuant to the Reorganization, Target will transfer to Acquiring Portfolio, and Acquiring Portfolio will acquire, at least 90% of the fair market value of the net assets, and at least 70% of the fair market
A-46
value of the gross assets, Target held immediately before the Reorganization; for the purposes of the foregoing, any amounts Target uses to pay its Reorganization expenses and to make redemptions and distributions immediately before the Reorganization (except (1) redemptions pursuant to section 22(e) of the 1940 Act and (2) dividends and other distributions declared and paid to ensure Target’s continuing qualification as a RIC and to avoid the imposition of fund-level tax) will be included as assets it held immediately before the Reorganization;
(h) None of the compensation AXA Equitable or any affiliate thereof receives as a service provider to Target will be separate consideration for, or allocable to, any of the Target Shares that AXA Equitable (on any Shareholder’s behalf) holds; none of the Acquiring Portfolio Shares AXA Equitable (on any Shareholder’s behalf) receives in the Reorganization will be separate consideration for, or allocable to, any employment agreement, investment advisory agreement, or other service agreement; and the compensation paid to AXA Equitable or any affiliate thereof will be for services actually rendered and will be commensurate with amounts paid to third parties bargaining at arm’s-length for similar services;
(i) Immediately after the Reorganization, AXA Equitable (through the Separate Accounts) will own shares constituting “control” (within the meaning of section 368(a)(2)(H)(i), i.e., as defined in section 304(c)) of Acquiring Portfolio;
(j) No expenses incurred by Target or on its behalf in connection with the Reorganization will be paid or assumed by Acquiring Portfolio, AXA Equitable or any affiliate thereof (including FMG LLC), or any other third party unless those expenses are solely and directly related to the Reorganization (determined in accordance with the guidelines set forth in Rev. Rul. 73-54, 1973-1 C.B. 187) (“Reorganization Expenses”), and no cash or property other than Acquiring Portfolio Shares will be transferred to Target or any of its shareholders with the intention that such cash or property be used to pay any expenses (even Reorganization Expenses) thereof;
(k) There will be no dissenters to the Reorganization under the applicable provisions of Delaware law, and Acquiring Portfolio will not pay cash in lieu of fractional Acquiring Portfolio Shares in connection with the Reorganization;
(l) The Reorganization is being undertaken for bona fide business purposes (and not a purpose to avoid federal income tax);
(m) The principal purpose of Acquiring Portfolio’s assumption of the Liabilities is a bona fide business purpose and is not avoidance of federal income tax on the transaction;
(n) The Trust shall have called and held a meeting of Target’s shareholders to consider and act on this Plan and to take all other action necessary to obtain approval of the transactions contemplated hereby (“Shareholders Meeting”); and this Plan shall have been approved at that meeting (including any adjournments or postponements thereof);
(o) All necessary filings shall have been made with the Commission and state securities authorities, and no order or directive shall have been received that any other or further action is required to permit the Trust to carry out the transactions contemplated hereby; the Registration Statement shall have become effective under the 1933 Act, no stop orders suspending the effectiveness thereof shall have been issued, and, to the Trust’s best knowledge, no investigation or proceeding for that purpose shall have been instituted or shall be pending, threatened, or contemplated under the 1933 Act or the 1940 Act; the Commission shall not have issued an unfavorable report with respect to the Reorganization under section 25(b) of the 1940 Act nor instituted any proceedings seeking to enjoin consummation of the transactions contemplated hereby under section 25(c) of the 1940 Act; and all consents, orders, and permits of federal, state, and local regulatory authorities (including the Commission and state securities authorities) the Trust deems necessary to permit consummation, in all material respects, of the transactions contemplated hereby shall have been obtained, except where failure to obtain same would not involve a risk of a material adverse effect on either Portfolio’s assets or properties;
A-47
(p) At the Effective Time, no action, suit, or other proceeding shall be pending (or, to the Trust’s best knowledge, threatened to be commenced) before any court, governmental agency, or arbitrator in which it is sought to enjoin the performance of, restrain, prohibit, affect the enforceability of, or obtain damages or other relief in connection with, the transactions contemplated hereby; and
(q) The Trust shall have received an opinion of K&L Gates LLP (“Counsel”) as to the federal income tax consequences mentioned below (“Tax Opinion”). In rendering the Tax Opinion, Counsel may assume satisfaction of all the conditions set forth in this paragraph 4, may treat them as representations and warranties the Trust made to Counsel, and may rely as to factual matters, exclusively and without independent verification, on those representations and warranties and, if Counsel requests, on representations and warranties made in a separate letter addressed to Counsel (collectively, “Representations”). The Tax Opinion shall be substantially to the effect that — based on the facts and assumptions stated therein and conditioned on the Representations’ being true and complete at the Effective Time and consummation of the Reorganization in accordance herewith (without the waiver or modification of any terms or conditions hereof and without taking into account any amendment hereof that Counsel has not approved) — for federal income tax purposes:
(1) Target’s transfer of the Assets to Acquiring Portfolio in exchange solely for Acquiring Portfolio Shares and Acquiring Portfolio’s assumption of the Liabilities, followed by Target’s distribution of those shares pro rata to the Shareholders actually or constructively in exchange for their Target Shares and in complete liquidation of Target, will qualify as a “reorganization” (as defined in section 368(a)(1)(D)), and each Portfolio will be “a party to a reorganization” (within the meaning of section 368(b));
(2) Target will recognize no gain or loss on the transfer of the Assets to Acquiring Portfolio in exchange solely for Acquiring Portfolio Shares and Acquiring Portfolio’s assumption of the Liabilities or on the subsequent distribution of those shares to the Shareholders in exchange for their Target Shares;
(3) Acquiring Portfolio will recognize no gain or loss on its receipt of the Assets in exchange solely for Acquiring Portfolio Shares and its assumption of the Liabilities;
(4) Acquiring Portfolio’s basis in each Asset will be the same as Target’s basis therein immediately before the Reorganization, and Acquiring Portfolio’s holding period for each Asset will include Target’s holding period therefor (except where Acquiring Portfolio’s investment activities have the effect of reducing or eliminating an Asset’s holding period);
(5) A Shareholder will recognize no gain or loss on the exchange of all its Target Shares solely for Acquiring Portfolio Shares pursuant to the Reorganization; and
(6) A Shareholder’s aggregate basis in the Acquiring Portfolio Shares it receives in the Reorganization will be the same as the aggregate basis in its Target Shares it actually or constructively surrenders in exchange for those Acquiring Portfolio Shares, and its holding period for those Acquiring Portfolio Shares will include, in each instance, its holding period for those Target Shares, provided the Shareholder holds the latter as capital assets at the Effective Time.
Notwithstanding subparagraphs (2) and (4), the Tax Opinion may state that no opinion is expressed as to the effect of the Reorganization on the Portfolios or any Shareholder with respect to any Asset as to which any unrealized gain or loss is required to be recognized for federal income tax purposes at the end of a taxable year (or on the termination or transfer thereof) under a mark-to-market system of accounting.
5. EXPENSES
Target shall bear all the Reorganization Expenses, except that (a) Target shall not bear any brokerage or similar expenses incurred by or for the benefit of Acquiring Portfolio in connection with the Reorganization, which shall be borne by Acquiring Portfolio, and (b) expenses shall be paid by the Portfolio directly incurring
A-48
them if and to the extent that the payment thereof by another person would result in that Portfolio’s disqualification as a RIC or would prevent the Reorganization from qualifying as a tax-free reorganization.
6. TERMINATION
The Board may terminate or delay this Plan and abandon or postpone the transactions contemplated hereby, at any time before the Effective Time, if circumstances develop that, in its opinion, make proceeding with the Reorganization inadvisable for either Portfolio.
7. AMENDMENTS
The Board may amend, modify, or supplement this Plan at any time in any manner, notwithstanding Target’s shareholders’ approval hereof; provided that, following that approval, no such amendment, modification, or supplement shall have a material adverse effect on the Shareholders’ interests.
8. MISCELLANEOUS
8.1 This Plan shall be governed by and construed in accordance with the internal laws of the State of Delaware, without giving effect to principles of conflicts of laws; provided that, in the case of any conflict between those laws and the federal securities laws, the latter shall govern.
8.2 Nothing expressed or implied herein is intended or shall be construed to confer on or give any person, firm, trust, or corporation other than the Trust (on the Portfolios’ behalf) and its successors and assigns any rights or remedies under or by reason hereof.
8.3 Notice is hereby given that this instrument is adopted on behalf of the Trust’s trustees solely in their capacities as trustees, and not individually, and that the Trust’s obligations under this instrument are not binding on or enforceable against any of its trustees, officers, shareholders, or series other than the Portfolios but are only binding on and enforceable against the Trust’s property attributable to and held for the benefit of each respective Portfolio (“Portfolio’s Property”) and not its property attributable to and held for the benefit of any other series thereof. The Trust, in asserting any rights or claims hereunder on either Portfolio’s behalf, shall look only to the other Portfolio’s Property in settlement of those rights or claims and not to the property of any other series of the Trust or to those trustees, officers, or shareholders.
8.4 Any term or provision hereof that is invalid or unenforceable in any jurisdiction shall, as to that jurisdiction, be ineffective to the extent of that invalidity or unenforceability without rendering invalid or unenforceable the remaining terms and provisions hereof or affecting the validity or enforceability of any of the terms and provisions hereof in any other jurisdiction.
Adopted as of December 1, 2016
A-49
APPENDIX B
MORE INFORMATION ON STRATEGIES AND RISK FACTORS
Investment Strategies
Changes in Investment Objectives and Principal Investment Strategies
Each Portfolio has its own investment objective(s), policies and strategies. There is no assurance that a Portfolio will achieve its investment objective. The investment objective of each Portfolio may be changed without shareholder approval. Except as otherwise noted, the investment policies and strategies of a Portfolio are not fundamental policies and may be changed without a shareholder vote. In addition, to the extent a Portfolio is new or is undergoing a transition (such as a rebalancing, or experiences large inflows or outflows) or takes a temporary defensive position, it may not be pursuing its investment objective or executing its principal investment strategies.
80% Policies
Among the Acquired Portfolios, each of the CharterSM Real Assets Portfolio and AXA/Pacific Global Small Cap Value Portfolio, and among the Acquiring Portfolios, each of the AXA/DoubleLine Opportunistic Core Plus Bond Portfolio, EQ/PIMCO Global Real Return Portfolio, and AXA/Horizon Small Cap Value Portfolio, has a policy that it will invest at least 80% of its net assets, plus borrowings for investment purposes, in the particular type of investment connoted by its name. Each such policy is subject to change only upon at least sixty (60) days prior notice to shareholders of the affected Portfolio.
Underlying Portfolios and ETFs
Each of the Acquired Portfolios (except AXA/Pacific Global Small Cap Value Portfolio), All Asset Growth- Alt 20 Portfolio, and CharterSM Moderate Portfolio, invests primarily in securities issued by other investment companies (“Underlying Portfolio(s)”) and ETFs (“Underlying ETF(s)”). Accordingly, a Portfolio’s performance depends upon a favorable allocation by the Manager among the Underlying Portfolios and the Underlying ETFs as well as the ability of the Underlying Portfolios and Underlying ETFs to generate favorable performance. The Underlying Portfolios are other mutual funds that are managed by the Manager and sub-advised by one or more investment sub-advisers, which may include affiliates of the Manager, and other investment companies (including open-end and closed-end investment companies) that are managed by investment managers other than the Manager. ETFs are investment companies or other investment vehicles whose shares are listed and traded on U.S. stock exchanges or otherwise traded in the over-the-counter market and may be purchased and sold throughout the trading day based on their market price. A passively-managed ETF seeks to track a securities index or a basket of securities that an “index provider” (such as Standard & Poor’s, Russell or Morgan Stanley Capital International (“MSCI”)) selects as representative of a market, market segment, industry sector, country or geographic region. A passively managed ETF generally holds the same stocks, bonds or other instruments as the index it tracks (or it may hold a representative sample of such instruments). Accordingly, such an ETF is designed so that its performance will correspond closely with that of the index it tracks.
Each of the Acquired Portfolios (except AXA/Pacific Global Small Cap Value Portfolio) and All Asset Growth- Alt 20 Portfolio has target investment percentages (an approximate percentage of the Portfolio’s assets invested in a particular asset category as represented by the primary holdings, as described in the prospectuses, of the Underlying Portfolios and Underlying ETFs). Generally, each Portfolio’s investments in other investment companies are subject to statutory limitations in the 1940 Act, which prohibit the acquisition of shares of other investment companies in excess of certain limits. However, there are statutory and regulatory exemptions from these restrictions under the 1940 Act on which the Portfolio rely to invest in other investment companies in excess of these limits, subject to certain conditions. In addition, many ETFs have obtained exemptive relief from the SEC to permit unaffiliated funds (such as the Portfolios) to invest in their shares beyond the statutory limits, subject to certain conditions and pursuant to contractual arrangements between the ETFs and the investing funds. Certain Portfolios rely on these exemptive orders when investing in ETFs.
B-1
Indexing Strategies
As discussed in this Prospectus, a portion of the AXA/Pacific Global Small Cap Value Portfolio and AXA/Horizon Small Cap Value Portfolio seek to track the performance (before fees and expenses) of a particular index. The following provides additional information regarding the management strategies employed by a Sub-Adviser of a Portfolio in pursuing this objective. The Sub-Adviser to a Portfolio (or portion thereof) that seeks to track the performance (before fees and expenses) of a particular index does not utilize customary economic, financial or market analyses or other traditional investment techniques to manage the Portfolio or portion. Rather, the Sub-Adviser may employ a full replication technique or sampling technique in seeking to track the performance (before fees and expenses) of the index. A full replication technique generally involves holding each security in a particular index in approximately the same weight that the security represents in the index. Conversely, a sampling technique strives to match the characteristics of a particular index without having to purchase every stock in that index by selecting a representative sample of securities for the Portfolio or portion thereof based on the characteristics of the index and the particular securities included therein. Such characteristics may include, with respect to equity indexes, industry weightings, market capitalizations and fundamental characteristics and, with respect to fixed income indexes, interest rate sensitivity, credit quality and sector diversification.
Allocation Strategies
As described in this Prospectus, the Manager allocates the assets of the AXA/Pacific Global Small Cap Value Portfolio and AXA/Horizon Small Cap Value Portfolio among two or more portions of the Portfolio, each of which is managed using different yet complementary investment strategies.
Active Management Strategies
Each Sub-Adviser has complete discretion to select portfolio securities for its portion of a Portfolio’s assets, subject to the Portfolio’s investment objectives, restrictions and policies and other parameters that maybe developed from time to time by the Manager. In selecting investments, the Sub-Advisers use their proprietary investment strategies, which are summarized above in the section “Comparison of Investment Objectives, Policies and Strategies.” The following is an additional general description of certain common types of active management strategies that may be used by the Sub-Advisers to the Portfolios.
Asset Allocation Strategy
The Manager determines the asset allocation target for the asset classes of certain Portfolios, the target investment percentages for each asset category and each Underlying Portfolio and Underlying ETF in which a Portfolio invests using a proprietary investment process, based on fundamental research regarding the investment characteristics of the asset classes, asset categories, Underlying Portfolios and Underlying ETFs, as well as its outlook for the economy and financial markets. The Manager’s selection of Underlying Portfolios may have a positive or negative effect on its revenues and/or profits. You should be aware that in addition to fees directly associated with each Portfolio, you will also indirectly bear the fees of the Underlying Portfolios and Underlying ETFs, which, with respect to the Underlying Portfolios, include management and administration fees paid to the Manager, and in certain instances, advisory fees paid by the Manager to its affiliates.
Each Portfolio may deviate from its asset allocation target and target investment percentages as a result of appreciation or depreciation of the equity securities holdings, alternative investment holdings, or fixed income securities holdings of the Underlying Portfolios or Underlying ETFs in which it invests. Each Portfolio has adopted certain policies to reduce the likelihood of such an occurrence. First, the Manager will rebalance each Portfolio’s holdings as deemed necessary to bring the asset allocation of the Portfolio back into alignment with its target allocations. Second, the Manager will not allocate any new investment dollars to any Underlying Portfolio or Underlying ETF that holds securities of a particular asset class or category whose maximum percentage has been exceeded. Third, the Manager will allocate new investment dollars on a priority basis to Underlying Portfolios or Underlying ETFs that hold securities of a particular asset class or category whose minimum percentage has not been achieved.
B-2
Hybrid Portfolios
Each allocation percentage for AXA/Horizon Small Cap Value Portfolio and AXA/Pacific Global Small Cap Value Portfolio (“Hybrid Portfolios”) is an asset allocation target established by FMG LLC intended to achieve the Hybrid Portfolio’s investment objective and may be changed without shareholder approval. Each Portion of a Hybrid Portfolio may deviate temporarily from its asset allocation target for defensive purposes, in response to large inflows or outflows of assets to and from the Hybrid Portfolio (e.g., in connection with asset allocation rebalancing transactions, reorganization transactions and separate account substitution transactions), or as a result of appreciation or depreciation of its holdings. FMG LLC rebalances each portion of the Hybrid Portfolio as it deems appropriate. To the extent that a Hybrid Portfolio is being rebalanced, experiences large inflows or outflows, or takes a temporary defensive position, it may not be pursuing its investment objective or executing its principal investment strategy.
Additional Strategies
The following provides additional information regarding the principal investment strategies discussed in “Comparison of Investment Objectives, Policies and Strategies,” in the Combined Proxy Statement/Prospectus and additional investment strategies that a Portfolio may employ in pursuing its investment objective. The Portfolios may make other types of investments to the extent permitted by applicable law. For further information about investment strategies, please see each Portfolio’s respective Statement of Additional Information.
Acquired Portfolios (except for Pac Global Portfolio)
Cash and Short-Term Investments. A Portfolio may hold cash or invest in short-term paper and other short-term investments (instead of being allocated to an Underlying Portfolio or Underlying ETF) as deemed appropriate by the Manager. Short-term paper generally includes any note, draft bill of exchange or banker’s acceptance payable on demand or having a maturity at the time of issuance that does not exceed nine months or any renewal thereof payable on demand or having a maturity that is likewise limited. A Portfolio also may invest its uninvested cash in high-quality, short-term debt securities, including repurchase agreements and high-quality money market instruments, and also may invest uninvested cash in money market funds, including money market funds managed by the Manager. To the extent a Portfolio invests in a money market fund, it generally is not subject to the limits placed on investments in other investment companies by the 1940 Act. Generally, these securities offer less potential for gains than other securities.
Illiquid Securities. Each Portfolio may invest up to 15% of its net assets in illiquid securities. Illiquid securities are securities that have no ready market.
Non-Traditional (Alternative) Investments. Non-traditional (alternative) investments are alternatives to traditional equity (stocks) or fixed income (bonds and cash) investments. Non-traditional (alternative) investments have the potential to enhance portfolio diversification and reduce overall portfolio volatility because these investments may not have a strong correlation (relationship) to one another or to traditional market indexes. Non-traditional (alternative) investments use a different approach to investing than do traditional investments. This approach may involve, for example, seeking excess returns that are not tied to traditional investment benchmarks (absolute return); taking both long and short positions in credit-sensitive securities (e.g., long/short credit); holding private securities instead of publicly traded securities (e.g., listed private equity); taking both long and short positions in futures contracts (e.g., managed futures); seeking to benefit from price movements caused by anticipated corporate events, such as mergers, acquisitions, or other special situations (e.g., merger arbitrage); or using derivatives or hedging strategies. This approach also may involve investing in a variety of non-traditional (alternative) strategies (e.g., multi strategies). Many non-traditional (alternative) investment strategies are designed to help reduce the role of overall market direction in determining return.
Portfolio Turnover. The Portfolios do not restrict the frequency of trading to limit expenses. A Portfolio may engage in active and frequent trading of portfolio securities to achieve its investment objectives. Frequent trading can result in a portfolio turnover in excess of 100% (high portfolio turnover).
B-3
Temporary Defensive Investments. For temporary defensive purposes in response to adverse market, economic, political or other conditions, a Portfolio may invest, without limit, in cash, money market instruments or high quality short-term debt securities, including repurchase agreements. To the extent a Portfolio is invested in these instruments, the Portfolio will not be pursuing its principal investment strategies and may not achieve its investment objective. In addition, a Portfolio may deviate from its asset allocation targets and target investment percentages for defensive purposes.
U.S. Government Securities. A Portfolio may invest in U.S. government securities, which include direct obligations of the U.S. Treasury (such as Treasury bills, notes or bonds) and obligations issued or guaranteed as to principal and interest (but not as to market value) by the U.S. government, its agencies or its instrumentalities. U.S. government securities include mortgage-backed securities issued or guaranteed by government agencies or government-sponsored enterprises. Other U.S. government securities may be backed by the full faith and credit of the U.S. government or supported primarily or solely by the creditworthiness of the government-related issuer or, in the case of mortgage-backed securities, by pools of assets.
Acquiring Portfolios (and Pac Global Portfolio)
Bank Loans. A Portfolio may invest in bank loans. A bank loan represents an interest in a loan or other direct indebtedness that entitles the acquirer of such interest to payments of interest, principal and/or other amounts due under the structure of the loan. A Portfolio may acquire a bank loan through a participation interest, which gives the Portfolio the right to receive payments of principal, interest and/or other amounts only from the lender selling the participation interest and only when the lender receives the payments from the borrower, or through an assignment in which a Portfolio succeeds to the rights of the assigning lender and becomes a lender under the loan agreement. Bank loans are typically borrowers’ senior debt obligations and, as such, are considered to hold a senior position in the borrower’s capital structure. The senior capital structure position generally gives the holders of bank loans a priority claim on some or all of the borrower’s assets in the event of a default. In many situations, the assets or cash flow of the borrowing corporation, partnership or other business entity may serve as collateral for the bank loan. Bank loans may be issued in connection with acquisitions, refinancings, and recapitalizations.
Cash Management. Each Portfolio may invest its uninvested cash in high-quality, short-term debt securities, including repurchase agreements and high-quality money market instruments, and also may invest uninvested cash in money market funds, including money market funds managed by the Manager. To the extent a Portfolio invests in a money market fund, it generally is not subject to the limits placed on investments in other investment companies. Generally, these securities offer less potential for gains than other types of securities.
Convertible Securities. Certain Portfolios may invest in convertible securities, including both convertible debt and convertible preferred stock. A convertible security is a generally a bond, preferred stock or other security that may be converted within a specified period of time and at a prestated price or formula into the common stock of the same or a different issuer. A convertible security entitles the holder to receive interest paid or accrued on debt or the dividend paid on preferred stock until the convertible security matures or is redeemed, converted or exchanged. The value of a convertible security is influenced by changes in interest rates, with investment value declining as interest rates increase and increasing as interest rates decline. The credit standing of the issuer and other factors also may have an effect on the convertible security’s investment value. Convertible securities are subordinate in rank to any senior debt obligations of the same issuer and, therefore, an issuer’s convertible securities entail more risk than its senior debt obligations. Convertible securities have unique investment characteristics in that they generally: (1) have higher yields than common stocks, but lower yields than comparable nonconvertible securities; (2) are less subject to fluctuation in value than the underlying stock because they have fixed income characteristics; and (3) provide the potential for capital appreciation if the market price of the underlying common stock increases.
Currency. A Portfolio may enter into foreign currency transactions for hedging and non-hedging purposes on a spot (i.e., cash) basis or through the use of derivatives. Forward foreign currency exchange contracts (“forward contract”) are a type of derivative that may be utilized by a Portfolio. A forward contract involves an
B-4
obligation to purchase or sell a specific currency at a future date, which may be any fixed number of days from the date of the contract agreed upon by the parties, at a price set at the time of the contract. These contracts are principally traded in the interbank market conducted directly between currency traders (usually large, commercial banks) and their customers. A forward contract generally has no margin deposit requirement and no commissions are charged at any stage for trades. Investments in foreign currencies are subject to the risk that those currencies will decline in value relative to the U.S. dollar.
Derivatives. Each Portfolio may use “derivative” instruments to hedge its portfolio against market, economic, currency, issuer and other risks, to gain or manage exposure to the markets, sectors and securities in which the Portfolio may invest and to other economic factors that affect the Portfolio’s performance (such as interest rate movements), to increase total return or income, to reduce transaction costs, to manage cash, and for other portfolio management purposes. In general terms, a derivative instrument is an investment contract the value of which is linked to (or is derived from), in whole or in part, the value of an underlying asset, reference rate or index (e.g., stocks, bonds, commodities, currencies, interest rates and market indexes). Certain derivative securities may have the effect of creating financial leverage by multiplying a change in the value of the asset underlying the derivative to produce a greater change in the value of the derivative security. This creates an opportunity for increased return but, at the same time, creates the possibility for greater loss (including the likelihood of greater volatility in the net asset value of the shares of a Portfolio). Futures and options contracts (including futures and options on individual securities and equity and bond market indexes and options on futures contracts), swaps (including interest rate swaps, total return swaps, currency swaps and credit default swaps) and forward contracts, and structured securities, including forward currency contracts, are examples of derivatives in which a Portfolio may invest. A Portfolio that engages in derivatives transactions may maintain a significant percentage of its assets in cash and cash equivalent instruments, which may serve as margin or collateral for the Portfolio’s obligations under derivative transactions.
Equity Securities. Certain Portfolios, including certain Portfolios that invest primarily in debt securities, may invest in equity securities. Equity securities may be bought on stock exchanges or in the over-the-counter market. Equity securities generally include common stock, preferred stock, warrants, securities convertible into common stock, securities of other investment companies and securities of real estate investment trusts.
Exchange Traded Funds. A Portfolio may invest in ETFs. ETFs are investment companies or other investment vehicles whose shares are listed and traded on U.S. stock exchanges or otherwise traded in the over-the-counter market and may be purchased and sold throughout the trading day based on their market price. Generally, each ETF seeks to track a securities index or a basket of securities that an “index provider” (such as Standard & Poor’s, Dow Jones, Russell or Morgan Stanley Capital International) selects as representative of a market, market segment, industry sector, country or geographic region. An ETF generally holds the same stocks or bonds as the index it tracks (or it may hold a representative sample of such securities). Accordingly, each ETF is designed so that its performance, before fees and expenses, will correspond closely with that of the index it tracks. By investing in a Portfolio that invests in ETFs, you will indirectly bear fees and expenses charged by the ETFs in which the Portfolio invests in addition to the Portfolio’s direct fees and expenses.
Generally, a Portfolio’s investments in other investment companies are subject to statutory limitations in the Investment Company Act of 1940, as amended (“1940 Act”), including in certain circumstances a prohibition against acquiring shares of another investment company if, immediately after such acquisition, the Portfolio and its affiliated persons (i) would hold more than 3% of such other investment company’s total outstanding shares, (ii) would have invested more than 5% of its total assets in such other investment company, or (iii) would have invested more than 10% of its total assets in investment companies. However, many ETFs have obtained exemptive relief from the SEC to permit other investment companies (such as the Portfolios) to invest in their shares beyond the statutory limits, subject to certain conditions and pursuant to contractual arrangements between the ETFs and the investing funds. A Portfolio may rely on these exemptive orders in investing in ETFs.
Fixed Income Securities. Each Portfolio may invest in short- and long-term fixed income securities in pursuing its investment objective and for other portfolio management purposes, such as to manage cash. Fixed income securities are debt securities such as bonds, notes, debentures and commercial paper. Domestic and
B-5
foreign governments, banks and companies raise cash by issuing or selling debt securities to investors. Most debt securities pay fixed or adjustable rates of interest at regular intervals until they mature, at which point investors receive their principal back.
Foreign Securities. Certain Portfolios may invest in foreign securities, including securities of companies in emerging markets. Generally, foreign securities are issued by companies organized outside the U.S. or by foreign governments or international organizations, are traded primarily in markets outside the U.S., and are denominated in a foreign currency. Foreign securities may include securities of issuers in developing countries or emerging markets, which generally involve greater risk because the economic structures of these countries and markets are less developed and their political systems are less stable. In addition, foreign securities may include depositary receipts of foreign companies. American Depositary Receipts are receipts typically issued by an American bank or trust company that evidence underlying securities issued by a foreign corporation. European Depositary Receipts (issued in Europe) and Global Depositary Receipts (issued throughout the world) each evidence a similar ownership arrangement. Depositary receipts also may be convertible into securities of foreign issuers. These securities may not necessarily be denominated in the same currency as the securities into which they may be converted.
Futures. A Portfolio may purchase or sell futures contracts on individual securities or securities indexes. In purchasing a futures contract, the buyer agrees to purchase a specified underlying instrument at a specified future date. In selling a futures contract, the seller agrees to sell a specified underlying instrument at a specified future date. The price at which the purchase and sale will take place is fixed when the buyer and seller enter into the contract. Futures can be held until their delivery dates, or can be closed out before then if a liquid market is available. The value of a futures contract tends to increase and decrease in tandem with the value of its underlying instrument. Therefore, purchasing futures contracts will tend to increase a fund’s exposure to positive and negative price fluctuations in the underlying instrument, much as if it had purchased the underlying instrument directly. When a fund sells a futures contract, by contrast, the value of its futures position will tend to move in a direction contrary to the market. Selling futures contracts, therefore, will tend to offset both positive and negative market price changes, much as if the underlying instrument had been sold. Futures contracts in which the Portfolio will invest are highly standardized contracts that typically trade on futures exchanges.
There is no assurance that a liquid market will exist for any particular futures contract at any particular time. Exchanges may establish daily price fluctuation limits for futures contracts, and may halt trading if a contract’s price moves upward or downward more than the limit in a given day. On volatile trading days when the price fluctuation limit is reached or a trading halt is imposed, it may be impossible to enter into new positions or close out existing positions. If the market for a contract is not liquid because of price fluctuation limits or other market conditions, it could prevent prompt liquidation of unfavorable positions, and potentially could require a fund to continue to hold a position until delivery or expiration regardless of changes in its value. As a result, a fund’s access to other assets held to cover its futures positions could also be impaired.
The use of futures contracts and similar instruments may be deemed to involve the use of leverage because the Portfolio is not required to invest the full market value of the futures contract upon entering into the contract. Instead, the Portfolio, upon entering into a futures contract (and to maintain its open position in a futures contract), is required to post collateral for the contract, known as “initial margin” and “variation margin,” the amount of which may vary but which generally equals a relatively small percentage (e.g., less than 5%) of the value of the contract being traded. While the use of futures contracts may involve the use of leverage, the Portfolio generally does not intend to use leverage to increase its net exposure to debt securities above approximately 100% of the Portfolio’s net asset value or below 0%.
Illiquid Securities. Each Portfolio may invest up to 15% of its net assets in illiquid securities. Illiquid securities are securities that have no ready market.
Inflation-Indexed Bonds. A Portfolio may invest in inflation-indexed bonds. Inflation-indexed bonds (other than municipal inflation indexed bonds and certain corporate inflation-indexed bonds, which are more fully described below) are fixed income securities whose principal value is periodically adjusted according to the rate of inflation. The U.S. Treasury uses the Consumer Price Index for Urban Consumers as the inflation
B-6
measure. Inflation-indexed bonds issued by a foreign government are generally adjusted to reflect a comparable inflation index, calculated by that government. If the index measuring inflation falls, the principal value of inflation-indexed bonds (other than municipal inflation-indexed bonds and certain corporate inflation-indexed bonds) will be adjusted downward, and consequently the interest payable on these securities (calculated with respect to a smaller principal amount) will be reduced. Repayment of the original bond principal upon maturity (as adjusted for inflation) is guaranteed in the case of U.S. Treasury inflation-indexed bonds. For bonds that do not provide a similar guarantee, the adjusted principal value of the bond repaid at maturity may be less than the original principal.
With regard to municipal inflation-indexed bonds and certain corporate inflation-indexed bonds, the inflation adjustment is reflected in the semi-annual coupon payment. As a result, the principal value of municipal inflation-indexed bonds and such corporate inflation-indexed bonds does not adjust according to the rate of inflation. The value of inflation-indexed bonds is expected to change in response to changes in real interest rates. Real interest rates are tied to the relationship between nominal interest rates and the rate of inflation. If nominal interest rates increase at a faster rate than inflation, real interest rates may rise, leading to a decrease in value of inflation-indexed bonds. Any increase in the principal amount of an inflation-indexed bond is considered taxable ordinary income to an investing Portfolio, which generally must distribute the amount of that income for federal income tax purposes, even though it does not receive the principal until maturity.
Because market convention for bonds is to use nominal yields to measure duration, duration for real return bonds, which are based on real yields, are converted to nominal durations through a conversion factor. The resulting nominal duration typically can range from 20% and 90% of the respective real duration. All security holdings will be measured in effective (nominal) duration terms. Similarly, the effective duration of the relevant index (e.g., the Bloomberg Barclays World Government Inflation-Linked Index (hedged)) will be calculated using the same conversion factors.
Inverse Floaters. A Portfolio may invest in inverse floaters. Inverse floaters are fixed income securities that have coupon rates that vary inversely at a multiple of a designated floating rate, such as London Inter-Bank Offered Rate. Any rise in the reference rate of an inverse floater (as a consequence of an increase in interest rates) causes a drop in the coupon rate while any drop in the reference rate of an inverse floater causes an increase in the coupon rate. Inverse floaters may exhibit substantially greater price volatility than fixed rate obligations having similar credit quality, redemption provisions and maturity, and inverse floater collateralized mortgage obligations (“CMOs”) exhibit greater price volatility than the majority of mortgage-related securities.
Investment Grade Securities. A Portfolio may invest in investment grade debt securities. Investment grade securities are rated in one of the four highest rating categories by Moody’s or S&P, comparably rated by another rating agency or, if unrated, determined by the applicable Sub-Adviser to be of comparable quality. Securities with lower investment grade ratings, while normally exhibiting adequate protection parameters, and may possess certain speculative characteristics as well. This means that changes in economic conditions or other circumstances are more likely to lead to a weakened capacity to make principal and interest payments than is the case for higher rated debt securities.
Large-Cap Companies. A Portfolio may invest in the securities of large-cap companies. These companies may be unable to respond quickly to new competitive challenges such as changes in technology and consumer tastes.
Loan Participations and Assignments. Certain Portfolios may invest in loan participations and assignments. These investments are typically secured or unsecured fixed or floating rate loans arranged through private negotiations between a borrowing corporation, government or other entity and one or more financial institutions, and may be in the form of participations in loans or assignments of all or a portion of loans from third parties.
Mid-Cap, Small-Cap and Micro-cap Companies. Each Portfolio may invest in the securities of mid-, small- and micro-cap companies. These companies are more likely than larger companies to have limited product lines, markets or financial resources or to depend on a small, inexperienced management group. Generally, they are more vulnerable than larger companies to adverse business or economic developments and their securities may be less well-known, trade less frequently and in more limited volume than the securities of larger more established companies.
B-7
Mortgage- and Asset-Backed Securities. A Portfolio may invest in mortgage- and asset-backed securities. A mortgage-backed security may be an obligation of the issuer backed by a mortgage or pool of mortgages or a direct interest in an underlying pool of mortgages. Some mortgage-backed securities make payments of both principal and interest at a variety of intervals; others make semiannual interest payments at a predetermined rate and repay principal at maturity (like a typical bond). Mortgage-backed securities are based on different types of mortgages including those on commercial real estate or residential properties.
Asset-backed securities have structural characteristics similar to mortgage-backed securities. However, the underlying assets are not first lien mortgage loans or interests therein but include assets such as motor vehicle installment sales contracts, other installment sales contracts, home equity loans, leases of various types of real and personal property and receivables from revolving credit (credit card) agreements. Such assets are securitized through the use of trusts or special purpose corporations. Payments or distributions of principal and interest may be guaranteed up to a certain amount and for a certain time period by a letter of credit or pool insurance policy issued by a financial institution unaffiliated with the issuer, or other credit enhancements may be present.
Non-Investment Grade Securities. Certain Portfolios, including Portfolios that invest primarily in equity securities, may invest in below investment grade debt securities. Securities rated below investment grade (i.e., BB or lower by S&P or Fitch, Inc. (“Fitch”), Ba or lower by Moody’s or determined by the applicable Sub-Adviser to be of comparable quality) are speculative in nature, involve greater risk of default by the issuing entity and may be subject to greater market fluctuations than higher rated fixed income securities. Non-investment grade debt securities, sometimes referred to as “junk bonds,” are usually issued by companies without long track records of sales and earnings or by those companies with questionable credit strength. The retail secondary market for these “junk bonds” may be less liquid than that of higher rated securities and adverse conditions could make it difficult at times to sell certain securities or could result in lower prices than those used in calculating the Portfolio’s net asset value.
Options. A Portfolio may write and purchase put and call options, including exchange-traded or over-the-counter put and call options on securities indices and put and call options on ETFs tracking certain securities indices, for hedging and non-hedging purposes and for the purpose of achieving its objective. In general, options give the purchaser the right, but not the obligation, to buy or sell in the future an asset at a predetermined price during the term of the option. A securities index option and an ETF option are option contracts whose values are based on the value of a securities index at some future point in time. A securities index fluctuates with changes in the market values of the securities included in the index. The effectiveness of purchasing or writing securities index options will depend upon the extent to which price movements in the Portfolio’s investment portfolio correlate with price movements of the securities index. By writing (selling) a call option, the Portfolio forgoes, in exchange for the premium less the commission, the opportunity to profit during the option period from an increase in the market value of an index above the exercise price. By writing (selling) a put option, the Portfolio, in exchange for the net premium received, accepts the risk of a decline in the market value of the index below the exercise price.
Portfolio Turnover. The Portfolios do not restrict the frequency of trading to limit expenses. The Portfolios may engage in active and frequent trading of portfolio securities to achieve their investment objectives. Frequent trading can result in a portfolio turnover in excess of 100% (high portfolio turnover).
Preferred Stocks. A Portfolio may invest in preferred stock. Although preferred stocks represent a partial ownership interest in a company, preferred stocks generally do not carry voting rights and have economic characteristics similar to fixed income securities. Preferred stocks generally are issued with a fixed par value and pay dividends based on a percentage of that par value at a fixed or variable rate. Preferred stocks often have a liquidation value that generally equals the original purchase price of the preferred stock at the date of issuance.
Real Estate Investment Trusts (“REITs”). Certain Portfolios may invest in REITs, which are pooled vehicles that invest primarily in income-producing real estate or loans related to real estate and are defined by U.S. tax laws. REITs are not subject to U.S. corporate income tax, provided they comply with a number of Internal Revenue Code requirements, including distributing a significant portion of their net income to shareholders. Various other countries have also adopted REIT-like structures that receive comparable tax treatment, provided certain requirements are met.
B-8
Securities of Other Investment Companies. Certain Portfolios may invest in the securities of other investment companies, including ETFs, to the extent permitted by applicable law. Generally, a Portfolio’s investments in other investment companies are subject to statutory limitations in the 1940 Act, which prohibit the acquisition of shares of other investment companies in excess of certain limits. However, there are statutory and regulatory exemptions from these restrictions under the 1940 Act on which the Portfolios may rely to invest in other investment companies in excess of these limits, subject to certain conditions. In addition, many ETFs have obtained exemptive relief from the Securities and Exchange Commission (“SEC”) to permit unaffiliated funds (such as the Portfolios) to invest in their shares beyond the statutory limits, subject to certain conditions and pursuant to contractual arrangements between the ETFs and the investing funds. A Portfolio may rely on these exemptive orders in investing in ETFs. A Portfolio that invests in other investment companies indirectly bears the fees and expenses of those investment companies.
Short Sales. A Portfolio may engage in short sales and may enter into derivative contracts that have a similar economic effect (e.g., taking a short position in a futures contract). A “short sale” is the sale by a portfolio of a security that has been borrowed from a third party on the expectation that the market price will drop. If the price of the security drops, the Portfolio will make a profit by purchasing the security in the open market at a lower price than at which it sold the security. If the price of the security rises, the Portfolio may have to cover short positions at a higher price than the short sale price, resulting in a loss. In addition, because a Portfolio’s potential loss on a short sale arises from increases in the value of the security sold short, the extent of such loss, like the price of the security sold short, is theoretically unlimited.
Swaps. A Portfolio may engage in swap transactions. Swap contracts are derivatives in the form of a contract or other similar instrument that is an agreement to exchange the return generated by one instrument for the return generated by another instrument. The payment streams are calculated by reference to a specified security or index and agreed upon notional amount. The term “specified index” includes, but is not limited to, currencies, fixed interest rates, prices and total return on interest rate indices, fixed income indices, total return on equity securities, stock indices and commodity indices (as well as amounts derived from arithmetic operations on these indices).
Temporary Defensive Investments. For temporary defensive purposes in response to adverse market, economic, political or other conditions, a Portfolio may invest, without limit, in cash, money market instruments or high quality short-term debt securities, including repurchase agreements. To the extent a Portfolio is invested in these instruments, the Portfolio will not be pursuing its principal investment strategies and may not achieve its investment objective. In addition, a Portfolio may deviate from its asset allocation targets and target investment percentages for defensive purposes.
U.S. Government Securities. A Portfolio may invest in U.S. government securities, which include direct obligations of the U.S. Treasury (such as Treasury bills, notes or bonds) and obligations issued or guaranteed as to principal and interest (but not as to market value) by the U.S. government, its agencies or its instrumentalities. U.S. government securities include mortgage-backed securities issued or guaranteed by government agencies or government-sponsored enterprises. Other U.S. government securities may be backed by the full faith and credit of the U.S. government or supported primarily or solely by the creditworthiness of the government-related issuer or, in the case of mortgage-backed securities, by pools of assets.
Risks
Risk is the chance that you will lose money on your investment or that it will not earn as much as you expect. In general, the greater the risk, the more money your investment can earn for you and the more you can lose. Like other investment companies, the value of a Portfolio’s shares may be affected by the Portfolio’s investment objective(s), principal investment strategies and particular risk factors. Consequently, each Portfolio may be subject to different risks. Some of the risks, including principal risks, of investing in the Portfolios are discussed below. However, other factors may also affect a Portfolio’s investment results. There is no guarantee that a Portfolio will achieve its investment objective(s) or that it will not lose value.
B-9
General Risks of the Portfolios and the Underlying Portfolios and Underlying ETFs
Each Portfolio and each of the Underlying Portfolios and Underlying ETFs may be subject to certain general investment risks, as discussed below. In this section, the term “Portfolio” may include a Portfolio, an Underlying Portfolio, an Underlying ETF, or all of the above.
Sub-Adviser Selection Risk: The risk that the Manager’s process for selecting or replacing an investment sub-adviser (“Sub-Adviser”) and its decision to select or replace a Sub-Adviser does not produce the intended results.
Affiliated Portfolio Risk: In managing a Portfolio that invests in Underlying Portfolios, the Manager will have the authority to select and substitute the Underlying Portfolios. The Manager may be subject to potential conflicts of interest in allocating a Portfolio’s assets among the various Underlying Portfolios because the fees payable to it by some of the Underlying Portfolios are higher than the fees payable by other Underlying Portfolios and because the Manager is also responsible for managing, administering, and with respect to certain Underlying Portfolios, its affiliates are responsible for sub-advising, the Underlying Portfolios. A Portfolio investing in Underlying Portfolios may from time to time own or control a significant percentage of an Underlying Portfolio’s shares. Accordingly, an Underlying Portfolio is subject to the potential for large-scale inflows and outflows as a result of purchases and redemptions of its shares by such a Portfolio. These inflows and outflows may be frequent and could negatively affect an Underlying Portfolio’s and, in turn, a Portfolio’s net asset value and performance and could cause an Underlying Portfolio to purchase or sell securities at a time when it would not normally do so. It would be particularly disadvantageous for an Underlying Portfolio if it experiences outflows and needs to sell securities at a time of volatility in the markets, when values could be falling. These inflows and outflows also could negatively affect an Underlying Portfolio’s and, in turn, a Portfolio’s ability to meet shareholder redemption requests or could limit an Underlying Portfolio’s and, in turn, a Portfolio’s ability to pay redemption proceeds within the time period stated in its prospectus because of unusual market conditions, an unusually high volume of redemption requests, or other reasons. During periods of declining or illiquid markets, the Manager also may be subject to potential conflicts of interest in selecting shares of Underlying Portfolios for redemption. In addition, these inflows and outflows could increase an Underlying Portfolio’s and, in turn, a Portfolio’s brokerage or other transaction costs, and large-scale outflows could cause an Underlying Portfolio’s and, in turn, a Portfolio’s, actual expenses to increase, or could result in an Underlying Portfolio’s current expenses being allocated over a smaller asset base, leading to an increase in the Underlying Portfolio’s and, in turn, a Portfolio’s expense ratio. Consistent with its fiduciary duties, the Manager seeks to implement each Portfolio’s and each Underlying Portfolio’s investment program in a manner that is in the best interest of that Portfolio and Underlying Portfolio and that is consistent with its investment objective, policies, and strategies.
Asset Class Risk: There is the risk that the returns from the asset classes, or types of securities, in which a Portfolio invests will underperform the general securities markets or different asset classes. Different asset classes tend to go through cycles of outperformance and underperformance in comparison to each other and to the general securities markets.
Cash Management Risk: Upon entering into certain derivatives contracts, such as futures contracts, and to maintain open positions in certain derivatives contracts, a Portfolio may be required to post collateral for the contract, the amount of which may vary. In addition, a Portfolio may maintain cash and cash equivalent positions to manage the Portfolio’s market exposure and for other portfolio management purposes. As such, a Portfolio may maintain cash balances, including foreign currency balances, which may be significant with counterparties such as the Trust’s custodian or its affiliates. A Portfolio is thus subject to counterparty risk and credit risk with respect to these arrangements.
Counterparty Risk: If an Underlying Portfolio or Underlying ETF concentrates in a particular market, industry, group of industries, country, region, group of countries, asset class or sector, that Underlying Portfolio or Underlying ETF may be adversely affected by the performance of those securities and may be subject to price volatility. In addition, an Underlying Portfolio or Underlying ETF that concentrates in a single market, industry, group of industries, country, region, group of countries, asset class or sector may be more susceptible to any single economic, market, political or regulatory occurrence affecting that industry or group of industries.
B-10
Cybersecurity and Operational Risk: A Portfolio, its service providers, and third party fund distribution platforms, and your ability to transact with a Portfolio, may be negatively impacted due to operational risks arising from, among other problems, systems and technology disruptions or failures, or cybersecurity incidents. The occurrence of any of these problems could result in a loss of information, regulatory scrutiny, reputational damage and other consequences, any of which could have a material adverse effect on a Portfolio or its shareholders. The Manager, through its monitoring and oversight of Portfolio service providers, endeavors to determine that service providers take appropriate precautions to avoid and mitigate risks that could lead to such problems. However, it is not possible for the Manager, Portfolio service providers, or third-party fund distribution platforms to identify all of the operational risks that may affect a Portfolio or to develop processes and controls to completely eliminate or mitigate their occurrence or effects. Cybersecurity incidents could also affect issuers of securities in which a Portfolio invests, leading to significant loss of value.
Derivatives Risk: A derivative instrument is an investment contract the value of which is linked to (or is derived from), in whole or in part, the value of an underlying asset, reference rate, index or event (e.g., stocks, bonds, commodities, currencies, interest rates and market indexes). Derivatives include options, swaps, futures, options on futures, forward contracts and structured securities. Investing in derivatives involves investment techniques and risks different from those associated with ordinary mutual fund securities transactions and may involve increased transaction costs. The successful use of derivatives will usually depend on the Manager’s or an Adviser’s ability to accurately forecast movements in the market relating to the underlying asset, reference rate, index or event. If the Manager or an Adviser does not predict correctly the direction of securities prices, interest rates and other economic factors, a Portfolio’s derivatives position could lose value. A Portfolio’s investment in derivatives may rise or fall more rapidly in value than other investments and may reduce a Portfolio’s returns. Changes in the value of the derivative may not correlate perfectly, or at all, with the underlying asset, reference rate or index, and a Portfolio could lose more than the principal amount invested. Derivatives also may be subject to certain other risks such as leveraging risk, liquidity risk, interest rate risk, market risk, credit risk, the risk that a counterparty may be unable or unwilling to honor its obligations, management risk and the risk of mispricing or improper valuation. Derivatives also may not behave as anticipated by a Portfolio, especially in abnormal market conditions. The use of derivatives may increase the volatility of a Portfolio’s net asset value. Derivatives may be leveraged such that a small investment in derivative securities can have a significant impact on a Portfolio’s exposure to stock market values, interest rates, currency exchange rates or other investments. As a result, a relatively small price movement in a derivatives contract may cause an immediate and substantial loss or gain. It may be difficult or impossible for a Portfolio to purchase or sell certain derivatives in sufficient amounts to achieve the desired level of exposure, which may result in a loss or may be costly to a Portfolio. In addition, the possible lack of a liquid secondary market for certain derivatives and the resulting inability of a Portfolio to sell or otherwise close-out a derivatives position could expose a Portfolio to losses and could make such derivatives more difficult for a Portfolio to value accurately. Assets segregated to cover these transactions may decline in value and may become illiquid. Some derivatives are more sensitive to market price fluctuations and to interest rate changes than other investments. A Portfolio also could suffer losses related to its derivatives positions as a result of unanticipated market movements, which losses are potentially unlimited. A Portfolio also may be exposed to losses if the counterparty in the transaction does not fulfill its contractual obligation. In addition, derivatives traded over-the-counter do not benefit from the protections provided by exchanges in the event that a counterparty is unable to fulfill its contractual obligation. Such over-the-counter derivatives therefore involve greater counterparty and credit risk and may be more difficult to value than exchange-traded derivatives. When a derivative is used as a hedge against a position that a Portfolio holds, any loss generated by the derivative should generally be offset by gains on the hedged instrument, and vice versa. While hedging can reduce or eliminate losses, it also can reduce or eliminate gains. Hedges are sometimes subject to imperfect matching between the derivative and the hedged investment, and there can be no assurance that a Portfolio’s hedging transactions will be effective. Also, suitable derivative transactions may not be available in all circumstances. There can be no assurance that a Portfolio will engage in derivative transactions to reduce exposure to other risks when that might be beneficial. The federal income tax treatment of a derivative may not be as favorable as a direct investment in an underlying asset and may adversely affect the timing, character and amount of income a Portfolio realizes from its investments. As a result, a larger portion of a Portfolio’s distributions may be treated as ordinary income rather than capital gains. In addition, certain derivatives are subject to mark-to-market or straddle provisions of
B-11
the Internal Revenue Code. If such provisions are applicable, there could be an increase (or decrease) in the amount of taxable dividends paid by a Portfolio. There have been numerous recent legislative and regulatory initiatives to implement a new regulatory framework for the derivatives markets. The Dodd-Frank Wall Street Reform and Consumer Protection Act (“Dodd-Frank Act”) substantially increased regulation of the over-the-counter derivatives market and participants in that market, imposing various requirements on transactions involving instruments that fall within the Dodd-Frank Act’s definition of “swap” and “security-based swap.” In particular, the Dodd-Frank Act may limit the availability of certain derivatives, may make the use of derivatives by a Portfolio more costly, and may otherwise adversely impact the performance and value of derivatives. Under the Dodd-Frank Act, a Portfolio also may be subject to additional recordkeeping and reporting requirements. In addition, the tax treatment of certain derivatives, such as swaps, is unsettled and may be subject to future legislation, regulation or administrative pronouncements issued by the Internal Revenue Service. Other future regulatory developments may also impact a Portfolio’s ability to invest or remain invested in certain derivatives. Legislation or regulation may also change the way in which a Portfolio itself is regulated. The Manager cannot predict the effects of any new governmental regulation that may be implemented on the ability of a Portfolio to use swaps or any other financial derivative product, and there can be no assurance that any new governmental regulation will not adversely affect a Portfolio’s ability to achieve its investment objective.
Exchange-Traded Funds (“ETFs”): A Portfolio may invest in ETFs. ETFs are investment companies or other investment vehicles whose shares are listed and traded on U.S. stock exchanges or otherwise traded in the over-the-counter market and may be purchased and sold throughout the trading day based on their market price. Generally, each ETF seeks to track a securities index or a basket of securities that an “index provider” (such as Standard & Poor’s, Dow Jones, Russell or Morgan Stanley Capital International) selects as representative of a market, market segment, industry sector, country or geographic region. An ETF generally holds the same stocks or bonds as the index it tracks (or it may hold a representative sample of such securities). Accordingly, each ETF is designed so that its performance, before fees and expenses, will correspond closely with that of the index it tracks. By investing in a Portfolio that invests in ETFs, you will indirectly bear fees and expenses charged by the ETFs in which a Portfolio invests in addition to a Portfolio’s direct fees and expenses.
Generally, a Portfolio’s investments in other investment companies are subject to statutory limitations in the Investment Company Act of 1940, as amended (“1940 Act”), including in certain circumstances a prohibition against acquiring shares of another investment company if, immediately after such acquisition, a Portfolio and its affiliated persons (i) would hold more than 3% of such other investment company’s total outstanding shares, (ii) would have invested more than 5% of its total assets in such other investment company, or (iii) would have invested more than 10% of its total assets in investment companies. However, many ETFs have obtained exemptive relief from the SEC to permit other investment companies (such as the Portfolios) to invest in their shares beyond the statutory limits, subject to certain conditions and pursuant to contractual arrangements between the ETFs and the investing funds. A Portfolio may rely on these exemptive orders in investing in ETFs.
Futures Contract Risk: The primary risks associated with the use of futures contracts are (a) the imperfect correlation between the change in market value of the instruments held by a Portfolio and the price of the futures contract; (b) liquidity risks, including the possible absence of a liquid secondary market for a futures contract and the resulting inability to close a futures contract when desired; (c) losses (potentially unlimited) caused by unanticipated market movements; (d) an adviser’s inability to predict correctly the direction of securities prices, interest rates, currency exchange rates and other economic factors; (e) the possibility that a counterparty, clearing member or clearinghouse will default in the performance of its obligations; (f) if a Portfolio has insufficient cash, it may have to sell securities from its portfolio to meet daily variation margin requirements, and a Portfolio may have to sell securities at a time when it may be disadvantageous to do so; and (g) transaction costs associated with investments in futures contracts may be significant, which could cause or increase losses or reduce gains. Futures contracts are also subject to the same risks as the underlying investments to which they provide exposure. In addition, futures contracts may subject a Portfolio to leveraging risk.
Index Strategy Risk: A Portfolio that employs an index strategy generally invests in the securities included in the relevant index or a representative sample of such securities regardless of market trends to track the performance of an unmanaged index of securities, whereas actively managed portfolios typically seek to
B-12
outperform a benchmark index. Such a Portfolio generally will not modify its index strategy to respond to changes in the economy, which means that it may be particularly susceptible to a general decline in the market segment relating to the relevant index. In addition, although the index strategy attempts to closely track its benchmark index, the Portfolio may not invest in all of the securities in the index. Also, the Portfolio’s fees and expenses will reduce the Portfolio’s returns, unlike those of the benchmark index. Cash flow into and out of the Portfolio, portfolio transaction costs, changes in the securities that comprise the index, and the Portfolio’s valuation procedures also may affect the Portfolio’s performance. Therefore, there can be no assurance that the performance of the index strategy will match that of the benchmark index.
Insurance Fund Risk: The Portfolios are available through Contracts offered by insurance company affiliates of the Manager, and the Portfolios may be used to fund all or a portion of certain benefits and guarantees available under the Contracts. To the extent the assets in a Portfolio are insufficient to fund those benefits and guarantees, the Manager’s insurance company affiliates might otherwise be obligated to fulfill them out of their own resources. The Manager may be subject to potential conflicts of interest in connection with providing advice to, or developing strategies and models used to manage, a Portfolio (e.g., with respect to the allocation of assets among Underlying Portfolios or between passively and actively managed portions of a Portfolio and the development and implementation of the models used to manage a Portfolio). The performance of a Portfolio may impact the obligations and financial exposure of the Manager’s insurance company affiliates under any death benefit, income benefit and other guarantees provided through Contracts that offer s Portfolio as an investment option and the ability of an insurance company affiliate to manage (e.g., through the use of various hedging techniques) the risks associated with these benefits and guarantees. The Manager’s investment decisions and the design of the Portfolios may be influenced by these factors. For example, the Portfolios or models and strategies may be managed or designed in a manner (e.g., using more conservative or less volatile investment styles, including volatility management strategies) that could reduce potential losses and/or mitigate financial risks to insurance company affiliates that provide the benefits and guarantees and offer the Portfolios as investment options in their products, and also could facilitate such an insurance company’s ability to provide benefits and guarantees under its Contracts, including by making more predictable the costs of the benefits and guarantees and by reducing the regulatory capital needed to provide them. The performance of a Portfolio also may adversely impact the value of Contracts that offer a Portfolio as an investment option and could suppress the value of the benefits and guarantees offered under a Contract. Please refer to your Contract prospectus for more information about any benefits and guarantees offered under the Contract. Consistent with its fiduciary duties, the Manager seeks to implement each Portfolio’s investment program in a manner that is in the best interests of a Portfolio and that is consistent with a Portfolio’s investment objective, policies and strategies described in detail in this Prospectus.
Investment Style Risk: An Adviser may use a particular style or set of styles, for example, growth, value, momentum or quantitative investing styles, to select investments. Those styles may be out of favor or may not produce the best results over short or longer time periods. They may also increase the volatility of a Portfolio’s share price. Growth investing generally focuses on companies that, due to their strong earnings and revenue potential, offer above-average prospects for capital growth, with less emphasis on dividend income. Earnings predictability and confidence in earnings forecasts are an important part of the selection process. As a result, the price of growth stocks may be more sensitive to changes in current or expected earnings than the prices of other stocks. An Adviser using this approach generally seeks out companies experiencing some or all of the following: high sales growth, high unit growth, high or improving returns on assets and equity, and a strong balance sheet. Such an Adviser also prefers companies with a competitive advantage such as unique management, marketing or research and development. Growth investing is also subject to the risk that the stock price of one or more companies will fall or will fail to appreciate as anticipated by the Adviser, regardless of movements in the securities market. Growth stocks tend to be more volatile than value stocks, so in a declining market their prices may decrease more than value stocks in general. Growth stocks also may increase the volatility of a Portfolio’s share price.
Issuer-Specific Risk: The value of an individual security or particular type of security can be more volatile than the market as a whole and can perform differently from the market as a whole. The value of a security may decline for a number of reasons which directly relate to the issuer, such as management performance, financial
B-13
leverage and reduced demand for the issuer’s goods or services, as well as the historical and prospective earnings of the issuer and the value of its assets. A change in the financial condition of a single issuer may affect securities markets as a whole. Certain unanticipated events, such as natural disasters, can have a dramatic adverse effect on the value of an issuer’s securities.
Leveraging Risk: When a Portfolio leverages its holdings, the value of an investment in that Portfolio will be more volatile and all other risks will tend to be compounded. For example, a Portfolio may take on leveraging risk when it takes a short position, engages in derivatives transactions, invests collateral from securities loans or borrows money. Leveraged holdings generally require corresponding holdings of cash and cash equivalents, which may impair a Portfolio’s ability to pursue its objectives. A Portfolio may experience leveraging risk in connection with investments in derivatives because its investments in derivatives may be purchased with a fraction of the assets that would be needed to purchase the securities directly, so that the remainder of the assets may be invested in other investments. Such investments may have the effect of leveraging a Portfolio because a Portfolio may experience gains or losses not only on its investments in derivatives, but also on the investments purchased with the remainder of the assets. If the value of a Portfolio’s investments in derivatives is increasing, this could be offset by declining values of a Portfolio’s other investments. Conversely, it is possible that the rise in the value of a Portfolio’s non-derivative investments could be offset by a decline in the value of a Portfolio’s investments in derivatives. In either scenario, a Portfolio may experience losses. In a market where the value of a Portfolio’s investments in derivatives is declining and the value of its other investments is declining, a Portfolio may experience substantial losses. The use of leverage may cause a Portfolio to liquidate portfolio positions when it may not be advantageous to do so to satisfy its obligations or to meet any required asset segregation requirements.
Liquidity Risk: The risk that certain investments may be difficult or impossible for a Portfolio to purchase or sell at an advantageous time or price or in sufficient amounts to achieve the desired level of exposure, or possibly requiring a Portfolio to dispose of other investments at unfavorable times or prices to satisfy obligations, which may require a Portfolio to dispose of other investments at unfavorable times or prices to satisfy obligations and may result in a loss or may be costly to a Portfolio. Investments in foreign securities, particularly those of issuers located in emerging markets, tend to have greater exposure to liquidity risk than domestic securities. Judgment plays a greater role in pricing illiquid investments than it does in pricing investments having more active markets and there is a greater risk that the investments may not be sold for the price at which a Portfolio is carrying them. Certain securities that were liquid when purchased may later become illiquid, particularly in times of overall economic distress.
Market Risk: The risk that the securities markets will move down, sometimes rapidly and unpredictably based on overall economic conditions and other factors. The value of a security may decline due to general market conditions which are not specifically related to a particular company, such as real or perceived adverse economic conditions, changes in the general outlook for corporate earnings, changes in interest or currency rates or adverse investment sentiment generally. Changes in the financial condition of a single issuer can impact a market as a whole. The value of a security may also decline due to factors which affect a particular industry or industries, such as labor shortages or increased production costs and competitive conditions within an industry. During a general downturn in the securities markets, multiple asset classes may decline in value simultaneously. Terrorism and related geo-political risks have led, and may in the future lead, to increased short-term market volatility and may have adverse long-term effects on world economies and markets generally. In addition, markets and market-participants are increasingly reliant upon both publicly available and proprietary information data systems. Data imprecision, software or other technology malfunctions, programming inaccuracies, unauthorized use or access, and similar circumstances may impair the performance of these systems and may have an adverse impact upon a single issuer, a group of issuers, or the market at-large. In certain cases, an exchange or market may close or issue trading halts on either specific securities or even the entire market, which may result in a Portfolio being, among other things, unable to buy or sell certain securities or financial instruments or accurately price its investments.
Multiple Adviser Risk: A Portfolio may have multiple Advisers, each of which is responsible for investing a specific allocated portion of a Portfolio’s assets. To a significant extent, a Portfolio’s performance will depend
B-14
on the success of the Manager in allocating a Portfolio’s assets to Advisers and its selection and oversight of the Advisers. Because each Adviser manages its allocated portion of a Portfolio independently from another Adviser, the same security may be held in different portions of a Portfolio, or may be acquired for one portion of ta Portfolio at a time when an Adviser to another portion deems it appropriate to dispose of the security from that other portion. Similarly, under some market conditions, one Adviser may believe that temporary, defensive investments in short-term instruments or cash are appropriate when another Adviser believes continued exposure to the equity or debt markets is appropriate for its allocated portion of a Portfolio. Because each Adviser directs the trading for its own portion of a Portfolio, and does not aggregate its transactions with those of the other Adviser, a Portfolio may incur higher brokerage costs than would be the case if a single Adviser were managing the entire Portfolio. In addition, while the Manager seeks to allocate a Portfolio’s assets among a Portfolio’s Advisers in a manner that it believes is consistent with achieving a Portfolio’s investment objective, the Manager may be subject to potential conflicts of interest in allocating a Portfolio’s assets among Advisers, including affiliated Advisers, because the Manager pays different fees to the Advisers and due to other factors that could impact the Manager’s revenues and profits.
Non-Diversification Risk: A non-diversified portfolio’s greater investment in a single issuer or a few issuers makes the portfolio more susceptible to adverse events impacting those issuers. A decline in the value of or default by a single security in a non-diversified portfolio may have a greater negative effect than a similar decline or default by a single security in a diversified portfolio.
Options: A Portfolio may write and purchase put and call options, including exchange-traded or over-the-counter put and call options on securities indices and put and call options on ETFs tracking certain securities indices, for hedging and non-hedging purposes and for the purpose of achieving its objective. In general, options give the purchaser the right, but not the obligation, to buy or sell in the future an asset at a predetermined price during the term of the option. A securities index option and an ETF option are option contracts whose values are based on the value of a securities index at some future point in time. A securities index fluctuates with changes in the market values of the securities included in the index. The effectiveness of purchasing or writing securities index options will depend upon the extent to which price movements in a Portfolio’s investment portfolio correlate with price movements of the securities index. By writing (selling) a call option, a Portfolio forgoes, in exchange for the premium less the commission, the opportunity to profit during the option period from an increase in the market value of an index above the exercise price. By writing (selling) a put option, a Portfolio, in exchange for the net premium received, accepts the risk of a decline in the market value of the index below the exercise price.
Portfolio Management Risk: The risk that strategies used by the Manager or the Advisers and their securities selections fail to produce the intended results.
Portfolio Turnover Risk: High portfolio turnover (generally, turnover in excess of 100% in any given fiscal year) may result in increased transaction costs to a Portfolio, which may result in higher fund expenses and lower total return.
Recent Market Conditions Risk: The financial crisis in the U.S. and many foreign economies over the past several years, including the European sovereign debt and banking crises, continues to affect global economies and financial markets. The crisis and its after-effects have resulted, and may continue to result, in an unusually high degree of volatility in the financial markets. Conditions in the U.S. and many foreign economies have resulted, and may continue to result, in fixed income instruments experiencing unusual liquidity issues, increased price volatility and, in some cases, credit downgrades and increased likelihood of default. These events have reduced the willingness and ability of some lenders to extend credit, and have made it more difficult for borrowers to obtain financing on attractive terms, if at all. In some cases, traditional market participants have been less willing to make a market in some types of debt instruments, which has affected the liquidity of those instruments. As a result, investors in many types of securities, including, but not limited to, mortgage-backed, asset-backed, and corporate debt securities, have and may continue to experience losses. During times of market turmoil, investors tend to look to the safety of securities issued or backed by the U.S. Treasury, causing the prices of these securities to rise and the yields to decline.
B-15
The reduced liquidity in fixed income and credit markets may negatively affect many issuers worldwide. In addition, global economies and financial markets are becoming increasingly interconnected, which increases the possibilities that conditions in one country or region might adversely impact issuers in a different country or region. Over the past several years and continuing into the present, the U.S. and other governments and the Federal Reserve and certain foreign central banks have taken steps to support financial markets. Certain of these entities have injected liquidity into the markets and taken other steps in an effort to stabilize the markets and grow economies. The ultimate effect of these efforts is not yet known. In some countries where economic conditions are recovering, they are nevertheless perceived as still fragile. A change in or withdrawal of government support, failure of efforts in response to the crisis, or investor perception that such efforts are not succeeding, could adversely impact the value and liquidity of certain securities. The severity or duration of adverse economic conditions may also be affected by policy changes made by governments or quasi-governmental organizations, including changes in tax laws. The Dodd-Frank Act initiated a dramatic revision of the U.S. financial regulatory framework that is expected to continue to unfold over several years. As a result, the impact of U.S. financial regulation and the practical implications for market participants may not be fully known for some time. In addition, political events within the U.S. and abroad may affect investor and consumer confidence and may adversely impact financial markets and the broader economy, perhaps suddenly and to a significant degree. High public debt in the U.S. and other countries creates ongoing systemic and market risks and policymaking uncertainty.
Redemption Risk: A Portfolio may experience periods of heavy redemptions that could cause a Portfolio to sell assets at inopportune times or at a loss or depressed value. Redemption risk is heightened during periods of declining or illiquid markets. Heavy redemptions could hurt a Portfolio’s performance. Market developments and other factors, including a general rise in interest rates, have the potential to cause investors to move out of fixed income securities on a large scale, which may increase redemptions from mutual funds that hold large amounts of fixed income securities. Such a move, coupled with a reduction in the ability or willingness of dealers and other institutional investors to buy or hold fixed income securities, may result in decreased liquidity and increased volatility in the fixed income markets.
Regulatory Risk: The Manager is registered with the Securities and Exchange Commission (“SEC”) as an investment adviser under the Investment Advisers Act of 1940, as amended. The Manager also is registered with the Commodity Futures Trading Commission (“CFTC”) as a commodity pool operator (“CPO”) under the Commodity Exchange Act, as amended, and, due to a Portfolio’s use of derivatives, serves as a CPO with respect to a Portfolio. Being subject to dual regulation by the SEC and the CFTC may increase compliance costs, which may be borne by a Portfolio and may affect Portfolio returns.
Repurchase Agreements Risk: A Portfolio may enter into repurchase agreements under which it purchases a security that a seller has agreed to repurchase from a Portfolio at a later date at the same price plus interest. If a seller defaults and the security declines in value, a Portfolio might incur a loss. If the seller declares bankruptcy, portfolio may not be able to sell the security at the desired time.
Risk Management: The Manager and Sub-Advisers undertake certain analyses with the intention of identifying particular types of risks and reducing a Portfolio’s exposure to them. However, risk is an essential part of investing, and the degree of return an investor might expect is often tied to the degree of risk the investor is willing to accept. By its very nature, risk involves exposure to the possibility of adverse events. Accordingly, no risk management program can eliminate a Portfolio’s exposure to such events; at best, it can only reduce the possibility that a Portfolio will be affected by adverse events, and especially those risks that are not intrinsic to a Portfolio’s investment program. While the prospectus describes material risk factors associated with a Portfolio’s investment program, there is no assurance that as a particular situation unfolds in the markets, the Manager or Sub-Advisers will identify all of the risks that might affect a Portfolio, rate their probability or potential magnitude correctly, or be able to take appropriate measures to reduce a Portfolio’s exposure to them. Measures taken with the intention of decreasing exposure to identified risks might have the unintended effect of increasing exposure to other risks.
Risks Related to Investments in Underlying Portfolios and Underlying ETFs: A Portfolio will indirectly bear the fees and expenses paid by the Underlying Portfolios and Underlying ETFs in which it invests, in addition to a Portfolio’s direct fees and expenses. The cost of investing in a Portfolio, therefore, may be higher than
B-16
the cost of investing in a mutual fund that invests directly in individual stocks and bonds. In addition, a Portfolio’s net asset value is subject to fluctuations in the net asset values of the Underlying Portfolios and the market values of the Underlying ETFs in which it invests. A Portfolio is also subject to the risks associated with the securities in which the Underlying Portfolios and Underlying ETFs invest and the ability of a Portfolio to meet its investment objective will directly depend on the ability of the Underlying Portfolios and Underlying ETFs to meet their investment objectives. A Portfolio, Underlying Portfolios and Underlying ETFs are subject to certain general investment risks, including market risk, asset class risk, issuer-specific risk, investment style risk and portfolio management risk. In addition, to the extent a Portfolio invests in Underlying Portfolios and Underlying ETFs that invest in equity securities, fixed income securities and/or foreign securities, a Portfolio is subject to the risks associated with investing in such securities. It is also possible that an active trading market for an Underlying ETF may not develop or be maintained, in which case the liquidity and value of a Portfolio’s investment in the Underlying ETF could be substantially and adversely affected. The extent to which the investment performance and risks associated with a Portfolio correlates to those of a particular Underlying Portfolio or Underlying ETF will depend upon the extent to which ta Portfolio’s assets are allocated from time to time for investment in the Underlying Portfolio or Underlying ETF, which will vary.
Sector Concentration Risk: To the extent a Portfolio invests more heavily in particular sectors, its performance will be especially sensitive to developments that significantly affect those sectors. Individual sectors may be more volatile, and may perform differently, than the broader market. The industries that constitute a sector may all react in the same way to economic, political or regulatory events.
Securities Lending Risk: For purposes of realizing additional income, each Portfolio may lend securities to broker-dealers approved by the Board of Trustees. Generally, any such loan of portfolio securities will be continuously secured by collateral at least equal to the value of the security loaned. Such collateral will be in the form of cash, marketable securities issued or guaranteed by the U.S. Government or its agencies, or a standby letter of credit issued by qualified banks. The risks in lending portfolio securities, as with other extensions of secured credit, consist of possible delay in receiving additional collateral or in the recovery of the securities or possible loss of rights in the collateral should the borrower fail financially. Loans will only be made to firms deemed by the Manager to be of good standing and will not be made unless, in the judgment of the Adviser, the consideration to be earned from such loans would justify the risk.
Securities Selection Risk: The securities selected for a Portfolio may not perform as well as other securities that were not selected for a Portfolio. As a result, a Portfolio may underperform the markets, its benchmark index(es) or other funds with the same objective or in the same asset class.
Short Position Risk: A Portfolio may engage in short sales and may enter into derivative contracts that have a similar economic effect (e.g., taking a short position in a futures contract). A Portfolio will incur a loss as a result of a short position if the price of the asset sold short increases in value between the date of the short position sale and the date on which an offsetting position is purchased plus any premiums or interest paid to the third party. Short positions may be considered speculative transactions and involve special risks that could increase losses or reduce gains. Short sales involve greater reliance on the investment adviser’s ability to accurately anticipate the future value of a security or instrument, potentially higher transaction costs, and imperfect correlation between the actual and desired level of exposure. Because a Portfolio’s potential loss on a short position arises from increases in the value of the asset sold short, the extent of such loss, like the price of the asset sold short, is theoretically unlimited. By investing the proceeds received from selling securities short, a Portfolio could be deemed to be employing a form of leverage, which creates special risks. A Portfolio’s long positions could decline in value at the same time that the value of the short positions increase, thereby increasing a Portfolio’s overall potential for loss more than it would be without the use of leverage. Market factors may prevent a Portfolio from closing out a short position at the most desirable time or at a favorable price. In addition, a lender of securities may request, or market conditions may dictate, that securities sold short are returned to the lender on short notice. If this happens, a Portfolio may have to buy the securities sold short at an unfavorable price. When a Portfolio is selling stocks short, it must maintain a segregated account of cash or high-grade securities equal to the margin requirement. As a result, a Portfolio may maintain high levels of cash or liquid assets (such as U.S. Treasury bills, money market accounts, repurchase agreements, certificates of deposit, high quality commercial
B-17
paper and long equity positions) or may utilize borrowings or the collateral obtained from securities lending for this cash. The need to maintain cash or other liquid assets in segregated accounts could limit a Portfolio’s ability to pursue other opportunities as they arise.
Swaps: A Portfolio may engage in swap transactions. Swap contracts are derivatives in the form of a contract or other similar instrument that is an agreement to exchange the return generated by one instrument for the return generated by another instrument. The payment streams are calculated by reference to a specified security or index and agreed upon notional amount. The term “specified index” includes, but is not limited to, currencies, fixed interest rates, prices and total return on interest rate indices, fixed income indices, total return on equity securities, stock indices and commodity indices (as well as amounts derived from arithmetic operations on these indices).
Tax Risk: The risk that the tax treatment of swap agreements and other derivative instruments, such as commodity-linked derivative instruments, including commodity index-linked notes, swap agreements, commodity options, futures, and options on futures, may be affected by future regulatory or legislative changes that could affect whether income from such investments is “qualifying income” under Subchapter M of the Internal Revenue Code, or otherwise affect the character, timing and/or amount of a Portfolio’s taxable income or gains and distributions.
Risks of Equity Investments
Each Portfolio may invest a portion of its assets in Underlying Portfolios or Underlying ETFs that emphasize investments in equity securities or other equity instruments. Therefore, as an investor in a Portfolio, the return on your investment will be based, to some extent, on the risk and rewards of equity securities or other equity instruments. The risks of investing in equity securities or other equity instruments may include:
Convertible Securities Risk: The value of convertible securities fluctuates in relation to changes in interest rates and the credit quality of the issuer and, in addition, fluctuates in relation to the underlying common stock. A convertible security tends to perform more like a stock when the underlying stock price is high relative to the conversion price (because more of the security’s value resides in the option to convert) and more like a debt security when the underlying stock price is low relative to the conversion price (because the option to convert is less valuable). Because its value can be influenced by many different factors, a convertible security generally is not as sensitive to interest rate changes as a similar non-convertible debt security, and generally has less potential for gain or loss than the underlying stock. A convertible security may be subject to redemption at the option of the issuer at a price established in the convertible security’s governing instrument, which may be less than the current market price of the security. If a convertible security held by a Portfolio is called for redemption, a Portfolio will be required to permit the issuer to redeem the security, convert it into underlying common stock or sell it to a third party. Convertible securities are subject to equity risk, interest rate risk and credit risk and are often lower-quality securities, which mean that they are subject to the same risks as an investment in lower rated debt securities. Since it derives a portion of its value from the common stock into which it may be converted, a convertible security is also subject to the same types of market and issuer-specific risks that apply to the underlying common stock. In addition, because companies that issue convertible securities are often small- or mid-cap companies, to the extent a Portfolio invests in convertible securities, it will be subject to the risks of investing in these companies. The stocks of small- and mid-cap companies are often more volatile and less liquid than the stocks of larger companies. Convertible securities are normally “junior” securities which mean an issuer usually must pay interest on its non-convertible debt before it can make payments on its convertible securities. If an issuer stops making interest or principal payments, these securities may become worthless and a Portfolio could lose its entire investment. In the event of a liquidation of the issuing company, holders of convertible securities may be paid before the company’s common stockholders but after holders of any senior debt obligations of the company. To the extent a Portfolio invests in securities that may be considered “enhanced” convertible securities, some or all of these risks may be more pronounced.
B-18
Equity Risk: In general, stocks and other equity security values fluctuate, and sometimes widely fluctuate, in response to changes in a company’s financial condition as well as general market, economic and political conditions and other factors. Equity securities generally have greater price volatility than fixed income securities.
Financial Services Sector Risk: To the extent a Portfolio invests in the financial services sector, the value of a Portfolio’s shares may be particularly vulnerable to factors affecting that sector, such as the availability and cost of capital funds, changes in interest rates, the rate of corporate and consumer debt defaults, extensive government regulation and price competition. The value of a Portfolio’s shares could experience significantly greater volatility than Portfolios investing in a diversified portfolio of securities.
Focused Portfolio Risk: A Portfolio that employs a strategy of investing in the securities of a limited number of companies, some of which may be in the same industry, including a Portfolio that is classified as “diversified”, may incur more risk because changes in the value of a single security may have a more significant effect, either positive or negative, on a Portfolio’s net asset value. Further, such a Portfolio may be more sensitive to events affecting a single industry. The use of such a focused investment strategy may increase the volatility of a Portfolio’s investment performance, as a Portfolio may be more susceptible to risks associated with a single economic, political or regulatory event than a Portfolio that is more broadly invested.
Initial Public Offering (“IPO”) Risk: Securities issued in IPOs are subject to many of the same risks as investing in companies with smaller market capitalizations. Securities issued in IPOs have no trading history, and information about the companies may be available for very limited periods. In addition, the prices of securities sold in IPOs may be highly volatile. Therefore, a Portfolio may hold IPO shares for a very short period of time. At any particular time or from time to time, a Portfolio may not be able to invest in securities issued in IPOs, or invest to the extent desired, because, for example, only a small portion (if any) of the securities being offered in an IPO may be made available to a Portfolio. In addition, under certain market conditions, a relatively small number of companies may issue securities in IPOs. Similarly, as the number of Portfolios to which IPO securities are allocated increases, the number of securities issued to any one Portfolio may decrease. To the extent a Portfolio invests in IPOs, a significant portion of its returns may be attributable to its investments in IPOs, which have a magnified impact on Portfolios with small asset bases. The impact of IPOs on a Portfolio’s performance will likely decrease as a Portfolio’s asset size increases, which could reduce a Portfolio’s returns. There is no guarantee that as a Portfolio’s assets grow it will continue to experience substantially similar performance by investing in profitable IPOs.
Large-Cap Company Risk: Larger more established companies may be unable to respond quickly to new competitive challenges such as changes in technology and consumer tastes. Many larger companies also may not be able to attain the high growth rate of successful smaller companies, especially during extended periods of economic expansion.
Listed Private Equity Company Risk: Listed private equity companies may include, among other companies, business development companies, publicly traded limited partnership interests, publicly traded venture capital funds, publicly traded private equity funds, publicly traded financial institutions that lend capital to or invest in privately held companies, and any other publicly traded vehicle whose purpose is to invest in privately held companies. Depending on their underlying investments, listed private equity companies are subject to various risks, which may include, but are not limited to, additional liquidity risk, industry risk, foreign securities risk, currency risk, valuation risk, credit risk, managed portfolio risk and derivatives risk. Generally, little public information exists for privately held companies, and there is a risk that investors may not be able to make a fully informed investment decision. Investing in less mature privately held companies involves greater risk than investing in well-established, publicly-traded companies.
Mid-Cap, Small-Cap and Micro-Cap Company Risk: A Portfolio’s investments in mid-, small- and micro-cap companies may involve greater risks than investments in larger, more established issuers because they generally are more vulnerable than larger companies to adverse business or economic developments. Such companies generally have narrower product lines, more limited financial resources and more limited markets for their stock as compared with larger companies. Their securities may be less well-known and trade less frequently and in limited volume compared with the securities of larger, more established companies. As a result, the value
B-19
of such securities may be more volatile than the securities of larger companies, and the portfolio may experience difficulty in purchasing or selling such securities at the desired time and price or in the desired amount. Mid-, small- and micro-cap companies also are typically subject to greater changes in earnings and business prospects than larger companies. Consequently, the prices of mid-, small- and micro-cap company stocks tend to rise and fall in value more frequently than the stocks of larger companies. Although investing in mid-, small- and micro-cap companies offers potential for above-average returns, the companies may not succeed and the value of their stock could decline significantly. In general, these risks are greater for small- and micro-capitalization companies than for mid-capitalization companies.
Real Estate Investing Risk: A Portfolio’s investments in mid-, small- and micro-cap companies may involve greater risks than investments in larger, more established issuers because they generally are more vulnerable than larger companies to adverse business or economic developments. Such companies generally have narrower product lines, more limited financial resources and more limited markets for their stock as compared with larger companies. Their securities may be less well-known and trade less frequently and in limited volume compared with the securities of larger, more established companies. As a result, the value of such securities may be more volatile than the securities of larger companies, and a portfolio may experience difficulty in purchasing or selling such securities at the desired time and price or in the desired amount. Mid-, small- and micro-cap companies also are typically subject to greater changes in earnings and business prospects than larger companies. Consequently, the prices of mid-, small- and micro-cap company stocks tend to rise and fall in value more frequently than the stocks of larger companies. Although investing in mid-, small- and micro-cap companies offers potential for above-average returns, the companies may not succeed and the value of their stock could decline significantly. In general, these risks are greater for small- and micro-capitalization companies than for mid-capitalization companies.
Special Situations Risk: A Portfolio may use aggressive investment techniques, including seeking to benefit from “special situations,” such as acquisitions, mergers, consolidations, bankruptcies, liquidations, reorganizations, restructurings, tender or exchange offers or other unusual events expected to affect a particular issuer. In general, securities of companies which are the subject of a tender or exchange offer or an acquisition, a merger, consolidation, liquidation, restructuring, bankruptcy or reorganization proposal sell at a premium to their historic market price immediately prior to the announcement of an offer for the company. However, it is possible that the value of securities of a company involved in such a transaction will not rise and in fact may fall, in which case a Portfolio would lose money. It is also possible that an Adviser’s assessment that a particular company is likely to be acquired or acquired during a specific time frame may be incorrect, in which case a Portfolio may not realize any premium on its investment and could lose money if the value of the securities declines during a Portfolio’s holding period. A Portfolio’s return also could be adversely impacted to the extent that an Adviser’s strategies fail to identify companies for investment by a Portfolio that become the subject of a merger or similar transaction that results in an increase in the value of the securities of those companies. Moreover, publicly announced mergers and similar types of transactions may be renegotiated or terminated, in which case a Portfolio may lose money. In addition, if a transaction takes longer time to close than an Adviser originally anticipated, a Portfolio may realize a lower-than-expected rate of return.
Unseasoned Companies Risk: These are companies that have been in operation less than three years, including operations of any predecessors. These securities may have limited liquidity and their prices may be very volatile.
Risks of Fixed Income Investments
Each Portfolio may invest a portion of its assets in Underlying Portfolios or Underlying ETFs that invest primarily in debt securities or other debt instruments. Therefore, as an investor in a Portfolio, the return on your investment will be based, to some extent, on the risks and rewards of fixed income securities or bonds or other debt instruments. Examples of bonds include, but are not limited to, corporate debt securities (including notes), mortgage-backed and asset-backed securities, securities issued by the U.S. government and obligations issued by both government agency and private issuers. Bond issuers may be foreign corporations or governments as
B-20
described in each Underlying Portfolio’s or Underlying ETF’s investment strategies. In addition to bonds, debt securities also include money market instruments. The risks of investing in fixed income securities or other fixed income instruments may include:
Banking Industry Sector Risk: To the extent a Portfolio invests in the banking industry, it is exposed to the risks generally associated with such industry, including interest rate risk, credit risk and the risk that regulatory developments relating to the banking industry may affect its investment.
Collateralized Loan Obligations Risk: In addition to the typical risks associated with fixed income securities discussed elsewhere in this Prospectus (e.g., interest rate risk and credit risk), collateralized loan obligations (“CLOs”) carry additional risks including, but are not limited to: (i) the possibility that distributions from collateral securities will not be adequate to make interest or other payments; (ii) the quality of the collateral may decline in value or default; (iii) the risk that a Portfolio may invest in CLOs that are subordinate to other classes; and (iv) the complex structure of the security may not be fully understood at the time of investment and may produce disputes with the issuer or unexpected investment results.
Credit Risk: The risk that the issuer or the guarantor of a fixed income security, or the counterparty to a derivatives contract, repurchase agreement, loan of portfolio securities or other transaction, is unable or unwilling, or is perceived (whether by market participants, ratings agencies, pricing services or otherwise) as unable or unwilling, to make timely principal and/or interest payments, or otherwise honor its obligations. Securities are subject to varying degrees of credit risk, which are often reflected in their credit ratings. The downgrade of the credit rating of a security held by a Portfolio may decrease its value. When a fixed income security is not rated, an Adviser may have to assess the risk of the security itself. Securities rated below investment grade (e.g., “junk bonds”) may include a substantial risk of default. U.S. government securities held by a Portfolio are supported by varying degrees of credit, and their value may fluctuate in response to political, market or economic developments. U.S. government securities, especially those that are not backed by the full faith and credit of the U.S. Treasury, such as securities supported only by the credit of the issuing governmental agency or government-sponsored enterprise, carry at least some risk of nonpayment, and the maximum potential liability of the issuers of such securities may greatly exceed their current resources. There is no assurance that the U.S. government would provide financial support to the issuing entity if not obligated to do so by law. Further, any government guarantees on U.S. government securities that a Portfolio owns extend only to the timely payment of interest and the repayment of principal on the securities themselves and do not extend to the market value of the securities or to shares of the Portfolios themselves.
Distressed Companies Risk: A Portfolio may invest in distressed securities, including loans, bonds and notes, many of which are not publicly traded and that may involve a substantial degree of risk. Debt obligations of distressed companies typically are unrated, lower-rated or close to default. Distressed securities include securities of companies that are in financial distress and that may be in or about to enter bankruptcy. In certain periods, there may be little or no liquidity in the markets for these securities or other instruments. In addition, the prices of such securities may be subject to periods of abrupt and erratic market movements and above-average price volatility. It may be difficult to obtain financial information regarding the financial condition of a borrower or issuer, and its financial condition may be changing rapidly. It may be more difficult to value such securities and the spread between the bid and asked prices of such securities may be greater than normally expected. A Portfolio may lose a substantial portion or all of its investment or it may be required to accept cash or securities with a value less than a Portfolio’s original investment. The Fund may incur additional expenses to the extent it is required to seek recovery upon a default in the payment of principal or interest on its portfolio holdings.
Floating Rate Loan Risk: Floating rate loans generally are subject to restrictions on resale. The liquidity of floating rate loans, including the volume and frequency of secondary market trading in such loans, varies significantly over time and among individual floating rate loans. For example, if the credit quality of a floating rate loan unexpectedly declines significantly, secondary market trading in that floating rate loan can also decline. During periods of infrequent trading, valuing a floating rate loan can be more difficult and buying and selling a floating rate loan at an acceptable price can be more difficult and delayed. Difficulty in selling a floating rate loan can result in a loss. The value of the collateral securing a floating rate loan can decline, be insufficient to meet the obligations of the borrower, or be difficult to liquidate. As a result, a floating rate loan may not be fully collateralized, and can decline significantly in value.
B-21
Inflation-Indexed Bonds Risk: Inflation-indexed bonds decline in value when real interest rates rise. In certain interest rate environments, such as when real interest rates are rising faster than nominal interest rates, inflation-indexed bonds may experience greater losses than other fixed income securities with similar durations. Interest payments on inflation-linked debt securities will vary as the principal and/or interest is adjusted for inflation and can be unpredictable. In periods of deflation, a Portfolio may have no income at all from such investments
Interest Rate Risk: The risk that fixed income securities will decline in value because of changes in interest rates. When interest rates decline, the value of a Portfolio’s debt securities generally rises. Conversely, when interest rates rise, the value of a Portfolio’s debt securities generally declines. A Portfolio with a longer average duration will be more sensitive to changes in interest rates, usually making it more volatile than a fund with a shorter average duration. During periods of falling interest rates, an issuer of a callable bond may “call” or repay a security before its stated maturity and a Portfolio may have to reinvest the proceeds at lower interest rates, resulting in a decline in Portfolio income. Conversely, when interest rates rise, certain obligations will be paid off by the issuer more slowly than anticipated, causing the value of these obligations to fall. Inflation-indexed bonds decline in value when real interest rates rise. In certain interest rate environments, such as when real interest rates are rising faster than nominal interest rates, inflation-indexed bonds may experience greater losses than other fixed income securities with similar durations. Preferred stocks may also be sensitive to changes in interest rates. When interest rates rise, the value of preferred stocks will generally decline. Variable and floating rate securities generally are less sensitive to interest rate changes but may decline in value if their interest rates do not rise as much, or as quickly, as interest rates in general. Conversely, floating rate securities will not generally increase in value if interest rates decline. When a Portfolio holds variable or floating rate securities, a decrease in market interest rates will adversely affect the income received from such securities and the net asset value of a Portfolio’s shares. A wide variety of factors can cause interest rates to rise (e.g., central bank monetary policies, inflation rates, general economic conditions, etc.). When the Federal Reserve raises the federal funds rate, interest rates are expected to rise. As of the date of this Prospectus, interest rates in the United States are at or near historic lows, but may rise significantly or rapidly, potentially resulting in losses to a Portfolio.
Inverse Floaters Risk: Inverse floaters, which are fixed income securities with a floating or variable rate of interest (i.e., the rate of interest varies with changes in specified market rates or indices, such as the prime rate, or at specified intervals), may exhibit substantially greater price volatility than fixed rate obligations having similar credit quality, redemption provisions and maturity. Any rise in the reference rate of an inverse floater (as a consequence of an increase in interest rates) causes a drop in the coupon rate while any drop in the reference rate of an inverse floater causes an increase in the coupon rate. Inverse floater collateralized mortgage obligations (“CMOs”) exhibit greater price volatility than the majority of mortgage-related securities. In addition, some inverse floater CMOs exhibit extreme sensitivity to changes in prepayments. As a result, the yield to maturity of an inverse floater CMO is sensitive not only to changes in interest rates but also to changes in prepayment rates on the related underlying mortgage assets.
Investment Grade Securities Risk: Debt securities generally are rated by national bond ratings agencies. A Portfolio considers securities to be investment grade if they are rated BBB or higher by S&P or Fitch or Baa or higher by Moody’s or, if unrated, are deemed to be of comparable quality by an Adviser. Securities rated in the lower investment grade rating categories (e.g., BBB or Baa) are considered investment grade securities, but are somewhat riskier than higher rated obligations because they are regarded as having only an adequate capacity to pay principal and interest, and are considered to lack outstanding investment characteristics and may possess certain speculative characteristics as well.
Loan Risk: Loan interests are subject to liquidity risk, prepayment risk (the risk that when interest rates fall, debt securities may be repaid more quickly than expected and a Portfolio may be required to reinvest in securities with a lower yield), extension risk (the risk that when interest rates rise, debt securities may be repaid more slowly than expected and the value of a Portfolio’s holdings may decrease), the risk of subordination to other creditors, restrictions on resale, and the lack of a regular trading market and publicly available information. In addition, liquidity risk may be more pronounced for a Portfolio investing in loans because certain loans may have a more limited secondary market. These loans may be difficult to value. Loan interests may have extended
B-22
trade settlement periods. Accordingly, the proceeds from the sale of a loan may not be available to make additional investments or to meet redemption obligations until potentially a substantial period after the sale of the loan. The extended trade settlement periods could force a Portfolio to liquidate other securities to meet redemptions and may present a risk that a Portfolio may incur losses in order to timely honor redemptions.
Money Market Risk: Although a money market fund is designed to be a relatively low risk investment, it is not free of risk. Despite the short maturities and high credit quality of a money market portfolio’s investments, increases in interest rates and deteriorations in the credit quality of the instruments the portfolio has purchased may reduce the portfolio’s yield and can cause the price of a money market security to decrease. In addition, a money market portfolio is subject to the risk that the value of an investment may be eroded over time by inflation.
Mortgage-Backed and Asset-Backed Securities Risk: The risk that the principal on mortgage- and asset-backed securities held by a Portfolio may be prepaid, which generally will reduce the yield and market value of these securities. Small movements in interest rates (both increases and decreases) may quickly and significantly reduce the value of certain mortgage-backed and asset-backed securities. If interest rates fall, the rate of prepayments tends to increase as borrowers are motivated to pay off debt and refinance at new lower rates. An increased rate of prepayments on a Portfolio’s mortgage-backed and asset-backed securities will result in an unforeseen loss of interest income to a Portfolio as a Portfolio may be required to reinvest assets at a lower interest rate. Because prepayments increase when interest rates fall, the prices of mortgage-backed and asset-backed securities do not increase as much as other fixed income securities when interest rates fall. When interest rates rise, borrowers are less likely to prepay their mortgage loans. A decreased rate of prepayments lengthens the expected maturity of a mortgage-backed security. Therefore, the prices of mortgage-backed securities may decrease more than prices of other fixed income securities when interest rates rise. Rising interest rates tend to extend the duration of these securities, making them more sensitive to changes in interest rates. This is known as extension risk. Rising interest rates also may increase the risk of default by borrowers. As a result, in a period of rising interest rates, a Portfolio that holds these types of securities may experience additional volatility and losses. Moreover, declines in the credit quality of and defaults by the issuers of mortgage- and asset-backed securities or instability in the markets for such securities may affect the value and liquidity of such securities, which could result in losses to a Portfolio. If a Portfolio purchases mortgage- or asset-backed securities that are “subordinated” to other interests in the same pool, a Portfolio as a holder of those securities may only receive payments after the pool’s obligations to other investors have been satisfied. For example, an unexpectedly high rate of defaults on the mortgages held by a mortgage pool may limit substantially the pool’s ability to make payments of principal or interest to a Portfolio as a holder of such subordinated securities, reducing the values of those securities or in some cases rendering them worthless. Certain mortgage- and asset-backed securities may include securities backed by pools of loans made to “subprime” borrowers or borrowers with blemished credit histories; the risk of defaults is generally higher in the case of mortgage pools that include such subprime mortgages. The underwriting standards for subprime loans are more flexible than the standards generally used by banks for borrowers with non-blemished credit histories with regard to the borrowers’ credit standing and repayment ability. Borrowers who qualify generally have impaired credit histories, which may include a record of major derogatory credit items such as outstanding judgments or prior bankruptcies. In addition, they may not have the documentation required to qualify for a standard loan. As a result, the loans in the pool are likely to experience rates of delinquency, foreclosure, and bankruptcy that are higher, and that may be substantially higher, than those experienced by loans underwritten in a more traditional manner. In addition, changes in the values of the assets underlying the loans (if any), as well as changes in interest rates, may have a greater effect on the delinquency, foreclosure, bankruptcy, and loss experience of the loans in the pool than on loans originated in a more traditional manner. Moreover, instability in the markets for mortgage- and asset-backed securities may affect the liquidity of such securities, which means that a Portfolio may be unable to sell such securities at an advantageous time and price. As a result, the value of such securities may decrease and a Portfolio may incur greater losses on the sale of such securities than under more stable market conditions. Furthermore, instability and illiquidity in the market for lower-rated mortgage- and asset-backed securities may affect the overall market for such securities, thereby impacting the liquidity and value of higher-rated securities.
B-23
Non-Investment Grade Securities Risk: Bonds rated below investment grade (i.e., BB or lower by S&P or Fitch or Ba or lower by Moody’s) or, if unrated, deemed to be of comparable quality by an Adviser are speculative in nature, involve greater risk of default by the issuing entity and may be subject to greater market fluctuations than higher rated fixed income securities. Non-investment grade bonds, sometimes referred to as “junk bonds,” are usually issued by companies without long track records of sales and earnings, or by those companies with questionable credit strength. The retail secondary market for these “junk bonds” may be less liquid than that of higher rated securities and adverse conditions could make it difficult at times to sell certain securities or could result in lower prices than those used in calculating a Portfolio’s net asset value. A Portfolio investing in “junk bonds” may also be subject to greater credit risk because it may invest in debt securities issued in connection with corporate restructuring by highly leveraged issuers or in debt securities not current in the payment of interest or principal or in default. If the issuer of a security is in default with respect to interest or principal payments, a Portfolio may lose its entire investment. Because of the risks involved in investing in below investment grade securities, an investment in a Portfolio that invests substantially in such securities should be considered speculative. “Junk bonds” may contain redemption or call provisions. If an issuer exercises these provisions in a declining interest rate market, a Portfolio would have to replace the security with a lower yielding security, resulting in a decreased return. Conversely, a junk bond’s value will decrease in a rising interest rate market, as will the value of a Portfolio’s assets. The credit rating of a below investment grade security does not necessarily address its market value risk and may not reflect its actual credit risk. Ratings and market value may change from time to time, positively or negatively, to reflect new developments regarding the issuer.
Prepayment and Extension Risk: Prepayment risk is the risk that the principal on securities held by a Portfolio may be paid off by the issuer more quickly than originally anticipated, and a Portfolio may have to reinvest the proceeds in an investment offering a lower yield, may not benefit from any increase in value that might otherwise result from declining interest rates and may lose any premium it paid to acquire the security. If interest rates fall, the rate of prepayments tends to increase as borrowers are motivated to pay off debt and refinance at new lower rates. Extension risk is the risk that the principal on securities held by a Portfolio may be paid off by the issuer more slowly than originally anticipated. Higher interest rates generally result in slower payoffs, which effectively increase duration, heighten interest rate risk, and increase the potential for price declines. The prices of variable and floating rate securities (including loans) can be less sensitive to prepayment risk.
Preferred Stock Risk: Preferred stock is subject to many of the risks associated with debt securities, including interest rate risk. Unlike interest payments on debt securities, dividends on preferred stock are generally payable at the discretion of the issuer’s board of directors. Preferred shareholders may have certain rights if dividends are not paid but generally have no legal recourse against the issuer. Shareholders may suffer a loss of value if dividends are not paid. In certain situations an issuer may call or redeem its preferred stock or convert it to common stock. The market prices of preferred stocks are generally more sensitive to changes in the issuer’s creditworthiness than are the prices of debt securities. Preferred stock also may be less liquid than common stock. To the extent that a Portfolio invests a substantial portion of its assets in convertible preferred stocks, declining common stock values may also cause the value of a Portfolio’s investments to decline.
Sovereign Debt Risk: Sovereign debt investments are subject to the risk that a governmental entity may delay or refuse to pay interest or repay principal on its sovereign debt for a variety of reasons including, for example, cash flow problems, insufficient foreign currency reserves, political considerations, the relative size of the governmental entity’s debt position in relation to the economy or the failure to put in place economic reforms required by the International Monetary Fund or other multilateral agencies. If a governmental entity defaults, it may ask for more time in which to pay or for further loans. In addition, there are generally no bankruptcy proceedings similar to those in the U.S. by which defaulted sovereign debt obligations may be collected and there may be few or no effective legal remedies for collecting on such debt. Sovereign debt risk is increased for emerging market issuers. Certain emerging market or developing countries are among the largest debtors to commercial banks and foreign governments. At times, certain emerging market countries have declared moratoria on the payment of principal and interest on external debt. Certain emerging market countries have experienced difficulty in servicing their sovereign debt on a timely basis that led to defaults and the restructuring of certain indebtedness.
B-24
Unrated Debt Securities Risk: Unrated debt securities determined by an Adviser to be of comparable quality to rated securities may be subject to a greater risk of illiquidity or price changes. Less public information is typically available about unrated securities or issuers.
U.S. Government Securities Risk: A Portfolio invests in securities issued or guaranteed by the U.S. government or its agencies and instrumentalities (such as securities issued by the Government National Mortgage Association (Ginnie Mae), the Federal National Mortgage Association (Fannie Mae), or the Federal Home Loan Mortgage Corporation (Freddie Mac). U.S. government securities are subject to market risk, interest rate risk and credit risk. Securities, such as those issued or guaranteed by Ginnie Mae or the U.S. Treasury, that are backed by the full faith and credit of the U.S. are guaranteed only as to the timely payment of interest and principal when held to maturity, and the market prices for such securities will fluctuate due to changing interest rates, among other factors. Notwithstanding that these securities are backed by the full faith and credit of the U.S., circumstances could arise that would prevent the payment of interest or principal. This would result in losses to a Portfolio. Securities issued or guaranteed by U.S. government related organizations, such as Fannie Mae and Freddie Mac, are not backed by the full faith and credit of the U.S. government and no assurance can be given that the U.S. government will provide financial support. Therefore, U.S. government related organizations may not have the funds to meet their payment obligations in the future.
Zero Coupon and Pay-in-Kind Securities Risk: A zero coupon or pay-in-kind security pays no interest in cash to its holder during its life. Accordingly, zero coupon securities usually trade at a deep discount from their face or par value and, together with pay-in-kind securities, will be subject to greater fluctuations in market value in response to changing interest rates than debt obligations of comparable maturities that make current distribution of interest in cash.
Risks of Foreign Securities Investments
Each Portfolio may invest a varying portion of its assets in Underlying Portfolios and Underlying ETFs that invest primarily in foreign securities or other foreign instruments. Therefore, as an investor in a Portfolio, the return on your investment will be based, to some extent, on the risk and rewards of foreign securities or other foreign instruments. The following is a more detailed description of the primary risks of investing in foreign securities and other foreign instruments:
Foreign Securities Risk: Investments in foreign securities, including depositary receipts, involve risks not associated with, or more prevalent than those that may be associated with, investing in U.S. securities. The economies of certain foreign markets may not compare favorably with the economy of the United States with respect to such issues as growth of gross national product, reinvestment of capital, resources and balance of payments position. Over a given period of time, foreign securities may underperform U.S. securities — sometimes for years. A Portfolio could also underperform if it invests in countries or regions whose economic performance falls short. Foreign markets, particularly emerging markets, may be less liquid, more volatile and subject to less government supervision and regulation than domestic markets. Security values also may be negatively affected by changes in the exchange rates between the U.S. dollar and foreign currencies. Differences between U.S. and foreign legal, political and economic systems, regulatory regimes and market practices also may impact security values and it may take more time to clear and settle trades involving foreign securities. Securities issued by U.S. entities with substantial foreign operations can involve risks relating to conditions in foreign countries. Foreign securities are also subject to the risks associated with the potential imposition of economic or other sanctions against a particular foreign country, its nationals, businesses or industries, which could adversely affect the value of a Portfolio’s investments.
Currency Risk: Investments in foreign currencies and in securities that trade in, or receive revenues in, or in derivatives that provide exposure to foreign currencies are subject to the risk that those currencies will decline in value relative to the U.S. dollar. Any such decline may erode or reverse any potential gains from an investment in securities denominated in foreign currency or may widen existing loss. In the case of hedging positions, there is the risk that the U.S. dollar will decline in value relative to the currency being hedged. Currency rates may fluctuate significantly over short periods of time for a number of reasons, including changes in interest rates, intervention (or the failure to intervene) by governments, central banks or supranational entities, or by the imposition of currency controls or other political developments in the U.S. or abroad.
B-25
Depositary Receipts Risk: Investments in depositary receipts (including American Depositary Receipts, European Depositary Receipts and Global Depositary Receipts) are generally subject to the same risks of investing in the foreign securities that they evidence or into which they may be converted. In addition, issuers underlying unsponsored depositary receipts may not provide as much information as U.S. issuers and issuers underlying sponsored depositary receipts. Unsponsored depositary receipts also may not carry the same voting privileges as sponsored depositary receipts.
Emerging Markets Risk: Emerging market countries generally are located in Asia, the Middle East, Eastern Europe, Central and South America and Africa. There are greater risks involved in investing in emerging market countries and/or their securities markets. Investments in these countries and/or markets may present market, credit, currency, liquidity, legal, political, technical and other risks different from, or greater than, the risks of investing in developed countries. For instance, these countries may be more likely than developed countries to experience rapid and significant adverse developments in their political or economic structures. Some emerging market countries restrict foreign investments, impose high withholding or other taxes on foreign investments, impose restrictive exchange control regulations, or may nationalize or expropriate the assets of private countries. Therefore, a Portfolio may be limited in its ability to make direct or additional investments in an emerging markets country or could lose the entire value of its investment in the affected market. Such restrictions also may have negative impacts on transaction costs, market price, investment returns and the legal rights and remedies of a Portfolio. In addition, the securities markets of emerging markets countries generally are smaller, less liquid and more volatile than those of developed countries. Emerging market countries often have less uniformity in accounting and reporting requirements and less reliable clearance and settlement, registration and custodial procedures which could result in ownership registration being completely lost. There are generally higher commission rates on foreign portfolio transactions, transfer taxes, and higher custodial costs. A Portfolio may not know the identity of trading counterparties, which may increase the possibility of a Portfolio not receiving payment or delivery of securities in a transaction. Emerging market countries also may be subject to high inflation and rapid currency devaluations and currency-hedging techniques may be unavailable in certain emerging market countries. In addition, some emerging market countries may be heavily dependent on international trade, which can materially affect their securities markets. The risks associated with investing in a narrowly defined geographic area also generally are more pronounced with respect to investments in emerging market countries. Investments in frontier markets may be subject to greater levels of these risks than investments in more developed and traditional emerging markets.
European Economic Risk: The European Union’s (the “EU”) Economic and Monetary Union (the “EMU”) requires Eurozone countries to comply with restrictions on interest rates, deficits, debt levels, and inflation rates, and other factors, each of which may significantly impact every European country and their economic partners. The economies of EU member countries and their trading partners may be adversely affected by changes in the exchange rate of the euro (the common currency of the EU), changes in EU or governmental regulations on trade and other areas, and the threat of default or an actual default by an EU member country on its sovereign debt, which could negatively impact a Portfolio’s investments and cause it to lose money. In recent years, the European financial markets have been negatively impacted by concerns relating to rising government debt levels and national unemployment; possible default on or restructuring of sovereign debt in several European countries; and economic downturns. A European country’s default or debt restructuring would adversely affect the holders of the country’s debt and sellers of credit default swaps linked to the country’s creditworthiness and could negatively impact global markets more generally. Recent events in Europe may adversely affect the euro’s exchange rate and value and may continue to impact the economies of every European country and their economic partners. In addition, one or more members could abandon the euro and/or withdraw from the EU. The impact of these actions, especially if they occur in a disorderly fashion, is not clear but could be significant and far reaching.
Geographic Concentration Risk: A Portfolio that invests a significant portion of its assets in securities of companies domiciled, or exercising the predominant part of their economic activity, in one country or geographic region assumes the risk that economic, political, social and environmental conditions in that particular country or region will have a significant impact on a Portfolio’s investment performance and that a Portfolio’s performance
B-26
will be more volatile than the performance of more geographically diversified funds. The economies and financial markets of certain regions can be highly interdependent and may decline all at the same time. In addition, certain areas are prone to natural disasters such as earthquakes, volcanoes, droughts or tsunamis and are economically sensitive to environmental events.
International Fair Value Pricing Risk: An Underlying Portfolio that invests in foreign securities is subject to the risk that its share price may be exposed to arbitrage attempts by investors seeking to capitalize on differences in the values of foreign securities trading on foreign exchanges that may close before the time the Underlying Portfolio’s net asset value is determined. If such arbitrage attempts are successful, the Underlying Portfolio’s net asset value might be diluted. An Underlying Portfolio’s use of fair value pricing in certain circumstances (by adjusting the closing market prices of foreign securities to reflect what the board of trustees believes to be their fair value) may help deter such arbitrage activities. The effect of such fair value pricing is that foreign securities may not be priced on the basis of quotations from the primary foreign securities market in which they are traded, but rather may be priced by another method that the Underlying Portfolio’s board of trustees believes reflects fair value. As such, fair value pricing is based on subjective judgment and it is possible that fair value may differ materially from the value realized on a sale of a foreign security. It is also possible that use of fair value pricing will limit an investment adviser’s ability to implement an Underlying Portfolio’s investment strategy (e.g., reducing the volatility of a Portfolio’s share price) or achieve its investment objective.
Political/Economic Risk: Changes in economic and tax policies, government instability, war or other political or economic actions or factors may have an adverse effect on a Portfolio’s foreign investments.
Regulatory Risk: Less information may be available about foreign companies. In general, foreign companies are not subject to uniform accounting, auditing and financial reporting standards or to other regulatory practices and requirements as are U.S. companies. Many foreign governments do not supervise and regulate stock exchanges, brokers and the sale of securities to the same extent as does the United States and may not have laws to protect investors that are comparable to U.S. securities laws. In addition, some countries may have legal systems that may make it difficult for a Portfolio to vote proxies, exercise shareholder rights, and pursue legal remedies with respect to its foreign investments.
Settlement Risk: Settlement and clearance procedures in certain foreign markets differ significantly from those in the United States. Foreign settlement and clearance procedures and trade regulations also may involve certain risks (such as delays in payment for or delivery of securities) not typically associated with the settlement of U.S. investments. At times, settlements in certain foreign countries have not kept pace with the number of securities transactions. These problems may make it difficult for a Portfolio to carry out transactions. If a Portfolio cannot settle or is delayed in settling a purchase of securities, it may miss attractive investment opportunities and certain of its assets may be un-invested with no return earned thereon for some period. If a Portfolio cannot settle or is delayed in settling a sale of securities, it may lose money if the value of the security then declines or, if it has contracted to sell the security to another party, a Portfolio could be liable for any losses incurred.
Transaction Costs Risk: The costs of buying and selling foreign securities, including tax, brokerage and custody costs, generally are higher than those involving domestic transactions.
Risks of Alternative Investments
Each Portfolio may invest in certain Underlying Portfolios and Underlying ETFs that invest in alternative investments. Therefore, as an investor in a Portfolio, the return on your investment will be based, to the extent of a Portfolio’s investment, on the risks and rewards of alternative investments. Alternative investments may use a different approach to investing than do traditional investments (such as equity or fixed income investments) and, as a result, may have different characteristics and risks than do traditional investments. Alternative investments may be less liquid, particularly in periods of stress, more complex and less transparent, and may have more complicated tax profiles than traditional investments. The use of alternative investments may not achieve the desired effect.
B-27
The following is a more detailed description of the primary risks of investing in alternative investments. In addition to the risks specific to alternative investments, the Underlying Portfolios and Underlying ETFs that invest in alternative investments may be subject to the risks associated with equity, fixed income and foreign investments, certain of which are discussed earlier in this Prospectus. Certain risks discussed below also may apply to Underlying Portfolios and Underlying ETFs that do not invest in alternative investments. An Underlying Portfolio and Underlying ETF may be subject to certain additional risks as discussed in its prospectus.
Commodity Price Volatility Risk: Because the value of the shares of an Underlying ETF that is based on a particular commodity depends on the price of that commodity, the value of those shares is subject to fluctuations similar to those affecting the commodity.
Commodity Risk: Exposure to the commodities markets may subject a Portfolio to greater volatility than investments in traditional securities. The commodities markets may fluctuate widely based on a variety of factors including changes in overall market movements, political and economic events and policies, war, acts of terrorism, changes in exchange rates, interest rates or inflation rates and/or investor expectations concerning such rates, and trading activities in commodities. Prices of various commodities may also be affected by factors such as drought, floods and weather, livestock disease and embargoes, tariffs and other regulatory developments. The prices of commodities can also fluctuate widely due to supply and demand disruptions in major producing or consuming regions. Certain commodities may be produced in a limited number of countries and may be controlled by a small number of producers. As a result, political, economic and supply related events in such countries could have a disproportionate impact on the prices of such commodities. Securities of companies that are dependent on a single commodity, or are concentrated in a single commodity sector, may exhibit even higher volatility attributable to commodity prices. No active trading market may exist for certain commodities investments. Because the value of a commodity-linked derivative instrument typically is based upon the price movements of a physical commodity, the value of a commodity-linked derivative instrument may be affected by changes in overall market movements, commodity index volatility, changes in interest rates, or factors affecting a particular industry or commodity. The value of these instruments will rise or fall in response to changes in the underlying commodity or related index of investment. Some commodity-linked investments are issued by companies in the financial services sector, including the banking, brokerage and insurance sectors. As a result, events affecting issuers in the financial services sector may adversely affect a Portfolio’s performance. Although investments in commodities may move in different directions than traditional equity securities and debt instruments, when the value of those traditional investments is declining due to adverse economic conditions, there is no guarantee that commodities will perform in that manner, and at certain times the price movements of commodity-linked investments have been parallel to those of traditional equity securities and debt instruments.
Concentration Risk: If an Underlying Portfolio or Underlying ETF concentrates in a particular market, industry, group of industries, country, region, group of countries, asset class or sector, that Underlying Portfolio or Underlying ETF may be adversely affected by the performance of those securities and may be subject to price volatility. In addition, an Underlying Portfolio or Underlying ETF that concentrates in a single market, industry, group of industries, country, region, group of countries, asset class or sector may be more susceptible to any single economic, market, political or regulatory occurrence affecting that industry or group of industries.
Energy Sector Risk: The energy sector is cyclical and highly dependent on commodities prices, and the market values of companies in the energy sector could be adversely affected by, among other factors, the levels and volatility of global energy prices, commodity price volatility, energy supply and demand, changes in exchange rates and interest rates, imposition of import controls, increased competition, capital expenditures on and the success of exploration and production, depletion of resources, development of alternative energy sources and energy conservation efforts, technological developments, tax treatment and labor relations. Companies in this sector are subject to substantial government regulation and contractual fixed pricing, which may increase the cost of business and limit these companies’ earnings, and a significant portion of their revenues depends on a relatively small number of customers, including governmental entities and utilities. As a result, governmental budget constraints may have a material adverse effect on the stock prices of companies in this industry. Energy companies also face a significant risk of civil liability from accidents resulting in injury or loss of life or property, pollution or other environmental mishaps, equipment malfunctions or mishandling of materials and a risk of loss
B-28
from terrorism, political strife and natural disasters. Energy companies may also operate in or engage in transactions involving countries with less developed regulatory regimes or a history of expropriation, nationalization or other adverse policies. Any such event could have serious consequences for the general population of the area affected and result in a material adverse impact to a Portfolio’s holdings and the performance of a Portfolio.
Infrastructure Sector Risk: Companies in the infrastructure industry may be subject to a variety of factors that could adversely affect their business or operations, including high interest costs in connection with capital construction programs, high degrees of leverage, costs associated with governmental, environmental and other regulations, the effects of economic slowdowns, increased competition from other providers of services, uncertainties concerning costs, the level of government spending on infrastructure projects, and other factors. Infrastructure companies may be adversely affected by commodity price volatility, changes in exchange rates, import controls, depletion of resources, technological developments, and labor relations. There is also the risk that corruption may negatively affect publicly funded infrastructure projects, especially in emerging markets, resulting in delays and cost overruns.
Infrastructure issuers can be significantly affected by government spending policies because companies involved in this industry rely to a significant extent on U.S. and other government demand for their products. In addition, infrastructure companies may be adversely affected by government regulation or world events (e.g., expropriation, nationalization, confiscation of assets and property or the imposition of restrictions on foreign investments and repatriation of capital, military coups, social or labor unrest, or violence) in the regions in which the companies operate. Infrastructure companies may have significant capital investments in, or engage in transactions involving, emerging market countries, which may heighten these risks. In addition, the failure of an infrastructure company to carry adequate insurance or to operate its assets appropriately could lead to significant losses. Infrastructure companies may be adversely affected by environmental clean-up costs and catastrophic events such as earthquakes, hurricanes and terrorist acts. Infrastructure-related securities may be issued by companies that are highly leveraged, less creditworthy or financially distressed. These investments are considered to be speculative and are subject to greater risk of loss, greater sensitivity to interest rate and economic changes, valuation difficulties, and potential illiquidity.
Natural Resources Sector Risk: The profitability of companies in the natural resources sector can be adversely affected by worldwide energy prices and other world events, limits on and the success of exploration projects, and production spending. Companies in the natural resources sector also could be adversely affected by commodity price volatility, changes in exchange rates, interest rates or inflation rates and/or investor expectations concerning such rates, changes in the supply of, or the demand for, natural resources, imposition of import controls, government regulation and intervention, civil conflict, economic conditions, increased competition, technological developments, and labor relations. In addition, companies in the natural resources sector may be subject to the risks generally associated with extraction of natural resources, such as the risks of mining and oil drilling, and the risks of the hazards associated with natural resources, such as natural or man-made disasters, fire, drought, liability for environmental damage claims, and increased regulatory and environmental costs. Prices of precious metals and of precious metal related securities have historically been very volatile due to various economic, financial, social and political factors and may adversely affect the financial condition of companies involved with precious metals.
Oil and Gas Sector Risk: The profitability of companies in the oil and gas sector is related to worldwide energy prices, exploration, and production spending. Companies in the oil and gas sector may be adversely affected by natural disasters or other catastrophes. Companies in the oil and gas sector may be at risk for environmental damage claims and other types of litigation, as well as negative publicity and perception. Companies in the oil and gas sector may be adversely affected by changes in exchange rates, interest rates, economic conditions, tax treatment, government regulation and intervention, and world events in the regions that the companies operate (e.g., expropriation, nationalization, confiscation of assets and property or the imposition of restrictions on foreign investments and repatriation of capital, military coups, social unrest, violence or labor unrest.) Companies in the oil and gas sector may have significant capital investments in, or engage in transactions involving, emerging market countries, which may heighten these risks.
B-29
Precious Metals Risk: Precious metals, such as gold and silver, generate no interest or dividends, and the return from investments in such precious metals will be derived solely from the gains and losses realized upon sale. Prices of precious metals may fluctuate, sharply or gradually, and over short or long periods of time. The prices of precious metals may be significantly affected by factors such as changes in inflation or expectations regarding inflation in various countries, the availability of supplies and demand, changes in industrial and commercial demand, developments in the precious metals mining industries, precious metals sales by governments, central banks or international institutions, investment speculation, hedging activity by producers, currency exchange rates, interest rates, and monetary and other economic policies of various governments. In addition, because the majority of the world’s supply of gold and silver is concentrated in a few countries, such investments may be particularly susceptible to political, economic and environmental conditions and events in those countries.
Sales by the Official Sector Risk: A significant portion of the aggregate world gold holdings is owned by governments, central banks and related institutions. If one or more of these institutions decides to sell in amounts large enough to cause a decline in world gold prices, the price of an Underlying ETF that invests in gold will be adversely affected.
Utilities Sector Risk: The utilities sector in general is subject to significant governmental regulation and review, which may result in limitations or delays with regard to changes in the rates that companies in this sector charge their customers. Other risk factors that may affect utility companies include the risk of increases in fuel and other operating costs; the high cost of borrowing to finance capital construction during inflationary periods; restrictions on operations and increased costs and delays associated with compliance with environmental and safety regulations; difficulties in obtaining natural gas or other key inputs; risks related to the construction and operation of power plants; the effects of energy conservation and the effects of regulatory changes. Any of these factors could result in a material adverse impact on the Underlying ETF’s portfolio securities and the performance of the Underlying ETF.
B-30
APPENDIX C
SECURITY OWNERSHIP OF CERTAIN BENEFICIAL OWNERS
OF PORTFOLIOS OF EQ TRUST
As of January 31, 2017, to EQ Trust’s knowledge, the following persons owned beneficially or of record 5% or more of the Class IA, Class IB, or Class K shares of an Acquiring Portfolio.
| | | | | | | | |
Shareholder’s or Contractholder’s Name/Address | | Percent
Beneficial Ownership of Shares of the Portfolio | | | Percent Beneficial
Ownership of
Shares of the
Combined
Portfolio
(assuming
the Reorganization
occurs) | |
| | |
| All Asset Growth-Alt 20 — Class K | | | | | | | | |
| | |
ALLIANCE FOR DENTAL CARE PLLC 40 WINTER ST STE 201 ROCHESTER, NH 03867-313 | | | 29.69% | | | | 11.14% | |
| | |
DEREK P. CIMLER, D.D.S. 46 NEW HAVEN RD VERGENNES, VT 05491-133 | | | 6.08% | | | | 2.28% | |
| | |
MOYES-IVERSON DENTAL, LLC 1770 COMBE RD # B OGDEN, UT 84403-517 | | | 29.27% | | | | 10.98% | |
| | |
BRENT E. CURTIS, D.D.S. 2025 S 1300 E SALT LAKE CTY, UT 84105-365 | | | 6.97% | | | | 2.62% | |
| | |
| AXA/Horizon Small Cap Value — Class IB | | | | | | | | |
| | |
MR STEPHEN PERRETTA 28 COMMUNITY DRIVE CORAM, NY 11727-2701 | | | 6.28% | | | | 2.14% | |
| | |
THE CLERGY ADVANTAGE 403(B) BY CHURCH AND CLERGY ALLIANCE PO BOX 272 LOVELAND, CO 80539 | | | 42.96% | | | | 14.62% | |
| | |
MR THOMAS K GARCEAU 39088 30TH STREET PAW PAW, MI 49079-9420 | | | 8.04% | | | | 2.74% | |
| | |
MR RONALD J DEMERECK 39741 32ND STREET PAW PAW, MI 49079-8441 | | | 13.51% | | | | 4.60% | |
C-1
| | | | | | | | |
Shareholder’s or Contractholder’s Name/Address | | Percent Beneficial Ownership of Shares of the Portfolio | | | Percent Beneficial
Ownership of
Shares of the
Combined
Portfolio
(assuming
the Reorganization
occurs) | |
| | |
| EQ/PIMCO Global Real Return — Class IB | | | | | | | | |
| | |
MR JOHN R SMERECZNIAK 1132 WILDFLOWER CT RED WING, MN 55066-3987 | | | 33.49% | | | | 22.10% | |
| | |
THE CLERGY ADVANTAGE 403(B) BY CHURCH AND CLERGY ALLIANCE PO BOX 272 LOVELAND, CO 80539 | | | 30.18% | | | | 19.91% | |
| | |
MISS SYLVIA EWING 5216 4TH STREET NE UNIT 201 WASHINGTON, DC 20011-6352 | | | 5.64% | | | | 3.73% | |
As of January 1, 2017, to EQ Trust’s knowledge, the following persons owned beneficially or of record 5% or more of the Class IB or Class K shares of an Acquired Portfolio.
| | | | | | | | |
| | |
Shareholder’s or Contractholder’s Name/Address | | Percent Beneficial Ownership of Shares of the Portfolio | | | Percent Beneficial
Ownership of
Shares of the
Combined
Portfolio
(assuming
the Reorganization
occurs) | |
| |
| All Asset Aggressive-Alt 25 — Class K | | | | | |
| | |
DANIEL T. NOVAK PS PLAN 2833 QUAKER VALLEY RD NEW PARIS, PA 15554-862 | | | 5.57% | | | | 3.48% | |
| | |
GREGORY D. LISKA DDS AND DARREN 1025 EVERGREEN LN N PLYMOUTH, MN 55441-486 | | | 11.45% | | | | 7.16% | |
| | |
JEFFREY D. JACOBSON, DDS 1024 COLINGTON RD # 1 KILL DEVIL HL, NC 27948-801 | | | 22.03% | | | | 13.77% | |
| | |
SERGE PAPIERNIK, D.D.S., P.A. 9350 S DIXIE HWY STE 920 MIAMI, FL 33156-299 | | | 15.44% | | | | 9.65% | |
C-2
| | | | | | | | |
| | |
Shareholder’s or Contractholder’s Name/Address | | Percent Beneficial Ownership of Shares of the Portfolio | | | Percent Beneficial
Ownership of
Shares of the
Combined
Portfolio
(assuming
the Reorganization
occurs) | |
|
| All Asset Aggressive-Alt 50 — Class IB | |
| | |
AARON M ATWOOD 15 UNION ST APT 3 CHARLESTOWN, MA 02129 | | | 6.37% | | | | 0.06% | |
| | |
JOSEPH K EDSON 4220 DENBIGH DR RICHMOND, VA 23235 | | | 5.19% | | | | 0.05% | |
| | |
RICHARD HSU 160 SANTIAGO AVE RUTHERFORD, NJ 07070 | | | 8.31% | | | | 0.08% | |
| | |
DIANE K UEBELHOER 8425 HASTA COURT FORT WAYNE, IN 46815 | | | 6.76% | | | | 0.07% | |
| | |
RICHARD A FENNESSY 1037 COLONY DR CRYSTAL LAKE, IL 60014 | | | 5.13% | | | | 0.05% | |
| | |
FIONA H FORREST 4026 LA JOLLA VILLAGE DR SAN DIEGO, CA 92037 | | | 14.86% | | | | 0.15% | |
| | |
AKEMI UYEMA 2305 W 165TH ST TORRANCE, CA 90504 | | | 11.87% | | | | 0.12% | |
| |
| All Asset Aggressive-Alt 75 — Class IB | | | | | |
| | |
STEPHEN UNGER 6178 VISTA LINDA LN BOCA RATON, FL 33433 | | | 12.03% | | | | 0.18% | |
| | |
CHER TRUST DTD 10/09 CHARLOTTE D BO 454 W CITATION LANE TEMPE, AZ 85284 | | | 7.04% | | | | 0.10% | |
| | |
BILL J REED 2881 KENDRICK STREET GOLDEN, CO 80401 | | | 13.74% | | | | 0.20% | |
| | |
KEVIN E DUPREE 5815 OUTLOOK MISSION, KS 66202 | | | 10.72% | | | | 0.16% | |
C-3
| | | | | | | | |
| | |
Shareholder’s or Contractholder’s Name/Address | | Percent Beneficial Ownership of Shares of the Portfolio | | | Percent Beneficial
Ownership of
Shares of the
Combined
Portfolio
(assuming
the Reorganization
occurs) | |
| |
| AXA/Pacific Global Small Cap Value — Class IB | | | | | |
| | |
MR JOHN R SMERECZNIAK 1132 WILDFLOWER CT RED WING, MN 55066-3987 | | | 33.49% | | | | 22.10% | |
| | |
THE CLERGY ADVANTAGE 403(B) BY CHURCH AND CLERGY ALLIANCE PO BOX 272 LOVELAND, CO 80539 | | | 30.18% | | | | 19.91% | |
| | |
MISS SYLVIA EWING 5216 4TH STREET NE UNIT 201 WASHINGTON, DC 20011-6352 | | | 5.64% | | | | 3.73% | |
| | |
CHRISTINE LEFKOWITZ 516 HARBOR RD COLD SPRING HARBOR, NY 11724 | | | 6.72% | | | | 1.24% | |
SECURITY OWNERSHIP OF CERTAIN BENEFICIAL OWNERS
OF PORTFOLIOS OF VIP TRUST
As of January 31, 2017, to VIP Trust’s knowledge, the following persons owned beneficially or of record 5% or more of the Class B shares of an Acquiring Portfolio.
| | | | | | | | |
Shareholder’s or Contractholder’s Name/Address | | Percent Beneficial Ownership of Shares of the Portfolio | | | Percent Beneficial
Ownership of
Shares of the
Combined
Portfolio
(assuming
the Reorganization
occurs) | |
|
| Charter Moderate — Class B | |
| | |
WILLIAM C WISWELL W4812 OVERLOOK DR ELKHORN, WI 53121 | | | 15.31% | | | | 13.86% | |
C-4
As of January 31, 2017, to VIP Trust’s knowledge, the following persons owned beneficially or of record 5% or more of the Class B shares of an Acquired Portfolio.
| | | | | | | | |
Shareholder’s or Contractholder’s Name/Address | | Percent Beneficial Ownership of Shares of the Portfolio | | | Percent Beneficial
Ownership of
Shares of the
Combined
Portfolio
(assuming
the Reorganization
occurs) | |
| | |
| Charter Income Strategies — Class B | | | | | | | | |
| | |
LVG TST DTD 7/17/07 ESTHER R HEIME 21 SUNCREST DRIVE DIX HILLS, NY 11746 | | | 5.93% | | | | 1.10% | |
| | |
| Charter International Moderate — Class B | | | | | | | | |
| | |
JANE ALPERT 177 BLACKWOOD LANE STAMFORD, CT 06903 | | | 8.24% | | | | 0.79% | |
| | |
MARIANGELA FILIPPELLI 12067 APOLLO DR N ROYALTON, OH 44133 | | | 9.22% | | | | 0.88% | |
| | |
BILL J REED 2881 KENDRICK STREET GOLDEN, CO 80401 | | | 10.89% | | | | 1.04% | |
| | |
| Charter Interest Rate Strategies — Class B | | | | | | | | |
| | |
MARIANNE ZITELLA 726 LOMBARD RD ADDISON, IL 60101 | | | 5.42% | | | | 1.12% | |
| | |
| Charter Real Assets — Class B | | | | | | | | |
| | |
YOLANDA M CELLUCCI 125 COOLIDGE AVE APT 809 WATERTOWN MA 02472-2875 | | | 5.27% | | | | 0.19% | |
| | |
LOUISE A EVANS 511 BOGGSTON AVE PITTSBURGH, PA 15210 | | | 5.23% | | | | 0.19% | |
| | |
CHER TRUST DTD 10/09 CHARLOTTE D BO 454 W CITATION LANE TEMPE, AZ 85284 | | | 5.08% | | | | 0.18% | |
C-5
STATEMENT OF ADDITIONAL INFORMATION
February 22, 2017
EQ ADVISORS TRUST
All Asset Aggressive-Alt 25 Portfolio
All Asset Aggressive-Alt 50 Portfolio
All Asset Aggressive-Alt 75 Portfolio
AXA/Pacific Global Small Cap Value Portfolio,
each a series of EQ Advisors Trust and
AXA PREMIER VIP TRUST
CharterSM Alt 100 Moderate Portfolio
CharterSM Income Strategies Portfolio
CharterSM Interest Rate Strategies Portfolio
CharterSM Real Assets Portfolio,
each a series of AXA Premier VIP Trust
(each, an “Acquired Portfolio” and together, the “Acquired Portfolios”)
AND
EQ ADVISORS TRUST
All Asset Growth-Alt 20 Portfolio
AXA/DoubleLine Opportunistic Core Plus Bond Portfolio
EQ/PIMCO Global Real Return Portfolio
AXA/Horizon Small Cap Value Portfolio,
each a series of EQ Advisors Trust
(each, an “Acquiring Portfolio” and together, the “Acquiring Portfolios”)
1290 Avenue of the Americas
New York, New York 10104
(877) 222-2144
| | |
| Acquisition of the assets and assumption of the liabilities of: | | By and in exchange for shares of: |
All Asset Aggressive-Alt 25 Portfolio All Asset Aggressive-Alt 50 Portfolio All Asset Aggressive-Alt 75 Portfolio CharterSM Alt 100 Moderate Portfolio | | All Asset Growth-Alt 20 Portfolio |
CharterSM Income Strategies Portfolio CharterSM Interest Rate Strategies Portfolio | | AXA/DoubleLine Opportunistic Core Plus Bond Portfolio |
| CharterSM Real Assets Portfolio | | EQ/PIMCO Global Real Return Portfolio |
| AXA/Pacific Global Small Cap Value Portfolio | | AXA/Horizon Small Cap Value Portfolio |
This Statement of Additional Information (the “SAI”) relates specifically to the proposed reorganization of each Acquired Portfolio into the corresponding Acquiring Portfolio under which the Acquiring Portfolio would acquire all of the assets of the Acquired Portfolio in exchange solely for shares of the Acquiring Portfolio and that Acquiring Portfolio’s assumption of all of the corresponding Acquired Portfolio’s liabilities (the “Reorganizations”). This SAI is available to owners of and participants in variable life insurance contracts and variable annuity contracts and certificates (the “Contracts”) with amounts allocated to an Acquired Portfolio and to other shareholders of the Acquired Portfolios as of December 31, 2016.
This SAI is not a prospectus. A Combined Proxy Statement and Prospectus dated February 22, 2017 relating to the Reorganizations (the “Combined Proxy Statement/Prospectus”) may be obtained, without charge, by writing to EQ Advisors Trust (“EQ Trust”) or AXA Premier VIP Trust (“VIP Trust”) at 1290 Avenue of the Americas, New York, New York 10104 or calling 1-877-222-2144. This SAI should be read in conjunction with the Combined Proxy Statement/Prospectus.
1
Contents of the SAI
This SAI consists of the cover page, the information set forth below, and the following documents, each of which was filed electronically with the Securities and Exchange Commission and is incorporated by reference herein:
With respect to the reorganization of the All Asset Aggressive-Alt 25 Portfolio, All Asset Aggressive-Alt 50 Portfolio, and All Asset Aggressive-Alt 75 Portfolio, each a series of EQ Trust, merging into All Asset Growth- Alt 20 Portfolio, a series of EQ Trust; and AXA/Pacific Global Small Cap Value Portfolio, a series of EQ Trust, merging into AXA/Horizon Small Cap Value Portfolio, a series of EQ Trust.
The combined Statement of Additional Information of EQ Trust dated May 1, 2016, as supplemented, with respect to the All Asset Growth-Alt 20 Portfolio and AXA/Horizon Small Cap Value Portfolio, each an Acquiring Portfolio, and the All Asset Aggressive-Alt 25 Portfolio, All Asset Aggressive-Alt 50 Portfolio, All Asset Aggressive-Alt 75 Portfolio, and AXA/Pacific Global Small Cap Value Portfolio, each an Acquired Portfolio (File Nos. 333-17217 and 811-07953).
The Statement of Additional Information includes information about EQ Trust’s other portfolios that is not relevant to the Reorganizations. Please disregard that information.
With respect to the reorganization of the CharterSM Alt 100 Moderate Portfolio, a series of VIP Trust, merging into All Asset Growth-Alt 20 Portfolio, a series of EQ Trust; the CharterSM Income Strategies Portfolio and CharterSM Income Strategies Portfolio, each a series of VIP Trust, merging into AXA/DoubleLine Opportunistic Core Plus Bond Portfolio, a series of EQ Trust; and the CharterSM Real Assets Portfolio, a series of VIP Trust, merging into EQ/PIMCO Global Real Return Portfolio, a series of EQ Trust.
The combined Statement of Additional Information of EQ Trust dated May 1, 2016, as supplemented, with respect to the All Asset Growth-Alt 20 Portfolio, AXA/DoubleLine Opportunistic Core Plus Bond Portfolio, and EQ/PIMCO Global Real Return Portfolio, each an Acquiring Portfolio (File Nos. 333-17217 and 811-07953).
The combined Statement of Additional Information of VIP Trust dated May 1, 2016, as supplemented, with respect to the CharterSM Alt 100 Moderate Portfolio, CharterSM Income Strategies Portfolio, CharterSM Interest Rate Strategies Portfolio, and CharterSM Real Assets Portfolio, each an Acquired Portfolio (File Nos. 333-70754 and 811-10509).
The Statements of Additional Information include information about EQ Trust’s and VIP Trust’s other portfolios that are not relevant to the Reorganizations. Please disregard that information.
Pro Forma Financial Information
CharterSM Real Assets Portfolio merging into EQ/PIMCO Global Real Return Portfolio
In accordance with the instructions to Form N-14, pro forma financial information for the CharterSM Real Assets Portfolio (“Real Assets Portfolio”) and the EQ/PIMCO Global Real Return Portfolio (“Global Real Return Portfolio”) after giving effect to the Reorganization are not required to be included in this SAI because the net assets of the Real Assets Portfolio within 30 days prior to the date of filing of the Combined Proxy Statement and Prospectus for the Reorganization are less than 10 percent of the net assets of the Global Real Return Portfolio.
All Asset Aggressive-Alt 25 Portfolio merging into All Asset Growth-Alt 20 Portfolio
The following tables set forth the pro forma Portfolio of Investments as of December 31, 2016, the pro forma condensed Statement of Assets and Liabilities as of December 31, 2016, and the pro forma condensed Statement of Operations for the one year period ended December 31, 2016 for the All Asset Aggressive-Alt 25 Portfolio (“Alt-25 Portfolio”) and the All Asset Growth-Alt 20 Portfolio (“Growth-Alt 20 Portfolio”), as adjusted giving effect to the Reorganization. The pro forma Portfolio of Investments contains information about the securities holdings of the combined Portfolio as of December 31, 2016, which has, and will continue to, change over time due to normal portfolio turnover in response to changes in market conditions. Thus, it is expected that some of the Alt-25 Portfolio’s holdings may not remain at the time of the Reorganization. It is also expected that, if the Reorganization is approved, the Alt-25 Portfolio’s holdings that are not compatible with the corresponding Growth-Alt 20 Portfolio’s investment objective and policies will be liquidated in an orderly manner in connection with the Reorganization, and the proceeds of these sales held in temporary investments or reinvested in assets that are consistent with the Growth-Alt 20 Portfolio’s investment objective and policies. The portion of an Alt-25 Portfolio’s assets that will be liquidated in connection with the Reorganization will depend on market conditions and on the assessment by AXA Equitable Funds Management Group, LLC, the Portfolios’ investment manager, of the compatibility of those holdings with the Growth-Alt 20 Portfolio’s portfolio composition, investment objective, and policies at the time of the Reorganization. The need for a Portfolio to sell investments in connection with the Reorganization may result in its selling securities at a disadvantageous time and price and could result in its realizing gains (or losses) that would not otherwise have been realized and incurring transaction costs that would not otherwise have been incurred.
2
EQ ADVISORS TRUST
PORTFOLIO OF INVESTMENTS
December 31, 2016 (Unaudited)
| | | | | | | | | | | | | | | | | | | | | | | | | | | | | | | | |
| | | All Asset
Aggressive-
Alt 25 | | | All Asset
Growth-
Alt 20 | | | Pro-forma
Adjustment | | | All Asset
Growth-
Alt 20
Combined
Pro-forma | | | All Asset
Aggressive-
Alt 25 | | | All Asset
Growth-
Alt 20 | | | Pro-forma
Adjustment | | | All Asset
Growth-
Alt 20
Combined
Pro-forma | |
| | | Number of
Shares | | | Number of
Shares | | | Number of
Shares | | | Number of
Shares | | | Value ($) | | | Value ($) | | | Value ($) | | | Value ($) | |
EXCHANGE TRADED FUNDS: | | | | | | | | | | | | | | | | | | | | | | | | | | | | | | | | |
iShares® China Large-Cap Fund (x) | | | 4,435 | | | | 38,800 | | | | — | | | | 43,235 | | | | 153,939 | | | | 1,346,748 | | | | — | | | | 1,500,687 | |
iShares® Gold Trust* | | | — | | | | 1,028,100 | | | | — | | | | 1,028,100 | | | | — | | | | 11,391,348 | | | | — | | | | 11,391,348 | |
iShares® International Developed Property Fund (x) | | | 11,740 | | | | 71,000 | | | | — | | | | 82,740 | | | | 394,581 | | | | 2,386,310 | | | | — | | | | 2,780,891 | |
iShares® JP Morgan USD Emerging Markets Bond Fund (x) | | | 1,870 | | | | 47,660 | | | | — | | | | 49,530 | | | | 206,111 | | | | 5,253,085 | | | | — | | | | 5,459,196 | |
iShares® MSCI EAFE Small-Cap Fund | | | 10,760 | | | | 80,600 | | | | — | | | | 91,360 | | | | 536,279 | | | | 4,017,104 | | | | — | | | | 4,553,383 | |
iShares® MSCI Global Gold Miners Fund | | | 3,144 | | | | 9,750 | | | | — | | | | 12,894 | | | | 53,857 | | | | 167,018 | | | | — | | | | 220,875 | |
iShares® Silver Trust* | | | — | | | | 76,950 | | | | — | | | | 76,950 | | | | — | | | | 1,162,714 | | | | — | | | | 1,162,714 | |
iShares® U.S. Oil & Gas Exploration & Production Fund (x) | | | 2,960 | | | | 15,320 | | | | — | | | | 18,280 | | | | 193,702 | | | | 1,002,541 | | | | — | | | | 1,196,243 | |
PowerShares DB Gold Fund (x)* | | | 46,850 | | | | 26,900 | | | | — | | | | 73,750 | | | | 1,734,856 | | | | 996,107 | | | | — | | | | 2,730,963 | |
PowerShares DB Silver Fund (x)*‡ | | | 16,440 | | | | 70,000 | | | | — | | | | 86,440 | | | | 408,698 | | | | 1,740,200 | | | | — | | | | 2,148,898 | |
SPDR S&P Emerging Asia Pacific Fund | | | 1,140 | | | | 4,100 | | | | — | | | | 5,240 | | | | 85,648 | | | | 308,033 | | | | — | | | | 393,681 | |
SPDR® S&P Emerging Markets SmallCap Fund | | | 3,805 | | | | 31,900 | | | | — | | | | 35,705 | | | | 151,135 | | | | 1,267,068 | | | | — | | | | 1,418,203 | |
| | | | | | | | | | | | | | | | | | | | | | | | | | | | | | | | |
Total Exchange Traded Funds (11.5%)
(Cost $32,344,862) | | | | | | | | | | | | | | | | | | | 3,918,806 | | | | 31,038,276 | | | | — | | | | 34,957,082 | |
| | | | | | | | | | | | | | | | | | | | | | | | | | | | | | | | |
INVESTMENT COMPANIES: | | | | | | | | | | | | | | | | | | | | | | | | | | | | | | | | |
AXA Natural Resources Portfolio‡ | | | 195,592 | | | | 1,504,427 | | | | — | | | | 1,700,019 | | | | 1,555,469 | | | | 11,964,159 | | | | — | | | | 13,519,628 | |
AXA Real Estate Portfolio‡ | | | 147,891 | | | | 1,067,135 | | | | — | | | | 1,215,026 | | | | 1,548,883 | | | | 11,176,284 | | | | — | | | | 12,725,167 | |
AXA/AB Small Cap Growth Portfolio‡ | | | 144,011 | | | | 912,351 | | | | — | | | | 1,056,362 | | | | 2,608,102 | | | | 16,523,133 | | | | — | | | | 19,131,235 | |
AXA/Janus Enterprise Portfolio*‡ | | | 10,555 | | | | 74,041 | | | | — | | | | 84,596 | | | | 167,862 | | | | 1,177,460 | | | | — | | | | 1,345,322 | |
AXA/Loomis Sayles Growth Portfolio‡ | | | 167,378 | | | | 2,091,832 | | | | — | | | | 2,259,210 | | | | 1,090,324 | | | | 13,626,510 | | | | — | | | | 14,716,834 | |
EQ/BlackRock Basic Value Equity Portfolio‡ | | | 101,570 | | | | 739,741 | | | | — | | | | 841,311 | | | | 2,351,590 | | | | 17,126,779 | | | | — | | | | 19,478,369 | |
EQ/Boston Advisors Equity Income Portfolio‡ | | | 206,677 | | | | 1,053,797 | | | | — | | | | 1,260,474 | | | | 1,190,213 | | | | 6,068,611 | | | | — | | | | 7,258,824 | |
EQ/Emerging Markets Equity PLUS Portfolio‡ | | | 118,296 | | | | 938,228 | | | | — | | | | 1,056,524 | | | | 946,879 | | | | 7,509,871 | | | | — | | | | 8,456,750 | |
EQ/GAMCO Mergers and Acquisitions Portfolio‡ | | | 147,809 | | | | 1,046,595 | | | | — | | | | 1,194,404 | | | | 1,930,553 | | | | 13,669,683 | | | | — | | | | 15,600,236 | |
EQ/GAMCO Small Company Value Portfolio‡ | | | 33,595 | | | | 281,723 | | | | — | | | | 315,318 | | | | 1,966,357 | | | | 16,489,358 | | | | — | | | | 18,455,715 | |
EQ/Global Bond PLUS Portfolio‡ | | | 89,934 | | | | 2,389,111 | | | | — | | | | 2,479,045 | | | | 788,304 | | | | 20,941,495 | | | | — | | | | 21,729,799 | |
EQ/High Yield Bond Portfolio‡ | | | 40,919 | | | | 879,168 | | | | — | | | | 920,087 | | | | 389,631 | | | | 8,371,482 | | | | — | | | | 8,761,113 | |
EQ/Intermediate Government Bond Portfolio‡ | | | 16,329 | | | | 465,277 | | | | — | | | | 481,606 | | | | 167,082 | | | | 4,760,850 | | | | — | | | | 4,927,932 | |
EQ/International Equity Index Portfolio‡ | | | 125,317 | | | | 1,128,677 | | | | — | | | | 1,253,994 | | | | 1,048,184 | | | | 9,440,531 | | | | — | | | | 10,488,715 | |
EQ/Invesco Comstock Portfolio‡ | | | 113,726 | | | | 795,725 | | | | — | | | | 909,451 | | | | 1,795,133 | | | | 12,560,314 | | | | — | | | | 14,355,447 | |
EQ/JPMorgan Value Opportunities Portfolio‡ | | | 73,274 | | | | 727,137 | | | | — | | | | 800,411 | | | | 1,359,592 | | | | 13,492,012 | | | | — | | | | 14,851,604 | |
EQ/MFS International Growth Portfolio‡ | | | 379,989 | | | | 2,910,996 | | | | — | | | | 3,290,985 | | | | 2,496,916 | | | | 19,128,204 | | | | — | | | | 21,625,120 | |
EQ/PIMCO Global Real Return Portfolio‡ | | | 53,121 | | | | 1,178,356 | | | | — | | | | 1,231,477 | | | | 515,639 | | | | 11,438,117 | | | | — | | | | 11,953,756 | |
EQ/PIMCO Ultra Short Bond Portfolio‡ | | | 9,956 | | | | 574,754 | | | | — | | | | 584,710 | | | | 98,237 | | | | 5,671,102 | | | | — | | | | 5,769,339 | |
EQ/T. Rowe Price Growth Stock Portfolio*‡ | | | 57,270 | | | | 376,510 | | | | — | | | | 433,780 | | | | 2,229,452 | | | | 14,657,094 | | | | — | | | | 16,886,546 | |
Multimanager Core Bond Portfolio‡ | | | 21,568 | | | | 640,212 | | | | — | | | | 661,780 | | | | 210,925 | | | | 6,260,897 | | | | — | | | | 6,471,822 | |
| | | | | | | | | | | | | | | | | | | | | | | | | | | | | | | | |
Total Investment Companies (88.2%)
(Cost $243,715,577) | | | | | | | | | | | | | | | | | | | 26,455,327 | | | | 242,053,946 | | | | — | | | | 268,509,273 | |
| | | | | | | | | | | | | | | | | | | | | | | | | | | | | | | | |
3
| | | | | | | | | | | | | | | | | | | | | | | | | | | | | | | | |
| | | All Asset
Aggressive-
Alt 25 | | | All Asset
Growth-
Alt 20 | | | Pro-forma
Adjustment | | | All Asset
Growth-
Alt 20
Combined
Pro-forma | | | All Asset
Aggressive-
Alt 25 | | | All Asset
Growth-
Alt 20 | | | Pro-forma
Adjustment | | | All Asset
Growth-
Alt 20
Combined
Pro-forma | |
| | | Number of
Shares | | | Number of
Shares | | | Number of
Shares | | | Number of
Shares | | | Value ($) | | | Value ($) | | | Value ($) | | | Value ($) | |
SHORT-TERM INVESTMENTS: | | | | | | | | | | | | | | | | | | | | | | | | | | | | | | | | |
Investment Company (0.4%) | | | | | | | | | | | | | | | | | | | | | | | | | | | | | | | | |
JPMorgan Prime Money Market Fund, IM Shares | | | 400,075 | | | | 769,263 | | | | — | | | | 1,169,338 | | | | 400,195 | | | | 769,494 | | | | — | | | | 1,169,689 | |
| | | | | | | | |
| | | All Asset
Aggressive-
Alt 25 | | | All Asset
Growth-
Alt 20 | | | Pro-forma
Adjustment | | | All Asset
Growth-
Alt 20
Combined
Pro-forma | | | | | | | | | | | | | |
| | | Principal
Amount ($) | | | Principal
Amount ($) | | | Principal
Amount ($) | | | Principal
Amount ($) | | | | | | | | | | | | | |
Repurchase Agreements (1.7%) | | | | | | | | | | | | | | | | | | | | | | | | | | | | | | | | |
Citigroup Global Markets Ltd., 0.71%, dated 12/30/16, due 1/3/17, repurchase price $325,911, collateralized by various Foreign Government Agency Securities, ranging from 0.000%-5.250%, maturing 1/23/17-1/24/44, U.S. Government Treasury Securities, ranging from 0.000%-5.375%, maturing 2/15/19-2/15/44; total market value $332,403. (xx) | | | 25,885 | | | | 300,000 | | | | — | | | | 325,885 | | | | 25,885 | | | | 300,000 | | | | — | | | | 325,885 | |
Deutsche Bank AG, 0.95%, dated 12/30/16, due 1/3/17, repurchase price $222,516, collateralized by various Corporate Bonds, ranging from 1.875%-2.500%, maturing 3/13/19-6/10/25; total market value $226,944. (xx) | | | 22,493 | | | | 200,000 | | | | — | | | | 222,493 | | | | 22,493 | | | | 200,000 | | | | — | | | | 222,493 | |
Deutsche Bank AG, 1.05%, dated 12/30/16, due 1/3/17, repurchase price $1,000,117, collateralized by various Common Stocks; total market value $1,111,555. (xx) | | | — | | | | 1,000,000 | | | | — | | | | 1,000,000 | | | | — | | | | 1,000,000 | | | | — | | | | 1,000,000 | |
Deutsche Bank AG, 1.05%, dated 12/30/16, due 1/3/17, repurchase price $2,900,339, collateralized by various Common Stocks; total market value $3,223,510. (xx) | | | 400,000 | | | | 2,500,000 | | | | — | | | | 2,900,000 | | | | 400,000 | | | | 2,500,000 | | | | — | | | | 2,900,000 | |
Deutsche Bank Securities, Inc., 0.50%, dated 12/30/16, due 1/3/17, repurchase price $569,970, collateralized by various U.S. Government Treasury Securities, 0.000%, maturing 2/15/40-5/15/40; total market value $581,337. (xx) | | | 175,632 | | | | 394,307 | | | | — | | | | 569,939 | | | | 175,632 | | | | 394,307 | | | | — | | | | 569,939 | |
Macquarie Bank Ltd., 0.76%, dated 12/30/16, due 1/3/17, repurchase price $300,025, collateralized by various U.S. Government Treasury Securities, ranging from 0.000%-8.750%, maturing 1/5/17-5/15/46; total market value $306,155. (xx) | | | — | | | | 300,000 | | | | — | | | | 300,000 | | | | — | | | | 300,000 | | | | — | | | | 300,000 | |
| | | | | | | | | | | | | | | | | | | | | | | | | | | | | | | | |
Total Repurchase Agreements | | | | | | | | | | | | | | | | | | | 624,010 | | | | 4,694,307 | | | | — | | | | 5,318,317 | |
| | | | | | | | | | | | | | | | | | | | | | | | | | | | | | | | |
Total Short-Term Investment (2.1%)
(Cost $6,487,736) | | | | | | | | | | | | | | | | | | | 1,024,205 | | | | 5,463,801 | | | | — | | | | 6,488,006 | |
| | | | | | | | | | | | | | | | | | | | | | | | | | | | | | | | |
Total Investments (101.8%)
(Cost $282,548,175) | | | | | | | | | | | | | | | | | | | 31,398,338 | | | | 278,556,023 | | | | — | | | | 309,954,361 | |
Other Assets Less Liabilities (-1.8%) | | | | | | | | | | | | | | | | | | | (706,675 | ) | | | (4,761,991 | ) | | | — | | | | (5,468,666 | ) |
| | | | | | | | | | | | | | | | | | | | | | | | | | | | | | | | |
Net Assets (100%) | | | | | | | | | | | | | | | | | | | 30,691,663 | | | | 273,794,032 | | | | — | | | | 304,485,695 | |
| | | | | | | | | | | | | | | | | | | | | | | | | | | | | | | | |
As of February 22, 2017 each security held by the Acquired Portfolio complies with the investment policies and restrictions of the Acquiring Portfolio.
| ‡ | | All, or a portion, of the security is an affiliated company as defined under the Investment Company Act of 1940. |
| (x) | | All or a portion of security is on loan at December 31, 2016. |
| (xx) | | At December 31, 2016, the Portfolio had loaned securities with a total value of $5,184,583. This was secured by cash collateral of $5,318,317 which was subsequently invested in joint repurchase agreements with a total valued at $5,318,317, as reported in the Portfolio of Investments as Repurchase Agreements. |
The holdings in affiliated Investment Companies are all Class K shares.
4
Investments in companies which were affiliates for the year ended December 31, 2016, were as follows:
| | | | | | | | | | | | | | | | | | | | | | | | |
| | | All Asset Aggressive-Alt 25 | |
Securities: | | Market Value
December 31,
2015 | | | Purchases
at Cost | | | Sales
at Cost | | | Market Value
December 31,
2016 | | | Dividend
Income | | | Realized
Gain
(Loss)† | |
AXA Natural Resources Portfolio | | $ | 1,018,846 | | | $ | 426,610 | | | $ | 178,515 | | | $ | 1,555,469 | | | $ | 35,830 | | | $ | (408 | ) |
AXA Real Estate Portfolio (a) | | | 1,239,705 | | | | 601,611 | | | | 328,475 | | | | 1,548,883 | | | | 12,987 | | | | 16,380 | |
AXA/AB Small Cap Growth Portfolio | | | 1,929,711 | | | | 912,045 | | | | 339,740 | | | | 2,608,102 | | | | 15,201 | | | | 159,157 | |
AXA/Janus Enterprise Portfolio (b) | | | 156,880 | | | | 34,431 | | | | 16,973 | | | | 167,862 | | | | — | | | | 60 | |
AXA/Loomis Sayles Growth Portfolio | | | 867,030 | | | | 169,267 | | | | — | | | | 1,090,324 | | | | 6,200 | | | | 23,067 | |
EQ/BlackRock Basic Value Equity Portfolio | | | 1,768,756 | | | | 692,563 | | | | 422,411 | | | | 2,351,590 | | | | 39,723 | | | | (121 | ) |
EQ/Boston Advisors Equity Income Portfolio | | | 882,828 | | | | 722,301 | | | | 400,648 | | | | 1,190,213 | | | | 26,827 | | | | 127,771 | |
EQ/Emerging Markets Equity PLUS Portfolio | | | 892,705 | | | | 267,438 | | | | 296,903 | | | | 946,879 | | | | 9,738 | | | | 317 | |
EQ/GAMCO Mergers and Acquisitions Portfolio | | | 1,377,156 | | | | 697,162 | | | | 178,114 | | | | 1,930,553 | | | | 4,372 | | | | 82,004 | |
EQ/GAMCO Small Company Value Portfolio | | | 1,332,383 | | | | 641,475 | | | | 280,685 | | | | 1,966,357 | | | | 13,596 | | | | 60,137 | |
EQ/Global Bond PLUS Portfolio | | | 680,650 | | | | 224,839 | | | | 101,798 | | | | 788,304 | | | | 17,184 | | | | 1,473 | |
EQ/High Yield Bond Portfolio | | | 299,296 | | | | 123,469 | | | | 50,874 | | | | 389,631 | | | | 20,389 | | | | 14 | |
EQ/Intermediate Government Bond Portfolio | | | 261,891 | | | | 212,737 | | | | 306,047 | | | | 167,082 | | | | 1,541 | | | | 1,655 | |
EQ/International Equity Index Portfolio | | | 907,078 | | | | 406,746 | | | | 261,391 | | | | 1,048,184 | | | | 30,326 | | | | (246 | ) |
EQ/Invesco Comstock Portfolio | | | 1,289,616 | | | | 594,226 | | | | 301,413 | | | | 1,795,133 | | | | 44,465 | | | | (11 | ) |
EQ/JPMorgan Value Opportunities Portfolio | | | 1,031,952 | | | | 140,511 | | | | 52,427 | | | | 1,359,592 | | | | 15,511 | | | | 7,573 | |
EQ/MFS International Growth Portfolio | | | 2,069,282 | | | | 790,725 | | | | 373,137 | | | | 2,496,916 | | | | 30,591 | | | | 4,253 | |
EQ/PIMCO Global Real Return Portfolio | | | 401,702 | | | | 164,464 | | | | 67,839 | | | | 515,639 | | | | 26,003 | | | | 1,032 | |
EQ/PIMCO Ultra Short Bond Portfolio | | | 78,883 | | | | 35,579 | | | | 16,960 | | | | 98,237 | | | | 1,219 | | | | 3 | |
EQ/T. Rowe Price Growth Stock Portfolio | | | 1,824,908 | | | | 759,269 | | | | 357,034 | | | | 2,229,452 | | | | — | | | | 36,890 | |
Multimanager Core Bond Portfolio | | | 141,495 | | | | 95,729 | | | | 25,446 | | | | 210,925 | | | | 3,980 | | | | 207 | |
| | | | | | | | | | | | | | | | | | | | | | | | |
| | $ | 20,452,753 | | | $ | 8,713,197 | | | $ | 4,356,830 | | | $ | 26,455,327 | | | $ | 355,683 | | | $ | 521,207 | |
| | | | | | | | | | | | | | | | | | | | | | | | |
| |
| | | All Asset Growth-Alt 20 | |
Securities: | | Market Value
December 31,
2015 | | | Purchases
at Cost | | | Sales
at Cost | | | Market Value
December 31,
2016 | | | Dividend
Income | | | Realized
Gain
(Loss)† | |
AXA Natural Resources Portfolio | | $ | 8,390,693 | | | $ | 1,927,283 | | | $ | 1,129,314 | | | $ | 11,964,159 | | | $ | 278,921 | | | $ | (31,804 | ) |
AXA Real Estate Portfolio (a) | | | 10,561,781 | | | | 1,378,359 | | | | 1,046,574 | | | | 11,176,284 | | | | 100,497 | | | | 177,334 | |
AXA/AB Small Cap Growth Portfolio | | | 15,952,175 | | | | 1,491,708 | | | | 1,684,527 | | | | 16,523,133 | | | | 99,499 | | | | 1,068,651 | |
AXA/Janus Enterprise Portfolio (b) | | | 1,562,479 | | | | 11,128 | | | | 339,431 | | | | 1,177,460 | | | | — | | | | 5,921 | |
AXA/Loomis Sayles Growth Portfolio | | | 9,753,249 | | | | 3,966,410 | | | | 912,928 | | | | 13,626,510 | | | | 77,480 | | | | 376,002 | |
EQ/BlackRock Basic Value Equity Portfolio | | | 16,250,142 | | | | 618,405 | | | | 1,871,422 | | | | 17,126,779 | | | | 289,888 | | | | 418,063 | |
EQ/Boston Advisors Equity Income Portfolio | | | 6,831,906 | | | | 1,060,956 | | | | 1,693,567 | | | | 6,068,611 | | | | 130,131 | | | | 729,777 | |
EQ/Emerging Markets Equity PLUS Portfolio | | | 8,197,362 | | | | 205,548 | | | | 1,625,934 | | | | 7,509,871 | | | | 78,380 | | | | 11,931 | |
EQ/GAMCO Mergers and Acquisitions Portfolio | | | 12,996,579 | | | | 1,121,785 | | | | 761,218 | | | | 13,669,683 | | | | 34,937 | | | | 672,451 | |
EQ/GAMCO Small Company Value Portfolio | | | 14,783,633 | | | | 978,664 | | | | 1,851,289 | | | | 16,489,358 | | | | 119,963 | | | | 634,156 | |
EQ/Global Bond PLUS Portfolio | | | 25,150,906 | | | | 1,666,731 | | | | 5,768,951 | | | | 20,941,495 | | | | 463,877 | | | | (66,758 | ) |
EQ/High Yield Bond Portfolio | | | 7,837,523 | | | | 782,190 | | | | 732,942 | | | | 8,371,482 | | | | 433,828 | | | | (5,433 | ) |
EQ/Intermediate Government Bond Portfolio | | | 2,950,097 | | | | 2,719,250 | | | | 868,957 | | | | 4,760,850 | | | | 38,294 | | | | 7,347 | |
EQ/International Equity Index Portfolio | | | 10,043,990 | | | | 468,557 | | | | 1,099,392 | | | | 9,440,531 | | | | 277,804 | | | | (92,595 | ) |
EQ/Invesco Comstock Portfolio | | | 11,626,948 | | | | 596,339 | | | | 1,274,589 | | | | 12,560,314 | | | | 320,809 | | | | (9,214 | ) |
EQ/JPMorgan Value Opportunities Portfolio | | | 10,574,246 | | | | 1,659,571 | | | | 1,204,350 | | | | 13,492,012 | | | | 159,571 | | | | 95,650 | |
EQ/MFS International Growth Portfolio | | | 20,266,149 | | | | 1,027,059 | | | | 2,252,791 | | | | 19,128,204 | | | | 238,354 | | | | 161,456 | |
EQ/PIMCO Global Real Return Portfolio | | | 10,664,883 | | | | 1,983,941 | | | | 1,700,309 | | | | 11,438,117 | | | | 559,415 | | | | 24,487 | |
EQ/PIMCO Ultra Short Bond Portfolio | | | 7,977,458 | | | | 823,302 | | | | 3,228,965 | | | | 5,671,102 | | | | 64,342 | | | | (56,633 | ) |
EQ/T. Rowe Price Growth Stock Portfolio | | | 15,149,696 | | | | 1,084,651 | | | | 1,531,574 | | | | 14,657,094 | | | | — | | | | 289,046 | |
Multimanager Core Bond Portfolio | | | 4,661,809 | | | | 1,803,323 | | | | 180,111 | | | | 6,260,897 | | | | 124,664 | | | | 5,446 | |
PowerShares DB Silver Fund | | | 1,073,817 | | | | 551,765 | | | | — | | | | 1,740,200 | | | | — | | | | — | |
| | | | | | | | | | | | | | | | | | | | | | | | |
| | $ | 233,257,521 | | | $ | 27,926,925 | | | $ | 32,759,135 | | | $ | 243,794,146 | | | $ | 3,890,654 | | | $ | 4,415,281 | |
| | | | | | | | | | | | | | | | | | | | | | | | |
5
| | | | | | | | | | | | | | | | | | | | | | | | |
| | | All Asset Growth-Alt 20 Combined Pro-forma | |
Securities: | | Market Value
December 31,
2015 | | | Purchases
at Cost | | | Sales
at Cost | | | Market Value
December 31,
2016 | | | Dividend
Income | | | Realized
Gain
(Loss)† | |
AXA Natural Resources Portfolio | | $ | 9,409,539 | | | $ | 2,353,893 | | | $ | 1,307,829 | | | $ | 13,519,628 | | | $ | 314,751 | | | $ | (32,212 | ) |
AXA Real Estate Portfolio (a) | | | 11,801,486 | | | | 1,979,970 | | | | 1,375,049 | | | | 12,725,167 | | | | 113,484 | | | | 193,714 | |
AXA/AB Small Cap Growth Portfolio | | | 17,881,886 | | | | 2,403,753 | | | | 2,024,267 | | | | 19,131,235 | | | | 114,700 | | | | 1,227,808 | |
AXA/Janus Enterprise Portfolio (b) | | | 1,719,359 | | | | 45,559 | | | | 356,404 | | | | 1,345,322 | | | | — | | | | 5,981 | |
AXA/Loomis Sayles Growth Portfolio | | | 10,620,279 | | | | 4,135,677 | | | | 912,928 | | | | 14,716,834 | | | | 83,680 | | | | 399,069 | |
EQ/BlackRock Basic Value Equity Portfolio | | | 18,018,898 | | | | 1,310,968 | | | | 2,293,833 | | | | 19,478,369 | | | | 329,611 | | | | 417,942 | |
EQ/Boston Advisors Equity Income Portfolio | | | 7,714,734 | | | | 1,783,257 | | | | 2,094,215 | | | | 7,258,824 | | | | 156,958 | | | | 857,548 | |
EQ/Emerging Markets Equity PLUS Portfolio | | | 9,090,067 | | | | 472,986 | | | | 1,922,837 | | | | 8,456,750 | | | | 88,118 | | | | 12,248 | |
EQ/GAMCO Mergers and Acquisitions Portfolio | | | 14,373,735 | | | | 1,818,947 | | | | 939,332 | | | | 15,600,236 | | | | 39,309 | | | | 754,455 | |
EQ/GAMCO Small Company Value Portfolio | | | 16,116,016 | | | | 1,620,139 | | | | 2,131,974 | | | | 18,455,715 | | | | 133,559 | | | | 694,293 | |
EQ/Global Bond PLUS Portfolio | | | 25,831,556 | | | | 1,891,570 | | | | 5,870,749 | | | | 21,729,799 | | | | 481,061 | | | | (65,285 | ) |
EQ/High Yield Bond Portfolio | | | 8,136,819 | | | | 905,659 | | | | 783,816 | | | | 8,761,113 | | | | 454,217 | | | | (5,419 | ) |
EQ/Intermediate Government Bond Portfolio | | | 3,211,988 | | | | 2,931,987 | | | | 1,175,004 | | | | 4,927,932 | | | | 39,835 | | | | 9,002 | |
EQ/International Equity Index Portfolio | | | 10,951,068 | | | | 875,303 | | | | 1,360,783 | | | | 10,488,715 | | | | 308,130 | | | | (92,841 | ) |
EQ/Invesco Comstock Portfolio | | | 12,916,564 | | | | 1,190,565 | | | | 1,576,002 | | | | 14,355,447 | | | | 365,274 | | | | (9,225 | ) |
EQ/JPMorgan Value Opportunities Portfolio | | | 11,606,198 | | | | 1,800,082 | | | | 1,256,777 | | | | 14,851,604 | | | | 175,082 | | | | 103,223 | |
EQ/MFS International Growth Portfolio | | | 22,335,431 | | | | 1,817,784 | | | | 2,625,928 | | | | 21,625,120 | | | | 268,945 | | | | 165,709 | |
EQ/PIMCO Global Real Return Portfolio | | | 11,066,585 | | | | 2,148,405 | | | | 1,768,148 | | | | 11,953,756 | | | | 585,418 | | | | 25,519 | |
EQ/PIMCO Ultra Short Bond Portfolio | | | 8,056,341 | | | | 858,881 | | | | 3,245,925 | | | | 5,769,339 | | | | 65,561 | | | | (56,630 | ) |
EQ/T. Rowe Price Growth Stock Portfolio | | | 16,974,604 | | | | 1,843,920 | | | | 1,888,608 | | | | 16,886,546 | | | | — | | | | 325,936 | |
Multimanager Core Bond Portfolio | | | 4,803,304 | | | | 1,899,052 | | | | 205,557 | | | | 6,471,822 | | | | 128,644 | | | | 5,653 | |
PowerShares DB Silver Fund | | | 1,073,817 | | | | 551,765 | | | | — | | | | 1,740,200 | | | | — | | | | — | |
| | | | | | | | | | | | | | | | | | | | | | | | |
| | $ | 253,710,274 | | | $ | 36,640,122 | | | $ | 37,115,965 | | | $ | 270,249,473 | | | $ | 4,246,337 | | | $ | 4,936,488 | |
| | | | | | | | | | | | | | | | | | | | | | | | |
| † | | When applicable, realized gain includes net distribution of realized gain received from underlying funds. |
| (a) | | Formerly known as EQ/Real Estate PLUS Portfolio. |
| (b) | | Formerly known as EQ/Morgan Stanley Mid Cap Growth Portfolio. |
The following is a summary of the inputs used to value the Portfolio’s assets and liabilities carried at fair value as of December 31, 2016:
The inputs or methodology used for valuing securities are not necessarily an indication of the risk associated with investing in those securities.
Various inputs are used in determining the value of the Portfolio’s investments. These inputs are summarized in the three broad levels listed below:
All Asset Aggressive Alt 25
| | | | | | | | | | | | | | | | |
Investment Type | | Level 1
Quoted Prices in
Active Markets for
Identical
Securities | | | Level 2
Significant Other
Observable Inputs
(including quoted prices
for similar securities,
interest rates,
prepayment speeds,
credit risk, etc.) | | | Level 3
Significant Unobservable
Inputs (including the
Portfolio’s own
assumptions in
determining the fair
value of investments) | | | Total | |
Assets: | | | | | | | | | | | | | | | | |
Exchange Traded Funds | | | | | | | | | | | | | | | | |
Exchange Traded Funds | | $ | 3,918,806 | | | $ | — | | | $ | — | | | $ | 3,918,806 | |
Investment Companies | | | | | | | | | | | | | | | | |
Investment Companies | | | — | | | | 26,455,327 | | | | — | | | | 26,455,327 | |
Short-Term Investments | | | | | | | | | | | | | | | | |
Investment Companies | | | 400,195 | | | | — | | | | — | | | | 400,195 | |
Repurchase Agreements | | | — | | | | 624,010 | | | | — | | | | 624,010 | |
| | | | | | | | | | | | | | | | |
Total Assets | | $ | 4,319,001 | | | $ | 27,079,337 | | | $ | ��� | | | $ | 31,398,338 | |
| | | | | | | | | | | | | | | | |
Total Liabilities | | $ | — | | | $ | — | | | $ | — | | | $ | — | |
| | | | | | | | | | | | | | | | |
Total | | $ | 4,319,001 | | | $ | 27,079,337 | | | $ | — | | | $ | 31,398,338 | |
| | | | | | | | | | | | | | | | |
6
All Asset Growth-Alt 20
| | | | | | | | | | | | | | | | |
Investment Type | | Level 1
Quoted Prices in
Active Markets for
Identical
Securities | | | Level 2
Significant Other
Observable Inputs
(including quoted prices
for similar securities,
interest rates,
prepayment speeds,
credit risk, etc.) | | | Level 3
Significant Unobservable
Inputs (including the
Portfolio’s own
assumptions in
determining the fair
value of investments) | | | Total | |
Assets: | | | | | | | | | | | | | | | | |
Exchange Traded Funds | | | | | | | | | | | | | | | | |
Exchange Traded Funds | | $ | 31,038,276 | | | $ | — | | | $ | — | | | $ | 31,038,276 | |
Investment Companies | | | | | | | | | | | | | | | | |
Investment Companies | | | — | | | | 242,053,946 | | | | — | | | | 242,053,946 | |
Short-Term Investments | | | | | | | | | | | | | | | | |
Investment Companies | | | 769,494 | | | | — | | | | — | | | | 769,494 | |
Repurchase Agreements | | | — | | | | 4,694,307 | | | | — | | | | 4,694,307 | |
| | | | | | | | | | | | | | | | |
Total Assets | | $ | 31,807,770 | | | $ | 246,748,253 | | | $ | — | | | $ | 278,556,023 | |
| | | | | | | | | | | | | | | | |
Total Liabilities | | $ | — | | | $ | — | | | $ | — | | | $ | — | |
| | | | | | | | | | | | | | | | |
Total Assets and Liabilities | | $ | 31,807,770 | | | $ | 246,748,253 | | | $ | — | | | $ | 278,556,023 | |
| | | | | | | | | | | | | | | | |
All Asset Growth-Alt 20 Combined Pro-forma
| | | | | | | | | | | | | | | | |
Investment Type | | Level 1
Quoted Prices in
Active Markets for
Identical
Securities | | | Level 2
Significant Other
Observable Inputs
(including quoted prices
for similar securities,
interest rates,
prepayment speeds,
credit risk, etc.) | | | Level 3
Significant Unobservable
Inputs (including the
Portfolio’s own
assumptions in
determining the fair
value of investments) | | | Total | |
Assets: | | | | | | | | | | | | | | | | |
Exchange Traded Funds | | | | | | | | | | | | | | | | |
Exchange Traded Funds | | $ | 34,957,082 | | | $ | — | | | $ | — | | | $ | 34,957,082 | |
Investment Companies | | | | | | | | | | | | | | | | |
Investment Companies | | | — | | | | 268,509,273 | | | | — | | | | 268,509,273 | |
Short-Term Investments | | | | | | | | | | | | | | | | |
Investment Companies | | | 1,169,689 | | | | — | | | | — | | | | 1,169,689 | |
Repurchase Agreements | | | — | | | | 5,318,317 | | | | — | | | | 5,318,317 | |
| | | | | | | | | | | | | | | | |
Total Assets | | $ | 36,126,771 | | | $ | 273,827,590 | | | $ | — | | | $ | 309,954,361 | |
| | | | | | | | | | | | | | | | |
Total Liabilities | | $ | — | | | $ | — | | | $ | — | | | $ | — | |
| | | | | | | | | | | | | | | | |
Total Assets and Liabilities | | $ | 36,126,771 | | | $ | 273,827,590 | | | $ | — | | | $ | 309,954,361 | |
| | | | | | | | | | | | | | | | |
There were no transfers between Levels 1, 2 or 3 during the year ended December 31, 2016.
The Portfolio held no derivatives contracts during the year ended December 31, 2016.
Investment security transactions for the year ended December 31, 2016 were as follows:
| | | | | | | | | | | | |
| | | All Asset
Aggressive
ALT 25 | | | All Asset
Growth
ALT 20 | | | All Asset
Growth-
Alt 20
Combined
Pro-forma | |
Cost of Purchases: | | | | | | | | | | | | |
Long-term investments other than U.S. government debt securities | | $ | 9,715,032 | | | $ | 29,740,840 | | | $ | 39,455,872 | |
Net Proceeds of Sales and Redemptions: | | | | | | | | | | | | |
Long-term investments other than U.S. government debt securities | | $ | 4,842,411 | | | $ | 37,558,272 | | | $ | 42,400,683 | |
7
As of December 31, 2016, the gross unrealized appreciation (depreciation) of investments based on the aggregate cost of investments for federal income tax purposes was as follows:
| | | | | | | | | | | | |
| | | All Asset
Aggressive
Alt 25 | | | All Asset
Growth
Alt 20 | | | All Asset
Growth-
Alt 20
Combined
Pro-forma | |
Aggregate gross unrealized appreciation | | $ | 1,258,934 | | | $ | 36,766,963 | | | $ | 38,025,897 | |
Aggregate gross unrealized depreciation | | | (1,152,958 | ) | | | (8,673,992 | ) | | | (9,826,950 | ) |
| | | | | | | | | | | | |
Net unrealized appreciation | | $ | 105,976 | | | $ | 28,092,971 | | | $ | 28,198,947 | |
| | | | | | | | | | | | |
Federal income tax cost of investments | | $ | 31,292,362 | | | $ | 250,463,052 | | | $ | 281,755,414 | |
| | | | | | | | | | | | |
Capital Loss Carry Forward:
All Asset Aggressive Alt 25
The Portfolio has no capital loss carryforward.
All Asset Growth Alt 20
The Portfolio has no capital loss carryforward.
All Asset Growth Alt 20 Combined Pro-Forma
The Portfolio has no capital loss carryforward.
8
EQ ADVISORS TRUST
STATEMENT OF ASSETS AND LIABILITIES
December 31, 2016 (Unaudited)
| | | | | | | | | | | | | | | | |
| | | All Asset
Aggressive-
Alt 25 | | | All Asset
Growth-
Alt 20 | | | Pro-Forma
Adjustment | | | All Asset
Growth-Alt 20
Combined
Pro-Forma | |
Investments at Cost, Affiliated Issuers | | $ | 26,352,574 | | | $ | 219,237,919 | | | $ | — | | | $ | 245,590,493 | |
Investments at Cost, Unaffiliated Issuers | | | 4,574,693 | | | | 27,064,672 | | | | — | | | | 31,639,365 | |
Investments at Cost, Repurchase Agreements | | | 624,010 | | | | 4,694,307 | | | | — | | | | 5,318,317 | |
ASSETS | | | | | | | | | | | | | | | | |
Investments at Value, Affiliated Issuers | | | 26,455,327 | | | | 243,794,146 | | | | — | | | | 270,249,473 | |
Investments at Value, Unaffiliated Issuers (x) | | | 4,319,001 | | | | 30,067,570 | | | | — | | | | 34,386,571 | |
Investments at Value, Repurchase Agreements | | | 624,010 | | | | 4,694,307 | | | | — | | | | 5,318,317 | |
Cash | | | 49,000 | | | | 103,606 | | | | — | | | | 152,606 | |
Receivable for securities sold | | | 60,048 | | | | 927,032 | | | | — | | | | 987,080 | |
Receivable from Separate Accounts for Trust shares sold | | | 19,842 | | | | 43,178 | | | | — | | | | 63,020 | |
Receivable from investment manager | | | 6,782 | | | | — | | | | — | | | | 6,782 | |
Securities lending income receivable | | | 868 | | | | 5,814 | | | | — | | | | 6,682 | |
Dividends, interest and other receivables | | | 232 | | | | 523 | | | | — | | | | 755 | |
Other assets | | | 84 | | | | 892 | | | | — | | | | 976 | |
| | | | | | | | | | | | | | | | |
Total assets | | | 31,535,194 | | | | 279,637,068 | | | | — | | | | 311,172,262 | |
| | | | | | | | | | | | | | | | |
| | | | |
LIABILITIES | | | | | | | | | | | | | | | | |
Payable for return of collateral on securities loaned | | | 624,010 | | | | 4,694,307 | | | | — | | | | 5,318,317 | |
Payable for securities purchased | | | 155,090 | | | | 733,452 | | | | — | | | | 888,542 | |
Payable to Separate Accounts for Trust shares redeemed | | | 17,167 | | | | 253,211 | | | | — | | | | 270,378 | |
Distribution fees payable-Class IB | | | 6,021 | | | | 53,991 | | | | — | | | | 60,012 | |
Administrative fees payable | | | — | | | | 32,738 | | | | — | | | | 32,738 | |
Distribution fees payable-Class IA | | | — | | | | 3,856 | | | | — | | | | 3,856 | |
Investment management fees payable | | | — | | | | 1,049 | | | | — | | | | 1,049 | |
Trustees’ fees payable | | | 29 | | | | 503 | | | | — | | | | 532 | |
Accrued expenses | | | 41,214 | | | | 69,929 | | | | — | | | | 111,143 | |
| | | | | | | | | | | | | | | | |
Total liabilities | | | 843,531 | | | | 5,843,036 | | | | — | | | | 6,686,567 | |
| | | | | | | | | | | | | | | | |
NET ASSETS | | $ | 30,691,663 | | | $ | 273,794,032 | | | $ | — | | | $ | 304,485,695 | |
| | | | | | | | | | | | | | | | |
Net assets were comprised of: | | | | | | | | | | | | | | | | |
Paid in capital | | $ | 30,200,145 | | | $ | 340,083,732 | | | $ | — | | | $ | 370,283,877 | |
Accumulated undistributed net investment income (loss) | | | 10,882 | | | | 333,143 | | | | — | | | | 344,025 | |
Accumulated undistributed net realized gain (loss) on investments | | | 633,575 | | | | (94,181,968 | ) | | | — | | | | (93,548,393 | ) |
Net unrealized appreciation (depreciation) on investments | | | (152,939 | ) | | | 27,559,125 | | | | — | | | | 27,406,186 | |
| | | | | | | | | | | | | | | | |
Net Assets | | $ | 30,691,663 | | | $ | 273,794,032 | | | $ | — | | | $ | 304,485,695 | |
| | | | | | | | | | | | | | | | |
Class IA Shares: | | | | | | | | | | | | | | | | |
Net Assets | | $ | — | | | $ | 18,357,789 | | | $ | — | | | $ | 18,357,789 | |
Shares outstanding | | | — | | | | 971,475 | | | | — | | | | 971,475 | |
Net asset value, offering and redemption price per share | | $ | — | | | $ | 18.90 | | | $ | — | | | $ | 18.90 | |
Class IB Shares: | | | | | | | | | | | | | | | | |
Net Assets | | $ | 29,003,704 | | | $ | 253,965,896 | | | $ | — | | | $ | 282,969,600 | |
Shares outstanding | | | 2,417,144 | | | | 13,405,347 | | | | (886,606 | )(a) | | | 14,935,885 | |
Net asset value, offering and redemption price per share | | $ | 12.00 | | | $ | 18.95 | | | $ | — | | | $ | 18.95 | |
Class K Shares: | | | | | | | | | | | | | | | | |
Net Assets | | $ | 1,687,959 | | | $ | 1,470,347 | | | $ | — | | | $ | 3,158,306 | |
Shares outstanding | | | 140,735 | | | | 77,963 | | | | (51,236 | )(a) | | | 167,462 | |
Net asset value, offering and redemption price per share | | $ | 11.99 | | | $ | 18.86 | | | $ | — | | | $ | 18.86 | |
(x) Includes value of securities on loan of: | | $ | 608,228 | | | $ | 4,576,355 | | | $ | — | | | $ | 5,184,583 | |
| (a) | | Reflects adjustments for retired shares of the acquired Portfolio. |
9
EQ ADVISORS TRUST
For the Year Ended December 31, 2016 (Unaudited)
| | | | | | | | | | | | | | | | |
| | | All Asset
Aggressive-
Alt 25 | | | All Asset
Growth-
Alt 20 | | | Pro-Forma
Adjustment | | | All Asset
Growth-
Alt 20
Combined
Pro-Forma | |
STATEMENT OF OPERATIONS | | | | | | | | | | | | | | | | |
Dividend income received from Affiliates | | $ | 355,683 | | | $ | 3,890,654 | | | $ | — | | | $ | 4,246,337 | |
INVESTMENT INCOME | | | | | | | | | | | | | | | | |
Dividends | | | 412,003 | | | | 4,503,857 | | | | — | | | | 4,915,860 | |
Interest | | | 206 | | | | 1,670 | | | | — | | | | 1,876 | |
Securities lending (net) | | | 8,211 | | | | 39,228 | | | | — | | | | 47,439 | |
| | | | | | | | | | | | | | | | |
Total income | | | 420,420 | | | | 4,544,755 | | | | — | | | | 4,965,175 | |
| | | | | | | | | | | | | | | | |
EXPENSES | | | | | | | | | | | | | | | | |
Distribution fees-Class IB | | | 62,389 | | | | 625,818 | | | | — | | | | 688,207 | |
Administrative fees | | | 38,981 | | | | 394,825 | | | | (21,018 | )(b) | | | 412,788 | |
Investment management fees | | | 26,484 | | | | 267,892 | | | | — | | | | 294,376 | |
Custodian fees | | | 111,000 | | | | 124,050 | | | | (111,000 | )(a) | | | 124,050 | |
Printing and mailing expenses | | | 7,779 | | | | 61,750 | | | | — | | | | 69,529 | |
Professional fees | | | 40,192 | | | | 43,453 | | | | (39,110 | )(a) | | | 44,535 | |
Distribution fees-Class IA | | | — | | | | 40,592 | | | | — | | | | 40,592 | |
Trustees’ fees | | | 581 | | | | 6,082 | | | | — | | | | 6,663 | |
Miscellaneous | | | 353 | | | | 4,604 | | | | — | | | | 4,957 | |
| | | | | | | | | | | | | | | | |
Gross expenses | | | 287,759 | | | | 1,569,066 | | | | (171,128 | ) | | | 1,685,697 | |
| | | | | | | | | | | | | | | | |
Less: Waiver from investment manager | | | (65,465 | ) | | | (22,212 | ) | | | 87,677 | (c) | | | — | |
Reimbursement from investment manager | | | (59,493 | ) | | | — | | | | 59,493 | (d) | | | — | |
| | | | | | | | | | | | | | | | |
Net expenses | | | 162,801 | | | | 1,546,854 | | | | (23,958 | ) | | | 1,685,697 | |
| | | | | | | | | | | | | | | | |
NET INVESTMENT INCOME (LOSS) | | | 257,619 | | | | 2,997,901 | | | | 23,958 | | | | 3,279,478 | |
| | | | | | | | | | | | | | | | |
Net Realized gain (loss) from affiliates | | | 5,691 | | | | 719,702 | | | | — | | | | 725,393 | |
Net distributions of realized gain (loss) received from affiliates | | | 515,516 | | | | 3,695,579 | | | | — | | | | 4,211,095 | |
REALIZED AND UNREALIZED GAIN (LOSS) | | | | | | | | | | | | | | | | |
Net Realized gain (loss) on: | | | | | | | | | | | | | | | | |
Investments | | | (30,305 | ) | | | 1,160,675 | | | | — | | | | 1,130,370 | |
Net distributions of realized gain (loss) received from underlying funds | | | 515,537 | | | | 3,695,579 | | | | — | | | | 4,211,116 | |
| | | | | | | | | | | | | | | | |
Net realized gain (loss) | | | 485,232 | | | | 4,856,254 | | | | — | | | | 5,341,486 | |
| | | | | | | | | | | | | | | | |
Net Change in unrealized appreciation (depreciation) from affiliates | | | 1,646,207 | | | | 15,368,835 | | | | — | | | | 17,015,042 | |
Net Change in unrealized appreciation (depreciation) on: | | | | | | | | | | | | | | | | |
Investments | | | 1,905,876 | | | | 16,690,231 | | | | — | | | | 18,596,107 | |
| | | | | | | | | | | | | | | | |
NET REALIZED AND UNREALIZED GAIN (LOSS) | | | 2,391,108 | | | | 21,546,485 | | | | — | | | | 23,937,593 | |
| | | | | | | | | | | | | | | | |
NET INCREASE (DECREASE) IN NET ASSETS RESULTING FROM OPERATIONS | | $ | 2,648,727 | | | $ | 24,544,386 | | | $ | 23,958 | | | $ | 27,217,071 | |
| | | | | | | | | | | | | | | | |
| (a) | | Reflects adjustment in expenses due to elimination of duplicative expenses. |
| (b) | | Reflects adjustment for new fee structure |
| (c) | | Reflects elimination of waiver due to expense adjustment |
| (d) | | Reflects elimination of reimbursement due to expense adjustment |
Note that the reorganization expenses for All Asset Aggressive-Alt 25 Portfolio, which are estimated to be $33,333, exceed the expense limit and will be paid by FMG LLC.
10
NOTES TO PRO FORMA COMBINED FINANCIAL STATEMENTS
As of December 31, 2016
NOTE 1 – BASIS OF COMBINATION AND SIGNIFICANT ACCOUNTING POLICIES:
EQ Advisors Trust (the “Trust”) was organized as a Delaware statutory trust on October 31, 1996 and is registered under the Investment Company Act of 1940, as amended, as an open-end management investment company with numerous portfolios. The Board of Trustees of the Trust approved a proposed Plan of Reorganization and Termination (“Reorganization Plan”) on December 1, 2016 that provides for the transfer of all assets of the All Asset Aggressive-Alt 25 Portfolio (“Alt 25 Portfolio” or “Acquired Portfolio”) to the All Asset Growth-Alt 20 Portfolio (“Alt 20 Portfolio”), each a series of the Trust, and the assumption by the Alt 20 Portfolio of all of the liabilities of the Acquired Portfolio in exchange for shares of the Alt 20 Portfolio having an aggregate value equal to the net assets of the Acquired Portfolio, the distribution of the Alt 20 Portfolio shares to the Acquired Portfolio shareholders of record determined immediately after the close of business on the closing date, and the subsequent liquidation of the Acquired Portfolio (the “Reorganization”).
The Alt 25 Portfolio’s annual contractual management fee equals 0.10% of average daily net assets. The Reorganization Plan is subject to the approval of the Acquired Portfolio’s shareholders. A special meeting of shareholders of the Acquired Portfolio will be held on or about March 28, 2017.
The Reorganization will be accounted for as a tax-free reorganization of investment companies. The unaudited pro forma combined financial statements are presented for the information of the reader and may not necessarily be representative of what the actual combined financial statements would have been had the Reorganization occurred at December 31, 2016. The unaudited pro forma combined portfolio of investments and statement of assets and liabilities reflect the financial position of the Alt 20 Portfolio and the Acquired Portfolio at December 31, 2016. The unaudited pro forma combined statement of operations reflects the results of operations of the Alt 20 Portfolio as if it had acquired the Acquired Portfolio at the beginning of the year ended December 31, 2016. These statements have been derived from the Portfolios’ respective books and records utilized in calculating daily net asset value at the dates indicated above for each Portfolio under accounting principles generally accepted in the United States of America. The historical cost of investment securities will be carried forward to the surviving entity and results of operations of the Alt 20 Portfolio for pre-combination periods will not be restated.
The unaudited pro forma combined portfolio of investments and statements of assets and liabilities and operations should be read in conjunction with the historical financial statements of the Portfolios included in the Trust’s Statement of Additional Information, the Portfolio has substantially the same significant policies as detailed in the historical financial statements. The preparation of financial statements in accordance with accounting principles generally accepted in the United States of America requires management to make estimates and assumptions that affect the reported amounts and disclosures. Actual results could differ from those estimates.
Following the Reorganization, the Alt 20 Portfolio is the “accounting survivor.” The general criteria that are applied to determine the proper accounting survivor are outlined in the “AICPA Accounting and Audit Guide for Investment Companies.” The legal survivor normally is considered the accounting survivor of a reorganization. In this case, the Alt 20 Portfolio is the legal survivor. Other criteria include:
| a.) | | Portfolio Management – The merged entity will be managed by the Manager, Sub-Advisers and portfolio managers to the Alt 20 Portfolio in a manner consistent with the current management style. |
| b.) | | Portfolio Composition – The merged entity’s portfolio holdings are expected to be consistent with the Alt 20 Portfolio’s current investment strategies and will more closely resemble the current portfolio holdings of the Alt 20 Portfolio than those of the Acquired Portfolio. |
| c.) | | Investment Objective, Policies and Restrictions – The merged entity’s investment objective, policies and fundamental and non-fundamental investment restrictions will be the same as the Alt 20 Portfolio’s current investment objective, policies and fundamental and non-fundamental investment restrictions. |
| d.) | | Expense Structure and Expense Ratios – The merged entity’s expense structure will be the same as that of Alt 20 Portfolio. The expense ratio of the merged entity will be the same as that of the Alt 20 Portfolio and lower than the Acquired Portfolio. |
| e.) | | Asset Size – The Alt 20 Portfolio is significantly larger than the Acquired Portfolio. |
11
NOTE 2 – SHARES:
The unaudited pro forma net asset value per share assumes additional common shares of beneficial interest issued in connection with the proposed acquisition of the Acquired Portfolio by the Alt 20 Portfolio as of December 31, 2016. The number of additional shares issued was calculated based on the net assets of the Acquired Portfolio and net asset value per share of the Alt 20 Portfolio at December 31, 2016.
NOTE 3 – VALUATION:
Equity securities (including securities issued by exchange-traded funds (“ETFs”)) listed on national securities exchanges are valued at the last sale price or official closing price on the date of valuation or, if there is no sale or official closing price, at the latest available bid price. Securities listed on the NASDAQ stock market will be valued using the NASDAQ Official Closing Price (“NOCP”). Generally, the NOCP will be the last sale price unless the reported trade for the security is outside the range of the bid/ask price. In such cases, the NOCP will be normalized to the nearer of the bid or ask price. Other unlisted stocks are valued at their last sale price or official closing price, or if there is no such price, at a bid price estimated by a broker.
Investments in shares of open-end investment companies (other than ETFs) held by a Portfolio will be valued at the net asset value (“NAV”) of the shares of such funds as described in the underlying funds’ prospectuses.
If market quotations are not readily available for a security or other financial instruments, such securities and instruments shall be referred to the Trust’s Valuation Committee (“Committee”), who will value the assets in good faith pursuant to procedures (“Pricing Procedures”) adopted by the Board of Trustees of the Trust (the “Board”).
The Board is responsible for ensuring that appropriate valuation methods are used to price securities for the Trust’s Portfolios. The Board has delegated the responsibility of calculating the NAVs of the Trust’s Portfolios and classes pursuant to these Pricing Procedures to the Trust’s administrator, FMG LLC (in its capacity as administrator, the “Administrator”). The Administrator has entered into a sub-administration agreement with JPMorgan Chase Bank, N.A. (the “Sub- Administrator”) to assist in performing certain of the duties described herein. The Committee, established by the Board, determines the value of the Trust’s securities and assets for which market quotations are not readily available or for which valuation cannot otherwise be provided in accordance with procedures adopted by the Board. The Committee is comprised of senior employees from FMG LLC.
Due to the inherent uncertainty of valuations of such securities, the fair value may differ significantly from the values that would have been used had a ready market for such securities existed.
Various inputs are used in determining the value of a Portfolio’s assets or liabilities carried at fair value. These inputs are summarized in three broad levels below:
| | • | | Level 1 - quoted prices in active markets for identical assets |
| | • | | Level 2 - other significant observable inputs (including quoted prices of similar securities, interest rates, prepayment speeds, credit risk, etc.) |
| | • | | Level 3 - significant unobservable inputs (including the Portfolio’s own assumptions in determining the fair value of investments) |
A summary of inputs used to value each Portfolio’s assets and liabilities carried at fair value as of December 31, 2016 is included in the Portfolio of Investments for each Portfolio. Changes in valuation techniques may result in transfers into or out of an investment’s assigned level. The Portfolios’ policy is to recognize transfers into and transfers out of the valuation levels as of the end of the reporting period.
Transfers between levels are included after the Summary of Level 1, Level 2 and Level 3 inputs, following the Portfolio of Investments for each Portfolio. Transfers between levels may be due to a decline or an increase in market activity (e.g., frequency of trades), which may result in a lack of, or increase in, available observable market inputs to determine price.
The inputs or methodology used to value securities are not necessarily an indication of the risk associated with investing in those securities. An investment’s level within the fair value hierarchy is based on the lowest level of any input, both individually and in aggregate, that is significant to the fair value measurement.
The Committee has the ability to meet and review reports based on the valuation techniques used to value Level 3 securities. As part of a review, the Committee would consider obtaining updates from its pricing vendors and Sub-Advisers for fair valued securities. For example, with respect to model driven prices, the Committee could receive reports regarding a review and recalculation of pricing models and related discounts. For those securities which are valued based on broker quotes, the Committee may evaluate variances between existing broker quotes and any alternative broker quotes provided by a Sub-Adviser or other pricing source.
To substantiate unobservable inputs used in a fair valuation, the Secretary of the Committee can perform an independent verification as well as additional research for fair value notifications received from the pricing agents. Among other factors, particular areas of focus may include: description of security, historical pricing, intra-day price movement, last trade information, corporate actions, related secu
rities, any available company news and announcements, any available trade data or other information. The Committee also notes the materiality of holdings and price changes on a Portfolio’s NAV.
12
The Committee reviews and considers changes in value for all fair valued securities that have occurred since the last review.
NOTE 4 – FEDERAL INCOME TAX CONSEQUENCES OF THE REORGANIZATIONS:
The Portfolio, as well as the Acquiring Portfolio after the Reorganization, intends to comply with the requirements of the Internal Revenue Code of 1986, as amended applicable to regulated investment companies (“RICS”) and to distribute substantially all of its net investment income and net realized capital gains to shareholders of each Portfolio. Therefore, no Federal income tax provision is required.
The estimated percentage of the holdings of the Alt 25 Portfolio that will be sold in connection with its respective Reorganization is 0%. The estimated portfolio transaction costs of the Reorganization of the Alt 25 Portfolio is $0. These are estimated amounts and are subject to change. Contractholders who had premiums or contributions allocated to the investment divisions of the Separate Accounts that are invested in shares of the Acquired Portfolios will not recognize any gain or loss for federal income tax purposes as a result of the Reorganizations.
NOTE 5 – UNAUDITED PRO FORMA COMBINED ADJUSTMENTS:
The accompanying unaudited pro forma combined financial statements reflect changes in the Alt 20 Portfolio’s shares as if the merger had taken place on December 31, 2016. AXA Equitable Funds Management Group, LLC will bear the expenses of the Reorganization (i.e., the costs associated with preparing, printing and distributing the prospectus and proxy materials, legal and accounting fees in connection with the Reorganization, and expenses of holding the shareholders meeting) which are estimated at approximately $33,333.
All Asset Aggressive-Alt 25 Portfolio, All Asset Aggressive-Alt 50 Portfolio, All Asset Aggressive-Alt 75 Portfolio and CharterSM Alternative 100 Moderate Portfolio merging into All Asset Growth-Alt 20 Portfolio
The following tables set forth the pro forma Combined Portfolio of Investments as of December 31, 2016, the pro forma condensed Combined Statement of Assets and Liabilities as of December 31, 2016, and the pro forma condensed Combined Statement of Operations for the one year period ended December 31, 2016, as adjusted giving effect to the Reorganization of the All Asset Aggressive-Alt 25 Portfolio (“Alt 25 Portfolio”), All Asset Aggressive-Alt 50 Portfolio (“Alt 50 Portfolio”), All Asset Aggressive-Alt 75 Portfolio (“Alt 75 Portfolio”), and CharterSM Alternative 100 Moderate Portfolio (“Alternative 100 Moderate Portfolio”) (the “Acquired Portfolios”) into the All Asset Growth-Alt 20 Portfolio (“Growth-Alt 20 Portfolio”) (the “Acquiring Portfolio”).
The pro forma Combined Portfolio of Investments contains information about the securities holdings of the combined Acquiring Portfolio as of December 31, 2016, which has, and will continue to, change over time due to normal portfolio turnover in response to changes in market conditions. Thus, it is expected that some of the Acquired Portfolios’ holdings may not remain at the time of the Reorganization. It is also expected that, if the Reorganization is approved, the Acquired Portfolios’ holdings that are not compatible with the Acquiring Portfolio’s investment objective and policies will be liquidated in an orderly manner in connection with the Reorganization, and the proceeds of these sales held in temporary investments or reinvested in assets that are consistent with the Acquiring Portfolio’s investment objective and policies. The portion of the Acquired Portfolios’ assets that will be liquidated in connection with the Reorganization will depend on market conditions and on the assessment by AXA Equitable Funds Management Group, LLC, the Portfolios’ investment manager, of the compatibility of those holdings with the Acquiring Portfolio’s portfolio composition, investment objective, and policies at the time of the Reorganization. The need for a Portfolio to sell investments in connection with the Reorganization may result in its selling securities at a disadvantageous time and price and could result in its realizing gains (or losses) that would not otherwise have been realized and incurring transaction costs that would not otherwise have been incurred.
13
EQ ADVISORS TRUST
PORTFOLIO OF INVESTMENTS
December 31, 2016 (Unaudited)
| | | | | | | | | | | | | | | | | | | | | | | | | | | | |
| | | All Asset
Aggressive-
Alt 25 | | | All Asset
Aggressive-
Alt 50 | | | All Asset
Aggressive-
Alt 75 | | | CharterSM
Alternative 100
Moderate | | | All Asset
Growth-
Alt 20 | | | Pro-forma
Adjustment | | | All Asset
Growth-
Alt 20
Combined
Pro-Forma | |
| | | Number of
Shares | | | Number of
Shares | | | Number of
Shares | | | Number of
Shares | | | Number of
Shares | | | Number of
Shares | | | Number of
Shares | |
EXCHANGE TRADED FUNDS: | | | | | | | | | | | | | | | | | | | | | | | | | | | | |
iShares® China Large-Cap Fund (x) | | | 4,435 | | | | 230 | | | | 140 | | | | — | | | | 38,800 | | | | — | | | | 43,605 | |
iShares® Emerging Markets Infrastructure Fund | | | — | | | | — | | | | — | | | | 6,670 | | | | — | | | | — | | | | 6,670 | |
iShares® Global Infrastructure Fund | | | — | | | | — | | | | — | | | | 17,300 | | | | — | | | | — | | | | 17,300 | |
iShares® Gold Trust* | | | — | | | | — | | | | — | | | | — | | | | 1,028,100 | | | | — | | | | 1,028,100 | |
iShares® International Developed Property Fund (x) | | | 11,740 | | | | 3,440 | | | | 5,330 | | | | — | | | | 71,000 | | | | — | | | | 91,510 | |
iShares® JP Morgan USD Emerging Markets Bond Fund (x) | | | 1,870 | | | | 120 | | | | 130 | | | | — | | | | 47,660 | | | | — | | | | 49,780 | |
iShares® MSCI EAFE Small-Cap Fund | | | 10,760 | | | | 790 | | | | 310 | | | | — | | | | 80,600 | | | | — | | | | 92,460 | |
iShares® MSCI Global Agriculture Producers Fund | | | — | | | | — | | | | — | | | | 6,700 | | | | — | | | | — | | | | 6,700 | |
iShares® MSCI Global Gold Miners Fund | | | 3,144 | | | | — | | | | — | | | | 7,440 | | | | 9,750 | | | | — | | | | 20,334 | |
iShares® Silver Trust* | | | — | | | | — | | | | — | | | | — | | | | 76,950 | | | | — | | | | 76,950 | |
iShares® U.S. Oil & Gas Exploration & Production Fund (x) | | | 2,960 | | | | 650 | | | | 1,320 | | | | 6,280 | | | | 15,320 | | | | — | | | | 26,530 | |
PowerShares DB Agriculture Fund* | | | — | | | | — | | | | — | | | | 1,780 | | | | — | | | | — | | | | 1,780 | |
PowerShares DB Base Metals Fund* | | | — | | | | — | | | | — | | | | 11,220 | | | | — | | | | — | | | | 11,220 | |
PowerShares DB Commodity Index Tracking Fund* | | | — | | | | — | | | | — | | | | 17,550 | | | | — | | | | — | | | | 17,550 | |
PowerShares DB G10 Currency Harvest Fund* | | | — | | | | — | | | | — | | | | 32,940 | | | | — | | | | — | | | | 32,940 | |
PowerShares DB Gold Fund (x)* | | | 46,850 | | | | 5,470 | | | | 6,320 | | | | 11,585 | | | | 26,900 | | | | — | | | | 97,125 | |
PowerShares DB Silver Fund (x)*‡ | | | 16,440 | | | | 1,940 | | | | 2,400 | | | | 2,930 | | | | 70,000 | | | | — | | | | 93,710 | |
PowerShares Multi-Strategy Alternative Portfolio | | | — | | | | — | | | | — | | | | 19,900 | | | | — | | | | — | | | | 19,900 | |
SPDR® S&P Emerging Asia Pacific Fund | | | 1,140 | | | | 150 | | | | 100 | | | | — | | | | 4,100 | | | | — | | | | 5,490 | |
SPDR® S&P Emerging Markets SmallCap Fund | | | 3,805 | | | | 240 | | | | 150 | | | | — | | | | 31,900 | | | | — | | | | 36,095 | |
WisdomTree Managed Futures Strategy Fund* | | | — | | | | — | | | | — | | | | 2,770 | | | | — | | | | — | | | | 2,770 | |
| | | | | | | | | | | | | | | | | | | | | | | | | | | | |
Total Exchange Traded Funds (12.6%)
(Cost $38,216,001) | | | | | | | | | | | | | | | | | | | | | | | | | | | | |
| | | | | | | | | | | | | | | | | | | | | | | | | | | | |
INVESTMENT COMPANIES | | | | | | | | | | | | | | | | | | | | | | | | | | | | |
AQR Managed Futures Strategy, Institutional Class* | | | — | | | | — | | | | — | | | | 21,780 | | | | — | | | | — | | | | 21,780 | |
AXA Natural Resources Portfolio | | | 195,592 | | | | 50,154 | | | | 90,828 | | | | 52,668 | | | | 1,504,427 | | | | — | | | | 1,893,669 | |
AXA Real Estate Portfolio | | | 147,891 | | | | 44,426 | | | | 62,975 | | | | 74,836 | | | | 1,067,135 | | | | — | | | | 1,397,263 | |
AXA/AB Small Cap Growth Portfolio‡ | | | 144,011 | | | | 9,038 | | | | 4,043 | | | | — | | | | 912,351 | | | | — | | | | 1,069,443 | |
AXA/Janus Enterprise Portfolio*‡ | | | 10,555 | | | | 1,251 | | | | 697 | | | | — | | | | 74,041 | | | | — | | | | 86,544 | |
AXA/Loomis Sayles Growth Portfolio‡ | | | 167,378 | | | | 13,065 | | | | 6,557 | | | | — | | | | 2,091,832 | | | | — | | | | 2,278,832 | |
BlackRock Global Long/Short Credit Fund, Institutional Class* | | | — | | | | — | | | | — | | | | 25,938 | | | | — | | | | — | | | | 25,938 | |
EQ/BlackRock Basic Value Equity Portfolio‡ | | | 101,570 | | | | 5,945 | | | | 3,116 | | | | — | | | | 739,741 | | | | — | | | | 850,372 | |
EQ/Boston Advisors Equity Income Portfolio‡ | | | 206,677 | | | | 13,016 | | | | 6,001 | | | | — | | | | 1,053,797 | | | | — | | | | 1,279,491 | |
EQ/Convertible Securities Portfolio | | | — | | | | — | | | | — | | | | 82,438 | | | | — | | | | — | | | | 82,438 | |
EQ/Emerging Markets Equity PLUS Portfolio‡ | | | 118,296 | | | | 7,262 | | | | 2,325 | | | | — | | | | 938,228 | | | | — | | | | 1,066,111 | |
EQ/Energy ETF Portfolio | | | — | | | | — | | | | — | | | | 56,138 | | | | — | | | | — | | | | 56,138 | |
EQ/GAMCO Mergers and Acquisitions Portfolio | | | 147,809 | | | | 13,536 | | | | 30,164 | | | | 87,551 | | | | 1,046,595 | | | | — | | | | 1,325,655 | |
EQ/GAMCO Small Company Value Portfolio‡ | | | 33,595 | | | | 2,180 | | | | 943 | | | | — | | | | 281,723 | | | | — | | | | 318,441 | |
EQ/Global Bond PLUS Portfolio‡ | | | 89,934 | | | | 3,044 | | | | 3,329 | | | | — | | | | 2,389,111 | | | | — | | | | 2,485,418 | |
EQ/High Yield Bond Portfolio‡ | | | 40,919 | | | | 2,175 | | | | 2,385 | | | | — | | | | 879,168 | | | | — | | | | 924,647 | |
EQ/Intermediate Government Bond Portfolio‡ | | | 16,329 | | | | 1,082 | | | | 713 | | | | — | | | | 465,277 | | | | — | | | | 483,401 | |
EQ/International Equity Index Portfolio‡ | | | 125,317 | | | | 10,710 | | | | 5,004 | | | | — | | | | 1,128,677 | | | | — | | | | 1,269,708 | |
EQ/Invesco Comstock Portfolio‡ | | | 113,726 | | | | 6,845 | | | | 3,219 | | | | — | | | | 795,725 | | | | — | | | | 919,515 | |
EQ/JPMorgan Value Opportunities Portfolio‡ | | | 73,274 | | | | 5,489 | | | | 2,567 | | | | — | | | | 727,137 | | | | — | | | | 808,467 | |
EQ/MFS International Growth Portfolio‡ | | | 379,989 | | | | 21,226 | | | | 10,219 | | | | — | | | | 2,910,996 | | | | — | | | | 3,322,430 | |
EQ/PIMCO Global Real Return Portfolio‡ | | | 53,121 | | | | 1,747 | | | | 1,920 | | | | — | | | | 1,178,356 | | | | — | | | | 1,235,144 | |
EQ/PIMCO Ultra Short Bond Portfolio‡ | | | 9,956 | | | | 550 | | | | 597 | | | | — | | | | 574,754 | | | | — | | | | 585,857 | |
EQ/T. Rowe Price Growth Stock Portfolio*‡ | | | 57,270 | | | | 3,460 | | | | 1,737 | | | | — | | | | 376,510 | | | | — | | | | 438,977 | |
Financial Investors Trust-Listed Private Equity Fund, Institutional Class* | | | — | | | | — | | | | — | | | | 12,113 | | | | — | | | | — | | | | 12,113 | |
Franklin K2 Alternative Strategies Fund, Advisor Class* | | | — | | | | — | | | | — | | | | 6,445 | | | | — | | | | — | | | | 6,445 | |
Multimanager Core Bond Portfolio‡ | | | 21,568 | | | | — | | | | — | | | | — | | | | 640,212 | | | | — | | | | 661,780 | |
| | | | | | | | | | | | | | | | | | | | | | | | | | | | |
Total Investment Companies (87.1%)
(Cost $253,429,687) | | | | | | | | | | | | | | | | | | | | | | | | | | | | |
| | | | | | | | | | | | | | | | | | | | | | | | | | | | |
14
EQ ADVISORS TRUST
PORTFOLIO OF INVESTMENTS
December 31, 2016 (Unaudited)
| | | | | | | | | | | | | | | | | | | | | | | | | | | | |
| | | All Asset
Aggressive-
Alt 25 | | | All Asset
Aggressive-
Alt 50 | | | All Asset
Aggressive-
Alt 75 | | | CharterSM
Alternative 100
Moderate | | | All Asset
Growth-
Alt 20 | | | Pro-forma
Adjustment | | | All Asset
Growth-
Alt 20
Combined
Pro-Forma | |
| | | Value ($) | | | Value ($) | | | Value ($) | | | Value ($) | | | Value ($) | | | Value ($) | | | Value ($) | |
EXCHANGE TRADED FUNDS: | | | | | | | | | | | | | | | | | | | | | | | | | | | | |
iShares® China Large-Cap Fund (x) | | | 153,939 | | | | 7,983 | | | | 4,859 | | | | — | | | | 1,346,748 | | | | — | | | | 1,513,529 | |
iShares® Emerging Markets Infrastructure Fund | | | — | | | | — | | | | — | | | | 187,360 | | | | — | | | | — | | | | 187,360 | |
iShares® Global Infrastructure Fund | | | — | | | | — | | | | — | | | | 675,392 | | | | — | | | | — | | | | 675,392 | |
iShares® Gold Trust* | | | — | | | | — | | | | — | | | | — | | | | 11,391,348 | | | | — | | | | 11,391,348 | |
iShares® International Developed Property Fund (x) | | | 394,581 | | | | 115,618 | | | | 179,141 | | | | — | | | | 2,386,310 | | | | — | | | | 3,075,650 | |
iShares® JP Morgan USD Emerging Markets Bond Fund (x) | | | 206,111 | | | | 13,226 | | | | 14,329 | | | | — | | | | 5,253,085 | | | | — | | | | 5,486,751 | |
iShares® MSCI EAFE Small-Cap Fund | | | 536,279 | | | | 39,374 | | | | 15,450 | | | | — | | | | 4,017,104 | | | | — | | | | 4,608,207 | |
iShares® MSCI Global Agriculture Producers Fund | | | — | | | | — | | | | — | | | | 167,260 | | | | — | | | | — | | | | 167,260 | |
iShares® MSCI Global Gold Miners Fund | | | 53,857 | | | | — | | | | — | | | | 127,447 | | | | 167,018 | | | | — | | | | 348,322 | |
iShares® Silver Trust* | | | — | | | | — | | | | — | | | | — | | | | 1,162,714 | | | | — | | | | 1,162,714 | |
iShares® U.S. Oil & Gas Exploration & Production Fund (x) | | | 193,702 | | | | 42,536 | | | | 86,381 | | | | 410,963 | | | | 1,002,541 | | | | — | | | | 1,736,123 | |
PowerShares DB Agriculture Fund* | | | — | | | | — | | | | — | | | | 35,547 | | | | — | | | | — | | | | 35,547 | |
PowerShares DB Base Metals Fund* | | | — | | | | — | | | | — | | | | 167,402 | | | | — | | | | — | | | | 167,402 | |
PowerShares DB Commodity Index Tracking Fund* | | | — | | | | — | | | | — | | | | 277,992 | | | | — | | | | — | | | | 277,992 | |
PowerShares DB G10 Currency Harvest Fund* | | | — | | | | — | | | | — | | | | 817,241 | | | | — | | | | — | | | | 817,241 | |
PowerShares DB Gold Fund (x)* | | | 1,734,856 | | | | 202,554 | | | | 234,030 | | | | 428,993 | | | | 996,107 | | | | — | | | | 3,596,540 | |
PowerShares DB Silver Fund (x)*‡ | | | 408,698 | | | | 48,228 | | | | 59,664 | | | | 72,840 | | | | 1,740,200 | | | | — | | | | 2,329,630 | |
PowerShares Multi-Strategy Alternative Portfolio | | | — | | | | — | | | | — | | | | 454,516 | | | | — | | | | — | | | | 454,516 | |
SPDR® S&P Emerging Asia Pacific Fund | | | 85,648 | | | | 11,270 | | | | 7,513 | | | | — | | | | 308,033 | | | | — | | | | 412,464 | |
SPDR® S&P Emerging Markets SmallCap Fund | | | 151,135 | | | | 9,533 | | | | 5,958 | | | | — | | | | 1,267,068 | | | | — | | | | 1,433,694 | |
WisdomTree Managed Futures Strategy Fund* | | | — | | | | — | | | | — | | | | 114,844 | | | | — | | | | — | | | | 114,844 | |
| | | | | | | | | | | | | | | | | | | | | | | | | | | | |
Total Exchange Traded Funds (12.6%)
(Cost $38,216,001) | |
|
3,918,806 |
| | | 490,322 | | | | 607,325 | | | | 3,937,797 | | | | 31,038,276 | | | | — | | | | 39,992,526 | |
| | | | | | | | | | | | | | | | | | | | | | | | | | | | |
INVESTMENT COMPANIES | | | | | | | | | | | | | | | | | | | | | | | | | | | | |
AQR Managed Futures Strategy, Institutional Class* | | | — | | | | — | | | | — | | | | 202,988 | | | | — | | | | — | | | | 202,988 | |
AXA Natural Resources Portfolio | | | 1,555,469 | | | | 398,855 | | | | 722,318 | | | | 418,847 | | | | 11,964,159 | | | | — | | | | 15,059,648 | |
AXA Real Estate Portfolio | | | 1,548,883 | | | | 465,280 | | | | 659,547 | | | | 783,773 | | | | 11,176,284 | | | | — | | | | 14,633,767 | |
AXA/AB Small Cap Growth Portfolio‡ | | | 2,608,102 | | | | 163,680 | | | | 73,212 | | | | — | | | | 16,523,133 | | | | — | | | | 19,368,127 | |
AXA/Janus Enterprise Portfolio*‡ | | | 167,862 | | | | 19,891 | | | | 11,081 | | | | — | | | | 1,177,460 | | | | — | | | | 1,376,294 | |
AXA/Loomis Sayles Growth Portfolio‡ | | | 1,090,324 | | | | 85,105 | | | | 42,715 | | | | — | | | | 13,626,510 | | | | — | | | | 14,844,654 | |
BlackRock Global Long/Short Credit Fund, Institutional Class* | | | — | | | | — | | | | — | | | | 262,492 | | | | — | | | | — | | | | 262,492 | |
EQ/BlackRock Basic Value Equity Portfolio‡ | | | 2,351,590 | | | | 137,636 | | | | 72,138 | | | | — | | | | 17,126,779 | | | | — | | | | 19,688,143 | |
EQ/Boston Advisors Equity Income Portfolio‡ | | | 1,190,213 | | | | 74,958 | | | | 34,557 | | | | — | | | | 6,068,611 | | | | — | | | | 7,368,339 | |
EQ/Convertible Securities Portfolio | | | — | | | | — | | | | — | | | | 839,538 | | | | — | | | | — | | | | 839,538 | |
EQ/Emerging Markets Equity PLUS Portfolio‡ | | | 946,879 | | | | 58,123 | | | | 18,606 | | | | — | | | | 7,509,871 | | | | — | | | | 8,533,479 | |
EQ/Energy ETF Portfolio | | | — | | | | — | | | | — | | | | 417,646 | | | | — | | | | — | | | | 417,646 | |
EQ/GAMCO Mergers and Acquisitions Portfolio | | | 1,930,553 | | | | 176,798 | | | | 393,982 | | | | 1,143,515 | | | | 13,669,683 | | | | — | | | | 17,314,531 | |
EQ/GAMCO Small Company Value Portfolio‡ | | | 1,966,357 | | | | 127,619 | | | | 55,188 | | | | — | | | | 16,489,358 | | | | — | | | | 18,638,522 | |
EQ/Global Bond PLUS Portfolio‡ | | | 788,304 | | | | 26,680 | | | | 29,179 | | | | — | | | | 20,941,495 | | | | — | | | | 21,785,658 | |
EQ/High Yield Bond Portfolio‡ | | | 389,631 | | | | 20,711 | | | | 22,713 | | | | — | | | | 8,371,482 | | | | — | | | | 8,804,537 | |
EQ/Intermediate Government Bond Portfolio‡ | | | 167,082 | | | | 11,067 | | | | 7,298 | | | | — | | | | 4,760,850 | | | | — | | | | 4,946,297 | |
EQ/International Equity Index Portfolio‡ | | | 1,048,184 | | | | 89,582 | | | | 41,854 | | | | — | | | | 9,440,531 | | | | — | | | | 10,620,151 | |
EQ/Invesco Comstock Portfolio‡ | | | 1,795,133 | | | | 108,044 | | | | 50,817 | | | | — | | | | 12,560,314 | | | | — | | | | 14,514,308 | |
EQ/JPMorgan Value Opportunities Portfolio‡ | | | 1,359,592 | | | | 101,855 | | | | 47,622 | | | | — | | | | 13,492,012 | | | | — | | | | 15,001,081 | |
EQ/MFS International Growth Portfolio‡ | | | 2,496,916 | | | | 139,479 | | | | 67,150 | | | | — | | | | 19,128,204 | | | | — | | | | 21,831,749 | |
EQ/PIMCO Global Real Return Portfolio‡ | | | 515,639 | | | | 16,958 | | | | 18,635 | | | | — | | | | 11,438,117 | | | | — | | | | 11,989,349 | |
EQ/PIMCO Ultra Short Bond Portfolio‡ | | | 98,237 | | | | 5,422 | | | | 5,892 | | | | — | | | | 5,671,102 | | | | — | | | | 5,780,653 | |
EQ/T. Rowe Price Growth Stock Portfolio*‡ | | | 2,229,452 | | | | 134,699 | | | | 67,611 | | | | — | | | | 14,657,094 | | | | — | | | | 17,088,856 | |
Financial Investors Trust-Listed Private Equity Fund, Institutional Class* | |
|
— |
| | | — | | | | — | | | | 78,492 | | | | — | | | | — | | | | 78,492 | |
Franklin K2 Alternative Strategies Fund, Advisor Class* | | | — | | | | — | | | | — | | | | 69,416 | | | | — | | | | — | | | | 69,416 | |
Multimanager Core Bond Portfolio‡ | | | 210,925 | | | | — | | | | — | | | | — | | | | 6,260,897 | | | | — | | | | 6,471,822 | |
| | | | | | | | | | | | | | | | | | | | | | | | | | | | |
Total Investment Companies (87.1%)
(Cost $253,429,687) | |
|
26,455,327 |
| | | 2,362,442 | | | | 2,442,115 | | | | 4,216,707 | | | | 242,053,946 | | | | — | | | | 277,530,537 | |
| | | | | | | | | | | | | | | | | | | | | | | | | | | | |
15
EQ ADVISORS TRUST
PORTFOLIO OF INVESTMENTS
December 31, 2016 (Unaudited)
| | | | | | | | | | | | | | | | | | | | | | | | | | | | |
| | | All Asset
Aggressive-
Alt 25 | | | All Asset
Aggressive-
Alt 50 | | | All Asset
Aggressive-
Alt 75 | | | CharterSM
Alternative 100
Moderate | | | All Asset
Growth-
Alt 20 | | | Pro-forma
Adjustment | | | All Asset
Growth-
Alt 20
Combined
Pro-Forma | |
| | | Number of
Shares | | | Number of
Shares | | | Number of
Shares | | | Number of
Shares | | | Number of
Shares | | | Number of
Shares | | | Number of
Shares | |
SHORT-TERM INVESTMENTS: | | | | | | | | | | | | | | | | | | | | | | | | | | | | |
Investment Company (0.4%) | | | | | | | | | | | | | | | | | | | | | | | | | | | | |
JPMorgan Prime Money Market Fund, Institutional Class Shares* | | | 400,075 | | | | 24,542 | | | | 26,362 | | | | 100,721 | | | | 769,263 | | | | — | | | | 1,320,963 | |
| | | | | | | | | | | | | | | | | | | | | | |
| | | Principal
Amount ($) | | | Principal
Amount ($) | | | Principal
Amount ($) | | | Principal
Amount ($) | | | Principal
Amount ($) | | | Principal
Amount ($) | | | Principal
Amount ($) | |
Repurchase Agreements (1.7%) | | | | | | | | | | | | | | | | | | | | | | | | | | | | |
Bank of Nova Scotia, 0.50%, dated 12/30/16, due 1/3/17, repurchase price $10,001, collateralized by various U.S. Government Treasury Securities, ranging from 0.875%-2.375%, maturing 11/30/17-1/15/27; total market value $10,200. (xx) | | | — | | | | — | | | | 10,000 | | | | — | | | | — | | | | — | | | | 10,000 | |
Citigroup Global Markets Ltd., 0.69%, dated 12/30/16, due 1/3/17, repurchase price $2,543, collateralized by various U.S. Government Treasury Securities, ranging from 1.375%-5.375%, maturing 7/31/18-2/15/45; total market value $2,594. (xx) | | | — | | | | 1,097 | | | | 1,446 | | | | — | | | | — | | | | — | | | | 2,543 | |
Citigroup Global Markets Ltd., 0.71%, dated 12/30/16, due 1/3/17, repurchase price $332,229, collateralized by various Foreign Government Agency Securities, ranging from 0.000%-5.250%, maturing 1/23/17-1/24/44, U.S. Government Treasury Securities, ranging from 0.000%-5.375%, maturing 2/15/19-2/15/44; total market value $338,848. (xx) | | | 25,885 | | | | 2,726 | | | | 3,592 | | | | — | | | | 300,000 | | | | — | | | | 332,203 | |
Deutsche Bank AG, 0.95%, dated 12/30/16, due 1/3/17, repurchase price $228,006, collateralized by various Corporate Bonds, ranging from 1.875%-2.500%, maturing 3/13/19-6/10/25; total market value $232,543. (xx) | | | 22,493 | | | | 2,369 | | | | 3,121 | | | | — | | | | 200,000 | | | | — | | | | 227,983 | |
Deutsche Bank AG, 1.05%, dated 12/30/16, due 1/3/17, repurchase price $1,000,117, collateralized by various Common Stocks; total market value $1,111,555. (xx) | | | — | | | | — | | | | — | | | | — | | | | 1,000,000 | | | | — | | | | 1,000,000 | |
Deutsche Bank AG, 1.05%, dated 12/30/16, due 1/3/17, repurchase price $2,900,339, collateralized by various Common Stocks; total market value $3,223,510. (xx) | | | 400,000 | | | | — | | | | — | | | | — | | | | 2,500,000 | | | | — | | | | 2,900,000 | |
Deutsche Bank Securities, Inc., 0.50%, dated 12/30/16, due 1/3/17, repurchase price $619,451, collateralized by various U.S. Government Treasury Securities, 0.000%, maturing 2/15/40-5/15/40; total market value $631,805. (xx) | | | 175,632 | | | | 24,569 | | | | 24,910 | | | | — | | | | 394,307 | | | | — | | | | 619,418 | |
Macquarie Bank Ltd., 0.76%, dated 12/30/16, due 1/3/17, repurchase price $300,025, collateralized by various U.S. Government Treasury Securities, ranging from 0.000%-8.750%, maturing 1/5/17-5/15/46; total market value $306,155. (xx) | | | — | | | | — | | | | — | | | | — | | | | 300,000 | | | | — | | | | 300,000 | |
Nomura Securities Co. Ltd., 0.50%, dated 12/30/16, due 1/3/17, repurchase price $10,001, collateralized by various U.S. Government Treasury Securities, ranging from 0.000%-3.875%, maturing 4/15/19-8/15/46; total market value $10,200. (xx) | | | — | | | | 10,000 | | | | — | | | | — | | | | — | | | | — | | | | 10,000 | |
| | | | | | | | | | | | | | | | | | | | | | | | | | | | |
Total Repurchase Agreements | | | | | | | | | | | | | | | | | | | | | | | | | | | | |
| | | | | | | | | | | | | | | | | | | | | | | | | | | | |
Total Short-Term Investment (2.1%)
(Cost $6,723,228) | | | | | | | | | | | | | | | | | | | | | | | | | | | | |
| | | | | | | | | | | | | | | | | | | | | | | | | | | | |
Total Investments (101.8%)
(Cost $298,368,916) | | | | | | | | | | | | | | | | | | | | | | | | | | | | |
Other Investments Less Liabilities (-1.8%) | | | | | | | | | | | | | | | | | | | | | | | | | | | | |
| | | | | | | | | | | | | | | | | | | | | | | | | | | | |
Net Assets (100%) | | | | | | | | | | | | | | | | | | | | | | | | | | | | |
| | | | | | | | | | | | | | | | | | | | | | | | | | | | |
As of February 22, 2017, each security held by the Acquired Portfolio complies with the investment policies and restrictions of the Acquiring Portfolio.
| ‡ | | All, or a portion, of the security is an affiliated company as defined under the Investment Company Act of 1940. |
| (a) | | Reflects adjustment made for seed capital withdrawal. |
| (x) | | All or a portion of security is on loan at December 31, 2016. |
| (xx) | | At December 31, 2016, the Portfolio had loaned securities with a value of $5,266,224. This was secured by collateral of $5,402,147 which was received as cash and subsequently invested in short-term investments currently valued at $5,402,147, as reported in the Portfolio of Investments. |
16
EQ ADVISORS TRUST
PORTFOLIO OF INVESTMENTS
December 31, 2016 (Unaudited)
| | | | | | | | | | | | | | | | | | | | | | | | | | | | |
| | | All Asset
Aggressive-
Alt 25 | | | All Asset
Aggressive-
Alt 50 | | | All Asset
Aggressive-
Alt 75 | | | CharterSM
Alternative 100
Moderate | | | All Asset
Growth-
Alt 20 | | | Pro-forma
Adjustment | | | All Asset
Growth-
Alt 20
Combined
Pro-Forma | |
| | |
Value ($) | | | Value ($) | | | Value ($) | | | Value ($) | | | Value ($) | | | Value ($) | | | Value ($) | |
SHORT-TERM INVESTMENTS: | | | | | | | | | | | | | | | | | | | | | | | | | | | | |
Investment Company (0.4%) | | | | | | | | | | | | | | | | | | | | | | | | | | | | |
JPMorgan Prime Money Market Fund, Institutional Class Shares* | |
|
400,195 |
| | | 24,550 | | | | 26,370 | | | | 100,752 | | | | 769,494 | | | | — | | | | 1,321,361 | |
Repurchase Agreements (1.7%) | | | | | | | | | | | | | | | | | | | | | | | | | | | | |
Bank of Nova Scotia, 0.50%, dated 12/30/16, due 1/3/17, repurchase price $10,001, collateralized by various U.S. Government Treasury Securities, ranging from 0.875%-2.375%, maturing 11/30/17-1/15/27; total market value $10,200. (xx) | |
|
— |
| | | — | | | | 10,000 | | | | — | | | | — | | | | — | | | | 10,000 | |
Citigroup Global Markets Ltd., 0.69%, dated 12/30/16, due 1/3/17, repurchase price $2,543, collateralized by various U.S. Government Treasury Securities, ranging from 1.375%-5.375%, maturing 7/31/18-2/15/45; total market value $2,594. (xx) | |
|
— |
| | | 1,097 | | | | 1,446 | | | | — | | | | — | | | | — | | | | 2,543 | |
Citigroup Global Markets Ltd., 0.71%, dated 12/30/16, due 1/3/17, repurchase price $332,229, collateralized by various Foreign Government Agency Securities, ranging from 0.000%-5.250%, maturing 1/23/17-1/24/44, U.S. Government Treasury Securities, ranging from 0.000%-5.375%, maturing 2/15/19-2/15/44; total market value $338,848. (xx) | |
|
25,885 |
| | | 2,726 | | | | 3,592 | | | | — | | | | 300,000 | | | | — | | | | 332,203 | |
Deutsche Bank AG, 0.95%, dated 12/30/16, due 1/3/17, repurchase price $228,006, collateralized by various Corporate Bonds, ranging from 1.875%-2.500%, maturing 3/13/19-6/10/25; total market value $232,543. (xx) | |
|
22,493 |
| | | 2,369 | | | | 3,121 | | | | — | | | | 200,000 | | | | — | | | | 227,983 | |
Deutsche Bank AG, 1.05%, dated 12/30/16, due 1/3/17, repurchase price $1,000,117, collateralized by various Common Stocks; total market value $1,111,555. (xx) | |
|
— |
| | | — | | | | — | | | | — | | | | 1,000,000 | | | | — | | | | 1,000,000 | |
Deutsche Bank AG, 1.05%, dated 12/30/16, due 1/3/17, repurchase price $2,900,339, collateralized by various Common Stocks; total market value $3,223,510. (xx) | |
|
400,000 |
| | | — | | | | — | | | | — | | | | 2,500,000 | | | | — | | | | 2,900,000 | |
Deutsche Bank Securities, Inc., 0.50%, dated 12/30/16, due 1/3/17, repurchase price $619,451, collateralized by various U.S. Government Treasury Securities, 0.000%, maturing 2/15/40-5/15/40; total market value $631,805. (xx) | |
|
175,632 |
| | | 24,569 | | | | 24,910 | | | | — | | | | 394,307 | | | | — | | | | 619,418 | |
Macquarie Bank Ltd., 0.76%, dated 12/30/16, due 1/3/17, repurchase price $300,025, collateralized by various U.S. Government Treasury Securities, ranging from 0.000%-8.750%, maturing 1/5/17-5/15/46; total market value $306,155. (xx) | |
|
— |
| | | — | | | | — | | | | — | | | | 300,000 | | | | — | | | | 300,000 | |
Nomura Securities Co. Ltd., 0.50%, dated 12/30/16, due 1/3/17, repurchase price $10,001, collateralized by various U.S. Government Treasury Securities, ranging from 0.000%-3.875%, maturing 4/15/19-8/15/46; total market value $10,200. (xx) | |
|
— |
| | | 10,000 | | | | — | | | | — | | | | — | | | | — | | | | 10,000 | |
| | | | | | | | | | | | | | | | | | | | | | | | | | | | |
Total Repurchase Agreements | | | 624,010 | | | | 40,761 | | | | 43,069 | | | | — | | | | 4,694,307 | | | | — | | | | 5,402,147 | |
| | | | | | | | | | | | | | | | | | | | | | | | | | | | |
Total Short-Term Investment (2.1%)
(Cost $6,723,228) | |
|
1,024,205 |
| | | 65,311 | | | | 69,439 | | | | 100,752 | | | | 5,463,801 | | | | — | | | | 6,723,508 | |
| | | | | | | | | | | | | | | | | | | | | | | | | | | | |
Total Investments (101.8%)
(Cost $298,368,916) | |
|
31,398,338 |
| | | 2,918,075 | | | | 3,118,879 | | | | 8,255,256 | | | | 278,556,023 | | | | — | | | | 324,246,571 | |
Other Investments Less Liabilities (-1.8%) | | | (706,675 | ) | | | (82,277 | ) | | | (85,303 | ) | | | (59,432 | ) | | | (4,761,991 | ) | | | (4,109,302 | )(a) | | | (9,804,980 | ) |
| | | | | | | | | | | | | | | | | | | | | | | | | | | | |
Net Assets (100%) | | | 30,691,663 | | | | 2,835,798 | | | | 3,033,576 | | | | 8,195,824 | | | | 273,794,032 | | | | (4,109,302 | ) | | | 314,441,591 | |
| | | | | | | | | | | | | | | | | | | | | | | | | | | | |
As of February 22, 2017, each security held by the Acquired Portfolio complies with the investment policies and restrictions of the Acquiring Portfolio.
| ‡ | | All, or a portion, of the security is an affiliated company as defined under the Investment Company Act of 1940. |
| (a) | | Reflects adjustment made for seed capital withdrawal. |
| (x) | | All or a portion of security is on loan at December 31, 2016. |
| (xx) | | At December 31, 2016, the Portfolio had loaned securities with a value of $5,266,224. This was secured by collateral of $5,402,147 which was received as cash and subsequently invested in short-term investments currently valued at $5,402,147, as reported in the Portfolio of Investments. |
17
| | | | | | | | | | | | | | | | | | | | | | | | |
| | | All Asset Aggressive-Alt 25 | |
Securities: | | Market Value
December 31,
2015 | | | Purchases
at Cost | | | Sales
at Cost | | | Market Value
December 31,
2016 | | | Dividend
Income | | | Realized
Gain
(Loss)† | |
AXA Natural Resources Portfolio | | $ | 1,018,846 | | | $ | 426,610 | | | $ | 178,515 | | | $ | 1,555,469 | | | $ | 35,830 | | | $ | (408 | ) |
AXA Real Estate Portfolio (a) | | | 1,239,705 | | | | 601,611 | | | | 328,475 | | | | 1,548,883 | | | | 12,987 | | | | 16,380 | |
AXA/AB Small Cap Growth Portfolio | | | 1,929,711 | | | | 912,045 | | | | 339,740 | | | | 2,608,102 | | | | 15,201 | | | | 159,157 | |
AXA/Janus Enterprise Portfolio (b) | | | 156,880 | | | | 34,431 | | | | 16,973 | | | | 167,862 | | | | — | | | | 60 | |
AXA/Loomis Sayles Growth Portfolio | | | 867,030 | | | | 169,267 | | | | — | | | | 1,090,324 | | | | 6,200 | | | | 23,067 | |
EQ/BlackRock Basic Value Equity Portfolio | | | 1,768,756 | | | | 692,563 | | | | 422,411 | | | | 2,351,590 | | | | 39,723 | | | | (121 | ) |
EQ/Boston Advisors Equity Income Portfolio | | | 882,828 | | | | 722,301 | | | | 400,648 | | | | 1,190,213 | | | | 26,827 | | | | 127,771 | |
EQ/Emerging Markets Equity PLUS Portfolio | | | 892,705 | | | | 267,438 | | | | 296,903 | | | | 946,879 | | | | 9,738 | | | | 317 | |
EQ/GAMCO Mergers and Acquisitions Portfolio | | | 1,377,156 | | | | 697,162 | | | | 178,114 | | | | 1,930,553 | | | | 4,372 | | | | 82,004 | |
EQ/GAMCO Small Company Value Portfolio | | | 1,332,383 | | | | 641,475 | | | | 280,685 | | | | 1,966,357 | | | | 13,596 | | | | 60,137 | |
EQ/Global Bond PLUS Portfolio | | | 680,650 | | | | 224,839 | | | | 101,798 | | | | 788,304 | | | | 17,184 | | | | 1,473 | |
EQ/High Yield Bond Portfolio | | | 299,296 | | | | 123,469 | | | | 50,874 | | | | 389,631 | | | | 20,389 | | | | 14 | |
EQ/Intermediate Government Bond Portfolio | | | 261,891 | | | | 212,737 | | | | 306,047 | | | | 167,082 | | | | 1,541 | | | | 1,655 | |
EQ/International Equity Index Portfolio | | | 907,078 | | | | 406,746 | | | | 261,391 | | | | 1,048,184 | | | | 30,326 | | | | (246 | ) |
EQ/Invesco Comstock Portfolio | | | 1,289,616 | | | | 594,226 | | | | 301,413 | | | | 1,795,133 | | | | 44,465 | | | | (11 | ) |
EQ/JPMorgan Value Opportunities Portfolio | | | 1,031,952 | | | | 140,511 | | | | 52,427 | | | | 1,359,592 | | | | 15,511 | | | | 7,573 | |
EQ/MFS International Growth Portfolio | | | 2,069,282 | | | | 790,725 | | | | 373,137 | | | | 2,496,916 | | | | 30,591 | | | | 4,253 | |
EQ/PIMCO Global Real Return Portfolio | | | 401,702 | | | | 164,464 | | | | 67,839 | | | | 515,639 | | | | 26,003 | | | | 1,032 | |
EQ/PIMCO Ultra Short Bond Portfolio | | | 78,883 | | | | 35,579 | | | | 16,960 | | | | 98,237 | | | | 1,219 | | | | 3 | |
EQ/T. Rowe Price Growth Stock Portfolio | | | 1,824,908 | | | | 759,269 | | | | 357,034 | | | | 2,229,452 | | | | — | | | | 36,890 | |
Multimanager Core Bond Portfolio | | | 141,495 | | | | 95,729 | | | | 25,446 | | | | 210,925 | | | | 3,980 | | | | 207 | |
| | | | | | | | | | | | | | | | | | | | | | | | |
Total: | | $ | 20,452,753 | | | $ | 8,713,197 | | | $ | 4,356,830 | | | $ | 26,455,327 | | | $ | 355,683 | | | $ | 521,207 | |
| | | | | | | | | | | | | | | | | | | | | | | | |
| |
| | | All Asset Aggressive-Alt 50 | |
Securities: | | Market Value
December 31,
2015 | | | Purchases
at Cost | | | Sales
at Cost | | | Market Value
December 31,
2016 | | | Dividend
Income | | | Realized
Gain
(Loss)† | |
AXA Natural Resources Portfolio | | $ | 538,888 | | | $ | 53,114 | | | $ | 326,605 | | | $ | 398,855 | | | $ | 9,263 | | | $ | (6,990 | ) |
AXA Real Estate Portfolio (a) | | | 691,431 | | | | 112,728 | | | | 358,126 | | | | 465,280 | | | | 4,024 | | | | 26,195 | |
AXA/AB Small Cap Growth Portfolio | | | 254,187 | | | | 43,818 | | | | 162,219 | | | | 163,680 | | | | 962 | | | | (8,537 | ) |
AXA/Janus Enterprise Portfolio (b) | | | 34,761 | | | | 2,201 | | | | 18,572 | | | | 19,891 | | | | — | | | | (3,202 | ) |
AXA/Loomis Sayles Growth Portfolio | | | 107,883 | | | | 32,284 | | | | 57,954 | | | | 85,105 | | | | 484 | | | | 6,346 | |
EQ/BlackRock Basic Value Equity Portfolio | | | 212,209 | | | | 22,716 | | | | 113,508 | | | | 137,636 | | | | 2,252 | | | | 9,293 | |
EQ/Boston Advisors Equity Income Portfolio | | | 100,476 | | | | 28,172 | | | | 60,057 | | | | 74,958 | | | | 1,583 | | | | 623 | |
EQ/Emerging Markets Equity PLUS Portfolio | | | 101,479 | | | | 7,912 | | | | 63,739 | | | | 58,123 | | | | 603 | | | | (4,503 | ) |
EQ/GAMCO Mergers and Acquisitions Portfolio | | | 248,578 | | | | 49,839 | | | | 128,741 | | | | 176,798 | | | | 450 | | | | 8,216 | |
EQ/GAMCO Small Company Value Portfolio | | | 168,803 | | | | 23,169 | | | | 91,609 | | | | 127,619 | | | | 891 | | | | 337 | |
EQ/Global Bond PLUS Portfolio | | | 66,298 | | | | 7,216 | | | | 50,032 | | | | 26,680 | | | | 587 | | | | (2,198 | ) |
EQ/High Yield Bond Portfolio | | | 30,337 | | | | 4,017 | | | | 16,257 | | | | 20,711 | | | | 1,094 | | | | (743 | ) |
EQ/Intermediate Government Bond Portfolio | | | 18,676 | | | | 6,316 | | | | 13,837 | | | | 11,067 | | | | 103 | | | | 144 | |
EQ/International Equity Index Portfolio | | | 140,776 | | | | 27,237 | | | | 85,664 | | | | 89,582 | | | | 2,620 | | | | (9,493 | ) |
EQ/Invesco Comstock Portfolio | | | 150,900 | | | | 16,598 | | | | 72,808 | | | | 108,044 | | | | 2,712 | | | | 110 | |
EQ/JPMorgan Value Opportunities Portfolio | | | 137,594 | | | | 11,162 | | | | 65,489 | | | | 101,855 | | | | 1,162 | | | | 11 | |
EQ/MFS International Growth Portfolio | | | 219,528 | | | | 25,979 | | | | 116,669 | | | | 139,479 | | | | 1,727 | | | | (6,625 | ) |
EQ/PIMCO Global Real Return Portfolio | | | 36,693 | | | | 3,822 | | | | 25,221 | | | | 16,958 | | | | 863 | | | | (171 | ) |
EQ/PIMCO Ultra Short Bond Portfolio | | | 8,800 | | | | 799 | | | | 4,297 | | | | 5,422 | | | | 68 | | | | (44 | ) |
EQ/T. Rowe Price Growth Stock Portfolio | | | 181,640 | | | | 55,595 | | | | 94,529 | | | | 134,699 | | | | — | | | | 7,634 | |
| | | | | | | | | | | | | | | | | | | | | | | | |
Total: | | $ | 3,449,937 | | | $ | 534,694 | | | $ | 1,925,933 | | | $ | 2,362,442 | | | $ | 31,448 | | | $ | 16,403 | |
| | | | | | | | | | | | | | | | | | | | | | | | |
18
| | | | | | | | | | | | | | | | | | | | | | | | |
| | | All Asset Aggressive-Alt 75 | |
Securities: | | Market Value
December 31,
2015 | | | Purchases
at Cost | | | Sales
at Cost | | | Market Value
December 31,
2016 | | | Dividend
Income | | | Realized
Gain
(Loss)† | |
AXA Natural Resources Portfolio | | $ | 883,808 | | | $ | 249,874 | | | $ | 662,385 | | | $ | 722,318 | | | $ | 16,769 | | | $ | (32,449 | ) |
AXA Real Estate Portfolio (a) | | | 950,734 | | | | 258,771 | | | | 573,330 | | | | 659,547 | | | | 5,828 | | | | 33,639 | |
AXA/AB Small Cap Growth Portfolio | | | 101,142 | | | | 40,473 | | | | 79,402 | | | | 73,212 | | | | 429 | | | | (2,357 | ) |
AXA/Janus Enterprise Portfolio (b) | | | 17,876 | | | | 3,621 | | | | 11,023 | | | | 11,081 | | | | — | | | | (1,487 | ) |
AXA/Loomis Sayles Growth Portfolio | | | 59,026 | | | | 10,547 | | | | 28,065 | | | | 42,715 | | | | 243 | | | | 2,139 | |
EQ/BlackRock Basic Value Equity Portfolio | | | 92,743 | | | | 24,683 | | | | 53,694 | | | | 72,138 | | | | 1,180 | | | | 3,155 | |
EQ/Boston Advisors Equity Income Portfolio | | | 36,342 | | | | 30,920 | | | | 33,722 | | | | 34,557 | | | | 729 | | | | 2,257 | |
EQ/Emerging Markets Equity PLUS Portfolio | | | 38,760 | | | | 5,617 | | | | 30,442 | | | | 18,606 | | | | 193 | | | | (1,547 | ) |
EQ/GAMCO Mergers and Acquisitions Portfolio | | | 517,841 | | | | 176,781 | | | | 313,199 | | | | 393,982 | | | | 1,003 | | | | 20,659 | |
EQ/GAMCO Small Company Value Portfolio | | | 82,927 | | | | 25,644 | | | | 66,540 | | | | 55,188 | | | | 385 | | | | 764 | |
EQ/Global Bond PLUS Portfolio | | | 56,092 | | | | 16,969 | | | | 45,853 | | | | 29,179 | | | | 641 | | | | (1,011 | ) |
EQ/High Yield Bond Portfolio | | | 35,470 | | | | 8,431 | | | | 24,475 | | | | 22,713 | | | | 1,199 | | | | (1,214 | ) |
EQ/Intermediate Government Bond Portfolio | | | 29,302 | | | | 6,697 | | | | 28,696 | | | | 7,298 | | | | 68 | | | | 147 | |
EQ/International Equity Index Portfolio | | | 56,903 | | | | 28,687 | | | | 46,543 | | | | 41,854 | | | | 1,224 | | | | (3,621 | ) |
EQ/Invesco Comstock Portfolio | | | 65,747 | | | | 17,547 | | | | 38,768 | | | | 50,817 | | | | 1,276 | | | | 19 | |
EQ/JPMorgan Value Opportunities Portfolio | | | 58,860 | | | | 9,343 | | | | 28,508 | | | | 47,622 | | | | 543 | | | | (8 | ) |
EQ/MFS International Growth Portfolio | | | 101,388 | | | | 24,456 | | | | 64,028 | | | | 67,150 | | | | 831 | | | | (3,959 | ) |
EQ/PIMCO Global Real Return Portfolio | | | 35,738 | | | | 8,219 | | | | 26,911 | | | | 18,635 | | | | 948 | | | | (10 | ) |
EQ/PIMCO Ultra Short Bond Portfolio | | | 8,896 | | | | 1,882 | | | | 5,006 | | | | 5,892 | | | | 75 | | | | (41 | ) |
EQ/T. Rowe Price Growth Stock Portfolio | | | 82,410 | | | | 43,070 | | | | 57,190 | | | | 67,611 | | | | — | | | | 1,224 | |
| | | | | | | | | | | | | | | | | | | | | | | | |
Total: | | $ | 3,312,005 | | | $ | 992,232 | | | $ | 2,217,780 | | | $ | 2,442,115 | | | $ | 33,564 | | | $ | 16,299 | |
| | | | | | | | | | | | | | | | | | | | | | | | |
| |
| | | All Asset Growth-Alt 20 | |
Securities: | | Market Value
December 31,
2015 | | | Purchases
at Cost | | | Sales
at Cost | | | Market Value
December 31,
2016 | | | Dividend
Income | | | Realized
Gain
(Loss)† | |
AXA Natural Resources Portfolio | | $ | 8,390,693 | | | $ | 1,927,283 | | | $ | 1,129,314 | | | $ | 11,964,159 | | | $ | 278,921 | | | $ | (31,804 | ) |
AXA Real Estate Portfolio (a) | | | 10,561,781 | | | | 1,378,359 | | | | 1,046,574 | | | | 11,176,284 | | | | 100,497 | | | | 177,334 | |
AXA/AB Small Cap Growth Portfolio | | | 15,952,175 | | | | 1,491,708 | | | | 1,684,527 | | | | 16,523,133 | | | | 99,499 | | | | 1,068,651 | |
AXA/Janus Enterprise Portfolio (b) | | | 1,562,479 | | | | 11,128 | | | | 339,431 | | | | 1,177,460 | | | | — | | | | 5,921 | |
AXA/Loomis Sayles Growth Portfolio | | | 9,753,249 | | | | 3,966,410 | | | | 912,928 | | | | 13,626,510 | | | | 77,480 | | | | 376,002 | |
EQ/BlackRock Basic Value Equity Portfolio | | | 16,250,142 | | | | 618,405 | | | | 1,871,422 | | | | 17,126,779 | | | | 289,888 | | | | 418,063 | |
EQ/Boston Advisors Equity Income Portfolio | | | 6,831,906 | | | | 1,060,956 | | | | 1,693,567 | | | | 6,068,611 | | | | 130,131 | | | | 729,777 | |
EQ/Emerging Markets Equity PLUS Portfolio | | | 8,197,362 | | | | 205,548 | | | | 1,625,934 | | | | 7,509,871 | | | | 78,380 | | | | 11,931 | |
EQ/GAMCO Mergers and Acquisitions Portfolio | | | 12,996,579 | | | | 1,121,785 | | | | 761,218 | | | | 13,669,683 | | | | 34,937 | | | | 672,451 | |
EQ/GAMCO Small Company Value Portfolio | | | 14,783,633 | | | | 978,664 | | | | 1,851,289 | | | | 16,489,358 | | | | 119,963 | | | | 634,156 | |
EQ/Global Bond PLUS Portfolio | | | 25,150,906 | | | | 1,666,731 | | | | 5,768,951 | | | | 20,941,495 | | | | 463,877 | | | | (66,758 | ) |
EQ/High Yield Bond Portfolio | | | 7,837,523 | | | | 782,190 | | | | 732,942 | | | | 8,371,482 | | | | 433,828 | | | | (5,433 | ) |
EQ/Intermediate Government Bond Portfolio | | | 2,950,097 | | | | 2,719,250 | | | | 868,957 | | | | 4,760,850 | | | | 38,294 | | | | 7,347 | |
EQ/International Equity Index Portfolio | | | 10,043,990 | | | | 468,557 | | | | 1,099,392 | | | | 9,440,531 | | | | 277,804 | | | | (92,595 | ) |
EQ/Invesco Comstock Portfolio | | | 11,626,948 | | | | 596,339 | | | | 1,274,589 | | | | 12,560,314 | | | | 320,809 | | | | (9,214 | ) |
EQ/JPMorgan Value Opportunities Portfolio | | | 10,574,246 | | | | 1,659,571 | | | | 1,204,350 | | | | 13,492,012 | | | | 159,571 | | | | 95,650 | |
EQ/MFS International Growth Portfolio | | | 20,266,149 | | | | 1,027,059 | | | | 2,252,791 | | | | 19,128,204 | | | | 238,354 | | | | 161,456 | |
EQ/PIMCO Global Real Return Portfolio | | | 10,664,883 | | | | 1,983,941 | | | | 1,700,309 | | | | 11,438,117 | | | | 559,415 | | | | 24,487 | |
EQ/PIMCO Ultra Short Bond Portfolio | | | 7,977,458 | | | | 823,302 | | | | 3,228,965 | | | | 5,671,102 | | | | 64,342 | | | | (56,633 | ) |
EQ/T. Rowe Price Growth Stock Portfolio | | | 15,149,696 | | | | 1,084,651 | | | | 1,531,574 | | | | 14,657,094 | | | | — | | | | 289,046 | |
Multimanager Core Bond Portfolio | | | 4,661,809 | | | | 1,803,323 | | | | 180,111 | | | | 6,260,897 | | | | 124,664 | | | | 5,446 | |
PowerShares DB Silver Fund | | | 1,073,817 | | | | 551,765 | | | | — | | | | 1,740,200 | | | | — | | | | — | |
| | | | | | | | | | | | | | | | | | | | | | | | |
Total: | | $ | 233,257,521 | | | $ | 27,926,925 | | | $ | 32,759,135 | | | $ | 243,794,146 | | | $ | 3,890,654 | | | $ | 4,415,281 | |
| | | | | | | | | | | | | | | | | | | | | | | | |
| |
| | | CharterSM Alternative 100 Moderate | |
Securities: | | Market Value
December 31,
2015 | | | Purchases
at Cost | | | Sales
at Cost | | | Market Value
December 31,
2016 | | | Dividend
Income | | | Realized
Gain
(Loss)† | |
AXA Natural Resources Portfolio | | $ | 671,243 | | | $ | 90,407 | | | $ | 604,038 | | | $ | 418,847 | | | $ | 9,649 | | | $ | (121,874 | ) |
AXA Real Estate Portfolio (a) | | | 1,376,046 | | | | 200,488 | | | | 814,528 | | | | 783,773 | | | | 7,119 | | | | 48,795 | |
EQ/Convertible Securities Portfolio | | | 1,361,218 | | | | 185,410 | | | | 751,980 | | | | 839,538 | | | | 25,286 | | | | (13,180 | ) |
EQ/Energy ETF Portfolio | | | 589,322 | | | | 167,927 | | | | 554,356 | | | | 417,646 | | | | 7,089 | | | | (108,212 | ) |
EQ/GAMCO Mergers and Acquisitions Portfolio | | | 1,843,689 | | | | 414,932 | | | | 1,174,864 | | | | 1,143,515 | | | | 2,883 | | | | 38,330 | |
PowerShares Multi-Strategy Alternative Portfolio* | | | 623,271 | | | | — | | | | 188,895 | | | | 454,516 | | | | 6,865 | | | | (5,071 | ) |
| | | | | | | | | | | | | | | | | | | | | | | | |
Total: | | $ | 6,464,789 | | | $ | 1,059,164 | | | $ | 4,088,661 | | | $ | 4,057,835 | | | $ | 58,891 | | | $ | (161,212 | ) |
| | | | | | | | | | | | | | | | | | | | | | | | |
19
| | | | | | | | | | | | | | | | | | | | | | | | |
| | | All Asset Growth-Alt 20 Combined Pro-Forma | |
Securities: | | Market Value
December 31,
2015 | | | Purchases
at Cost | | | Sales
at Cost | | | Market Value
December 31,
2016 | | | Dividend
Income | | | Realized
Gain
(Loss)† | |
AXA Natural Resources Portfolio | | $ | 11,503,478 | | | $ | 2,747,288 | | | $ | 2,900,857 | | | $ | 15,059,648 | | | $ | 350,432 | | | $ | (193,525 | ) |
AXA Real Estate Portfolio (a) | | | 14,819,697 | | | | 2,551,957 | | | | 3,121,033 | | | | 14,633,767 | | | | 130,455 | | | | 302,343 | |
AXA/AB Small Cap Growth Portfolio | | | 18,237,215 | | | | 2,488,044 | | | | 2,265,888 | | | | 19,368,127 | | | | 116,091 | | | | 1,216,914 | |
AXA/Janus Enterprise Portfolio (b) | | | 1,771,996 | | | | 51,381 | | | | 385,999 | | | | 1,376,294 | | | | — | | | | 1,292 | |
AXA/Loomis Sayles Growth Portfolio | | | 10,787,188 | | | | 4,178,508 | | | | 998,947 | | | | 14,844,654 | | | | 84,407 | | | | 407,554 | |
EQ/BlackRock Basic Value Equity Portfolio | | | 18,323,850 | | | | 1,358,367 | | | | 2,461,035 | | | | 19,688,143 | | | | 333,043 | | | | 430,390 | |
EQ/Boston Advisors Equity Income Portfolio | | | 7,851,552 | | | | 1,842,349 | | | | 2,187,994 | | | | 7,368,339 | | | | 159,270 | | | | 860,428 | |
EQ/Convertible Securities Portfolio | | | 1,361,218 | | | | 185,410 | | | | 751,980 | | | | 839,538 | | | | 25,286 | | | | (13,180 | ) |
EQ/Emerging Markets Equity PLUS Portfolio | | | 9,230,306 | | | | 486,515 | | | | 2,017,018 | | | | 8,533,479 | | | | 88,914 | | | | 6,198 | |
EQ/Energy ETF Portfolio | | | 589,322 | | | | 167,927 | | | | 554,356 | | | | 417,646 | | | | 7,089 | | | | (108,212 | ) |
EQ/GAMCO Mergers and Acquisitions Portfolio | | | 16,983,843 | | | | 2,460,499 | | | | 2,556,136 | | | | 17,314,531 | | | | 43,645 | | | | 821,660 | |
EQ/GAMCO Small Company Value Portfolio | | | 16,367,746 | | | | 1,668,952 | | | | 2,290,123 | | | | 18,638,522 | | | | 134,835 | | | | 695,394 | |
EQ/Global Bond PLUS Portfolio | | | 25,953,946 | | | | 1,915,755 | | | | 5,966,634 | | | | 21,785,658 | | | | 482,289 | | | | (68,494 | ) |
EQ/High Yield Bond Portfolio | | | 8,202,626 | | | | 918,107 | | | | 824,548 | | | | 8,804,537 | | | | 456,510 | | | | (7,376 | ) |
EQ/Intermediate Government Bond Portfolio | | | 3,259,966 | | | | 2,945,000 | | | | 1,217,537 | | | | 4,946,297 | | | | 40,006 | | | | 9,293 | |
EQ/International Equity Index Portfolio | | | 11,148,747 | | | | 931,227 | | | | 1,492,990 | | | | 10,620,151 | | | | 311,974 | | | | (105,955 | ) |
EQ/Invesco Comstock Portfolio | | | 13,133,211 | | | | 1,224,710 | | | | 1,687,578 | | | | 14,514,308 | | | | 369,262 | | | | (9,096 | ) |
EQ/JPMorgan Value Opportunities Portfolio | | | 11,802,652 | | | | 1,820,587 | | | | 1,350,774 | | | | 15,001,081 | | | | 176,787 | | | | 103,226 | |
EQ/MFS International Growth Portfolio | | | 22,656,347 | | | | 1,868,219 | | | | 2,806,625 | | | | 21,831,749 | | | | 271,503 | | | | 155,125 | |
EQ/PIMCO Global Real Return Portfolio | | | 11,139,016 | | | | 2,160,446 | | | | 1,820,280 | | | | 11,989,349 | | | | 587,229 | | | | 25,338 | |
EQ/PIMCO Ultra Short Bond Portfolio | | | 8,074,037 | | | | 861,562 | | | | 3,255,228 | | | | 5,780,653 | | | | 65,704 | | | | (56,715 | ) |
EQ/T. Rowe Price Growth Stock Portfolio | | | 17,238,654 | | | | 1,942,585 | | | | 2,040,327 | | | | 17,088,856 | | | | — | | | | 334,794 | |
Multimanager Core Bond Portfolio | | | 4,803,304 | | | | 1,899,052 | | | | 205,557 | | | | 6,471,822 | | | | 128,644 | | | | 5,653 | |
PowerShares DB Silver Fund | | | 1,073,817 | | | | 551,765 | | | | — | | | | 1,740,200 | | | | — | | | | — | |
PowerShares Multi-Strategy Alternative Portfolio* | | | 623,271 | | | | — | | | | 188,895 | | | | 454,516 | | | | 6,865 | | | | (5,071 | ) |
| | | | | | | | | | | | | | | | | | | | | | | | |
Total: | | $ | 266,937,005 | | | $ | 39,226,212 | | | $ | 45,348,339 | | | $ | 279,111,865 | | | $ | 4,370,240 | | | $ | 4,807,978 | |
| | | | | | | | | | | | | | | | | | | | | | | | |
| * | | Not affiliated at December 31, 2015. |
| † | | When applicable, realized gain includes net distribution of realized gain received from underlying funds. |
| (a) | | Formerly known as EQ/Real Estate PLUS Portfolio. |
| (b) | | Formerly known as EQ/Morgan Stanley Mid Cap Growth Portfolio. |
The following is a summary of the inputs used to value the Portfolio’s net assets as of December 31, 2016:
The inputs or methodology used for valuing securities are not necessarily an indication of the risk associated with investing in those securities.
Various inputs are used in determining the value of the Portfolio’s investments. These inputs are summarized in the three broad levels listed below:
All Asset Aggressive-Alt 25
| | | | | | | | | | | | | | | | |
Description | | Quoted Prices in
Active Markets for
Identical
Securities
(Level 1) | | | Significant Other
Observable Inputs
(Level 2) | | | Significant
Unobservable
Inputs
(Level 3) | | | Total | |
Assets | | | | | | | | | | | | | | | | |
Investment Companies | | | | | | | | | | | | | | | | |
Exchange Traded Funds (ETFs) | | $ | 3,918,806 | | | $ | — | | | $ | — | | | $ | 3,918,806 | |
Investment Companies | | | — | | | | 26,455,327 | | | | — | | | | 26,455,327 | |
Other Exchange Traded Funds | | | — | | | | — | | | | �� | | | | — | |
Short-Term Investments | | | | | | | | | | | | | | | | |
Investment Companies | | | 400,195 | | | | — | | | | — | | | | 400,195 | |
Repurchase Agreements | | | — | | | | 624,010 | | | | — | | | | 624,010 | |
| | | | | | | | | | | | | | | | |
Total | | $ | 4,319,001 | | | $ | 27,079,337 | | | $ | — | | | $ | 31,398,338 | |
| | | | | | | | | | | | | | | | |
Liabilities | | | | | | | | | | | | | | | | |
Total Liabilities | | $ | — | | | $ | — | | | $ | — | | | $ | — | |
| | | | | | | | | | | | | | | | |
Total Assets and Liabilities | | $ | 4,319,001 | | | $ | 27,079,337 | | | $ | — | | | $ | 31,398,338 | |
| | | | | | | | | | | | | | | | |
20
All Asset Aggressive-Alt 50
| | | | | | | | | | | | | | | | |
Investment Type | | Level 1
Quoted Prices in
Active Markets for
Identical
Securities | | | Level 2
Significant Other
Observable Inputs
(including quoted prices
for similar securities,
interest rates,
prepayment speeds,
credit risk, etc.) | | | Level 3
Significant Unobservable
Inputs (including the
Portfolio’s own
assumptions in
determining the fair
value of investments) | | | Total | |
Assets | | | | | | | | | | | | | | | | |
Investment Companies | | | | | | | | | | | | | | | | |
Exchange Traded Funds (ETFs) | | $ | 490,322 | | | $ | — | | | $ | — | | | $ | 490,322 | |
Investment Companies | | | — | | | | 2,362,442 | | | | — | | | | 2,362,442 | |
Other Exchange Traded Funds | | | — | | | | — | | | | — | | | | — | |
Short-Term Investments | | | | | | | | | | | | | | | | |
Investment Companies | | | 24,550 | | | | — | | | | — | | | | 24,550 | |
Repurchase Agreements | | | — | | | | 40,761 | | | | — | | | | 40,761 | |
| | | | | | | | | | | | | | | | |
Total | | $ | 514,872 | | | $ | 2,403,203 | | | $ | — | | | $ | 2,918,075 | |
| | | | | | | | | | | | | | | | |
Liabilities | | | | | | | | | | | | | | | | |
Total Liabilities | | $ | — | | | $ | — | | | $ | — | | | $ | — | |
| | | | | | | | | | | | | | | | |
Total Assets and Liabilities | | $ | 514,872 | | | $ | 2,403,203 | | | $ | — | | | $ | 2,918,075 | |
| | | | | | | | | | | | | | | | |
All Asset Aggressive-Alt 75
| | | | | | | | | | | | | | | | |
Investment Type | | Level 1
Quoted Prices in
Active Markets for
Identical
Securities | | | Level 2
Significant Other
Observable Inputs
(including quoted prices
for similar securities,
interest rates,
prepayment speeds,
credit risk, etc.) | | | Level 3
Significant Unobservable
Inputs (including the
Portfolio’s own
assumptions in
determining the fair
value of investments) | | | Total | |
Assets | | | | | | | | | | | | | | | | |
Investment Companies | | | | | | | | | | | | | | | | |
Exchange Traded Funds (ETFs) | | $ | 607,325 | | | $ | — | | | $ | — | | | $ | 607,325 | |
Investment Companies | | | — | | | | 2,442,115 | | | | — | | | | 2,442,115 | |
Other Exchange Traded Funds | | | — | | | | — | | | | — | | | | — | |
Short-Term Investments | | | | | | | | | | | | | | | | |
Investment Companies | | | 26,370 | | | | — | | | | — | | | | 26,370 | |
Repurchase Agreements | | | — | | | | 43,069 | | | | — | | | | 43,069 | |
| | | | | | | | | | | | | | | | |
Total | | $ | 633,695 | | | $ | 2,485,184 | | | $ | — | | | $ | 3,118,879 | |
| | | | | | | | | | | | | | | | |
Liabilities | | | | | | | | | | | | | | | | |
Total Liabilities | | $ | — | | | $ | — | | | $ | — | | | $ | — | |
| | | | | | | | | | | | | | | | |
Total Assets and Liabilities | | $ | 633,695 | | | $ | 2,485,184 | | | $ | — | | | $ | 3,118,879 | |
| | | | | | | | | | | | | | | | |
CharterSM Alternative 100 Moderate
| | | | | | | | | | | | | | | | |
Investment Type | | Level 1
Quoted Prices in
Active Markets for
Identical
Securities | | | Level 2
Significant Other
Observable Inputs
(including quoted prices
for similar securities,
interest rates,
prepayment speeds,
credit risk, etc.) | | | Level 3
Significant Unobservable
Inputs (including the
Portfolio’s own
assumptions in
determining the fair
value of investments) | | | Total | |
Assets | | | | | | | | | | | | | | | | |
Investment Companies | | | | | | | | | | | | | | | | |
Exchange Traded Funds (ETFs) | | $ | 3,937,797 | | | $ | — | | | $ | — | | | $ | 3,937,797 | |
Investment Companies | | | 613,388 | | | | 3,603,319 | | | | — | | | | 4,216,707 | |
Other Exchange Traded Funds | | | — | | | | — | | | | — | | | | — | |
Short-Term Investments | | | | | | | | | | | | | | | | |
Investment Companies | | | 100,752 | | | | — | | | | — | | | | 100,752 | |
Repurchase Agreements | | | — | | | | — | | | | — | | | | — | |
| | | | | | | | | | | | | | | | |
Total | | $ | 4,651,937 | | | $ | 3,603,319 | | | $ | — | | | $ | 8,255,256 | |
| | | | | | | | | | | | | | | | |
| | | | |
Liabilities | | | | | | | | | | | | | | | | |
Total Liabilities | | $ | — | | | $ | — | | | $ | — | | | $ | — | |
| | | | | | | | | | | | | | | | |
Total Assets and Liabilities | | $ | 4,651,937 | | | $ | 3,603,319 | | | $ | — | | | $ | 8,255,256 | |
| | | | | | | | | | | | | | | | |
21
All Asset Growth-Alt 20
| | | | | | | | | | | | | | | | |
Investment Type | | Level 1
Quoted Prices in
Active Markets for
Identical
Securities | | | Level 2
Significant Other
Observable Inputs
(including quoted prices
for similar securities,
interest rates,
prepayment speeds,
credit risk, etc.) | | | Level 3
Significant Unobservable
Inputs (including the
Portfolio’s own
assumptions in
determining the fair
value of investments) | | | Total | |
Assets | | | | | | | | | | | | | | | | |
Investment Companies | | | | | | | | | | | | | | | | |
Exchange Traded Funds (ETFs) | | $ | 31,038,276 | | | $ | — | | | $ | — | | | $ | 31,038,276 | |
Investment Companies | | | — | | | | 242,053,946 | | | | — | | | | 242,053,946 | |
Other Exchange Traded Funds | | | — | | | | — | | | | — | | | | — | |
Short-Term Investments | | | | | | | | | | | | | | | | |
Investment Companies | | | 769,494 | | | | — | | | | — | | | | 769,494 | |
Repurchase Agreements | | | — | | | | 4,694,307 | | | | — | | | | 4,694,307 | |
| | | | | | | | | | | | | | | | |
Total | | $ | 31,807,770 | | | $ | 246,748,253 | | | $ | — | | | $ | 278,556,023 | |
| | | | | | | | | | | | | | | | |
| | | | |
Liabilities | | | | | | | | | | | | | | | | |
Total Liabilities | | $ | — | | | $ | — | | | $ | — | | | $ | — | |
| | | | | | | | | | | | | | | | |
Total Assets and Liabilities | | $ | 31,807,770 | | | $ | 246,748,253 | | | $ | — | | | $ | 278,556,023 | |
| | | | | | | | | | | | | | | | |
All Asset Growth-Alt 20 Combined Pro-Forma
| | | | | | | | | | | | | | | | |
Investment Type | | Level 1
Quoted Prices in
Active Markets for
Identical
Securities | | | Level 2
Significant Other
Observable Inputs
(including quoted prices
for similar securities,
interest rates,
prepayment speeds,
credit risk, etc.) | | | Level 3
Significant Unobservable
Inputs (including the
Portfolio’s own
assumptions in
determining the fair
value of investments) | | | Total | |
Assets | | | | | | | | | | | | | | | | |
Investment Companies | | | | | | | | | | | | | | | | |
Exchange Traded Funds (ETFs) | | $ | 39,992,526 | | | $ | — | | | $ | — | | | $ | 39,992,526 | |
Investment Companies | | | 613,388 | | | | 276,917,149 | | | | — | | | | 277,530,537 | |
Other Exchange Traded Funds | | | — | | | | — | | | | — | | | | — | |
Short-Term Investments | | | | | | | | | | | | | | | | |
Investment Companies | | | 1,321,361 | | | | — | | | | — | | | | 1,321,361 | |
Repurchase Agreements | | | — | | | | 5,402,147 | | | | — | | | | 5,402,147 | |
| | | | | | | | | | | | | | | | |
Total | | $ | 41,927,275 | | | $ | 282,319,296 | | | $ | — | | | $ | 324,246,571 | |
| | | | | | | | | | | | | | | | |
Liabilities | | | | | | | | | | | | | | | | |
Total Liabilities | | $ | — | | | $ | — | | | $ | — | | | $ | — | |
| | | | | | | | | | | | | | | | |
Total Assets and Liabilities | | $ | 41,927,275 | | | $ | 282,319,296 | | | $ | — | | | $ | 324,246,571 | |
| | | | | | | | | | | | | | | | |
There were no transfers between Levels 1, 2 or 3 during the year ended December 31, 2016.
Investment security transactions for the year ended December 31, 2016 were as follows:
| | | | | | | | | | | | | | | | | | | | | | | | |
| | | All Asset
Aggressive-
Alt 25 | | | All Asset
Aggressive-
Alt 50 | | | All Asset
Aggressive-
Alt 75 | | | CharterSM
Alternative 100
Moderate | | | All Asset
Growth-
Alt 20 | | | All Asset
Growth-
Alt 20
Combined
Pro-Forma | |
Cost of Purchases: | | | | | | | | | | | | | | | | | | | | | | | | |
Long-term investments other than U.S. government debt securities | | $ | 9,715,032 | | | $ | 605,089 | | | $ | 1,102,981 | | | $ | 1,651,398 | | | $ | 29,740,840 | | | $ | 42,815,340 | |
Net Proceeds of Sales and Redemptions: | | | | | | | | | | | | | | | | | | | | | | | | |
Long-term investments other than U.S. government debt securities | | $ | 4,842,411 | | | $ | 2,297,835 | | | $ | 2,643,910 | | | $ | 7,345,969 | | | $ | 37,558,272 | | | $ | 54,688,397 | |
22
As of December 31, 2016, the gross unrealized appreciation (depreciation) of investments based on the aggregate cost of investments for Federal income tax purposes was as follows:
| | | | | | | | | | | | | | | | | | | | | | | | |
| | | All Asset
Aggressive-
Alt 25 | | | All Asset
Aggressive-
Alt 50 | | | All Asset
Aggressive-
Alt 75 | | | CharterSM
Alternative 100
Moderate | | | All Asset
Growth-
Alt 20 | | | All Asset
Growth-
Alt 20
Combined
Pro-Forma | |
Aggregate gross unrealized appreciation | | $ | 1,258,934 | | | $ | 109,193 | | | $ | 55,316 | | | $ | 37,028 | | | $ | 36,766,963 | | | $ | 38,227,434 | |
Aggregate gross unrealized depreciation | | | (1,152,958 | ) | | | (307,456 | ) | | | (375,877 | ) | | | (596,267 | ) | | | (8,673,992 | ) | | | (11,106,550 | ) |
| | | | | | | | | | | | | | | | | | | | | | | | |
Net unrealized appreciation | | $ | 105,976 | | | $ | (198,263 | ) | | $ | (320,561 | ) | | $ | (559,239 | ) | | $ | 28,092,971 | | | $ | 27,120,884 | |
| | | | | | | | | | | | | | | | | | | | | | | | |
Federal income tax cost of investments | | $ | 31,292,362 | | | $ | 3,116,338 | | | $ | 3,439,440 | | | $ | 8,814,495 | | | $ | 250,463,052 | | | $ | 297,125,687 | |
| | | | | | | | | | | | | | | | | | | | | | | | |
Capital Loss Carry Forward:
All Asset Aggressive Alt 25
The Portfolio has no capital loss carryforward.
All Asset Aggressive Alt 50
Losses incurred that will be carried forward under the provisions of the Regulated Investment Company Modernization Act of 2010 are $41,199 of Long Term losses.
All Asset Aggressive Alt 75
Losses incurred that will be carried forward under the provisions of the Regulated Investment Company Modernization Act of 2010 are $64,214 of Long Term losses.
CharterSM Alternative 100 Moderate
Losses incurred that will be carried forward under the provisions of the Regulated Investment Company Modernization Act of 2010 are $116,874 of Short Term losses and $591,496 of Long Term losses.
All Asset Growth Alt 20
The Portfolio has no capital loss carryforward.
All Asset Growth Alt 20 Combined Pro-Forma
Losses incurred that will be carried forward under the provisions of the Regulated Investment Company Modernization Act of 2010 are $105,413 of Long Term losses.
23
EQ ADVISORS TRUST
STATEMENT OF ASSETS AND LIABILITIES
December 31, 2016 (Unaudited)
| | | | | | | | | | | | | | | | | | | | | | | | | | | | |
| | | All Asset
Aggressive-
Alt 25 | | | All Asset
Aggressive-
Alt 50 | | | All Asset
Aggressive-
Alt 75 | | | CharterSM
Alternative 100
Moderate | | | All Asset
Growth-
Alt 20 | | | Adjustment | | | All Asset
Growth-Alt 20
Combined
Pro-Forma | |
Investments at Cost, Affiliated Issuers | | $ | 26,352,574 | | | $ | 2,488,860 | | | $ | 2,659,138 | | | $ | 4,387,126 | | | $ | 219,237,919 | | | $ | — | | | $ | 255,125,617 | |
Investments at Cost, Unaffiliated Issuers | | | 4,574,693 | | | | 601,006 | | | | 762,699 | | | | 4,838,082 | | | | 27,064,672 | | | | — | | | | 37,841,152 | |
Investments at Cost, Repurchase Agreements | | | 624,010 | | | | 40,761 | | | | 43,069 | | | | — | | | | 4,694,307 | | | | — | | | | 5,402,147 | |
ASSETS | | | | | | | | | | | | | | | | | | | | | | | | | | | | |
Investments at Value, Affiliated Issuers (x) | | | 26,455,327 | | | | 2,362,442 | | | | 2,442,115 | | | | 4,057,835 | | | | 243,794,146 | | | | — | | | | 279,111,865 | |
Investments at Value, Unaffiliated Issuers (x) | | | 4,319,001 | | | | 514,872 | | | | 633,695 | | | | 4,197,421 | | | | 30,067,570 | | | | — | | | | 39,732,559 | |
Investments at Value, Repurchase Agreements | | | 624,010 | | | | 40,761 | | | | 43,069 | | | | — | | | | 4,694,307 | | | | — | | | | 5,402,147 | |
Cash | | | 49,000 | | | | 7,180 | | | | 6,998 | | | | 22,000 | | | | 103,606 | | | | — | | | | 188,784 | |
Receivable for securities sold | | | 60,048 | | | | 6,672 | | | | 14,679 | | | | — | | | | 927,032 | | | | — | | | | 1,008,431 | |
Receivable from Separate Accounts for Trust shares sold | | | 19,842 | | | | — | | | | — | | | | 62 | | | | 43,178 | | | | — | | | | 63,082 | |
Receivable from investment manager | | | 6,782 | | | | 7,264 | | | | 6,829 | | | | — | | | | — | | | | — | | | | 20,875 | |
Securities lending income receivable | | | 868 | | | | 58 | | | | 111 | | | | — | | | | 5,814 | | | | — | | | | 6,851 | |
Dividends, interest, and other receivables | | | 232 | | | | 15 | | | | 14 | | | | 43 | | | | 523 | | | | — | | | | 827 | |
Other assets | | | 84 | | | | 16 | | | | 14 | | | | 60 | | | | 892 | | | | — | | | | 1,066 | |
| | | | | | | | | | | | | | | | | | | | | | | | | | | | |
Total assets | | | 31,535,194 | | | | 2,939,280 | | | | 3,147,524 | | | | 8,277,421 | | | | 279,637,068 | | | | — | | | | 325,536,487 | |
| | | | | | | | | | | | | | | | | | | | | | | | | | | | |
LIABILITIES | | | | | | | | | | | | | | | | | | | | | | | | | | | | |
Payable for return of collateral on securities loaned | | | 624,010 | | | | 40,761 | | | | 43,069 | | | | — | | | | 4,694,307 | | | | — | | | | 5,402,147 | |
Payable for securities purchased | | | 155,090 | | | | 8,208 | | | | 15,809 | | | | 716 | | | | 733,452 | | | | — | | | | 913,275 | |
Payable to Separate Accounts for Trust shares redeemed | | | 17,167 | | | | 24 | | | | 34 | | | | 172 | | | | 253,211 | | | | 4,109,302 | (a) | | | 4,379,910 | |
Distribution fees payable-Class IB | | | 6,021 | | | | 598 | | | | 639 | | | | 1,725 | | | | 53,991 | | | | — | | | | 62,974 | |
Administrative fees payable | | | — | | | | — | | | | — | | | | 6,290 | | | | 32,738 | | | | — | | | | 39,028 | |
Distribution fees payable-Class IA | | | — | | | | — | | | | — | | | | — | | | | 3,856 | | | | — | | | | 3,856 | |
Trustees’ fees payable | | | 29 | | | | 8 | | | | 8 | | | | 934 | | | | 503 | | | | — | | | | 1,482 | |
Investment management fees payable | | | — | | | | — | | | | — | | | | — | | | | 1,049 | | | | — | | | | 1,049 | |
Accrued expenses | | | 41,214 | | | | 53,883 | | | | 54,389 | | | | 71,760 | | | | 69,929 | | | | — | | | | 291,175 | |
| | | | | | | | | | | | | | | | | | | | | | | | | | | | |
Total liabilities | | | 843,531 | | | | 103,482 | | | | 113,948 | | | | 81,597 | | | | 5,843,036 | | | | 4,109,302 | | | | 11,094,896 | |
| | | | | | | | | | | | | | | | | | | | | | | | | | | | |
NET ASSETS | | $ | 30,691,663 | | | $ | 2,835,798 | | | $ | 3,033,576 | | | $ | 8,195,824 | | | $ | 273,794,032 | | | $ | (4,109,302 | ) | | $ | 314,441,591 | |
| | | | | | | | | | | | | | | | | | | | | | | | | | | | |
Net assets were comprised of: | | | | | | | | | | | | | | | | | | | | | | | | | | | | |
Paid in capital | | $ | 30,200,145 | | | $ | 3,072,961 | | | $ | 3,415,266 | | | $ | 9,464,407 | | | $ | 340,083,732 | | | $ | (4,109,302 | )(a) | | $ | 382,127,209 | |
Accumulated undistributed net investment income (loss) | | | 10,882 | | | | 4,351 | | | | 6,409 | | | | 9,190 | | | | 333,143 | | | | — | | | | 363,975 | |
Accumulated undistributed net realized gain (loss) on investments | | | 633,575 | | | | (28,962 | ) | | | (42,072 | ) | | | (307,821 | ) | | | (94,181,968 | ) | | | — | | | | (93,927,248 | ) |
Net unrealized appreciation (depreciation) on investments | | | (152,939 | ) | | | (212,552 | ) | | | (346,027 | ) | | | (969,952 | ) | | | 27,559,125 | | | | — | | | | 25,877,655 | |
| | | | | | | | | | | | | | | | | | | | | | | | | | | | |
Net Assets | | $ | 30,691,663 | | | $ | 2,835,798 | | | $ | 3,033,576 | | | $ | 8,195,824 | | | $ | 273,794,032 | | | $ | (4,109,302 | ) | | $ | 314,441,591 | |
| | | | | | | | | | | | | | | | | | | | | | | | | | | | |
Class IA Shares: | | | | | | | | | | | | | | | | | | | | | | | | | | | | |
Net Assets | | $ | — | | | $ | — | | | $ | — | | | $ | — | | | $ | 18,357,789 | | | $ | — | | | $ | 18,357,789 | |
Shares outstanding | | | — | | | | — | | | | — | | | | — | | | | 971,475 | | | | — | | | | 971,475 | |
Net asset value, offering and redemption price per share | | $ | — | | | $ | — | | | $ | — | | | $ | — | | | $ | 18.90 | | | $ | — | | | $ | 18.90 | |
Class IB Shares: | | | | | | | | | | | | | | | | | | | | | | | | | | | | |
Net Assets | | $ | 29,003,704 | | | $ | 2,835,798 | | | $ | 3,033,576 | | | $ | 8,195,824 | | | $ | 253,965,896 | | | $ | (4,109,302 | )(a)(b) | | $ | 292,925,496 | |
Shares outstanding | | | 2,417,144 | | | | 305,172 | | | | 338,896 | | | | 898,592 | | | | 13,405,347 | | | | (1,903,889 | )(a)(b) | | | 15,461,262 | |
Net asset value, offering and redemption price per share | | $ | 12.00 | | | $ | 9.29 | | | $ | 8.95 | | | $ | 9.12 | | | $ | 18.95 | | | $ | — | | | $ | 18.95 | |
Class K Shares: | | | | | | | | | | | | | | | | | | | | | | | | | | | | |
Net Assets | | $ | 1,687,959 | | | $ | — | | | $ | — | | | $ | — | | | $ | 1,470,347 | | | $ | — | | | $ | 3,158,306 | |
Shares outstanding | | | 140,735 | | | | — | | | | — | | | | — | | | | 77,963 | | | | (51,236 | )(b) | | | 167,462 | |
Net asset value, offering and redemption price per share | | $ | 11.99 | | | $ | — | | | $ | — | | | $ | — | | | $ | 18.86 | | | $ | — | | | $ | 18.86 | |
(x) Includes value of securities on loan of: | | $ | 608,228 | | | $ | 39,702 | | | $ | 41,939 | | | $ | — | | | $ | 4,576,355 | | | $ | — | | | $ | 5,266,224 | |
| (a) | | Reflects adjustment made for impact of seed capital withdrawal. |
| (b) | | Reflects adjustment for retired shares of the acquired Portfolios. |
24
EQ ADVISORS TRUST
For the Year Ended December 31, 2016 (Unaudited)
| | | | | | | | | | | | | | | | | | | | | | | | | | | | |
| | | All Asset
Aggressive-
Alt 25 | | | All Asset
Aggressive-
Alt 50 | | | All Asset
Aggressive-
Alt 75 | | | CharterSM
Alternative 100
Moderate | | | All Asset
Growth-
Alt 20 | | | Adjustment | | | All Asset
Growth-Alt 20
Combined
Pro-Forma | |
STATEMENT OF OPERATIONS | | | | | | | | | | | | | | | | | | | | | | | | | | | | |
Dividend income received from Affiliates | | $ | 355,683 | | | $ | 31,448 | | | $ | 33,564 | | | $ | 58,891 | | | $ | 3,890,654 | | | $ | — | | | $ | 4,370,240 | |
INVESTMENT INCOME | | | | | | | | | | | | | | | | | | | | | | | | | | | | |
Dividends | | | 412,003 | | | | 42,719 | | | | 47,978 | | | | 106,888 | | | | 4,503,857 | | | | — | | | | 5,113,445 | |
Interest | | | 206 | | | | 51 | | | | 53 | | | | 2,561 | | | | 1,670 | | | | — | | | | 4,541 | |
Securities lending (net) | | | 8,211 | | | | 1,416 | | | | 1,689 | | | | — | | | | 39,228 | | | | — | | | | 50,544 | |
| | | | | | | | | | | | | | | | | | | | | | | | | | | | |
Total income | | | 420,420 | | | | 44,186 | | | | 49,720 | | | | 109,449 | | | | 4,544,755 | | | | — | | | | 5,168,530 | |
| | | | | | | | | | | | | | | | | | | | | | | | | | | | |
EXPENSES | | | | | | | | | | | | | | | | | | | | | | | | | | | | |
Distribution fees-Class IB | | | 62,389 | | | | 6,474 | | | | 6,868 | | | | 25,977 | | | | 625,818 | | | | (10,152 | )(d) | | | 717,374 | |
Administrative fees | | | 38,981 | | | | 32,505 | | | | 32,504 | | | | 32,507 | | | | 394,825 | | | | (99,603 | )(a) | | | 431,719 | |
Custodian fees | | | 111,000 | | | | 89,000 | | | | 89,500 | | | | 39,500 | | | | 124,050 | | | | (329,000 | )(a) | | | 124,050 | |
Investment management fees | | | 26,484 | | | | 3,542 | | | | 3,665 | | | | 15,587 | | | | 267,892 | | | | (9,239 | )(c)(d) | | | 307,931 | |
Professional fees | | | 40,192 | | | | 39,594 | | | | 39,597 | | | | 37,564 | | | | 43,453 | | | | (157,441 | )(a) | | | 42,959 | |
Printing and mailing expenses | | | 7,779 | | | | 422 | | | | 428 | | | | 1,575 | | | | 61,750 | | | | — | | | | 71,954 | |
Distribution fees-Class IA | | | — | | | | — | | | | — | | | | — | | | | 40,592 | | | | — | | | | 40,592 | |
Trustees’ fees | | | 581 | | | | 88 | | | | 89 | | | | 430 | | | | 6,082 | | | | — | | | | 7,270 | |
Miscellaneous | | | 353 | | | | 364 | | | | 366 | | | | 325 | | | | 4,604 | | | | — | | | | 6,012 | |
Tax expense | | | — | | | | 74 | | | | 102 | | | | — | | | | — | | | | (176 | )(e) | | | — | |
| | | | | | | | | | | | | | | | | | | | | | | | | | | | |
Gross expenses | | | 287,759 | | | | 172,063 | | | | 173,119 | | | | 153,465 | | | | 1,569,066 | | | | (605,611 | ) | | | 1,749,861 | |
| | | | | | | | | | | | | | | | | | | | | | | | | | | | |
Less: Waiver from investment manager | | | (65,465 | ) | | | (36,047 | ) | | | (36,169 | ) | | | (48,094 | ) | | | (22,212 | ) | | | 207,987 | (b) | | | — | |
Reimbursement from investment manager | | | (59,493 | ) | | | (115,641 | ) | | | (115,615 | ) | | | (32,641 | ) | | | — | | | | 323,390 | (b) | | | — | |
| | | | | | | | | | | | | | | | | | | | | | | | | | | | |
Net expenses | | | 162,801 | | | | 20,375 | | | | 21,335 | | | | 72,730 | | | | 1,546,854 | | | | (74,234 | ) | | | 1,749,861 | |
| | | | | | | | | | | | | | | | | | | | | | | | | | | | |
NET INVESTMENT INCOME (LOSS) | | | 257,619 | | | | 23,811 | | | | 28,385 | | | | 36,719 | | | | 2,997,901 | | | | 74,234 | | | | 3,418,669 | |
| | | | | | | | | | | | | | | | | | | | | | | | | | | | |
Realized gain (loss) from affiliates | | | 5,691 | | | | (23,897 | ) | | | (22,989 | ) | | | (227,151 | ) | | | 719,702 | | | | — | | | | 451,356 | |
Net distributions of realized gain received from affiliates | | | 515,516 | | | | 40,300 | | | | 39,288 | | | | 65,939 | | | | 3,695,579 | | | | — | | | | 4,356,622 | |
REALIZED AND UNREALIZED GAIN (LOSS) | | | | | | | | | | | | | | | | | | | | | | | | | | | | |
Realized gain (loss) on: | | | | | | | | | | | | | | | | | | | | | | | | | | | | |
Investments | | | (30,305 | ) | | | (56,317 | ) | | | (59,343 | ) | | | (471,827 | ) | | | 1,160,675 | | | | — | | | | 542,883 | |
Net distributions of realized gain received from underlying funds | | | 515,537 | | | | 40,300 | | | | 39,288 | | | | 65,939 | | | | 3,695,579 | | | | — | | | | 4,356,643 | |
| | | | | | | | | | | | | | | | | | | | | | | | | | | | |
Net realized gain (loss) | | | 485,232 | | | | (16,017 | ) | | | (20,055 | ) | | | (405,888 | ) | | | 4,856,254 | | | | — | | | | 4,899,526 | |
| | | | | | | | | | | | | | | | | | | | | | | | | | | | |
Change in unrealized appreciation (depreciation) from affiliates | | | 1,646,207 | | | | 303,744 | | | | 355,658 | | | | 622,543 | | | | 15,368,835 | | | | — | | | | 18,296,987 | |
Change in unrealized appreciation (depreciation) on: | | | | | | | | | | | | | | | | | | | | | | | | | | | | |
Investments | | | 1,905,876 | | | | 411,321 | | | | 474,730 | | | | 1,530,301 | | | | 16,690,231 | | | | — | | | | 21,012,459 | |
| | | | | | | | | | | | | | | | | | | | | | | | | | | | |
Net change in unrealized appreciation (depreciation) | | | 1,905,876 | | | | 411,321 | | | | 474,730 | | | | 1,530,301 | | | | 16,690,231 | | | | — | | | | 21,012,459 | |
| | | | | | | | | | | | | | | | | | | | | | | | | | | | |
NET REALIZED AND UNREALIZED GAIN (LOSS) | | | 2,391,108 | | | | 395,304 | | | | 454,675 | | | | 1,124,413 | | | | 21,546,485 | | | | — | | | | 25,911,985 | |
| | | | | | | | | | | | | | | | | | | | | | | | | | | | |
NET INCREASE (DECREASE) IN NET ASSETS RESULTING FROM OPERATIONS | | $ | 2,648,727 | | | $ | 419,115 | | | $ | 483,060 | | | $ | 1,161,132 | | | $ | 24,544,386 | | | $ | 74,234 | | | $ | 29,330,654 | |
| | | | | | | | | | | | | | | | | | | | | | | | | | | | |
| (a) | | Reflects adjustment in expenses due to elimination of duplicative expenses. |
| (b) | | Reflects eliminination of waiver and reimbursement due to expense adjustments. |
| (c) | | Reflects adjustment in expenses due to effects of new contract rate. |
| (d) | | Reflects adjustment made for the impact of seed capital withdrawal. |
| (e) | | Reflects adjustment made to eliminate non-recurring expenses. |
Note that the Reorganization expenses for the All Asset Aggressive-Alt 25 Portfolio, All Asset Aggressive-Alt 50 Portfolio, All Asset Aggressive-Alt 75 Portfolio, and CharterSM Alternative 100 Moderate Portfolio, which are estimated to be $33,333 for each Portfolio, exceed the expense limit for each Portfolio and will be paid by FMG LLC.
25
NOTES TO PRO FORMA COMBINED FINANCIAL STATEMENTS
As of December 31, 2016
NOTE 1 – BASIS OF COMBINATION AND SIGNIFICANT ACCOUNTING POLICIES:
EQ Advisors Trust (the “Trust”) was organized as a Delaware statutory trust on October 31, 1996 and is registered under the Investment Company Act of 1940, as amended, as an open-end management investment company with numerous portfolios. The Board of Trustees of the Trust and the Board of Trustees of the AXA Premier VIP Trust (“VIP Trust”), approved proposed Plans of Reorganization and Termination and an Agreement and Plan of Reorganization and Termination (each a “Reorganization Plan”) on December 1, 2016 that provide for the transfer of all assets of the All Asset Aggressive-Alt 25 Portfolio (“Alt 25 Portfolio”), All Asset Aggressive-Alt 50 Portfolio (“Alt 50 Portfolio”), All Asset Aggressive-Alt 75 Portfolio (“Alt 75 Portfolio”), each a series of Trust, and CharterSM Alt 100 Moderate Portfolio (“Alt 100 Moderate Portfolio”), a series of the VIP Trust, (each an “Acquired Portfolio” and together the “Acquired Portfolios”) to the All Asset Growth-Alt 20 Portfolio, a series of the Trust (“Alt 20 Portfolio”), and the assumption by Alt 20 Portfolio of all of the liabilities of the Acquired Portfolios in exchange for shares of the Alt 20 Portfolio having an aggregate value equal to the net assets of the Acquired Portfolios, the distribution of the Alt 20 Portfolio shares to the Acquired Portfolios shareholders of record determined immediately after the close of business on the closing date, and the subsequent liquidation of the Acquired Portfolios (with respect to each Acquired Portfolio, each, a “Reorganization” and together, the “Reorganizations”). The consummation of one Reorganization is not contingent on the consummation of any other Reorganization.
The Alt 25 Portfolio’s annual contractual management fee equals 0.10% of average daily net assets. The Alt 50 Portfolio’s annual contractual management fee equals 0.10% of average daily net assets. The Alt 75 Portfolio’s annual contractual management fee equals 0.10% of average daily net assets. The Alt 100 Moderate Portfolio’s annual contractual management fee equals 0.15% of average daily net assets. The Alt 20 Portfolio’s annual contractual management fee equals 0.10% of average daily net assets. The Reorganization Plans are subject to the approval of the Acquired Portfolios’ shareholders. A special meeting of shareholders of the Acquired Portfolios will be held on or about March 28, 2017.
The Reorganizations of the Alt 50 Portfolio and the Alt 75 Portfolio into the All Asset Growth-Alt 20 Portfolio will be accounted for as taxable reorganizations of investment companies. The Reorganizations of the Alt 25 Portfolio and Alt 100 Moderate Portfolio into All Asset Growth-Alt 20 Portfolio will be accounted for as tax-free reorganizations of investment companies. The unaudited pro forma combined financial statements are presented for the information of the reader and may not necessarily be representative of what the actual combined financial statements would have been had the Reorganizations occurred at December 31, 2016. The unaudited pro forma combined portfolio of investments and statement of assets and liabilities reflect the financial position of the Alt 20 Portfolio and the Acquired Portfolios at December 31, 2016. The unaudited pro forma combined statement of operations reflects the results of operations of the Alt 20 Portfolio as if it had acquired the Acquired Portfolios at the beginning of the year ended December 31, 2016. These statements have been derived from the Portfolios’ respective books and records utilized in calculating daily net asset value at the dates indicated above for each Portfolio under accounting principles generally accepted in the United States of America.
The unaudited pro forma combined portfolio of investments and statements of assets and liabilities and operations should be read in conjunction with the historical financial statements of the Portfolios included in the Trust’s Statement of Additional Information and the VIP Trust’s Statement of Additional Information, each of the Portfolios has substantially the same significant policies as detailed in the historical financial statements. The preparation of financial statements in accordance with accounting principles generally accepted in the United States of America requires management to make estimates and assumptions that affect the reported amounts and disclosures. Actual results could differ from those estimates.
Following the Reorganizations, the Alt 20 Portfolio is the “accounting survivor.” The general criteria that are applied to determine the proper accounting survivor are outlined in the “AICPA Accounting and Audit Guide for Investment Companies.” The legal survivor normally is considered the accounting survivor of a reorganization. In this case, the Alt 20 Portfolio is the legal survivor. Other criteria include:
| a.) | | Portfolio Management – The merged entity will be managed by the Manager, Sub-Advisers and portfolio managers to the Alt 20 Portfolio in a manner consistent with the current management style. |
| b.) | | Portfolio Composition – The merged entity’s portfolio holdings are expected to be consistent with the Alt 20 Portfolio’s current investment strategies and will more closely resemble the current portfolio holdings of the Alt 20 Portfolio than those of the Acquired Portfolios. |
| c.) | | Investment Objective, Policies and Restrictions – The merged entity’s investment objective, policies and fundamental and non-fundamental investment restrictions will be the same as the Alt 20 Portfolio’s current investment objective, policies and fundamental and non-fundamental investment restrictions. |
26
| d.) | | Expense Structure and Expense Ratios – The merged entity’s expense structure will be the same as that of Alt 20 Portfolio. The expense ratio of the merged entity will be the same as that of the Alt 20 Portfolio and lower than the Acquired Portfolios. |
| e.) | | Asset Size – The Alt 20 Portfolio is significantly larger than the Acquired Portfolios. |
NOTE 2 – SHARES:
The unaudited pro forma net asset value per share assumes additional common shares of beneficial interest issued in connection with the proposed acquisition of the Acquired Portfolios by the Alt 20 Portfolio as of December 31, 2016. The number of additional shares issued was calculated based on the net assets of the Acquired Portfolios and net asset value per share of the Alt 20 Portfolio at December 31, 2016.
NOTE 3 – VALUATION:
Equity securities (including securities issued by exchange-traded funds (“ETFs”)) listed on national securities exchanges are valued at the last sale price or official closing price on the date of valuation or, if there is no sale or official closing price, at the latest available bid price. Securities listed on the NASDAQ stock market will be valued using the NASDAQ Official Closing Price (“NOCP”). Generally, the NOCP will be the last sale price unless the reported trade for the security is outside the range of the bid/ask price. In such cases, the NOCP will be normalized to the nearer of the bid or ask price. Other unlisted stocks are valued at their last sale price or official closing price, or if there is no such price, at a bid price estimated by a broker.
Investments in shares of open-end investment companies (other than ETFs) held by a Portfolio will be valued at the net asset value (“NAV”) of the shares of such funds as described in the underlying funds’ prospectuses.
If market quotations are not readily available for a security or other financial instruments, such securities and instruments shall be referred to the Trust’s Valuation Committee (“Committee”), who will value the assets in good faith pursuant to procedures (“Pricing Procedures”) adopted by the Board of Trustees of the Trust (the “Board”).
The Board is responsible for ensuring that appropriate valuation methods are used to price securities for the Trust’s Portfolios. The Board has delegated the responsibility of calculating the NAVs of the Trust’s Portfolios and classes pursuant to these Pricing Procedures to the Trust’s administrator, FMG LLC (in its capacity as administrator, the “Administrator”). The Administrator has entered into a sub-administration agreement with JPMorgan Chase Bank, N.A. (the “Sub- Administrator”) to assist in performing certain of the duties described herein. The Committee, established by the Board, determines the value of the Trust’s securities and assets for which market quotations are not readily available or for which valuation cannot otherwise be provided in accordance with procedures adopted by the Board. The Committee is comprised of senior employees from FMG LLC.
Due to the inherent uncertainty of valuations of such securities, the fair value may differ significantly from the values that would have been used had a ready market for such securities existed.
Various inputs are used in determining the value of a Portfolio’s assets or liabilities carried at fair value. These inputs are summarized in three broad levels below:
| | • | | Level 1 - quoted prices in active markets for identical assets |
| | • | | Level 2 - other significant observable inputs (including quoted prices of similar securities, interest rates, prepayment speeds, credit risk, etc.) |
| | • | | Level 3 - significant unobservable inputs (including the Portfolio’s own assumptions in determining the fair value of investments) |
A summary of inputs used to value each Portfolio’s assets and liabilities carried at fair value as of December 31, 2016 is included in the Portfolio of Investments for each Portfolio. Changes in valuation techniques may result in transfers into or out of an investment’s assigned level. The Portfolios’ policy is to recognize transfers into and transfers out of the valuation levels as of the end of the reporting period.
Transfers between levels are included after the Summary of Level 1, Level 2 and Level 3 inputs, following the Portfolio of Investments for each Portfolio. Transfers between levels may be due to a decline or an increase in market activity (e.g., frequency of trades), which may result in a lack of, or increase in, available observable market inputs to determine price.
The inputs or methodology used to value securities are not necessarily an indication of the risk associated with investing in those securities. An investment’s level within the fair value hierarchy is based on the lowest level of any input, both individually and in aggregate, that is significant to the fair value measurement.
The Committee has the ability to meet and review reports based on the valuation techniques used to value Level 3 securities. As part of a review, the Committee would consider obtaining updates from its pricing vendors and Sub-Advisers for fair valued securities. For example, with respect to model driven prices, the Committee could receive reports regarding a review and recalculation of pricing models and related discounts. For those securities which are valued based on broker quotes, the Committee may evaluate variances between existing broker quotes and any alternative broker quotes provided by a Sub-Adviser or other pricing source.
27
To substantiate unobservable inputs used in a fair valuation, the Secretary of the Committee can perform an independent verification as well as additional research for fair value notifications received from the pricing agents. Among other factors, particular areas of focus may include: description of security, historical pricing, intra-day price movement, last trade information, corporate actions, related securities, any available company news and announcements, any available trade data or other information. The Committee also notes the materiality of holdings and price changes on a Portfolio’s NAV.
The Committee reviews and considers changes in value for all fair valued securities that have occurred since the last review.
NOTE 4 – FEDERAL INCOME TAX CONSEQUENCES OF THE REORGANIZATIONS:
Each Portfolio, as well as the Acquiring Portfolio after the Reorganization, intends to comply with the requirements of the Internal Revenue Code of 1986, as amended applicable to regulated investment companies (“RICS”) and to distribute substantially all of its net investment income and net realized capital gains to shareholders of each Portfolio. Therefore, no Federal income tax provision is required.
The estimated percentage of the holdings of the Alt 25 Portfolio, Alt 50 Portfolio, Alt 75 Portfolio and Alternative 100 Moderate Portfolio that will be sold in connection with its respective Reorganization is 0%, 0%, 0% and 100%, respectively. The estimated portfolio transaction costs of the Reorganization of the Alt 25 Portfolio, Alt 50 Portfolio, Alt 75 Portfolio and Alternative 100 Moderate Portfolio are $0, $0, $0, and $1,200, respectively. These are estimated amounts and are subject to change. Contractholders who had premiums or contributions allocated to the investment divisions of the Separate Accounts that are invested in shares of the Acquired Portfolios will not recognize any gain or loss for federal income tax purposes as a result of the Reorganizations.
NOTE 5 – UNAUDITED PRO FORMA COMBINED ADJUSTMENTS:
The accompanying unaudited pro forma combined financial statements reflect changes in the Alt 20 Portfolio’s shares as if the merger had taken place on December 31, 2016. The Acquired Portfolios will bear the expenses of the Reorganization (i.e., the costs associated with preparing, printing and distributing the prospectus and proxy materials, legal and accounting fees in connection with the Reorganization, and expenses of holding the shareholders meeting) which are estimated at approximately $133,332 ($33,333 per Acquired Portfolio). However, FMG LLC has voluntarily agreed to pay expenses of the Reorganization that exceed the Acquired Portfolios’ expense limitations set forth in its expense limitation agreements.
AXA/Pacific Global Small Cap Value Portfolio merging into AXA/Horizon Small Cap Value Portfolio
The following tables set forth the pro forma Portfolio of Investments as of December 31, 2016, the pro forma condensed Statement of Assets and Liabilities as of December 31, 2016, and the pro forma condensed Statement of Operations for the one year period ended December 31, 2016 for the AXA/Pacific Global Small Cap Value Portfolio (“Pac Global Portfolio”) and the AXA/Horizon Small Cap Value Portfolio (“Horizon Portfolio”), as adjusted giving effect to the Reorganization.
The pro forma Portfolio of Investments contains information about the securities holdings of the combined Portfolio as of December 31, 2016, which has, and will continue to, change over time due to normal portfolio turnover in response to changes in market conditions. Thus, it is expected that some of the Pac Global Portfolio’s holdings may not remain at the time of the Reorganization. It is also expected that, if the Reorganization is approved, the Pac Global Portfolio’s holdings that are not compatible with the Horizon Portfolio’s investment objective and policies will be liquidated in an orderly manner in connection with the Reorganization, and the proceeds of these sales held in temporary investments or reinvested in assets that are consistent with the Horizon Portfolio’s investment objective and policies. The portion of the Pac Global Portfolio’s assets that will be liquidated in connection with the Reorganization will depend on market conditions and on the assessment by AXA Equitable Funds Management Group, LLC, the Portfolios’ investment manager, of the compatibility of those holdings with the Horizon Portfolio’s portfolio composition, investment objective, and policies at the time of the Reorganization. The need for a Portfolio to sell investments in connection with the Reorganization may result in its selling securities at a disadvantageous time and price and could result in its realizing gains (or losses) that would not otherwise have been realized and incurring transaction costs that would not otherwise have been incurred.
28
EQ ADVISORS TRUST
PORTFOLIO OF INVESTMENTS
December 31, 2016 (Unaudited)
| | | | | | | | | | | | | | | | | | | | | | | | | | | | | | | | |
| | | Pacific Global
Small Cap
Value | | | Horizon
Small Cap
Value | | | Pro-forma
Adjustment | | | AXA/Horizon
Small Cap
Value
Combined
Pro-forma | | | Pacific
Global Small
Cap Value | | | Horizon
Small Cap
Value | | | Pro-forma
Adjustment | | | AXA/Horizon
Small Cap
Value
Combined
Pro-forma | |
| | | Number of
Shares | | | Number of
Shares | | | Number of
Shares | | | Number of
Shares | | | Value ($) | | | Value ($) | | | Value ($) | | | Value ($) | |
COMMON STOCKS: | | | | | | | | | | | | | | | | | | | | | | | | | | | | | | | | |
Consumer Discretionary (13.9%) | | | | | | | | | | | | | | | | | | | | | | | | | | | | | | | | |
Auto Components (1.6%) | | | | | | | | | | | | | | | | | | | | | | | | | | | | | | | | |
Cooper Tire & Rubber Co. | | | 4,406 | | | | 4,978 | | | | — | | | | 9,384 | | | | 171,173 | | | | 193,395 | | | | — | | | | 364,568 | |
Cooper-Standard Holdings, Inc.* | | | 86 | | | | 99 | | | | — | | | | 185 | | | | 8,891 | | | | 10,235 | | | | — | | | | 19,126 | |
Dana, Inc. | | | 11,872 | | | | 13,210 | | | | — | | | | 25,082 | | | | 225,330 | | | | 250,726 | | | | — | | | | 476,056 | |
Dorman Products, Inc.* | | | — | | | | 11,000 | | | | — | | | | 11,000 | | | | — | | | | 803,659 | | | | — | | | | 803,659 | |
Federal-Mogul Holdings Corp.* | | | 2,433 | | | | 2,692 | | | | — | | | | 5,125 | | | | 25,084 | | | | 27,755 | | | | — | | | | 52,839 | |
Gentherm, Inc.* | | | 90,000 | | | | — | | | | — | | | | 90,000 | | | | 3,046,500 | | | | — | | | | — | | | | 3,046,500 | |
Metaldyne Performance Group, Inc. | | | 466 | | | | 547 | | | | — | | | | 1,013 | | | | 10,695 | | | | 12,554 | | | | — | | | | 23,249 | |
Modine Manufacturing Co.* | | | 3,789 | | | | 4,251 | | | | — | | | | 8,040 | | | | 56,456 | | | | 63,340 | | | | — | | | | 119,796 | |
Motorcar Parts of America, Inc.* | | | 101 | | | | 108 | | | | — | | | | 209 | | | | 2,719 | | | | 2,907 | | | | — | | | | 5,626 | |
Spartan Motors, Inc. | | | 2,614 | | | | 3,007 | | | | — | | | | 5,621 | | | | 24,179 | | | | 27,815 | | | | — | | | | 51,994 | |
Standard Motor Products, Inc. | | | 691 | | | | 773 | | | | — | | | | 1,464 | | | | 36,775 | | | | 41,139 | | | | — | | | | 77,914 | |
Strattec Security Corp. | | | 270 | | | | 319 | | | | — | | | | 589 | | | | 10,881 | | | | 12,856 | | | | — | | | | 23,737 | |
Superior Industries International, Inc. | | | 1,999 | | | | 2,238 | | | | — | | | | 4,237 | | | | 52,674 | | | | 58,971 | | | | — | | | | 111,645 | |
Tower International, Inc. | | | 1,657 | | | | 1,861 | | | | — | | | | 3,518 | | | | 46,976 | | | | 52,759 | | | | — | | | | 99,735 | |
| | | | | | | | | | | | | | | | | | | | | | | | | | | | | | | | |
| | | | | | | | | | | | | | | | | | | 3,718,333 | | | | 1,558,111 | | | | — | | | | 5,276,444 | |
| | | | | | | | | | | | | | | | | | | | | | | | | | | | | | | | |
Distributors (0.0%) | | | | | | | | | | | | | | | | | | | | | | | | | | | | | | | | |
Weyco Group, Inc. | | | 428 | | | | 507 | | | | — | | | | 935 | | | | 13,396 | | | | 15,869 | | | | — | | | | 29,265 | |
| | | | | | | | | | | | | | | | | | | | | | | | | | | | | | | | |
Diversified Consumer Services (0.4%) | | | | | | | | | | | | | | | | | | | | | | | | | | | | | | | | |
American Public Education, Inc.* | | | 1,246 | | | | 1,399 | | | | — | | | | 2,645 | | | | 30,589 | | | | 34,345 | | | | — | | | | 64,934 | |
Apollo Education Group, Inc.* | | | 6,910 | | | | 7,736 | | | | — | | | | 14,646 | | | | 68,409 | | | | 76,587 | | | | — | | | | 144,996 | |
Ascent Capital Group, Inc., Class A* | | | 835 | | | | 936 | | | | — | | | | 1,771 | | | | 13,577 | | | | 15,219 | | | | — | | | | 28,796 | |
Bridgepoint Education, Inc.* | | | 1,479 | | | | 1,630 | | | | — | | | | 3,109 | | | | 14,982 | | | | 16,512 | | | | — | | | | 31,494 | |
Cambium Learning Group, Inc.* | | | 964 | | | | 1,018 | | | | — | | | | 1,982 | | | | 4,810 | | | | 5,080 | | | | — | | | | 9,890 | |
Capella Education Co. | | | 60 | | | | 68 | | | | — | | | | 128 | | | | 5,268 | | | | 5,970 | | | | — | | | | 11,238 | |
Career Education Corp.* | | | 5,368 | | | | 6,015 | | | | — | | | | 11,383 | | | | 54,163 | | | | 60,691 | | | | — | | | | 114,854 | |
Carriage Services, Inc. | | | 94 | | | | 82 | | | | — | | | | 176 | | | | 2,692 | | | | 2,348 | | | | — | | | | 5,040 | |
Chegg, Inc.(x)* | | | 3,726 | | | | 4,183 | | | | — | | | | 7,909 | | | | 27,498 | | | | 30,871 | | | | — | | | | 58,369 | |
DeVry Education Group, Inc. | | | 4,979 | | | | 5,636 | | | | — | | | | 10,615 | | | | 155,345 | | | | 175,844 | | | | — | | | | 331,189 | |
Houghton Mifflin Harcourt Co.* | | | 3,313 | | | | 3,719 | | | | — | | | | 7,032 | | | | 35,946 | | | | 40,351 | | | | — | | | | 76,297 | |
K12, Inc.* | | | 2,731 | | | | 3,064 | | | | — | | | | 5,795 | | | | 46,864 | | | | 52,578 | | | | — | | | | 99,442 | |
Liberty Tax, Inc., Class A | | | 118 | | | | 122 | | | | — | | | | 240 | | | | 1,581 | | | | 1,635 | | | | — | | | | 3,216 | |
Regis Corp.* | | | 2,999 | | | | 3,361 | | | | — | | | | 6,360 | | | | 43,546 | | | | 48,802 | | | | — | | | | 92,348 | |
Sotheby’s, Inc. | | | 1,710 | | | | 1,961 | | | | — | | | | 3,671 | | | | 68,161 | | | | 78,166 | | | | — | | | | 146,327 | |
Strayer Education, Inc.* | | | 479 | | | | 532 | | | | — | | | | 1,011 | | | | 38,622 | | | | 42,895 | | | | — | | | | 81,517 | |
Weight Watchers International,
Inc.(x)* | | | 198 | | | | 198 | | | | — | | | | 396 | | | | 2,267 | | | | 2,267 | | | | — | | | | 4,534 | |
| | | | | | | | | | | | | | | | | | | | | | | | | | | | | | | | |
| | | | | | | | | | | | | | | | | | | 614,320 | | | | 690,161 | | | | — | | | | 1,304,481 | |
| | | | | | | | | | | | | | | | | | | | | | | | | | | | | | | | |
Hotels, Restaurnats & Leisure (3.4%) | | | | | | | | | | | | | | | | | | | | | | | | | | | | | | | | |
Belmond Ltd., Class A* | | | 6,748 | | | | 7,545 | | | | — | | | | 14,293 | | | | 90,086 | | | | 100,725 | | | | — | | | | 190,811 | |
Biglari Holdings, Inc.* | | | 74 | | | | 84 | | | | — | | | | 158 | | | | 35,017 | | | | 39,749 | | | | — | | | | 74,766 | |
Caesars Acquisition Co., Class A* | | | 3,769 | | | | 4,237 | | | | — | | | | 8,006 | | | | 50,881 | | | | 57,200 | | | | — | | | | 108,081 | |
Caesars Entertainment Corp.(x)* | | | 4,476 | | | | 5,005 | | | | — | | | | 9,481 | | | | 38,046 | | | | 42,543 | | | | — | | | | 80,589 | |
Carrols Restaurant Group, Inc.* | | | 274 | | | | 358 | | | | — | | | | 632 | | | | 4,178 | | | | 5,460 | | | | — | | | | 9,638 | |
Century Casinos, Inc.* | | | 858 | | | | 967 | | | | — | | | | 1,825 | | | | 7,061 | | | | 7,958 | | | | — | | | | 15,019 | |
Cracker Barrel Old Country Store, Inc.(x) | | | 81 | | | | 98 | | | | — | | | | 179 | | | | 13,525 | | | | 16,364 | | | | — | | | | 29,889 | |
Del Frisco’s Restaurant Group, Inc.* | | | 1,758 | | | | 1,972 | | | | — | | | | 3,730 | | | | 29,886 | | | | 33,524 | | | | — | | | | 63,410 | |
Del Taco Restaurants, Inc.* | | | 1,902 | | | | 2,271 | | | | — | | | | 4,173 | | | | 26,856 | | | | 32,067 | | | | — | | | | 58,923 | |
Denny’s Corp.* | | | 1,632 | | | | 1,843 | | | | — | | | | 3,475 | | | | 20,939 | | | | 23,646 | | | | — | | | | 44,585 | |
DineEquity, Inc. | | | 612 | | | | 687 | | | | — | | | | 1,299 | | | | 47,124 | | | | 52,899 | | | | — | | | | 100,023 | |
El Pollo Loco Holdings, Inc.(x)* | | | 1,644 | | | | 1,851 | | | | — | | | | 3,495 | | | | 20,221 | | | | 22,767 | | | | — | | | | 42,988 | |
Eldorado Resorts, Inc.(x)* | | | 212 | | | | 240 | | | | — | | | | 452 | | | | 3,593 | | | | 4,068 | | | | — | | | | 7,661 | |
Empire Resorts, Inc.(x)* | | | 232 | | | | 265 | | | | — | | | | 497 | | | | 5,278 | | | | 6,029 | | | | — | | | | 11,307 | |
Fiesta Restaurant Group, Inc.* | | | 390 | | | | 441 | | | | — | | | | 831 | | | | 11,641 | | | | 13,164 | | | | — | | | | 24,805 | |
Fogo De Chao, Inc.* | | | 402 | | | | 457 | | | | — | | | | 859 | | | | 5,769 | | | | 6,558 | | | | — | | | | 12,327 | |
Golden Entertainment, Inc. | | | 650 | | | | 733 | | | | — | | | | 1,383 | | | | 7,872 | | | | 8,877 | | | | — | | | | 16,749 | |
ILG, Inc. | | | 8,233 | | | | 9,242 | | | | — | | | | 17,475 | | | | 149,594 | | | | 167,926 | | | | — | | | | 317,520 | |
29
| | | | | | | | | | | | | | | | | | | | | | | | | | | | | | | | |
| | | Pacific Global
Small Cap
Value | | | Horizon
Small Cap
Value | | | Pro-forma
Adjustment | | | AXA/Horizon
Small Cap
Value
Combined
Pro-forma | | | Pacific
Global Small
Cap Value | | | Horizon
Small Cap
Value | | | Pro-forma
Adjustment | | | AXA/Horizon
Small Cap
Value
Combined
Pro-forma | |
| | | Number of
Shares | | | Number of
Shares | | | Number of
Shares | | | Number of
Shares | | | Value ($) | | | Value ($) | | | Value ($) | | | Value ($) | |
International Speedway Corp., Class A | | | 2,108 | | | | 2,358 | | | | — | | | | 4,466 | | | | 77,574 | | | | 86,774 | | | | — | | | | 164,348 | |
Intrawest Resorts Holdings, Inc.* | | | 1,294 | | | | 1,445 | | | | — | | | | 2,739 | | | | 23,098 | | | | 25,793 | | | | — | | | | 48,891 | |
J Alexander’s Holdings, Inc.* | | | 1,073 | | | | 1,190 | | | | — | | | | 2,263 | | | | 11,535 | | | | 12,793 | | | | — | | | | 24,328 | |
Jack in the Box, Inc. | | | 577 | | | | 664 | | | | — | | | | 1,241 | | | | 64,416 | | | | 74,129 | | | | — | | | | 138,545 | |
Kona Grill, Inc.(x)* | | | 297 | | | | 342 | | | | — | | | | 639 | | | | 3,727 | | | | 4,292 | | | | — | | | | 8,019 | |
La Quinta Holdings, Inc.* | | | 5,431 | | | | 6,096 | | | | — | | | | 11,527 | | | | 77,175 | | | | 86,624 | | | | — | | | | 163,799 | |
Luby’s, Inc.* | | | 1,561 | | | | 1,754 | | | | — | | | | 3,315 | | | | 6,681 | | | | 7,507 | | | | — | | | | 14,188 | |
Marcus Corp. (The) | | | 1,472 | | | | 1,648 | | | | — | | | | 3,120 | | | | 46,368 | | | | 51,912 | | | | — | | | | 98,280 | |
Marriott Vacations Worldwide Corp. | | | 1,670 | | | | 1,889 | | | | — | | | | 3,559 | | | | 141,700 | | | | 160,281 | | | | — | | | | 301,981 | |
Monarch Casino & Resort, Inc.* | | | 825 | | | | 929 | | | | — | | | | 1,754 | | | | 21,269 | | | | 23,950 | | | | — | | | | 45,219 | |
Noodles & Co.(x)* | | | 301 | | | | 320 | | | | — | | | | 621 | | | | 1,234 | | | | 1,312 | | | | — | | | | 2,546 | |
Penn National Gaming, Inc.* | | | 843 | | | | 955 | | | | — | | | | 1,798 | | | | 11,625 | | | | 13,169 | | | | — | | | | 24,794 | |
Pinnacle Entertainment, Inc.* | | | 4,013 | | | | 4,607 | | | | — | | | | 8,620 | | | | 58,189 | | | | 66,802 | | | | — | | | | 124,991 | |
Red Lion Hotels Corp.* | | | 1,093 | | | | 1,225 | | | | — | | | | 2,318 | | | | 9,127 | | | | 10,229 | | | | — | | | | 19,356 | |
Red Robin Gourmet Burgers, Inc.* | | | 827 | | | | 952 | | | | — | | | | 1,779 | | | | 46,643 | | | | 53,693 | | | | — | | | | 100,336 | |
Ruby Tuesday, Inc.* | | | 4,844 | | | | 5,420 | | | | — | | | | 10,264 | | | | 15,646 | | | | 17,507 | | | | — | | | | 33,153 | |
Speedway Motorsports, Inc. | | | 944 | | | | 1,054 | | | | — | | | | 1,998 | | | | 20,456 | | | | 22,840 | | | | — | | | | 43,296 | |
Tropicana Entertainment, Inc.* | | | — | | | | 112,200 | | | | — | | | | 112,200 | | | | — | | | | 3,405,269 | | | | — | | | | 3,405,269 | |
Wendy’s Co. (The) | | | — | | | | 413,200 | | | | — | | | | 413,200 | | | | — | | | | 5,586,463 | | | | — | | | | 5,586,463 | |
| | | | | | | | | | | | | | | | | | | | | | | | | | | | | | | | |
| | | | | | | | | | | | | | | | | | | 1,204,030 | | | | 10,352,863 | | | | — | | | | 11,556,893 | |
| | | | | | | | | | | | | | | | | | | | | | | | | | | | | | | | |
Household Durables (1.1%) | | | | | | | | | | | | | | | | | | | | | | | | | | | | | | | | |
Bassett Furniture Industries, Inc. | | | 356 | | | | 430 | | | | — | | | | 786 | | | | 10,822 | | | | 13,072 | | | | — | | | | 23,894 | |
Beazer Homes USA, Inc.(x)* | | | 2,577 | | | | 2,897 | | | | — | | | | 5,474 | | | | 34,274 | | | | 38,530 | | | | — | | | | 72,804 | |
Century Communities, Inc.* | | | 1,133 | | | | 1,276 | | | | — | | | | 2,409 | | | | 23,793 | | | | 26,796 | | | | — | | | | 50,589 | |
CSS Industries, Inc. | | | 690 | | | | 766 | | | | — | | | | 1,456 | | | | 18,678 | | | | 20,736 | | | | — | | | | 39,414 | |
Flexsteel Industries, Inc. | | | 504 | | | | 565 | | | | — | | | | 1,069 | | | | 31,082 | | | | 34,844 | | | | — | | | | 65,926 | |
GoPro, Inc., Class A(x)* | | | 8,178 | | | | 9,275 | | | | — | | | | 17,453 | | | | 71,230 | | | | 80,785 | | | | — | | | | 152,015 | |
Green Brick Partners, Inc.(x)* | | | 1,907 | | | | 32,051 | | | | — | | | | 33,958 | | | | 19,165 | | | | 322,113 | | | | — | | | | 341,278 | |
Hooker Furniture Corp. | | | 818 | | | | 929 | | | | — | | | | 1,747 | | | | 31,043 | | | | 35,256 | | | | — | | | | 66,299 | |
Hovnanian Enterprises, Inc., Class A(x)* | | | 9,887 | | | | 11,143 | | | | — | | | | 21,030 | | | | 26,992 | | | | 30,420 | | | | — | | | | 57,412 | |
KB Home(x) | | | 5,261 | | | | 5,912 | | | | — | | | | 11,173 | | | | 83,176 | | | | 93,469 | | | | — | | | | 176,645 | |
La-Z-Boy, Inc. | | | 2,279 | | | | 2,559 | | | | — | | | | 4,838 | | | | 70,763 | | | | 79,457 | | | | — | | | | 150,220 | |
LGI Homes, Inc.(x)* | | | 81 | | | | 91 | | | | — | | | | 172 | | | | 2,327 | | | | 2,614 | | | | — | | | | 4,941 | |
Libbey, Inc. | | | 1,634 | | | | 1,833 | | | | — | | | | 3,467 | | | | 31,798 | | | | 35,670 | | | | — | | | | 67,468 | |
Lifetime Brands, Inc. | | | 890 | | | | 1,022 | | | | — | | | | 1,912 | | | | 15,798 | | | | 18,141 | | | | — | | | | 33,939 | |
M.D.C. Holdings, Inc. | | | 2,058 | | | | 2,378 | | | | — | | | | 4,436 | | | | 52,808 | | | | 61,019 | | | | — | | | | 113,827 | |
M/I Homes, Inc.* | | | 1,540 | | | | 1,730 | | | | — | | | | 3,270 | | | | 38,777 | | | | 43,561 | | | | — | | | | 82,338 | |
Meritage Homes Corp.* | | | 2,857 | | | | 3,217 | | | | — | | | | 6,074 | | | | 99,424 | | | | 111,952 | | | | — | | | | 211,376 | |
NACCO Industries, Inc., Class A | | | 310 | | | | 345 | | | | — | | | | 655 | | | | 28,071 | | | | 31,240 | | | | — | | | | 59,311 | |
New Home Co., Inc. (The)* | | | 836 | | | | 887 | | | | — | | | | 1,723 | | | | 9,790 | | | | 10,387 | | | | — | | | | 20,177 | |
Newell Brands, Inc. | | | — | | | | 13,000 | | | | — | | | | 13,000 | | | | — | | | | 580,450 | | | | — | | | | 580,450 | |
TopBuild Corp.* | | | 2,679 | | | | 3,064 | | | | — | | | | 5,743 | | | | 95,372 | | | | 109,078 | | | | — | | | | 204,450 | |
TRI Pointe Group, Inc.* | | | 11,149 | | | | 73,876 | | | | — | | | | 85,025 | | | | 127,991 | | | | 848,095 | | | | — | | | | 976,086 | |
UCP, Inc., Class A* | | | 641 | | | | 718 | | | | — | | | | 1,359 | | | | 7,724 | | | | 8,652 | | | | — | | | | 16,376 | |
WCI Communities, Inc.* | | | 1,758 | | | | 1,978 | | | | — | | | | 3,736 | | | | 41,225 | | | | 46,384 | | | | — | | | | 87,609 | |
William Lyon Homes, Class A(x)* | | | 1,944 | | | | 2,185 | | | | — | | | | 4,129 | | | | 36,994 | | | | 41,581 | | | | — | | | | 78,575 | |
ZAGG, Inc.* | | | 1,946 | | | | 2,198 | | | | — | | | | 4,144 | | | | 13,817 | | | | 15,606 | | | | — | | | | 29,423 | |
| | | | | | | | | | | | | | | | | | | | | | | | | | | | | | | | |
| | | | | | | | | | | | | | | | | | | 1,022,934 | | | | 2,739,908 | | | | — | | | | 3,762,842 | |
| | | | | | | | | | | | | | | | | | | | | | | | | | | | | | | | |
Internet & Direct Marketing Retail (0.0%) | | | | | | | | | | | | | | | | | | | | | | | | | | | | | | | | |
1-800-Flowers.com, Inc., Class A* | | | 1,515 | | | | 1,435 | | | | — | | | | 2,950 | | | | 16,211 | | | | 15,355 | | | | — | | | | 31,566 | |
FTD Cos., Inc.* | | | 1,401 | | | | 1,579 | | | | — | | | | 2,980 | | | | 33,400 | | | | 37,643 | | | | — | | | | 71,043 | |
Gaia, Inc., Class A* | | | 329 | | | | 608 | | | | — | | | | 937 | | | | 2,846 | | | | 5,259 | | | | — | | | | 8,105 | |
Lands’ End, Inc.(x)* | | | 1,203 | | | | 1,354 | | | | — | | | | 2,557 | | | | 18,225 | | | | 20,513 | | | | — | | | | 38,738 | |
| | | | | | | | | | | | | | | | | | | | | | | | | | | | | | | | |
| | | | | | | | | | | | | | | | | | | 70,682 | | | | 78,770 | | | | — | | | | 149,452 | |
| | | | | | | | | | | | | | | | | | | | | | | | | | | | | | | | |
Leisure Products (0.1%) | | | | | | | | | | | | | | | | | | | | | | | | | | | | | | | | |
Acushnet Holdings Corp.* | | | 624 | | | | 583 | | | | — | | | | 1,207 | | | | 12,299 | | | | 11,491 | | | | — | | | | 23,790 | |
Arctic Cat, Inc. | | | 616 | | | | 695 | | | | — | | | | 1,311 | | | | 9,252 | | | | 10,439 | | | | — | | | | 19,691 | |
Callaway Golf Co. | | | 4,738 | | | | 5,306 | | | | — | | | | 10,044 | | | | 51,929 | | | | 58,153 | | | | — | | | | 110,082 | |
Escalade, Inc. | | | 806 | | | | 914 | | | | — | | | | 1,720 | | | | 10,639 | | | | 12,065 | | | | — | | | | 22,704 | |
JAKKS Pacific, Inc.(x)* | | | 1,211 | | | | 1,398 | | | | — | | | | 2,609 | | | | 6,237 | | | | 7,200 | | | | — | | | | 13,437 | |
Johnson Outdoors, Inc., Class A | | | 383 | | | | 424 | | | | — | | | | 807 | | | | 15,201 | | | | 16,829 | | | | — | | | | 32,030 | |
| | | | | | | | | | | | | | | | | | | | | | | | | | | | | | | | |
| | | | | | | | | | | | | | | | | | | 105,557 | | | | 116,177 | | | | — | | | | 221,734 | |
| | | | | | | | | | | | | | | | | | | | | | | | | | | | | | | | |
30
| | | | | | | | | | | | | | | | | | | | | | | | | | | | | | | | |
| | | Pacific Global
Small Cap
Value | | | Horizon
Small Cap
Value | | | Pro-forma
Adjustment | | | AXA/Horizon
Small Cap
Value
Combined
Pro-forma | | | Pacific
Global Small
Cap Value | | | Horizon
Small Cap
Value | | | Pro-forma
Adjustment | | | AXA/Horizon
Small Cap
Value
Combined
Pro-forma | |
| | | Number of
Shares | | | Number of
Shares | | | Number of
Shares | | | Number of
Shares | | | Value ($) | | | Value ($) | | | Value ($) | | | Value ($) | |
Media (2.5%) | | | | | | | | | | | | | | | | | | | | | | | | | | | | | | | | |
AMC Entertainment Holdings, Inc., Class A | | | 1,852 | | | | 2,079 | | | | — | | | | 3,931 | | | | 62,320 | | | | 69,959 | | | | — | | | | 132,279 | |
Daily Journal Corp.(x)* | | | 28 | | | | 32 | | | | — | | | | 60 | | | | 6,770 | | | | 7,738 | | | | — | | | | 14,508 | |
Entercom Communications Corp., Class A | | | 2,095 | | | | 2,346 | | | | — | | | | 4,441 | | | | 32,053 | | | | 35,894 | | | | — | | | | 67,947 | |
Eros International plc(x)* | | | 2,380 | | | | 2,669 | | | | — | | | | 5,049 | | | | 31,059 | | | | 34,830 | | | | — | | | | 65,889 | |
EW Scripps Co. (The), Class A* | | | 4,721 | | | | 5,410 | | | | — | | | | 10,131 | | | | 91,257 | | | | 104,575 | | | | — | | | | 195,832 | |
Gannett Co., Inc. | | | 9,473 | | | | 10,612 | | | | — | | | | 20,085 | | | | 91,983 | | | | 103,043 | | | | — | | | | 195,026 | |
Global Eagle Entertainment, Inc.(x)* | | | 3,493 | | | | 3,924 | | | | — | | | | 7,417 | | | | 22,565 | | | | 25,349 | | | | — | | | | 47,914 | |
Gray Television, Inc.* | | | 1,956 | | �� | | 2,199 | | | | — | | | | 4,155 | | | | 21,223 | | | | 23,859 | | | | — | | | | 45,082 | |
Hemisphere Media Group, Inc.* | | | 66 | | | | 81 | | | | — | | | | 147 | | | | 739 | | | | 907 | | | | — | | | | 1,646 | |
Liberty Media Corp-Liberty Braves, Class A* | | | 691 | | | | 779 | | | | — | | | | 1,470 | | | | 14,158 | | | | 15,962 | | | | — | | | | 30,120 | |
Liberty Media Corp-Liberty Braves, Class C* | | | 2,359 | | | | 2,634 | | | | — | | | | 4,993 | | | | 48,572 | | | | 54,234 | | | | — | | | | 102,806 | |
Liberty Media Corp-Liberty Media, Class A* | | | 1,531 | | | | 1,689 | | | | — | | | | 3,220 | | | | 47,997 | | | | 52,950 | | | | — | | | | 100,947 | |
Liberty Media Corp-Liberty Media, Class C* | | | 3,090 | | | | 3,483 | | | | — | | | | 6,573 | | | | 96,810 | | | | 109,123 | | | | — | | | | 205,933 | |
Lions Gate Entertainment Corp., Class B* | | | — | | | | 31,884 | | | | — | | | | 31,884 | | | | — | | | | 782,432 | | | | — | | | | 782,432 | |
Live Nation Entertainment, Inc.* | | | — | | | | 145,000 | | | | — | | | | 145,000 | | | | — | | | | 3,856,999 | | | | — | | | | 3,856,999 | |
Loral Space & Communications, Inc.* | | | — | | | | 6,100 | | | | — | | | | 6,100 | | | | — | | | | 250,404 | | | | — | | | | 250,404 | |
MDC Partners, Inc., Class A | | | 2,898 | | | | 3,250 | | | | — | | | | 6,148 | | | | 18,982 | | | | 21,288 | | | | — | | | | 40,270 | |
Media General, Inc.* | | | 8,766 | | | | 9,619 | | | | — | | | | 18,385 | | | | 165,064 | | | | 181,126 | | | | — | | | | 346,190 | |
Meredith Corp. | | | 3,023 | | | | 3,379 | | | | — | | | | 6,402 | | | | 178,810 | | | | 199,868 | | | | — | | | | 378,678 | |
MSG Networks, Inc., Class A* | | | 3,198 | | | | 3,661 | | | | — | | | | 6,859 | | | | 68,757 | | | | 78,712 | | | | — | | | | 147,469 | |
National CineMedia, Inc. | | | 5,023 | | | | 5,624 | | | | — | | | | 10,647 | | | | 73,989 | | | | 82,842 | | | | — | | | | 156,831 | |
New Media Investment Group, Inc. | | | 2,751 | | | | 2,928 | | | | — | | | | 5,679 | | | | 43,988 | | | | 46,819 | | | | — | | | | 90,807 | |
New York Times Co. (The), Class A | | | 10,047 | | | | 11,280 | | | | — | | | | 21,327 | | | | 133,625 | | | | 150,024 | | | | — | | | | 283,649 | |
Promotora de Informaciones SA (ADR)* | | | — | | | | 26,310 | | | | — | | | | 26,310 | | | | — | | | | 142,074 | | | | — | | | | 142,074 | |
Reading International, Inc., Class A* | | | 978 | | | | 1,153 | | | | — | | | | 2,131 | | | | 16,235 | | | | 19,140 | | | | — | | | | 35,375 | |
Saga Communications, Inc., Class A | | | 283 | | | | 318 | | | | — | | | | 601 | | | | 14,235 | | | | 15,995 | | | | — | | | | 30,230 | |
Salem Media Group, Inc. | | | 895 | | | | 1,007 | | | | — | | | | 1,902 | | | | 5,594 | | | | 6,294 | | | | — | | | | 11,888 | |
Scholastic Corp. | | | 2,187 | | | | 2,485 | | | | — | | | | 4,672 | | | | 103,861 | | | | 118,013 | | | | — | | | | 221,874 | |
Time, Inc. | | | 8,208 | | | | 9,290 | | | | — | | | | 17,498 | | | | 146,513 | | | | 165,827 | | | | — | | | | 312,340 | |
Townsquare Media, Inc., Class A* | | | 703 | | | | 833 | | | | — | | | | 1,536 | | | | 7,318 | | | | 8,672 | | | | — | | | | 15,990 | |
tronc, Inc.(x) | | | 875 | | | | 974 | | | | — | | | | 1,849 | | | | 12,136 | | | | 13,509 | | | | — | | | | 25,645 | |
| | | | | | | | | | | | | | | | | | | | | | | | | | | | | | | | |
| | | | | | | | | | | | | | | | | | | 1,556,613 | | | | 6,778,461 | | | | — | | | | 8,335,074 | |
| | | | | | | | | | | | | | | | | | | | | | | | | | | | | | | | |
Multiline Retail (0.0%) | | | | | | | | | | | | | | | | | | | | | | | | | | | | | | | | |
Fred’s, Inc., Class A(x) | | | 2,672 | | | | 2,997 | | | | — | | | | 5,669 | | | | 49,592 | | | | 55,625 | | | | — | | | | 105,217 | |
Sears Holdings Corp.(x)* | | | 711 | | | | 794 | | | | — | | | | 1,505 | | | | 6,605 | | | | 7,376 | | | | — | | | | 13,981 | |
Tuesday Morning Corp.* | | | 3,605 | | | | 4,048 | | | | — | | | | 7,653 | | | | 19,467 | | | | 21,859 | | | | — | | | | 41,326 | |
| | | | | | | | | | | | | | | | | | | | | | | | | | | | | | | | |
| | | | | | | | | | | | | | | | | | | 75,664 | | | | 84,860 | | | | — | | | | 160,524 | |
| | | | | | | | | | | | | | | | | | | | | | | | | | | | | | | | |
Specialty Retail (4.2%) | | | | | | | | | | | | | | | | | | | | | | | | | | | | | | | | |
Aaron’s, Inc. | | | 5,246 | | | | 5,926 | | | | — | | | | 11,172 | | | | 167,820 | | | | 189,573 | | | | — | | | | 357,393 | |
Abercrombie & Fitch Co., Class A(x) | | | 5,500 | | | | 6,100 | | | | — | | | | 11,600 | | | | 66,000 | | | | 73,200 | | | | — | | | | 139,200 | |
American Eagle Outfitters, Inc. | | | 1,332 | | | | 1,493 | | | | — | | | | 2,825 | | | | 20,206 | | | | 22,649 | | | | — | | | | 42,855 | |
America’s Car-Mart, Inc.* | | | 635 | | | | 713 | | | | — | | | | 1,348 | | | | 27,781 | | | | 31,194 | | | | — | | | | 58,975 | |
Ascena Retail Group, Inc.* | | | 9,211 | | | | 10,200 | | | | — | | | | 19,411 | | | | 57,016 | | | | 63,138 | | | | — | | | | 120,154 | |
At Home Group, Inc.* | | | 410 | | | | 460 | | | | — | | | | 870 | | | | 5,998 | | | | 6,730 | | | | — | | | | 12,728 | |
Barnes & Noble Education, Inc.* | | | 3,226 | | | | 3,620 | | | | — | | | | 6,846 | | | | 37,002 | | | | 41,521 | | | | — | | | | 78,523 | |
Barnes & Noble, Inc. | | | 5,080 | | | | 5,666 | | | | — | | | | 10,746 | | | | 56,642 | | | | 63,176 | | | | — | | | | 119,818 | |
Big 5 Sporting Goods Corp. | | | 1,418 | | | | 1,589 | | | | — | | | | 3,007 | | | | 24,602 | | | | 27,569 | | | | — | | | | 52,171 | |
Boot Barn Holdings, Inc.(x)* | | | 1,064 | | | | 1,189 | | | | — | | | | 2,253 | | | | 13,321 | | | | 14,886 | | | | — | | | | 28,207 | |
Buckle, Inc. (The)(x) | | | 1,519 | | | | 1,704 | | | | — | | | | 3,223 | | | | 34,633 | | | | 38,851 | | | | — | | | | 73,484 | |
Build-A-Bear Workshop, Inc.* | | | 999 | | | | 1,145 | | | | — | | | | 2,144 | | | | 13,736 | | | | 15,744 | | | | — | | | | 29,480 | |
Caleres, Inc. | | | 3,397 | | | | 3,839 | | | | — | | | | 7,236 | | | | 111,490 | | | | 125,996 | | | | — | | | | 237,486 | |
Camping World Holdings, Inc., Class A | | | 52 | | | | — | | | | — | | | | 52 | | | | 1,695 | | | | — | | | | — | | | | 1,695 | |
Cato Corp. (The), Class A | | | 1,647 | | | | 1,847 | | | | — | | | | 3,494 | | | | 49,542 | | | | 55,558 | | | | — | | | | 105,100 | |
Chico’s FAS, Inc. | | | 1,044 | | | | 1,219 | | | | — | | | | 2,263 | | | | 15,023 | | | | 17,541 | | | | — | | | | 32,564 | |
Citi Trends, Inc. | | | 1,133 | | | | 1,284 | | | | — | | | | 2,417 | | | | 21,346 | | | | 24,191 | | | | — | | | | 45,537 | |
Conn’s, Inc.* | | | 286,586 | | | | 1,845 | | | | — | | | | 288,431 | | | | 3,625,313 | | | | 23,339 | | | | — | | | | 3,648,652 | |
Container Store Group, Inc. (The)(x)* | | | 981 | | | | 1,097 | | | | — | | | | 2,078 | | | | 6,229 | | | | 6,966 | | | | — | | | | 13,195 | |
Destination XL Group, Inc.* | | | 858 | | | | 922 | | | | — | | | | 1,780 | | | | 3,646 | | | | 3,919 | | | | — | | | | 7,565 | |
DSW, Inc., Class A | | | 5,356 | | | | 6,060 | | | | — | | | | 11,416 | | | | 121,313 | | | | 137,259 | | | | — | | | | 258,572 | |
Express, Inc.* | | | 5,990 | | | | 6,699 | | | | — | | | | 12,689 | | | | 64,452 | | | | 72,081 | | | | — | | | | 136,533 | |
Finish Line, Inc. (The), Class A(x) | | | 2,322 | | | | 2,604 | | | | — | | | | 4,926 | | | | 43,677 | | | | 48,981 | | | | — | | | | 92,658 | |
Genesco, Inc.* | | | 1,438 | | | | 1,629 | | | | — | | | | 3,067 | | | | 89,300 | | | | 101,161 | | | | — | | | | 190,461 | |
31
| | | | | | | | | | | | | | | | | | | | | | | | | | | | | | | | |
| | | Pacific Global
Small Cap
Value | | | Horizon
Small Cap
Value | | | Pro-forma
Adjustment | | | AXA/Horizon
Small Cap
Value
Combined
Pro-forma | | | Pacific
Global Small
Cap Value | | | Horizon
Small Cap
Value | | | Pro-forma
Adjustment | | | AXA/Horizon
Small Cap
Value
Combined
Pro-forma | |
| | | Number of
Shares | | | Number of
Shares | | | Number of
Shares | | | Number of
Shares | | | Value ($) | | | Value ($) | | | Value ($) | | | Value ($) | |
Group 1 Automotive, Inc. | | | 1,286 | | | | 1,434 | | | | — | | | | 2,720 | | | | 100,231 | | | | 111,766 | | | | — | | | | 211,997 | |
Guess?, Inc.(x) | | | 4,917 | | | | 5,472 | | | | — | | | | 10,389 | | | | 59,496 | | | | 66,211 | | | | — | | | | 125,707 | |
Haverty Furniture Cos., Inc. | | | 1,482 | | | | 1,743 | | | | — | | | | 3,225 | | | | 35,123 | | | | 41,309 | | | | — | | | | 76,432 | |
Hibbett Sports, Inc.(x)* | | | 73,379 | | | | 424 | | | | — | | | | 73,803 | | | | 2,737,037 | | | | 15,815 | | | | — | | | | 2,752,852 | |
Kirkland’s, Inc.* | | | 668 | | | | 747 | | | | — | | | | 1,415 | | | | 10,361 | | | | 11,586 | | | | — | | | | 21,947 | |
Lumber Liquidators Holdings, Inc.(x)* | | | 2,125 | | | | 2,384 | | | | — | | | | 4,509 | | | | 33,447 | | | | 37,524 | | | | — | | | | 70,971 | |
MarineMax, Inc.* | | | 874 | | | | 982 | | | | — | | | | 1,856 | | | | 16,912 | | | | 19,002 | | | | — | | | | 35,914 | |
Office Depot, Inc. | | | 44,051 | | | | 49,609 | | | | — | | | | 93,660 | | | | 199,111 | | | | 224,233 | | | | — | | | | 423,344 | |
Party City Holdco, Inc.(x)* | | | 1,213 | | | | 1,364 | | | | — | | | | 2,577 | | | | 17,225 | | | | 19,369 | | | | — | | | | 36,594 | |
Penske Automotive Group, Inc.(x) | | | — | | | | 14,000 | | | | — | | | | 14,000 | | | | — | | | | 725,759 | | | | — | | | | 725,759 | |
Pier 1 Imports, Inc. | | | 5,547 | | | | 6,228 | | | | — | | | | 11,775 | | | | 47,371 | | | | 53,187 | | | | — | | | | 100,558 | |
Rent-A-Center, Inc. | | | 4,163 | | | | 4,670 | | | | — | | | | 8,833 | | | | 46,834 | | | | 52,538 | | | | — | | | | 99,372 | |
Restoration Hardware Holdings,
Inc.(x)* | | | 3,115 | | | | 3,500 | | | | — | | | | 6,615 | | | | 95,631 | | | | 107,450 | | | | — | | | | 203,081 | |
Sears Hometown and Outlet Stores,
Inc.(x)* | | | 948 | | | | 1,047 | | | | — | | | | 1,995 | | | | 4,456 | | | | 4,921 | | | | — | | | | 9,377 | |
Shoe Carnival, Inc.(x) | | | 1,035 | | | | 1,195 | | | | — | | | | 2,230 | | | | 27,924 | | | | 32,241 | | | | — | | | | 60,165 | |
Sonic Automotive, Inc., Class A | | | 122,268 | | | | 2,546 | | | | — | | | | 124,814 | | | | 2,799,937 | | | | 58,303 | | | | — | | | | 2,858,240 | |
Sportsman’s Warehouse Holdings,
Inc.* | | | 143 | | | | 158 | | | | — | | | | 301 | | | | 1,343 | | | | 1,484 | | | | — | | | | 2,827 | |
Stage Stores, Inc.(x) | | | 2,125 | | | | 2,335 | | | | — | | | | 4,460 | | | | 9,286 | | | | 10,204 | | | | — | | | | 19,490 | |
Tailored Brands, Inc. | | | 2,751 | | | | 3,087 | | | | — | | | | 5,838 | | | | 70,288 | | | | 78,873 | | | | — | | | | 149,161 | |
Tilly’s, Inc., Class A* | | | 955 | | | | 1,078 | | | | — | | | | 2,033 | | | | 12,596 | | | | 14,219 | | | | — | | | | 26,815 | |
Vitamin Shoppe, Inc.* | | | 1,827 | | | | 2,050 | | | | — | | | | 3,877 | | | | 43,391 | | | | 48,688 | | | | — | | | | 92,079 | |
West Marine, Inc.* | | | 1,478 | | | | 1,667 | | | | — | | | | 3,145 | | | | 15,475 | | | | 17,453 | | | | — | | | | 32,928 | |
Zumiez, Inc.(x)* | | | 1,450 | | | | 1,627 | | | | — | | | | 3,077 | | | | 31,683 | | | | 35,550 | | | | — | | | | 67,233 | |
| | | | | | | | | | | | | | | | | | | | | | | | | | | | | | | | |
| | | | | | | | | | | | | | | | | | | 11,092,941 | | | | 2,992,908 | | | | — | | | | 14,085,849 | |
| | | | | | | | | | | | | | | | | | | | | | | | | | | | | | | | |
Textiles, Apparel & Luxury Goods (0.5%) | | | | | | | | | | | | | | | | | | | | | | | | | | | | | | | | |
Deckers Outdoor Corp.* | | | 2,414 | | | | 2,733 | | | | — | | | | 5,147 | | | | 133,711 | | | | 151,381 | | | | — | | | | 285,092 | |
Delta Apparel, Inc.* | | | 575 | | | | 648 | | | | — | | | | 1,223 | | | | 11,920 | | | | 13,433 | | | | — | | | | 25,353 | |
Fossil Group, Inc.(x)* | | | 3,340 | | | | 3,784 | | | | — | | | | 7,124 | | | | 86,372 | | | | 97,854 | | | | — | | | | 184,226 | |
G-III Apparel Group Ltd.* | | | 696 | | | | 781 | | | | — | | | | 1,477 | | | | 20,574 | | | | 23,086 | | | | — | | | | 43,660 | |
Iconix Brand Group, Inc.* | | | 3,470 | | | | 3,894 | | | | — | | | | 7,364 | | | | 32,410 | | | | 36,370 | | | | — | | | | 68,780 | |
Movado Group, Inc. | | | 1,236 | | | | 17,784 | | | | — | | | | 19,020 | | | | 35,535 | | | | 511,289 | | | | — | | | | 546,824 | |
Perry Ellis International, Inc.* | | | 996 | | | | 1,122 | | | | — | | | | 2,118 | | | | 24,810 | | | | 27,949 | | | | — | | | | 52,759 | |
Sequential Brands Group, Inc.* | | | 3,338 | | | | 3,744 | | | | — | | | | 7,082 | | | | 15,622 | | | | 17,522 | | | | — | | | | 33,144 | |
Unifi, Inc.* | | | 1,251 | | | | 1,404 | | | | — | | | | 2,655 | | | | 40,820 | | | | 45,813 | | | | — | | | | 86,633 | |
Vera Bradley, Inc.* | | | 501 | | | | 511 | | | | — | | | | 1,012 | | | | 5,872 | | | | 5,989 | | | | — | | | | 11,861 | |
Vince Holding Corp.(x)* | | | 1,596 | | | | 1,810 | | | | — | | | | 3,406 | | | | 6,464 | | | | 7,331 | | | | — | | | | 13,795 | |
Wolverine World Wide, Inc. | | | 6,507 | | | | 7,350 | | | | — | | | | 13,857 | | | | 142,829 | | | | 161,333 | | | | — | | | | 304,162 | |
| | | | | | | | | | | | | | | | | | | | | | | | | | | | | | | | |
| | | | | | | | | | | | | | | | | | | 556,939 | | | | 1,099,350 | | | | — | | | | 1,656,289 | |
| | | | | | | | | | | | | | | | | | | | | | | | | | | | | | | | |
Total Consumer Discretionary | | | | | | | | | | | | | | | | | | | 20,031,409 | | | | 26,507,438 | | | | — | | | | 46,538,847 | |
| | | | | | | | | | | | | | | | | | | | | | | | | | | | | | | | |
Consumer Staples (3.4%) | | | | | | | | | | | | | | | | | | | | | | | | | | | | | | | | |
Beverages (0.1%) | | | | | | | | | | | | | | | | | | | | | | | | | | | | | | | | |
Craft Brew Alliance, Inc.(x)* | | | 690 | | | | 741 | | | | — | | | | 1,431 | | | | 11,661 | | | | 12,523 | | | | — | | | | 24,184 | |
Crimson Wine Group Ltd.* | | | — | | | | 42,400 | | | | — | | | | 42,400 | | | | — | | | | 397,288 | | | | — | | | | 397,288 | |
| | | | | | | | | | | | | | | | | | | | | | | | | | | | | | | | |
| | | | | | | | | | | | | | | | | | | 11,661 | | | | 409,811 | | | | — | | | | 421,472 | |
| | | | | | | | | | | | | | | | | | | | | | | | | | | | | | | | |
Food & Staples Retailing (1.1%) | | | | | | | | | | | | | | | | | | | | | | | | | | | | | | | | |
Andersons, Inc. (The) | | | 2,123 | | | | 2,426 | | | | — | | | | 4,549 | | | | 94,898 | | | | 108,442 | | | | — | | | | 203,340 | |
Chefs’ Warehouse, Inc. (The)* | | | 133,139 | | | | 159 | | | | — | | | | 133,298 | | | | 2,103,596 | | | | 2,512 | | | | — | | | | 2,106,108 | |
Ingles Markets, Inc., Class A | | | 1,101 | | | | 1,265 | | | | — | | | | 2,366 | | | | 52,958 | | | | 60,847 | | | | — | | | | 113,805 | |
Natural Grocers by Vitamin Cottage,
Inc.(x)* | | | 752 | | | | 848 | | | | — | | | | 1,600 | | | | 8,941 | | | | 10,083 | | | | — | | | | 19,024 | |
Smart & Final Stores, Inc.(x)* | | | 597 | | | | 671 | | | | — | | | | 1,268 | | | | 8,418 | | | | 9,461 | | | | — | | | | 17,879 | |
SpartanNash Co. | | | 2,933 | | | | 3,337 | | | | — | | | | 6,270 | | | | 115,971 | | | | 131,945 | | | | — | | | | 247,916 | |
SUPERVALU, Inc.* | | | 21,418 | | | | 24,019 | | | | — | | | | 45,437 | | | | 100,022 | | | | 112,169 | | | | — | | | | 212,191 | |
United Natural Foods, Inc.* | | | 3,952 | | | | 4,386 | | | | — | | | | 8,338 | | | | 188,589 | | | | 209,300 | | | | — | | | | 397,889 | |
Village Super Market, Inc., Class A | | | 584 | | | | 647 | | | | — | | | | 1,231 | | | | 18,046 | | | | 19,992 | | | | — | | | | 38,038 | |
Weis Markets, Inc. | | | 757 | | | | 848 | | | | — | | | | 1,605 | | | | 50,598 | | | | 56,680 | | | | — | | | | 107,278 | |
| | | | | | | | | | | | | | | | | | | | | | | | | | | | | | | | |
| | | | | | | | | | | | | | | | | | | 2,742,037 | | | | 721,431 | | | | — | | | | 3,463,468 | |
| | | | | | | | | | | | | | | | | | | | | | | | | | | | | | | | |
Food Products (1.3%) | | | | | | | | | | | | | | | | | | | | | | | | | | | | | | | | |
AdvancePierre Foods Holdings, Inc. | | | 635 | | | | 713 | | | | — | | | | 1,348 | | | | 18,910 | | | | 21,233 | | | | — | | | | 40,143 | |
Alico, Inc. | | | 246 | | | | 1,465 | | | | — | | | | 1,711 | | | | 6,679 | | | | 39,775 | | | | — | | | | 46,454 | |
32
| | | | | | | | | | | | | | | | | | | | | | | | | | | | | | | | |
| | | Pacific Global
Small Cap
Value | | | Horizon
Small Cap
Value | | | Pro-forma
Adjustment | | | AXA/Horizon
Small Cap
Value
Combined
Pro-forma | | | Pacific
Global Small
Cap Value | | | Horizon
Small Cap
Value | | | Pro-forma
Adjustment | | | AXA/Horizon
Small Cap
Value
Combined
Pro-forma | |
| | | Number of
Shares | | | Number of
Shares | | | Number of
Shares | | | Number of
Shares | | | Value ($) | | | Value ($) | | | Value ($) | | | Value ($) | |
Cal-Maine Foods, Inc.(x) | | | 554 | | | | 621 | | | | — | | | | 1,175 | | | | 24,473 | | | | 27,433 | | | | — | | | | 51,906 | |
Darling Ingredients, Inc.* | | | 179,552 | | | | 10,834 | | | | — | | | | 190,386 | | | | 2,318,016 | | | | 139,867 | | | | — | | | | 2,457,883 | |
Dean Foods Co. | | | 3,691 | | | | 4,236 | | | | — | | | | 7,927 | | | | 80,390 | | | | 92,260 | | | | — | | | | 172,650 | |
Fresh Del Monte Produce, Inc. | | | 2,445 | | | | 2,765 | | | | — | | | | 5,210 | | | | 148,240 | | | | 167,642 | | | | — | | | | 315,882 | |
John B. Sanfilippo & Son, Inc. | | | 492 | | | | 560 | | | | — | | | | 1,052 | | | | 34,632 | | | | 39,418 | | | | — | | | | 74,050 | |
Landec Corp.* | | | 1,621 | | | | 1,867 | | | | — | | | | 3,488 | | | | 22,370 | | | | 25,765 | | | | — | | | | 48,135 | |
Limoneira Co. | | | 85 | | | | 86 | | | | — | | | | 171 | | | | 1,828 | | | | 1,850 | | | | — | | | | 3,678 | |
Omega Protein Corp.* | | | 1,659 | | | | 1,697 | | | | — | | | | 3,356 | | | | 41,558 | | | | 42,510 | | | | — | | | | 84,068 | |
Sanderson Farms, Inc.(x) | | | 1,611 | | | | 1,823 | | | | — | | | | 3,434 | | | | 151,821 | | | | 171,800 | | | | — | | | | 323,621 | |
Seaboard Corp.* | | | 21 | | | | 24 | | | | — | | | | 45 | | | | 82,992 | | | | 94,848 | | | | — | | | | 177,840 | |
Seneca Foods Corp., Class A* | | | 520 | | | | 589 | | | | — | | | | 1,109 | | | | 20,826 | | | | 23,589 | | | | — | | | | 44,415 | |
Snyder’s-Lance, Inc. | | | 6,423 | | | | 7,161 | | | | — | | | | 13,584 | | | | 246,258 | | | | 274,552 | | | | — | | | | 520,810 | |
| | | | | | | | | | | | | | | | | | | | | | | | | | | | | | | | |
| | | | | | | | | | | | | | | | | | | 3,198,993 | | | | 1,162,542 | | | | — | | | | 4,361,535 | |
| | | | | | | | | | | | | | | | | | | | | | | | | | | | | | | | |
Household Products (1.1%)(0.01)% | | | | | | | | | | | | | | | | | | | | | | | | | | | | | | | | |
Central Garden & Pet Co.(x)* | | | 722 | | | | 884 | | | | — | | | | 1,606 | | | | 23,891 | | | | 29,252 | | | | — | | | | 53,143 | |
Central Garden & Pet Co., Class A* | | | 2,330 | | | | 2,616 | | | | — | | | | 4,946 | | | | 71,997 | | | | 80,833 | | | | — | | | | 152,830 | |
Oil-Dri Corp. of America | | | 381 | | | | 431 | | | | — | | | | 812 | | | | 14,558 | | | | 16,469 | | | | — | | | | 31,027 | |
| | | | | | | | | | | | | | | | | | | | | | | | | | | | | | | | |
| | | | | | | | | | | | | | | | | | | 110,446 | | | | 126,554 | | | | — | | | | 237,000 | |
| | | | | | | | | | | | | | | | | | | | | | | | | | | | | | | | |
Personal Products (0.7%) | | | | | | | | | | | | | | | | | | | | | | | | | | | | | | | | |
Avon Products, Inc.* | | | 27,773 | | | | 31,180 | | | | — | | | | 58,953 | | | | 139,976 | | | | 157,148 | | | | — | | | | 297,124 | |
elf Beauty, Inc.(x)* | | | 389 | | | | 392 | | | | — | | | | 781 | | | | 11,258 | | | | 11,344 | | | | — | | | | 22,602 | |
Inter Parfums, Inc. | | | 768 | | | | 55,659 | | | | — | | | | 56,427 | | | | 25,152 | | | | 1,822,833 | | | | — | | | | 1,847,985 | |
Nature’s Sunshine Products, Inc. | | | 647 | | | | 753 | | | | — | | | | 1,400 | | | | 9,705 | | | | 11,295 | | | | — | | | | 21,000 | |
Nutraceutical International Corp. | | | 655 | | | | 731 | | | | — | | | | 1,386 | | | | 22,892 | | | | 25,548 | | | | — | | | | 48,440 | |
Revlon, Inc., Class A* | | | 666 | | | | 748 | | | | — | | | | 1,414 | | | | 19,414 | | | | 21,804 | | | | — | | | | 41,218 | |
Synutra International, Inc.* | | | 1,303 | | | | 1,489 | | | | — | | | | 2,792 | | | | 6,971 | | | | 7,966 | | | | — | | | | 14,937 | |
| | | | | | | | | | | | | | | | | | | | | | | | | | | | | | | | |
| | | | | | | | | | | | | | | | | | | 235,368 | | | | 2,057,938 | | | | — | | | | 2,293,306 | |
| | | | | | | | | | | | | | | | | | | | | | | | | | | | | | | | |
Tobacco (0.1%) | | | | | | | | | | | | | | | | | | | | | | | | | | | | | | | | |
Alliance One International, Inc.* | | | 700 | | | | 787 | | | | — | | | | 1,487 | | | | 13,440 | | | | 15,110 | | | | — | | | | 28,550 | |
Turning Point Brands, Inc.* | | | 231 | | | | 270 | | | | — | | | | 501 | | | | 2,830 | | | | 3,308 | | | | — | | | | 6,138 | |
Universal Corp. | | | 1,781 | | | | 2,030 | | | | — | | | | 3,811 | | | | 113,539 | | | | 129,412 | | | | — | | | | 242,951 | |
Vector Group Ltd.(x) | | | 4,233 | | | | 4,671 | | | | — | | | | 8,904 | | | | 96,258 | | | | 106,219 | | | | — | | | | 202,477 | |
| | | | | | | | | | | | | | | | | | | | | | | | | | | | | | | | |
| | | | | | | | | | | | | | | | | | | 226,067 | | | | 254,049 | | | | — | | | | 480,116 | |
| | | | | | | | | | | | | | | | | | | | | | | | | | | | | | | | |
Total Consumer Staples | | | | | | | | | | | | | | | | | | | 6,524,572 | | | | 4,732,325 | | | | — | | | | 11,256,897 | |
| | | | | | | | | | | | | | | | | | | | | | | | | | | | | | | | |
Energy (7.7%) | | | | | | | | | | | | | | | | | | | | | | | | | | | | | | | | |
Energy Equipment & Services (5.4%) | | | | | | | | | | | | | | | | | | | | | | | | | | | | | | | | |
Archrock, Inc. | | | 5,585 | | | | 6,379 | | | | — | | | | 11,964 | | | | 73,722 | | | | 84,203 | | | | — | | | | 157,925 | |
Atwood Oceanics, Inc.(x) | | | 4,887 | | | | 5,571 | | | | — | | | | 10,458 | | | | 64,166 | | | | 73,147 | | | | — | | | | 137,313 | |
Bristow Group, Inc.(x) | | | 2,711 | | | | 3,049 | | | | — | | | | 5,760 | | | | 55,521 | | | | 62,444 | | | | — | | | | 117,965 | |
CARBO Ceramics, Inc.(x) | | | 1,569 | | | | 1,764 | | | | — | | | | 3,333 | | | | 16,412 | | | | 18,451 | | | | — | | | | 34,863 | |
Dawson Geophysical Co.* | | | 1,636 | | | | 1,837 | | | | — | | | | 3,473 | | | | 13,153 | | | | 14,769 | | | | — | | | | 27,922 | |
Era Group, Inc.* | | | 1,581 | | | | 1,798 | | | | — | | | | 3,379 | | | | 26,830 | | | | 30,512 | | | | — | | | | 57,342 | |
Exterran Corp.* | | | 2,558 | | | | 2,839 | | | | — | | | | 5,397 | | | | 61,136 | | | | 67,852 | | | | — | | | | 128,988 | |
Fairmount Santrol Holdings, Inc.(x)* | | | 7,115 | | | | 7,970 | | | | — | | | | 15,085 | | | | 83,886 | | | | 93,966 | | | | — | | | | 177,852 | |
Forum Energy Technologies, Inc.* | | | 4,826 | | | | 5,481 | | | | — | | | | 10,307 | | | | 106,172 | | | | 120,582 | | | | — | | | | 226,754 | |
Geospace Technologies Corp.(x)* | | | 1,047 | | | | 1,175 | | | | — | | | | 2,222 | | | | 21,317 | | | | 23,923 | | | | — | | | | 45,240 | |
Helix Energy Solutions Group, Inc.* | | | 228,060 | | | | 10,334 | | | | — | | | | 238,394 | | | | 2,011,489 | | | | 91,146 | | | | — | | | | 2,102,635 | |
Hornbeck Offshore Services, Inc.(x)* | | | 217,666 | | | | 2,969 | | | | — | | | | 220,635 | | | | 1,571,549 | | | | 21,436 | | | | — | | | | 1,592,985 | |
Independence Contract Drilling, Inc.* | | | 2,439 | | | | 2,666 | | | | — | | | | 5,105 | | | | 16,341 | | | | 17,862 | | | | — | | | | 34,203 | |
Mammoth Energy Services, Inc.* | | | 407 | | | | 414 | | | | — | | | | 821 | | | | 6,186 | | | | 6,293 | | | | — | | | | 12,479 | |
Matrix Service Co.* | | | 130,133 | | | | 2,396 | | | | — | | | | 132,529 | | | | 2,954,019 | | | | 54,389 | | | | — | | | | 3,008,408 | |
McDermott International, Inc.* | | | 19,232 | | | | 21,776 | | | | — | | | | 41,008 | | | | 142,125 | | | | 160,925 | | | | — | | | | 303,050 | |
Natural Gas Services Group, Inc.* | | | 103,955 | | | | 1,076 | | | | — | | | | 105,031 | | | | 3,342,153 | | | | 34,593 | | | | — | | | | 3,376,746 | |
Newpark Resources, Inc.* | | | 6,641 | | | | 7,466 | | | | — | | | | 14,107 | | | | 49,808 | | | | 55,995 | | | | — | | | | 105,803 | |
Noble Corp. plc(x) | | | 250,000 | | | | — | | | | — | | | | 250,000 | | | | 1,480,000 | | | | — | | | | — | | | | 1,480,000 | |
North American Energy Partners, Inc. | | | 515,000 | | | | — | | | | — | | | | 515,000 | | | | 1,982,750 | | | | — | | | | — | | | | 1,982,750 | |
Oil States International, Inc.* | | | 4,124 | | | | 4,664 | | | | — | | | | 8,788 | | | | 160,836 | | | | 181,896 | | | | — | | | | 342,732 | |
Parker Drilling Co.* | | | 399,668 | | | | 10,875 | | | | — | | | | 410,543 | | | | 1,039,137 | | | | 28,275 | | | | — | | | | 1,067,412 | |
PHI, Inc. (Non-Voting)* | | | 873 | | | | 743 | | | | — | | | | 1,616 | | | | 15,732 | | | | 13,389 | | | | — | | | | 29,121 | |
Pioneer Energy Services Corp.* | | | 5,701 | | | | 6,421 | | | | — | | | | 12,122 | | | | 39,052 | | | | 43,984 | | | | — | | | | 83,036 | |
RigNet, Inc.* | | | 943 | | | | 1,068 | | | | — | | | | 2,011 | | | | 21,830 | | | | 24,724 | | | | — | | | | 46,554 | |
33
| | | | | | | | | | | | | | | | | | | | | | | | | | | | | | | | |
| | | Pacific Global
Small Cap
Value | | | Horizon
Small Cap
Value | | | Pro-forma
Adjustment | | | AXA/Horizon
Small Cap
Value
Combined
Pro-forma | | | Pacific
Global Small
Cap Value | | | Horizon
Small Cap
Value | | | Pro-forma
Adjustment | | | AXA/Horizon
Small Cap
Value
Combined
Pro-forma | |
| | | Number of
Shares | | | Number of
Shares | | | Number of
Shares | | | Number of
Shares | | | Value ($) | | | Value ($) | | | Value ($) | | | Value ($) | |
SEACOR Holdings, Inc.* | | | 1,283 | | | | 1,437 | | | | — | | | | 2,720 | | | | 91,452 | | | | 102,429 | | | | — | | | | 193,881 | |
Seadrill Ltd.(x)* | | | 30,387 | | | | 34,149 | | | | — | | | | 64,536 | | | | 103,620 | | | | 116,448 | | | | — | | | | 220,068 | |
Smart Sand, Inc.* | | | 796 | | | | 874 | | | | — | | | | 1,670 | | | | 13,174 | | | | 14,465 | | | | — | | | | 27,639 | |
Subsea 7 SA (ADR)* | | | — | | | | 60,000 | | | | — | | | | 60,000 | | | | — | | | | 755,701 | | | | — | | | | 755,701 | |
TerraVest Capital, Inc. | | | — | | | | 300 | | | | — | | | | 300 | | | | — | | | | 1,989 | | | | — | | | | 1,989 | |
Tesco Corp. | | | 3,649 | | | | 4,105 | | | | — | | | | 7,754 | | | | 30,104 | | | | 33,866 | | | | — | | | | 63,970 | |
TETRA Technologies, Inc.* | | | 2,527 | | | | 2,952 | | | | — | | | | 5,479 | | | | 12,686 | | | | 14,819 | | | | — | | | | 27,505 | |
Tidewater, Inc.(x) | | | 3,744 | | | | 4,206 | | | | — | | | | 7,950 | | | | 12,767 | | | | 14,342 | | | | — | | | | 27,109 | |
Unit Corp.* | | | 4,075 | | | | 4,580 | | | | — | | | | 8,655 | | | | 109,495 | | | | 123,065 | | | | — | | | | 232,560 | |
Willbros Group, Inc.* | | | 3,471 | | | | 3,900 | | | | — | | | | 7,371 | | | | 11,246 | | | | 12,636 | | | | — | | | | 23,882 | |
| | | | | | | | | | | | | | | | | | | | | | | | | | | | | | | | |
| | | | | | | | | | | | | | | | | | | 15,739,866 | | | | 2,514,516 | | | | — | | | | 18,254,382 | |
| | | | | | | | | | | | | | | | | | | | | | | | | | | | | | | | |
Oil, Gas & Consumable Fuels (2.3%) | | | | | | | | | | | | | | | | | | | | | | | | | | | | | | | | |
Abraxas Petroleum Corp.(x)* | | | 5,780 | | | | 5,992 | | | | — | | | | 11,772 | | | | 14,855 | | | | 15,399 | | | | — | | | | 30,254 | |
Adams Resources & Energy, Inc. | | | 166 | | | | 183 | | | | — | | | | 349 | | | | 6,582 | | | | 7,256 | | | | — | | | | 13,838 | |
Alon USA Energy, Inc. | | | 2,587 | | | | 2,864 | | | | — | | | | 5,451 | | | | 29,440 | | | | 32,592 | | | | — | | | | 62,032 | |
Ardmore Shipping Corp. | | | 2,303 | | | | 2,515 | | | | — | | | | 4,818 | | | | 17,042 | | | | 18,611 | | | | — | | | | 35,653 | |
Bill Barrett Corp.(x)* | | | 3,958 | | | | 4,445 | | | | — | | | | 8,403 | | | | 27,666 | | | | 31,071 | | | | — | | | | 58,737 | |
California Resources Corp.(x)* | | | 2,553 | | | | 2,869 | | | | — | | | | 5,422 | | | | 54,353 | | | | 61,081 | | | | — | | | | 115,434 | |
Clayton Williams Energy, Inc.(x)* | | | 481 | | | | 539 | | | | — | | | | 1,020 | | | | 57,364 | | | | 64,281 | | | | — | | | | 121,645 | |
Clean Energy Fuels Corp.(x)* | | | 7,029 | | | | 7,888 | | | | — | | | | 14,917 | | | | 20,103 | | | | 22,560 | | | | — | | | | 42,663 | |
Cobalt International Energy, Inc.* | | | 32,864 | | | | 36,918 | | | | — | | | | 69,782 | | | | 40,094 | | | | 45,040 | | | | — | | | | 85,134 | |
Contango Oil & Gas Co.* | | | 1,886 | | | | 2,108 | | | | — | | | | 3,994 | | | | 17,615 | | | | 19,689 | | | | — | | | | 37,304 | |
CVR Energy, Inc.(x) | | | 1,174 | | | | 1,319 | | | | — | | | | 2,493 | | | | 29,808 | | | | 33,489 | | | | — | | | | 63,297 | |
Delek U.S. Holdings, Inc. | | | 4,901 | | | | 5,594 | | | | — | | | | 10,495 | | | | 117,967 | | | | 134,648 | | | | — | | | | 252,615 | |
Denbury Resources, Inc.* | | | 28,226 | | | | 31,803 | | | | — | | | | 60,029 | | | | 103,872 | | | | 117,035 | | | | — | | | | 220,907 | |
DHT Holdings, Inc. | | | 7,409 | | | | 8,304 | | | | — | | | | 15,713 | | | | 30,673 | | | | 34,379 | | | | — | | | | 65,052 | |
Dorian LPG Ltd.* | | | 1,998 | | | | 2,198 | | | | — | | | | 4,196 | | | | 16,404 | | | | 18,046 | | | | — | | | | 34,450 | |
Earthstone Energy, Inc.* | | | 110 | | | | 99 | | | | — | | | | 209 | | | | 1,511 | | | | 1,360 | | | | — | | | | 2,871 | |
Eclipse Resources Corp.* | | | 4,604 | | | | 5,222 | | | | — | | | | 9,826 | | | | 12,293 | | | | 13,943 | | | | — | | | | 26,236 | |
EP Energy Corp., Class A(x)* | | | 3,063 | | | | 3,446 | | | | — | | | | 6,509 | | | | 20,063 | | | | 22,571 | | | | — | | | | 42,634 | |
Erin Energy Corp.(x)* | | | 925 | | | | 985 | | | | — | | | | 1,910 | | | | 2,821 | | | | 3,004 | | | | — | | | | 5,825 | |
EXCO Resources, Inc.(x)* | | | 11,123 | | | | 12,627 | | | | — | | | | 23,750 | | | | 9,718 | | | | 11,032 | | | | — | | | | 20,750 | |
Frontline Ltd.(x) | | | 5,216 | | | | 5,858 | | | | — | | | | 11,074 | | | | 37,086 | | | | 41,650 | | | | — | | | | 78,736 | |
GasLog Ltd. | | | 3,272 | | | | 3,671 | | | | — | | | | 6,943 | | | | 52,679 | | | | 59,103 | | | | — | | | | 111,782 | |
Gener8 Maritime, Inc.* | | | 3,281 | | | | 3,708 | | | | — | | | | 6,989 | | | | 14,699 | | | | 16,612 | | | | — | | | | 31,311 | |
Golar LNG Ltd. | | | 7,527 | | | | 8,398 | | | | — | | | | 15,925 | | | | 172,669 | | | | 192,650 | | | | — | | | | 365,319 | |
Green Plains, Inc. | | | 2,869 | | | | 3,267 | | | | — | | | | 6,136 | | | | 79,902 | | | | 90,986 | | | | — | | | | 170,888 | |
International Seaways, Inc.* | | | 1,181 | | | | 1,266 | | | | — | | | | 2,447 | | | | 16,581 | | | | 17,775 | | | | — | | | | 34,356 | |
Jones Energy, Inc., Class A(x)* | | | 4,550 | | | | 5,454 | | | | — | | | | 10,004 | | | | 22,750 | | | | 27,270 | | | | — | | | | 50,020 | |
Navigator Holdings Ltd.* | | | — | | | | 10,800 | | | | — | | | | 10,800 | | | | — | | | | 100,440 | | | | — | | | | 100,440 | |
Navios Maritime Acquisition Corp. | | | 6,395 | | | | 7,356 | | | | — | | | | 13,751 | | | | 10,872 | | | | 12,505 | | | | — | | | | 23,377 | |
Nordic American Tankers Ltd.(x) | | | 7,939 | | | | 9,031 | | | | — | | | | 16,970 | | | | 66,688 | | | | 75,860 | | | | — | | | | 142,548 | |
Northern Oil and Gas, Inc.(x)* | | | 3,711 | | | | 4,185 | | | | — | | | | 7,896 | | | | 10,205 | | | | 11,509 | | | | — | | | | 21,714 | |
Oasis Petroleum, Inc.* | | | 18,627 | | | | 21,032 | | | | — | | | | 39,659 | | | | 282,013 | | | | 318,424 | | | | — | | | | 600,437 | |
Overseas Shipholding Group, Inc., Class A | | | 3,208 | | | | 3,052 | | | | — | | | | 6,260 | | | | 12,287 | | | | 11,689 | | | | — | | | | 23,976 | |
Pacific Ethanol, Inc.* | | | 2,335 | | | | 2,622 | | | | — | | | | 4,957 | | | | 22,182 | | | | 24,909 | | | | — | | | | 47,091 | |
Panhandle Oil and Gas, Inc., Class A | | | 575 | | | | 651 | | | | — | | | | 1,226 | | | | 13,541 | | | | 15,331 | | | | — | | | | 28,872 | |
Par Pacific Holdings, Inc.(x)* | | | 1,538 | | | | 31,428 | | | | — | | | | 32,966 | | | | 22,363 | | | | 456,963 | | | | — | | | | 479,326 | |
PDC Energy, Inc.* | | | 4,477 | | | | 4,992 | | | | — | | | | 9,469 | | | | 324,941 | | | | 362,319 | | | | — | | | | 687,260 | |
Permian Basin Royalty Trust | | | — | | | | 63,100 | | | | — | | | | 63,100 | | | | — | | | | 486,502 | | | | — | | | | 486,502 | |
Renewable Energy Group, Inc.(x)* | | | 2,859 | | | | 2,984 | | | | — | | | | 5,843 | | | | 27,732 | | | | 28,945 | | | | — | | | | 56,677 | |
REX American Resources Corp.* | | | 454 | | | | 511 | | | | — | | | | 965 | | | | 44,832 | | | | 50,461 | | | | — | | | | 95,293 | |
Ring Energy, Inc.* | | | 3,182 | | | | 3,604 | | | | — | | | | 6,786 | | | | 41,334 | | | | 46,816 | | | | — | | | | 88,150 | |
RSP Permian, Inc.* | | | 7,860 | | | | 8,762 | | | | — | | | | 16,622 | | | | 350,713 | | | | 390,960 | | | | — | | | | 741,673 | |
Sanchez Energy Corp.(x)* | | | 3,028 | | | | 3,406 | | | | — | | | | 6,434 | | | | 27,343 | | | | 30,756 | | | | — | | | | 58,099 | |
Scorpio Tankers, Inc. | | | 13,181 | | | | 15,119 | | | | — | | | | 28,300 | | | | 59,710 | | | | 68,489 | | | | — | | | | 128,199 | |
SemGroup Corp., Class A | | | 5,314 | | | | 5,853 | | | | — | | | | 11,167 | | | | 221,860 | | | | 244,363 | | | | — | | | | 466,223 | |
Ship Finance International Ltd.(x) | | | 4,868 | | | | 5,451 | | | | — | | | | 10,319 | | | | 72,290 | | | | 80,947 | | | | — | | | | 153,237 | |
Synergy Resources Corp.(x)* | | | 13,270 | | | | 15,081 | | | | — | | | | 28,351 | | | | 118,236 | | | | 134,372 | | | | — | | | | 252,608 | |
Teekay Corp. | | | 3,871 | | | | 4,560 | | | | — | | | | 8,431 | | | | 31,084 | | | | 36,617 | | | | — | | | | 67,701 | |
Teekay Tankers Ltd., Class A | | | 9,435 | | | | 10,578 | | | | — | | | | 20,013 | | | | 21,323 | | | | 23,906 | | | | — | | | | 45,229 | |
W&T Offshore, Inc.* | | | 2,830 | | | | 3,280 | | | | — | | | | 6,110 | | | | 7,839 | | | | 9,086 | | | | — | | | | 16,925 | |
Western Refining, Inc. | | | 6,446 | | | | 7,150 | | | | — | | | | 13,596 | | | | 243,981 | | | | 270,628 | | | | — | | | | 514,609 | |
34
| | | | | | | | | | | | | | | | | | | | | | | | | | | | | | | | |
| | | Pacific Global
Small Cap
Value | | | Horizon
Small Cap
Value | | | Pro-forma
Adjustment | | | AXA/Horizon
Small Cap
Value
Combined
Pro-forma | | | Pacific
Global Small
Cap Value | | | Horizon
Small Cap
Value | | | Pro-forma
Adjustment | | | AXA/Horizon
Small Cap
Value
Combined
Pro-forma | |
| | | Number of
Shares | | | Number of
Shares | | | Number of
Shares | | | Number of
Shares | | | Value ($) | | | Value ($) | | | Value ($) | | | Value ($) | |
Westmoreland Coal Co.(x)* | | | 1,496 | | | | 1,718 | | | | — | | | | 3,214 | | | | 26,434 | | | | 30,357 | | | | — | | | | 56,791 | |
| | | | | | | | | | | | | | | | | | | | | | | | | | | | | | | | |
| | | | | | | | | | | | | | | | | | | 3,086,413 | | | | 4,476,287 | | | | — | | | | 7,562,700 | |
| | | | | | | | | | | | | | | | | | | | | | | | | | | | | | | | |
Total Energy | | | | | | | | | | | | | | | | | | | 18,826,279 | | | | 6,990,803 | | | | — | | | | 25,817,082 | |
| | | | | | | | | | | | | | | | | | | | | | | | | | | | | | | | |
Financials (26.0%) | | | | | | | | | | | | | | | | | | | | | | | | | | | | | | | | |
Banks (11.3%) | | | | | | | | | | | | | | | | | | | | | | | | | | | | | | | | |
1st Source Corp. | | | 1,251 | | | | 1,403 | | | | — | | | | 2,654 | | | | 55,870 | | | | 62,658 | | | | — | | | | 118,528 | |
Access National Corp.(x) | | | 655 | | | | 736 | | | | — | | | | 1,391 | | | | 18,183 | | | | 20,431 | | | | — | | | | 38,614 | |
ACNB Corp. | | | 469 | | | | 527 | | | | — | | | | 996 | | | | 14,656 | | | | 16,469 | | | | — | | | | 31,125 | |
Allegiance Bancshares, Inc.* | | | 798 | | | | 900 | | | | — | | | | 1,698 | | | | 28,848 | | | | 32,535 | | | | — | | | | 61,383 | |
American National Bankshares, Inc. | | | 641 | | | | 717 | | | | — | | | | 1,358 | | | | 22,307 | | | | 24,952 | | | | — | | | | 47,259 | |
Ameris Bancorp | | | 717 | | | | 848 | | | | — | | | | 1,565 | | | | 31,261 | | | | 36,973 | | | | — | | | | 68,234 | |
Ames National Corp. | | | 676 | | | | 758 | | | | — | | | | 1,434 | | | | 22,308 | | | | 25,014 | | | | — | | | | 47,322 | |
Arrow Financial Corp. | | | 894 | | | | 1,011 | | | | — | | | | 1,905 | | | | 36,207 | | | | 40,946 | | | | — | | | | 77,153 | |
Atlantic Capital Bancshares, Inc.* | | | 1,135 | | | | 1,279 | | | | — | | | | 2,414 | | | | 21,565 | | | | 24,301 | | | | — | | | | 45,866 | |
Banc of California, Inc.(x) | | | 1,101 | | | | 1,351 | | | | — | | | | 2,452 | | | | 19,102 | | | | 23,440 | | | | — | | | | 42,542 | |
BancFirst Corp. | | | 626 | | | | 723 | | | | — | | | | 1,349 | | | | 58,249 | | | | 67,275 | | | | — | | | | 125,524 | |
Banco Latinoamericano de Comercio Exterior S.A., Class E | | | 2,451 | | | | 2,805 | | | | — | | | | 5,256 | | | | 72,157 | | | | 82,579 | | | | — | | | | 154,736 | |
Bancorp, Inc. (The)* | | | 4,049 | | | | 4,529 | | | | — | | | | 8,578 | | | | 31,825 | | | | 35,598 | | | | — | | | | 67,423 | |
BancorpSouth, Inc. | | | 6,911 | | | | 7,821 | | | | — | | | | 14,732 | | | | 214,587 | | | | 242,842 | | | | — | | | | 457,429 | |
Bank of Marin Bancorp | | | 475 | | | | 534 | | | | — | | | | 1,009 | | | | 33,131 | | | | 37,247 | | | | — | | | | 70,378 | |
Bank of NT Butterfield & Son Ltd. (The) | | | 759 | | | | 777 | | | | — | | | | 1,536 | | | | 23,863 | | | | 24,429 | | | | — | | | | 48,292 | |
Bankwell Financial Group, Inc. | | | 387 | | | | 438 | | | | — | | | | 825 | | | | 12,577 | | | | 14,235 | | | | — | | | | 26,812 | |
Banner Corp. | | | 2,413 | | | | 2,762 | | | | — | | | | 5,175 | | | | 134,670 | | | | 154,147 | | | | — | | | | 288,817 | |
Bar Harbor Bankshares | | | 474 | | | | 534 | | | | — | | | | 1,008 | | | | 22,434 | | | | 25,274 | | | | — | | | | 47,708 | |
Berkshire Hills Bancorp, Inc. | | | 2,495 | | | | 2,781 | | | | — | | | | 5,276 | | | | 91,941 | | | | 102,480 | | | | — | | | | 194,421 | |
Blue Hills Bancorp, Inc. | | | 1,802 | | | | 2,027 | | | | — | | | | 3,829 | | | | 33,788 | | | | 38,006 | | | | — | | | | 71,794 | |
BNC Bancorp | | | 2,966 | | | | 3,387 | | | | — | | | | 6,353 | | | | 94,615 | | | | 108,045 | | | | — | | | | 202,660 | |
Boston Private Financial Holdings, Inc. | | | 6,619 | | | | 7,535 | | | | — | | | | 14,154 | | | | 109,544 | | | | 124,704 | | | | — | | | | 234,248 | |
Bridge Bancorp, Inc. | | | 1,335 | | | | 1,499 | | | | — | | | | 2,834 | | | | 50,597 | | | | 56,812 | | | | — | | | | 107,409 | |
Brookline Bancorp, Inc. | | | 5,590 | | | | 6,273 | | | | — | | | | 11,863 | | | | 91,676 | | | | 102,877 | | | | — | | | | 194,553 | |
Bryn Mawr Bank Corp. | | | 1,333 | | | | 1,497 | | | | — | | | | 2,830 | | | | 56,186 | | | | 63,099 | | | | — | | | | 119,285 | |
BSB Bancorp, Inc.* | | | 629 | | | | 728 | | | | — | | | | 1,357 | | | | 18,210 | | | | 21,076 | | | | — | | | | 39,286 | |
C&F Financial Corp. | | | 258 | | | | 290 | | | | — | | | | 548 | | | | 12,861 | | | | 14,457 | | | | — | | | | 27,318 | |
California First National Bancorp | | | 152 | | | | 163 | | | | — | | | | 315 | | | | 2,379 | | | | 2,551 | | | | — | | | | 4,930 | |
Camden National Corp. | | | 1,221 | | | | 1,371 | | | | — | | | | 2,592 | | | | 54,273 | | | | 60,941 | | | | — | | | | 115,214 | |
Capital Bank Financial Corp., Class A | | | 1,133 | | | | 1,196 | | | | — | | | | 2,329 | | | | 44,470 | | | | 46,943 | | | | — | | | | 91,413 | |
Capital City Bank Group, Inc. | | | 915 | | | | 1,001 | | | | — | | | | 1,916 | | | | 18,739 | | | | 20,500 | | | | — | | | | 39,239 | |
Cardinal Financial Corp. | | | 2,366 | | | | 2,712 | | | | — | | | | 5,078 | | | | 77,581 | | | | 88,926 | | | | — | | | | 166,507 | |
Carolina Financial Corp.(x) | | | 821 | | | | 923 | | | | — | | | | 1,744 | | | | 25,279 | | | | 28,419 | | | | — | | | | 53,698 | |
Cascade Bancorp* | | | 2,617 | | | | 2,893 | | | | — | | | | 5,510 | | | | 21,250 | | | | 23,491 | | | | — | | | | 44,741 | |
Cathay General Bancorp | | | 5,924 | | | | 6,701 | | | | — | | | | 12,625 | | | | 225,290 | | | | 254,839 | | | | — | | | | 480,129 | |
CenterState Banks, Inc. | | | 3,746 | | | | 4,291 | | | | — | | | | 8,037 | | | | 94,287 | | | | 108,004 | | | | — | | | | 202,291 | |
Central Pacific Financial Corp. | | | 2,431 | | | | 2,728 | | | | — | | | | 5,159 | | | | 76,382 | | | | 85,714 | | | | — | | | | 162,096 | |
Central Valley Community Bancorp | | | 698 | | | | 784 | | | | — | | | | 1,482 | | | | 13,932 | | | | 15,649 | | | | — | | | | 29,581 | |
Century Bancorp, Inc., Class A | | | 248 | | | | 323 | | | | — | | | | 571 | | | | 14,880 | | | | 19,380 | | | | — | | | | 34,260 | |
Chemical Financial Corp. | | | 3,552 | | | | 4,024 | | | | — | | | | 7,576 | | | | 192,412 | | | | 217,980 | | | | — | | | | 410,392 | |
Chemung Financial Corp.(x) | | | 246 | | | | 275 | | | | — | | | | 521 | | | | 8,942 | | | | 9,996 | | | | — | | | | 18,938 | |
Citizens & Northern Corp. | | | 907 | | | | 1,026 | | | | — | | | | 1,933 | | | | 23,763 | | | | 26,881 | | | | — | | | | 50,644 | |
City Holding Co. | | | 1,166 | | | | 1,308 | | | | — | | | | 2,474 | | | | 78,822 | | | | 88,421 | | | | — | | | | 167,243 | |
CNB Financial Corp. | | | 1,112 | | | | 1,237 | | | | — | | | | 2,349 | | | | 29,735 | | | | 33,077 | | | | — | | | | 62,812 | |
CoBiz Financial, Inc. | | | 2,674 | | | | 3,003 | | | | — | | | | 5,677 | | | | 45,164 | | | | 50,721 | | | | — | | | | 95,885 | |
Codorus Valley Bancorp, Inc.(x) | | | 642 | | | | 722 | | | | — | | | | 1,364 | | | | 18,361 | | | | 20,649 | | | | — | | | | 39,010 | |
Columbia Banking System, Inc. | | | 4,660 | | | | 5,126 | | | | — | | | | 9,786 | | | | 208,209 | | | | 229,030 | | | | — | | | | 437,239 | |
Community Bank System, Inc.(x) | | | 3,461 | | | | 3,924 | | | | — | | | | 7,385 | | | | 213,855 | | | | 242,464 | | | | — | | | | 456,319 | |
Community Trust Bancorp, Inc. | | | 1,214 | | | | 1,363 | | | | — | | | | 2,577 | | | | 60,214 | | | | 67,605 | | | | — | | | | 127,819 | |
ConnectOne Bancorp, Inc. | | | 2,295 | | | | 2,581 | | | | — | | | | 4,876 | | | | 59,555 | | | | 66,977 | | | | — | | | | 126,532 | |
County Bancorp, Inc. | | | 116 | | | | 131 | | | | — | | | | 247 | | | | 3,129 | | | | 3,533 | | | | — | | | | 6,662 | |
CU Bancorp* | | | 1,139 | | | | 1,283 | | | | — | | | | 2,422 | | | | 40,776 | | | | 45,931 | | | | — | | | | 86,707 | |
Customers Bancorp, Inc.* | | | 1,177 | | | | 1,327 | | | | — | | | | 2,504 | | | | 42,160 | | | | 47,533 | | | | — | | | | 89,693 | |
CVB Financial Corp. | | | 8,056 | | | | 9,139 | | | | — | | | | 17,195 | | | | 184,724 | | | | 209,557 | | | | — | | | | 394,281 | |
Eagle Bancorp, Inc.* | | | 524 | | | | 619 | | | | — | | | | 1,143 | | | | 31,938 | | | | 37,728 | | | | — | | | | 69,666 | |
East West Bancorp, Inc. | | | 70,000 | | | | — | | | | — | | | | 70,000 | | | | 3,558,100 | | | | — | | | | — | | | | 3,558,100 | |
35
| | | | | | | | | | | | | | | | | | | | | | | | | | | | | | | | |
| | | Pacific Global
Small Cap
Value | | | Horizon
Small Cap
Value | | | Pro-forma
Adjustment | | | AXA/Horizon
Small Cap
Value
Combined
Pro-forma | | | Pacific
Global Small
Cap Value | | | Horizon
Small Cap
Value | | | Pro-forma
Adjustment | | | AXA/Horizon
Small Cap
Value
Combined
Pro-forma | |
| | | Number of
Shares | | | Number of
Shares | | | Number of
Shares | | | Number of
Shares | | | Value ($) | | | Value ($) | | | Value ($) | | | Value ($) | |
Enterprise Bancorp, Inc. | | | 731 | | | | 880 | | | | — | | | | 1,611 | | | | 27,456 | | | | 33,053 | | | | — | | | | 60,509 | |
Enterprise Financial Services Corp. | | | 1,536 | | | | 1,725 | | | | — | | | | 3,261 | | | | 66,048 | | | | 74,175 | | | | — | | | | 140,223 | |
Equity Bancshares, Inc., Class A* | | | 420 | | | | 476 | | | | — | | | | 896 | | | | 14,129 | | | | 16,013 | | | | — | | | | 30,142 | |
Farmers Capital Bank Corp. | | | 588 | | | | 661 | | | | — | | | | 1,249 | | | | 24,725 | | | | 27,795 | | | | — | | | | 52,520 | |
Farmers National Banc Corp. | | | 1,975 | | | | 2,216 | | | | — | | | | 4,191 | | | | 28,045 | | | | 31,467 | | | | — | | | | 59,512 | |
FB Financial Corp.* | | | 338 | | | | 263 | | | | — | | | | 601 | | | | 8,771 | | | | 6,825 | | | | — | | | | 15,596 | |
FCB Financial Holdings, Inc., Class A* | | | 2,429 | | | | 2,769 | | | | — | | | | 5,198 | | | | 115,863 | | | | 132,081 | | | | — | | | | 247,944 | |
Fidelity Southern Corp. | | | 1,669 | | | | 1,876 | | | | — | | | | 3,545 | | | | 39,505 | | | | 44,405 | | | | — | | | | 83,910 | |
Financial Institutions, Inc. | | | 1,094 | | | | 1,241 | �� | | | — | | | | 2,335 | | | | 37,415 | | | | 42,442 | | | | — | | | | 79,857 | |
First Bancorp | | | 1,580 | | | | 1,774 | | | | — | | | | 3,354 | | | | 42,881 | | | | 48,146 | | | | — | | | | 91,027 | |
First BanCorp* | | | 9,613 | | | | 10,766 | | | | — | | | | 20,379 | | | | 63,542 | | | | 71,163 | | | | — | | | | 134,705 | |
First Bancorp, Inc. | | | 794 | | | | 902 | | | | — | | | | 1,696 | | | | 26,281 | | | | 29,856 | | | | — | | | | 56,137 | |
First Busey Corp. | | | 2,491 | | | | 2,775 | | | | — | | | | 5,266 | | | | 76,673 | | | | 85,415 | | | | — | | | | 162,088 | |
First Business Financial Services, Inc. | | | 655 | | | | 713 | | | | — | | | | 1,368 | | | | 15,537 | | | | 16,912 | | | | — | | | | 32,449 | |
First Citizens BancShares, Inc., Class A | | | 607 | | | | 688 | | | | — | | | | 1,295 | | | | 215,485 | | | | 244,240 | | | | — | | | | 459,725 | |
First Commonwealth Financial Corp. | | | 7,146 | | | | 8,191 | | | | — | | | | 15,337 | | | | 101,330 | | | | 116,148 | | | | — | | | | 217,478 | |
First Community Bancshares, Inc. | | | 1,260 | | | | 1,395 | | | | — | | | | 2,655 | | | | 37,976 | | | | 42,045 | | | | — | | | | 80,021 | |
First Community Financial Partners, Inc.(x)* | | | 1,105 | | | | 1,243 | | | | — | | | | 2,348 | | | | 12,929 | | | | 14,543 | | | | — | | | | 27,472 | |
First Connecticut Bancorp, Inc. | | | 859 | | | | 957 | | | | — | | | | 1,816 | | | | 19,456 | | | | 21,676 | | | | — | | | | 41,132 | |
First Financial Bancorp | | | 4,894 | | | | 5,560 | | | | — | | | | 10,454 | | | | 139,234 | | | | 158,182 | | | | — | | | | 297,416 | |
First Financial Bankshares, Inc.(x) | | | 1,928 | | | | 2,201 | | | | — | | | | 4,129 | | | | 87,146 | | | | 99,485 | | | | — | | | | 186,631 | |
First Financial Corp. | | | 796 | | | | 893 | | | | — | | | | 1,689 | | | | 42,029 | | | | 47,150 | | | | — | | | | 89,179 | |
First Financial Northwest, Inc. | | | 617 | | | | 808 | | | | — | | | | 1,425 | | | | 12,180 | | | | 15,950 | | | | — | | | | 28,130 | |
First Foundation, Inc.* | | | 738 | | | | 802 | | | | — | | | | 1,540 | | | | 21,033 | | | | 22,857 | | | | — | | | | 43,890 | |
First Internet Bancorp | | | 425 | | | | 479 | | | | — | | | | 904 | | | | 13,600 | | | | 15,328 | | | | — | | | | 28,928 | |
First Interstate BancSystem, Inc., Class A(x) | | | 1,596 | | | | 1,834 | | | | — | | | | 3,430 | | | | 67,910 | | | | 78,037 | | | | — | | | | 145,947 | |
First Merchants Corp. | | | 3,257 | | | | 3,752 | | | | — | | | | 7,009 | | | | 122,626 | | | | 141,263 | | | | — | | | | 263,889 | |
First Mid-Illinois Bancshares, Inc. | | | 632 | | | | 709 | | | | — | | | | 1,341 | | | | 21,488 | | | | 24,106 | | | | — | | | | 45,594 | |
First Midwest Bancorp, Inc. | | | 6,452 | | | | 7,300 | | | | — | | | | 13,752 | | | | 162,784 | | | �� | 184,179 | | | | — | | | | 346,963 | |
First NBC Bank Holding Co.(x)* | | | 1,320 | | | | 1,424 | | | | — | | | | 2,744 | | | | 9,636 | | | | 10,395 | | | | — | | | | 20,031 | |
First Northwest Bancorp* | | | 913 | | | | 1,031 | | | | — | | | | 1,944 | | | | 14,243 | | | | 16,084 | | | | — | | | | 30,327 | |
First of Long Island Corp. (The) | | | 1,706 | | | | 1,917 | | | | — | | | | 3,623 | | | | 48,706 | | | | 54,730 | | | | — | | | | 103,436 | |
Flushing Financial Corp. | | | 2,247 | | | | 2,511 | | | | — | | | | 4,758 | | | | 66,039 | | | | 73,798 | | | | — | | | | 139,837 | |
FNB Corp. | | | 16,799 | | | | 18,680 | | | | — | | | | 35,479 | | | | 269,288 | | | | 299,440 | | | | — | | | | 568,728 | |
Franklin Financial Network, Inc.(x)* | | | 612 | | | | 620 | | | | — | | | | 1,232 | | | | 25,612 | | | | 25,947 | | | | — | | | | 51,559 | |
Fulton Financial Corp. | | | 13,720 | | | | 15,498 | | | | — | | | | 29,218 | | | | 257,936 | | | | 291,362 | | | | — | | | | 549,298 | |
German American Bancorp, Inc. | | | 1,132 | | | | 1,271 | | | | — | | | | 2,403 | | | | 59,555 | | | | 66,867 | | | | — | | | | 126,422 | |
Glacier Bancorp, Inc. | | | 6,119 | | | | 6,745 | | | | — | | | | 12,864 | | | | 221,691 | | | | 244,371 | | | | — | | | | 466,062 | |
Great Southern Bancorp, Inc. | | | 860 | | | | 966 | | | | — | | | | 1,826 | | | | 46,999 | | | | 52,792 | | | | — | | | | 99,791 | |
Great Western Bancorp, Inc. | | | 4,741 | | | | 5,362 | | | | — | | | | 10,103 | | | | 206,660 | | | | 233,730 | | | | — | | | | 440,390 | |
Green Bancorp, Inc.* | | | 1,673 | | | | 1,884 | | | | — | | | | 3,557 | | | | 25,430 | | | | 28,637 | | | | — | | | | 54,067 | |
Guaranty Bancorp | | | 1,214 | | | | 1,347 | | | | — | | | | 2,561 | | | | 29,379 | | | | 32,597 | | | | — | | | | 61,976 | |
Hancock Holding Co. | | | 6,174 | | | | 6,971 | | | | — | | | | 13,145 | | | | 266,099 | | | | 300,450 | | | | — | | | | 566,549 | |
Hanmi Financial Corp. | | | 2,536 | | | | 2,909 | | | | — | | | | 5,445 | | | | 88,506 | | | | 101,524 | | | | — | | | | 190,030 | |
HarborOne Bancorp, Inc.* | | | 1,077 | | | | 1,208 | | | | — | | | | 2,285 | | | | 20,829 | | | | 23,363 | | | | — | | | | 44,192 | |
Heartland Financial USA, Inc. | | | 1,777 | | | | 2,031 | | | | — | | | | 3,808 | | | | 85,296 | | | | 97,488 | | | | — | | | | 182,784 | |
Heritage Commerce Corp. | | | 1,877 | | | | 2,121 | | | | — | | | | 3,998 | | | | 27,085 | | | | 30,606 | | | | — | | | | 57,691 | |
Heritage Financial Corp. | | | 2,365 | | | | 2,655 | | | | — | | | | 5,020 | | | | 60,899 | | | | 68,366 | | | | — | | | | 129,265 | |
Heritage Oaks Bancorp | | | 1,949 | | | | 2,169 | | | | — | | | | 4,118 | | | | 24,031 | | | | 26,744 | | | | — | | | | 50,775 | |
Hilltop Holdings, Inc. | | | 6,028 | | | | 6,807 | | | | — | | | | 12,835 | | | | 179,634 | | | | 202,849 | | | | — | | | | 382,483 | |
HomeTrust Bancshares, Inc.* | | | 1,338 | | | | 1,515 | | | | — | | | | 2,853 | | | | 34,654 | | | | 39,239 | | | | — | | | | 73,893 | |
Hope Bancorp, Inc. | | | 10,245 | | | | 11,586 | | | | — | | | | 21,831 | | | | 224,263 | | | | 253,618 | | | | — | | | | 477,881 | |
Horizon Bancorp | | | 1,564 | | | | 1,735 | | | | — | | | | 3,299 | | | | 43,792 | | | | 48,580 | | | | — | | | | 92,372 | |
IBERIABANK Corp. | | | 3,492 | | | | 3,927 | | | | — | | | | 7,419 | | | | 292,455 | | | | 328,886 | | | | — | | | | 621,341 | |
Independent Bank Corp. | | | 3,707 | | | | 4,186 | | | | — | | | | 7,893 | | | | 182,232 | | | | 206,276 | | | | — | | | | 388,508 | |
Independent Bank Group, Inc. | | | 901 | | | | 1,002 | | | | — | | | | 1,903 | | | | 56,222 | | | | 62,525 | | | | — | | | | 118,747 | |
International Bancshares Corp. | | | 4,390 | | | | 4,933 | | | | — | | | | 9,323 | | | | 179,112 | | | | 201,266 | | | | — | | | | 380,378 | |
Investors Bancorp, Inc. | | | 23,746 | | | | 26,547 | | | | — | | | | 50,293 | | | | 331,257 | | | | 370,331 | | | | — | | | | 701,588 | |
Lakeland Bancorp, Inc. | | | 3,119 | | | | 3,500 | | | | — | | | | 6,619 | | | | 60,821 | | | | 68,250 | | | | — | | | | 129,071 | |
Lakeland Financial Corp. | | | 1,943 | | | | 2,222 | | | | — | | | | 4,165 | | | | 92,020 | | | | 105,234 | | | | — | | | | 197,254 | |
LCNB Corp. | | | 673 | | | | 753 | | | | — | | | | 1,426 | | | | 15,647 | | | | 17,507 | | | | — | | | | 33,154 | |
LegacyTexas Financial Group, Inc. | | | 3,560 | | | | 4,026 | | | | — | | | | 7,586 | | | | 153,294 | | | | 173,360 | | | | — | | | | 326,654 | |
Macatawa Bank Corp. | | | 2,113 | | | | 2,373 | | | | — | | | | 4,486 | | | | 21,996 | | | | 24,703 | | | | — | | | | 46,699 | |
36
| | | | | | | | | | | | | | | | | | | | | | | | | | | | | | | | |
| | | Pacific Global
Small Cap
Value | | | Horizon
Small Cap
Value | | | Pro-forma
Adjustment | | | AXA/Horizon
Small Cap
Value
Combined
Pro-forma | | | Pacific
Global Small
Cap Value | | | Horizon
Small Cap
Value | | | Pro-forma
Adjustment | | | AXA/Horizon
Small Cap
Value
Combined
Pro-forma | |
| | | Number of
Shares | | | Number of
Shares | | | Number of
Shares | | | Number of
Shares | | | Value ($) | | | Value ($) | | | Value ($) | | | Value ($) | |
MainSource Financial Group, Inc. | | | 1,846 | | | | 2,073 | | | | — | | | | 3,919 | | | | 63,502 | | | | 71,311 | | | | — | | | | 134,813 | |
MB Financial, Inc. | | | 6,056 | | | | 6,738 | | | | — | | | | 12,794 | | | | 286,025 | | | | 318,236 | | | | — | | | | 604,261 | |
MBT Financial Corp.(x) | | | 1,405 | | | | 1,577 | | | | — | | | | 2,982 | | | | 15,947 | | | | 17,899 | | | | — | | | | 33,846 | |
Mercantile Bank Corp. | | | 1,267 | | | | 1,423 | | | | — | | | | 2,690 | | | | 47,766 | | | | 53,647 | | | | — | | | | 101,413 | |
Merchants Bancshares, Inc. | | | 441 | | | | 515 | | | | — | | | | 956 | | | | 23,902 | | | | 27,913 | | | | — | | | | 51,815 | |
Middleburg Financial Corp. | | | 369 | | | | 414 | | | | — | | | | 783 | | | | 12,823 | | | | 14,387 | | | | — | | | | 27,210 | |
Midland States Bancorp, Inc. | | | 304 | | | | 343 | | | | — | | | | 647 | | | | 10,999 | | | | 12,410 | | | | — | | | | 23,409 | |
MidWestOne Financial Group, Inc. | | | 656 | | | | 744 | | | | — | | | | 1,400 | | | | 24,666 | | | | 27,974 | | | | — | | | | 52,640 | |
MutualFirst Financial, Inc.(x) | | | 419 | | | | 471 | | | | — | | | | 890 | | | | 13,869 | | | | 15,590 | | | | — | | | | 29,459 | |
National Bankshares, Inc./
Virginia(x) | | | 531 | | | | 605 | | | | — | | | | 1,136 | | | | 23,072 | | | | 26,287 | | | | — | | | | 49,359 | |
National Commerce Corp.* | | | 673 | | | | 759 | | | | — | | | | 1,432 | | | | 25,002 | | | | 28,197 | | | | — | | | | 53,199 | |
NBT Bancorp, Inc. | | | 3,422 | | | | 3,881 | | | | — | | | | 7,303 | | | | 143,313 | | | | 162,536 | | | | — | | | | 305,849 | |
Nicolet Bankshares, Inc.* | | | 606 | | | | 683 | | | | — | | | | 1,289 | | | | 28,900 | | | | 32,572 | | | | — | | | | 61,472 | |
Northrim BanCorp, Inc. | | | 543 | | | | 610 | | | | — | | | | 1,153 | | | | 17,159 | | | | 19,276 | | | | — | | | | 36,435 | |
OFG Bancorp | | | 3,508 | | | | 3,923 | | | | — | | | | 7,431 | | | | 45,955 | | | | 51,391 | | | | — | | | | 97,346 | |
Old Line Bancshares, Inc. | | | 671 | | | | 562 | | | | — | | | | 1,233 | | | | 16,091 | | | | 13,477 | | | | — | | | | 29,568 | |
Old National Bancorp | | | 10,680 | | | | 11,734 | | | | — | | | | 22,414 | | | | 193,842 | | | | 212,972 | | | | — | | | | 406,814 | |
Old Second Bancorp, Inc. | | | 2,279 | | | | 2,103 | | | | — | | | | 4,382 | | | | 25,183 | | | | 23,238 | | | | — | | | | 48,421 | |
Opus Bank | | | 496 | | | | 360 | | | | — | | | | 856 | | | | 14,905 | | | | 10,818 | | | | — | | | | 25,723 | |
Orrstown Financial Services, Inc. | | | 581 | | | | 485 | | | | — | | | | 1,066 | | | | 13,014 | | | | 10,864 | | | | — | | | | 23,878 | |
Pacific Continental Corp. | | | 1,670 | | | | 1,971 | | | | — | | | | 3,641 | | | | 36,490 | | | | 43,066 | | | | — | | | | 79,556 | |
Pacific Mercantile Bancorp* | | | 1,219 | | | | 1,372 | | | | — | | | | 2,591 | | | | 8,899 | | | | 10,016 | | | | — | | | | 18,915 | |
Pacific Premier Bancorp, Inc.* | | | 1,453 | | | | 1,630 | | | | — | | | | 3,083 | | | | 51,364 | | | | 57,621 | | | | — | | | | 108,985 | |
Paragon Commercial Corp.* | | | 70 | | | | — | | | | — | | | | 70 | | | | 3,060 | | | | — | | | | — | | | | 3,060 | |
Park National Corp. | | | 1,068 | | | | 1,213 | | | | — | | | | 2,281 | | | | 127,797 | | | | 145,148 | | | | — | | | | 272,945 | |
Park Sterling Corp. | | | 2,799 | | | | 3,147 | | | | — | | | | 5,946 | | | | 30,201 | | | | 33,956 | | | | — | | | | 64,157 | |
Peapack-Gladstone Financial Corp. | | | 1,264 | | | | 1,439 | | | | — | | | | 2,703 | | | | 39,032 | | | | 44,436 | | | | — | | | | 83,468 | |
Penns Woods Bancorp, Inc. | | | 364 | | | | 402 | | | | — | | | | 766 | | | | 18,382 | | | | 20,301 | | | | — | | | | 38,683 | |
Peoples Bancorp, Inc. | | | 1,286 | | | | 1,443 | | | | — | | | | 2,729 | | | | 41,744 | | | | 46,840 | | | | — | | | | 88,584 | |
Peoples Financial Services Corp. | | | 547 | | | | 615 | | | | — | | | | 1,162 | | | | 26,639 | | | | 29,951 | | | | — | | | | 56,590 | |
People’s Utah Bancorp | | | 1,060 | | | | 1,152 | | | | — | | | | 2,212 | | | | 28,461 | | | | 30,931 | | | | — | | | | 59,392 | |
Pinnacle Financial Partners, Inc. | | | 3,000 | | | | 3,386 | | | | — | | | | 6,386 | | | | 207,900 | | | | 234,650 | | | | — | | | | 442,550 | |
Preferred Bank | | | 965 | | | | 1,082 | | | | — | | | | 2,047 | | | | 50,585 | | | | 56,718 | | | | — | | | | 107,303 | |
Premier Financial Bancorp, Inc. | | | 740 | | | | 828 | | | | — | | | | 1,568 | | | | 14,874 | | | | 16,643 | | | | — | | | | 31,517 | |
PrivateBancorp, Inc. | | | 6,284 | | | | 7,005 | | | | — | | | | 13,289 | | | | 340,530 | | | | 379,601 | | | | — | | | | 720,131 | |
Prosperity Bancshares, Inc. | | | 5,345 | | | | 5,973 | | | | — | | | | 11,318 | | | | 383,664 | | | | 428,742 | | | | — | | | | 812,406 | |
QCR Holdings, Inc. | | | 953 | | | | 1,072 | | | | — | | | | 2,025 | | | | 41,265 | | | | 46,418 | | | | — | | | | 87,683 | |
Renasant Corp. | | | 3,263 | | | | 3,744 | | | | — | | | | 7,007 | | | | 137,764 | | | | 158,072 | | | | — | | | | 295,836 | |
Republic Bancorp, Inc., Class A | | | 772 | | | | 856 | | | | — | | | | 1,628 | | | | 30,525 | | | | 33,846 | | | | — | | | | 64,371 | |
Republic First Bancorp, Inc.* | | | 3,672 | | | | 3,976 | | | | — | | | | 7,648 | | | | 30,661 | | | | 33,200 | | | | — | | | | 63,861 | |
S&T Bancorp, Inc. | | | 2,731 | | | | 3,107 | | | | — | | | | 5,838 | | | | 106,618 | | | | 121,297 | | | | — | | | | 227,915 | |
Sandy Spring Bancorp, Inc. | | | 1,884 | | | | 2,113 | | | | — | | | | 3,997 | | | | 75,341 | | | | 84,499 | | | | — | | | | 159,840 | |
Seacoast Banking Corp. of Florida* | | | 2,390 | | | | 2,689 | | | | — | | | | 5,079 | | | | 52,723 | | | | 59,319 | | | | — | | | | 112,042 | |
Shore Bancshares, Inc. | | | 1,011 | | | | 1,135 | | | | — | | | | 2,146 | | | | 15,418 | | | | 17,309 | | | | — | | | | 32,727 | |
Sierra Bancorp | | | 930 | | | | 1,039 | | | | — | | | | 1,969 | | | | 24,729 | | | | 27,627 | | | | — | | | | 52,356 | |
Simmons First National Corp., Class A(x) | | | 2,347 | | | | 2,660 | | | | — | | | | 5,007 | | | | 145,866 | | | | 165,319 | | | | — | | | | 311,185 | |
South State Corp. | | | 1,893 | | | | 2,082 | | | | — | | | | 3,975 | | | | 165,448 | | | | 181,967 | | | | — | | | | 347,415 | |
Southern First Bancshares, Inc.* | | | 455 | | | | 512 | | | | — | | | | 967 | | | | 16,380 | | | | 18,432 | | | | — | | | | 34,812 | |
Southern National Bancorp of Virginia, Inc. | | | 880 | | | | 988 | | | | — | | | | 1,868 | | | | 14,379 | | | | 16,144 | | | | — | | | | 30,523 | |
Southside Bancshares, Inc. | | | 1,975 | | | | 2,263 | | | | — | | | | 4,238 | | | | 74,398 | | | | 85,247 | | | | — | | | | 159,645 | |
Southwest Bancorp, Inc./Oklahoma | | | 1,451 | | | | 1,631 | | | | — | | | | 3,082 | | | | 42,079 | | | | 47,299 | | | | — | | | | 89,378 | |
State Bank Financial Corp. | | | 2,829 | | | | 3,146 | | | | — | | | | 5,975 | | | | 75,987 | | | | 84,502 | | | | — | | | | 160,489 | |
Sterling Bancorp | | | 10,126 | | | | 11,230 | | | | — | | | | 21,356 | | | | 236,948 | | | | 262,782 | | | | — | | | | 499,730 | |
Stock Yards Bancorp, Inc. | | | 1,709 | | | | 1,901 | | | | — | | | | 3,610 | | | | 80,238 | | | | 89,252 | | | | — | | | | 169,490 | |
Stonegate Bank | | | 992 | | | | 1,161 | | | | — | | | | 2,153 | | | | 41,396 | | | | 48,449 | | | | — | | | | 89,845 | |
Suffolk Bancorp | | | 917 | | | | 1,030 | | | | — | | | | 1,947 | | | | 39,266 | | | | 44,105 | | | | — | | | | 83,371 | |
Summit Financial Group, Inc.(x) | | | 665 | | | | 746 | | | | — | | | | 1,411 | | | | 18,307 | | | | 20,537 | | | | — | | | | 38,844 | |
Sun Bancorp, Inc. | | | 874 | | | | 945 | | | | — | | | | 1,819 | | | | 22,724 | | | | 24,570 | | | | — | | | | 47,294 | |
Texas Capital Bancshares, Inc.* | | | 3,624 | | | | 4,059 | | | | — | | | | 7,683 | | | | 284,122 | | | | 318,226 | | | | — | | | | 602,348 | |
Tompkins Financial Corp.(x) | | | 1,168 | | | | 1,330 | | | | — | | | | 2,498 | | | | 110,423 | | | | 125,738 | | | | — | | | | 236,161 | |
Towne Bank | | | 4,462 | | | | 5,062 | | | | — | | | | 9,524 | | | | 148,362 | | | | 168,312 | | | | — | | | | 316,674 | |
TriCo Bancshares | | | 1,621 | | | | 1,820 | | | | — | | | | 3,441 | | | | 55,406 | | | | 62,208 | | | | — | | | | 117,614 | |
TriState Capital Holdings, Inc.* | | | 1,772 | | | | 1,996 | | | | — | | | | 3,768 | | | | 39,161 | | | | 44,112 | | | | — | | | | 83,273 | |
Triumph Bancorp, Inc.* | | | 1,245 | | | | 1,403 | | | | — | | | | 2,648 | | | | 32,557 | | | | 36,688 | | | | — | | | | 69,245 | |
37
| | | | | | | | | | | | | | | | | | | | | | | | | | | | | | | | |
| | | Pacific Global
Small Cap
Value | | | Horizon
Small Cap
Value | | | Pro-forma
Adjustment | | | AXA/Horizon
Small Cap
Value
Combined
Pro-forma | | | Pacific
Global Small
Cap Value | | | Horizon
Small Cap
Value | | | Pro-forma
Adjustment | | | AXA/Horizon
Small Cap
Value
Combined
Pro-forma | |
| | | Number of
Shares | | | Number of
Shares | | | Number of
Shares | | | Number of
Shares | | | Value ($) | | | Value ($) | | | Value ($) | | | Value ($) | |
Trustmark Corp. | | | 5,407 | | | | 6,103 | | | | — | | | | 11,510 | | | | 192,760 | | | | 217,572 | | | | — | | | | 410,332 | |
UMB Financial Corp. | | | 3,580 | | | | 3,991 | | | | — | | | | 7,571 | | | | 276,090 | | | | 307,786 | | | | — | | | | 583,876 | |
Umpqua Holdings Corp. | | | 17,625 | | | | 19,700 | | | | — | | | | 37,325 | | | | 330,998 | | | | 369,966 | | | | — | | | | 700,964 | |
Union Bankshares Corp. | | | 3,507 | | | | 3,985 | | | | — | | | | 7,492 | | | | 125,340 | | | | 142,424 | | | | — | | | | 267,764 | |
United Bankshares, Inc.(x) | | | 5,241 | | | | 5,828 | | | | — | | | | 11,069 | | | | 242,396 | | | | 269,545 | | | | — | | | | 511,941 | |
United Community Banks, Inc. | | | 5,630 | | | | 6,367 | | | | — | | | | 11,997 | | | | 166,761 | | | | 188,591 | | | | — | �� | | | 355,352 | |
Univest Corp. of Pennsylvania | | | 1,976 | | | | 2,218 | | | | — | | | | 4,194 | | | | 61,058 | | | | 68,536 | | | | — | | | | 129,594 | |
Valley National Bancorp | | | 19,775 | | | | 22,381 | | | | — | | | | 42,156 | | | | 230,181 | | | | 260,515 | | | | — | | | | 490,696 | |
Veritex Holdings, Inc.* | | | 460 | | | | 520 | | | | — | | | | 980 | | | | 12,287 | | | | 13,889 | | | | — | | | | 26,176 | |
Washington Trust Bancorp, Inc. | | | 1,189 | | | | 1,335 | | | | — | | | | 2,524 | | | | 66,643 | | | | 74,827 | | | | — | | | | 141,470 | |
WashingtonFirst Bankshares, Inc. | | | 672 | | | | 756 | | | | — | | | | 1,428 | | | | 19,481 | | | | 21,916 | | | | — | | | | 41,397 | |
Webster Financial Corp. | | | 7,336 | | | | 8,191 | | | | — | | | | 15,527 | | | | 398,198 | | | | 444,607 | | | | — | | | | 842,805 | |
WesBanco, Inc.(x) | | | 3,244 | | | | 3,679 | | | | — | | | | 6,923 | | | | 139,687 | | | | 158,418 | | | | — | | | | 298,105 | |
West Bancorporation, Inc. | | | 1,259 | | | | 1,417 | | | | — | | | | 2,676 | | | | 31,097 | | | | 35,000 | | | | — | | | | 66,097 | |
Westamerica Bancorp(x) | | | 1,988 | | | | 2,260 | | | | — | | | | 4,248 | | | | 125,105 | | | | 142,222 | | | | — | | | | 267,327 | |
Wintrust Financial Corp. | | | 4,109 | | | | 4,577 | | | | — | | | | 8,686 | | | | 298,190 | | | | 332,153 | | | | — | | | | 630,343 | |
Xenith Bankshares, Inc.* | | | 489 | | | | 617 | | | | — | | | | 1,106 | | | | 13,790 | | | | 17,399 | | | | — | | | | 31,189 | |
Yadkin Financial Corp. | | | 4,011 | | | | 4,598 | | | | — | | | | 8,609 | | | | 137,417 | | | | 157,527 | | | | — | | | | 294,944 | |
| | | | | | | | | | | | | | | | | | | | | | | | | | | | | | | | |
| | | | | | | | | | | | | | | | | | | 19,768,741 | | | | 18,221,177 | | | | — | | | | 37,989,918 | |
| | | | | | | | | | | | | | | | | | | | | | | | | | | | | | | | |
Capital Markets (2.6%) | | | | | | | | | | | | | | | | | | | | | | | | | | | | | | | | |
Actua Corp.* | | | 2,886 | | | | 3,239 | | | | — | | | | 6,125 | | | | 40,404 | | | | 45,346 | | | | — | | | | 85,750 | |
Arlington Asset Investment Corp., Class A(x) | | | 1,806 | | | | 2,009 | | | | — | | | | 3,815 | | | | 26,765 | | | | 29,773 | | | | — | | | | 56,538 | |
Associated Capital Group, Inc., Class A | | | 365 | | | | 117,197 | | | | — | | | | 117,562 | | | | 11,990 | | | | 3,849,920 | | | | — | | | | 3,861,910 | |
B. Riley Financial, Inc. | | | 726 | | | | 805 | | | | — | | | | 1,531 | | | | 13,395 | | | | 14,852 | | | | — | | | | 28,247 | |
BGC Partners, Inc., Class A | | | — | | | | 200 | | | | — | | | | 200 | | | | — | | | | 2,046 | | | | — | | | | 2,046 | |
Calamos Asset Management, Inc., Class A | | | 1,341 | | | | 1,501 | | | | — | | | | 2,842 | | | | 11,466 | | | | 12,834 | | | | — | | | | 24,300 | |
Clarke, Inc. | | | — | | | | 3,700 | | | | — | | | | 3,700 | | | | — | | | | 25,794 | | | | — | | | | 25,794 | |
Cowen Group, Inc., Class A(x)* | | | 1,957 | | | | 2,200 | | | | — | | | | 4,157 | | | | 30,333 | | | | 34,100 | | | | — | | | | 64,433 | |
Dundee Corp., Class A* | | | — | | | | 151,400 | | | | — | | | | 151,400 | | | | — | | | | 670,701 | | | | — | | | | 670,701 | |
FBR & Co. | | | 501 | | | | 548 | | | | — | | | | 1,049 | | | | 6,513 | | | | 7,124 | | | | — | | | | 13,637 | |
Federated Investors, Inc., Class B | | | — | | | | 14,600 | | | | — | | | | 14,600 | | | | — | | | | 412,887 | | | | — | | | | 412,887 | |
GAIN Capital Holdings, Inc. | | | 2,491 | | | | 2,798 | | | | — | | | | 5,289 | | | | 16,391 | | | | 18,411 | | | | — | | | | 34,802 | |
GAMCO Investors, Inc., Class A | | | 288 | | | | 5,649 | | | | — | | | | 5,937 | | | | 8,896 | | | | 174,498 | | | | — | | | | 183,394 | |
Greenhill & Co., Inc. | | | 579 | | | | 650 | | | | — | | | | 1,229 | | | | 16,038 | | | | 18,005 | | | | — | | | | 34,043 | |
INTL FCStone, Inc.* | | | 1,209 | | | | 1,405 | | | | — | | | | 2,614 | | | | 47,876 | | | | 55,638 | | | | — | | | | 103,514 | |
Investment Technology Group, Inc. | | | 2,274 | | | | 2,530 | | | | — | | | | 4,804 | | | | 44,889 | | | | 49,942 | | | | — | | | | 94,831 | |
Janus Capital Group, Inc. | | | 11,501 | | | | 13,055 | | | | — | | | | 24,556 | | | | 152,618 | | | | 173,240 | | | | — | | | | 325,858 | |
KCG Holdings, Inc., Class A* | | | 4,202 | | | | 4,838 | | | | — | | | | 9,040 | | | | 55,677 | | | | 64,104 | | | | — | | | | 119,781 | |
Ladenburg Thalmann Financial Services, Inc.* | | | 7,223 | | | | 8,110 | | | | — | | | | 15,333 | | | | 17,624 | | | | 19,788 | | | | — | | | | 37,412 | |
Manning & Napier, Inc. | | | 1,207 | | | | 1,352 | | | | — | | | | 2,559 | | | | 9,113 | | | | 10,208 | | | | — | | | | 19,321 | |
Medley Management, Inc.,
Class A(x) | | | 259 | | | | 304 | | | | — | | | | 563 | | | | 2,564 | | | | 3,010 | | | | — | | | | 5,574 | |
Morningstar, Inc. | | | 14,000 | | | | — | | | | — | | | | 14,000 | | | | 1,029,840 | | | | — | | | | — | | | | 1,029,840 | |
OM Asset Management plc | | | 1,029 | | | | 1,163 | | | | — | | | | 2,192 | | | | 14,921 | | | | 16,864 | | | | — | | | | 31,785 | |
Oppenheimer Holdings, Inc., Class A | | | 813 | | | | 622 | | | | — | | | | 1,435 | | | | 15,122 | | | | 11,569 | | | | — | | | | 26,691 | |
Piper Jaffray Cos.* | | | 1,169 | | | | 1,340 | | | | — | | | | 2,509 | | | | 84,753 | | | | 97,150 | | | | — | | | | 181,903 | |
PJT Partners, Inc., Class A | | | 1,425 | | | | 1,461 | | | | — | | | | 2,886 | | | | 44,004 | | | | 45,116 | | | | — | | | | 89,120 | |
Pzena Investment Management, Inc., Class A | | | 286 | | | | 323 | | | | — | | | | 609 | | | | 3,177 | | | | 3,589 | | | | — | | | | 6,766 | |
Safeguard Scientifics, Inc.* | | | 1,619 | | | | 1,820 | | | | — | | | | 3,439 | | | | 21,776 | | | | 24,479 | | | | — | | | | 46,255 | |
Senvest Capital, Inc.* | | | — | | | | 1,110 | | | | — | | | | 1,110 | | | | — | | | | 141,370 | | | | — | | | | 141,370 | |
Stifel Financial Corp.* | | | 5,113 | | | | 5,693 | | | | — | | | | 10,806 | | | | 255,394 | | | | 284,365 | | | | — | | | | 539,759 | |
Virtu Financial, Inc., Class A | | | 136 | | | | 159 | | | | — | | | | 295 | | | | 2,169 | | | | 2,536 | | | | — | | | | 4,705 | |
Virtus Investment Partners, Inc.(x) | | | 354 | | | | 412 | | | | — | | | | 766 | | | | 41,790 | | | | 48,637 | | | | — | | | | 90,427 | |
Waddell & Reed Financial, Inc.,
Class A(x) | | | 5,699 | | | | 6,502 | | | | — | | | | 12,201 | | | | 111,187 | | | | 126,854 | | | | — | | | | 238,041 | |
Walter Investment Management
Corp.(x)* | | | 1,412 | | | | 1,658 | | | | — | | | | 3,070 | | | | 6,707 | | | | 7,876 | | | | — | | | | 14,583 | |
Wins Finance Holdings, Inc.(x)* | | | 109 | | | | 119 | | | | — | | | | 228 | | | | 19,620 | | | | 21,420 | | | | — | | | | 41,040 | |
| | | | | | | | | | | | | | | | | | | | | | | | | | | | | | | | |
| | | | | | | | | | | | | | | | | | | 2,163,012 | | | | 6,524,046 | | | | — | | | | 8,687,058 | |
| | | | | | | | | | | | | | | | | | | | | | | | | | | | | | | | |
Consumer Finance (1.6%) | | | | | | | | | | | | | | | | | | | | | | | | | | | | | | | | |
Emergent Capital, Inc.(x)* | | | — | | | | 364,700 | | | | — | | | | 364,700 | | | | — | | | | 441,286 | | | | — | | | | 441,286 | |
Encore Capital Group, Inc.(x)* | | | 1,930 | | | | 2,176 | | | | — | | | | 4,106 | | | | 55,294 | | | | 62,342 | | | | — | | | | 117,636 | |
Enova International, Inc.* | | | 2,161 | | | | 2,430 | | | | — | | | | 4,591 | | | | 27,121 | | | | 30,497 | | | | — | | | | 57,618 | |
EZCORP, Inc., Class A* | | | 4,063 | | | | 4,539 | | | | — | | | | 8,602 | | | | 43,271 | | | | 48,340 | | | | — | | | | 91,611 | |
38
| | | | | | | | | | | | | | | | | | | | | | | | | | | | | | | | |
| | | Pacific Global
Small Cap
Value | | | Horizon
Small Cap
Value | | | Pro-forma
Adjustment | | | AXA/Horizon
Small Cap
Value
Combined
Pro-forma | | | Pacific
Global Small
Cap Value | | | Horizon
Small Cap
Value | | | Pro-forma
Adjustment | | | AXA/Horizon
Small Cap
Value
Combined
Pro-forma | |
| | | Number of
Shares | | | Number of
Shares | | | Number of
Shares | | | Number of
Shares | | | Value ($) | | | Value ($) | | | Value ($) | | | Value ($) | |
FirstCash, Inc. | | | 1,609 | | | | 1,838 | | | | — | | | | 3,447 | | | | 75,623 | | | | 86,386 | | | | — | | | | 162,009 | |
Green Dot Corp., Class A* | | | 2,836 | | | | 3,252 | | | | — | | | | 6,088 | | | | 66,788 | | | | 76,585 | | | | — | | | | 143,373 | |
LendingClub Corp.* | | | 14,809 | | | | 16,889 | | | | — | | | | 31,698 | | | | 77,747 | | | | 88,667 | | | | — | | | | 166,414 | |
Nelnet, Inc., Class A | | | 1,628 | | | | 1,828 | | | | — | | | | 3,456 | | | | 82,621 | | | | 92,771 | | | | — | | | | 175,392 | |
PRA Group, Inc.* | | | 3,672 | | | | 4,166 | | | | — | | | | 7,838 | | | | 143,575 | | | | 162,891 | | | | — | | | | 306,466 | |
Regional Management Corp.* | | | 140,787 | | | | 884 | | | | — | | | | 141,671 | | | | 3,699,882 | | | | 23,232 | | | | — | | | | 3,723,114 | |
World Acceptance Corp.(x)* | | | 492 | | | | 552 | | | | — | | | | 1,044 | | | | 31,626 | | | | 35,483 | | | | — | | | | 67,109 | |
| | | | | | | | | | | | | | | | | | | | | | | | | | | | | | | | |
| | | | | | | | | | | | | | | | | | | 4,303,548 | | | | 1,148,480 | | | | — | | | | 5,452,028 | |
| | | | | | | | | | | | | | | | | | | | | | | | | | | | | | | | |
Diversified Financial Services (5.1%) | | | | | | | | | | | | | | | | | | | | | | | | | | | | | | | | |
FNFV Group* | | | 5,369 | | | | 6,136 | | | | — | | | | 11,505 | | | | 73,555 | | | | 84,063 | | | | — | | | | 157,618 | |
Marlin Business Services Corp. | | | 633 | | | | 703 | | | | — | | | | 1,336 | | | | 13,230 | | | | 14,693 | | | | — | | | | 27,923 | |
NewStar Financial, Inc.* | | | 1,754 | | | | 2,042 | | | | — | | | | 3,796 | | | | 16,224 | | | | 18,889 | | | | — | | | | 35,113 | |
On Deck Capital, Inc.(x)* | | | 3,895 | | | | 3,552 | | | | — | | | | 7,447 | | | | 18,034 | | | | 16,446 | | | | — | | | | 34,480 | |
Onex Corp. | | | — | | | | 49,100 | | | | — | | | | 49,100 | | | | — | | | | 3,327,517 | | | | — | | | | 3,327,517 | |
PICO Holdings, Inc.* | | | 1,624 | | | | 1,474 | | | | — | | | | 3,098 | | | | 24,604 | | | | 22,331 | | | | — | | | | 46,935 | |
Texas Pacific Land Trust | | | — | | | | 45,500 | | | | — | | | | 45,500 | | | | — | | | | 13,503,034 | | | | — | | | | 13,503,034 | |
Tiptree Financial, Inc., Class A | | | 1,808 | | | | 2,390 | | | | — | | | | 4,198 | | | | 11,119 | | | | 14,699 | | | | — | | | | 25,818 | |
| | | | | | | | | | | | | | | | | | | | | | | | | | | | | | | | |
| | | | | | | | | | | | | | | | | | | 156,766 | | | | 17,001,672 | | | | — | | | | 17,158,438 | |
| | | | | | | | | | | | | | | | | | | | | | | | | | | | | | | | |
Insurance (2.4%) | | | | | | | | | | | | | | | | | | | | | | | | | | | | | | | | |
Ambac Financial Group, Inc.* | | | 3,460 | | | | 3,840 | | | | — | | | | 7,300 | | | | 77,850 | | | | 86,400 | | | | — | | | | 164,250 | |
American Equity Investment Life Holding Co. | | | 6,670 | | | | 7,484 | | | | — | | | | 14,154 | | | | 150,342 | | | | 168,689 | | | | — | | | | 319,031 | |
AMERISAFE, Inc. | | | 393 | | | | 468 | | | | — | | | | 861 | | | | 24,503 | | | | 29,180 | | | | — | | | | 53,683 | |
AmTrust Financial Services, Inc. | | | — | | | | 17,100 | | | | — | | | | 17,100 | | | | — | | | | 468,198 | | | | — | | | | 468,198 | |
Argo Group International Holdings Ltd. | | | 2,298 | | | | 2,533 | | | | — | | | | 4,831 | | | | 151,438 | | | | 166,925 | | | | — | | | | 318,363 | |
Atlas Financial Holdings, Inc.* | | | 476 | | | | 519 | | | | — | | | | 995 | | | | 8,592 | | | | 9,368 | | | | — | | | | 17,960 | |
Baldwin & Lyons, Inc., Class B | | | 761 | | | | 840 | | | | — | | | | 1,601 | | | | 19,177 | | | | 21,168 | | | | — | | | | 40,345 | |
Blue Capital Reinsurance Holdings Ltd. | | | 486 | | | | 551 | | | | — | | | | 1,037 | | | | 8,967 | | | | 10,166 | | | | — | | | | 19,133 | |
Citizens, Inc.(x)* | | | 3,723 | | | | 4,304 | | | | — | | | | 8,027 | | | | 36,560 | | | | 42,265 | | | | — | | | | 78,825 | |
CNO Financial Group, Inc. | | | 14,331 | | | | 16,155 | | | | — | | | | 30,486 | | | | 274,439 | | | | 309,368 | | | | — | | | | 583,807 | |
Donegal Group, Inc., Class A | | | 698 | | | | 793 | | | | — | | | | 1,491 | | | | 12,201 | | | | 13,862 | | | | — | | | | 26,063 | |
EMC Insurance Group, Inc. | | | 692 | | | | 772 | | | | — | | | | 1,464 | | | | 20,767 | | | | 23,168 | | | | — | | | | 43,935 | |
Employers Holdings, Inc. | | | 2,536 | | | | 2,821 | | | | — | | | | 5,357 | | | | 100,426 | | | | 111,712 | | | | — | | | | 212,138 | |
Enstar Group Ltd.* | | | 909 | | | | 1,030 | | | | — | | | | 1,939 | | | | 179,709 | | | | 203,631 | | | | — | | | | 383,340 | |
FBL Financial Group, Inc., Class A | | | 812 | | | | 912 | | | | — | | | | 1,724 | | | | 63,458 | | | | 71,273 | | | | — | | | | 134,731 | |
Federated National Holding Co. | | | 1,045 | | | | 1,160 | | | | — | | | | 2,205 | | | | 19,531 | | | | 21,680 | | | | — | | | | 41,211 | |
Fidelity & Guaranty Life(x) | | | 1,009 | | | | 1,143 | | | | — | | | | 2,152 | | | | 23,913 | | | | 27,089 | | | | — | | | | 51,002 | |
Genworth Financial, Inc., Class A* | | | 37,550 | | | | 42,109 | | | | — | | | | 79,659 | | | | 143,065 | | | | 160,435 | | | | — | | | | 303,500 | |
Global Indemnity Ltd.* | | | 705 | | | | 790 | | | | — | | | | 1,495 | | | | 26,938 | | | | 30,186 | | | | — | | | | 57,124 | |
Greenlight Capital Reinsurance Ltd., Class A* | | | 2,343 | | | | 51,774 | | | | — | | | | 54,117 | | | | 53,420 | | | | 1,180,446 | | | | — | | | | 1,233,866 | |
Hallmark Financial Services, Inc.* | | | 1,207 | | | | 1,315 | | | | — | | | | 2,522 | | | | 14,037 | | | | 15,293 | | | | — | | | | 29,330 | |
HCI Group, Inc.(x) | | | 734 | | | | 826 | | | | — | | | | 1,560 | | | | 28,978 | | | | 32,610 | | | | — | | | | 61,588 | |
Heritage Insurance Holdings, Inc. | | | 2,193 | | | | 2,467 | | | | — | | | | 4,660 | | | | 34,364 | | | | 38,658 | | | | — | | | | 73,022 | |
Horace Mann Educators Corp. | | | 3,238 | | | | 3,553 | | | | — | | | | 6,791 | | | | 138,586 | | | | 152,068 | | | | — | | | | 290,654 | |
Independence Holding Co. | | | 625 | | | | 784 | | | | — | | | | 1,409 | | | | 12,219 | | | | 15,327 | | | | — | | | | 27,546 | |
Infinity Property & Casualty Corp. | | | 871 | | | | 1,011 | | | | — | | | | 1,882 | | | | 76,561 | | | | 88,867 | | | | — | | | | 165,428 | |
Investors Title Co. | | | 121 | | | | 136 | | | | — | | | | 257 | | | | 19,140 | | | | 21,512 | | | | — | | | | 40,652 | |
James River Group Holdings Ltd. | | | 1,166 | | | | 1,349 | | | | — | | | | 2,515 | | | | 48,447 | | | | 56,051 | | | | — | | | | 104,498 | |
Kemper Corp. | | | 3,156 | | | | 3,479 | | | | — | | | | 6,635 | | | | 139,811 | | | | 154,120 | | | | — | | | | 293,931 | |
Kinsale Capital Group, Inc. | | | 480 | | | | 611 | | | | — | | | | 1,091 | | | | 16,325 | | | | 20,780 | | | | — | | | | 37,105 | |
Maiden Holdings Ltd. | | | 4,524 | | | | 4,970 | | | | — | | | | 9,494 | | | | 78,944 | | | | 86,727 | | | | — | | | | 165,671 | |
MBIA, Inc.* | | | 10,604 | | | | 11,865 | | | | — | | | | 22,469 | | | | 113,463 | | | | 126,956 | | | | — | | | | 240,419 | |
National General Holdings Corp. | | | 1,638 | | | | 1,937 | | | | — | | | | 3,575 | | | | 40,934 | | | | 48,406 | | | | — | | | | 89,340 | |
National Western Life Group, Inc., Class A | | | 187 | | | | 211 | | | | — | | | | 398 | | | | 58,120 | | | | 65,579 | | | | — | | | | 123,699 | |
Navigators Group, Inc. (The) | | | 905 | | | | 1,042 | | | | — | | | | 1,947 | | | | 106,564 | | | | 122,696 | | | | — | | | | 229,260 | |
OneBeacon Insurance Group Ltd., Class A | | | 1,619 | | | | 1,860 | | | | — | | | | 3,479 | | | | 25,985 | | | | 29,853 | | | | — | | | | 55,838 | |
RLI Corp. | | | 548 | | | | 642 | | | | — | | | | 1,190 | | | | 34,595 | | | | 40,529 | | | | — | | | | 75,124 | |
Safety Insurance Group, Inc. | | | 1,161 | | | | 1,300 | | | | — | | | | 2,461 | | | | 85,566 | | | | 95,810 | | | | — | | | | 181,376 | |
Selective Insurance Group, Inc. | | | 4,499 | | | | 5,126 | | | | — | | | | 9,625 | | | | 193,682 | | | | 220,674 | | | | — | | | | 414,356 | |
State Auto Financial Corp. | | | 1,249 | | | | 1,413 | | | | — | | | | 2,662 | | | | 33,486 | | | | 37,883 | | | | — | | | | 71,369 | |
State National Cos., Inc. | | | 2,304 | | | | 2,578 | | | | — | | | | 4,882 | | | | 31,933 | | | | 35,731 | | | | — | | | | 67,664 | |
39
| | | | | | | | | | | | | | | | | | | | | | | | | | | | | | | | |
| | | Pacific Global
Small Cap
Value | | | Horizon
Small Cap
Value | | | Pro-forma
Adjustment | | | AXA/Horizon
Small Cap
Value
Combined
Pro-forma | | | Pacific
Global Small
Cap Value | | | Horizon
Small Cap
Value | | | Pro-forma
Adjustment | | | AXA/Horizon
Small Cap
Value
Combined
Pro-forma | |
| | | Number of
Shares | | | Number of
Shares | | | Number of
Shares | | | Number of
Shares | | | Value ($) | | | Value ($) | | | Value ($) | | | Value ($) | |
Stewart Information Services Corp. | | | 1,819 | | | | 2,073 | | | | — | | | | 3,892 | | | | 83,819 | | | | 95,524 | | | | — | | | | 179,343 | |
Third Point Reinsurance Ltd.* | | | 4,913 | | | | 5,763 | | | | — | | | | 10,676 | | | | 56,745 | | | | 66,563 | | | | — | | | | 123,308 | |
United Fire Group, Inc. | | | 1,746 | | | | 1,957 | | | | — | | | | 3,703 | | | | 85,851 | | | | 96,226 | | | | — | | | | 182,077 | |
United Insurance Holdings Corp. | | | 370 | | | | 416 | | | | — | | | | 786 | | | | 5,602 | | | | 6,298 | | | | — | | | | 11,900 | |
Universal Insurance Holdings, Inc.(x) | | | 737 | | | | 820 | | | | — | | | | 1,557 | | | | 20,931 | | | | 23,288 | | | | — | | | | 44,219 | |
| | | | | | | | | | | | | | | | | | | | | | | | | | | | | | | | |
| | | | | | | | | | | | | | | | | | | 2,979,984 | | | | 4,949,238 | | | | — | | | | 7,929,222 | |
| | | | | | | | | | | | | | | | | | | | | | | | | | | | | | | | |
Mortgage Real Estate Investment Trusts (REITs) (1.0%) | | | | | | | | | | | | | | | | | | | | | | | | | | | | | | | | |
AG Mortgage Investment Trust, Inc. (REIT) | | | 2,240 | | | | 2,514 | | | | — | | | | 4,754 | | | | 38,326 | | | | 43,015 | | | | — | | | | 81,341 | |
Altisource Residential Corp. (REIT) | | | 4,219 | | | | 4,733 | | | | — | | | | 8,952 | | | | 46,578 | | | | 52,252 | | | | — | | | | 98,830 | |
Anworth Mortgage Asset Corp. (REIT) | | | 7,581 | | | | 8,572 | | | | — | | | | 16,153 | | | | 39,194 | | | | 44,317 | | | | — | | | | 83,511 | |
Apollo Commercial Real Estate Finance, Inc. (REIT) | | | 5,783 | | | | 6,486 | | | | — | | | | 12,269 | | | | 96,113 | | | | 107,797 | | | | — | | | | 203,910 | |
Ares Commercial Real Estate Corp. (REIT) | | | 2,175 | | | | 2,455 | | | | — | | | | 4,630 | | | | 29,863 | | | | 33,707 | | | | — | | | | 63,570 | |
ARMOUR Residential REIT, Inc. (REIT) | | | 2,940 | | | | 3,294 | | | | — | | | | 6,234 | | | | 63,777 | | | | 71,452 | | | | — | | | | 135,229 | |
Capstead Mortgage Corp. (REIT) | | | 7,710 | | | | 8,647 | | | | — | | | | 16,357 | | | | 78,565 | | | | 88,113 | | | | — | | | | 166,678 | |
Colony Capital, Inc. (REIT), Class A(x) | | | 9,046 | | | | 9,956 | | | | — | | | | 19,002 | | | | 183,181 | | | | 201,610 | | | | — | | | | 384,791 | |
CYS Investments, Inc. (REIT) | | | 12,164 | | | | 13,856 | | | | — | | | | 26,020 | | | | 94,028 | | | | 107,107 | | | | — | | | | 201,135 | |
Dynex Capital, Inc. (REIT) | | | 3,552 | | | | 3,978 | | | | — | | | | 7,530 | | | | 24,225 | | | | 27,130 | | | | — | | | | 51,355 | |
Great Ajax Corp. (REIT) | | | 1,196 | | | | 1,337 | | | | — | | | | 2,533 | | | | 15,871 | | | | 17,742 | | | | — | | | | 33,613 | |
Hannon Armstrong Sustainable Infrastructure Capital, Inc. (REIT) | | | 3,276 | | | | 3,783 | | | | — | | | | 7,059 | | | | 62,211 | | | | 71,839 | | | | — | | | | 134,050 | |
Invesco Mortgage Capital, Inc. (REIT) | | | 9,026 | | | | 10,254 | | | | — | | | | 19,280 | | | | 131,780 | | | | 149,709 | | | | — | | | | 281,489 | |
Ladder Capital Corp. (REIT) | | | 3,074 | | | | 3,446 | | | | — | | | | 6,520 | | | | 42,175 | | | | 47,279 | | | | — | | | | 89,454 | |
MTGE Investment Corp. (REIT) | | | 3,741 | | | | 4,192 | | | | — | | | | 7,933 | | | | 58,734 | | | | 65,814 | | | | — | | | | 124,548 | |
New Residential Investment Corp. (REIT) | | | 19,562 | | | | 21,668 | | | | — | | | | 41,230 | | | | 307,515 | | | | 340,622 | | | | — | | | | 648,137 | |
New York Mortgage Trust, Inc. (REIT)(x) | | | 8,864 | | | | 10,000 | | | | — | | | | 18,864 | | | | 58,502 | | | | 66,000 | | | | — | | | | 124,502 | |
Orchid Island Capital, Inc. (REIT)(x) | | | 1,563 | | | | 1,374 | | | | — | | | | 2,937 | | | | 16,927 | | | | 14,880 | | | | — | | | | 31,807 | |
Owens Realty Mortgage, Inc. (REIT)(x) | | | 789 | | | | 697 | | | | — | | | | 1,486 | | | | 14,612 | | | | 12,908 | | | | — | | | | 27,520 | |
PennyMac Mortgage Investment Trust (REIT) | | | 5,459 | | | | 6,121 | | | | — | | | | 11,580 | | | | 89,364 | | | | 100,201 | | | | — | | | | 189,565 | |
Redwood Trust, Inc. (REIT) | | | 6,126 | | | | 7,021 | | | | — | | | | 13,147 | | | | 93,176 | | | | 106,789 | | | | — | | | | 199,965 | |
Resource Capital Corp. (REIT)(x) | | | 2,450 | | | | 2,751 | | | | — | | | | 5,201 | | | | 20,409 | | | | 22,916 | | | | — | | | | 43,325 | |
Western Asset Mortgage Capital Corp. (REIT) | | | 3,325 | | | | 3,760 | | | | — | | | | 7,085 | | | | 33,483 | | | | 37,863 | | | | — | | | | 71,346 | |
| | | | | | | | | | | | | | | | | | | | | | | | | | | | | | | | |
| | | | | | | | | | | | | | | | | | | 1,638,609 | | | | 1,831,062 | | | | — | | | | 3,469,671 | |
| | | | | | | | | | | | | | | | | | | | | | | | | | | | | | | | |
Thrifts & Mortgage Financet (2.0%) | | | | | | | | | | | | | | | | | | | | | | | | | | | | | | | | |
Astoria Financial Corp. | | | 7,429 | | | | 8,360 | | | | — | | | | 15,789 | | | | 138,551 | | | | 155,914 | | | | — | | | | 294,465 | |
Bank Mutual Corp. | | | 3,281 | | | | 3,676 | | | | — | | | | 6,957 | | | | 31,005 | | | | 34,738 | | | | — | | | | 65,743 | |
BankFinancial Corp. | | | 1,196 | | | | 1,383 | | | | — | | | | 2,579 | | | | 17,725 | | | | 20,496 | | | | — | | | | 38,221 | |
Bear State Financial, Inc.(x) | | | 1,479 | | | | 1,665 | | | | — | | | | 3,144 | | | | 15,012 | | | | 16,900 | | | | — | | | | 31,912 | |
Beneficial Bancorp, Inc. | | | 5,608 | | | | 6,491 | | | | — | | | | 12,099 | | | | 103,187 | | | | 119,434 | | | | — | | | | 222,621 | |
BofI Holding, Inc.(x)* | | | 314 | | | | 357 | | | | — | | | | 671 | | | | 8,965 | | | | 10,192 | | | | — | | | | 19,157 | |
Capitol Federal Financial, Inc. | | | 10,258 | | | | 11,624 | | | | — | | | | 21,882 | | | | 168,847 | | | | 191,331 | | | | — | | | | 360,178 | |
Charter Financial Corp. | | | 1,097 | | | | 1,235 | | | | — | | | | 2,332 | | | | 18,287 | | | | 20,587 | | | | — | | | | 38,874 | |
Clifton Bancorp, Inc.(x) | | | 1,753 | | | | 1,966 | | | | — | | | | 3,719 | | | | 29,661 | | | | 33,265 | | | | — | | | | 62,926 | |
Dime Community Bancshares, Inc. | | | 2,533 | | | | 2,845 | | | | — | | | | 5,378 | | | | 50,913 | | | | 57,185 | | | | — | | | | 108,098 | |
ESSA Bancorp, Inc. | | | 655 | | | | 737 | | | | — | | | | 1,392 | | | | 10,296 | | | | 11,586 | | | | — | | | | 21,882 | |
EverBank Financial Corp. | | | 8,293 | | | | 9,454 | | | | — | | | | 17,747 | | | | 161,299 | | | | 183,880 | | | | — | | | | 345,179 | |
Federal Agricultural Mortgage Corp., Class C | | | 693 | | | | 780 | | | | — | | | | 1,473 | | | | 39,688 | | | | 44,671 | | | | — | | | | 84,359 | |
First Defiance Financial Corp. | | | 705 | | | | 790 | | | | — | | | | 1,495 | | | | 35,772 | | | | 40,085 | | | | — | | | | 75,857 | |
Flagstar Bancorp, Inc.* | | | 1,698 | | | | 1,960 | | | | — | | | | 3,658 | | | | 45,744 | | | | 52,802 | | | | — | | | | 98,546 | |
Greene County Bancorp, Inc.(x) | | | 181 | | | | 202 | | | | — | | | | 383 | | | | 4,145 | | | | 4,626 | | | | — | | | | 8,771 | |
Hingham Institution for Savings | | | 58 | | | | 65 | | | | — | | | | 123 | | | | 11,413 | | | | 12,791 | | | | — | | | | 24,204 | |
Home Bancorp, Inc. | | | 394 | | | | 442 | | | | — | | | | 836 | | | | 15,212 | | | | 17,066 | | | | — | | | | 32,278 | |
HomeStreet, Inc.* | | | 1,908 | | | | 2,137 | | | | — | | | | 4,045 | | | | 60,293 | | | | 67,529 | | | | — | | | | 127,822 | |
Impac Mortgage Holdings, Inc.(x)* | | | 859 | | | | 965 | | | | — | | | | 1,824 | | | | 12,043 | | | | 13,529 | | | | — | | | | 25,572 | |
Kearny Financial Corp. | | | 6,974 | | | | 8,025 | | | | — | | | | 14,999 | | | | 108,446 | | | | 124,789 | | | | — | | | | 233,235 | |
Lake Sunapee Bank Group | | | 630 | | | | 708 | | | | — | | | | 1,338 | | | | 14,862 | | | | 16,702 | | | | — | | | | 31,564 | |
Meridian Bancorp, Inc. | | | 3,273 | | | | 3,676 | | | | — | | | | 6,949 | | | | 61,860 | | | | 69,476 | | | | — | | | | 131,336 | |
Meta Financial Group, Inc. | | | 661 | | | | 742 | | | | — | | | | 1,403 | | | | 68,017 | | | | 76,352 | | | | — | | | | 144,369 | |
MGIC Investment Corp.* | | | 27,277 | | | | 30,340 | | | | — | | | | 57,617 | | | | 277,953 | | | | 309,164 | | | | — | | | | 587,117 | |
40
| | | | | | | | | | | | | | | | | | | | | | | | | | | | | | | | |
| | | Pacific Global
Small Cap
Value | | | Horizon
Small Cap
Value | | | Pro-forma
Adjustment | | | AXA/Horizon
Small Cap
Value
Combined
Pro-forma | | | Pacific
Global Small
Cap Value | | | Horizon
Small Cap
Value | | | Pro-forma
Adjustment | | | AXA/Horizon
Small Cap
Value
Combined
Pro-forma | |
| | | Number of
Shares | | | Number of
Shares | | | Number of
Shares | | | Number of
Shares | | | Value ($) | | | Value ($) | | | Value ($) | | | Value ($) | |
Nationstar Mortgage Holdings, Inc.(x)* | | | 1,355 | | | | 1,614 | | | | — | | | | 2,969 | | | | 24,471 | | | | 29,149 | | | | — | | | | 53,620 | |
NMI Holdings, Inc., Class A* | | | 4,039 | | | | 4,537 | | | | — | | | | 8,576 | | | | 43,015 | | | | 48,319 | | | | — | | | | 91,334 | |
Northfield Bancorp, Inc. | | | 3,046 | | | | 3,417 | | | | — | | | | 6,463 | | | | 60,829 | | | | 68,237 | | | | — | | | | 129,066 | |
Northwest Bancshares, Inc. | | | 7,736 | | | | 8,787 | | | | — | | | | 16,523 | | | | 139,480 | | | | 158,430 | | | | — | | | | 297,910 | |
OceanFirst Financial Corp. | | | 1,820 | | | | 2,046 | | | | — | | | | 3,866 | | | | 54,655 | | | | 61,441 | | | | — | | | | 116,096 | |
Ocwen Financial Corp.* | | | 8,185 | | | | 9,184 | | | | — | | | | 17,369 | | | | 44,117 | | | | 49,502 | | | | — | | | | 93,619 | |
Oritani Financial Corp. | | | 3,086 | | | | 3,239 | | | | — | | | | 6,325 | | | | 57,862 | | | | 60,731 | | | | — | | | | 118,593 | |
PennyMac Financial Services, Inc., Class A* | | | 468 | | | | 468 | | | | — | | | | 936 | | | | 7,792 | | | | 7,792 | | | | — | | | | 15,584 | |
PHH Corp.* | | | 4,160 | | | | 4,519 | | | | — | | | | 8,679 | | | | 63,066 | | | | 68,508 | | | | — | | | | 131,574 | |
Provident Bancorp, Inc.* | | | 320 | | | | 361 | | | | — | | | | 681 | | | | 5,728 | | | | 6,462 | | | | — | | | | 12,190 | |
Provident Financial Holdings, Inc. | | | 522 | | | | 586 | | | | — | | | | 1,108 | | | | 10,555 | | | | 11,849 | | | | — | | | | 22,404 | |
Provident Financial Services, Inc. | | | 4,925 | | | | 5,550 | | | | — | | | | 10,475 | | | | 139,377 | | | | 157,065 | | | | — | | | | 296,442 | |
Radian Group, Inc. | | | 17,229 | | | | 19,158 | | | | — | | | | 36,387 | | | | 309,777 | | | | 344,460 | | | | — | | | | 654,237 | |
SI Financial Group, Inc. | | | 884 | | | | 995 | | | | — | | | | 1,879 | | | | 13,614 | | | | 15,323 | | | | — | | | | 28,937 | |
Southern Missouri Bancorp, Inc.(x) | | | 459 | | | | 515 | | | | — | | | | 974 | | | | 16,239 | | | | 18,221 | | | | — | | | | 34,460 | |
Territorial Bancorp, Inc. | | | 606 | | | | 673 | | | | — | | | | 1,279 | | | | 19,901 | | | | 22,101 | | | | — | | | | 42,002 | |
TrustCo Bank Corp. | | | 7,325 | | | | 8,214 | | | | — | | | | 15,539 | | | | 64,094 | | | | 71,873 | | | | — | | | | 135,967 | |
United Community Financial Corp. | | | 3,732 | | | | 4,187 | | | | — | | | | 7,919 | | | | 33,364 | | | | 37,432 | | | | — | | | | 70,796 | |
United Financial Bancorp, Inc. | | | 4,051 | | | | 4,547 | | | | — | | | | 8,598 | | | | 73,566 | | | | 82,574 | | | | — | | | | 156,140 | |
Walker & Dunlop, Inc.* | | | 2,218 | | | | 2,564 | | | | — | | | | 4,782 | | | | 69,202 | | | | 79,997 | | | | — | | | | 149,199 | |
Washington Federal, Inc. | | | 7,267 | | | | 8,235 | | | | — | | | | 15,502 | | | | 249,621 | | | | 282,872 | | | | — | | | | 532,493 | |
Waterstone Financial, Inc. | | | 2,024 | | | | 2,277 | | | | — | | | | 4,301 | | | | 37,242 | | | | 41,897 | | | | — | | | | 79,139 | |
Western New England Bancorp, Inc. | | | 1,677 | | | | 1,297 | | | | — | | | | 2,974 | | | | 15,680 | | | | 12,127 | | | | — | | | | 27,807 | |
WSFS Financial Corp. | | | 2,314 | | | | 2,637 | | | | — | | | | 4,951 | | | | 107,254 | | | | 122,225 | | | | — | | | | 229,479 | |
| | | | | | | | | | | | | | | | | | | | | | | | | | | | | | | | |
| | | | | | | | | | | | | | | | | | | 3,169,697 | | | | 3,563,677 | | | | — | | | | 6,733,374 | |
| | | | | | | | | | | | | | | | | | | | | | | | | | | | | | | | |
Total Financials | | | | | | | | | | | | | | | | | | | 34,180,357 | | | | 53,239,352 | | | | — | | | | 87,419,709 | |
| | | | | | | | | | | | | | | | | | | | | | | | | | | | | | | | |
Health Care (2.9%) | | | | | | | | | | | | | | | | | | | | | | | | | | | | | | | | |
Biotechnology (0.8%) | | | | | | | | | | | | | | | | | | | | | | | | | | | | | | | | |
Acorda Therapeutics, Inc.* | | | 2,990 | | | | 3,461 | | | | — | | | | 6,451 | | | | 56,212 | | | | 65,067 | | | | — | | | | 121,279 | |
Adamas Pharmaceuticals, Inc.(x)* | | | 693 | | | | 782 | | | | — | | | | 1,475 | | | | 11,712 | | | | 13,216 | | | | — | | | | 24,928 | |
Adverum Biotechnologies, Inc.(x)* | | | 1,932 | | | | 2,147 | | | | — | | | | 4,079 | | | | 5,603 | | | | 6,226 | | | | — | | | | 11,829 | |
Agenus, Inc.(x)* | | | 1,006 | | | | 1,118 | | | | — | | | | 2,124 | | | | 4,145 | | | | 4,606 | | | | — | | | | 8,751 | |
Akebia Therapeutics, Inc.* | | | 2,000 | | | | 2,230 | | | | — | | | | 4,230 | | | | 20,820 | | | | 23,214 | | | | — | | | | 44,034 | |
AMAG Pharmaceuticals, Inc.(x)* | | | 1,959 | | | | 2,194 | | | | — | | | | 4,153 | | | | 68,173 | | | | 76,351 | | | | — | | | | 144,524 | |
Ardelyx, Inc.* | | | 2,093 | | | | 2,489 | | | | — | | | | 4,582 | | | | 29,721 | | | | 35,344 | | | | — | | | | 65,065 | |
ARIAD Pharmaceuticals, Inc.(x)* | | | 908 | | | | 1,007 | | | | — | | | | 1,915 | | | | 11,295 | | | | 12,527 | | | | — | | | | 23,822 | |
Array BioPharma, Inc.(x)* | | | 12,139 | | | | 13,781 | | | | — | | | | 25,920 | | | | 106,702 | | | | 121,135 | | | | — | | | | 227,837 | |
Arrowhead Pharmaceuticals, Inc.(x)* | | | 345 | | | | 368 | | | | — | | | | 713 | | | | 535 | | | | 570 | | | | — | | | | 1,105 | |
Atara Biotherapeutics, Inc.(x)* | | | 1,732 | | | | 1,964 | | | | — | | | | 3,696 | | | | 24,594 | | | | 27,889 | | | | — | | | | 52,483 | |
Audentes Therapeutics, Inc.* | | | 67 | | | | — | | | | — | | | | 67 | | | | 1,224 | | | | — | | | | — | | | | 1,224 | |
Bellicum Pharmaceuticals, Inc.(x)* | | | 577 | | | | 641 | | | | — | | | | 1,218 | | | | 7,859 | | | | 8,730 | | | | — | | | | 16,589 | |
BioCryst Pharmaceuticals, Inc.(x)* | | | 996 | | | | 1,048 | | | | — | | | | 2,044 | | | | 6,305 | | | | 6,634 | | | | — | | | | 12,939 | |
Bluebird Bio, Inc.* | | | 2,013 | | | | 2,265 | | | | — | | | | 4,278 | | | | 124,202 | | | | 139,750 | | | | — | | | | 263,952 | |
Cara Therapeutics, Inc.(x)* | | | 1,496 | | | | 1,667 | | | | — | | | | 3,163 | | | | 13,898 | | | | 15,486 | | | | — | | | | 29,384 | |
Celldex Therapeutics, Inc.(x)* | | | 7,706 | | | | 8,632 | | | | — | | | | 16,338 | | | | 27,279 | | | | 30,557 | | | | — | | | | 57,836 | |
Cellular Biomedicine Group, Inc.* | | | 298 | | | | 330 | | | | — | | | | 628 | | | | 3,904 | | | | 4,323 | | | | — | | | | 8,227 | |
Chimerix, Inc.* | | | 3,541 | | | | 3,806 | | | | — | | | | 7,347 | | | | 16,289 | | | | 17,508 | | | | — | | | | 33,797 | |
Cidara Therapeutics, Inc.(x)* | | | 924 | | | | 889 | | | | — | | | | 1,813 | | | | 9,610 | | | | 9,246 | | | | — | | | | 18,856 | |
Concert Pharmaceuticals, Inc.* | | | 793 | | | | 878 | | | | — | | | | 1,671 | | | | 8,160 | | | | 9,035 | | | | — | | | | 17,195 | |
Corvus Pharmaceuticals, Inc.(x)* | | | 223 | | | | 243 | | | | — | | | | 466 | | | | 3,189 | | | | 3,475 | | | | — | | | | 6,664 | |
CytRx Corp.(x)* | | | — | | | | 680 | | | | — | | | | 680 | | | | — | | | | 253 | | | | — | | | | 253 | |
Dimension Therapeutics, Inc.* | | | 604 | | | | 664 | | | | — | | | | 1,268 | | | | 2,627 | | | | 2,888 | | | | — | | | | 5,515 | |
Edge Therapeutics, Inc.* | | | 807 | | | | 896 | | | | — | | | | 1,703 | | | | 10,087 | | | | 11,200 | | | | — | | | | 21,287 | |
Enanta Pharmaceuticals, Inc.* | | | 1,260 | | | | 1,410 | | | | — | | | | 2,670 | | | | 42,210 | | | | 47,235 | | | | — | | | | 89,445 | |
Epizyme, Inc.(x)* | | | 951 | | | | 1,059 | | | | — | | | | 2,010 | | | | 11,507 | | | | 12,814 | | | | — | | | | 24,321 | |
Esperion Therapeutics, Inc.(x)* | | | 1,196 | | | | 1,339 | | | | — | | | | 2,535 | | | | 14,974 | | | | 16,764 | | | | — | | | | 31,738 | |
Exelixis, Inc.* | | | 6,981 | | | | 7,879 | | | | — | | | | 14,860 | | | | 104,087 | | | | 117,476 | | | | — | | | | 221,563 | |
Five Prime Therapeutics, Inc.* | | | 1,669 | | | | 1,912 | | | | — | | | | 3,581 | | | | 83,634 | | | | 95,810 | | | | — | | | | 179,444 | |
Idera Pharmaceuticals, Inc.(x)* | | | 465 | | | | 614 | | | | — | | | | 1,079 | | | | 697 | | | | 921 | | | | — | | | | 1,618 | |
Ignyta, Inc.(x)* | | | 837 | | | | 947 | | | | — | | | | 1,784 | | | | 4,436 | | | | 5,019 | | | | — | | | | 9,455 | |
Immunomedics, Inc.(x)* | | | 561 | | | | 686 | | | | — | | | | 1,247 | | | | 2,059 | | | | 2,518 | | | | — | | | | 4,577 | |
41
| | | | | | | | | | | | | | | | | | | | | | | | | | | | | | | | |
| | | Pacific Global
Small Cap
Value | | | Horizon
Small Cap
Value | | | Pro-forma
Adjustment | | | AXA/Horizon
Small Cap
Value
Combined
Pro-forma | | | Pacific
Global Small
Cap Value | | | Horizon
Small Cap
Value | | | Pro-forma
Adjustment | | | AXA/Horizon
Small Cap
Value
Combined
Pro-forma | |
| | | Number of
Shares | | | Number of
Shares | | | Number of
Shares | | | Number of
Shares | | | Value ($) | | | Value ($) | | | Value ($) | | | Value ($) | |
Inotek Pharmaceuticals Corp.(x)* | | | 234 | | | | 100 | | | | — | | | | 334 | | | | 1,427 | | | | 610 | | | | — | | | | 2,037 | |
Karyopharm Therapeutics, Inc.* | | | 1,524 | | | | 1,699 | | | | — | | | | 3,223 | | | | 14,326 | | | | 15,971 | | | | — | | | | 30,297 | |
Merrimack Pharmaceuticals, Inc.(x)* | | | 3,723 | | | | 4,174 | | | | — | | | | 7,897 | | | | 15,190 | | | | 17,030 | | | | — | | | | 32,220 | |
Momenta Pharmaceuticals, Inc.* | | | 4,003 | | | | 4,658 | | | | — | | | | 8,661 | | | | 60,245 | | | | 70,103 | | | | — | | | | 130,348 | |
NantKwest, Inc.(x)* | | | 1,200 | | | | 1,329 | | | | — | | | | 2,529 | | | | 6,864 | | | | 7,602 | | | | — | | | | 14,466 | |
NewLink Genetics Corp.* | | | 434 | | | | 481 | | | | — | | | | 915 | | | | 4,461 | | | | 4,945 | | | | — | | | | 9,406 | |
Osiris Therapeutics, Inc.(x)* | | | 133 | | | | 148 | | | | — | | | | 281 | | | | 653 | | | | 727 | | | | — | | | | 1,380 | |
Otonomy, Inc.* | | | 1,927 | | | | 2,067 | | | | — | | | | 3,994 | | | | 30,639 | | | | 32,865 | | | | — | | | | 63,504 | |
OvaScience, Inc.(x)* | | | 2,255 | | | | 2,308 | | | | — | | | | 4,563 | | | | 3,450 | | | | 3,531 | | | | — | | | | 6,981 | |
PDL BioPharma, Inc. | | | 13,495 | | | | 13,728 | | | | — | | | | 27,223 | | | | 28,609 | | | | 29,103 | | | | — | | | | 57,712 | |
Pfenex, Inc.* | | | 79 | | | | 96 | | | | — | | | | 175 | | | | 717 | | | | 871 | | | | — | | | | 1,588 | |
Portola Pharmaceuticals, Inc.(x)* | | | 342 | | | | 378 | | | | — | | | | 720 | | | | 7,674 | | | | 8,482 | | | | — | | | | 16,156 | |
Protagonist Therapeutics, Inc.(x)* | | | 102 | | | | 90 | | | | — | | | | 192 | | | | 2,243 | | | | 1,979 | | | | — | | | | 4,222 | |
PTC Therapeutics, Inc.(x)* | | | 2,689 | | | | 3,011 | | | | — | | | | 5,700 | | | | 29,337 | | | | 32,850 | | | | — | | | | 62,187 | |
REGENXBIO, Inc.(x)* | | | 1,624 | | | | 1,929 | | | | — | | | | 3,553 | | | | 30,125 | | | | 35,783 | | | | — | | | | 65,908 | |
Retrophin, Inc.(x)* | | | 2,913 | | | | 3,363 | | | | — | | | | 6,276 | | | | 55,143 | | | | 63,662 | | | | — | | | | 118,805 | |
Rigel Pharmaceuticals, Inc.* | | | 1,410 | | | | 1,751 | | | | — | | | | 3,161 | | | | 3,356 | | | | 4,167 | | | | — | | | | 7,523 | |
Selecta Biosciences, Inc.* | | | 66 | | | | 80 | | | | — | | | | 146 | | | | 1,132 | | | | 1,372 | | | | — | | | | 2,504 | |
Spectrum Pharmaceuticals, Inc.* | | | 4,345 | | | | 5,348 | | | | — | | | | 9,693 | | | | 19,248 | | | | 23,692 | | | | — | | | | 42,940 | |
Stemline Therapeutics, Inc.* | | | 1,089 | | | | 1,218 | | | | — | | | | 2,307 | | | | 11,652 | | | | 13,033 | | | | — | | | | 24,685 | |
Syndax Pharmaceuticals, Inc.* | | | 187 | | | | 203 | | | | — | | | | 390 | | | | 1,341 | | | | 1,456 | | | | — | | | | 2,797 | |
Syros Pharmaceuticals, Inc.* | | | 130 | | | | — | | | | — | | | | 130 | | | | 1,581 | | | | — | | | | — | | | | 1,581 | |
Trovagene, Inc.* | | | — | | | | 191 | | | | — | | | | 191 | | | | — | | | | 401 | | | | — | | | | 401 | |
Versartis, Inc.* | | | 2,268 | | | | 2,447 | | | | — | | | | 4,715 | | | | 33,793 | | | | 36,460 | | | | — | | | | 70,253 | |
Voyager Therapeutics, Inc.(x)* | | | 520 | | | | 577 | | | | — | | | | 1,097 | | | | 6,625 | | | | 7,351 | | | | — | | | | 13,976 | |
Zafgen, Inc.* | | | 1,896 | | | | 2,116 | | | | — | | | | 4,012 | | | | 6,029 | | | | 6,729 | | | | — | | | | 12,758 | |
| | | | | | | | | | | | | | | | | | | | | | | | | | | | | | | | |
| | | | | | | | | | | | | | | | | | | 1,213,609 | | | | 1,364,562 | | | | — | | | | 2,578,171 | |
| | | | | | | | | | | | | | | | | | | | | | | | | | | | | | | | |
Health Care Equipment & Supplies (1.4%) | | | | | | | | | | | | | | | | | | | | | | | | | | | | | | | | |
Abaxis, Inc. | | | 45,000 | | | | — | | | | — | | | | 45,000 | | | | 2,374,650 | | | | — | | | | — | | | | 2,374,650 | |
Analogic Corp. | | | 904 | | | | 1,037 | | | | — | | | | 1,941 | | | | 74,987 | | | | 86,019 | | | | — | | | | 161,006 | |
AngioDynamics, Inc.* | | | 2,167 | | | | 2,435 | | | | — | | | | 4,602 | | | | 36,557 | | | | 41,078 | | | | — | | | | 77,635 | |
Anika Therapeutics, Inc.* | | | 204 | | | | 241 | | | | — | | | | 445 | | | | 9,988 | | | | 11,799 | | | | — | | | | 21,787 | |
AtriCure, Inc.* | | | 527 | | | | 602 | | | | — | | | | 1,129 | | | | 10,313 | | | | 11,781 | | | | — | | | | 22,094 | |
Cerus Corp.(x)* | | | 1,051 | | | | 1,233 | | | | — | | | | 2,284 | | | | 4,572 | | | | 5,364 | | | | — | | | | 9,936 | |
CONMED Corp. | | | 2,218 | | | | 2,530 | | | | — | | | | 4,748 | | | | 97,969 | | | | 111,750 | | | | — | | | | 209,719 | |
CryoLife, Inc. | | | 908 | | | | 938 | | | | — | | | | 1,846 | | | | 17,388 | | | | 17,963 | | | | — | | | | 35,351 | |
Exactech, Inc.* | | | 826 | | | | 929 | | | | — | | | | 1,755 | | | | 22,550 | | | | 25,362 | | | | — | | | | 47,912 | |
Haemonetics Corp.* | | | 4,085 | | | | 4,678 | | | | — | | | | 8,763 | | | | 164,217 | | | | 188,055 | | | | — | | | | 352,272 | |
Halyard Health, Inc.* | | | 3,741 | | | | 4,290 | | | | — | | | | 8,031 | | | | 138,342 | | | | 158,643 | | | | — | | | | 296,985 | |
ICU Medical, Inc.* | | | 379 | | | | 416 | | | | — | | | | 795 | | | | 55,846 | | | | 61,298 | | | | — | | | | 117,144 | |
Integer Holdings Corp.* | | | 2,460 | | | | 2,773 | | | | — | | | | 5,233 | | | | 72,447 | | | | 81,665 | | | | — | | | | 154,112 | |
Invacare Corp. | | | 2,560 | | | | 2,872 | | | | — | | | | 5,432 | | | | 33,408 | | | | 37,480 | | | | — | | | | 70,888 | |
K2M Group Holdings, Inc.* | | | 1,416 | | | | 1,591 | | | | — | | | | 3,007 | | | | 28,377 | | | | 31,884 | | | | — | | | | 60,261 | |
Meridian Bioscience, Inc. | | | 460 | | | | 498 | | | | — | | | | 958 | | | | 8,142 | | | | 8,815 | | | | — | | | | 16,957 | |
Merit Medical Systems, Inc.* | | | 2,109 | | | | 2,447 | | | | — | | | | 4,556 | | | | 55,889 | | | | 64,846 | | | | — | | | | 120,735 | |
Quidel Corp.* | | | 139 | | | | 127 | | | | — | | | | 266 | | | | 2,977 | | | | 2,720 | | | | — | | | | 5,697 | |
Rockwell Medical, Inc.(x)* | | | 350 | | | | 367 | | | | — | | | | 717 | | | | 2,293 | | | | 2,404 | | | | — | | | | 4,697 | |
RTI Surgical, Inc.* | | | 4,724 | | | | 5,330 | | | | — | | | | 10,054 | | | | 15,353 | | | | 17,323 | | | | — | | | | 32,676 | |
Tactile Systems Technology, Inc.* | | | 25 | | | | — | | | | — | | | | 25 | | | | 410 | | | | — | | | | — | | | | 410 | |
TransEnterix, Inc.(x)* | | | 5,107 | | | | 5,705 | | | | — | | | | 10,812 | | | | 6,639 | | | | 7,417 | | | | — | | | | 14,056 | |
Wright Medical Group NV* | | | 8,277 | | | | 9,137 | | | | — | | | | 17,414 | | | | 190,205 | | | | 209,967 | | | | — | | | | 400,172 | |
| | | | | | | | | | | | | | | | | | | | | | | | | | | | | | | | |
| | | | | | | | | | | | | | | | | | | 3,423,519 | | | | 1,183,633 | | | | — | | | | 4,607,152 | |
| | | | | | | | | | | | | | | | | | | | | | | | | | | | | | | | |
Health Care Providers & Services (0.5%) | | | | | | | | | | | | | | | | | | | | | | | | | | | | | | | | |
Aceto Corp.(x) | | | 245 | | | | 264 | | | | — | | | | 509 | | | | 5,383 | | | | 5,800 | | | | — | | | | 11,183 | |
Addus HomeCare Corp.* | | | 521 | | | | 604 | | | | — | | | | 1,125 | | | | 18,261 | | | | 21,170 | | | | — | | | | 39,431 | |
Almost Family, Inc.* | | | 485 | | | | 547 | | | | — | | | | 1,032 | | | | 21,388 | | | | 24,123 | | | | — | | | | 45,511 | |
American Renal Associates Holdings,
Inc.(x)* | | | 89 | | | | 108 | | | | — | | | | 197 | | | | 1,894 | | | | 2,298 | | | | — | | | | 4,192 | |
BioScrip, Inc.(x)* | | | 7,960 | | | | 8,963 | | | | — | | | | 16,923 | | | | 8,278 | | | | 9,322 | | | | — | | | | 17,600 | |
Community Health Systems, Inc.* | | | 8,801 | | | | 9,863 | | | | — | | | | 18,664 | | | | 49,198 | | | | 55,134 | | | | — | | | | 104,332 | |
Genesis Healthcare, Inc.* | | | 1,560 | | | | 1,587 | | | | — | | | | 3,147 | | | | 6,630 | | | | 6,745 | | | | — | | | | 13,375 | |
Healthways, Inc.* | | | 2,540 | | | | 2,926 | | | | — | | | | 5,466 | | | | 57,785 | | | | 66,567 | | | | — | | | | 124,352 | |
42
| | | | | | | | | | | | | | | | | | | | | | | | | | | | | | | | |
| | | Pacific Global
Small Cap
Value | | | Horizon
Small Cap
Value | | | Pro-forma
Adjustment | | | AXA/Horizon
Small Cap
Value
Combined
Pro-forma | | | Pacific
Global Small
Cap Value | | | Horizon
Small Cap
Value | | | Pro-forma
Adjustment | | | AXA/Horizon
Small Cap
Value
Combined
Pro-forma | |
| | | Number of
Shares | | | Number of
Shares | | | Number of
Shares | | | Number of
Shares | | | Value ($) | | | Value ($) | | | Value ($) | | | Value ($) | |
Kindred Healthcare, Inc. | | | 6,727 | | | | 7,544 | | | | — | | | | 14,271 | | | | 52,807 | | | | 59,220 | | | | — | | | | 112,027 | |
LHC Group, Inc.* | | | 1,119 | | | | 1,254 | | | | — | | | | 2,373 | | | | 51,138 | | | | 57,308 | | | | — | | | | 108,446 | |
Magellan Health, Inc.* | | | 545 | | | | 629 | | | | — | | | | 1,174 | | | | 41,011 | | | | 47,332 | | | | — | | | | 88,343 | |
Molina Healthcare, Inc.* | | | 1,164 | | | | 1,340 | | | | — | | | | 2,504 | | | | 63,159 | | | | 72,708 | | | | — | | | | 135,867 | |
National HealthCare Corp. | | | 887 | | | | 996 | | | | — | | | | 1,883 | | | | 67,226 | | | | 75,487 | | | | — | | | | 142,713 | |
National Research Corp., Class A | | | 117 | | | | 159 | | | | — | | | | 276 | | | | 2,223 | | | | 3,021 | | | | — | | | | 5,244 | |
Nobilis Health Corp.(x)* | | | 4,295 | | | | 4,608 | | | | — | | | | 8,903 | | | | 9,019 | | | | 9,677 | | | | — | | | | 18,696 | |
Owens & Minor, Inc. | | | 4,427 | | | | 4,853 | | | | — | | | | 9,280 | | | | 156,229 | | | | 171,263 | | | | — | | | | 327,492 | |
PharMerica Corp.* | | | 2,361 | | | | 2,726 | | | | — | | | | 5,087 | | | | 59,379 | | | | 68,559 | | | | — | | | | 127,938 | |
Select Medical Holdings Corp.* | | | 7,926 | | | | 8,901 | | | | — | | | | 16,827 | | | | 105,020 | | | | 117,938 | | | | — | | | | 222,958 | |
Surgery Partners, Inc.* | | | 646 | | | | 692 | | | | — | | | | 1,338 | | | | 10,239 | | | | 10,968 | | | | — | | | | 21,207 | |
Triple-S Management Corp., Class B* | | | 1,874 | | | | 2,182 | | | | — | | | | 4,056 | | | | 38,792 | | | | 45,167 | | | | — | | | | 83,959 | |
Universal American Corp.* | | | 3,261 | | | | 3,817 | | | | — | | | | 7,078 | | | | 32,447 | | | | 37,979 | | | | — | | | | 70,426 | |
| | | | | | | | | | | | | | | | | | | | | | | | | | | | | | | | |
| | | | | | | | | | | | | | | | | | | 857,506 | | | | 967,786 | | | | — | | | | 1,825,292 | |
| | | | | | | | | | | | | | | | | | | | | | | | | | | | | | | | |
Health Care Technology (0.0%) | | | | | | | | | | | | | | | | | | | | | | | | | | | | | | | | |
Cotiviti Holdings, Inc.(x)* | | | 274 | | | | 307 | | | | — | | | | 581 | | | | 9,425 | | | | 10,561 | | | | — | | | | 19,986 | |
Evolent Health, Inc., Class A(x)* | | | 1,296 | | | | 1,456 | | | | — | | | | 2,752 | | | | 19,181 | | | | 21,548 | | | | — | | | | 40,729 | |
NantHealth, Inc.* | | | 173 | | | | — | | | | — | | | | 173 | | | | 1,720 | | | | — | | | | — | | | | 1,720 | |
Vocera Communications, Inc.* | | | 630 | | | | 663 | | | | — | | | | 1,293 | | | | 11,649 | | | | 12,259 | | | | — | | | | 23,908 | |
| | | | | | | | | | | | | | | | | | | | | | | | | | | | | | | | |
| | | | | | | | | | | | | | | | | | | 41,975 | | | | 44,368 | | | | — | | | | 86,343 | |
| | | | | | | | | | | | | | | | | | | | | | | | | | | | | | | | |
Life Sciences Tools & Services (0.0%) | | | | | | | | | | | | | | | | | | | | | | | | | | | | | | | | |
Accelerate Diagnostics, Inc.(x)* | | | 110 | | | | 126 | | | | — | | | | 236 | | | | 2,283 | | | | 2,615 | | | | — | | | | 4,898 | |
Albany Molecular Research, Inc.(x)* | | | 1,111 | | | | 1,270 | | | | — | | | | 2,381 | | | | 20,843 | | | | 23,825 | | | | — | | | | 44,668 | |
Enzo Biochem, Inc.* | | | 278 | | | | 136 | | | | — | | | | 414 | | | | 1,929 | | | | 944 | | | | — | | | | 2,873 | |
Luminex Corp.* | | | 1,845 | | | | 2,072 | | | | — | | | | 3,917 | | | | 37,324 | | | | 41,916 | | | | — | | | | 79,240 | |
Medpace Holdings, Inc.* | | | 189 | | | | 212 | | | | — | | | | 401 | | | | 6,817 | | | | 7,647 | | | | — | | | | 14,464 | |
| | | | | | | | | | | | | | | | | | | | | | | | | | | | | | | | |
| | | | | | | | | | | | | | | | | | | 69,196 | | | | 76,947 | | | | — | | | | 146,143 | |
| | | | | | | | | | | | | | | | | | | | | | | | | | | | | | | | |
Pharmaceuticals (0.1%) | | | | | | | | | | | | | | | | | | | | | | | | | | | | | | | | |
Aratana Therapeutics, Inc.* | | | 223 | | | | 237 | | | | — | | | | 460 | | | | 1,601 | | | | 1,702 | | | | — | | | | 3,303 | |
Clearside Biomedical, Inc.* | | | 109 | | | | — | | | | — | | | | 109 | | | | 975 | | | | — | | | | — | | | | 975 | |
Egalet Corp.(x)* | | | 1,330 | | | | 1,491 | | | | — | | | | 2,821 | | | | 10,175 | | | | 11,406 | | | | — | | | | 21,581 | |
Endocyte, Inc.* | | | 2,837 | | | | 3,217 | | | | — | | | | 6,054 | | | | 7,234 | | | | 8,203 | | | | — | | | | 15,437 | |
Flex Pharma, Inc.(x)* | | | 137 | | | | 136 | | | | — | | | | 273 | | | | 723 | | | | 718 | | | | — | | | | 1,441 | |
Innoviva, Inc.(x)* | | | 753 | | | | 798 | | | | — | | | | 1,551 | | | | 8,057 | | | | 8,539 | | | | — | | | | 16,596 | |
Lannett Co., Inc.(x)* | | | 2,225 | | | | 2,575 | | | | — | | | | 4,800 | | | | 49,061 | | | | 56,780 | | | | — | | | | 105,841 | |
Medicines Co. (The)(x)* | | | 466 | | | | 522 | | | | — | | | | 988 | | | | 15,816 | | | | 17,717 | | | | — | | | | 33,533 | |
Novan, Inc.* | | | 60 | | | | 67 | | | | — | | | | 127 | | | | 1,621 | | | | 1,810 | | | | — | | | | 3,431 | |
Omeros Corp.(x)* | | | 1,167 | | | | 1,228 | | | | — | | | | 2,395 | | | | 11,577 | | | | 12,182 | | | | — | | | | 23,759 | |
Phibro Animal Health Corp., Class A | | | 105 | | | | 121 | | | | — | | | | 226 | | | | 3,077 | | | | 3,545 | | | | — | | | | 6,622 | |
Tetraphase Pharmaceuticals, Inc.* | | | 3,025 | | | | 3,380 | | | | — | | | | 6,405 | | | | 12,191 | | | | 13,621 | | | | — | | | | 25,812 | |
TherapeuticsMD, Inc.(x)* | | | 759 | | | | 856 | | | | — | | | | 1,615 | | | | 4,379 | | | | 4,939 | | | | — | | | | 9,318 | |
WaVe Life Sciences Ltd.(x)* | | | 108 | | | | 122 | | | | — | | | | 230 | | | | 2,824 | | | | 3,190 | | | | — | | | | 6,014 | |
Zogenix, Inc.(x)* | | | 2,020 | | | | 2,269 | | | | — | | | | 4,289 | | | | 24,543 | | | | 27,568 | | | | — | | | | 52,111 | |
| | | | | | | | | | | | | | | | | | | | | | | | | | | | | | | | |
| | | | | | | | | | | | | | | | | | | 153,854 | | | | 171,920 | | | | — | | | | 325,774 | |
| | | | | | | | | | | | | | | | | | | | | | | | | | | | | | | | |
Total Health Care | | | | | | | | | | | | | | | | | | | 5,759,659 | | | | 3,809,216 | | | | — | | | | 9,568,875 | |
| | | | | | | | | | | | | | | | | | | | | | | | | | | | | | | | |
Industrials (18.3%) | | | | | | | | | | | | | | | | | | | | | | | | | | | | | | | | |
Aerospace & Defense (1.1%) | | | | | | | | | | | | | | | | | | | | | | | | | | | | | | | | |
AAR Corp. | | | 2,659 | | | | 2,980 | | | | — | | | | 5,639 | | | | 87,880 | | | | 98,489 | | | | — | | | | 186,369 | |
Aerojet Rocketdyne Holdings, Inc.* | | | 2,335 | | | | 2,625 | | | | — | | | | 4,960 | | | | 41,913 | | | | 47,119 | | | | — | | | | 89,032 | |
Aerovironment, Inc.(x)* | | | 1,368 | | | | 1,535 | | | | — | | | | 2,903 | | | | 36,703 | | | | 41,184 | | | | — | | | | 77,887 | |
Cubic Corp. | | | 2,039 | | | | 2,293 | | | | — | | | | 4,332 | | | | 97,770 | | | | 109,949 | | | | — | | | | 207,719 | |
Curtiss-Wright Corp. | | | 972 | | | | 1,090 | | | | — | | | | 2,062 | | | | 95,606 | | | | 107,212 | | | | — | | | | 202,818 | |
DigitalGlobe, Inc.* | | | 5,077 | | | | 5,713 | | | | — | | | | 10,790 | | | | 145,456 | | | | 163,677 | | | | — | | | | 309,133 | |
Ducommun, Inc.* | | | 843 | | | | 949 | | | | — | | | | 1,792 | | | | 21,547 | | | | 24,256 | | | | — | | | | 45,803 | |
Engility Holdings, Inc.* | | | 1,440 | | | | 1,616 | | | | — | | | | 3,056 | | | | 48,528 | | | | 54,459 | | | | — | | | | 102,987 | |
Esterline Technologies Corp.* | | | 2,359 | | | | 2,666 | | | | — | | | | 5,025 | | | | 210,423 | | | | 237,808 | | | | — | | | | 448,231 | |
KEYW Holding Corp. (The)(x)* | | | 2,868 | | | | 3,218 | | | | — | | | | 6,086 | | | | 33,814 | | | | 37,940 | | | | — | | | | 71,754 | |
KLX, Inc.* | | | 4,231 | | | | 4,780 | | | | — | | | | 9,011 | | | | 190,860 | | | | 215,626 | | | | — | | | | 406,486 | |
Kratos Defense & Security Solutions,
Inc.(x)* | | | 4,283 | | | | 4,707 | | | | — | | | | 8,990 | | | | 31,694 | | | | 34,832 | | | | — | | | | 66,526 | |
43
| | | | | | | | | | | | | | | | | | | | | | | | | | | | | | | | |
| | | Pacific Global
Small Cap
Value | | | Horizon
Small Cap
Value | | | Pro-forma
Adjustment | | | AXA/Horizon
Small Cap
Value
Combined
Pro-forma | | | Pacific
Global Small
Cap Value | | | Horizon
Small Cap
Value | | | Pro-forma
Adjustment | | | AXA/Horizon
Small Cap
Value
Combined
Pro-forma | |
| | | Number of
Shares | | | Number of
Shares | | | Number of
Shares | | | Number of
Shares | | | Value ($) | | | Value ($) | | | Value ($) | | | Value ($) | |
Mercury Systems, Inc.* | | | 2,898 | | | | 3,310 | | | | — | | | | 6,208 | | | | 87,578 | | | | 100,028 | | | | — | | | | 187,606 | |
Moog, Inc., Class A* | | | 2,326 | | | | 2,610 | | | | — | | | | 4,936 | | | | 152,772 | | | | 171,425 | | | | — | | | | 324,197 | |
National Presto Industries, Inc. | | | 345 | | | | 385 | | | | — | | | | 730 | | | | 36,708 | | | | 40,964 | | | | — | | | | 77,672 | |
Sparton Corp.* | | | 694 | | | | 784 | | | | — | | | | 1,478 | | | | 16,552 | | | | 18,698 | | | | — | | | | 35,250 | |
Teledyne Technologies, Inc.* | | | 1,963 | | | | 2,182 | | | | — | | | | 4,145 | | | | 241,449 | | | | 268,387 | | | | — | | | | 509,836 | |
Triumph Group, Inc. | | | 3,908 | | | | 4,433 | | | | — | | | | 8,341 | | | | 103,562 | | | | 117,475 | | | | — | | | | 221,037 | |
Vectrus, Inc.* | | | 718 | | | | 804 | | | | — | | | | 1,522 | | | | 17,124 | | | | 19,175 | | | | — | | | | 36,299 | |
| | | | | | | | | | | | | | | | | | | | | | | | | | | | | | | | |
| | | | | | | | | | | | | | | | | | | 1,697,939 | | | | 1,908,703 | | | | — | | | | 3,606,642 | |
| | | | | | | | | | | | | | | | | | | | | | | | | | | | | | | | |
Air Freight & Logistics (0.3%) | | | | | | | | | | | | | | | | | | | | | | | | | | | | | | | | |
Air Transport Services Group, Inc.* | | | 3,303 | | | | 3,826 | | | | — | | | | 7,129 | | | | 52,716 | | | | 61,063 | | | | — | | | | 113,779 | |
Atlas Air Worldwide Holdings, Inc.* | | | 1,969 | | | | 2,247 | | | | — | | | | 4,216 | | | | 102,683 | | | | 117,181 | | | | — | | | | 219,864 | |
Echo Global Logistics, Inc.* | | | 330 | | | | 371 | | | | — | | | | 701 | | | | 8,267 | | | | 9,294 | | | | — | | | | 17,561 | |
Hub Group, Inc., Class A* | | | 192 | | | | 207 | | | | — | | | | 399 | | | | 8,400 | | | | 9,056 | | | | — | | | | 17,456 | |
Park-Ohio Holdings Corp. | | | 688 | | | | 772 | | | | — | | | | 1,460 | | | | 29,309 | | | | 32,887 | | | | — | | | | 62,196 | |
Radiant Logistics, Inc.* | | | 1,156 | | | | 1,285 | | | | — | | | | 2,441 | | | | 4,508 | | | | 5,012 | | | | — | | | | 9,520 | |
XPO Logistics, Inc.* | | | 7,824 | | | | 8,724 | | | | — | | | | 16,548 | | | | 337,684 | | | | 376,527 | | | | — | | | | 714,211 | |
| | | | | | | | | | | | | | | | | | | | | | | | | | | | | | | | |
| | | | | | | | | | | | | | | | | | | 543,567 | | | | 611,020 | | | | — | | | | 1,154,587 | |
| | | | | | | | | | | | | | | | | | | | | | | | | | | | | | | | |
Airlines (0.1%) | | | | | | | | | | | | | | | | | | | | | | | | | | | | | | | | |
SkyWest, Inc | | | 3,987 | | | | 4,483 | | | | — | | | | 8,470 | | | | 145,326 | | | | 163,405 | | | | — | | | | 308,731 | |
| | | | | | | | | | | | | | | | | | | | | | | | | | | | | | | | |
Building Products (0.9%) | | | | | | | | | | | | | | | | | | | | | | | | | | | | | | | | |
Armstrong Flooring, Inc.* | | | 1,763 | | | | 1,978 | | | | — | | | | 3,741 | | | | 35,101 | | | | 39,382 | | | | — | | | | 74,483 | |
CSW Industrials, Inc.* | | | 1,157 | | | | 1,299 | | | | — | | | | 2,456 | | | | 42,636 | | | | 47,868 | | | | — | | | | 90,504 | |
Gibraltar Industries, Inc.* | | | 888 | | | | 998 | | | | — | | | | 1,886 | | | | 36,985 | | | | 41,567 | | | | — | | | | 78,552 | |
Griffon Corp. | | | 391 | | | | 441 | | | | — | | | | 832 | | | | 10,244 | | | | 11,554 | | | | — | | | | 21,798 | |
Insteel Industries, Inc. | | | 71,000 | | | | — | | | | — | | | | 71,000 | | | | 2,530,440 | | | | — | | | | — | | | | 2,530,440 | |
Quanex Building Products Corp. | | | 2,500 | | | | 2,805 | | | | — | | | | 5,305 | | | | 50,750 | | | | 56,941 | | | | — | | | | 107,691 | |
Universal Forest Products, Inc. | | | 208 | | | | 225 | | | | — | | | | 433 | | | | 21,254 | | | | 22,991 | | | | — | | | | 44,245 | |
| | | | | | | | | | | | | | | | | | | | | | | | | | | | | | | | |
| | | | | | | | | | | | | | | | | | | 2,727,410 | | | | 220,303 | | | | — | | | | 2,947,713 | |
| | | | | | | | | | | | | | | | | | | | | | | | | | | | | | | | |
Commercial Services & Supplies (2.8%) | | | | | | | | | | | | | | | | | | | | | | | | | | | | | | | | |
ABM Industries, Inc. | | | 4,432 | | | | 4,935 | | | | — | | | | 9,367 | | | | 181,003 | | | | 201,544 | | | | — | | | | 382,547 | |
ACCO Brands Corp.* | | | 8,481 | | | | 9,618 | | | | — | | | | 18,099 | | | | 110,677 | | | | 125,515 | | | | — | | | | 236,192 | |
Advanced Disposal Services, Inc.* | | | 404 | | | | 324 | | | | — | | | | 728 | | | | 8,977 | | | | 7,199 | | | | — | | | | 16,176 | |
ARC Document Solutions, Inc.* | | | 3,499 | | | | 3,956 | | | | — | | | | 7,455 | | | | 17,775 | | | | 20,096 | | | | — | | | | 37,871 | |
Brady Corp., Class A | | | 873 | | | | 978 | | | | — | | | | 1,851 | | | | 32,781 | | | | 36,724 | | | | — | | | | 69,505 | |
Casella Waste Systems, Inc., Class A* | | | 3,102 | | | | 3,492 | | | | — | | | | 6,594 | | | | 38,496 | | | | 43,336 | | | | — | | | | 81,832 | |
CECO Environmental Corp. | | | 2,348 | | | | 2,632 | | | | — | | | | 4,980 | | | | 32,754 | | | | 36,716 | | | | — | | | | 69,470 | |
CompX International, Inc. | | | 131 | | | | 134 | | | | — | | | | 265 | | | | 2,109 | | | | 2,157 | | | | — | | | | 4,266 | |
Ennis, Inc. | | | 2,039 | | | | 2,280 | | | | — | | | | 4,319 | | | | 35,377 | | | | 39,558 | | | | — | | | | 74,935 | |
Essendant, Inc. | | | 2,992 | | | | 3,322 | | | | — | | | | 6,314 | | | | 62,533 | | | | 69,430 | | | | — | | | | 131,963 | |
G&K Services, Inc., Class A | | | 375 | | | | 435 | | | | — | | | | 810 | | | | 36,169 | | | | 41,956 | | | | — | | | | 78,125 | |
Heritage-Crystal Clean, Inc.* | | | 511 | | | | 521 | | | | — | | | | 1,032 | | | | 8,023 | | | | 8,180 | | | | — | | | | 16,203 | |
InnerWorkings, Inc.* | | | 287 | | | | 246 | | | | — | | | | 533 | | | | 2,827 | | | | 2,423 | | | | — | | | | 5,250 | |
Interface, Inc. | | | 601 | | | | 674 | | | | — | | | | 1,275 | | | | 11,148 | | | | 12,503 | | | | — | | | | 23,651 | |
Kimball International, Inc., Class B | | | 459 | | | | 511 | | | | — | | | | 970 | | | | 8,060 | | | | 8,973 | | | | — | | | | 17,033 | |
McGrath RentCorp. | | | 1,877 | | | | 2,104 | | | | — | | | | 3,981 | | | | 73,560 | | | | 82,456 | | | | — | | | | 156,016 | |
Mobile Mini, Inc. | | | 85,928 | | | | 1,040 | | | | — | | | | 86,968 | | | | 2,599,322 | | | | 31,460 | | | | — | | | | 2,630,782 | |
MSA Safety, Inc. | | | 785 | | | | 909 | | | | — | | | | 1,694 | | | | 54,424 | | | | 63,021 | | | | — | | | | 117,445 | |
NL Industries, Inc.* | | | 606 | | | | 728 | | | | — | | | | 1,334 | | | | 4,939 | | | | 5,933 | | | | — | | | | 10,872 | |
Quad/Graphics, Inc. | | | 1,090 | | | | 1,221 | | | | — | | | | 2,311 | | | | 29,299 | | | | 32,820 | | | | — | | | | 62,119 | |
SP Plus Corp.* | | | 95 | | | | 83 | | | | — | | | | 178 | | | | 2,674 | | | | 2,336 | | | | — | | | | 5,010 | |
Team, Inc.*. | | | 107,168 | | | | 191 | | | | — | | | | 107,359 | | | | 4,206,344 | | | | 7,497 | | | | — | | | | 4,213,841 | |
Tetra Tech, Inc. | | | 3,881 | | | | 4,392 | | | | — | | | | 8,273 | | | | 167,465 | | | | 189,515 | | | | — | | | | 356,980 | |
TRC Cos., Inc.* | | | 1,521 | | | | 1,636 | | | | — | | | | 3,157 | | | | 16,123 | | | | 17,342 | | | | — | | | | 33,465 | |
UniFirst Corp. | | | 1,099 | | | | 1,247 | | | | — | | | | 2,346 | | | | 157,871 | | | | 179,132 | | | | — | | | | 337,003 | |
Viad Corp. | | | 723 | | | | 808 | | | | — | | | | 1,531 | | | | 31,884 | | | | 35,633 | | | | — | | | | 67,517 | |
VSE Corp. | | | 718 | | | | 803 | | | | — | | | | 1,521 | | | | 27,887 | | | | 31,189 | | | | — | | | | 59,076 | |
West Corp. | | | 3,018 | | | | 3,472 | | | | — | | | | 6,490 | | | | 74,726 | | | | 85,967 | | | | — | | | | 160,693 | |
| | | | | | | | | | | | | | | | | | | | | | | | | | | | | | | | |
| | | | | | | | | | | | | | | | | | | 8,035,227 | | | | 1,420,611 | | | | — | | | | 9,455,838 | |
| | | | | | | | | | | | | | | | | | | | | | | | | | | | | | | | |
Construction & Engineering (1.2%) | | | | | | | | | | | | | | | | | | | | | | | | | | | | | | | | |
Aegion Corp.* | | | 2,806 | | | | 3,146 | | | | — | | | | 5,952 | | | | 66,502 | | | | 74,560 | | | | — | | | | 141,062 | |
Ameresco, Inc., Class A* | | | 1,708 | | | | 1,933 | | | | — | | | | 3,641 | | | | 9,394 | | | | 10,632 | | | | — | | | | 20,026 | |
44
| | | | | | | | | | | | | | | | | | | | | | | | | | | | | | | | |
| | | Pacific Global
Small Cap
Value | | | Horizon
Small Cap
Value | | | Pro-forma
Adjustment | | | AXA/Horizon
Small Cap
Value
Combined
Pro-forma | | | Pacific
Global Small
Cap Value | | | Horizon
Small Cap
Value | | | Pro-forma
Adjustment | | | AXA/Horizon
Small Cap
Value
Combined
Pro-forma | |
| | | Number of
Shares | | | Number of
Shares | | | Number of
Shares | | | Number of
Shares | | | Value ($) | | | Value ($) | | | Value ($) | | | Value ($) | |
EMCOR Group, Inc. | | | 4,017 | | | | 4,492 | | | | — | | | | 8,509 | | | | 284,243 | | | | 317,854 | | | | — | | | | 602,097 | |
Granite Construction, Inc. | | | 761 | | | | 890 | | | | — | | | | 1,651 | | | | 41,855 | | | | 48,950 | | | | — | | | | 90,805 | |
Great Lakes Dredge & Dock Corp.* | | | 4,354 | | | | 4,864 | | | | — | | | | 9,218 | | | | 18,287 | | | | 20,429 | | | | — | | | | 38,716 | |
HC2 Holdings, Inc.* | | | 2,625 | | | | 2,952 | | | | — | | | | 5,577 | | | | 15,566 | | | | 17,505 | | | | — | | | | 33,071 | |
IES Holdings, Inc.* | | | 54 | | | | — | | | | — | | | | 54 | | | | 1,034 | | | | — | | | | — | | | | 1,034 | |
Layne Christensen Co.* | | | 1,473 | | | | 1,651 | | | | — | | | | 3,124 | | | | 16,011 | | | | 17,946 | | | | — | | | | 33,957 | |
MYR Group, Inc.* | | | 1,194 | | | | 1,401 | | | | — | | | | 2,595 | | | | 44,990 | | | | 52,790 | | | | — | | | | 97,780 | |
NV5 Global, Inc.* | | | 150 | | | | 169 | | | | — | | | | 319 | | | | 5,010 | | | | 5,645 | | | | — | | | | 10,655 | |
Orion Group Holdings, Inc.* | | | 296,968 | | | | 1,733 | | | | — | | | | 298,701 | | | | 2,954,832 | | | | 17,243 | | | | — | | | | 2,972,075 | |
Tutor Perini Corp.* | | | 2,563 | | | | 2,875 | | | | — | | | | 5,438 | | | | 71,764 | | | | 80,500 | | | | — | | | | 152,264 | |
| | | | | | | | | | | | | | | | | | | | | | | | | | | | | | | | |
| | | | | | | | | | | | | | | | | | | 3,529,488 | | | | 664,054 | | | | — | | | | 4,193,542 | |
| | | | | | | | | | | | | | | | | | | | | | | | | | | | | | | | |
Electrical Equipment (0.3%) | | | | | | | | | | | | | | | | | | | | | | | | | | | | | | | | |
American Superconductor Corp.* | | | 944 | | | | 1,069 | | | | — | | | | 2,013 | | | | 6,957 | | | | 7,879 | | | | — | | | | 14,836 | |
Atkore International Group, Inc.* | | | 397 | | | | 446 | | | | — | | | | 843 | | | | 9,492 | | | | 10,664 | | | | — | | | | 20,156 | |
Babcock & Wilcox Enterprises, Inc.* | | | 3,687 | | | | 4,136 | | | | — | | | | 7,823 | | | | 61,167 | | | | 68,616 | | | | — | | | | 129,783 | |
Encore Wire Corp. | | | 1,630 | | | | 1,872 | | | | — | | | | 3,502 | | | | 70,660 | | | | 81,151 | | | | — | | | | 151,811 | |
EnerSys, Inc. | | | 2,447 | | | | 2,763 | | | | — | | | | 5,210 | | | | 191,111 | | | | 215,789 | | | | — | | | | 406,900 | |
FuelCell Energy, Inc.(x)* | | | 2,337 | | | | 2,542 | | | | — | | | | 4,879 | | | | 4,090 | | | | 4,449 | | | | — | | | | 8,539 | |
General Cable Corp. | | | 302 | | | | 320 | | | | — | | | | 622 | | | | 5,753 | | | | 6,096 | | | | — | | | | 11,849 | |
LSI Industries, Inc. | | | 1,657 | | | | 1,790 | | | | — | | | | 3,447 | | | | 16,139 | | | | 17,435 | | | | — | | | | 33,574 | |
Plug Power, Inc.(x)* | | | 5,278 | | | | 5,716 | | | | — | | | | 10,994 | | | | 6,334 | | | | 6,859 | | | | — | | | | 13,193 | |
Powell Industries, Inc. | | | 694 | | | | 775 | | | | — | | | | 1,469 | | | | 27,066 | | | | 30,225 | | | | — | | | | 57,291 | |
Power Solutions International, Inc.(x)* | | | 99 | | | | 115 | | | | — | | | | 214 | | | | 743 | | | | 863 | | | | — | | | | 1,606 | |
Preformed Line Products Co. | | | 195 | | | | 224 | | | | — | | | | 419 | | | | 11,333 | | | | 13,019 | | | | — | | | | 24,352 | |
Sunrun, Inc.(x)* | | | 5,112 | | | | 5,736 | | | | — | | | | 10,848 | | | | 27,145 | | | | 30,458 | | | | — | | | | 57,603 | |
Thermon Group Holdings, Inc.* | | | 2,576 | | | | 2,889 | | | | — | | | | 5,465 | | | | 49,176 | | | | 55,151 | | | | — | | | | 104,327 | |
TPI Composites, Inc.(x)* | | | 450 | | | | 505 | | | | — | | | | 955 | | | | 7,218 | | | | 8,100 | | | | — | | | | 15,318 | |
Vicor Corp.* | | | 113 | | | | 117 | | | | — | | | | 230 | | | | 1,706 | | | | 1,767 | | | | — | | | | 3,473 | |
| | | | | | | | | | | | | | | | | | | | | | | | | | | | | | | | |
| | | | | | | | | | | | | | | | | | | 496,090 | | | | 558,521 | | | | — | | | | 1,054,611 | |
| | | | | | | | | | | | | | | | | | | | | | | | | | | | | | | | |
Industrial Conglomerates (0.0%) | | | | | | | | | | | | | | | | | | | | | | | | | | | | | | | | |
Raven Industries, Inc. | | | 1,087 | | | | 1,218 | | | | — | | | | 2,305 | | | | 27,392 | | | | 30,694 | | | | — | | | | 58,086 | |
| | | | | | | | | | | | | | | | | | | | | | | | | | | | | | | | |
Machinery (2.9%) | | | | | | | | | | | | | | | | | | | | | | | | | | | | | | | | |
Actuant Corp., Class A | | | 2,463 | | | | 2,763 | | | | — | | | | 5,226 | | | | 63,915 | | | | 71,700 | | | | — | | | | 135,615 | |
Alamo Group, Inc. | | | 585 | | | | 657 | | | | — | | | | 1,242 | | | | 44,519 | | | | 49,998 | | | | — | | | | 94,517 | |
Albany International Corp., Class A | | | 1,951 | | | | 2,219 | | | | — | | | | 4,170 | | | | 90,331 | | | | 102,740 | | | | — | | | | 193,071 | |
Altra Industrial Motion Corp. | | | 337 | | | | 382 | | | | — | | | | 719 | | | | 12,435 | | | | 14,096 | | | | — | | | | 26,531 | |
American Railcar Industries, Inc.(x) | | | 615 | | | | 688 | | | | — | | | | 1,303 | | | | 27,853 | | | | 31,160 | | | | — | | | | 59,013 | |
Astec Industries, Inc. | | | 816 | | | | 942 | | | | — | | | | 1,758 | | | | 55,047 | | | | 63,547 | | | | — | | | | 118,594 | |
Barnes Group, Inc. | | | 4,001 | | | | 4,521 | | | | — | | | | 8,522 | | | | 189,727 | | | | 214,385 | | | | — | | | | 404,112 | |
Blue Bird Corp.* | | | 398 | | | | 451 | | | | — | | | | 849 | | | | 6,149 | | | | 6,968 | | | | — | | | | 13,117 | |
Briggs & Stratton Corp. | | | 3,418 | | | | 3,910 | | | | — | | | | 7,328 | | | | 76,085 | | | | 87,037 | | | | — | | | | 163,122 | |
Chart Industries, Inc.* | | | 2,462 | | | | 2,763 | | | | — | | | | 5,225 | | | | 88,681 | | | | 99,523 | | | | — | | | | 188,204 | |
CIRCOR International, Inc. | | | 1,326 | | | | 1,516 | | | | — | | | | 2,842 | | | | 86,031 | | | | 98,358 | | | | — | | | | 184,389 | |
Colfax Corp.* | �� | | — | | | | 12,000 | | | | — | | | | 12,000 | | | | — | | | | 431,159 | | | | — | | | | 431,159 | |
Columbus McKinnon Corp. | | | 1,569 | | | | 1,764 | | | | — | | | | 3,333 | | | | 42,426 | | | | 47,699 | | | | — | | | | 90,125 | |
DMC Global, Inc. | | | 1,095 | | | | 1,236 | | | | — | | | | 2,331 | | | | 17,356 | | | | 19,591 | | | | — | | | | 36,947 | |
Douglas Dynamics, Inc. | | | 246 | | | | 284 | | | | — | | | | 530 | | | | 8,278 | | | | 9,557 | | | | — | | | | 17,835 | |
ESCO Technologies, Inc. | | | 2,042 | | | | 2,327 | | | | — | | | | 4,369 | | | | 115,679 | | | | 131,824 | | | | — | | | | 247,503 | |
ExOne Co. (The)(x)* | | | 766 | | | | 841 | | | | — | | | | 1,607 | | | | 7,155 | | | | 7,855 | | | | — | | | | 15,010 | |
Federal Signal Corp. | | | 4,804 | | | | 5,389 | | | | — | | | | 10,193 | | | | 74,991 | | | | 84,122 | | | | — | | | | 159,113 | |
Franklin Electric Co., Inc. | | | 220 | | | | 258 | | | | — | | | | 478 | | | | 8,558 | | | | 10,036 | | | | — | | | | 18,594 | |
FreightCar America, Inc. | | | 961 | | | | 1,085 | | | | — | | | | 2,046 | | | | 14,348 | | | | 16,199 | | | | — | | | | 30,547 | |
Gencor Industries, Inc.* | | | 588 | | | | 673 | | | | — | | | | 1,261 | | | | 9,232 | | | | 10,566 | | | | — | | | | 19,798 | |
Global Brass & Copper Holdings, Inc. | | | 152 | | | | 151 | | | | — | | | | 303 | | | | 5,214 | | | | 5,179 | | | | — | | | | 10,393 | |
Gorman-Rupp Co. (The) | | | 189 | | | | 215 | | | | — | | | | 404 | | | | 5,850 | | | | 6,654 | | | | — | | | | 12,504 | |
Graham Corp. | | | 776 | | | | 857 | | | | — | | | | 1,633 | | | | 17,188 | | | | 18,983 | | | | — | | | | 36,171 | |
Greenbrier Cos., Inc. (The)(x) | | | 2,184 | | | | 2,494 | | | | — | | | | 4,678 | | | | 90,745 | | | | 103,626 | | | | — | | | | 194,371 | |
Hardinge, Inc. | | | 947 | | | | 1,065 | | | | — | | | | 2,012 | | | | 10,493 | | | | 11,800 | | | | — | | | | 22,293 | |
Harsco Corp. | | | 6,395 | | | | 7,274 | | | | — | | | | 13,669 | | | | 86,972 | | | | 98,926 | | | | — | | | | 185,898 | |
Hurco Cos., Inc. | | | 511 | | | | 573 | | | | — | | | | 1,084 | | | | 16,914 | | | | 18,966 | | | | — | | | | 35,880 | |
Hyster-Yale Materials Handling, Inc. | | | 521 | | | | 585 | | | | — | | | | 1,106 | | | | 33,224 | | | | 37,305 | | | | — | | | | 70,529 | |
Joy Global, Inc. | | | 7,856 | | | | 8,763 | | | | — | | | | 16,619 | | | | 219,968 | | | | 245,363 | | | | — | �� | | | 465,331 | |
45
| | | | | | | | | | | | | | | | | | | | | | | | | | | | | | | | |
| | | Pacific Global
Small Cap
Value | | | Horizon
Small Cap
Value | | | Pro-forma
Adjustment | | | AXA/Horizon
Small Cap
Value
Combined
Pro-forma | | | Pacific
Global Small
Cap Value | | | Horizon
Small Cap
Value | | | Pro-forma
Adjustment | | | AXA/Horizon
Small Cap
Value
Combined
Pro-forma | |
| | | Number of
Shares | | | Number of
Shares | | | Number of
Shares | | | Number of
Shares | | | Value ($) | | | Value ($) | | | Value ($) | | | Value ($) | |
Kadant, Inc. | | | 707 | | | | 792 | | | | — | | | | 1,499 | | | | 43,268 | | | | 48,470 | | | | — | | | | 91,738 | |
Kennametal, Inc. | | | 6,293 | | | | 7,106 | | | | — | | | | 13,399 | | | | 196,719 | | | | 222,133 | | | | — | | | | 418,852 | |
Lindsay Corp. | | | 112 | | | | 121 | | | | — | | | | 233 | | | | 8,356 | | | | 9,028 | | | | — | | | | 17,384 | |
Manitowoc Co., Inc. (The)* | | | 10,259 | | | | 11,453 | | | | — | | | | 21,712 | | | | 61,349 | | | | 68,489 | | | | — | | | | 129,838 | |
Meritor, Inc.* | | | 6,630 | | | | 7,425 | | | | — | | | | 14,055 | | | | 82,345 | | | | 92,219 | | | | — | | | | 174,564 | |
Milacron Holdings Corp.* | | | 178 | | | | 206 | | | | — | | | | 384 | | | | 3,316 | | | | 3,838 | | | | — | | | | 7,154 | |
Miller Industries, Inc. | | | 803 | | | | 882 | | | | — | | | | 1,685 | | | | 21,239 | | | | 23,329 | | | | — | | | | 44,568 | |
Mueller Industries, Inc. | | | 1,292 | | | | 1,435 | | | | — | | | | 2,727 | | | | 51,628 | | | | 57,343 | | | | — | | | | 108,971 | |
Navistar International Corp.* | | | 120,696 | | | | 4,179 | | | | — | | | | 124,875 | | | | 3,786,234 | | | | 131,094 | | | | — | | | | 3,917,328 | |
NN, Inc. | | | 2,114 | | | | 2,373 | | | | — | | | | 4,487 | | | | 40,272 | | | | 45,206 | | | | — | | | | 85,478 | |
Rexnord Corp.* | | | 1,556 | | | | 1,749 | | | | — | | | | 3,305 | | | | 30,482 | | | | 34,263 | | | | — | | | | 64,745 | |
SPX Corp.* | | | 3,242 | | | | 3,647 | | | | — | | | | 6,889 | | | | 76,900 | | | | 86,507 | | | | — | | | | 163,407 | |
SPX FLOW, Inc.* | | | 2,853 | | | | 3,239 | | | | — | | | | 6,092 | | | | 91,467 | | | | 103,842 | | | | — | | | | 195,309 | |
Standex International Corp. | | | 234 | | | | 262 | | | | — | | | | 496 | | | | 20,557 | | | | 23,017 | | | | — | | | | 43,574 | |
Sun Hydraulics Corp. | | | 190 | | | | 215 | | | | — | | | | 405 | | | | 7,594 | | | | 8,594 | | | | — | | | | 16,188 | |
Supreme Industries, Inc., Class A | | | 426 | | | | 475 | | | | — | | | | 901 | | | | 6,688 | | | | 7,458 | | | | — | | | | 14,146 | |
Tennant Co. | | | 81 | | | | 88 | | | | — | | | | 169 | | | | 5,767 | | | | 6,266 | | | | — | | | | 12,033 | |
Titan International, Inc.(x) | | | 3,577 | | | | 4,017 | | | | — | | | | 7,594 | | | | 40,098 | | | | 45,031 | | | | — | | | | 85,129 | |
TriMas Corp.* | | | 3,632 | | | | 4,072 | | | | — | | | | 7,704 | | | | 85,352 | | | | 95,692 | | | | — | | | | 181,044 | |
Wabash National Corp. | | | 3,813 | | | | 4,280 | | | | — | | | | 8,093 | | | | 60,322 | | | | 67,710 | | | | — | | | | 128,032 | |
Watts Water Technologies, Inc., Class A | | | 153 | | | | 177 | | | | — | | | | 330 | | | | 9,976 | | | | 11,540 | | | | — | | | | 21,516 | |
| | | | | | | | | | | | | | | | | | | | | | | | | | | | | | | | |
| | | | | | | | | | | | | | | | | | | 6,255,293 | | | | 3,345,991 | | | | — | | | | 9,601,284 | |
| | | | | | | | | | | | | | | | | | | | | | | | | | | | | | | | |
Marine (1.4%) | | | | | | | | | | | | | | | | | | | | | | | | | | | | | | | | |
Clarkson plc | | | — | | | | 18,000 | | | | — | | | | 18,000 | | | | — | | | | 482,041 | | | | — | | | | 482,041 | |
Costamare, Inc. | | | 2,102 | | | | 2,358 | | | | — | | | | 4,460 | | | | 11,771 | | | | 13,205 | | | | — | | | | 24,976 | |
Kirby Corp.* | | | 48,000 | | | | — | | | | — | | | | 48,000 | | | | 3,192,000 | | | | — | | | | — | | | | 3,192,000 | |
Matson, Inc. | | | 1,910 | | | | 2,182 | | | | — | | | | 4,092 | | | | 67,595 | | | | 77,221 | | | | — | | | | 144,816 | |
Scorpio Bulkers, Inc.* | | | 4,509 | | | | 5,149 | | | | — | | | | 9,658 | | | | 22,771 | | | | 26,002 | | | | — | | | | 48,773 | |
Stolt-Nielsen Ltd. | | | — | | | | 62,600 | | | | — | | | | 62,600 | | | | — | | | | 768,423 | | | | — | | | | 768,423 | |
| | | | | | | | | | | | | | | | | | | | | | | | | | | | | | | | |
| | | | | | | | | | | | | | | | | | | 3,294,137 | | | | 1,366,892 | | | | — | | | | 4,661,029 | |
| | | | | | | | | | | | | | | | | | | | | | | | | | | | | | | | |
Professional Services (0.5%) | | | | | | | | | | | | | | | | | | | | | | | | | | | | | | | | |
Acacia Research Corp. | | | 3,321 | | | | 4,549 | | | | — | | | | 7,870 | | | | 21,586 | | | | 29,569 | | | | — | | | | 51,155 | |
CBIZ, Inc.* | | | 4,103 | | | | 4,569 | | | | — | | | | 8,672 | | | | 56,211 | | | | 62,595 | | | | — | | | | 118,806 | |
Cogint, Inc.(x)* | | | 1,299 | | | | 1,457 | | | | — | | | | 2,756 | | | | 4,482 | | | | 5,027 | | | | — | | | | 9,509 | |
CRA International, Inc. | | | 691 | | | | 810 | | | | — | | | | 1,501 | | | | 25,291 | | | | 29,646 | | | | — | | | | 54,937 | |
Franklin Covey Co.* | | | 184 | | | | 211 | | | | — | | | | 395 | | | | 3,708 | | | | 4,252 | | | | — | | | | 7,960 | |
FTI Consulting, Inc.* | | | 3,061 | | | | 3,496 | | | | — | | | | 6,557 | | | | 137,990 | | | | 157,599 | | | | — | | | | 295,589 | |
Heidrick & Struggles International, Inc. | | | 1,472 | | | | 1,651 | | | | — | | | | 3,123 | | | | 35,549 | | | | 39,872 | | | | — | | | | 75,421 | |
Hill International, Inc.* | | | 1,738 | | | | 1,961 | | | | — | | | | 3,699 | | | | 7,560 | | | | 8,530 | | | | — | | | | 16,090 | |
Huron Consulting Group, Inc.* | | | 1,537 | | | | 1,752 | | | | — | | | | 3,289 | | | | 77,849 | | | | 88,739 | | | | — | | | | 166,588 | |
ICF International, Inc.* | | | 1,485 | | | | 1,699 | | | | — | | | | 3,184 | | | | 81,972 | | | | 93,785 | | | | — | | | | 175,757 | |
Kelly Services, Inc., Class A | | | 2,367 | | | | 2,629 | | | | — | | | | 4,996 | | | | 54,252 | | | | 60,257 | | | | — | | | | 114,509 | |
Korn/Ferry International | | | 1,894 | | | | 2,127 | | | | — | | | | 4,021 | | | | 55,740 | | | | 62,598 | | | | — | | | | 118,338 | |
Navigant Consulting, Inc.* | | | 3,841 | | | | 4,129 | | | | — | | | | 7,970 | | | | 100,557 | | | | 108,096 | | | | — | | | | 208,653 | |
Resources Connection, Inc. | | | 2,650 | | | | 2,851 | | | | — | | | | 5,501 | | | | 51,013 | | | | 54,882 | | | | — | | | | 105,895 | |
RPX Corp.* | | | 4,090 | | | | 4,588 | | | | — | | | | 8,678 | | | | 44,172 | | | | 49,550 | | | | — | | | | 93,722 | |
TrueBlue, Inc.* | | | 3,173 | | | | 3,569 | | | | — | | | | 6,742 | | | | 78,214 | | | | 87,976 | | | | — | | | | 166,190 | |
| | | | | | | | | | | | | | | | | | | | | | | | | | | | | | | | |
| | | | | | | | | | | | | | | | | | | 836,146 | | | | 942,973 | | | | — | | | | 1,779,119 | |
| | | | | | | | | | | | | | | | | | | | | | | | | | | | | | | | |
Road & Rail (2.2%) | | | | | | | | | | | | | | | | | | | | | | | | | | | | | | | | |
ArcBest Corp. | | | 1,980 | | | | 2,218 | | | | — | | | | 4,198 | | | | 54,747 | | | | 61,328 | | | | — | | | | 116,075 | |
Celadon Group, Inc. | | | 2,205 | | | | 2,580 | | | | — | | | | 4,785 | | | | 15,766 | | | | 18,447 | | | | — | | | | 34,213 | |
Covenant Transportation Group, Inc., Class A* | | | 943 | | | | 1,059 | | | | — | | | | 2,002 | | | | 18,238 | | | | 20,481 | | | | — | | | | 38,719 | |
Genesee & Wyoming, Inc., Class A* | | | 43,000 | | | | — | | | | — | | | | 43,000 | | | | 2,984,630 | | | | — | | | | — | | | | 2,984,630 | |
Knight Transportation, Inc. | | | 352 | | | | 419 | | | | — | | | | 771 | | | | 11,634 | | | | 13,848 | | | | — | | | | 25,482 | |
Marten Transport Ltd. | | | 1,821 | | | | 2,039 | | | | — | | | | 3,860 | | | | 42,429 | | | | 47,509 | | | | — | | | | 89,938 | |
P.A.M. Transportation Services, Inc.* | | | 196 | | | | 20 | | | | — | | | | 216 | | | | 5,092 | | | | 520 | | | | — | | | | 5,612 | |
Roadrunner Transportation Systems, Inc.* | | | 2,534 | | | | 2,871 | | | | — | | | | 5,405 | | | | 26,328 | | | | 29,830 | | | | — | | | | 56,158 | |
Saia, Inc.* | | | 84,517 | | | | 2,262 | | | | — | | | | 86,779 | | | | 3,731,425 | | | | 99,867 | | | | — | | | | 3,831,292 | |
Universal Logistics Holdings, Inc. | | | 212 | | | | 212 | | | | — | | | | 424 | | | | 3,466 | | | | 3,466 | | | | — | | | | 6,932 | |
USA Truck, Inc.* | | | 728 | | | | 818 | | | | — | | | | 1,546 | | | | 6,341 | | | | 7,125 | | | | — | | | | 13,466 | |
46
| | | | | | | | | | | | | | | | | | | | | | | | | | | | | | | | |
| | | Pacific Global
Small Cap
Value | | | Horizon
Small Cap
Value | | | Pro-forma
Adjustment | | | AXA/Horizon
Small Cap
Value
Combined
Pro-forma | | | Pacific
Global Small
Cap Value | | | Horizon
Small Cap
Value | | | Pro-forma
Adjustment | | | AXA/Horizon
Small Cap
Value
Combined
Pro-forma | |
| | | Number of
Shares | | | Number of
Shares | | | Number of
Shares | | | Number of
Shares | | | Value ($) | | | Value ($) | | | Value ($) | | | Value ($) | |
Werner Enterprises, Inc. | | | 3,567 | | | | 4,057 | | | | — | | | | 7,624 | | | | 96,131 | | | | 109,335 | | | | — | | | | 205,466 | |
YRC Worldwide, Inc.* | | | 2,083 | | | | 2,317 | | | | — | | | | 4,400 | | | | 27,662 | | | | 30,770 | | | | — | | | | 58,432 | |
| | | | | | | | | | | | | | | | | | | | | | | | | | | | | | | | |
| | | | | | | | | | | | | | | | | | | 7,023,889 | | | | 442,526 | | | | — | | | | 7,466,415 | |
| | | | | | | | | | | | | | | | | | | | | | | | | | | | | | | | |
Trading Companies & Distributors (4.5%) | | | | | | | | | | | | | | | | | | | | | | | | | | | | | | | | |
Aircastle Ltd. | | | 3,846 | | | | 4,306 | | | | — | | | | 8,152 | | | | 80,189 | | | | 89,780 | | | | — | | | | 169,969 | |
Applied Industrial Technologies, Inc. | | | 1,647 | | | | 1,844 | | | | — | | | | 3,491 | | | | 97,832 | | | | 109,534 | | | | — | | | | 207,366 | |
BMC Stock Holdings, Inc.(x)* | | | 125,657 | | | | 737 | | | | — | | | | 126,394 | | | | 2,450,311 | | | | 14,372 | | | | — | | | | 2,464,683 | |
CAI International, Inc.* | | | 1,297 | | | | 1,498 | | | | — | | | | 2,795 | | | | 11,245 | | | | 12,988 | | | | — | | | | 24,233 | |
DXP Enterprises, Inc.* | | | 97,197 | | | | 1,324 | | | | — | | | | 98,521 | | | | 3,376,624 | | | | 45,996 | | | | — | | | | 3,422,620 | |
GATX Corp.(x) | | | 3,266 | | | | 3,692 | | | | — | | | | 6,958 | | | | 201,120 | | | | 227,352 | | | | — | | | | 428,472 | |
Kaman Corp. | | | 1,959 | | | | 2,232 | | | | — | | | | 4,191 | | | | 95,854 | | | | 109,212 | | | | — | | | | 205,066 | |
Lawson Products, Inc.* | | | 142 | | | | 116 | | | | — | | | | 258 | | | | 3,380 | | | | 2,761 | | | | — | | | | 6,141 | |
MRC Global, Inc.* | | | 7,505 | | | | 8,499 | | | | — | | | | 16,004 | | | | 152,051 | | | | 172,190 | | | | — | | | | 324,241 | |
Neff Corp., Class A* | | | 453 | | | | 591 | | | | — | | | | 1,044 | | | | 6,387 | | | | 8,333 | | | | — | | | | 14,720 | |
NOW, Inc.* | | | 8,510 | | | | 9,624 | | | | — | | | | 18,134 | | | | 174,200 | | | | 197,003 | | | | — | | | | 371,203 | |
Real Industry, Inc.* | | | — | | | | 4,200 | | | | — | | | | 4,200 | | | | — | | | | 25,620 | | | | — | | | | 25,620 | |
Rush Enterprises, Inc., Class A* | | | 115,318 | | | | 2,665 | | | | — | | | | 117,983 | | | | 3,678,644 | | | | 85,013 | | | | — | | | | 3,763,657 | |
Rush Enterprises, Inc., Class B* | | | 493 | | | | 519 | | | | — | | | | 1,012 | | | | 15,219 | | | | 16,022 | | | | — | | | | 31,241 | |
Textainer Group Holdings Ltd.(x) | | | 1,840 | | | | 2,070 | | | | — | | | | 3,910 | | | | 13,708 | | | | 15,422 | | | | — | | | | 29,130 | |
Titan Machinery, Inc.* | | | 1,426 | | | | 1,609 | | | | — | | | | 3,035 | | | | 20,777 | | | | 23,443 | | | | — | | | | 44,220 | |
Triton International Ltd. | | | 221,648 | | | | 2,965 | | | | — | | | | 224,613 | | | | 3,502,038 | | | | 46,847 | | | | — | | | | 3,548,885 | |
Veritiv Corp.* | | | 630 | | | | 707 | | | | — | | | | 1,337 | | | | 33,863 | | | | 38,001 | | | | — | | | | 71,864 | |
Willis Lease Finance Corp.* | | | 309 | | | | 409 | | | | — | | | | 718 | | | | 7,904 | | | | 10,462 | | | | — | | | | 18,366 | |
| | | | | | | | | | | | | | | | | | | | | | | | | | | | | | | | |
| | | | | | | | | | | | | | | | | | | 13,921,346 | | | | 1,250,351 | | | | — | | | | 15,171,697 | |
| | | | | | | | | | | | | | | | | | | | | | | | | | | | | | | | |
Transportation Infrastructure (0.0%) | | | | | | | | | | | | | | | | | | | | | | | | | | | | | | | | |
Wesco Aircraft Holdings, Inc.* | | | 3,468 | | | | 3,888 | | | | — | | | | 7,356 | | | | 51,847 | | | | 58,126 | | | | — | | | | 109,973 | |
| | | | | | | | | | | | | | | | | | | | | | | | | | | | | | | | |
Total Industries | | | | | | | | | | | | | | | | | | | 48,585,097 | | | | 12,984,170 | | | | — | | | | 61,569,267 | |
| | | | | | | | | | | | | | | | | | | | | | | | | | | | | | | | |
Information Technology (6.4%) | | | | | | | | | | | | | | | | | | | | | | | | | | | | | | | | |
Communications Equipment (1.3%) | | | | | | | | | | | | | | | | | | | | | | | | | | | | | | | | |
ADTRAN, Inc. | | | 1,386 | | | | 1,554 | | | | — | | | | 2,940 | | | | 30,977 | | | | 34,732 | | | | — | | | | 65,709 | |
Applied Optoelectronics, Inc.* | | | 1,324 | | | | 1,493 | | | | — | | | | 2,817 | | | | 31,035 | | | | 34,996 | | | | — | | | | 66,031 | |
Bel Fuse, Inc., Class B | | | 737 | | | | 830 | | | | — | | | | 1,567 | | | | 22,773 | | | | 25,647 | | | | — | | | | 48,420 | |
Black Box Corp. | | | 1,174 | | | | 1,339 | | | | — | | | | 2,513 | | | | 17,904 | | | | 20,420 | | | | — | | | | 38,324 | |
Calix, Inc.* | | | 3,317 | | | | 3,724 | | | | — | | | | 7,041 | | | | 25,541 | | | | 28,675 | | | | — | | | | 54,216 | |
Comtech Telecommunications Corp. | | | 1,805 | | | | 2,024 | | | | — | | | | 3,829 | | | | 21,389 | | | | 23,984 | | | | — | | | | 45,373 | |
Digi International, Inc.* | | | 2,068 | | | | 2,327 | | | | — | | | | 4,395 | | | | 28,435 | | | | 31,996 | | | | — | | | | 60,431 | |
EchoStar Corp., Class A* | | | — | | | | 36,000 | | | | — | | | | 36,000 | | | | — | | | | 1,850,041 | | | | — | | | | 1,850,041 | |
EMCORE Corp. | | | 2,139 | | | | 2,374 | | | | — | | | | 4,513 | | | | 18,609 | | | | 20,654 | | | | — | | | | 39,263 | |
Finisar Corp.* | | | 8,582 | | | | 9,566 | | | | — | | | | 18,148 | | | | 259,777 | | | | 289,563 | | | | — | | | | 549,340 | |
Harmonic, Inc.(x)* | | | 6,166 | | | | 6,924 | | | | — | | | | 13,090 | | | | 30,830 | | | | 34,620 | | | | — | | | | 65,450 | |
Infinera Corp.* | | | 3,412 | | | | 3,832 | | | | — | | | | 7,244 | | | | 28,968 | | | | 32,534 | | | | — | | | | 61,502 | |
Ixia* | | | 5,172 | | | | 5,927 | | | | — | | | | 11,099 | | | | 83,269 | | | | 95,425 | | | | — | | | | 178,694 | |
KVH Industries, Inc.* | | | 1,235 | | | | 1,398 | | | | — | | | | 2,633 | | | | 14,573 | | | | 16,496 | | | | — | | | | 31,069 | |
NETGEAR, Inc.* | | | 873 | | | | 980 | | | | — | | | | 1,853 | | | | 47,448 | | | | 53,263 | | | | — | | | | 100,711 | |
NetScout Systems, Inc.* | | | 7,201 | | | | 7,949 | | | | — | | | | 15,150 | | | | 226,832 | | | | 250,394 | | | | — | | | | 477,226 | |
Oclaro, Inc.* | | | 1,369 | | | | 1,557 | | | | — | | | | 2,926 | | | | 12,253 | | | | 13,935 | | | | — | | | | 26,188 | |
Quantenna Communications, Inc.* | | | 219 | | | | 219 | | | | — | | | | 438 | | | | 3,970 | | | | 3,970 | | | | — | | | | 7,940 | |
ShoreTel, Inc.* | | | 4,132 | | | | 4,641 | | | | — | | | | 8,773 | | | | 29,544 | | | | 33,183 | | | | — | | | | 62,727 | |
Silicom Ltd. | | | 335 | | | | 358 | | | | — | | | | 693 | | | | 13,765 | | | | 14,710 | | | | — | | | | 28,475 | |
Sonus Networks, Inc.* | | | 3,318 | | | | 3,724 | | | | — | | | | 7,042 | | | | 20,903 | | | | 23,461 | | | | — | | | | 44,364 | |
ViaSat, Inc.* | | | 455 | | | | 3,346 | | | | — | | | | 3,801 | | | | 30,130 | | | | 221,572 | | | | — | | | | 251,702 | |
Viavi Solutions, Inc.* | | | 18,804 | | | | 21,213 | | | | — | | | | 40,017 | | | | 153,817 | | | | 173,522 | | | | — | | | | 327,339 | |
| | | | | | | | | | | | | | | | | | | | | | | | | | | | | | | | |
| | | | | | | | | | | | | | | | | | | 1,152,742 | | | | 3,327,793 | | | | — | | | | 4,480,535 | |
| | | | | | | | | | | | | | | | | | | | | | | | | | | | | | | | |
Electronic Equipment, Instruments & Componentst (1.6%) | | | | | | | | | | | | | | | | | | | | | | | | | | | | | | | | |
Agilysys, Inc.* | | | 1,108 | | | | 1,227 | | | | — | | | | 2,335 | | | | 11,479 | | | | 12,712 | | | | — | | | | 24,191 | |
Anixter International, Inc.* | | | 2,307 | | | | 2,560 | | | | — | | | | 4,867 | | | | 186,982 | | | | 207,488 | | | | — | | | | 394,470 | |
AVX Corp. | | | 3,705 | | | | 4,154 | | | | — | | | | 7,859 | | | | 57,909 | | | | 64,927 | | | | — | | | | 122,836 | |
Benchmark Electronics, Inc.* | | | 3,930 | | | | 4,546 | | | | — | | | | 8,476 | | | | 119,865 | | | | 138,653 | | | | — | | | | 258,518 | |
Control4 Corp.* | | | 1,616 | | | | 1,790 | | | | — | | | | 3,406 | | | | 16,483 | | | | 18,258 | | | | — | | | | 34,741 | |
CTS Corp. | | | 2,502 | | | | 2,807 | | | | — | | | | 5,309 | | | | 56,045 | | | | 62,877 | | | | — | | | | 118,922 | |
47
| | | | | | | | | | | | | | | | | | | | | | | | | | | | | | | | |
| | | Pacific Global
Small Cap
Value | | | Horizon
Small Cap
Value | | | Pro-forma
Adjustment | | | AXA/Horizon
Small Cap
Value
Combined
Pro-forma | | | Pacific
Global Small
Cap Value | | | Horizon
Small Cap
Value | | | Pro-forma
Adjustment | | | AXA/Horizon
Small Cap
Value
Combined
Pro-forma | |
| | | Number of
Shares | | | Number of
Shares | | | Number of
Shares | | | Number of
Shares | | | Value ($) | | | Value ($) | | | Value ($) | | | Value ($) | |
Daktronics, Inc. | | | 3,028 | | | | 3,399 | | | | — | | | | 6,427 | | | | 32,400 | | | | 36,369 | | | | — | | | | 68,769 | |
Electro Scientific Industries, Inc.* | | | 2,187 | | | | 2,462 | | | | — | | | | 4,649 | | | | 12,947 | | | | 14,575 | | | | — | | | | 27,522 | |
ePlus, Inc.* | | | 141 | | | | 160 | | | | — | | | | 301 | | | | 16,243 | | | | 18,432 | | | | — | | | | 34,675 | |
FARO Technologies, Inc.* | | | 998 | | | | 1,120 | | | | — | | | | 2,118 | | | | 35,928 | | | | 40,320 | | | | — | | | | 76,248 | |
II-VI, Inc.* | | | 3,403 | | | | 3,930 | | | | — | | | | 7,333 | | | | 100,899 | | | | 116,525 | | | | — | | | | 217,424 | |
Insight Enterprises, Inc.* | | | 2,911 | | | | 3,290 | | | | — | | | | 6,201 | | | | 117,721 | | | | 133,048 | | | | — | | | | 250,769 | |
InvenSense, Inc.* | | | 6,588 | | | | 7,400 | | | | — | | | | 13,988 | | | | 84,261 | | | | 94,646 | | | | — | | | | 178,907 | |
Kimball Electronics, Inc.* | | | 2,234 | | | | 2,524 | | | | — | | | | 4,758 | | | | 40,659 | | | | 45,937 | | | | — | | | | 86,596 | |
Knowles Corp.(x)* | | | 7,068 | | | | 7,980 | | | | — | | | | 15,048 | | | | 118,106 | | | | 133,346 | | | | — | | | | 251,452 | |
Maxwell Technologies, Inc.(x)* | | | 2,569 | | | | 2,907 | | | | — | | | | 5,476 | | | | 13,153 | | | | 14,884 | | | | — | | | | 28,037 | |
Methode Electronics, Inc. | | | 238 | | | | 272 | | | | — | | | | 510 | | | | 9,841 | | | | 11,247 | | | | — | | | | 21,088 | |
MTS Systems Corp. | | | 122 | | | | 123 | | | | — | | | | 245 | | | | 6,917 | | | | 6,974 | | | | — | | | | 13,891 | |
Novanta, Inc.* | | | 1,868 | | | | 2,100 | | | | — | | | | 3,968 | | | | 39,228 | | | | 44,100 | | | | — | | | | 83,328 | |
OSI Systems, Inc.* | | | 1,413 | | | | 1,608 | | | | — | | | | 3,021 | | | | 107,558 | | | | 122,401 | | | | — | | | | 229,959 | |
Park Electrochemical Corp. | | | 1,534 | | | | 1,727 | | | | — | | | | 3,261 | | | | 28,609 | | | | 32,209 | | | | — | | | | 60,818 | |
PC Connection, Inc. | | | 893 | | | | 860 | | | | — | | | | 1,753 | | | | 25,084 | | | | 24,157 | | | | — | | | | 49,241 | |
Plexus Corp.* | | | 2,649 | | | | 3,056 | | | | — | | | | 5,705 | | | | 143,152 | | | | 165,146 | | | | — | | | | 308,298 | |
RadiSys Corp.* | | | 165 | | | | 158 | | | | — | | | | 323 | | | | 731 | | | | 700 | | | | — | | | | 1,431 | |
Rogers Corp.* | | | 952 | | | | 1,091 | | | | — | | | | 2,043 | | | | 73,123 | | | | 83,800 | | | | — | | | | 156,923 | |
Sanmina Corp.* | | | 5,848 | | | | 6,493 | | | | — | | | | 12,341 | | | | 214,329 | | | | 237,968 | | | | — | | | | 452,297 | |
ScanSource, Inc.* | | | 2,030 | | | | 2,271 | | | | — | | | | 4,301 | | | | 81,911 | | | | 91,635 | | | | — | | | | 173,546 | |
SYNNEX Corp. | | | 2,341 | | | | 2,601 | | | | — | | | | 4,942 | | | | 283,308 | | | | 314,772 | | | | — | | | | 598,080 | |
Systemax, Inc. | | | 875 | | | | 991 | | | | — | | | | 1,866 | | | | 7,674 | | | | 8,691 | | | | — | | | | 16,365 | |
Tech Data Corp.* | | | 2,781 | | | | 3,110 | | | | — | | | | 5,891 | | | | 235,495 | | | | 263,354 | | | | — | | | | 498,849 | |
TTM Technologies, Inc.* | | | 5,865 | | | | 6,556 | | | | — | | | | 12,421 | | | | 79,940 | | | | 89,358 | | | | — | | | | 169,298 | |
Vishay Intertechnology, Inc.(x) | | | 10,820 | | | | 12,269 | | | | — | | | | 23,089 | | | | 175,284 | | | | 198,758 | | | | — | | | | 374,042 | |
Vishay Precision Group, Inc.* | | | 960 | | | | 1,114 | | | | — | | | | 2,074 | | | | 18,144 | | | | 21,055 | | | | — | | | | 39,199 | |
| | | | | | | | | | | | | | | | | | | | | | | | | | | | | | | | |
| | | | | | | | | | | | | | | | | | | 2,551,408 | | | | 2,869,322 | | | | — | | | | 5,420,730 | |
| | | | | | | | | | | | | | | | | | | | | | | | | | | | | | | | |
Internet Software & Services (0.8%) | | | | | | | | | | | | | | | | | | | | | | | | | | | | | | | | |
Apptio, Inc., Class A* | | | 97 | | | | 110 | | | | — | | | | 207 | | | | 1,797 | | | | 2,038 | | | | — | | | | 3,835 | |
Autobytel, Inc.* | | | 551 | | | | 622 | | | | — | | | | 1,173 | | | | 7,411 | | | | 8,366 | | | | — | | | | 15,777 | |
Bankrate, Inc.* | | | 3,834 | | | | 4,306 | | | | — | | | | 8,140 | | | | 42,366 | | | | 47,581 | | | | — | | | | 89,947 | |
Bazaarvoice, Inc.* | | | 6,596 | | | | 7,422 | | | | — | | | | 14,018 | | | | 31,991 | | | | 35,997 | | | | — | | | | 67,988 | |
Blucora, Inc.* | | | 2,508 | | | | 2,817 | | | | — | | | | 5,325 | | | | 36,993 | | | | 41,551 | | | | — | | | | 78,544 | |
ChannelAdvisor Corp.* | | | 130 | | | | — | | | | — | | | | 130 | | | | 1,866 | | | | — | | | | — | | | | 1,866 | |
Coupa Software, Inc.(x)* | | | 123 | | | | 137 | | | | — | | | | 260 | | | | 3,076 | | | | 3,426 | | | | — | | | | 6,502 | |
Global Sources Ltd.* | | | 642 | | | | 719 | | | | — | | | | 1,361 | | | | 5,682 | | | | 6,363 | | | | — | | | | 12,045 | |
Intralinks Holdings, Inc.* | | | 3,141 | | | | 3,530 | | | | — | | | | 6,671 | | | | 42,466 | | | | 47,726 | | | | — | | | | 90,192 | |
Limelight Networks, Inc.(x)* | | | 5,814 | | | | 6,684 | | | | — | | | | 12,498 | | | | 14,651 | | | | 16,844 | | | | — | | | | 31,495 | |
Liquidity Services, Inc.* | | | 1,982 | | | | 2,233 | | | | — | | | | 4,215 | | | | 19,325 | | | | 21,772 | | | | — | | | | 41,097 | |
Marchex, Inc., Class B | | | 2,799 | | | | 3,090 | | | | — | | | | 5,889 | | | | 7,417 | | | | 8,189 | | | | — | | | | 15,606 | |
MeetMe, Inc.* | | | 415 | | | | 470 | | | | — | | | | 885 | | | | 2,046 | | | | 2,317 | | | | — | | | | 4,363 | |
NIC, Inc. | | | 90,000 | | | | — | | | | — | | | | 90,000 | | | | 2,151,000 | | | | — | | | | — | | | | 2,151,000 | |
Numerex Corp., Class A* | | | 890 | | | | 1,005 | | | | — | | | | 1,895 | | | | 6,586 | | | | 7,437 | | | | — | | | | 14,023 | |
QuinStreet, Inc.* | | | 2,966 | | | | 3,324 | | | | — | | | | 6,290 | | | | 11,152 | | | | 12,498 | | | | — | | | | 23,650 | |
RealNetworks, Inc.* | | | 1,897 | | | | 2,054 | | | | — | | | | 3,951 | | | | 9,220 | | | | 9,982 | | | | — | | | | 19,202 | |
Reis, Inc. | | | 237 | | | | 280 | | | | — | | | | 517 | | | | 5,273 | | | | 6,230 | | | | — | | | | 11,503 | |
RetailMeNot, Inc.* | | | 3,111 | | | | 3,493 | | | | — | | | | 6,604 | | | | 28,932 | | | | 32,485 | | | | — | | | | 61,417 | |
Rightside Group Ltd.* | | | 905 | | | | 1,015 | | | | — | | | | 1,920 | | | | 7,484 | | | | 8,394 | | | | — | | | | 15,878 | |
TechTarget, Inc.* | | | 862 | | | | 1,132 | | | | — | | | | 1,994 | | | | 7,353 | | | | 9,656 | | | | — | | | | 17,009 | |
Trade Desk, Inc. (The), Class A(x)* | | | 272 | | | | 327 | | | | — | | | | 599 | | | | 7,526 | | | | 9,048 | | | | — | | | | 16,574 | |
| | | | | | | | | | | | | | | | | | | | | | | | | | | | | | | | |
| | | | | | | | | | | | | | | | | | | 2,451,613 | | | | 337,900 | | | | — | | | | 2,789,513 | |
| | | | | | | | | | | | | | | | | | | | | | | | | | | | | | | | |
IT Services (0.5%) | | | | | | | | | | | | | | | | | | | | | | | | | | | | | | | | |
Acxiom Corp.* | | | 3,213 | | | | 3,669 | | | | — | | | | 6,882 | | | | 86,108 | | | | 98,329 | | | | — | | | | 184,437 | |
CACI International, Inc., Class A* | | | 1,950 | | | | 2,157 | | | | — | | | | 4,107 | | | | 242,385 | | | | 268,116 | | | | — | | | | 510,501 | |
Cass Information Systems, Inc. | | | 367 | | | | 409 | | | | — | | | | 776 | | | | 27,000 | | | | 30,090 | | | | — | | | | 57,090 | |
Convergys Corp. | | | 3,584 | | | | 4,069 | | | | — | | | | 7,653 | | | | 88,023 | | | | 99,935 | | | | — | | | | 187,958 | |
Datalink Corp.* | | | 1,499 | | | | 1,705 | | | | — | | | | 3,204 | | | | 16,879 | | | | 19,198 | | | | — | | | | 36,077 | |
EVERTEC, Inc. | | | 934 | | | | 1,049 | | | | — | | | | 1,983 | | | | 16,578 | | | | 18,620 | | | | — | | | | 35,198 | |
ManTech International Corp., Class A | | | 2,002 | | | | 2,283 | | | | — | | | | 4,285 | | | | 84,584 | | | | 96,457 | | | | — | | | | 181,041 | |
MoneyGram International, Inc.* | | | 2,386 | | | | 2,693 | | | | — | | | | 5,079 | | | | 28,179 | | | | 31,804 | | | | — | | | | 59,983 | |
NCI, Inc., Class A | | | 524 | | | | 589 | | | | — | | | | 1,113 | | | | 7,310 | | | | 8,217 | | | | — | | | | 15,527 | |
48
| | | | | | | | | | | | | | | | | | | | | | | | | | | | | | | | |
| | | Pacific Global
Small Cap
Value | | | Horizon
Small Cap
Value | | | Pro-forma
Adjustment | | | AXA/Horizon
Small Cap
Value
Combined
Pro-forma | | | Pacific
Global Small
Cap Value | | | Horizon
Small Cap
Value | | | Pro-forma
Adjustment | | | AXA/Horizon
Small Cap
Value
Combined
Pro-forma | |
| | | Number of
Shares | | | Number of
Shares | | | Number of
Shares | | | Number of
Shares | | | Value ($) | | | Value ($) | | | Value ($) | | | Value ($) | |
NeuStar, Inc., Class A* | | | 359 | | | | 381 | | | | — | | | | 740 | | | | 11,991 | | | | 12,725 | | | | — | | | | 24,716 | |
Perficient, Inc.* | | | 918 | | | | 1,037 | | | | — | | | | 1,955 | | | | 16,056 | | | | 18,137 | | | | — | | | | 34,193 | |
PFSweb, Inc.* | | | 116 | | | | 60 | | | | — | | | | 176 | | | | 986 | | | | 510 | | | | — | | | | 1,496 | |
ServiceSource International, Inc.* | | | 1,772 | | | | 2,171 | | | | — | | | | 3,943 | | | | 10,065 | | | | 12,331 | | | | — | | | | 22,396 | |
Sykes Enterprises, Inc.* | | | 3,176 | | | | 3,620 | | | | — | | | | 6,796 | | | | 91,659 | | | | 104,474 | | | | — | | | | 196,133 | |
Travelport Worldwide Ltd. | | | 2,485 | | | | 2,784 | | | | — | | | | 5,269 | | | | 35,039 | | | | 39,254 | | | | — | | | | 74,293 | |
Unisys Corp.(x)* | | | 1,359 | | | | 1,551 | | | | — | | | | 2,910 | | | | 20,317 | | | | 23,187 | | | | — | | | | 43,504 | |
| | | | | | | | | | | | | | | | | | | | | | | | | | | | | | | | |
| | | | | | | | | | | | | | | | | | | 783,159 | | | | 881,384 | | | | — | | | | 1,664,543 | |
| | | | | | | | | | | | | | | | | | | | | | | | | | | | | | | | |
Semiconductors & Semiconductor Equipment (1.4%) | | | | | | | | | | | | | | | | | | | | | | | | | | | | | | | | |
Advanced Energy Industries, Inc.* | | | 176 | | | | 168 | | | | — | | | | 344 | | | | 9,636 | | | | 9,198 | | | | — | | | | 18,834 | |
Advanced Micro Devices, Inc.* | | | 31,281 | | | | 34,851 | | | | — | | | | 66,132 | | | | 354,726 | | | | 395,211 | | | | — | | | | 749,937 | |
Alpha & Omega Semiconductor Ltd.* | | | 1,426 | | | | 1,685 | | | | — | | | | 3,111 | | | | 30,331 | | | | 35,840 | | | | — | | | | 66,171 | |
Ambarella, Inc.(x)* | | | 1,537 | | | | 1,753 | | | | — | | | | 3,290 | | | | 83,198 | | | | 94,890 | | | | — | | | | 178,088 | |
Amkor Technology, Inc.* | | | 7,585 | | | | 8,481 | | | | — | | | | 16,066 | | | | 80,022 | | | | 89,475 | | | | — | | | | 169,497 | |
Axcelis Technologies, Inc.* | | | 2,323 | | | | 2,606 | | | | — | | | | 4,929 | | | | 33,800 | | | | 37,917 | | | | — | | | | 71,717 | |
Brooks Automation, Inc. | | | 5,454 | | | | 6,231 | | | | — | | | | 11,685 | | | | 93,100 | | | | 106,363 | | | | — | | | | 199,463 | |
Cabot Microelectronics Corp. | | | 1,641 | | | | 1,867 | | | | — | | | | 3,508 | | | | 103,662 | | | | 117,938 | | | | — | | | | 221,600 | |
Cavium, Inc.* | | | 664 | | | | 744 | | | | — | | | | 1,408 | | | | 41,460 | | | | 46,455 | | | | — | | | | 87,915 | |
Cohu, Inc. | | | 2,092 | | | | 2,357 | | | | — | | | | 4,449 | | | | 29,079 | | | | 32,762 | | | | — | | | | 61,841 | |
Diodes, Inc.* | | | 3,067 | | | | 3,506 | | | | — | | | | 6,573 | | | | 78,730 | | | | 89,999 | | | | — | | | | 168,729 | |
DSP Group, Inc.* | | | 1,708 | | | | 1,894 | | | | — | | | | 3,602 | | | | 22,289 | | | | 24,717 | | | | — | | | | 47,006 | |
Entegris, Inc.* | | | 4,228 | | | | 4,833 | | | | — | | | | 9,061 | | | | 75,681 | | | | 86,511 | | | | — | | | | 162,192 | |
Exar Corp.* | | | 2,677 | | | | 3,002 | | | | — | | | | 5,679 | | | | 28,858 | | | | 32,362 | | | | — | | | | 61,220 | |
FormFactor, Inc.* | | | 2,333 | | | | 2,614 | | | | — | | | | 4,947 | | | | 26,130 | | | | 29,277 | | | | — | | | | 55,407 | |
GigPeak, Inc.* | | | 4,265 | | | | 4,949 | | | | — | | | | 9,214 | | | | 10,748 | | | | 12,471 | | | | — | | | | 23,219 | |
Impinj, Inc.(x)* | | | 174 | | | | 196 | | | | — | | | | 370 | | | | 6,149 | | | | 6,927 | | | | — | | | | 13,076 | |
Intersil Corp., Class A | | | 10,682 | | | | 11,951 | | | | — | | | | 22,633 | | | | 238,209 | | | | 266,508 | | | | — | | | | 504,717 | |
IXYS Corp. | | | 1,991 | | | | 2,218 | | | | — | | | | 4,209 | | | | 23,693 | | | | 26,394 | | | | — | | | | 50,087 | |
Kopin Corp.* | | | 4,879 | | | | 5,536 | | | | — | | | | 10,415 | | | | 13,856 | | | | 15,722 | | | | — | | | | 29,578 | |
MKS Instruments, Inc. | | | 4,017 | | | | 4,475 | | | | — | | | | 8,492 | | | | 238,610 | | | | 265,815 | | | | — | | | | 504,425 | |
Nanometrics, Inc.* | | | 349 | | | | 397 | | | | — | | | | 746 | | | | 8,746 | | | | 9,949 | | | | — | | | | 18,695 | |
NeoPhotonics Corp.* | | | 2,067 | | | | 2,316 | | | | — | | | | 4,383 | | | | 22,344 | | | | 25,036 | | | | — | | | | 47,380 | |
NVE Corp. | | | 186 | | | | 209 | | | | — | | | | 395 | | | | 13,286 | | | | 14,929 | | | | — | | | | 28,215 | |
PDF Solutions, Inc.* | | | 118 | | | | 77 | | | | — | | | | 195 | | | | 2,661 | | | | 1,736 | | | | — | | | | 4,397 | |
Photronics, Inc.* | | | 5,215 | | | | 6,011 | | | | — | | | | 11,226 | | | | 58,929 | | | | 67,924 | | | | — | | | | 126,853 | |
Rambus, Inc.* | | | 6,515 | | | | 7,443 | | | | — | | | | 13,958 | | | | 89,712 | | | | 102,490 | | | | — | | | | 192,202 | |
Rudolph Technologies, Inc.* | | | 2,399 | | | | 2,693 | | | | — | | | | 5,092 | | | | 56,017 | | | | 62,882 | | | | — | | | | 118,899 | |
Sigma Designs, Inc.* | | | 2,861 | | | | 3,243 | | | | — | | | | 6,104 | | | | 17,166 | | | | 19,458 | | | | — | | | | 36,624 | |
Tessera Holding Corp. | | | 1,384 | | | | 1,552 | | | | — | | | | 2,936 | | | | 61,173 | | | | 68,598 | | | | — | | | | 129,771 | |
Ultra Clean Holdings, Inc.* | | | 2,535 | | | | 2,859 | | | | — | | | | 5,394 | | | | 24,589 | | | | 27,732 | | | | — | | | | 52,321 | |
Ultratech, Inc.* | | | 1,588 | | | | 1,783 | | | | — | | | | 3,371 | | | | 38,080 | | | | 42,756 | | | | — | | | | 80,836 | |
Veeco Instruments, Inc.* | | | 3,202 | | | | 3,589 | | | | — | | | | 6,791 | | | | 93,338 | | | | 104,619 | | | | — | | | | 197,957 | |
Xcerra Corp.* | | | 4,248 | | | | 4,778 | | | | — | | | | 9,026 | | | | 32,455 | | | | 36,504 | | | | — | | | | 68,959 | |
| | | | | | | | | | | | | | | | | | | | | | | | | | | | | | | | |
| | | | | | | | | | | | | | | | | | | 2,140,463 | | | | 2,407,365 | | | | — | | | | 4,547,828 | |
| | | | | | | | | | | | | | | | | | | | | | | | | | | | | | | | |
Software (0.6%) | | | | | | | | | | | | | | | | | | | | | | | | | | | | | | | | |
Blackline, Inc.* | | | 128 | | | | 138 | | | | — | | | | 266 | | | | 3,537 | | | | 3,813 | | | | — | | | | 7,350 | |
Bottomline Technologies de, Inc.* | | | 435 | | | | 488 | | | | — | | | | 923 | | | | 10,884 | | | | 12,210 | | | | — | | | | 23,094 | |
Digimarc Corp.* | | | 37 | | | | 45 | | | | — | | | | 82 | | | | 1,110 | | | | 1,350 | | | | — | | | | 2,460 | |
EnerNOC, Inc.(x)* | | | 312 | | | | 350 | | | | — | | | | 662 | | | | 1,872 | | | | 2,100 | | | | — | | | | 3,972 | |
Everbridge, Inc.(x)* | | | 89 | | | | 115 | | | | — | | | | 204 | | | | 1,642 | | | | 2,122 | | | | — | | | | 3,764 | |
Glu Mobile, Inc.(x)* | | | 8,306 | | | | 9,348 | | | | — | | | | 17,654 | | | | 16,114 | | | | 18,135 | | | | — | | | | 34,249 | |
Mentor Graphics Corp. | | | 8,562 | | | | 9,541 | | | | — | | | | 18,103 | | | | 315,852 | | | | 351,968 | | | | — | | | | 667,820 | |
MicroStrategy, Inc., Class A* | | | 359 | | | | 403 | | | | — | | | | 762 | | | | 70,866 | | | | 79,552 | | | | — | | | | 150,418 | |
Park City Group, Inc.(x)* | | | 68 | | | | 62 | | | | — | | | | 130 | | | | 864 | | | | 787 | | | | — | | | | 1,651 | |
Progress Software Corp. | | | 3,498 | | | | 3,979 | | | | — | | | | 7,477 | | | | 111,691 | | | | 127,049 | | | | — | | | | 238,740 | |
QAD, Inc., Class A | | | 775 | | | | 831 | | | | — | | | | 1,606 | | | | 23,560 | | | | 25,262 | | | | — | | | | 48,822 | |
Rosetta Stone, Inc.* | | | 345 | | | | 387 | | | | — | | | | 732 | | | | 3,074 | | | | 3,448 | | | | — | | | | 6,522 | |
Rubicon Project, Inc. (The)* | | | 1,808 | | | | 2,036 | | | | — | | | | 3,844 | | | | 13,415 | | | | 15,107 | | | | — | | | | 28,522 | |
SecureWorks Corp., Class A* | | | 345 | | | | 385 | | | | — | | | | 730 | | | | 3,653 | | | | 4,077 | | | | — | | | | 7,730 | |
Silver Spring Networks, Inc.* | | | 172 | | | | 174 | | | | — | | | | 346 | | | | 2,289 | | | | 2,316 | | | | — | | | | 4,605 | |
Tangoe, Inc.* | | | 2,225 | | | | 2,505 | | | | — | | | | 4,730 | | | | 17,533 | | | | 19,739 | | | | — | | | | 37,272 | |
49
| | | | | | | | | | | | | | | | | | | | | | | | | | | | | | | | |
| | | Pacific Global
Small Cap
Value | | | Horizon
Small Cap
Value | | | Pro-forma
Adjustment | | | AXA/Horizon
Small Cap
Value
Combined
Pro-forma | | | Pacific
Global Small
Cap Value | | | Horizon
Small Cap
Value | | | Pro-forma
Adjustment | | | AXA/Horizon
Small Cap
Value
Combined
Pro-forma | |
| | | Number of
Shares | | | Number of
Shares | | | Number of
Shares | | | Number of
Shares | | | Value ($) | | | Value ($) | | | Value ($) | | | Value ($) | |
Telenav, Inc.* | | | 2,598 | | | | 2,967 | | | | — | | | | 5,565 | | | | 18,316 | | | | 20,917 | | | | — | | | | 39,233 | |
TiVo Corp.* | | | 6,473 | | | | 7,420 | | | | — | | | | 13,893 | | | | 135,286 | | | | 155,078 | | | | — | | | | 290,364 | |
VASCO Data Security International, Inc.* | | | 249 | | | | 281 | | | | — | | | | 530 | | | | 3,399 | | | | 3,836 | | | | — | | | | 7,235 | |
Verint Systems, Inc.* | | | 4,992 | | | | 5,500 | | | | — | | | | 10,492 | | | | 175,968 | | | | 193,876 | | | | — | | | | 369,844 | |
| | | | | | | | | | | | | | | | | | | | | | | | | | | | | | | | |
| | | | | | | | | | | | | | | | | | | 930,925 | | | | 1,042,742 | | | | — | | | | 1,973,667 | |
| | | | | | | | | | | | | | | | | | | | | | | | | | | | | | | | |
Technology Hardware, Storage & Peripherals (0.1%) | | | | | | | | | | | | | | | | | | | | | | | | | | | | | | | | |
Avid Technology, Inc.* | | | 865 | | | | 991 | | | | — | | | | 1,856 | | | | 3,806 | | | | 4,360 | | | | — | | | | 8,166 | |
CPI Card Group, Inc. | | | 1,100 | | | | 1,252 | | | | — | | | | 2,352 | | | | 4,565 | | | | 5,196 | | | | — | | | | 9,761 | |
Diebold Nixdorf, Inc. | | | 3,665 | | | | 4,175 | | | | — | | | | 7,840 | | | | 92,175 | | | | 105,001 | | | | — | | | | 197,176 | |
Eastman Kodak Co.* | | | 259 | | | | 301 | | | | — | | | | 560 | | | | 4,014 | | | | 4,666 | | | | — | | | | 8,680 | |
Immersion Corp.* | | | 1,590 | | | | 1,796 | | | | — | | | | 3,386 | | | | 16,902 | | | | 19,091 | | | | — | | | | 35,993 | |
Stratasys Ltd.* | | | 2,077 | | | | 2,330 | | | | — | | | | 4,407 | | | | 34,354 | | | | 38,538 | | | | — | | | | 72,892 | |
Super Micro Computer, Inc.* | | | 2,449 | | | | 2,817 | | | | — | | | | 5,266 | | | | 68,694 | | | | 79,017 | | | | — | | | | 147,711 | |
USA Technologies, Inc.(x)* | | | 371 | | | | 380 | | | | — | | | | 751 | | | | 1,595 | | | | 1,634 | | | | — | | | | 3,229 | |
| | | | | | | | | | | | | | | | | | | | | | | | | | | | | | | | |
| | | | | | | | | | | | | | | | | | | 226,105 | | | | 257,503 | | | | — | | | | 483,608 | |
| | | | | | | | | | | | | | | | | | | | | | | | | | | | | | | | |
Total Information Technology | | | | | | | | | | | | | | | | | | | 10,236,415 | | | | 11,124,009 | | | | — | | | | 21,360,424 | |
| | | | | | | | | | | | | | | | | | | | | | | | | | | | | | | | |
Materials (2.6%) | | | | | | | | | | | | | | | | | | | | | | | | | | | | | | | | |
Chemicals (1.2%) | | | | | | | | | | | | | | | | | | | | | | | | | | | | | | | | |
A. Schulman, Inc. | | | 2,274 | | | | 2,599 | | | | — | | | | 4,873 | | | | 76,065 | | | | 86,937 | | | | — | | | | 163,002 | |
AgroFresh Solutions, Inc.* | | | 1,825 | | | | 2,056 | | | | — | | | | 3,881 | | | | 4,836 | | | | 5,448 | | | | — | | | | 10,284 | |
American Vanguard Corp. | | | 2,267 | | | | 2,544 | | | | — | | | | 4,811 | | | | 43,413 | | | | 48,718 | | | | — | | | | 92,131 | |
Calgon Carbon Corp. | | | 4,050 | | | | 4,544 | | | | — | | | | 8,594 | | | | 68,850 | | | | 77,248 | | | | — | | | | 146,098 | |
Chemours Co. (The) | | | 2,400 | | | | 2,755 | | | | — | | | | 5,155 | | | | 53,016 | | | | 60,858 | | | | — | | | | 113,874 | |
Chemtura Corp.* | | | 2,525 | | | | 2,870 | | | | — | | | | 5,395 | | | | 83,830 | | | | 95,284 | | | | — | | | | 179,114 | |
FutureFuel Corp. | | | 1,987 | | | | 2,250 | | | | — | | | | 4,237 | | | | 27,619 | | | | 31,275 | | | | — | | | | 58,894 | |
GCP Applied Technologies, Inc.* | | | 890 | | | | 999 | | | | — | | | | 1,889 | | | | 23,808 | | | | 26,723 | | | | — | | | | 50,531 | |
Hawkins, Inc. | | | 612 | | | | 686 | | | | — | | | | 1,298 | | | | 33,017 | | | | 37,010 | | | | — | | | | 70,027 | |
Ingevity Corp.* | | | 676 | | | | 759 | | | | — | | | | 1,435 | | | | 37,085 | | | | 41,639 | | | | — | | | | 78,724 | |
Innophos Holdings, Inc. | | | 165 | | | | 188 | | | | — | | | | 353 | | | | 8,623 | | | | 9,825 | | | | — | | | | 18,448 | |
Innospec, Inc. | | | 1,880 | | | | 2,134 | | | | — | | | | 4,014 | | | | 128,780 | | | | 146,178 | | | | — | | | | 274,958 | |
KMG Chemicals, Inc. | | | 401 | | | | 454 | | | | — | | | | 855 | | | | 15,595 | | | | 17,656 | | | | — | | | | 33,251 | |
Koppers Holdings, Inc.* | | | 323 | | | | 366 | | | | — | | | | 689 | | | | 13,017 | | | | 14,750 | | | | — | | | | 27,767 | |
Kraton Corp.* | | | 2,377 | | | | 2,720 | | | | — | | | | 5,097 | | | | 67,697 | | | | 77,466 | | | | — | | | | 145,163 | |
Kronos Worldwide, Inc.(x) | | | 1,760 | | | | 1,937 | | | | — | | | | 3,697 | | | | 21,014 | | | | 23,128 | | | | — | | | | 44,142 | |
LSB Industries, Inc.(x)* | | | 1,684 | | | | 1,895 | | | | — | | | | 3,579 | | | | 14,179 | | | | 15,956 | | | | — | | | | 30,135 | |
Minerals Technologies, Inc. | | | 1,289 | | | | 1,467 | | | | — | | | | 2,756 | | | | 99,575 | | | | 113,326 | | | | — | | | | 212,901 | |
Olin Corp. | | | 13,224 | | | | 14,778 | | | | — | | | | 28,002 | | | | 338,667 | | | | 378,464 | | | | — | | | | 717,131 | |
OMNOVA Solutions, Inc.* | | | 1,261 | | | | 903 | | | | — | | | | 2,164 | | | | 12,610 | | | | 9,030 | | | | — | | | | 21,640 | |
Platform Specialty Products Corp.(x)* | | | — | | | | 82,940 | | | | — | | | | 82,940 | | | | — | | | | 813,640 | | | | — | | | | 813,640 | |
Quaker Chemical Corp. | | | 257 | | | | 288 | | | | — | | | | 545 | | | | 32,881 | | | | 36,847 | | | | — | | | | 69,728 | |
Rayonier Advanced Materials, Inc.(x) | | | 1,377 | | | | 1,548 | | | | — | | | | 2,925 | | | | 21,289 | | | | 23,932 | | | | — | | | | 45,221 | |
Stepan Co. | | | 1,426 | | | | 1,616 | | | | — | | | | 3,042 | | | | 116,191 | | | | 131,672 | | | | — | | | | 247,863 | |
TerraVia Holdings, Inc.(x)* | | | 6,339 | | | | 7,139 | | | | — | | | | 13,478 | | | | 7,290 | | | | 8,210 | | | | — | | | | 15,500 | |
Trecora Resources* | | | 271 | | | | 308 | | | | — | | | | 579 | | | | 3,753 | | | | 4,266 | | | | — | | | | 8,019 | |
Tredegar Corp. | | | 2,030 | | | | 2,276 | | | | — | | | | 4,306 | | | | 48,720 | | | | 54,624 | | | | — | | | | 103,344 | |
Tronox Ltd., Class A | | | 5,177 | | | | 5,822 | | | | — | | | | 10,999 | | | | 53,375 | | | | 60,025 | | | | — | | | | 113,400 | |
Valhi, Inc. | | | 1,880 | | | | 2,143 | | | | — | | | | 4,023 | | | | 6,505 | | | | 7,415 | | | | — | | | | 13,920 | |
| | | | | | | | | | | | | | | | | | | | | | | | | | | | | | | | |
| | | | | | | | | | | | | | | | | | | 1,461,300 | | | | 2,457,550 | | | | — | | | | 3,918,850 | |
| | | | | | | | | | | | | | | | | | | | | | | | | | | | | | | | |
Construction Materials (0.0%) | | | | | | | | | | | | | | | | | | | | | | | | | | | | | | | | |
United States Lime & Minerals, Inc. | | | 153 | | | | 147 | | | | — | | | | 300 | | | | 11,590 | | | | 11,135 | | | | — | | | | 22,725 | |
| | | | | | | | | | | | | | | | | | | | | | | | | | | | | | | | |
Containers & Packaging (0.1%) | | | | | | | | | | | | | | | | | | | | | | | | | | | | | | | | |
Greif, Inc., Class A | | | 2,029 | | | | 2,313 | | | | — | | | | 4,342 | | | | 104,108 | | | | 118,680 | | | | — | | | | 222,788 | |
Greif, Inc., Class B | | | 460 | | | | 502 | | | | — | | | | 962 | | | | 31,073 | | | | 33,910 | | | | — | | | | 64,983 | |
UFP Technologies, Inc.* | | | 507 | | | | 574 | | | | — | | | | 1,081 | | | | 12,903 | | | | 14,608 | | | | — | | | | 27,511 | |
| | | | | | | | | | | | | | | | | | | | | | | | | | | | | | | | |
| | | | | | | | | | | | | | | | | | | 148,084 | | | | 167,198 | | | | — | | | | 315,282 | |
| | | | | | | | | | | | | | | | | | | | | | | | | | | | | | | | |
Metals & Mining (1.1%) | | | | | | | | | | | | | | | | | | | | | | | | | | | | | | | | |
AK Steel Holding Corp.* | | | 24,776 | | | | 27,833 | | | | — | | | | 52,609 | | | | 252,963 | | | | 284,175 | | | | — | | | | 537,138 | |
Allegheny Technologies, Inc.(x) | | | 8,691 | | | | 9,799 | | | | — | | | | 18,490 | | | | 138,448 | | | | 156,098 | | | | — | | | | 294,546 | |
Ampco-Pittsburgh Corp. | | | 683 | | | | 769 | | | | — | | | | 1,452 | | | | 11,440 | | | | 12,881 | | | | — | | | | 24,321 | |
50
| | | | | | | | | | | | | | | | | | | | | | | | | | | | | | | | |
| | | Pacific Global
Small Cap
Value | | | Horizon
Small Cap
Value | | | Pro-forma
Adjustment | | | AXA/Horizon
Small Cap
Value
Combined
Pro-forma | | | Pacific
Global Small
Cap Value | | | Horizon
Small Cap
Value | | | Pro-forma
Adjustment | | | AXA/Horizon
Small Cap
Value
Combined
Pro-forma | |
| | | Number of
Shares | | | Number of
Shares | | | Number of
Shares | | | Number of
Shares | | | Value ($) | | | Value ($) | | | Value ($) | | | Value ($) | |
Carpenter Technology Corp. | | | 3,680 | | | | 4,181 | | | | — | | | | 7,861 | | | | 133,106 | | | | 151,227 | | | | — | | | | 284,333 | |
Century Aluminum Co.* | | | 3,759 | | | | 4,223 | | | | — | | | | 7,982 | | | | 32,177 | | | | 36,149 | | | | — | | | | 68,326 | |
Cliffs Natural Resources, Inc.* | | | 17,609 | | | | 19,956 | | | | — | | | | 37,565 | | | | 148,092 | | | | 167,830 | | | | — | | | | 315,922 | |
Coeur Mining, Inc.* | | | 3,654 | | | | 4,204 | | | | — | | | | 7,858 | | | | 33,215 | | | | 38,214 | | | | — | | | | 71,429 | |
Commercial Metals Co. | | | 9,160 | | | | 10,128 | | | | — | | | | 19,288 | | | | 199,505 | | | | 220,588 | | | | — | | | | 420,093 | |
Dominion Diamond Corp. | | | — | | | | 10,000 | | | | — | | | | 10,000 | | | | — | | | | 96,800 | | | | — | | | | 96,800 | |
Ferroglobe plc(x) | | | 5,264 | | | | 5,921 | | | | — | | | | 11,185 | | | | 57,009 | | | | 64,124 | | | | — | | | | 121,133 | |
Gold Resource Corp.(x) | | | 785 | | | | 882 | | | | — | | | | 1,667 | | | | 3,415 | | | | 3,837 | | | | — | | | | 7,252 | |
Handy & Harman Ltd.* | | | 241 | | | | 272 | | | | — | | | | 513 | | | | 6,157 | | | | 6,950 | | | | — | | | | 13,107 | |
Haynes International, Inc. | | | 992 | | | | 1,115 | | | | — | | | | 2,107 | | | | 42,646 | | | | 47,934 | | | | — | | | | 90,580 | |
Hecla Mining Co. | | | 30,696 | | | | 34,180 | | | | — | | | | 64,876 | | | | 160,847 | | | | 179,103 | | | | — | | | | 339,950 | |
Kaiser Aluminum Corp. | | | 895 | | | | 1,007 | | | | — | | | | 1,902 | | | | 69,532 | | | | 78,234 | | | | — | | | | 147,766 | |
Materion Corp. | | | 1,596 | | | | 1,794 | | | | — | | | | 3,390 | | | | 63,202 | | | | 71,042 | | | | — | | | | 134,244 | |
McEwen Mining, Inc.(x) | | | — | | | | 33,454 | | | | — | | | | 33,454 | | | | — | | | | 97,351 | | | | — | | | | 97,351 | |
Olympic Steel, Inc. | | | 724 | | | | 732 | | | | — | | | | 1,456 | | | | 17,542 | | | | 17,736 | | | | — | | | | 35,278 | |
Ryerson Holding Corp.* | | | 1,016 | | | | 1,234 | | | | — | | | | 2,250 | | | | 13,564 | | | | 16,474 | | | | — | | | | 30,038 | |
Sandstorm Gold Ltd.* | | | — | | | | 12,000 | | | | — | | | | 12,000 | | | | — | | | | 46,800 | | | | — | | | | 46,800 | |
Schnitzer Steel Industries, Inc., Class A | | | 2,088 | | | | 2,341 | | | | — | | | | 4,429 | | | | 53,662 | | | | 60,164 | | | | — | | | | 113,826 | |
Stillwater Mining Co.* | | | 9,802 | | | | 11,086 | | | | — | | | | 20,888 | | | | 157,910 | | | | 178,595 | | | | — | | | | 336,505 | |
SunCoke Energy, Inc.* | | | 5,180 | | | | 5,814 | | | | — | | | | 10,994 | | | | 58,741 | | | | 65,931 | | | | — | | | | 124,672 | |
TimkenSteel Corp.* | | | 3,178 | | | | 3,568 | | | | — | | | | 6,746 | | | | 49,195 | | | | 55,233 | | | | — | | | | 104,428 | |
| | | | | | | | | | | | | | | | | | | | | | | | | | | | | | | | |
| | | | | | | | | | | | | | | | | | | 1,702,368 | | | | 2,153,470 | | | | — | | | | 3,855,838 | |
| | | | | | | | | | | | | | | | | | | | | | | | | | | | | | | | |
Paper & Forest Products (0.2%) | | | | | | | | | | | | | | | | | | | | | | | | | | | | | | | | |
Boise Cascade Co.* | | | 452 | | | | 511 | | | | — | | | | 963 | | | | 10,170 | | | | 11,498 | | | | — | | | | 21,668 | |
KapStone Paper and Packaging Corp. | | | 6,417 | | | | 7,265 | | | | — | | | | 13,682 | | | | 141,495 | | | | 160,193 | | | | — | | | | 301,688 | |
Louisiana-Pacific Corp.* | | | 797 | | | | 900 | | | | — | | | | 1,697 | | | | 15,087 | | | | 17,037 | | | | — | | | | 32,124 | |
P.H. Glatfelter Co. | | | 3,498 | | | | 3,915 | | | | — | | | | 7,413 | | | | 83,567 | | | | 93,529 | | | | — | | | | 177,096 | |
Schweitzer-Mauduit International, Inc. | | | 1,964 | | | | 2,243 | | | | — | | | | 4,207 | | | | 89,421 | | | | 102,124 | | | | — | | | | 191,545 | |
| | | | | | | | | | | | | | | | | | | | | | | | | | | | | | | | |
| | | | | | | | | | | | | | | | | | | 339,740 | | | | 384,381 | | | | | | | | 724,121 | |
| | | | | | | | | | | | | | | | | | | | | | | | | | | | | | | | |
Total Materials | | | | | | | | | | | | | | | | | | | 3,663,082 | | | | 5,173,734 | | | | — | | | | 8,836,816 | |
| | | | | | | | | | | | | | | | | | | | | | | | | | | | | | | | |
Real Estate (7.3%) | | | | | | | | | | | | | | | | | | | | | | | | | | | | | | | | |
Equity Real Estate Investment Trusts (REITs) (5.0%) | | | | | | | | | | | | | | | | | | | | | | | | | | | | | | | | |
Acadia Realty Trust (REIT) | | | 5,047 | | | | 5,706 | | | | — | | | | 10,753 | | | | 164,936 | | | | 186,472 | | | | — | | | | 351,408 | |
Agree Realty Corp. (REIT) | | | 1,873 | | | | 2,094 | | | | — | | | | 3,967 | | | | 86,252 | | | | 96,429 | | | | — | | | | 182,681 | |
Alexander’s, Inc. (REIT) | | | 7 | | | | 5 | | | | — | | | | 12 | | | | 2,988 | | | | 2,134 | | | | — | | | | 5,122 | |
American Assets Trust, Inc. (REIT) | | | 2,040 | | | | 2,294 | | | | — | | | | 4,334 | | | | 87,883 | | | | 98,826 | | | | — | | | | 186,709 | |
Armada Hoffler Properties, Inc. (REIT) | | | 309 | | | | 363 | | | | — | | | | 672 | | | | 4,502 | | | | 5,289 | | | | — | | | | 9,791 | |
Ashford Hospitality Prime, Inc. (REIT) | | | 1,902 | | | | 2,240 | | | | — | | | | 4,142 | | | | 25,962 | | | | 30,576 | | | | — | | | | 56,538 | |
Ashford Hospitality Trust, Inc. (REIT) | | | 6,346 | | | | 7,130 | | | | — | | | | 13,476 | | | | 49,245 | | | | 55,329 | | | | — | | | | 104,574 | |
Bluerock Residential Growth REIT, Inc. (REIT) | | | 1,516 | | | | 1,668 | | | | — | | | | 3,184 | | | | 20,799 | | | | 22,885 | | | | — | | | | 43,684 | |
CatchMark Timber Trust, Inc. (REIT), Class A | | | 3,098 | | | | 3,476 | | | | — | | | | 6,574 | | | | 34,883 | | | | 39,140 | | | | — | | | | 74,023 | |
CBL & Associates Properties, Inc. (REIT) | | | 13,585 | | | | 15,439 | | | | — | | | | 29,024 | | | | 156,227 | | | | 177,549 | | | | — | | | | 333,776 | |
Cedar Realty Trust, Inc. (REIT) | | | 6,657 | | | | 7,484 | | | | — | | | | 14,141 | | | | 43,470 | | | | 48,871 | | | | — | | | | 92,341 | |
Chatham Lodging Trust (REIT) | | | 3,020 | | | | 3,394 | | | | — | | | | 6,414 | | | | 62,061 | | | | 69,747 | | | | — | | | | 131,808 | |
Chesapeake Lodging Trust (REIT) | | | 3,505 | | | | 3,995 | | | | — | | | | 7,500 | | | | 90,639 | | | | 103,311 | | | | — | | | | 193,950 | |
City Office REIT, Inc. (REIT) | | | 286 | | | | 333 | | | | — | | | | 619 | | | | 3,767 | | | | 4,386 | | | | — | | | | 8,153 | |
Colony Starwood Homes (REIT) | | | 5,213 | | | | 5,737 | | | | — | | | | 10,950 | | | | 150,187 | | | | 165,283 | | | | — | | | | 315,470 | |
Community Healthcare Trust, Inc. (REIT) | | | 1,010 | | | | 1,140 | | | | — | | | | 2,150 | | | | 23,260 | | | | 26,254 | | | | — | | | | 49,514 | |
CorEnergy Infrastructure Trust, Inc.
(REIT)(x) | | | 959 | | | | 1,076 | | | | — | | | | 2,035 | | | | 33,450 | | | | 37,531 | | | | — | | | | 70,981 | |
Cousins Properties, Inc. (REIT) | | | 27,046 | | | | 30,064 | | | | — | | | | 57,110 | | | | 230,161 | | | | 255,845 | | | | — | | | | 486,006 | |
DiamondRock Hospitality Co. (REIT) | | | 16,003 | | | | 18,417 | | | | — | | | | 34,420 | | | | 184,515 | | | | 212,348 | | | | — | | | | 396,863 | |
Easterly Government Properties, Inc. (REIT) | | | 2,592 | | | | 2,912 | | | | — | | | | 5,504 | | | | 51,892 | | | | 58,298 | | | | — | | | | 110,190 | |
Education Realty Trust, Inc. (REIT) | | | 5,168 | | | | 5,841 | | | | — | | | | 11,009 | | | | 218,606 | | | | 247,074 | | | | — | | | | 465,680 | |
Equity LifeStyle Properties, Inc. (REIT) | | | — | | | | 7,000 | | | | — | | | | 7,000 | | | | — | | | | 504,699 | | | | — | | | | 504,699 | |
Farmland Partners, Inc. (REIT)(x) | | | 944 | | | | 1,075 | | | | — | | | | 2,019 | | | | 10,535 | | | | 11,997 | | | | — | | | | 22,532 | |
FelCor Lodging Trust, Inc. (REIT) | | | 1,385 | | | | 1,570 | | | | — | | | | 2,955 | | | | 11,094 | | | | 12,576 | | | | — | | | | 23,670 | |
First Industrial Realty Trust, Inc. (REIT) | | | 7,293 | | | | 8,035 | | | | — | | | | 15,328 | | | | 204,569 | | | | 225,382 | | | | — | | | | 429,951 | |
First Potomac Realty Trust (REIT) | | | 4,665 | | | | 5,240 | | | | — | | | | 9,905 | | | | 51,175 | | | | 57,483 | | | | — | | | | 108,658 | |
51
| | | | | | | | | | | | | | | | | | | | | | | | | | | | | | | | |
| | | Pacific Global
Small Cap
Value | | | Horizon
Small Cap
Value | | | Pro-forma
Adjustment | | | AXA/Horizon
Small Cap
Value
Combined
Pro-forma | | | Pacific
Global Small
Cap Value | | | Horizon
Small Cap
Value | | | Pro-forma
Adjustment | | | AXA/Horizon
Small Cap
Value
Combined
Pro-forma | |
| | | Number of
Shares | | | Number of
Shares | | | Number of
Shares | | | Number of
Shares | | | Value ($) | | | Value ($) | | | Value ($) | | | Value ($) | |
Four Corners Property Trust, Inc. (REIT) | | | 1,102 | | | | 1,238 | | | | — | | | | 2,340 | | | | 22,613 | | | | 25,404 | | | | — | | | | 48,017 | |
Franklin Street Properties Corp. (REIT) | | | 8,392 | | | | 9,567 | | | | — | | | | 17,959 | | | | 108,760 | | | | 123,988 | | | | — | | | | 232,748 | |
GEO Group, Inc. (The) (REIT) | | | 4,674 | | | | 5,287 | | | | — | | | | 9,961 | | | | 167,937 | | | | 189,962 | | | | — | | | | 357,899 | |
Getty Realty Corp. (REIT) | | | 2,086 | | | | 2,346 | | | | — | | | | 4,432 | | | | 53,172 | | | | 59,800 | | | | — | | | | 112,972 | |
Gladstone Commercial Corp. (REIT) | | | 1,746 | | | | 1,980 | | | | — | | | | 3,726 | | | | 35,095 | | | | 39,798 | | | | — | | | | 74,893 | |
Global Medical REIT, Inc. (REIT)(x) | | | 613 | | | | 688 | | | | — | | | | 1,301 | | | | 5,468 | | | | 6,137 | | | | — | | | | 11,605 | |
Global Net Lease, Inc. (REIT)(x) | | | 13,688 | | | | 15,732 | | | | — | | | | 29,420 | | | | 107,177 | | | | 123,182 | | | | — | | | | 230,359 | |
Government Properties Income Trust (REIT) | | | 5,612 | | | | 6,180 | | | | — | | | | 11,792 | | | | 106,993 | | | | 117,822 | | | | — | | | | 224,815 | |
Gramercy Property Trust (REIT) | | | 28,642 | | | | 32,040 | | | | — | | | | 60,682 | | | | 262,934 | | | | 294,126 | | | | — | | | | 557,060 | |
Healthcare Realty Trust, Inc. (REIT) | | | 9,119 | | | | 10,186 | | | | — | | | | 19,305 | | | | 276,488 | | | | 308,839 | | | | — | | | | 585,327 | |
Hersha Hospitality Trust (REIT) | | | 3,182 | | | | 3,554 | | | | — | | | | 6,736 | | | | 68,413 | | | | 76,411 | | | | — | | | | 144,824 | |
Hudson Pacific Properties, Inc. (REIT) | | | 8,430 | | | | 9,479 | | | | — | | | | 17,909 | | | | 293,195 | | | | 329,679 | | | | — | | | | 622,874 | |
Independence Realty Trust, Inc. (REIT)(x) | | | 4,499 | | | | 5,036 | | | | — | | | | 9,535 | | | | 40,131 | | | | 44,921 | | | | — | | | | 85,052 | |
InfraREIT, Inc. (REIT)* | | | 3,238 | | | | 3,643 | | | | — | | | | 6,881 | | | | 57,993 | | | | 65,246 | | | | — | | | | 123,239 | |
Investors Real Estate Trust (REIT) | | | 9,711 | | | | 10,903 | | | | — | | | | 20,614 | | | | 69,239 | | | | 77,738 | | | | — | | | | 146,977 | |
Kite Realty Group Trust (REIT) | | | 6,630 | | | | 7,310 | | | | — | | | | 13,940 | | | | 155,672 | | | | 171,639 | | | | — | | | | 327,311 | |
LaSalle Hotel Properties (REIT) | | | 8,515 | | | | 9,473 | | | | — | | | | 17,988 | | | | 259,452 | | | | 288,641 | | | | — | | | | 548,093 | |
Lexington Realty Trust (REIT) | | | 18,303 | | | | 20,942 | | | | — | | | | 39,245 | | | | 197,672 | | | | 226,174 | | | | — | | | | 423,846 | |
LTC Properties, Inc. (REIT) | | | 407 | | | | 460 | | | | — | | | | 867 | | | | 19,121 | | | | 21,611 | | | | — | | | | 40,732 | |
Mack-Cali Realty Corp. (REIT) | | | 7,186 | | | | 7,910 | | | | — | | | | 15,096 | | | | 208,538 | | | | 229,548 | | | | — | | | | 438,086 | |
MedEquities Realty Trust, Inc. (REIT) | | | 457 | | | | 420 | | | | — | | | | 877 | | | | 5,073 | | | | 4,662 | | | | — | | | | 9,735 | |
Medical Properties Trust, Inc. (REIT) | | | 15,690 | | | | 17,730 | | | | — | | | | 33,420 | | | | 192,987 | | | | 218,079 | | | | — | | | | 411,066 | |
Monmouth Real Estate Investment Corp. (REIT)(x) | | | 4,305 | | | | 4,686 | | | | — | | | | 8,991 | | | | 65,608 | | | | 71,415 | | | | — | | | | 137,023 | |
Monogram Residential Trust, Inc.
(REIT)(x) | | | 13,546 | | | | 15,490 | | | | — | | | | 29,036 | | | | 146,568 | | | | 167,602 | | | | — | | | | 314,170 | |
National Storage Affiliates Trust (REIT) | | | 2,515 | | | | 2,822 | | | | — | | | | 5,337 | | | | 55,506 | | | | 62,282 | | | | — | | | | 117,788 | |
New Senior Investment Group, Inc. (REIT) | | | 6,221 | | | | 6,886 | | | | — | | | | 13,107 | | | | 60,904 | | | | 67,414 | | | | — | | | | 128,318 | |
New York REIT, Inc. (REIT) | | | 13,284 | | | | 15,209 | | | | — | | | | 28,493 | | | | 134,434 | | | | 153,915 | | | | — | | | | 288,349 | |
NexPoint Residential Trust, Inc. (REIT) | | | 1,440 | | | | 1,610 | | | | — | | | | 3,050 | | | | 32,170 | | | | 35,967 | | | | — | | | | 68,137 | |
NorthStar Realty Europe Corp. (REIT) | | | 4,344 | | | | 5,139 | | | | — | | | | 9,483 | | | | 54,604 | | | | 64,597 | | | | — | | | | 119,201 | |
One Liberty Properties, Inc. (REIT) | | | 1,043 | | | | 1,031 | | | | — | | | | 2,074 | | | | 26,200 | | | | 25,899 | | | | — | | | | 52,099 | |
Parkway, Inc. (REIT)* | | | 3,405 | | | | 3,824 | | | | — | | | | 7,229 | | | | 75,761 | | | | 85,084 | | | | — | | | | 160,845 | |
Pebblebrook Hotel Trust (REIT) | | | 5,756 | | | | 6,565 | | | | — | | | | 12,321 | | | | 171,241 | | | | 195,309 | | | | — | | | | 366,550 | |
Pennsylvania REIT (REIT) | | | 3,921 | | | | 4,468 | | | | — | | | | 8,389 | | | | 74,342 | | | | 84,713 | | | | — | | | | 159,055 | |
Physicians Realty Trust (REIT) | | | 5,277 | | | | 6,028 | | | | — | | | | 11,305 | | | | 100,052 | | | | 114,291 | | | | — | | | | 214,343 | |
Preferred Apartment Communities, Inc. (REIT), Class A(x) | | | 1,767 | | | | 1,975 | | | | — | | | | 3,742 | | | | 26,346 | | | | 29,447 | | | | — | | | | 55,793 | |
RAIT Financial Trust (REIT) | | | 7,044 | | | | 8,141 | | | | — | | | | 15,185 | | | | 23,668 | | | | 27,354 | | | | — | | | | 51,022 | |
Ramco-Gershenson Properties Trust (REIT) | | | 6,337 | | | | 6,891 | | | | — | | | | 13,228 | | | | 105,067 | | | | 114,253 | | | | — | | | | 219,320 | |
Retail Opportunity Investments Corp. (REIT) | | | 2,525 | | | | 2,811 | | | | — | | | | 5,336 | | | | 53,353 | | | | 59,396 | | | | — | | | | 112,749 | |
Rexford Industrial Realty, Inc. (REIT) | | | 3,249 | | | | 3,723 | | | | — | | | | 6,972 | | | | 75,344 | | | | 86,336 | | | | — | | | | 161,680 | |
RLJ Lodging Trust (REIT) | | | 9,704 | | | | 10,814 | | | | — | | | | 20,518 | | | | 237,651 | | | | 264,835 | | | | — | | | | 502,486 | |
Sabra Health Care REIT, Inc. (REIT) | | | 4,368 | | | | 4,962 | | | | — | | | | 9,330 | | | | 106,667 | | | | 121,172 | | | | — | | | | 227,839 | |
Saul Centers, Inc. (REIT) | | | 90 | | | | 101 | | | | — | | | | 191 | | | | 5,995 | | | | 6,728 | | | | — | | | | 12,723 | |
Select Income REIT (REIT) | | | 5,089 | | | | 5,571 | | | | — | | | | 10,660 | | | | 128,243 | | | | 140,389 | | | | — | | | | 268,632 | |
Seritage Growth Properties (REIT), Class A(x) | | | 2,008 | | | | 2,292 | | | | — | | | | 4,300 | | | | 85,762 | | | | 97,891 | | | | — | | | | 183,653 | |
Silver Bay Realty Trust Corp. (REIT) | | | 2,692 | | | | 3,026 | | | | — | | | | 5,718 | | | | 46,141 | | | | 51,866 | | | | — | | | | 98,007 | |
Summit Hotel Properties, Inc. (REIT) | | | 6,991 | | | | 8,019 | | | | — | | | | 15,010 | | | | 112,066 | | | | 128,545 | | | | — | | | | 240,611 | |
Sunstone Hotel Investors, Inc. (REIT) | | | 17,335 | | | | 19,795 | | | | — | | | | 37,130 | | | | 264,359 | | | | 301,873 | | | | — | | | | 566,232 | |
Terreno Realty Corp. (REIT) | | | 2,713 | | | | 3,105 | | | | — | | | | 5,818 | | | | 77,293 | | | | 88,461 | | | | — | | | | 165,754 | |
Tier REIT, Inc. (REIT) | | | 3,840 | | | | 4,313 | | | | — | | | | 8,153 | | | | 66,778 | | | | 75,003 | | | | — | | | | 141,781 | |
UMH Properties, Inc. (REIT) | | | 1,373 | | | | 1,550 | | | | — | | | | 2,923 | | | | 20,664 | | | | 23,328 | | | | — | | | | 43,992 | |
Washington Prime Group, Inc. (REIT) | | | 11,816 | | | | 13,381 | | | | — | | | | 25,197 | | | | 123,005 | | | | 139,296 | | | | — | | | | 262,301 | |
Washington Real Estate Investment Trust (REIT) | | | 3,864 | | | | 4,384 | | | | — | | | | 8,248 | | | | 126,314 | | | | 143,313 | | | | — | | | | 269,627 | |
Whitestone REIT (REIT) | | | 2,054 | | | | 2,300 | | | | — | | | | 4,354 | | | | 29,536 | | | | 33,074 | | | | — | | | | 62,610 | |
Xenia Hotels & Resorts, Inc. (REIT) | | | 8,324 | | | | 9,093 | | | | — | | | | 17,417 | | | | 161,652 | | | | 176,586 | | | | — | | | | 338,238 | |
| | | | | | | | | | | | | | | | | | | | | | | | | | | | | | | | |
| | | | | | | | | | | | | | | | | | | 7,590,475 | | | | 9,036,755 | | | | — | | | | 16,627,230 | |
| | | | | | | | | | | | | | | | | | | | | | | | | | | | | | | | |
Real Estate Management & Development (2.4%) | | | | | | | | | | | | | | | | | | | | | | | | | | | | | | | | |
Alexander & Baldwin, Inc. | | | 1,764 | | | | 1,973 | | | | — | | | | 3,737 | | | | 79,151 | | | | 88,529 | | | | — | | | | 167,680 | |
AV Homes, Inc.* | | | 673 | | | | 754 | | | | — | | | | 1,427 | | | | 10,633 | | | | 11,913 | | | | — | | | | 22,546 | |
52
| | | | | | | | | | | | | | | | | | | | | | | | | | | | | | | | |
| | | Pacific Global
Small Cap
Value | | | Horizon
Small Cap
Value | | | Pro-forma
Adjustment | | | AXA/Horizon
Small Cap
Value
Combined
Pro-forma | | | Pacific
Global Small
Cap Value | | | Horizon
Small Cap
Value | | | Pro-forma
Adjustment | | | AXA/Horizon
Small Cap
Value
Combined
Pro-forma | |
| | | Number of
Shares | | | Number of
Shares | | | Number of
Shares | | | Number of
Shares | | | Value ($) | | | Value ($) | | | Value ($) | | | Value ($) | |
Consolidated-Tomoka Land Co. | | | 38 | | | | 445 | | | | — | | | | 483 | | | | 2,030 | | | | 23,772 | | | | — | | | | 25,802 | |
Dream Unlimited Corp., Class A* | | | — | | | | 382,700 | | | | — | | | | 382,700 | | | | — | | | | 1,891,036 | | | | — | | | | 1,891,036 | |
Forestar Group, Inc.* | | | 2,492 | | | | 2,800 | | | | — | | | | 5,292 | | | | 33,144 | | | | 37,240 | | | | — | | | | 70,384 | |
FRP Holdings, Inc.* | | | 500 | | | | 566 | | | | — | | | | 1,066 | | | | 18,850 | | | | 21,338 | | | | — | | | | 40,188 | |
Griffin Industrial Realty, Inc. | | | 49 | | | | 52 | | | | — | | | | 101 | | | | 1,555 | | | | 1,650 | | | | — | | | | 3,205 | |
Howard Hughes Corp. (The)* | | | — | | | | 45,000 | | | | — | | | | 45,000 | | | | — | | | | 5,134,499 | | | | — | | | | 5,134,499 | |
Kennedy-Wilson Holdings, Inc. | | | 3,313 | | | | 3,804 | | | | — | | | | 7,117 | | | | 67,916 | | | | 77,982 | | | | — | | | | 145,898 | |
RE/MAX Holdings, Inc., Class A | | | 1,424 | | | | 1,584 | | | | — | | | | 3,008 | | | | 79,744 | | | | 88,704 | | | | — | | | | 168,448 | |
St Joe Co. (The)* | | | 4,045 | | | | 4,544 | | | | — | | | | 8,589 | | | | 76,855 | | | | 86,336 | | | | — | | | | 163,191 | |
Stratus Properties, Inc.* | | | 494 | | | | 552 | | | | — | | | | 1,046 | | | | 16,178 | | | | 18,078 | | | | — | | | | 34,256 | |
Tejon Ranch Co.* | | | 1,111 | | | | 1,249 | | | | — | | | | 2,360 | | | | 28,253 | | | | 31,762 | | | | — | | | | 60,015 | |
Trinity Place Holdings, Inc.* | | | 1,396 | | | | 1,733 | | | | — | | | | 3,129 | | | | 12,941 | | | | 16,065 | | | | — | | | | 29,006 | |
| | | | | | | | | | | | | | | | | | | | | | | | | | | | | | | | |
| | | | | | | | | | | | | | | | | | | 427,250 | | | | 7,528,904 | | | | — | | | | 7,956,154 | |
| | | | | | | | | | | | | | | | | | | | | | | | | | | | | | | | |
Total Real Estate | | | | | | | | | | | | | | | | | | | 8,017,725 | | | | 16,565,659 | | | | — | | | | 24,583,384 | |
| | | | | | | | | | | | | | | | | | | | | | | | | | | | | | | | |
Telecommunication Services (0.3%) | | | | | | | | | | | | | | | | | | | | | | | | | | | | | | | | |
Diversified Telecommunication Services (0.3%) | | | | | | | | | | | | | | | | | | | | | | | | | | | | | | | | |
ATN International, Inc. | | | 839 | | | | 939 | | | | — | | | | 1,778 | | | | 67,229 | | | | 75,242 | | | | — | | | | 142,471 | |
Cincinnati Bell, Inc.* | | | 3,411 | | | | 3,906 | | | | — | | | | 7,317 | | | | 76,236 | | | | 87,300 | | | | — | | | | 163,536 | |
Consolidated Communications Holdings, Inc.(x) | | | 1,218 | | | | 1,372 | | | | — | | | | 2,590 | | | | 32,703 | | | | 36,838 | | | | — | | | | 69,541 | |
FairPoint Communications, Inc.* | | | 405 | | | | 472 | | | | — | | | | 877 | | | | 7,573 | | | | 8,826 | | | | — | | | | 16,399 | |
Globalstar, Inc.(x)* | | | 11,139 | | | | 12,551 | | | | — | | | | 23,690 | | | | 17,600 | | | | 19,831 | | | | — | | | | 37,431 | |
Hawaiian Telcom Holdco, Inc.* | | | 499 | | | | 563 | | | | — | | | | 1,062 | | | | 12,365 | | | | 13,951 | | | | — | | | | 26,316 | |
IDT Corp., Class B | | | 552 | | | | 621 | | | | — | | | | 1,173 | | | | 10,234 | | | | 11,513 | | | | — | | | | 21,747 | |
Intelsat S.A.* | | | 2,462 | | | | 2,778 | | | | — | | | | 5,240 | | | | 6,573 | | | | 7,417 | | | | — | | | | 13,990 | |
Iridium Communications, Inc.(x)* | | | 6,711 | | | | 7,744 | | | | — | | | | 14,455 | | | | 64,426 | | | | 74,342 | | | | — | | | | 138,768 | |
Lumos Networks Corp.* | | | 1,409 | | | | 1,536 | | | | — | | | | 2,945 | | | | 22,009 | | | | 23,992 | | | | — | | | | 46,001 | |
ORBCOMM, Inc.* | | | 454 | | | | 70 | | | | — | | | | 524 | | | | 3,755 | | | | 579 | | | | — | | | | 4,334 | |
pdvWireless, Inc.(x)* | | | 828 | | | | 793 | | | | — | | | | 1,621 | | | | 18,671 | | | | 17,882 | | | | — | | | | 36,553 | |
Vonage Holdings Corp.* | | | 13,774 | | | | 15,701 | | | | — | | | | 29,475 | | | | 94,352 | | | | 107,553 | | | | — | | | | 201,905 | |
Windstream Holdings, Inc.(x) | | | 6,722 | | | | 7,767 | | | | — | | | | 14,489 | | | | 49,272 | | | | 56,932 | | | | — | | | | 106,204 | |
| | | | | | | | | | | | | | | | | | | | | | | | | | | | | | | | |
| | | | | | | | | | | | | | | | | | | 482,998 | | | | 542,198 | | | | — | | | | 1,025,196 | |
| | | | | | | | | | | | | | | | | | | | | | | | | | | | | | | | |
Wireless Telecommunication Services (0.0%) | | | | | | | | | | | | | | | | | | | | | | | | | | | | | | | | |
Boingo Wireless, Inc.* | | | 1,198 | | | | 1,286 | | | | — | | | | 2,484 | | | | 14,604 | | | | 15,676 | | | | — | | | | 30,280 | |
NII Holdings, Inc.* | | | 4,565 | | | | 5,175 | | | | — | | | | 9,740 | | | | 9,815 | | | | 11,126 | | | | — | | | | 20,941 | |
Spok Holdings, Inc. | | | 1,627 | | | | 1,821 | | | | — | | | | 3,448 | | | | 33,760 | | | | 37,786 | | | | — | | | | 71,546 | |
| | | | | | | | | | | | | | | | | | | | | | | | | | | | | | | | |
| | | | | | | | | | | | | | | | | | | 58,179 | | | | 64,588 | | | | | | | | 122,767 | |
| | | | | | | | | | | | | | | | | | | | | | | | | | | | | | | | |
Total Telecommunication Services | | | | | | | | | | | | | | | | | | | 541,177 | | | | 606,786 | | | | — | | | | 1,147,963 | |
| | | | | | | | | | | | | | | | | | | | | | | | | | | | | | | | |
Utilities (3.5%) | | | | | | | | | | | | | | | | | | | | | | | | | | | | | | | | |
Electric Utilities (1.0%) | | | | | | | | | | | | | | | | | | | | | | | | | | | | | | | | |
ALLETE, Inc. | | | 3,966 | | | | 4,420 | | | | — | | | | 8,386 | | | | 254,577 | | | | 283,720 | | | | — | | | | 538,297 | |
El Paso Electric Co. | | | 3,240 | | | | 3,687 | | | | — | | | | 6,927 | | | | 150,660 | | | | 171,446 | | | | — | | | | 322,106 | |
Empire District Electric Co. (The) | | | 3,534 | | | | 4,016 | | | | — | | | | 7,550 | | | | 120,474 | | | | 136,905 | | | | — | | | | 257,379 | |
Genie Energy Ltd., Class B(x) | | | 1,028 | | | | 1,160 | | | | — | | | | 2,188 | | | | 5,911 | | | | 6,670 | | | | — | | | | 12,581 | |
IDACORP, Inc. | | | 4,037 | | | | 4,514 | | | | — | | | | 8,551 | | | | 325,180 | | | | 363,602 | | | | — | | | | 688,782 | |
MGE Energy, Inc. | | | 1,501 | | | | 1,715 | | | | — | | | | 3,216 | | | | 98,015 | | | | 111,990 | | | | — | | | | 210,005 | |
Otter Tail Corp. | | | 3,052 | | | | 3,321 | | | | — | | | | 6,373 | | | | 124,522 | | | | 135,497 | | | | — | | | | 260,019 | |
PNM Resources, Inc. | | | 6,383 | | | | 7,136 | | | | — | | | | 13,519 | | | | 218,937 | | | | 244,765 | | | | — | | | | 463,702 | |
Portland General Electric Co. | | | 7,160 | | | | 7,994 | | | | — | | | | 15,154 | | | | 310,243 | | | | 346,380 | | | | — | | | | 656,623 | |
| | | | | | | | | | | | | | | | | | | | | | | | | | | | | | | | |
| | | | | | | | | | | | | | | | | | | 1,608,519 | | | | 1,800,975 | | | | — | | | | 3,409,494 | |
| | | | | | | | | | | | | | | | | | | | | | | | | | | | | | | | |
Gas Utilities (1.5%) | | | | | | | | | | | | | | | | | | | | | | | | | | | | | | | | |
Chesapeake Utilities Corp. | | | 1,105 | | | | 1,161 | | | | — | | | | 2,266 | | | | 73,980 | | | | 77,729 | | | | — | | | | 151,709 | |
Delta Natural Gas Co., Inc. | | | 526 | | | | 568 | | | | — | | | | 1,094 | | | | 15,427 | | | | 16,659 | | | | — | | | | 32,086 | |
New Jersey Resources Corp. | | | 6,303 | | | | 7,170 | | | | — | | | | 13,473 | | | | 223,756 | | | | 254,535 | | | | — | | | | 478,291 | |
Northwest Natural Gas Co. | | | 2,177 | | | | 2,469 | | | | — | | | | 4,646 | | | | 130,185 | | | | 147,646 | | | | — | | | | 277,831 | |
ONE Gas, Inc. | | | 4,166 | | | | 4,642 | | | | — | | | | 8,808 | | | | 266,457 | | | | 296,902 | | | | — | | | | 563,359 | |
Rubis SCA | | | — | | | | 16,950 | | | | — | | | | 16,950 | | | | — | | | | 1,397,598 | | | | — | | | | 1,397,598 | |
South Jersey Industries, Inc. | | | 6,411 | | | | 7,288 | | | | — | | | | 13,699 | | | | 215,987 | | | | 245,533 | | | | — | | | | 461,520 | |
Southwest Gas Corp. | | | 3,387 | | | | 3,853 | | | | — | | | | 7,240 | | | | 259,512 | | | | 295,217 | | | | — | | | | 554,729 | |
53
| | | | | | | | | | | | | | | | | | | | | | | | | | | | | | | | |
| | | Pacific Global
Small Cap
Value | | | Horizon
Small Cap
Value | | | Pro-forma
Adjustment | | | AXA/Horizon
Small Cap
Value
Combined
Pro-forma | | | Pacific
Global Small
Cap Value | | | Horizon
Small Cap
Value | | | Pro-forma
Adjustment | | | AXA/Horizon
Small Cap
Value
Combined
Pro-forma | |
| | | Number of
Shares | | | Number of
Shares | | | Number of
Shares | | | Number of
Shares | | | Value ($) | | | Value ($) | | | Value ($) | | | Value ($) | |
Spire, Inc. | | | 3,574 | | | | 4,059 | | | | — | | | | 7,633 | | | | 230,702 | | | | 262,008 | | | | — | | | | 492,710 | |
WGL Holdings, Inc. | | | 3,828 | | | | 4,350 | | | | — | | | | 8,178 | | | | 292,000 | | | | 331,818 | | | | — | | | | 623,818 | |
| | | | | | | | | | | | | | | | | | | | | | | | | | | | | | | | |
| | | | | | | | | | | | | | | | | | | 1,708,006 | | | | 3,325,645 | | | | — | | | | 5,033,651 | |
| | | | | | | | | | | | | | | | | | | | | | | | | | | | | | | | |
Independent Power and Renewable Electricity Producers (0.4%) | | | | | | | | | | | | | | | | | | | | | | | | | | | | | | | | |
Atlantic Power Corp. | | | 8,891 | | | | 11,062 | | | | — | | | | 19,953 | | | | 22,227 | | | | 27,655 | | | | — | | | | 49,882 | |
Atlantica Yield plc(x) | | | 4,693 | | | | 5,436 | | | | — | | | | 10,129 | | | | 90,810 | | | | 105,186 | | | | — | | | | 195,996 | |
Dynegy, Inc.* | | | 9,273 | | | | 10,530 | | | | — | | | | 19,803 | | | | 78,450 | | | | 89,084 | | | | — | | | | 167,534 | |
NRG Yield, Inc., Class A | | | 2,845 | | | | 3,340 | | | | — | | | | 6,185 | | | | 43,699 | | | | 51,302 | | | | — | | | | 95,001 | |
NRG Yield, Inc., Class C | | | 5,072 | | | | 5,777 | | | | — | | | | 10,849 | | | | 80,138 | | | | 91,276 | | | | — | | | | 171,414 | |
Ormat Technologies, Inc. | | | 1,714 | | | | 1,841 | | | | — | | | | 3,555 | | | | 91,905 | | | | 98,714 | | | | — | | | | 190,619 | |
Pattern Energy Group, Inc. | | | 1,049 | | | | 1,249 | | | | — | | | | 2,298 | | | | 19,920 | | | | 23,719 | | | | — | | | | 43,639 | |
TerraForm Global, Inc., Class A | | | 7,403 | | | | 8,348 | | | | — | | | | 15,751 | | | | 29,242 | | | | 32,975 | | | | — | | | | 62,217 | |
TerraForm Power, Inc., Class A(x)* | | | 7,043 | | | | 8,011 | | | | — | | | | 15,054 | | | | 90,221 | | | | 102,621 | | | | — | | | | 192,842 | |
Vivint Solar, Inc.(x)* | | | 1,981 | | | | 2,250 | | | | — | | | | 4,231 | | | | 5,051 | | | | 5,738 | | | | — | | | | 10,789 | |
| | | | | | | | | | | | | | | | | | | | | | | | | | | | | | | | |
| | | | | | | | | | | | | | | | | | | 551,663 | | | | 628,270 | | | | — | | | | 1,179,933 | |
| | | | | | | | | | | | | | | | | | | | | | | | | | | | | | | | |
Multi-Utilities (0.5%) | | | | | | | | | | | | | | | | | | | | | | | | | | | | | | | | |
Avista Corp. | | | 5,079 | | | | 5,736 | | | | — | | | | 10,815 | | | | 203,109 | | | | 229,383 | | | | — | | | | 432,492 | |
Black Hills Corp. | | | 4,125 | | | | 4,599 | | | | — | | | | 8,724 | | | | 253,028 | | | | 282,102 | | | | — | | | | 535,130 | |
NorthWestern Corp. | | | 3,889 | | | | 4,427 | | | | — | | | | 8,316 | | | | 221,167 | | | | 251,763 | | | | — | | | | 472,930 | |
Unitil Corp. | | | 1,105 | | | | 1,240 | | | | — | | | | 2,345 | | | | 50,101 | | | | 56,222 | | | | — | | | | 106,323 | |
| | | | | | | | | | | | | | | | | | | | | | | | | | | | | | | | |
| | | | | | | | | | | | | | | | | | | 727,405 | | | | 819,470 | | | | — | | | | 1,546,875 | |
| | | | | | | | | | | | | | | | | | | | | | | | | | | | | | | | |
Water Utilities (0.2%) | | | | | | | | | | | | | | | | | | | | | | | | | | | | | | | | |
American States Water Co. | | | 986 | | | | 1,107 | | | | — | | | | 2,093 | | | | 44,922 | | | | 50,435 | | | | — | | | | 95,357 | |
AquaVenture Holdings Ltd.* | | | 183 | | | | 134 | | | | — | | | | 317 | | | | 4,489 | | | | 3,287 | | | | — | | | | 7,776 | |
Artesian Resources Corp., Class A | | | 605 | | | | 666 | | | | — | | | | 1,271 | | | | 19,324 | | | | 21,272 | | | | — | | | | 40,596 | |
California Water Service Group | | | 1,566 | | | | 1,808 | | | | — | | | | 3,374 | | | | 53,087 | | | | 61,291 | | | | — | | | | 114,378 | |
Connecticut Water Service, Inc. | | | 664 | | | | 745 | | | | — | | | | 1,409 | | | | 37,084 | | | | 41,608 | | | | — | | | | 78,692 | |
Consolidated Water Co., Ltd. | | | 1,157 | | | | 1,284 | | | | — | | | | 2,441 | | | | 12,553 | | | | 13,931 | | | | — | | | | 26,484 | |
Middlesex Water Co. | | | 175 | | | | 197 | | | | — | | | | 372 | | | | 7,515 | | | | 8,459 | | | | — | | | | 15,974 | |
SJW Group | | | 1,305 | | | | 1,466 | | | | — | | | | 2,771 | | | | 73,054 | | | | 82,068 | | | | — | | | | 155,122 | |
York Water Co. (The) | | | 113 | | | | 102 | | | | — | | | | 215 | | | | 4,317 | | | | 3,896 | | | | — | | | | 8,213 | |
| | | | | | | | | | | | | | | | | | | | | | | | | | | | | | | | |
| | | | | | | | | | | | | | | | | | | 256,345 | | | | 286,247 | | | | — | | | | 542,592 | |
| | | | | | | | | | | | | | | | | | | | | | | | | | | | | | | | |
Total Utilities | | | | | | | | | | | | | | | | | | | 4,851,938 | | | | 6,860,607 | | | | — | | | | 11,712,545 | |
| | | | | | | | | | | | | | | | | | | | | | | | | | | | | | | | |
Total Common Stock (92.3%)
(Cost $247,505,320) | | | | | | | | | | | | | | | | | | | 161,217,710 | | | | 148,594,099 | | | | — | | | | 309,811,809 | |
| | | | | | | | | | | | | | | | | | | | | | | | | | | | | | | | |
CLOSED END FUND: | | | | | | | | | | | | | | | | | | | | | | | | | | | | | | | | |
JZ Capital Partners Ltd. | | | — | | | | 27,800 | | | | — | | | | 27,800 | | | | — | | | | 173,702 | | | | — | | | | 173,702 | |
| | | | | | | | | | | | | | | | | | | | | | | | | | | | | | | | |
Total Closed End Funds (0.1%)
(Cost $190,347) | | | | | | | | | | | | | | | | | | | — | | | | 173,702 | | | | — | | | | 173,702 | |
| | | | | | | | | | | | | | | | | | | | | | | | | | | | | | | | |
MASTER LIMITED PARTNERSHIPS: | | | | | | | | | | | | | | | | | | | | | | | | | | | | | | | | |
Energy (0.0%) | | | | | | | | | | | | | | | | | | | | | | | | | | | | | | | | |
Oil, Gas & Consumable Fuels (0.0%) | | | | | | | | | | | | | | | | | | | | | | | | | | | | | | | | |
Atlas Energy Group LLC* | | | — | | | | 150,000 | | | | — | | | | 150,000 | | | | — | | | | 108,000 | | | | — | | | | 108,000 | |
| | | | | | | | | | | | | | | | | | | | | | | | | | | | | | | | |
Total Energy | | | | | | | | | | | | | | | | | | | — | | | | 108,000 | | | | — | | | | 108,000 | |
| | | | | | | | | | | | | | | | | | | | | | | | | | | | | | | | |
Industrials (1.4%) | | | | | | | | | | | | | | | | | | | | | | | | | | | | | | | | |
Industrial Conglomerates (1.4%) | | | | | | | | | | | | | | | | | | | | | | | | | | | | | | | | |
Icahn Enterprises LP | | | — | | | | 77,138 | | | | — | | | | 77,138 | | | | — | | | | 4,622,109 | | | | — | | | | 4,622,109 | |
| | | | | | | | | | | | | | | | | | | | | | | | | | | | | | | | |
Total Industrials | | | | | | | | | | | | | | | | | | | — | | | | 4,622,109 | | | | — | | | | 4,622,109 | |
| | | | | | | | | | | | | | | | | | | | | | | | | | | | | | | | |
Total Master Limited Partnerships (1.4%)
(Cost $3,713,811) | | | | | | | | | | | | | | | | | | | — | | | | 4,730,109 | | | | — | | | | 4,730,109 | |
| | | | | | | | | | | | | | | | | | | | | | | | | | | | | | | | |
54
| | | | | | | | | | | | | | | | | | | | | | | | | | | | | | | | |
| | | Pacific Global
Small Cap
Value | | | Horizon
Small Cap
Value | | | Pro-forma
Adjustment | | | AXA/Horizon
Small Cap
Value
Combined
Pro-forma | | | Pacific Global
Small Cap
Value | | | Horizon
Small Cap
Value | | | Pro-forma
Adjustment | | | AXA/Horizon
Small Cap
Value
Combined
Pro-forma | |
| | | Number of
Rights | | | Number of
Rights | | | Number of
Rights | | | Number of
Rights | | | Value ($) | | | Value ($) | | | Value ($) | | | Value ($) | |
RIGHTS: | | | | | | | | | | | | | | | | | | | | | | | | | | | | | | | | |
Information Technology (0.0%) | | | | | | | | | | | | | | | | | | | | | | | | | | | | | | | | |
Electronic Equipment, Instruments & Componentst (0.0%) | | | | | | | | | | | | | | | | | | | | | | | | | | | | | | | | |
Gerber Scientific, Inc. (Contingent Value
Shares)*† | | | 2,344 | | | | 2,344 | | | | — | | | | 4,688 | | | | — | | | | — | | | | — | | | | — | |
| | | | | | | | | | | | | | | | | | | | | | | | | | | | | | | | |
Total Information Technology | | | | | | | | | | | | | | | | | | | | | | | | | | | | | | | | |
Telecommunication Services (0.0%) | | | | | | | | | | | | | | | | | | | | | | | | | | | | | | | | |
Wireless Telecommunication Services (0.0%) | | | | | | | | | | | | | | | | | | | | | | | | | | | | | | | | |
Leap Wireless International, Inc. (Contingent Value Shares)*† | | | 3,801 | | | | 3,800 | | | | — | | | | 7,601 | | | | 8,552 | | | | 8,550 | | | | — | | | | 17,102 | |
| | | | | | | | | | | | | | | | | | | | | | | | | | | | | | | | |
Total Telecommunication Services | | | | | | | | | | | | | | | | | | | 8,552 | | | | 8,550 | | | | — | | | | 17,102 | |
| | | | | | | | | | | | | | | | | | | | | | | | | | | | | | | | |
Total Rights (0.0%)
(Cost $0) | | | | | | | | | | | | | | | | | | | 8,552 | | | | 8,550 | | | | — | | | | 17,102 | |
| | | | | | | | | | | | | | | | | | | | | | | | | | | | | | | | |
| | | | | | | | |
| | | Pacific Global
Small Cap
Value | | | Horizon
Small Cap
Value | | | Pro-forma
Adjustment | | | AXA/Horizon
Small Cap
Value
Combined
Pro-forma | | | Pacific Global
Small Cap
Value | | | Horizon
Small Cap
Value | | | Pro-forma
Adjustment | | | AXA/Horizon
Small Cap
Value
Combined
Pro-forma | |
| | | Number of
Shares | | | Number of
Shares | | | Number of
Shares | | | Number of
Shares | | | Value ($) | | | Value ($) | | | Value ($) | | | Value ($) | |
SHORT-TERM INVESTMENTS: | | | | | | | | | | | | | | | | | | | | | | | | | | | | | | | | |
Investment Company (3.6%) | | | | | | | | | | | | | | | | | | | | | | | | | | | | | | | | |
JPMorgan Prime Money Market Fund, IM Class Shares* | | | 40,478 | | | | 12,153,690 | | | | — | | | | 12,194,168 | | | | 40,490 | | | | 12,157,336 | | | | — | | | | 12,197,826 | |
| | | | | | | | | | | | | | | | | | | | | | | | | | | | | | | | |
| | | | | | | | |
| | | Pacific Global
Small Cap
Value | | | Horizon
Small Cap
Value | | | Pro-forma
Adjustment | | | AXA/Horizon
Small Cap
Value
Combined
Pro-forma | | | Pacific Global
Small Cap
Value | | | Horizon
Small Cap
Value | | | Pro-forma
Adjustment | | | AXA/Horizon
Small Cap
Value
Combined
Pro-forma | |
| | | Principal
Amount ($) | | | Principal
Amount ($) | | | Principal
Amount ($) | | | Principal
Amount ($) | | | Value ($) | | | Value ($) | | | Value ($) | | | Value ($) | |
Repurchase Agreements (4.0%) | | | | | | | | | | | | | | | | | | | | | | | | | | | | | | | | |
Bank of Nova Scotia, 0.50%, dated 12/30/16, due 1/3/17, repurchase price $1,000,056, collateralized by various U.S. Government Treasury Securities, ranging from 0.875%-2.375%, maturing 11/30/17-1/15/27; total market value $1,020,000. (xx) | | | 500,000 | | | | 500,000 | | | | — | | | | 1,000,000 | | | | 500,000 | | | | 500,000 | | | | — | | | | 1,000,000 | |
Citigroup Global Markets Ltd., 0.69%, dated 12/30/16, due 1/3/17, repurchase price $200,016, collateralized by various U.S. Government Treasury Securities, ranging from 1.375%-5.375%, maturing 7/31/18-2/15/45; total market value $204,000. (xx) | | | 100,000 | | | | 100,000 | | | | — | | | | 200,000 | | | | 100,000 | | | | 100,000 | | | | — | | | | 200,000 | |
Citigroup Global Markets Ltd., 0.71%, dated 12/30/16, due 1/3/17, repurchase price $600,048, collateralized by various Foreign Government Agency Securities, ranging from 0.000%-5.250%, maturing 1/23/17-1/24/44, U.S. Government Treasury Securities, ranging from 0.000%-5.375%, maturing 2/15/19-2/15/44; total market value $612,000. (xx) | | | 300,000 | | | | 300,000 | | | | — | | | | 600,000 | | | | 300,000 | | | | 300,000 | | | | — | | | | 600,000 | |
Deutsche Bank AG, 0.95%, dated 12/30/16, due 1/3/17, repurchase price $400,042, collateralized by various Corporate Bonds, ranging from 1.875%-2.500%, maturing 3/13/19-6/10/25; total market value $408,002. (xx) | | | 200,000 | | | | 200,000 | | | | — | | | | 400,000 | | | | 200,000 | | | | 200,000 | | | | — | | | | 400,000 | |
Deutsche Bank AG, 1.05%, dated 12/30/16, due 1/3/17, repurchase price $3,400,396, collateralized by various Common Stocks; total market value $3,779,287. (xx) | | | 2,000,000 | | | | 1,400,000 | | | | — | | | | 3,400,000 | | | | 2,000,000 | | | | 1,400,000 | | | | — | | | | 3,400,000 | |
55
| | | | | | | | | | | | | | | | | | | | | | | | | | | | | | | | |
| | | Pacific Global
Small Cap
Value | | | Horizon
Small Cap
Value | | | Pro-forma
Adjustment | | | AXA/Horizon
Small Cap
Value
Combined
Pro-forma | | | Pacific Global
Small Cap
Value | | | Horizon
Small Cap
Value | | | Pro-forma
Adjustment | | | AXA/Horizon
Small Cap
Value
Combined
Pro-forma | |
| | | Principal
Amount ($) | | | Principal
Amount ($) | | | Principal
Amount ($) | | | Principal
Amount ($) | | | Value ($) | | | Value ($) | | | Value ($) | | | Value ($) | |
Deutsche Bank Securities, Inc., 0.50%, dated 12/30/16, due 1/3/17, repurchase price $2,461,635, collateralized by various U.S. Government Treasury Securities, 0.000%, maturing 2/15/40-5/15/40; total market value $2,510,728. (xx) | | | 1,458,779 | | | | 1,002,719 | | | | — | | | | 2,461,498 | | | | 1,458,779 | | | | 1,002,719 | | | | — | | | | 2,461,498 | |
HSBC Securities, Inc., 0.46%, dated 12/30/16, due 1/3/17, repurchase price $1,000,052, collateralized by various U.S. Government Treasury Securities, ranging from 1.375%-1.750%, maturing 12/15/19-9/30/22; total market value $1,020,012. (xx) | | | 500,000 | | | | 500,000 | | | | — | | | | 1,000,000 | | | | 500,000 | | | | 500,000 | | | | — | | | | 1,000,000 | |
Macquarie Bank Limited, 0.57%, dated 12/30/16, due 1/3/17, repurchase price $800,050, collateralized by various U.S Government Treasury Securities, ranging from 0.000%-8.750%, maturing 1/5/17-5/15/46; total market value $816,414. (xx) | | | 400,000 | | | | 400,000 | | | | — | | | | 800,000 | | | | 400,000 | | | | 400,000 | | | | — | | | | 800,000 | |
Macquarie Bank Limited, 0.76%, dated 12/30/16, due 1/3/17, repurchase price $600,050, collateralized by various U.S. Government Treasury Securities, ranging from 0.000%-8.750%, maturing 1/5/17-5/15/46; total market value $612,310. (xx) | | | 300,000 | | | | 300,000 | | | | — | | | | 600,000 | | | | 300,000 | | | | 300,000 | | | | — | | | | 600,000 | |
Natixis, 0.50%, dated 12/30/16, due 1/3/17, repurchase price $800,044, collateralized by various U.S. Government Treasury Securities, ranging from 0.000%-3.625%, maturing 5/25/17-5/15/46; total market value $816,046. (xx) | | | 400,000 | | | | 400,000 | | | | — | | | | 800,000 | | | | 400,000 | | | | 400,000 | | | | — | | | | 800,000 | |
Nomura Securities Co., Ltd., 0.50%, dated 12/30/16, due 1/3/17, repurchase price $600,033, collateralized by various U.S. Government Treasury Securities, ranging from 0.000%-3.875%, maturing 4/15/19-8/15/46; total market value $612,000. (xx) | | | 400,000 | | | | 200,000 | | | | — | | | | 600,000 | | | | 400,000 | | | | 200,000 | | | | — | | | | 600,000 | |
RBC Capital Markets, 0.45%, dated 12/30/16, due 1/3/17, repurchase price $600,030, collateralized by various U.S Government Agency Securities, ranging from $2.434%-4.500%, maturing 12/1/26-1/1/47; total market value $612,000. (xx) | | | 600,000 | | | | — | | | | — | | | | 600,000 | | | | 600,000 | | | | — | | | | — | | | | 600,000 | |
RBS Securities, Inc., 0.45%, dated 12/30/16, due 1/3/17, repurchase price $1,000,050, collateralized by various U.S. Government Treasury Securities, ranging from 0.625%-2.625%, maturing 8/31/17-2/15/25; total market value $1,020,007. (xx) | | | — | | | | 1,000,000 | | | | — | | | | 1,000,000 | | | | — | | | | 1,000,000 | | | | — | | | | 1,000,000 | |
| | | | | | | | | | | | | | | | | | | | | | | | | | | | | | | | |
Total Repurchase Agreements | | | | | | | | | | | | | | | | | | | 7,158,779 | | | | 6,302,719 | | | | — | | | | 13,461,498 | |
| | | | | | | | | | | | | | | | | | | | | | | | | | | | | | | | |
Total Short-Term Investments (7.6%)
(Cost $25,656,019) | | | | | | | | | | | | | | | | | | | 7,199,269 | | | | 18,460,055 | | | | — | | | | 25,659,324 | |
| | | | | | | | | | | | | | | | | | | | | | | | | | | | | | | | |
Total Investments (101.4%)
(Cost $277,065,497) | | | | | | | | | | | | | | | | | | | 168,425,531 | | | | 171,966,515 | | | | — | | | | 340,392,046 | |
Other Assets Less Liabilities (-1.4%) | | | | | | | | | | | | | | | | | | | (6,510,109 | ) | | | 1,707,392 | | | | | | | | (4,802,717 | ) |
| | | | | | | | | | | | | | | | | | | | | | | | | | | | | | | | |
Net Assets (100%) | | | | | | | | | | | | | | | | | | | 161,915,422 | | | | 173,673,907 | | | | — | | | | 335,589,329 | |
| | | | | | | | | | | | | | | | | | | | | | | | | | | | | | | | |
As of February 22, 2017 each security held by the Acquired Portfolio complies with the investment policies and restrictions of the Acquiring Portfolio.
| † | | Securities (totaling $17,102 or 0.0% of net assets) held at fair value by management. |
| ‡ | | All, or a portion, of the security is an affiliated company as defined under the Investment Company Act of 1940. |
| (x) | | All or a portion of security is on loan at December 31, 2016. |
| (xx) | | At December 31, 2016, the Portfolios had loaned securities with a total value of $13,059,749. This was secured by cash collateral of $13,461,498 which was subsequently invested in joint repurchase agreements with a total value of $13,461,498, for which the Portfolio has a proportionate interest as reported in the Portfolio of Investments as Repurchase Agreements, and $95,753 collateralized by various U.S. Government Treasury Securities, ranging from 0.000%-8.125%, maturing 1/12/17-5/15/45. |
56
AXA/Horizon Small Cap Value
Investments in companies which were affiliates for the year ended December 31, 2016, were as follows:
| | | | | | | | | | | | | | | | | | | | | | | | |
Securities | | Value
December 31,
2015 | | | Purchases
at Cost | | | Sales at
Cost | | | Value
December 31,
2016 | | | Dividend
Income | | | Realized
Gain(Loss) | |
PennyMac Financial Services, Inc., Class A | | $ | 7,189 | | | $ | — | | | $ | — | | | $ | 7,792 | | | $ | — | | | $ | — | |
PennyMac Mortgage Investment Trust (REIT) | | | 64,245 | | | | 34,404 | | | | 3,718 | | | | 100,201 | | | | 10,719 | | | | (201 | ) |
| | | | | | | | | | | | | | | | | | | | | | | | |
| | $ | 71,434 | | | $ | 34,404 | | | $ | 3,718 | | | $ | 107,993 | | | $ | 10,719 | | | $ | (201 | ) |
| | | | | | | | | | | | | | | | | | | | | | | | |
AXA/Pacific Global Small Cap Value
| | | | | | | | | | | | | | | | | | | | | | | | |
Securities: | | Value
December 31,
2015 | | | Purchases
at Cost | | | Sales at
Cost | | | Value
December 31,
2016 | | | Dividend
Income | | | Realized
Gain(Loss) | |
PennyMac Financial Services, Inc., Class A | | $ | 7,188 | | | $ | — | | | $ | — | | | $ | 7,792 | | | $ | — | | | $ | — | |
PennyMac Mortgage Investment Trust (REIT) | | | 64,245 | | | | 23,262 | | | | 3,206 | | | | 89,364 | | | | 9,770 | | | | (172 | ) |
| | | | | | | | | | | | | | | | | | | | | | | | |
| | $ | 71,433 | | | $ | 23,262 | | | $ | 3,206 | | | $ | 97,156 | | | $ | 9,770 | | | $ | (172 | ) |
| | | | | | | | | | | | | | | | | | | | | | | | |
AXA/Horizon Small Cap Value Combined Pro-forma
| | | | | | | | | | | | | | | | | | | | | | | | |
Securities: | | Value
December 31,
2015 | | | Purchases
at Cost | | | Sales at
Cost | | | Value
December 31,
2016 | | | Dividend
Income | | | Realized
Gain(Loss) | |
PennyMac Financial Services, Inc., Class A | | $ | 14,377 | | | $ | — | | | $ | — | | | $ | 15,584 | | | $ | — | | | $ | — | |
PennyMac Mortgage Investment Trust (REIT) | | | 128,490 | | | | 57,666 | | | | 6,924 | | | | 189,565 | | | | 20,489 | | | | (373 | ) |
| | | | | | | | | | | | | | | | | | | | | | | | |
| | $ | 142,867 | | | $ | 57,666 | | | $ | 6,924 | | | $ | 205,149 | | | $ | 20,489 | | | $ | (373 | ) |
| | | | | | | | | | | | | | | | | | | | | | | | |
At December 31, 2016, the Portfolios had the following futures contracts open:
AXA/Horizon Small Cap Value
| | | | | | | | | | | | | | | | | | | | |
Purchases | | Number of
Contracts | | | Expiration
Date | | | Original
Value | | | Value at
12/31/2016 | | | Unrealized
Appreciation/
Depreciation | |
Russell 2000 Mini Index | | | 7 | | | | March-17 | | | $ | 476,808 | | | $ | 474,915 | | | $ | (1,893 | ) |
| | | | | | | | | | | | | | | | | | | | |
AXA/Pacific Global Small Cap Value
| | | | | | | | | | | | | | | | | | | | |
Purchases | | Number of
Contracts | | | Expiration
Date | | | Original
Value | | | Value at
12/31/2016 | | | Unrealized
Appreciation/
Depreciation | |
Russell 2000 Mini Index | | | 10 | | | | March-17 | | | $ | 681,169 | | | $ | 678,450 | | | $ | (2,719 | ) |
| | | | | | | | | | | | | | | | | | | | |
AXA/Horizon Small Cap Value Combined Pro-forma
| | | | | | | | | | | | | | | | | | | | |
Purchases | | Number of
Contracts | | | Expiration
Date | | | Original
Value | | | Value at
12/31/2016 | | | Unrealized
Appreciation/
Depreciation | |
Russell 2000 Mini Index | | | 17 | | | | March-17 | | | $ | 1,157,977 | | | $ | 1,153,365 | | | $ | (4,612 | ) |
| | | | | | | | | | | | | | | | | | | | |
57
The following is a summary of the inputs used to value the Portfolio’s net assets as of December 31, 2016 :
The inputs or methodology used for valuing securities are not necessarily an indication of the risk associated with investing in those securities.
Various inputs are used in determining the value of the Portfolio’s investments. These inputs are summarized in the three broad levels listed below:
AXA/Horizon Small Cap Value
| | | | | | | | | | | | | | | | |
Investment Type | | Quoted Prices in
Active Markets for
Identical
Securities
(Level 1) | | | Significant Other
Observable Inputs
(including quoted prices
for similar securities,
interest rates,
prepayment speeds,
credit risk, etc.)
(Level 2) (a) | | | Significant
Unobservable Inputs
(including the
Portfolio’s own
assumptions in
determining the fair
value of investments)
(Level 3) | | | Total | |
Assets: | | | | | | | | | | | | | | | | |
Closed End Funds | | $ | — | | | $ | 173,702 | | | $ | — | | | $ | 173,702 | |
Common Stocks | | | | | | | | | | | | | | | | |
Consumer Discretionary | | | 22,920,345 | | | | 3,587,093 | | | | — | | | | 26,507,438 | |
Consumer Staples | | | 4,692,550 | | | | 39,775 | | | | — | | | | 4,732,325 | |
Energy | | | 6,233,114 | | | | 757,689 | | | | — | | | | 6,990,803 | |
Financials | | | 49,744,671 | | | | 3,494,681 | | | | — | | | | 53,239,352 | |
Health Care | | | 3,809,216 | | | | — | | | | — | | | | 3,809,216 | |
Industrials | | | 11,733,706 | | | | 1,250,464 | | | | — | | | | 12,984,170 | |
Information Technology | | | 11,124,009 | | | | — | | | | — | | | | 11,124,009 | |
Materials | | | 5,173,734 | | | | — | | | | — | | | | 5,173,734 | |
Real Estate | | | 16,564,009 | | | | 1,650 | | | | — | | | | 16,565,659 | |
Telecommunication Services | | | 606,786 | | | | — | | | | — | | | | 606,786 | |
Utilities | | | 5,463,010 | | | | 1,397,597 | | | | — | | | | 6,860,607 | |
Master Limited Partnerships | | | | | | | | | | | | | | | | |
Energy | | | 108,000 | | | | — | | | | — | | | | 108,000 | |
Industrials | | | 4,622,109 | | | | — | | | | — | | | | 4,622,109 | |
Rights | | | | | | | | | | | | | | | | |
Information Technology | | | — | | | | — | | | | — | (b) | | | — | (b) |
Telecommunication Services | | | — | | | | — | | | | 8,550 | | | | 8,550 | |
Short-Term Investments | | | | | | | | | | | | | | | | |
Investment Companies | | | 12,157,336 | | | | — | | | | — | | | | 12,157,336 | |
Repurchase Agreements | | | — | | | | 6,302,719 | | | | — | | | | 6,302,719 | |
| | | | | | | | | | | | | | | | |
Total Assets | | $ | 154,952,595 | | | $ | 17,005,370 | | | $ | 8,550 | | | $ | 171,966,515 | |
| | | | | | | | | | | | | | | | |
Liabilities: | | | | | | | | | | | | | | | | |
Futures | | $ | (1,893 | ) | | | — | | | | — | | | | (1,893 | ) |
| | | | | | | | | | | | | | | | |
Total Liabilities | | $ | (1,893 | ) | | $ | — | | | $ | — | | | $ | (1,893 | ) |
| | | | | | | | | | | | | | | | |
Total | | $ | 154,950,702 | | | $ | 17,005,370 | | | $ | 8,550 | | | $ | 171,964,622 | |
| | | | | | | | | | | | | | | | |
| (a) | | A security with a market value of $39,775 transferred from Level 1 to Level 2 at the end of the end of the year due to inactive trading. |
There were no additional transfers between Levels 1, 2 or 3 during the year ended December 31, 2016.
58
AXA/Pacific Global Small Cap Value
| | | | | | | | | | | | | | | | |
Investment Type | | Quoted Prices in
Active Markets for
Identical
Securities
(Level 1) | | | Significant Other
Observable Inputs
(including quoted prices
for similar securities,
interest rates,
prepayment speeds,
credit risk, etc.)
(Level 2) (a) | | | Significant
Unobservable Inputs
(including the
Portfolio’s own
assumptions in
determining the fair
value of investments)
(Level 3) | | | Total | |
Assets: | | | | | | | | | | | | | | | | |
Common Stocks | | | | | | | | | | | | | | | | |
Consumer Discretionary | | $ | 19,996,392 | | | $ | 35,017 | | | $ | — | | | $ | 20,031,409 | |
Consumer Staples | | | 6,517,893 | | | | 6,679 | | | | — | | | | 6,524,572 | |
Energy | | | 18,826,279 | | | | — | | | | — | | | | 18,826,279 | |
Financials | | | 34,180,357 | | | | — | | | | — | | | | 34,180,357 | |
Health Care | | | 5,759,659 | | | | — | | | | — | | | | 5,759,659 | |
Industrials | | | 48,585,097 | | | | — | | | | — | | | | 48,585,097 | |
Information Technology | | | 10,236,415 | | | | — | | | | — | | | | 10,236,415 | |
Materials | | | 3,663,082 | | | | — | | | | — | | | | 3,663,082 | |
Real Estate | | | 8,016,170 | | | | 1,555 | | | | — | | | | 8,017,725 | |
Telecommunication Services | | | 541,177 | | | | — | | | | — | | | | 541,177 | |
Utilities | | | 4,851,938 | | | | — | | | | — | | | | 4,851,938 | |
Rights | | | | | | | | | | | | | | | | |
Information Technology | | | — | | | | — | | | | — | (b) | | | — | (b) |
Telecommunication Services | | | — | | | | — | | | | 8,552 | | | | 8,552 | |
Short-Term Investments | | | | | | | | | | | | | | | | |
Investment Companies | | | 40,490 | | | | — | | | | — | | | | 40,490 | |
Repurchase Agreements | | | — | | | | 7,158,779 | | | | — | | | | 7,158,779 | |
| | | | | | | | | | | | | | | | |
Total Assets | | $ | 161,214,949 | | | $ | 7,202,030 | | | $ | 8,552 | | | $ | 168,425,531 | |
| | | | | | | | | | | | | | | | |
Liabilities: | | | | | | | | | | | | | | | | |
Futures | | $ | (2,719 | ) | | $ | — | | | $ | — | | | | (2,719 | ) |
| | | | | | | | | | | | | | | | |
Total Liabilities | | $ | (2,719 | ) | | $ | — | | | $ | — | | | $ | (2,719 | ) |
| | | | | | | | | | | | | | | | |
Total | | $ | 161,212,230 | | | $ | 7,202,030 | | | $ | 8,552 | | | $ | 168,422,812 | |
| | | | | | | | | | | | | | | | |
| (a) | | A security with a market value of $6,679 transferred from Level 1 to Level 2 at the end of the end of the year due to inactive trading. |
There were no additional transfers between Levels 1, 2 or 3 during the year ended December 31, 2016.
59
AXA/Horizon Small Cap Value Combined Pro-forma
| | | | | | | | | | | | | | | | |
Description | | Level 1
Quoted Prices in
Active Markets for
Identical
Securities | | | Level 2
Significant Other
Observable Inputs
(including quoted prices
for similar securities,
interest rates,
prepayment speeds,
credit risk, etc.) | | | Level 3
Significant Unobservable
Inputs (including the
Portfolio’s own
assumptions in
determining the fair
value of investments) | | | Total | |
Assets: | | | | | | | | | | | | | | | | |
Closed End Funds | | $ | — | | | $ | 173,702 | | | $ | — | | | $ | 173,702 | |
Common Stocks | | | | | | | | | | | | | | | | |
Consumer Discretionary | | | 42,916,737 | | | | 3,622,110 | | | | — | | | | 46,538,847 | |
Consumer Staples | | | 11,210,443 | | | | 46,454 | | | | — | | | | 11,256,897 | |
Energy | | | 25,059,393 | | | | 757,689 | | | | — | | | | 25,817,082 | |
Financials | | | 83,925,028 | | | | 3,494,681 | | | | — | | | | 87,419,709 | |
Health Care | | | 9,568,875 | | | | — | | | | — | | | | 9,568,875 | |
Industrials | | | 60,318,803 | | | | 1,250,464 | | | | — | | | | 61,569,267 | |
Information Technology | | | 21,360,424 | | | | — | | | | — | | | | 21,360,424 | |
Materials | | | 8,836,816 | | | | — | | | | — | | | | 8,836,816 | |
Real Estate | | | 24,580,179 | | | | 3,205 | | | | — | | | | 24,583,384 | |
Telecommunication Services | | | 1,147,963 | | | | — | | | | — | | | | 1,147,963 | |
Utilities | | | 10,314,948 | | | | 1,397,597 | | | | — | | | | 11,712,545 | |
Master Limited Partnerships | | | | | | | | | | | | | | | | |
Energy | | | 108,000 | | | | — | | | | — | | | | 108,000 | |
Industrials | | | 4,622,109 | | | | — | | | | — | | | | 4,622,109 | |
Rights | | | | | | | | | | | | | | | | |
Information Technology | | | — | | | | — | | | | — | (b) | | | — | (b) |
Telecommunication Services | | | — | | | | — | | | | 17,102 | | | | 17,102 | |
Short-Term Investments | | | | | | | | | | | | | | | | |
Investment Companies | | | 12,197,826 | | | | — | | | | — | | | | 12,197,826 | |
Repurchase Agreements | | | — | | | | 13,461,498 | | | | — | | | | 13,461,498 | |
| | | | | | | | | | | | | | | | |
Total Assets | | $ | 316,167,544 | | | $ | 24,207,400 | | | $ | 17,102 | | | $ | 340,392,046 | |
| | | | | | | | | | | | | | | | |
Liabilities | | | | | | | | | | | | | | | | |
Futures | | | (4,612 | ) | | | — | | | | — | | | | (4,612 | ) |
| | | | | | | | | | | | | | | | |
Total Liabilities | | $ | (4,612 | ) | | $ | — | | | $ | — | | | $ | (4,612 | ) |
| | | | | | | | | | | | | | | | |
Total | | $ | 316,162,932 | | | $ | 24,207,400 | | | $ | 17,102 | | | $ | 340,387,434 | |
| | | | | | | | | | | | | | | | |
| (a) | | A security with a market value of $46,454 transferred from Level 1 to Level 2 at the end of the end of the year due to inactive trading. |
There were no additional transfers between Levels 1, 2 or 3 during the year ended December 31, 2016.
Fair Values of Derivative Instruments as of December 31, 2016:
AXA/Horizon Small Cap Value
| | | | | | |
| | | Statements of Assets and Liabilities | |
Derivatives Not Accounted for as
Hedging Instrument^ | | Liability Derivatives | | Fair Value | |
Equity contracts | | Payables, Net assets –
Unrealized appreciation | | $ | (1,893 | )* |
| | | | | | |
| * | | Includes cumulative appreciation/depreciation of futures contracts as reported in the Portfolio of Investments. Only variation margin is reported within the Statement of Assets & Liabilities. |
The Effect of Derivative Instruments on the Statement of Operations for the year ended December 31, 2016:
| | | | | | | | | | | | |
| | | Amount of Realized Gain or (Loss)
on Derivatives Recognized in Income | |
| | | Futures | | | Forward
Currency
Contracts | | | Total | |
Foreign exchange contracts | | $ | — | | | $ | 749 | | | $ | 749 | |
Equity contracts | | | 93,491 | | | | — | | | | 93,491 | |
| | | | | | | | | | | | |
Total | | $ | 93,491 | | | $ | 749 | | | $ | 94,240 | |
| | | | | | | | | | | | |
60
| | | | |
| | | Amount of Unrealized Appreciation or
(Depreciation) on Derivatives Recognized in Income | |
Derivatives Not Accounted for as
Hedging Instruments^ | | Futures | |
Equity contracts | | $ | 7,498 | |
| | | | |
| ^ | | The Portfolio held futures contracts as a substitute for investing in conventional securities. |
The Portfolio held futures contracts with an average notional balance of approximately $719,000 and forward foreign currency contracts with an average settlement value of approximately $39,000 for six days during the year ended December 31, 2016.
AXA/Pacific Global Small Cap Value
| | | | | | |
| | | Statement of Assets and Liabilities | |
Derivatives Not Accounted for as
Hedging Instrument^ | | Liability Derivatives | | Fair Value | |
Equity contracts | | Payables, Net assets –
Unrealized appreciation | | $ | (2,719 | )* |
| | | | | | |
| * | | Includes cumulative appreciation/depreciation of futures contracts as reported in the Portfolio of Investments. Only variation margin is reported within the Statement of Assets & Liabilities. |
The Effect of Derivative Instruments on the Statement of Operations for the year ended December 31, 2016:
| | | | |
| | | Amount of Realized Gain or (Loss)
on Derivatives Recognized in Income | |
Derivatives Not Accounted for as
Hedging Instruments^ | | Futures | |
Equity contracts | | $ | 67,733 | |
| | | | |
| | | | |
| | | Amount of Unrealized Appreciation or
(Depreciation) on Derivatives Recognized in Income | |
Derivatives Not Accounted for as
Hedging Instruments^ | | Futures | |
Equity contracts | | $ | 7,539 | |
| | | | |
| ^ | | The Portfolio held futures contracts as a substitute for investing in conventional securities. |
The Portfolio held futures contracts with an average notional balance of approximately $691,000 during the year ended December 31, 2016.
AXA/Horizon Small Cap Value Combined Pro-forma
| | | | | | |
Derivatives Not Accounted for as
Hedging Instrument | | Liability Derivatives | | Fair Value | |
Equity contracts | | Payables, Net assets –
Unrealized appreciation | | $ | (4,612 | )* |
| | | | | | |
| * | | Includes cumulative appreciation/depreciation of futures contracts as reported in the Portfolio of Investments. Only variation margin is reported within the Statement of Assets & Liabilities. |
61
| | | | | | | | | | | | |
| | | Amount of Realized Gain or (Loss) on Derivatives
Recognized in Income | |
Derivatives Not Accounted for as
Hedging Instruments | | Futures | | | Forward
Currency
Contracts | | | Total | |
Foreign exchange contracts | | $ | — | | | $ | 749 | | | $ | 749 | |
Equity contracts | | | 161,224 | | | | — | | | | 161,224 | |
| | | | | | | | | | | | |
Total | | $ | 161,224 | | | $ | 749 | | | $ | 161,973 | |
| | | | | | | | | | | | |
| | | | |
| | | Amount of Unrealized Appreciation or
(Depreciation) on Derivatives Recognized in Income | |
Derivatives Not Accounted for as
Hedging Instruments | | Futures | |
Equity contracts | | $ | 15,037 | |
| | | | |
The Portfolio held futures contracts as a substitute for investing in conventional securities.
The Portfolio held futures contracts with an average notional balance of approximately $1,410,000 and forward foreign currency contracts with an average settlement value of approximately $39,000 for six days during the year ended December 31, 2016.
Investment security transactions for the year ended December 31, 2016 were as follows:
| | | | | | | | | | | | |
| | | AXA/Pacific
Global Small Cap Value | | | AXA/Horizon
Small Cap Value | | | AXA/Horizon
Small Cap
Value
Combined
Pro-forma | |
Cost of Purchases: | | | | | | | | | | | | |
Long-term investments other than U.S. government debt securities (affiliated 22%)* | | $ | 35,453,296 | | | $ | 31,290,450 | | | $ | 66,743,746 | |
Net Proceeds of Sales and Redemptions: | | | | | | | | | | | | |
Long-term investments other than U.S. government debt securities (affiliated 28%)* | | $ | 42,472,963 | | | $ | 44,739,134 | | | $ | 87,212,097 | |
| * | | During the year ended December 31, 2016, the Portfolios engaged in purchases and sales of securities pursuant to Rule 17a-7 of the 1940 Act (amount is percentage of total Purchases and/or Sales). |
As of December 31, 2016, the gross unrealized appreciation (depreciation) of investments based on the aggregate cost of investments for federal income tax purposes was as follows:
| | | | | | | | | | | | |
| | | AXA/Pacific
Global Small Cap
Value | | | AXA/Horizon
Small Cap Value | | | AXA/Horizon
Small Cap
Value
Combined
Pro-forma | |
Aggregate gross unrealized appreciation | | $ | 42,050,558 | | | $ | 54,873,910 | | | $ | 96,924,468 | |
Aggregate gross unrealized depreciation | | | (16,070,233 | ) | | | (16,529,370 | ) | | | (32,599,603 | ) |
| | | | | | | | | | | | |
Net unrealized appreciation | | $ | 25,980,325 | | | $ | 38,344,540 | | | $ | 64,324,865 | |
| | | | | | | | | | | | |
Federal income tax cost of investments | | $ | 142,445,206 | | | $ | 133,621,975 | | | $ | 276,067,181 | |
| | | | | | | | | | | | |
Capital Loss Carry Forward:
AXA/Pacific Global Small Cap Value
Losses incurred that will be carried forward under the provisions of the Regulated Investment Company Modernization Act of 2010 are $463,920 of Short Term losses and $536,688 of Long Term losses.
AXA/Horizon Small Cap Value
The Portfolio has no capital loss carryforward.
AXA/Horizon Small Cap Value Combined Pro-Forma
Losses incurred that will be carried forward under the provisions of the Regulated Investment Company Modernization Act of 2010 are $463,920 of Short Term losses and $536,688 of Long Term losses.
62
EQ ADVISORS TRUST
STATEMENT OF ASSETS AND LIABILITIES
December 31, 2016 (Unaudited)
| | | | | | | | | | | | | | | | |
| | | AXA/Pacific
Global
Small Cap
Value | | | AXA/Horizon
Small Cap
Value | | | Pro Forma
Adjustments | | | AXA/Horizon
Small
Cap Value
Combined
Pro Forma | |
Investments at Cost, Affiliated Issuers | | $ | 119,129 | | | $ | 129,759 | | | $ | — | | | $ | 248,888 | |
Investments at Cost, Unaffiliated Issuers | | | 135,153,314 | | | | 128,201,797 | | | | — | | | | 263,355,111 | |
Investments at Cost, Repurchase Agreements | | | 7,158,779 | | | | 6,302,719 | | | | — | | | | 13,461,498 | |
ASSETS | | | | | | | | | | | | | | | | |
Investments at Value, Affiliated Issuers | | | 97,156 | | | | 107,993 | | | | — | | | | 205,149 | |
Investments at Value, Unaffiliated Issuers (x) | | | 161,169,596 | | | | 165,555,803 | | | | — | | | | 326,725,399 | |
Investments at Value, Repurchase Agreements | | | 7,158,779 | | | | 6,302,719 | | | | — | | | | 13,461,498 | |
Cash | | | 473,851 | | | | 7,874,312 | | | | — | | | | 8,348,163 | |
Dividends, interest, and other receivables | | | 243,882 | | | | 189,519 | | | | — | | | | 433,401 | |
Receivable for securities sold | | | 279,412 | | | | 73,477 | | | | — | | | | 352,889 | |
Cash held as collateral at broker | | | 33,200 | | | | 23,800 | | | | — | | | | 57,000 | |
Securities lending income receivable | | | 15,764 | | | | 13,754 | | | | — | | | | 29,518 | |
Receivable from Separate Accounts for Trust shares sold | | | 5,223 | | | | 5,108 | | | | — | | | | 10,331 | |
Other assets | | | 430 | | | | 489 | | | | — | | | | 919 | |
| | | | | | | | | | | | | | | | |
Total assets | | | 169,477,293 | | | | 180,146,974 | | | | — | | | | 349,624,267 | |
| | | | | | | | | | | | | | | | |
LIABILITIES | | | | | | | | | | | | | | | | |
Payable for return of collateral on securites securities loaned | | | 7,158,779 | | | | 6,302,719 | | | | — | | | | 13,461,498 | |
Payable for securities purchased | | | 241,227 | | | | — | | | | — | | | | 241,227 | |
Investment management fees payable | | | 83,365 | | | | 89,902 | | | | — | | | | 173,267 | |
Administrative fees payable | | | 17,300 | | | | 18,388 | | | | — | | | | 35,688 | |
Payable to Separate Accounts for Trust shares redeemed | | | 10,692 | | | | 12,717 | | | | — | | | | 23,409 | |
Due to broker for futures variation margin | | | 2,843 | | | | 2,004 | | | | — | | | | 4,847 | |
Trustees’ fees payable | | | 225 | | | | 233 | | | | — | | | | 458 | |
Distribution fees payable-Class IB | | | 105 | | | | 81 | | | | — | | | | 186 | |
Accrued expenses | | | 47,335 | | | | 47,023 | | | | — | | | | 94,358 | |
| | | | | | | | | | | | | | | | |
Total liabilities | | | 7,561,871 | | | | 6,473,067 | | | | — | | | | 14,034,938 | |
| | | | | | | | | | | | | | | | |
NET ASSETS | | $ | 161,915,422 | | | $ | 173,673,907 | | | $ | — | | | $ | 335,589,329 | |
| | | | | | | | | | | | | | | | |
Net assets were comprised of: | | | | | | | | | | | | | | | | |
Paid in capital | | $ | 137,045,025 | | | $ | 136,538,119 | | | $ | — | | | $ | 273,583,144 | |
Accumulated undistributed net investment income (loss) | | | 206,755 | | | | 52,569 | | | | — | | | | 259,324 | |
Accumulated undistributed net realized gain (loss) on investments, futures and foreign currnecy transactions | | | (1,327,948 | ) | | | (247,024 | ) | | | — | | | | (1,574,972 | ) |
Net unrealized appreciation (depreciation) on investments, futures and foreign currency translations | | | 25,991,590 | | | | 37,330,243 | | | | — | | | | 63,321,833 | |
| | | | | | | | | | | | | | | | |
Net Assets | | $ | 161,915,422 | | | $ | 173,673,907 | | | $ | — | | | $ | 335,589,329 | |
| | | | | | | | | | | | | | | | |
Class IB Shares: | | | | | | | | | | | | | | | | |
Net Assets | | $ | 510,514 | | | $ | 417,546 | | | $ | — | | | $ | 928,060 | |
Shares outstanding | | | 55,631 | | | | 42,423 | | | | (3,750 | )(a) | | | 94,304 | |
Net asset value, offering and redemption price per share | | $ | 9.18 | | | $ | 9.84 | | | $ | — | | | $ | 9.84 | |
Class K Shares: | | | | | | | | | | | | | | | | |
Net Assets | | $ | 161,404,908 | | | $ | 173,256,361 | | | $ | — | | | $ | 334,661,269 | |
Shares outstanding | | | 17,604,560 | | | | 17,621,220 | | | | (1,184,936 | )(a) | | | 34,040,844 | |
Net asset value, offering and redemption price per share | | $ | 9.17 | | | $ | 9.83 | | | $ | — | | | $ | 9.83 | |
(x) Includes value of securities on loan of: | | $ | 6,985,266 | | | $ | 6,074,483 | | | $ | — | | | $ | 13,059,749 | |
| (a) | | Reflects adjustment for retired shares of the acquired Portfolio. |
63
EQ ADVISORS TRUST
For the Year Ended December 31, 2016 (Unaudited)
| | | | | | | | | | | | | | | | |
| | | AXA/Pacific
Global
Small Cap
Value | | | AXA/Horizon
Small Cap
Value | | | Pro Forma
Adjustments | | | AXA/Horizon
Small Cap
Value
Combined
Pro Forma | |
STATEMENT OF OPERATIONS | | | | | | | | | | | | | | | | |
Income Received from Affiliates | | $ | 9,770 | | | $ | 10,719 | | | $ | — | | | $ | 20,489 | |
Foreign withholding Tax on Dividends | | | 5,691 | | | | 8,237 | | | | — | | | | 13,928 | |
INVESTMENT INCOME | | | | | | | | | | | | | | | | |
Dividends | | | 2,128,552 | | | | 2,531,441 | | | | — | | | | 4,659,993 | |
Interest | | | 1,631 | | | | 20,795 | | | | — | | | | 22,426 | |
Securities lending (net) | | | 214,094 | | | | 109,482 | | | | — | | | | 323,576 | |
| | | | | | | | | | | | | | | | |
Total income | | | 2,344,277 | | | | 2,661,718 | | | | — | | | | 5,005,995 | |
| | | | | | | | | | | | | | | | |
EXPENSES | | | | | | | | | | | | | | | | |
Investment management fees | | | 1,083,337 | | | | 1,216,535 | | | | — | | | | 2,299,872 | |
Administrative fees | | | 169,841 | | | | 190,713 | | | | — | | | | 360,554 | |
Custodian fees | | | 69,500 | | | | 63,825 | | | | (69,500 | )(b) | | | 63,825 | |
Professional fees | | | 55,099 | | | | 55,504 | | | | (49,728 | )(b) | | | 60,875 | |
Printing and mailing expenses | | | 9,413 | | | | 10,526 | | | | — | | | | 19,939 | |
Miscellaneous | | | 6,766 | | | | 7,960 | | | | — | | | | 14,726 | |
Trustees’ fees | | | 3,095 | | | | 3,441 | | | | — | | | | 6,536 | |
Distribution fees-Class IB | | | 757 | | | | 614 | | | | — | | | | 1,371 | |
| | | | | | | | | | | | | | | | |
Gross expenses | | | 1,397,808 | | | | 1,549,118 | | | | (119,228 | ) | | | 2,827,698 | |
Less: Waiver from investment manager | | | (134,202 | ) | | | (130,536 | ) | | | 27,159 | (c) | | | (237,579 | ) |
| | | | | | | | | | | | | | | | |
Net expenses | | | 1,263,606 | | | | 1,418,582 | | | | (92,069 | ) | | | 2,590,119 | |
| | | | | | | | | | | | | | | | |
NET INVESTMENT INCOME (LOSS) | | | 1,080,671 | | | | 1,243,136 | | | | 92,069 | | | | 2,415,876 | |
| | | | | | | | | | | | | | | | |
Realized gain (loss) from affiliates | | | (172 | ) | | | (201 | ) | | | — | | | | (373 | ) |
Net distributions of realized gain (loss) received from affiliates | | | — | | | | — | | | | — | | | | — | |
REALIZED AND UNREALIZED GAIN (LOSS) | | | | | | | | | | | | | | | | |
Realized gain (loss) on: | | | | | | | | | | | | | | | | |
Investments | | | 670,428 | | | | 6,881,825 | | | | — | | | | 7,552,253 | |
Net distributions of realized gain received from underlying funds | | | 11 | | | | 5 | | | | — | | | | 16 | |
Futures | | | 67,733 | | | | 93,491 | | | | — | | | | 161,224 | |
Foreign currency translations | | | — | | | | (2,296 | ) | | | — | | | | (2,296 | ) |
| | | | | | | | | | | | | | | | |
Net realized gain (loss) | | | 738,172 | | | | 6,973,025 | | | | — | | | | 7,711,197 | |
| | | | | | | | | | | | | | | | |
Change in unrealized appreciation (depreciation) on Affiliates | | | 5,667 | | | | 5,873 | | | | — | | | | 11,540 | |
Change in unrealized appreciation (depreciation) on: | | | | | | | | | | | | | | | | |
Investments | | | 34,697,003 | | | | 26,270,932 | | | | — | | | | 60,967,935 | |
Futures | | | 7,539 | | | | 7,498 | | | | — | | | | 15,037 | |
Foreign currency translations | | | — | | | | (65 | ) | | | — | | | | (65 | ) |
| | | | | | | | | | | | | | | | |
Net change in unrealized appreciation (depreciation) | | | 34,704,542 | | | | 26,278,365 | | | | — | | | | 60,982,907 | |
| | | | | | | | | | | | | | | | |
NET REALIZED AND UNREALIZED GAIN (LOSS) | | | 35,442,714 | | | | 33,251,390 | | | | — | | | | 68,694,104 | |
| | | | | | | | | | | | | | | | |
NET INCREASE (DECREASE) IN NET ASSETS RESULTING FROM OPERATIONS | | $ | 36,523,385 | | | $ | 34,494,526 | | | $ | 92,069 | | | $ | 71,109,980 | |
| | | | | | | | | | | | | | | | |
| (b) | | Reflects adjustment in expenses due to elimination of duplicative expenses. |
| (c) | | Reflects adjustment of waiver due to the effects of the new expense limitation rate. |
Note that the Reorganisation expenses for the AXA/Pacific Global Small Cap Value Portfolio, which are estimated to be $33,333, exceed the expense limit and will be paid by FMG LLC.
64
NOTES TO PRO FORMA COMBINED FINANCIAL STATEMENTS
As of December 31, 2016
NOTE 1 – BASIS OF COMBINATION AND SIGNIFICANT ACCOUNTING POLICIES:
EQ Advisors Trust (the “Trust”) was organized as a Delaware statutory trust on October 31, 1996 and is registered under the Investment Company Act of 1940, as amended, as an open-end management investment company with numerous portfolios. The Board of Trustees of the Trust approved the proposed Plan of Reorganization and Termination (“Reorganization Plan”) on December 1, 2016 that provides for the transfer of all assets of the AXA/Pacific Global Small Cap Value Portfolio to the AXA/Horizon Small Cap Value Portfolio, both series of the Trust, and the assumption by AXA/Horizon Small Cap Value Portfolio of all of the liabilities of the AXA/Pacific Global Small Cap Value Portfolio in exchange for shares of the AXA/Horizon Small Cap Value Portfolio having an aggregate value equal to the net assets of the AXA/Pacific Global Small Cap Value Portfolio, the distribution of the AXA/Horizon Small Cap Value Portfolio shares to the AXA/Pacific Global Small Cap Value Portfolio shareholders of record determined immediately after the close of business on the closing date, and the subsequent liquidation of the AXA/Pacific Global Small Cap Value Portfolio (the “Reorganization”).
The AXA/Pacific Global Small Cap Value Portfolio’s annual contractual management fee equals 0.800% of average daily net assets for the first $2 billion, 0.750% of average daily net assets for the next $1 billion, 0.725% for the next $3 billion, 0.700% for the next $5 billion, and 0.675% of average daily net assets thereafter. AXA/Horizon Small Cap Value Portfolio’s annual contractual management fee equals 0.800% of average daily net assets for the first $2 billion, 0.750% of average daily net assets for the next $1 billion, 0.725% for the next $3 billion, 0.700% for the next $5 billion, and 0.675% of average daily net assets thereafter. The Reorganization Plan is subject to the approval of the AXA/Pacific Global Small Cap Value Portfolio’s shareholders. A special meeting of shareholders of the AXA/Pacific Global Small Cap Value Portfolio will be held on or about March 28, 2017.
The Reorganization will be accounted for as a tax-free reorganization of investment companies. The unaudited pro forma combined financial statements are presented for the information of the reader and may not necessarily be representative of what the actual combined financial statements would have been had the Reorganization occurred at December 31, 2016. The unaudited pro forma combined portfolio of investments and statement of assets and liabilities reflect the financial position of the AXA/Horizon Small Cap Value Portfolio and the AXA/Pacific Global Small Cap Value Portfolio at December 31, 2016. The unaudited pro forma combined statement of operations reflects the results of operations of the AXA/Horizon Small Cap Value Portfolio as if it had acquired the AXA/Pacific Global Small Cap Value Portfolio at the beginning of the year ended December 31, 2016. These statements have been derived from the Portfolios’ respective books and records utilized in calculating daily net asset value at the dates indicated above for each Portfolio under accounting principles generally accepted in the United States of America. The historical cost of investment securities will be carried forward to the surviving entity and results of operations of the AXA/Horizon Small Cap Value Portfolio for pre-combination periods will not be restated.
The unaudited pro forma combined portfolio of investments and statements of assets and liabilities and operations should be read in conjunction with the historical financial statements of the Portfolios included in the Trust’s Statement of Additional Information, each of the Portfolios has substantially the same significant policies as detailed in the historical financial statements. The preparation of financial statements in accordance with accounting principles generally accepted in the United States of America requires management to make estimates and assumptions that affect the reported amounts and disclosures. Actual results could differ from those estimates.
Following the Reorganization, the AXA/Horizon Small Cap Value Portfolio is the “accounting survivor.” The general criteria that are applied to determine the proper accounting survivor are outlined in the “AICPA Accounting and Audit Guide for Investment Companies.” The legal survivor normally is considered the accounting survivor of a reorganization. In this case, the AXA/Horizon Small Cap Value Portfolio is the legal survivor. Other criteria include:
| a.) | | Portfolio Management – The merged entity will be managed by the Manager, Sub-Advisers and portfolio managers to the AXA/Horizon Small Cap Value Portfolio in a manner consistent with the current management style. |
| b.) | | Portfolio Composition – The merged entity’s portfolio holdings are expected to be consistent with the AXA/Horizon Small Cap Value Portfolio’s current investment strategies and will more closely resemble the current portfolio holdings of the AXA/Horizon Small Cap Value Portfolio than those of the AXA/Pacific Global Small Cap Value Portfolio. |
| c.) | | Investment Objective, Policies and Restrictions – The merged entity’s investment objective, policies and fundamental and non-fundamental investment restrictions will be the same as the AXA/Horizon Small Cap Value Portfolio’s current investment objective, policies and fundamental and non-fundamental investment restrictions. |
| d.) | | Expense Structure and Expense Ratios – The merged entity’s expense structure will be the same as that of AXA/Horizon Small Cap Value Portfolio. The expense ratio of the merged entity will be the same as that of the AXA/Horizon Small Cap Value Portfolio and lower than the AXA/Pacific Global Small Cap Value Portfolio. |
| e.) | | Asset Size – The asset size of AXA/Horizon Small Cap Value Portfolio is relatively the same as that of the AXA/Pacific Global Small Cap Value Portfolio. |
65
NOTE 2 – SHARES:
The unaudited pro forma net asset value per share assumes additional common shares of beneficial interest issued in connection with the proposed acquisition of the AXA/Pacific Global Small Cap Value Portfolio by the AXA/Horizon Small Cap Value Portfolio as of December 31, 2016. The number of additional shares issued was calculated based on the net assets of the AXA/Pacific Global Small Cap Value Portfolio and net asset value per share of the AXA/Horizon Small Cap Value Portfolio at December 31, 2016.
NOTE 3 – VALUATION:
Equity securities (including securities issued by exchange-traded funds (“ETFs”)) listed on national securities exchanges are valued at the last sale price or official closing price on the date of valuation or, if there is no sale or official closing price, at the latest available bid price. Securities listed on the NASDAQ stock market will be valued using the NASDAQ Official Closing Price (“NOCP”). Generally, the NOCP will be the last sale price unless the reported trade for the security is outside the range of the bid/ask price. In such cases, the NOCP will be normalized to the nearer of the bid or ask price. Other unlisted stocks are valued at their last sale price or official closing price, or if there is no such price, at a bid price estimated by a broker.
Investments in shares of open-end investment companies (other than ETFs) held by a Portfolio will be valued at the net asset value of the shares of such underlying funds as described in the underlying funds’ prospectuses.
Futures contracts are generally valued at their last settlement price or, if there is no sale, at the latest available bid price.
Forward foreign exchange contracts are valued by interpolating between the forward and spot currency rates as quoted by a pricing service as of a designated hour on the valuation date. The pricing service may utilize data such as actual trading information and foreign currency exchange rates gathered from leading market makers and foreign currency exchange trading centers throughout the world in making evaluations. Forward foreign exchange contracts may be settled with the counterparty in U.S. Dollars without the delivery of foreign currency.
If market quotations are not readily available for a security or other financial instruments, such securities and instruments shall be referred to the Trust’s Valuation Committee (“Committee”), who will value the assets in good faith pursuant to procedures (“Pricing Procedures”) adopted by the Board of Trustees of the Trust (the “Board”).
The Board is responsible for ensuring that appropriate valuation methods are used to price securities for the Trust’s Portfolios. The Board has delegated the responsibility of calculating the net asset values (“NAVs”) of the Trust’s Portfolios and classes pursuant to these Pricing Procedures to the Trust’s administrator, FMG LLC (in its capacity as administrator, the “Administrator”). The Administrator has entered into a sub-administration agreement with JPMorgan Chase Bank, N.A. (the “Sub-Administrator”) to assist in performing certain of the duties described herein. The Committee, established by the Board, determines the value of the Trust’s securities and assets for which market quotations are not readily available or for which valuation cannot otherwise be provided in accordance with procedures adopted by the Board. The Committee is comprised of senior employees from FMG LLC.
Due to the inherent uncertainty of valuations of such securities, the fair value may differ significantly from the values that would have been used had a ready market for such securities existed.
Various inputs are used in determining the value of a Portfolio’s assets or liabilities carried at fair value. These inputs are summarized in three broad levels below:
| | • | | Level 1 - quoted prices in active markets for identical assets |
| | • | | Level 2 - other significant observable inputs (including quoted prices of similar securities, interest rates, prepayment speeds, credit risk, etc.) |
| | • | | Level 3 - significant unobservable inputs (including the Portfolio’s own assumptions in determining the fair value of investments) |
A summary of inputs used to value each Portfolio’s assets and liabilities carried at fair value as of December 31, 2016, is included in the Portfolio of Investments for each Portfolio. Changes in valuation techniques may result in transfers in or out of an investment’s assigned level. The Portfolios’ policy is to recognize transfers into and transfers out of the valuation levels as of the end of the reporting period.
Transfers between levels are included after the Summary of Level 1, Level 2 and Level 3 inputs, following the Portfolio of Investments for each Portfolio. Transfers between levels may be due to a decline or an increase in market activity (e.g., frequency of trades), which may result in a lack of, or increase in, available observable market inputs to determine price.
Transfers into and transfers out of Level 3, if material, are included in the Level 3 reconciliation following the Portfolio of Investments for each Portfolio.
The inputs or methodology used to value securities are not necessarily an indication of the risk associated with investing in those securities. An investment’s level within the fair value hierarchy is based on the lowest level of any input, both individually and in the aggregate, that is significant to the fair value measurement.
66
The Committee has the ability to meet and review reports based on the valuation techniques used to value Level 3 securities. As part of a review, the Committee would consider obtaining updates from its pricing vendors and Sub-Advisers for fair valued securities. For example, with respect to model driven prices, the Committee could receive reports regarding a review and recalculation of pricing models and related discounts. For those securities which are valued based on broker quotes, the Committee may evaluate variances between existing broker quotes and any alternative broker quotes provided by a Sub-Adviser or other pricing source.
To substantiate unobservable inputs used in a fair valuation, the Secretary of the Committee can perform an independent verification as well as additional research for fair value notifications received from the pricing agents. Among other factors, particular areas of focus may include: description of security, historical pricing, intra-day price movement, last trade information, corporate actions, related securities, any available company news and announcements, any available trade data or other information. The Committee also notes the materiality of holdings and price changes on a Portfolio’s NAV.
The Committee reviews and considers changes in value for all fair valued securities that have occurred since the last review.
NOTE 4 – FEDERAL INCOME TAX CONSEQUENCES OF THE REORGANIZATIONS:
Each Portfolio, as well as the Acquiring Portfolio after the Reorganization, intends to comply with the requirements of the Internal Revenue Code of 1986, as amended applicable to regulated investment companies (“RICS”) and to distribute substantially all of its net investment income and net realized capital gains to shareholders of each Portfolio. Therefore, no Federal income tax provision is required.
The estimated percentage of the holdings of the AXA/Pacific Global Small Cap Value Portfolio that will be sold in connection with its Reorganization is 2.3%. The estimated portfolio transaction costs of the Reorganization of the AXA/Pacific Global Small Cap Value Portfolio are $44,505. These are estimated amounts and are subject to change. Contractholders who had premiums or contributions allocated to the investment divisions of the Separate Accounts that are invested in shares of the Acquired Portfolio will not recognize any gain or loss for federal income tax purposes as a result of the Reorganization.
NOTE 5 – UNAUDITED PRO FORMA COMBINED ADJUSTMENTS:
The accompanying unaudited pro forma combined financial statements reflect changes in the AXA/Horizon Small Cap Value Portfolio’s shares as if the merger had taken place on December 31, 2016. The AXA/Pacific Global Small Cap Value Portfolio will bear the expenses of the Reorganization (i.e., the costs associated with preparing, printing and distributing the prospectus and proxy materials, legal and accounting fees in connection with the Reorganization, and expenses of holding the shareholders meeting) which are estimated at approximately $33,333. However, FMG LLC has voluntarily agreed to pay expenses of the Reorganization that exceed the AXA/Pacific Global Small Cap Value Portfolio’s expense limitation set forth in its expense limitation agreement.
CharterSM Income Strategies Portfolio and CharterSM Interest Rate Strategies Portfolio merging into AXA/DoubleLine Opportunistic Core Plus Bond Portfolio
The following tables set forth the pro forma Combined Portfolio of Investments as of December 31, 2016, the pro forma condensed Combined Statement of Assets and Liabilities as of December 31, 2016, and the pro forma condensed Combined Statement of Operations for the one year period ended December 31, 2016, as adjusted giving effect to the Reorganization of the CharterSM Income Strategies Portfolio (“Income Strategies Portfolio”) and CharterSM Interest Rate Strategies Portfolio (“Interest Rate Strategies Portfolio”) (the Acquired Portfolios”) into the AXA/DoubleLine Opportunistic Core Plus Bond Portfolio (the “Acquiring Portfolio”).
The pro forma Combined Portfolio of Investments contains information about the securities holdings of the combined Acquiring Portfolio as of December 31, 2016, which has, and will continue to, change over time due to normal portfolio turnover in response to changes in market conditions. It is anticipated that immediately prior to the Closing Date, each Acquired Portfolio will liquidate its securities holdings and hold cash. The sale of portfolio holdings by the Acquired Portfolios in connection with the Reorganization may result in the Acquired Portfolios selling securities at a disadvantageous time and price and could result in it realizing gains (or losses) that would not otherwise have been realized and incurring transaction costs that would not otherwise have been incurred.
67
EQ ADVISORS TRUST
PORTFOLIO OF INVESTMENTS
December 31, 2016 (Unaudited)
| | | | | | | | | | | | | | | | | | | | | | | | | | | | | | | | | | | | | | | | |
| | | CharterSM
Interest Rate
Strategies | | | CharterSM
Income
Strategies | | | AXA/DoubleLine
Opportunistic
Core Plus Bond | | | Pro-forma
Adjustment | | | AXA/DoubleLine
Opportunistic
Core Plus Bond
Combined
Pro-forma | | | CharterSM
Interest Rate
Strategies | | | CharterSM
Income
Strategies | | | AXA/DoubleLine
Opportunistic
Core Plus Bond | | | Pro-forma
Adjustment | | | AXA/DoubleLine
Opportunistic
Core Plus Bond
Combined
Pro-forma | |
| | | Number of
Shares | | | Number of
Shares | | | Principal
Amount | | | Principal
Amount | | | Principal
Amount | | | Value ($) | | | Value ($) | | | Value ($) | | | Value ($) | | | Value ($) | |
LONG TERM DEBT SECURITIES: | | | | | | | | | | | | | | | | | | | | | | | | | | | | | | | | | | | | | | | | |
Asset-Backed Securities (5.5%) | | | | | | | | | | | | | | | | | | | | | | | | | | | | | | | | | | | | | | | | |
Apidos CLO XXI, Series 2015-21A C, 4.432%, 07/18/27 (l)§ | | | — | | | | — | | | | 500,000 | | | | — | | | | 500,000 | | | | — | | | | — | | | | 478,401 | | | | — | | | | 478,401 | |
Apidos CLO XXI, Series 2015-21A D, 6.432%,
07/18/27 (l)§ | | | — | | | | — | | | | 250,000 | | | | — | | | | 250,000 | | | | — | | | | — | | | | 232,018 | | | | — | | | | 232,018 | |
Babson CLO Ltd., Series 2012-2A CR, 4.506%,
05/15/23 (l)§ | | | — | | | | — | | | | 250,000 | | | | — | | | | 250,000 | | | | — | | | | — | | | | 249,461 | | | | — | | | | 249,461 | |
BlueMountain CLO Ltd., Series
2015-2A D, 4.432%, 07/18/27 (l)§ | | | — | | | | — | | | | 250,000 | | | | — | | | | 250,000 | | | | — | | | | — | | | | 239,042 | | | | — | | | | 239,042 | |
BlueMountain CLO Ltd., Series
2016-2A C, 4.796%, 08/20/28 (l)§ | | | — | | | | — | | | | 500,000 | | | | — | | | | 500,000 | | | | — | | | | — | | | | 500,196 | | | | — | | | | 500,196 | |
Carlyle Global Market Strategies CLO Ltd., Series 2016-2A D2, 7.084%, 07/15/27 (l)§ | | | — | | | | — | | | | 600,000 | | | | — | | | | 600,000 | | | | — | | | | — | | | | 590,221 | | | | — | | | | 590,221 | |
Eaton Vance CDO VIII Ltd., Series 2006-8A B, 1.556%, 08/15/22 (l)§ | | | — | | | | — | | | | 250,000 | | | | — | | | | 250,000 | | | | — | | | | — | | | | 247,400 | | | | — | | | | 247,400 | |
LCM XII LP, Series 12A DR, 4.578%, 10/19/22 (l)§ | | | — | | | | — | | | | 500,000 | | | | — | | | | 500,000 | | | | — | | | | — | | | | 493,575 | | | | — | | | | 493,575 | |
Madison Park Funding XV Ltd., Series 2014-15A A2, 3.286%, 01/27/26 (l)§ | | | — | | | | — | | | | 285,000 | | | | — | | | | 285,000 | | | | — | | | | — | | | | 285,092 | | | | — | | | | 285,092 | |
Madison Park Funding XV Ltd., Series 2014-15A C, 4.586%, 01/27/26 (l)§ | | | — | | | | — | | | | 250,000 | | | | — | | | | 250,000 | | | | — | | | | — | | | | 245,667 | | | | — | | | | 245,667 | |
OneMain Financial Issuance Trust, Series 2015-1A A, 3.190%, 03/18/26 | | | — | | | | — | | | | 411,000 | | | | — | | | | 411,000 | | | | — | | | | — | | | | 413,668 | | | | — | | | | 413,668 | |
OneMain Financial Issuance Trust, Series 2015-2A A, 2.570%, 07/18/25 | | | — | | | | — | | | | 150,000 | | | | — | | | | 150,000 | | | | — | | | | — | | | | 149,910 | | | | — | | | | 149,910 | |
Venture XVII CLO Ltd., Series 2014-17A C, 3.730%, 07/15/26 (l)§ | | | — | | | | — | | | | 250,000 | | | | — | | | | 250,000 | | | | — | | | | — | | | | 250,138 | | | | — | | | | 250,138 | |
| | | | | | | | | | | | | | | | | | | | | | | | | | | | | | | | | | | | | | | | |
Total Asset-Backed Securities | | | | | | | | | | | | | | | | | | | | | | | — | | | | — | | | | 4,374,789 | | | | — | | | | 4,374,789 | |
| | | | | | | | | | | | | | | | | | | | | | | | | | | | | | | | | | | | | | | | |
Collateralized Mortgage Obligations (14.8%) | | | | | | | | | | | | | | | | | | | | | | | | | | | | | | | | | | | | | | | | |
Alternative Loan Trust, Series
2006-19CB A15, 6.000%, 08/25/2036 | | | — | | | | — | | | | 429,644 | | | | — | | | | 429,644 | | | | — | | | | — | | | | 382,842 | �� | | | — | | | | 382,842 | |
Banc of America Funding Trust, Series 2005-6 1A8, 6.000%, 10/25/2035 | | | — | | | | — | | | | 660,252 | | | | — | | | | 660,252 | | | | — | | | | — | | | | 636,819 | | | | — | | | | 636,819 | |
CHL Mortgage Pass-Through Trust, Series 2006-J4 A5, 6.250%, 09/25/2036 | | | — | | | | — | | | | 763,204 | | | | — | | | | 763,204 | | | | — | | | | — | | | | 629,529 | | | | — | | | | 629,529 | |
CHL Mortgage Pass-Through Trust, Series 2007-HY1 1A1, 3.034%, 04/25/37 (l) | | | — | | | | — | | | | 719,390 | | | | — | | | | 719,390 | | | | — | | | | — | | | | 671,265 | | | | — | | | | 671,265 | |
CHL Mortgage Pass-Through Trust, Series 2007-HY1 2A1, 4.391%, 03/25/37 (l) | | | — | | | | — | | | | 357,970 | | | | — | | | | 357,970 | | | | — | | | | — | | | | 335,026 | | | | — | | | | 335,026 | |
Citigroup Mortgage Loan Trust, Series 2006-AR2 1A2, 3.034%, 03/25/36 (l) | | | — | | | | — | | | | 1,029,476 | | | | — | | | | 1,029,476 | | | | — | | | | — | | | | 980,184 | | | | — | | | | 980,184 | |
FHLMC, Series 3998 AZ, 4.000%, 02/15/2042 | | | — | | | | — | | | | 1,606,737 | | | | — | | | | 1,606,737 | | | | — | | | | — | | | | 1,691,635 | | | | — | | | | 1,691,635 | |
FHLMC, Series 4444 CZ, 3.000%, 02/15/2045 | | | — | | | | — | | | | 528,234 | | | | — | | | | 528,234 | | | | — | | | | — | | | | 477,644 | | | | — | | | | 477,644 | |
FHLMC, Series 4471 GA, 3.000%, 02/15/2044 | | | — | | | | — | | | | 824,082 | | | | — | | | | 824,082 | | | | — | | | | — | | | | 832,314 | | | | — | | | | 832,314 | |
FHLMC, Series 4483 CA, 3.000%, 06/15/2044 | | | — | | | | — | | | | 520,294 | | | | — | | | | 520,294 | | | | — | | | | — | | | | 525,218 | | | | — | | | | 525,218 | |
FHLMC Multifamily Structured Pass Through Certificates, Series K050 A2, 3.334%, 08/25/25 (l) | | | — | | | | — | | | | 50,000 | | | | — | | | | 50,000 | | | | — | | | | — | | | | 51,713 | | | | — | | | | 51,713 | |
68
| | | | | | | | | | | | | | | | | | | | | | | | | | | | | | | | | | | | | | | | |
| | | CharterSM
Interest Rate
Strategies | | | CharterSM
Income
Strategies | | | AXA/DoubleLine
Opportunistic
Core Plus Bond | | | Pro-forma
Adjustment | | | AXA/DoubleLine
Opportunistic
Core Plus Bond
Combined
Pro-forma | | | CharterSM
Interest Rate
Strategies | | | CharterSM
Income
Strategies | | | AXA/DoubleLine
Opportunistic
Core Plus Bond | | | Pro-forma
Adjustment | | | AXA/DoubleLine
Opportunistic
Core Plus Bond
Combined
Pro-forma | |
| | | Number of
Shares | | | Number of
Shares | | | Principal
Amount | | | Principal
Amount | | | Principal
Amount | | | Value ($) | | | Value ($) | | | Value ($) | | | Value ($) | | | Value ($) | |
First Horizon Mortgage Pass-Through Trust, Series 2006-2 1A3, 6.000%, 08/25/2036 | | | — | | | | — | | | | 475,063 | | | | — | | | | 475,063 | | | | — | | | | — | | | | 439,604 | | | | — | | | | 439,604 | |
FNMA, Series 2015-42 CA, 3.000%, 03/25/2044 | | | — | | | | — | | | | 1,415,001 | | | | — | | | | 1,415,001 | | | | — | | | | — | | | | 1,428,063 | | | | — | | | | 1,428,063 | |
FNMA, Series 2015-9 HA, 3.000%, 01/25/2045 | | | — | | | | — | | | | 677,045 | | | | — | | | | 677,045 | | | | — | | | | — | | | | 693,216 | | | | — | | | | 693,216 | |
RFMSI Series Trust, Series 2006-S6 A14, 6.000%, 07/25/36 | | | — | | | | — | | | | 614,850 | | | | — | | | | 614,850 | | | | — | | | | — | | | | 585,488 | | | | — | | | | 585,488 | |
Suntrust Alternative Loan Trust, Series 2005-1F 2A8, 6.000%, 12/25/2035 | | | — | | | | — | | | | 540,128 | | | | — | | | | 540,128 | | | | — | | | | — | | | | 509,828 | | | | — | | | | 509,828 | |
Wells Fargo Alternative Loan Trust, Series 2007-PA2 1A1, 6.000%, 06/25/2037 | | | — | | | | — | | | | 687,709 | | | | — | | | | 687,709 | | | | — | | | | — | | | | 691,198 | | | | — | | | | 691,198 | |
| | | | | | | | | | | | | | | | | | | | | | | | | | | | | | | | | | | | | | | | |
Total Collateralized Mortgage Obligations | | | | | | | | | | | | | | | | | | | | | | | — | | | | — | | | | 11,561,586 | | | | — | | | | 11,561,586 | |
| | | | | | | | | | | | | | | | | | | | | | | | | | | | | | | | | | | | | | | | |
Commercial Mortgage-Backed Securities (7.2%) | | | | | | | | | | | | | | | | | | | | | | | | | | | | | | | | | | | | | | | | |
CD Commercial Mortgage Trust, Series 2007-CD4 AM, 5.301%, 12/11/49 (l)§ | | | — | | | | — | | | | 90,000 | | | | — | | | | 90,000 | | | | — | | | | — | | | | 90,127 | | | | — | | | | 90,127 | |
CFCRE Commercial Mortgage Trust, Series 2016-C7 A3, 3.839%, 12/10/2054 | | | — | | | | — | | | | 92,000 | | | | — | | | | 92,000 | | | | — | | | | — | | | | 95,037 | | | | — | | | | 95,037 | |
CFCRE Commercial Mortgage Trust, Series 2016-C3 XA, 1.091%, 01/10/48 (l) | | | — | | | | — | | | | 993,021 | | | | — | | | | 993,021 | | | | — | | | | — | | | | 71,940 | | | | — | | | | 71,940 | |
Citigroup Commercial Mortgage Trust, Series 2016-P4 A4, 2.902%, 07/10/2049 | | | — | | | | — | | | | 89,000 | | | | — | | | | 89,000 | | | | — | | | | — | | | | 86,107 | | | | — | | | | 86,107 | |
Citigroup Commercial Mortgage Trust, Series 2016-SMPL D, 3.520%, 09/10/2031 | | | — | | | | — | | | | 91,000 | | | | — | | | | 91,000 | | | | — | | | | — | | | | 87,966 | | | | — | | | | 87,966 | |
Citigroup Commercial Mortgage Trust, Series 2015-GC35 XA, 0.903%, 11/10/48 (l) | | | — | | | | — | | | | 844,959 | | | | — | | | | 844,959 | | | | — | | | | — | | | | 44,586 | | | | — | | | | 44,586 | |
Citigroup Commercial Mortgage Trust, Series 2016-P4 XA, 2.016%, 07/10/49 (l) | | | — | | | | — | | | | 997,806 | | | | — | | | | 997,806 | | | | — | | | | — | | | | 133,125 | | | | — | | | | 133,125 | |
Citigroup Commercial Mortgage Trust, Series 2016-P6 A5, 3.720%, 12/10/49 (l) | | | — | | | | — | | | | 73,000 | | | | — | | | | 73,000 | | | | — | | | | — | | | | 75,304 | | | | — | | | | 75,304 | |
COMM Mortgage Trust, Series 2013-CR10 XA, 0.928%,
08/10/46 (l) | | | — | | | | — | | | | 2,139,476 | | | | — | | | | 2,139,476 | | | | — | | | | — | | | | 81,972 | | | | — | | | | 81,972 | |
COMM Mortgage Trust, Series 2015-CR22 D, 4.126%,
03/10/48 (l)§ | | | — | | | | — | | | | 140,000 | | | | — | | | | 140,000 | | | | — | | | | — | | | | 109,895 | | | | — | | | | 109,895 | |
COMM Mortgage Trust, Series 2015-CR23 D, 4.256%,
05/10/48 (l) | | | — | | | | — | | | | 140,000 | | | | — | | | | 140,000 | | | | — | | | | — | | | | 100,295 | | | | — | | | | 100,295 | |
COMM Mortgage Trust, Series 2015-CR26 B, 4.495%,
10/10/48 (l) | | | — | | | | — | | | | 100,000 | | | | — | | | | 100,000 | | | | — | | | | — | | | | 104,094 | | | | — | | | | 104,094 | |
COMM Mortgage Trust, Series 2015-CR26 XA, 1.056%,
10/10/48 (l) | | | — | | | | — | | | | 1,290,494 | | | | — | | | | 1,290,494 | | | | — | | | | — | | | | 82,347 | | | | — | | | | 82,347 | |
COMM Mortgage Trust, Series 2015-LC23 C, 4.646%,
10/10/53 (l) | | | — | | | | — | | | | 64,000 | | | | — | | | | 64,000 | | | | — | | | | — | | | | 61,393 | | | | — | | | | 61,393 | |
COMM Mortgage Trust, Series 2016-CR28 C, 4.647%,
02/10/49 (l) | | | — | | | | — | | | | 73,000 | | | | — | | | | 73,000 | | | | — | | | | — | | | | 70,662 | | | | — | | | | 70,662 | |
COMM Mortgage Trust, Series 2016-DC2 XA, 1.077%,
02/10/49 (l) | | | — | | | | — | | | | 994,709 | | | | — | | | | 994,709 | | | | — | | | | — | | | | 67,324 | | | | — | | | | 67,324 | |
Commercial Mortgage Trust, Series 2007-GG9 AMFX, 5.475%,
03/10/2039 | | | — | | | | — | | | | 89,888 | | | | — | | | | 89,888 | | | | — | | | | — | | | | 89,787 | | | | — | | | | 89,787 | |
Commercial Mortgage Trust, Series 2007-GG11 AJ, 6.032%,
12/10/49 (l) | | | — | | | | — | | | | 140,000 | | | | — | | | | 140,000 | | | | — | | | | — | | | | 139,789 | | | | — | | | | 139,789 | |
Cosmopolitan Hotel Trust, Series 2016-CSMO C, 3.354%,
11/15/33 (l)§ | | | — | | | | — | | | | 70,000 | | | | — | | | | 70,000 | | | | — | | | | — | | | | 70,260 | | | | — | | | | 70,260 | |
69
| | | | | | | | | | | | | | | | | | | | | | | | | | | | | | | | | | | | | | | | |
| | | CharterSM
Interest Rate
Strategies | | | CharterSM
Income
Strategies | | | AXA/DoubleLine
Opportunistic
Core Plus Bond | | | Pro-forma
Adjustment | | | AXA/DoubleLine
Opportunistic
Core Plus Bond
Combined
Pro-forma | | | CharterSM
Interest Rate
Strategies | | | CharterSM
Income
Strategies | | | AXA/DoubleLine
Opportunistic
Core Plus Bond | | | Pro-forma
Adjustment | | | AXA/DoubleLine
Opportunistic
Core Plus Bond
Combined
Pro-forma | |
| | | Number of
Shares | | | Number of
Shares | | | Principal
Amount | | | Principal
Amount | | | Principal
Amount | | | Value ($) | | | Value ($) | | | Value ($) | | | Value ($) | | | Value ($) | |
Credit Suisse Commercial Mortgage Trust, Series 2007-C4 A1AM, 5.935%, 09/15/39 (l) | | | — | | | | — | | | | 140,000 | | | | — | | | | 140,000 | | | | — | | | | — | | | | 141,067 | | | | — | | | | 141,067 | |
CSAIL Commercial Mortgage Trust, Series 2015-C1 XA, 0.958%, 04/15/50 (l) | | | — | | | | — | | | | 1,536,832 | | | | — | | | | 1,536,832 | | | | — | | | | — | | | | 84,873 | | | | — | | | | 84,873 | |
Csail Commercial Mortgage Trust, Series 2015-C2 AS, 3.849%, 06/15/57 (l) | | | — | | | | — | | | | 140,000 | | | | — | | | | 140,000 | | | | — | | | | — | | | | 142,405 | | | | — | | | | 142,405 | |
CSAIL Commercial Mortgage Trust, Series 2015-C4 C, 4.585%, 11/15/48 (l) | | | — | | | | — | | | | 64,000 | | | | — | | | | 64,000 | | | | — | | | | — | | | | 61,576 | | | | — | | | | 61,576 | |
FHLMC Multifamily Structured Pass Through Certificates, Series K722 X1, 1.311%, 03/25/23 (l) | | | — | | | | — | | | | 998,173 | | | | — | | | | 998,173 | | | | — | | | | — | | | | 65,670 | | | | — | | | | 65,670 | |
FNMA, Series 2016-M3 A2, 2.702%, 02/25/2026 | | | — | | | | — | | | | 67,000 | | | | — | | | | 67,000 | | | | — | | | | — | | | | 65,768 | | | | — | | | | 65,768 | |
GE Commercial Mortgage Corp. Trust, Series 2007-C1 AM, 5.606%, 12/10/49 (l) | | | — | | | | — | | | | 85,700 | | | | — | | | | 85,700 | | | | — | | | | — | | | | 85,558 | | | | — | | | | 85,558 | |
GS Mortgage Securities Corp. II, Series 2013-GC10 XA, 1.595%, 02/10/46 (l) | | | — | | | | — | | | | 1,442,614 | | | | — | | | | 1,442,614 | | | | — | | | | — | | | | 104,514 | | | | — | | | | 104,514 | |
GS Mortgage Securities Trust, Series 2014-GC20 XA, 1.157%, 04/10/47 (l) | | | — | | | | — | | | | 1,933,307 | | | | — | | | | 1,933,307 | | | | — | | | | — | | | | 108,456 | | | | — | | | | 108,456 | |
GS Mortgage Securities Trust, Series 2014-GC26 D, 4.511%, 11/10/47 (l)§ | | | — | | | | — | | | | 43,000 | | | | — | | | | 43,000 | | | | — | | | | — | | | | 34,676 | | | | — | | | | 34,676 | |
J.P. Morgan Chase Commercial Mortgage Securities Trust, Series 2006-LDP9 AM, 5.372%, 05/15/2047 | | | — | | | | — | | | | 105,150 | | | | — | | | | 105,150 | | | | — | | | | — | | | | 105,217 | | | | — | | | | 105,217 | |
J.P. Morgan Chase Commercial Mortgage Securities Trust, Series 2016-JP2 B, 3.459%, 08/15/2049 | | | — | | | | — | | | | 28,000 | | | | — | | | | 28,000 | | | | — | | | | — | | | | 27,506 | | | | — | | | | 27,506 | |
J.P. Morgan Chase Commercial Mortgage Securities Trust, Series 2007-C1 AM, 6.055%, 02/15/51 (l) | | | — | | | | — | | | | 140,000 | | | | — | | | | 140,000 | | | | — | | | | — | | | | 141,647 | | | | — | | | | 141,647 | |
J.P. Morgan Chase Commercial Mortgage Securities Trust, Series 2007-LD11 AM, 5.753%, 06/15/49 (l) | | | — | | | | — | | | | 91,000 | | | | — | | | | 91,000 | | | | — | | | | — | | | | 91,869 | | | | — | | | | 91,869 | |
J.P. Morgan Chase Commercial Mortgage Securities Trust, Series 2007-LD12 AM, 6.039%, 02/15/51 (l) | | | — | | | | — | | | | 100,000 | | | | — | | | | 100,000 | | | | — | | | | — | | | | 102,119 | | | | — | | | | 102,119 | |
J.P. Morgan Chase Commercial Mortgage Securities Trust, Series 2007-LDPX AM, 5.464%, 01/15/49 (l) | | | — | | | | — | | | | 91,400 | | | | — | | | | 91,400 | | | | — | | | | — | | | | 90,343 | | | | — | | | | 90,343 | |
J.P. Morgan Chase Commercial Mortgage Securities Trust, Series 2015-JP1 XA, 1.151%, 01/15/49 (l) | | | — | | | | — | | | | 993,851 | | | | — | | | | 993,851 | | | | — | | | | — | | | | 59,253 | | | | — | | | | 59,253 | |
J.P. Morgan Chase Commercial Mortgage Securities Trust, Series 2016-JP2 C, 3.796%, 08/15/49 (l) | | | — | | | | — | | | | 22,000 | | | | — | | | | 22,000 | | | | — | | | | — | | | | 20,994 | | | | — | | | | 20,994 | |
J.P. Morgan Chase Commercial Mortgage Securities Trust, Series 2016-JP2 XA, 1.866%, 08/15/49 (l) | | | — | | | | — | | | | 293,354 | | | | — | | | | 293,354 | | | | — | | | | — | | | | 39,028 | | | | — | | | | 39,028 | |
J.P. Morgan Chase Commercial Mortgage Securities Trust, Series 2016-WPT E, 5.704%, 10/15/33 (l)§ | | | — | | | | — | | | | 92,000 | | | | — | | | | 92,000 | | | | — | | | | — | | | | 92,187 | | | | — | | | | 92,187 | |
JPMBB Commercial Mortgage Securities Trust, Series 2014-C21 XA, 1.094%, 08/15/47 (l) | | | — | | | | — | | | | 1,431,346 | | | | — | | | | 1,431,346 | | | | — | | | | — | | | | 85,600 | | | | — | | | | 85,600 | |
JPMBB Commercial Mortgage Securities Trust, Series 2015-C32 C, 4.668%, 11/15/48 (l) | | | — | | | | — | | | | 105,000 | | | | — | | | | 105,000 | | | | — | | | | — | | | | 95,588 | | | | — | | | | 95,588 | |
70
| | | | | | | | | | | | | | | | | | | | | | | | | | | | | | | | | | | | | | | | |
| | | CharterSM
Interest Rate
Strategies | | | CharterSM
Income
Strategies | | | AXA/DoubleLine
Opportunistic
Core Plus Bond | | | Pro-forma
Adjustment | | | AXA/DoubleLine
Opportunistic
Core Plus Bond
Combined
Pro-forma | | | CharterSM
Interest Rate
Strategies | | | CharterSM
Income
Strategies | | | AXA/DoubleLine
Opportunistic
Core Plus Bond | | | Pro-forma
Adjustment | | | AXA/DoubleLine
Opportunistic
Core Plus Bond
Combined
Pro-forma | |
| | | Number of
Shares | | | Number of
Shares | | | Principal
Amount | | | Principal
Amount | | | Principal
Amount | | | Value ($) | | | Value ($) | | | Value ($) | | | Value ($) | | | Value ($) | |
JPMBB Commercial Mortgage Securities Trust, Series 2016-C1 C, 4.905%, 03/15/49 (l) | | | — | | | | — | | | | 66,000 | | | | — | | | | 66,000 | | | | — | | | | — | | | | 65,758 | | | | — | | | | 65,758 | |
JPMDB Commercial Mortgage Securities Trust, Series 2016-C2 XA, 1.713%, 06/15/49 (l) | | | — | | | | — | | | | 997,187 | | | | — | | | | 997,187 | | | | — | | | | — | | | | 101,577 | | | | — | | | | 101,577 | |
LB-UBS Commercial Mortgage Trust, Series 2007-C1 AJ, 5.484%, 02/15/2040 | | | — | | | | — | | | | 65,000 | | | | — | | | | 65,000 | | | | — | | | | — | | | | 65,031 | | | | — | | | | 65,031 | |
LB-UBS Commercial Mortgage Trust, Series 2007-C2 AM, 5.493%, 02/15/40 (l) | | | — | | | | — | | | | 59,000 | | | | — | | | | 59,000 | | | | — | | | | — | | | | 59,403 | | | | — | | | | 59,403 | |
LSTAR Commercial Mortgage Trust, Series 2016-4 C, 4.549%, 03/10/49 (l)§ | | | — | | | | — | | | | 72,000 | | | | — | | | | 72,000 | | | | — | | | | — | | | | 66,182 | | | | — | | | | 66,182 | |
ML-CFC Commercial Mortgage Trust, Series 2007-5 AM, 5.419%, 08/12/2048 | | | — | | | | — | | | | 72,191 | | | | — | | | | 72,191 | | | | — | | | | — | | | | 72,190 | | | | — | | | | 72,190 | |
Morgan Stanley Bank of America Merrill Lynch Trust, Series 2014-C19 C, 4.000%, 12/15/2047 | | | — | | | | — | | | | 125,000 | | | | — | | | | 125,000 | | | | — | | | | — | | | | 111,931 | | | | — | | | | 111,931 | |
Morgan Stanley Bank of America Merrill Lynch Trust, Series 2015-C20 C, 4.462%, 02/15/48 (l) | | | — | | | | — | | | | 125,000 | | | | — | | | | 125,000 | | | | — | | | | — | | | | 116,110 | | | | — | | | | 116,110 | |
Morgan Stanley Bank of America Merrill Lynch Trust, Series 2015-C26 D, 3.060%, 10/15/48 | | | — | | | | — | | | | 100,000 | | | | — | | | | 100,000 | | | | — | | | | — | | | | 69,302 | | | | — | | | | 69,302 | |
Morgan Stanley Bank of America Merrill Lynch Trust, Series 2016-C32 A4, 3.720%, 12/15/2049 | | | — | | | | — | | | | 76,000 | | | | — | | | | 76,000 | | | | — | | | | — | | | | 77,783 | | | | — | | | | 77,783 | |
Morgan Stanley Capital I Trust, Series 2007-HQ11 AJ, 5.508%, 02/12/44 (l) | | | — | | | | — | | | | 64,000 | | | | — | | | | 64,000 | | | | — | | | | — | | | | 64,000 | | | | — | | | | 64,000 | |
Morgan Stanley Capital I Trust, Series 2015-UBS8 XA, 0.975%, 12/15/48 (l) | | | — | | | | — | | | | 1,091,250 | | | | — | | | | 1,091,250 | | | | — | | | | — | | | | 68,859 | | | | — | | | | 68,859 | |
Morgan Stanley Capital I Trust, Series 2015-XLF2 AFSC, 3.704%, 08/15/26 (l) | | | — | | | | — | | | | 65,000 | | | | — | | | | 65,000 | | | | — | | | | — | | | | 64,918 | | | | — | | | | 64,918 | |
Morgan Stanley Capital I Trust, Series 2016-UB11 XA, 1.683%, 08/15/49 (l) | | | — | | | | — | | | | 994,868 | | | | — | | | | 994,868 | | | | — | | | | — | | | | 104,969 | | | | — | | | | 104,969 | |
MSCG Trust, Series 2016-SNR C, 5.205%, 11/15/34 | | | — | | | | — | | | | 92,000 | | | | — | | | | 92,000 | | | | — | | | | — | | | | 91,940 | | | | — | | | | 91,940 | |
SG Commercial Mortgage Securities Trust, Series 2016-C5 XA, 2.032%, 10/10/48 (l) | | | — | | | | — | | | | 643,683 | | | | — | | | | 643,683 | | | | — | | | | — | | | | 80,813 | | | | — | | | | 80,813 | |
Wells Fargo Commercial Mortgage Trust, Series 2014-LC16 D, 3.938%, 08/15/50 | | | — | | | | — | | | | 150,000 | | | | — | | | | 150,000 | | | | — | | | | — | | | | 114,790 | | | | — | | | | 114,790 | |
Wells Fargo Commercial Mortgage Trust, Series 2015-C28 C, 4.136%, 05/15/48 (l) | | | — | | | | — | | | | 140,000 | | | | — | | | | 140,000 | | | | — | | | | — | | | | 125,887 | | | | — | | | | 125,887 | |
Wells Fargo Commercial Mortgage Trust, Series 2015-C31 C, 4.611%, 11/15/48 (l) | | | — | | | | — | | | | 105,000 | | | | — | | | | 105,000 | | | | — | | | | — | | | | 104,477 | | | | — | | | | 104,477 | |
Wells Fargo Commercial Mortgage Trust, Series 2015-C31 XA, 1.112%, 11/15/48 (l) | | | — | | | | — | | | | 1,239,718 | | | | — | | | | 1,239,718 | | | | — | | | | — | | | | 86,491 | | | | — | | | | 86,491 | |
Wells Fargo Commercial Mortgage Trust, Series 2015-LC22 C, 4.540%, 09/15/58 (l) | | | — | | | | — | | | | 50,000 | | | | — | | | | 50,000 | | | | — | | | | — | | | | 49,553 | | | | — | | | | 49,553 | |
Wells Fargo Commercial Mortgage Trust, Series 2015-P2 A4, 3.809%, 12/15/2048 | | | — | | | | — | | | | 66,000 | | | | — | | | | 66,000 | | | | — | | | | — | | | | 68,919 | | | | — | | | | 68,919 | |
71
| | | | | | | | | | | | | | | | | | | | | | | | | | | | | | | | | | | | | | | | |
| | | CharterSM
Interest Rate
Strategies | | | CharterSM
Income
Strategies | | | AXA/DoubleLine
Opportunistic
Core Plus Bond | | | Pro-forma
Adjustment | | | AXA/DoubleLine
Opportunistic
Core Plus Bond
Combined
Pro-forma | | | CharterSM
Interest Rate
Strategies | | | CharterSM
Income
Strategies | | | AXA/DoubleLine
Opportunistic
Core Plus Bond | | | Pro-forma
Adjustment | | | AXA/DoubleLine
Opportunistic
Core Plus Bond
Combined
Pro-forma | |
| | | Number of
Shares | | | Number of
Shares | | | Principal
Amount | | | Principal
Amount | | | Principal
Amount | | | Value ($) | | | Value ($) | | | Value ($) | | | Value ($) | | | Value ($) | |
Wells Fargo Commercial Mortgage Trust, Series 2015-P2 XA, 1.029%, 12/15/48 (l) | | | — | | | | — | | | | 995,305 | | | | — | | | | 995,305 | | | | — | | | | — | | | | 62,503 | | | | — | | | | 62,503 | |
Wells Fargo Commercial Mortgage Trust, Series 2016-C32 C, 4.721%, 01/15/59 (l) | | | — | | | | — | | | | 51,000 | | | | — | | | | 51,000 | | | | — | | | | — | | | | 47,666 | | | | — | | | | 47,666 | |
Wells Fargo Commercial Mortgage Trust, Series 2016-NXS6 XA, 1.663%, 11/15/49 (l) | | | — | | | | — | | | | 998,576 | | | | — | | | | 998,576 | | | | — | | | | — | | | | 105,815 | | | | — | | | | 105,815 | |
WFRBS Commercial Mortgage Trust, Series 2014-C21 XA, 1.157%, 08/15/47 (l) | | | — | | | | — | | | | 2,925,034 | | | | — | | | | 2,925,034 | | | | — | | | | — | | | | 173,852 | | | | — | | | | 173,852 | |
| | | | | | | | | | | | | | | | | | | | | | | | | | | | | | | | | | | | | | | | |
Total Commercial Mortgage-Backed Securities | | | | | | | | | | | | | | | | | | | | | | | — | | | | — | | | | 5,728,643 | | | | — | | | | 5,728,643 | |
| | | | | | | | | | | | | | | | | | | | | | | | | | | | | | | | | | | | | | | | |
Convertible Bond (0.0%) | | | | | | | | | | | | | | | | | | | | | | | | | | | | | | | | | | | | | | | | |
SandRidge Energy, Inc | | | — | | | | — | | | | 1,130 | | | | — | | | | 1,130 | | | | — | | | | — | | | | 1,408 | | | | — | | | | 1,408 | |
| | | | | | | | | | | | | | | | | | | | | | | | | | | | | | | | | | | | | | | | |
Total Convertible Bond | | | | | | | | | | | | | | | | | | | | | | | — | | | | — | | | | 1,408 | | | | — | | | | 1,408 | |
| | | | | | | | | | | | | | | | | | | | | | | | | | | | | | | | | | | | | | | | |
Corporate Bonds (20.9%) | | | | | | | | | | | | | | | | | | | | | | | | | | | | | | | | | | | | | | | | |
Consumer Discretionary (1.5%) | |
Auto Components (0.2%) | | | | | | | | | | | | | | | | | | | | | | | | | | | | | | | | | | | | | | | | |
Allison Transmission, Inc., 5.000%, 10/01/24§ | | | — | | | | — | | | | 10,000 | | | | — | | | | 10,000 | | | | — | | | | — | | | | 10,125 | | | | — | | | | 10,125 | |
American Axle & Manufacturing, Inc., 6.625%, 10/15/2022 | | | — | | | | — | | | | 25,000 | | | | — | | | | 25,000 | | | | — | | | | — | | | | 25,733 | | | | — | | | | 25,733 | |
Dana, Inc., 5.500%, 12/15/2024 | | | — | | | | — | | | | 15,000 | | | | — | | | | 15,000 | | | | — | | | | — | | | | 15,375 | | | | — | | | | 15,375 | |
Delphi Automotive plc, 4.250%, 01/15/2026 | | | — | | | | — | | | | 8,000 | | | | — | | | | 8,000 | | | | — | | | | — | | | | 8,278 | | | | — | | | | 8,278 | |
Delphi Corp., 4.150%, 03/15/2024 | | | — | | | | — | | | | 60,000 | | | | — | | | | 60,000 | | | | — | | | | — | | | | 62,040 | | | | — | | | | 62,040 | |
Goodyear Tire & Rubber Co. (The), 5.125%, 11/15/2023 | | | — | | | | — | | | | 25,000 | | | | — | | | | 25,000 | | | | — | | | | — | | | | 25,750 | | | | — | | | | 25,750 | |
| | | | | | | | | | | | | | | | | | | | | | | | | | | | | | | | | | | | | | | | |
| | | | | | | | | | | | | | | | | | | | | | | | | | | | | | | 147,301 | | | | | | | | 147,301 | |
| | | | | | | | | | | | | | | | | | | | | | | | | | | | | | | | | | | | | | | | |
Automobiles (0.1%) | | | | | | | | | | | | | | | | | | | | | | | | | | | | | | | | | | | | | | | | |
Ford Motor Co., 7.450%, 07/16/2031 | | | — | | | | — | | | | 65,000 | | | | — | | | | 65,000 | | | | — | | | | — | | | | 81,268 | | | | — | | | | 81,268 | |
| | | | | | | | | | | | | | | | | | | | | | | | | | | | | | | | | | | | | | | | |
Diversified Consumer Services (0.0%) | | | | | | | | | | | | | | | | | | | | | | | | | | | | | | | | | | | | | | | | |
ServiceMaster Co. LLC (The), 5.125%, 11/15/24 | | | — | | | | — | | | | 10,000 | | | | — | | | | 10,000 | | | | — | | | | — | | | | 10,175 | | | | — | | | | 10,175 | |
| | | | | | | | | | | | | | | | | | | | | | | | | | | | | | | | | | | | | | | | |
Hotels, Restaurants & Leisure (0.2%) | | | | | | | | | | | | | | | | | | | | | | | | | | | | | | | | | | | | | | | | |
ESH Hospitality, Inc., 5.250%, 05/01/25 | | | — | | | | — | | | | 25,000 | | | | — | | | | 25,000 | | | | — | | | | — | | | | 24,875 | | | | — | | | | 24,875 | |
GLP Capital LP, 5.375%, 04/15/2026 | | | — | | | | — | | | | 10,000 | | | | — | | | | 10,000 | | | | — | | | | — | | | | 10,410 | | | | — | | | | 10,410 | |
Hilton Domestic Operating Co., Inc., 4.250%, 09/01/24 | | | — | | | | — | | | | 20,000 | | | | — | | | | 20,000 | | | | — | | | | — | | | | 19,400 | | | | — | | | | 19,400 | |
Jack Ohio Finance LLC, 6.750%, 11/15/21 | | | — | | | | — | | | | 20,000 | | | | — | | | | 20,000 | | | | — | | | | — | | | | 20,250 | | | | — | | | | 20,250 | |
MGM Resorts International, 4.625%, 09/01/2026 | | | — | | | | — | | | | 15,000 | | | | — | | | | 15,000 | | | | — | | | | — | | | | 14,475 | | | | — | | | | 14,475 | |
NCL Corp. Ltd., (b)
4.750%, 12/15/21 | | | — | | | | — | | | | 20,000 | | | | — | | | | 20,000 | | | | — | | | | — | | | | 19,988 | | | | — | | | | 19,988 | |
Pinnacle Entertainment, Inc. 5.625%, 5/1/24§ | | | — | | | | — | | | | 20,000 | | | | — | | | | 20,000 | | | | — | | | | — | | | | 20,026 | | | | — | | | | 20,026 | |
Sabre GLBL, Inc., 5.250%, 11/15/23 | | | — | | | | — | | | | 15,000 | | | | — | | | | 15,000 | | | | — | | | | — | | | | 15,403 | | | | — | | | | 15,403 | |
Scientific Games International, Inc., 7.000%, 01/01/22 | | | — | | | | — | | | | 10,000 | | | | — | | | | 10,000 | | | | — | | | | — | | | | 10,725 | | | | — | | | | 10,725 | |
Station Casinos LLC, 7.500%, 03/01/2021 | | | — | | | | — | | | | 15,000 | | | | — | | | | 15,000 | | | | — | | | | — | | | | 15,712 | | | | — | | | | 15,712 | |
Viking Cruises Ltd., 8.500%, 10/15/22 | | | — | | | | — | | | | 25,000 | | | | — | | | | 25,000 | | | | — | | | | — | | | | 25,938 | | | | — | | | | 25,938 | |
| | | | | | | | | | | | | | | | | | | | | | | | | | | | | | | | | | | | | | | | |
| | | | | | | | | | | | | | | | | | | | | | | | | | | | | | | 197,202 | | | | | | | | 197,202 | |
| | | | | | | | | | | | | | | | | | | | | | | | | | | | | | | | | | | | | | | | |
Household Durables (0.0%) | | | | | | | | | | | | | | | | | | | | | | | | | | | | | | | | | | | | | | | | |
Newell Brands, Inc., 3.150%, 04/01/2021 | | | — | | | | — | | | | 15,000 | | | | — | | | | 15,000 | | | | — | | | | — | | | | 15,219 | | | | — | | | | 15,219 | |
| | | | | | | | | | | | | | | | | | | | | | | | | | | | | | | | | | | | | | | | |
Internet & Direct Marketing Retail (0.0%) | | | | | | | | | | | | | | | | | | | | | | | | | | | | | | | | | | | | | | | | |
Amazon.com, Inc., 3.800%, 12/05/2024 | | | — | | | | — | | | | 30,000 | | | | — | | | | 30,000 | | | | — | | | | — | | | | 31,448 | | | | — | | | | 31,448 | |
| | | | | | | | | | | | | | | | | | | | | | | | | | | | | | | | | | | | | | | | |
72
| | | | | | | | | | | | | | | | | | | | | | | | | | | | | | | | | | | | | | | | |
| | | CharterSM
Interest Rate
Strategies | | | CharterSM
Income
Strategies | | | AXA/DoubleLine
Opportunistic
Core Plus
Bond | | | Pro-forma
Adjustment | | | AXA/DoubleLine
Opportunistic
Core Plus Bond
Combined
Pro-forma | | | CharterSM
Interest Rate
Strategies | | | CharterSM
Income
Strategies | | | AXA/DoubleLine
Opportunistic
Core Plus
Bond | | | Pro-forma
Adjustment | | | AXA/
DoubleLine
Opportunistic
Core Plus Bond
Combined
Pro-forma | |
| | | Number of
Shares | | | Number of
Shares | | | Principal
Amount | | | Principal
Amount | | | Principal
Amount | | | Value ($) | | | Value ($) | | | Value ($) | | | Value ($) | | | Value ($) | |
Media (0.7%) | | | | | | | | | | | | | | | | | | | | | | | | | | | | | | | | | | | | | | | | |
AMC Entertainment Holdings, Inc., 5.875%, 11/15/26 | | | — | | | | — | | | | 10,000 | | | | — | | | | 10,000 | | | | — | | | | — | | | | 10,225 | | | | — | | | | 10,225 | |
Cengage Learning, Inc., 9.500%, 06/15/24 | | | — | | | | — | | | | 15,000 | | | | — | | | | 15,000 | | | | — | | | | — | | | | 13,275 | | | | — | | | | 13,275 | |
Cequel Communications Holdings I LLC, 6.375%, 09/15/2020 | | | — | | | | — | | | | 25,000 | | | | — | | | | 25,000 | | | | — | | | | — | | | | 25,719 | | | | — | | | | 25,719 | |
Comcast Corp., 4.200%, 08/15/2034 | | | — | | | | — | | | | 15,000 | | | | — | | | | 15,000 | | | | — | | | | — | | | | 15,329 | | | | — | | | | 15,329 | |
Comcast Corp., 4.400%, 08/15/2035 | | | — | | | | — | | | | 50,000 | | | | — | | | | 50,000 | | | | — | | | | — | | | | 52,442 | | | | — | | | | 52,442 | |
CSC Holdings LLC, 5.250%, 06/01/2024 | | | — | | | | — | | | | 10,000 | | | | — | | | | 10,000 | | | | — | | | | — | | | | 9,725 | | | | — | | | | 9,725 | |
CSC Holdings LLC, 5.500%, 04/15/27 (b)§ | | | — | | | | — | | | | 10,000 | | | | — | | | | 10,000 | | | | — | | | | — | | | | 10,125 | | | | — | | | | 10,125 | |
Globo Comunicacao e Participacoes S.A., 5.307%, 05/11/22 (e)(m) | | | — | | | | — | | | | 200,000 | | | | — | | | | 200,000 | | | | — | | | | — | | | | 199,000 | | | | — | | | | 199,000 | |
Gray Television, Inc., 5.875%, 07/15/26 (b)§ | | | — | | | | — | | | | 15,000 | | | | — | | | | 15,000 | | | | — | | | | — | | | | 14,887 | | | | — | | | | 14,887 | |
Gray Television, Inc., 5.125%, 10/15/24 | | | — | | | | — | | | | 10,000 | | | | — | | | | 10,000 | | | | — | | | | — | | | | 9,725 | | | | — | | | | 9,725 | |
Live Nation Entertainment, Inc., 4.875%, 11/01/24 | | | — | | | | — | | | | 20,000 | | | | — | | | | 20,000 | | | | — | | | | — | | | | 20,000 | | | | — | | | | 20,000 | |
Nexstar Escrow Corp., 5.625%, 08/01/24 | | | — | | | | — | | | | 15,000 | | | | — | | | | 15,000 | | | | — | | | | — | | | | 14,850 | | | | — | | | | 14,850 | |
Omnicom Group, Inc., 3.600%, 04/15/2026 | | | — | | | | — | | | | 70,000 | | | | — | | | | 70,000 | | | | — | | | | — | | | | 69,299 | | | | — | | | | 69,299 | |
Sinclair Television Group, Inc., 5.625%, 08/01/24 | | | — | | | | — | | | | 25,000 | | | | — | | | | 25,000 | | | | — | | | | — | | | | 25,500 | | | | — | | | | 25,500 | |
Sirius XM Radio, Inc., 5.375%, 07/15/26 | | | — | | | | — | | | | 25,000 | | | | — | | | | 25,000 | | | | — | | | | — | | | | 24,438 | | | | — | | | | 24,438 | |
TEGNA, Inc., 4.875%, 09/15/21 | | | — | | | | — | | | | 25,000 | | | | — | | | | 25,000 | | | | — | | | | — | | | | 25,500 | | | | — | | | | 25,500 | |
WMG Acquisition Corp., 6.750%, 04/15/22 | | | — | | | | — | | | | 20,000 | | | | — | | | | 20,000 | | | | — | | | | — | | | | 21,075 | | | | — | | | | 21,075 | |
| | | | | | | | | | | | | | | | | | | | | | | | | | | | | | | | | | | | | | | | |
| | | | | | | | | | | | | | | | | | | | | | | | | | | | | | | 561,114 | | | | | | | | 561,114 | |
| | | | | | | | | | | | | | | | | | | | | | | | | | | | | | | | | | | | | | | | |
Multiline Retail (0.0%) | | | | | | | | | | | | | | | | | | | | | | | | | | | | | | | | | | | | | | | | |
Dollar Tree, Inc., 5.750%, 03/01/2023 | | | — | | | | — | | | | 10,000 | | | | — | | | | 10,000 | | | | — | | | | — | | | | 10,575 | | | | — | | | | 10,575 | |
| | | | | | | | | | | | | | | | | | | | | | | | | | | | | | | | | | | | | | | | |
Specialty Retail (0.2%) | | | | | | | | | | | | | | | | | | | | | | | | | | | | | | | | | | | | | | | | |
Asbury Automotive Group, Inc., 6.000%, 12/15/2024 | | | — | | | | — | | | | 15,000 | | | | — | | | | 15,000 | | | | — | | | | — | | | | 15,337 | | | | — | | | | 15,337 | |
Home Depot, Inc. (The), 3.350%, 09/15/2025 | | | — | | | | — | | | | 36,000 | | | | — | | | | 36,000 | | | | — | | | | — | | | | 36,871 | | | | — | | | | 36,871 | |
Home Depot, Inc. (The), 3.000%, 04/01/2026 | | | — | | | | — | | | | 30,000 | | | | — | | | | 30,000 | | | | — | | | | — | | | | 29,870 | | | | — | | | | 29,870 | |
PetSmart, Inc., 7.125%, 03/15/23 | | | — | | | | — | | | | 20,000 | | | | — | | | | 20,000 | | | | — | | | | — | | | | 20,400 | | | | — | | | | 20,400 | |
Sally Holdings LLC, 5.750%, 06/01/2022 | | | — | | | | — | | | | 25,000 | | | | — | | | | 25,000 | | | | — | | | | — | | | | 25,969 | | | | — | | | | 25,969 | |
| | | | | | | | | | | | | | | | | | | | | | | | | | | | | | | | | | | | | | | | |
| | | | | | | | | | | | | | | | | | | | | | | | | | | | | | | 128,447 | | | | | | | | 128,447 | |
| | | | | | | | | | | | | | | | | | | | | | | | | | | | | | | | | | | | | | | | |
Textiles, Apparel & Luxury Goods (0.0%) | | | | | | | | | | | | | | | | | | | | | | | | | | | | | | | | | | | | | | | | |
Levi Strauss & Co., 5.000%, 05/01/2025 | | | — | | | | — | | | | 15,000 | | | | — | | | | 15,000 | | | | — | | | | — | | | | 15,000 | | | | — | | | | 15,000 | |
| | | | | | | | | | | | | | | | | | | | | | | | | | | | | | | | | | | | | | | | |
Total Consumer Discretionary | | | | | | | | | | | | | | | | | | | | | | | — | | | | — | | | | 1,197,749 | | | | — | | | | 1,197,749 | |
| | | | | | | | | | | | | | | | | | | | | | | | | | | | | | | | | | | | | | | | |
Consumer Staples (1.9%) | | | | | | | | | | | | | | | | | | | | | | | | | | | | | | | | | | | | | | | | |
Beverages (0.5%) | | | | | | | | | | | | | | | | | | | | | | | | | | | | | | | | | | | | | | | | |
Anheuser-Busch InBev Finance, Inc., 4.900%, 02/01/2046 | | | — | | | | — | | | | 30,000 | | | | — | | | | 30,000 | | | | — | | | | — | | | | 32,485 | | | | — | | | | 32,485 | |
Central American Bottling Corp., 6.750%, 02/09/22 (m) | | | — | | | | — | | | | 200,000 | | | | — | | | | 200,000 | | | | — | | | | — | | | | 204,000 | | | | — | | | | 204,000 | |
Coca-Cola Co. (The), 1.875%, 10/27/2020 | | | — | | | | — | | | | 15,000 | | | | — | | | | 15,000 | | | | — | | | | — | | | | 14,879 | | | | — | | | | 14,879 | |
Coca-Cola Co. (The), 1.550%, 09/01/2021 | | | — | | | | — | | | | 60,000 | | | | — | | | | 60,000 | | | | — | | | | — | | | | 58,153 | | | | — | | | | 58,153 | |
PepsiCo, Inc., 3.450%, 10/06/2046 | | | — | | | | — | | | | 80,000 | | | | — | | | | 80,000 | | | | — | | | | — | | | | 72,352 | | | | — | | | | 72,352 | |
| | | | | | | | | | | | | | | | | | | | | | | | | | | | | | | | | | | | | | | | |
| | | | | | | | | | | | | | | | | | | | | | | | | | | | | | | 381,869 | | | | | | | | 381,869 | |
| | | | | | | | | | | | | | | | | | | | | | | | | | | | | | | | | | | | | | | | |
73
| | | | | | | | | | | | | | | | | | | | | | | | | | | | | | | | | | | | | | | | |
| | | CharterSM
Interest Rate
Strategies | | | CharterSM
Income
Strategies | | | AXA/DoubleLine
Opportunistic
Core Plus Bond | | | Pro-forma
Adjustment | | | AXA/DoubleLine
Opportunistic
Core Plus Bond
Combined
Pro-forma | | | CharterSM
Interest Rate
Strategies | | | CharterSM
Income
Strategies | | | AXA/DoubleLine
Opportunistic
Core Plus Bond | | | Pro-forma
Adjustment | | | AXA/DoubleLine
Opportunistic
Core Plus Bond
Combined
Pro-forma | |
| | | Number of
Shares | | | Number of
Shares | | | Principal
Amount | | | Principal
Amount | | | Principal
Amount | | | Value ($) | | | Value ($) | | | Value ($) | | | Value ($) | | | Value ($) | |
Food & Staples Retailing (0.5%) | | | | | | | | | | | | | | | | | | | | | | | | | | | | | | | | | | | | | | | | |
Albertsons Cos. LLC, 5.750%, 03/15/25 | | | — | | | | — | | | | 15,000 | | | | — | | | | 15,000 | | | | — | | | | — | | | | 14,887 | | | | — | | | | 14,887 | |
Cencosud SA, 5.150%, 02/12/25 (m) | | | — | | | | — | | | | 200,000 | | | | — | | | | 200,000 | | | | — | | | | — | | | | 201,250 | | | | — | | | | 201,250 | |
CVS Health Corp., 2.875%, 06/01/2026 | | | — | | | | — | | | | 40,000 | | | | — | | | | 40,000 | | | | — | | | | — | | | | 38,071 | | | | — | | | | 38,071 | |
Kroger Co. (The), 3.400%, 04/15/2022 | | | — | | | | — | | | | 85,000 | | | | — | | | | 85,000 | | | | — | | | | — | | | | 86,837 | | | | — | | | | 86,837 | |
Rite Aid Corp., 6.125%, 04/01/23 | | | — | | | | — | | | | 20,000 | | | | — | | | | 20,000 | | | | — | | | | — | | | | 21,500 | | | | — | | | | 21,500 | |
| | | | | | | | | | | | | | | | | | | | | | | | | | | | | | | | | | | | | | | | |
| | | | | | | | | | | | | | | | | | | | | | | | | | | | | | | 362,545 | | | | | | | | 362,545 | |
| | | | | | | | | | | | | | | | | | | | | | | | | | | | | | | | | | | | | | | | |
Food Products (0.8%) | | | | | | | | | | | | | | | | | | | | | | | | | | | | | | | | | | | | | | | | |
JBS USA LUX SA, 5.750%, 06/15/25 | | | — | | | | — | | | | 15,000 | | | | — | | | | 15,000 | | | | — | | | | — | | | | 15,277 | | | | — | | | | 15,277 | |
Kraft Heinz Foods Co., 1.600%, 06/30/2017 | | | — | | | | — | | | | 35,000 | | | | — | | | | 35,000 | | | | — | | | | — | | | | 35,011 | | | | — | | | | 35,011 | |
Kraft Heinz Foods Co., 2.000%, 07/02/2018 | | | — | | | | — | | | | 40,000 | | | | — | | | | 40,000 | | | | — | | | | — | | | | 39,999 | | | | — | | | | 39,999 | |
Marfrig Holdings Europe BV, 8.000%, 06/08/23 | | | — | | | | — | | | | 200,000 | | | | — | | | | 200,000 | | | | — | | | | — | | | | 206,000 | | | | — | | | | 206,000 | |
Minerva Luxembourg S.A., 8.750%, 04/03/19
(l)(m)(y) | | | — | | | | — | | | | 200,000 | | | | — | | | | 200,000 | | | | — | | | | — | | | | 205,250 | | | | — | | | | 205,250 | |
Pilgrim’s Pride Corp., 5.750%, 03/15/25 | | | — | | | | — | | | | 25,000 | | | | — | | | | 25,000 | | | | — | | | | — | | | | 25,000 | | | | — | | | | 25,000 | |
TreeHouse Foods, Inc., 6.000%, 02/15/24 | | | — | | | | — | | | | 10,000 | | | | — | | | | 10,000 | | | | — | | | | — | | | | 10,475 | | | | — | | | | 10,475 | |
Tyson Foods, Inc., 3.950%, 08/15/2024 | | | — | | | | — | | | | 135,000 | | | | — | | | | 135,000 | | | | — | | | | — | | | | 138,235 | | | | — | | | | 138,235 | |
| | | | | | | | | | | | | | | | | | | | | | | | | | | | | | | | | | | | | | | | |
| | | | | | | | | | | | | | | | | | | | | | | | | | | | | | | 675,247 | | | | | | | | 675,247 | |
| | | | | | | | | | | | | | | | | | | | | | | | | | | | | | | | | | | | | | | | |
Household Products (0.0%) | | | | | | | | | | | | | | | | | | | | | | | | | | | | | | | | | | | | | | | | |
Kronos Acquisition Holdings, Inc., 9.000%, 08/15/23 (b)§ | | | — | | | | — | | | | 10,000 | | | | — | | | | 10,000 | | | | — | | | | — | | | | 10,000 | | | | — | | | | 10,000 | |
Spectrum Brands, Inc., 5.750%, 07/15/2025 | | | — | | | | — | | | | 25,000 | | | | — | | | | 25,000 | | | | — | | | | — | | | | 25,875 | | | | — | | | | 25,875 | |
| | | | | | | | | | | | | | | | | | | | | | | | | | | | | | | | | | | | | | | | |
| | | | | | | | | | | | | | | | | | | | | | | | | | | | | | | 35,875 | | | | | | | | 35,875 | |
| | | | | | | | | | | | | | | | | | | | | | | | | | | | | | | | | | | | | | | | |
Personal Products (0.0%) | | | | | | | | | | | | | | | | | | | | | | | | | | | | | | | | | | | | | | | | |
Revlon Consumer Products Corp., 5.750%, 02/15/2021 | | | — | | | | — | | | | 15,000 | | | | — | | | | 15,000 | | | | — | | | | — | | | | 15,113 | | | | — | | | | 15,113 | |
Revlon Consumer Products Corp., 6.250%, 08/01/2024 | | | — | | | | — | | | | 5,000 | | | | — | | | | 5,000 | | | | — | | | | — | | | | 5,150 | | | | — | | | | 5,150 | |
| | | | | | | | | | | | | | | | | | | | | | | | | | | | | | | | | | | | | | | | |
| | | | | | | | | | | | | | | | | | | | | | | | | | | | | | | 20,263 | | | | | | | | 20,263 | |
| | | | | | | | | | | | | | | | | | | | | | | | | | | | | | | | | | | | | | | | |
Tobacco (0.1%) | | | | | | | | | | | | | | | | | | | | | | | | | | | | | | | | | | | | | | | | |
Reynolds American, Inc., 4.000%, 06/12/2022 | | | — | | | | — | | | | 65,000 | | | | — | | | | 65,000 | | | | — | | | | — | | | | 67,732 | | | | — | | | | 67,732 | |
| | | | | | | | | | | | | | | | | | | | | | | | | | | | | | | | | | | | | | | | |
Total Consumer Staples | | | | | | | | | | | | | | | | | | | | | | | — | | | | — | | | | 1,543,531 | | | | — | | | | 1,543,531 | |
| | | | | | | | | | | | | | | | | | | | | | | | | | | | | | | | | | | | | | | | |
Energy (2.3%) | | | | | | | | | | | | | | | | | | | | | | | | | | | | | | | | | | | | | | | | |
Energy Equipment & Services (0.0%) | | | | | | | | | | | | | | | | | | | | | | | | | | | | | | | | | | | | | | | | |
Schlumberger Holdings Corp., 2.350%, 12/21/18 | | | — | | | | — | | | | 35,000 | | | | — | | | | 35,000 | | | | — | | | | — | | | | 35,299 | | | | — | | | | 35,299 | |
| | | | | | | | | | | | | | | | | | | | | | | | | | | | | | | | | | | | | | | | |
Oil, Gas & Consumable Fuels (2.2%) | | | | | | | | | | | | | | | | | | | | | | | | | | | | | | | | | | | | | | | | |
Apache Corp., 4.750%, 04/15/2043 | | | — | | | | — | | | | 40,000 | | | | — | | | | 40,000 | | | | — | | | | — | | | | 40,818 | | | | — | | | | 40,818 | |
BP Capital Markets plc, 3.017%, 01/16/2027 | | | — | | | | — | | | | 25,000 | | | | — | | | | 25,000 | | | | — | | | | — | | | | 24,138 | | | | — | | | | 24,138 | |
BP Capital Markets plc, 3.723%, 11/28/2028 | | | — | | | | — | | | | 45,000 | | | | — | | | | 45,000 | | | | — | | | | — | | | | 45,415 | | | | — | | | | 45,415 | |
Chevron Corp., 1.790%, 11/16/2018 | | | — | | | | — | | | | 23,000 | | | | — | | | | 23,000 | | | | — | | | | — | | | | 23,056 | | | | — | | | | 23,056 | |
Chevron Corp., 1.561%, 05/16/2019 | | | — | | | | — | | | | 45,000 | | | | — | | | | 45,000 | | | | — | | | | — | | | | 44,790 | | | | — | | | | 44,790 | |
Cosan Overseas Ltd., 8.250%, 02/05/17 (m)(y) | | | — | | | | — | | | | 300,000 | | | | — | | | | 300,000 | | | | — | | | | — | | | | 298,277 | | | | — | | | | 298,277 | |
Delek & Avner Tamar Bond Ltd., 4.435%, 12/30/20 | | | — | | | | — | | | | 200,000 | | | | — | | | | 200,000 | | | | — | | | | — | | | | 203,000 | | | | — | | | | 203,000 | |
Energy Transfer Equity LP, 5.500%, 06/01/2027 | | | — | | | | — | | | | 15,000 | | | | — | | | | 15,000 | | | | — | | | | — | | | | 14,625 | | | | — | | | | 14,625 | |
74
| | | | | | | | | | | | | | | | | | | | | | | | | | | | | | | | | | | | | | | | |
| | | CharterSM
Interest Rate
Strategies | | | CharterSM
Income
Strategies | | | AXA/DoubleLine
Opportunistic
Core Plus Bond | | | Pro-forma
Adjustment | | | AXA/DoubleLine
Opportunistic
Core Plus Bond
Combined
Pro-forma | | | CharterSM
Interest Rate
Strategies | | | CharterSM
Income
Strategies | | | AXA/DoubleLine
Opportunistic
Core Plus Bond | | | Pro-forma
Adjustment | | | AXA/DoubleLine
Opportunistic
Core Plus Bond
Combined
Pro-forma | |
| | | Number of
Shares | | | Number of
Shares | | | Principal
Amount | | | Principal
Amount | | | Principal
Amount | | | Value ($) | | | Value ($) | | | Value ($) | | | Value ($) | | | Value ($) | |
Energy Transfer Partners LP, 4.750%, 01/15/2026 | | | — | | | | — | | | | 65,000 | | | | — | | | | 65,000 | | | | — | | | | — | | | | 67,002 | | | | — | | | | 67,002 | |
EOG Resources, Inc., 4.150%, 01/15/2026 | | | — | | | | — | | | | 40,000 | | | | — | | | | 40,000 | | | | — | | | | — | | | | 42,021 | | | | — | | | | 42,021 | |
Extraction Oil & Gas Holdings LLC, 7.875%, 07/15/21 | | | — | | | | — | | | | 10,000 | | | | — | | | | 10,000 | | | | — | | | | — | | | | 10,619 | | | | — | | | | 10,619 | |
Kinder Morgan Energy Partners LP, 6.950%, 01/15/2038 | | | — | | | | — | | | | 50,000 | | | | — | | | | 50,000 | | | | — | | | | — | | | | 57,976 | | | | — | | | | 57,976 | |
Memorial Production Partners LP, 6.875%, 08/01/2022 | | | — | | | | — | | | | 35,000 | | | | — | | | | 35,000 | | | | — | | | | — | | | | 16,625 | | | | — | | | | 16,625 | |
National Gas Co. of Trinidad & Tobago Ltd., 6.050%, 01/15/36 (m) | | | — | | | | — | | | | 100,000 | | | | — | | | | 100,000 | | | | — | | | | — | | | | 102,750 | | | | — | | | | 102,750 | |
NGL Energy Partners LP, 7.500%, 11/01/23§ | | | — | | | | — | | | | 10,000 | | | | — | | | | 10,000 | | | | — | | | | — | | | | 10,325 | | | | — | | | | 10,325 | |
Noble Holding International Ltd., 7.750%, 01/15/2024 | | | — | | | | — | | | | 5,000 | | | | — | | | | 5,000 | | | | — | | | | — | | | | 4,703 | | | | — | | | | 4,703 | |
Occidental Petroleum Corp., 3.400%, 04/15/2026 | | | — | | | | — | | | | 15,000 | | | | — | | | | 15,000 | | | | — | | | | — | | | | 15,075 | | | | — | | | | 15,075 | |
ONGC Videsh Vankorneft Pte. Ltd., 3.750%, 07/27/26 (m) | | | — | | | | — | | | | 250,000 | | | | — | | | | 250,000 | | | | — | | | | — | | | | 238,048 | | | | — | | | | 238,048 | |
PDC Energy, Inc., 6.125%, 09/15/24§ | | | — | | | | — | | | | 5,000 | | | | — | | | | 5,000 | | | | — | | | | — | | | | 5,112 | | | | — | | | | 5,112 | |
Phillips 66, 5.875%, 05/01/2042 | | | — | | | | — | | | | 19,000 | | | | — | | | | 19,000 | | | | — | | | | — | | | | 22,491 | | | | — | | | | 22,491 | |
Phillips 66, 4.875%, 11/15/2044 | | | — | | | | — | | | | 10,000 | | | | — | | | | 10,000 | | | | — | | | | — | | | | 10,425 | | | | — | | | | 10,425 | |
Reliance Holding USA, Inc., 5.400%, 02/14/22 (m) | | | — | | | | — | | | | 250,000 | | | | — | | | | 250,000 | | | | — | | | | — | | | | 269,512 | | | | — | | | | 269,512 | |
Sanchez Energy Corp., 6.125%, 01/15/2023 | | | — | | | | — | | | | 10,000 | | | | — | | | | 10,000 | | | | — | | | | — | | | | 9,500 | | | | — | | | | 9,500 | |
SandRidge Energy, Inc., 8.750%, 06/01/20†(h) | | | — | | | | — | | | | 5,000 | | | | — | | | | 5,000 | | | | — | | | | — | | | | — | | | | — | | | | — | |
Sinopec Group Overseas Development 2016 Ltd., 2.000%, 09/29/21§ | | | — | | | | — | | | | 200,000 | | | | — | | | | 200,000 | | | | — | | | | — | | | | 190,185 | | | | — | | | | 190,185 | |
Targa Resources Partners LP, 5.375%, 02/01/27 (b)§ | | | — | | | | — | | | | 10,000 | | | | — | | | | 10,000 | | | | — | | | | — | | | | 9,900 | | | | — | | | | 9,900 | |
Williams Partners LP, 4.875%, 03/15/2024 | | | — | | | | — | | | | 20,000 | | | | — | | | | 20,000 | | | | — | | | | — | | | | 20,073 | | | | — | | | | 20,073 | |
| | | | | | | | | | | | | | | | | | | | | | | | | | | | | | | | | | | | | | | | |
| | | | | | | | | | | | | | | | | | | | | | | | | | | | | | | 1,796,461 | | | | | | | | 1,796,461 | |
| | | | | | | | | | | | | | | | | | | | | | | | | | | | | | | | | | | | | | | | |
Total Energy | | | | | | | | | | | | | | | | | | | | | | | — | | | | — | | | | 1,831,760 | | | | — | | | | 1,831,760 | |
| | | | | | | | | | | | | | | | | | | | | | | | | | | | | | | | | | | | | | | | |
Financials (6.9%) | | | | | | | | | | | | | | | | | | | | | | | | | | | | | | | | | | | | | | | | |
Banks (5.1%) | | | | | | | | | | | | | | | | | | | | | | | | | | | | | | | | | | | | | | | | |
Agromercantil Senior Trust, 6.250%, 04/10/19 (m) | | | — | | | | — | | | | 200,000 | | | | — | | | | 200,000 | | | | — | | | | — | | | | 205,250 | | | | — | | | | 205,250 | |
Australia & New Zealand Banking Group Ltd./New York, 4.875%, 01/12/21§ | | | — | | | | — | | | | 100,000 | | | | — | | | | 100,000 | | | | — | | | | — | | | | 108,356 | | | | — | | | | 108,356 | |
Banco de Credito del Peru, 2.250%, 10/25/19§ | | | — | | | | — | | | | 200,000 | | | | — | | | | 200,000 | | | | — | | | | — | | | | 197,250 | | | | — | | | | 197,250 | |
Banco de Reservas de la Republica Dominicana, 7.000%, 02/01/23§ | | | — | | | | — | | | | 200,000 | | | | — | | | | 200,000 | | | | — | | | | — | | | | 200,327 | | | | — | | | | 200,327 | |
Banco GNB Sudameris S.A., 7.500%, 07/30/22 (m) | | | — | | | | — | | | | 200,000 | | | | — | | | | 200,000 | | | | — | | | | — | | | | 209,000 | | | | — | | | | 209,000 | |
Banco Nacional de Costa Rica, 4.875%, 11/01/18 (m) | | | — | | | | — | | | | 200,000 | | | | — | | | | 200,000 | | | | — | | | | — | | | | 201,250 | | | | — | | | | 201,250 | |
Banco Santander Mexico SA Institucion de Banca Multiple Grupo Financiero Santand, 4.125%, 11/09/22 (m) | | | — | | | | — | | | | 200,000 | | | | — | | | | 200,000 | | | | — | | | | — | | | | 200,000 | | | | — | | | | 200,000 | |
Bank of America Corp., 2.000%, 01/11/2018 | | | — | | | | — | | | | 55,000 | | | | — | | | | 55,000 | | | | — | | | | — | | | | 55,113 | | | | — | | | | 55,113 | |
Bank of America Corp., 2.503%, 10/21/2022 | | | — | | | | — | | | | 55,000 | | | | — | | | | 55,000 | | | | — | | | | — | | | | 53,038 | | | | — | | | | 53,038 | |
Bank of Montreal, 1.900%, 08/27/2021 | | | — | | | | — | | | | 70,000 | | | | — | | | | 70,000 | | | | — | | | | — | | | | 67,795 | | | | — | | | | 67,795 | |
BB&T Corp., 2.450%, 01/15/2020 | | | — | | | | — | | | | 60,000 | | | | — | | | | 60,000 | | | | — | | | | — | | | | 60,357 | | | | — | | | | 60,357 | |
BB&T Corp., 2.050%, 05/10/2021 | | | — | | | | — | | | | 55,000 | | | | — | | | | 55,000 | | | | — | | | | — | | | | 53,928 | | | | — | | | | 53,928 | |
Citigroup, Inc., 2.700%, 03/30/2021 | | | — | | | | — | | | | 105,000 | | | | — | | | | 105,000 | | | | — | | | | — | | | | 104,373 | | | | — | | | | 104,373 | |
Corp. Group Banking SA, 6.750%, 03/15/23 (m) | | | — | | | | — | | | | 250,000 | | | | — | | | | 250,000 | | | | — | | | | — | | | | 237,188 | | | | — | | | | 237,188 | |
75
| | | | | | | | | | | | | | | | | | | | | | | | | | | | | | | | | | | | | | | | |
| | | CharterSM
Interest Rate
Strategies | | | CharterSM
Income
Strategies | | | AXA/DoubleLine
Opportunistic
Core Plus Bond | | | Pro-forma
Adjustment | | | AXA/DoubleLine
Opportunistic
Core Plus Bond
Combined
Pro-forma | | | CharterSM
Interest Rate
Strategies | | | CharterSM
Income
Strategies | | | AXA/DoubleLine
Opportunistic
Core Plus Bond | | | Pro-forma
Adjustment | | | AXA/DoubleLine
Opportunistic
Core Plus Bond
Combined
Pro-forma | |
| | | Number of
Shares | | | Number of
Shares | | | Principal
Amount | | | Principal
Amount | | | Principal
Amount | | | Value ($) | | | Value ($) | | | Value ($) | | | Value ($) | | | Value ($) | |
Global Bank Corp., 5.125%, 10/30/19 (m) | | | — | | | | — | | | | 200,000 | | | | — | | | | 200,000 | | | | — | | | | — | | | | 203,859 | | | | — | | | | 203,859 | |
Grupo Aval Ltd., 4.750%, 09/26/22 (m) | | | — | | | | — | | | | 200,000 | | | | — | | | | 200,000 | | | | — | | | | — | | | | 195,500 | | | | — | | | | 195,500 | |
Grupo Elektra SAB de CV, 7.250%, 08/06/18 (m) | | | — | | | | — | | | | 91,000 | | | | — | | | | 91,000 | | | | — | | | | — | | | | 91,114 | | | | — | | | | 91,114 | |
Industrial Senior Trust, 5.500%, 11/01/22 (m) | | | — | | | | — | | | | 200,000 | | | | — | | | | 200,000 | | | | — | | | | — | | | | 192,355 | | | | — | | | | 192,355 | |
JPMorgan Chase & Co., 4.250%, 10/01/2027 | | | — | | | | — | | | | 65,000 | | | | — | | | | 65,000 | | | | — | | | | — | | | | 66,750 | | | | — | | | | 66,750 | |
JPMorgan Chase & Co., 2.972%, 01/15/2023 | | | — | | | | — | | | | 70,000 | | | | — | | | | 70,000 | | | | — | | | | — | | | | 69,711 | | | | — | | | | 69,711 | |
Malayan Banking Bhd., 3.250%, 09/20/22 (l)(m) | | | — | | | | — | | | | 200,000 | | | | — | | | | 200,000 | | | | — | | | | — | | | | 200,850 | | | | — | | | | 200,850 | |
MUFG Americas Holdings Corp., 1.625%, 02/09/2018 | | | — | | | | — | | | | 60,000 | | | | — | | | | 60,000 | | | | — | | | | — | | | | 59,734 | | | | — | | | | 59,734 | |
MUFG Americas Holdings Corp., 2.250%, 02/10/2020 | | | — | | | | — | | | | 10,000 | | | | — | | | | 10,000 | | | | — | | | | — | | | | 10,005 | | | | — | | | | 10,005 | |
Oversea-Chinese Banking Corp., Ltd., 4.000%, 10/15/24 (l)(m) | | | — | | | | — | | | | 200,000 | | | | — | | | | 200,000 | | | | — | | | | — | | | | 205,250 | | | | — | | | | 205,250 | |
PNC Financial Services Group, Inc. (The), 3.300%, 03/08/2022 | | | — | | | | — | | | | 65,000 | | | | — | | | | 65,000 | | | | — | | | | — | | | | 66,907 | | | | — | | | | 66,907 | |
Royal Bank of Canada, 2.500%, 01/19/2021 | | | — | | | | — | | | | 15,000 | | | | — | | | | 15,000 | | | | — | | | | — | | | | 15,010 | | | | — | | | | 15,010 | |
Sumitomo Mitsui Financial Group, Inc., 2.934%, 03/09/2021 | | | — | | | | — | | | | 65,000 | | | | — | | | | 65,000 | | | | — | | | | — | | | | 65,377 | | | | — | | | | 65,377 | |
Sumitomo Mitsui Financial Group, Inc., 2.058%, 07/14/2021 | | | — | | | | — | | | | 50,000 | | | | — | | | | 50,000 | | | | — | | | | — | | | | 48,319 | | | | — | | | | 48,319 | |
Toronto-Dominion Bank (The), 1.800%, 07/13/2021 | | | — | | | | — | | | | 105,000 | | | | — | | | | 105,000 | | | | — | | | | — | | | | 101,590 | | | | — | | | | 101,590 | |
United Overseas Bank Ltd., 3.750%, 09/19/24 (l)(m) | | | — | | | | — | | | | 200,000 | | | | — | | | | 200,000 | | | | — | | | | — | | | | 203,820 | | | | — | | | | 203,820 | |
Wells Fargo & Co., 3.000%, 04/22/2026 | | | — | | | | — | | | | 55,000 | | | | — | | | | 55,000 | | | | — | | | | — | | | | 52,487 | | | | — | | | | 52,487 | |
Wells Fargo & Co., 3.000%, 10/23/2026 | | | — | | | | — | | | | 50,000 | | | | — | | | | 50,000 | | | | — | | | | — | | | | 47,473 | | | | — | | | | 47,473 | |
Wells Fargo & Co., 3.550%, 09/29/2025 | | | — | | | | — | | | | 35,000 | | | | — | | | | 35,000 | | | | — | | | | — | | | | 34,914 | | | | — | | | | 34,914 | |
Westpac Banking Corp., 2.600%, 11/23/2020 | | | — | | | | — | | | | 60,000 | | | | — | | | | 60,000 | | | | — | | | | — | | | | 60,192 | | | | — | | | | 60,192 | |
Westpac Banking Corp., 2.000%, 08/19/2021 | | | — | | | | — | | | | 10,000 | | | | — | | | | 10,000 | | | | — | | | | — | | | | 9,692 | | | | — | | | | 9,692 | |
| | | | | | | | | | | | | | | | | | | | | | | | | | | | | | | | | | | | | | | | |
| | | | | | | | | | | | | | | | | | | | | | | | | | | | | | | 3,954,134 | | | | | | | | 3,954,134 | |
| | | | | | | | | | | | | | | | | | | | | | | | | | | | | | | | | | | | | | | | |
Capital Markets (0.7%) | | | | | | | | | | | | | | | | | | | | | | | | | | | | | | | | | | | | | | | | |
Goldman Sachs Group, Inc. (The), 2.350%, 11/15/2021 | | | — | | | | — | | | | 80,000 | | | | — | | | | 80,000 | | | | — | | | | — | | | | 77,358 | | | | — | | | | 77,358 | |
Israel Electric Corp. Ltd., 5.000%, 11/12/24 (m) | | | — | | | | — | | | | 200,000 | | | | — | | | | 200,000 | | | | — | | | | — | | | | 207,500 | | | | — | | | | 207,500 | |
Morgan Stanley, 3.875%, 01/27/2026 | | | — | | | | — | | | | 40,000 | | | | — | | | | 40,000 | | | | — | | | | — | | | | 40,491 | | | | — | | | | 40,491 | |
Morgan Stanley, 2.500%, 04/21/2021 | | | — | | | | — | | | | 25,000 | | | | — | | | | 25,000 | | | | — | | | | — | | | | 24,684 | | | | — | | | | 24,684 | |
Morgan Stanley, 2.625%, 11/17/2021 | | | — | | | | — | | | | 45,000 | | | | — | | | | 45,000 | | | | — | | | | — | | | | 44,279 | | | | — | | | | 44,279 | |
Morgan Stanley, 3.125%, 07/27/2026 | | | — | | | | — | | | | 30,000 | | | | — | | | | 30,000 | | | | — | | | | — | | | | 28,603 | | | | — | | | | 28,603 | |
S&P Global, Inc., 4.400%, 02/15/2026 | | | — | | | | — | | | | 30,000 | | | | — | | | | 30,000 | | | | — | | | | — | | | | 31,758 | | | | — | | | | 31,758 | |
State Street Corp., 3.550%, 08/18/2025 | | | — | | | | — | | | | 45,000 | | | | — | | | | 45,000 | | | | — | | | | — | | | | 45,985 | | | | — | | | | 45,985 | |
State Street Corp., 2.650%, 05/19/2026 | | | — | | | | — | | | | 25,000 | | | | — | | | | 25,000 | | | | — | | | | — | | | | 23,669 | | | | — | | | | 23,669 | |
| | | | | | | | | | | | | | | | | | | | | | | | | | | | | | | | | | | | | | | | |
| | | | | | | | | | | | | | | | | | | | | | | | | | | | | | | 524,327 | | | | | | | | 524,327 | |
| | | | | | | | | | | | | | | | | | | | | | | | | | | | | | | | | | | | | | | | |
Consumer Finance (0.5%) | | | | | | | | | | | | | | | | | | | | | | | | | | | | | | | | | | | | | | | | |
Ally Financial, Inc., 4.125%, 03/30/2020 | | | — | | | | — | | | | 75,000 | | | | — | | | | 75,000 | | | | — | | | | — | | | | 75,563 | | | | — | | | | 75,563 | |
American Express Credit Corp., 2.250%, 08/15/2019 | | | — | | | | — | | | | 35,000 | | | | — | | | | 35,000 | | | | — | | | | — | | | | 35,236 | | | | — | | | | 35,236 | |
American Express Credit Corp., 2.250%, 05/05/2021 | | | — | | | | — | | | | 105,000 | | | | — | | | | 105,000 | | | | — | | | | — | | | | 103,718 | | | | — | | | | 103,718 | |
76
| | | | | | | | | | | | | | | | | | | | | | | | | | | | | | | | | | | | | | | | |
| | | CharterSM
Interest Rate
Strategies | | | CharterSM
Income
Strategies | | | AXA/DoubleLine
Opportunistic
Core Plus Bond | | | Pro-forma
Adjustment | | | AXA/DoubleLine
Opportunistic
Core Plus Bond
Combined
Pro-forma | | | CharterSM
Interest Rate
Strategies | | | CharterSM
Income
Strategies | | | AXA/DoubleLine
Opportunistic
Core Plus Bond | | | Pro-forma
Adjustment | | | AXA/DoubleLine
Opportunistic
Core Plus Bond
Combined
Pro-forma | |
| | | Number of
Shares | | | Number of
Shares | | | Principal
Amount | | | Principal
Amount | | | Principal
Amount | | | Value ($) | | | Value ($) | | | Value ($) | | | Value ($) | | | Value ($) | |
General Motors Financial Co., Inc., 3.200%, 07/13/2020 | | | — | | | | — | | | | 30,000 | | | | — | | | | 30,000 | | | | — | | | | — | | | | 30,036 | | | | — | | | | 30,036 | |
General Motors Financial Co., Inc., 2.400%, 05/09/2019 | | | — | | | | — | | | | 55,000 | | | | — | | | | 55,000 | | | | — | | | | — | | | | 54,742 | | | | — | | | | 54,742 | |
General Motors Financial Co., Inc., 3.200%, 07/06/2021 | | | — | | | | — | | | | 20,000 | | | | — | | | | 20,000 | | | | — | | | | — | | | | 19,684 | | | | — | | | | 19,684 | |
Synchrony Financial, 3.000%, 08/15/2019 | | | — | | | | — | | | | 65,000 | | | | — | | | | 65,000 | | | | — | | | | — | | | | 65,600 | | | | — | | | | 65,600 | |
| | | | | | | | | | | | | | | | | | | | | | | | | | | | | | | | | | | | | | | | |
| | | | | | | | | | | | | | | | | | | | | | | | | | | | | | | 384,579 | | | | | | | | 384,579 | |
| | | | | | | | | | | | | | | | | | | | | | | | | | | | | | | | | | | | | | | | |
Diversified Financial Services (0.4%) | | | | | | | | | | | | | | | | | | | | | | | | | | | | | | | | | | | | | | | | |
Guanay Finance Ltd., 6.000%, 12/15/20 (m) | | | — | | | | — | | | | 205,771 | | | | — | | | | 205,771 | | | | — | | | | — | | | | 206,903 | | | | — | | | | 206,903 | |
National Rural Utilities Cooperative Finance Corp., 2.000%, 01/27/2020 | | | — | | | | — | | | | 55,000 | | | | — | | | | 55,000 | | | | — | | | | — | | | | 54,715 | | | | — | | | | 54,715 | |
Nationstar Mortgage LLC, 6.500%, 07/01/2021 | | | — | | | | — | | | | 10,000 | | | | — | | | | 10,000 | | | | — | | | | — | | | | 10,125 | | | | — | | | | 10,125 | |
Shell International Finance BV, 1.375%, 05/10/2019 | | | — | | | | — | | | | 70,000 | | | | — | | | | 70,000 | | | | — | | | | — | | | | 69,131 | | | | — | | | | 69,131 | |
| | | | | | | | | | | | | | | | | | | | | | | | | | | | | | | | | | | | | | | | |
| | | | | | | | | | | | | | | | | | | | | | | | | | | | | | | 340,874 | | | | | | | | 340,874 | |
| | | | | | | | | | | | | | | | | | | | | | | | | | | | | | | | | | | | | | | | |
Insurance (0.2%) | | | | | | | | | | | | | | | | | | | | | | | | | | | | | | | | | | | | | | | | |
Liberty Mutual Group, Inc., 6.500%, 05/01/2042 | | | — | | | | — | | | | 80,000 | | | | — | | | | 80,000 | | | | — | | | | — | | | | 94,233 | | | | — | | | | 94,233 | |
TIAA Asset Management Finance Co. LLC, 2.950%, 11/01/2019 | | | — | | | | — | | | | 70,000 | | | | — | | | | 70,000 | | | | — | | | | — | | | | 71,034 | | | | — | | | | 71,034 | |
| | | | | | | | | | | | | | | | | | | | | | | | | | | | | | | | | | | | | | | | |
| | | | | | | | | | | | | | | | | | | | | | | | | | | | | | | 165,267 | | | | | | | | 165,267 | |
| | | | | | | | | | | | | | | | | | | | | | | | | | | | | | | | | | | | | | | | |
Total Financials | | | | | | | | | | | | | | | | | | | | | | | — | | | | — | | | | 5,369,181 | | | | — | | | | 5,369,181 | |
| | | | | | | | | | | | | | | | | | | | | | | | | | | | | | | | | | | | | | | | |
Health Care (1.8%) | | | | | | | | | | | | | | | | | | | | | | | | | | | | | | | | | | | | | | | | |
Biotechnology (0.1%) | | | | | | | | | | | | | | | | | | | | | | | | | | | | | | | | | | | | | | | | |
AbbVie, Inc., 4.700%, 05/14/2045 | | | — | | | | — | | | | 76,000 | | | | — | | | | 76,000 | | | | — | | | | — | | | | 74,543 | | | | — | | | | 74,543 | |
Celgene Corp., 3.875%, 08/15/2025 | | | — | | | | — | | | | 35,000 | | | | — | | | | 35,000 | | | | — | | | | — | | | | 35,513 | | | | — | | | | 35,513 | |
| | | | | | | | | | | | | | | | | | | | | | | | | | | | | | | | | | | | | | | | |
| | | | | | | | | | | | | | | | | | | | | | | | | | | | | | | 110,056 | | | | | | | | 110,056 | |
| | | | | | | | | | | | | | | | | | | | | | | | | | | | | | | | | | | | | | | | |
Health Care Equipment & Supplies (0.1%) | | | | | | | | | | | | | | | | | | | | | | | | | | | | | | | | | | | | | | | | |
Zimmer Biomet Holdings, Inc., 1.450%, 04/01/2017 | | | — | | | | — | | | | 55,000 | | | | — | | | | 55,000 | | | | — | | | | — | | | | 54,994 | | | | — | | | | 54,994 | |
Zimmer Biomet Holdings, Inc., 2.700%, 04/01/2020 | | | — | | | | — | | | | 15,000 | | | | — | | | | 15,000 | | | | — | | | | — | | | | 14,963 | | | | — | | | | 14,963 | |
| | | | | | | | | | | | | | | | | | | | | | | | | | | | | | | | | | | | | | | | |
| | | | | | | | | | | | | | | | | | | | | | | | | | | | | | | 69,957 | | | | | | | | 69,957 | |
| | | | | | | | | | | | | | | | | | | | | | | | | | | | | | | | | | | | | | | | |
Health Care Providers & Services (0.8%) | | | | | | | | | | | | | | | | | | | | | | | | | | | | | | | | | | | | | | | | |
Acadia Healthcare Co., Inc., 5.625%, 02/15/2023 | | | — | | | | — | | | | 20,000 | | | | — | | | | 20,000 | | | | — | | | | — | | | | 20,000 | | | | — | | | | 20,000 | |
Air Medical Group Holdings, Inc., 6.375%, 05/15/23§ | | | — | | | | — | | | | 30,000 | | | | — | | | | 30,000 | | | | — | | | | — | | | | 28,800 | | | | — | | | | 28,800 | |
Anthem, Inc., 2.300%, 07/15/2018 | | | — | | | | — | | | | 70,000 | | | | — | | | | 70,000 | | | | — | | | | — | | | | 70,347 | | | | — | | | | 70,347 | |
Cardinal Health, Inc., 1.950%, 06/15/2018 | | | — | | | | — | | | | 70,000 | | | | — | | | | 70,000 | | | | — | | | | — | | | | 70,111 | | | | — | | | | 70,111 | |
Centene Corp., 5.625%, 02/15/2021 | | | — | | | | — | | | | 10,000 | | | | — | | | | 10,000 | | | | — | | | | — | | | | 10,514 | | | | — | | | | 10,514 | |
Centene Corp., 4.750%, 01/15/2025 | | | — | | | | — | | | | 20,000 | | | | — | | | | 20,000 | | | | — | | | | — | | | | 19,525 | | | | — | | | | 19,525 | |
DJO Finco, Inc., 8.125%, 06/15/21§ | | | — | | | | — | | | | 5,000 | | | | — | | | | 5,000 | | | | — | | | | — | | | | 4,337 | | | | — | | | | 4,337 | |
Envision Healthcare Corp., 6.250%, 12/01/24§ | | | — | | | | — | | | | 25,000 | | | | — | | | | 25,000 | | | | — | | | | — | | | | 26,437 | | | | — | | | | 26,437 | |
Express Scripts Holding Co., 4.500%, 02/25/2026 | | | — | | | | — | | | | 30,000 | | | | — | | | | 30,000 | | | | — | | | | — | | | | 30,877 | | | | — | | | | 30,877 | |
Express Scripts Holding Co., 3.400%, 03/01/2027 | | | — | | | | — | | | | 25,000 | | | | — | | | | 25,000 | | | | — | | | | — | | | | 23,218 | | | | — | | | | 23,218 | |
HCA, Inc., 5.875%, 02/15/2026 (x) | | | — | | | | — | | | | 10,000 | | | | — | | | | 10,000 | | | | — | | | | — | | | | 10,310 | | | | — | | | | 10,310 | |
Laboratory Corp. of America Holdings, 2.500%, 11/01/2018 | | | — | | | | — | | | | 70,000 | | | | — | | | | 70,000 | | | | — | | | | — | | | | 70,695 | | | | — | | | | 70,695 | |
Laboratory Corp. of America Holdings, 4.700%, 02/01/2045 | | | — | | | | — | | | | 70,000 | | | | — | | | | 70,000 | | | | — | | | | — | | | | 69,492 | | | | — | | | | 69,492 | |
LifePoint Health, Inc., 5.375%, 05/01/24§ | | | — | | | | — | | | | 10,000 | | | | — | | | | 10,000 | | | | — | | | | — | | | | 9,770 | | | | �� | | | | 9,770 | |
77
| | | | | | | | | | | | | | | | | | | | | | | | | | | | | | | | | | | | | | | | |
| | | CharterSM
Interest Rate
Strategies | | | CharterSM
Income
Strategies | | | AXA/DoubleLine
Opportunistic
Core Plus Bond | | | Pro-forma
Adjustment | | | AXA/DoubleLine
Opportunistic
Core Plus Bond
Combined
Pro-forma | | | CharterSM
Interest Rate
Strategies | | | CharterSM
Income
Strategies | | | AXA/DoubleLine
Opportunistic
Core Plus Bond | | | Pro-forma
Adjustment | | | AXA/DoubleLine
Opportunistic
Core Plus Bond
Combined
Pro-forma | |
| | | Number of
Shares | | | Number of
Shares | | | Principal
Amount | | | Principal
Amount | | | Principal
Amount | | | Value ($) | | | Value ($) | | | Value ($) | | | Value ($) | | | Value ($) | |
MPH Acquisition Holdings LLC, 7.125%, 06/01/24§ | | | — | | | | — | | | | 30,000 | | | | — | | | | 30,000 | | | | — | | | | — | | | | 31,578 | | | | — | | | | 31,578 | |
RegionalCare Hospital Partners Holdings, Inc., 8.250%, 05/01/23§ | | | — | | | | — | | | | 10,000 | | | | — | | | | 10,000 | | | | — | | | | — | | | | 9,957 | | | | — | | | | 9,957 | |
Select Medical Corp., 6.375%, 06/01/2021 (x) | | | — | | | | — | | | | 30,000 | | | | — | | | | 30,000 | | | | — | | | | — | | | | 30,000 | | | | — | | | | 30,000 | |
Team Health, Inc., 7.250%, 12/15/23§ | | | — | | | | — | | | | 10,000 | | | | — | | | | 10,000 | | | | — | | | | — | | | | 11,375 | | | | — | | | | 11,375 | |
Tenet Healthcare Corp., 6.750%, 06/15/2023 | | | — | | | | — | | | | 30,000 | | | | — | | | | 30,000 | | | | — | | | | — | | | | 26,475 | | | | — | | | | 26,475 | |
UnitedHealth Group, Inc., 4.200%, 01/15/2047 | | | — | | | | — | | | | 70,000 | | | | — | | | | 70,000 | | | | — | | | | — | | | | 70,658 | | | | — | | | | 70,658 | |
Vizient, Inc., 10.375%, 03/01/2024 | | | — | | | | — | | | | 15,000 | | | | — | | | | 15,000 | | | | — | | | | — | | | | 16,988 | | | | — | | | | 16,988 | |
| | | | | | | | | | | | | | | | | | | | | | | | | | | | | | | | | | | | | | | | |
| | | | | | | | | | | | | | | | | | | | | | | | | | | | | | | 661,464 | | | | | | | | 661,464 | |
| | | | | | | | | | | | | | | | | | | | | | | | | | | | | | | | | | | | | | | | |
Health Care Technology (0.0%) | | | | | | | | | | | | | | | | | | | | | | | | | | | | | | | | | | | | | | | | |
Quintiles IMS, Inc., 4.875%, 05/15/23§ | | | — | | | | — | | | | 15,000 | | | | — | | | | 15,000 | | | | — | | | | — | | | | 15,201 | | | | — | | | | 15,201 | |
| | | | | | | | | | | | | | | | | | | | | | | | | | | | | | | | | | | | | | | | |
Life Sciences Tools & Services (0.1%) | | | | | | | | | | | | | | | | | | | | | | | | | | | | | | | | | | | | | | | | |
Thermo Fisher Scientific, Inc., 3.300%, 02/15/2022 | | | — | | | | — | | | | 100,000 | | | | — | | | | 100,000 | | | | — | | | | — | | | | 100,815 | | | | — | | | | 100,815 | |
| | | | | | | | | | | | | | | | | | | | | | | | | | | | | | | | | | | | | | | | |
Pharmaceuticals (0.6%) | | | | | | | | | | | | | | | | | | | | | | | | | | | | | | | | | | | | | | | | |
Actavis Funding SCS, 2.350%, 03/12/2018 | | | — | | | | — | | | | 69,000 | | | | — | | | | 69,000 | | | | — | | | | — | | | | 69,323 | | | | — | | | | 69,323 | |
AstraZeneca plc, 2.375%, 11/16/2020 | | | — | | | | — | | | | 80,000 | | | | — | | | | 80,000 | | | | — | | | | — | | | | 80,344 | | | | — | | | | 80,344 | |
Eli Lilly & Co., 3.700%, 03/01/2045 | | | — | | | | — | | | | 50,000 | | | | — | | | | 50,000 | | | | — | | | | — | | | | 47,155 | | | | — | | | | 47,155 | |
Endo Finance LLC, 5.875%, 01/15/23§ | | | — | | | | — | | | | 20,000 | | | | — | | | | 20,000 | | | | — | | | | — | | | | 16,950 | | | | — | | | | 16,950 | |
inVentiv Group Holdings, Inc., 7.500%, 10/01/24§ | | | — | | | | — | | | | 15,000 | | | | — | | | | 15,000 | | | | — | | | | — | | | | 15,778 | | | | — | | | | 15,778 | |
Mylan NV, 3.150%, 06/15/21§ | | | — | | | | — | | | | 70,000 | | | | — | | | | 70,000 | | | | — | | | | — | | | | 69,239 | | | | — | | | | 69,239 | |
Shire Acquisitions Investments Ireland DAC, 2.875%, 09/23/2023 | | | — | | | | — | | | | 75,000 | | | | — | | | | 75,000 | | | | — | | | | — | | | | 71,157 | | | | — | | | | 71,157 | |
Teva Pharmaceutical Finance Co. BV, 2.950%, 12/18/2022 | | | — | | | | — | | | | 65,000 | | | | — | | | | 65,000 | | | | — | | | | — | | | | 62,562 | | | | — | | | | 62,562 | |
Teva Pharmaceutical Finance Netherlands III BV, 2.800%, 07/21/2023 | | | — | | | | — | | | | 25,000 | | | | — | | | | 25,000 | | | | — | | | | — | | | | 23,463 | | | | — | | | | 23,463 | |
| | | | | | | | | | | | | | | | | | | | | | | | | | | | | | | | | | | | | | | | |
| | | | | | | | | | | | | | | | | | | | | | | | | | | | | | | 455,971 | | | | | | | | 455,971 | |
| | | | | | | | | | | | | | | | | | | | | | | | | | | | | | | | | | | | | | | | |
Total Health Care | | | | | | | | | | | | | | | | | | | | | | | — | | | | — | | | | 1,413,464 | | | | — | | | | 1,413,464 | |
| | | | | | | | | | | | | | | | | | | | | | | | | | | | | | | | | | | | | | | | |
Industrials (1.9%) | | | | | | | | | | | | | | | | | | | | | | | | | | | | | | | | | | | | | | | | |
Aerospace & Defense (0.2%) | | | | | | | | | | | | | | | | | | | | | | | | | | | | | | | | | | | | | | | | |
Boeing Co. (The), 6.875%, 03/15/2039 | | | — | | | | — | | | | 40,000 | | | | — | | | | 40,000 | | | | — | | | | — | | | | 56,259 | | | | — | | | | 56,259 | |
Lockheed Martin Corp., 4.700%, 05/15/2046 | | | — | | | | — | | | | 60,000 | | | | — | | | | 60,000 | | | | — | | | | — | | | | 65,615 | | | | — | | | | 65,615 | |
TransDigm, Inc., 6.000%, 07/15/2022 | | | — | | | | — | | | | 25,000 | | | | — | | | | 25,000 | | | | — | | | | — | | | | 26,000 | | | | — | | | | 26,000 | |
| | | | | | | | | | | | | | | | | | | | | | | | | | | | | | | | | | | | | | | | |
| | | | | | | | | | | | | | | | | | | | | | | | | | | | | | | 147,874 | | | | | | | | 147,874 | |
| | | | | | | | | | | | | | | | | | | | | | | | | | | | | | | | | | | | | | | | |
Air Freight & Logistics (0.1%) | | | | | | | | | | | | | | | | | | | | | | | | | | | | | | | | | | | | | | | | |
FedEx Corp., 4.750%, 11/15/2045 | | | — | | | | — | | | | 65,000 | | | | — | | | | 65,000 | | | | — | | | | — | | | | 67,240 | | | | — | | | | 67,240 | |
| | | | | | | | | | | | | | | | | | | | | | | | | | | | | | | | | | | | | | | | |
Building Products (0.0%) | | | | | | | | | | | | | | | | | | | | | | | | | | | | | | | | | | | | | | | | |
Builders FirstSource, Inc., 5.625%, 09/01/2024 | | | — | | | | — | | | | 8,000 | | | | — | | | | 8,000 | | | | — | | | | — | | | | 8,040 | | | | — | | | | 8,040 | |
| | | | | | | | | | | | | | | | | | | | | | | | | | | | | | | | | | | | | | | | |
Commercial Services & Supplies (0.1%) | | | | | | | | | | | | | | | | | | | | | | | | | | | | | | | | | | | | | | | | |
Gates Global LLC, 6.000%, 07/15/22§ | | | — | | | | — | | | | 25,000 | | | | — | | | | 25,000 | | | | — | | | | — | | | | 24,437 | | | | — | | | | 24,437 | |
Prime Security Services Borrower LLC, 9.250%, 05/15/23§ | | | — | | | | — | | | | 25,000 | | | | — | | | | 25,000 | | | | — | | | | — | | | | 27,250 | | | | — | | | | 27,250 | |
Waste Management, Inc., 4.100%, 03/01/2045 | | | — | | | | — | | | | 50,000 | | | | — | | | | 50,000 | | | | — | | | | — | | | | 49,320 | | | | — | | | | 49,320 | |
| | | | | | | | | | | | | | | | | | | | | | | | | | | | | | | | | | | | | | | | |
| | | | | | | | | | | | | | | | | | | | | | | | | | | | | | | 101,007 | | | | | | | | 101,007 | |
| | | | | | | | | | | | | | | | | | | | | | | | | | | | | | | | | | | | | | | | |
Construction & Engineering (0.0%) | | | | | | | | | | | | | | | | | | | | | | | | | | | | | | | | | | | | | | | | |
Signode Industrial Group Lux SA, 6.375%, 05/01/22§ | | | — | | | | — | | | | 20,000 | | | | — | | | | 20,000 | | | | — | | | | — | | | | 19,950 | | | | — | | | | 19,950 | |
| | | | | | | | | | | | | | | | | | | | | | | | | | | | | | | | | | | | | | | | |
78
| | | | | | | | | | | | | | | | | | | | | | | | | | | | | | | | | | | | | | | | |
| | | CharterSM
Interest Rate
Strategies | | | CharterSM
Income
Strategies | | | AXA/DoubleLine
Opportunistic
Core Plus Bond | | | Pro-forma
Adjustment | | | AXA/DoubleLine
Opportunistic
Core Plus Bond
Combined
Pro-forma | | | CharterSM
Interest Rate
Strategies | | | CharterSM
Income
Strategies | | | AXA/DoubleLine
Opportunistic
Core Plus Bond | | | Pro-forma
Adjustment | | | AXA/DoubleLine
Opportunistic
Core Plus Bond
Combined
Pro-forma | |
| | | Number of
Shares | | | Number of
Shares | | | Principal
Amount | | | Principal
Amount | | | Principal
Amount | | | Value ($) | | | Value ($) | | | Value ($) | | | Value ($) | | | Value ($) | |
Machinery (0.1%) | | | | | | | | | | | | | | | | | | | | | | | | | | | | | | | | | | | | | | | | |
Grinding Media, Inc., 7.375%,
12/15/23 (b)§ | | | — | | | | — | | | | 10,000 | | | | — | | | | 10,000 | | | | — | | | | — | | | | 10,506 | | | | — | | | | 10,506 | |
Milacron LLC, 7.750%, 02/15/21§ | | | — | | | | — | | | | 35,000 | | | | — | | | | 35,000 | | | | — | | | | — | | | | 35,962 | | | | — | | | | 35,962 | |
Terex Corp., 6.000%, 05/15/2021 | | | — | | | | — | | | | 25,000 | | | | — | | | | 25,000 | | | | — | | | | — | | | | 25,563 | | | | — | | | | 25,563 | |
| | | | | | | | | | | | | | | | | | | | | | | | | | | | | | | | | | | | | | | | |
| | | | | | | | | | | | | | | | | | | | | | | | | | | | | | | 72,031 | | | | | | | | 72,031 | |
| | | | | | | | | | | | | | | | | | | | | | | | | | | | | | | | | | | | | | | | |
Metals & Mining (0.0%) | | | | | | | | | | | | | | | | | | | | | | | | | | | | | | | | | | | | | | | | |
Novelis Corp., 6.250%, 08/15/24§ | | | — | | | | — | | | | 10,000 | | | | — | | | | 10,000 | | | | — | | | | — | | | | 10,600 | | | | — | | | | 10,600 | |
Novelis Corp., 5.875%, 09/30/26§ | | | — | | | | — | | | | 5,000 | | | | — | | | | 5,000 | | | | — | | | | — | | | | 5,050 | | | | — | | | | 5,050 | |
| | | | | | | | | | | | | | | | | | | | | | | | | | | | | | | | | | | | | | | | |
| | | | | | | | | | | | | | | | | | | | | | | | | | | | | | | 15,650 | | | | | | | | 15,650 | |
| | | | | | | | | | | | | | | | | | | | | | | | | | | | | | | | | | | | | | | | |
Road & Rail (0.2%) | | | | | | | | | | | | | | | | | | | | | | | | | | | | | | | | | | | | | | | | |
Burlington Northern Santa Fe LLC, 4.550%, 09/01/2044 | | | — | | | | — | | | | 65,000 | | | | — | | | | 65,000 | | | | — | | | | — | | | | 68,869 | | | | — | | | | 68,869 | |
CSX Corp., 3.800%, 11/01/2046 | | | — | | | | — | | | | 75,000 | | | | — | | | | 75,000 | | | | — | | | | — | | | | 68,935 | | | | — | | | | 68,935 | |
Kenan Advantage Group, Inc. (The), 7.875%, 07/31/23§ | | | — | | | | — | | | | 10,000 | | | | — | | | | 10,000 | | | | — | | | | — | | | | 10,100 | | | | — | | | | 10,100 | |
| | | | | | | | | | | | | | | | | | | | | | | | | | | | | | | | | | | | | | | | |
| | | | | | | | | | | | | | | | | | | | | | | | | | | | | | | 147,904 | | | | | | | | 147,904 | |
| | | | | | | | | | | | | | | | | | | | | | | | | | | | | | | | | | | | | | | | |
Trading Companies & Distributors (0.1%) | | | | | | | | | | | | | | | | | | | | | | | | | | | | | | | | | | | | | | | | |
Air Lease Corp., 3.750%, 02/01/2022 | | | — | | | | — | | | | 65,000 | | | | — | | | | 65,000 | | | | — | | | | — | | | | 66,544 | | | | — | | | | 66,544 | |
| | | | | | | | | | | | | | | | | | | | | | | | | | | | | | | | | | | | | | | | |
Transportation Infrastructure (1.1%) | | | | | | | | | | | | | | | | | | | | | | | | | | | | | | | | | | | | | | | | |
Adani Ports & Special Economic Zone Ltd., 3.500%,
07/29/20 (m) | | | — | | | | — | | | | 200,000 | | | | — | | | | 200,000 | | | | — | | | | — | | | | 198,421 | | | | — | | | | 198,421 | |
Aeropuerto Internacional de Tocumen S.A., 5.750%, 10/09/2023 | | | — | | | | — | | | | 200,000 | | | | — | | | | 200,000 | | | | — | | | | — | | | | 208,850 | | | | — | | | | 208,850 | |
Aeropuertos Dominicanos Siglo XXI S.A., 9.750%, 11/13/19 (m) | | | — | | | | — | | | | 200,000 | | | | — | | | | 200,000 | | | | — | | | | — | | | | 208,250 | | | | — | | | | 208,250 | |
ENA Norte Trust, 4.950%, 04/25/23 (m) | | | — | | | | — | | | | 275,305 | | | | — | | | | 275,305 | | | | — | | | | — | | | | 284,390 | | | | — | | | | 284,390 | |
| | | | | | | | | | | | | | | | | | | | | | | | | | | | | | | | | | | | | | | | |
| | | | | | | | | | | | | | | | | | | | | | | | | | | | | | | 899,911 | | | | | | | | 899,911 | |
| | | | | | | | | | | | | | | | | | | | | | | | | | | | | | | | | | | | | | | | |
Total Industrials | | | | | | | | | | | | | | | | | | | | | | | — | | | | — | | | | 1,546,151 | | | | — | | | | 1,546,151 | |
| | | | | | | | | | | | | | | | | | | | | | | | | | | | | | | | | | | | | | | | |
Information Technology (1.0%) | | | | | | | | | | | | | | | | | | | | | | | | | | | | | | | | | | | | | | | | |
Communications Equipment (0.1%) | | | | | | | | | | | | | | | | | | | | | | | | | | | | | | | | | | | | | | | | |
Cisco Systems, Inc., 1.850%, 09/20/2021 | | | — | | | | — | | | | 75,000 | | | | — | | | | 75,000 | | | | — | | | | — | | | | 73,033 | | | | — | | | | 73,033 | |
CommScope, Inc., 5.000%, 06/15/21§ | | | — | | | | — | | | | 25,000 | | | | — | | | | 25,000 | | | | — | | | | — | | | | 25,750 | | | | — | | | | 25,750 | |
| | | | | | | | | | | | | | | | | | | | | | | | | | | | | | | | | | | | | | | | |
| | | | | | | | | | | | | | | | | | | | | | | | | | | | | | | 98,783 | | | | | | | | 98,783 | |
| | | | | | | | | | | | | | | | | | | | | | | | | | | | | | | | | | | | | | | | |
IT Services (0.2%) | | | | | | | | | | | | | | | | | | | | | | | | | | | | | | | | | | | | | | | | |
Fidelity National Information Services, Inc., 3.625%, 10/15/2020 | | | — | | | | — | | | | 45,000 | | | | — | | | | 45,000 | | | | — | | | | — | | | | 46,524 | | | | — | | | | 46,524 | |
First Data Corp., 5.750%, 01/15/24§ | | | — | | | | — | | | | 15,000 | | | | — | | | | 15,000 | | | | — | | | | — | | | | 15,431 | | | | — | | | | 15,431 | |
First Data Corp., 7.000%, 12/01/23§ | | | — | | | | — | | | | 10,000 | | | | — | | | | 10,000 | | | | — | | | | — | | | | 10,688 | | | | — | | | | 10,688 | |
Xerox Corp., 2.950%, 03/15/2017 | | | — | | | | — | | | | 55,000 | | | | — | | | | 55,000 | | | | — | | | | — | | | | 55,157 | | | | — | | | | 55,157 | |
| | | | | | | | | | | | | | | | | | | | | | | | | | | | | | | | | | | | | | | | |
| | | | | | | | | | | | | | | | | | | | | | | | | | | | | | | 127,800 | | | | | | | | 127,800 | |
| | | | | | | | | | | | | | | | | | | | | | | | | | | | | | | | | | | | | | | | |
Semiconductors & Semiconductor Equipment (0.2%) | | | | | | | | | | | | | | | | | | | | | | | | | | | | | | | | | | | | | | | | |
Analog Devices, Inc., 2.500%, 12/05/2021 | | | — | | | | — | | | | 75,000 | | | | — | | | | 75,000 | | | | — | | | | — | | | | 74,243 | | | | — | | | | 74,243 | |
Intel Corp., 4.100%, 05/19/2046 | | | — | | | | — | | | | 40,000 | | | | — | | | | 40,000 | | | | — | | | | — | | | | 39,444 | | | | — | | | | 39,444 | |
Microsemi Corp., 9.125%, 04/15/23§ | | | — | | | | — | | | | 4,000 | | | | — | | | | 4,000 | | | | — | | | | — | | | | 4,660 | | | | — | | | | 4,660 | |
NXP BV, 4.125%, 06/01/21§ | | | — | | | | — | | | | 20,000 | | | | — | | | | 20,000 | | | | — | | | | — | | | | 20,650 | | | | — | | | | 20,650 | |
| | | | | | | | | | | | | | | | | | | | | | | | | | | | | | | | | | | | | | | | |
| | | | | | | | | | | | | | | | | | | | | | | | | | | | | | | 138,997 | | | | | | | | 138,997 | |
| | | | | | | | | | | | | | | | | | | | | | | | | | | | | | | | | | | | | | | | |
Software (0.4%) | | | | | | | | | | | | | | | | | | | | | | | | | | | | | | | | | | | | | | | | |
Genesys Telecommunications Laboratories, Inc., 10.000%, 11/30/24§ | | | — | | | | — | | | | 20,000 | | | | — | | | | 20,000 | | | | — | | | | — | | | | 21,188 | | | | — | | | | 21,188 | |
Infor U.S., Inc., 6.500%, 05/15/2022 | | | — | | | | — | | | | 20,000 | | | | — | | | | 20,000 | | | | — | | | | — | | | | 20,850 | | | | — | | | | 20,850 | |
Microsoft Corp., 4.450%, 11/03/2045 | | | — | | | | — | | | | 70,000 | | | | — | | | | 70,000 | | | | — | | | | — | | | | 74,432 | | | | — | | | | 74,432 | |
Open Text Corp., 5.875%, 06/01/26§ | | | — | | | | — | | | | 15,000 | | | | — | | | | 15,000 | | | | — | | | | — | | | | 15,788 | | | | — | | | | 15,788 | |
79
| | | | | | | | | | | | | | | | | | | | | | | | | | | | | | | | | | | | | | | | |
| | | CharterSM
Interest Rate
Strategies | | | CharterSM
Income
Strategies | | | AXA/DoubleLine
Opportunistic
Core Plus Bond | | | Pro-forma
Adjustment | | | AXA/DoubleLine
Opportunistic
Core Plus Bond
Combined
Pro-forma | | | CharterSM
Interest Rate
Strategies | | | CharterSM
Income
Strategies | | | AXA/DoubleLine
Opportunistic
Core Plus Bond | | | Pro-forma
Adjustment | | | AXA/DoubleLine
Opportunistic
Core Plus Bond
Combined
Pro-forma | |
| | | Number of
Shares | | | Number of
Shares | | | Principal
Amount | | | Principal
Amount | | | Principal
Amount | | | Value ($) | | | Value ($) | | | Value ($) | | | Value ($) | | | Value ($) | |
Oracle Corp., 4.125%, 05/15/2045 | | | — | | | | — | | | | 75,000 | | | | — | | | | 75,000 | | | | — | | | | — | | | | 73,286 | | | | — | | | | 73,286 | |
Oracle Corp., 1.900%, 09/15/2021 | | | — | | | | — | | | | 75,000 | | | | — | | | | 75,000 | | | | — | | | | — | | | | 73,198 | | | | — | | | | 73,198 | |
Solera LLC, 10.500%, 03/01/24§ | | | — | | | | — | | | | 15,000 | | | | — | | | | 15,000 | | | | — | | | | — | | | | 16,875 | | | | — | | | | 16,875 | |
Sophia LP, 9.000%, 09/30/23§ | | | — | | | | — | | | | 25,000 | | | | — | | | | 25,000 | | | | — | | | | — | | | | 26,562 | | | | — | | | | 26,562 | |
| | | | | | | | | | | | | | | | | | | | | | | | | | | | | | | | | | | | | | | | |
| | | | | | | | | | | | | | | | | | | | | | | | | | | | | | | 322,179 | | | | | | | | 322,179 | |
| | | | | | | | | | | | | | | | | | | | | | | | | | | | | | | | | | | | | | | | |
Technology Hardware, Storage & Peripherals (0.1%) | | | | | | | | | | | | | | | | | | | | | | | | | | | | | | | | | | | | | | | | |
Diamond 1 Finance Corp., 7.125%, 06/15/24§ | | | — | | | | — | | | | 20,000 | | | | — | | | | 20,000 | | | | — | | | | — | | | | 22,100 | | | | — | | | | 22,100 | |
Hewlett Packard Enterprise Co., 3.600%, | | | — | | | | — | | | | 51,000 | | | | — | | | | 51,000 | | | | — | | | | — | | | | 52,058 | | | | — | | | | 52,058 | |
Western Digital Corp., 7.375%, 04/01/23§ | | | — | | | | — | | | | 5,000 | | | | — | | | | 5,000 | | | | — | | | | — | | | | 5,500 | | | | — | | | | 5,500 | |
| | | | | | | | | | | | | | | | | | | | | | | | | | | | | | | | | | | | | | | | |
| | | | | | | | | | | | | | | | | | | | | | | | | | | | | | | 79,658 | | | | | | | | 79,658 | |
| | | | | | | | | | | | | | | | | | | | | | | | | | | | | | | | | | | | | | | | |
Total Information Technology | | | | | | | | | | | | | | | | | | | | | | | — | | | | — | | | | 767,417 | | �� | | — | | | | 767,417 | |
| | | | | | | | | | | | | | | | | | | | | | | | | | | | | | | | | | | | | | | | |
Materials (0.6%) | | | | | | | | | | | | | | | | | | | | | | | | | | | | | | | | | | | | | | | | |
Chemicals (0.3%) | | | | | | | | | | | | | | | | | | | | | | | | | | | | | | | | | | | | | | | | |
Ashland LLC, 4.750%, 08/15/2022 | | | — | | | | — | | | | 15,000 | | | | — | | | | 15,000 | | | | — | | | | — | | | | 15,535 | | | | — | | | | 15,535 | |
Grupo Idesa S.A. de C.V., 7.875%, 12/18/20 (m) | | | — | | | | — | | | | 200,000 | | | | — | | | | 200,000 | | | | — | | | | — | | | | 179,250 | | | | — | | | | 179,250 | |
Potash Corp. of Saskatchewan, Inc., 4.000%, 12/15/2026 | | | — | | | | — | | | | 15,000 | | | | — | | | | 15,000 | | | | — | | | | — | | | | 15,095 | | | | — | | | | 15,095 | |
PQ Corp., 6.750%, 11/15/22§ | | | — | | | | — | | | | 15,000 | | | | — | | | | 15,000 | | | | — | | | | — | | | | 16,050 | | | | — | | | | 16,050 | |
| | | | | | | | | | | | | | | | | | | | | | | | | | | | | | | | | | | | | | | | |
| | | | | | | | | | | | | | | | | | | | | | | | | | | | | | | 225,930 | | | | | | | | 225,930 | |
| | | | | | | | | | | | | | | | | | | | | | | | | | | | | | | | | | | | | | | | |
Containers & Packaging (0.1%) | | | | | | | | | | | | | | | | | | | | | | | | | | | | | | | | | | | | | | | | |
Berry Plastics Corp., 5.500%, 05/15/2022 | | | — | | | | — | | | | 15,000 | | | | — | | | | 15,000 | | | | — | | | | — | | | | 15,459 | | | | — | | | | 15,459 | |
International Paper Co., 3.000%, 02/15/2027 | | | — | | | | — | | | | 35,000 | | | | — | | | | 35,000 | | | | — | | | | — | | | | 32,924 | | | | — | | | | 32,924 | |
Plastipak Holdings, Inc., 6.500%, 10/01/21§ | | | — | | | | — | | | | 15,000 | | | | — | | | | 15,000 | | | | — | | | | — | | | | 15,675 | | | | — | | | | 15,675 | |
| | | | | | | | | | | | | | | | | | | | | | | | | | | | | | | | | | | | | | | | |
| | | | | | | | | | | | | | | | | | | | | | | | | | | | | | | 64,058 | | | | | | | | 64,058 | |
| | | | | | | | | | | | | | | | | | | | | | | | | | | | | | | | | | | | | | | | |
Metals & Mining (0.0%) | | | | | | | | | | | | | | | | | | | | | | | | | | | | | | | | | | | | | | | | |
Lundin Mining Corp., 7.500%, 11/01/20§ | | | — | | | | — | | | | 15,000 | | | | — | | | | 15,000 | | | | — | | | | — | | | | 15,900 | | | | — | | | | 15,900 | |
| | | | | | | | | | | | | | | | | | | | | | | | | | | | | | | | | | | | | | | | |
Paper & Forest Products (0.2%) | | | | | | | | | | | | | | | | | | | | | | | | | | | | | | | | | | | | | | | | |
Georgia-Pacific LLC, 3.600%, 03/01/25§ | | | — | | | | — | | | | 135,000 | | | | — | | | | 135,000 | | | | — | | | | — | | | | 136,587 | | | | — | | | | 136,587 | |
| | | | | | | | | | | | | | | | | | | | | | | | | | | | | | | | | | | | | | | | |
Total Materials | | | | | | | | | | | | | | | | | | | | | | | — | | | | — | | | | 442,475 | | | | — | | | | 442,475 | |
| | | | | | | | | | | | | | | | | | | | | | | | | | | | | | | | | | | | | | | | |
Real Estate (0.2%) | | | | | | | | | | | | | | | | | | | | | | | | | | | | | | | | | | | | | | | | |
Equity Real Estate Investment Trusts (REITs) (0.2%) | | | | | | | | | | | | | | | | | | | | | | | | | | | | | | | | | | | | | | | | |
Boston Properties LP (REIT), 4.125%, 05/15/2021 | | | — | | | | — | | | | 65,000 | | | | — | | | | 65,000 | | | | — | | | | — | | | | 68,503 | | | | — | | | | 68,503 | |
Equinix, Inc. (REIT), 5.875%, 01/15/2026 | | | — | | | | — | | | | 15,000 | | | | — | | | | 15,000 | | | | — | | | | — | | | | 15,787 | | | | — | | | | 15,787 | |
MGM Growth Properties Operating Partnership LP (REIT), 5.625%, 05/01/2024 | | | — | | | | — | | | | 5,000 | | | | — | | | | 5,000 | | | | — | | | | — | | | | 5,225 | | | | — | | | | 5,225 | |
Simon Property Group LP (REIT), 3.300%, 01/15/2026 | | | — | | | | — | | | | 70,000 | | | | — | | | | 70,000 | | | | — | | | | — | | | | 69,610 | | | | — | | | | 69,610 | |
| | | | | | | | | | | | | | | | | | | | | | | | | | | | | | | | | | | | | | | | |
Total Real Estate | | | | | | | | | | | | | | | | | | | | | | | — | | | | — | | | | 159,125 | | | | — | | | | 159,125 | |
| | | | | | | | | | | | | | | | | | | | | | | | | | | | | | | | | | | | | | | | |
Telecommunication Services (1.0%) | | | | | | | | | | | | | | | | | | | | | | | | | | | | | | | | | | | | | | | | |
Diversified Telecommunication Services (0.5%) | | | | | | | | | | | | | | | | | | | | | | | | | | | | | | | | | | | | | | | | |
British Telecommunications plc, 5.950%, 01/15/2018 | | | — | | | | — | | | | 100,000 | | | | — | | | | 100,000 | | | | — | | | | — | | | | 104,172 | | | | — | | | | 104,172 | |
CCO Holdings LLC, 5.250%, 09/30/2022 | | | — | | | | — | | | | 15,000 | | | | — | | | | 15,000 | | | | — | | | | — | | | | 15,600 | | | | — | | | | 15,600 | |
80
| | | | | | | | | | | | | | | | | | | | | | | | | | | | | | | | | | | | | | | | |
| | | CharterSM
Interest Rate
Strategies | | | CharterSM
Income
Strategies | | | AXA/DoubleLine
Opportunistic
Core Plus Bond | | | Pro-forma
Adjustment | | | AXA/DoubleLine
Opportunistic
Core Plus Bond
Combined
Pro-forma | | | CharterSM
Interest Rate
Strategies | | | CharterSM
Income
Strategies | | | AXA/DoubleLine
Opportunistic
Core Plus Bond | | | Pro-forma
Adjustment | | | AXA/DoubleLine
Opportunistic
Core Plus Bond
Combined
Pro-forma | |
| | | Number of
Shares | | | Number of
Shares | | | Principal
Amount | | | Principal
Amount | | | Principal
Amount | | | Value ($) | | | Value ($) | | | Value ($) | | | Value ($) | | | Value ($) | |
CCO Holdings LLC, 5.125%, 05/01/23§ | | | — | | | | — | | | | 10,000 | | | | — | | | | 10,000 | | | | — | | | | — | | | | 10,275 | | | | — | | | | 10,275 | |
Cincinnati Bell, Inc., 7.000%, 07/15/24§ | | | — | | | | — | | | | 20,000 | | | | — | | | | 20,000 | | | | — | | | | — | | | | 21,150 | | | | — | | | | 21,150 | |
Embarq Corp., 7.995%, 06/01/2036 | | | — | | | | — | | | | 15,000 | | | | — | | | | 15,000 | | | | — | | | | — | | | | 14,100 | | | | — | | | | 14,100 | |
Intelsat Jackson Holdings SA, 8.000%, 02/15/24 (x)§ | | | — | | | | — | | | | 5,000 | | | | — | | | | 5,000 | | | | — | | | | — | | | | 5,137 | | | | — | | | | 5,137 | |
Level 3 Communications, Inc., 5.750%, 12/01/2022 | | | — | | | | — | | | | 25,000 | | | | — | | | | 25,000 | | | | — | | | | — | | | | 25,625 | | | | — | | | | 25,625 | |
Orange SA, 2.750%, 02/06/2019 | | | — | | | | — | | | | 70,000 | | | | — | | | | 70,000 | | | | — | | | | — | | | | 70,807 | | | | — | | | | 70,807 | |
Telesat Canada, 8.875%, 11/15/24§ | | | — | | | | — | | | | 15,000 | | | | — | | | | 15,000 | | | | — | | | | — | | | | 15,638 | | | | — | | | | 15,638 | |
Verizon Communications, Inc., 4.400%, 11/01/2034 | | | — | | | | — | | | | 140,000 | | | | — | | | | 140,000 | | | | — | | | | — | | | | 137,709 | | | | — | | | | 137,709 | |
| | | | | | | | | | | | | | | | | | | | | | | | | | | | | | | | | | | | | | | | |
| | | | | | | | | | | | | | | | | | | | | | | | | | | | | | | 420,213 | | | | | | | | 420,213 | |
| | | | | | | | | | | | | | | | | | | | | | | | | | | | | | | | | | | | | | | | |
Wireless Telecommunication Services (0.5%) | | | | | | | | | | | | | | | | | | | | | | | | | | | | | | | | | | | | | | | | |
Digicel Group Ltd., 7.125%, 04/01/22 (m) | | | — | | | | — | | | | 250,000 | | | | — | | | | 250,000 | | | | — | | | | — | | | | 193,375 | | | | — | | | | 193,375 | |
Telefonica Celular del Paraguay S.A., 6.750%, 12/13/22 (m) | | | — | | | | — | | | | 200,000 | | | | — | | | | 200,000 | | | | — | | | | — | | | | 204,500 | | | | — | | | | 204,500 | |
| | | | | | | | | | | | | | | | | | | | | | | | | | | | | | | | | | | | | | | | |
| | | | | | | | | | | | | | | | | | | | | | | | | | | | | | | 397,875 | | | | | | | | 397,875 | |
| | | | | | | | | | | | | | | | | | | | | | | | | | | | | | | | | | | | | | | | |
Total Telecommunication Services | | | | | | | | | | | | | | | | | | | | | | | — | | | | — | | | | 818,088 | | | | — | | | | 818,088 | |
| | | | | | | | | | | | | | | | | | | | | | | | | | | | | | | | | | | | | | | | |
Utilities (1.6%) | | | | | | | | | | | | | | | | | | | | | | | | | | | | | | | | | | | | | | | | |
Electric Utilities (0.9%) | | | | | | | | | | | | | | | | | | | | | | | | | | | | | | | | | | | | | | | | |
AES Andres BV, 7.950%, 05/11/2026 | | | — | | | | — | | | | 200,000 | | | | — | | | | 200,000 | | | | — | | | | — | | | | 206,000 | | | | — | | | | 206,000 | |
Comision Federal de Electricidad, 4.750%, 02/23/2027 | | | — | | | | — | | | | 200,000 | | | | — | | | | 200,000 | | | | — | | | | — | | | | 192,000 | | | | — | | | | 192,000 | |
Duke Energy Corp., 3.750%, 09/01/2046 | | | — | | | | — | | | | 25,000 | | | | — | | | | 25,000 | | | | — | | | | — | | | | 22,525 | | | | — | | | | 22,525 | |
Duke Energy Progress LLC, 4.150%, 12/01/2044 | | | — | | | | — | | | | 65,000 | | | | — | | | | 65,000 | | | | — | | | | — | | | | 63,688 | | | | — | | | | 63,688 | |
Exelon Corp., 3.400%, 04/15/2026 | | | — | | | | — | | | | 40,000 | | | | — | | | | 40,000 | | | | — | | | | — | | | | 39,069 | | | | — | | | | 39,069 | |
Fortis, Inc., 2.100%, 10/04/2021 | | | — | | | | — | | | | 70,000 | | | | — | | | | 70,000 | | | | — | | | | — | | | | 67,584 | | | | — | | | | 67,584 | |
Southern Co. (The), 2.450%, 09/01/2018 | | | — | | | | — | | | | 95,000 | | | | — | | | | 95,000 | | | | — | | | | — | | | | 95,873 | | | | — | | | | 95,873 | |
Southern Co. (The), 1.850%, 07/01/2019 | | | — | | | | — | | | | 5,000 | | | | — | | | | 5,000 | | | | — | | | | — | | | | 4,982 | | | | — | | | | 4,982 | |
| | | | | | | | | | | | | | | | | | | | | | | | | | | | | | | | | | | | | | | | |
| | | | | | | | | | | | | | | | | | | | | | | | | | | | | | | 691,721 | | | | | | | | 691,721 | |
| | | | | | | | | | | | | | | | | | | | | | | | | | | | | | | | | | | | | | | | |
Gas Utilities (0.3%) | | | | | | | | | | | | | | | | | | | | | | | | | | | | | | | | | | | | | | | | |
Empresa de Energia de Bogota S.A. ESP, 6.125%, 11/10/21 (m) | | | — | | | | — | | | | 200,000 | | | | — | | | | 200,000 | | | | — | | | | — | | | | 205,250 | | | | — | | | | 205,250 | |
| | | | | | | | | | | | | | | | | | | | | | | | | | | | | | | | | | | | | | | | |
Independent Power and Renewable Electricity Producers (0.0%) | | | | | | | | | | | | | | | | | | | | | | | | | | | | | | | | | | | | | | | | |
Calpine Corp., 5.750%, 01/15/2025 (x) | | | — | | | | — | | | | 10,000 | | | | — | | | | 10,000 | | | | — | | | | — | | | | 9,650 | | | | — | | | | 9,650 | |
NRG Energy, Inc., 7.250%, 05/15/26§ | | | — | | | | — | | | | 15,000 | | | | — | | | | 15,000 | | | | — | | | | — | | | | 14,925 | | | | — | | | | 14,925 | |
| | | | | | | | | | | | | | | | | | | | | | | | | | | | | | | | | | | | | | | | |
| | | | | | | | | | | | | | | | | | | | | | | | | | | | | | | 24,575 | | | | | | | | 24,575 | |
| | | | | | | | | | | | | | | | | | | | | | | | | | | | | | | | | | | | | | | | |
Multi-Utilities (0.4%) | | | | | | | | | | | | | | | | | | | | | | | | | | | | | | | | | | | | | | | | |
Berkshire Hathaway Energy Co., 6.500%, 09/15/2037 | | | — | | | | — | | | | 76,000 | | | | — | | | | 76,000 | | | | — | | | | — | | | | 97,868 | | | | — | | | | 97,868 | |
Empresas Publicas de Medellin ESP, 7.625%, 07/29/19 (m) | | | — | | | | — | | | | 200,000 | | | | — | | | | 200,000 | | | | — | | | | — | | | | 223,250 | | | | — | | | | 223,250 | |
| | | | | | | | | | | | | | | | | | | | | | | | | | | | | | | | | | | | | | | | |
| | | | | | | | | | | | | | | | | | | | | | | | | | | | | | | 321,118 | | | | | | | | 321,118 | |
| | | | | | | | | | | | | | | | | | | | | | | | | | | | | | | | | | | | | | | | |
Total Utilities | | | | | | | | | | | | | | | | | | | | | | | — | | | | — | | | | 1,242,664 | | | | — | | | | 1,242,664 | |
| | | | | | | | | | | | | | | | | | | | | | | | | | | | | | | | | | | | | | | | |
Total Corporate Bonds | | | | | | | | | | | | | | | | | | | | | | | — | | | | — | | | | 16,331,605 | | | | — | | | | 16,331,605 | |
| | | | | | | | | | | | | | | | | | | | | | | | | | | | | | | | | | | | | | | | |
Foreign Government Securities (2.8%) | | | | | | | | | | | | | | | | | | | | | | | | | | | | | | | | | | | | | | | | |
Banco de Costa Rica, 5.250%, 08/12/18 (m) | | | — | | | | — | | | | 200,000 | | | | — | | | | 200,000 | | | | — | | | | — | | | | 201,500 | | | | — | | | | 201,500 | |
Dominican Republic, 7.500%, 05/06/21 (m) | | | — | | | | — | | | | 200,000 | | | | — | | | | 200,000 | | | | — | | | | — | | | | 216,750 | | | | — | | | | 216,750 | |
81
| | | | | | | | | | | | | | | | | | | | | | | | | | | | | | | | | | | | | | | | |
| | | CharterSM
Interest Rate
Strategies | | | CharterSM
Income
Strategies | | | AXA/DoubleLine
Opportunistic
Core Plus Bond | | | Pro-forma
Adjustment | | | AXA/DoubleLine
Opportunistic
Core Plus Bond
Combined
Pro-forma | | | CharterSM
Interest Rate
Strategies | | | CharterSM
Income
Strategies | | | AXA/DoubleLine
Opportunistic
Core Plus Bond | | | Pro-forma
Adjustment | | | AXA/DoubleLine
Opportunistic
Core Plus Bond
Combined
Pro-forma | |
| | | Number of
Shares | | | Number of
Shares | | | Principal
Amount | | | Principal
Amount | | | Principal
Amount | | | Value ($) | | | Value ($) | | | Value ($) | | | Value ($) | | | Value ($) | |
Petroleos Mexicanos, 6.750%, 09/21/47§ | | | — | | | | — | | | | 35,000 | | | | — | | | | 35,000 | | | | — | | | | — | | | | 33,024 | | | | — | | | | 33,024 | |
Petroleos Mexicanos, 5.500%, 02/04/19 (m) | | | — | | | | — | | | | 100,000 | | | | — | | | | 100,000 | | | | — | | | | — | | | | 103,875 | | | | — | | | | 103,875 | |
Republic of Costa Rica, 9.995%, 08/01/20 (m) | | | — | | | | — | | | | 200,000 | | | | — | | | | 200,000 | | | | — | | | | — | | | | 235,250 | | | | — | | | | 235,250 | |
Republic of Hungary, 4.000%, 03/25/19 | | | — | | | | — | | | | 200,000 | | | | — | | | | 200,000 | | | | — | | | | — | | | | 206,770 | | | | — | | | | 206,770 | |
United Mexican States, 4.000%, 10/02/23 | | | — | | | | — | | | | 96,000 | | | | — | | | | 96,000 | | | | — | | | | — | | | | 96,240 | | | | — | | | | 96,240 | |
United Mexican States, 4.125%, 01/21/26 | | | — | | | | — | | | | 200,000 | | | | — | | | | 200,000 | | | | — | | | | — | | | | 198,500 | | | | — | | | | 198,500 | |
Republic of Panama, 5.200%, 01/30/20 | | | — | | | | — | | | | 200,000 | | | | — | | | | 200,000 | | | | — | | | | — | | | | 214,750 | | | | — | | | | 214,750 | |
Republic of Panama, 3.875%, 03/17/28 | | | — | | | | — | | | | 200,000 | | | | — | | | | 200,000 | | | | — | | | | — | | | | 196,000 | | | | — | | | | 196,000 | |
Republic of Poland, 5.125%, 04/21/21 | | | — | | | | — | | | | 200,000 | | | | — | | | | 200,000 | | | | — | | | | — | | | | 218,298 | | | | — | | | | 218,298 | |
State of Qatar, 2.375%, 06/02/21 (m) | | | — | | | | — | | | | 200,000 | | | | — | | | | 200,000 | | | | — | | | | — | | | | 195,750 | | | | — | | | | 195,750 | |
United Mexican States, 4.750%, 03/08/44 | | | — | | | | — | | | | 50,000 | | | | — | | | | 50,000 | | | | — | | | | — | | | | 45,563 | | | | — | | | | 45,563 | |
| | | | | | | | | | | | | | | | | | | | | | | | | | | | | | | | | | | | | | | | |
Total Foreign Government Securities | | | | | | | | | | | | | | | | | | | | | | | — | | | | — | | | | 2,162,270 | | | | — | | | | 2,162,270 | |
| | | | | | | | | | | | | | | | | | | | | | | | | | | | | | | | | | | | | | | | |
Mortgage-Backed Securities (7.5%) | | | | | | | | | | | | | | | | | | | | | | | | | | | | | | | | | | | | | | | | |
FHLMC, 3.000%, 07/01/2045 | | | — | | | | — | | | | 879,158 | | | | — | | | | 879,158 | | | | — | | | | — | | | | 875,002 | | | | — | | | | 875,002 | |
FHLMC, 3.000%, 08/01/2045 | | | — | | | | — | | | | 1,327,447 | | | | — | | | | 1,327,447 | | | | — | | | | — | | | | 1,321,173 | | | | — | | | | 1,321,173 | |
FNMA, 3.000%, 04/01/2045 | | | — | | | | — | | | | 1,154,774 | | | | — | | | | 1,154,774 | | | | — | | | | — | | | | 1,138,219 | | | | — | | | | 1,138,219 | |
FNMA, 3.000%, 09/01/2046 | | | — | | | | — | | | | 2,559,861 | | | | — | | | | 2,559,861 | | | | — | | | | — | | | | 2,547,961 | | | | — | | | | 2,547,961 | |
| | | | | | | | | | | | | | | | | | | | | | | | | | | | | | | | | | | | | | | | |
Total Mortgage-Backed Securities | | | | | | | | | | | | | | | | | | | | | | | — | | | | — | | | | 5,882,355 | | | | — | | | | 5,882,355 | |
| | | | | | | | | | | | | | | | | | | | | | | | | | | | | | | | | | | | | | | | |
Municipal Bonds (0.6%) | | | | | | | | | | | | | | | | | | | | | | | | | | | | | | | | | | | | | | | | |
City of Houston Tx Combined Utility System Revenue Bonds, 5.000%, 11/15/2035 | | | — | | | | — | | | | 120,000 | | | | — | | | | 120,000 | | | | — | | | | — | | | | 138,139 | | | | — | | | | 138,139 | |
Los Angeles County California Metropolitan Transportation Authority Sales Tax Revenue Bonds, 5.000%, 06/01/2033 | | | — | | | | — | | | | 60,000 | | | | — | | | | 60,000 | | | | — | | | | — | | | | 70,522 | | | | — | | | | 70,522 | |
Massachusetts School Building Authority, Dedicated Sales Tax Revenue Bonds, 5.000%, 11/15/2034 | | | — | | | | — | | | | 90,000 | | | | — | | | | 90,000 | | | | — | | | | — | | | | 105,515 | | | | — | | | | 105,515 | |
North Texas Municipal Water District, Revenue Bonds, 5.000%, 09/01/2035 | | | — | | | | — | | | | 70,000 | | | | — | | | | 70,000 | | | | — | | | | — | | | | 80,833 | | | | — | | | | 80,833 | |
State of California, Various Purpose, General Obligations Bonds, 5.000%, 08/01/2033 | | | — | | | | — | | | | 70,000 | | | | — | | | | 70,000 | | | | — | | | | — | | | | 80,023 | | | | — | | | | 80,023 | |
| | | | | | | | | | | | | | | | | | | | | | | | | | | | | | | | | | | | | | | | |
Total Municipal Bonds | | | | | | | | | | | | | | | | | | | | | | | — | | | | — | | | | 475,032 | | | | — | | | | 475,032 | |
| | | | | | | | | | | | | | | | | | | | | | | | | | | | | | | | | | | | | | | | |
U.S. Treasury Obligations (25.4%) | | | | | | | | | | | | | | | | | | | | | | | | | | | | | | | | | | | | | | | | |
U.S. Treasury Bond, 2.750%, 11/15/2042 | | | — | | | | — | | | | 620,000 | | | | — | | | | 620,000 | | | | — | | | | — | | | | 585,488 | | | | — | | | | 585,488 | |
U.S. Treasury Bond, 1.000%, 02/15/2046 TIPS | | | — | | | | — | | | | 1,290,000 | | | | — | | | | 1,290,000 | | | | — | | | | — | | | | 1,321,366 | | | | — | | | | 1,321,366 | |
U.S. Treasury Note, 0.125%, 07/15/2024 TIPS | | | — | | | | — | | | | 1,250,000 | | | | — | | | | 1,250,000 | | | | — | | | | — | | | | 1,250,566 | | | | — | | | | 1,250,566 | |
U.S. Treasury Note, 0.125%, 04/15/2021 TIPS | | | — | | | | — | | | | 560,000 | | | | — | | | | 560,000 | | | | — | | | | — | | | | 574,619 | | | | — | | | | 574,619 | |
U.S. Treasury Note, 0.125%, 07/15/2026 TIPS | | | — | | | | — | | | | 870,000 | | | | — | | | | 870,000 | | | | — | | | | — | | | | 848,598 | | | | — | | | | 848,598 | |
U.S. Treasury Note, 0.625%, 01/15/2024 TIPS | | | — | | | | — | | | | 810,000 | | | | — | | | | 810,000 | | | | — | | | | — | | | | 854,148 | | | | — | | | | 854,148 | |
U.S. Treasury Note, 2.125%, 01/31/2021 | | | — | | | | — | | | | 2,250,000 | | | | — | | | | 2,250,000 | | | | — | | | | — | | | | 2,279,751 | | | | — | | | | 2,279,751 | |
U.S. Treasury Note, 2.250%, 03/31/2021 | | | — | | | | — | | | | 2,430,000 | | | | — | | | | 2,430,000 | | | | — | | | | — | | | | 2,473,949 | | | | — | | | | 2,473,949 | |
U.S. Treasury Note, 0.500%, 01/31/2017 | | | — | | | | — | | | | 510,000 | | | | — | | | | 510,000 | | | | — | | | | — | | | | 509,953 | | | | — | | | | 509,953 | |
82
| | | | | | | | | | | | | | | | | | | | | | | | | | | | | | | | | | | | | | | | |
| | | CharterSM
Interest Rate
Strategies | | | CharterSM
Income
Strategies | | | AXA/DoubleLine
Opportunistic
Core Plus Bond | | | Pro-forma
Adjustment | | | AXA/DoubleLine
Opportunistic
Core Plus Bond
Combined
Pro-forma | | | CharterSM
Interest Rate
Strategies | | | CharterSM
Income
Strategies | | | AXA/DoubleLine
Opportunistic
Core Plus Bond | | | Pro-forma
Adjustment | | | AXA/DoubleLine
Opportunistic
Core Plus Bond
Combined
Pro-forma | |
| | | Number of
Shares | | | Number of
Shares | | | Principal
Amount | | | Principal
Amount | | | Principal
Amount | | | Value ($) | | | Value ($) | | | Value ($) | | | Value ($) | | | Value ($) | |
U.S. Treasury Note, 1.750%, 03/31/2022 | | | — | | | | — | | | | 1,290,000 | | | | — | | | | 1,290,000 | | | | — | | | | — | | | | 1,272,905 | | | | — | | | | 1,272,905 | |
U.S. Treasury Note, 2.000%, 08/15/2025 | | | — | | | | — | | | | 35,000 | | | | — | | | | 35,000 | | | | — | | | | — | | | | 33,909 | | | | — | | | | 33,909 | |
U.S. Treasury Note, 2.125%, 05/15/2025 | | | — | | | | — | | | | 1,490,000 | | | | — | | | | 1,490,000 | | | | — | | | | — | | | | 1,461,015 | | | | — | | | | 1,461,015 | |
U.S. Treasury Note, 1.750%, 12/31/2020 | | | — | | | | — | | | | 60,000 | | | | — | | | | 60,000 | | | | — | | | | — | | | | 59,978 | | | | — | | | | 59,978 | |
U.S. Treasury Note, 1.500%, 02/28/2023 | | | — | | | | — | | | | 60,000 | | | | — | | | | 60,000 | | | | — | | | | — | | | | 57,712 | | | | — | | | | 57,712 | |
U.S. Treasury Note, 1.500%, 03/31/2023 | | | — | | | | — | | | | 1,230,000 | | | | — | | | | 1,230,000 | | | | — | | | | — | | | | 1,182,241 | | | | — | | | | 1,182,241 | |
U.S. Treasury Note, 2.000%, 11/30/2020 | | | — | | | | — | | | | 2,140,000 | | | | — | | | | 2,140,000 | | | | — | | | | — | | | | 2,161,839 | | | | — | | | | 2,161,839 | |
U.S. Treasury Notes, 1.000%, 02/15/2018 | | | — | | | | — | | | | 1,840,000 | | | | — | | | | 1,840,000 | | | | — | | | | — | | | | 1,840,647 | | | | — | | | | 1,840,647 | |
U.S. Treasury Notes, 1.000%, 05/15/2018 | | | — | | | | — | | | | 145,000 | | | | — | | | | 145,000 | | | | — | | | | — | | | | 144,950 | | | | — | | | | 144,950 | |
U.S. Treasury Notes, 0.625%, 05/31/2017 | | | — | | | | — | | | | 930,000 | | | | — | | | | 930,000 | | | | — | | | | — | | | | 929,946 | | | | — | | | | 929,946 | |
| | | | | | | | | | | | | | | | | | | | | | | | | | | | | | | | | | | | | | | | |
Total U.S. Treasury Obligations | | | | | | | | | | | | | | | | | | | | | | | — | | | | — | | | | 19,843,580 | | | | — | | | | 19,843,580 | |
| | | | | | | | | | | | | | | | | | | | | | | | | | | | | | | | | | | | | | | | |
Total Long Term Debt Securities (84.9%)
(Cost $67,323,043) | | | | | | | | | | | | | | | | | | | | | | | — | | | | — | | | | 66,361,268 | | | | — | | | | 66,361,268 | |
| | | | | | | | | | | | | | | | | | | | | | | | | | | | | | | | | | | | | | | | |
| | | | | | | | | | | | | | | | | | | | | | | | | | | | | | | | | | | | | | | | |
| | | CharterSM
Interest Rate
Strategies | | | CharterSM
Income
Strategies | | | AXA/DoubleLine
Opportunistic
Core Plus Bond | | | Pro-forma
Adjustment | | | AXA/DoubleLine
Opportunistic
Core Plus Bond
Combined
Pro-forma | | | CharterSM
Interest Rate
Strategies | | | CharterSM
Income
Strategies | | | AXA/DoubleLine
Opportunistic
Core Plus Bond | | | Pro-forma
Adjustment | | | AXA/DoubleLine
Opportunistic
Core Plus Bond
Combined
Pro-forma | |
| | | Number of
Shares | | | Number of
Shares | | | Number of
Shares | | | Number of
Shares | | | Number of
Shares | | | Value ($) | | | Value ($) | | | Value ($) | | | Value ($) | | | Value ($) | |
COMMON STOCK: | | | | | | | | | | | | | | | | | | | | | | | | | | | | | | | | | | | | | | | | |
Energy (0.0%) | | | | | | | | | | | | | | | | | | | | | | | | | | | | | | | | | | | | | | | | |
Oil, Gas & Consumable Fuels (0.0%) | | | | | | | | | | | | | | | | | | | | | | | | | | | | | | | | | | | | | | | | |
SandRidge Energy, Inc.* | | | — | | | | — | | | | 48 | | | | — | | | | 48 | | | | — | | | | — | | | | 1,129 | | | | — | | | | 1,129 | |
| | | | | | | | | | | | | | | | | | | | | | | | | | | | | | | | | | | | | | | | |
Total Common Stock (0.0%)
(Cost $1,013) | | | | | | | | | | | | | | | | | | | | | | | — | | | | — | | | | 1,129 | | | | — | | | | 1,129 | |
| | | | | | | | | | | | | | | | | | | | | | | | | | | | | | | | | | | | | | | | |
EXCHANGE TRADED FUNDS: | | | | | | | | | | | | | | | | | | | | | | | | | | | | | | | | | | | | | | | | |
iShares Aaa - A Rated Corporate Bond Fund | | | — | | | | 2,380 | | | | — | | | | — | | | | 2,380 | | | | — | | | | 122,237 | | | | — | | | | — | | | | 122,237 | |
iShares Emerging Markets Infrastructure Fund | | | 1,520 | | | | 3,270 | | | | — | | | | — | | | | 4,790 | | | | 42,697 | | | | 91,854 | | | | — | | | | — | | | | 134,551 | |
iShares Floating Rate Bond Fund | | | 12,960 | | | | 1,420 | | | | — | | | | — | | | | 14,380 | | | | 657,461 | | | | 72,037 | | | | — | | | | — | | | | 729,498 | |
iShares Global Infrastructure Fund | | | 4,920 | | | | 9,080 | | | | — | | | | — | | | | 14,000 | | | | 192,077 | | | | 354,483 | | | | — | | | | — | | | | 546,560 | |
iShares iBoxx $ Investment Grade Corporate Bond Fund | | | — | | | | 1,600 | | | | — | | | | — | | | | 1,600 | | | | — | | | | 187,488 | | | | — | | | | — | | | | 187,488 | |
iShares International High Yield Bond Fund | | | 710 | | | | 950 | | | | — | | | | — | | | | 1,660 | | | | 32,553 | | | | 43,558 | | | | — | | | | — | | | | 76,111 | |
iShares International Select Dividend Fund | | | 10,720 | | | | 8,120 | | | | — | | | | — | | | | 18,840 | | | | 316,883 | | | | 240,027 | | | | — | | | | — | | | | 556,910 | |
iShares JP Morgan USD Emerging Markets Bond Fund | | | 980 | | | | 1,020 | | | | — | | | | — | | | | 2,000 | | | | 108,016 | | | | 112,424 | | | | — | | | | — | | | | 220,440 | |
iShares U.S. Preferred Stock Fund | | | — | | | | 9,040 | | | | — | | | | — | | | | 9,040 | | | | — | | | | 336,378 | | | | — | | | | — | | | | 336,378 | |
PowerShares Global Short Term High Yield Bond Portfolio | | | 210 | | | | 420 | | | | — | | | | — | | | | 630 | | | | 5,132 | | | | 10,265 | | | | — | | | | — | | | | 15,397 | |
PowerShares S&P 500 BuyWrite Portfolio | | | 3,900 | | | | 13,470 | | | | — | | | | — | | | | 17,370 | | | | 82,953 | | | | 286,507 | | | | — | | | | — | | | | 369,460 | |
SPDR Bloomberg Barclays Short Term High Yield Bond Fund | | | 3,070 | | | | 2,370 | | | | — | | | | — | | | | 5,440 | | | | 84,978 | | | | 65,602 | | | | — | | | | — | | | | 150,580 | |
SPDR® Nuveen S&P High Yield Municipal Bond Fund | | | — | | | | 2,350 | | | | — | | | | — | | | | 2,350 | | | | — | | | | 131,530 | | | | — | | | | — | | | | 131,530 | |
Vanguard Short-Term Inflation-Protected Securities Fund | | | 1,270 | | | | 440 | | | | — | | | | — | | | | 1,710 | | | | 62,433 | | | | 21,630 | | | | — | | | | — | | | | 84,063 | |
Vanguard Total International Bond Fund | | | 1,850 | | | | 170 | | | | — | | | | — | | | | 2,020 | | | | 100,436 | | | | 9,229 | | | | — | | | | — | | | | 109,665 | |
| | | | | | | | | | | | | | | | | | | | | | | | | | | | | | | | | | | | | | | | |
Total Exchange Traded Funds (4.8%)
(Cost $4,017,620) | | | | | | | | | | | | | | | | | | | | | | | 1,685,619 | | | | 2,085,249 | | | | — | | | | — | | | | 3,770,868 | |
| | | | | | | | | | | | | | | | | | | | | | | | | | | | | | | | | | | | | | | | |
83
| | | | | | | | | | | | | | | | | | | | | | | | | | | | | | | | | | | | | | | | |
| | | CharterSM
Interest Rate
Strategies | | | CharterSM
Income
Strategies | | | AXA/DoubleLine
Opportunistic
Core Plus Bond | | | Pro-forma
Adjustment | | | AXA/DoubleLine
Opportunistic
Core Plus Bond
Combined
Pro-forma | | | CharterSM
Interest Rate
Strategies | | | CharterSM
Income
Strategies | | | AXA/DoubleLine
Opportunistic
Core Plus Bond | | | Pro-forma
Adjustment | | | AXA/DoubleLine
Opportunistic
Core Plus Bond
Combined
Pro-forma | |
| | | Number of
Shares | | | Number of
Shares | | | Number of
Shares | | | Number of
Shares | | | Number of
Shares | | | Value ($) | | | Value ($) | | | Value ($) | | | Value ($) | | | Value ($) | |
INVESTMENT COMPANIES: | | | | | | | | | | | | | | | | | | | | | | | | | | | | | | | | | | | | | | | | |
AXA Natural Resources Portfolio‡ | | | 16,630 | | | | 9,903 | | | | — | | | | — | | | | 26,533 | | | | 132,252 | | | | 78,753 | | | | — | | | | — | | | | 211,005 | |
AXA Real Estate Portfolio‡ | | | 21,094 | | | | 25,505 | | | | — | | | | — | | | | 46,599 | | | | 220,920 | | | | 267,120 | | | | — | | | | — | | | | 488,040 | |
BlackRock Global Long/Short Credit Fund, Institutional Class* | | | 10,706 | | | | 11,451 | | | | — | | | | — | | | | 22,157 | | | | 108,347 | | | | 115,880 | | | | — | | | | — | | | | 224,227 | |
DoubleLine Floating Rate Fund‡ | | | — | | | | — | | | | 97,776 | | | | — | | | | 97,776 | | | | — | | | | — | | | | 970,911 | | | | — | | | | 970,911 | |
Eaton Vance Floating-Rate Fund, Institutional Class | | | 4,668 | | | | 18,491 | | | | — | | | | — | | | | 23,159 | | | | 41,775 | | | | 165,495 | | | | — | | | | — | | | | 207,270 | |
EQ/Boston Advisors Equity Income Portfolio‡ | | | 68,338 | | | | 100,905 | | | | — | | | | — | | | | 169,243 | | | | 393,548 | | | | 581,092 | | | | — | | | | — | | | | 974,640 | |
EQ/Convertible Securities Portfolio‡ | | | 35,075 | | | | — | | | | — | | | | — | | | | 35,075 | | | | 357,197 | | | | — | | | | — | | | | — | | | | 357,197 | |
EQ/Core Bond Index Portfolio‡ | | | — | | | | 23,277 | | | | — | | | | — | | | | 23,277 | | | | — | | | | 229,209 | | | | — | | | | — | | | | 229,209 | |
EQ/Energy ETF Portfolio‡ | | | 18,532 | | | | 9,528 | | | | — | | | | — | | | | 28,060 | | | | 137,870 | | | | 70,882 | | | | — | | | | — | | | | 208,752 | |
EQ/Global Bond PLUS Portfolio‡ | | | 10,693 | | | | 12,479 | | | | — | | | | — | | | | 23,172 | | | | 93,724 | | | | 109,384 | | | | — | | | | — | | | | 203,108 | |
EQ/High Yield Bond Portfolio‡ | | | 4,694 | | | | 22,420 | | | | — | | | | — | | | | 27,114 | | | | 44,693 | | | | 213,481 | | | | — | | | | — | | | | 258,174 | |
EQ/Low Volatility Global ETF Portfolio‡ | | | 34,763 | | | | — | | | | — | | | | — | | | | 34,763 | | | | 355,019 | | | | — | | | | — | | | | — | | | | 355,019 | |
EQ/PIMCO Global Real Return Portfolio‡ | | | 36,897 | | | | 10,097 | | | | — | | | | — | | | | 46,994 | | | | 358,151 | | | | 98,009 | | | | — | | | | — | | | | 456,160 | |
EQ/PIMCO Ultra Short Bond Portfolio‡ | | | 14,046 | | | | — | | | | — | | | | — | | | | 14,046 | | | | 138,594 | | | | — | | | | — | | | | — | | | | 138,594 | |
EQ/Quality Bond PLUS Portfolio‡ | | | — | | | | 8,313 | | | | — | | | | — | | | | 8,313 | | | | — | | | | 70,323 | | | | — | | | | — | | | | 70,323 | |
Multimanager Core Bond Portfolio‡ | | | — | | | | 41,450 | | | | — | | | | — | | | | 41,450 | | | | — | | | | 405,357 | | | | — | | | | — | | | | 405,357 | |
PIMCO Foreign Bond Fund Unhedged, Institutional Class | | | — | | | | 10,218 | | | | — | | | | — | | | | 10,218 | | | | — | | | | 94,111 | | | | — | | | | — | | | | 94,111 | |
PIMCO Unconstrained Bond Fund, Institutional Class | | | 15,905 | | | | — | | | | — | | | | — | | | | 15,905 | | | | 169,387 | | | | — | | | | — | | | | — | | | | 169,387 | |
| | | | | | | | | | | | | | | | | | | | | | | | | | | | | | | | | | | | | | | | |
Total Investment Companies (7.7%)
(Cost $6,453,307) | | | | | | | | | | | | | | | | | | | | | | | 2,551,477 | | | | 2,499,096 | | | | 970,911 | | | | — | | | | 6,021,484 | |
| | | | | | | | | | | | | | | | | | | | | | | | | | | | | | | | | | | | | | | | |
| | | | | | | | | | | | | | | | | | | | | | | | | | | | | | | | | | | | | | | | |
| | | | | | | | | | |
| | | CharterSM
Interest Rate
Strategies | | | CharterSM
Income
Strategies | | | AXA/DoubleLine
Opportunistic
Core Plus Bond | | | Pro-forma
Adjustment | | | AXA/DoubleLine
Opportunistic
Core Plus Bond
Combined
Pro-forma | | | CharterSM
Interest Rate
Strategies | | | CharterSM
Income
Strategies | | | AXA/DoubleLine
Opportunistic
Core Plus Bond | | | Pro-forma
Adjustment | | | AXA/DoubleLine
Opportunistic
Core Plus Bond
Combined
Pro-forma | |
| | | Principal
Amount | | | Principal
Amount | | | Principal
Amount | | | Principal
Amount | | | Principal
Amount | | | Value ($) | | | Value ($) | | | Value ($) | | | Value ($) | | | Value ($) | |
SHORT-TERM INVESTMENTS: | | | | | | | | | | | | | | | | | | | | | | | | | | | | | | | | | | | | | | | | |
Investment Company (0.0%) | | | | | | | | | | | | | | | | | | | | | | | | | | | | | | | | | | | | | | | | |
JPMorgan Prime Money Market Fund, IM Shares* | | | 14,385 | | | | 13,329 | | | | — | | | | — | | | | 27,714 | | | | 14,389 | | | | 13,333 | | | | — | | | | — | | | | 27,722 | |
| | | | | | | | | | | | | | | | | | | | | | | | | | | | | | | | | | | | | | | | |
Repurchase Agreements (0.1%) | | | | | | | | | | | | | | | | | | | | | | | | | | | | | | | | | | | | | | | | |
Citigroup Global Markets Ltd., 0.71%, dated 12/30/16, due 1/3/17, repurchase price $2,398, collateralized by various Foreign Government Agency Securities, ranging from 0.000%-5.250%, maturing 1/23/17-1/24/44; total market value $2,446. (xx) | | | — | | | | — | | | | 2,398 | | | | — | | | | 2,398 | | | | — | | | | — | | | | 2,398 | | | | — | | | | 2,398 | |
Citigroup Global Markets Ltd., 0.69%, dated 12/30/16, due 1/3/17, repurchase price $965, collateralized by various U.S. Government Treasury Securities, ranging from 1.375%-5.375%, maturing 7/31/18-2/15/45; total market value $984. (xx) | | | — | | | | — | | | | 965 | | | | — | | | | 965 | | | | — | | | | — | | | | 965 | | | | — | | | | 965 | |
Deutsche Bank AG, 1.05%, dated 12/30/16, due 1/3/17, repurchase price $10,001, collateralized by various Common Stocks; total market value $11,116. (xx) | | | — | | | | — | | | | 10,000 | | | | — | | | | 10,000 | | | | — | | | | — | | | | 10,000 | | | | — | | | | 10,000 | |
84
| | | | | | | | | | | | | | | | | | | | | | | | | | | | | | | | | | | | | | | | |
| | | CharterSM
Interest Rate
Strategies | | | CharterSM
Income
Strategies | | | AXA/DoubleLine
Opportunistic
Core Plus Bond | | | Pro-forma
Adjustment | | | AXA/DoubleLine
Opportunistic
Core Plus Bond
Combined
Pro-forma | | | CharterSM
Interest Rate
Strategies | | | CharterSM
Income
Strategies | | | AXA/DoubleLine
Opportunistic
Core Plus Bond | | | Pro-forma
Adjustment | | | AXA/DoubleLine
Opportunistic
Core Plus Bond
Combined
Pro-forma | |
| | | Principal
Amount | | | Principal
Amount | | | Principal
Amount | | | Principal
Amount | | | Principal
Amount | | | Value ($) | | | Value ($) | | | Value ($) | | | Value ($) | | | Value ($) | |
Deutsche Bank AG, 0.95%, dated 12/30/16, due 1/3/17, repurchase price $2,084, collateralized by various Corporate Bonds, ranging from 1.875%-2.500%, maturing 3/13/19-6/10/25; total market value $2,126. (xx) | | | — | | | | — | | | | 2,084 | | | | — | | | | 2,084 | | | | — | | | | — | | | | 2,084 | | | | — | | | | 2,084 | |
Deutsche Bank Securities, Inc., 0.50%, dated 12/30/16, due 1/3/17, repurchase price $3,968, collateralized by various U.S. Government Treasury Securities, 0.000%, maturing 2/15/40-5/15/40; total market value $4,047. (xx) | | | — | | | | — | | | | 3,968 | | | | — | | | | 3,968 | | | | — | | | | — | | | | 3,968 | | | | — | | | | 3,968 | |
Macquarie Bank Ltd., 0.76%, dated 12/30/16, due 1/3/17, repurchase price $2,661, collateralized by various U.S. Government Treasury Securities, ranging from 0.000%-8.750%, maturing 1/5/17-5/15/46; total market value $2,716. (xx) | | | — | | | | — | | | | 2,661 | | | | — | | | | 2,661 | | | | — | | | | — | | | | 2,661 | | | | — | | | | 2,661 | |
Macquarie Bank Ltd., 0.57%, dated 12/30/16, due 1/3/17, repurchase price $3,562, collateralized by various U.S. Government Treasury Securities, ranging from 0.000%-8.750%, maturing 1/5/17-5/15/46; total market value $3,635. (xx) | | | — | | | | — | | | | 3,562 | | | | — | | | | 3,562 | | | | — | | | | — | | | | 3,562 | | | | — | | | | 3,562 | |
Natixis, 0.50%, dated 12/30/16, due 1/3/17, repurchase price $5,000, collateralized by various U.S. Government Treasury Securities, ranging from 0.000%-3.625%, maturing 5/25/17-5/15/46; total market value $5,100. (xx) | | | — | | | | — | | | | 5,000 | | | | — | | | | 5,000 | | | | — | | | | — | | | | 5,000 | | | | — | | | | 5,000 | |
RBS Securities, Inc., 0.45%, dated 12/30/16, due 1/3/17, repurchase price $15,001, collateralized by various U.S. Government Treasury Securities, ranging from 0.625%-2.625%, maturing 8/31/17-2/15/25; total market value $15,300. (xx) | | | — | | | | — | | | | 15,000 | | | | — | | | | 15,000 | | | | — | | | | — | | | | 15,000 | | | | — | | | | 15,000 | |
| | | | | | | | | | | | | | | | | | | | | | | | | | | | | | | | | | | | | | | | |
Total Repurchase Agreements | | | | | | | | | | | | | | | | | | | | | | | — | | | | — | | | | 45,638 | | | | — | | | | 45,638 | |
| | | | | | | | | | | | | | | | | | | | | | | | | | | | | | | | | | | | | | | | |
Total Short-Term Investment (0.1%)
(Cost $73,360) | | | | | | | | | | | | | | | | | | | | | | | 14,389 | | | | 13,333 | | | | 45,638 | | | | — | | | | 73,360 | |
| | | | | | | | | | | | | | | | | | | | | | | | | | | | | | | | | | | | | | | | |
Total Investments (97.5%)
(Cost $77,868,343) | | | | | | | | | | | | | | | | | | | | | | | 4,251,485 | | | | 4,597,678 | | | | 67,378,946 | | | | — | | | | 76,228,109 | |
Other Assets Less Liabilities (2.5%) | | | | | | | | | | | | | | | | | | | | | | | (31,377 | ) | | | (46,851 | ) | | | 3,874,926 | | | | (1,849,131 | )(a) | | | 1,947,567 | |
| | | | | | | | | | | | | | | | | | | | | | | | | | | | | | | | | | | | | | | | |
Net Assets (100%) | | | | | | | | | | | | | | | | | | | | | | | 4,220,108 | | | | 4,550,827 | | | | 71,253,872 | | | | (1,849,131 | ) | | | 78,175,676 | |
| | | | | | | | | | | | | | | | | | | | | | | | | | | | | | | | | | | | | | | | |
85
As of February 22, 2017, each security held by the Acquired Portfolio complies with the investment policies and restrictions of the Acquiring Portfolio.
| † | | Securities (totaling $0 or 0.0% of net assets) held at fair value by management. |
| ‡ | | All, or a portion, of the security is an affiliated company as defined under the Investment Company Act of 1940. |
| § | | Securities exempt from Registration under Rule 144A of the Securities Act of 1933. These securities may only be resold to qualified institutional buyers. At December 31, 2016, the market value of these securities amounted to $8,275,102 or 10.6% of net assets. Securities denoted with “§” but not “b” have been determined to be liquid under the guidelines established by the Board of Trustees. To the extent that any securities might provide a right to demand registration, such rights have not been relied upon when determining liquidity. |
| (a) | | Reflects adjustment made for seed capital withdrawal. |
| (b) | | Rule 144A illiquid security. At December 31, 2016, the market value of these securities amounted to $620,715 or 0.8% of net assets. |
| (e) | | Step Bond - Coupon rate increases in increments to maturity. Rate disclosed is as of December 31, 2016. Maturity date disclosed is the ultimate maturity date. |
| (h) | | Defaulted security. A security is classified as defaulted if the issuer fils bankruptcy or fails to make a scheduled interest or principal payment within the grace period set forth in the security’s governing documents. |
| (l) | | Floating Rate Security. Rate disclosed is as of December 31, 2016. |
| (m) | | Regulation S is an exemption for securities offerings that are made outside of the United States and do not involve direct selling efforts in the United States. Resale restrictions may apply for purposes of the Securities Act of 1933. At December 31, 2016, the market value of these securities amounted to $7,319,737 or 9.4% of net assets. |
| (x) | | All or a portion of security is on loan at December 31, 2016. |
| (xx) | | At December 31, 2016, the Portfolio had loaned securities with a total value of $44,764. This was secured by cash collateral of $45,638 which was subsequently invested in joint repurchase agreements with a totla value of $45,638, for which the Portfolio has a proportionate interest as reported in the portfolio of Investments as Repurchase Agreemnets. |
| (y) | | Securities are perpetual and, thus, do not have a predetermined maturity date. The coupon rate for these maturities are fixed for a period of time and may be structured to adjust thereafter. The date shown, if applicable, reflects the next call date. The coupon rate shown is the rate in effect as of December 31, 2016. |
Glossary:
CLO - Collateralized Mortgage Obligations
FHLMC - Federal Home Loan Mortgage Corp.
FNMA - Federal National Mortgage Association
IO Interest Only
TIPS - Treasury Inflation Protected Security
| | | | |
| Country Diversification | | | |
As a Percentage of Total Net Assets | | | | |
Australia | | | 0.2 | % |
Belgium | | | 0.0 | # |
Brazil | | | 1.2 | |
Canada | | | 0.4 | |
Cayman Islands | | | 4.8 | |
Chile | | | 0.8 | |
China | | | 0.2 | |
Colombia | | | 1.0 | |
Costa Rica | | | 0.8 | |
Dominican Republic | | | 1.0 | |
France | | | 0.1 | |
Guatemala | | | 0.8 | |
Hungary | | | 0.3 | |
India | | | 0.9 | |
Israel | | | 0.6 | |
Jamaica | | | 0.2 | |
Japan | | | 0.1 | |
Luxembourg | | | 0.0 | # |
Malaysia | | | 0.3 | |
Mexico | | | 1.4 | |
Netherlands | | | 0.1 | |
Panama | | | 1.4 | |
Paraguay | | | 0.3 | |
Peru | | | 0.2 | |
Poland | | | 0.3 | |
Qatar | | | 0.3 | |
Singapore | | | 0.5 | |
Trinidad and Tobago | | | 0.1 | |
United Kingdom | | | 0.4 | |
United States | | | 76.5 | |
Cash and Other | | | 4.8 | |
| | | | |
| | | 100.0 | % |
| | | | |
| # | | Percent shown is less than 0.05%. |
86
Investments in companies which were affiliates for the year ended December 31, 2016, were as follows:
| | | | | | | | | | | | | | | | | | | | | | | | |
| | | CharterSM Income Strategies | |
Securities: | | Market Value
December 31,
2015 | | | Purchases
at Cost | | | Sales
at Cost | | | Market Value
December 31,
2016 | | | Dividend
Income | | | Realized
Gain
(Loss)† | |
AXA Natural Resources Portfolio | | $ | 83,231 | | | $ | 15,892 | | | $ | 38,707 | | | $ | 78,753 | | | $ | 1,834 | | | $ | (157 | ) |
AXA Real Estate Portfolio (a) | | | 306,197 | | | | 76,870 | | | | 121,348 | | | | 267,120 | | | | 2,390 | | | | 7,797 | |
EQ/Boston Advisors Equity Income Portfolio | | | 630,977 | | | | 216,962 | | | | 278,182 | | | | 581,092 | | | | 12,318 | | | | 48,983 | |
EQ/Core Bond Index Portfolio | | | 262,847 | | | | 71,634 | | | | 104,708 | | | | 229,209 | | | | 4,069 | | | | 681 | |
EQ/Energy ETF Portfolio | | | 58,701 | | | | 25,289 | | | | 25,998 | | | | 70,882 | | | | 1,230 | | | | 852 | |
EQ/Global Bond PLUS Portfolio | | | 125,600 | | | | 30,629 | | | | 46,501 | | | | 109,384 | | | | 2,414 | | | | (265 | ) |
EQ/High Yield Bond Portfolio | | | 246,691 | | | | 53,485 | | | | 103,357 | | | | 213,481 | | | | 11,310 | | | | (2,308 | ) |
EQ/PIMCO Global Real Return Portfolio | | | 107,865 | | | | 25,666 | | | | 40,152 | | | | 98,009 | | | | 5,007 | | | | 148 | |
EQ/Quality Bond PLUS Portfolio | | | 93,422 | | | | 17,620 | | | | 40,600 | | | | 70,323 | | | | 1,008 | | | | 485 | |
Multimanager Core Bond Portfolio | | | 460,269 | | | | 127,863 | | | | 185,348 | | | | 405,357 | | | | 9,609 | | | | 156 | |
| | | | | | | | | | | | | | | | | | | | | | | | |
| | $ | 2,375,800 | | | $ | 661,910 | | | $ | 984,901 | | | $ | 2,123,610 | | | $ | 51,189 | | | $ | 56,372 | |
| | | | | | | | | | | | | | | | | | | | | | | | |
| | | | | | | | | | | | | | | | | | | | | | | | |
| | | CharterSM Interest Rate Strategies | |
Securities: | | Market Value
December 31,
2015 | | | Purchases
at Cost | | | Sales
at Cost | | | Market Value
December 31,
2016 | | | Dividend
Income | | | Realized
Gain
(Loss)† | |
AXA Natural Resources Portfolio | | $ | 155,965 | | | $ | 36,319 | | | $ | 103,620 | | | $ | 132,252 | | | $ | 3,073 | | | $ | (10,109 | ) |
AXA Real Estate Portfolio (a) | | | 342,693 | | | | 33,438 | | | | 159,362 | | | | 220,920 | | | | 2,040 | | | | 7,467 | |
EQ/Boston Advisors Equity Income Portfolio | | | 524,349 | | | | 101,828 | | | | 254,757 | | | | 393,548 | | | | 8,320 | | | | 9,386 | |
EQ/Convertible Securities Portfolio | | | 494,347 | | | | 71,236 | | | | 226,717 | | | | 357,197 | | | | 10,853 | | | | (7,785 | ) |
EQ/Energy ETF Portfolio | | | 148,571 | | | | 43,633 | | | | 89,693 | | | | 137,870 | | | | 2,359 | | | | (8,153 | ) |
EQ/Global Bond PLUS Portfolio | | | 144,156 | | | | 14,989 | | | | 67,841 | | | | 93,724 | | | | 2,063 | | | | (1,799 | ) |
EQ/High Yield Bond Portfolio | | | 61,482 | | | | 7,610 | | | | 29,237 | | | | 44,693 | | | | 2,351 | | | | (1,857 | ) |
EQ/Low Volatility Global ETF Portfolio | | | 533,108 | | | | 62,635 | | | | 249,488 | | | | 355,019 | | | | 9,117 | | | | 15,224 | |
EQ/PIMCO Global Real Return Portfolio | | | 506,436 | | | | 77,772 | | | | 248,066 | | | | 358,151 | | | | 18,252 | | | | (1,350 | ) |
EQ/PIMCO Ultra Short Bond Portfolio | | | 210,772 | | | | 26,489 | | | | 101,340 | | | | 138,594 | | | | 1,744 | | | | (1,232 | ) |
| | | | | | | | | | | | | | | | | | | | | | | | |
| | $ | 3,121,879 | | | $ | 475,949 | | | $ | 1,530,121 | | | $ | 2,231,968 | | | $ | 60,172 | | | $ | (208 | ) |
| | | | | | | | | | | | | | | | | | | | | | | | |
| |
| | | AXA/DoubleLine Opportunistic Core Plus Bond | |
Securities | | Market Value
December 31,
2015 | | | Purchases
at Cost | | | Sales
at Cost | | | Market Value
December 31,
2016 | | | Dividend
Income | | | Realized
Gain
(Loss)† | |
DoubleLine Floating Rate Fund | | $ | 1,650,994 | | | $ | — | | | $ | 716,378 | | | $ | 970,911 | | | $ | 41,826 | | | $ | (16,378 | ) |
| | | | | | | | | | | | | | | | | | | | | | | | |
| |
| | | AXA/DoubleLine Opportunistic Core Plus Bond Combined Pro-forma | |
Securities: | | Market Value
December 31,
2015 | | | Purchases
at Cost | | | Sales
at Cost | | | Market Value
December 31,
2016 | | | Dividend
Income | | | Realized
Gain
(Loss)† | |
AXA Natural Resources Portfolio | | $ | 239,196 | | | $ | 52,211 | | | $ | 142,327 | | | $ | 211,005 | | | $ | 4,907 | | | $ | (10,266 | ) |
AXA Real Estate Portfolio (a) | | | 648,890 | | | | 110,308 | | | | 280,710 | | | | 488,040 | | | | 4,430 | | | | 15,264 | |
DoubleLine Floating Rate Fund | | | 1,650,994 | | | | — | | | | 716,378 | | | | 970,911 | | | | 41,826 | | | | (16,378 | ) |
EQ/Boston Advisors Equity Income Portfolio | | | 1,155,326 | | | | 318,790 | | | | 532,939 | | | | 974,640 | | | | 20,638 | | | | 58,369 | |
EQ/Convertible Securities Portfolio | | | 494,347 | | | | 71,236 | | | | 226,717 | | | | 357,197 | | | | 10,853 | | | | (7,785 | ) |
EQ/Core Bond Index Portfolio | | | 262,847 | | | | 71,634 | | | | 104,708 | | | | 229,209 | | | | 4,069 | | | | 681 | |
EQ/Energy ETF Portfolio | | | 207,272 | | | | 68,922 | | | | 115,691 | | | | 208,752 | | | | 3,589 | | | | (7,301 | ) |
EQ/Global Bond PLUS Portfolio | | | 269,756 | | | | 45,618 | | | | 114,342 | | | | 203,108 | | | | 4,477 | | | | (2,064 | ) |
EQ/High Yield Bond Portfolio | | | 308,173 | | | | 61,095 | | | | 132,594 | | | | 258,174 | | | | 13,661 | | | | (4,165 | ) |
EQ/Low Volatility Global ETF Portfolio | | | 533,108 | | | | 62,635 | | | | 249,488 | | | | 355,019 | | | | 9,117 | | | | 15,224 | |
EQ/PIMCO Global Real Return Portfolio | | | 614,301 | | | | 103,438 | | | | 288,218 | | | | 456,160 | | | | 23,259 | | | | (1,202 | ) |
EQ/PIMCO Ultra Short Bond Portfolio | | | 210,772 | | | | 26,489 | | | | 101,340 | | | | 138,594 | | | | 1,744 | | | | (1,232 | ) |
EQ/Quality Bond PLUS Portfolio | | | 93,422 | | | | 17,620 | | | | 40,600 | | | | 70,323 | | | | 1,008 | | | | 485 | |
Multimanager Core Bond Portfolio | | | 460,269 | | | | 127,863 | | | | 185,348 | | | | 405,357 | | | | 9,609 | | | | 156 | |
| | | | | | | | | | | | | | | | | | | | | | | | |
| | $ | 7,148,673 | | | $ | 1,137,859 | | | $ | 3,231,400 | | | $ | 5,326,489 | | | $ | 153,187 | | | $ | 39,786 | |
| | | | | | | | | | | | | | | | | | | | | | | | |
| † | | When applicable, realized gain includes net distribution of realized gain received from underlying funds. |
| (a) | | Formerly known as EQ/Real Estate PLUS Portfolio. |
The following is a summary of the inputs used to value the Portfolio’s net assets as of December 31, 2016:
The inputs or methodology used for valuing securities are not necessarily an indication of the risk associated with investing in those securities.
87
Various inputs are used in determining the value of the Portfolio’s investments. These inputs are summarized in the three broad levels listed below:
CharterSM Income Strategies
| | | | | | | | | | | | | | | | |
Investment Type | | Level 1
Quoted Prices in
Active Markets for
Identical
Securities | | | Level 2
Significant Other
Observable Inputs
(including quoted prices
for similar securities,
interest rates,
prepayment speeds,
credit risk, etc.) | | | Level 3
Significant Unobservable
Inputs (including the
Portfolio’s own
assumptions in
determining the fair
value of investments) | | | Total | |
Assets | | | | | | | | | | | | | | | | |
Exchange Traded Funds | | | | | | | | | | | | | | | | |
Exchange Traded Funds | | $ | 2,085,249 | | | $ | — | | | $ | — | | | $ | 2,085,249 | |
Investment Companies | | | | | | | | | | | | | | | | |
Investment Companies | | | 375,486 | | | | 2,123,610 | | | | — | | | | 2,499,096 | |
Short-Term Investments | | | | | | | | | | | | | | | | |
Investment Companies | | | 13,333 | | | | — | | | | — | | | | 13,333 | |
| | | | | | | | | | | | | | | | |
Total Assets | | $ | 2,474,068 | | | $ | 2,123,610 | | | $ | — | | | $ | 4,597,678 | |
| | | | | | | | | | | | | | | | |
Total Liabilities | | $ | — | | | $ | — | | | $ | — | | | $ | — | |
| | | | | | | | | | | | | | | | |
Total Assets and Liabilities | | $ | 2,474,068 | | | $ | 2,123,610 | | | $ | — | | | $ | 4,597,678 | |
| | | | | | | | | | | | | | | | |
CharterSM Interest Rate Strategies
| | | | | | | | | | | | | | | | |
Investment Type | | Level 1
Quoted Prices in
Active Markets for
Identical
Securities | | | Level 2
Significant Other
Observable Inputs
(including quoted prices
for similar securities,
interest rates,
prepayment speeds,
credit risk, etc.) | | | Level 3
Significant Unobservable
Inputs (including the
Portfolio’s own
assumptions in
determining the fair
value of investments) | | | Total | |
Assets | | | | | | | | | | | | | | | | |
Exchange Traded Funds | | | | | | | | | | | | | | | | |
Exchange Traded Funds | | $ | 1,685,619 | | | $ | — | | | $ | — | | | $ | 1,685,619 | |
Investment Companies | | | | | | | | | | | | | | | | |
Investment Companies | | | 319,509 | | | | 2,231,968 | | | | — | | | | 2,551,477 | |
Short-Term Investments | | | | | | | | | | | | | | | | |
Investment Companies | | | 14,389 | | | | — | | | | — | | | | 14,389 | |
| | | | | | | | | | | | | | | | |
Total Assets | | $ | 2,019,517 | | | $ | 2,231,968 | | | $ | — | | | $ | 4,251,485 | |
| | | | | | | | | | | | | | | | |
Total Liabilities | | $ | — | | | $ | — | | | $ | — | | | $ | — | |
| | | | | | | | | | | | | | | | |
Total Assets and Liabilities | | $ | 2,019,517 | | | $ | 2,231,968 | | | $ | — | | | $ | 4,251,485 | |
| | | | | | | | | | | | | | | | |
AXA/DoubleLine Opportunistic Core Plus Bond
| | | | | | | | | | | | | | | | |
Investment Type | | Level 1
Quoted Prices in
Active Markets for
Identical
Securities | | | Level 2
Significant Other
Observable Inputs
(including quoted prices
for similar securities,
interest rates,
prepayment speeds,
credit risk, etc.) | | | Level 3
Significant Unobservable
Inputs (including the
Portfolio’s own
assumptions in
determining the fair
value of investments) | | | Total | |
Assets | | | | | | | | | | | | | | | | |
Asset-Backed Securities | | $ | — | | | $ | 4,374,789 | | | $ | — | | | $ | 4,374,789 | |
Collateralized Mortgage Obligations | | | — | | | | 11,561,586 | | | | — | | | | 11,561,586 | |
Commercial Mortgage-Backed Securities | | | — | | | | 5,728,643 | | | | — | | | | 5,728,643 | |
Common Stocks | | | | | | | | | | | | | | | | |
Energy | | | 1,129 | | | | — | | | | — | | | | 1,129 | |
Convertible Bonds | | | | | | | | | | | | | | | | |
Energy | | | — | | | | 1,408 | | | | — | | | | 1,408 | |
Corporate Bonds | | | | | | | | | | | | | | | | |
Consumer Discretionary | | | — | | | | 1,197,749 | | | | — | | | | 1,197,749 | |
Consumer Staples | | | — | | | | 1,543,531 | | | | — | | | | 1,543,531 | |
Energy | | | — | | | | 1,831,760 | | | | — | (a) | | | 1,831,760 | |
Financials | | | — | | | | 5,369,181 | | | | — | | | | 5,369,181 | |
88
| | | | | | | | | | | | | | | | |
Investment Type | | Level 1
Quoted Prices in
Active Markets for
Identical
Securities | | | Level 2
Significant Other
Observable Inputs
(including quoted prices
for similar securities,
interest rates,
prepayment speeds,
credit risk, etc.) | | | Level 3
Significant Unobservable
Inputs (including the
Portfolio’s own
assumptions in
determining the fair
value of investments) | | | Total | |
Health Care | | $ | — | | | $ | 1,413,464 | | | $ | — | | | $ | 1,413,464 | |
Industrials | | | — | | | | 1,546,151 | | | | — | | | | 1,546,151 | |
Information Technology | | | — | | | | 767,417 | | | | — | | | | 767,417 | |
Materials | | | — | | | | 442,475 | | | | — | | | | 442,475 | |
Real Estate | | | — | | | | 159,125 | | | | — | | | | 159,125 | |
Telecommunication Services | | | — | | | | 818,088 | | | | — | | | | 818,088 | |
Utilities | | | — | | | | 1,242,664 | | | | — | | | | 1,242,664 | |
Foreign Government Securities | | | — | | | | 2,162,270 | | | | — | | | | 2,162,270 | |
Investment Companies | | | | | | | | | | | | | | | | |
Investment Companies | | | 970,911 | | | | — | | | | — | | | | 970,911 | |
Mortgage-Backed Securities | | | — | | | | 5,882,355 | | | | — | | | | 5,882,355 | |
Municipal Bonds | | | — | | | | 475,032 | | | | — | | | | 475,032 | |
Short-Term Investments | | | | | | | | | | | | | | | | |
Repurchase Agreements | | | — | | | | 45,638 | | | | — | | | | 45,638 | |
U.S. Treasury Obligations | | | — | | | | 19,843,580 | | | | — | | | | 19,843,580 | |
| | | | | | | | | | | | | | | | |
Total Assets | | $ | 972,040 | | | $ | 66,406,906 | | | $ | — | | | $ | 67,378,946 | |
| | | | | | | | | | | | | | | | |
Total Liabilities | | $ | — | | | $ | — | | | $ | — | | | $ | — | |
| | | | | | | | | | | | | | | | |
Total Assets and Liabilities | | $ | 972,040 | | | $ | 66,406,906 | | | $ | — | | | $ | 67,378,946 | |
| | | | | | | | | | | | | | | | |
AXA/DoubleLine Opportunistic Core Plus Bond Combined Pro-Forma
| | | | | | | | | | | | | | | | |
Investment Type | | Level 1
Quoted Prices in
Active Markets for
Identical
Securities | | | Level 2
Significant Other
Observable Inputs
(including quoted prices
for similar securities,
interest rates,
prepayment speeds,
credit risk, etc.) | | | Level 3
Significant Unobservable
Inputs (including the
Portfolio’s own
assumptions in
determining the fair
value of investments) | | | Total | |
Assets | | | | | | | | | | | | | | | | |
Asset-Backed Securities | | $ | — | | | $ | 4,374,789 | | | $ | — | | | $ | 4,374,789 | |
Collateralized Mortgage Obligations | | | — | | | | 11,561,586 | | | | — | | | | 11,561,586 | |
Commercial Mortgage-Backed Securities | | | — | | | | 5,728,643 | | | | — | | | | 5,728,643 | |
Common Stocks | | | | | | | | | | | | | | | | |
Energy | | | 1,129 | | | | — | | | | — | | | | 1,129 | |
Convertible Bonds | | | | | | | | | | | | | | | | |
Energy | | | — | | | | 1,408 | | | | — | | | | 1,408 | |
Corporate Bonds | | | | | | | | | | | | | | | | |
Consumer Discretionary | | | — | | | | 1,197,749 | | | | — | | | | 1,197,749 | |
Consumer Staples | | | — | | | | 1,543,531 | | | | — | | | | 1,543,531 | |
Energy | | | — | | | | 1,831,760 | | | | — | | | | 1,831,760 | |
Financials | | | — | | | | 5,369,181 | | | | — | | | | 5,369,181 | |
Health Care | | | — | | | | 1,413,464 | | | | — | | | | 1,413,464 | |
Industrials | | | — | | | | 1,546,151 | | | | — | | | | 1,546,151 | |
Information Technology | | | — | | | | 767,417 | | | | — | | | | 767,417 | |
Materials | | | — | | | | 442,475 | | | | — | | | | 442,475 | |
Real Estate | | | — | | | | 159,125 | | | | — | | | | 159,125 | |
Telecommunication Services | | | — | | | | 818,088 | | | | — | | | | 818,088 | |
Utilities | | | — | | | | 1,242,664 | | | | — | | | | 1,242,664 | |
Foreign Government Securities | | | — | | | | 2,162,270 | | | | — | | | | 2,162,270 | |
Exchange Traded Funds | | | | | | | | | | | | | | | | |
Exchange Traded Funds | | | 3,770,868 | | | | — | | | | — | | | | 3,770,868 | |
Investment Companies | | | | | | | | | | | | | | | | |
Investment Companies | | | 1,665,906 | | | | 4,355,578 | | | | — | | | | 6,021,484 | |
Mortgage-Backed Securities | | | — | | | | 5,882,355 | | | | — | | | | 5,882,355 | |
Municipal Bonds | | | — | | | | 475,032 | | | | — | | | | 475,032 | |
Short-Term Investments | | | | | | | | | | | | | | | | |
Investment Companies | | | 27,722 | | | | — | | | | — | | | | 27,722 | |
Repurchase Agreements | | | — | | | | 45,638 | | | | — | | | | 45,638 | |
U.S. Treasury Obligations | | | — | | | | 19,843,580 | | | | — | | | | 19,843,580 | |
| | | | | | | | | | | | | | | | |
Total Assets | | $ | 5,465,625 | | | $ | 70,762,484 | | | $ | — | | | $ | 76,228,109 | |
| | | | | | | | | | | | | | | | |
Total Liabilities | | $ | — | | | $ | — | | | $ | — | | | $ | — | |
| | | | | | | | | | | | | | | | |
Total Assets and Liabilities | | $ | 5,465,625 | | | $ | 70,762,484 | | | $ | — | | | $ | 76,228,109 | |
| | | | | | | | | | | | | | | | |
There were no transfers between Levels 1, 2 or 3 during the year ended December 31, 2016.
89
Investment security transactions for the year ended December 31, 2016 were as follows:
| | | | | | | | | | | | | | | | |
| | | CharterSM
Income
Strategies | | | CharterSM
Interest Rate
Strategies | | | AXA/DoubleLine
Opportunistic
Core Plus Bond | | | AXA/DoubleLine
Opportunistic
Core Plus Bond
Combined
Pro-Forma | |
Cost of Purchases: | | | | | | | | | | | | | | | | |
Long-term investments other than U.S. government debt securities | | $ | 1,031,954 | | | $ | 624,236 | | | $ | 24,656,644 | | | $ | 26,312,834 | |
Long-term U.S. government debt securities | | | — | | | | — | | | | 31,749,401 | | | | 31,749,401 | |
| | | | | | | | | | | | | | | | |
| | $ | 1,031,954 | | | $ | 624,236 | | | $ | 56,406,045 | | | $ | 58,062,235 | |
| | | | | | | | | | | | | | | | |
Net Proceeds of Sales and Redemptions: | | | | | | | | | | | | | | | | |
Long-term investments other than U.S. government debt securities | | $ | 1,699,365 | | | $ | 2,504,659 | | | $ | 23,722,652 | | | $ | 27,926,676 | |
Long-term U.S. government debt securities | | | — | | | | — | | | | 22,476,638 | | | | 22,476,638 | |
| | | | | | | | | | | | | | | | |
| | $ | 1,699,365 | | | $ | 2,504,659 | | | $ | 46,199,290 | | | $ | 50,403,314 | |
| | | | | | | | | | | | | | | | |
As of December 31, 2016, the gross unrealized appreciation (depreciation) of investments based on the aggregate cost of investments for Federal income tax purposes was as follows:
| | | | | | | | | | | | | | | | |
| | | CharterSM
Income
Strategies | | | CharterSM
Interest Rate
Strategies | | | AXA/DoubleLine
Opportunistic
Core Plus Bond | | | AXA/DoubleLine
Opportunistic
Core Plus Bond
Combined
Pro-Forma | |
| | | | |
Aggregate gross unrealized appreciation | | $ | 8,901 | | | $ | 19,901 | | | $ | 276,886 | | | $ | 305,688 | |
Aggregate gross unrealized depreciation | | | (361,845 | ) | | | (343,194 | ) | | | (1,276,037 | ) | | | (1,981,076 | ) |
| | | | | | | | | | | | | | | | |
Net unrealized depreciation | | $ | (352,944 | ) | | $ | (323,293 | ) | | $ | (999,151 | ) | | $ | (1,675,388 | ) |
| | | | | | | | | | | | | | | | |
Federal income tax cost of investments | | $ | 4,950,622 | | | $ | 4,574,778 | | | $ | 68,378,097 | | | $ | 77,903,497 | |
| | | | | | | | | | | | | | | | |
Capital Loss Carry Forward:
CharterSM Income Strategies
The Portfolio has no capital loss carryforward.
CharterSM Interest Rate Strategies
Losses incurred that will be carried forward under the provisions of the Regulated Investment Company Modernization Act of 2010 are $6,943 of Short Term losses and $73,321 of Long Term losses.
AXA/DoubleLine Opportunistic Core Plus Bond
The Portfolio utilized $254,902 of net capital loss carryforwards during the year ending December 31, 2016, all of which was for Short Term losses.
Losses incurred that will be carried forward under the provisions of the Regulated Investment Company Modernization Act of 2010 are $49,028 of Long Term losses.
AXA/DoubleLine Opportunistic Core Plus Bond Combined Pro-Forma
The Portfolio utilized $254,902 of net capital loss carryforwards during the year ending December 31, 2016, all of which was for Short Term losses.
Losses incurred that will be carried forward under the provisions of the Regulated Investment Company Modernization Act of 2010 are $6,943 of Short Term losses and $122,329 of Long Term losses.
90
EQ ADVISORS TRUST
STATEMENT OF ASSETS AND LIABILITIES
December 31, 2016 (Unaudited)
| | | | | | | | | | | | | | | | | | | | |
| | | CharterSM
Income
Strategies | | | CharterSM
Interest Rate
Strategies | | | AXA/DoubleLine
Opportunistic
Core Plus Bond | | | Pro-Forma
Adjustment | | | AXA/DoubleLine
Opportunistic
Core Plus Bond
Combined
Pro-Forma | |
Investments at Cost, Affiliated Issuers | | $ | 2,329,555 | | | $ | 2,408,570 | | | $ | 983,622 | | | $ | — | | | $ | 5,721,747 | |
Investments at Cost, Unaffiliated Issuers | | | 2,609,424 | | | | 2,167,478 | | | | 67,324,056 | | | | — | | | | 72,100,958 | |
Investments at Cost, Repurchase Agreements | | | — | | | | — | | | | 45,638 | | | | — | | | | 45,638 | |
ASSETS | | | | | | | | | | | | | | | | | | | | |
Investments at Value, Affiliated Issuers | | | 2,123,610 | | | | 2,231,968 | | | | 970,911 | | | | — | | | | 5,326,489 | |
Investments at Value, Unaffiliated Issuers (x) | | | 2,474,068 | | | | 2,019,517 | | | | 66,362,397 | | | | — | | | | 70,855,982 | |
Investments at Value, Repurchase Agreements | | | — | | | | — | | | | 45,638 | | | | — | | | | 45,638 | |
Cash | | | 9,197 | | | | 19,000 | | | | 3,420,335 | | | | — | | | | 3,448,532 | |
Dividends, interest and other receivables | | | 1,478 | | | | 884 | | | | 452,009 | | | | — | | | | 454,371 | |
Due from Custodian | | | — | | | | — | | | | 204,019 | | | | — | | | | 204,019 | |
Receivable for securities sold | | | 59 | | | | — | | | | 114,137 | | | | — | | | | 114,196 | |
Receivable from Separate Accounts for Trust shares sold | | | — | | | | — | | | | 55,044 | | | | — | | | | 55,044 | |
Receivable from investment manager | | | 3,313 | | | | 2,877 | | | | — | | | | — | | | | 6,190 | |
Securities lending income receivable | | | — | | | | — | | | | 51 | | | | — | | | | 51 | |
Other assets | | | 16 | | | | 17 | | | | 232 | | | | — | | | | 265 | |
| | | | | | | | | | | | | | | | | | | | |
Total assets | | | 4,611,741 | | | | 4,274,263 | | | | 71,624,773 | | | | — | | | | 80,510,777 | |
| | | | | | | | | | | | | | | | | | | | |
| | | | | | | | | | | | | | | | | | | | |
LIABILITIES | | | | | | | | | | | | | | | | | | | | |
Payable for securities purchased | | | 742 | | | | 2,243 | | | | 204,019 | | | | — | | | | 207,004 | |
Payable for return of collateral on securities loaned | | | — | | | | — | | | | 45,638 | | | | — | | | | 45,638 | |
Investment management fees payable | | | — | | | | — | | | | 31,292 | | | | — | | | | 31,292 | |
Payable to Separate Accounts for Trust shares redeemed | | | 9,243 | | | | 122 | | | | 525 | | | | 1,849,131 | (a) | | | 1,859,021 | |
Administrative fees payable | | | — | | | | — | | | | 5,880 | | | | — | | | | 5,880 | |
Distribution fees payable - Class IB | | | 962 | | | | 888 | | | | 2,090 | | | | — | | | | 3,940 | |
Trustees’ fees payable | | | 653 | | | | 680 | | | | 42 | | | | — | | | | 1,375 | |
Accrued expenses | | | 49,314 | | | | 50,222 | | | | 81,415 | | | | — | | | | 180,951 | |
| | | | | | | | | | | | | | | | | | | | |
Total liabilities | | | 60,914 | | | | 54,155 | | | | 370,901 | | | | 1,849,131 | | | | 2,335,101 | |
| | | | | | | | | | | | | | | | | | | | |
NET ASSETS | | $ | 4,550,827 | | | $ | 4,220,108 | | | $ | 71,253,872 | | | $ | (1,849,131 | ) | | $ | 78,175,676 | |
| | | | | | | | | | | | | | | | | | | | |
Net assets were comprised of: | | | | | | | | | | | | | | | | | | | | |
Paid in capital | | $ | 4,856,705 | | | $ | 4,623,835 | | | $ | 72,368,330 | | | $ | (1,849,131 | )(a) | | $ | 79,999,739 | |
Accumulated undistributed net investment income (loss) | | | 2,165 | | | | 5,469 | | | | 37,711 | | | | — | | | | 45,345 | |
Accumulated undistributed net realized gain (loss) on investments | | | 33,258 | | | | (84,633 | ) | | | (177,799 | ) | | | — | | | | (229,174 | ) |
Net unrealized appreciation (depreciation) on investments | | | (341,301 | ) | | | (324,563 | ) | | | (974,370 | ) | | | — | | | | (1,640,234 | ) |
| | | | | | | | | | | | | | | | | | | | |
Net Assets | | $ | 4,550,827 | | | $ | 4,220,108 | | | $ | 71,253,872 | | | $ | (1,849,131 | ) | | $ | 78,175,676 | |
| | | | | | | | | | | | | | | | | | | | |
Class IB Shares: | | | | | | | | | | | | | | | | | | | | |
Net Assets | | $ | 4,550,827 | | | $ | 4,220,108 | | | $ | 10,303,899 | | | $ | (1,849,131 | )(a) | | $ | 17,225,703 | |
Shares outstanding | | | 484,237 | | | | 446,404 | | | | 1,049,975 | | | | (225,054 | )(a),(b) | | | 1,755,562 | |
Net asset value, offering and redemption price per share | | $ | 9.40 | | | $ | 9.45 | | | $ | 9.81 | | | $ | — | | | $ | 9.81 | |
Class K Shares: | | | | | | | | | | | | | | | | | | | | |
Net Assets | | $ | — | | | $ | — | | | $ | 60,949,973 | | | $ | — | | | $ | 60,949,973 | |
Shares outstanding | | | — | | | | — | | | | 6,210,703 | | | | — | | | | 6,210,703 | |
Net asset value, offering and redemption price per share | | $ | — | | | $ | — | | | $ | 9.81 | | | $ | — | | | $ | 9.81 | |
(x) Includes value of securities on loan of: | | $ | — | | | $ | — | | | $ | 44,764 | | | $ | — | | | $ | 44,764 | |
| (a) | | Reflects adjustment made for impact of seed capital withdrawal. |
| (b) | | Reflects adjustment for retired shares of the acquired Portfolios. |
91
EQ ADVISORS TRUST
For the Year Ended December 31, 2016 (Unaudited)
| | | | | | | | | | | | | | | | | | | | |
| | | CharterSM
Income
Strategies | | | CharterSM
Interest Rate
Strategies | | | AXA/DoubleLine
Opportunistic
Core Plus Bond | | | Pro-Forma
Adjustment | | | AXA/DoubleLine
Opportunistic
Core Plus Bond
Combined
Pro-Forma | |
STATEMENT OF OPERATIONS | | | | | | | | | | | | | | | | | | | | |
Dividend Income Received from Affiliates | | $ | 51,189 | | | $ | 60,172 | | | $ | 41,826 | | | $ | — | | | $ | 153,187 | |
Foreign withholding Tax on Interest | | | — | | | | — | | | | 243 | | | | — | | | | 243 | |
INVESTMENT INCOME | | | | | | | | | | | | | | | | | | | | |
Interest | | | 2,578 | | | | 2,156 | | | | 2,389,839 | | | | — | | | | 2,394,573 | |
Dividends | | | 138,635 | | | | 113,479 | | | | 42,130 | | | | — | | | | 294,244 | |
Securities lending (net) | | | — | | | | — | | | | 742 | | | | — | | | | 742 | |
| | | | | | | | | | | | | | | | | | | | |
Total income | | | 141,213 | | | | 115,635 | | | | 2,432,711 | | | | — | | | | 2,689,559 | |
| | | | | | | | | | | | | | | | | | | | |
EXPENSES | | | | | | | | | | | | | | | | | | | | |
Investment management fees | | | 7,080 | | | | 6,961 | | | | 399,563 | | | | 31,050 | (d) | | | 444,654 | |
Professional fees | | | 35,866 | | | | 35,862 | | | | 66,229 | | | | (70,661 | )(b) | | | 67,296 | |
Administrative fees | | | 32,500 | | | | 32,500 | | | | 66,861 | | | | (58,938 | )(b) | | | 72,923 | |
Distribution fees - Class IB | | | 11,799 | | | | 11,601 | | | | 15,408 | | | | (4,622 | )(a) | | | 34,186 | |
Offering costs | | | — | | | | — | | | | 13,732 | | | | — | | | | 13,732 | |
Custodian fees | | | 67,000 | | | | 62,300 | | | | 10,000 | | | | (129,300 | )(b) | | | 10,000 | |
Printing and mailing expenses | | | 681 | | | | 676 | | | | 4,415 | | | | (1,357 | )(a) | | | 4,415 | |
Trustees’ fees | | | 182 | | | | 188 | | | | 1,464 | | | | (370 | )(a) | | | 1,464 | |
Miscellaneous | | | 176 | | | | 186 | | | | 20,776 | | | | (362 | )(b) | | | 20,776 | |
| | | | | | | | | | | | | | | | | | | | |
Gross expenses | | | 155,284 | | | | 150,274 | | | | 598,448 | | | | (301,226 | ) | | | 669,446 | |
| | | | | | | | | | | | | | | | | | | | |
Less: Waiver from investment manager | | | (39,580 | ) | | | (39,461 | ) | | | (28,810 | ) | | | 79,195 | (c) | | | (28,656 | ) |
Reimbursement from investment manager | | | (88,020 | ) | | | (84,392 | ) | | | — | | �� | | 239,078 | (c) | | | — | |
Reimbursement from sub-advisor | | | — | | | | — | | | | (8,322 | ) | | | — | | | | (8,322 | ) |
| | | | | | | | | | | | | | | | | | | | |
Net expenses | | | 27,684 | | | | 26,421 | | | | 561,316 | | | | 17,047 | | | | 632,468 | |
| | | | | | | | | | | | | | | | | | | | |
NET INVESTMENT INCOME (LOSS) | | | 113,529 | | | | 89,214 | | | | 1,871,395 | | | | (17,047 | ) | | | 2,061,835 | |
| | | | | | | | | | | | | | | | | | | | |
Net Realized gain (loss) from affiliates | | | (6,722 | ) | | | (53,870 | ) | | | (16,378 | ) | | | — | | | | (76,970 | ) |
Net distributions of realized gain (loss) received from affiliates | | | 63,094 | | | | 53,662 | | | | — | | | | — | | | | 116,756 | |
REALIZED AND UNREALIZED GAIN (LOSS) | | | | | | | | | | | | | | | | | | | | |
Net Realized gain (loss) on Investments | | | (10,918 | ) | | | (124,792 | ) | | | 287,348 | | | | — | | | | 151,638 | |
Net Distributions of realized gain received from Underlying funds | | | 65,466 | | | | 54,652 | | | | — | | | | — | | | | 120,118 | |
| | | | | | | | | | | | | | | | | | | | |
Net realized gain (loss) | | | 54,548 | | | | (70,140 | ) | | | 287,348 | | | | — | | | | 271,756 | |
| | | | | | | | | | | | | | | | | | | | |
Net Change in unrealized appreciation (depreciation) from Affiliates | | | 70,801 | | | | 164,261 | | | | 36,295 | | | | — | | | | 271,357 | |
Net Change in unrealized appreciation (depreciation) on: | | | | | | | | | | | | | | | | | | | | |
Investments | | | 151,231 | | | | 302,823 | | | | 979,426 | | | | — | | | | 1,433,480 | |
| | | | | | | | | | | | | | | | | | | | |
Net change in unrealized appreciation (depreciation) | | | 151,231 | | | | 302,823 | | | | 979,426 | | | | — | | | | 1,433,480 | |
| | | | | | | | | | | | | | | | | | | | |
NET REALIZED AND UNREALIZED GAIN (LOSS) | | | 205,779 | | | | 232,683 | | | | 1,266,774 | | | | — | | | | 1,705,236 | |
| | | | | | | | | | | | | | | | | | | | |
NET INCREASE (DECREASE) IN NET ASSETS RESULTING FROM OPERATIONS | | $ | 319,308 | | | $ | 321,897 | | | $ | 3,138,169 | | | $ | (17,047 | ) | | $ | 3,762,327 | |
| | | | | | | | | | | | | | | | | | | | |
| (a) | | Reflects adjustment made for the impact of the seed capital withdrawal. |
| (b) | | Reflects adjustment in expenses due to elimination of duplicative expenses. |
| (c) | | Reflects adjustment of waiver due to change in expense limitation agreement. |
| (d) | | Reflects adjustment due to change in management fees |
Note that the reorganization expenses for the CharterSM Income Strategies and CharterSM Interest Rate Strategies, which are estimated to be $33,333 for each Portfolio, exceed the expense limit and will be paid by FMG LLC.
92
NOTES TO PRO FORMA COMBINED FINANCIAL STATEMENTS
As of December 31, 2016
NOTE 1 – BASIS OF COMBINATION AND SIGNIFICANT ACCOUNTING POLICIES:
EQ Advisors Trust (the “Trust”) was organized as a Delaware statutory trust on October 31, 1996 and is registered under the Investment Company Act of 1940, as amended, as an open-end management investment company with numerous portfolios. The Board of Trustees of the Trust and the Board of Trustees of the AXA Premier VIP Trust (“VIP Trust”), approved proposed Plans of Reorganization and Termination and an Agreement and Plan of Reorganization and Termination (each a “Reorganization Plan”) on December 1, 2016 that provide for the transfer of all assets of the CharterSM Income Strategies Portfolio (“Income Strategies Portfolio”) and CharterSM Interest Rate StrategiesPortfolio (“Interest Rate Strategies Portfolio”), each a series of the VIP Trust, (each an “Acquired Portfolio” and together the “Acquired Portfolios”) to the AXA/DoubleLine Opportunistic Core Plus Bond Portfolio, a series of the Trust and the assumption by AXA/DoubleLine Opportunistic Core Plus Bond Portfolio of all of the liabilities of the Acquired Portfolios in exchange for shares of the AXA/DoubleLine Opportunistic Core Plus Bond Portfolio having an aggregate value equal to the net assets of the Acquired Portfolios, the distribution of the AXA/DoubleLine Opportunistic Core Plus Bond Portfolio shares to the Acquired Portfolios shareholders of record determined immediately after the close of business on the closing date, and the subsequent liquidation of the Acquired Portfolios (with respect to each Acquired Portfolio, each, a “Reorganization” and together, the “Reorganizations”). The consummation of one Reorganization is not contingent on the consummation of any other Reorganization.
The Income Strategies Portfolio’s annual contractual management fee equals 0.15% of average daily net assets. The Interest Rate Strategies Portfolio’s annual contractual management fee equals 0.15% of average daily net assets. The AXA/DoubleLine Opportunistic Core Plus Bond Portfolio’s annual contractual management fee equals 0.60% of average daily net assets for the first $750 million, 0.575% of average daily net assets on the next $750 million, 0.55% on the next $1 billion, 0.53% on the next $2.5 billion, and 0.52% of average daily nets assets thereafter. The Reorganization Plans are subject to the approval of the Acquired Portfolios’ shareholders. A special meeting of shareholders of the Acquired Portfolios will be held on or about March 28, 2017.
The Reorganizations of the Income Strategies Portfolio and the Interest Rate Strategies Portfolio into the AXA/DoubleLine Opportunistic Core Plus Bond Portfolio will be accounted for as taxable reorganizations of investment companies. The unaudited pro forma combined financial statements are presented for the information of the reader and may not necessarily be representative of what the actual combined financial statements would have been had the Reorganizations occurred at December 31, 2016. The unaudited pro forma combined portfolio of investments and statement of assets and liabilities reflect the financial position of the AXA/DoubleLine Opportunistic Core Plus Bond Portfolio and the Acquired Portfolios at December 31, 2016. The unaudited pro forma combined statement of operations reflects the results of operations of the AXA/DoubleLine Opportunistic Core Plus Bond Portfolio as if it had acquired the Acquired Portfolios at the beginning of the year ended December 31, 2016. These statements have been derived from the Portfolios’ respective books and records utilized in calculating daily net asset value at the dates indicated above for each Portfolio under accounting principles generally accepted in the United States of America. The historical cost of investment securities will be carried forward to the surviving entity and results of operations of the AXA/DoubleLine Opportunistic Core Plus Bond Portfolio for pre-combination periods will not be restated.
The unaudited pro forma combined portfolio of investments and statements of assets and liabilities and operations should be read in conjunction with the historical financial statements of the Portfolios included in the Trust’s Statement of Additional Information and the VIP Trust’s Statement of Additional Information, each of the Portfolios has substantially the same significant policies as detailed in the historical financial statements. The preparation of financial statements in accordance with accounting principles generally accepted in the United States of America requires management to make estimates and assumptions that affect the reported amounts and disclosures. Actual results could differ from those estimates.
Following the Reorganizations, the AXA/DoubleLine Opportunistic Core Plus Bond Portfolio is the “accounting survivor.” The general criteria that are applied to determine the proper accounting survivor are outlined in the “AICPA Accounting and Audit Guide for Investment Companies.” The legal survivor normally is considered the accounting survivor of a reorganization. In this case, the Alt 20 Portfolio is the legal survivor. Other criteria include:
| a) | | Portfolio Management – The merged entity will be managed by the Manager, Sub-Advisers and portfolio managers to the AXA/DoubleLine Opportunistic Core Plus Bond Portfolio in a manner consistent with the current management style. |
| b) | | Portfolio Composition – The merged entity’s portfolio holdings are expected to be consistent with the AXA/DoubleLine Opportunistic Core Plus Bond Portfolio’s current investment strategies and will more closely resemble the current portfolio holdings of the AXA/DoubleLine Opportunistic Core Plus Bond Portfolio than those of the Acquired Portfolios. |
93
| c) | | Investment Objective, Policies and Restrictions – The merged entity’s investment objective, policies and fundamental and non-fundamental investment restrictions will be the same as the AXA/DoubleLine Opportunistic Core Plus Bond Portfolio’s current investment objective, policies and fundamental and non-fundamental investment restrictions. |
| d) | | Expense Structure and Expense Ratios – The merged entity’s expense structure will be the same as that of AXA/DoubleLine Opportunistic Core Plus Bond Portfolio. The expense ratio of the merged entity will be the same as that of the AXA/DoubleLine Opportunistic Core Plus Bond Portfolio and lower than the Acquired Portfolios. |
| e) | | Asset Size – The AXA/DoubleLine Opportunistic Core Plus Bond Portfolio is significantly larger than the Acquired Portfolios. |
NOTE 2 – SHARES:
The unaudited pro forma net asset value per share assumes additional common shares of beneficial interest issued in connection with the proposed acquisition of the Acquired Portfolios by the AXA/DoubleLine Opportunistic Core Plus Bond Portfolio as of December 31, 2016. The number of additional shares issued was calculated based on the net assets of the Acquired Portfolios and net asset value per share of the AXA/DoubleLine Opportunistic Core Plus Bond Portfolio at December 31, 2016.
NOTE 3 – VALUATION:
Equity securities (including securities issued by exchange-traded funds (“ETFs”)) listed on national securities exchanges are valued at the last sale price or official closing price on the date of valuation or, if there is no sale or official closing price, at the latest available bid price. Securities listed on the NASDAQ stock market will be valued using the NASDAQ Official Closing Price (“NOCP”). Generally, the NOCP will be the last sale price unless the reported trade for the security is outside the range of the bid/ask price. In such cases, the NOCP will be normalized to the nearer of the bid or ask price. Other unlisted stocks are valued at their last sale price or official closing price, or if there is no such price, at a bid price estimated by a broker.
Corporate and Municipal bonds and notes are generally valued on the basis of prices provided by a pricing service. The pricing service may utilize many factors in making evaluations, trading in similar groups of securities and any developments related to specific securities. However, when such prices are not available, such bonds and notes are valued at a bid price estimated by a broker.
Mortgage-backed and asset-backed securities are valued at evaluated prices obtained from a pricing service where available, or at a bid price obtained from one or more of the major dealers in such securities. The pricing service may utilize data such as issuer type, coupon, cash flows, collateral performance, mortgage prepayment projection tables and Adjustable Rate Mortgage evaluations that incorporate index data, periodic and life caps, the next coupon reset date and the convertibility of the bond in making evaluations. If a quoted price is unavailable, an equivalent yield or yield spread quotes will be obtained from a broker and converted to a price.
U.S. Treasury securities and other obligations issued or guaranteed by the U.S. Government, its agencies or instrumentalities, are valued at prices obtained from a bond pricing service where available. The pricing service may utilize data received from active market makers and broker-dealers, yield curves and the spread over comparable U.S. Treasury issues in making evaluations.
Foreign securities, including foreign government securities, not traded directly in the U.S., or traded in American Depositary Receipts (“ADR”) or similar form, are valued at representative quoted prices from the primary exchange in the currency of the country of origin. Foreign currency is converted into U.S. dollar equivalent at current exchange rates.
Investments in shares of open-end investment companies (other than ETFs) held by a Portfolio will be valued at the net asset value (“NAV”) of the shares of such funds as described in the underlying funds’ prospectuses.
Forward foreign exchange contracts are valued by interpolating between the forward and spot currency rates as quoted by a pricing service as of a designated hour on the valuation date. The pricing service may utilize data such as actual trading information and foreign currency exchange rates gathered from leading market makers and foreign currency exchange trading centers throughout the world in making evaluations. Forward foreign exchange contracts may be settled with the counterparty in U.S. Dollars without the delivery of foreign currency.
If market quotations are not readily available for a security or other financial instruments, such securities and instruments shall be referred to the Trust’s Valuation Committee (“Committee”), who will value the assets in good faith pursuant to procedures (“Pricing Procedures”) adopted by the Board of Trustees of the Trust (the “Board”).
The Board is responsible for ensuring that appropriate valuation methods are used to price securities for the Trust’s Portfolios. The Board has delegated the responsibility of calculating the NAVs of the Trust’s Portfolios and classes pursuant to these Pricing Procedures
94
to the Trust’s administrator, FMG LLC (in its capacity as administrator, the “Administrator”). The Administrator has entered into a subadministration agreement with JPMorgan Chase Bank, N.A. (the “Sub- Administrator”) to assist in performing certain of the duties described herein. The Committee, established by the Board, determines the value of the Trust’s securities and assets for which market quotations are not readily available or for which valuation cannot otherwise be provided in accordance with procedures adopted by the Board. The Committee is comprised of senior employees from FMG LLC.
Due to the inherent uncertainty of valuations of such securities, the fair value may differ significantly from the values that would have been used had a ready market for such securities existed.
Various inputs are used in determining the value of a Portfolio’s assets or liabilities carried at fair value. These inputs are summarized in three broad levels below:
| | • | | Level 1 - quoted prices in active markets for identical assets |
| | • | | Level 2 - other significant observable inputs (including quoted prices of similar securities, interest rates, prepayment speeds, credit risk, etc.) |
| | • | | Level 3 - significant unobservable inputs (including the Portfolio’s own assumptions in determining the fair value of investments) |
A summary of inputs used to value each Portfolio’s assets and liabilities carried at fair value as of December 31, 2016 is included in the Portfolio of Investments for each Portfolio. Changes in valuation techniques may result in transfers into or out of an investment’s assigned level. The Portfolios’ policy is to recognize transfers into and transfers out of the valuation levels as of the end of the reporting period.
Transfers between levels are included after the Summary of Level 1, Level 2 and Level 3 inputs, following the Portfolio of Investments for each Portfolio. Transfers between levels may be due to a decline or an increase in market activity (e.g., frequency of trades), which may result in a lack of, or increase in, available observable market inputs to determine price.
Transfers into and transfers out of Level 3, if material, are included in the Level 3 reconciliation following the Portfolio of Investments for each Portfolio.
The inputs or methodology used to value securities are not necessarily an indication of the risk associated with investing in those securities. An investment’s level within the fair value hierarchy is based on the lowest level of any input, both individually and in aggregate, that is significant to the fair value measurement.
The Committee has the ability to meet and review reports based on the valuation techniques used to value Level 3 securities. As part of a review, the Committee would consider obtaining updates from its pricing vendors and Sub-Advisers for fair valued securities. For example, with respect to model driven prices, the Committee could receive reports regarding a review and recalculation of pricing models and related discounts. For those securities which are valued based on broker quotes, the Committee may evaluate variances between existing broker quotes and any alternative broker quotes provided by a Sub-Adviser or other pricing source.
To substantiate unobservable inputs used in a fair valuation, the Secretary of the Committee can perform an independent verification as well as additional research for fair value notifications received from the pricing agents. Among other factors, particular areas of focus may include: description of security, historical pricing, intra-day price movement, last trade information, corporate actions, related securities, any available company news and announcements, any available trade data or other information. The Committee also notes the materiality of holdings and price changes on a Portfolio’s NAV.
The Committee reviews and considers changes in value for all fair valued securities that have occurred since the last review.
NOTE 4 – FEDERAL INCOME TAX CONSEQUENCES OF THE REORGANIZATIONS:
Each Portfolio, as well as the Acquiring Portfolio after the Reorganization, intends to comply with the requirements of the Internal Revenue Code of 1986, as amended applicable to regulated investment companies (“RICS”) and to distribute substantially all of its net investment income and net realized capital gains to shareholders of each Portfolio. Therefore, no Federal income tax provision is required.
The estimated percentage of the holdings of the Income Strategies Portfolio and the Interest Rate Strategies Portfolio that will be sold in connection with its respective Reorganization is 100% and 100%, respectively. The estimated portfolio transaction costs of the Reorganization of the Income Strategies Portfolio and the Interest Rate Strategies Portfolio are $500 and $400, respectively. These are estimated amounts and are subject to change. Contractholders who had premiums or contributions allocated to the investment divisions of the Separate Accounts that are invested in shares of the Acquired Portfolios will not recognize any gain or loss for federal income tax purposes as a result of the Reorganizations.
95
NOTE 5 – UNAUDITED PRO FORMA COMBINED ADJUSTMENTS:
The accompanying unaudited pro forma combined financial statements reflect changes in the AXA/DoubleLine Opportunistic Core Plus Bond Portfolio’s shares as if the merger had taken place on December 31, 2016. The Acquired Portfolios will bear the expenses of the Reorganization (i.e., the costs associated with preparing, printing and distributing the prospectus and proxy materials, legal and accounting fees in connection with the Reorganization, and expenses of holding the shareholders meeting) which are estimated at approximately $66,666 ($33,333 per Acquired Portfolio). However, FMG LLC has voluntarily agreed to pay expenses of the Reorganization that exceed the Acquired Portfolios’ expense limitations set forth in its expense limitation agreements.
96
EQ Advisors Trust
Financial Statements
December 31, 2016
EQ Advisors Trust Financial Statements
December 31, 2016
Table of Contents
EQ ADVISORS TRUST
ALL ASSET GROWTH-ALT 20 PORTFOLIO
PORTFOLIO OF INVESTMENTS
December 31, 2016
| | | | | | | | |
| | | Number of
Shares | | | Value (Note 1) | |
| | | | | | | | |
EXCHANGE TRADED FUNDS: | | | | | | | | |
iShares China Large-Cap Fund (x) | | | 38,800 | | | $ | 1,346,748 | |
iShares Gold Trust* | | | 1,028,100 | | | | 11,391,348 | |
iShares International Developed Property Fund (x) | | | 71,000 | | | | 2,386,310 | |
iShares JP Morgan USD Emerging Markets Bond Fund (x) | | | 47,660 | | | | 5,253,085 | |
iShares MSCI EAFE Small-Cap Fund | | | 80,600 | | | | 4,017,104 | |
iShares MSCI Global Gold Miners Fund | | | 9,750 | | | | 167,018 | |
iShares Silver Trust* | | | 76,950 | | | | 1,162,714 | |
iShares U.S. Oil & Gas Exploration & Production Fund (x) | | | 15,320 | | | | 1,002,541 | |
PowerShares DB Gold Fund (x)* | | | 26,900 | | | | 996,107 | |
PowerShares DB Silver Fund (x)*‡ | | | 70,000 | | | | 1,740,200 | |
SPDR S&P Emerging Asia Pacific Fund | | | 4,100 | | | | 308,033 | |
SPDR S&P Emerging Markets SmallCap Fund | | | 31,900 | | | | 1,267,068 | |
| | | | | | | | |
Total Exchange Traded
Funds (11.3%)
(Cost $28,170,292) | | | | | | | 31,038,276 | |
| | | | | | | | |
INVESTMENT COMPANIES: | | | | | | | | |
AXA Natural Resources Portfolio‡ | | | 1,504,427 | | | | 11,964,159 | |
AXA Real Estate Portfolio‡ | | | 1,067,135 | | | | 11,176,284 | |
AXA/AB Small Cap Growth Portfolio‡ | | | 912,351 | | | | 16,523,133 | |
AXA/Janus Enterprise Portfolio*‡ | | | 74,041 | | | | 1,177,460 | |
AXA/Loomis Sayles Growth Portfolio‡ | | | 2,091,832 | | | | 13,626,510 | |
EQ/BlackRock Basic Value Equity Portfolio‡ | | | 739,741 | | | | 17,126,779 | |
EQ/Boston Advisors Equity Income Portfolio‡ | | | 1,053,797 | | | | 6,068,611 | |
EQ/Emerging Markets Equity PLUS Portfolio‡ | | | 938,228 | | | | 7,509,871 | |
EQ/GAMCO Mergers and Acquisitions Portfolio‡ | | | 1,046,595 | | | | 13,669,683 | |
EQ/GAMCO Small Company Value Portfolio‡ | | | 281,723 | | | | 16,489,358 | |
EQ/Global Bond PLUS Portfolio‡ | | | 2,389,111 | | | | 20,941,495 | |
EQ/High Yield Bond Portfolio‡ | | | 879,168 | | | | 8,371,482 | |
EQ/Intermediate Government Bond Portfolio‡ | | | 465,277 | | | | 4,760,850 | |
EQ/International Equity Index Portfolio‡ | | | 1,128,677 | | | | 9,440,531 | |
EQ/Invesco Comstock Portfolio‡ | | | 795,725 | | | | 12,560,314 | |
EQ/JPMorgan Value Opportunities Portfolio‡ | | | 727,137 | | | | 13,492,012 | |
EQ/MFS International Growth Portfolio‡ | | | 2,910,996 | | | | 19,128,204 | |
EQ/PIMCO Global Real Return Portfolio‡ | | | 1,178,356 | | | | 11,438,117 | |
| | | | | | | | |
EQ/PIMCO Ultra Short Bond Portfolio‡ | | | 574,754 | | | $ | 5,671,102 | |
EQ/T. Rowe Price Growth Stock Portfolio*‡ | | | 376,510 | | | | 14,657,094 | |
Multimanager Core Bond Portfolio‡ | | | 640,212 | | | | 6,260,897 | |
| | | | | | | | |
Total Investment Companies (88.4%)
(Cost $217,363,003) | | | | | | | 242,053,946 | |
| | | | | | | | |
SHORT-TERM INVESTMENTS: | | | | | | | | |
Investment Company (0.3%) | | | | | | | | |
JPMorgan Prime Money Market Fund, IM Shares | | | 769,263 | | | | 769,494 | |
| | | | | | | | |
| | | Principal
Amount | | | Value
(Note 1) | |
Repurchase Agreements (1.7%) | | | | | | | | |
Citigroup Global Markets Ltd.,
0.71%, dated 12/30/16, due 1/3/17, repurchase price $300,024, collateralized by various Foreign Government Agency Securities, ranging from 0.000%-5.250%, maturing 1/23/17-1/24/44, U.S. Government Treasury Securities, ranging from 0.000%-5.375%, maturing 2/15/19-2/15/44; total market value $306,000. (xx) | | $ | 300,000 | | | | 300,000 | |
Deutsche Bank AG,
1.05%, dated 12/30/16, due 1/3/17, repurchase price $1,000,117, collateralized by various Common Stocks; total market value $1,111,555. (xx) | | | 1,000,000 | | | | 1,000,000 | |
Deutsche Bank AG,
1.05%, dated 12/30/16, due 1/3/17, repurchase price $2,500,292, collateralized by various Common Stocks; total market value $2,778,888. (xx) | | | 2,500,000 | | | | 2,500,000 | |
Deutsche Bank AG,
0.95%, dated 12/30/16, due 1/3/17, repurchase price $200,021, collateralized by various Corporate Bonds, ranging from 1.875%-2.500%, maturing 3/13/19-6/10/25; total market value $204,001. (xx) | | | 200,000 | | | | 200,000 | |
Deutsche Bank Securities, Inc.,
0.50%, dated 12/30/16, due 1/3/17, repurchase price $394,328, collateralized by various U.S. Government Treasury Securities, 0.000%, maturing 2/15/40-5/15/40; total market value $402,193. (xx) | | | 394,307 | | | | 394,307 | |
See Notes to Financial Statements.
2
EQ ADVISORS TRUST
ALL ASSET GROWTH-ALT 20 PORTFOLIO
PORTFOLIO OF INVESTMENTS (Continued)
December 31, 2016
| | | | | | | | |
| | | Principal
Amount | | | Value
(Note 1) | |
| | | | | | | | |
Macquarie Bank Ltd.,
0.76%, dated 12/30/16, due 1/3/17, repurchase price $300,025, collateralized by various U.S. Government Treasury Securities, ranging from 0.000%-8.750%, maturing 1/5/17-5/15/46; total market value $306,155. (xx) | | $ | 300,000 | | | $ | 300,000 | |
| | | | | | | | |
Total Repurchase Agreements | | | | | | | 4,694,307 | |
| | | | | | | | |
Total Short-Term Investments (2.0%)
(Cost $5,463,603) | | | | | | | 5,463,801 | |
| | | | | | | | |
Total Investments (101.7%)
(Cost $250,996,898) | | | | | | | 278,556,023 | |
Other Assets Less Liabilities (-1.7%) | | | | | | | (4,761,991 | ) |
| | | | | | | | |
Net Assets (100%) | | | | | | $ | 273,794,032 | |
| | | | | | | | |
| ‡ | All, or a portion, of the security is an affiliated company as defined under the Investment Company Act of 1940. |
| (x) | All or a portion of security is on loan at December 31, 2016. |
| (xx) | At December 31, 2016, the Portfolio had loaned securities with a total value of $4,576,355. This was secured by cash collateral of $4,694,307 which was subsequently invested in joint repurchase agreements with a total value of $4,694,307, as detailed in the Notes to the Financial Statements, for which the Portfolio has a proportionate interest as reported in the Portfolio of Investments as Repurchase Agreements. |
The holdings in affiliated Investment Companies are all Class K shares except PowerShares DB Silver Fund.
Investments in companies which were affiliates for the year ended December 31, 2016, were as follows:
| | | | | | | | | | | | | | | | | | | | | | | | |
Securities | | Value
December 31,
2015 | | | Purchases
at Cost | | | Sales
at Cost | | | Value
December 31,
2016 | | | Dividend
Income | | | Realized
Gain
(Loss)† | |
AXA Natural Resources Portfolio | | $ | 8,390,693 | | | $ | 1,927,283 | | | $ | 1,129,314 | | | $ | 11,964,159 | | | $ | 278,921 | | | $ | (31,804 | ) |
AXA Real Estate Portfolio (a) | | | 10,561,781 | | | | 1,378,359 | | | | 1,046,574 | | | | 11,176,284 | | | | 100,497 | | | | 177,334 | |
AXA/AB Small Cap Growth Portfolio | | | 15,952,175 | | | | 1,491,708 | | | | 1,684,527 | | | | 16,523,133 | | | | 99,499 | | | | 1,068,651 | |
AXA/Janus Enterprise Portfolio (b) | | | 1,562,479 | | | | 11,128 | | | | 339,431 | | | | 1,177,460 | | | | — | | | | 5,921 | |
AXA/Loomis Sayles Growth Portfolio | | | 9,753,249 | | | | 3,966,410 | | | | 912,928 | | | | 13,626,510 | | | | 77,480 | | | | 376,002 | |
EQ/BlackRock Basic Value Equity Portfolio | | | 16,250,142 | | | | 618,405 | | | | 1,871,422 | | | | 17,126,779 | | | | 289,888 | | | | 418,063 | |
EQ/Boston Advisors Equity Income Portfolio | | | 6,831,906 | | | | 1,060,956 | | | | 1,693,567 | | | | 6,068,611 | | | | 130,131 | | | | 729,777 | |
EQ/Emerging Markets Equity PLUS Portfolio | | | 8,197,362 | | | | 205,548 | | | | 1,625,934 | | | | 7,509,871 | | | | 78,380 | | | | 11,931 | |
EQ/GAMCO Mergers and Acquisitions Portfolio | | | 12,996,579 | | | | 1,121,785 | | | | 761,218 | | | | 13,669,683 | | | | 34,937 | | | | 672,451 | |
EQ/GAMCO Small Company Value Portfolio | | | 14,783,633 | | | | 978,664 | | | | 1,851,289 | | | | 16,489,358 | | | | 119,963 | | | | 634,156 | |
EQ/Global Bond PLUS Portfolio | | | 25,150,906 | | | | 1,666,731 | | | | 5,768,951 | | | | 20,941,495 | | | | 463,877 | | | | (66,758 | ) |
EQ/High Yield Bond Portfolio | | | 7,837,523 | | | | 782,190 | | | | 732,942 | | | | 8,371,482 | | | | 433,828 | | | | (5,433 | ) |
EQ/Intermediate Government Bond Portfolio | | | 2,950,097 | | | | 2,719,250 | | | | 868,957 | | | | 4,760,850 | | | | 38,294 | | | | 7,347 | |
EQ/International Equity Index Portfolio | | | 10,043,990 | | | | 468,557 | | | | 1,099,392 | | | | 9,440,531 | | | | 277,804 | | | | (92,595 | ) |
EQ/Invesco Comstock Portfolio | | | 11,626,948 | | | | 596,339 | | | | 1,274,589 | | | | 12,560,314 | | | | 320,809 | | | | (9,214 | ) |
EQ/JPMorgan Value Opportunities Portfolio | | | 10,574,246 | | | | 1,659,571 | | | | 1,204,350 | | | | 13,492,012 | | | | 159,571 | | | | 95,650 | |
EQ/MFS International Growth Portfolio | | | 20,266,149 | | | | 1,027,059 | | | | 2,252,791 | | | | 19,128,204 | | | | 238,354 | | | | 161,456 | |
EQ/PIMCO Global Real Return Portfolio | | | 10,664,883 | | | | 1,983,941 | | | | 1,700,309 | | | | 11,438,117 | | | | 559,415 | | | | 24,487 | |
EQ/PIMCO Ultra Short Bond Portfolio | | | 7,977,458 | | | | 823,302 | | | | 3,228,965 | | | | 5,671,102 | | | | 64,342 | | | | (56,633 | ) |
EQ/T. Rowe Price Growth Stock Portfolio | | | 15,149,696 | | | | 1,084,651 | | | | 1,531,574 | | | | 14,657,094 | | | | — | | | | 289,046 | |
Multimanager Core Bond Portfolio | | | 4,661,809 | | | | 1,803,323 | | | | 180,111 | | | | 6,260,897 | | | | 124,664 | | | | 5,446 | |
PowerShares DB Silver Fund | | | 1,073,817 | | | | 551,765 | | | | — | | | | 1,740,200 | | | | — | | | | — | |
| | | | | | | | | | | | | | | | | | | | | | | | |
| | $ | 233,257,521 | | | $ | 27,926,925 | | | $ | 32,759,135 | | | $ | 243,794,146 | | | $ | 3,890,654 | | | $ | 4,415,281 | |
| | | | | | | | | | | | | | | | | | | | | | | | |
| † | When applicable, realized gain includes net distributions of realized gain received from underlying funds. |
| (a) | Formerly known as EQ/Real Estate PLUS Portfolio. |
| (b) | Formerly known as EQ/Morgan Stanley Mid Cap Growth Portfolio. |
See Notes to Financial Statements.
3
EQ ADVISORS TRUST
ALL ASSET GROWTH-ALT 20 PORTFOLIO
PORTFOLIO OF INVESTMENTS (Continued)
December 31, 2016
The following is a summary of the inputs used to value the Portfolio’s assets and liabilities carried at fair value as of December 31, 2016:
The inputs or methodology used for valuing securities are not necessarily an indication of the risk associated with investing in those securities.
Various inputs are used in determining the value of the Portfolio’s investments. These inputs are summarized in the three broad levels listed below:
| | | | | | | | | | | | | | | | |
| | | | | |
| Investment Type | | Level 1
Quoted Prices in
Active Markets for
Identical
Securities | | | Level 2
Significant Other
Observable Inputs
(including quoted prices
for similar securities,
interest rates,
prepayment speeds,
credit risk, etc.) | | | Level 3
Significant Unobservable
Inputs (including the
Portfolio’s own
assumptions in
determining the fair
value of investments) | | | Total | |
Assets: | | | | | |
Exchange Traded Funds | | | | | | | | | | | | | | | | |
Exchange Traded Funds | | $ | 31,038,276 | | | $ | — | | | $ | — | | | $ | 31,038,276 | |
Investment Companies | | | | | | | | | | | | | | | | |
Investment Companies | | | — | | | | 242,053,946 | | | | — | | | | 242,053,946 | |
Short-Term Investments | | | | | | | | | | | | | | | | |
Investment Companies | | | 769,494 | | | | — | | | | — | | | | 769,494 | |
Repurchase Agreements | | | — | | | | 4,694,307 | | | | — | | | | 4,694,307 | |
| | | | | | | | | | | | | | | | |
Total Assets | | $ | 31,807,770 | | | $ | 246,748,253 | | | $ | — | | | $ | 278,556,023 | |
| | | | | | | | | | | | | | | | |
Total Liabilities | | $ | — | | | $ | — | | | $ | — | | | $ | — | |
| | | | | | | | | | | | | | | | |
Total | | $ | 31,807,770 | | | $ | 246,748,253 | | | $ | — | | | $ | 278,556,023 | |
| | | | | | | | | | | | | | | | |
There were no transfers between Levels 1, 2 or 3 during the year ended December 31, 2016.
The Portfolio held no derivatives contracts during the year ended December 31, 2016.
Investment security transactions for the year ended December 31, 2016 were as follows:
| | | | |
Cost of Purchases: | | | | |
Long-term investments other than U.S. government debt securities | | $ | 29,740,840 | |
Net Proceeds of Sales and Redemptions: | | | | |
Long-term investments other than U.S. government debt securities | | $ | 37,558,272 | |
As of December 31, 2016, the gross unrealized appreciation (depreciation) of investments based on the aggregate cost of investments for Federal income tax purposes was as follows:
| | | | |
Aggregate gross unrealized appreciation | | $ | 36,766,963 | |
Aggregate gross unrealized depreciation | | | (8,673,992 | ) |
| | | | |
Net unrealized appreciation | | $ | 28,092,971 | |
| | | | |
Federal income tax cost of investments | | $ | 250,463,052 | |
| | | | |
See Notes to Financial Statements.
4
EQ ADVISORS TRUST
ALL ASSET GROWTH-ALT 20 PORTFOLIO
STATEMENT OF ASSETS AND LIABILITIES
December 31, 2016
| | | | |
ASSETS | |
Investments at value (x): | | | | |
Affiliated Issuers (Cost $219,237,919) | | $ | 243,794,146 | |
Unaffiliated Issuers (Cost $27,064,672) | | | 30,067,570 | |
Repurchase Agreements (Cost $4,694,307) | | | 4,694,307 | |
Cash | | | 103,606 | |
Receivable for securities sold | | | 927,032 | |
Receivable from Separate Accounts for Trust shares sold | | | 43,178 | |
Securities lending income receivable | | | 5,814 | |
Dividends, interest and other receivables | | | 523 | |
Other assets | | | 892 | |
| | | | |
Total assets | | | 279,637,068 | |
| | | | |
LIABILITIES | |
Payable for return of collateral on securities loaned | | | 4,694,307 | |
Payable for securities purchased | | | 733,452 | |
Payable to Separate Accounts for Trust shares redeemed | | | 253,211 | |
Distribution fees payable – Class IB | | | 53,991 | |
Administrative fees payable | | | 32,738 | |
Distribution fees payable – Class IA | | | 3,856 | |
Investment management fees payable | | | 1,049 | |
Trustees’ fees payable | | | 503 | |
Accrued expenses | | | 69,929 | |
| | | | |
Total liabilities | | | 5,843,036 | |
| | | | |
NET ASSETS | | $ | 273,794,032 | |
| | | | |
Net assets were comprised of: | |
Paid in capital | | $ | 340,083,732 | |
Accumulated undistributed net investment income (loss) | | | 333,143 | |
Accumulated undistributed net realized gain (loss) on investments | | | (94,181,968 | ) |
Net unrealized appreciation (depreciation) on investments | | | 27,559,125 | |
| | | | |
Net assets | | $ | 273,794,032 | |
| | | | |
Class IA | | | | |
Net asset value, offering and redemption price per share, $18,357,789 / 971,475 shares outstanding (unlimited amount authorized: $0.01 par value) | | $ | 18.90 | |
| | | | |
Class IB | | | | |
Net asset value, offering and redemption price per share, $253,965,896 / 13,405,347 shares outstanding (unlimited amount authorized: $0.01 par value) | | $ | 18.95 | |
| | | | |
Class K | | | | |
Net asset value, offering and redemption price per share, $1,470,347 / 77,963 shares outstanding (unlimited amount authorized: $0.01 par value) | | $ | 18.86 | |
| | | | |
| (x) | Includes value of securities on loan of $4,576,355. |
STATEMENT OF OPERATIONS
For the Year Ended December 31, 2016
| | | | |
INVESTMENT INCOME | |
Dividends ($3,890,654 of dividend income received from affiliates) | | $ | 4,503,857 | |
Interest | | | 1,670 | |
Securities lending (net) | | | 39,228 | |
| | | | |
Total income | | | 4,544,755 | |
| | | | |
EXPENSES | |
Distribution fees – Class IB | | | 625,818 | |
Administrative fees | | | 394,825 | |
Investment management fees | | | 267,892 | |
Custodian fees | | | 124,050 | |
Printing and mailing expenses | | | 61,750 | |
Professional fees | | | 43,453 | |
Distribution fees – Class IA | | | 40,592 | |
Trustees’ fees | | | 6,082 | |
Miscellaneous | | | 4,604 | |
| | | | |
Gross expenses | | | 1,569,066 | |
Less: Waiver from investment manager | | | (22,212 | ) |
| | | | |
Net expenses | | | 1,546,854 | |
| | | | |
NET INVESTMENT INCOME (LOSS) | | | 2,997,901 | |
| | | | |
REALIZED AND UNREALIZED GAIN (LOSS) | |
Net realized gain (loss) on investments ($719,702 of realized gain (loss) from affiliates) | | | 1,160,675 | |
Net distributions of realized gain received from underlying funds (All realized gains received from affiliates) | | | 3,695,579 | |
| | | | |
Net realized gain (loss) | | | 4,856,254 | |
| | | | |
Net change in unrealized appreciation (depreciation) on investments ($15,368,835 of change in unrealized appreciation (depreciation) from affiliates) | | | 16,690,231 | |
| | | | |
NET REALIZED AND UNREALIZED GAIN (LOSS) | | | 21,546,485 | |
| | | | |
NET INCREASE (DECREASE) IN NET ASSETS RESULTING FROM OPERATIONS | | $ | 24,544,386 | |
| | | | |
See Notes to Financial Statements.
5
EQ ADVISORS TRUST
ALL ASSET GROWTH-ALT 20 PORTFOLIO
STATEMENT OF CHANGES IN NET ASSETS
| | | | | | | | |
| | | Year Ended December 31, | |
| | | 2016 | | | 2015 | |
INCREASE (DECREASE) IN NET ASSETS FROM OPERATIONS: | | | | | | | | |
Net investment income (loss) | | $ | 2,997,901 | | | $ | 1,765,857 | |
Net realized gain (loss) on investments and net distributions of realized gain received from underlying funds | | | 4,856,254 | | | | 8,839,024 | |
Net change in unrealized appreciation (depreciation) on investments | | | 16,690,231 | | | | (21,445,361 | ) |
| | | | | | | | |
NET INCREASE (DECREASE) IN NET ASSETS RESULTING FROM OPERATIONS | | | 24,544,386 | | | | (10,840,480 | ) |
| | | | | | | | |
DIVIDENDS AND DISTRIBUTIONS: | | | | | | | | |
Dividends from net investment income | | | | | | | | |
Class IA | | | (235,749 | ) | | | (125,303 | ) |
Class IB | | | (3,273,856 | ) | | | (2,154,819 | ) |
Class K | | | (22,511 | ) | | | (13,313 | ) |
| | | | | | | | |
| | | (3,532,116 | ) | | | (2,293,435 | ) |
| | | | | | | | |
Distributions from net realized capital gains | | | | | | | | |
Class IA | | | (352,382 | ) | | | (428,083 | ) |
Class IB | | | (5,287,707 | ) | | | (7,400,691 | ) |
Class K | | | (29,242 | ) | | | (33,277 | ) |
| | | | | | | | |
| | | (5,669,331 | ) | | | (7,862,051 | ) |
| | | | | | | | |
TOTAL DIVIDENDS AND DISTRIBUTIONS | | | (9,201,447 | ) | | | (10,155,486 | ) |
| | | | | | | | |
CAPITAL SHARES TRANSACTIONS: | | | | | | | | |
Class IA | | | | | | | | |
Capital shares sold [ 199,159 and 234,159 shares, respectively ] | | | 3,682,880 | | | | 4,525,051 | |
Capital shares issued in reinvestment of dividends and distributions [ 30,746 and 30,625 shares, respectively ] | | | 588,131 | | | | 553,386 | |
Capital shares repurchased [ (83,891) and (89,448) shares, respectively ] | | | (1,542,041 | ) | | | (1,679,706 | ) |
| | | | | | | | |
Total Class IA transactions | | | 2,728,970 | | | | 3,398,731 | |
| | | | | | | | |
Class IB | | | | | | | | |
Capital shares sold [ 758,070 and 745,781 shares, respectively ] | | | 14,029,294 | | | | 14,339,901 | |
Capital shares issued in reinvestment of dividends and distributions [ 446,186 and 527,474 shares, respectively ] | | | 8,561,563 | | | | 9,555,510 | |
Capital shares repurchased [ (1,649,726) and (1,735,098) shares, respectively ] | | | (30,638,274 | ) | | | (33,441,027 | ) |
| | | | | | | | |
Total Class IB transactions | | | (8,047,417 | ) | | | (9,545,616 | )�� |
| | | | | | | | |
Class K | | | | | | | | |
Capital shares sold [ 29,927 and 24,103 shares, respectively ] | | | 558,915 | | | | 465,580 | |
Capital shares issued in reinvestment of dividends and distributions [ 2,710 and 2,583 shares, respectively ] | | | 51,753 | | | | 46,590 | |
Capital shares repurchased [ (21,575) and (8,122) shares, respectively ] | | | (403,904 | ) | | | (158,802 | ) |
| | | | | | | | |
Total Class K transactions | | | 206,764 | | | | 353,368 | |
| | | | | | | | |
NET INCREASE (DECREASE) IN NET ASSETS RESULTING FROM CAPITAL SHARE TRANSACTIONS | | | (5,111,683 | ) | | | (5,793,517 | ) |
| | | | | | | | |
TOTAL INCREASE (DECREASE) IN NET ASSETS | | | 10,231,256 | | | | (26,789,483 | ) |
NET ASSETS: | | | | | | | | |
Beginning of year | | | 263,562,776 | | | | 290,352,259 | |
| | | | | | | | |
End of year (a) | | $ | 273,794,032 | | | $ | 263,562,776 | |
| | | | | | | | |
(a) Includes accumulated undistributed (overdistributed) net investment income (loss) of | | $ | 333,143 | | | $ | 292,906 | |
| | | | | | | | |
See Notes to Financial Statements.
6
EQ ADVISORS TRUST
ALL ASSET GROWTH-ALT 20 PORTFOLIO
FINANCIAL HIGHLIGHTS
| | | | | | | | | | | | | | | | | | | | |
| | | Year Ended December 31, | |
| Class IA | | 2016 | | | 2015 | | | 2014 | | | 2013 | | | 2012 | |
Net asset value, beginning of year | | $ | 17.84 | | | $ | 19.30 | | | $ | 19.59 | | | $ | 18.42 | | | $ | 17.11 | |
| | | | | | | | | | | | | | | | | | | | |
Income (loss) from investment operations: | | | | | | | | | | | | | | | | | | | | |
Net investment income (loss) (e)(x) | | | 0.23 | | | | 0.14 | | | | 0.24 | | | | 0.21 | | | | 0.25 | |
Net realized and unrealized gain (loss) on investments | | | 1.48 | | | | (0.90 | ) | | | 0.25 | | | | 2.37 | | | | 1.80 | |
| | | | | | | | | | | | | | | | | | | | |
Total from investment operations | | | 1.71 | | | | (0.76 | ) | | | 0.49 | | | | 2.58 | | | | 2.05 | |
| | | | | | | | | | | | | | | | | | | | |
Less distributions: | | | | | | | | | | | | | | | | | | | | |
Dividends from net investment income | | | (0.25 | ) | | | (0.16 | ) | | | (0.28 | ) | | | (0.27 | ) | | | (0.29 | ) |
Distributions from net realized gains | | | (0.40 | ) | | | (0.54 | ) | | | (0.50 | ) | | | (1.14 | ) | | | (0.45 | ) |
| | | | | | | | | | | | | | | | | | | | |
Total dividends and distributions | | | (0.65 | ) | | | (0.70 | ) | | | (0.78 | ) | | | (1.41 | ) | | | (0.74 | ) |
| | | | | | | | | | | | | | | | | | | | |
Net asset value, end of year | | $ | 18.90 | | | $ | 17.84 | | | $ | 19.30 | | | $ | 19.59 | | | $ | 18.42 | |
| | | | | | | | | | | | | | | | | | | | |
Total return | | | 9.55 | % | | | (3.94 | )% | | | 2.42 | % | | | 14.12 | % | | | 11.98 | % |
| | | | | | | | | | | | | | | | | | | | |
Ratios/Supplemental Data: | | | | | | | | | | | | | | | | | | | | |
Net assets, end of year (000’s) | | $ | 18,358 | | | $ | 14,722 | | | $ | 12,546 | | | $ | 9,868 | | | $ | 6,218 | |
Ratio of expenses to average net assets: | | | | | | | | | | | | | | | | | | | | |
After waivers and reimbursements (f) | | | 0.58 | % | | | 0.57 | % | | | 0.51 | % | | | 0.35 | % | | | 0.35 | % |
Before waivers and reimbursements (f) | | | 0.59 | % | | | 0.57 | % | | | 0.58 | % | | | 0.58 | % | | | 0.62 | % |
Ratio of net investment income (loss) to average net assets: | | | | | | | | | | | | | | | | | | | | |
After waivers and reimbursements (f)(x) | | | 1.26 | % | | | 0.71 | % | | | 1.21 | % | | | 1.09 | % | | | 1.37 | % |
Before waivers and reimbursements (f)(x) | | | 1.25 | % | | | 0.71 | % | | | 1.14 | % | | | 0.86 | % | | | 1.09 | % |
Portfolio turnover rate^ | | | 11 | % | | | 14 | % | | | 18 | % | | | 43 | % | | | 43 | % |
| |
| | | Year Ended December 31, | |
| Class IB | | 2016 | | | 2015 | | | 2014 | | | 2013 | | | 2012 | |
Net asset value, beginning of year | | $ | 17.88 | | | $ | 19.34 | | | $ | 19.64 | | | $ | 18.46 | | | $ | 17.15 | |
| | | | | | | | | | | | | | | | | | | | |
Income (loss) from investment operations: | | | | | | | | | | | | | | | | | | | | |
Net investment income (loss) (e)(x) | | | 0.21 | | | | 0.12 | | | | 0.21 | | | | 0.17 | | | | 0.22 | |
Net realized and unrealized gain (loss) on investments | | | 1.51 | | | | (0.88 | ) | | | 0.27 | | | | 2.42 | | | | 1.83 | |
| | | | | | | | | | | | | | | | | | | | |
Total from investment operations | | | 1.72 | | | | (0.76 | ) | | | 0.48 | | | | 2.59 | | | | 2.05 | |
| | | | | | | | | | | | | | | | | | | | |
Less distributions: | | | | | | | | | | | | | | | | | | | | |
Dividends from net investment income | | | (0.25 | ) | | | (0.16 | ) | | | (0.28 | ) | | | (0.27 | ) | | | (0.29 | ) |
Distributions from net realized gains | | | (0.40 | ) | | | (0.54 | ) | | | (0.50 | ) | | | (1.14 | ) | | | (0.45 | ) |
| | | | | | | | | | | | | | | | | | | | |
Total dividends and distributions | | | (0.65 | ) | | | (0.70 | ) | | | (0.78 | ) | | | (1.41 | ) | | | (0.74 | ) |
| | | | | | | | | | | | | | | | | | | | |
Net asset value, end of year | | $ | 18.95 | | | $ | 17.88 | | | $ | 19.34 | | | $ | 19.64 | | | $ | 18.46 | |
| | | | | | | | | | | | | | | | | | | | |
Total return | | | 9.59 | % | | | (3.93 | )% | | | 2.36 | % | | | 14.15 | % | | | 11.95 | % |
| | | | | | | | | | | | | | | | | | | | |
Ratios/Supplemental Data: | | | | | | | | | | | | | | | | | | | | |
Net assets, end of year (000’s) | | $ | 253,966 | | | $ | 247,650 | | | $ | 276,875 | | | $ | 285,902 | | | $ | 267,515 | |
Ratio of expenses to average net assets: | | | | | | | | | | | | | | | | | | | | |
After waivers and reimbursements (f) | | | 0.58 | % | | | 0.57 | % | | | 0.50 | % | | | 0.35 | % | | | 0.35 | % |
Before waivers and reimbursements (f) | | | 0.59 | % | | | 0.57 | % | | | 0.58 | % | | | 0.58 | % | | | 0.62 | % |
Ratio of net investment income (loss) to average net assets: | | | | | | | | | | | | | | | | | | | | |
After waivers and reimbursements (f)(x) | | | 1.11 | % | | | 0.62 | % | | | 1.06 | % | | | 0.88 | % | | | 1.22 | % |
Before waivers and reimbursements (f)(x) | | | 1.10 | % | | | 0.62 | % | | | 0.98 | % | | | 0.65 | % | | | 0.95 | % |
Portfolio turnover rate^ | | | 11 | % | | | 14 | % | | | 18 | % | | | 43 | % | | | 43 | % |
See Notes to Financial Statements.
7
EQ ADVISORS TRUST
ALL ASSET GROWTH-ALT 20 PORTFOLIO
FINANCIAL HIGHLIGHTS (Continued)
| | | | | | | | | | | | | | | | | | | | |
| | |
| | | Year Ended December 31, | | | August 29, 2012* to
December 31, 2012 | |
| Class K | | 2016 | | | 2015 | | | 2014 | | | 2013 | | |
Net asset value, beginning of period | | $ | 17.80 | | | $ | 19.26 | | | $ | 19.56 | | | $ | 18.39 | | | $ | 18.34 | |
| | | | | | | | | | | | | | | | | | | | |
Income (loss) from investment operations: | | | | | | | | | | | | | | | | | | | | |
Net investment income (loss) (e)(x) | | | 0.27 | | | | 0.20 | | | | 0.31 | | | | 0.38 | | | | 0.39 | |
Net realized and unrealized gain (loss) on investments | | | 1.48 | | | | (0.92 | ) | | | 0.22 | | | | 2.25 | | | | 0.32 | |
| | | | | | | | | | | | | | | | | | | | |
Total from investment operations | | | 1.75 | | | | (0.72 | ) | | | 0.53 | | | | 2.63 | | | | 0.71 | |
| | | | | | | | | | | | | | | | | | | | |
Less distributions: | | | | | | | | | | | | | | | | | | | | |
Dividends from net investment income | | | (0.29 | ) | | | (0.20 | ) | | | (0.33 | ) | | | (0.32 | ) | | | (0.32 | ) |
Distributions from net realized gains | | | (0.40 | ) | | | (0.54 | ) | | | (0.50 | ) | | | (1.14 | ) | | | (0.34 | ) |
| | | | | | | | | | | | | | | | | | | | |
Total dividends and distributions | | | (0.69 | ) | | | (0.74 | ) | | | (0.83 | ) | | | (1.46 | ) | | | (0.66 | ) |
| | | | | | | | | | | | | | | | | | | | |
Net asset value, end of period | | $ | 18.86 | | | $ | 17.80 | | | $ | 19.26 | | | $ | 19.56 | | | $ | 18.39 | |
| | | | | | | | | | | | | | | | | | | | |
Total return (b) | | | 9.84 | % | | | (3.72 | )% | | | 2.62 | % | | | 14.43 | % | | | 3.86 | % |
| | | | | | | | | | | | | | | | | | | | |
Ratios/Supplemental Data: | | | | | | | | | | | | | | | | | | | | |
Net assets, end of period (000’s) | | $ | 1,470 | | | $ | 1,191 | | | $ | 931 | | | $ | 674 | | | $ | 52 | |
Ratio of expenses to average net assets: | | | | | | | | | | | | | | | | | | | | |
After waivers and reimbursements (a)(f) | | | 0.33 | % | | | 0.32 | % | | | 0.26 | % | | | 0.10 | % | | | 0.10 | % |
Before waivers and reimbursements (a)(f) | | | 0.34 | % | | | 0.32 | % | | | 0.33 | % | | | 0.33 | % | | | 0.44 | % |
Ratio of net investment income (loss) to average net assets: | | | | | | | | | | | | | | | | | | | | |
After waivers and reimbursements (a)(f)(x) | | | 1.45 | % | | | 1.06 | % | | | 1.56 | % | | | 1.89 | % | | | 6.17 | %(l) |
Before waivers and reimbursements (a)(f)(x) | | | 1.44 | % | | | 1.06 | % | | | 1.49 | % | | | 1.66 | % | | | 5.83 | %(l) |
Portfolio turnover rate^ | | | 11 | % | | | 14 | % | | | 18 | % | | | 43 | % | | | 43 | % |
| * | Commencement of Operations. |
| ^ | Portfolio turnover rate excludes derivatives, if any. |
| (a) | Ratios for periods less than one year are annualized. |
| (b) | Total returns for periods less than one year are not annualized. |
| (e) | Net investment income (loss) per share is based on average shares outstanding. |
| (f) | Expenses do not include the expenses of the underlying funds (“indirect expenses”), if applicable. |
| (l) | The annualized ratio of net investment income to average net assets may not be indicative of operating results for a full year. |
| (x) | Recognition of net investment income is affected by the timing of dividend declarations by the underlying funds in which the Portfolio invests. |
See Notes to Financial Statements.
8
EQ ADVISORS TRUST
ALL ASSET AGGRESSIVE-ALT 25 PORTFOLIO
PORTFOLIO OF INVESTMENTS
December 31, 2016
| | | | | | | | |
| | | Number of
Shares | | | Value
(Note 1) | |
| | | | | | | | |
EXCHANGE TRADED FUNDS: | | | | | | | | |
iShares China Large-Cap Fund (x) | | | 4,435 | | | $ | 153,939 | |
iShares International Developed Property Fund (x) | | | 11,740 | | | | 394,581 | |
iShares JP Morgan USD Emerging Markets Bond Fund (x) | | | 1,870 | | | | 206,111 | |
iShares MSCI EAFE Small-Cap Fund | | | 10,760 | | | | 536,279 | |
iShares MSCI Global Gold Miners Fund | | | 3,144 | | | | 53,857 | |
iShares U.S. Oil & Gas Exploration & Production Fund (x) | | | 2,960 | | | | 193,702 | |
PowerShares DB Gold Fund* | | | 46,850 | | | | 1,734,856 | |
PowerShares DB Silver Fund (x)* | | | 16,440 | | | | 408,698 | |
SPDR S&P Emerging Asia Pacific Fund | | | 1,140 | | | | 85,648 | |
SPDR S&P Emerging Markets SmallCap Fund | | | 3,805 | | | | 151,135 | |
| | | | | | | | |
Total Exchange Traded Funds (12.8%)
(Cost $4,174,570) | | | | | | | 3,918,806 | |
| | | | | | | | |
INVESTMENT COMPANIES: | | | | | | | | |
AXA Natural Resources Portfolio‡ | | | 195,592 | | | | 1,555,469 | |
AXA Real Estate Portfolio‡ | | | 147,891 | | | | 1,548,883 | |
AXA/AB Small Cap Growth Portfolio‡ | | | 144,011 | | | | 2,608,102 | |
AXA/Janus Enterprise Portfolio*‡ | | | 10,555 | | | | 167,862 | |
AXA/Loomis Sayles Growth Portfolio‡ | | | 167,378 | | | | 1,090,324 | |
EQ/BlackRock Basic Value Equity Portfolio‡ | | | 101,570 | | | | 2,351,590 | |
EQ/Boston Advisors Equity Income Portfolio‡ | | | 206,677 | | | | 1,190,213 | |
EQ/Emerging Markets Equity PLUS Portfolio‡ | | | 118,296 | | | | 946,879 | |
EQ/GAMCO Mergers and Acquisitions Portfolio‡ | | | 147,809 | | | | 1,930,553 | |
EQ/GAMCO Small Company Value Portfolio‡ | | | 33,595 | | | | 1,966,357 | |
EQ/Global Bond PLUS Portfolio‡ | | | 89,934 | | | | 788,304 | |
EQ/High Yield Bond Portfolio‡ | | | 40,919 | | | | 389,631 | |
EQ/Intermediate Government Bond Portfolio‡ | | | 16,329 | | | | 167,082 | |
EQ/International Equity Index Portfolio‡ | | | 125,317 | | | | 1,048,184 | |
EQ/Invesco Comstock Portfolio‡ | | | 113,726 | | | | 1,795,133 | |
EQ/JPMorgan Value Opportunities Portfolio‡ | | | 73,274 | | | | 1,359,592 | |
EQ/MFS International Growth Portfolio‡ | | | 379,989 | | | | 2,496,916 | |
EQ/PIMCO Global Real Return Portfolio‡ | | | 53,121 | | | | 515,639 | |
EQ/PIMCO Ultra Short Bond Portfolio‡ | | | 9,956 | | | | 98,237 | |
EQ/T. Rowe Price Growth Stock Portfolio*‡ | | | 57,270 | | | | 2,229,452 | |
Multimanager Core Bond Portfolio‡ | | | 21,568 | | | | 210,925 | |
| | | | | | | | |
Total Investment Companies (86.2%)
(Cost $26,352,574) | | | | | | | 26,455,327 | |
| | | | | | | | |
SHORT-TERM INVESTMENTS: | | | | | | | | |
Investment Company (1.3%) | | | | | | | | |
JPMorgan Prime Money Market Fund, IM Shares | | | 400,075 | | | | 400,195 | |
| | | | | | | | |
| | | Principal
Amount | | | Value
(Note 1) | |
| | | | | | | | |
Repurchase Agreements (2.0%) | | | | | | | | |
Citigroup Global Markets Ltd.,
0.71%, dated 12/30/16, due 1/3/17, repurchase price $25,887, collateralized by various Foreign Government Agency Securities, ranging from 0.000%-5.250%, maturing 1/23/17-1/24/44, U.S. Government Treasury Securities, ranging from 0.000%-5.375%, maturing 2/15/19-2/15/44; total market value $26,403. (xx) | | $ | 25,885 | | | | 25,885 | |
Deutsche Bank AG,
0.95%, dated 12/30/16, due 1/3/17, repurchase price $22,495, collateralized by various Corporate Bonds, ranging from 1.875%-2.500%, maturing 3/13/19-6/10/25; total market value $22,943. (xx) | | | 22,493 | | | | 22,493 | |
Deutsche Bank AG,
1.05%, dated 12/30/16, due 1/3/17, repurchase price $400,047, collateralized by various Common Stocks; total market value $444,622. (xx) | | | 400,000 | | | | 400,000 | |
Deutsche Bank Securities, Inc.,
0.50%, dated 12/30/16, due 1/3/17, repurchase price $175,642, collateralized by various U.S. Government Treasury Securities, 0.000%, maturing 2/15/40-5/15/40; total market value $179,144. (xx) | | | 175,632 | | | | 175,632 | |
| | | | | | | | |
Total Repurchase Agreements | | | | | | | 624,010 | |
| | | | | | | | |
Total Short-Term Investments (3.3%)
(Cost $1,024,133) | | | | | | | 1,024,205 | |
| | | | | | | | |
Total Investments (102.3%)
(Cost $31,551,277) | | | | | | | 31,398,338 | |
Other Assets Less Liabilities (-2.3%) | | | | | | | (706,675 | ) |
| | | | | | | | |
Net Assets (100%) | | | | | | $ | 30,691,663 | |
| | | | | | | | |
| ‡ | All, or a portion, of the security is an affiliated company as defined under the Investment Company Act of 1940. |
| (x) | All or a portion of security is on loan at December 31, 2016. |
| (xx) | At December 31, 2016, the Portfolio had loaned securities with a total value of $608,228. This was secured by cash collateral of $624,010 which was subsequently invested in joint repurchase agreements with a total value of $624,010, as detailed in the Notes to the Financial Statements, for which the Portfolio has a proportionate interest as detailed in the Notes to the Financial Statements, for which the Portfolio has a proportionate interest as reported in the Portfolio of Investments as Repurchase Agreements as Repurchase Agreements. |
The holdings in affiliated Investment Companies are all Class K shares.
See Notes to Financial Statements.
9
EQ ADVISORS TRUST
ALL ASSET AGGRESSIVE-ALT 25 PORTFOLIO
PORTFOLIO OF INVESTMENTS (Continued)
December 31, 2016
Investments in companies which were affiliates for the year ended December 31, 2016, were as follows:
| | | | | | | | | | | | | | | | | | | | | | | | |
Securities | | Value
December 31,
2015 | | | Purchases
at Cost | | | Sales
at Cost | | | Value
December 31,
2016 | | | Dividend
Income | | | Realized
Gain
(Loss)† | |
AXA Natural Resources Portfolio | | $ | 1,018,846 | | | $ | 426,610 | | | $ | 178,515 | | | $ | 1,555,469 | | | $ | 35,830 | | | $ | (408 | ) |
AXA Real Estate Portfolio (a) | | | 1,239,705 | | | | 601,611 | | | | 328,475 | | | | 1,548,883 | | | | 12,987 | | | | 16,380 | |
AXA/AB Small Cap Growth Portfolio | | | 1,929,711 | | | | 912,045 | | | | 339,740 | | | | 2,608,102 | | | | 15,201 | | | | 159,157 | |
AXA/Janus Enterprise Portfolio (b) | | | 156,880 | | | | 34,431 | | | | 16,973 | | | | 167,862 | | | | — | | | | 60 | |
AXA/Loomis Sayles Growth Portfolio | | | 867,030 | | | | 169,267 | | | | — | | | | 1,090,324 | | | | 6,200 | | | | 23,067 | |
EQ/BlackRock Basic Value Equity Portfolio | | | 1,768,756 | | | | 692,563 | | | | 422,411 | | | | 2,351,590 | | | | 39,723 | | | | (121 | ) |
EQ/Boston Advisors Equity Income Portfolio | | | 882,828 | | | | 722,301 | | | | 400,648 | | | | 1,190,213 | | | | 26,827 | | | | 127,771 | |
EQ/Emerging Markets Equity PLUS Portfolio | | | 892,705 | | | | 267,438 | | | | 296,903 | | | | 946,879 | | | | 9,738 | | | | 317 | |
EQ/GAMCO Mergers and Acquisitions Portfolio | | | 1,377,156 | | | | 697,162 | | | | 178,114 | | | | 1,930,553 | | | | 4,372 | | | | 82,004 | |
EQ/GAMCO Small Company Value Portfolio | | | 1,332,383 | | | | 641,475 | | | | 280,685 | | | | 1,966,357 | | | | 13,596 | | | | 60,137 | |
EQ/Global Bond PLUS Portfolio | | | 680,650 | | | | 224,839 | | | | 101,798 | | | | 788,304 | | | | 17,184 | | | | 1,473 | |
EQ/High Yield Bond Portfolio | | | 299,296 | | | | 123,469 | | | | 50,874 | | | | 389,631 | | | | 20,389 | | | | 14 | |
EQ/Intermediate Government Bond Portfolio | | | 261,891 | | | | 212,737 | | | | 306,047 | | | | 167,082 | | | | 1,541 | | | | 1,655 | |
EQ/International Equity Index Portfolio | | | 907,078 | | | | 406,746 | | | | 261,391 | | | | 1,048,184 | | | | 30,326 | | | | (246 | ) |
EQ/Invesco Comstock Portfolio | | | 1,289,616 | | | | 594,226 | | | | 301,413 | | | | 1,795,133 | | | | 44,465 | | | | (11 | ) |
EQ/JPMorgan Value Opportunities Portfolio | | | 1,031,952 | | | | 140,511 | | | | 52,427 | | | | 1,359,592 | | | | 15,511 | | | | 7,573 | |
EQ/MFS International Growth Portfolio | | | 2,069,282 | | | | 790,725 | | | | 373,137 | | | | 2,496,916 | | | | 30,591 | | | | 4,253 | |
EQ/PIMCO Global Real Return Portfolio | | | 401,702 | | | | 164,464 | | | | 67,839 | | | | 515,639 | | | | 26,003 | | | | 1,032 | |
EQ/PIMCO Ultra Short Bond Portfolio | | | 78,883 | | | | 35,579 | | | | 16,960 | | | | 98,237 | | | | 1,219 | | | | 3 | |
EQ/T. Rowe Price Growth Stock Portfolio | | | 1,824,908 | | | | 759,269 | | | | 357,034 | | | | 2,229,452 | | | | — | | | | 36,890 | |
Multimanager Core Bond Portfolio | | | 141,495 | | | | 95,729 | | | | 25,446 | | | | 210,925 | | | | 3,980 | | | | 207 | |
| | | | | | | | | | | | | | | | | | | | | | | | |
| | $ | 20,452,753 | | | $ | 8,713,197 | | | $ | 4,356,830 | | | $ | 26,455,327 | | | $ | 355,683 | | | $ | 521,207 | |
| | | | | | | | | | | | | | | | | | | | | | | | |
| † | When applicable, realized gain includes net distributions of realized gain received from underlying funds. |
| (a) | Formerly known as EQ/Real Estate PLUS Portfolio. |
| (b) | Formerly known as EQ/Morgan Stanley Mid Cap Growth Portfolio. |
See Notes to Financial Statements.
10
EQ ADVISORS TRUST
ALL ASSET AGGRESSIVE-ALT 25 PORTFOLIO
PORTFOLIO OF INVESTMENTS (Continued)
December 31, 2016
The following is a summary of the inputs used to value the Portfolio’s assets and liabilities carried at fair value as of December 31, 2016:
The inputs or methodology used for valuing securities are not necessarily an indication of the risk associated with investing in those securities.
Various inputs are used in determining the value of the Portfolio’s investments. These inputs are summarized in the three broad levels listed below:
| | | | | | | | | | | | | | | | |
| | | | | |
| Investment Type | | Level 1
Quoted Prices in
Active Markets for
Identical
Securities | | | Level 2
Significant Other
Observable Inputs
(including quoted prices
for similar securities,
interest rates,
prepayment speeds,
credit risk, etc.) | | | Level 3
Significant Unobservable
Inputs (including the
Portfolio’s own
assumptions in
determining the fair
value of investments) | | | Total | |
Assets: | | | | | | | | | | | | | | | | |
Exchange Traded Funds | | | | | | | | | | | | | | | | |
Exchange Traded Funds | | $ | 3,918,806 | | | $ | — | | | $ | — | | | $ | 3,918,806 | |
Investment Companies | | | | | | | | | | | | | | | | |
Investment Companies | | | — | | | | 26,455,327 | | | | — | | | | 26,455,327 | |
Short-Term Investments | | | | | | | | | | | | | | | | |
Investment Companies | | | 400,195 | | | | — | | | | — | | | | 400,195 | |
Repurchase Agreements | | | — | | | | 624,010 | | | | — | | | | 624,010 | |
| | | | | | | | | | | | | | | | |
Total Assets | | $ | 4,319,001 | | | $ | 27,079,337 | | | $ | — | | | $ | 31,398,338 | |
| | | | | | | | | | | | | | | | |
Total Liabilities | | $ | — | | | $ | — | | | $ | — | | | $ | — | |
| | | | | | | | | | | | | | | | |
Total | | $ | 4,319,001 | | | $ | 27,079,337 | | | $ | — | | | $ | 31,398,338 | |
| | | | | | | | | | | | | | | | |
There were no transfers between Levels 1, 2 or 3 during the year ended December 31, 2016.
The Portfolio held no derivatives contracts during the year ended December 31, 2016.
Investment security transactions for the year ended December 31, 2016 were as follows:
| | | | |
Cost of Purchases: | | | | |
Long-term investments other than U.S. government debt securities | | $ | 9,715,032 | |
Net Proceeds of Sales and Redemptions: | | | | |
Long-term investments other than U.S. government debt securities | | $ | 4,842,411 | |
As of December 31, 2016, the gross unrealized appreciation (depreciation) of investments based on the aggregate cost of investments for Federal income tax purposes was as follows:
| | | | |
Aggregate gross unrealized appreciation | | $ | 1,258,934 | |
Aggregate gross unrealized depreciation | | | (1,152,958 | ) |
| | | | |
Net unrealized depreciation | | $ | 105,976 | |
| | | | |
Federal income tax cost of investments | | $ | 31,292,362 | |
| | | | |
See Notes to Financial Statements.
11
EQ ADVISORS TRUST
ALL ASSET AGGRESSIVE-ALT 25 PORTFOLIO
STATEMENT OF ASSETS AND LIABILITIES
December 31, 2016
| | | | |
ASSETS | | | | |
Investments at value (x): | | | | |
Affiliated Issuers (Cost $26,352,574) | | $ | 26,455,327 | |
Unaffiliated Issuers (Cost $4,574,693) | | | 4,319,001 | |
Repurchase Agreements (Cost $624,010) | | | 624,010 | |
Cash | | | 49,000 | |
Receivable for securities sold | | | 60,048 | |
Receivable from Separate Accounts for Trust shares sold | | | 19,842 | |
Receivable from investment manager | | | 6,782 | |
Securities lending income receivable | | | 868 | |
Dividends, interest and other receivables | | | 232 | |
Other assets | | | 84 | |
| | | | |
Total assets | | | 31,535,194 | |
| | | | |
LIABILITIES | |
Payable for return of collateral on securities loaned | | | 624,010 | |
Payable for securities purchased | | | 155,090 | |
Payable to Separate Accounts for Trust shares redeemed | | | 17,167 | |
Distribution fees payable – Class IB | | | 6,021 | |
Trustees’ fees payable | | | 29 | |
Accrued expenses | | | 41,214 | |
| | | | |
Total liabilities | | | 843,531 | |
| | | | |
NET ASSETS | | $ | 30,691,663 | |
| | | | |
Net assets were comprised of: | |
Paid in capital | | $ | 30,200,145 | |
Accumulated undistributed net investment income (loss) | | | 10,882 | |
Accumulated undistributed net realized gain (loss) on investments | | | 633,575 | |
Net unrealized appreciation (depreciation) on investments | | | (152,939 | ) |
| | | | |
Net assets | | $ | 30,691,663 | |
| | | | |
Class IB | | | | |
Net asset value, offering and redemption price per share, $29,003,704 / 2,417,144 shares outstanding (unlimited amount authorized: $0.01 par value) | | $ | 12.00 | |
| | | | |
Class K | | | | |
Net asset value, offering and redemption price per share, $1,687,959 / 140,735 shares outstanding (unlimited amount authorized: $0.01 par value) | | $ | 11.99 | |
| | | | |
| (x) | Includes value of securities on loan of $608,228. |
STATEMENT OF OPERATIONS
For the Year Ended December 31, 2016
| | | | |
INVESTMENT INCOME | | | | |
Dividends ($355,683 of dividend income received from affiliates) | | $ | 412,003 | |
Interest | | | 206 | |
Securities lending (net) | | | 8,211 | |
| | | | |
Total income | | | 420,420 | |
| | | | |
EXPENSES | |
Custodian fees | | | 111,000 | |
Distribution fees – Class IB | | | 62,389 | |
Professional fees | | | 40,192 | |
Administrative fees | | | 38,981 | |
Investment management fees | | | 26,484 | |
Printing and mailing expenses | | | 7,779 | |
Trustees’ fees | | | 581 | |
Miscellaneous | | | 353 | |
| | | | |
Gross expenses | | | 287,759 | |
Less: Waiver from investment manager | | | (65,465 | ) |
Reimbursement from investment manager | | | (59,493 | ) |
| | | | |
Net expenses | | | 162,801 | |
| | | | |
NET INVESTMENT INCOME (LOSS) | | | 257,619 | |
| | | | |
REALIZED AND UNREALIZED GAIN (LOSS) | | | | |
Net realized gain (loss) on investments ($5,691 of realized gain (loss) from affiliates) | | | (30,305 | ) |
Net distributions of realized gain received from underlying funds ($515,516 received from affiliates) | | | 515,537 | |
| | | | |
Net realized gain (loss) | | | 485,232 | |
| | | | |
Net change in unrealized appreciation (depreciation) on investments ($1,646,207 of change in unrealized appreciation (depreciation) from affiliates) | | | 1,905,876 | |
| | | | |
NET REALIZED AND UNREALIZED GAIN (LOSS) | | | 2,391,108 | |
| | | | |
NET INCREASE (DECREASE) IN NET ASSETS RESULTING FROM OPERATIONS | | $ | 2,648,727 | |
| | | | |
See Notes to Financial Statements.
12
EQ ADVISORS TRUST
ALL ASSET AGGRESSIVE-ALT 25 PORTFOLIO
STATEMENT OF CHANGES IN NET ASSETS
| | | | | | | | |
| | | Year Ended December 31, | |
| | | 2016 | | | 2015 | |
INCREASE (DECREASE) IN NET ASSETS FROM OPERATIONS: | | | | | | | | |
Net investment income (loss) | | $ | 257,619 | | | $ | 140,421 | |
Net realized gain (loss) on investments and net distributions of realized gain received from underlying funds | | | 485,232 | | | | 547,499 | |
Net change in unrealized appreciation (depreciation) on investments | | | 1,905,876 | | | | (1,790,068 | ) |
| | | | | | | | |
NET INCREASE (DECREASE) IN NET ASSETS RESULTING FROM OPERATIONS | | | 2,648,727 | | | | (1,102,148 | ) |
| | | | | | | | |
DIVIDENDS AND DISTRIBUTIONS: | | | | | | | | |
Dividends from net investment income | | | | | | | | |
Class IB | | | (289,003 | ) | | | (174,159 | ) |
Class K | | | (21,341 | ) | | | (13,759 | ) |
| | | | | | | | |
| | | (310,344 | ) | | | (187,918 | ) |
| | | | | | | | |
Distributions from net realized capital gains | | | | | | | | |
Class IB | | | (274,189 | ) | | | (336,705 | ) |
Class K | | | (17,052 | ) | | | (21,862 | ) |
| | | | | | | | |
| | | (291,241 | ) | | | (358,567 | ) |
| | | | | | | | |
TOTAL DIVIDENDS AND DISTRIBUTIONS | | | (601,585 | ) | | | (546,485 | ) |
| | | | | | | | |
CAPITAL SHARES TRANSACTIONS: | | | | | | | | |
Class IB | | | | | | | | |
Capital shares sold [ 889,324 and 1,008,273 shares, respectively ] | | | 10,283,964 | | | | 11,997,915 | |
Capital shares issued in reinvestment of dividends and distributions [ 46,609 and 45,664 shares,
respectively ] | | | 563,192 | | | | 510,864 | |
Capital shares repurchased [ (541,838) and (381,981) shares, respectively ] | | | (6,235,700 | ) | | | (4,555,033 | ) |
| | | | | | | | |
Total Class IB transactions | | | 4,611,456 | | | | 7,953,746 | |
| | | | | | | | |
Class K | | | | | | | | |
Capital shares sold [ 48,239 and 33,804 shares, respectively ] | | | 563,136 | | | | 402,234 | |
Capital shares issued in reinvestment of dividends and distributions [ 3,178 and 3,182 shares,
respectively ] | | | 38,393 | | | | 35,621 | |
Capital shares repurchased [ (32,167) and (43,894) shares, respectively ] | | | (377,898 | ) | | | (533,047 | ) |
| | | | | | | | |
Total Class K transactions | | | 223,631 | | | | (95,192 | ) |
| | | | | | | | |
NET INCREASE (DECREASE) IN NET ASSETS RESULTING FROM CAPITAL SHARE TRANSACTIONS | | | 4,835,087 | | | | 7,858,554 | |
| | | | | | | | |
TOTAL INCREASE (DECREASE) IN NET ASSETS | | | 6,882,229 | | | | 6,209,921 | |
NET ASSETS: | | | | | | | | |
Beginning of year | | | 23,809,434 | | | | 17,599,513 | |
| | | | | | | | |
End of year (a) | | $ | 30,691,663 | | | $ | 23,809,434 | |
| | | | | | | | |
(a) Includes accumulated undistributed (overdistributed) net investment income (loss) of | | $ | 10,882 | | | $ | 4,299 | |
| | | | | | | | |
See Notes to Financial Statements.
13
EQ ADVISORS TRUST
ALL ASSET AGGRESSIVE-ALT 25 PORTFOLIO
FINANCIAL HIGHLIGHTS
| | | | | | | | | | | | | | | | | | | | |
| | | Year Ended December 31, | | | August 29, 2012* to
December 31, 2012 | |
| Class IB | | 2016 | | | 2015 | | | 2014 | | | 2013 | | |
Net asset value, beginning of period | | $ | 11.10 | | | $ | 11.90 | | | $ | 11.91 | | | $ | 10.29 | | | $ | 10.00 | |
| | | | | | | | | | | | | | | | | | | | |
Income (loss) from investment operations: | | | | | | | | | | | | | | | | | | | | |
Net investment income (loss) (e)(x) | | | 0.11 | | | | 0.08 | | | | 0.18 | | | | 0.27 | | | | 0.11 | |
Net realized and unrealized gain (loss) on investments | | | 1.04 | | | | (0.60 | ) | | | 0.11 | | | | 1.59 | | | | 0.30 | |
| | | | | | | | | | | | | | | | | | | | |
Total from investment operations | | | 1.15 | | | | (0.52 | ) | | | 0.29 | | | | 1.86 | | | | 0.41 | |
| | | | | | | | | | | | | | | | | | | | |
Less distributions: | | | | | | | | | | | | | | | | | | | | |
Dividends from net investment income | | | (0.12 | ) | | | (0.09 | ) | | | (0.17 | ) | | | (0.16 | ) | | | (0.12 | ) |
Distributions from net realized gains | | | (0.13 | ) | | | (0.19 | ) | | | (0.13 | ) | | | (0.08 | ) | | | — | # |
| | | | | | | | | | | | | | | | | | | | |
Total dividends and distributions | | | (0.25 | ) | | | (0.28 | ) | | | (0.30 | ) | | | (0.24 | ) | | | (0.12 | ) |
| | | | | | | | | | | | | | | | | | | | |
Net asset value, end of period | | $ | 12.00 | | | $ | 11.10 | | | $ | 11.90 | | | $ | 11.91 | | | $ | 10.29 | |
| | | | | | | | | | | | | | | | | | | | |
Total return (b) | | | 10.34 | % | | | (4.44 | )% | | | 2.36 | % | | | 18.08 | % | | | 4.14 | % |
| | | | | | | | | | | | | | | | | | | | |
Ratios/Supplemental Data: | | | | | | | | | | | | | | | | | | | | |
Net assets, end of period (000’s) | | $ | 29,004 | | | $ | 22,461 | | | $ | 16,073 | | | $ | 4,911 | | | $ | 262 | |
Ratio of expenses to average net assets: | | | | | | | | | | | | | | | | | | | | |
After waivers and reimbursements (a)(f) | | | 0.63 | % | | | 0.65 | % | | | 0.59 | % | | | 0.35 | % | | | 0.35 | % |
Before waivers and reimbursements (a)(f) | | | 1.10 | % | | | 1.32 | % | | | 2.20 | % | | | 6.43 | % | | | 36.02 | % |
Ratio of net investment income (loss) to average net assets: | | | | | | | | | | | | | | | | | | | | |
After waivers and reimbursements (a)(f)(x) | | | 0.96 | % | | | 0.65 | % | | | 1.52 | % | | | 2.32 | % | | | 3.08 | %(l) |
Before waivers and reimbursements (a)(f)(x) | | | 0.49 | % | | | (0.02 | )% | | | (0.10 | )% | | | (3.76 | )% | | | (32.59 | )%(l) |
Portfolio turnover rate (z)^ | | | 18 | % | | | 24 | % | | | 34 | % | | | 41 | % | | | 3 | % |
| | |
| | | Year Ended December 31, | | | August 29, 2012* to
December 31, 2012 | |
| Class K | | 2016 | | | 2015 | | | 2014 | | | 2013 | | |
Net asset value, beginning of period | | $ | 11.10 | | | $ | 11.89 | | | $ | 11.91 | | | $ | 10.29 | | | $ | 10.00 | |
| | | | | | | | | | | | | | | | | | | | |
Income (loss) from investment operations: | | | | | | | | | | | | | | | | | | | | |
Net investment income (loss) (e)(x) | | | 0.13 | | | | 0.09 | | | | 0.15 | | | | 0.19 | | | | 0.12 | |
Net realized and unrealized gain (loss) on investments | | | 1.04 | | | | (0.57 | ) | | | 0.16 | | | | 1.70 | | | | 0.30 | |
| | | | | | | | | | | | | | | | | | | | |
Total from investment operations | | | 1.17 | | | | (0.48 | ) | | | 0.31 | | | | 1.89 | | | | 0.42 | |
| | | | | | | | | | | | | | | | | | | | |
Less distributions: | | | | | | | | | | | | | | | | | | | | |
Dividends from net investment income | | | (0.15 | ) | | | (0.12 | ) | | | (0.20 | ) | | | (0.19 | ) | | | (0.13 | ) |
Distributions from net realized gains | | | (0.13 | ) | | | (0.19 | ) | | | (0.13 | ) | | | (0.08 | ) | | | — | # |
| | | | | | | | | | | | | | | | | | | | |
Total dividends and distributions | | | (0.28 | ) | | | (0.31 | ) | | | (0.33 | ) | | | (0.27 | ) | | | (0.13 | ) |
| | | | | | | | | | | | | | | | | | | | |
Net asset value, end of period | | $ | 11.99 | | | $ | 11.10 | | | $ | 11.89 | | | $ | 11.91 | | | $ | 10.29 | |
| | | | | | | | | | | | | | | | | | | | |
Total return (b) | | | 10.53 | % | | | (4.11 | )% | | | 2.53 | % | | | 18.38 | % | | | 4.23 | % |
| | | | | | | | | | | | | | | | | | | | |
Ratios/Supplemental Data: | | | | | | | | | | | | | | | | | | | | |
Net assets, end of period (000’s) | | $ | 1,688 | | | $ | 1,348 | | | $ | 1,527 | | | $ | 981 | | | $ | 261 | |
Ratio of expenses to average net assets: | | | | | | | | | | | | | | | | | | | | |
After waivers and reimbursements (a)(f) | | | 0.38 | % | | | 0.40 | % | | | 0.32 | % | | | 0.10 | % | | | 0.10 | % |
Before waivers and reimbursements (a)(f) | | | 0.85 | % | | | 1.07 | % | | | 2.06 | % | | | 7.74 | % | | | 35.77 | % |
Ratio of net investment income (loss) to average net assets: | | | | | | | | | | | | | | | | | | | | |
After waivers and reimbursements (a)(f)(x) | | | 1.17 | % | | | 0.72 | % | | | 1.27 | % | | | 1.64 | % | | | 3.33 | %(l) |
Before waivers and reimbursements (a)(f)(x) | | | 0.70 | % | | | 0.05 | % | | | (0.47 | )% | | | (6.00 | )% | | | (32.35 | )%(l) |
Portfolio turnover rate (z)^ | | | 18 | % | | | 24 | % | | | 34 | % | | | 41 | % | | | 3 | % |
See Notes to Financial Statements.
14
EQ ADVISORS TRUST
ALL ASSET AGGRESSIVE-ALT 25 PORTFOLIO
FINANCIAL HIGHLIGHTS (Continued)
| * | Commencement of Operations. |
| # | Per share amount is less than $0.005. |
| ^ | Portfolio turnover rate excludes derivatives, if any. |
| (a) | Ratios for periods less than one year are annualized. |
| (b) | Total returns for periods less than one year are not annualized. |
| (e) | Net investment income (loss) per share is based on average shares outstanding. |
| (f) | Expenses do not include the expenses of the underlying funds (“indirect expenses”), if applicable. |
| (l) | The annualized ratio of net investment income to average net assets may not be indicative of operating results for a full year. |
| (x) | Recognition of net investment income is affected by the timing of dividend declarations by the underlying funds in which the Portfolio invests. |
| (z) | Portfolio turnover rate for periods less than one year is not annualized. |
See Notes to Financial Statements.
15
EQ ADVISORS TRUST
ALL ASSET AGGRESSIVE-ALT 50 PORTFOLIO
PORTFOLIO OF INVESTMENTS
December 31, 2016
| | | | | | | | |
| | | Number of
Shares | | | Value
(Note 1) | |
EXCHANGE TRADED FUNDS: | |
iShares China Large-Cap Fund (x) | | | 230 | | | $ | 7,983 | |
iShares International Developed Property Fund | | | 3,440 | | | | 115,618 | |
iShares JP Morgan USD Emerging Markets Bond Fund (x) | | | 120 | | | | 13,226 | |
iShares MSCI EAFE Small-Cap Fund | | | 790 | | | | 39,374 | |
iShares U.S. Oil & Gas Exploration & Production Fund (x) | | | 650 | | | | 42,536 | |
PowerShares DB Gold Fund* | | | 5,470 | | | | 202,554 | |
PowerShares DB Silver Fund* | | | 1,940 | | | | 48,228 | |
SPDR S&P Emerging Asia Pacific Fund | | | 150 | | | | 11,270 | |
SPDR S&P Emerging Markets SmallCap Fund | | | 240 | | | | 9,533 | |
| | | | | | | | |
Total Exchange Traded Funds (17.3%)
(Cost $576,461) | | | | | | | 490,322 | |
| | | | | | | | |
INVESTMENT COMPANIES: | |
AXA Natural Resources Portfolio‡ | | | 50,154 | | | | 398,855 | |
AXA Real Estate Portfolio‡ | | | 44,426 | | | | 465,280 | |
AXA/AB Small Cap Growth Portfolio‡ | | | 9,038 | | | | 163,680 | |
AXA/Janus Enterprise Portfolio*‡ | | | 1,251 | | | | 19,891 | |
AXA/Loomis Sayles Growth Portfolio‡ | | | 13,065 | | | | 85,105 | |
EQ/BlackRock Basic Value Equity Portfolio‡ | | | 5,945 | | | | 137,636 | |
EQ/Boston Advisors Equity Income Portfolio‡ | | | 13,016 | | | | 74,958 | |
EQ/Emerging Markets Equity PLUS Portfolio‡ | | | 7,262 | | | | 58,123 | |
EQ/GAMCO Mergers and Acquisitions Portfolio‡ | | | 13,536 | | | | 176,798 | |
EQ/GAMCO Small Company Value Portfolio‡ | | | 2,180 | | | | 127,619 | |
EQ/Global Bond PLUS Portfolio‡ | | | 3,044 | | | | 26,680 | |
EQ/High Yield Bond Portfolio‡ | | | 2,175 | | | | 20,711 | |
EQ/Intermediate Government Bond Portfolio‡ | | | 1,082 | | | | 11,067 | |
EQ/International Equity Index Portfolio‡ | | | 10,710 | | | | 89,582 | |
EQ/Invesco Comstock Portfolio‡ | | | 6,845 | | | | 108,044 | |
EQ/JPMorgan Value Opportunities Portfolio‡ | | | 5,489 | | | | 101,855 | |
EQ/MFS International Growth Portfolio‡ | | | 21,226 | | | | 139,479 | |
EQ/PIMCO Global Real Return Portfolio‡ | | | 1,747 | | | | 16,958 | |
EQ/PIMCO Ultra Short Bond Portfolio‡ | | | 550 | | | | 5,422 | |
EQ/T. Rowe Price Growth Stock Portfolio*‡ | | | 3,460 | | | | 134,699 | |
| | | | | | | | |
Total Investment Companies (83.3%)
(Cost $2,488,860) | | | | | | | 2,362,442 | |
| | | | | | | | |
SHORT-TERM INVESTMENTS: | | | | | | | | |
Investment Company (0.9%) | | | | | | | | |
JPMorgan Prime Money Market Fund, IM Shares | | | 24,542 | | | | 24,550 | |
| | | | | | | | |
| | | Principal
Amount | | | Value
(Note 1) | |
Repurchase Agreements (1.4%) | | | | | | | | |
Citigroup Global Markets Ltd., | | | | | | | | |
0.71%, dated 12/30/16, due 1/3/17, repurchase price $2,726, collateralized by various Foreign Government Agency Securities, ranging from 0.000%-5.250%, maturing 1/23/17-1/24/44, U.S. Government Treasury Securities, ranging from 0.000%-5.375%, maturing 2/15/19-2/15/44; total market value $2,781. (xx) | | $ | 2,726 | | | $ | 2,726 | |
Citigroup Global Markets Ltd., | | | | | | | | |
0.69%, dated 12/30/16, due 1/3/17, repurchase price $1,097, collateralized by various U.S. Government Treasury Securities, ranging from 1.375%-5.375%, maturing 7/31/18-2/15/45; total market value $1,119. (xx) | | | 1,097 | | | | 1,097 | |
Deutsche Bank AG, | | | | | | | | |
0.95%, dated 12/30/16, due 1/3/17, repurchase price $2,369, collateralized by various Corporate Bonds, ranging from 1.875%-2.500%, maturing 3/13/19-6/10/25; total market value $2,416. (xx) | | | 2,369 | | | | 2,369 | |
Deutsche Bank Securities, Inc., | | | | | | | | |
0.50%, dated 12/30/16, due 1/3/17, repurchase price $24,570, collateralized by various U.S. Government Treasury Securities, 0.000%, maturing 2/15/40-5/15/40; total market value $25,060. (xx) | | | 24,569 | | | | 24,569 | |
Nomura Securities Co. Ltd., | | | | | | | | |
0.50%, dated 12/30/16, due 1/3/17, repurchase price $10,001, collateralized by various U.S. Government Treasury Securities, ranging from 0.000%-3.875%, maturing 4/15/19-8/15/46; total market value $10,200. (xx) | | | 10,000 | | | | 10,000 | |
| | | | | | | | |
Total Repurchase Agreements | | | | | | | 40,761 | |
| | | | | | | | |
Total Short-Term Investments (2.3%) (Cost $65,306) | | | | | | | 65,311 | |
| | | | | | | | |
Total Investments (102.9%)
(Cost $3,130,627) | | | | | | | 2,918,075 | |
Other Assets Less Liabilities (-2.9%) | | | | | | | (82,277 | ) |
| | | | | | | | |
Net Assets (100%) | | | | | | $ | 2,835,798 | |
| | | | | | | | |
| ‡ | All, or a portion, of the security is an affiliated company as defined under the Investment Company Act of 1940. |
| (x) | All or a portion of security is on loan at December 31, 2016. |
| (xx) | At December 31, 2016, the Portfolio had loaned securities with a total value of $39,702. This was secured by cash collateral of $40,761 which was subsequently invested in joint repurchase agreements with a total value of $40,761, as detailed in the Notes to the Financial Statements, for which the Portfolio has a proportionate interest as reported in the Portfolio of Investments as Repurchase Agreements. |
The holdings in affiliated Investment Companies are all Class K shares
See Notes to Financial Statements.
16
EQ ADVISORS TRUST
ALL ASSET AGGRESSIVE-ALT 50 PORTFOLIO
PORTFOLIO OF INVESTMENTS (Continued)
December 31, 2016
Investments in companies which were affiliates for the year ended December 31, 2016, were as follows:
| | | | | | | | | | | | | | | | | | | | | | | | |
Securities | | Value
December 31,
2015 | | | Purchases
at Cost | | | Sales
at Cost | | | Value
December 31,
2016 | | | Dividend
Income | | | Realized
Gain
(Loss)† | |
AXA Natural Resources Portfolio | | $ | 538,888 | | | $ | 53,114 | | | $ | 326,605 | | | $ | 398,855 | | | $ | 9,263 | | | $ | (6,990 | ) |
AXA Real Estate Portfolio (a) | | | 691,431 | | | | 112,728 | | | | 358,126 | | | | 465,280 | | | | 4,024 | | | | 26,195 | |
AXA/AB Small Cap Growth Portfolio | | | 254,187 | | | | 43,818 | | | | 162,219 | | | | 163,680 | | | | 962 | | | | (8,537 | ) |
AXA/Janus Enterprise Portfolio (b) | | | 34,761 | | | | 2,201 | | | | 18,572 | | | | 19,891 | | | | — | | | | (3,202 | ) |
AXA/Loomis Sayles Growth Portfolio | | | 107,883 | | | | 32,284 | | | | 57,954 | | | | 85,105 | | | | 484 | | | | 6,346 | |
EQ/BlackRock Basic Value Equity Portfolio | | | 212,209 | | | | 22,716 | | | | 113,508 | | | | 137,636 | | | | 2,252 | | | | 9,293 | |
EQ/Boston Advisors Equity Income Portfolio | | | 100,476 | | | | 28,172 | | | | 60,057 | | | | 74,958 | | | | 1,583 | | | | 623 | |
EQ/Emerging Markets Equity PLUS Portfolio | | | 101,479 | | | | 7,912 | | | | 63,739 | | | | 58,123 | | | | 603 | | | | (4,503 | ) |
EQ/GAMCO Mergers and Acquisitions Portfolio | | | 248,578 | | | | 49,839 | | | | 128,741 | | | | 176,798 | | | | 450 | | | | 8,216 | |
EQ/GAMCO Small Company Value Portfolio | | | 168,803 | | | | 23,169 | | | | 91,609 | | | | 127,619 | | | | 891 | | | | 337 | |
EQ/Global Bond PLUS Portfolio | | | 66,298 | | | | 7,216 | | | | 50,032 | | | | 26,680 | | | | 587 | | | | (2,198 | ) |
EQ/High Yield Bond Portfolio | | | 30,337 | | | | 4,017 | | | | 16,257 | | | | 20,711 | | | | 1,094 | | | | (743 | ) |
EQ/Intermediate Government Bond Portfolio | | | 18,676 | | | | 6,316 | | | | 13,837 | | | | 11,067 | | | | 103 | | | | 144 | |
EQ/International Equity Index Portfolio | | | 140,776 | | | | 27,237 | | | | 85,664 | | | | 89,582 | | | | 2,620 | | | | (9,493 | ) |
EQ/Invesco Comstock Portfolio | | | 150,900 | | | | 16,598 | | | | 72,808 | | | | 108,044 | | | | 2,712 | | | | 110 | |
EQ/JPMorgan Value Opportunities Portfolio | | | 137,594 | | | | 11,162 | | | | 65,489 | | | | 101,855 | | | | 1,162 | | | | 11 | |
EQ/MFS International Growth Portfolio | | | 219,528 | | | | 25,979 | | | | 116,669 | | | | 139,479 | | | | 1,727 | | | | (6,625 | ) |
EQ/PIMCO Global Real Return Portfolio | | | 36,693 | | | | 3,822 | | | | 25,221 | | | | 16,958 | | | | 863 | | | | (171 | ) |
EQ/PIMCO Ultra Short Bond Portfolio | | | 8,800 | | | | 799 | | | | 4,297 | | | | 5,422 | | | | 68 | | | | (44 | ) |
EQ/T. Rowe Price Growth Stock Portfolio | | | 181,640 | | | | 55,595 | | | | 94,529 | | | | 134,699 | | | | — | | | | 7,634 | |
| | | | | | | | | | | | | | | | | | | | | | | | |
| | $ | 3,449,937 | | | $ | 534,694 | | | $ | 1,925,933 | | | $ | 2,362,442 | | | $ | 31,448 | | | $ | 16,403 | |
| | | | | | | | | | | | | | | | | | | | | | | | |
| † | When applicable, realized gain includes net distributions of realized gain received from underlying funds. |
| (a) | Formerly known as EQ/Real Estate PLUS Portfolio. |
| (b) | Formerly known as EQ/Morgan Stanley Mid Cap Growth Portfolio. |
See Notes to Financial Statements.
17
EQ ADVISORS TRUST
ALL ASSET AGGRESSIVE-ALT 50 PORTFOLIO
PORTFOLIO OF INVESTMENTS (Continued)
December 31, 2016
The following is a summary of the inputs used to value the Portfolio’s assets and liabilities carried at fair value as of December 31, 2016:
The inputs or methodology used for valuing securities are not necessarily an indication of the risk associated with investing in those securities.
Various inputs are used in determining the value of the Portfolio’s investments. These inputs are summarized in the three broad levels listed below:
| | | | | | | | | | | | | | | | |
| | | | | |
| Investment Type | | Level 1
Quoted Prices in
Active Markets for
Identical
Securities | | | Level 2
Significant Other
Observable Inputs
(including quoted prices
for similar securities,
interest rates,
prepayment speeds,
credit risk, etc.) | | | Level 3
Significant Unobservable
Inputs (including the
Portfolio’s own
assumptions in
determining the fair
value of investments) | | | Total | |
Assets: | | | | | |
Exchange Traded Funds | | | | | | | | | | | | | | | | |
Exchange Traded Funds | | $ | 490,322 | | | $ | — | | | $ | — | | | $ | 490,322 | |
Investment Companies | | | | | | | | | | | | | | | | |
Investment Companies | | | — | | | | 2,362,442 | | | | — | | | | 2,362,442 | |
Short-Term Investments | | | | | | | | | | | | | | | | |
Investment Companies | | | 24,550 | | | | — | | | | — | | | | 24,550 | |
Repurchase Agreements | | | — | | | | 40,761 | | | | — | | | | 40,761 | |
| | | | | | | | | | | | | | | | |
Total Assets | | $ | 514,872 | | | $ | 2,403,203 | | | $ | — | | | $ | 2,918,075 | |
| | | | | | | | | | | | | | | | |
Total Liabilities | | $ | — | | | $ | — | | | $ | — | | | $ | — | |
| | | | | | | | | | | | | | | | |
Total | | $ | 514,872 | | | $ | 2,403,203 | | | $ | — | | | $ | 2,918,075 | |
| | | | | | | | | | | | | | | | |
There were no transfers between Levels 1, 2 or 3 during the year ended December 31, 2016.
The Portfolio held no derivatives contracts during the year ended December 31, 2016.
Investment security transactions for the year ended December 31, 2016 were as follows:
| | | | |
Cost of Purchases: | | | | |
Long-term investments other than U.S. government debt securities | | $ | 605,089 | |
Net Proceeds of Sales and Redemptions: | | | | |
Long-term investments other than U.S. government debt securities | | $ | 2,297,835 | |
As of December 31, 2016, the gross unrealized appreciation (depreciation) of investments based on the aggregate cost of investments for Federal income tax purposes was as follows:
| | | | |
Aggregate gross unrealized appreciation | | $ | 109,193 | |
Aggregate gross unrealized depreciation | | | (307,456 | ) |
| | | | |
Net unrealized depreciation | | $ | (198,263 | ) |
| | | | |
Federal income tax cost of investments | | $ | 3,116,338 | |
| | | | |
See Notes to Financial Statements.
18
EQ ADVISORS TRUST
ALL ASSET AGGRESSIVE-ALT 50 PORTFOLIO
STATEMENT OF ASSETS AND LIABILITIES
December 31, 2016
| | | | |
ASSETS | |
Investments at value (x): | | | | |
Affiliated Issuers (Cost $2,488,860) | | $ | 2,362,442 | |
Unaffiliated Issuers (Cost $601,006) | | | 514,872 | |
Repurchase Agreements (Cost $40,761) | | | 40,761 | |
Cash | | | 7,180 | |
Receivable from investment manager | | | 7,264 | |
Receivable for securities sold | | | 6,672 | |
Securities lending income receivable | | | 58 | |
Dividends, interest and other receivables | | | 15 | |
Other assets | | | 16 | |
| | | | |
Total assets | | | 2,939,280 | |
| | | | |
LIABILITIES | |
Payable for return of collateral on securities loaned | | | 40,761 | |
Payable for securities purchased | | | 8,208 | |
Distribution fees payable – Class IB | | | 598 | |
Payable to Separate Accounts for Trust shares redeemed | | | 24 | |
Trustees’ fees payable | | | 8 | |
Accrued expenses | | | 53,883 | |
| | | | |
Total liabilities | | | 103,482 | |
| | | | |
NET ASSETS | | $ | 2,835,798 | |
| | | | |
Net assets were comprised of: | |
Paid in capital | | $ | 3,072,961 | |
Accumulated undistributed net investment income (loss) | | | 4,351 | |
Accumulated undistributed net realized gain (loss) on investments | | | (28,962 | ) |
Net unrealized appreciation (depreciation) on investments | | | (212,552 | ) |
| | | | |
Net assets | | $ | 2,835,798 | |
| | | | |
Class IB | | | | |
Net asset value, offering and redemption price per share, $2,835,798 / 305,172 shares outstanding (unlimited amount authorized: $0.01 par value) | | $ | 9.29 | |
| | | | |
| (x) | Includes value of securities on loan of $39,702. |
STATEMENT OF OPERATIONS
For the Year Ended December 31, 2016
| | | | |
INVESTMENT INCOME | | | | |
Dividends ($31,448 of dividend income received from affiliates) | | $ | 42,719 | |
Interest | | | 51 | |
Securities lending (net) | | | 1,416 | |
| | | | |
Total income | | | 44,186 | |
| | | | |
EXPENSES | | | | |
Custodian fees | | | 89,000 | |
Professional fees | | | 39,594 | |
Administrative fees | | | 32,505 | |
Distribution fees – Class IB | | | 6,474 | |
Investment management fees | | | 3,542 | |
Printing and mailing expenses | | | 422 | |
Trustees’ fees | | | 88 | |
Tax expense | | | 74 | |
Miscellaneous | | | 364 | |
| | | | |
Gross expenses | | | 172,063 | |
Less: Waiver from investment manager | | | (36,047 | ) |
Reimbursement from investment manager | | | (115,641 | ) |
| | | | |
Net expenses | | | 20,375 | |
| | | | |
NET INVESTMENT INCOME (LOSS) | | | 23,811 | |
| | | | |
REALIZED AND UNREALIZED GAIN (LOSS) | | | | |
Net realized gain (loss) on investments ($(23,897) of realized gain (loss) from affiliates) | | | (56,317 | ) |
Net distributions of realized gain received from underlying funds (All realized gains received from affiliates) | | | 40,300 | |
| | | | |
Net realized gain (loss) | | | (16,017 | ) |
| | | | |
Net change in unrealized appreciation (depreciation) on investments ($303,744 of change in unrealized appreciation (depreciation) from affiliates) | | | 411,321 | |
| | | | |
NET REALIZED AND UNREALIZED GAIN (LOSS) | | | 395,304 | |
| | | | |
NET INCREASE (DECREASE) IN NET ASSETS RESULTING FROM OPERATIONS | | $ | 419,115 | |
| | | | |
See Notes to Financial Statements.
19
EQ ADVISORS TRUST
ALL ASSET AGGRESSIVE-ALT 50 PORTFOLIO
STATEMENT OF CHANGES IN NET ASSETS
| | | | | | | | |
| | | Year Ended December 31, | |
| | 2016 | | | 2015 | |
INCREASE (DECREASE) IN NET ASSETS FROM OPERATIONS: | |
Net investment income (loss) | | $ | 23,811 | | | $ | 33,445 | |
Net realized gain (loss) on investments and net distributions of realized gain received from underlying funds | | | (16,017 | ) | | | 65,633 | |
Net change in unrealized appreciation (depreciation) on investments | | | 411,321 | | | | (398,020 | ) |
| | | | | | | | |
NET INCREASE (DECREASE) IN NET ASSETS RESULTING FROM OPERATIONS | | | 419,115 | | | | (298,942 | ) |
| | | | | | | | |
DIVIDENDS AND DISTRIBUTIONS: | | | | | | | | |
Dividends from net investment income | | | | | | | | |
Class IB | | | (31,067 | ) | | | (20,319 | ) |
Class K (b) | | | — | | | | (21,336 | ) |
| | | | | | | | |
| | | (31,067 | ) | | | (41,655 | ) |
| | | | | | | | |
Distributions from net realized capital gains | | | | | | | | |
Class IB | | | (16,944 | ) | | | (88,246 | ) |
Class K (b) | | | — | | | | (75,683 | ) |
| | | | | | | | |
| | | (16,944 | ) | | | (163,929 | ) |
| | | | | | | | |
TOTAL DIVIDENDS AND DISTRIBUTIONS | | | (48,011 | ) | | | (205,584 | ) |
| | | | | | | | |
CAPITAL SHARES TRANSACTIONS: | | | | | | | | |
Class IB | | | | | | | | |
Capital shares sold [ 31,787 and 20,828 shares, respectively ] | | | 274,962 | | | | 189,815 | |
Capital shares issued in reinvestment of dividends and distributions [ 5,128 and 12,654 shares, respectively ] | | | 48,011 | | | | 108,565 | |
Capital shares repurchased [ (2,527) and (5,210) shares, respectively ] | | | (22,950 | ) | | | (49,959 | ) |
| | | | | | | | |
Total Class IB transactions | | | 300,023 | | | | 248,421 | |
| | | | | | | | |
Class K (b) | | | | | | | | |
Capital shares issued in reinvestment of dividends and distributions [ 0 and 11,294 shares, respectively ] | | | — | | | | 97,019 | |
Capital shares repurchased [ (223,210) and 0 shares, respectively ] | | | (2,029,849 | ) | | | — | |
| | | | | | | | |
Total Class K transactions | | | (2,029,849 | ) | | | 97,019 | |
| | | | | | | | |
NET INCREASE (DECREASE) IN NET ASSETS RESULTING FROM CAPITAL SHARE TRANSACTIONS | | | (1,729,826 | ) | | | 345,440 | |
| | | | | | | | |
TOTAL INCREASE (DECREASE) IN NET ASSETS | | | (1,358,722 | ) | | | (159,086 | ) |
NET ASSETS: | | | | | | | | |
Beginning of year | | | 4,194,520 | | | | 4,353,606 | |
| | | | | | | | |
End of year (a) | | $ | 2,835,798 | | | $ | 4,194,520 | |
| | | | | | | | |
(a) Includes accumulated undistributed (overdistributed) net investment income (loss) of | | $ | 4,351 | | | $ | 4,863 | |
| | | | | | | | |
(b) After the close of business on July 7, 2016, operations for Class K ceased and shares of seed capital were fully redeemed. | |
See Notes to Financial Statements.
20
EQ ADVISORS TRUST
ALL ASSET AGGRESSIVE-ALT 50 PORTFOLIO
FINANCIAL HIGHLIGHTS
| | | | | | | | | | | | | | | | |
| | | Year Ended December 31, | | | October 28, 2013* to
December 31, 2013 | |
| Class IB | | 2016 | | | 2015 | | | 2014 | | |
Net asset value, beginning of period | | $ | 8.49 | | | $ | 9.58 | | | $ | 9.68 | | | $ | 10.00 | |
| | | | | | | | | | | | | | | | |
Income (loss) from investment operations: | | | | | | | | | | | | | | | | |
Net investment income (loss) (e)(x) | | | 0.09 | | | | 0.06 | | | | 0.15 | | | | 0.11 | |
Net realized and unrealized gain (loss) on investments | | | 0.87 | | | | (0.71 | ) | | | 0.01 | † | | | (0.16 | ) |
| | | | | | | | | | | | | | | | |
Total from investment operations | | | 0.96 | | | | (0.65 | ) | | | 0.16 | | | | (0.05 | ) |
| | | | | | | | | | | | | | | | |
Less distributions: | |
Dividends from net investment income | | | (0.10 | ) | | | (0.08 | ) | | | (0.26 | ) | | | (0.17 | ) |
Distributions from net realized gains | | | (0.06 | ) | | | (0.36 | ) | | | — | | | | (0.10 | ) |
| | | | | | | | | | | | | | | | |
Total dividends and distributions | | | (0.16 | ) | | | (0.44 | ) | | | (0.26 | ) | | | (0.27 | ) |
| | | | | | | | | | | | | | | | |
Net asset value, end of period | | $ | 9.29 | | | $ | 8.49 | | | $ | 9.58 | | | $ | 9.68 | |
| | | | | | | | | | | | | | | | |
Total return (b) | | | 11.31 | % | | | (6.87 | )% | | | 1.69 | % | | | (0.47 | )% |
| | | | | | | | | | | | | | | | |
Ratios/Supplemental Data: | |
Net assets, end of period (000’s) | | $ | 2,836 | | | $ | 2,299 | | | $ | 2,323 | | | $ | 2,010 | |
Ratio of expenses to average net assets: | | | | | | | | | | | | | | | | |
After waivers and reimbursements (a)(f) | | | 0.64 | % | | | 0.65 | % | | | 0.56 | % | | | 0.35 | % |
Before waivers and reimbursements (a)(f) | | | 5.39 | % | | | 4.56 | % | | | 5.06 | % | | | 4.16 | % |
Ratio of net investment income (loss) to average net assets: | | | | | | | | | | | | | | | | |
After waivers and reimbursements (a)(f)(x) | | | 0.97 | % | | | 0.67 | % | | | 1.53 | % | | | 6.41 | %(l) |
Before waivers and reimbursements (a)(f)(x) | | | (3.78 | )% | | | (3.24 | )% | | | (2.97 | )% | | | 2.59 | %(l) |
Portfolio turnover rate (z)^ | | | 17 | % | | | 15 | % | | | 12 | % | | | 1 | % |
| | | |
| | | January 1, 2016 to
July 7, 2016‡ | | | Year Ended December 31, | | | October 28, 2013* to December 31, 2013 | |
| Class K | | | 2015 | | | 2014 | | |
Net asset value, beginning of period | | $ | 8.49 | | | $ | 9.58 | | | $ | 9.68 | | | $ | 10.00 | |
| | | | | | | | | | | | | | | | |
Income (loss) from investment operations: | | | | | | | | | | | | | | | | |
Net investment income (loss) (e)(x) | | | (0.01 | ) | | | 0.08 | | | | 0.17 | | | | 0.11 | |
Net realized and unrealized gain (loss) on investments | | | 0.63 | | | | (0.71 | ) | | | 0.02 | † | | | (0.16 | ) |
| | | | | | | | | | | | | | | | |
Total from investment operations | | | 0.62 | | | | (0.63 | ) | | | 0.19 | �� | | | (0.05 | ) |
| | | | | | | | | | | | | | | | |
Less distributions: | |
Dividends from net investment income | | | — | | | | (0.10 | ) | | | (0.29 | ) | | | (0.17 | ) |
Distributions from net realized gains | | | — | | | | (0.36 | ) | | | — | | | | (0.10 | ) |
| | | | | | | | | | | | | | | | |
Total dividends and distributions | | | — | | | | (0.46 | ) | | | (0.29 | ) | | | (0.27 | ) |
| | | | | | | | | | | | | | | | |
Net asset value, end of period | | $ | 9.11 | | | $ | 8.49 | | | $ | 9.58 | | | $ | 9.68 | |
| | | | | | | | | | | | | | | | |
Total return (b) | | | 7.30 | % | | | (6.65 | )% | | | 1.95 | % | | | (0.43 | )% |
| | | | | | | | | | | | | | | | |
Ratios/Supplemental Data: | |
Net assets, end of period (000’s) | | $ | — | | | $ | 1,895 | | | $ | 2,030 | | | $ | 1,992 | |
Ratio of expenses to average net assets: | | | | | | | | | | | | | | | | |
After waivers and reimbursements (a)(f) | | | 0.40 | % | | | 0.40 | % | | | 0.30 | % | | | 0.10 | % |
Before waivers and reimbursements (a)(f) | | | 3.41 | % | | | 4.29 | % | | | 4.71 | % | | | 3.89 | % |
Ratio of net investment income (loss) to average net assets: | | | | | | | | | | | | | | | | |
After waivers and reimbursements (a)(f)(x) | | | (0.13 | )% | | | 0.88 | % | | | 1.68 | % | | | 6.62 | %(l) |
Before waivers and reimbursements (a)(f)(x) | | | (3.14 | )% | | | (3.01 | )% | | | (2.73 | )% | | | 2.84 | %(l) |
Portfolio turnover rate^ | | | 17 | % | | | 15 | % | | | 12 | % | | | 1 | %(z) |
See Notes to Financial Statements.
21
EQ ADVISORS TRUST
ALL ASSET AGGRESSIVE-ALT 50 PORTFOLIO
FINANCIAL HIGHLIGHTS (Continued)
| * | Commencement of Operations. |
| ‡ | After the close of business on July 7, 2016, operations ceased and shares of seed capital were fully redeemed. |
| ^ | Portfolio turnover rate excludes derivatives, if any. |
| (a) | Ratios for periods less than one year are annualized. |
| (b) | Total returns for periods less than one year are not annualized. |
| (e) | Net investment income (loss) per share is based on average shares outstanding. |
| (f) | Expenses do not include the expenses of the underlying funds (“indirect expenses”), if applicable. |
| (l) | The annualized ratio of net investment income to average net assets may not be indicative of operating results for a full year. |
| (x) | Recognition of net investment income is affected by the timing of dividend declarations by the underlying funds in which the Portfolio invests. |
| (z) | Portfolio turnover rate for periods less than one year is not annualized. |
See Notes to Financial Statements.
22
EQ ADVISORS TRUST
ALL ASSET AGGRESSIVE-ALT 75 PORTFOLIO
PORTFOLIO OF INVESTMENTS
December 31, 2016
| | | | | | | | |
| | | Number of
Shares | | | Value
(Note 1) | |
| | | | | | | | |
EXCHANGE TRADED FUNDS: | |
iShares China Large-Cap Fund (x) | | | 140 | | | $ | 4,859 | |
iShares International Developed Property Fund | | | 5,330 | | | | 179,141 | |
iShares JP Morgan USD Emerging Markets Bond Fund (x) | | | 130 | | | | 14,329 | |
iShares MSCI EAFE Small-Cap Fund | | | 310 | | | | 15,450 | |
iShares U.S. Oil & Gas Exploration & Production Fund (x) | | | 1,320 | | | | 86,381 | |
PowerShares DB Gold Fund* | | | 6,320 | | | | 234,030 | |
PowerShares DB Silver Fund (x)* | | | 2,400 | | | | 59,664 | |
SPDR S&P Emerging Asia Pacific Fund | | | 100 | | | | 7,513 | |
SPDR S&P Emerging Markets SmallCap Fund | | | 150 | | | | 5,958 | |
| | | | | | | | |
Total Exchange Traded Funds (20.0%)
(Cost $736,334) | | | | | | | 607,325 | |
| | | | | | | | |
INVESTMENT COMPANIES: | |
AXA Natural Resources Portfolio‡ | | | 90,828 | | | | 722,318 | |
AXA Real Estate Portfolio‡ | | | 62,975 | | | | 659,547 | |
AXA/AB Small Cap Growth Portfolio‡ | | | 4,043 | | | | 73,212 | |
AXA/Janus Enterprise Portfolio*‡ | | | 697 | | | | 11,081 | |
AXA/Loomis Sayles Growth Portfolio‡ | | | 6,557 | | | | 42,715 | |
EQ/BlackRock Basic Value Equity Portfolio‡ | | | 3,116 | | | | 72,138 | |
EQ/Boston Advisors Equity Income Portfolio‡ | | | 6,001 | | | | 34,557 | |
EQ/Emerging Markets Equity PLUS Portfolio‡ | | | 2,325 | | | | 18,606 | |
EQ/GAMCO Mergers and Acquisitions Portfolio‡ | | | 30,164 | | | | 393,982 | |
EQ/GAMCO Small Company Value Portfolio‡ | | | 943 | | | | 55,188 | |
EQ/Global Bond PLUS Portfolio‡ | | | 3,329 | | | | 29,179 | |
EQ/High Yield Bond Portfolio‡ | | | 2,385 | | | | 22,713 | |
EQ/Intermediate Government Bond Portfolio‡ | | | 713 | | | | 7,298 | |
EQ/International Equity Index Portfolio‡ | | | 5,004 | | | | 41,854 | |
EQ/Invesco Comstock Portfolio‡ | | | 3,219 | | | | 50,817 | |
EQ/JPMorgan Value Opportunities Portfolio‡ | | | 2,567 | | | | 47,622 | |
EQ/MFS International Growth Portfolio‡ | | | 10,219 | | | | 67,150 | |
EQ/PIMCO Global Real Return Portfolio‡ | | | 1,920 | | | | 18,635 | |
EQ/PIMCO Ultra Short Bond Portfolio‡ | | | 597 | | | | 5,892 | |
EQ/T. Rowe Price Growth Stock Portfolio*‡ | | | 1,737 | | | | 67,611 | |
| | | | | | | | |
Total Investment Companies (80.5%)
(Cost $2,659,138) | | | | | | | 2,442,115 | |
| | | | | | | | |
SHORT-TERM INVESTMENTS: | | | | | |
Investment Company (0.9%) | | | | | |
JPMorgan Prime Money Market Fund, IM Shares | | | 26,362 | | | | 26,370 | |
| | | | | | | | |
| | | Principal
Amount | | | Value
(Note 1) | |
| | | | | | | | |
Repurchase Agreements (1.4%) | | | | | |
Bank of Nova Scotia,
0.50%, dated 12/30/16, due 1/3/17, repurchase price $10,001, collateralized by various U.S. Government Treasury Securities, ranging from 0.875%-2.375%, maturing 11/30/17-1/15/27; total market value $10,200. (xx) | | $ | 10,000 | | | $ | 10,000 | |
Citigroup Global Markets Ltd.,
0.69%, dated 12/30/16, due 1/3/17, repurchase price $1,446, collateralized by various U.S. Government Treasury Securities, ranging from 1.375%-5.375%, maturing 7/31/18-2/15/45; total market value $1,475. (xx) | | | 1,446 | | | | 1,446 | |
Citigroup Global Markets Ltd.,
0.71%, dated 12/30/16, due 1/3/17, repurchase price $3,592, collateralized by various Foreign Government Agency Securities, ranging from 0.000%-5.250%, maturing 1/23/17-1/24/44, U.S. Government Treasury Securities, ranging from 0.000%-5.375%, maturing 2/15/19-2/15/44; total market value $3,664. (xx) | | | 3,592 | | | | 3,592 | |
Deutsche Bank AG,
0.95%, dated 12/30/16, due 1/3/17, repurchase price $3,121, collateralized by various Corporate Bonds, ranging from 1.875%-2.500%, maturing 3/13/19-6/10/25; total market value $3,183. (xx) | | | 3,121 | | | | 3,121 | |
Deutsche Bank Securities, Inc.,
0.50%, dated 12/30/16, due 1/3/17, repurchase price $24,911, collateralized by various U.S. Government Treasury Securities, 0.000%, maturing 2/15/40-5/15/40; total market value $25,408. (xx) | | | 24,910 | | | | 24,910 | |
| | | | | | | | |
Total Repurchase Agreements | | | | | | | 43,069 | |
| | | | | |
Total Short-Term Investments (2.3%) (Cost $69,434) | | | | | | | 69,439 | |
| | | | | | | | |
Total Investments (102.8%)
(Cost $3,464,906) | | | | | | | 3,118,879 | |
Other Assets Less Liabilities (-2.8%) | | | | | | | (85,303 | ) |
| | | | | | | | |
Net Assets (100%) | | | | | | $ | 3,033,576 | |
| | | | | | | | |
| ‡ | All, or a portion, of the security is an affiliated company as defined under the Investment Company Act of 1940. |
| (x) | All or a portion of security is on loan at December 31, 2016. |
| (xx) | At December 31, 2016, the Portfolio had loaned securities with a total value of $41,939. This was secured by cash collateral of $43,069 which was subsequently invested in joint repurchase agreements with a total value of $43,069, as detailed in the Notes to the Financial Statements, for which the Portfolio has a proportionate interest as reported in the Portfolio of Investments as Repurchase Agreements. |
The holdings in affiliated Investment Companies are all Class K shares.
See Notes to Financial Statements.
23
EQ ADVISORS TRUST
ALL ASSET AGGRESSIVE-ALT 75 PORTFOLIO
PORTFOLIO OF INVESTMENTS (Continued)
December 31, 2016
Investments in companies which were affiliates for the year ended December 31, 2016, were as follows:
| | | | | | | | | | | | | | | | | | | | | | | | |
Securities | | Value
December 31,
2015 | | | Purchases
at Cost | | | Sales
at Cost | | | Value
December 31,
2016 | | | Dividend
Income | | | Realized
Gain
(Loss)† | |
AXA Natural Resources Portfolio | | $ | 883,808 | | | $ | 249,874 | | | $ | 662,385 | | | $ | 722,318 | | | $ | 16,769 | | | $ | (32,449 | ) |
AXA Real Estate Portfolio (a) | | | 950,734 | | | | 258,771 | | | | 573,330 | | | | 659,547 | | | | 5,828 | | | | 33,639 | |
AXA/AB Small Cap Growth Portfolio | | | 101,142 | | | | 40,473 | | | | 79,402 | | | | 73,212 | | | | 429 | | | | (2,357 | ) |
AXA/Janus Enterprise Portfolio (b) | | | 17,876 | | | | 3,621 | | | | 11,023 | | | | 11,081 | | | | — | | | | (1,487 | ) |
AXA/Loomis Sayles Growth Portfolio | | | 59,026 | | | | 10,547 | | | | 28,065 | | | | 42,715 | | | | 243 | | | | 2,139 | |
EQ/BlackRock Basic Value Equity Portfolio | | | 92,743 | | | | 24,683 | | | | 53,694 | | | | 72,138 | | | | 1,180 | | | | 3,155 | |
EQ/Boston Advisors Equity Income Portfolio | | | 36,342 | | | | 30,920 | | | | 33,722 | | | | 34,557 | | | | 729 | | | | 2,257 | |
EQ/Emerging Markets Equity PLUS Portfolio | | | 38,760 | | | | 5,617 | | | | 30,442 | | | | 18,606 | | | | 193 | | | | (1,547 | ) |
EQ/GAMCO Mergers and Acquisitions Portfolio | | | 517,841 | | | | 176,781 | | | | 313,199 | | | | 393,982 | | | | 1,003 | | | | 20,659 | |
EQ/GAMCO Small Company Value Portfolio | | | 82,927 | | | | 25,644 | | | | 66,540 | | | | 55,188 | | | | 385 | | | | 764 | |
EQ/Global Bond PLUS Portfolio | | | 56,092 | | | | 16,969 | | | | 45,853 | | | | 29,179 | | | | 641 | | | | (1,011 | ) |
EQ/High Yield Bond Portfolio | | | 35,470 | | | | 8,431 | | | | 24,475 | | | | 22,713 | | | | 1,199 | | | | (1,214 | ) |
EQ/Intermediate Government Bond Portfolio | | | 29,302 | | | | 6,697 | | | | 28,696 | | | | 7,298 | | | | 68 | | | | 147 | |
EQ/International Equity Index Portfolio | | | 56,903 | | | | 28,687 | | | | 46,543 | | | | 41,854 | | | | 1,224 | | | | (3,621 | ) |
EQ/Invesco Comstock Portfolio | | | 65,747 | | | | 17,547 | | | | 38,768 | | | | 50,817 | | | | 1,276 | | | | 19 | |
EQ/JPMorgan Value Opportunities Portfolio | | | 58,860 | | | | 9,343 | | | | 28,508 | | | | 47,622 | | | | 543 | | | | (8 | ) |
EQ/MFS International Growth Portfolio | | | 101,388 | | | | 24,456 | | | | 64,028 | | | | 67,150 | | | | 831 | | | | (3,959 | ) |
EQ/PIMCO Global Real Return Portfolio | | | 35,738 | | | | 8,219 | | | | 26,911 | | | | 18,635 | | | | 948 | | | | (10 | ) |
EQ/PIMCO Ultra Short Bond Portfolio | | | 8,896 | | | | 1,882 | | | | 5,006 | | | | 5,892 | | | | 75 | | | | (41 | ) |
EQ/T. Rowe Price Growth Stock Portfolio | | | 82,410 | | | | 43,070 | | | | 57,190 | | | | 67,611 | | | | — | | | | 1,224 | |
| | | | | | | | | | | | | | | | | | | | | | | | |
| | $ | 3,312,005 | | | $ | 992,232 | | | $ | 2,217,780 | | | $ | 2,442,115 | | | $ | 33,564 | | | $ | 16,299 | |
| | | | | | | | | | | | | | | | | | | | | | | | |
| † | When applicable, realized gain includes net distributions of realized gain received from underlying funds. |
| (a) | Formerly known as EQ/Real Estate PLUS Portfolio. |
| (b) | Formerly known as EQ/Morgan Stanley Mid Cap Growth Portfolio. |
See Notes to Financial Statements.
24
EQ ADVISORS TRUST
ALL ASSET AGGRESSIVE-ALT 75 PORTFOLIO
PORTFOLIO OF INVESTMENTS (Continued)
December 31, 2016
The following is a summary of the inputs used to value the Portfolio’s assets and liabilities carried at fair value as of December 31, 2016:
The inputs or methodology used for valuing securities are not necessarily an indication of the risk associated with investing in those securities.
Various inputs are used in determining the value of the Portfolio’s investments. These inputs are summarized in the three broad levels listed below:
| | | | | | | | | | | | | | | | |
| | | | | |
| Investment Type | | Level 1
Quoted Prices in
Active Markets for
Identical
Securities | | | Level 2
Significant Other
Observable Inputs
(including quoted prices
for similar securities,
interest rates,
prepayment speeds,
credit risk, etc.) | | | Level 3
Significant Unobservable
Inputs (including the
Portfolio’s own
assumptions in
determining the fair
value of investments) | | | Total | |
Assets: | | | | | | | | | | | | | | | | |
Exchange Traded Funds | | | | | | | | | | | | | | | | |
Exchange Traded Funds | | $ | 607,325 | | | $ | — | | | $ | — | | | $ | 607,325 | |
Investment Companies | | | | | | | | | | | | | | | | |
Investment Companies | | | — | | | | 2,442,115 | | | | — | | | | 2,442,115 | |
Short-Term Investments | | | | | | | | | | | | | | | | |
Investment Companies | | | 26,370 | | | | — | | | | — | | | | 26,370 | |
Repurchase Agreements | | | — | | | | 43,069 | | | | — | | | | 43,069 | |
| | | | | | | | | | | | | | | | |
Total Assets | | $ | 633,695 | | | $ | 2,485,184 | | | $ | — | | | $ | 3,118,879 | |
| | | | | | | | | | | | | | | | |
Total Liabilities | | $ | — | | | $ | — | | | $ | — | | | $ | — | |
| | | | | | | | | | | | | | | | |
Total | | $ | 633,695 | | | $ | 2,485,184 | | | $ | — | | | $ | 3,118,879 | |
| | | | | | | | | | | | | | | | |
There were no transfers between Levels 1, 2 or 3 during the year ended December 31, 2016.
The Portfolio held no derivatives contracts during the year ended December 31, 2016.
Investment security transactions for the year ended December 31, 2016 were as follows:
| | | | |
Cost of Purchases: | | | | |
Long-term investments other than U.S. government debt securities | | $ | 1,102,981 | |
Net Proceeds of Sales and Redemptions: | | | | |
Long-term investments other than U.S. government debt securities | | $ | 2,643,910 | |
As of December 31, 2016, the gross unrealized appreciation (depreciation) of investments based on the aggregate cost of investments for Federal income tax purposes was as follows:
| | | | |
Aggregate gross unrealized appreciation | | $ | 55,316 | |
Aggregate gross unrealized depreciation | | | (375,877 | ) |
| | | | |
Net unrealized depreciation | | $ | (320,561 | ) |
| | | | |
Federal income tax cost of investments | | $ | 3,439,440 | |
| | | | |
See Notes to Financial Statements.
25
EQ ADVISORS TRUST
ALL ASSET AGGRESSIVE-ALT 75 PORTFOLIO
STATEMENT OF ASSETS AND LIABILITIES
December 31, 2016
| | | | |
ASSETS | | | | |
Investments at value (x): | | | | |
Affiliated Issuers (Cost $2,659,138) | | $ | 2,442,115 | |
Unaffiliated Issuers (Cost $762,699) | | | 633,695 | |
Repurchase Agreements (Cost $43,069) | | | 43,069 | |
Cash | | | 6,998 | |
Receivable for securities sold | | | 14,679 | |
Receivable from investment manager | | | 6,829 | |
Securities lending income receivable | | | 111 | |
Dividends, interest and other receivables | | | 14 | |
Other assets | | | 14 | |
| | | | |
Total assets | | | 3,147,524 | |
| | | | |
LIABILITIES | | | | |
Payable for return of collateral on securities loaned | | | 43,069 | |
Payable for securities purchased | | | 15,809 | |
Distribution fees payable – Class IB | | | 639 | |
Payable to Separate Accounts for Trust shares redeemed | | | 34 | |
Trustees’ fees payable | | | 8 | |
Accrued expenses | | | 54,389 | |
| | | | |
Total liabilities | | | 113,948 | |
| | | | |
NET ASSETS | | $ | 3,033,576 | |
| | | | |
Net assets were comprised of: | | | | |
Paid in capital | | $ | 3,415,266 | |
Accumulated undistributed net investment income (loss) | | | 6,409 | |
Accumulated undistributed net realized gain (loss) on investments | | | (42,072 | ) |
Net unrealized appreciation (depreciation) on investments | | | (346,027 | ) |
| | | | |
Net assets | | $ | 3,033,576 | |
| | | | |
Class IB | | | | |
Net asset value, offering and redemption price per share, $3,033,576 / 338,896 shares outstanding (unlimited amount authorized: $0.01 par value) | | $ | 8.95 | |
| | | | |
| (x) | Includes value of securities on loan of $41,939. |
STATEMENT OF OPERATIONS
For the Year Ended December 31, 2016
| | | | |
INVESTMENT INCOME | |
Dividends ($33,564 of dividend income received from affiliates) | | $ | 47,978 | |
Interest | | | 53 | |
Securities lending (net) | | | 1,689 | |
| | | | |
Total income | | | 49,720 | |
| | | | |
EXPENSES | | | | |
Custodian fees | | | 89,500 | |
Professional fees | | | 39,597 | |
Administrative fees | | | 32,504 | |
Distribution fees – Class IB | | | 6,868 | |
Investment management fees | | | 3,665 | |
Printing and mailing expenses | | | 428 | |
Tax expense | | | 102 | |
Trustees’ fees | | | 89 | |
Miscellaneous | | | 366 | |
| | | | |
Gross expenses | | | 173,119 | |
Less: Waiver from investment manager | | | (36,169 | ) |
Reimbursement from investment manager | | | (115,615 | ) |
| | | | |
Net expenses | | | 21,335 | |
| | | | |
NET INVESTMENT INCOME (LOSS) | | | 28,385 | |
| | | | |
REALIZED AND UNREALIZED GAIN (LOSS) | | | | |
Net realized gain (loss) on investments ($(22,989) of realized gain (loss) from affiliates) | | | (59,343 | ) |
Net distributions of realized gain received from underlying funds (All realized gains received from affiliates) | | | 39,288 | |
| | | | |
Net realized gain (loss) | | | (20,055 | ) |
| | | | |
Net change in unrealized appreciation (depreciation) on investments ($355,658 of change in unrealized appreciation (depreciation) from affiliates) | | | 474,730 | |
| | | | |
NET REALIZED AND UNREALIZED GAIN (LOSS) | | | 454,675 | |
| | | | |
NET INCREASE (DECREASE) IN NET ASSETS RESULTING FROM OPERATIONS | | $ | 483,060 | |
| | | | |
See Notes to Financial Statements.
26
EQ ADVISORS TRUST
ALL ASSET AGGRESSIVE-ALT 75 PORTFOLIO
STATEMENT OF CHANGES IN NET ASSETS
| | | | | | | | |
| | | Year Ended December 31, | |
| | 2016 | | | 2015 | |
INCREASE (DECREASE) IN NET ASSETS FROM OPERATIONS: | | | | | | | | |
Net investment income (loss) | | $ | 28,385 | | | $ | 39,223 | |
Net realized gain (loss) on investments and net distributions of realized gain received from underlying funds | | | (20,055 | ) | | | 46,239 | |
Net change in unrealized appreciation (depreciation) on investments | | | 474,730 | | | | (500,091 | ) |
| | | | | | | | |
NET INCREASE (DECREASE) IN NET ASSETS RESULTING FROM OPERATIONS | | | 483,060 | | | | (414,629 | ) |
| | | | | | | | |
DIVIDENDS AND DISTRIBUTIONS: | | | | | | | | |
Dividends from net investment income | | | | | | | | |
Class IB | | | (41,759 | ) | | | (27,776 | ) |
Class K (b) | | | — | | | | (25,616 | ) |
| | | | | | | | |
| | | (41,759 | ) | | | (53,392 | ) |
| | | | | | | | |
Distributions from net realized capital gains | | | | | | | | |
Class IB | | | — | | | | (70,956 | ) |
Class K (b) | | | — | | | | (54,867 | ) |
| | | | | | | | |
| | | — | | | | (125,823 | ) |
| | | | | | | | |
TOTAL DIVIDENDS AND DISTRIBUTIONS | | | (41,759 | ) | | | (179,215 | ) |
| | | | | | | | |
CAPITAL SHARES TRANSACTIONS: | | | | | | | | |
Class IB | | | | | | | | |
Capital shares sold [ 96,432 and 24,630 shares, respectively ] | | | 849,712 | | | | 222,289 | |
Capital shares issued in reinvestment of dividends and distributions [ 4,688 and 12,012 shares, respectively ] | | | 41,759 | | | | 98,732 | |
Capital shares repurchased [ (56,010) and (4,438) shares, respectively ] | | | (500,308 | ) | | | (41,581 | ) |
| | | | | | | | |
Total Class IB transactions | | | 391,163 | | | | 279,440 | |
| | | | | | | | |
Class K (b) | | | | | | | | |
Capital shares issued in reinvestment of dividends and distributions [ 0 and 9,784 shares, respectively ] | | | — | | | | 80,483 | |
Capital shares repurchased [ (222,714) and 0 shares, respectively ] | | | (1,975,768 | ) | | | — | |
| | | | | | | | |
Total Class K transactions | | | (1,975,768 | ) | | | 80,483 | |
| | | | | | | | |
NET INCREASE (DECREASE) IN NET ASSETS RESULTING FROM CAPITAL SHARE TRANSACTIONS | | | (1,584,605 | ) | | | 359,923 | |
| | | | | | | | |
TOTAL INCREASE (DECREASE) IN NET ASSETS | | | (1,143,304 | ) | | | (233,921 | ) |
NET ASSETS: | | | | | | | | |
Beginning of year | | | 4,176,880 | | | | 4,410,801 | |
| | | | | | | | |
End of year (a) | | $ | 3,033,576 | | | $ | 4,176,880 | |
| | | | | | | | |
(a) Includes accumulated undistributed (overdistributed) net investment income (loss) of | | $ | 6,409 | | | $ | 6,862 | |
| | | | | | | | |
(b) After the close of business on July 7, 2016, operations for Class K ceased and shares of seed capital were fully redeemed. | |
See Notes to Financial Statements.
27
EQ ADVISORS TRUST
ALL ASSET AGGRESSIVE-ALT 75 PORTFOLIO
FINANCIAL HIGHLIGHTS
| | | | | | | | | | | | | | | | |
| | | Year Ended December 31, | | | October 28, 2013* to
December 31, 2013 | |
| Class IB | | 2016 | | | 2015 | | | 2014 | | |
Net asset value, beginning of period | | $ | 8.09 | | | $ | 9.30 | | | $ | 9.56 | | | $ | 10.00 | |
| | | | | | | | | | | | | | | | |
Income (loss) from investment operations: | | | | | | | | | | | | | | | | |
Net investment income (loss) (e)(x) | | | 0.09 | | | | 0.07 | | | | 0.19 | | | | 0.11 | |
Net realized and unrealized gain (loss) on investments | | | 0.90 | | | | (0.92 | ) | | | (0.15 | ) | | | (0.28 | ) |
| | | | | | | | | | | | | | | | |
Total from investment operations | | | 0.99 | | | | (0.85 | ) | | | 0.04 | | | | (0.17 | ) |
| | | | | | | | | | | | | | | | |
Less distributions: | | | | | | | | | | | | | | | | |
Dividends from net investment income | | | (0.13 | ) | | | (0.10 | ) | | | (0.30 | ) | | | (0.17 | ) |
Distributions from net realized gains | | | — | | | | (0.26 | ) | | | — | | | | (0.06 | ) |
Return of capital | | | — | | | | — | | | | — | | | | (0.04 | ) |
| | | | | | | | | | | | | | | | |
Total dividends and distributions | | | (0.13 | ) | | | (0.36 | ) | | | (0.30 | ) | | | (0.27 | ) |
| | | | | | | | | | | | | | | | |
Net asset value, end of period | | $ | 8.95 | | | $ | 8.09 | | | $ | 9.30 | | | $ | 9.56 | |
| | | | | | | | | | | | | | | | |
Total return (b) | | | 12.18 | % | | | (9.24 | )% | | | 0.38 | % | | | (1.66 | )% |
| | | | | | | | | | | | | | | | |
Ratios/Supplemental Data: | | | | | | | | | | | | | | | | |
Net assets, end of period (000’s) | | $ | 3,034 | | | $ | 2,376 | | | $ | 2,432 | | | $ | 1,981 | |
Ratio of expenses to average net assets: | | | | | | | | | | | | | | | | |
After waivers and reimbursements (a)(f) | | | 0.64 | % | | | 0.65 | % | | | 0.56 | % | | | 0.35 | % |
Before waivers and reimbursements (a)(f) | | | 5.16 | % | | | 4.52 | % | | | 5.01 | % | | | 4.20 | % |
Ratio of net investment income (loss) to average net assets: | | | | | | | | | | | | | | | | |
After waivers and reimbursements (a)(f)(x) | | | 1.06 | % | | | 0.80 | % | | | 1.88 | % | | | 6.50 | %(l) |
Before waivers and reimbursements (a)(f)(x) | | | (3.46 | )% | | | (3.07 | )% | | | (2.56 | )% | | | 2.64 | %(l) |
Portfolio turnover rate (z)^ | | | 30 | % | | | 13 | % | | | 11 | % | | | 1 | % |
| | | |
| | | January 1, 2016 to
July 7, 2016‡ | | | Year Ended December 31, | | | October 28, 2013* to
December 31, 2013 | |
| Class K | | | 2015 | | | 2014 | | |
Net asset value, beginning of period | | $ | 8.09 | | | $ | 9.30 | | | $ | 9.56 | | | $ | 10.00 | |
| | | | | | | | | | | | | | | | |
Income (loss) from investment operations: | | | | | | | | | | | | | | | | |
Net investment income (loss) (e)(x) | | | — | # | | | 0.09 | | | | 0.19 | | | | 0.11 | |
Net realized and unrealized gain (loss) on investments | | | 0.81 | | | | (0.92 | ) | | | (0.13 | ) | | | (0.27 | ) |
| | | | | | | | | | | | | | | | |
Total from investment operations | | | 0.81 | | | | (0.83 | ) | | | 0.06 | | | | (0.16 | ) |
| | | | | | | | | | | | | | | | |
Less distributions: | | | | | | | | | | | | | | | | |
Dividends from net investment income | | | — | | | | (0.12 | ) | | | (0.32 | ) | | | (0.18 | ) |
Distributions from net realized gains | | | — | | | | (0.26 | ) | | | — | | | | (0.06 | ) |
Return of capital | | | — | | | | — | | | | — | | | | (0.04 | ) |
| | | | | | | | | | | | | | | | |
Total dividends and distributions | | | — | | | | (0.38 | ) | | | (0.32 | ) | | | (0.28 | ) |
| | | | | | | | | | | | | | | | |
Net asset value, end of period | | $ | 8.90 | | | $ | 8.09 | | | $ | 9.30 | | | $ | 9.56 | |
| | | | | | | | | | | | | | | | |
Total return (b) | | | 10.01 | % | | | (9.01 | )% | | | 0.64 | % | | | (1.61 | )% |
| | | | | | | | | | | | | | | | |
Ratios/Supplemental Data: | | | | | | | | | | | | | | | | |
Net assets, end of period (000’s) | | $ | — | | | $ | 1,801 | | | $ | 1,979 | | | $ | 1,967 | |
Ratio of expenses to average net assets: | | | | | | | | | | | | | | | | |
After waivers and reimbursements (a)(f) | | | 0.40 | % | | | 0.40 | % | | | 0.30 | % | | | 0.10 | % |
Before waivers and reimbursements (a)(f) | | | 3.41 | % | | | 4.24 | % | | | 4.61 | % | | | 3.95 | % |
Ratio of net investment income (loss) to average net assets: | | | | | | | | | | | | | | | | |
After waivers and reimbursements (a)(f)(x) | | | (0.07 | )% | | | 1.01 | % | | | 1.95 | % | | | 6.73 | %(l) |
Before waivers and reimbursements (a)(f)(x) | | | (3.08 | )% | | | (2.83 | )% | | | (2.36 | )% | | | 2.88 | %(l) |
Portfolio turnover rate^ | | | 30 | % | | | 13 | % | | | 11 | % | | | 1 | %(z) |
See Notes to Financial Statements.
28
EQ ADVISORS TRUST
ALL ASSET AGGRESSIVE-ALT 75 PORTFOLIO
FINANCIAL HIGHLIGHTS (Continued)
| * | Commencement of Operations. |
| # | Per share amount is less than $0.005. |
| ^ | Portfolio turnover rate excludes derivatives, if any. |
| ‡ | After the close of business on July 7, 2016, operations for Class K ceased and shares of seed capital were fully redeemed. |
| (a) | Ratios for periods less than one year are annualized. |
| (b) | Total returns for periods less than one year are not annualized. |
| (e) | Net investment income (loss) per share is based on average shares outstanding. |
| (f) | Expenses do not include the expenses of the underlying funds (“indirect expenses”), if applicable. |
| (l) | The annualized ratio of net investment income to average net assets may not be indicative of operating results for a full year. |
| (x) | Recognition of net investment income is affected by the timing of dividend declarations by the underlying funds in which the Portfolio invests. |
| (z) | Portfolio turnover rate for periods less than one year is not annualized. |
See Notes to Financial Statements.
29
EQ ADVISORS TRUST
AXA/DOUBLELINE OPPORTUNISTIC CORE PLUS BOND PORTFOLIO
PORTFOLIO OF INVESTMENTS
December 31, 2016
| | | | | | | | |
| | | Principal
Amount | | | Value
(Note 1) | |
| | | | | | | | |
LONG-TERM DEBT SECURITIES: | | | | | |
Asset-Backed Securities (6.2%) | | | | | | | | |
Apidos CLO XXI, | | | | | | | | |
Series 2015-21A C
4.432%, 7/18/27 (l)§ | | $ | 500,000 | | | $ | 478,401 | |
Series 2015-21A D
6.432%, 7/18/27 (l)§ | | | 250,000 | | | | 232,018 | |
Babson CLO Ltd., | | | | | | | | |
Series 2012-2A CR
4.506%, 5/15/23 (l)§ | | | 250,000 | | | | 249,461 | |
BlueMountain CLO Ltd., | | | | | | | | |
Series 2015-2A D
4.432%, 7/18/27 (l)§ | | | 250,000 | | | | 239,042 | |
Series 2016-2A C
4.796%, 8/20/28 (l)§ | | | 500,000 | | | | 500,196 | |
Carlyle Global Market Strategies CLO Ltd., | | | | | | | | |
Series 2016-2A D2
7.084%, 7/15/27 (b)(l)§ | | | 600,000 | | | | 590,221 | |
Eaton Vance CDO VIII Ltd., | | | | | | | | |
Series 2006-8A B
1.556%, 8/15/22 (l)§ | | | 250,000 | | | | 247,400 | |
LCM XII LP, | | | | | | | | |
Series 12A DR
4.578%, 10/19/22 (l)§ | | | 500,000 | | | | 493,575 | |
Madison Park Funding XV Ltd., | | | | | | | | |
Series 2014-15A A2
3.286%, 1/27/26 (l)§ | | | 285,000 | | | | 285,092 | |
Series 2014-15A C
4.586%, 1/27/26 (l)§ | | | 250,000 | | | | 245,667 | |
OneMain Financial Issuance Trust, | | | | | | | | |
Series 2015-1A A
3.190%, 3/18/26§ | | | 411,000 | | | | 413,668 | |
Series 2015-2A A
2.570%, 7/18/25§ | | | 150,000 | | | | 149,910 | |
Venture XVII CLO Ltd., | | | | | | | | |
Series 2014-17A C
3.730%, 7/15/26 (l)§ | | | 250,000 | | | | 250,138 | |
| | | | | | | | |
Total Asset-Backed Securities | | | | | | | 4,374,789 | |
| | | | | | | | |
Collateralized Mortgage Obligations (16.2%) | | | | | |
Alternative Loan Trust, | | | | | | | | |
Series 2006-19CB A15
6.000%, 8/25/36 | | | 429,644 | | | | 382,842 | |
Banc of America Funding Trust, | | | | | | | | |
Series 2005-6 1A8
6.000%, 10/25/35 | | | 660,252 | | | | 636,819 | |
CHL Mortgage Pass-Through Trust, | | | | | | | | |
Series 2006-J4 A5
6.250%, 9/25/36 | | | 763,204 | | | | 629,529 | |
Series 2007-HY1 1A1
3.030%, 4/25/37 (l) | | | 719,390 | | | | 671,265 | |
Series 2007-HY1 2A1
4.389%, 3/25/37 (l) | | | 357,970 | | | | 335,026 | |
Citigroup Mortgage Loan Trust, | | | | | | | | |
Series 2006-AR2 1A2
3.034%, 3/25/36 (l) | | | 1,029,476 | | | | 980,184 | |
FHLMC, | | | | | | | | |
Series 3998 AZ
4.000%, 2/15/42 | | | 1,606,737 | | | | 1,691,635 | |
| | | | | | | | |
Series 4444 CZ
3.000%, 2/15/45 | | $ | 528,234 | | | $ | 477,644 | |
Series 4471 GA
3.000%, 2/15/44 | | | 824,082 | | | | 832,314 | |
Series 4483 CA
3.000%, 6/15/44 | | | 520,294 | | | | 525,218 | |
FHLMC Multifamily Structured Pass Through-Certificates, | | | | | | | | |
Series K050 A2
3.334%, 8/25/25 (l) | | | 50,000 | | | | 51,713 | |
First Horizon Mortgage Pass-Through Trust, | | | | | | | | |
Series 2006-2 1A3
6.000%, 8/25/36 | | | 475,063 | | | | 439,604 | |
FNMA, | | | | | | | | |
Series 2015-42 CA
3.000%, 3/25/44 | | | 1,415,001 | | | | 1,428,063 | |
Series 2015-9 HA
3.000%, 1/25/45 | | | 677,045 | | | | 693,216 | |
RFMSI Trust, | | | | | | | | |
Series 2006-S6 A14
6.000%, 7/25/36 | | | 614,850 | | | | 585,488 | |
Suntrust Alternative Loan Trust, | | | | | | | | |
Series 2005-1F 2A8
6.000%, 12/25/35 | | | 540,128 | | | | 509,828 | |
Wells Fargo Alternative Loan Trust, | | | | | | | | |
Series 2007-PA2 1A1
6.000%, 6/25/37 | | | 687,709 | | | | 691,198 | |
| | | | | | | | |
Total Collateralized Mortgage Obligations | | | | | | | 11,561,586 | |
| | | | | | | | |
Commercial Mortgage-Backed Securities (8.1%) | | | | | |
CD Commercial Mortgage Trust, | | | | | | | | |
Series 2007-CD4 AM
5.301%, 12/11/49 (l)§ | | | 90,000 | | | | 90,127 | |
CFCRE Commercial Mortgage Trust, | | | | | | | | |
Series 2016-C3 XA
1.091%, 1/10/48 IO (l) | | | 993,021 | | | | 71,940 | |
Series 2016-C7 A3
3.839%, 12/10/54 | | | 92,000 | | | | 95,037 | |
Citigroup Commercial Mortgage Trust, | | | | | | | | |
Series 2015-GC35 XA
0.903%, 11/10/48 IO (l) | | | 844,959 | | | | 44,586 | |
Series 2016-P4 A4
2.902%, 7/10/49 | | | 89,000 | | | | 86,107 | |
Series 2016-P4 XA
2.016%, 7/10/49 IO (l) | | | 997,806 | | | | 133,125 | |
Series 2016-P6 A5
3.720%, 12/10/49 (l) | | | 73,000 | | | | 75,304 | |
Series 2016-SMPL D
3.520%, 9/10/31§ | | | 91,000 | | | | 87,966 | |
COMM Mortgage Trust, | | | | | | | | |
Series 2013-CR10 XA
0.928%, 8/10/46 IO (l) | | | 2,139,476 | | | | 81,972 | |
Series 2015-CR22 D
4.126%, 3/10/48 (l)§ | | | 140,000 | | | | 109,895 | |
Series 2015-CR23 D
4.256%, 5/10/48 (l) | | | 140,000 | | | | 100,295 | |
Series 2015-CR26 B
4.495%, 10/10/48 (l) | | | 100,000 | | | | 104,094 | |
See Notes to Financial Statements.
30
EQ ADVISORS TRUST
AXA/DOUBLELINE OPPORTUNISTIC CORE PLUS BOND PORTFOLIO
PORTFOLIO OF INVESTMENTS (Continued)
December 31, 2016
| | | | | | | | |
| | | Principal
Amount | | | Value
(Note 1) | |
| | | | | | | | |
Series 2015-CR26 XA
1.056%, 10/10/48 IO (l) | | $ | 1,290,494 | | | $ | 82,347 | |
Series 2015-LC23 C
4.646%, 10/10/53 (l) | | | 64,000 | | | | 61,393 | |
Series 2016-CR28 C
4.647%, 2/10/49 (l) | | | 73,000 | | | | 70,662 | |
Series 2016-DC2 XA
1.077%, 2/10/49 IO (l) | | | 994,709 | | | | 67,324 | |
Commercial Mortgage Trust, | | | | | | | | |
Series 2007-GG11 AJ
6.032%, 12/10/49 (l) | | | 140,000 | | | | 139,789 | |
Series 2007-GG9 AMFX
5.475%, 3/10/39 | | | 89,888 | | | | 89,787 | |
Cosmopolitan Hotel Trust, | | | | | | | | |
Series 2016-CSMO C
3.354%, 11/15/33 (l)§ | | | 70,000 | | | | 70,260 | |
Credit Suisse Commercial Mortgage Trust, | | | | | | | | |
Series 2007-C4 A1AM
5.935%, 9/15/39 (l) | | | 140,000 | | | | 141,067 | |
CSAIL Commercial Mortgage Trust, | | | | | | | | |
Series 2015-C1 XA
0.958%, 4/15/50 IO (l) | | | 1,536,832 | | | | 84,873 | |
Series 2015-C2 AS
3.849%, 6/15/57 (l) | | | 140,000 | | | | 142,405 | |
Series 2015-C4 C
4.585%, 11/15/48 (l) | | | 64,000 | | | | 61,576 | |
FHLMC Multifamily Structured Pass-Through Certificates, | | | | | | | | |
Series K722 X1
1.311%, 3/25/23 IO (l) | | | 998,173 | | | | 65,670 | |
FNMA, | | | | | | | | |
Series 2016-M3 A2
2.702%, 2/25/26 | | | 67,000 | | | | 65,768 | |
GE Commercial Mortgage Corp. Trust, | | | | | | | | |
Series 2007-C1 AM
5.606%, 12/10/49 (l) | | | 85,700 | | | | 85,558 | |
GS Mortgage Securities Corp. II, | | | | | | | | |
Series 2013-GC10 XA
1.595%, 2/10/46 IO (l) | | | 1,442,614 | | | | 104,514 | |
GS Mortgage Securities Trust, | | | | | | | | |
Series 2014-GC20 XA
1.157%, 4/10/47 IO (l) | | | 1,933,307 | | | | 108,456 | |
Series 2014-GC26 D
4.511%, 11/10/47 (l)§ | | | 43,000 | | | | 34,676 | |
JP Morgan Chase Commercial Mortgage Securities Trust, | | | | | | | | |
Series 2006-LDP9 AM
5.372%, 5/15/47 | | | 105,150 | | | | 105,217 | |
Series 2007-C1 AM
6.263%, 2/15/51 (l) | | | 140,000 | | | | 141,646 | |
Series 2007-LD11 AM
5.753%, 6/15/49 (l) | | | 91,000 | | | | 91,869 | |
Series 2007-LD12 AM
6.039%, 2/15/51 (l) | | | 100,000 | | | | 102,119 | |
Series 2007-LDPX AM
5.464%, 1/15/49 (l) | | | 91,400 | | | | 90,343 | |
Series 2015-JP1 XA
1.151%, 1/15/49 IO (l) | | | 993,851 | | | | 59,253 | |
Series 2016-JP2 B
3.460%, 8/15/49 | | | 28,000 | | | | 27,506 | |
| | | | | | | | |
Series 2016-JP2 C
3.796%, 8/15/49 (l) | | $ | 22,000 | | | $ | 20,994 | |
Series 2016-JP2 XA
1.866%, 8/15/49 IO (l) | | | 293,354 | | | | 39,029 | |
Series 2016-WPT E
5.704%, 10/15/33 (l)§ | | | 92,000 | | | | 92,187 | |
JPMBB Commercial Mortgage Securities Trust, | | | | | | | | |
Series 2014-C21 XA
1.094%, 8/15/47 IO (l) | | | 1,431,346 | | | | 85,600 | |
Series 2015-C32 C
4.668%, 11/15/48 (l) | | | 105,000 | | | | 95,588 | |
Series 2016-C1 C
4.905%, 3/15/49 (l) | | | 66,000 | | | | 65,758 | |
JPMDB Commercial Mortgage Securities Trust, | | | | | | | | |
Series 2016-C2 XA
1.713%, 6/15/49 IO (l) | | | 997,187 | | | | 101,577 | |
LB-UBS Commercial Mortgage Trust, | | | | | | | | |
Series 2007-C1 AJ
5.484%, 2/15/40 | | | 65,000 | | | | 65,031 | |
Series 2007-C2 AM
5.493%, 2/15/40 (l) | | | 59,000 | | | | 59,403 | |
LSTAR Commercial Mortgage Trust, | | | | | | | | |
Series 2016-4 C
4.549%, 3/10/49 (l)§ | | | 72,000 | | | | 66,182 | |
ML-CFC Commercial Mortgage Trust, | | | | | | | | |
Series 2007-5 AM
5.419%, 8/12/48 | | | 72,191 | | | | 72,190 | |
Morgan Stanley Bank of America Merrill Lynch Trust, | | | | | | | | |
Series 2014-C19 C
4.000%, 12/15/47 | | | 125,000 | | | | 111,931 | |
Series 2015-C20 C
4.462%, 2/15/48 (l) | | | 125,000 | | | | 116,110 | |
Series 2015-C26 D
3.060%, 10/15/48§ | | | 100,000 | | | | 69,302 | |
Series 2016-C32 A4
3.720%, 12/15/49 | | | 76,000 | | | | 77,783 | |
Morgan Stanley Capital I Trust, | | | | | | | | |
Series 2007-HQ11 AJ
5.508%, 2/12/44 (l) | | | 64,000 | | | | 64,000 | |
Series 2015-UBS8 XA
0.975%, 12/15/48 IO (l) | | | 1,091,250 | | | | 68,859 | |
Series 2015-XLF2 AFSC
3.704%, 8/15/26 (l)§ | | | 65,000 | | | | 64,918 | |
Series 2016-UB11 XA
1.824%, 8/15/49 IO (l) | | | 994,868 | | | | 104,969 | |
MSCG Trust, | | | | | | | | |
Series 2016-SNR C
5.205%, 11/15/34§ | | | 92,000 | | | | 91,940 | |
SG Commercial Mortgage Securities Trust, | | | | | |
Series 2016-C5 XA
2.032%, 10/10/48 IO (l) | | | 643,683 | | | | 80,813 | |
Wells Fargo Commercial Mortgage Trust, | | | | | |
Series 2014-LC16 D
3.938%, 8/15/50§ | | | 150,000 | | | | 114,790 | |
Series 2015-C28 C
4.136%, 5/15/48 (l) | | | 140,000 | | | | 125,887 | |
See Notes to Financial Statements.
31
EQ ADVISORS TRUST
AXA/DOUBLELINE OPPORTUNISTIC CORE PLUS BOND PORTFOLIO
PORTFOLIO OF INVESTMENTS (Continued)
December 31, 2016
| | | | | | | | |
| | | Principal
Amount | | | Value
(Note 1) | |
| | | | | | | | |
Series 2015-C31 C
4.611%, 11/15/48 (l) | | $ | 105,000 | | | $ | 104,477 | |
Series 2015-C31 XA
1.112%, 11/15/48 IO (l) | | | 1,239,718 | | | | 86,491 | |
Series 2015-LC22 C
4.540%, 9/15/58 (l) | | | 50,000 | | | | 49,553 | |
Series 2015-P2 A4
3.809%, 12/15/48 | | | 66,000 | | | | 68,919 | |
Series 2015-P2 XA
1.029%, 12/15/48 IO (l) | | | 995,305 | | | | 62,503 | |
Series 2016-C32 C
4.721%, 1/15/59 (l) | | | 51,000 | | | | 47,666 | |
Series 2016-NXS6 XA
1.663%, 11/15/49 IO (l) | | | 998,576 | | | | 105,815 | |
WFRBS Commercial Mortgage Trust, | | | | | | | | |
Series 2014-C21 XA
1.157%, 8/15/47 IO (l) | | | 2,925,034 | | | | 173,852 | |
| | | | | | | | |
Total Commercial Mortgage-Backed Securities | | | | | | | 5,728,643 | |
| | | | | | | | |
Convertible Bond (0.0%) | |
Energy (0.0%) | | | | | |
Oil, Gas & Consumable Fuels (0.0%) | |
SandRidge Energy, Inc. | | | | | | | | |
(Zero Coupon), 10/4/20 | | | 1,130 | | | | 1,408 | |
| | | | | | | | |
Total Convertible Bond | | | | | | | 1,408 | |
| | | | | | | | |
Corporate Bonds (22.9%) | |
Consumer Discretionary (1.7%) | | | | | |
Auto Components (0.2%) | |
Allison Transmission, Inc. | | | | | | | | |
5.000%, 10/1/24§ | | | 10,000 | | | | 10,125 | |
American Axle & Manufacturing, Inc. | | | | | | | | |
6.625%, 10/15/22 | | | 25,000 | | | | 25,733 | |
Dana, Inc. | | | | | | | | |
5.500%, 12/15/24 | | | 15,000 | | | | 15,375 | |
Delphi Automotive plc | | | | | | | | |
4.250%, 1/15/26 | | | 8,000 | | | | 8,278 | |
Delphi Corp. | | | | | | | | |
4.150%, 3/15/24 | | | 60,000 | | | | 62,040 | |
Goodyear Tire & Rubber Co. (The) | | | | | | | | |
5.125%, 11/15/23 | | | 25,000 | | | | 25,750 | |
| | | | | | | | |
| | | | | | | 147,301 | |
| | | | | | | | |
Automobiles (0.1%) | |
Ford Motor Co. | | | | | | | | |
7.450%, 7/16/31 | | | 65,000 | | | | 81,268 | |
| | | | | | | | |
Diversified Consumer Services (0.0%) | |
ServiceMaster Co. LLC (The) | | | | | | | | |
5.125%, 11/15/24§ | | | 10,000 | | | | 10,175 | |
| | | | | | | | |
Hotels, Restaurants & Leisure (0.3%) | |
ESH Hospitality, Inc. | | | | | | | | |
5.250%, 5/1/25§ | | | 25,000 | | | | 24,875 | |
GLP Capital LP | | | | | | | | |
5.375%, 4/15/26 | | | 10,000 | | | | 10,410 | |
Hilton Domestic Operating Co., Inc. | | | | | | | | |
4.250%, 9/1/24§ | | | 20,000 | | | | 19,400 | |
| | | | | | | | |
Jack Ohio Finance LLC | | | | | | | | |
6.750%, 11/15/21§ | | $ | 20,000 | | | $ | 20,250 | |
MGM Resorts International | | | | | | | | |
4.625%, 9/1/26 | | | 15,000 | | | | 14,475 | |
NCL Corp. Ltd. | | | | | | | | |
4.750%, 12/15/21 (b)§ | | | 20,000 | | | | 19,988 | |
Pinnacle Entertainment, Inc. | | | | | | | | |
5.625%, 5/1/24§ | | | 20,000 | | | | 20,026 | |
Sabre GLBL, Inc. | | | | | | | | |
5.250%, 11/15/23§ | | | 15,000 | | | | 15,403 | |
Scientific Games International, Inc. | | | | | | | | |
7.000%, 1/1/22§ | | | 10,000 | | | | 10,725 | |
Station Casinos LLC | | | | | | | | |
7.500%, 3/1/21 | | | 15,000 | | | | 15,712 | |
Viking Cruises Ltd. | | | | | | | | |
8.500%, 10/15/22§ | | | 25,000 | | | | 25,938 | |
| | | | | | | | |
| | | | | | | 197,202 | |
| | | | | | | | |
Household Durables (0.0%) | |
Newell Brands, Inc. | | | | | | | | |
3.150%, 4/1/21 | | | 15,000 | | | | 15,219 | |
| | | | | | | | |
Internet & Direct Marketing Retail (0.1%) | |
Amazon.com, Inc. | | | | | | | | |
3.800%, 12/5/24 | | | 30,000 | | | | 31,448 | |
| | | | | | | | |
Media (0.8%) | |
AMC Entertainment Holdings, Inc. | | | | | | | | |
5.875%, 11/15/26§ | | | 10,000 | | | | 10,225 | |
Cengage Learning, Inc. | | | | | | | | |
9.500%, 6/15/24§ | | | 15,000 | | | | 13,275 | |
Cequel Communications Holdings I LLC | | | | | | | | |
6.375%, 9/15/20§ | | | 25,000 | | | | 25,719 | |
Comcast Corp. | | | | | | | | |
4.200%, 8/15/34 | | | 15,000 | | | | 15,329 | |
4.400%, 8/15/35 | | | 50,000 | | | | 52,442 | |
CSC Holdings LLC | | | | | | | | |
5.250%, 6/1/24 | | | 10,000 | | | | 9,725 | |
5.500%, 4/15/27§ | | | 10,000 | | | | 10,125 | |
Globo Comunicacao e Participacoes SA | | | | | | | | |
5.307%, 5/11/22 (e)(m) | | | 200,000 | | | | 199,000 | |
Gray Television, Inc. | | | | | | | | |
5.125%, 10/15/24§ | | | 10,000 | | | | 9,725 | |
5.875%, 7/15/26§ | | | 15,000 | | | | 14,887 | |
Live Nation Entertainment, Inc. | | | | | | | | |
4.875%, 11/1/24§ | | | 20,000 | | | | 20,000 | |
Nexstar Escrow Corp. | | | | | | | | |
5.625%, 8/1/24§ | | | 15,000 | | | | 14,850 | |
Omnicom Group, Inc. | | | | | | | | |
3.600%, 4/15/26 | | | 70,000 | | | | 69,299 | |
Sinclair Television Group, Inc. | | | | | | | | |
5.625%, 8/1/24§ | | | 25,000 | | | | 25,500 | |
Sirius XM Radio, Inc. | | | | | | | | |
5.375%, 7/15/26§ | | | 25,000 | | | | 24,438 | |
TEGNA, Inc. | | | | | | | | |
4.875%, 9/15/21§ | | | 25,000 | | | | 25,500 | |
WMG Acquisition Corp. | | | | | | | | |
6.750%, 4/15/22§ | | | 20,000 | | | | 21,075 | |
| | | | | | | | |
| | | | | | | 561,114 | |
| | | | | | | | |
See Notes to Financial Statements.
32
EQ ADVISORS TRUST
AXA/DOUBLELINE OPPORTUNISTIC CORE PLUS BOND PORTFOLIO
PORTFOLIO OF INVESTMENTS (Continued)
December 31, 2016
| | | | | | | | |
| | | Principal
Amount | | | Value
(Note 1) | |
| | | | | | | | |
Multiline Retail (0.0%) | |
Dollar Tree, Inc. | | | | | | | | |
5.750%, 3/1/23 | | $ | 10,000 | | | $ | 10,575 | |
| | | | | | | | |
Specialty Retail (0.2%) | |
Asbury Automotive Group, Inc. | | | | | | | | |
6.000%, 12/15/24 | | | 15,000 | | | | 15,337 | |
Home Depot, Inc. (The) | | | | | | | | |
3.350%, 9/15/25 | | | 36,000 | | | | 36,871 | |
3.000%, 4/1/26 | | | 30,000 | | | | 29,870 | |
PetSmart, Inc. | | | | | | | | |
7.125%, 3/15/23§ | | | 20,000 | | | | 20,400 | |
Sally Holdings LLC | | | | | | | | |
5.750%, 6/1/22 | | | 25,000 | | | | 25,969 | |
| | | | | | | | |
| | | | | | | 128,447 | |
| | | | | | | | |
Textiles, Apparel & Luxury Goods (0.0%) | |
Levi Strauss & Co. | | | | | | | | |
5.000%, 5/1/25 | | | 15,000 | | | | 15,000 | |
| | | | | | | | |
Total Consumer Discretionary | | | | | | | 1,197,749 | |
| | | | | | | | |
Consumer Staples (2.2%) | | | | | |
Beverages (0.5%) | |
Anheuser-Busch InBev Finance, Inc. | | | | | |
4.900%, 2/1/46 | | | 30,000 | | | | 32,485 | |
Central American Bottling Corp. | | | | | | | | |
6.750%, 2/9/22 (m) | | | 200,000 | | | | 204,000 | |
Coca-Cola Co. (The) | | | | | | | | |
1.875%, 10/27/20 | | | 15,000 | | | | 14,879 | |
1.550%, 9/1/21 | | | 60,000 | | | | 58,153 | |
PepsiCo, Inc. | | | | | | | | |
3.450%, 10/6/46 | | | 80,000 | | | | 72,352 | |
| | | | | | | | |
| | | | | | | 381,869 | |
| | | | | | | | |
Food & Staples Retailing (0.5%) | |
Albertsons Cos. LLC | | | | | | | | |
5.750%, 3/15/25§ | | | 15,000 | | | | 14,887 | |
Cencosud SA | | | | | | | | |
5.150%, 2/12/25 (m) | | | 200,000 | | | | 201,250 | |
CVS Health Corp. | | | | | | | | |
2.875%, 6/1/26 | | | 40,000 | | | | 38,071 | |
Kroger Co. (The) | | | | | | | | |
3.400%, 4/15/22 | | | 85,000 | | | | 86,837 | |
Rite Aid Corp. | | | | | | | | |
6.125%, 4/1/23§ | | | 20,000 | | | | 21,500 | |
| | | | | | | | |
| | | | | | | 362,545 | |
| | | | | | | | |
Food Products (1.0%) | |
JBS USA LUX SA | | | | | | | | |
5.750%, 6/15/25§ | | | 15,000 | | | | 15,277 | |
Kraft Heinz Foods Co. | | | | | | | | |
1.600%, 6/30/17 | | | 35,000 | | | | 35,011 | |
2.000%, 7/2/18 | | | 40,000 | | | | 39,999 | |
Marfrig Holdings Europe BV | | | | | | | | |
8.000%, 6/8/23§ | | | 200,000 | | | | 206,000 | |
Minerva Luxembourg SA | | | | | | | | |
8.750%, 4/3/19 (l)(m)(y) | | | 200,000 | | | | 205,250 | |
Pilgrim’s Pride Corp. | | | | | | | | |
5.750%, 3/15/25§ | | | 25,000 | | | | 25,000 | |
| | | | | | | | |
TreeHouse Foods, Inc. | | | | | | | | |
6.000%, 2/15/24§ | | $ | 10,000 | | | $ | 10,475 | |
Tyson Foods, Inc. | | | | | | | | |
3.950%, 8/15/24 | | | 135,000 | | | | 138,235 | |
| | | | | | | | |
| | | | | | | 675,247 | |
| | | | | | | | |
Household Products (0.1%) | |
Kronos Acquisition Holdings, Inc. | | | | | | | | |
9.000%, 8/15/23§ | | | 10,000 | | | | 10,000 | |
Spectrum Brands, Inc. | | | | | | | | |
5.750%, 7/15/25 | | | 25,000 | | | | 25,875 | |
| | | | | | | | |
| | | | | | | 35,875 | |
| | | | | | | | |
Personal Products (0.0%) | |
Revlon Consumer Products Corp. | | | | | | | | |
5.750%, 2/15/21 | | | 15,000 | | | | 15,113 | |
6.250%, 8/1/24 | | | 5,000 | | | | 5,150 | |
| | | | | | | | |
| | | | | | | 20,263 | |
| | | | | | | | |
Tobacco (0.1%) | |
Reynolds American, Inc. | | | | | | | | |
4.000%, 6/12/22 | | | 65,000 | | | | 67,732 | |
| | | | | | | | |
Total Consumer Staples | | | | | | | 1,543,531 | |
| | | | | | | | |
Energy (2.6%) | | | | | |
Energy Equipment & Services (0.1%) | |
Schlumberger Holdings Corp. | | | | | | | | |
2.350%, 12/21/18§ | | | 35,000 | | | | 35,299 | |
| | | | | | | | |
Oil, Gas & Consumable Fuels (2.5%) | |
Apache Corp. | | | | | | | | |
4.750%, 4/15/43 | | | 40,000 | | | | 40,818 | |
BP Capital Markets plc | | | | | | | | |
3.017%, 1/16/27 | | | 25,000 | | | | 24,138 | |
3.723%, 11/28/28 | | | 45,000 | | | | 45,415 | |
Chevron Corp. | | | | | | | | |
1.790%, 11/16/18 | | | 23,000 | | | | 23,056 | |
1.561%, 5/16/19 | | | 45,000 | | | | 44,790 | |
Cosan Overseas Ltd. | | | | | | | | |
8.250%, 2/5/17 (m)(y) | | | 300,000 | | | | 298,277 | |
Delek & Avner Tamar Bond Ltd. | | | | | | | | |
4.435%, 12/30/20§ | | | 200,000 | | | | 203,000 | |
Energy Transfer Equity LP | | | | | | | | |
5.500%, 6/1/27 | | | 15,000 | | | | 14,625 | |
Energy Transfer Partners LP | | | | | | | | |
4.750%, 1/15/26 | | | 65,000 | | | | 67,002 | |
EOG Resources, Inc. | | | | | | | | |
4.150%, 1/15/26 | | | 40,000 | | | | 42,021 | |
Extraction Oil & Gas Holdings LLC | | | | | |
7.875%, 7/15/21§ | | | 10,000 | | | | 10,619 | |
Kinder Morgan Energy Partners LP | | | | | | | | |
6.950%, 1/15/38 | | | 50,000 | | | | 57,976 | |
Memorial Production Partners LP | | | | | | | | |
6.875%, 8/1/22 | | | 35,000 | | | | 16,625 | |
National Gas Co. of Trinidad & Tobago Ltd. | | | | | | | | |
6.050%, 1/15/36 (m) | | | 100,000 | | | | 102,750 | |
NGL Energy Partners LP | | | | | | | | |
7.500%, 11/1/23§ | | | 10,000 | | | | 10,325 | |
See Notes to Financial Statements.
33
EQ ADVISORS TRUST
AXA/DOUBLELINE OPPORTUNISTIC CORE PLUS BOND PORTFOLIO
PORTFOLIO OF INVESTMENTS (Continued)
December 31, 2016
| | | | | | | | |
| | | Principal
Amount | | | Value
(Note 1) | |
| | | | | | | | |
Noble Holding International Ltd. | | | | | | | | |
7.750%, 1/15/24 | | $ | 5,000 | | | $ | 4,703 | |
Occidental Petroleum Corp. | | | | | | | | |
3.400%, 4/15/26 | | | 15,000 | | | | 15,075 | |
ONGC Videsh Vankorneft Pte. Ltd. | | | | | | | | |
3.750%, 7/27/26 (m) | | | 250,000 | | | | 238,048 | |
PDC Energy, Inc. | | | | | | | | |
6.125%, 9/15/24§ | | | 5,000 | | | | 5,112 | |
Phillips 66 | | | | | | | | |
5.875%, 5/1/42 | | | 19,000 | | | | 22,491 | |
4.875%, 11/15/44 | | | 10,000 | | | | 10,425 | |
Reliance Holding USA, Inc. | | | | | | | | |
5.400%, 2/14/22 (m) | | | 250,000 | | | | 269,512 | |
Sanchez Energy Corp. | | | | | | | | |
6.125%, 1/15/23 | | | 10,000 | | | | 9,500 | |
SandRidge Energy, Inc. | | | | | | | | |
8.750%, 6/1/20 (h)† | | | 5,000 | | | | — | |
Sinopec Group Overseas Development 2016 Ltd. | | | | | | | | |
2.000%, 9/29/21§ | | | 200,000 | | | | 190,185 | |
Targa Resources Partners LP | | | | | | | | |
5.375%, 2/1/27§ | | | 10,000 | | | | 9,900 | |
Williams Partners LP | | | | | | | | |
4.875%, 3/15/24 | | | 20,000 | | | | 20,073 | |
| | | | | | | | |
| | | | | | | 1,796,461 | |
| | | | | | | | |
Total Energy | | | | | | | 1,831,760 | |
| | | | | | | | |
Financials (7.5%) | | | | | | | | |
Banks (5.6%) | | | | | | | | |
Agromercantil Senior Trust | | | | | | | | |
6.250%, 4/10/19 (m) | | | 200,000 | | | | 205,250 | |
Australia & New Zealand Banking Group Ltd. | | | | | | | | |
4.875%, 1/12/21§ | | | 100,000 | | | | 108,356 | |
Banco de Credito del Peru | | | | | | | | |
2.250%, 10/25/19§ | | | 200,000 | | | | 197,250 | |
Banco de Reservas de la Republica Dominicana | | | | | | | | |
7.000%, 2/1/23§ | | | 200,000 | | | | 200,327 | |
Banco GNB Sudameris SA | | | | | | | | |
7.500%, 7/30/22 (m) | | | 200,000 | | | | 209,000 | |
Banco Nacional de Costa Rica | | | | | | | | |
4.875%, 11/1/18 (m) | | | 200,000 | | | | 201,250 | |
Banco Santander Mexico SA Institucion de Banca Multiple Grupo Financiero Santand | | | | | | | | |
4.125%, 11/9/22 (m) | | | 200,000 | | | | 200,000 | |
Bank of America Corp. | | | | | | | | |
2.000%, 1/11/18 | | | 55,000 | | | | 55,113 | |
2.503%, 10/21/22 | | | 55,000 | | | | 53,038 | |
Bank of Montreal | | | | | | | | |
1.900%, 8/27/21 | | | 70,000 | | | | 67,795 | |
BB&T Corp. | | | | | | | | |
2.450%, 1/15/20 | | | 60,000 | | | | 60,357 | |
2.050%, 5/10/21 | | | 55,000 | | | | 53,928 | |
Citigroup, Inc. | | | | | | | | |
2.700%, 3/30/21 | | | 105,000 | | | | 104,373 | |
| | | | | | | | |
CorpGroup Banking SA | | | | | | | | |
6.750%, 3/15/23 (m) | | $ | 250,000 | | | $ | 237,188 | |
Global Bank Corp. | | | | | | | | |
5.125%, 10/30/19 (m) | | | 200,000 | | | | 203,859 | |
Grupo Aval Ltd. | | | | | | | | |
4.750%, 9/26/22 (m) | | | 200,000 | | | | 195,500 | |
Grupo Elektra SAB de CV | | | | | | | | |
7.250%, 8/6/18 (m) | | | 91,000 | | | | 91,114 | |
Industrial Senior Trust | | | | | | | | |
5.500%, 11/1/22 (m) | | | 200,000 | | | | 192,355 | |
JPMorgan Chase & Co. | | | | | | | | |
2.972%, 1/15/23 | | | 70,000 | | | | 69,711 | |
4.250%, 10/1/27 | | | 65,000 | | | | 66,750 | |
Malayan Banking Bhd. | | | | | | | | |
3.250%, 9/20/22 (l)(m) | | | 200,000 | | | | 200,850 | |
MUFG Americas Holdings Corp. | | | | | | | | |
1.625%, 2/9/18 | | | 60,000 | | | | 59,734 | |
2.250%, 2/10/20 | | | 10,000 | | | | 10,005 | |
Oversea-Chinese Banking Corp., Ltd. | | | | | | | | |
4.000%, 10/15/24 (l)(m) | | | 200,000 | | | | 205,250 | |
PNC Financial Services Group, Inc. (The) | | | | | | | | |
3.300%, 3/8/22 | | | 65,000 | | | | 66,907 | |
Royal Bank of Canada | | | | | | | | |
2.500%, 1/19/21 | | | 15,000 | | | | 15,010 | |
Sumitomo Mitsui Financial Group, Inc. | | | | | | | | |
2.934%, 3/9/21 | | | 65,000 | | | | 65,377 | |
2.058%, 7/14/21 | | | 50,000 | | | | 48,319 | |
Toronto-Dominion Bank (The) | | | | | | | | |
1.800%, 7/13/21 | | | 105,000 | | | | 101,590 | |
United Overseas Bank Ltd. | | | | | | | | |
3.750%, 9/19/24 (l)(m) | | | 200,000 | | | | 203,820 | |
Wells Fargo & Co. | | | | | | | | |
3.550%, 9/29/25 | | | 35,000 | | | | 34,914 | |
3.000%, 4/22/26 | | | 55,000 | | | | 52,487 | |
3.000%, 10/23/26 | | | 50,000 | | | | 47,473 | |
Westpac Banking Corp. | | | | | | | | |
2.600%, 11/23/20 | | | 60,000 | | | | 60,192 | |
2.000%, 8/19/21 | | | 10,000 | | | | 9,692 | |
| | | | | | | | |
| | | | | | | 3,954,134 | |
| | | | | | | | |
Capital Markets (0.7%) | |
Goldman Sachs Group, Inc. (The) | | | | | | | | |
2.350%, 11/15/21 | | | 80,000 | | | | 77,358 | |
Israel Electric Corp. Ltd. | | | | | | | | |
5.000%, 11/12/24 (m) | | | 200,000 | | | | 207,500 | |
Morgan Stanley | | | | | | | | |
2.500%, 4/21/21 | | | 25,000 | | | | 24,684 | |
2.625%, 11/17/21 | | | 45,000 | | | | 44,279 | |
3.875%, 1/27/26 | | | 40,000 | | | | 40,491 | |
3.125%, 7/27/26 | | | 30,000 | | | | 28,603 | |
S&P Global, Inc. | | | | | | | | |
4.400%, 2/15/26 | | | 30,000 | | | | 31,758 | |
State Street Corp. | | | | | | | | |
3.550%, 8/18/25 | | | 45,000 | | | | 45,985 | |
2.650%, 5/19/26 | | | 25,000 | | | | 23,669 | |
| | | | | | | | |
| | | | | | | 524,327 | |
| | | | | | | | |
See Notes to Financial Statements.
34
EQ ADVISORS TRUST
AXA/DOUBLELINE OPPORTUNISTIC CORE PLUS BOND PORTFOLIO
PORTFOLIO OF INVESTMENTS (Continued)
December 31, 2016
| | | | | | | | |
| | | Principal
Amount | | | Value
(Note 1) | |
| | | | | | | | |
Consumer Finance (0.5%) | |
Ally Financial, Inc. | | | | | | | | |
4.125%, 3/30/20 | | $ | 75,000 | | | $ | 75,563 | |
American Express Credit Corp. | | | | | | | | |
2.250%, 8/15/19 | | | 35,000 | | | | 35,236 | |
2.250%, 5/5/21 | | | 105,000 | | | | 103,718 | |
General Motors Financial Co., Inc. | | | | | | | | |
2.400%, 5/9/19 | | | 55,000 | | | | 54,742 | |
3.200%, 7/13/20 | | | 30,000 | | | | 30,036 | |
3.200%, 7/6/21 | | | 20,000 | | | | 19,684 | |
Synchrony Financial | | | | | | | | |
3.000%, 8/15/19 | | | 65,000 | | | | 65,600 | |
| | | | | | | | |
| | | | | | | 384,579 | |
| | | | | | | | |
Diversified Financial Services (0.5%) | |
Guanay Finance Ltd. | | | | | | | | |
6.000%, 12/15/20 (m) | | | 205,771 | | | | 206,903 | |
National Rural Utilities Cooperative Finance Corp. | | | | | | | | |
2.000%, 1/27/20 | | | 55,000 | | | | 54,715 | |
Nationstar Mortgage LLC | | | | | | | | |
6.500%, 7/1/21 | | | 10,000 | | | | 10,125 | |
Shell International Finance BV | | | | | | | | |
1.375%, 5/10/19 | | | 70,000 | | | | 69,131 | |
| | | | | | | | |
| | | | | | | 340,874 | |
| | | | | | | | |
Insurance (0.2%) | |
Liberty Mutual Group, Inc. | | | | | | | | |
6.500%, 5/1/42§ | | | 80,000 | | | | 94,233 | |
TIAA Asset Management Finance Co. LLC | | | | | | | | |
2.950%, 11/1/19§ | | | 70,000 | | | | 71,034 | |
| | | | | | | | |
| | | | | | | 165,267 | |
| | | | | | | | |
Total Financials | | | | | | | 5,369,181 | |
| | | | | | | | |
Health Care (2.0%) | | | | | |
Biotechnology (0.2%) | |
AbbVie, Inc. | | | | | | | | |
4.700%, 5/14/45 | | | 76,000 | | | | 74,543 | |
Celgene Corp. | | | | | | | | |
3.875%, 8/15/25 | | | 35,000 | | | | 35,513 | |
| | | | | | | | |
| | | | | | | 110,056 | |
| | | | | | | | |
Health Care Equipment & Supplies (0.1%) | |
Zimmer Biomet Holdings, Inc. | | | | | | | | |
1.450%, 4/1/17 | | | 55,000 | | | | 54,994 | |
2.700%, 4/1/20 | | | 15,000 | | | | 14,963 | |
| | | | | | | | |
| | | | | | | 69,957 | |
| | | | | | | | |
Health Care Providers & Services (0.9%) | |
Acadia Healthcare Co., Inc. | | | | | | | | |
5.625%, 2/15/23 | | | 20,000 | | | | 20,000 | |
Air Medical Group Holdings, Inc. | | | | | | | | |
6.375%, 5/15/23§ | | | 30,000 | | | | 28,800 | |
Anthem, Inc. | | | | | | | | |
2.300%, 7/15/18 | | | 70,000 | | | | 70,347 | |
Cardinal Health, Inc. | | | | | | | | |
1.950%, 6/15/18 | | | 70,000 | | | | 70,111 | |
| | | | | | | | |
Centene Corp. | | | | | | | | |
5.625%, 2/15/21 | | $ | 10,000 | | | $ | 10,514 | |
4.750%, 1/15/25 | | | 20,000 | | | | 19,525 | |
DJO Finco, Inc. | | | | | | | | |
8.125%, 6/15/21§ | | | 5,000 | | | | 4,337 | |
Envision Healthcare Corp. | | | | | | | | |
6.250%, 12/1/24§ | | | 25,000 | | | | 26,437 | |
Express Scripts Holding Co. | | | | | | | | |
4.500%, 2/25/26 | | | 30,000 | | | | 30,877 | |
3.400%, 3/1/27 | | | 25,000 | | | | 23,218 | |
HCA, Inc. | | | | | | | | |
5.875%, 2/15/26 (x) | | | 10,000 | | | | 10,310 | |
Laboratory Corp. of America Holdings | | | | | | | | |
2.500%, 11/1/18 | | | 70,000 | | | | 70,695 | |
4.700%, 2/1/45 | | | 70,000 | | | | 69,492 | |
LifePoint Health, Inc. | | | | | | | | |
5.375%, 5/1/24§ | | | 10,000 | | | | 9,770 | |
MPH Acquisition Holdings LLC | | | | | | | | |
7.125%, 6/1/24§ | | | 30,000 | | | | 31,578 | |
RegionalCare Hospital Partners Holdings, Inc. | | | | | | | | |
8.250%, 5/1/23§ | | | 10,000 | | | | 9,957 | |
Select Medical Corp. | | | | | | | | |
6.375%, 6/1/21 (x) | | | 30,000 | | | | 30,000 | |
Team Health, Inc. | | | | | | | | |
7.250%, 12/15/23§ | | | 10,000 | | | | 11,375 | |
Tenet Healthcare Corp. | | | | | | | | |
6.750%, 6/15/23 | | | 30,000 | | | | 26,475 | |
UnitedHealth Group, Inc. | | | | | | | | |
4.200%, 1/15/47 | | | 70,000 | | | | 70,658 | |
Vizient, Inc. | | | | | | | | |
10.375%, 3/1/24§ | | | 15,000 | | | | 16,988 | |
| | | | | | | | |
| | | | | | | 661,464 | |
| | | | | | | | |
Health Care Technology (0.0%) | |
Quintiles IMS, Inc. | | | | | | | | |
4.875%, 5/15/23§ | | | 15,000 | | | | 15,201 | |
| | | | | | | | |
Life Sciences Tools & Services (0.2%) | |
Thermo Fisher Scientific, Inc. | | | | | | | | |
3.300%, 2/15/22 | | | 100,000 | | | | 100,815 | |
| | | | | | | | |
Pharmaceuticals (0.6%) | |
Actavis Funding SCS | | | | | | | | |
2.350%, 3/12/18 | | | 69,000 | | | | 69,323 | |
AstraZeneca plc | | | | | | | | |
2.375%, 11/16/20 | | | 80,000 | | | | 80,344 | |
Eli Lilly & Co. | | | | | | | | |
3.700%, 3/1/45 | | | 50,000 | | | | 47,155 | |
Endo Finance LLC | | | | | | | | |
5.875%, 1/15/23§ | | | 20,000 | | | | 16,950 | |
inVentiv Group Holdings, Inc. | | | | | | | | |
7.500%, 10/1/24§ | | | 15,000 | | | | 15,778 | |
Mylan NV | | | | | | | | |
3.150%, 6/15/21§ | | | 70,000 | | | | 69,239 | |
Shire Acquisitions Investments Ireland DAC | | | | | | | | |
2.875%, 9/23/23 | | | 75,000 | | | | 71,157 | |
Teva Pharmaceutical Finance Co. BV | | | | | | | | |
2.950%, 12/18/22 | | | 65,000 | | | | 62,562 | |
See Notes to Financial Statements.
35
EQ ADVISORS TRUST
AXA/DOUBLELINE OPPORTUNISTIC CORE PLUS BOND PORTFOLIO
PORTFOLIO OF INVESTMENTS (Continued)
December 31, 2016
| | | | | | | | |
| | | Principal
Amount | | | Value
(Note 1) | |
| | | | | | | | |
Teva Pharmaceutical Finance Netherlands III BV | | | | | | | | |
2.800%, 7/21/23 | | $ | 25,000 | | | $ | 23,463 | |
| | | | | | | | |
| | | | | | | 455,971 | |
| | | | | | | | |
Total Health Care | | | | | | | 1,413,464 | |
| | | | | | | | |
Industrials (2.2%) | | | | | |
Aerospace & Defense (0.2%) | |
Boeing Co. (The) | | | | | | | | |
6.875%, 3/15/39 | | | 40,000 | | | | 56,259 | |
Lockheed Martin Corp. | | | | | | | | |
4.700%, 5/15/46 | | | 60,000 | | | | 65,615 | |
TransDigm, Inc. | | | | | | | | |
6.000%, 7/15/22 | | | 25,000 | | | | 26,000 | |
| | | | | | | | |
| | | | | | | 147,874 | |
| | | | | | | | |
Air Freight & Logistics (0.1%) | |
FedEx Corp. | | | | | | | | |
4.750%, 11/15/45 | | | 65,000 | | | | 67,240 | |
| | | | | | | | |
Building Products (0.0%) | |
Builders FirstSource, Inc. | | | | | | | | |
5.625%, 9/1/24§ | | | 8,000 | | | | 8,040 | |
| | | | | | | | |
Commercial Services & Supplies (0.2%) | |
Gates Global LLC | | | | | | | | |
6.000%, 7/15/22§ | | | 25,000 | | | | 24,437 | |
Prime Security Services Borrower LLC | | | | | | | | |
9.250%, 5/15/23§ | | | 25,000 | | | | 27,250 | |
Waste Management, Inc. | | | | | | | | |
4.100%, 3/1/45 | | | 50,000 | | | | 49,320 | |
| | | | | | | | |
| | | | | | | 101,007 | |
| | | | | | | | |
Construction & Engineering (0.0%) | |
Signode Industrial Group Lux SA | | | | | | | | |
6.375%, 5/1/22§ | | | 20,000 | | | | 19,950 | |
| | | | | | | | |
Machinery (0.1%) | |
Grinding Media, Inc. | | | | | | | | |
7.375%, 12/15/23 (b)§ | | | 10,000 | | | | 10,506 | |
Milacron LLC | | | | | | | | |
7.750%, 2/15/21§ | | | 35,000 | | | | 35,962 | |
Terex Corp. | | | | | | | | |
6.000%, 5/15/21 | | | 25,000 | | | | 25,563 | |
| | | | | | | | |
| | | | | | | 72,031 | |
| | | | | | | | |
Metals & Mining (0.0%) | |
Novelis Corp. | | | | | | | | |
6.250%, 8/15/24§ | | | 10,000 | | | | 10,600 | |
5.875%, 9/30/26§ | | | 5,000 | | | | 5,050 | |
| | | | | | | | |
| | | | | | | 15,650 | |
| | | | | | | | |
Road & Rail (0.2%) | |
Burlington Northern Santa Fe LLC | | | | | | | | |
4.550%, 9/1/44 | | | 65,000 | | | | 68,869 | |
CSX Corp. | | | | | | | | |
3.800%, 11/1/46 | | | 75,000 | | | | 68,935 | |
Kenan Advantage Group, Inc. (The) | | | | | | | | |
7.875%, 7/31/23§ | | | 10,000 | | | | 10,100 | |
| | | | | | | | |
| | | | | | | 147,904 | |
| | | | | | | | |
Trading Companies & Distributors (0.1%) | |
Air Lease Corp. | | | | | | | | |
3.750%, 2/1/22 | | | 65,000 | | | | 66,544 | |
| | | | | | | | |
| | | | | | | | |
Transportation Infrastructure (1.3%) | |
Adani Ports & Special Economic Zone Ltd. | | | | | | | | |
3.500%, 7/29/20 (m) | | $ | 200,000 | | | $ | 198,421 | |
Aeropuerto Internacional de Tocumen SA
5.750%, 10/9/23 | | | 200,000 | | | | 208,850 | |
Aeropuertos Dominicanos Siglo XXI SA
9.750%, 11/13/19 (m) | | | 200,000 | | | | 208,250 | |
ENA Norte Trust
4.950%, 4/25/23 (m) | | | 275,305 | | | | 284,390 | |
| | | | | | | | |
| | | | 899,911 | |
| | | | | | | | |
Total Industrials | | | | | | | 1,546,151 | |
| | | | | | | | |
Information Technology (1.1%) | | | | | | | | |
Communications Equipment (0.1%) | | | | | | | | |
Cisco Systems, Inc.
1.850%, 9/20/21 | | | 75,000 | | | | 73,033 | |
CommScope, Inc.
5.000%, 6/15/21§ | | | 25,000 | | | | 25,750 | |
| | | | | | | | |
| | | | | | | 98,783 | |
| | | | | | | | |
IT Services (0.2%) | | | | | | | | |
Fidelity National Information Services, Inc.
3.625%, 10/15/20 | | | 45,000 | | | | 46,524 | |
First Data Corp. | | | | | | | | |
7.000%, 12/1/23§ | | | 10,000 | | | | 10,688 | |
5.750%, 1/15/24§ | | | 15,000 | | | | 15,431 | |
Xerox Corp.
2.950%, 3/15/17 | | | 55,000 | | | | 55,157 | |
| | | | | | | | |
| | | | | | | 127,800 | |
| | | | | | | | |
Semiconductors & Semiconductor Equipment (0.2%) | |
Analog Devices, Inc.
2.500%, 12/5/21 | | | 75,000 | | | | 74,243 | |
Intel Corp.
4.100%, 5/19/46 | | | 40,000 | | | | 39,444 | |
Microsemi Corp.
9.125%, 4/15/23§ | | | 4,000 | | | | 4,660 | |
NXP BV
4.125%, 6/1/21§ | | | 20,000 | | | | 20,650 | |
| | | | | | | | |
| | | | | | | 138,997 | |
| | | | | | | | |
Software (0.5%) | | | | | | | | |
Genesys Telecommunications Laboratories, Inc.
10.000%, 11/30/24§ | | | 20,000 | | | | 21,188 | |
Infor U.S., Inc.
6.500%, 5/15/22 | | | 20,000 | | | | 20,850 | |
Microsoft Corp.
4.450%, 11/3/45 | | | 70,000 | | | | 74,432 | |
Open Text Corp.
5.875%, 6/1/26§ | | | 15,000 | | | | 15,788 | |
Oracle Corp. | | | | | | | | |
1.900%, 9/15/21 | | | 75,000 | | | | 73,198 | |
4.125%, 5/15/45 | | | 75,000 | | | | 73,286 | |
Solera LLC
10.500%, 3/1/24§ | | | 15,000 | | | | 16,875 | |
Sophia LP
9.000%, 9/30/23§ | | | 25,000 | | | | 26,562 | |
| | | | | | | | |
| | | | | | | 322,179 | |
| | | | | | | | |
See Notes to Financial Statements.
36
EQ ADVISORS TRUST
AXA/DOUBLELINE OPPORTUNISTIC CORE PLUS BOND PORTFOLIO
PORTFOLIO OF INVESTMENTS (Continued)
December 31, 2016
| | | | | | | | |
| | | Principal
Amount | | | Value
(Note 1) | |
| | | | | | | | |
Technology Hardware, Storage & Peripherals (0.1%) | |
Diamond 1 Finance Corp.
7.125%, 6/15/24§ | | $ | 20,000 | | | $ | 22,100 | |
Hewlett Packard Enterprise Co.
3.600%, 10/15/20 | | | 51,000 | | | | 52,058 | |
Western Digital Corp.
7.375%, 4/1/23§ | | | 5,000 | | | | 5,500 | |
| | | | | | | | |
| | | | | | | 79,658 | |
| | | | | | | | |
Total Information Technology | | | | | | | 767,417 | |
| | | | | | | | |
Materials (0.6%) | | | | | | | | |
Chemicals (0.3%) | | | | | | | | |
Ashland LLC
4.750%, 8/15/22 | | | 15,000 | | | | 15,535 | |
Grupo Idesa SA de CV
7.875%, 12/18/20 (m) | | | 200,000 | | | | 179,250 | |
Potash Corp. of Saskatchewan, Inc.
4.000%, 12/15/26 | | | 15,000 | | | | 15,095 | |
PQ Corp.
6.750%, 11/15/22§ | | | 15,000 | | | | 16,050 | |
| | | | | | | | |
| | | | | | | 225,930 | |
| | | | | | | | |
Containers & Packaging (0.1%) | | | | | | | | |
Berry Plastics Corp.
5.500%, 5/15/22 | | | 15,000 | | | | 15,459 | |
International Paper Co.
3.000%, 2/15/27 | | | 35,000 | | | | 32,924 | |
Plastipak Holdings, Inc.
6.500%, 10/1/21§ | | | 15,000 | | | | 15,675 | |
| | | | | | | | |
| | | | | | | 64,058 | |
| | | | | | | | |
Metals & Mining (0.0%) | | | | | | | | |
Lundin Mining Corp.
7.500%, 11/1/20§ | | | 15,000 | | | | 15,900 | |
| | | | | | | | |
Paper & Forest Products (0.2%) | | | | | | | | |
Georgia-Pacific LLC
3.600%, 3/1/25§ | | | 135,000 | | | | 136,587 | |
| | | | | | | | |
Total Materials | | | | | | | 442,475 | |
| | | | | | | | |
Real Estate (0.2%) | | | | | | | | |
Equity Real Estate Investment Trusts (REITs) (0.2%) | |
Boston Properties LP (REIT)
4.125%, 5/15/21 | | | 65,000 | | | | 68,503 | |
Equinix, Inc. (REIT)
5.875%, 1/15/26 | | | 15,000 | | | | 15,787 | |
MGM Growth Properties Operating Partnership LP (REIT)
5.625%, 5/1/24§ | | | 5,000 | | | | 5,225 | |
Simon Property Group LP (REIT)
3.300%, 1/15/26 | | | 70,000 | | | | 69,610 | |
| | | | | | | | |
Total Real Estate | | | | | | | 159,125 | |
| | | | | | | | |
Telecommunication Services (1.1%) | | | | | | | | |
Diversified Telecommunication Services (0.6%) | |
British Telecommunications plc
5.950%, 1/15/18 | | | 100,000 | | | | 104,172 | |
CCO Holdings LLC | | | | | | | | |
5.250%, 9/30/22 | | | 15,000 | | | | 15,600 | |
5.125%, 5/1/23§ | | | 10,000 | | | | 10,275 | |
Cincinnati Bell, Inc.
7.000%, 7/15/24§ | | | 20,000 | | | | 21,150 | |
| | | | | | | | |
Embarq Corp.
7.995%, 6/1/36 | | $ | 15,000 | | | $ | 14,100 | |
Intelsat Jackson Holdings SA
8.000%, 2/15/24 (x)§ | | | 5,000 | | | | 5,137 | |
Level 3 Communications, Inc.
5.750%, 12/1/22 | | | 25,000 | | | | 25,625 | |
Orange SA
2.750%, 2/6/19 | | | 70,000 | | | | 70,807 | |
Telesat Canada
8.875%, 11/15/24§ | | | 15,000 | | | | 15,638 | |
Verizon Communications, Inc.
4.400%, 11/1/34 | | | 140,000 | | | | 137,709 | |
| | | | | | | | |
| | | | | | | 420,213 | |
| | | | | | | | |
Wireless Telecommunication Services (0.5%) | |
Digicel Group Ltd.
7.125%, 4/1/22 (m) | | | 250,000 | | | | 193,375 | |
Telefonica Celular del Paraguay SA
6.750%, 12/13/22 (m) | | | 200,000 | | | | 204,500 | |
| | | | | | | | |
| | | | | | | 397,875 | |
| | | | | | | | |
Total Telecommunication Services | | | | | | | 818,088 | |
| | | | | | | | |
Utilities (1.7%) | | | | | |
Electric Utilities (1.0%) | |
AES Andres BV
7.950%, 5/11/26§ | | | 200,000 | | | | 206,000 | |
Comision Federal de Electricidad
4.750%, 2/23/27 (m) | | | 200,000 | | | | 192,000 | |
Duke Energy Corp.
3.750%, 9/1/46 | | | 25,000 | | | | 22,525 | |
Duke Energy Progress LLC
4.150%, 12/1/44 | | | 65,000 | | | | 63,688 | |
Exelon Corp.
3.400%, 4/15/26 | | | 40,000 | | | | 39,069 | |
Fortis, Inc.
2.100%, 10/4/21§ | | | 70,000 | | | | 67,584 | |
Southern Co. (The) | | | | | | | | |
2.450%, 9/1/18 | | | 95,000 | | | | 95,873 | |
1.850%, 7/1/19 | | | 5,000 | | | | 4,982 | |
| | | | | | | | |
| | | | | | | 691,721 | |
| | | | | | | | |
Gas Utilities (0.3%) | |
Empresa de Energia de Bogota SA ESP
6.125%, 11/10/21 (m) | | | 200,000 | | | | 205,250 | |
| | | | | | | | |
Independent Power and Renewable Electricity Producers (0.0%) | |
Calpine Corp.
5.750%, 1/15/25 (x) | | | 10,000 | | | | 9,650 | |
NRG Energy, Inc.
7.250%, 5/15/26§ | | | 15,000 | | | | 14,925 | |
| | | | | | | | |
| | | | | | | 24,575 | |
| | | | | | | | |
Multi-Utilities (0.4%) | |
Berkshire Hathaway Energy Co.
6.500%, 9/15/37 | | | 76,000 | | | | 97,868 | |
Empresas Publicas de Medellin ESP
7.625%, 7/29/19 (m) | | | 200,000 | | | | 223,250 | |
| | | | | | | | |
| | | | | | | 321,118 | |
| | | | | | | | |
Total Utilities | | | | | | | 1,242,664 | |
| | | | | | | | |
Total Corporate Bonds | | | | | | | 16,331,605 | |
| | | | | | | | |
See Notes to Financial Statements.
37
EQ ADVISORS TRUST
AXA/DOUBLELINE OPPORTUNISTIC CORE PLUS BOND PORTFOLIO
PORTFOLIO OF INVESTMENTS (Continued)
December 31, 2016
| | | | | | | | |
| | | Principal
Amount | | | Value
(Note 1) | |
| | | | | | | | |
Foreign Government Securities (3.0%) | |
Banco de Costa Rica
5.250%, 8/12/18 (m) | | $ | 200,000 | | | $ | 201,500 | |
Dominican Republic
7.500%, 5/6/21 (m) | | | 200,000 | | | | 216,750 | |
Petroleos Mexicanos | | | | | | | | |
5.500%, 2/4/19 (m) | | | 100,000 | | | | 103,875 | |
6.750%, 9/21/47§ | | | 35,000 | | | | 33,024 | |
Republic of Costa Rica
9.995%, 8/1/20 (m) | | | 200,000 | | | | 235,250 | |
Republic of Hungary
4.000%, 3/25/19 | | | 200,000 | | | | 206,770 | |
Republic of Panama | | | | | | | | |
5.200%, 1/30/20 | | | 200,000 | | | | 214,750 | |
3.875%, 3/17/28 | | | 200,000 | | | | 196,000 | |
Republic of Poland
5.125%, 4/21/21 | | | 200,000 | | | | 218,298 | |
State of Qatar
2.375%, 6/2/21 (m) | | | 200,000 | | | | 195,750 | |
United Mexican States | | | | | | | | |
4.000%, 10/2/23 | | | 96,000 | | | | 96,240 | |
4.125%, 1/21/26 | | | 200,000 | | | | 198,500 | |
4.750%, 3/8/44 | | | 50,000 | | | | 45,563 | |
| | | | | | | | |
Total Foreign Government Securities | | | | | | | 2,162,270 | |
| | | | | | | | |
Mortgage-Backed Securities (8.2%) | |
FHLMC | | | | | | | | |
3.000%, 7/1/45 | | | 879,158 | | | | 875,002 | |
3.000%, 8/1/45 | | | 1,327,447 | | | | 1,321,173 | |
FNMA | | | | | | | | |
3.000%, 4/1/45 | | | 1,154,774 | | | | 1,138,219 | |
3.000%, 9/1/46 | | | 2,559,861 | | | | 2,547,961 | |
| | | | | | | | |
Total Mortgage-Backed Securities | | | | | | | 5,882,355 | |
| | | | | | | | |
Municipal Bonds (0.7%) | |
City of Houston, Combined Utility System Revenue Bonds,
Series B
5.000%, 11/15/35 | | | 120,000 | | | | 138,139 | |
Los Angeles County Metropolitan Transportation Authority, Sales Tax Revenue Bonds,
Series A
5.000%, 6/1/33 | | | 60,000 | | | | 70,522 | |
Massachusetts School Building Authority, Dedicated Sales Tax Revenue Bonds,
Series C
5.000%, 11/15/34 | | | 90,000 | | | | 105,515 | |
North Texas Municipal Water District, Revenue Bonds
5.000%, 9/1/35 | | | 70,000 | | | | 80,833 | |
State of California, Various Purpose, General Obligations Bonds
5.000%, 8/1/33 | | | 70,000 | | | | 80,023 | |
| | | | | | | | |
Total Municipal Bonds | | | | | | | 475,032 | |
| | | | | | | | |
U.S. Treasury Obligations (27.8%) | |
U.S. Treasury Bonds | | | | | | | | |
2.750%, 11/15/42 | | | 620,000 | | | | 585,488 | |
| | | | | | | | |
1.000%, 2/15/46 TIPS | | $ | 1,316,045 | | | $ | 1,321,366 | |
U.S. Treasury Notes | | | | | | | | |
0.500%, 1/31/17 | | | 510,000 | | | | 509,953 | |
0.625%, 5/31/17 | | | 930,000 | | | | 929,946 | |
1.000%, 2/15/18 | | | 1,840,000 | | | | 1,840,647 | |
1.000%, 5/15/18 | | | 145,000 | | | | 144,950 | |
2.000%, 11/30/20 | | | 2,140,000 | | | | 2,161,839 | |
1.750%, 12/31/20 | | | 60,000 | | | | 59,978 | |
2.125%, 1/31/21 | | | 2,250,000 | | | | 2,279,751 | |
2.250%, 3/31/21 | | | 2,430,000 | | | | 2,473,949 | |
0.125%, 4/15/21 TIPS | | | 571,155 | | | | 574,619 | |
1.750%, 3/31/22 | | | 1,290,000 | | | | 1,272,905 | |
1.500%, 2/28/23 | | | 60,000 | | | | 57,712 | |
1.500%, 3/31/23 | | | 1,230,000 | | | | 1,182,241 | |
0.625%, 1/15/24 TIPS | | | 839,152 | | | | 854,148 | |
0.125%, 7/15/24 TIPS | | | 1,272,550 | | | | 1,250,566 | |
2.125%, 5/15/25 | | | 1,490,000 | | | | 1,461,015 | |
2.000%, 8/15/25 | | | 35,000 | | | | 33,909 | |
0.125%, 7/15/26 TIPS | | | 877,360 | | | | 848,598 | |
| | | | | | | | |
Total U.S. Treasury Obligations | | | | | | | 19,843,580 | |
| | | | | | | | |
Total Long-Term Debt Securities (93.1%)
(Cost $67,323,043) | | | | | | | 66,361,268 | |
| | | | | | | | |
| | | Number of
Shares | | | Value
(Note 1) | |
COMMON STOCK: | | | | | | | | |
Energy (0.0%) | | | | | | | | |
Oil, Gas & Consumable Fuels (0.0%) | | | | | | | | |
SandRidge Energy, Inc.* | | | 48 | | | | 1,129 | |
| | | | | | | | |
Total Common Stock (0.0%)
(Cost $1,013) | | | | | | | 1,129 | |
| | | | | | | | |
INVESTMENT COMPANY: | | | | | | | | |
DoubleLine Floating Rate Fund‡ | | | | | | | | |
Total Investment Company (1.4%)
(Cost $983,622) | | | 97,776 | | | | 970,911 | |
| | | | | | | | |
| | | Principal
Amount | | | Value
(Note 1) | |
SHORT-TERM INVESTMENTS: | | | | | | | | |
Repurchase Agreements (0.1%) | | | | | | | | |
Citigroup Global Markets Ltd.,
0.71%, dated 12/30/16, due 1/3/17, repurchase price $2,398, collateralized by various Foreign Government Agency Securities, ranging from 0.000%-5.250%, maturing 1/23/17-1/24/44, U.S. Government Treasury Securities, ranging from 0.000%-5.375%, maturing 2/15/19-2/15/44; total market value $2,446. (xx) | | $ | 2,398 | | | | 2,398 | |
Citigroup Global Markets Ltd.,
0.69%, dated 12/30/16, due 1/3/17, repurchase price $965, collateralized by various U.S. Government Treasury Securities, ranging from 1.375%-5.375%, maturing 7/31/18-2/15/45; total market value $984. (xx) | | | 965 | | | | 965 | |
See Notes to Financial Statements.
38
EQ ADVISORS TRUST
AXA/DOUBLELINE OPPORTUNISTIC CORE PLUS BOND PORTFOLIO
PORTFOLIO OF INVESTMENTS (Continued)
December 31, 2016
| | | | | | | | |
| | | Principal
Amount | | | Value
(Note 1) | |
| | | | | | | | |
Deutsche Bank AG,
1.05%, dated 12/30/16, due 1/3/17, repurchase price $10,001, collateralized by various Common Stocks; total market value $11,116. (xx) | | $ | 10,000 | | | $ | 10,000 | |
Deutsche Bank AG,
0.95%, dated 12/30/16, due 1/3/17, repurchase price $2,084, collateralized by various Corporate Bonds, ranging from 1.875%-2.500%, maturing 3/13/19-6/10/25; total market value $2,126. (xx) | | | 2,084 | | | | 2,084 | |
Deutsche Bank Securities, Inc.,
0.50%, dated 12/30/16, due 1/3/17, repurchase price $3,968, collateralized by various U.S. Government Treasury Securities, 0.000%, maturing 2/15/40-5/15/40; total market value $4,047. (xx) | | | 3,968 | | | | 3,968 | |
Macquarie Bank Ltd.,
0.76%, dated 12/30/16, due 1/3/17, repurchase price $2,661, collateralized by various U.S. Government Treasury Securities, ranging from 0.000%-8.750%, maturing 1/5/17-5/15/46; total market value $2,716. (xx) | | | 2,661 | | | | 2,661 | |
Macquarie Bank Ltd.,
0.57%, dated 12/30/16, due 1/3/17, repurchase price $3,562, collateralized by various U.S. Government Treasury Securities, ranging from 0.000%-8.750%, maturing 1/5/17-5/15/46; total market value $3,635. (xx) | | | 3,562 | | | | 3,562 | |
Natixis,
0.50%, dated 12/30/16, due 1/3/17, repurchase price $5,000, collateralized by various U.S. Government Treasury Securities, ranging from 0.000%-3.625%, maturing 5/25/17-5/15/46; total market value $5,100. (xx) | | | 5,000 | | | | 5,000 | |
RBS Securities, Inc.,
0.45%, dated 12/30/16, due 1/3/17, repurchase price $15,001, collateralized by various U.S. Government Treasury Securities, ranging from 0.625%-2.625%, maturing 8/31/17-2/15/25; total market value $15,300. (xx) | | | 15,000 | | | | 15,000 | |
| | | | | | | | |
Total Repurchase Agreements | | | | | | | 45,638 | |
| | | | | | | | |
Total Short-Term Investments (0.1%)
(Cost $45,638) | | | | | | | 45,638 | |
| | | | | | | | |
Total Investments (94.6%)
(Cost $68,353,316) | | | | | | | 67,378,946 | |
Other Assets Less Liabilities (5.4%) | | | | | | | 3,874,926 | |
| | | | | | | | |
Net Assets (100%) | | | | | | $ | 71,253,872 | |
| | | | | | | | |
| † | Securities (totaling $0 or 0.0% of net assets) held at fair value by management. |
| ‡ | All, or a portion, of the security is an affiliated company as defined under the Investment Company Act of 1940. |
| § | Securities exempt from registration under Rule 144A of the Securities Act of 1933. These securities may only be resold to qualified institutional buyers. At December 31, 2016, the market value of these securities amounted to $8,275,102 or 11.6% of net assets. Securities denoted with “§” but without “b” have been determined to be liquid under the guidelines established by the Board of Trustees. To the extent any securities might provide a right to demand registration, such rights have not been relied upon when determining liquidity. |
| (b) | Rule 144A Illiquid Security. At December 31, 2016, the market value of these securities amounted to $620,715 or 0.9% of net assets. |
| (e) | Step Bond — Coupon rate increases in increments to maturity. Rate disclosed is as of December 31, 2016. Maturity date disclosed is the ultimate maturity date. |
| (h) | Defaulted security. A security is classified as defaulted if the issuer files for bankruptcy or fails to make a scheduled interest or principal payment within the grace period set forth in the security’s governing documents. |
| (l) | Floating Rate Security. Rate disclosed is as of December 31, 2016. |
| (m) | Regulation S is an exemption for securities offerings that are made outside of the United States and do not involve direct selling efforts in the United States. Resale restrictions may apply for purposes of the Securities Act of 1933. At December 31, 2016, the market value of these securities amounted to $7,319,737 or 10.3% of net assets. |
| (x) | All or a portion of security is on loan at December 31, 2016. |
| (xx) | At December 31, 2016, the Portfolio had loaned securities with a total value of $44,764. This was secured by cash collateral of $45,638 which was subsequently invested in joint repurchase agreements with a total value of $45,638, as detailed in the Notes to the Financial Statements, for which the Portfolio has a proportionate interest as reported in the Portfolio of Investments as Repurchase Agreements. |
| (y) | Securities are perpetual and, thus, do not have a predetermined maturity date. The coupon rate for these securities are fixed for a period of time and may be structured to adjust thereafter. The date shown, if applicable, reflects the next call date. The coupon rate shown is the rate in effect as of December 31, 2016. |
Glossary:
| | CLO | — Collateralized Mortgage Obligation |
| | FHLMC | — Federal Home Loan Mortgage Corp. |
| | FNMA | — Federal National Mortgage Association |
| | TIPS | — Treasury Inflation Protected Security |
See Notes to Financial Statements.
39
EQ ADVISORS TRUST
AXA/DOUBLELINE OPPORTUNISTIC CORE PLUS BOND PORTFOLIO
PORTFOLIO OF INVESTMENTS (Continued)
December 31, 2016
| | | | |
Country Diversification
As a Percentage of Total Net Assets | | | |
Australia | | | 0.2 | % |
Belgium | | | 0.0 | # |
Brazil | | | 1.3 | |
Canada | | | 0.5 | |
Cayman Islands | | | 5.3 | |
Chile | | | 0.9 | |
China | | | 0.3 | |
Colombia | | | 1.2 | |
Costa Rica | | | 0.9 | |
Dominican Republic | | | 1.2 | |
France | | | 0.1 | |
Guatemala | | | 0.8 | |
Hungary | | | 0.3 | |
India | | | 1.0 | |
Israel | | | 0.7 | |
Jamaica | | | 0.3 | |
Japan | | | 0.2 | |
Luxembourg | | | 0.0 | # |
Malaysia | | | 0.3 | |
Mexico | | | 1.6 | |
Netherlands | | | 0.1 | |
Panama | | | 1.6 | |
Paraguay | | | 0.3 | |
Peru | | | 0.3 | |
Poland | | | 0.3 | |
Qatar | | | 0.3 | |
Singapore | | | 0.6 | |
Trinidad and Tobago | | | 0.1 | |
United Kingdom | | | 0.4 | |
United States | | | 73.5 | |
Cash and Other | | | 5.4 | |
| | | | | |
| | | | 100.0 | % |
| | | | | |
| # | Percent shown is less than 0.05%. |
Investments in companies which were affiliates for the year ended December 31, 2016, were as follows:
| | | | | | | | | | | | | | | | | | | | | | | | |
Securities | | Value
December 31,
2015 | | | Purchases
at Cost | | | Sales
at Cost | | | Value
December 31,
2016 | | | Dividend
Income | | | Realized
Gain
(Loss)† | |
DoubleLine Floating Rate Fund | | $ | 1,650,994 | | | $ | — | | | $ | 716,378 | | | $ | 970,911 | | | $ | 41,826 | | | $ | (16,378 | ) |
| | | | | | | | | | | | | | | | | | | | | | | | |
| † | When applicable, realized gain includes net distributions of realized gain received from underlying funds. |
See Notes to Financial Statements.
40
EQ ADVISORS TRUST
AXA/DOUBLELINE OPPORTUNISTIC CORE PLUS BOND PORTFOLIO
PORTFOLIO OF INVESTMENTS (Continued)
December 31, 2016
The following is a summary of the inputs used to value the Portfolio’s assets and liabilities carried at fair value as of December 31, 2016:
The inputs or methodology used for valuing securities are not necessarily an indication of the risk associated with investing in those securities.
Various inputs are used in determining the value of the Portfolio’s investments. These inputs are summarized in the three broad levels listed below:
| | | | | | | | | | | | | | | | |
| | | | | |
| Investment Type | | Level 1
Quoted Prices in
Active Markets for
Identical
Securities | | | Level 2
Significant Other
Observable Inputs
(including quoted prices
for similar securities,
interest rates,
prepayment speeds,
credit risk, etc.) | | | Level 3
Significant Unobservable
Inputs (including the
Portfolio’s own
assumptions in
determining the fair
value of investments) | | | Total | |
Assets: | | | | | | | | | | | | | | | | |
Asset-Backed Securities | | $ | — | | | $ | 4,374,789 | | | $ | — | | | $ | 4,374,789 | |
Collateralized Mortgage Obligations | | | — | | | | 11,561,586 | | | | — | | | | 11,561,586 | |
Commercial Mortgage-Backed Securities | | | — | | | | 5,728,643 | | | | — | | | | 5,728,643 | |
Common Stocks | | | | | | | | | | | | | | | | |
Energy | | | 1,129 | | | | — | | | | — | | | | 1,129 | |
Convertible Bonds | | | | | | | | | | | | | | | | |
Energy | | | — | | | | 1,408 | | | | — | | | | 1,408 | |
Corporate Bonds | | | | | | | | | | | | | | | | |
Consumer Discretionary | | | — | | | | 1,197,749 | | | | — | | | | 1,197,749 | |
Consumer Staples | | | — | | | | 1,543,531 | | | | — | | | | 1,543,531 | |
Energy | | | — | | | | 1,831,760 | | | | — | (a) | | | 1,831,760 | |
Financials | | | — | | | | 5,369,181 | | | | — | | | | 5,369,181 | |
Health Care | | | — | | | | 1,413,464 | | | | — | | | | 1,413,464 | |
Industrials | | | — | | | | 1,546,151 | | | | — | | | | 1,546,151 | |
Information Technology | | | — | | | | 767,417 | | | | — | | | | 767,417 | |
Materials | | | — | | | | 442,475 | | | | — | | | | 442,475 | |
Real Estate | | | — | | | | 159,125 | | | | — | | | | 159,125 | |
Telecommunication Services | | | — | | | | 818,088 | | | | — | | | | 818,088 | |
Utilities | | | — | | | | 1,242,664 | | | | — | | | | 1,242,664 | |
Foreign Government Securities | | | — | | | | 2,162,270 | | | | — | | | | 2,162,270 | |
Investment Companies | | | 970,911 | | | | — | | | | — | | | | 970,911 | |
Mortgage-Backed Securities | | | — | | | | 5,882,355 | | | | — | | | | 5,882,355 | |
Municipal Bonds | | | — | | | | 475,032 | | | | — | | | | 475,032 | |
Short-Term Investments | | | | | | | | | | | | | | | | |
Repurchase Agreements | | | — | | | | 45,638 | | | | — | | | | 45,638 | |
U.S. Treasury Obligations | | | — | | | | 19,843,580 | | | | — | | | | 19,843,580 | |
| | | | | | | | | | | | | | | | |
Total Assets | | $ | 972,040 | | | $ | 66,406,906 | | | $ | — | | | $ | 67,378,946 | |
| | | | | | | | | | | | | | | | |
Total Liabilities | | $ | — | | | $ | — | | | $ | — | | | $ | — | |
| | | | | | | | | | | | | | | | |
Total | | $ | 972,040 | | | $ | 66,406,906 | | | $ | — | | | $ | 67,378,946 | |
| | | | | | | | | | | | | | | | |
There were no transfers between Levels 1, 2 or 3 during the year ended December 31, 2016.
The Portfolio held no derivatives contracts during the year ended December 31, 2016.
See Notes to Financial Statements.
41
EQ ADVISORS TRUST
AXA/DOUBLELINE OPPORTUNISTIC CORE PLUS BOND PORTFOLIO
PORTFOLIO OF INVESTMENTS (Continued)
December 31, 2016
Investment security transactions for the year ended December 31, 2016 were as follows:
| | | | |
Cost of Purchases: | | | | |
Long-term investments other than U.S. government debt securities | | $ | 24,656,644 | |
Long-term U.S. government debt securities | | | 31,749,401 | |
| | | | |
| | $ | 56,406,045 | |
| | | | |
Net Proceeds of Sales and Redemptions: | | | | |
Long-term investments other than U.S. government debt securities | | $ | 23,722,652 | |
Long-term U.S. government debt securities | | | 22,476,638 | |
| | | | |
| | $ | 46,199,290 | |
| | | | |
As of December 31, 2016, the gross unrealized appreciation (depreciation) of investments based on the aggregate cost of investments for Federal income tax purposes was as follows:
| | | | |
Aggregate gross unrealized appreciation | | $ | 276,886 | |
Aggregate gross unrealized depreciation | | | (1,276,037 | ) |
| | | | |
Net unrealized depreciation | | $ | (999,151 | ) |
| | | | |
Federal income tax cost of investments | | $ | 68,378,097 | |
| | | | |
See Notes to Financial Statements.
42
EQ ADVISORS TRUST
AXA/DOUBLELINE OPPORTUNISTIC CORE PLUS BOND PORTFOLIO
STATEMENT OF ASSETS AND LIABILITIES
December 31, 2016
| | | | |
ASSETS | | | | |
Investments at value (x): | | | | |
Affiliated Issuers (Cost $983,622) | | $ | 970,911 | |
Unaffiliated Issuers (Cost $67,324,056) | | | 66,362,397 | |
Repurchase Agreements (Cost $45,638) | | | 45,638 | |
Cash | | | 3,420,335 | |
Dividends, interest and other receivables | | | 452,009 | |
Due from Custodian | | | 204,019 | |
Receivable for securities sold | | | 114,137 | |
Receivable from Separate Accounts for Trust shares sold | | | 55,044 | |
Securities lending income receivable | | | 51 | |
Other assets | | | 232 | |
| | | | |
Total assets | | | 71,624,773 | |
| | | | |
LIABILITIES | | | | |
Payable for securities purchased | | | 204,019 | |
Payable for return of collateral on securities loaned | | | 45,638 | |
Investment management fees payable | | | 31,292 | |
Administrative fees payable | | | 5,880 | |
Distribution fees payable – Class IB | | | 2,090 | |
Payable to Separate Accounts for Trust shares redeemed | | | 525 | |
Trustees’ fees payable | | | 42 | |
Accrued expenses | | | 81,415 | |
| | | | |
Total liabilities | | | 370,901 | |
| | | | |
NET ASSETS | | $ | 71,253,872 | |
| | | | |
Net assets were comprised of: | | | | |
Paid in capital | | $ | 72,368,330 | |
Accumulated undistributed net investment income (loss) | | | 37,711 | |
Accumulated undistributed net realized gain (loss) on investments | | | (177,799 | ) |
Net unrealized appreciation (depreciation) on investments | | | (974,370 | ) |
| | | | |
Net assets | | $ | 71,253,872 | |
| | | | |
Class IB | | | | |
Net asset value, offering and redemption price per share, $10,303,899 / 1,049,975 shares outstanding (unlimited amount authorized: $0.01 par value) | | $ | 9.81 | |
| | | | |
Class K | | | | |
Net asset value, offering and redemption price per share, $60,949,973 / 6,210,703 shares outstanding (unlimited amount authorized: $0.01 par value) | | $ | 9.81 | |
| | | | |
| (x) | Includes value of securities on loan of $44,764. |
STATEMENT OF OPERATIONS
For the Year Ended December 31, 2016
| | | | |
INVESTMENT INCOME | |
Interest (net of $243 foreign withholding tax) | | $ | 2,389,839 | |
Dividends ($41,826 of dividend income received from affiliates) | | | 42,130 | |
Securities lending (net) | | | 742 | |
| | | | |
Total income | | | 2,432,711 | |
| | | | |
EXPENSES | | | | |
Investment management fees | | | 399,563 | |
Administrative fees | | | 66,861 | |
Professional fees | | | 66,229 | |
Distribution fees – Class IB | | | 15,408 | |
Offering costs | | | 13,732 | |
Custodian fees | | | 10,000 | |
Printing and mailing expenses | | | 4,415 | |
Trustees’ fees | | | 1,464 | |
Miscellaneous | | | 20,776 | |
| | | | |
Gross expenses | | | 598,448 | |
Less: Waiver from investment manager | | | (28,810 | ) |
Reimbursement from sub-advisor | | | (8,322 | ) |
| | | | |
Net expenses | | | 561,316 | |
| | | | |
NET INVESTMENT INCOME (LOSS) | | | 1,871,395 | |
| | | | |
REALIZED AND UNREALIZED GAIN (LOSS) | | | | |
Net realized gain (loss) on investments ($(16,378) of realized gain (loss) from affiliates) | | | 287,348 | |
Net change in unrealized appreciation (depreciation) on investments ($36,295 of change in unrealized appreciation (depreciation) from affiliates) | | | 979,426 | |
| | | | |
NET REALIZED AND UNREALIZED GAIN (LOSS) | | | 1,266,774 | |
| | | | |
NET INCREASE (DECREASE) IN NET ASSETS RESULTING FROM OPERATIONS | | $ | 3,138,169 | |
| | | | |
See Notes to Financial Statements.
43
EQ ADVISORS TRUST
AXA/DOUBLELINE OPPORTUNISTIC CORE PLUS BOND PORTFOLIO
STATEMENT OF CHANGES IN NET ASSETS
| | | | | | | | |
| | | Year Ended
December 31, 2016 | | | May 1, 2015* to
December 31, 2015 | |
INCREASE (DECREASE) IN NET ASSETS FROM OPERATIONS: | | | | | | | | |
Net investment income (loss) | | $ | 1,871,395 | | | $ | 999,785 | |
Net realized gain (loss) on investments | | | 287,348 | | | | (203,814 | ) |
Net change in unrealized appreciation (depreciation) on investments | | | 979,426 | | | | (1,953,796 | ) |
| | | | | | | | |
NET INCREASE (DECREASE) IN NET ASSETS RESULTING FROM OPERATIONS | | | 3,138,169 | | | | (1,157,825 | ) |
| | | | | | | | |
DIVIDENDS: | | | | | | | | |
Dividends from net investment income | | | | | | | | |
Class IB | | | (259,317 | ) | | | (36,621 | ) |
Class K | | | (1,734,919 | ) | | | (1,107,140 | ) |
| | | | | | | | |
TOTAL DIVIDENDS: | | | (1,994,236 | ) | | | (1,143,761 | ) |
| | | | | | | | |
CAPITAL SHARES TRANSACTIONS: | | | | | | | | |
Class IB | | | | | | | | |
Capital shares sold [ 818,751 and 263,299 shares, respectively ] | | | 8,201,352 | | | | 2,597,346 | |
Capital shares issued in reinvestment of dividends [ 26,649 and 3,805 shares, respectively ] | | | 259,317 | | | | 36,621 | |
Capital shares repurchased [ (41,424) and (21,105) shares, respectively ] | | | (416,515 | ) | | | (208,655 | ) |
| | | | | | | | |
Total Class IB transactions | | | 8,044,154 | | | | 2,425,312 | |
| | | | | | | | |
Class K | | | | | | | | |
Capital shares sold [ 0 and 5,917,371 shares, respectively ] | | | — | | | | 59,100,000 | |
Capital shares issued in reinvestment of dividends [ 178,301 and 115,031 shares, respectively ] | | | 1,734,919 | | | | 1,107,140 | |
| | | | | | | | |
Total Class K transactions | | | 1,734,919 | | | | 60,207,140 | |
| | | | | | | | |
NET INCREASE (DECREASE) IN NET ASSETS RESULTING FROM CAPITAL SHARE TRANSACTIONS | | | 9,779,073 | | | | 62,632,452 | |
| | | | | | | | |
TOTAL INCREASE (DECREASE) IN NET ASSETS | | | 10,923,006 | | | | 60,330,866 | |
NET ASSETS: | | | | | | | | |
Beginning of period | | | 60,330,866 | | | | — | |
| | | | | | | | |
End of period (a) | | $ | 71,253,872 | | | $ | 60,330,866 | |
| | | | | | | | |
(a) Includes accumulated undistributed (overdistributed) net investment income (loss) of | | $ | 37,711 | | | $ | — | |
| | | | | | | | |
* The Portfolio commenced operations on May 1, 2015. | | | | | | | | |
See Notes to Financial Statements.
44
EQ ADVISORS TRUST
AXA/DOUBLELINE OPPORTUNISTIC CORE PLUS BOND PORTFOLIO
FINANCIAL HIGHLIGHTS
| | | | | | | | |
| Class IB | | Year Ended
December 31, 2016 | | | May 1, 2015* to
December 31, 2015 | |
Net asset value, beginning of period | | $ | 9.61 | | | $ | 10.00 | |
| | | | | | | | |
Income (loss) from investment operations: | | | | | | | | |
Net investment income (loss) (e) | | | 0.25 | | | | 0.17 | |
Net realized and unrealized gain (loss) on investments | | | 0.21 | | | | (0.39 | ) |
| | | | | | | | |
Total from investment operations | | | 0.46 | | | | (0.22 | ) |
| | | | | | | | |
Less distributions: | | | | | | | | |
Dividends from net investment income | | | (0.26 | ) | | | (0.17 | ) |
| | | | | | | | |
Net asset value, end of period | | $ | 9.81 | | | $ | 9.61 | |
| | | | | | | | |
Total return (b) | | | 4.83 | % | | | (2.20 | )% |
| | | | | | | | |
Ratios/Supplemental Data: | |
Net assets, end of period (000’s) | | $ | 10,304 | | | $ | 2,364 | |
Ratio of expenses to average net assets: | | | | | | | | |
After waivers (a)(f) | | | 1.06 | % | | | 1.08 | % |
Before waivers (a)(f) | | | 1.11 | % | | | 1.26 | % |
Ratio of net investment income (loss) to average net assets: | | | | | | | | |
After waivers (a)(f) | | | 2.52 | % | | | 2.54 | %(l) |
Before waivers (a)(f) | | | 2.47 | % | | | 2.36 | %(l) |
Portfolio turnover rate (z)^ | | | 76 | % | | | 79 | % |
| | | | | | | | |
| | |
| Class K | | Year Ended
December 31, 2016 | | | May 1, 2015* to
December 31, 2015 | |
Net asset value, beginning of period | | $ | 9.61 | | | $ | 10.00 | |
| | | | | | | | |
Income (loss) from investment operations: | | | | | | | | |
Net investment income (loss) (e) | | | 0.28 | | | | 0.18 | |
Net realized and unrealized gain (loss) on investments | | | 0.21 | | | | (0.38 | ) |
| | | | | | | | |
Total from investment operations | | | 0.49 | | | | (0.20 | ) |
| | | | | | | | |
Less distributions: | | | | | | | | |
Dividends from net investment income | | | (0.29 | ) | | | (0.19 | ) |
| | | | | | | | |
Net asset value, end of period | | $ | 9.81 | | | $ | 9.61 | |
| | | | | | | | |
Total return (b) | | | 5.10 | % | | | (2.03 | )% |
| | | | | | | | |
Ratios/Supplemental Data: | | | | | | | | |
Net assets, end of period (000’s) | | $ | 60,950 | | | $ | 57,967 | |
Ratio of expenses to average net assets: | | | | | | | | |
After waivers (a)(f) | | | 0.82 | % | | | 0.84 | % |
Before waivers (a)(f) | | | 0.88 | % | | | 1.04 | % |
Ratio of net investment income (loss) to average net assets: | | | | | | | | |
After waivers (a)(f) | | | 2.84 | % | | | 2.67 | %(l) |
Before waivers (a)(f) | | | 2.78 | % | | | 2.47 | %(l) |
Portfolio turnover rate (z)^ | | | 76 | % | | | 79 | % |
| * | Commencement of Operations. |
| ^ | Portfolio turnover rate excludes derivatives, if any. |
| (a) | Ratios for periods less than one year are annualized. |
| (b) | Total returns for periods less than one year are not annualized. |
| (e) | Net investment income (loss) per share is based on average shares outstanding. |
| (f) | Expenses do not include the expenses of the underlying funds (“indirect expenses”), if applicable. |
| (l) | The annualized ratio of net investment income to average net assets may not be indicative of operating results for a full year. |
| (z) | Portfolio turnover rate for periods less than one year is not annualized. |
See Notes to Financial Statements.
45
EQ ADVISORS TRUST
AXA/HORIZON SMALL CAP VALUE PORTFOLIO
PORTFOLIO OF INVESTMENTS
December 31, 2016
| | | | | | | | |
| | | Number of
Shares | | | Value
(Note 1) | |
| | | | | | | | |
COMMON STOCKS: | |
Consumer Discretionary (15.3%) | |
Auto Components (0.9%) | |
Cooper Tire & Rubber Co. | | | 4,978 | | | $ | 193,395 | |
Cooper-Standard Holdings, Inc.* | | | 99 | | | | 10,235 | |
Dana, Inc. | | | 13,210 | | | | 250,726 | |
Dorman Products, Inc.* | | | 11,000 | | | | 803,659 | |
Federal-Mogul Holdings Corp.* | | | 2,692 | | | | 27,755 | |
Metaldyne Performance Group, Inc. | | | 547 | | | | 12,554 | |
Modine Manufacturing Co.* | | | 4,251 | | | | 63,340 | |
Motorcar Parts of America, Inc.* | | | 108 | | | | 2,907 | |
Spartan Motors, Inc. | | | 3,007 | | | | 27,815 | |
Standard Motor Products, Inc. | | | 773 | | | | 41,139 | |
Strattec Security Corp. | | | 319 | | | | 12,856 | |
Superior Industries International, Inc. | | | 2,238 | | | | 58,971 | |
Tower International, Inc. | | | 1,861 | | | | 52,759 | |
| | | | | | | | |
| | | | | | | 1,558,111 | |
| | | | | | | | |
Distributors (0.0%) | |
Weyco Group, Inc. | | | 507 | | | | 15,869 | |
| | | | | | | | |
Diversified Consumer Services (0.4%) | |
American Public Education, Inc.* | | | 1,399 | | | | 34,345 | |
Apollo Education Group, Inc.* | | | 7,736 | | | | 76,587 | |
Ascent Capital Group, Inc., Class A* | | | 936 | | | | 15,219 | |
Bridgepoint Education, Inc.* | | | 1,630 | | | | 16,512 | |
Cambium Learning Group, Inc.* | | | 1,018 | | | | 5,080 | |
Capella Education Co. | | | 68 | | | | 5,970 | |
Career Education Corp.* | | | 6,015 | | | | 60,691 | |
Carriage Services, Inc. | | | 82 | | | | 2,348 | |
Chegg, Inc. (x)* | | | 4,183 | | | | 30,871 | |
DeVry Education Group, Inc. | | | 5,636 | | | | 175,844 | |
Houghton Mifflin Harcourt Co.* | | | 3,719 | | | | 40,351 | |
K12, Inc.* | | | 3,064 | | | | 52,578 | |
Liberty Tax, Inc. | | | 122 | | | | 1,635 | |
Regis Corp.* | | | 3,361 | | | | 48,802 | |
Sotheby’s* | | | 1,961 | | | | 78,166 | |
Strayer Education, Inc.* | | | 532 | | | | 42,895 | |
Weight Watchers International, Inc. (x)* | | | 198 | | | | 2,267 | |
| | | | | | | | |
| | | | | | | 690,161 | |
| | | | | | | | |
Hotels, Restaurants & Leisure (6.1%) | |
Belmond Ltd., Class A* | | | 7,545 | | | | 100,725 | |
Biglari Holdings, Inc.* | | | 84 | | | | 39,749 | |
Caesars Acquisition Co., Class A* | | | 4,237 | | | | 57,200 | |
Caesars Entertainment Corp. (x)* | | | 5,005 | | | | 42,543 | |
Carrols Restaurant Group, Inc.* | | | 358 | | | | 5,460 | |
Century Casinos, Inc.* | | | 967 | | | | 7,958 | |
Cracker Barrel Old Country Store, Inc. (x) | | | 98 | | | | 16,364 | |
Del Frisco’s Restaurant Group, Inc.* | | | 1,972 | | | | 33,524 | |
Del Taco Restaurants, Inc.* | | | 2,271 | | | | 32,067 | |
Denny’s Corp.* | | | 1,843 | | | | 23,646 | |
DineEquity, Inc. | | | 687 | | | | 52,899 | |
El Pollo Loco Holdings, Inc. (x)* | | | 1,851 | | | | 22,767 | |
Eldorado Resorts, Inc. (x)* | | | 240 | | | | 4,068 | |
Empire Resorts, Inc. (x)* | | | 265 | | | | 6,029 | |
| | | | | | | | |
Fiesta Restaurant Group, Inc.* | | | 441 | | | $ | 13,164 | |
Fogo De Chao, Inc.* | | | 457 | | | | 6,558 | |
Golden Entertainment, Inc. | | | 733 | | | | 8,877 | |
ILG, Inc. | | | 9,242 | | | | 167,926 | |
International Speedway Corp., Class A | | | 2,358 | | | | 86,774 | |
Intrawest Resorts Holdings, Inc.* | | | 1,445 | | | | 25,793 | |
J Alexander’s Holdings, Inc.* | | | 1,190 | | | | 12,793 | |
Jack in the Box, Inc. | | | 664 | | | | 74,129 | |
Kona Grill, Inc. (x)* | | | 342 | | | | 4,292 | |
La Quinta Holdings, Inc.* | | | 6,096 | | | | 86,624 | |
Luby’s, Inc.* | | | 1,754 | | | | 7,507 | |
Marcus Corp. (The) | | | 1,648 | | | | 51,912 | |
Marriott Vacations Worldwide Corp. | | | 1,889 | | | | 160,281 | |
Monarch Casino & Resort, Inc.* | | | 929 | | | | 23,950 | |
Noodles & Co. (x)* | | | 320 | | | | 1,312 | |
Penn National Gaming, Inc.* | | | 955 | | | | 13,169 | |
Pinnacle Entertainment, Inc.* | | | 4,607 | | | | 66,802 | |
Red Lion Hotels Corp.* | | | 1,225 | | | | 10,229 | |
Red Robin Gourmet Burgers, Inc.* | | | 952 | | | | 53,693 | |
Ruby Tuesday, Inc.* | | | 5,420 | | | | 17,507 | |
Speedway Motorsports, Inc. | | | 1,054 | | | | 22,840 | |
Tropicana Entertainment, Inc.* | | | 112,200 | | | | 3,405,269 | |
Wendy’s Co. (The) | | | 413,200 | | | | 5,586,463 | |
| | | | | | | | |
| | | | | | | 10,352,863 | |
| | | | | | | | |
Household Durables (1.6%) | |
Bassett Furniture Industries, Inc. | | | 430 | | | | 13,072 | |
Beazer Homes USA, Inc.* | | | 2,897 | | | | 38,530 | |
Century Communities, Inc.* | | | 1,276 | | | | 26,796 | |
CSS Industries, Inc. | | | 766 | | | | 20,736 | |
Flexsteel Industries, Inc. | | | 565 | | | | 34,844 | |
GoPro, Inc., Class A (x)* | | | 9,275 | | | | 80,785 | |
Green Brick Partners, Inc. (x)* | | | 32,051 | | | | 322,113 | |
Hooker Furniture Corp. | | | 929 | | | | 35,256 | |
Hovnanian Enterprises, Inc., Class A (x)* | | | 11,143 | | | | 30,420 | |
KB Home (x) | | | 5,912 | | | | 93,469 | |
La-Z-Boy, Inc. | | | 2,559 | | | | 79,457 | |
LGI Homes, Inc. (x)* | | | 91 | | | | 2,614 | |
Libbey, Inc. | | | 1,833 | | | | 35,670 | |
Lifetime Brands, Inc. | | | 1,022 | | | | 18,141 | |
M.D.C. Holdings, Inc. | | | 2,378 | | | | 61,019 | |
M/I Homes, Inc.* | | | 1,730 | | | | 43,561 | |
Meritage Homes Corp.* | | | 3,217 | | | | 111,952 | |
NACCO Industries, Inc., Class A | | | 345 | | | | 31,240 | |
New Home Co., Inc. (The)* | | | 887 | | | | 10,387 | |
Newell Brands, Inc. | | | 13,000 | | | | 580,450 | |
TopBuild Corp.* | | | 3,064 | | | | 109,078 | |
TRI Pointe Group, Inc.* | | | 73,876 | | | | 848,095 | |
UCP, Inc., Class A* | | | 718 | | | | 8,652 | |
WCI Communities, Inc.* | | | 1,978 | | | | 46,384 | |
William Lyon Homes, Class A* | | | 2,185 | | | | 41,581 | |
ZAGG, Inc.* | | | 2,198 | | | | 15,606 | |
| | | | | | | | |
| | | | | | | 2,739,908 | |
| | | | | | | | |
Internet & Direct Marketing Retail (0.0%) | |
1-800-Flowers.com, Inc., Class A* | | | 1,435 | | | | 15,355 | |
FTD Cos., Inc.* | | | 1,579 | | | | 37,643 | |
See Notes to Financial Statements.
46
EQ ADVISORS TRUST
AXA/HORIZON SMALL CAP VALUE PORTFOLIO
PORTFOLIO OF INVESTMENTS (Continued)
December 31, 2016
| | | | | | | | |
| | | Number of
Shares | | | Value
(Note 1) | |
| | | | | | | | |
Gaia, Inc.* | | | 608 | | | $ | 5,259 | |
Lands’ End, Inc. (x)* | | | 1,354 | | | | 20,513 | |
| | | | | | | | |
| | | | | | | 78,770 | |
| | | | | | | | |
Leisure Products (0.1%) | |
Acushnet Holdings Corp.* | | | 583 | | | | 11,491 | |
Arctic Cat, Inc. | | | 695 | | | | 10,439 | |
Callaway Golf Co. | | | 5,306 | | | | 58,153 | |
Escalade, Inc. | | | 914 | | | | 12,065 | |
JAKKS Pacific, Inc. (x)* | | | 1,398 | | | | 7,200 | |
Johnson Outdoors, Inc., Class A | | | 424 | | | | 16,829 | |
| | | | | | | | |
| | | | | | | 116,177 | |
| | | | | | | | |
Media (3.9%) | |
AMC Entertainment Holdings, Inc., Class A | | | 2,079 | | | | 69,959 | |
Daily Journal Corp. (x)* | | | 32 | | | | 7,738 | |
Entercom Communications Corp., Class A | | | 2,346 | | | | 35,894 | |
Eros International plc (x)* | | | 2,669 | | | | 34,830 | |
EW Scripps Co. (The), Class A* | | | 5,410 | | | | 104,575 | |
Gannett Co., Inc. | | | 10,612 | | | | 103,043 | |
Global Eagle Entertainment, Inc. (x)* | | | 3,924 | | | | 25,349 | |
Gray Television, Inc.* | | | 2,199 | | | | 23,859 | |
Hemisphere Media Group, Inc.* | | | 81 | | | | 907 | |
Liberty Media Corp-Liberty Braves, Class A* | | | 779 | | | | 15,962 | |
Liberty Media Corp-Liberty Braves, Class C* | | | 2,634 | | | | 54,234 | |
Liberty Media Corp-Liberty Media, Class A* | | | 1,689 | | | | 52,950 | |
Liberty Media Corp-Liberty Media, Class C* | | | 3,483 | | | | 109,123 | |
Lions Gate Entertainment Corp., Class B* | | | 31,884 | | | | 782,432 | |
Live Nation Entertainment, Inc.* | | | 145,000 | | | | 3,856,999 | |
Loral Space & Communications, Inc.* | | | 6,100 | | | | 250,404 | |
MDC Partners, Inc., Class A | | | 3,250 | | | | 21,288 | |
Media General, Inc.* | | | 9,619 | | | | 181,126 | |
Meredith Corp. | | | 3,379 | | | | 199,868 | |
MSG Networks, Inc., Class A* | | | 3,661 | | | | 78,712 | |
National CineMedia, Inc. | | | 5,624 | | | | 82,842 | |
New Media Investment Group, Inc. | | | 2,928 | | | | 46,819 | |
New York Times Co. (The), Class A | | | 11,280 | | | | 150,024 | |
Promotora de Informaciones SA (ADR)* | | | 26,310 | | | | 142,074 | |
Reading International, Inc., Class A* | | | 1,153 | | | | 19,140 | |
Saga Communications, Inc., Class A | | | 318 | | | | 15,995 | |
Salem Media Group, Inc. | | | 1,007 | | | | 6,294 | |
Scholastic Corp. | | | 2,485 | | | | 118,013 | |
Time, Inc. | | | 9,290 | | | | 165,827 | |
Townsquare Media, Inc., Class A* | | | 833 | | | | 8,672 | |
tronc, Inc. (x) | | | 974 | | | | 13,509 | |
| | | | | | | | |
| | | | | | | 6,778,461 | |
| | | | | | | | |
| | | | | | | | |
Multiline Retail (0.0%) | |
Fred’s, Inc., Class A (x) | | | 2,997 | | | $ | 55,625 | |
Sears Holdings Corp. (x)* | | | 794 | | | | 7,376 | |
Tuesday Morning Corp.* | | | 4,048 | | | | 21,859 | |
| | | | | | | | |
| | | | | | | 84,860 | |
| | | | | | | | |
Specialty Retail (1.7%) | |
Aaron’s, Inc. | | | 5,926 | | | | 189,573 | |
Abercrombie & Fitch Co., Class A | | | 6,100 | | | | 73,200 | |
American Eagle Outfitters, Inc. | | | 1,493 | | | | 22,649 | |
America’s Car-Mart, Inc.* | | | 713 | | | | 31,194 | |
Ascena Retail Group, Inc.* | | | 10,200 | | | | 63,138 | |
At Home Group, Inc.* | | | 460 | | | | 6,730 | |
Barnes & Noble Education, Inc.* | | | 3,620 | | | | 41,521 | |
Barnes & Noble, Inc. | | | 5,666 | | | | 63,176 | |
Big 5 Sporting Goods Corp. | | | 1,589 | | | | 27,569 | |
Boot Barn Holdings, Inc. (x)* | | | 1,189 | | | | 14,886 | |
Buckle, Inc. (The) (x) | | | 1,704 | | | | 38,851 | |
Build-A-Bear Workshop, Inc.* | | | 1,145 | | | | 15,744 | |
Caleres, Inc. | | | 3,839 | | | | 125,996 | |
Cato Corp. (The), Class A | | | 1,847 | | | | 55,558 | |
Chico’s FAS, Inc. | | | 1,219 | | | | 17,541 | |
Citi Trends, Inc. | | | 1,284 | | | | 24,191 | |
Conn’s, Inc.* | | | 1,845 | | | | 23,339 | |
Container Store Group, Inc. (The) (x)* | | | 1,097 | | | | 6,966 | |
Destination XL Group, Inc.* | | | 922 | | | | 3,919 | |
DSW, Inc., Class A | | | 6,060 | | | | 137,259 | |
Express, Inc.* | | | 6,699 | | | | 72,081 | |
Finish Line, Inc. (The), Class A (x) | | | 2,604 | | | | 48,981 | |
Genesco, Inc.* | | | 1,629 | | | | 101,161 | |
Group 1 Automotive, Inc. | | | 1,434 | | | | 111,766 | |
Guess?, Inc. | | | 5,472 | | | | 66,211 | |
Haverty Furniture Cos., Inc. | | | 1,743 | | | | 41,309 | |
Hibbett Sports, Inc. (x)* | | | 424 | | | | 15,815 | |
Kirkland’s, Inc.* | | | 747 | | | | 11,586 | |
Lumber Liquidators Holdings, Inc. (x)* | | | 2,384 | | | | 37,524 | |
MarineMax, Inc.* | | | 982 | | | | 19,002 | |
Office Depot, Inc. | | | 49,609 | | | | 224,233 | |
Party City Holdco, Inc. (x)* | | | 1,364 | | | | 19,369 | |
Penske Automotive Group, Inc. (x) | | | 14,000 | | | | 725,759 | |
Pier 1 Imports, Inc. | | | 6,228 | | | | 53,187 | |
Rent-A-Center, Inc. | | | 4,670 | | | | 52,538 | |
Restoration Hardware Holdings, Inc.* | | | 3,500 | | | | 107,450 | |
Sears Hometown and Outlet Stores, Inc. (x)* | | | 1,047 | | | | 4,921 | |
Shoe Carnival, Inc. (x) | | | 1,195 | | | | 32,241 | |
Sonic Automotive, Inc., Class A | | | 2,546 | | | | 58,303 | |
Sportsman’s Warehouse Holdings, Inc.* | | | 158 | | | | 1,484 | |
Stage Stores, Inc. (x) | | | 2,335 | | | | 10,204 | |
Tailored Brands, Inc. | | | 3,087 | | | | 78,873 | |
Tilly’s, Inc., Class A* | | | 1,078 | | | | 14,219 | |
Vitamin Shoppe, Inc.* | | | 2,050 | | | | 48,688 | |
West Marine, Inc.* | | | 1,667 | | | | 17,453 | |
Zumiez, Inc. (x)* | | | 1,627 | | | | 35,550 | |
| | | | | | | | |
| | | | | | | 2,992,908 | |
| | | | | | | | |
See Notes to Financial Statements.
47
EQ ADVISORS TRUST
AXA/HORIZON SMALL CAP VALUE PORTFOLIO
PORTFOLIO OF INVESTMENTS (Continued)
December 31, 2016
| | | | | | | | |
| | | Number of
Shares | | | Value
(Note 1) | |
| | | | | | | | |
Textiles, Apparel & Luxury Goods (0.6%) | |
Deckers Outdoor Corp.* | | | 2,733 | | | $ | 151,381 | |
Delta Apparel, Inc.* | | | 648 | | | | 13,433 | |
Fossil Group, Inc.* | | | 3,784 | | | | 97,854 | |
G-III Apparel Group Ltd.* | | | 781 | | | | 23,086 | |
Iconix Brand Group, Inc.* | | | 3,894 | | | | 36,370 | |
Movado Group, Inc. | | | 17,784 | | | | 511,289 | |
Perry Ellis International, Inc.* | | | 1,122 | | | | 27,949 | |
Sequential Brands Group, Inc.* | | | 3,744 | | | | 17,522 | |
Unifi, Inc.* | | | 1,404 | | | | 45,813 | |
Vera Bradley, Inc.* | | | 511 | | | | 5,989 | |
Vince Holding Corp. (x)* | | | 1,810 | | | | 7,331 | |
Wolverine World Wide, Inc. | | | 7,350 | | | | 161,333 | |
| | | | | | | | |
| | | | | | | 1,099,350 | |
| | | | | | | | |
Total Consumer Discretionary | | | | | | | 26,507,438 | |
| | | | | | | | |
Consumer Staples (2.7%) | |
Beverages (0.2%) | |
Craft Brew Alliance, Inc. (x)* | | | 741 | | | | 12,523 | |
Crimson Wine Group Ltd.* | | | 42,400 | | | | 397,288 | |
| | | | | | | | |
| | | | | | | 409,811 | |
| | | | | | | | |
Food & Staples Retailing (0.4%) | |
Andersons, Inc. (The) | | | 2,426 | | | | 108,442 | |
Chefs’ Warehouse, Inc. (The)* | | | 159 | | | | 2,512 | |
Ingles Markets, Inc., Class A | | | 1,265 | | | | 60,847 | |
Natural Grocers by Vitamin Cottage, Inc. (x)* | | | 848 | | | | 10,083 | |
Smart & Final Stores, Inc. (x)* | | | 671 | | | | 9,461 | |
SpartanNash Co. | | | 3,337 | | | | 131,945 | |
SUPERVALU, Inc.* | | | 24,019 | | | | 112,169 | |
United Natural Foods, Inc.* | | | 4,386 | | | | 209,300 | |
Village Super Market, Inc., Class A | | | 647 | | | | 19,992 | |
Weis Markets, Inc. | | | 848 | | | | 56,680 | |
| | | | | | | | |
| | | | | | | 721,431 | |
| | | | | | | | |
Food Products (0.7%) | |
AdvancePierre Foods Holdings, Inc. | | | 713 | | | | 21,233 | |
Alico, Inc. | | | 1,465 | | | | 39,775 | |
Cal-Maine Foods, Inc. (x) | | | 621 | | | | 27,433 | |
Darling Ingredients, Inc.* | | | 10,834 | | | | 139,867 | |
Dean Foods Co. | | | 4,236 | | | | 92,260 | |
Fresh Del Monte Produce, Inc. | | | 2,765 | | | | 167,642 | |
John B. Sanfilippo & Son, Inc. | | | 560 | | | | 39,418 | |
Landec Corp.* | | | 1,867 | | | | 25,765 | |
Limoneira Co. | | | 86 | | | | 1,850 | |
Omega Protein Corp.* | | | 1,697 | | | | 42,510 | |
Sanderson Farms, Inc. (x) | | | 1,823 | | | | 171,800 | |
Seaboard Corp.* | | | 24 | | | | 94,848 | |
Seneca Foods Corp., Class A* | | | 589 | | | | 23,589 | |
Snyder’s-Lance, Inc. | | | 7,161 | | | | 274,552 | |
| | | | | | | | |
| | | | | | | 1,162,542 | |
| | | | | | | | |
Household Products (0.1%) | |
Central Garden & Pet Co. (x)* | | | 884 | | | | 29,252 | |
Central Garden & Pet Co., Class A* | | | 2,616 | | | | 80,833 | |
Oil-Dri Corp. of America | | | 431 | | | | 16,469 | |
| | | | | | | | |
| | | | | | | 126,554 | |
| | | | | | | | |
| | | | | | | | |
Personal Products (1.2%) | |
Avon Products, Inc.* | | | 31,180 | | | $ | 157,148 | |
elf Beauty, Inc. (x)* | | | 392 | | | | 11,344 | |
Inter Parfums, Inc. | | | 55,659 | | | | 1,822,833 | |
Nature’s Sunshine Products, Inc. | | | 753 | | | | 11,295 | |
Nutraceutical International Corp. | | | 731 | | | | 25,548 | |
Revlon, Inc., Class A* | | | 748 | | | | 21,804 | |
Synutra International, Inc.* | | | 1,489 | | | | 7,966 | |
| | | | | | | | |
| | | | | | | 2,057,938 | |
| | | | | | | | |
Tobacco (0.1%) | |
Alliance One International, Inc.* | | | 787 | | | | 15,110 | |
Turning Point Brands, Inc.* | | | 270 | | | | 3,308 | |
Universal Corp. | | | 2,030 | | | | 129,412 | |
Vector Group Ltd. (x) | | | 4,671 | | | | 106,219 | |
| | | | | | | | |
| | | | | | | 254,049 | |
| | | | | | | | |
Total Consumer Staples | | | | | | | 4,732,325 | |
| | | | | | | | |
Energy (4.0%) | |
Energy Equipment & Services (1.4%) | |
Archrock, Inc. | | | 6,379 | | | | 84,203 | |
Atwood Oceanics, Inc. (x) | | | 5,571 | | | | 73,147 | |
Bristow Group, Inc. | | | 3,049 | | | | 62,444 | |
CARBO Ceramics, Inc. (x)* | | | 1,764 | | | | 18,451 | |
Dawson Geophysical Co.* | | | 1,837 | | | | 14,769 | |
Era Group, Inc.* | | | 1,798 | | | | 30,512 | |
Exterran Corp.* | | | 2,839 | | | | 67,852 | |
Fairmount Santrol Holdings, Inc. (x)* | | | 7,970 | | | | 93,966 | |
Forum Energy Technologies, Inc.* | | | 5,481 | | | | 120,582 | |
Geospace Technologies Corp. (x)* | | | 1,175 | | | | 23,923 | |
Helix Energy Solutions Group, Inc.* | | | 10,334 | | | | 91,146 | |
Hornbeck Offshore Services, Inc.* | | | 2,969 | | | | 21,436 | |
Independence Contract Drilling, Inc.* | | | 2,666 | | | | 17,862 | |
Mammoth Energy Services, Inc.* | | | 414 | | | | 6,293 | |
Matrix Service Co.* | | | 2,396 | | | | 54,389 | |
McDermott International, Inc.* | | | 21,776 | | | | 160,925 | |
Natural Gas Services Group, Inc.* | | | 1,076 | | | | 34,593 | |
Newpark Resources, Inc.* | | | 7,466 | | | | 55,995 | |
Oil States International, Inc.* | | | 4,664 | | | | 181,896 | |
Parker Drilling Co.* | | | 10,875 | | | | 28,275 | |
PHI, Inc. (Non-Voting)* | | | 743 | | | | 13,389 | |
Pioneer Energy Services Corp.* | | | 6,421 | | | | 43,984 | |
RigNet, Inc.* | | | 1,068 | | | | 24,724 | |
SEACOR Holdings, Inc.* | | | 1,437 | | | | 102,429 | |
Seadrill Ltd. (x)* | | | 34,149 | | | | 116,448 | |
Smart Sand, Inc.* | | | 874 | | | | 14,465 | |
Subsea 7 SA (ADR)* | | | 60,000 | | | | 755,701 | |
TerraVest Capital, Inc. | | | 300 | | | | 1,989 | |
Tesco Corp.* | | | 4,105 | | | | 33,866 | |
TETRA Technologies, Inc.* | | | 2,952 | | | | 14,819 | |
Tidewater, Inc. (x)* | | | 4,206 | | | | 14,342 | |
Unit Corp.* | | | 4,580 | | | | 123,065 | |
Willbros Group, Inc.* | | | 3,900 | | | | 12,636 | |
| | | | | | | | |
| | | | | | | 2,514,516 | |
| | | | | | | | |
See Notes to Financial Statements.
48
EQ ADVISORS TRUST
AXA/HORIZON SMALL CAP VALUE PORTFOLIO
PORTFOLIO OF INVESTMENTS (Continued)
December 31, 2016
| | | | | | | | |
| | | Number of
Shares | | | Value
(Note 1) | |
| | | | | | | | |
Oil, Gas & Consumable Fuels (2.6%) | |
Abraxas Petroleum Corp. (x)* | | | 5,992 | | | $ | 15,399 | |
Adams Resources & Energy, Inc. | | | 183 | | | | 7,256 | |
Alon USA Energy, Inc. | | | 2,864 | | | | 32,592 | |
Ardmore Shipping Corp. | | | 2,515 | | | | 18,611 | |
Bill Barrett Corp. (x)* | | | 4,445 | | | | 31,071 | |
California Resources Corp.* | | | 2,869 | | | | 61,081 | |
Clayton Williams Energy, Inc. (x)* | | | 539 | | | | 64,281 | |
Clean Energy Fuels Corp. (x)* | | | 7,888 | | | | 22,560 | |
Cobalt International Energy, Inc.* | | | 36,918 | | | | 45,040 | |
Contango Oil & Gas Co.* | | | 2,108 | | | | 19,689 | |
CVR Energy, Inc. (x) | | | 1,319 | | | | 33,489 | |
Delek U.S. Holdings, Inc. | | | 5,594 | | | | 134,648 | |
Denbury Resources, Inc.* | | | 31,803 | | | | 117,035 | |
DHT Holdings, Inc. | | | 8,304 | | | | 34,379 | |
Dorian LPG Ltd.* | | | 2,198 | | | | 18,046 | |
Earthstone Energy, Inc.* | | | 99 | | | | 1,360 | |
Eclipse Resources Corp.* | | | 5,222 | | | | 13,943 | |
EP Energy Corp., Class A (x)* | | | 3,446 | | | | 22,571 | |
Erin Energy Corp. (x)* | | | 985 | | | | 3,004 | |
EXCO Resources, Inc. (x)* | | | 12,627 | | | | 11,032 | |
Frontline Ltd. (x) | | | 5,858 | | | | 41,650 | |
GasLog Ltd. | | | 3,671 | | | | 59,103 | |
Gener8 Maritime, Inc.* | | | 3,708 | | | | 16,612 | |
Golar LNG Ltd. | | | 8,398 | | | | 192,650 | |
Green Plains, Inc. | | | 3,267 | | | | 90,986 | |
International Seaways, Inc.* | | | 1,266 | | | | 17,775 | |
Jones Energy, Inc., Class A (x)* | | | 5,454 | | | | 27,270 | |
Navigator Holdings Ltd.* | | | 10,800 | | | | 100,440 | |
Navios Maritime Acquisition Corp. | | | 7,356 | | | | 12,505 | |
Nordic American Tankers Ltd. (x) | | | 9,031 | | | | 75,860 | |
Northern Oil and Gas, Inc. (x)* | | | 4,185 | | | | 11,509 | |
Oasis Petroleum, Inc.* | | | 21,032 | | | | 318,424 | |
Overseas Shipholding Group, Inc., Class A | | | 3,052 | | | | 11,689 | |
Pacific Ethanol, Inc.* | | | 2,622 | | | | 24,909 | |
Panhandle Oil and Gas, Inc., Class A | | | 651 | | | | 15,331 | |
Par Pacific Holdings, Inc. (x)* | | | 31,428 | | | | 456,963 | |
PDC Energy, Inc.* | | | 4,992 | | | | 362,319 | |
Permian Basin Royalty Trust | | | 63,100 | | | | 486,502 | |
Renewable Energy Group, Inc. (x)* | | | 2,984 | | | | 28,945 | |
REX American Resources Corp.* | | | 511 | | | | 50,461 | |
Ring Energy, Inc.* | | | 3,604 | | | | 46,816 | |
RSP Permian, Inc.* | | | 8,762 | | | | 390,960 | |
Sanchez Energy Corp. (x)* | | | 3,406 | | | | 30,756 | |
Scorpio Tankers, Inc. | | | 15,119 | | | | 68,489 | |
SemGroup Corp., Class A | | | 5,853 | | | | 244,363 | |
Ship Finance International Ltd. (x) | | | 5,451 | | | | 80,947 | |
Synergy Resources Corp. (x)* | | | 15,081 | | | | 134,372 | |
Teekay Corp. | | | 4,560 | | | | 36,617 | |
Teekay Tankers Ltd., Class A | | | 10,578 | | | | 23,906 | |
W&T Offshore, Inc.* | | | 3,280 | | | | 9,086 | |
Western Refining, Inc. | | | 7,150 | | | | 270,628 | |
Westmoreland Coal Co. (x)* | | | 1,718 | | | | 30,357 | |
| | | | | | | | |
| | | | | | | 4,476,287 | |
| | | | | | | | |
Total Energy | | | | | | | 6,990,803 | |
| | | | | | | | |
| | | | | | | | |
Financials (30.7%) | |
Banks (10.4%) | |
1st Source Corp. | | | 1,403 | | | $ | 62,658 | |
Access National Corp. (x) | | | 736 | | | | 20,431 | |
ACNB Corp. | | | 527 | | | | 16,469 | |
Allegiance Bancshares, Inc.* | | | 900 | | | | 32,535 | |
American National Bankshares, Inc. | | | 717 | | | | 24,952 | |
Ameris Bancorp | | | 848 | | | | 36,973 | |
Ames National Corp. | | | 758 | | | | 25,014 | |
Arrow Financial Corp. | | | 1,011 | | | | 40,946 | |
Atlantic Capital Bancshares, Inc.* | | | 1,279 | | | | 24,301 | |
Banc of California, Inc. (x) | | | 1,351 | | | | 23,440 | |
BancFirst Corp. | | | 723 | | | | 67,275 | |
Banco Latinoamericano de Comercio Exterior SA, Class E | | | 2,805 | | | | 82,579 | |
Bancorp, Inc. (The)* | | | 4,529 | | | | 35,598 | |
BancorpSouth, Inc. | | | 7,821 | | | | 242,842 | |
Bank of Marin Bancorp | | | 534 | | | | 37,247 | |
Bank of NT Butterfield & Son Ltd. (The) | | | 777 | | | | 24,429 | |
Bankwell Financial Group, Inc. | | | 438 | | | | 14,235 | |
Banner Corp. | | | 2,762 | | | | 154,147 | |
Bar Harbor Bankshares | | | 534 | | | | 25,274 | |
Berkshire Hills Bancorp, Inc. | | | 2,781 | | | | 102,480 | |
Blue Hills Bancorp, Inc. | | | 2,027 | | | | 38,006 | |
BNC Bancorp | | | 3,387 | | | | 108,045 | |
Boston Private Financial Holdings, Inc. | | | 7,535 | | | | 124,704 | |
Bridge Bancorp, Inc. | | | 1,499 | | | | 56,812 | |
Brookline Bancorp, Inc. | | | 6,273 | | | | 102,877 | |
Bryn Mawr Bank Corp. | | | 1,497 | | | | 63,099 | |
BSB Bancorp, Inc.* | | | 728 | | | | 21,076 | |
C&F Financial Corp. | | | 290 | | | | 14,457 | |
California First National Bancorp | | | 163 | | | | 2,551 | |
Camden National Corp. | | | 1,371 | | | | 60,941 | |
Capital Bank Financial Corp., Class A | | | 1,196 | | | | 46,943 | |
Capital City Bank Group, Inc. | | | 1,001 | | | | 20,500 | |
Cardinal Financial Corp. | | | 2,712 | | | | 88,926 | |
Carolina Financial Corp. (x) | | | 923 | | | | 28,419 | |
Cascade Bancorp* | | | 2,893 | | | | 23,491 | |
Cathay General Bancorp | | | 6,701 | | | | 254,839 | |
CenterState Banks, Inc. | | | 4,291 | | | | 108,004 | |
Central Pacific Financial Corp. | | | 2,728 | | | | 85,714 | |
Central Valley Community Bancorp | | | 784 | | | | 15,649 | |
Century Bancorp, Inc., Class A | | | 323 | | | | 19,380 | |
Chemical Financial Corp. | | | 4,024 | | | | 217,980 | |
Chemung Financial Corp. (x) | | | 275 | | | | 9,996 | |
Citizens & Northern Corp. | | | 1,026 | | | | 26,881 | |
City Holding Co. | | | 1,308 | | | | 88,421 | |
CNB Financial Corp. | | | 1,237 | | | | 33,077 | |
CoBiz Financial, Inc. | | | 3,003 | | | | 50,721 | |
Codorus Valley Bancorp, Inc. (x) | | | 722 | | | | 20,649 | |
Columbia Banking System, Inc. | | | 5,126 | | | | 229,030 | |
Community Bank System, Inc. | | | 3,924 | | | | 242,464 | |
Community Trust Bancorp, Inc. | | | 1,363 | | | | 67,605 | |
ConnectOne Bancorp, Inc. | | | 2,581 | | | | 66,977 | |
County Bancorp, Inc. | | | 131 | | | | 3,533 | |
CU Bancorp* | | | 1,283 | | | | 45,931 | |
See Notes to Financial Statements.
49
EQ ADVISORS TRUST
AXA/HORIZON SMALL CAP VALUE PORTFOLIO
PORTFOLIO OF INVESTMENTS (Continued)
December 31, 2016
| | | | | | | | |
| | | Number of
Shares | | | Value
(Note 1) | |
| | | | | | | | |
Customers Bancorp, Inc.* | | | 1,327 | | | $ | 47,533 | |
CVB Financial Corp. | | | 9,139 | | | | 209,557 | |
Eagle Bancorp, Inc.* | | | 619 | | | | 37,728 | |
Enterprise Bancorp, Inc. | | | 880 | | | | 33,053 | |
Enterprise Financial Services Corp. | | | 1,725 | | | | 74,175 | |
Equity Bancshares, Inc., Class A* | | | 476 | | | | 16,013 | |
Farmers Capital Bank Corp. | | | 661 | | | | 27,795 | |
Farmers National Banc Corp. | | | 2,216 | | | | 31,467 | |
FB Financial Corp.* | | | 263 | | | | 6,825 | |
FCB Financial Holdings, Inc., Class A* | | | 2,769 | | | | 132,081 | |
Fidelity Southern Corp. | | | 1,876 | | | | 44,405 | |
Financial Institutions, Inc. | | | 1,241 | | | | 42,442 | |
First Bancorp | | | 1,774 | | | | 48,146 | |
First BanCorp* | | | 10,766 | | | | 71,163 | |
First Bancorp, Inc. | | | 902 | | | | 29,856 | |
First Busey Corp. | | | 2,775 | | | | 85,415 | |
First Business Financial Services, Inc. | | | 713 | | | | 16,912 | |
First Citizens BancShares, Inc., Class A | | | 688 | | | | 244,240 | |
First Commonwealth Financial Corp. | | | 8,191 | | | | 116,148 | |
First Community Bancshares, Inc. | | | 1,395 | | | | 42,045 | |
First Community Financial Partners, Inc. (x)* | | | 1,243 | | | | 14,543 | |
First Connecticut Bancorp, Inc. | | | 957 | | | | 21,676 | |
First Financial Bancorp | | | 5,560 | | | | 158,182 | |
First Financial Bankshares, Inc. (x) | | | 2,201 | | | | 99,485 | |
First Financial Corp. | | | 893 | | | | 47,150 | |
First Financial Northwest, Inc. | | | 808 | | | | 15,950 | |
First Foundation, Inc.* | | | 802 | | | | 22,857 | |
First Internet Bancorp | | | 479 | | | | 15,328 | |
First Interstate BancSystem, Inc., Class A (x) | | | 1,834 | | | | 78,037 | |
First Merchants Corp. | | | 3,752 | | | | 141,263 | |
First Mid-Illinois Bancshares, Inc. | | | 709 | | | | 24,106 | |
First Midwest Bancorp, Inc. | | | 7,300 | | | | 184,179 | |
First NBC Bank Holding Co. (x)* | | | 1,424 | | | | 10,395 | |
First Northwest Bancorp* | | | 1,031 | | | | 16,084 | |
First of Long Island Corp. (The) | | | 1,917 | | | | 54,730 | |
Flushing Financial Corp. | | | 2,511 | | | | 73,798 | |
FNB Corp. | | | 18,680 | | | | 299,440 | |
Franklin Financial Network, Inc. (x)* | | | 620 | | | | 25,947 | |
Fulton Financial Corp. | | | 15,498 | | | | 291,362 | |
German American Bancorp, Inc. | | | 1,271 | | | | 66,867 | |
Glacier Bancorp, Inc. | | | 6,745 | | | | 244,371 | |
Great Southern Bancorp, Inc. | | | 966 | | | | 52,792 | |
Great Western Bancorp, Inc. | | | 5,362 | | | | 233,730 | |
Green Bancorp, Inc.* | | | 1,884 | | | | 28,637 | |
Guaranty Bancorp | | | 1,347 | | | | 32,597 | |
Hancock Holding Co. | | | 6,971 | | | | 300,450 | |
Hanmi Financial Corp. | | | 2,909 | | | | 101,524 | |
HarborOne Bancorp, Inc.* | | | 1,208 | | | | 23,363 | |
Heartland Financial USA, Inc. | | | 2,031 | | | | 97,488 | |
Heritage Commerce Corp. | | | 2,121 | | | | 30,606 | |
Heritage Financial Corp. | | | 2,655 | | | | 68,366 | |
Heritage Oaks Bancorp | | | 2,169 | | | | 26,744 | |
| | | | | | | | |
Hilltop Holdings, Inc. | | | 6,807 | | | $ | 202,849 | |
HomeTrust Bancshares, Inc.* | | | 1,515 | | | | 39,239 | |
Hope Bancorp, Inc. | | | 11,586 | | | | 253,618 | |
Horizon Bancorp | | | 1,735 | | | | 48,580 | |
IBERIABANK Corp. | | | 3,927 | | | | 328,886 | |
Independent Bank Corp./Massachusetts | | | 2,368 | | | | 166,825 | |
Independent Bank Corp./Michigan | | | 1,818 | | | | 39,451 | |
Independent Bank Group, Inc. | | | 1,002 | | | | 62,525 | |
International Bancshares Corp. | | | 4,933 | | | | 201,266 | |
Investors Bancorp, Inc. | | | 26,547 | | | | 370,331 | |
Lakeland Bancorp, Inc. | | | 3,500 | | | | 68,250 | |
Lakeland Financial Corp. | | | 2,222 | | | | 105,234 | |
LCNB Corp. | | | 753 | | | | 17,507 | |
LegacyTexas Financial Group, Inc. | | | 4,026 | | | | 173,360 | |
Macatawa Bank Corp. | | | 2,373 | | | | 24,703 | |
MainSource Financial Group, Inc. | | | 2,073 | | | | 71,311 | |
MB Financial, Inc. | | | 6,738 | | | | 318,236 | |
MBT Financial Corp. (x) | | | 1,577 | | | | 17,899 | |
Mercantile Bank Corp. | | | 1,423 | | | | 53,647 | |
Merchants Bancshares, Inc. | | | 515 | | | | 27,913 | |
Middleburg Financial Corp. | | | 414 | | | | 14,387 | |
Midland States Bancorp, Inc. | | | 343 | | | | 12,410 | |
MidWestOne Financial Group, Inc. | | | 744 | | | | 27,974 | |
MutualFirst Financial, Inc. (x) | | | 471 | | | | 15,590 | |
National Bankshares, Inc. (x) | | | 605 | | | | 26,287 | |
National Commerce Corp.* | | | 759 | | | | 28,197 | |
NBT Bancorp, Inc. | | | 3,881 | | | | 162,536 | |
Nicolet Bankshares, Inc.* | | | 683 | | | | 32,572 | |
Northrim BanCorp, Inc. | | | 610 | | | | 19,276 | |
OFG Bancorp | | | 3,923 | | | | 51,391 | |
Old Line Bancshares, Inc. | | | 562 | | | | 13,477 | |
Old National Bancorp | | | 11,734 | | | | 212,972 | |
Old Second Bancorp, Inc. | | | 2,103 | | | | 23,238 | |
Opus Bank | | | 360 | | | | 10,818 | |
Orrstown Financial Services, Inc. | | | 485 | | | | 10,864 | |
Pacific Continental Corp. | | | 1,971 | | | | 43,066 | |
Pacific Mercantile Bancorp* | | | 1,372 | | | | 10,016 | |
Pacific Premier Bancorp, Inc.* | | | 1,630 | | | | 57,621 | |
Park National Corp. | | | 1,213 | | | | 145,148 | |
Park Sterling Corp. | | | 3,147 | | | | 33,956 | |
Peapack-Gladstone Financial Corp. | | | 1,439 | | | | 44,436 | |
Penns Woods Bancorp, Inc. | | | 402 | | | | 20,301 | |
Peoples Bancorp, Inc. | | | 1,443 | | | | 46,840 | |
Peoples Financial Services Corp. | | | 615 | | | | 29,951 | |
People’s Utah Bancorp | | | 1,152 | | | | 30,931 | |
Pinnacle Financial Partners, Inc. | | | 3,386 | | | | 234,650 | |
Preferred Bank | | | 1,082 | | | | 56,718 | |
Premier Financial Bancorp, Inc. | | | 828 | | | | 16,643 | |
PrivateBancorp, Inc. | | | 7,005 | | | | 379,601 | |
Prosperity Bancshares, Inc. | | | 5,973 | | | | 428,742 | |
QCR Holdings, Inc. | | | 1,072 | | | | 46,418 | |
Renasant Corp. | | | 3,744 | | | | 158,072 | |
Republic Bancorp, Inc., Class A | | | 856 | | | | 33,846 | |
Republic First Bancorp, Inc.* | | | 3,976 | | | | 33,200 | |
S&T Bancorp, Inc. | | | 3,107 | | | | 121,297 | |
Sandy Spring Bancorp, Inc. | | | 2,113 | | | | 84,499 | |
See Notes to Financial Statements.
50
EQ ADVISORS TRUST
AXA/HORIZON SMALL CAP VALUE PORTFOLIO
PORTFOLIO OF INVESTMENTS (Continued)
December 31, 2016
| | | | | | | | |
| | | Number of
Shares | | | Value
(Note 1) | |
| | | | | | | | |
Seacoast Banking Corp. of Florida* | | | 2,689 | | | $ | 59,319 | |
Shore Bancshares, Inc. | | | 1,135 | | | | 17,309 | |
Sierra Bancorp | | | 1,039 | | | | 27,627 | |
Simmons First National Corp., Class A (x) | | | 2,660 | | | | 165,319 | |
South State Corp. | | | 2,082 | | | | 181,967 | |
Southern First Bancshares, Inc.* | | | 512 | | | | 18,432 | |
Southern National Bancorp of Virginia, Inc. | | | 988 | | | | 16,144 | |
Southside Bancshares, Inc. | | | 2,263 | | | | 85,247 | |
Southwest Bancorp, Inc. | | | 1,631 | | | | 47,299 | |
State Bank Financial Corp. | | | 3,146 | | | | 84,502 | |
Sterling Bancorp | | | 11,230 | | | | 262,782 | |
Stock Yards Bancorp, Inc. | | | 1,901 | | | | 89,252 | |
Stonegate Bank | | | 1,161 | | | | 48,449 | |
Suffolk Bancorp | | | 1,030 | | | | 44,105 | |
Summit Financial Group, Inc. (x) | | | 746 | | | | 20,537 | |
Sun Bancorp, Inc. | | | 945 | | | | 24,570 | |
Texas Capital Bancshares, Inc.* | | | 4,059 | | | | 318,226 | |
Tompkins Financial Corp. | | | 1,330 | | | | 125,738 | |
Towne Bank | | | 5,062 | | | | 168,312 | |
TriCo Bancshares | | | 1,820 | | | | 62,208 | |
TriState Capital Holdings, Inc.* | | | 1,996 | | | | 44,112 | |
Triumph Bancorp, Inc.* | | | 1,403 | | | | 36,688 | |
Trustmark Corp. | | | 6,103 | | | | 217,572 | |
UMB Financial Corp. | | | 3,991 | | | | 307,786 | |
Umpqua Holdings Corp. | | | 19,700 | | | | 369,966 | |
Union Bankshares Corp. | | | 3,985 | | | | 142,424 | |
United Bankshares, Inc. (x) | | | 5,828 | | | | 269,545 | |
United Community Banks, Inc. | | | 6,367 | | | | 188,591 | |
Univest Corp. of Pennsylvania | | | 2,218 | | | | 68,536 | |
Valley National Bancorp | | | 22,381 | | | | 260,515 | |
Veritex Holdings, Inc.* | | | 520 | | | | 13,889 | |
Washington Trust Bancorp, Inc. | | | 1,335 | | | | 74,827 | |
WashingtonFirst Bankshares, Inc. | | | 756 | | | | 21,916 | |
Webster Financial Corp. | | | 8,191 | | | | 444,607 | |
WesBanco, Inc. | | | 3,679 | | | | 158,418 | |
West Bancorporation, Inc. | | | 1,417 | | | | 35,000 | |
Westamerica Bancorp (x) | | | 2,260 | | | | 142,222 | |
Wintrust Financial Corp. | | | 4,577 | | | | 332,153 | |
Xenith Bankshares, Inc.* | | | 617 | | | | 17,399 | |
Yadkin Financial Corp. | | | 4,598 | | | | 157,527 | |
| | | | | | | | |
| | | | | | | 18,221,177 | |
| | | | | | | | |
Capital Markets (3.8%) | |
Actua Corp.* | | | 3,239 | | | | 45,346 | |
Arlington Asset Investment Corp., Class A (x) | | | 2,009 | | | | 29,773 | |
Associated Capital Group, Inc., Class A | | | 117,197 | | | | 3,849,920 | |
B. Riley Financial, Inc. | | | 805 | | | | 14,852 | |
BGC Partners, Inc., Class A | | | 200 | | | | 2,046 | |
Calamos Asset Management, Inc., Class A | | | 1,501 | | | | 12,834 | |
Clarke, Inc. | | | 3,700 | | | | 25,794 | |
Cowen Group, Inc., Class A (x)* | | | 2,200 | | | | 34,100 | |
Dundee Corp., Class A* | | | 151,400 | | | | 670,701 | |
FBR & Co. | | | 548 | | | | 7,124 | |
Federated Investors, Inc., Class B | | | 14,600 | | | | 412,887 | |
GAIN Capital Holdings, Inc. | | | 2,798 | | | | 18,411 | |
| | | | | | | | |
GAMCO Investors, Inc., Class A | | | 5,649 | | | $ | 174,498 | |
Greenhill & Co., Inc. | | | 650 | | | | 18,005 | |
INTL FCStone, Inc.* | | | 1,405 | | | | 55,638 | |
Investment Technology Group, Inc. | | | 2,530 | | | | 49,942 | |
Janus Capital Group, Inc. | | | 13,055 | | | | 173,240 | |
KCG Holdings, Inc., Class A* | | | 4,838 | | | | 64,104 | |
Ladenburg Thalmann Financial Services, Inc.* | | | 8,110 | | | | 19,788 | |
Manning & Napier, Inc. | | | 1,352 | | | | 10,208 | |
Medley Management, Inc., Class A (x) | | | 304 | | | | 3,010 | |
OM Asset Management plc | | | 1,163 | | | | 16,864 | |
Oppenheimer Holdings, Inc., Class A | | | 622 | | | | 11,569 | |
Piper Jaffray Cos.* | | | 1,340 | | | | 97,150 | |
PJT Partners, Inc., Class A | | | 1,461 | | | | 45,116 | |
Pzena Investment Management, Inc., Class A | | | 323 | | | | 3,589 | |
Safeguard Scientifics, Inc.* | | | 1,820 | | | | 24,479 | |
Senvest Capital, Inc.* | | | 1,110 | | | | 141,370 | |
Stifel Financial Corp.* | | | 5,693 | | | | 284,365 | |
Virtu Financial, Inc., Class A | | | 159 | | | | 2,536 | |
Virtus Investment Partners, Inc. (x) | | | 412 | | | | 48,637 | |
Waddell & Reed Financial, Inc., Class A | | | 6,502 | | | | 126,854 | |
Walter Investment Management Corp. (x)* | | | 1,658 | | | | 7,876 | |
Wins Finance Holdings, Inc. (x)* | | | 119 | | | | 21,420 | |
| | | | | | | | |
| | | | | | | 6,524,046 | |
| | | | | | | | |
Consumer Finance (0.7%) | |
Emergent Capital, Inc. (x)* | | | 364,700 | | | | 441,286 | |
Encore Capital Group, Inc. (x)* | | | 2,176 | | | | 62,342 | |
Enova International, Inc.* | | | 2,430 | | | | 30,497 | |
EZCORP, Inc., Class A* | | | 4,539 | | | | 48,340 | |
FirstCash, Inc. | | | 1,838 | | | | 86,386 | |
Green Dot Corp., Class A* | | | 3,252 | | | | 76,585 | |
LendingClub Corp.* | | | 16,889 | | | | 88,667 | |
Nelnet, Inc., Class A | | | 1,828 | | | | 92,771 | |
PRA Group, Inc.* | | | 4,166 | | | | 162,891 | |
Regional Management Corp.* | | | 884 | | | | 23,232 | |
World Acceptance Corp. (x)* | | | 552 | | | | 35,483 | |
| | | | | | | | |
| | | | | | | 1,148,480 | |
| | | | | | | | |
Diversified Financial Services (9.8%) | |
FNFV Group* | | | 6,136 | | | | 84,063 | |
Marlin Business Services Corp. | | | 703 | | | | 14,693 | |
NewStar Financial, Inc.* | | | 2,042 | | | | 18,889 | |
On Deck Capital, Inc. (x)* | | | 3,552 | | | | 16,446 | |
Onex Corp. | | | 49,100 | | | | 3,327,517 | |
PICO Holdings, Inc.* | | | 1,474 | | | | 22,331 | |
Texas Pacific Land Trust | | | 45,500 | | | | 13,503,034 | |
Tiptree Financial, Inc. | | | 2,390 | | | | 14,699 | |
| | | | | | | | |
| | | | | | | 17,001,672 | |
| | | | | | | | |
Insurance (2.8%) | |
Ambac Financial Group, Inc.* | | | 3,840 | | | | 86,400 | |
American Equity Investment Life Holding Co. | | | 7,484 | | | | 168,689 | |
See Notes to Financial Statements.
51
EQ ADVISORS TRUST
AXA/HORIZON SMALL CAP VALUE PORTFOLIO
PORTFOLIO OF INVESTMENTS (Continued)
December 31, 2016
| | | | | | | | |
| | | Number of
Shares | | | Value
(Note 1) | |
| | | | | | | | |
AMERISAFE, Inc. | | | 468 | | | $ | 29,180 | |
AmTrust Financial Services, Inc. | | | 17,100 | | | | 468,198 | |
Argo Group International Holdings Ltd. | | | 2,533 | | | | 166,925 | |
Atlas Financial Holdings, Inc.* | | | 519 | | | | 9,368 | |
Baldwin & Lyons, Inc., Class B | | | 840 | | | | 21,168 | |
Blue Capital Reinsurance Holdings Ltd. | | | 551 | | | | 10,166 | |
Citizens, Inc.* | | | 4,304 | | | | 42,265 | |
CNO Financial Group, Inc. | | | 16,155 | | | | 309,368 | |
Donegal Group, Inc., Class A | | | 793 | | | | 13,862 | |
EMC Insurance Group, Inc. | | | 772 | | | | 23,168 | |
Employers Holdings, Inc. | | | 2,821 | | | | 111,712 | |
Enstar Group Ltd.* | | | 1,030 | | | | 203,631 | |
FBL Financial Group, Inc., Class A | | | 912 | | | | 71,273 | |
Federated National Holding Co. | | | 1,160 | | | | 21,680 | |
Fidelity & Guaranty Life (x) | | | 1,143 | | | | 27,089 | |
Genworth Financial, Inc., Class A* | | | 42,109 | | | | 160,435 | |
Global Indemnity Ltd.* | | | 790 | | | | 30,186 | |
Greenlight Capital Reinsurance Ltd., Class A* | | | 51,774 | | | | 1,180,446 | |
Hallmark Financial Services, Inc.* | | | 1,315 | | | | 15,293 | |
HCI Group, Inc. (x) | | | 826 | | | | 32,610 | |
Heritage Insurance Holdings, Inc. | | | 2,467 | | | | 38,658 | |
Horace Mann Educators Corp. | | | 3,553 | | | | 152,068 | |
Independence Holding Co. | | | 784 | | | | 15,327 | |
Infinity Property & Casualty Corp. | | | 1,011 | | | | 88,867 | |
Investors Title Co. | | | 136 | | | | 21,512 | |
James River Group Holdings Ltd. | | | 1,349 | | | | 56,051 | |
Kemper Corp. | | | 3,479 | | | | 154,120 | |
Kinsale Capital Group, Inc. | | | 611 | | | | 20,780 | |
Maiden Holdings Ltd. | | | 4,970 | | | | 86,727 | |
MBIA, Inc.* | | | 11,865 | | | | 126,956 | |
National General Holdings Corp. | | | 1,937 | | | | 48,406 | |
National Western Life Group, Inc., Class A | | | 211 | | | | 65,579 | |
Navigators Group, Inc. (The) | | | 1,042 | | | | 122,696 | |
OneBeacon Insurance Group Ltd., Class A | | | 1,860 | | | | 29,853 | |
RLI Corp. | | | 642 | | | | 40,529 | |
Safety Insurance Group, Inc. | | | 1,300 | | | | 95,810 | |
Selective Insurance Group, Inc. | | | 5,126 | | | | 220,674 | |
State Auto Financial Corp. | | | 1,413 | | | | 37,883 | |
State National Cos., Inc. | | | 2,578 | | | | 35,731 | |
Stewart Information Services Corp. | | | 2,073 | | | | 95,524 | |
Third Point Reinsurance Ltd.* | | | 5,763 | | | | 66,563 | |
United Fire Group, Inc. | | | 1,957 | | | | 96,226 | |
United Insurance Holdings Corp. | | | 416 | | | | 6,298 | |
Universal Insurance Holdings, Inc. (x) | | | 820 | | | | 23,288 | |
| | | | | | | | |
| | | | | | | 4,949,238 | |
| | | | | | | | |
Mortgage Real Estate Investment Trusts (REITs) (1.1%) | |
AG Mortgage Investment Trust, Inc. (REIT) | | | 2,514 | | | | 43,015 | |
Altisource Residential Corp. (REIT) | | | 4,733 | | | | 52,252 | |
| | | | | | | | |
Anworth Mortgage Asset Corp. (REIT) | | | 8,572 | | | $ | 44,317 | |
Apollo Commercial Real Estate Finance, Inc. (REIT) | | | 6,486 | | | | 107,797 | |
Ares Commercial Real Estate Corp. (REIT) | | | 2,455 | | | | 33,707 | |
ARMOUR Residential REIT, Inc. (REIT) | | | 3,294 | | | | 71,452 | |
Capstead Mortgage Corp. (REIT) | | | 8,647 | | | | 88,113 | |
Colony Capital, Inc. (REIT), Class A (x) | | | 9,956 | | | | 201,610 | |
CYS Investments, Inc. (REIT) | | | 13,856 | | | | 107,107 | |
Dynex Capital, Inc. (REIT) | | | 3,978 | | | | 27,130 | |
Great Ajax Corp. (REIT) | | | 1,337 | | | | 17,742 | |
Hannon Armstrong Sustainable Infrastructure Capital, Inc. (REIT) | | | 3,783 | | | | 71,839 | |
Invesco Mortgage Capital, Inc. (REIT) | | | 10,254 | | | | 149,709 | |
Ladder Capital Corp. (REIT) | | | 3,446 | | | | 47,279 | |
MTGE Investment Corp. (REIT) | | | 4,192 | | | | 65,814 | |
New Residential Investment Corp. (REIT) | | | 21,668 | | | | 340,622 | |
New York Mortgage Trust, Inc. (REIT) (x) | | | 10,000 | | | | 66,000 | |
Orchid Island Capital, Inc. (REIT) (x) | | | 1,374 | | | | 14,880 | |
Owens Realty Mortgage, Inc. (REIT) (x) | | | 697 | | | | 12,908 | |
PennyMac Mortgage Investment Trust (REIT)‡ | | | 6,121 | | | | 100,201 | |
Redwood Trust, Inc. (REIT) | | | 7,021 | | | | 106,789 | |
Resource Capital Corp. (REIT) (x) | | | 2,751 | | | | 22,916 | |
Western Asset Mortgage Capital Corp. (REIT) | | | 3,760 | | | | 37,863 | |
| | | | | | | | |
| | | | | | | 1,831,062 | |
| | | | | | | | |
Thrifts & Mortgage Finance (2.1%) | |
Astoria Financial Corp. | | | 8,360 | | | | 155,914 | |
Bank Mutual Corp. | | | 3,676 | | | | 34,738 | |
BankFinancial Corp. | | | 1,383 | | | | 20,496 | |
Bear State Financial, Inc. (x) | | | 1,665 | | | | 16,900 | |
Beneficial Bancorp, Inc. | | | 6,491 | | | | 119,434 | |
BofI Holding, Inc. (x)* | | | 357 | | | | 10,192 | |
Capitol Federal Financial, Inc. | | | 11,624 | | | | 191,331 | |
Charter Financial Corp. | | | 1,235 | | | | 20,587 | |
Clifton Bancorp, Inc. | | | 1,966 | | | | 33,265 | |
Dime Community Bancshares, Inc. | | | 2,845 | | | | 57,185 | |
ESSA Bancorp, Inc. | | | 737 | | | | 11,586 | |
EverBank Financial Corp. | | | 9,454 | | | | 183,880 | |
Federal Agricultural Mortgage Corp., Class C | | | 780 | | | | 44,671 | |
First Defiance Financial Corp. | | | 790 | | | | 40,085 | |
Flagstar Bancorp, Inc.* | | | 1,960 | | | | 52,802 | |
Greene County Bancorp, Inc. (x) | | | 202 | | | | 4,626 | |
Hingham Institution for Savings | | | 65 | | | | 12,791 | |
Home Bancorp, Inc. | | | 442 | | | | 17,066 | |
HomeStreet, Inc.* | | | 2,137 | | | | 67,529 | |
See Notes to Financial Statements.
52
EQ ADVISORS TRUST
AXA/HORIZON SMALL CAP VALUE PORTFOLIO
PORTFOLIO OF INVESTMENTS (Continued)
December 31, 2016
| | | | | | | | |
| | | Number of
Shares | | | Value
(Note 1) | |
| | | | | | | | |
Impac Mortgage Holdings, Inc. (x)* | | | 965 | | | $ | 13,529 | |
Kearny Financial Corp. | | | 8,025 | | | | 124,789 | |
Lake Sunapee Bank Group | | | 708 | | | | 16,702 | |
Meridian Bancorp, Inc. | | | 3,676 | | | | 69,476 | |
Meta Financial Group, Inc. | | | 742 | | | | 76,352 | |
MGIC Investment Corp.* | | | 30,340 | | | | 309,164 | |
Nationstar Mortgage Holdings, Inc. (x)* | | | 1,614 | | | | 29,149 | |
NMI Holdings, Inc., Class A* | | | 4,537 | | | | 48,319 | |
Northfield Bancorp, Inc. | | | 3,417 | | | | 68,237 | |
Northwest Bancshares, Inc. | | | 8,787 | | | | 158,430 | |
OceanFirst Financial Corp. | | | 2,046 | | | | 61,441 | |
Ocwen Financial Corp.* | | | 9,184 | | | | 49,502 | |
Oritani Financial Corp. | | | 3,239 | | | | 60,731 | |
PennyMac Financial Services, Inc., Class A*‡ | | | 468 | | | | 7,792 | |
PHH Corp.* | | | 4,519 | | | | 68,508 | |
Provident Bancorp, Inc.* | | | 361 | | | | 6,462 | |
Provident Financial Holdings, Inc. | | | 586 | | | | 11,849 | |
Provident Financial Services, Inc. | | | 5,550 | | | | 157,065 | |
Radian Group, Inc. | | | 19,158 | | | | 344,460 | |
SI Financial Group, Inc. | | | 995 | | | | 15,323 | |
Southern Missouri Bancorp, Inc. (x) | | | 515 | | | | 18,221 | |
Territorial Bancorp, Inc. | | | 673 | | | | 22,101 | |
TrustCo Bank Corp. | | | 8,214 | | | | 71,873 | |
United Community Financial Corp. | | | 4,187 | | | | 37,432 | |
United Financial Bancorp, Inc. | | | 4,547 | | | | 82,574 | |
Walker & Dunlop, Inc.* | | | 2,564 | | | | 79,997 | |
Washington Federal, Inc. | | | 8,235 | | | | 282,872 | |
Waterstone Financial, Inc. | | | 2,277 | | | | 41,897 | |
Western New England Bancorp, Inc. | | | 1,297 | | | | 12,127 | |
WSFS Financial Corp. | | | 2,637 | | | | 122,225 | |
| | | | | | | | |
| | | | | | | 3,563,677 | |
| | | | | | | | |
Total Financials | | | | | | | 53,239,352 | |
| | | | | | | | |
Health Care (2.2%) | |
Biotechnology (0.8%) | |
Acorda Therapeutics, Inc.* | | | 3,461 | | | | 65,067 | |
Adamas Pharmaceuticals, Inc. (x)* | | | 782 | | | | 13,216 | |
Adverum Biotechnologies, Inc. (x)* | | | 2,147 | | | | 6,226 | |
Agenus, Inc. (x)* | | | 1,118 | | | | 4,606 | |
Akebia Therapeutics, Inc.* | | | 2,230 | | | | 23,214 | |
AMAG Pharmaceuticals, Inc. (x)* | | | 2,194 | | | | 76,351 | |
Ardelyx, Inc.* | | | 2,489 | | | | 35,344 | |
ARIAD Pharmaceuticals, Inc. (x)* | | | 1,007 | | | | 12,527 | |
Array BioPharma, Inc. (x)* | | | 13,781 | | | | 121,135 | |
Arrowhead Pharmaceuticals, Inc. (x)* | | | 368 | | | | 570 | |
Atara Biotherapeutics, Inc. (x)* | | | 1,964 | | | | 27,889 | |
Bellicum Pharmaceuticals, Inc. (x)* | | | 641 | | | | 8,730 | |
BioCryst Pharmaceuticals, Inc. (x)* | | | 1,048 | | | | 6,634 | |
| | | | | | | | |
Bluebird Bio, Inc.* | | | 2,265 | | | $ | 139,750 | |
Cara Therapeutics, Inc. (x)* | | | 1,667 | | | | 15,486 | |
Celldex Therapeutics, Inc. (x)* | | | 8,632 | | | | 30,557 | |
Cellular Biomedicine Group, Inc.* | | | 330 | | | | 4,323 | |
Chimerix, Inc.* | | | 3,806 | | | | 17,508 | |
Cidara Therapeutics, Inc.* | | | 889 | | | | 9,246 | |
Concert Pharmaceuticals, Inc.* | | | 878 | | | | 9,035 | |
Corvus Pharmaceuticals, Inc.* | | | 243 | | | | 3,475 | |
CytRx Corp. (x)* | | | 680 | | | | 253 | |
Dimension Therapeutics, Inc.* | | | 664 | | | | 2,888 | |
Edge Therapeutics, Inc.* | | | 896 | | | | 11,200 | |
Enanta Pharmaceuticals, Inc.* | | | 1,410 | | | | 47,235 | |
Epizyme, Inc. (x)* | | | 1,059 | | | | 12,814 | |
Esperion Therapeutics, Inc. (x)* | | | 1,339 | | | | 16,764 | |
Exelixis, Inc.* | | | 7,879 | | | | 117,476 | |
Five Prime Therapeutics, Inc.* | | | 1,912 | | | | 95,810 | |
Idera Pharmaceuticals, Inc. (x)* | | | 614 | | | | 921 | |
Ignyta, Inc. (x)* | | | 947 | | | | 5,019 | |
Immunomedics, Inc. (x)* | | | 686 | | | | 2,518 | |
Inotek Pharmaceuticals Corp. (x)* | | | 100 | | | | 610 | |
Karyopharm Therapeutics, Inc.* | | | 1,699 | | | | 15,971 | |
Merrimack Pharmaceuticals, Inc. (x)* | | | 4,174 | | | | 17,030 | |
Momenta Pharmaceuticals, Inc.* | | | 4,658 | | | | 70,103 | |
NantKwest, Inc. (x)* | | | 1,329 | | | | 7,602 | |
NewLink Genetics Corp.* | | | 481 | | | | 4,945 | |
Osiris Therapeutics, Inc. (x)* | | | 148 | | | | 727 | |
Otonomy, Inc.* | | | 2,067 | | | | 32,865 | |
OvaScience, Inc. (x)* | | | 2,308 | | | | 3,531 | |
PDL BioPharma, Inc. | | | 13,728 | | | | 29,103 | |
Pfenex, Inc.* | | | 96 | | | | 871 | |
Portola Pharmaceuticals, Inc. (x)* | | | 378 | | | | 8,482 | |
Protagonist Therapeutics, Inc. (x)* | | | 90 | | | | 1,979 | |
PTC Therapeutics, Inc. (x)* | | | 3,011 | | | | 32,850 | |
REGENXBIO, Inc. (x)* | | | 1,929 | | | | 35,783 | |
Retrophin, Inc.* | | | 3,363 | | | | 63,662 | |
Rigel Pharmaceuticals, Inc.* | | | 1,751 | | | | 4,167 | |
Selecta Biosciences, Inc.* | | | 80 | | | | 1,372 | |
Spectrum Pharmaceuticals, Inc.* | | | 5,348 | | | | 23,692 | |
Stemline Therapeutics, Inc.* | | | 1,218 | | | | 13,033 | |
Syndax Pharmaceuticals, Inc.* | | | 203 | | | | 1,456 | |
Trovagene, Inc.* | | | 191 | | | | 401 | |
Versartis, Inc.* | | | 2,447 | | | | 36,460 | |
Voyager Therapeutics, Inc.* | | | 577 | | | | 7,351 | |
Zafgen, Inc.* | | | 2,116 | | | | 6,729 | |
| | | | | | | | |
| | | | | | | 1,364,562 | |
| | | | | | | | |
Health Care Equipment & Supplies (0.7%) | |
Analogic Corp. | | | 1,037 | | | | 86,019 | |
AngioDynamics, Inc.* | | | 2,435 | | | | 41,078 | |
Anika Therapeutics, Inc.* | | | 241 | | | | 11,799 | |
AtriCure, Inc.* | | | 602 | | | | 11,781 | |
Cerus Corp. (x)* | | | 1,233 | | | | 5,364 | |
CONMED Corp. | | | 2,530 | | | | 111,750 | |
CryoLife, Inc.* | | | 938 | | | | 17,963 | |
Exactech, Inc.* | | | 929 | | | | 25,362 | |
Haemonetics Corp.* | | | 4,678 | | | | 188,055 | |
Halyard Health, Inc.* | | | 4,290 | | | | 158,643 | |
ICU Medical, Inc.* | | | 416 | | | | 61,298 | |
See Notes to Financial Statements.
53
EQ ADVISORS TRUST
AXA/HORIZON SMALL CAP VALUE PORTFOLIO
PORTFOLIO OF INVESTMENTS (Continued)
December 31, 2016
| | | | | | | | |
| | | Number of
Shares | | | Value
(Note 1) | |
| | | | | | | | |
Integer Holdings Corp.* | | | 2,773 | | | $ | 81,665 | |
Invacare Corp. | | | 2,872 | | | | 37,480 | |
K2M Group Holdings, Inc.* | | | 1,591 | | | | 31,884 | |
Meridian Bioscience, Inc. | | | 498 | | | | 8,815 | |
Merit Medical Systems, Inc.* | | | 2,447 | | | | 64,846 | |
Quidel Corp.* | | | 127 | | | | 2,720 | |
Rockwell Medical, Inc.* | | | 367 | | | | 2,404 | |
RTI Surgical, Inc.* | | | 5,330 | | | | 17,323 | |
TransEnterix, Inc. (x)* | | | 5,705 | | | | 7,417 | |
Wright Medical Group NV* | | | 9,137 | | | | 209,967 | |
| | | | | | | | |
| | | | | | | 1,183,633 | |
| | | | | | | | |
Health Care Providers & Services (0.6%) | |
Aceto Corp. (x) | | | 264 | | | | 5,800 | |
Addus HomeCare Corp.* | | | 604 | | | | 21,170 | |
Almost Family, Inc.* | | | 547 | | | | 24,123 | |
American Renal Associates Holdings, Inc. (x)* | | | 108 | | | | 2,298 | |
BioScrip, Inc. (x)* | | | 8,963 | | | | 9,322 | |
Community Health Systems, Inc.* | | | 9,863 | | | | 55,134 | |
Genesis Healthcare, Inc.* | | | 1,587 | | | | 6,745 | |
Healthways, Inc.* | | | 2,926 | | | | 66,567 | |
Kindred Healthcare, Inc. | | | 7,544 | | | | 59,220 | |
LHC Group, Inc.* | | | 1,254 | | | | 57,308 | |
Magellan Health, Inc.* | | | 629 | | | | 47,332 | |
Molina Healthcare, Inc.* | | | 1,340 | | | | 72,708 | |
National HealthCare Corp. | | | 996 | | | | 75,487 | |
National Research Corp., Class A | | | 159 | | | | 3,021 | |
Nobilis Health Corp. (x)* | | | 4,608 | | | | 9,677 | |
Owens & Minor, Inc. | | | 4,853 | | | | 171,263 | |
PharMerica Corp.* | | | 2,726 | | | | 68,559 | |
Select Medical Holdings Corp.* | | | 8,901 | | | | 117,938 | |
Surgery Partners, Inc.* | | | 692 | | | | 10,968 | |
Triple-S Management Corp., Class B* | | | 2,182 | | | | 45,167 | |
Universal American Corp.* | | | 3,817 | | | | 37,979 | |
| | | | | | | | |
| | | | | | | 967,786 | |
| | | | | | | | |
Health Care Technology (0.0%) | |
Cotiviti Holdings, Inc. (x)* | | | 307 | | | | 10,561 | |
Evolent Health, Inc., Class A (x)* | | | 1,456 | | | | 21,548 | |
Vocera Communications, Inc.* | | | 663 | | | | 12,259 | |
| | | | | | | | |
| | | | | | | 44,368 | |
| | | | | | | | |
Life Sciences Tools & Services (0.0%) | |
Accelerate Diagnostics, Inc. (x)* | | | 126 | | | | 2,615 | |
Albany Molecular Research, Inc.* | | | 1,270 | | | | 23,825 | |
Enzo Biochem, Inc.* | | | 136 | | | | 944 | |
Luminex Corp.* | | | 2,072 | | | | 41,916 | |
Medpace Holdings, Inc.* | | | 212 | | | | 7,647 | |
| | | | | | | | |
| | | | | | | 76,947 | |
| | | | | | | | |
Pharmaceuticals (0.1%) | |
Aratana Therapeutics, Inc.* | | | 237 | | | | 1,702 | |
Egalet Corp. (x)* | | | 1,491 | | | | 11,406 | |
Endocyte, Inc.* | | | 3,217 | | | | 8,203 | |
Flex Pharma, Inc. (x)* | | | 136 | | | | 718 | |
Innoviva, Inc. (x)* | | | 798 | | | | 8,539 | |
Lannett Co., Inc. (x)* | | | 2,575 | | | | 56,780 | |
Medicines Co. (The) (x)* | | | 522 | | | | 17,717 | |
Novan, Inc.* | | | 67 | | | | 1,810 | |
Omeros Corp. (x)* | | | 1,228 | | | | 12,182 | |
| | | | | | | | |
Phibro Animal Health Corp., Class A | | | 121 | | | $ | 3,545 | |
Tetraphase Pharmaceuticals, Inc.* | | | 3,380 | | | | 13,621 | |
TherapeuticsMD, Inc. (x)* | | | 856 | | | | 4,939 | |
WaVe Life Sciences Ltd. (x)* | | | 122 | | | | 3,190 | |
Zogenix, Inc. (x)* | | | 2,269 | | | | 27,568 | |
| | | | | | | | |
| | | | | | | 171,920 | |
| | | | | | | | |
Total Health Care | | | | | | | 3,809,216 | |
| | | | | | | | |
Industrials (7.5%) | |
Aerospace & Defense (1.1%) | |
AAR Corp. | | | 2,980 | | | | 98,489 | |
Aerojet Rocketdyne Holdings, Inc.* | | | 2,625 | | | | 47,119 | |
Aerovironment, Inc. (x)* | | | 1,535 | | | | 41,184 | |
Cubic Corp. | | | 2,293 | | | | 109,949 | |
Curtiss-Wright Corp. | | | 1,090 | | | | 107,212 | |
DigitalGlobe, Inc.* | | | 5,713 | | | | 163,677 | |
Ducommun, Inc.* | | | 949 | | | | 24,256 | |
Engility Holdings, Inc.* | | | 1,616 | | | | 54,459 | |
Esterline Technologies Corp.* | | | 2,666 | | | | 237,808 | |
KEYW Holding Corp. (The) (x)* | | | 3,218 | | | | 37,940 | |
KLX, Inc.* | | | 4,780 | | | | 215,626 | |
Kratos Defense & Security Solutions, Inc. (x)* | | | 4,707 | | | | 34,832 | |
Mercury Systems, Inc.* | | | 3,310 | | | | 100,028 | |
Moog, Inc., Class A* | | | 2,610 | | | | 171,425 | |
National Presto Industries, Inc. | | | 385 | | | | 40,964 | |
Sparton Corp.* | | | 784 | | | | 18,698 | |
Teledyne Technologies, Inc.* | | | 2,182 | | | | 268,387 | |
Triumph Group, Inc. | | | 4,433 | | | | 117,475 | |
Vectrus, Inc.* | | | 804 | | | | 19,175 | |
| | | | | | | | |
| | | | | | | 1,908,703 | |
| | | | | | | | |
Air Freight & Logistics (0.4%) | |
Air Transport Services Group, Inc.* | | | 3,826 | | | | 61,063 | |
Atlas Air Worldwide Holdings, Inc.* | | | 2,247 | | | | 117,181 | |
Echo Global Logistics, Inc.* | | | 371 | | | | 9,294 | |
Hub Group, Inc., Class A* | | | 207 | | | | 9,056 | |
Park-Ohio Holdings Corp. | | | 772 | | | | 32,887 | |
Radiant Logistics, Inc.* | | | 1,285 | | | | 5,012 | |
XPO Logistics, Inc.* | | | 8,724 | | | | 376,527 | |
| | | | | | | | |
| | | | | | | 611,020 | |
| | | | | | | | |
Airlines (0.1%) | |
SkyWest, Inc. | | | 4,483 | | | | 163,405 | |
| | | | | | | | |
Building Products (0.1%) | |
Armstrong Flooring, Inc.* | | | 1,978 | | | | 39,382 | |
CSW Industrials, Inc.* | | | 1,299 | | | | 47,868 | |
Gibraltar Industries, Inc.* | | | 998 | | | | 41,567 | |
Griffon Corp. | | | 441 | | | | 11,554 | |
Quanex Building Products Corp. | | | 2,805 | | | | 56,941 | |
Universal Forest Products, Inc. | | | 225 | | | | 22,991 | |
| | | | | | | | |
| | | | | | | 220,303 | |
| | | | | | | | |
Commercial Services & Supplies (0.8%) | |
ABM Industries, Inc., Class A | | | 4,935 | | | | 201,544 | |
ACCO Brands Corp.* | | | 9,618 | | | | 125,515 | |
See Notes to Financial Statements.
54
EQ ADVISORS TRUST
AXA/HORIZON SMALL CAP VALUE PORTFOLIO
PORTFOLIO OF INVESTMENTS (Continued)
December 31, 2016
| | | | | | | | |
| | | Number of
Shares | | | Value
(Note 1) | |
| | | | | | | | |
Advanced Disposal Services, Inc.* | | | 324 | | | $ | 7,199 | |
ARC Document Solutions, Inc.* | | | 3,956 | | | | 20,096 | |
Brady Corp., Class A | | | 978 | | | | 36,724 | |
Casella Waste Systems, Inc., Class A* | | | 3,492 | | | | 43,336 | |
CECO Environmental Corp. | | | 2,632 | | | | 36,716 | |
CompX International, Inc. | | | 134 | | | | 2,157 | |
Ennis, Inc. | | | 2,280 | | | | 39,558 | |
Essendant, Inc. | | | 3,322 | | | | 69,430 | |
G&K Services, Inc., Class A | | | 435 | | | | 41,956 | |
Heritage-Crystal Clean, Inc.* | | | 521 | | | | 8,180 | |
InnerWorkings, Inc.* | | | 246 | | | | 2,423 | |
Interface, Inc. | | | 674 | | | | 12,503 | |
Kimball International, Inc., Class B | | | 511 | | | | 8,973 | |
McGrath RentCorp | | | 2,104 | | | | 82,456 | |
Mobile Mini, Inc. | | | 1,040 | | | | 31,460 | |
MSA Safety, Inc. | | | 909 | | | | 63,021 | |
NL Industries, Inc.* | | | 728 | | | | 5,933 | |
Quad/Graphics, Inc. | | | 1,221 | | | | 32,820 | |
SP Plus Corp.* | | | 83 | | | | 2,336 | |
Team, Inc.* | | | 191 | | | | 7,497 | |
Tetra Tech, Inc. | | | 4,392 | | | | 189,515 | |
TRC Cos., Inc.* | | | 1,636 | | | | 17,342 | |
UniFirst Corp. | | | 1,247 | | | | 179,132 | |
Viad Corp. | | | 808 | | | | 35,633 | |
VSE Corp. | | | 803 | | | | 31,189 | |
West Corp. | | | 3,472 | | | | 85,967 | |
| | | | | | | | |
| | | | | | | 1,420,611 | |
| | | | | | | | |
Construction & Engineering (0.4%) | |
Aegion Corp.* | | | 3,146 | | | | 74,560 | |
Ameresco, Inc., Class A* | | | 1,933 | | | | 10,632 | |
EMCOR Group, Inc. | | | 4,492 | | | | 317,854 | |
Granite Construction, Inc. | | | 890 | | | | 48,950 | |
Great Lakes Dredge & Dock Corp.* | | | 4,864 | | | | 20,429 | |
HC2 Holdings, Inc.* | | | 2,952 | | | | 17,505 | |
Layne Christensen Co.* | | | 1,651 | | | | 17,946 | |
MYR Group, Inc.* | | | 1,401 | | | | 52,790 | |
NV5 Global, Inc.* | | | 169 | | | | 5,645 | |
Orion Group Holdings, Inc.* | | | 1,733 | | | | 17,243 | |
Tutor Perini Corp.* | | | 2,875 | | | | 80,500 | |
| | | | | | | | |
| | | | | | | 664,054 | |
| | | | | | | | |
Electrical Equipment (0.3%) | |
American Superconductor Corp.* | | | 1,069 | | | | 7,879 | |
Atkore International Group, Inc.* | | | 446 | | | | 10,664 | |
Babcock & Wilcox Enterprises, Inc.* | | | 4,136 | | | | 68,616 | |
Encore Wire Corp. | | | 1,872 | | | | 81,151 | |
EnerSys | | | 2,763 | | | | 215,789 | |
FuelCell Energy, Inc. (x)* | | | 2,542 | | | | 4,449 | |
General Cable Corp. | | | 320 | | | | 6,096 | |
LSI Industries, Inc. | | | 1,790 | | | | 17,435 | |
Plug Power, Inc. (x)* | | | 5,716 | | | | 6,859 | |
Powell Industries, Inc. | | | 775 | | | | 30,225 | |
Power Solutions International, Inc. (x)* | | | 115 | | | | 863 | |
Preformed Line Products Co. | | | 224 | | | | 13,019 | |
Sunrun, Inc. (x)* | | | 5,736 | | | | 30,458 | |
Thermon Group Holdings, Inc.* | | | 2,889 | | | | 55,151 | |
| | | | | | | | |
TPI Composites, Inc.* | | | 505 | | | $ | 8,100 | |
Vicor Corp.* | | | 117 | | | | 1,767 | |
| | | | | | | | |
| | | | | | | 558,521 | |
| | | | | | | | |
Industrial Conglomerates (0.0%) | | | | | | | | |
Raven Industries, Inc. | | | 1,218 | | | | 30,694 | |
| | | | | | | | |
Machinery (2.0%) | | | | | | | | |
Actuant Corp., Class A | | | 2,763 | | | | 71,700 | |
Alamo Group, Inc. | | | 657 | | | | 49,998 | |
Albany International Corp., Class A | | | 2,219 | | | | 102,740 | |
Altra Industrial Motion Corp. | | | 382 | | | | 14,096 | |
American Railcar Industries, Inc. (x) | | | 688 | | | | 31,160 | |
Astec Industries, Inc. | | | 942 | | | | 63,547 | |
Barnes Group, Inc. | | | 4,521 | | | | 214,385 | |
Blue Bird Corp.* | | | 451 | | | | 6,968 | |
Briggs & Stratton Corp. | | | 3,910 | | | | 87,037 | |
Chart Industries, Inc.* | | | 2,763 | | | | 99,523 | |
CIRCOR International, Inc. | | | 1,516 | | | | 98,358 | |
Colfax Corp.* | | | 12,000 | | | | 431,159 | |
Columbus McKinnon Corp. | | | 1,764 | | | | 47,699 | |
DMC Global, Inc. | | | 1,236 | | | | 19,591 | |
Douglas Dynamics, Inc. | | | 284 | | | | 9,557 | |
ESCO Technologies, Inc. | | | 2,327 | | | | 131,824 | |
ExOne Co. (The) (x)* | | | 841 | | | | 7,855 | |
Federal Signal Corp. | | | 5,389 | | | | 84,122 | |
Franklin Electric Co., Inc. | | | 258 | | | | 10,036 | |
FreightCar America, Inc. | | | 1,085 | | | | 16,199 | |
Gencor Industries, Inc.* | | | 673 | | | | 10,566 | |
Global Brass & Copper Holdings, Inc. | | | 151 | | | | 5,179 | |
Gorman-Rupp Co. (The) | | | 215 | | | | 6,654 | |
Graham Corp. | | | 857 | | | | 18,983 | |
Greenbrier Cos., Inc. (The) (x) | | | 2,494 | | | | 103,626 | |
Hardinge, Inc. | | | 1,065 | | | | 11,800 | |
Harsco Corp. | | | 7,274 | | | | 98,926 | |
Hurco Cos., Inc. | | | 573 | | | | 18,966 | |
Hyster-Yale Materials Handling, Inc. | | | 585 | | | | 37,305 | |
Joy Global, Inc. | | | 8,763 | | | | 245,363 | |
Kadant, Inc. | | | 792 | | | | 48,470 | |
Kennametal, Inc. | | | 7,106 | | | | 222,133 | |
Lindsay Corp. | | | 121 | | | | 9,028 | |
Manitowoc Co., Inc. (The)* | | | 11,453 | | | | 68,489 | |
Meritor, Inc.* | | | 7,425 | | | | 92,219 | |
Milacron Holdings Corp.* | | | 206 | | | | 3,838 | |
Miller Industries, Inc. | | | 882 | | | | 23,329 | |
Mueller Industries, Inc. | | | 1,435 | | | | 57,343 | |
Navistar International Corp.* | | | 4,179 | | | | 131,094 | |
NN, Inc. | | | 2,373 | | | | 45,206 | |
Rexnord Corp.* | | | 1,749 | | | | 34,263 | |
SPX Corp.* | | | 3,647 | | | | 86,507 | |
SPX FLOW, Inc.* | | | 3,239 | | | | 103,842 | |
Standex International Corp. | | | 262 | | | | 23,017 | |
Sun Hydraulics Corp. | | | 215 | | | | 8,594 | |
Supreme Industries, Inc., Class A | | | 475 | | | | 7,458 | |
Tennant Co. | | | 88 | | | | 6,266 | |
Titan International, Inc. (x) | | | 4,017 | | | | 45,031 | |
TriMas Corp.* | | | 4,072 | | | | 95,692 | |
Wabash National Corp. | | | 4,280 | | | | 67,710 | |
See Notes to Financial Statements.
55
EQ ADVISORS TRUST
AXA/HORIZON SMALL CAP VALUE PORTFOLIO
PORTFOLIO OF INVESTMENTS (Continued)
December 31, 2016
| | | | | | | | |
| | | Number of
Shares | | | Value
(Note 1) | |
| | | | | | | | |
Watts Water Technologies, Inc., Class A | | | 177 | | | $ | 11,540 | |
| | | | | | | | |
| | | | | | | 3,345,991 | |
| | | | | | | | |
Marine (0.8%) | | | | | | | | |
Clarkson plc | | | 18,000 | | | | 482,041 | |
Costamare, Inc. | | | 2,358 | | | | 13,205 | |
Matson, Inc. | | | 2,182 | | | | 77,221 | |
Scorpio Bulkers, Inc.* | | | 5,149 | | | | 26,002 | |
Stolt-Nielsen Ltd. | | | 62,600 | | | | 768,423 | |
| | | | | | | | |
| | | | | | | 1,366,892 | |
| | | | | | | | |
Professional Services (0.5%) | | | | | | | | |
Acacia Research Corp. | | | 4,549 | | | | 29,569 | |
CBIZ, Inc.* | | | 4,569 | | | | 62,595 | |
Cogint, Inc. (x)* | | | 1,457 | | | | 5,027 | |
CRA International, Inc. | | | 810 | | | | 29,646 | |
Franklin Covey Co.* | | | 211 | | | | 4,252 | |
FTI Consulting, Inc.* | | | 3,496 | | | | 157,599 | |
Heidrick & Struggles International, Inc. | | | 1,651 | | | | 39,872 | |
Hill International, Inc.* | | | 1,961 | | | | 8,530 | |
Huron Consulting Group, Inc.* | | | 1,752 | | | | 88,739 | |
ICF International, Inc.* | | | 1,699 | | | | 93,785 | |
Kelly Services, Inc., Class A | | | 2,629 | | | | 60,257 | |
Korn/Ferry International | | | 2,127 | | | | 62,598 | |
Navigant Consulting, Inc.* | | | 4,129 | | | | 108,096 | |
Resources Connection, Inc. | | | 2,851 | | | | 54,882 | |
RPX Corp.* | | | 4,588 | | | | 49,550 | |
TrueBlue, Inc.* | | | 3,569 | | | | 87,976 | |
| | | | | | | | |
| | | | | | | 942,973 | |
| | | | | | | | |
Road & Rail (0.3%) | | | | | | | | |
ArcBest Corp. | | | 2,218 | | | | 61,328 | |
Celadon Group, Inc. | | | 2,580 | | | | 18,447 | |
Covenant Transportation Group, Inc., Class A* | | | 1,059 | | | | 20,481 | |
Knight Transportation, Inc. | | | 419 | | | | 13,848 | |
Marten Transport Ltd. | | | 2,039 | | | | 47,509 | |
P.A.M. Transportation Services, Inc.* | | | 20 | | | | 520 | |
Roadrunner Transportation Systems, Inc.* | | | 2,871 | | | | 29,830 | |
Saia, Inc.* | | | 2,262 | | | | 99,867 | |
Universal Logistics Holdings, Inc. | | | 212 | | | | 3,466 | |
USA Truck, Inc.* | | | 818 | | | | 7,125 | |
Werner Enterprises, Inc. | | | 4,057 | | | | 109,335 | |
YRC Worldwide, Inc.* | | | 2,317 | | | | 30,770 | |
| | | | | | | | |
| | | | | | | 442,526 | |
| | | | | | | | |
Trading Companies & Distributors (0.7%) | |
Aircastle Ltd. | | | 4,306 | | | | 89,780 | |
Applied Industrial Technologies, Inc. | | | 1,844 | | | | 109,534 | |
BMC Stock Holdings, Inc. (x)* | | | 737 | | | | 14,372 | |
CAI International, Inc.* | | | 1,498 | | | | 12,988 | |
DXP Enterprises, Inc.* | | | 1,324 | | | | 45,996 | |
GATX Corp. (x) | | | 3,692 | | | | 227,352 | |
Kaman Corp. | | | 2,232 | | | | 109,212 | |
Lawson Products, Inc.* | | | 116 | | | | 2,761 | |
MRC Global, Inc.* | | | 8,499 | | | | 172,190 | |
| | | | | | | | |
Neff Corp., Class A* | | | 591 | | | $ | 8,333 | |
NOW, Inc.* | | | 9,624 | | | | 197,003 | |
Real Industry, Inc.* | | | 4,200 | | | | 25,620 | |
Rush Enterprises, Inc., Class A* | | | 2,665 | | | | 85,013 | |
Rush Enterprises, Inc., Class B* | | | 519 | | | | 16,022 | |
Textainer Group Holdings Ltd. (x) | | | 2,070 | | | | 15,422 | |
Titan Machinery, Inc.* | | | 1,609 | | | | 23,443 | |
Triton International Ltd. | | | 2,965 | | | | 46,847 | |
Veritiv Corp.* | | | 707 | | | | 38,001 | |
Willis Lease Finance Corp.* | | | 409 | | | | 10,462 | |
| | | | | | | | |
| | | | | | | 1,250,351 | |
| | | | | | | | |
Transportation Infrastructure (0.0%) | | | | | |
Wesco Aircraft Holdings, Inc.* | | | 3,888 | | | | 58,126 | |
| | | | | | | | |
Total Industrials | | | | | | | 12,984,170 | |
| | | | | | | | |
Information Technology (6.4%) | | | | | | | | |
Communications Equipment (1.9%) | |
ADTRAN, Inc. | | | 1,554 | | | | 34,732 | |
Applied Optoelectronics, Inc.* | | | 1,493 | | | | 34,996 | |
Bel Fuse, Inc., Class B | | | 830 | | | | 25,647 | |
Black Box Corp. | | | 1,339 | | | | 20,420 | |
Calix, Inc.* | | | 3,724 | | | | 28,675 | |
Comtech Telecommunications Corp. | | | 2,024 | | | | 23,984 | |
Digi International, Inc.* | | | 2,327 | | | | 31,996 | |
EchoStar Corp., Class A* | | | 36,000 | | | | 1,850,041 | |
EMCORE Corp. | | | 2,374 | | | | 20,654 | |
Finisar Corp.* | | | 9,566 | | | | 289,563 | |
Harmonic, Inc. (x)* | | | 6,924 | | | | 34,620 | |
Infinera Corp.* | | | 3,832 | | | | 32,534 | |
Ixia* | | | 5,927 | | | | 95,425 | |
KVH Industries, Inc.* | | | 1,398 | | | | 16,496 | |
NETGEAR, Inc.* | | | 980 | | | | 53,263 | |
NetScout Systems, Inc.* | | | 7,949 | | | | 250,394 | |
Oclaro, Inc.* | | | 1,557 | | | | 13,935 | |
Quantenna Communications, Inc.* | | | 219 | | | | 3,970 | |
ShoreTel, Inc.* | | | 4,641 | | | | 33,183 | |
Silicom Ltd. | | | 358 | | | | 14,710 | |
Sonus Networks, Inc.* | | | 3,724 | | | | 23,461 | |
ViaSat, Inc.* | | | 3,346 | | | | 221,572 | |
Viavi Solutions, Inc.* | | | 21,213 | | | | 173,522 | |
| | | | | | | | |
| | | | | | | 3,327,793 | |
| | | | | | | | |
Electronic Equipment, Instruments & Components (1.7%) | |
Agilysys, Inc.* | | | 1,227 | | | | 12,712 | |
Anixter International, Inc.* | | | 2,560 | | | | 207,488 | |
AVX Corp. | | | 4,154 | | | | 64,927 | |
Benchmark Electronics, Inc.* | | | 4,546 | | | | 138,653 | |
Control4 Corp.* | | | 1,790 | | | | 18,258 | |
CTS Corp. | | | 2,807 | | | | 62,877 | |
Daktronics, Inc. | | | 3,399 | | | | 36,369 | |
Electro Scientific Industries, Inc.* | | | 2,462 | | | | 14,575 | |
ePlus, Inc.* | | | 160 | | | | 18,432 | |
FARO Technologies, Inc.* | | | 1,120 | | | | 40,320 | |
II-VI, Inc.* | | | 3,930 | | | | 116,525 | |
Insight Enterprises, Inc.* | | | 3,290 | | | | 133,048 | |
InvenSense, Inc.* | | | 7,400 | | | | 94,646 | |
Kimball Electronics, Inc.* | | | 2,524 | | | | 45,937 | |
Knowles Corp. (x)* | | | 7,980 | | | | 133,346 | |
See Notes to Financial Statements.
56
EQ ADVISORS TRUST
AXA/HORIZON SMALL CAP VALUE PORTFOLIO
PORTFOLIO OF INVESTMENTS (Continued)
December 31, 2016
| | | | | | | | |
| | | Number of
Shares | | | Value
(Note 1) | |
| | | | | | | | |
Maxwell Technologies, Inc. (x)* | | | 2,907 | | | $ | 14,884 | |
Methode Electronics, Inc. | | | 272 | | | | 11,247 | |
MTS Systems Corp. | | | 123 | | | | 6,974 | |
Novanta, Inc.* | | | 2,100 | | | | 44,100 | |
OSI Systems, Inc.* | | | 1,608 | | | | 122,401 | |
Park Electrochemical Corp. | | | 1,727 | | | | 32,209 | |
PC Connection, Inc. | | | 860 | | | | 24,157 | |
Plexus Corp.* | | | 3,056 | | | | 165,146 | |
RadiSys Corp.* | | | 158 | | | | 700 | |
Rogers Corp.* | | | 1,091 | | | | 83,800 | |
Sanmina Corp.* | | | 6,493 | | | | 237,968 | |
ScanSource, Inc.* | | | 2,271 | | | | 91,635 | |
SYNNEX Corp. | | | 2,601 | | | | 314,772 | |
Systemax, Inc. | | | 991 | | | | 8,691 | |
Tech Data Corp.* | | | 3,110 | | | | 263,354 | |
TTM Technologies, Inc.* | | | 6,556 | | | | 89,358 | |
Vishay Intertechnology, Inc. (x) | | | 12,269 | | | | 198,758 | |
Vishay Precision Group, Inc.* | | | 1,114 | | | | 21,055 | |
| | | | | | | | |
| | | | | | | 2,869,322 | |
| | | | | | | | |
Internet Software & Services (0.2%) | | | | | | | | |
Apptio, Inc., Class A* | | | 110 | | | | 2,038 | |
Autobytel, Inc.* | | | 622 | | | | 8,366 | |
Bankrate, Inc.* | | | 4,306 | | | | 47,581 | |
Bazaarvoice, Inc.* | | | 7,422 | | | | 35,997 | |
Blucora, Inc.* | | | 2,817 | | | | 41,551 | |
Coupa Software, Inc. (x)* | | | 137 | | | | 3,426 | |
Global Sources Ltd.* | | | 719 | | | | 6,363 | |
Intralinks Holdings, Inc.* | | | 3,530 | | | | 47,726 | |
Limelight Networks, Inc. (x)* | | | 6,684 | | | | 16,844 | |
Liquidity Services, Inc.* | | | 2,233 | | | | 21,772 | |
Marchex, Inc., Class B* | | | 3,090 | | | | 8,189 | |
MeetMe, Inc.* | | | 470 | | | | 2,317 | |
Numerex Corp., Class A* | | | 1,005 | | | | 7,437 | |
QuinStreet, Inc.* | | | 3,324 | | | | 12,498 | |
RealNetworks, Inc.* | | | 2,054 | | | | 9,982 | |
Reis, Inc. | | | 280 | | | | 6,230 | |
RetailMeNot, Inc.* | | | 3,493 | | | | 32,485 | |
Rightside Group Ltd.* | | | 1,015 | | | | 8,394 | |
TechTarget, Inc.* | | | 1,132 | | | | 9,656 | |
Trade Desk, Inc. (The), Class A (x)* | | | 327 | | | | 9,048 | |
| | | | | | | | |
| | | | | | | 337,900 | |
| | | | | | | | |
IT Services (0.5%) | | | | | | | | |
Acxiom Corp.* | | | 3,669 | | | | 98,329 | |
CACI International, Inc., Class A* | | | 2,157 | | | | 268,116 | |
Cass Information Systems, Inc. | | | 409 | | | | 30,090 | |
Convergys Corp. | | | 4,069 | | | | 99,935 | |
Datalink Corp.* | | | 1,705 | | | | 19,198 | |
EVERTEC, Inc. | | | 1,049 | | | | 18,620 | |
ManTech International Corp., Class A | | | 2,283 | | | | 96,457 | |
MoneyGram International, Inc.* | | | 2,693 | | | | 31,804 | |
NCI, Inc., Class A | | | 589 | | | | 8,217 | |
NeuStar, Inc., Class A* | | | 381 | | | | 12,725 | |
Perficient, Inc.* | | | 1,037 | | | | 18,137 | |
PFSweb, Inc.* | | | 60 | | | | 510 | |
ServiceSource International, Inc.* | | | 2,171 | | | | 12,331 | |
Sykes Enterprises, Inc.* | | | 3,620 | | | | 104,474 | |
| | | | | | | | |
Travelport Worldwide Ltd. | | | 2,784 | | | $ | 39,254 | |
Unisys Corp. (x)* | | | 1,551 | | | | 23,187 | |
| | | | | | | | |
| | | | | | | 881,384 | |
| | | | | | | | |
Semiconductors & Semiconductor Equipment (1.4%) | | | | | | | | |
Advanced Energy Industries, Inc.* | | | 168 | | | | 9,198 | |
Advanced Micro Devices, Inc.* | | | 34,851 | | | | 395,211 | |
Alpha & Omega Semiconductor Ltd.* | | | 1,685 | | | | 35,840 | |
Ambarella, Inc. (x)* | | | 1,753 | | | | 94,890 | |
Amkor Technology, Inc.* | | | 8,481 | | | | 89,475 | |
Axcelis Technologies, Inc.* | | | 2,606 | | | | 37,917 | |
Brooks Automation, Inc. | | | 6,231 | | �� | | 106,363 | |
Cabot Microelectronics Corp. | | | 1,867 | | | | 117,938 | |
Cavium, Inc.* | | | 744 | | | | 46,455 | |
Cohu, Inc. | | | 2,357 | | | | 32,762 | |
Diodes, Inc.* | | | 3,506 | | | | 89,999 | |
DSP Group, Inc.* | | | 1,894 | | | | 24,717 | |
Entegris, Inc.* | | | 4,833 | | | | 86,511 | |
Exar Corp.* | | | 3,002 | | | | 32,362 | |
FormFactor, Inc.* | | | 2,614 | | | | 29,277 | |
GigPeak, Inc.* | | | 4,949 | | | | 12,471 | |
Impinj, Inc. (x)* | | | 196 | | | | 6,927 | |
Intersil Corp., Class A | | | 11,951 | | | | 266,508 | |
IXYS Corp. | | | 2,218 | | | | 26,394 | |
Kopin Corp.* | | | 5,536 | | | | 15,722 | |
MKS Instruments, Inc. | | | 4,475 | | | | 265,815 | |
Nanometrics, Inc.* | | | 397 | | | | 9,949 | |
NeoPhotonics Corp.* | | | 2,316 | | | | 25,036 | |
NVE Corp. | | | 209 | | | | 14,929 | |
PDF Solutions, Inc.* | | | 77 | | | | 1,736 | |
Photronics, Inc.* | | | 6,011 | | | | 67,924 | |
Rambus, Inc.* | | | 7,443 | | | | 102,490 | |
Rudolph Technologies, Inc.* | | | 2,693 | | | | 62,882 | |
Sigma Designs, Inc.* | | | 3,243 | | | | 19,458 | |
Tessera Holding Corp. | | | 1,552 | | | | 68,598 | |
Ultra Clean Holdings, Inc.* | | | 2,859 | | | | 27,732 | |
Ultratech, Inc.* | | | 1,783 | | | | 42,756 | |
Veeco Instruments, Inc.* | | | 3,589 | | | | 104,619 | |
Xcerra Corp.* | | | 4,778 | | | | 36,504 | |
| | | | | | | | |
| | | | | | | 2,407,365 | |
| | | | | | | | |
Software (0.6%) | | | | | | | | |
Blackline, Inc.* | | | 138 | | | | 3,813 | |
Bottomline Technologies de, Inc.* | | | 488 | | | | 12,210 | |
Digimarc Corp.* | | | 45 | | | | 1,350 | |
EnerNOC, Inc. (x)* | | | 350 | | | | 2,100 | |
Everbridge, Inc. (x)* | | | 115 | | | | 2,122 | |
Glu Mobile, Inc. (x)* | | | 9,348 | | | | 18,135 | |
Mentor Graphics Corp. | | | 9,541 | | | | 351,968 | |
MicroStrategy, Inc., Class A* | | | 403 | | | | 79,552 | |
Park City Group, Inc. (x)* | | | 62 | | | | 787 | |
Progress Software Corp. | | | 3,979 | | | | 127,049 | |
QAD, Inc., Class A | | | 831 | | | | 25,262 | |
Rosetta Stone, Inc.* | | | 387 | | | | 3,448 | |
Rubicon Project, Inc. (The)* | | | 2,036 | | | | 15,107 | |
SecureWorks Corp., Class A* | | | 385 | | | | 4,077 | |
Silver Spring Networks, Inc.* | | | 174 | | | | 2,316 | |
Tangoe, Inc.* | | | 2,505 | | | | 19,739 | |
See Notes to Financial Statements.
57
EQ ADVISORS TRUST
AXA/HORIZON SMALL CAP VALUE PORTFOLIO
PORTFOLIO OF INVESTMENTS (Continued)
December 31, 2016
| | | | | | | | |
| | | Number of
Shares | | | Value
(Note 1) | |
| | | | | | | | |
Telenav, Inc.* | | | 2,967 | | | $ | 20,917 | |
TiVo Corp.* | | | 7,420 | | | | 155,078 | |
VASCO Data Security International, Inc.* | | | 281 | | | | 3,836 | |
Verint Systems, Inc.* | | | 5,500 | | | | 193,876 | |
| | | | | | | | |
| | | | | | | 1,042,742 | |
| | | | | | | | |
Technology Hardware, Storage & Peripherals (0.1%) | |
Avid Technology, Inc.* | | | 991 | | | | 4,360 | |
CPI Card Group, Inc. | | | 1,252 | | | | 5,196 | |
Diebold Nixdorf, Inc. | | | 4,175 | | | | 105,001 | |
Eastman Kodak Co.* | | | 301 | | | | 4,666 | |
Immersion Corp.* | | | 1,796 | | | | 19,091 | |
Stratasys Ltd.* | | | 2,330 | | | | 38,538 | |
Super Micro Computer, Inc.* | | | 2,817 | | | | 79,017 | |
USA Technologies, Inc. (x)* | | | 380 | | | | 1,634 | |
| | | | | | | | |
| | | | | | | 257,503 | |
| | | | | | | | |
Total Information Technology | | | | | | | 11,124,009 | |
| | | | | | | | |
Materials (3.0%) | | | | | | | | |
Chemicals (1.5%) | | | | | | | | |
A. Schulman, Inc. | | | 2,599 | | | | 86,937 | |
AgroFresh Solutions, Inc.* | | | 2,056 | | | | 5,448 | |
American Vanguard Corp. | | | 2,544 | | | | 48,718 | |
Calgon Carbon Corp. | | | 4,544 | | | | 77,248 | |
Chemours Co. (The) | | | 2,755 | | | | 60,858 | |
Chemtura Corp.* | | | 2,870 | | | | 95,284 | |
FutureFuel Corp. | | | 2,250 | | | | 31,275 | |
GCP Applied Technologies, Inc.* | | | 999 | | | | 26,723 | |
Hawkins, Inc. | | | 686 | | | | 37,010 | |
Ingevity Corp.* | | | 759 | | | | 41,639 | |
Innophos Holdings, Inc. | | | 188 | | | | 9,825 | |
Innospec, Inc. | | | 2,134 | | | | 146,178 | |
KMG Chemicals, Inc. | | | 454 | | | | 17,656 | |
Koppers Holdings, Inc.* | | | 366 | | | | 14,750 | |
Kraton Corp.* | | | 2,720 | | | | 77,466 | |
Kronos Worldwide, Inc. (x) | | | 1,937 | | | | 23,128 | |
LSB Industries, Inc. (x)* | | | 1,895 | | | | 15,956 | |
Minerals Technologies, Inc. | | | 1,467 | | | | 113,326 | |
Olin Corp. | | | 14,778 | | | | 378,464 | |
OMNOVA Solutions, Inc.* | | | 903 | | | | 9,030 | |
Platform Specialty Products Corp. (x)* | | | 82,940 | | | | 813,640 | |
Quaker Chemical Corp. | | | 288 | | | | 36,847 | |
Rayonier Advanced Materials, Inc. | | | 1,548 | | | | 23,932 | |
Stepan Co. | | | 1,616 | | | | 131,672 | |
TerraVia Holdings, Inc. (x)* | | | 7,139 | | | | 8,210 | |
Trecora Resources* | | | 308 | | | | 4,266 | |
Tredegar Corp. | | | 2,276 | | | | 54,624 | |
Tronox Ltd., Class A | | | 5,822 | | | | 60,025 | |
Valhi, Inc. | | | 2,143 | | | | 7,415 | |
| | | | | | | | |
| | | | | | | 2,457,550 | |
| | | | | | | | |
Construction Materials (0.0%) | | | | | | | | |
United States Lime & Minerals, Inc. | | | 147 | | | | 11,135 | |
| | | | | | | | |
Containers & Packaging (0.1%) | | | | | | | | |
Greif, Inc., Class A | | | 2,313 | | | | 118,680 | |
| | | | | | | | |
Greif, Inc., Class B | | | 502 | | | $ | 33,910 | |
UFP Technologies, Inc.* | | | 574 | | | | 14,608 | |
| | | | | | | | |
| | | | | | | 167,198 | |
| | | | | | | | |
Metals & Mining (1.2%) | | | | | | | | |
AK Steel Holding Corp.* | | | 27,833 | | | | 284,175 | |
Allegheny Technologies, Inc. (x) | | | 9,799 | | | | 156,098 | |
Ampco-Pittsburgh Corp. | | | 769 | | | | 12,881 | |
Carpenter Technology Corp. | | | 4,181 | | | | 151,227 | |
Century Aluminum Co.* | | | 4,223 | | | | 36,149 | |
Cliffs Natural Resources, Inc.* | | | 19,956 | | | | 167,830 | |
Coeur Mining, Inc.* | | | 4,204 | | | | 38,214 | |
Commercial Metals Co. | | | 10,128 | | | | 220,588 | |
Dominion Diamond Corp. | | | 10,000 | | | | 96,800 | |
Ferroglobe plc | | | 5,921 | | | | 64,124 | |
Gold Resource Corp. (x) | | | 882 | | | | 3,837 | |
Handy & Harman Ltd.* | | | 272 | | | | 6,950 | |
Haynes International, Inc. | | | 1,115 | | | | 47,934 | |
Hecla Mining Co. | | | 34,180 | | | | 179,103 | |
Kaiser Aluminum Corp. | | | 1,007 | | | | 78,234 | |
Materion Corp. | | | 1,794 | | | | 71,042 | |
McEwen Mining, Inc. (x) | | | 33,454 | | | | 97,351 | |
Olympic Steel, Inc. | | | 732 | | | | 17,736 | |
Ryerson Holding Corp.* | | | 1,234 | | | | 16,474 | |
Sandstorm Gold Ltd.* | | | 12,000 | | | | 46,800 | |
Schnitzer Steel Industries, Inc., Class A | | | 2,341 | | | | 60,164 | |
Stillwater Mining Co.* | | | 11,086 | | | | 178,595 | |
SunCoke Energy, Inc.* | | | 5,814 | | | | 65,931 | |
TimkenSteel Corp.* | | | 3,568 | | | | 55,233 | |
| | | | | | | | |
| | | | | | | 2,153,470 | |
| | | | | | | | |
Paper & Forest Products (0.2%) | | | | | | | | |
Boise Cascade Co.* | | | 511 | | | | 11,498 | |
KapStone Paper and Packaging Corp. | | | 7,265 | | | | 160,193 | |
Louisiana-Pacific Corp.* | | | 900 | | | | 17,037 | |
P.H. Glatfelter Co. | | | 3,915 | | | | 93,529 | |
Schweitzer-Mauduit International, Inc. | | | 2,243 | | | | 102,124 | |
| | | | | | | | |
| | | | | | | 384,381 | |
| | | | | | | | |
Total Materials | | | | | | | 5,173,734 | |
| | | | | | | | |
Real Estate (9.5%) | | | | | | | | |
Equity Real Estate Investment Trusts (REITs) (5.2%) | |
Acadia Realty Trust (REIT) | | | 5,706 | | | | 186,472 | |
Agree Realty Corp. (REIT) | | | 2,094 | | | | 96,429 | |
Alexander’s, Inc. (REIT) | | | 5 | | | | 2,134 | |
American Assets Trust, Inc. (REIT) | | | 2,294 | | | | 98,826 | |
Armada Hoffler Properties, Inc. (REIT) | | | 363 | | | | 5,289 | |
Ashford Hospitality Prime, Inc. (REIT) | | | 2,240 | | | | 30,576 | |
Ashford Hospitality Trust, Inc. (REIT) | | | 7,130 | | | | 55,329 | |
Bluerock Residential Growth REIT, Inc. (REIT) | | | 1,668 | | | | 22,885 | |
CatchMark Timber Trust, Inc. (REIT), Class A | | | 3,476 | | | | 39,140 | |
See Notes to Financial Statements.
58
EQ ADVISORS TRUST
AXA/HORIZON SMALL CAP VALUE PORTFOLIO
PORTFOLIO OF INVESTMENTS (Continued)
December 31, 2016
| | | | | | | | |
| | | Number of
Shares | | | Value
(Note 1) | |
| | | | | | | | |
CBL & Associates Properties, Inc. (REIT) | | | 15,439 | | | $ | 177,549 | |
Cedar Realty Trust, Inc. (REIT) | | | 7,484 | | | | 48,871 | |
Chatham Lodging Trust (REIT) | | | 3,394 | | | | 69,747 | |
Chesapeake Lodging Trust (REIT) | | | 3,995 | | | | 103,311 | |
City Office REIT, Inc. (REIT) | | | 333 | | | | 4,386 | |
Colony Starwood Homes (REIT) | | | 5,737 | | | | 165,283 | |
Community Healthcare Trust, Inc. (REIT) | | | 1,140 | | | | 26,254 | |
CorEnergy Infrastructure Trust, Inc. (REIT) (x) | | | 1,076 | | | | 37,531 | |
Cousins Properties, Inc. (REIT) | | | 30,064 | | | | 255,845 | |
DiamondRock Hospitality Co. (REIT) | | | 18,417 | | | | 212,348 | |
Easterly Government Properties, Inc. (REIT) | | | 2,912 | | | | 58,298 | |
Education Realty Trust, Inc. (REIT) | | | 5,841 | | | | 247,074 | |
Equity LifeStyle Properties, Inc. (REIT) | | | 7,000 | | | | 504,699 | |
Farmland Partners, Inc. (REIT) (x) | | | 1,075 | | | | 11,997 | |
FelCor Lodging Trust, Inc. (REIT) | | | 1,570 | | | | 12,576 | |
First Industrial Realty Trust, Inc. (REIT) | | | 8,035 | | | | 225,382 | |
First Potomac Realty Trust (REIT) | | | 5,240 | | | | 57,483 | |
Four Corners Property Trust, Inc. (REIT) | | | 1,238 | | | | 25,404 | |
Franklin Street Properties Corp. (REIT) | | | 9,567 | | | | 123,988 | |
GEO Group, Inc. (The) (REIT) | | | 5,287 | | | | 189,962 | |
Getty Realty Corp. (REIT) | | | 2,346 | | | | 59,800 | |
Gladstone Commercial Corp. (REIT) | | | 1,980 | | | | 39,798 | |
Global Medical REIT, Inc. (REIT) (x) | | | 688 | | | | 6,137 | |
Global Net Lease, Inc. (REIT) (x) | | | 15,732 | | | | 123,182 | |
Government Properties Income Trust (REIT) | | | 6,180 | | | | 117,822 | |
Gramercy Property Trust (REIT) | | | 32,040 | | | | 294,126 | |
Healthcare Realty Trust, Inc. (REIT) | | | 10,186 | | | | 308,839 | |
Hersha Hospitality Trust (REIT) | | | 3,554 | | | | 76,411 | |
Hudson Pacific Properties, Inc. (REIT) | | | 9,479 | | | | 329,679 | |
Independence Realty Trust, Inc. (REIT) (x) | | | 5,036 | | | | 44,921 | |
InfraREIT, Inc. (REIT)* | | | 3,643 | | | | 65,246 | |
Investors Real Estate Trust (REIT) | | | 10,903 | | | | 77,738 | |
Kite Realty Group Trust (REIT) | | | 7,310 | | | | 171,639 | |
LaSalle Hotel Properties (REIT) | | | 9,473 | | | | 288,641 | |
Lexington Realty Trust (REIT) | | | 20,942 | | | | 226,174 | |
LTC Properties, Inc. (REIT) | | | 460 | | | | 21,611 | |
Mack-Cali Realty Corp. (REIT) | | | 7,910 | | | | 229,548 | |
MedEquities Realty Trust, Inc. (REIT) | | | 420 | | | | 4,662 | |
| | | | | | | | |
Medical Properties Trust, Inc. (REIT) | | | 17,730 | | | | 218,079 | |
Monmouth Real Estate Investment Corp. (REIT) | | | 4,686 | | | | 71,415 | |
Monogram Residential Trust, Inc. (REIT) | | | 15,490 | | | | 167,602 | |
National Storage Affiliates Trust (REIT) | | | 2,822 | | | | 62,282 | |
New Senior Investment Group, Inc. (REIT) | | | 6,886 | | | | 67,414 | |
New York REIT, Inc. (REIT) | | | 15,209 | | | | 153,915 | |
NexPoint Residential Trust, Inc. (REIT) | | | 1,610 | | | | 35,967 | |
NorthStar Realty Europe Corp. (REIT) | | | 5,139 | | | | 64,597 | |
One Liberty Properties, Inc. (REIT) | | | 1,031 | | | | 25,899 | |
Parkway, Inc. (REIT)* | | | 3,824 | | | | 85,084 | |
Pebblebrook Hotel Trust (REIT) | | | 6,565 | | | | 195,309 | |
Pennsylvania REIT (REIT) | | | 4,468 | | | | 84,713 | |
Physicians Realty Trust (REIT) | | | 6,028 | | | | 114,291 | |
Preferred Apartment Communities, Inc. (REIT), Class A (x) | | | 1,975 | | | | 29,447 | |
RAIT Financial Trust (REIT) | | | 8,141 | | | | 27,354 | |
Ramco-Gershenson Properties Trust (REIT) | | | 6,891 | | | | 114,253 | |
Retail Opportunity Investments Corp. (REIT) | | | 2,811 | | | | 59,396 | |
Rexford Industrial Realty, Inc. (REIT) | | | 3,723 | | | | 86,336 | |
RLJ Lodging Trust (REIT) | | | 10,814 | | | | 264,835 | |
Sabra Health Care REIT, Inc. (REIT) | | | 4,962 | | | | 121,172 | |
Saul Centers, Inc. (REIT) | | | 101 | | | | 6,728 | |
Select Income REIT (REIT) | | | 5,571 | | | | 140,389 | |
Seritage Growth Properties (REIT), Class A (x) | | | 2,292 | | | | 97,891 | |
Silver Bay Realty Trust Corp. (REIT) | | | 3,026 | | | | 51,866 | |
Summit Hotel Properties, Inc. (REIT) | | | 8,019 | | | | 128,545 | |
Sunstone Hotel Investors, Inc. (REIT) | | | 19,795 | | | | 301,873 | |
Terreno Realty Corp. (REIT) | | | 3,105 | | | | 88,461 | |
Tier REIT, Inc. (REIT) | | | 4,313 | | | | 75,003 | |
UMH Properties, Inc. (REIT) | | | 1,550 | | | | 23,328 | |
Washington Prime Group, Inc. (REIT) | | | 13,381 | | | | 139,296 | |
Washington Real Estate Investment Trust (REIT) | | | 4,384 | | | | 143,313 | |
Whitestone REIT (REIT) | | | 2,300 | | | | 33,074 | |
Xenia Hotels & Resorts, Inc. (REIT) | | | 9,093 | | | | 176,586 | |
| | | | | | | | |
| | | | | | | 9,036,755 | |
| | | | | | | | |
Real Estate Management & Development (4.3%) | |
Alexander & Baldwin, Inc. | | | 1,973 | | | | 88,529 | |
AV Homes, Inc.* | | | 754 | | | | 11,913 | |
Consolidated-Tomoka Land Co. | | | 445 | | | | 23,772 | |
Dream Unlimited Corp., Class A* | | | 382,700 | | | | 1,891,036 | |
See Notes to Financial Statements.
59
EQ ADVISORS TRUST
AXA/HORIZON SMALL CAP VALUE PORTFOLIO
PORTFOLIO OF INVESTMENTS (Continued)
December 31, 2016
| | | | | | | | |
| | | Number of
Shares | | | Value
(Note 1) | |
| | | | | | | | |
Forestar Group, Inc.* | | | 2,800 | | | $ | 37,240 | |
FRP Holdings, Inc.* | | | 566 | | | | 21,338 | |
Griffin Industrial Realty, Inc. | | | 52 | | | | 1,650 | |
Howard Hughes Corp. (The)* | | | 45,000 | | | | 5,134,499 | |
Kennedy-Wilson Holdings, Inc. | | | 3,804 | | | | 77,982 | |
RE/MAX Holdings, Inc., Class A | | | 1,584 | | | | 88,704 | |
St Joe Co. (The)* | | | 4,544 | | | | 86,336 | |
Stratus Properties, Inc.* | | | 552 | | | | 18,078 | |
Tejon Ranch Co.* | | | 1,249 | | | | 31,762 | |
Trinity Place Holdings, Inc.* | | | 1,733 | | | | 16,065 | |
| | | | | | | | |
| | | | | | | 7,528,904 | |
| | | | | | | | |
Total Real Estate | | | | | | | 16,565,659 | |
| | | | | | | | |
Telecommunication Services (0.3%) | | | | | | | | |
Diversified Telecommunication Services (0.3%) | |
ATN International, Inc. | | | 939 | | | | 75,242 | |
Cincinnati Bell, Inc.* | | | 3,906 | | | | 87,300 | |
Consolidated Communications Holdings, Inc. (x) | | | 1,372 | | | | 36,838 | |
FairPoint Communications, Inc.* | | | 472 | | | | 8,826 | |
Globalstar, Inc. (x)* | | | 12,551 | | | | 19,831 | |
Hawaiian Telcom Holdco, Inc.* | | | 563 | | | | 13,951 | |
IDT Corp., Class B | | | 621 | | | | 11,513 | |
Intelsat SA* | | | 2,778 | | | | 7,417 | |
Iridium Communications, Inc. (x)* | | | 7,744 | | | | 74,342 | |
Lumos Networks Corp.* | | | 1,536 | | | | 23,992 | |
ORBCOMM, Inc.* | | | 70 | | | | 579 | |
pdvWireless, Inc. (x)* | | | 793 | | | | 17,882 | |
Vonage Holdings Corp.* | | | 15,701 | | | | 107,553 | |
Windstream Holdings, Inc. (x) | | | 7,767 | | | | 56,932 | |
| | | | | | | | |
| | | | | | | 542,198 | |
| | | | | | | | |
Wireless Telecommunication Services (0.0%) | |
Boingo Wireless, Inc.* | | | 1,286 | | | | 15,676 | |
NII Holdings, Inc.* | | | 5,175 | | | | 11,126 | |
Spok Holdings, Inc. | | | 1,821 | | | | 37,786 | |
| | | | | | | | |
| | | | | | | 64,588 | |
| | | | | | | | |
Total Telecommunication Services | | | | | | | 606,786 | |
| | | | | | | | |
Utilities (4.0%) | | | | | | | | |
Electric Utilities (1.0%) | | | | | | | | |
ALLETE, Inc. | | | 4,420 | | | | 283,720 | |
El Paso Electric Co. | | | 3,687 | | | | 171,446 | |
Empire District Electric Co. (The) | | | 4,016 | | | | 136,905 | |
Genie Energy Ltd., Class B* | | | 1,160 | | | | 6,670 | |
IDACORP, Inc. | | | 4,514 | | | | 363,602 | |
MGE Energy, Inc. | | | 1,715 | | | | 111,990 | |
Otter Tail Corp. | | | 3,321 | | | | 135,497 | |
PNM Resources, Inc. | | | 7,136 | | | | 244,765 | |
Portland General Electric Co. | | | 7,994 | | | | 346,380 | |
| | | | | | | | |
| | | | | | | 1,800,975 | |
| | | | | | | | |
Gas Utilities (1.9%) | | | | | | | | |
Chesapeake Utilities Corp. | | | 1,161 | | | | 77,729 | |
Delta Natural Gas Co., Inc. | | | 568 | | | | 16,659 | |
New Jersey Resources Corp. | | | 7,170 | | | | 254,535 | |
Northwest Natural Gas Co. | | | 2,469 | | | | 147,646 | |
ONE Gas, Inc. | | | 4,642 | | | | 296,902 | |
Rubis SCA | | | 16,950 | | | | 1,397,598 | |
| | | | | | | | |
South Jersey Industries, Inc. | | | 7,288 | | | $ | 245,533 | |
Southwest Gas Corp. | | | 3,853 | | | | 295,217 | |
Spire, Inc. | | | 4,059 | | | | 262,008 | |
WGL Holdings, Inc. | | | 4,350 | | | | 331,818 | |
| | | | | | | | |
| | | | | | | 3,325,645 | |
| | | | | | | | |
Independent Power and Renewable Electricity Producers (0.4%) | |
Atlantic Power Corp.* | | | 11,062 | | | | 27,655 | |
Atlantica Yield plc (x) | | | 5,436 | | | | 105,186 | |
Dynegy, Inc.* | | | 10,530 | | | | 89,084 | |
NRG Yield, Inc., Class A | | | 3,340 | | | | 51,302 | |
NRG Yield, Inc., Class C | | | 5,777 | | | | 91,276 | |
Ormat Technologies, Inc. | | | 1,841 | | | | 98,714 | |
Pattern Energy Group, Inc. | | | 1,249 | | | | 23,719 | |
TerraForm Global, Inc., Class A* | | | 8,348 | | | | 32,975 | |
TerraForm Power, Inc., Class A (x)* | | | 8,011 | | | | 102,621 | |
Vivint Solar, Inc. (x)* | | | 2,250 | | | | 5,738 | |
| | | | | | | | |
| | | | | | | 628,270 | |
| | | | | | | | |
Multi-Utilities (0.5%) | | | | | | | | |
Avista Corp. | | | 5,736 | | | | 229,383 | |
Black Hills Corp. | | | 4,599 | | | | 282,102 | |
NorthWestern Corp. | | | 4,427 | | | | 251,763 | |
Unitil Corp. | | | 1,240 | | | | 56,222 | |
| | | | | | | | |
| | | | | | | 819,470 | |
| | | | | | | | |
Water Utilities (0.2%) | | | | | | | | |
American States Water Co. | | | 1,107 | | | | 50,435 | |
AquaVenture Holdings Ltd.* | | | 134 | | | | 3,287 | |
Artesian Resources Corp., Class A | | | 666 | | | | 21,272 | |
California Water Service Group | | | 1,808 | | | | 61,291 | |
Connecticut Water Service, Inc. | | | 745 | | | | 41,608 | |
Consolidated Water Co. Ltd. | | | 1,284 | | | | 13,931 | |
Middlesex Water Co. | | | 197 | | | | 8,459 | |
SJW Group | | | 1,466 | | | | 82,068 | |
York Water Co. (The) | | | 102 | | | | 3,896 | |
| | | | | | | | |
| | | | | | | 286,247 | |
| | | | | | | | |
Total Utilities | | | | | | | 6,860,607 | |
| | | | | | | | |
Total Common Stocks (85.6%)
(Cost $112,273,367) | | | | | | | 148,594,099 | |
| | | | | | | | |
CLOSED END FUND: | | | | | | | | |
JZ Capital Partners Ltd. | | | 27,800 | | | | 173,702 | |
| | | | | | | | |
Total Close End Funds (0.1%)
(Cost $190,347) | | | | | | | 173,702 | |
| | | | | | | | |
MASTER LIMITED PARTNERSHIPS: | | | | | |
Energy (0.1%) | | | | | | | | |
Oil, Gas & Consumable Fuels (0.1%) | |
Atlas Energy Group LLC* | | | 150,000 | | | | 108,000 | |
| | | | | | | | |
Total Energy | | | | | | | 108,000 | |
| | | | | | | | |
Industrials (2.6%) | | | | | | | | |
Industrial Conglomerates (2.6%) | | | | | | | | |
Icahn Enterprises LP | | | 77,138 | | | | 4,622,109 | |
| | | | | | | | |
Total Industrials | | | | | | | 4,622,109 | |
| | | | | | | | |
Total Master Limited Partnerships (2.7%)
(Cost $3,713,811) | | | | | | | 4,730,109 | |
| | | | | | | | |
See Notes to Financial Statements.
60
EQ ADVISORS TRUST
AXA/HORIZON SMALL CAP VALUE PORTFOLIO
PORTFOLIO OF INVESTMENTS (Continued)
December 31, 2016
| | | | | | | | |
| | | Number of
Rights | | | Value
(Note 1) | |
| | | | | | | | |
RIGHTS: | | | | | | | | |
Information Technology (0.0%) | | | | | | | | |
Electronic Equipment, Instruments & Components (0.0%) | |
Gerber Scientific, Inc. (Contingent Value Shares)*† | | | 2,344 | | | $ | — | |
| | | | | | | | |
Total Information Technology | | | | | | | — | |
| | | | | | | | |
Telecommunication Services (0.0%) | | | | | | | | |
Wireless Telecommunication Services (0.0%) | |
Leap Wireless International, Inc. (Contingent Value Shares)*† | | | 3,800 | | | | 8,550 | |
| | | | | | | | |
Total Telecommunication Services | | | | | | | 8,550 | |
| | | | | | | | |
Total Rights (0.0%)
(Cost $ —) | | | | | | | 8,550 | |
| | | | | | | | |
| | | Number of
Shares | | | Value
(Note 1) | |
SHORT-TERM INVESTMENTS: | | | | | | | | |
Investment Company (7.0%) | | | | | | | | |
JPMorgan Prime Money Market Fund, IM Shares | | | 12,153,690 | | | | 12,157,336 | |
| | | | | | | | |
| | | Principal
Amount | | | Value
(Note 1) | |
Repurchase Agreements (3.6%) | | | | | | | | |
Bank of Nova Scotia, | | | | | | | | |
0.50%, dated 12/30/16, due 1/3/17, repurchase price $500,028, collateralized by various U.S. Government Treasury Securities, ranging from 0.875%-2.375%, maturing 11/30/17-1/15/27; total market value $510,000. (xx) | | $ | 500,000 | | | | 500,000 | |
Citigroup Global Markets Ltd., | | | | | | | | |
0.71%, dated 12/30/16, due 1/3/17, repurchase price $300,024, collateralized by various Foreign Government Agency Securities, ranging from 0.000%-5.250%, maturing 1/23/17-1/24/44, U.S. Government Treasury Securities, ranging from 0.000%-5.375%, maturing 2/15/19-2/15/44; total market value $306,000. (xx) | | | 300,000 | | | | 300,000 | |
Citigroup Global Markets Ltd., | | | | | | | | |
0.69%, dated 12/30/16, due 1/3/17, repurchase price $100,008, collateralized by various U.S. Government Treasury Securities, ranging from 1.375%-5.375%, maturing 7/31/18-2/15/45; total market value $102,000. (xx) | | | 100,000 | | | | 100,000 | |
Deutsche Bank AG, | | | | | | | | |
1.05%, dated 12/30/16, due 1/3/17, repurchase price $1,400,163, collateralized by various Common Stocks; total market value $1,556,177. (xx) | | | 1,400,000 | | | | 1,400,000 | |
| | | | | | | | |
Deutsche Bank AG, | | | | | | | | |
0.95%, dated 12/30/16, due 1/3/17, repurchase price $200,021, collateralized by various Corporate Bonds, ranging from 1.875%-2.500%, maturing 3/13/19-6/10/25; total market value $204,001. (xx) | | $ | 200,000 | | | $ | 200,000 | |
Deutsche Bank Securities, Inc., | | | | | | | | |
0.50%, dated 12/30/16, due 1/3/17, repurchase price $1,002,775, collateralized by various U.S. Government Treasury Securities, 0.000%, maturing 2/15/40-5/15/40; total market value $1,022,774. (xx) | | | 1,002,719 | | | | 1,002,719 | |
HSBC Securities, Inc., | | | | | | | | |
0.46%, dated 12/30/16, due 1/3/17, repurchase price $500,026, collateralized by various U.S. Government Treasury Securities, ranging from 1.375%-1.750%, maturing 12/15/19-9/30/22; total market value $510,006. (xx) | | | 500,000 | | | | 500,000 | |
Macquarie Bank Ltd., | | | | | | | | |
0.57%, dated 12/30/16, due 1/3/17, repurchase price $400,025, collateralized by various U.S. Government Treasury Securities, ranging from 0.000%-8.750%, maturing 1/5/17-5/15/46; total market value $408,207. (xx) | | | 400,000 | | | | 400,000 | |
Macquarie Bank Ltd., | | | | | | | | |
0.76%, dated 12/30/16, due 1/3/17, repurchase price $300,025, collateralized by various U.S. Government Treasury Securities, ranging from 0.000%-8.750%, maturing 1/5/17-5/15/46; total market value $306,155. (xx) | | | 300,000 | | | | 300,000 | |
Natixis, | | | | | | | | |
0.50%, dated 12/30/16, due 1/3/17, repurchase price $400,022, collateralized by various U.S. Government Treasury Securities, ranging from 0.000%-3.625%, maturing 5/25/17-5/15/46; total market value $408,023. (xx) | | | 400,000 | | | | 400,000 | |
Nomura Securities Co. Ltd., | | | | | | | | |
0.50%, dated 12/30/16, due 1/3/17, repurchase price $200,011, collateralized by various U.S. Government Treasury Securities, ranging from 0.000%-3.875%, maturing 4/15/19-8/15/46; total market value $204,000. (xx) | | | 200,000 | | | | 200,000 | |
See Notes to Financial Statements.
61
EQ ADVISORS TRUST
AXA/HORIZON SMALL CAP VALUE PORTFOLIO
PORTFOLIO OF INVESTMENTS (Continued)
December 31, 2016
| | | | | | | | |
| | | Principal
Amount | | | Value
(Note 1) | |
| | | | | | | | |
RBS Securities, Inc., | | | | | | | | |
0.45%, dated 12/30/16, due 1/3/17, repurchase price $1,000,050, collateralized by various U.S. Government Treasury Securities, ranging from 0.625%-2.625%, maturing 8/31/17-2/15/25; total market value $1,020,007. (xx) | | $ | 1,000,000 | | | $ | 1,000,000 | |
| | | | | | | | |
Total Repurchase Agreements | | | | | | | 6,302,719 | |
| | | | | | | | |
Total Short-Term Investments (10.6%)
(Cost $18,456,750) | | | | | | | 18,460,055 | |
| | | | | | | | |
Total Investments (99.0%)
(Cost $134,634,275) | | | | | | | 171,966,515 | |
Other Assets Less Liabilities (1.0%) | | | | | | | 1,707,392 | |
| | | | | | | | |
Net Assets (100%) | | | | | | $ | 173,673,907 | |
| | | | | | | | |
| † | Securities (totaling $8,550 or 0.0% of net assets) held at fair value by management. |
| ‡ | All, or a portion, of the security is an affiliated company as defined under the Investment Company Act of 1940. |
| (x) | All or a portion of security is on loan at December 31, 2016. |
| (xx) | At December 31, 2016, the Portfolio had loaned securities with a total value of $6,074,483. This was secured by cash collateral of $6,302,719 which was subsequently invested in joint repurchase agreements with a total value of $6,302,719, as detailed in the Notes to the Financial Statements, for which the Portfolio has a proportionate interest as reported in the Portfolio of Investments as Repurchase Agreements, and $13,636 collateralized by various U.S. Government Treasury Securities, ranging from 0.000% - 3.625%, maturing 1/12/17 - 5/15/45. |
Glossary:
| | ADR | — American Depositary Receipt |
Investments in companies which were affiliates for the year ended December 31, 2016, were as follows:
| | | | | | | | | | | | | | | | | | | | | | | | |
Securities | | Value
December 31,
2015 | | | Purchases
at Cost | | | Sales
at Cost | | | Value
December 31,
2016 | | | Dividend
Income | | | Realized
Gain
(Loss) | |
PennyMac Financial Services, Inc., Class A | | $ | 7,189 | | | $ | — | | | $ | — | | | $ | 7,792 | | | $ | — | | | $ | — | |
PennyMac Mortgage Investment Trust (REIT) | | | 64,245 | | | | 34,404 | | | | 3,718 | | | | 100,201 | | | | 10,719 | | | | (201 | ) |
| | | | | | | | | | | | | | | | | | | | | | | | |
| | $ | 71,434 | | | $ | 34,404 | | | $ | 3,718 | | | $ | 107,993 | | | $ | 10,719 | | | $ | (201 | ) |
| | | | | | | | | | | | | | | | | | | | | | | | |
At December 31, 2016, the Portfolio had the following futures contracts open: (Note 1)
| | | | | | | | | | | | | | | | | | | | |
Purchases | | Number of
Contracts | | | Expiration
Date | | | Original
Value | | | Value at
12/31/2016 | | | Unrealized
Appreciation/
(Depreciation) | |
Russell 2000 Mini Index | | | 7 | | | | March-17 | | | $ | 476,808 | | | $ | 474,915 | | | $ | (1,893 | ) |
| | | | | | | | | | | | | | | | | | | | |
See Notes to Financial Statements.
62
EQ ADVISORS TRUST
AXA/HORIZON SMALL CAP VALUE PORTFOLIO
PORTFOLIO OF INVESTMENTS (Continued)
December 31, 2016
The following is a summary of the inputs used to value the Portfolio’s assets and liabilities carried at fair value as of December 31, 2016:
The inputs or methodology used for valuing securities are not necessarily an indication of the risk associated with investing in those securities.
Various inputs are used in determining the value of the Portfolio’s investments. These inputs are summarized in the three broad levels listed below:
| | | | | | | | | | | | | | | | |
| | | | | |
| Investment Type | | Level 1
Quoted Prices in
Active Markets for
Identical
Securities | | | Level 2
Significant Other
Observable Inputs
(including quoted prices
for similar securities,
interest rates,
prepayment speeds,
credit risk, etc.) (a) | | | Level 3
Significant Unobservable
Inputs (including the
Portfolio’s own
assumptions in
determining the fair
value of investments) | | | Total | |
Assets: | |
Closed End Funds | | $ | — | | | $ | 173,702 | | | $ | — | | | $ | 173,702 | |
Common Stocks | | | | | | | | | | | | | | | | |
Consumer Discretionary | | | 22,920,345 | | | | 3,587,093 | | | | — | | | | 26,507,438 | |
Consumer Staples | | | 4,692,550 | | | | 39,775 | | | | — | | | | 4,732,325 | |
Energy | | | 6,233,114 | | | | 757,689 | | | | — | | | | 6,990,803 | |
Financials | | | 49,744,671 | | | | 3,494,681 | | | | — | | | | 53,239,352 | |
Health Care | | | 3,809,216 | | | | — | | | | — | | | | 3,809,216 | |
Industrials | | | 11,733,706 | | | | 1,250,464 | | | | — | | | | 12,984,170 | |
Information Technology | | | 11,124,009 | | | | — | | | | — | | | | 11,124,009 | |
Materials | | | 5,173,734 | | | | — | | | | — | | | | 5,173,734 | |
Real Estate | | | 16,564,009 | | | | 1,650 | | | | — | | | | 16,565,659 | |
Telecommunication Services | | | 606,786 | | | | — | | | | — | | | | 606,786 | |
Utilities | | | 5,463,010 | | | | 1,397,597 | | | | — | | | | 6,860,607 | |
Master Limited Partnerships | | | | | | | | | | | | | | | | |
Energy | | | 108,000 | | | | — | | | | — | | | | 108,000 | |
Industrials | | | 4,622,109 | | | | — | | | | — | | | | 4,622,109 | |
Rights | | | | | | | | | | | | | | | | |
Information Technology | | | — | | | | — | | | | — | (b) | | | — | (b) |
Telecommunication Services | | | — | | | | — | | | | 8,550 | | | | 8,550 | |
Short-Term Investments | | | | | | | | | | | | | | | | |
Investment Companies | | | 12,157,336 | | | | — | | | | — | | | | 12,157,336 | |
Repurchase Agreements | | | — | | | | 6,302,719 | | | | — | | | | 6,302,719 | |
| | | | | | | | | | | | | | | | |
Total Assets | | $ | 154,952,595 | | | $ | 17,005,370 | | | $ | 8,550 | | | $ | 171,966,515 | |
| | | | | | | | | | | | | | | | |
|
Liabilities: | |
Futures | | $ | (1,893 | ) | | $ | — | | | $ | — | | | $ | (1,893 | ) |
| | | | | | | | | | | | | | | | |
Total Liabilities | | $ | (1,893 | ) | | $ | — | | | $ | — | | | $ | (1,893 | ) |
| | | | | | | | | | | | | | | | |
Total | | $ | 154,950,702 | | | $ | 17,005,370 | | | $ | 8,550 | | | $ | 171,964,622 | |
| | | | | | | | | | | | | | | | |
| (a) | A security with a market value of $39,775 transferred from Level 1 to Level 2 at the end of the year due to inactive trading. |
There were no additional transfers between Levels 1, 2 or 3 during the year ended December 31, 2016.
See Notes to Financial Statements.
63
EQ ADVISORS TRUST
AXA/HORIZON SMALL CAP VALUE PORTFOLIO
PORTFOLIO OF INVESTMENTS (Continued)
December 31, 2016
Fair Values of Derivative Instruments as of December 31, 2016:
| | | | | | |
| | | Statement of Assets and Liabilities | |
Derivatives Not Accounted for as
Hedging Instrument^ | | Liability Derivatives | | Fair Value | |
Equity contracts | | Payables, Net assets –
Unrealized depreciation | | $ | (1,893 | )* |
| | | | | | |
| * | Includes cumulative appreciation/depreciation of futures contracts as reported in the Portfolio of Investments. Only variation margin is reported within the Statement of Assets & Liabilities. |
The Effect of Derivative Instruments on the Statement of Operations for the year ended December 31, 2016:
| | | | | | | | | | | | |
| Amount of Realized Gain or (Loss) on Derivatives Recognized in Income | |
| | | Futures | | | Forward
Foreign
Currency
Contracts | | | Total | |
Foreign exchange contracts | | $ | — | | | $ | 749 | | | $ | 749 | |
Equity contracts | | | 93,491 | | | | — | | | | 93,491 | |
| | | | | | | | | | | | |
Total | | $ | 93,491 | | | $ | 749 | | | $ | 94,240 | |
| | | | | | | | | | | | |
| | | | | | | | | | | | |
| Amount of Unrealized Appreciation or (Depreciation) on Derivatives Recognized in Income | |
Derivatives Not Accounted for as
Hedging Instrument^ | | Futures | | | | | | | |
Equity contracts | | $ | 7,498 | | | | | | | | | |
| | | | | | | | | | | | |
^ The Portfolio held forward foreign currency contracts and futures contracts as a substitute for investing in conventional securities and hedging.
The Portfolio held futures contracts with an average notional balance of approximately $719,000 and forward foreign currency contracts with an average settlement value of approximately $39,000 for six days during the year ended December 31, 2016.
Investment security transactions for the year ended December 31, 2016 were as follows:
| | | | |
Cost of Purchases: | | | | |
Long-term investments other than U.S. government debt securities (affiliated 25%)* | | $ | 31,290,450 | |
Net Proceeds of Sales and Redemptions: | | | | |
Long-term investments other than U.S. government debt securities (affiliated 29%)* | | $ | 44,739,134 | |
* During the year ended December 31, 2016, the Portfolio engaged in purchases and sales of securities pursuant to Rule 17a-7 of the 1940 Act (amount is percentage of total Purchases and/or Sales).
As of December 31, 2016, the gross unrealized appreciation (depreciation) of investments based on the aggregate cost of investments for Federal income tax purposes was as follows:
| | | | |
Aggregate gross unrealized appreciation | | $ | 54,873,910 | |
Aggregate gross unrealized depreciation | | | (16,529,370 | ) |
| | | | |
Net unrealized appreciation | | $ | 38,344,540 | |
| | | | |
Federal income tax cost of investments | | $ | 133,621,975 | |
| | | | |
See Notes to Financial Statements.
64
EQ ADVISORS TRUST
AXA/HORIZON SMALL CAP VALUE PORTFOLIO
STATEMENT OF ASSETS AND LIABILITIES
December 31, 2016
| | | | |
ASSETS | |
Investments at value (x): | | | | |
Affiliated Issuers (Cost $129,759) | | $ | 107,993 | |
Unaffiliated Issuers (Cost $128,201,797) | | | 165,555,803 | |
Repurchase Agreements (Cost $6,302,719) | | | 6,302,719 | |
Cash | | | 7,874,312 | |
Cash held as collateral at broker | | | 23,800 | |
Dividends, interest and other receivables | | | 189,519 | |
Receivable for securities sold | | | 73,477 | |
Securities lending income receivable | | | 13,754 | |
Receivable from Separate Accounts for Trust shares sold | | | 5,108 | |
Other assets | | | 489 | |
| | | | |
Total assets | | | 180,146,974 | |
| | | | |
LIABILITIES | |
Payable for return of collateral on securities loaned | | | 6,302,719 | |
Investment management fees payable | | | 89,902 | |
Administrative fees payable | | | 18,388 | |
Payable to Separate Accounts for Trust shares redeemed | | | 12,717 | |
Due to broker for futures variation margin | | | 2,004 | |
Trustees’ fees payable | | | 233 | |
Distribution fees payable – Class IB | | | 81 | |
Accrued expenses | | | 47,023 | |
| | | | |
Total liabilities | | | 6,473,067 | |
| | | | |
NET ASSETS | | $ | 173,673,907 | |
| | | | |
Net assets were comprised of: | | | | |
Paid in capital | | $ | 136,538,119 | |
Accumulated undistributed net investment income (loss) | | | 52,569 | |
Accumulated undistributed net realized gain (loss) on investments, futures and foreign currency transactions | | | (247,024 | ) |
Net unrealized appreciation (depreciation) on investments, futures and foreign currency translations | | | 37,330,243 | |
| | | | |
Net assets | | $ | 173,673,907 | |
| | | | |
Class IB | | | | |
Net asset value, offering and redemption price per share, $417,546 / 42,423 shares outstanding (unlimited amount authorized: $0.01 par value) | | $ | 9.84 | |
| | | | |
Class K | | | | |
Net asset value, offering and redemption price per share, $173,256,361 / 17,621,220 shares outstanding (unlimited amount authorized: $0.01 par value) | | $ | 9.83 | |
| | | | |
| (x) | Includes value of securities on loan of $6,074,483. |
STATEMENT OF OPERATIONS
For the Year Ended December 31, 2016
| | | | |
INVESTMENT INCOME | |
Dividends ($10,719 of dividend income received from affiliates) (net of $8,237 foreign withholding tax) | | $ | 2,531,441 | |
Interest | | | 20,795 | |
Securities lending (net) | | | 109,482 | |
| | | | |
Total income | | | 2,661,718 | |
| | | | |
EXPENSES | |
Investment management fees | | | 1,216,535 | |
Administrative fees | | | 190,713 | |
Custodian fees | | | 63,825 | |
Professional fees | | | 55,504 | |
Printing and mailing expenses | | | 10,526 | |
Trustees’ fees | | | 3,441 | |
Distribution fees – Class IB | | | 614 | |
Miscellaneous | | | 7,960 | |
| | | | |
Gross expenses | | | 1,549,118 | |
Less: Waiver from investment manager | | | (130,536 | ) |
| | | | |
Net expenses | | | 1,418,582 | |
| | | | |
NET INVESTMENT INCOME (LOSS) | | | 1,243,136 | |
| | | | |
REALIZED AND UNREALIZED GAIN (LOSS) | |
Realized gain (loss) on: | | | | |
Investments ($(201) of realized gain (loss) from affiliates) | | | 6,881,825 | |
Net distributions of realized gain received from underlying funds | | | 5 | |
Futures | | | 93,491 | |
Foreign currency transactions | | | (2,296 | ) |
| | | | |
Net realized gain (loss) | | | 6,973,025 | |
| | | | |
Change in unrealized appreciation (depreciation) on: | | | | |
Investments ($5,873 of change in unrealized appreciation (depreciation) from affiliates) | | | 26,270,932 | |
Futures | | | 7,498 | |
Foreign currency translations | | | (65 | ) |
| | | | |
Net change in unrealized appreciation (depreciation) | | | 26,278,365 | |
| | | | |
NET REALIZED AND UNREALIZED GAIN (LOSS) | | | 33,251,390 | |
| | | | |
NET INCREASE (DECREASE) IN NET ASSETS RESULTING FROM OPERATIONS | | $ | 34,494,526 | |
| | | | |
See Notes to Financial Statements.
65
EQ ADVISORS TRUST
AXA/HORIZON SMALL CAP VALUE PORTFOLIO
STATEMENT OF CHANGES IN NET ASSETS
| | | | | | | | |
| | | Year Ended December 31, | |
| | 2016 | | | 2015 | |
INCREASE (DECREASE) IN NET ASSETS FROM OPERATIONS: | |
Net investment income (loss) | | $ | 1,243,136 | | | $ | 774,156 | |
Net realized gain (loss) on investments, futures, foreign currency transactions and net distributions of realized gain received from underlying funds | | | 6,973,025 | | | | 6,311,731 | |
Net change in unrealized appreciation (depreciation) on investments, futures and foreign currency translations | | | 26,278,365 | | | | (21,173,698 | ) |
| | | | | | | | |
NET INCREASE (DECREASE) IN NET ASSETS RESULTING FROM OPERATIONS | | | 34,494,526 | | | | (14,087,811 | ) |
| | | | | | | | |
DIVIDENDS AND DISTRIBUTIONS: | | | | | | | | |
Dividends from net investment income | | | | | | | | |
Class IB | | | (1,646 | ) | | | — | |
Class K | | | (791,438 | ) | | | (305,814 | ) |
| | | | | | | | |
| | | (793,084 | ) | | | (305,814 | ) |
| | | | | | | | |
Distributions from net realized capital gains | | | | | | | | |
Class IB | | | (17,322 | ) | | | (6,599 | ) |
Class K | | | (8,019,068 | ) | | | (6,072,483 | ) |
| | | | | | | | |
| | | (8,036,390 | ) | | | (6,079,082 | ) |
| | | | | | | | |
Return of capital | | | | | | | | |
Class IB | | | (9,168 | ) | | | (431 | ) |
Class K | | | (4,409,629 | ) | | | (388,266 | ) |
| | | | | | | | |
| | | (4,418,797 | ) | | | (388,697 | ) |
| | | | | | | | |
TOTAL DIVIDENDS AND DISTRIBUTIONS | | | (13,248,271 | ) | | | (6,773,593 | ) |
| | | | | | | | |
CAPITAL SHARES TRANSACTIONS: | | | | | | | | |
Class IB | | | | | | | | |
Capital shares sold [ 22,501 and 18,672 shares, respectively ] | | | 212,467 | | | | 181,093 | |
Capital shares issued in reinvestment of dividends and distributions [ 2,842 and 831 shares,
respectively ] | | | 28,136 | | | | 7,030 | |
Capital shares repurchased [ (2,303) and (2,692) shares, respectively ] | | | (21,743 | ) | | | (27,319 | ) |
| | | | | | | | |
Total Class IB transactions | | | 218,860 | | | | 160,804 | |
| | | | | | | | |
Class K | | | | | | | | |
Capital shares sold [ 965,278 and 2,707,991 shares, respectively ] | | | 8,280,365 | | | | 25,125,963 | |
Capital shares issued in reinvestment of dividends and distributions [ 1,336,950 and 800,610 shares,
respectively ] | | | 13,220,135 | | | | 6,766,563 | |
Capital shares repurchased [ (2,159,670) and (3,081,169) shares, respectively ] | | | (18,743,864 | ) | | | (28,699,577 | ) |
| | | | | | | | |
Total Class K transactions | | | 2,756,636 | | | | 3,192,949 | |
| | | | | | | | |
NET INCREASE (DECREASE) IN NET ASSETS RESULTING FROM CAPITAL SHARE TRANSACTIONS | | | 2,975,496 | | | | 3,353,753 | |
| | | | | | | | |
TOTAL INCREASE (DECREASE) IN NET ASSETS | | | 24,221,751 | | | | (17,507,651 | ) |
NET ASSETS: | |
Beginning of year | | | 149,452,156 | | | | 166,959,807 | |
| | | | | | | | |
End of year (a) | | $ | 173,673,907 | | | $ | 149,452,156 | |
| | | | | | | | |
(a) Includes accumulated undistributed (overdistributed) net investment income (loss) of | | $ | 52,569 | | | $ | 8,107 | |
| | | | | | | | |
See Notes to Financial Statements.
66
EQ ADVISORS TRUST
AXA/HORIZON SMALL CAP VALUE PORTFOLIO
FINANCIAL HIGHLIGHTS
| | | | | | | | | | | | | | | | |
| Class IB | | Year Ended
December 31, 2016 | | | May 1, 2015** to December 31, 2015 | | | January 1, 2015 to April 13, 2015‡ | | | April 21, 2014* to
December 31, 2014 | |
Net asset value, beginning of period | | $ | 8.55 | | | $ | 10.00 | | | $ | 9.79 | | | $ | 10.00 | |
| | | | | | | | | | | | | | | | |
Income (loss) from investment operations: | | | | | | | | | | | | | | | | |
Net investment income (loss) (e) | | | 0.06 | | | | 0.03 | | | | — | # | | | 0.02 | |
Net realized and unrealized gain (loss) on investments, futures and foreign currency transactions | | | 2.02 | | | | (1.10 | ) | | | 0.41 | | | | 0.06 | |
| | | | | | | | | | | | | | | | |
Total from investment operations | | | 2.08 | | | | (1.07 | ) | | | 0.41 | | | | 0.08 | |
| | | | | | | | | | | | | | | | |
Less distributions: | | | | | | | | | |
Dividends from net investment income | | | (0.03 | ) | | | — | | | | — | | | | — | # |
Distributions from net realized gains | | | (0.50 | ) | | | (0.36 | ) | | | — | | | | (0.27 | ) |
Return of capital | | | (0.26 | ) | | | (0.02 | ) | | | — | | | | (0.02 | ) |
| | | | | | | | | | | | | | | | |
Total dividends and distributions | | | (0.79 | ) | | | (0.38 | ) | | | — | | | | (0.29 | ) |
| | | | | | | | | | | | | | | | |
Net asset value, end of period | | $ | 9.84 | | | $ | 8.55 | | | $ | 10.20 | | | $ | 9.79 | |
| | | | | | | | | | | | | | | | |
Total return (b) | | | 24.19 | % | | | (10.63 | )% | | | 4.19 | % | | | 0.73 | % |
| | | | | | | | | | | | | | | | |
Ratios/Supplemental Data: | | | | | | | | | |
Net assets, end of period (000’s) | | $ | 418 | | | $ | 166 | | | $ | — | | | $ | 25 | |
Ratio of expenses to average net assets: | | | | | | | | | | | | | | | | |
After waivers (a)(f) | | | 1.18 | % | | | 1.22 | % | | | 1.25 | % | | | 1.25 | % |
Before waivers (a)(f) | | | 1.27 | % | | | 1.24 | % | | | 1.25 | % | | | 5.75 | % |
Ratio of net investment income (loss) to average net assets: | | | | | | | | | | | | | | | | |
After waivers (a)(f) | | | 0.61 | % | | | 0.41 | %(l) | | | 0.15 | %(l) | | | 0.30 | %(l) |
Before waivers (a)(f) | | | 0.52 | % | | | 0.39 | %(l) | | | 0.15 | %(l) | | | (4.20 | )%(l) |
Portfolio turnover rate (z)^ | | | 23 | % | | | 17 | % | | | 17 | % | | | 18 | % |
| | | | | | | | | | | | |
| | | Year Ended December 31, | | | April 21, 2014* to
December 31, 2014 | |
| | | | | |
| Class K | | 2016 | | | 2015 | | |
Net asset value, beginning of period | | $ | 8.54 | | | $ | 9.79 | | | $ | 10.00 | |
| | | | | | | | | | | | |
Income (loss) from investment operations: | | | | | | | | | | | | |
Net investment income (loss) (e) | | | 0.07 | | | | 0.05 | | | | 0.04 | |
Net realized and unrealized gain (loss) on investments, futures and foreign currency transactions | | | 2.03 | | | | (0.90 | ) | | | 0.05 | |
| | | | | | | | | | | | |
Total from investment operations | | | 2.10 | | | | (0.85 | ) | | | 0.09 | |
| | | | | | | | | | | | |
Less distributions: | |
Dividends from net investment income | | | (0.04 | ) | | | (0.02 | ) | | | (0.01 | ) |
Distributions from net realized gains | | | (0.50 | ) | | | (0.36 | ) | | | (0.27 | ) |
Return of capital | | | (0.27 | ) | | | (0.02 | ) | | | (0.02 | ) |
| | | | | | | | | | | | |
Total dividends and distributions | | | (0.81 | ) | | | (0.40 | ) | | | (0.30 | ) |
| | | | | | | | | | | | |
Net asset value, end of period | | $ | 9.83 | | | $ | 8.54 | | | $ | 9.79 | |
| | | | | | | | | | | | |
Total return (b) | | | 24.54 | % | | | (8.58 | )% | | | 0.91 | % |
| | | | | | | | | | | | |
Ratios/Supplemental Data: | |
Net assets, end of period (000’s) | | $ | 173,256 | | | $ | 149,286 | | | $ | 166,935 | |
Ratio of expenses to average net assets: | | | | | | | | | | | | |
After waivers (a)(f) | | | 0.93 | % | | | 0.98 | % | | | 1.00 | % |
Before waivers (a)(f) | | | 1.02 | % | | | 0.99 | % | | | 1.03 | % |
Ratio of net investment income (loss) to average net assets: | | | | | | | | | | | | |
After waivers (a)(f) | | | 0.82 | % | | | 0.48 | % | | | 0.55 | %(l) |
Before waivers (a)(f) | | | 0.73 | % | | | 0.48 | % | | | 0.52 | %(l) |
Portfolio turnover rate (z)^ | | | 23 | % | | | 17 | % | | | 18 | % |
See Notes to Financial Statements.
67
EQ ADVISORS TRUST
AXA/HORIZON SMALL CAP VALUE PORTFOLIO
FINANCIAL HIGHLIGHTS (Continued)
| * | Commencement of Operations. |
| ‡ | After the close of business on April 13, 2015, operations ceased and shares were fully redeemed. |
| # | Per share amount is less than $0.005. |
| ^ | Portfolio turnover rate excludes derivatives, if any. |
| (a) | Ratios for periods less than one year are annualized. |
| (b) | Total returns for periods less than one year are not annualized. |
| (e) | Net investment income (loss) per share is based on average shares outstanding. |
| (f) | Expenses do not include the expenses of the underlying funds (“indirect expenses”), if applicable. |
| (l) | The annualized ratio of net investment income to average net assets may not be indicative of operating results for a full year. |
| (z) | Portfolio turnover rate for periods less than one year is not annualized. |
See Notes to Financial Statements.
68
EQ ADVISORS TRUST
AXA/PACIFIC GLOBAL SMALL CAP VALUE PORTFOLIO
PORTFOLIO OF INVESTMENTS
December 31, 2016
| | | | | | | | |
| | | Number of
Shares | | | Value
(Note 1) | |
| | | | | | | | |
COMMON STOCKS: | |
Consumer Discretionary (12.4%) | |
Auto Components (2.3%) | |
Cooper Tire & Rubber Co. | | | 4,406 | | | $ | 171,173 | |
Cooper-Standard Holdings, Inc.* | | | 86 | | | | 8,891 | |
Dana, Inc. | | | 11,872 | | | | 225,330 | |
Federal-Mogul Holdings Corp.* | | | 2,433 | | | | 25,084 | |
Gentherm, Inc.* | | | 90,000 | | | | 3,046,500 | |
Metaldyne Performance Group, Inc. | | | 466 | | | | 10,695 | |
Modine Manufacturing Co.* | | | 3,789 | | | | 56,456 | |
Motorcar Parts of America, Inc.* | | | 101 | | | | 2,719 | |
Spartan Motors, Inc. | | | 2,614 | | | | 24,179 | |
Standard Motor Products, Inc. | | | 691 | | | | 36,775 | |
Strattec Security Corp. | | | 270 | | | | 10,881 | |
Superior Industries International, Inc. | | | 1,999 | | | | 52,674 | |
Tower International, Inc. | | | 1,657 | | | | 46,976 | |
| | | | | | | | |
| | | | | | | 3,718,333 | |
| | | | | | | | |
Distributors (0.0%) | |
Weyco Group, Inc. | | | 428 | | | | 13,396 | |
| | | | | | | | |
Diversified Consumer Services (0.4%) | |
American Public Education, Inc.* | | | 1,246 | | | | 30,589 | |
Apollo Education Group, Inc.* | | | 6,910 | | | | 68,409 | |
Ascent Capital Group, Inc., Class A* | | | 835 | | | | 13,577 | |
Bridgepoint Education, Inc.* | | | 1,479 | | | | 14,982 | |
Cambium Learning Group, Inc.* | | | 964 | | | | 4,810 | |
Capella Education Co. | | | 60 | | | | 5,268 | |
Career Education Corp.* | | | 5,368 | | | | 54,163 | |
Carriage Services, Inc. | | | 94 | | | | 2,692 | |
Chegg, Inc. (x)* | | | 3,726 | | | | 27,498 | |
DeVry Education Group, Inc. | | | 4,979 | | | | 155,345 | |
Houghton Mifflin Harcourt Co.* | | | 3,313 | | | | 35,946 | |
K12, Inc.* | | | 2,731 | | | | 46,864 | |
Liberty Tax, Inc. | | | 118 | | | | 1,581 | |
Regis Corp.* | | | 2,999 | | | | 43,546 | |
Sotheby’s* | | | 1,710 | | | | 68,161 | |
Strayer Education, Inc.* | | | 479 | | | | 38,622 | |
Weight Watchers International, Inc. (x)* | | | 198 | | | | 2,267 | |
| | | | | | | | |
| | | | | | | 614,320 | |
| | | | | | | | |
Hotels, Restaurants & Leisure (0.7%) | |
Belmond Ltd., Class A* | | | 6,748 | | | | 90,086 | |
Biglari Holdings, Inc.* | | | 74 | | | | 35,017 | |
Caesars Acquisition Co., Class A* | | | 3,769 | | | | 50,881 | |
Caesars Entertainment Corp. (x)* | | | 4,476 | | | | 38,046 | |
Carrols Restaurant Group, Inc.* | | | 274 | | | | 4,178 | |
Century Casinos, Inc.* | | | 858 | | | | 7,061 | |
Cracker Barrel Old Country Store, Inc. (x) | | | 81 | | | | 13,525 | |
Del Frisco’s Restaurant Group, Inc.* | | | 1,758 | | | | 29,886 | |
Del Taco Restaurants, Inc.* | | | 1,902 | | | | 26,856 | |
Denny’s Corp.* | | | 1,632 | | | | 20,939 | |
DineEquity, Inc. | | | 612 | | | | 47,124 | |
El Pollo Loco Holdings, Inc. (x)* | | | 1,644 | | | | 20,221 | |
Eldorado Resorts, Inc. (x)* | | | 212 | | | | 3,593 | |
Empire Resorts, Inc. (x)* | | | 232 | | | | 5,278 | |
Fiesta Restaurant Group, Inc.* | | | 390 | | | | 11,641 | |
| | | | | | | | |
| | | | | | | | |
Fogo De Chao, Inc.* | | | 402 | | | $ | 5,769 | |
Golden Entertainment, Inc. | | | 650 | | | | 7,872 | |
ILG, Inc. | | | 8,233 | | | | 149,594 | |
International Speedway Corp., Class A | | | 2,108 | | | | 77,574 | |
Intrawest Resorts Holdings, Inc.* | | | 1,294 | | | | 23,098 | |
J Alexander’s Holdings, Inc.* | | | 1,073 | | | | 11,535 | |
Jack in the Box, Inc. | | | 577 | | | | 64,416 | |
Kona Grill, Inc. (x)* | | | 297 | | | | 3,727 | |
La Quinta Holdings, Inc.* | | | 5,431 | | | | 77,175 | |
Luby’s, Inc.* | | | 1,561 | | | | 6,681 | |
Marcus Corp. (The) | | | 1,472 | | | | 46,368 | |
Marriott Vacations Worldwide Corp. | | | 1,670 | | | | 141,700 | |
Monarch Casino & Resort, Inc.* | | | 825 | | | | 21,269 | |
Noodles & Co. (x)* | | | 301 | | | | 1,234 | |
Penn National Gaming, Inc.* | | | 843 | | | | 11,625 | |
Pinnacle Entertainment, Inc.* | | | 4,013 | | | | 58,189 | |
Red Lion Hotels Corp.* | | | 1,093 | | | | 9,127 | |
Red Robin Gourmet Burgers, Inc.* | | | 827 | | | | 46,643 | |
Ruby Tuesday, Inc.* | | | 4,844 | | | | 15,646 | |
Speedway Motorsports, Inc. | | | 944 | | | | 20,456 | |
| | | | | | | | |
| | | | | | | 1,204,030 | |
| | | | | | | | |
Household Durables (0.6%) | |
Bassett Furniture Industries, Inc. | | | 356 | | | | 10,822 | |
Beazer Homes USA, Inc. (x)* | | | 2,577 | | | | 34,274 | |
Century Communities, Inc.* | | | 1,133 | | | | 23,793 | |
CSS Industries, Inc. | | | 690 | | | | 18,678 | |
Flexsteel Industries, Inc. | | | 504 | | | | 31,082 | |
GoPro, Inc., Class A (x)* | | | 8,178 | | | | 71,230 | |
Green Brick Partners, Inc.* | | | 1,907 | | | | 19,165 | |
Hooker Furniture Corp. | | | 818 | | | | 31,043 | |
Hovnanian Enterprises, Inc., Class A (x)* | | | 9,887 | | | | 26,992 | |
KB Home (x) | | | 5,261 | | | | 83,176 | |
La-Z-Boy, Inc. | | | 2,279 | | | | 70,763 | |
LGI Homes, Inc. (x)* | | | 81 | | | | 2,327 | |
Libbey, Inc. | | | 1,634 | | | | 31,798 | |
Lifetime Brands, Inc. | | | 890 | | | | 15,798 | |
M.D.C. Holdings, Inc. | | | 2,058 | | | | 52,808 | |
M/I Homes, Inc.* | | | 1,540 | | | | 38,777 | |
Meritage Homes Corp.* | | | 2,857 | | | | 99,424 | |
NACCO Industries, Inc., Class A | | | 310 | | | | 28,071 | |
New Home Co., Inc. (The)* | | | 836 | | | | 9,790 | |
TopBuild Corp.* | | | 2,679 | | | | 95,372 | |
TRI Pointe Group, Inc.* | | | 11,149 | | | | 127,991 | |
UCP, Inc., Class A* | | | 641 | | | | 7,724 | |
WCI Communities, Inc.* | | | 1,758 | | | | 41,225 | |
William Lyon Homes, Class A (x)* | | | 1,944 | | | | 36,994 | |
ZAGG, Inc.* | | | 1,946 | | | | 13,817 | |
| | | | | | | | |
| | | | | | | 1,022,934 | |
| | | | | | | | |
Internet & Direct Marketing Retail (0.0%) | |
1-800-Flowers.com, Inc., Class A* | | | 1,515 | | | | 16,211 | |
FTD Cos., Inc.* | | | 1,401 | | | | 33,400 | |
Gaia, Inc.* | | | 329 | | | | 2,846 | |
Lands’ End, Inc. (x)* | | | 1,203 | | | | 18,225 | |
| | | | | | | | |
| | | | | | | 70,682 | |
| | | | | | | | |
See Notes to Financial Statements.
69
EQ ADVISORS TRUST
AXA/PACIFIC GLOBAL SMALL CAP VALUE PORTFOLIO
PORTFOLIO OF INVESTMENTS (Continued)
December 31, 2016
| | | | | | | | |
| | | Number of
Shares | | | Value
(Note 1) | |
| | | | | | | | |
| | | | | | | | |
Leisure Products (0.1%) | |
Acushnet Holdings Corp.* | | | 624 | | | $ | 12,299 | |
Arctic Cat, Inc. | | | 616 | | | | 9,252 | |
Callaway Golf Co. | | | 4,738 | | | | 51,929 | |
Escalade, Inc. | | | 806 | | | | 10,639 | |
JAKKS Pacific, Inc. (x)* | | | 1,211 | | | | 6,237 | |
Johnson Outdoors, Inc., Class A | | | 383 | | | | 15,201 | |
| | | | | | | | |
| | | | | | | 105,557 | |
| | | | | | | | |
Media (1.0%) | |
AMC Entertainment Holdings, Inc., Class A | | | 1,852 | | | | 62,320 | |
Daily Journal Corp. (x)* | | | 28 | | | | 6,770 | |
Entercom Communications Corp., Class A | | | 2,095 | | | | 32,053 | |
Eros International plc (x)* | | | 2,380 | | | | 31,059 | |
EW Scripps Co. (The), Class A* | | | 4,721 | | | | 91,257 | |
Gannett Co., Inc. | | | 9,473 | | | | 91,983 | |
Global Eagle Entertainment, Inc. (x)* | | | 3,493 | | | | 22,565 | |
Gray Television, Inc.* | | | 1,956 | | | | 21,223 | |
Hemisphere Media Group, Inc.* | | | 66 | | | | 739 | |
Liberty Media Corp-Liberty Braves, Class A* | | | 691 | | | | 14,158 | |
Liberty Media Corp-Liberty Braves, Class C* | | | 2,359 | | | | 48,572 | |
Liberty Media Corp-Liberty Media, Class A* | | | 1,531 | | | | 47,997 | |
Liberty Media Corp-Liberty Media, Class C* | | | 3,090 | | | | 96,810 | |
MDC Partners, Inc., Class A | | | 2,898 | | | | 18,982 | |
Media General, Inc.* | | | 8,766 | | | | 165,064 | |
Meredith Corp. | | | 3,023 | | | | 178,810 | |
MSG Networks, Inc., Class A* | | | 3,198 | | | | 68,757 | |
National CineMedia, Inc. | | | 5,023 | | | | 73,989 | |
New Media Investment Group, Inc. | | | 2,751 | | | | 43,988 | |
New York Times Co. (The), Class A | | | 10,047 | | | | 133,625 | |
Reading International, Inc., Class A* | | | 978 | | | | 16,235 | |
Saga Communications, Inc., Class A | | | 283 | | | | 14,235 | |
Salem Media Group, Inc. | | | 895 | | | | 5,594 | |
Scholastic Corp. | | | 2,187 | | | | 103,861 | |
Time, Inc. | | | 8,208 | | | | 146,513 | |
Townsquare Media, Inc., Class A* | | | 703 | | | | 7,318 | |
tronc, Inc. (x) | | | 875 | | | | 12,136 | |
| | | | | | | | |
| | | | | | | 1,556,613 | |
| | | | | | | | |
Multiline Retail (0.1%) | |
Fred’s, Inc., Class A (x) | | | 2,672 | | | | 49,592 | |
Sears Holdings Corp. (x)* | | | 711 | | | | 6,605 | |
Tuesday Morning Corp.* | | | 3,605 | | | | 19,467 | |
| | | | | | | | |
| | | | | | | 75,664 | |
| | | | | | | | |
Specialty Retail (6.9%) | |
Aaron’s, Inc. | | | 5,246 | | | | 167,820 | |
Abercrombie & Fitch Co., Class A (x) | | | 5,500 | | | | 66,000 | |
American Eagle Outfitters, Inc. | | | 1,332 | | | | 20,206 | |
America’s Car-Mart, Inc.* | | | 635 | | | | 27,781 | |
| | | | | | | | |
| | | | | | | | |
Ascena Retail Group, Inc.* | | | 9,211 | | | $ | 57,016 | |
At Home Group, Inc.* | | | 410 | | | | 5,998 | |
Barnes & Noble Education, Inc.* | | | 3,226 | | | | 37,002 | |
Barnes & Noble, Inc. | | | 5,080 | | | | 56,642 | |
Big 5 Sporting Goods Corp. | | | 1,418 | | | | 24,602 | |
Boot Barn Holdings, Inc. (x)* | | | 1,064 | | | | 13,321 | |
Buckle, Inc. (The) (x) | | | 1,519 | | | | 34,633 | |
Build-A-Bear Workshop, Inc.* | | | 999 | | | | 13,736 | |
Caleres, Inc. | | | 3,397 | | | | 111,490 | |
Camping World Holdings, Inc., Class A | | | 52 | | | | 1,695 | |
Cato Corp. (The), Class A | | | 1,647 | | | | 49,542 | |
Chico’s FAS, Inc. | | | 1,044 | | | | 15,023 | |
Citi Trends, Inc. | | | 1,133 | | | | 21,346 | |
Conn’s, Inc.* | | | 286,586 | | | | 3,625,313 | |
Container Store Group, Inc. (The) (x)* | | | 981 | | | | 6,229 | |
Destination XL Group, Inc.* | | | 858 | | | | 3,646 | |
DSW, Inc., Class A | | | 5,356 | | | | 121,313 | |
Express, Inc.* | | | 5,990 | | | | 64,452 | |
Finish Line, Inc. (The), Class A (x) | | | 2,322 | | | | 43,677 | |
Genesco, Inc.* | | | 1,438 | | | | 89,300 | |
Group 1 Automotive, Inc. | | | 1,286 | | | | 100,231 | |
Guess?, Inc. (x) | | | 4,917 | | | | 59,496 | |
Haverty Furniture Cos., Inc. | | | 1,482 | | | | 35,123 | |
Hibbett Sports, Inc. (x)* | | | 73,379 | | | | 2,737,037 | |
Kirkland’s, Inc.* | | | 668 | | | | 10,361 | |
Lumber Liquidators Holdings, Inc. (x)* | | | 2,125 | | | | 33,447 | |
MarineMax, Inc.* | | | 874 | | | | 16,912 | |
Office Depot, Inc. | | | 44,051 | | | | 199,111 | |
Party City Holdco, Inc. (x)* | | | 1,213 | | | | 17,225 | |
Pier 1 Imports, Inc. | | | 5,547 | | | | 47,371 | |
Rent-A-Center, Inc. | | | 4,163 | | | | 46,834 | |
Restoration Hardware Holdings, Inc. (x)* | | | 3,115 | | | | 95,631 | |
Sears Hometown and Outlet Stores, Inc. (x)* | | | 948 | | | | 4,456 | |
Shoe Carnival, Inc. (x) | | | 1,035 | | | | 27,924 | |
Sonic Automotive, Inc., Class A | | | 122,268 | | | | 2,799,937 | |
Sportsman’s Warehouse Holdings, Inc.* | | | 143 | | | | 1,343 | |
Stage Stores, Inc. (x) | | | 2,125 | | | | 9,286 | |
Tailored Brands, Inc. | | | 2,751 | | | | 70,288 | |
Tilly’s, Inc., Class A* | | | 955 | | | | 12,596 | |
Vitamin Shoppe, Inc.* | | | 1,827 | | | | 43,391 | |
West Marine, Inc.* | | | 1,478 | | | | 15,475 | |
Zumiez, Inc. (x)* | | | 1,450 | | | | 31,683 | |
| | | | | | | | |
| | | | | | | 11,092,941 | |
| | | | | | | | |
Textiles, Apparel & Luxury Goods (0.3%) | |
Deckers Outdoor Corp.* | | | 2,414 | | | | 133,711 | |
Delta Apparel, Inc.* | | | 575 | | | | 11,920 | |
Fossil Group, Inc. (x)* | | | 3,340 | | | | 86,372 | |
G-III Apparel Group Ltd.* | | | 696 | | | | 20,574 | |
Iconix Brand Group, Inc.* | | | 3,470 | | | | 32,410 | |
Movado Group, Inc. | | | 1,236 | | | | 35,535 | |
Perry Ellis International, Inc.* | | | 996 | | | | 24,810 | |
Sequential Brands Group, Inc.* | | | 3,338 | | | | 15,622 | |
Unifi, Inc.* | | | 1,251 | | | | 40,820 | |
Vera Bradley, Inc.* | | | 501 | | | | 5,872 | |
See Notes to Financial Statements.
70
EQ ADVISORS TRUST
AXA/PACIFIC GLOBAL SMALL CAP VALUE PORTFOLIO
PORTFOLIO OF INVESTMENTS (Continued)
December 31, 2016
| | | | | | | | |
| | | Number of
Shares | | | Value
(Note 1) | |
| | | | | | | | |
| | | | | | | | |
Vince Holding Corp. (x)* | | | 1,596 | | | $ | 6,464 | |
Wolverine World Wide, Inc. | | | 6,507 | | | | 142,829 | |
| | | | | | | | |
| | | | | | | 556,939 | |
| | | | | | | | |
Total Consumer Discretionary | | | | | | | 20,031,409 | |
| | | | | | | | |
Consumer Staples (4.0%) | |
Beverages (0.0%) | |
Craft Brew Alliance, Inc. (x)* | | | 690 | | | | 11,661 | |
| | | | | | | | |
Food & Staples Retailing (1.7%) | |
Andersons, Inc. (The) | | | 2,123 | | | | 94,898 | |
Chefs’ Warehouse, Inc. (The)* | | | 133,139 | | | | 2,103,596 | |
Ingles Markets, Inc., Class A | | | 1,101 | | | | 52,958 | |
Natural Grocers by Vitamin Cottage, Inc. (x)* | | | 752 | | | | 8,941 | |
Smart & Final Stores, Inc. (x)* | | | 597 | | | | 8,418 | |
SpartanNash Co. | | | 2,933 | | | | 115,971 | |
SUPERVALU, Inc.* | | | 21,418 | | | | 100,022 | |
United Natural Foods, Inc.* | | | 3,952 | | | | 188,589 | |
Village Super Market, Inc., Class A | | | 584 | | | | 18,046 | |
Weis Markets, Inc. | | | 757 | | | | 50,598 | |
| | | | | | | | |
| | | | | | | 2,742,037 | |
| | | | | | | | |
Food Products (2.0%) | |
AdvancePierre Foods Holdings, Inc. | | | 635 | | | | 18,910 | |
Alico, Inc. | | | 246 | | | | 6,679 | |
Cal-Maine Foods, Inc. (x) | | | 554 | | | | 24,473 | |
Darling Ingredients, Inc.* | | | 179,552 | | | | 2,318,016 | |
Dean Foods Co. | | | 3,691 | | | | 80,390 | |
Fresh Del Monte Produce, Inc. | | | 2,445 | | | | 148,240 | |
John B. Sanfilippo & Son, Inc. | | | 492 | | | | 34,632 | |
Landec Corp.* | | | 1,621 | | | | 22,370 | |
Limoneira Co. | | | 85 | | | | 1,828 | |
Omega Protein Corp.* | | | 1,659 | | | | 41,558 | |
Sanderson Farms, Inc. (x) | | | 1,611 | | | | 151,821 | |
Seaboard Corp.* | | | 21 | | | | 82,992 | |
Seneca Foods Corp., Class A* | | | 520 | | | | 20,826 | |
Snyder’s-Lance, Inc. | | | 6,423 | | | | 246,258 | |
| | | | | | | | |
| | | | | | | 3,198,993 | |
| | | | | | | | |
Household Products (0.1%) | |
Central Garden & Pet Co. (x)* | | | 722 | | | | 23,891 | |
Central Garden & Pet Co., Class A* | | | 2,330 | | | | 71,997 | |
Oil-Dri Corp. of America | | | 381 | | | | 14,558 | |
| | | | | | | | |
| | | | | | | 110,446 | |
| | | | | | | | |
Personal Products (0.1%) | |
Avon Products, Inc.* | | | 27,773 | | | | 139,976 | |
elf Beauty, Inc. (x)* | | | 389 | | | | 11,258 | |
Inter Parfums, Inc. | | | 768 | | | | 25,152 | |
Nature’s Sunshine Products, Inc. | | | 647 | | | | 9,705 | |
Nutraceutical International Corp. | | | 655 | | | | 22,892 | |
Revlon, Inc., Class A* | | | 666 | | | | 19,414 | |
Synutra International, Inc.* | | | 1,303 | | | | 6,971 | |
| | | | | | | | |
| | | | | | | 235,368 | |
| | | | | | | | |
Tobacco (0.1%) | |
Alliance One International, Inc.* | | | 700 | | | | 13,440 | |
Turning Point Brands, Inc.* | | | 231 | | | | 2,830 | |
| | | | | | | | |
| | | | | | | | |
Universal Corp. | | | 1,781 | | | $ | 113,539 | |
Vector Group Ltd. (x) | | | 4,233 | | | | 96,258 | |
| | | | | | | | |
| | | | | | | 226,067 | |
| | | | | | | | |
Total Consumer Staples | | | | | | | 6,524,572 | |
| | | | | | | | |
Energy (11.6%) | |
Energy Equipment & Services (9.7%) | |
Archrock, Inc. | | | 5,585 | | | | 73,722 | |
Atwood Oceanics, Inc. (x) | | | 4,887 | | | | 64,166 | |
Bristow Group, Inc. (x) | | | 2,711 | | | | 55,521 | |
CARBO Ceramics, Inc. (x)* | | | 1,569 | | | | 16,412 | |
Dawson Geophysical Co.* | | | 1,636 | | | | 13,153 | |
Era Group, Inc.* | | | 1,581 | | | | 26,830 | |
Exterran Corp.* | | | 2,558 | | | | 61,136 | |
Fairmount Santrol Holdings, Inc. (x)* | | | 7,115 | | | | 83,886 | |
Forum Energy Technologies, Inc.* | | | 4,826 | | | | 106,172 | |
Geospace Technologies Corp. (x)* | | | 1,047 | | | | 21,317 | |
Helix Energy Solutions Group, Inc.* | | | 228,060 | | | | 2,011,489 | |
Hornbeck Offshore Services, Inc. (x)* | | | 217,666 | | | | 1,571,549 | |
Independence Contract Drilling, Inc.* | | | 2,439 | | | | 16,341 | |
Mammoth Energy Services, Inc.* | | | 407 | | | | 6,186 | |
Matrix Service Co.* | | | 130,133 | | | | 2,954,019 | |
McDermott International, Inc.* | | | 19,232 | | | | 142,125 | |
Natural Gas Services Group, Inc.* | | | 103,955 | | | | 3,342,153 | |
Newpark Resources, Inc.* | | | 6,641 | | | | 49,808 | |
Noble Corp. plc (x) | | | 250,000 | | | | 1,480,000 | |
North American Energy Partners, Inc. | | | 515,000 | | | | 1,982,750 | |
Oil States International, Inc.* | | | 4,124 | | | | 160,836 | |
Parker Drilling Co.* | | | 399,668 | | | | 1,039,137 | |
PHI, Inc. (Non-Voting)* | | | 873 | | | | 15,732 | |
Pioneer Energy Services Corp.* | | | 5,701 | | | | 39,052 | |
RigNet, Inc.* | | | 943 | | | | 21,830 | |
SEACOR Holdings, Inc.* | | | 1,283 | | | | 91,452 | |
Seadrill Ltd. (x)* | | | 30,387 | | | | 103,620 | |
Smart Sand, Inc.* | | | 796 | | | | 13,174 | |
Tesco Corp.* | | | 3,649 | | | | 30,104 | |
TETRA Technologies, Inc.* | | | 2,527 | | | | 12,686 | |
Tidewater, Inc. (x)* | | | 3,744 | | | | 12,767 | |
Unit Corp.* | | | 4,075 | | | | 109,495 | |
Willbros Group, Inc.* | | | 3,471 | | | | 11,246 | |
| | | | | | | | |
| | | | | | | 15,739,866 | |
| | | | | | | | |
Oil, Gas & Consumable Fuels (1.9%) | |
Abraxas Petroleum Corp. (x)* | | | 5,780 | | | | 14,855 | |
Adams Resources & Energy, Inc. | | | 166 | | | | 6,582 | |
Alon USA Energy, Inc. | | | 2,587 | | | | 29,440 | |
Ardmore Shipping Corp. | | | 2,303 | | | | 17,042 | |
Bill Barrett Corp. (x)* | | | 3,958 | | | | 27,666 | |
California Resources Corp. (x)* | | | 2,553 | | | | 54,353 | |
Clayton Williams Energy, Inc. (x)* | | | 481 | | | | 57,364 | |
Clean Energy Fuels Corp. (x)* | | | 7,029 | | | | 20,103 | |
Cobalt International Energy, Inc.* | | | 32,864 | | | | 40,094 | |
Contango Oil & Gas Co.* | | | 1,886 | | | | 17,615 | |
See Notes to Financial Statements.
71
EQ ADVISORS TRUST
AXA/PACIFIC GLOBAL SMALL CAP VALUE PORTFOLIO
PORTFOLIO OF INVESTMENTS (Continued)
December 31, 2016
| | | | | | | | |
| | | Number of
Shares | | | Value
(Note 1) | |
| | | | | | | | |
| | | | | | | | |
CVR Energy, Inc. (x) | | | 1,174 | | | $ | 29,808 | |
Delek U.S. Holdings, Inc. | | | 4,901 | | | | 117,967 | |
Denbury Resources, Inc.* | | | 28,226 | | | | 103,872 | |
DHT Holdings, Inc. | | | 7,409 | | | | 30,673 | |
Dorian LPG Ltd.* | | | 1,998 | | | | 16,404 | |
Earthstone Energy, Inc.* | | | 110 | | | | 1,511 | |
Eclipse Resources Corp.* | | | 4,604 | | | | 12,293 | |
EP Energy Corp., Class A (x)* | | | 3,063 | | | | 20,063 | |
Erin Energy Corp. (x)* | | | 925 | | | | 2,821 | |
EXCO Resources, Inc. (x)* | | | 11,123 | | | | 9,718 | |
Frontline Ltd. (x) | | | 5,216 | | | | 37,086 | |
GasLog Ltd. | | | 3,272 | | | | 52,679 | |
Gener8 Maritime, Inc.* | | | 3,281 | | | | 14,699 | |
Golar LNG Ltd. | | | 7,527 | | | | 172,669 | |
Green Plains, Inc. | | | 2,869 | | | | 79,902 | |
International Seaways, Inc.* | | | 1,181 | | | | 16,581 | |
Jones Energy, Inc., Class A (x)* | | | 4,550 | | | | 22,750 | |
Navios Maritime Acquisition Corp. | | | 6,395 | | | | 10,872 | |
Nordic American Tankers Ltd. (x) | | | 7,939 | | | | 66,688 | |
Northern Oil and Gas, Inc. (x)* | | | 3,711 | | | | 10,205 | |
Oasis Petroleum, Inc.* | | | 18,627 | | | | 282,013 | |
Overseas Shipholding Group, Inc., Class A | | | 3,208 | | | | 12,287 | |
Pacific Ethanol, Inc.* | | | 2,335 | | | | 22,182 | |
Panhandle Oil and Gas, Inc., Class A | | | 575 | | | | 13,541 | |
Par Pacific Holdings, Inc. (x)* | | | 1,538 | | | | 22,363 | |
PDC Energy, Inc.* | | | 4,477 | | | | 324,941 | |
Renewable Energy Group, Inc. (x)* | | | 2,859 | | | | 27,732 | |
REX American Resources Corp.* | | | 454 | | | | 44,832 | |
Ring Energy, Inc.* | | | 3,182 | | | | 41,334 | |
RSP Permian, Inc.* | | | 7,860 | | | | 350,713 | |
Sanchez Energy Corp. (x)* | | | 3,028 | | | | 27,343 | |
Scorpio Tankers, Inc. | | | 13,181 | | | | 59,710 | |
SemGroup Corp., Class A | | | 5,314 | | | | 221,860 | |
Ship Finance International Ltd. (x) | | | 4,868 | | | | 72,290 | |
Synergy Resources Corp. (x)* | | | 13,270 | | | | 118,236 | |
Teekay Corp. | | | 3,871 | | | | 31,084 | |
Teekay Tankers Ltd., Class A | | | 9,435 | | | | 21,323 | |
W&T Offshore, Inc.* | | | 2,830 | | | | 7,839 | |
Western Refining, Inc. | | | 6,446 | | | | 243,981 | |
Westmoreland Coal Co.* | | | 1,496 | | | | 26,434 | |
| | | | | | | | |
| | | | | | | 3,086,413 | |
| | | | | | | | |
Total Energy | | | | | | | 18,826,279 | |
| | | | | | | | |
Financials (21.1%) | |
Banks (12.2%) | |
1st Source Corp. | | | 1,251 | | | | 55,870 | |
Access National Corp. (x) | | | 655 | | | | 18,183 | |
ACNB Corp. | | | 469 | | | | 14,656 | |
Allegiance Bancshares, Inc.* | | | 798 | | | | 28,848 | |
American National Bankshares, Inc. | | | 641 | | | | 22,307 | |
Ameris Bancorp | | | 717 | | | | 31,261 | |
Ames National Corp. | | | 676 | | | | 22,308 | |
Arrow Financial Corp. | | | 894 | | | | 36,207 | |
Atlantic Capital Bancshares, Inc.* | | | 1,135 | | | | 21,565 | |
Banc of California, Inc. (x) | | | 1,101 | | | | 19,102 | |
| | | | | | | | |
| | | | | | | | |
BancFirst Corp. | | | 626 | | | $ | 58,249 | |
Banco Latinoamericano de Comercio Exterior SA, Class E | | | 2,451 | | | | 72,157 | |
Bancorp, Inc. (The)* | | | 4,049 | | | | 31,825 | |
BancorpSouth, Inc. | | | 6,911 | | | | 214,587 | |
Bank of Marin Bancorp | | | 475 | | | | 33,131 | |
Bank of NT Butterfield & Son Ltd. (The) | | | 759 | | | | 23,863 | |
Bankwell Financial Group, Inc. | | | 387 | | | | 12,577 | |
Banner Corp. | | | 2,413 | | | | 134,670 | |
Bar Harbor Bankshares | | | 474 | | | | 22,434 | |
Berkshire Hills Bancorp, Inc. | | | 2,495 | | | | 91,941 | |
Blue Hills Bancorp, Inc. | | | 1,802 | | | | 33,788 | |
BNC Bancorp | | | 2,966 | | | | 94,615 | |
Boston Private Financial Holdings, Inc. | | | 6,619 | | | | 109,544 | |
Bridge Bancorp, Inc. | | | 1,335 | | | | 50,597 | |
Brookline Bancorp, Inc. | | | 5,590 | | | | 91,676 | |
Bryn Mawr Bank Corp. | | | 1,333 | | | | 56,186 | |
BSB Bancorp, Inc.* | | | 629 | | | | 18,210 | |
C&F Financial Corp. | | | 258 | | | | 12,861 | |
California First National Bancorp | | | 152 | | | | 2,379 | |
Camden National Corp. | | | 1,221 | | | | 54,273 | |
Capital Bank Financial Corp., Class A | | | 1,133 | | | | 44,470 | |
Capital City Bank Group, Inc. | | | 915 | | | | 18,739 | |
Cardinal Financial Corp. | | | 2,366 | | | | 77,581 | |
Carolina Financial Corp. (x) | | | 821 | | | | 25,279 | |
Cascade Bancorp* | | | 2,617 | | | | 21,250 | |
Cathay General Bancorp | | | 5,924 | | | | 225,290 | |
CenterState Banks, Inc. | | | 3,746 | | | | 94,287 | |
Central Pacific Financial Corp. | | | 2,431 | | | | 76,382 | |
Central Valley Community Bancorp | | | 698 | | | | 13,932 | |
Century Bancorp, Inc., Class A | | | 248 | | | | 14,880 | |
Chemical Financial Corp. | | | 3,552 | | | | 192,412 | |
Chemung Financial Corp. (x) | | | 246 | | | | 8,942 | |
Citizens & Northern Corp. | | | 907 | | | | 23,763 | |
City Holding Co. | | | 1,166 | | | | 78,822 | |
CNB Financial Corp. | | | 1,112 | | | | 29,735 | |
CoBiz Financial, Inc. | | | 2,674 | | | | 45,164 | |
Codorus Valley Bancorp, Inc. (x) | | | 642 | | | | 18,361 | |
Columbia Banking System, Inc. | | | 4,660 | | | | 208,209 | |
Community Bank System, Inc. (x) | | | 3,461 | | | | 213,855 | |
Community Trust Bancorp, Inc. | | | 1,214 | | | | 60,214 | |
ConnectOne Bancorp, Inc. | | | 2,295 | | | | 59,555 | |
County Bancorp, Inc. | | | 116 | | | | 3,129 | |
CU Bancorp* | | | 1,139 | | | | 40,776 | |
Customers Bancorp, Inc.* | | | 1,177 | | | | 42,160 | |
CVB Financial Corp. | | | 8,056 | | | | 184,724 | |
Eagle Bancorp, Inc.* | | | 524 | | | | 31,938 | |
East West Bancorp, Inc. | | | 70,000 | | | | 3,558,100 | |
Enterprise Bancorp, Inc. | | | 731 | | | | 27,456 | |
Enterprise Financial Services Corp. | | | 1,536 | | | | 66,048 | |
Equity Bancshares, Inc., Class A* | | | 420 | | | | 14,129 | |
Farmers Capital Bank Corp. | | | 588 | | | | 24,725 | |
Farmers National Banc Corp. | | | 1,975 | | | | 28,045 | |
FB Financial Corp.* | | | 338 | | | | 8,771 | |
FCB Financial Holdings, Inc., Class A* | | | 2,429 | | | | 115,863 | |
Fidelity Southern Corp. | | | 1,669 | | | | 39,505 | |
See Notes to Financial Statements.
72
EQ ADVISORS TRUST
AXA/PACIFIC GLOBAL SMALL CAP VALUE PORTFOLIO
PORTFOLIO OF INVESTMENTS (Continued)
December 31, 2016
| | | | | | | | |
| | | Number of
Shares | | | Value
(Note 1) | |
| | | | | | | | |
| | | | | | | | |
Financial Institutions, Inc. | | | 1,094 | | | $ | 37,415 | |
First Bancorp | | | 1,580 | | | | 42,881 | |
First BanCorp* | | | 9,613 | | | | 63,542 | |
First Bancorp, Inc. | | | 794 | | | | 26,281 | |
First Busey Corp. | | | 2,491 | | | | 76,673 | |
First Business Financial Services, Inc. | | | 655 | | | | 15,537 | |
First Citizens BancShares, Inc., Class A | | | 607 | | | | 215,485 | |
First Commonwealth Financial Corp. | | | 7,146 | | | | 101,330 | |
First Community Bancshares, Inc. | | | 1,260 | | | | 37,976 | |
First Community Financial Partners, Inc. (x)* | | | 1,105 | | | | 12,929 | |
First Connecticut Bancorp, Inc. | | | 859 | | | | 19,456 | |
First Financial Bancorp | | | 4,894 | | | | 139,234 | |
First Financial Bankshares, Inc. (x) | | | 1,928 | | | | 87,146 | |
First Financial Corp. | | | 796 | | | | 42,029 | |
First Financial Northwest, Inc. | | | 617 | | | | 12,180 | |
First Foundation, Inc.* | | | 738 | | | | 21,033 | |
First Internet Bancorp | | | 425 | | | | 13,600 | |
First Interstate BancSystem, Inc., Class A (x) | | | 1,596 | | | | 67,910 | |
First Merchants Corp. | | | 3,257 | | | | 122,626 | |
First Mid-Illinois Bancshares, Inc. | | | 632 | | | | 21,488 | |
First Midwest Bancorp, Inc. | | | 6,452 | | | | 162,784 | |
First NBC Bank Holding Co. (x)* | | | 1,320 | | | | 9,636 | |
First Northwest Bancorp* | | | 913 | | | | 14,243 | |
First of Long Island Corp. (The) | | | 1,706 | | | | 48,706 | |
Flushing Financial Corp. | | | 2,247 | | | | 66,039 | |
FNB Corp. | | | 16,799 | | | | 269,288 | |
Franklin Financial Network, Inc. (x)* | | | 612 | | | | 25,612 | |
Fulton Financial Corp. | | | 13,720 | | | | 257,936 | |
German American Bancorp, Inc. | | | 1,132 | | | | 59,555 | |
Glacier Bancorp, Inc. | | | 6,119 | | | | 221,691 | |
Great Southern Bancorp, Inc. | | | 860 | | | | 46,999 | |
Great Western Bancorp, Inc. | | | 4,741 | | | | 206,660 | |
Green Bancorp, Inc.* | | | 1,673 | | | | 25,430 | |
Guaranty Bancorp | | | 1,214 | | | | 29,379 | |
Hancock Holding Co. | | | 6,174 | | | | 266,099 | |
Hanmi Financial Corp. | | | 2,536 | | | | 88,506 | |
HarborOne Bancorp, Inc.* | | | 1,077 | | | | 20,829 | |
Heartland Financial USA, Inc. | | | 1,777 | | | | 85,296 | |
Heritage Commerce Corp. | | | 1,877 | | | | 27,085 | |
Heritage Financial Corp. | | | 2,365 | | | | 60,899 | |
Heritage Oaks Bancorp | | | 1,949 | | | | 24,031 | |
Hilltop Holdings, Inc. | | | 6,028 | | | | 179,634 | |
HomeTrust Bancshares, Inc.* | | | 1,338 | | | | 34,654 | |
Hope Bancorp, Inc. | | | 10,245 | | | | 224,263 | |
Horizon Bancorp | | | 1,564 | | | | 43,792 | |
IBERIABANK Corp. | | | 3,492 | | | | 292,455 | |
Independent Bank Corp. | | | 3,707 | | | | 182,232 | |
Independent Bank Group, Inc. | | | 901 | | | | 56,222 | |
International Bancshares Corp. | | | 4,390 | | | | 179,112 | |
Investors Bancorp, Inc. | | | 23,746 | | | | 331,257 | |
Lakeland Bancorp, Inc. | | | 3,119 | | | | 60,821 | |
Lakeland Financial Corp. | | | 1,943 | | | | 92,020 | |
LCNB Corp. | | | 673 | | | | 15,647 | |
LegacyTexas Financial Group, Inc. | | | 3,560 | | | | 153,294 | |
| | | | | | | | |
| | | | | | | | |
Macatawa Bank Corp. | | | 2,113 | | | $ | 21,996 | |
MainSource Financial Group, Inc. | | | 1,846 | | | | 63,502 | |
MB Financial, Inc. | | | 6,056 | | | | 286,025 | |
MBT Financial Corp. (x) | | | 1,405 | | | | 15,947 | |
Mercantile Bank Corp. | | | 1,267 | | | | 47,766 | |
Merchants Bancshares, Inc. | | | 441 | | | | 23,902 | |
Middleburg Financial Corp. | | | 369 | | | | 12,823 | |
Midland States Bancorp, Inc. | | | 304 | | | | 10,999 | |
MidWestOne Financial Group, Inc. | | | 656 | | | | 24,666 | |
MutualFirst Financial, Inc. (x) | | | 419 | | | | 13,869 | |
National Bankshares, Inc./Virginia (x) | | | 531 | | | | 23,072 | |
National Commerce Corp.* | | | 673 | | | | 25,002 | |
NBT Bancorp, Inc. | | | 3,422 | | | | 143,313 | |
Nicolet Bankshares, Inc.* | | | 606 | | | | 28,900 | |
Northrim BanCorp, Inc. | | | 543 | | | | 17,159 | |
OFG Bancorp | | | 3,508 | | | | 45,955 | |
Old Line Bancshares, Inc. | | | 671 | | | | 16,091 | |
Old National Bancorp | | | 10,680 | | | | 193,842 | |
Old Second Bancorp, Inc. | | | 2,279 | | | | 25,183 | |
Opus Bank | | | 496 | | | | 14,905 | |
Orrstown Financial Services, Inc. | | | 581 | | | | 13,014 | |
Pacific Continental Corp. | | | 1,670 | | | | 36,490 | |
Pacific Mercantile Bancorp* | | | 1,219 | | | | 8,899 | |
Pacific Premier Bancorp, Inc.* | | | 1,453 | | | | 51,364 | |
Paragon Commercial Corp.* | | | 70 | | | | 3,060 | |
Park National Corp. | | | 1,068 | | | | 127,797 | |
Park Sterling Corp. | | | 2,799 | | | | 30,201 | |
Peapack-Gladstone Financial Corp. | | | 1,264 | | | | 39,032 | |
Penns Woods Bancorp, Inc. | | | 364 | | | | 18,382 | |
Peoples Bancorp, Inc. | | | 1,286 | | | | 41,744 | |
Peoples Financial Services Corp. | | | 547 | | | | 26,639 | |
People’s Utah Bancorp | | | 1,060 | | | | 28,461 | |
Pinnacle Financial Partners, Inc. | | | 3,000 | | | | 207,900 | |
Preferred Bank | | | 965 | | | | 50,585 | |
Premier Financial Bancorp, Inc. | | | 740 | | | | 14,874 | |
PrivateBancorp, Inc. | | | 6,284 | | | | 340,530 | |
Prosperity Bancshares, Inc. | | | 5,345 | | | | 383,664 | |
QCR Holdings, Inc. | | | 953 | | | | 41,265 | |
Renasant Corp. | | | 3,263 | | | | 137,764 | |
Republic Bancorp, Inc., Class A | | | 772 | | | | 30,525 | |
Republic First Bancorp, Inc.* | | | 3,672 | | | | 30,661 | |
S&T Bancorp, Inc. | | | 2,731 | | | | 106,618 | |
Sandy Spring Bancorp, Inc. | | | 1,884 | | | | 75,341 | |
Seacoast Banking Corp. of Florida* | | | 2,390 | | | | 52,723 | |
Shore Bancshares, Inc. | | | 1,011 | | | | 15,418 | |
Sierra Bancorp | | | 930 | | | | 24,729 | |
Simmons First National Corp., Class A (x) | | | 2,347 | | | | 145,866 | |
South State Corp. | | | 1,893 | | | | 165,448 | |
Southern First Bancshares, Inc.* | | | 455 | | | | 16,380 | |
Southern National Bancorp of Virginia, Inc. | | | 880 | | | | 14,379 | |
Southside Bancshares, Inc. | | | 1,975 | | | | 74,398 | |
Southwest Bancorp, Inc./Oklahoma | | | 1,451 | | | | 42,079 | |
State Bank Financial Corp. | | | 2,829 | | | | 75,987 | |
Sterling Bancorp | | | 10,126 | | | | 236,948 | |
Stock Yards Bancorp, Inc. | | | 1,709 | | | | 80,238 | |
See Notes to Financial Statements.
73
EQ ADVISORS TRUST
AXA/PACIFIC GLOBAL SMALL CAP VALUE PORTFOLIO
PORTFOLIO OF INVESTMENTS (Continued)
December 31, 2016
| | | | | | | | |
| | | Number of
Shares | | | Value
(Note 1) | |
| | | | | | | | |
Stonegate Bank | | | 992 | | | $ | 41,396 | |
Suffolk Bancorp | | | 917 | | | | 39,266 | |
Summit Financial Group, Inc. (x) | | | 665 | | | | 18,307 | |
Sun Bancorp, Inc. | | | 874 | | | | 22,724 | |
Texas Capital Bancshares, Inc.* | | | 3,624 | | | | 284,122 | |
Tompkins Financial Corp. (x) | | | 1,168 | | | | 110,423 | |
Towne Bank | | | 4,462 | | | | 148,362 | |
TriCo Bancshares | | | 1,621 | | | | 55,406 | |
TriState Capital Holdings, Inc.* | | | 1,772 | | | | 39,161 | |
Triumph Bancorp, Inc.* | | | 1,245 | | | | 32,557 | |
Trustmark Corp. | | | 5,407 | | | | 192,760 | |
UMB Financial Corp. | | | 3,580 | | | | 276,090 | |
Umpqua Holdings Corp. | | | 17,625 | | | | 330,998 | |
Union Bankshares Corp. | | | 3,507 | | | | 125,340 | |
United Bankshares, Inc. (x) | | | 5,241 | | | | 242,396 | |
United Community Banks, Inc. | | | 5,630 | | | | 166,761 | |
Univest Corp. of Pennsylvania | | | 1,976 | | | | 61,058 | |
Valley National Bancorp | | | 19,775 | | | | 230,181 | |
Veritex Holdings, Inc.* | | | 460 | | | | 12,287 | |
Washington Trust Bancorp, Inc. | | | 1,189 | | | | 66,643 | |
WashingtonFirst Bankshares, Inc. | | | 672 | | | | 19,481 | |
Webster Financial Corp. | | | 7,336 | | | | 398,198 | |
WesBanco, Inc. (x) | | | 3,244 | | | | 139,687 | |
West Bancorporation, Inc. | | | 1,259 | | | | 31,097 | |
Westamerica Bancorp (x) | | | 1,988 | | | | 125,105 | |
Wintrust Financial Corp. | | | 4,109 | | | | 298,190 | |
Xenith Bankshares, Inc.* | | | 489 | | | | 13,790 | |
Yadkin Financial Corp. | | | 4,011 | | | | 137,417 | |
| | | | | | | | |
| | | | | | | 19,768,741 | |
| | | | | | | | |
Capital Markets (1.3%) | |
Actua Corp.* | | | 2,886 | | | | 40,404 | |
Arlington Asset Investment Corp., Class A (x) | | | 1,806 | | | | 26,765 | |
Associated Capital Group, Inc., Class A | | | 365 | | | | 11,990 | |
B. Riley Financial, Inc. | | | 726 | | | | 13,395 | |
Calamos Asset Management, Inc., Class A | | | 1,341 | | | | 11,466 | |
Cowen Group, Inc., Class A (x)* | | | 1,957 | | | | 30,333 | |
FBR & Co. | | | 501 | | | | 6,513 | |
GAIN Capital Holdings, Inc. | | | 2,491 | | | | 16,391 | |
GAMCO Investors, Inc., Class A | | | 288 | | | | 8,896 | |
Greenhill & Co., Inc. | | | 579 | | | | 16,038 | |
INTL FCStone, Inc.* | | | 1,209 | | | | 47,876 | |
Investment Technology Group, Inc. | | | 2,274 | | | | 44,889 | |
Janus Capital Group, Inc. | | | 11,501 | | | | 152,618 | |
KCG Holdings, Inc., Class A* | | | 4,202 | | | | 55,677 | |
Ladenburg Thalmann Financial Services, Inc.* | | | 7,223 | | | | 17,624 | |
Manning & Napier, Inc. | | | 1,207 | | | | 9,113 | |
Medley Management, Inc., Class A (x) | | | 259 | | | | 2,564 | |
Morningstar, Inc. | | | 14,000 | | | | 1,029,840 | |
OM Asset Management plc | | | 1,029 | | | | 14,921 | |
Oppenheimer Holdings, Inc., Class A | | | 813 | | | | 15,122 | |
Piper Jaffray Cos.* | | | 1,169 | | | | 84,753 | |
PJT Partners, Inc., Class A | | | 1,425 | | | | 44,004 | |
Pzena Investment Management, Inc., Class A | | | 286 | | | | 3,177 | |
| | | | | | | | |
Safeguard Scientifics, Inc.* | | | 1,619 | | | $ | 21,776 | |
Stifel Financial Corp.* | | | 5,113 | | | | 255,394 | |
Virtu Financial, Inc., Class A | | | 136 | | | | 2,169 | |
Virtus Investment Partners, Inc. (x) | | | 354 | | | | 41,790 | |
Waddell & Reed Financial, Inc., Class A (x) | | | 5,699 | | | | 111,187 | |
Walter Investment Management Corp. (x)* | | | 1,412 | | | | 6,707 | |
Wins Finance Holdings, Inc. (x)* | | | 109 | | | | 19,620 | |
| | | | | | | | |
| | | | | | | 2,163,012 | |
| | | | | | | | |
Consumer Finance (2.7%) | |
Encore Capital Group, Inc. (x)* | | | 1,930 | | | | 55,294 | |
Enova International, Inc.* | | | 2,161 | | | | 27,121 | |
EZCORP, Inc., Class A* | | | 4,063 | | | | 43,271 | |
FirstCash, Inc. | | | 1,609 | | | | 75,623 | |
Green Dot Corp., Class A* | | | 2,836 | | | | 66,788 | |
LendingClub Corp.* | | | 14,809 | | | | 77,747 | |
Nelnet, Inc., Class A | | | 1,628 | | | | 82,621 | |
PRA Group, Inc.* | | | 3,672 | | | | 143,575 | |
Regional Management Corp.* | | | 140,787 | | | | 3,699,882 | |
World Acceptance Corp. (x)* | | | 492 | | | | 31,626 | |
| | | | | | | | |
| | | | | | | 4,303,548 | |
| | | | | | | | |
Diversified Financial Services (0.1%) | |
FNFV Group* | | | 5,369 | | | | 73,555 | |
Marlin Business Services Corp. | | | 633 | | | | 13,230 | |
NewStar Financial, Inc.* | | | 1,754 | | | | 16,224 | |
On Deck Capital, Inc. (x)* | | | 3,895 | | | | 18,034 | |
PICO Holdings, Inc.* | | | 1,624 | | | | 24,604 | |
Tiptree Financial, Inc. | | | 1,808 | | | | 11,119 | |
| | | | | | | | |
| | | | | | | 156,766 | |
| | | | | | | | |
Insurance (1.8%) | |
Ambac Financial Group, Inc.* | | | 3,460 | | | | 77,850 | |
American Equity Investment Life Holding Co. | | | 6,670 | | | | 150,342 | |
AMERISAFE, Inc. | | | 393 | | | | 24,503 | |
Argo Group International Holdings Ltd. | | | 2,298 | | | | 151,438 | |
Atlas Financial Holdings, Inc.* | | | 476 | | | | 8,592 | |
Baldwin & Lyons, Inc., Class B | | | 761 | | | | 19,177 | |
Blue Capital Reinsurance Holdings Ltd. | | | 486 | | | | 8,967 | |
Citizens, Inc. (x)* | | | 3,723 | | | | 36,560 | |
CNO Financial Group, Inc. | | | 14,331 | | | | 274,439 | |
Donegal Group, Inc., Class A | | | 698 | | | | 12,201 | |
EMC Insurance Group, Inc. | | | 692 | | | | 20,767 | |
Employers Holdings, Inc. | | | 2,536 | | | | 100,426 | |
Enstar Group Ltd.* | | | 909 | | | | 179,709 | |
FBL Financial Group, Inc., Class A | | | 812 | | | | 63,458 | |
Federated National Holding Co. | | | 1,045 | | | | 19,531 | |
Fidelity & Guaranty Life (x) | | | 1,009 | | | | 23,913 | |
Genworth Financial, Inc., Class A* | | | 37,550 | | | | 143,065 | |
Global Indemnity Ltd.* | | | 705 | | | | 26,938 | |
Greenlight Capital Reinsurance Ltd., Class A* | | | 2,343 | | | | 53,420 | |
Hallmark Financial Services, Inc.* | | | 1,207 | | | | 14,037 | |
HCI Group, Inc. (x) | | | 734 | | | | 28,978 | |
See Notes to Financial Statements.
74
EQ ADVISORS TRUST
AXA/PACIFIC GLOBAL SMALL CAP VALUE PORTFOLIO
PORTFOLIO OF INVESTMENTS (Continued)
December 31, 2016
| | | | | | | | |
| | | Number of
Shares | | | Value
(Note 1) | |
| | | | | | | | |
Heritage Insurance Holdings, Inc. | | | 2,193 | | | $ | 34,364 | |
Horace Mann Educators Corp. | | | 3,238 | | | | 138,586 | |
Independence Holding Co. | | | 625 | | | | 12,219 | |
Infinity Property & Casualty Corp. | | | 871 | | | | 76,561 | |
Investors Title Co. | | | 121 | | | | 19,140 | |
James River Group Holdings Ltd. | | | 1,166 | | | | 48,447 | |
Kemper Corp. | | | 3,156 | | | | 139,811 | |
Kinsale Capital Group, Inc. | | | 480 | | | | 16,325 | |
Maiden Holdings Ltd. | | | 4,524 | | | | 78,944 | |
MBIA, Inc.* | | | 10,604 | | | | 113,463 | |
National General Holdings Corp. | | | 1,638 | | | | 40,934 | |
National Western Life Group, Inc., Class A | | | 187 | | | | 58,120 | |
Navigators Group, Inc. (The) | | | 905 | | | | 106,564 | |
OneBeacon Insurance Group Ltd., Class A | | | 1,619 | | | | 25,985 | |
RLI Corp. | | | 548 | | | | 34,595 | |
Safety Insurance Group, Inc. | | | 1,161 | | | | 85,566 | |
Selective Insurance Group, Inc. | | | 4,499 | | | | 193,682 | |
State Auto Financial Corp. | | | 1,249 | | | | 33,486 | |
State National Cos., Inc. | | | 2,304 | | | | 31,933 | |
Stewart Information Services Corp. | | | 1,819 | | | | 83,819 | |
Third Point Reinsurance Ltd.* | | | 4,913 | | | | 56,745 | |
United Fire Group, Inc. | | | 1,746 | | | | 85,851 | |
United Insurance Holdings Corp. | | | 370 | | | | 5,602 | |
Universal Insurance Holdings, Inc. (x) | | | 737 | | | | 20,931 | |
| | | | | | | | |
| | | | | | | 2,979,984 | |
| | | | | | | | |
Mortgage Real Estate Investment Trusts (REITs) (1.0%) | |
AG Mortgage Investment Trust, Inc. (REIT) | | | 2,240 | | | | 38,326 | |
Altisource Residential Corp. (REIT) | | | 4,219 | | | | 46,578 | |
Anworth Mortgage Asset Corp. (REIT) | | | 7,581 | | | | 39,194 | |
Apollo Commercial Real Estate Finance, Inc. (REIT) | | | 5,783 | | | | 96,113 | |
Ares Commercial Real Estate Corp. (REIT) | | | 2,175 | | | | 29,863 | |
ARMOUR Residential REIT, Inc. (REIT) | | | 2,940 | | | | 63,777 | |
Capstead Mortgage Corp. (REIT) | | | 7,710 | | | | 78,565 | |
Colony Capital, Inc. (REIT), Class A (x) | | | 9,046 | | | | 183,181 | |
CYS Investments, Inc. (REIT) | | | 12,164 | | | | 94,028 | |
Dynex Capital, Inc. (REIT) | | | 3,552 | | | | 24,225 | |
Great Ajax Corp. (REIT) | | | 1,196 | | | | 15,871 | |
Hannon Armstrong Sustainable Infrastructure Capital, Inc. (REIT) | | | 3,276 | | | | 62,211 | |
Invesco Mortgage Capital, Inc. (REIT) | | | 9,026 | | | | 131,780 | |
Ladder Capital Corp. (REIT) | | | 3,074 | | | | 42,175 | |
MTGE Investment Corp. (REIT) | | | 3,741 | | | | 58,734 | |
New Residential Investment Corp. (REIT) | | | 19,562 | | | | 307,515 | |
New York Mortgage Trust, Inc. (REIT) (x) | | | 8,864 | | | | 58,502 | |
| | | | | | | | |
Orchid Island Capital, Inc. (REIT) (x) | | | 1,563 | | | $ | 16,927 | |
Owens Realty Mortgage, Inc. (REIT) (x) | | | 789 | | | | 14,612 | |
PennyMac Mortgage Investment Trust (REIT)‡ | | | 5,459 | | | | 89,364 | |
Redwood Trust, Inc. (REIT) | | | 6,126 | | | | 93,176 | |
Resource Capital Corp. (REIT) (x) | | | 2,450 | | | | 20,409 | |
Western Asset Mortgage Capital Corp. (REIT) | | | 3,325 | | | | 33,483 | |
| | | | | | | | |
| | | | | | | 1,638,609 | |
| | | | | | | | |
Thrifts & Mortgage Finance (2.0%) | |
Astoria Financial Corp. | | | 7,429 | | | | 138,551 | |
Bank Mutual Corp. | | | 3,281 | | | | 31,005 | |
BankFinancial Corp. | | | 1,196 | | | | 17,725 | |
Bear State Financial, Inc. (x) | | | 1,479 | | | | 15,012 | |
Beneficial Bancorp, Inc. | | | 5,608 | | | | 103,187 | |
BofI Holding, Inc. (x)* | | | 314 | | | | 8,965 | |
Capitol Federal Financial, Inc. | | | 10,258 | | | | 168,847 | |
Charter Financial Corp. | | | 1,097 | | | | 18,287 | |
Clifton Bancorp, Inc. (x) | | | 1,753 | | | | 29,661 | |
Dime Community Bancshares, Inc. | | | 2,533 | | | | 50,913 | |
ESSA Bancorp, Inc. | | | 655 | | | | 10,296 | |
EverBank Financial Corp. | | | 8,293 | | | | 161,299 | |
Federal Agricultural Mortgage Corp., Class C | | | 693 | | | | 39,688 | |
First Defiance Financial Corp. | | | 705 | | | | 35,772 | |
Flagstar Bancorp, Inc.* | | | 1,698 | | | | 45,744 | |
Greene County Bancorp, Inc. (x) | | | 181 | | | | 4,145 | |
Hingham Institution for Savings | | | 58 | | | | 11,413 | |
Home Bancorp, Inc. | | | 394 | | | | 15,212 | |
HomeStreet, Inc.* | | | 1,908 | | | | 60,293 | |
Impac Mortgage Holdings, Inc. (x)* | | | 859 | | | | 12,043 | |
Kearny Financial Corp. | | | 6,974 | | | | 108,446 | |
Lake Sunapee Bank Group | | | 630 | | | | 14,862 | |
Meridian Bancorp, Inc. | | | 3,273 | | | | 61,860 | |
Meta Financial Group, Inc. | | | 661 | | | | 68,017 | |
MGIC Investment Corp.* | | | 27,277 | | | | 277,953 | |
Nationstar Mortgage Holdings, Inc. (x)* | | | 1,355 | | | | 24,471 | |
NMI Holdings, Inc., Class A* | | | 4,039 | | | | 43,015 | |
Northfield Bancorp, Inc. | | | 3,046 | | | | 60,829 | |
Northwest Bancshares, Inc. | | | 7,736 | | | | 139,480 | |
OceanFirst Financial Corp. | | | 1,820 | | | | 54,655 | |
Ocwen Financial Corp.* | | | 8,185 | | | | 44,117 | |
Oritani Financial Corp. | | | 3,086 | | | | 57,862 | |
PennyMac Financial Services, Inc., Class A*‡ | | | 468 | | | | 7,792 | |
PHH Corp.* | | | 4,160 | | | | 63,066 | |
Provident Bancorp, Inc.* | | | 320 | | | | 5,728 | |
Provident Financial Holdings, Inc. | | | 522 | | | | 10,555 | |
Provident Financial Services, Inc. | | | 4,925 | | | | 139,377 | |
Radian Group, Inc. | | | 17,229 | | | | 309,777 | |
SI Financial Group, Inc. | | | 884 | | | | 13,614 | |
Southern Missouri Bancorp, Inc. (x) | | | 459 | | | | 16,239 | |
Territorial Bancorp, Inc. | | | 606 | | | | 19,901 | |
TrustCo Bank Corp. | | | 7,325 | | | | 64,094 | |
United Community Financial Corp. | | | 3,732 | | | | 33,364 | |
United Financial Bancorp, Inc. | | | 4,051 | | | | 73,566 | |
See Notes to Financial Statements.
75
EQ ADVISORS TRUST
AXA/PACIFIC GLOBAL SMALL CAP VALUE PORTFOLIO
PORTFOLIO OF INVESTMENTS (Continued)
December 31, 2016
| | | | | | | | |
| | | Number of
Shares | | | Value
(Note 1) | |
| | | | | | | | |
Walker & Dunlop, Inc.* | | | 2,218 | | | $ | 69,202 | |
Washington Federal, Inc. | | | 7,267 | | | | 249,621 | |
Waterstone Financial, Inc. | | | 2,024 | | | | 37,242 | |
Western New England Bancorp, Inc. | | | 1,677 | | | | 15,680 | |
WSFS Financial Corp. | | | 2,314 | | | | 107,254 | |
| | | | | | | | |
| | | | | | | 3,169,697 | |
| | | | | | | | |
Total Financials | | | | | | | 34,180,357 | |
| | | | | | | | |
Health Care (3.6%) | |
Biotechnology (0.8%) | |
Acorda Therapeutics, Inc.* | | | 2,990 | | | | 56,212 | |
Adamas Pharmaceuticals, Inc. (x)* | | | 693 | | | | 11,712 | |
Adverum Biotechnologies, Inc. (x)* | | | 1,932 | | | | 5,603 | |
Agenus, Inc. (x)* | | | 1,006 | | | | 4,145 | |
Akebia Therapeutics, Inc.* | | | 2,000 | | | | 20,820 | |
AMAG Pharmaceuticals, Inc.* | | | 1,959 | | | | 68,173 | |
Ardelyx, Inc.* | | | 2,093 | | | | 29,721 | |
ARIAD Pharmaceuticals, Inc. (x)* | | | 908 | | | | 11,295 | |
Array BioPharma, Inc. (x)* | | | 12,139 | | | | 106,702 | |
Arrowhead Pharmaceuticals, Inc. (x)* | | | 345 | | | | 535 | |
Atara Biotherapeutics, Inc. (x)* | | | 1,732 | | | | 24,594 | |
Audentes Therapeutics, Inc.* | | | 67 | | | | 1,224 | |
Bellicum Pharmaceuticals, Inc. (x)* | | | 577 | | | | 7,859 | |
BioCryst Pharmaceuticals, Inc. (x)* | | | 996 | | | | 6,305 | |
Bluebird Bio, Inc.* | | | 2,013 | | | | 124,202 | |
Cara Therapeutics, Inc. (x)* | | | 1,496 | | | | 13,898 | |
Celldex Therapeutics, Inc. (x)* | | | 7,706 | | | | 27,279 | |
Cellular Biomedicine Group, Inc.* | | | 298 | | | | 3,904 | |
Chimerix, Inc.* | | | 3,541 | | | | 16,289 | |
Cidara Therapeutics, Inc. (x)* | | | 924 | | | | 9,610 | |
Concert Pharmaceuticals, Inc.* | | | 793 | | | | 8,160 | |
Corvus Pharmaceuticals, Inc. (x)* | | | 223 | | | | 3,189 | |
Dimension Therapeutics, Inc.* | | | 604 | | | | 2,627 | |
Edge Therapeutics, Inc.* | | | 807 | | | | 10,087 | |
Enanta Pharmaceuticals, Inc.* | | | 1,260 | | | | 42,210 | |
Epizyme, Inc. (x)* | | | 951 | | | | 11,507 | |
Esperion Therapeutics, Inc. (x)* | | | 1,196 | | | | 14,974 | |
Exelixis, Inc.* | | | 6,981 | | | | 104,087 | |
Five Prime Therapeutics, Inc.* | | | 1,669 | | | | 83,634 | |
Idera Pharmaceuticals, Inc. (x)* | | | 465 | | | | 697 | |
Ignyta, Inc. (x)* | | | 837 | | | | 4,436 | |
Immunomedics, Inc. (x)* | | | 561 | | | | 2,059 | |
Inotek Pharmaceuticals Corp. (x)* | | | 234 | | | | 1,427 | |
Karyopharm Therapeutics, Inc.* | | | 1,524 | | | | 14,326 | |
Merrimack Pharmaceuticals, Inc. (x)* | | | 3,723 | | | | 15,190 | |
Momenta Pharmaceuticals, Inc.* | | | 4,003 | | | | 60,245 | |
NantKwest, Inc. (x)* | | | 1,200 | | | | 6,864 | |
NewLink Genetics Corp.* | | | 434 | | | | 4,461 | |
Osiris Therapeutics, Inc. (x)* | | | 133 | | | | 653 | |
Otonomy, Inc.* | | | 1,927 | | | | 30,639 | |
OvaScience, Inc. (x)* | | | 2,255 | | | | 3,450 | |
PDL BioPharma, Inc. | | | 13,495 | | | | 28,609 | |
| | | | | | | | |
Pfenex, Inc.* | | | 79 | | | $ | 717 | |
Portola Pharmaceuticals, Inc. (x)* | | | 342 | | | | 7,674 | |
Protagonist Therapeutics, Inc. (x)* | | | 102 | | | | 2,243 | |
PTC Therapeutics, Inc.* | | | 2,689 | | | | 29,337 | |
REGENXBIO, Inc.* | | | 1,624 | | | | 30,125 | |
Retrophin, Inc. (x)* | | | 2,913 | | | | 55,143 | |
Rigel Pharmaceuticals, Inc.* | | | 1,410 | | | | 3,356 | |
Selecta Biosciences, Inc.* | | | 66 | | | | 1,132 | |
Spectrum Pharmaceuticals, Inc.* | | | 4,345 | | | | 19,248 | |
Stemline Therapeutics, Inc.* | | | 1,089 | | | | 11,652 | |
Syndax Pharmaceuticals, Inc.* | | | 187 | | | | 1,341 | |
Syros Pharmaceuticals, Inc.* | | | 130 | | | | 1,581 | |
Versartis, Inc.* | | | 2,268 | | | | 33,793 | |
Voyager Therapeutics, Inc. (x)* | | | 520 | | | | 6,625 | |
Zafgen, Inc.* | | | 1,896 | | | | 6,029 | |
| | | | | | | | |
| | | | | | | 1,213,609 | |
| | | | | | | | |
Health Care Equipment & Supplies (2.1%) | |
Abaxis, Inc. | | | 45,000 | | | | 2,374,650 | |
Analogic Corp. | | | 904 | | | | 74,987 | |
AngioDynamics, Inc.* | | | 2,167 | | | | 36,557 | |
Anika Therapeutics, Inc.* | | | 204 | | | | 9,988 | |
AtriCure, Inc.* | | | 527 | | | | 10,313 | |
Cerus Corp. (x)* | | | 1,051 | | | | 4,572 | |
CONMED Corp. | | | 2,218 | | | | 97,969 | |
CryoLife, Inc.* | | | 908 | | | | 17,388 | |
Exactech, Inc.* | | | 826 | | | | 22,550 | |
Haemonetics Corp.* | | | 4,085 | | | | 164,217 | |
Halyard Health, Inc.* | | | 3,741 | | | | 138,342 | |
ICU Medical, Inc.* | | | 379 | | | | 55,846 | |
Integer Holdings Corp.* | | | 2,460 | | | | 72,447 | |
Invacare Corp. | | | 2,560 | | | | 33,408 | |
K2M Group Holdings, Inc.* | | | 1,416 | | | | 28,377 | |
Meridian Bioscience, Inc. | | | 460 | | | | 8,142 | |
Merit Medical Systems, Inc.* | | | 2,109 | | | | 55,889 | |
Quidel Corp.* | | | 139 | | | | 2,977 | |
Rockwell Medical, Inc. (x)* | | | 350 | | | | 2,293 | |
RTI Surgical, Inc.* | | | 4,724 | | | | 15,353 | |
Tactile Systems Technology, Inc.* | | | 25 | | | | 410 | |
TransEnterix, Inc. (x)* | | | 5,107 | | | | 6,639 | |
Wright Medical Group NV* | | | 8,277 | | | | 190,205 | |
| | | | | | | | |
| | | | | | | 3,423,519 | |
| | | | | | | | |
Health Care Providers & Services (0.5%) | |
Aceto Corp. (x) | | | 245 | | | | 5,383 | |
Addus HomeCare Corp.* | | | 521 | | | | 18,261 | |
Almost Family, Inc.* | | | 485 | | | | 21,388 | |
American Renal Associates Holdings, Inc. (x)* | | | 89 | | | | 1,894 | |
BioScrip, Inc. (x)* | | | 7,960 | | | | 8,278 | |
Community Health Systems, Inc.* | | | 8,801 | | | | 49,198 | |
Genesis Healthcare, Inc.* | | | 1,560 | | | | 6,630 | |
Healthways, Inc.* | | | 2,540 | | | | 57,785 | |
Kindred Healthcare, Inc. | | | 6,727 | | | | 52,807 | |
LHC Group, Inc.* | | | 1,119 | | | | 51,138 | |
Magellan Health, Inc.* | | | 545 | | | | 41,011 | |
Molina Healthcare, Inc.* | | | 1,164 | | | | 63,159 | |
National HealthCare Corp. | | | 887 | | | | 67,226 | |
National Research Corp., Class A | | | 117 | | | | 2,223 | |
Nobilis Health Corp. (x)* | | | 4,295 | | | | 9,019 | |
Owens & Minor, Inc. | | | 4,427 | | | | 156,229 | |
See Notes to Financial Statements.
76
EQ ADVISORS TRUST
AXA/PACIFIC GLOBAL SMALL CAP VALUE PORTFOLIO
PORTFOLIO OF INVESTMENTS (Continued)
December 31, 2016
| | | | | | | | |
| | | Number of
Shares | | | Value
(Note 1) | |
| | | | | | | | |
PharMerica Corp.* | | | 2,361 | | | $ | 59,379 | |
Select Medical Holdings Corp.* | | | 7,926 | | | | 105,020 | |
Surgery Partners, Inc.* | | | 646 | | | | 10,239 | |
Triple-S Management Corp., Class B* | | | 1,874 | | | | 38,792 | |
Universal American Corp.* | | | 3,261 | | | | 32,447 | |
| | | | | | | | |
| | | | | | | 857,506 | |
| | | | | | | | |
Health Care Technology (0.0%) | |
Cotiviti Holdings, Inc. (x)* | | | 274 | | | | 9,425 | |
Evolent Health, Inc., Class A (x)* | | | 1,296 | | | | 19,181 | |
NantHealth, Inc.* | | | 173 | | | | 1,720 | |
Vocera Communications, Inc.* | | | 630 | | | | 11,649 | |
| | | | | | | | |
| | | | | | | 41,975 | |
| | | | | | | | |
Life Sciences Tools & Services (0.1%) | |
Accelerate Diagnostics, Inc. (x)* | | | 110 | | | | 2,283 | |
Albany Molecular Research, Inc. (x)* | | | 1,111 | | | | 20,843 | |
Enzo Biochem, Inc.* | | | 278 | | | | 1,929 | |
Luminex Corp.* | | | 1,845 | | | | 37,324 | |
Medpace Holdings, Inc.* | | | 189 | | | | 6,817 | |
| | | | | | | | |
| | | | | | | 69,196 | |
| | | | | | | | |
Pharmaceuticals (0.1%) | |
Aratana Therapeutics, Inc.* | | | 223 | | | | 1,601 | |
Clearside Biomedical, Inc.* | | | 109 | | | | 975 | |
Egalet Corp. (x)* | | | 1,330 | | | | 10,175 | |
Endocyte, Inc.* | | | 2,837 | | | | 7,234 | |
Flex Pharma, Inc. (x)* | | | 137 | | | | 723 | |
Innoviva, Inc. (x)* | | | 753 | | | | 8,057 | |
Lannett Co., Inc. (x)* | | | 2,225 | | | | 49,061 | |
Medicines Co. (The) (x)* | | | 466 | | | | 15,816 | |
Novan, Inc.* | | | 60 | | | | 1,621 | |
Omeros Corp. (x)* | | | 1,167 | | | | 11,577 | |
Phibro Animal Health Corp., Class A | | | 105 | | | | 3,077 | |
Tetraphase Pharmaceuticals, Inc.* | | | 3,025 | | | | 12,191 | |
TherapeuticsMD, Inc. (x)* | | | 759 | | | | 4,379 | |
WaVe Life Sciences Ltd. (x)* | | | 108 | | | | 2,824 | |
Zogenix, Inc. (x)* | | | 2,020 | | | | 24,543 | |
| | | | | | | | |
| | | | | | | 153,854 | |
| | | | | | | | |
Total Health Care | | | | | | | 5,759,659 | |
| | | | | | | | |
Industrials (30.0%) | |
Aerospace & Defense (1.1%) | |
AAR Corp. | | | 2,659 | | | | 87,880 | |
Aerojet Rocketdyne Holdings, Inc.* | | | 2,335 | | | | 41,913 | |
Aerovironment, Inc. (x)* | | | 1,368 | | | | 36,703 | |
Cubic Corp. | | | 2,039 | | | | 97,770 | |
Curtiss-Wright Corp. | | | 972 | | | | 95,606 | |
DigitalGlobe, Inc.* | | | 5,077 | | | | 145,456 | |
Ducommun, Inc.* | | | 843 | | | | 21,547 | |
Engility Holdings, Inc.* | | | 1,440 | | | | 48,528 | |
Esterline Technologies Corp.* | | | 2,359 | | | | 210,423 | |
KEYW Holding Corp. (The) (x)* | | | 2,868 | | | | 33,814 | |
KLX, Inc.* | | | 4,231 | | | | 190,860 | |
Kratos Defense & Security Solutions, Inc. (x)* | | | 4,283 | | | | 31,694 | |
Mercury Systems, Inc.* | | | 2,898 | | | | 87,578 | |
| | | | | | | | |
Moog, Inc., Class A* | | | 2,326 | | | $ | 152,772 | |
National Presto Industries, Inc. | | | 345 | | | | 36,708 | |
Sparton Corp.* | | | 694 | | | | 16,552 | |
Teledyne Technologies, Inc.* | | | 1,963 | | | | 241,449 | |
Triumph Group, Inc. | | | 3,908 | | | | 103,562 | |
Vectrus, Inc.* | | | 718 | | | | 17,124 | |
| | | | | | | | |
| | | | | | | 1,697,939 | |
| | | | | | | | |
Air Freight & Logistics (0.3%) | |
Air Transport Services Group, Inc.* | | | 3,303 | | | | 52,716 | |
Atlas Air Worldwide Holdings, Inc.* | | | 1,969 | | | | 102,683 | |
Echo Global Logistics, Inc.* | | | 330 | | | | 8,267 | |
Hub Group, Inc., Class A* | | | 192 | | | | 8,400 | |
Park-Ohio Holdings Corp. | | | 688 | | | | 29,309 | |
Radiant Logistics, Inc.* | | | 1,156 | | | | 4,508 | |
XPO Logistics, Inc.* | | | 7,824 | | | | 337,684 | |
| | | | | | | | |
| | | | | | | 543,567 | |
| | | | | | | | |
Airlines (0.1%) | |
SkyWest, Inc. | | | 3,987 | | | | 145,326 | |
| | | | | | | | |
Building Products (1.7%) | |
Armstrong Flooring, Inc.* | | | 1,763 | | | | 35,101 | |
CSW Industrials, Inc.* | | | 1,157 | | | | 42,636 | |
Gibraltar Industries, Inc.* | | | 888 | | | | 36,985 | |
Griffon Corp. | | | 391 | | | | 10,244 | |
Insteel Industries, Inc. | | | 71,000 | | | | 2,530,440 | |
Quanex Building Products Corp. | | | 2,500 | | | | 50,750 | |
Universal Forest Products, Inc. | | | 208 | | | | 21,254 | |
| | | | | | | | |
| | | | | | | 2,727,410 | |
| | | | | | | | |
Commercial Services & Supplies (5.0%) | |
ABM Industries, Inc. | | | 4,432 | | | | 181,003 | |
ACCO Brands Corp.* | | | 8,481 | | | | 110,677 | |
Advanced Disposal Services, Inc.* | | | 404 | | | | 8,977 | |
ARC Document Solutions, Inc.* | | | 3,499 | | | | 17,775 | |
Brady Corp., Class A | | | 873 | | | | 32,781 | |
Casella Waste Systems, Inc., Class A* | | | 3,102 | | | | 38,496 | |
CECO Environmental Corp. | | | 2,348 | | | | 32,754 | |
CompX International, Inc. | | | 131 | | | | 2,109 | |
Ennis, Inc. | | | 2,039 | | | | 35,377 | |
Essendant, Inc. | | | 2,992 | | | | 62,533 | |
G&K Services, Inc., Class A | | | 375 | | | | 36,169 | |
Heritage-Crystal Clean, Inc.* | | | 511 | | | | 8,023 | |
InnerWorkings, Inc.* | | | 287 | | | | 2,827 | |
Interface, Inc. | | | 601 | | | | 11,148 | |
Kimball International, Inc., Class B | | | 459 | | | | 8,060 | |
McGrath RentCorp | | | 1,877 | | | | 73,560 | |
Mobile Mini, Inc. | | | 85,928 | | | | 2,599,322 | |
MSA Safety, Inc. | | | 785 | | | | 54,424 | |
NL Industries, Inc.* | | | 606 | | | | 4,939 | |
Quad/Graphics, Inc. | | | 1,090 | | | | 29,299 | |
SP Plus Corp.* | | | 95 | | | | 2,674 | |
Team, Inc.* | | | 107,168 | | | | 4,206,344 | |
Tetra Tech, Inc. | | | 3,881 | | | | 167,465 | |
TRC Cos., Inc.* | | | 1,521 | | | | 16,123 | |
UniFirst Corp. | | | 1,099 | | | | 157,871 | |
Viad Corp. | | | 723 | | | | 31,884 | |
See Notes to Financial Statements.
77
EQ ADVISORS TRUST
AXA/PACIFIC GLOBAL SMALL CAP VALUE PORTFOLIO
PORTFOLIO OF INVESTMENTS (Continued)
December 31, 2016
| | | | | | | | |
| | | Number of
Shares | | | Value
(Note 1) | |
| | | | | | | | |
VSE Corp. | | | 718 | | | $ | 27,887 | |
West Corp. | | | 3,018 | | | | 74,726 | |
| | | | | | | | |
| | | | | | | 8,035,227 | |
| | | | | | | | |
Construction & Engineering (2.2%) | |
Aegion Corp.* | | | 2,806 | | | | 66,502 | |
Ameresco, Inc., Class A* | | | 1,708 | | | | 9,394 | |
EMCOR Group, Inc. | | | 4,017 | | | | 284,243 | |
Granite Construction, Inc. | | | 761 | | | | 41,855 | |
Great Lakes Dredge & Dock Corp.* | | | 4,354 | | | | 18,287 | |
HC2 Holdings, Inc.* | | | 2,625 | | | | 15,566 | |
IES Holdings, Inc.* | | | 54 | | | | 1,034 | |
Layne Christensen Co.* | | | 1,473 | | | | 16,011 | |
MYR Group, Inc.* | | | 1,194 | | | | 44,990 | |
NV5 Global, Inc.* | | | 150 | | | | 5,010 | |
Orion Group Holdings, Inc.* | | | 296,968 | | | | 2,954,832 | |
Tutor Perini Corp.* | | | 2,563 | | | | 71,764 | |
| | | | | | | | |
| | | | | | | 3,529,488 | |
| | | | | | | | |
Electrical Equipment (0.3%) | |
American Superconductor Corp.* | | | 944 | | | | 6,957 | |
Atkore International Group, Inc.* | | | 397 | | | | 9,492 | |
Babcock & Wilcox Enterprises, Inc.* | | | 3,687 | | | | 61,167 | |
Encore Wire Corp. | | | 1,630 | | | | 70,660 | |
EnerSys | | | 2,447 | | | | 191,111 | |
FuelCell Energy, Inc. (x)* | | | 2,337 | | | | 4,090 | |
General Cable Corp. | | | 302 | | | | 5,753 | |
LSI Industries, Inc. | | | 1,657 | | | | 16,139 | |
Plug Power, Inc. (x)* | | | 5,278 | | | | 6,334 | |
Powell Industries, Inc. | | | 694 | | | | 27,066 | |
Power Solutions International, Inc. (x)* | | | 99 | | | | 743 | |
Preformed Line Products Co. | | | 195 | | | | 11,333 | |
Sunrun, Inc. (x)* | | | 5,112 | | | | 27,145 | |
Thermon Group Holdings, Inc.* | | | 2,576 | | | | 49,176 | |
TPI Composites, Inc. (x)* | | | 450 | | | | 7,218 | |
Vicor Corp.* | | | 113 | | | | 1,706 | |
| | | | | | | | |
| | | | | | | 496,090 | |
| | | | | | | | |
Industrial Conglomerates (0.0%) | |
Raven Industries, Inc. | | | 1,087 | | | | 27,392 | |
| | | | | | | | |
Machinery (3.9%) | |
Actuant Corp., Class A | | | 2,463 | | | | 63,915 | |
Alamo Group, Inc. | | | 585 | | | | 44,519 | |
Albany International Corp., Class A | | | 1,951 | | | | 90,331 | |
Altra Industrial Motion Corp. | | | 337 | | | | 12,435 | |
American Railcar Industries, Inc. (x) | | | 615 | | | | 27,853 | |
Astec Industries, Inc. | | | 816 | | | | 55,047 | |
Barnes Group, Inc. | | | 4,001 | | | | 189,727 | |
Blue Bird Corp.* | | | 398 | | | | 6,149 | |
Briggs & Stratton Corp. | | | 3,418 | | | | 76,085 | |
Chart Industries, Inc.* | | | 2,462 | | | | 88,681 | |
CIRCOR International, Inc. | | | 1,326 | | | | 86,031 | |
Columbus McKinnon Corp. | | | 1,569 | | | | 42,426 | |
DMC Global, Inc. | | | 1,095 | | | | 17,356 | |
Douglas Dynamics, Inc. | | | 246 | | | | 8,278 | |
ESCO Technologies, Inc. | | | 2,042 | | | | 115,679 | |
| | | | | | | | |
ExOne Co. (The) (x)* | | | 766 | | | $ | 7,155 | |
Federal Signal Corp. | | | 4,804 | | | | 74,991 | |
Franklin Electric Co., Inc. | | | 220 | | | | 8,558 | |
FreightCar America, Inc. | | | 961 | | | | 14,348 | |
Gencor Industries, Inc.* | | | 588 | | | | 9,232 | |
Global Brass & Copper Holdings, Inc. | | | 152 | | | | 5,214 | |
Gorman-Rupp Co. (The) | | | 189 | | | | 5,850 | |
Graham Corp. | | | 776 | | | | 17,188 | |
Greenbrier Cos., Inc. (The) (x) | | | 2,184 | | | | 90,745 | |
Hardinge, Inc. | | | 947 | | | | 10,493 | |
Harsco Corp. | | | 6,395 | | | | 86,972 | |
Hurco Cos., Inc. | | | 511 | | | | 16,914 | |
Hyster-Yale Materials Handling, Inc. | | | 521 | | | | 33,224 | |
Joy Global, Inc. | | | 7,856 | | | | 219,968 | |
Kadant, Inc. | | | 707 | | | | 43,268 | |
Kennametal, Inc. | | | 6,293 | | | | 196,719 | |
Lindsay Corp. | | | 112 | | | | 8,356 | |
Manitowoc Co., Inc. (The)* | | | 10,259 | | | | 61,349 | |
Meritor, Inc.* | | | 6,630 | | | | 82,345 | |
Milacron Holdings Corp.* | | | 178 | | | | 3,316 | |
Miller Industries, Inc. | | | 803 | | | | 21,239 | |
Mueller Industries, Inc. | | | 1,292 | | | | 51,628 | |
Navistar International Corp.* | | | 120,696 | | | | 3,786,234 | |
NN, Inc. | | | 2,114 | | | | 40,272 | |
Rexnord Corp.* | | | 1,556 | | | | 30,482 | |
SPX Corp.* | | | 3,242 | | | | 76,900 | |
SPX FLOW, Inc.* | | | 2,853 | | | | 91,467 | |
Standex International Corp. | | | 234 | | | | 20,557 | |
Sun Hydraulics Corp. | | | 190 | | | | 7,594 | |
Supreme Industries, Inc., Class A | | | 426 | | | | 6,688 | |
Tennant Co. | | | 81 | | | | 5,767 | |
Titan International, Inc. (x) | | | 3,577 | | | | 40,098 | |
TriMas Corp.* | | | 3,632 | | | | 85,352 | |
Wabash National Corp. | | | 3,813 | | | | 60,322 | |
Watts Water Technologies, Inc., Class A | | | 153 | | | | 9,976 | |
| | | | | | | | |
| | | | | | | 6,255,293 | |
| | | | | | | | |
Marine (2.0%) | |
Costamare, Inc. | | | 2,102 | | | | 11,771 | |
Kirby Corp.* | | | 48,000 | | | | 3,192,000 | |
Matson, Inc. | | | 1,910 | | | | 67,595 | |
Scorpio Bulkers, Inc.* | | | 4,509 | | | | 22,771 | |
| | | | | | | | |
| | | | | | | 3,294,137 | |
| | | | | | | | |
Professional Services (0.5%) | |
Acacia Research Corp. | | | 3,321 | | | | 21,586 | |
CBIZ, Inc.* | | | 4,103 | | | | 56,211 | |
Cogint, Inc. (x)* | | | 1,299 | | | | 4,482 | |
CRA International, Inc. | | | 691 | | | | 25,291 | |
Franklin Covey Co.* | | | 184 | | | | 3,708 | |
FTI Consulting, Inc.* | | | 3,061 | | | | 137,990 | |
Heidrick & Struggles International, Inc. | | | 1,472 | | | | 35,549 | |
Hill International, Inc.* | | | 1,738 | | | | 7,560 | |
Huron Consulting Group, Inc.* | | | 1,537 | | | | 77,849 | |
ICF International, Inc.* | | | 1,485 | | | | 81,972 | |
Kelly Services, Inc., Class A | | | 2,367 | | | | 54,252 | |
Korn/Ferry International | | | 1,894 | | | | 55,740 | |
Navigant Consulting, Inc.* | | | 3,841 | | | | 100,557 | |
See Notes to Financial Statements.
78
EQ ADVISORS TRUST
AXA/PACIFIC GLOBAL SMALL CAP VALUE PORTFOLIO
PORTFOLIO OF INVESTMENTS (Continued)
December 31, 2016
| | | | | | | | |
| | | Number of
Shares | | | Value
(Note 1) | |
| | | | | | | | |
Resources Connection, Inc. | | | 2,650 | | | $ | 51,013 | |
RPX Corp.* | | | 4,090 | | | | 44,172 | |
TrueBlue, Inc.* | | | 3,173 | | | | 78,214 | |
| | | | | | | | |
| | | | | | | 836,146 | |
| | | | | | | | |
Road & Rail (4.3%) | |
ArcBest Corp. | | | 1,980 | | | | 54,747 | |
Celadon Group, Inc. | | | 2,205 | | | | 15,766 | |
Covenant Transportation Group, Inc., Class A* | | | 943 | | | | 18,238 | |
Genesee & Wyoming, Inc., Class A* | | | 43,000 | | | | 2,984,630 | |
Knight Transportation, Inc. | | | 352 | | | | 11,634 | |
Marten Transport Ltd. | | | 1,821 | | | | 42,429 | |
P.A.M. Transportation Services, Inc.* | | | 196 | | | | 5,092 | |
Roadrunner Transportation Systems, Inc.* | | | 2,534 | | | | 26,328 | |
Saia, Inc.* | | | 84,517 | | | | 3,731,425 | |
Universal Logistics Holdings, Inc. | | | 212 | | | | 3,466 | |
USA Truck, Inc.* | | | 728 | | | | 6,341 | |
Werner Enterprises, Inc. | | | 3,567 | | | | 96,131 | |
YRC Worldwide, Inc.* | | | 2,083 | | | | 27,662 | |
| | | | | | | | |
| | | | | | | 7,023,889 | |
| | | | | | | | |
Trading Companies & Distributors (8.6%) | |
Aircastle Ltd. | | | 3,846 | | | | 80,189 | |
Applied Industrial Technologies, Inc. | | | 1,647 | | | | 97,832 | |
BMC Stock Holdings, Inc. (x)* | | | 125,657 | | | | 2,450,311 | |
CAI International, Inc.* | | | 1,297 | | | | 11,245 | |
DXP Enterprises, Inc.* | | | 97,197 | | | | 3,376,624 | |
GATX Corp. (x) | | | 3,266 | | | | 201,120 | |
Kaman Corp. | | | 1,959 | | | | 95,854 | |
Lawson Products, Inc.* | | | 142 | | | | 3,380 | |
MRC Global, Inc.* | | | 7,505 | | | | 152,051 | |
Neff Corp., Class A* | | | 453 | | | | 6,387 | |
NOW, Inc.* | | | 8,510 | | | | 174,200 | |
Rush Enterprises, Inc., Class A* | | | 115,318 | | | | 3,678,644 | |
Rush Enterprises, Inc., Class B* | | | 493 | | | | 15,219 | |
Textainer Group Holdings Ltd. (x) | | | 1,840 | | | | 13,708 | |
Titan Machinery, Inc.* | | | 1,426 | | | | 20,777 | |
Triton International Ltd. | | | 221,648 | | | | 3,502,038 | |
Veritiv Corp.* | | | 630 | | | | 33,863 | |
Willis Lease Finance Corp.* | | | 309 | | | | 7,904 | |
| | | | | | | | |
| | | | | | | 13,921,346 | |
| | | | | | | | |
Transportation Infrastructure (0.0%) | |
Wesco Aircraft Holdings, Inc.* | | | 3,468 | | | | 51,847 | |
| | | | | | | | |
Total Industrials | | | | | | | 48,585,097 | |
| | | | | | | | |
Information Technology (6.3%) | |
Communications Equipment (0.7%) | |
ADTRAN, Inc. | | | 1,386 | | | | 30,977 | |
Applied Optoelectronics, Inc.* | | | 1,324 | | | | 31,035 | |
Bel Fuse, Inc., Class B | | | 737 | | | | 22,773 | |
Black Box Corp. | | | 1,174 | | | | 17,904 | |
Calix, Inc.* | | | 3,317 | | | | 25,541 | |
Comtech Telecommunications Corp. | | | 1,805 | | | | 21,389 | |
Digi International, Inc.* | | | 2,068 | | | | 28,435 | |
| | | | | | | | |
EMCORE Corp. | | | 2,139 | | | $ | 18,609 | |
Finisar Corp.* | | | 8,582 | | | | 259,777 | |
Harmonic, Inc. (x)* | | | 6,166 | | | | 30,830 | |
Infinera Corp.* | | | 3,412 | | | | 28,968 | |
Ixia* | | | 5,172 | | | | 83,269 | |
KVH Industries, Inc.* | | | 1,235 | | | | 14,573 | |
NETGEAR, Inc.* | | | 873 | | | | 47,448 | |
NetScout Systems, Inc.* | | | 7,201 | | | | 226,832 | |
Oclaro, Inc.* | | | 1,369 | | | | 12,253 | |
Quantenna Communications, Inc.* | | | 219 | | | | 3,970 | |
ShoreTel, Inc.* | | | 4,132 | | | | 29,544 | |
Silicom Ltd. | | | 335 | | | | 13,765 | |
Sonus Networks, Inc.* | | | 3,318 | | | | 20,903 | |
ViaSat, Inc.* | | | 455 | | | | 30,130 | |
Viavi Solutions, Inc.* | | | 18,804 | | | | 153,817 | |
| | | | | | | | |
| | | | | | | 1,152,742 | |
| | | | | | | | |
Electronic Equipment, Instruments & Components (1.6%) | |
Agilysys, Inc.* | | | 1,108 | | | | 11,479 | |
Anixter International, Inc.* | | | 2,307 | | | | 186,982 | |
AVX Corp. | | | 3,705 | | | | 57,909 | |
Benchmark Electronics, Inc.* | | | 3,930 | | | | 119,865 | |
Control4 Corp.* | | | 1,616 | | | | 16,483 | |
CTS Corp. | | | 2,502 | | | | 56,045 | |
Daktronics, Inc. | | | 3,028 | | | | 32,400 | |
Electro Scientific Industries, Inc.* | | | 2,187 | | | | 12,947 | |
ePlus, Inc.* | | | 141 | | | | 16,243 | |
FARO Technologies, Inc.* | | | 998 | | | | 35,928 | |
II-VI, Inc.* | | | 3,403 | | | | 100,899 | |
Insight Enterprises, Inc.* | | | 2,911 | | | | 117,721 | |
InvenSense, Inc.* | | | 6,588 | | | | 84,261 | |
Kimball Electronics, Inc.* | | | 2,234 | | | | 40,659 | |
Knowles Corp. (x)* | | | 7,068 | | | | 118,106 | |
Maxwell Technologies, Inc. (x)* | | | 2,569 | | | | 13,153 | |
Methode Electronics, Inc. | | | 238 | | | | 9,841 | |
MTS Systems Corp. | | | 122 | | | | 6,917 | |
Novanta, Inc.* | | | 1,868 | | | | 39,228 | |
OSI Systems, Inc.* | | | 1,413 | | | | 107,558 | |
Park Electrochemical Corp. | | | 1,534 | | | | 28,609 | |
PC Connection, Inc. | | | 893 | | | | 25,084 | |
Plexus Corp.* | | | 2,649 | | | | 143,152 | |
RadiSys Corp.* | | | 165 | | | | 731 | |
Rogers Corp.* | | | 952 | | | | 73,123 | |
Sanmina Corp.* | | | 5,848 | | | | 214,329 | |
ScanSource, Inc.* | | | 2,030 | | | | 81,911 | |
SYNNEX Corp. | | | 2,341 | | | | 283,308 | |
Systemax, Inc. | | | 875 | | | | 7,674 | |
Tech Data Corp.* | | | 2,781 | | | | 235,495 | |
TTM Technologies, Inc.* | | | 5,865 | | | | 79,940 | |
Vishay Intertechnology, Inc. (x) | | | 10,820 | | | | 175,284 | |
Vishay Precision Group, Inc.* | | | 960 | | | | 18,144 | |
| | | | | | | | |
| | | | | | | 2,551,408 | |
| | | | | | | | |
Internet Software & Services (1.5%) | |
Apptio, Inc., Class A* | | | 97 | | | | 1,797 | |
Autobytel, Inc.* | | | 551 | | | | 7,411 | |
Bankrate, Inc.* | | | 3,834 | | | | 42,366 | |
Bazaarvoice, Inc.* | | | 6,596 | | | | 31,991 | |
Blucora, Inc.* | | | 2,508 | | | | 36,993 | |
ChannelAdvisor Corp.* | | | 130 | | | | 1,866 | |
Coupa Software, Inc. (x)* | | | 123 | | | | 3,076 | |
See Notes to Financial Statements.
79
EQ ADVISORS TRUST
AXA/PACIFIC GLOBAL SMALL CAP VALUE PORTFOLIO
PORTFOLIO OF INVESTMENTS (Continued)
December 31, 2016
| | | | | | | | |
| | | Number of
Shares | | | Value
(Note 1) | |
| | | | | | | | |
Global Sources Ltd.* | | | 642 | | | $ | 5,682 | |
Intralinks Holdings, Inc.* | | | 3,141 | | | | 42,466 | |
Limelight Networks, Inc. (x)* | | | 5,814 | | | | 14,651 | |
Liquidity Services, Inc.* | | | 1,982 | | | | 19,325 | |
Marchex, Inc., Class B* | | | 2,799 | | | | 7,417 | |
MeetMe, Inc.* | | | 415 | | | | 2,046 | |
NIC, Inc. | | | 90,000 | | | | 2,151,000 | |
Numerex Corp., Class A* | | | 890 | | | | 6,586 | |
QuinStreet, Inc.* | | | 2,966 | | | | 11,152 | |
RealNetworks, Inc.* | | | 1,897 | | | | 9,220 | |
Reis, Inc. | | | 237 | | | | 5,273 | |
RetailMeNot, Inc.* | | | 3,111 | | | | 28,932 | |
Rightside Group Ltd.* | | | 905 | | | | 7,484 | |
TechTarget, Inc.* | | | 862 | | | | 7,353 | |
Trade Desk, Inc. (The), Class A (x)* | | | 272 | | | | 7,526 | |
| | | | | | | | |
| | | | | | | 2,451,613 | |
| | | | | | | | |
IT Services (0.5%) | |
Acxiom Corp.* | | | 3,213 | | | | 86,108 | |
CACI International, Inc., Class A* | | | 1,950 | | | | 242,385 | |
Cass Information Systems, Inc. | | | 367 | | | | 27,000 | |
Convergys Corp. | | | 3,584 | | | | 88,023 | |
Datalink Corp.* | | | 1,499 | | | | 16,879 | |
EVERTEC, Inc. | | | 934 | | | | 16,578 | |
ManTech International Corp., Class A | | | 2,002 | | | | 84,584 | |
MoneyGram International, Inc.* | | | 2,386 | | | | 28,179 | |
NCI, Inc., Class A | | | 524 | | | | 7,310 | |
NeuStar, Inc., Class A* | | | 359 | | | | 11,991 | |
Perficient, Inc.* | | | 918 | | | | 16,056 | |
PFSweb, Inc.* | | | 116 | | | | 986 | |
ServiceSource International, Inc.* | | | 1,772 | | | | 10,065 | |
Sykes Enterprises, Inc.* | | | 3,176 | | | | 91,659 | |
Travelport Worldwide Ltd. | | | 2,485 | | | | 35,039 | |
Unisys Corp. (x)* | | | 1,359 | | | | 20,317 | |
| | | | | | | | |
| | | | | | | 783,159 | |
| | | | | | | | |
Semiconductors & Semiconductor Equipment (1.3%) | |
Advanced Energy Industries, Inc.* | | | 176 | | | | 9,636 | |
Advanced Micro Devices, Inc.* | | | 31,281 | | | | 354,726 | |
Alpha & Omega Semiconductor Ltd.* | | | 1,426 | | | | 30,331 | |
Ambarella, Inc. (x)* | | | 1,537 | | | | 83,198 | |
Amkor Technology, Inc.* | | | 7,585 | | | | 80,022 | |
Axcelis Technologies, Inc.* | | | 2,323 | | | | 33,800 | |
Brooks Automation, Inc. | | | 5,454 | | | | 93,100 | |
Cabot Microelectronics Corp. | | | 1,641 | | | | 103,662 | |
Cavium, Inc.* | | | 664 | | | | 41,460 | |
Cohu, Inc. | | | 2,092 | | | | 29,079 | |
Diodes, Inc.* | | | 3,067 | | | | 78,730 | |
DSP Group, Inc.* | | | 1,708 | | | | 22,289 | |
Entegris, Inc.* | | | 4,228 | | | | 75,681 | |
Exar Corp.* | | | 2,677 | | | | 28,858 | |
FormFactor, Inc.* | | | 2,333 | | | | 26,130 | |
GigPeak, Inc.* | | | 4,265 | | | | 10,748 | |
Impinj, Inc. (x)* | | | 174 | | | | 6,149 | |
Intersil Corp., Class A | | | 10,682 | | | | 238,209 | |
IXYS Corp. | | | 1,991 | | | | 23,693 | |
Kopin Corp.* | | | 4,879 | | | | 13,856 | |
| | | | | | | | |
MKS Instruments, Inc. | | | 4,017 | | | $ | 238,610 | |
Nanometrics, Inc.* | | | 349 | | | | 8,746 | |
NeoPhotonics Corp.* | | | 2,067 | | | | 22,344 | |
NVE Corp. | | | 186 | | | | 13,286 | |
PDF Solutions, Inc.* | | | 118 | | | | 2,661 | |
Photronics, Inc.* | | | 5,215 | | | | 58,929 | |
Rambus, Inc.* | | | 6,515 | | | | 89,712 | |
Rudolph Technologies, Inc.* | | | 2,399 | | | | 56,017 | |
Sigma Designs, Inc.* | | | 2,861 | | | | 17,166 | |
Tessera Holding Corp. | | | 1,384 | | | | 61,173 | |
Ultra Clean Holdings, Inc.* | | | 2,535 | | | | 24,589 | |
Ultratech, Inc.* | | | 1,588 | | | | 38,080 | |
Veeco Instruments, Inc.* | | | 3,202 | | | | 93,338 | |
Xcerra Corp.* | | | 4,248 | | | | 32,455 | |
| | | | | | | | |
| | | | | | | 2,140,463 | |
| | | | | | | | |
Software (0.6%) | |
Blackline, Inc.* | | | 128 | | | | 3,537 | |
Bottomline Technologies de, Inc.* | | | 435 | | | | 10,884 | |
Digimarc Corp.* | | | 37 | | | | 1,110 | |
EnerNOC, Inc. (x)* | | | 312 | | | | 1,872 | |
Everbridge, Inc. (x)* | | | 89 | | | | 1,642 | |
Glu Mobile, Inc. (x)* | | | 8,306 | | | | 16,114 | |
Mentor Graphics Corp. | | | 8,562 | | | | 315,852 | |
MicroStrategy, Inc., Class A* | | | 359 | | | | 70,866 | |
Park City Group, Inc. (x)* | | | 68 | | | | 864 | |
Progress Software Corp. | | | 3,498 | | | | 111,691 | |
QAD, Inc., Class A | | | 775 | | | | 23,560 | |
Rosetta Stone, Inc.* | | | 345 | | | | 3,074 | |
Rubicon Project, Inc. (The)* | | | 1,808 | | | | 13,415 | |
SecureWorks Corp., Class A* | | | 345 | | | | 3,653 | |
Silver Spring Networks, Inc.* | | | 172 | | | | 2,289 | |
Tangoe, Inc.* | | | 2,225 | | | | 17,533 | |
Telenav, Inc.* | | | 2,598 | | | | 18,316 | |
TiVo Corp.* | | | 6,473 | | | | 135,286 | |
VASCO Data Security International, Inc.* | | | 249 | | | | 3,399 | |
Verint Systems, Inc.* | | | 4,992 | | | | 175,968 | |
| | | | | | | | |
| | | | | | | 930,925 | |
| | | | | | | | |
Technology Hardware, Storage & Peripherals (0.1%) | |
Avid Technology, Inc.* | | | 865 | | | | 3,806 | |
CPI Card Group, Inc. | | | 1,100 | | | | 4,565 | |
Diebold Nixdorf, Inc. | | | 3,665 | | | | 92,175 | |
Eastman Kodak Co.* | | | 259 | | | | 4,014 | |
Immersion Corp.* | | | 1,590 | | | | 16,902 | |
Stratasys Ltd.* | | | 2,077 | | | | 34,354 | |
Super Micro Computer, Inc.* | | | 2,449 | | | | 68,694 | |
USA Technologies, Inc. (x)* | | | 371 | | | | 1,595 | |
| | | | | | | | |
| | | | | | | 226,105 | |
| | | | | | | | |
Total Information Technology | | | | | | | 10,236,415 | |
| | | | | | | | |
Materials (2.3%) | |
Chemicals (0.9%) | |
A. Schulman, Inc. | | | 2,274 | | | | 76,065 | |
AgroFresh Solutions, Inc.* | | | 1,825 | | | | 4,836 | |
American Vanguard Corp. | | | 2,267 | | | | 43,413 | |
Calgon Carbon Corp. | | | 4,050 | | | | 68,850 | |
Chemours Co. (The) | | | 2,400 | | | | 53,016 | |
Chemtura Corp.* | | | 2,525 | | | | 83,830 | |
FutureFuel Corp. | | | 1,987 | | | | 27,619 | |
See Notes to Financial Statements.
80
EQ ADVISORS TRUST
AXA/PACIFIC GLOBAL SMALL CAP VALUE PORTFOLIO
PORTFOLIO OF INVESTMENTS (Continued)
December 31, 2016
| | | | | | | | |
| | | Number of
Shares | | | Value
(Note 1) | |
| | | | | | | | |
GCP Applied Technologies, Inc.* | | | 890 | | | $ | 23,808 | |
Hawkins, Inc. | | | 612 | | | | 33,017 | |
Ingevity Corp.* | | | 676 | | | | 37,085 | |
Innophos Holdings, Inc. | | | 165 | | | | 8,623 | |
Innospec, Inc. | | | 1,880 | | | | 128,780 | |
KMG Chemicals, Inc. | | | 401 | | | | 15,595 | |
Koppers Holdings, Inc.* | | | 323 | | | | 13,017 | |
Kraton Corp.* | | | 2,377 | | | | 67,697 | |
Kronos Worldwide, Inc. (x) | | | 1,760 | | | | 21,014 | |
LSB Industries, Inc. (x)* | | | 1,684 | | | | 14,179 | |
Minerals Technologies, Inc. | | | 1,289 | | | | 99,575 | |
Olin Corp. | | | 13,224 | | | | 338,667 | |
OMNOVA Solutions, Inc.* | | | 1,261 | | | | 12,610 | |
Quaker Chemical Corp. | | | 257 | | | | 32,881 | |
Rayonier Advanced Materials, Inc. (x) | | | 1,377 | | | | 21,289 | |
Stepan Co. | | | 1,426 | | | | 116,191 | |
TerraVia Holdings, Inc. (x)* | | | 6,339 | | | | 7,290 | |
Trecora Resources* | | | 271 | | | | 3,753 | |
Tredegar Corp. | | | 2,030 | | | | 48,720 | |
Tronox Ltd., Class A | | | 5,177 | | | | 53,375 | |
Valhi, Inc. | | | 1,880 | | | | 6,505 | |
| | | | | | | | |
| | | | | | | 1,461,300 | |
| | | | | | | | |
Construction Materials (0.0%) | |
United States Lime & Minerals, Inc. | | | 153 | | | | 11,590 | |
| | | | | | | | |
Containers & Packaging (0.1%) | |
Greif, Inc., Class A | | | 2,029 | | | | 104,108 | |
Greif, Inc., Class B | | | 460 | | | | 31,073 | |
UFP Technologies, Inc.* | | | 507 | | | | 12,903 | |
| | | | | | | | |
| | | | | | | 148,084 | |
| | | | | | | | |
Metals & Mining (1.1%) | |
AK Steel Holding Corp.* | | | 24,776 | | | | 252,963 | |
Allegheny Technologies, Inc. (x) | | | 8,691 | | | | 138,448 | |
Ampco-Pittsburgh Corp. | | | 683 | | | | 11,440 | |
Carpenter Technology Corp. | | | 3,680 | | | | 133,106 | |
Century Aluminum Co.* | | | 3,759 | | | | 32,177 | |
Cliffs Natural Resources, Inc.* | | | 17,609 | | | | 148,092 | |
Coeur Mining, Inc.* | | | 3,654 | | | | 33,215 | |
Commercial Metals Co. | | | 9,160 | | | | 199,505 | |
Ferroglobe plc (x) | | | 5,264 | | | | 57,009 | |
Gold Resource Corp. (x) | | | 785 | | | | 3,415 | |
Handy & Harman Ltd.* | | | 241 | | | | 6,157 | |
Haynes International, Inc. | | | 992 | | | | 42,646 | |
Hecla Mining Co. | | | 30,696 | | | | 160,847 | |
Kaiser Aluminum Corp. | | | 895 | | | | 69,532 | |
Materion Corp. | | | 1,596 | | | | 63,202 | |
Olympic Steel, Inc. | | | 724 | | | | 17,542 | |
Ryerson Holding Corp.* | | | 1,016 | | | | 13,564 | |
Schnitzer Steel Industries, Inc., Class A | | | 2,088 | | | | 53,662 | |
Stillwater Mining Co.* | | | 9,802 | | | | 157,910 | |
SunCoke Energy, Inc.* | | | 5,180 | | | | 58,741 | |
TimkenSteel Corp.* | | | 3,178 | | | | 49,195 | |
| | | | | | | | |
| | | | | | | 1,702,368 | |
| | | | | | | | |
Paper & Forest Products (0.2%) | |
Boise Cascade Co.* | | | 452 | | | | 10,170 | |
KapStone Paper and Packaging Corp. | | | 6,417 | | | | 141,495 | |
| | | | | | | | |
Louisiana-Pacific Corp.* | | | 797 | | | $ | 15,087 | |
P.H. Glatfelter Co. | | | 3,498 | | | | 83,567 | |
Schweitzer-Mauduit International, Inc. | | | 1,964 | | | | 89,421 | |
| | | | | | | | |
| | | | | | | 339,740 | |
| | | | | | | | |
Total Materials | | | | | | | 3,663,082 | |
| | | | | | | | |
Real Estate (5.0%) | |
Equity Real Estate Investment Trusts (REITs) (4.7%) | |
Acadia Realty Trust (REIT) | | | 5,047 | | | | 164,936 | |
Agree Realty Corp. (REIT) | | | 1,873 | | | | 86,252 | |
Alexander’s, Inc. (REIT) | | | 7 | | | | 2,988 | |
American Assets Trust, Inc. (REIT) | | | 2,040 | | | | 87,883 | |
Armada Hoffler Properties, Inc. (REIT) | | | 309 | | | | 4,502 | |
Ashford Hospitality Prime, Inc. (REIT) | | | 1,902 | | | | 25,962 | |
Ashford Hospitality Trust, Inc. (REIT) | | | 6,346 | | | | 49,245 | |
Bluerock Residential Growth REIT, Inc. (REIT) | | | 1,516 | | | | 20,799 | |
CatchMark Timber Trust, Inc. (REIT), Class A | | | 3,098 | | | | 34,883 | |
CBL & Associates Properties, Inc. (REIT) | | | 13,585 | | | | 156,227 | |
Cedar Realty Trust, Inc. (REIT) | | | 6,657 | | | | 43,470 | |
Chatham Lodging Trust (REIT) | | | 3,020 | | | | 62,061 | |
Chesapeake Lodging Trust (REIT) | | | 3,505 | | | | 90,639 | |
City Office REIT, Inc. (REIT) | | | 286 | | | | 3,767 | |
Colony Starwood Homes (REIT) | | | 5,213 | | | | 150,187 | |
Community Healthcare Trust, Inc. (REIT) | | | 1,010 | | | | 23,260 | |
CorEnergy Infrastructure Trust, Inc. (REIT) (x) | | | 959 | | | | 33,450 | |
Cousins Properties, Inc. (REIT) | | | 27,046 | | | | 230,161 | |
DiamondRock Hospitality Co. (REIT) | | | 16,003 | | | | 184,515 | |
Easterly Government Properties, Inc. (REIT) | | | 2,592 | | | | 51,892 | |
Education Realty Trust, Inc. (REIT) | | | 5,168 | | | | 218,606 | |
Farmland Partners, Inc. (REIT) (x) | | | 944 | | | | 10,535 | |
FelCor Lodging Trust, Inc. (REIT) | | | 1,385 | | | | 11,094 | |
First Industrial Realty Trust, Inc. (REIT) | | | 7,293 | | | | 204,569 | |
First Potomac Realty Trust (REIT) | | | 4,665 | | | | 51,175 | |
Four Corners Property Trust, Inc. (REIT) | | | 1,102 | | | | 22,613 | |
Franklin Street Properties Corp. (REIT) | | | 8,392 | | | | 108,760 | |
GEO Group, Inc. (The) (REIT) | | | 4,674 | | | | 167,937 | |
Getty Realty Corp. (REIT) | | | 2,086 | | | | 53,172 | |
Gladstone Commercial Corp. (REIT) | | | 1,746 | | | | 35,095 | |
Global Medical REIT, Inc. (REIT) (x) | | | 613 | | | | 5,468 | |
See Notes to Financial Statements.
81
EQ ADVISORS TRUST
AXA/PACIFIC GLOBAL SMALL CAP VALUE PORTFOLIO
PORTFOLIO OF INVESTMENTS (Continued)
December 31, 2016
| | | | | | | | |
| | | Number of
Shares | | | Value
(Note 1) | |
| | | | | | | | |
Global Net Lease, Inc. (REIT) (x) | | | 13,688 | | | $ | 107,177 | |
Government Properties Income Trust (REIT) | | | 5,612 | | | | 106,993 | |
Gramercy Property Trust (REIT) | | | 28,642 | | | | 262,934 | |
Healthcare Realty Trust, Inc. (REIT) | | | 9,119 | | | | 276,488 | |
Hersha Hospitality Trust (REIT) | | | 3,182 | | | | 68,413 | |
Hudson Pacific Properties, Inc. (REIT) | | | 8,430 | | | | 293,195 | |
Independence Realty Trust, Inc. (REIT) (x) | | | 4,499 | | | | 40,131 | |
InfraREIT, Inc. (REIT)* | | | 3,238 | | | | 57,993 | |
Investors Real Estate Trust (REIT) | | | 9,711 | | | | 69,239 | |
Kite Realty Group Trust (REIT) | | | 6,630 | | | | 155,672 | |
LaSalle Hotel Properties (REIT) | | | 8,515 | | | | 259,452 | |
Lexington Realty Trust (REIT) | | | 18,303 | | | | 197,672 | |
LTC Properties, Inc. (REIT) | | | 407 | | | | 19,121 | |
Mack-Cali Realty Corp. (REIT) | | | 7,186 | | | | 208,538 | |
MedEquities Realty Trust, Inc. (REIT) | | | 457 | | | | 5,073 | |
Medical Properties Trust, Inc. (REIT) | | | 15,690 | | | | 192,987 | |
Monmouth Real Estate Investment Corp. (REIT) (x) | | | 4,305 | | | | 65,608 | |
Monogram Residential Trust, Inc. (REIT) (x) | | | 13,546 | | | | 146,568 | |
National Storage Affiliates Trust (REIT) | | | 2,515 | | | | 55,506 | |
New Senior Investment Group, Inc. (REIT) | | | 6,221 | | | | 60,904 | |
New York REIT, Inc. (REIT) | | | 13,284 | | | | 134,434 | |
NexPoint Residential Trust, Inc. (REIT) | | | 1,440 | | | | 32,170 | |
NorthStar Realty Europe Corp. (REIT) | | | 4,344 | | | | 54,604 | |
One Liberty Properties, Inc. (REIT) | | | 1,043 | | | | 26,200 | |
Parkway, Inc. (REIT)* | | | 3,405 | | | | 75,761 | |
Pebblebrook Hotel Trust (REIT) | | | 5,756 | | | | 171,241 | |
Pennsylvania REIT (REIT) | | | 3,921 | | | | 74,342 | |
Physicians Realty Trust (REIT) | | | 5,277 | | | | 100,052 | |
Preferred Apartment Communities, Inc. (REIT), Class A (x) | | | 1,767 | | | | 26,346 | |
RAIT Financial Trust (REIT) | | | 7,044 | | | | 23,668 | |
Ramco-Gershenson Properties Trust (REIT) | | | 6,337 | | | | 105,067 | |
Retail Opportunity Investments Corp. (REIT) | | | 2,525 | | | | 53,353 | |
Rexford Industrial Realty, Inc. (REIT) | | | 3,249 | | | | 75,344 | |
RLJ Lodging Trust (REIT) | | | 9,704 | | | | 237,651 | |
Sabra Health Care REIT, Inc. (REIT) | | | 4,368 | | | | 106,667 | |
Saul Centers, Inc. (REIT) | | | 90 | | | | 5,995 | |
Select Income REIT (REIT) | | | 5,089 | | | | 128,243 | |
Seritage Growth Properties (REIT), Class A (x) | | | 2,008 | | | | 85,762 | |
Silver Bay Realty Trust Corp. (REIT) | | | 2,692 | | | | 46,141 | |
Summit Hotel Properties, Inc. (REIT) | | | 6,991 | | | | 112,066 | |
| | | | | | | | |
Sunstone Hotel Investors, Inc. (REIT) | | | 17,335 | | | $ | 264,359 | |
Terreno Realty Corp. (REIT) | | | 2,713 | | | | 77,293 | |
Tier REIT, Inc. (REIT) | | | 3,840 | | | | 66,778 | |
UMH Properties, Inc. (REIT) | | | 1,373 | | | | 20,664 | |
Washington Prime Group, Inc. (REIT) | | | 11,816 | | | | 123,005 | |
Washington Real Estate Investment Trust (REIT) | | | 3,864 | | | | 126,314 | |
Whitestone REIT (REIT) | | | 2,054 | | | | 29,536 | |
Xenia Hotels & Resorts, Inc. (REIT) | | | 8,324 | | | | 161,652 | |
| | | | | | | | |
| | | | | | | 7,590,475 | |
| | | | | | | | |
Real Estate Management & Development (0.3%) | |
Alexander & Baldwin, Inc. | | | 1,764 | | | | 79,151 | |
AV Homes, Inc.* | | | 673 | | | | 10,633 | |
Consolidated-Tomoka Land Co. | | | 38 | | | | 2,030 | |
Forestar Group, Inc.* | | | 2,492 | | | | 33,144 | |
FRP Holdings, Inc.* | | | 500 | | | | 18,850 | |
Griffin Industrial Realty, Inc. | | | 49 | | | | 1,555 | |
Kennedy-Wilson Holdings, Inc. | | | 3,313 | | | | 67,916 | |
RE/MAX Holdings, Inc., Class A | | | 1,424 | | | | 79,744 | |
St Joe Co. (The)* | | | 4,045 | | | | 76,855 | |
Stratus Properties, Inc.* | | | 494 | | | | 16,178 | |
Tejon Ranch Co.* | | | 1,111 | | | | 28,253 | |
Trinity Place Holdings, Inc.* | | | 1,396 | | | | 12,941 | |
| | | | | | | | |
| | | | | | | 427,250 | |
| | | | | | | | |
Total Real Estate | | | | | | | 8,017,725 | |
| | | | | | | | |
Telecommunication Services (0.3%) | |
Diversified Telecommunication Services (0.3%) | |
ATN International, Inc. | | | 839 | | | | 67,229 | |
Cincinnati Bell, Inc.* | | | 3,411 | | | | 76,236 | |
Consolidated Communications Holdings, Inc. (x) | | | 1,218 | | | | 32,703 | |
FairPoint Communications, Inc.* | | | 405 | | | | 7,573 | |
Globalstar, Inc. (x)* | | | 11,139 | | | | 17,600 | |
Hawaiian Telcom Holdco, Inc.* | | | 499 | | | | 12,365 | |
IDT Corp., Class B | | | 552 | | | | 10,234 | |
Intelsat SA* | | | 2,462 | | | | 6,573 | |
Iridium Communications, Inc. (x)* | | | 6,711 | | | | 64,426 | |
Lumos Networks Corp.* | | | 1,409 | | | | 22,009 | |
ORBCOMM, Inc.* | | | 454 | | | | 3,755 | |
pdvWireless, Inc. (x)* | | | 828 | | | | 18,671 | |
Vonage Holdings Corp.* | | | 13,774 | | | | 94,352 | |
Windstream Holdings, Inc. (x) | | | 6,722 | | | | 49,272 | |
| | | | | | | | |
| | | | | | | 482,998 | |
| | | | | | | | |
Wireless Telecommunication Services (0.0%) | |
Boingo Wireless, Inc.* | | | 1,198 | | | | 14,604 | |
NII Holdings, Inc.* | | | 4,565 | | | | 9,815 | |
Spok Holdings, Inc. | | | 1,627 | | | | 33,760 | |
| | | | | | | | |
| | | | | | | 58,179 | |
| | | | | | | | |
Total Telecommunication Services | | | | | | | 541,177 | |
| | | | | | | | |
See Notes to Financial Statements.
82
EQ ADVISORS TRUST
AXA/PACIFIC GLOBAL SMALL CAP VALUE PORTFOLIO
PORTFOLIO OF INVESTMENTS (Continued)
December 31, 2016
| | | | | | | | |
| | | Number of
Shares | | | Value
(Note 1) | |
| | | | | | | | |
Utilities (3.0%) | |
Electric Utilities (1.0%) | |
ALLETE, Inc. | | | 3,966 | | | $ | 254,577 | |
El Paso Electric Co. | | | 3,240 | | | | 150,660 | |
Empire District Electric Co. (The) | | | 3,534 | | | | 120,474 | |
Genie Energy Ltd., Class B (x)* | | | 1,028 | | | | 5,911 | |
IDACORP, Inc. | | | 4,037 | | | | 325,180 | |
MGE Energy, Inc. | | | 1,501 | | | | 98,015 | |
Otter Tail Corp. | | | 3,052 | | | | 124,522 | |
PNM Resources, Inc. | | | 6,383 | | | | 218,937 | |
Portland General Electric Co. | | | 7,160 | | | | 310,243 | |
| | | | | | | | |
| | | | | | | 1,608,519 | |
| | | | | | | | |
Gas Utilities (1.1%) | |
Chesapeake Utilities Corp. | | | 1,105 | | | | 73,980 | |
Delta Natural Gas Co., Inc. | | | 526 | | | | 15,427 | |
New Jersey Resources Corp. | | | 6,303 | | | | 223,756 | |
Northwest Natural Gas Co. | | | 2,177 | | | | 130,185 | |
ONE Gas, Inc. | | | 4,166 | | | | 266,457 | |
South Jersey Industries, Inc. | | | 6,411 | | | | 215,987 | |
Southwest Gas Corp. | | | 3,387 | | | | 259,512 | |
Spire, Inc. | | | 3,574 | | | | 230,702 | |
WGL Holdings, Inc. | | | 3,828 | | | | 292,000 | |
| | | | | | | | |
| | | | | | | 1,708,006 | |
| | | | | | | | |
Independent Power and Renewable Electricity Producers (0.3%) | |
Atlantic Power Corp.* | | | 8,891 | | | | 22,227 | |
Atlantica Yield plc (x) | | | 4,693 | | | | 90,810 | |
Dynegy, Inc.* | | | 9,273 | | | | 78,450 | |
NRG Yield, Inc., Class A | | | 2,845 | | | | 43,699 | |
NRG Yield, Inc., Class C | | | 5,072 | | | | 80,138 | |
Ormat Technologies, Inc. | | | 1,714 | | | | 91,905 | |
Pattern Energy Group, Inc. | | | 1,049 | | | | 19,920 | |
TerraForm Global, Inc., Class A* | | | 7,403 | | | | 29,242 | |
TerraForm Power, Inc., Class A (x)* | | | 7,043 | | | | 90,221 | |
Vivint Solar, Inc. (x)* | | | 1,981 | | | | 5,051 | |
| | | | | | | | |
| | | | | | | 551,663 | |
| | | | | | | | |
Multi-Utilities (0.4%) | |
Avista Corp. | | | 5,079 | | | | 203,109 | |
Black Hills Corp. | | | 4,125 | | | | 253,028 | |
NorthWestern Corp. | | | 3,889 | | | | 221,167 | |
Unitil Corp. | | | 1,105 | | | | 50,101 | |
| | | | | | | | |
| | | | | | | 727,405 | |
| | | | | | | | |
Water Utilities (0.2%) | |
American States Water Co. | | | 986 | | | | 44,922 | |
AquaVenture Holdings Ltd.* | | | 183 | | | | 4,489 | |
Artesian Resources Corp., Class A | | | 605 | | | | 19,324 | |
California Water Service Group | | | 1,566 | | | | 53,087 | |
Connecticut Water Service, Inc. | | | 664 | | | | 37,084 | |
Consolidated Water Co. Ltd. | | | 1,157 | | | | 12,553 | |
Middlesex Water Co. | | | 175 | | | | 7,515 | |
SJW Group | | | 1,305 | | | | 73,054 | |
York Water Co. (The) | | | 113 | | | | 4,317 | |
| | | | | | | | |
| | | | | | | 256,345 | |
| | | | | | | | |
Total Utilities | | | | | | | 4,851,938 | |
| | | | | | | | |
Total Common Stocks (99.6%)
(Cost $135,231,953) | | | | | | | 161,217,710 | |
| | | | | | | | |
| | | Number of
Rights | | | Value
(Note 1) | |
| | | | | | | | |
RIGHTS: | |
Information Technology (0.0%) | |
Electronic Equipment, Instruments & Components (0.0%) | |
Gerber Scientific, Inc. (Contingent Value Shares)*† | | | 2,344 | | | $ | — | |
| | | | | | | | |
Total Information Technology | | | | | | | — | |
| | | | | | | | |
Telecommunication Services (0.0%) | |
Wireless Telecommunication Services (0.0%) | |
Leap Wireless International, Inc. (Contingent Value Shares)*† | | | 3,801 | | | | 8,552 | |
| | | | | | | | |
Total Telecommunication Services | | | | | | | 8,552 | |
| | | | | | | | |
Total Rights (0.0%)
(Cost $—) | | | | | | | 8,552 | |
| | | | | | | | |
| | | Number of
Shares | | | Value
(Note 1) | |
SHORT-TERM INVESTMENTS: | | | | | |
Investment Company (0.0%) | | | | | |
JPMorgan Prime Money Market Fund, IM Shares | | | 40,478 | | | | 40,490 | |
| | | | | | | | |
| | | Principal
Amount | | | Value
(Note 1) | |
| | | | | | | | |
Repurchase Agreements (4.4%) | | | | | |
Bank of Nova Scotia,
0.50%, dated 12/30/16, due 1/3/17, repurchase price $500,028, collateralized by various U.S. Government Treasury Securities, ranging from 0.875%-2.375%, maturing 11/30/17-1/15/27; total market value $510,000. (xx) | | $ | 500,000 | | | | 500,000 | |
Citigroup Global Markets Ltd.,
0.71%, dated 12/30/16, due 1/3/17, repurchase price $300,024, collateralized by various Foreign Government Agency Securities, ranging from 0.000%-5.250%, maturing 1/23/17-1/24/44, U.S. Government Treasury Securities, ranging from 0.000%-5.375%, maturing 2/15/19-2/15/44; total market value $306,000. (xx) | | | 300,000 | | | | 300,000 | |
Citigroup Global Markets Ltd.,
0.69%, dated 12/30/16, due 1/3/17, repurchase price $100,008, collateralized by various U.S. Government Treasury Securities, ranging from 1.375%-5.375%, maturing 7/31/18-2/15/45; total market value $102,000. (xx) | | | 100,000 | | | | 100,000 | |
Deutsche Bank AG,
1.05%, dated 12/30/16, due 1/3/17, repurchase price $2,000,233, collateralized by various Common Stocks; total market value $2,223,110. (xx) | | | 2,000,000 | | | | 2,000,000 | |
See Notes to Financial Statements.
83
EQ ADVISORS TRUST
AXA/PACIFIC GLOBAL SMALL CAP VALUE PORTFOLIO
PORTFOLIO OF INVESTMENTS (Continued)
December 31, 2016
| | | | | | | | |
| | | Principal
Amount | | | Value
(Note 1) | |
| | | | | | | | |
Deutsche Bank AG,
0.95%, dated 12/30/16, due 1/3/17, repurchase price $200,021, collateralized by various Corporate Bonds, ranging from 1.875%-2.500%, maturing 3/13/19-6/10/25; total market value $204,001. (xx) | | $ | 200,000 | | | $ | 200,000 | |
Deutsche Bank Securities, Inc.,
0.50%, dated 12/30/16, due 1/3/17, repurchase price $1,458,860, collateralized by various U.S. Government Treasury Securities, 0.000%, maturing 2/15/40-5/15/40; total market value $1,487,954. (xx) | | | 1,458,779 | | | | 1,458,779 | |
HSBC Securities, Inc.,
0.46%, dated 12/30/16, due 1/3/17, repurchase price $500,026, collateralized by various U.S. Government Treasury Securities, ranging from 1.375%-1.750%, maturing 12/15/19-9/30/22; total market value $510,006. (xx) | | | 500,000 | | | | 500,000 | |
Macquarie Bank Ltd,
0.57%, dated 12/30/16, due 1/3/17, repurchase price $400,025, collateralized by various U.S. Government Treasury Securities, ranging from 0.000%-8.750%, maturing 1/5/17-5/15/46; total market value $408,207. (xx) | | | 400,000 | | | | 400,000 | |
Macquarie Bank Ltd,
0.76%, dated 12/30/16, due 1/3/17, repurchase price $300,025, collateralized by various U.S. Government Treasury Securities, ranging from 0.000%-8.750%, maturing 1/5/17-5/15/46; total market value $306,155. (xx) | | | 300,000 | | | | 300,000 | |
Natixis,
0.50%, dated 12/30/16, due 1/3/17, repurchase price $400,022, collateralized by various U.S. Government Treasury Securities, ranging from 0.000%-3.625%, maturing 5/25/17-5/15/46; total market value $408,023. (xx) | | | 400,000 | | | | 400,000 | |
| | | | | | | | |
Nomura Securities Co. Ltd.,
0.50%, dated 12/30/16, due 1/3/17, repurchase price $400,022, collateralized by various U.S. Government Treasury Securities, ranging from 0.000%-3.875%, maturing 4/15/19-8/15/46; total market value $408,000. (xx) | | $ | 400,000 | | | $ | 400,000 | |
RBC Capital Markets,
0.45%, dated 12/30/16, due 1/3/17, repurchase price $600,030, collateralized by various U.S. Government Agency Securities, ranging from 2.434%-4.500%, maturing 12/1/26-1/1/47; total market value $612,000. (xx) | | | 600,000 | | | | 600,000 | |
| | | | | | | | |
Total Repurchase Agreements | | | | | | | 7,158,779 | |
| | | | | |
Total Short-Term Investments (4.4%)
(Cost $7,199,269) | | | | | | | 7,199,269 | |
| | | | | | | | |
Total Investments (104.0%)
(Cost $142,431,222) | | | | | | | 168,425,531 | |
Other Assets Less Liabilities (-4.0%) | | | | | | | (6,510,109 | ) |
| | | | | | | | |
Net Assets (100%) | | | | | | $ | 161,915,422 | |
| | | | | | | | |
| † | Securities (totaling $8,552 or 0.0% of net assets) held at fair value by management. |
| ‡ | All, or a portion, of the security is an affiliated company as defined under the Investment Company Act of 1940. |
| (x) | All or a portion of security is on loan at December 31, 2016. |
| (xx) | At December 31, 2016, the Portfolio had loaned securities with a total value of $6,985,266. This was secured by cash collateral of $7,158,779 which was subsequently invested in joint repurchase agreements with a total value of $7,158,779, as detailed in the Notes to the Financial Statements, for which the Portfolio has a proportionate interest as reported in the Portfolio of Investments as Repurchase Agreements, and $82,117 collateralized by various U.S. Government Treasury Securities, ranging from 0.000% - 8.125%, maturing 1/12/17 - 5/15/45. |
Investments in companies which were affiliates for the year ended December 31, 2016, were as follows:
| | | | | | | | | | | | | | | | | | | | | | | | |
Securities | | Value
December 31,
2015 | | | Purchases
at Cost | | | Sales
at Cost | | | Value
December 31,
2016 | | | Dividend
Income | | | Realized
Gain
(Loss) | |
PennyMac Financial Services, Inc., Class A | | $ | 7,188 | | | $ | — | | | $ | — | | | $ | 7,792 | | | $ | — | | | $ | — | |
PennyMac Mortgage Investment Trust (REIT) | | | 64,245 | | | | 23,262 | | | | 3,206 | | | | 89,364 | | | | 9,770 | | | | (172 | ) |
| | | | | | | | | | | | | | | | | | | | | | | | |
| | $ | 71,433 | | | $ | 23,262 | | | $ | 3,206 | | | $ | 97,156 | | | $ | 9,770 | | | $ | (172 | ) |
| | | | | | | | | | | | | | | | | | | | | | | | |
See Notes to Financial Statements.
84
EQ ADVISORS TRUST
AXA/PACIFIC GLOBAL SMALL CAP VALUE PORTFOLIO
PORTFOLIO OF INVESTMENTS (Continued)
December 31, 2016
At December 31, 2016, the Portfolio had the following futures contracts open: (Note 1)
| | | | | | | | | | | | | | | | | | | | |
Purchase | | Number of
Contracts | | | Expiration
Date | | | Original
Value | | | Value at
12/31/2016 | | | Unrealized
Appreciation/
(Depreciation) | |
Russell 2000 Mini Index | | | 10 | | | | March-17 | | | $ | 681,169 | | | $ | 678,450 | | | $ | (2,719 | ) |
| | | | | | | | | | | | | | | | | | | | |
The following is a summary of the inputs used to value the Portfolio’s assets and liabilities carried at fair value as of December 31, 2016:
The inputs or methodology used for valuing securities are not necessarily an indication of the risk associated with investing in those securities.
Various inputs are used in determining the value of the Portfolio’s investments. These inputs are summarized in the three broad levels listed below:
| | | | | | | | | | | | | | | | |
| | | | | |
| Investment Type | | Level 1
Quoted Prices in
Active Markets for
Identical
Securities | | | Level 2
Significant Other
Observable Inputs
(including quoted prices
for similar securities,
interest rates,
prepayment speeds,
credit risk, etc.) (a) | | | Level 3
Significant Unobservable
Inputs (including the
Portfolio’s own
assumptions in
determining the fair
value of investments) | | | Total | |
Assets: | |
Common Stocks | | | | | | | | | | | | | | | | |
Consumer Discretionary | | $ | 19,996,392 | | | $ | 35,017 | | | $ | — | | | $ | 20,031,409 | |
Consumer Staples | | | 6,517,893 | | | | 6,679 | | | | — | | | | 6,524,572 | |
Energy | | | 18,826,279 | | | | — | | | | — | | | | 18,826,279 | |
Financials | | | 34,180,357 | | | | — | | | | — | | | | 34,180,357 | |
Health Care | | | 5,759,659 | | | | — | | | | — | | | | 5,759,659 | |
Industrials | | | 48,585,097 | | | | — | | | | — | | | | 48,585,097 | |
Information Technology | | | 10,236,415 | | | | — | | | | — | | | | 10,236,415 | |
Materials | | | 3,663,082 | | | | — | | | | — | | | | 3,663,082 | |
Real Estate | | | 8,016,170 | | | | 1,555 | | | | — | | | | 8,017,725 | |
Telecommunication Services | | | 541,177 | | | | — | | | | — | | | | 541,177 | |
Utilities | | | 4,851,938 | | | | — | | | | — | | | | 4,851,938 | |
Rights | | | | | | | | | | | | | | | | |
Information Technology | | | — | | | | — | | | | — | (b) | | | — | (b) |
Telecommunication Services | | | — | | | | — | | | | 8,552 | | | | 8,552 | |
Short-Term Investments | | | | | | | | | | | | | | | | |
Investment Companies | | | 40,490 | | | | — | | | | — | | | | 40,490 | |
Repurchase Agreements | | | — | | | | 7,158,779 | | | | — | | | | 7,158,779 | |
| | | | | | | | | | | | | | | | |
Total Assets | | $ | 161,214,949 | | | $ | 7,202,030 | | | $ | 8,552 | | | $ | 168,425,531 | |
| | | | | | | | | | | | | | | | |
Liabilities: | |
Futures | | $ | (2,719 | ) | | $ | — | | | $ | — | | | $ | (2,719 | ) |
| | | | | | | | | | | | | | | | |
Total Liabilities | | $ | (2,719 | ) | | $ | — | | | $ | — | | | $ | (2,719 | ) |
| | | | | | | | | | | | | | | | |
Total | | $ | 161,212,230 | | | $ | 7,202,030 | | | $ | 8,552 | | | $ | 168,422,812 | |
| | | | | | | | | | | | | | | | |
| (a) | A security with a market value of $6,679 transferred from Level 1 to Level 2 at the end of the year due to inactive trading. |
There were no additional transfers between Levels 1, 2 or 3 during the year ended December 31, 2016.
See Notes to Financial Statements.
85
EQ ADVISORS TRUST
AXA/PACIFIC GLOBAL SMALL CAP VALUE PORTFOLIO
PORTFOLIO OF INVESTMENTS (Continued)
December 31, 2016
Fair Values of Derivative Instruments as of December 31, 2016:
| | | | | | |
| | | Statement of Assets and Liabilities | |
Derivatives Not Accounted for as
Hedging Instrument^ | | Liability Derivatives | | Fair
Value | |
Equity contracts | | Payables, Net assets –
Unrealized depreciation | | $ | (2,719 | )* |
| | | | | | |
| * | Includes cumulative appreciation/depreciation of futures contracts as reported in the Portfolio of Investments. Only variation margin is reported within the Statement of Assets & Liabilities. |
The Effect of Derivative Instruments on the Statement of Operations for the year ended December 31, 2016:
| | | | |
| Amount of Realized Gain or (Loss) on Derivatives Recognized in Income | |
Derivatives Not Accounted for as
Hedging Instrument^ | | Futures | |
Equity contracts | | $ | 67,733 | |
| | | | |
| | | | |
| Amount of Unrealized Appreciation or (Depreciation) on Derivatives Recognized in Income | |
Derivatives Not Accounted for as
Hedging Instrument^ | | Futures | |
Equity contracts | | $ | 7,539 | |
| | | | |
^ The Portfolio held futures contracts as a substitute for investing in conventional securities.
The Portfolio held futures contracts with an average notional balance of approximately $691,000 during the year ended December 31, 2016.
Investment security transactions for the year ended December 31, 2016 were as follows:
| | | | |
Cost of Purchases: | | | | |
Long-term investments other than U.S. government debt securities (affiliated 20%)* | | $ | 35,453,296 | |
Net Proceeds of Sales and Redemptions: | | | | |
Long-term investments other than U.S. government debt securities (affiliated 27%)* | | $ | 42,472,963 | |
* During the year ended December 31, 2016, the Portfolio engaged in purchases and sales of securities pursuant to Rule 17a-7 of the 1940 Act (amount is percentage of total Purchases and/or Sales).
As of December 31, 2016, the gross unrealized appreciation (depreciation) of investments based on the aggregate cost of investments for Federal income tax purposes was as follows:
| | | | |
Aggregate gross unrealized appreciation | | $ | 42,050,558 | |
Aggregate gross unrealized depreciation | | | (16,070,233 | ) |
| | | | |
Net unrealized appreciation | | $ | 25,980,325 | |
| | | | |
Federal income tax cost of investments | | $ | 142,445,206 | |
| | | | |
See Notes to Financial Statements.
86
EQ ADVISORS TRUST
AXA/PACIFIC GLOBAL SMALL CAP VALUE PORTFOLIO
STATEMENT OF ASSETS AND LIABILITIES
December 31, 2016
| | | | |
ASSETS | | | | |
Investments at value (x): | | | | |
Affiliated Issuers (Cost $119,129) | | $ | 97,156 | |
Unaffiliated Issuers (Cost $135,153,314) | | | 161,169,596 | |
Repurchase Agreements (Cost $7,158,779) | | | 7,158,779 | |
Cash | | | 473,851 | |
Cash held as collateral at broker | | | 33,200 | |
Receivable for securities sold | | | 279,412 | |
Dividends, interest and other receivables | | | 243,882 | |
Securities lending income receivable | | | 15,764 | |
Receivable from Separate Accounts for Trust shares sold | | | 5,223 | |
Other assets | | | 430 | |
| | | | |
Total assets | | | 169,477,293 | |
| | | | |
LIABILITIES | | | | |
Payable for return of collateral on securities loaned | | | 7,158,779 | |
Payable for securities purchased | | | 241,227 | |
Investment management fees payable | | | 83,365 | |
Administrative fees payable | | | 17,300 | |
Payable to Separate Accounts for Trust shares redeemed | | | 10,692 | |
Due to broker for futures variation margin | | | 2,843 | |
Trustees’ fees payable | | | 225 | |
Distribution fees payable – Class IB | | | 105 | |
Accrued expenses | | | 47,335 | |
| | | | |
Total liabilities | | | 7,561,871 | |
| | | | |
NET ASSETS | | $ | 161,915,422 | |
| | | | |
Net assets were comprised of: | | | | |
Paid in capital | | $ | 137,045,025 | |
Accumulated undistributed net investment income (loss) | | | 206,755 | |
Accumulated undistributed net realized gain (loss) on investments and futures | | | (1,327,948 | ) |
Net unrealized appreciation (depreciation) on investments and futures | | | 25,991,590 | |
| | | | |
Net assets | | $ | 161,915,422 | |
| | | | |
Class IB | | | | |
Net asset value, offering and redemption price per share, $510,514 / 55,631 shares outstanding (unlimited amount authorized: $0.01 par value) | | $ | 9.18 | |
| | | | |
Class K | | | | |
Net asset value, offering and redemption price per share, $161,404,908 / 17,604,560 shares outstanding (unlimited amount authorized: $0.01 par value) | | $ | 9.17 | |
| | | | |
| (x) | Includes value of securities on loan of $6,985,266. |
STATEMENT OF OPERATIONS
For the Year Ended December 31, 2016
| | | | |
INVESTMENT INCOME | | | | |
Dividends ($9,770 of dividend income received from affiliates) (net of $5,691 foreign withholding tax) | | $ | 2,128,552 | |
Interest | | | 1,631 | |
Securities lending (net) | | | 214,094 | |
| | | | |
Total income | | | 2,344,277 | |
| | | | |
EXPENSES | | | | |
Investment management fees | | | 1,083,337 | |
Administrative fees | | | 169,841 | |
Custodian fees | | | 69,500 | |
Professional fees | | | 55,099 | |
Printing and mailing expenses | | | 9,413 | |
Trustees’ fees | | | 3,095 | |
Distribution fees – Class IB | | | 757 | |
Miscellaneous | | | 6,766 | |
| | | | |
Gross expenses | | | 1,397,808 | |
Less: Waiver from investment manager | | | (134,202 | ) |
| | | | |
Net expenses | | | 1,263,606 | |
| | | | |
NET INVESTMENT INCOME (LOSS) | | | 1,080,671 | |
| | | | |
REALIZED AND UNREALIZED GAIN (LOSS) | | | | |
Realized gain (loss) on: | | | | |
Investments ($(172) of realized gain (loss) from affiliates) | | | 670,428 | |
Net distributions of realized gain received from underlying funds | | | 11 | |
Futures | | | 67,733 | |
| | | | |
Net realized gain (loss) | | | 738,172 | |
| | | | |
Change in unrealized appreciation (depreciation) on: | | | | |
Investments ($5,667 of change in unrealized appreciation (depreciation) from affiliates) | | | 34,697,003 | |
Futures | | | 7,539 | |
| | | | |
Net change in unrealized appreciation (depreciation) | | | 34,704,542 | |
| | | | |
NET REALIZED AND UNREALIZED GAIN (LOSS) | | | 35,442,714 | |
| | | | |
NET INCREASE (DECREASE) IN NET ASSETS RESULTING FROM OPERATIONS | | $ | 36,523,385 | |
| | | | |
See Notes to Financial Statements.
87
EQ ADVISORS TRUST
AXA/PACIFIC GLOBAL SMALL CAP VALUE PORTFOLIO
STATEMENT OF CHANGES IN NET ASSETS
| | | | | | | | |
| | | Year Ended December 31, | |
| | 2016 | | | 2015 | |
INCREASE (DECREASE) IN NET ASSETS FROM OPERATIONS: | | | | | | | | |
Net investment income (loss) | | $ | 1,080,671 | | | $ | 354,906 | |
Net realized gain (loss) on investments, futures and net distributions of realized gain received from underlying funds | | | 738,172 | | | | 638,809 | |
Net change in unrealized appreciation (depreciation) on investments and futures | | | 34,704,542 | | | | (30,746,625 | ) |
| | | | | | | | |
NET INCREASE (DECREASE) IN NET ASSETS RESULTING FROM OPERATIONS | | | 36,523,385 | | | | (29,752,910 | ) |
| | | | | | | | |
DIVIDENDS AND DISTRIBUTIONS: | | | | | | | | |
Dividends from net investment income | | | | | | | | |
Class IB | | | (2,367 | ) | | | (161 | ) |
Class K | | | (1,135,781 | ) | | | (443,720 | ) |
| | | | | | | | |
| | | (1,138,148 | ) | | | (443,881 | ) |
| | | | | | | | |
Distributions from net realized capital gains | | | | | | | | |
Class IB | | | — | | | | (3,565 | ) |
Class K | | | — | | | | (2,424,508 | ) |
| | | | | | | | |
| | | — | | | | (2,428,073 | ) |
| | | | | | | | |
Return of capital | | | | | | | | |
Class IB | | | (305 | ) | | | (111 | ) |
Class K | | | (146,574 | ) | | | (73,554 | ) |
| | | | | | | | |
| | | (146,879 | ) | | | (73,665 | ) |
| | | | | | | | |
TOTAL DIVIDENDS AND DISTRIBUTIONS | | | (1,285,027 | ) | | | (2,945,619 | ) |
| | | | | | | | |
CAPITAL SHARES TRANSACTIONS: | | | | | | | | |
Class IB | | | | | | | | |
Capital shares sold [ 32,016 and 28,166 shares, respectively ] | | | 249,499 | | | | 238,177 | |
Capital shares issued in reinvestment of dividends and distributions [ 288 and 541 shares, respectively ] | | | 2,672 | | | | 3,837 | |
Capital shares repurchased [ (5,124) and (2,821) shares, respectively ] | | | (38,951 | ) | | | (25,136 | ) |
| | | | | | | | |
Total Class IB transactions | | | 213,220 | | | | 216,878 | |
| | | | | | | | |
Class K | | | | | | | | |
Capital shares sold [ 1,159,770 and 3,165,814 shares, respectively ] | | | 8,187,280 | | | | 25,125,964 | |
Capital shares issued in reinvestment of dividends and distributions [ 138,526 and 414,607 shares, respectively ] | | | 1,282,355 | | | | 2,941,782 | |
Capital shares repurchased [ (2,476,240) and (2,629,873) shares, respectively ] | | | (17,573,113 | ) | | | (20,946,491 | ) |
| | | | | | | | |
Total Class K transactions | | | (8,103,478 | ) | | | 7,121,255 | |
| | | | | | | | |
NET INCREASE (DECREASE) IN NET ASSETS RESULTING FROM CAPITAL SHARE TRANSACTIONS | | | (7,890,258 | ) | | | 7,338,133 | |
| | | | | | | | |
TOTAL INCREASE (DECREASE) IN NET ASSETS | | | 27,348,100 | | | | (25,360,396 | ) |
NET ASSETS: | | | | | | | | |
Beginning of year | | | 134,567,322 | | | | 159,927,718 | |
| | | | | | | | |
End of year (a) | | $ | 161,915,422 | | | $ | 134,567,322 | |
| | | | | | | | |
(a) Includes accumulated undistributed (overdistributed) net investment income (loss) of | | $ | 206,755 | | | $ | 181,389 | |
| | | | | | | | |
See Notes to Financial Statements.
88
EQ ADVISORS TRUST
AXA/PACIFIC GLOBAL SMALL CAP VALUE PORTFOLIO
FINANCIAL HIGHLIGHTS
| | | | | | | | | | | | | | | | |
| | | Year Ended
December 31, 2016 | | | May 1, 2015** to
December 31, 2015 | | | January 1, 2015 to
April 13, 2015‡ | | | April 21, 2014* to
December 31, 2014 | |
| Class IB | | | | |
Net asset value, beginning of period | | $ | 7.16 | | | $ | 8.84 | | | $ | 8.97 | | | $ | 10.00 | |
| | | | | | | | | | | | | | | | |
Income (loss) from investment operations: | | | | | | | | | | | | | | | | |
Net investment income (loss) (e) | | | 0.05 | | | | 0.01 | | | | — | # | | | (0.01 | ) |
Net realized and unrealized gain (loss) on investments and futures | | | 2.02 | | | | (1.55 | ) | | | 0.06 | | | | (0.79 | ) |
| | | | | | | | | | | | | | | | |
Total from investment operations | | | 2.07 | | | | (1.54 | ) | | | 0.06 | | | | (0.80 | ) |
| | | | | | | | | | | | | | | | |
Less distributions: | | | | | | | | | | | | | |
Dividends from net investment income | | | (0.04 | ) | | | (0.01 | ) | | | — | | | | — | |
Distributions from net realized gains | | | — | | | | (0.13 | ) | | | — | | | | (0.23 | ) |
Return of capital | | | (0.01 | ) | | | — | # | | | — | | | | — | |
| | | | | | | | | | | | | | | | |
Total dividends and distributions | | | (0.05 | ) | | | (0.14 | ) | | | — | | | | (0.23 | ) |
| | | | | | | | | | | | | | | | |
Net asset value, end of period | | $ | 9.18 | | | $ | 7.16 | | | $ | 9.03 | | | $ | 8.97 | |
| | | | | | | | | | | | | | | | |
Total return (b) | | | 28.90 | % | | | (17.39 | )% | | | 0.67 | % | | | (7.98 | )% |
| | | | | | | | | | | | | | | | |
Ratios/Supplemental Data: | | | | | | | | | | | | | |
Net assets, end of period (000’s) | | $ | 511 | | | $ | 204 | | | $ | — | | | $ | 23 | |
Ratio of expenses to average net assets: | | | | | | | | | | | | | | | | |
After waivers and reimbursements (a)(f) | | | 1.18 | % | | | 1.22 | % | | | 1.25 | % | | | 1.25 | % |
Before waivers and reimbursements (a)(f) | | | 1.28 | % | | | 1.26 | % | | | 1.25 | % | | | 5.96 | % |
Ratio of net investment income (loss) to average net assets: | | | | | | | | | | | | | | | | |
After waivers and reimbursements (a)(f) | | | 0.62 | % | | | 0.21 | %(l) | | | (0.12 | )%(l) | | | (0.13 | )%(l) |
Before waivers and reimbursements (a)(f) | | | 0.52 | % | | | 0.17 | %(l) | | | (0.12 | )%(l) | | | (4.84 | )%(l) |
Portfolio turnover rate (z)^ | | | 26 | % | | | 26 | % | | | 26 | % | | | 18 | % |
| | | | | | | | | | | | |
| | |
| | | Year Ended December 31, | | | April 21, 2014* to December 31, 2014 | |
| Class K | | 2016 | | | 2015 | | |
Net asset value, beginning of period | | $ | 7.15 | | | $ | 8.97 | | | $ | 10.00 | |
| | | | | | | | | | | | |
Income (loss) from investment operations: | | | | | | | | | | | | |
Net investment income (loss) (e) | | | 0.06 | | | | 0.02 | | | | 0.01 | |
Net realized and unrealized gain (loss) on investments and futures | | | 2.03 | | | | (1.69 | ) | | | (0.80 | ) |
| | | | | | | | | | | | |
Total from investment operations | | | 2.09 | | | | (1.67 | ) | | | (0.79 | ) |
| | | | | | | | | | | | |
Less distributions: | |
Dividends from net investment income | | | (0.06 | ) | | | (0.02 | ) | | | (0.01 | ) |
Distributions from net realized gains | | | — | | | | (0.13 | ) | | | (0.23 | ) |
Return of capital | | | (0.01 | ) | | | — | # | | | — | |
| | | | | | | | | | | | |
Total dividends and distributions | | | (0.07 | ) | | | (0.15 | ) | | | (0.24 | ) |
| | | | | | | | | | | | |
Net asset value, end of period | | $ | 9.17 | | | $ | 7.15 | | | $ | 8.97 | |
| | | | | | | | | | | | |
Total return (b) | | | 29.27 | % | | | (18.49 | )% | | | (7.84 | )% |
| | | | | | | | | | | | |
Ratios/Supplemental Data: | |
Net assets, end of period (000’s) | | $ | 161,405 | | | $ | 134,364 | | | $ | 159,905 | |
Ratio of expenses to average net assets: | | | | | | | | | | | | |
After waivers and reimbursements (a)(f) | | | 0.93 | % | | | 0.98 | % | | | 1.00 | % |
Before waivers and reimbursements (a)(f) | | | 1.03 | % | | | 1.00 | % | | | 1.03 | % |
Ratio of net investment income (loss) to average net assets: | | | | | | | | | | | | |
After waivers and reimbursements (a)(f) | | | 0.80 | % | | | 0.24 | % | | | 0.14 | %(l) |
Before waivers and reimbursements (a)(f) | | | 0.70 | % | | | 0.22 | % | | | 0.11 | %(l) |
Portfolio turnover rate (z)^ | | | 26 | % | | | 26 | % | | | 18 | % |
See Notes to Financial Statements.
89
EQ ADVISORS TRUST
AXA/PACIFIC GLOBAL SMALL CAP VALUE PORTFOLIO
FINANCIAL HIGHLIGHTS (Continued)
| * | Commencement of Operations. |
| ‡ | After the close of business on April 30, 2015, operations ceased and shares were fully redeemed. |
| # | Per share amount is less than $0.005. |
| ^ | Portfolio turnover rate excludes derivatives, if any. |
| (a) | Ratios for periods less than one year are annualized. |
| (b) | Total returns for periods less than one year are not annualized. |
| (e) | Net investment income (loss) per share is based on average shares outstanding. |
| (f) | Expenses do not include the expenses of the underlying funds (“indirect expenses”), if applicable. |
| (l) | The annualized ratio of net investment income to average net assets may not be indicative of operating results for a full year. |
| (z) | Portfolio turnover rate for periods less than one year is not annualized. |
See Notes to Financial Statements.
90
EQ ADVISORS TRUST
EQ/PIMCO GLOBAL REAL RETURN PORTFOLIO
PORTFOLIO OF INVESTMENTS
December 31, 2016
| | | | | | | | |
| | | Principal
Amount | | | Value
(Note 1) | |
LONG-TERM DEBT SECURITIES: | |
Asset-Backed Securities (5.4%) | |
Ares XXV CLO Ltd., | | | | | |
Series 2012-3A AR
2.100%, 1/17/24 (l)§ | | $ | 300,000 | | | $ | 300,001 | |
Carlyle Global Market Strategies CLO Ltd., | | | | | |
Series 2012-1A AR
2.111%, 4/20/22 (l)§ | | | 147,700 | | | | 147,702 | |
CIFC Funding Ltd., | | | | | |
Series 2012-1A A1R2
2.176%, 8/14/24 (l)§ | | | 288,892 | | | | 288,890 | |
Series 2012-2A A1R
2.292%, 12/5/24 (l)§ | | | 200,000 | | | | 199,968 | |
Cordatus CLO I plc, | | | | | |
Series 2006-1X A2
0.819%, 1/30/24 (l)(m) | | GBP | 56,820 | | | | 69,701 | |
Cordatus CLO II plc, | | | | | |
Series 2007-1X A1F
0.042%, 7/25/24 (l)(m) | | EUR | 198,596 | | | | 208,338 | |
Series 2007-1X A2
0.844%, 7/25/24 (l)(m) | | GBP | 81,864 | | | | 99,657 | |
Countrywide Asset-Backed Certificates, | | | | | |
Series 2004-ECC1 M2
1.806%, 9/25/34 (l) | | $ | 121,154 | | | | 115,933 | |
Denali Capital CLO VII Ltd., | |
Series 2007-1A A1L
1.112%, 1/22/22 (l)§ | | | 297,968 | | | | 294,641 | |
Highlander Euro CDO III BV, | | | | | |
Series 2007-3A A
0.000%, 5/1/23 (l)§ | | EUR | 92,866 | | | | 97,483 | |
HSI Asset Securitization Corp. Trust, | | | | | |
Series 2007-WF1 1A1
0.916%, 5/25/37 (l) | | $ | 131,466 | | | | 126,386 | |
JP Morgan Mortgage Acquisition Trust, | | | | | |
Series 2006-NC1 A4
0.926%, 4/25/36 (l) | | | 145,575 | | | | 144,207 | |
Navient Student Loan Trust, | | | | | |
Series 2016-7A A
1.906%, 3/25/66 (l)§ | | | 98,802 | | | | 99,810 | |
NovaStar Mortgage Funding Trust, | | | | | |
Series 2005-3 M2
1.226%, 1/25/36 (l) | | | 200,000 | | | | 177,810 | |
Option One Mortgage Loan Trust, | | | | | |
Series 2004-3 M2
1.611%, 11/25/34 (l) | | | 28,680 | | | | 26,673 | |
Penta CLO 2 BV, | | | | | |
Series 2015-2A ANV
1.300%, 8/4/28 (l)§ | | EUR | 250,000 | | | | 264,085 | |
RAAC Trust, | | | | | |
Series 2007-SP3 A1
1.956%, 9/25/47 (l) | | $ | 51,786 | | | | 50,857 | |
Symphony CLO VIII LP, | | | | | |
Series 2012-8A AR
1.976%, 1/9/23 (l)§ | | | 228,848 | | | | 228,847 | |
U.S. Residential Opportunity Fund II Trust, | | | | | |
Series 2016-3II A
3.598%, 10/27/36 (e)§ | | | 98,407 | | | | 98,593 | |
VOLT XL LLC, | | | | | |
Series 2015-NP14 A1
4.375%, 11/27/45 (e)§ | | | 62,342 | | | | 62,873 | |
VOLT XLI LLC, | | | | | | | | |
Series 2016-NPL1 A1
4.250%, 2/26/46 (e)§ | | $ | 224,972 | | | $ | 227,965 | |
VOLT XXXIX LLC, | | | | | |
Series 2015-NP13 A1
4.125%, 10/25/45 (e)§ | | | 68,222 | | | | 68,732 | |
Voya CLO Ltd., | | | | | |
Series 2012-2A AR
2.180%, 10/15/22 (l)§ | | | 100,000 | | | | 100,000 | |
WhiteHorse VI Ltd., | | | | | |
Series 2012-1A A1R
2.078%, 2/3/25 (l)§ | | | 300,000 | | | | 299,998 | |
| | | | | | | | |
Total Asset-Backed Securities | | | | | | | 3,799,150 | |
| | | | | | | | |
Collateralized Mortgage Obligations (1.7%) | |
DSLA Mortgage Loan Trust, | | | | | |
Series 2005-AR6 2A1A
1.026%, 10/19/45 (l) | | | 102,524 | | | | 91,042 | |
GNMA, | | | | | |
Series 2016-H17 FC
1.360%, 8/20/66 (l) | | | 298,743 | | | | 302,040 | |
GSR Mortgage Loan Trust, | | | | | |
Series 2004-12 3A6
3.096%, 12/25/34 (l) | | | 29,153 | | | | 29,593 | |
Series 2005-AR4 6A1
3.209%, 7/25/35 (l) | | | 162,582 | | | | 163,775 | |
JP Morgan Mortgage Trust, | | | | | |
Series 2005-A2 5A2
3.188%, 4/25/35 (l) | | | 44,309 | | | | 44,272 | |
Lehman Mortgage Trust, | | | | | |
Series 2005-3 4A1
5.314%, 1/25/36 (l) | | | 39,539 | | | | 37,353 | |
Sequoia Mortgage Trust, | | | | | |
Series 6 A
1.376%, 4/19/27 (l) | | | 303,772 | | | | 279,213 | |
Trinity Square plc, | | | | | |
Series 2015-1A A
1.551%, 7/15/51 (l)§ | | GBP | 173,703 | | | | 214,734 | |
| | | | | | | | |
Total Collateralized Mortgage Obligations | | | | | | | 1,162,022 | |
| | | | | | | | |
Commercial Mortgage-Backed Security (0.1%) | |
Morgan Stanley Capital I Trust, | | | | | |
Series 2007-IQ16 A4
5.809%, 12/12/49 | | $ | 71,750 | | | | 72,774 | |
| | | | | | | | |
Total Commercial Mortgage-Backed Securities | | | | | | | 72,774 | |
| | | | | | | | |
Corporate Bonds (5.1%) | |
Consumer Discretionary (0.3%) | | | | | |
Media (0.3%) | |
Altice Financing SA | | | | | | | | |
5.250%, 2/15/23§ | | EUR | 200,000 | | | | 223,099 | |
| | | | | | | | |
Total Consumer Discretionary | | | | | | | 223,099 | |
| | | | | | | | |
See Notes to Financial Statements.
91
EQ ADVISORS TRUST
EQ/PIMCO GLOBAL REAL RETURN PORTFOLIO
PORTFOLIO OF INVESTMENTS (Continued)
December 31, 2016
| | | | | | | | |
| | | Principal
Amount | | | Value
(Note 1) | |
Energy (0.3%) | | | | | |
Oil, Gas & Consumable Fuels (0.3%) | |
Petrobras Global Finance BV | | | | | |
8.375%, 5/23/21 | | $ | 200,000 | | | $ | 215,460 | |
| | | | | | | | |
Total Energy | | | | | | | 215,460 | |
| | | | | | | | |
Financials (3.2%) | | | | | |
Banks (0.6%) | |
JPMorgan Chase & Co. | | | | | |
1.432%, 4/25/18 (l) | | | 180,000 | | | | 180,411 | |
Nordea Kredit Realkreditaktieselskab | | | | | |
1.000%, 10/1/17 | | DKK | 200,000 | | | | 28,595 | |
2.000%, 10/1/17 | | | 600,000 | | | | 86,418 | |
2.500%, 10/1/47 | | | 100,000 | | | | 14,287 | |
Santander Holdings USA, Inc. | | | | | |
2.380%, 11/24/17 (l) | | $ | 100,000 | | | | 100,787 | |
| | | | | | | | |
| | | | | | | 410,498 | |
| | | | | | | | |
Capital Markets (0.9%) | |
Deutsche Bank AG | | | | | |
4.250%, 10/14/21§ | | | 350,000 | | | | 350,610 | |
Goldman Sachs Group, Inc. (The) | | | | | |
2.163%, 9/15/20 (l) | | | 200,000 | | | | 201,750 | |
ING Bank NV | | | | | |
2.625%, 12/5/22§ | | | 100,000 | | | | 99,157 | |
| | | | | | | | |
| | | | | | | 651,517 | |
| | | | | | | | |
Consumer Finance (0.5%) | |
Ally Financial, Inc. | | | | | |
5.500%, 2/15/17 | | | 200,000 | | | | 200,750 | |
Volkswagen Bank GmbH | | | | | |
0.096%, 11/27/17 (l)(m) | | EUR | 100,000 | | | | 105,286 | |
| | | | | | | | |
| | | | | | | 306,036 | |
| | | | | | | | |
Thrifts & Mortgage Finance (1.2%) | |
BRFkredit A/S | | | | | |
2.000%, 10/1/17 | | DKK | 300,000 | | | | 43,209 | |
4.000%, 1/1/18 | | | 200,000 | | | | 29,530 | |
2.500%, 10/1/47 | | | 100,000 | | | | 14,283 | |
Nykredit Realkredit A/S | | | | | |
1.000%, 7/1/17 | | | 200,000 | | | | 28,489 | |
1.000%, 10/1/17 | | | 900,000 | | | | 128,738 | |
2.000%, 10/1/17 | | | 400,000 | | | | 57,612 | |
4.000%, 1/1/18 | | | 200,000 | | | | 29,490 | |
2.000%, 4/1/18 | | | 400,000 | | | | 58,242 | |
2.500%, 10/1/47 (m) | | | 500,000 | | | | 71,381 | |
3.000%, 10/1/47 | | | 100,000 | | | | 14,676 | |
Realkredit Danmark A/S | | | | | |
1.000%, 1/1/17 | | | 400,000 | | | | 56,637 | |
1.000%, 4/1/17 | | | 300,000 | | | | 42,605 | |
2.000%, 4/1/17 | | | 400,000 | | | | 56,944 | |
1.000%, 1/1/18 | | | 500,000 | | | | 71,698 | |
2.000%, 1/1/18 | | | 100,000 | | | | 14,482 | |
1.000%, 4/1/18 | | | 500,000 | | | | 71,892 | |
2.500%, 10/1/47 | | | 400,000 | | | | 57,161 | |
| | | | | | | | |
| | | | | | | 847,069 | |
| | | | | | | | |
Total Financials | | | | | | | 2,215,120 | |
| | | | | | | | |
Health Care (1.1%) | | | | | |
Health Care Equipment & Supplies (0.5%) | |
Zimmer Biomet Holdings, Inc. | | | | | |
2.000%, 4/1/18 | | $ | 400,000 | | | $ | 400,468 | |
| | | | | | | | |
Pharmaceuticals (0.6%) | |
Actavis Funding SCS | | | | | |
1.850%, 3/1/17 | | | 100,000 | | | | 100,097 | |
2.033%, 3/12/18 (l) | | | 100,000 | | | | 100,576 | |
2.350%, 3/12/18 | | | 100,000 | | | | 100,467 | |
3.450%, 3/15/22 | | | 100,000 | | | | 101,492 | |
| | | | | | | | |
| | | | | | | 402,632 | |
| | | | | | | | |
Total Health Care | | | | | | | 803,100 | |
| | | | | | | | |
Information Technology (0.1%) | | | | | |
Technology Hardware, Storage & Peripherals (0.1%) | |
Hewlett Packard Enterprise Co. | | | | | |
2.450%, 10/5/17 | | | 50,000 | | | | 50,232 | |
| | | | | | | | |
Total Information Technology | | | | | | | 50,232 | |
| | | | | | | | |
Real Estate (0.1%) | | | | | |
Real Estate Management & Development (0.1%) | |
Vonovia Finance BV | | | | | |
3.200%, 10/2/17 (m) | | | 100,000 | | | | 100,923 | |
| | | | | | | | |
Total Real Estate | | | | | | | 100,923 | |
| | | | | | | | |
Total Corporate Bonds | | | | | | | 3,607,934 | |
| | | | | | | | |
Foreign Government Securities (59.2%) | |
Australia Government Bond | | | | | |
1.369%, 2/21/22 (m) | | AUD | 200,000 | | | | 163,672 | |
3.539%, 9/20/25 (m) | | | 500,000 | | | | 504,502 | |
Autonomous Community of Catalonia | | | | | |
4.750%, 6/4/18 | | EUR | 100,000 | | | | 109,861 | |
Canadian Government Bond | | | | | |
6.637%, 12/1/21 | | CAD | 2,267,672 | | | | 2,050,126 | |
Canadian Government Real Return Bond | | | | | |
1.674%, 12/1/44 | | | 145,109 | | | | 135,744 | |
1.306%, 12/1/47 | | | 523,300 | | | | 472,769 | |
Denmark Government Bond | | | | | |
0.104%, 11/15/23 | | DKK | 6,371,572 | | | | 969,183 | |
Deutsche Bundesrepublik Inflation Linked Bond | | | | | |
1.939%, 4/15/20 (m) | | EUR | 220,418 | | | | 257,740 | |
0.099%, 4/15/26 | | | 527,192 | | | | 623,057 | |
0.498%, 4/15/30 (m) | | | 284,626 | | | | 356,708 | |
0.100%, 4/15/46 (m) | | | 81,715 | | | | 107,020 | |
France Government Bond OAT | | | | | |
0.261%, 7/25/18 (m) | | | 3,787,244 | | | | 4,110,986 | |
2.762%, 7/25/20 (m) | | | 748,818 | | | | 898,605 | |
0.101%, 7/25/21 (m)(z) | | | 375,014 | | | | 423,930 | |
1.196%, 7/25/22 (m)(z) | | | 454,768 | | | | 543,830 | |
0.255%, 7/25/24 (m) | | | 102,193 | | | | 118,051 | |
1.982%, 7/25/27 (m) | | | 806,558 | | | | 1,083,990 | |
0.705%, 7/25/30 (m)(z) | | | 201,624 | | | | 248,082 | |
2.066%, 7/25/40 (m) | | | 264,990 | | | | 414,881 | |
0.100%, 7/25/47 (m) | | | 210,846 | | | | 231,134 | |
Japanese Government CPI Linked Bond | | | | | |
0.100%, 3/10/26 | | JPY | 139,557,600 | | | | 1,271,710 | |
See Notes to Financial Statements.
92
EQ ADVISORS TRUST
EQ/PIMCO GLOBAL REAL RETURN PORTFOLIO
PORTFOLIO OF INVESTMENTS (Continued)
December 31, 2016
| | | | | | | | |
| | | Principal
Amount | | | Value
(Note 1) | |
Kingdom of Spain | | | | | |
0.550%, 11/30/19 (m) | | EUR | 644,704 | | | $ | 705,841 | |
1.809%, 11/30/24 (m) | | | 241,764 | | | | 288,788 | |
Kingdom of Sweden | | | | | |
0.125%, 6/1/26 | | SEK | 400,000 | | | | 50,761 | |
Mexican Udibonos | | | | | |
4.500%, 11/22/35 | | MXN | 1,670,164 | | | | 90,087 | |
New Zealand Government Bond | | | | | |
3.000%, 4/15/20 (m) | | NZD | 100,000 | | | | 70,467 | |
2.079%, 9/20/25 (m) | | | 600,000 | | | | 438,086 | |
2.536%, 9/20/35 (m) | | | 100,000 | | | | 71,810 | |
Republic of Italy | | | | | |
1.720%, 9/15/18 | | EUR | 325,446 | | | | 357,658 | |
2.646%, 9/15/19 | | | 1,002,258 | | | | 1,143,396 | |
0.101%, 5/15/22 (m) | | | 446,213 | | | | 470,298 | |
2.364%, 9/15/24 (m) | | | 1,101,968 | | | | 1,323,011 | |
3.291%, 9/15/26 | | | 426,744 | | | | 548,618 | |
1.250%, 9/15/32 (m) | | | 200,980 | | | | 220,972 | |
2.818%, 9/15/41 (m) | | | 393,480 | | | | 518,632 | |
Sweden Inflation Linked Bond | | | | | |
0.250%, 6/1/22 | | SEK | 700,000 | | | | 87,730 | |
United Kingdom Gilt | | | | | | | | |
0.000%, 7/17/24 | | GBP | 22,000 | | | | 99,747 | |
2.000%, 9/7/25 | | | 628,000 | | | | 831,690 | |
4.125%, 7/22/30 | | | 17,000 | | | | 77,336 | |
3.250%, 1/22/44 | | | 480,000 | | | | 764,117 | |
United Kingdom Gilt Inflation Linked Bond | | | | | |
0.125%, 3/22/24 (m)(z) | | | 2,999,862 | | | | 4,357,245 | |
1.250%, 11/22/32 (m)(z) | | | 873,136 | | | | 1,662,469 | |
0.625%, 11/22/42 (m) | | | 18,698 | | | | 39,753 | |
0.125%, 3/22/44 (m)(z) | | | 812,493 | | | | 1,580,468 | |
0.128%, 3/22/46 (m) | | | 1,982,824 | | | | 3,971,367 | |
0.250%, 3/22/52 (m)(z) | | | 438,192 | | | | 1,007,541 | |
1.722%, 11/22/55 (m) | | | 399,611 | | | | 1,245,263 | |
0.129%, 3/22/58 (m)(z) | | | 605,159 | | | | 1,509,869 | |
0.375%, 3/22/62 (m) | | | 88,720 | | | | 256,954 | |
0.132%, 3/22/68 (m)(z) | | | 244,242 | | | | 741,690 | |
United Kingdom Treasury Inflation Linked Gilt | | | | | |
1.250%, 11/22/17 (m) | | | 58,786 | | | | 75,176 | |
2.414%, 11/22/22 (m) | | | 9,015 | | | | 14,165 | |
1.705%, 11/22/27 (m) | | | 455,813 | | | | 774,561 | |
0.139%, 3/22/29 (m) | | | 351,386 | | | | 547,511 | |
0.850%, 3/22/34 (m) | | | 222,388 | | | | 406,907 | |
| | | | | | | | |
Total Foreign Government Securities | | | | | | | 41,445,565 | |
| | | | | | | | |
Mortgage-Backed Security (4.3%) | |
FNMA | | | | | |
3.000%, 1/25/47 TBA | | $ | 1,000,000 | | | | 994,219 | |
3.500%, 1/25/47 TBA | | | 2,000,000 | | | | 2,050,000 | |
| | | | | | | | |
Total Mortgage-Backed Securities | | | | | | | 3,044,219 | |
| | | | | | | | |
U.S. Treasury Obligations (52.7%) | |
U.S. Treasury Inflation Index Bonds | | | | | |
2.375%, 1/15/25 TIPS (z) | | | 3,064,936 | | | | 3,518,331 | |
1.750%, 1/15/28 TIPS | | | 1,200,014 | | | | 1,340,114 | |
3.625%, 4/15/28 TIPS | | | 672,548 | | | | 884,715 | |
2.500%, 1/15/29 TIPS | | | 1,812,683 | | | | 2,187,133 | |
3.875%, 4/15/29 TIPS | | | 294,086 | | | | 402,300 | |
2.125%, 2/15/40 TIPS | | | 11,184 | | | | 13,856 | |
2.125%, 2/15/41 TIPS (v) | | $ | 298,034 | | | $ | 371,178 | |
0.750%, 2/15/42 TIPS | | | 96,280 | | | | 91,160 | |
0.625%, 2/15/43 TIPS | | | 105,140 | | | | 96,310 | |
1.375%, 2/15/44 TIPS (z) | | | 2,209,236 | | | | 2,411,238 | |
1.000%, 2/15/46 TIPS | | | 1,316,045 | | | | 1,321,366 | |
U.S. Treasury Inflation Index Notes | | | | | |
1.625%, 1/15/18 TIPS (l) | | | 115,386 | | | | 118,382 | |
0.125%, 4/15/18 TIPS | | | 2,421,888 | | | | 2,443,457 | |
1.375%, 7/15/18 TIPS (l) | | | 56,049 | | | | 58,144 | |
0.125%, 4/15/19 TIPS (z) | | | 1,392,687 | | | | 1,409,769 | |
0.125%, 4/15/20 TIPS (z) | | | 4,448,911 | | | | 4,495,486 | |
1.250%, 7/15/20 TIPS | | | 110,841 | | | | 117,070 | |
0.125%, 4/15/21 TIPS | | | 958,725 | | | | 964,539 | |
0.625%, 7/15/21 TIPS | | | 1,254,848 | | | | 1,294,945 | |
0.125%, 1/15/22 TIPS | | | 74,761 | | | | 74,909 | |
0.125%, 7/15/22 TIPS | | | 136,651 | | | | 137,034 | |
0.125%, 1/15/23 TIPS | | | 1,586,584 | | | | 1,575,444 | |
0.375%, 7/15/23 TIPS | | | 1,308,787 | | | | 1,321,044 | |
0.625%, 1/15/24 TIPS (z) | | | 3,035,451 | | | | 3,089,698 | |
0.125%, 7/15/24 TIPS (z) | | | 4,845,870 | | | | 4,762,156 | |
0.250%, 1/15/25 TIPS | | | 673,583 | | | | 662,499 | |
0.375%, 7/15/25 TIPS | | | 458,703 | | | | 456,199 | |
0.625%, 1/15/26 TIPS | | | 539,185 | | | | 543,882 | |
0.125%, 7/15/26 TIPS | | | 181,523 | | | | 175,572 | |
U.S. Treasury Notes | | | | | |
2.125%, 9/30/21 | | | 100,000 | | | | 100,874 | |
2.000%, 2/15/25 (z) | | | 520,000 | | | | 506,187 | |
| | | | | | | | |
Total U.S. Treasury Obligations | | | | | | | 36,944,991 | |
| | | | | | | | |
Total Long-Term Debt Securities (128.5%)
(Cost $88,022,209) | | | | | | | 90,076,655 | |
| | | | | | | | |
SHORT-TERM INVESTMENTS: | | | | | |
Certificates of Deposit (2.9%) | | | | | |
Barclays Bank plc | | | | | |
1.75%, 9/8/17 (l) | | | 200,000 | | | | 200,407 | |
1.74%, 11/6/17 (l) | | | 200,000 | | | | 200,212 | |
Mitsubishi UFJ Trust & Banking Corp. | | | | | |
1.71%, 9/19/17 (l) | | | 200,000 | | | | 200,447 | |
Natixis SA | | | | | |
1.68%, 9/25/17 (l) | | | 300,000 | | | | 300,577 | |
Norinchukin Bank | | | | | |
1.58%, 10/11/17 (l) | | | 300,000 | | | | 300,920 | |
Sumitomo Mitsui Banking Corp. | | | | | |
1.66%, 9/15/17 (l) | | | 300,000 | | | | 300,335 | |
Sumitomo Mitsui Trust Bank Ltd. | | | | | |
1.72%, 9/18/17 (l) | | | 400,000 | | | | 401,263 | |
1.57%, 10/6/17 (l) | | | 100,000 | | | | 100,303 | |
| | | | | | | | |
Total Certificates of Deposit | | | | | | | 2,004,464 | |
| | | | | | | | |
Foreign Government Treasury Bills (6.6%) | | | | | |
Federative Republic of Brazil | | | | | |
0.00%, 4/1/17 (p) | | BRL | 4,700,000 | | | | 1,399,541 | |
0.00%, 1/1/18 (p) | | | 5,800,000 | | | | 1,598,631 | |
Japanese Treasury Bills | | | | | |
0.12%, 1/10/17 (p) | | JPY | 140,000,000 | | | | 1,197,822 | |
(0.19)%, 2/6/17 (p) | | | 50,000,000 | | | | 427,888 | |
| | | | | | | | |
Total Foreign Government Treasury Bills | | | | | | | 4,623,882 | |
| | | | | | | | |
See Notes to Financial Statements.
93
EQ ADVISORS TRUST
EQ/PIMCO GLOBAL REAL RETURN PORTFOLIO
PORTFOLIO OF INVESTMENTS (Continued)
December 31, 2016
| | | | | | | | |
| | | Shares | | | Value
(Note 1) | |
Investment Company (0.9%) | | | | | |
JPMorgan Prime Money Market Fund, IM Shares | | | 601,680 | | | $ | 601,860 | |
| | | | | | | | |
| | | Principal
Amount | | | Value
(Note 1) | |
U.S. Government Agency Securities (1.1%) | | | | | |
FHLB | | | | | |
0.38%, 1/23/17 (o)(p) | | $ | 600,000 | | | | 599,856 | |
0.42%, 2/13/17 (o)(p) | | | 200,000 | | | | 199,897 | |
| | | | | | | | |
Total U.S. Government Agency Securities | | | | | | | 799,753 | |
| | | | | | | | |
U.S. Treasury Obligations (1.2%) | |
U.S. Treasury Bills | | | | | | | | |
0.38%, 2/2/17 (p)(w) | | | 483,000 | | | | 482,831 | |
0.41%, 2/9/17 (p)(w) | | | 382,000 | | | | 381,826 | |
| | | | | | | | |
Total U.S. Treasury Obligations | | | | | | | 864,657 | |
| | | | | | | | |
Total Short-Term
Investments (12.7%)
(Cost $9,110,368) | | | | | | | 8,894,616 | |
| | | | | | | | |
| | | Number of
Contracts | | | Value
(Note 1) | |
OPTION PURCHASED: | | | | | | | | |
Put Option (0.0%) | | | | | | | | |
90 Day Sterling Futures June 2017 @ GBP 98.50* | | | 17 | | | | — | |
| | | | | | | | |
Total Options Purchased (0.0%)
(Cost $940) | | | | | | | — | |
| | | | | | | | |
Total Investments Before Options Written (141.2%)
(Cost $97,133,517) | | | | | | | 98,971,271 | |
| | | | | | | | |
OPTIONS WRITTEN: | | | | | | | | |
Put Options (0.0%) | | | | | | | | |
10 Year U.S. Treasury Notes January 2017 @ $122.50* | | | (3 | ) | | | (516 | ) |
90 Day Sterling Futures June 2017 @ GBP 98.00* | | | (17 | ) | | | — | |
| | | | | | | | |
| | | | | | | (516 | ) |
| | | | | | | | |
Total Options Written (0.0%)
(Premiums Received $1,687) | | | | | | | (516 | ) |
| | | | | | | | |
Total Investments after Options Written (141.2%)
(Cost $97,131,830) | | | | | | | 98,970,755 | |
Other Assets Less Liabilities (-41.2%) | | | | | | | (28,899,265 | ) |
| | | | | | | | |
Net Assets (100%) | | | | | | $ | 70,071,490 | |
| | | | | | | | |
| § | Securities exempt from registration under Rule 144A of the Securities Act of 1933. These securities may only be resold to qualified institutional buyers. At December 31, 2016, the market value of these securities amounted to $3,667,188 or 5.2% of net assets. Securities denoted with “§” but without “b” have been determined to be liquid under the guidelines established by the Board of Trustees. To the extent any securities might provide a right to demand registration, such rights have not been relied upon when determining liquidity. |
| (e) | Step Bond — Coupon rate increases in increments to maturity. Rate disclosed is as of December 31, 2016. Maturity date disclosed is the ultimate maturity date. |
| (l) | Floating Rate Security. Rate disclosed is as of December 31, 2016. |
| (m) | Regulation S is an exemption for securities offerings that are made outside of the United States and do not involve direct selling efforts in the United States. Resale restrictions may apply for purposes of the Securities Act of 1933. At December 31, 2016, the market value of these securities amounted to $32,417,261 or 46.3% of net assets. |
| (o) | Discount Note Security. Effective rate calculated as of December 31, 2016. |
| (v) | All, or a portion of security held by broker as collateral for forward foreign currency contracts, with a total collateral value of $252,941. |
| (w) | All, or a portion of security held by broker as collateral for TBA contracts, with a total collateral value of $574,578. |
| (z) | All or a portion of the Security is held as a Sale-Buyback position. See Note 1 |
Glossary:
| | CLO | — Collateralized Loan Obligation |
| | EUR | — European Currency Unit |
| | FHLB | — Federal Home Loan Bank |
| | FNMA | — Federal National Mortgage Association |
| | GNMA | — Government National Mortgage Association |
| | TBA | — To Be Announced; Security is subject to delayed |
| | TIPS | — Treasury Inflation Protected Security |
See Notes to Financial Statements.
94
EQ ADVISORS TRUST
EQ/PIMCO GLOBAL REAL RETURN PORTFOLIO
PORTFOLIO OF INVESTMENTS (Continued)
December 31, 2016
| | | | |
Country Diversification As a Percentage of Total Net Assets | |
Australia | | | 1.0 | % |
Brazil | | | 4.6 | |
Canada | | | 3.8 | |
Cayman Islands | | | 2.4 | |
Denmark | | | 2.8 | |
France | | | 12.0 | |
Germany | | | 2.7 | |
Ireland | | | 0.5 | |
Italy | | | 6.5 | |
Japan | | | 6.0 | |
Luxembourg | | | 0.3 | |
Mexico | | | 0.1 | |
Netherlands | | | 0.5 | |
New Zealand | | | 0.8 | |
Spain | | | 1.6 | |
Sweden | | | 0.2 | |
United Kingdom | | | 29.4 | |
United States | | | 66.0 | |
Cash and Other | | | (41.2 | ) |
| | | | | |
| | | | 100.0 | % |
| | | | | |
At December 31, 2016, the Portfolio had the following futures contracts open: (Note 1)
| | | | | | | | | | | | | | | | | | | | |
Purchases | | Number of
Contracts | | | Expiration
Date | | | Original
Value | | | Value at
12/31/2016 | | | Unrealized
Appreciation/
(Depreciation) | |
5 Year U.S. Treasury Notes | | | 4 | | | | March-17 | | | $ | 466,504 | | | $ | 470,656 | | | $ | 4,152 | |
Euro-Bund | | | 3 | | | | March-17 | | | | 512,128 | | | | 518,378 | | | | 6,250 | |
| | | | | | | | | | | | | | | | | | | | |
| | | | | | | | | | | | | | | | | | $ | 10,402 | |
| | | | | | | | | | | | | | | | | | | | |
Sales | | | | | | | | | | | | | | | |
10 Year Japanese Government Bond | | | 1 | | | | March-17 | | | $ | 1,285,509 | | | $ | 1,285,476 | | | $ | 33 | |
10 Year U.S. Treasury Notes | | | 35 | | | | March-17 | | | | 4,375,111 | | | | 4,349,844 | | | | 25,267 | |
2 Year U.S. Treasury Notes | | | 63 | | | | March-17 | | | | 13,667,004 | | | | 13,651,313 | | | | 15,691 | |
90 Day Eurodollar | | | 5 | | | | March-17 | | | | 1,238,750 | | | | 1,237,000 | | | | 1,750 | |
Euro-Bobl | | | 8 | | | | March-17 | | | | 1,114,980 | | | | 1,125,325 | | | | (10,345 | ) |
Euro-BTP | | | 1 | | | | March-17 | | | | 140,764 | | | | 142,434 | | | | (1,670 | ) |
Euro-OAT | | | 1 | | | | March-17 | | | | 158,201 | | | | 159,813 | | | | (1,612 | ) |
U.S. Treasury Long Bond | | | 10 | | | | March-17 | | | | 1,518,346 | | | | 1,506,563 | | | | 11,783 | |
| | | | | | | | | | | | | | | | | | | | |
| | | | | | | | | | | | | | | | | | $ | 40,897 | |
| | | | | | | | | | | | | | | | | | | | |
| | | | | | | | | | | | | | | | | | $ | 51,299 | |
| | | | | | | | | | | | | | | | | | | | |
| | | | | | | | | | | | | | | | | | |
At December 31, 2016, the Portfolio had outstanding foreign currency contracts to buy/sell foreign currencies as follows: (Note 1) | |
Foreign Currency Buy Contracts | | Counterparty | | Local
Contract Buy
Amount
(000’s) | | | U.S. $
Current
Value | | | U.S. $
Settlement
Value | | | Unrealized
Appreciation/
(Depreciation) | |
Brazilian Real vs. U.S. Dollar, expiring 1/4/17 | | Bank of America | | | 111 | | | $ | 34,006 | | | $ | 32,311 | | | $ | 1,695 | |
Brazilian Real vs. U.S. Dollar, expiring 1/4/17 | | Deutsche Bank AG | | | 2,000 | | | | 614,496 | | | | 616,179 | | | | (1,683 | ) |
Brazilian Real vs. U.S. Dollar, expiring 1/4/17 | | Deutsche Bank AG | | | 600 | | | | 184,349 | | | | 181,893 | | | | 2,456 | |
Brazilian Real vs. U.S. Dollar, expiring 1/4/17 | | Deutsche Bank AG | | | 1,500 | | | | 460,872 | | | | 433,214 | | | | 27,658 | |
Brazilian Real vs. U.S. Dollar, expiring 1/4/17 | | JPMorgan Chase Bank | | | 309 | | | | 94,823 | | | | 90,200 | | | | 4,623 | |
Brazilian Real vs. U.S. Dollar, expiring 1/4/17 | | JPMorgan Chase Bank | | | 267 | | | | 82,015 | | | | 78,800 | | | | 3,215 | |
Brazilian Real vs. U.S. Dollar, expiring 1/4/17 | | JPMorgan Chase Bank | | | 700 | | | | 215,073 | | | | 211,544 | | | | 3,529 | |
Brazilian Real vs. U.S. Dollar, expiring 2/2/17 | | Deutsche Bank AG | | | 686 | | | | 208,952 | | | | 202,964 | | | | 5,988 | |
British Pound vs. U.S. Dollar, expiring 1/6/17 | | Credit Suisse | | | 841 | | | | 1,036,526 | | | | 1,055,004 | | | | (18,478 | ) |
Danish Krone vs. U.S. Dollar, expiring 1/3/17 | | JPMorgan Chase Bank | | | 54 | | | | 7,591 | | | | 8,000 | | | | (409 | ) |
European Union Euro vs. U.S. Dollar, expiring 1/6/17 | | Bank of America | | | 523 | | | | 550,618 | | | | 556,905 | | | | (6,287 | ) |
European Union Euro vs. U.S. Dollar, expiring 1/6/17 | | Bank of America | | | 13,890 | | | | 14,623,761 | | | | 14,445,867 | | | | 177,894 | |
European Union Euro vs. U.S. Dollar, expiring 1/6/17 | | Bank of America | | | 93 | | | | 97,911 | | | | 98,765 | | | | (854 | ) |
See Notes to Financial Statements.
95
EQ ADVISORS TRUST
EQ/PIMCO GLOBAL REAL RETURN PORTFOLIO
PORTFOLIO OF INVESTMENTS (Continued)
December 31, 2016
| | | | | | | | | | | | | | | | | | |
Foreign Currency Buy Contracts | | Counterparty | | Local
Contract Buy
Amount
(000’s) | | | U.S. $
Current
Value | | | U.S. $
Settlement
Value | | | Unrealized
Appreciation/
(Depreciation) | |
European Union Euro vs. U.S. Dollar, expiring 1/6/17 | | Credit Suisse | | | 80 | | | $ | 84,225 | | | $ | 86,429 | | | $ | (2,204 | ) |
Japanese Yen vs. U.S. Dollar, expiring 1/6/17 | | JPMorgan Chase Bank | | | 120,600 | | | | 1,032,051 | | | | 1,061,754 | | | | (29,703 | ) |
Japanese Yen vs. U.S. Dollar, expiring 1/6/17 | | JPMorgan Chase Bank | | | 31,800 | | | | 272,133 | | | | 279,414 | | | | (7,281 | ) |
Japanese Yen vs. U.S. Dollar, expiring 1/6/17 | | JPMorgan Chase Bank | | | 149,125 | | | | 1,276,161 | | | | 1,268,612 | | | | 7,549 | |
Mexican Peso vs. U.S. Dollar,
expiring 2/13/17 | | Bank of America | | | 7,442 | | | | 356,891 | | | | 387,833 | | | | (30,942 | ) |
Mexican Peso vs. U.S. Dollar,
expiring 2/13/17 | | Deutsche Bank AG | | | 3,369 | | | | 161,559 | | | | 164,000 | | | | (2,441 | ) |
Russian Ruble vs. U.S. Dollar,
expiring 2/22/17 | | Bank of America | | | 7,161 | | | | 115,537 | | | | 111,921 | | | | 3,616 | |
Russian Ruble vs. U.S. Dollar,
expiring 2/22/17 | | Credit Suisse | | | 3,581 | | | | 57,770 | | | | 57,733 | | | | 37 | |
Singapore Dollar vs. U.S. Dollar, expiring 1/17/17 | | Bank of America | | | 235 | | | | 162,327 | | | | 162,676 | | | | (349 | ) |
| | | | | | | | | | | | | | | | | | |
| | | | | | | | | | | | | | | | $ | 137,629 | |
| | | | | | | | | | | | | | | | | | |
| | | | | | | | | | | | | | | | | | |
Foreign Currency Sell Contracts | | Counterparty | | Local
Contract Sell
Amount
(000’s) | | | U.S. $
Settlement
Value | | | U.S. $
Current
Value | | | Unrealized
Appreciation/
(Depreciation) | |
Australian Dollar vs. U.S. Dollar, expiring 1/6/17 | | Bank of America | | | 1,168 | | | $ | 868,233 | | | $ | 842,837 | | | $ | 25,396 | |
Brazilian Real vs. U.S. Dollar,
expiring 1/4/17 | | Deutsche Bank AG | | | 600 | | | | 137,859 | | | | 184,349 | | | | (46,490 | ) |
Brazilian Real vs. U.S. Dollar,
expiring 1/4/17 | | Deutsche Bank AG | | | 100 | | | | 23,709 | | | | 30,725 | | | | (7,016 | ) |
Brazilian Real vs. U.S. Dollar,
expiring 1/4/17 | | Deutsche Bank AG | | | 2,100 | | | | 498,044 | | | | 645,221 | | | | (147,177 | ) |
Brazilian Real vs. U.S. Dollar,
expiring 1/4/17 | | Deutsche Bank AG | | | 686 | | | | 204,784 | | | | 210,843 | | | | (6,059 | ) |
Brazilian Real vs. U.S. Dollar,
expiring 1/4/17 | | JPMorgan Chase Bank | | | 2,000 | | | | 470,477 | | | | 614,496 | | | | (144,019 | ) |
Brazilian Real vs. U.S. Dollar,
expiring 4/4/17 | | JPMorgan Chase Bank | | | 1,300 | | | | 372,615 | | | | 389,682 | | | | (17,067 | ) |
Brazilian Real vs. U.S. Dollar,
expiring 4/4/17 | | JPMorgan Chase Bank | | | 1,700 | | | | 493,111 | | | | 509,585 | | | | (16,474 | ) |
Brazilian Real vs. U.S. Dollar,
expiring 4/4/17 | | JPMorgan Chase Bank | | | 1,700 | | | | 489,350 | | | | 509,585 | | | | (20,235 | ) |
Brazilian Real vs. U.S. Dollar,
expiring 1/3/18 | | Deutsche Bank AG | | | 2,200 | | | | 619,427 | | | | 620,247 | | | | (820 | ) |
Brazilian Real vs. U.S. Dollar,
expiring 1/3/18 | | Deutsche Bank AG | | | 700 | | | | 193,995 | | | | 197,351 | | | | (3,356 | ) |
Brazilian Real vs. U.S. Dollar,
expiring 1/3/18 | | Deutsche Bank AG | | | 2,100 | | | | 555,907 | | | | 592,054 | | | | (36,147 | ) |
Brazilian Real vs. U.S. Dollar,
expiring 1/3/18 | | JPMorgan Chase Bank | | | 800 | | | | 221,147 | | | | 225,544 | | | | (4,397 | ) |
British Pound vs. U.S. Dollar,
expiring 1/6/17 | | Bank of America | | | 593 | | | | 748,600 | | | | 730,868 | | | | 17,732 | |
British Pound vs. U.S. Dollar,
expiring 1/6/17 | | JPMorgan Chase Bank | | | 7,399 | | | | 9,369,223 | | | | 9,119,214 | | | | 250,009 | |
British Pound vs. U.S. Dollar,
expiring 1/6/17 | | JPMorgan Chase Bank | | | 843 | | | | 1,072,716 | | | | 1,038,991 | | | | 33,725 | |
Canadian Dollar vs. U.S. Dollar,
expiring 1/6/17 | | JPMorgan Chase Bank | | | 3,631 | | | | 2,706,264 | | | | 2,704,425 | | | | 1,839 | |
Chinese Renminbi vs. U.S. Dollar,
expiring 2/15/17 | | Deutsche Bank AG | | | 6,658 | | | | 977,822 | | | | 956,382 | | | | 21,440 | |
Danish Krone vs. U.S. Dollar,
expiring 1/3/17 | | Bank of America | | | 6,700 | | | | 1,012,735 | | | | 948,673 | | | | 64,062 | |
See Notes to Financial Statements.
96
EQ ADVISORS TRUST
EQ/PIMCO GLOBAL REAL RETURN PORTFOLIO
PORTFOLIO OF INVESTMENTS (Continued)
December 31, 2016
| | | | | | | | | | | | | | | | | | |
Foreign Currency Sell Contracts | | Counterparty | | Local
Contract Sell
Amount
(000’s) | | | U.S. $
Settlement
Value | | | U.S. $
Current
Value | | | Unrealized
Appreciation/
(Depreciation) | |
Danish Krone vs. U.S. Dollar,
expiring 1/3/17 | | Bank of America | | | 200 | | | $ | 28,150 | | | $ | 28,319 | | | $ | (169 | ) |
Danish Krone vs. U.S. Dollar,
expiring 1/3/17 | | Bank of America | | | 100 | | | | 15,117 | | | | 14,159 | | | | 958 | |
Danish Krone vs. U.S. Dollar,
expiring 1/3/17 | | Bank of America | | | 295 | | | | 41,656 | | | | 41,770 | | | | (114 | ) |
Danish Krone vs. U.S. Dollar,
expiring 1/3/17 | | Bank of America | | | 404 | | | | 61,869 | | | | 57,204 | | | | 4,665 | |
Danish Krone vs. U.S. Dollar,
expiring 1/3/17 | | Bank of America | | | 200 | | | | 28,141 | | | | 28,319 | | | | (178 | ) |
Danish Krone vs. U.S. Dollar,
expiring 1/3/17 | | Bank of America | | | 700 | | | | 102,766 | | | | 99,115 | | | | 3,651 | |
Danish Krone vs. U.S. Dollar,
expiring 1/3/17 | | Credit Suisse | | | 520 | | | | 77,768 | | | | 73,628 | | | | 4,140 | |
Danish Krone vs. U.S. Dollar,
expiring 1/3/17 | | JPMorgan Chase Bank | | | 305 | | | | 44,929 | | | | 43,186 | | | | 1,743 | |
Danish Krone vs. U.S. Dollar,
expiring 1/3/17 | | JPMorgan Chase Bank | | | 205 | | | | 30,829 | | | | 29,027 | | | | 1,802 | |
Danish Krone vs. U.S. Dollar,
expiring 1/3/17 | | JPMorgan Chase Bank | | | 220 | | | | 32,610 | | | | 31,150 | | | | 1,460 | |
Danish Krone vs. U.S. Dollar,
expiring 1/3/17 | | JPMorgan Chase Bank | | | 405 | | | | 56,603 | | | | 57,345 | | | | (742 | ) |
Danish Krone vs. U.S. Dollar,
expiring 4/3/17 | | Bank of America | | | 507 | | | | 76,897 | | | | 72,092 | | | | 4,805 | |
Danish Krone vs. U.S. Dollar,
expiring 4/3/17 | | Bank of America | | | 204 | | | | 30,946 | | | | 29,087 | | | | 1,859 | |
Danish Krone vs. U.S. Dollar,
expiring 7/3/17 | | JPMorgan Chase Bank | | | 202 | | | | 30,791 | | | | 28,894 | | | | 1,897 | |
Danish Krone vs. U.S. Dollar,
expiring 10/2/17 | | JPMorgan Chase Bank | | | 1,927 | | | | 295,376 | | | | 277,137 | | | | 18,239 | |
Danish Krone vs. U.S. Dollar,
expiring 10/2/17 | | JPMorgan Chase Bank | | | 210 | | | | 32,186 | | | | 30,202 | | | | 1,984 | |
Danish Krone vs. U.S. Dollar,
expiring 10/3/17 | | JPMorgan Chase Bank | | | 410 | | | | 62,375 | | | | 58,969 | | | | 3,406 | |
European Union Euro vs. U.S. Dollar,
expiring 1/6/17 | | Bank of America | | | 14,586 | | | | 15,472,591 | | | | 15,356,515 | | | | 116,076 | |
European Union Euro vs. U.S. Dollar,
expiring 2/2/17 | | Bank of America | | | 13,890 | | | | 14,466,008 | | | | 14,645,029 | | | | (179,021 | ) |
Japanese Yen vs. U.S. Dollar,
expiring 1/6/17 | | Bank of America | | | 297,625 | | | | 2,649,468 | | | | 2,546,970 | | | | 102,498 | |
Japanese Yen vs. U.S. Dollar,
expiring 1/6/17 | | Credit Suisse | | | 3,900 | | | | 34,462 | | | | 33,375 | | | | 1,087 | |
Japanese Yen vs. U.S. Dollar,
expiring 1/10/17 | | Bank of America | | | 10,000 | | | | 99,125 | | | | 85,606 | | | | 13,519 | |
Japanese Yen vs. U.S. Dollar,
expiring 1/10/17 | | JPMorgan Chase Bank | | | 70,000 | | | | 691,859 | | | | 599,243 | | | | 92,616 | |
Japanese Yen vs. U.S. Dollar,
expiring 1/10/17 | | JPMorgan Chase Bank | | | 20,000 | | | | 198,157 | | | | 171,212 | | | | 26,945 | |
Japanese Yen vs. U.S. Dollar,
expiring 1/10/17 | | JPMorgan Chase Bank | | | 40,000 | | | | 388,350 | | | | 342,425 | | | | 45,925 | |
Japanese Yen vs. U.S. Dollar,
expiring 2/2/17 | | JPMorgan Chase Bank | | | 149,125 | | | | 1,270,184 | | | | 1,278,164 | | | | (7,980 | ) |
Japanese Yen vs. U.S. Dollar,
expiring 2/6/17 | | Bank of America | | | 50,000 | | | | 477,403 | | | | 428,624 | | | | 48,779 | |
Mexican Peso vs. U.S. Dollar,
expiring 2/13/17 | | JPMorgan Chase Bank | | | 5,763 | | | | 305,697 | | | | 276,382 | | | | 29,315 | |
New Zealand Dollar vs. U.S. Dollar,
expiring 1/6/17 | | Bank of America | | | 867 | | | | 613,563 | | | | 602,260 | | | | 11,303 | |
Singapore Dollar vs. U.S. Dollar,
expiring 1/17/17 | | Bank of America | | | 235 | | | | 166,669 | | | | 162,327 | | | | 4,342 | |
See Notes to Financial Statements.
97
EQ ADVISORS TRUST
EQ/PIMCO GLOBAL REAL RETURN PORTFOLIO
PORTFOLIO OF INVESTMENTS (Continued)
December 31, 2016
| | | | | | | | | | | | | | | | | | |
Foreign Currency Sell Contracts | | Counterparty | | Local
Contract Sell
Amount
(000’s) | | | U.S. $
Settlement
Value | | | U.S. $
Current
Value | | | Unrealized
Appreciation/
(Depreciation) | |
Singapore Dollar vs. U.S. Dollar,
expiring 3/17/17 | | Bank of America | | | 235 | | | $ | 162,626 | | | $ | 162,285 | | | $ | 341 | |
Swedish Krona vs. U.S. Dollar,
expiring 1/5/17 | | JPMorgan Chase Bank | | | 1,170 | | | | 127,119 | | | | 128,434 | | | | (1,315 | ) |
| | | | | | | | | | | | | | | | | | |
| | | | | | | | | | | | | | | | $ | 318,782 | |
| | | | | | | | | | | | | | | | | | |
| | | | | | | | | | | | | | | | $ | 456,411 | |
| | | | | | | | | | | | | | | | | | |
Options Written:
Options written for the year ended December 31, 2016 were as follows:
| | | | | | | | |
| | | Total
Number of
Contracts | | | Total
Premiums
Received | |
Options Outstanding – January 1, 2016 | | | 84 | | | $ | 3,194 | |
Options Written | | | 244 | | | | 46,644 | |
Options Terminated in Closing Purchase Transactions | | | (276 | ) | | | (46,148 | ) |
Options Expired | | | (32 | ) | | | (2,003 | ) |
Options Exercised | | | — | | | | — | |
| | | | | | | | |
Options Outstanding – December 31, 2016 | | | 20 | | | $ | 1,687 | |
| | | | | | | | |
The following is a summary of the inputs used to value the Portfolio’s assets and liabilities carried at fair value as of December 31, 2016:
The inputs or methodology used for valuing securities are not necessarily an indication of the risk associated with investing in those securities.
Various inputs are used in determining the value of the Portfolio’s investments. These inputs are summarized in the three broad levels listed below:
| | | | | | | | | | | | | | | | |
| | | | | |
| Investment Type | | Level 1
Quoted Prices in
Active Markets for
Identical
Securities | | | Level 2
Significant Other
Observable Inputs
(including quoted prices
for similar securities,
interest rates,
prepayment speeds,
credit risk, etc.) | | | Level 3
Significant Unobservable
Inputs (including the
Portfolio’s own
assumptions in
determining the fair
value of investments) | | | Total | |
Assets: | |
Asset-Backed Securities | | $ | — | | | $ | 3,799,150 | | | $ | — | | | $ | 3,799,150 | |
Collateralized Mortgage Obligations | | | — | | | | 1,162,022 | | | | — | | | | 1,162,022 | |
Commercial Mortgage-Backed Securities | | | — | | | | 72,774 | | | | — | | | | 72,774 | |
Corporate Bonds | | | | | | | | | | | | | | | | |
Consumer Discretionary | | | — | | | | 223,099 | | | | — | | | | 223,099 | |
Energy | | | — | | | | 215,460 | | | | — | | | | 215,460 | |
Financials | | | — | | | | 2,215,120 | | | | — | | | | 2,215,120 | |
Health Care | | | — | | | | 803,100 | | | | — | | | | 803,100 | |
Information Technology | | | — | | | | 50,232 | | | | — | | | | 50,232 | |
Real Estate | | | — | | | | 100,923 | | | | — | | | | 100,923 | |
Foreign Government Securities | | | — | | | | 41,445,565 | | | | — | | | | 41,445,565 | |
Forward Currency Contracts | | | — | | | | 1,195,818 | | | | — | | | | 1,195,818 | |
Futures | | | 64,926 | | | | — | | | | — | | | | 64,926 | |
Mortgage-Backed Securities | | | — | | | | 3,044,219 | | | | — | | | | 3,044,219 | |
Options Purchased | | | | | | | | | | | | | | | | |
Put Options Purchased | | | — | (a) | | | — | | | | — | | | | — | (a) |
See Notes to Financial Statements.
98
EQ ADVISORS TRUST
EQ/PIMCO GLOBAL REAL RETURN PORTFOLIO
PORTFOLIO OF INVESTMENTS (Continued)
December 31, 2016
| | | | | | | | | | | | | | | | |
| | | | | |
| Investment Type | | Level 1
Quoted Prices in
Active Markets for
Identical
Securities | | | Level 2
Significant Other
Observable Inputs
(including quoted prices
for similar securities,
interest rates,
prepayment speeds,
credit risk, etc.) | | | Level 3
Significant Unobservable
Inputs (including the
Portfolio’s own
assumptions in
determining the fair
value of investments) | | | Total | |
Short-Term Investments | | | | | | | | | | | | | | | | |
Certificates of Deposit | | $ | — | | | $ | 2,004,464 | | | $ | — | | | $ | 2,004,464 | |
Foreign Government Treasury Bills | | | — | | | | 4,623,882 | | | | — | | | | 4,623,882 | |
Investment Companies | | | 601,860 | | | | — | | | | — | | | | 601,860 | |
U.S. Government Agency Securities | | | — | | | | 799,753 | | | | — | | | | 799,753 | |
U.S. Treasury Obligations | | | — | | | | 864,657 | | | | — | | | | 864,657 | |
U.S. Treasury Obligations | | | — | | | | 36,944,991 | | | | — | | | | 36,944,991 | |
| | | | | | | | | | | | | | | | |
Total Assets | | $ | 666,786 | | | $ | 99,565,229 | | | $ | — | | | $ | 100,232,015 | |
| | | | | | | | | | | | | | | | |
Liabilities: | |
Forward Currency Contracts | | $ | — | | | $ | (739,407 | ) | | $ | — | | | $ | (739,407 | ) |
Futures | | | (13,627 | ) | | | — | | | | — | | | | (13,627 | ) |
Options Written | | | | | | | | | | | | | | | | |
Put Options Written | | | (516 | ) | | | — | | | | — | | | | (516 | ) |
| | | | | | | | | | | | | | | | |
Total Liabilities | | $ | (14,143 | ) | | $ | (739,407 | ) | | $ | — | | | $ | (753,550 | ) |
| | | | | | | | | | | | | | | | |
Total | | $ | 652,643 | | | $ | 98,825,822 | | | $ | — | | | $ | 99,478,465 | |
| | | | | | | | | | | | | | | | |
There were no transfers between Levels 1, 2 and 3 during the year ended December 31, 2016.
See Notes to Financial Statements.
99
EQ ADVISORS TRUST
EQ/PIMCO GLOBAL REAL RETURN PORTFOLIO
PORTFOLIO OF INVESTMENTS (Continued)
December 31, 2016
Fair Values of Derivative Instruments as of December 31, 2016:
| | | | | | |
| | | Statement of Assets and Liabilities | |
Derivatives Not Accounted for as
Hedging Instrument^ | | Asset Derivatives | | Fair Value | |
Interest rate contracts | | Receivables, Net assets
Unrealized appreciation | | $ | 64,926 | * |
Foreign exchange contracts | | Receivables | | | 1,195,818 | |
| | | | | | |
Total | | | | $ | 1,260,744 | |
| | | | | | |
| | |
| | | Liability Derivatives | | Fair Value | |
Interest rate contracts | | Payables, Net assets Unrealized depreciation | | $ | (14,143 | )* |
Foreign exchange contracts | | Payables | | | (739,407 | ) |
| | | | | | |
Total | | | | $ | (753,550 | ) |
| | | | | | |
| * | Includes cumulative appreciation/depreciation of futures contracts as reported in the Portfolio of Investments. Only variation margin is reported within the Statement of Assets & Liabilities. |
The Effect of Derivative Instruments on the Statement of Operations for the year ended December 31, 2016:
| | | | | | | | | | | | | | | | |
| Amount of Realized Gain or (Loss) on Derivatives Recognized in Income | |
Derivatives Not Accounted for as
Hedging Instrument^ | | Options | | | Futures | | | Forward
Foreign
Currency
Contracts | | | Total | |
Interest rate contracts | | $ | 20,549 | | | $ | (371,984 | ) | | $ | — | | | $ | (351,435 | ) |
Foreign exchange contracts | | | — | | | | — | | | | 1,188,771 | | | | 1,188,771 | |
| | | | | | | | | | | | | | | | |
Total | | $ | 20,549 | | | $ | (371,984 | ) | | $ | 1,188,771 | | | $ | 837,336 | |
| | | | | | | | | | | | | | | | |
| | | | | | | | | | | | | | | | |
| Amount of Unrealized Appreciation or (Depreciation) on Derivatives Recognized in Income | |
Derivatives Not Accounted for as
Hedging Instrument^ | | Options | | | Futures | | | Forward
Foreign
Currency
Contracts | | | Total | |
Interest rate contracts | | $ | (20 | ) | | $ | 41,670 | | | $ | — | | | $ | 41,650 | |
Foreign exchange contracts | | | — | | | | — | | | | 469,639 | | | | 469,639 | |
| | | | | | | | | | | | | | | | |
Total | | $ | (20 | ) | | $ | 41,670 | | | $ | 469,639 | | | $ | 511,289 | |
| | | | | | | | | | | | | | | | |
^ This Portfolio held forward foreign currency contracts, futures and options contracts as a substitute for investing in conventional securities, hedging and in an attempt to enhance returns.
The Portfolio held forward foreign currency contracts with an average settlement value of approximately $67,335,000 during the year ended December 31, 2016 and option contracts and futures contracts with an average notional balance of approximately $5,000 and $29,901,000, respectively during the year ended December 31, 2016.
See Notes to Financial Statements.
100
EQ ADVISORS TRUST
EQ/PIMCO GLOBAL REAL RETURN PORTFOLIO
PORTFOLIO OF INVESTMENTS (Continued)
December 31, 2016
The following table presents the Portfolio’s gross derivative assets and liabilities by counterparty net of amounts available for offset under netting arrangements and any related collateral received or pledged by the Portfolio as of December 31, 2016:
| | | | | | | | | | | | | | | | |
Counterparty | | Gross Amount of
Derivative Assets
Presented in the
Statement of Assets
and Liabilities (a) | | | Derivatives
Available
for Offset | | | Collateral
Received* | | | Net Amount Due
from Counterparty | |
Bank of America | | $ | 603,191 | | | $ | (217,914 | ) | | $ | (385,277 | ) | | $ | — | |
Credit Suisse | | | 5,264 | | | | (5,264 | ) | | | — | | | | — | |
Deutsche Bank AG | | | 57,542 | | | | (57,542 | ) | | | — | | | | — | |
JPMorgan Chase Bank | | | 529,821 | | | | (249,622 | ) | | | (280,199 | ) | | | — | |
| | | | | | | | | | | | | | | | |
Total | | $ | 1,195,818 | | | $ | (530,342 | ) | | $ | (665,476 | ) | | $ | — | |
| | | | | | | | | | | | | | | | |
| | | | |
Counterparty | | Gross Amount of
Derivative Liabilities
Presented in the
Statement of Assets
and Liabilities (a) | | | Derivatives
Available
for Offset | | | Collateral
Pledged** | | | Net Amount Due
to Counterparty | |
Bank of America | | $ | 217,914 | | | $ | (217,914 | ) | | $ | — | | | $ | — | |
Credit Suisse | | | 20,682 | | | | (5,264 | ) | | | — | | | | 15,418 | |
Deutsche Bank AG | | | 251,189 | | | | (57,542 | ) | | | (193,647 | ) | | | — | |
JPMorgan Chase Bank | | | 249,622 | | | | (249,622 | ) | | | — | | | | — | |
| | | | | | | | | | | | | | | | |
Total | | $ | 739,407 | | | $ | (530,342 | ) | | $ | (193,647 | ) | | $ | 15,418 | |
| | | | | | | | | | | | | | | | |
| * | Per GAAP disclosure requirements, the table above does not include the additional collateral received from the counterparty. Total additional collateral received was $244,524. |
| ** | Per GAAP disclosure requirements, the table above does not include the additional collateral pledged to the counterparty. Total additional collateral pledged was $59,294. |
| (a) | For financial reporting purposes the Portfolio does not offset derivative assets and derivative liabilities subject to master netting arrangements in the Statement of Assets and Liabilities. |
Sale-Buyback Transactions:
| | | | | | | | | | | | | | | | | | | | |
Counterparty | | Borrowing
Rate | | | Borrowing
Date | | | Maturity
Date | | | Amount
Borrowed (1) | | | Payable for
Sale-Buyback
Transactions (2) | |
BNP Paribas S.A. | | | (0.30 | )% | | | 10/6/2016 | | | | 1/24/2017 | | | $ | (521,201 | ) | | $ | (519,302 | ) |
BNP Paribas S.A. | | | (0.30 | ) | | | 10/6/2016 | | | | 1/24/2017 | | | | (420,855 | ) | | | (420,377 | ) |
BNP Paribas S.A. | | | (0.30 | ) | | | 10/6/2016 | | | | 1/24/2017 | | | | (253,656 | ) | | | (253,010 | ) |
BNP Paribas S.A. | | | 0.53 | | | | 10/13/2016 | | | | 1/17/2017 | | | | (1,675,372 | ) | | | (1,674,297 | ) |
BNP Paribas S.A. | | | 0.53 | | | | 10/13/2016 | | | | 1/17/2017 | | | | (1,305,603 | ) | | | (1,307,062 | ) |
BNP Paribas S.A. | | | 0.53 | | | | 10/13/2016 | | | | 1/17/2017 | | | | (1,062,099 | ) | | | (1,063,151 | ) |
BNP Paribas S.A. | | | 0.53 | | | | 10/13/2016 | | | | 1/17/2017 | | | | (3,833,007 | ) | | | (3,837,014 | ) |
BNP Paribas S.A. | | | 0.53 | | | | 10/13/2016 | | | | 1/17/2017 | | | | (790,450 | ) | | | (791,389 | ) |
BNP Paribas S.A. | | | 0.53 | | | | 10/13/2016 | | | | 1/17/2017 | | | | (2,664,722 | ) | | | (2,667,819 | ) |
BNP Paribas S.A. | | | 1.10 | | | | 12/19/2016 | | | | 3/17/2017 | | | | (3,046,458 | ) | | | (3,049,984 | ) |
BNP Paribas S.A. | | | 1.10 | | | | 12/19/2016 | | | | 3/17/2017 | | | | (501,800 | ) | | | (500,679 | ) |
BNP Paribas S.A. | | | 1.10 | | | | 12/19/2016 | | | | 3/17/2017 | | | | (1,449,457 | ) | | | (1,452,840 | ) |
BNP Paribas S.A. | | | 1.10 | | | | 12/19/2016 | | | | 3/17/2017 | | | | (4,689,335 | ) | | | (4,700,227 | ) |
BNP Paribas S.A. | | | 1.09 | | | | 12/22/2016 | | | | 3/17/2017 | | | | (1,109,903 | ) | | | (1,109,483 | ) |
BNP Paribas S.A. | | | 1.50 | | | | 12/27/2016 | | | | 1/4/2017 | | | | (3,494,440 | ) | | | (3,494,084 | ) |
| | | | | | | | | | | | | | | | | | | | |
| | | | | | | | | | | | | | | | | | $ | (26,840,718 | ) |
| | | | | | | | | | | | | | | | | | | | |
| (1) | The average amount of borrowings while outstanding for 366 days during the year ended December 31, 2016, was approximately $27,977,000 at a weighted average interest rate of 0.58%. |
| (2) | Payable for sale-buyback transactions includes $22,360 of deferred price drop on sale-buyback transactions. |
See Notes to Financial Statements.
101
EQ ADVISORS TRUST
EQ/PIMCO GLOBAL REAL RETURN PORTFOLIO
PORTFOLIO OF INVESTMENTS (Continued)
December 31, 2016
The following is a summary by counterparty of Borrowings and Other Financial Transactions and collateral (received)/pledged as of December 31, 2016:
| | | | | | | | | | | | |
Counterparty | | Payable for
Sale-Buyback
Transactions | | | Collateral
(Received)/
Pledged | | | Net
Exposure (3) | |
BNP Paribas S.A. | | $ | (26,840,718 | ) | | $ | 26,558,082 | | | $ | (282,636 | ) |
| (3) | Net Exposure represents the net receivable/(payable) that would be due from/to the counterparty in the event of default. |
| | | | | | | | | | | | | | | | | | | | |
| | | December 31, 2016 | |
| | | Remaining Contractual Maturity of the Agreements | |
| | | Overnight
and
Continuous | | | Up to 30
Days | | | 30 - 90
Days | | | Greater
than 90
Days | | | Total | |
Sale-Buyback | | | | | | | | | | | | | | | | | | | | |
U.S. Treasury Bonds | | $ | — | | | $ | 3,494,084 | | | $ | 1,109,483 | | | $ | — | | | $ | 4,603,567 | |
U.S. Treasury Notes | | | — | | | | — | | | | 9,703,730 | | | | — | | | | 9,703,730 | |
Foreign Governments | | | — | | | | 12,533,421 | | | | — | | | | — | | | | 12,533,421 | |
| | | | | | | | | | | | | | | | | | | | |
Total Borrowings | | $ | — | | | $ | 16,027,505 | | | $ | 10,813,213 | | | $ | — | | | $ | 26,840,718 | |
| | | | | | | | | | | | | | | | | | | | |
Gross amount of recognized liabilities for sale-buybacks | | | | | | | | | | | | | | | | | | $ | 26,840,718 | |
| | | | | | | | | | | | | | | | | | | | |
Investment security transactions for the year ended December 31, 2016 were as follows:
| | | | |
Cost of Purchases: | | | | |
Long-term investments other than U.S. government debt securities | | $ | 70,343,857 | |
Long-term U.S. government debt securities | | | 37,387,346 | |
| | | | |
| | $ | 107,731,203 | |
| | | | |
Net Proceeds of Sales and Redemptions: | | | | |
Long-term investments other than U.S. government debt securities | | $ | 58,412,476 | |
Long-term U.S. government debt securities | | | 33,934,536 | |
| | | | |
| | $ | 92,347,012 | |
| | | | |
As of December 31, 2016, the gross unrealized appreciation (depreciation) of investments based on the aggregate cost of investments for Federal income tax purposes was as follows:
| | | | |
Aggregate gross unrealized appreciation | | $ | 2,940,652 | |
Aggregate gross unrealized depreciation | | | (3,201,923 | ) |
| | | | |
Net unrealized appreciation | | $ | (261,271 | ) |
| | | | |
Federal income tax cost of investments | | $ | 99,232,542 | |
| | | | |
See Notes to Financial Statements.
102
EQ ADVISORS TRUST
EQ/PIMCO GLOBAL REAL RETURN PORTFOLIO
STATEMENT OF ASSETS AND LIABILITIES
December 31, 2016
| | | | |
ASSETS | | | | |
Investments at value(Cost $97,133,517) | | $ | 98,971,271 | |
Cash | | | 66,198 | |
Foreign cash (Cost $29,976) | | | 29,787 | |
Cash held as collateral at broker | | | 141,803 | |
Receivable for securities sold | | | 1,661,579 | |
Unrealized appreciation on forward foreign currency contracts | | | 1,195,818 | |
Receivable for forward commitments | | | 979,219 | |
Dividends, interest and other receivables | | | 199,005 | |
Receivable from Separate Accounts for Trust shares sold | | | 103,275 | |
Due from broker for futures variation margin | | | 67,773 | |
Other assets | | | 197 | |
| | | | |
Total assets | | | 103,415,925 | |
| | | | |
LIABILITIES | | | | |
Payable for sale-buyback financing transactions | | | 26,840,718 | |
Payable for forward commitments | | | 4,057,969 | |
Payable for return of cash collateral on forward contracts | | | 910,000 | |
Unrealized depreciation on forward foreign currency contracts | | | 739,407 | |
Payable for securities purchased | | | 694,347 | |
Investment management fees payable | | | 11,949 | |
Payable to Separate Accounts for Trust shares redeemed | | | 10,964 | |
Distribution fees payable – Class IB | | | 7,928 | |
Administrative fees payable | | | 5,673 | |
Options written, at value (Premiums received $1,687) | | | 516 | |
Trustees’ fees payable | | | 71 | |
Accrued expenses | | | 64,893 | |
| | | | |
Total liabilities | | | 33,344,435 | |
| | | | |
NET ASSETS | | $ | 70,071,490 | |
| | | | |
Net assets were comprised of: | | | | |
Paid in capital | | $ | 70,655,840 | |
Accumulated undistributed net investment income (loss) | | | 446,216 | |
Accumulated undistributed net realized gain (loss) on investments, options written, futures and foreign currency transactions | | | (3,360,768 | ) |
Net unrealized appreciation (depreciation) on investments, options written, futures and foreign currency translations | | | 2,330,202 | |
| | | | |
Net assets | | $ | 70,071,490 | |
| | | | |
Class IB | | | | |
Net asset value, offering and redemption price per share, $38,725,246 / 3,997,385 shares outstanding (unlimited amount authorized: $0.01 par value) | | $ | 9.69 | |
| | | | |
Class K | | | | |
Net asset value, offering and redemption price per share, $31,346,244 / 3,229,192 shares outstanding (unlimited amount authorized: $0.01 par value) | | $ | 9.71 | |
| | | | |
STATEMENT OF OPERATIONS
For the Year Ended December 31, 2016
| | | | |
INVESTMENT INCOME | | | | |
Interest (net of $3,282 foreign withholding tax) | | $ | 1,342,839 | |
Dividends | | | 2,485 | |
Securities lending (net) | | | 4 | |
| | | | |
Total income | | | 1,345,328 | |
| | | | |
EXPENSES | | | | |
Investment management fees | | | 363,241 | |
Interest expense | | | 182,911 | |
Distribution fees – Class IB | | | 77,835 | |
Professional fees | | | 71,074 | |
Administrative fees | | | 60,762 | |
Custodian fees | | | 53,700 | |
Printing and mailing expenses | | | 4,024 | |
Trustees’ fees | | | 1,315 | |
Miscellaneous | | | 8,533 | |
| | | | |
Gross expenses | | | 823,395 | |
Less: Waiver from investment manager | | | (108,544 | ) |
| | | | |
Net expenses | | | 714,851 | |
| | | | |
NET INVESTMENT INCOME (LOSS) | | | 630,477 | |
| | | | |
REALIZED AND UNREALIZED GAIN (LOSS) | | | | |
Realized gain (loss) on: | | | | |
Investments | | | (2,064,801 | ) |
Net distributions of realized gain received from underlying funds | | | 13 | |
Futures | | | (371,984 | ) |
Foreign currency transactions | | | 4,230,779 | |
Options written | | | 30,313 | |
| | | | |
Net realized gain (loss) | | | 1,824,320 | |
| | | | |
Change in unrealized appreciation (depreciation) on: | | | | |
Investments | | | 3,618,812 | |
Futures | | | 41,670 | |
Foreign currency translations | | | (296,886 | ) |
Options written | | | (51 | ) |
| | | | |
Net change in unrealized appreciation (depreciation) | | | 3,363,545 | |
| | | | |
NET REALIZED AND UNREALIZED GAIN (LOSS) | | | 5,187,865 | |
| | | | |
NET INCREASE (DECREASE) IN NET ASSETS RESULTING FROM OPERATIONS | | $ | 5,818,342 | |
| | | | |
See Notes to Financial Statements.
103
EQ ADVISORS TRUST
EQ/PIMCO GLOBAL REAL RETURN PORTFOLIO
STATEMENT OF CHANGES IN NET ASSETS
| | | | | | | | |
| | | Year Ended December 31, | |
| | | 2016 | | | 2015 | |
INCREASE (DECREASE) IN NET ASSETS FROM OPERATIONS: | | | | | | | | |
Net investment income (loss) | | $ | 630,477 | | | $ | 211,022 | |
Net realized gain (loss) on investments, options written, futures, foreign currency transactions and net distributions of realized gain received from underlying funds | | | 1,824,320 | | | | (288,629 | ) |
Net change in unrealized appreciation (depreciation) on investments, options written, futures and foreign currency translations | | | 3,363,545 | | | | (1,213,716 | ) |
| | | | | | | | |
NET INCREASE (DECREASE) IN NET ASSETS RESULTING FROM OPERATIONS | | | 5,818,342 | | | | (1,291,323 | ) |
| | | | | | | | |
DIVIDENDS AND DISTRIBUTIONS: | | | | | | | | |
Dividends from net investment income | | | | | | | | |
Class IB | | | (1,848,682 | ) | | | (325,837 | ) |
Class K | | | (1,571,382 | ) | | | (375,840 | ) |
| | | | | | | | |
| | | (3,420,064 | ) | | | (701,677 | ) |
| | | | | | | | |
Distributions from net realized capital gains | | | | | | | | |
Class IB | | | (71,834 | ) | | | (137,620 | ) |
Class K | | | (65,048 | ) | | | (153,630 | ) |
| | | | | | | | |
| | | (136,882 | ) | | | (291,250 | ) |
| | | | | | | | |
TOTAL DIVIDENDS AND DISTRIBUTIONS | | | (3,556,946 | ) | | | (992,927 | ) |
| | | | | | | | |
CAPITAL SHARES TRANSACTIONS: | | | | | | | | |
Class IB | | | | | | | | |
Capital shares sold [ 1,895,487 and 1,767,719 shares, respectively ] | | | 18,732,041 | | | | 17,083,369 | |
Capital shares issued in reinvestment of dividends and distributions [ 202,594 and 49,322 shares, respectively ] | | | 1,920,516 | | | | 463,457 | |
Capital shares repurchased [ (845,785) and (514,412) shares, respectively ] | | | (8,317,780 | ) | | | (4,930,655 | ) |
| | | | | | | | |
Total Class IB transactions | | | 12,334,777 | | | | 12,616,171 | |
| | | | | | | | |
Class K | | | | | | | | |
Capital shares sold [ 531,701 and 1,481,358 shares, respectively ] | | | 5,210,076 | | | | 14,308,246 | |
Capital shares issued in reinvestment of dividends and distributions [ 172,238 and 56,245 shares, respectively ] | | | 1,636,430 | | | | 529,470 | |
Capital shares repurchased [ (501,994) and (511,450) shares, respectively ] | | | (4,888,478 | ) | | | (4,951,450 | ) |
| | | | | | | | |
Total Class K transactions | | | 1,958,028 | | | | 9,886,266 | |
| | | | | | | | |
NET INCREASE (DECREASE) IN NET ASSETS RESULTING FROM CAPITAL SHARE TRANSACTIONS | | | 14,292,805 | | | | 22,502,437 | |
| | | | | | | | |
TOTAL INCREASE (DECREASE) IN NET ASSETS | | | 16,554,201 | | | | 20,218,187 | |
NET ASSETS: | | | | | | | | |
Beginning of year | | | 53,517,289 | | | | 33,299,102 | |
| | | | | | | | |
End of year (a) | | $ | 70,071,490 | | | $ | 53,517,289 | |
| | | | | | | | |
(a) Includes accumulated undistributed (overdistributed) net investment income (loss) of | | $ | 446,216 | | | $ | (36,170 | ) |
| | | | | | | | |
See Notes to Financial Statements.
104
EQ ADVISORS TRUST
EQ/PIMCO GLOBAL REAL RETURN PORTFOLIO
STATEMENT OF CASH FLOWS
For the Year Ended December 31, 2016
| | | | |
INCREASE (DECREASE) IN CASH | | | | |
Cash flows provided (used) by operating activities: | | | | |
Net increase/(decrease) in net assets from operations | | $ | 5,818,342 | |
Adjustments to reconcile net increase/(decrease) in net assets from operations to net cash provided (used) by operating activities: | | | | |
Purchase of investment securities | | | (107,731,203 | ) |
Proceeds from disposition of investment securities | | | 92,347,012 | |
Proceeds/(Purchases) of short-term investments, net | | | (2,365,398 | ) |
Decrease in premuims received on written options | | | (1,507 | ) |
Change in unrealized (appreciation)/depreciation on investments | | | (3,618,812 | ) |
Change in unrealized (appreciation)/depreciation on written options | | | 51 | |
Net realized (gain)/ loss on investments | | | 2,064,788 | |
Net amortization (accretion) of income | | | (457,350 | ) |
Increase in payable for forward commitments | | | 4,057,969 | |
Increase in payable for return of cash collateral on forward currency contracts | | | 800,000 | |
Decrease in receivable for securities sold | | | 569,351 | |
Increase in unrealized depreciation on forward foreign currency contracts | | | 228,884 | |
Decrease in cash held as collateral at broker | | | 13,197 | |
Decrease in dividends, interest and other receivables | | | 11,380 | |
Increase in accrued expenses | | | 3,079 | |
Increase in distribution fees payable – Class IB | | | 2,557 | |
Increase in administrative fees payable | | | 1,110 | |
Increase in Trustees’ fees payable | | | 41 | |
Increase in other assets | | | (58 | ) |
Decrease in investment management fees payable | | | (573 | ) |
Increase in due from broker for futures variation margin | | | (9,793 | ) |
Increase in unrealized appreciation on forward foreign currency contracts | | | (698,523 | ) |
Increase in receivable for forward commitments | | | (979,219 | ) |
Decrease in payable for securities purchased | | | (1,699,519 | ) |
| | | | |
Net cash provided (used) by operating activities | | | (11,644,194 | ) |
| | | | |
Cash flows provided (used) by financing activities: | | | | |
Proceeds from shares issued | | | 23,838,842 | |
Payment for shares redeemed | | | (13,195,294 | ) |
Proceeds from sale-buyback transactions | | | 619,096,053 | |
Payments on sale-buyback transactions | | | (619,165,027 | ) |
Increase in payable for sale-buyback financing transactions | | | 1,040,542 | |
| | | | |
Net cash provided (used) by financing activities | | | 11,615,116 | |
| | | | |
Net decrease in cash | | | (29,078 | ) |
| | | | |
Cash: | | | | |
Beginning of year (including foreign currency of $56,587) | | | 125,063 | |
| | | | |
End of year (including foreign currency of $29,787) | | $ | 95,985 | |
| | | | |
Supplemental disclosure of cash flow information:
For the year ended December 31, 2016, the Portfolio paid $182,911 in interest expense and had reinvestments of dividends and distributions in the amount of $3,556,946.
See Notes to Financial Statements.
105
EQ ADVISORS TRUST
EQ/PIMCO GLOBAL REAL RETURN PORTFOLIO
FINANCIAL HIGHLIGHTS
| | | | | | | | | | | | | | | | |
| | | Year Ended December 31, | | | February 8, 2013* to
December 31, 2013 | |
| Class IB | | 2016 | | | 2015 | | | 2014 | | |
Net asset value, beginning of period | | $ | 9.26 | | | $ | 9.67 | | | $ | 9.40 | | | $ | 10.00 | |
| | | | | | | | | | | | | | | | |
Income (loss) from investment operations: | | | | | | | | | | | | | | | | |
Net investment income (loss) (e) | | | 0.09 | | | | 0.04 | | | | 0.06 | | | | — | # |
Net realized and unrealized gain (loss) on investments, options written, futures and foreign currency transactions | | | 0.85 | | | | (0.27 | ) | | | 0.68 | | | | (0.59 | ) |
| | | | | | | | | | | | | | | | |
Total from investment operations | | | 0.94 | | | | (0.23 | ) | | | 0.74 | | | | (0.59 | ) |
| | | | | | | | | | | | | | | | |
Less distributions: | | | | | | | | | | | | | | | | |
Dividends from net investment income | | | (0.49 | ) | | | (0.13 | ) | | | (0.47 | ) | | | (0.01 | ) |
Distributions from net realized gains | | | (0.02 | ) | | | (0.05 | ) | | | — | | | | — | |
| | | | | | | | | | | | | | | | |
Total dividends and distributions | | | (0.51 | ) | | | (0.18 | ) | | | (0.47 | ) | | | (0.01 | ) |
| | | | | | | | | | | | | | | | |
Net asset value, end of period | | $ | 9.69 | | | $ | 9.26 | | | $ | 9.67 | | | $ | 9.40 | |
| | | | | | | | | | | | | | | | |
Total return (b) | | | 10.35 | % | | | (2.36 | )% | | | 7.86 | % | | | (5.90 | )% |
| | | | | | | | | | | | | | | | |
Ratios/Supplemental Data: | | | | | | | | | | | | | | | | |
Net assets, end of period (000’s) | | $ | 38,725 | | | $ | 25,420 | | | $ | 13,949 | | | $ | 3,804 | |
Ratio of expenses to average net assets: | | | | | | | | | | | | | | | | |
After waivers and reimbursements (a)(f) | | | 1.31 | %**** | | | 1.12 | %*** | | | 1.05 | %** | | | 1.00 | % |
Before waivers and reimbursements (a)(f) | | | 1.49 | %**** | | | 1.36 | %*** | | | 1.46 | %** | | | 1.95 | % |
Ratio of net investment income (loss) to average net assets: | | | | | | | | | | | | | | | | |
After waivers and reimbursements (a)(f) | | | 0.92 | % | | | 0.42 | % | | | 0.65 | % | | | — | %(l)‡‡ |
Before waivers and reimbursements (a)(f) | | | 0.74 | % | | | 0.18 | % | | | 0.24 | % | | | (0.97 | )%(l) |
Portfolio turnover rate (z)^ | | | 108 | % | | | 66 | % | | | 92 | % | | | 555 | % |
| | |
| | | Year Ended December 31, | | | February 8, 2013* to
December 31, 2013 | |
| Class K | | 2016 | | | 2015 | | | 2014 | | |
Net asset value, beginning of period | | $ | 9.28 | | | $ | 9.67 | | | $ | 9.40 | | | $ | 10.00 | |
| | | | | | | | | | | | | | | | |
Income (loss) from investment operations: | | | | | | | | | | | | | | | | |
Net investment income (loss) (e) | | | 0.12 | | | | 0.05 | | | | 0.10 | | | | 0.05 | |
Net realized and unrealized gain (loss) on investments, options written, futures and foreign currency transactions | | | 0.85 | | | | (0.26 | ) | | | 0.66 | | | | (0.62 | ) |
| | | | | | | | | | | | | | | | |
Total from investment operations | | | 0.97 | | | | (0.21 | ) | | | 0.76 | | | | (0.57 | ) |
| | | | | | | | | | | | | | | | |
Less distributions: | | | | | | | | | | | | | | | | |
Dividends from net investment income | | | (0.52 | ) | | | (0.13 | ) | | | (0.49 | ) | | | (0.03 | ) |
Distributions from net realized gains | | | (0.02 | ) | | | (0.05 | ) | | | — | | | | — | |
| | | | | | | | | | | | | | | | |
Total dividends and distributions | | | (0.54 | ) | | | (0.18 | ) | | | (0.49 | ) | | | (0.03 | ) |
| | | | | | | | | | | | | | | | |
Net asset value, end of period | | $ | 9.71 | | | $ | 9.28 | | | $ | 9.67 | | | $ | 9.40 | |
| | | | | | | | | | | | | | | | |
Total return (b) | | | 10.63 | % | | | (2.15 | )% | | | 8.14 | % | | | (5.69 | )% |
| | | | | | | | | | | | | | | | |
Ratios/Supplemental Data: | | | | | | | | | | | | | | | | |
Net assets, end of period (000’s) | | $ | 31,346 | | | $ | 28,098 | | | $ | 19,350 | | | $ | 15,546 | |
Ratio of expenses to average net assets: | | | | | | | | | | | | | | | | |
After waivers and reimbursements (a)(f) | | | 1.05 | %***** | | | 0.87 | %*** | | | 0.80 | %** | | | 0.75 | % |
Before waivers and reimbursements (a)(f) | | | 1.22 | %***** | | | 1.11 | %*** | | | 1.18 | %** | | | 1.70 | % |
Ratio of net investment income (loss) to average net assets: | | | | | | | | | | | | | | | | |
After waivers and reimbursements (a)(f) | | | 1.17 | % | | | 0.48 | % | | | 1.00 | % | | | 0.59 | %(l) |
Before waivers and reimbursements (a)(f) | | | 0.99 | % | | | 0.23 | % | | | 0.62 | % | | | (0.37 | )%(l) |
Portfolio turnover rate (z)^ | | | 108 | % | | | 66 | % | | | 92 | % | | | 555 | % |
See Notes to Financial Statements.
106
EQ ADVISORS TRUST
EQ/PIMCO GLOBAL REAL RETURN PORTFOLIO
FINANCIAL HIGHLIGHTS (Continued)
| * | Commencement of Operations. |
| ** | Includes Interest Expense of 0.05%. |
| *** | Includes Interest Expense of 0.12%. |
| **** | Includes Interest Expense of 0.31% |
| ***** | Includes Interest Expense of 0.30% |
| # | Per share amount is less than $0.005. |
| ‡‡ | Amount is less than 0.005%. |
| ^ | Portfolio turnover rate excludes derivatives, if any. |
| (a) | Ratios for periods less than one year are annualized. |
| (b) | Total returns for periods less than one year are not annualized. |
| (e) | Net investment income (loss) per share is based on average shares outstanding. |
| (f) | Expenses do not include the expenses of the underlying funds (“indirect expenses”), if applicable. |
| (l) | The annualized ratio of net investment income to average net assets may not be indicative of operating results for a full year. |
| (z) | Portfolio turnover rate for periods less than one year is not annualized. |
See Notes to Financial Statements.
107
EQ ADVISORS TRUST
NOTES TO FINANCIAL STATEMENTS
December 31, 2016
| Note 1 | Organization and Significant Accounting Policies |
EQ Advisors Trust (the “Trust”) was organized as a Delaware statutory trust on October 31, 1996, and is registered under the Investment Company Act of 1940, as amended (the “1940 Act”), as an open-end management investment company. The Trust currently offers eighty-four diversified portfolios and two non-diversified portfolios (each a “Portfolio”). These financial statements present eight of the diversified Portfolios. The investment manager to each Portfolio is AXA Equitable Funds Management Group, LLC (“FMG LLC” or the “Manager”), a wholly-owned subsidiary of AXA Equitable Life Insurance Company (“AXA Equitable”).
On April 30, 2015, FMG LLC contributed seed capital in the following amounts into the specific classes as shown below. Operations for these classes commenced on May 1, 2015.
| | | | | | | | |
Portfolios: | | Class | | | Seed capital | |
AXA/DoubleLine Opportunistic Core Plus Bond | | | Class IB | | | $ | 100,000 | |
AXA/DoubleLine Opportunistic Core Plus Bond | | | Class K | | | | 49,900,000 | |
AXA/Horizon Small Cap Value | | | Class IB | | | | 100,000 | |
AXA/Pacific Global Small Cap Value | | | Class IB | | | | 100,000 | |
Under the Trust’s organizational documents, the Trust’s officers and trustees are indemnified against certain liabilities arising out of the performance of their duties to the Trust. In addition, in the normal course of business, the Trust enters into contracts with vendors and others that may provide for general indemnifications. A Portfolio’s maximum exposure under these arrangements is unknown as this would involve future claims that may be made against the Portfolio. However, based on experience, the Trust and management expect the risk of loss to be remote.
The Manager and each of the investment sub-advisers (each, a “Sub-Adviser”), subject to the supervision of the Manager, independently choose and maintain a portfolio of securities for the Portfolio(s).
Each of the All Asset Growth-Alt 20 Portfolio, All Asset Aggressive-Alt 25 Portfolio, All Asset Aggressive-Alt 50 Portfolio and All Asset Aggressive-Alt 75 Portfolio (each, an “All Asset Portfolio” and together, the “All Asset Portfolios”) is a type of mutual fund often described as a “fund-of-funds”. The All Asset Portfolios pursue their investment objectives by investing exclusively in other mutual funds managed by FMG LLC and unaffiliated investment companies or exchange-traded funds (“ETFs”).
Each of the AXA/Horizon Small Cap Value Portfolio and AXA/Pacific Global Small Cap Value Portfolio may employ multiple Sub-Advisers (each a “Multiadviser Portfolio” and together, the “Multiadviser Portfolios”). Each of the Sub-Advisers independently chooses and maintains a portfolio of securities for the Multiadviser Portfolio and each is responsible for investing a specific allocated portion of the Multiadviser Portfolio’s assets. Because each Sub-Adviser will be managing its allocated portion of the Multiadviser Portfolio independently from the other Sub-Advisers, the same security may be held in different portions of the Multiadviser Portfolio, or may be acquired for one portion of the Multiadviser Portfolio at a time when the Sub-Adviser of another portion deems it appropriate to dispose of the security. Similarly, under some market conditions, one Sub-Adviser may believe that temporary defensive investments in short-term instruments or cash are appropriate when the other Sub-Adviser or Sub-Advisers believe continued exposure to the equity or fixed income markets is appropriate for their portions of the Multiadviser Portfolio. Because each Sub-Adviser is responsible for the trading for its own portion of the Multiadviser Portfolio, and does not aggregate its transactions with those of the other Sub-Advisers, the Multiadviser Portfolio may incur higher brokerage costs, and have higher portfolio turnover, than would be the case if a single Sub-Adviser were managing the entire Multiadviser Portfolio.
108
EQ ADVISORS TRUST
NOTES TO FINANCIAL STATEMENTS (Continued)
December 31, 2016
The Trust issues three classes of shares, Class IA, Class IB and Class K, as shown in the respective Portfolio’s Statement of Assets and Liabilities. The Class IA and Class IB shares are subject to distribution fees imposed under a distribution plan (“Distribution Plan”) adopted pursuant to Rule 12b-1 under the 1940 Act. Under the Trust’s multiple class distribution system, all three classes of shares have identical voting, dividend, liquidation and other rights, other than the payment of distribution fees under the applicable Distribution Plan. The Trust’s shares are currently sold only to insurance company separate accounts in connection with variable life insurance contracts and variable annuity certificates and contracts issued by AXA Equitable, AXA Life and Annuity Company, other affiliated or unaffiliated insurance companies and to the AXA Equitable 401(k) Plan. Shares also may be sold to other tax-qualified retirement plans, to other series of the Trust and to series of AXA Premier VIP Trust, a separate registered investment company managed by FMG LLC.
The investment objectives of each Portfolio are as follows:
All Asset Growth-Alt 20 Portfolio — Seeks long-term capital appreciation and current income.
All Asset Aggressive-Alt 25 Portfolio — Seeks long-term capital appreciation and current income, with a greater emphasis on capital appreciation.
All Asset Aggressive-Alt 50 Portfolio — Seeks long-term capital appreciation.
All Asset Aggressive-Alt 75 Portfolio — Seeks long-term capital appreciation.
AXA/DoubleLine Opportunistic Core Plus Bond Portfolio (sub-advised by DoubleLine Capital LP) — Seeks to maximize current income and total return.
AXA/Horizon Small Cap Value Portfolio (sub-advised by BlackRock Investment Management, LLC (“BlackRock”) and Horizon Asset Management LLC) — Seeks to achieve long-term growth of capital.
AXA/Pacific Global Small Cap Value Portfolio (sub-advised by BlackRock and Pacific Global Investment Management Company) — Seeks to achieve long-term growth of capital.
EQ/PIMCO Global Real Return Portfolio (sub-advised by Pacific Investment Management Company LLC) — Seeks to achieve maximum real return, consistent with preservation of capital and prudent investment management.
The following is a summary of the significant accounting policies of the Trust:
In October 2016, the Securities and Exchange Commission (“SEC”) issued a new rule, Investment Company Reporting Modernization, which, among other provisions, amends Regulation S-X to require standardized, enhanced disclosures, particularly related to derivatives, in Investment Company financial statements. Compliance with the guidance is required for financial statements filed with the SEC on or after August 1, 2017; management believes that the adoption of this rule will have no material effect on the Portfolios’ net assets or results of operations.
The preparation of financial statements in accordance with United States of America generally accepted accounting principles (“U.S. GAAP”) requires management to make estimates and assumptions that affect the reported amounts and disclosures. Actual results could differ from those estimates. The Portfolios are investment companies and, accordingly, follow the investment company accounting and reporting guidance of the Financial Accounting Standards Board Accounting Standards Codification Topic 946 — Investment Companies, which is part of U.S. GAAP.
109
EQ ADVISORS TRUST
NOTES TO FINANCIAL STATEMENTS (Continued)
December 31, 2016
Valuation:
Equity securities (including securities issued by ETFs listed on national securities exchanges are valued at the last sale price or official closing price on the date of valuation or, if there is no sale or official closing price, at the latest available bid price. Securities listed on the NASDAQ stock market will be valued using the NASDAQ Official Closing Price (“NOCP”). Generally, the NOCP will be the last sale price unless the reported trade for the security is outside the range of the bid/ask price. In such cases, the NOCP will be normalized to the nearer of the bid or ask price. Other unlisted stocks are valued at their last sale price or official closing price, or if there is no such price, at a bid price estimated by a broker.
Corporate and Municipal bonds and notes are generally valued on the basis of prices provided by a pricing service. The pricing service may utilize many factors in making evaluations, trading in similar groups of securities and any developments related to specific securities. However, when such prices are not available, such bonds and notes are valued at a bid price estimated by a broker.
Convertible bonds and unlisted convertible preferred stocks are valued using prices obtained from a pricing service for such investments or, if a pricing service price is not available, at bid prices obtained from one or more of the major dealers in such bonds or stocks. Where there is a discrepancy between dealers, values may be adjusted based on recent premium spreads to the underlying common stocks. Convertible bonds may be matrix-priced based upon the conversion value to the underlying common stocks and market premiums.
Mortgage-backed and asset-backed securities are valued at evaluated prices obtained from a pricing service where available, or at a bid price obtained from one or more of the major dealers in such securities. The pricing service may utilize data such as issuer type, coupon, cash flows, collateral performance, mortgage prepayment projection tables and Adjustable Rate Mortgage evaluations that incorporate index data, periodic and life caps, the next coupon reset date and the convertibility of the bond in making evaluations. If a quoted price is unavailable, an equivalent yield or yield spread quotes will be obtained from a broker and converted to a price.
Options that are traded on an exchange are generally valued at their last sale price or official closing price on the date of valuation. Options not traded on an exchange or actively traded are valued according to fair value methods. The market value of a put or call option will usually reflect, among other factors, the market price of the underlying security.
U.S. Treasury securities and other obligations issued or guaranteed by the U.S. Government, its agencies or instrumentalities, are valued at prices obtained from a bond pricing service where available. The pricing service may utilize data received from active market makers and broker-dealers, yield curves and the spread over comparable U.S. Treasury issues in making evaluations.
Foreign securities, including foreign government securities, not traded directly in the U.S., or traded in American Depositary Receipts (“ADR”) or similar form, are valued at representative quoted prices from the primary exchange in the currency of the country of origin. Foreign currency is converted into U.S. dollar equivalent at current exchange rates.
Investments in shares of open-end investment companies (other than ETFs) held by a Portfolio will be valued at the net asset value of the shares of such underlying funds as described in the underlying funds’ prospectuses.
Futures contracts are generally valued at their last settlement price or, if there is no sale, at the latest available bid price.
Forward foreign exchange contracts are valued by interpolating between the forward and spot currency rates as quoted by a pricing service as of a designated hour on the valuation date. The pricing service may utilize data such as actual trading information and foreign currency
110
EQ ADVISORS TRUST
NOTES TO FINANCIAL STATEMENTS (Continued)
December 31, 2016
exchange rates gathered from leading market makers and foreign currency exchange trading centers throughout the world in making evaluations. Forward foreign exchange contracts may be settled with the counterparty in U.S. Dollars without the delivery of foreign currency.
During the year ended December 31, 2016, each of the AXA/Horizon Small Cap Value Portfolio and EQ/PIMCO Global Real Return Portfolio held forward foreign currency contracts to either gain exposure to certain currencies, or enter into an economic hedge against changes in the values of securities held in the Portfolio, that do not qualify for hedge accounting under Accounting Standards Codification (“ASC”) 815. The Statement of Operations for each Portfolio reflects realized gains or losses, if any, in forward currency transactions and change in unrealized gains or losses in forward currency exchange transactions. Further information on the impact of these positions on the Portfolios’ financial statements can be found in the Statement of Operations and Portfolio of Investments for each Portfolio.
If market quotations are not readily available for a security or other financial instruments, such securities and instruments shall be referred to the Trust’s Valuation Committee (“Committee”), who will value the assets in good faith pursuant to procedures (“Pricing Procedures”) adopted by the Board of Trustees of the Trust (the “Board”).
The Board is responsible for ensuring that appropriate valuation methods are used to price securities for the Trust’s Portfolios. The Board has delegated the responsibility of calculating the net asset values (“NAVs”) of the Trust’s Portfolios and classes pursuant to these Pricing Procedures to the Trust’s administrator, FMG LLC (in its capacity as administrator, the “Administrator”). The Administrator has entered into a sub-administration agreement with JPMorgan Chase Bank, N.A. (the “Sub-Administrator”) to assist in performing certain of the duties described herein. The Committee, established by the Board, determines the value of the Trust’s securities and assets for which market quotations are not readily available or for which valuation cannot otherwise be provided in accordance with procedures adopted by the Board. The Committee is comprised of senior employees from FMG LLC.
Due to the inherent uncertainty of valuations of such securities, the fair value may differ significantly from the values that would have been used had a ready market for such securities existed.
Various inputs are used in determining the value of a Portfolio’s assets or liabilities carried at fair value. These inputs are summarized in three broad levels below:
| | • | | Level 1 - quoted prices in active markets for identical assets |
| | • | | Level 2 - other significant observable inputs (including quoted prices of similar securities, interest rates, prepayment speeds, credit risk, etc.) |
| | • | | Level 3 - significant unobservable inputs (including the Portfolio’s own assumptions in determining the fair value of investments) |
A summary of inputs used to value each Portfolio’s assets and liabilities carried at fair value as of December 31, 2016, is included in the Portfolio of Investments for each Portfolio. Changes in valuation techniques may result in transfers in or out of an investment’s assigned level. The Portfolios’ policy is to recognize transfers into and transfers out of the valuation levels as of the end of the reporting period.
Transfers between levels are included after the Summary of Level 1, Level 2 and Level 3 inputs, following the Portfolio of Investments for each Portfolio. Transfers between levels may be due to a decline or an increase in market activity (e.g., frequency of trades), which may result in a lack of, or increase in, available observable market inputs to determine price.
Transfers into and transfers out of Level 3, if material, are included in the Level 3 reconciliation following the Portfolio of Investments for each Portfolio.
111
EQ ADVISORS TRUST
NOTES TO FINANCIAL STATEMENTS (Continued)
December 31, 2016
The inputs or methodology used to value securities are not necessarily an indication of the risk associated with investing in those securities. An investment’s level within the fair value hierarchy is based on the lowest level of any input, both individually and in the aggregate, that is significant to the fair value measurement.
The Committee has the ability to meet and review reports based on the valuation techniques used to value Level 3 securities. As part of a review, the Committee would consider obtaining updates from its pricing vendors and Sub-Advisers for fair valued securities. For example, with respect to model driven prices, the Committee could receive reports regarding a review and recalculation of pricing models and related discounts. For those securities which are valued based on broker quotes, the Committee may evaluate variances between existing broker quotes and any alternative broker quotes provided by a Sub-Adviser or other pricing source.
To substantiate unobservable inputs used in a fair valuation, the Secretary of the Committee can perform an independent verification as well as additional research for fair value notifications received from the pricing agents. Among other factors, particular areas of focus may include: description of security, historical pricing, intra-day price movement, last trade information, corporate actions, related securities, any available company news and announcements, any available trade data or other information. The Committee also notes the materiality of holdings and price changes on a Portfolio’s NAV.
The Committee reviews and considers changes in value for all fair valued securities that have occurred since the last review.
Pursuant to procedures approved by the Board, events or circumstances affecting the values of portfolio securities that occur between the closing of their principal markets and the time the NAV is determined may be reflected in the Trust’s calculation of NAV for each applicable Portfolio when FMG LLC deems that the particular event or circumstance would materially affect such Portfolio’s NAV. At December 31, 2016, none of the Portfolios applied these procedures.
Security Transactions and Investment Income:
Securities transactions are recorded on the trade date net of brokerage fees, commissions, and transfer fees. Dividend income (net of withholding taxes) and distributions to shareholders are recorded on the ex-dividend date, except that certain dividends from foreign securities, if any, are recognized as soon as the Portfolio is informed of the ex-dividend date. Interest income (including amortization of premium and accretion of discount on long-term securities using the effective yield method) and interest expense are accrued daily. The Trust records paydown gains and losses realized on prepayments received on mortgage-backed securities as an adjustment to interest income.
The Portfolios record distributions received in excess of income from underlying investments as a reduction of cost of investments and/or realized gain. Those classified as short-term gain distributions are reflected as such for book but as ordinary income for tax. Such amounts are based on estimates if actual amounts are not available and actual amounts of income, realized gain and return of capital may differ from the estimated amounts. The Portfolios adjust the estimated amounts of components of distributions (and consequently its net investment income) as necessary once the issuers provide information about the actual composition of the distributions.
Realized gains and losses on the sale of investments are computed on the basis of the specific identified cost of the investments sold. Unrealized appreciation (depreciation) on investments and foreign currency denominated assets and liabilities, if any, is presented net of deferred taxes on unrealized appreciation in the Statements of Assets and Liabilities.
112
EQ ADVISORS TRUST
NOTES TO FINANCIAL STATEMENTS (Continued)
December 31, 2016
Capital Gains Taxes:
Certain Portfolios may be subject to capital gains and repatriation taxes imposed by certain countries in which they invest. These Portfolios have recorded a deferred tax liability with respect to unrealized appreciation on foreign securities for potential capital gains and repatriation taxes at December 31, 2016. The accrual for capital gains and repatriation taxes is included in net unrealized appreciation (depreciation) on investments in the Statements of Assets and Liabilities for the Portfolios. The amounts related to capital gain taxes for securities that have been sold are included in the net realized gain (loss) on investments in the Statements of Operations for the Portfolios.
Allocation of Expenses and Income:
Expenses attributable to a single Portfolio or class are charged to that Portfolio or class. Expenses of the Trust not attributable to a single Portfolio or class are charged to each Portfolio or class in proportion to the average net assets of each Portfolio or other appropriate allocation methods.
Offering costs are amortized and recorded as an expense on a straight line basis over 12 months from the date of the Portfolio’s commencement of public offering of shares.
All income earned and expenses incurred by each Portfolio are borne on a pro-rata basis by each outstanding class of shares, based on the proportionate interest in the Portfolio represented by the daily net assets of such class, except for distribution fees which are charged on a class specific basis.
Offering costs incurred during the year ended December 31, 2015 by the Portfolio shown below were:
| | | | |
Portfolio: | | Amount | |
AXA/DoubleLine Opportunistic Core Plus Bond | | $ | 41,535 | |
Foreign Currency Valuation:
The books and records of the Trust are kept in U.S. dollars. Foreign currency amounts are translated into U.S. dollars at current exchange rates at the following dates:
(i) Market value of investment securities, other assets and liabilities — at the valuation date.
(ii) Purchases and sales of investment securities, income and expenses — at the date of such transactions.
The Portfolios do not isolate that portion of the results of operations resulting from changes in foreign exchange rates on investments from the fluctuations arising from changes in market prices of securities held. Such fluctuations are included with the net realized and unrealized gain or loss on investments.
Net currency gains or losses realized and unrealized as a result of differences between interest or dividends, withholding taxes, security payables/receivables, forward foreign currency exchange contracts and foreign cash recorded on a Portfolio’s books and the U.S. dollar equivalent amount actually received or paid are presented under foreign currency transactions and foreign currency translations in the realized and unrealized gains and losses section, respectively, of the Statements of Operations of the Portfolios. Net realized gains (losses) on foreign currency transactions represent net foreign exchange gains (losses) from forward foreign currency contracts, disposition of foreign currencies, currency gains or losses realized between the trade and settlement dates on securities transactions, and the difference between the amount of investment income and foreign withholding taxes recorded on a Portfolio’s books and the U.S. dollar equivalent of amounts actually received or paid.
113
EQ ADVISORS TRUST
NOTES TO FINANCIAL STATEMENTS (Continued)
December 31, 2016
Taxes:
The Trust intends to comply with the requirements of the Internal Revenue Code of 1986, as amended applicable to regulated investment companies (“RICs”) and to distribute substantially all of its net investment income and net realized capital gains to shareholders of each Portfolio. Therefore, no Federal, state and local income tax provisions are required.
The Portfolios are not aware of any tax positions for which it is reasonably possible that the total amounts of unrecognized tax benefits will significantly change in the next twelve months. However, the Portfolios’ conclusions may be subject to future review based on changes in, or the interpretation of, the accounting standards or tax laws and regulations. The Portfolios recognize interest and penalties, if any, related to uncertain tax positions as income tax expense in the Statements of Operations. During the year ended December 31, 2016, the Portfolios did not incur any interest or penalties. Each of the tax years in the four year period ended December 31, 2016 remains subject to examination by the Internal Revenue Service, state and local taxing authorities.
Dividends from net investment income, if any, are declared and distributed at least annually for all Portfolios. Dividends from net realized short-term and long-term capital gains are declared and distributed at least annually to the shareholders of the Portfolios to which such gains are attributable. All dividends are reinvested in additional full and fractional shares of the related Portfolios. All distributions are calculated on a tax basis and, as such, the amounts may differ from financial statement investment income and realized gains. Those differences which are significant to the Portfolios are primarily due to Capital Loss Carryforwards (All Asset Aggressive-Alt 50, All Asset Aggressive-Alt 75 and AXA/Pacific Global Small Cap Value), Wash Sale Loss Deferrals (All Asset Aggressive-Alt 75 and EQ/PIMCO Global Real Return), Post-October Loss Deferrals (AXA/Horizon Small Cap Value and EQ/PIMCO Global Real Return), Deferral of loss on offsetting positions, (EQ/PIMCO Global Real Return), Loss Deferrals due to investments in affiliated Fund of Fund Investments (All Asset Growth-Alt 20) and Partnership Basis Adjustments (All Asset Aggressive-Alt 25, All Asset Aggressive-Alt 50, All Asset Aggressive-Alt 75 and AXA/Horizon Small Cap Value).
In addition, short-term capital gains and foreign currency gains are treated as capital gains for U.S. GAAP purposes but are considered ordinary income for tax purposes. Capital and net specified losses incurred after October 31 and within the taxable year are deemed to arise on the first business day of the Portfolio’s next taxable year. The tax composition of distributed and undistributed income and gains for the years ended December 31, 2016 and December 31, 2015, were as follows:
| | | | | | | | | | | | | | | | | | | | | | | | | | | | | | | | |
| | | Year Ended December 31, 2016 | | | Year Ended December 31, 2015 | |
Portfolios: | | Distributed
Ordinary
Income | | | Distributed
Long Term
Gains | | | Accumulated
Undistributed
Ordinary
Income | | | Accumulated
Undistributed
Long Term
Gains | | | Distributed
Ordinary
Income | | | Distributed
Long Term
Gains | | | Accumulated
Undistributed
Ordinary
Income | | | Accumulated
Undistributed
Long Term
Gains | |
All Asset Growth-Alt 20 | | $ | 3,534,970 | | | $ | 5,666,477 | | | $ | 83,025 | | | $ | 3,171,267 | | | $ | 4,338,800 | | | $ | 5,816,686 | | | $ | 8,616 | | | $ | 4,937,488 | |
All Asset Aggressive-Alt 25 | | | 310,344 | | | | 291,241 | | | | 9,320 | | | | 376,222 | | | | 187,918 | | | | 358,567 | | | | 3,026 | | | | 424,581 | |
All Asset Aggressive-Alt 50 | | | 31,144 | | | | 16,867 | | | | 2,299 | | | | — | | | | 65,219 | | | | 140,365 | | | | 746 | | | | 49,806 | |
All Asset Aggressive-Alt 75 | | | 41,759 | | | | — | | | | 3,085 | | | | — | | | | 74,443 | | | | 104,772 | | | | 482 | | | | 24,310 | |
AXA/DoubleLine Opportunistic Core Plus Bond | | | 1,994,236 | | | | — | | | | 37,711 | | | | — | | | | 1,143,761 | | | | — | | | | — | | | | — | |
AXA/Horizon Small Cap Value | | | 793,084 | | | | 8,036,390 | | | | — | | | | — | | | | 1,357,034 | | | | 5,027,862 | | | | — | | | | — | |
AXA/Pacific Global Small Cap Value | | | 1,138,148 | | | | — | | | | — | | | | — | | | | 790,107 | | | | 2,081,847 | | | | — | | | | — | |
EQ/PIMCO Global Real Return | | | 3,556,946 | | | | — | | | | 1,045,511 | | | | — | | | | 992,927 | | | | — | | | | 127,177 | | | | — | |
114
EQ ADVISORS TRUST
NOTES TO FINANCIAL STATEMENTS (Continued)
December 31, 2016
The following Portfolios had a Return of Capital during the year ended December 31, 2016:
| | | | |
Portfolios: | | Return of Capital | |
AXA/Horizon Small Cap Value | | $ | 4,418,797 | |
AXA/Pacific Global Small Cap Value | | | 146,879 | |
Additionally, the following Portfolios had a Return of Capital during the year ended December 31, 2015:
| | | | |
Portfolios: | | Return of Capital | |
AXA/Horizon Small Cap Value | | $ | 388,697 | |
AXA/Pacific Global Small Cap Value | | | 73,665 | |
Permanent book and tax differences relating to shareholder distributions resulted in reclassifications to undistributed (overdistributed) net investment income (loss), accumulated net realized gain (loss) and paid-in-capital at December 31, 2016 as follows:
| | | | | | | | | | | | |
Portfolios: | | Undistributed
Net Investment
Income (Loss) | | | Accumulated
Net Realized
Gain (Loss) | | | Paid In
Capital | |
All Asset Growth-Alt 20 | | $ | 574,452 | | | $ | (574,452 | ) | | $ | — | |
All Asset Aggressive-Alt 25 | | | 59,308 | | | | (59,309 | ) | | | 1 | |
All Asset Aggressive-Alt 50 | | | 6,744 | | | | (6,746 | ) | | | 2 | |
All Asset Aggressive-Alt 75 | | | 12,921 | | | | (10,085 | ) | | | (2,836 | ) |
AXA/DoubleLine Opportunistic Core Plus Bond | | | 160,552 | | | | (146,820 | ) | | | (13,732 | ) |
AXA/Horizon Small Cap Value | | | (405,590 | ) | | | 325,361 | | | | 80,229 | |
AXA/Pacific Global Small Cap Value | | | 82,843 | | | | (31 | ) | | | (82,812 | ) |
EQ/PIMCO Global Real Return | | | 3,271,973 | | | | (3,251,861 | ) | | | (20,112 | ) |
The significant permanent book to tax differences related to the adjustments above are related to Short Term Capital Gain Distributions received from Fund of Fund Investments (All Asset Aggressive-Alt 75) and Reclassification of Gains and Losses from Foreign Currency Transactions (EQ/PIMCO Global Real Return).
Net Capital and net specified gains/losses incurred after October 31, and within the taxable year are deemed to arise on the first business day of the Portfolio’s next taxable year. For the year ended December 31, 2016, the following Portfolios deferred to January 1, 2017 post-October losses of:
| | | | | | | | | | | | |
Portfolios: | | Specified
Loss | | | Short-Term
Capital
Loss (gain) | | | Long-Term
Capital
Loss (gain) | |
All Asset Growth-Alt 20 | | $ | — | | | $ | — | | | $ | — | |
All Asset Aggressive-Alt 25 | | | — | | | | — | | | | — | |
All Asset Aggressive-Alt 50 | | | — | | | | — | | | | — | |
All Asset Aggressive-Alt 75 | | | — | | | | — | | | | — | |
AXA/DoubleLine Opportunistic Core Plus Bond | | | — | | | | 79,177 | | | | 24,813 | |
AXA/Horizon Small Cap Value | | | — | | | | (79,425 | ) | | | 1,288,072 | |
AXA/Pacific Global Small Cap Value | | | — | | | | (137,255 | ) | | | 246,575 | |
EQ/PIMCO Global Real Return | | | — | | | | (2,141,166 | ) | | | 2,885,866 | |
Under the Regulated Investment Company Modernization Act of 2010 (the “RIC Mod Act”), net capital losses recognized by the Portfolios after December 31, 2010, may get carried forward indefinitely, and retain their character as short-term and/or long term losses. Prior to the RIC Mod Act, net capital losses incurred by the Portfolios were carried forward for up to eight years and treated as 100% short-term. The RIC Mod Act requires that post-enactment net capital losses be used before pre-enactment net capital losses; therefore some net capital loss carryforwards that
115
EQ ADVISORS TRUST
NOTES TO FINANCIAL STATEMENTS (Continued)
December 31, 2016
would have been utilized under prior law may expire unused. Pre-enactment and post-enactment net capital losses that will be carried forward, if any, are presented in the table below.
There were no capital loss carryforward amounts from prior to the RIC Mod Act available for use and utilized during 2016.
The following Portfolios utilized net capital loss carryforwards during 2016 and/or have losses incurred that will be carried forward under the provisions of the RIC Mod Act are as follows:
| | | | | | | | | | | | | | | | |
| | | Utilized | | | Losses Carried Forward | |
Portfolios: | | Short Term | | | Long Term | | | Short Term | | | Long Term | |
All Asset Aggressive-Alt 50 | | $ | — | | | $ | — | | | $ | — | | | $ | 41,199 | |
All Asset Aggressive-Alt 75 | | | — | | | | — | | | | — | | | | 64,214 | |
AXA/DoubleLine Opportunistic Core Plus Bond | | | 254,902 | | | | — | | | | — | | | | 49,028 | |
AXA/Pacific Global Small Cap Value | | | — | | | | — | | | | 463,920 | | | | 536,688 | |
EQ/PIMCO Global Real Return | | | — | | | | — | | | | — | | | | 205,346 | |
Sale-Buybacks:
The EQ/PIMCO Global Real Return Portfolio entered into financing transactions referred to as “sale-buybacks” during the year ended December 31, 2016. A sale-buyback transaction consists of a sale of a security by a Portfolio to a financial institution, the counterparty, with a simultaneous agreement to repurchase the same or substantially the same security at an agreed-upon price and date. The Portfolio is not entitled to receive principal and interest payments, if any, made on the security sold to the counterparty during the term of the agreement. The agreed-upon proceeds for securities to be repurchased by the Portfolio are reflected as a liability on the Portfolio’s Statement of Assets and Liabilities. The Portfolio will recognize net income represented by the price differential between the price received for the transferred security and the agreed-upon repurchase price. This is commonly referred to as the “price drop.” A price drop consists of: (i) the foregone interest and inflationary income adjustments, if any, the Portfolio would have otherwise received had the security not been sold; and (ii) the negotiated financing terms between the Portfolio and counterparty. Foregone interest and inflationary income adjustments, if any, are recorded as components of interest income on the Portfolio’s Statement of Operations. Interest payments based upon negotiated financing terms made by the Portfolio to counterparties are recorded as a component of interest expense on the Portfolio’s Statement of Operations. In periods of increased demand for the security, the Portfolio may receive a fee for use of the security by the counterparty, which may result in interest income to the Portfolio. The Portfolio will segregate assets determined to be liquid to cover its obligations under sale-buyback transactions. In the event the net exposure for sale-buybacks and certain derivatives trades exceeds $250,000 (on a per counterparty basis) the Portfolio will post additional collateral. The EQ/PIMCO Global Real Return Portfolio had open sale-buybacks at December 31, 2016.
Cash and Statement of Cash Flows:
Due to the volume of sale-buyback transactions during the year ended December 31, 2016, the EQ/PIMCO Global Real Return Portfolio is presenting a Statement of Cash Flows. The Statement of Cash Flows, as applicable, has been prepared using the indirect method which requires increase (decrease) in net assets resulting from operations to be adjusted to reconcile to net cash flows from operating activities. Consistent with EQ/PIMCO Global Real Return Portfolio’s investment strategy, management has determined that Cash and Foreign Cash, which are comprised of U.S. dollar and foreign currency deposits at the Custodian, are considered cash for purposes of preparing the statement of cash flows.
Accounting for Derivative Instruments:
Following is a description of how and why the Portfolios use derivative instruments, the type of derivatives utilized by the Portfolios during the reporting period, as well as the primary
116
EQ ADVISORS TRUST
NOTES TO FINANCIAL STATEMENTS (Continued)
December 31, 2016
underlying risk exposures related to each instrument type. Derivatives accounted for as hedging instruments must be disclosed separately from those that do not qualify for hedge accounting. Even though the Portfolios may use derivatives in an attempt to achieve an economic hedge, the Portfolio’s derivatives are not accounted for as hedging instruments because the Portfolios account for their derivatives at fair value and record any changes in fair value in current period earnings in the Statement of Operations. All open derivative positions at period end are reflected on each respective Portfolio’s Portfolio of Investments. The volume of derivative activity, based on month-end notional amounts during the period is also noted in each respective Portfolio’s Portfolio of Investments. Portfolio securities are reserved and/or pledged with the custodian for current or potential derivative holdings as necessary throughout the year.
Options:
Certain Portfolios write (sell) covered options as a hedge to provide protection against adverse movements in the price of securities in the Portfolio or to enhance investment performance. Certain Portfolios purchase and sell exchange traded options on foreign currencies. When a Portfolio writes an option, an amount equal to the premium received by the Portfolio is recorded as a liability and is subsequently adjusted on a daily basis to the current market price of the option written. Premiums received from writing options that expire unexercised are recognized as gains on the expiration date. Premiums received from writing options that are exercised or are cancelled in closing purchase transactions are offset against the cost of any securities purchased or added to the proceeds or netted against the amount paid on the transaction to determine the realized gain or loss. In writing options, a Portfolio must assume that the option may be exercised at any time prior to the expiration of its obligation as a writer, and that in such circumstances the net proceeds of the sale (or cost of) purchase of the underlying securities and currencies pursuant to the call or put option may be substantially below or above the prevailing market price. A Portfolio also has the additional risk of not being able to enter into a closing purchase transaction if a liquid secondary market does not exist and bears the risk of unfavorable changes in the price of the financial instruments underlying the options.
Certain Portfolios may purchase put options on securities to increase the Portfolio’s total investment return or to protect its holdings against a substantial decline in market value. The purchase of put options on securities will enable a Portfolio to preserve, at least partially, unrealized gains in an appreciated security in its portfolio without actually selling the security. In addition, the Portfolios will continue to receive interest or dividend income on the security. The Portfolios may also purchase call options on securities to protect against substantial increases in prices of securities that Portfolios intend to purchase pending their ability to invest in an orderly manner in those securities. The Portfolios may sell put or call options they have previously purchased, which could result in a net gain or loss depending on whether the amount received on the sale is more or less than the premium and other transaction costs paid on the put or call option which was bought.
Futures Contracts, Options on Futures Contracts, Forward Commitments and Foreign Currency Exchange Contracts:
The futures contracts used by the Portfolios are agreements to buy or sell a financial instrument for a set price in the future. Options on futures contracts used by the Portfolios are rights to buy, or sell a futures contract for a set price in the future. Certain Portfolios buy or sell futures contracts for the purpose of protecting their portfolio securities against future changes in interest rates and indices which might adversely affect the value of the Portfolios’ securities or the price of securities that they intend to purchase at a later date. Initial margin deposits are made upon entering into futures contracts and can be in cash, certain money market instruments, treasury securities or other liquid, high grade debt securities. During the period the futures contracts are open, changes in the market price of the contracts are recognized as
117
EQ ADVISORS TRUST
NOTES TO FINANCIAL STATEMENTS (Continued)
December 31, 2016
unrealized gains or losses by “marking-to-market” at the end of each trading day. Variation margin payments on futures contracts are received or made, depending upon whether unrealized gains or losses are incurred. When the contract is closed, the Portfolio records a realized gain or loss equal to the difference between the proceeds from or cost of the closing transactions and the Portfolio’s basis in the contract. Should interest rates or indices move unexpectedly, the Portfolio may not achieve the anticipated benefits of the futures contracts and may incur a loss. The use of futures contracts transactions involves the risk of imperfect correlation in movements in the price of futures contracts, interest rates and the underlying hedged assets. Use of long futures contracts subjects the Portfolios to risk of loss in excess of the amounts shown on the Statements of Assets and Liabilities, up to the notional value of the futures contracts. Use of short futures contracts subjects the Portfolios to unlimited risk of loss. The Portfolios enter into futures contracts only on exchanges or boards of trade. The exchange or board of trade acts as the counterparty to each futures transaction; therefore, a Portfolio’s credit risk is limited to failure of the exchange or board of trade.
Certain Portfolios may make contracts to purchase or sell securities for a fixed price at a future date beyond customary settlement time (“forward commitments”). Portfolios may designate the segregation, either on their records or with the Trust’s custodian, of cash or other liquid securities in an amount sufficient to meet the purchase price, or may enter into offsetting contracts for the forward sale of other securities they own. These commitments are reported at market value in the financial statements. Forward commitments may be considered securities in themselves and involve a risk of loss if the value of the security to be purchased declines or if the value of the security to be sold increases prior to the settlement date, which is a risk in addition to the risk of decline in value of the Portfolio’s other assets. Where such purchases or sales are made through dealers, a Portfolio relies on the dealer to consummate the sale. The dealer’s failure to do so may result in the loss to a Portfolio of an advantageous yield or price. Market risk exists on these commitments to the same extent as if the securities were owned on a settled basis and gains and losses are recorded and reported in the same manner. However, during the commitment period, these investments earn no interest or dividends. The use of forward commitments may result in market risk to the Portfolios that is greater than if the Portfolios had engaged solely in transactions that settle in the customary time.
The Portfolios may be exposed to foreign currency risks associated with portfolio investments. During the reporting period, certain Portfolios entered into certain forward foreign currency exchange contracts for the purchase or sale of a specific foreign currency at a fixed price on a future date to hedge or otherwise manage these exposures. Unrealized gains or losses on forward foreign currency exchange contracts are recorded by the Portfolios on a daily basis and realized gains or losses are recorded on the settlement date of a contract.
Certain Portfolios may purchase foreign currency on a spot (or cash) basis. In addition, certain Portfolios enter into contracts to purchase or sell foreign currencies at a future date (“forward contracts”). A forward foreign currency exchange contract is a commitment to purchase or sell a foreign currency at a future date at a negotiated forward rate. Daily fluctuations in the value of such contracts are recognized as unrealized appreciation or depreciation by “marking to market.” The gain or loss arising from the difference between the original contracts and the closing of such contracts is included in realized gains or losses from foreign currency transactions in the Statements of Operations of the Portfolios. The Portfolios may engage in these forward contracts to protect against uncertainty in the level of future exchange rates in connection with the purchase and sale of Portfolio securities (“transaction hedging”) and to protect the value of specific portfolio positions (“position hedging”). The Portfolios also buy forward foreign currency exchange contracts to gain exposure to currencies. The Portfolios are subject to off-balance sheet risk to the extent of the value of the contracts for purchase of foreign currency and in an unlimited amount for sales of foreign currency.
118
EQ ADVISORS TRUST
NOTES TO FINANCIAL STATEMENTS (Continued)
December 31, 2016
Joint Repurchase Agreements
During the year ended December 31, 2016, certain Portfolios have transferred cash collateral received from the securities lending program to a joint account at JPMorgan, the lending agent. The joint account aggregates cash collateral received from the participating Portfolios, along with other customers of JPMorgan, in order to execute joint repurchase agreement transactions with various counterparties (the “Joint Repurchase Agreements”). As such, each Portfolio has a proportionate interest in one or more of the Joint Repurchase Agreements. The Joint Repurchase Agreements can contractually be collateralized by U.S. Government Treasury Securities, U.S. Government Agency Securities, Foreign Government Agency Securities, Corporate Bonds or Common Stocks and are held at a financial institution acting as a tri-party custodian. In a Joint Repurchase Agreement, the seller of the security agrees to repurchase the security at a mutually agreed upon time and price, which reflects the effective rate of return for the term of the agreement. The underlying collateral is marked to market daily to ensure that the value of the collateral pledged is equal to or greater than the agreed upon repurchase price, including accrued interest. In the event of default of the obligation to repurchase, the Portfolio has the right to cause JPMorgan to liquidate the collateral. JPMorgan shall indemnify the Portfolios against a decline in the value of the collateral below the agreed upon repurchase price. However, the execution of such actions may result in the delay of realization of the collateral by the Portfolios. The details of the proportionate share of the Joint Repurchase Agreements open at December 31, 2016 for the Portfolios are reflected in each Portfolio’s Portfolio of Investments. At December 31, 2016, the Joint Repurchase Agreements (on a gross basis) in which the Portfolios participated were as follows:
Bank of Nova Scotia, 0.50%, dated 12/30/16, due 1/3/17, repurchase price $100,005,556, collateralized by various U.S. Government Treasury Securities, ranging from 0.875%-2.375%, maturing 11/30/17-1/15/27; total market value $102,000,093.
Citigroup Global Markets Ltd., 0.69%, dated 12/30/16, due 1/3/17, repurchase price $100,007,667, collateralized by various U.S. Government Treasury Securities, ranging from 1.375%-5.375%, maturing 7/31/18-2/15/45; total market value $102,000,002.
Citigroup Global Markets Ltd., 0.71%, dated 12/30/16, due 1/3/17, repurchase price $250,019,723, collateralized by various Foreign Government Agency Securities, ranging from 0.000%-5.250%, maturing 1/23/17-1/24/44, U.S. Government Treasury Securities, ranging from 0.000%-5.375%, maturing 2/15/19-2/15/44; total market value $255,000,020.
Deutsche Bank AG, 0.95%, dated 12/30/16, due 1/3/17, repurchase price $200,021,112, collateralized by various Corporate Bonds, ranging from 1.875%-2.500%, maturing 3/13/19-6/10/25; total market value $204,000,724.
Deutsche Bank AG, 1.05%, dated 12/30/16, due 1/3/17, repurchase price $200,023,334, collateralized by various Common Stocks; total market value $222,311,004.
Deutsche Bank AG, 1.05%, dated 12/30/16, due 1/3/17, repurchase price $375,043,751, collateralized by various Common Stocks; total market value $416,833,133.
Deutsche Bank Securities, Inc., 0.50%, dated 12/30/16, due 1/3/17, repurchase price $175,009,723, collateralized by various U.S. Government Treasury Securities, 0.000%, maturing 2/15/40-5/15/40; total market value $178,500,040.
HSBC Securities, Inc., 0.46%, dated 12/30/16, due 1/3/17, repurchase price $100,005,111, collateralized by various U.S. Government Treasury Securities, ranging from 1.375%-1.750%, maturing 12/15/19-9/30/22; total market value $102,001,237.
Macquarie Bank Ltd., 0.76%, dated 12/30/16, due 1/3/17, repurchase price $250,021,110, collateralized by various U.S. Government Treasury Securities, ranging from 0.000%-8.750%, maturing 1/15/17-5/15/46; total market value $255,129,193.
119
EQ ADVISORS TRUST
NOTES TO FINANCIAL STATEMENTS (Continued)
December 31, 2016
Macquarie Bank Ltd., 0.57%, dated 12/30/16, due 1/3/17, repurchase price $400,025,332, collateralized by various U.S. Government Treasury Securities, ranging from 0.000%-8.750%, maturing 1/15/17-5/15/46; total market value $408,206,708.
Natixis, 0.50%, dated 12/30/16, due 1/3/17, repurchase price $500,027,780, collateralized by various U.S. Government Treasury Securities, ranging from 0.000%-3.625%, maturing 5/25/17-5/15/46; total market value $510,028,335.
Nomura Securities Co. Ltd., 0.50%, dated 12/30/16, due 1/3/17, repurchase price $150,008,334, collateralized by various U.S. Government Treasury Securities, ranging from 0.000%-3.875%, maturing 4/15/19-8/15/46; total market value $153,000,050.
RBC Capital Markets, 0.45%, dated 12/30/16, due 1/3/17, repurchase price $100,005,000, collateralized by various U.S. Government Agency Securities, ranging from 2.434%-4.500%, maturing 12/1/26-1/1/47; total market value $102,000,037.
RBS Securities, Inc., 0.45%, dated 12/30/16, due 1/3/17, repurchase price $250,012,500, collateralized by various U.S. Government Treasury Securities, ranging from 0.625%-2.625%, maturing 8/31/17-2/15/25; total market value $255,001,858.
Securities Lending:
During the year ended December 31, 2016, certain Portfolios entered into securities lending transactions. To generate additional income, a Portfolio may lend its portfolio securities, up to 30% of the market value of the Portfolio’s total assets, to brokers, dealers, and other financial institutions.
JPMorgan serves as securities lending agent for the securities lending program of the Trust. Securities lending transactions are considered to be overnight and continuous and can be terminated by a Portfolio or the borrower at anytime.
The Portfolios’ securities lending policies and procedures require that the borrower (i) deliver cash or U.S. Government securities as collateral with respect to each new loan of U.S. securities, equal to at least 102% of the value of the portfolio securities loaned, and with respect to each new loan on non-U.S. securities, collateral of at least 105% of the value of the portfolio securities loaned; and (ii) at all times thereafter mark-to-market the collateral on a daily basis so that the market value of such collateral is at least 100% of the value of securities loaned. Cash collateral received is generally invested in joint repurchase agreements and shown in the Portfolio of Investments and included in calculating the Portfolio’s total assets. U.S. Government securities received as collateral, if any, are held in safe-keeping by JPMorgan and cannot be sold or repledged by the Portfolio and accordingly are not reflected in the Portfolio’s total assets. For additional information on the non-cash collateral received, please refer to note (xx) in the Portfolio of Investments. Certain of the securities on loan may have been sold prior to the close of the reporting period and are included in Receivables for Securities Sold on the Statements of Assets and Liabilities.
The Portfolios receive payments from the lending agent equivalent to any dividends and/or interest that would have been earned on the securities loaned while simultaneously seeking to earn income on the investment of cash collateral. Securities lending income includes any fees charged to borrowers less expenses associated with the loan. Income from the securities lending program is recorded when earned from the lending agent and reflected in the Statements of Operations under “Securities lending (net).” The Portfolios may invest cash collateral in joint repurchase agreements or government money market funds as indicated on the Portfolio of Investments, and record a liability in the Statements of Assets and Liabilities for the return of the collateral, during the period the securities are on loan. There may be risks of delay or restrictions in recovery of the securities or disposal of collateral should the borrower of the securities fail financially. Loans are made, however, only to borrowers deemed by the lending
120
EQ ADVISORS TRUST
NOTES TO FINANCIAL STATEMENTS (Continued)
December 31, 2016
agent to be of good standing and creditworthy and approved by FMG LLC. Loans are subject to termination by a Portfolio or the borrower at any time, and, therefore, are not considered to be illiquid investments. The lending agent receives a fee based on a percentage of earnings derived from the investment of cash collateral. The Portfolios receive 90% of the net earnings of the Repurchase Agreements up to $45 million of aggregate earnings across all Portfolios, including Portfolios of the Trust not presented in these financial statements, within a calendar year and 92% thereafter. The market value of the securities on loan and the value of the related collateral as of December 31, 2016 were as follows:
| | | | | | | | | | | | |
Portfolios | | Securities on Loan | | | Collateral | | | Collateralization | |
All Asset Growth-Alt 20 | | $ | 4,576,355 | | | $ | 4,694,307 | | | | 103 | % |
All Asset Aggressive-Alt 25 | | | 608,228 | | | | 624,010 | | | | 103 | % |
All Asset Aggressive-Alt 50 | | | 39,702 | | | | 40,761 | | | | 103 | % |
All Asset Aggressive-Alt 75 | | | 41,939 | | | | 43,069 | | | | 103 | % |
AXA/DoubleLine Opportunistic Core Plus Bond | | | 44,764 | | | | 45,638 | | | | 102 | % |
AXA/Horizon Small Cap Value | | | 6,074,483 | | | | 6,316,355 | | | | 104 | % |
AXA/Pacific Global Small Cap Value | | | 6,985,266 | | | | 7,240,896 | | | | 104 | % |
In accordance with guidance presented in FASB Accounting Standards Update (“ASU”) 2014-11, Balance Sheet (Topic) 860: Repurchase-to-Maturity Transactions, Repurchase Financings, and Disclosures, liabilities under the outstanding securities lending transactions as of December 31, 2016, were as follows:
| | | | |
Portfolios | | Liabilities as presented
in the Statements of
Assets and Liabilities | |
All Asset Growth-Alt 20 | | $ | 4,694,307 | |
All Asset Aggressive-Alt 25 | | | 624,010 | |
All Asset Aggressive-Alt 50 | | | 40,761 | |
All Asset Aggressive-Alt 75 | | | 43,069 | |
AXA/DoubleLine Opportunistic Core Plus Bond | | | 45,638 | |
AXA/Horizon Small Cap Value | | | 6,302,719 | |
AXA/Pacific Global Small Cap Value | | | 7,158,779 | |
The Securities Lending Agreement between the Trust and JPMorgan provides that in the event of a default by a borrower with respect to any loan, a Portfolio may terminate the loan and JPMorgan will exercise any and all remedies provided under the applicable borrower agreement to make the Portfolio whole. These remedies include purchasing replacement securities by applying the collateral held from the defaulting borrower against the purchase cost of the replacement securities. If, despite such efforts by JPMorgan to exercise these remedies, the Portfolio sustains losses as a result of a borrower’s default, JPMorgan indemnifies the Portfolio by purchasing replacement securities at JPMorgan’s expense, or paying the Portfolio an amount equal to the market value of the replacement securities, subject to certain limitations which are set forth in detail in the Securities Lending Agreement between the Portfolio and JPMorgan.
At December 31, 2016, the Securities Lending Agreement does not permit the Portfolio to enforce a netting arrangement.
Market and Credit Risk:
A Portfolio’s investments in financial instruments expose the Portfolio to various risks such as, but not limited to, interest rate, foreign currency, forward commitments and equity risks.
Interest rate risk is the risk that fixed income securities will decline in value because of changes in interest rates. As nominal interest rates decline the value of a certain fixed-income
121
EQ ADVISORS TRUST
NOTES TO FINANCIAL STATEMENTS (Continued)
December 31, 2016
securities of a Portfolio is likely to rise. Conversely, as nominal interest rates rise, the value of certain fixed income securities held by a Portfolio is likely to decrease. A nominal interest rate can be described as the sum of a real interest rate and an expected inflation rate. Interest rate changes can be sudden and unpredictable, and a Portfolio may lose money if these changes are not anticipated by Portfolio management. A Portfolio may not be able to hedge against changes in interest rates or may choose not to do so for cost or other reasons. In addition, any hedges may not work as intended. Fixed income securities with longer durations tend to be more sensitive to changes in interest rates, usually making them more volatile than securities with shorter durations. Duration is useful primarily as a measure of the sensitivity of a security’s market price to interest rate (i.e., yield) movements. As of December 31, 2016, interest rates are near historic lows in the United States, and below zero in other parts of the world, including certain European countries and Japan. A Portfolio is subject to greater risk of rising interest rates due to these market conditions. A significant or rapid rise in interest rates could result in losses to the Portfolio.
Foreign (non-U.S.) securities in this report are classified by the country of risk of a holding.
If a Portfolio invests directly in foreign currencies or in securities that trade in, and receive revenues in, foreign currencies, or in financial derivatives that provide exposure to foreign currencies, it will be subject to the risk that those currencies will decline in value relative to the base currency of the Portfolio, or, in the case of hedging positions, that the Portfolio’s base currency will decline in value relative to the currency being hedged. Currency rates in foreign countries may fluctuate significantly over short periods of time for a number of reasons, including changes in interest rates, intervention (or the failure to intervene) by U.S. or foreign governments, central banks or supranational entities such as the International Monetary Fund, or by the imposition of currency controls or other political developments in the United States or abroad. As a result, a Portfolio’s investments in foreign currency denominated securities may reduce the Portfolio’s returns.
Forward commitments and forward foreign currency exchange contracts involve elements of both market and credit risk in excess of the amounts reflected in the Statements of Assets and Liabilities. They are executed directly with the counterparty and not through an exchange and can be terminated only by agreement of both parties to such contracts. With respect to such transactions there is no daily margin settlement. There is also the risk that the security will not be issued or that the other party to the transaction will not meet its obligations. If this occurs, the Portfolio may lose both the investment opportunity for its assets if set aside to pay for the security and any gain in the security.
The market values of the Portfolio’s investments may decline due to general market conditions which are not specifically related to a particular company or issuer, such as real or perceived adverse economic conditions, changes in the general outlook for corporate earnings, changes in interest or currency rates or adverse investor sentiment generally. They may also decline due to factors which affect a particular industry or industries, such as labor shortages or increased production costs and competitive conditions within an industry. Equity securities and equity related investments generally have greater market price volatility than fixed income securities, although under certain market conditions fixed income securities may have comparable or greater price volatility. Credit ratings downgrades may also negatively affect securities held by a Portfolio. Even when markets perform well, there is no assurance that the investments held by a Portfolio will increase in value along with the broader market. In addition, market risk includes the risk that geopolitical events will disrupt the economy on a national or global level.
A Portfolio will be exposed to credit risk to parties with whom it trades and will also bear the risk of settlement default. A Portfolio seeks to minimize concentrations of credit risk by undertaking transactions with a large number of counterparties on recognized and reputable exchanges, where applicable. A Portfolio could lose money if the issuer or guarantor of a fixed
122
EQ ADVISORS TRUST
NOTES TO FINANCIAL STATEMENTS (Continued)
December 31, 2016
income security, or the counterparty of a financial derivatives contract, repurchase agreement or a loan of portfolio securities or other transactions, is unable or unwilling, or is perceived (whether by market participants, rating agencies, pricing services or otherwise) as unable or unwilling to make timely principal and/or interest payments, or to otherwise honor its obligations. Securities are subject to varying degrees of credit risk, which are often reflected in credit ratings.
Certain Portfolios may invest in below investment grade high-yield securities (“junk bonds”). These securities are considered to be high risk investments. Securities rated below investment grade are speculative in nature, involve greater risk of default by the issuing entity and may be subject to greater market fluctuations than higher rated fixed income securities because such securities are generally unsecured and subordinated to other creditors’ claims. The retail secondary market for these “junk bonds” may be less liquid than that of higher rated securities and adverse economic conditions could make it difficult to sell certain securities or could result in lower prices than those used in calculating the Portfolio’s net asset value.
Because certain Portfolios invest in affiliated mutual funds, unaffiliated investment companies or ETFs, the Portfolios indirectly pay a portion of the expenses incurred by the underlying funds and ETFs. As a result, the cost of investing in the Portfolios may be higher than the cost of investing in a Portfolio that invests directly in individual securities and financial instruments. The Portfolios are also subject to certain risks related to the underlying funds’ and ETFs’ investments in securities and financial instruments such as fixed income securities, including high yield, asset-backed and mortgage-related securities; equity securities, foreign and emerging markets securities, commodities and real estate securities. These securities are subject to risks specific to their structure, sector with their individual investment strategies including futures, forward currency exchange contracts, options, swaps, and other derivatives, which are also subject to specific risks related to their structure, sector or market and may be riskier than investments in other types of securities.
At December 31, 2016, EQ/PIMCO Global Real Return Portfolio held significant collateral balances with limited brokers or BNP Paribas S.A. The Portfolio is subject to credit risk arising should BNP Paribas S.A. be unable to fulfill its obligations.
Offsetting Assets and Liabilities:
The Portfolios may be subject to various netting arrangements with select counterparties (“Master Agreements”). Master Agreements govern the terms of certain transactions, and are intended to reduce the counterparty risk associated with relevant transactions by specifying credit protection mechanisms and providing standardization that is intended to improve legal certainty. As the Master Agreements are specific to unique operations of different asset types; they allow a Portfolio to close out and net its total exposure to a counterparty in the event of a default with respect to all the transactions governed under a single Master Agreement with a counterparty. For financial reporting purposes the Statement of Assets and Liabilities generally show derivative assets and liabilities on a gross basis, which reflects the full risks and exposures prior to netting.
| Note 2 | Management of the Trust |
The Trust has entered into three separate investment management agreements (the “Management Agreements”) with FMG LLC. With the exception of the All Asset Portfolios, the Management Agreements state that the Manager will, among other things: (i) have overall supervisory responsibility for the general management and investment of each Portfolio’s assets; (ii) select and contract with the Sub-Advisers to manage the investment operations and composition of each and every Portfolio; (iii) monitor the Sub-Advisers’ investment programs and results; (iv) oversee compliance by the Trust with various federal and state statutes; and (v) carry out the directives of the Board. With respect to the Management Agreements for the All Asset
123
EQ ADVISORS TRUST
NOTES TO FINANCIAL STATEMENTS (Continued)
December 31, 2016
Portfolios, the Management Agreements provide that the Manager will, among other things: (i) provide investment management and advisory services; (ii) render investment advice concerning the Underlying Portfolios, as applicable, in which to invest and the appropriate allocations for each Portfolio; (iii) monitor the investment programs and results; (iv) apprise the Trust of developments materially affecting the Portfolios; (v) oversee compliance by the Portfolio with various federal and state statutes; and (vi) carry out the directives of the Board. For the year ended December 31, 2016, for its services under the Management Agreements, the Manager was entitled to receive an annual fee as a percentage of average daily net assets, for each of the following Portfolios, calculated daily and payable monthly as follows:
| | |
Portfolios: | | Management Fee |
All Asset Growth-Alt 20 | | 0.100% of average daily net assets |
All Asset Aggressive-Alt 25 | | 0.100% of average daily net assets |
All Asset Aggressive-Alt 50 | | 0.100% of average daily net assets |
All Asset Aggressive-Alt 75 | | 0.100% of average daily net assets |
| | | | | | | | | | | | | | | | | | | | |
| | | (as a percentage of average daily net assets) | |
Portfolios: | | First
$750 Million | | | Next
$750 Million | | | Next
$1 Billion | | | Next
$2.5 Billion | | | Thereafter | |
AXA/DoubleLine Opportunistic Core Plus Bond | | | 0.600 | % | | | 0.575 | % | | | 0.550 | % | | | 0.530 | % | | | 0.520 | % |
EQ/PIMCO Global Real Return | | | 0.600 | | | | 0.575 | | | | 0.550 | | | | 0.530 | | | | 0.520 | |
| | | | | | | | | | | | | | | | | | | | |
| | | (as a percentage of average daily net assets) | |
Portfolios: | | First
$2 Billion | | | Next
$1 Billion | | | Next
$3 Billion | | | Next
$5 Billion | | | Thereafter | |
AXA/Horizon Small Cap Value | | | 0.800 | % | | | 0.750 | % | | | 0.725 | % | | | 0.700 | % | | | 0.675 | % |
AXA/Pacific Global Small Cap Value | | | 0.800 | | | | 0.750 | | | | 0.725 | | | | 0.700 | | | | 0.675 | |
With the exception of the All Asset Portfolios, the Manager has entered into an investment advisory agreement (“Sub-Advisory Agreements”) with each of the Sub-Advisers with respect to the Trust’s Portfolios. Each of the Sub-Advisory Agreements obligates the Sub-Advisers for the respective Portfolios to: (i) continuously furnish investment programs for the Portfolios; (ii) place all orders for the purchase and sale of investments for the Portfolios with brokers or dealers selected by the Manager or the respective Sub-Advisers; and (iii) perform certain limited related administrative functions in connection therewith. The Manager pays the expenses of providing investment sub-advisory services to the Portfolios, including the fees of the Sub-Advisers of each Portfolio.
124
EQ ADVISORS TRUST
NOTES TO FINANCIAL STATEMENTS (Continued)
December 31, 2016
| Note 3 | Administrative Fees |
FMG LLC serves as Administrator to the Trust. As Administrator, FMG LLC provides the Trust with necessary administrative, fund accounting, and compliance services. FMG LLC may carry out its responsibilities either directly or through sub-contracting with third party providers. For these services, the Trust pays FMG LLC an annual fee payable monthly as follows:
The Multiadviser Portfolios each pay the greater of $32,500 per Portfolio, or its proportionate share of an asset based fee:
Total aggregated average daily net asset charge of the AXA/AB Dynamic Growth Portfolio*, AXA/AB Dynamic Moderate Growth Portfolio*, AXA/Goldman Sachs Strategic Allocation Portfolio*, AXA/Invesco Strategic Allocation Portfolio*, AXA/Legg Mason Strategic Allocation Portfolio*, the Tactical Portfolios** and the Multiadviser Portfolios***
0.15% on the first $25 billion
0.11% on the next $10 billion
0.10% on the next $5 billion
0.095% on assets thereafter
| * | Portfolios of the Trust not presented in these financial statements. |
| ** | The Tactical Portfolios are the AXA 500 Managed Volatility Portfolio, AXA 400 Managed Volatility Portfolio, AXA 2000 Managed Volatility Portfolio, AXA International Managed Volatility Portfolio, ATM International Managed Volatility Portfolio, ATM Large Cap Managed Volatility Portfolio, ATM Mid Cap Managed Volatility Portfolio and the ATM Small Cap Managed Volatility Portfolio, Portfolios of the Trust not presented in these financial statements. |
| *** | Including the AXA Global Equity Managed Volatility Portfolio, AXA International Core Managed Volatility Portfolio, AXA International Value Managed Volatility Portfolio, AXA Large Cap Core Managed Volatility Portfolio, AXA Large Cap Growth Managed Volatility Portfolio, AXA Large Cap Value Managed Volatility Portfolio, AXA Mid Cap Value Managed Volatility Portfolio, AXA/AB Small Cap Growth Portfolio, AXA/Franklin Balanced Managed Volatility Portfolio, AXA/Franklin Small Cap Value Managed Volatility Portfolio, AXA/Lord Abbett Micro Cap Portfolio, AXA/Morgan Stanley Small Cap Growth Portfolio, AXA/Mutual Large Cap Equity Managed Volatility Portfolio, AXA/Templeton Global Equity Managed Volatility Portfolio, EQ/Convertible Securities Portfolio, EQ/Emerging Markets Equity PLUS Portfolio, EQ/Global Bond PLUS Portfolio, EQ/High Yield Bond Portfolio, EQ/Quality Bond PLUS Portfolio, Multimanager Aggressive Equity Portfolio, Multimanager Core Bond Portfolio, Multimanager Mid Cap Growth Portfolio, Multimanager Mid Cap Value Portfolio and Multimanager Technology Portfolio, Portfolios of the Trust not presented in these financial statements. |
125
EQ ADVISORS TRUST
NOTES TO FINANCIAL STATEMENTS (Continued)
December 31, 2016
Each All Asset Portfolio pays the greater of $32,500 per Portfolio, or its proportionate share of an asset based fee:
Total average daily net asset charge of the All Asset Portfolios*, the AXA Strategy Portfolios** and the AXA/Franklin Templeton Allocation Managed Volatility Portfolio*** of the Trust and the AXA Allocation Portfolios, Charter Allocation Portfolios, and the Target Allocation Portfolios of the AXA Premier VIP Trust, a separate registered investment company managed by FMG LLC
0.15% of the first $35 billion
0.11% of the next $10 billion
0.10% of the next $5 billion
0.095% on assets thereafter
| * | Including the All Asset Moderate Growth-Alt 15 Portfolio, a Portfolio of the Trust not presented in these financial statements. |
| ** | The AXA Strategy Portfolios are the AXA Ultra Conservative Strategy Portfolio, AXA Conservative Strategy Portfolio, AXA Conservative Growth Strategy Portfolio, AXA Balanced Strategy Portfolio, AXA Moderate Growth Strategy Portfolio, AXA Growth Strategy Portfolio and AXA Aggressive Strategy Portfolio, Portfolios of the Trust not presented in these financial statements. |
| *** | A Portfolio of the Trust not presented in these financial statements. |
For all other Portfolios:
All other Portfolios each pay the greater of $30,000 per Portfolio, or its proportionate share of an asset based fee:
Total aggregated average daily net asset charge for all other Portfolios*
0.10% on the first $30 billion
0.0975% on the next $10 billion
0.095% on the next $5 billion
0.0925% on assets thereafter
| * | With the exception of the All Asset Portfolios, AXA/Franklin Templeton Allocation Managed Volatility Portfolio, AXA/AB Dynamic Growth Portfolio, AXA/AB Dynamic Moderate Growth Portfolio, AXA/Goldman Sachs Strategic Allocation Portfolio, AXA/Invesco Strategic Allocation Portfolio, AXA/Legg Mason Strategic Allocation Portfolio, AXA Strategy Portfolios, Tactical Portfolios and the Multiadviser Portfolios, including Portfolios of the Trust not presented in these financial statements. |
126
EQ ADVISORS TRUST
NOTES TO FINANCIAL STATEMENTS (Continued)
December 31, 2016
Prior to October 1, 2016, the Administration fees were as follows:
Each Multiadviser Portfolios each paid the greater of $32,500 per Portfolio, or its proportionate share of an asset based fee:
Total aggregated average daily net asset charge of the AXA/AB Dynamic Growth Portfolio*, AXA/AB Dynamic Moderate Growth Portfolio*, AXA/Goldman Sachs Strategic Allocation Portfolio*, AXA/Invesco Strategic Allocation Portfolio*, AXA/Legg Mason Strategic Allocation Portfolio*, the Tactical Portfolios** and the Multiadviser Portfolios***
0.15% on the first $14 billion
0.11% on the next $6 billion
0.10% on the next $5 billion
0.0975% on assets thereafter
| * | Portfolios of the Trust not presented in these financial statements. |
| ** | The Tactical Portfolios are the AXA 500 Managed Volatility Portfolio, AXA 400 Managed Volatility Portfolio, AXA 2000 Managed Volatility Portfolio, AXA International Managed Volatility Portfolio, ATM International Managed Volatility Portfolio, ATM Large Cap Managed Volatility Portfolio, ATM Mid Cap Managed Volatility Portfolio and the ATM Small Cap Managed Volatility Portfolio, Portfolios of the Trust not presented in these financial statements. |
| *** | Including the AXA Global Equity Managed Volatility Portfolio, AXA International Core Managed Volatility Portfolio, AXA International Value Managed Volatility Portfolio, AXA Large Cap Core Managed Volatility Portfolio, AXA Large Cap Growth Managed Volatility Portfolio, AXA Large Cap Value Managed Volatility Portfolio, AXA Mid Cap Value Managed Volatility Portfolio, AXA/AB Small Cap Growth Portfolio, AXA/Franklin Balanced Managed Volatility Portfolio, AXA/Franklin Small Cap Value Managed Volatility Portfolio, AXA/Lord Abbett Micro Cap Portfolio, AXA/Morgan Stanley Small Cap Growth Portfolio, AXA/Mutual Large Cap Equity Managed Volatility Portfolio, AXA/Templeton Global Equity Managed Volatility Portfolio, EQ/Convertible Securities Portfolio, EQ/Emerging Markets Equity PLUS Portfolio, EQ/Global Bond PLUS Portfolio, EQ/High Yield Bond Portfolio, EQ/Quality Bond PLUS Portfolio, Multimanager Aggressive Equity Portfolio, Multimanager Core Bond Portfolio, Multimanager Mid Cap Growth Portfolio, Multimanager Mid Cap Value Portfolio and Multimanager Technology Portfolio, Portfolios of the Trust not presented in these financial statements. |
Each All Asset Portfolio paid the greater of $32,500 per Portfolio, or its proportionate share of an asset based fee:
Total average daily net asset charge of the All Asset Portfolios*, the AXA Strategy Portfolios** and the AXA/Franklin Templeton Allocation Managed Volatility Portfolio***
0.15% of the first $20 billion
0.125% of the next $5 billion
0.10% on assets thereafter
| * | Including the All Asset Moderate Growth-Alt 15 Portfolio, a Portfolio of the Trust not presented in these financial statements. |
| ** | The AXA Strategy Portfolios are AXA Ultra Conservative Strategy Portfolio, AXA Conservative Strategy Portfolio, AXA Conservative Growth Strategy Portfolio, AXA Balanced Strategy Portfolio, AXA Moderate Growth Strategy Portfolio, AXA Growth Strategy Portfolio and AXA Aggressive Strategy Portfolio, Portfolios of the Trust not presented in these financial statements. |
| *** | A Portfolio of the Trust not presented in these financial statements. |
127
EQ ADVISORS TRUST
NOTES TO FINANCIAL STATEMENTS (Continued)
December 31, 2016
For all other Portfolios:
All other Portfolios each paid the greater of $30,000 per Portfolio, or its proportionate share of an asset based fee:
Total aggregated average daily net asset charge for all other Portfolios*
0.12% on the first $3 billion
0.11% on the next $3 billion
0.105% on the next $4 billion
0.10% on the next $20 billion
0.0975% on the next $10 billion
0.095% on assets thereafter
| * | With the exception of the All Asset Portfolios, AXA/Franklin Templeton Allocation Managed Volatility Portfolio, AXA/AB Dynamic Growth Portfolio, AXA/AB Dynamic Moderate Growth Portfolio, AXA/Goldman Sachs Strategic Allocation Portfolio, AXA/Invesco Strategic Allocation Portfolio, AXA/Legg Mason Strategic Allocation Portfolio, AXA Strategy Portfolios, Tactical Portfolios and the Multiadviser Portfolios, including Portfolios of the Trust not presented in these financial statements. |
Pursuant to a sub-administration arrangement with FMG LLC, the Sub-Administrator provides the Trust with certain administrative services, including portfolio compliance and portfolio accounting support services, subject to the supervision of FMG LLC.
The Trust has entered into a Custody Agreement with JPMorgan Chase Bank, N.A. (in this capacity, the “Custodian”). The Custody Agreement provides for an annual fee based on the amount of assets under custody plus transaction charges. The Custodian serves as custodian of the Trust’s portfolio securities and other assets. Under the terms of the Custody Agreement between the Trust and the Custodian, the Custodian maintains and deposits in each Portfolio’s account, cash, securities and other assets of the Portfolios. The Custodian is also required, upon the order of the Trust, to deliver securities held by the Custodian, and to make payments for securities purchased by the Trust. The Custodian has also entered into sub-custodian agreements with a number of foreign banks and clearing agencies, pursuant to which portfolio securities purchased outside the United States are maintained in the custody of these entities. At year end, certain of the Portfolios maintain significant cash balance with the Custodian or its affiliates. These balances are presented as cash on each Portfolio’s Statement of Assets and Liabilities.
The Trust has entered into distribution agreements with AXA Distributors, LLC (“AXA Distributors” or the “Distributor”), an indirect wholly-owned subsidiary of AXA Equitable and an affiliate of FMG LLC, pursuant to which the Distributor serves as the principal underwriter of the Class IA, Class IB and Class K shares of the Trust. The Trust has adopted in the manner prescribed under Rule 12b-1 under the 1940 Act a plan of distribution pertaining to each of Class IA and Class IB shares of the Trust (“Distribution Plans”). The Distribution Plans provide that the Distributor will be entitled to receive a maximum distribution fee at the annual rate of 0.25% of the average daily net assets attributable to the Trust’s Class IA and Class IB shares for which it provides service.
FMG LLC has contractually agreed to limit the expenses of certain Portfolios (exclusive of taxes, interest, brokerage commissions, capitalized expenses, fees and expenses of other investment companies in which a Portfolio invests and extraordinary expenses) through
128
EQ ADVISORS TRUST
NOTES TO FINANCIAL STATEMENTS (Continued)
December 31, 2016
April 30, 2017 (unless the Board consents to an earlier revision or termination of this arrangement) (“Expense Limitation Agreement”), pursuant to which FMG LLC has agreed to waive or limit its fees and to assume other expenses so that the total annual operating expenses do not exceed the following annual rates:
| | | | | | | | | | | | |
Portfolios: | | Maximum Annual Operating
Expense Limit | |
| | | Class K | | | Class IA+ | | | Class IB+ | |
All Asset Growth-Alt 20* | | | 0.40 | % | | | 0.65 | % | | | 0.65 | % |
All Asset Aggressive-Alt 25* | | | 0.40 | | | | N/A | | | | 0.65 | |
All Asset Aggressive-Alt 50* | | | 0.40 | | | | N/A | | | | 0.65 | |
All Asset Aggressive-Alt 75* | | | 0.40 | | | | N/A | | | | 0.65 | |
AXA/DoubleLine Opportunistic Core Plus Bond* | | | 0.85 | | | | N/A | | | | 1.10 | |
AXA/Horizon Small Cap Value* | | | 0.95 | | | | N/A | | | | 1.20 | |
AXA/Pacific Global Small Cap Value* | | | 0.95 | | | | N/A | | | | 1.20 | |
EQ/PIMCO Global Real Return | | | 0.75 | | | | N/A | | | | 1.00 | |
| + | Includes amounts payable pursuant to Rule 12b-1 of the Investment Company Act of 1940. |
| * | Effective September 1, 2016, FMG LLC voluntarily agreed to forgo any amounts eligible for recoupment that were waived or reimbursed prior to September 1, 2016. |
Prior to May 1, 2016, FMG LLC had agreed to make payments or waive its management, administrative and other fees so that the annual operating expenses of each Portfolio (other than interest, taxes, brokerage commissions, dividend and interest expenses on securities sold short, expenses of Underlying Portfolios and Underlying ETFs, other expenditures that are capitalized in accordance with generally accepted accounting principles and other extraordinary expenses not incurred in the ordinary course of each Portfolio’s business), do not exceed the following annualized rates:
| | | | | | | | | | |
Portfolios: | | Maximum Annual Operating
Expense Limit | |
| | | Class K | | | Class IA+ | | Class IB+ | |
AXA/Horizon Small Cap Value | | | 1.00 | % | | N/A | | | 1.25 | % |
AXA/Pacific Global Small Cap Value | | | 1.00 | | | N/A | | | 1.25 | |
| + | Includes amounts payable pursuant to Rule 12b-1 of the Investment Company Act of 1940. |
FMG LLC first waives its management fees, then waives its administration fees, and then reimburses the Portfolio’s expenses out of its own resources. Each Portfolio may at a later date reimburse to FMG LLC the management fees waived or other expenses assumed and paid for by FMG LLC pursuant to the Expense Limitation Agreement within the prior three fiscal years, provided such Portfolio has reached a sufficient asset size to permit such reimbursement to be made without causing the total annual expense ratio of each Portfolio to exceed the percentage limits mentioned above for the respective period. Consequently, no reimbursement by a Portfolio will be made unless: (i) the Portfolio’s total annual expense ratio is less than the respective percentages stated above for the respective period; and (ii) the payment of such reimbursement has been approved by the Board. Any reimbursement, called recoupment fees on the Statement of Operations, will be based on the earliest fees waived or assumed by FMG LLC. During the year ended December 31, 2016, FMG LLC received recoupment of $255,641, including recoupments of Portfolios of the Trust not included in these financial statements and including recoupment from the following Portfolio:
| | | | |
Portfolio: | | Recoupment | |
AXA/DoubleLine Opportunistic Core Plus Bond | | $ | 13,419 | |
129
EQ ADVISORS TRUST
NOTES TO FINANCIAL STATEMENTS (Continued)
December 31, 2016
Recoupments in excess of waivers during the period would be presented as Recoupment Fees in the Statement of Operations. At December 31, 2016, under the Expense Limitation Agreement, the amount that would be recoverable from each Portfolio is as follows:
| | | | | | | | | | | | | | | | |
Portfolio: | | 2017 | | | 2018 | | | 2019 | | | Total Eligible
For
Recoupment | |
EQ/PIMCO Global Real Return | | $ | 100,113 | | | $ | 113,993 | | | $ | 108,544 | | | $ | 322,650 | |
During the year ended December 31, 2016, FMG LLC voluntarily waived fees for the certain Portfolios. The amounts waived were as follows and are not eligible for recoupment:
| | | | |
Portfolios: | | Voluntary Waivers | |
All Asset Growth-Alt 20 | | $ | 22,212 | |
All Asset Aggressive-Alt 25 | | | 44,028 | |
All Asset Aggressive-Alt 50 | | | 65,381 | |
All Asset Aggressive-Alt 75 | | | 65,107 | |
AXA/DoubleLine Opportunistic Core Plus Bond | | | 18,452 | |
AXA/Horizon Small Cap Value | | | 98,659 | |
AXA/Pacific Global Small Cap Value | | | 97,716 | |
During the year ended December 31, 2016, DoubleLine Capital LP reimbursed AXA/DoubleLine Opportunistic Core Plus Bond Portfolio $8,322 of Investment Management fees from the DoubleLine Floating Rate Fund which is an underlying investment in this Portfolio. This reimbursement is not eligible for recoupment.
Note 7 Percentage of Ownership by Affiliates
At December 31, 2016, AXA Equitable and/or FMG LLC held investments in each of the Portfolios as follows:
| | | | |
Portfolios: | | Percentage of
Ownership | |
All Asset Aggressive-Alt 50 | | | 74.01 | % |
All Asset Aggressive-Alt 75 | | | 66.28 | |
AXA/DoubleLine Opportunistic Core Plus Bond | | | 72.28 | |
Shares of the Portfolios may be held as underlying investments by the All Asset Portfolios of the Trust and the AXA Allocation Portfolios and the Charter Allocation Portfolios of the AXA Premier VIP Trust. The following tables represent the percentage of ownership that each of the All Asset Portfolios, AXA Allocation Portfolios and Charter Allocation Portfolios has in each respective Portfolio’s net assets as of December 31, 2016.
| | | | | | | | | | | | | | | | | | | | |
Portfolios: | | All Asset
Moderate
Growth-
Alt 15 | | | All Asset
Growth-
Alt 20 | | | All Asset
Aggressive-
Alt 25 | | | All Asset
Aggressive-
Alt 50 | | | All Asset
Aggressive-
Alt 75 | |
AXA Natural Resources | | | 5.09 | % | | | 51.95 | % | | | 6.75 | % | | | 1.73 | % | | | 3.14 | % |
AXA Real Estate | | | 3.67 | | | | 36.57 | | | | 5.07 | | | | 1.52 | | | | 2.16 | |
AXA/AB Small Cap Growth | | | 0.12 | | | | 0.90 | | | | 0.14 | | | | 0.01 | | | | — | # |
AXA/Janus Enterprise | | | 0.01 | | | | 0.15 | | | | 0.02 | | | | — | # | | | — | # |
AXA/Loomis Sayles Growth | | | 0.19 | | | | 2.55 | | | | 0.20 | | | | 0.02 | | | | 0.01 | |
EQ/BlackRock Basic Value Equity | | | 0.11 | | | | 0.90 | | | | 0.12 | | | | 0.01 | | | | — | # |
EQ/Boston Advisors Equity Income | | | 0.12 | | | | 0.92 | | | | 0.18 | | | | 0.01 | | | | 0.01 | |
EQ/Emerging Markets Equity PLUS | | | 1.38 | | | | 18.14 | | | | 2.29 | | | | 0.14 | | | | 0.04 | |
EQ/GAMCO Mergers and Acquisitions | | | 0.56 | | | | 5.50 | | | | 0.78 | | | | 0.07 | | | | 0.16 | |
EQ/GAMCO Small Company Value | | | 0.05 | | | | 0.53 | | | | 0.06 | | | | — | # | | | — | # |
130
EQ ADVISORS TRUST
NOTES TO FINANCIAL STATEMENTS (Continued)
December 31, 2016
| | | | | | | | | | | | | | | | | | | | |
Portfolios: | | All Asset
Moderate
Growth-
Alt 15 | | | All Asset
Growth-
Alt 20 | | | All Asset
Aggressive-
Alt 25 | | | All Asset
Aggressive-
Alt 50 | | | All Asset
Aggressive-
Alt 75 | |
EQ/Global Bond PLUS | | | 1.65 | % | | | 6.83 | % | | | 0.26 | % | | | 0.01 | % | | | 0.01 | % |
EQ/High Yield Bond | | | 0.91 | | | | 4.53 | | | | 0.21 | | | | 0.01 | | | | 0.01 | |
EQ/Intermediate Government Bond | | | 0.01 | | | | 0.06 | | | | — | # | | | — | # | | | — | # |
EQ/International Equity Index | | | 0.05 | | | | 0.59 | | | | 0.07 | | | | 0.01 | | | | — | # |
EQ/Invesco Comstock | | | 0.70 | | | | 5.82 | | | | 0.83 | | | | 0.05 | | | | 0.02 | |
EQ/JPMorgan Value Opportunities | | | 0.21 | | | | 2.35 | | | | 0.24 | | | | 0.02 | | | | 0.01 | |
EQ/MFS International Growth | | | 0.17 | | | | 1.53 | | | | 0.20 | | | | 0.01 | | | | 0.01 | |
EQ/PIMCO Global Real Return | | | 3.17 | | | | 16.32 | | | | 0.74 | | | | 0.02 | | | | 0.03 | |
EQ/PIMCO Ultra Short Bond | | | 0.12 | | | | 0.41 | | | | 0.01 | | | | — | # | | | — | # |
EQ/T. Rowe Price Growth Stock | | | 0.18 | | | | 1.47 | | | | 0.22 | | | | 0.01 | | | | 0.01 | |
Multimanager Core Bond | | | 0.19 | | | | 0.88 | | | | 0.03 | | | | — | | | | — | |
| # | Percentage of ownership is less than 0.005%. |
| | | | | | | | | | | | | | | | | | | | |
Portfolios: | | AXA
Conservative
Allocation | | | AXA
Conservative-
Plus
Allocation | | | AXA
Moderate
Allocation | | | AXA
Moderate-
Plus
Allocation | | | AXA
Aggressive
Allocation | |
AXA/Horizon Small Cap Value | | | — | % | | | 3.49 | % | | | 19.67 | % | | | 27.31 | % | | | 9.67 | % |
AXA/Pacific Global Small Cap Value | | | — | | | | 2.51 | | | | 18.06 | | | | 29.52 | | | | 10.18 | |
| | | | | | | | | | | | | | | | | | | | | | | | | | | | |
Portfolios: | | CharterSM
Conservative | | | CharterSM
Moderate | | | CharterSM
Moderate
Growth | | | CharterSM
Growth | | | CharterSM
Aggressive
Growth | | | CharterSM
International
Moderate | | | CharterSM
Income
Strategies | |
AXA/DoubleLine Opportunistic Core Plus Bond | | | — | % | | | — | % | | | — | % | | | — | % | | | — | % | | | — | % | | | — | % |
AXA/Horizon Small Cap Value | | | — | | | | — | | | | — | | | | — | | | | — | | | | — | | | | — | |
AXA/Pacific Global Small Cap Value | | | — | | | | — | | | | — | | | | — | | | | — | | | | — | | | | — | |
EQ/PIMCO Global Real Return | | | 2.64 | | | | 1.61 | | | | 1.07 | | | | 0.37 | | | | 0.06 | | | | 0.77 | | | | 0.14 | |
| | | | | | | | | | | | | | | | | | | | | | | | |
Portfolios: | | CharterSM
Interest
Rate
Strategies | | | CharterSM
Multi-
Sector
Bond | | | CharterSM
Real
Assets | | | CharterSM
Small
Cap
Growth | | | CharterSM
Small
Cap
Value | | | CharterSM
Alternative
100
Moderate | |
AXA/DoubleLine Opportunistic Core Plus Bond | | | — | % | | | 13.41 | % | | | — | % | | | — | % | | | — | % | | | — | % |
AXA/Horizon Small Cap Value | | | — | | | | — | | | | — | | | | — | | | | 39.63 | | | | — | |
AXA/Pacific Global Small Cap Value | | | — | | | | — | | | | — | | | | — | | | | 39.41 | | | | — | |
EQ/PIMCO Global Real Return | | | 0.51 | | | | 15.55 | | | | 1.73 | | | | — | | | | — | | | | — | |
The Portfolio is permitted to purchase or sell securities from or to certain affiliated entities under specified conditions outlined in procedures adopted by the Board. The procedures have been designed to ensure that any such securities transactions comply with Rule 17a-7 under the 1940 Act. Further, as defined under the procedures, each transaction is effected at the independent current market price. The 17a-7 transactions which are material to the Portfolios are reflected in the Portfolio of Investments.
131
EQ ADVISORS TRUST
NOTES TO FINANCIAL STATEMENTS (Continued)
December 31, 2016
The Manager evaluated subsequent events from December 31, 2016, the date of these financial statements, through the date these financial statements were issued and available.
On December 1, 2016, the Board approved forms of Plans of Reorganization and Termination (each, a “Reorganization Plan,” and collectively, the “Reorganization Plans”) that provide for the reorganization of certain Portfolios of the Trust into another existing Portfolio of the Trust (each, a “Reorganization” and collectively, the “Reorganizations”) as follows:
| | |
| Proposed Aquired Portfolios | | Proposed Acquiring Portfolios |
| AXA/Pacific Global Small Cap Value Portfolio | | AXA/Horizon Small Cap Value Portfolio |
All Asset Aggressive – Alt 25 Portfolio All Asset Aggressive – Alt 50 Portfolio All Asset Aggressive – Alt 75 Portfolio | | All Asset Growth-Alt 20 Portfolio |
| (each, an “Acquired Portfolio,” and collectively, the “Acquired Portfolios”) | | (each, an “Acquiring Portfolio,” and collectively, the “Acquiring Portfolios”) |
Each Reorganization Plan is subject to approval by the shareholders of the respective Acquired Portfolio. A special shareholder meeting of the Acquired Portfolios is anticipated to be held on or about March 28, 2017 to vote on the Reorganization Plans. If shareholders approve the Reorganization Plans, it is anticipated that the Reorganizations will take place on or about May 19, 2017.
| Note 9 | Pending Legal Proceedings |
In July 2011, a lawsuit was filed in the United States District Court for the District of New Jersey, entitled Mary Ann Sivolella v. AXA Equitable Life Insurance Company and AXA Equitable Funds Management Group, LLC (“Sivolella Litigation”). The lawsuit was filed derivatively on behalf of eight Portfolios of the Trust: EQ/Common Stock Index Portfolio; EQ/Equity Growth PLUS Portfolio; EQ/Equity 500 Index Portfolio; AXA Large Cap Value Managed Volatility Portfolio; AXA Global Equity Managed Volatility Portfolio; AXA Mid Cap Value Managed Volatility Portfolio; EQ/Intermediate Government Bond Index Portfolio; and EQ/GAMCO Small Company Value Portfolio (the “Sivolella Portfolios”). Note, in June 2014, the EQ/Equity Growth PLUS Portfolio was reorganized into the AXA Large Cap Growth Managed Volatility Portfolio. The lawsuit seeks recovery under Section 36(b) of the 1940 Act, for alleged excessive fees paid to FMG LLC and AXA Equitable (the “Defendants”) for investment management services. The Plaintiff seeks recovery of the alleged overpayments, or alternatively, rescission of the contracts and restitution of all fees paid, interest, costs, and fees. In October 2011, FMG LLC and AXA Equitable filed a motion to dismiss the complaint. In November 2011, the Plaintiff filed an Amended Complaint seeking the same relief, but adding new claims under: (1) Section 26(f) of the 1940 Act alleging that the variable annuity contracts sold by the Defendants charged excessive management fees, and seeking restitution and rescission of those contracts under Section 47(b) of the 1940 Act; and (2) a claim for unjust enrichment. The Defendants filed a motion to dismiss the Amended Complaint in December 2011. In May 2012, Plaintiff voluntarily dismissed the Section 26(f) claim seeking restitution and rescission under Section 47(b). In September 2012, the United States District Court for the District of New Jersey denied the motion to dismiss the Amended Complaint as it related to the Section 36(b) claim and granted the motion to as it related to the unjust enrichment claim.
In January 2013, a second lawsuit against FMG LLC was filed in the United States District Court for the District of New Jersey by a group of Plaintiffs asserting substantially similar claims under Section 36(b) and seeking substantially similar damages as in the Sivolella Litigation. The lawsuit, entitled Glenn D. Sanford, et al. v. AXA Equitable Funds Management Group, LLC (“Sanford Litigation”), was filed derivatively on behalf of the EQ/PIMCO Ultra Short Bond Portfolio, the EQ/T. Rowe Price Growth Stock Portfolio, the EQ/Global Bond PLUS Portfolio, and the EQ/Core Bond
132
EQ ADVISORS TRUST
NOTES TO FINANCIAL STATEMENTS (Continued)
December 31, 2016
Index Portfolio, in addition to four of the Sivolella Portfolios. In light of the similarities of the allegations in the Sivolella and Sanford Litigations, the court consolidated the two lawsuits.
In April 2013, the Plaintiffs in the Sivolella and Sanford Litigations amended the complaints to add additional claims under Section 36(b) of the 1940 Act for recovery of alleged excessive fees paid to FMG LLC in its capacity as the Administrator to the Trust. The Plaintiffs seek recovery of the alleged overpayments, or alternatively, rescission of the contract and restitution of the excessive fees paid, interest, costs, and fees. In January 2015, Plaintiffs and Defendants filed motions for summary judgment and other pre-trial motions, which were denied by the Court in August 2015.
The non-jury trial commenced in January 2016 and testimony concluded in February 2016. Closing arguments occurred in June 2016 following post-trial briefing. On August 25, 2016, the Court issued its decision in favor of FMG LLC and AXA Equitable, finding that the Plaintiffs had failed to meet their burden to demonstrate that FMG LLC and AXA Equitable breached their fiduciary duty in violation of Section 36(b) or show any actual damages. In September 2016, the Plaintiffs filed a motion to amend the trial opinion and to amend or make new findings of fact and/or conclusions of law, which was denied by the Court in December 2016. In December 2016, Plaintiff filed a notice to appeal the Court’s decision to the United States Court of Appeals for the Third Circuit.
No liability for litigation relating to these matters has been accrued in the financial statements of the Portfolios because any potential damages would be the responsibility of the Defendants.
In November 2010, the Trust, and several of its Portfolios, were named as defendants and putative members of the proposed defendant class of contractholders in a lawsuit brought by The Official Committee of Unsecured Creditors of Tribune Company (the “Committee”) in the United States Bankruptcy Court for the District of Delaware regarding Tribune Company’s Chapter 11 bankruptcy proceeding (In re Tribune Company). The lawsuit relates to amounts paid to the Trust, and several of its Portfolios, as holders of publicly-traded shares of Tribune Company, which were components of certain broad-based securities market indices, for which there were public tender offers during 2007. The suit seeks return of the share price received by Tribune Company shareholders in the tender offers plus interest and attorneys’ fees and expenses.
In July 2011, retiree participants in certain Tribune-defined compensation plans (the “Retirees”) initiated a lawsuit in the United States District Court for the Southern District of New York against certain Tribune Company shareholders who sold their shares as part of the 2007 public tender offers (the “Retiree Suit”). This Retiree Suit also seeks return of the share price received by Tribune Company shareholders in connection with the tender offers plus interest and attorneys’ fees and expenses.
In August 2011, the trustees of certain trusts that hold notes issued by Tribune Company (the “Noteholders”) initiated a separate lawsuit in the United States District Court for the Southern District of New York against certain Tribune Company shareholders who sold their shares as part of the 2007 public tender offers (the “Noteholder Suit”). The Noteholder Suit also seeks return of the share price received by Tribune Company shareholders in connection with the tender offers plus interest and attorneys’ fees and expenses.
The Committee’s Suit, the Retiree Suit, and the Noteholder Suit have each been consolidated with a number of related lawsuits filed by the Noteholders and Retirees around the United States into a single multi-district litigation proceeding now pending in the United States District Court for the Southern District of New York (In re: Tribune Company Fraudulent Conveyance Litigation).
The EQ/Equity 500 Index Portfolio, the EQ/GAMCO Mergers and Acquisitions Portfolio and the AXA Mid Cap Value Managed Volatility Portfolio are named as defendants in the Noteholder Suit and the Retiree Suit. The EQ/Equity 500 Index Portfolio, the EQ/GAMCO Mergers and Acquisitions Portfolio, the AXA Mid Cap Value Managed Volatility Portfolio, the AXA Large Cap Core Managed Volatility Portfolio, the EQ/ Small Company Index II Portfolio,
133
EQ ADVISORS TRUST
NOTES TO FINANCIAL STATEMENTS (Concluded)
December 31, 2016
the EQ/Common Stock Index II Portfolio, and EQ Advisors Trust are all putative members of the proposed defendant class of shareholders in the Committee’s suit. The EQ/Equity 500 Index Portfolio, the EQ/GAMCO Mergers and Acquisition Portfolio, the AXA Large Cap Core Managed Volatility Portfolio, and EQ Advisors Trust are also named separately in the Committee’s suit, in the event it is not certified as class action. The amounts paid to the above six Portfolios in connection with the public tender offers were approximately: (i) the EQ/Equity 500 Index Portfolio — $1,740,800; (ii) the EQ/ GAMCO Mergers and Acquisitions Portfolio — $1,122,000; (iii) the AXA Mid Cap Value Managed Volatility Portfolio — $2,992,000; (iv) the AXA Large Cap Core Managed Volatility Portfolio — $64,600; (v) the EQ/ Small Company Index II Portfolio (now called EQ/Small Company Index) — $61,200; (vi) the EQ/Common Stock Index II Portfolio (now called EQ/Common Stock Index) — $18,360; and (vii) the Multimanager Large Cap Value Portfolio (now called AXA Large Cap Value Managed Volatility Portfolio) — $3,359,200.
The lawsuits do not allege any misconduct by the Trust or its Portfolios. Certain of the Plaintiffs’ claims have been dismissed and in March 2016, the United States Court of Appeals for the Second Circuit (the “Second Circuit”) has affirmed the dismissal of those claims. In September 2016, Plaintiffs filed a petition for a writ of certiorari with the United States Supreme Court, which is currently pending. In January 2017, the United States District Court for the Southern District of New York dismissed the remaining claims involving shareholders, such as the Trust and several of its Portfolios, who sold their shares as part of the public tender offers. The Plaintiffs have requested permission from the court to appeal its decision to the Second Circuit. The Trusts or its Portfolios cannot predict the outcome of these lawsuits. If the lawsuits were to be decided or settled in a manner adverse to the Portfolios, the payment of such judgments or settlements could have an adverse effect on each Portfolio’s NAV. However, no liability for litigation relating to this matter has been accrued in the financial statements of the Portfolios, as the Manager believes a loss is not probable.
134
Report of Independent Registered Public Accounting Firm
To the Board of Trustees and Shareholders of EQ Advisors Trust
In our opinion, the accompanying statements of assets and liabilities, including the portfolios of investments, and the related statements of operations and of changes in net assets and of cash flows (EQ/PIMCO Global Real Return Portfolio only) and the financial highlights present fairly, in all material respects, the financial position of each of the portfolios of EQ Advisors Trust listed in the Table of Contents to the Annual Report in which these financial statements appear (collectively referred to as the “Trust”) as of December 31, 2016, the results of each of their operations, the changes in each of their net assets and their cash flows (EQ/PIMCO Global Real Return Portfolio only) and the financial highlights for each of the periods presented, in conformity with accounting principles generally accepted in the United States of America. These financial statements and financial highlights (hereafter referred to as “financial statements”) are the responsibility of the Trust’s management. Our responsibility is to express an opinion on these financial statements based on our audits. We conducted our audits of these financial statements in accordance with the standards of the Public Company Accounting Oversight Board (United States). Those standards require that we plan and perform the audit to obtain reasonable assurance about whether the financial statements are free of material misstatement. An audit includes examining, on a test basis, evidence supporting the amounts and disclosures in the financial statements, assessing the accounting principles used and significant estimates made by management, and evaluating the overall financial statement presentation. We believe that our audits, which included confirmation of securities as of December 31, 2016 by correspondence with the custodian, transfer agents and brokers, provide a reasonable basis for our opinion.
PricewaterhouseCoopers LLP
New York, New York
February 17, 2017
135
AXA Premier VIP Trust
Financial Statements
December 31, 2016
AXA Premier VIP Trust Financial Statements
December 31, 2016
Table of Contents
AXA PREMIER VIP TRUST
CHARTERSM MODERATE PORTFOLIO
PORTFOLIO OF INVESTMENTS
December 31, 2016
| | | | | | | | |
| | | Number of Shares | | | Value (Note 1) | |
EXCHANGE TRADED FUNDS: | | | | | | | | |
iShares Floating Rate Bond Fund | | | 16,710 | | | $ | 847,698 | |
iShares Global Infrastructure Fund | | | 4,460 | | | | 174,119 | |
iShares International Treasury Bond Fund | | | 1,620 | | | | 145,509 | |
iShares JP Morgan USD Emerging Markets Bond Fund | | | 11,550 | | | | 1,273,041 | |
iShares Micro-Cap Fund | | | 830 | | | | 71,247 | |
iShares MSCI EAFE Small-Cap Fund | | | 3,560 | | | | 177,431 | |
iShares U.S. Oil & Gas Exploration & Production Fund | | | 1,460 | | | | 95,542 | |
PowerShares DB Base Metals Fund* | | | 2,410 | | | | 35,957 | |
PowerShares DB Commodity Index Tracking Fund* | | | 3,830 | | | | 60,667 | |
PowerShares DB G10 Currency Harvest Fund* | | | 8,920 | | | | 221,305 | |
PowerShares DB Gold Fund* | | | 2,830 | | | | 104,795 | |
PowerShares DB Silver Fund* | | | 290 | | | | 7,209 | |
PowerShares S&P 500 BuyWrite Portfolio | | | 8,090 | | | | 172,074 | |
SPDR Bloomberg Barclays Short Term High Yield Bond Fund | | | 16,170 | | | | 447,586 | |
Vanguard Short-Term Inflation-Protected Securities Fund | | | 3,500 | | | | 172,060 | |
Vanguard Total International Bond Fund | | | 17,320 | | | | 940,303 | |
| | | | | | | | |
Total Exchange Traded Funds (21.0%)
(Cost $5,045,160) | | | | | | | 4,946,543 | |
| | | | | | | | |
INVESTMENT COMPANIES: | | | | | | | | |
AQR Managed Futures Strategy, Institutional Class | | | 17,159 | | | | 159,925 | |
AXA Natural Resources Portfolio‡ | | | 12,332 | | | | 98,074 | |
AXA Real Estate Portfolio‡ | | | 18,237 | | | | 190,999 | |
AXA SmartBeta Equity Portfolio‡ | | | 18,971 | | | | 211,628 | |
AXA/AB Small Cap Growth Portfolio‡ | | | 24,077 | | | | 436,040 | |
AXA/ClearBridge Large Cap Growth Portfolio*‡ | | | 36,940 | | | | 401,954 | |
AXA/Janus Enterprise Portfoliop*‡ | | | 37,067 | | | | 589,471 | |
AXA/Lord Abbett Micro Cap Portfolio‡ | | | 16,701 | | | | 165,998 | |
BlackRock Global Long/Short Credit Fund, Institutional Class* | | | 17,482 | | | | 176,922 | |
Eaton Vance Floating-Rate Fund, Institutional Class | | | 49,488 | | | | 442,915 | |
EQ/BlackRock Basic Value Equity Portfolio‡ | | | 18,339 | | | | 424,596 | |
EQ/Capital Guardian Research Portfolio‡ | | | 37,093 | | | | 838,580 | |
EQ/Convertible Securities Portfolio‡ | | | 152,285 | | | | 1,550,845 | |
EQ/Core Bond Index Portfolio‡ | | | 2,074 | | | | 20,418 | |
EQ/Emerging Markets Equity PLUS Portfolio‡ | | | 52,218 | | | | 417,971 | |
EQ/Energy ETF Portfolio‡ | | | 12,620 | | | | 93,890 | |
EQ/GAMCO Mergers and Acquisitions Portfolio‡ | | | 32,226 | | | | 420,911 | |
EQ/GAMCO Small Company Value Portfolio‡ | | | 7,409 | | | | 433,661 | |
EQ/Global Bond PLUS Portfolio‡ | | | 143,699 | | | | 1,259,579 | |
EQ/High Yield Bond Portfolio‡ | | | 88,336 | | | | 841,144 | |
EQ/Intermediate Government Bond Portfolio‡ | | | 124,107 | | | $ | 1,269,895 | |
EQ/International Equity Index Portfolio‡ | | | 124,755 | | | | 1,043,479 | |
EQ/Invesco Comstock Portfolio‡ | | | 26,769 | | | | 422,535 | |
EQ/Low Volatility Global ETF Portfolio‡ | | | 19,030 | | | | 194,340 | |
EQ/MFS International Growth Portfolio‡ | | | 90,246 | | | | 593,010 | |
EQ/PIMCO Global Real Return Portfolio‡ | | | 116,229 | | | | 1,128,219 | |
EQ/PIMCO Ultra Short Bond Portfolio‡ | | | 129,080 | | | | 1,273,636 | |
EQ/T. Rowe Price Growth Stock Portfolio*‡ | | | 11,057 | | | | 430,418 | |
Financial Investors Trust – Listed Private Equity Fund, Institutional Class | | | 23,019 | | | | 149,161 | |
Franklin K2 Alternative Strategies Fund, Advisor Class | | | 8,127 | | | | 87,523 | |
Morgan Stanley Institutional Fund, Inc.-Frontier Emerging Markets Portfolio, Institutional Class | | | 10,903 | | | | 189,595 | |
Multimanager Core Bond Portfolio‡ | | | 129,639 | | | | 1,267,789 | |
Multimanager Mid Cap Value Portfolio‡ | | | 42,476 | | | | 664,400 | |
PIMCO Foreign Bond Fund Unhedged, Institutional Class | | | 18,200 | | | | 167,626 | |
Templeton Emerging Markets Small Cap Fund, Advisor Class | | | 15,812 | | | | 183,578 | |
Templeton Global Smaller Companies Fund, Advisor Class | | | 25,533 | | | | 224,177 | |
| | | | | | | | |
Total Investment Companies (78.2%)
(Cost $18,773,267) | | | | | | | 18,464,902 | |
| | | | | | | | |
SHORT-TERM INVESTMENT: | | | | | | | | |
Investment Company (0.8%) | | | | | | | | |
JPMorgan Prime Money Market Fund, IM Shares | | | 195,638 | | | | 195,697 | |
| | | | | | | | |
Total Short-Term Investment (0.8%)
(Cost $195,645) | | | | | | | 195,697 | |
| | | | | | | | |
Total Investments (100.0%)
(Cost $24,014,072) | | | | | | | 23,607,142 | |
Other Assets Less Liabilities (0.0%) | | | | | | | 3,957 | |
| | | | | | | | |
Net Assets (100%) | | | | | | $ | 23,611,099 | |
| | | | | | | | |
| ‡ | All, or a portion, of the security is an affiliated company as defined under the Investment Company Act of 1940. |
The holdings in affiliated Investment Companies are all Class K shares.
See Notes to Financial Statements.
2
AXA PREMIER VIP TRUST
CHARTERSM MODERATE PORTFOLIO
PORTFOLIO OF INVESTMENTS (Continued)
December 31, 2016
Investments in companies which were affiliates for the year ended December 31, 2016, were as follows:
| | | | | | | | | | | | | | | | | | | | | | | | |
Securities | | Value
December 31,
2015 | | | Purchases
at Cost | | | Sales
at Cost | | | Value
December 31,
2016 | | | Dividend
Income | | | Realized
Gain
(Loss)† | |
AXA Natural Resources Portfolio | | $ | 67,595 | | | $ | 20,838 | | | $ | 9,200 | | | $ | 98,074 | | | $ | 2,290 | | | $ | (69 | ) |
AXA Real Estate Portfolio (a) | | | 164,709 | | | | 41,275 | | | | 18,271 | | | | 190,999 | | | | 1,745 | | | | 2,423 | |
AXA SmartBeta Equity Portfolio | | | 176,855 | | | | 49,607 | | | | 22,837 | | | | 211,628 | | | | 3,217 | | | | 9 | |
AXA/AB Small Cap Growth Portfolio | | | 340,223 | | | | 153,742 | | | | 85,566 | | | | 436,040 | | | | 2,578 | | | | 26,218 | |
AXA/ClearBridge Large Cap Growth Portfolio (b) | | | 365,228 | | | | 105,360 | | | | 76,219 | | | | 401,954 | | | | — | | | | 762 | |
AXA/Janus Enterprise Portfolio (c) | | | 513,481 | | | | 215,097 | | | | 130,484 | | | | 589,471 | | | | — | | | | (1,111 | ) |
AXA/Lord Abbett Micro Cap Portfolio | | | 134,926 | | | | 28,099 | | | | 14,410 | | | | 165,998 | | | | 138 | | | | (576 | ) |
EQ/BlackRock Basic Value Equity Portfolio | | | 338,834 | | | | 90,453 | | | | 63,562 | | | | 424,596 | | | | 6,986 | | | | 526 | |
EQ/Capital Guardian Research Portfolio | | | 685,485 | | | | 226,259 | | | | 132,424 | | | | 838,580 | | | | 9,325 | | | | (249 | ) |
EQ/Convertible Securities Portfolio | | | 1,276,051 | | | | 418,549 | | | | 217,156 | | | | 1,550,845 | | | | 47,333 | | | | (2,511 | ) |
EQ/Core Bond Index Portfolio | | | 20,090 | | | | 361 | | | | — | | | | 20,418 | | | | 361 | | | | — | |
EQ/Emerging Markets Equity PLUS Portfolio | | | 312,929 | | | | 132,832 | | | | 66,628 | | | | 417,971 | | | | 3,781 | | | | 45 | |
EQ/Energy ETF Portfolio | | | 67,591 | | | | 20,182 | | | | 9,361 | | | | 93,890 | | | | 1,616 | | | | (212 | ) |
EQ/GAMCO Mergers and Acquisitions Portfolio | | | 353,315 | | | | 95,848 | | | | 36,635 | | | | 420,911 | | | | 1,077 | | | | 20,465 | |
EQ/GAMCO Small Company Value Portfolio | | | 349,011 | | | | 100,302 | | | | 85,223 | | | | 433,661 | | | | 3,045 | | | | 15,655 | |
EQ/Global Bond PLUS Portfolio | | | 1,105,399 | | | | 419,171 | | | | 237,485 | | | | 1,259,579 | | | | 27,870 | | | | 2,768 | |
EQ/High Yield Bond Portfolio | | | 722,189 | | | | 211,606 | | | | 134,272 | | | | 841,144 | | | | 44,504 | | | | (1,930 | ) |
EQ/Intermediate Government Bond Portfolio | | | 1,086,653 | | | | 395,382 | | | | 202,887 | | | | 1,269,895 | | | | 11,996 | | | | 2,251 | |
EQ/International Equity Index Portfolio | | | 842,571 | | | | 306,003 | | | | 105,735 | | | | 1,043,479 | | | | 30,649 | | | | (685 | ) |
EQ/Invesco Comstock Portfolio | | | 356,888 | | | | 94,223 | | | | 84,819 | | | | 422,535 | | | | 10,756 | | | | 2,268 | |
EQ/Low Volatility Global ETF Portfolio | | | 174,664 | | | | 56,847 | | | | 42,308 | | | | 194,340 | | | | 5,022 | | | | 5,974 | |
EQ/MFS International Growth Portfolio | | | 520,419 | | | | 129,031 | | | | 59,940 | | | | 593,010 | | | | 7,359 | | | | 517 | |
EQ/PIMCO Global Real Return Portfolio | | | 942,463 | | | | 305,680 | | | | 159,633 | | | | 1,128,219 | | | | 57,759 | | | | 2,275 | |
EQ/PIMCO Ultra Short Bond Portfolio | | | 1,086,604 | | | | 354,374 | | | | 178,311 | | | | 1,273,636 | | | | 16,099 | | | | (484 | ) |
EQ/T. Rowe Price Growth Stock Portfolio | | | 349,376 | | | | 125,945 | | | | 49,553 | | | | 430,418 | | | | — | | | | 7,413 | |
Multimanager Core Bond Portfolio | | | 1,084,114 | | | | 380,636 | | | | 197,418 | | | | 1,267,789 | | | | 27,213 | | | | 1,249 | |
Multimanager Mid Cap Value Portfolio | | | 510,921 | | | | 163,616 | | | | 111,436 | | | | 664,400 | | | | 8,051 | | | | (89 | ) |
| | | | | | | | | | | | | | | | | | | | | | | | |
| | $ | 13,948,584 | | | $ | 4,641,318 | | | $ | 2,531,773 | | | $ | 16,683,480 | | | $ | 330,770 | | | $ | 82,902 | |
| | | | | | | | | | | | | | | | | | | | | | | | |
| † | When applicable, realized gain includes net distributions of realized gain received from underlying funds. |
| (a) | Formerly known as EQ/Real Estate PLUS Portfolio. |
| (b) | Formerly known as EQ/Wells Fargo Omega Growth Portfolio. |
| (c) | Formerly known as EQ/Morgan Stanley Mid Cap Growth Portfolio. |
See Notes to Financial Statements.
3
AXA PREMIER VIP TRUST
CHARTERSM MODERATE PORTFOLIO
PORTFOLIO OF INVESTMENTS (Continued)
December 31, 2016
The following is a summary of the inputs used to value the Portfolio’s assets and liabilities carried at fair value as of December 31, 2016:
The inputs or methodology used for valuing securities are not necessarily an indication of the risk associated with investing in those securities.
Various inputs are used in determining the value of the Portfolio’s investments. These inputs are summarized in the three broad levels listed below:
| | | | | | | | | | | | | | | | |
| | | | | |
| Investment Type | | Level 1
Quoted Prices in
Active Markets for
Identical
Securities | | | Level 2
Significant Other
Observable Inputs
(including quoted prices
for similar securities,
interest rates,
prepayment speeds,
credit risk, etc.) | | | Level 3
Significant Unobservable
Inputs (including the
Portfolio’s own
assumptions in
determining the fair
value of investments) | | | Total | |
Assets: | | | | | |
Exchange Traded Funds | | | | | | | | | | | | | | | | |
Exchange Traded Funds | | $ | 4,946,543 | | | $ | — | | | $ | — | | | $ | 4,946,543 | |
Investment Companies | | | | | | | | | | | | | | | | |
Investment Companies | | | 1,781,422 | | | | 16,683,480 | | | | — | | | | 18,464,902 | |
Short-Term Investments | | | | | | | | | | | | | | | | |
Investment Companies | | | 195,697 | | | | — | | | | — | | | | 195,697 | |
| | | | | | | | | | | | | | | | |
Total Assets | | $ | 6,923,662 | | | $ | 16,683,480 | | | $ | — | | | $ | 23,607,142 | |
| | | | | | | | | | | | | | | | |
Total Liabilities | | $ | — | | | $ | — | | | $ | — | | | $ | — | |
| | | | | | | | | | | | | | | | |
Total | | $ | 6,923,662 | | | $ | 16,683,480 | | | $ | — | | | $ | 23,607,142 | |
| | | | | | | | | | | | | | | | |
There were no transfers between Levels 1, 2 or 3 during the year ended December 31, 2016.
The Portfolio held no derivatives contracts during the year ended December 31, 2016.
Investment security transactions for the year ended December 31, 2016 were as follows:
| | | | |
Cost of Purchases: | | | | |
Long-term investments other than U.S. government debt securities | | $ | 5,680,681 | |
Net Proceeds of Sales and Redemptions: | | | | |
Long-term investments other than U.S. government debt securities | | $ | 2,711,443 | |
As of December 31, 2016, the gross unrealized appreciation (depreciation) of investments based on the aggregate cost of investments for Federal income tax purposes was as follows:
| | | | |
Aggregate gross unrealized appreciation | | $ | 452,661 | |
Aggregate gross unrealized depreciation | | | (819,644 | ) |
| | | | |
Net unrealized depreciation | | $ | (366,983 | ) |
| | | | |
Federal income tax cost of investments | | $ | 23,974,125 | |
| | | | |
See Notes to Financial Statements.
4
AXA PREMIER VIP TRUST
CHARTERSM MODERATE PORTFOLIO
STATEMENT OF ASSETS AND LIABILITIES
December 31, 2016
| | | | |
ASSETS | |
Investments at value: | | | | |
Affiliated Issuers (Cost $16,918,838) | | $ | 16,683,480 | |
Unaffiliated Issuers (Cost $7,095,234) | | | 6,923,662 | |
Cash | | | 35,078 | |
Receivable from Separate Accounts for Trust shares sold | | | 42,685 | |
Receivable from investment manager | | | 5,890 | |
Dividends, interest and other receivables | | | 4,200 | |
Other assets | | | 64 | |
| | | | |
Total assets | | | 23,695,059 | |
| | | | |
LIABILITIES | |
Payable to Separate Accounts for Trust shares redeemed | | | 15,342 | |
Distribution fees payable – Class B | | | 4,988 | |
Payable for securities purchased | | | 2,501 | |
Trustees’ fees payable | | | 418 | |
Accrued expenses | | | 60,711 | |
| | | | |
Total liabilities | | | 83,960 | |
| | | | |
NET ASSETS | | $ | 23,611,099 | |
| | | | |
Net assets were comprised of: | |
Paid in capital | | $ | 23,956,722 | |
Accumulated undistributed net investment income (loss) | | | 2,815 | |
Accumulated undistributed net realized gain (loss) on investments | | | 58,492 | |
Net unrealized appreciation (depreciation) on investments | | | (406,930 | ) |
| | | | |
Net assets | | $ | 23,611,099 | |
| | | | |
Class B | | | | |
Net asset value, offering and redemption price per share, $23,611,099 / 2,408,733 shares outstanding (unlimited amount authorized: $0.001 par value) | | $ | 9.80 | |
| | | | |
STATEMENT OF OPERATIONS
For the Year Ended December 31, 2016
| | | | |
INVESTMENT INCOME | |
Dividends ($330,770 of dividend income received from affiliates) | | $ | 483,921 | |
Interest | | | 2,724 | |
| | | | |
Total income | | | 486,645 | |
| | | | |
EXPENSES | |
Custodian fees | | | 165,900 | |
Distribution fees – Class B | | | 54,018 | |
Professional fees | | | 38,664 | |
Administrative fees | | | 32,542 | |
Investment management fees | | | 32,411 | |
Printing and mailing expenses | | | 3,044 | |
Trustees’ fees | | | 783 | |
Miscellaneous | | | 387 | |
| | | | |
Gross expenses | | | 327,749 | |
Less: Waiver from investment manager | | | (64,953 | ) |
Reimbursement from investment manager | | | (137,253 | ) |
| | | | |
Net expenses | | | 125,543 | |
| | | | |
NET INVESTMENT INCOME (LOSS) | | | 361,102 | |
| | | | |
REALIZED AND UNREALIZED GAIN (LOSS) | |
Net realized gain (loss) on investments ($(6,204) of realized gain (loss) from affiliates) | | | (6,114 | ) |
Net distributions of realized gain received from underlying funds ($89,106 received from affiliates) | | | 91,299 | |
| | | | |
Net realized gain (loss) | | | 85,185 | |
| | | | |
Net change in unrealized appreciation (depreciation) on investments ($625,351 of change in unrealized appreciation (depreciation) from affiliates) | | | 862,936 | |
| | | | |
NET REALIZED AND UNREALIZED GAIN (LOSS) | | | 948,121 | |
| | | | |
NET INCREASE (DECREASE) IN NET ASSETS RESULTING FROM OPERATIONS | | $ | 1,309,223 | |
| | | | |
See Notes to Financial Statements.
5
AXA PREMIER VIP TRUST
CHARTERSM MODERATE PORTFOLIO
STATEMENT OF CHANGES IN NET ASSETS
| | | | | | | | |
| | | Year Ended December 31, | |
| | 2016 | | | 2015 | |
INCREASE (DECREASE) IN NET ASSETS FROM OPERATIONS: | |
Net investment income (loss) | | $ | 361,102 | | | $ | 229,605 | |
Net realized gain (loss) on investments and net distributions of realized gain received from underlying funds | | | 85,185 | | | | 118,418 | |
Net change in unrealized appreciation (depreciation) on investments | | | 862,936 | | | | (825,038 | ) |
| | | | | | | | |
NET INCREASE (DECREASE) IN NET ASSETS RESULTING FROM OPERATIONS | | | 1,309,223 | | | | (477,015 | ) |
| | | | | | | | |
DIVIDENDS AND DISTRIBUTIONS: | | | | | | | | |
Dividends from net investment income | | | | | | | | |
Class B | | | (378,663 | ) | | | (273,933 | ) |
Distributions from net realized capital gains | | | | | | | | |
Class B | | | (109,477 | ) | | | (135,166 | ) |
| | | | | | | | |
TOTAL DIVIDENDS AND DISTRIBUTIONS | | | (488,140 | ) | | | (409,099 | ) |
| | | | | | | | |
CAPITAL SHARES TRANSACTIONS: | | | | | | | | |
Class B | | | | | | | | |
Capital shares sold [ 561,803 and 953,193 shares, respectively ] | | | 5,425,745 | | | | 9,427,556 | |
Capital shares issued in reinvestment of dividends and distributions [ 49,619 and 43,053 shares,
respectively ] | | | 488,140 | | | | 409,099 | |
Capital shares repurchased [ (303,434) and (681,183) shares, respectively ] | | | (2,912,934 | ) | | | (6,891,992 | ) |
| | | | | | | | |
NET INCREASE (DECREASE) IN NET ASSETS RESULTING FROM CAPITAL SHARE TRANSACTIONS | | | 3,000,951 | | | | 2,944,663 | |
| | | | | | | | |
TOTAL INCREASE (DECREASE) IN NET ASSETS | | | 3,822,034 | | | | 2,058,549 | |
NET ASSETS: | |
Beginning of year | | | 19,789,065 | | | | 17,730,516 | |
| | | | | | | | |
End of year (a) | | $ | 23,611,099 | | | $ | 19,789,065 | |
| | | | | | | | |
(a) Includes accumulated undistributed (overdistributed) net investment income (loss) of | | $ | 2,815 | | | $ | 911 | |
| | | | | | | | |
See Notes to Financial Statements.
6
AXA PREMIER VIP TRUST
CHARTERSM MODERATE PORTFOLIO
FINANCIAL HIGHLIGHTS
| | | | | | | | | | | | | | | | |
| | | Year Ended December 31, | | | October 30, 2013* to
December 31, 2013 | |
| Class B | | 2016 | | | 2015 | | | 2014 | | |
Net asset value, beginning of period | | $ | 9.42 | | | $ | 9.93 | | | $ | 9.93 | | | $ | 10.00 | |
| | | | | | | | | | | | | | | | |
Income (loss) from investment operations: | | | | | | | | | | | | | | | | |
Net investment income (loss) (e)(x) | | | 0.16 | | | | 0.12 | | | | 0.19 | | | | 0.08 | |
Net realized and unrealized gain (loss) on investments | | | 0.43 | | | | (0.43 | ) | | | (0.02 | ) | | | — | # |
| | | | | | | | | | | | | | | | |
Total from investment operations | | | 0.59 | | | | (0.31 | ) | | | 0.17 | | | | 0.08 | |
| | | | | | | | | | | | | | | | |
Less distributions: | | | | | | | | | | | | | | | | |
Dividends from net investment income | | | (0.16 | ) | | | (0.13 | ) | | | (0.16 | ) | | | (0.12 | ) |
Distributions from net realized gains | | | (0.05 | ) | | | (0.07 | ) | | | (0.01 | ) | | | (0.03 | ) |
| | | | | | | | | | | | | | | | |
Total dividends and distributions | | | (0.21 | ) | | | (0.20 | ) | | | (0.17 | ) | | | (0.15 | ) |
| | | | | | | | | | | | | | | | |
Net asset value, end of period | | $ | 9.80 | | | $ | 9.42 | | | $ | 9.93 | | | $ | 9.93 | |
| | | | | | | | | | | | | | | | |
Total return (b) | | | 6.22 | % | | | (3.04 | )% | | | 1.78 | % | | | 0.84 | % |
| | | | | | | | | | | | | | | | |
Ratios/Supplemental Data: | | | | | | | | | | | | | | | | |
Net assets, end of period (000’s) | | $ | 23,611 | | | $ | 19,789 | | | $ | 17,731 | | | $ | 4,481 | |
Ratio of expenses to average net assets: | | | | | | | | | | | | | | | | |
After waivers and reimbursements (a)(f) | | | 0.58 | %(j) | | | 0.63 | % | | | 0.65 | % | | | 0.65 | % |
Before waivers and reimbursements (a)(f) | | | 1.52 | % | | | 1.81 | % | | | 2.86 | % | | | 3.78 | % |
Ratio of net investment income (loss) to average net assets: | | | | | | | | | | | | | | | | |
After waivers and reimbursements (a)(f)(x). | | | 1.67 | % | | | 1.24 | % | | | 1.87 | % | | | 4.87 | %(l) |
Before waivers and reimbursements (a)(f)(x) | | | 0.74 | % | | | 0.06 | % | | | (0.35 | )% | | | 1.74 | %(l) |
Portfolio turnover rate (z)^ | | | 13 | % | | | 39 | % | | | 13 | % | | | 15 | % |
| * | Commencement of Operations. |
| # | Per share amount is less than $0.005. |
| ^ | Portfolio turnover rate excludes derivatives, if any. |
| (a) | Ratios for periods less than one year are annualized. |
| (b) | Total returns for periods less than one year are not annualized. |
| (e) | Net investment income (loss) per share is based on average shares outstanding. |
| (f) | Expenses do not include the expenses of the underlying funds (“indirect expenses”), if applicable. |
| (j) | Including direct and indirect expenses, the net expense ratio after waivers and reimbursements would be 1.07%. |
| (l) | The annualized ratio of net investment income to average net assets may not be indicative of operating results for a full year. |
| (x) | Recognition of net investment income is affected by the timing of dividend declarations by the underlying funds in which the Portfolio invests. |
| (z) | Portfolio turnover rate for periods less than one year is not annualized. |
See Notes to Financial Statements.
7
AXA PREMIER VIP TRUST
CHARTERSM INTERNATIONAL MODERATE PORTFOLIO
PORTFOLIO OF INVESTMENTS
December 31, 2016
| | | | | | | | |
| | | Number of
Shares | | | Value
(Note 1) | |
EXCHANGE TRADED FUNDS: | | | | | |
iShares Emerging Markets Infrastructure Fund | | | 1,110 | | | $ | 31,180 | |
iShares Global Infrastructure Fund | | | 3,290 | | | | 128,442 | |
iShares International High Yield Bond Fund | | | 20,960 | | | | 961,016 | |
iShares International Select Dividend Fund | | | 19,190 | | | | 567,256 | |
iShares International Treasury Bond Fund | | | 410 | | | | 36,826 | |
iShares JP Morgan USD Emerging Markets Bond Fund | | | 10,010 | | | | 1,103,302 | |
iShares MSCI EAFE Small-Cap Fund | | | 4,240 | | | | 211,322 | |
iShares MSCI Frontier 100 Fund | | | 240 | | | | 5,964 | |
PowerShares DB G10 Currency Harvest Fund | | | 6,120 | | | | 151,837 | |
PowerShares Global Short Term High Yield Bond Portfolio | | | 7,200 | | | | 175,965 | |
SPDR Citi International Government Inflation-Protected Bond Fund* | | | 10,260 | | | | 533,725 | |
SPDR S&P Emerging Markets SmallCap Fund | | | 1,400 | | | | 55,608 | |
Vanguard Short-Term Inflation-Protected Securities Fund | | | 920 | | | | 45,227 | |
Vanguard Total International Bond Fund | | | 4,120 | | | | 223,675 | |
| | | | | | | | |
Total Exchange Traded Funds (51.3%)
(Cost $4,780,124) | | | | | | | 4,231,345 | |
| | | | | | | | |
INVESTMENT COMPANIES: | | | | | | | | |
AXA Real Estate Portfolio‡ | | | 44,290 | | | | 463,857 | |
AXA SmartBeta Equity Portfolio‡ | | | 16,944 | | | | 189,013 | |
EQ/Emerging Markets Equity PLUS Portfolio‡ | | | 32,813 | | | | 262,647 | |
EQ/Global Bond PLUS Portfolio‡ | | | 83,600 | | | | 732,791 | |
EQ/International Equity Index Portfolio‡ | | | 78,611 | | | | 657,522 | |
EQ/Low Volatility Global ETF Portfolio‡ | | | 18,887 | | | $ | 192,884 | |
EQ/MFS International Growth Portfolio‡ | | | 53,327 | | | | 350,415 | |
EQ/PIMCO Global Real Return Portfolio‡ | | | 55,589 | | | | 539,597 | |
Morgan Stanley Institutional Fund, Inc. – Frontier Emerging Markets Portfolio, Institutional Class | | | 10,784 | | | | 187,535 | |
PIMCO Foreign Bond Fund Unhedged, Institutional Class | | | 15,794 | | | | 145,462 | |
Templeton Emerging Markets Small Cap Fund, Advisor Class | | | 11,046 | | | | 128,240 | |
Templeton Global Smaller Companies Fund, Advisor Class | | | 15,770 | | | | 138,457 | |
| | | | | | | | |
Total Investment Companies (48.4%)
(Cost $4,260,738) | | | | | | | 3,988,420 | |
| | | | | | | | |
SHORT-TERM INVESTMENT: | | | | | | | | |
Investment Company (1.0%) | | | | | | | | |
JPMorgan Prime Money Market Fund, IM Shares | | | 85,159 | | | | 85,185 | |
| | | | | | | | |
Total Short-Term Investment (1.0%)
(Cost $85,176) | | | | | | | 85,185 | |
| | | | | | | | |
Total Investments (100.7%)
(Cost $9,126,038) | | | | | | | 8,304,950 | |
Other Assets Less Liabilities (-0.7%) | | | | | | | (61,594 | ) |
| | | | | | | | |
Net Assets (100%) | | | | | | $ | 8,243,356 | |
| | | | | | | | |
| ‡ | All, or a portion, of the security is an affiliated company as defined under the Investment Company Act of 1940. |
The holdings in affiliated Investment Companies are all Class K shares.
Investments in companies which were affiliates for the year ended December 31, 2016, were as follows:
| | | | | | | | | | | | | | | | | | | | | | | | |
Securities | | Value
December 31,
2015 | | | Purchases
at Cost | | | Sales
at Cost | | | Value
December 31,
2016 | | | Dividend
Income | | | Realized
Gain
(Loss)† | |
AXA Real Estate Portfolio (a) | | $ | 846,589 | | | $ | 73,225 | | | $ | 473,361 | | | $ | 463,857 | | | $ | 4,275 | | | $ | 35,084 | |
AXA SmartBeta Equity Portfolio | | | 335,341 | | | | 26,282 | | | | 171,761 | | | | 189,013 | | | | 2,849 | | | | 16,113 | |
EQ/Emerging Markets Equity PLUS Portfolio | | | 415,055 | | | | 33,530 | | | | 241,069 | | | | 262,647 | | | | 2,356 | | | | (24,025 | ) |
EQ/Global Bond PLUS Portfolio | | | 1,289,654 | | | | 117,345 | | | | 705,078 | | | | 732,791 | | | | 16,074 | | | | (5,017 | ) |
EQ/International Equity Index Portfolio | | | 1,028,384 | | | | 171,825 | | | | 591,722 | | | | 657,522 | | | | 19,154 | | | | (61,199 | ) |
EQ/Low Volatility Global ETF Portfolio | | | 334,567 | | | | 33,717 | | | | 182,541 | | | | 192,884 | | | | 4,937 | | | | 17,280 | |
EQ/MFS International Growth Portfolio | | | 593,127 | | | | 49,353 | | | | 326,729 | | | | 350,415 | | | | 4,311 | | | | (25,615 | ) |
EQ/PIMCO Global Real Return Portfolio | | | 792,355 | | | | 124,211 | | | | 414,197 | | | | 539,597 | | | | 27,413 | | | | 7,841 | |
| | | | | | | | | | | | | | | | | | | | | | | | |
| | $ | 5,635,072 | | | $ | 629,488 | | | $ | 3,106,458 | | | $ | 3,388,726 | | | $ | 81,369 | | | $ | (39,538 | ) |
| | | | | | | | | | | | | | | | | | | | | | | | |
| † | When applicable, realized gain includes net distributions of realized gain received from underlying funds. |
| (a) | Formerly known as EQ/Real Estate PLUS Portfolio. |
See Notes to Financial Statements.
8
AXA PREMIER VIP TRUST
CHARTERSM INTERNATIONAL MODERATE PORTFOLIO
PORTFOLIO OF INVESTMENTS (Continued)
December 31, 2016
The following is a summary of the inputs used to value the Portfolio’s assets and liabilities carried at fair value as of December 31, 2016:
The inputs or methodology used for valuing securities are not necessarily an indication of the risk associated with investing in those securities.
Various inputs are used in determining the value of the Portfolio’s investments. These inputs are summarized in the three broad levels listed below:
| | | | | | | | | | | | | | | | |
| | | | | |
| Investment Type | | Level 1
Quoted Prices in
Active Markets for
Identical
Securities | | | Level 2
Significant Other
Observable Inputs
(including quoted prices
for similar securities,
interest rates,
prepayment speeds,
credit risk, etc.) | | | Level 3
Significant Unobservable
Inputs (including the
Portfolio’s own
assumptions in
determining the fair
value of investments) | | | Total | |
Assets: | | | | | | | | | | | | | | | | |
Exchange Traded Funds | | | | | | | | | | | | | | | | |
Exchange Traded Funds | | $ | 4,231,345 | | | $ | — | | | $ | — | | | $ | 4,231,345 | |
Investment Companies | | | | | | | | | | | | | | | | |
Investment Companies | | | 599,694 | | | | 3,388,726 | | | | — | | | | 3,988,420 | |
Short-Term Investments | | | | | | | | | | | | | | | | |
Investment Companies | | | 85,185 | | | | — | | | | — | | | | 85,185 | |
| | | | | | | | | | | | | | | | |
Total Assets | | $ | 4,916,224 | | | $ | 3,388,726 | | | $ | — | | | $ | 8,304,950 | |
| | | | | | | | | | | | | | | | |
Total Liabilities | | $ | — | | | $ | — | | | $ | — | | | $ | — | |
| | | | | | | | | | | | | | | | |
Total | | $ | 4,916,224 | | | $ | 3,388,726 | | | $ | — | | | $ | 8,304,950 | |
| | | | | | | | | | | | | | | | |
There were no transfers between Levels 1, 2 or 3 during the year ended December 31, 2016.
The Portfolio held no derivatives contracts during the year ended December 31, 2016.
Investment security transactions for the year ended December 31, 2016 were as follows:
| | | | |
Cost of Purchases: | | | | |
Long-term investments other than U.S. government debt securities | | $ | 965,239 | |
Net Proceeds of Sales and Redemptions: | | | | |
Long-term investments other than U.S. government debt securities | | $ | 6,723,941 | |
As of December 31, 2016, the gross unrealized appreciation (depreciation) of investments based on the aggregate cost of investments for Federal income tax purposes was as follows:
| | | | |
Aggregate gross unrealized appreciation | | $ | 51,152 | |
Aggregate gross unrealized depreciation | | | (861,044 | ) |
| | | | |
Net unrealized depreciation | | $ | (809,892 | ) |
| | | | |
Federal income tax cost of investments | | $ | 9,114,842 | |
| | | | |
See Notes to Financial Statements.
9
AXA PREMIER VIP TRUST
CHARTERSM INTERNATIONAL MODERATE PORTFOLIO
STATEMENT OF ASSETS AND LIABILITIES
December 31, 2016
| | | | |
ASSETS | | | | |
Investments at value: | | | | |
Affiliated Issuers (Cost $3,642,456) | | $ | 3,388,726 | |
Unaffiliated Issuers (Cost $5,483,582) | | | 4,916,224 | |
Cash | | | 10,000 | |
Dividends, interest and other receivables | | | 6,992 | |
Receivable from Separate Accounts for Trust shares sold | | | 154 | |
Receivable for securities sold | | | 37 | |
Other assets | | | 59 | |
| | | | |
Total assets | | | 8,322,192 | |
| | | | |
LIABILITIES | | | | |
Administrative fees payable | | | 3,588 | |
Distribution fees payable – Class B | | | 1,727 | |
Trustees’ fees payable | | | 837 | |
Payable for securities purchased | | | 198 | |
Payable to Separate Accounts for Trust shares redeemed | | | 50 | |
Accrued expenses | | | 72,436 | |
| | | | |
Total liabilities | | | 78,836 | |
| | | | |
NET ASSETS | | $ | 8,243,356 | |
| | | | |
Net assets were comprised of: | | | | |
Paid in capital | | $ | 9,345,198 | |
Accumulated undistributed net investment income (loss) | | | 5,075 | |
Accumulated undistributed net realized gain (loss) on investments | | | (285,829 | ) |
Net unrealized appreciation (depreciation) on investments | | | (821,088 | ) |
| | | | |
Net assets | | $ | 8,243,356 | |
| | | | |
Class B | | | | |
Net asset value, offering and redemption price per share, $8,243,356 / 906,792 shares outstanding (unlimited amount authorized: $0.001 par value) | | $ | 9.09 | |
| | | | |
STATEMENT OF OPERATIONS
For the Year Ended December 31, 2016
| | | | |
INVESTMENT INCOME | |
Dividends ($81,369 of dividend income received from affiliates) | | $ | 242,271 | |
Interest | | | 2,827 | |
| | | | |
Total income | | | 245,098 | |
| | | | |
EXPENSES | |
Custodian fees | | | 53,500 | |
Professional fees | | | 37,589 | |
Administrative fees | | | 32,503 | |
Distribution fees – Class B | | | 27,709 | |
Investment management fees | | | 16,625 | |
Printing and mailing expenses | | | 1,705 | |
Trustees’ fees | | | 459 | |
Miscellaneous | | | 311 | |
| | | | |
Gross expenses | | | 170,401 | |
Less: Waiver from investment manager | | | (49,128 | ) |
Reimbursement from investment manager | | | (55,240 | ) |
| | | | |
Net expenses | | | 66,033 | |
| | | | |
NET INVESTMENT INCOME (LOSS) | | | 179,065 | |
| | | | |
REALIZED AND UNREALIZED GAIN (LOSS) | |
Net realized gain (loss) on investments ($(54,240) of realized gain (loss) from affiliates) | | | (250,302 | ) |
Net distributions of realized gain received from underlying funds ($14,702 received from affiliates) | | | 21,911 | |
| | | | |
Net realized gain (loss) | | | (228,391 | ) |
| | | | |
Net change in unrealized appreciation (depreciation) on investments ($230,624 of change in unrealized appreciation (depreciation) from affiliates) | | | 784,728 | |
| | | | |
NET REALIZED AND UNREALIZED GAIN (LOSS) | | | 556,337 | |
| | | | |
NET INCREASE (DECREASE) IN NET ASSETS RESULTING FROM OPERATIONS | | $ | 735,402 | |
| | | | |
See Notes to Financial Statements.
10
AXA PREMIER VIP TRUST
CHARTERSM INTERNATIONAL MODERATE PORTFOLIO
STATEMENT OF CHANGES IN NET ASSETS
| | | | | | | | |
| | | Year Ended December 31, | |
| | 2016 | | | 2015 (ag) | |
INCREASE (DECREASE) IN NET ASSETS FROM OPERATIONS: | | | | | | | | |
Net investment income (loss) | | $ | 179,065 | | | $ | 138,265 | |
Net realized gain (loss) on investments and net distributions of realized gain received from underlying funds | | | (228,391 | ) | | | (8,433 | ) |
Net change in unrealized appreciation (depreciation) on investments | | | 784,728 | | | | (328,510 | ) |
| | | | | | | | |
NET INCREASE (DECREASE) IN NET ASSETS RESULTING FROM OPERATIONS | | | 735,402 | | | | (198,678 | ) |
| | | | | | | | |
DIVIDENDS AND DISTRIBUTIONS: | | | | | | | | |
Dividends from net investment income | | | | | | | | |
Class B | | | (187,952 | ) | | | (150,705 | ) |
Distributions from net realized capital gains | | | | | | | | |
Class B | | | — | | | | (16,277 | ) |
Return of capital | | | | | | | | |
Class B | | | (21,324 | ) | | | — | |
| | | | | | | | |
TOTAL DIVIDENDS AND DISTRIBUTIONS | | | (209,276 | ) | | | (166,982 | ) |
| | | | | | | | |
CAPITAL SHARES TRANSACTIONS: | | | | | | | | |
Class B | | | | | | | | |
Capital shares sold [ 114,708 and 72,783 shares, respectively ] | | | 1,068,303 | | | | 672,733 | |
Capital shares issued in connection with merger (Note 9) [ 0 and 962,890 shares, respectively ] | | | — | | | | 8,571,057 | |
Capital shares issued in reinvestment of dividends and distributions [ 23,196 and 18,767 shares, respectively ] | | | 209,276 | | | | 166,982 | |
Capital shares repurchased [ (757,835) and (32,138) shares, respectively ] | | | (7,076,461 | ) | | | (299,237 | ) |
| | | | | | | | |
NET INCREASE (DECREASE) IN NET ASSETS RESULTING FROM CAPITAL SHARE TRANSACTIONS | | | (5,798,882 | ) | | | 9,111,535 | |
| | | | | | | | |
TOTAL INCREASE (DECREASE) IN NET ASSETS | | | (5,272,756 | ) | | | 8,745,875 | |
NET ASSETS: | |
Beginning of year | | | 13,516,112 | | | | 4,770,237 | |
| | | | | | | | |
End of year (a) | | $ | 8,243,356 | | | $ | 13,516,112 | |
| | | | | | | | |
(a) Includes accumulated undistributed (overdistributed) net investment income (loss) of | | $ | 5,075 | | | $ | 9,087 | |
| | | | | | | | |
(ag) On September 25, 2015, this Portfolio received, through a merger transaction, the assets and liabilities of the CharterSM International Conservative Portfolio and CharterSM International Growth Portfolio that followed the same objectives as this Portfolio. Information prior to the period ended September 25, 2015 represents the results of operations of the CharterSM International Moderate Portfolio. | |
See Notes to Financial Statements.
11
AXA PREMIER VIP TRUST
CHARTERSM INTERNATIONAL MODERATE PORTFOLIO (ag)
FINANCIAL HIGHLIGHTS
| | | | | | | | | | | | | | | | |
| | | Year Ended December 31, | | | October 30, 2013* to
December 31, 2013 | |
| Class B | | 2016 | | | 2015 | | | 2014 | | |
Net asset value, beginning of period | | $ | 8.85 | | | $ | 9.46 | | | $ | 9.77 | | | $ | 10.00 | |
| | | | | | | | | | | | | | | | |
Income (loss) from investment operations: | | | | | | | | | | | | | | | | |
Net investment income (loss) (e)(x) | | | 0.15 | | | | 0.18 | | | | 0.26 | | | | 0.09 | |
Net realized and unrealized gain (loss) on investments | | | 0.32 | | | | (0.66 | ) | | | (0.29 | ) | | | (0.17 | ) |
| | | | | | | | | | | | | | | | |
Total from investment operations | | | 0.47 | | | | (0.48 | ) | | | (0.03 | ) | | | (0.08 | ) |
| | | | | | | | | | | | | | | | |
Less distributions: | | | | | | | | | | | | | | | | |
Dividends from net investment income | | | (0.21 | ) | | | (0.10 | ) | | | (0.28 | ) | | | (0.11 | ) |
Distributions from net realized gains | | | — | | | | (0.03 | ) | | | — | | | | (0.01 | ) |
Return of capital | | | (0.02 | ) | | | — | | | | — | | | | (0.03 | ) |
| | | | | | | | | | | | | | | | |
Total dividends and distributions | | | (0.23 | ) | | | (0.13 | ) | | | (0.28 | ) | | | (0.15 | ) |
| | | | | | | | | | | | | | | | |
Net asset value, end of period | | $ | 9.09 | | | $ | 8.85 | | | $ | 9.46 | | | $ | 9.77 | |
| | | | | | | | | | | | | | | | |
Total return (b) | | | 5.41 | % | | | (5.07 | )% | | | (0.29 | )% | | | (0.81 | )% |
| | | | | | | | | | | | | | | | |
Ratios/Supplemental Data: | | | | | | | | | | | | | | | | |
Net assets, end of period (000’s) | | $ | 8,243 | | | $ | 13,516 | | | $ | 4,770 | | | $ | 3,971 | |
Ratio of expenses to average net assets: | | | | | | | | | | | | | | | | |
After waivers and reimbursements (a)(f) | | | 0.60 | %(j) | | | 0.60 | % | | | 0.65 | % | | | 0.65 | % |
Before waivers and reimbursements (a)(f) | | | 1.54 | % | | | 2.89 | % | | | 4.19 | % | | | 3.88 | % |
Ratio of net investment income (loss) to average net assets: | | | | | | | | | | | | | | | | |
After waivers and reimbursements (a)(f)(x) | | | 1.62 | % | | | 1.91 | % | | | 2.59 | % | | | 5.14 | %(l) |
Before waivers and reimbursements (a)(f)(x) | | | 0.67 | % | | | (0.37 | )% | | | (0.95 | )% | | | 1.91 | %(l) |
Portfolio turnover rate (z)^ | | | 9 | % | | | 13 | % | | | 12 | % | | | 13 | % |
| * | Commencement of Operations. |
| ^ | Portfolio turnover rate excludes derivatives, if any. |
| (a) | Ratios for periods less than one year are annualized. |
| (b) | Total returns for periods less than one year are not annualized. |
| (e) | Net investment income (loss) per share is based on average shares outstanding. |
| (f) | Expenses do not include the expenses of the underlying funds (“indirect expenses”), if applicable. |
| (j) | Including direct and indirect expenses, the net expense ratio after waivers and reimbursements would be 0.97%. |
| (l) | The annualized ratio of net investment income to average net assets may not be indicative of operating results for a full year. |
| (x) | Recognition of net investment income is affected by the timing of dividend declarations by the underlying funds in which the Portfolio invests. |
| (z) | Portfolio turnover rate for periods less than one year is not annualized. |
| (ag) | On September 25, 2015, this Portfolio received, through a merger transaction, the assets and liabilities of the CharterSM International Conservative Portfolio and CharterSM International Growth Portfolio that followed the same objectives as this Portfolio. Information prior to the period ended September 25, 2015 represents the results of operations of the CharterSM International Moderate Portfolio. |
See Notes to Financial Statements.
12
AXA PREMIER VIP TRUST
CHARTERSM INCOME STRATEGIES PORTFOLIO
PORTFOLIO OF INVESTMENTS
December 31, 2016
| | | | | | | | |
| | | Number of
Shares | | | Value
(Note 1) | |
EXCHANGE TRADED FUNDS: | | | | | | | | |
iShares Aaa – A Rated Corporate Bond Fund | | | 2,380 | | | $ | 122,237 | |
iShares Emerging Markets Infrastructure Fund | | | 3,270 | | | | 91,854 | |
iShares Floating Rate Bond Fund | | | 1,420 | | | | 72,037 | |
iShares Global Infrastructure Fund | | | 9,080 | | | | 354,483 | |
iShares iBoxx $ Investment Grade Corporate Bond Fund | | | 1,600 | | | | 187,488 | |
iShares International High Yield Bond Fund | | | 950 | | | | 43,558 | |
iShares International Select Dividend Fund | | | 8,120 | | | | 240,027 | |
iShares JP Morgan USD Emerging Markets Bond Fund | | | 1,020 | | | | 112,424 | |
iShares US Preferred Stock Fund | | | 9,040 | | | | 336,378 | |
PowerShares Global Short Term High Yield Bond Portfolio | | | 420 | | | | 10,265 | |
PowerShares S&P 500 BuyWrite Portfolio | | | 13,470 | | | | 286,507 | |
SPDR Bloomberg Barclays Short Term High Yield Bond Fund | | | 2,370 | | | | 65,602 | |
SPDR Nuveen S&P High Yield Municipal Bond Fund | | | 2,350 | | | | 131,530 | |
Vanguard Short-Term Inflation-Protected Securities Fund | | | 440 | | | | 21,630 | |
Vanguard Total International Bond Fund | | | 170 | | | | 9,229 | |
| | | | | | | | |
Total Exchange Traded Funds (45.8%)
(Cost $2,200,991) | | | | | | | 2,085,249 | |
| | | | | | | | |
INVESTMENT COMPANIES: | | | | | | | | |
AXA Natural Resources Portfolio‡ | | | 9,903 | | | | 78,753 | |
AXA Real Estate Portfolio‡ | | | 25,505 | | | | 267,120 | |
BlackRock Global Long/Short Credit Fund, Institutional Class* | | | 11,451 | | | | 115,880 | |
Eaton Vance Floating-Rate Fund, Institutional Class | | | 18,491 | | | $ | 165,495 | |
EQ/Boston Advisors Equity Income Portfolio‡ | | | 100,905 | | | | 581,092 | |
EQ/Core Bond Index Portfolio‡ | | | 23,277 | | | | 229,209 | |
EQ/Energy ETF Portfolio‡ | | | 9,528 | | | | 70,882 | |
EQ/Global Bond PLUS Portfolio‡ | | | 12,479 | | | | 109,384 | |
EQ/High Yield Bond Portfolio‡ | | | 22,420 | | | | 213,481 | |
EQ/PIMCO Global Real Return Portfolio‡ | | | 10,097 | | | | 98,009 | |
EQ/Quality Bond PLUS Portfolio‡ | | | 8,313 | | | | 70,323 | |
Multimanager Core Bond Portfolio‡ | | | 41,450 | | | | 405,357 | |
PIMCO Foreign Bond Fund Unhedged, Institutional Class | | | 10,218 | | | | 94,111 | |
| | | | | | | | |
Total Investment Companies (54.9%)
(Cost $2,724,655) | | | | | | | 2,499,096 | |
| | | | | | | | |
SHORT-TERM INVESTMENT: | | | | | | | | |
Investment Company (0.3%) | | | | | | | | |
JPMorgan Prime Money Market Fund, IM Shares | | | 13,329 | | | | 13,333 | |
| | | | | | | | |
Total Short-Term Investment (0.3%)
(Cost $13,333) | | | | | | | 13,333 | |
| | | | | | | | |
Total Investments (101.0%)
(Cost $4,938,979) | | | | | | | 4,597,678 | |
Other Assets Less Liabilities (-1.0%) | | | | | | | (46,851 | ) |
| | | | | | | | |
Net Assets (100%) | | | | | | $ | 4,550,827 | |
| | | | | | | | |
| ‡ | All, or a portion, of the security is an affiliated company as defined under the Investment Company Act of 1940. |
The holdings in affiliated Investment Companies are all Class K shares.
Investments in companies which were affiliates for the year ended December 31, 2016, were as follows:
| | | | | | | | | | | | | | | | | | | | | | | | |
Securities | | Value
December 31,
2015 | | | Purchases
at Cost | | | Sales
at Cost | | | Value
December 31,
2016 | | | Dividend
Income | | | Realized
Gain
(Loss)† | |
AXA Natural Resources Portfolio | | $ | 83,231 | | | $ | 15,892 | | | $ | 38,707 | | | $ | 78,753 | | | $ | 1,834 | | | $ | (157 | ) |
AXA Real Estate Portfolio (a) | | | 306,197 | | | | 76,870 | | | | 121,348 | | | | 267,120 | | | | 2,390 | | | | 7,797 | |
EQ/Boston Advisors Equity Income Portfolio | | | 630,977 | | | | 216,962 | | | | 278,182 | | | | 581,092 | | | | 12,318 | | | | 48,983 | |
EQ/Core Bond Index Portfolio | | | 262,847 | | | | 71,634 | | | | 104,708 | | | | 229,209 | | | | 4,069 | | | | 681 | |
EQ/Energy ETF Portfolio | | | 58,701 | | | | 25,289 | | | | 25,998 | | | | 70,882 | | | | 1,230 | | | | 852 | |
EQ/Global Bond PLUS Portfolio | | | 125,600 | | | | 30,629 | | | | 46,501 | | | | 109,384 | | | | 2,414 | | | | (265 | ) |
EQ/High Yield Bond Portfolio | | | 246,691 | | | | 53,485 | | | | 103,357 | | | | 213,481 | | | | 11,310 | | | | (2,308 | ) |
EQ/PIMCO Global Real Return Portfolio | | | 107,865 | | | | 25,666 | | | | 40,152 | | | | 98,009 | | | | 5,007 | | | | 148 | |
EQ/Quality Bond PLUS Portfolio | | | 93,422 | | | | 17,620 | | | | 40,600 | | | | 70,323 | | | | 1,008 | | | | 485 | |
Multimanager Core Bond Portfolio | | | 460,269 | | | | 127,863 | | | | 185,348 | | | | 405,357 | | | | 9,609 | | | | 156 | |
| | | | | | | | | | | | | | | | | | | | | | | | |
| | $ | 2,375,800 | | | $ | 661,910 | | | $ | 984,901 | | | $ | 2,123,610 | | | $ | 51,189 | | | $ | 56,372 | |
| | | | | | | | | | | | | | | | | | | | | | | | |
| † | When applicable, realized gain includes net distributions of realized gain received from underlying funds. |
| (a) | Formerly known as EQ/Real Estate PLUS Portfolio. |
See Notes to Financial Statements.
13
AXA PREMIER VIP TRUST
CHARTERSM INCOME STRATEGIES PORTFOLIO
PORTFOLIO OF INVESTMENTS (Continued)
December 31, 2016
The following is a summary of the inputs used to value the Portfolio’s assets and liabilities carried at fair value as of December 31, 2016:
The inputs or methodology used for valuing securities are not necessarily an indication of the risk associated with investing in those securities.
Various inputs are used in determining the value of the Portfolio’s investments. These inputs are summarized in the three broad levels listed below:
| | | | | | | | | | | | | | | | |
| | | | | |
| Investment Type | | Level 1
Quoted Prices in
Active Markets for
Identical
Securities | | | Level 2
Significant Other
Observable Inputs
(including quoted prices
for similar securities,
interest rates,
prepayment speeds,
credit risk, etc.) | | | Level 3
Significant Unobservable
Inputs (including the
Portfolio’s own
assumptions in
determining the fair
value of investments) | | | Total | |
Assets: | | | | | |
Exchange Traded Funds | | | | | | | | | | | | | | | | |
Exchange Traded Funds | | $ | 2,085,249 | | | $ | — | | | $ | — | | | $ | 2,085,249 | |
Investment Companies | | | | | | | | | | | | | | | | |
Investment Companies | | | 375,486 | | | | 2,123,610 | | | | — | | | | 2,499,096 | |
Short-Term Investments | | | | | | | | | | | | | | | | |
Investment Companies | | | 13,333 | | | | — | | | | — | | | | 13,333 | |
| | | | | | | | | | | | | | | | |
Total Assets | | $ | 2,474,068 | | | $ | 2,123,610 | | | $ | — | | | $ | 4,597,678 | |
| | | | | | | | | | | | | | | | |
Total Liabilities | | $ | — | | | $ | — | | | $ | — | | | $ | — | |
| | | | | | | | | | | | | | | | |
Total | | $ | 2,474,068 | | | $ | 2,123,610 | | | $ | — | | | $ | 4,597,678 | |
| | | | | | | | | | | | | | | | |
There were no transfers between Levels 1, 2 or 3 during the year ended December 31, 2016.
The Portfolio held no derivatives contracts during the year ended December 31, 2016.
Investment security transactions for the year ended December 31, 2016 were as follows:
| | | | |
Cost of Purchases: | | | | |
Long-term investments other than U.S. government debt securities | | $ | 1,031,954 | |
Net Proceeds of Sales and Redemptions: | | | | |
Long-term investments other than U.S. government debt securities | | $ | 1,699,365 | |
As of December 31, 2016, the gross unrealized appreciation (depreciation) of investments based on the aggregate cost of investments for Federal income tax purposes was as follows:
| | | | |
Aggregate gross unrealized appreciation | | $ | 8,901 | |
Aggregate gross unrealized depreciation | | | (361,845 | ) |
| | | | |
Net unrealized depreciation | | $ | (352,944 | ) |
| | | | |
Federal income tax cost of investments | | $ | 4,950,622 | |
| | | | |
See Notes to Financial Statements.
14
AXA PREMIER VIP TRUST
CHARTERSM INCOME STRATEGIES PORTFOLIO
STATEMENT OF ASSETS AND LIABILITIES
December 31, 2016
| | | | |
ASSETS | |
Investments at value: | | | | |
Affiliated Issuers (Cost $2,329,555) | | $ | 2,123,610 | |
Unaffiliated Issuers (Cost $2,609,424) | | | 2,474,068 | |
Cash | | | 9,197 | |
Receivable from investment manager | | | 3,313 | |
Dividends, interest and other receivables | | | 1,478 | |
Receivable for securities sold | | | 59 | |
Other assets | | | 16 | |
| | | | |
Total assets | | | 4,611,741 | |
| | | | |
LIABILITIES | |
Payable to Separate Accounts for Trust shares redeemed | | | 9,243 | |
Distribution fees payable – Class B | | | 962 | |
Payable for securities purchased | | | 742 | |
Trustees’ fees payable | | | 653 | |
Accrued expenses | | | 49,314 | |
| | | | |
Total liabilities | | | 60,914 | |
| | | | |
NET ASSETS | | $ | 4,550,827 | |
| | | | |
Net assets were comprised of: | |
Paid in capital | | $ | 4,856,705 | |
Accumulated undistributed net investment income (loss) | | | 2,165 | |
Accumulated undistributed net realized gain (loss) on investments | | | 33,258 | |
Net unrealized appreciation (depreciation) on investments | | | (341,301 | ) |
| | | | |
Net assets | | $ | 4,550,827 | |
| | | | |
Class B | | | | |
Net asset value, offering and redemption price per share, $4,550,827 / 484,237 shares outstanding (unlimited amount authorized: $0.001 par value) | | $ | 9.40 | |
| | | | |
STATEMENT OF OPERATIONS
For the Year Ended December 31, 2016
| | | | |
INVESTMENT INCOME | |
Dividends ($51,189 of dividend income received from affiliates) | | $ | 138,635 | |
Interest | | | 2,578 | |
| | | | |
Total income | | | 141,213 | |
| | | | |
EXPENSES | |
Custodian fees | | | 67,000 | |
Professional fees | | | 35,866 | |
Administrative fees | | | 32,500 | |
Distribution fees – Class B | | | 11,799 | |
Investment management fees | | | 7,080 | |
Printing and mailing expenses | | | 681 | |
Trustees’ fees | | | 182 | |
Miscellaneous | | | 176 | |
| | | | |
Gross expenses | | | 155,284 | |
Less: Waiver from investment manager | | | (39,580 | ) |
Reimbursement from investment manager | | | (88,020 | ) |
| | | | |
Net expenses | | | 27,684 | |
| | | | |
NET INVESTMENT INCOME (LOSS) | | | 113,529 | |
| | | | |
REALIZED AND UNREALIZED GAIN (LOSS) | |
Net realized gain (loss) on investments ($(6,722) of realized gain (loss) from affiliates) | | | (10,918 | ) |
Net distributions of realized gain received from underlying funds ($63,094 received from affiliates) | | | 65,466 | |
| | | | |
Net realized gain (loss) | | | 54,548 | |
| | | | |
Net change in unrealized appreciation (depreciation) on investments ($70,801 of change in unrealized appreciation (depreciation) from affiliates) | | | 151,231 | |
| | | | |
NET REALIZED AND UNREALIZED GAIN (LOSS) | | | 205,779 | |
| | | | |
NET INCREASE (DECREASE) IN NET ASSETS RESULTING FROM OPERATIONS | | $ | 319,308 | |
| | | | |
See Notes to Financial Statements.
15
AXA PREMIER VIP TRUST
CHARTERSM INCOME STRATEGIES PORTFOLIO
STATEMENT OF CHANGES IN NET ASSETS
| | | | | | | | |
| | | Year Ended December 31, | |
| | 2016 | | | 2015 | |
INCREASE (DECREASE) IN NET ASSETS FROM OPERATIONS: | | | | | | | | |
Net investment income (loss) | | $ | 113,529 | | | $ | 117,185 | |
Net realized gain (loss) on investments and net distributions of realized gain received from underlying funds | | | 54,548 | | | | 64,083 | |
Net change in unrealized appreciation (depreciation) on investments | | | 151,231 | | | | (306,865 | ) |
| | | | | | | | |
NET INCREASE (DECREASE) IN NET ASSETS RESULTING FROM OPERATIONS | | | 319,308 | | | | (125,597 | ) |
| | | | | | | | |
DIVIDENDS AND DISTRIBUTIONS: | | | | | | | | |
Dividends from net investment income | | | | | | | | |
Class B | | | (120,377 | ) | | | (128,728 | ) |
Distributions from net realized capital gains | | | | | | | | |
Class B | | | (58,344 | ) | | | (76,347 | ) |
| | | | | | | | |
TOTAL DIVIDENDS AND DISTRIBUTIONS | | | (178,721 | ) | | | (205,075 | ) |
| | | | | | | | |
CAPITAL SHARES TRANSACTIONS: | | | | | | | | |
Class B | | | | | | | | |
Capital shares sold [ 105,519 and 114,223 shares, respectively ] | | | 1,001,264 | | | | 1,112,369 | |
Capital shares issued in reinvestment of dividends and distributions [ 18,828 and 22,204 shares, respectively ] | | | 178,721 | | | | 205,075 | |
Capital shares repurchased [ (196,490) and (255,788) shares, respectively ] | | | (1,856,434 | ) | | | (2,566,992 | ) |
| | | | | | | | |
NET INCREASE (DECREASE) IN NET ASSETS RESULTING FROM CAPITAL SHARE TRANSACTIONS | | | (676,449 | ) | | | (1,249,548 | ) |
| | | | | | | | |
TOTAL INCREASE (DECREASE) IN NET ASSETS | | | (535,862 | ) | | | (1,580,220 | ) |
NET ASSETS: | |
Beginning of year | | | 5,086,689 | | | | 6,666,909 | |
| | | | | | | | |
End of year (a) | | $ | 4,550,827 | | | $ | 5,086,689 | |
| | | | | | | | |
(a) Includes accumulated undistributed (overdistributed) net investment income (loss) of | | $ | 2,165 | | | $ | 5,674 | |
| | | | | | | | |
See Notes to Financial Statements.
16
AXA PREMIER VIP TRUST
CHARTERSM INCOME STRATEGIES PORTFOLIO
FINANCIAL HIGHLIGHTS
| | | | | | | | | | | | | | | | |
| | | Year Ended December 31, | | | October 30, 2013* to
December 31, 2013 | |
| Class B | | 2016 | | | 2015 | | | 2014 | | |
Net asset value, beginning of period | | $ | 9.14 | | | $ | 9.87 | | | $ | 9.76 | | | $ | 10.00 | |
| | | | | | | | | | | | | | | | |
Income (loss) from investment operations: | | | | | | | | | | | | | | | | |
Net investment income (loss) (e)(x) | | | 0.23 | | | | 0.21 | | | | 0.30 | | | | 0.16 | |
Net realized and unrealized gain (loss) on investments | | | 0.41 | | | | (0.55 | ) | | | 0.15 | | | | (0.18 | ) |
| | | | | | | | | | | | | | | | |
Total from investment operations | | | 0.64 | | | | (0.34 | ) | | | 0.45 | | | | (0.02 | ) |
| | | | | | | | | | | | | | | | |
Less distributions: | | | | | | | | | | | | | | | | |
Dividends from net investment income | | | (0.26 | ) | | | (0.24 | ) | | | (0.30 | ) | | | (0.19 | ) |
Distributions from net realized gains | | | (0.12 | ) | | | (0.15 | ) | | | (0.04 | ) | | | (0.03 | ) |
| | | | | | | | | | | | | | | | |
Total dividends and distributions | | | (0.38 | ) | | | (0.39 | ) | | | (0.34 | ) | | | (0.22 | ) |
| | | | | | | | | | | | | | | | |
Net asset value, end of period | | $ | 9.40 | | | $ | 9.14 | | | $ | 9.87 | | | $ | 9.76 | |
| | | | | | | | | | | | | | | | |
Total return (b) | | | 7.00 | % | | | (3.46 | )% | | | 4.58 | % | | | (0.11 | )% |
| | | | | | | | | | | | | | | | |
Ratios/Supplemental Data: | | | | | | | | | | | | | | | | |
Net assets, end of period (000’s) | | $ | 4,551 | | | $ | 5,087 | | | $ | 6,667 | | | $ | 4,017 | |
Ratio of expenses to average net assets: | | | | | | | | | | | | | | | | |
After waivers and reimbursements (a)(f) | | | 0.59 | %(j) | | | 0.63 | % | | | 0.65 | % | | | 0.65 | % |
Before waivers and reimbursements (a)(f) | | | 3.29 | % | | | 3.46 | % | | | 3.94 | % | | | 3.85 | % |
Ratio of net investment income (loss) to average net assets: | | | | | | | | | | | | | | | | |
After waivers and reimbursements (a)(f)(x) | | | 2.41 | % | | | 2.16 | % | | | 2.94 | % | | | 9.54 | %(l) |
Before waivers and reimbursements (a)(f)(x) | | | (0.30 | )% | | | (0.67 | )% | | | (0.36 | )% | | | 6.33 | %(l) |
Portfolio turnover rate (z)^ | | | 22 | % | | | 25 | % | | | 17 | % | | | 11 | % |
| * | Commencement of Operations. |
| ^ | Portfolio turnover rate excludes derivatives, if any. |
| (a) | Ratios for periods less than one year are annualized. |
| (b) | Total returns for periods less than one year are not annualized. |
| (e) | Net investment income (loss) per share is based on average shares outstanding. |
| (f) | Expenses do not include the expenses of the underlying funds (“indirect expenses”), if applicable. |
| (j) | Including direct and indirect expenses, the net expense ratio after waivers and reimbursements would be 0.98%. |
| (l) | The annualized ratio of net investment income to average net assets may not be indicative of operating results for a full year. |
| (x) | Recognition of net investment income is affected by the timing of dividend declarations by the underlying funds in which the Portfolio invests. |
| (z) | Portfolio turnover rate for periods less than one year is not annualized. |
See Notes to Financial Statements.
17
AXA PREMIER VIP TRUST
CHARTERSM INTEREST RATE STRATEGIES PORTFOLIO
PORTFOLIO OF INVESTMENTS
December 31, 2016
| | | | | | | | |
| | | Number of
Shares | | | Value
(Note 1) | |
| | | | | | | | |
EXCHANGE TRADED FUNDS: | | | | | | | | |
iShares Emerging Markets Infrastructure Fund | | | 1,520 | | | $ | 42,697 | |
iShares Floating Rate Bond Fund | | | 12,960 | | | | 657,461 | |
iShares Global Infrastructure Fund | | | 4,920 | | | | 192,077 | |
iShares International High Yield Bond Fund | | | 710 | | | | 32,553 | |
iShares International Select Dividend Fund | | | 10,720 | | | | 316,883 | |
iShares JP Morgan USD Emerging Markets Bond Fund | | | 980 | | | | 108,016 | |
PowerShares Global Short Term High Yield Bond Portfolio | | | 210 | | | | 5,132 | |
PowerShares S&P 500 BuyWrite Portfolio | | | 3,900 | | | | 82,953 | |
SPDR Bloomberg Barclays Short Term High Yield Bond Fund | | | 3,070 | | | | 84,978 | |
Vanguard Short-Term Inflation-Protected Securities Fund | | | 1,270 | | | | 62,433 | |
Vanguard Total International Bond Fund | | | 1,850 | | | | 100,436 | |
| | | | | | | | |
Total Exchange Traded Funds (39.9%)
(Cost $1,816,629) | | | | | | | 1,685,619 | |
| | | | | | | | |
INVESTMENT COMPANIES: | | | | | | | | |
AXA Natural Resources Portfolio‡ | | | 16,630 | | | | 132,252 | |
AXA Real Estate Portfolio‡ | | | 21,094 | | | | 220,920 | |
BlackRock Global Long/Short Credit Fund, Institutional Class* | | | 10,706 | | | | 108,347 | |
Eaton Vance Floating-Rate Fund, Institutional Class | | | 4,668 | | | | 41,775 | |
EQ/Boston Advisors Equity Income Portfolio‡ | | | 68,338 | | | | 393,548 | |
EQ/Convertible Securities Portfolio‡ | | | 35,075 | | | | 357,197 | |
| | | | | | | | |
EQ/Energy ETF Portfolio‡ | | | 18,532 | | | $ | 137,870 | |
EQ/Global Bond PLUS Portfolio‡ | | | 10,693 | | | | 93,724 | |
EQ/High Yield Bond Portfolio‡ | | | 4,694 | | | | 44,693 | |
EQ/Low Volatility Global ETF Portfolio‡ | | | 34,763 | | | | 355,019 | |
EQ/PIMCO Global Real Return Portfolio‡ | | | 36,897 | | | | 358,151 | |
EQ/PIMCO Ultra Short Bond Portfolio‡ | | | 14,046 | | | | 138,594 | |
PIMCO Unconstrained Bond Fund, Institutional Class | | | 15,905 | | | | 169,387 | |
| | | | | | | | |
Total Investment Companies (60.5%)
(Cost $2,745,030) | | | | | | | 2,551,477 | |
| | | | | | | | |
SHORT-TERM INVESTMENT: | | | | | | | | |
Investment Company (0.3%) | | | | | | | | |
JPMorgan Prime Money Market Fund, IM Shares | | | 14,385 | | | | 14,389 | |
| | | | | | | | |
Total Short-Term Investment (0.3%)
(Cost $14,389) | | | | | | | 14,389 | |
| | | | | | | | |
Total Investments (100.7%)
(Cost $4,576,048) | | | | | | | 4,251,485 | |
Other Assets Less Liabilities (-0.7%) | | | | | | | (31,377 | ) |
| | | | | | | | |
Net Assets (100%) | | | | | | $ | 4,220,108 | |
| | | | | | | | |
| ‡ | All, or a portion, of the security is an affiliated company as defined under the Investment Company Act of 1940. |
The holdings in affiliated Investment Companies are all Class K shares.
Investments in companies which were affiliates for the year ended December 31, 2016, were as follows:
| | | | | | | | | | | | | | | | | | | | | | | | |
Securities | | Value
December 31,
2015 | | | Purchases
at Cost | | | Sales
at Cost | | | Value
December 31,
2016 | | | Dividend
Income | | | Realized
Gain
(Loss)† | |
AXA Natural Resources Portfolio | | $ | 155,965 | | | $ | 36,319 | | | $ | 103,620 | | | $ | 132,252 | | | $ | 3,073 | | | $ | (10,109 | ) |
AXA Real Estate Portfolio (a) | | | 342,693 | | | | 33,438 | | | | 159,362 | | | | 220,920 | | | | 2,040 | | | | 7,467 | |
EQ/Boston Advisors Equity Income Portfolio | | | 524,349 | | | | 101,828 | | | | 254,757 | | | | 393,548 | | | | 8,320 | | | | 9,386 | |
EQ/Convertible Securities Portfolio | | | 494,347 | | | | 71,236 | | | | 226,717 | | | | 357,197 | | | | 10,853 | | | | (7,785 | ) |
EQ/Energy ETF Portfolio | | | 148,571 | | | | 43,633 | | | | 89,693 | | | | 137,870 | | | | 2,359 | | | | (8,153 | ) |
EQ/Global Bond PLUS Portfolio | | | 144,156 | | | | 14,989 | | | | 67,841 | | | | 93,724 | | | | 2,063 | | | | (1,799 | ) |
EQ/High Yield Bond Portfolio | | | 61,482 | | | | 7,610 | | | | 29,237 | | | | 44,693 | | | | 2,351 | | | | (1,857 | ) |
EQ/Low Volatility Global ETF Portfolio | | | 533,108 | | | | 62,635 | | | | 249,488 | | | | 355,019 | | | | 9,117 | | | | 15,224 | |
EQ/PIMCO Global Real Return Portfolio | | | 506,436 | | | | 77,772 | | | | 248,066 | | | | 358,151 | | | | 18,252 | | | | (1,350 | ) |
EQ/PIMCO Ultra Short Bond Portfolio | | | 210,772 | | | | 26,489 | | | | 101,340 | | | | 138,594 | | | | 1,744 | | | | (1,232 | ) |
| | | | | | | | | | | | | | | | | | | | | | | | |
| | $ | 3,121,879 | | | $ | 475,949 | | | $ | 1,530,121 | | | $ | 2,231,968 | | | $ | 60,172 | | | $ | (208 | ) |
| | | | | | | | | | | | | | | | | | | | | | | | |
| † | When applicable, realized gain includes net distributions of realized gain received from underlying funds. |
| (a) | Formerly known as EQ/Real Estate PLUS Portfolio. |
See Notes to Financial Statements.
18
AXA PREMIER VIP TRUST
CHARTERSM INTEREST RATE STRATEGIES PORTFOLIO
PORTFOLIO OF INVESTMENTS (Continued)
December 31, 2016
The following is a summary of the inputs used to value the Portfolio’s assets and liabilities carried at fair value as of December 31, 2016:
The inputs or methodology used for valuing securities are not necessarily an indication of the risk associated with investing in those securities.
Various inputs are used in determining the value of the Portfolio’s investments. These inputs are summarized in the three broad levels listed below:
| | | | | | | | | | | | | | | | |
| | | | | |
| Investment Type | | Level 1
Quoted Prices in
Active Markets for
Identical
Securities | | | Level 2
Significant Other
Observable Inputs
(including quoted prices
for similar securities,
interest rates,
prepayment speeds,
credit risk, etc.) | | | Level 3
Significant Unobservable
Inputs (including the
Portfolio’s own
assumptions in
determining the fair
value of investments) | | | Total | |
Assets: | | | | | | | | | | | | | | | | |
Exchange Traded Funds | | | | | | | | | | | | | | | | |
Exchange Traded Funds | | $ | 1,685,619 | | | $ | — | | | $ | — | | | $ | 1,685,619 | |
Investment Companies | | | | | | | | | | | | | | | | |
Investment Companies | | | 319,509 | | | | 2,231,968 | | | | — | | | | 2,551,477 | |
Short-Term Investments | | | | | | | | | | | | | | | | |
Investment Companies | | | 14,389 | | | | — | | | | — | | | | 14,389 | |
| | | | | | | | | | | | | | | | |
Total Assets | | $ | 2,019,517 | | | $ | 2,231,968 | | | $ | — | | | $ | 4,251,485 | |
| | | | | | | | | | | | | | | | |
Total Liabilities | | $ | — | | | $ | — | | | $ | — | | | $ | — | |
| | | | | | | | | | | | | | | | |
Total | | $ | 2,019,517 | | | $ | 2,231,968 | | | $ | — | | | $ | 4,251,485 | |
| | | | | | | | | | | | | | | | |
There were no transfers between Levels 1, 2 or 3 during the year ended December 31, 2016.
The Portfolio held no derivatives contracts during the year ended December 31, 2016.
Investment security transactions for the year ended December 31, 2016 were as follows:
| | | | |
Cost of Purchases: | | | | |
Long-term investments other than U.S. government debt securities | | $ | 624,236 | |
Net Proceeds of Sales and Redemptions: | | | | |
Long-term investments other than U.S. government debt securities | | $ | 2,504,659 | |
As of December 31, 2016, the gross unrealized appreciation (depreciation) of investments based on the aggregate cost of investments for Federal income tax purposes was as follows:
| | | | |
Aggregate gross unrealized appreciation | | $ | 19,901 | |
Aggregate gross unrealized depreciation | | | (343,194 | ) |
| | | | |
Net unrealized depreciation | | $ | (323,293 | ) |
| | | | |
Federal income tax cost of investments | | $ | 4,574,778 | |
| | | | |
See Notes to Financial Statements.
19
AXA PREMIER VIP TRUST
CHARTERSM INTEREST RATE STRATEGIES PORTFOLIO
STATEMENT OF ASSETS AND LIABILITIES
December 31, 2016
| | | | |
| |
ASSETS | | | | |
Investments at value: | | | | |
Affiliated Issuers (Cost $2,408,570) | | $ | 2,231,968 | |
Unaffiliated Issuers (Cost $2,167,478) | | | 2,019,517 | |
Cash | | | 19,000 | |
Receivable from investment manager | | | 2,877 | |
Dividends, interest and other receivables | | | 884 | |
Other assets | | | 17 | |
| | | | |
Total assets | | | 4,274,263 | |
| | | | |
LIABILITIES | | | | |
Payable for securities purchased | | | 2,243 | |
Distribution fees payable – Class B | | | 888 | |
Trustees’ fees payable | | | 680 | |
Payable to Separate Accounts for Trust shares redeemed | | | 122 | |
Accrued expenses | | | 50,222 | |
| | | | |
Total liabilities | | | 54,155 | |
| | | | |
NET ASSETS | | $ | 4,220,108 | |
| | | | |
Net assets were comprised of: | | | | |
Paid in capital | | $ | 4,623,835 | |
Accumulated undistributed net investment income (loss) | | | 5,469 | |
Accumulated undistributed net realized gain (loss) on investments | | | (84,633 | ) |
Net unrealized appreciation (depreciation) on investments | | | (324,563 | ) |
| | | | |
Net assets | | $ | 4,220,108 | |
| | | | |
Class B | | | | |
Net asset value, offering and redemption price per share, $4,220,108 / 446,404 shares outstanding (unlimited amount authorized: $0.001 par value) | | $ | 9.45 | |
| | | | |
STATEMENT OF OPERATIONS
For the Year Ended December 31, 2016
| | | | |
| |
INVESTMENT INCOME | | | | |
Dividends ($60,172 of dividend income received from affiliates) | | $ | 113,479 | |
Interest | | | 2,156 | |
| | | | |
Total income | | | 115,635 | |
| | | | |
EXPENSES | | | | |
Custodian fees | | | 62,300 | |
Professional fees | | | 35,862 | |
Administrative fees | | | 32,500 | |
Distribution fees – Class B | | | 11,601 | |
Investment management fees | | | 6,961 | |
Printing and mailing expenses | | | 676 | |
Trustees’ fees | | | 188 | |
Miscellaneous | | | 186 | |
| | | | |
Gross expenses | | | 150,274 | |
Less: Waiver from investment manager | | | (39,461 | ) |
Reimbursement from investment manager | | | (84,392 | ) |
| | | | |
Net expenses | | | 26,421 | |
| | | | |
NET INVESTMENT INCOME (LOSS) | | | 89,214 | |
| | | | |
REALIZED AND UNREALIZED GAIN (LOSS) | | | | |
Net realized gain (loss) on investments ($(53,870) of realized gain (loss) from affiliates) | | | (124,792 | ) |
Net distributions of realized gain received from underlying funds ($53,662 received from affiliates) | | | 54,652 | |
| | | | |
Net realized gain (loss) | | | (70,140 | ) |
| | | | |
Net change in unrealized appreciation (depreciation) on investments ($164,261 of change in unrealized appreciation (depreciation) from affiliates) | | | 302,823 | |
| | | | |
NET REALIZED AND UNREALIZED GAIN (LOSS) | | | 232,683 | |
| | | | |
NET INCREASE (DECREASE) IN NET ASSETS RESULTING FROM OPERATIONS | | $ | 321,897 | |
| | | | |
| | | | |
See Notes to Financial Statements.
20
AXA PREMIER VIP TRUST
CHARTERSM INTEREST RATE STRATEGIES PORTFOLIO
STATEMENT OF CHANGES IN NET ASSETS
| | | | | | | | |
| | | Year Ended December 31, | |
| | 2016 | | | 2015 | |
INCREASE (DECREASE) IN NET ASSETS FROM OPERATIONS: | |
Net investment income (loss) | | $ | 89,214 | | | $ | 105,084 | |
Net realized gain (loss) on investments and net distributions of realized gain received from underlying funds | | | (70,140 | ) | | | 48,248 | |
Net change in unrealized appreciation (depreciation) on investments | | | 302,823 | | | | (416,462 | ) |
| | | | | | | | |
NET INCREASE (DECREASE) IN NET ASSETS RESULTING FROM OPERATIONS | | | 321,897 | | | | (263,130 | ) |
| | | | | | | | |
DIVIDENDS AND DISTRIBUTIONS: | | | | | | | | |
Dividends from net investment income | | | | | | | | |
Class B | | | (103,175 | ) | | | (115,616 | ) |
Distributions from net realized capital gains | | | | | | | | |
Class B | | | (40,070 | ) | | | (66,016 | ) |
Return of capital | | | | | | | | |
Class B | | | (14,012 | ) | | | — | |
| | | | | | | | |
TOTAL DIVIDENDS AND DISTRIBUTIONS | | | (157,257 | ) | | | (181,632 | ) |
| | | | | | | | |
CAPITAL SHARES TRANSACTIONS: | | | | | | | | |
Class B | | | | | | | | |
Capital shares sold [ 50,613 and 149,886 shares, respectively ] | | | 476,808 | | | | 1,455,709 | |
Capital shares issued in reinvestment of dividends and distributions [ 16,495 and 19,785 shares, respectively ] | | | 157,257 | | | | 181,632 | |
Capital shares repurchased [ (274,951) and (388,917) shares, respectively ] | | | (2,529,302 | ) | | | (3,831,662 | ) |
| | | | | | | | |
NET INCREASE (DECREASE) IN NET ASSETS RESULTING FROM CAPITAL SHARE TRANSACTIONS | | | (1,895,237 | ) | | | (2,194,321 | ) |
| | | | | | | | |
TOTAL INCREASE (DECREASE) IN NET ASSETS | | | (1,730,597 | ) | | | (2,639,083 | ) |
NET ASSETS: | | | | | | | | |
Beginning of year | | | 5,950,705 | | | | 8,589,788 | |
| | | | | | | | |
End of year (a) | | $ | 4,220,108 | | | $ | 5,950,705 | |
| | | | | | | | |
(a) Includes accumulated undistributed (overdistributed) net investment income (loss) of | | $ | 5,469 | | | $ | 12,022 | |
| | | | | | | | |
See Notes to Financial Statements.
21
AXA PREMIER VIP TRUST
CHARTERSM INTEREST RATE STRATEGIES PORTFOLIO
FINANCIAL HIGHLIGHTS
| | | | | | | | | | | | | | | | |
| | | Year Ended December 31, | | | October 30, 2013* to
December 31, 2013 | |
| Class B | | 2016 | | | 2015 | | | 2014 | | |
Net asset value, beginning of period | | $ | 9.10 | | | $ | 9.83 | | | $ | 9.84 | | | $ | 10.00 | |
| | | | | | | | | | | | | | | | |
Income (loss) from investment operations: | | | | | | | | | | | | | | | | |
Net investment income (loss) (e)(x) | | | 0.18 | | | | 0.14 | | | | 0.24 | | | | 0.09 | |
Net realized and unrealized gain (loss) on investments | | | 0.53 | | | | (0.60 | ) | | | 0.01 | † | | | (0.10 | ) |
| | | | | | | | | | | | | | | | |
Total from investment operations | | | 0.71 | | | | (0.46 | ) | | | 0.25 | | | | (0.01 | ) |
| | | | | | | | | | | | | | | | |
Less distributions: | | | | | | | | | | | | | | | | |
Dividends from net investment income | | | (0.24 | ) | | | (0.17 | ) | | | (0.25 | ) | | | (0.12 | ) |
Distributions from net realized gains | | | (0.09 | ) | | | (0.10 | ) | | | (0.01 | ) | | | (0.03 | ) |
Return of capital | | | (0.03 | ) | | | — | | | | — | | | | — | |
| | | | | | | | | | | | | | | | |
Total dividends and distributions | | | (0.36 | ) | | | (0.27 | ) | | | (0.26 | ) | | | (0.15 | ) |
| | | | | | | | | | | | | | | | |
Net asset value, end of period | | $ | 9.45 | | | $ | 9.10 | | | $ | 9.83 | | | $ | 9.84 | |
| | | | | | | | | | | | | | | | |
Total return (b) | | | 7.82 | % | | | (4.55 | )% | | | 2.51 | % | | | (0.01 | )% |
| | | | | | | | | | | | | | | | |
Ratios/Supplemental Data: | | | | | | | | | | | | | | | | |
Net assets, end of period (000’s) | | $ | 4,220 | | | $ | 5,951 | | | $ | 8,590 | | | $ | 4,000 | |
Ratio of expenses to average net assets: | | | | | | | | | | | | | | | | |
After waivers and reimbursements (a)(f) | | | 0.57 | %(j) | | | 0.63 | % | | | 0.65 | % | | | 0.65 | % |
Before waivers and reimbursements (a)(f) | | | 3.24 | % | | | 2.60 | % | | | 3.19 | % | | | 3.86 | % |
Ratio of net investment income (loss) to average net assets: | | | | | | | | | | | | | | | | |
After waivers and reimbursements (a)(f)(x) | | | 1.92 | % | | | 1.46 | % | | | 2.37 | % | | | 5.53 | %(l) |
Before waivers and reimbursements (a)(f)(x) | | | (0.75 | )% | | | (0.51 | )% | | | (0.17 | )% | | | 2.33 | %(l) |
Portfolio turnover rate (z)^ | | | 13 | % | | | 27 | % | | | 26 | % | | | 14 | % |
| * | Commencement of Operations. |
| † | The amount shown for a share outstanding throughout the period does not accord with the aggregate net income and/or gain on investments for that period because of the timing of sales and repurchases of the Portfolio shares in relation to fluctuating market value of the investments in the Portfolio. |
| ^ | Portfolio turnover rate excludes derivatives, if any. |
| (a) | Ratios for periods less than one year are annualized. |
| (b) | Total returns for periods less than one year are not annualized. |
| (e) | Net investment income (loss) per share is based on average shares outstanding. |
| (f) | Expenses do not include the expenses of the underlying funds (“indirect expenses”), if applicable. |
| (j) | Including direct and indirect expenses, the net expense ratio after waivers and reimbursements would be 0.96%. |
| (l) | The annualized ratio of net investment income to average net assets may not be indicative of operating results for a full year. |
| (x) | Recognition of net investment income is affected by the timing of dividend declarations by the underlying funds in which the Portfolio invests. |
| (z) | Portfolio turnover rate for periods less than one year is not annualized. |
See Notes to Financial Statements.
22
AXA PREMIER VIP TRUST
CHARTERSM REAL ASSETS PORTFOLIO
PORTFOLIO OF INVESTMENTS
December 31, 2016
| | | | | | | | |
| | | Number of Shares | | | Value
(Note 1) | |
| | | | | | | | |
EXCHANGE TRADED FUNDS: | | | | | | | | |
iShares Emerging Markets Infrastructure Fund | | | 3,870 | | | $ | 108,708 | |
iShares Global Infrastructure Fund | | | 11,560 | | | | 451,302 | |
iShares MSCI Global Agriculture Producers Fund | | | 3,540 | | | | 88,373 | |
iShares MSCI Global Gold Miners Fund | | | 4,475 | | | | 76,657 | |
iShares U.S. Oil & Gas Exploration & Production Fund | | | 2,990 | | | | 195,666 | |
PowerShares DB Agriculture Fund* | | | 950 | | | | 18,972 | |
PowerShares DB Base Metals Fund* | | | 7,150 | | | | 106,678 | |
PowerShares DB Commodity Index Tracking Fund* | | | 9,960 | | | | 157,766 | |
PowerShares DB G10 Currency Harvest Fund* | | | 18,590 | | | | 461,218 | |
PowerShares DB Gold Fund* | | | 7,330 | | | | 271,430 | |
PowerShares DB Silver Fund* | | | 1,830 | | | | 45,494 | |
Vanguard Short-Term Inflation-Protected Securities Fund | | | 5,170 | | | | 254,157 | |
| | | | | | | | |
Total Exchange Traded Funds (46.5%)
(Cost $2,463,932) | | | | | | | 2,236,421 | |
| | | | | | | | |
INVESTMENT COMPANIES: | | | | | | | | |
AXA Natural Resources Portfolio‡ | | | 38,885 | | | | 309,239 | |
AXA Real Estate Portfolio‡ | | | 53,065 | | | | 555,757 | |
Eaton Vance Diversified Currency Income Fund, Institutional Class | | | 9,637 | | | | 83,265 | |
| | | | | | | | |
EQ/Energy ETF Portfolio‡ | | | 44,588 | | | $ | 331,712 | |
EQ/PIMCO Global Real Return Portfolio‡ | | | 125,045 | | | | 1,213,796 | |
PIMCO Commodity RealReturn Strategy Fund, Institutional Class | | | 13,499 | | | | 96,656 | |
| | | | | | | | |
Total Investment Companies (53.8%)
(Cost $2,729,697) | | | | | | | 2,590,425 | |
| | | | | | | | |
SHORT-TERM INVESTMENT: | | | | | | | | |
Investment Company (1.5%) | | | | | | | | |
JPMorgan Prime Money Market Fund, IM Shares | | | 71,559 | | | | 71,580 | |
| | | | | | | | |
Total Short-Term Investment (1.5%)
(Cost $71,568) | | | | | | | 71,580 | |
| | | | | | | | |
Total Investments (101.8%)
(Cost $5,265,197) | | | | | | | 4,898,426 | |
Other Assets Less Liabilities (-1.8%) | | | | | | | (85,830 | ) |
| | | | | | | | |
Net Assets (100%) | | | | | | $ | 4,812,596 | |
| | | | | | | | |
| ‡ | All, or a portion, of the security is an affiliated company as defined under the Investment Company Act of 1940. |
The holdings in affiliated Investment Companies are all Class K shares.
Investments in companies which were affiliates for the year ended December 31, 2016, were as follows:
| | | | | | | | | | | | | | | | | | | | | | | | |
Securities | | Value
December 31,
2015 | | | Purchases
at Cost | | | Sales
at Cost | | | Value
December 31,
2016 | | | Dividend
Income | | | Realized
Gain
(Loss)† | |
AXA Natural Resources Portfolio | | $ | 228,956 | | | $ | 94,126 | | | $ | 84,499 | | | $ | 309,239 | | | $ | 7,130 | | | $ | (1,667 | ) |
AXA Real Estate Portfolio (a) | | | 506,248 | | | | 151,889 | | | | 114,952 | | | | 555,757 | | | | 4,815 | | | | 9,290 | |
EQ/Energy ETF Portfolio | | | 248,065 | | | | 95,299 | | | | 71,635 | | | | 331,712 | | | | 5,638 | | | | (2,640 | ) |
EQ/PIMCO Global Real Return Portfolio | | | 1,064,717 | | | | 376,343 | | | | 272,027 | | | | 1,213,796 | | | | 61,298 | | | | 2,124 | |
| | | | | | | | | | | | | | | | | | | | | | | | |
| | $ | 2,047,986 | | | $ | 717,657 | | | $ | 543,113 | | | $ | 2,410,504 | | | $ | 78,881 | | | $ | 7,107 | |
| | | | | | | | | | | | | | | | | | | | | | | | |
| † | When applicable, realized gain includes net distributions of realized gain received from underlying funds. |
| (a) | Formerly known as EQ/Real Estate PLUS Portfolio. |
See Notes to Financial Statements.
23
AXA PREMIER VIP TRUST
CHARTERSM REAL ASSETS PORTFOLIO
PORTFOLIO OF INVESTMENTS (Continued)
December 31, 2016
The following is a summary of the inputs used to value the Portfolio’s assets and liabilities carried at fair value as of December 31, 2016:
The inputs or methodology used for valuing securities are not necessarily an indication of the risk associated with investing in those securities.
Various inputs are used in determining the value of the Portfolio’s investments. These inputs are summarized in the three broad levels listed below:
| | | | | | | | | | | | | | | | |
| | | | | |
| Investment Type | | Level 1
Quoted Prices in
Active Markets for
Identical
Securities | | | Level 2
Significant Other
Observable Inputs
(including quoted prices
for similar securities,
interest rates,
prepayment speeds,
credit risk, etc.) | | | Level 3
Significant Unobservable
Inputs (including the
Portfolio’s own
assumptions in
determining the fair
value of investments) | | | Total | |
Assets: | |
Exchange Traded Funds | | | | | | | | | | | | | | | | |
Exchange Traded Funds | | $ | 2,236,421 | | | $ | — | | | $ | — | | | $ | 2,236,421 | |
Investment Companies | | | | | | | | | | | | | | | | |
Investment Companies | | | 179,921 | | | | 2,410,504 | | | | — | | | | 2,590,425 | |
Short-Term Investments | | | | | | | | | | | | | | | | |
Investment Companies | | | 71,580 | | | | — | | | | — | | | | 71,580 | |
| | | | | | | | | | | | | | | | |
Total Assets | | $ | 2,487,922 | | | $ | 2,410,504 | | | $ | — | | | $ | 4,898,426 | |
| | | | | | | | | | | | | | | | |
Total Liabilities | | $ | — | | | $ | — | | | $ | — | | | $ | — | |
| | | | | | | | | | | | | | | | |
Total | | $ | 2,487,922 | | | $ | 2,410,504 | | | $ | — | | | $ | 4,898,426 | |
| | | | | | | | | | | | | | | | |
There were no transfers between Levels 1, 2 or 3 during the year ended December 31, 2016.
The Portfolio held no derivatives contracts during the year ended December 31, 2016.
Investment security transactions for the year ended December 31, 2016 were as follows:
| | | | |
Cost of Purchases: | | | | |
Long-term investments other than U.S. government debt securities | | $ | 1,232,038 | |
Net Proceeds of Sales and Redemptions: | | | | |
Long-term investments other than U.S. government debt securities | | $ | 953,469 | |
As of December 31, 2016, the gross unrealized appreciation (depreciation) of investments based on the aggregate cost of investments for Federal income tax purposes was as follows:
| | | | |
Aggregate gross unrealized appreciation | | $ | 24,294 | |
Aggregate gross unrealized depreciation | | | (242,344 | ) |
| | | | |
Net unrealized depreciation | | $ | (218,050 | ) |
| | | | |
Federal income tax cost of investments | | $ | 5,116,476 | |
| | | | |
See Notes to Financial Statements.
24
AXA PREMIER VIP TRUST
CHARTERSM REAL ASSETS PORTFOLIO
STATEMENT OF ASSETS AND LIABILITIES
December 31, 2016
| | | | |
ASSETS | |
Investments at value: | | | | |
Affiliated Issuers (Cost $2,505,862) | | $ | 2,410,504 | |
Unaffiliated Issuers (Cost $2,759,335) | | | 2,487,922 | |
Cash | | | 10,000 | |
Receivable from Separate Accounts for Trust shares sold | | | 45 | |
Dividends, interest and other receivables | | | 45 | |
Other assets | | | 14 | |
| | | | |
Total assets | | | 4,908,530 | |
| | | | |
LIABILITIES | | | | |
Payable to Separate Accounts for Trust shares redeemed | | | 28,828 | |
Payable for securities purchased | | | 12,661 | |
Administrative fees payable | | | 1,442 | |
Distribution fees payable – Class B | | | 1,014 | |
Trustees’ fees payable | | | 614 | |
Accrued expenses | | | 51,375 | |
| | | | |
Total liabilities | | | 95,934 | |
| | | | |
NET ASSETS | | $ | 4,812,596 | |
| | | | |
Net assets were comprised of: | | | | |
Paid in capital | | $ | 5,203,996 | |
Accumulated undistributed net investment income (loss) | | | 6,536 | |
Accumulated undistributed net realized gain (loss) on investments | | | (31,165 | ) |
Net unrealized appreciation (depreciation) on investments | | | (366,771 | ) |
| | | | |
Net assets | | $ | 4,812,596 | |
| | | | |
Class B | | | | |
Net asset value, offering and redemption price per share, $4,812,596 / 529,533 shares outstanding (unlimited amount authorized: $0.001 par value) | | $ | 9.09 | |
| | | | |
STATEMENT OF OPERATIONS
For the Year Ended December 31, 2016
| | | | |
INVESTMENT INCOME | |
Dividends ($78,881 of dividend income received from affiliates) | | $ | 102,909 | |
Interest | | | 2,538 | |
| | | | |
Total income | | | 105,447 | |
| | | | |
EXPENSES | | | | |
Professional fees | | | 37,057 | |
Administrative fees | | | 32,509 | |
Custodian fees | | | 29,700 | |
Distribution fees – Class B | | | 11,120 | |
Investment management fees | | | 6,672 | |
Printing and mailing expenses | | | 637 | |
Trustees’ fees | | | 164 | |
Miscellaneous | | | 163 | |
| | | | |
Gross expenses | | | 118,022 | |
Less: Waiver from investment manager | | | (39,181 | ) |
Reimbursement from investment manager | | | (47,241 | ) |
| | | | |
Net expenses | | | 31,600 | |
| | | | |
NET INVESTMENT INCOME (LOSS) | | | 73,847 | |
| | | | |
REALIZED AND UNREALIZED GAIN (LOSS) | | | | |
Net realized gain (loss) on investments ($(1,741) of realized gain (loss) from affiliates) | | | 9,894 | |
Net distributions of realized gain received from underlying funds ($8,848 received from affiliates) | | | 9,025 | |
| | | | |
Net realized gain (loss) | | | 18,919 | |
| | | | |
Net change in unrealized appreciation (depreciation) on investments ($187,974 of change in unrealized appreciation (depreciation) from affiliates) | | | 425,559 | |
| | | | |
NET REALIZED AND UNREALIZED GAIN (LOSS) | | | 444,478 | |
| | | | |
NET INCREASE (DECREASE) IN NET ASSETS RESULTING FROM OPERATIONS | | $ | 518,325 | |
| | | | |
See Notes to Financial Statements.
25
AXA PREMIER VIP TRUST
CHARTERSM REAL ASSETS PORTFOLIO
STATEMENT OF CHANGES IN NET ASSETS
| | | | | | | | |
| | | Year Ended December 31, | |
| | 2016 | | | 2015 | |
INCREASE (DECREASE) IN NET ASSETS FROM OPERATIONS: | | | | | | | | |
Net investment income (loss) | | $ | 73,847 | | | $ | 31,782 | |
Net realized gain (loss) on investments and net distributions of realized gain received from underlying funds | | | 18,919 | | | | (34,898 | ) |
Net change in unrealized appreciation (depreciation) on investments | | | 425,559 | | | | (535,968 | ) |
| | | | | | | | |
NET INCREASE (DECREASE) IN NET ASSETS RESULTING FROM OPERATIONS | | | 518,325 | | | | (539,084 | ) |
| | | | | | | | |
DIVIDENDS: | | | | | | | | |
Dividends from net investment income | | | | | | | | |
Class B | | | (82,701 | ) | | | (39,104 | ) |
Return of capital | | | | | | | | |
Class B | | | (8,704 | ) | | | — | |
| | | | | | | | |
TOTAL DIVIDENDS: | | | (91,405 | ) | | | (39,104 | ) |
| | | | | | | | |
CAPITAL SHARES TRANSACTIONS: | | | | | | | | |
Class B | | | | | | | | |
Capital shares sold [ 107,751 and 46,244 shares, respectively ] | | | 982,601 | | | | 416,988 | |
Capital shares issued in reinvestment of dividends [ 10,121 and 4,723 shares, respectively ] | | | 91,405 | | | | 39,104 | |
Capital shares repurchased [ (88,057) and (59,529) shares, respectively ] | | | (795,816 | ) | | | (527,941 | ) |
| | | | | | | | |
NET INCREASE (DECREASE) IN NET ASSETS RESULTING FROM CAPITAL SHARE TRANSACTIONS | | | 278,190 | | | | (71,849 | ) |
| | | | | | | | |
TOTAL INCREASE (DECREASE) IN NET ASSETS | | | 705,110 | | | | (650,037 | ) |
NET ASSETS: | | | | | | | | |
Beginning of year | | | 4,107,486 | | | | 4,757,523 | |
| | | | | | | | |
End of year (a) | | $ | 4,812,596 | | | $ | 4,107,486 | |
| | | | | | | | |
(a) Includes accumulated undistributed (overdistributed) net investment income (loss) of | | $ | 6,536 | | | $ | 6,659 | |
| | | | | | | | |
See Notes to Financial Statements.
26
AXA PREMIER VIP TRUST
CHARTERSM REAL ASSETS PORTFOLIO
FINANCIAL HIGHLIGHTS
| | | | | | | | | | | | | | | | |
| | | Year Ended December 31, | | | | |
| Class B | | 2016 | | | 2015 | | | 2014 | | | October 30, 2013* to
December 31, 2013 | |
Net asset value, beginning of period | | $ | 8.22 | | | $ | 9.36 | | | $ | 9.60 | | | $ | 10.00 | |
| | | | | | | | | | | | | | | | |
Income (loss) from investment operations: | | | | | | | | | | | | | | | | |
Net investment income (loss) (e)(x) | | | 0.15 | | | | 0.06 | | | | 0.23 | | | | 0.06 | |
Net realized and unrealized gain (loss) on investments | | | 0.90 | | | | (1.12 | ) | | | (0.22 | ) | | | (0.35 | ) |
| | | | | | | | | | | | | | | | |
Total from investment operations | | | 1.05 | | | | (1.06 | ) | | | 0.01 | | | | (0.29 | ) |
| | | | | | | | | | | | | | | | |
Less distributions: | | | | | | | | | | | | | | | | |
Dividends from net investment income | | | (0.16 | ) | | | (0.08 | ) | | | (0.25 | ) | | | (0.07 | ) |
Return of capital | | | (0.02 | ) | | | — | | | | — | | | | (0.04 | ) |
| | | | | | | | | | | | | | | | |
Total dividends and distributions | | | (0.18 | ) | | | (0.08 | ) | | | (0.25 | ) | | | (0.11 | ) |
| | | | | | | | | | | | | | | | |
Net asset value, end of period | | $ | 9.09 | | | $ | 8.22 | | | $ | 9.36 | | | $ | 9.60 | |
| | | | | | | | | | | | | | | | |
Total return (b) | | | 12.73 | % | | | (11.34 | )% | | | 0.09 | % | | | (2.88 | )% |
| | | | | | | | | | | | | | | | |
Ratios/Supplemental Data: | | | | | | | | | | | | | | | | |
Net assets, end of period (000’s) | | $ | 4,813 | | | $ | 4,107 | | | $ | 4,758 | | | $ | 3,886 | |
Ratio of expenses to average net assets: | | | | | | | | | | | | | | | | |
After waivers and reimbursements (a)(f) | | | 0.71 | %(j) | | | 0.65 | % | | | 0.65 | % | | | 0.65 | % |
Before waivers and reimbursements (a)(f) | | | 2.65 | % | | | 3.22 | % | | | 3.87 | % | | | 3.92 | % |
Ratio of net investment income (loss) to average net assets: | | | | | | | | | | | | | | | | |
After waivers and reimbursements (a)(f)(x) | | | 1.66 | % | | | 0.70 | % | | | 2.31 | % | | | 3.44 | %(l) |
Before waivers and reimbursements (a)(f)(x) | | | (0.28 | )% | | | (1.88 | )% | | | (0.90 | )% | | | 0.17 | %(l) |
Portfolio turnover rate (z)^ | | | 21 | % | | | 21 | % | | | 14 | % | | | 15 | % |
| * | Commencement of Operations. |
| ^ | Portfolio turnover rate excludes derivatives, if any. |
| (a) | Ratios for periods less than one year are annualized. |
| (b) | Total returns for periods less than one year are not annualized. |
| (e) | Net investment income (loss) per share is based on average shares outstanding. |
| (f) | Expenses do not include the expenses of the underlying funds (“indirect expenses”), if applicable. |
| (j) | Including direct and indirect expenses, the net expense ratio after waivers and reimbursements would be 1.17% for Class B. |
| (l) | The annualized ratio of net investment income to average net assets may not be indicative of operating results for a full year. |
| (x) | Recognition of net investment income is affected by the timing of dividend declarations by the underlying funds in which the Portfolio invests. |
| (z) | Portfolio turnover rate for periods less than one year is not annualized. |
See Notes to Financial Statements.
27
AXA PREMIER VIP TRUST
CHARTERSM ALTERNATIVE 100 MODERATE PORTFOLIO
PORTFOLIO OF INVESTMENTS
December 31, 2016
| | | | | | | | |
| | | Number of
Shares | | | Value
(Note 1) | |
EXCHANGE TRADED FUNDS: | | | | | | | | |
iShares Emerging Markets Infrastructure Fund | | | 6,670 | | | $ | 187,360 | |
iShares Global Infrastructure Fund | | | 17,300 | | | | 675,392 | |
iShares MSCI Global Agriculture Producers Fund | | | 6,700 | | | | 167,260 | |
iShares MSCI Global Gold Miners Fund | | | 7,440 | | | | 127,447 | |
iShares U.S. Oil & Gas Exploration & Production Fund | | | 6,280 | | | | 410,963 | |
PowerShares DB Agriculture Fund* | | | 1,780 | | | | 35,547 | |
PowerShares DB Base Metals Fund* | | | 11,220 | | | | 167,402 | |
PowerShares DB Commodity Index Tracking Fund* | | | 17,550 | | | | 277,992 | |
PowerShares DB G10 Currency Harvest Fund* | | | 32,940 | | | | 817,241 | |
PowerShares DB Gold Fund* | | | 11,585 | | | | 428,993 | |
PowerShares DB Silver Fund* | | | 2,930 | | | | 72,840 | |
PowerShares Multi-Strategy Alternative Portfolio‡ | | | 19,900 | | | | 454,516 | |
WisdomTree Managed Futures Strategy Fund* | | | 2,770 | | | | 114,844 | |
| | | | | | | | |
Total Exchange Traded Funds (48.0%)
(Cost $4,558,344) | | | | | | | 3,937,797 | |
| | | | | | | | |
INVESTMENT COMPANIES: | | | | | | | | |
AQR Managed Futures Strategy, Institutional Class | | | 21,780 | | | | 202,988 | |
AXA Natural Resources Portfolio‡ | | | 52,668 | | | | 418,847 | |
AXA Real Estate Portfolio‡ | | | 74,836 | | | | 783,773 | |
BlackRock Global Long/Short Credit Fund, Institutional Class* | | | 25,938 | | | | 262,492 | |
EQ/Convertible Securities Portfolio‡ | | | 82,438 | | | $ | 839,538 | |
EQ/Energy ETF Portfolio‡ | | | 56,138 | | | | 417,646 | |
EQ/GAMCO Mergers and Acquisitions Portfolio‡ | | | 87,551 | | | | 1,143,515 | |
Financial Investors Trust - Listed Private Equity Fund, Institutional Class | | | 12,113 | | | | 78,492 | |
Franklin K2 Alternative Strategies Fund, Advisor Class | | | 6,445 | | | | 69,416 | |
| | | | | | | | |
Total Investment Companies (51.5%) (Cost $4,566,112) | | | | | | | 4,216,707 | |
| | | | | | | | |
SHORT-TERM INVESTMENT: | | | | | | | | |
Investment Company (1.2%) | | | | | | | | |
JPMorgan Prime Money Market Fund, IM Shares | | | 100,721 | | | | 100,752 | |
| | | | | | | | |
Total Short-Term Investment (1.2%) (Cost $100,752) | | | | | | | 100,752 | |
| | | | | | | | |
Total Investments (100.7%)
(Cost $9,225,208) | | | | | | | 8,255,256 | |
Other Assets Less Liabilities (-0.7%) | | | | | | | (59,432 | ) |
| | | | | | | | |
Net Assets (100%) | | | | | | $ | 8,195,824 | |
| | | | | | | | |
| ‡ | All, or a portion, of the security is an affiliated company as defined under the Investment Company Act of 1940. |
The holdings in affiliated Investment Companies are all Class K shares except PowerShares Multi-Strategy Alternative Portfolio.
Investments in companies which were affiliates for the year ended December 31, 2016, were as follows:
| | | | | | | | | | | | | | | | | | | | | | | | |
Securities | | Value
December 31,
2015 | | | Purchases
at Cost | | | Sales
at Cost | | | Value
December 31,
2016 | | | Dividend
Income | | | Realized
Gain
(Loss)† | |
AXA Natural Resources Portfolio | | $ | 671,243 | | | $ | 90,407 | | | $ | 604,038 | | | $ | 418,847 | | | $ | 9,649 | | | $ | (121,874 | ) |
AXA Real Estate Portfolio (a) | | | 1,376,046 | | | | 200,488 | | | | 814,528 | | | | 783,773 | | | | 7,119 | | | | 48,795 | |
EQ/Convertible Securities Portfolio | | | 1,361,218 | | | | 185,410 | | | | 751,980 | | | | 839,538 | | | | 25,286 | | | | (13,180 | ) |
EQ/Energy ETF Portfolio | | | 589,322 | | | | 167,927 | | | | 554,356 | | | | 417,646 | | | | 7,089 | | | | (108,212 | ) |
EQ/GAMCO Mergers and Acquisitions Portfolio | | | 1,843,689 | | | | 414,932 | | | | 1,174,864 | | | | 1,143,515 | | | | 2,883 | | | | 38,330 | |
PowerShares Multi-Strategy Alternative Portfolio* | | | 623,271 | | | | — | | | | 188,895 | | | | 454,516 | | | | 6,865 | | | | (5,071 | ) |
| | | | | | | | | | | | | | | | | | | | | | | | |
| | $ | 6,464,789 | | | $ | 1,059,164 | | | $ | 4,088,661 | | | $ | 4,057,835 | | | $ | 58,891 | | | $ | (161,212 | ) |
| | | | | | | | | | | | | | | | | | | | | | | | |
| * | Not affiliated at December 31, 2015. |
| † | When applicable, realized gain includes net distributions of realized gain received from underlying funds. |
| (a) | Formerly known as EQ/Real Estate PLUS Portfolio. |
See Notes to Financial Statements.
28
AXA PREMIER VIP TRUST
CHARTERSM ALTERNATIVE 100 MODERATE PORTFOLIO
PORTFOLIO OF INVESTMENTS (Continued)
December 31, 2016
The following is a summary of the inputs used to value the Portfolio’s assets and liabilities carried at fair value as of December 31, 2016:
The inputs or methodology used for valuing securities are not necessarily an indication of the risk associated with investing in those securities.
Various inputs are used in determining the value of the Portfolio’s investments. These inputs are summarized in the three broad levels listed below:
| | | | | | | | | | | | | | | | |
| | | | | |
| Investment Type | | Level 1
Quoted Prices in
Active Markets for
Identical
Securities | | | Level 2
Significant Other
Observable Inputs
(including quoted prices
for similar securities,
interest rates,
prepayment speeds,
credit risk, etc.) | | | Level 3
Significant Unobservable
Inputs (including the
Portfolio’s own
assumptions in
determining the fair
value of investments) | | | Total | |
Assets: | |
Exchange Traded Funds | | | | | | | | | | | | | | | | |
Exchange Traded Funds | | $ | 3,937,797 | | | $ | — | | | $ | — | | | $ | 3,937,797 | |
Investment Companies | | | | | | | | | | | | | | | | |
Investment Companies | | | 613,388 | | | | 3,603,319 | | | | — | | | | 4,216,707 | |
Short-Term Investments | | | | | | | | | | | | | | | | |
Investment Companies | | | 100,752 | | | | — | | | | — | | | | 100,752 | |
| | | | | | | | | | | | | | | | |
Total Assets | | $ | 4,651,937 | | | $ | 3,603,319 | | | $ | — | | | $ | 8,255,256 | |
| | | | | | | | | | | | | | | | |
Total Liabilities | | $ | — | | | $ | — | | | $ | — | | | $ | — | |
| | | | | | | | | | | | | | | | |
Total | | $ | 4,651,937 | | | $ | 3,603,319 | | | $ | — | | | $ | 8,255,256 | |
| | | | | | | | | | | | | | | | |
There were no transfers between Levels 1, 2 or 3 during the year ended December 31, 2016.
The Portfolio held no derivatives contracts during the year ended December 31, 2016.
Investment security transactions for the year ended December 31, 2016 were as follows:
| | | | |
Cost of Purchases: | | | | |
Long-term investments other than U.S. government debt securities | | $ | 1,651,398 | |
Net Proceeds of Sales and Redemptions: | | | | |
Long-term investments other than U.S. government debt securities | | $ | 7,345,969 | |
As of December 31, 2016, the gross unrealized appreciation (depreciation) of investments based on the aggregate cost of investments for Federal income tax purposes was as follows:
| | | | |
Aggregate gross unrealized appreciation | | $ | 37,028 | |
Aggregate gross unrealized depreciation | | | (596,267 | ) |
| | | | |
Net unrealized depreciation | | $ | (559,239 | ) |
| | | | |
Federal income tax cost of investments | | $ | 8,814,495 | |
| | | | |
See Notes to Financial Statements.
29
AXA PREMIER VIP TRUST
CHARTERSM ALTERNATIVE 100 MODERATE PORTFOLIO
STATEMENT OF ASSETS AND LIABILITIES
December 31, 2016
| | | | |
ASSETS | | | | |
Investments at value: | | | | |
Affiliated Issuers (Cost $4,387,126) | | $ | 4,057,835 | |
Unaffiliated Issuers (Cost $4,838,082) | | | 4,197,421 | |
Cash | | | 22,000 | |
Receivable from Separate Accounts for Trust shares sold | | | 62 | |
Dividends, interest and other receivables | | | 43 | |
Other assets | | | 60 | |
| | | | |
Total assets | | | 8,277,421 | |
| | | | |
LIABILITIES | | | | |
Administrative fees payable | | | 6,290 | |
Distribution fees payable – Class B | | | 1,725 | |
Trustees’ fees payable | | | 934 | |
Payable for securities purchased | | | 716 | |
Payable to Separate Accounts for Trust shares redeemed | | | 172 | |
Accrued expenses | | | 71,760 | |
| | | | |
Total liabilities | | | 81,597 | |
| | | | |
NET ASSETS | | $ | 8,195,824 | |
| | | | |
Net assets were comprised of: | | | | |
Paid in capital | | $ | 9,464,407 | |
Accumulated undistributed net investment income (loss) | | | 9,190 | |
Accumulated undistributed net realized gain (loss) on investments | | | (307,821 | ) |
Net unrealized appreciation (depreciation) on investments | | | (969,952 | ) |
| | | | |
Net assets | | $ | 8,195,824 | |
| | | | |
Class B | | | | |
Net asset value, offering and redemption price per share, $8,195,824 / 898,592 shares outstanding (unlimited amount authorized: $0.001 par value) | | $ | 9.12 | |
| | | | |
STATEMENT OF OPERATIONS
For the Year Ended December 31, 2016
| | | | |
INVESTMENT INCOME | |
Dividends ($58,891 of dividend income received from affiliates) | | $ | 106,888 | |
Interest | | | 2,561 | |
| | | | |
Total income | | | 109,449 | |
| | | | |
EXPENSES | | | | |
Custodian fees | | | 39,500 | |
Professional fees | | | 37,564 | |
Administrative fees | | | 32,507 | |
Distribution fees – Class B | | | 25,977 | |
Investment management fees | | | 15,587 | |
Printing and mailing expenses | | | 1,575 | |
Trustees’ fees | | | 430 | |
Miscellaneous | | | 325 | |
| | | | |
Gross expenses | | | 153,465 | |
Less: Waiver from investment manager | | | (48,094 | ) |
Reimbursement from investment manager | | | (32,641 | ) |
| | | | |
Net expenses | | | 72,730 | |
| | | | |
NET INVESTMENT INCOME (LOSS) | | | 36,719 | |
| | | | |
REALIZED AND UNREALIZED GAIN (LOSS) | | | | |
Net realized gain (loss) on investments ($(227,151) of realized gain (loss) from affiliates) | | | (471,827 | ) |
Net distributions of realized gain received from underlying funds (All realized gains received from affiliates) | | | 65,939 | |
| | | | |
Net realized gain (loss) | | | (405,888 | ) |
| | | | |
Net change in unrealized appreciation (depreciation) on investments ($622,543 of change in unrealized appreciation (depreciation) from affiliates) | | | 1,530,301 | |
| | | | |
NET REALIZED AND UNREALIZED GAIN (LOSS) | | | 1,124,413 | |
| | | | |
NET INCREASE (DECREASE) IN NET ASSETS RESULTING FROM OPERATIONS | | $ | 1,161,132 | |
| | | | |
See Notes to Financial Statements.
30
AXA PREMIER VIP TRUST
CHARTERSM ALTERNATIVE 100 MODERATE PORTFOLIO
STATEMENT OF CHANGES IN NET ASSETS
| | | | | | | | |
| | | Year Ended December 31, | |
| | | 2016 | | | 2015 (ag) | |
INCREASE (DECREASE) IN NET ASSETS FROM OPERATIONS: | |
Net investment income (loss) | | $ | 36,719 | | | $ | 120,215 | |
Net realized gain (loss) on investments and net distributions of realized gain received from underlying funds | | | (405,888 | ) | | | 119,723 | |
Net change in unrealized appreciation (depreciation) on investments | | | 1,530,301 | | | | (815,215 | ) |
| | | | | | | | |
NET INCREASE (DECREASE) IN NET ASSETS RESULTING FROM OPERATIONS | | | 1,161,132 | | | | (575,277 | ) |
| | | | | | | | |
DIVIDENDS AND DISTRIBUTIONS: | | | | | | | | |
Dividends from net investment income | | | | | | | | |
Class B | | | (70,904 | ) | | | (185,335 | ) |
Distributions from net realized capital gains | | | | | | | | |
Class B | | | — | | | | (123,957 | ) |
Return of capital | | | | | | | | |
Class B | | | (38,932 | ) | | | — | |
| | | | | | | | |
TOTAL DIVIDENDS AND DISTRIBUTIONS | | | (109,836 | ) | | | (309,292 | ) |
| | | | | | | | |
CAPITAL SHARES TRANSACTIONS: | | | | | | | | |
Class B | | | | | | | | |
Capital shares sold [ 189,141 and 228,623 shares, respectively ] | | | 1,679,734 | | | | 2,128,331 | |
Capital shares issued in connection with merger (Note 9) [ 0 and 859,895 shares, respectively ] | | | — | | | | 7,365,800 | |
Capital shares issued in reinvestment of dividends and distributions [ 12,077 and 36,490 shares,
respectively ] | | | 109,836 | | | | 309,292 | |
Capital shares repurchased [ (832,263) and (405,905) shares, respectively ] | | | (7,425,910 | ) | | | (3,871,760 | ) |
| | | | | | | | |
NET INCREASE (DECREASE) IN NET ASSETS RESULTING FROM CAPITAL SHARE TRANSACTIONS | | | (5,636,340 | ) | | | 5,931,663 | |
| | | | | | | | |
TOTAL INCREASE (DECREASE) IN NET ASSETS | | | (4,585,044 | ) | | | 5,047,094 | |
NET ASSETS: | | | | | | | | |
Beginning of year | | | 12,780,868 | | | | 7,733,774 | |
| | | | | | | | |
End of year (a) | | $ | 8,195,824 | | | $ | 12,780,868 | |
| | | | | | | | |
(a) Includes accumulated undistributed (overdistributed) net investment income (loss) of | | $ | 9,190 | | | $ | 15,164 | |
| | | | | | | | |
(ag) On September 25, 2015, this Portfolio received, through a merger transaction, the assets and liabilities of the CharterSM Alternative 100 Conservative Plus Portfolio and CharterSM Alternative 100 Growth Portfolio that followed the same objectives as this Portfolio. Information prior to the period ended September 25, 2015 represents the results of operations of the CharterSM Alternative 100 Moderate Portfolio. | |
See Notes to Financial Statements.
31
AXA PREMIER VIP TRUST
CHARTERSM ALTERNATIVE 100 MODERATE PORTFOLIO (AG)
FINANCIAL HIGHLIGHTS
| | | | | | | | | | | | | | | | |
| | | Year Ended December 31, | | | October 30, 2013* to
December 31, 2013 | |
| Class B | | 2016 | | | 2015 | | | 2014 | | |
Net asset value, beginning of period | | $ | 8.36 | | | $ | 9.54 | | | $ | 9.73 | | | $ | 10.00 | |
| | | | | | | | | | | | | | | | |
Income (loss) from investment operations: | | | | | | | | | | | | | | | | |
Net investment income (loss) (e)(x) | | | 0.03 | | | | 0.13 | | | | 0.13 | | | | 0.07 | |
Net realized and unrealized gain (loss) on investments | | | 0.85 | | | | (1.04 | ) | | | (0.15 | ) | | | (0.17 | ) |
| | | | | | | | | | | | | | | | |
Total from investment operations | | | 0.88 | | | | (0.91 | ) | | | (0.02 | ) | | | (0.10 | ) |
| | | | | | | | | | | | | | | | |
Less distributions: | | | | | | | | | | | | | | | | |
Dividends from net investment income | | | (0.08 | ) | | | (0.13 | ) | | | (0.17 | ) | | | (0.14 | ) |
Distributions from net realized gains | | | — | | | | (0.14 | ) | | | — | | | | (0.02 | ) |
Return of capital | | | (0.04 | ) | | | — | | | | — | | | | (0.01 | ) |
| | | | | | | | | | | | | | | | |
Total dividends and distributions | | | (0.12 | ) | | | (0.27 | ) | | | (0.17 | ) | | | (0.17 | ) |
| | | | | | | | | | | | | | | | |
Net asset value, end of period | | $ | 9.12 | | | $ | 8.36 | | | $ | 9.54 | | | $ | 9.73 | |
| | | | | | | | | | | | | | | | |
Total return (b) | | | 10.58 | % | | | (9.50 | )% | | | (0.16 | )% | | | (1.01 | )% |
| | | | | | | | | | | | | | | | |
Ratios/Supplemental Data: | | | | | | | | | | | | | | | | |
Net assets, end of period (000’s) | | $ | 8,196 | | | $ | 12,781 | | | $ | 7,734 | | | $ | 4,269 | |
Ratio of expenses to average net assets: | | | | | | | | | | | | | | | | |
After waivers and reimbursements (a)(f) | | | 0.70 | %(j) | | | 0.66 | %** | | | 0.65 | % | | | 0.65 | % |
Before waivers and reimbursements (a)(f) | | | 1.48 | % | | | 2.36 | % | | | 3.01 | % | | | 3.82 | % |
Ratio of net investment income (loss) to average net assets: | | | | | | | | | | | | | | | | |
After waivers and reimbursements (a)(f)(x) | | | 0.35 | % | | | 1.40 | % | | | 1.27 | % | | | 4.13 | %(l) |
Before waivers and reimbursements (a)(f)(x) | | | (0.42 | )% | | | (0.31 | )% | | | (1.09 | )% | | | 0.96 | %(l) |
Portfolio turnover rate (z)^ | | | 16 | % | | | 30 | % | | | 13 | % | | | 7 | % |
| * | Commencement of Operations. |
| ** | Includes Tax Expense of 0.01%. |
| ^ | Portfolio turnover rate excludes derivatives, if any. |
| (a) | Ratios for periods less than one year are annualized. |
| (b) | Total returns for periods less than one year are not annualized. |
| (e) | Net investment income (loss) per share is based on average shares outstanding. |
| (f) | Expenses do not include the expenses of the underlying funds (“indirect expenses”), if applicable. |
| (j) | Including direct and indirect expenses, the net expense ratio after waivers and reimbursements would be 1.20%. |
| (l) | The annualized ratio of net investment income to average net assets may not be indicative of operating results for a full year. |
| (x) | Recognition of net investment income is affected by the timing of dividend declarations by the underlying funds in which the Portfolio invests. |
| (z) | Portfolio turnover rate for periods less than one year is not annualized. |
| (ag) | On September 25, 2015, this Portfolio received, through a merger transaction, the assets and liabilities of the CharterSM Alternative 100 Conservative Plus Portfolio and CharterSM Alternative 100 Growth Portfolio that followed the same objectives as this Portfolio. Information prior to the period ended September 25, 2015 represents the results of operations of the CharterSM Alternative 100 Moderate Portfolio. |
See Notes to Financial Statements.
32
AXA PREMIER VIP TRUST
NOTES TO FINANCIAL STATEMENTS
December 31, 2016
| Note 1 | Organization and Significant Accounting Policies |
AXA Premier VIP Trust (the “Trust”) was organized as a Delaware statutory trust on October 2, 2001 and is registered under the Investment Company Act of 1940, as amended (the “1940 Act”), as an open-end management investment company with twenty-three diversified Portfolios (each a “Portfolio” and together “the Portfolios”). These financial statements present six of the diversified Portfolios. The investment manager to each Portfolio is AXA Equitable Funds Management Group, LLC (“FMG LLC” or the “Manager”), a wholly-owned subsidiary of AXA Equitable Life Insurance Company (“AXA Equitable”).
Under the Trust’s organizational documents, the Trust’s officers and trustees are indemnified against certain liabilities arising out of the performance of their duties to the Trust. In addition, in the normal course of business, the Trust enters into contracts with certain vendors and others that provide for general indemnifications. The Trust’s maximum exposure under these arrangements is unknown as this would involve future claims that may be made against the Trust. However, based on experience, the Trust and management expect the risk of loss to be remote.
The Portfolios are types of mutual funds often described as a “fund of funds.” Each of the CharterSM Moderate Portfolio, CharterSM International Moderate Portfolio, CharterSM Income Strategies Portfolio, CharterSM Interest Rate Strategies Portfolio, CharterSM Real Assets Portfolio, and CharterSM Alternative 100 Moderate Portfolio (each a “Charter Allocation Portfolio” and together the “Charter Allocation Portfolios”) pursues its investment objective by investing in other affiliated mutual funds within the EQ Advisors Trust, a separately registered investment company managed by FMG LLC, and unaffiliated investment companies or exchange-traded funds (“ETFs”).
The Trust issues three classes of shares, Class A, Class B and Class K. The Class A and Class B shares are each subject to distribution fees imposed under distribution plans (“Distribution Plans”) adopted pursuant to Rule 12b-1 under the 1940 Act. Under the Trust’s multiple class distribution system, each class of shares has identical voting, dividend, liquidation and other rights, other than the payment of distribution fees under the applicable Distribution Plan. The Trust’s shares are currently sold only to insurance company separate accounts in connection with variable life insurance contracts and variable annuity certificates and contracts issued by AXA Equitable, AXA Life and Annuity Company and other affiliated or unaffiliated insurance companies and to the AXA Equitable 401(k) Plan. Shares also may be sold to other tax-qualified retirement plans.
The investment objectives of each Portfolio are as follows:
CharterSM Moderate Portfolio — Seeks long-term capital appreciation and current income, with a greater emphasis on current income.
CharterSM International Moderate Portfolio — Seeks long-term capital appreciation and current income, with a greater emphasis on current income.
CharterSM Income Strategies Portfolio — Seeks a high level of current income.
CharterSM Interest Rate Strategies Portfolio — Seeks to achieve long-term total return, consistent with the preservation of capital and prudent investment management.
CharterSM Real Assets Portfolio — Seeks to achieve maximum real return.
CharterSM Alternative 100 Moderate Portfolio — Seeks long-term capital appreciation.
The following is a summary of the significant accounting policies of the Trust:
In October 2016, the Securities and Exchange Commission (“SEC”) issued a new rule, Investment Company Reporting Modernization, which, among other provisions, amends
33
AXA PREMIER VIP TRUST
NOTES TO FINANCIAL STATEMENTS (Continued)
December 31, 2016
Regulation S-X to require standardized, enhanced disclosures, particularly related to derivatives, in Investment Company financial statements. Compliance with the guidance is required for financial statements filed with the SEC on or after August 1, 2017; management believes that the adoption of the rule will have no material effect on the Portfolios’ net assets or results of operations.
The preparation of financial statements in accordance with United States of America generally accepted accounting principles (“U.S. GAAP”) requires management to make estimates and assumptions that affect the reported amounts and disclosures. Actual results could differ from those estimates. The Portfolios are investment companies and, accordingly, follow the investment company accounting and reporting guidance of the Financial Accounting Standards Board Accounting Standards Codification Topic 946 — Investment Companies, which is part of U.S. GAAP.
Valuation:
Equity securities (including securities issued by ETFs) listed on national securities exchanges are valued at the last sale price or official closing price on the date of valuation or, if there is no sale or official closing price, at the latest available bid price. Securities listed on the NASDAQ stock market will be valued using the NASDAQ Official Closing Price (“NOCP”). Generally, the NOCP will be the last sale price unless the reported trade for the security is outside the range of the bid/ask price. In such cases, the NOCP will be normalized to the nearer of the bid or ask price. Other unlisted stocks are valued at their last sale price or official closing price, or if there is no such price, at a bid price estimated by a broker.
Investments in shares of open-end investment companies (other than ETFs) held by a Portfolio will be valued at the net asset value (“NAV”) of the shares of such funds as described in the underlying funds’ prospectuses.
If market quotations are not readily available for a security or other financial instruments, such securities and instruments shall be referred to the Trust’s Valuation Committee (“Committee”), who will value the assets in good faith pursuant to procedures (“Pricing Procedures”) adopted by the Board of Trustees of the Trust (the “Board”).
The Board is responsible for ensuring that appropriate valuation methods are used to price securities for the Trust’s Portfolios. The Board has delegated the responsibility of calculating the NAVs of the Trust’s Portfolios and classes pursuant to these Pricing Procedures to the Trust’s administrator, FMG LLC (in its capacity as administrator, the “Administrator”). The Administrator has entered into a sub-administration agreement with JPMorgan Chase Bank, N.A. (the “Sub- Administrator”) to assist in performing certain of the duties described herein. The Committee, established by the Board, determines the value of the Trust’s securities and assets for which market quotations are not readily available or for which valuation cannot otherwise be provided in accordance with procedures adopted by the Board. The Committee is comprised of senior employees from FMG LLC.
Due to the inherent uncertainty of valuations of such securities, the fair value may differ significantly from the values that would have been used had a ready market for such securities existed.
Various inputs are used in determining the value of a Portfolio’s assets or liabilities carried at fair value. These inputs are summarized in three broad levels below:
| | • | | Level 1 - quoted prices in active markets for identical assets |
| | • | | Level 2 - other significant observable inputs (including quoted prices of similar securities, interest rates, prepayment speeds, credit risk, etc.) |
| | • | | Level 3 - significant unobservable inputs (including the Portfolio’s own assumptions in determining the fair value of investments) |
34
AXA PREMIER VIP TRUST
NOTES TO FINANCIAL STATEMENTS (Continued)
December 31, 2016
A summary of inputs used to value each Portfolio’s assets and liabilities carried at fair value as of December 31, 2016 is included in the Portfolio of Investments for each Portfolio. Changes in valuation techniques may result in transfers into or out of an investment’s assigned level. The Portfolios’ policy is to recognize transfers into and transfers out of the valuation levels as of the end of the reporting period.
Transfers between levels are included after the Summary of Level 1, Level 2 and Level 3 inputs, following the Portfolio of Investments for each Portfolio. Transfers between levels may be due to a decline or an increase in market activity (e.g., frequency of trades), which may result in a lack of, or increase in, available observable market inputs to determine price.
The inputs or methodology used to value securities are not necessarily an indication of the risk associated with investing in those securities. An investment’s level within the fair value hierarchy is based on the lowest level of any input, both individually and in aggregate, that is significant to the fair value measurement.
The Committee has the ability to meet and review reports based on the valuation techniques used to value Level 3 securities. As part of a review, the Committee would consider obtaining updates from its pricing vendors for fair valued securities. For example, with respect to model driven prices, the Committee could receive reports regarding a review and recalculation of pricing models and related discounts. For those securities which are valued based on broker quotes, the Committee may evaluate variances between existing broker quotes and any alternative broker quotes or other pricing source.
To substantiate unobservable inputs used in a fair valuation, the Secretary of the Committee can perform an independent verification as well as additional research for fair value notifications received from the pricing agents. Among other factors, particular areas of focus may include: description of security, historical pricing, intra-day price movement, last trade information, corporate actions, related securities, any available company news and announcements, any available trade data or other information. The Committee also notes the materiality of holdings and price changes on a Portfolio’s NAV.
The Committee reviews and considers changes in value for all fair valued securities that have occurred since the last review.
Pursuant to procedures approved by the Board, events or circumstances affecting the values of portfolio securities that occur between the closing of their principal markets and the time the NAV is determined may be reflected in the Trust’s calculation of NAVs for each applicable Portfolio when the Manager deems that the particular event or circumstance would materially affect such Portfolio’s NAV. At December 31, 2016, none of the Portfolios applied these procedures.
Security Transactions and Investment Income:
Securities transactions are recorded on the trade date net of brokerage fees, commissions, and transfer fees. Dividend income and distributions to shareholders are recorded on the ex-dividend date. Interest income (including amortization of premium and accretion of discount on long-term securities using the effective yield method) and interest expense are accrued daily.
The Portfolios record distributions received in excess of income from underlying investments as a reduction of cost of investments and/or realized gain. Those classified as short-term gain distributions are reflected as such for book but as ordinary income for tax. Such amounts are based on estimates if actual amounts are not available and actual amounts of income, realized gain and return of capital may differ from the estimated amounts. The Portfolios adjust the estimated amounts of components of distributions (and consequently its net investment income) as necessary once the issuers provide information about the actual composition of the distributions.
35
AXA PREMIER VIP TRUST
NOTES TO FINANCIAL STATEMENTS (Continued)
December 31, 2016
Realized gains and losses on the sale of investments are computed on the basis of the specific identified cost of the investments sold.
Allocation of Expenses and Income:
Expenses attributable to a single Portfolio or class are charged to that Portfolio or class. Expenses of the Trust not attributable to a single Portfolio or class are charged to each Portfolio or class in proportion to the average net assets of each Portfolio or other appropriate allocation methods.
All income earned and expenses incurred by each Portfolio are borne on a pro-rata basis by each outstanding class of shares, based on the proportionate interest in the Portfolio represented by the daily net assets of such class, except for distribution fees which are charged on a class specific basis.
Market and Credit Risk:
Because the Portfolios invest in affiliated mutual funds, unaffiliated investment companies or ETFs, the Portfolios indirectly pay a portion of the expenses incurred by the underlying funds and ETFs. As a result, the cost of investing in the Portfolios may be higher than the cost of investing in a Portfolio that invests directly in individual securities and financial instruments. The Portfolios are also subject to certain risks related to the underlying funds’ and ETFs’ investments in securities and financial instruments such as fixed income securities, including high yield, asset-backed and mortgage-related securities; equity securities, foreign and emerging markets securities, commodities and real estate securities. These securities are subject to risks specific to their structure, sector or market. In addition, the underlying funds and ETFs may use derivative instruments in connection with their individual investment strategies including futures, forward currency exchange contracts, options, swaps, and other derivatives, which are also subject to specific risks related to their structure, sector or market and may be riskier than investments in other types of securities.
Taxes:
The Trust intends to comply with the requirements of the Internal Revenue Code of 1986, as amended, applicable to regulated investment companies (“RICs”) and to distribute substantially all of its net investment income and net realized capital gains to shareholders of each Portfolio. Therefore, no Federal, state and local income tax provisions are required.
The Portfolios are not aware of any tax positions for which it is reasonably possible that the total amounts of unrecognized tax benefits will significantly change in the next twelve months. However, the Portfolios’ conclusions may be subject to future review based on changes in, or the interpretation of, the accounting standards or tax laws and regulations. The Portfolios recognize interest and penalties, if any, related to uncertain tax positions as income tax expense in the Statements of Operations. During the year ended December 31, 2016, the Portfolios did not incur any interest or penalties. Each of the tax years in the four-year period ended December 31, 2016 remains subject to examination by the Internal Revenue Service, state and local taxing authorities.
Dividends from net investment income, if any, are declared and distributed at least annually for all Portfolios. Dividends from net realized short-term and long-term capital gains are declared and distributed at least annually to the shareholders of the Portfolios to which such gains are attributable. All dividends are reinvested in additional full and fractional shares of the related Portfolios. All distributions are calculated on a tax basis and, as such, the amounts may differ from financial statement investment income and realized gains. Those differences which are significant to the Portfolios are primarily due to Capital Loss Carryforwards (CharterSM International Moderate, CharterSM Interest Rate Strategies, CharterSM Real Assets and CharterSM Alternative 100 Moderate), and Partnership Basis Adjustments (CharterSM Real
36
AXA PREMIER VIP TRUST
NOTES TO FINANCIAL STATEMENTS (Continued)
December 31, 2016
Assets and CharterSM Alternative 100 Moderate). In addition, short-term capital gains and foreign currency gains are treated as capital gains for U.S. GAAP purposes but are considered ordinary income for tax purposes. Capital and net specified losses incurred after October 31 and within the taxable year are deemed to arise on the first business day of a Portfolio’s next taxable year. The tax composition of distributed and undistributed income and gains for the years ended December 31, 2016 and December 31, 2015, were as follows:
| | | | | | | | | | | | | | | | | | | | | | | | | | | | | | | | |
| | | Year Ended December 31, 2016 | | | Year Ended December 31, 2015 | |
Portfolios: | | Distributed
Ordinary
Income | | | Distributed
Long Term
Gains | | | Accumulated
Undistributed
Ordinary
Income | | | Accumulated
Undistributed
Long Term
Gains | | | Distributed
Ordinary
Income | | | Distributed
Long Term
Gains | | | Accumulated
Undistributed
Ordinary
Income | | | Accumulated
Undistributed
Long Term
Gains | |
CharterSM Moderate | | $ | 378,663 | | | $ | 109,477 | | | $ | — | | | $ | 21,742 | | | $ | 270,914 | | | $ | 138,185 | | | $ | — | | | $ | 90,219 | |
CharterSM International Moderate | | | 187,952 | | | | — | | | | — | | | | — | | | | 150,902 | | | | 16,080 | | | | — | | | | — | |
CharterSM Income Strategies | | | 123,040 | | | | 55,681 | | | | — | | | | 47,210 | | | | 137,954 | | | | 67,121 | | | | 3,453 | | | | 42,489 | |
CharterSM Interest Rate Strategies | | | 108,006 | | | | 35,239 | | | | — | | | | — | | | | 115,616 | | | | 66,016 | | | | 13,505 | | | | 35,236 | |
CharterSM Real Assets | | | 82,701 | | | | — | | | | — | | | | — | | | | 39,104 | | | | — | | | | — | | | | — | |
CharterSM Alternative 100 Moderate | | | 70,904 | | | | — | | | | — | | | | — | | | | 209,371 | | | | 99,921 | | | | — | | | | 18,628 | |
The following Portfolios had a Return of Capital during the year ended December 31, 2016:
| | | | |
Portfolios: | | Return of Capital | |
CharterSM International Moderate | | $ | 21,324 | |
CharterSM Interest Rate Strategies | | | 14,012 | |
CharterSM Real Assets | | | 8,704 | |
CharterSM Alternative 100 Moderate | | | 38,932 | |
There was no Return of Capital for 2015.
Permanent book and tax basis differences relating to shareholder distributions resulted in reclassifications to undistributed (overdistributed) net investment income (loss), accumulated net realized gain (loss) and paid-in capital at December 31, 2016 as follows:
| | | | | | | | | | | | |
Portfolios: | | Undistributed
Net Investment
Income (Loss) | | | Accumulated
Net Realized
Gain (Loss) | | | Paid In
Capital | |
CharterSM Moderate | | $ | 19,465 | | | $ | (19,467 | ) | | $ | 2 | |
CharterSM International Moderate | | | 4,875 | | | | (1,378 | ) | | | (3,497 | ) |
CharterSM Income Strategies | | | 3,339 | | | | (3,339 | ) | | | — | |
CharterSM Interest Rate Strategies | | | 7,408 | | �� | | (7,408 | ) | | | — | |
CharterSM Real Assets | | | 8,731 | | | | (731 | ) | | | (8,000 | ) |
CharterSM Alternative 100 Moderate | | | 28,211 | | | | 150,765 | | | | (178,976 | ) |
Net Capital and net specified gains/losses incurred after October 31, and within the taxable year are deemed to arise on the first business day of the Portfolio’s next taxable year. For the year ended December 31, 2016, the following Portfolios deferred to January 1, 2017 post-October losses of:
| | | | | | | | | | | | |
Portfolios: | | Specified Loss | | | Short-Term
Capital Loss | | | Long-Term
Capital Loss | |
CharterSM Moderate | | $ | — | | | $ | — | | | $ | — | |
CharterSM International Moderate | | | — | | | | — | | | | — | |
CharterSM Income Strategies | | | — | | | | — | | | | — | |
CharterSM Interest Rate Strategies | | | — | | | | — | | | | — | |
CharterSM Real Assets | | | — | | | | 925 | | | | — | |
CharterSM Alternative 100 Moderate | | | — | | | | 123 | | | | 431 | |
37
AXA PREMIER VIP TRUST
NOTES TO FINANCIAL STATEMENTS (Continued)
December 31, 2016
Under the Regulated Investment Company Modernization Act of 2010 (the “RIC Mod Act”), net capital losses recognized by the Portfolios after December 31, 2010, may get carried forward indefinitely, and retain their character as short-term and/or long term losses. Prior to the RIC Mod Act, net capital losses incurred by the Portfolios were carried forward for up to eight years and treated as 100% short-term. The RIC Mod Act requires that post-enactment net capital losses be used before pre-enactment net capital losses, therefore some net capital loss carryforwards that would have been utilized under prior law may expire unused. None of the Portfolios presented in these statements have pre-enactment and post-enactment net capital losses that will be carried forward.
The following Portfolios utilized net capital loss carryforwards during 2016 and/or have losses incurred that will be carried forward under the provisions of the Regulated Investment Company Modernization Act of 2010 are as follows:
| | | | | | | | | | | | | | | | |
| | | Utilized | | | Losses carried forward | |
| Portfolios: | | Short Term | | | Long Term | | | Short Term | | | Long Term | |
CharterSM International Moderate | | $ | 13,261 | | | $ | — | | | $ | — | | | $ | 291,628 | |
CharterSM Interest Rate Strategies | | | — | | | | — | | | | 6,943 | | | | 73,321 | |
CharterSM Real Assets | | | — | | | | — | | | | 68,716 | | | | 103,603 | |
CharterSM Alternative 100 Moderate | | | — | | | | — | | | | 116,874 | | | | 591,496 | |
| Note 2 | Management of the Trust |
The Trust has entered into an investment management agreement (the “Management Agreement”) with FMG LLC. The Management Agreement for the Portfolios obligates the Manager to, among other things: (i) provide investment management and advisory services; (ii) render investment advice concerning the underlying funds in which to invest and the appropriate allocations for each of the Portfolios; (iii) implement and monitor the investment programs and results; (iv) apprise the Trustees/Trust of developments materially affecting the Portfolios; (v) oversee each Portfolio’s compliance with investment objectives and policies as well as the Trust’s compliance with various federal and state statutes; and (vi) carry out the directives of the Board. For the year ended December 31, 2016, for its services under the Management Agreement, the Manager was entitled to receive an annual fee as a percentage of average daily net assets, for each of the following Portfolios, calculated daily and payable monthly as follows:
| | |
Portfolios: | | Management Fee |
CharterSM Moderate | | 0.150% of average daily net assets |
CharterSM International Moderate | | 0.150% of average daily net assets |
CharterSM Income Strategies | | 0.150% of average daily net assets |
CharterSM Interest Rate Strategies | | 0.150% of average daily net assets |
CharterSM Real Assets | | 0.150% of average daily net assets |
CharterSM Alternative 100 Moderate | | 0.150% of average daily net assets |
| Note 3 | Administrative Fees |
Pursuant to an administrative agreement (“Mutual Funds Service Agreement”), the Administrator provides the Trust with necessary administrative, fund accounting, and compliance services. In addition, the Administrator makes available the office space, equipment, personnel and facilities required to provide such administrative services to the Trust. FMG LLC may carry out its responsibilities either directly or through sub-contracting with third party providers. For these services, each Charter Allocation Portfolio pays FMG LLC, as Administrator, its proportionate share of an asset-based administration fee, subject to a minimum annual fee of $32,500.
38
AXA PREMIER VIP TRUST
NOTES TO FINANCIAL STATEMENTS (Continued)
December 31, 2016
For purposes of calculating the asset-based administration fee, the assets of the AXA Allocation Portfolios*, Target Allocation Portfolios** and Charter Allocation Portfolios*** are aggregated with those of the AXA Strategic Allocation Portfolios, AXA All Asset Allocation Series Portfolios and the AXA/Franklin Templeton Allocation Managed Volatility Portfolio of EQ Advisors Trust (the “EQAT Fund-of-Funds Portfolios”), which are also managed by FMG LLC. The asset-based administration fee is equal to an annual rate of 0.150% of the first $35 billion of the aggregate average daily net assets of the AXA Allocation Portfolios, Target Allocation Portfolios and Charter Allocation Portfolios and EQAT Fund-of-Funds Portfolios; 0.110% on the next $10 billion; 0.100% on the next $5 billion; and 0.095% thereafter.
Prior to October 1, 2016, the Administration fees were as follows:
For purposes of calculating the asset-based administration fee, the assets of the AXA Allocation Portfolios*, Target Allocation Portfolios** and Charter Allocation Portfolios*** were aggregated. The asset-based administration fee was equal to an annual rate of 0.150% of the first $20 billion of the aggregate average daily net assets of the AXA Allocation Portfolios, Target Allocation Portfolios and Charter Allocation Portfolios; 0.125% on the next $5 billion; and 0.100% thereafter.
| * | The AXA Allocation Portfolios consist of the AXA Conservative Allocation Portfolio, AXA Conservative-Plus Allocation Portfolio, AXA Moderate Allocation Portfolio, AXA Moderate-Plus Allocation Portfolio and AXA Aggressive Allocation Portfolio, which are Portfolios of the Trust not presented in these financial statements. |
| ** | The Target Allocation Portfolios consist of the Target 2015 Allocation Portfolio, Target 2025 Allocation Portfolio, Target 2035 Allocation Portfolio, Target 2045 Allocation Portfolio and Target 2055 Allocation Portfolio, which are Portfolios of the Trust not presented in these financial statements. |
| *** | Including the CharterSM Conservative Portfolio, CharterSM Moderate Growth Portfolio, CharterSM Growth Portfolio, CharterSM Aggressive Growth Portfolio, CharterSM Multi-Sector Bond Portfolio, CharterSM Small Cap Growth Portfolio and CharterSM Small Cap Value Portfolio, which are Portfolios of the Trust not presented in these financial statements. |
Pursuant to a sub-administration agreement with FMG LLC, the Sub-Administrator provides the Trust with certain administrative services, including monitoring of portfolio compliance and portfolio accounting services.
The Trust has entered into a Custody Agreement with JPMorgan Chase Bank, N.A. (in this capacity, the “Custodian”). The Custody Agreement provides for an annual fee based on the amount of assets under custody plus transaction charges. The Custodian serves as custodian of the Trust’s portfolio securities and other assets. Under the terms of the Custody Agreement between the Trust and the Custodian, the Custodian maintains and deposits in each Portfolio’s account, cash, securities and other assets of the Portfolios. The Custodian is also required, upon the order of the Trust, to deliver securities held by the Custodian, and to make payments for securities purchased by the Trust. The Custodian has also entered into sub-custodian agreements with a number of foreign banks and clearing agencies, pursuant to which portfolio securities purchased outside the U.S. are maintained in the custody of these entities.
The Trust has entered into distribution agreements with AXA Distributors, LLC (“AXA Distributors” or the “Distributor”), an indirect wholly-owned subsidiary of AXA Equitable and an affiliate of FMG LLC, pursuant to which the Distributor serves as the principal underwriter of the Class A, Class B and Class K shares of the Trust. The Trust has adopted in the manner prescribed under Rule 12b-1 under the 1940 Act a plan of distribution pertaining to each of the Class A and
39
AXA PREMIER VIP TRUST
NOTES TO FINANCIAL STATEMENTS (Continued)
December 31, 2016
Class B shares of the Trust (“Distribution Plans”). The Distribution Plans provide that the Distributor will be entitled to receive a maximum distribution fee at the annual rate of 0.25% of the average daily net assets attributable to each of the Trust’s Class A and Class B shares for which it provides service.
In the interest of limiting through April 30, 2017 (unless the Board consents to an earlier revision or termination of this arrangement) the expenses of certain Portfolios, FMG LLC has entered into an expense limitation agreement with the Trust (“Expense Limitation Agreement”). Pursuant to that Expense Limitation Agreement, FMG LLC has agreed to make payments or waive its management, administrative and other fees so that the annual operating expenses of each Portfolio, inclusive of fees and expenses of other investment companies in which a Portfolio invests (but exclusive of interest, taxes, brokerage commissions, dividend and interest expenses on securities sold short, other expenditures that are capitalized in accordance with generally accepted accounting principles and other extraordinary expenses not incurred in the ordinary course of each Portfolio’s business), are limited to the following annualized rates:
| | | | | | | | | | | | |
| | | Maximum Annual Operating Expense Limit | |
Portfolios: | | Class K | | | Class A+ | | | Class B+ | |
CharterSM Moderate* | | | N/A | | | | N/A | | | | 1.30 | % |
CharterSM International Moderate* | | | N/A | | | | N/A | | | | 1.25 | |
CharterSM Income Strategies* | | | N/A | | | | N/A | | | | 1.20 | |
CharterSM Interest Rate Strategies* | | | N/A | | | | N/A | | | | 1.20 | |
CharterSM Real Assets* | | | N/A | | | | N/A | | | | 1.40 | |
CharterSM Alternative 100 Moderate* | | | N/A | | | | N/A | | | | 1.55 | |
| + | Includes amounts payable pursuant to Rule 12b-1 |
| * | The Trust offers only Class B shares of this Portfolio. |
Prior to May 1, 2016, FMG LLC had agreed to make payments or waive its management, administrative and other fees so that the annual operating expenses of each Portfolio (other than interest, taxes, brokerage commissions, dividend and interest expenses on securities sold short, expenses of Underlying Portfolios and Underlying ETFs, other expenditures that are capitalized in accordance with generally accepted accounting principles and other extraordinary expenses not incurred in the ordinary course of each Portfolio’s business), did not exceed the following annualized rates:
| | | | | | | | | | | | |
| | | Maximum Annual Operating Expense Limit | |
Portfolios: | | Class K | | | Class A+ | | | Class B+ | |
CharterSM Moderate* | | | N/A | | | | N/A | | | | 0.65 | % |
CharterSM International Moderate* | | | N/A | | | | N/A | | | | 0.65 | |
CharterSM Income Strategies* | | | N/A | | | | N/A | | | | 0.65 | |
CharterSM Interest Rate Strategies* | | | N/A | | | | N/A | | | | 0.65 | |
CharterSM Real Assets* | | | N/A | | | | N/A | | | | 0.65 | |
CharterSM Alternative 100 Moderate* | | | N/A | | | | N/A | | | | 0.65 | |
| + | Includes amounts payable pursuant to Rule 12b-1. |
| * | The Trust offers only Class B shares of this Portfolio. |
FMG LLC first waives its management fees, then waives its administration fees, and then reimburses a Portfolio’s expenses out of its own resources. FMG LLC may be reimbursed the amount of any such payments or waivers in the future provided that the payments or waivers are reimbursed within three years of the payments or waivers being made and the combination of the Portfolio’s expense ratio and such reimbursements do not exceed the Portfolio’s expense cap. If the actual expense ratio is less than the expense cap and FMG LLC has recouped any
40
AXA PREMIER VIP TRUST
NOTES TO FINANCIAL STATEMENTS (Continued)
December 31, 2016
eligible previous payments or waivers made, the Portfolio will be charged such lower expenses. FMG LLC’s selection of Underlying Portfolios and Underlying ETFs may positively or negatively impact its obligations under the Expense Limitation Agreement and its ability to recoup previous payments or waivers made under the Expense Limitation Agreement.
During the year ended December 31, 2016, FMG LLC received recoupment of $93,384 from Portfolios of the Trust not included in these financial statements.
Recoupments in excess of waivers during the period would be presented as Recoupment Fees in the Statement of Operations. At December 31, 2016, under the Expense Limitation Agreement, the amount that would be recoverable from each Portfolio is as follows:
| | | | | | | | | | | | | | | | |
Portfolios: | | 2017 | | | 2018 | | | 2019 | | | Total Eligible
For
Recoupment | |
CharterSM Moderate | | $ | 256,110 | | | $ | 213,810 | | | $ | 195,749 | | | $ | 665,669 | |
CharterSM International Moderate | | | 157,720 | | | | 161,752 | | | | 99,884 | | | | 419,356 | |
CharterSM Income Strategies | | | 176,457 | | | | 152,377 | | | | 125,994 | | | | 454,828 | |
CharterSM Interest Rate Strategies | | | 176,251 | | | | 140,317 | | | | 122,166 | | | | 438,734 | |
CharterSM Real Assets | | | 138,870 | | | | 117,616 | | | | 86,422 | | | | 342,908 | |
CharterSM Alternative 100 Moderate | | | 145,055 | | | | 146,465 | | | | 80,735 | | | | 372,255 | |
During the year ended December 31, 2016, FMG LLC voluntarily agreed to waive the following (voluntary waivers may be reduced or discontinued at anytime without notice and are not eligible for recoupment):
| | | | |
Portfolios: | | Voluntary Waivers | |
CharterSM Moderate | | $ | 6,457 | |
CharterSM International Moderate | | | 4,484 | |
CharterSM Income Strategies | | | 1,606 | |
CharterSM Interest Rate Strategies | | | 1,687 | |
| Note 7 | Trustees Deferred Compensation Plan |
A deferred compensation plan (the “Plan”) for the benefit of the Independent Trustees has been adopted by the Trust. Under the Plan, each Trustee may defer payment of all or part of the fees payable for such Trustee’s services. Each Trustee may defer payment of such fees until their retirement as a Trustee or until the earlier attainment of a specified age. Fees deferred under the Plan, together with accrued earnings thereon, will be disbursed to a participating Trustee in monthly installments over a five- to twenty-year period elected by such Trustee. At December 31, 2016, the total amount deferred by the Trustees participating in the Plan was $814,091*.
| * | The total deferred compensation relates to the entire Trust which includes Portfolios not presented in these financial statements. |
| Note 8 | Percentage of Ownership by Affiliates |
At December 31, 2016, AXA Equitable held investments in each of the Portfolios as follows:
| | | | |
Portfolios: | | Percentage of
Ownership | |
CharterSM International Moderate | | | 71.35 | % |
CharterSM Income Strategies | | | 28.12 | |
CharterSM Interest Rate Strategies | | | 13.50 | |
CharterSM Real Assets | | | 70.07 | |
41
AXA PREMIER VIP TRUST
NOTES TO FINANCIAL STATEMENTS (Continued)
December 31, 2016
Shares of affiliated underlying investment companies may be held by the Portfolios. The following tables represent the percentage of ownership that each Portfolio has in each respective affiliated underlying investment company’s net assets as of December 31, 2016.
| | | | | | | | | | | | | | | | | | | | | | | | |
Portfolios: | | CharterSM
Moderate | | | CharterSM
International
Moderate | | | CharterSM
Income
Strategies | | | CharterSM
Interest
Rate
Strategies | | | CharterSM
Real
Assets | | | CharterSM
Alternative
100
Moderate | |
EQ/Energy ETF | | | 1.58 | % | | | — | % | | | 1.19 | % | | | 2.31 | % | | | 5.57 | % | | | 7.01 | % |
EQ/Low Volatility Global ETF | | | 3.82 | | | | 3.79 | | | | — | | | | 6.98 | | | | — | | | | — | |
AXA Natural Resources | | | 0.43 | | | | — | | | | 0.34 | | | | 0.57 | | | | 1.34 | | | | 1.82 | |
AXA Real Estate | | | 0.63 | | | | 1.52 | | | | 0.87 | | | | 0.72 | | | | 1.82 | | | | 2.56 | |
AXA SmartBeta Equity | | | 1.46 | | | | 1.31 | | | | — | | | | — | | | | — | | | | — | |
AXA/AB Small Cap Growth | | | 0.02 | | | | — | | | | — | | | | — | | | | — | | | | — | |
AXA/ClearBridge Large Cap Growth | | | 0.12 | | | | — | | | | — | | | | — | | | | — | | | | — | |
AXA/Janus Enterprise | | | 0.08 | | | | — | | | | — | | | | — | | | | — | | | | — | |
AXA/Lord Abbett Micro Cap | | | 0.13 | | | | — | | | | — | | | | — | | | | — | | | | — | |
EQ/BlackRock Basic Value Equity | | | 0.02 | | | | — | | | | — | | | | — | | | | — | | | | — | |
EQ/Boston Advisors Equity Income | | | — | | | | — | | | | 0.09 | | | | 0.06 | | | | — | | | | — | |
EQ/Capital Guardian Research | | | 0.24 | | | | — | | | | — | | | | — | | | | — | | | | — | |
EQ/Convertible Securities | | | 9.31 | | | | — | | | | — | | | | 2.14 | | | | — | | | | 5.04 | |
EQ/Core Bond Index | | | — | # | | | — | | | | — | # | | | — | | | | — | | | | — | |
EQ/Emerging Markets Equity PLUS | | | 1.01 | | | | 0.63 | | | | — | | | | — | | | | — | | | | — | |
EQ/GAMCO Mergers and Acquisitions | | | 0.17 | | | | — | | | | — | | | | — | | | | — | | | | 0.46 | |
EQ/GAMCO Small Company Value | | | 0.01 | | | | — | | | | — | | | | — | | | | — | | | | — | |
EQ/Global Bond PLUS | | | 0.41 | | | | 0.24 | | | | 0.04 | | | | 0.03 | | | | — | | | | — | |
EQ/High Yield Bond | | | 0.46 | | | | — | | | | 0.12 | | | | 0.02 | | | | — | | | | — | |
EQ/Intermediate Government Bond | | | 0.02 | | | | — | | | | — | | | | — | | | | — | | | | — | |
EQ/International Equity Index | | | 0.06 | | | | 0.04 | | | | — | | | | — | | | | — | | | | — | |
EQ/Invesco Comstock | | | 0.20 | | | | — | | | | — | | | | — | | | | — | | | | — | |
EQ/MFS International Growth | | | 0.05 | | | | 0.03 | | | | — | | | | — | | | | — | | | | — | |
EQ/PIMCO Global Real Return | | | 1.61 | | | | 0.77 | | | | 0.14 | | | | 0.51 | | | | 1.73 | | | | — | |
EQ/PIMCO Ultra Short Bond | | | 0.09 | | | | — | | | | — | | | | 0.01 | | | | — | | | | — | |
EQ/Quality Bond PLUS | | | — | | | | — | | | | — | # | | | — | | | | — | | | | — | |
EQ/T. Rowe Price Growth Stock | | | 0.04 | | | | — | | | | — | | | | — | | | | — | | | | — | |
Multimanager Core Bond | | | 0.18 | | | | — | | | | 0.06 | | | | — | | | | — | | | | — | |
Multimanager Mid Cap Value | | | 0.31 | | | | — | | | | — | | | | — | | | | — | | | | — | |
| # | Percentage of ownership is less than 0.005%. |
42
AXA PREMIER VIP TRUST
NOTES TO FINANCIAL STATEMENTS (Continued)
December 31, 2016
| Note 9 | Substitution, Reorganization and In-Kind Transactions |
The following transactions occurred during 2015:
After the close of business on September 25, 2015, CharterSM International Moderate Portfolio acquired the net assets of CharterSM International Conservative Portfolio and CharterSM International Growth Portfolio pursuant to a Plan of Reorganization and Termination as approved by contractholders on September 17, 2015. For U.S. GAAP purposes, this transaction was treated as a merger. The purpose of this merger was to combine funds managed by FMG LLC with comparable investment objectives. The reorganization was accomplished by a tax-free exchange resulting in CharterSM International Moderate Portfolio issuing 962,890 Class B shares (valued at $8,571,057) in exchange for 475,178 and 499,110 Class B shares of the CharterSM International Conservative Portfolio and CharterSM International Growth Portfolio, respectively. The securities held by CharterSM International Conservative Portfolio and CharterSM International Growth Portfolio, with a fair value of $4,252,534 and $4,399,558, respectively, and identified cost of $4,723,379 and $4,957,409, respectively, at September 25, 2015, were the principal assets acquired by CharterSM International Moderate Portfolio. For U.S. GAAP purposes, assets received and shares issued by CharterSM International Moderate Portfolio were recorded at fair value; however, the cost basis of the investments from CharterSM International Conservative Portfolio and CharterSM International Growth Portfolio was carried forward to align ongoing reporting of CharterSM International Moderate Portfolio’s realized and unrealized gains and losses with amounts distributable to contractholders for tax purposes. CharterSM International Conservative Portfolio and CharterSM International Growth Portfolio’s net assets at the merger date of $4,210,022 and $4,361,035, respectively, including $(470,845) and $(557,851), respectively, of unrealized depreciation, $2,583 and $(10,396), respectively, of undistributed net investment income/(loss) and $(24,282) and $(17,443) respectively, of undistributed net realized loss on investments, were combined with those of CharterSM International Moderate Portfolio. Assuming the acquisition had been completed January 1, 2015, the beginning of the annual reporting period of CharterSM International Moderate Portfolio, pro forma results of operations for the year ended December 31, 2015 would include net investment income of $212,891 and net realized and unrealized loss on investments of $(932,442), resulting in a decrease in net assets from operations of $(719,551). Because the combined investment portfolios have been managed as a single integrated portfolio since the acquisition date, it is not practicable to separate the amounts of revenue and earnings of the CharterSM International Conservative Portfolio and CharterSM International Growth Portfolio that have been included in CharterSM International Moderate Portfolio’s Statement of Operations since the merger date, September 25, 2015. Prior to the combination, the net assets of the CharterSM International Moderate Portfolio totaled $4,669,340. Immediately after the combination, the net assets of the CharterSM International Moderate Portfolio totaled $13,240,397. The cost of securities transferred by CharterSM International Conservative Portfolio and CharterSM International Growth Portfolio is excluded from CharterSM International Moderate Portfolio’s portfolio turnover calculation and excluded from the cost of long-term purchases.
After the close of business on September 25, 2015, CharterSM Alternative 100 Moderate Portfolio acquired the net assets of the CharterSM Alternative 100 Conservative-Plus Portfolio and CharterSM Alternative 100 Growth Portfolio pursuant to a Plan of Reorganization and Termination as approved by contractholders on September 17, 2015. For U.S. GAAP purposes, this transaction was treated as a merger. The purpose of this merger was to combine funds managed by FMG LLC with identical investment objectives. The reorganization was accomplished by a tax-free exchange resulting in the CharterSM Alternative 100 Moderate Portfolio issuing 859,895 Class B shares (valued at $7,365,800) in exchange for 412,800 and 479,681 Class B shares of the CharterSM Alternative 100 Conservative-Plus Portfolio and CharterSM Alternative 100 Growth Portfolio, respectively. The securities held by CharterSM Alternative 100 Conservative-Plus Portfolio and CharterSM Alternative 100 Growth Portfolio,
43
AXA PREMIER VIP TRUST
NOTES TO FINANCIAL STATEMENTS (Continued)
December 31, 2016
with a fair value of $3,551,807 and $3,873,133, respectively, and identified cost of $3,973,545 and $4,732,004, respectively, at September 25, 2015, were the principal assets acquired by CharterSM Alternative 100 Moderate Portfolio. For U.S. GAAP purposes, assets received and shares issued by CharterSM Alternative 100 Moderate Portfolio were recorded at fair value; however, the cost basis of the investments from CharterSM Alternative 100 Conservative-Plus Portfolio and CharterSM Alternative 100 Growth Portfolio was carried forward to align ongoing reporting of CharterSM Alternative 100 Moderate Portfolio’s realized and unrealized gains and losses with amounts distributable to contractholders for tax purposes. CharterSM Alternative 100 Conservative Plus Portfolio and CharterSM Alternative 100 Growth Portfolio’s net assets at the merger date of $3,519,922 and $3,845,878, respectively, including $(421,738) and $(858,871), respectively, of unrealized depreciation, $(78,810) and $(20,481), respectively, of undistributed net investment loss and $(53,584) and $(13,740), respectively, of undistributed net realized loss on investments, were combined with those of CharterSM Alternative 100 Moderate Portfolio. Assuming the acquisition had been completed January 1, 2015, the beginning of the annual reporting period of CharterSM Alternative 100 Moderate Portfolio, pro forma results of operations for the year ended December 31, 2015 would include net investment income of $122,875 and net realized and unrealized loss on investments of $(1,366,198), resulting in a decrease in net assets from operations of $(1,243,323). Because the combined investment portfolios have been managed as a single integrated portfolio since the acquisition date, it is not practicable to separate the amounts of revenue and earnings of the CharterSM Alternative 100 Conservative Plus Portfolio and CharterSM Alternative 100 Growth Portfolio that have been included in CharterSM Alternative 100 Moderate Portfolio’s Statement of Operations since the merger date, September 25, 2015. Prior to the combination, the net assets of the CharterSM Alternative 100 Moderate Portfolio totaled $5,577,677. Immediately after the combination, the net assets of the CharterSM CharterSM Alternative 100 Moderate Portfolio totaled $12,943,477. The cost of securities transferred from CharterSM Alternative 100 Conservative Plus Portfolio and CharterSM Alternative 100 Growth Portfolio is excluded from CharterSM Alternative 100 Moderate Portfolio’s portfolio turnover calculation and excluded from the cost of long-term purchases.
The Manager evaluated subsequent events from December 31, 2016, the date of these financial statements, through the date these financial statements were issued and available.
On December 5, 2016, the Board approved a form of Plan of Reorganization and Termination and a form of Agreement and Plan of Reorganization and Termination (each, a “Reorganization Plan,” and collectively, the “Reorganization Plans”) that provide for the reorganization of certain Portfolios of the Trust into another existing Portfolio of the Trust or other existing Portfolios of EQ Advisors Trust (each, a “Reorganization,” and collectively, the “Reorganizations”) as follows:
| | |
| Proposed Acquired Portfolio | | Proposed Acquiring Portfolio |
| CharterSM International Moderate Portfolio | | CharterSM Moderate Portfolio |
| CharterSM Alternative 100 Moderate Portfolio | | All Asset Growth-Alt 20 Portfolio |
CharterSM Income Strategies Portfolio CharterSM Interest Rate Strategies Portfolio | | AXA/DoubleLine Opportunistic Core Plus Bond Portfolio |
| CharterSM Real Assets Portfolio | | EQ/PIMCO Global Real Return Portfolio |
| (each, an “Acquired Portfolio,” and collectively, the “Acquired Portfolios”) | | (each, an “Acquiring Portfolio,” and collectively, the “Acquiring Portfolios”) |
44
AXA PREMIER VIP TRUST
NOTES TO FINANCIAL STATEMENTS (Continued)
December 31, 2016
Each Reorganization Plan is subject to approval by the shareholders of the respective Acquired Portfolio. A special shareholder meeting of the Acquired Portfolios is anticipated to be held on or about March 28, 2017 to vote on the Reorganization Plans. If shareholders approve the Reorganization Plans, it is anticipated that the Reorganizations will take place on or about May 19, 2017.
| Note 11 | Pending Legal Proceedings |
In July 2011, a lawsuit was filed in the United States District Court for the District of New Jersey, entitled Mary Ann Sivolella v. AXA Equitable Life Insurance Company and AXA Equitable Funds Management Group, LLC (“Sivolella Litigation”). The lawsuit was filed derivatively on behalf of eight portfolios of EQ Advisors Trust, which is also managed by FMG LLC: EQ/Common Stock Index Portfolio; EQ/Equity Growth PLUS Portfolio; EQ/Equity 500 Index Portfolio; AXA Large Cap Value Managed Volatility Portfolio; AXA Global Equity Managed Volatility Portfolio; AXA Mid Cap Value Managed Volatility Portfolio; EQ/Intermediate Government Bond Index Portfolio; and EQ/GAMCO Small Company Value Portfolio (the “Sivolella Portfolios”). Note, in June 2014, the EQ/Equity Growth PLUS Portfolio was reorganized into the AXA Large Cap Growth Managed Volatility Portfolio. The lawsuit seeks recovery under Section 36(b) of the 1940 Act, for alleged excessive fees paid to FMG LLC and AXA Equitable (the “Defendants”) for investment management services. The Plaintiff seeks recovery of the alleged overpayments, or alternatively, rescission of the contracts and restitution of all fees paid, interest, costs and fees. In October 2011, FMG LLC and AXA Equitable filed a motion to dismiss the complaint. In November 2011, the Plaintiff filed an Amended Complaint seeking the same relief, but adding new claims under: (1) Section 26(f) of the 1940 Act alleging that the variable annuity contracts sold by the Defendants charged excessive management fees, and seeking restitution and rescission of those contracts under Section 47(b) of the 1940 Act; and (2) a claim for unjust enrichment. The Defendants filed a motion to dismiss the Amended Complaint in December 2011. In May 2012, Plaintiff voluntarily dismissed the Section 26(f) claim seeking restitution and rescission under Section 47(b). In September 2012, the United States District Court for the District of New Jersey denied the motion to dismiss the Amended Complaint as it related to the Section 36(b) claim and granted the motion to dismiss as it related to the unjust enrichment claim.
In January 2013, a second lawsuit against FMG LLC was filed in the United States District Court for the District of New Jersey by a group of plaintiffs asserting substantially similar claims under Section 36(b) and seeking substantially similar damages as in the Sivolella Litigation. The lawsuit, entitled Glenn D. Sanford, et al. v. AXA Equitable Funds Management Group, LLC (“Sanford Litigation”), was filed derivatively on behalf of the EQ/PIMCO Ultra Short Bond Portfolio, the EQ/T. Rowe Price Growth Stock Portfolio, the EQ/Global Bond PLUS Portfolio, and the EQ/Core Bond Index Portfolio, in addition to four of the Sivolella Portfolios. In light of the similarities of the allegations in the Sivolella and Sanford Litigations, the parties agreed to consolidate the two lawsuits.
In April 2013, the Plaintiffs in the Sivolella and Sanford Litigations amended the complaints to add additional claims under Section 36(b) of the 1940 Act for recovery of alleged excessive fees paid to FMG LLC in its capacity as the Administrator of EQ Advisors Trust. The Plaintiffs seek recovery of the alleged overpayments, or alternatively, rescission of the contract and restitution of the excessive fees paid, interest, costs and fees. In January 2015, Plaintiffs and Defendants filed motions for summary judgment and other pre-trial motions, which were denied by the Court in August 2015.
The non-jury trial commenced in January 2016 and testimony concluded in February 2016. Closing arguments occurred in June 2016 following post-trial briefing. On August 25, 2016, the Court issued its decision in favor of FMG LLC and AXA Equitable, finding that the Plaintiffs had failed to meet their burden to demonstrate that FMG LLC and AXA Equitable breached
45
AXA PREMIER VIP TRUST
NOTES TO FINANCIAL STATEMENTS (Continued)
December 31, 2016
their fiduciary duty in violation of Section 36(b) or show any actual damages. In September 2016, the Plaintiffs filed a motion to amend the trial opinion and to amend or make new findings of fact and/or conclusions of law, which was denied by the Court in December 2016. In December 2016, Plaintiffs filed a notice to appeal the Court’s decision to the United States Court of Appeals for the Third Circuit.
No liability for litigation relating to these matters has been accrued in the financial statements of the portfolios because any potential damages would be the responsibility of the Defendants.
In November 2010, the Trust and EQ Advisors Trust, and several of their respective portfolios, were named as defendants and putative members of the proposed defendant class of shareholders in a lawsuit brought by The Official Committee of Unsecured Creditors of Tribune Company (the “Committee”) in the United States Bankruptcy Court for the District of Delaware regarding Tribune Company’s Chapter 11 bankruptcy proceeding (In re Tribune Company). The lawsuit relates to amounts paid to the Trust and EQ Advisors Trust, and several of their respective portfolios, as holders of publicly-traded shares of Tribune Company, which were components of certain broad-based securities market indices, for which there were public tender offers during 2007. The suit seeks return of the share price received by Tribune Company shareholders in the tender offers plus interest and attorneys’ fees and expenses.
The Committee’s suit has been consolidated with a number of related lawsuits around the United States into a single multi-district litigation proceeding now pending in the United States District Court for the Southern District of New York (In re: Tribune Company Fraudulent Conveyance Litigation).
The lawsuits do not allege any misconduct by the Trust, EQ Advisors Trust or their respective portfolios. Certain of the Plaintiffs’ claims have been dismissed and in March 2016 the United States Court of Appeals for the Second Circuit (the “Second Circuit”) affirmed the dismissal of those claims. In September 2016, Plaintiffs filed a petition for a writ of certiorari with the United States Supreme Court, which is currently pending. In January 2017, the United States District Court for the Southern District of New York dismissed the remaining claims involving shareholders, such as the portfolios, who sold their shares as part of the public tender offers. The Plaintiffs have requested permission from the court to appeal its decision to the Second Circuit. The portfolios cannot predict the outcome of these lawsuits. If the lawsuits were to be decided or settled in a manner adverse to the portfolios, the payment of such judgments or settlements could have an adverse effect on each portfolio’s net asset value. However, no liability for litigation relating to this matter has been accrued in the financial statements of the portfolios, as FMG LLC believes a loss is not probable.
46
Report of Independent Registered Public Accounting Firm
To the Board of Trustees and Shareholders of AXA Premier VIP Trust
In our opinion, the accompanying statements of assets and liabilities, including the portfolios of investments, and the related statements of operations and of changes in net assets and the financial highlights present fairly, in all material respects, the financial position of each of the portfolios of AXA Premier VIP Trust listed in the Table of Contents to the Annual Report in which these financial statements appear (collectively referred to as the “Trust”) as of December 31, 2016, the results of each of their operations, the changes in each of their net assets and the financial highlights for each of the periods presented, in conformity with accounting principles generally accepted in the United States of America. These financial statements and financial highlights (hereafter referred to as “financial statements”) are the responsibility of the Trust’s management. Our responsibility is to express an opinion on these financial statements based on our audits. We conducted our audits of these financial statements in accordance with the standards of the Public Company Accounting Oversight Board (United States). Those standards require that we plan and perform the audit to obtain reasonable assurance about whether the financial statements are free of material misstatement. An audit includes examining, on a test basis, evidence supporting the amounts and disclosures in the financial statements, assessing the accounting principles used and significant estimates made by management, and evaluating the overall financial statement presentation. We believe that our audits, which included confirmation of securities as of December 31, 2016 by correspondence with the custodian, transfer agents and brokers, provide a reasonable basis for our opinion.
PricewaterhouseCoopers LLP
New York, New York
February 17, 2017
47
PART C: OTHER INFORMATION
Second Amended and Restated Agreement and Declaration of Trust (“Declaration of Trust”) and Amended and Restated By-Laws (“By-Laws”)
Article VII, Section 2 of the Declaration of Trust of EQ Advisors Trust (“Trust”) states, in relevant part, that a “Trustee or officer of the Trust, when acting in such capacity, shall not be personally liable to any Person, other than to the Trust, a Series or a Shareholder to the extent expressly provided in this Article VII. No person who is or has been a Trustee or officer of the Trust shall be liable to the Trust, or a Series or a Shareholder for any action or failure to act or for any other reason except solely for his or her own willful misfeasance, bad faith, gross negligence or reckless disregard of the duties involved in the conduct of his or her office of Trustee or officer as described herein, and shall not be liable for errors of judgment or mistakes of fact or law. A Trustee or officer of the Trust shall not be responsible or liable in any event for any neglect or wrongdoing of any person, including any other Trustee, officer, agent, employee, Manager, or Principal Underwriter of the Trust or any Series.” Article VII, Section 4 of the Trust’s Declaration of Trust states, in relevant part, that the “Trustees shall be entitled and empowered to the fullest extent permitted by law to purchase with Trust assets insurance for liability and for all expenses reasonably incurred or paid or expected to be paid by a Trustee, officer, employee, or agent of the Trust in connection with any claim, action, suit, or proceeding in which he or she may become involved by virtue of his or her capacity or former capacity as a Trustee of the Trust.” Article VII, Section 5 of the Trust’s Declaration of Trust further states:
(a) Subject to the exceptions and limitations contained in subsection (b) below:
(i) every person who is, or has been, a Trustee or an officer or employee of the Trust, or is or was serving at the request of the Trust as a trustee, director, officer, employee or agent of another organization in which the Trust has any interest as a shareholder, creditor or otherwise (“Covered Person”) shall be indemnified by the Trust and each Series to the maximum extent permitted by law against liability and against all expenses reasonably incurred or paid by him or her in connection with any claim, action, suit or proceeding in which he or she becomes involved as a party or otherwise by virtue of his or her being or having been a Covered Person and against amounts paid or incurred by him or her in the settlement thereof.
(b) To the extent required under the 1940 Act, but only to such extent, no indemnification shall be provided hereunder to a Covered Person:
(i) who shall have been adjudicated by a court or body before which the proceeding was brought to be liable to the Trust, a Series or any Shareholder by reason of willful misfeasance, bad faith, gross negligence or reckless disregard of the duties involved in the conduct of his or her office as described herein; or
(ii) in the event of a settlement, unless there has been a determination that such Covered Person did not engage in willful misfeasance, bad faith, gross negligence or reckless disregard of the duties involved in the conduct of his or her office as described herein: (A) by the court or other body approving the settlement; (B) by at least a majority of those Trustees who are neither Interested Persons of the Trust nor are parties to the matter based upon a review of readily available facts (as opposed to a full trial-type inquiry); or (C) by written opinion of independent legal counsel based upon a review of readily available facts (as opposed to a full trial-type inquiry).
(c) The rights of indemnification herein provided may be insured against by policies maintained by the Trust, shall be severable, shall not be exclusive of or affect any other rights to which any Covered Person may now or hereafter be entitled, and shall inure to the benefit of the heirs, executors and administrators of a Covered Person.
Registrant’s Investment Management Agreement states:
Limitations on Liability. Manager will exercise its best judgment in rendering its services to the Trust, and the Trust agrees, as an inducement to Manager’s undertaking to do so, that the Manager will not be liable for any error of judgment or mistake of law or for any loss suffered by the Trust in connection with the matters to which this Agreement relates, but will be liable only for willful misconduct, bad faith, gross negligence, reckless disregard of
its duties or its failure to exercise due care in rendering its services to the Trust as specified in this Agreement. Any person, even though an officer, director, employee or agent of Manager, who may be or become an officer, Trustee, employee or agent of the Trust, shall be deemed, when rendering services to the Trust or when acting on any business of the Trust, to be rendering such services to or to be acting solely for the Trust and not as an officer, director, employee or agent, or one under the control or direction of Manager, even though paid by it.
The Registrant’s Investment Advisory Agreements generally state:
Except as may otherwise be provided by the Investment Company Act or any other federal securities law, neither the Adviser nor any of its officers, members or employees (its “Affiliates”) shall be liable for any losses, claims, damages, liabilities or litigation (including legal and other expenses) incurred or suffered by the Manager or the Trust as a result of any error of judgment or mistake of law by the Adviser or its Affiliates with respect to the services provided to the Portfolio, except that nothing in this Agreement shall operate or purport to operate in any way to exculpate, waive or limit the liability of the Adviser or its Affiliates for, and the Adviser shall indemnify and hold harmless the Trust, the Manager, all affiliated persons thereof (within the meaning of Section 2(a)(3) of the Investment Company Act) and all controlling persons (as described in Section 15 of the Securities Act of 1933, as amended (“1933 Act”)) (collectively, “Manager Indemnitees”) against any and all losses, claims, damages, liabilities or litigation (including reasonable legal and other expenses) to which any of the Manager Indemnitees may become subject under the 1933 Act, the Investment Company Act, the Advisers Act, or under any other statute, at common law or otherwise arising out of or based on (i) any willful misconduct, bad faith, reckless disregard or gross negligence of the Adviser in the performance of any of its duties or obligations hereunder or (ii) any untrue statement of a material fact contained in the Prospectus and SAI, proxy materials, reports, advertisements, sales literature, or other materials pertaining to the Portfolio or the omission to state therein a material fact known to the Adviser which was required to be stated therein or necessary to make the statements therein not misleading, if such statement or omission was made in reliance upon information furnished to the Manager or the Trust by the Adviser Indemnitees (as defined below) for use therein.
Except as may otherwise be provided by the Investment Company Act or any other federal securities law, the Manager and the Trust shall not be liable for any losses, claims, damages, liabilities or litigation (including reasonable legal and other expenses) incurred or suffered by the Adviser as a result of any error of judgment or mistake of law by the Manager with respect to the Portfolio, except that nothing in this Agreement shall operate or purport to operate in any way to exculpate, waive or limit the liability of the Manager for, and the Manager shall indemnify and hold harmless the Adviser, all affiliated persons thereof (within the meaning of Section 2(a)(3) of the Investment Company Act) and all controlling persons (as described in Section 15 of the 1933 Act) (collectively, “Adviser Indemnitees”) against any and all losses, claims, damages, liabilities or litigation (including reasonable legal and other expenses) to which any of the Adviser Indemnities may become subject under the 1933 Act, the Investment Company Act, the Advisers Act, or under any other statute, at common law or otherwise arising out of or based on (i) any willful misconduct, bad faith, reckless disregard or gross negligence of the Manager in the performance of any of its duties or obligations hereunder or (ii) any untrue statement of a material fact contained in the Prospectus and SAI, proxy materials, reports, advertisements, sales literature, or other materials pertaining to the Portfolio or the omission to state therein a material fact known to the Manager which was required to be stated therein or necessary to make the statements therein not misleading, unless such statement or omission was made in reliance upon information furnished to the Manager or the Trust by the Adviser Indemnitees for use therein.
Section 14 of each of the Registrant’s Distribution Agreements states:
The Trust shall indemnify and hold harmless [the Distributor] from any and all losses, claims, damages or liabilities (or actions in respect thereof) to which [the Distributor] may be subject, insofar as such losses, claims, damages or liabilities (or actions in respect thereof) arise out of or result from negligent, improper, fraudulent or unauthorized acts or omissions by the Trust or its officers, trustees, agents or representatives, other than acts or omissions caused directly or indirectly by [the Distributor].
[The Distributor] will indemnify and hold harmless the Trust, its officers, trustees, agents and representatives against any losses, claims, damages or liabilities, to which the Trust, its officers, trustees, agents and representatives may become subject, insofar as such losses, claims, damages or liabilities (or actions in respect thereof) arise out of or are based upon: (i) any untrue statement or alleged untrue statement of any material fact contained in the Trust
Prospectus and/or SAI or any supplements thereto; (ii) the omission or alleged omission to state any material fact required to be stated in the Trust Prospectus and/or SAI or any supplements thereto or necessary to make the statements therein not misleading; or (iii) other misconduct or negligence of [the Distributor] in its capacity as a principal underwriter of the Trust’s Class [IA, IB and/or K] shares and will reimburse the Trust, its officers, Trustees, agents and representatives for any legal or other expenses reasonably incurred by any of them in connection with investigating or defending against such loss, claim, damage, liability or action; provided, however, that [the Distributor] shall not be liable in any such instance to the extent that any such loss, claim, damage or liability arises out of or is based upon an untrue statement or alleged untrue statement or omission or alleged omission made in the Trust Prospectus and/or SAI or any supplement in good faith reliance upon and in conformity with written information furnished by the Preparing Parties specifically for use in the preparation of the Trust Prospectus and/or SAI.
Section 6 of the Registrant’s Amended and Restated Mutual Fund Service Agreement states:
(a) FMG LLC shall not be liable for any error of judgment or mistake of law or for any loss or expense suffered by the Trust, in connection with the matters to which this Agreement relates, except for a loss or expense caused by or resulting from or attributable to willful misfeasance, bad faith or gross negligence on FMG LLC’s part (or on the part of any third party to whom FMG LLC has delegated any of its duties and obligations pursuant to Section 4(c) hereunder) in the performance of its (or such third party’s) duties or from reckless disregard by FMG LLC (or by such third party) of its obligations and duties under this Agreement (in the case of FMG LLC) or under an agreement with FMG LLC (in the case of such third party) or, subject to Section 10 below, FMG LLC’s (or such third party) refusal or failure to comply with the terms of this Agreement (in the case of FMG LLC) or an agreement with FMG LLC (in the case of such third party) or its breach of any representation or warranty under this Agreement (in the case of FMG LLC) or under an agreement with FMG LLC (in the case of such third party). In no event shall FMG LLC (or such third party) be liable for any indirect, incidental special or consequential losses or damages of any kind whatsoever (including but not limited to lost profits), even if FMG LLC (or such third party) has been advised of the likelihood of such loss or damage and regardless of the form of action.
(b) Except to the extent that FMG LLC may be held liable pursuant to Section 6(a) above, FMG LLC shall not be responsible for, and the Trust shall indemnify and hold FMG LLC harmless from and against any and all losses, damages, costs, reasonable attorneys’ fees and expenses, payments, expenses and liabilities including, but not limited to, those arising out of or attributable to:
(i) any and all actions of FMG LLC or its officers or agents required to be taken pursuant to this Agreement;
(ii) the reliance on or use by FMG LLC or its officers or agents of information, records, or documents which are received by FMG LLC or its officers or agents and furnished to it or them by or on behalf of the Trust, and which have been prepared or maintained by the Trust or any third party on behalf of the Trust;
(iii) the Trust’s refusal or failure to comply with the terms of this Agreement or the Trust’s lack of good faith, or its actions, or lack thereof, involving gross negligence or willful misfeasance;
(iv) the breach of any representation or warranty of the Trust hereunder;
(v) the reliance on or the carrying out by FMG LLC or its officers or agents of any proper instructions reasonably believed to be duly authorized, or requests of the Trust;
(vi) any delays, inaccuracies, errors in or omissions from information or data provided to FMG LLC by data services, including data services providing information in connection with any third party computer system licensed to FMG LLC, and by any corporate action services, pricing services or securities brokers and dealers;
(vii) the offer or sale of shares by the Trust in violation of any requirement under the Federal securities laws or regulations or the securities laws or regulations of any state, or in violation of any stop order or other determination or ruling by any Federal agency or any state agency with respect to the offer or sale of such shares in
such state (1) resulting from activities, actions, or omissions by the Trust or its other service providers and agents, or (2) existing or arising out of activities, actions or omissions by or on behalf of the Trust prior to the effective date of this Agreement;
(viii) any failure of the Trust’s Registration Statement to comply with the 1933 Act and the 1940 Act (including the rules and regulations thereunder) and any other applicable laws, or any untrue statement of a material fact or omission of a material fact necessary to make any statement therein not misleading in a Trust’s prospectus;
(ix) except as provided for in Schedule B.III., the actions taken by the Trust, its Manager, its investment advisers, and its distributor in compliance with applicable securities, tax, commodities and other laws, rules and regulations, or the failure to so comply, and
(x) all actions, inactions, omissions, or errors caused by third parties to whom FMG LLC or the Trust has assigned any rights and/or delegated any duties under this Agreement at the specific request of or as required by the Trust, its Portfolio, investment advisers, or Trust distributors.
The Trust shall not be liable for any indirect, incidental, special or consequential losses or damages of any kind whatsoever (including, but not limited to, lost profits) even if the Trust has been advised of the likelihood of such loss or damage and regardless of the form of action, except when the Trust is required to indemnify FMG LLC pursuant to this Agreement.
Section 12(a)(iv) of the Global Custody Agreement states:
(A) Customer shall indemnify and hold Bank and its directors, officers, agents and employees (collectively the “Indemnitees”) harmless from and against any and all claims, liabilities, losses, damages, fines, penalties, and expenses, including out-of-pocket and incidental expenses and legal fees (“Losses”) that may be incurred by, or asserted against, the Indemnitees or any of them for following any instructions or other directions upon which Bank is authorized to rely pursuant to the terms of this Agreement. (B) In addition to and not in limitation of the preceding subparagraph, Customer shall also indemnify and hold the Indemnitees and each of them harmless from and against any and all Losses that may be incurred by, or asserted against, the Indemnitees or any of them in connection with or arising out of Bank’s performance under this Agreement, provided the Indemnitees have not acted with negligence or engaged in willful misconduct. (C) In performing its obligations hereunder, Bank may rely on the genuineness of any document which it reasonably believes in good faith to have been validly executed.
Article VIII of the Registrant’s Participation Agreements generally state:
8.1(a). AXA Equitable Life Insurance Company (for the purposes of this Article, “Equitable”) agrees to indemnify and hold harmless the Trust, each member of the Board, the Distributors, and the directors and officers and each person, if any, who controls any such person within the meaning of Section 15 of the 1933 Act (collectively, the “Indemnified Parties” for purposes of this Section 8.1) against any and all losses, claims, damages, liabilities (including amounts paid in settlement with the written consent of Equitable), investigation of claims or litigation (including legal and other expenses), to which the Indemnified Parties may become subject under any statute, regulation, at common law or otherwise, insofar as such losses, claims, damages, liabilities or expenses (or actions in respect thereof) or settlements are related to the sale or acquisition of the Trust’s shares or the Equitable Contracts or interests in the Accounts and:
(i) arise out of or are based upon any untrue statements or alleged untrue statements of any material fact contained in the registration statement, prospectus, or Statement of Additional Information for the Equitable Contracts or contained in the Equitable Contracts or sales literature for the Equitable Contracts (or any amendment or supplement to any of the foregoing), or arise out of or are based upon the omission or the alleged omission to state therein a material fact required to be stated therein or necessary to make the statements therein not misleading, provided that this agreement to indemnify shall not apply as to any Indemnified Party if such statement or omission or such alleged statement or omission was made in reliance upon and in conformity with information furnished to Equitable by or on behalf of the Trust for use in the registration statement, prospectus, or Statement of Additional Information for the Equitable Contracts or in the Equitable Contracts or sales literature (or any amendment or supplement) or otherwise for use in connection with the sale of the Equitable Contracts or Trust shares; or
(ii) arise out of or as a result of statements or representations (other than statements or representations contained in the Registration Statement, prospectus or Statement of Additional Information, or sales literature of the Trust not supplied by Equitable or persons under its control) or wrongful conduct of Equitable or persons under its control, with respect to the sale or distribution of the Equitable Contracts or Trust shares; or
(iii) arise out of any untrue statement or alleged untrue statement of a material fact contained in a Registration Statement, prospectus, or Statement of Additional Information, or sales literature of the Trust or any amendment thereof or supplement thereto or the omission or alleged omission to state therein a material fact required to be stated therein or necessary to make the statements therein not misleading if such a statement or omission was made in reliance upon information furnished to the Trust by or on behalf of Equitable; or
(iv) arise as a result of any failure by Equitable to provide the services and furnish the materials required to be provided or furnished by it under the terms of this Agreement; or
(v) arise out of or result from any material breach of any representation and/or warranty made by Equitable in this Agreement or arise out of or result from any other material breach of this Agreement by Equitable;
as limited by and in accordance with the provisions of Sections 8.1(b) and 8.1(c) hereof…
8.2(a). Each of the Distributors agrees to indemnify and hold harmless Equitable, and the Trust and each of their directors and officers and each person, if any, who controls Equitable within the meaning of Section 15 of the 1933 Act (collectively, the “Indemnified Parties” for purposes of this Section 8.2) against any and all losses, claims, damages, liabilities (including amounts paid in settlement with the written consent of the Distributors), investigation of claims or litigation (including legal and other expenses) to which the Indemnified Parties may become subject under any statute, regulation, at common law or otherwise, insofar as such losses, claims, damages, liabilities or expenses (or actions in respect thereof) or settlements are related to the sale or acquisition of the Trust’s shares or the Equitable Contracts or interests in the Accounts and:
(i) arise out of or are based upon any untrue statement or alleged untrue statement of any material fact contained in the Registration Statement, prospectus or Statement of Additional Information, or sales literature of the Trust (or any amendment or supplement to any of the foregoing), or arise out of or are based upon the omission or the alleged omission to state therein a material fact required to be stated therein or necessary to make the statements therein not misleading, provided that this agreement to indemnify shall not apply as to any Indemnified Party if such statement or omission or such alleged statement or omission was made in reliance upon and in conformity with information furnished to the Distributors or Trust by or on behalf of Equitable for use in the Registration Statement, prospectus, or Statement of Additional Information for the Trust, or in sales literature (or any amendment or supplement) or otherwise for use in connection with the sale of the Equitable Contracts or Trust shares; or
(ii) arise out of or as a result of statements or representations (other than statements or representations contained in the registration statement, prospectus or Statement of Additional Information, or sales literature for the Equitable Contracts not supplied by the Distributors or persons under their control) or wrongful conduct of the Distributors or persons under their control, with respect to the sale or distribution of the Equitable Contracts or Trust shares; or
(iii) arise out of any untrue statement or alleged untrue statement of a material fact contained in a registration statement, prospectus, or Statement of Additional Information or sales literature covering the Equitable Contracts, or any amendment thereof or supplement thereto, or the omission or alleged omission to state therein a material fact required to be stated therein or necessary to make the statement or statements therein not misleading, if such statement or omission was made in reliance upon information furnished to Equitable by or on behalf of the Distributors or the Trust; or
(iv) arise as a result of any failure by the Distributors or the Trust to provide the services and furnish the materials required to be provided or furnished by the Distributors or the Trust under the terms of this Agreement (including a failure, whether unintentional or in good faith or otherwise, to comply with the diversification or other qualification requirements specified in Article VI of this Agreement); or
(v) arise out of or result from any material breach of any representation and/or warranty made by the Distributors in this Agreement or arise out of or result from any other material breach of this Agreement by the Distributors;
as limited by and in accordance with the provisions of Sections 8.2(b) and 8.2(c) hereof…
8.3(a) The Trust agrees to indemnify and hold harmless Equitable and each of its directors and officers and each person, if any, who controls Equitable within the meaning of Section 15 of the 1933 Act (collectively, the “Indemnified Parties” for purposes of this Section 8.3) against any and all losses, claims, damages, liabilities (including amounts paid in settlement with the written consent of the Trust), investigation of claims or litigation (including legal and other expenses) to which the Indemnified Parties may become subject under any statute, regulation, at common law or otherwise, insofar as such losses, claims, damages, liabilities or expenses (or actions in respect thereof) or settlements result from the gross negligence, bad faith or willful misconduct of the Board or any member thereof, are related to the operations of the Trust and:
(i) arise as a result of any failure by the Trust to provide the services and furnish the materials required to be provided or furnished by it under the terms of this Agreement (including a failure to comply with the diversification and other qualification requirements specified in … this Agreement); or
(ii) arise out of or result from any material breach of any representation and/or warranty made by the Trust in this Agreement or arise out of or result from any other material breach of this Agreement by the Trust;
as limited by and in accordance with the provisions of Sections 8.3(b) and 8.3(c) hereof…
Undertaking
Insofar as indemnification for liability arising under the Securities Act of 1933 may be permitted to directors, officers and controlling persons of the Registrant pursuant to the foregoing provisions, or otherwise, the Registrant has been advised that in the opinion of the Securities and Exchange Commission such indemnification is against public policy as expressed in the Act and is, therefore, unenforceable. In the event that a claim for indemnification against such liabilities (other than the payment by the Registrant of expenses incurred or paid by a director, officer or controlling person of the registrant in the successful defense of any action, suit or proceeding) is asserted by such director, officer or controlling person in connection with the securities being registered, the Registrant will, unless in the opinion of its counsel the matter has been settled by controlling precedent, submit to a court of appropriate jurisdiction the question whether such indemnification by it is against public policy as expressed in the Act and will be governed by the final adjudication of such issue.
| | |
Item 16. | | Exhibits |
| |
(1)(a) | | Agreement and Declaration of Trust.1 |
| |
(1)(a)(ii) | | Amended and Restated Agreement and Declaration of Trust.2 |
| |
(1)(a)(ii)(A) | | Amendment No. 1 to the Amended and Restated Agreement and Declaration of Trust.4 |
| |
(1)(a)(ii)(B) | | Amendment No. 2 to the Amended and Restated Agreement and Declaration of Trust.6 |
| |
(1)(a)(iii) | | Second Amended and Restated Agreement and Declaration of Trust.50 |
| |
(1)(b) | | Certificate of Trust.1 |
| |
(1)(b)(ii) | | Certificate of Amendment to the Certificate of Trust.2 |
| |
(2)(a) | | By-Laws of the Trust.1 |
| |
(2)(a)(ii) | | Amended and Restated By-Laws.50 |
| |
(3) | | None. |
| |
(4)(a) | | Form of Agreement and Plan of Reorganization and Termination between EQ Advisors Trust, on behalf of its separate series, All Asset Aggressive- Alt 50 Portfolio, All Asset Aggressive- Alt 75 Portfolio, All Asset Growth- Alt 20 Portfolio, EQ/PIMCO Global Real Return Portfolio, and AXA/DoubleLine Opportunities Core Plus Bond Portfolio, and AXA Premier VIP Trust, on behalf of its separate series, CharterSM Real Assets Portfolio, CharterSM Income Strategies Portfolio, and CharterSM Interest Rate Strategies Portfolio (filed herein as Appendix A.1 to the Combined Proxy Statement and Prospectus). |
| | |
| |
(4)(b) | | Form of Agreement and Plan of Reorganization and Termination between EQ Advisors Trust, on behalf of its separate series, All Asset Aggressive- Alt 25 Portfolio and All Asset Growth -Alt 20 Portfolio, and AXA Premier VIP Trust, on behalf of its separate series, CharterSM Alternative 100 Moderate Portfolio (filed herein as Appendix A.2 to the Combined Proxy Statement and Prospectus). |
| |
(4)(c) | | Form of Plan of Reorganization and Termination between EQ Advisors Trust, on behalf of its separate series, AXA/Pacific Global Small Cap Value Portfolio and AXA/Horizon Small Cap Value Portfolio (filed herein as Appendix A.4 to the Combined Proxy Statement and Prospectus). |
| |
(5) | | Provisions of instruments defining the rights of holders of the securities being registered are contained in the Registrant’s Second Amended and Restated Agreement and Declaration of Trust and Amended and Restated By-Laws (Exhibits (1)(a)(iii) and (2)(a)(ii)). |
| |
(6) | | Investment Advisory Contracts |
| |
(6)(a) | | Investment Management Agreement dated as of May 1, 2011 between EQ Advisors Trust (the “Trust”) and AXA Equitable Funds Management Group, LLC (“FMG LLC” or “AXA FMG”). 29 |
| |
(6)(a)(ii) | | Amendment No. 1 effective as of August 1, 2011 to the Investment Management Agreement dated as of May 1, 2011 between the Trust and FMG LLC. 29 |
| |
(6)(a)(iii) | | Amendment No. 2 effective as of September 1, 2011 to the Investment Management Agreement dated as of May 1, 2011 between the Trust and FMG LLC. 29 |
| |
(6)(a)(iv) | | Amendment No. 3 effective as of October 1, 2011 to the Investment Management Agreement dated as of May 1, 2011 between the Trust and FMG LLC.31 |
| |
(6)(a)(v) | | Amendment No. 4 effective as of February 8, 2013 to the Investment Management Agreement dated as of May 1, 2011 between the Trust and FMG LLC.36 |
| |
(6)(a)(vi) | | Amendment No. 5 effective as of September 1, 2012 to the Investment Management Agreement dated as of May 1, 2011 between the Trust and FMG LLC. 36 |
| |
(6)(a)(vii) | | Amendment No. 6 effective as of May 1, 2013 to the Investment Management Agreement dated as of May 1, 2011 between the Trust and FMG LLC. 39 |
| |
(6)(a)(viii) | | Amendment No. 7 effective as of September 1, 2013 to the Investment Management Agreement dated as of May 1, 2011 between the Trust and FMG LLC. 39 |
| |
(6)(a)(ix) | | Amendment No. 8 effective as of October 21, 2013 to the Investment Management Agreement dated as of May 1, 2011 between the Trust and FMG LLC. 39 |
| |
(6)(a)(x) | | Amendment No. 9 effective as of April 4, 2014 to the Investment Management Agreement dated as of May 1, 2011 between the Trust and FMG LLC. 43 |
| |
(6)(a)(xi) | | Amendment No. 10 effective as of June 1, 2014 to the Investment Management Agreement dated as of May 1, 2011 between the Trust and FMG LLC. 43 |
| |
(6)(a)(xii) | | Amendment No. 11 effective as of July 16, 2014 to the Investment Management Agreement dated as of May 1, 2011 between the Trust and FMG LLC. 44 |
| | |
| |
(6)(a)(xiii) | | Amendment No. 12 effective as of January 20, 2015 to the Investment Management Agreement dated as of May 1, 2011 between the Trust and FMG LLC. 44 |
| |
(6)(a)(xiv) | | Amendment No. 13 effective as of April 30, 2015 to the Investment Management Agreement dated as of May 1, 2011 between the Trust and FMG LLC. 45 |
| |
(6)(a)(xv) | | Amendment No. 14 effective as of July 14, 2015 to the Investment Management Agreement dated as of May 1, 2011 between the Trust and FMG LLC. 47 |
| |
(6)(a)(xvi) | | Amendment No. 15 effective as of September 1, 2015 to the Investment Management Agreement dated as of May 1, 2011 between the Trust and FMG LLC. 47 |
| |
(6)(a)(xvii) | | Amendment No.16 effective as of December 21, 2015 to the Investment Management Agreement dated as of May 1, 2011 between the Trust and FMG LLC. 48 |
| |
(6)(a)(xviii) | | Amendment No. 17 effective as of January 1, 2016 to the Investment Management Agreement dated as of May 1, 2011 between the Trust and FMG LLC. 48 |
| |
(6)(b)(i) | | Investment Management Agreement dated as of May 1, 2011 between the Trust and FMG LLC with respect to the All Asset Growth – Alt 20 Portfolio (formerly, the All Asset Allocation Portfolio), EQ/Boston Advisors Equity Income Portfolio, EQ/GAMCO Mergers and Acquisitions Portfolio, EQ/GAMCO Small Company Value Portfolio, EQ/MFS International Growth Portfolio, AXA/Loomis Sayles Growth Portfolio (formerly, EQ/Montag & Caldwell Growth Portfolio), EQ/PIMCO Ultra Short Bond Portfolio, EQ/T. Rowe Price Growth Stock Portfolio and EQ/UBS Growth and Income Portfolio (collectively, the “MONY Portfolios”). 29 |
| |
(6)(b)(ii) | | Amendment No. 1 effective as of April 30, 2012 to the Investment Management Agreement dated as of May 1, 2011 between the Trust and FMG LLC on behalf of the MONY Portfolios. 34 |
| |
(6)(b)(iii) | | Amendment No. 2 effective as of September 1, 2012 to the Investment Management Agreement dated as of May 1, 2011 between the Trust and AXA FMG on behalf of the MONY Portfolios. 36 |
| |
(6)(b)(iv) | | Amendment No. 3 effective as of September 1, 2014 to the Investment Management Agreement dated as of May 1, 2011 between the Trust and AXA FMG on behalf of the MONY Portfolios. 44 |
| |
(6)(c)(i) | | Investment Management Agreement dated as of May 1, 2011 between the Trust and FMG LLC with respect to certain fund of funds portfolios (“Fund of Funds Portfolios”). 29 |
| |
(6)(c)(ii) | | Amendment No. 1 dated as of June 7, 2011 to the Investment Management Agreement dated as of May 1, 2011 between the Trust and FMG LLC with respect to the Fund of Funds Portfolios. 30 |
| |
(6)(c)(iii) | | Amendment No. 2 effective as of April 12, 2012 to the Investment Management Agreement dated as of May 1, 2011 between the Trust and FMG LLC with respect to the Fund of Funds Portfolios. 34 |
| |
(6)(c)(iv) | | Amendment No. 3 effective as of August 29, 2012 to the Investment Management Agreement dated as of May 1, 2011 between the Trust and FMG LLC with respect to the Fund of Funds Portfolios. 36 |
| | |
| |
(6)(c)(v) | | Amendment No. 4 effective as of October 21, 2013 to the Investment Management Agreement dated as of May 1, 2011 between the Trust and FMG LLC with respect to the Fund of Funds Portfolios. 39 |
| |
(6)(c)(vi) | | Amendment No. 5 effective as of July 16, 2014 to the Investment Management Agreement dated as of May 1, 2011 between the Trust and FMG LLC with respect to the Fund of Funds Portfolios. 44 |
| |
(6)(d)(i) | | Investment Advisory Agreement between FMG LLC and T. Rowe Price Associates, Inc. (“T. Rowe Price”) dated as of May 1, 2011. 29 |
| |
(6)(d)(ii) | | Amendment No. 1 effective as of June 6, 2013, to the Investment Advisory Agreement between FMG LLC and T. Rowe Price dated as of May 1, 2011. 40 |
| |
(6)(d)(iii) | | Amendment No. 2 effective as of June 1, 2014, to the Investment Advisory Agreement between FMG LLC and T. Rowe Price dated as of May 1, 2011. 43 |
| |
(6)(d)(iv) | | Amendment No. 3 effective as of July 16, 2014, to the Investment Advisory Agreement between FMG LLC and T. Rowe Price dated as of May 1, 2011. 44 |
| |
(6)(d)(iv) | | Amendment No. 4 effective as of June 1, 2015, to the Investment Advisory Agreement between FMG LLC and T. Rowe Price dated as of May 1, 2011. 48 |
| |
(6)(e)(i) | | Investment Advisory Agreement between FMG LLC and Massachusetts Financial Services Company (doing business as MFS Investment Management) (“MFSIM”) dated as of May 1, 2011. 29 |
| |
(6)(e)(ii) | | Amendment No. 1 effective as of June 6, 2013, to the Investment Advisory Agreement between FMG LLC and MFSIM dated as of May 1, 2011. 40 |
| |
(6)(e)(iii) | | Amendment No. 2 effective June 1, 2014, to the Investment Advisory Agreement between FMG LLC and MFSIM dated as of May 1, 2011. 44 |
| |
(6)(e)(iv) | | Amendment No. 3 effective as of July 16, 2014 to the Investment Advisory Agreement between FMG LLC and MFSIM dated as of May 1, 2011. 44 |
| |
(6)(f)(i) | | Investment Advisory Agreement between FMG LLC and Morgan Stanley Investment Management (“MSIM”) dated as of May 1, 2011. 29 |
| |
(6)(f)(ii) | | Amendment No. 1 effective as of April 4, 2014 to the Investment Advisory Agreement between FMG LLC and MSIM dated as of May 1, 2011. 42 |
| |
(6)(f)(iii) | | Amendment No. 2 effective as of July 16, 2014 to the Investment Advisory Agreement between FMG LLC and MSIM dated as of May 1, 2011. 44 |
| |
(6)(g)(i) | | Investment Advisory Agreement between FMG LLC and J.P. Morgan Investment Management, Inc. (“J.P. Morgan”) dated as of May 1, 2011. 29 |
| |
(6)(h)(i) | | Investment Advisory Agreement between FMG LLC and AllianceBernstein L.P. (“AllianceBernstein”) effective as of May 1, 2011. 29 |
| |
(6)(h)(ii) | | Amendment No. 1 effective as of September 1, 2011 to the Investment Advisory Agreement between FMG LLC and AllianceBernstein effective as of May 1, 2011. 31 |
| | |
| |
(6)(h)(iii) | | Amendment No. 2 effective as of August 1, 2012 to the Investment Advisory Agreement between FMG LLC and AllianceBernstein effective as of May 1, 2011. 36 |
| |
(6)(h)(iv) | | Amendment No. 3 effective as of September 1, 2012, to the Investment Advisory Agreement between FMG LLC and AllianceBernstein effective as of May 1, 2011. 36 |
| |
(6)(h)(v) | | Amendment No. 4 effective as of June 1, 2014, to the Investment Advisory Agreement between FMG LLC and AllianceBernstein effective as of May 1, 2011. 43 |
| |
(6)(h)(vi) | | Amendment No. 5 effective as of July 16, 2014 to the Investment Advisory Agreement between FMG LLC and AllianceBernstein effective as of May 1, 2011. 44 |
| |
(6)(h)(vii) | | Amendment No. 6 effective as of April 30, 2015 to the Investment Advisory Agreement between FMG LLC and AllianceBernstein effective as of May 1, 2011. 45 |
| |
(6)(h)(viii) | | Amendment No. 7 effective as of October 1, 2015 to the Investment Advisory Agreement between FMG LLC and AllianceBernstein effective as of May 1, 2011. 48 |
| |
(6)(h)(ix) | | Amendment No. 8 effective as of February 22, 2016 to the Investment Advisory Agreement between FMG LLC and AllianceBernstein effective as of May 1, 2011.48 |
| |
(6)(i)(i) | | Investment Advisory Agreement between FMG LLC and AllianceBernstein effective as of May 1, 2011 with respect to the ATM Core Bond Portfolio and the ATM Intermediate Government Bond Portfolio. 29 |
| |
(6)(i)(ii) | | Amendment No. 1 effective as of December 4, 2012 to the Investment Advisory Agreement between FMG LLC and AllianceBernstein effective as of May 1, 2011 with respect to the EQ/AllianceBernstein Short Duration Government Bond Portfolio (formerly, ATM Intermediate Government Bond Portfolio). 36 |
| |
(6)(i)(iii) | | Amendment No. 2 effective as of July 16, 2014 to the Investment Advisory Agreement between FMG LLC and AllianceBernstein effective as of May 1, 2011 with respect to the EQ/AllianceBernstein Short Duration Government Bond Portfolio (formerly, ATM Intermediate Government Bond Portfolio). 44 |
| |
(6)(i)(iv) | | Amendment No. 3 effective as of April 30, 2015 to the Investment Advisory Agreement between FMG LLC and AllianceBernstein effective as of May 1, 2011 with respect to the AXA/AB Short Duration Government Bond Portfolio (formerly, EQ/AllianceBernstein Short Duration Government Bond Portfolio). 46 |
| |
(6)(j)(i) | | Investment Advisory Agreement between FMG LLC and AllianceBernstein effective as of May 1, 2011 with respect to the EQ/Small Company Index Portfolio. 29 |
| |
(6)(k)(i) | | Investment Advisory Agreement between FMG LLC and Capital Guardian Trust Company (“Capital Guardian”) dated as of May 1, 2011. 29 |
| |
(6)(k)(ii) | | Amendment No. 1 effective as of June 24, 2013, to the Investment Advisory Agreement between FMG LLC and Capital Guardian dated as of May 1, 2011. 40 |
| |
(6)(k)(iii) | | Amendment No. 2 effective as of July 16, 2014 to the Investment Advisory Agreement between FMG LLC and Capital Guardian as of May 1, 2011. 44 |
| |
(6)(l)(i) | | Investment Advisory Agreement between FMG LLC and Calvert Investment Management, Inc. (“Calvert”) dated as of May 1, 2011. 29 |
| | |
| |
(6)(l)(ii) | | Amended and Restated Investment Advisory Agreement between FMG LLC and Calvert dated as of August 1, 2011. 29 |
| |
(6)(m)(i) | | Investment Advisory Agreement between FMG LLC and Marsico Capital Management, LLC (“Marsico”) dated as of May 1, 2011. 29 |
| |
(6)(m)(ii) | | Amendment No. 1 effective as of June 1, 2014 to the Investment Advisory Agreement between FMG LLC and Marsico dated as of May 1, 2011. 43 |
| |
(6)(m)(iii) | | Amendment No. 2 effective as of July 16, 2014 to the Investment Advisory Agreement between FMG LLC and Marsico dated as of May 1, 2011. 44 |
| |
(6)(n)(i) | | Investment Advisory Agreement between FMG LLC and Pacific Investment Management Company, LLC (“PIMCO”) dated as of May 1, 2011. 29 |
| |
(6)(n)(ii) | | Amendment No. 1 effective as of May 1, 2012 to the Investment Advisory Agreement between FMG LLC and PIMCO dated as of May 1, 2011. 36 |
| |
(6)(n)(iii) | | Amendment No. 2 effective as of February 8, 2013 to the Investment Advisory Agreement between FMG LLC and PIMCO dated as of May 1, 2011. 36 |
| |
(6)(n)(iv) | | Amendment No. 3 effective as of July 19, 2013 to the Investment Advisory Agreement between FMG LLC and PIMCO dated as of May 1, 2011. 40 |
| |
(6)(n)(v) | | Amendment No. 4 effective as of June 1, 2014 to the Investment Advisory Agreement between FMG LLC and PIMCO dated as of May 1, 2011. 42 |
| |
(6)(n)(vi) | | Amendment No. 5 effective as of July 16, 2014 to the Investment Advisory Agreement between FMG LLC and PIMCO dated as of May 1, 2011. 44 |
| |
(6)(n)(vii) | | Amendment No. 6 effective as of February 22, 2016 to the Investment Advisory Agreement between FMG LLC and PIMCO dated as of May 1, 2011. 48 |
| |
(6)(o)(i) | | Investment Advisory Agreement between FMG LLC and Wellington Management Company, LLP (“Wellington”) dated as of May 1, 2011. 29 |
| |
(6)(o)(ii) | | Amendment No. 1 effective as of June 1, 2014 to the Investment Advisory Agreement between FMG LLC and Wellington dated as of May 1, 2011. 43 |
| |
(6)(o)(iii) | | Amendment No. 2 effective as of July 16, 2014 to the Investment Advisory Agreement between FMG LLC and Wellington dated as of May 1, 2011. 44 |
| |
(6)(p)(i) | | Investment Advisory Agreement between FMG LLC and Boston Advisors, LLC (“Boston Advisors”) dated as of May 1, 2011. 29 |
| |
(6)(q)(i) | | Investment Advisory Agreement between FMG LLC and GAMCO Asset Management, Inc. (“GAMCO”) dated as of May 1, 2011. 29 |
| |
(6)(r)(i) | | Investment Advisory Agreement between FMG LLC and Montag & Caldwell, LLC (“Montag”) dated as of May 1, 2011. 29 |
| |
(6)(s)(i) | | Investment Advisory Agreement between FMG LLC and SSgA Funds Management, Inc. (“SSgA FM”) dated as of May 1, 2011. 29 |
| | |
| |
(6)(s)(ii) | | Amendment No. 1 effective as of July 10, 2012 to the Investment Advisory Agreement between FMG LLC and SSgA FM dated as of May 1, 2011. 36 |
| |
(6)(s)(iii) | | Amendment No. 2 effective as of June 1, 2014 to the Investment Advisory Agreement between FMG LLC and SSgA FM dated as of May 1, 2011. 43 |
| |
(6)(t)(i) | | Investment Advisory Agreement between FMG LLC and UBS Global Asset Management (Americas) Inc. (“UBS”) dated as of May 1, 2011. 29 |
| |
(6)(u)(i) | | Investment Advisory Agreement between FMG LLC and Wells Capital Management, Inc. (“Wells Capital”) dated as of May 1, 2011. 29 |
| |
(6)(u)(ii) | | Amendment No. 1 effective as of June 6, 2013, to the Investment Advisory Agreement between FMG LLC and Wells Capital dated as of May 1, 2011. 40 |
| |
(6)(u)(iii) | | Amendment No. 2 effective as of July 16, 2014 to the Investment Advisory Agreement between FMG LLC and Wells Capital dated as of May 1, 2011. 44 |
| |
(6)(v)(i) | | Investment Advisory Agreement between FMG LLC, Wells Capital and First International Advisers, LLC (“First International”) dated as of May 1, 2011. 29 |
| |
(6)(w)(i) | | Investment Advisory Agreement between FMG LLC and Lord Abbett & Co. LLC (“Lord Abbett”) dated as of May 1, 2011. 29 |
| |
(6)(w)(ii) | | Amendment No. 1 effective as of April 11, 2014, to the Investment Advisory Agreement between FMG LLC and Lord Abbett dated as of May 1, 2011. 42 |
| |
(6)(w)(iii) | | Amendment No. 2 effective June 1, 2014, to the Investment Advisory Agreement between FMG LLC and Lord Abbett dated as of May 1, 2011. 42 |
| |
(6)(w)(iv) | | Amendment No. 3 effective as of July 16, 2014 to the Investment Advisory Agreement between FMG LLC and Lord Abbett dated as of May 1, 2011. 44 |
| |
(6)(x)(i) | | Investment Advisory Agreement between FMG LLC and The Dreyfus Corporation (“Dreyfus”) dated as of May 1, 2011. 29 |
| |
(6)(y)(i) | | Investment Advisory Agreement between FMG LLC and Bridgeway Capital Management, Inc. (“Bridgeway”) dated as of May 1, 2011. 29 |
| |
(6)(z)(i) | | Investment Advisory Agreement between FMG LLC and Davis Selected Advisers, L. P. (“Davis”) dated as of May 1, 2011. 29 |
| |
(6)(aa)(i) | | Investment Advisory Agreement between FMG LLC and Franklin Advisory Services, LLC (“Franklin Advisory”) dated as of May 1, 2011. 29 |
| |
(6)(aa)(ii) | | Amendment No. 1 effective as of July 16, 2014 to the Investment Advisory Agreement between FMG LLC and Franklin Advisory dated as of May 1, 2011. 44 |
| |
(6)(bb)(i) | | Investment Advisory Agreement between FMG LLC and Franklin Mutual Advisers, LLC (“Franklin Mutual”) dated as of May 1, 2011. 29 |
| |
(6)(bb)(ii) | | Amendment No. 1 effective as of July 16, 2014 to the Investment Advisory Agreement between FMG LLC and Franklin Mutual dated as of May 1, 2011. 44 |
| | |
| |
(6)(cc)(i) | | Investment Advisory Agreement between FMG LLC and OppenheimerFunds, Inc. (“Oppenheimer”) dated as of May 1, 2011. 29 |
| |
(6)(cc)(ii) | | Amendment No. 1 dated July 19, 2013, to the Investment Advisory Agreement between FMG LLC and Oppenheimer dated as of May 1, 2011. 40 |
| |
(6)(cc)(iii) | | Amendment No. 2 effective as of July 16, 2014 to the Investment Advisory Agreement between FMG LLC and Oppenheimer dated as of May 1, 2011. 44 |
| |
(6)(cc)(iv) | | Amendment No. 3 effective as of July 1, 2015 to the Investment Advisory Agreement between FMG LLC and Oppenheimer dated as of May 1, 2011. 48 |
| |
(6)(dd)(i) | | Investment Advisory Agreement between FMG LLC and Franklin Advisers, Inc. (“Franklin Advisers”) dated as of May 1, 2011. 29 |
| |
(6)(dd)(ii) | | Amendment No. 1 effective as of June 1, 2014, to the Investment Advisory Agreement between FMG LLC and Franklin Advisers dated as of May 1, 2011. 43 |
| |
(6)(dd)(iii) | | Amendment No. 2 effective as of July 16, 2014, to the Investment Advisory Agreement between FMG LLC and Franklin Advisers dated as of May 1, 2011. 44 |
| |
(6)(dd)(iv) | | Amendment No. 3 effective as of July 1, 2015, to the Investment Advisory Agreement between FMG LLC and Franklin Advisers dated as of May 1, 2011. 48 |
| |
(6)(ee)(i) | | Investment Advisory Agreement between FMG LLC and BlackRock Investment Management LLC (“BlackRock Investment”) effective as of May 1, 2011. 29 |
| |
(6)(ee)(ii) | | Amendment No. 1 effective as of July 26, 2013, to the Investment Advisory Agreement between FMG LLC and BlackRock Investment effective as of May 1, 2011. 40 |
| |
(6)(ee)(iii) | | Amendment No. 2 effective as of April 4, 2014, to the Investment Advisory Agreement between FMG LLC and BlackRock Investment effective as of May 1, 2011. 42 |
| |
(6)(ee)(iv) | | Amendment No. 3 effective as of June 1, 2014, to the Investment Advisory Agreement between FMG LLC and BlackRock Investment effective as of May 1, 2011. 42 |
| |
(6)(ee)(v) | | Amendment No. 4 effective as of July 16, 2014, to the Investment Advisory agreement between FMG LLC and BlackRock Investment effective as of May 1, 2011. 44 |
| |
(6)(ff)(i) | | Investment Advisory Agreement between FMG LLC and BlackRock Investment effective as of May 1, 2011 with respect to the Tactical Manager Portfolios. 29 |
| |
(6)(ff)(ii) | | Amended and Restated Investment Advisory Agreement between FMG LLC and BlackRock Investment effective as of August 1, 2011 with respect to the Tactical Manager Portfolios. 33 |
| |
(6)(ff)(iii) | | Amendment No. 1 effective as of July 16, 2014 to the Amended and Restated Investment Advisory Agreement between FMG LLC and BlackRock Investment effective as of August 1, 2011 with respect to the Tactical Manager Portfolios. 44 |
| |
(6)(ff)(iv) | | Amendment No. 2 effective as of October 1, 2015 to the Amended and Restated Investment Advisory Agreement between FMG LLC and BlackRock Investment effective as of August 1, 2011 with respect to the Tactical Manager Portfolios. 48 |
| |
(6)(gg)(i) | | Investment Advisory Agreement between FMG LLC and Institutional Capital, LLC (“ICAP”) dated as of May 1, 2011.29 |
| | |
| |
(6)(gg)(ii) | | Amendment No. 1 effective as of July 16, 2014 to the Investment Advisory Agreement between FMG LLC and ICAP dated as of May 1, 2011. 44 |
| |
(6)(hh)(i) | | Investment Advisory Agreement between FMG LLC, Wentworth Hauser and Violich, Inc. (“Wentworth Hauser”) and Hirayama Investments, LLC (“Hirayama Investments”) dated as of May 1, 2011. 29 |
| |
(6)(hh)(ii) | | Amended and Restated Investment Advisory Agreement by and among FMG LLC, WHV Investment Management (“WHV”) (formerly known as Wentworth Hauser) and Hirayama Investments effective as of July 10, 2012. 36 |
| |
(6)(hh)(iii) | | Amendment No. 1 as of effective July 16, 2014 to the Amended and Restated Investment Advisory Agreement by and among FMG LLC, WHV and Hirayama Investments effective as of July 10, 2012. 44 |
| |
(6)(ii)(i) | | Investment Advisory Agreement between FMG LLC and BlackRock Capital Management, Inc. (“BlackRock Capital”) effective as of May 1, 2011. 29 |
| |
(6)(ii)(ii) | | Amendment No. 1 effective July 26, 2013, to the Investment Advisory Agreement between FMG LLC and BlackRock Capital effective as of May 1, 2011. 40 |
| |
(6)(jj)(i) | | Investment Advisory Agreement between FMG LLC and Invesco Advisers, Inc. (“Invesco”) dated as of May 1, 2011. 29 |
| |
(6)(jj)(ii) | | Amendment No. 1 effective as of July 16, 2014, to the Investment Advisory Agreement between FMG LLC and Invesco dated as of May 1, 2011. 44 |
| |
(6)(jj)(iii) | | Amendment No. 2 effective as of April 30, 2015, to the Investment Advisory Agreement between FMG LLC and Invesco dated as of May 1, 2011. 45 |
| |
(6)(kk)(i) | | Investment Advisory Agreement between FMG LLC and Northern Cross, LLC (“Northern Cross”) dated as of May 1, 2011. 29 |
| |
(6)(kk)(ii) | | Amendment No. 1 effective as of July 16, 2014 to the Investment Advisory Agreement between FMG LLC and Northern Cross dated as of May 1, 2011. 44 |
| |
(6)(ll)(i) | | Investment Advisory Agreement between FMG LLC and Templeton Investment Counsel, LLC (“Templeton Investment”) dated as of May 1, 2011. 29 |
| |
(6)(ll)(ii) | | Amendment No. 1 effective as of July 16, 2014 to the Investment Advisory Agreement between FMG LLC and Templeton Investment dated as of May 1, 2011.44 |
| |
(6)(mm)(i) | | Investment Advisory Agreement between AXA FMG and EARNEST Partners, LLC (“EARNEST”) dated as of August 1, 2012. 36 |
| |
(6)(mm)(ii) | | Amendment No. 1 effective as of June 1, 2014, to the Investment Advisory Agreement between FMG LLC and EARNEST dated as of August 1, 2012. 42 |
| |
(6)(mm)(iii) | | Amendment No. 2 effective as of July 1, 2014, to the Investment Advisory Agreement between FMG LLC and EARNEST dated as of August 1, 2012. 44 |
| |
(6)(nn)(i) | | Investment Advisory Agreement between AXA FMG and RBC Global Asset Management (U.S.) Inc. (“RBC GAM US”) dated as of December 12, 2012. 36 |
| | |
| |
(6)(oo)(i) | | Investment Advisory Agreement between FMG LLC and AXA Investment Managers, Inc. (“AXA IM”) effective as of February 8, 2013. 36 |
| |
(6)(oo)(ii) | | Amendment No. 1 dated October 1, 2014 to the Investment Advisory Agreement between FMG LLC and AXA IM effective as of February 8, 2013. 44 |
| |
(6)(pp)(i) | | Investment Advisory Agreement between FMG LLC and Palisade Capital Management, L.L.C. (“Palisade Capital”) effective as of October 21, 2013. 43 |
| |
(6)(qq)(i) | | Investment Advisory Agreement between FMG LLC and AXA Rosenberg Investment Management LLC (“AXA Rosenberg”) effective as of October 21, 2013. 43 |
| |
(6)(qq)(ii) | | Amendment No. 1 effective as of October 1, 2014 to the Investment Advisory Agreement between FMG LLC and AXA Rosenberg effective as of October 21, 2013. 44 |
| |
(6)(rr)(i) | | Investment Advisory Agreement between FMG LLC and Diamond Hill Capital Management, Inc. (“Diamond Hill”) effective as of June 6, 2013. 40 |
| |
(6)(rr)(ii) | | Amendment No. 1 effective as of June 1, 2014, to the Investment Advisory Agreement between FMG LLC and Diamond Hill dated as of June 6, 2013. 42 |
| |
(6)(rr)(iii) | | Amendment No. 2 effective as of July 1, 2014 to the Investment Advisory Agreement between FMG LLC and Diamond Hill dated as of June 6, 2013. 44 |
| |
(6)(ss)(i) | | Investment Sub-Advisory Agreement between FMG LLC and Allianz Global Investors U.S. LLC (“Allianz”) dated as of June 1, 2014. 44 |
| |
(6)(tt)(i) | | Investment Sub-Advisory Agreement between FMG LLC and BlackRock Financial Management, Inc. (“BlackRock Financial”) dated as of June 1, 2014. 43 |
| |
(6)(uu)(i) | | Investment Advisory Agreement between FMG LLC and ClearBridge Investments, LLC (“ClearBridge”) dated as of June 1, 2014. 42 |
| |
(6)(vv)(i) | | Investment Sub-Advisory Agreement between FMG LLC and Horizon Asset Management LLC (“Horizon”) dated as of April 4, 2014. 42 |
| |
(6)(ww)(i) | | Investment Sub-Advisory Agreement between FMG LLC and Knightsbridge Asset Management, LLC (“Knightsbridge”) dated as of June 1, 2014. 43 |
| |
(6)(xx)(i) | | Investment Sub-Advisory Agreement between FMG LLC and Pacific Global Investment Management Company (“Pacific Global”) effective as of April 4, 2014. 42 |
| |
(6)(yy)(i) | | Investment Sub-Advisory Agreement between FMG LLC and Scotia Institutional Asset Management US, Ltd. (“Scotia Institutional”) effective as of June 1, 2014. 43 |
| |
(6)(zz)(i) | | Investment Sub-Advisory Agreement between FMG LLC and Westfield Capital Management Company (“Westfield”) effective as of June 1, 2014. 43 |
| |
(6)(aaa)(i) | | Investment Sub-Advisory Agreement between FMG LLC and Post Advisory Group, LLC (“Post”) dated as of June 1, 2014. 43 |
| |
(6)(bbb)(i) | | Investment Sub-Advisory Agreement between FMG LLC and Thornburg Investment Management, Inc. (“Thornburg”) dated as of June 1, 2014. 43 |
| | |
| |
(6)(bbb)(ii) | | Amendment No. 1 effective as of July 16, 2014 to the Investment Sub-Advisory Agreement between FMG LLC and Thornburg dated as of June 1, 2014. 44 |
| |
(6)(ccc)(i) | | Investment Sub-Advisory Agreement between FMG LLC and DoubleLine Capital LP. (“DoubleLine”) effective as of January 13, 2015. 44 |
| |
(6)(ccc)(ii) | | Amendment No. 1 dated as of April 30, 2015, to the Investment Sub-Advisory Agreement between FMG LLC and DoubleLine dated as of January 13, 2015. 48 |
| |
(6)(ddd)(i) | | Investment Sub-Advisory Agreement between FMG LLC and Goldman Sachs Asset Management, L.P. (“Goldman”) dated as of April 30, 2015. 45 |
| |
(6)(eee)(i) | | Investment Sub-Advisory Agreement between FMG LLC and Loomis Sayles & Company, L.P. (“Loomis Sayles”) effective as of September 1, 2014. 44 |
| |
(6)(eee)(ii) | | Amendment No. 1 dated as of January 29, 2016, to the Investment Sub-Advisory Agreement between FMG LLC and Loomis Sayles, effective as of September 1, 2014. 48 |
| |
(6)(fff)(i) | | Investment Sub-Advisory Agreement between FMG LLC and QS Investors, LLC (“QS Investors”) effective as of December 21, 2015.48 |
| |
(6)(ggg))(i) | | Investment Sub-Advisory Agreement between FMG LLC and Federated Global Investment Management Corp. (“Federated”) effective as of January 29, 2016. 48 |
| |
(6)(hhh)(i) | | Investment Sub-Advisory Agreement between FMG LLC and Vaughan Nelson Investment Management (“Vaughan Nelson”) effective as of January 29, 2016. 48 |
| |
(7) | | Underwriting Contracts or Distribution Agreements |
| |
(7)(a)(i) | | Amended and Restated Distribution Agreement between the Trust and AXA Distributors, LLC (“AXA Distributors”) dated as of July 15, 2002 with respect to Class IB shares. 6 |
| |
(7)(a)(ii) | | Amendment No. 1, dated May 2, 2003, to the Amended and Restated Distribution Agreement between the Trust and AXA Distributors, dated as of July 15, 2002 with respect to Class IB shares. 7 |
| |
(7)(a)(iii) | | Amendment No. 2, dated July 8, 2004, to the Amended and Restated Distribution Agreement between the Trust and AXA Distributors, dated as of July 15, 2002 with respect to Class IB shares. 8 |
| |
(7)(a)(iv) | | Amendment No. 3, dated October 1, 2004 to the Amended and Restated Distribution Agreement between the Trust and AXA Distributors, dated as of July 15, 2002 with respect to Class IB shares. 8 |
| |
(7)(a)(v) | | Amendment No. 4, dated May 1, 2005 to the Amended and Restated Distribution Agreement between the Trust and AXA Distributors dated as of July 15, 2002 with respect to Class IB shares. 10 |
| |
(7)(a)(vi) | | Amendment No. 5, dated September 30, 2005 to the Amended and Restated Distribution Agreement between the Trust and AXA Distributors dated as of July 15, 2002 with respect to Class IB shares. 11 |
| |
(7)(a)(vii) | | Amendment No. 6 dated August 1, 2006 to the Amended and Restated Distribution Agreement between the Trust and AXA Distributors dated as of July 15, 2002 with respect to Class IB shares. 13 |
| | |
| |
(7)(a)(viii) | | Amendment No. 7 dated May 1, 2007 to the Amended and Restated Distribution Agreement between the Trust and AXA Distributors dated as of July 15, 2002 with respect to Class IB shares. 15 |
| |
(7)(a)(ix) | | Amendment No. 8 dated July 11, 2007 to the Amended and Restated Distribution Agreement between the Trust and AXA Distributors dated as of July 15, 2002 with respect to Class IB shares. 16 |
| |
(7)(a)(x) | | Amendment No. 9 dated January 1, 2008 to the Amended and Restated Distribution Agreement between the Trust and AXA Distributors dated as of July 15, 2002 with respect to Class IB shares. 17 |
| |
(7)(a)(xi) | | Amendment No. 10 dated May 1, 2008 to the Amended and Restated Distribution Agreement between the Trust and AXA Distributors dated as of July 15, 2002 with respect to Class IB shares. 20 |
| |
(7)(a)(xii) | | Amendment No. 11 dated January 1, 2009 to the Amended and Restated Distribution Agreement between the Trust and AXA Distributors dated as of July 15, 2002 with respect to Class IB shares. 21 |
| |
(7)(a)(xiii) | | Amendment No. 12 dated May 1, 2009 to the Amended and Restated Distribution Agreement between the Trust and AXA Distributors dated as of July 15, 2002 with respect to Class IB shares. 22 |
| |
(7)(a)(xiv) | | Amendment No. 13 dated September 29, 2009 to the Amended and Restated Distribution Agreement between the Trust and AXA Distributors dated as of July 15, 2002 with respect to Class IB shares. 24 |
| |
(7)(a)(xv) | | Amendment No. 14 dated as of August 16, 2010 to the Amended and Restated Distribution Agreement between the Trust and AXA Distributors dated as of July 15, 2002 with respect to Class IB shares. 27 |
| |
(7)(a)(xvi) | | Amendment No. 15 dated as of December 15, 2010 to the Amended and Restated Distribution Agreement between the Trust and AXA Distributors dated as of July 15, 2002 with respect to Class IB shares. 27 |
| |
(7)(a)(xvii) | | Amendment No. 16 dated as of June 7, 2011 to the Amended and Restated Distribution Agreement between the Trust and AXA Distributors dated as of July 15, 2002 with respect to Class IB shares. 30 |
| |
(7)(a)(xviii) | | Amendment No. 17 dated as of April 12, 2012 to the Amended and Restated Distribution Agreement between the Trust and AXA Distributors dated as of July 15, 2002 with respect to Class IB shares. 34 |
| |
(7)(a)(xviv) | | Amendment No. 18 dated as of August 29, 2012 to the Amended and Restated Distribution Agreement between the Trust and AXA Distributors dated as of July 15, 2002 with respect to Class IB shares. 36 |
| |
(7)(a)(xx) | | Amendment No. 19 dated as of May 1, 2013 to the Amended and Restated Distribution Agreement between the Trust and AXA Distributors dated as of July 15, 2002 with respect to Class IB shares. 39 |
| |
(7)(a)(xxi) | | Amendment No. 20 dated as of October 21, 2013 to the Amended and Restated Distribution Agreement between the Trust and AXA Distributors dated as of July 15, 2002 with respect to Class IB shares. 39 |
| | |
| |
(7)(a)(xxii) | | Amendment No. 21 dated as of April 4, 2014 to the Amended and Restated Distribution Agreement between the Trust and AXA Distributors dated as of July 15, 2002 with respect to Class IB shares. 43 |
| |
(7)(a)(xxiii) | | Amendment No. 22 dated as of June 1, 2014 to the Amended and Restated Distribution Agreement between the Trust and AXA Distributors dated as of July 15, 2002 with respect to the Class IB shares. 43 |
| |
(7)(a)(xxiv) | | Amendment No. 23 dated as of July 16, 2014 to the Amended and Restated Distribution Agreement between the Trust and AXA Distributors dated as of July 15, 2002 with respect to the Class IB shares. 44 |
| |
(7)(a)(xxv) | | Amendment No. 24 dated as of April 30, 2015 to the Amended and Restated Distribution Agreement between the Trust and AXA Distributors dated as of July 15, 2002 with respect to the Class IB shares. 45 |
| |
(7)(a)(xxvi) | | Amendment No. 25 dated as of December 21, 2015, to the Amended and Restated Distribution Agreement between the Trust and AXA Distributors dated as of July 15, 2002 with respect to the Class IB shares. 48 |
| |
(7)(b)(i) | | Distribution Agreement between the Trust and AXA Distributors, dated as of July 1, 2004 with respect to the Class IB shares of the MONY Portfolios. 8 |
| |
(7)(b)(ii) | | Amendment No. 1 dated July 11, 2007 to the Distribution Agreement between the Trust and AXA Distributors, dated as of July 1, 2004 with respect to the Class IB shares of the MONY Portfolios. 16 |
| |
(7)(b)(iii) | | Amendment No. 2 dated as of May 1, 2009 to the Distribution Agreement between the Trust and AXA Distributors, dated as of July 1, 2004 with respect to the Class IB shares of the MONY Portfolios. 23 |
| |
(7)(b)(iv) | | Amendment No. 3 dated as of September 29, 2009 to the Distribution Agreement between the Trust and AXA Distributors, dated as of July 1, 2004 with respect to the Class IB shares of the MONY Portfolios. 24 |
| |
(7)(b)(v) | | Amendment No. 4 dated as of May 1, 2011 to the Distribution Agreement between the Trust and AXA Distributors, dated as of July 1, 2004 with respect to the Class IB shares of the MONY Portfolios. 29 |
| |
(7)(b)(vi) | | Amendment No. 5 dated as of April 30, 2012 to the Distribution Agreement between the Trust and AXA Distributors dated as of July 1, 2004 with respect to the Class IB shares of the MONY Portfolios. 34 |
| |
(7)(b)(vii) | | Amendment No. 6 dated as of September 1, 2014 to the Distribution Agreement between the Trust and AXA Distributors dated as of July 1, 2014 with respect to the Class IB shares of the MONY Portfolios. 44 |
| |
(7)(c)(i) | | Distribution Agreement between the Trust and AXA Distributors dated as of August 1, 2011 with respect to Class K shares. 29 |
| |
(7)(c)(ii) | | Amendment No. 1 dated as of April 12, 2012 to the Distribution Agreement between the Trust and AXA Distributors dated as of August 1, 2011 with respect to Class K shares. 34 |
| |
(7)(c)(iii) | | Amendment No. 2 dated as of August 29, 2012 to the Distribution Agreement between the Trust and AXA Distributors dated as of August 1, 2011 with respect to Class K shares. 36 |
| | |
| |
(7)(c)(iv) | | Amendment No. 3 dated as of May 1, 2013 to the Distribution Agreement between the Trust and AXA Distributors dated August 1, 2011 with respect to Class K shares. 39 |
| |
(7)(c)(v) | | Amendment No. 4 dated as of October 21, 2013 to the Distribution Agreement between the Trust and AXA Distributors dated August 1, 2011 with respect to Class K shares. 39 |
| |
(7)(c)(vi) | | Amendment No. 5 dated as of April 4, 2014 to the Distribution Agreement between the Trust and AXA Distributors dated August 1, 2011 with respect to Class K shares. 43 |
| |
(7)(c)(vii) | | Amendment No. 6 dated as of June 1, 2014 to the Distribution Agreement between the Trust and AXA Distributors dated August 1, 2011 with respect to Class K shares. 43 |
| |
(7)(c)(viii) | | Amendment No. 7 dated as of July 16, 2014 to the Distribution Agreement between the Trust and AXA Distributors dated August 1, 2011 with respect to Class K shares. 44 |
| |
(7)(c)(ix) | | Amendment No. 8 dated as of April 30, 2015 to the Distribution Agreement between the Trust and AXA Distributors dated August 1, 2011 with respect to Class K shares. 45 |
| |
(7)(c)(x) | | Amendment No. 9 dated as of December 21, 2015 to the Distribution Agreement between the Trust and AXA Distributors dated August 1, 2011 with respect to Class K shares. 48 |
| |
(7)(d)(i) | | Distribution Agreement between the Trust and AXA Distributors dated as of August 1, 2011 with respect to the Class K shares of the MONY Portfolios. 29 |
| |
(7)(d)(ii) | | Amendment No. 1 dated as of April 30, 2012 to the Distribution Agreement between the Trust and AXA Distributors dated as of August 1, 2011 with respect to the Class K shares of the MONY Portfolios. 34 |
| |
(7)(d)(iii) | | Amendment No. 2 dated as of September 1, 2014 to the Distribution Agreement between the Trust and AXA Distributors dated as of August 1, 2011 with respect to the Class K shares of the MONY Portfolios. 44 |
| |
(7)(e)(i) | | Amended and Restated Distribution Agreement between the Trust and AXA Distributors effective January 1, 2012 with respect to the Class IA shares. 35 |
| |
(7)(e)(ii) | | Amendment No. 1 effective as of March 1, 2012 to the Amended and Restated Distribution Agreement between the Trust and AXA Distributors effective January 1, 2012 with respect to the Class IA shares. 35 |
| |
(7)(e)(iii) | | Amendment No. 2 dated as of April 30, 2012, to the Amended and Restated Distribution Agreement between the Trust and AXA Distributors dated as of January 1, 2012 with respect to the Class IA shares. 36 |
| |
(7)(e)(iv) | | Amendment No. 3 dated as of July 10, 2012, to the Amended and Restated Distribution Agreement between the Trust and AXA Distributors dated as of January 1, 2012 with respect to the Class IA shares. 36 |
| |
(7)(e)(v) | | Amendment No. 4 dated as of June 1, 2014, to the Amended and Restated Distribution Agreement between the Trust and AXA Distributors dated as of January 1, 2012 with respect to the Class IA shares. 43 |
| |
(7)(e)(vi) | | Amendment No. 5 dated as of July 16, 2014 to the Amended and Restated Distribution Agreement between the Trust and AXA Distributors dated as of January 1, 2012 with respect to the Class IA shares. 44 |
| | |
| |
(7)(e)(vii) | | Amendment No. 6 dated as of July 14, 2015 to the Amended and Restated Distribution Agreement between the Trust and AXA Distributors dated as of January 1, 2012 with respect to the Class IA shares. 47 |
| |
(8) | | Form of Deferred Compensation Plan. 3 |
| |
(9) | | Custodian Agreements |
| |
(9)(a)(i) | | Amended and Restated Global Custody Agreement between the Trust and JPMorgan Chase Bank dated February 1, 2002. 5 |
| |
(9)(a)(ii) | | Amendment No. 1, dated May 2, 2003, to the Amended and Restated Global Custody Agreement between the Trust and JP Morgan Chase Bank dated February 1, 2002. 7 |
| |
(9)(a)(iii) | | Amendment No. 2, dated July 8, 2004, to the Amended and Restated Global Custody Agreement between the Trust and JP Morgan Chase Bank dated February 1, 2002. 8 |
| |
(9)(a)(iv) | | Amendment No. 3, dated September 13, 2004, to the Amended and Restated Global Custody Agreement between the Trust and JP Morgan Chase Bank dated February 1, 2002. 8 |
| |
(9)(a)(v) | | Amendment No. 4 dated May 1, 2005 to the Amended and Restated Global Custody Agreement between the Trust and JP Morgan Chase Bank dated February 1, 2002. 10 |
| |
(9)(a)(vi) | | Amendment No. 5 dated September 30, 2005 to the Amended and Restated Global Custody Agreement between the Trust and JP Morgan Chase Bank dated February 1, 2002. 11 |
| |
(9)(a)(vii) | | Amendment No. 6 dated August 1, 2006 to the Amended and Restated Global Custody Agreement between the Trust and JP Morgan Chase Bank dated February 1, 2002. 14 |
| |
(9)(a)(viii) | | Amendment No. 7 dated May 1, 2007 to the Amended and Restated Global Custody Agreement between the Trust and JP Morgan Chase Bank dated February 1, 2002. 15 |
| |
(9)(a)(ix) | | Amendment No. 8 dated April 1, 2007 to the Amended and Restated Global Custody Agreement between the Trust and JP Morgan Chase Bank dated February 1, 2002. 16 |
| |
(9)(a)(x) | | Amendment No. 9 dated January 1, 2008 to the Amended and Restated Global Custody Agreement between the Trust and JPMorgan Chase Bank dated February 1, 2002. 17 |
| |
(9)(a)(xi) | | Amendment No. 10 dated May 1, 2008 to the Amended and Restated Global Custody Agreement between the Trust and JPMorgan Chase Bank dated February 1, 2002. 20 |
| |
(9)(a)(xii) | | Amendment No. 11 dated July 1, 2008 to the Amended and Restated Global Custody Agreement between the Trust and JPMorgan Chase Bank dated February 1, 2002. 20 |
| |
(9)(a)(xiii) | | Amendment No. 12 dated January 1, 2009 to the Amended and Restated Global Custody Agreement between the Trust and JPMorgan Chase Bank dated February 1, 2002. 21 |
| |
(9)(a)(xiv) | | Amendment No. 13 dated May 1, 2009 to the Amended and Restated Global Custody Agreement between the Trust and JPMorgan Chase Bank dated February 1, 2002. 22 |
| |
(9)(a)(xv) | | Amendment No. 14 dated as of September 29, 2009, to the Amended and Restated Global Custody Agreement between the Trust and JPMorgan Chase Bank dated February 1, 2002. 24 |
| |
(9)(a)(xvi) | | Amendment No. 15 dated as of October 1, 2009, to the Amended and Restated Global Custody Agreement between the Trust and JPMorgan Chase Bank dated February 1, 2002. 24 |
| | |
| |
(9)(a)(xvii) | | Amendment No. 16 dated as of August 16, 2010 to the Amended and Restated Global Custody Agreement between the Trust and JPMorgan Chase Bank dated February 1, 2002. 27 |
| |
(9)(a)(xviii) | | Amendment No. 17 dated as of December 15, 2010 to the Amended and Restated Global Custody Agreement between the Trust and JPMorgan Chase Bank dated February 1, 2002. 27 |
| |
(9)(a)(xix) | | Amendment No. 18 dated as of December 7, 2010 to the Amended and Restated Global Custody Agreement between the Trust and JPMorgan Chase Bank dated February 1, 2002. 28 |
| |
(9)(a)(xx) | | Amendment No. 19 dated as of May 1, 2011 to the Amended and Restated Global Custody Agreement between the Trust and JPMorgan Chase Bank dated February 1, 2002. 29 |
| |
(9)(a)(xxi) | | Amendment No. 20 dated as of July 20, 2011 to the Amended and Restated Global Custody Agreement between the Trust and JPMorgan Chase Bank dated February 1, 2002. 29 |
| |
(9)(a)(xxii) | | Amendment No. 21 dated as of April 30, 2012 to the Amended and Restated Global Custody Agreement between the Trust and JPMorgan Chase Bank dated February 1, 2002. 34 |
| |
(9)(a)(xxiii) | | Amendment No. 22 dated as of June 1, 2013 to the Amended and Restated Global Custody Agreement between the Trust and JPMorgan Chase Bank dated February 1, 2002. 39 |
| |
(9)(a)(xxiv) | | Amendment No. 23 dated as of October 21, 2013 to the Amended and Restated Global Custody Agreement between the Trust and JPMorgan Chase Bank dated February 1, 2002. 39 |
| |
(9)(a)(xxv) | | Amendment No. 24 dated as of April 4, 2014 to the Amended and Restated Global Custody Agreement between the Trust and JPMorgan Chase Bank dated February 1, 2002. 43 |
| |
(9)(a)(xxvi) | | Amendment No. 25 dated as of June 1, 2014 to the Amended and Restated Global Custody Agreement between the Trust and JPMorgan Chase Bank dated February 1, 2002. 43 |
| |
(9)(a)(xxvii) | | Amendment No. 26 dated as of July 16, 2014 to the Amended and Restated Global Custody Agreement between the Trust and JPMorgan Chase Bank dated February 1, 2002. 44 |
| |
(9)(a)(xxviii) | | Amendment No. 27 dated as of April 30, 2015 to the Amended and Restated Global Custody Agreement between the Trust and JPMorgan Chase Bank dated February 1, 2002. 46 |
| |
(9)(a)(xxvix) | | Amendment No. 28 dated as of December 21, 2015 to the Amended and Restated Global Custody Agreement between the Trust and JPMorgan Chase Bank dated February 1, 2002. 48 |
| |
(10) | | Distribution Plan and Multiple Share Class Plan |
| |
(10)(a)(i) | | Amended and Restated Distribution Plan pursuant to Rule 12b-1 under the 1940 Act for the Trust’s Class IB shares adopted as of July 14, 2010. 26 |
| |
(10)(a)(ii) | | Amended and Restated Distribution Plan pursuant to Rule 12b-1 under the 1940 Act for the Trust’s Class IB shares of the MONY Portfolios adopted as of July 14, 2010. 26 |
| |
(10)(b)(i) | | Shareholder Services and Distribution Plan pursuant to Rule 12b-1 under the 1940 Act for the Trust’s Class IA shares adopted as of July 12, 2011. 33 |
| |
(10)(c)(i) | | Revised Amended and Restated Plan Pursuant to Rule 18f-3 under the 1940 Act. 29 |
| |
(11) | | Opinion and Consent of Counsel regarding the legality of the securities being registered (filed herewith). |
| | |
| |
(12) | | Opinion of K&L Gates LLP as to tax matters (to be filed by amendment). |
| |
(13) | | Other Material Contracts |
| |
(13)(a)(i) | | Mutual Fund Service Agreement dated May 1, 2011 between the Trust and FMG LLC. 29 |
| |
(13)(a)(ii) | | Amendment No. 1 dated June 7, 2011 to the Mutual Fund Service Agreement between the Trust and FMG LLC dated May 1, 2011. 30 |
| |
(13)(a)(iii) | | Amendment No. 2 dated September 1, 2011 to the Mutual Fund Service Agreement dated May 1, 2011 between the Trust and FMG LLC. 29 |
| |
(13)(a)(iv) | | Amendment No. 3 dated as of October 1, 2011 to the Mutual Fund Service Agreement dated May 1, 2011 between the Trust and FMG LLC. 31 |
| |
(13)(a)(v) | | Amendment No. 4 dated as of April 12, 2012 to the Mutual Fund Service Agreement dated May 1, 2011 between the Trust and FMG LLC. 34 |
| |
(13)(a)(vi) | | Amendment No. 5 dated as of September 1, 2012, to the Mutual Fund Service Agreement dated May 1, 2011 between the Trust and FMG LLC. 36 |
| |
(13)(a)(vii) | | Amendment No. 6 dated as of May 1, 2013 to the Mutual Fund Service Agreement dated May 1, 2011 between the Trust and FMG LLC. 39 |
| |
(13)(a)(viii) | | Amendment No. 7 dated as of September 1, 2013 to the Mutual Fund Service Agreement dated May 1, 2011 between the Trust and FMG LLC. 39 |
| |
(13)(a)(ix) | | Amendment No. 8 dated as of October 21, 2013 to the Mutual Fund Service Agreement dated May 1, 2011 between the Trust and FMG LLC. 39 |
| |
(13)(ax) | | Amendment No. 9 dated as of April 4, 2014 to the Mutual Fund Service Agreement dated May 1, 2011 between the Trust and FMG LLC. 43 |
| |
(13)(a)(xi) | | Amendment No. 10 dated as of June 1, 2014 to the Mutual Fund Service Agreement dated May 1, 2011 between the Trust and FMG LLC. 43 |
| |
(13)(axii) | | Amendment No. 11 dated as of July 16, 2014 to the Mutual Fund Service Agreement dated May 1, 2011 between the Trust and FMG LLC. 44 |
| |
(13)(a)(xiii) | | Amendment No. 12 dated as of September 1, 2014 to the Mutual Fund Service Agreement dated May 1, 2011 between the Trust and FMG LLC. 44 |
| |
(13)(a)(xiv) | | Amendment No. 13 dated as of January 20, 2015 to the Mutual Fund Service Agreement dated May 1, 2011 between the Trust and FMG LLC. 44 |
| |
(13)(b)(i) | | Amended and Restated Mutual Fund Service Agreement dated April 1, 2015 between the Trust and FMG LLC. 45 |
| |
(13)(b)(ii) | | Amendment No. 1 dated as of July 14, 2015 to the Amended and Restated Mutual Fund Service Agreement dated April 1, 2015 between the Trust and FMG LLC. 47 |
| |
(13)(b)(iii) | | Amendment No. 2 dated as of September 1, 2015 to the Amended and Restated Mutual Fund Service Agreement dated April 1, 2015 between the Trust and FMG LLC. 47 |
| | |
| |
(13)(b)(iv) | | Amendment No. 3 dated as of December 21, 2015 to the Amended and Restated Mutual Fund Service Agreement dated April 1, 2015 between the Trust and FMG LLC. 48 |
| |
(13)(b)(v) | | Amendment No. 4 dated as of January 1, 2016 to the Amended and Restated Mutual Fund Service Agreement dated April 1, 2015 between the Trust and FMG LLC. 48 |
| |
(13)(c)(i) | | Sub-Administration Agreement between FMG LLC and JPMorgan Chase Bank dated May 1, 2011. 29 |
| |
(13)(d)(i) | | Sub-Administration Agreement dated April 1, 2015 between FMG LLC and JPMorgan Chase Bank. 46 |
| |
(13)(e)(i) | | Expense Limitation Agreement dated as of May 1, 2011 between the Trust and FMG LLC. 29 |
| |
(13)(e)(ii) | | Amendment No. 1 dated as of June 7, 2011 to the Expense Limitation Agreement between the Trust and FMG LLC dated May 1, 2011. 30 |
| |
(13)(e)(iii) | | Amendment No. 2 dated as of August 19, 2011 to the Expense Limitation Agreement between the Trust and FMG LLC dated May 1, 2011. 29 |
| |
(13)(e)(iv) | | Amendment No. 3 effective as of January 1, 2012 to the Expense Limitation Agreement between the Trust and FMG LLC dated May 1, 2011. 31 |
| |
(13)(e)(v) | | Amendment No. 4 effective as of April 12, 2012 to the Expense Limitation Agreement between the Trust and FMG LLC dated May 1, 2011. 34 |
| |
(13)(e)(vi) | | Amendment No. 5 effective as of May 1, 2013 to the Expense Limitation Agreement between the Trust and FMG LLC dated May 1, 2011. 37 |
| |
(13)(e)(vii) | | Amendment No. 6 effective as of May 1, 2013 to the Expense Limitation Agreement between the Trust and FMG LLC dated May 1, 2011. 37 |
| |
(13)(e)(viii) | | Amendment No. 7 effective as of April 11, 2014 to the Expense Limitation Agreement between the Trust and FMG LLC dated May 1, 2011. 43 |
| |
(13)(e)(ix) | | Amendment No. 8 effective as of May 1, 2014 to the Expense Limitation Agreement between the Trust and FMG LLC dated May 1, 2011. 43 |
| |
(13)(e)(x) | | Amendment No. 9 effective as of June 1, 2014 to the Expense Limitation Agreement between the Trust and FMG LLC dated May 1, 2011. 43 |
| |
(13)(e)(xi) | | Amendment No. 10 effective as of July 16, 2014 to the Expense Limitation Agreement between the Trust and FMG LLC dated May 1, 2011. 44 |
| |
(13)(e)(xii) | | Amendment No. 11 effective as of September 1, 2014 to the Expense Limitation Agreement between the Trust and FMG LLC dated May 1, 2011. 44 |
| |
(13)(e)(xiii) | | Amendment No. 12 effective as of April 30, 2015 to the Expense Limitation Agreement between the Trust and FMG LLC dated May 1, 2011. 45 |
| |
(13)(e)(xiv) | | Amendment No. 13 effective as of December 21, 2015 to the Expense Limitation Agreement between the Trust and FMG LLC dated May 1, 2011. 48 |
| |
(13)(e)(xv) | | Amendment No. 14 effective as of January 1, 2016 to the Expense Limitation Agreement between the Trust and FMG LLC dated May 1, 2011. 48 |
| | |
| |
(13)(e)(xv) | | Amendment No. 15 effective as of May 1, 2016 to the Expense Limitation Agreement between the Trust and FMG LLC dated May 1, 2011. 50 |
| |
(13)(e)(xvi) | | Amendment No. 16 effective as of December 1, 2016 to the Expense Limitation Agreement between the Trust and FMG LLC dated May 1, 2011. 50 |
| |
13(e)(xvii) | | Amendment No. 17 effective as of January 13, 2017 to the Expense Limitation Agreement between the Trust and FMG LLC dated May 1, 2011. 50 |
| |
13(e)(xviii) | | Form of Amendment No. 18 effective as of [ ] to the Expense Limitation Agreement between the Trust and FMG LLC dated May 1, 2011. 50 |
| |
(13)(f)(i) | | Amended and Restated Participation Agreement among the Trust, AXA Equitable Life Insurance Company (“AXA Equitable”), AXA Distributors and AXA Advisors dated as of July 15, 2002. 6 |
| |
(13)(f)(ii) | | Amendment No. 1, dated May 2, 2003, to the Amended and Restated Participation Agreement among the Trust, AXA Equitable, AXA Distributors and AXA Advisors dated July 15, 2002. 7 |
| |
(13)(f)(iii) | | Amendment No. 2, dated July 9, 2004, to the Amended and Restated Participation Agreement among the Trust, AXA Equitable, AXA Distributors and AXA Advisors dated July 15, 2002. 8 |
| |
(13)(f)(iv) | | Amendment No. 3, dated October 1, 2004, to the Amended and Restated Participation Agreement among the Trust, AXA Equitable, AXA Distributors and AXA Advisors dated July 15, 2002. 8 |
| |
(13)(f)(v) | | Amendment No. 4 dated May 1, 2005 to the Amended and Restated Participation Agreement among the Trust, AXA Equitable, AXA Distributors and AXA Advisors dated July 15, 2002. 10 |
| |
(13)(f)(vi) | | Amendment No. 5 dated September 30, 2005 to the Amended and Restated Participation Agreement among the Trust, AXA Equitable, AXA Distributors and AXA Advisors dated July 15, 2002. 12 |
| |
(13)(f)(vii) | | Amendment No. 6 dated August 1, 2006 to the Amended and Restated Participation Agreement among the Trust, AXA Equitable, AXA Distributors and AXA Advisors dated July 15, 2002. 14 |
| |
(13)(f)(viii) | | Amendment No. 7 dated May 1, 2007 to the Amended and Restated Participation Agreement among the Trust, AXA Equitable, AXA Distributors and AXA Advisors dated July 15, 2002. 15 |
| |
(13)(f)(ix) | | Amendment No. 8 dated January 1, 2008 to the Amended and Restated Participation Agreement among the Trust, AXA Equitable, AXA Distributors and AXA Advisors dated July 15, 2002. 17 |
| |
(13)(f)(x) | | Amendment No. 9 dated May 1, 2008 to the Amended and Restated Participation Agreement among the Trust, AXA Equitable, AXA Distributors and AXA Advisors dated July 15, 2002. 20 |
| |
(13)(f)(xi) | | Amendment No. 10 dated January 1, 2009 to the Amended and Restated Participation Agreement among the Trust, AXA Equitable, AXA Distributors and AXA Advisors dated July 15, 2002. 21 |
| | |
| |
(13)(f)(xii) | | Amendment No. 11 dated May 1, 2009 to the Amended and Restated Participation Agreement among the Trust, AXA Equitable, AXA Distributors and AXA Advisors dated July 15, 2002. 22 |
| |
(13)(f)(xiii) | | Amendment No. 12 dated September 29, 2009 to the Amended and Restated Participation Agreement among the Trust, AXA Equitable, AXA Distributors and AXA Advisors dated July 15, 2002. 24 |
| |
(13)(f)(xiv) | | Amendment No. 13 dated August 16, 2010 to the Amended and Restated Participation Agreement among the Trust, AXA Equitable, AXA Distributors and AXA Advisors dated July 15, 2002. 27 |
| |
(13)(f)(xv) | | Amendment No. 14 dated as of December 15, 2010 to the Amended and Restated Participation Agreement among the Trust, AXA Equitable, AXA Distributors and AXA Advisors dated July 15, 2002. 27 |
| |
(13)(f)(xvi) | | Amendment No. 15 dated June 7, 2011 to the Amended and Restated Participation Agreement among the Trust, AXA Equitable, AXA Distributors and AXA Advisors dated July 15, 2002. 30 |
| |
(13)(f)(xvii) | | Amendment No. 16 dated as of April 30, 2012 to the Amended and Restated Participation Agreement among the Trust, AXA Equitable and AXA Distributors dated July 15, 2002. 36 |
| |
(13)(f)(xviii) | | Second Amended and Restated Participation Agreement among the Trust, AXA Equitable, FMG LLC and AXA Distributors dated May 23, 2012. 38 |
| |
(13)(f)(xix) | | Amendment No. 1 dated as of June 4, 2013 to the Second Amended and Restated Participation Agreement among the Trust, AXA Equitable, FMG LLC and AXA Distributors dated May 23, 2012. 39 |
| |
(13)(f)(xx) | | Amendment No. 2 dated as of October 21, 2013 to the Second Amended and Restated Participation Agreement among the Trust, AXA Equitable, FMG LLC and AXA Distributors dated May 23, 2012. 39 |
| |
(13)(f)(xxi) | | Amendment No. 3 dated as of April 4, 2014 to the Second Amended and Restated Participation Agreement among the Trust, AXA Equitable, FMG LLC and AXA Distributors dated May 23, 2012. 43 |
| |
(13)(f)(xxii) | | Amendment No. 4 dated as of June 1, 2014 to the Second Amended and Restated Participation Agreement among the Trust, AXA Equitable, FMG LLC and AXA Distributors dated May 23, 2012. 43 |
| |
(13)(f)(xxiii) | | Amendment No. 5 dated as of July 16, 2014 to the Second Amended and Restated Participation Agreement among the Trust, AXA Equitable, FMG LLC and AXA Distributors dated May 23, 2012. 44 |
| |
(13)(f)(xxiv) | | Amendment No. 6 dated as of April 30, 2015 to the Second Amended and Restated Participation Agreement among the Trust, AXA Equitable, FMG LLC and AXA Distributors dated May 23, 2012. 45 |
| |
(13)(f)(xxv) | | Amendment No. 7 dated as of December 21, 2015 to the Second Amended and Restated Participation Agreement among the Trust, AXA Equitable, FMG LLC and AXA Distributors dated May 23, 2012. 48 |
| | |
| |
(13)(g)(i) | | Amended and Restated Retirement Plan Participation Agreement among the Trust, AXA Advisors, the Investment Plan for Employees, Managers and Agents, and AXA Equitable dated July 10, 2002. 6 |
| |
(13)(g)(ii) | | Second Amended and Restated Retirement Plan Participation Agreement among the Trust, AXA Distributors, the AXA Equitable 401(k) Plan and AXA Equitable dated April 26, 2012. 36 |
| |
(13)(g)(iii) | | Amendment No. 1 dated as of September 1, 2014 to the Second Amended and Restated Retirement Plan Participation Agreement among the Trust, AXA Distributors, the AXA Equitable 401(k) Plan and AXA Equitable dated April 26, 2012. 44 |
| |
(13)(g)(iv) | | Amendment No. 2 dated as of April 30, 2015 to the Second Amended and Restated Retirement Plan Participation Agreement among the Trust, AXA Distributors, the AXA Equitable 401(k) Plan and AXA Equitable dated April 26, 2012. 46 |
| |
(13)(h)(i) | | Participation Agreement among the Trust, MONY Life Insurance Company (“MONY Life”), and AXA Distributors dated as of May 23, 2012. 40 |
| |
(13)(h)(ii) | | Amendment No. 1 dated June 4, 2013 to the Amended and Restated Participation Agreement among the Trust, MONY Life, and AXA Distributors dated as of May 23, 2012. 40 |
| |
(13)(h)(iii) | | Participation Agreement among the Trust, MONY Life Insurance Company (“MONY”) and AXA Distributors effective as of October 1, 2013. 40 |
| |
(13)(h)(iv) | | Amendment No. 1 dated as of April 4, 2014 to the Participation Agreement among the Trust, MONY and AXA Distributors effective as of October 1, 2013. 43 |
| |
(13)(h)(v) | | Amendment No. 2 dated as of June 1, 2014 to the Participation Agreement among the Trust, MONY and AXA Distributors effective as of October 1, 2013. 43 |
| |
(13)(h)(vi) | | Amendment No. 3 dated as of July 16, 2014 to the Participation Agreement among the Trust, MONY and AXA Distributors effective as of October 1, 2013. 44 |
| |
(13)(h)(vii) | | Amendment No. 4 dated as of April 30, 2015 to the Participation Agreement among the Trust, MONY, and AXA Distributors effective as of October 1, 2013.47 |
| |
(13)(i)(i) | | Amended and Restated Participation Agreement among the Trust, MONY Life Insurance Company of America (“MLOA”) and AXA Distributors dated as of May 23, 2012. 40 |
| |
(13)(i)(ii) | | Amendment No. 1 dated as of June 4, 2013 to the Amended and Restated Participation Agreement among the Trust, MLOA and AXA Distributors dated as of May 23, 2012. 40 |
| |
(13)(i)(iii) | | Amendment No. 2 dated as of October 21, 2013 to the Amended and Restated Participation Agreement among the Trust, MLOA and AXA Distributors dated as of May 23, 2012. 40 |
| |
(13)(i)(iv) | | Amendment No. 3 dated as of November 1, 2013 to the Amended and Restated Participation Agreement among the Trust, MLOA and AXA Distributors dated as of May 23, 2012. 42 |
| |
(13)(i)(v) | | Amendment No. 4 dated as of April 4, 2014 to the Amended and Restated Participation Agreement among the Trust, MLOA and AXA Distributors dated as of May 23, 2012. 43 |
| |
(13)(i)(vi) | | Amendment No. 5 dated as of June 1, 2014 to the Amended and Restated Participation Agreement among the Trust, MLOA and AXA Distributors dated as of May 23, 2012. 43 |
| | |
| |
| (13)(i)(vii) | | Amendment No. 6 dated as of July 16, 2014 to the Amended and Restated Participation Agreement among the Trust, MLOA and AXA Distributors dated as of May 23, 2012. 44 |
| |
| (13)(i)(viii) | | Amendment No. 7 dated as of April 30, 2015 to the Amended and Restated Participation Agreement among the Trust, MLOA and AXA Distributors dated as of May 23, 2012. 45 |
| |
| (13)(i)(ix) | | Amendment No. 8 dated as of December 21, 2015 to the Amended and Restated Participation Agreement among the Trust, MLOA and AXA Distributors dated as of May 23, 2012. 48 |
| |
| (13)(j)(i) | | Form of Securities Lending Agreement with JPMorgan Chase Bank National Association. |
| |
| (14) | | Consent of Independent Public Accountants (filed herewith). |
| |
| (15) | | Not Applicable. |
| |
| (16) | | Powers of Attorney (filed herewith). |
| |
| (17) | | Forms of Voting Instruction and Proxy Cards (filed herewith). |
| 1. | Incorporated by reference to and/or previously filed with Registrant’s Registration Statement on Form N-1A filed on December 3, 1996 (File No. 333-17217). |
| 2. | Incorporated by reference to and/or previously filed with Pre-Effective Amendment No. 1 to Registrant’s Registration Statement on Form N-1A filed on January 23, 1997 (File No. 333-17217). |
| 3. | Incorporated by reference to and/or previously filed with Pre-Effective Amendment No. 2 to Registrant’s Registration Statement on Form N-1A filed on April 7, 1997 (File No. 333-17217). |
| 4. | Incorporated by reference to and/or previously filed with Post-Effective Amendment No. 18 to Registrant’s Registration Statement on Form N-1A filed on January 23, 2001 (File No. 333-17217). |
| 5. | Incorporated by reference to and/or previously filed with Post-Effective Amendment No. 24 to Registrant’s Registration Statement on Form N-1A filed on April 3, 2002 (File No. 333-17217). |
| 6. | Incorporated by reference to and/or previously filed with Post-Effective Amendment No. 25 to Registrant’s Registration Statement on Form N-1A filed on February 7, 2003 (File No. 333-17217). |
| 7. | Incorporated by reference to and/or previously filed with Post-Effective Amendment No. 28 to Registrant’s Registration Statement on Form N-1A filed on February 10, 2004 (File No. 333-17217). |
| 8. | Incorporated by reference to and/or previously filed with Post-Effective Amendment No. 35 to Registrant’s Registration Statement on Form N-1A filed on October 15, 2004 (File No. 333-17217). |
| 9. | Incorporated by reference to and/or previously filed with Post-Effective Amendment No. 36 to Registrant’s Registration Statement on Form N-1A filed on February 8, 2005 (File No. 333-17217). |
| 10. | Incorporated by reference to and/or previously filed with Post-Effective Amendment No. 37 to Registrant’s Registration Statement on Form N-1A filed on April 7, 2005 (File No. 333-17217). |
| 11. | Incorporated by reference to and/or previously filed with Post-Effective Amendment No. 42 to Registrant’s Registration Statement on Form N-1A filed on August 24, 2005 (File No. 333-17217). |
| 12. | Incorporated by reference to and/or previously filed with Post-Effective Amendment No. 44 to Registrant’s Registration Statement on Form N-1A filed on April 5, 2006 (File No. 333-17217). |
| 13. | Incorporated by reference to and/or previously filed with Post-Effective Amendment No. 46 to Registrant’s Registration Statement on Form N-1A filed on August 23, 2006 (File No. 333-17217). |
| 14. | Incorporated by reference to Post-Effective Amendment No. 51 to Registrant’s Registration Statement on Form N-1A filed on February 2, 2007 (File No. 333-17217). |
| 15. | Incorporated by reference to and/or previously filed with Post-Effective Amendment No. 53 to Registrant’s Registration Statement on Form N-1A filed on April 27, 2007 (File No. 333-17217). |
| 16. | Incorporated by reference to Post-Effective Amendment No. 54 to Registrant’s Registration Statement on Form N-1A filed on October 4, 2007 (File No. 333-17217). |
| 17. | Incorporated by reference to and/or previously filed with Post-Effective Amendment No. 56 to Registrant’s Registration Statement on Form N-1A filed on December 27, 2007 (File No. 333-17217). |
| 18. | Incorporated by reference to Post-Effective Amendment No. 57 to Registrant’s Registration Statement on Form N-1A filed on February 1, 2008 (File No. 333-17217). |
| 19. | Incorporated by reference to and/or previously filed with Post-Effective Amendment No. 58 to the Registrant’s Registration Statement on Form N-1A filed on April 1, 2008 (File No. 333-17217). |
| 20. | Incorporated by reference to Post-Effective Amendment No. 61 to the Registrant’s Registration Statement on Form N-1A filed on February 13, 2009 (File No. 333-17217). |
| 21. | Incorporated by reference to Post-Effective Amendment No. 64 to the Registrant’s Registration Statement on Form N-1A filed on March 16, 2009 (File No. 333-17217). |
| 22. | Incorporated by reference to and/or previously filed with Post-Effective Amendment No. 67 to the Registrant’s Registration Statement on Form N-1A filed on April 15, 2009 (File No. 333-17217). |
| 23. | Incorporated by reference to and/or previously filed with Post-Effective Amendment No. 68 to the Registrant’s Registration Statement on Form N-1A filed on April 29, 2009 (File No. 333-17217). |
| 24. | Incorporated by reference to and/or previously filed with Post-Effective Amendment No. 70 to the Registrant’s Registration Statement on Form N-1A filed on January 21, 2010 (File No. 333-17217). |
| 26. | Incorporated by reference to and/or previously filed with Post-Effective Amendment No. 75 to the Registrant’s Registration Statement on Form N-1A filed on October 5, 2010 (File No. 333-17217). |
| 27. | Incorporated by reference to and/or previously filed with Post-Effective Amendment No. 77 to the Registrant’s Registration Statement on Form N-1A filed on February 3, 2011 (File No. 333-17217). |
| 28. | Incorporated by reference to and/or previously filed with Post-Effective Amendment No. 79 to the Registrant’s Registration Statement on Form N-1A filed on April 28, 2011 (File No. 333-17217). |
| 29. | Incorporated by reference to and/or previously filed with Post-Effective Amendment No. 83 to the Registrant’s Registration Statement on Form N-1A filed on August 16, 2011 (File No. 333-17217). |
| 30. | Incorporated by reference to and/or previously filed with Post-Effective Amendment No. 84 to the Registrant’s Registration Statement on Form N-1A filed on August 17, 2011 (File No. 333-17217). |
| 31. | Incorporated by reference to and/or previously filed with Post-Effective Amendment No. 87 to the Registrant’s Registration Statement on Form N-1A filed on January 13, 2012 (File No. 333-17217). |
| 32. | Incorporated by reference to and/or previously filed with Post-Effective Amendment No. 88 to the Registrant’s Registration Statement on Form N-1A filed on February 1, 2012 (File No. 333-17217). |
| 33. | Incorporated by reference to and/or previously filed with Post-Effective Amendment No. 89 to the Registrant’s Registration Statement on Form N-1A filed on February 6, 2012 (File No. 333-17217). |
| 34 | Incorporated by reference to and/or previously filed with Post-Effective Amendment No. 91 to the Registrant’s Registration Statement on Form N-1A filed on April 25, 2012 (File No. 333-17217). |
| 35. | Incorporated by reference to and/or previously filed with Post-Effective Amendment No. 92 to the Registrant’s Registration Statement on Form N-1A filed on April 25, 2012 (File No. 333-17217). |
| 36. | Incorporated by reference to and/or previously filed with Post-Effective Amendment No. 96 to the Registrant’s Registration Statement on Form N-1A filed on February 7, 2013 (File No. 333-17217). |
| 37. | Incorporated by reference and/or previously filed with Post-Effective Amendment No. 98 to the Registrant’s Registration Statement filed on April 30, 2013 (File No. 333-17217). |
| 38. | Incorporated by reference and/or previously filed with Post-Effective Amendment No. 100 to the Registrant’s Registration Statement filed on July 22, 2013 (File No. 333-17217). |
| 39. | Incorporated by reference and/or previously filed with Post-Effective Amendment No. 101 to the Registrant’s Registration Statement filed on October 1, 2013 (File No. 333-17217). |
| 40. | Incorporated by reference and/or previously filed with Post-Effective Amendment No. 103 to the Registrant’s Registration Statement filed on January 10, 2014 (File No. 333-17217). |
| 41. | Incorporated by reference and/or previously filed with Post-Effective Amendment No. 104 to the Registrant’s Registration Statement filed on February 11, 2014 (File No. 333-17217). |
| 42. | Incorporated by reference and/or previously filed with Post-Effective Amendment No. 106 to the Registrant’s Registration Statement filed on April 11, 2014 (File No. 333-17217). |
| 43. | Incorporated by reference and/or previously filed with Post-Effective Amendment No. 108 to the Registrant’s Registration Statement filed on April 30, 2014 (File No. 333-17217). |
| 44. | Incorporated by reference and/or previously filed with Post-Effective Amendment No. 112 to the Registrant’s Registration Statement filed on February 5, 2015. (File No. 333-17217). |
| 45. | Incorporated by reference and/or previously filed with Post-Effective Amendment No. 113 to the Registrant’s Registration Statement filed on April 17, 2015. (File No. 333-17217). |
| 46. | Incorporated by reference and/or previously filed with Post-Effective Amendment No. 114 to the Registrant’s Registration Statement filed on April 24, 2015. (File No. 333-17217). |
| 47. | Incorporated by reference and/or previously filed with Post-Effective Amendment No. 118 to the Registrant’s Registration Statement filed on December 17, 2015. (File No. 333-17217).\ |
| 48. | Incorporated by reference and/or previously filed with Post-Effective Amendment No. 120 to the Registrant’s Registration Statement filed on February 11, 2016. (File No. 333-17217). |
| 49. | Incorporated by reference and/or previously filed with Post-Effective Amendment No. 121 to the Registrant’s Registration Statement filed on April 25, 2016. (File No. 333-17217). |
| 50. | Incorporated herein by reference to Registrant’s Registration Statement on Form N-14 filed on January 17, 2017 (File No. 333-215584). |
(1) The undersigned Registrant agrees that prior to any public reoffering of the securities registered through the use of a prospectus which is a part of this registration statement by any person or party who is deemed to be an underwriter within the meaning of Rule 145(c) of the Securities Act of 1933 (17 CFR 230.145(c)), the reoffering prospectus will contain the information called for by the applicable registration form for the reofferings by persons who may be deemed underwriters, in addition to the information called for by the other items of the applicable form.
(2) The undersigned Registrant agrees that every prospectus that is filed under paragraph (1) above will be filed as a part of an amendment to the registration statement and will not be used until the amendment is effective, and that, in determining any liability under the 1933 Act, each post-effective amendment shall be deemed to be a new registration statement for the securities offered therein, and the offering of the securities at that time shall be deemed to be the initial bona fide offering of them.
(3) The Registrant agrees to file an executed copy of the opinion of counsel supporting the tax consequences of the proposed reorganizations as an amendment to this Registration Statement within a reasonable time after receipt of such opinion.
SIGNATURES
Pursuant to the requirements of the Securities Act of 1933, as amended, the Registrant has duly caused this Pre-Effective Amendment No. 2 to the Registration Statement on Form N-14 to be signed on its behalf by the undersigned, thereunto duly authorized, in the city of New York and state of New York on the 22nd day of February, 2017.
EQ ADVISORS TRUST
| | |
| By: | | /s/ Steven M. Joenk |
| | Steven M. Joenk |
| | Trustee, Chairman, President and Chief Executive Officer |
Pursuant to the requirements of the Securities Act of 1933, as amended, this Registration Statement has been signed below by the following persons in the capacities and on the dates indicated.
| | | | |
Signature | | Title | | Date |
| | |
/s/ Steven M. Joenk | | President | | February 22, 2017 |
| Steven M. Joenk | | (principal executive officer) | | |
| | |
/s/ Thomas W. Brock* | | Trustee | | February 22, 2017 |
| Thomas W. Brock* | | | | |
| | |
/s/ Donald E. Foley* | | Trustee | | February 22, 2017 |
| Donald E. Foley | | | | |
| | |
/s/ Christopher P.A. Komisarjevsky* | | Trustee | | February 22, 2017 |
| Christopher P.A. Komisarjevsky | | | | |
| | |
/s/ H. Thomas McMeekin* | | Trustee | | February 22, 2017 |
| H. Thomas McMeekin | | | | |
| | |
/s/ Gary S. Schpero* | | Trustee | | February 22, 2017 |
| Gary S. Schpero | | | | |
| | |
/s/ Kenneth Walker* | | Trustee | | February 22, 2017 |
| Kenneth Walker | | | | |
| | |
/s/ Caroline L. Williams* | | Trustee | | February 22, 2017 |
| Caroline L. Williams | | | | |
| | |
/s/ Brian Walsh* | | Treasurer and Chief Financial Officer | | February 22, 2017 |
| Brian Walsh | | (principal accounting officer) | | |
| | |
| * By: | | /s/ Steven M. Joenk |
| | Steven M. Joenk |
| | Attorney-in-Fact |
EXHIBIT INDEX
| | |
| (11) | | Opinion and Consent of Counsel regarding the legality of the securities being registered. |
| |
| (14) | | Consent of Independent Public Accountants. |
| |
| (16) | | Powers of Attorney. |
| |
| (17) | | Forms of Voting Instructions and Proxy Cards. |