UNITED STATES SECURITIES AND EXCHANGE COMMISSION Washington, D.C. 20549
FORM N-CSR
CERTIFIED SHAREHOLDER REPORT OF REGISTERED MANAGEMENT INVESTMENT COMPANIES
Investment Company Act file Number _811-568_
Value Line Fund, Inc.
(Exact name of registrant as specified in charter)
220 East 42nd Street, New York, N.Y. 10017
(Address of principal executive offices) (Zip Code)
Registrant’s telephone number, including area code: 212-907-1500
Date of fiscal year end: December 31, 2007
Date of reporting period: December 31, 2007
Item IReports to Stockholders.
A copy of the Annual Report to Stockholders for the period ended 12/31/07 is included with this Form.
INVESTMENT ADVISER
Value Line, Inc. 220 East 42nd Street New York, NY 10017-5891
DISTRIBUTOR
Value Line Securities, Inc. 220 East 42nd Street New York, NY 10017-5891
CUSTODIAN BANK
State Street Bank and Trust Co. 225 Franklin Street Boston, MA 02110
SHAREHOLDER SERVICING AGENT
State Street Bank and Trust Co. c/o BFDS P.O. Box 219729 Kansas City, MO 64121-9729
INDEPENDENT REGISTERED PUBLIC ACCOUNTING FIRM
PricewaterhouseCoopers LLP 300 Madison Avenue New York, NY 10017
LEGAL COUNSEL
Peter D. Lowenstein, Esq. 496 Valley Road Cos Cob, CT 06807-0272
DIRECTORS
Jean Bernhard Buttner John W. Chandler Frances T. Newton Francis C. Oakley David H. Porter Paul Craig Roberts Nancy-Beth Sheerr
OFFICERS
Jean Bernhard Buttner Chairman and President David T. Henigson Vice President/ Secretary/Chief Compliance Officer Stephen R. Anastasio Treasurer Howard A. Brecher Assistant Secretary/ Assistant Treasurer
This audited report is issued for information to shareholders. It is not authorized for distribution to prospective investors unless preceded or accompanied by a currently effective prospectus of the Fund (obtainable from the Distributor).
#540347
ANNUAL REPORT
December 31, 2007
The Value Line Fund, Inc.
The Value Line Fund, Inc.
To Our Value Line
To Our Shareholders (unaudited):
For the twelve months ended December 31, 2007, the total return for The Value Line Fund (the “Fund”) was 19.50%. This was well above the S&P 500 Index(1) return of 5.49% for the same twelve-month period.
Despite reaching a new high in 2007, the stock market faced considerable uncertainty. For most of the year, the markets were concerned with the collapse of subprime mortgages and its effect on the credit markets. Financial companies were hit the hardest in 2007, beginning with mortgage firms. Finance companies posted writedowns in excess of $80 billion. The Federal Reserve Board was forced to raise liquidity and lower interest rates. The federal funds rate was cut 100 basis points from 5.25% to 4.25% last year. Two additional rate cuts have been voted so far in 2008.
The top performing sectors in the market for the twelve-month period ended December 31, 2007 were semiconductors and computers. Apple was a top performer with strong sales for its new iPhone. Other top performers were Google and Research in Motion. The worst performing sectors for the same period were financial services, including banks and homebuilding.
The Value Line Fund generally invests in multi-cap stocks that are ranked in the Highest category for relative price performance over the next six to twelve months by the Value Line Timeliness Ranking System. The System favors stocks with strong price and earnings momentum relative to those of all other equities in the Value Line Investment Survey of approximately 1,700 stocks. The Fund has very limited exposure to the financial sector, approximately one percent, which was the weakest sector of the market for the twelve-month period ended December 31, 2007. The Fund had three percent of its market value in the semiconductor sector, which was one of the top performing sectors for the same time period. In addition, the Fund had positions in Apple, Google, Research in Motion and Amazon, all top performers for the year, which contributed to its outperformance versus the S&P 500 Index.
We appreciate your confidence in the Value Line Fund and look forward to serving your investment needs in the future.
Sincerely,
Jean Bernhard Buttner Chairman and President
February 1, 2008
(1)
The Standard & Poor’s 500 Index consists of 500 stocks which are traded on the New York Stock Exchange, American Stock Exchange and the NASDAQ National Market System and is representative of the broad stock market. This is an unmanaged index and does not reflect charges, expenses or taxes, and it is not possible to directly invest in this index.
2
The Value Line Fund, Inc.
Fund Shareholders
Economic Observations (unaudited)
The year-ahead economic outlook is growing increasingly guarded, with weakness now present in the major consumer and industrial markets. What’s more, there is no quick or easy solution for what ails the U.S. economy, with softness likely to continue in housing, retailing, and employment. The economy, which began to slow noticeably during the final quarter of 2007, when gross domestic product growth slowed to a minuscule 0.6%, is unlikely to pick up meaningfully until later in the new year—if then. Indeed, we now think there is at least an even chance that the United States will fall into a recession in 2008.
Moreover, even a modest rate of business growth this year—which would be a best-case scenario—assumes that there will be no exogenous shocks to the system, such as a worsening of the situation in the Middle East or a further surge in oil prices. Either of these events, along with a marked worsening of the housing slump or a serious miscalculation by the Federal Reserve on the interest-rate front (where the nation’s central bank is now taking aggressive action), might prove sufficiently troubling to almost assure a recession—and perhaps a moderate to severe one—or generate an unwanted increase in inflation.
Currently, inflation remains under control for the most part, thanks to generally contained labor costs and steady levels of productivity growth (i.e., labor cost efficiency). Adequate supplies of raw materials should also help keep the costs of production from undue escalation. We caution, though, that as the pace of economic growth accelerates after 2008 and 2009, some increase in pricing pressures may emerge. Absent a stronger long-term business expansion than we now forecast, or a further surge in oil prices, inflation should be held in relative check through the early years of the next decade.
3
The Value Line Fund, Inc.
(unaudited)
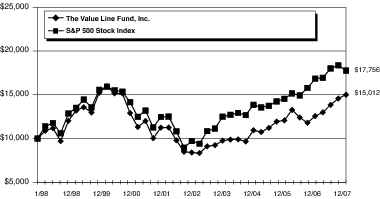
The following graph compares the performance of The Value Line Fund, Inc. to that of the S&P 500 Index. The Value Line Fund, Inc. is a professionally managed mutual fund, while the Index is not available for investment and is unmanaged. The returns for the Index do not reflect charges, expenses or taxes but do include the reinvestment of dividends. The comparison is shown for illustrative purposes only.
Comparison of a Change in Value of a $10,000 Investment in the Value Line Fund, Inc. and the S&P 500 Index*
*
The Standard and Poor’s 500 Stock Index is an unmanaged index that is representative of the larger-capitalization stocks traded in the United States.
Performance Data:**
Average Annual Total Return
Growth of an Assumed Investment of $10,000
1 year ended 12/31/07
19.50
%
$
11,950
5 years ended 12/31/07
12.33
%
$
17,882
10 years ended 12/31/07
4.15
%
$
15,012
**
The performance data quoted represent past performance and are no guarantee of future performance. The average annual total returns and growth of an assumed investment of $10,000 include dividends reinvested and capital gains distributions accepted in shares. The investment return and principal value of an investment will fluctuate so that an investment, when redeemed, may be worth more or less than its original cost. The performance data and graph do not reflect the deduction of taxes that a shareholder would pay on fund distributions or the redemption of fund shares.
4
The Value Line Fund, Inc.
FUND EXPENSES (unaudited):
Example
As a shareholder of the Fund, you incur ongoing costs, including management fees; distribution and service (12b-1) fees; and other Fund expenses. This Example is intended to help you understand your ongoing costs (in dollars) of investing in the Fund and to compare these costs with the ongoing costs of investing in other mutual funds.
The Example is based on an investment of $1,000 invested at the beginning of the period and held for the entire period (July 1, 2007 through December 31, 2007).
Actual Expenses
The first line of the table below provides information about actual account values and actual expenses. You may use the information in this line, together with the amount you invested, to estimate the expenses that you paid over the period. Simply divide your account value by $1,000 (for example an $8,600 account value divided by $1,000=8.6), then multiply the result by the number in the first line under the heading “Expenses Paid During Period” to estimate the expenses you paid on your account during this period.
Hypothetical Example for Comparison Purposes
The second line of the table below provides information about hypothetical account values and hypothetical expenses based on the Fund’s actual expense ratio and an assumed rate of return of 5% per year before expenses, which is not the Fund’s actual return. The hypothetical account values and expenses may not be used to estimate the actual ending account balance or expenses you paid for the period. You may use this information to compare the ongoing costs of investing in the Fund and other funds. To do so, compare this 5% hypothetical example with the 5% hypothetical examples that appear in the shareholder reports of the other funds.
Please note that the expenses shown in the table are meant to highlight your ongoing costs only and do not reflect any transactional costs, such as sales charges (loads), redemption fees, or exchange fees. Therefore, the table is useful in comparing ongoing costs only, and will not help you determine the relative total costs of owning different funds. In addition, if transactional costs were included, your costs would have been higher.
Beginning account value 7/1/07
Ending account value 12/31/07
Expenses* paid during period 7/1/07 thru 12/31/07
Actual
$
1,000.00
$
1,083.83
$
4.20
Hypothetical (5% return before expenses)
$
1,000.00
$
1,021.17
$
4.08
*
Expenses are equal to the Fund’s annualized expense ratio of 0.80% multiplied by the average account value over the period, multiplied by 184/365 to reflect the one-half period. This expense ratio may differ from the expense ratio shown in the Financial Highlights.
5
The Value Line Fund, Inc.
Portfolio Highlights at December 31, 2007 (unaudited)
Ten Largest Holdings
Issue
Shares
Value
Percentage of Net Assets
Agrium, Inc.
33,000
$
2,382,930
1.17
%
Apple, Inc.
12,000
$
2,376,960
1.17
%
Fresh Del Monte Produce, Inc.
68,000
$
2,283,440
1.12
%
Manitowoc Company, Inc. (The)
46,000
$
2,246,180
1.11
%
Nasdaq Stock Market, Inc.
45,000
$
2,227,050
1.10
%
FTI Consulting, Inc.
36,000
$
2,219,040
1.09
%
SunPower Corp. Class A
17,000
$
2,216,630
1.09
%
Merck & Co., Inc.
38,000
$
2,208,180
1.09
%
Charles Schwab Corp. (The)
85,000
$
2,171,750
1.07
%
Valmont Industries, Inc.
24,000
$
2,138,880
1.05
%
Asset Allocation — Percentage of Net Assets
Sector Weightings — Percentage of Total Investment Securities
6
The Value Line Fund, Inc.
Schedule of Investments December 31, 2007
Shares
Value
COMMON STOCKS (96.3%)
AEROSPACE/DEFENSE (2.0%)
317,000
Bombardier, Inc. Class B *
$
1,902,638
15,000
Precision Castparts Corp.
2,080,500
3,983,138
AUTO PARTS (1.0%)
100,000
LKQ Corp. *
2,102,000
BEVERAGE — SOFT DRINK (2.1%)
34,000
Coca-Cola Co. (The)
2,086,580
64,000
PepsiAmericas, Inc.
2,132,480
4,219,060
BIOTECHNOLOGY (0.9%)
20,000
Invitrogen Corp. *
1,868,200
BUILDING MATERIALS (2.7%)
29,000
Dynamic Materials Corp.
1,708,100
13,000
Fluor Corp.
1,894,360
20,000
Jacobs Engineering Group, Inc. *
1,912,200
5,514,660
CHEMICAL — BASIC (2.2%)
33,000
Agrium, Inc.
2,382,930
14,000
Potash Corporation of Saskatchewan, Inc.
2,015,440
4,398,370
CHEMICAL — DIVERSIFIED (1.0%)
19,000
Monsanto Co.
2,122,110
CHEMICAL — SPECIALTY (0.9%)
20,000
Mosaic Co. (The) *
1,886,800
COMPUTER & PERIPHERALS (4.7%)
12,000
Apple, Inc. *
2,376,960
98,000
EMC Corp. *
1,815,940
77,000
Seagate Technology
1,963,500
29,000
Sigma Designs, Inc. *
1,600,800
59,000
Western Digital Corp. *
1,782,390
9,539,590
COMPUTER SOFTWARE & SERVICES (5.8%)
51,000
ANSYS, Inc. *
$
2,114,460
54,000
BMC Software, Inc. *
1,924,560
73,000
CA, Inc.
1,821,350
76,000
Jack Henry & Associates, Inc.
1,849,840
54,000
Microsoft Corp.
1,922,400
93,000
Oracle Corp. *
2,099,940
11,732,550
DIVERSIFIED COMPANIES (3.1%)
36,000
McDermott International, Inc. *
2,125,080
27,000
Textron, Inc.
1,925,100
24,000
Valmont Industries, Inc.
2,138,880
6,189,060
DRUG (6.8%)
21,000
Covance, Inc. *
1,819,020
41,000
LifeCell Corp. *
1,767,510
38,000
Merck & Co., Inc.
2,208,180
32,000
Novo Nordisk A/S ADR
2,075,520
33,000
Onyx Pharmaceuticals, Inc. *
1,835,460
41,000
OSI Pharmaceuticals, Inc. *
1,988,910
61,000
Perrigo Co.
2,135,610
13,830,210
EDUCATIONAL SERVICES (3.8%)
26,000
Apollo Group, Inc. Class A *
1,823,900
38,000
DeVry, Inc.
1,974,480
84,000
Learning Tree International, Inc. *
1,928,640
11,500
Strayer Education, Inc.
1,961,670
7,688,690
ELECTRICAL EQUIPMENT (1.8%)
59,000
FLIR Systems, Inc. *
1,846,700
18,000
Garmin Ltd.
1,746,000
3,592,700
ELECTRONICS (1.8%)
50,000
Cubic Corp.
1,960,000
20,000
MEMC Electronic Materials, Inc. *
1,769,800
3,729,800
See Notes to Financial Statements.
7
The Value Line Fund, Inc.
Schedule of Investments
Shares
Value
ENTERTAINMENT TECHNOLOGY (1.9%)
38,000
Dolby Laboratories, Inc. Class A *
$
1,889,360
86,000
Zoran Corp. *
1,935,860
3,825,220
ENVIRONMENTAL (0.9%)
32,000
Stericycle, Inc. *
1,900,800
FINANCIAL SERVICES — DIVERSIFIED (2.1%)
59,000
Janus Capital Group, Inc.
1,938,150
45,000
Nasdaq Stock Market, Inc. *
2,227,050
4,165,200
FOOD PROCESSING (1.1%)
68,000
Fresh Del Monte Produce, Inc. *
2,283,440
HEALTH CARE INFORMATION SYSTEMS (1.0%)
82,000
Eclipsys Corp. *
2,075,420
INDUSTRIAL SERVICES (1.1%)
36,000
FTI Consulting, Inc. *
2,219,040
INFORMATION SERVICES (1.0%)
35,000
IHS, Inc. Class A *
2,119,600
INSURANCE — LIFE (0.9%)
30,000
AFLAC, Inc.
1,878,900
INTERNET (4.9%)
23,000
Amazon.com, Inc. *
2,130,720
57,000
eBay, Inc. *
1,891,830
69,300
Global Sources Ltd. *
1,955,646
3,000
Google, Inc. Class A *
2,074,440
16,000
Priceline.com, Inc. *
1,837,760
9,890,396
MACHINERY (7.9%)
28,000
AGCO Corp. *
$
1,903,440
20,000
Bucyrus International, Inc. Class A
1,987,800
30,000
CNH Global N.V.
1,974,600
22,000
Deere & Co.
2,048,640
21,000
Flowserve Corp.
2,020,200
26,000
Lindsay Corp.
1,837,940
46,000
Manitowoc Company, Inc. (The)
2,246,180
26,000
Robbins & Myers, Inc.
1,966,380
15,985,180
MEDICAL SERVICES (0.9%)
21,000
WellPoint, Inc. *
1,842,330
MEDICAL SUPPLIES (4.6%)
39,000
ArthroCare Corp. *
1,873,950
27,000
Charles River Laboratories International, Inc. *
1,776,600
32,000
IDEXX Laboratories, Inc. *
1,876,160
6,000
Intuitive Surgical, Inc. *
1,947,000
33,000
Kinetic Concepts, Inc. *
1,767,480
9,241,190
METALS & MINING DIVERSIFIED (2.7%)
53,000
AMCOL International Corp.
1,909,590
26,000
BHP Billiton Ltd. ADR
1,821,040
17,000
Southern Copper Corp.
1,787,210
5,517,840
NATURAL GAS — DIVERSIFIED (2.0%)
35,000
Southwestern Energy Co. *
1,950,200
58,000
Williams Companies, Inc. (The)
2,075,240
4,025,440
OILFIELD SERVICES/EQUIPMENT (3.0%)
44,000
Cameron International Corp. *
2,117,720
16,000
Core Laboratories N.V. *
1,995,520
27,000
National-Oilwell Varco, Inc. *
1,983,420
6,096,660
PACKAGING & CONTAINER (1.9%)
41,000
Owens-Illinois, Inc. *
2,029,500
67,000
Packaging Corp. of America
1,889,400
3,918,900
See Notes to Financial Statements.
8
The Value Line Fund, Inc.
December 31, 2007
Shares
Value
PAPER & FOREST PRODUCTS (0.8%)
111,000
Glatfelter
$
1,699,410
PHARMACY SERVICES (0.9%)
26,000
Express Scripts, Inc. *
1,898,000
POWER (1.1%)
17,000
SunPower Corp. Class A *
2,216,630
PRECISION INSTRUMENT (2.7%)
47,000
Axsys Technologies, Inc. *
1,722,550
57,000
National Instruments Corp.
1,899,810
24,000
Waters Corp. *
1,897,680
5,520,040
RETAIL — AUTOMOTIVE (0.9%)
45,000
Copart, Inc. *
1,914,750
RETAIL — SPECIAL LINES (2.7%)
36,000
Best Buy Co., Inc.
1,895,400
43,000
Fossil, Inc. *
1,805,140
29,000
GameStop Corp. Class A *
1,801,190
5,501,730
SECURITIES BROKERAGE (1.1%)
85,000
Charles Schwab Corp. (The)
2,171,750
SEMICONDUCTOR (2.9%)
52,500
Cypress Semiconductor Corp. *
1,891,575
59,000
NVIDIA Corp. *
2,007,180
57,000
Texas Instruments, Inc.
1,903,800
5,802,555
SHOE (0.9%)
12,000
Deckers Outdoor Corp. *
1,860,720
TELECOMMUNICATION SERVICES (1.0%)
20,000
Telefonica S.A. ADR
1,951,800
TELECOMMUNICATIONS EQUIPMENT (1.8%)
107,000
Foundry Networks, Inc. *
1,874,640
48,000
Nokia Oyj ADR
1,842,720
3,717,360
WIRELESS NETWORKING (1.0%)
18,000
Research In Motion Ltd. *
$
2,041,200
TOTAL COMMON STOCKS AND TOTAL INVESTMENT SECURITIES (96.3%) (Cost $169,372,999)
$
195,678,439
Principal Amount
Value
REPURCHASE AGREEMENTS (3.6%)
$7,400,000
With Morgan Stanley, 0.95%, dated 12/31/07, due 1/2/08, delivery value $7,400,391 (collateralized by $7,265,000 U.S. Treasury Notes 5.50%, due 5/15/09, with a value of $7,552,743)
7,400,000
TOTAL REPURCHASE AGREEMENTS (Cost $7,400,000)
7,400,000
CASH AND OTHER ASSETS IN EXCESS OF LIABILITIES (0.1%)
195,181
NET ASSETS (100%)
$
203,273,620
NET ASSET VALUE OFFERING AND REDEMPTION PRICE, PER OUTSTANDING SHARE ($203,273,620 ÷ 15,846,126 shares outstanding)
$12.83
*
Non-income producing.
ADR
American Depositary Receipt
See Notes to Financial Statements.
9
The Value Line Fund, Inc.
Statement of Assets and Liabilities at December 31, 2007
Assets:
Investment securities, at value (Cost—$169,372,999)
$
195,678,439
Repurchase agreements (Cost—$7,400,000)
7,400,000
Cash
166,386
Receivable for securities sold
5,778,688
Interest and dividends receivable
115,358
Receivable for capital shares sold
21,702
Prepaid expenses
15,217
Total Assets
209,175,790
Liabilities:
Payable for securities purchased
5,648,198
Payable for capital shares repurchased
86,377
Accrued expenses:
Advisory fee
117,211
Directors’ fees and expenses
3,535
Other
46,849
Total Liabilities
5,902,170
Net Assets
$
203,273,620
Net assets consist of:
Capital stock, at $1.00 par value (authorized 50,000,000, outstanding 15,846,126 shares)
$
15,846,126
Additional paid-in capital
157,273,751
Accumulated net realized gain on investments
3,848,303
Net unrealized appreciation of investments
26,305,440
Net Assets
$
203,273,620
Net Asset Value, Offering and Redemption Price per Outstanding Share ($203,273,620 ÷ 15,846,126 shares outstanding)
$
12.83
Statement of Operations for the Year Ended December 31, 2007
Investment Income:
Dividends (Net of foreign withholding tax of $11,755)
$
1,140,779
Interest
278,754
Total Income
1,419,533
Expenses:
Advisory fee
1,351,288
Service and distribution plan fees
500,496
Transfer agent fees
114,799
Auditing and legal fees
63,652
Printing and postage
55,151
Custodian fees
39,517
Directors’ fees and expenses
15,003
Telephone
11,001
Registration and filing fees
1,899
Insurance
899
Other
3,302
Total Expenses Before Custody Credits and Fees Waived
2,157,007
Less: Service and Distribution Plan Fees Waived
(500,496
)
Less: Custody Credits
(9,617
)
Net Expenses
1,646,894
Net Investment Loss
(227,361
)
Net Realized and Unrealized Gain/(Loss) on Investments and Foreign Exchange Transactions:
Net Realized Gain
30,404,146
Change in Net Unrealized Appreciation/(Depreciation)
5,312,314
Net Realized Gain and Change in Net Unrealized Appreciation/(Depreciation) on Investments and Foreign Exchange Transactions
35,716,460
Net Increase in Net Assets from Operations
$
35,489,099
See Notes to Financial Statements.
10
The Value Line Fund, Inc.
Statement of Changes in Net Assets for the Years Ended December 31, 2007 and 2006
Year Ended December 31, 2007
Year Ended December 31, 2006
Operations:
Net investment loss
$
(227,361
)
$
(788,625
)
Net realized gain on investments
30,404,146
11,577,224
Change in net unrealized appreciation/(depreciation)
5,312,314
(2,751,158
)
Net increase in net assets from operations
35,489,099
8,037,441
Distributions to Shareholders:
Net realized gain from investment transactions
(27,740,813
)
(17,374,630
)
Capital Share Transactions:
Proceeds from sale of shares
3,289,737
5,750,466
Proceeds from reinvestment of distributions to shareholders
26,184,717
16,373,788
Cost of shares repurchased
(31,298,206
)
(29,153,331
)
Decrease from capital share transactions
(1,823,752
)
(7,029,077
)
Total Increase/(Decrease) in Net Assets
5,924,534
(16,366,266
)
Net Assets:
Beginning of year
197,349,086
213,715,352
End of year
$
203,273,620
$
197,349,086
See Notes to Financial Statements.
11
The Value Line Fund, Inc.
Notes to Financial Statements
1.
Significant Accounting Policies
Value Line Fund, Inc. (the “Fund”) is registered under the Investment Company Act of 1940, as amended, as a diversified, open-end management investment company whose primary investment objective is long-term growth of capital.
The preparation of financial statements in conformity with generally accepted accounting principles requires management to make estimates and assumptions that affect the reported amounts of assets and liabilities and disclosure of contingent assets and liabilities at the date of the financial statements and the reported amounts of revenues and expenses during the reporting period. Actual results could differ from those estimates. The following is a summary of significant accounting policies consistently followed by the Fund in the preparation of its financial statements.
(A) Security Valuation. Securities listed on a securities exchange are valued at the closing sales prices on the date as of which the net asset value is being determined. Securities traded on the NASDAQ Stock Market are valued at the NASDAQ Official Closing Price. In the absence of closing sales prices for such securities and for securities traded in the over-the-counter market, the security is valued at the midpoint between the latest available and representative asked and bid prices. Short-term instruments with maturities of 60 days or less at the date of purchase are valued at amortized cost, which approximates market value. Short-term instruments with maturities greater than 60 days at the date of purchase are valued at the mid point between the latest available and representative asked and bid prices, and commencing 60 days prior to maturity such securities are valued at amortized cost. Securities for which market quotations are not readily available or that are not readily marketable and all other assets of the Fund are valued at fair value as the Board of Directors may determine in good faith. In addition, the Fund may use the fair value of a security when the closing market price on the primary exchange where the security is traded no longer accurately reflects the value of a security due to factors affecting one or more relevant securities markets or the specific issuer.
In September 2006, the Financial Accounting Standards Board (FASB) issued Statement of Financial Accounting Standards No. 157, “Fair Value Measurements” (SFAS No. 157). SFAS No. 157 defines fair value, establishes a framework for measuring fair value in accordance with generally accepted accounting principles and expands disclosure about fair value measurements. SFAS No. 157 is effective for fiscal years beginning after November 15, 2007. Management is currently evaluating the impact the adoption of SFAS No. 157 will have on the Fund’s financial statement disclosures.
(B) Repurchase Agreements. In connection with transactions in repurchase agreements, the Fund’s custodian takes possession of the underlying collateral securities, the value of which exceeds the principal amount of the repurchase transaction, including accrued interest. To the extent that any repurchase transaction exceeds one business day, it is the Fund’s policy to mark-to-market the collateral on a daily basis to ensure the adequacy of the collateral. In the event of default of the obligation to repurchase, the Fund has the right to liquidate the collateral and apply the proceeds in satisfaction of the obligation. Under certain circumstances, in the event of default or bankruptcy by the other party to the agreement, realization and/or retention of the collateral or proceeds may be subject to legal proceedings.
(C) Federal Income Taxes. It is the Fund’s policy to comply with the requirements of the Internal Revenue Code applicable to regulated investment companies, including the distribution requirements of the Tax Reform Act of 1986, and to distribute all of its taxable income to its shareholders. Therefore, no federal income tax provision is required.
In July 2006, the Financial Accounting Standards Board issued Interpretation No. 48, “Accounting for Uncertainty in Income Taxes — an Interpretation of FASB Statement No. 109” (the “Interpretation” or “FIN 48”). The Interpretation establishes for all entities, including pass-through entities such as the Fund, a minimum threshold for financial statement recognition of the benefit of positions taken in filing tax returns (including whether an entity is taxable
12
The Value Line Fund, Inc.
December 31, 2007
in a particular jurisdiction), and requires certain expanded tax disclosures. The Interpretation is effective for fiscal years beginning after December 15, 2006, and is to be applied to all open tax years as of the date of effectiveness. As of December 31, 2007, management has reviewed the tax positions for the tax years still subject to tax audit under the statute of limitations, evaluated the implication of FIN 48, and determined that there is no impact to the Fund’s financial statements at this time.
(D) Security Transactions and Distributions. Security transactions are accounted for on the date the securities are purchased or sold. Interest income is accrued as earned. Realized gains and losses on sales of securities are calculated for financial accounting and federal income tax purposes on the identified cost basis. Dividend income and distributions to shareholders are recorded on the ex-dividend date. Distributions are determined in accordance with income tax regulations which may differ from generally accepted accounting principles.
(E) Foreign Currency Translation. The books and records of the Fund are maintained in U.S. dollars. Assets and liabilities which are denominated in foreign currencies are translated to U.S. dollars at the prevailing rates of exchange. The Fund does not isolate changes in the value of investments caused by foreign exchange rate differences from the changes due to other circumstances.
Income and expenses are translated to U.S. dollars based upon the rates of exchange on the respective dates of such transactions.
Net realized foreign exchange gains or losses arise from currency fluctuations realized between the trade and settlement dates on securities transactions, the differences between the U.S. dollar amounts of dividends, interest, and foreign withholding taxes recorded by the Fund, and the U.S. dollar equivalent of the amounts actually received or paid. Net unrealized foreign exchange gains and losses arise from changes in the value of assets and liabilities, other than investments, at the end of the fiscal period, resulting from changes in the exchange rates. The effect of the change in foreign exchange rates on the value of investments is included in realized gain/loss on investments and change in net unrealized appreciation/depreciation on investments.
(F) Representations and Indemnifications. In the normal course of business, the Fund enters into contracts that contain a variety of representations and warranties which provide general indemnifications. The Fund’s maximum exposure under these arrangements is unknown, as this would involve future claims that may be made against the Fund that have not yet occurred. However, based on experience, the Fund expects the risk of loss to be remote.
(G) Foreign Taxes. The Fund may be subject to foreign taxes on income, gains on investments, or currency repatriation, a portion of which may be recoverable. The Fund will accrue such taxes and recoveries as applicable, based upon its current interpretation of tax rules and regulations that exist in the markets in which it invests.
2.
Capital Share Transactions, Dividends and Distributions to Shareholders
Transactions in capital stock were as follows:
Year Ended December 31, 2007
Year Ended December 31, 2006
Shares sold
237,070
424,616
Shares issued to shareholders in reinvestment of dividends and distributions
2,111,782
1,309,937
2,348,852
1,734,553
Shares repurchased
(2,315,940
)
(2,180,922
)
Net increase/(decrease)
32,912
(446,369
)
Distributions per share from net realized gains
$
2.0136
$
1.1869
13
The Value Line Fund, Inc.
Notes to Financial Statements
3.
Purchases and Sales of Securities
Purchases and sales of investment securities, excluding short-term securities, were as follows:
Year Ended December 31, 2007
Purchases: Investment Securities
$
418,977,163
Sales: Investment Securities
$
451,565,309
4.
Income Taxes
At December 31, 2007, information on the tax components of capital is as follows:
Cost of investments for tax purposes
$
176,781,026
Gross tax unrealized appreciation
$
28,697,750
Gross tax unrealized depreciation
(2,400,337
)
Net tax unrealized appreciation on investments
$
26,297,413
Undistributed ordinary income
$
2,308,197
Undistributed long-term gain
$
1,548,132
The difference between book and tax basis unrealized appreciation/(depreciation) on investments was primarily attributed to wash sale loss deferrals.
Permanent book tax differences relating to the current year were reclassified within the composition of the net asset accounts. The Fund decreased accumulated net investment loss by $227,361 and decreased accumulated net realized gain by approximately $227,361. Net assets were not affected by this reclassification. These reclassifications were primarily due to differing treatments of net operating losses for tax purposes.
The tax composition of distributions to shareholders for the years ended December 31, 2007 and December 31, 2006 were as follows:
2007
2006
Ordinary income
$
23,180,166
$
6,149,470
Long-term capital gain
4,560,647
11,225,160
$
27,740,813
$
17,374,630
5.
Investment Advisory Fee, Service and Distribution Fees and Transactions With Affiliates
An advisory fee of $1,351,288 was paid or payable to Value Line, Inc., the Fund’s investment adviser, (the “Adviser”), for the year ended December 31, 2007. This was computed at the rate of 0.70% of the first $100 million of the Fund’s average daily net assets plus 0.65% on the excess thereof, and paid monthly. The Adviser provides research, investment programs, supervision of the investment portfolio and pays costs of administrative services, office space, equipment and compensation of administrative, bookkeeping and clerical personnel necessary for managing the affairs of the Fund. The Adviser also provides persons, satisfactory to the Fund’s Board of Directors, to act as officers and employees of the Fund and pays their salaries and wages. Direct expenses of the Fund are charged to the Fund while common expenses of the Value Line Funds are allocated proportionately based upon the funds’ respective net assets. The Fund bears all other costs and expenses.
The Fund has a Service and Distribution Plan (the “Plan”), adopted pursuant to Rule 12b-1 under the Investment Company Act of 1940, for the payment of certain expenses incurred by Value Line Securities, Inc. (the “Distributor”), a wholly-owned subsidiary of the Adviser, in advertising, marketing and distributing the Fund’s shares and for servicing the Fund’s shareholders at an annual rate of 0.25% of the Fund’s average daily net assets. For the year ended December 31, 2007, fees amounting to $500,496, before fee waivers, were accrued under the Plan. Effective August 31, 2006 the Distributor voluntarily waived the
14
The Value Line Fund, Inc.
December 31, 2007
12b-1 fee. Effective May 1, 2007, the Distributor contractually agreed to waive the Fund’s 12b-1 fee for a one year period. For the year ended December 31, 2007, the fees waived amounted to $500,496. The Distributor has no right to recoup prior waivers.
For the year ended December 31, 2007, the Fund’s expenses were reduced by $9,617 under a custody credit arrangement with the custodian.
Certain officers and directors of the Adviser and the Distributor are also officers and directors of the Fund.
The Adviser and/or affiliated companies and the Value Line, Inc. Profit Sharing and Savings Plan owned 552,280 shares of the Fund’s capital stock, representing 3.49% of the outstanding shares at December 31, 2007. In addition, officers and directors of the Fund as a group owned 12,215 shares of the Fund, representing less than 1% of the outstanding shares.
15
The Value Line Fund, Inc.
Financial Highlights
Selected data for a share of capital stock outstanding throughout each year:
Years Ended December 31,
2007
2006
2005
2004
2003
Net asset value, beginning of year
$
12.48
$
13.14
$
13.90
$
14.25
$
13.67
Income/(loss) from investment operations:
Net investment loss
(0.01
)
(0.05
)
(0.07
)
(0.08
)
(0.03
)
Net gains or losses on securities (both realized and unrealized)
2.37
0.58
1.53
1.80
2.24
Total from investment operations
2.36
0.53
1.46
1.72
2.21
Less distributions:
Distributions from net realized gains
(2.01
)
(1.19
)
(2.22
)
(2.07
)
(1.63
)
Net asset value, end of year
$
12.83
$
12.48
$
13.14
$
13.90
$
14.25
Total return
19.50
%
4.00
%
10.40
%
12.09
%
16.28
%
Ratios/Supplemental Data:
Net assets, end of year (in thousands)
$
203,274
$
197,349
$
213,715
$
215,025
$
216,047
Ratio of expenses to average net assets(1)
1.08
%
1.12
%
1.13
%
1.13
%
1.13
%
Ratio of expenses to average net assets(2)
0.82
%
1.04
%
1.13
%
1.13
%
1.13
%
Ratio of net investment loss to average net assets
(0.11
) %
(0.37
) %
(0.52
) %
(0.58
) %
(0.19
) %
Portfolio turnover rate
216
%
224
%
224
%
297
%
129
%
(1)
Ratio reflects expenses grossed up for custody credit arrangement and grossed up for the waiver of service and distribution plan fees by the Distributor.The ratio of expenses to average net assets net of custody credits, but exclusive of the waiver of the service and distribution plan fees by the Distributor, would have been 1.07% for the year ended December 31, 2007 and would not have changed for the other years shown.
(2)
Ratio reflects expenses net of the custody credit arrangement and net of the waiver of the service and distribution plan fees by the Distributor.
See Notes to Financial Statements.
16
The Value Line Fund, Inc.
Report of Independent Registered Public Accounting Firm
To the Board of Directors and Shareholders of The Value Line Fund, Inc.
In our opinion, the accompanying statement of assets and liabilities, including the schedule of investments, and the related statements of operations and of changes in net assets and the financial highlights present fairly, in all material respects, the financial position of The Value Line Fund, Inc. (the “Fund”) at December 31, 2007, the results of its operations for the year then ended, the changes in its net assets for each of the two years in the period then ended and the financial highlights for each of the five years in the period then ended, in conformity with accounting principles generally accepted in the United States of America. These financial statements and financial highlights (hereafter referred to as “financial statements”) are the responsibility of the Fund’s management; our responsibility is to express an opinion on these financial statements based on our audits. We conducted our audits of these financial statements in accordance with the standards of the Public Company Accounting Oversight Board (United States). Those standards require that we plan and perform the audit to obtain reasonable assurance about whether the financial statements are free of material misstatement. An audit includes examining, on a test basis, evidence supporting the amounts and disclosures in the financial statements, assessing the accounting principles used and significant estimates made by management, and evaluating the overall financial statement presentation. We believe that our audits, which included confirmation of securities at December 31, 2007 by correspondence with the custodian and brokers, provide a reasonable basis for our opinion.
PricewaterhouseCoopers LLP New York, New York
February 25, 2008
17
The Value Line Fund, Inc.
Federal Tax Notice (unaudited)
For corporate taxpayers, 7.10% of the ordinary income distribution paid during the calendar year 2007 qualify for the corporate dividends received deductions.
During the calendar year 2007, 7.63% of the ordinary income distribution are treated as qualified dividends.
During the calendar year 2007, the Fund distributed $4,560,647 of long-term capital gain to its shareholders.
The Fund files its complete schedule of portfolio holdings with the Securities and Exchange Commission (“SEC”) for the first and third quarters of each fiscal year on Form N-Q. The Fund’s Forms N-Q are available on the SEC’s website at http://www.sec.gov and may be reviewed and copied at the SEC’s Public Reference Room in Washington, D.C. Information on the operation of the Public Reference Room may be obtained by calling 1-800-SEC-0330.
A description of the policies and procedures that the Fund uses to determine how to vote proxies relating to portfolio securities, and information regarding how the Fund voted these proxies during the most recent 12-month period ended June 30 is available through the Fund’s website at http://www.vlfunds.com and on the SEC’s website at http://www.sec.gov. The description of the policies and procedures is also available without charge, upon request, by calling 1-800-243-2729.
18
The Value Line Fund, Inc.
Management of the Fund
MANAGEMENT INFORMATION
The business and affairs of the Fund are managed by the Fund’s officers under the direction of the Board of Directors. The following table sets forth information on each Director and Officer of the Fund. Each Director serves as a director or trustee of each of the 14 Value Line Funds. Each Director serves until his or her successor is elected and qualified.
Name, Address, and Age
Position
Length of Time Served
Principal Occupation During the Past 5 Years
Other Directorships Held by Director
Interested Director*
Jean Bernhard Buttner Age 73
Chairman of the Board of Directors and President
Since 1983
Chairman, President and Chief Executive Officer of Value Line, Inc. (the “Adviser”) and Value Line Publishing, Inc. Chairman and President of each of the 14 Value Line Funds and Value Line Securities, Inc. (the “Distributor”).
Value Line, Inc.
Non-Interested Directors
John W. Chandler 116 North Hemlock Lane Williamstown, MA 01267 Age 84
Director (Lead Independent Director since 2007)
Since 1991
Consultant, Academic Search Consultation Service, Inc. (1994–2004); Trustee Emeritus and Chairman (1993–1994) of the Board of Trustees of Duke University; President Emeritus, Williams College.
None
Frances T. Newton 4921 Buckingham Drive Charlotte, NC 28209 Age 66
Director
Since 2000
Retired. Customer Support Analyst, Duke Power Company until April 2007.
None
Francis C. Oakley 54 Scott Hill Road Williamstown, MA 01267 Age 76
Director
Since 2000
Professor of History, Williams College, (1961–2002); Professor Emeritus since 2002. President Emeritus since 1994 and President, (1985–1994); Chairman (1993–1997) and Interim President (2002–2003) of the American Council of Learned Societies. Trustee since 1997 and Chairman of the Board since 2005, National Humanities Center.
None
David H. Porter 5 Birch Run Drive Saratoga Springs, NY 12866 Age 72
Director
Since 1997
Visiting Professor of Classics, Williams College, since 1999; President Emeritus, Skidmore College since 1999 and President, (1987–1998).
None
19
The Value Line Fund, Inc.
Management of the Fund
Name, Address, and Age
Position
Length of Time Served
Principal Occupation During the Past 5 Years
Other Directorships Held by Director
Paul Craig Roberts 169 Pompano St. Panama City Beach, FL 32413 Age 68
Director
Since 1983
Chairman, Institute for Political Economy.
None
Nancy-Beth Sheerr 1409 Beaumont Drive Gladwyne, PA 19035 Age 58
Director, Vice President and Chief Compliance Officer of the Adviser. Director and Vice President of the Distributor. Vice President, Secretary and Chief Compliance Officer of each of the 14 Value Line Funds.
Stephen R. Anastasio Age 48
Treasurer
Since 2005
Corporate Controller of the Adviser until 2003; Chief Financial Officer of the Adviser (2003–2005); Treasurer of the Adviser since 2005; Treasurer of each of the 14 Value Line Funds since 2005.
Howard A. Brecher Age 53
Assistant Treasurer/ Assistant Secretary
Since 2005
Director, Vice President and Secretary of the Adviser. Director and Vice President of the Distributor.
*
Mrs. Buttner is an “interested person” as defined in the Investment Company Act of 1940 by virtue of her positions with the Adviser and her indirect ownership of a controlling interest in the Adviser.
Unless otherwise indicated, the address for each of the above is 220 East 42nd Street, New York, NY 10017.
The Fund’s Statement of Additional Information (SAI) includes additional information about the Fund’s directors and is available, without charge, upon request by calling 1-800-243-2729.
20
The Value Line Fund, Inc.
[This page is intentionally left blank.]
21
The Value Line Fund, Inc.
[This page is intentionally left blank.]
22
The Value Line Fund, Inc.
[This page is intentionally left blank.]
23
The Value Line Fund, Inc.
The Value Line Family of Funds
1950 — The Value Line Fund seeks long-term growth of capital. Current income is a secondary objective.
1952 — Value Line Income and Growth Fund’s primary investment objective is income, as high and dependable as is consistent with reasonable risk. Capital growth to increase total return is a secondary objective.
1956 — The Value Line Premier Growth Fund seeks long-term growth of capital. No consideration is given to current income in the choice of investments.
1972 — Value Line Larger Companies Fund’s sole investment objective is to realize capital growth.
1979 — The Value Line Cash Fund, a money market fund, seeks to secure as high a level of current income as is consistent with maintaining liquidity and preserving capital. An investment in the Fund is not insured or guaranteed by the Federal Deposit Insurance Corporation or any other government agency. Although the Fund seeks to preserve the value of your investment at $1.00 per share, it is possible to lose money by investing in the Fund.
1981 — Value Line U.S. Government Securities Fund seeks maximum income without undue risk to capital. Under normal conditions, at least 80% of the value of its net assets will be invested in securities issued or guaranteed by the U.S. Government and its agencies and instrumentalities.
1983 — Value Line Centurion Fund* seeks long-term growth of capital.
1984 — The Value Line Tax Exempt Fund seeks to provide investors with the maximum income exempt from federal income taxes while avoiding undue risk to principal. The fund may be subject to state and local taxes and the Alternative Minimum Tax (if applicable).
1985 — Value Line Convertible Fund seeks high current income together with capital appreciation primarily from convertible securities ranked 1 or 2 for year-ahead performance by the Value Line Convertible Ranking System.
1986 — Value Line Aggressive Income Trust seeks to maximize current income.
1987 — Value Line New York Tax Exempt Trust seeks to provide New York taxpayers with the maximum income exempt from New York State, New York City and federal income taxes while avoiding undue risk to principal. The Trust may be subject to state and local taxes and the Alternative Minimum Tax (if applicable).
1987 — Value Line Strategic Asset Management Trust* seeks to achieve a high total investment return consistent with reasonable risk.
1993 — Value Line Emerging Opportunities Fund invests primarily in common stocks or securities convertible into common stock, with its primary objective being long-term growth of capital.
1993 — Value Line Asset Allocation Fund seeks high total investment return, consistent with reasonable risk. The Fund invests in stocks, bonds and money market instruments utilizing quantitative modeling to determine the asset mix.
*
Only available through the purchase of Guardian Investor, a tax deferred variable annuity, or ValuePlus, a variable life insurance policy.
For more complete information about any of the Value Line Funds, including charges and expenses, send for a prospectus from Value Line Securities, Inc., 220 East 42nd Street, New York, New York 10017-5891 or call 1-800-243-2729, 9am–5pm CST, Monday–Friday, or visit us at www.vlfunds.com. Read the prospectus carefully before you invest or send money.
24
Item 2.Code of Ethics
(a) The Registrant has adopted a Code of Ethics that applies to its principal
executive officer, and principal financial officer and principal accounting officer.
(f) Pursuant to item 12(a), the Registrant is attaching as an exhibit a copy of its
Code of Ethics that applies to its principal executive officer, and principal financial officer and principal accounting officer.
Item 3.Audit Committee Financial Expert.
(a)(1)The Registrant has an Audit Committee Financial Expert serving on its Audit Committee.
(2) The Registrant’s Board has designated John W. Chandler, a member of the Registrant’s Audit Committee, as the Registrant’s Audit Committee Financial Expert. Mr. Chandler is an independent director who is a senior consultant with Academic Search Consultation Service. He spent most of his professional career at Williams College, where he served as a faculty member, Dean of the Faculty, and President (1973-85). He
also served as President of Hamilton College (1968-73), and as President of the Association of American Colleges and Universities (1985-90). He has also previously served as Trustee Emeritus and Chairman of the Board of Trustees of Duke University.
A person who is designated as an “audit committee financial expert” shall not make such person an "expert" for any purpose, including without limitation under Section 11 of the Securities Act of 1933 or under applicable fiduciary laws, as a result of being designated or identified as an audit committee financial expert. The designation or identification of a person as an audit committee financial expert does not impose on such person any duties, obligations, or liabilities that are greater than the duties, obligations, and liabilities imposed on such person as a member of the audit committee and Board of Trustees in the absence of such designation or identification.
Item 4.Principal Accountant Fees and Services
(a)Audit Fees 2007 - $35,894
(b) Audit-Related fees – None.
(c) Tax Preparation Fees 2007 -$7,517
(d) All Other Fees – None
(e) (1) Audit Committee Pre-Approval Policy. All services to be performed for
the Registrant by PricewaterhouseCoopers LLP must be pre-approved
by the audit committee. All services performed were pre-approved by the committee.
(e) (2) Not applicable.
(f) Not applicable.
(g) Aggregate Non-Audit Fees 2007 -$7,517
(h) Not applicable.
Item 11.Controls and Procedures.
(a)
The registrant’s principal executive officer and principal financial officer have concluded that the registrant’s disclosure controls and procedures (as defined in rule 30a-2(c) under the Act (17 CFR 270.30a-2(c) ) based on their evaluation of these controls and procedures as of a date within 90 days of the filing date of this report, are appropriately designed to ensure that material information relating to the registrant is made known to such officers and are operating effectively.
(b)
The registrant’s principal executive officer and principal financial officer have determined that there have been no significant changes in the registrant’s internal controls or in other factors that could significantly affect these controls subsequent to the date of their evaluation, including corrective actions with regard to significant deficiencies and material weaknesses.
Item 12.Exhibits.
(a)
Code of Business Conduct and Ethics for Principal Executive and Senior Financial Officers attached hereto as Exhibit 99.COE
(b)
(1) Certification pursuant to Rule 30a-2(a) under the Investment Company Act of 1940 (17 CFR 270.30a-2) attached hereto as Exhibit 99.CERT.
(2) Certification pursuant to Section 906 of the Sarbanes-Oxley Act of 2002
attached hereto as Exhibit 99.906.CERT.
SIGNATURES
Pursuant to the requirements of the Securities Exchange Act of 1934 and the Investment Company Act of 1940, the registrant has duly caused this report to be signed on its behalf by the undersigned, thereunto duly authorized.
By
/s/_________________________________
Jean B. Buttner, President
Date:
February 26, 2008
Pursuant to the requirements of the Securities Exchange Act of 1934 and the Investment Company Act of 1940, this report has been signed below by the following persons on behalf of the registrant and in the capacities and on the dates indicated.
By:
/s/____________________________________________
Jean B. Buttner, President, Principal Executive Officer
Stephen R. Anastasio, Treasurer, Principal Financial Officer
Date February 26, 2008
We use cookies on this site to provide a more responsive and personalized service. Continuing to browse, clicking I Agree, or closing this banner indicates agreement. See our Cookie Policy for more information.