UNITED STATES
SECURITIES AND EXCHANGE COMMISSION
Washington, D.C. 20549
FORM N-CSR
CERTIFIED SHAREHOLDER REPORT OF REGISTERED
MANAGEMENT INVESTMENT COMPANIES
Investment Company Act file Number _811-02265_
Value Line Fund, Inc.
(Exact name of registrant as specified in charter)
220 East 42nd Street, New York, N.Y. 10017
(Address of principal executive offices) (Zip Code)
Registrant’s telephone number, including area code: 212-907-1500
Date of fiscal year end: December 31
Date of reporting period: December 31, 2009
Item I. Reports to Stockholders.
A copy of the Annual Report to Stockholders for the period ended 12/31/09 is included with this Form.
| | | | | | |
| | | | | | |
| INVESTMENT ADVISER | | EULAV Asset Management, LLC 220 East 42nd Street | | A N N U A L R E P O R T | |
| | | | D e c e m b e r 3 1 , 2 0 0 9 | |
| | | | | | |
DISTRIBUTOR CUSTODIAN BANK SHAREHOLDER SERVICING AGENT INDEPENDENT REGISTERED PUBLIC ACCOUNTING FIRM LEGAL COUNSEL DIRECTORS OFFICERS | | EULAV Securities, Inc. 220 East 42nd Street New York, NY 10017-5891 State Street Bank and Trust Co. 225 Franklin Street Boston, MA 02110 State Street Bank and Trust Co. c/o BFDS P.O. Box 219729 Kansas City, MO 64121-9729 PricewaterhouseCoopers LLP 300 Madison Avenue New York, NY 10017 Peter D. Lowenstein, Esq. 496 Valley Road Cos Cob, CT 06807-0272 Joyce E. Heinzerling Francis C. Oakley David H. Porter Paul Craig Roberts Thomas T. Sarkany Nancy-Beth Sheerr Daniel S. Vandivort Mitchell E. Appel President Howard A. Brecher Vice President and Secretary Michael J. Wagner Chief Compliance Officer Emily D. Washington Treasurer | | | |
| | | | |
| This audited report is issued for information to shareholders. It is not authorized for distribution to prospective investors unless preceded or accompanied by a currently effective prospectus of the Fund (obtainable from the Distributor). | | | |
| #00069461 | | | |
| The Value Line Fund, Inc. |
| |
| To Our Value Line |
To Our Shareholders: (unaudited)
Enclosed is your annual report for the period ended December 31, 2009. We encourage you to carefully review this report, which includes economic observations, your Fund’s performance data and highlights, the schedule of investments, and financial statements.
The Value Line Fund, Inc. (the “Fund”) earned a total return of 9.49% in 2009. That compared with a total return of 26.46% for the benchmark, the Standard & Poor’s 500 Index(1). The Fund was too heavily weighted in defensive holdings, the more stable stocks that are less sensitive to shifts in the economy, most notably in the healthcare sector. When cyclical and more-volatile stocks led the market’s sharp rebound, the portfolio’s defensive holdings could not keep pace.
We have recently taken steps to improve the performance of the Value Line Fund. First, we broadened the Fund’s stock selection universe. Rather than mechanically invest only in the weekly list of stocks in the top one hundred Rank 1’s of the Value Line Timeliness Ranking System, the portfolio manager now selects investments from among the 1,250 or so stocks in the top three Ranks. This allows greater diversification of the portfolio, reducing exposure to any single economic sector. It also results in decreased turnover of portfolio holdings, which lowers trading expenses. Second, we appointed senior portfolio manager Stephen E. Grant to actively manage the Fund. In his 24 years with Value Line, Inc. Mr. Grant has demonstrated widely recognized success with our other equity funds.
The Fund’s newly expanded stock selection criteria allow us to implement our disciplined investment strategy to full advantage. We invest in proven winners—those companies that have established five to ten year records of superior relative earnings growth and stock price growth. We also look for companies demonstrating strong short-term, quarter-to-quarter, relative earnings momentum and stock price momentum. If a holding later falters on these measures, we do not hesitate to replace it with a stock showing superior strength.
The Fund invests in companies of all sizes. Its approximately 150 holdings are well diversified in that respect, comprised of about 30% large-capitalization companies, 40% mid cap and 30% small cap.
Thank you for investing with us.
| | |
| | Sincerely, |
| | |
| | -s- Mitchell Appel | |
| | Mitchell Appel, President |
| | February 5, 2010 |
| | |
| (1) | The Standard & Poor’s 500 Index consists of 500 stocks which are traded on the New York Stock Exchange, American Stock Exchange and the NASDAQ National Market System and is representative of the broad stock market. This is an unmanaged index and does not reflect charges, expenses or taxes. It is not possible to directly invest in this index. |
| The Value Line Fund, Inc. |
| |
| Fund Shareholders |
Economic Observations (unaudited)
The recession, which commenced in the latter stages of 2007 and proved to be long and severe, most likely ended in the third quarter of last year, although the National Bureau of Economic Research, which assigns dates to the beginning and end of recessions, has yet to determine the exact conclusion of the recent downturn. In all, the business contraction—which produced a succession of quarterly declines in the nation’s gross domestic product along with countless additional upheavals—apparently concluded with the restoration of a modest 2.2% rise in GDP in the third quarter of 2009. The nascent up cycle was underpinned initially by strengthening consumer spending, lesser declines in housing construction and home sales (with that ailing sector boosted by government assistance for first-time home buyers), and an irregular comeback in business spending.
Going forward, the upturn should be supported by further, but uneven, improvement in consumer and industrial activity. It is worth noting that the prospective rate of GDP growth in the year upcoming should be, at an estimated 2.5%-3.0%, well below the historical norm of 3%-4%. The problem is that there is just too much overall weakness in certain critical sectors—notably housing and employment—to generate the greater levels of consumer spending needed for significantly higher levels of economic growth, in our opinion.
The long and painful recession was traceable to several events, beginning with sharp declines in housing construction, home sales, and real estate prices. We also experienced a large reduction in credit availability, a high level of bank failures, increasing foreclosures and bank repossessions, a multi-decade high in unemployment, weak retail activity, and trendless manufacturing. Unfortunately, several of these problems are likely to stay with us for some time—notably the weakness in housing and employment. Such continuing difficulties underscore why we expect below-trend rates of U.S. GDP growth though 2010. Encouragingly, though, most business barometers are now either stabilizing or improving selectively. It is much the same overseas, where severe business declines had been seen earlier across Europe and Asia. Those prior setbacks, which generally got under way several months after our own reversal commenced, have also largely run their course. Following this initially moderate business recovery state-side, we would look for sufficient brightening in housing and employment to help underpin a more substantial economic recovery in 2011 and through the middle years of the next decade. By then, in fact, we would expect GDP growth to average a fairly sustainable 3.0%-3.5%.
Inflation, which moved up sharply last year, following dramatic gains in oil, food, and commodity prices, has moved onto a more irregular path recently. Going forward, we expect pricing to chart an uneven path, with further up-and-down swings in oil and commodities being the norm, as the economy’s expansion matures. On average, we think that pricing will increase less sharply over the next year or two than it did before the 2007-2009 recession. Looking further out, we expect pricing pressures to evolve later on in the business up cycle—as is only natural, as demand for labor and materials increases. The Federal Reserve, meanwhile, continues to express support for an accommodative monetary approach. As a result, we believe that it is unlikely to start raising interest rates until well into 2010, and to do so rather gently once it does finally opt to tighten the credit reins. Clearly, the risks to the sustainability of the economic up cycle appear too great for the Fed to consider tightening aggressively anytime soon.
Overall, we see a comparatively benign period ahead for the equity and fixed-income markets over the next year or so.
| The Value Line Fund, Inc. |
| |
| (unaudited) |
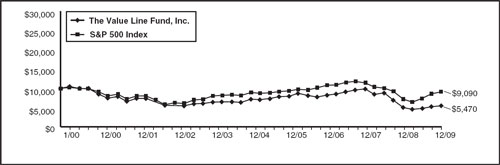
The following graph compares the performance of The Value Line Fund, Inc. to that of the S&P 500 Index. The Value Line Fund, Inc. is a professionally managed mutual fund, while the Index is not available for investment and is unmanaged. The returns for the Index do not reflect charges, expenses or taxes, but do include the reinvestment of dividends. The comparison is shown for illustrative purposes only.
Comparison of a Change in Value of a $10,000 Investment in the
Value Line Fund, Inc. and the S&P 500 Index*
Performance Data: **
| | | | | | | | |
| | | Average Annual Total Return | | Growth of an Assumed Investment of $10,000 | |
| 1 year ended 12/31/09 | | 9.49 | % | | $ | 10,949 | | |
| 5 years ended 12/31/09 | | (5.29 | )% | | $ | 7,619 | | |
| 10 years ended 12/31/09 | | (5.85 | )% | | $ | 5,470 | | |
| | |
| * | The Standard and Poor’s 500 Index is an unmanaged index that is representative of the larger - capitalization stocks traded in the United States. |
| | |
| ** | The performance data quoted represent past performance and are no guarantee of future performance. The average annual total returns and growth of an assumed investment of $10,000 include dividends reinvested and capital gains distributions accepted in shares. The investment return and principal value of an investment will fluctuate so that an investment, when redeemed, may be worth more or less than its original cost. The performance data and graph do not reflect the deduction of taxes that a shareholder would pay on fund distributions or the redemption of fund shares. |
| The Value Line Fund, Inc. |
| |
FUND EXPENSES (unaudited): |
Example
As a shareholder of the Fund, you incur ongoing costs, including management fees, distribution and service (12b-1) fees, and other Fund expenses. This Example is intended to help you understand your ongoing costs (in dollars) of investing in the Fund and to compare these costs with the ongoing costs of investing in other mutual funds.
The Example is based on an investment of $1,000 invested at the beginning of the period and held for the entire period (July 1, 2009 through December 31, 2009).
Actual Expenses
The first line of the table below provides information about actual account values and actual expenses. You may use the information in this line, together with the amount you invested, to estimate the expenses that you paid over the period. Simply divide your account value by $1,000 (for example an $8,600 account value divided by $1,000 = 8.6), then multiply the result by the number in the first line under the heading “Expenses Paid During Period” to estimate the expenses you paid on your account during this period.
Hypothetical Example for Comparison Purposes
The second line of the table below provides information about hypothetical account values and hypothetical expenses based on the Fund’s actual expense ratio and an assumed rate of return of 5% per year before expenses, which is not the Fund’s actual return. The hypothetical account values and expenses may not be used to estimate the actual ending account balance or expenses you paid for the period. You may use this information to compare the ongoing costs of investing in the Fund and other funds. To do so, compare this 5% hypothetical example with the 5% hypothetical examples that appear in the shareholder reports of the other funds.
Please note that the expenses shown in the table are meant to highlight your ongoing costs only and do not reflect any transactional costs, such as sales charges (loads), redemption fees, or exchange fees. Therefore, the table is useful in comparing ongoing costs only and will not help you determine the relative total costs of owning different funds. In addition, if transactional costs were included, your costs would have been higher.
| | | | | | | | | | | |
| | | Beginning account value 7/1/09 | | Ending account value 12/31/09 | | Expenses paid during period 7/1/09 thru 12/31/09* | |
| Actual | | $ | 1,000.00 | | $ | 1,144.54 | | $ | 5.44 | |
| Hypothetical (5% return before expenses) | | $ | 1,000.00 | | $ | 1,020.13 | | $ | 5.13 | |
| | |
| * | Expenses are equal to the Fund’s annualized expense ratio of 1.01% multiplied by the average account value over the period, multiplied by 184/365 to reflect the one-half year period. This expense ratio may differ from the expense ratio shown in the Financial Highlights. |
| The Value Line Fund, Inc. |
| |
| Portfolio Highlights at December 31, 2009 (unaudited) |
Ten Largest Common Stock Holdings
| | | | | | | | | | | |
| Issue | | | Shares | | Value | | Percentage of Net Assets |
| Priceline.com, Inc. | | | 10,000 | | $ | 2,185,000 | | | 2.4 | % |
| Green Mountain Coffee Roasters, Inc. | | | 24,500 | | $ | 1,996,015 | | | 2.2 | % |
| Cognizant Technology Solutions Corp. Class A | | | 38,000 | | $ | 1,721,400 | | | 1.9 | % |
| Edwards Lifesciences Corp. | | | 19,000 | | $ | 1,650,150 | | | 1.8 | % |
| American Tower Corp. Class A | | | 34,000 | | $ | 1,469,140 | | | 1.6 | % |
| FMC Corp. | | | 24,000 | | $ | 1,338,240 | | | 1.4 | % |
| Teva Pharmaceutical Industries Ltd. | | | 23,000 | | $ | 1,292,140 | | | 1.4 | % |
| Computer Programs & Systems, Inc. | | | 28,000 | | $ | 1,289,400 | | | 1.4 | % |
| Sybase, Inc. | | | 29,000 | | $ | 1,258,600 | | | 1.4 | % |
| Oracle Corp. | | | 51,000 | | $ | 1,251,540 | | | 1.4 | % |
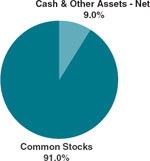
| Asset Allocation – Percentage of Net Assets |
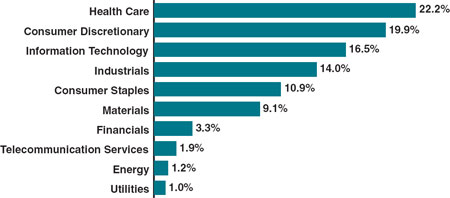
| Sector Weightings – Percentage of Total Investment Securities |
| The Value Line Fund, Inc. |
| |
| Schedule of Investments | December 31, 2009 |
| Shares | | | | Value | |
| COMMON STOCKS (91.0%) | | | | |
| | | | CONSUMER DISCRETIONARY (18.1%) | | | | |
| | 24,000 | | Aaron’s, Inc. | | $ | 665,520 | |
| | 10,000 | | Advance Auto Parts, Inc. | | | 404,800 | |
| | 11,200 | | Aeropostale, Inc. * | | | 381,360 | |
| | 6,000 | | Apollo Group, Inc. Class A * | | | 363,480 | |
| | 7,000 | | AutoZone, Inc. * | | | 1,106,490 | |
| | 20,000 | | Buckle, Inc. (The) | | | 585,600 | |
| | 5,000 | | Buffalo Wild Wings, Inc. * | | | 201,350 | |
| | 6,000 | | Deckers Outdoor Corp. * | | | 610,320 | |
| | 25,000 | | DIRECTV Class A * | | | 833,750 | |
| | 10,000 | | Dollar Tree, Inc. * | | | 483,000 | |
| | 26,700 | | Expedia, Inc. * | | | 686,457 | |
| | 15,000 | | Guess?, Inc. | | | 634,500 | |
| | 3,000 | | Interactive Data Corp. | | | 75,900 | |
| | 27,000 | | Johnson Controls, Inc. | | | 735,480 | |
| | 11,000 | | LKQ Corp. * | | | 215,490 | |
| | 5,800 | | National Presto Industries, Inc. | | | 633,534 | |
| | 2,000 | | Netflix, Inc. * | | | 110,280 | |
| | 2,000 | | O’Reilly Automotive, Inc. * | | | 76,240 | |
| | 14,000 | | Panera Bread Co. Class A * | | | 937,580 | |
| | 5,000 | | Peet’s Coffee & Tea, Inc. * | | | 166,650 | |
| | 3,000 | | PF Chang’s China Bistro, Inc. * | | | 113,730 | |
| | 10,000 | | Priceline.com, Inc. * | | | 2,185,000 | |
| | 21,000 | | Shaw Communications, Inc. Class B | | | 431,970 | |
| | 4,000 | | Strayer Education, Inc. | | | 849,960 | |
| | 30,000 | | TJX Companies, Inc. (The) | | | 1,096,500 | |
| | 9,100 | | Unifirst Corp. | | | 437,801 | |
| | 10,000 | | Warnaco Group, Inc. (The) * | | | 421,900 | |
| | 10,000 | | WMS Industries, Inc. * | | | 400,000 | |
| | 28,000 | | Yum! Brands, Inc. | | | 979,160 | |
| | | | | | | 16,823,802 | |
| | | | CONSUMER STAPLES (9.9%) | | | | |
| | 2,000 | | British American Tobacco PLC ADR | | | 129,320 | |
| | 13,200 | | Casey’s General Stores, Inc. | | | 421,344 | |
| | 2,000 | | Chattem, Inc. * | | | 186,600 | |
| | 11,000 | | Church & Dwight Co., Inc. | | | 664,950 | |
| | 33,000 | | Cott Corp. * | | | 270,600 | |
| | 29,000 | | Diamond Foods, Inc. | | | 1,030,660 | |
| | 30,000 | | Flowers Foods, Inc. | | | 712,800 | |
| | 12,000 | | General Mills, Inc. | | | 849,720 | |
| | | | | | | | |
| Shares | | | | Value | |
| | 24,500 | | Green Mountain Coffee Roasters, Inc.* | | $ | 1,996,015 | |
| | 7,000 | | Hansen Natural Corp. * | | | 268,800 | |
| | 23,000 | | J&J Snack Foods Corp. | | | 919,080 | |
| | 12,900 | | Lancaster Colony Corp. | | | 641,130 | |
| | 28,000 | | TreeHouse Foods, Inc. * | | | 1,088,080 | |
| | | | | | �� | 9,179,099 | |
| | | | ENERGY (1.1%) | | | | |
| | 1,000 | | Core Laboratories N.V. | | | 118,120 | |
| | 7,200 | | Dresser-Rand Group, Inc. * | | | 227,592 | |
| | 3,000 | | Enbridge, Inc. | | | 138,660 | |
| | 11,000 | | Southwestern Energy Co. * | | | 530,200 | |
| | | | | | | 1,014,572 | |
| | | | FINANCIALS (3.0%) | | | | |
| | 21,000 | | AFLAC, Inc. | | | 971,250 | |
| | 3,000 | | Bank of Montreal | | | 159,240 | |
| | 1,400 | | Capitol Federal Financial | | | 44,044 | |
| | 15,000 | | Knight Capital Group, Inc. Class A * | | | 231,000 | |
| | 8,000 | | Royal Bank of Canada | | | 428,400 | |
| | 2,000 | | Stifel Financial Corp. * | | | 118,480 | |
| | 15,000 | | T. Rowe Price Group, Inc. | | | 798,750 | |
| | | | | | | 2,751,164 | |
| | | | HEALTH CARE (20.2%) | | | | |
| | 15,000 | | Allergan, Inc. | | | 945,150 | |
| | 14,000 | | AmerisourceBergen Corp. | | | 364,980 | |
| | 2,000 | | Bio-Rad Laboratories, Inc. Class A * | | | 192,920 | |
| | 19,400 | | Catalyst Health Solutions, Inc. * | | | 707,518 | |
| | 9,000 | | Cerner Corp. * | | | 741,960 | |
| | 2,000 | | Chemed Corp. | | | 95,940 | |
| | 28,000 | | Computer Programs & Systems, Inc. | | | 1,289,400 | |
| | 4,000 | | Covance, Inc. * | | | 218,280 | |
| | 12,000 | | Covidien PLC | | | 574,680 | |
| | 3,000 | | DENTSPLY International, Inc. | | | 105,510 | |
| | 19,000 | | Edwards Lifesciences Corp. * | | | 1,650,150 | |
| | 4,000 | | ev3, Inc. * | | | 53,360 | |
| | 13,000 | | Express Scripts, Inc. * | | | 1,123,850 | |
| | 23,000 | | Gilead Sciences, Inc. * | | | 995,440 | |
| | 9,000 | | Haemonetics Corp. * | | | 496,350 | |
| | 4,000 | | Henry Schein, Inc. * | | | 210,400 | |
See Notes to Financial Statements.
| The Value Line Fund, Inc. |
| |
| December 31, 2009 |
| Shares | | | | Value | |
| | 6,000 | | Hospira, Inc. * | | $ | 306,000 | |
| | 13,000 | | Illumina, Inc. * | | | 398,450 | |
| | 2,200 | | Intuitive Surgical, Inc. * | | | 667,304 | |
| | 6,000 | | Laboratory Corporation of America Holdings * | | | 449,040 | |
| | 4,000 | | Life Technologies Corp. * | | | 208,920 | |
| | 14,000 | | Medco Health Solutions, Inc. * | | | 894,740 | |
| | 8,000 | | MEDNAX, Inc. * | | | 480,880 | |
| | 16,000 | | Novo Nordisk A/S ADR | | | 1,021,600 | |
| | 4,000 | | NuVasive, Inc. * | | | 127,920 | |
| | 13,000 | | Owens & Minor, Inc. | | | 558,090 | |
| | 22,000 | | ResMed, Inc. * | | | 1,149,940 | |
| | 23,000 | | Teva Pharmaceutical Industries Ltd. ADR | | | 1,292,140 | |
| | 13,000 | | Thermo Fisher Scientific, Inc. * | | | 619,970 | |
| | 28,000 | | Thoratec Corp. * | | | 753,760 | |
| | | | | | | 18,694,642 | |
| | | | INDUSTRIALS (12.7%) | | | | |
| | 7,000 | | Alliant Techsystems, Inc. * | | | 617,890 | |
| | 45,000 | | Applied Signal Technology, Inc. | | | 868,050 | |
| | 6,000 | | C.H. Robinson Worldwide, Inc. | | | 352,380 | |
| | 12,100 | | Cubic Corp. | | | 451,330 | |
| | 6,000 | | Danaher Corp. | | | 451,200 | |
| | 15,000 | | Elbit Systems Ltd. | | | 974,550 | |
| | 4,000 | | FTI Consulting, Inc. * | | | 188,640 | |
| | 16,000 | | IHS, Inc. Class A * | | | 876,960 | |
| | 12,000 | | ITT Corp. | | | 596,880 | |
| | 12,000 | | L-3 Communications Holdings, Inc. | | | 1,043,400 | |
| | 1,000 | | Middleby Corp. (The) * | | | 49,020 | |
| | 17,000 | | Oshkosh Corp. | | | 629,510 | |
| | 50,000 | | Rollins, Inc. | | | 964,000 | |
| | 6,000 | | Roper Industries, Inc. | | | 314,220 | |
| | 700 | | Stantec, Inc. * | | | 20,139 | |
| | 15,000 | | Stericycle, Inc. * | | | 827,550 | |
| | 12,000 | | Tetra Tech, Inc. * | | | 326,040 | |
| | 9,000 | | United Technologies Corp. | | | 624,690 | |
| | 11,000 | | URS Corp. * | | | 489,720 | |
| | 10,000 | | Valmont Industries, Inc. | | | 784,500 | |
| | 2,000 | | W.W. Grainger, Inc. | | | 193,660 | |
| | 4,000 | | Waste Connections, Inc. * | | | 133,360 | |
| | | | | | | 11,777,689 | |
| | | | | | | | |
| Shares | | | | Value | |
| | | | INFORMATION TECHNOLOGY (15.0%) | | | | |
| | 12,000 | | Accenture PLC. Class A | | $ | 498,000 | |
| | 17,000 | | Advent Software, Inc. * | | | 692,410 | |
| | 9,000 | | Amphenol Corp. Class A | | | 415,620 | |
| | 5,000 | | ANSYS, Inc. * | | | 217,300 | |
| | 200 | | Apple, Inc. * | | | 42,172 | |
| | 24,000 | | Check Point Software Technologies Ltd. * | | | 813,120 | |
| | 38,000 | | Cognizant Technology Solutions Corp. Class A * | | | 1,721,400 | |
| | 9,000 | | Dolby Laboratories, Inc. Class A * | | | 429,570 | |
| | 7,000 | | Equinix, Inc. * | | | 743,050 | |
| | 5,000 | | F5 Networks, Inc. * | | | 264,900 | |
| | 18,000 | | FactSet Research Systems, Inc. | | | 1,185,660 | |
| | 700 | | Google, Inc. Class A * | | | 433,986 | |
| | 33,000 | | Informatica Corp. * | | | 853,380 | |
| | 1,200 | | International Business Machines Corp. | | | 157,080 | |
| | 2,200 | | MasterCard, Inc. Class A | | | 563,156 | |
| | 5,000 | | MAXIMUS, Inc. | | | 250,000 | |
| | 4,000 | | MICROS Systems, Inc. * | | | 124,120 | |
| | 25,000 | | Open Text Corp. * | | | 1,016,250 | |
| | 51,000 | | Oracle Corp. | | | 1,251,540 | |
| | 7,000 | | OSI Systems, Inc. * | | | 190,960 | |
| | 6,000 | | Salesforce.com, Inc. * | | | 442,620 | |
| | 9,000 | | Solera Holdings, Inc. | | | 324,090 | |
| | 29,000 | | Sybase, Inc. * | | | 1,258,600 | |
| | | | | | | 13,888,984 | |
| | | | MATERIALS (8.3%) | | | | |
| | 8,000 | | Airgas, Inc. | | | 380,800 | |
| | 10,000 | | Ball Corp. | | | 517,000 | |
| | 23,000 | | Calgon Carbon Corp. * | | | 319,700 | |
| | 37,000 | | Crown Holdings, Inc. * | | | 946,460 | |
| | 3,000 | | Ecolab, Inc. | | | 133,740 | |
| | 24,000 | | FMC Corp. | | | 1,338,240 | |
| | 7,000 | | NewMarket Corp. | | | 803,390 | |
| | 9,000 | | Praxair, Inc. | | | 722,790 | |
| | 8,000 | | Rock-Tenn Co. Class A | | | 403,280 | |
| | 15,000 | | Scotts Miracle-Gro Co. (The) Class A | | | 589,650 | |
| | 12,000 | | Sigma-Aldrich Corp. | | | 606,360 | |
| | 16,000 | | Silgan Holdings, Inc. | | | 926,080 | |
| | | | | | | 7,687,490 | |
See Notes to Financial Statements.
| The Value Line Fund, Inc. |
| |
| Schedule of Investments |
| Shares | | | | Value | |
| | | | TELECOMMUNICATION SERVICES (1.8%) | | | | |
| | 34,000 | | American Tower Corp. Class A * | | $ | 1,469,140 | |
| | 2,000 | | Telefonica S.A. ADR | | | 167,040 | |
| | | | | | | 1,636,180 | |
| | | | UTILITIES (0.9%) | | | | |
| | 9,000 | | ITC Holdings Corp. | | | 468,810 | |
| | 3,000 | | Ormat Technologies, Inc. | | | 113,520 | |
| | 6,000 | | Wisconsin Energy Corp. | | | 298,980 | |
| | | | | | | 881,310 | |
| | | | TOTAL COMMON STOCKS AND TOTAL INVESTMENT SECURITIES (1) (91.0%)
(Cost $65,507,525) | | | 84,334,932 | |
| | | | | | | | |
| | Principal Amount | | | | | Value | |
| SHORT-TERM INVESTMENTS (8.6%) | | | | |
| | | | | | | | |
| | | | U.S. GOVERNMENT AGENCY OBLIGATIONS (6.5%) | | | | |
| $ | 3,000,000 | | Federal Home Loan Mortgage Corp. Discount Notes, 0.08%, 1/26/10 (2) | | $ | 2,999,896 | |
| | 3,000,000 | | Federal National Mortgage Association Discount Notes, 0.08%, 3/10/10 (2) | | | 2,999,490 | |
| | | | | | | 5,999,386 | |
| | | | REPURCHASE AGREEMENTS (2.1%) | | | | |
| | 2,000,000 | | With Morgan Stanley, 0.00%, dated 12/31/09, due 01/04/10, delivery value $2,000,000 (collateralized by $2,035,000 U.S. Treasury Notes 1.1250%, due 06/30/11, with a value of $2,043,585) | | | 2,000,000 | |
| | | | TOTAL SHORT-TERM INVESTMENTS (3)
(Cost $7,999,386) | | | 7,999,386 | |
| | | | | | | | |
Principal Amount | | | | | Value | |
| CASH AND OTHER ASSETS IN EXCESS OF LIABILITIES (0.4%) | | $ | 345,553 | |
| NET ASSETS (100%) | | $ | 92,679,871 | |
| NET ASSET VALUE OFFERING AND REDEMPTION PRICE, PER OUTSTANDING SHARE ($92,679,871 ÷ 13,601,879 SHARES OUTSTANDING) | | $ | 6.81 | |
| * | Non-income producing. |
| (1) | Unless otherwise indicated, the values of the Portfolio are determined based on Level 1 inputs established by FASB ASC 820-10, Fair Value Measurements and Disclosures.. |
| (2) | The rate shown on discount securities represents the yield or rate as of December 31, 2009. |
| (3) | Values determined based on Level 2 inputs established by FASB ASC 820-10, Fair Value Measurements and Disclosures. |
| ADR | American Depositary Receipt. |
See Notes to Financial Statements.
| The Value Line Fund, Inc. |
| |
Statement of Assets and Liabilities at December 31, 2009 |
| Assets: | | | | |
Investment securities, at value
(Cost - $65,507,525) | | $ | 84,334,932 | |
Short-term investments
(Cost - $7,999,386) | | | 7,999,386 | |
| Cash | | | 155,699 | |
| Receivable for securities sold | | | 245,593 | |
| Dividends receivable | | | 30,168 | |
| Prepaid expenses | | | 10,820 | |
| Total Assets | | | 92,776,598 | |
| | | | | |
| Liabilities: | | | | |
| Payable for capital shares redeemed | | | 9,267 | |
| Accrued expenses: | | | | |
| Advisory fee | | | 46,774 | |
| Other | | | 40,686 | |
| Total Liabilities | | | 96,727 | |
| Net Assets | | $ | 92,679,871 | |
| | | | | |
| Net assets consist of: | | | | |
| Capital stock, at $1.00 par value (authorized 50,000,000, outstanding 13,601,879 shares) | | $ | 13,601,879 | |
| Additional paid-in capital | | | 139,835,929 | |
| Accumulated net investment loss | | | (11 | ) |
| Accumulated net realized loss on investments and foreign currency | | | (79,585,333 | ) |
| Net unrealized appreciation of investments | | | 18,827,407 | |
| Net Assets | | $ | 92,679,871 | |
| Net Asset Value, Offering and Redemption Price per Outstanding Share ($92,679,871 ÷ 13,601,879 shares outstanding) | | $ | 6.81 | |
Statement of Operations for the Year Ended December 31, 2009 |
| Investment Income: | | | | |
| Dividends (net of foreign withholding tax of $15,310) | | $ | 711,484 | |
| Interest | | | 5,082 | |
| Total Income | | | 716,566 | |
| | | | | |
| Expenses: | | | | |
| Advisory fee | | | 609,897 | |
| Service and distribution plan fees | | | 217,820 | |
| Transfer agent fees | | | 99,817 | |
| Printing and postage | | | 84,858 | |
| Auditing and legal fees | | | 66,239 | |
| Custodian fees | | | 34,258 | |
| Registration and filing fees | | | 31,902 | |
| Insurance | | | 11,020 | |
| Directors’ fees and expenses | | | 3,261 | |
| Other | | | 23,242 | |
| Total Expenses Before Custody Credits and Fees Waived | | | 1,182,314 | |
| Less: Advisory Fee Waived | | | (59,089 | ) |
| Less: Service and Distribution Plan Fees Waived | | | (217,820 | ) |
| Less: Custody Credits | | | (13 | ) |
| Net Expenses | | | 905,392 | |
| Net Investment Loss | | | (188,826 | ) |
| Net Realized and Unrealized Gain/(Loss) on Investments and Foreign Exchange Transactions: | | | | |
| | | | | |
| Net Realized Loss | | | (13,753,709 | ) |
| Change in Net Unrealized Appreciation/(Depreciation) | | | 21,941,228 | |
| Net Realized Loss and Change in Net Unrealized Appreciation/(Depreciation) on Investments and Foreign Exchange Transactions | | | 8,187,519 | |
| Net Increase in Net Assets from Operations | | $ | 7,998,693 | |
See Notes to Financial Statements.
| The Value Line Fund, Inc. |
| |
Statement of Changes in Net Assets for the Years Ended December 31, 2009 and 2008 |
| | | Year Ended December 31, 2009 | | Year Ended December 31, 2008 | |
| | | | | | | | |
| Operations: | | | | | | | |
| Net investment loss | | $ | (188,826 | ) | $ | (391,455 | ) |
| Net realized loss on investments and foreign currency | | | (13,753,709 | ) | | (65,713,102 | ) |
| Change in net unrealized appreciation/(depreciation) | | | 21,941,228 | | | (29,419,261 | ) |
| Net increase/(decrease) in net assets from operations | | | 7,998,693 | | | (95,523,818 | ) |
| | | | | | | | |
| Distributions to Shareholders: | | | | | | | |
| Net realized gain from investment transactions | | | — | | | (3,966,886 | ) |
| | | | | | | | |
| Capital Share Transactions: | | | | | | | |
| Proceeds from sale of shares | | | 1,206,054 | | | 2,949,282 | |
| Proceeds from reinvestment of distributions to shareholders | | | — | | | 3,752,515 | |
| Cost of shares redeemed | | | (9,623,697 | ) | | (17,385,892 | ) |
| Net decrease in net assets from capital share transactions | | | (8,417,643 | ) | | (10,684,095 | ) |
| Total Decrease in Net Assets | | | (418,950 | ) | | (110,174,799 | ) |
| | | | | | | | |
| Net Assets: | | | | | | | |
| Beginning of year | | | 93,098,821 | | | 203,273,620 | |
| End of year | | $ | 92,679,871 | | $ | 93,098,821 | |
| Accumulated net investment loss, at end of year | | $ | (11 | ) | $ | (118 | ) |
See Notes to Financial Statements.
| The Value Line Fund, Inc. |
| |
| Notes to Financial Statements |
| 1. | Significant Accounting Policies |
The Value Line Fund, Inc., (the “Fund”) is registered under the Investment Company Act of 1940, as amended, as a diversified, open-end management investment company whose primary investment objective is long term-growth of capital.
The preparation of financial statements in conformity with generally accepted accounting principles requires management to make estimates and assumptions that affect the reported amounts of assets and liabilities and disclosure of contingent assets and liabilities at the date of the financial statements and the reported amounts of revenues and expenses during the reporting period. Actual results could differ from those estimates. The following is a summary of significant accounting policies consistently followed by the Fund in the preparation of its financial statements.
(A) Security Valuation: Securities listed on a securities exchange are valued at the closing sales prices on the date as of which the net asset value is being determined. Securities traded on the NASDAQ Stock Market are valued at the NASDAQ Official Closing Price. In the absence of closing sales prices for such securities and for securities traded in the over-the-counter market, the security is valued at the midpoint between the latest available and representative asked and bid prices. Short-term instruments with maturities of 60 days or less at the date of purchase are valued at amortized cost, which approximates market value. Short- term instruments with maturities greater than 60 days at the date of purchase are valued at the midpoint between the latest available and representative asked and bid prices, and commencing 60 days prior to maturity such securities are valued at amortized cost. Securities for which market quotations are not readily available or that are not readily marketable and all other assets of the Fund are valued at fair value as the Board of Directors may determine in good faith. In addition, the Fund may use the fair value of a security when the closing market price on the primary exchange where the security is traded no longer accurately reflects the value of a security due to factors affecting one or more relevant securities markets or the specific issuer.
(B) Fair Value Measurements: In accordance with Financial Accounting Standards Board Accounting Standards Codification (FASB ASC) 820-10, Fair Value Measurements and Disclosures, (formerly Statement of Financial Accounting Standards (“SFAS”) No. 157), the Fund discloses the fair value of its investments in a hierarchy that prioritizes the inputs to valuation techniques used to measure the fair value. The hierarchy gives the highest priority to valuations based upon unadjusted quoted prices in active markets for identical assets or liabilities (level 1 measurement) and the lowest priority to valuations based upon unobservable inputs that are significant to the valuation (level 3 measurements). FASB ASC 820-10-35-39 to 55 provides three levels of the fair value hierarchy as follows:
| | |
| • | Level 1 - Inputs that reflect unadjusted quoted prices in active markets for identical assets or liabilities that the Fund has the ability to access at the measurement date; |
| | |
| • | Level 2 - Inputs other than quoted prices that are observable for the asset or liability either directly or indirectly, including inputs in markets that are not considered to be active; |
| | |
| • | Level 3 - Inputs that are unobservable. |
In 2009, the Fund adopted the authoritative guidance included in FASB ASC 820-10, Fair Value Measurements and Disclosures, on determining fair value when the volume and level of activity for the asset or liability have significantly decreased and identifying transactions that are not orderly (formerly FSP FAS 157-4). FASB ASC 820-10-35-51A to 51H indicates that if an entity determines that either the volume and/or level of activity for an asset or liability has significantly decreased (from normal conditions for that asset or liability) or price quotations or observable inputs are not associated with orderly transactions, increased analysis and management judgment will be required to estimate fair value. Valuation techniques such as an income approach might be appropriate to supplement or replace a market approach in those circumstances. It provides a list of factors to determine whether there has been a significant decrease in relation to normal market activity. Regardless, however, of the valuation technique and inputs used, the objective for the fair value measurement in those circumstances is unchanged from what it would be if markets were operating at normal activity levels and/or transactions were orderly; that is, to determine the current exit price as promulgated by FASB ASC 820-10.
| The Value Line Fund, Inc. |
| |
| December 31, 2009 |
The following is a summary of the inputs used as of December 31, 2009 in valuing the Fund’s investments carried at value:
| | | | | | | | | | | | | | |
| Investments in Securities: | | Level 1 | | Level 2 | | Level 3 | | Total | |
| Assets Common Stocks | | $ | 84,334,932 | | $ | 0 | | $ | 0 | | $ | 84,334,932 | |
| Short Term Investments | | | 0 | | | 7,999,386 | | | 0 | | | 7,999,386 | |
| Total Investments in Securities | | $ | 84,334,932 | | $ | 7,999,386 | | $ | 0 | | $ | 92,334,318 | |
For the year ended December 31, 2009, there were no Level 3 investments. The types of inputs used to value each security are identified in the Schedule of Investments, which also includes a breakdown of the Schedule’s investments by category.
(C) Repurchase Agreements: In connection with transactions in repurchase agreements, the Fund’s custodian takes possession of the underlying collateral securities, the value of which exceeds the principal amount of the repurchase transaction, including accrued interest. To the extent that any repurchase transaction exceeds one business day, it is the Fund’s policy to mark-to-market the collateral on a daily basis to ensure the adequacy of the collateral. In the event of default of the obligation to repurchase, the Fund has the right to liquidate the collateral and apply the proceeds in satisfaction of the obligation. Under certain circumstances, in the event of default or bankruptcy by the other party to the agreement, realization and/or retention of the collateral or proceeds may be subject to legal proceedings.
(D) Federal Income Taxes: It is the Fund’s policy to comply with the requirements of the Internal Revenue Code applicable to regulated investment companies, including the distribution requirements of the Tax Reform Act of 1986, and to distribute all of its taxable income to its shareholders. Therefore, no federal income tax provision is required.
(E) Security Transactions and Distributions: Security transactions are accounted for on the date the securities are purchased or sold. Interest income is accrued as earned. Realized gains and losses on sales of securities are calculated for financial accounting and federal income tax purposes on the identified cost basis. Dividend income and distributions to shareholders are recorded on the ex-dividend date. Distributions are determined in accordance with income tax regulations which may differ from generally accepted accounting principles.
(F) Foreign Currency Translation: The books and records of the Fund are maintained in U.S. dollars. Assets and liabilities which are denominated in foreign currencies are translated to U.S. dollars at the prevailing rates of exchange. The Fund does not isolate changes in the value of investments caused by foreign exchange rate differences from the changes due to other circumstances.
Income and expenses are translated to U.S. dollars based upon the rates of exchange on the respective dates of such transactions.
| The Value Line Fund, Inc. |
| |
| Notes to Financial Statements |
Net realized foreign exchange gains or losses arise from currency fluctuations realized between the trade and settlement dates on securities transactions, the differences between the U.S. dollar amounts of dividends, interest, and foreign withholding taxes recorded by the Fund, and the U.S. dollar equivalent of the amounts actually received or paid. Net unrealized foreign exchange gains and losses arise from changes in the value of assets and liabilities, other than investments, at the end of the fiscal period, resulting from changes in the exchange rates. The effect of the change in foreign exchange rates on the value of investments is included in realized gain/loss on investments and change in net unrealized appreciation/ depreciation on investments.
(G) Representations and Indemnifications: In the normal course of business, the Fund enters into contracts that contain a variety of representations and warranties which provide general indemnifications. The Fund’s maximum exposure under these arrangements is unknown, as this would involve future claims that may be made against the Fund that have not yet occurred. However, based on experience, the Fund expects the risk of loss to be remote.
(H) Foreign Taxes: The Fund may be subject to foreign taxes on income, gains on investments, or currency repatriation, a portion of which may be recoverable. The Fund will accrue such taxes and recoveries as applicable, based upon its current interpretation of tax rules and regulations that exist in the markets in which it invests.
(I) Other: On November 4, 2009, the Securities and Exchange Commission (“SEC”) and Value Line, Inc. (“VLI”), Value Line Securities, Inc. (currently, EULAV Securities, Inc. (“ESI” or the “Distributor”)), Jean B. Buttner, former Chairman, President and Chief Executive Officer of VLI and David Henigson, a former Director and Officer of VLI, settled a matter related to brokerage commissions charged by ESI to certain Value Line mutual funds (“Funds”), including the Fund, from 1986 through November of 2004. The matter also involved alleged misleading disclosures provided by VLI to the Boards of Directors/Trustees and shareholders of the Funds regarding such brokerage commissions. VLI agreed to pay disgorgement in the amount of $24,168,979 (representing disgorgement of commissions received), prejudgment interest of $9,536,786, and a civil penalty in the amount of $10,000,000. Also as part of the settlement, Mrs. Buttner and Mr. Henigson each agreed to pay a civil penalty, are barred from association with any broker, dealer or investment adviser, and are prohibited from serving as an employee, officer, director, member of an advisory board, investment adviser or depositor of, or principal underwriter for, a registered investment company or affiliated person of such investment adviser, depositor, or principal underwriter, subject to a limited exception (limited in scope and for a one-year period) for Mrs. Buttner. Pursuant to Section 308(a) of the Sarbanes-Oxley Act of 2002, a fund will be created for VLI’s disgorgement, interest and penalty (“Fair Fund”). VLI will bear all costs associated with any Fair Fund distribution, including retaining a third-party consultant approved by the SEC staff to administer any Fair Fund distribution. VLI informed the Funds’ Boards that it has paid the settlement, continues to have adequate liquid assets, and that the resolution of this matter will not have a materially adverse effect on the ability of EULAV Asset Management LLC (“EULAV” or the “Adviser”), the Funds’ investment adviser, or ESI, the Funds’ distributor, to perform their respective contracts with the Funds.
(J) Subsequent Events: Management has evaluated all subsequent transactions and events after the balance sheet date through February 26, 2010, the date on which these financial statements were issued, and except as already included in the notes to these financial statements, has determined that no additional items require disclosure.
| The Value Line Fund, Inc. |
| |
| December 31, 2009 |
| 2. | Capital Share Transactions, Dividends and Distributions to Shareholders |
Transactions in capital stock were as follows:
| | | | | | | | |
| | | Year Ended December 31, 2009 | | Year Ended December 31, 2008 | |
| Shares sold | | | 200,697 | | | 327,686 | |
| Shares issued to shareholders in reinvestment of dividends and distributions | | | — | | | 628,471 | |
| Shares redeemed | | | (1,577,819 | ) | | (1,823,282 | ) |
| Net increase/(decrease) | | | (1,377,122 | ) | | (867,125 | ) |
| Distributions per share from net realized gains | | $ | — | | $ | 0.2759 | |
| 3. | Purchases and Sales of Securities |
Purchases and sales of investment securities, excluding short-term securities, were as follows:
| | | | | |
| | | Year Ended December 31, 2009 | |
| Purchases: | | | | |
| Investment Securities | | $ | 100,418,214 | |
| Sales: | | | | |
| Investment Securities | | $ | 114,628,545 | |
At December 31, 2009, information on the tax components of capital is as follows:
| | | | | |
| Cost of investments for tax purposes | | $ | 74,122,756 | |
| Gross tax unrealized appreciation | | $ | 18,889,908 | |
| Gross tax unrealized depreciation | | $ | (678,346 | ) |
| Net tax unrealized appreciation on investments | | $ | 18,211,562 | |
| Capital loss carryforward, expires | | | | |
| December 31, 2016 | | $ | (37,251,300 | ) |
| December 31, 2017 | | $ | (41,718,189 | ) |
During the year ended December 31, 2009, as permitted under federal income tax regulations, the Fund elected to defer $11 of post-October net currency losses to the next taxable year.
To the extent that current or future capital gains are offset by capital losses, the Fund does not anticipate distributing any such gains to shareholders.
It is uncertain whether the Fund will be able to realize the benefits of the losses before they expire.
The differences between book basis and tax basis unrealized appreciation/(depreciation) on investments were primarily attributed to wash sales.
Permanent book-tax differences relating to the current year were reclassified within the composition of the net asset accounts. The Fund increased undistributed net investment income by approximately $188,933, increased accumulated realized loss by approximately $95, and decreased additional paid-in-capital by $188,838. These reclassifications were primarily due to differing treatments of net operating losses, foreign currency translation for tax purposes and investments in partnerships.
| The Value Line Fund, Inc. |
| |
| Notes to Financial Statements |
The tax composition of distributions to shareholders for the years ended December 31, 2009 and December 31, 2008 were as follows:
| | | | | | | | |
| | | 2009 | | 2008 | |
| Ordinary income | | $ | — | | $ | 2,418,777 | |
| Long-term capital gain | | | — | | | 1,548,109 | |
| | | $ | — | | $ | 3,966,886 | |
| 5. | Investment Advisory Fee, Service and Distribution Fees and Transactions With Affiliates |
An advisory fee of $609,897 was paid or payable to EULAV Asset Management, LLC (the “Adviser”) for the year ended December 31, 2009. This was computed at the rate of 0.70% of the first $100 million of the Fund’s average daily net assets plus 0.65% of the excess thereof, and paid monthly. The Adviser provides research, investment programs, supervision of the investment portfolio and pays costs of administrative services, office space, equipment and compensation of administrative, bookkeeping, and clerical personnel necessary for managing the affairs of the Fund.
The Adviser also provides persons, satisfactory to the Fund’s Board of Directors, to act as officers and employees of the Fund and pays their salaries. Effective May 1, 2009, the Adviser contractually reduced the advisory fee by .10% of the first $100 million of the Fund’s average daily net assets and .15% on the excess there of for a one year period. The fees waived amounted to $59,089 for the year ended December 31, 2009. The Adviser has no right to recoup previously waived amounts.
The Fund has a Service and Distribution Plan (the “Plan”), adopted pursuant to Rule 12b-1 under the Investment Company Act of 1940, for the payment of certain expenses incurred by EULAV Securities, Inc. (the “Distributor”), for advertising, marketing and distributing the Fund’s shares and for servicing the Fund’s shareholders at an annual rate of 0.25% of the Fund’s average daily net assets. For the year ended December 31, 2009, fees amounting to $217,820 before fee waivers were accrued under the Plan. Effective May 1, 2007, 2008 and 2009, the Distributor contractually agreed to waive the Fund’s 12b-1 fee for one year periods. For the year ended December 31, 2009 the fees waived amounted to $217,820. The Distributor has no right to recoup prior waivers.
For the year ended December 31, 2009, the Fund’s expenses were reduced by $13 under a custody credit arrangement with the custodian.
Direct expenses of the Fund are charged to the Fund while common expenses of the Value Line Funds are allocated proportionately based upon the Funds’ respective net assets. The Fund bears all other costs and expenses.
Certain officers, employees and a director of Value Line and/or affiliated companies are also officers and a director of the Fund.
The Adviser and/or affiliated companies and the Value Line Profit Sharing and Savings Plan owned 292,888 shares of the Fund’s capital stock, representing 2.15% of the outstanding shares at December 31, 2009. In addition, officers and directors of the Fund as a group owned 729 shares of the Fund, representing less than 1% of the outstanding shares.
| The Value Line Fund, Inc. |
| |
| Financial Highlights |
Selected data for a share of capital stock outstanding throughout each year:
| | | | | | | | | | | | | | | | | |
| | | Years Ended December 31, | |
| | | 2009 | | 2008 | | 2007 | | 2006 | | 2005 | |
| Net asset value, beginning of year | | $ | 6.22 | | $ | 12.83 | | $ | 12.48 | | $ | 13.14 | | $ | 13.90 | |
| | | | | | | | | | | | | | | | | |
| Income from investment operations: | | | | | | | | | | | | | | | | |
| Net investment loss | | | (0.01 | ) | | (0.03 | ) | | (0.01 | ) | | (0.05 | ) | | (0.07 | ) |
Net gains or (losses) on securities
(both realized and unrealized) | | | 0.60 | | | (6.30 | ) | | 2.37 | | | 0.58 | | | 1.53 | |
| Total from investment operations | | | 0.59 | | | (6.33 | ) | | 2.36 | | | 0.53 | | | 1.46 | |
| | | | | | | | | | | | | | | | | |
| Less distributions: | | | | | | | | | | | | | | | | |
| Distributions from net realized gains | | | — | | | (0.28 | ) | | (2.01 | ) | | (1.19 | ) | | (2.22 | ) |
| Net asset value, end of year | | $ | 6.81 | | $ | 6.22 | | $ | 12.83 | | $ | 12.48 | | $ | 13.14 | |
| | | | | | | | | | | | | | | | | |
| Total return | | | 9.49 | % | | (49.28 | )% | | 19.50 | % | | 4.00 | % | | 10.40 | % |
| | | | | | | | | | | | | | | | | |
| Ratios/Supplemental Data: | | | | | | | | | | | | | | | | |
| Net assets, end of year (in thousands) | | $ | 92,680 | | $ | 93,099 | | $ | 203,274 | | $ | 197,349 | | $ | 213,715 | |
Ratio of expenses to average net assets(1) | | | 1.36 | % | | 1.17 | % | | 1.08 | % | | 1.12 | % | | 1.13 | % |
Ratio of expenses to average net assets(2) | | | 1.04 | % | | 0.92 | % | | 0.82 | % | | 1.04 | % | | 1.13 | % |
| Ratio of net investment loss to average net assets | | | (0.22 | )% | | (0.26 | )% | | (0.11 | )% | | (0.37 | )% | | (0.52 | )% |
| Portfolio turnover rate | | | 122 | % | | 273 | % | | 216 | % | | 224 | % | | 224 | % |
| (1) | Ratio reflects expenses grossed up for advisory fees waived by the Adviser, custody credit arrangement and grossed up for the waiver of the service and distribution plan fees by the Distributor. The ratio of expenses to average net assets, net of custody credits, but exclusive of the waiver of the service and distribution plan fees by the Distributor and the advisory fee waiver, would have been 1.07% for the year ended December 31, 2007 and would have been unchanged for the other years shown. |
| | |
| (2) | Ratio reflects expenses net of the advisory fees waived, custody credit arrangement and net of the waiver of the service and distribution plan fees by the Distributor. |
See Notes to Financial Statements.
| The Value Line Fund, Inc. |
| |
| Report of Independent Registered Public Accounting Firm |
To the Board of Directors and Shareholders of The Value Line Fund, Inc.
In our opinion, the accompanying statement of assets and liabilities, including the schedule of investments, and the related statements of operations and of changes in net assets and the financial highlights present fairly, in all material respects, the financial position of The Value Fund, Inc. (the “Fund”) at December 31, 2009, the results of its operations for the year then ended, the changes in its net assets for each of the two years in the period then ended and the financial highlights for each of the five years in the period then ended, in conformity with accounting principles generally accepted in the United States of America. These financial statements and financial highlights (hereafter referred to as “financial statements”) are the responsibility of the Fund’s management; our responsibility is to express an opinion on these financial statements based on our audits. We conducted our audits of these financial statements in accordance with the standards of the Public Company Accounting Oversight Board (United States). Those standards require that we plan and perform the audit to obtain reasonable assurance about whether the financial statements are free of material misstatement. An audit includes examining, on a test basis, evidence supporting the amounts and disclosures in the financial statements, assessing the accounting principles used and significant estimates made by management, and evaluating the overall financial statement presentation. We believe that our audits, which included confirmation of securities at December 31, 2009 by correspondence with the custodian, provide a reasonable basis for our opinion.
PricewaterhouseCoopers LLP
New York, New York
February 26, 2010
| The Value Line Fund, Inc. |
| |
| |
The Fund files its complete schedule of portfolio holdings with the Securities and Exchange Commission (“SEC”) for the first and third quarters of each fiscal year on Form N-Q. The Fund’s Forms N-Q are available on the SEC’s website at http://www.sec.gov and may be reviewed and copied at the SEC’s Public Reference Room in Washington, D.C. Information on the operation of the Public Reference Room may be obtained by calling 1-800-SEC-0330.
A description of the policies and procedures that the Fund uses to determine how to vote proxies relating to portfolio securities, and information regarding how the Fund voted these proxies for the 12-month period ended June 30 is available through the Fund’s website at http://www.vlfunds.com and on the SEC’s website at http://www.sec.gov. The description of the policies and procedures is also available without charge, upon request, by calling 1-800-243-2729.
| The Value Line Fund, Inc. |
| |
| Management of the Fund |
MANAGEMENT INFORMATION
The business and affairs of the Fund are managed by the Fund’s officers under the direction of the Board of Directors. The following table sets forth information on each Director and Officer of the Fund. Each Director serves as a director or trustee of each of the 14 Value Line Funds. Each Director serves until his or her successor is elected and qualified.
| | | | | | | | | |
| Name, Address, and DOB | | Position | | Length of Time Served | | Principal Occupation During the Past 5 Years | | Other Directorships Held by Director |
| Interested Director* | | | | | | | | |
Thomas T. Sarkany DOB: June 1946 | | Director | | Since 2008 | | Mutual Fund Marketing Director of EULAV Securities, Inc. (the “Distributor”), formerly Value Line Securities, Inc. Secretary of Value Line, Inc. since November 2009. | | None |
| Non-Interested Directors | | | | | | | | |
Joyce E. Heinzerling 500 East 77th Street New York, NY 10162 DOB: January 1956 | | Director | | Since 2008 | | President, Meridian Fund Advisers LLC. (consultants) since April 2009; General Counsel, Archery Capital LLC (private investment fund) until April 2009. | | Burnham Investors Trust, since 2004 (4 funds). |
Francis C. Oakley 54 Scott Hill Road Williamstown, MA 01267 DOB: October 1931 | | Director (Lead Independent Director since 2008) | | Since 1993 | | Professor of History, Williams College, (1961-2002). Professor Emeritus since 2002; President Emeritus since 1994 and President, (1985-1994) Chairman (1993-1997) and Interim President (2002-2003) of the American Council of Learned Societies. Trustee since 1997 and Chairman of the Board since 2005, National Humanities Center. | | None |
David H. Porter 5 Birch Run Drive Saratoga Springs, NY 12866 DOB: October 1935 | | Director | | Since 1997 | | Professor, Skidmore College, since 2008; Visiting Professor of Classics, Williams College, (1999-2008); President Emeritus, Skidmore College since 1999 and President, (1987-1998). | | None |
Paul Craig Roberts 169 Pompano St. Panama City Beach, FL 32413 DOB: April 1939 | | Director | | Since 1983 | | Chairman, Institute for Political Economy. | | None |
Nancy-Beth Sheerr 1409 Beaumont Drive Gladwyne, PA 19035 DOB: March 1949 | | Director | | Since 1996 | | Senior Financial Adviser, Veritable L.P. (Investment Adviser) since 2004. | | None |
| The Value Line Fund, Inc. |
| |
| Management of the Fund |
| Name, Address, and DOB | | Position | | Length of Time Served | | Principal Occupation During the Past 5 Years | | Other Directorships Held by Director |
Daniel S. Vandivort 59 Indian Head Road Riverside, CT 06878 DOB: July 1954 | | Director | | Since 2008 | | President, Chief Investment Officer, Weiss, Peck and Greer/Robeco Investment Management 2005-2007; Managing Director, Weiss, Peck and Greer, 1995-2005. | | None |
| Officers | | | | | | |
Mitchell E. Appel DOB: August 1970 | | President | | Since 2008 | | President of each of the Value Line Funds since June 2008; Chief Financial Officer of Value Line since April 2008 and from September 2005 to November 2007; Treasurer from June 2005 to September 2005; Chief Financial Officer of XTF Asset Management from November 2007 to April 2008; Chief Financial Officer of Circle Trust Company from 2003 through May 2005; Chief Financial Officer of the Distributor since April 2008 and President since February 2009; President of the Adviser since February 2009. |
Howard A. Brecher DOB: October 1953 | | Vice President and Secretary | | Since 2008 | | Vice President and Secretary of each of the Value Line Funds since June 2008; Vice President and Secretary of Value Line until November 2009; Director of Value Line; Acting Chairman and Acting CEO of Value Line since November 2009; Secretary and Treasurer of the Adviser since February 2009; Vice President, Secretary, Treasurer, General Counsel and a Director of Arnold Bernhard & Co., Inc. |
Michael J. Wagner DOB: November 1950 | | Chief Compliance Officer | | Since 2009 | | Chief Compliance Officer of Value Line Funds since June 2009; President of Northern Lights Compliance Service, LLC (formerly Fund Compliance Services, LLC (2006-present) and Senior Vice President (2004-2006) and Chief Operations Officer (2003-2006) of Gemini Fund Services, LLC; Director of Constellation Trust Company until 2008. |
Emily D. Washington DOB: January 1979 | | Treasurer | | Since 2008 | | Treasurer and Chief Financial Officer (Principal Financial and Accounting Officer) of each of the Value Line Funds since August 2008; Associate Director of Mutual Fund Accounting at Value Line until August 2008. |
| * | Mr. Sarkany is an “interested person” as defined in the Investment Company Act of 1940 by virtue of his position with the Distributor. |
Unless otherwise indicated, the address for each of the above officers is c/o Value Line Funds, 220 East 42nd Street, New York, NY 10017.
| The Fund’s Statement of Additional Information (SAI) includes additional information about the Fund’s Directors and is available, without charge, upon request by calling 1-800-243-2729 or on the Fund’s website, www.vlfunds.com |
| The Value Line Fund, Inc. |
| |
| |
[This Page Intentionally Left Blank.]
| The Value Line Fund, Inc. |
| |
| |
[This Page Intentionally Left Blank.]
| The Value Line Fund, Inc. |
| |
| The Value Line Family of Funds |
1950 — The Value Line Fund seeks long-term growth of capital. Current income is a secondary objective.
1952 — Value Line Income and Growth Fund’s primary investment objective is income, as high and dependable as is consistent with reasonable risk. Capital growth to increase total return is a secondary objective.
1956 — Value Line Premier Growth Fund seeks long-term growth of capital. No consideration is given to current income in the choice of investments.
1972 — Value Line Larger Companies Fund’s sole investment objective is to realize capital growth.
1979 — Value Line U.S. Government Money Market Fund**, a money market fund, seeks to secure as high a level of current income as is consistent with maintaining liquidity and preserving capital. An investment in the Fund is not insured or guaranteed by the Federal Deposit Insurance Corporation or any other government agency. Although the Fund seeks to preserve the value of your investment at $1.00 per share, it is possible to lose money by investing in the Fund.
1981 — Value Line U.S. Government Securities Fund seeks maximum income without undue risk to capital. Under normal conditions, at least 80% of the value of its net assets will be invested in securities issued or guaranteed by the U.S. Government and its agencies and instrumentalities.
1983 — Value Line Centurion Fund* seeks long-term growth of capital.
1984 — The Value Line Tax Exempt Fund seeks to provide investors with the maximum income exempt from federal income taxes while avoiding undue risk to principal. The fund may be subject to state and local taxes and the Alternative Minimum Tax (if applicable).
1985 — Value Line Convertible Fund seeks high current income together with capital appreciation primarily from convertible securities ranked 1, 2 or 3 for the year-ahead performance by the Value Line Convertible Ranking System.
1986 — Value Line Aggressive Income Trust seeks to maximize current income.
1987 — Value Line New York Tax Exempt Trust seeks to provide New York taxpayers with the maximum income exempt from New York State, New York City and federal income taxes while avoiding undue risk to principal. The Trust may be subject to state and local taxes and the Alternative Minimum Tax (if applicable).
1987 — Value Line Strategic Asset Management Trust* seeks to achieve a high total investment return consistent with reasonable risk.
1993 — Value Line Emerging Opportunities Fund invests in US common stocks of small capitalization companies, with its primary objective being long-term growth of capital.
1993 — Value Line Asset Allocation Fund seeks high total investment return, consistent with reasonable risk. The Fund invests in stocks, bonds and money market instruments utilizing quantitative modeling to determine the asset mix.
| | |
| * | Only available through the purchase of Guardian Investor, a tax deferred variable annuity, or ValuePlus, a variable life insurance policy. |
| | |
| ** | Effective August 19, 2009, The Value Line Cash Fund, Inc. changed its name to the Value Line U.S. Government Money Market Fund, Inc. |
For more complete information about any of the Value Line Funds, including charges and expenses, send for a prospectus from EULAV Securities, Inc., 220 East 42nd Street, New York, New York 10017-5891 or call 1-800-243-2729, 9am–5pm CST, Monday–Friday, or visit us at www.vlfunds.com. Read the prospectus carefully before you invest or send money.
Item 2. Code of Ethics
(a) The Registrant has adopted a Code of Ethics that applies to its principal executive officer, and principal financial officer and principal accounting officer.
(f) Pursuant to item 12(a), the Registrant is attaching as an exhibit a copy of its Code of Ethics that applies to its principal executive officer, and principal financial officer and principal accounting officer.
Item 3. Audit Committee Financial Expert.
(a)(1)The Registrant has an Audit Committee Financial Expert serving on its Audit Committee.
(2) The Registrant’s Board has designated Daniel S. Vandivort, a member of the Registrant’s Audit Committee, as the Registrant’s Audit Committee Financial Expert. Mr. Vandivort is an independent director who has served as President, Chief Investment Officer of Weis, Peck and Greer/Robeco Investment Management. He has also previously served as Managing Director for Weis, Peck and Greer (1995-2005).
A person who is designated as an “audit committee financial expert” shall not make such person an "expert" for any purpose, including without limitation under Section 11 of the Securities Act of 1933 or under applicable fiduciary laws, as a result of being designated or identified as an audit committee financial expert. The designation or identification of a person as an audit committee financial expert does not impose on such person any duties, obligations, or liabilities that are greater than the duties, obligations, and liabilities imposed on such person as a member of the audit committee and Board of Trustees in the absence of such designation or identification.
Item 4. Principal Accountant Fees and Services
| | (a) | Audit Fees 2009 - $22,966 |
| | | |
| | (b) | Audit-Related fees – None. |
| | | |
| | (c) | Tax Preparation Fees 2009 -$14,584 |
| | | |
| | (d) | All Other Fees – None |
| | | |
| | (e) (1) | Audit Committee Pre-Approval Policy. All services to be performed for the Registrant by PricewaterhouseCoopers LLP must be pre-approved by the audit committee. All services performed were pre-approved by the committee. |
| | | |
| | (e) (2) | Not applicable. |
| | | |
| | (f) | Not applicable. |
| | | |
| | (g) | Aggregate Non-Audit Fees 2009 -$2,050 |
| | | |
| | (h) | Not applicable. |
Item 11. Controls and Procedures.
| | (a) | The registrant’s principal executive officer and principal financial officer have concluded that the registrant’s disclosure controls and procedures (as defined in rule 30a-2(c) under the Act (17 CFR 270.30a-2(c) ) based on their evaluation of these controls and procedures as of a date within 90 days of the filing date of this report, are appropriately designed to ensure that material information relating to the registrant is made known to such officers and are operating effectively. |
| | | |
| | (b) | The registrant’s principal executive officer and principal financial officer have determined that there have been no significant changes in the registrant’s internal controls or in other factors that could significantly affect these controls subsequent to the date of their evaluation, including corrective actions with regard to significant deficiencies and material weaknesses. |
Item 12. Exhibits.
| | (a) | Code of Business Conduct and Ethics for Principal Executive and Senior Financial Officers attached hereto as Exhibit 99.2R CODE ETH. |
| | | |
| | (b) | (1) Certification pursuant to Rule 30a-2(a) under the Investment Company Act of 1940 (17 CFR 270.30a-2) attached hereto as Exhibit 99.CERT. |
| | | |
| | | (2) Certification pursuant to Section 906 of the Sarbanes-Oxley Act of 2002 attached hereto as Exhibit 99.906.CERT. |
SIGNATURES
Pursuant to the requirements of the Securities Exchange Act of 1934 and the Investment Company Act of 1940, the registrant has duly caused this report to be signed on its behalf by the undersigned, thereunto duly authorized.
| By | /s/ Mitchell E. Appel | |
| | Mitchell E. Appel, President |
| | | |
| | | |
| Date: | February 26, 2010 | |
Pursuant to the requirements of the Securities Exchange Act of 1934 and the Investment Company Act of 1940, this report has been signed below by the following persons on behalf of the registrant and in the capacities and on the dates indicated.
| By: | /s/ Mitchell E. Appel | |
| | Mitchell E. Appel, President, Principal Executive Officer |
| | | |
| | | |
| By: | /s/ Emily D. Washington | |
| | Emily D. Washington, Treasurer, Principal Financial Officer |
| | | |
| | | |
| Date: | February 26, 2010 | |