UNITED STATES
SECURITIES AND EXCHANGE COMMISSION
Washington, D.C. 20549
FORM N-CSR
CERTIFIED SHAREHOLDER REPORT OF REGISTERED
MANAGEMENT INVESTMENT COMPANIES
Investment Company Act file Number 811-02265
| Value Line Fund, Inc. | | |
| (Exact name of registrant as specified in charter) |
| | | |
7 Times Square, New York, N.Y. 10036 | |
| (Address of principal executive offices) (Zip Code) |
Registrant’s telephone number, including area code: 212-907-1900
Date of fiscal year end: December 31
Date of reporting period: June 30, 2013
Item I. Reports to Stockholders.
A copy of the Semi-Annual Report to Stockholders for the period ended 6/30/13 is included with this Form.
| | INVESTMENT ADVISER | EULAV Asset Management | | S E M I - A N N U A L R E P O R T | |
| | | 7 Times Square 21st Floor | | J u n e 3 0 , 2 0 1 3 | |
| | | New York, NY 10036-6524 | | | |
| | DISTRIBUTOR | EULAV Securities LLC | | Value Line Premier Growth Fund, Inc. The Value Line Fund, Inc. Value Line Income and Growth Fund, Inc. Value Line Larger Companies Fund, Inc. | |
| | | 7 Times Square 21st Floor | | |
| | | New York, NY 10036-6524 | | |
| | CUSTODIAN BANK | State Street Bank and Trust Co. | | |
| | | 225 Franklin Street | | |
| | | Boston, MA 02110 | | |
| | SHAREHOLDER | State Street Bank and Trust Co. | | |
| | SERVICING AGENT | c/o BFDS | | |
| | | P.O. Box 219729 | | |
| | | Kansas City, MO 64121-9729 | | |
| | INDEPENDENT | PricewaterhouseCoopers LLP | | |
| | REGISTERED PUBLIC | 300 Madison Avenue | | |
| | ACCOUNTING FIRM | New York, NY 10017 | | |
| | LEGAL COUNSEL | Peter D. Lowenstein, Esq. | | |
| | | 515 West Lyon Farm Drive | | |
| | | Greenwich, CT 06831 | | |
| | DIRECTORS | Mitchell E. Appel | | |
| | | Joyce E. Heinzerling | | |
| | | Francis C. Oakley | | |
| | | David H. Porter | | |
| | | Paul Craig Roberts | | |
| | | Nancy-Beth Sheerr | | |
| | | Daniel S. Vandivort | | |
| | OFFICERS | Mitchell E. Appel | | |
| | | President | | |
| | | Michael J. Wagner | | | |
| | | Chief Compliance Officer | | | |
| | | Emily D. Washington | | | |
| | | Treasurer and Secretary | | | |
| | | | | |
| | | |  | |
| |  | | | |
 | |
| | This unaudited report is issued for information to shareholders. It is not authorized for distribution to prospective investors unless preceded or accompanied by a currently effective prospectus of the Funds (obtainable from the Distributor). | | | |
| | | | | |
| | #00102360 | | | |
To Our Shareholders (unaudited):
Welcome to our consolidated semi-annual report for the six months ended June 30, 2013. Enclosed in the report you will find the following funds (individually a “Fund” and collectively, the “Funds”):
| | ● | Value Line Premier Growth Fund, Inc. |
| | ● | The Value Line Fund, Inc. |
| | ● | Value Line Income and Growth Fund, Inc. |
| | ● | Value Line Larger Companies Fund, Inc. |
We encourage you to carefully review the information in this report, which includes economic observations, each of your Fund’s performance data and highlights, schedule of investments, and financial statements. The following sub sections describe the manager’s commentary for each of the individual funds.
Value Line Premier Growth Fund, Inc.
The Value Line Premier Growth Fund, Inc. (symbol: VALSX) earned a total return of 9.08% for the six-month period, versus a total return of 13.82% for the benchmark Standard & Poor’s 500 Stock Index.(1) The Fund invests primarily in “Growth” stocks, which trailed “Value” stocks during the period. In particular, the portfolio’s returns lagged in the Financial Services and Healthcare sectors.
Notwithstanding short-term ebbs and flows, the Fund has widely outpaced the S&P 500 benchmark since the current senior portfolio manager first took the reins in late 1996. Moreover, the Fund has outperformed its peers for the three-, five- and ten-year periods ending June 30, 2013, as noted by both of the leading independent mutual fund advisory services, Morningstar(2) (mid-cap growth category) and Lipper Inc.(3) (multi-cap growth category). Morningstar gives the Fund an overall Return rating of Above Average and an overall Risk rating of Below Average, an enviable combinationi. Lipper awards its top Lipper Leader rating of 5 to the Fund for overall Total Return (439 funds), overall Consistent Return (436), and overall Preservation (10,312), versus peers as of July 2013ii.
Our disciplined investment strategy has served the Fund well. First and foremost, we invest in high-quality companies with proven records of success, demonstrated by superior earnings performance and superior stock performance relative to competition over the past ten years or more. Second, we closely monitor quarterly earnings reports and relative stock price momentum of the Fund’s holdings for any signs of sub-par performance. With about 200 stocks in the portfolio, we do not become attached to any single holding and do not hesitate to sell laggards, replacing them with stocks showing superior momentum. This discipline is key to your Fund’s long-term success. Yet annual portfolio turnover has averaged a moderate 15% over the past five years, limiting trading costs.
Controlling risk is of major importance to us. Risk measures published by Morningstar show that your Fund has protected shareholders from downside volatility significantly better than the average fund in its peer group. We achieve this through maintaining a widely diversified portfolio of high-quality companies, containing representatives from nearly every industry. Only 12% of the Fund’s assets are invested in its ten largest holdings, as of June 30th. We invest across the entire range of company size, too. Current holdings are about 45% large-cap stocks, 40% mid-cap and 15% small-cap.
We believe our time-tested investment discipline will continue to benefit the Premier Growth Fund’s shareholders in the future.
The Value Line Fund, Inc.
The Value Line Fund, Inc. (symbol: VLIFX) earned a total return of 10.81% for the six months ending June 30, 2013. That compared with a total return of 13.82% for the benchmark index, the Standard & Poor’s 500.(1) The Fund invests primarily in “Growth” stocks, which trailed “Value” stocks during the period. In particular, the portfolio’s returns lagged in the Healthcare and Financial Services sectors. In 2009, we repositioned your Fund for improved performance. We are gratified by the results. For the three years ended June 30, 2013, the Fund earned an average annual total return of 19.25%. Compared with an average annual total return of 18.45% for the S&P 500 (1-yr 17.02%, 5-yr 0.87% & 10-yr 4.43%). For the same three year period, your Fund placed in the top quintile of its peer group, as measured by both of the leading independent mutual fund advisory services, Morningstar (mid-cap growth category-637 funds) and Lipper Inc. (multi-cap growth category-439 funds)iii. The 2009 repositioning included a broadening of Value Line Fund’s stock selection universe to encompass the 1,200 or so stocks in the top three Ranks of the Value Line Timeliness Ranking System. This has allowed greater diversification of the portfolio, which reduces exposure to any single economic sector. It has also resulted in decreased turnover of portfolio holdings, which lowers trading costs. At the same time, we handed the reins to our senior portfolio manager who has demonstrated widely recognized success managing other equity portfolios in our fund family for over twenty years.
The Fund’s expanded stock selection criteria allow us to implement our disciplined investment strategy to full advantage. We invest in proven winners---those companies that have established ten-year records of superior relative earnings growth and stock price growth. We also look for companies demonstrating strong short-term, quarter-to-quarter, relative earnings momentum and stock price momentum. If a holding later falters on these measures, we do not hesitate to replace it with a stock showing superior strength.
The Fund invests in companies of all sizes. Its approximately 150 holdings are well-diversified in that respect, currently comprised of about 40% large-capitalization companies, 40% mid-cap and 20% small-cap. In addition, the portfolio is widely diversified across many industries. Moreover, only about 15% of assets are invested in the Value Line Fund’s top ten holdings.
We will continue to maintain our time-tested investment discipline for this Fund.
Value Line Income and Growth Fund, Inc.
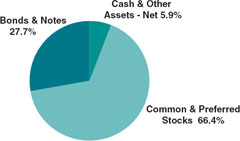
The Value Line Income and Growth Fund, Inc. (symbol: VALIX) had a total return of 8.05% for the first six months of 2013. This compares to a total return of 7.32% for the blended index of 60% Standard & Poor’s 500 stock Index(1) and 40% Barclay’s Capital US Aggregate Bond Index(4) for the same period. The Fund’s asset allocation at the end of June had a weighting of 71% in stocks and bonds convertible into common stock, 23% in fixed income and 6% in cash.
Prospects of a slow but steady economic recovery were boosted by continued improvement in the housing sector and US employment over the first six months of the year. While global macro-economic events caused periods of uncertainty, stocks ended the period with solid gains. The role of the Federal Reserve and its commitment to its Quantitative Easing program that supplies liquidity to the financial markets will be hotly contested going forward and will likely add volatility to share prices for the remainder of the year and beyond.
The Fund benefited by having an asset allocation that underweighted fixed income securities and over-weighted equities versus its benchmark during the period. In its stock allocation, the Fund benefited from good stock selection in the consumer staples, financials, healthcare, technology, and utility sectors. An underweighted position in technology also benefited the Fund. Detracting from the Fund’s performance in the period was stock selection in the energy and materials sectors. At the end of June, the Fund was over-weighted in industrials, utilities (where many stocks with higher dividend yields reside) and financials while being underweighted in energy, consumer discretionary, and healthcare sectors. We continue to emphasize stocks with healthy and growing dividend yields selling at reasonable valuation levels in our investment process.
In our fixed income investments for this Fund, we continue to believe that bonds are less attractive than stocks and continue to underweight them at this time. We believe improving economic conditions will send fixed income prices lower while stocks will benefit from higher earnings and cash flow. Going forward, we will be mindful of the possibility of another economic slowdown and its potential effects on both stocks and bonds and continue to emphasize opportunities that afford reasonable valuation levels, healthy balance sheets, income generation and positive cash flows.
The current environment is especially conducive to a well-diversified balanced approach to investing. Our goal in this Fund is to preserve capital in the short term while generating solid total returns (income plus capital appreciation) in the longer term across economic cycles.
Value Line Larger Companies Fund, Inc.
The Value Line Larger Companies Fund, Inc. (symbol: VALLX) had a total return of 9.10% for the first six months of 2013 which compares to a total return of 13.82% for the Standard & Poor’s 500 stock Index(1) and 11.80% for the Russell 1000 Growth Index.(5)
Results in the Fund for the first six months of the year benefited from good stock selection in the healthcare and consumer staples sectors. An underweighted position in the energy sector and an over weighted position in consumer discretionary sector also benefited the Fund. However, an underweighted position in the financial services sector detracted from the Fund’s performance for the period as did over-weighted positions in technology and materials. Stock selection in the technology and materials sectors also detracted from the Fund’s results as those stocks underperformed the overall market for the period.
In this Fund, we continue to emphasize larger-capitalized stocks that generally are ranked in the higher categories of 1, 2 or 3 in the Value Line Timeliness Ranking System. The Fund ended the period with over-weighted positions in the consumer discretionary, technology, materials, and healthcare sectors, while being underweighted in the financials, consumer staples and energy sectors.
Our goal continues to be to generate solid returns through capital growth across economic cycles.
Sincerely,
/s/ Mitchell Appel | | |
| Mitchell Appel | |
| President of the Value Line Funds | |
| | |
/s/ Stephen Grant | | |
| Stephen Grant | |
| Portfolio Manager of The Value Line Premier Growth Fund and The Value Line Fund | |
| | |
/s/ Mark Spellman | | |
| Mark Spellman | |
| Portfolio Manager of The Value Line Income and Growth Fund and The Value Line Larger Companies Fund |
Past performance does not guarantee future results. Investment return and principal value of an investment can fluctuate so that an investor’s shares, when redeemed, may be worth more or less than their original cost; and that current performance may be lower or higher than the performance data quoted. Investors should carefully consider the investment objectives, risks, charges and expense of a fund. This and other important information about a fund is contained in the fund’s prospectus. A copy of our fund’s prospectus can be obtained free of charge by going to our website at www.vlfunds.com or calling 800.243.2729.
| (1) | The S&P 500 Index consists of 500 stocks which are traded on the New York Stock Exchange, American Stock Exchange and the NASDAQ National Market System and is representative of the broad stock market. This is an unmanaged index and does not reflect charges, expenses or taxes, and it is not possible to directly invest in this index. |
| (2) | The Morningstar RatingTM for funds methodology rates funds based on an enhanced Morningstar Risk-Adjusted Return measure, which also accounts for the effects of all sales charges, loads, or redemption fees. Funds are ranked by their Morningstar Risk-Adjusted Return scores and stars are assigned using the following scale: 5 stars for top 10%; 4 stars next 22.5%; 3 stars next 35%; 2 stars next 22.5%; 1 star for bottom 10%. Funds are rated for up to three periods: the trailing three-, five-, and 10-years. For a fund that does not change categories during the evaluation period, the overall rating is calculated using the following weights: At least 3 years, but less than 5 years uses 100% three-year rating. At least 5 years but less than 10 years uses 60% five-year rating / 40% three-year rating. At least 10 years uses 50% ten-year rating / 30% five-year rating / 20% three-year rating. |
i Morningstar Risk: 3-yr Low, 5-Yr & 10-yr Below Avg. Morningstar Return: 3-yr & 10-yr Above Avg, 5-yr Average.
ii Total Return 3-yr 5/439, 5-yr 4/383, 10-yr 5/250; Consistent Return 3-yr 5/436, 5-yr 5/380, 10-yr 5/247.
Preservation 3-yr 5/10312, 5-yr 5/8800, 10-yr 4/5073.
iii1-yr 315/508 funds, 5-yr 363/383,10-yr 244/250.
| (3) | Lipper Leader ratings are derived from highly sophisticated formulas that analyze funds against clearly defined criteria. Funds are compared to similar funds, and only those that truly stand out are awarded Lipper Leader status. Funds are ranked against their peers on each of four measures: Total Return, Consistent Return, Preservation, and Expense. A fifth measure, Tax Efficiency, applies in the United States. Scores are subject to change every month and are calculated for the following periods: 3-year, 5-year, 10-year, and overall. The overall calculation is based on an equal-weighted average of percentile ranks for each measure over 3-year, 5-year, and 10-year periods (if applicable). For each measure, the highest 20% of funds in each peer group are named Lipper Leaders. The next 20% receive a rating of 4; the middle 20% are rated 3; the next 20% are rated 2, and the lowest 20% are rated 1. |
| (4) | The Barclay’s Capital U.S. Aggregate Bond Index is a broad-based benchmark that measures the investment grade, U.S. dollar-denominated, fixed-rate taxable bond market, including Treasuries, government-related and corporate securities, MBS (agency fixed-rate and hybrid ARM pass-through’s), ABS, and CMBS. |
| (5) | The Russell 1000 Index is representative of the large-cap segment of the U.S. equity market. |
| Economic Highlights (unaudited): |
The S&P 500 Index continued its upward climb in 2013 returning 13.82 % for the six months ended June 30, 2013. The equity market found support from a significantly stronger real estate market and a modest drop in the national unemployment rate from 2012 levels.
The U.S. economy grew modestly in the second quarter. Real GDP rose 1.7%, constrained by tax hikes and defense spending cuts. Consumer spending, the largest component of GDP, was quite modest despite a rebound in personal income of 4.1%. The personal savings rate rose to 4.5%, suggesting that the consumer may have some financial cushion to increase spending going forward. Some strength in business investment indicates that a 3% growth rate in the U.S. is possible later in 2013. However, sequestration is expected to continue to remain a bit of a headwind for the economy in the third quarter.
Recent jobs gains also raise hopes for a stronger economy in the second half of 2013. U.S. employers added 195,000 jobs in June and hiring was more robust in the two previous months than had been previously estimated. The three-month stretch, April through June, delivered the best jobs numbers since early 2012. The unemployment rate stayed at 7.6% despite an influx of additional people starting to look for work.
Despite this improvement in job creation, it has not been enough for the Fed to alter its economic stimulus policy of keeping short term interest rates at extremely low levels. While the Fed has indicated a willingness to slow its monthly bond buying program, it is clear that any tapering of this program remains data dependent.
Inflationary pressures have remained modest this year despite a growing economy. The Consumer Price Index rose 0.5% in June on a seasonally adjusted basis. Much of the monthly rise was due to increased gasoline prices. Over the last 12 months the all items index increased 1.8%. While advances in the indexes for shelter, medical care, and apparel accounted for most of the rise, limited wage growth was a partial offset and contributed to the relatively benign inflationary environment.
FUND EXPENSES (unaudited):
Example
As a shareholder of the Funds, you incur ongoing costs, including management fees, distribution and service (12b-1) fees, and other Fund expenses. This Example is intended to help you understand your ongoing costs (in dollars) of investing in each Fund and to compare these costs with the ongoing costs of investing in other mutual funds.
The Example is based on an investment of $1,000 invested at the beginning of the period and held for the entire period (January 1, 2013 through June 30, 2013).
Actual Expenses
The first line in the table below for each Fund provides information about actual account values and actual expenses. You may use this information, together with the amount you invested, to estimate the expenses that you paid over the period. Simply divide your account value by $1,000 (for example an $8,600 account value divided by $1,000 = 8.6), then multiply the result by the number in the first line for each Fund under the heading “Expenses Paid During Period” to estimate the expenses you paid on your account during this period.
Hypothetical Example for Comparison Purposes
The second line in the table for each Fund provides information about hypothetical account values and hypothetical expenses based on the Fund’s actual expense ratio and an assumed rate of return of 5% per year before expenses, which is not the Funds’ actual return. The hypothetical account values and expenses may not be used to estimate the actual ending account balance or expenses you paid for the period. You may use this information to compare the ongoing costs of investing in the Fund and other funds. To do so, compare this 5% hypothetical example with the 5% hypothetical examples that appear in the shareholder reports of other funds.
Please note that the expenses shown in the table are meant to highlight your ongoing costs only and do not reflect any transactional costs, such as sales charges (loads), redemption fees, or exchange fees. Therefore, the table is useful in comparing ongoing costs only and will not help you determine the relative total costs of owning different funds. In addition, if transactional costs were included, your costs would have been higher.
| | | | | | | | | | | | | |
| | | Beginning account value 1/1/13 | | Ending account value 6/30/13 | | Expenses paid during period 1/1/13 thru 6/30/13* |
| Actual | | | | | | | | | | | | |
| Value Line Premier Growth Fund, Inc. | | $ | 1,000.00 | | | $ | 1,090.85 | | | $ | 6.35 | |
| The Value Line Fund, Inc. | | | 1,000.00 | | | | 1,108.11 | | | | 5.34 | |
| Value Line Income and Growth Fund, Inc. | | | 1,000.00 | | | | 1,080.54 | | | | 5.67 | |
| Value Line Larger Companies, Fund, Inc. | | | 1,000.00 | | | | 1,091.00 | | | | 5.16 | |
| Hypothetical (5% return before expenses) | | | | | | | | | | | | |
| Value Line Premier Growth Fund, Inc. | | | 1,000.00 | | | | 1,018.72 | | | | 6.13 | |
| The Value Line Fund, Inc. | | | 1,000.00 | | | | 1,019.72 | | | | 5.12 | |
| Value Line Income and Growth Fund, Inc. | | | 1,000.00 | | | | 1,019.35 | | | | 5.50 | |
| Value Line Larger Companies, Fund, Inc. | | | 1,000.00 | | | | 1,019.86 | | | | 4.99 | |
| * | Expenses are equal to the Funds’ annualized expense ratio of 1.22%, 1.02%, 1.10%, and 1.00%, respectively, multiplied by the average account value over the period, multiplied by 181/365 to reflect the one-half year period. These expense ratios may differ from the expense ratios shown in the Financial Highlights. |
| Value Line Premier Growth Fund, Inc. |
| Portfolio Highlights at June 30, 2013 (unaudited) |
Ten Largest Holdings
| | | | | | | | | | | |
| Issue | | Shares | | Value | | Percentage of Net Assets | |
| MasterCard, Inc. Class A | | | 10,600 | | $ | 6,089,700 | | 1.7 | % | |
| Companhia de Bebidas das Americas ADR | | | 130,000 | | | 4,855,500 | | 1.3 | % | |
| Roper Industries, Inc. | | | 36,000 | | | 4,471,920 | | 1.2 | % | |
| ANSYS, Inc. | | | 60,000 | | | 4,386,000 | | 1.2 | % | |
| Alexion Pharmaceuticals, Inc. | | | 47,000 | | | 4,335,280 | | 1.2 | % | |
| Stericycle, Inc. | | | 37,600 | | | 4,152,168 | | 1.1 | % | |
| AMETEK, Inc. | | | 96,750 | | | 4,092,525 | | 1.1 | % | |
| Precision Castparts Corp. | | | 17,800 | | | 4,022,978 | | 1.1 | % | |
| FMC Technologies, Inc. | | | 70,000 | | | 3,897,600 | | 1.1 | % | |
| Union Pacific Corp. | | | 25,000 | | | 3,857,000 | | 1.1 | % | |
| | | | | | | | | | | |
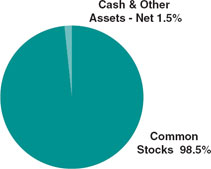
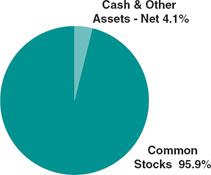
| Asset Allocation – Percentage of Net Assets |
| |
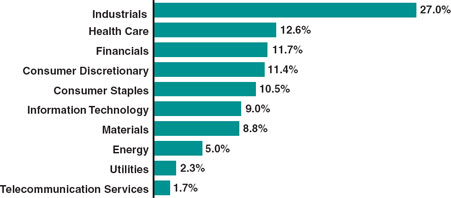
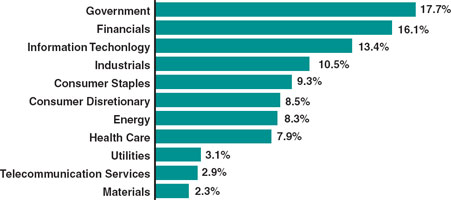
| Sector Weightings – Percentage of Total Investment Securities* |
*Sector weightings exclude short-term investments.
| The Value Line Fund, Inc. |
| Portfolio Highlights at June 30, 2013 (unaudited) |
Ten Largest Holdings
| | | | | | | | | | | |
| Issue | | Shares | | Value | | Percentage of Net Assets | |
| TJX Companies, Inc. (The) | | | 44,000 | | $ | 2,202,640 | | 2.0 | % | |
| Rollins, Inc. | | | 79,600 | | | 2,061,640 | | 1.8 | % | |
| Yum! Brands, Inc. | | | 24,800 | | | 1,719,632 | | 1.5 | % | |
| AutoZone, Inc. | | | 4,000 | | | 1,694,760 | | 1.5 | % | |
| Church & Dwight Co., Inc. | | | 26,000 | | | 1,604,460 | | 1.4 | % | |
| AMETEK, Inc. | | | 36,750 | | | 1,554,525 | | 1.4 | % | |
| Roper Industries, Inc. | | | 12,400 | | | 1,540,328 | | 1.4 | % | |
| McDonald’s Corp. | | | 15,300 | | | 1,514,700 | | 1.3 | % | |
| Alliance Data Systems Corp. | | | 8,300 | | | 1,502,549 | | 1.3 | % | |
| Express Scripts Holding Co. | | | 24,340 | | | 1,501,534 | | 1.3 | % | |
| | | | | | | | | | | |
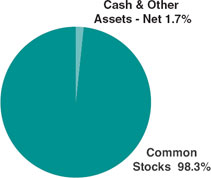
| Asset Allocation – Percentage of Net Assets | | | | | | | | | | |
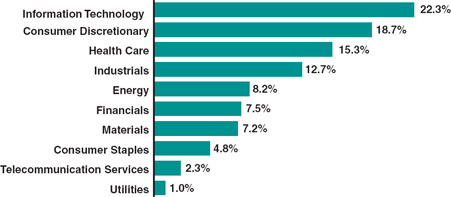
| Sector Weightings – Percentage of Total Investment Securities* |
*Sector weightings exclude short-term investments.
| Value Line Income and Growth Fund, Inc. |
| Portfolio Highlights at June 30, 2013 (unaudited) |
Ten Largest Holdings
| | | | | | | | | | | |
| Issue | | Shares/Principal Amount | | Value | | Percentage of Net Assets | |
| Google, Inc. Class A | | | 4,000 | | $ | 3,521,480 | | 1.1 | % | |
| Johnson & Johnson | | | 37,000 | | | 3,176,820 | | 1.0 | % | |
| Intel Corp. | | | 129,000 | | | 3,124,380 | | 1.0 | % | |
| Procter & Gamble Co. (The) | | | 40,000 | | | 3,079,600 | | 1.0 | % | |
| Exxon Mobil Corp. | | | 34,000 | | | 3,071,900 | | 1.0 | % | |
| U.S. Treasury Notes, 1.00%, 9/30/16 | | $ | 3,000,000 | | | 3,020,391 | | 1.0 | % | |
| U.S. Treasury Notes, 0.50%, 10/15/14 | | $ | 3,000,000 | | | 3,010,782 | | 1.0 | % | |
| JPMorgan Chase & Co. | | | 57,000 | | | 3,009,030 | | 1.0 | % | |
| Microsoft Corp. | | | 87,000 | | | 3,004,110 | | 1.0 | % | |
| U.S. Treasury Notes, 3.63%, 2/15/20 | | $ | 2,650,000 | | | 2,956,200 | | 1.0 | % | |
| | | | | | | | | | | |
| Asset Allocation – Percentage of Net Assets | | | | | | | | | | |
| Sector Weightings – Percentage of Total Investment Securities* |
*Sector weightings exclude short-term investments.
| Value Line Larger Companies Fund, Inc. |
| Portfolio Highlights at June 30, 2013 (unaudited) |
Ten Largest Holdings
| | | | | | | | | | | |
| Issue | | Shares | | Value | | Percentage of Net Assets | |
| Google, Inc. Class A | | | 3,700 | | $ | 3,257,369 | | 1.7 | % | |
| Union Pacific Corp. | | | 20,000 | | | 3,085,600 | | 1.7 | % | |
| Actavis, Inc. | | | 24,000 | | | 3,029,280 | | 1.6 | % | |
| Starbucks Corp. | | | 44,000 | | | 2,881,560 | | 1.5 | % | |
| Visa, Inc. Class A | | | 15,000 | | | 2,741,250 | | 1.5 | % | |
| Precision Castparts Corp. | | | 12,000 | | | 2,712,120 | | 1.5 | % | |
| DIRECTV | | | 44,000 | | | 2,711,280 | | 1.5 | % | |
| Viacom, Inc. Class B | | | 39,000 | | | 2,653,950 | | 1.4 | % | |
| Costco Wholesale Corp. | | | 24,000 | | | 2,653,680 | | 1.4 | % | |
| Apple, Inc. | | | 6,500 | | | 2,574,520 | | 1.4 | % | |
| | | | | | | | | | | |
| Asset Allocation – Percentage of Net Assets | | | | | | | | | | |
| Sector Weightings – Percentage of Total Investment Securities* |
*Sector weightings exclude short-term investments.
| | |
| Value Line Premier Growth Fund, Inc. | |
| Schedule of Investments (unaudited) | June 30, 2013 |
| | | | | | | | |
| Shares | | | | Value | |
| COMMON STOCKS (98.5%) | | | | |
| | | | | |
| | | | CONSUMER DISCRETIONARY (11.2%) | | | | |
| | 8,400 | | AutoZone, Inc. * | | $ | 3,558,996 | |
| | 28,000 | | BorgWarner, Inc. * | | | 2,412,200 | |
| | 40,000 | | Brinker International, Inc. | | | 1,577,200 | |
| | 10,500 | | Buckle, Inc. (The) (1) | | | 546,210 | |
| | 37,000 | | Darden Restaurants, Inc. | | | 1,867,760 | |
| | 30,000 | | Dick’s Sporting Goods, Inc. | | | 1,501,800 | |
| | 34,000 | | Domino’s Pizza, Inc. | | | 1,977,100 | |
| | 23,000 | | Genuine Parts Co. | | | 1,795,610 | |
| | 15,200 | | Gildan Activewear, Inc. | | | 615,752 | |
| | 3,600 | | HSN, Inc. | | | 193,392 | |
| | 27,000 | | Johnson Controls, Inc. | | | 966,330 | |
| | 8,600 | | Life Time Fitness, Inc. * | | | 430,946 | |
| | 112,000 | | LKQ Corp. * | | | 2,884,000 | |
| | 24,000 | | McDonald’s Corp. | | | 2,376,000 | |
| | 49,000 | | NIKE, Inc. Class B | | | 3,120,320 | |
| | 18,000 | | O’Reilly Automotive, Inc. * | | | 2,027,160 | |
| | 13,000 | | Penn National Gaming, Inc. * | | | 687,180 | |
| | 12,828 | | PVH Corp. | | | 1,604,141 | |
| | 10,000 | | Signet Jewelers Ltd. | | | 674,300 | |
| | 40,000 | | Starbucks Corp. | | | 2,619,600 | |
| | 68,600 | | TJX Companies, Inc. (The) | | | 3,434,116 | |
| | 5,400 | | VF Corp. | | | 1,042,524 | |
| | 36,000 | | Yum! Brands, Inc. | | | 2,496,240 | |
| | | | | | | 40,408,877 | |
| | | | | | | | |
| | | | CONSUMER STAPLES (10.4%) | | | | |
| | 71,000 | | BRF S.A. ADR (1) | | | 1,541,410 | |
| | 17,000 | | British American Tobacco PLC ADR (1) | | | 1,749,980 | |
| | 21,300 | | Brown-Forman Corp. Class B | | | 1,438,815 | |
| | 24,000 | | Bunge Ltd. | | | 1,698,480 | |
| | 48,400 | | Church & Dwight Co., Inc. | | | 2,986,764 | |
| | 16,800 | | Coca-Cola Femsa, SAB de C.V. ADR (1) | | | 2,356,872 | |
| | 130,000 | | Companhia de Bebidas das Americas ADR | | | 4,855,500 | |
| | 14,000 | | Costco Wholesale Corp. | | | 1,547,980 | |
| | 23,400 | | Energizer Holdings, Inc. | | | 2,351,934 | |
| | 89,813 | | Flowers Foods, Inc. | | | 1,980,366 | |
| | 20,000 | | Fomento Economico Mexicano SAB de C.V. ADR | | | 2,063,800 | |
| | 64,000 | | General Mills, Inc. | | | 3,105,920 | |
| | 23,000 | | Green Mountain Coffee Roasters, Inc. * (1) | | | 1,726,380 | |
| | | | | | | | |
| Shares | | | | Value | |
| | 32,000 | | Harris Teeter Supermarkets, Inc. | | $ | 1,499,520 | |
| | 43,000 | | Hormel Foods Corp. | | | 1,658,940 | |
| | 29,000 | | PepsiCo, Inc. | | | 2,371,910 | |
| | 22,000 | | Reynolds American, Inc. | | | 1,064,140 | |
| | 29,000 | | Whole Foods Market, Inc. | | | 1,492,920 | |
| | | | | | | 37,491,631 | |
| | | | | | | | |
| | | | ENERGY (4.9%) | | | | |
| | 12,000 | | Cameron International Corp. * | | | 733,920 | |
| | 8,600 | | CNOOC Ltd. ADR (1) | | | 1,440,328 | |
| | 14,600 | | Core Laboratories N.V. | | | 2,214,236 | |
| | 17,000 | | Enbridge, Inc. | | | 715,190 | |
| | 24,000 | | EQT Corp. | | | 1,904,880 | |
| | 70,000 | | FMC Technologies, Inc. * | | | 3,897,600 | |
| | 51,400 | | Noble Energy, Inc. | | | 3,086,056 | |
| | 6,000 | | Oceaneering International, Inc. | | | 433,200 | |
| | 5,000 | | Oil States International, Inc. * | | | 463,200 | |
| | 5,346 | | Pioneer Natural Resources Co. | | | 773,834 | |
| | 8,000 | | Tenaris S.A. ADR (1) | | | 322,160 | |
| | 26,000 | | TransCanada Corp. (1) | | | 1,120,860 | |
| | 24,000 | | Ultrapar Participacoes S.A. ADR | | | 574,560 | |
| | | | | | | 17,680,024 | |
| | | | | | | | |
| | | | FINANCIALS (11.5%) | | | | |
| | 8,000 | | ACE Ltd. | | | 715,840 | |
| | 21,000 | | Affiliated Managers Group, Inc. * | | | 3,442,740 | |
| | 20,600 | | AFLAC, Inc. | | | 1,197,272 | |
| | 300 | | Alleghany Corp. * | | | 114,993 | |
| | 36,000 | | American Tower Corp. REIT | | | 2,634,120 | |
| | 45,000 | | Arch Capital Group Ltd. * | | | 2,313,450 | |
| | 8,316 | | Banco de Chile ADR (1) | | | 724,157 | |
| | 30,000 | | Bancolombia S.A. ADR | | | 1,695,000 | |
| | 13,300 | | Bank of Montreal (1) | | | 771,799 | |
| | 22,100 | | Bank of Nova Scotia (1) | | | 1,183,455 | |
| | 7,700 | | BlackRock, Inc. | | | 1,977,745 | |
| | 16,000 | | BRE Properties, Inc. REIT | | | 800,320 | |
| | 11,400 | | Camden Property Trust REIT | | | 788,196 | |
| | 8,200 | | Canadian Imperial Bank of Commerce (1) | | | 582,036 | |
| | 27,000 | | Digital Realty Trust, Inc. (1) | | | 1,647,000 | |
| | 11,600 | | Equity Lifestyle Properties, Inc. REIT | | | 911,644 | |
| | 9,400 | | Essex Property Trust, Inc. REIT | | | 1,493,848 | |
| | 17,000 | | HCP, Inc. REIT | | | 772,480 | |
| See Notes to Financial Statements. |
| 13 |
| Schedule of Investments (unaudited) |
| | | | | | | | |
| Shares | | | | Value | |
| | 75,500 | | HDFC Bank Ltd. ADR | | $ | 2,736,120 | |
| | 78,513 | | Itau Unibanco Holding S.A. ADR | | | 1,014,388 | |
| | 22,000 | | M&T Bank Corp. (1) | | | 2,458,500 | |
| | 10,000 | | PartnerRe Ltd. | | | 905,600 | |
| | 9,000 | | Portfolio Recovery Associates, Inc. * | | | 1,382,670 | |
| | 30,000 | | ProAssurance Corp. | | | 1,564,800 | |
| | 21,500 | | Prudential Financial, Inc. | | | 1,570,145 | |
| | 26,000 | | Royal Bank of Canada | | | 1,516,060 | |
| | 17,000 | | Stifel Financial Corp. * | | | 606,390 | |
| | 21,000 | | T. Rowe Price Group, Inc. | | | 1,536,150 | |
| | 8,000 | | Taubman Centers, Inc. REIT | | | 601,200 | |
| | 7,400 | | Toronto-Dominion Bank (The) | | | 594,738 | |
| | 30,000 | | Wells Fargo & Co. | | | 1,238,100 | |
| | | | | | | 41,490,956 | |
| | | | | | | | |
| | | | HEALTH CARE (12.4%) | | | | |
| | 47,000 | | Alexion Pharmaceuticals, Inc. * | | | 4,335,280 | |
| | 17,200 | | Allergan, Inc. | | | 1,448,928 | |
| | 16,000 | | Bayer AG ADR (1) | | | 1,706,720 | |
| | 14,500 | | Becton, Dickinson & Co. | | | 1,433,035 | |
| | 2,000 | | Bio-Rad Laboratories, Inc. Class A * | | | 224,400 | |
| | 14,800 | | Bio-Reference Laboratories, Inc. * (1) | | | 425,500 | |
| | 17,000 | | C.R. Bard, Inc. | | | 1,847,560 | |
| | 56,000 | | Catamaran Corp. * | | | 2,728,320 | |
| | 34,000 | | Cerner Corp. * | | | 3,267,060 | |
| | 6,200 | | Cooper Cos., Inc. (The) | | | 738,110 | |
| | 6,000 | | DaVita HealthCare Partners, Inc. * | | | 724,800 | |
| | 6,000 | | DENTSPLY International, Inc. | | | 245,760 | |
| | 26,000 | | Edwards Lifesciences Corp. * | | | 1,747,200 | |
| | 46,000 | | Express Scripts Holding Co. * | | | 2,837,740 | |
| | 34,800 | | Fresenius Medical Care AG & Co. KGaA ADR (1) | | | 1,227,396 | |
| | 38,800 | | Henry Schein, Inc. * | | | 3,715,100 | |
| | 38,600 | | HMS Holdings Corp. * | | | 899,380 | |
| | 24,000 | | IDEXX Laboratories, Inc. * | | | 2,154,720 | |
| | 5,000 | | Intuitive Surgical, Inc. * | | | 2,532,900 | |
| | 7,000 | | McKesson Corp. | | | 801,500 | |
| | 13,400 | | Mettler-Toledo International, Inc. * | | | 2,696,080 | |
| | 4,700 | | MWI Veterinary Supply, Inc. * | | | 579,228 | |
| | 17,800 | | Novo Nordisk A/S ADR | | | 2,758,466 | |
| | | | | | | | |
| Shares | | | | Value | |
| | 23,000 | | Teva Pharmaceutical Industries Ltd. ADR | | $ | 901,600 | |
| | 27,000 | | Thermo Fisher Scientific, Inc. | | | 2,285,010 | |
| | 7,000 | | WellPoint, Inc. | | | 572,880 | |
| | | | | | | 44,834,673 | |
| | | | | | | | |
| | | | INDUSTRIALS (26.6%) | | | | |
| | 85,000 | | ABB Ltd. ADR * | | | 1,841,100 | |
| | 25,300 | | Acuity Brands, Inc. | | | 1,910,656 | |
| | 96,750 | | AMETEK, Inc. | | | 4,092,525 | |
| | 39,200 | | AZZ, Inc. | | | 1,511,552 | |
| | 15,000 | | C.H. Robinson Worldwide, Inc. | | | 844,650 | |
| | 29,900 | | Canadian National Railway Co. | | | 2,908,373 | |
| | 31,000 | | Chicago Bridge & Iron Co. N.V. | | | 1,849,460 | |
| | 35,000 | | CLARCOR, Inc. | | | 1,827,350 | |
| | 10,000 | | Clean Harbors, Inc. * | | | 505,300 | |
| | 53,000 | | Danaher Corp. | | | 3,354,900 | |
| | 56,000 | | Donaldson Co., Inc. | | | 1,996,960 | |
| | 45,200 | | Eaton Corp. PLC | | | 2,974,612 | |
| | 30,000 | | EnerSys | | | 1,471,200 | |
| | 14,800 | | Equifax, Inc. | | | 872,164 | |
| | 18,000 | | Esterline Technologies Corp. * | | | 1,301,220 | |
| | 30,000 | | Fastenal Co. | | | 1,375,500 | |
| | 15,000 | | FedEx Corp. | | | 1,478,700 | |
| | 12,000 | | Flowserve Corp. | | | 648,120 | |
| | 13,000 | | General Dynamics Corp. | | | 1,018,290 | |
| | 6,000 | | Graco, Inc. | | | 379,260 | |
| | 23,250 | | HEICO Corp. | | | 1,171,103 | |
| | 47,850 | | IDEX Corp. | | | 2,574,808 | |
| | 16,600 | | IHS, Inc. Class A * | | | 1,732,708 | |
| | 31,776 | | Iron Mountain, Inc. | | | 845,559 | |
| | 33,000 | | J.B. Hunt Transport Services, Inc. | | | 2,383,920 | |
| | 21,000 | | Kansas City Southern | | | 2,225,160 | |
| | 36,000 | | Kirby Corp. * | | | 2,863,440 | |
| | 5,000 | | L-3 Communications Holdings, Inc. | | | 428,700 | |
| | 4,100 | | Latam Airlines Group S.A. ADR (1) | | | 69,249 | |
| | 26,000 | | Lincoln Electric Holdings, Inc. | | | 1,489,020 | |
| | 20,000 | | Norfolk Southern Corp. | | | 1,453,000 | |
| | 33,000 | | Parker Hannifin Corp. | | | 3,148,200 | |
| | 17,800 | | Precision Castparts Corp. | | | 4,022,978 | |
| | 66,500 | | Republic Services, Inc. | | | 2,257,010 | |
| | 3,000 | | Rockwell Automation, Inc. | | | 249,420 | |
| See Notes to Financial Statements. |
| 14 |
| | | | | | | | |
| Shares | | | | Value | |
| | 11,000 | | Rockwell Collins, Inc. | | $ | 697,510 | |
| | 54,000 | | Rollins, Inc. | | | 1,398,600 | |
| | 36,000 | | Roper Industries, Inc. | | | 4,471,920 | |
| | 50,700 | | Rush Enterprises, Inc. Class A * | | | 1,254,825 | |
| | 2,000 | | Snap-on, Inc. | | | 178,760 | |
| | 37,600 | | Stericycle, Inc. * | | | 4,152,168 | |
| | 17,000 | | Teledyne Technologies, Inc. * | | | 1,314,950 | |
| | 66,000 | | Toro Co. (The) | | | 2,997,060 | |
| | 16,700 | | Towers Watson & Co. Class A | | | 1,368,398 | |
| | 25,000 | | Union Pacific Corp. | | | 3,857,000 | |
| | 31,000 | | United Technologies Corp. | | | 2,881,140 | |
| | 10,700 | | Valmont Industries, Inc. | | | 1,531,063 | |
| | 12,600 | | W.W. Grainger, Inc. | | | 3,177,468 | |
| | 42,800 | | Wabtec Corp. | | | 2,286,804 | |
| | 66,200 | | Waste Connections, Inc. | | | 2,723,468 | |
| | 24,000 | | Woodward Inc. | | | 960,000 | |
| | | | | | | 96,327,301 | |
| | | | | | | | |
| | | | INFORMATION TECHNOLOGY (8.8%) | | | | |
| | 25,000 | | Accenture PLC Class A | | | 1,799,000 | |
| | 19,400 | | Alliance Data Systems Corp. * | | | 3,511,982 | |
| | 30,800 | | Amphenol Corp. Class A | | | 2,400,552 | |
| | 9,700 | | Anixter International, Inc. * | | | 735,357 | |
| | 60,000 | | ANSYS, Inc. * | | | 4,386,000 | |
| | 42,000 | | Cognizant Technology Solutions Corp. Class A * | | | 2,629,620 | |
| | 16,000 | | Equinix, Inc. * | | | 2,955,520 | |
| | 10,600 | | MasterCard, Inc. Class A | | | 6,089,700 | |
| | 32,000 | | MICROS Systems, Inc. * (1) | | | 1,380,800 | |
| | 3,000 | | NCR Corp. * | | | 98,970 | |
| | 80,000 | | Salesforce.com, Inc. * | | | 3,054,400 | |
| | 56,000 | | Trimble Navigation Ltd. * | | | 1,456,560 | |
| | 20,300 | | WEX, Inc. * | | | 1,557,010 | |
| | | | | | | 32,055,471 | |
| | | | | | | | |
| | | | MATERIALS (8.7%) | | | | |
| | 16,000 | | Agrium, Inc. (1) | | | 1,391,360 | |
| | 15,000 | | Air Products & Chemicals, Inc. | | | 1,373,550 | |
| | 8,000 | | Airgas, Inc. | | | 763,680 | |
| | 3,600 | | Albemarle Corp. | | | 224,244 | |
| | 30,700 | | AptarGroup, Inc. | | | 1,694,947 | |
| | 20,000 | | Ball Corp. | | | 830,800 | |
| | 14,000 | | BASF SE ADR | | | 1,252,860 | |
| | 4,000 | | CF Industries Holdings, Inc. | | | 686,000 | |
| | 4,000 | | Compass Minerals International, Inc. | | | 338,120 | |
| | | | �� | | | | |
| Shares | | | | Value | |
| | 29,000 | | Crown Holdings, Inc. * | | $ | 1,192,770 | |
| | 14,200 | | Cytec Industries, Inc. | | | 1,040,150 | |
| | 43,000 | | Ecolab, Inc. | | | 3,663,170 | |
| | 24,000 | | FMC Corp. | | | 1,465,440 | |
| | 8,100 | | NewMarket Corp. (1) | | | 2,126,736 | |
| | 31,000 | | Praxair, Inc. | | | 3,569,960 | |
| | 24,000 | | Rockwood Holdings, Inc. | | | 1,536,720 | |
| | 20,200 | | Scotts Miracle-Gro Co. (The) Class A (1) | | | 975,862 | |
| | 8,000 | | Sherwin-Williams Co. (The) | | | 1,412,800 | |
| | 30,000 | | Sigma-Aldrich Corp. | | | 2,410,800 | |
| | 12,800 | | Syngenta AG ADR | | | 996,608 | |
| | 39,000 | | Valspar Corp. (The) | | | 2,522,130 | |
| | | | | | | 31,468,707 | |
| | | | | | | | |
| | | | TELECOMMUNICATION SERVICES (1.7%) | | | | |
| | 40,000 | | Crown Castle International Corp. * | | | 2,895,600 | |
| | 43,000 | | SBA Communications Corp. Class A * | | | 3,187,160 | |
| | | | | | | 6,082,760 | |
| | | | | | | | |
| | | | UTILITIES (2.3%) | | | | |
| | 165,600 | | Cia de Saneamento Basico do Estado de Sao Paulo ADR (1) | | | 1,723,896 | |
| | 20,000 | | ITC Holdings Corp. | | | 1,826,000 | |
| | 32,000 | | ONEOK, Inc. | | | 1,321,920 | |
| | 52,000 | | Questar Corp. | | | 1,240,200 | |
| | 14,000 | | Sempra Energy | | | 1,144,640 | |
| | 26,800 | | Wisconsin Energy Corp. | | | 1,098,532 | |
| | | | | | | 8,355,188 | |
| | | | TOTAL COMMON STOCKS (Cost $189,196,642) (98.5%) | | | 356,195,588 | |
| | | | | | | | |
| Principal | | | | | | |
| Amount | | | | Value | |
| SHORT-TERM INVESTMENTS (7.7%) | | | | |
| | | | REPURCHASE AGREEMENTS (1.2%) | | | | |
| $ | 4,300,000 | | With Morgan Stanley, 0.01%, dated 06/28/13, due 07/01/13, delivery value $4,300,004 (collateralized by $4,355,000 U.S. Treasury Notes 1.000% due 08/31/16, with a value of $4,402,899) | | | 4,300,000 | |
| See Notes to Financial Statements. |
| 15 |
| Schedule of Investments (unaudited) |
| | | | | | | | |
| Principal | | | | | | |
| Amount | | | | Value | |
| | | | JOINT REPURCHASE AGREEMENTS (Investments of Cash Collateral for Securities on Loan) (6.5%) | | | | |
| $ | 6,949,705 | | Joint Repurchase Agreement with Morgan Stanley, 0.12%, dated 06/28/13, due 07/01/13, delivery value $6,949,775 (collateralized by $7,030,600 U.S. Treasury Notes 1.250% - 1.500% due 02/15/14 - 08/31/18, with a value of $7,088,709) | | $ | 6,949,705 | |
| | 8,617,635 | | Joint Repurchase Agreement with Barclays, 0.10%, dated 06/28/13, due 07/01/13, delivery value $8,617,707 (collateralized by $8,879,527 U.S. Treasury Inflation Indexed Notes 0.125% due 07/15/22, with a value of $8,789,996) | | | 8,617,635 | |
| | 8,061,658 | | Joint Repurchase Agreement with Credit Suisse First Boston, 0.10%, dated 06/28/13, due 07/01/13, delivery value $8,061,725 (collateralized by $8,361,886 U.S. Treasury Notes 1.000% due 05/31/18, with a value of $8,223,873) | | | 8,061,658 | |
| | | | TOTAL INVESTMENTS OF CASH COLLATERAL FOR SECURITIES ON LOAN (Cost $23,628,998) (6.5%) | | | 23,628,998 | |
| | | | TOTAL SHORT-TERM INVESTMENTS (Cost $27,928,998) (7.7%) | | | 27,928,998 | |
| | | | TOTAL INVESTMENT SECURITIES (106.2%) (Cost $217,125,640) | | | 384,124,586 | |
| | | | | | | | |
Principal Amount | | | | Value | |
| EXCESS OF LIABILITIES OVER CASH AND OTHER ASSETS (-6.2%) | | $ | (22,401,074 | ) |
| NET ASSETS (100%) | | $ | 361,723,512 | |
| NET ASSET VALUE OFFERING AND REDEMPTION PRICE, PER OUTSTANDING SHARE ($361,723,512 ÷ 11,497,451 shares outstanding) | | $ | 31.46 | |
| | |
| * | Non-income producing. |
| (1) | A portion or all of the security was held on loan. As of June 30, 2013, the market value of the securities on loan was $23,307,778. |
| ADR | American Depositary Receipt. |
| REIT | Real Estate Investment Trust. |
| See Notes to Financial Statements. |
| 16 |
| The Value Line Fund, Inc. | |
| Schedule of Investments (unaudited) | June 30, 2013 |
| Shares | | | | Value | |
| COMMON STOCKS (98.3%) | | | | |
| | | | | | | | |
| | | | CONSUMER DISCRETIONARY (15.6%) | | | | |
| | 4,000 | | AutoZone, Inc. * | | $ | 1,694,760 | |
| | 6,800 | | BorgWarner, Inc. * | | | 585,820 | |
| | 22,400 | | Brinker International, Inc. | | | 883,232 | |
| | 6,000 | | Buckle, Inc. (The) (1) | | | 312,120 | |
| | 7,600 | | Buffalo Wild Wings, Inc. * | | | 746,016 | |
| | 17,500 | | Darden Restaurants, Inc. | | | 883,400 | |
| | 1,700 | | Deckers Outdoor Corp. * (1) | | | 85,867 | |
| | 9,000 | | Dick’s Sporting Goods, Inc. | | | 450,540 | |
| | 11,000 | | Domino’s Pizza, Inc. | | | 639,650 | |
| | 7,300 | | Genuine Parts Co. | | | 569,911 | |
| | 8,700 | | Gildan Activewear, Inc. | | | 352,437 | |
| | 33,000 | | LKQ Corp. * | | | 849,750 | |
| | 15,300 | | McDonald’s Corp. | | | 1,514,700 | |
| | 14,000 | | NIKE, Inc. Class B | | | 891,520 | |
| | 3,200 | | O’Reilly Automotive, Inc. * | | | 360,384 | |
| | 4,600 | | Panera Bread Co. Class A * | | | 855,324 | |
| | 10,400 | | Penn National Gaming, Inc. * | | | 549,744 | |
| | 9,300 | | Starbucks Corp. | | | 609,057 | |
| | 44,000 | | TJX Companies, Inc. (The) | | | 2,202,640 | |
| | 2,600 | | VF Corp. | | | 501,956 | |
| | 7,000 | | Wolverine World Wide, Inc. | | | 382,270 | |
| | 24,800 | | Yum! Brands, Inc. | | | 1,719,632 | |
| | | | | | | 17,640,730 | |
| | | | | | | | |
| | | | CONSUMER STAPLES (11.5%) | | | | |
| | 3,100 | | Boston Beer Co., Inc. (The) Class A * (1) | | | 528,984 | |
| | 4,900 | | British American Tobacco PLC ADR (1) | | | 504,406 | |
| | 4,000 | | Bunge Ltd. | | | 283,080 | |
| | 11,400 | | Casey’s General Stores, Inc. | | | 685,824 | |
| | 26,000 | | Church & Dwight Co., Inc. | | | 1,604,460 | |
| | 7,000 | | Costco Wholesale Corp. | | | 773,990 | |
| | 7,500 | | Energizer Holdings, Inc. | | | 753,825 | |
| | 40,500 | | Flowers Foods, Inc. | | | 893,025 | |
| | 21,000 | | General Mills, Inc. | | | 1,019,130 | |
| | 8,000 | | Harris Teeter Supermarkets, Inc. | | | 374,880 | |
| | 4,400 | | Herbalife Ltd. (1) | | | 198,616 | |
| | 33,000 | | Hormel Foods Corp. | | | 1,273,140 | |
| | 15,700 | | Ingredion, Inc. | | | 1,030,234 | |
| | 18,100 | | J&J Snack Foods Corp. | | | 1,408,180 | |
| | 9,000 | | PepsiCo, Inc. | | | 736,110 | |
| | 6,000 | | Reynolds American, Inc. | | | 290,220 | |
| | 12,000 | | Whole Foods Market, Inc. | | | 617,760 | |
| | | | | | | 12,975,864 | |
| Shares | | | | Value | |
| | | | ENERGY (2.4%) | | | | |
| | 2,000 | | Core Laboratories N.V. | | $ | 303,320 | |
| | 14,000 | | Enbridge, Inc. | | | 588,980 | |
| | 8,000 | | EQT Corp. | | | 634,960 | |
| | 5,600 | | FMC Technologies, Inc. * | | | 311,808 | |
| | 13,400 | | Noble Energy, Inc. | | | 804,536 | |
| | | | | | | 2,643,604 | |
| | | | | | | | |
| | | | FINANCIALS (6.7%) | | | | |
| | 8,000 | | Affiliated Managers Group, Inc. * | | | 1,311,520 | |
| | 20,000 | | AFLAC, Inc. | | | 1,162,400 | |
| | 9,000 | | American Tower Corp. REIT | | | 658,530 | |
| | 2,000 | | Axis Capital Holdings Ltd. | | | 91,560 | |
| | 12,000 | | Bank of Montreal | | | 696,360 | |
| | 3,000 | | BlackRock, Inc. | | | 770,550 | |
| | 2,300 | | Camden Property Trust REIT | | | 159,022 | |
| | 6,300 | | M&T Bank Corp. | | | 704,025 | |
| | 2,000 | | PartnerRe Ltd. | | | 181,120 | |
| | 5,000 | | Prudential Financial, Inc. | | | 365,150 | |
| | 8,000 | | Royal Bank of Canada | | | 466,480 | |
| | 6,900 | | Stifel Financial Corp. * | | | 246,123 | |
| | 10,000 | | T. Rowe Price Group, Inc. | | | 731,500 | |
| | | | | | | 7,544,340 | |
| | | | | | | | |
| | | | HEALTH CARE (13.2%) | | | | |
| | 12,600 | | Alexion Pharmaceuticals, Inc. * | | | 1,162,224 | |
| | 9,600 | | Allergan, Inc. | | | 808,704 | |
| | 5,800 | | C.R. Bard, Inc. | | | 630,344 | |
| | 13,740 | | Catamaran Corp. * | | | 669,413 | |
| | 12,200 | | Cerner Corp. * | | | 1,172,298 | |
| | 3,000 | | DaVita HealthCare Partners, Inc. * | | | 362,400 | |
| | 3,000 | | DENTSPLY International, Inc. | | | 122,880 | |
| | 22,000 | | Edwards Lifesciences Corp. * | | | 1,478,400 | |
| | 24,340 | | Express Scripts Holding Co. * | | | 1,501,534 | |
| | 12,700 | | Henry Schein, Inc. * | | | 1,216,025 | |
| | 5,400 | | IDEXX Laboratories, Inc. * | | | 484,812 | |
| | 1,000 | | Intuitive Surgical, Inc. * | | | 506,580 | |
| | 1,800 | | McKesson Corp. | | | 206,100 | |
| | 8,400 | | Mednax, Inc. * | | | 769,272 | |
| | 4,700 | | Mettler-Toledo International, Inc. * | | | 945,640 | |
| | 9,100 | | Novo Nordisk A/S ADR | | | 1,410,227 | |
| | 14,000 | | Teva Pharmaceutical Industries Ltd. ADR | | | 548,800 | |
| | 10,200 | | Thermo Fisher Scientific, Inc. | | | 863,226 | |
| | | | | | | 14,858,879 | |
| See Notes to Financial Statements. | |
| | 17 |
| Schedule of Investments (unaudited) | |
| Shares | | | | Value | |
| | | | INDUSTRIALS (26.0%) | | | | |
| | 2,800 | | Acuity Brands, Inc. | | $ | 211,456 | |
| | 36,750 | | AMETEK, Inc. | | | 1,554,525 | |
| | 11,100 | | Canadian National Railway Co. | | | 1,079,697 | |
| | 800 | | Canadian Pacific Railway Ltd. | | | 97,104 | |
| | 10,000 | | Chicago Bridge & Iron Co. N.V. | | | 596,600 | |
| | 15,000 | | CLARCOR, Inc. | | | 783,150 | |
| | 6,000 | | Clean Harbors, Inc. * | | | 303,180 | |
| | 20,700 | | Danaher Corp. | | | 1,310,310 | |
| | 31,000 | | Donaldson Co., Inc. | | | 1,105,460 | |
| | 5,000 | | Eaton Corp. PLC | | | 329,050 | |
| | 3,800 | | Equifax, Inc. | | | 223,934 | |
| | 2,400 | | Esterline Technologies Corp. * | | | 173,496 | |
| | 8,000 | | Fastenal Co. | | | 366,800 | |
| | 7,000 | | FedEx Corp. | | | 690,060 | |
| | 7,300 | | Graco, Inc. | | | 461,433 | |
| | 11,187 | | HEICO Corp. | | | 563,489 | |
| | 15,000 | | IDEX Corp. | | | 807,150 | |
| | 6,200 | | IHS, Inc. Class A * | | | 647,156 | |
| | 5,850 | | ITT Corp. | | | 172,049 | |
| | 6,800 | | J.B. Hunt Transport Services, Inc. | | | 491,232 | |
| | 10,000 | | Kansas City Southern | | | 1,059,600 | |
| | 15,700 | | Kirby Corp. * | | | 1,248,778 | |
| | 5,400 | | L-3 Communications Holdings, Inc. | | | 462,996 | |
| | 2,000 | | Lincoln Electric Holdings, Inc. | | | 114,540 | |
| | 2,300 | | Middleby Corp. (The) * | | | 391,207 | |
| | 9,200 | | Parker Hannifin Corp. | | | 877,680 | |
| | 6,200 | | Precision Castparts Corp. | | | 1,401,262 | |
| | 16,000 | | Republic Services, Inc. | | | 543,040 | |
| | 79,600 | | Rollins, Inc. | | | 2,061,640 | |
| | 12,400 | | Roper Industries, Inc. | | | 1,540,328 | |
| | 12,000 | | Stericycle, Inc. * | | | 1,325,160 | |
| | 13,600 | | Toro Co. (The) | | | 617,576 | |
| | 8,800 | | Union Pacific Corp. | | | 1,357,664 | |
| | 11,400 | | United Technologies Corp. | | | 1,059,516 | |
| | 5,600 | | Valmont Industries, Inc. | | | 801,304 | |
| | 4,900 | | W.W. Grainger, Inc. | | | 1,235,682 | |
| | 4,000 | | Wabtec Corp. | | | 213,720 | |
| | 25,300 | | Waste Connections, Inc. | | | 1,040,842 | |
| | | | | | | 29,319,866 | |
| Shares | | | | Value | |
| | | | INFORMATION TECHNOLOGY (9.3%) | | | | |
| | 19,600 | | Accenture PLC Class A | | $ | 1,410,416 | |
| | 8,300 | | Alliance Data Systems Corp. * (1) | | | 1,502,549 | |
| | 7,000 | | Amphenol Corp. Class A | | | 545,580 | |
| | 3,700 | | Anixter International, Inc. * | | | 280,497 | |
| | 13,500 | | ANSYS, Inc. * | | | 986,850 | |
| | 16,000 | | Cognizant Technology Solutions Corp. Class A * | | | 1,001,760 | |
| | 5,400 | | Equinix, Inc. * | | | 997,488 | |
| | 2,000 | | Fiserv, Inc. * | | | 174,820 | |
| | 2,300 | | MasterCard, Inc. Class A | | | 1,321,350 | |
| | 6,400 | | MICROS Systems, Inc. * (1) | | | 276,160 | |
| | 8,800 | | Open Text Corp. (1) | | | 602,536 | |
| | 24,000 | | Salesforce.com, Inc. * | | | 916,320 | |
| | 6,100 | | WEX, Inc. * | | | 467,870 | |
| | | | | | | 10,484,196 | |
| | | | | | | | |
| | | | MATERIALS (10.6%) | | | | |
| | 3,000 | | Airgas, Inc. | | | 286,380 | |
| | 14,000 | | Ball Corp. | | | 581,560 | |
| | 4,200 | | CF Industries Holdings, Inc. | | | 720,300 | |
| | 28,000 | | Crown Holdings, Inc. * | | | 1,151,640 | |
| | 4,600 | | Cytec Industries, Inc. | | | 336,950 | |
| | 12,000 | | Ecolab, Inc. | | | 1,022,280 | |
| | 23,400 | | FMC Corp. | | | 1,428,804 | |
| | 2,300 | | NewMarket Corp. (1) | | | 603,888 | |
| | 10,000 | | Packaging Corp. of America | | | 489,600 | |
| | 11,300 | | Praxair, Inc. | | | 1,301,308 | |
| | 12,000 | | Scotts Miracle-Gro Co. (The) Class A (1) | | | 579,720 | |
| | 3,000 | | Sherwin-Williams Co. (The) | | | 529,800 | |
| | 11,400 | | Sigma-Aldrich Corp. | | | 916,104 | |
| | 25,900 | | Silgan Holdings, Inc. | | | 1,216,264 | |
| | 12,400 | | Valspar Corp. (The) | | | 801,908 | |
| | | | | | | 11,966,506 | |
| | | | | | | | |
| | | | TELECOMMUNICATION SERVICES (0.8%) | | | | |
| | 13,000 | | Crown Castle International Corp. * | | | 941,070 | |
| | | | | | | | |
| | | | UTILITIES (2.2%) | | | | |
| | 10,000 | | ITC Holdings Corp. | | | 913,000 | |
| | 15,000 | | ONEOK, Inc. | | | 619,650 | |
| | 23,000 | | Questar Corp. | | | 548,550 | |
| | 10,900 | | Wisconsin Energy Corp. | | | 446,791 | |
| | | | | | | 2,527,991 | |
| | | | | | | | |
| | | | TOTAL COMMON STOCKS (Cost $68,518,704) (98.3%) | | | 110,903,046 | |
| See Notes to Financial Statements. | |
| 18 | |
Principal Amount | | | | Value | |
| SHORT-TERM INVESTMENTS (4.1%) | | | | |
| | | | JOINT REPURCHASE AGREEMENTS (Investments of Cash Collateral for Securities on Loan) (4.1%) | | | | |
| $ | 1,371,975 | | Joint Repurchase Agreement with Morgan Stanley, 0.12%, dated 06/28/13, due 07/01/13, delivery value $1,371,989 (collateralized by $1,387,945 U.S. Treasury Notes 1.250% - 1.500% due 02/15/14 - 08/31/18, with a value of $1,399,417) | | $ | 1,371,975 | |
| | 1,701,250 | | Joint Repurchase Agreement with Barclays, 0.10%, dated 06/28/13, due 07/01/13, delivery value $1,701,264 (collateralized by $1,752,951 U.S. Treasury Inflation Indexed Notes 0.125% due 07/15/22, with a value of $1,735,276) | | | 1,701,250 | |
| | 1,591,492 | | Joint Repurchase Agreement with Credit Suisse First Boston, 0.10%, dated 06/28/13, due 07/01/13, delivery value $1,591,505 (collateralized by $1,650,761 U.S. Treasury Notes 1.000% due 05/31/18, with a value of $1,623,515) | | | 1,591,492 | |
| | | | TOTAL INVESTMENTS OF CASH COLLATERAL FOR SECURITIES ON LOAN (Cost $4,664,717) (4.1%) | | | 4,664,717 | |
| | | | TOTAL SHORT-TERM INVESTMENTS (Cost $4,664,717) (4.1%) | | | 4,664,717 | |
| | | | TOTAL INVESTMENT SECURITIES (102.4%) (Cost $73,183,421) | | $ | 115,567,763 | |
Principal Amount | | | | Value | |
| EXCESS OF LIABILITIES OVER CASH AND OTHER ASSETS (-2.4%) | | $ | (2,729,546 | ) |
| NET ASSETS (100%) | | $ | 112,838,217 | |
| NET ASSET VALUE OFFERING AND REDEMPTION PRICE, PER OUTSTANDING SHARE ($112,838,217 ÷ 9,825,262 shares outstanding) | | $ | 11.48 | |
| * | Non-income producing. |
| (1) | A portion or all of the security was held on loan. As of June 30, 2013, the market value of the securities on loan was $4,597,541. |
| ADR | American Depositary Receipt. |
| REIT | Real Estate Investment Trust. |
| See Notes to Financial Statements. | |
| | |
| Value Line Income and Growth Fund, Inc. | |
| Schedule of Investments (unaudited) | June 30, 2013 |
| Shares | | | | Value | |
| COMMON STOCKS (64.7%) |
| |
| | | | CONSUMER DISCRETIONARY (6.9%) | | | | |
| | 26,000 | | Brinker International, Inc. (1) | | $ | 1,025,180 | |
| | 41,000 | | Comcast Corp. Class A | | | 1,626,470 | |
| | 31,000 | | DIRECTV * | | | 1,910,220 | |
| | 14,000 | | Genuine Parts Co. | | | 1,092,980 | |
| | 14,000 | | Home Depot, Inc. | | | 1,084,580 | |
| | 30,000 | | Las Vegas Sands Corp. | | | 1,587,900 | |
| | 40,000 | | Lowe’s Cos., Inc. | | | 1,636,000 | |
| | 29,000 | | McDonald’s Corp. | | | 2,871,000 | |
| | 135,000 | | Staples, Inc. | | | 2,141,100 | |
| | 23,000 | | Target Corp. | | | 1,583,780 | |
| | 13,000 | | Time Warner Cable, Inc. | | | 1,462,240 | |
| | 33,000 | | TJX Companies, Inc. (The) | | | 1,651,980 | |
| | 25,000 | | Walt Disney Co. (The) | | | 1,578,750 | |
| | | | | | | 21,252,180 | |
| | | | | | | | |
| | | | CONSUMER STAPLES (7.2%) | | | | |
| | 32,000 | | Coca-Cola Co. (The) | | | 1,283,520 | |
| | 30,000 | | ConAgra Foods, Inc. | | | 1,047,900 | |
| | 22,000 | | CVS Caremark Corp. | | | 1,257,960 | |
| | 25,000 | | Dr. Pepper Snapple Group, Inc. | | | 1,148,250 | |
| | 51,000 | | General Mills, Inc. | | | 2,475,030 | |
| | 26,000 | | Hormel Foods Corp. | | | 1,003,080 | |
| | 15,000 | | Ingredion, Inc. | | | 984,300 | |
| | 46,000 | | Kroger Co. (The) | | | 1,588,840 | |
| | 27,000 | | PepsiCo, Inc. | | | 2,208,330 | |
| | 40,000 | | Procter & Gamble Co. (The) | | | 3,079,600 | |
| | 88,000 | | Safeway, Inc. | | | 2,082,080 | |
| | 28,000 | | Wal-Mart Stores, Inc. | | | 2,085,720 | |
| | 40,000 | | Walgreen Co. | | | 1,768,000 | |
| | | | | | | 22,012,610 | |
| | | | | | | | |
| | | | ENERGY (6.3%) | | | | |
| | 38,000 | | Boardwalk Pipeline Partners L.P. | | | 1,147,600 | |
| | 20,000 | | Chevron Corp. | | | 2,366,800 | |
| | 28,000 | | ConocoPhillips | | | 1,694,000 | |
| | 33,000 | | Diamond Offshore Drilling, Inc. | | | 2,270,070 | |
| | 17,955 | | Ensco PLC Class A | | | 1,043,545 | |
| | 21,000 | | Enterprise Products Partners L.P. | | | 1,305,150 | |
| | 34,000 | | Exxon Mobil Corp. | | | 3,071,900 | |
| | 16,500 | | Hess Corp. | | | 1,097,085 | |
| Shares | | | | Value | |
| | 16,000 | | Royal Dutch Shell PLC ADR (1) | | $ | 1,060,320 | |
| | 32,000 | | Schlumberger Ltd. | | | 2,293,120 | |
| | 21,000 | | Total S.A. ADR | | | 1,022,700 | |
| | 22,000 | | TransCanada Corp. (1) | | | 948,420 | |
| | | | | | | 19,320,710 | |
| | | | | | | | |
| | | | FINANCIALS (11.1%) | | | | |
| | 13,000 | | Ameriprise Financial, Inc. | | �� | 1,051,440 | |
| | 28,000 | | Bank of Montreal | | | 1,624,840 | |
| | 7,000 | | BlackRock, Inc. | | | 1,797,950 | |
| | 19,000 | | Canadian Imperial Bank of Commerce (1) | | | 1,348,620 | |
| | 25,000 | | Capital One Financial Corp. | | | 1,570,250 | |
| | 120,000 | | Charles Schwab Corp. (The) | | | 2,547,600 | |
| | 27,000 | | Digital Realty Trust, Inc. (1) | | | 1,647,000 | |
| | 58,000 | | Discover Financial Services | | | 2,763,120 | |
| | 46,960 | | Hartford Financial Services Group, Inc. | | | 1,452,003 | |
| | 22,000 | | Health Care REIT, Inc. | | | 1,474,660 | |
| | 57,000 | | JPMorgan Chase & Co. | | | 3,009,030 | |
| | 20,000 | | M&T Bank Corp. | | | 2,235,000 | |
| | 17,000 | | PartnerRe Ltd. | | | 1,539,520 | |
| | 117,000 | | People’s United Financial, Inc. | | | 1,743,300 | |
| | 30,000 | | Prudential Financial, Inc. | | | 2,190,900 | |
| | 34,000 | | State Street Corp. | | | 2,217,140 | |
| | 73,000 | | U.S. Bancorp | | | 2,638,950 | |
| | 32,000 | | Wells Fargo & Co. | | | 1,320,640 | |
| | | | | | | 34,171,963 | |
| | | | | | | | |
| | | | HEALTH CARE (7.5%) | | | | |
| | 13,000 | | Actavis, Inc. * | | | 1,640,860 | |
| | 13,000 | | Amgen, Inc. | | | 1,282,580 | |
| | 12,000 | | Becton, Dickinson & Co. | | | 1,185,960 | |
| | 23,000 | | Bristol-Myers Squibb Co. | | | 1,027,870 | |
| | 20,000 | | Eli Lilly & Co. | | | 982,400 | |
| | 44,000 | | Gilead Sciences, Inc. * | | | 2,253,240 | |
| | 37,000 | | Johnson & Johnson | | | 3,176,820 | |
| | 49,000 | | Merck & Co., Inc. | | | 2,276,050 | |
| | 16,000 | | Novartis AG ADR | | | 1,131,360 | |
| | 95,788 | | Pfizer, Inc. | | | 2,683,022 | |
| | 31,000 | | Sanofi-Aventis ADR | | | 1,596,810 | |
| | 27,437 | | Teva Pharmaceutical Industries Ltd. ADR | | | 1,075,530 | |
| | 13,000 | | Thermo Fisher Scientific, Inc. | | | 1,100,190 | |
| See Notes to Financial Statements. |
| 20 |
| Shares | | | | Value | |
| | 20,500 | | UnitedHealth Group, Inc. | | $ | 1,342,340 | |
| | 8,128 | | Zoetis, Inc. | | | 251,074 | |
| | | | | | | 23,006,106 | |
| | | | | | | | |
| | | | INDUSTRIALS (8.6%) | | | | |
| | 37,000 | | ADT Corp. (The) * | | | 1,474,450 | |
| | 11,000 | | Canadian National Railway Co. | | | 1,069,970 | |
| | 37,000 | | Chicago Bridge & Iron Co. N.V. (2) | | | 2,207,420 | |
| | 24,000 | | Cintas Corp. | | | 1,092,960 | |
| | 18,000 | | Emerson Electric Co. | | | 981,720 | |
| | 30,215 | | Expeditors International of Washington, Inc. | | | 1,148,472 | |
| | 16,600 | | FedEx Corp. | | | 1,636,428 | |
| | 14,000 | | General Dynamics Corp. | | | 1,096,620 | |
| | 18,000 | | Illinois Tool Works, Inc. | | | 1,245,060 | |
| | 11,000 | | Lockheed Martin Corp. | | | 1,193,060 | |
| | 14,000 | | MSC Industrial Direct Co., Inc. Class A | | | 1,084,440 | |
| | 15,000 | | Northrop Grumman Corp. | | | 1,242,000 | |
| | 43,000 | | Raytheon Co. | | | 2,843,160 | |
| | 50,000 | | Republic Services, Inc. | | | 1,697,000 | |
| | 16,000 | | Rockwell Collins, Inc. | | | 1,014,560 | |
| | 26,000 | | Tyco International Ltd. | | | 856,700 | |
| | 13,000 | | Union Pacific Corp. | | | 2,005,640 | |
| | 26,000 | | United Technologies Corp. | | | 2,416,440 | |
| | | | | | | 26,306,100 | |
| | | | | | | | |
| | | | INFORMATION TECHNOLOGY (11.2%) | | | | |
| | 31,000 | | Accenture PLC Class A | | | 2,230,760 | |
| | 24,000 | | Adobe Systems, Inc. * | | | 1,093,440 | |
| | 3,000 | | Apple, Inc. | | | 1,188,240 | |
| | 25,000 | | Automatic Data Processing, Inc. | | | 1,721,500 | |
| | 42,000 | | Avago Technologies Ltd. | | | 1,569,960 | |
| | 20,000 | | BMC Software, Inc. * | | | 902,800 | |
| | 24,500 | | Cognizant Technology Solutions Corp. Class A * (2) | | | 1,533,945 | |
| | 28,000 | | eBay, Inc. * | | | 1,448,160 | |
| | 93,442 | | EMC Corp. | | | 2,207,100 | |
| | 4,000 | | Google, Inc. Class A * | | | 3,521,480 | |
| | 33,000 | | Harris Corp. | | | 1,625,250 | |
| | 129,000 | | Intel Corp. | | | 3,124,380 | |
| | 14,000 | | International Business Machines Corp. | | | 2,675,540 | |
| | 87,000 | | Microsoft Corp. | | | 3,004,110 | |
| | 59,000 | | Oracle Corp. | | | 1,812,480 | |
| | 27,000 | | QUALCOMM, Inc. | | | 1,649,160 | |
| Shares | | | | Value | |
| | 29,000 | | SAP AG ADR | | $ | 2,112,070 | |
| | 24,000 | | TE Connectivity Ltd. | | | 1,092,960 | |
| | | | | | | 34,513,335 | |
| | | | | | | | |
| | | | MATERIALS (1.6%) | | | | |
| | 16,000 | | BHP Billiton Ltd. ADR (1) | | | 922,560 | |
| | 33,000 | | E.I. du Pont de Nemours & Co. | | | 1,732,500 | |
| | 16,000 | | Rockwood Holdings, Inc. | | | 1,024,480 | |
| | 136,000 | | Yamana Gold, Inc. (1) | | | 1,293,360 | |
| | | | | | | 4,972,900 | |
| | | | | | | | |
| | | | TELECOMMUNICATION SERVICES (2.0%) | | | | |
| | 80,000 | | AT&T, Inc. | | | 2,832,000 | |
| | 39,000 | | BCE, Inc. | | | 1,599,780 | |
| | 35,000 | | Verizon Communications, Inc. | | | 1,761,900 | |
| | | | | | | 6,193,680 | |
| | | | | | | | |
| | | | UTILITIES (2.3%) | | | | |
| | 23,500 | | AGL Resources, Inc. | | | 1,007,210 | |
| | 22,000 | | American Electric Power Company, Inc. | | | 985,160 | |
| | 19,500 | | American States Water Co. | | | 1,046,565 | |
| | 36,000 | | CMS Energy Corp. | | | 978,120 | |
| | 13,000 | | Sempra Energy | | | 1,062,880 | |
| | 27,000 | | Wisconsin Energy Corp. | | | 1,106,730 | |
| | 34,000 | | Xcel Energy, Inc. | | | 963,560 | |
| | | | | | | 7,150,225 | |
| | | | | | | | |
| | | | TOTAL COMMON STOCKS (Cost $145,215,092) (64.7%) | | | 198,899,809 | |
| | | | | | | | |
| PREFERRED STOCKS (0.0%) |
| | | | | | | | |
| | | | FINANCIALS (0.0%) | | | | |
| | 5,000 | | MetLife, Inc. Series B, 6.50% (1) | | | 126,400 | |
| | | | TOTAL PREFERRED STOCKS (Cost $125,000) (0.0%) | | | 126,400 | |
| | | | | | | | |
| CONVERTIBLE PREFERRED STOCKS (1.7%) |
| | | | | | | | |
| | | | CONSUMER DISCRETIONARY (0.2%) | | | | |
| | 4,000 | | General Motors Co., Convertible Fixed, Series B, 4.75% (1) | | | 192,640 | |
| | 7,000 | | Goodyear Tire & Rubber Co. (The), 5.88% | | | 344,820 | |
| | | | | | | 537,460 | |
| See Notes to Financial Statements. |
| 21 |
| Schedule of Investments (unaudited) |
| Shares | | | | Value | |
| | | | CONSUMER STAPLES (0.2%) | | | | |
| | 4,000 | | Bunge Ltd., 4.88% | | $ | 402,600 | |
| | 2,500 | | Post Holdings, Inc., 3.75% (3) | | | 272,028 | |
| | | | | | | 674,628 | |
| | | | | | | | |
| | | | ENERGY (0.5%) | | | | |
| | 33,500 | | Apache Corp., Convertible Fixed, Series D, 6.00% | | | 1,599,290 | |
| | | | | | | | |
| | | | FINANCIALS (0.8%) | | | | |
| | 6,000 | | AMG Capital Trust II, Convertible Fixed, 5.15% | | | 323,625 | |
| | 250 | | Huntington Bancshares, Inc., Series A, 8.50% | | | 305,002 | |
| | 1,000 | | KeyCorp, Series A, 7.75% | | | 124,550 | |
| | 16,000 | | MetLife, Inc., 5.00% | | | 876,640 | |
| | 7,000 | | UBS AG, Convertible Fixed, 6.75% (1) | | | 98,657 | |
| | 250 | | Wells Fargo & Co. Series L, 7.50% | | | 298,500 | |
| | 2,000 | | Weyerhaeuser Co. Series A, 6.38% | | | 102,000 | |
| | 6,000 | | Wintrust Financial Corp., 7.50% (1) | | | 324,840 | |
| | | | | | | 2,453,814 | |
| | | | | | | | |
| | | | HEALTH CARE (0.0%) | | | | |
| | 1,800 | | National Healthcare Corp. Series A, 0.80% | | | 26,460 | |
| | | | TOTAL CONVERTIBLE PREFERRED STOCKS (Cost $5,336,419) (1.7%) | | | 5,291,652 | |
Principal Amount | | | | Value | |
| U.S. TREASURY OBLIGATIONS (8.5%) |
| $ | 1,000,000 | | U.S. Treasury Bonds, 5.25%, 11/15/28 | | | 1,271,250 | |
| | 1,350,000 | | U.S. Treasury Bonds, 3.75%, 8/15/41 | | | 1,425,304 | |
| | 250,000 | | U.S. Treasury Bonds, 2.75%, 8/15/42 | | | 215,781 | |
| | 500,000 | | U.S. Treasury Notes, 0.13%, 12/31/13 | | | 500,000 | |
| | 3,000,000 | | U.S. Treasury Notes, 0.50%, 10/15/14 | | | 3,010,782 | |
| | 2,000,000 | | U.S. Treasury Notes, 0.38%, 11/15/14 | | | 2,004,062 | |
Principal Amount | | | | | Value | |
| $ | 1,250,000 | | U.S. Treasury Notes, 0.38%, 4/15/15 | | $ | 1,251,123 | |
| | 3,000,000 | | U.S. Treasury Notes, 1.00%, 9/30/16 | | | 3,020,391 | |
| | 2,000,000 | | U.S. Treasury Notes, 1.00%, 10/31/16 | | | 2,011,876 | |
| | 1,000,000 | | U.S. Treasury Notes, 0.88%, 11/30/16 | | | 1,000,625 | |
| | 500,000 | | U.S. Treasury Notes, 0.63%, 5/31/17 | | | 492,031 | |
| | 2,000,000 | | U.S. Treasury Notes, 1.38%, 9/30/18 | | | 1,991,250 | |
| | 1,750,000 | | U.S. Treasury Notes, 1.38%, 11/30/18 | | | 1,737,969 | |
| | 1,000,000 | | U.S. Treasury Notes, 1.38%, 2/28/19 | | | 989,062 | |
| | 2,650,000 | | U.S. Treasury Notes, 3.63%, 2/15/20 | | | 2,956,200 | |
| | 1,000,000 | | U.S. Treasury Notes, 2.13%, 8/15/21 | | | 995,938 | |
| | 1,000,000 | | U.S. Treasury Notes, 2.00%, 11/15/21 | | | 982,734 | |
| | 150,000 | | U.S. Treasury Notes, 2.00%, 2/15/23 | | | 144,363 | |
| | | | TOTAL U.S. TREASURY OBLIGATIONS (Cost $25,979,737) (8.5%) | | | 26,000,741 | |
| | | | | | | | |
| COMMERCIAL MORTGAGE-BACKED SECURITIES (0.7%) |
| | 500,000 | | Federal Home Loan Mortgage Corp. Multifamily Structured Pass Through Certificates, Series K710, Class A2, 1.88%, 5/25/19 | | | 490,897 | |
| | 248,450 | | Government National Mortgage Association, Series 2013-12 Class AB, 1.83%, 11/16/52 | | | 241,487 | |
| | 250,000 | | Government National Mortgage Association, Series 2013-12, Class B, 2.45%, 11/16/52 (4) | | | 239,176 | |
| | 250,000 | | Morgan Stanley Bank of America Merrill Lynch Trust, Series 2012-C5, Class A4, 3.18%, 8/15/45 | | | 239,796 | |
| | 500,000 | | Morgan Stanley Bank of America Merrill Lynch Trust, Series 2013-C7, Class A4, 2.92%, 2/15/46 | | | 465,117 | |
| |
| See Notes to Financial Statements. |
| 22 |
Principal Amount | | | | Value | |
| $ | 500,000 | | UBS-Barclays Commercial Mortgage Trust, Series 2012-C4, Class A5, 2.85%, 12/10/45 | | $ | 462,482 | |
| | | | TOTAL COMMERCIAL MORTGAGE-BACKED SECURITIES (Cost $2,310,753) (0.7%) | | | 2,138,955 | |
| | | | | | | | |
| CORPORATE BONDS & NOTES (6.8%) |
| | | | | | | | |
| | | | BASIC MATERIALS (0.4%) | | | | |
| | 250,000 | | International Flavors & Fragrances, Inc., Senior Unsecured Notes, 3.20%, 5/1/23 | | | 237,220 | |
| | 375,000 | | PPG Industries, Inc., Senior Unsecured Notes, 3.60%, 11/15/20 | | | 385,305 | |
| | 560,000 | | Southern Copper Corp., Senior Unsecured Notes, 6.38%, 7/27/15 | | | 606,474 | |
| | | | | | | 1,228,999 | |
| | | | | | | | |
| | | | COMMUNICATIONS (0.5%) | | | | |
| | 250,000 | | DIRECTV Holdings LLC/DIRECTV Financing Co., Inc., Guaranteed Notes, 3.80%, 3/15/22 | | | 240,147 | |
| | 250,000 | | Harris Corp., Senior Unsecured Notes, 4.40%, 12/15/20 | | | 259,349 | |
| | 500,000 | | Time Warner Cable, Inc., Guaranteed Notes, 5.85%, 5/1/17 | | | 550,904 | |
| | 333,000 | | Viacom, Inc., Senior Unsecured Notes, 4.38%, 9/15/14 | | | 347,177 | |
| | | | | | | 1,397,577 | |
| | | | | | | | |
| | | | CONSUMER, CYCLICAL (0.6%) | | | | |
| | 250,000 | | Home Depot, Inc. (The), Senior Unsecured Notes, 3.95%, 9/15/20 | | | 271,028 | |
| | 500,000 | | Lowe’s Cos., Inc., Senior Unsecured Notes, 2.13%, 4/15/16 | | | 515,060 | |
Principal Amount | | | | Value | |
| $ | 250,000 | | Marriott International, Inc., Senior Unsecured Notes, 3.25%, 9/15/22 | | $ | 232,779 | |
| | 500,000 | | Nordstrom, Inc., Senior Unsecured Notes, 4.75%, 5/1/20 | | | 551,454 | |
| | 100,000 | | Toll Brothers Finance Corp., Guaranteed Notes, 4.38%, 4/15/23 (1) | | | 93,000 | |
| | 250,000 | | Wyndham Worldwide Corp., Senior Unsecured Notes, 3.90%, 3/1/23 | | | 238,183 | |
| | | | | | | 1,901,504 | |
| | | | | | | | |
| | | | CONSUMER, NON-CYCLICAL (0.3%) | | | | |
| | 150,000 | | Constellation Brands, Inc., Guaranteed Notes, 3.75%, 5/1/21 | | | 140,438 | |
| | 250,000 | | Hawk Acquisition Sub, Inc., Secured Notes, 4.25%, 10/15/20 (3) | | | 239,062 | |
| | 500,000 | | Humana, Inc., Senior Notes, 6.45%, 6/1/16 | | | 566,492 | |
| | | | | | | 945,992 | |
| | | | | | | | |
| | | | ENERGY (0.6%) | | | | |
| | 500,000 | | Devon Energy Corp., Senior Unsecured Notes, 2.40%, 7/15/16 | | | 512,294 | |
| | 500,000 | | Enterprise Products Operating LLC, Guaranteed Notes, 4.85%, 8/15/42 | | | 471,223 | |
| | 250,000 | | Marathon Oil Corp., Senior Unsecured Notes, 2.80%, 11/1/22 | | | 231,290 | |
| | 250,000 | | Phillips 66, Guaranteed Notes, 4.30%, 4/1/22 | | | 258,306 | |
| | 500,000 | | Williams Partners L.P., Senior Unsecured Notes, 4.13%, 11/15/20 | | | 503,990 | |
| | | | | | | 1,977,103 | |
| | | | | | | | |
| | | | FINANCIAL (2.8%) | | | | |
| | 250,000 | | American International Group, Inc., Senior Unsecured Notes, 4.88%, 6/1/22 | | | 266,481 | |
| See Notes to Financial Statements. |
| 23 |
| Schedule of Investments (unaudited) |
| | | | | | | | |
Principal Amount | | | | Value | |
| $ | 250,000 | | Bank of America Corp. MTN, Senior Unsecured Notes, 3.30%, 1/11/23 | | $ | 236,287 | |
| | 250,000 | | Bank of Montreal MTN, Senior Unsecured Notes, 2.50%, 1/11/17 | | | 256,268 | |
| | 500,000 | | Berkshire Hathaway, Inc., Senior Unsecured Notes, 3.75%, 8/15/21 (1) | | | 515,597 | |
| | 250,000 | | Boston Properties L.P., Senior Unsecured Notes, 3.13%, 9/1/23 | | | 230,925 | |
| | 250,000 | | Capital One NA/Mclean, Senior Notes, 1.50%, 3/22/18 | | | 240,963 | |
| | 250,000 | | Citigroup, Inc., Senior Unsecured Notes, 5.85%, 7/2/13 | | | 250,000 | |
| | 250,000 | | Credit Agricole S.A., Senior Unsecured Notes, 2.13%, 4/17/18 (1) (3) | | | 242,858 | |
| | 500,000 | | Fifth Third Bank, Senior Unsecured Notes, 1.45%, 2/28/18 | | | 483,008 | |
| | 500,000 | | Ford Motor Credit Co. LLC, Senior Unsecured Notes, 2.38%, 1/16/18 | | | 481,423 | |
| | 250,000 | | General Electric Capital Corp. MTN, Senior Unsecured Notes, 1.03%, 8/11/15 (4) | | | 250,891 | |
| | 300,000 | | General Motors Financial Co., Inc., Senior Unsecured Notes, 3.25%, 5/15/18 (3) | | | 291,750 | |
| | 500,000 | | Goldman Sachs Group, Inc. (The), Senior Unsecured Notes, 5.75%, 1/24/22 | | | 551,506 | |
| | 500,000 | | JPMorgan Chase & Co., Senior Unsecured Notes, 4.50%, 1/24/22 | | | 523,561 | |
| | 500,000 | | Morgan Stanley, Senior Unsecured Notes, 4.75%, 3/22/17 | | | 530,328 | |
| | 350,000 | | PNC Funding Corp., Guaranteed Notes, 3.30%, 3/8/22 | | | 336,442 | |
| | 1,000,000 | | Private Export Funding Corp., Series GG, 2.45%, 7/15/24 | | | 929,526 | |
| | | | | | | | |
| Principal | | | | | | |
| Amount | | | | Value | |
| $ | 1,000,000 | | ProLogis, Senior Unsecured Notes, 6.25%, 3/15/17 | | $ | 1,116,207 | |
| | 250,000 | | State Street Corp., Senior Unsecured Notes, 1.35%, 5/15/18 | | | 242,923 | |
| | 168,000 | | Wachovia Bank NA, Subordinated Notes, 4.80%, 11/1/14 | | | 176,828 | |
| | 500,000 | | Wells Fargo & Co. MTN, Senior Unsecured Notes, 3.50%, 3/8/22 | | | 505,658 | |
| | | | | | | 8,659,430 | |
| | | | | | | | |
| | | | INDUSTRIAL (0.8%) | | | | |
| | 500,000 | | Danaher Corp., Senior Unsecured Notes, 3.90%, 6/23/21 | | | 528,412 | |
| | 500,000 | | General Electric Co., Senior Unsecured Notes, 4.13%, 10/9/42 | | | 465,248 | |
| | 254,000 | | Masco Corp., Senior Unsecured Notes, 6.13%, 10/3/16 | | | 274,320 | |
| | 250,000 | | Ryder System, Inc. MTN, Senior Unsecured Notes, 3.50%, 6/1/17 | | | 258,853 | |
| | 314,000 | | Thermo Fisher Scientific, Inc., Senior Unsecured Notes, 3.20%, 3/1/16 | | | 325,914 | |
| | 500,000 | | Union Pacific Corp., Senior Unsecured Notes, 4.00%, 2/1/21 | | | 535,821 | |
| | | | | | | 2,388,568 | |
| | | | | | | | |
| | | | TECHNOLOGY (0.2%) | | | | |
| | 500,000 | | Intel Corp., Senior Unsecured Notes, 3.30%, 10/1/21 | | | 501,843 | |
| | | | | | | | |
| | | | UTILITIES (0.6%) | | | | |
| | 250,000 | | Alabama Power Co., Senior Unsecured Notes, 3.85%, 12/1/42 | | | 218,580 | |
| | 250,000 | | Carolina Power & Light Co., 2.80%, 5/15/22 | | | 239,927 | |
| | 500,000 | | Dominion Resources, Inc., Senior Unsecured Notes, 2.25%, 9/1/15 | | | 512,328 | |
| See Notes to Financial Statements. |
| 24 |
| | | | | | | | |
| Principal | | | | | | |
| Amount | | | | Value | |
| $ | 250,000 | | Florida Power & Light Co., 4.05%, 6/1/42 | | $ | 232,392 | |
| | 500,000 | | Sempra Energy, Senior Unsecured Notes, 2.00%, 3/15/14 | | | 504,258 | |
| | 250,000 | | South Carolina Electric & Gas Co., 4.35%, 2/1/42 | | | 235,672 | |
| | | | | | | 1,943,157 | |
| | | | TOTAL CORPORATE BONDS & NOTES (Cost $21,143,646) (6.8%) | | | 20,944,173 | |
| | | | | | | | |
| CONVERTIBLE CORPORATE BONDS & NOTES (4.2%) | | | | |
| | | | | | | | |
| | | | BASIC MATERIALS (0.2%) | | | | |
| | 100,000 | | Allegheny Technologies, Inc., Convertible Fixed, 4.25%, 6/1/14 | | | 103,000 | |
| | 100,000 | | ArcelorMittal, Senior Notes, 5.00%, 5/15/14 | | | 102,000 | |
| | 350,000 | | Steel Dynamics, Inc., Guaranteed Notes, 5.13%, 6/15/14 | | | 373,406 | |
| | | | | | | 578,406 | |
| | | | | | | | |
| | | | COMMUNICATIONS (0.3%) | | | | |
| | 300,000 | | Equinix, Inc., Convertible Fixed, 4.75%, 6/15/16 | | | 681,187 | |
| | 100,000 | | VeriSign, Inc., Junior Subordinated Debentures, 3.25%, 8/15/37 (3) | | | 140,688 | |
| | | | | | | 821,875 | |
| | | | | | | | |
| | | | CONSUMER, CYCLICAL (0.3%) | | | | |
| | 150,000 | | Home Inns & Hotels Management, Inc., Senior Notes, 2.00%, 12/15/15 (3) | | | 130,781 | |
| | 200,000 | | International Game Technology, Senior Unsecured Notes, 3.25%, 5/1/14 | | | 213,250 | |
| | 200,000 | | MGM Resorts International, Guaranteed Senior Notes, 4.25%, 4/15/15 | | | 223,875 | |
| | | | | | | | |
| Principal | | | | | | |
| Amount | | | | Value | |
| $ | 300,000 | | Navistar International Corp., Senior Subordinated Notes, 3.00%, 10/15/14 | | $ | 291,375 | |
| | | | | | | 859,281 | |
| | | | | | | | |
| | | | CONSUMER, NON-CYCLICAL (1.0%) | | | | |
| | 1,000,000 | | Alere, Inc., Convertible Fixed, 3.00%, 5/15/16 | | | 985,625 | |
| | 150,000 | | Alliance Data Systems Corp., Fixed, 1.75%, 8/1/13 | | | 340,781 | |
| | 350,000 | | Avis Budget Group, Inc., Convertible Fixed, 3.50%, 10/1/14 | | | 640,500 | |
| | 100,000 | | Gilead Sciences, Inc., Convertible Fixed, Series D, 1.63%, 5/1/16 | | | 226,313 | |
| | 300,000 | | Insulet Corp., Senior Unsecured Notes, 3.75%, 6/15/16 | | | 391,125 | |
| | 123,000 | | Salix Pharmaceuticals Ltd., Senior Unsecured Notes, 2.75%, 5/15/15 | | | 187,268 | |
| | 300,000 | | Smithfield Foods, Inc., Senior Notes, 4.00%, 6/30/13 | | | 395,820 | |
| | | | | | | 3,167,432 | |
| | | | | | | | |
| | | | ENERGY (0.3%) | | | | |
| | 250,000 | | Goodrich Petroleum Corp., Senior Unsecured Notes, 5.00%, 10/1/29 | | | 248,125 | |
| | 250,000 | | Hornbeck Offshore Services, Inc., Guaranteed Notes, 1.63%, 11/15/26 (5) | | | 288,425 | |
| | 800,000 | | Peabody Energy Corp., Junior Subordinate Debentures, 4.75%, 12/15/41 (1) | | | 555,500 | |
| | | | | | | 1,092,050 | |
| | | | | | | | |
| | | | FINANCIAL (0.4%) | | | | |
| | 150,000 | | Digital Realty Trust L.P., Guaranteed Notes, 5.50%, 4/15/29 (3) | | | 232,875 | |
| | 300,000 | | Fidelity National Financial, Inc. 4.25%, 8/15/18 | | | 393,562 | |
| | 100,000 | | ProLogis, Guaranteed Notes, 3.25%, 3/15/15 | | | 115,438 | |
| See Notes to Financial Statements. |
| 25 |
| Schedule of Investments (unaudited) |
| | | | | | | | |
| Principal | | | | | | |
| Amount | | | | Value | |
| $ | 200,000 | | SL Green Operating Partnership L.P., Convertible Fixed, 3.00%, 10/15/17 (3) | | $ | 241,125 | |
| | 200,000 | | Tower Group, Inc., Senior Notes Convertible, 5.00%, 9/15/14 | | | 209,750 | |
| | | | | | | 1,192,750 | |
| | | | | | | | |
| | | | INDUSTRIAL (0.5%) | | | | |
| | 100,000 | | AGCO Corp., Senior Subordinated Notes, 1.25%, 12/15/36 | | | 124,250 | |
| | 150,000 | | Alliant Techsystems, Inc., Guaranteed Notes, 3.00%, 8/15/24 | | | 172,031 | |
| | 250,000 | | Bristow Group, Inc., Guaranteed Notes, 3.00%, 6/15/38 | | | 294,688 | |
| | 200,000 | | EnerSys, Senior Notes, 3.38%, 6/1/38 (5) | | | 261,750 | |
| | 150,000 | | MasTec, Inc., Convertible Fixed, 4.00%, 6/15/14 | | | 315,562 | |
| | 300,000 | | Trinity Industries, Inc., Subordinated Notes Convertible, 3.88%, 6/1/36 | | | 351,750 | |
| | | | | | | 1,520,031 | |
| | | | | | | | |
| | | | TECHNOLOGY (1.2%) | | | | |
| | 350,000 | | CACI International, Inc., Senior Subordinate Debenture, 2.13%, 5/1/14 | | | 419,125 | |
| | 350,000 | | CSG Systems International, Inc., Senior Subordinate Debenture, 3.00%, 3/1/17 (3) | | | 397,250 | |
| | 200,000 | | DST Systems, Inc., Convertible, 0.54%, 8/15/23 (4) | | | 276,625 | |
| | 150,000 | | Intel Corp., Junior Subordinated Notes, 3.25%, 8/1/39 | | | 191,156 | |
| | 200,000 | | Lam Research Corp., Senior Unsecured Notes, 1.25%, 5/15/18 (1) | | | 221,875 | |
| | | | | | | | |
| Principal | | | | | | |
| Amount | | | | Value | |
| $ | 350,000 | | ON Semiconductor Corp., Senior Subordinated Notes, 2.63%, 12/15/26 | | $ | 355,469 | |
| | 150,000 | | SanDisk Corp., Senior Unsecured Notes, 1.50%, 8/15/17 | | | 199,969 | |
| | 200,000 | | Xilinx, Inc., Senior Notes, 2.63%, 6/15/17 | | | 285,750 | |
| | 1,000,000 | | Xilinx, Inc., Subordinated Debentures, 3.13%, 3/15/37 | | | 1,380,000 | |
| | | | | | | 3,727,219 | |
| | | | | | | | |
| | | | TOTAL CONVERTIBLE CORPORATE BONDS & NOTES (Cost $10,895,577) (4.2%) | | | 12,959,044 | |
| | | | | | | | |
| FOREIGN GOVERNMENT OBLIGATIONS (0.2%) | | | | |
| | 500,000 | | Asian Development Bank MTN, Senior Unsecured Notes, 1.38%, 3/23/20 | | | 479,205 | |
| | 250,000 | | International Bank for Reconstruction & Development, Senior Unsecured Notes, 0.50%, 4/15/16 | | | 249,148 | |
| | | | | | | | |
| | | | TOTAL FOREIGN GOVERNMENT OBLIGATIONS (Cost $749,291) (0.2%) | | | 728,353 | |
| | | | | | | | |
| LONG-TERM MUNICIPAL SECURITIES (0.4%) | | | | |
| | | | | | | | |
| | | | CALIFORNIA (0.1%) | | | | |
| | 250,000 | | California State Department of Water Resources, Revenue Bonds, 2.44%, 12/1/21 | | | 236,007 | |
| | 250,000 | | San Francisco Bay Area Rapid Transit District, Revenue Bonds, Series B, 4.09%, 7/1/32 | | | 237,515 | |
| | | | | | | 473,522 | |
| See Notes to Financial Statements. |
| 26 |
| | | | | | | | |
| Principal | | | | | | |
| Amount | | | | Value | |
| | | | NEW YORK (0.1%) | | | | |
| $ | 185,000 | | Metropolitan Transportation Authority, Build America Bonds, Revenue Bonds, Ser. C-1, 5.12%, 11/15/19 | | $ | 203,124 | |
| | | | | | | | |
| | | | PUERTO RICO (0.1%) | | | | |
| | 250,000 | | Government Development Bank for Puerto Rico, Revenue Bonds, Senior Notes, Ser. B, 4.70%, 5/1/16 | | | 250,728 | |
| | | | | | | | |
| | | | TEXAS (0.1%) | | | | |
| | 250,000 | | Tarrant County Cultural Education Facilities Finance Corp., Revenue Bonds, Baylor Health Care System Project, Series C, 4.45%, 11/15/43 | | | 223,400 | |
| | | | | | | | |
| | | | TOTAL LONG-TERM MUNICIPAL SECURITIES (Cost $1,222,335) (0.4%) | | | 1,150,774 | |
| | | | | | | | |
| U.S. GOVERNMENT AGENCY OBLIGATIONS AND GOVERNMENT SPONSORED OBLIGATIONS (6.9%) | | | | |
| | 500,000 | | Federal Home Loan Bank, 1.13%, 3/10/17 | | | 499,812 | |
| | 250,000 | | Federal Home Loan Bank, 3.13%, 12/8/17 | | | 268,045 | |
| | 175,000 | | Federal Home Loan Bank, 2.75%, 6/8/18 | | | 184,993 | |
| | 250,000 | | Federal Home Loan Bank, 1.63%, 2/27/19 | | | 246,676 | |
| | 415,000 | | Federal Home Loan Bank, 4.13%, 12/13/19 | | | 459,073 | |
| | 486,999 | | Federal Home Loan Mortgage Corp., 2.00%, 1/15/33 | | | 479,769 | |
| | 197,417 | | Federal Home Loan Mortgage Corp. Pool #A84814, 4.50%, 3/1/39 | | | 207,856 | |
| | 1,037,508 | | Federal Home Loan Mortgage Corp. Pool #A86830, 4.50%, 6/1/39 | | | 1,092,372 | |
| | | | | | | | |
| Principal | | | | | | |
| Amount | | | | Value | |
| $ | 121,431 | | Federal Home Loan Mortgage Corp. Pool #A96997, 4.50%, 2/1/41 | | $ | 128,229 | |
| | 429,159 | | Federal Home Loan Mortgage Corp. Pool #A97264, 4.00%, 2/1/41 | | | 447,500 | |
| | 413,295 | | Federal Home Loan Mortgage Corp. Pool #C09027, 3.00%, 2/1/43 | | | 403,466 | |
| | 76,768 | | Federal Home Loan Mortgage Corp. Pool #G08521, 3.00%, 1/1/43 | | | 74,942 | |
| | 1,237,824 | | Federal Home Loan Mortgage Corp. Pool #J13314, 3.50%, 10/1/25 | | | 1,286,147 | |
| | 408,240 | | Federal Home Loan Mortgage Corp. Pool #J17969, 3.00%, 2/1/27 | | | 421,498 | |
| | 964,020 | | Federal Home Loan Mortgage Corp. Pool #Q04096, 4.00%, 10/1/41 | | | 1,003,160 | |
| | 1,281,241 | | Federal Home Loan Mortgage Corp. Pool #Q06884, 3.50%, 3/1/42 | | | 1,299,582 | |
| | 113,272 | | Federal Home Loan Mortgage Corp. Pool #Q11077, 3.50%, 9/1/42 | | | 114,894 | |
| | 500,000 | | Federal National Mortgage Association, 2.00%, 9/21/15 | | | 516,403 | |
| | 500,000 | | Federal National Mortgage Association, 0.38%, 12/21/15 | | | 497,207 | |
| | 94,330 | | Federal National Mortgage Association Pool #973333, 4.50%, 2/1/38 | | | 99,772 | |
| | 355,415 | | Federal National Mortgage Association Pool #AA0466, 4.50%, 2/1/39 | | | 375,918 | |
| | 1,034,463 | | Federal National Mortgage Association Pool #AB1796, 3.50%, 11/1/40 | | | 1,051,534 | |
| | 772,848 | | Federal National Mortgage Association Pool #AB3900, 3.00%, 11/1/26 | | | 795,803 | |
| | 28,202 | | Federal National Mortgage Association Pool #AB3943, 4.00%, 11/1/41 | | | 29,421 | |
| See Notes to Financial Statements. |
| 27 |
| Schedule of Investments (unaudited) |
| | | | | | | | |
| Principal | | | | | | |
| Amount | | | | Value | |
| $ | 469,719 | | Federal National Mortgage Association Pool #AB5231, 2.50%, 5/1/27 | | $ | 473,224 | |
| | 488,907 | | Federal National Mortgage Association Pool #AD7128, 4.50%, 7/1/40 | | | 518,001 | |
| | 311,093 | | Federal National Mortgage Association Pool #AD8529, 4.50%, 8/1/40 | | | 329,606 | |
| | 614,635 | | Federal National Mortgage Association Pool #AE3040, 4.00%, 9/1/40 | | | 640,627 | |
| | 995,172 | | Federal National Mortgage Association Pool #AE9759, 4.00%, 12/1/40 | | | 1,037,256 | |
| | 33,378 | | Federal National Mortgage Association Pool #AK6513, 4.00%, 3/1/42 | | | 34,890 | |
| | 731,327 | | Federal National Mortgage Association Pool #AL0160, 4.50%, 5/1/41 | | | 776,202 | |
| | 448,510 | | Federal National Mortgage Association Pool #AQ1853, 3.00%, 11/1/42 | | | 438,837 | |
| | 68,594 | | Federal National Mortgage Association Pool #MA0406, 4.50%, 5/1/30 | | | 72,692 | |
| | 490,035 | | Federal National Mortgage Association REMIC Trust Series 2013-18 Class AE, 2.00%, 3/25/28 | | | 483,340 | |
| | 342,632 | | Federal National Mortgage Association REMIC Trust Series 2013-41 Class WD, 2.00%, 11/25/42 | | | 329,838 | |
| | 600,000 | | Federal National Mortgage Association TBA, 3.50%, 7/1/28 | | | 624,938 | |
| | 1,000,000 | | Federal National Mortgage Association TBA, 4.50%, 7/1/43 | | | 1,058,125 | |
| | 127,422 | | Government National Mortgage Association I Pool #539285, 3.00%, 5/15/42 | | | 126,273 | |
| | | | | | | | |
| Principal | | | | | | |
| Amount | | | | Value | |
| $ | 658,094 | | Government National Mortgage Association I Pool #553450, 3.00%, 1/15/42 | | $ | 652,159 | |
| | 195,433 | | Government National Mortgage Association I Pool #744842, 3.00%, 5/15/42 | | | 193,670 | |
| | 1,227,037 | | Government National Mortgage Association I Pool #AA0448, 3.50%, 5/15/42 | | | 1,261,246 | |
| | | | | | | | |
| | | | TOTAL U.S. GOVERNMENT AGENCY OBLIGATIONS AND GOVERNMENT SPONSORED OBLIGATIONS
(Cost $21,572,200) (6.9%) | | | 21,034,996 | |
| | | | | | | | |
| SHORT-TERM INVESTMENTS (8.8%) | | | | |
| | | | | | | | |
| | | | REPURCHASE AGREEMENTS (5.9%) | | | | |
| $ | 18,000,000 | | With Morgan Stanley, 0.01%, dated 06/28/13, due 07/01/13, delivery value $18,000,015 (collateralized by $18,225,000 U.S. Treasury Notes 1.000% due 08/31/16, with a value of $18,425,450) | | | 18,000,000 | |
| | | | | | | | |
| | | | JOINT REPURCHASE AGREEMENTS (Investments of Cash Collateral for Securities on Loan) (2.9%) | | | | |
| | 2,638,752 | | Joint Repurchase Agreement with Morgan Stanley, 0.12%, dated 06/28/13, due 07/01/13, delivery value $2,638,778 (collateralized by $2,669,467 U.S. Treasury Notes 1.250% - 1.500% due 02/15/14 - 08/31/18, with a value of $2,691,530) | | | 2,638,752 | |
| See Notes to Financial Statements. |
| 28 |
| | | | | | | | |
| Principal | | | | | | |
| Amount | | | | Value | |
| $ | 3,272,053 | | Joint Repurchase Agreement with Barclays, 0.10%, dated 06/28/13, due 07/01/13, delivery value $3,272,080 (collateralized by $3,371,491 U.S. Treasury Inflation Indexed Notes 0.125% due 07/15/22, with a value of $3,337,497) | | $ | 3,272,053 | |
| | 3,060,952 | | Joint Repurchase Agreement with Credit Suisse First Boston, 0.10%, dated 06/28/13, due 07/01/13, delivery value $3,060,978 (collateralized by $3,174,946 U.S. Treasury Notes 1.000% due 05/31/18, with a value of $3,122,544) | | | 3,060,952 | |
| | | | | | | | |
| | | | TOTAL INVESTMENTS OF CASH COLLATERAL FOR SECURITIES ON LOAN (Cost $8,971,757) (2.9%) | | $ | 8,971,757 | |
| | | | TOTAL SHORT-TERM INVESTMENTS (Cost $26,971,757) (8.8%) | | | 26,971,757 | |
| | | | TOTAL INVESTMENT SECURITIES EXCLUDING OPTIONS WRITTEN (102.9%) (Cost $261,521,807) | | $ | 316,246,654 | |
| | | | | | | | |
| Contracts | | | | Value | |
| CALL OPTIONS WRITTEN (0.0%) | | | | |
| | | | | | | | |
| | | | INDUSTRIALS (0.0%) | | | | |
| | 100 | | Chicago Bridge & Iron Co. N.V., expiring 7/20/13, exercise price $65 | | $ | (2,700 | ) |
| | | | | | | | |
| Contracts | | | | Value | |
| | | | INFORMATION TECHNOLOGY (0.0%) | | | | |
| | 100 | | Cognizant Technology Solutions Corp., expiring 7/20/13, exercise price $70 | | $ | (2,000 | ) |
| | | | TOTAL CALL OPTIONS WRITTEN (Premiums Received $20,592) (0.0%) | | | (4,700 | ) |
| | | | TOTAL INVESTMENT SECURITIES (102.9%) (Cost $261,501,215) | | $ | 316,241,954 | |
| EXCESS OF LIABILITIES OVER CASH AND OTHER ASSETS (-2.9%) | | | (9,035,706 | ) |
| NET ASSETS (100%) | | $ | 307,206,248 | |
NET ASSET VALUE OFFERING AND REDEMPTION PRICE, PER OUTSTANDING SHARE ($307,206,248 ÷ 32,985,898 shares outstanding) | | $ | 9.31 | |
| | |
| (1) | A portion or all of the security was held on loan. As of June 30, 2013, the market value of the securities on loan was $8,959,061. |
| * | Non-income producing. |
| (2) | A portion or all of the security was pledged as collateral for call options written. |
| (3) | Pursuant to Rule 144A under the Securities Act of 1933, this security can only be sold to qualified institutional investors. |
| (4) | The rate shown on floating rate securities is the rate at the end of the reporting period. |
| (5) | Step Bond - The rate shown is as of June 30, 2013 and will reset at a future date. |
| ADR | American Depositary Receipt. |
| MTN | Medium Term Note. |
| REIT | Real Estate Investment Trust. |
| TBA | To Be Announced. |
| See Notes to Financial Statements. |
| 29 |
| Value Line Larger Companies Fund, Inc. | |
| Schedule of Investments (unaudited) | June 30, 2013 |
| Shares | | | | Value | |
| COMMON STOCKS (95.9%) | | | | |
| | | | | | | | |
| | | | CONSUMER DISCRETIONARY (17.9%) | | | | |
| | 5,000 | | AutoZone, Inc. * | | $ | 2,118,450 | |
| | 60,000 | | Comcast Corp. Class A | | | 2,380,200 | |
| | 44,000 | | DIRECTV * | | | 2,711,280 | |
| | 41,000 | | Las Vegas Sands Corp. | | | 2,170,130 | |
| | 24,000 | | McDonald’s Corp. | | | 2,376,000 | |
| | 40,000 | | NIKE, Inc. Class B | | | 2,547,200 | |
| | 3,000 | | Priceline.com, Inc. * | | | 2,481,390 | |
| | 11,000 | | Ralph Lauren Corp. | | | 1,911,140 | |
| | 44,000 | | Starbucks Corp. | | | 2,881,560 | |
| | 33,000 | | Target Corp. | | | 2,272,380 | |
| | 50,000 | | TJX Companies, Inc. (The) | | | 2,503,000 | |
| | 39,000 | | Viacom, Inc. Class B | | | 2,653,950 | |
| | 36,000 | | Walt Disney Co. (The) | | | 2,273,400 | |
| | 31,000 | | Yum! Brands, Inc. | | | 2,149,540 | |
| | | | | | | 33,429,620 | |
| | | | | | | | |
| | | | CONSUMER STAPLES (4.6%) | | | | |
| | 24,000 | | Costco Wholesale Corp. | | | 2,653,680 | |
| | 20,000 | | CVS Caremark Corp. | | | 1,143,600 | |
| | 46,000 | | General Mills, Inc. | | | 2,232,380 | |
| | 31,000 | | PepsiCo, Inc. | | | 2,535,490 | |
| | | | | | | 8,565,150 | |
| | | | | | | | |
| | | | ENERGY (7.9%) | | | | |
| | 30,000 | | Cameron International Corp. * | | | 1,834,800 | |
| | 16,000 | | Chevron Corp. | | | 1,893,440 | |
| | 39,000 | | Enterprise Products Partners L.P. | | | 2,423,850 | |
| | 17,000 | | EOG Resources, Inc. | | | 2,238,560 | |
| | 26,000 | | Exxon Mobil Corp. | | | 2,349,100 | |
| | 28,000 | | Schlumberger Ltd. | | | 2,006,480 | |
| | 45,000 | | TransCanada Corp. (1) | | | 1,939,950 | |
| | | | | | | 14,686,180 | |
| | | | | | | | |
| | | | FINANCIALS (7.2%) | | | | |
| | 17,000 | | American Tower Corp. REIT | | | 1,243,890 | |
| | 9,000 | | BlackRock, Inc. | | | 2,311,650 | |
| | 37,000 | | Capital One Financial Corp. | | | 2,323,970 | |
| | 48,000 | | JPMorgan Chase & Co. | | | 2,533,920 | |
| | 21,700 | | M&T Bank Corp. | | | 2,424,975 | |
| | 70,000 | | U.S. Bancorp | | | 2,530,500 | |
| | | | | | | 13,368,905 | |
| | | | | | | | |
| | | | HEALTH CARE (14.7%) | | | | |
| | 24,000 | | Actavis, Inc. * | | | 3,029,280 | |
| | 21,000 | | Allergan, Inc. | | | 1,769,040 | |
| Shares | | | | Value | |
| | 23,000 | | Amgen, Inc. | | $ | 2,269,180 | |
| | 11,500 | | Biogen Idec, Inc. * | | | 2,474,800 | |
| | 45,000 | | Bristol-Myers Squibb Co. | | | 2,011,050 | |
| | 40,000 | | Express Scripts Holding Co. * | | | 2,467,600 | |
| | 48,000 | | Gilead Sciences, Inc. * | | | 2,458,080 | |
| | 21,000 | | McKesson Corp. | | | 2,404,500 | |
| | 27,000 | | Novartis AG ADR | | | 1,909,170 | |
| | 15,000 | | Novo Nordisk A/S ADR | | | 2,324,550 | |
| | 21,500 | | Thermo Fisher Scientific, Inc. | | | 1,819,545 | |
| | 38,000 | | UnitedHealth Group, Inc. | | | 2,488,240 | |
| | | | | | | 27,425,035 | |
| | | | | | | | |
| | | | INDUSTRIALS (12.2%) | | | | |
| | 45,000 | | ADT Corp. (The) * | | | 1,793,250 | |
| | 24,000 | | Boeing Co. (The) | | | 2,458,560 | |
| | 25,000 | | Canadian National Railway Co. | | | 2,431,750 | |
| | 39,000 | | Danaher Corp. | | | 2,468,700 | |
| | 53,085 | | Expeditors International of Washington, Inc. | | | 2,017,761 | |
| | 21,000 | | FedEx Corp. | | | 2,070,180 | |
| | 12,000 | | Precision Castparts Corp. | | | 2,712,120 | |
| | 40,000 | | Tyco International Ltd. | | | 1,318,000 | |
| | 20,000 | | Union Pacific Corp. | | | 3,085,600 | |
| | 25,000 | | United Technologies Corp. | | | 2,323,500 | |
| | | | | | | 22,679,421 | |
| | | | | | | | |
| | | | INFORMATION TECHNOLOGY (21.3%) | | | | |
| | 34,000 | | Accenture PLC Class A | | | 2,446,640 | |
| | 6,500 | | Apple, Inc. | | | 2,574,520 | |
| | 49,700 | | ARM Holdings PLC ADR (1) | | | 1,798,146 | |
| | 36,000 | | Cognizant Technology Solutions Corp. Class A * | | | 2,253,960 | |
| | 40,000 | | eBay, Inc. * | | | 2,068,800 | |
| | 95,000 | | EMC Corp. | | | 2,243,900 | |
| | 3,700 | | Google, Inc. Class A * | | | 3,257,369 | |
| | 91,000 | | Intel Corp. | | | 2,204,020 | |
| | 12,000 | | International Business Machines Corp. | | | 2,293,320 | |
| | 33,900 | | Intuit, Inc. | | | 2,068,917 | |
| | 36,071 | | Motorola Solutions, Inc. | | | 2,082,379 | |
| | 64,000 | | Oracle Corp. | | | 1,966,080 | |
| | 36,000 | | QUALCOMM, Inc. | | | 2,198,880 | |
| | 49,000 | | Salesforce.com, Inc. * | | | 1,870,820 | |
| | 29,900 | | SAP AG ADR | | | 2,177,617 | |
| | 55,000 | | Texas Instruments, Inc. | | | 1,917,850 | |
| | 15,000 | | Visa, Inc. Class A | | | 2,741,250 | |
| | 24,000 | | VMware, Inc. Class A * | | | 1,607,760 | |
| | | | | | | 39,772,228 | |
| See Notes to Financial Statements. | |
| 30 | |
| Shares | | | | Value | |
| | | | MATERIALS (6.9%) | | | | |
| | 20,000 | | Air Products & Chemicals, Inc. | | $ | 1,831,400 | |
| | 26,000 | | BHP Billiton Ltd. ADR | | | 1,499,160 | |
| | 36,000 | | E.I. du Pont de Nemours & Co. | | | 1,890,000 | |
| | 30,000 | | Ecolab, Inc. | | | 2,555,700 | |
| | 22,000 | | Monsanto Co. | | | 2,173,600 | |
| | 16,000 | | Praxair, Inc. | | | 1,842,560 | |
| | 116,000 | | Yamana Gold, Inc. (1) | | | 1,103,160 | |
| | | | | | | 12,895,580 | |
| | | | | | | | |
| | | | TELECOMMUNICATION SERVICES (2.2%) | | | | |
| | 92,000 | | America Movil SAB de C.V. Series L, ADR | | | 2,001,000 | |
| | 50,000 | | BCE, Inc. | | | 2,051,000 | |
| | | | | | | 4,052,000 | |
| | | | | | | | |
| | | | UTILITIES (1.0%) | | | | |
| | 26,333 | | Duke Energy Corp. | | | 1,777,477 | |
| | | | | | | | |
| | | | TOTAL COMMON STOCKS (Cost $120,336,956) (95.9%) | | | 178,651,596 | |
Principal Amount | | | | Value | |
| SHORT-TERM INVESTMENTS (6.6%) | | | | |
| | | | | | | | |
| | | | REPURCHASE AGREEMENTS (4.0%) | | | | |
| $ | 7,500,000 | | With Morgan Stanley, 0.01%, dated 06/28/13, due 07/01/13, delivery value $7,500,006 (collateralized by $7,120,000 U.S. Treasury Notes 3.125% due 05/15/21, with a value of $7,669,067) | | $ | 7,500,000 | |
| | | | | | | | |
| | | | JOINT REPURCHASE AGREEMENTS (Investments of Cash Collateral for Securities on Loan) (2.6%) | | | | |
| | 1,416,504 | | Joint Repurchase Agreement with Morgan Stanley, 0.12%, dated 06/28/13, due 07/01/13, delivery value $1,416,518 (collateralized by $1,432,992 U.S. Treasury Notes 1.250% - 1.500 due 02/15/14 - 08/31/18, with a value of $1,444,836) | | | 1,416,504 | |
Principal Amount | | | | Value | |
| $ | 1,756,465 | | Joint Repurchase Agreement with Barclays, 0.10%, dated 06/28/13, due 07/01/13, delivery value $1,756,479 (collateralized by $1,809,844 U.S. Treasury Inflation Indexed Notes 0.125% due 07/15/22, with a value of $1,791,596) | | $ | 1,756,465 | |
| | 1,643,144 | | Joint Repurchase Agreement with Credit Suisse First Boston, 0.10%, dated 06/28/13, due 07/01/13, delivery value $1,643,158 (collateralized by $1,704,337 U.S. Treasury Notes 1.000% due 05/31/18, with a value of $1,676,207) | | | 1,643,144 | |
| | | | TOTAL INVESTMENTS OF CASH COLLATERAL FOR SECURITIES ON LOAN (Cost $4,816,113) (2.6%) | | | 4,816,113 | |
| | | | TOTAL SHORT-TERM INVESTMENTS (Cost $12,316,113) (6.6%) | | | 12,316,113 | |
| | | | TOTAL INVESTMENT SECURITIES (102.5%) (Cost $132,653,069) | | $ | 190,967,709 | |
| EXCESS OF LIABILITIES OVER CASH AND OTHER ASSETS (-2.5%) | | | (4,636,493 | ) |
| NET ASSETS (100%) | | $ | 186,331,216 | |
| NET ASSET VALUE OFFERING AND REDEMPTION PRICE, PER OUTSTANDING SHARE ($186,331,216 ÷ 8,632,887 shares outstanding) | | $ | 21.58 | |
| * | Non-income producing. |
| (1) | A portion or all of the security was held on loan. As of June 30, 2013, the market value of the securities on loan was $4,843,741. |
| ADR | American Depositary Receipt. |
| REIT | Real Estate Investment Trust. |
| See Notes to Financial Statements. | |
| | 31 |
Statements of Assets and Liabilities
at June 30, 2013 (unaudited) |
| | | Value Line Premier | | | The Value Line | | | Value Line Income and | | | Value Line Larger | |
| | | Growth Fund, Inc. | | | Fund, Inc. | | | | | | Companies Fund, Inc. | |
| Assets: | | | | | | | | | | | | |
| Investment securities, at value* | | | | | | | | | | | | |
Investments(1) | | $ | 356,195,588 | | | $ | 110,903,046 | | | $ | 289,274,897 | | | $ | 178,651,596 | |
Repurchase agreements(2) | | | 27,928,998 | | | | 4,664,717 | | | | 26,971,757 | | | | 12,316,113 | |
| Total investments, at value | | $ | 384,124,586 | | | $ | 115,567,763 | | | $ | 316,246,654 | | | $ | 190,967,709 | |
| Cash | | | 424,421 | | | | 991,910 | | | | 396,540 | | | | 248,543 | |
| Receivable for securities sold | | | 1,710,425 | | | | 1,084,265 | | | | 959,807 | | | | — | |
| Interest and dividends receivable | | | 461,426 | | | | 63,240 | | | | 750,217 | | | | 180,288 | |
| Receivable for capital shares sold | | | 161,329 | | | | 1,081 | | | | 17,737 | | | | 261 | |
| Prepaid expenses | | | 28,379 | | | | 15,554 | | | | 27,707 | | | | 22,378 | |
Receivable for securities lending income | | | 6,936 | | | | 1,605 | | | | 6,791 | | | | 6,631 | |
Total Assets | | | 386,917,502 | | | | 117,725,418 | | | | 318,405,453 | | | | 191,425,810 | |
| Liabilities: | | | | | | | | | | | | | | | | |
Payable upon return of securities on loan | | | 23,919,505 | | | | 4,722,067 | | | | 9,082,060 | | | | 4,875,325 | |
| Payable for securities purchased | | | — | | | | — | | | | 1,692,257 | | | | — | |
Payable for capital shares redeemed | | | 859,796 | | | | 21,616 | | | | 82,088 | | | | 12,756 | |
Option contracts written, at value (premiums received $0, $0, $20,592 and $0, respectively) | | | — | | | | — | | | | 4,700 | | | | — | |
| Accrued expenses: | | | | | | | | | | | | | | | | |
| Advisory fee | | | 209,884 | | | | 60,612 | | | | 152,775 | | | | 108,717 | |
| Service and distribution plan fees | | | 69,962 | | | | — | | | | 46,646 | | | | — | |
| Directors’ fees and expenses | | | — | | | | 503 | | | | 1,070 | | | | 710 | |
| Other | | | 134,843 | | | | 82,403 | | | | 137,609 | | | | 97,086 | |
Total Liabilities | | | 25,193,990 | | | | 4,887,201 | | | | 11,199,205 | | | | 5,094,594 | |
Net Assets | | $ | 361,723,512 | | | $ | 112,838,217 | | | $ | 307,206,248 | | | $ | 186,331,216 | |
| Net assets consist of: | | | | | | | | | | | | | | | | |
Capital stock, at $1.00 par value (authorized 100,000,000, 50,000,000, 75,000,000 and 50,000,000 shares, respectively) | | $ | 11,497,451 | | | $ | 9,825,262 | | | $ | 32,985,898 | | | $ | 8,632,887 | |
| Additional paid-in capital | | | 169,907,125 | | | | 108,223,474 | | | | 210,538,567 | | | | 159,126,058 | |
Undistributed net investment income | | | 188,451 | | | | 647,387 | | | | 83,053 | | | | 1,930,447 | |
Accumulated net realized gain (loss) on investments and foreign currency | | | 13,131,738 | | | | (48,242,186 | ) | | | 8,858,551 | | | | (41,671,926 | ) |
| Net unrealized appreciation of: | | | | | | | | | | | | | | | | |
Investments and foreign currency translations | | | 166,998,747 | | | | 42,384,280 | | | | 54,724,287 | | | | 58,313,750 | |
| Written options | | | — | | | | — | | | | 15,892 | | | | — | |
Net Assets | | $ | 361,723,512 | | | $ | 112,838,217 | | | $ | 307,206,248 | | | $ | 186,331,216 | |
| Shares Outstanding | | | 11,497,451 | | | | 9,825,262 | | | | 32,985,898 | | | | 8,632,887 | |
Net Asset Value, Offering and Redemption Price per Outstanding Share | | $ | 31.46 | | | $ | 11.48 | | | $ | 9.31 | | | $ | 21.58 | |
| * Includes securities on loan of | | $ | 23,307,778 | | | $ | 4,597,541 | | | $ | 8,959,061 | | | $ | 4,843,741 | |
(1)Cost of investments | | $ | 189,196,642 | | | $ | 68,518,704 | | | $ | 234,550,050 | | | $ | 120,336,956 | |
(2)Cost of repurchase agreements | | $ | 27,928,998 | | | $ | 4,664,717 | | | $ | 26,971,757 | | | $ | 12,316,113 | |
| See Notes to Financial Statements. | |
| 32 | |
Statements of Operations
for the Six Months Ended June 30, 2013 (unaudited) |
| | | Value Line Premier | | | The Value Line | | | Value Line Income and | | | Value Line Larger | |
| | | | | | Fund, Inc. | | | | | | Companies Fund, Inc. | |
| Investment Income: | | | | | | | | | | | | |
Dividends (net of foreign withholding tax of $65,355, $13,717, $51,448 and $47,368, respectively) | | $ | 2,334,752 | | | $ | 649,429 | | | $ | 2,667,345 | | | $ | 1,491,068 | |
| Interest | | | 5,955 | | | | 941 | | | | 978,110 | | | | 2,678 | |
| Securities lending income | | | 54,635 | | | | 17,467 | | | | 41,270 | | | | 18,128 | |
| Total Income | | | 2,395,342 | | | | 667,837 | | | | 3,686,725 | | | | 1,511,874 | |
| Expenses: | | | | | | | | | | | | | | | | |
| Advisory fee | | | 1,335,977 | | | | 387,115 | | | | 1,005,032 | | | | 701,433 | |
| Service and distribution plan fees | | | 445,326 | | | | 139,459 | | | | 377,120 | | | | 233,811 | |
| Sub-transfer agent fees | | | 48,612 | | | | 3,459 | | | | 26,885 | | | | 5,771 | |
| Custodian fees | | | 34,009 | | | | 15,772 | | | | 35,512 | | | | 17,811 | |
| Auditing and legal fees | | | 95,017 | | | | 39,706 | | | | 88,273 | | | | 55,632 | |
| Transfer agent fees | | | 79,313 | | | | 46,163 | | | | 70,533 | | | | 51,494 | |
| Directors’ fees and expenses | | | 36,237 | | | | 11,723 | | | | 31,556 | | | | 19,671 | |
| Printing and postage | | | 62,467 | | | | 39,592 | | | | 59,994 | | | | 46,024 | |
| Registration and filing fees | | | 20,664 | | | | 14,427 | | | | 14,994 | | | | 16,389 | |
| Insurance | | | 19,299 | | | | 7,278 | | | | 18,023 | | | | 10,969 | |
| Other | | | 27,941 | | | | 11,404 | | | | 23,227 | | | | 16,063 | |
Total Expenses Before Fees Waived | | | 2,204,862 | | | | 716,098 | | | | 1,751,149 | | | | 1,175,068 | |
Less: Service and Distribution Plan Fees Waived | | | — | | | | (139,459 | ) | | | (75,424 | ) | | | (233,811 | ) |
| Net Expenses | | | 2,204,862 | | | | 576,639 | | | | 1,675,725 | | | | 941,257 | |
Net Investment Income | | | 190,480 | | | | 91,198 | | | | 2,011,000 | | | | 570,617 | |
Net Realized and Unrealized Gain (Loss) on Investments, Foreign Exchange Transactions and Written Options: | | | | | | | | | | | | | | | | |
| Net Realized Gain (Loss) from: | | | | | | | | | | | | | | | | |
| Investments | | | 9,189,849 | | | | 4,003,129 | | | | 6,903,281 | | | | 5,615,170 | |
| Foreign currency transactions | | | 2,523 | | | | (817 | ) | | | (773 | ) | | | 81 | |
| Written options | | | — | | | | — | | | | 24,295 | | | | — | |
| | | | 9,192,372 | | | | 4,002,312 | | | | 6,926,803 | | | | 5,615,251 | |
Change in Net Unrealized Appreciation/(Depreciation) of: | | | | | | | | | | | | | | | | |
| Investments | | | 21,461,435 | | | | 7,568,614 | | | | 14,668,763 | | | | 10,415,504 | |
| Foreign currency transactions | | | (179 | ) | | | (51 | ) | | | (356 | ) | | | (582 | ) |
| Written options | | | — | | | | — | | | | 15,892 | | | | — | |
| | | | 21,461,256 | | | | 7,568,563 | | | | 14,684,299 | | | | 10,414,922 | |
Net Realized Gain and Change in Net Unrealized Appreciation/(Depreciation) on Investments, Foreign Exchange Transactions and Written Options | | | 30,653,628 | | | | 11,570,875 | | | | 21,611,102 | | | | 16,030,173 | |
Net Increase in Net Assets from Operations | | $ | 30,844,108 | | | $ | 11,662,073 | | | $ | 23,622,102 | | | $ | 16,600,790 | |
| See Notes to Financial Statements. | |
| | 33 |
Statement of Changes in Net Assets
for the Six Months Ended June 30, 2013 (unaudited) and for the Year Ended December 31, 2012 |
| | | Value Line Premier Growth Fund, Inc. | |
| | | Six Months Ended | | | | |
| | | June 30, 2013 | | | Year Ended | |
| | | (unaudited) | | | December 31, 2012 | |
| Operations: | | | | | | |
| Net investment income | | $ | 190,480 | | | $ | 916,159 | |
| Net realized gain on investments and foreign currency | | | 9,192,372 | | | | 24,763,062 | |
| Change in net unrealized appreciation/(depreciation) | | | 21,461,256 | | | | 26,967,212 | |
Net increase in net assets from operations | | | 30,844,108 | | | | 52,646,433 | |
| | | | | | | | | |
| Distributions to Shareholders: | | | | | | | | |
| Net investment income | | | — | | | | (1,001,240 | ) |
| Net realized gain from investment transactions | | | — | | | | (24,163,438 | ) |
Net decrease in net assets from distributions to shareholders | | | — | | | | (25,164,678 | ) |
| | | | | | | | | |
| Capital Share Transactions: | | | | | | | | |
| Proceeds from sale of shares | | | 26,795,322 | | | | 59,483,434 | |
| Proceeds from reinvestment of dividends and distributions to shareholders | | | — | | | | 24,174,754 | |
| Cost of shares redeemed | | | (33,351,839 | ) | | | (72,131,660 | ) |
Net increase/(decrease) in net assets from capital share transactions | | | (6,556,517 | ) | | | 11,526,528 | |
Total Increase in Net Assets | | | 24,287,591 | | | | 39,008,283 | |
| Net Assets: | | | | | | | | |
| Beginning of period | | | 337,435,921 | | | | 298,427,638 | |
| End of period | | $ | 361,723,512 | | | $ | 337,435,921 | |
Undistributed net investment income, and distributions in excess of net investment income, at end of period | | $ | 188,451 | | | $ | (2,029 | ) |
| See Notes to Financial Statements. | |
| 34 | |
Statement of Changes in Net Assets
for the Six Months Ended June 30, 2013 (unaudited) and for the Year Ended December 31, 2012 |
| | | The Value Line Fund, Inc. | |
| | | Six Months Ended | | | | |
| | | June 30, 2013 | | | Year Ended | |
| | | (unaudited) | | | December 31, 2012 | |
| Operations: | | | | | | |
| Net investment income | | $ | 91,198 | | | $ | 558,673 | |
| Net realized gain on investments and foreign currency | | | 4,002,312 | | | | 13,414,151 | |
| Change in net unrealized appreciation/(depreciation) | | | 7,568,563 | | | | 3,749,359 | |
Net increase in net assets from operations | | | 11,662,073 | | | | 17,722,183 | |
| | | | | | | | | |
| Capital Share Transactions: | | | | | | | | |
| Proceeds from sale of shares | | | 1,244,222 | | | | 3,226,854 | |
| Cost of shares redeemed | | | (9,865,967 | ) | | | (44,487,216 | ) |
Net decrease in net assets from capital share transactions | | | (8,621,745 | ) | | | (41,260,362 | ) |
Total Increase/(Decrease) in Net Assets | | | 3,040,328 | | | | (23,538,179 | ) |
| | | | | | | | | |
| Net Assets: | | | | | | | | |
| Beginning of period | | | 109,797,889 | | | | 133,336,068 | |
| End of period | | $ | 112,838,217 | | | $ | 109,797,889 | |
| Undistributed net investment income, at end of period | | $ | 647,387 | | | $ | 556,189 | |
| See Notes to Financial Statements. | |
| | 35 |
Statement of Changes in Net Assets
for the Six Months Ended June 30, 2013 (unaudited) and for the Year Ended December 31, 2012 |
| | | Value Line Income and Growth
Fund, Inc. | |
| | | Six Months Ended | | | | |
| | | June 30, 2013 | | | Year Ended | |
| | | (unaudited) | | | December 31, 2012 | |
| Operations: | | | | | | |
| Net investment income | | $ | 2,011,000 | | | $ | 4,498,399 | |
| Net realized gain on investments, foreign currency and written options | | | 6,926,803 | | | | 13,218,671 | |
| Change in net unrealized appreciation/(depreciation) | | | 14,684,299 | | | | 13,315,963 | |
Net increase in net assets from operations | | | 23,622,102 | | | | 31,033,033 | |
| | | | | | | | | |
| Distributions to Shareholders: | | | | | | | | |
| Net investment income | | | (1,914,569 | ) | | | (4,463,988 | ) |
| Net realized gain from investment transactions | | | — | | | | (11,203,043 | ) |
Total Distributions | | | (1,914,569 | ) | | | (15,667,031 | ) |
| | | | | | | | | |
| Capital Share Transactions: | | | | | | | | |
| Proceeds from sale of shares | | | 8,262,437 | | | | 7,178,813 | |
| Proceeds from reinvestment of dividends and distributions to shareholders | | | 1,718,977 | | | | 14,279,164 | |
| Cost of shares redeemed | | | (20,187,958 | ) | | | (47,345,268 | ) |
Net decrease in net assets from capital share transactions | | | (10,206,544 | ) | | | (25,887,291 | ) |
Total Increase/(Decrease) in Net Assets | | | 11,500,989 | | | | (10,521,289 | ) |
| | | | | | | | | |
| Net Assets: | | | | | | | | |
| Beginning of period | | | 295,705,259 | | | | 306,226,548 | |
| End of period | | $ | 307,206,248 | | | $ | 295,705,259 | |
Undistributed net investment income, and distributions in excess of net investment income, at end of period | | $ | 83,053 | | | $ | (13,378 | ) |
| See Notes to Financial Statements. | |
| 36 | |
Statement of Changes in Net Assets
for the Six Months Ended June 30, 2013 (unaudited) and for the Year Ended December 31, 2012 |
| | | Value Line Larger Companies
Fund, Inc. | |
| | | Six Months Ended | | | | |
| | | June 30, 2013 | | | Year Ended | |
| | | (unaudited) | | | December 31, 2012 | |
| Operations: | | | | | | |
| Net investment income | | $ | 570,617 | | | $ | 1,359,399 | |
| Net realized gain on investments and foreign currency | | | 5,615,251 | | | | 3,786,520 | |
| Change in net unrealized appreciation/(depreciation) | | | 10,414,922 | | | | 20,499,383 | |
Net increase in net assets from operations | | | 16,600,790 | | | | 25,645,302 | |
| | | | | | | | | |
| Distributions to Shareholders: | | | | | | | | |
| Net investment income | | | — | | | | (1,087,423 | ) |
| | | | | | | | | |
| Capital Share Transactions: | | | | | | | | |
| Proceeds from sale of shares | | | 806,631 | | | | 2,278,669 | |
| Proceeds from reinvestment of dividends to shareholders | | | 157 | | | | 1,033,051 | |
| Cost of shares redeemed | | | (15,318,944 | ) | | | (22,410,433 | ) |
Net decrease in net assets from capital share transactions | | | (14,512,156 | ) | | | (19,098,713 | ) |
Total Increase in Net Assets | | | 2,088,634 | | | | 5,459,166 | |
| | | | | | | | | |
| Net Assets: | | | | | | | | |
| Beginning of period | | | 184,242,582 | | | | 178,783,416 | |
| End of period | | $ | 186,331,216 | | | $ | 184,242,582 | |
| Undistributed net investment income, at end of period | | $ | 1,930,447 | | | $ | 1,359,830 | |
| See Notes to Financial Statements. | |
| | 37 |
| Notes to Financial Statements (unaudited) |
1. Significant Accounting Policies
Value Line Premier Growth Fund, Inc., The Value Line Fund, Inc., Value Line Income and Growth Fund, Inc., and Value Line Larger Companies Fund, Inc. are each registered under the Investment Company Act of 1940, as amended, as diversified, open-end management investment companies. The primary investment objective of the Value Line Premier Growth Fund, Inc. and The Value Line Fund, Inc. is long-term growth of capital. The primary investment objective of the Value Line Income and Growth Fund, Inc. is income, as high and dependable as is consistent with reasonable risk and capital growth to increase total return is a secondary objective. The sole investment objective of the Value Line Larger Companies Fund, Inc. is to realize capital growth.
The preparation of financial statements in conformity with generally accepted accounting principles requires management to make estimates and assumptions that affect the reported amounts of assets and liabilities and disclosure of contingent assets and liabilities at the date of the financial statements and the reported amounts of revenues and expenses during the reporting period. Actual results could differ from those estimates. The following is a summary of significant accounting policies consistently followed by the Funds in the preparation of their financial statements.
(A) Security Valuation: Securities listed on a securities exchange are valued at the closing sales prices on the date as of which the net asset value is being determined. Securities traded on the NASDAQ Stock Market are valued at the NASDAQ Official Closing Price. In the absence of closing sales prices for such securities and for securities traded in the over-the-counter market, the security is valued at the midpoint between the latest available and representative asked and bid prices. Short-term instruments with maturities of 60 days or less at the date of purchase are valued at amortized cost, which approximates market value. Short-term instruments with maturities greater than 60 days at the date of purchase are valued at the midpoint between the latest available and representative asked and bid prices, and commencing 60 days prior to maturity such securities are valued at amortized cost.
The Board of Directors (the “Board”) has adopted procedures for valuing portfolio securities in circumstances where market quotes are not readily available, and has delegated the responsibility for applying the valuation methods to the Adviser. The Funds’ Valuation Committee was established by the Board to oversee the implementation of the Fund’s valuation methods and to make fair value determinations on behalf of the Board, as instructed. The Adviser monitors the continued appropriateness of methods applied and determines if adjustments should be made in light of market changes, events affecting the issuer, or other factors. If the Adviser determines that a valuation method may no longer be appropriate, another valuation method may be selected, or the Valuation Committee will be convened to consider the matter and take any appropriate action in accordance with procedures set forth by the Board. The Board shall review the appropriateness of the valuation methods and these methods may be amended or supplemented from time to time by the Valuation Committee. In addition, the Funds may use the fair value of a security when the closing market price on the primary exchange where the security is traded no longer accurately reflects the value of a security due to factors affecting one or more relevant securities markets or the specific issuer.
(B) Fair Value Measurements: The Funds follow fair valuation accounting standards (FASB ASC 820-10) which establish a definition of fair value and set out a hierarchy for measuring fair value. These standards require additional disclosures about the various inputs and valuation techniques used to develop the measurements of fair value and a discussion of changes in valuation techniques and related inputs during the period. These inputs are summarized in the three broad levels listed below:
| ● | Level 1 – | Inputs that reflect unadjusted quoted prices in active markets for identical assets or liabilities that the Fund has the ability to access at the measurement date; |
| ● | Level 2 – | Inputs other than quoted prices that are observable for the asset or liability either directly or indirectly, including inputs in markets that are not considered to be active; |
| ● | Level 3 – | Inputs that are unobservable. |
Transfers between investment levels may occur as the markets fluctuate and/or the availability of data used in an investment’s valuation changes. The inputs or methodologies used for valuing securities are not necessarily an indication of the risk associated with investing in those securities.
The following table summarizes the inputs used to value the Funds’ investments in securities as of June 30, 2013:
| | | Level 1 | | | Level 2 | | | Level 3 | | | Total | |
| Value Line Premier Growth Fund, Inc. | | | | | | | | | | | | |
| Assets: | | | | | | | | | | | | |
| Common Stocks | | $ | 356,195,588 | | | $ | — | | | $ | — | | | $ | 356,195,588 | |
| Short-Term Investments | | | — | | | | 27,928,998 | | | | — | | | | 27,928,998 | |
Total | | $ | 356,195,588 | | | $ | 27,928,998 | | | $ | — | | | $ | 384,124,586 | |
| | | | | | | | | | | | | | | | | |
| The Value Line Fund, Inc. | | | | | | | | | | | | | | | | |
| Assets: | | | | | | | | | | | | | | | | |
| Common Stocks | | $ | 110,903,046 | | | $ | — | | | $ | — | | | $ | 110,903,046 | |
| Short-Term Investments | | | — | | | | 4,664,717 | | | | — | | | | 4,664,717 | |
Total | | $ | 110,903,046 | | | $ | 4,664,717 | | | $ | — | | | $ | 115,567,763 | |
| | | | | | | | | | | | | | | | | |
Value Line Income and Growth Fund, Inc. | | | | | | | | | | | | | | | | |
| Assets: | | | | | | | | | | | | | | | | |
| Common Stocks | | $ | 198,899,809 | | | $ | — | | | $ | — | | | $ | 198,899,809 | |
| Preferred Stocks | | | 126,400 | | | | — | | | | — | | | | 126,400 | |
| Convertible Preferred Stocks | | | 4,272,503 | | | | 1,019,149 | | | | — | | | | 5,291,652 | |
| U.S.Treasuty Obligations | | | — | | | | 26,000,741 | | | | — | | | | 26,000,741 | |
Commercial Mortgage-Backed Securities | | | — | | | | 2,138,955 | | | | — | | | | 2,138,955 | |
| Corporate Bonds & Notes | | | — | | | | 20,944,173 | | | | — | | | | 20,944,173 | |
| Convertible Corporate Bonds & Notes | | | — | | | | 12,959,044 | | | | — | | | | 12,959,044 | |
| Foreign Government Obligations | | | — | | | | 728,353 | | | | — | | | | 728,353 | |
| Long-Term Municipal Securities | | | — | | | | 1,150,774 | | | | — | | | | 1,150,774 | |
U.S.Government Agency Obligations & Government Sponsored Obligations | | | — | | | | 21,034,996 | | | | — | | | | 21,034,996 | |
| Short-Term Investments | | | — | | | | 26,971,757 | | | | — | | | | 26,971,757 | |
Total | | $ | 203,298,712 | | | $ | 112,947,942 | | | $ | — | | | $ | 316,246,654 | |
| | | | | | | | | | | | | | | | | |
| Liabilities: | | | | | | | | | | | | | | | | |
| Call Options Written | | $ | (4,700 | ) | | $ | — | | | $ | — | | | $ | (4,700 | ) |
| | | | | | | | | | | | | | | | | |
Value Line Larger Companies Fund, Inc. | | | | | | | | | | | | | | | | |
| Assets: | | | | | | | | | | | | | | | | |
| Common Stocks | | $ | 178,651,596 | | | $ | — | | | $ | — | | | $ | 178,651,596 | |
| Short-Term Investments | | | — | | | | 12,316,113 | | | | — | | | | 12,316,113 | |
| Total | | $ | 178,651,596 | | | $ | 12,316,113 | | | $ | — | | | $ | 190,967,709 | |
Notes to Financial Statements (unaudited) |
The Funds follow the updated provisions surrounding fair value measurements and disclosures on transfers in and out of all levels of the fair value hierarchy on a gross basis and the reasons for the transfers as well as to disclosures about the valuation techniques and inputs used to measure fair value for investments that fall in either Level 2 or Level 3 of the fair value hierarchy.
The Funds’ policy is to recognize transfers between levels at the beginning of the reporting period.
The amounts and reasons for all transfers in and out of each level within the three-tier hierarchy are disclosed when the Funds had an amount of total transfers during the reporting period that were meaningful in relation to their net assets as of the end of the reporting period. An investment asset’s or liability’s level within the fair value hierarchy is based on the lowest level input, individually or in aggregate, that is significant to fair value measurement. The objective of fair value measurement remains the same even when there is a significant decrease in the volume and level of activity for an asset or liability and regardless of the valuation techniques used.
For the six months ended June 30, 2013 there were no Level 3 investments. The Schedule of Investments includes a breakdown of the Schedules’ investments by category.
(C) Repurchase Agreements: Each Fund may enter into repurchase agreements, under the terms of a Master Repurchase Agreement, with selected commercial banks and broker-dealers, under which the Funds acquire securities as collateral and agrees to resell the securities at an agreed upon time and at an agreed upon price. Each Fund, through the custodian or a sub-custodian, receives delivery of the underlying securities collateralizing repurchase agreements. The Funds’ custodian takes possession of the underlying collateral securities, the value of which exceeds the principal amount of the repurchase transaction, including accrued interest. To the extent that any repurchase transaction exceeds one business day, it is the Funds’ policy to mark-to-market on a daily basis to ensure the adequacy of the collateral. In the event of default of the obligation to repurchase, under the Master Repurchase Agreement, the Funds have the right to liquidate the collateral and apply the proceeds in satisfaction of the obligation. Under certain circumstances, in the event of default or bankruptcy by the other party to the agreement, realization and/or retention of the collateral or proceeds may be subject to legal proceedings.
At period end, Value Line Premier Growth Fund, Inc., Value Line Income and Growth Fund, Inc., and Value Line Larger Companies Fund, Inc., respectively, had investments in repurchase agreements with a gross value of $4,300,000, $18,000,000, and $7,500,000 on the Statements of Assets and Liabilities. The value of each Fund’s related collateral exceeded the value of the repurchase agreements at period end. There were no open repurchase agreements for The Value Line Fund, Inc. at June 28, 2013.
(D) Federal Income Taxes: It is the policy of the Funds to each qualify as a regulated investment company by complying with the provisions available to regulated investment companies, as defined in applicable sections of the Internal Revenue Code, and to distribute all of their investment income and capital gains to its shareholders. Therefore, no provision for federal income tax is required.
Management has analyzed the Funds’ tax positions taken on federal and state income tax returns for all open tax years (fiscal years ended December 31, 2009 through December 31, 2012), and has concluded that no provision for federal or state income tax is required in the Funds’ financial statements. The Funds’ federal and state income tax returns for tax years for which the applicable statutes of limitations have not expired are subject to examination by the Internal Revenue Service and state departments of revenue.
(E) Security Transactions and Distributions: Security transactions are accounted for on the date the securities are purchased or sold. Interest income is accrued as earned. Realized gains and losses on sales of securities are calculated for financial accounting and federal income tax purposes on the identified cost basis. Dividend income and distributions to shareholders are recorded on the ex-dividend date. Distributions are determined in accordance with income tax regulations, which may differ from generally accepted accounting principles.
(F) Foreign Currency Translation: The books and records of the Funds are maintained in U.S. dollars. Assets and liabilities which are denominated in foreign currencies are translated to U.S. dollars at the prevailing rates of exchange. The Funds do not isolate changes in the value of investments caused by foreign exchange rate differences from the changes due to other circumstances.
Income and expenses are translated to U.S. dollars based upon the rates of exchange on the respective dates of such transactions.
Net realized foreign exchange gains or losses arise from currency fluctuations realized between the trade and settlement dates on securities transactions, the differences between the U.S. dollar amounts of dividends, interest, and foreign withholding taxes recorded by the Funds, and the U.S. dollar equivalent of the amounts actually received or paid. Net unrealized foreign exchange gains and losses arise from changes in the value of assets and liabilities, other than investments, at the end of the fiscal period, resulting from changes in the exchange rates. The effect of the change in foreign exchange rates on the value of investments is included in realized gain/loss on investments and change in net unrealized appreciation/depreciation on investments.
(G) Representations and Indemnifications: In the normal course of business, the Funds enter into contracts that contain a variety of representations and warranties which provide general indemnifications. The Funds’ maximum exposure under these arrangements is unknown, as this would involve future claims that may be made against the Funds that have not yet occurred. However, based on experience, the Funds expect the risk of loss to be remote.
(H) Accounting for Real Estate Investment Trusts: The Funds own shares of Real Estate Investment Trusts (“REITs”) which report information on the source of their distributions annually. Distributions received from REITs during the year which represent a return of capital are recorded as a reduction of cost and distributions which represent a capital gain dividend are recorded as a realized long-term capital gain on investments.
(I) Foreign Taxes: The Funds may be subject to foreign taxes on income, gains on investments, or currency repatriation, a portion of which may be recoverable. The Funds will accrue such taxes and recoveries as applicable, based upon its current interpretation of tax rules and regulations that exist in the markets in which it invests.
(J) Securities Lending: Under an agreement with State Street Bank & Trust (“State Street”), the Funds can lend their securities to brokers, dealers and other financial institutions approved by the Board of Directors. By lending their investment securities, the Funds attempt to increase their net investment income through receipt of interest on the loan. Any gain or loss in the market price of the securities loaned that might occur and any interest or dividends declared during the term of the loan would accrue to the account of the Funds. Risks of delay in recovery of the securities or even loss of rights in the collateral may occur should the borrower of the securities fail financially. Generally, in the event of a counter-party default, the Funds have the right to use the collateral to offset the losses incurred. The lending fees received and the Funds’ portion of the interest income earned on the cash collateral are included in the Statement of Operations.
| Notes to Financial Statements (unaudited) |
Upon entering into a securities lending transaction, the Funds receive cash or other securities as collateral in an amount equal to or exceeding 102% of the current market value of the loaned securities. Any cash received as collateral is invested by State Street Global Advisors, acting in its capacity as securities lending agent (the “Agent”), in The Value Line Funds collateral account, which is subsequently invested into joint repurchase agreements. A portion of the dividends received on the collateral is rebated to the borrower of the securities and the remainder is split between the Agent and the Funds.
The Funds enter into joint repurchase agreements whereby their uninvested cash collateral from securities lending is deposited into a joint cash account with other funds managed by the investment adviser and is used to invest in one or more repurchase agreements. The value and face amount of the joint repurchase agreement are allocated to the funds based on their pro-rata interest. A repurchase agreement is accounted for as a loan by the funds to the seller, collateralized by securities which are delivered to the fund’s custodian. The market value, including accrued interest, of the initial collateralization is required to be at least 102% of the dollar amount invested by the funds, with the value of the underlying securities marked to market daily to maintain coverage of at least 100%. The joint repurchase agreement held by the Funds at the six months ended had been entered into on June 28, 2013.
As of June 28, 2013, the Funds loaned securities which were collateralized by cash. The value of the related collateral exceeded the value of the securities loaned at period end. The value of the securities on loan and the value of the related collateral were as follows:
| | | | | | | | | | | |
| Fund | | Value of Securities Loaned | | Value of Collateral | | Total Collateral (including Calculated Mark) | |
| Value Line Premier Growth Fund, Inc. | | $ | 23,307,778 | | $ | 23,919,505 | | $ | 23,836,432 | |
| The Value Line Fund, Inc. | | | 4,597,541 | | | 4,722,067 | | | 4,697,024 | |
| Value Line Income and Growth Fund, Inc. | | | 8,959,061 | | | 9,082,060 | | | 9,155,213 | |
| Value Line Larger Companies Fund, Inc. | | | 4,843,741 | | | 4,875,325 | | | 4,949,900 | |
(K) Options: The Value Line Income and Growth Fund, Inc.’s investment strategy allows the use of options. The Fund utilizes options to hedge against changes in market conditions or to provide market exposure while trying to reduce transaction costs.
When the Fund writes a put or call option, an amount equal to the premiums received is included on the Statement of Assets and Liabilities as a liability. The amount of the liability is subsequently marked-to-market to reflect the current market value of the option. If an option expires on its stipulated expiration date or if the Fund enters into a closing purchase transaction, a gain or loss is realized. If a written call option on an individual security is exercised, a gain or loss is realized for the sale of the underlying security, and the proceeds from the sale are increased by the premium originally received. If a written put option on an individual security is exercised, the cost of the security acquired is decreased by the premium originally received. As a writer of an option, a Fund bears the market risk of an unfavorable change in the price of the individual security underlying the written option. Additionally, written call options may involve the risk of limited gains.
The Fund may also purchase put and call options. When a Fund purchases a put or call option, an amount equal to the premium paid is included on the Fund’s Statement of Assets and Liabilities as an investment, and is subsequently marked-to-market to reflect the current market value of the option. If an option expires on the stipulated expiration date or if the Fund enters into a closing sale transaction, a gain or loss is realized. If the Fund exercises a call option on an individual security, the cost of the security acquired is increased by the premium paid for the call. If the Fund exercises a put option on an individual security, a gain or loss is realized from the sale of the underlying security, and the proceeds from such a sale are decreased by the premium originally paid. Written and purchased options are non-income producing securities.
As of June 30, 2013, the Value Line Income and Growth Fund, Inc. engaged in written call option transactions. All open option contracts are included on each Fund’s Schedule of Investments.
The Value Line Income and Growth Fund, Inc.’s written options are collateralized by securities held at the Options Clearing Corporation’s account at the Fund’s custodian. The securities pledged as collateral are included on the Schedule of Investments. Such collateral is restricted from the Fund’s use.
The number of options contracts written and the premiums received by the Value Line Income and Growth Fund, Inc. during the period ended June 30, 2013, were as follows:
| | | | | | | | |
| | | Number of Contracts | | Premiums Received | |
| Options outstanding at December 31, 2012 | | | — | | $ | 0 | |
| Options written | | | 400 | | | 44,887 | |
| Options expired/closed | | | (200 | ) | | (24,295 | ) |
| Options outstanding at June 30, 2013 | | | 200 | | $ | 20,592 | |
The following is a summary of how these derivatives are treated in the financial statements and their impact on the Fund:
| | | | | | | | | | | |
| | | | | Gain or (Loss) Derivative Recognized in Income | |
| Risk Type | | Liability Derivative Gross Amount at Fair Value(a) | | Realized Gain(b) | | Change in Appreciation(c) | |
| Equity - Written options | | $ | 4,700 | | $ | 24,295 | | $ | 15,892 | |
Written Options Contracts and Collateral Held by Counterparty as of June 30, 2013:
| | | | | | | | | | | | | | |
| Counterparty | | Gross Amounts of Liabilities Presented in Statement of Assets & Liabilities | | Financial Instrument | | Collateral Shares Pledged(d) | | Net Amount (not less than 0) | |
| Morgan Stanley | | $ | 4,700 | | $ | 0 | | $ | 4,700 | | $ | 0 | |
| Notes to Financial Statements (unaudited) |
For the six months ended June 30, 2013, the Fund’s quarterly holdings of written options contracts were as follows:
| | | | | |
| Quarter Ended | | Number of Written Options Contracts Outstanding | |
| March 31, 2013 | | | — | |
| June 30, 2013 | | | 200 | |
| (a) | Statements of Assets and Liabilities location: Option contracts written, at value |
| (b) | Statements of Operations location: Net Realized Gain (Loss) from: Written options |
| (c) | Statements of Operations location: Change in Net Unrealized Appreciation/(Depreciation) of: Written options |
| (d) | In some instances, the actual collateral received and/or pledged may be more than the amount shown here due to overcol-lateralization. |
(L) Subsequent Events: Effective August 1, 2013, Value Line Larger Companies Fund, Inc.’s 12b-1 fee will be charged at a rate of 0.15% of the Fund’s average daily net assets after giving effect to a waiver equal to 0.10% of the Fund’s average daily net assets. This waiver is effective through June 30, 2014 and cannot be changed or terminated during this period unless approved by your Fund’s board and principal underwriter, EULAV Securities LLC.
Effective August 1, 2013, The Value Line Fund, Inc.’s 12b-1 fee will be charged at a rate of 0.25% of the Fund’s average daily net assets.
Management has evaluated all subsequent transactions and events through the date on which these financial statements were issued and has determined that no additional items require disclosure.
2. Investment Risks
Securities issued by U.S. Government agencies or government-sponsored enterprises may not be guaranteed by the U.S. Treasury. The Government National Mortgage Association (“GNMA” or “Ginnie Mae”), a wholly-owned U.S. Government corporation, is authorized to guarantee, with the full faith and credit of the U.S. Government, the timely payment of principal and interest on securities issued by institutions approved by GNMA and backed by pools of mortgages insured by the Federal Housing Administration or guaranteed by the Department of Veterans Affairs. Government-related guarantors (i.e., not backed by the full faith and credit of the U.S. Government) include the Federal National Mortgage Association (“FNMA” or “Fannie Mae”) and the Federal Home Loan Mortgage Corporation (“FHLMC” or “Freddie Mac”). Pass-through securities issued by FNMA are guaranteed as to timely payment of principal and interest by FNMA, but are not backed by the full faith and credit of the U.S. Government. FHLMC guarantees the timely payment of interest and ultimate collection of principal, but its participation certificates are not backed by the full faith and credit of the U.S. Government.
3. Capital Share Transactions, Dividends and Distributions to Shareholders
Transactions in capital stock were as follows:
| | | | | | | | |
| | | Six Months Ended June 30, 2013 (unaudited) | | Year Ended December 31, 2012 | |
| Value Line Premier Growth Fund, Inc. | | | | | | | |
| Shares sold | | | 871,464 | | | 2,042,295 | |
| Shares issued to shareholders in reinvestment of dividends and distributions | | | — | | | 850,616 | |
| Shares redeemed | | | (1,074,678 | ) | | (2,463,509 | ) |
| Net increase/(decrease) | | | (203,214 | ) | | 429,402 | |
| Dividends per share from net investment income | | $ | — | | $ | 0.0925 | |
| Distributions per share from net realized gains | | $ | — | | $ | 2.2262 | |
| | | | | | | | |
| The Value Line Fund, Inc. | | | | | | | |
| Shares sold | | | 111,156 | | | 328,898 | |
| Shares redeemed | | | (885,090 | ) | | (4,481,149 | ) |
| Net decrease | | | (773,934 | ) | | (4,152,251 | ) |
| | | | | | | | |
| Value Line Income and Growth Fund, Inc. | | | | | | | |
| Shares sold | | | 895,069 | | | 821,795 | |
| Shares issued to shareholders in reinvestment of dividends and distributions | | | 185,846 | | | 1,657,336 | |
| Shares redeemed | | | (2,200,972 | ) | | (5,417,424 | ) |
| Net decrease | | | (1,120,057 | ) | | (2,938,293 | ) |
| | | | | | | | |
| Dividends per share from net investment income | | $ | 0.0578 | | $ | 0.1303 | |
| Distributions per share from net realized gains | | $ | — | | $ | 0.3403 | |
| | | | | | | | |
| Value Line Larger Companies Fund, Inc. | | | | | | | |
| Shares sold | | | 38,047 | | | 119,348 | |
| Shares issued to shareholders in reinvestment of dividends | | | 8 | | | 53,004 | |
| Shares redeemed | | | (720,954 | ) | | (1,169,950 | ) |
| Net decrease | | | (682,899 | ) | | (997,598 | ) |
| | | | | | | | |
| Dividends per share from net investment income | | $ | — | | $ | 0.1173 | |
| Notes to Financial Statements (unaudited) |
4. Purchases and Sales of Securities
Purchases and sales of securities, excluding short-term investments, were as follows:
| | | | | | | | | | | | | | |
| Fund | | Purchases of Investment Securities | | Sales of Investment Securities | | Purchases of U.S. Government Agency Obligations | | Sales of U.S. Government Agency Obligations | |
| Value Line Premier Growth Fund, Inc. | | $ | 17,167,230 | | $ | 19,618,884 | | $ | — | | $ | — | |
| The Value Line Fund, Inc. | | | 2,869,143 | | | 11,233,839 | | | — | | | — | |
| Value Line Income and Growth Fund, Inc. | | | 23,343,725 | | | 33,834,552 | | | 13,987,729 | | | 21,880,674 | |
| Value Line Larger Companies Fund, Inc. | | | 10,666,950 | | | 28,090,109 | | | — | | | — | |
5. Income Taxes
At June 30, 2013, information on the tax components of capital is as follows:
| | | | | | | | | | | | | | |
| Fund | | Cost of investments for tax purposes | | Gross tax unrealized appreciation | | Gross tax unrealized depreciation | | Net tax unrealized appreciation on investments | |
| Value Line Premier Growth Fund, Inc. | | $ | 217,125,640 | | $ | 167,505,299 | | $ | (506,353 | ) | $ | 166,998,946 | |
| The Value Line Fund, Inc. | | | 73,183,421 | | | 42,548,176 | | | (163,834 | ) | | 42,384,342 | |
| Value Line Income and Growth Fund, Inc. | | | 261,521,807 | | | 59,163,553 | | | (4,438,706 | ) | | 54,724,847 | |
| Value Line Larger Companies Fund, Inc. | | | 132,653,069 | | | 60,332,010 | | | (2,017,370 | ) | | 58,314,640 | |
6. Investment Advisory Fee, Service and Distribution Fees and Transactions With Affiliates
Advisory fees of $1,335,977, $387,115, $1,005,032 and $701,433 for the Value Line Premier Growth Fund, Inc., The Value Line Fund, Inc., Value Line Income and Growth Fund, Inc., and Value Line Larger Companies Fund, Inc., respectively, were paid or payable to EULAV Asset Management (the “Adviser”) for the six months ended June 30, 2013. This was computed at an annual rate of 0.75% of the daily net assets during the period and paid monthly for the Value Line Premier Growth Fund, Inc. and Value Line Larger Companies Fund, Inc. and was computed at an annual rate of 0.70% of the first $100 million of the Fund’s average daily net assets plus 0.65% of the excess thereof, and paid monthly for The Value Line Fund, Inc. and Value Line Income and Growth Fund, Inc. The Adviser provides research, investment programs, and supervision of the investment portfolio and pays costs of administrative services, office space, equipment and compensation of administrative, bookkeeping, and clerical personnel necessary for managing the affairs of the Funds. The Adviser also provides persons, satisfactory to the Funds’ Board of Directors, to act as officers and employees of the Funds and pays their salaries.
The Funds have a Service and Distribution Plan (the “Plan”), adopted pursuant to Rule 12b-1 under the Investment Company Act of 1940, which compensates EULAV Securities LLC (the “Distributor”) for advertising, marketing and distributing the Funds’ shares and for servicing the Funds’ shareholders at an annual rate of 0.25% of the Funds’ average daily net assets. For the six months ended June 30, 2013, fees amounting to $445,326, $139,459, $377,120 and $233,811 before fee waivers for the Value Line Premier Growth Fund, Inc., The Value Line Fund, Inc., Value Line Income and Growth Fund, Inc., and Value Line Larger Companies Fund, Inc., respectively, were accrued under this Plan. Effective May 1, 2009, and renewed annually, the Distributor contractually agreed to waive The Value Line Fund, Inc.’s 12b-1 fee. Effective March 1, 2009, and renewed annually, the Distributor contractually agreed to reduce the fee for the Value Line Income and Growth Fund, Inc. by 0.05%. Effective May 1, 2007, and renewed annually, the Distributor contractually agreed to waive Value Line Larger Companies Fund, Inc.’s 12b-1 fee. For the six months ended June 30, 2013, all 12b-1 fees were waived for The Value Line Fund, Inc. and Value Line Larger Companies Fund, Inc. The Value Line Income and Growth Fund, Inc.’s fees waived amounted to $75,424. The Distributor has no right to recoup previously waived amounts.
Effective July 5, 2012, the Funds have a Sub-Transfer Agent Plan (the “sub TA plan”) which compensates financial intermediaries that provide sub-transfer agency and related services to investors that hold their Fund shares in omnibus accounts maintained by the financial intermediaries with the Funds. The sub-transfer agency fee, which may be paid directly to the financial intermediary or indirectly via the Distributor, is equal to the lower of (i) the aggregate amount of additional transfer agency fees and expenses that the Funds would otherwise pay to the transfer agent if each subaccount in the omnibus account maintained by the financial intermediary with the Funds were a direct account with the Funds and (ii) the amount by which the fees charged by the financial intermediary for including the Funds on its platform and providing shareholder, sub-transfer agency and related services exceed the amount paid under the Funds’ Plan with respect to each Fund’s assets attributable to shares held by the financial intermediary in the omnibus account. In addition, the amount of sub-transfer agency fees payable by the Fund’s to all financial intermediaries in the aggregate is subject to a maximum cap of 0.05% of each Fund’s average daily net assets. If the sub-transfer agency fee is paid to financial intermediaries indirectly via the Distributor, the Distributor does not retain any amount thereof and such fee otherwise reduces the amount that the Distributor is contractually obligated to pay to the financial intermediary. For the six months ended June 30, 2013, fees amounting to $48,612, $3,459, $26,885 and $5,771 for the Value Line Premier Growth Fund, Inc., The Value Line Fund, Inc., Value Line Income and Growth Fund, Inc., and Value Line Larger Companies Fund, Inc., respectively, were paid under the sub TA plan.
Each Fund bears direct expenses incurred specifically on its behalf while common expenses of the Value Line Funds are allocated proportionately based upon each Fund’s respective net assets. The Funds bear all other costs and expenses.
Certain officers and a Trustee of the Adviser are also officers and a director of the Funds. At June 30, 2013, the officers and directors of the Value Line Premier Growth Fund, Inc., The Value Line Fund, Inc., Value Line Income and Growth Fund, Inc., and Value Line Larger Companies Fund, Inc. as a group owned 346, 1,072, 2,091 and 560 shares, representing less than 1% of the outstanding shares of each fund respectively.
| Notes to Financial Statements (unaudited) |
7. Other
The Value Line Income and Growth Fund, Inc. received notice that it has been named in a class of defendants in a lawsuit that the Unsecured Creditors Committee (the “Committee”) of the Tribune Company has filed in Delaware bankruptcy court. The Committee is seeking to recover all payments made to beneficial owners of common stock in connection with a leveraged buyout of Tribune, including those made in connection with a 2007 tender offer in which the Fund participated. The complaint alleges no misconduct by the Fund, and management intends to vigorously defend any lawsuit. The value of the proceeds received by the Fund is $490,522 (less than 1% of net assets) and the Fund could incur legal expenses from defending this lawsuit. A Defendants’ Executive Committee consisting of counsel for many of the shareholder defendants with the most at issue has filed a motion to dismiss all the complaints. Under a Case Management Order issued by the court, that motion is deemed filed on behalf of all defendants including the Fund. Management is currently assessing the case and has not yet determined the effect, if any, on the Fund’s net assets and results of operations.
Selected data for a share of capital stock outstanding throughout each period:
| | | | | | | | | | | | | | | | | | | | |
| | | | | Value Line Premier Growth Fund, Inc. | |
| | | Six Months Ended June 30, 2013 (unaudited) | | | |
| | | | Years Ended December 31, | |
| | | | 2012 | | 2011 | | 2010 | | 2009 | | 2008 | |
| Net asset value, beginning of period | | $ | 28.84 | | $ | 26.48 | | $ | 26.82 | | $ | 22.07 | | $ | 16.69 | | $ | 29.38 | |
| Income from investment operations: | | | | | | | | | | | | | | | | | | | |
| Net investment income/(loss) | | | 0.02 | | | 0.09 | | | (0.08 | ) | | (0.01 | )(1) | | 0.02 | | | 0.01 | |
| Net gains or (losses) on securities (both realized and unrealized) | | | 2.60 | | | 4.59 | | | 1.30 | | | 4.79 | | | 5.37 | | | (11.85 | ) |
| Total from investment operations | | | 2.62 | | | 4.68 | | | 1.22 | | | 4.78 | | | 5.39 | | | (11.84 | ) |
| | | | | | | | | | | | | | | | | | | | |
| Less distributions: | | | | | | | | | | | | | | | | | | | |
| Dividends from net investment income | | | — | | | (0.09 | ) | | — | | | (0.03 | ) | | (0.01 | ) | | — | |
| Distributions from net realized gains | | | — | | | (2.23 | ) | | (1.56 | ) | | — | | | — | | | (0.85 | ) |
| Total distributions | | | — | | | (2.32 | ) | | (1.56 | ) | | (0.03 | ) | | (0.01 | ) | | (0.85 | ) |
| Net asset value, end of period | | $ | 31.46 | | $ | 28.84 | | $ | 26.48 | | $ | 26.82 | | $ | 22.07 | | $ | 16.69 | |
| Total return | | | 9.08 | %(2) | | 17.80 | % | | 4.59 | % | | 21.66 | % | | 32.29 | % | | (40.13 | )% |
| | | | | | | | | | | | | | | | | | | | |
| Ratios/Supplemental Data: | | | | | | | | | | | | | | | | | | | |
| Net assets, end of period (in thousands) | | $ | 361,724 | | $ | 337,436 | | $ | 298,428 | | $ | 311,829 | | $ | 347,938 | | $ | 312,591 | |
Ratio of expenses to average net assets(3) | | | 1.22 | %(4) | | 1.25 | % | | 1.24 | % | | 1.23 | %(5) | | 1.22 | % | | 1.16 | % |
| Ratio of net investment income/(loss) to average net assets | | | 0.11 | %(4) | | 0.28 | % | | (0.28 | )% | | (0.02 | )% | | 0.11 | % | | 0.03 | % |
| Portfolio turnover rate | | | 5 | %(2) | | 15 | % | | 20 | % | | 16 | % | | 8 | % | | 18 | % |
| (1) | Based on average shares outstanding. |
| (2) | Not annualized. |
| (3) | Ratio reflects expenses grossed up for the custody credit arrangement. The ratio of expenses to average net assets, net of custody credits, would have been unchanged for the periods shown. |
| (4) | Annualized. |
| (5) | Ratio reflects expenses grossed up for the reimbursement by Value Line, Inc. of certain expenses incurred by the Fund. The ratio of expenses to average net assets net of the reimbursement by Value Line, Inc. and net of custody credits would have been 1.19% for the year ended December 31, 2010. |
Selected data for a share of capital stock outstanding throughout each period:
| | | | | | | | | | | | | | | | | | | | |
| | | | | The Value Line Fund, Inc. | |
| | | Six Months Ended June 30, 2013 (unaudited) | | | |
| | | | Years Ended December 31, | |
| | | | 2012 | | 2011 | | 2010 | | 2009 | | 2008 | |
| Net asset value, beginning of period | | $ | 10.36 | | $ | 9.04 | | $ | 8.55 | | $ | 6.81 | | $ | 6.22 | | $ | 12.83 | |
| Income from investment operations: | | | | | | | | | | | | | | | | | | | |
| Net investment income/(loss) | | | 0.01 | | | 0.05 | | | (0.00 | )(1) | | 0.00 | (1) | | (0.01 | ) | | (0.03 | ) |
| Net gains or (losses) on securities (both realized and unrealized) | | | 1.11 | | | 1.27 | | | 0.49 | | | 1.74 | | | 0.60 | | | (6.30 | ) |
| Total from investment operations | | | 1.12 | | | 1.32 | | | 0.49 | | | 1.74 | | | 0.59 | | | (6.33 | ) |
| | | | | | | | | | | | | | | | | | | | |
| Less distributions: | | | | | | | | | | | | | | | | | | | |
| Dividends from net investment income | | | — | | | — | | | (0.00 | )(1) | | — | | | — | | | — | |
| Distributions from net realized gains | | | — | | | — | | | — | | | — | | | — | | | (0.28 | ) |
| Total distributions | | | — | | | — | | | (0.00 | )(1) | | — | | | — | | | (0.28 | ) |
| Net asset value, end of period | | $ | 11.48 | | $ | 10.36 | | $ | 9.04 | | $ | 8.55 | | $ | 6.81 | | $ | 6.22 | |
| Total return | | | 10.81 | %(2) | | 14.60 | % | | 5.75 | % | | 25.55 | % | | 9.49 | % | | (49.28 | )% |
| | | | | | | | | | | | | | | | | | | | |
| Ratios/Supplemental Data: | | | | | | | | | | | | | | | | | | | |
Net assets, end of period (in thousands)(3) | | $ | 112,838 | | $ | 109,798 | | $ | 133,336 | | $ | 104,200 | | $ | 92,680 | | $ | 93,099 | |
Ratio of expenses to average net assets(6) | | | 1.27 | %(4) | | 1.28 | % | | 1.29 | % | | 1.31 | %(5) | | 1.36 | % | | 1.17 | % |
| Ratio of expenses to average net assets | | | 1.02 | %(4) | | 1.03 | % | | 0.94 | % | | 0.91 | %(7) | | 1.04 | % | | 0.92 | % |
| Ratio of net investment income/(loss) to average net assets | | | 0.16 | %(4) | | 0.46 | % | | (0.02 | )% | | 0.02 | % | | (0.22 | )% | | (0.26 | )% |
| Portfolio turnover rate | | | 3 | %(2) | | 6 | % | | 18 | % | | 27 | % | | 122 | % | | 273 | % |
| (1) | Amount is less than $.01 per share. |
| (2) | Not annualized. |
| (3) | Ratio reflects expenses grossed up for the custody credit arrangement and grossed up for the waiver of the advisory fees by the Adviser and the service and distribution plan fees by the Distributor. The ratio of expenses to average net assets net of custody credits, but exclusive of the fee waivers would have been unchanged for the periods shown. |
| (4) | Annualized. |
| (5) | Ratio reflects expenses grossed up for the reimbursement by Value Line, Inc. of certain expenses incurred by the Fund. |
| (6) | Ratio reflects expenses net of the custody credit arrangement and net of the waiver of the advisory fee by the Adviser and the service and distribution plan fees by the Distributor. |
| (7) | Ratio reflects expenses net of the reimbursement by Value Line, Inc. of certain expenses incurred by the Fund. |
Selected data for a share of capital stock outstanding throughout each period:
| | | | | | | | | | | | | | | | | | | | |
| | | | | Value Line Income and Growth Fund, Inc. | |
| | | Six Months Ended June 30, 2013 (unaudited) | | | |
| | | | Years Ended December 31, | |
| | | | 2012 | | 2011 | | 2010 | | 2009 | | 2008 | |
| Net asset value, beginning of period | | $ | 8.67 | | $ | 8.27 | | $ | 8.46 | | $ | 7.75 | | $ | 6.39 | | $ | 8.45 | |
| | | | | | | | | | | | | | | | | | | | |
| Income from investment operations: | | | | | | | | | | | | | | | | | | | |
| Net investment income | | | 0.06 | | | 0.13 | | | 0.11 | | | 0.10 | | | 0.10 | | | 0.14 | |
| Net gains or (losses) on securities (both realized and unrealized) | | | 0.64 | | | 0.74 | | | (0.19 | ) | | 0.71 | | | 1.36 | | | (1.94 | ) |
| Total from investment operations | | | 0.70 | | | 0.87 | | | (0.08 | ) | | 0.81 | | | 1.46 | | | (1.80 | ) |
| | | | | | | | | | | | | | | | | | | | |
| Less distributions: | | | | | | | | | | | | | | | | | | | |
| Dividends from net investment income | | | (0.06 | ) | | (0.13 | ) | | (0.11 | ) | | (0.10 | ) | | (0.10 | ) | | (0.15 | ) |
| Distributions from net realized gains | | | — | | | (0.34 | ) | | — | | | — | | | — | | | (0.03 | ) |
| Return of capital | | | — | | | — | | | — | | | — | | | — | | | (0.08 | ) |
| Total distributions | | | (0.06 | ) | | (0.47 | ) | | (0.11 | ) | | (0.10 | ) | | (0.10 | ) | | (0.26 | ) |
| Net asset value, end of period | | $ | 9.31 | | $ | 8.67 | | $ | 8.27 | | $ | 8.46 | | $ | 7.75 | | $ | 6.39 | |
| Total return | | | 8.05 | %(1) | | 10.62 | % | | (0.90 | )% | | 10.55 | % | | 23.07 | % | | (21.52 | )% |
| Ratios/Supplemental Data: | | | | | | | | | | | | | | | | | | | |
| Net assets, end of period (in thousands) | | $ | 307,206 | | $ | 295,705 | | $ | 306,227 | | $ | 332,695 | | $ | 340,210 | | $ | 307,748 | |
Ratio of expenses to average net assets(2) | | | 1.15 | %(3) | | 1.19 | % | | 1.20 | % | | 1.14 | %(4) | | 1.13 | % | | 1.10 | % |
Ratio of expenses to average net assets(5) | | | 1.10 | %(3) | | 1.14 | % | | 1.15 | % | | 1.05 | %(6) | | 1.09 | % | | 1.09 | % |
| Ratio of net investment income to average net assets | | | 1.32 | %(3) | | 1.48 | % | | 1.25 | % | | 1.22 | % | | 1.49 | % | | 1.87 | % |
| Portfolio turnover rate | | | 13 | %(1) | | 31 | % | | 57 | % | | 46 | % | | 56 | % | | 86 | % |
| (1) | Not annualized. |
| (2) | Ratio reflects expenses grossed up for the custody credit arrangement and grossed up for the waiver of a portion of the service and distribution plan fees by the Distributor. The ratio of expenses to average net assets, net of custody credits, but exclusive of the fee waivers, would have been 1.09% for the year ended December 31, 2008 and would have been unchanged for the other periods shown. |
| (3) | Annualized. |
| (4) | Ratio reflects expenses grossed up for the reimbursement by Value Line, Inc. of certain expenses incurred by the Fund. |
| (5) | Ratio reflects expenses net of the custody credit arrangement and net of the waiver of a portion of the service and distribution plan fees by the Distributor. |
| (6) | Ratio reflects expenses net of the reimbursement by Value Line, Inc. of certain expenses incurred by the Fund. |
Selected data for a share of capital stock outstanding throughout each period:
| | | | | | | | | | | | | | | | | | | | |
| | | | | Value Line Larger Companies Fund, Inc. | |
| | | Six Months Ended June 30, 2013 (unaudited) | | | |
| | | | Years Ended December 31, | |
| | | | 2012 | | 2011 | | 2010 | | 2009 | | 2008 | |
| Net asset value, beginning of period | | $ | 19.78 | | $ | 17.34 | | $ | 17.47 | | $ | 15.40 | | $ | 13.18 | | $ | 21.63 | |
| | | | | | | | | | | | | | | | | | | | |
| Income from investment operations: | | | | | | | | | | | | | | | | | | | |
| Net investment income | | | 0.08 | | | 0.16 | | | 0.12 | | | 0.09 | | | 0.10 | | | 0.09 | |
| Net gains or (losses) on securities (both realized and unrealized) | | | 1.72 | | | 2.40 | | | (0.17 | ) | | 2.08 | | | 2.22 | | | (8.34 | ) |
| Total from investment operations | | | 1.80 | | | 2.56 | | | (0.05 | ) | | 2.17 | | | 2.32 | | | (8.25 | ) |
| | | | | | | | | | | | | | | | | | | | |
| Less distributions: | | | | | | | | | | | | | | | | | | | |
| Dividends from net investment income | | | — | | | (0.12 | ) | | (0.08 | ) | | (0.10 | ) | | (0.10 | ) | | (0.03 | ) |
| Distributions from net realized gains | | | — | | | — | | | — | | | — | | | — | | | (0.17 | ) |
| Total distributions | | | — | | | (0.12 | ) | | (0.08 | ) | | (0.10 | ) | | (0.10 | ) | | (0.20 | ) |
| Net asset value, end of period | | $ | 21.58 | | $ | 19.78 | | $ | 17.34 | | $ | 17.47 | | $ | 15.40 | | $ | 13.18 | |
| Total return | | | 9.10 | %(1) | | 14.82 | % | | (0.27 | )% | | 14.09 | % | | 17.62 | % | | (38.12 | )% |
| Ratios/Supplemental Data: | | | | | | | | | | | | | | | | | | | |
| Net assets, end of period (in thousands) | | $ | 186,331 | | $ | 184,243 | | $ | 178,783 | | $ | 199,524 | | $ | 202,454 | | $ | 191,950 | |
Ratio of expenses to average net assets(2) | | | 1.24 | %(3) | | 1.27 | % | | 1.25 | % | | 1.21 | %(4) | | 1.26 | % | | 1.18 | % |
Ratio of expenses to average net assets(5) | | | 1.00 | %(3) | | 1.02 | % | | 1.00 | % | | 0.92 | %(6) | | 1.01 | % | | 0.93 | % |
| Ratio of net investment income to average net assets | | | 0.60 | %(3) | | 0.72 | % | | 0.60 | % | | 0.44 | % | | 0.62 | % | | 0.53 | % |
| Portfolio turnover rate | | | 6 | %(1) | | 17 | % | | 30 | % | | 153 | % | | 157 | % | | 157 | % |
| (1) | Not annualized. |
| (2) | Ratio reflects expenses grossed up for the custody credit arrangement and grossed up for the waiver of the service and distribution plan fees by the Distributor. The ratio of expenses to average net assets net of custody credits but exclusive of the fee waivers, would have been 1.17% for the year ended December 31, 2008 and would not have changed for the other periods shown. |
| (3) | Annualized. |
| (4) | Ratio reflects expenses grossed up for the reimbursement by Value Line, Inc. of certain expenses incurred by the Fund. |
| (5) | Ratio reflects expenses net of the service and distribution fees by the Distributor, but exclusive of the custody credit arrangement. |
| (6) | Ratio reflects expenses net of the reimbursement by Value Line, Inc. of certain expenses incurred by the Fund. |
FACTORS CONSIDERED BY THE BOARD IN APPROVING CONTINUANCE OF THE INVESTMENT ADVISORY AGREEMENTS FOR THE VALUE LINE FUND, INC., VALUE LINE INCOME AND GROWTH FUND, INC., VALUE LINE LARGER COMPANIES FUND, INC., AND VALUE LINE PREMIER GROWTH FUND, INC. |
The Investment Company Act of 1940 (the “1940 Act”) requires the Boards of Directors (the “Board”) of The Value Line Fund, Inc. (“Value Line Fund”), Value Line Income and Growth Fund, Inc. (“Income & Growth Fund”), Value Line Larger Companies Fund, Inc. (“Larger Companies Fund”) and Value Line Premier Growth Fund, Inc. (“Premier Growth Fund”) (each, a “Fund” and collectively, the “Funds”), including a majority of each Board’s Directors who are not “interested persons,” as that term is defined in the 1940 Act (the “Independent Directors”), to annually consider the continuance of each Fund’s investment advisory agreement (each, an “Agreement”) with its investment adviser, EULAV Asset Management.1
In considering whether the continuance of the Agreement was in the best interests of each Fund and its shareholders, the Board requested and the Adviser provided such information as the Board deemed to be reasonably necessary to evaluate the terms of such Agreement. At meetings held throughout the year, including the meeting specifically focused upon the review of each Agreement, the Independent Directors met in executive sessions separately from the non-Independent Director of the Funds and any officers of the Adviser. In selecting the Adviser and approving the continuance of each Agreement, the Independent Directors relied upon the assistance of counsel to the Independent Directors.
Both in the meeting specifically focused upon the review of the Agreements and at other meetings, the Board, including the Independent Directors, received materials relating to the Adviser’s investment and management services under the Agreements. These materials included information for each Fund regarding: (i) the investment performance of the Fund, including comparisons to a peer group of funds representing its Performance Universe (as defined below), and its benchmark index, both as classified and prepared by Lipper Inc., an independent evaluation service (“Lipper”); (ii) the investment process, portfolio holdings, investment restrictions, valuation procedures, and financial statements for the Fund; (iii) purchases and redemptions of the Fund’s shares; (iv) the general investment outlook in the markets in which the Fund invests; (v) arrangements with respect to the distribution of the Fund’s shares; (vi) the allocation and cost of the Fund’s brokerage (none of which was effected through any affiliate of the Adviser, including the Distributor); and (vii) the overall nature, quality and extent of services provided by the Adviser.
As part of their review, the Board requested, and the Adviser provided, additional information in order to evaluate the quality of the Adviser’s services and the reasonableness of its fees under each of the Agreements. In a separate executive session, the Independent Directors reviewed information for each Fund, which included data comparing: (i) the Fund’s management fee, transfer agent, sub-transfer agent and custodian fees, Rule 12b-1 fee, and other non-management expenses, to those incurred by a peer group of funds representing its Expense Group (as defined below), and a peer group of funds representing its Expense Universe (as defined below); (ii) the Fund’s expense ratio to those of its Expense Group and Expense Universe; and (iii) the Fund’s investment performance over various time periods to the average performance of the Performance Universe as well as the appropriate Lipper Index, as selected objectively by Lipper (the “Lipper Index”).
1 For periods prior to December 23, 2010, the term “Adviser” means the Adviser’s predecessor entities that previously served as the Fund’s adviser, EULAV Asset Management, LLC and Value Line, Inc. (“VLI”). Likewise, for periods prior to December 23, 2010, the term “Distributor” refers to the predecessor entities of the Fund’s current distributor, EULAV Securities LLC (the “Distributor”), which included EULAV Securities, Inc. and Value Line Securities, Inc.
Value Line Fund. The Performance Universe for Value Line Fund consists of the Fund and all retail and institutional multi-cap growth funds, regardless of asset size or primary channel of distribution. The Expense Group for Value Line Fund consists of the Fund and 16 other retail no-load multi-cap growth funds (excluding outliers), as selected objectively by Lipper. The Expense Universe for the Fund consists of its Expense Group and all other retail no-load multi-cap growth funds (excluding outliers), as selected objectively by Lipper.
Income & Growth Fund. The Performance Universe for Income & Growth Fund consists of the Fund and all retail and institutional mixed-asset target allocation moderate funds, regardless of asset size or primary channel of distribution. The Expense Group for Income & Growth Fund consists of the Fund and three other retail no-load mixed-asset target allocation moderate funds and eight retail no-load mixed-asset target allocation growth funds (excluding outliers), as selected objectively by Lipper. The Expense Universe for the Fund consists of its Expense Group and all other retail no-load mixed-asset target allocation moderate funds and retail no-load mixed-asset target allocation growth funds (excluding outliers), as selected objectively by Lipper.
Larger Companies Fund. The Performance Universe for Larger Companies Fund consists of the Fund and all retail and institutional large-cap growth funds, regardless of asset size or primary channel of distribution. The Expense Group for Larger Companies Fund consists of the Fund and 15 other retail no-load large-cap growth funds (excluding outliers), as selected objectively by Lipper. The Expense Universe for the Fund consists of its Expense Group and all other retail no-load large-cap growth funds (excluding outliers), as selected objectively by Lipper.
Premier Growth Fund. The Performance Universe for Premier Growth Fund consists of the Fund and all retail and institutional multi-cap growth funds, regardless of asset size or primary channel of distribution. The Expense Group for Premier Growth Fund consists of the Fund and 13 other retail no-load multi-cap growth funds (excluding outliers), as selected objectively by Lipper. The Expense Universe for the Fund consists of its Expense Group and all other retail no-load multi-cap growth funds (excluding outliers), as selected objectively by Lipper.
In their executive session, the Independent Directors also reviewed information regarding: (a) the financial results and condition of the Adviser and the Distributor and their profitability from the services that have been performed for each Fund and the Value Line family of funds; (b) the Adviser’s investment management staffing and resources; (c) the ownership, control and day-to-day management of the Adviser; and (d) each Fund’s potential for achieving economies of scale. In support of its review of the statistical information, the Board was provided with a description of the methodology used by Lipper to determine the Expense Group, the Expense Universe and the Performance Universe to prepare its information.
The Board observed that there is a range of investment options available to shareholders of the Funds, including other mutual funds, and that each Fund’s shareholders have chosen to invest in the Fund.
The following summarizes matters considered by the Board in connection with its continuance of each of the Agreements. However, the Board did not identify any single factor as all-important or controlling, each Director may have weighed certain factors differently, and the summary does not detail all the matters that were considered.
Investment Performance. The Board reviewed each Fund’s overall investment performance and compared it to its Performance Universe and the Lipper Index.
Value Line Fund. The Board noted that the Fund outperformed the Performance Universe average and the Lipper Index for the one-year and three-year periods ended March 31, 2013. The Board also noted that the Fund’s performance for the five-year and ten-year periods ended March 31, 2013 was below the performance of the Performance Universe average and the Lipper Index.
Income & Growth Fund. The Board noted that the Fund outperformed the Performance Universe average and the Lipper Index for the one-year, five-year and ten-year periods ended March 31, 2013. The Board also noted that the Fund’s performance for the three-year period ended March 31, 2013 was below the performance of the Performance Universe average and the Lipper Index.
Larger Companies Fund. The Board noted that the Fund outperformed the Performance Universe average and the Lipper Index for the one-year and three-year periods ended March 31, 2013. The Board also noted that the Fund’s performance for the five-year and ten-year periods ended March 31, 2013 was below the performance of the Performance Universe average and the Lipper Index.
Premier Growth Fund. The Board noted that the Fund outperformed the Performance Universe average and the Lipper Index for the one-year, three-year, five-year, and ten-year periods ended March 31, 2013.
The Adviser’s Personnel and Methods. The Board reviewed the background of the portfolio managers responsible for the daily management of each Fund’s portfolio, seeking to achieve the applicable Fund’s investment objectives and adhering to such Fund’s investment strategies. The Independent Directors also engaged in discussions with the Adviser’s senior management responsible for the overall functioning of each Fund’s investment operations. The Board viewed favorably: (i) the Adviser’s use of analytic tools in support of the portfolio management, compliance and shareholder relation functions which the Adviser previously committed resources to acquire; (ii) the continuity of the Adviser’s staff attributable in part to its actions taken to attract and retain personnel, including its ongoing improvements to employee benefit programs and previous increases in base compensation and merit-based compensation for certain staff members to be more industry competitive; and (iii) that the Adviser continues to receive the Value Line ranking systems without cost. The Board concluded that each Fund’s management team and the Adviser’s overall resources were adequate and that the Adviser had investment management capabilities and personnel essential to performing its duties under the Agreement.
Management Fee. The Board considered the Adviser’s management fee under each of the Agreements relative to the management fee applicable to the funds in each Fund’s Expense Group and Expense Universe averages, both before and after applicable fee waivers. The Board noted that the Adviser bears the costs of providing fund accounting services for each of the Funds as part of the management fee. The Board was informed that the management fee rates for funds in the Expense Groups and Expense Universes most likely did not include the provision of fund accounting services and, if it did, each of the Fund’s management fee rates would have compared more favorably. After a review of the information set forth below, the Board concluded that each of the Fund’s management fee rates was satisfactory for the purpose of approving continuance of each Fund’s Agreement.
Value Line Fund. Before giving effect to fee waivers applicable to certain funds in the Expense Group, the Board noted that, for the most recent fiscal year for which audited financial data is available, the Fund’s management fee rate was slightly lower than that of the Expense Group average. After giving effect to applicable fee waivers, the Board also noted that, for the most recent fiscal year for which audited financial data is available, the Fund’s management fee rate was slightly lower than that of the Expense Group median and higher than that of the Expense Universe median.
Income & Growth Fund. Before giving effect to fee waivers applicable to certain funds in the Expense Group, the Board noted that, for the most recent fiscal year for which audited financial data is available, the Fund’s management fee rate was higher than that of the Expense Group average. After giving effect to applicable fee waivers, the Board also noted that, for the most recent fiscal year for which audited financial data is available, the Fund’s management fee rate was lower than that of the Expense Group median and approximately the same as that of the Expense Universe median.
Larger Companies. Before giving effect to fee waivers applicable to certain funds in the Expense Group, the Board noted that, for the most recent fiscal year for which audited financial data is available, the Fund’s management fee rate was higher than that of the Expense Group average. After giving effect to applicable fee waivers, the Board also noted that, for the most recent fiscal year for which audited financial data is available, the Fund’s management fee rate was higher than that of the Expense Group median and the Expense Universe median.
Premier Growth Fund. Before giving effect to fee waivers applicable to certain funds in the Expense Group, the Board noted that, for the most recent fiscal year for which audited financial data is available, the Fund’s management fee rate was higher than that of the Expense Group average. After giving effect to applicable fee waivers, the Board also noted that, for the most recent fiscal year for which audited financial data is available, the Fund’s management fee rate was the same as that of the Expense Group median and higher than that of the Expense Universe median.
Expenses. The Board also considered each Fund’s total expense ratio relative to its Expense Group and Expense Universe averages. After a review of the information set forth below, the Board concluded that each Fund’s average expense ratio was satisfactory for the purpose of approving continuance of the Fund’s Agreement.
Value Line Fund. The Board noted that, for the most recent fiscal year for which audited financial data is available, the Fund’s expense ratio was lower than that of the Expense Group median and the Expense Universe median, after giving effect to fee waivers applicable to the Fund and certain funds in the Expense Group and Universe. The Board also noted that the Fund’s expense ratio will be higher as a result of its agreement with the Distributor to terminate the existing contractual waiver of the Fund’s Rule 12b-1 fee effective August 1, 2013, permitting the Fund to pay a Rule 12b-1 fee at the rate of 0.25% of the Fund’s average daily net assets.
Income & Growth Fund. The Distributor and the Board agreed that the Distributor will extend the existing contractual waiver of a portion of the Fund’s Rule 12b-1 fee for another one-year period ending June 30, 2014. This waiver effectively reduces the Fund’s Rule 12b-1 fee rate from 0.25% to 0.20% of the Fund’s average daily net assets. Such waiver cannot be changed during the contractual waiver period without the approval of the Board and the Distributor. The Board noted that, for the most recent fiscal year for which audited financial data is available, the Fund’s expense ratio was higher than that of the Expense Group median and the Expense Universe median, after giving effect to fee waivers applicable to the Fund and certain funds in the Expense Group and Universe.
Larger Companies Fund. The Board noted that, for the most recent fiscal year for which audited financial data is available, the Fund’s expense ratio was lower than that of the Expense Group median and slightly lower than that of the Expense Universe median, after giving effect to fee waivers applicable to the Fund and certain funds in the Expense Group and Universe. The Distributor and the Board agreed to change and extend the period of the existing contractual waiver of the Fund’s Rule 12b-1 fee for another one-year period ending June 30, 2014. This waiver effectively reduces the Fund’s Rule 12b-1 fee rate from 0.25% to 0.15% of the Fund’s average daily net assets. Such waiver cannot be changed during the contractual waiver period without the approval of the Board and the Distributor. The Board also noted that the Fund’s expense ratio will be higher as a result of the change in the waiver rate.
Premier Growth Fund. The Board noted that, for the most recent fiscal year for which audited financial data is available, the Fund’s expense ratio was higher than that of the Expense Group median and the Expense Universe median, after giving effect to fee waivers applicable to the Fund and certain funds in the Expense Group and Universe.
Nature, Extent and Quality of Services. The Board considered the nature, extent and quality of other services provided by the Adviser and the Distributor. At meetings held throughout the year, the Board reviewed the resources and effectiveness of the Adviser’s overall compliance program, as well as the services provided by the Distributor. The Board viewed favorably the additional resources devoted by the Adviser to enhance its and the Funds’ overall compliance program as well as steps being undertaken to enhance the shareholders’ experience with each of the Funds, such as a more robust website. The Board reviewed the services provided by the Adviser and the Distributor in supervising each of the Fund’s third-party service providers. The Board also reviewed the services of the Distributor in engaging financial intermediaries to provide sub-transfer agency and related services to shareholders who hold their shares of a Fund in omnibus accounts. The Board noted that the Distributor and the Adviser retained no portion of a Fund’s sub-transfer agency fees as compensation for these services, but the Board considered that the Fund’s payment of such fees to financial intermediaries might reduce amounts that the Distributor or the Adviser would otherwise pay out of their own resources to the financial intermediaries. Based on this review, the Board concluded that the nature, quality, cost, and extent of such other services provided by the Adviser and the Distributor were satisfactory, reliable and beneficial to each Fund’s shareholders.
Profitability. The Board considered the level of profitability of the Adviser and the Distributor with respect to each Fund individually and in the aggregate for all the funds within the Value Line group of funds, including the impact of the restructuring of the Adviser and Distributor in 2010 and certain actions taken during prior years. These actions included the reduction (voluntary in some instances, contractual or permanent in other instances) of management and/or Rule 12b-1 fees for certain funds, the Adviser’s termination of the use of soft dollar research, and the cessation of trading through the Distributor. The Board also considered the Adviser’s continued attention to the rationalization and differentiation of funds within the Value Line group of funds to better identify opportunities for savings and efficiencies among the funds. The Board concluded that the profitability of the Adviser and the Distributor with respect to each Fund, including the financial results derived from each Fund’s Agreement, was within a range the Board considered reasonable.
Other Benefits. The Board also considered the character and amount of other direct and incidental benefits received by the Adviser and the Distributor from their association with each Fund. The Board concluded that potential “fall-out” benefits that the Adviser and the Distributor may receive, such as greater name recognition, appear to be reasonable, and may in some cases benefit the Funds.
Economies of Scale.
Value Line Fund. The Board noted the Agreement includes a breakpoint applicable to the Adviser’s fee under which the first $100 million of the Fund’s average daily net assets are subject to a fee of 0.70% and any additional assets are subject to a fee of 0.65%. The Board considered that, given the current and anticipated size of the Fund, any perceived and potential economies of scale were not yet a significant consideration for the Fund and that the addition of more break points to the fee structure was not currently necessary.
Income & Growth Fund. The Board noted the Agreement includes a breakpoint applicable to the Adviser’s fee under which the first $100 million of the Fund’s average daily net assets are subject to a fee of 0.70% and any additional assets are subject to a fee of 0.65%. The Board considered that, given the current and anticipated size of the Fund, any perceived and potential economies of scale were not yet a significant consideration for the Fund and that the addition of more break points to the fee structure was not currently necessary
Larger Companies Fund; Premier Growth Fund. The Board considered that, given the current and anticipated size of each Fund, any perceived and potential economies of scale were not yet a significant consideration for either Fund and that the addition of break points to the fee structure was not currently necessary.
Fees and Services Provided for Other Comparable Funds/Accounts Managed by the Adviser. The Board was informed by the Adviser that the Adviser does not currently manage any non-mutual fund account that has similar objectives and policies as those of the Funds.
Conclusion. The Board examined the totality of the information it was provided at the meeting specifically addressing approval of the Agreements and at other meetings held during the past year and did not identify any single controlling factor. Based on its evaluation of all material factors deemed relevant and with the advice of independent counsel, the Board concluded that the rate at which each Fund pays a management fee to the Adviser under its Agreement does not constitute a fee that is so disproportionately large as to bear no reasonable relationship to the services rendered and that could not have been the product of arm’s-length bargaining. Further, the Board concluded that each Fund’s Agreement, and the management fee rate thereunder, is fair and reasonable and voted to continue each Agreement as in the best interest of that Fund and its shareholders.
The Funds file their complete schedule of portfolio holdings with the Securities and Exchange Commission (“SEC”) for the first and third quarters of each fiscal year on Form N-Q. The Funds’ Form N-Q is available on the SEC’s website at http://www.sec.gov and may be reviewed and copied at the SEC’s Public Reference Room in Washington, D.C. Information on the operation of the Public Reference Room may be obtained by calling 1-800-SEC-0330.
A description of the policies and procedures that the Funds use to determine how to vote proxies relating to portfolio securities, and information regarding how the Funds voted these proxies for the 12-month period ended June 30 is available through the Funds’ website at http://www.vlfunds.com and on the SEC’s website at http://www.sec.gov. The description of the policies and procedures is also available without charge, upon request, by calling 1-800-243-2729.
The Value Line Family of Funds |
In 1950, Value Line started its first mutual fund. Since then, knowledgeable investors have been relying on the Value Line Funds to help them build their financial futures. Over the years, Value Line Funds has evolved into what we are today – a diversified family of no-load mutual funds with a wide range of investment objectives – ranging from small, mid and large capitalization equities to taxable and tax-exempt fixed income. We also provide strategies that effectively combine both equities and fixed income, diligently taking into account the potential risk and reward of each investment.
1950 — The Value Line Fund seeks long-term growth of capital. Current income is a secondary objective.
1952 — Value Line Income and Growth Fund’s primary investment objective is income, as high and dependable as is consistent with reasonable risk. Capital growth to increase total return is a secondary objective.
1956 — Value Line Premier Growth Fund seeks long-term growth of capital. No consideration is given to current income in the choice of investments.
1972 — Value Line Larger Companies Fund’s sole investment objective is to realize capital growth.
1983 — Value Line Centurion Fund* seeks long-term growth of capital.
1984 — The Value Line Tax Exempt Fund seeks to provide investors with the maximum income exempt from federal income taxes while avoiding undue risk to principal. The fund may be subject to state and local taxes and the Alternative Minimum Tax (if applicable).
1986 — Value Line Core Bond Fund** seeks to maximize current income.
1987 — Value Line Strategic Asset Management Trust* seeks to achieve a high total investment return consistent with reasonable risk.
1993 — Value Line Small Cap Opportunities Fund*** invests in U.S. common stocks of small capitalization companies, with its primary objective being long-term growth of capital.
1993 — Value Line Asset Allocation Fund seeks high total investment return, consistent with reasonable risk. The Fund invests in stocks, bonds and money market instruments utilizing quantitative modeling to determine the asset mix.
| * | Only available through the purchase of Guardian Investor, a tax deferred variable annuity, or ValuePlus, a variable life insurance policy. |
| ** | Formerly known as the Value Line Aggressive Income Trust. |
| *** | Formerly known as the Value Line Emerging Opportunities Fund, Inc. |
For more complete information about any of the Value Line Funds, including charges and expenses, send for a prospectus from EULAV Securities LLC, 7 Times Square, New York, New York 10036-6524 or call 1-800-243-2729, 9am–5pm CST, Monday–Friday, or visit us at www.vlfunds.com. Read the prospectus carefully before you invest or send money.
Item 5. Audit Committee of Listed Registrants
Not Applicable.
Item 6. Investments
Not Applicable
Item 7. Disclosure of Proxy Voting Policies and Procedures for Closed-End Management Investment Companies
Not Applicable
Item 8. Portfolio Managers of Closed-End Management Investment Companies
Not Applicable
Item 9. Purchases of Equity Securities by Closed-End Management Investment Company and Affiliated Purchasers
Not Applicable
Item 10. Submission of Matters to a Vote of Security Holders
Not Applicable
Item 11. Controls and Procedures.
| | (a) | The registrant’s principal executive officer and principal financial officer have concluded that the registrant’s disclosure controls and procedures (as defined in rule 30a-2(c) under the Act (17 CFR 270.30a-2(c) ) based on their evaluation of these controls and procedures as of a date within 90 days of the filing date of this report, are appropriately designed to ensure that material information relating to the registrant is made known to such officers and are operating effectively. |
| | (b) | The registrant’s principal executive officer and principal financial officer have determined that there have been no significant changes in the registrant’s internal controls or in other factors that could significantly affect these controls subsequent to the date of their evaluation, including corrective actions with regard to significant deficiencies and material weaknesses. |
Item 12. Exhibits.
| | (a) | (1) Certification pursuant to Rule 30a-2(a) under the Investment Company Act of 1940 (17 CFR 270.30a-2) attached hereto as Exhibit 99.CERT. |
| | | (2) Certification pursuant to Section 906 of the Sarbanes-Oxley Act of 2002 attached hereto as Exhibit 99.906.CERT. |
SIGNATURES
Pursuant to the requirements of the Securities Exchange Act of 1934 and the Investment Company Act of 1940, the registrant has duly caused this report to be signed on its behalf by the undersigned, thereunto duly authorized.
| By | /s/ Mitchell E. Appel | |
| | Mitchell E. Appel, President | |
| | | |
| Date: | September 9, 2013 | | |
| | | |
Pursuant to the requirements of the Securities Exchange Act of 1934 and the Investment Company Act of 1940, this report has been signed below by the following persons on behalf of the registrant and in the capacities and on the dates indicated.
| By: | /s/ Mitchell E. Appel | |
| | Mitchell E. Appel, President, Principal Executive Officer | |
| | | |
| By: | /s/ Emily D. Washington | |
| | Emily D. Washington, Treasurer, Principal Financial Officer | |