Selected data for a share of capital stock outstanding throughout each year:
| | | Income/(loss) from investment operations: | | | Less distributions: | |
| | | | | | | | | Net gains/ | | | | | | | | | | | | | | | | | | | |
| | | Net asset | | | Net | | | (losses) on | | | | | | | | | Dividends | | | Distributions | | | | | | | |
| | | value, | | | investment | | | securities (both | | | Total from | | | | | | from net | | | from net | | | Distributions | | | | |
| | | beginning | | | income/ | | | realized and | | | investment | | | Redemption | | | investment | | | realized | | | from return | | | Total | |
| | | of year | | | (loss) | | | unrealized) | | | operations | | | fees | | | income | | | gains | | | of capital | | | distributions | |
| Value Line Premier Growth Fund, Inc. | | | | | | | | | | | | | | | | | | | | | | | | | | | |
Period ended June 30, 2014(1) | | $ | 33.99 | | | | 0.03 | | | | 1.45 | | | | 1.48 | | | | — | | | | — | | | | — | | | | — | | | | — | |
| Year ended December 31, 2013 | | | 28.84 | | | | 0.00 | (4) | | | 7.64 | | | | 7.64 | | | | — | | | | — | | | | (2.49 | ) | | | — | | | | (2.49 | ) |
| Year ended December 31, 2012 | | | 26.48 | | | | 0.09 | | | | 4.59 | | | | 4.68 | | | | — | | | | (0.09 | ) | | | (2.23 | ) | | | — | | | | (2.32 | ) |
| Year ended December 31, 2011 | | | 26.82 | | | | (0.08 | ) | | | 1.30 | | | | 1.22 | | | | — | | | | — | | | | (1.56 | ) | | | — | | | | (1.56 | ) |
| Year ended December 31, 2010 | | | 22.07 | | | | (0.01 | )(5) | | | 4.79 | | | | 4.78 | | | | — | | | | (0.03 | ) | | | — | | | | — | | | | (0.03 | ) |
| Year ended December 31, 2009 | | | 16.69 | | | | 0.02 | | | | 5.37 | | | | 5.39 | | | | — | | | | (0.01 | ) | | | — | | | | — | | | | (0.01 | ) |
| The Value Line Fund, Inc. | | | | | | | | | | | | | | | | | | | | | | | | | | | | | | | | | | | | |
Period ended June 30, 2014(1) | | | 13.50 | | | | 0.01 | | | | 0.55 | | | | 0.56 | | | | — | | | | — | | | | — | | | | — | | | | — | |
| Year ended December 31, 2013 | | | 10.36 | | | | 0.01 | | | | 3.19 | | | | 3.20 | | | | — | | | | (0.06 | ) | | | — | | | | — | | | | (0.06 | ) |
| Year ended December 31, 2012 | | | 9.04 | | | | 0.05 | | | | 1.27 | | | | 1.32 | | | | — | | | | — | | | | — | | | | — | | | | — | |
| Year ended December 31, 2011 | | | 8.55 | | | | (0.00 | )(4) | | | 0.49 | | | | 0.49 | | | | — | | | | (0.00 | )(4) | | | — | | | | — | | | | (0.00 | )(4) |
| Year ended December 31, 2010 | | | 6.81 | | | | 0.00 | (4) | | | 1.74 | | | | 1.74 | | | | — | | | | — | | | | — | | | | — | | | | — | |
| Year ended December 31, 2009 | | | 6.22 | | | | (0.01 | ) | | | 0.60 | | | | 0.59 | | | | — | | | | — | | | | — | | | | — | | | | — | |
| Value Line Income and Growth Fund, Inc. | | | | | | | | | | | | | | | | | | | | | | | | | | | | | | | | | | | | |
Period ended June 30, 2014(1) | | | 9.82 | | | | 0.07 | | | | 0.47 | | | | 0.54 | | | | — | | | | (0.07 | ) | | | — | | | | — | | | | (0.07 | ) |
| Year ended December 31, 2013 | | | 8.67 | | | | 0.12 | | | | 1.57 | | | | 1.69 | | | | — | | | | (0.12 | ) | | | (0.42 | ) | | | — | | | | (0.54 | ) |
| Year ended December 31, 2012 | | | 8.27 | | | | 0.13 | | | | 0.74 | | | | 0.87 | | | | — | | | | (0.13 | ) | | | (0.34 | ) | | | — | | | | (0.47 | ) |
| Year ended December 31, 2011 | | | 8.46 | | | | 0.11 | | | | (0.19 | ) | | | (0.08 | ) | | | — | | | | (0.11 | ) | | | — | | | | — | | | | (0.11 | ) |
| Year ended December 31, 2010 | | | 7.75 | | | | 0.10 | | | | 0.71 | | | | 0.81 | | | | — | | | | (0.10 | ) | | | — | | | | — | | | | (0.10 | ) |
| Year ended December 31, 2009 | | | 6.39 | | | | 0.10 | | | | 1.36 | | | | 1.46 | | | | — | | | | (0.10 | ) | | | — | | | | — | | | | (0.10 | ) |
| Value Line Larger Companies Fund, Inc. | | | | | | | | | | | | | | | | | | | | | | | | | | | | | | | | | | | | |
Period ended June 30, 2014(1) | | | 25.57 | | | | 0.06 | | | | 1.35 | | | | 1.41 | | | | — | | | | — | | | | — | | | | — | | | | — | |
| Year ended December 31, 2013 | | | 19.78 | | | | 0.13 | | | | 5.81 | | | | 5.94 | | | | — | | | | (0.15 | ) | | | — | | | | — | | | | (0.15 | ) |
| Year ended December 31, 2012 | | | 17.34 | | | | 0.16 | | | | 2.40 | | | | 2.56 | | | | — | | | | (0.12 | ) | | | — | | | | — | | | | (0.12 | ) |
| Year ended December 31, 2011 | | | 17.47 | | | | 0.12 | | | | (0.17 | ) | | | (0.05 | ) | | | — | | | | (0.08 | ) | | | — | | | | — | | | | (0.08 | ) |
| Year ended December 31, 2010 | | | 15.40 | | | | 0.09 | | | | 2.08 | | | | 2.17 | | | | — | | | | (0.10 | ) | | | — | | | | — | | | | (0.10 | ) |
| Year ended December 31, 2009 | | | 13.18 | | | | 0.10 | | | | 2.22 | | | | 2.32 | | | | — | | | | (0.10 | ) | | | — | | | | — | | | | (0.10 | ) |
| Value Line Core Bond Fund | | | | | | | | | | | | | | | | | | | | | | | | | | | | | | | | | | | | |
Period ended June 30, 2014(1) | | | 4.85 | | | | 0.04 | | | | 0.13 | | | | 0.17 | | | | — | | | | (0.04 | ) | | | — | | | | — | | | | (0.04 | ) |
Period ended December 31, 2013(8) | | | 5.07 | | | | 0.06 | | | | (0.22 | ) | | | (0.16 | ) | | | — | | | | (0.05 | ) | | | — | | | | (0.01 | ) | | | (0.06 | ) |
| Year ended January 31, 2013 | | | 4.92 | | | | 0.26 | | | | 0.15 | | | | 0.41 | | | | 0.00 | (4) | | | (0.26 | ) | | | (0.00 | )(4) | | | — | | | | (0.26 | ) |
| Year ended January 31, 2012 | | | 4.95 | | | | 0.29 | | | | (0.03 | ) | | | 0.26 | | | | 0.00 | (4) | | | (0.29 | ) | | | — | | | | — | | | | (0.29 | ) |
| Year ended January 31, 2011 | | | 4.70 | | | | 0.30 | | | | 0.25 | | | | 0.55 | | | | 0.00 | (4) | | | (0.30 | ) | | | — | | | | — | | | | (0.30 | ) |
| Year ended January 31, 2010 | | | 3.89 | | | | 0.28 | | | | 0.81 | | | | 1.09 | | | | 0.00 | (4) | | | (0.28 | ) | | | — | | | | — | | | | (0.28 | ) |
| Year ended January 31, 2009 | | | 4.83 | | | | 0.32 | | | | (0.95 | ) | | | (0.63 | ) | | | 0.00 | (4) | | | (0.31 | ) | | | — | | | | — | | | | (0.31 | ) |
| * | Ratio reflects expenses grossed up for the custody credit arrangement, waiver of the advisory fees by the Adviser and the service and distribution plan fees by the Distributor. The custody credit arrangement was discontinued as of January 1, 2013. |
| ** | Ratio reflects expenses net of the custody credit arrangement, waiver of the advisory fees by the Adviser and the service and distribution plan fees by the Distributor. The custody credit arrangement was discontinued as of January 1, 2013. |
| (1) | Unaudited for the six month period. |
| (2) | Not annualized. |
| (3) | Annualized. |
| (4) | Amount is less than $0.01 per share. |
| (5) | Based on average shares outstanding. |
| (6) | Ratio reflects expenses grossed up for the reimbursement by Value Line, Inc. of certain expenses incurred by the Fund. |
| (7) | Ratio reflects expenses net of the reimbursement by Value Line, Inc. of certain expenses incurred by the Fund. |
| (8) | Period from February 1, 2013 to December 31, 2013. |
| (9) | The ratio of expenses to average net assets, net of custody credits, but exclusive of the fee waivers would have been 1.48%. |
| See Notes to Financial Statements. |
| |
| 48 |
| Ratios/Supplemental Data: | |
| | | | | | | | | | Ratio of | | | Ratio of | | | Ratio of | | | | |
| | | | | | | Net assets, | | | gross expenses | | | net expenses | | | net investment | | | | |
| Net asset | | | | | | end of | | | to average | | | to average | | | income/(loss) to | | | Portfolio | |
| value, end | | | Total | | | year | | | net | | | net | | | average net | | | turnover | |
| of year | | | return | | | (in thousands) | | | assets* | | | assets** | | | assets | | | rate | |
| | | | | | | | | | | | | | | | | | | | |
| | | | | | | | | | | | | | | | | | | | |
| $ | 35.47 | | | | 4.35 | %(2) | | $ | 392,963 | | | | 1.22 | %(3) | | | 1.22 | %(3) | | | 0.15 | %(3) | | | 2 | %(2) |
| | 33.99 | | | | 26.56 | % | | | 402,073 | | | | 1.24 | % | | | 1.24 | % | | | (0.02 | )% | | | 11 | % |
| | 28.84 | | | | 17.80 | % | | | 337,436 | | | | 1.25 | % | | | 1.25 | % | | | 0.28 | % | | | 15 | % |
| | 26.48 | | | | 4.59 | % | | | 298,428 | | | | 1.24 | % | | | 1.24 | % | | | (0.28 | )% | | | 20 | % |
| | 26.82 | | | | 21.66 | % | | | 311,829 | | | | 1.23 | %(6) | | | 1.19 | %(7) | | | (0.02 | )% | | | 16 | % |
| | 22.07 | | | | 32.29 | % | | | 347,938 | | | | 1.22 | % | | | 1.22 | % | | | 0.11 | % | | | 8 | % |
| | | | | | | | | | | | | | | | | | | | | | | | | | | |
| | 14.06 | | | | 4.15 | %(2) | | | 125,991 | | | | 1.22 | %(3) | | | 1.22 | %(3) | | | 0.15 | %(3) | | | 4 | %(2) |
| | 13.50 | | | | 30.86 | % | | | 125,268 | | | | 1.26 | % | | | 1.12 | % | | | 0.05 | % | | | 7 | % |
| | 10.36 | | | | 14.60 | % | | | 109,798 | | | | 1.28 | % | | | 1.03 | % | | | 0.46 | % | | | 6 | % |
| | 9.04 | | | | 5.75 | % | | | 133,336 | | | | 1.29 | % | | | 0.94 | % | | | (0.02 | )% | | | 18 | % |
| | 8.55 | | | | 25.55 | % | | | 104,200 | | | | 1.31 | %(6) | | | 0.91 | %(7) | | | 0.02 | % | | | 27 | % |
| | 6.81 | | | | 9.49 | % | | | 92,680 | | | | 1.36 | % | | | 1.04 | % | | | (0.22 | )% | | | 122 | % |
| | | | | | | | | | | | | | | | | | | | | | | | | | | |
| | 10.29 | | | | 5.53 | %(2) | | | 345,165 | | | | 1.13 | %(3) | | | 1.08 | %(3) | | | 1.49 | %(3) | | | 19 | %(2) |
| | 9.82 | | | | 19.55 | % | | | 330,698 | | | | 1.16 | % | | | 1.11 | % | | | 1.26 | % | | | 27 | % |
| | 8.67 | | | | 10.62 | % | | | 295,705 | | | | 1.19 | % | | | 1.14 | % | | | 1.48 | % | | | 31 | % |
| | 8.27 | | | | (0.90 | )% | | | 306,227 | | | | 1.20 | % | | | 1.15 | % | | | 1.25 | % | | | 57 | % |
| | 8.46 | | | | 10.55 | % | | | 332,695 | | | | 1.14 | %(6) | | | 1.05 | %(7) | | | 1.22 | % | | | 46 | % |
| | 7.75 | | | | 23.07 | % | | | 340,210 | | | | 1.13 | % | | | 1.09 | % | | | 1.49 | % | | | 56 | % |
| | | | | | | | | | | | | | | | | | | | | | | | | | | |
| | 26.98 | | | | 5.51 | %(2) | | | 216,406 | | | | 1.21 | %(3) | | | 1.11 | %(3) | | | 0.46 | %(3) | | | 27 | %(2) |
| | 25.57 | | | | 30.05 | % | | | 211,508 | | | | 1.25 | % | | | 1.06 | % | | | 0.48 | % | | | 8 | % |
| | 19.78 | | | | 14.82 | % | | | 184,243 | | | | 1.27 | % | | | 1.02 | % | | | 0.72 | % | | | 17 | % |
| | 17.34 | | | | (0.27 | )% | | | 178,783 | | | | 1.25 | % | | | 1.00 | % | | | 0.60 | % | | | 30 | % |
| | 17.47 | | | | 14.09 | % | | | 199,524 | | | | 1.21 | %(6) | | | 0.92 | %(7) | | | 0.44 | % | | | 153 | % |
| | 15.40 | | | | 17.62 | % | | | 202,454 | | | | 1.26 | % | | | 1.01 | % | | | 0.62 | % | | | 157 | % |
| | | | | | | | | | | | | | | | | | | | | | | | | | | |
| | 4.98 | | | | 3.52 | %(2) | | | 83,481 | | | | 1.28 | %(3) | | | 1.13 | %(3) | | | 1.74 | %(3) | | | 69 | %(2) |
| | | | | | | | | | | | | | | | | | | | | | | | | | | |
| | 4.85 | | | | (3.13 | )%(2) | | | 85,045 | | | | 1.30 | %(3) | | | 1.15 | %(3) | | | 1.17 | %(3) | | | 61 | %(2) |
| | 5.07 | | | | 8.49 | % | | | 30,550 | | | | 1.62 | % | | | 1.32 | % | | | 5.18 | % | | | 103 | % |
| | 4.92 | | | | 5.48 | % | | | 32,203 | | | | 1.55 | % | | | 1.25 | % | | | 5.95 | % | | | 50 | % |
| | 4.95 | | | | 12.01 | % | | | 34,885 | | | | 1.48 | %(6) | | | 1.13 | %(7) | | | 6.20 | % | | | 42 | % |
| | 4.70 | | | | 28.92 | % | | | 37,787 | | | | 1.56 | % | | | 1.13 | % | | | 6.51 | % | | | 51 | % |
| | 3.89 | | | | (13.42 | )% | | | 25,924 | | | | 1.50 | %(9) | | | 0.98 | % | | | 7.17 | % | | | 39 | % |
| Notes to Financial Statements (unaudited) |
1. Significant Accounting Policies
Value Line Premier Growth Fund, Inc., The Value Line Fund, Inc., Value Line Income and Growth Fund, Inc., Value Line Larger Companies Fund, Inc., and Value Line Core Bond Fund, (individually a “Fund” and collectively, the “Funds”) are each registered under the Investment Company Act of 1940, as amended, as diversified, open-end management investment companies. The primary investment objective of the Value Line Premier Growth Fund, Inc. and The Value Line Fund, Inc. is long-term growth of capital. The primary investment objective of the Value Line Income and Growth Fund, Inc. is income, as high and dependable as is consistent with reasonable risk and capital growth to increase total return is a secondary objective. The sole investment objective of the Value Line Larger Companies Fund, Inc. is to realize capital growth. The primary investment objective of the Value Line Core Bond Fund is to maximize current income. As a secondary investment objective, the Fund will seek capital appreciation, but only when consistent with its primary objective. The Value Line Funds (the “Value Line Funds”) is a family of 10 mutual funds that includes a wide range of solutions designed to meet virtually any investment goal and consists of a variety of equity, fixed income, and hybrid funds.
The preparation of financial statements in conformity with generally accepted accounting principles requires management to make estimates and assumptions that affect the reported amounts of assets and liabilities and disclosure of contingent assets and liabilities at the date of the financial statements and the reported amounts of revenues and expenses during the reporting period. Actual results could differ from those estimates. The following is a summary of significant accounting policies consistently followed by the Funds in the preparation of their financial statements.
(A) Security Valuation: Securities listed on a securities exchange are valued at the closing sales prices on the date as of which the net asset value (“NAV”) is being determined. Securities traded on the National Association of Securities Dealers Automated Quotations (“NASDAQ”) Stock Market are valued at the NASDAQ Official Closing Price. In the absence of closing sales prices for such securities and for securities traded in the over-the-counter market, the security is valued at the midpoint between the latest available and representative asked and bid prices. Short-term instruments with maturities of 60 days or less at the date of purchase are valued at amortized cost, which approximates fair value. Short-term instruments with maturities greater than 60 days at the date of purchase are valued at the midpoint between the latest available and representative asked and bid prices, and commencing 60 days prior to maturity such securities are valued at amortized cost.
The Board of Directors (the “Board”) has determined that the value of bonds and other fixed income corporate securities be calculated on the valuation date by reference to valuations obtained from an independent pricing service that determines valuations for normal institutional-size trading units of debt securities, without exclusive reliance upon quoted prices. This service takes into account appropriate factors such as institutional-size trading in similar groups of securities, yield, quality, coupon rate, maturity, type of issue, trading characteristics and other market data in determining valuations. Bonds and fixed income securities are valued at the evaluated bid on the date as of which the NAV is being determined. Securities, other than bonds and other fixed income securities, not priced in this manner are valued at the midpoint between the latest available and representative bid and asked prices, or when stock valuations are used, at the latest quoted sale price as of the regular close of business of the New York Stock Exchange (“NYSE”) on the valuation date.
Investments in shares of open-end mutual funds, including money market funds, are valued at their daily NAV which is calculated as of the close of regular trading on the NYSE (usually 4:00 P.M. Eastern Standard Time) on each day on which the NYSE is open for business. NAV per share is determined by dividing each Fund’s total net assets by each Fund’s total number of shares outstanding at the time of calculation.
The Board has adopted procedures for valuing portfolio securities in circumstances where market quotes are not readily available, and has delegated the responsibility for applying the valuation methods to the Adviser. A valuation committee (the “Valuation Committee”) was established by the Board to oversee the implementation of the Funds’ valuation methods and to make fair value determinations on behalf of the Board, as instructed. The Adviser monitors the continued appropriateness of methods applied and determines if adjustments should be made in light of market changes, events affecting the issuer, or other factors. If the Adviser determines that a valuation method may no longer be appropriate, another valuation method may be selected, or the Valuation Committee will be convened to consider the matter and take any appropriate action in accordance with procedures set forth by the Board. The Board shall review the appropriateness of the valuation methods and these methods may be amended or supplemented from time to time by the Valuation Committee. In addition, the Funds may use the fair value of a security when the closing market price on the primary exchange where the security is traded no longer reflects the value of a security due to factors affecting one or more relevant securities markets or the specific issuer.
(B) Fair Value Measurements: The Funds follow fair valuation accounting standards (FASB ASC 820-10) which establishes a definition of fair value and set out a hierarchy for measuring fair value. These standards require additional disclosures about the various inputs and valuation techniques used to develop the measurements of fair value and a discussion of changes in valuation techniques and related inputs during the period. These inputs are summarized in the three broad levels listed below:
| | | |
| ● | Level 1 – | Inputs that reflect unadjusted quoted prices in active markets for identical assets or liabilities that the Fund has the ability to access at the measurement date; |
| | | |
| ● | Level 2 – | Inputs other than quoted prices that are observable for the asset or liability either directly or indirectly, including inputs in markets that are not considered to be active; |
| | | |
| ● | Level 3 – | Inputs that are unobservable. |
Transfers between investment levels may occur as the markets fluctuate and/or the availability of data used in an investment’s valuation changes. The inputs or methodologies used for valuing securities are not necessarily an indication of the risk associated with investing in those securities.
The Funds follow the updated provisions surrounding fair value measurements and disclosures on transfers in and out of all levels of the fair value hierarchy on a gross basis and the reasons for the transfers as well as to disclosures about the valuation techniques and inputs used to measure fair value for investments that fall in either Level 2 or Level 3 of the fair value hierarchy.
For the six months ended June 30, 2014, there were no transfers between Level 1, Level 2, and Level 3 assets for each fund.
The Funds’ policy is to recognize transfers between levels at the beginning of the reporting period.
The amounts and reasons for all transfers in and out of each level within the three-tier hierarchy are disclosed when the Funds had an amount of total transfers during the reporting period that were meaningful in relation to their net assets as of the end of the reporting period (e.g. greater than 1%). An investment asset’s or liability’s level within the fair value hierarchy is based on the lowest level input, individually or in aggregate, that is significant to fair value measurement. The objective of fair value measurement remains the same even when there is a significant decrease in the volume and level of activity for an asset or liability and regardless of the valuation techniques used.
For the six months ended June 30, 2014, there were no Level 3 investments. The Schedule of Investments includes a breakdown of the Funds’ investments by category.
(C) Repurchase Agreements: Each Fund may enter into repurchase agreements, under the terms of a Master Repurchase Agreement, with selected commercial banks and broker-dealers, under which the Funds acquire securities as collateral and agrees to resell the securities at an agreed upon time and at an agreed upon price. Each Fund, through the custodian or a sub-custodian, receives delivery of the underlying securities collateralizing repurchase agreements. The Funds’ custodian takes possession of the underlying collateral securities, the value of which exceeds the principal amount of the repurchase transaction, including accrued interest. To the extent that any repurchase transaction exceeds one business day, it is the Funds’ policy to mark-to-market the value of the underlying securities daily to ensure the adequacy of the collateral. In the event of default by either the seller or the Funds, the Master Repurchase Agreement may permit the non-defaulting party to net and close out all transactions. The Funds have the right to liquidate the collateral and apply the proceeds in satisfaction of the obligation. Under certain circumstances, in the event of default or bankruptcy by the other party to the agreement, realization and/or retention of the collateral or proceeds may be subject to legal proceedings. At period end, there were no open repurchase agreements for the Value Line Funds.
(D) Federal Income Taxes: It is the policy of each Fund to continue to qualify as a regulated investment company by complying with the provisions available to regulated investment companies, as defined in applicable sections of the Internal Revenue Code, and to distribute all of their investment income and capital gains to their shareholders. Therefore, no provision for federal income tax is required.
| Notes to Financial Statements (unaudited) (continued) |
Management has analyzed the Funds’ tax positions taken on federal and state income tax returns for all open tax years (fiscal years ended December 31, 2010 through December 31, 2013), and has concluded that no provision for federal or state income tax is required in the Funds’ financial statements. The Funds’ federal and state income tax returns for tax years for which the applicable statutes of limitations have not expired are subject to examination by the Internal Revenue Service and state departments of revenue.
(E) Security Transactions and Distributions: Security transactions are accounted for on the date the securities are purchased or sold. Realized gains and losses on sales of securities are calculated for financial accounting and federal income tax purposes on the basis of first in first out convention (“FIFO”). Dividend income and distributions to shareholders are recorded on the ex-dividend date. Distributions are determined in accordance with income tax regulations, which may differ from generally accepted accounting principles. Interest income, adjusted for the amortization of discount and premium, is earned from settlement date and recognized on the accrual basis. Gains and losses realized on prepayments received on mortgage-related securities are recorded as interest income.
The dividends and distributions were as follows:
| | | Six Months Ended | | | | |
| | | June 30, 2014 | | | Year Ended | |
| | | (unaudited) | | | December 31, 2013 | |
| Value Line Premier Growth Fund, Inc. | | | | | | |
| Distributions per share from net realized gains | | $ | — | | | $ | 2.4934 | |
| | | | | | | | | |
| The Value Line Fund, Inc. | | | | | | | | |
| Dividends per share from net investment income | | $ | — | | | $ | 0.0570 | |
| | | | | | | | | |
| Value Line Income and Growth Fund, Inc. | | | | | | | | |
| Dividends per share from net investment income | | $ | 0.0718 | | | $ | 0.1157 | |
| Distributions per share from net realized gains | | $ | — | | | $ | 0.4174 | |
| | | | | | | | | |
| Value Line Larger Companies Fund, Inc. | | | | | | | | |
| Dividends per share from net investment income | | $ | — | | | $ | 0.1521 | |
| | | | | | | | | |
| Value Line Core Bond Fund | | | | | | | | |
| Dividends per share from net investment income | | $ | 0.0400 | | | $ | 0.0537 | |
| | | | | | | | | |
| Distributions per share from return of capital | | $ | — | | | $ | 0.0089 | |
The Funds may purchase mortgage pass-through securities on a to-be-announced (“TBA”) basis, with payment and delivery scheduled for a future date. The Funds may enter into a TBA agreement, sell the obligation to purchase the pools stipulated in the TBA agreement prior to the stipulated settlement date and enter into a new TBA agreement for future delivery of pools of mortgage pass-through securities (a “TBA roll”). A TBA roll is treated by the Funds as a purchase transaction and a sale transaction in which the Funds realize a gain or loss. The Funds’ use of TBA rolls may cause the Funds to experience higher portfolio turnover and higher transaction costs. The Funds could be exposed to possible risk if there is an adverse market action, expenses or delays in connection with TBA transactions, or if the counterparty fails to complete the transaction.
The Value Line Core Bond Fund may invest in Treasury Inflation-Protection Securities (“TIPS”). The principal value and interest payout of TIPS are periodically adjusted according to the rate of inflation based on the Consumer Price Index. The adjustments for principal and income due to inflation are reflected in interest income in the Statements of Operations.
Income dividends and capital gains distributions are automatically reinvested in additional shares of the Fund unless the shareholder has requested otherwise. Income earned by the Fund on weekends, holidays and other days on which the Fund is closed for business is declared as a dividend on the next day on which the Fund is open for business. The Value Line Income and Growth Fund, Inc. distributes all of its net investment income quarterly and the Value Line Premier Growth Fund, Inc., The Value Line Fund, Inc., and the Value Line Larger Companies Fund, Inc. distribute all of their net investment income annually. The Value Line Core Bond fund declares and pays dividends monthly. Net realized capital gains, if any, are distributed to shareholders annually or more frequently if necessary to comply with the Internal Revenue Code.
(F) Foreign Currency Translation: The books and records of the Funds are maintained in U.S. dollars. Assets and liabilities which are denominated in foreign currencies are translated to U.S. dollars at the prevailing rates of exchange at the valuation date. The Funds do not isolate changes in the value of investments caused by foreign exchange rate differences from the changes due to other circumstances.
Income and expenses are translated to U.S. dollars based upon the rates of exchange on the respective dates of such transactions.
Net realized foreign exchange gains or losses arise from currency fluctuations realized between the trade and settlement dates on securities transactions, the differences between the U.S. dollar amounts of dividends, interest, and foreign withholding taxes recorded by the Funds, and the U.S. dollar equivalent of the amounts actually received or paid. Net unrealized foreign exchange gains and losses arise from changes in the value of assets and liabilities, other than investments, at the end of the fiscal period, resulting from changes in the exchange rates. The effect of the change in foreign exchange rates on the value of investments is included in realized gain/(loss) on investments and change in net unrealized appreciation/(depreciation) on investments.
(G) Representations and Indemnifications: In the normal course of business, the Funds enter into contracts that contain a variety of representations and warranties which provide general indemnifications. The Funds’ maximum exposure under these arrangements is unknown, as this would involve future claims that may be made against the Funds that have not yet occurred. However, based on experience, management expects the risk of loss to be remote.
(H) Accounting for Real Estate Investment Trusts: The Funds own shares of Real Estate Investment Trusts (“REITs”) which report information on the source of their distributions annually. Distributions received from REITs during the year which represent a return of capital are recorded as a reduction of cost and distributions which represent a capital gain dividend are recorded as a realized long-term capital gain on investments.
(I) Foreign Taxes: The Funds may be subject to foreign taxes on income, gains on investments, or currency repatriation, a portion of which may be recoverable. The Funds will accrue such taxes and recoveries as applicable, based upon its current interpretation of tax rules and regulations that exist in the markets in which it invests.
(J) Securities Lending: Under an agreement with State Street Bank & Trust (“State Street”), the Funds can lend their securities to brokers, dealers and other financial institutions approved by the Board. By lending their investment securities, the Funds attempt to increase their net investment income through receipt of interest on the loan. Any gain or loss in the market price of the securities loaned that might occur and any interest or dividends declared during the term of the loan would accrue to the account of the Funds. Risks of delay in recovery of the securities or even loss of rights in the collateral may occur should the borrower of the securities fail financially. Generally, in the event of a counter-party default, the Funds have the right to use the collateral to offset the losses incurred. The lending fees received and the Funds’ portion of the interest income earned on the cash collateral are included in the Statements of Operations.
Upon entering into a securities lending transaction, the Funds receive cash or other securities as collateral in an amount equal to or exceeding 102% of the current market value of the loaned securities. Any cash received as collateral is invested by State Street Global Advisors, acting in its capacity as securities lending agent (the “Agent”), in The Value Line Funds collateral account, which is subsequently invested into joint repurchase agreements. A portion of the dividends received on the collateral is rebated to the borrower of the securities and the remainder is split between the Agent and the Funds.
The Funds enter into joint repurchase agreements whereby their uninvested cash collateral from securities lending is deposited into a joint cash account with other funds managed by the Adviser and is used to invest in one or more repurchase agreements. The value and face amount of the joint repurchase agreement are allocated to the funds based on their pro-rata interest in the repurchase agreement. A repurchase agreement is accounted for as a loan by the funds to the seller, collateralized by securities which are delivered to the Fund’s custodian. The market value, including accrued interest, of the initial collateralization is required to be at least 102% of the dollar amount invested by the funds, with the value of the underlying securities marked-to-market daily to maintain coverage of at least 100%.
At period end, there were no open joint repurchase agreements for the Value Line Funds.
| Notes to Financial Statements (unaudited) (continued) |
As of June 30, 2014, the Funds loaned securities which were collateralized by cash. The value of the securities on loan and the value of the related collateral were as follows:
| | | | | | | | | Total Collateral | |
| | | Value of Securities | | | | | | (including | |
| Fund | | Loaned | | | Value of Collateral | | | Calculated Mark)* | |
| Value Line Premier Growth Fund, Inc | | $ | 6,545,741 | | | $ | 6,696,523 | | | $ | 6,681,773 | |
| The Value Line Fund, Inc. | | | 1,300,270 | | | | 1,327,000 | | | | 1,326,500 | |
| Value Line Income and Growth Fund, Inc. | | | 13,742,949 | | | | 14,009,948 | | | | 14,051,350 | |
| Value Line Larger Companies Fund, Inc. | | | 2,302,300 | | | | 2,347,150 | | | | 2,354,625 | |
| Value Line Core Bond Fund | | | 1,198,169 | | | | 1,222,250 | | | | 1,222,625 | |
| * | Balances represent the end of day mark-to-market of securities lending collateral that will be reflected by the Funds as of the next business day. |
(K) Options: The Value Line Income and Growth Fund, Inc.’s investment strategy allows the use of options. The Fund utilizes options to hedge against changes in market conditions or to provide market exposure while trying to reduce transaction costs.
When the Fund writes a put or call option, an amount equal to the premiums received is included on the Statement of Assets and Liabilities as a liability. The amount of the liability is subsequently marked-to-market to reflect the current market value of the option. If an option expires on its stipulated expiration date or if the Fund enters into a closing purchase transaction, a gain or loss is realized. If a written call option on an individual security is exercised, a gain or loss is realized for the sale of the underlying security, and the proceeds from the sale are increased by the premium originally received. If a written put option on an individual security is exercised, the cost of the security acquired is decreased by the premium originally received. As a writer of an option, a Fund bears the market risk of an unfavorable change in the price of the individual security underlying the written option. Additionally, written call options may involve the risk of limited gains.
The Fund may also purchase put and call options. When a Fund purchases a put or call option, an amount equal to the premium paid is included on the Fund’s Statement of Assets and Liabilities as an investment, and is subsequently marked-to-market to reflect the current market value of the option. If an option expires on the stipulated expiration date or if the Fund enters into a closing sale transaction, a gain or loss is realized. If the Fund exercises a call option on an individual security, the cost of the security acquired is increased by the premium paid for the call. If the Fund exercises a put option on an individual security, a gain or loss is realized from the sale of the underlying security, and the proceeds from such a sale are decreased by the premium originally paid. Written and purchased options are non-income producing securities.
As of June 30, 2014, the Value Line Income and Growth Fund, Inc. had no open options contracts.
The Value Line Income and Growth Fund, Inc.’s written options are collateralized securities held at the Options Clearing Corporation’s account at the Fund’s custodian. The securities pledged as collateral are included on the Schedule of Investments. Such collateral is restricted from the Fund’s use.
There were no options contracts written in the Value Line Income and Growth Fund, Inc. during the period ended June 30, 2014.
(L) Subsequent Events: Management has evaluated all subsequent transactions and events through the date on which these financial statements were issued and has determined that no additional items require adjustment to or disclosure in the financial statements.
2. Investment Risks
Securities issued by U.S. Government agencies or government-sponsored enterprises may not be guaranteed by the U.S. Treasury. The Government National Mortgage Association (“GNMA” or “Ginnie Mae”), a wholly-owned U.S. Government corporation, is authorized to guarantee, with the full faith and credit of the U.S. Government, the timely payment of principal and interest on securities issued by institutions approved by GNMA and backed by pools of mortgages insured by the Federal Housing Administration or guaranteed by the Department of Veterans Affairs. Government-related guarantors (i.e., not backed by the full faith and credit of the U.S. Government) include the Federal National Mortgage Association (“FNMA” or “Fannie Mae”) and the Federal Home Loan Mortgage Corporation (“FHLMC” or “Freddie Mac”). Pass-through securities issued by FNMA are guaranteed as to timely payment of principal and interest by FNMA, but are not backed by the full faith and credit of the U.S. Government. FHLMC guarantees the timely payment of interest and ultimate collection of principal, but its participation certificates are not backed by the full faith and credit of the U.S. Government.
3. Reorganization
On December 13, 2012, the Board approved an agreement and plan of reorganization (the “Reorganization”) pursuant to which the Value Line U.S. Government Securities Fund, Inc. (the “Acquired Fund”) would merge into and become shareholders of the Value Line Core Bond Fund (the “Surviving Fund”). The Board believes the reorganization would be advantageous to the shareholders of both Funds for the reason that both Funds have similar investment objectives, improved performance and a larger and more diverse investment universe, potentially allowing for economies of scale to be realized over time.
On March 22, 2013, the Surviving Fund acquired all of the assets and assumed the liabilities of the Acquired Fund, in a tax-free exchange for Federal tax purposes, pursuant to the Reorganization approved by the Board of both Funds and shareholders of record of the Acquired Fund as of the applicable record date. All of the expenses incurred in connection with the Reorganization were paid by both the Acquired and Surviving Funds proportionately based on the Funds’ respective net assets. The total Reorganization costs are $172,439. The value of shares issued by the Surviving Fund is presented in the Statement of Changes in Net Assets. The following table sets forth the number of shares issued by the Surviving Fund, the net assets and unrealized appreciation or depreciation of the Acquired Fund immediately prior to the Reorganization, and the net assets of the Surviving Fund immediately prior to and after the Reorganization:
| | | | | Shares | | | Net Assets | | | Net Assets | |
| Date of | | Surviving | | Issued In | | | Before | | | After | |
| Reorganization | | Fund | | Acquisition | | | Reorganization | | | Reorganization | |
| 3-22-13 | | Value Line Core Bond Fund | | | 14,453,737 | | | $ | 29,565,559 | | | $ | 102,961,637 | |
| | | | | | | | | | | Acquired | |
| | | | | | | | Acquired | | | Portfolio | |
| Date of | | Acquired | | Shares | | | Portfolio | | | Unrealized | |
| Reorganization | | Fund | | Outstanding | | | Net Assets | | | Depreciation | |
| 3-22-13 | | Value Line U.S. Government Securities Fund, Inc. | | | 6,308,486 | | | $ | 73,396,078 | | | $ | 1,483,441 | |
Assuming the Reorganization had been completed on February 1, 2013, the beginning of the period for the Surviving Fund, the Surviving Fund’s pro forma results of operations for the year ended December 31, 2013 would have been as follows:
| Net investment income | | $ | 1,580,309 | |
| Net loss on investments | | $ | (4,057,854 | ) |
| Net decrease in net assets from operations | | $ | (2,477,545 | ) |
Because the combined investment portfolios have been managed as a single integrated portfolio since the closing of the Reorganization, it is not practicable to separate the amounts of revenue and earnings of the Acquired Fund that have been included in the Surviving Fund’s Statement of Operations since March 22, 2013.
4. Purchases and Sales of Securities
Purchases and sales of securities, excluding short-term investments, were as follows:
| | | | | | | | | Purchases of | | | Sales of U.S. | |
| | | Purchases of | | | Sales of | | | U.S. Government | | | Government | |
| | | Investment | | | Investment | | | Agency | | | Agency | |
| Fund | | Securities | | | Securities | | | Obligations | | | Obligations | |
| Value Line Premier Growth Fund, Inc. | | $ | 9,096,074 | | | $ | 35,322,690 | | | $ | — | | | $ | — | |
| The Value Line Fund, Inc. | | | 4,440,843 | | | | 9,166,217 | | | | — | | | | — | |
| Value Line Income and Growth Fund, Inc. | | | 62,560,235 | | | | 45,566,830 | | | | 3,209,078 | | | | 14,435,755 | |
| Value Line Larger Companies Fund, Inc. | | | 55,039,554 | | | | 60,045,064 | | | | — | | | | — | |
| Value Line Core Bond Fund | | | 40,369,760 | | | | 22,135,580 | | | | 16,595,733 | | | | 38,509,059 | |
| Notes to Financial Statements (unaudited) (continued) |
5. Income Taxes
At June 30, 2014, information on the tax components of capital is as follows:
| | | | | | | | | | | | Net tax | |
| | | Cost of | | | | | | | | | unrealized | |
| | | investments | | | Gross tax | | | Gross tax | | | appreciation/ | |
| | | for tax | | | unrealized | | | unrealized | | | (depreciation) | |
| Fund | | purposes | | | appreciation | | | depreciation | | | on investments | |
| Value Line Premier Growth Fund, Inc. | | $ | 183,543,715 | | | $ | 209,314,244 | | | $ | (344,866 | ) | | $ | 208,969,378 | |
| The Value Line Fund, Inc. | | | 67,458,595 | | | | 58,599,248 | | | | (14,027 | ) | | | 58,585,221 | |
| Value Line Income and Growth Fund, Inc. | | | 263,679,901 | | | | 83,145,918 | | | | (1,055,178 | ) | | | 82,090,740 | |
| Value Line Larger Companies Fund, Inc. | | | 138,748,802 | | | | 77,995,432 | | | | (318,153 | ) | | | 77,677,279 | |
| Value Line Core Bond Fund | | | 84,466,713 | | | | 1,485,743 | | | | (554,085 | ) | | | 931,658 | |
6. Investment Advisory Fee, Service and Distribution Fees and Transactions With Affiliates
Advisory fees of $1,455,789, $424,644, $1,100,055, $783,587 and $209,515 for the Value Line Premier Growth Fund, Inc., The Value Line Fund, Inc., Value Line Income and Growth Fund, Inc., Value Line Larger Companies Fund, Inc., and Value Line Core Bond Fund, respectively, were paid or payable to the Adviser for the six months ended June 30, 2014. For the Value Line Premier Growth Fund, Inc. and Value Line Larger Companies Fund, Inc. advisory fees were computed at an annual rate of 0.75% of the daily net assets during the period. For The Value Line Fund, Inc. and Value Line Income and Growth Fund, Inc. advisory fees were computed at an annual rate of 0.70% of the first $100 million of the Fund’s average daily net assets plus 0.65% of the excess thereof. For the Value Line Core Bond Fund advisory fees were computed at an annual rate of 0.50% of the Fund’s average daily net assets during the period prior to any fee waivers. The Funds advisory fees are paid monthly. The Adviser provides research, investment programs, and supervision of the investment portfolio and pays costs of administrative services, office space, equipment and compensation of administrative, bookkeeping, and clerical personnel necessary for managing the affairs of the Funds. The Adviser also provides persons, satisfactory to the Funds’ Board, to act as officers and employees of the Funds and pays their salaries. Effective February 1, 2013, and voluntarily renewed annually through June 30, 2014, the Adviser contractually agreed to waive 0.10% of the advisory fee for the Value Line Core Bond Fund. The fees waived amounted to $41,903 for the period ended June 30, 2014. The Adviser has no right to recoup previously waived amounts.
The Funds have a Service and Distribution Plan (the “Plan”), adopted pursuant to Rule 12b-1 under the Investment Company Act of 1940, which compensates EULAV Securities LLC (the “Distributor”) for advertising, marketing and distributing the Funds’ shares and for servicing the Funds’ shareholders at an annual rate of 0.25% of the Funds’ average daily net assets. For the period ended June 30, 2014, fees amounting to $485,263, $153,788, $413,562, $261,196 and $104,757 before fee waivers for the Value Line Premier Growth Fund, Inc., The Value Line Fund, Inc., Value Line Income and Growth Fund, Inc., Value Line Larger Companies Fund, Inc., and Value Line Core Bond Fund, respectively, were accrued under this Plan. Effective May 1, 2009, and voluntarily renewed annually through July 31, 2013, the Distributor contractually agreed to waive The Value Line Fund, Inc.’s 12b-1 fee by 0.25%; effective August 1, 2013, the Distributor discontinued to waive The Value Line Fund, Inc.’s 12b-1 fee. Effective March 1, 2009, and voluntarily renewed annually, the Distributor contractually agreed to reduce the fee for the Value Line Income and Growth Fund, Inc. by 0.05%. Effective May 1, 2007, and voluntarily renewed annually through July 31, 2013, the Distributor contractually agreed to waive Value Line Larger Companies Fund, Inc.’s 12b-1 fee by 0.25%; effective August 1, 2013 and voluntarily renewed annually, the Distributor contractually agreed to waive the Value Line Larger Companies Fund, Inc.’s 12b-1 fee by 0.10%. Effective June 1, 2007, and voluntarily renewed annually, the Distributor contractually agreed to reduce the 12b-1 fee by 0.10% for the Value Line Core Bond Fund. The Value Line Income and Growth Fund, Inc., Value Line Larger Companies Fund, Inc. and Value Line Core Bond Fund’s fees waived amounted to $82,712, $104,478, and $20,951, respectively, for the six months ended June 30, 2014. The Distributor has no right to recoup previously waived amounts.
Effective July 5, 2012, the Funds have a Sub-Transfer Agent Plan (the “sub TA plan”) which compensates financial intermediaries that provide sub-transfer agency and related services to investors that hold their Fund shares in omnibus accounts maintained by the financial intermediaries with the Funds. The sub-transfer agency fee, which may be paid directly to the financial intermediary or indirectly via the Distributor, is equal to the lower of (i) the aggregate amount of additional transfer agency fees and expenses that the Funds would otherwise pay to the transfer agent if each subaccount in the omnibus account maintained by the financial intermediary with the Funds were a direct account with the Funds and (ii) the amount by which the fees charged by the financial intermediary for including the Funds on its platform and providing shareholder, sub-transfer agency and related services exceed the amount paid under the Funds’ Plan with respect to each Fund’s assets attributable to shares held by the financial intermediary in the omnibus account. In addition, the amount of sub-transfer agency fees payable by the Fund’s to all financial intermediaries in the aggregate is subject to a maximum cap of 0.05% of each Fund’s average daily net assets. If the sub-transfer agency fee is paid to financial intermediaries indirectly via the Distributor, the Distributor does not retain any amount thereof and such fee otherwise reduces the amount that the Distributor is contractually obligated to pay to the financial intermediary. For the six months ended June 30, 2014, fees amounting to $43,406, $2,880, $24,635 and $5,114 for the Value Line Premier Growth Fund, Inc., The Value Line Fund, Inc., Value Line Income and Growth Fund, Inc., and Value Line Larger Companies Fund, Inc., respectively, were paid under the sub TA plan.
Each Fund bears direct expenses incurred specifically on its behalf while common expenses of the Value Line Funds are allocated proportionately based upon each Fund’s respective net assets. The Funds bear all other costs and expenses.
Certain officers and a trustee of the Adviser are also officers and a director of the Funds. At June 30, 2014, the officers and directors of the Value Line Premier Growth Fund, Inc., The Value Line Fund, Inc., Value Line Income and Growth Fund, Inc., Value Line Larger Companies Fund, Inc., and Value Line Core Bond Fund as a group owned less than 1% of the outstanding shares of each Fund.
7. Other
The Value Line Income and Growth Fund, Inc. received notice that it has been named as a defendant in In re: Tribune Company Fraudulent Conveyance Litigation, Consol. MDL 11 MD 2296 (RJS), which includes two specific cases in which the Fund is named, Kirschner, as Litigation Trustee for the Tribune Litigation Trust v. Fitzsimone, et al., 12 CV 02652 (RJS) (The “Trustee Litigation”) and Deutsche Bank Trust Company Americas, in its Capacity as Successor Indenture Trustee for Certain Series of Senior Notes, et al. v. Adaly Opportunity Fund TD Securities Inc. c/o Adaly Investment Management Co., et al., No. 1:11-cv-04784-RJH (S.D.N.Y.) (the “Adaly Action”). The Adaly Action is part of a larger group of noteholder and individual creditor complaints, which were dismissed by the lower federal district court on September 23, 2013, but are now part of an appeal by counsel for some of the individual creditors. Both the Adaly Action and Trustee Litigation seek to recover alleged transfers received in connection with the purchase, repurchase or redemption of Tribune stock as a result of a 2007 leveraged buyout and tender offer. The alleged value of the proceeds received by the Fund is $490,522 (less than 1% of net assets) and the Fund will incur legal expenses in the defense of these actions. Management continues to assess the actions and has made no determination about the effect, if any, on the Fund’s net assets and results of operations.
| Fund Expenses (unaudited) |
Example
As a shareholder of the Funds, you incur ongoing costs, including management fees, distribution and service (12b-1) fees, and other Fund expenses. This Example is intended to help you understand your ongoing costs (in dollars) of investing in each Fund and to compare these costs with the ongoing costs of investing in other mutual funds.
The Example is based on an investment of $1,000 invested at the beginning of the period and held for the entire period (January 1, 2014 through June 30, 2014).
Actual Expenses
The first line of the table below provides information about actual account values and actual expenses. You may use the information in this line, together with the amount you invested, to estimate the expenses that you paid over the period. Simply divide your account value by $1,000 (for example an $8,600 account value divided by $1,000 = 8.6), then multiply the result by the number in the first line under the heading “Expenses Paid During Period” to estimate the expenses you paid on your account during this period.
Hypothetical Example for Comparison Purposes
The second line of the table below provides information about hypothetical account values and hypothetical expenses based on the Funds’ actual expense ratio and an assumed rate of return of 5% per year before expenses, which is not the Funds’ actual return. The hypothetical account values and expenses may not be used to estimate the actual ending account balance or expenses you paid for the period. You may use this information to compare the ongoing costs of investing in the Fund and other funds. To do so, compare this 5% hypothetical example with the 5% hypothetical examples that appear in the shareholder reports of other funds.
Please note that the expenses shown in the table are meant to highlight your ongoing costs only and do not reflect any transactional costs, such as sales charges (loads), redemption fees, or exchange fees. Therefore, the table is useful in comparing ongoing costs only and will not help you determine the relative total costs of owning different funds. In addition, if transactional costs were included, your costs would have been higher.
| | | | | | | | | Expenses | |
| | | Beginning | | | Ending | | | paid during | |
| | | account value | �� | | account value | | | period 1/1/14 | |
| | | 1/1/14 | | | 6/30/14 | | | thru 6/30/14* | |
| Actual | | | | | | | | | |
| Value Line Premier Growth Fund, Inc. | | $ | 1,000.00 | | | $ | 1,043.54 | | | $ | 6.16 | |
| The Value Line Fund, Inc. | | | 1,000.00 | | | | 1,041.48 | | | | 6.17 | |
| Value Line Income and Growth Fund, Inc. | | | 1,000.00 | | | | 1,055.29 | | | | 5.50 | |
| Value Line Larger Companies Fund, Inc. | | | 1,000.00 | | | | 1,055.14 | | | | 5.68 | |
| Value Line Core Bond Fund | | | 1,000.00 | | | | 1,035.15 | | | | 5.69 | |
| Hypothetical (5% return before expenses) | | | | | | | | | | | | |
| Value Line Premier Growth Fund, Inc. | | | 1,000.00 | | | | 1,018.76 | | | | 6.09 | |
| The Value Line Fund, Inc. | | | 1,000.00 | | | | 1,018.75 | | | | 6.10 | |
| Value Line Income and Growth Fund, Inc. | | | 1,000.00 | | | | 1,019.44 | | | | 5.41 | |
| Value Line Larger Companies Fund, Inc. | | | 1,000.00 | | | | 1,019.27 | | | | 5.58 | |
| Value Line Core Bond Fund | | | 1,000.00 | | | | 1,019.20 | | | | 5.64 | |
| * | Expenses are equal to the Funds’ annualized expense ratio of 1.22%, 1.22%, 1.08%, 1.11%, and 1.13%, respectively, multiplied by the average account value over the period, multiplied by 181/365 to reflect the one-half year period. These expense ratios may differ from the expense ratios shown in the Financial Highlights. |
FACTORS CONSIDERED BY THE BOARD IN APPROVING CONTINUANCE OF THE INVESTMENT ADVISORY AGREEMENTS FOR THE VALUE LINE FUND, INC., VALUE LINE INCOME AND GROWTH FUND, INC., VALUE LINE LARGER COMPANIES FUND, INC., VALUE LINE PREMIER GROWTH FUND, INC., AND VALUE LINE CORE BOND FUND
The Investment Company Act of 1940 (the “1940 Act”) requires the Boards (the “Board”) of The Value Line Fund, Inc. (“Value Line Fund”), Value Line Income and Growth Fund, Inc. (“Income & Growth Fund”), Value Line Larger Companies Fund, Inc. (“Larger Companies Fund”), Value Line Premier Growth Fund, Inc. (“Premier Growth Fund”), and Value Line Core Bond Fund (“Core Bond Fund”) (each, a “Fund” and collectively, the “Funds”), including a majority of each Board’s Directors or Trustees who are not “interested persons,” as that term is defined in the 1940 Act (the “Independent Directors”), to annually consider the continuance of each Fund’s investment advisory agreement (each, an “Agreement”) with its investment adviser, EULAV Asset Management.
In considering whether the continuance of a Fund’s Agreement was in the best interests of such Fund and its shareholders, the Board requested and the Adviser provided such information as the Board deemed to be reasonably necessary to evaluate the terms of such Agreement. At meetings held throughout the year, including the meeting specifically focused upon the review of each Agreement, the Independent Directors met in executive sessions separately from the non-Independent Director of the Funds and any officers of the Adviser. In selecting the Adviser and approving the continuance of each Agreement, the Independent Directors relied upon the assistance of counsel to the Independent Directors.
Both in the meeting specifically focused upon the review of the Agreements and at other meetings, the Board, including the Independent Directors, received materials relating to the Adviser’s investment and management services under the Agreements. These materials included information for each Fund regarding: (i) the investment performance of the Fund, including comparisons to a peer group of funds representing its Performance Universe (as described below), and its benchmark index, both as classified and prepared by Lipper Inc., an independent evaluation service (“Lipper”); (ii) the investment process, portfolio holdings, investment restrictions, valuation procedures, and financial statements for the Fund; (iii) purchases and redemptions of the Fund’s shares; (iv) the general investment outlook in the markets in which the Fund invests; (v) arrangements with respect to the distribution of the Fund’s shares; (vi) the allocation and cost of the Fund’s brokerage (none of which was effected through any affiliate of the Adviser, including EULAV Securities LLC (the “Distributor”)); and (vii) the overall nature, quality and extent of services provided by the Adviser.
As part of their review, the Board requested, and the Adviser provided, additional information in order to evaluate the quality of the Adviser’s services and the reasonableness of its fees under each Agreement. In a separate executive session, the Independent Directors reviewed information for each Fund, which included data comparing: (i) the Fund’s management fee, transfer agent, sub-transfer agent (if applicable) and custodian fees, Rule 12b-1 fee, and other non-management expenses, to those incurred by a peer group of funds representing its Expense Group (as described below), and a peer group of funds representing its Expense Universe (as described below); (ii) the Fund’s expense ratio to those of its Expense Group and Expense Universe; and (iii) the Fund’s investment performance over various time periods to the average performance of the Performance Universe as well as the appropriate Lipper index, as selected objectively by Lipper (the “Lipper Index”).
In their executive session, the Independent Directors also reviewed information regarding: (a) the financial results and condition of the Adviser and the Distributor and their profitability from the services that have been performed for each Fund and the Value Line family of funds; (b) the Adviser’s investment management staffing and resources; (c) the ownership, control and day-to-day management of the Adviser; and (d) each Fund’s potential for achieving economies of scale. In support of its review of the statistical information, the Board was provided with a description of the methodology used by Lipper to determine the Expense Group, the Expense Universe and the Performance Universe to prepare its information.
The Board observed that there is a range of investment options available to shareholders of the Funds, including other mutual funds, and that each Fund’s shareholders have chosen to invest in their Fund.
Performance Universes, Expense Groups and Expense Universes.
Value Line Fund. The Performance Universe for Value Line Fund consists of the Fund and all retail and institutional multi-cap growth funds, regardless of asset size or primary channel of distribution. The Expense Group for Value Line Fund consists of the Fund, 16 other retail no-load multi-cap growth funds, and one retail no-load large-cap growth fund, as selected objectively by Lipper. The Expense Universe for the Fund consists of its Expense Group and all other retail no-load multi-cap growth funds and large-cap growth funds (excluding outliers), as selected objectively by Lipper.
Core Bond Fund. The Performance Universe for Core Bond Fund consists of the Fund and all retail and institutional core bond funds, regardless of asset size or primary channel of distribution. The Expense Group for Core Bond Fund consists of the Fund and 10 other retail no-load core bond funds, as selected objectively by Lipper. The Expense Universe for the Fund consists of its Expense Group and all other retail no-load core bond funds (excluding outliers), as selected objectively by Lipper.
Income & Growth Fund. The Performance Universe for Income & Growth Fund consists of the Fund and all retail and institutional mixed-asset target allocation moderate funds, regardless of asset size or primary channel of distribution. The Expense Group for Income & Growth Fund consists of the Fund, three other retail no-load mixed-asset target allocation moderate funds, and 11 retail no-load mixed-asset target allocation growth funds, as selected objectively by Lipper. The Expense Universe for the Fund consists of its Expense Group and all other retail no-load mixed-asset target allocation moderate funds and retail no-load mixed-asset target allocation growth funds (excluding outliers), as selected objectively by Lipper.
Larger Companies Fund. The Performance Universe for Larger Companies Fund consists of the Fund and all retail and institutional large-cap growth funds, regardless of asset size or primary channel of distribution. The Expense Group for Larger Companies Fund consists of the Fund and 12 other retail no-load large-cap growth funds, as selected objectively by Lipper. The Expense Universe for the Fund consists of its Expense Group and all other retail no-load large-cap growth funds (excluding outliers), as selected objectively by Lipper.
Premier Growth Fund. The Performance Universe for Premier Growth Fund consists of the Fund and all retail and institutional multi-cap growth funds, regardless of asset size or primary channel of distribution. The Expense Group for Premier Growth Fund consists of the Fund, 11 other retail no-load multi-cap growth funds, and one retail no-load mid-cap growth fund, as selected objectively by Lipper. The Expense Universe for the Fund consists of its Expense Group and all other retail no-load multi-cap growth funds and mid-cap growth funds (excluding outliers), as selected objectively by Lipper.
The following summarizes matters considered by the Board in connection with its continuance of each of the Agreements. However, the Board did not identify any single factor as all-important or controlling, each Director may have weighed certain factors differently, and the summary does not detail all the matters that were considered.
Investment Performance. The Board reviewed each Fund’s overall investment performance and compared it to its Performance Universe and the Lipper Index as described below for each Fund.
Value Line Fund. The Board noted that the Fund outperformed the Performance Universe average and the Lipper Index for the three-year period ended March 31, 2014. The Board also noted that the Fund’s performance for the one-year, five-year and ten-year periods ended March 31, 2014 was below the performance of the Performance Universe average and the Lipper Index.
Core Bond Fund. The Board reviewed the Fund’s overall investment performance for various periods of time and compared it to the Performance Universe average and the Lipper Index since the change in the Fund’s investment approach from a high yield fund to a core bond fund on December 3, 2012, which the Board determined was the most relevant time period for these purposes. The Board noted that the Fund underperformed the Performance Universe average and the Lipper Index for the one-year period ended March 31, 2014. The Board also noted that the Fund outperformed the Performance Universe average but not the Lipper Index for the period December 3, 2013 to ended March 31, 2014.
Income & Growth Fund. The Board noted that the Fund outperformed the Performance Universe average and the Lipper Index for the one-year, three-year and ten-year periods ended March 31, 2014. The Board also noted that the Fund’s performance for the five-year period ended March 31, 2014 was slightly below the performance of the Performance Universe average and below the performance of the Lipper Index.
Larger Companies Fund. The Board noted that the Fund outperformed the Performance Group average for the one-year, three-year and ten-year periods and underperformed the Performance Group average for the five-year period ended March 31, 2014. The Board also noted that, similar to the average performance by the Performance Group, the Fund underperformed the Lipper Index for the one-year, three-year, five-year and ten-year periods ended March 31, 2014.
Premier Growth Fund. The Board noted that the Fund underperformed the Performance Universe average and the Lipper Index for the one-year period ended March 31, 2014. The Board also noted that the Fund outperformed the Performance Universe average and slightly underperformed the Lipper Index for the three-year period ended March 31, 2014, and that the Fund outperformed both the Performance Universe average and the Lipper Index for the five-year and ten-year periods ended March 31, 2014.
The Adviser’s Personnel and Methods. The Board reviewed the background of the portfolio managers responsible for the daily management of each Fund’s portfolio, seeking to achieve the applicable Fund’s investment objectives and adhering to such Fund’s investment strategies. The Independent Directors also engaged in discussions with the Adviser’s senior management responsible for the overall functioning of each Fund’s investment operations. The Board viewed favorably: (i) the Adviser’s use of analytic tools in support of the portfolio management, compliance and shareholder relation functions which the Adviser previously committed resources to acquire; (ii) the low turnover of the Adviser’s staff attributable in part to its actions taken to attract and retain personnel, including its ongoing improvements to employee benefit programs and previous increases in base compensation and merit-based compensation for certain staff members to be more industry competitive; and (iii) that the Adviser continues to receive the Value Line ranking systems without cost. The Board concluded that each Fund’s management team and the Adviser’s overall resources were adequate and that the Adviser had investment management capabilities and personnel essential to performing its duties under the Agreement.
Management Fee. The Board considered the Adviser’s management fee rate under each Fund’s Agreement relative to the management fee rate applicable to the funds in such Fund’s Expense Group and Expense Universe, both before and after applicable fee waivers, as described below for each Fund. The Board noted that the Adviser bears the costs of providing fund accounting services for each of the Funds as part of the management fee. The Board was informed that, unlike the management fee rates for the Funds, the management fee rates for funds in the Expense Groups and Expense Universes most likely did not cover the costs of administrative and fund accounting services being provided to funds in the Expense Groups and Expense Universes. Accordingly, each Fund’s management fee rate would compare more favorably to such other management fee rates if the costs of administrative and fund accounting services were so included. After a review of the information provided to the Board, the Board concluded that each of the Fund’s management fee rates was satisfactory for the purpose of approving continuance of each Fund’s Agreement.
Value Line Fund. Before giving effect to fee waivers applicable to certain funds in the Expense Group, the Board noted that, for the most recent fiscal year for which audited financial data is available, the Fund’s management fee rate was lower than that of the Expense Group median. After giving effect to fee waivers applicable to certain funds, the Board also noted that, for the most recent fiscal year for which audited financial data is available, the Fund’s management fee rate was lower than that of the Expense Group median and higher than that of the Expense Universe median.
Core Bond Fund. Before giving effect to the Fund’s existing fee waiver of 0.10% of the Fund’s average daily net assets and fee waivers applicable to certain funds in the Expense Group, the Board noted that, for the most recent fiscal year for which audited financial data is available, the Fund’s management fee rate was slightly lower than that of the Expense Group median. After giving effect to applicable fee waivers, the Board also noted that, for the most recent fiscal year for which audited financial data is available, the Fund’s management fee rate was the same as that of the Expense Group median and higher than that of the Expense Universe median. The Adviser and the Board agreed to further reduce the Fund’s management fee rate by increasing the amount of the waiver of the Fund’s management fee (effective July 1, 2014) and extend the period of the contractual fee waiver for another one-year period ending June 30, 2015. This new waiver is in an amount equal to 0.20% of the Fund’s average daily net assets and effectively reduces the Fund’s management fee rate from 0.50% to 0.30% of the Fund’s average daily net assets. Such waiver cannot be changed during the contractual waiver period without the approval of the Board and the Adviser. The Board noted that, as a result of this new waiver, the management fee rate paid by the Fund will be lower than that of both the Expense Group and Expense Universe medians.
Income & Growth Fund. Before giving effect to fee waivers applicable to certain funds in the Expense Group, the Board noted that, for the most recent fiscal year for which audited financial data is available, the Fund’s management fee rate was lower than that of the Expense Group median. After giving effect to fee waivers applicable to certain funds, the Board also noted that, for the most recent fiscal year for which audited financial data is available, the Fund’s management fee rate was lower than that of the Expense Group median and slightly higher than that of the Expense Universe median.
Larger Companies Fund. Before giving effect to fee waivers applicable to certain funds in the Expense Group, the Board noted that, for the most recent fiscal year for which audited financial data is available, the Fund’s management fee rate was slightly lower than that of the Expense Group median. After giving effect to fee waivers applicable to certain funds, the Board also noted that, for the most recent fiscal year for which audited financial data is available, the Fund’s management fee rate was approximately the same as that of the Expense Group median and higher than that of the Expense Universe median.
Premier Growth Fund. Before giving effect to fee waivers applicable to certain funds in the Expense Group, the Board noted that, for the most recent fiscal year for which audited financial data is available, the Fund’s management fee rate was lower than that of the Expense Group median. After giving effect to fee waivers applicable to certain funds, the Board also noted that, for the most recent fiscal year for which audited financial data is available, the Fund’s management fee rate was approximately the same as that of the Expense Group median and higher than that of the Expense Universe median.
Expenses. The Board also considered each Fund’s total expense ratio relative to its Expense Group and Expense Universe averages as described below for each Fund. After a review of the information provided to the Board, the Board concluded that each Fund’s average expense ratio was satisfactory for the purpose of approving continuance of the Fund’s Agreement.
Value Line Fund. The Board noted that, for the most recent fiscal year for which audited financial data is available, the Fund’s expense ratio was lower than that of the Expense Group median and higher than that of the Expense Universe median, after giving effect to fee waivers applicable to the Fund and certain funds in the Expense Group and Universe.
Core Bond Fund. The Board noted that, for the most recent fiscal year for which audited financial data is available, the Fund’s expense ratio was higher than that of the Expense Group median and the Expense Universe median, after giving effect to fee waivers applicable to the Fund and certain funds in the Expense Group and Universe. In addition to the management fee waiver described above, the Distributor and the Board agreed to further reduce the Fund’s Rule 12b-1 fee rate (effective July 1, 2014) and extend the period of the contractual waiver for another one-year period ending June 30, 2015. This new waiver effectively reduces the Fund’s Rule 12b-1 fee rate from 0.25% to 0.10% of the Fund’s average daily net assets. Such waiver cannot be changed during the contractual waiver period without the approval of the Board and the Distributor. The Board noted that, as a result of this new waiver and the new management fee waiver described above, the Fund’s expense ratio will be lowered by 0.35% of the Fund’s average daily net assets during the waiver period.
Income & Growth Fund. The Board noted that, for the most recent fiscal year for which audited financial data is available, the Fund’s expense ratio was higher than that of the Expense Group median and the Expense Universe median, after giving effect to fee waivers applicable to the Fund and certain funds in the Expense Group and Expense Universe. The Board also noted the Fund’s expense ratio will be higher by 0.05% of the Fund’s average daily net assets as a result of the expiration of the existing contractual waiver of a portion of the Fund’s 12b-1 fee effective July 1, 2014.
Larger Companies Fund. The Board noted that, for the most recent fiscal year for which audited financial data is available, the Fund’s expense ratio was lower than that of the Expense Group median and higher than that of the Expense Universe median, after giving effect to fee waivers applicable to the Fund and certain funds in the Expense Group and Universe. The Distributor and the Board agreed that the existing contractual waiver of a portion of the Fund’s Rule 12b-1 fee will continue in effect for another one-year period ending June 30, 2015. This waiver effectively reduces the Fund’s Rule 12b-1 fee rate from 0.25% to 0.15% of the Fund’s average daily net assets. Such waiver cannot be changed during the contractual waiver period without the approval of the Board and the Distributor.
Premier Growth Fund. The Board noted that, for the most recent fiscal year for which audited financial data is available, the Fund’s expense ratio was slightly lower than that of the Expense Group median and higher than that of the Expense Universe median, after giving effect to fee waivers applicable to the Fund and certain funds in the Expense Group and Universe.
Nature, Extent and Quality of Services. The Board considered the nature, extent and quality of other services provided by the Adviser and the Distributor. At meetings held throughout the year, the Board reviewed the resources and effectiveness of the Adviser’s overall compliance program, as well as the services provided by the Distributor. The Board viewed favorably the steps taken by the Adviser to enhance the portfolio management process, including improvements to how the Funds’ cash balances are invested and the Adviser’s hiring of a fixed income analyst, the additional resources devoted by the Adviser to enhance its and the Funds’ overall compliance program as well as steps being undertaken to enhance the shareholders’ experience with each of the Funds, such as a more robust website. The Board reviewed the services provided by the Adviser and the Distributor in supervising each of the Fund’s third-party service providers. With respect to the Value Line Fund, Income & Growth Fund, Larger Companies Fund and Premier Growth Fund only, the Board also reviewed the services of the Distributor in engaging financial intermediaries to provide sub-transfer agency and related services to shareholders who hold their shares of a Fund in omnibus accounts. The Board noted that the Distributor and the Adviser retained no portion of a Fund’s sub-transfer agency fees as compensation for these services, but the Board considered that the Fund’s payment of such fees to financial intermediaries might reduce amounts that the Distributor or the Adviser would otherwise pay out of their own resources to the financial intermediaries. Based on this review, the Board concluded that the nature, quality, cost, and extent of such other services provided by the Adviser and the Distributor were satisfactory, reliable and beneficial to each Fund’s shareholders.
Profitability. The Board considered the level of profitability of the Adviser and the Distributor with respect to each Fund individually and in the aggregate for all the funds within the Value Line group of funds, including the impact of the restructuring of the Adviser and Distributor in 2010 and certain actions taken during prior years. These actions included the reduction (voluntary in some instances, contractual or permanent in other instances) of management and/or Rule 12b-1 fees for certain funds, the Adviser’s termination of the use of soft dollar research, and the cessation of trading through the Distributor. The Board also considered the Adviser’s continued attention to the rationalization and differentiation of funds within the Value Line group of funds to better identify opportunities for savings and efficiencies among the funds. The Board concluded that the profitability of the Adviser and the Distributor with respect to each Fund, including the financial results derived from each Fund’s Agreement, was within a range the Board considered reasonable.
Other Benefits. The Board also considered the character and amount of other direct and incidental benefits received by the Adviser and the Distributor from their association with each Fund. The Board concluded that potential “fall-out” benefits that the Adviser and the Distributor may receive, such as greater name recognition, appear to be reasonable, and may in some cases benefit the Funds.
Economies of Scale.
Value Line Fund. The Board noted the Agreement includes a breakpoint applicable to the Adviser’s fee under which the first $100 million of the Fund’s average daily net assets are subject to a fee at the rate of 0.70% and any additional assets are subject to a fee at the rate of 0.65%. The Board considered that, given the current and anticipated size of the Fund, any perceived and potential economies of scale were not yet a significant consideration for the Fund and that the addition of more break points to the fee structure was not currently necessary.
Income & Growth Fund. The Board noted the Agreement includes a breakpoint applicable to the Adviser’s fee under which the first $100 million of the Fund’s average daily net assets are subject to a fee at the rate of 0.70% and any additional assets are subject to a fee of 0.65%. The Board considered that, given the current and anticipated size of the Fund, any perceived and potential economies of scale were not yet a significant consideration for the Fund and that the addition of more break points to the fee structure was not currently necessary.
Larger Companies Fund; Premier Growth Fund; Core Bond Fund. The Board considered that, given the current and anticipated size of each Fund, any perceived and potential economies of scale were not yet a significant consideration for any of these Funds and that the addition of break points to the fee structures was not currently necessary.
Fees and Services Provided for Other Comparable Funds/Accounts Managed by the Adviser. The Board was informed by the Adviser that the Adviser does not currently manage any non-mutual fund account that has similar objectives and policies as those of the Funds.
Conclusion. The Board examined the totality of the information it was provided at the meeting specifically addressing approval of the Agreements and at other meetings held during the past year and did not identify any single controlling factor. Based on its evaluation of all material factors deemed relevant and with the advice of independent counsel, the Board concluded that the rate at which each Fund pays a management fee to the Adviser under its Agreement does not constitute a fee that is so disproportionately large as to bear no reasonable relationship to the services rendered and that could not have been the product of arm’s-length bargaining. Further, the Board concluded that each Fund’s Agreement, and the management fee rate thereunder, is fair and reasonable and voted to continue each Agreement as in the best interest of that Fund and its shareholders.
The Value Line Family of Funds
In 1950, Value Line started its first mutual fund. Since then, knowledgeable investors have been relying on the Value Line Funds to help them build their financial futures. Over the years, Value Line Funds has evolved into what we are today – a diversified family of no-load mutual funds with a wide range of investment objectives – ranging from small, mid and large capitalization equities to fixed income. We also provide strategies that effectively combine both equities and fixed income, diligently taking into account the potential risk and reward of each investment.
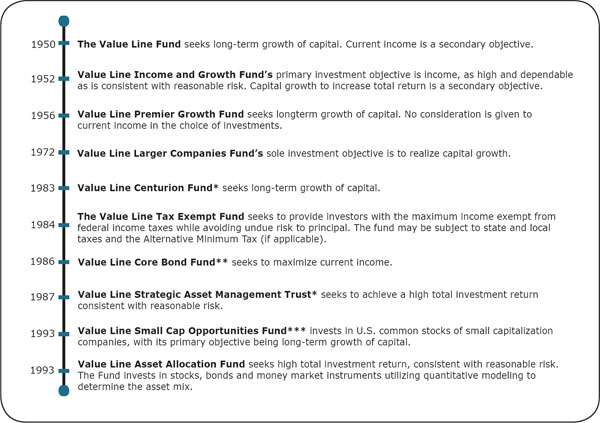
| * | | Only available through the purchase of Guardian Investor, a tax deferred variable annuity, or ValuePlus, a variable life insurance policy. |
| ** | | Formerly known as the Value Line Aggressive Income Trust. |
| *** | | Formerly known as the Value Line Emerging Opportunities Fund, Inc. |
| | | |
| | | For more complete information about any of the Value Line Funds, including charges and expenses, send for a prospectus from EULAV Securities LLC, 7 Times Square, New York, New York 10036-6524 or call 1-800-243-2729, 9am–5pm CST, Monday–Friday, or visit us at www.vlfunds.com. Read the prospectus carefully before you invest or send money. |