UNITED STATES
SECURITIES AND EXCHANGE COMMISSION
Washington, D.C. 20549
SECURITIES AND EXCHANGE COMMISSION
Washington, D.C. 20549
FORM N-CSR
CERTIFIED SHAREHOLDER REPORT OF REGISTERED
MANAGEMENT INVESTMENT COMPANIES
Investment Company Act file number 811-07959
Advisors Series Trust
(Exact name of registrant as specified in charter)
(Exact name of registrant as specified in charter)
615 East Michigan Street
Milwaukee, WI 53202
(Address of principal executive offices) (Zip code)
(Address of principal executive offices) (Zip code)
Jeffrey T. Rauman, President/Chief Executive Officer
Advisors Series Trust
c/o U.S. Bancorp Fund Services, LLC
777 East Wisconsin Avenue, 5th Floor
Milwaukee, WI 53202
(Name and address of agent for service)
(Name and address of agent for service)
(626) 914-7363
(Registrant's telephone number, including area code)
Date of fiscal year end: April 30, 2024
Date of reporting period: October 31, 2023
Item 1. Reports to Stockholders.
| (a) |
Reverb ETF
(RVRB)
Listed on Cboe BZX Exchange, Inc.
SEMI-ANNUAL REPORT
October 31, 2023
Reverb ETF
TABLE OF CONTENTS
| Letter to Shareholders | 1 |
| Sector Allocation of Portfolio Assets | 7 |
| Expense Example | 8 |
| Schedules of Investments | 10 |
| Statements of Assets and Liabilities | 33 |
| Statements of Operations | 34 |
| Statements of Changes in Net Assets | 35 |
| Financial Highlights | 36 |
| Notes to Financial Statements | 37 |
| Notice to Shareholders | 49 |
| Householding | 50 |
| Statement Regarding Liquidity Risk Management Program | 51 |
| Privacy Notice | 52 |
Reverb (RVRB) Shareholder Letter No. 2
Ratings, Returns, and Incentive Reinforcements
Fund Advisor: Distribution Cognizant, LLC*
12/1/23
Dear Shareholders,
The Reverb Exchange Traded Fund (ticker: RVRB) eclipsed a year of trading on November 4, 2023. During that time, our team built and refined an effective quantitative trading platform and operational program, developed our marketing message and the AI tools that amplify our mission, and raised funds from a small but intrepid circle of investors who share a common belief in the potential of thoughtful market mechanisms to improve overall wellbeing. Most remarkable of all, we received valuable ratings from almost 20,000 users of our free Reverberate1 app, characterizing the impacts that major corporations have had on their lives.
Why is the submission of these ratings remarkable? To the best of our knowledge, we provide a unique incentive for truthful reporting from Reverberate’s users: share your voice knowing your ratings will be put to work determining capital allocations in accordance with the average interests revealed by these ratings. From a common sense, Golden Rule-motivated standpoint, this is a fair and logical approach, and barring any fraudulent or conspiratorial strategies it is intuitive that reporting your own interests truthfully is in your own interest.
Our core belief is that markets have the potential, and, over the long run, a general tendency to improve the wellbeing of society. By investing on information related to average wellbeing, Reverb picks up the sentiment not only of customers of particular corporations but also of general citizens and stakeholders who may be future customers or catalysts of regulatory shifts. And by soliciting truthful reporting straight from this population, Reverb may gain an investment edge over time. As of October 31, 2023, RVRB had returned 14.20% at market price and 14.19% at Net Asset Value since inception, assuming dividend reinvestment, while our benchmark2 had returned 14.63% over that same period.3 Over the last six months ending October 31, 2023, RVRB returned 1.42% at market prices (1.41% at NAV) while our benchmark returned 1.39%. This is in spite of approximately 15 basis points in fees dragging on RVRB performance over that window of time. Our recent relative outperformance is detailed below, but it is worth noting that we have had both more app use and subsequently more “active share”4 over the last six months than we did over our first six months of existence.
_____________
| * | Please address comments or questions to rvrb@disco.llc; visit reverb-etf.com for full prospectus. |
1 | Free, easy to use and anonymous: www.rev.vote |
2 | The S&P500 Index, which tracks the performance of 500 of the largest publicly traded companies listed on U.S. stock exchanges. Investors cannot invest in this index itself, only in portfolios tracking this index with some degree of inaccuracy due to things like transaction costs. |
3 | Performance data shown represents past performance and is no guarantee of, and not necessarily indicative of future results. Total return and value will vary and you may have a gain or loss when shares are sold. Current performance may be lower or higher than quoted. For most recent month-end performance visit reverb-etf.com. |
4 | Active share is a reference to the deviation of the holdings of a fund from those of the benchmark index. |
1
This letter is slightly shorter than our first shareholder letter, where we elaborated on the economic logic behind Reverb. Below you will find a brief summary of our trades throughout the past year, an introduction to an exciting new application of AI that we are using to provide a richer voice to Reverberate users, and a short sign-off.
Attribution by the Numbers
Reverb has strict position limits in place to avoid significant active risk. Our preference is to be a product with measured outperformance and “active” bets taken in accordance with the strength of our signal (which is to say, the size of our app user base). As such, we only increased our overall “active share” above 3% for the first time this past month. As it turns out, this has been our best month in both absolute and benchmark-relative terms.
Our total turnover for the trading year has been around 7%. This is a relatively low number, and we are happy about that…needlessly trading back and forth is a surefire way to bleed fund money to commissions and the bid/ask spread. However, we also want our signal to be responsive to any news that we have received via Reverberate prior to its dissemination through other channels to the rest of the market. And in fact, we have traded both in and out of several names during the year.
While we hold a diversified portfolio and stand ready to take active over-or under-weights in many names should Reverberate users begin to rate them frequently, the Reverb ETF’s significant, signal-driven active positions have been concentrated in a relatively small set of very large market capitalization companies.
We have broken the most significant of these trades – Amazon, Apple, Coca-Cola, McDonald’s, Microsoft, and Walmart – into two ad hoc categories and plotted with solid lines the percent changes in our positions (driven by proportionate changes in our ratings-based signal) alongside the percentage price movements (dashed lines). When the Reverb ETF is working well with Reverberate data, the direction (slope) of the solid lines should predict the slope of the dashed lines (aka a move up in a trade slope/solid line should be followed by a move up in the price action slope/dashed line immediately to the right).

Figure 1: Active Position and Standardized Price, Consumer Tech
2
For example, looking at Figure 1, it is apparent that we traded Apple relatively well throughout the year. Initial overweights were followed by an extended price increase, while a subsequent underweight around August preceded an eventual price decrease. However, our final trades in Apple were ill-positioned for subsequent price action. Figure 1 also shows that our success with Microsoft was mixed, but that we traded Amazon fairly effectively until Q4.
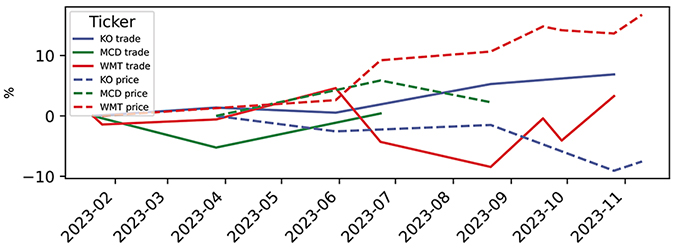
Figure 2: Active Position and Standardized Price, Legacy Retail
Figure 2 shows that we traded Walmart poorly at times and well at others; an initial underweight was followed by a price increase, while subsequent overweights were followed by substantial price increases. We then took a series of misguided underweights before returning to an overweight and enjoying a significant November pop. Coca-Cola also was a mixed success. Our bets on McDonald’s did not pay off.
Elsewhere, we were well positioned for Meta’s large bounce, timed Tesla well more often than not, and took what turned out to be fairly inconsequential positions in Berkshire Hathaway, Netflix and Visa. As we are fundamentally market-cap skewed, our success with Apple has had the largest impact on our portfolio.5
Attribution in Color
By design, Reverb takes its positions only on the basis of changes in a blend of average and median ratings that we use to measure overall preferences of our users, to avoid biasing against any particular reasons users might have for giving their ratings.6 We do not want to, and do not think we should, be in the business of deciding what is a “good” or “bad” basis for a person’s preferences; we proudly treat people’s opinions equally.
So, our approach to portfolio positioning is intentionally “dry.” But we also think Reverberate users have important specifics to provide, and many of them
_____________
5 | As of 12/1/2023, Reverb net assets include 6.92% Microsoft, 6.36% Apple, 3.78% Amazon, 1.97% Meta, 1.6% Berkshire, 1.58% Tesla, 1.32% Visa, 0.86% Walmart, 0.61% Coca-Cola, and 0.43% McDonald’s. Please visit reverb-etf.com for a complete list of our latest holdings. |
6 | Average ratings are more skewed towards extreme ratings, while median ratings more precisely captures the interests of the largest possible block of Reverberate users, which is why we like to combine the two figures. |
3
are generous enough with their time to leave comments alongside their ratings. While we will not use the comments to impact our capital allocations, we have wanted to find some other way to deploy them for the benefit of society (hopefully reinforcing positive incentives for users to engage with Reverberate in the process), and this problem has arrived at what might be a perfect time in human history – the advent of highly sophisticated language models, commonly described as “AI.”7
These language models/AI are not all-knowing, and cannot be deemed free of bias just because they are not human; we must treat them with care. But they are, unequivocally, excellent at some tasks that are extremely burdensome for humans…like reading thousands and thousands of comments and summarizing them with accuracy. And that is precisely what we are doing.
Our starting point is the so-called Falcon-7b8 model, an industry-leading AI that has been shown to have less hidden bias than competitors. We have taken a version of this AI that has been further trained on a particular dataset developed to increase accuracy with respect to tricky linguistic problems, and cloned our own copy. This AI, which we maintain and control on our own servers (not subject to the whims of any third party), has been further trained on our comment dataset and can now answer questions like “What are the general sentiments associated with Company Z that seem likely to have caused an [increase/decrease] in its ratings on Reverberate recently?”
The answers are fascinating. A visual inspection shows that not all of the comments we receive are interesting or even pertinent. But our AI (yet to be named – we are open to suggestions!) does a remarkable job of extracting themes, some of which seem predictable or obvious (“prices are going up too fast”) but some of which seem truly surprising coming from what is, essentially, an AI modeled after the consciousness of our users (as it applies to their perceptions of corporations, anyways) – sentiment bemoaning anti-competitive behavior or planned obsolescence, for example, or a degree of frustration with shoplifting that might run contrary to media narratives.
We do not intend to monetize this product except through whatever marketing benefits RVRB may receive in the process of sharing the insights it generates (including, potentially, research we may conduct with academic coauthors). But we are truly excited about developing a “voice” that may be able to reflect, in a relatively unbiased way, the interests of society. And we are hopeful that it may provide valuable guidance for management seeking to better serve both their customers and their greater community.
A Final Word About Incentives
We never stop thinking (and rarely stop talking) about incentive alignment at Distribution Cognizant.9 We think our product represents a social and economic
_____________
7 | Former colleagues and I applied an earlier generation of these models to scraping SEC filings for alpha; suffice to say these models are shockingly more sophisticated just several years later. |
8 | As in “7 billion parameters,” a de facto measure of the AI’s”brain size” (and it’s computational costs). |
9 | See our Shareholder Letter No. 1. |
4
windfall because it puts Reverberate users and Reverb investors on the same page, with potential to bring corporate management into alignment as well by imprinting average interests on the stock price mechanism. We hope you’ll stay tuned for some additional developments we have in the works towards this end.
For our part, we are committed to running our company ethically and transparently, and we think we are highly incentivized to do so: who would place their trust – their information and/or their money – in us without believing that we walk the walk? You can visit www.disco.llc to learn more about our mission and team, and we hope it will be apparent that we see our incentives as aligned with yours. As always, please do not hesitate to reach out to us with questions or comments; we are truly honored by your belief in RVRB and will continue to work diligently on your behalf.
Thanks and Kind Regards,

Patrick Neal, CFA, PhD
Chief Investment Officer, Reverb
Managing Partner, Distribution Cognizant
Fund Performance and Expense Ratio
As of October 31, 2023, the Reverb ETF has cumulatively gained 14.20% net of fees at market prices and 14.19% at NAV since inception (11/4/2022), compared to 14.63% over the same period for our benchmark S&P 500 index. These figures include hypothetical dividend reinvestment. Performance data represents past performance and is no guarantee of, and not necessarily indicative of future results. Total return and value will vary and you may have a gain or loss when shares are sold. Current performance may be lower or higher than quoted.
The Reverb ETF charges a total annual expense ratio of 0.30% of fund assets, deducted incrementally from fund assets over the course of the year.
Important Information
The Fund’s investment objectives, risks, charges, and expenses must be considered carefully before investing. The prospectus contains this and other important information about the investment company and can found at reverb-etf.com. Please read carefully before investing.
Investing involves risk including possible loss of principal. The investment strategies, practices and risk analysis used by the Adviser may not produce the desired results. Other risks exist, including New Adviser Risk, Management Risk, Consumer Sentiment Risk, Research Risk, General Market Risk, Equity Securities Risk, High Portfolio Turnover Risk, general ETF Risks, New Fund Risk, and Sector Emphasis Risk, among others. Please see the detailed prospectus here for more details.
The Reverberate App is a new web-based utility and currently has limited users. The ability of the App to properly and accurately gauge public sentiment is highly dependent on its ability to attain a high level of regular usage among a broad market segment of the population. If the Adviser (Distribution Cognizant, LLC) is unable to take material active positions due to lack of sufficient data or otherwise, the Fund will likely experience performance similar to the broad large capitalization market in general. In that event, the information provided by the App may not properly
5
reflect sentiment regarding a company, leading the Adviser to take active positions in a company that are inconsistent with broad market sentiment. The investment strategy of relying entirely on general public sentiment as expressed on a web-based user app in order to take active positions is novel. The strategy may not work and this may have a significant negative impact on the value of your investment.
The Adviser’s strategy is to base its investment decisions on the expressions of sentiment as identified in the Reverberate App. As a result, the Fund is subject to the risks, which may be substantial, that negative developments effecting a held company, the economy, or markets in general, may not be apparent to the users of the Reverberate App. Information received from the App may be inaccurate, incomplete, misleading, duplicative or outdated, making the information ineffective for accurately gauging current sentiment. There is a possibility that users have an undisclosed agenda and attempt to manipulate a company’s stock price. These potential developments could have a negative impact on the fund’s portfolio.
Shares are bought and sold are market price, not net asset value (NAV). Market returns are based upon the midpoint of the bid/ask spread at 4:00 p.m. Eastern time. NAV represents the value of each share’s portion of the fund’s underlying assets and cash at the end of the trading day. Your returns may differ if you traded shares at other times.
Distributor: Quasar Distributors, LLC.
6
Reverb ETF
SECTOR ALLOCATION OF PORTFOLIO ASSETS – October 31, 2023 (Unaudited)

Percentages represent market value as a percentage of total investments.
7
Reverb ETF
EXPENSE EXAMPLE – October 31, 2023 (Unaudited)
As a shareholder of a fund, you incur two types of costs: (1) transaction costs, including sales charges (loads) on purchase payments; redemption fees; and exchange fees; and (2) ongoing costs, including management fees; distribution and/or service fees; and other fund expenses. This Example is intended to help you understand your ongoing costs (in dollars) of investing in the Fund and to compare these costs with the ongoing costs of investing in other mutual funds. The Example is based on an investment of $1,000 invested at the beginning of the period and held for the entire period (5/1/23 – 10/31/23).
Actual Expenses
The first line of the table below provides information about actual account values and actual expenses. Although the Fund charges no sales load or transaction fees, you will be assessed fees for outgoing wire transfers, returned checks, and stop payment orders at prevailing rates charged by U.S. Bancorp Fund Services, LLC, the Fund’s transfer agent. The example below includes, but is not limited to, management fees, fund accounting, custody and transfer agent fees. You may use the information in this line, together with the amount you invested, to estimate the expenses that you paid over the period. Simply divide your account value by $1,000 (for example, an $8,600 account value divided by $1,000 = 8.6), then multiply the result by the number in the first line under the heading entitled “Expenses Paid During Period” to estimate the expenses you paid on your account during this period.
Hypothetical Example for Comparison Purposes
The second line of the table below provides information about hypothetical account values and hypothetical expenses based on the Fund’s actual expense ratio and an assumed rate of return of 5% per year before expenses, which is not the Fund’s actual return. The hypothetical account values and expenses may not be used to estimate the actual ending account balance or expenses you paid for the period. You may use this information to compare the ongoing costs of investing in the Fund and other funds. To do so, compare this 5% hypothetical example with the 5% hypothetical examples that appear in the shareholder reports of the other funds. Please note that the expenses shown in the table are meant to highlight your ongoing costs only and do not reflect any transactional costs, such as sales charges (loads), redemption fees, or exchange fees. Therefore, the second line of the table is useful in comparing ongoing costs only and will not help you determine the relative total costs of owning different funds. In addition, if these transactional costs were included, your costs would have been higher.
8
Reverb ETF
EXPENSE EXAMPLE – October 31, 2023 (Unaudited), Continued
| Beginning | Ending | Expenses Paid | |
| Account Value | Account Value | During Period | |
5/1/23 | 10/31/23 | 5/1/23 – 10/31/23* | |
| Actual | $1,000.00 | $1,014.10 | $1.52 |
| Hypothetical (5% return | |||
| before expenses) | $1,000.00 | $1,023.63 | $1.53 |
| * | Expenses are equal to the Fund’s annualized expense ratio of 0.30%, multiplied by the average account value over the period, multiplied by 184 (days in most recent fiscal half-year)/366 days to reflect the one-half year expense. |
9
Reverb ETF
SCHEDULE OF INVESTMENTS at October 31, 2023 (Unaudited)
| Shares | COMMON STOCKS - 97.8% | Value | |||||
| Accounting Tax Preparation | |||||||
| Bookkeeping and Payroll Services - 0.1% | |||||||
| 30 | Paychex, Inc. | $ | 3,332 | ||||
| Advertising Public Relations | |||||||
| and Related Services - 0.1% | |||||||
| 15 | Omnicom Group, Inc. | 1,124 | |||||
| 39 | Trade Desk, Inc. - Class A (a) | 2,767 | |||||
| 3,891 | |||||||
| Aerospace Product and | |||||||
| Parts Manufacturing - 1.5% | |||||||
| 48 | Boeing Co. (a) | 8,967 | |||||
| 21 | General Dynamics Corp. | 5,068 | |||||
| 12 | HEICO Corp. | 1,526 | |||||
| 54 | Honeywell International, Inc. | 9,895 | |||||
| 21 | Lockheed Martin Corp. | 9,547 | |||||
| 120 | Raytheon Technologies Corp. | 9,767 | |||||
| 15 | Textron, Inc. | 1,140 | |||||
| 6 | TransDigm Group, Inc. (a) | 4,969 | |||||
| 50,879 | |||||||
| Agencies Brokerages and | |||||||
| Other Insurance Related Activities - 0.6% | |||||||
| 18 | Aon PLC | 5,569 | |||||
| 18 | Arthur J Gallagher & Co. | 4,239 | |||||
| 24 | Brown & Brown, Inc. | 1,666 | |||||
| 39 | Marsh & McLennan Cos., Inc. | 7,396 | |||||
| 9 | Willis Towers Watson PLC | 2,123 | |||||
| 20,993 | |||||||
| Agriculture Construction and | |||||||
| Mining Machinery - 0.5% | |||||||
| 42 | Caterpillar, Inc. | 9,494 | |||||
| 24 | Deere & Co. | 8,769 | |||||
| 18,263 | |||||||
| Alumina and Aluminum | |||||||
| Production and Processing - 0.0% | |||||||
| 33 | Howmet Aerospace, Inc. | 1,455 | |||||
| Animal Slaughtering and Processing - 0.1% | |||||||
| 45 | Hormel Foods Corp. | 1,464 | |||||
The accompanying notes are an integral part of these financial statements.
10
Reverb ETF
SCHEDULE OF INVESTMENTS at October 31, 2023 (Unaudited), Continued
| Shares | COMMON STOCKS - 97.8%, Continued | Value | |||||
| Animal Slaughtering and | |||||||
| Processing - 0.1%, Continued | |||||||
| 30 | Tyson Foods, Inc. - Class A | $ | 1,391 | ||||
| 2,855 | |||||||
| Architectural and Structural | |||||||
| Metals Manufacturing - 0.1% | |||||||
| 21 | Nucor Corp. | 3,104 | |||||
| Architectural Engineering | |||||||
| and Related Services - 0.1% | |||||||
| 9 | Jacobs Solutions, Inc. | 1,199 | |||||
| 3 | Teledyne Technologies, Inc. (a) | 1,124 | |||||
| 2,323 | |||||||
| Automotive Parts Accessories | |||||||
| and Tire Stores - 0.2% | |||||||
| 6 | O’Reilly Automotive, Inc. (a) | 5,583 | |||||
| Basic Chemical Manufacturing - 0.5% | |||||||
| 9 | FMC Corp. | 479 | |||||
| 21 | International Flavors & Fragrances, Inc. | 1,435 | |||||
| 39 | Linde PLC | 14,905 | |||||
| 16,819 | |||||||
| Beverage Manufacturing - 1.7% | |||||||
| 39 | Brown-Forman Corp. - Class B | 2,190 | |||||
| 6 | Celsius Holdings, Inc. (a) | 913 | |||||
| 384 | Coca-Cola Co. | 21,691 | |||||
| 39 | Coca-Cola Europacific Partners PLC | 2,282 | |||||
| 15 | Constellation Brands, Inc. | 3,512 | |||||
| 114 | Keurig Dr Pepper, Inc. | 3,458 | |||||
| 87 | Monster Beverage Corp. (a) | 4,446 | |||||
| 117 | PepsiCo, Inc. | 19,104 | |||||
| 57,596 | |||||||
| Boiler Tank and Shipping | |||||||
| Container Manufacturing - 0.0% | |||||||
| 27 | Ball Corp. | 1,300 | |||||
| Building Equipment Contractors - 0.1% | |||||||
| 12 | Quanta Services, Inc. | 2,005 | |||||
| Building Material and Supplies Dealers - 1.1% | |||||||
| 90 | Home Depot, Inc. | 25,622 | |||||
The accompanying notes are an integral part of these financial statements.
11
Reverb ETF
SCHEDULE OF INVESTMENTS at October 31, 2023 (Unaudited), Continued
| Shares | COMMON STOCKS - 97.8%, Continued | Value | |||||
| Building Material and | |||||||
| Supplies Dealers - 1.1%, Continued | |||||||
| 48 | Lowe’s Cos., Inc. | $ | 9,147 | ||||
| 34,769 | |||||||
| Business Support Services - 3.1% | |||||||
| 18 | Coinbase Global, Inc. (a) | 1,388 | |||||
| 9 | Equifax, Inc. | 1,526 | |||||
| 3 | Fair Isaac Corp. (a) | 2,538 | |||||
| 48 | Fidelity National Information Services, Inc. | 2,357 | |||||
| 6 | FleetCor Technologies, Inc. (a) | 1,351 | |||||
| 18 | Live Nation Entertainment, Inc. (a) | 1,440 | |||||
| 78 | Mastercard, Inc. - Class A | 29,355 | |||||
| 15 | Moody’s Corp. | 4,620 | |||||
| 6 | MSCI, Inc. | 2,829 | |||||
| 387 | NU Holdings Ltd. (a) | 3,174 | |||||
| 93 | PayPal Holdings, Inc. (a) | 4,817 | |||||
| 51 | ROBLOX Corp. (a) | 1,622 | |||||
| 27 | Royalty Pharma PLC | 725 | |||||
| 12 | TransUnion | 527 | |||||
| 186 | Visa, Inc. - Class A | 43,730 | |||||
| 101,999 | |||||||
| Cable and Other Subscription | |||||||
| Programming - 0.6% | |||||||
| 339 | Comcast Corp. | 13,998 | |||||
| 18 | Liberty Media Corp.-Liberty Formula One (a) | 1,164 | |||||
| 42 | Rogers Communications, Inc. | 1,557 | |||||
| 201 | Warner Bros Discovery, Inc. (a) | 1,998 | |||||
| 18,717 | |||||||
| Cement and Concrete | |||||||
| Product Manufacturing - 0.1% | |||||||
| 57 | CRH PLC | 3,053 | |||||
| Chemical and Allied Products | |||||||
| Merchant Wholesalers - 0.1% | |||||||
| 27 | LyondellBasell Industries NV | 2,436 | |||||
| Clothing Stores - 0.6% | |||||||
| 12 | Charter Communications, Inc. - Class A (a) | 4,834 | |||||
| 69 | KKR & Co., Inc. | 3,823 | |||||
| 27 | Ross Stores, Inc. | 3,131 | |||||
The accompanying notes are an integral part of these financial statements.
12
Reverb ETF
SCHEDULE OF INVESTMENTS at October 31, 2023 (Unaudited), Continued
| Shares | COMMON STOCKS - 97.8%, Continued | Value | |||||
| Clothing Stores - 0.6%, Continued | |||||||
| 93 | TJX Cos., Inc. | $ | 8,190 | ||||
| 19,978 | |||||||
| Commercial and Industrial | |||||||
| Machinery and Equipment - 0.1% | |||||||
| 12 | AerCap Holdings NV (a) | 745 | |||||
| 6 | United Rentals, Inc. | 2,438 | |||||
| 3,183 | |||||||
| Commercial and Service Industry | |||||||
| Machinery Manufacturing - 0.2% | |||||||
| 12 | KLA Corp. | 5,636 | |||||
| Communications Equipment | |||||||
| Manufacturing - 6.9% | |||||||
| 1,233 | Apple, Inc. | 210,560 | |||||
| 6 | MongoDB, Inc. (a) | 2,068 | |||||
| 15 | Motorola Solutions, Inc. | 4,177 | |||||
| 90 | QUALCOMM, Inc. | 9,809 | |||||
| 226,614 | |||||||
| Computer and Peripheral | |||||||
| Equipment Manufacturing - 1.4% | |||||||
| 24 | Arista Networks, Inc. (a) | 4,809 | |||||
| 333 | Cisco Systems, Inc. | 17,359 | |||||
| 60 | Dell Technologies, Inc. | 4,015 | |||||
| 63 | Fortinet, Inc. (a) | 3,602 | |||||
| 81 | HP, Inc. | 2,133 | |||||
| 75 | International Business Machines Corp. | 10,848 | |||||
| 18 | NetApp, Inc. | 1,310 | |||||
| 3 | Super Micro Computer, Inc. (a) | 718 | |||||
| 6 | Western Digital Corp. (a) | 241 | |||||
| 45,035 | |||||||
| Computer Systems Design | |||||||
| and Related Services - 5.5% | |||||||
| 1,128 | Alphabet, Inc. - Class A (a) | 139,962 | |||||
| 12 | CDW Corp. | 2,405 | |||||
| 18 | CGI, Inc. (a) | 1,735 | |||||
| 42 | Cognizant Technology Solutions Corp. - Class A | 2,708 | |||||
| 6 | ICON PLC (a) | 1,464 | |||||
The accompanying notes are an integral part of these financial statements.
13
Reverb ETF
SCHEDULE OF INVESTMENTS at October 31, 2023 (Unaudited), Continued
| Shares | COMMON STOCKS - 97.8%, Continued | Value | |||||
| Computer Systems Design | |||||||
| and Related Services - 5.5%, Continued | |||||||
| 177 | Palantir Technologies, Inc. (a) | $ | 2,620 | ||||
| 24 | Palo Alto Networks, Inc. (a) | 5,832 | |||||
| 6 | Paycom Software, Inc. | 1,470 | |||||
| 3 | Seagate Technology Holdings PLC | 205 | |||||
| 18 | ServiceNow, Inc. (a) | 10,473 | |||||
| 132 | Snap, Inc. (a) | 1,321 | |||||
| 27 | Snowflake, Inc. (a) | 3,919 | |||||
| 24 | Unity Software, Inc. (a) | 609 | |||||
| 21 | Workday, Inc. - Class A (a) | 4,446 | |||||
| 12 | Zscaler, Inc. (a) | 1,904 | |||||
| 181,073 | |||||||
| Consumer Goods Rental - 0.4% | |||||||
| 36 | Netflix, Inc. (a) | 14,821 | |||||
| Converted Paper Product Manufacturing - 0.1% | |||||||
| 6 | Avery Dennison Corp. | 1,044 | |||||
| 27 | Kimberly-Clark Corp. | 3,231 | |||||
| 4,275 | |||||||
| Couriers and Express Delivery Services - 0.5% | |||||||
| 21 | FedEx Corp. | 5,042 | |||||
| 69 | United Parcel Service, Inc. - Class B | 9,746 | |||||
| 14,788 | |||||||
| Cut and Sew Apparel Manufacturing - 0.1% | |||||||
| 9 | Lululemon Athletica, Inc. (a) | 3,541 | |||||
| Dairy Product Manufacturing - 0.3% | |||||||
| 102 | Kraft Heinz Co. | 3,209 | |||||
| 111 | Mondelez International, Inc. - Class A | 7,349 | |||||
| 10,558 | |||||||
| Data Processing Hosting and Related Services - 0.8% | |||||||
| 51 | Airbnb, Inc. - Class A (a) | 6,033 | |||||
| 33 | Automatic Data Processing, Inc. | 7,201 | |||||
| 9 | Broadridge Financial Solutions, Inc. | 1,536 | |||||
| 3 | FactSet Research Systems, Inc. | 1,296 | |||||
| 51 | Fiserv, Inc. (a) | 5,801 | |||||
| 12 | Verisk Analytics, Inc. | 2,728 | |||||
| 24,595 | |||||||
The accompanying notes are an integral part of these financial statements.
14
Reverb ETF
SCHEDULE OF INVESTMENTS at October 31, 2023 (Unaudited), Continued
| Shares | COMMON STOCKS - 97.8%, Continued | Value | |||||
| Department Stores - 1.2% | |||||||
| 231 | Walmart, Inc. | $ | 37,748 | ||||
| Depository Credit Intermediation - 3.4% | |||||||
| 585 | Bank of America Corp. | 15,408 | |||||
| 60 | Bank of Montreal | 4,533 | |||||
| 63 | Bank of New York Mellon Corp. | 2,678 | |||||
| 99 | Bank of Nova Scotia | 4,007 | |||||
| 75 | Canadian Imperial Bank of Commerce | 2,645 | |||||
| 30 | Capital One Financial Corp. | 3,039 | |||||
| 156 | Citigroup, Inc. | 6,160 | |||||
| 168 | Deutsche Bank AG | 1,850 | |||||
| 21 | Discover Financial Services | 1,724 | |||||
| 90 | Huntington Bancshares, Inc. | 869 | |||||
| 225 | JPMorgan Chase & Co. | 31,288 | |||||
| 57 | KeyCorp | 583 | |||||
| 15 | M&T Bank Corp. | 1,691 | |||||
| 12 | Northern Trust Corp. | 791 | |||||
| 33 | PNC Financial Services Group, Inc. | 3,778 | |||||
| 57 | Regions Financial Corp. | 828 | |||||
| 24 | State Street Corp. | 1,551 | |||||
| 27 | Synchrony Financial | 757 | |||||
| 150 | Toronto-Dominion Bank | 8,376 | |||||
| 108 | Truist Financial Corp. | 3,063 | |||||
| 126 | US Bancorp | 4,017 | |||||
| 297 | Wells Fargo & Co. | 11,812 | |||||
| 111,448 | |||||||
| Direct Selling Establishments - 0.1% | |||||||
| 33 | DoorDash, Inc. (a) | 2,473 | |||||
| Drinking Places (Alcoholic Beverages) - 0.1% | |||||||
| 9 | Cintas Corp. | 4,564 | |||||
| Drugs and Druggists’ Sundries | |||||||
| Merchant Wholesalers - 0.3% | |||||||
| 15 | AmerisourceBergen Corp. | 2,777 | |||||
| 21 | Cardinal Health, Inc. | 1,911 | |||||
| 12 | McKesson Corp. | 5,464 | |||||
| 10,152 | |||||||
The accompanying notes are an integral part of these financial statements.
15
Reverb ETF
SCHEDULE OF INVESTMENTS at October 31, 2023 (Unaudited), Continued
| Shares | COMMON STOCKS - 97.8%, Continued | Value | |||||
| Electric Power Generation | |||||||
| Transmission and Distribution - 1.8% | |||||||
| 42 | AES Corp. | $ | 626 | ||||
| 21 | Ameren Corp. | 1,590 | |||||
| 42 | American Electric Power Co., Inc. | 3,173 | |||||
| 24 | Avangrid, Inc. | 717 | |||||
| 24 | CMS Energy Corp. | 1,304 | |||||
| 27 | Consolidated Edison, Inc. | 2,370 | |||||
| 27 | Constellation Energy Corp. | 3,049 | |||||
| 18 | DTE Energy Co. | 1,735 | |||||
| 63 | Duke Energy Corp. | 5,600 | |||||
| 30 | Edison International | 1,892 | |||||
| 18 | Entergy Corp. | 1,721 | |||||
| 81 | Exelon Corp. | 3,154 | |||||
| 9 | First Solar, Inc. (a) | 1,282 | |||||
| 48 | FirstEnergy Corp. | 1,709 | |||||
| 165 | NextEra Energy, Inc. | 9,619 | |||||
| 204 | PG&E Corp. (a) | 3,325 | |||||
| 60 | PPL Corp. | 1,474 | |||||
| 42 | Public Service Enterprise Group, Inc. | 2,589 | |||||
| 90 | Southern Co. | 6,057 | |||||
| 27 | WEC Energy Group, Inc. | 2,198 | |||||
| 45 | Xcel Energy, Inc. | 2,667 | |||||
| 57,851 | |||||||
| Electrical Equipment Manufacturing - 0.1% | |||||||
| 9 | Rockwell Automation, Inc. | 2,365 | |||||
| Electronic Shopping and | |||||||
| Mail-Order Houses - 3.9% | |||||||
| 927 | Amazon.com, Inc. (a) | 123,375 | |||||
| 27 | Chewy, Inc. (a) | 522 | |||||
| 147 | Coupang, Inc. (a) | 2,499 | |||||
| 45 | eBay, Inc. | 1,765 | |||||
| 9 | Etsy, Inc. (a) | 561 | |||||
| 128,722 | |||||||
| Engine Turbine and Power | |||||||
| Transmission Equipment - 0.4% | |||||||
| 12 | Cummins, Inc. | 2,596 | |||||
| 90 | General Electric Co. | 9,776 | |||||
| 12,372 | |||||||
The accompanying notes are an integral part of these financial statements.
16
Reverb ETF
SCHEDULE OF INVESTMENTS at October 31, 2023 (Unaudited), Continued
| Shares | COMMON STOCKS - 97.8%, Continued | Value | |||||
| Footwear Manufacturing - 0.4% | |||||||
| 135 | NIKE, Inc. - Class A | $ | 13,874 | ||||
| Freight Transportation Arrangement - 0.2% | |||||||
| 12 | Expeditors International of Washington, Inc. | 1,311 | |||||
| 9 | JB Hunt Transport Services, Inc. | 1,547 | |||||
| 18 | Norfolk Southern Corp. | 3,434 | |||||
| 6,292 | |||||||
| Fruit and Vegetable Preserving | |||||||
| and Specialty Foods - 0.1% | |||||||
| 18 | Campbell Soup Co. | 727 | |||||
| 30 | Conagra Brands, Inc. | 821 | |||||
| 9 | Lamb Weston Holdings, Inc. | 808 | |||||
| 2,356 | |||||||
| General Freight Trucking - 0.1% | |||||||
| 9 | Old Dominion Freight Line, Inc. | 3,390 | |||||
| General Medical and Surgical Hospitals - 0.1% | |||||||
| 21 | HCA Healthcare, Inc. | 4,748 | |||||
| General Merchandise Stores - 0.9% | |||||||
| 39 | Costco Wholesale Corp. | 21,544 | |||||
| 18 | Dollar General Corp. | 2,143 | |||||
| 18 | Dollar Tree, Inc. (a) | 2,000 | |||||
| 39 | Target Corp. | 4,321 | |||||
| 30,008 | |||||||
| Glass and Glass Product Manufacturing - 0.1% | |||||||
| 69 | Corning, Inc. | 1,846 | |||||
| Grain and Oilseed Milling - 0.2% | |||||||
| 45 | Archer-Daniels-Midland Co. | 3,220 | |||||
| 12 | Bunge Ltd. | 1,272 | |||||
| 27 | Kellanova | 1,363 | |||||
| 5,855 | |||||||
| Grocery and Related Product Wholesalers - 0.1% | |||||||
| 42 | Sysco Corp. | 2,793 | |||||
| Grocery Stores - 0.1% | |||||||
| 60 | Kroger Co. | 2,722 | |||||
| Hardware and Plumbing and | |||||||
| Heating Equipment - 0.1% | |||||||
| 18 | Ferguson PLC | 2,704 | |||||
The accompanying notes are an integral part of these financial statements.
17
Reverb ETF
SCHEDULE OF INVESTMENTS at October 31, 2023 (Unaudited), Continued
| Shares | COMMON STOCKS - 97.8%, Continued | Value | |||||
| Health and Personal Care Stores - 0.3% | |||||||
| 105 | CVS Health Corp. | $ | 7,246 | ||||
| 3 | Ulta Beauty, Inc. (a) | 1,144 | |||||
| 72 | Walgreens Boots Alliance, Inc. | 1,518 | |||||
| 9,908 | |||||||
| Household Appliances | |||||||
| Electrical Electronic Goods - 0.2% | |||||||
| 57 | Johnson Controls International PLC | 2,794 | |||||
| 27 | TE Connectivity Ltd. | 3,182 | |||||
| 5,976 | |||||||
| Industrial Machinery Manufacturing - 0.3% | |||||||
| 69 | Applied Materials, Inc. | 9,132 | |||||
| Insurance Carriers - 5.0% | |||||||
| 48 | Aflac, Inc. | 3,749 | |||||
| 21 | Allstate Corp. | 2,691 | |||||
| 57 | American International Group, Inc. | 3,495 | |||||
| 162 | Berkshire Hathaway, Inc. - Class B (a) | 55,295 | |||||
| 45 | Centene Corp. (a) | 3,104 | |||||
| 33 | Chubb Ltd. | 7,082 | |||||
| 24 | Cigna Group | 7,421 | |||||
| 12 | Cincinnati Financial Corp. | 1,196 | |||||
| 18 | Elevance Health, Inc. | 8,102 | |||||
| 3 | Everest Group Ltd. | 1,187 | |||||
| 24 | Hartford Financial Services Group, Inc. | 1,763 | |||||
| 9 | Humana, Inc. | 4,713 | |||||
| 6 | Loews Corp. | 384 | |||||
| 150 | Manulife Financial Corp. | 2,613 | |||||
| 63 | MetLife, Inc. | 3,781 | |||||
| 21 | Principal Financial Group, Inc. | 1,421 | |||||
| 48 | Progressive Corp. | 7,588 | |||||
| 30 | Prudential Financial, Inc. | 2,743 | |||||
| 48 | Sun Life Financial, Inc. | 2,192 | |||||
| 18 | Travelers Cos., Inc. | 3,014 | |||||
| 72 | UnitedHealth Group, Inc. | 38,560 | |||||
| 21 | W R Berkley Corp. | 1,416 | |||||
| 163,510 | |||||||
| Internet Software & Services - 0.1% | |||||||
| 3 | MercadoLibre, Inc. (a) | 3,722 | |||||
The accompanying notes are an integral part of these financial statements.
18
Reverb ETF
SCHEDULE OF INVESTMENTS at October 31, 2023 (Unaudited), Continued
| Shares | COMMON STOCKS - 97.8%, Continued | Value | |||||
| Investigation and Security Services - 0.0% | |||||||
| 27 | Cloudflare, Inc. (a) | $ | 1,531 | ||||
| Iron and Steel Mills and | |||||||
| Ferroalloy Manufacturing - 0.1% | |||||||
| 69 | ArcelorMittal SA | 1,519 | |||||
| Lessors of Nonfinancial Intangible Assets - 0.1% | �� | ||||||
| 27 | Restaurant Brands International, Inc. | 1,815 | |||||
| Machinery Equipment and Supplies | |||||||
| Merchant Wholesalers - 0.1% | |||||||
| 48 | Fastenal Co. | 2,801 | |||||
| 3 | WW Grainger, Inc. | 2,189 | |||||
| 4,990 | |||||||
| Management of Companies | |||||||
| and Enterprises - 0.5% | |||||||
| 27 | Brookfield Infrastructure Partners LP | 611 | |||||
| 108 | Carnival Corp. (a) | 1,238 | |||||
| 30 | Citizens Financial Group, Inc. | 703 | |||||
| 108 | CNH Industrial NV | 1,186 | |||||
| 24 | Icahn Enterprises LP | 396 | |||||
| 75 | Koninklijke Philips NV (a) | 1,422 | |||||
| 78 | Rivian Automotive, Inc. - Class A (a) | 1,265 | |||||
| 114 | Royal Bank of Canada | 9,106 | |||||
| 15,927 | |||||||
| Management Scientific and | |||||||
| Technical Consulting - 0.7% | |||||||
| 51 | Accenture PLC - Class A | 15,152 | |||||
| 12 | Booz Allen Hamilton Holding Corp. | 1,439 | |||||
| 33 | Eaton Corp. PLC | 6,861 | |||||
| 23,452 | |||||||
| Media Streaming Distribution Services, Social | |||||||
| Networks, and Other Media Networks - 0.0% | |||||||
| 315 | Sirius XM Holdings, Inc. | 1,348 | |||||
| Medical and Diagnostic Laboratories - 0.1% | |||||||
| 6 | Fortrea Holdings, Inc. (a) | 170 | |||||
| 6 | Laboratory Corp. of America Holdings | 1,199 | |||||
| 9 | Quest Diagnostics, Inc. | 1,171 | |||||
| 2,540 | |||||||
The accompanying notes are an integral part of these financial statements.
19
Reverb ETF
SCHEDULE OF INVESTMENTS at October 31, 2023 (Unaudited), Continued
| Shares | COMMON STOCKS - 97.8%, Continued | Value | |||||
| Medical Equipment and | |||||||
| Supplies Manufacturing - 2.2% | |||||||
| 45 | 3M Co. | $ | 4,093 | ||||
| 6 | Align Technology, Inc. (a) | 1,108 | |||||
| 42 | Baxter International, Inc. | 1,362 | |||||
| 24 | Becton Dickinson and Co. | 6,067 | |||||
| 120 | Boston Scientific Corp. (a) | 6,143 | |||||
| 3 | Cooper Cos., Inc. | 935 | |||||
| 33 | Dexcom, Inc. (a) | 2,931 | |||||
| 51 | Edwards Lifesciences Corp. (a) | 3,250 | |||||
| 3 | Insulet Corp. (a) | 398 | |||||
| 30 | Intuitive Surgical, Inc. (a) | 7,867 | |||||
| 180 | Johnson & Johnson | 26,700 | |||||
| 12 | ResMed, Inc. | 1,695 | |||||
| 30 | Stryker Corp. | 8,107 | |||||
| 18 | Zimmer Biomet Holdings, Inc. | 1,879 | |||||
| 72,535 | |||||||
| Metal and Mineral (except Petroleum) | |||||||
| Merchant Wholesalers - 0.1% | |||||||
| 6 | Reliance Steel & Aluminum Co. | 1,526 | |||||
| Metal Ore Mining - 0.6% | |||||||
| 42 | Agnico Eagle Mines Ltd. | 1,970 | |||||
| 144 | Barrick Gold Corp. | 2,301 | |||||
| 36 | Cameco Corp. | 1,473 | |||||
| 15 | Franco-Nevada Corp. | 1,823 | |||||
| 117 | Freeport-McMoRan, Inc. | 3,952 | |||||
| 66 | Newmont Corp. | 2,473 | |||||
| 63 | Southern Copper Corp. | 4,467 | |||||
| 36 | Wheaton Precious Metals Corp. | 1,521 | |||||
| 19,980 | |||||||
| Motion Picture and Video Industries - 0.1% | |||||||
| 15 | Take-Two Interactive Software, Inc. (a) | 2,006 | |||||
| Motor Vehicle and Motor Vehicle Parts | |||||||
| and Supplies Merchant Wholesalers - 0.2% | |||||||
| 78 | Copart, Inc. (a) | 3,395 | |||||
| 12 | Genuine Parts Co. | 1,546 | |||||
| 15 | LKQ Corp. | 659 | |||||
| 5,600 | |||||||
The accompanying notes are an integral part of these financial statements.
20
Reverb ETF
SCHEDULE OF INVESTMENTS at October 31, 2023 (Unaudited), Continued
| Shares | COMMON STOCKS - 97.8%, Continued | Value | |||||
| Motor Vehicle Manufacturing - 1.8% | |||||||
| 327 | Ford Motor Co. | $ | 3,188 | ||||
| 114 | General Motors Co. | 3,215 | |||||
| 42 | PACCAR, Inc. | 3,466 | |||||
| 246 | Tesla, Inc. (a) | 49,407 | |||||
| 59,276 | |||||||
| Motor Vehicle Parts Manufacturing - 0.1% | |||||||
| 24 | Aptiv PLC (a) | 2,093 | |||||
| 24 | Magna International, Inc. | 1,154 | |||||
| 3,247 | |||||||
| Natural Gas Distribution - 0.5% | |||||||
| 12 | Atmos Energy Corp. | 1,292 | |||||
| 51 | CenterPoint Energy, Inc. | 1,371 | |||||
| 30 | Eversource Energy | 1,614 | |||||
| 39 | Fortis, Inc. | 1,549 | |||||
| 183 | Kinder Morgan, Inc. | 2,965 | |||||
| 48 | ONEOK, Inc. | 3,129 | |||||
| 51 | Sempra Energy | 3,571 | |||||
| 15,491 | |||||||
| Navigational Measuring Electromedical and | |||||||
| Control Instruments Manufacturing - 2.1% | |||||||
| 24 | Agilent Technologies, Inc. | 2,481 | |||||
| 18 | AMETEK, Inc. | 2,534 | |||||
| 42 | Avantor, Inc. (a) | 732 | |||||
| 60 | Danaher Corp. | 11,521 | |||||
| 30 | Fortive Corp. | 1,958 | |||||
| 36 | GE HealthCare Technologies, Inc. | 2,397 | |||||
| 21 | Hologic, Inc. (a) | 1,390 | |||||
| 6 | IDEXX Laboratories, Inc. (a) | 2,397 | |||||
| 12 | Illumina, Inc. (a) | 1,313 | |||||
| 15 | Keysight Technologies, Inc. (a) | 1,831 | |||||
| 15 | L3Harris Technologies, Inc. | 2,691 | |||||
| 108 | Medtronic PLC | 7,621 | |||||
| 12 | Northrop Grumman Corp. | 5,657 | |||||
| 9 | PerkinElmer, Inc. | 746 | |||||
| 9 | Roper Technologies, Inc. | 4,397 | |||||
| 12 | Teradyne, Inc. | 999 | |||||
| 33 | Thermo Fisher Scientific, Inc. | 14,677 | |||||
The accompanying notes are an integral part of these financial statements.
21
Reverb ETF
SCHEDULE OF INVESTMENTS at October 31, 2023 (Unaudited), Continued
| Shares | COMMON STOCKS - 97.8%, Continued | Value | |||||
| Navigational Measuring Electromedical | |||||||
| and Control Instruments | |||||||
| Manufacturing - 2.1%, Continued | |||||||
| 18 | Trane Technologies PLC | $ | 3,426 | ||||
| 15 | Trimble, Inc. (a) | 707 | |||||
| 6 | Waters Corp. (a) | 1,431 | |||||
| 70,906 | |||||||
| Newspaper Periodical Book | |||||||
| and Directory Publishers - 0.1% | |||||||
| 36 | Thomson Reuters Corp. | 4,316 | |||||
| Nondepository Credit Intermediation - 0.4% | |||||||
| 60 | American Express Co. | 8,762 | |||||
| 264 | UBS Group AG | 6,193 | |||||
| 14,955 | |||||||
| Nonmetallic Mineral Mining | |||||||
| and Quarrying - 0.2% | |||||||
| 6 | Martin Marietta Materials, Inc. | 2,454 | |||||
| 12 | Vulcan Materials Co. | 2,358 | |||||
| 4,812 | |||||||
| Nonresidential Building Construction - 0.1% | |||||||
| 252 | Stellantis NV | 4,707 | |||||
| Office Administrative Services - 0.1% | |||||||
| 84 | Baker Hughes Co. | 2,891 | |||||
| Offices of Physicians - 0.1% | |||||||
| 6 | Molina Healthcare, Inc. (a) | 1,998 | |||||
| Offices of Real Estate Agents and Brokers - 0.1% | |||||||
| 24 | CBRE Group, Inc. (a) | 1,664 | |||||
| Oil and Gas Extraction - 0.9% | |||||||
| 90 | Canadian Natural Resources Ltd. | 5,718 | |||||
| 63 | Coterra Energy, Inc. | 1,733 | |||||
| 51 | Devon Energy Corp. | 2,375 | |||||
| 69 | Dominion Energy, Inc. | 2,782 | |||||
| 48 | EOG Resources, Inc. | 6,059 | |||||
| 33 | EQT Corp. | 1,399 | |||||
| 51 | Marathon Oil Corp. | 1,393 | |||||
| 72 | Occidental Petroleum Corp. | 4,450 | |||||
| 18 | Pioneer Natural Resources Co. | 4,302 | |||||
| 30,211 | |||||||
The accompanying notes are an integral part of these financial statements.
22
Reverb ETF
SCHEDULE OF INVESTMENTS at October 31, 2023 (Unaudited), Continued
| Shares | COMMON STOCKS - 97.8%, Continued | Value | |||||
| Other Electrical Equipment and | |||||||
| Component Manufacturing - 0.0% | |||||||
| 3 | Hubbell, Inc. | $ | 810 | ||||
| Other Fabricated Metal | |||||||
| Product Manufacturing - 0.2% | |||||||
| 3 | Axon Enterprise, Inc. (a) | 613 | |||||
| 48 | Emerson Electric Co. | 4,271 | |||||
| 4,884 | |||||||
| Other Financial Investment Activities - 1.5% | |||||||
| 9 | Ameriprise Financial, Inc. | 2,831 | |||||
| 45 | Apollo Global Management, Inc. | 3,485 | |||||
| 15 | Ares Management Corp. | 1,479 | |||||
| 12 | BlackRock, Inc. | 7,347 | |||||
| 63 | Blackstone, Inc. | 5,818 | |||||
| 135 | Brookfield Corp. | 3,935 | |||||
| 15 | Ferrari NV | 4,525 | |||||
| 141 | Lucid Group, Inc. (a) | 581 | |||||
| 135 | Morgan Stanley | 9,561 | |||||
| 27 | S&P Global, Inc. | 9,431 | |||||
| 18 | T Rowe Price Group, Inc. | 1,629 | |||||
| 144 | Vinfast Auto Ltd. (a) | 782 | |||||
| 51,404 | |||||||
| Other Food Manufacturing - 0.2% | |||||||
| 48 | General Mills, Inc. | 3,131 | |||||
| 6 | J M Smucker Co. | 683 | |||||
| 15 | McCormick & Co., Inc. | 964 | |||||
| 21 | McCormick & Co., Inc.+ | 1,342 | |||||
| 6,120 | |||||||
| Other General Purpose | |||||||
| Machinery Manufacturing - 0.5% | |||||||
| 6 | IDEX Corp. | 1,148 | |||||
| 24 | Illinois Tool Works, Inc. | 5,379 | |||||
| 3 | Mettler-Toledo International, Inc. (a) | 2,956 | |||||
| 12 | Parker-Hannifin Corp. | 4,427 | |||||
| 21 | Xylem, Inc. | 1,964 | |||||
| 15,874 | |||||||
The accompanying notes are an integral part of these financial statements.
23
Reverb ETF
SCHEDULE OF INVESTMENTS at October 31, 2023 (Unaudited), Continued
| Shares | COMMON STOCKS - 97.8%, Continued | Value | |||||
| Other Information Services - 1.9% | |||||||
| 33 | CoStar Group, Inc. (a) | $ | 2,423 | ||||
| 192 | Meta Platforms, Inc. - Class A (a) | 57,843 | |||||
| 54 | Pinterest, Inc. (a) | 1,614 | |||||
| 9 | VeriSign, Inc. (a) | 1,797 | |||||
| 63,677 | |||||||
| Other Investment Pools and Funds - 0.1% | |||||||
| 39 | Alcon, Inc. | 2,781 | |||||
| 15 | Garmin Ltd. | 1,538 | |||||
| 15 | Incyte Corp. (a) | 809 | |||||
| 5,128 | |||||||
| Other Miscellaneous Store Retailers - 0.1% | |||||||
| 90 | Amcor PLC | 800 | |||||
| 9 | Tractor Supply Co. | 1,733 | |||||
| 2,533 | |||||||
| Other Professional Scientific | |||||||
| and Technical Services - 0.1% | |||||||
| 6 | Gartner, Inc. (a) | 1,992 | |||||
| 15 | IQVIA Holdings, Inc. (a) | 2,713 | |||||
| 4,705 | |||||||
| Other Telecommunications - 0.5% | |||||||
| 75 | BCE, Inc. | 2,785 | |||||
| 117 | TELUS Corp. | 1,886 | |||||
| 321 | Verizon Communications, Inc. | 11,277 | |||||
| 15,948 | |||||||
| Other Transit and Ground | |||||||
| Passenger Transportation - 0.2% | |||||||
| 168 | Uber Technologies, Inc. (a) | 7,271 | |||||
| Paint Coating and | |||||||
| Adhesive Manufacturing - 0.2% | |||||||
| 18 | PPG Industries, Inc. | 2,210 | |||||
| 21 | Sherwin-Williams Co. | 5,002 | |||||
| 7,212 | |||||||
| Pesticide Fertilizer and Other | |||||||
| Agricultural Chemical Manufacturing - 0.1% | |||||||
| 15 | CF Industries Holdings, Inc. | 1,197 | |||||
| 21 | Mosaic Co. | 682 | |||||
The accompanying notes are an integral part of these financial statements.
24
Reverb ETF
SCHEDULE OF INVESTMENTS at October 31, 2023 (Unaudited), Continued
| Shares | COMMON STOCKS - 97.8%, Continued | Value | |||||
| Pesticide Fertilizer and Other Agricultural | |||||||
| Chemical Manufacturing - 0.1%, Continued | |||||||
| 39 | NUTRIEN Ltd. | $ | 2,094 | ||||
| 3,973 | |||||||
| Petroleum and Coal | |||||||
| Products Manufacturing - 2.2% | |||||||
| 156 | Chevron Corp. | 22,734 | |||||
| 300 | Exxon Mobil Corp. | 31,755 | |||||
| 24 | Hess Corp. | 3,466 | |||||
| 33 | Marathon Petroleum Corp. | 4,991 | |||||
| 36 | Phillips 66 | 4,107 | |||||
| 105 | Suncor Energy, Inc. | 3,402 | |||||
| 30 | Valero Energy Corp. | 3,810 | |||||
| 74,265 | |||||||
| Petroleum and Petroleum Products | |||||||
| Merchant Wholesalers - 0.1% | |||||||
| 258 | Energy Transfer LP | 3,393 | |||||
| Pharmaceutical and Medicine | |||||||
| Manufacturing - 5.3% | |||||||
| 141 | Abbott Laboratories | 13,332 | |||||
| 144 | AbbVie, Inc. | 20,330 | |||||
| 9 | Alnylam Pharmaceuticals, Inc. (a) | 1,366 | |||||
| 45 | Amgen, Inc. | 11,507 | |||||
| 12 | Biogen, Inc. (a) | 2,850 | |||||
| 15 | BioMarin Pharmaceutical, Inc. (a) | 1,222 | |||||
| 171 | Bristol-Myers Squibb Co. | 8,812 | |||||
| 78 | Eli Lilly & Co. | 43,206 | |||||
| 102 | Gilead Sciences, Inc. | 8,011 | |||||
| 207 | Merck & Co., Inc. | 21,259 | |||||
| 30 | Moderna, Inc. (a) | 2,279 | |||||
| 462 | Pfizer, Inc. | 14,119 | |||||
| 9 | Regeneron Pharmaceuticals, Inc. (a) | 7,019 | |||||
| 15 | Seagen, Inc. (a) | 3,192 | |||||
| 21 | Vertex Pharmaceuticals, Inc. (a) | 7,604 | |||||
| 6 | West Pharmaceutical Services, Inc. | 1,910 | |||||
| 39 | Zoetis, Inc. | 6,123 | |||||
| 174,141 | |||||||
The accompanying notes are an integral part of these financial statements.
25
Reverb ETF
SCHEDULE OF INVESTMENTS at October 31, 2023 (Unaudited), Continued
| Shares | COMMON STOCKS - 97.8%, Continued | Value | |||||
| Pipeline Transportation of Crude Oil - 0.2% | |||||||
| 174 | Enbridge, Inc. | $ | 5,575 | ||||
| Pipeline Transportation of Natural Gas - 0.4% | |||||||
| 177 | Enterprise Products Partners LP | 4,609 | |||||
| 45 | Pembina Pipeline Corp. | 1,385 | |||||
| 81 | TC Energy Corp. | 2,791 | |||||
| 99 | Williams Cos., Inc. | 3,406 | |||||
| 12,191 | |||||||
| Plastics Product Manufacturing - 0.0% | |||||||
| 9 | Entegris, Inc. | 792 | |||||
| Printing and Related Support Activities - 0.0% | |||||||
| 42 | Warner Music Group Corp. | 1,315 | |||||
| Professional and Commercial Equipment - 0.1% | |||||||
| 33 | Samsara, Inc. (a) | 761 | |||||
| 9 | STERIS PLC | 1,890 | |||||
| 2,651 | |||||||
| Radio and Television Broadcasting - 0.4% | |||||||
| 30 | Fox Corp. | 837 | |||||
| 15 | Spotify Technology SA (a) | 2,471 | |||||
| 141 | Walt Disney Co. (a) | 11,504 | |||||
| 14,812 | |||||||
| Rail Transportation - 0.8% | |||||||
| 54 | Canadian National Railway Co. | 5,711 | |||||
| 75 | Canadian Pacific Kansas City Ltd. | 5,323 | |||||
| 162 | CSX Corp. | 4,836 | |||||
| 51 | Union Pacific Corp. | 10,587 | |||||
| 26,457 | |||||||
| Railroad Rolling Stock Manufacturing - 0.1% | |||||||
| 15 | Westinghouse Air Brake Technologies Corp. | 1,590 | |||||
| Residential Building Construction - 0.2% | |||||||
| 27 | DR Horton, Inc. | 2,819 | |||||
| 24 | Lennar Corp. | 2,367 | |||||
| 18 | PulteGroup, Inc. | 1,325 | |||||
| 6,511 | |||||||
The accompanying notes are an integral part of these financial statements.
26
Reverb ETF
SCHEDULE OF INVESTMENTS at October 31, 2023 (Unaudited), Continued
| Shares | COMMON STOCKS - 97.8%, Continued | Value | |||||
| Resin Synthetic Rubber | |||||||
| and Artificial Synthetic - 0.2% | |||||||
| 9 | Albemarle Corp. | $ | 1,141 | ||||
| 57 | Dow, Inc. | 2,755 | |||||
| 39 | DuPont de Nemours, Inc. | 2,843 | |||||
| 9 | Westlake Corp. | 1,038 | |||||
| 7,777 | |||||||
| Restaurants and Other Eating Places - 1.1% | |||||||
| 3 | Chipotle Mexican Grill, Inc. (a) | 5,827 | |||||
| 9 | Darden Restaurants, Inc. | 1,310 | |||||
| 54 | McDonald’s Corp. | 14,157 | |||||
| 93 | Starbucks Corp. | 8,578 | |||||
| 6 | Veralto Corp. (a) | 414 | |||||
| 33 | Yum China Holdings, Inc. | 1,734 | |||||
| 24 | Yum! Brands, Inc. | 2,901 | |||||
| 34,921 | |||||||
| Sawmills and Wood Preservation - 0.0% | |||||||
| 9 | Builders FirstSource, Inc. (a) | 977 | |||||
| Scheduled Air Transportation - 0.1% | |||||||
| 39 | American Airlines Group, Inc. (a) | 435 | |||||
| 54 | Delta Air Lines, Inc. | 1,688 | |||||
| 48 | Southwest Airlines Co. | 1,067 | |||||
| 21 | United Airlines Holdings, Inc. (a) | 735 | |||||
| 3,925 | |||||||
| Scientific Research and | |||||||
| Development Services - 0.1% | |||||||
| 12 | Exact Sciences Corp. (a) | 739 | |||||
| 81 | MPLX LP | 2,919 | |||||
| 3,658 | |||||||
| Securities and Commodity Contracts | |||||||
| Intermediation and Brokerage - 0.6% | |||||||
| 150 | Charles Schwab Corp. | 7,806 | |||||
| 27 | Goldman Sachs Group, Inc. | 8,198 | |||||
| 18 | Raymond James Financial, Inc. | 1,718 | |||||
| 18 | Tradeweb Markets, Inc. | 1,620 | |||||
| 19,342 | |||||||
The accompanying notes are an integral part of these financial statements.
27
Reverb ETF
SCHEDULE OF INVESTMENTS at October 31, 2023 (Unaudited), Continued
| Shares | COMMON STOCKS - 97.8%, Continued | Value | |||||
| Securities and Commodity Exchanges - 0.4% | |||||||
| 30 | CME Group, Inc. | $ | 6,404 | ||||
| 48 | Intercontinental Exchange, Inc. | 5,157 | |||||
| 6 | LPL Financial Holdings, Inc. | 1,347 | |||||
| 39 | Nasdaq, Inc. | 1,934 | |||||
| 14,842 | |||||||
| Semiconductor and Other Electronic | |||||||
| Component Manufacturing - 6.0% | |||||||
| 132 | Advanced Micro Devices, Inc. (a) | 13,002 | |||||
| 48 | Amphenol Corp. - Class A | 3,866 | |||||
| 42 | Analog Devices, Inc. | 6,608 | |||||
| 18 | Best Buy Co., Inc. | 1,203 | |||||
| 33 | Broadcom, Inc. | 27,766 | |||||
| 9 | Enphase Energy, Inc. (a) | 716 | |||||
| 21 | Global Payments, Inc. | 2,231 | |||||
| 45 | GLOBALFOUNDRIES, Inc. (a) | 2,233 | |||||
| 342 | Intel Corp. | 12,483 | |||||
| 3 | Jabil, Inc. | 368 | |||||
| 12 | Lam Research Corp. | 7,059 | |||||
| 72 | Marvell Technology, Inc. | 3,400 | |||||
| 45 | Microchip Technology, Inc. | 3,208 | |||||
| 90 | Micron Technology, Inc. | 6,018 | |||||
| 3 | Monolithic Power Systems, Inc. | 1,325 | |||||
| 201 | NVIDIA Corp. | 81,969 | |||||
| 21 | NXP Semiconductors NV | 3,620 | |||||
| 36 | ON Semiconductor Corp. (a) | 2,255 | |||||
| 33 | Otis Worldwide Corp. | 2,548 | |||||
| 12 | Skyworks Solutions, Inc. | 1,041 | |||||
| 75 | STMicroelectronics NV | 2,849 | |||||
| 75 | Texas Instruments, Inc. | 10,651 | |||||
| 9 | Vertiv Holdings Co. | 353 | |||||
| 196,772 | |||||||
| Services to Buildings and Dwellings - 0.0% | |||||||
| 39 | Rollins, Inc. | 1,467 | |||||
| Soap Cleaning Compound and | |||||||
| Toilet Preparation - 1.6% | |||||||
| 18 | Air Products and Chemicals, Inc. | 5,084 | |||||
| 21 | Church & Dwight Co., Inc. | 1,910 | |||||
The accompanying notes are an integral part of these financial statements.
28
Reverb ETF
SCHEDULE OF INVESTMENTS at October 31, 2023 (Unaudited), Continued
| Shares | COMMON STOCKS - 97.8%, Continued | Value | |||||
| Soap Cleaning Compound and | |||||||
| Toilet Preparation - 1.6%, Continued | |||||||
| 9 | Clorox Co. | $ | 1,059 | ||||
| 69 | Colgate-Palmolive Co. | 5,183 | |||||
| 24 | Ecolab, Inc. | 4,026 | |||||
| 30 | Estee Lauder Cos., Inc. | 3,866 | |||||
| 156 | Kenvue, Inc. | 2,902 | |||||
| 192 | Procter & Gamble Co. | 28,805 | |||||
| 52,835 | |||||||
| Software Publishers - 10.1% | |||||||
| 36 | Adobe, Inc. (a) | 19,154 | |||||
| 12 | Akamai Technologies, Inc. (a) | 1,240 | |||||
| 6 | ANSYS, Inc. (a) | 1,670 | |||||
| 21 | Atlassian Corp. - Class A (a) | 3,793 | |||||
| 18 | Autodesk, Inc. (a) | 3,557 | |||||
| 24 | Bentley Systems, Inc. | 1,167 | |||||
| 51 | Block, Inc. (a) | 2,053 | |||||
| 21 | Cadence Design Systems, Inc. (a) | 5,037 | |||||
| 9 | Check Point Software Technologies Ltd. (a) | 1,208 | |||||
| 21 | Crowdstrike Holdings, Inc. - Class A (a) | 3,712 | |||||
| 27 | Datadog, Inc. - Class A (a) | 2,200 | |||||
| 24 | Dynatrace, Inc. (a) | 1,073 | |||||
| 21 | Electronic Arts, Inc. | 2,600 | |||||
| 105 | Hewlett Packard Enterprise Co. | 1,615 | |||||
| 3 | HubSpot, Inc. (a) | 1,271 | |||||
| 24 | Intuit, Inc. | 11,879 | |||||
| 603 | Microsoft Corp. | 203,880 | |||||
| 66 | Mobileye Global, Inc. (a) | 2,354 | |||||
| 225 | Oracle Corp. | 23,265 | |||||
| 9 | PTC, Inc. (a) | 1,264 | |||||
| 81 | Salesforce, Inc. (a) | 16,267 | |||||
| 105 | Shopify, Inc. (a) | 4,955 | |||||
| 15 | Splunk, Inc. (a) | 2,207 | |||||
| 12 | Synopsys, Inc. (a) | 5,633 | |||||
| 3 | Tyler Technologies, Inc. (a) | 1,119 | |||||
| 12 | Veeva Systems, Inc. - Class A (a) | 2,313 | |||||
| 36 | VMware, Inc. (a) | 5,243 | |||||
| 331,729 | |||||||
The accompanying notes are an integral part of these financial statements.
29
Reverb ETF
SCHEDULE OF INVESTMENTS at October 31, 2023 (Unaudited), Continued
| Shares | COMMON STOCKS - 97.8%, Continued | Value | |||||
| Steel Product Manufacturing | |||||||
| from Purchased Steel - 0.1% | |||||||
| 15 | Steel Dynamics, Inc. | $ | 1,598 | ||||
| Sugar and Confectionery | |||||||
| Product Manufacturing - 0.1% | |||||||
| 18 | Hershey Co. | 3,372 | |||||
| Support Activities for Crop Production - 0.1% | |||||||
| 57 | Corteva, Inc. | 2,744 | |||||
| Support Activities for Mining - 0.9% | |||||||
| 156 | Cenovus Energy, Inc. | 2,976 | |||||
| 99 | ConocoPhillips | 11,760 | |||||
| 15 | Diamondback Energy, Inc. | 2,405 | |||||
| 75 | Halliburton Co. | 2,951 | |||||
| 117 | Schlumberger Ltd. | 6,513 | |||||
| 18 | Targa Resources Corp. | 1,505 | |||||
| 42 | Teck Resources Ltd. | 1,484 | |||||
| 29,594 | |||||||
| Tobacco Manufacturing - 0.5% | |||||||
| 144 | Altria Group, Inc. | 5,784 | |||||
| 126 | Philip Morris International, Inc. | 11,235 | |||||
| 17,019 | |||||||
| Travel Arrangement and | |||||||
| Reservation Services - 0.3% | |||||||
| 3 | Booking Holdings, Inc. (a) | 8,369 | |||||
| 12 | Expedia Group, Inc. (a) | 1,143 | |||||
| 21 | Royal Caribbean Cruises Ltd. (a) | 1,779 | |||||
| 11,291 | |||||||
| Traveler Accommodation - 0.4% | |||||||
| 21 | Hilton Worldwide Holdings, Inc. | 3,182 | |||||
| 63 | Las Vegas Sands Corp. | 2,990 | |||||
| 24 | Marriott International, Inc. - Class A | 4,526 | |||||
| 21 | MGM Resorts International | 733 | |||||
| 11,431 | |||||||
| Ventilation Heating Air-Conditioning | |||||||
| and Commercial Refrigeration | |||||||
| Equipment Manufacturing - 0.2% | |||||||
| 69 | Carrier Global Corp. | 3,289 | |||||
| 12 | Dover Corp. | 1,559 | |||||
The accompanying notes are an integral part of these financial statements.
30
Reverb ETF
SCHEDULE OF INVESTMENTS at October 31, 2023 (Unaudited), Continued
| Shares | COMMON STOCKS - 97.8%, Continued | Value | |||||
| Ventilation Heating Air-Conditioning | |||||||
| and Commercial Refrigeration | |||||||
| Equipment Manufacturing - 0.2%, Continued | |||||||
| 33 | Ingersoll Rand, Inc. | $ | 2,002 | ||||
| 6,850 | |||||||
| Waste Treatment and Disposal - 0.4% | |||||||
| 27 | Republic Services, Inc. | 4,009 | |||||
| 21 | Waste Connections, Inc. | 2,720 | |||||
| 33 | Waste Management, Inc. | 5,423 | |||||
| 12,152 | |||||||
| Water Sewage and Other Systems - 0.1% | |||||||
| 15 | American Water Works Co., Inc. | 1,765 | |||||
| Wired and Wireless | |||||||
| Telecommunications Carriers - 0.3% | |||||||
| 585 | AT&T, Inc. | 9,009 | |||||
| Wired Telecommunications Carriers - 0.4% | |||||||
| 93 | T-Mobile US, Inc. (a) | 13,379 | |||||
| 24 | Zoom Video Communications, Inc. - Class A (a) | 1,440 | |||||
| 14,819 | |||||||
| TOTAL COMMON STOCKS | |||||||
| (Cost $3,072,219) | 3,214,364 | ||||||
| REITs - 1.9% | |||||||
| Lessors of Real Estate - 1.6% | |||||||
| 39 | American Tower Corp. | 6,949 | |||||
| 12 | AvalonBay Communities, Inc. | 1,989 | |||||
| 36 | Crown Castle, Inc. | 3,347 | |||||
| 24 | Digital Realty Trust, Inc. | 2,985 | |||||
| 9 | Equinix, Inc. | 6,567 | |||||
| 30 | Equity Residential | 1,660 | |||||
| 9 | Mid-America Apartment Communities, Inc. | 1,063 | |||||
| 75 | Prologis, Inc. | 7,556 | |||||
| 15 | Public Storage | 3,581 | |||||
| 57 | Realty Income Corp. | 2,701 | |||||
| 9 | SBA Communications Corp. | 1,878 | |||||
| 27 | Simon Property Group, Inc. | 2,967 | |||||
| 9 | Sun Communities, Inc. | 1,001 | |||||
The accompanying notes are an integral part of these financial statements.
31
Reverb ETF
SCHEDULE OF INVESTMENTS at October 31, 2023 (Unaudited), Continued
| Shares | REITs - 1.9%, Continued | Value | |||||
| Lessors of Real Estate - 1.6%, Continued | |||||||
| 33 | Ventas, Inc. | $ | 1,401 | ||||
| 84 | VICI Properties, Inc. | 2,344 | |||||
| 42 | Welltower, Inc. | 3,512 | |||||
| 12 | WP Carey, Inc. | 644 | |||||
| 52,145 | |||||||
| Offices of Real Estate Agents and Brokers - 0.1% | |||||||
| 15 | Alexandria Real Estate Equities, Inc. | 1,397 | |||||
| 51 | Invitation Homes, Inc. | 1,514 | |||||
| 2,911 | |||||||
| Veneer Plywood and Engineered | |||||||
| Wood Product Manufacturing - 0.1% | |||||||
| 60 | Weyerhaeuser Co. | 1,721 | |||||
| Warehousing and Storage - 0.1% | |||||||
| 18 | Extra Space Storage, Inc. | 1,864 | |||||
| 24 | Iron Mountain, Inc. | 1,418 | |||||
| 3,282 | |||||||
| TOTAL REITs | |||||||
| (Cost $66,192) | 60,059 | ||||||
| MONEY MARKET FUND - 0.3% | |||||||
| 10,230 | First American Treasury Obligations Fund, | ||||||
| Class X, 5.275% (b) | 10,230 | ||||||
| TOTAL MONEY MARKET FUND | |||||||
| (Cost $10,230) | 10,230 | ||||||
| TOTAL INVESTMENTS | |||||||
| (Cost $3,148,641) - 100.0% | 3,284,653 | ||||||
| Other Assets in Excess of Liabilities - 0.0% | 1,771 | ||||||
| TOTAL NET ASSETS - 100.00% | $ | 3,286,424 | |||||
AG - Aktiengesellschaft
MSCI - Morgan Stanley Capital International
NV - Naamloze Vennootschap
PLC - Public Limited Company
REIT - Real Estate Investment Trust
S&P - Standards & Poor’s
SA - Société Anonyme
| (a) | Non-income producing security. |
| (b) | Rate shown represents the 7-day annualized yield as of October 31, 2023. |
| + | Non-voting shares. |
The accompanying notes are an integral part of these financial statements.
32
Reverb ETF
STATEMENT OF ASSETS AND LIABILITIES at October 31, 2023 (Unaudited)
| ASSETS | ||||
| Investments in securities, at value (cost $3,148,641) | $ | 3,284,653 | ||
| Receivables: | ||||
| Dividends and interest | 2,497 | |||
| Dividend tax reclaim | 124 | |||
| Total assets | 3,287,274 | |||
| LIABILITIES | ||||
| Payables: | ||||
| Due to advisor | 850 | |||
| Total liabilities | 850 | |||
| NET ASSETS | $ | 3,286,424 | ||
| CALCULATION OF NET ASSET VALUE PER SHARE | ||||
| Net assets applicable to shares outstanding | $ | 3,286,424 | ||
| Shares issued and outstanding [unlimited number | ||||
| of shares (par value $0.01) authorized] | 150,000 | |||
| Net asset value per share | $ | 21.91 | ||
| COMPONENTS OF NET ASSETS | ||||
| Paid-in capital | $ | 3,344,028 | ||
| Total accumulated deficit | (57,604 | ) | ||
| Net assets | $ | 3,286,424 | ||
The accompanying notes are an integral part of these financial statements.
33
Reverb ETF
STATEMENT OF OPERATIONS For the Six Months Ended October 31, 2023 (Unaudited)
| INVESTMENT INCOME | ||||
| Income | ||||
| Dividends (net of foreign tax withheld of $431) | $ | 21,158 | ||
| Interest | 261 | |||
| Total income | 21,419 | |||
| Expenses | ||||
| Management fees | 4,205 | |||
| Total expenses | 4,205 | |||
| Net investment income | 17,214 | |||
| REALIZED AND UNREALIZED | ||||
| LOSS ON INVESTMENTS | ||||
| Net realized loss on transactions from: | ||||
| Investments | (1,978 | ) | ||
| Net change in unrealized appreciation on: | ||||
| Investments | (65,330 | ) | ||
| Net realized and unrealized loss on investments | (67,308 | ) | ||
| Net decrease in net assets | ||||
| resulting from operations | $ | (50,094 | ) | |
The accompanying notes are an integral part of these financial statements.
34
Reverb ETF
STATEMENTS OF CHANGES IN NET ASSETS
| Six Months | November 3, | |||||||
| Ended | 2022* | |||||||
| October 31, 2023 | through | |||||||
| (Unaudited) | April 30, 2023 | |||||||
| INCREASE/(DECREASE) IN NET ASSETS FROM: | ||||||||
| OPERATIONS | ||||||||
| Net investment income | $ | 17,214 | $ | 14,137 | ||||
| Net realized gain/(loss) on transactions from: | ||||||||
| Investments | (1,978 | ) | (2,408 | ) | ||||
| Redemption in-kind (Note 5) | — | 215,418 | ||||||
| Foreign currency | — | (2 | ) | |||||
| Net change in unrealized appreciation on: | ||||||||
| Investments | (65,330 | ) | 201,342 | |||||
| Net increase/(decrease) in | ||||||||
| net assets resulting from operations | (50,094 | ) | 428,487 | |||||
| DISTRIBUTIONS TO SHAREHOLDERS | ||||||||
| Net dividends and distributions | — | (5,409 | ) | |||||
| Total dividends and distributions | — | (5,409 | ) | |||||
| CAPITAL SHARE TRANSACTIONS | ||||||||
| Net increase in net assets derived from | ||||||||
| net change in outstanding shares (a) | 1,175,960 | 1,737,480 | ||||||
| Total increase in net assets | 1,125,866 | 2,160,558 | ||||||
| NET ASSETS | ||||||||
| Beginning of period | 2,160,558 | — | ||||||
| End of period | $ | 3,286,424 | $ | 2,160,558 | ||||
| (a) | A summary of share transactions is as follows: |
| Six Months Ended | November 3, 2022* | ||||||||||||||||
| October 31, 2023 | through | ||||||||||||||||
| (Unaudited) | April 30, 2023 | ||||||||||||||||
| Shares | Paid-in Capital | Shares | Paid-in Capital | ||||||||||||||
| Shares sold | 50,000 | $ | 1,175,960 | 1,250,000 | $ | 24,356,600 | |||||||||||
| Shares redeemed | — | — | (1,150,000 | ) | (22,619,120 | ) | |||||||||||
| Net increase | 50,000 | $ | 1,175,960 | 100,000 | $ | 1,737,480 | |||||||||||
| * | Commencement of operations. |
The accompanying notes are an integral part of these financial statements.
35
Reverb ETF
FINANCIAL HIGHLIGHTS – For a share outstanding throughout each period
| Six Months | November 3, | |||||||
| Ended | 2022* | |||||||
| October 31, 2023 | through | |||||||
| (Unaudited) | April 30, 2023 | |||||||
| Net asset value, beginning of period | $ | 21.61 | $ | 19.24 | ||||
| Income from investment operations: | ||||||||
| Net investment income | 0.17 | 0.14 | ||||||
| Net realized and unrealized | ||||||||
| gain on investments | 0.13 | 2.28 | ||||||
| Total from investment operations | 0.30 | 2.42 | ||||||
| Less distributions: | ||||||||
| From net investment income | — | (0.05 | ) | |||||
| Total distributions | — | (0.05 | ) | |||||
| Net asset value, end of period | $ | 21.91 | $ | 21.61 | ||||
| Total return, at NAV | 1.41 | %(2) | 12.60 | %(2) | ||||
| Total return, at Market | 1.42 | %(2) | 12.60 | %(2) | ||||
| Ratios/supplemental data: | ||||||||
| Net assets, end of period (thousands) | $ | 3,286 | $ | 2,161 | ||||
| Ratio of expenses to average net assets | 0.30 | %(1) | 0.30 | %(1) | ||||
| Ratio of net investment income | ||||||||
| to average net assets | 1.23 | %(1) | 1.27 | %(1) | ||||
Portfolio turnover rate(3) | 7.32 | %(2) | 2.37 | %(2) | ||||
| (1) | Annualized. |
| (2) | Not Annualized. |
| (3) | Excludes impact of in-kind transactions. |
| * | Commencement of operations. |
The accompanying notes are an integral part of these financial statements.
36
Reverb ETF
NOTES TO FINANCIAL STATEMENTS at October 31, 2023 (Unaudited)
NOTE 1 – ORGANIZATION
The Reverb ETF (the “Fund”) is a diversified series of Advisors Series Trust (the “Trust”), which is registered under the Investment Company Act of 1940 (the “1940 Act”), as amended, as an open-end management investment company. The Fund follows the investment company accounting and reporting guidance of the Financial Accounting Standards Board (“FASB”) Accounting Standard Codification Topic 946 “Financial Services – Investment Companies.” The Fund began operations on November 3, 2022. The investment objective of the Fund is to achieve long-term capital appreciation.
Shares of the Fund are listed on Cboe BZX Exchange, Inc. (the “Exchange”) and trade on the Exchange at market prices. These prices may differ from the shares’ net asset value (“NAV”). The Fund issues and redeems shares at NAV only in large blocks known as “Creation Units,” which generally consist of 50,000 shares, though this may change from time to time. The Fund generally issues and redeems Creation Units in exchange for a portfolio of securities closely approximating the holdings of the Fund and/or a designated amount of U.S. cash. Once created, shares trade in the secondary market in quantities less than a Creation Unit. Except when aggregated in Creation Units, shares are not redeemable securities of the Fund. Shares of the Fund may only be purchased directly from or redeemed directly to the Fund by certain financial institutions (“Authorized Participants”). An Authorized Participant is either (i) a broker-dealer or other participant in the clearing process through the Continuous Net Settlement System of the National Securities Clearing Corporation or (ii) a DTC participant and, in each case, must have executed a Participant Agreement with Quasar Distributors, LLC (the “Distributor”). Most retail investors do not qualify as Authorized Participants or have the resources to buy and sell whole Creation Units. Therefore, most retail investors may purchase shares in the secondary market with the assistance of a broker and are subject to customary brokerage commissions or fees.
The Fund currently offers one class of shares, which has no front-end sales load, no deferred sales charge, and no redemption fee. A purchase (i.e., creation) transaction fee is imposed for the transfer and other transaction costs associated with the purchase of Creation Units. The Fund charges $500 for the standard fixed creation fee, payable to the Custodian. In addition, a variable fee may be charged on cash purchases, non-standard orders, or partial cash purchases of Creation Units of up to a maximum of 2% as a percentage of the total value of the Creation Units subject to the transaction. Variable fees received by the Fund are displayed in the Capital Share Transactions section of the Statement of Changes in Net Assets. The Fund may issue an unlimited number of shares of beneficial interest, with $0.01 par value per share.
37
Reverb ETF
NOTES TO FINANCIAL STATEMENTS at October 31, 2023 (Unaudited), Continued
NOTE 2 – SIGNIFICANT ACCOUNTING POLICIES
The following is a summary of significant accounting policies consistently followed by the Fund. These policies are in conformity with accounting principles generally accepted in the United States of America.
| A. | Security Valuation: All investments in securities are generally valued using market valuations, as described in Note 3. | |
| B. | Federal Income Taxes: It is the Fund’s policy to comply with the requirements of Subchapter M of the Internal Revenue Code applicable to regulated investment companies and to distribute substantially all of its taxable income to its shareholders. Therefore, no Federal income or excise tax provision is required. | |
| The Fund recognizes the tax benefits of uncertain tax positions only where the position is “more likely than not” to be sustained assuming examination by tax authorities. The Fund identifies its major tax jurisdictions as U.S. Federal and the state of Wisconsin; however, the Fund is not aware of any tax positions for which it is reasonably possible that the total amounts of unrecognized tax benefits will change materially in the next twelve months. | ||
| C. | Security Transactions, Income and Distributions: Security transactions are accounted for on the trade date. Realized gains and losses on securities sold are determined on a specific identification basis. Interest income is recorded on an accrual basis. Dividend income and distributions to shareholders are recorded on the ex-dividend date. Withholding taxes on foreign dividends have been provided for in accordance with the Fund’s understanding of the applicable country’s tax rules and rates. | |
| Common expenses of the Trust are typically allocated among the funds in the Trust based on a fund’s respective net assets, or by other equitable means. | ||
| The Fund distributes substantially all net investment income, if any, and net realized gains, if any, annually. Distributions from net realized gains for book purposes may include short-term capital gains. All short-term capital gains are included in ordinary income for tax purposes. | ||
| The amount of dividends and distributions to shareholders from net investment income and net realized capital gains is determined in accordance with federal income tax regulations which differ from accounting principles generally accepted in the United States of America. To the extent these book/tax differences are permanent, such amounts are reclassified within the capital accounts based on their federal tax treatment. | ||
| D. | Reclassification of Capital Accounts: Accounting principles generally accepted in the United States of America require that certain components of net assets relating to permanent differences be reclassified between |
38
Reverb ETF
NOTES TO FINANCIAL STATEMENTS at October 31, 2023 (Unaudited), Continued
| financial and tax reporting. These reclassifications have no effect on net assets or net asset value per share. | ||
| E. | Use of Estimates: The preparation of financial statements in conformity with accounting principles generally accepted in the United States of America requires management to make estimates and assumptions that affect the reported amounts of assets and liabilities at the date of the financial statements and the reported amounts of increases and decreases in net assets during the reporting period. Actual results could differ from those estimates. | |
| F. | REITs: The Fund has made certain investments in real estate investment trusts (“REITs”) which pay dividends to their shareholders based upon available funds from operations. It is quite common for these dividends to exceed the REITs’ taxable earnings and profits resulting in the excess portion being designated as a return of capital. The Fund intends to include the gross dividends from such REITs in its annual distributions to its shareholders and, accordingly, a portion of the Fund’s distributions may also be designated as a return of capital. | |
| G. | Events Subsequent to the Fiscal Period End: In preparing the financial statements as of October 31, 2023, management considered the impact of subsequent events for potential recognition or disclosure in the financial statements. Management has determined there were no subsequent events that would need to be disclosed in the Fund’s financial statements. |
NOTE 3 – SECURITIES VALUATION
The Fund has adopted authoritative fair value accounting standards which establish an authoritative definition of fair value and set out a hierarchy for measuring fair value. These standards require additional disclosures about the various inputs and valuation techniques used to develop the measurements of fair value, a discussion in changes in valuation techniques and related inputs during the period and expanded disclosure of valuation levels for a majority of security types. These inputs are summarized in the three broad levels listed below:
| Level 1 – | Unadjusted quoted prices in active markets for identical assets or liabilities that the Fund has the ability to access. | |
| Level 2 – | Observable inputs other than quoted prices included in Level 1 that are observable for the asset or liability, either directly or indirectly. These inputs may include quoted prices for the identical instrument on an inactive market, prices for similar instruments, interest rates, prepayment speeds, credit risk, yield curves, default rates and similar data. | |
| Level 3 – | Unobservable inputs for the asset or liability, to the extent relevant observable inputs are not available, representing the Fund’s own |
39
Reverb ETF
NOTES TO FINANCIAL STATEMENTS at October 31, 2023 (Unaudited), Continued
| assumptions about the assumptions a market participant would use in valuing the asset or liability, and would be based on the best information available. |
Following is a description of the valuation techniques applied to the Fund’s major categories of assets and liabilities measured at fair value on a recurring basis.
The Fund calculates its net asset value per share as of the scheduled close of regular trading on the New York Stock Exchange (“NYSE”), generally 4:00 p.m. Eastern time, each day the NYSE is open for business.
Equity Securities: The Fund’s investments are carried at fair value. Equity securities, including common stocks and real estate investment trusts, that are primarily traded on a national securities exchange shall be valued at the last sale price on the exchange on which they are primarily traded on the day of valuation or, if there has been no sale on such day, at the mean between the bid and asked prices. Securities primarily traded in the NASDAQ Global Market System for which market quotations are readily available shall be valued using the NASDAQ Official Closing Price (“NOCP”). If the NOCP is not available, such securities shall be valued at the last sale price on the day of valuation, or if there has been no sale on such day, at the mean between the bid and asked prices. Over-the-counter securities which are not traded in the NASDAQ Global Market System shall be valued at the most recent sales price. To the extent these securities are actively traded and valuation adjustments are not applied, they are categorized in Level 1 of the fair value hierarchy.
Investment Companies: Investments in open-end mutual funds, including money market funds, are generally priced at their net asset value per share provided by the service agent of the funds and will be classified in Level 1 of the fair value hierarchy.
Short-Term Securities: Short-term debt securities, including those securities having a maturity of 60 days or less, are valued at the evaluated mean between the bid and asked prices. To the extent the inputs are observable and timely, these securities would be classified in Level 2 of the fair value hierarchy.
The Board of Trustees (the “Board”) has adopted a valuation policy for use by the Fund and its Valuation Designee (as defined below) in calculating the Fund’s net asset value (“NAV”). Pursuant to Rule 2a-5 under the 1940 Act, the Board has designated the Fund’s investment adviser, Distribution Cognizant, LLC (“Adviser”), as the “Valuation Designee” to perform all of the fair value determinations as well as to perform all of the responsibilities that may be performed by the Valuation Designee in accordance with Rule 2a-5, subject to the Board’s oversight. The Adviser, as Valuation Designee is, authorized to make all necessary determinations of the fair values of portfolio securities and other assets for which market quotations are not readily available or if it is deemed that the prices obtained from brokers and dealers or independent pricing services are unreliable.
40
Reverb ETF
NOTES TO FINANCIAL STATEMENTS at October 31, 2023 (Unaudited), Continued
Depending on the relative significance of the valuation inputs, fair valued securities may be classified in either Level 2 or Level 3 of the fair value hierarchy.
The inputs or methodology used for valuing securities are not an indication of the risk associated with investing in those securities. The following is a summary of the inputs used to value the Fund’s securities as of October 31, 2023:
| Level 1 | Level 2 | Level 3 | Total | ||||||||||||||
| Common Stocks | |||||||||||||||||
| Accommodation | |||||||||||||||||
| and Food Services | $ | 50,916 | $ | — | $ | — | $ | 50,916 | |||||||||
| Administrative Support | |||||||||||||||||
| and Waste Management | 131,331 | — | — | 131,331 | |||||||||||||
| Agriculture, Forestry, | |||||||||||||||||
| Fishing, and Hunting | 2,744 | — | — | 2,744 | |||||||||||||
| Construction | 13,223 | — | — | 13,223 | |||||||||||||
| Finance and Insurance | 405,345 | — | — | 405,345 | |||||||||||||
| Health Care and | |||||||||||||||||
| Social Assistance | 9,286 | — | — | 9,286 | |||||||||||||
| Information | 482,009 | — | — | 482,009 | |||||||||||||
| Management of Companies | |||||||||||||||||
| and Enterprises | 15,927 | — | — | 15,927 | |||||||||||||
| Manufacturing | 1,280,142 | — | — | 1,280,142 | |||||||||||||
| Mining, Quarrying, and | |||||||||||||||||
| Oil and Gas Extraction | 84,597 | — | — | 84,597 | |||||||||||||
| Professional, Scientific, | |||||||||||||||||
| and Technical Services | 245,699 | — | — | 245,699 | |||||||||||||
| Real Estate, Rental, | |||||||||||||||||
| and Leasing | 21,483 | — | — | 21,483 | |||||||||||||
| Retail Trade | 274,444 | — | — | 274,444 | |||||||||||||
| Transportation | |||||||||||||||||
| and Warehousing | 79,890 | — | — | 79,890 | |||||||||||||
| Utilities | 75,107 | — | — | 75,107 | |||||||||||||
| Wholesale Trade | 42,221 | — | — | 42,221 | |||||||||||||
| Total Common Stocks | 3,214,364 | — | — | 3,214,364 | |||||||||||||
| REITs | 60,059 | — | — | 60,059 | |||||||||||||
| Money Market Fund | 10,230 | — | — | 10,230 | |||||||||||||
| Total Investments | $ | 3,284,653 | $ | — | $ | — | $ | 3,284,653 | |||||||||
Refer to the Fund’s schedule of investments for a detailed break-out of securities by industry classification.
Accounting Pronouncements – In June 2022, the FASB issued Accounting Standards Update 2022-03, which amends Fair Value Measurement (Topic 820):
41
Reverb ETF
NOTES TO FINANCIAL STATEMENTS at October 31, 2023 (Unaudited), Continued
Fair Value Measurement of Equity Securities Subject to Contractual Sale Restrictions (“ASU 2022-03”). ASU 2022-03 clarifies guidance for fair value measurement of an equity security subject to a contractual sale restriction and establishes new disclosure requirements for such equity securities. ASU 2022-03 is effective for fiscal years beginning after December 15, 2023 and for interim periods within those fiscal years, with early adoption permitted. Management is currently evaluating the impact of these amendments on the Fund’s financial statements.
In October 2022, the Securities and Exchange Commission (the “SEC”) adopted a final rule relating to Tailored Shareholder Reports for Mutual Funds and Exchange-Traded Funds; Fee Information in Investment Company Advertisements. The rule and form amendments will, among other things, require the Fund to transmit concise and visually engaging shareholder reports that highlight key information. The amendments will require that funds tag information in a structured data format and that certain more in-depth information be made available online and available for delivery free of charge to investors on request. The amendments became effective January 24, 2023. There is an 18-month transition period after the effective date of the amendment.
NOTE 4 – INVESTMENT ADVISORY FEE AND OTHER TRANSACTIONS WITH AFFILIATES
The Adviser serves as the investment adviser to the Fund. Pursuant to an Investment Advisory Agreement (“Advisory Agreement”) between the Trust, on behalf of the Fund, and the Adviser, the Adviser furnishes all investment advice, office space, and facilities, and provides most of the personnel needed by the Fund. Under the Advisory Agreement, the Adviser has agreed to pay all expenses of the Fund, except for: the fee paid to the Adviser pursuant to the Advisory Agreement, taxes and governmental fees, brokerage fees, commissions and other transaction expenses, certain foreign custodial fees and expenses, costs of borrowing money, including interest expenses, and extraordinary expenses (such as litigation and indemnification expenses and shareholder proxy). For the services it provides to the Fund, the Fund pays the Adviser a unified management fee, which is calculated daily and paid monthly, at an annual rate of 0.30% of the Fund’s average daily net assets.
The Adviser has overall responsibility for overseeing the investment of the Fund’s assets, managing the Fund’s business affairs, and providing certain clerical, bookkeeping and other administrative services for the Trust. Penserra Capital Management, LLC (“Penserra” or “the Sub-Adviser”) acts as the Sub-Adviser to the Fund. The Sub-Adviser has responsibility to make day-to-day investment decisions for the Fund and selects broker-dealers for executing portfolio transactions, subject to the Sub-Adviser’s best execution obligations
42
Reverb ETF
NOTES TO FINANCIAL STATEMENTS at October 31, 2023 (Unaudited), Continued
and the Trust’s and the Sub-Adviser’s brokerage policies. Sub-Advisory fees earned by Penserra are paid by the Adviser. For the services it provides to the Fund, the Sub-Adviser is compensated by the Adviser from the management fees paid by the Fund to the Adviser.
U.S. Bancorp Fund Services, LLC, doing business as U.S. Bank Global Fund Services (“Fund Services”) serves as the Fund’s administrator, fund accountant and transfer agent. U.S. Bank N.A. serves as custodian (the “Custodian”) to the Fund. The Custodian is an affiliate of Fund Services. Fund Services maintains the Fund’s books and records, calculates the Fund’s NAV, prepares various federal and state regulatory filings, coordinates the payment of fund expenses, reviews expense accruals and prepares materials supplied to the Board of Trustees. The officers of the Trust and the Chief Compliance Officer are also employees of Fund Services.
Quasar Distributors, LLC (“Quasar”) acts as the Fund’s principal underwriter in a continuous public offering of the Fund’s shares. Quasar is a wholly-owned broker-dealer subsidiary of Foreside Financial Group, LLC, doing business as ACA Foreside, a division of ACA Group.
NOTE 5 – PURCHASES AND SALES OF SECURITIES
For the six months ended October 31, 2023, the cost of purchases and the proceeds from sales of securities, excluding short-term securities, were $1,389,754 and $200,006, respectively.
For the six months ended October 31, 2023, in-kind transactions associated with creations and redemptions were $1,171,351 and $0, respectively. There were no purchases or sales of U.S. Government securities during the six months ended October 31, 2023.
During the six months ended October 31, 2023, the Fund realized net capital gains of $0 resulting from in-kind redemptions in which shareholders exchanged Fund shares for securities held by the Fund rather than for cash.
43
Reverb ETF
NOTES TO FINANCIAL STATEMENTS at October 31, 2023 (Unaudited), Continued
NOTE 6 – INCOME TAXES AND DISTRIBUTIONS TO SHAREHOLDERS
As of April 30, 2023, the Fund’s most recent fiscal year end, the components of accumulated earnings/(losses) on a tax basis were as follows:
| Cost of investments (a) | $ | 1,952,412 | |||
| Gross unrealized appreciation | 264,721 | ||||
| Gross unrealized depreciation | (63,103 | ) | |||
| Net unrealized appreciation (a) | 201,618 | ||||
| Undistributed ordinary income | 8,599 | ||||
| Undistributed long-term capital gain | — | ||||
| Total distributable earnings | 8,599 | ||||
| Other accumulated gain/(loss) | (2,433 | ) | |||
| Total accumulated gain/(loss) | $ | 207,784 |
| (a) | The difference between the book-basis and tax-basis net unrealized appreciation and cost is attributable to partnership adjustments. |
The tax character of distributions paid during the six months ended October 31, 2023 and the period ended April 30, 2023 was as follows:
October 31, 2023 | April 30, 2023 | ||
| Ordinary income | $ — | $5,409 |
As of April 30, 2023, the Fund has short-term capital loss carryforward of $2,414, which has no expiration.
NOTE 7 – PRINCIPAL RISKS
Below is a summary of some, but not all, of the principal risks of investing in the Fund, each of which may adversely affect the Fund’s net asset value and total return. The Fund’s most recent prospectus provides further descriptions of the Fund’s investment objective, principal investment strategies and principal risks.
| • | New Adviser Risk. The Adviser is a new entity formed in 2021 and has not previously managed an ETF. ETFs and their advisers are subject to restrictions and limitations imposed by the Investment Company Act of 1940, as amended (the “1940 Act”) and the Internal Revenue Code. As a result, investors do not have a long-term track record of managing a pooled investment vehicle from which to judge the newly-formed Adviser and the Adviser may not achieve the intended result in managing the Fund. | |
| • | Management Risk. The investment strategies, practices and risk analysis used by the Adviser may not produce the desired results. The ability of the Fund to meet its investment objective is directly related to the Adviser’s investment strategies for the Fund. If the Adviser’s investment strategies do not produce the expected results, your investment could be diminished or even lost. |
44
Reverb ETF
NOTES TO FINANCIAL STATEMENTS at October 31, 2023 (Unaudited), Continued
| • | Consumer Sentiment Risk. Investment decisions that are based primarily on consumer sentiment involve additional risks. Information received may be inaccurate, incomplete or misleading. Information received may be outdated or could be duplicative making the information ineffective for accurately gauging current sentiment. There is a possibility that users have an undisclosed agenda with an attempt to manipulate a company’s stock price. | |
| • | Research Risk. The Adviser does not conduct company research on any of the positions held in the portfolio outside of analysis of the sentiment data received from the Reverberate App. The Adviser also does not consider market developments or the status of the economy in its management of the Fund. The Adviser’s strategy is to base its investment decisions entirely on the expressions of sentiment as identified in the Reverberate App. As a result, the Fund is subject to the risks, which may be substantial, that negative developments effecting a held company, the economy, or markets in general, may not be apparent to the users of the Reverberate App. These negative developments could have significant negative impact on the value of your investment and the Fund’s portfolio. | |
| • | Reverberate App. The Reverberate App is a new web-based utility and currently has a limited number of users. The ability of the App to properly and accurately gauge public sentiment is highly dependent on its ability to attain a high level of regular usage among a broad market segment of the population. If the App is unable to draw sufficient users to express their views on a company, the Adviser will invest in the company at a level equal to its market-capitalization proportional to that of the Investable Universe. If the Adviser is unable to take material active positions due to lack of sufficient data or otherwise, the Fund will likely experience performance similar to the broad large capitalization market in general. In addition, while the App seeks to use tools and technology to identify and limit the influence of non-human users (Bots) or multiple votes by the same user, there is no guarantee that it will be successful in doing so. In that event, the information provided by the App may not properly reflect sentiment regarding a company, leading the Adviser to take active positions in a company that are inconsistent with true market sentiment. The investment strategy of relying entirely on general public sentiment as expressed on a web-based user app in order to take active positions is novel. The strategy may not work and this may have a significant negative impact on the value of your investment. | |
| • | General Market Risk. Economies and financial markets throughout the world are becoming increasingly interconnected, which increases the likelihood that events or conditions in one country or region will adversely |
45
Reverb ETF
NOTES TO FINANCIAL STATEMENTS at October 31, 2023 (Unaudited), Continued
| impact markets or issuers in other countries or regions. Securities in the Fund’s portfolio may underperform in comparison to securities in general financial markets, a particular financial market or other asset classes due to a number of factors, including: inflation (or expectations for inflation); interest rates; global demand for particular products or resources; natural disasters or events; pandemic diseases; terrorism; regulatory events; and government controls. U.S. and international markets have experienced significant periods of volatility in recent years and months due to a number of economic, political and global macro factors, which has resulted in disruptions to business operations and supply chains, stress on the global healthcare system, growth concerns in the U.S. and overseas, staffing shortages and the inability to meet consumer demand, and widespread concern and uncertainty. Continuing uncertainties regarding interest rates, rising inflation, political events, rising government debt in the U.S. and trade tensions also contribute to market volatility. As a result of continuing political tensions and armed conflicts, including the war between Ukraine and Russia, the U.S. and the European Union imposed sanctions on certain Russian individuals and companies, including certain financial institutions, and have limited certain exports and imports to and from Russia. The war has contributed to recent market volatility and may continue to do so. | ||
| • | Equity Securities Risk. The value of the Fund’s shares will go up or down based on the movement of the overall stock market and the value of the individual securities held by the Fund, both of which can sometimes be volatile. | |
| • | High Portfolio Turnover Risk. The Fund may be subject to increased trading based on the level of user responses received and this trading can lead to higher than normal portfolio turnover. The Fund may frequently buy and sell portfolio securities and other assets to rebalance the Fund’s exposure to specific securities. Higher portfolio turnover may result in the Fund paying higher levels of transaction costs and generating greater tax liabilities for shareholders. Portfolio turnover may cause the Fund’s performance to be less than you expect. | |
| • | ETF Risks. The Fund is an ETF, and, as a result of an ETF’s structure, it is exposed to the following risks: |
| • | Authorized Participants, Market Makers, and Liquidity Providers Concentration Risk. The Fund has a limited number of financial institutions that may act as Authorized Participants (“APs”). In addition, there may be a limited number of market makers and/or liquidity providers in the marketplace. To the extent either of the following events occur, Shares may trade at a material discount to NAV and possibly face delisting: (i) APs exit the business or otherwise become unable to |
46
Reverb ETF
NOTES TO FINANCIAL STATEMENTS at October 31, 2023 (Unaudited), Continued
| process creation and/or redemption orders and no other APs step forward to perform these services, or (ii) market makers and/or liquidity providers exit the business or significantly reduce their business activities and no other entities step forward to perform their functions. | ||
| • | Costs of Buying or Selling Shares. Due to the costs of buying or selling Shares, including brokerage commissions imposed by brokers and bid-ask spreads, frequent trading of Shares may significantly reduce investment results and an investment in Shares may not be advisable for investors who anticipate regularly making small investments. | |
| • | Shares May Trade at Prices Other Than NAV. As with all ETFs, Shares may be bought and sold in the secondary market at market prices. Although it is expected that the market price of Shares will approximate the Fund’s NAV, there may be times when the market price of Shares is more than the NAV intra-day (premium) or less than the NAV intra-day (discount) due to supply and demand of Shares or during periods of market volatility. This risk is heightened in times of market volatility, periods of steep market declines, and periods when there is limited trading activity for Shares in the secondary market, in which case such premiums or discounts may be significant. | |
| • | Trading. Although Shares are listed for trading on Cboe BZX Exchange, Inc. (the “Exchange”), and may be traded on U.S. exchanges other than the Exchange, there can be no assurance that Shares will trade with any volume, or at all, on any stock exchange. In stressed market conditions, the liquidity of Shares may begin to mirror the liquidity of the Fund’s underlying portfolio holdings, which can be significantly less liquid than Shares, and this could lead to differences between the market price of the Shares and the underlying value of those Shares. |
| • | Newer Fund Risk. The Fund is a recently organized investment company with a limited operating history. There can be no assurance that the Fund will grow to or maintain an economically viable size, in which case the Board may determine to liquidate the Fund. | |
| • | Sector Emphasis Risk. The securities of companies in the same or related businesses, if comprising a significant portion of the Fund’s portfolio, could react in some circumstances negatively to market conditions, interest rates and economic, regulatory or financial developments and adversely affect the value of the portfolio to a greater extent than if such business comprised a lesser portion of the Fund’s portfolio. The Adviser does not manage the Fund’s sector exposure so that at any given time the Fund may have significant exposure to individual sectors. |
47
Reverb ETF
NOTES TO FINANCIAL STATEMENTS at October 31, 2023 (Unaudited), Continued
NOTE 8 – TRUSTEES AND OFFICERS
At a meeting held on June 22-23, 2023, the Board of Trustees of the Trust appointed Ms. Lillian A. Kabakali as the Assistant Secretary of the Trust, effective July 10, 2023. Effective July 20, 2023, Mr. Michael L. Ceccato retired from his service as Vice President, Chief Compliance Officer and Anti-Money Laundering Officer of the Trust. At a meeting held on July 20, 2023, the Board of Trustees of the Trust appointed Mr. Joseph Kolinsky as the successor Vice President, Chief Compliance Officer and Anti-Money Laundering Officer of the Trust, effective July 20, 2023.
Effective October 18, 2023, Mr. Ray Woolson retired from his service as Trustee and Chairman of the Board of Trustees of the Trust (the “Board”) to attend to health-related matters. At the recommendation of the Nominating and Governance Committee, on October 24, 2023, the Board appointed Mr. David Mertens as the successor Chairman of the Board, and Ms. Michele Rackey was appointed as Chairman of the Nominating and Governance Committee of the Board.
48
Reverb ETF
NOTICE TO SHAREHOLDERS at October 31, 2023 (Unaudited)
How to Obtain a Copy of the Fund’s Proxy Voting Policies
A description of the policies and procedures that the Fund uses to determine how to vote proxies relating to portfolio securities is available without charge, upon request, by calling 1-800-617-0004 or on the SEC’s website at http://www.sec.gov.
How to Obtain a Copy of the Fund’s Proxy Voting Records for the 12-Month Period Ended June 30
Information regarding how the Fund voted proxies relating to portfolio securities during the most recent 12-month period ended June 30 is available without charge, upon request, by calling 1-800-617-0004. Furthermore, you can obtain the Fund’s proxy voting records on the SEC’s website at http://www.sec.gov.
Quarterly Filings on Form N-PORT
The Fund files its complete schedule of portfolio holdings with the SEC for the first and third quarters of each fiscal year on Part F of Form N-PORT. The Fund’s Form N-PORT is available on the SEC’s website at www.sec.gov. Information included in the Fund’s Form N-PORT is also available, upon request, by calling 1-800-617-0004.
Frequency Distribution of Premiums and Discounts
Information regarding how often shares of the Fund traded on the exchange at a price above (i.e., at a premium) or below (i.e., at a discount) the NAV of the Fund is available on the Fund’s website at www.reverb-etf.com.
49
Reverb ETF
HOUSEHOLDING (Unaudited)
In an effort to decrease costs, the Fund will reduce the number of duplicate prospectuses, supplements, and certain other shareholder documents that you receive by sending only one copy of each to those addresses shown by two or more accounts. Please call the Fund’s transfer agent toll free at 1-800-617-0004 to request individual copies of these documents. The Fund will begin sending individual copies 30 days after receiving your request. This policy does not apply to account statements.
50
Reverb ETF
STATEMENT REGARDING LIQUIDITY RISK MANAGEMENT PROGRAM (Unaudited)
The Fund has adopted a liquidity risk management program (the “program”). The Board has designated a committee at the Advisor to serve as the administrator of the program. The Advisor’s committee conducts the day-to-day operation of the program pursuant to policies and procedures administered by the committee.
Under the program, the Advisor’s committee manages the Fund’s liquidity risk, which is the risk that the Fund could not meet shareholder redemption requests without significant dilution of remaining shareholders’ interests in the Fund. This risk is managed by monitoring the degree of liquidity of the Fund’s investments, limiting the amount of the Fund’s illiquid investments, and utilizing various risk management tools and facilities available to the Fund for meeting shareholder redemptions, among other means. The committee’s process of determining the degree of liquidity of the Fund’s investments is supported by one or more third-party liquidity assessment vendors.
The Board reviewed a report prepared by the committee regarding the operation and effectiveness of the program for the period November 3, 2022 through June 30, 2023. No significant liquidity events impacting the Fund were noted in the report. In addition, the committee provided its assessment that the program had been effective in managing the Fund’s liquidity risk.
51
Reverb ETF
PRIVACY NOTICE
The Fund collects non-public information about you from the following sources:
• Information we receive about you on applications or other forms;
• Information you give us orally; and/or
• Information about your transactions with us or others.
We do not disclose any non-public personal information about our customers or former customers without the customer’s authorization, except as permitted by law or in response to inquiries from governmental authorities. We may share information with affiliated and unaffiliated third parties with whom we have contracts for servicing the Fund. We will provide unaffiliated third parties with only the information necessary to carry out their assigned responsibilities. We maintain physical, electronic and procedural safeguards to guard your non-public personal information and require third parties to treat your personal information with the same high degree of confidentiality.
In the event that you hold shares of the Fund through a financial intermediary, including, but not limited to, a broker-dealer, bank, or trust company, the privacy policy of your financial intermediary would govern how your non-public personal information would be shared by those entities with unaffiliated third parties.
52
(This Page Intentionally Left Blank.)
Advisor
Distribution Cognizant, LLC
288 Pearl Street, #304
Monterey, California 93940
Sub-Advisor
Penserra Capital Management, LLC
4 Orinda Way, Suite 100-A
Orinda, California 94563
Distributor
Quasar Distributors, LLC
111 East Kilbourn Avenue, Suite 2200
Milwaukee, Wisconsin 53202
Transfer Agent
U.S. Bank Global Fund Services
615 East Michigan Street
Milwaukee, Wisconsin 53202
(800) 617-0004
Custodian
U.S. Bank N.A.
1555 N. RiverCenter Drive, Suite 302
Milwaukee, Wisconsin 53212
Independent Registered Public Accounting Firm
Tait, Weller & Baker LLP
Two Liberty Place
50 South 16th Street, Suite 2900
Philadelphia, Pennsylvania 19102
Legal Counsel
Sullivan & Worcester LLP
1633 Broadway, 32nd Floor
New York, New York 10019
This report is intended for shareholders of the Fund and may not be used as sales literature unless preceded or accompanied by a current prospectus. For a current prospectus please call 1-800-617-0004.
| (b) | Not applicable. |
Item 2. Code of Ethics.
Not applicable for semi-annual reports.
Item 3. Audit Committee Financial Expert.
Not applicable for semi-annual reports.
Item 4. Principal Accountant Fees and Services.
Not applicable for semi-annual reports.
Item 5. Audit Committee of Listed Registrants.
| (a) | Not applicable for semi-annual reports. |
| (b) | Not applicable. |
Item 6. Investments.
| (a) | Schedule of Investments is included as part of the report to shareholders filed under Item 1 of this Form. |
| (b) | Not Applicable. |
Item 7. Disclosure of Proxy Voting Policies and Procedures for Closed-End Management Investment Companies.
Not applicable to open-end investment companies.
Item 8. Portfolio Managers of Closed-End Management Investment Companies.
Not applicable to open-end investment companies.
Item 9. Purchases of Equity Securities by Closed‑End Management Investment Company and Affiliated Purchasers.
Not applicable to open-end investment companies.
Item 10. Submission of Matters to a Vote of Security Holders.
There have been no material changes to the procedures by which shareholders may recommend nominees to the Registrant’s Board of Trustees.
Item 11. Controls and Procedures.
| (a) | The Registrant’s President/Chief Executive Officer/Principal Executive Officer and Vice President/Treasurer/Principal Financial Officer have reviewed the Registrant's disclosure controls and procedures (as defined in Rule 30a-3(c) under the Investment Company Act of 1940, as amended, (the “Act”)) as of a date within 90 days of the filing of this report, as required by Rule 30a-3(b) under the Act and Rules 13a-15(b) or 15d‑15(b) under the Securities Exchange Act of 1934. Based on their review, such officers have concluded that the disclosure controls and procedures are effective in ensuring that information required to be disclosed in this report is appropriately recorded, processed, summarized and reported and made known to them by others within the Registrant and by the Registrant’s service provider. |
| (b) | There were no changes in the Registrant's internal control over financial reporting (as defined in Rule 30a-3(d) under the Act) that occurred during the period covered by this report that has materially affected, or is reasonably likely to materially affect, the Registrant's internal control over financial reporting. |
Item 12. Disclosure of Securities Lending Activities for Closed-End Management Investment Companies.
Not applicable to open-end investment companies.
Item 13. Exhibits.
| (a) | (1) Any code of ethics or amendment thereto, that is the subject of the disclosure required by Item 2, to the extent that the registrant intends to satisfy Item 2 requirements through filing an exhibit. Not Applicable. |
(3) Any written solicitation to purchase securities under Rule 23c‑1 under the Act sent or given during the period covered by the report by or on behalf of the registrant to 10 or more persons. Not applicable to open-end investment companies.
(4) Change in the registrant’s independent public accountant. There was no change in the registrant’s independent public accountant for the period covered by this report.
SIGNATURES
Pursuant to the requirements of the Securities Exchange Act of 1934 and the Investment Company Act of 1940, the registrant has duly caused this report to be signed on its behalf by the undersigned, thereunto duly authorized.
(Registrant) Advisors Series Trust
By (Signature and Title)* /s/ Jeffrey T. Rauman
Jeffrey T. Rauman, President/Chief Executive
Officer/Principal Executive Officer
Date 1/5/24
Pursuant to the requirements of the Securities Exchange Act of 1934 and the Investment Company Act of 1940, this report has been signed below by the following persons on behalf of the registrant and in the capacities and on the dates indicated.
By (Signature and Title)* /s/ Jeffrey T. Rauman
Jeffrey T. Rauman, President/Chief Executive
Officer/Principal Executive Officer
Date 1/5/24
By (Signature and Title)* /s/ Kevin J. Hayden
Kevin J. Hayden, Vice President/Treasurer/Principal
Financial Officer
Date 1/5/24
* Print the name and title of each signing officer under his or her signature