Jeffrey T. Rauman, President/Chief Executive Officer
c/o U.S. Bancorp Fund Services, LLC

Semi-Annual Report
December 31, 2023
Dear Shareholder:
At the beginning of 2023, there was little optimism for strength in equity markets. With history as a guide, many investors anticipated that the Federal Reserve’s (“the Fed”) aggressive fight against inflation would cool the U.S. economy and likely push it into recession. This sentiment persisted in March, when several banks went bankrupt due to rapid deposit runs and funding issues. With higher cost of capital for businesses, consumers, and the government, the case for pessimism seemed reasonable.
However, as we like to remind ourselves at Davidson Funds, more things can happen than will. In spite of headwinds to economic growth, the domestic labor market remained strong – unemployment remained below 4% throughout 2023; the U.S. consumer continued to earn and spend; and energy markets fell throughout the year as ample supplies in the U.S. offset turmoil abroad. The nascent idea of Artificial Intelligence (AI) provided a boost to investor sentiment and propelled shares of technology and AI-exposed companies to record levels by the end of the year. Even the housing market - which many prognosticators expected to decline - has yet to exhibit broad-based distress (though housing affordability is plummeting to all-time lows in light of higher mortgage rates).
Whereas in early 2023 Fed Chair Jerome Powell was warning the market that he was willing to force unemployment higher and the economy into a recession to combat inflation, by the end of the year he was signaling rate cuts were coming in 2024.
Though the likelihood of a soft landing – or no landing at all – is higher, this path is not without potential issues. Inflation (albeit lower than in early 2023), burgeoning government deficits, and global turmoil continue to loom. In times like these, we believe a consistent, disciplined, and long-term approach to investing can help cut through the noise and position investors for capital preservation and growth. At Davidson Funds, our goal is to run an actively managed portfolio of quality companies with identifiable growth potential. Unconstrained by market capitalization and style, we focus on investing in companies and segments of the market where we view the greatest potential to achieve long-term risk-adjusted returns for our shareholders.
Performance
The Class A shares of the Fund generated a total return of 1.79% on a fully-loaded basis and 5.49% on a no-load* basis during the six-month period ended December 31, 2023. The Class I shares of the Fund returned 5.62% over the same time period. The S&P Composite 1500® Index, the benchmark for the Davidson Multi-Cap Equity Fund, returned 8.02% during the semi-annual fiscal period ended December 31, 2023.
The Information Technology sector was the Fund’s primary contributor to performance during the six-month period ending December 31, 2023, with shares of Arista Networks, Inc. (“Arista”), Splunk, Inc. (“Splunk”), and Intuit, Inc. (“Intuit”) notably appreciating. Arista reported fiscal third quarter earnings above consensus expectations and issued full-year guidance above consensus while maintaining their longer-term growth outlook. Cisco Systems, Inc. announced it would acquire Splunk for $157 per share in cash; the deal is expected to close by the end of third quarter of calendar year 2024, subject to regulatory approval. Intuit posted solid fiscal first quarter 2024 results, exceeding expectations for both revenue and earnings per share, led by the Small Business group, which saw 18% year-over-year revenue growth.
The Health Care sector was the Fund’s main detractor from performance, with shares of Align Technology, Inc. (“Align”) and Bristol-Myers Squibb Co. (“Bristol-Myers”) declining. Align’s third quarter earnings missed consensus expectations, given a weak macro environment and deteriorating pricing trends. Bristol-Myers reported disappointing third quarter results; the company lowered its near- and medium-term targets for its new product portfolio, as well as margin expectations, given unfavorable product mix and increased investments into said new product portfolio. Security selection in the Industrials sector also negatively impacted performance. RTX Corp. (“RTX”) experienced a manufacturing issue involving its geared turbofan (GTF) engine, which was broader in scope and would cost more than originally expected.
During the semi-annual fiscal period ended December 31, 2023, we exited our position in Sprouts Farmers Markets, Inc., as our investment thesis had played out, and initiated positions in Micron Technology, Inc. (“Micron”), Advanced Micro Devices, Inc. (“Advanced Micro”), and AstraZeneca PLC (“AstraZeneca”). Micron is an industry leader in innovative memory and storage solutions. It manufactures and markets a portfolio of high-performance DRAM, NAND and NOR memory and storage products. Over the next couple of years, we anticipate higher sales and profits from Micron driven by a cyclical recovery; rising memory content in PCs, servers, mobile phones, networking equipment and automobiles; and improving profitability due to industry consolidation. Advanced Micro produces semiconductor products and devices such as microprocessors, graphics and data processors, as well as field programmable gate arrays. The company is well-positioned in AI edge applications with its broad portfolio of products. AstraZeneca has leading positioning across Oncology, Biopharmaceuticals and Rare Disease. We are particularly excited about the company’s robust position in Antibody Drug Conjugates (ADCs), a new form of “smart chemotherapy.” The company’s current strategic priorities are to launch 15 new medicines by 2030 and have more than 50% of lung cancer patients treated by an AstraZeneca medicine.
Outlook
Markets cheered the now-prevailing view that the Fed has reached its limit in terms of interest rate increases. Given the substantial progress in slowing inflation and the increasing line of sight to its 2% target, it is likely the Fed will begin cutting rates in 2024, with the market having already priced in several cuts in the first half of the year. It remains to be seen if the Fed will share as optimistic of a view as the market when it comes to the timing and magnitude of rate cuts; however, to date, the Fed has been able to slow inflation without incurring significant job losses. A stronger economy risks inflation remaining stubbornly high, and therefore, the potential of fewer rate cuts.
We thank you for your continued support and confidence in Davidson Funds, and as always, welcome any questions or comments you may have.
Sincerely,

Andrew I. Davidson
President
Davidson Investment Advisors, Inc.
Must be preceded or accompanied by a prospectus.
Past performance does not guarantee future results. Investment performance reflects fee waivers and in the absence of these waivers returns would be lower.
Mutual fund investing involves risk. Principal loss is possible. Small- and medium-capitalization companies tend to have limited liquidity and greater price volatility than large-capitalization companies. Growth stocks typically are more volatile than value stocks; however, value stocks have a lower expected growth rate in earnings and sales. Investments in foreign securities involve greater volatility and political, economic and currency risks and differences in accounting methods. These risks are greater for emerging markets investments. Investments in exchange-traded funds (“ETFs”) are subject to additional risks that do not apply to conventional mutual funds, including the risks that the market price of an ETF’s shares may trade at a discount to its net asset value (“NAV”), an active secondary trading market may not develop or be maintained, or trading may be halted by the exchange in which they trade, which may impact a fund’s ability to sell its shares. The Fund will bear its share of the fees and expenses of the underlying funds. Shareholders will pay higher expenses than would be the case if making direct investments in the underlying funds.
The S&P Composite 1500® Index combines three leading indices, the S&P 500®, the S&P MidCap 400® and the S&P SmallCap 600® to cover approximately 90% of the U.S. market capitalization. It is designed for investors seeking to replicate the performance of the U.S. equity market or benchmark against a representative universe of tradeable stocks. One cannot invest directly in an index.
Fund holdings and/or sector allocations are subject to change at any time and are not recommendations to buy or sell any security. Please refer to the Schedule of Investments for a complete listing of Fund holdings. Current and future portfolio holdings are subject to risk.
The Global Industry Classification Standard (GICS®) was developed by and/or is the exclusive property of MSCI, Inc. and S&P Global Ratings (“S&P”). GICS is a service mark of MSCI and S&P and has been licensed for use by U.S. Bank Global Fund Services.
Diversification does not guarantee a profit or protect from loss in a declining market.
The opinions expressed in this letter are those of the Fund manager, are subject to change, are not guaranteed, and should not be considered recommendations to buy or sell any security.
*The no-load basis refers to the performance with front-end and back-end sales loads waived. Effective October 28, 2020, the fully-loaded returns reflect a 3.50% sales load for the A shares, reduced from 5.00%.
Davidson Investment Advisors, Inc. is the advisor to the Davidson Funds, which are distributed by Quasar Distributors, LLC.
Davidson Multi-Cap Equity Fund
EXPENSE EXAMPLE at December 31, 2023 (Unaudited)
Shareholders in mutual funds generally incur two types of costs: (1) transaction costs, including sales charges (loads) on purchase payments, reinvested dividends, or other distributions; redemption fees; and exchange fees; and (2) ongoing costs, including management fees; distribution and/or service fees; and other Fund expenses. This Example is intended to help you understand your ongoing costs (in dollars) of investing in the Fund and to compare these costs with the ongoing costs of investing in other mutual funds. The Example is based on an investment of $1,000 invested in Class A and Class I at the beginning of the period and held for the entire period (7/1/23 – 12/31/23).
Actual Expenses
The first line of the tables below provides information about actual account values and actual expenses. The Example below includes, but is not limited to, management fees, fund accounting, custody and transfer agent fees. However, the Example below does not include portfolio trading commissions and related expenses. In addition, you will be assessed fees for outgoing wire transfers, returned checks, and stop payment orders at prevailing rates charged by U.S. Bank Global Fund Services, the Fund’s transfer agent. You may use the information in the first line of the tables, together with the amount you invested, to estimate the expenses that you paid over the period. Simply divide your account value by $1,000 (for example, an $8,600 account value divided by $1,000 = 8.6), then multiply the result by the number in the first line under the heading entitled “Expenses Paid During Period’’ to estimate the expenses you paid on your account during this period.
Hypothetical Example for Comparison Purposes
The second line of the tables below provides information about hypothetical account values and hypothetical expenses based on the Fund’s actual expense ratio and an assumed rate of return of 5% per year before expenses, which is not the Fund’s actual return. The hypothetical account values and expenses may not be used to estimate the actual ending account balance or expenses you paid for the period. You may use this information to compare the ongoing costs of investing in the Fund and other funds. To do so, compare this 5% hypothetical example with the 5% hypothetical examples that appear in the shareholder reports of the other funds. Please note that the expenses shown in the tables are meant to highlight your ongoing costs only and will not help you determine the relative total costs of owning different funds, as they may charge transactional costs, such as sales charges (loads), redemption fees, or exchange fees. Therefore, the second line of the tables is useful in comparing ongoing costs only and will not help you determine the relative total costs of owning different funds. In addition, if these transactional costs were included, your costs would have been higher.
| Class A | | | | | | |
| | Beginning | | Ending | | Expenses Paid |
| | | Account Value | | Account Value | | During Period* |
| | | 7/1/23 | | 12/31/23 | | 7/1/23 - 12/31/23 |
| Actual | | $1,000.00 | | $1,054.90 | | $5.94 |
| Hypothetical (5% return before expenses) | | $1,000.00 | | $1,019.36 | | $5.84 |
*Expenses are equal to the Fund’s annualized expense ratio of 1.15%, multiplied by the average account value over the period, multiplied by 184 (days in most recent fiscal half-year)/366 days to reflect the one-half year expense.
Davidson Multi-Cap Equity Fund
EXPENSE EXAMPLE at December 31, 2023 (Unaudited), Continued
| Class I | |
| |
| |
|
| | | Beginning | | Ending | | Expenses Paid |
| | | Account Value | | Account Value | | During Period* |
| | | 7/1/23 | | 12/31/23 | | 7/1/23 - 12/31/23 |
| Actual | | $1,000.00 | | $1,056.20 | | $4.65 |
| Hypothetical (5% return before expenses) | | $1,000.00 | | $1,020.61 | | $4.57 |
*Expenses are equal to the Fund’s annualized expense ratio of 0.90%, multiplied by the average account value over the period, multiplied by 184 (days in most recent fiscal half-year)/366 days to reflect the one-half year expense.
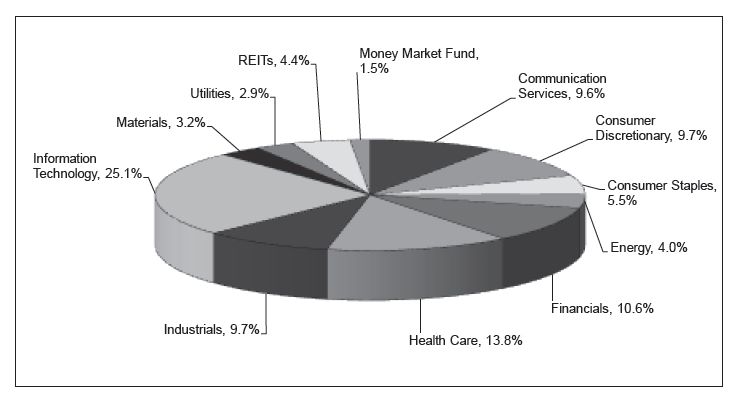
Davidson Multi-Cap Equity Fund
SECTOR ALLOCATION OF PORTFOLIO ASSETS at December 31, 2023 (Unaudited)
Percentages represent market value as a percentage of total investments.
The Global Industry Classification Standard (GICS®) was developed by and/or is the exclusive property of MSCI, Inc. and S&P Global Ratings (“S&P”). GICS is a service mark of MSCI and S&P and has been licensed for use by U.S. Bank Global Fund Services.
Davidson Multi-Cap Equity Fund
SCHEDULE OF INVESTMENTS at December 31, 2023 (Unaudited)
| Shares | | | COMMON STOCKS - 94.1% | | Value | |
| | | | | | | | |
| 27,235 | | | Aerospace & Defense — 1.9% RTX Corp. | | $ | 2,291,553 | |
| | | | | | | | |
| 9,290 | | | Air Freight & Logistics — 2.0% Fedex Corp. | | | 2,350,091 | |
| | | | | | | | |
| 21,707 | | | Automobile Components — 1.7% Aptiv PLC (a) | | | 1,947,552 | |
| | | | | | | | |
| 51,910 | | | Banks — 2.3% Citigroup, Inc. | | | 2,670,250 | |
| | | | | | | | |
| 10,342 | | | Beverages — 2.1% Constellation Brands, Inc. - Class A | | | 2,500,178 | |
| | | | | | | | |
| 5,611 | | | Biotechnology — 1.9% Vertex Pharmaceuticals, Inc. (a) | | | 2,283,060 | |
| | | | | | | | |
| 34,556 | | | Broadline Retail — 4.5% Amazon.com, Inc. (a) | | | 5,250,439 | |
| | | | | | | | |
| 7,881 | | | Capital Markets — 2.6% Goldman Sachs Group, Inc. | | | 3,040,253 | |
| | | | | | | | |
| 38,791 | | | Chemicals — 3.2% Corteva, Inc. | | | 1,858,865 | |
| 23,944 | | | HB Fuller Co. | | | 1,949,281 | |
| | | | | | | 3,808,146 | |
| 12,817 | | | Communications Equipment — 2.6% Arista Networks, Inc. (a) | | | 3,018,532 | |
| | | | | | | | |
| 15,744 | | | Consumer Staples Distribution & Retail — 2.1% Walmart, Inc. | | | 2,482,042 | |
| | | | | | | | |
| 44,593 | | | Electric Utilities — 1.4% Exelon Corp. | | | 1,600,889 | |
| | | | | | | | |
| 10,895 | | | Electrical Equipment — 2.2% Eaton Corp. PLC | | | 2,623,734 | |
| | | | | | | | |
| 13,884 | | | Entertainment — 3.4% Electronic Arts, Inc. | | | 1,899,470 | |
| 4,357 | | | Netflix, Inc. (a) | | | 2,121,336 | |
| | | | | | | 4,020,806 | |
The accompanying notes are an integral part of these financial statements.
Davidson Multi-Cap Equity Fund
SCHEDULE OF INVESTMENTS at December 31, 2023 (Unaudited), Continued
| Shares | | | COMMON STOCKS - 94.1% continued | | Value | |
| | | | | | | | |
| | | | Financial Services — 3.1% | | | | |
| 24,117 | | | PayPal Holdings, Inc. (a) | | $ | 1,481,025 | |
| 8,270 | | | Visa, Inc. - Class A | | | 2,153,094 | |
| | | | | | | 3,634,119 | |
| | | | Health Care Equipment & Supplies — 4.9% | | | | |
| 4,866 | | | Align Technology, Inc. (a) | | | 1,333,284 | |
| 9,681 | | | Becton, Dickinson & Co. | | | 2,360,518 | |
| 25,040 | | | Medtronic PLC | | | 2,062,795 | |
| | | | | | | 5,756,597 | |
| | | | Health Care Providers & Services — 4.0% | | | | |
| 7,904 | | | Cigna Group | | | 2,366,853 | |
| 10,494 | | | Laboratory Corp. of America Holdings | | | 2,385,181 | |
| | | | | | | 4,752,034 | |
| | | | Hotels, Restaurants & Leisure — 1.6% | | | | |
| 20,059 | | | Starbucks Corp. | | | 1,925,865 | |
| | | | | | | | |
| | | | Industrial Conglomerates — 1.5% | | | | |
| 8,497 | | | Honeywell International, Inc. | | | 1,781,906 | |
| | | | | | | | |
| | | | Insurance — 2.7% | | | | |
| 19,777 | | | Progressive Corp. | | | 3,150,081 | |
| | | | | | | | |
| | | | Interactive Media & Services — 4.2% | | | | |
| 35,176 | | | Alphabet, Inc. - Class C (a) | | | 4,957,354 | |
| | | | | | | | |
| | | | Machinery — 2.0% | | | | |
| 26,804 | | | Otis Worldwide Corp. | | | 2,398,154 | |
| | | | | | | | |
| | | | Multi-Utilities — 1.5% | | | | |
| 24,231 | | | Sempra | | | 1,810,783 | |
| | | | | | | | |
| | | | Oil, Gas & Consumable Fuels — 4.0% | | | | |
| 15,849 | | | Chevron Corp. | | | 2,364,037 | |
| 19,367 | | | EOG Resources, Inc. | | | 2,342,438 | |
| | | | | | | 4,706,475 | |
| | | | Personal Care Products — 1.2% | | | | |
| 9,915 | | | Estee Lauder Cos., Inc. - Class A | | | 1,450,069 | |
The accompanying notes are an integral part of these financial statements.
Davidson Multi-Cap Equity Fund
SCHEDULE OF INVESTMENTS at December 31, 2023 (Unaudited), Continued
| Shares | | | COMMON STOCKS - 94.1% continued | | Value | |
| | | | | | | | |
| | | | Pharmaceuticals — 3.0% | | | | |
| 26,482 | | | AstraZeneca PLC - ADR | | $ | 1,783,562 | |
| 33,241 | | | Bristol-Myers Squibb Co. | | | 1,705,596 | |
| | | | | | | 3,489,158 | |
| | | | Semiconductors & Semiconductor Equipment — 4.4% | | | | |
| 15,630 | | | Advanced Micro Devices, Inc. (a) | | | 2,304,018 | |
| 17,508 | | | Micron Technology, Inc. | | | 1,494,133 | |
| 10,516 | | | Silicon Laboratories, Inc. (a) | | | 1,390,951 | |
| | | | | | | 5,189,102 | |
| | | | Software — 14.1% | | | | |
| 32,595 | | | Fortinet, Inc. (a) | | | 1,907,785 | |
| 4,818 | | | Intuit, Inc. | | | 3,011,395 | |
| 14,002 | | | Microsoft Corp. | | | 5,265,312 | |
| 13,086 | | | Salesforce, Inc. (a) | | | 3,443,450 | |
| 19,905 | | | Splunk, Inc. (a) | | | 3,032,527 | |
| | | | | | | 16,660,469 | |
| | | | Technology Hardware, Storage & Peripherals — 4.0% | | | | |
| 24,792 | | | Apple, Inc. | | | 4,773,204 | |
| | | | | | | | |
| | | | Textiles, Apparel & Luxury Goods — 2.0% | | | | |
| 70,203 | | | Gildan Activewear, Inc. | | | 2,320,911 | |
| | | | | | | | |
| | | | Wireless Telecommunication Services — 2.0% | | | | |
| 14,325 | | | T-Mobile US, Inc. | | | 2,296,727 | |
| | | | | | | | |
| | | | TOTAL COMMON STOCKS (COST $62,456,827) | | | 110,940,533 | |
| | | | | | | | |
| | | | REITs - 4.4% | | | | |
| | | | | | | | |
| | | | Mortgage Real Estate Investment Trusts — 1.3% | | | | |
| | | AGNC Investment Corp. | | | 1,613,745 | |
| | | | | | | | |
| | | | Residential REITs — 1.5% | | | | |
| 17,769 | | | Camden Property Trust | | | 1,764,284 | |
| | | | | | | | |
| | | | Specialized REITs — 1.6% | | | | |
| 40,219 | | | CubeSmart | | | 1,864,151 | |
| | | | | | | | |
| | | | TOTAL REITs (COST $4,003,004) | | | 5,242,180 | |
The accompanying notes are an integral part of these financial statements.
Davidson Multi-Cap Equity Fund
SCHEDULE OF INVESTMENTS at December 31, 2023 (Unaudited), Continued
| Shares | | | MONEY MARKET FUND - 1.5% | | Value | |
| | | | | | | | |
| | | First American Government Obligations Fund, Class X, 5.29% (b) | | $ | 1,797,614 | |
| | | | TOTAL MONEY MARKET FUND (COST $1,797,614) | | | 1,797,614 | |
| | | | | | | | |
| | | | Total Investments (Cost $68,257,445) — 100.0% | | | 117,980,327 | |
| | | | Liabilities in Excess of Other Assets — (0.0)% | | | (15,937 | ) |
| | | | TOTAL NET ASSETS — 100.00% | | $ | 117,964,390 | |
The Global Industry Classification Standard (GICS®) was developed by and/or is the exclusive property of MSCI, Inc. and Standard & Poor’s Financial Services LLC (“S&P”). GICS is a service mark of MSCI and S&P and has been licensed for use by U.S. Bank Global Fund Services.
| ADR | | American Depositary Receipt |
| PLC | | Public Limited Company |
| REIT | | Real Estate Investment Trust |
| (a) | | Non-income producing security. |
| (b) | | Rate shown is the 7-day annualized yield as of December 31, 2023. |
The accompanying notes are an integral part of these financial statements.
Davidson Multi-Cap Equity Fund
STATEMENT OF ASSETS AND LIABILITIES at December 31, 2023 (Unaudited)
| ASSETS: | | | |
| Investments in securities, at value (identified cost $68,257,445) | | $ | 117,980,327 | |
| Receivables | | | | |
| Fund shares sold | | | 36,290 | |
| Dividends and interest | | | 123,075 | |
| Prepaid expenses | | | 27,140 | |
| Total assets | | | 118,166,832 | |
LIABILITIES: Payables | | |
| |
| Fund shares redeemed | | | 33,897 | |
| Advisory fee (Note 4) | | | 49,043 | |
| 12b-1 distribution fees - Class A | | | 38,272 | |
| Administration fees | | | 29,320 | |
| Transfer agent fees and expenses | | | 13,905 | |
| Audit fees | | | 11,312 | |
| Fund accounting fees | | | 10,904 | |
| Custody fees | | | 4,733 | |
| Shareholder reporting | | | 3,454 | |
| Chief Compliance Officer fees | | | 2,540 | |
| Trustee fees and expenses | | | 866 | |
| Other expenses | | | 4,196 | |
| Total liabilities | | | 202,442 | |
| | | | | |
| NET ASSETS | | $ | 117,964,390 | |
| | | | | |
| COMPONENTS OF NET ASSETS: | | | | |
| Paid-in capital | | $ | 69,853,480 | |
| Total distributable earnings | | | 48,110,910 | |
| Net assets | | $ | 117,964,390 | |
CALCULATION OF NET ASSET VALUE PER SHARE: Class A Net assets applicable to shares outstanding | | $ | 61,042,364 | |
| Shares issued and outstanding [unlimited number of shares (par value $0.01) authorized] | | | 2,067,778
| |
Net asset value and redemption price per share (1) | | $ | 29.52 | |
| Maximum offering price per share (Net asset value per share divided by 96.50%) | | $ | 30.59
| |
| |
|
| |
| Class I | | | | |
| Net assets applicable to shares outstanding | | $ | 56,922,026 | |
| Shares issued and outstanding [unlimited number of shares (par value $0.01) authorized] | | | 1,931,719
| |
| Net asset value, redemption and offering price per share (1) | | $ | 29.47
| |
| (1) | Effective October 28, 2023, the Fund does not charge redemption fees. Prior to October 28, 2023 a redemption fee of 1.00% was assessed against shares held for seven calendar days or less. |
The accompanying notes are an integral part of these financial statements.
Davidson Multi-Cap Equity Fund
STATEMENT OF OPERATIONS For the Six Months Ended December 31, 2023 (Unaudited)
| INVESTMENT INCOME | | | |
| Income | | | |
| Dividends (net of withholding taxes of $4,624) | | $ | 877,777 | |
| Interest | | | 85,280 | |
| Total investment income | | | 963,057 | |
| Expenses | | | | |
| Advisory fees (Note 4) | | | 367,942 | |
| Administration fees (Note 4) | | | 86,197 | |
| 12b-1 distribution fees - Class A (Note 5) | | | 75,228 | |
| Transfer agent fees and expenses (Note 4) | | | 37,922 | |
| Fund accounting fees (Note 4) | | | 33,535 | |
| Federal and state registration fees | | | 16,984 | |
| Audit fees | | | 11,311 | |
| Trustee fees and expenses | | | 8,990 | |
| Chief Compliance Officer fee (Note 4) | | | 7,540 | |
| Custody fees (Note 4) | | | 7,131 | |
| Reports to shareholders | | | 5,653 | |
| Legal fees | | | 4,366 | |
| Insurance expense | | | 2,429 | |
| Other expenses | | | 5,524 | |
| Total expenses before advisory fee waiver | | | 670,752 | |
| Less: advisory fee waiver (Note 4) | | | (86,066 | ) |
| Net expenses | | | 584,686 | |
| Net investment income | | | 378,371 | |
| REALIZED AND UNREALIZED GAIN/(LOSS) ON INVESTMENTS AND REDEMPTION IN-KIND: | | | | |
| Net realized loss on investments | | | (254,355 | ) |
| Net realized gain on redemption in-kind | | | 663,453 | |
| Net change in unrealized appreciation/(depreciation) on investments | | | 5,302,653 | |
| Net realized and unrealized gain on investments and redemption in-kind | | | 5,711,751 | |
| Net increase in net assets resulting from operations | | $ | 6,090,122 | |
The accompanying notes are an integral part of these financial statements.
Davidson Multi-Cap Equity Fund
STATEMENTS OF CHANGES IN NET ASSETS
| | | Six Month Ended | | | | |
| | | December 31, 2023 | | | Year Ended | |
| | (Unaudited) | | | June 30, 2023 | |
| INCREASE/(DECREASE) IN NET ASSETS FROM OPERATIONS: | | | |
| Net investment income | | $ | 378,371 | | | $ | 414,764 | |
| Net realized gain/(loss) on investments | | | (254,355 | ) | | | 3,066,147 | |
| Net realized gain on redemption in-kind | | | 663,453 | | | | 3,618,488 | |
| Capital Gain Distributions from regulated investment companies | | | — | | | | 3 | |
| Net change in unrealized appreciation/(depreciation) on investments | | | 5,302,653 | | | | 8,494,809 | |
| Net increase in net assets resulting from operations | | | 6,090,122 | | | | 15,594,211 | |
| | | | | | | | | |
| DISTRIBUTIONS TO SHAREHOLDERS: | | | | | | | | |
| Net dividends and distributions to shareholders - Class A | | | (1,275,998 | ) | | | (6,215,717 | ) |
| Net dividends and distributions to shareholders - Class I | | | (1,296,279 | ) | | | (4,471,951 | ) |
| Total distributions to shareholders | | | (2,572,277 | ) | | | (10,687,668 | ) |
| | | | | | | | | |
| CAPITAL SHARE TRANSACTIONS: | | | | | | | | |
| Net increase/(decrease) in net assets derived from net change in outstanding shares (a) | | | 1,692,082 | | | | (3,602,087 | ) |
| Total increase in net assets | | | 5,209,927 | | | | 1,304,456 | |
| | | | | | | | | |
| NET ASSETS: | | | | | | | | |
| Beginning of period | | | 112,754,463 | | | | 111,450,007 | |
| End of period | | $ | 117,964,390 | | | $ | 112,754,463 | |
| (a) | A summary of share transactions can be found on the following page. |
The accompanying notes are an integral part of these financial statements.
Davidson Multi-Cap Equity Fund
STATEMENTS OF CHANGES IN NET ASSETS, Continued
| | | Class A | |
| | | Six Months Ended | | | | | | | |
| | | December 31, 2023 | | | Year Ended | |
| | | (Unaudited) | | | June 30, 2023 | |
| | | | Shares | | | | Paid-in Capital | | | | Shares | | | | Paid-in Capital | |
| Shares sold | | | 51,777 | | | $ | 1,493,831 | | | | 43,367 | | | $ | 1,189,358 | |
| Shares issued on reinvestments of distributions | | | 39,822 | | | | 1,127,748 | | | | 215,285 | | | | 5,711,499 | |
| Shares redeemed | | | (153,886 | ) | | | (4,382,969 | ) | | | (484,352 | ) | | | (13,587,933 | ) |
| Net decrease | | | (62,287 | ) | | $ | (1,762,390 | ) | | | (225,700 | ) | | $ | (6,687,076 | ) |
| | | Class I | |
| | | Six Months Ended | | | | | | | |
| | | December 31, 2023 | | | Year Ended | |
| | | (Unaudited) | | | June 30, 2023 | |
| | | | Shares | | | | Paid-in Capital | | | | Shares | | | | Paid-in Capital | |
| Shares sold | | | 264,518 | | | $ | 7,524,542 | | | | 411,439 | | | $ | 11,332,854 | |
| Shares issued on reinvestments of distributions | | | 34,692 | | | | 980,742 | | | | 145,696 | | | | 3,858,040 | |
| Shares redeemed* | | | (180,427 | ) | | | (5,050,812 | ) | | | (418,797 | ) | | | (12,105,905 | ) |
| Net increase | | | 118,783 | | | $ | 3,454,472 | | | | 138,338 | | | $ | 3,084,989 | |
| | | | | | | | | | | | | | | | | |
| * Net of redemption fees of | | | | | | $ | 5 | | | | | | | $ | — | |
The accompanying notes are an integral part of these financial statements.
Davidson Multi-Cap Equity Fund - Class A
FINANCIAL HIGHLIGHTS
For a share outstanding throughout each period
| | | Six Months Ended | | | | | | | | | | | | | | | | |
| | | December 31, 2023 | | | Year Ended June 30, | |
| | | (Unaudited) | | | 2023 | | | 2022 | | | 2021 | | | 2020 | | | 2019 | |
| Net asset value, beginning of period | | $ | 28.60 | | | $ | 27.65 | | | $ | 32.80 | | | $ | 24.99 | | | $ | 25.26 | | | $ | 26.01 | |
| Income from investment operations: | | | | | | | | | | | | | | | | | | | | | | | | |
| Net investment income^ | | | 0.08 | | | | 0.08 | | | | 0.05 | | | | 0.13 | | | | 0.16 | | | | 0.15 | |
| Net realized and unrealized gain/(loss) on investments | | | 1.47 | | | | 3.83 | | | | (2.29 | ) | | | 10.98 | | | | 1.40 | | | | 1.58 | |
| Total from investment operations | | | 1.55 | | | | 3.91 | | | | (2.24 | ) | | | 11.11 | | | | 1.56 | | | | 1.73 | |
| | | | | | | | | | | | | | | | | | | | | | | | | |
Less distributions: From net investment income | | | (0.10 | ) | | | (0.07 | ) | | | (0.07 | ) | | | (0.13 | ) | | | (0.15 | ) | | | (0.36 | ) |
| From net realized gain on investments | | | (0.53 | ) | | | (2.89 | ) | | | (2.84 | ) | | | (3.17 | ) | | | (1.68 | ) | | | (2.12 | ) |
| Total distributions | | | (0.63 | ) | | | (2.96 | ) | | | (2.91 | ) | | | (3.30 | ) | | | (1.83 | ) | | | (2.48 | ) |
| | | | | | | | | | | | | | | | | | | | | | | | | |
| Redemption fees retained | | | — | | | | — | | | | 0.00 | ^# | | | — | | | | — | | | | 0.00 | ^# |
| Net asset value, end of period | | $ | 29.52 | | | $ | 28.60 | | | $ | 27.65 | | | $ | 32.80 | | | $ | 24.99 | | | $ | 25.26 | |
| | | | | | | | | | | | | | | | | | | | | | | | | |
| Total return | | | 5.49 | %‡ | | | 14.98 | % | | | -8.10 | % | | | 47.29 | % | | | 6.20 | % | | | 7.71 | % |
| | | | | | | | | | | | | | | | | | | | | | | | | |
Ratios/supplemental data: Net assets, end of period (thousands) | | $ | 61,042 | | | $ | 60,926 | | | $ | 65,143 | | | $ | 79,939 | | | $ | 61.821 | | | $ | 70,763 | |
| Ratio of expenses to average net assets: | | | | | | | | | | | | | | | | | | | | | | | | |
| Before fee waivers | | | 1.30 | %† | | | 1.30 | % | | | 1.26 | % | | | 1.26 | % | | | 1.30 | % | | | 1.28 | % |
| After fee waivers | | | 1.15 | %† | | | 1.15 | % | | | 1.15 | % | | | 1.15 | % | | | 1.15 | % | | | 1.15 | % |
| Ratio of net investment income to average net assets: | | | | | | | | | | | | | | | | | | | | | | | | |
| Before fee waivers | | | 0.40 | %† | | | 0.12 | % | | | 0.04 | % | | | 0.33 | % | | | 0.48 | % | | | 0.47 | % |
| After fee waivers | | | 0.55 | %† | | | 0.27 | % | | | 0.15 | % | | | 0.44 | % | | | 0.63 | % | | | 0.60 | % |
| Portfolio turnover rate | | | 20.16 | %‡ | | | 16.44 | % | | | 15.60 | % | | | 25.04 | % | | | 22.69 | % | | | 21.39 | % |
^ Based on average shares outstanding.
# Amount is less than $0.01 per share.
† Annualized.
‡ Not annualized.
The accompanying notes are an integral part of these financial statements.
Davidson Multi-Cap Equity Fund - Class I
FINANCIAL HIGHLIGHTS
For a share outstanding throughout each period
| | | Six Months Ended | | | | | | | | | | | | | | | | |
| | | December 31, 2023 | | | Year Ended June 30, | |
| | | (Unaudited) | | | 2023 | | | 2022 | | | 2021 | | | 2020 | | | 2019 | |
| Net asset value, beginning of period | | $ | 28.59 | | | $ | 27.65 | | | $ | 32.80 | | | $ | 24.99 | | | $ | 25.06 | | | $ | 26.06 | |
| Income from investment operations: | | | | | | | | | | | | | | | | | | | | | | | | |
| Net investment income^ | | | 0.11 | | | | 0.15 | | | | 0.13 | | | | 0.20 | | | | 0.22 | | | | 0.23 | |
| Net realized and unrealized gain/(loss) on investments | | | 1.47 | | | | 3.83 | | | | (2.29 | ) | | | 10.98 | | | | 1.41 | | | | 1.55 | |
| Total from investment operations | | | 1.58 | | | | 3.98 | | | | (2.16 | ) | | | 11.18 | | | | 1.63 | | | | 1.78 | |
| | | | | | | | | | | | | | | | | | | | | | | | | |
| Less distributions: | | | | | | | | | | | | | | | | | | | | | | | | |
| From net investment income | | | (0.17 | ) | | | (0.15 | ) | | | (0.15 | ) | | | (0.20 | ) | | | (0.22 | ) | | | (0.46 | ) |
| From net realized gain on investments | | | (0.53 | ) | | | (2.89 | ) | | | (2.84 | ) | | | (3.17 | ) | | | (1.68 | ) | | | (2.12 | ) |
| Total distributions | | | (0.70 | ) | | | (3.04 | ) | | | (2.99 | ) | | | (3.37 | ) | | | (1.90 | ) | | | (2.58 | ) |
| | | | | | | | | | | | | | | | | | | | | | | | | |
| Redemption fees retained | | | 0.00 | ^# | | | — | | | | 0.00 | ^# | | | — | | | | 0.00 | ^# | | | — | |
| | | | | | | | | | | | | | | | | | | | | | | | | |
| Net asset value, end of period | | $ | 29.47 | | | $ | 28.59 | | | $ | 27.65 | | | $ | 32.80 | | | $ | 24.99 | | | $ | 25.26 | |
| | | | | | | | | | | | | | | | | | | | | | | | | |
| Total return | | | | | | | | | | | | | | | | | | | | | | | | |
| | | | 5.62 | %‡ | | | 15.28 | % | | | -7.87 | % | | | 47.65 | % | | | 6.47 | % | | | 7.96 | % |
| Ratios/supplemental data: | | | | | | | | | | | | | | | | | | | | | | | | |
| Net assets, end of period (thousands) | | $ | 56,922 | | | $ | 51,828 | | | $ | 46,307 | | | $ | 54,106 | | | $ | 39,419 | | | $ | 41,261 | |
| Ratio of expenses to average net assets: | | | | | | | | | | | | | | | | | | | | | | | | |
| Before fee waivers | | | 1.05 | %† | | | 1.05 | % | | | 1.01 | % | | | 1.01 | % | | | 1.05 | % | | | 1.03 | % |
| After fee waivers | | | 0.90 | %† | | | 0.90 | % | | | 0.90 | % | | | 0.90 | % | | | 0.90 | % | | | 0.90 | % |
| Ratio of net investment income to average net assets: | | | | | | | | | | | | | | | | | | | | | | | | |
| Before fee waivers | | | 0.65 | %† | | | 0.38 | % | | | 0.29 | % | | | 0.58 | % | | | 0.73 | % | | | 0.77 | % |
| After fee waivers | | | 0.80 | %† | | | 0.53 | % | | | 0.40 | % | | | 0.69 | % | | | 0.88 | % | | | 0.90 | % |
| Portfolio turnover rate | | | 20.16 | %‡ | | | 16.44 | % | | | 15.60 | % | | | 25.04 | % | | | 22.69 | % | | | 21.39 | % |
^ Based on average shares outstanding.
# Amount is less than $0.01 per share.
† Annualized.
‡ Not annualized.
The accompanying notes are an integral part of these financial statements.
Davidson Multi-Cap Equity Fund
NOTES TO FINANCIAL STATEMENTS at December 31, 2023 (Unaudited)
NOTE 1 – ORGANIZATION
The Davidson Multi-Cap Equity Fund (the “Fund”) is a diversified series of Advisors Series Trust (the “Trust”), which is registered under the Investment Company Act of 1940, as amended, (the “1940 Act”) as an open-end management investment company. The Fund follows the investment company accounting and reporting guidance of the Financial Accounting Standards Board (“FASB”) Accounting Standard Codification Topic 946 “Financial Services – Investment Companies”. The Fund’s investment objective is to seek long-term capital appreciation. The Fund offers Class A and Class I shares. The Fund’s Class A shares and Class I shares commenced operations on August 11, 2008 and October 30, 2013, respectively. Class A shares are subject to a maximum front-end sales load of 3.50%, which decreases depending on the amount invested.
NOTE 2 – SIGNIFICANT ACCOUNTING POLICIES
The following is a summary of significant accounting policies consistently followed by the Fund. These policies are in conformity with accounting principles generally accepted in the United States of America.
| A. | Security Valuation: All investments in securities are recorded at their estimated fair value, as described in Note 3. |
| B. | Federal Income Taxes: It is the Fund’s policy to comply with the requirements of Subchapter M of the Internal Revenue Code applicable to regulated investment companies and to distribute substantially all of its taxable income to its shareholders. Therefore, no Federal income or excise tax provision is required. |
The Fund recognizes the tax benefits of uncertain tax positions only where the position is “more likely than not” to be sustained assuming examination by tax authorities. The tax returns of the Fund’s prior three fiscal years are open for examination. Management has reviewed all open tax years in major jurisdictions and concluded that there is no impact on the Fund’s net assets and no tax liability resulting from unrecognized tax events relating to uncertain income tax positions taken or expected to be taken on the tax return. The Fund identifies its major tax jurisdictions as U.S. Federal and the state of Wisconsin; however the Fund is not aware of any tax positions for which it is reasonably possible that the total amounts of unrecognized tax benefits will change materially in the next twelve months.
| C. | Securities Transactions, Income and Distributions: Securities transactions are accounted for on the trade date. Realized gains and losses on securities sold are determined on a last-in, first-out basis. Interest income is recorded on an accrual basis. Dividend income, income and capital gain distributions from underlying funds, and distributions to shareholders are recorded on the ex-dividend date. Withholding taxes on foreign dividends have been provided for in accordance with the Fund’s understanding of the applicable country’s tax rules and rates. |
Investment income, expenses (other than those specific to the class of shares), and realized and unrealized gains and losses on investments are allocated to the separate classes of the Fund based upon their relative net assets on the date income is earned or expensed and realized and unrealized gains and losses are incurred.
The Fund is charged for those expenses that are directly attributable to it, such as investment advisory, custody and transfer agent fees. Common expenses of the Trust are typically allocated among the funds in the Trust based on a fund’s respective net assets, or by other equitable means.
Davidson Multi-Cap Equity Fund
NOTES TO FINANCIAL STATEMENTS at December 31, 2023 (Unaudited), Continued
The Fund distributes substantially all net investment income, if any, and net realized capital gains, if any, annually. Distributions from net realized gains for book purposes may include short-term capital gains. All short-term capital gains are included in ordinary income for tax purposes. The amount of dividends and distributions to shareholders from net investment income and net realized capital gains is determined in accordance with Federal income tax regulations, which differs from accounting principles generally accepted in the United States of America. To the extent these book/tax differences are permanent, such amounts are reclassified within the capital accounts based on their Federal tax treatment.
| D. | Reclassification of Capital Accounts: Accounting principles generally accepted in the United States of America require that certain components of net assets relating to permanent differences be reclassified between financial and tax reporting. These reclassifications have no effect on net assets or net asset value per share. |
| E. | Use of Estimates: The preparation of financial statements in conformity with accounting principles generally accepted in the United States of America requires management to make estimates and assumptions that affect the reported amounts of assets and liabilities at the date of the financial statements and the reported amounts of increases and decreases in net assets during the reporting period. Actual results could differ from those estimates. |
| F. | Redemption Fees: Effective October 28, 2023, the Fund does not charge a redemption fee. Prior to October 28, 2023, the Fund charged a 1.00% redemption fee to shareholders who redeemed shares held for seven days or less. Such fees are retained by the Fund and accounted for as an addition to paid-in capital. Redemption fees retained are disclosed in the statements of change of net assets. |
| G. | Events Subsequent to the Fiscal Period End: In preparing the financial statements as of December 31, 2023, management considered the impact of subsequent events for potential recognition or disclosure in the financial statements. Management has determined there were no subsequent events that would need to be disclosed in the Fund’s financial statements. |
NOTE 3 – SECURITIES VALUATION
The Fund has adopted authoritative fair value accounting standards which establish an authoritative definition of fair value and set out a hierarchy for measuring fair value. These standards require additional disclosures about the various inputs and valuation techniques used to develop the measurements of fair value, a discussion in changes in valuation techniques and related inputs during the period and expanded disclosure of valuation levels for majority security types. These inputs are summarized in the three broad levels listed below:
| ● | Level 1 – Unadjusted quoted prices in active markets for identical assets or liabilities that the Fund has the ability to access. |
| ● | Level 2 – Observable inputs other than quoted prices included in Level 1 that are observable for the asset or liability, either directly or indirectly. These inputs may include quoted prices for the identical instrument on an inactive market, prices for similar instruments, interest rates, prepayment speeds, credit risk, yield curves, default rates and similar data. |
Davidson Multi-Cap Equity Fund
NOTES TO FINANCIAL STATEMENTS at December 31, 2023 (Unaudited), Continued
| ● | Level 3 – Unobservable inputs for the asset or liability, to the extent relevant observable inputs are not available, representing the Fund’s own assumptions about the assumptions a market participant would use in valuing the asset or liability, and would be based on the best information available. |
Following is a description of the valuation techniques applied to the Fund’s major categories of assets and liabilities measured at fair value on a recurring basis.
The Fund determines the fair value of its investments and computes its net asset value per share as of the close of regular trading on the New York Stock Exchange (4:00 pm EST).
Equity Securities: The Fund’s investments are carried at fair value. Equity securities, including common stocks, real estate investment trusts, and exchange-traded funds, that are primarily traded on a national securities exchange shall be valued at the last sale price on the exchange on which they are primarily traded on the day of valuation or, if there has been no sale on such day, at the mean between the bid and asked prices. Securities primarily traded in the NASDAQ Global Market System for which market quotations are readily available shall be valued using the NASDAQ Official Closing Price (“NOCP”). If the NOCP is not available, such securities shall be valued at the last sale price on the day of valuation, or if there has been no sale on such day, at the mean between the bid and asked prices. Over-the-counter securities which are not traded in the NASDAQ Global Market System shall be valued at the most recent sales price. To the extent, these securities are actively traded and valuation adjustments are not applied, they are categorized in Level 1 of the fair value hierarchy.
Investment Companies: Investments in open-end mutual funds, including money market funds, are generally priced at their net asset value per share provided by the service agent of the funds and will be classified in Level 1 of the fair value hierarchy.
Short-Term Debt Securities: Short-term debt securities, including those securities having a maturity of 60 days or less, are valued at the evaluated mean between the bid and asked prices. To the extent the inputs are observable and timely, these securities would be classified in Level 2 of the fair value hierarchy.
Accounting Pronouncements: The Board of Trustees (the “Board”) has adopted a valuation policy for use by the Fund and its Valuation Designee (as defined below) in calculating the Fund’s net asset value (“NAV”). Pursuant to Rule 2a-5 under the 1940 Act, the Board has designated the Fund’s investment advisor, Davidson Investment Advisors, Inc. (“Advisor”), as the “Valuation Designee” to perform all of the fair value determinations as well as to perform all of the responsibilities that may be performed by the Valuation Designee in accordance with Rule 2a-5, subject to the Board’s oversight. The Advisor, as Valuation Designee is, authorized to make all necessary determinations of the fair values of portfolio securities and other assets for which market quotations are not readily available or if it is deemed that the prices obtained from brokers and dealers or independent pricing services are unreliable.
Depending on the relative significance of the valuation inputs, fair valued securities may be classified in either Level 2 or Level 3 of the fair value hierarchy.
Davidson Multi-Cap Equity Fund
NOTES TO FINANCIAL STATEMENTS at December 31, 2023 (Unaudited), Continued
The inputs or methodology used for valuing securities are not an indication of the risk associated with investing in those securities. The following is a summary of the inputs used to value the Fund’s securities as of December 31, 2023:
| | Level 1 | | | Level 2 | | | Level 3 | | | Total | |
| Common Stocks | | | | | | | | | |
| Communication Services | | $ | 11,274,887 | | | $ | — | | | $ | — | | | $ | 11,274,887 | |
| Consumer Discretionary | | | 11,444,767 | | | | — | | | | — | | | | 11,444,767 | |
| Consumer Staples | | | 6,432,289 | | | | — | | | | — | | | | 6,432,289 | |
| Energy | | | 4,706,475 | | | | — | | | | — | | | | 4,706,475 | |
| Financials | | | 12,494,703 | | | | — | | | | — | | | | 12,494,703 | |
| Health Care | | | 16,280,849 | | | | — | | | | — | | | | 16,280,849 | |
| Industrials | | | 11,445,438 | | | | — | | | | — | | | | 11,445,438 | |
| Information Technology | | | 23,641,307 | | | | — | | | | — | | | | 23,641,307 | |
| Materials | | | 3,808,146 | | | | — | | | | — | | | | 3,808,146 | |
| Utilities | | | 3,411,672 | | | | — | | | | — | | | | 3,411,672 | |
| Total Common Stocks | | | 110,940,533 | | | | — | | | | — | | | | 110,940,533 | |
| REITs | | | 5,242,180 | | | | — | | | | — | | | | 5,242,180 | |
| Money Market Fund | | | 1,797,614 | | | | — | | | | — | | | | 1,797,614 | |
| Total Investments | | $ | 117,980,327 | | | $ | — | | | $ | — | | | $ | 117,980,327 | |
Refer to the Fund’s schedule of investments for a detailed break-out of securities by industry classification.
In June 2022, the FASB issued Accounting Standards Update 2022-03, which amends Fair Value Measurement (Topic 820): Fair Value Measurement of Equity Securities Subject to Contractual Sale Restrictions (“ASU 2022-03”). ASU 2022-03 clarifies guidance for fair value measurement of an equity security subject to a contractual sale restriction and establishes new disclosure requirements for such equity securities. ASU 2022-03 is effective for fiscal years beginning after December 15, 2023 and for interim periods within those fiscal years, with early adoption permitted. Management is currently evaluating the impact of these amendments on the Fund’s financial statements.
In October 2022, the Securities and Exchange Commission (the “SEC”) adopted a final rule relating to Tailored Shareholder Reports for Mutual Funds and Exchange-Traded Funds; Fee Information in Investment Company Advertisements. The rule and form amendments will, among other things, require the Fund to transmit concise and visually engaging shareholder reports that highlight key information. The amendments will require that funds tag information in a structured data format and that certain more in-depth information be made available online and available for delivery free of charge to investors on request. The amendments became effective January 24, 2023. There is an 18-month transition period after the effective date of the amendment.
Davidson Multi-Cap Equity Fund
NOTES TO FINANCIAL STATEMENTS at December 31, 2023 (Unaudited), Continued
NOTE 4 – INVESTMENT ADVISORY FEE AND OTHER TRANSACTIONS WITH AFFILIATES
The Advisor provides the Fund with investment management services under an investment advisory agreement. The Advisor furnishes all investment advice, office space, facilities, and provides most of the personnel needed by the Fund. As compensation for its services, the Advisor is entitled to a monthly fee at the annual rate of 0.65% based upon the average daily net assets of the Fund. For the six months ended December 31, 2023, the Fund incurred $367,942 in advisory fees. Advisory fees payable at December 31, 2023 for the Fund were $49,043.
The Fund is responsible for its own operating expenses. The Advisor has contractually agreed to waive all or a portion of its management fees and pay expenses of the Fund to ensure that the total annual fund operating expenses (excluding acquired fund fees and expenses, taxes, interest expense, dividend on securities sold short and extraordinary expenses, Rule 12b-1 fees, and other class-specific expenses) do not exceed 0.90% of average daily net assets of the Fund. Any such reductions made by the Advisor in its fees or payment of expenses which are the Fund’s obligation are subject to reimbursement by the Fund to the Advisor, if so requested by the Advisor, in any subsequent month in the 36-month period from the date of the management fee reduction and expense payment if the aggregate amount actually paid by the Fund toward the operating expenses for such fiscal year (taking into account the reimbursement) will not cause the Fund to exceed the lesser of: (1) the expense limitation in place at the time of the management fee reduction and expense payment; or (2) the expense limitation in place at the time of the reimbursement. Any such reimbursement is also contingent upon Board’s review and approval. Such reimbursement may not be paid prior to the Fund’s payment of current ordinary operating expenses. For the six months ended December 31, 2023, the Advisor reduced its fees and absorbed Fund expenses in the amount of $86,066. The Advisor may recapture portions of the amounts shown below no later than the corresponding dates:
| 6/30/2024 | | 6/30/2025 | | 6/30/2026 | | 12/31/2026 | | Total |
| $62,031 | | $140,086 | | $165,594 | | $86,066 | | $453,777 |
U.S. Bancorp Fund Services, LLC, doing business as U.S. Bank Global Fund Services (“Fund Services”) serves as the Fund’s administrator, fund accountant and transfer agent. U.S. Bank N.A. serves as the custodian (the “Custodian”) to the Fund. The Custodian is an affiliate of Fund Services. Fund Services maintains the Fund’s books and records, calculates the Fund’s NAV, prepares various federal and state regulatory filings, coordinates the payment of fund expenses, reviews expense accruals and prepares materials supplied to the Board.
The officers of the Trust and the Chief Compliance Officer are also employees of Fund Services. Fees paid by the Fund for administration and accounting, transfer agency, custody and compliance services for the six months ended December 31, 2023, are disclosed in the statement of operations.
Quasar Distributors, LLC (“Quasar” or “Distributor”) acts as the Fund’s principal underwriter in a continuous public offering of the Fund’s shares. Quasar is a wholly-owned broker-dealer subsidiary of Foreside Financial Group, LLC, doing business as ACA Group.
The Distributor has advised the Fund that it has received $27,054 in front-end sales charges resulting from sales of Class A shares. For the six months ended December 31, 2023, the Distributor paid commissions of $11,325 to D.A. Davidson & Co. (“DAD”), the Advisor’s affiliated broker dealer. Effective October 28, 2023, the Fund does not charge a redemption fee. Additionally, DAD will receive all of the initial sales charges for purchases of Class A shares of the Fund without a dealer of record and the 1.00% charge on Class A shares redeemed within twelve months of purchase.
Davidson Multi-Cap Equity Fund
NOTES TO FINANCIAL STATEMENTS at December 31, 2023 (Unaudited), Continued
NOTE 5 – DISTRIBUTION AGREEMENT AND PLAN
The Fund has adopted a Distribution Plan pursuant to Rule 12b-1 (the “Plan”). The Plan permits the Fund to pay the Distributor for distribution and related expenses at an annual rate of up to 0.25% of the Class A shares average daily net assets. The expenses covered by the Plan may include the cost of preparing and distributing prospectuses and other sales material, advertising and public relations expenses, payments to financial intermediaries and compensation of personnel involved in selling shares of the Fund. Payments made pursuant to the Plan will represent compensation for distribution and service activities, not reimbursements for specific expenses incurred. For the six months ended December 31, 2023, the 12b-1 distribution fees incurred under the Plan by the Fund’s shares are disclosed in the statement of operations.
NOTE 6 – PURCHASES AND SALES OF SECURITIES
For the six months ended December 31, 2023, the cost of purchases and the proceeds from sales of securities, excluding short-term securities, were $22,545,872 and $22,286,869, respectively. There were no purchases or sales of long-term U.S. Government securities.
For the six months ended December 31, 2023, the proceeds from sales of securities, excluding short-term securities, includes securities redeemed in-kind of $1,807,305.
NOTE 7 – CONTROL OWNERSHIP
The beneficial ownership, either directly or indirectly of more than 25% of the voting securities of a fund creates a presumption of control of the fund, under Section 2(a)(9) of the 1940 Act. At December 31, 2023, the Fund’s percentage of control ownership positions greater than 25% is as follows:
| | | Percentage of Shares Held |
| D.A. Davidson & Co., Inc. | | 28.28% |
| D.A. Davidson & Co., Inc. FBO Customer | | 26.77% |
NOTE 8 – INCOME TAXES AND DISTRIBUTIONS TO SHAREHOLDERS
The tax character of distributions paid during the six months ended December 31, 2023 and year ended June 30, 2023 was as follows:
| | | Six Months Ended | | | Year Ended | |
| | | December 31, 2023 | | | June 30, 2023 | |
| Ordinary Income | | $ | 523,281 | | | $ | 401,057 | |
| Long-term capital gains | | | 2,048,996 | | | | 10,286,611 | |
Davidson Multi-Cap Equity Fund
NOTES TO FINANCIAL STATEMENTS at December 31, 2023 (Unaudited), Continued
As of June 30, 2023, the Fund’s most recently completed fiscal year end, the components of accumulated earnings/(losses) on a tax basis were as follows:
| Cost of investments (a) | | $ | 68,413,064 | |
| Gross tax unrealized appreciation | | | 46,778,348 | |
| Gross tax unrealized depreciation | | | (2,379,076 | ) |
| Net tax unrealized appreciation (a) | | | 44,399,272 | |
| Undistributed ordinary income | | | 193,793 | |
| Total distributable earnings | | | 193,793 | |
| Total accumulated earnings/(losses) | | $ | 44,593,065 | |
(a) The difference between book-basis and tax-basis net unrealized appreciation and cost is attributable primarily to the tax deferral of losses on wash sales.
NOTE 9 – PRINCIPAL RISKS
Below is a summary of some, but not all, of the principal risks of investing in the Fund, each of which may adversely affect the Fund’s net asset value and total return. The Fund’s most recent prospectus provides further descriptions of the Fund’s investment objective, principal investment strategies and principal risks.
| ● | General Market Risk. Economies and financial markets throughout the world are becoming increasingly interconnected, which increases the likelihood that events or conditions in one country or region will adversely impact markets or issuers in other countries or regions. Securities in the Fund’s portfolio may underperform in comparison to securities in general financial markets, a particular financial market or other asset classes due to a number of factors, including: inflation (or expectations for inflation); interest rates; global demand for particular products or resources; natural disasters or events; pandemic diseases; terrorism; regulatory events; and government controls. U.S. and international markets have experienced significant periods of volatility in recent years and months due to a number of economic, political and global macro factors, which has resulted in disruptions to business operations and supply chains, stress on the global healthcare system, growth concerns in the U.S. and overseas, staffing shortages and the inability to meet consumer demand, and widespread concern and uncertainty. Continuing uncertainties regarding interest rates, rising inflation, political events, rising government debt in the U.S. and trade tensions also contribute to market volatility. As a result of continuing political tensions and armed conflicts, including the war between Ukraine and Russia, the U.S. and the European Union imposed sanctions on certain Russian individuals and companies, including certain financial institutions, and have limited certain exports and imports to and from Russia. The war has contributed to recent market volatility and may continue to do so. |
| ● | Small and Medium Companies Risk. Investing in securities of small- and medium-capitalization companies may involve greater volatility than investing in larger and more established companies because small and medium capitalization companies can be subject to more abrupt or erratic share price changes than larger, more established companies. |
Davidson Multi-Cap Equity Fund
NOTES TO FINANCIAL STATEMENTS at December 31, 2023 (Unaudited), Continued
| ● | Foreign and Emerging Market Securities Risk. Foreign securities may be more volatile and less liquid than domestic (U.S.) securities, which could affect the Fund’s investments. Securities markets of other countries are generally smaller than U.S. securities markets. These risks are enhanced in emerging markets. |
| ● | ETF and Mutual Fund Risk. When the Fund invests in a mutual fund or ETF, it will bear additional expenses based on its pro rata share of the mutual fund’s or ETF’s operating expenses, including the potential duplication of management fees. The risk of owning a mutual fund or ETF generally reflects the risks of owning the underlying securities the mutual fund or ETF holds. The Fund also will incur brokerage costs when it purchases ETFs. |
NOTE 10 – TRUSTEES
Effective October 18, 2023, Mr. Ray Woolson retired from his service as Trustee and Board Chair to attend to health-related matters. At the recommendation of the Governance and Nominating Committee, on October 24, 2023, the Board appointed Mr. David Mertens as the successor Board Chair, and Ms. Michele Rackey was appointed as Governance and Nominating Committee Board Chair.
Davidson Multi-Cap Equity Fund
NOTICE TO SHAREHOLDERS at December 31, 2023 (Unaudited)
How to Obtain a Copy of the Fund’s Proxy Voting Policies
A description of the policies and procedures that the Fund uses to determine how to vote proxies relating to portfolio securities is available without charge upon request by calling 1-877-332-0529 or on the U.S. Securities and Exchange Commission’s website at http://www.sec.gov.
How to Obtain a Copy of the Fund’s Proxy Voting Records for the 12-Month Period Ended June 30
Information regarding how the Fund voted proxies relating to portfolio securities during the most recent 12-month period ended June 30 is available without charge, upon request, by calling 1-877-332-0529. Furthermore, you can obtain the Fund’s proxy voting records on the SEC’s website at http://www.sec.gov.
Quarterly Filings on Form N-PORT
The Fund files its complete schedule of portfolio holdings with the SEC for the first and third quarters of each fiscal year on Part F of Form N-PORT. The Fund’s Form N-PORT is available on the SEC’s website at http://www.sec. gov. Information included in the Fund’s Form N-PORT is also available by calling 1-877-332-0529.
Householding
In an effort to decrease costs, the Fund will reduce the number of duplicate prospectuses, supplements, and certain other shareholder documents that you receive by sending only one copy of each to those addresses shown by two or more accounts. Please call the Fund’s transfer agent toll free at 1-877-332-0529 to request individual copies of these documents. The Fund will begin sending individual copies 30 days after receiving your request. This policy does not apply to account statements.
Davidson Multi-Cap Core Fund
STATEMENT REGARDING LIQUIDITY RISK MANAGEMENT PROGRAM (Unaudited)
The Fund has adopted a liquidity risk managment program (the “program”). The Board has designated a committee at the Advisor to serve as the administrator of the program. The Advisor’s committee conducts the day-to-day operation of the program pursuant to policies and procedures administered by the committee.
Under the program, the Advisor’s committee manages the Fund’s liquidity risk, which is the risk that the Fund could not meet shareholder redemption requests without significant dilution of remaining shareholders’ interests in the Fund. This risk is managed by monitoring the degree of liquidity of the Fund’s investments, limiting the amount of the Fund’s illiquid investments, and utilizing various risk management tools and facilities available to the Fund for meeting shareholder redemptions, among other means. The committee’s process of determining the degree of liquidity of the Fund’s investments is supported by one or more third-party liquidity assessment vendors.
The Board reviewed a report prepared by the committee regarding the operation and effectiveness of the program for the period July 1, 2022 through June 30, 2023. No significant liquidity events impacting the Fund were noted in the report. The report noted that the Fund made limited use of redemptions in-kind during the reporting period and that the use of redemptions in-kind was not the result of liquidity concerns. In addition, the committee provided its assessment that the program had been effective in managing the Fund’s liquidity risk.
Davidson Multi-Cap Equity Fund
APPROVAL OF INVESTMENT ADVISORY AGREEMENT (Unaudited)
At meetings held on October 18, 2023 and December 14-15, 2023, the Board (which is comprised of three persons, all of whom are Independent Trustees as defined under the Investment Company Act of 1940, as amended), considered and approved, for another annual term, the continuance of the investment advisory agreement (the “Advisory Agreement”) between Advisors Series Trust (the “Trust”) and Davidson Investment Advisors, Inc. (the “Advisor”) on behalf of the Davidson Multi-Cap Equity Fund (the “Fund”). At both meetings, the Board received and reviewed substantial information regarding the Fund, the Advisor and the services provided by the Advisor to the Fund under the Advisory Agreement. This information, together with the information provided to the Board throughout the course of the year, formed the primary (but not exclusive) basis for the Board’s determinations. Below is a summary of the factors considered by the Board and the conclusions that formed the basis for the Board’s approval of the continuance of the Advisory Agreement:
| 1. | THE NATURE, EXTENT AND QUALITY OF THE SERVICES PROVIDED AND TO BE PROVIDED BY THE ADVISOR UNDER THE ADVISORY AGREEMENT. The Board considered the nature, extent and quality of the Advisor’s overall services provided to the Fund, as well as its specific responsibilities in all aspects of day-to-day investment management of the Fund. The Board considered the qualifications, experience and responsibilities of the portfolio managers, as well as the responsibilities of other key personnel of the Advisor involved in the day-to-day activities of the Fund. The Board also considered the resources and compliance structure of the Advisor, including information regarding its compliance program, its chief compliance officer and the Advisor’s compliance record, as well as the Advisor’s cybersecurity program, liquidity risk management program, valuation procedures, business continuity plan, and risk management process. The Board also noted that the Advisor was working towards implementation of newly adopted Securities and Exchange Commission rules applicable to the Fund, including the new tailored shareholder reports. The Board further considered the prior relationship between the Advisor and the Trust, as well as the Board’s knowledge of the Advisor’s operations, and noted that during the course of the prior year they had met with certain personnel of the Advisor to discuss the Fund’s performance and investment outlook as well as various marketing and compliance topics. The Board concluded that the Advisor had the quality and depth of personnel, resources, investment processes and compliance policies and procedures essential to performing its duties under the Advisory Agreement and that they were satisfied with the nature, overall quality and extent of such management services. |
| 2. | THE FUND’S HISTORICAL PERFORMANCE AND THE OVERALL PERFORMANCE OF THE ADVISOR. In assessing the quality of the portfolio management delivered by the Advisor, the Board reviewed the short-term and long-term performance of the Fund as of June 30, 2023, on both an absolute basis and a relative basis in comparison to its peer funds utilizing Morningstar classifications, an appropriate securities market benchmark, a cohort that is comprised of similarly managed funds selected by an independent third-party consulting firm engaged by the Board to assist it in its 15(c) review (the “Cohort”), and the Advisor’s similarly managed accounts. While the Board considered both short-term and long-term performance, it placed greater emphasis on longer term performance. When reviewing performance against the comparative Morningstar peer group universe, the Board took into account that the investment objective and strategies of the Fund, as well as its level of risk tolerance, may differ significantly from funds in the peer universe. When reviewing the Fund’s performance against a broad market benchmark, the Board took into account the differences in portfolio construction between the Fund and such benchmark as well as other differences between actively managed funds and passive benchmarks, such as objectives and risks. In assessing periods of relative underperformance or outperformance, the Board took into account that relative performance can be significantly impacted by performance measurement periods and that some periods of underperformance may be transitory in nature while others may reflect more significant underlying issues. |
Davidson Multi-Cap Equity Fund
APPROVAL OF INVESTMENT ADVISORY AGREEMENT (Unaudited), Continued
The Board noted that the Fund underperformed the average of the Morningstar peer group and the Cohort for the one-year period and outperformed the average of both for the three-and five-year periods, all periods ended June 30, 2023. The Board reviewed the performance of the Fund against a broad-based securities market benchmark, noting that it had underperformed its primary benchmark index for the one-year period and outperformed for the three- and five-year periods ended June 30, 2023.
The Board also noted that the Fund’s Class I shares outperformed the similarly managed composite for the one-year period and underperformed for the three- and five-year periods ended June 30, 2023 but that such differences were not material.
| 3. | THE COSTS OF THE SERVICES TO BE PROVIDED BY THE ADVISOR AND THE STRUCTURE OF THE ADVISOR’S FEE UNDER THE ADVISORY AGREEMENT. In considering the advisory fee and total fees and expenses of the Fund, the Board reviewed comparisons to the Morningstar peer funds, the cohort and the Advisor’s similarly managed separate accounts, if any, for other types of clients as well as all expense waivers and reimbursements. When reviewing fees charged to other similarly managed accounts, the Board took into account the type of account and the differences in the management of that account that might be germane to the difference, if any, in the fees charged to such accounts. |
The Board noted that the Advisor had contractually agreed to maintain an annual expense ratio of 0.90% for the Fund, excluding certain operating expenses and class-level expenses (the “Expense Cap”). In comparison to the Cohort, the Board considered that the Fund’s contractual management fee was at the median and slightly below the average of its Cohort. The Board noted that the Fund’s net expense ratio (less the 12b-1 fee) was above the average and median of its Cohort and that the Fund’s net expense ratio (less the 12b-1 fee) was above the Morningstar peer group average.
Davidson Multi-Cap Equity Fund
APPROVAL OF INVESTMENT ADVISORY AGREEMENT (Unaudited), Continued
The Board also took into consideration the services the Advisor provided to its similarly managed account clients, comparing the fees charged for those management services to the fees charged to the Fund. The Board found that the management fees charged to the Fund were generally in line with the management fees charged to the Advisor’s similarly managed account clients and to the extent fees charged to the Fund were higher than for similarly managed separate accounts, it was largely a reflection of the nature of the client.
The Board determined that it would continue to monitor the appropriateness of the advisory fee for the Fund and concluded that, at this time, the fees to be paid to the Advisor were fair and reasonable.
| 4. | ECONOMIES OF SCALE. The Board also considered whether economies of scale were being realized by the Advisor that should be shared with shareholders. The Board noted that the Advisor contractually agreed to reduce its advisory fee or reimburse Fund expenses so that the Fund does not exceed the specified Expense Cap. The Board noted that at current asset levels, the Advisor continued to subsidize expenses to maintain the Expense Cap and determined to revisit the issue of economies of scale when the Fund has grown to a point that this subsidization is no longer in effect. |
| 5. | THE PROFITS TO BE REALIZED BY THE ADVISOR AND ITS AFFILIATES FROM ITS RELATIONSHIP WITH THE FUND. The Board reviewed the Advisor’s financial information and took into account both the direct benefits and the indirect benefits to the Advisor from advising the Fund. The Board considered the profitability to the Advisor from its relationship with the Fund and considered any additional material benefits derived by the Advisor from its relationship with the Fund, including Rule 12b-1 fees paid to the Advisor’s affiliated broker-dealer – D.A. Davidson & Co. – in connection with the sale of Class A shares of the Fund. The Board also considered that the Fund does not utilize “soft dollars.” After such review, the Board determined that the profitability to the Advisor with respect to the Advisory Agreement was not excessive, and that the Advisor had maintained adequate profit levels to support the services it provides to the Fund. |
No single factor was determinative of the Board’s decision to approve the continuance of the Advisory Agreement for the Fund, but rather the Trustees based their determination on the total mix of information available to them. Based on a consideration of all the factors in their totality, the Trustees determined that the advisory arrangements with the Advisor, including the advisory fees, were fair and reasonable to the Fund. The Board, including a majority of the Independent Trustees, therefore determined that the continuance of the Advisory Agreement for the Fund would be in the best interests of the Fund and its shareholders.
PRIVACY NOTICE
The Fund collects non-public information about you from the following sources:
| ● | Information we receive about you on applications or other forms; |
| ● | Information you give us orally; and/or |
| ● | Information about your transactions with us or others. |
We do not disclose any non-public personal information about our customers or former customers without the customer’s authorization, except as permitted by law or in response to inquiries from governmental authorities. We may share information with affiliated and unaffiliated third parties with whom we have contracts for servicing the Fund. We will provide unaffiliated third parties with only the information necessary to carry out their assigned responsibilities. We maintain physical, electronic and procedural safeguards to guard your non-public personal information and require third parties to treat your personal information with the same high degree of confidentiality.
In the event that you hold shares of the Fund through a financial intermediary, including, but not limited to, a broker-dealer, bank, or trust company, the privacy policy of your financial intermediary would govern how your non-public personal information would be shared by those entities with unaffiliated third parties.
Advisor Davidson Investment Advisors, Inc. Davidson Building 8 Third Street North Great Falls, Montana 59401 www.davidsonmutualfunds.com Distributor Quasar Distributors, LLC 3 Canal Plaza Suite 100 Portland, Maine 04101 Custodian U.S. Bank N.A. 1555 North RiverCenter Drive Suite 302 Milwaukee, Wisconsin 53212 Transfer Agent Fund Accountant and Fund Administrator U.S. Bank Global Fund Services 615 East Michigan Street Milwaukee, Wisconsin 53202 Independent Registered Public Accounting Firm Tait, Weller & Baker LLP Two Liberty Place 50 South 16th Street Suite 2900 Philadelphia, Pennsylvania 19102 Legal Counsel Sullivan & Worcester LLP 1633 Broadway 32nd Floor New York, New York 10019 |  DAVIDSON MULTI-CAP EQUITY FUND SEMI-ANNUAL REPORT For the period ended December 31, 2023 |
This report is intened for the shareholders of the Fund and may not be used as sales literature unless preceded or accompanied by a current prospectus.
To obtain a free prospectus please call 877-882-0529.
Not applicable for semi-annual reports.
Not applicable for semi-annual reports.
Not applicable for semi-annual reports.
Not applicable to open-end investment companies.
Not applicable to open-end investment companies.
Not applicable to open-end investment companies.
There have been no material changes to the procedures by which shareholders may recommend nominees to the Registrant’s Board of Trustees.
Not applicable to open-end investment companies.
Pursuant to the requirements of the Securities Exchange Act of 1934 and the Investment Company Act of 1940, as amended, the registrant has duly caused this report to be signed on its behalf by the undersigned, thereunto duly authorized.
Jeffrey T. Rauman, President/Chief Executive Officer/Principal
Pursuant to the requirements of the Securities Exchange Act of 1934 and the Investment Company Act of 1940, as amended, this report has been signed below by the following persons on behalf of the registrant and in the capacities and on the dates indicated.
Jeffrey T. Rauman, President/Chief Executive Officer/Principal Executive Officer
Kevin J. Hayden, Vice President/Treasurer/Principal Financial Officer
* Print the name and title of each signing officer under his or her signature.