SEMI-ANNUAL REPORT
January 31, 2024
O’Shaughnessy Market Leaders Value Fund
Class I Shares – OFVIX
TABLE OF CONTENTS
| Letter to Shareholders | | 1 |
| Expense Example | | 3 |
| Sector Allocation of Portfolio Assets | | 4 |
| Schedule of Investments | | 5 |
| Statement of Assets and Liabilities | | 9 |
| Statement of Operations | | 10 |
| Statements of Changes in Net Assets | | 11 |
| Financial Highlights | | 12 |
| Notes to Financial Statements | | 13 |
| Approval of Investment Advisory Agreement | | 19 |
| Statement Regarding Liquidity Risk Management Program | | 21 |
| Notice to Shareholders | | 22 |
| Householding | | 22 |
| Privacy Notice | | 23 |
Market Leaders Value Fund
For the 6-month period ended January 31, 2024, the O’Shaughnessy Market Leaders Value Fund (the “Market Leaders Value Fund” or the “Fund”) outperformed its benchmark index, with Class I shares returning 5.89%, while the Russell 1000 Value™ Index returned 2.54%.
Having a lower exposure to mega cap stocks than the benchmark hurt the strategy by -5.42%. Our focus on the top decile of stocks by Shareholder Yield added +8.57%. From the top decile of Shareholder Yield, we eliminate low quality stocks. This contributed +2.19% from relative returns. Finally, our portfolio construction methodology, which seeks to own more stocks qualifying more frequently, recently, and with the highest overall factor profile detracted -1.98%.
Within allocation effects, an underweight to Utilities, Consumer Staples, and Health Care aided performance. An overweight to Materials and Consumer Discretionary detracted from returns. Selection within Health Care, Energy, and Information Technology was the largest contributor to performance, while selection within Industrials and Communication Services was the largest detractor.
The Market Leaders Value Fund benefitted from holdings in Marathon Petroleum, Builders Firstsource, and Cardinal Health, Inc. Positions in CH Robinson Worldwide, Altria Group, Inc., and 3M Co. detracted from returns.
Based on our key themes, we attempt to position the strategy with strong and consistent characteristic advantages versus its benchmark and relative to the overall market. Portfolio positions generally have higher levels of return on capital, lower reliance on external financing, and trade at deep discounts across a number of valuation factors. Past performance does not guarantee future results.
Outlook
Stocks deliver returns to shareholders over time based on three drivers—ability to grow their business, expansion of their price multiple, and prudent capital allocation practices like returning capital to shareholders.
We view share buybacks as one of many levers that management teams can use to allocate capital. Within Shareholder Yield, buybacks sit side-by-side with dividend yield, another mechanism for the return of capital.
We acknowledge that all companies executing buybacks are not created equally, and some firms should likely not be returning cash. We believe these firms will likely go on to underperform, and our process is designed to exclude such stocks from our portfolio.
We focus on a subset of firms returning capital to shareholders at super-normal rates, as this tends to be indicative of management’s conviction in the underlying business. Our quality screens further attempt to exclude firms executing buybacks for the wrong reasons—performing debt for equity swaps and manipulating earnings per share.
When the combination of buybacks and dividends is paired with assessments of valuation and business quality, we believe the portfolio narrows in on a set of businesses with conservative accounting practices that are indicative of strong cash generation, low reliance on outside sources of capital, and that are generating good cash returns on businesses.
Our Shareholder Yield signal has always been viewed on a trailing twelve-month basis. In other words, dividends and buybacks that have actually been executed. We do this because companies with strong Shareholder Yield have historically experienced positive excess returns over the following 12-18 months on average, even after the buyback programs have run their course.
As of January 31st, the Fund’s holdings showed significantly higher Shareholder Yield than the benchmark. Our Fund returned over 2.5 times the capital to shareholders while maintaining a discounted Price to Earnings and Price to Sales ratio, 25% and 35% respectively. Additionally, our holdings have over 2.6 times the free cashflow yield. Our Fund chooses holdings with disciplined management teams that have been returning capital to shareholders at super-normal rates.
Because we build portfolios from the bottom up using time-tested screening “factors,” we think about performance through the lens of factors first, and individual stocks and industries second. The stocks and industries where we have active exposures are a result of the factors themselves, so in some sense they measure the effects of factor combinations that we believe to be beneficial over the long term.
Our research leads us to believe that market leadership is cyclical, but that valuation, momentum, and yield are incredibly effective individual selection factors given a three- to five-year time horizon.
We believe that maintaining a portfolio of stocks trading at discounted valuations that possess reasonable quality, decent momentum, and high yields is a compelling long-term investment strategy with a considerably higher probability of success than trying to generate outperformance through market timing or traditional stock picking.
Opinions expressed are subject to change at any time, are not guaranteed and should not be considered investment advice.
Mutual fund investing involves risk. Principal loss is possible. Investments in foreign securities involve political, economic and currency risks, greater volatility, and differences in accounting methods. Emerging markets countries involve greater risks, such as immature economic structures, national policies restricting investments by foreigners, and different legal systems. Such risks may be magnified with respect to securities of issuers in frontier emerging markets. Real estate investment trusts and foreign real estate companies may be less diversified than other pools of securities, may have lower trading volumes and may be subject to more abrupt and erratic price movements than the overall securities markets. Investments in small-and medium-capitalization companies tend to have limited liquidity and greater price volatility than large-capitalization companies. Risks of derivatives include the possible imperfect correlation between the value of instruments and the underlying assets; risks of default by the other party to the transaction; risks that the transactions may result in losses that partially or completely offset gains in portfolio positions; and risks that instruments may not be liquid. The Market Leaders Value Fund may experience higher fees and is subject to additional risks due to investments in other investment companies (including ETFs).
Fund holdings and sector allocations are subject to change at any time and are not recommendations to buy or sell any security. Please read the Schedule of Investments for a complete list of Fund holdings.
The Russell 1000 Value® Index (“Russell 1000”) measures the performance of the large-cap value segment of the U.S. equity universe. It includes those Russell 1000 companies with lower price-to-book ratios and lower expected growth values. You cannot invest directly in an index.
“Shareholder Yield” is the combination of dividend yield and the rate at which the company is buying back shares of its stock at the time of initial purchase.
“Buyback” is a repurchase of outstanding shares by a company to reduce the number of shares on the market and increase the value of remaining shares.
“Dividend yield” is the financial ratio that shows how much a company pays out in dividends each year relative to its share price (equal to most recent dividend payment per share (annualized) divided by price per share).
“Cash Flows” are the net amount of cash and cash-equivalents moving into and out of a business.
“Price-to-Earnings Ratio” or “P/E valuation” is a ratio for valuing a company that measures its current share price relative to its per-share earnings (equal to Market Value per Share divided by Earnings per Share).
“Price to Sales ratio” shows how much investors are willing to pay per dollar of sales for a stock. The P/S ratio is calculated by dividing the stock price by the underlying company’s sales per share.
“Return on capital” (ROC) is a ratio used as a measure of the profitability and value-creating potential of companies after taking into account the amount of initial capital invested. The ratio is calculated by dividing the after-tax operating income by the book value of both debt and equity capital less cash/equivalents.
Earnings growth is not representative of the Fund’s future performance.
Must be preceded or accompanied by a prospectus.
The O’Shaughnessy Market Leaders Value Fund is distributed by Quasar Distributors, LLC.
Expense Example
at January 31, 2024 (Unaudited)
Shareholders in mutual funds generally incur two types of costs: (1) transaction costs, including sales charges (loads) on purchase payments, redemption fees, and exchange fees, and (2) ongoing costs, including management fees, distribution and/or service fees, and other fund expenses. This Example is intended to help you understand your ongoing costs (in dollars) of investing in the Fund and to compare these costs with the ongoing costs of investing in other mutual funds. The Example is based on an investment of $1,000 invested at the beginning of the period and held for the entire period (8/1/23 – 1/31/24).
Actual Expenses
The first line of the table below provides information about actual account values and actual expenses. You will be assessed fees for outgoing wire transfers, returned checks, and stop payment orders at prevailing rates charged by U.S. Bank Global Fund Services, the Fund’s transfer agent. The Example below includes, but is not limited to, management fees, fund accounting, custody and transfer agent fees. You may use the information in this line, together with the amount you invested, to estimate the expenses that you paid over the period. Simply divide your account value by $1,000 (for example, an $8,600 account value divided by $1,000 = 8.6), then multiply the result by the number in the first line under the heading entitled “Expenses Paid During Period” for your fund and class to estimate the expenses you paid on your account during this period.
Hypothetical Example for Comparison Purposes
The second line of the table below provides information about hypothetical account values and hypothetical expenses based on the Fund’s actual expense ratio and an assumed rate of return of 5% per year before expenses, which is not the Fund’s actual return. The hypothetical account values and expenses may not be used to estimate the actual ending account balance or expenses you paid for the period. You may use this information to compare the ongoing costs of investing in the Fund and other funds. To do so, compare this 5% hypothetical example with the 5% hypothetical examples that appear in the shareholder reports of the other funds. Please note that the expenses shown in the table are meant to highlight your ongoing costs only and do not reflect any transaction costs, such as sales charges (loads), redemption fees, or exchange fees. Therefore, the second line of the tables useful in comparing ongoing costs only and will not help you determine the relative total costs of owning different funds. In addition, if these transaction costs were included, your costs would have been higher.
| | Beginning | Ending | Expenses Paid |
| | Account Value | Account Value | During Period* |
| | 8/1/23 | 1/31/24 | 8/1/23 – 1/31/24 |
| Actual | $1,000.00 | $1,058.90 | $2.79 |
| Hypothetical (5% return before expenses) | $1,000.00 | $1,022.42 | $2.75 |
| * | Expenses are equal to the Fund’s annualized expense ratio of 0.54% for Class I, multiplied by the average account value over the period, multiplied by 184 (days in the most recent fiscal half-year)/366 days to reflect the one-half year expense. |
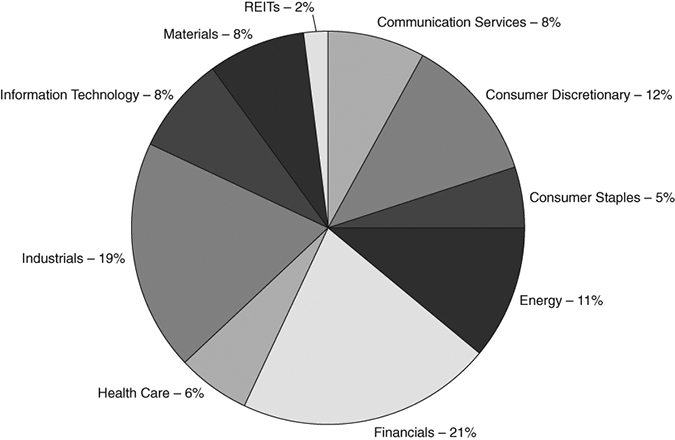
Sector Allocation of Portfolio Assets
at January 31, 2024 (Unaudited)
Percentages represent market value as a percentage of total investments.
The Global Industry Classification Standard (GICS®) was developed by and/or is the exclusive property of MSCI, Inc. and Standard & Poor’s Financial Services, LLC (“S&P”). GICS is a service mark of MSCI and S&P and has been licensed for use by U.S. Bank Global Fund Services.
Schedule of Investments
at January 31, 2024 (Unaudited)
| | | Shares | | | Value | |
| COMMON STOCKS – 97.0% | | | | | | |
| Aerospace & Defense – 2.5% | | | | | | |
| Lockheed Martin Corp. | | | 13,755 | | | $ | 5,906,535 | |
| | | | | | | | | |
| Air Freight & Logistics – 4.2% | | | | | | | | |
| C.H. Robinson Worldwide, Inc. | | | 45,780 | | | | 3,849,640 | |
| Expeditors International of Washington, Inc. | | | 48,284 | | | | 6,099,718 | |
| | | | | | | | 9,949,358 | |
| Broadline Retail – 0.6% | | | | | | | | |
| eBay, Inc. | | | 34,711 | | | | 1,425,581 | |
| | | | | | | | | |
| Building Products – 4.4% | | | | | | | | |
| Builders FirstSource, Inc.(a) | | | 55,513 | | | | 9,644,273 | |
| Owens Corning | | | 7,642 | | | | 1,157,992 | |
| | | | | | | | 10,802,265 | |
| Capital Markets – 3.9% | | | | | | | | |
| Bank of New York Mellon Corp. | | | 48,490 | | | | 2,689,255 | |
| Goldman Sachs Group, Inc. | | | 4,183 | | | | 1,606,314 | |
| Morgan Stanley | | | 8,757 | | | | 763,961 | |
| State Street Corp. | | | 57,283 | | | | 4,231,495 | |
| | | | | | | | 9,291,025 | |
| Chemicals – 2.8% | | | | | | | | |
| Dow, Inc. | | | 62,460 | | | | 3,347,856 | |
| DuPont de Nemours, Inc. | | | 54,660 | | | | 3,377,988 | |
| | | | | | | | 6,725,844 | |
| Commercial Banks – 2.1% | | | | | | | | |
| Citizens Financial Group, Inc. | | | 11,059 | | | | 361,629 | |
| PNC Financial Services Group, Inc. | | | 12,783 | | | | 1,932,917 | |
| Wells Fargo & Co. | | | 55,028 | | | | 2,761,306 | |
| | | | | | | | 5,055,852 | |
| Consumer Finance – 4.2% | | | | | | | | |
| Discover Financial Services | | | 36,275 | | | | 3,827,738 | |
| Synchrony Financial | | | 159,250 | | | | 6,190,047 | |
| | | | | | | | 10,017,785 | |
| Consumer Staples Distribution & Retail – 0.2% | | | | | | | | |
| Walgreens Boots Alliance, Inc. | | | 18,527 | | | | 418,154 | |
| | | | | | | | | |
| Containers & Packaging – 2.1% | | | | | | | | |
| Amcor PLC | | | 279,724 | | | | 2,637,797 | |
| International Paper Co. | | | 63,889 | | | | 2,289,143 | |
| | | | | | | | 4,926,940 | |
| Distributors – 0.7% | | | | | | | | |
| LKQ Corp. | | | 36,255 | | | | 1,692,021 | |
| | | | | | | | | |
| Diversified Telecommunication Services – 1.9% | | | | | | | | |
| Verizon Communications, Inc. | | | 108,168 | | | | 4,580,915 | |
The accompanying notes are an integral part of these financial statements.
Schedule of Investments (Continued)
at January 31, 2024 (Unaudited)
| | | Shares | | | Value | |
| COMMON STOCKS (Continued) | | | | | | |
| Financial Services – 2.8% | | | | | | |
| Equitable Holdings, Inc. | | | 49,740 | | | $ | 1,626,001 | |
| Global Payments, Inc. | | | 37,330 | | | | 4,973,476 | |
| | | | | | | | 6,599,477 | |
| Food Products – 0.6% | | | | | | | | |
| General Mills, Inc. | | | 20,392 | | | | 1,323,645 | |
| | | | | | | | | |
| Health Care Providers & Services – 4.9% | | | | | | | | |
| Cardinal Health, Inc. | | | 53,785 | | | | 5,872,783 | |
| Cigna Group | | | 9,862 | | | | 2,967,969 | |
| McKesson Corp. | | | 3,072 | | | | 1,535,662 | |
| Quest Diagnostics, Inc. | | | 9,827 | | | | 1,262,082 | |
| | | | | | | | 11,638,496 | |
| Hotels, Restaurants & Leisure – 5.1% | | | | | | | | |
| Booking Holdings, Inc.(a) | | | 2,103 | | | | 7,376,209 | |
| Expedia Group, Inc.(a) | | | 18,262 | | | | 2,708,802 | |
| Marriott International, Inc. – Class A | | | 8,319 | | | | 1,994,314 | |
| | | | | | | | 12,079,325 | |
| Household Durables – 1.3% | | | | | | | | |
| PulteGroup, Inc. | | | 29,935 | | | | 3,130,004 | |
| | | | | | | | | |
| Industrial Conglomerates – 2.9% | | | | | | | | |
| 3M Co. | | | 74,136 | | | | 6,994,732 | |
| | | | | | | | | |
| Insurance – 8.2% | | | | | | | | |
| Aflac, Inc. | | | 49,042 | | | | 4,136,202 | |
| American International Group, Inc. | | | 93,175 | | | | 6,476,594 | |
| Hartford Financial Services Group, Inc. | | | 76,230 | | | | 6,628,960 | |
| Principal Financial Group, Inc. | | | 33,137 | | | | 2,621,137 | |
| | | | | | | | 19,862,893 | |
| IT Services – 1.4% | | | | | | | | |
| GoDaddy, Inc. – Class A(a) | | | 30,453 | | | | 3,248,117 | |
| | | | | | | | | |
| Machinery – 0.6% | | | | | | | | |
| Stanley Black & Decker, Inc. | | | 15,097 | | | | 1,408,550 | |
| | | | | | | | | |
| Media – 4.3% | | | | | | | | |
| Comcast Corp. – Class A | | | 177,652 | | | | 8,267,924 | |
| Fox Corp. – Class A | | | 65,056 | | | | 2,101,309 | |
| | | | | | | | 10,369,233 | |
| Metals & Mining – 2.9% | | | | | | | | |
| Steel Dynamics, Inc. | | | 59,089 | | | | 7,131,451 | |
The accompanying notes are an integral part of these financial statements.
Schedule of Investments (Continued)
at January 31, 2024 (Unaudited)
| | | Shares | | | Value | |
| COMMON STOCKS (Continued) | | | | | | |
| Oil, Gas & Consumable Fuels – 10.7% | | | | | | |
| ConocoPhillips | | | 27,323 | | | $ | 3,056,624 | |
| Coterra Energy, Inc. | | | 222,944 | | | | 5,546,847 | |
| Marathon Petroleum Corp. | | | 62,989 | | | | 10,430,978 | |
| Phillips 66 | | | 1,780 | | | | 256,872 | |
| Valero Energy Corp. | | | 45,462 | | | | 6,314,672 | |
| | | | | | | | 25,605,993 | |
| Pharmaceuticals – 1.4% | | | | | | | | |
| Bristol-Myers Squibb Co. | | | 24,256 | | | | 1,185,391 | |
| Johnson & Johnson | | | 14,068 | | | | 2,235,405 | |
| | | | | | | | 3,420,796 | |
| Professional Services – 3.5% | | | | | | | | |
| Verisk Analytics, Inc. | | | 34,192 | | | | 8,258,394 | |
| | | | | | | | | |
| Semiconductors & Semiconductor Equipment – 3.1% | | | | | | | | |
| KLA Corp. | | | 12,660 | | | | 7,520,547 | |
| | | | | | | | | |
| Software – 0.1% | | | | | | | | |
| Fair Isaac Corp.(a) | | | 224 | | | | 268,538 | |
| | | | | | | | | |
| Specialty Retail – 3.9% | | | | | | | | |
| Best Buy Co., Inc. | | | 61,941 | | | | 4,490,103 | |
| Lowe’s Cos., Inc. | | | 22,933 | | | | 4,881,060 | |
| | | | | | | | 9,371,163 | |
| Technology Hardware, Storage & Peripherals – 3.7% | | | | | | | | |
| Dell Technologies, Inc. – Class C | | | 28,368 | | | | 2,351,140 | |
| HP, Inc. | | | 83,247 | | | | 2,390,021 | |
| NetApp, Inc. | | | 16,160 | | | | 1,409,152 | |
| Seagate Technology Holdings PLC | | | 31,741 | | | | 2,719,569 | |
| | | | | | | | 8,869,882 | |
| Tobacco – 4.2% | | | | | | | | |
| Altria Group, Inc. | | | 252,479 | | | | 10,129,458 | |
| | | | | | | | | |
| Trading Companies & Distributors – 0.6% | | | | | | | | |
| Ferguson PLC | | | 7,427 | | | | 1,395,236 | |
| | | | | | | | | |
| Wireless Telecommunication Services – 1.2% | | | | | | | | |
| T-Mobile U.S., Inc. | | | 17,152 | | | | 2,765,417 | |
| Total Common Stocks (Cost $200,654,906) | | | | | | | 232,183,622 | |
The accompanying notes are an integral part of these financial statements.
Schedule of Investments (Continued)
at January 31, 2024 (Unaudited)
| | | Shares | | | Value | |
| REITs – 1.9% | | | | | | |
| Host Hotels & Resorts, Inc. | | | 38,770 | | | $ | 745,159 | |
| Simon Property Group, Inc. | | | 15,442 | | | | 2,140,416 | |
| Weyerhaeuser Co. | | | 50,312 | | | | 1,648,724 | |
| Total REITs (Cost $3,813,267) | | | | | | | 4,534,299 | |
| Total Investments – 98.9% (Cost $204,468,173) | | | | | | | 236,717,921 | |
| Other Assets in Excess of Liabilities – 1.1% | | | | | | | 2,534,731 | |
| Total Net Assets – 100.0% | | | | | | $ | 239,252,652 | |
The Global Industry Classification Standard (GICS®) was developed by and/or is the exclusive property of MSCI, Inc. and Standard & Poor’s Financial Services LLC (“S&P”). GICS is a service mark of MSCI, Inc. and S&P and has been licensed for use by U.S. Bank Global Fund Services.
PLC – Public Limited Company
REIT – Real Estate Investment Trust
(a) Non-income producing security.
The accompanying notes are an integral part of these financial statements.
Statement of Assets and Liabilities
at January 31, 2024 (Unaudited)
| ASSETS | | | |
| Investments in securities, at value (cost $204,468,173) | | $ | 236,717,921 | |
| Cash | | | 996,718 | |
| Receivables: | | | | |
| Securities sold | | | 16,513,404 | |
| Fund shares issued | | | 217,995 | |
| Dividends | | | 234,084 | |
| Dividend tax reclaim | | | 11,485 | |
| Prepaid expenses | | | 25,148 | |
| Total assets | | | 254,716,755 | |
| | | | | |
| LIABILITIES | | | | |
| Payables: | | | | |
| Fund shares redeemed | | | 33,325 | |
| Securities purchased | | | 15,271,339 | |
| Administration fees | | | 11,873 | |
| Audit fees | | | 10,558 | |
| Transfer agent fees and expenses | | | 26,746 | |
| Due to Advisor (Note 4) | | | 81,296 | |
| Custody fees | | | 4,748 | |
| Legal fees | | | 1,010 | |
| Fund accounting fees | | | 8,323 | |
| Chief Compliance Officer fee | | | 3,790 | |
| Trustee fees and expenses | | | 3,492 | |
| Shareholder reporting | | | 6,483 | |
| Accrued other expenses | | | 1,120 | |
| Total liabilities | | | 15,464,103 | |
| NET ASSETS | | $ | 239,252,652 | |
| | | | | |
| CALCULATION OF NET ASSET VALUE PER SHARE | | | | |
| Class I Shares | | | | |
| Net assets applicable to shares outstanding | | $ | 239,252,652 | |
| Shares issued and outstanding | | | | |
| [unlimited number of shares (par value $0.01) authorized] | | | 13,277,599 | |
| Net asset value, offering and redemption price per share | | $ | 18.02 | |
| | | | | |
| COMPONENTS OF NET ASSETS | | | | |
| Paid-in capital | | $ | 219,383,765 | |
| Total distributable earnings | | | 19,868,887 | |
| Net assets | | $ | 239,252,652 | |
The accompanying notes are an integral part of these financial statements.
Statement of Operations
For the Six Months Ended January 31, 2024 (Unaudited)
| INVESTMENT INCOME | | | |
| Income | | | |
| Dividends | | $ | 3,333,160 | |
| Total income | | | 3,333,160 | |
| Expenses | | | | |
| Advisory fees (Note 4) | | | 473,585 | |
| Transfer agent fees and expenses (Note 4) | | | 47,073 | |
| Administration fees (Note 4) | | | 23,970 | |
| Fund accounting fees (Note 4) | | | 16,498 | |
| Registration fees | | | 15,838 | |
| Audit fees | | | 10,558 | |
| Reports to shareholders | | | 9,138 | |
| Trustee fees and expenses | | | 8,606 | |
| Custody fees (Note 4) | | | 8,468 | |
| Chief Compliance Officer fee (Note 4) | | | 7,540 | |
| Miscellaneous expense | | | 5,255 | |
| Legal fees | | | 4,232 | |
| Insurance expense | | | 3,704 | |
| Total expenses | | | 634,465 | |
| Net investment income | | | 2,698,695 | |
| | | | | |
| REALIZED AND UNREALIZED GAIN ON INVESTMENTS | | | | |
| Net realized gain on investments | | | 8,106,102 | |
| Net change in unrealized appreciation/(depreciation) on investments | | | 1,819,742 | |
| Net realized and unrealized gain on investments | | | 9,925,844 | |
| Net increase in net assets resulting from operations | | $ | 12,624,539 | |
The accompanying notes are an integral part of these financial statements.
Statements of Changes in Net Assets
| | | Six Months Ended | | | | |
| | | January 31, 2024 | | | Year Ended | |
| | | (Unaudited) | | | July 31, 2023 | |
| INCREASE/(DECREASE) IN NET ASSETS FROM: | | | | | | |
| OPERATIONS | | | | | | |
| Net investment income | | $ | 2,698,695 | | | $ | 5,142,001 | |
| Net realized gain on investments | | | 8,106,102 | | | | 8,345,060 | |
| Net change in unrealized appreciation/(depreciation) on investments | | | 1,819,742 | | | | 14,039,879 | |
| Net increase in net assets resulting from operations | | | 12,624,539 | | | | 27,526,940 | |
| | | | | | | | | |
| DISTRIBUTIONS TO SHAREHOLDERS | | | | | | | | |
| Net distributions to shareholders | | | (9,599,602 | ) | | | (18,420,211 | ) |
| Total distributions to shareholders | | | (9,599,602 | ) | | | (18,420,211 | ) |
| | | | | | | | | |
| CAPITAL SHARE TRANSACTIONS | | | | | | | | |
| Net decrease in net assets derived | | | | | | | | |
| from net change in outstanding shares (a) | | | (8,855,057 | ) | | | (19,696,289 | ) |
| Total decrease in net assets | | | (5,830,120 | ) | | | (10,589,560 | ) |
| | | | | | | | | |
| NET ASSETS | | | | | | | | |
| Beginning of period | | | 245,082,772 | | | | 255,672,332 | |
| End of period | | $ | 239,252,652 | | | $ | 245,082,772 | |
| | | | | | | | | |
| (a) A summary of share transactions is as follows: | | | | | | | | |
| | | | | | | | | |
| Class I Shares | | | | | | | | |
| Net proceeds from shares sold | | $ | 9,758,024 | | | $ | 39,048,916 | |
| Distributions reinvested | | | 8,523,063 | | | | 16,702,581 | |
| Payment for shares redeemed | | | (27,136,144 | ) | | | (75,447,786 | ) |
| Net decrease in net assets from capital share transactions | | $ | (8,855,057 | ) | | $ | (19,696,289 | ) |
| | | | | | | | | |
| Class I Shares | | | | | | | | |
| Shares sold | | | 559,192 | | | | 2,343,946 | |
| Shares issued on reinvestment of distributions | | | 499,301 | | | | 1,027,219 | |
| Shares redeemed | | | (1,586,107 | ) | | | (4,595,266 | ) |
| Net decrease in shares outstanding | | | (527,614 | ) | | | (1,224,101 | ) |
The accompanying notes are an integral part of these financial statements.
Financial Highlights
For a share outstanding throughout each period
Class I Shares
| | | Six Months | | | | | | | | | | | | | | | | |
| | | Ended | | | Year | | | Year | | | Year | | | Year | | | Year | |
| | | January 31, | | | Ended | | | Ended | | | Ended | | | Ended | | | Ended | |
| | | 2024 | | | July 31, | | | July 31, | | | July 31, | | | July 31, | | | July 31, | |
| | | (Unaudited) | | | 2023 | | | 2022 | | | 2021 | | | 2020 | | | 2019 | |
| Net asset value, beginning of period | | $ | 17.75 | | | $ | 17.01 | | | $ | 17.62 | | | $ | 11.95 | | | $ | 13.64 | | | $ | 14.78 | |
| | | | | | | | | | | | | | | | | | | | | | | | | |
| Income from investment operations: | | | | | | | | | | | | | | | | | | | | | | | | |
| Net investment income | | | 0.22 | | | | 0.37 | | | | 0.33 | | | | 0.31 | | | | 0.27 | † | | | 0.24 | † |
| Net realized and unrealized | | | | | | | | | | | | | | | | | | | | | | | | |
| gain/(loss) on investments | | | 0.79 | | | | 1.62 | | | | (0.61 | ) | | | 5.67 | | | | (1.73 | ) | | | (0.49 | ) |
| Total from investment operations | | | 1.01 | | | | 1.99 | | | | (0.28 | ) | | | 5.98 | | | | (1.46 | ) | | | (0.25 | ) |
| | | | | | | | | | | | | | | | | | | | | | | | | |
| Less distributions: | | | | | | | | | | | | | | | | | | | | | | | | |
| From net investment income | | | (0.40 | ) | | | (0.34 | ) | | | (0.33 | ) | | | (0.31 | ) | | | (0.23 | ) | | | (0.12 | ) |
| From net realized gain on investments | | | (0.34 | ) | | | (0.91 | ) | | | — | | | | — | | | | — | | | | (0.77 | ) |
| Total distributions | | | (0.74 | ) | | | (1.25 | ) | | | (0.33 | ) | | | (0.31 | ) | | | (0.23 | ) | | | (0.89 | ) |
| | | | | | | | | | | | | | | | | | | | | | | | | |
| Redemption fees retained | | | — | | | | — | | | | — | | | | — | | | 0.00 | †^ | | 0.00 | †^ |
| | | | | | | | | | | | | | | | | | | | | | | | | |
| Net asset value, end of period | | $ | 18.02 | | | $ | 17.75 | | | $ | 17.01 | | | $ | 17.62 | | | $ | 11.95 | | | $ | 13.64 | |
| | | | | | | | | | | | | | | | | | | | | | | | | |
| Total return | | | 5.89 | %++ | | | 12.38 | % | | | -1.67 | % | | | 50.66 | % | | | -10.97 | % | | | -0.90 | % |
| | | | | | | | | | | | | | | | | | | | | | | | | |
| Ratios/supplemental data: | | | | | | | | | | | | | | | | | | | | | | | | |
| Net assets, end of period (thousands) | | $ | 239,253 | | | $ | 245,083 | | | $ | 255,672 | | | $ | 255,000 | | | $ | 160,980 | | | $ | 207,655 | |
| | | | | | | | | | | | | | | | | | | | | | | | | |
| Ratio of expenses to average net assets: | | | | | | | | | | | | | | | | | | | | | | | | |
| Before fee waiver | | | 0.54 | %+ | | | 0.53 | % | | | 0.52 | % | | | 0.56 | % | | | 0.57 | % | | | 0.59 | % |
| After fee waiver | | | 0.54 | %+ | | | 0.53 | % | | | 0.52 | % | | | 0.56 | % | | | 0.57 | % | | | 0.59 | % |
| | | | | | | | | | | | | | | | | | | | | | | | | |
| Ratio of net investment income | | | | | | | | | | | | | | | | | | | | | | | | |
| to average net assets: | | | | | | | | | | | | | | | | | | | | | | | | |
| Before fee waiver | | | 2.30 | %+ | | | 2.13 | % | | | 1.89 | % | | | 1.98 | % | | | 2.09 | % | | | 1.76 | % |
| After fee waiver | | | 2.30 | %+ | | | 2.13 | % | | | 1.89 | % | | | 1.98 | % | | | 2.09 | % | | | 1.76 | % |
| | | | | | | | | | | | | | | | | | | | | | | | | |
| Portfolio turnover rate | | | 32.38 | %++ | | | 63.50 | % | | | 96.82 | % | | | 68.71 | % | | | 83.04 | % | | | 53.98 | % |
+ | | Annualized. |
++ | | Not annualized. |
| † | | Based on average shares outstanding. |
| ^ | | Amount is less than $0.01 per share. |
The accompanying notes are an integral part of these financial statements.
Notes to Financial Statements
at January 31, 2024 (Unaudited)
NOTE 1 – ORGANIZATION
The O’Shaughnessy Market Leaders Value Fund (the “Fund”) is a series of Advisors Series Trust (the “Trust”), which is registered under the Investment Company Act of 1940 (the “1940 Act”), as amended, as an open-end management investment company. The Fund follows the investment company accounting and reporting guidance of the Financial Accounting Standards Board (“FASB”) Accounting Standard Codification Topic 946 “Financial Services – Investment Companies”. The Fund, which is a diversified fund, began operations on February 26, 2016. The investment objective of the Fund is to seek long-term capital appreciation and current income. The Fund currently offers only Class I shares.
NOTE 2 – SIGNIFICANT ACCOUNTING POLICIES
The following is a summary of significant accounting policies consistently followed by the Fund. These policies are in conformity with accounting principles generally accepted in the United States of America.
| A. | Security Valuation: All investments in securities are recorded at their estimated fair value, as described in Note 3. |
| | |
| B. | Federal Income Taxes: It is the Fund’s policy to comply with the requirements of Subchapter M of the Internal Revenue Code applicable to regulated investment companies and to distribute substantially all of its taxable income to its shareholders. Therefore, no Federal income or excise tax provision is required. |
| | |
| | The Fund recognizes the tax benefits of uncertain tax positions only where the position is “more likely than not” to be sustained assuming examination by tax authorities. The tax returns of the Fund’s prior three fiscal years are open for examination. Management has reviewed all open tax years in major jurisdictions and concluded that there is no impact on the Fund’s net assets and no tax liability resulting from unrecognized tax events relating to uncertain income tax positions taken or expected to be taken on a tax return. The Fund identifies its major tax jurisdictions as U.S. federal and the state of Wisconsin. The Fund is not aware of any tax positions for which it is reasonably possible that the total amounts of unrecognized tax benefits will change materially in the next twelve months. |
| | |
| C. | Security Transactions, Income and Distributions: Security transactions are accounted for on the trade date. Realized gains and losses on securities sold are determined on the basis of identified cost. Interest income is recorded on an accrual basis. Dividend income and distributions to shareholders are recorded on the ex-dividend date. Withholding taxes on foreign dividends have been provided for in accordance with the Fund’s understanding of the applicable country’s tax rules and rates. |
| | |
| | The Fund distributes substantially all net investment income, if any, and net realized gains, if any, annually. Distributions from net realized gains for book purposes may include short-term capital gains. All short-term capital gains are included in ordinary income for tax purposes. The amount of dividends and distributions to shareholders from net investment income and net realized capital gains is determined in accordance with Federal income tax regulations which differ from accounting principles generally accepted in the United States of America. To the extent these book/tax differences are permanent, such amounts are reclassified within the capital accounts based on their Federal tax treatment. |
| | |
| | Common expenses of the Trust are typically allocated among the funds in the Trust based on a fund’s respective net assets, or by other equitable means. |
| | |
| D. | Reclassification of Capital Accounts: Accounting principles generally accepted in the United States of America require that certain components of net assets relating to permanent differences be reclassified between financial and tax reporting. These reclassifications have no effect on net assets or net asset value per share. |
| | |
| E. | Use of Estimates: The preparation of financial statements in conformity with accounting principles generally accepted in the United States of America requires management to make estimates and assumptions that affect the reported amounts of assets and liabilities at the date of the financial statements and the reported amounts of increases and decreases in net assets during the reporting period. Actual results could differ from those estimates. |
Notes to Financial Statements (Continued)
at January 31, 2024 (Unaudited)
NOTE 2 – SIGNIFICANT ACCOUNTING POLICIES (Continued)
| F. | REITs: The Fund may invest in real estate investment trusts (“REITs”) which pay dividends to their shareholders based upon funds available from operations. It is quite common for these dividends to exceed the REIT’s taxable earnings and profits resulting in the excess portion of such dividends being designated as a return of capital. The Fund intends to include the gross dividends from such REITs in their annual distributions to its shareholders and, accordingly, a portion of the Fund’s distributions may also be designated as a return of capital. |
| | |
| G. | Foreign Currency: Investment securities and other assets and liabilities denominated in foreign currencies are translated into U.S. dollar amounts at the date of valuation. Purchases and sales of investment securities and income and expense items denominated in foreign currencies are translated to U.S. dollar amounts on the respective dates of such transactions. |
| | |
| | The Fund does not isolate those portions of the results of operations resulting from changes in foreign exchange rates on investments from the fluctuations arising from changes in market prices of securities held. Such fluctuations are included with the net realized and unrealized gain or loss from investments. |
| | |
| | Reported net realized foreign exchange gains or losses arise from sales of foreign currencies, currency gains or losses realized between the trade and settlement dates on securities transactions, and the difference between the amounts of dividends, interest, and foreign withholding taxes recorded on the Fund’s books and the U.S. dollar equivalent of the amounts actually received or paid. Net unrealized foreign exchange gains and losses arise from changes in the fair values of assets and liabilities, other than investments in securities at fiscal period-end, resulting from changes in exchange rates. |
| | |
| H. | Events Subsequent to the Fiscal Period End: In preparing the financial statements as of January 31, 2024, management considered the impact of subsequent events for potential recognition or disclosure in the financial statements. Refer to Note 12 for more information about subsequent events. |
NOTE 3 – SECURITIES VALUATION
The Fund has adopted authoritative fair value accounting standards which establish an authoritative definition of fair value and set out a hierarchy for measuring fair value. These standards require additional disclosures about the various inputs and valuation techniques used to develop the measurements of fair value, a discussion in changes in valuation techniques and related inputs during the period and expanded disclosure of valuation levels for major security types. These inputs are summarized in the three broad levels listed below:
| Level 1 – | Unadjusted quoted prices in active markets for identical assets or liabilities that the Fund has the ability to access. |
| | |
| Level 2 – | Observable inputs other than quoted prices included in Level 1 that are observable for the asset or liability, either directly or indirectly. These inputs may include quoted prices for the identical instrument on an inactive market, prices for similar instruments, interest rates, prepayment speeds, credit risk, yield curves, default rates and similar data. |
| | |
| Level 3 – | Unobservable inputs for the asset or liability, to the extent relevant observable inputs are not available, representing the Fund’s own assumptions about the assumptions a market participant would use in valuing the asset or liability, and would be based on the best information available. |
Following is a description of the valuation techniques applied to the Fund’s major categories of assets and liabilities measured at fair value on a recurring basis.
The Fund determines the fair value of its investments and computes its net asset value per share as of the close of regular trading on the New York Stock Exchange (4:00 pm EST).
Equity Securities: The Fund’s investments are carried at fair value. Equity securities, including common stocks and real estate investment trusts, that are primarily traded on a national securities exchange shall be valued at the last sale price on the exchange on which they are primarily traded on the day of valuation or, if there has been
Notes to Financial Statements (Continued)
at January 31, 2024 (Unaudited)
NOTE 3 – SECURITIES VALUATION (Continued)
no sale on such day, at the mean between the bid and asked prices. Securities primarily traded in the NASDAQ Global Market system for which market quotations are readily available shall be valued using the NASDAQ Official Closing Price (“NOCP”). If the NOCP is not available, such securities shall be valued at the last sale price on the day of valuation, or if there has been no sale on such day, at the mean between the bid and asked prices. Over-the-counter securities which are not traded in the NASDAQ Global Market System shall be valued at the most recent sales price. The values for foreign securities are reported in local currency and converted to U.S. dollars using currency exchange rates. Exchange rates are provided daily by a recognized independent pricing agent. To the extent these securities are actively traded and valuation adjustments are not applied, they are categorized in Level 1 of the fair value hierarchy.
Investment Companies: Investments in open-end mutual funds, including money market funds, are generally priced at their net asset value per share provided by the service agent of the funds and will be classified in Level 1 of the fair value hierarchy.
Short-Term Securities: Short-term debt securities, including those securities having a maturity of 60 days or less, are valued at the evaluated mean between the bid and asked prices. To the extent the inputs are observable and timely, these securities would be classified in Level 2 of the fair value hierarchy.
The Board of Trustees (the “Board”) has adopted a valuation policy for use by the Fund and its Valuation Designee (as defined below) in calculating the Fund’s net asset value (“NAV”). Pursuant to Rule 2a-5 under the 1940 Act, the Board has designated the Fund’s investment advisor, O’Shaughnessy Asset Management, LLC (the “Advisor”), as the “Valuation Designee” to perform all of the fair value determinations as well as to perform all of the responsibilities that may be performed by the Valuation Designee in accordance with Rule 2a-5, subject to the Board’s oversight. The Advisor, as Valuation Designee is, authorized to make all necessary determinations of the fair values of portfolio securities and other assets for which market quotations are not readily available or if it is deemed that the prices obtained from brokers and dealers or independent pricing services are unreliable.
Depending on the relative significance of the valuation inputs, fair valued securities may be classified in either Level 2 or Level 3 of the fair value hierarchy.
The inputs or methodology used for valuing securities are not an indication of the risk associated with investing in those securities. The following is a summary of the inputs used to value the Fund’s securities as of January 31, 2024:
| | | Level 1 | | | Level 2 | | | Level 3 | | | Total | |
| Investments | | | | | | | | | | | | |
| Common Stocks | | $ | 232,183,622 | | | $ | — | | | $ | — | | | $ | 232,183,622 | |
| REITs | | | 4,534,299 | | | | — | | | | — | | | | 4,534,299 | |
| Total Investments | | $ | 236,717,921 | | | $ | — | | | $ | — | | | $ | 236,717,921 | |
Refer to the Fund’s schedule of investments for a detailed break-out of securities by industry classification.
In October 2022, the Securities and Exchange Commission (the “SEC”) adopted a final rule relating to Tailored Shareholder Reports for Mutual Funds and Exchange-Traded Funds; Fee Information in Investment Company Advertisements. The rule and form amendments will, among other things, require the Fund to transmit concise and visually engaging shareholder reports that highlight key information. The amendments will require that funds tag information in a structured data format and that certain more in-depth information be made available online and available for delivery free of charge to investors on request. The amendments became effective January 24, 2023. There is an 18-month transition period after the effective date of the amendment.
In June 2022, the FASB issued Accounting Standards Update 2022-03, which amends Fair Value Measurement (Topic 820): Fair Value Measurement of Equity Securities Subject to Contractual Sale Restrictions (“ASU 2022-03”). ASU 2022-03 clarifies guidance for fair value measurement of an equity security subject to a contractual sale restriction and establishes new disclosure requirements for such equity securities. ASU 2022-03 is effective for fiscal years beginning after December 15, 2023 and for interim periods within those fiscal years, with early adoption permitted. Management is currently evaluating the impact of these amendments on the Fund’s financial statements.
Notes to Financial Statements (Continued)
at January 31, 2024 (Unaudited)
NOTE 4 – INVESTMENT ADVISORY FEE AND OTHER TRANSACTIONS WITH AFFILIATES
The Advisor provides the Fund with investment management services under an investment advisory agreement. The Advisor furnishes all investment advice, office space, facilities, and provides most of the personnel needed by the Fund. As compensation for its services, the Advisor is entitled to a fee, computed daily and payable monthly. The Fund pays fees calculated at an annual rate of 0.55% of average daily net assets for the first $25 million of assets, 0.45% of the Fund’s average daily net assets for the next $75 million of assets, and 0.35% of the Fund’s average daily net assets in excess of $100 million. For the six months ended January 31, 2024, the Fund incurred $473,585 in advisory fees.
The Fund is responsible for its own operating expenses. The Advisor has contractually agreed to reduce fees payable to it by the Fund and to pay Fund operating expenses (excluding acquired fund fees and expenses, taxes, interest expense, extraordinary expenses or class specific expenses such as Rule 12b-1 fees or shareholder servicing plan fees) to the extent necessary to limit the Fund’s aggregate annual operating expenses to 0.65% of average daily net assets.
The Advisor may request recoupment of previously waived fees and paid expenses in any subsequent month in the 36-month period from the date of the management fee reduction and expense payment if the aggregate amount actually paid by the Fund towards the operating expenses for such fiscal year (taking into account the reimbursement) will not cause the Fund to exceed the lesser of: (1) the expense limitation in place at the time of the management fee reduction and expense payment; or (2) the expense limitation in place at the time of the reimbursement. Any such reimbursement is also contingent upon Board of Trustees review and approval. Such reimbursement may not be paid prior to the Fund’s payment of current ordinary operating expenses. For the six months ended January 31, 2024, there were no expenses waived or recouped by the Advisor. At January 31, 2024, there were no cumulative expenses subject to recapture.
U.S. Bancorp Fund Services, LLC, doing business as U.S. Bank Global Fund Services (“Fund Services”), serves as the Fund’s administrator, fund accountant and transfer agent. U.S. Bank N.A. serves as custodian (the “Custodian”) to the Fund. The Custodian is an affiliate of Fund Services. Fund Services maintains the Fund’s books and records, calculates the Fund’s NAV, prepares various federal and state regulatory filings, coordinates the payment of fund expenses, reviews expense accruals and prepares materials supplied to the Board of Trustees. The officers of the Trust, including the Chief Compliance Officer, are employees of Fund Services. Fees paid by the Fund for administration and accounting, transfer agency, custody and compliance services for the six months ended January 31, 2024 are disclosed in the Statement of Operations.
Quasar Distributors, LLC (“Quasar”) acts as the Fund’s principal underwriter in a continuous public offering of the Fund’s shares. Quasar is a wholly-owned subsidiary of Foreside Financial Group, LLC, doing business as ACA Group.
NOTE 5 – SHAREHOLDER SERVICING FEE
The Fund has entered into a shareholder servicing agreement (the “Agreement”) with the Advisor, under which the Fund may pay servicing fees at an annual rate of up to 0.15% of the Fund’s average daily net assets. Payments to the Advisor under the Agreement may reimburse the Advisor for payments it makes to selected brokers, dealers and administrators which have entered into service agreements with the Advisor for services provided to shareholders of the Fund. The services provided by such intermediaries are primarily designed to assist shareholders of the Fund and include the furnishing of office space and equipment, telephone facilities, personnel and assistance to the Fund in servicing such shareholders. Services provided by such intermediaries also include the provision of support services to the Fund and includes establishing and maintaining shareholders’ accounts and record processing, purchase and redemption transactions, answering routine client inquiries regarding the Fund, and providing such other personal services to shareholders as the Fund may reasonably request. For the six months ended January 31, 2024, the Fund did not accrue shareholder servicing fees.
Notes to Financial Statements (Continued)
at January 31, 2024 (Unaudited)
NOTE 6 – PURCHASES AND SALES OF SECURITIES
For the six months ended January 31, 2024, the cost of purchases and the proceeds from sales of securities, excluding short-term securities, were $75,378,791 and $92,068,925, respectively. There were no purchases or sales of U.S. government securities during the six months ended January 31, 2024.
NOTE 7 – LINE OF CREDIT
The Fund has a secured line of credit in the amount of $5,000,000, or 10% of the market value of the Fund, or 33.33% of the fair value of unencumbered assets of the Fund. This line of credit is intended to provide short-term financing, if necessary, subject to certain restrictions, in connection with shareholder redemptions. The credit facility is with the Fund’s custodian, U.S. Bank N.A. During the six months ended January 31, 2024, the Fund did not draw upon its line of credit.
NOTE 8 – INCOME TAXES AND DISTRIBUTIONS TO SHAREHOLDERS
The tax character of distributions paid during the six months ended January 31, 2024 and the year ended July 31, 2023 were as follows:
| | | January 31, 2024 | | | July 31, 2023 | |
| Ordinary income | | $ | 5,200,746 | | | $ | 5,064,766 | |
| Long-term capital gains | | | 4,398,856 | | | | 13,355,445 | |
As of July 31, 2023, the Fund’s most recent fiscal year end, the components of accumulated earnings/(losses) on a tax basis were as follows:
| Cost of investments (a) | | $ | 213,053,994 | |
| Gross tax unrealized appreciation | | | 34,534,067 | |
| Gross tax unrealized depreciation | | | (4,105,831 | ) |
| Net tax unrealized appreciation (a) | | | 30,428,236 | |
| Undistributed ordinary income | | | 2,740,752 | |
| Undistributed long-term capital gain | | | 2,085,746 | |
| Total distributable earnings | | | 4,826,498 | |
| Other accumulated gains/(losses) | | | (18,410,784 | ) |
| Total accumulated earnings/(losses) | | $ | 16,843,950 | |
| (a) | The difference between book basis and tax basis net unrealized appreciation and cost are attributable primarily to the tax deferral of losses on wash sales adjustments. |
At July 31, 2023, the Fund had short-term and long-term capital loss carryforwards of $17,822,443 and $588,341, respectively. These capital losses may be carried forward indefinitely to offset future gains.
NOTE 9 – PRINCIPAL RISKS
Below is a summary of some, but not all, of the principal risks of investing in the Fund, each of which may adversely affect the Fund’s net asset value and total return. The Fund’s most recent prospectus provides further descriptions of the Fund’s investment objective, principal investment strategies and principal risks.
| • | Equity Securities Risk. The price of equity securities may rise or fall because of economic or political changes or changes in a company’s financial condition, sometimes rapidly or unpredictably. These price movements may result from factors affecting individual companies, sectors or industries selected for the Fund’s portfolio or the securities market as a whole, such as changes in economic or political conditions. The values of convertible securities tend to decline as interest rates rise and, because of the conversion feature, tend to vary with fluctuations in the market value of the underlying equity security. |
| | |
| • | General Market Risk. Economies and financial markets throughout the world are becoming increasingly interconnected, which increases the likelihood that events or conditions in one country or region will adversely |
Notes to Financial Statements (Continued)
at January 31, 2024 (Unaudited)
NOTE 9 – PRINCIPAL RISKS (Continued)
| | impact markets or issuers in other countries or regions. Securities in the Fund’s portfolio may underperform in comparison to securities in general financial markets, a particular financial market or other asset classes due to a number of factors, including: inflation (or expectations for inflation); interest rates; global demand for particular products or resources; natural disasters or events; pandemic diseases; terrorism; regulatory events; and government controls. U.S. and international markets have experienced significant periods of volatility in recent years and months due to a number of economic, political and global macro factors, which has resulted in disruptions to business operations and supply chains, stress on the global healthcare system, growth concerns in the U.S. and overseas, staffing shortages and the inability to meet consumer demand, and widespread concern and uncertainty. Continuing uncertainties regarding interest rates, rising inflation, political events, rising government debt in the U.S. and trade tensions also contribute to market volatility. As a result of continuing political tensions and armed conflicts, including the war between Ukraine and Russia, the U.S. and the European Union imposed sanctions on certain Russian individuals and companies, including certain financial institutions, and have limited certain exports and imports to and from Russia. The war has contributed to recent market volatility and may continue to do so. |
| | |
| • | Value Style Investing Risk. At times when the value investing style is out of favor, the Fund may underperform other funds that use different investing styles. Value stocks may be purchased based upon the belief that a given security may be out of favor; that belief may be misplaced or the security may stay out of favor for an extended period of time. |
| | |
| • | Large-Sized Companies Risk. Larger, more established companies may be unable to respond quickly to new competitive challenges like changes in consumer tastes or innovative smaller competitors. In addition, large-cap companies are sometimes unable to attain the high growth rates of successful, smaller companies, especially during extended periods of economic expansion. |
| | |
| • | Small- and Medium-Sized Companies Risk. Small- and medium-sized companies often have less predictable earnings, more limited product lines, markets, distribution channels or financial resources and the management of such companies may be dependent upon one or few key people. The market movements of equity securities of small- and medium-sized companies may be more abrupt and volatile than the market movements of equity securities of larger, more established companies or the stock market in general and small-sized companies in particular, are generally less liquid than the equity securities of larger companies. |
| | |
| • | Sector Risk. To the extent the Fund invests a significant portion of its assets in the securities of companies in the same sector of the market, the Fund is more susceptible to economic, political, regulatory and other occurrences influencing those sectors. |
| | |
| • | REITs and Foreign Real Estate Company Risk. Investing in REITs and foreign real estate companies makes the Fund more susceptible to risks associated with the ownership of real estate and with the real estate industry in general, as well as tax compliance risks, and may involve duplication of management fees and other expenses. REITs and foreign real estate companies may be less diversified than other pools of securities, may have lower trading volumes and may be subject to more abrupt or erratic price movements than the overall securities markets. |
| | |
| • | Management Risk. The Fund is an actively managed portfolio. The Adviser’s management practices and investment strategies might not work to meet the Fund’s investment objective. |
| | |
| • | Depositary Receipts Risk. The Fund’s equity investments may take the form of sponsored or unsponsored depositary receipts. Holders of unsponsored depositary receipts generally bear all the costs of such facilities and the depositary of an unsponsored facility frequently is under no obligation to distribute shareholder communications received from the issuer of the deposited security or to pass through voting rights to the holders of such receipts of the deposited securities. |
Notes to Financial Statements (Continued)
at January 31, 2024 (Unaudited)
| • | Foreign Securities and Emerging Markets Risk. The risks of investing in the securities of foreign issuers, including depositary receipts, can include fluctuations in foreign currencies, foreign currency exchange controls, political and economic instability, differences in securities regulation and trading, and foreign taxation issues. These risks are greater in emerging markets. |
| | |
| • | Investment Company Risk. When the Fund invests in an ETF or mutual fund, it will bear additional expenses based on its pro rata share of the ETF’s or mutual fund’s operating expenses, including the potential duplication of management fees. The risk of owning an ETF or mutual fund generally reflects the risks of owning the underlying securities the ETF or mutual fund holds. The Fund also will incur brokerage costs when it purchases ETFs. |
| | |
| • | Frontier Markets Risk. There is an additional increased risk of price volatility associated with frontier market countries (pre-emerging markets), which may be further magnified by currency fluctuations relative to the U.S. dollar. Frontier market countries generally have smaller economies or less developed capital markets than in more advanced emerging markets and, as a result, the risks of investing in emerging market countries may be magnified in frontier market countries. |
NOTE 10 – CONTROL OWNERSHIP
The beneficial ownership, either directly or indirectly of more than 25% of the voting securities of the Fund creates a presumption of control of the Fund, under Section 2(a)(9) of the 1940 Act. As of January 31, 2024, National Financial Services LLC, for the benefit of their customers, owned 34.14% of the outstanding shares of the Fund.
NOTE 11 – TRUSTEES
Effective October 18, 2023, Mr. Ray Woolson retired from his service as Trustee and Board Chair to attend to health-related matters. At the recommendation of the Governance and Nominating Committee, on October 24, 2023, the Board appointed Mr. David Mertens as the successor Board Chair, and Ms. Michele Rackey was appointed as Governance and Nominating Committee Chair.
NOTE 12 – SUBSEQUENT EVENT
Effective on February 2, 2024, Christopher Meredith will no longer serve as a portfolio manager of the Fund. Effective the same day, Ehren Stanhope will begin serving as a portfolio manager of the Fund. Scott Bartone, Daniel Nitiutomo and Claire Noel will remain as portfolio managers jointly and primarily responsible for the day-to-day management of the Fund together with Ehren Stanhope.
Approval of Investment Advisory Agreement
(Unaudited)
At meetings held on October 18, 2023 and December 14-15, 2023, the Board (which is comprised of three persons, all of whom are Independent Trustees as defined under the Investment Company Act of 1940, as amended), considered and approved, for another annual term, the continuance of the investment advisory agreement (the “Advisory Agreement”) between Advisors Series Trust (the “Trust”) and O’Shaughnessy Asset Management, LLC (the “Advisor”) on behalf of the O’Shaughnessy Markets Leaders Value Fund (the “Market Leaders Value Fund” or the “Fund”). At both meetings, the Board received and reviewed substantial information regarding the Fund, the Advisor and the services provided by the Advisor to the Fund under the Advisory Agreement. This information, together with the information provided to the Board throughout the course of the year, formed the primary (but not exclusive) basis for the Board’s determinations. Below is a summary of the factors considered by the Board and the conclusions that formed the basis for the Board’s approval of the continuance of the Advisory Agreement:
| 1. | THE NATURE, EXTENT AND QUALITY OF THE SERVICES PROVIDED AND TO BE PROVIDED BY THE ADVISOR UNDER THE ADVISORY AGREEMENT. The Board considered the nature, extent and quality of the Advisor’s overall services provided to the Fund, as well as its responsibilities in all aspects of day-to-day investment management of the Fund. The Board considered the qualifications, experience and responsibilities of the portfolio managers, as well as the responsibilities of other key personnel of the Advisor involved in the day-to-day activities of the Fund. The Board also considered the resources and compliance structure of the Advisor, including information regarding its compliance program, its chief compliance officer and the Advisor’s compliance record, as well as the Advisor’s cybersecurity program, liquidity risk management program, valuation procedures, business continuity plan, and risk management process. The Board also noted that the Advisor was working towards implementation of newly adopted Securities and Exchange Commission rules applicable to the Fund, including the new tailored shareholder reports. The Board further considered the prior relationship between the Advisor and the Trust, as well as the Board’s knowledge of the Advisor’s operations, and noted that during the course of the prior year they had met with certain personnel of the Advisor to discuss Fund performance and investment outlook as well as various marketing and compliance topics. The Board concluded that the Advisor had the quality and depth of personnel, resources, investment processes, and compliance policies and procedures essential to performing its duties under the Advisory Agreement and that they were satisfied with the nature, overall quality and extent of such management services. |
| | |
| 2. | THE FUND’S HISTORICAL PERFORMANCE AND THE OVERALL PERFORMANCE OF THE ADVISOR. In assessing the quality of the portfolio management delivered by the Advisor, the Board reviewed the short-term and long-term performance of the Fund as of June 30, 2023 on both an absolute basis and a relative basis in comparison to its peer funds utilizing Morningstar classifications, appropriate securities market benchmarks, a cohort that is comprised of similarly managed funds selected by an independent third-party consulting firm engaged by the Board to assist it in its 15(c) review (the “Cohort”), and the Advisor’s similarly managed accounts. While the Board considered both short-term and long-term performance, it placed greater emphasis on longer term performance. When reviewing performance against the comparative peer group universe, the Board took into account that the investment objectives and strategies of the Fund, as well as its level of risk tolerance, may differ significantly from funds in the peer universe. When reviewing the Fund’s performance against a broad market benchmark, the Board took into account the differences in portfolio construction between the Fund and such benchmark as well as other differences between actively managed funds and passive benchmarks, such as objectives and risks. In assessing periods of relative underperformance or outperformance, the Board took into account that relative performance can be significantly impacted by performance measurement periods and that some periods of underperformance may be transitory in nature while others may reflect more significant underlying issues. |
| | |
| | The Board noted that the Fund outperformed the Morningstar peer group average for the one- and three-year periods and underperformed the average for the five-year period ended June 30, 2023. The Board also considered that the Fund outperformed the Cohort average for the one, three- and five-year periods ended June 30, 2023. The Board also reviewed the performance of the Fund against a broad-based securities market benchmark, noting that it had outperformed its primary benchmark index for the one- and three-year periods and underperformed for the five-year period ended June 30, 2023. |
Approval of Investment Advisory Agreement (Continued)
(Unaudited)
| | The Board also considered the Fund’s performance compared to the Advisor’s similarly managed composite, noting that the Fund had outperformed its similarly managed composite for the one-, three- and five-year periods ended June 30, 2023. |
| | |
| 3. | THE COSTS OF THE SERVICES TO BE PROVIDED BY THE ADVISOR AND THE STRUCTURE OF THE ADVISOR’S FEE UNDER THE ADVISORY AGREEMENT. In considering the advisory fee and total fees and expenses of the Fund, the Board reviewed comparisons to the peer funds and the Advisor’s similarly managed separate accounts for other types of clients, as well as all expense waivers and reimbursements. When reviewing fees charged to other similarly managed accounts, the Board took into account the type of account and the differences in the management of that account that might be germane to the difference, if any, in the fees charged to such accounts. |
| | |
| | The Board noted that the Advisor had contractually agreed to maintain an expense limitation for the Fund of 0.65%, excluding certain operating expenses and class-level expenses (the “Expense Cap”). The Board noted that the Fund’s contractual management fee and net expense ratio were below the median and average of its Cohort. The Board also noted that the Fund’s net expense ratio was below the average of its Morningstar peer group. |
| | |
| | The Board also took into consideration the services the Advisor provided to its similarly managed account clients, comparing the fees charged for those management services to the management fees charged to the Fund. The Board found that the management fees charged to the Fund were the same as those charged to the similarly managed separate accounts. |
| | |
| | The Board determined that it would continue to monitor the appropriateness of the advisory fee for the Fund and concluded that, at this time, the fees to be paid to the Advisor were fair and reasonable. |
| | |
| 4. | ECONOMIES OF SCALE. The Board also considered whether economies of scale were being realized by the Advisor that should be shared with shareholders. In this regard, the Board noted that the Advisor contractually agreed to reduce its advisory fees or reimburse Fund expenses so that the Fund does not exceed its specified Expense Cap and that the Fund’s expenses are currently running below the Expense Cap. In this regard, the Board also considered that the advisory agreement included breakpoints and that the breakpoints were currently in effect for the Fund. The Board noted that at current asset levels, it did not appear that there were additional significant economies of scale being realized by the Advisor and concluded that it would continue to monitor economies of scale in the future as circumstances changed and assuming asset levels continued to increase. |
| | |
| 5. | THE PROFITS TO BE REALIZED BY THE ADVISOR AND ITS AFFILIATES FROM THEIR RELATIONSHIP WITH THE FUND. The Board reviewed the Advisor’s financial information and took into account both the direct benefits and the indirect benefits to the Advisor from advising the Fund. The Board also considered that the Fund does not charge a Rule 12b-1 fee or utilize “soft dollars.” The Board considered the profitability to the Advisor from its relationship with the Fund and considered any additional material benefits derived by the Advisor from its relationship with the Fund. After such review, the Board determined that the profitability to the Advisor with respect to the Advisory Agreement was not excessive, and that the Advisor had maintained adequate profit levels to support the services it provides to the Fund. |
No single factor was determinative of the Board’s decision to approve the continuance of the Advisory Agreement for the Fund, but rather the Trustees based their determination on the total mix of information available to them. Based on a consideration of all the factors in their totality, the Trustees determined that the advisory arrangements with the Advisor, including the advisory fees, were fair and reasonable to the Fund. The Board, including a majority of the Independent Trustees, therefore determined that the continuance of the Advisory Agreement for the Fund would be in the best interests of the Fund and its shareholders.
Statement Regarding Liquidity Risk Management Program
(Unaudited)
The Fund has adopted a liquidity risk management program (the “program”). The Board has designated a committee at the Advisor to serve as the administrator of the program. The Advisor’s committee conducts the day-to-day operation of the program pursuant to policies and procedures administered by the committee.
Under the program, the Advisor’s committee manages the Fund’s liquidity risk, which is the risk that the Fund could not meet shareholder redemption requests without significant dilution of remaining shareholders’ interests in the Fund. This risk is managed by monitoring the degree of liquidity of the Fund’s investments, limiting the amount of the Fund’s illiquid investments, and utilizing various risk management tools and facilities available to the Fund for meeting shareholder redemptions, among other means. The committee’s process of determining the degree of liquidity of the Fund’s investments is supported by one or more third-party liquidity assessment vendors.
The Board reviewed a report prepared by the committee regarding the operation and effectiveness of the program for the period July 1, 2022 through June 30, 2023. No significant liquidity events impacting the Fund were noted in the report. In addition, the committee provided its assessment that the program had been effective in managing the Fund’s liquidity risk.
Notice to Shareholders
at January 31, 2024 (Unaudited)
HOW TO OBTAIN A COPY OF THE FUND’S PROXY VOTING POLICIES
A description of the policies and procedures that the Fund uses to determine how to vote proxies relating to portfolio securities is available without charge, upon request, by calling 1-877-291-7827 or on the U.S. Securities and Exchange Commission’s (SEC’s) website at http://www.sec.gov.
HOW TO OBTAIN A COPY OF THE FUND’S PROXY VOTING RECORDS FOR THE 12-MONTH PERIOD ENDED JUNE 30
Information regarding how the Fund voted proxies relating to portfolio securities during the most recent 12-month period ended June 30 is available without charge, upon request, by calling 1-877-291-7827. Furthermore, you can obtain the Fund’s proxy voting records on the SEC’s website at http://www.sec.gov.
QUARTERLY FILINGS ON FORM N-PORT
The Fund files its complete schedule of portfolio holdings with the SEC for the first and third quarters of each fiscal year on Part F of Form N-PORT. The Fund’s Form N-PORT is available on the SEC’s website at http://www.sec.gov. Information included in the Fund’s Form N-PORT is also available by calling 1-877-291-7827.
HOUSEHOLDING
In an effort to decrease costs, the Fund will reduce the number of duplicate prospectuses, supplements, and certain other shareholder documents that you receive by sending only one copy of each to those addresses shown by two or more accounts. Please call the Fund’s transfer agent toll-free at 1-877-291-7827 to request individual copies of these documents. The Fund will begin sending individual copies 30 days after receiving your request. This policy does not apply to account statements.
Privacy Notice
The Fund collects non-public information about you from the following sources:
• Information we receive about you on applications or other forms;
• Information you give us orally; and/or
• Information about your transactions with us or others.
We do not disclose any non-public personal information about our customers or former customers without the customer’s authorization, except as permitted by law or in response to inquiries from governmental authorities. We may share information with affiliated and unaffiliated third parties with whom we have contracts for servicing the Fund. We will provide unaffiliated third parties with only the information necessary to carry out their assigned responsibilities. We maintain physical, electronic and procedural safeguards to guard your non-public personal information and require third parties to treat your personal information with the same high degree of confidentiality.
In the event that you hold shares of the Fund through a financial intermediary, including, but not limited to, a broker-dealer, bank, or trust company, the privacy policy of your financial intermediary would govern how your non-public personal information would be shared by those entities with unaffiliated third parties.
(This Page Intentionally Left Blank.)
Investment Advisor
O’Shaughnessy Asset Management, LLC
6 Suburban Avenue
Stamford, Connecticut 06901
Distributor
Quasar Distributors, LLC
3 Canal Plaza, Suite 100
Portland, Maine 04101
Custodian
U.S. Bank National Association
Custody Operations
1555 North RiverCenter Drive, Suite 302
Milwaukee, Wisconsin 53212
Transfer Agent
U.S. Bank Global Fund Services
615 East Michigan Street
Milwaukee, Wisconsin 53202
Independent Registered Public Accounting Firm
Tait, Weller & Baker LLP
Two Liberty Place
50 South 16th Street, Suite 2900
Philadelphia, Pennsylvania 19102
Legal Counsel
Sullivan & Worcester LLP
1633 Broadway, 32nd Floor
New York, New York 10019
This report is intended for shareholders of the Fund and may not be used as sales literature unless preceded or
accompanied by a current prospectus. For a current prospectus, please call 1-877-291-7827.
(b) Not Applicable.
Item 2. Code of Ethics.
Not applicable for semi-annual reports.
Item 3. Audit Committee Financial Expert.
Not applicable for semi-annual reports.
Item 4. Principal Accountant Fees and Services.
Not applicable for semi-annual reports.
Item 5. Audit Committee of Listed Registrants.
| (a) | Not applicable to registrants who are not listed issuers (as defined in Rule 10A-3 under the Securities Exchange Act of 1934). |
Item 6. Investments.
| (a) | Schedule of Investments is included as part of the report to shareholders filed under Item 1 of this Form. |
Item 7. Disclosure of Proxy Voting Policies and Procedures for Closed-End Management Investment Companies.
Not applicable to open-end investment companies.
Item 8. Portfolio Managers of Closed-End Management Investment Companies.
Not applicable to open-end investment companies.
Item 9. Purchases of Equity Securities by Closed‑End Management Investment Company and Affiliated Purchasers.
Not applicable to open-end investment companies.
Item 10. Submission of Matters to a Vote of Security Holders.
There have been no material changes to the procedures by which shareholders may recommend nominees to the Registrant’s Board of Trustees.
Item 11. Controls and Procedures.
| (a) | The Registrant’s President/Chief Executive Officer/Principal Executive Officer and Vice President/Treasurer/Principal Financial Officer have reviewed the Registrant's disclosure controls and procedures (as defined in Rule 30a-3(c) under the Investment Company Act of 1940, as amended, (the “Act”)) as of a date within 90 days of the filing of this report, as required by Rule 30a-3(b) under the Act and Rules 13a-15(b) or 15d‑15(b) under the Securities Exchange Act of 1934. Based on their review, such officers have concluded that the disclosure controls and procedures are effective in ensuring that information required to be disclosed in this report is appropriately recorded, processed, summarized and reported and made known to them by others within the Registrant and by the Registrant’s service provider. |
| (b) | There were no changes in the Registrant's internal control over financial reporting (as defined in Rule 30a-3(d) under the Act) that occurred during the period covered by this report that has materially affected, or is reasonably likely to materially affect, the Registrant's internal control over financial reporting. |
Item 12. Disclosure of Securities Lending Activities for Closed-End Management Investment Companies.
Not applicable to open-end investment companies.
Item 13. Exhibits.
| (a) | (1) Any code of ethics or amendment thereto, that is the subject of the disclosure required by Item 2, to the extent that the registrant intends to satisfy Item 2 requirements through filing an exhibit. Not Applicable. |
(3) Any written solicitation to purchase securities under Rule 23c‑1 under the Act sent or given during the period covered by the report by or on behalf of the registrant to 10 or more persons. Not applicable to open-end investment companies.
(4) Change in the registrant’s independent public accountant. There was no change in the registrant’s independent public accountant for the period covered by this report.
SIGNATURES
Pursuant to the requirements of the Securities Exchange Act of 1934 and the Investment Company Act of 1940, as amended, the registrant has duly caused this report to be signed on its behalf by the undersigned, thereunto duly authorized.
(Registrant) Advisors Series Trust
By (Signature and Title)* /s/ Jeffrey T. Rauman
Jeffrey T. Rauman, President/Chief Executive Officer/Principal
Executive Officer
Date 4/2/2024
Pursuant to the requirements of the Securities Exchange Act of 1934 and the Investment Company Act of 1940, as amended, this report has been signed below by the following persons on behalf of the registrant and in the capacities and on the dates indicated.
By (Signature and Title)* /s/ Jeffrey T. Rauman
Jeffrey T. Rauman, President/Chief Executive Officer/Principal
Executive Officer
Date 4/2/2024
By (Signature and Title)* /s/ Kevin J. Hayden
Kevin J. Hayden, Vice President/Treasurer/Principal Financial
Officer
Date 4/2/2024
* Print the name and title of each signing officer under his or her signature.