
SHENKMAN CAPITAL FUNDS
Shenkman Capital Floating Rate High Income Fund
Shenkman Capital Short Duration High Income Fund
Core Financial Statements
September 30, 2024
UNITED STATES
SECURITIES AND EXCHANGE COMMISSION
Washington, D.C. 20549
FORM N-CSR
CERTIFIED SHAREHOLDER REPORT OF REGISTERED
MANAGEMENT INVESTMENT COMPANIES
Investment Company Act file number 811-07959
Advisors Series Trust
(Exact name of registrant as specified in charter)
615 East Michigan Street
Milwaukee, WI 53202
(Address of principal executive offices) (Zip code)
Jeffrey T. Rauman, President/Chief Executive Officer
Advisors Series Trust
c/o U.S. Bancorp Fund Services, LLC
777 East Wisconsin Avenue, 4th Floor
Milwaukee, WI 53202
(Name and address of agent for service)
(626) 914-7235
Registrant’s telephone number, including area code
Date of fiscal year end: September 30, 2024
Date of reporting period: September 30, 2024
Item 1. Reports to Stockholders.
| (a) |
 | Shenkman Capital Floating Rate High Income Fund |  |
| Class F | SFHFX | ||
| Annual Shareholder Report | September 30, 2024 |
Class Name | Costs of a $10,000 investment | Costs paid as a percentage of a $10,000 investment |
| Class F | $58 | 0.56% |
Top Contributors | |
| ↑ | The top contributors for the period included the Fund’s out-of-Index allocation to high yield bonds, which outperformed leveraged loans for the period. |
Top Detractors | |
| ↓ | Conversely, our underweight in the B- rated loans and being underweight in the Telecommunication Services sector both detracted from the Fund’s performance. |
| Shenkman Capital Floating Rate High Income Fund | PAGE 1 | TSR-AR-00770X485 |
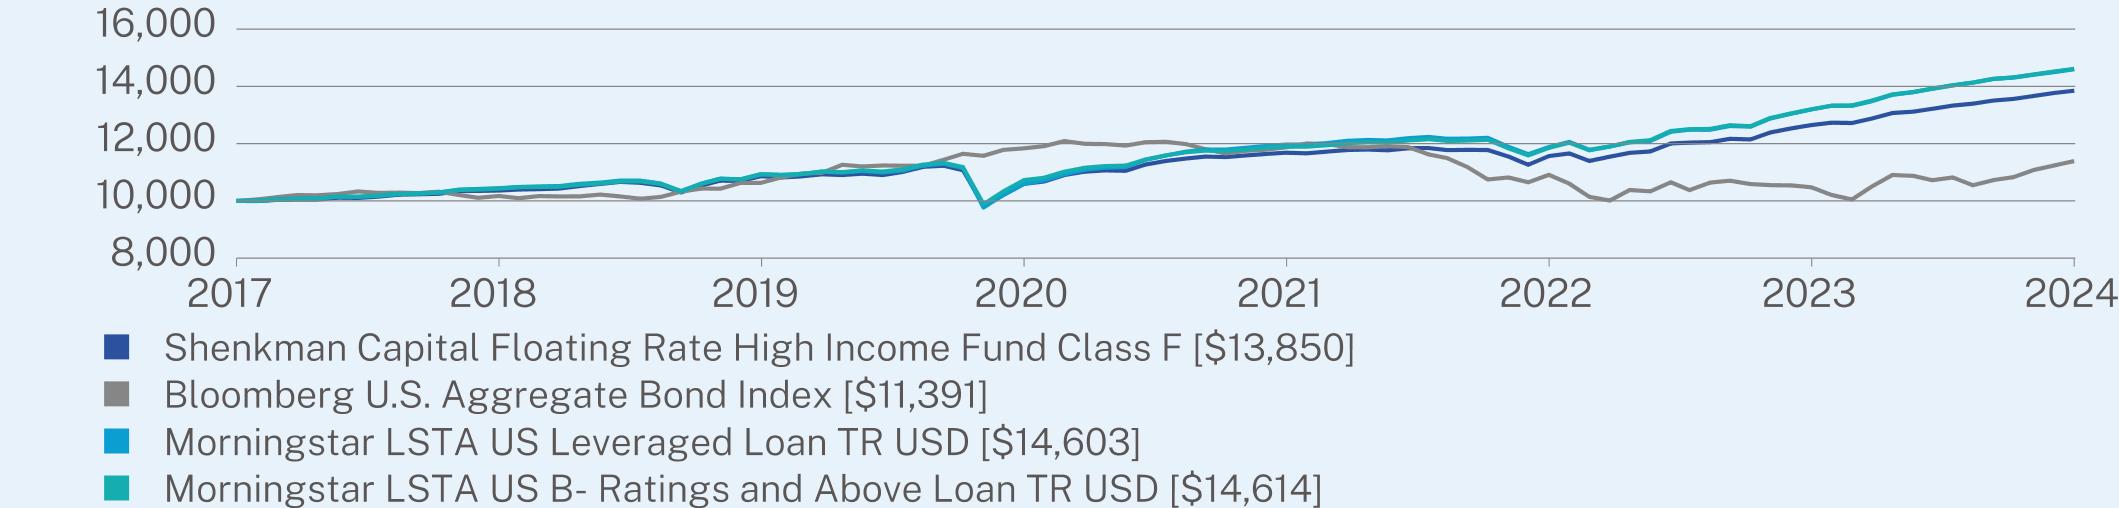
1 Year | 5 Year | Since Inception (03/01/2017) | |
Class F | 8.77 | 4.81 | 4.39 |
Bloomberg U.S. Aggregate Bond Index | 11.57 | 0.33 | 1.73 |
Morningstar LSTA US Leveraged Loan TR USD | 9.59 | 5.74 | 5.12 |
Morningstar LSTA US B- Ratings and Above Loan TR USD | 9.69 | 5.71 | 5.13 |
| * | The Fund’s past performance is not a good predictor of the Fund’s future performance. The returns do not reflect the deduction of taxes that a shareholder would pay on Fund distributions or redemption of Fund shares. |
Net Assets | $274,354,993 |
Number of Holdings | 492 |
Net Advisory Fee | $866,106 |
Portfolio Turnover | 70% |
Average Credit Quality | B+ / B1* |
Weighted Average Maturity | 4.53 years |
30-Day SEC Yield | 8.22% |
30-Day SEC Yield Unsubsidized | 8.04% |
| * | Credit quality ratings reflect the highest rating assigned by S&P Global Ratings, Fitch or Moody’s if ratings differ. These ratings agencies are independent, nationally recognized statistical rating organizations and are widely used. Investment grade ratings are BBB/Baa or higher. Below investment grade ratings are BB/Ba or lower. |
| Shenkman Capital Floating Rate High Income Fund | PAGE 2 | TSR-AR-00770X485 |
Top 10 Securities | (% of net assets) |
First American Government Obligations Fund | 5.0% |
Gen Digital, Inc. | 0.8% |
Cloud Software Group, Inc. | 0.7% |
AssuredPartners, Inc. | 0.7% |
Acrisure LLC | 0.7% |
Flutter Financing BV | 0.7% |
Delivery Hero Finco LLC | 0.7% |
Alterra Mountain Co. | 0.7% |
UKG, Inc. | 0.6% |
Asurion LLC | 0.6% |
Security Type | (% of net assets) |
Bank Loans | 84.8% |
Corporate Bonds | 12.7% |
Money Market Funds | 5.0% |
Cash & Other | -2.5% |
| Shenkman Capital Floating Rate High Income Fund | PAGE 3 | TSR-AR-00770X485 |
 | Shenkman Capital Floating Rate High Income Fund |  |
| Institutional Class | SFHIX | ||
| Annual Shareholder Report | September 30, 2024 |
Class Name | Costs of a $10,000 investment | Costs paid as a percentage of a $10,000 investment |
| Institutional Class | $56 | 0.54% |
Top Contributors | |
| ↑ | The top contributors for the period included the Fund’s out-of-Index allocation to high yield bonds, which outperformed leveraged loans for the period. |
Top Detractors | |
| ↓ | Conversely, our underweight in the B- rated loans and being underweight in the Telecommunication Services sector both detracted from the Fund’s performance. |
| Shenkman Capital Floating Rate High Income Fund | PAGE 1 | TSR-AR-00770X576 |
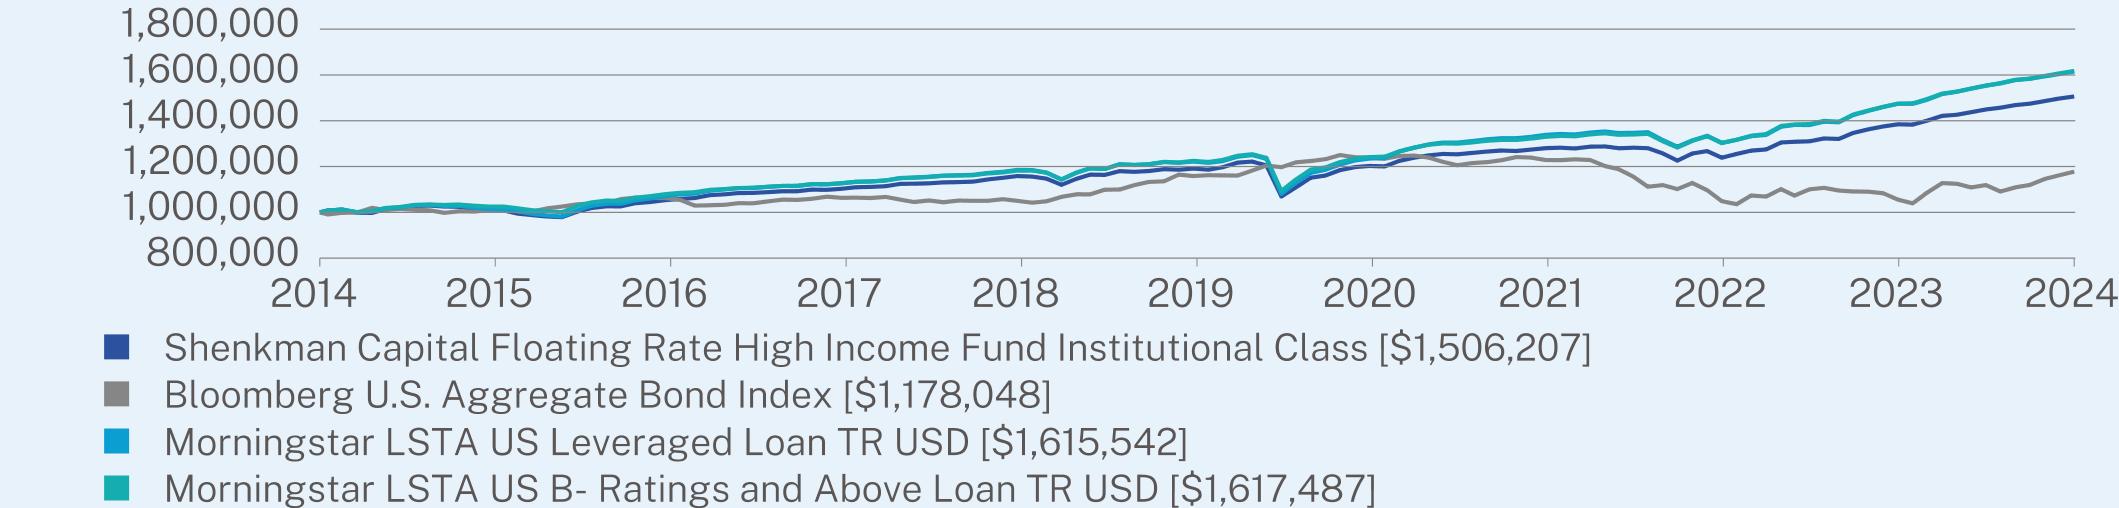
1 Year | 5 Year | Since Inception (10/15/2014) | |
Institutional Class | 8.79 | 4.80 | 4.20 |
Bloomberg U.S. Aggregate Bond Index | 11.57 | 0.33 | 1.66 |
Morningstar LSTA US Leveraged Loan TR USD | 9.59 | 5.74 | 4.93 |
Morningstar LSTA US B- Ratings and Above Loan TR USD | 9.69 | 5.71 | 4.95 |
| * | The Fund’s past performance is not a good predictor of the Fund’s future performance. The returns do not reflect the deduction of taxes that a shareholder would pay on Fund distributions or redemption of Fund shares. |
Net Assets | $274,354,993 |
Number of Holdings | 492 |
Net Advisory Fee | $866,106 |
Portfolio Turnover | 70% |
Average Credit Quality | B+ / B1* |
Weighted Average Maturity | 4.53 years |
30-Day SEC Yield | 8.26% |
30-Day SEC Yield Unsubsidized | 8.08% |
| * | Credit quality ratings reflect the highest rating assigned by S&P Global Ratings, Fitch or Moody’s if ratings differ. These ratings agencies are independent, nationally recognized statistical rating organizations and are widely used. Investment grade ratings are BBB/Baa or higher. Below investment grade ratings are BB/Ba or lower. |
| Shenkman Capital Floating Rate High Income Fund | PAGE 2 | TSR-AR-00770X576 |
Top 10 Securities | (% of net assets) |
First American Government Obligations Fund | 5.0% |
Gen Digital, Inc. | 0.8% |
Cloud Software Group, Inc. | 0.7% |
AssuredPartners, Inc. | 0.7% |
Acrisure LLC | 0.7% |
Flutter Financing BV | 0.7% |
Delivery Hero Finco LLC | 0.7% |
Alterra Mountain Co. | 0.7% |
UKG, Inc. | 0.6% |
Asurion LLC | 0.6% |
Security Type | (% of net assets) |
Bank Loans | 84.8% |
Corporate Bonds | 12.7% |
Money Market Funds | 5.0% |
Cash & Other | -2.5% |
| Shenkman Capital Floating Rate High Income Fund | PAGE 3 | TSR-AR-00770X576 |
 | Shenkman Capital Short Duration High Income Fund |  |
| Class A | SCFAX | ||
| Annual Shareholder Report | September 30, 2024 |
Class Name | Costs of a $10,000 investment | Costs paid as a percentage of a $10,000 investment |
| Class A | $100 | 0.96% |
Top Contributors | |
| ↑ | The top contributors for the period were the Fund’s higher exposure and selection to bonds with final maturities greater than 3 years as those bonds saw greater benefits from the decline in rates. Additional contributors were our selection in the BB rate credits, allocation to CCC & Below rated credits, selection in Utilities, and zero weighting in Oil & Gas. |
Top Detractors | |
| ↓ | Some of the detractors over the period included our negative selection and underweight in the B rated credits, underweight in Consumer Staples Discretionary, and negative selection in Healthcare. |
| Shenkman Capital Short Duration High Income Fund | PAGE 1 | TSR-AR-00770X501 |
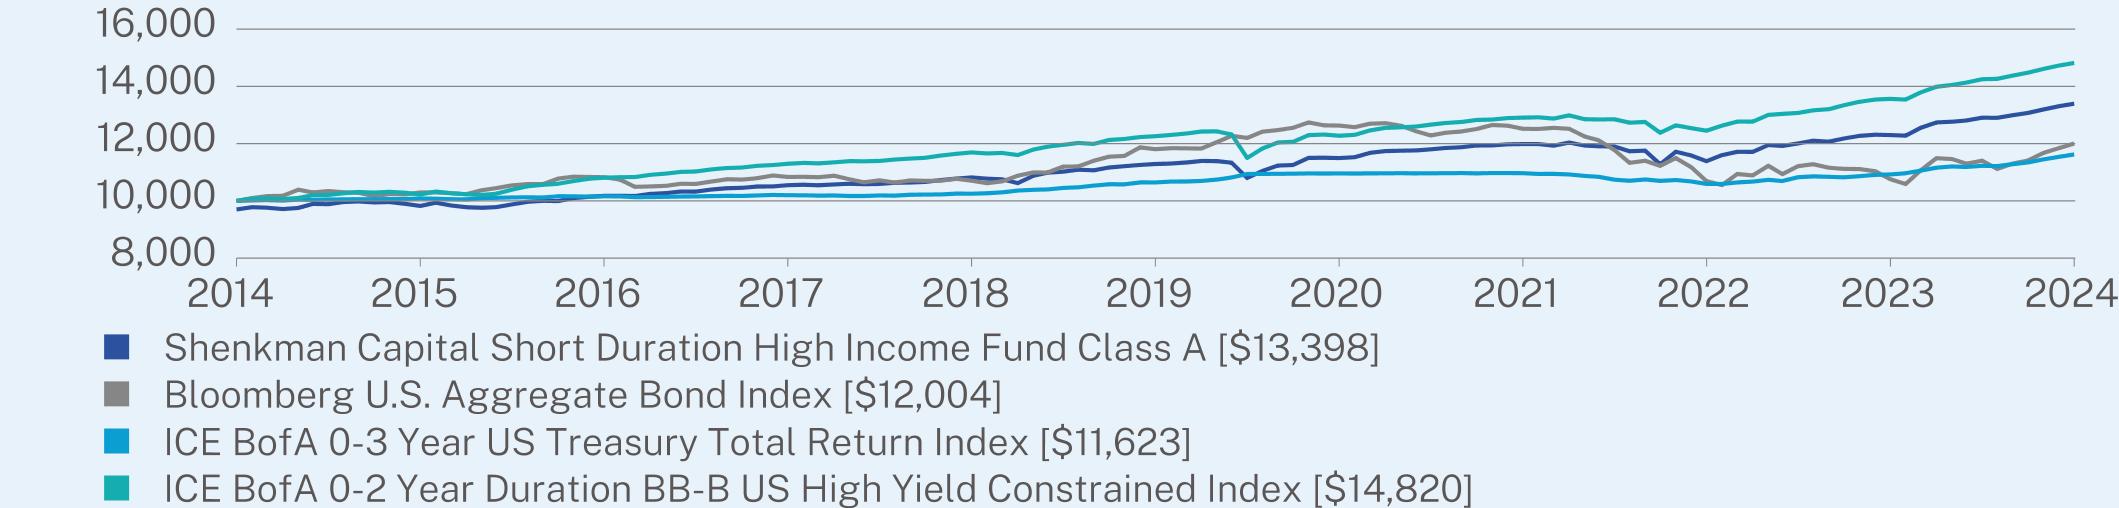
1 Year | 5 Year | 10 Year | |
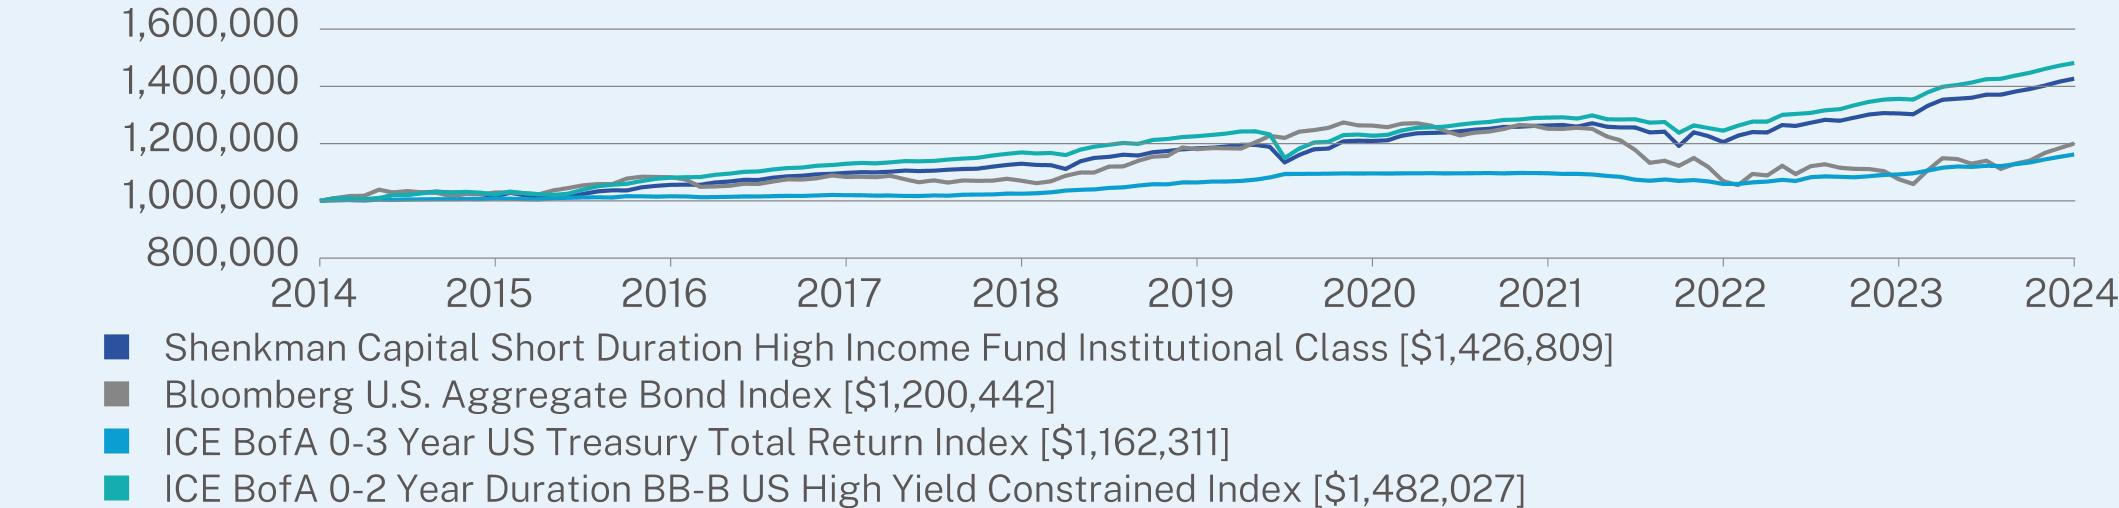
Class A (without sales charge) | 8.93 | 3.48 | 3.28 |
Class A (with sales charge)** | 5.63 | 2.86 | 2.97 |
Bloomberg U.S. Aggregate Bond Index | 11.57 | 0.33 | 1.84 |
ICE BofA 0-3 Year US Treasury Total Return Index | 6.39 | 1.78 | 1.52 |
ICE BofA 0-2 Year Duration BB-B US High Yield Constrained Index | 9.26 | 3.87 | 4.01 |
| * | The Fund’s past performance is not a good predictor of the Fund’s future performance. The returns do not reflect the deduction of taxes that a shareholder would pay on Fund distributions or redemption of Fund shares. |
| ** | Class A shares may be subject to a 3.00% front-end sales charge imposed on purchases (as a precentage of offering price). |
Net Assets | $1,866,939,775 |
Number of Holdings | 375 |
Net Advisory Fee | $9,755,069 |
Portfolio Turnover | 59% |
Average Credit Quality | BB- / Ba3* |
Weighted Average Maturity | 2.49 years |
Effective Duration | 1.13 years |
30-Day SEC Yield | 4.96% |
30-Day SEC Yield Unsubsidized | 4.94% |
| * | Credit quality ratings reflect the highest rating assigned by S&P Global Ratings, Fitch or Moody’s if ratings differ. These ratings agencies are independent, nationally recognized statistical rating organizations and are widely used. Investment grade ratings are BBB/Baa or higher. Below investment grade ratings are BB/Ba or lower. |
| Shenkman Capital Short Duration High Income Fund | PAGE 2 | TSR-AR-00770X501 |
Top 10 Securities | (% of net assets) |
Tenet Healthcare Corp. | 1.3% |
Caesars Entertainment, Inc. | 1.2% |
Uber Technologies, Inc. | 1.2% |
IQVIA, Inc. | 1.2% |
Clarios Global LP / Clarios US Finance Co. | 1.0% |
CCO Holdings LLC / CCO Holdings Capital Corp. | 1.0% |
International Game Technology PLC | 1.0% |
Carnival Holdings Bermuda Ltd. | 0.9% |
First American Government Obligations Fund | 0.9% |
Teva Pharmaceutical Finance Netherlands III BV | 0.8% |
Security Type | (% of net assets) |
Corporate Bonds | 86.3% |
Bank Loans | 9.0% |
Convertible Bonds | 1.2% |
Money Market Funds | 0.9% |
Cash & Other | 2.6% |
| Shenkman Capital Short Duration High Income Fund | PAGE 3 | TSR-AR-00770X501 |
 | Shenkman Capital Short Duration High Income Fund |  |
| Class C | SCFCX | ||
| Annual Shareholder Report | September 30, 2024 |
Class Name | Costs of a $10,000 investment | Costs paid as a percentage of a $10,000 investment |
| Class C | $177 | 1.70% |
Top Contributors | |
| ↑ | The top contributors for the period were the Fund’s higher exposure and selection to bonds with final maturities greater than 3 years as those bonds saw greater benefits from the decline in rates. Additional contributors were our selection in the BB rate credits, allocation to CCC & Below rated credits, selection in Utilities, and zero weighting in Oil & Gas. |
Top Detractors | |
| ↓ | Some of the detractors over the period included our negative selection and underweight in the B rated credits, underweight in Consumer Staples Discretionary, and negative selection in Healthcare. |
| Shenkman Capital Short Duration High Income Fund | PAGE 1 | TSR-AR-00770X600 |

1 Year | 5 Year | 10 Year | |
Class C (without sales charge) | 8.16 | 2.73 | 2.52 |
Class C (with sales charge)** | 7.16 | 2.73 | 2.52 |
Bloomberg U.S. Aggregate Bond Index | 11.57 | 0.33 | 1.84 |
ICE BofA 0-3 Year US Treasury Total Return Index | 6.39 | 1.78 | 1.52 |
ICE BofA 0-2 Year Duration BB-B US High Yield Constrained Index | 9.26 | 3.87 | 4.01 |
| * | The Fund’s past performance is not a good predictor of the Fund’s future performance. The returns do not reflect the deduction of taxes that a shareholder would pay on Fund distributions or redemption of Fund shares. |
| ** | Class C shares may be subject to a 1.00% deferred sales charge if shares are redeemed within 18 months of purchase (as a percentage of original purchase price or redemption price, whichever is less). |
Net Assets | $1,866,939,775 |
Number of Holdings | 375 |
Net Advisory Fee | $9,755,069 |
Portfolio Turnover | 59% |
Average Credit Quality | BB- / Ba3* |
Weighted Average Maturity | 2.49 years |
Effective Duration | 1.13 years |
30-Day SEC Yield | 4.32% |
30-Day SEC Yield Unsubsidized | 4.31% |
| * | Credit quality ratings reflect the highest rating assigned by S&P Global Ratings, Fitch or Moody’s if ratings differ. These ratings agencies are independent, nationally recognized statistical rating organizations and are widely used. Investment grade ratings are BBB/Baa or higher. Below investment grade ratings are BB/Ba or lower. |
| Shenkman Capital Short Duration High Income Fund | PAGE 2 | TSR-AR-00770X600 |
Top 10 Securities | (% of net assets) |
Tenet Healthcare Corp. | 1.3% |
Caesars Entertainment, Inc. | 1.2% |
Uber Technologies, Inc. | 1.2% |
IQVIA, Inc. | 1.2% |
Clarios Global LP / Clarios US Finance Co. | 1.0% |
CCO Holdings LLC / CCO Holdings Capital Corp. | 1.0% |
International Game Technology PLC | 1.0% |
Carnival Holdings Bermuda Ltd. | 0.9% |
First American Government Obligations Fund | 0.9% |
Teva Pharmaceutical Finance Netherlands III BV | 0.8% |
Security Type | (% of net assets) |
Corporate Bonds | 86.3% |
Bank Loans | 9.0% |
Convertible Bonds | 1.2% |
Money Market Funds | 0.9% |
Cash & Other | 2.6% |
| Shenkman Capital Short Duration High Income Fund | PAGE 3 | TSR-AR-00770X600 |
 | Shenkman Capital Short Duration High Income Fund |  |
| Class F | SCFFX | ||
| Annual Shareholder Report | September 30, 2024 |
Class Name | Costs of a $10,000 investment | Costs paid as a percentage of a $10,000 investment |
| Class F | $74 | 0.71% |
Top Contributors | |
| ↑ | The top contributors for the period were the Fund’s higher exposure and selection to bonds with final maturities greater than 3 years as those bonds saw greater benefits from the decline in rates. Additional contributors were our selection in the BB rate credits, allocation to CCC & Below rated credits, selection in Utilities, and zero weighting in Oil & Gas. |
Top Detractors | |
| ↓ | Some of the detractors over the period included our negative selection and underweight in the B rated credits, underweight in Consumer Staples Discretionary, and negative selection in Healthcare. |
| Shenkman Capital Short Duration High Income Fund | PAGE 1 | TSR-AR-00770X766 |
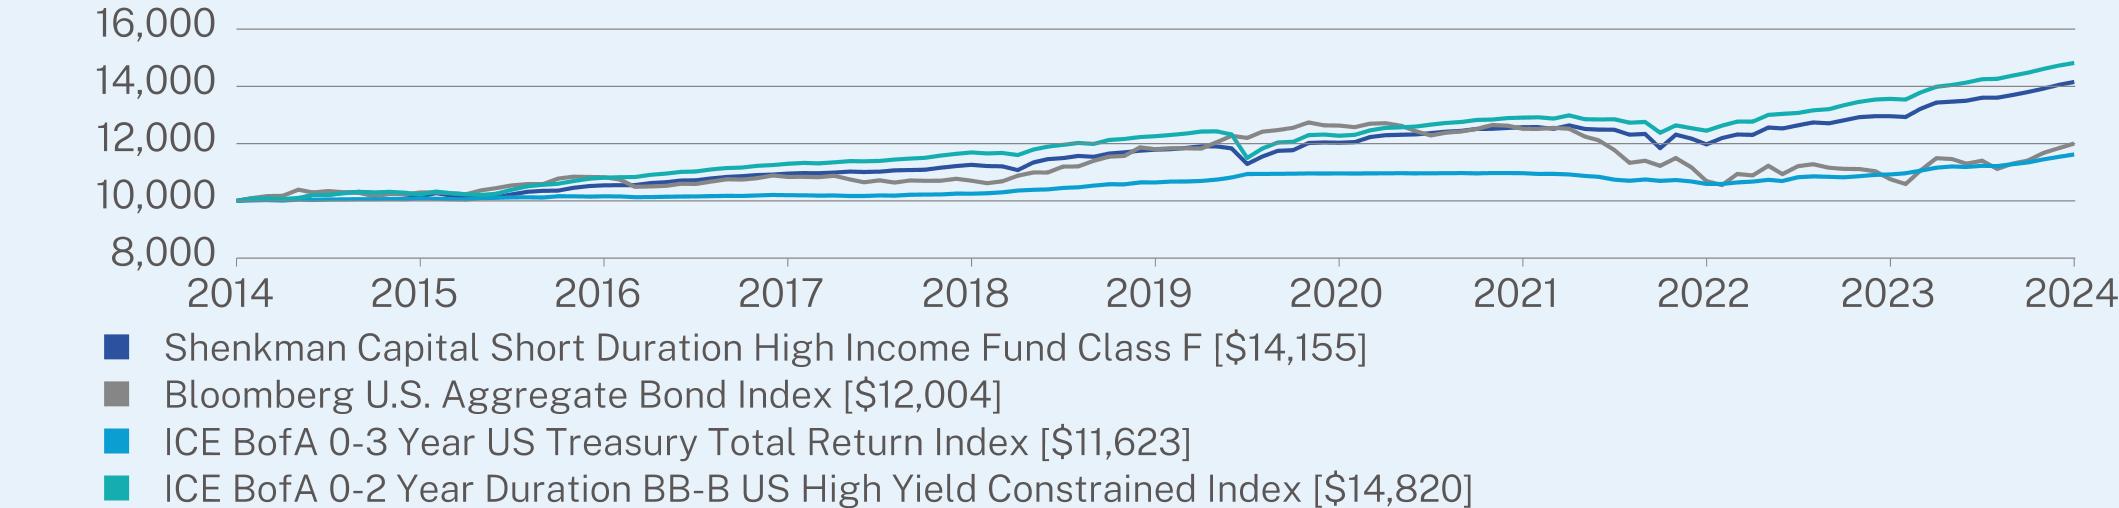
1 Year | 5 Year | 10 Year | |
Class F | 9.21 | 3.73 | 3.54 |
Bloomberg U.S. Aggregate Bond Index | 11.57 | 0.33 | 1.84 |
ICE BofA 0-3 Year US Treasury Total Return Index | 6.39 | 1.78 | 1.52 |
ICE BofA 0-2 Year Duration BB-B US High Yield Constrained Index | 9.26 | 3.87 | 4.01 |
| * | The Fund’s past performance is not a good predictor of the Fund’s future performance. The returns do not reflect the deduction of taxes that a shareholder would pay on Fund distributions or redemption of Fund shares. |
Net Assets | $1,866,939,775 |
Number of Holdings | 375 |
Net Advisory Fee | $9,755,069 |
Portfolio Turnover | 59% |
Average Credit Quality | BB- / Ba3* |
Weighted Average Maturity | 2.49 years |
Effective Duration | 1.13 years |
30-Day SEC Yield | 5.36% |
30-Day SEC Yield Unsubsidized | 5.34% |
| * | Credit quality ratings reflect the highest rating assigned by S&P Global Ratings, Fitch or Moody’s if ratings differ. These ratings agencies are independent, nationally recognized statistical rating organizations and are widely used. Investment grade ratings are BBB/Baa or higher. Below investment grade ratings are BB/Ba or lower. |
| Shenkman Capital Short Duration High Income Fund | PAGE 2 | TSR-AR-00770X766 |
Top 10 Securities | (% of net assets) |
Tenet Healthcare Corp. | 1.3% |
Caesars Entertainment, Inc. | 1.2% |
Uber Technologies, Inc. | 1.2% |
IQVIA, Inc. | 1.2% |
Clarios Global LP / Clarios US Finance Co. | 1.0% |
CCO Holdings LLC / CCO Holdings Capital Corp. | 1.0% |
International Game Technology PLC | 1.0% |
Carnival Holdings Bermuda Ltd. | 0.9% |
First American Government Obligations Fund | 0.9% |
Teva Pharmaceutical Finance Netherlands III BV | 0.8% |
Security Type | (% of net assets) |
Corporate Bonds | 86.3% |
Bank Loans | 9.0% |
Convertible Bonds | 1.2% |
Money Market Funds | 0.9% |
Cash & Other | 2.6% |
| Shenkman Capital Short Duration High Income Fund | PAGE 3 | TSR-AR-00770X766 |
 | Shenkman Capital Short Duration High Income Fund |  |
| Institutional Class | SCFIX | ||
| Annual Shareholder Report | September 30, 2024 |
Class Name | Costs of a $10,000 investment | Costs paid as a percentage of a $10,000 investment |
| Institutional Class | $68 | 0.65% |
Top Contributors | |
| ↑ | The top contributors for the period were the Fund’s higher exposure and selection to bonds with final maturities greater than 3 years as those bonds saw greater benefits from the decline in rates. Additional contributors were our selection in the BB rate credits, allocation to CCC & Below rated credits, selection in Utilities, and zero weighting in Oil & Gas. |
Top Detractors | |
| ↓ | Some of the detractors over the period included our negative selection and underweight in the B rated credits, underweight in Consumer Staples Discretionary, and negative selection in Healthcare. |
| Shenkman Capital Short Duration High Income Fund | PAGE 1 | TSR-AR-00770X709 |
1 Year | 5 Year | 10 Year | |
Institutional Class | 9.28 | 3.80 | 3.62 |
Bloomberg U.S. Aggregate Bond Index | 11.57 | 0.33 | 1.84 |
ICE BofA 0-3 Year US Treasury Total Return Index | 6.39 | 1.78 | 1.52 |
ICE BofA 0-2 Year Duration BB-B US High Yield Constrained Index | 9.26 | 3.87 | 4.01 |
| * | The Fund’s past performance is not a good predictor of the Fund’s future performance. The returns do not reflect the deduction of taxes that a shareholder would pay on Fund distributions or redemption of Fund shares. |
Net Assets | $1,866,939,775 |
Number of Holdings | 375 |
Net Advisory Fee | $9,755,069 |
Portfolio Turnover | 59% |
Average Credit Quality | BB- / Ba3* |
Weighted Average Maturity | 2.49 years |
Effective Duration | 1.13 years |
30-Day SEC Yield | 5.45% |
30-Day SEC Yield Unsubsidized | 5.43% |
| * | Credit quality ratings reflect the highest rating assigned by S&P Global Ratings, Fitch or Moody’s if ratings differ. These ratings agencies are independent, nationally recognized statistical rating organizations and are widely used. Investment grade ratings are BBB/Baa or higher. Below investment grade ratings are BB/Ba or lower. |
| Shenkman Capital Short Duration High Income Fund | PAGE 2 | TSR-AR-00770X709 |
Top 10 Securities | (% of net assets) |
Tenet Healthcare Corp. | 1.3% |
Caesars Entertainment, Inc. | 1.2% |
Uber Technologies, Inc. | 1.2% |
IQVIA, Inc. | 1.2% |
Clarios Global LP / Clarios US Finance Co. | 1.0% |
CCO Holdings LLC / CCO Holdings Capital Corp. | 1.0% |
International Game Technology PLC | 1.0% |
Carnival Holdings Bermuda Ltd. | 0.9% |
First American Government Obligations Fund | 0.9% |
Teva Pharmaceutical Finance Netherlands III BV | 0.8% |
Security Type | (% of net assets) |
Corporate Bonds | 86.3% |
Bank Loans | 9.0% |
Convertible Bonds | 1.2% |
Money Market Funds | 0.9% |
Cash & Other | 2.6% |
| Shenkman Capital Short Duration High Income Fund | PAGE 3 | TSR-AR-00770X709 |
| (b) | Not applicable. |
Item 2. Code of Ethics.
The registrant has adopted a code of ethics that applies to the registrant’s principal executive officer and principal financial officer. The registrant has not made any substantive amendments to its code of ethics during the period covered by this report. The registrant has not granted any waivers from any provisions of the code of ethics during the period covered by this report.
A copy of the registrant’s Code of Ethics is filed herewith.
Item 3. Audit Committee Financial Expert.
The registrant’s Board of Trustees has determined that there is at least one audit committee financial expert serving on its audit committee. Mr. Joe D. Redwine, Ms. Michele Rackey, Ms. Anne Kritzmire and Mr. Craig Wainscott are the “audit committee financial experts” and are considered to be “independent” as each term is defined in Item 3 of Form N-CSR.
Item 4. Principal Accountant Fees and Services.
The registrant has engaged its principal accountant to perform audit services, audit-related services, tax services and other services during the past two fiscal years. “Audit services” refer to performing an audit of the registrant’s annual financial statements or services that are normally provided by the accountant in connection with statutory and regulatory filings or engagements for those fiscal years. “Audit-related services” refer to the assurance and related services by the principal accountant that are reasonably related to the performance of the audit. “Tax services” refer to professional services rendered by the principal accountant including the review of federal income tax returns, review of federal excise tax returns, review of state tax returns, if any, and assistance with calculation of required income, capital gain and excise distributions. There were no “other services” provided by the principal accountant. The following table details the aggregate fees billed or expected to be billed for each of the last two fiscal years for audit fees, audit-related fees, tax fees and other fees by the principal accountant.
| FYE 9/30/2024 | FYE 9/30/2023 | |
| (a) Audit Fees | $52,000 | $50,700 |
| (b) Audit-Related Fees | N/A | N/A |
| (c) Tax Fees | $7,200 | $7,200 |
| (d) All Other Fees | N/A | N/A |
(e)(1) The audit committee has adopted pre-approval policies and procedures that require the audit committee to pre-approve all audit and non-audit services of the registrant, including services provided to any entity affiliated with the registrant.
(e)(2) The percentage of fees billed by Tait, Weller & Baker LLP applicable to non-audit services pursuant to waiver of pre-approval requirement were as follows:
| FYE 9/30/2024 | FYE 9/30/2023 | |
| Audit-Related Fees | 0% | 0% |
| Tax Fees | 0% | 0% |
| All Other Fees | 0% | 0% |
(f) During the audit of the registrant’s financial statements, 100 percent of the hours were attributed to work performed by persons other than full-time permanent employees of the principal accountant.
(g) The following table indicates the non-audit fees billed or expected to be billed by the registrant’s accountant for services to the registrant and to the registrant’s investment adviser (and any other controlling entity, etc.—not sub-adviser) for the last two years.
| Non-Audit Related Fees | FYE 9/30/2024 | FYE 9/30/2023 |
| Registrant | N/A | N/A |
| Registrant’s Investment Adviser | N/A | N/A |
(h) The audit committee of the board of trustees/directors has considered whether the provision of non-audit services that were rendered to the registrant’s investment adviser is compatible with maintaining the principal accountant’s independence and has concluded that the provision of such non-audit services by the accountant has not compromised the accountant’s independence.
The registrant has not been identified by the U.S. Securities and Exchange Commission as having filed an annual report issued by a registered public accounting firm branch or office that is located in a foreign jurisdiction where the Public Company Accounting Oversight Board is unable to inspect or completely investigate because of a position taken by an authority in that jurisdiction.
The registrant is not a foreign issuer.
Item 5. Audit Committee of Listed Registrants.
Not applicable.
Item 6. Investments.
| (a) | Schedules of Investments is included within the financial statements filed under Item 7 of this Form. |
| (b) | Not applicable. |
Item 7. Financial Statements and Financial Highlights for Open-End Investment Companies.
| (a) |
Page | |||
Principal Value | Fair Value | |||||
BANK LOANS - 84.8%(e) | ||||||
AEROSPACE & DEFENSE - 1.4% | ||||||
Apple Bidco LLC, Senior Secured First Lien, 8.35% (1 mo. SOFR US + 3.50%), 09/25/2028 | $627,469 | $629,605 | ||||
Barnes Group, Inc., Senior Secured First Lien, 7.35% (1 mo. SOFR US + 2.50%), 08/30/2030 | 589,710 | 590,816 | ||||
Brown Group Holding LLC, Senior Secured First Lien | ||||||
7.60% (1 mo. SOFR US + 2.75%), 07/01/2031 | 267,874 | 267,613 | ||||
7.81% (3 mo. SOFR US + 2.75%), 07/01/2031 | 203,194 | 202,996 | ||||
8.00% (3 mo. SOFR US + 2.75%), 07/01/2031 | 428,206 | 427,789 | ||||
Dynasty Acquisition Co., Inc., Senior Secured First Lien, 8.35% (1 mo. SOFR US + 3.50%), 08/24/2028 | 565,902 | 566,980 | ||||
LSF11 Trinity Bidco, Inc., Senior Secured First Lien, 8.42% (1 mo. SOFR US + 3.50%), 06/17/2030 | 389,353 | 390,326 | ||||
Standard Aero Ltd., Senior Secured First Lien, 8.35% (1 mo. SOFR US + 3.50%), 08/24/2028 | 218,197 | 218,613 | ||||
TransDigm, Inc., Senior Secured First Lien, 7.32% (3 mo. SOFR US + 2.50%), 01/20/2032 | 511,000 | 509,562 | ||||
3,804,300 | ||||||
AUTO RETAIL - 0.3% | ||||||
CWGS Group LLC, Senior Secured First Lien | ||||||
7.57% (1 mo. SOFR US + 2.50%), 06/05/2028 | 20,474 | 19,643 | ||||
7.58% (1 mo. SOFR US + 2.50%), 06/05/2028 | 332,912 | 319,387 | ||||
LS Group OpCo Acquistion LLC, Senior Secured First Lien, 7.85% (1 mo. SOFR US + 3.00%), 04/23/2031 | 407,828 | 408,466 | ||||
747,496 | ||||||
AUTOMOTIVE - 1.2% | ||||||
Adient US LLC, Senior Secured First Lien, 7.60% (1 mo. SOFR US + 2.75%), 01/29/2031 | 404,259 | 405,187 | ||||
American Axle & Manufacturing, Inc., Senior Secured First Lien, 8.20% (1 mo. SOFR US + 3.00%), 12/13/2029 | 732,266 | 735,473 | ||||
Autokiniton US Holdings, Inc., Senior Secured First Lien, 9.07% (1 mo. SOFR US + 4.00%), 04/06/2028 | 296,681 | 296,982 | ||||
Clarios Global LP, Senior Secured First Lien, 7.35% (1 mo. SOFR US + 2.50%), 05/06/2030 | 260,000 | 260,434 | ||||
Principal Value | Fair Value | |||||
First Brands Group LLC, Senior Secured First Lien | ||||||
10.78% (3 mo. SOFR US + 5.00%), 03/30/2027 | $465,345 | $461,274 | ||||
10.78% (3 mo. SOFR US + 5.00%), 03/30/2027 | 272,135 | 269,712 | ||||
Tenneco, Inc., Senior Secured First Lien | ||||||
9.80% (3 mo. SOFR US + 5.00%), 11/17/2028 | 1,354 | 1,290 | ||||
10.29% (3 mo. SOFR US + 4.75%), 11/17/2028 | 232,409 | 220,243 | ||||
10.33% (3 mo. SOFR US + 5.00%), 11/17/2028 | 479,646 | 456,711 | ||||
Thor Industries, Inc., Senior Secured First Lien, 7.10% (1 mo. SOFR US + 2.25%), 11/15/2030 | 165,367 | 165,780 | ||||
3,273,086 | ||||||
BUILDING PRODUCTS - 1.6% | ||||||
Cornerstone Building Brands, Inc., Senior Secured First Lien, 8.55% (1 mo. SOFR US + 3.25%), 04/12/2028 | 405,642 | 397,981 | ||||
Janus International Group LLC, Senior Secured First Lien, 7.35% (1 mo. SOFR US + 2.50%), 08/05/2030 | 769,910 | 771,235 | ||||
MIWD Holdco II LLC, Senior Secured First Lien, 8.35% (1 mo. SOFR US + 3.50%), 03/28/2031 | 477,803 | 479,229 | ||||
Quikrete Holdings, Inc., Senior Secured First Lien, 7.35% (1 mo. SOFR US + 2.50%), 04/14/2031 | 497,500 | 498,234 | ||||
Star Holding LLC, Senior Secured First Lien, 9.35% (1 mo. SOFR US + 4.50%), 07/31/2031 | 557,000 | 545,373 | ||||
STS Operating, Inc., Senior Secured First Lien, 8.95% (1 mo. SOFR US + 4.00%), 03/25/2031 | 628,840 | 625,501 | ||||
Summit Materials LLC, Senior Secured First Lien, 7.05% (3 mo. SOFR US + 1.75%), 01/12/2029 | 271,009 | 272,448 | ||||
Tamko Building Products LLC, Senior Secured First Lien, 8.17% (1 mo. SOFR US + 3.25%), 09/20/2030 | 452,483 | 454,179 | ||||
Verde Purchaser LLC, Senior Secured First Lien, 9.10% (3 mo. SOFR US + 4.50%), 12/02/2030 | 359,100 | 356,593 | ||||
4,400,773 | ||||||
CHEMICALS - 2.6% | ||||||
Axalta Coating Systems US Holdings, Inc., Senior Secured First Lien, 6.60% (3 mo. SOFR US + 2.00%), 12/20/2029 | 777,180 | 780,379 | ||||
Consolidated Energy Finance SA, Senior Secured First Lien, 9.56% (3 mo. SOFR US + 4.50%), 11/18/2030 | 336,310 | 317,091 | ||||
1 |
Principal Value | Fair Value | |||||
BANK LOANS - (Continued) | ||||||
CHEMICALS - (Continued) | ||||||
Discovery Purchaser Corp., Senior Secured First Lien, 9.69% (3 mo. SOFR US + 4.38%), 10/04/2029 | $412,533 | $411,329 | ||||
EcovystCatalyst Technologies LLC, Senior Secured First Lien | ||||||
7.50% (3 mo. SOFR US + 2.25%), 06/12/2031 | 173,057 | 172,232 | ||||
7.50% (3 mo. SOFR US + 2.25%), 06/12/2031 | 66,750 | 66,432 | ||||
INEOS US Finance LLC, Senior Secured First Lien, 8.10% (1 mo. SOFR US + 3.25%), 02/19/2030 | 310,000 | 310,222 | ||||
INEOS US Petrochem LLC, Senior Secured First Lien | ||||||
7.82% (1 mo. SOFR US + 2.75%), 01/29/2026 | 176,807 | 176,880 | ||||
8.80% (1 mo. SOFR US + 3.75%), 03/01/2030 | 236,013 | 236,456 | ||||
Koppers, Inc., Senior Secured First Lien, 8.10% (1 mo. SOFR US + 3.00%), 04/10/2030 | 231,348 | 232,505 | ||||
LSF11 A5 HoldCo LLC, Senior Secured First Lien, 8.57% (1 mo. SOFR US + 3.50%), 10/16/2028 | 769,421 | 768,940 | ||||
Lummus Technology Holdings V LLC, Senior Secured First Lien, 8.57% (1 mo. SOFR US + 3.50%), 12/31/2029 | 585,060 | 587,465 | ||||
Nouryon USA LLC, Senior Secured First Lien, 8.82% (3 mo. SOFR US + 3.50%), 04/03/2028 | 305,916 | 306,999 | ||||
Olympus Water US Holding Corp., Senior Secured First Lien, 8.10% (3 mo. SOFR US + 3.50%), 06/23/2031 | 261,653 | 261,980 | ||||
Polar US Borrower LLC, Senior Secured First Lien | ||||||
10.24% (3 mo. SOFR US + 4.75%), 10/15/2025 | 259,516 | 205,450 | ||||
10.24% (3 mo. SOFR US + 4.75%), 10/15/2025 | 221,794 | 175,586 | ||||
SCIH Salt Holdings, Inc., Senior Secured First Lien, 8.87% (3 mo. SOFR US + 3.50%), 03/16/2027 | 787,742 | 788,593 | ||||
Sparta US HoldCo LLC, Senior Secured First Lien, 8.57% (1 mo. SOFR US + 3.25%), 08/02/2028 | 514,453 | 514,987 | ||||
Tronox Finance LLC, Senior Secured First Lien, 7.60% (1 mo. SOFR US + 2.50%), 09/30/2031 | 411,000 | 410,400 | ||||
Vibrantz Technologies, Inc., Senior Secured First Lien, 9.85% (3 mo. SOFR US + 4.25%), 04/23/2029 | 224,316 | 219,290 | ||||
Principal Value | Fair Value | |||||
Windsor Holdings III LLC, Senior Secured First Lien, 8.46% (1 mo. SOFR US + 3.50%), 08/01/2030 | $315,619 | $317,508 | ||||
7,260,724 | ||||||
COMMERCIAL SERVICES - 5.3% | ||||||
AlixPartners LLP, Senior Secured First Lien, 7.57% (1 mo. SOFR US + 2.50%), 02/04/2028 | 1,186,049 | 1,188,718 | ||||
Allied Universal Holdco LLC, Senior Secured First Lien, 8.80% (1 mo. SOFR US + 3.75%), 05/15/2028 | 394,964 | 391,558 | ||||
American Auto Auction Group LLC, Senior Secured First Lien, 9.90% (3 mo. SOFR US + 5.00%), 12/30/2027 | 539,485 | 542,522 | ||||
Apex Group Treasury LLC, Senior Secured First Lien, 9.39% (6 mo. SOFR US + 3.75%), 07/27/2028 | 401,083 | 402,085 | ||||
Aramark Services, Inc., Senior Secured First Lien | ||||||
6.94% (1 mo. SOFR US + 1.75%), 01/15/2027 | 398,000 | 398,571 | ||||
6.85% (1 mo. SOFR US + 2.00%), 06/24/2030 | 270,872 | 271,922 | ||||
Camelot US Acquisition LLC, Senior Secured First Lien | ||||||
7.60% (1 mo. SOFR US + 2.75%), 01/31/2031 | 315,531 | 315,452 | ||||
7.60% (1 mo. SOFR US + 2.75%), 01/31/2031 | 73,550 | 73,532 | ||||
7.60% (1 mo. SOFR US + 2.75%), 01/31/2031 | 6,252 | 6,250 | ||||
CoreLogic, Inc., Senior Secured First Lien, 8.57% (1 mo. SOFR US + 3.50%), 06/02/2028 | 554,514 | 550,406 | ||||
Deerfield Dakota Holding LLC, Senior Secured First Lien, 8.35% (3 mo. SOFR US + 3.75%), 04/09/2027 | 685,607 | 672,622 | ||||
Dun & Bradstreet Corp., Senior Secured First Lien, 7.61% (1 mo. SOFR US + 2.75%), 01/18/2029 | 394,507 | 394,617 | ||||
EAB Global, Inc., Senior Secured First Lien, 8.21% (1 mo. SOFR US + 3.25%), 08/16/2028 | 555,347 | 554,028 | ||||
First Advantage Holdings LLC, Senior Secured First Lien, 8.35% (1 mo. Term SOFR + 3.25%), 10/31/2031 | 746,000 | 743,669 | ||||
Foundever Worldwide Corp., Senior Secured First Lien, 8.82% (1 mo. SOFR US + 3.75%), 08/28/2028 | 862,476 | 572,740 | ||||
Garda World Security Corp., Senior Secured First Lien, 8.60% (1 mo. SOFR US + 3.50%), 02/01/2029 | 1,373,223 | 1,374,768 | ||||
Grant Thornton LLP, Senior Secured First Lien, 8.10% (1 mo. SOFR US + 3.25%), 05/30/2031 | 271,000 | 271,698 | ||||
2 |
Principal Value | Fair Value | |||||
BANK LOANS - (Continued) | ||||||
COMMERCIAL SERVICES - (Continued) | ||||||
HomeServe USA Corp., Senior Secured First Lien, 7.21% (1 mo. SOFR US + 2.50%), 10/21/2030 | $356,210 | $355,987 | ||||
Indy US Bidco LLC, Senior Secured First Lien | ||||||
8.82% (1 mo. SOFR US + 3.75%), 03/06/2028 | 308,896 | 305,973 | ||||
8.82% (1 mo. SOFR US + 3.75%), 03/06/2028 | 178,723 | 177,032 | ||||
Indy US Holdco LLC, Senior Secured First Lien | ||||||
9.60% (1 mo. SOFR US + 4.75%), 03/06/2028 | 516,588 | 515,728 | ||||
9.60% (1 mo. SOFR US + 4.75%), 03/06/2028 | 375,032 | 374,408 | ||||
9.60% (1 mo. SOFR US + 4.75%), 03/06/2028 | 12,380 | 12,359 | ||||
Iron Mountain Information Management LLC, Senior Secured First Lien, 6.85% (1 mo. SOFR US + 2.00%), 01/31/2031 | 271,189 | 270,002 | ||||
Isolved, Inc., Senior Secured First Lien, 8.35% (1 mo. SOFR US + 3.50%), 10/15/2030 | 427,853 | 430,065 | ||||
OMNIA Partners LLC, Senior Secured First Lien | ||||||
8.53% (3 mo. SOFR US + 3.25%), 07/25/2030 | 511,569 | 513,669 | ||||
8.53% (3 mo. SOFR US + 3.25%), 07/25/2030 | 90,921 | 91,294 | ||||
Planet US Buyer LLC, Senior Secured First Lien, 8.60% (3 mo. SOFR US + 3.50%), 02/10/2031 | 794,010 | 796,392 | ||||
Pre-Paid Legal Services, Inc., Senior Secured First Lien, 8.82% (1 mo. SOFR US + 3.75%), 12/15/2028 | 657,435 | 657,764 | ||||
Saphilux Sarl, Senior Secured First Lien, 8.56% (3 mo. SOFR US + 3.50%), 07/27/2028 | 412,787 | 414,077 | ||||
Tempo Acquisition LLC, Senior Secured First Lien, 7.10% (1 mo. SOFR US + 2.25%), 08/31/2028 | 406,847 | 407,512 | ||||
VT Topco, Inc., Senior Secured First Lien, 8.35% (1 mo. SOFR US + 3.50%), 08/12/2030 | 406,803 | 408,540 | ||||
14,455,960 | ||||||
CONSTRUCTION & ENGINEERING - 1.7% | ||||||
Amentum Holdings, Inc., Senior Secured First Lien, 8.10% (3 mo. SOFR US + 2.25%), 09/29/2031 | 947,000 | 945,224 | ||||
American Residential Services LLC, Senior Secured First Lien, 8.63% (3 mo. SOFR US + 3.50%), 10/15/2027 | 653,538 | 655,583 | ||||
Principal Value | Fair Value | |||||
APi Group DE, Inc., Senior Secured First Lien, 6.85% (1 mo. SOFR US + 2.00%), 01/03/2029 | $542,000 | $542,276 | ||||
Brand Industrial Services, Inc., Senior Secured First Lien, 9.75% (3 mo. SOFR US + 4.50%), 08/01/2030 | 540,111 | 526,357 | ||||
Centuri Group, Inc., Senior Secured First Lien, 7.57% (1 mo. SOFR US + 2.50%), 08/28/2028 | 486,732 | 486,315 | ||||
Tecta America Corp., Senior Secured First Lien | ||||||
9.07% (1 mo. SOFR US + 4.00%), 04/10/2028 | 678,152 | 682,177 | ||||
9.32% (1 mo. SOFR US + 4.25%), 04/10/2028 | 210,870 | 212,122 | ||||
Tiger Acquisition LLC, Senior Secured First Lien, 8.30% (1 mo. SOFR US + 3.25%), 06/01/2028 | 562,480 | 560,511 | ||||
4,610,565 | ||||||
CONSUMER DISCRETIONARY - 2.3% | ||||||
American Greetings Corp., Senior Secured First Lien, 10.60% (1 mo. SOFR US + 5.75%), 10/30/2029 | 388,556 | 392,139 | ||||
Fugue Finance LLC, Senior Secured First Lien, 9.06% (3 mo. SOFR US + 4.00%), 01/26/2028 | 440,681 | 444,064 | ||||
Hanesbrands, Inc., Senior Secured First Lien, 8.60% (1 mo. SOFR US + 3.75%), 03/08/2030 | 498,410 | 498,410 | ||||
KUEHG Corp., Senior Secured First Lien, 9.10% (3 mo. SOFR US + 4.50%), 06/12/2030 | 350,722 | 352,158 | ||||
Learning Care Group USNo 2, Inc., Senior Secured First Lien | ||||||
8.60% (3 mo. SOFR US + 4.00%), 08/11/2028 | 7,065 | 7,111 | ||||
9.11% (3 mo. SOFR US + 4.00%), 08/11/2028 | 25,833 | 26,003 | ||||
9.26% (3 mo. SOFR US + 4.00%), 08/11/2028 | 77,500 | 78,009 | ||||
9.29% (3 mo. SOFR US + 4.00%), 08/11/2028 | 43,056 | 43,338 | ||||
Peloton Interactive, Inc., Senior Secured First Lien, 10.85% (1 mo. SOFR US + 6.00%), 05/30/2029 | 407,978 | 410,323 | ||||
Prometric Holdings, Inc., Senior Secured First Lien, 9.82% (1 mo. SOFR US + 4.75%), 01/31/2028 | 807,134 | 813,188 | ||||
Renaissance Holdings Corp., Senior Secured First Lien, 9.10% (1 mo. SOFR US + 4.25%), 04/30/2030 | 722,714 | 723,248 | ||||
Samsonite IP Holdings Sarl, Senior Secured First Lien, 6.85% (1 mo. SOFR US + 2.00%), 06/10/2030 | 377,197 | 379,006 | ||||
3 |
Principal Value | Fair Value | |||||
BANK LOANS - (Continued) | ||||||
CONSUMER DISCRETIONARY - (Continued) | ||||||
Spring Education Group, Inc., Senior Secured First Lien, 8.60% (3 mo. SOFR US + 4.00%), 10/04/2030 | $358,293 | $361,338 | ||||
Tory Burch LLC, Senior Secured First Lien, 8.32% (1 mo. SOFR US + 3.25%), 04/14/2028 | 362,813 | 363,818 | ||||
Wand NewCo3, Inc., Senior Secured First Lien | ||||||
7.85% (3 mo. SOFR US + 3.25%), 01/30/2031 | 398,165 | 398,165 | ||||
8.10% (1 mo. SOFR US + 3.25%), 01/30/2031 | 684,122 | 684,122 | ||||
Weber-Stephen Products LLC, Senior Secured First Lien, 8.32% (1 mo. SOFR US + 3.25%), 10/29/2027 | 294,065 | 278,178 | ||||
WW International, Inc., Senior Secured First Lien, 8.57% (1 mo. SOFR US + 3.50%), 04/13/2028 | 240,686 | 66,378 | ||||
6,318,996 | ||||||
CONSUMER NON-DISCRETIONARY - 0.1% | ||||||
Kronos Acquisition Holdings, Inc., Senior Secured First Lien, 9.31% (3 mo. SOFR US + 4.00%), 07/08/2031 | 279,000 | 262,260 | ||||
ENVIRONMENTAL & FACILITIES SERVICES - 1.8% | ||||||
Action Environmental Group, Inc., Senior Secured First Lien | ||||||
8.60% (3 mo. SOFR US + 4.00%), 10/24/2030 | 656,217 | 658,677 | ||||
9.33% (1 mo. SOFR US + 4.00%), 10/24/2030(g) | 94,857 | 95,213 | ||||
Belfor Holdings, Inc., Senior Secured First Lien, 8.60% (1 mo. SOFR US + 3.75%), 11/04/2030 | 937,074 | 942,350 | ||||
GFL Environmental, Inc., Senior Secured First Lien, 7.32% (3 mo. SOFR US + 2.00%), 06/27/2031 | 769,000 | 769,138 | ||||
Gopher Resource LLC, Senior Secured First Lien, 8.21% (1 mo. Synthetic LIBOR + 3.25%), 03/06/2025(a) | 308,711 | 301,331 | ||||
JFL-Tiger Acquisition Co., Inc., Senior Secured First Lien, 9.46% (3 mo. SOFR US + 4.50%), 10/17/2030 | 423,798 | 425,916 | ||||
ReworldHolding Corp., Senior Secured First Lien | ||||||
7.35% (1 mo. SOFR US + 2.50%), 11/30/2028 | 335,518 | 336,174 | ||||
7.59% (6 mo. SOFR US + 2.50%), 11/30/2028 | 26,282 | 26,333 | ||||
7.59% (6 mo. SOFR US + 2.50%), 11/30/2028 | 6,570 | 6,583 | ||||
Principal Value | Fair Value | |||||
7.85% (1 mo. SOFR US + 2.75%), 11/30/2028 | $419,856 | $420,862 | ||||
7.85% (1 mo. SOFR US + 2.75%), 11/30/2028 | 23,000 | 23,056 | ||||
Win Waste Innovations Holdings, Inc., Senior Secured First Lien, 7.82% (1 mo. SOFR US + 2.75%), 03/27/2028 | 987,060 | 942,643 | ||||
4,948,276 | ||||||
FINANCIALS: BANKS - 0.1% | ||||||
EnergySolutions LLC, Senior Secured First Lien, 8.35% (1 mo. SOFR US + 3.75%), 09/23/2030 | 341,420 | 344,196 | ||||
FINANCIALS: DIVERSIFIED - 5.2% | ||||||
Armor Holdco, Inc., Senior Secured First Lien, 10.26% (6 mo. SOFR US + 4.50%), 12/11/2028 | 544,562 | 548,646 | ||||
Ascensus Holdings, Inc., Senior Secured First Lien, 8.57% (1 mo. SOFR US + 3.50%), 08/02/2028 | 784,791 | 785,776 | ||||
Avolon TLB Borrower 1 US LLC, Senior Secured First Lien, 6.96% (1 mo. SOFR US + 2.00%), 06/22/2028 | 901,002 | 903,922 | ||||
BCPE Pequod Buyer, Inc., Senior Secured First Lien, 8.42% (1 mo. Term SOFR + 3.50%), 09/19/2031 | 751,000 | 748,574 | ||||
Blackhawk Network Holdings, Inc., Senior Secured First Lien, 9.85% (1 mo. SOFR US + 5.00%), 03/12/2029 | 469,823 | 472,465 | ||||
Boost Newco Borrower LLC, Senior Secured First Lien, 7.10% (3 mo. SOFR US + 2.50%), 01/31/2031 | 952,000 | 953,585 | ||||
CastlelakeAviation One DAC, Senior Secured First Lien | ||||||
7.45% (3 mo. SOFR US + 2.50%), 10/22/2026 | 525,216 | 526,991 | ||||
7.70% (3 mo. SOFR US + 2.75%), 10/22/2027 | 516,795 | 519,273 | ||||
Citco Funding LLC, Senior Secured First Lien, 7.31% (6 mo. SOFR US + 2.75%), 04/27/2028 | 672,859 | 677,276 | ||||
Corp. Service Co., Senior Secured First Lien | ||||||
7.95% (1 mo. SOFR US + 2.50%), 11/03/2027 | 381,210 | 381,210 | ||||
7.45% (1 mo. SOFR US + 2.50%), 11/05/2029 | 542,581 | 544,162 | ||||
Edelman Financial Engines Center LLC, Senior Secured First Lien, 8.10% (1 mo. SOFR US + 3.25%), 04/07/2028 | 444,450 | 444,130 | ||||
4 |
Principal Value | Fair Value | |||||
BANK LOANS - (Continued) | ||||||
FINANCIALS: DIVERSIFIED - (Continued) | ||||||
Edelman Financial Engines Center LLC, Senior Secured Second Lien, 10.10% (1 mo. SOFR US + 5.25%), 10/06/2028 | $1,021,000 | $1,020,576 | ||||
EIG Management Co. LLC, Senior Secured First Lien, 9.96% (1 mo. SOFR US + 5.00%), 05/17/2029 | 632,988 | 634,570 | ||||
Focus Financial Partners LLC, Senior Secured First Lien | ||||||
8.33% (1 mo. SOFR US + 3.25%), 09/17/2031 | 559,869 | 558,839 | ||||
8.41% (1 mo. SOFR US + 3.25%), 09/17/2031 | 60,131 | 60,021 | ||||
June Purchaser LLC, Senior Secured First Lien | ||||||
8.67% (1 mo. Term SOFR + 3.25%), 09/11/2031 | 486,000 | 484,481 | ||||
8.67% (1 mo. Term SOFR + 3.25%), 09/11/2031 | 81,000 | 80,747 | ||||
Lakeland Holdings LLC, Senior Unsecured First Lien | ||||||
8.00%, 09/27/2027 | 225,670 | 42,877 | ||||
8.00%, 09/27/2027 | 107,661 | 20,456 | ||||
MoneyGram International, Inc., Senior Secured First Lien, 9.68% (3 mo. SOFR US + 4.75%), 06/03/2030 | 265,200 | 253,350 | ||||
NAB Holdings LLC, Senior Secured First Lien, 7.35% (3 mo. SOFR US + 2.75%), 11/24/2028 | 491,847 | 490,991 | ||||
Neon Maple US Debt Mergersub, Inc., Senior Secured First Lien, 8.35% (1 mo. Term SOFR + 3.00%), 07/21/2031 | 503,000 | 498,076 | ||||
NuveiTechnologies Corp., Senior Secured First Lien | ||||||
8.06% (1 mo. SOFR US + 3.00%), 12/19/2030 | 141,849 | 142,229 | ||||
8.06% (1 mo. SOFR US + 3.00%), 12/19/2030 | 95,281 | 95,537 | ||||
8.06% (1 mo. SOFR US + 3.00%), 12/19/2030 | 24,637 | 24,703 | ||||
VFH Parent LLC, Senior Secured First Lien, 7.60% (1 mo. SOFR US + 2.75%), 06/23/2031 | 910,000 | 912,275 | ||||
WEX, Inc., Senior Secured First Lien, 7.25% (1 mo. SOFR US + 2.00%), 04/03/2028 | 692,053 | 694,153 | ||||
Zelis Payments Buyer, Inc., Senior Secured First Lien, 7.60% (1 mo. SOFR US + 2.75%), 09/28/2029 | 659,685 | 660,064 | ||||
14,179,955 | ||||||
Principal Value | Fair Value | |||||
FINANCIALS: INSURANCE - 4.2% | ||||||
AcrisureLLC, Senior Secured First Lien | ||||||
7.96% (1 mo. SOFR US + 3.00%), 02/16/2027 | $1,902,891 | $1,900,912 | ||||
8.21% (1 mo. SOFR US + 3.25%), 11/06/2030 | 408,015 | 404,828 | ||||
Alliant Holdings Intermediate LLC, Senior Secured First Lien, 8.10% (1 mo. SOFR US + 3.00%), 09/19/2031 | 295,000 | 293,682 | ||||
AssuredPartners, Inc., Senior Secured First Lien, 8.35% (1 mo. SOFR US + 3.50%), 02/14/2031 | 1,921,345 | 1,921,681 | ||||
Asurion LLC, Senior Secured First Lien, 8.32% (1 mo. SOFR US + 3.25%), 12/23/2026 | 1,667,958 | 1,668,508 | ||||
Asurion LLC, Senior Secured Second Lien, 10.32% (1 mo. SOFR US + 5.25%), 02/03/2028 | 718,000 | 676,073 | ||||
BroadStreet Partners, Inc., Senior Secured First Lien | ||||||
8.10% (1 mo. SOFR US + 3.25%), 06/16/2031 | 289,982 | 289,160 | ||||
8.10% (1 mo. SOFR US + 3.25%), 06/16/2031 | 29,683 | 29,599 | ||||
HUB International Ltd., Senior Secured First Lien, 8.26% (3 mo. SOFR US + 3.00%), 06/20/2030 | 1,294,503 | 1,294,076 | ||||
Jones Deslauriers Insurance Management, Inc., Senior Secured First Lien, 8.40% (3 mo. SOFR US + 3.25%), 03/15/2030 | 274,165 | 274,439 | ||||
TIH Insurance Holdings LLC, Senior Secured First Lien, 7.85% (3 mo. SOFR US + 3.25%), 05/06/2031 | 1,447,000 | 1,447,152 | ||||
TIH Insurance Holdings LLC, Senior Secured Second Lien, 9.35% (3 mo. SOFR US + 4.75%), 05/06/2032 | 505,000 | 514,469 | ||||
USI, Inc., Senior Secured First Lien, 7.35% (3 mo. SOFR US + 2.75%), 11/23/2029 | 938,794 | 937,099 | ||||
11,651,678 | ||||||
FOOD & BEVERAGE - 1.8% | ||||||
BCPE Empire Holdings, Inc., Senior Secured First Lien, 8.85% (1 mo. SOFR US + 4.00%), 12/26/2028 | 663,396 | 664,434 | ||||
Delivery Hero Finco LLC, Senior Secured First Lien, 10.10% (3 mo. SOFR US + 5.00%), 12/12/2029 | 1,778,476 | 1,788,792 | ||||
FroneriUS, Inc., Senior Secured First Lien | ||||||
7.30% (1 mo. SOFR US + 2.25%), 02/01/2027 | 270,024 | 269,822 | ||||
7.70% (1 mo. SOFR US + 2.25%), 02/01/2027 | 122,872 | 122,780 | ||||
5 |
Principal Value | Fair Value | |||||
BANK LOANS - (Continued) | ||||||
FOOD & BEVERAGE - (Continued) | ||||||
HLF Financing Sarl LLC, Senior Secured First Lien, 11.60% (1 mo. SOFR US + 6.75%), 04/12/2029 | $319,950 | $303,473 | ||||
Pegasus Bidco BV, Senior Secured First Lien, 8.87% (3 mo. SOFR US + 3.75%), 07/12/2029 | 527,242 | 528,726 | ||||
Saratoga Food Specialties LLC, Senior Secured First Lien, 8.70% (3 mo. SOFR US + 3.75%), 03/07/2029 | 379,050 | 381,182 | ||||
Triton Water Holdings, Inc., Senior Secured First Lien, 9.11% (3 mo. SOFR US + 3.25%), 03/31/2028 | 815,066 | 814,577 | ||||
4,873,786 | ||||||
HEALTHCARE: EQUIPMENT & SUPPLIES - 2.4% | ||||||
AthenaHealth Group, Inc., Senior Secured First Lien, 8.50% (1 mo. SOFR US + 3.25%), 02/15/2029 | 743,168 | 739,765 | ||||
Azalea Topco, Inc., Senior Secured First Lien, 8.35% (1 mo. SOFR US + 3.50%), 04/24/2031 | 1,134,000 | 1,132,889 | ||||
Bausch + Lomb Corp., Senior Secured First Lien, 8.37% (1 mo. SOFR US + 3.25%), 05/10/2027 | 581 | 579 | ||||
Covetrus, Inc., Senior Secured First Lien, 10.33% (3 mo. SOFR US + 5.00%), 10/15/2029 | 231,475 | 220,047 | ||||
Gainwell Acquisition Corp., Senior Secured First Lien, 8.80% (3 mo. SOFR US + 4.00%), 10/01/2027 | 942,229 | 899,239 | ||||
Insulet Corp., Senior Secured First Lien, 7.75% (1 mo. SOFR US + 2.50%), 08/01/2031 | 1,263,735 | 1,271,045 | ||||
Medline Borrower LP, Senior Secured First Lien, 7.60% (1 mo. SOFR US + 2.75%), 10/23/2028 | 1,590,499 | 1,592,941 | ||||
Waystar Technologies, Inc., Senior Secured First Lien, 7.60% (1 mo. SOFR US + 2.75%), 10/22/2029 | 718,626 | 719,977 | ||||
6,576,482 | ||||||
HEALTHCARE: FACILITIES - 4.0% | ||||||
ADMI Corp., Senior Secured First Lien, 8.82% (1 mo. SOFR US + 3.75%), 12/23/2027 | 414,173 | 406,258 | ||||
CHG Healthcare Services, Inc., Senior Secured First Lien | ||||||
8.46% (1 mo. SOFR US + 3.50%), 09/29/2028 | 387,377 | 388,424 | ||||
Principal Value | Fair Value | |||||
8.57% (1 mo. SOFR US + 3.50%), 09/29/2028 | $160,917 | $161,127 | ||||
Concentra Health Services, Inc., Senior Secured First Lien, 7.10% (1 mo. SOFR US + 2.25%), 07/28/2031 | 407,000 | 406,746 | ||||
Examworks Bidco, Inc., Senior Secured First Lien, 8.07% (1 mo. SOFR US + 3.00%), 11/01/2028 | 947,537 | 949,906 | ||||
Global Medical Response, Inc., Senior Secured First Lien | ||||||
10.46% (includes 0.75% PIK) (1 mo. SOFR US + 4.75%), 10/02/2028 | 838,974 | 835,501 | ||||
10.46% (includes 0.75% PIK) (1 mo. SOFR US + 4.75%), 10/02/2028 | 19,737 | 19,655 | ||||
HAH Group Holding Co. LLC, Senior Secured First Lien, 9.96% (1 mo. Term SOFR), 09/17/2031 | 554,000 | 547,856 | ||||
Heartland Dental LLC, Senior Secured First Lien, 9.35% (1 mo. SOFR US + 4.50%), 04/28/2028 | 806,165 | 793,653 | ||||
Hunter US Bidco, Inc., Senior Secured First Lien, 9.68% (3 mo. SOFR US + 4.25%), 08/21/2028 | 276,000 | 274,965 | ||||
Inception Finco Sarl, Senior Secured First Lien, 9.10% (3 mo. SOFR US + 4.50%), 04/09/2031 | 570,000 | 574,631 | ||||
LifePoint Health, Inc., Senior Secured First Lien, 8.96% (1 mo. SOFR US + 4.00%), 05/14/2031 | 839,238 | 840,363 | ||||
ModivCare, Inc., Senior Secured First Lien, 10.08% (3 mo. SOFR US + 4.75%), 07/01/2031 | 336,158 | 318,405 | ||||
Option Care Health, Inc., Senior Secured First Lien, 7.21% (1 mo. SOFR US + 2.25%), 10/27/2028 | 407,605 | 409,559 | ||||
Pacific Dental Services, Inc., Senior Secured First Lien, 7.85% (1 mo. SOFR US + 2.75%), 03/17/2031 | 477,600 | 477,899 | ||||
Pluto Acquisition I, Inc., Senior Secured First Lien | ||||||
10.25% (3 mo. SOFR US + 5.50%), 06/20/2028 | 90,065 | 91,416 | ||||
10.25% (3 mo. SOFR US + 5.50%), 06/20/2028 | 1,801 | 1,828 | ||||
9.13% (3 mo. SOFR US + 4.00%), 09/20/2028 | 192,261 | 176,560 | ||||
Radnet Management, Inc., Senior Secured First Lien, 7.78% (3 mo. SOFR US + 2.50%), 04/18/2031 | 406,980 | 407,829 | ||||
Select Medical Corp., Senior Secured First Lien, 8.25% (1 mo. SOFR US + 3.00%), 03/05/2027 | 130,469 | 131,148 | ||||
6 |
Principal Value | Fair Value | |||||
BANK LOANS - (Continued) | ||||||
HEALTHCARE: FACILITIES - (Continued) | ||||||
SonravaHealth Co.-Borrower LLC, Senior Secured First Lien | ||||||
7.68% (3 mo. SOFR US + 6.50%), 05/18/2028 | $115,398 | $116,552 | ||||
11.50% (1 mo. SOFR US + 7.25%), 08/18/2028 | 335,319 | 225,641 | ||||
Sotera Health Holdings LLC, Senior Secured First Lien, 8.10% (1 mo. SOFR US + 3.25%), 05/30/2031 | 648,000 | 646,785 | ||||
Surgery Center Holdings, Inc., Senior Secured First Lien, 7.67% (1 mo. SOFR US + 2.75%), 12/19/2030 | 1,299,470 | 1,301,809 | ||||
US Radiology Specialists, Inc., Senior Secured First Lien, 9.35% (3 mo. SOFR US + 4.75%), 12/15/2027 | 525,744 | 527,058 | ||||
11,031,574 | ||||||
HEALTHCARE: LIFE SCIENCES - 1.2% | ||||||
Avantor Funding, Inc., Senior Secured First Lien, 7.05% (1 mo. SOFR US + 2.00%), 11/08/2027 | 542,937 | 546,594 | ||||
Cambrex Corp., Senior Secured First Lien, 8.55% (1 mo. SOFR US + 3.50%), 12/07/2026 | 274,149 | 272,949 | ||||
Catalent Pharma Solutions, Inc., Senior Secured First Lien, 7.92% (1 mo. SOFR US + 3.00%), 02/22/2028 | 519,390 | 520,364 | ||||
Curia Global, Inc., Senior Secured First Lien, 9.20% (3 mo. SOFR US + 3.75%), 08/28/2026 | 703,962 | 672,118 | ||||
Phoenix Newco, Inc., Senior Secured First Lien, 7.85% (1 mo. SOFR US + 3.00%), 11/15/2028 | 589,622 | 590,403 | ||||
Star Parent, Inc., Senior Secured First Lien, 9.08% (3 mo. SOFR US + 3.75%), 09/30/2030 | 816,149 | 795,288 | ||||
3,397,716 | ||||||
HEALTHCARE: MANAGED HEALTH CARE - 0.9% | ||||||
Bella Holding Co. LLC, Senior Secured First Lien, 8.80% (1 mo. SOFR US + 3.75%), 05/10/2028 | 434,879 | 435,423 | ||||
Charlotte Buyer, Inc., Senior Secured First Lien, 9.85% (1 mo. SOFR US + 4.75%), 02/11/2028 | 284,831 | 287,368 | ||||
Cotiviti, Inc., Senior Secured First Lien, 8.45% (1 mo. SOFR US + 3.25%), 04/30/2031 | 1,651,700 | 1,652,732 | ||||
2,375,523 | ||||||
Principal Value | Fair Value | |||||
HEALTHCARE: PHARMA & BIOTECH - 1.7% | ||||||
Elanco Animal Health, Inc., Senior Secured First Lien, 7.15% (1 mo. SOFR US + 1.75%), 08/02/2027 | $404,980 | $404,505 | ||||
Endo Finance Holdings, Inc., Senior Secured First Lien, 9.78% (3 mo. SOFR US + 4.50%), 04/23/2031 | 716,000 | 716,222 | ||||
Financiere Mendel SASU, Senior Secured First Lien, 8.35% (3 mo. SOFR US + 3.25%), 11/13/2030 | 668,640 | 670,589 | ||||
Grifols Worldwide Operations USA, Inc., Senior Secured First Lien, 7.55% (3 mo. SOFR US + 2.00%), 11/15/2027 | 839,343 | 817,311 | ||||
Jazz Financing Lux Sarl, Senior Secured First Lien, 7.10% (1 mo. SOFR US + 2.25%), 05/05/2028 | 1,529,265 | 1,529,402 | ||||
Perrigo Investments LLC, Senior Secured First Lien, 7.30% (1 mo. SOFR US + 2.25%), 04/20/2029 | 465,989 | 466,378 | ||||
4,604,407 | ||||||
INDUSTRIAL MACHINERY - 3.8% | ||||||
AI Aqua Merger Sub, Inc., Senior Secured First Lien, 8.70% (1 mo. SOFR US + 3.50%), 07/31/2028 | 1,146,072 | 1,146,015 | ||||
Ali Group North America Corp., Senior Secured First Lien, 7.07% (1 mo. SOFR US + 2.00%), 07/23/2029 | 498,856 | 501,118 | ||||
AZZ, Inc., Senior Secured First Lien | ||||||
7.35% (1 mo. SOFR US + 2.50%), 05/11/2029 | 290,645 | 292,410 | ||||
7.35% (1 mo. SOFR US + 2.50%), 05/11/2029 | 189,405 | 190,554 | ||||
Chart Industries, Inc., Senior Secured First Lien, 7.82% (3 mo. SOFR US + 2.50%), 03/18/2030 | 851,627 | 851,095 | ||||
Columbus McKinnon Corp., Senior Secured First Lien, 7.10% (3 mo. SOFR US + 2.50%), 05/15/2028 | 516,579 | 517,871 | ||||
Crosby US Acquisition Corp., Senior Secured First Lien, 9.25% (1 mo. SOFR US + 4.00%), 08/16/2029 | 495,510 | 497,058 | ||||
Dynamo US Bidco, Inc., Senior Secured First Lien, 9.10% (1 mo. Term SOFR + 4.00%), 09/25/2031 | 416,000 | 417,560 | ||||
Gates Global LLC, Senior Secured First Lien, 7.10% (1 mo. SOFR US + 2.25%), 11/16/2029 | 516,460 | 517,751 | ||||
7 |
Principal Value | Fair Value | |||||
BANK LOANS - (Continued) | ||||||
INDUSTRIAL MACHINERY - (Continued) | ||||||
Madison IAQ LLC, Senior Secured First Lien, 8.00% (6 mo. SOFR US + 2.75%), 06/21/2028 | $404,109 | $404,265 | ||||
Madison Safety & Flow LLC, Senior Secured First Lien, 8.36% (1 mo. Term SOFR + 3.25%), 09/26/2031 | 358,000 | 358,337 | ||||
Oregon Tool Holdings, Inc., Senior Secured First Lien, 8.98% (3 mo. SOFR US + 4.00%), 10/16/2028 | 407,501 | 303,079 | ||||
PG Polaris BidCo Sarl, Senior Secured First Lien, 8.10% (3 mo. SOFR US + 3.50%), 03/24/2031 | 538,650 | 540,333 | ||||
Pro Mach Group, Inc., Senior Secured First Lien, 8.35% (1 mo. SOFR US + 3.50%), 08/31/2028 | 965,117 | 969,407 | ||||
Roper Industrial Products Investment Co., Senior Secured First Lien, 7.85% (3 mo. SOFR US + 3.25%), 11/23/2029 | 533,911 | 535,483 | ||||
TK Elevator US Newco, Inc., Senior Secured First Lien | ||||||
8.59% (6 mo. SOFR US + 3.50%), 04/30/2030 | 503,690 | 505,264 | ||||
8.59% (6 mo. SOFR US + 3.50%), 04/30/2030 | 289,333 | 290,237 | ||||
Vertiv Group Corp., Senior Secured First Lien, 7.20% (1 mo. SOFR US + 2.00%), 03/02/2027 | 564,425 | 565,483 | ||||
Wec US Holdings Ltd., Senior Secured First Lien, 7.60% (1 mo. SOFR US + 2.75%), 01/27/2031 | 949,720 | 950,584 | ||||
10,353,904 | ||||||
LEISURE: CASINOS & GAMING - 3.5% | ||||||
888 Acquisitions LLC, Senior Secured First Lien, 9.60% (6 mo. SOFR US + 5.25%), 07/03/2028 | 686,907 | 673,739 | ||||
Allwyn Entertainment Financing US LLC, Senior Secured First Lien, 7.57% (3 mo. Term SOFR + 2.25%), 06/30/2031 | 574,560 | 574,741 | ||||
Aristocrat Technologies, Inc., Senior Secured First Lien, 7.05% (3 mo. SOFR US + 2.25%), 05/24/2029 | 224,143 | 225,431 | ||||
Bally’s Corp., Senior Secured First Lien, 9.06% (3 mo. SOFR US + 3.25%), 10/02/2028 | 412,455 | 393,766 | ||||
Caesars Entertainment, Inc., Senior Secured First Lien | ||||||
7.70% (1 mo. SOFR US + 2.75%), 02/06/2030 | 673,785 | 675,099 | ||||
7.60% (1 mo. SOFR US + 2.75%), 02/06/2031 | 562,175 | 563,010 | ||||
Principal Value | Fair Value | |||||
Entain Holdings Gibraltar Ltd., Senior Secured First Lien, 7.96% (6 mo. SOFR US + 2.50%), 03/16/2027 | $1,343,514 | $1,349,808 | ||||
Everi Holdings, Inc., Senior Secured First Lien, 7.57% (1 mo. SOFR US + 2.50%), 08/03/2028 | 449,888 | 451,633 | ||||
Fertitta Entertainment LLC, Senior Secured First Lien, 8.85% (1 mo. SOFR US + 3.75%), 01/29/2029 | 543,384 | 542,499 | ||||
Flutter Financing BV, Senior Secured First Lien, 6.70% (3 mo. SOFR US + 2.25%), 11/29/2030 | 1,867,276 | 1,871,608 | ||||
Light & Wonder International, Inc., Senior Secured First Lien, 7.33% (1 mo. SOFR US + 2.25%), 04/16/2029 | 852,843 | 853,678 | ||||
Ontario Gaming GTA LP, Senior Secured First Lien, 8.89% (3 mo. SOFR US + 4.25%), 08/01/2030 | 732,465 | 732,692 | ||||
Penn Entertainment, Inc., Senior Secured First Lien, 7.80% (1 mo. SOFR US + 2.75%), 05/03/2029 | 584,983 | 586,996 | ||||
9,494,700 | ||||||
LEISURE: HOTELS - 2.8% | ||||||
Alterra Mountain Co., Senior Secured First Lien, 8.10% (1 mo. SOFR US + 3.25%), 08/17/2028 | 1,782,101 | 1,788,410 | ||||
Carnival Corp., Senior Secured First Lien, 8.00% (1 mo. SOFR US + 2.75%), 10/18/2028 | 810,873 | 813,492 | ||||
Herschend Entertainment Co. LLC, Senior Secured First Lien, 7.85% (1 mo. SOFR US + 3.00%), 08/28/2028 | 787,580 | 790,534 | ||||
Hilton Domestic Operating Co., Inc., Senior Secured First Lien, 6.70% (1 mo. SOFR US + 1.75%), 11/08/2030 | 408,000 | 408,373 | ||||
Hilton Grand Vacations Borrower LLC, Senior Secured First Lien | ||||||
7.46% (1 mo. SOFR US + 2.50%), 08/02/2028 | 430,680 | 428,708 | ||||
7.61% (1 mo. SOFR US + 2.25%), 01/17/2031 | 412,698 | 410,377 | ||||
Marriott Ownership Resorts, Inc., Senior Secured First Lien, 7.10% (1 mo. SOFR US + 2.25%), 04/01/2031 | 399,000 | 398,711 | ||||
RHP Hotel Properties LP, Senior Secured First Lien, 7.10% (1 mo. SOFR US + 2.25%), 05/20/2030 | 373,951 | 374,792 | ||||
8 |
Principal Value | Fair Value | |||||
BANK LOANS - (Continued) | ||||||
LEISURE: HOTELS - (Continued) | ||||||
Sabre GLBL, Inc., Senior Secured First Lien | ||||||
8.57% (1 mo. SOFR US + 3.50%), 12/17/2027 | $143,000 | $134,002 | ||||
8.57% (1 mo. SOFR US + 3.50%), 12/17/2027 | 90,501 | 84,807 | ||||
9.30% (1 mo. SOFR US + 4.25%), 06/30/2028 | 64,915 | 61,182 | ||||
10.05% (1 mo. SOFR US + 5.00%), 06/30/2028 | 465,000 | 443,659 | ||||
Six Flags Entertainment Corp., Senior Secured First Lien, 6.85% (1 mo. SOFR US + 2.00%), 05/01/2031 | 514,710 | 514,581 | ||||
Travel + Leisure Co., Senior Secured First Lien, 8.37% (1 mo. SOFR US + 3.25%), 12/14/2029 | 500,220 | 502,283 | ||||
TripAdvisor, Inc., Senior Secured First Lien, 7.60% (1 mo. SOFR US + 2.75%), 07/08/2031 | 482,000 | 481,848 | ||||
7,635,759 | ||||||
LEISURE: RESTAURANTS - 1.2% | ||||||
BCPE Grill Parent, Inc., Senior Secured First Lien, 10.00% (3 mo. SOFR US + 4.75%), 09/30/2030 | 265,990 | 256,514 | ||||
Dave & Buster’s, Inc., Senior Secured First Lien, 7.88% (3 mo. SOFR US + 3.25%), 06/29/2029 | 661,163 | 659,741 | ||||
IRB Holding Corp., Senior Secured First Lien, 8.20% (1 mo. SOFR US + 2.75%), 12/15/2027 | 1,549,882 | 1,549,665 | ||||
Tacala Investment Corp., Senior Secured First Lien, 8.35% (1 mo. SOFR US + 4.00%), 01/31/2031 | 525,360 | 526,805 | ||||
Whatabrands LLC, Senior Secured First Lien, 7.60% (1 mo. SOFR US + 2.75%), 08/03/2028 | 407,004 | 406,868 | ||||
3,399,593 | ||||||
MEDIA: BROADCASTING - 0.5% | ||||||
Hubbard Radio LLC, Senior Secured First Lien, 9.35% (1 mo. SOFR US + 4.50%), 09/30/2027 | 399,987 | 317,989 | ||||
Nexstar Media, Inc., Senior Secured First Lien, 7.57% (1 mo. SOFR US + 2.50%), 09/18/2026 | 676,873 | 677,466 | ||||
Univision Communications, Inc., Senior Secured First Lien, 8.32% (1 mo. SOFR US + 3.25%), 03/13/2026 | 451,464 | 451,875 | ||||
1,447,330 | ||||||
Principal Value | Fair Value | |||||
MEDIA: CABLE & SATELLITE - 2.1% | ||||||
Charter Communications Operating LLC, Senior Secured First Lien | ||||||
7.03% (3 mo. SOFR US + 1.75%), 02/01/2027 | $661,276 | $661,207 | ||||
7.03% (3 mo. SOFR US + 1.75%), 02/01/2027 | 1,745 | 1,745 | ||||
Connect Finco Sarl, Senior Secured First Lien | ||||||
8.35% (1 mo. SOFR US + 3.50%), 12/11/2026 | 680,910 | 679,085 | ||||
9.35% (1 mo. SOFR US + 4.50%), 09/28/2029 | 247,000 | 232,365 | ||||
Coral-US Co.-Borrower LLC, Senior Secured First Lien, 7.58% (1 mo. SOFR US + 2.25%), 01/31/2028 | 655,000 | 648,404 | ||||
CSC Holdings LLC, Senior Secured First Lien, 9.60% (1 mo. SOFR US + 4.50%), 01/18/2028 | 850,113 | 827,950 | ||||
Directv Financing LLC, Senior Secured First Lien, 10.22% (1 mo. SOFR US + 5.00%), 08/02/2027 | 536,724 | 537,709 | ||||
Iridium Satellite LLC, Senior Secured First Lien, 7.10% (1 mo. SOFR US + 2.25%), 09/20/2030 | 829,933 | 816,704 | ||||
Midcontinent Communications, Senior Secured First Lien, 7.60% (1 mo. SOFR US + 2.50%), 08/18/2031 | 443,000 | 445,769 | ||||
Telenet Financing USD LLC, Senior Secured First Lien, 7.33% (1 mo. SOFR US + 2.00%), 04/28/2028 | 407,000 | 393,137 | ||||
Virgin Media Bristol LLC, Senior Secured First Lien, 7.83% (1 mo. SOFR US + 2.50%), 01/31/2028 | 630,000 | 603,748 | ||||
5,847,823 | ||||||
MEDIA: DIVERSIFIED - 1.2% | ||||||
Abe Investment Holdings, Inc., Senior Secured First Lien, 8.95% (3 mo. SOFR US + 4.50%), 02/19/2026 | 774,471 | 771,571 | ||||
ABG Intermediate Holdings 2 LLC, Senior Secured First Lien, 7.60% (1 mo. SOFR US + 2.75%), 12/21/2028 | 463,531 | 464,530 | ||||
Arches Buyer, Inc., Senior Secured First Lien, 8.30% (1 mo. SOFR US + 3.25%), 12/06/2027 | 271,548 | 261,045 | ||||
McGraw-Hill Education, Inc., Senior Secured First Lien, 8.70% (3 mo. SOFR US + 4.00%), 08/06/2031 | 820,593 | 824,696 | ||||
9 |
Principal Value | Fair Value | |||||
BANK LOANS - (Continued) | ||||||
MEDIA: DIVERSIFIED - (Continued) | ||||||
Neptune Bidco US, Inc., Senior Secured First Lien, 10.25% (3 mo. SOFR US + 4.75%), 10/11/2028 | $1,023,843 | $960,109 | ||||
3,281,951 | ||||||
MEDIA: ENTERTAINMENT - 2.1% | ||||||
Cirque Du Soleil Holding USA Newco, Inc., Senior Secured First Lien | ||||||
8.35% (3 mo. SOFR US + 3.75%), 03/08/2030 | 441,614 | 436,867 | ||||
8.35% (3 mo. SOFR US + 3.75%), 03/08/2030 | 223,619 | 221,215 | ||||
Creative Artists Agency LLC, Senior Secured First Lien, 8.50% (1 mo. SOFR US + 3.25%), 11/27/2028 | 763,268 | 763,745 | ||||
Delta 2 Lux Sarl, Senior Secured First Lien | ||||||
7.20% (1 mo. SOFR US + 2.00%), 09/19/2031 | 206,333 | 206,699 | ||||
7.20% (1 mo. Term SOFR + 2.00%), 09/19/2031 | 102,667 | 102,848 | ||||
Hoya Midco LLC, Senior Secured First Lien, 7.85% (1 mo. SOFR US + 3.00%), 02/05/2029 | 553,203 | 556,663 | ||||
Live Nation Entertainment, Inc., Senior Secured First Lien, 6.91% (1 mo. SOFR US + 1.75%), 10/19/2026 | 667,653 | 668,140 | ||||
StubHub Holdco Sub LLC, Senior Secured First Lien, 9.60% (1 mo. SOFR US + 4.75%), 03/15/2030 | 1,094,276 | 1,095,184 | ||||
UFC Holdings LLC, Senior Secured First Lien, 8.55% (3 mo. SOFR US + 2.75%), 04/29/2026 | 727,366 | 728,861 | ||||
William Morris Endeavor Entertainment LLC, Senior Secured First Lien | ||||||
7.82% (1 mo. SOFR US + 2.75%), 05/19/2025 | 584,657 | 585,753 | ||||
7.82% (1 mo. SOFR US + 2.75%), 05/19/2025 | 281,097 | 281,624 | ||||
7.82% (1 mo. SOFR US + 2.75%), 05/19/2025 | 53,372 | 53,472 | ||||
7.82% (1 mo. SOFR US + 2.75%), 05/19/2025 | 25,661 | 25,709 | ||||
5,726,780 | ||||||
METALS & MINING - 0.5% | ||||||
Arsenal AIC Parent LLC, Senior Secured First Lien, 8.10% (1 mo. SOFR US + 3.25%), 08/19/2030 | 504,916 | 505,168 | ||||
Principal Value | Fair Value | |||||
Grinding Media, Inc., Senior Secured First Lien | ||||||
9.83% (3 mo. SOFR US + 4.00%), 10/12/2028 | $638,602 | $638,602 | ||||
9.83% (3 mo. SOFR US + 4.00%), 10/12/2028 | 178,420 | 178,420 | ||||
1,322,190 | ||||||
MIDSTREAM: STORAGE & TRANSPORT - 2.3% | ||||||
Brazos Delaware II LLC, Senior Secured First Lien, 8.25% (6 mo. SOFR US + 3.50%), 02/11/2030 | 268,650 | 269,297 | ||||
Buckeye Partners LP, Senior Secured First Lien, 6.60% (1 mo. SOFR US + 1.75%), 11/02/2026 | 767,776 | 768,736 | ||||
CPPIB OVM Member US LLC, Senior Secured First Lien, 7.85% (3 mo. SOFR US + 3.25%), 08/20/2031 | 419,000 | 419,698 | ||||
ITT Holdings LLC, Senior Secured First Lien, 8.05% (1 mo. SOFR US + 3.00%), 10/11/2030 | 640,546 | 642,147 | ||||
NGP XI Midstream Holdings LLC, Senior Secured First Lien, 8.60% (3 mo. SOFR US + 4.00%), 07/17/2031 | 506,000 | 506,632 | ||||
Northriver Midstream Finance LP, Senior Secured First Lien, 7.83% (3 mo. SOFR US + 2.50%), 08/16/2030 | 732,736 | 733,560 | ||||
Oryx Midstream Services Permian Basin LLC, Senior Secured First Lien, 8.34% (1 mo. SOFR US + 3.00%), 10/05/2028 | 1,488,052 | 1,490,321 | ||||
TransMontaigne Operating Co. LP, Senior Secured First Lien | ||||||
8.57% (1 mo. SOFR US + 3.50%), 11/17/2028 | 231,445 | 232,045 | ||||
8.57% (1 mo. SOFR US + 3.50%), 11/17/2028 | 231,445 | 232,045 | ||||
8.57% (1 mo. SOFR US + 3.50%), 11/17/2028 | 71,032 | 71,216 | ||||
Traverse Midstream Partners LLC, Senior Secured First Lien, 8.85% (3 mo. SOFR US + 3.50%), 02/16/2028 | 652,652 | 655,100 | ||||
UGI Energy Services LLC, Senior Secured First Lien, 7.35% (1 mo. SOFR US + 2.50%), 02/22/2030 | 370,403 | 371,195 | ||||
6,391,992 | ||||||
OIL & GAS: E&P - 0.1% | ||||||
Discovery Energy Holding Corp., Senior Secured First Lien, 9.35% (3 mo. SOFR US + 4.75%), 05/01/2031 | 368,078 | 371,988 | ||||
10 |
Principal Value | Fair Value | |||||
BANK LOANS - (Continued) | ||||||
PACKAGING - 1.5% | ||||||
Clydesdale Acquisition Holdings, Inc., Senior Secured First Lien, 8.12% (1 mo. SOFR US + 3.18%), 04/13/2029 | $274,140 | $273,043 | ||||
LABL, Inc., Senior Secured First Lien, 10.05% (1 mo. SOFR US + 5.00%), 10/30/2028 | 425,438 | 416,684 | ||||
M2S Group Intermediate Holdings, Inc., Senior Secured First Lien, 9.85% (3 mo. SOFR US + 4.75%), 08/22/2031 | 785,000 | 755,562 | ||||
Mauser Packaging Solutions Holding Co., Senior Secured First Lien, 8.70% (1 mo. SOFR US + 3.50%), 04/16/2027 | 822,663 | 825,234 | ||||
Pregis TopCo LLC, Senior Secured First Lien, 8.85% (1 mo. SOFR US + 4.00%), 07/31/2026 | 519,113 | 520,826 | ||||
Sabert Corp., Senior Secured First Lien, 8.15% (1 mo. SOFR US + 3.00%), 12/10/2026 | 343,688 | 345,623 | ||||
Trident TPI Holdings, Inc., Senior Secured First Lien, 8.60% (3 mo. SOFR US + 4.00%), 09/18/2028 | 906,093 | 908,575 | ||||
4,045,547 | ||||||
REAL ESTATE: MANAGEMENT - 0.3% | ||||||
Cushman & Wakefield US Borrower LLC, Senior Secured First Lien, 8.60% (1 mo. SOFR US + 3.75%), 01/31/2030 | 287,280 | 287,819 | ||||
Greystar Real Estate Partners LLC, Senior Secured First Lien, 7.67% (1 mo. SOFR US + 2.75%), 08/21/2030 | 542,537 | 542,537 | ||||
830,356 | ||||||
RETAIL: FOOD & DRUG - 0.2% | ||||||
JP Intermediate B LLC, Senior Secured First Lien, 11.13% (3 mo. SOFR US + 5.50%), 11/22/2027 | 447,191 | 36,893 | ||||
TKC Holdings, Inc., Senior Secured First Lien, 9.96% (1 mo. SOFR US + 5.00%), 05/15/2028 | 543,694 | 543,357 | ||||
580,250 | ||||||
RETAILING - 3.2% | ||||||
Amer Sports Co., Senior Secured First Lien | ||||||
8.35% (3 mo. SOFR US + 3.25%), 02/18/2031 | 261,100 | 262,079 | ||||
8.35% (3 mo. SOFR US + 3.25%), 02/18/2031 | 62,478 | 62,712 | ||||
Principal Value | Fair Value | |||||
Belron Finance US LLC, Senior Secured First Lien, 7.43% (3 mo. SOFR US + 1.93%), 04/28/2028 | $1,182,441 | $1,183,180 | ||||
Great Outdoors Group LLC, Senior Secured First Lien, 8.82% (1 mo. SOFR US + 3.75%), 03/06/2028 | 1,089,474 | 1,090,721 | ||||
Harbor Freight Tools USA, Inc., Senior Secured First Lien | ||||||
7.24% (3 mo. SOFR US + 2.50%), 06/11/2031 | 106,377 | 104,893 | ||||
7.35% (1 mo. SOFR US + 2.50%), 06/11/2031 | 798,623 | 787,478 | ||||
Mavis Tire Express Services Topco Corp., Senior Secured First Lien, 8.35% (1 mo. SOFR US + 3.50%), 05/04/2028 | 672,801 | 673,258 | ||||
Michaels Cos., Inc., Senior Secured First Lien, 9.38% (3 mo. SOFR US + 4.25%), 04/17/2028 | 577,486 | 458,235 | ||||
Peer Holding III BV, Senior Secured First Lien | ||||||
3.30% (3 mo. SOFR US + 3.25%), 10/28/2030 | 629,835 | 632,789 | ||||
3.05% (3 mo. SOFR US + 3.00%), 07/01/2031 | 334,000 | 335,461 | ||||
PetSmart LLC, Senior Secured First Lien, 8.80% (1 mo. SOFR US + 3.75%), 02/14/2028 | 1,365,756 | 1,356,121 | ||||
RH, Senior Secured First Lien | ||||||
7.57% (1 mo. SOFR US + 2.50%), 10/20/2028 | 108,109 | 104,190 | ||||
8.30% (1 mo. SOFR US + 3.25%), 10/20/2028 | 582,985 | 568,320 | ||||
Sally Holdings LLC, Senior Secured First Lien, 6.60% (1 mo. SOFR US + 1.75%), 02/28/2030 | 473,785 | 474,278 | ||||
Staples, Inc., Senior Secured First Lien, 10.69% (3 mo. SOFR US + 5.75%), 09/10/2029 | 648,000 | 590,373 | ||||
8,684,088 | ||||||
TECHNOLOGY HARDWARE - 1.4% | ||||||
CommScope LLC, Senior Secured First Lien, 8.32% (1 mo. SOFR US + 3.25%), 04/06/2026 | 1,147,599 | 1,114,365 | ||||
Fortress Intermediate 3, Inc., Senior Secured First Lien, 8.60% (1 mo. SOFR US + 3.75%), 06/27/2031 | 273,000 | 272,829 | ||||
Ingram Micro, Inc., Senior Secured First Lien, 7.56% (3 mo. SOFR US + 2.75%), 09/22/2031 | 502,418 | 503,048 | ||||
MKS Instruments, Inc., Senior Secured First Lien, 7.17% (1 mo. SOFR US + 2.25%), 08/17/2029 | 356,736 | 357,316 | ||||
11 |
Principal Value | Fair Value | |||||
BANK LOANS - (Continued) | ||||||
TECHNOLOGY HARDWARE - (Continued) | ||||||
Synaptics, Inc., Senior Secured First Lien, 7.79% (1 mo. SOFR US + 2.25%), 12/04/2028 | $1,081,670 | $1,080,859 | ||||
World Wide Technology Holding Co. LLC, Senior Secured First Lien, 7.91% (1 mo. SOFR US + 2.75%), 03/01/2030 | 664,112 | 666,602 | ||||
3,995,019 | ||||||
TECHNOLOGY: SOFTWARE & SERVICES - 12.0% | ||||||
Access CIG LLC, Senior Secured First Lien, 10.25% (3 mo. SOFR US + 5.00%), 08/18/2028 | 707,850 | 711,768 | ||||
Barracuda Networks, Inc., Senior Secured First Lien, 9.81% (6 mo. SOFR US + 4.50%), 08/15/2029 | 407,691 | 397,358 | ||||
Barracuda Networks, Inc., Senior Secured Second Lien, 12.25% (3 mo. SOFR US + 7.00%), 08/15/2030 | 358,333 | 323,217 | ||||
Boxer Parent Co., Inc., Senior Secured First Lien, 9.01% (3 mo. SOFR US + 3.75%), 07/30/2031 | 951,020 | 950,264 | ||||
Boxer Parent Co., Inc., Senior Secured Second Lien, 11.01% (3 mo. SOFR US + 5.75%), 07/30/2032 | 535,770 | 528,181 | ||||
Central Parent LLC, Senior Secured First Lien, 7.85% (3 mo. SOFR US + 3.25%), 07/06/2029 | 272,940 | 270,439 | ||||
Cloud Software Group, Inc., Senior Secured First Lien | ||||||
8.60% (3 mo. SOFR US + 4.00%), 03/29/2029 | 2,050,865 | 2,044,876 | ||||
8.60% (3 mo. SOFR US + 4.00%), 03/29/2029 | 5,153 | 5,138 | ||||
ConnectWise LLC, Senior Secured First Lien, 8.63% (3 mo. SOFR US + 3.50%), 09/29/2028 | 1,318,535 | 1,319,194 | ||||
Dayforce, Inc., Senior Secured First Lien, 7.35% (1 mo. SOFR US + 2.50%), 03/03/2031 | 274,313 | 274,827 | ||||
Dcert Buyer, Inc., Senior Secured First Lien, 9.25% (1 mo. SOFR US + 4.00%), 10/16/2026 | 144,621 | 140,690 | ||||
E2open LLC, Senior Secured First Lien, 8.57% (1 mo. SOFR US + 3.50%), 02/04/2028 | 601,712 | 604,273 | ||||
Ensono, Inc., Senior Secured First Lien | ||||||
9.07% (1 mo. SOFR US + 4.00%), 05/30/2028 | 618,060 | 617,869 | ||||
9.07% (1 mo. SOFR US + 4.00%), 05/30/2028 | 73,049 | 73,026 | ||||
9.07% (1 mo. SOFR US + 4.00%), 05/30/2028 | 73,049 | 73,026 | ||||
Principal Value | Fair Value | |||||
Flexera Software LLC, Senior Secured First Lien, 8.46% (1 mo. SOFR US + 3.50%), 03/03/2028 | $1,359,710 | $1,362,028 | ||||
Genesys Cloud Services Holdings II LLC, Senior Secured First Lien | ||||||
8.35% (1 mo. SOFR US + 3.50%), 12/01/2027 | 372,159 | 373,337 | ||||
8.35% (1 mo. SOFR US + 3.50%), 12/01/2027 | 174,302 | 174,854 | ||||
8.82% (1 mo. SOFR US + 3.75%), 12/01/2027 | 369,145 | 369,885 | ||||
Go Daddy Operating Co. LLC, Senior Secured First Lien, 6.60% (1 mo. SOFR US + 1.75%), 06/02/2031 | 544,635 | 543,862 | ||||
Informatica LLC, Senior Secured First Lien, 7.10% (1 mo. SOFR US + 2.25%), 10/30/2028 | 664,188 | 664,324 | ||||
Leia Finco US LLC, Senior Secured First Lien, 8.82% (3 mo. SOFR US + 3.25%), 07/02/2031 | 490,000 | 483,057 | ||||
Leia Finco US LLC, Senior Secured Second Lien, 10.58% (1 mo. SOFR US + 5.25%), 07/02/2032 | 281,000 | 275,030 | ||||
Marcel Bidco LLC, Senior Secured First Lien, 9.33% (Daily SOFR US + 4.00%), 11/13/2030 | 770,197 | 775,973 | ||||
McAfee Corp., Senior Secured First Lien, 8.45% (1 mo. SOFR US + 3.25%), 03/01/2029 | 1,035,616 | 1,033,271 | ||||
MH Sub I LLC, Senior Secured First Lien | ||||||
9.10% (1 mo. SOFR US + 4.25%), 05/03/2028 | 816,920 | 812,717 | ||||
11.59% (1 mo. SOFR US + 6.25%), 02/23/2029 | 215,000 | 211,545 | ||||
Modena Buyer LLC, Senior Secured First Lien, 9.10% (3 mo. SOFR US + 4.50%), 07/01/2031 | 1,000,000 | 959,690 | ||||
Mosel Bidco SE, Senior Secured First Lien | ||||||
9.10% (3 mo. SOFR US + 4.50%), 09/16/2030 | 429,847 | 432,534 | ||||
9.10% (3 mo. SOFR US + 4.50%), 09/16/2030 | 302,153 | 304,041 | ||||
N-Able International Holdings II LLC, Senior Secured First Lien, 8.33% (3 mo. SOFR US + 2.75%), 07/19/2028 | 497,610 | 498,232 | ||||
Optiv Parent, Inc., Senior Secured First Lien, 10.53% (3 mo. SOFR US + 5.25%), 08/26/2026 | 594,264 | 540,533 | ||||
Peraton Corp., Senior Secured First Lien, 8.80% (1 mo. SOFR US + 3.75%), 02/01/2028 | 1,134,719 | 1,094,414 | ||||
12 |
Principal Value | Fair Value | |||||
BANK LOANS - (Continued) | ||||||
TECHNOLOGY: SOFTWARE & SERVICES - (Continued) | ||||||
Plano HoldCo, Inc., Senior Secured First Lien, 9.35% (3 mo. SOFR US + 3.50%), 10/02/2031 | $971,000 | $973,427 | ||||
Polaris Newco LLC, Senior Secured First Lien, 9.63% (3 mo. SOFR US + 4.00%), 06/05/2028 | 1,388,943 | 1,367,609 | ||||
Project Alpha Intermediate Holding, Inc., Senior Secured First Lien, 9.00% (3 mo. SOFR US + 3.75%), 10/28/2030 | 1,091,884 | 1,095,542 | ||||
Proofpoint, Inc., Senior Secured First Lien, 7.85% (1 mo. SOFR US + 3.00%), 08/31/2028 | 1,607,970 | 1,609,023 | ||||
Quartz Acquireco LLC, Senior Secured First Lien, 7.35% (3 mo. SOFR US + 2.75%), 06/28/2030 | 521,730 | 522,711 | ||||
RealPage, Inc., Senior Secured First Lien, 8.07% (1 mo. SOFR US + 3.00%), 04/24/2028 | 427,897 | 415,916 | ||||
RithumHoldings, Inc., Senior Secured First Lien | ||||||
9.45% (1 mo. SOFR US + 4.00%), 12/02/2027 | 719,358 | 671,071 | ||||
11.60% (1 mo. SOFR US + 6.25%), 12/29/2027 | 270,623 | 262,504 | ||||
Rocket Software, Inc., Senior Secured First Lien, 9.60% (1 mo. SOFR US + 4.75%), 11/28/2028 | 806,890 | 808,685 | ||||
Sedgwick Claims Management Services, Inc., Senior Secured First Lien, 8.25% (3 mo. SOFR US + 3.00%), 02/24/2028 | 1,306,463 | 1,305,522 | ||||
Skopima Consilio Parent LLC, Senior Secured First Lien, 9.48% (1 mo. SOFR US + 4.00%), 05/17/2028 | 546,708 | 546,538 | ||||
SolarWinds Holdings, Inc., Senior Secured First Lien, 7.60% (1 mo. SOFR US + 2.75%), 02/05/2030 | 1,056,319 | 1,058,300 | ||||
Sovos Compliance LLC, Senior Secured First Lien, 9.57% (1 mo. SOFR US + 4.50%), 08/14/2028 | 409,078 | 409,428 | ||||
UKG, Inc., Senior Secured First Lien, 8.55% (3 mo. SOFR US + 3.25%), 02/10/2031 | 1,779,540 | 1,781,764 | ||||
VS Buyer LLC, Senior Secured First Lien, 8.35% (1 mo. SOFR US + 3.25%), 04/14/2031 | 981,130 | 983,990 | ||||
33,055,503 | ||||||
TELECOM SERVICES: DIVERSIFIED - 2.4% | ||||||
Altice France SA, Senior Secured First Lien, 10.80% (3 mo. SOFR US + 5.50%), 08/31/2028 | 333,511 | 250,967 | ||||
Principal Value | Fair Value | |||||
Cincinnati Bell, Inc., Senior Secured First Lien, 8.35% (1 mo. SOFR US + 3.25%), 11/22/2028 | $662,292 | $661,713 | ||||
Crown Subsea Communications Holding, Inc., Senior Secured First Lien, 9.25% (3 mo. SOFR US + 4.00%), 01/30/2031 | 926,678 | 933,512 | ||||
Eagle Broadband Investments LLC, Senior Secured First Lien, 8.13% (3 mo. SOFR US + 3.00%), 11/12/2027 | 275,643 | 275,402 | ||||
Frontier Communications Holdings LLC, Senior Secured First Lien, 8.76% (6 mo. SOFR US + 3.50%), 07/01/2031 | 824,000 | 831,210 | ||||
Level 3 Financing, Inc., Senior Secured First Lien, 11.84% (1 mo. Term SOFR + 6.56%), 04/16/2029 | 274,182 | 280,385 | ||||
Lumen Technologies, Inc., Senior Secured First Lien | ||||||
7.43% (1 mo. SOFR US + 2.35%), 04/16/2029 | 264,154 | 232,522 | ||||
7.43% (1 mo. SOFR US + 2.35%), 04/15/2030 | 264,154 | 229,650 | ||||
Radiate Holdco LLC, Senior Secured First Lien, 8.32% (1 mo. SOFR US + 3.25%), 09/25/2026 | 488,478 | 420,397 | ||||
SBA Senior Finance II LLC, Senior Secured First Lien, 6.85% (1 mo. SOFR US + 2.00%), 01/27/2031 | 269,645 | 270,024 | ||||
Voyage Australia Pty Ltd., Senior Secured First Lien, 9.31% (3 mo. SOFR US + 3.50%), 07/20/2028 | 467,773 | 468,299 | ||||
Windstream Services LLC, Senior Secured First Lien, 10.35% (1 mo. SOFR US), 09/23/2031 | 370,000 | 370,925 | ||||
Zayo Group Holdings, Inc., Senior Secured First Lien, 9.10% (1 mo. SOFR US + 4.25%), 03/09/2027 | 886,727 | 819,836 | ||||
Ziggo Financing Partnership, Senior Secured First Lien, 7.83% (1 mo. SOFR US + 2.50%), 04/28/2028 | 455,000 | 444,919 | ||||
6,489,761 | ||||||
TELECOM SERVICES: WIRELESS - 0.2% | ||||||
CCI Buyer, Inc., Senior Secured First Lien, 8.60% (3 mo. SOFR US + 4.00%), 12/17/2027 | 525,925 | 525,844 | ||||
TRANSPORTATION - 1.5% | ||||||
AAdvantage Loyalty IP Ltd., Senior Secured First Lien, 10.56% (3 mo. SOFR US + 4.75%), 04/20/2028 | 545,388 | 561,521 | ||||
13 |
Principal Value | Fair Value | |||||
BANK LOANS - (Continued) | ||||||
TRANSPORTATION - (Continued) | ||||||
ASP LS Acquisition Corp., Senior Secured First Lien, 9.63% (3 mo. SOFR US + 4.50%), 05/08/2028 | $728,079 | $463,149 | ||||
Avis Budget Car Rental LLC, Senior Secured First Lien, 6.82% (1 mo. SOFR US + 1.75%), 08/06/2027 | 397,823 | 396,630 | ||||
Cubic Corp., Senior Secured First Lien | ||||||
9.83% (3 mo. SOFR US + 4.25%), 05/25/2028 | 703,956 | 547,132 | ||||
9.83% (3 mo. SOFR US + 4.25%), 05/25/2028 | 151,863 | 118,032 | ||||
Genesee & Wyoming, Inc., Senior Secured First Lien, 6.60% (3 mo. SOFR US + 2.00%), 04/10/2031 | 647,000 | 646,097 | ||||
United Airlines, Inc., Senior Secured First Lien, 8.03% (3 mo. SOFR US + 2.75%), 02/24/2031 | 334,320 | 335,365 | ||||
WWEX Uni Topco Holdings LLC, Senior Secured First Lien, 9.86% (3 mo. SOFR US + 4.00%), 07/26/2028 | 681,014 | 685,094 | ||||
XPO, Inc., Senior Secured First Lien, 7.11% (1 mo. SOFR US + 2.00%), 02/28/2031 | 271,000 | 271,734 | ||||
4,024,754 | ||||||
UTILITIES: POWER - 2.2% | ||||||
Alpha Generation LLC, Senior Secured First Lien, 7.85% (1 mo. SOFR US + 2.75%), 09/30/2031 | 480,000 | 480,686 | ||||
Calpine Corp., Senior Secured First Lien, 6.85% (1 mo. SOFR US + 2.00%), 12/16/2027 | 266,000 | 265,252 | ||||
Eastern Power LLC, Senior Secured First Lien, 10.10% (1 mo. SOFR US + 5.25%), 10/02/2025 | 306,289 | 307,036 | ||||
Lightning Power LLC, Senior Secured First Lien, 8.35% (3 mo. SOFR US + 3.25%), 08/18/2031 | 834,000 | 836,665 | ||||
Lightstone Holdco LLC, Senior Secured First Lien | ||||||
11.00% (3 mo. SOFR US + 5.75%), 01/29/2027 | 932,838 | 947,912 | ||||
11.00% (3 mo. SOFR US + 5.75%), 01/29/2027 | 52,657 | 53,508 | ||||
NRG Energy, Inc., Senior Secured First Lien, 7.26% (3 mo. SOFR US + 2.00%), 04/16/2031 | 408,282 | 409,455 | ||||
Thunder Generation Funding LLC, Senior Secured First Lien, 7.96%, 09/27/2031(h) | 463,000 | 463,000 | ||||
Principal Value | Fair Value | |||||
Vistra Zero Operating Co. LLC, Senior Secured First Lien, 7.60% (1 mo. SOFR US + 2.75%), 04/30/2031 | $323,375 | $324,709 | ||||
WaterBridge Midstream Operating LLC, Senior Secured First Lien, 9.39% (3 mo. SOFR US + 4.75%), 06/27/2029 | 1,399,000 | 1,354,533 | ||||
WaterBridge NDB Operating LLC, Senior Secured First Lien, 9.60% (3 mo. SOFR US + 4.50%), 05/10/2029 | 521,000 | 520,758 | ||||
5,963,514 | ||||||
TOTAL BANK LOANS (Cost $233,149,664) | 232,586,399 | |||||
CORPORATE BONDS - 12.7%(f) | ||||||
AEROSPACE & DEFENSE - 0.4% | ||||||
AAR Escrow Issuer LLC, 6.75%, 03/15/2029(b) | 506,000 | 526,834 | ||||
Bombardier, Inc. | ||||||
7.13%, 06/15/2026(b) | 176,000 | 178,859 | ||||
7.88%, 04/15/2027(b) | 397,000 | 398,293 | ||||
1,103,986 | ||||||
AUTOMOTIVE - 0.5% | ||||||
Clarios Global LP / Clarios US Finance Co., 8.50%, 05/15/2027(b) | 1,350,000 | 1,356,512 | ||||
BUILDING PRODUCTS - 0.2% | ||||||
Standard Industries, Inc., 3.38%, 01/15/2031(b) | 600,000 | 535,177 | ||||
CHEMICALS - 0.1% | ||||||
Olympus Water US Holding Corp., 7.13%, 10/01/2027(b) | 200,000 | 204,389 | ||||
Trinseo Materials Operating SCA / Trinseo Materials Finance, Inc., 5.13%, 04/01/2029(b) | 238,000 | 115,865 | ||||
320,254 | ||||||
COMMERCIAL SERVICES - 0.2% | ||||||
OPENLANE, Inc., 5.13%, 06/01/2025(b) | 424,000 | 423,113 | ||||
CONSTRUCTION & ENGINEERING - 0.4% | ||||||
Pike Corp., 5.50%, 09/01/2028(b) | 1,043,000 | 1,022,482 | ||||
FINANCIALS: THRIFTS & MORTGAGES - 0.1% | ||||||
Freedom Mortgage Corp., 6.63%, 01/15/2027(b) | 278,000 | 278,865 | ||||
HEALTHCARE: EQUIPMENT & SUPPLIES - 0.2% | ||||||
Neogen Food Safety Corp., 8.63%, 07/20/2030(b) | 397,000 | 439,779 | ||||
14 |
Principal Value | Fair Value | |||||
CORPORATE BONDS - (Continued) | ||||||
HEALTHCARE: FACILITIES - 1.7% | ||||||
CHS/Community Health Systems, Inc., 5.63%, 03/15/2027(b) | $275,000 | $270,829 | ||||
Fresenius Medical Care US Finance III, Inc., 2.38%, 02/16/2031(b) | 925,000 | 782,202 | ||||
Prime Healthcare Services, Inc., 9.38%, 09/01/2029(b) | 1,006,000 | 1,040,216 | ||||
Select Medical Corp., 6.25%, 08/15/2026(b) | 1,335,000 | 1,344,198 | ||||
Tenet Healthcare Corp., 6.25%, 02/01/2027 | 1,311,000 | 1,314,154 | ||||
4,751,599 | ||||||
HEALTHCARE: LIFE SCIENCES - 0.1% | ||||||
Charles River Laboratories International, Inc., 4.25%, 05/01/2028(b) | 188,000 | 183,005 | ||||
HEALTHCARE: PHARMA & BIOTECH - 0.8% | ||||||
Organon & Co. / Organon Foreign Debt Co.-Issuer BV, 4.13%, 04/30/2028(b) | 1,435,000 | 1,381,117 | ||||
Teva Pharmaceutical Finance Netherlands III BV, 3.15%, 10/01/2026 | 765,000 | 735,919 | ||||
2,117,036 | ||||||
HEALTHCARE: REITs - 0.3% | ||||||
MPT Operating Partnership LP / MPT Finance Corp., 3.50%, 03/15/2031 | 1,270,000 | 928,972 | ||||
INDUSTRIAL MACHINERY - 0.3% | ||||||
WESCO Distribution, Inc., 6.38%, 03/15/2029(b) | 912,000 | 943,531 | ||||
LEISURE: CASINOS & GAMING - 1.6% | ||||||
Allwyn Entertainment Financing UK PLC, 7.88%, 04/30/2029(b) | 440,000 | 463,989 | ||||
International Game Technology PLC, 4.13%, 04/15/2026(b) | 1,095,000 | 1,081,555 | ||||
Light & Wonder International, Inc., 7.00%, 05/15/2028(b) | 404,000 | 407,986 | ||||
Premier Entertainment Sub LLC / Premier Entertainment Finance Corp. | ||||||
5.63%, 09/01/2029(b) | 561,000 | 420,293 | ||||
5.88%, 09/01/2031(b) | 562,000 | 383,996 | ||||
Raptor Acquisition Corp. / Raptor Co.-Issuer LLC, 4.88%, 11/01/2026(b) | 524,000 | 509,002 | ||||
VICI Properties LP / VICI Note Co., Inc., 3.50%, 02/15/2025(b) | 1,145,000 | 1,137,142 | ||||
4,403,963 | ||||||
LEISURE: HOTELS - 1.3% | ||||||
NCL Corp. Ltd. | ||||||
3.63%, 12/15/2024(b) | 409,000 | 408,655 | ||||
8.38%, 02/01/2028(b) | 444,000 | 466,698 | ||||
Principal Value | Fair Value | |||||
Park Intermediate Holdings LLC / PK Domestic Property LLC / PK Finance Co.-Issuer, 5.88%, 10/01/2028(b) | $548,000 | $547,586 | ||||
Royal Caribbean Cruises Ltd., 5.50%, 08/31/2026(b) | 421,000 | 425,318 | ||||
Sabre GLBL, Inc., 8.63%, 06/01/2027(b) | 972,000 | 953,853 | ||||
VOC Escrow Ltd., 5.00%, 02/15/2028(b) | 836,000 | 826,980 | ||||
3,629,090 | ||||||
LEISURE: RESTAURANTS - 0.2% | ||||||
CEC Entertainment LLC, 6.75%, 05/01/2026(b) | 660,000 | 656,068 | ||||
MEDIA: CABLE & SATELLITE - 0.3% | ||||||
DISH DBS Corp., 5.13%, 06/01/2029 | 575,000 | 386,484 | ||||
Sable International Finance Ltd., 5.75%, 09/07/2027(b) | 430,000 | 429,310 | ||||
815,794 | ||||||
MEDIA: ENTERTAINMENT - 0.4% | ||||||
Live Nation Entertainment, Inc., 6.50%, 05/15/2027(b) | 393,000 | 401,094 | ||||
Playtika Holding Corp., 4.25%, 03/15/2029(b) | 821,000 | 754,213 | ||||
1,155,307 | ||||||
METALS & MINING - 0.2% | ||||||
GrafTech Finance, Inc., 4.63%, 12/15/2028(b) | 127,000 | 84,872 | ||||
GrafTech Global Enterprises, Inc., 9.88%, 12/15/2028(b) | 468,000 | 375,447 | ||||
460,319 | ||||||
MIDSTREAM: STORAGE & TRANSPORT - 0.5% | ||||||
Venture Global Calcasieu Pass LLC | ||||||
6.25%, 01/15/2030(b) | 290,000 | 304,225 | ||||
3.88%, 11/01/2033(b) | 510,000 | 457,640 | ||||
Venture Global LNG, Inc., 8.13%, 06/01/2028(b) | 712,000 | 742,838 | ||||
1,504,703 | ||||||
OIL & GAS: EQUIPMENT & SERVICES - 0.2% | ||||||
Borr IHC Ltd. / Borr Finance LLC, 10.00%, 11/15/2028(b) | 410,415 | 426,633 | ||||
REAL ESTATE: HOMEBUILDING - 0.1% | ||||||
LGI Homes, Inc., 8.75%, 12/15/2028(b) | 380,000 | 407,229 | ||||
TECHNOLOGY HARDWARE - 0.4% | ||||||
Entegris, Inc., 4.75%, 04/15/2029(b) | 1,005,000 | 991,439 | ||||
15 |
Principal Value | Fair Value | |||||
CORPORATE BONDS - (Continued) | ||||||
TECHNOLOGY: SOFTWARE & SERVICES - 1.1% | ||||||
Elastic NV, 4.13%, 07/15/2029(b) | $844,000 | $789,254 | ||||
Gen Digital, Inc., 5.00%, 04/15/2025(b) | 2,220,000 | 2,209,307 | ||||
2,998,561 | ||||||
TELECOM SERVICES: DIVERSIFIED - 0.3% | ||||||
Altice France SA, 5.50%, 01/15/2028(b) | 400,000 | 291,456 | ||||
Iliad Holding SASU, 7.00%, 10/15/2028(b) | 400,000 | 407,234 | ||||
698,690 | ||||||
TRANSPORTATION - 0.8% | ||||||
Uber Technologies, Inc., 8.00%, 11/01/2026(b) | 1,175,000 | 1,177,591 | ||||
XPO, Inc. | ||||||
6.25%, 06/01/2028(b) | 758,000 | 776,018 | ||||
7.13%, 06/01/2031(b) | 264,000 | 276,647 | ||||
2,230,256 | ||||||
UTILITIES: PROPANE - 0.0%(c) | ||||||
AmeriGas Partners LP/AmeriGas Finance Corp., 5.50%, 05/20/2025 | 146,000 | 145,600 | ||||
TOTAL CORPORATE BONDS (Cost $35,130,097) | 34,927,963 | |||||
Shares | ||||||
SHORT-TERM INVESTMENTS - 5.0%(f) | ||||||
Money Market Funds - 5.0% | ||||||
First American Government Obligations Fund - Class X, 4.82%(d) | 13,586,536 | 13,586,536 | ||||
TOTAL SHORT-TERM INVESTMENTS (Cost $13,586,536) | 13,586,536 | |||||
TOTAL INVESTMENTS - 102.5% (Cost $281,866,297) | 281,100,898 | |||||
Liabilities in Excess of Other Assets - (2.5)% | (6,745,905) | |||||
TOTAL NET ASSETS - 100.0% | $274,354,993 | |||||
(a) | Securities referencing LIBOR are expected to transition to an alternative reference rate by the security’s next scheduled coupon reset date. |
(b) | Security is exempt from registration pursuant to Rule 144A under the Securities Act of 1933, as amended. These securities may only be resold in transactions exempt from registration to qualified institutional investors. As of September 30, 2024, the value of these securities total $31,416,834 or 11.5% of the Fund’s net assets. |
(c) | Represents less than 0.05% of net assets. |
(d) | The rate shown represents the 7-day annualized effective yield as of September 30, 2024. |
(e) | Rates for senior loans will typically have interest rates that redetermine periodically by reference to a base lending rate plus a spread. Senior loans that reference SOFR may be subject to a credit spread adjustment, particularly to legacy LIBOR bank loans that have transitioned to SOFR as the base lending rate. |
(f) | All or a portion is posted as collateral for delayed settlement securities. |
(g) | All or a portion of the loan is unfunded. |
(h) | Coupon rate is variable or floats based on components including but not limited to reference rate and spread. These securities may not indicate a reference rate and/or spread in their description. The rate disclosed is as of September 30, 2024. |
16 |
Principal Amount | Fair Value | |||||
CORPORATE BONDS - 86.3%(e) | ||||||
Aerospace & Defense - 1.8% | ||||||
AAR Escrow Issuer LLC, 6.75%, 03/15/2029(a) | $960,000 | $ 999,526 | ||||
Bombardier, Inc. | ||||||
7.13%, 06/15/2026(a) | 2,565,000 | 2,606,668 | ||||
7.88%, 04/15/2027(a) | 1,000,000 | 1,003,257 | ||||
TransDigm, Inc. | ||||||
5.50%, 11/15/2027 | 13,683,000 | 13,646,907 | ||||
6.38%, 03/01/2029(a) | 8,041,000 | 8,317,844 | ||||
Triumph Group, Inc., 9.00%, 03/15/2028 (a) | 6,027,000 | 6,329,700 | ||||
32,903,902 | ||||||
Auto Retail - 1.6% | ||||||
Global Auto Holdings Ltd./AAG FH UK Ltd., 8.38%, 01/15/2029(a) | 5,265,000 | 5,097,356 | ||||
Group 1 Automotive, Inc., 4.00%, 08/15/2028(a) | 5,741,000 | 5,483,964 | ||||
Lithia Motors, Inc., 4.63%, 12/15/2027 (a) | 7,670,000 | 7,504,313 | ||||
Penske Automotive Group, Inc., 3.50%, 09/01/2025 | 12,118,000 | 11,924,366 | ||||
30,009,999 | ||||||
Automotive - 8.3% | ||||||
Adient Global Holdings Ltd. | ||||||
4.88%, 08/15/2026(a) | 6,692,000 | 6,638,556 | ||||
7.00%, 04/15/2028(a) | 3,035,000 | 3,128,706 | ||||
Allison Transmission, Inc., 4.75%, 10/01/2027(a) | 11,389,000 | 11,214,448 | ||||
American Axle & Manufacturing, Inc. | ||||||
6.25%, 03/15/2026 | 971,000 | 976,050 | ||||
6.50%, 04/01/2027 | 12,662,000 | 12,702,708 | ||||
Clarios Global LP / Clarios US Finance Co. | ||||||
6.25%, 05/15/2026(a) | 19,377,000 | 19,386,764 | ||||
8.50%, 05/15/2027(a) | 13,543,000 | 13,608,331 | ||||
Dana Financing Luxembourg Sarl, 5.75%, 04/15/2025(a) | 5,131,000 | 5,135,152 | ||||
Dana, Inc. | ||||||
5.38%, 11/15/2027 | 8,296,000 | 8,236,465 | ||||
5.63%, 06/15/2028 | 1,193,000 | 1,170,826 | ||||
Ford Motor Co., 9.63%, 04/22/2030 | 1,956,000 | 2,318,677 | ||||
Ford Motor Credit Co. LLC | ||||||
5.13%, 06/16/2025 | 8,815,000 | 8,814,494 | ||||
3.38%, 11/13/2025 | 8,955,000 | 8,786,556 | ||||
7.89% (SOFR + 2.95%), 03/06/2026 | 3,675,000 | 3,769,225 | ||||
6.95%, 06/10/2026 | 6,162,000 | 6,345,566 | ||||
3.82%, 11/02/2027 | 1,005,000 | 968,716 | ||||
Principal Amount | Fair Value | |||||
Goodyear Tire & Rubber Co. | ||||||
9.50%, 05/31/2025 | $6,408,000 | $ 6,438,098 | ||||
5.00%, 05/31/2026 | 7,622,000 | 7,511,050 | ||||
IHO Verwaltungs GmbH, 4.75% (5.50% PIK), 09/15/2026(a) | 8,264,000 | 8,097,691 | ||||
Jaguar Land Rover Automotive PLC, 7.75%, 10/15/2025(a) | 5,576,000 | 5,569,655 | ||||
Patrick Industries, Inc., 7.50%, 10/15/2027(a) | 5,306,000 | 5,328,142 | ||||
Phinia, Inc., 6.75%, 04/15/2029(a) | 2,060,000 | 2,128,954 | ||||
ZF North America Capital, Inc. | ||||||
4.75%, 04/29/2025(a) | 3,790,000 | 3,759,296 | ||||
6.88%, 04/14/2028(a) | 2,775,000 | 2,820,044 | ||||
154,854,170 | ||||||
Building Products - 1.5% | ||||||
AmeriTex HoldCo Intermediate LLC, 10.25%, 10/15/2028(a) | 4,203,000 | 4,399,793 | ||||
Eco Material Technologies, Inc., 7.88%, 01/31/2027(a) | 5,970,000 | 6,038,774 | ||||
Herc Holdings, Inc. | ||||||
5.50%, 07/15/2027(a) | 10,479,000 | 10,474,290 | ||||
6.63%, 06/15/2029(a) | 2,919,000 | 3,025,208 | ||||
Standard Industries, Inc., 5.00%, 02/15/2027(a) | 4,010,000 | 3,980,409 | ||||
27,918,474 | ||||||
Chemicals - 1.8% | ||||||
Consolidated Energy Finance SA, 6.50%, 05/15/2026(a) | 890,000 | 880,469 | ||||
INEOS Finance PLC | ||||||
6.75%, 05/15/2028(a) | 3,202,000 | 3,238,086 | ||||
7.50%, 04/15/2029(a) | 1,072,000 | 1,122,053 | ||||
Methanex Corp. | ||||||
4.25%, 12/01/2024 | 4,906,000 | 4,892,241 | ||||
5.13%, 10/15/2027 | 1,981,000 | 1,962,397 | ||||
NOVA Chemicals Corp., 5.25%, 06/01/2027(a) | 3,325,000 | 3,291,401 | ||||
Olympus Water US Holding Corp. | ||||||
7.13%, 10/01/2027(a) | 3,162,000 | 3,231,400 | ||||
9.75%, 11/15/2028(a) | 5,401,000 | 5,771,309 | ||||
SCIH Salt Holdings, Inc., 4.88%, 05/01/2028(a) | 2,869,000 | 2,768,372 | ||||
SCIL IV LLC / SCIL USA Holdings LLC, 5.38%, 11/01/2026(a) | 2,910,000 | 2,877,846 | ||||
SNF Group SACA, 3.13%, 03/15/2027 (a) | 1,085,000 | 1,036,727 | ||||
Trinseo Materials Operating SCA / Trinseo Materials Finance, Inc., 5.38%, 09/01/2025(a) | 1,018,000 | 898,970 | ||||
WR Grace Holdings LLC, 4.88%, 06/15/2027(a) | 1,000,000 | 986,727 | ||||
32,957,998 | ||||||
17 |
Principal Amount | Fair Value | |||||
CORPORATE BONDS - (Continued) | ||||||
Commercial Services - 3.6% | ||||||
Aramark Services, Inc. | ||||||
5.00%, 04/01/2025(a) | $12,445,000 | $ 12,446,450 | ||||
5.00%, 02/01/2028(a) | 2,446,000 | 2,440,576 | ||||
Camelot Finance SA, 4.50%, 11/01/2026 (a) | 9,268,000 | 9,141,226 | ||||
Garda World Security Corp. | ||||||
4.63%, 02/15/2027(a) | 644,000 | 632,833 | ||||
9.50%, 11/01/2027(a) | 5,174,000 | 5,184,767 | ||||
7.75%, 02/15/2028(a) | 3,107,000 | 3,223,742 | ||||
Iron Mountain, Inc. | ||||||
4.88%, 09/15/2027(a) | 12,234,000 | 12,151,358 | ||||
5.00%, 07/15/2028(a) | 1,000,000 | 987,781 | ||||
7.00%, 02/15/2029(a) | 1,504,000 | 1,569,003 | ||||
OPENLANE, Inc., 5.13%, 06/01/2025(a) | 5,938,000 | 5,925,572 | ||||
SS&C Technologies, Inc., 5.50%, 09/30/2027(a) | 13,727,000 | 13,735,098 | ||||
67,438,406 | ||||||
Construction & Engineering - 0.7% | ||||||
Pike Corp., 5.50%, 09/01/2028(a) | 1,948,000 | 1,909,679 | ||||
Williams Scotsman, Inc. | ||||||
6.13%, 06/15/2025(a) | 8,333,000 | 8,331,875 | ||||
6.63%, 06/15/2029(a) | 2,364,000 | 2,436,093 | ||||
12,677,647 | ||||||
Environmental & Facilities Services - 1.3% | ||||||
Clean Harbors, Inc., 4.88%, 07/15/2027 (a) | 2,495,000 | 2,463,189 | ||||
GFL Environmental, Inc. | ||||||
3.75%, 08/01/2025(a) | 12,656,000 | 12,567,185 | ||||
5.13%, 12/15/2026(a) | 7,045,000 | 7,034,091 | ||||
4.00%, 08/01/2028(a) | 2,094,000 | 2,014,166 | ||||
24,078,631 | ||||||
Financials: Consumer Finance - 3.4% | ||||||
Ally Financial, Inc. | ||||||
5.75%, 11/20/2025 | 4,439,000 | 4,464,966 | ||||
7.10%, 11/15/2027 | 10,054,000 | 10,659,863 | ||||
6.99% to 06/13/2028 then SOFR + 3.26%, 06/13/2029 | 1,456,000 | 1,539,334 | ||||
goeasy Ltd. | ||||||
4.38%, 05/01/2026(a) | 5,663,000 | 5,590,110 | ||||
9.25%, 12/01/2028(a) | 4,564,000 | 4,927,290 | ||||
7.63%, 07/01/2029(a) | 3,325,000 | 3,450,286 | ||||
Navient Corp. | ||||||
5.88%, 10/25/2024 | 1,000,000 | 1,000,336 | ||||
6.75%, 06/25/2025 | 9,082,000 | 9,144,702 | ||||
6.75%, 06/15/2026 | 1,617,000 | 1,654,191 | ||||
5.00%, 03/15/2027 | 5,050,000 | 5,009,979 | ||||
Principal Amount | Fair Value | |||||
OneMain Finance Corp. | ||||||
7.13%, 03/15/2026 | $7,515,000 | $ 7,684,065 | ||||
3.50%, 01/15/2027 | 1,381,000 | 1,321,086 | ||||
7.88%, 03/15/2030 | 2,507,000 | 2,623,064 | ||||
SLM Corp., 3.13%, 11/02/2026 | 5,285,000 | 5,090,076 | ||||
64,159,348 | ||||||
Financials: Diversified - 2.0% | ||||||
Aircastle Ltd. | ||||||
5.25%, 08/11/2025(a) | 4,810,000 | 4,814,055 | ||||
6.50%, 07/18/2028(a) | 4,575,000 | 4,799,402 | ||||
Block, Inc., 2.75%, 06/01/2026 | 4,154,000 | 4,030,948 | ||||
Castlelake Aviation Finance DAC, 5.00%, 04/15/2027(a) | 2,175,000 | 2,188,428 | ||||
Credit Acceptance Corp., 9.25%, 12/15/2028(a) | 1,050,000 | 1,124,075 | ||||
Macquarie Airfinance Holdings Ltd. | ||||||
8.38%, 05/01/2028(a) | 9,424,000 | 9,925,649 | ||||
6.40%, 03/26/2029(a) | 1,090,000 | 1,136,988 | ||||
8.13%, 03/30/2029(a) | 2,587,000 | 2,742,872 | ||||
5.15%, 03/17/2030(a) | 2,265,000 | 2,272,388 | ||||
Starwood Property Trust, Inc. | ||||||
3.75%, 12/31/2024(a) | 1,383,000 | 1,376,249 | ||||
3.63%, 07/15/2026(a) | 2,809,000 | 2,715,130 | ||||
37,126,184 | ||||||
Financials: Insurance - 0.6% | ||||||
Acrisure LLC / Acrisure Finance, Inc. | ||||||
8.25%, 02/01/2029(a) | 1,000,000 | 1,032,647 | ||||
8.50%, 06/15/2029(a) | 1,636,000 | 1,709,800 | ||||
AmWINS Group, Inc., 6.38%, 02/15/2029(a) | 3,980,000 | 4,079,607 | ||||
AssuredPartners, Inc., 5.63%, 01/15/2029(a) | 1,123,000 | 1,082,408 | ||||
GTCR AP Finance, Inc., 8.00%, 05/15/2027(a) | 2,683,000 | 2,684,822 | ||||
10,589,284 | ||||||
Financials: Thrifts & Mortgages - 2.9% | ||||||
Nationstar Mortgage Holdings, Inc. | ||||||
5.00%, 02/01/2026(a) | 7,092,000 | 7,063,541 | ||||
6.00%, 01/15/2027(a) | 7,406,000 | 7,414,517 | ||||
6.50%, 08/01/2029(a) | 3,344,000 | 3,402,895 | ||||
PennyMac Financial Services, Inc. | ||||||
5.38%, 10/15/2025(a) | 9,158,000 | 9,150,007 | ||||
7.88%, 12/15/2029(a) | 1,195,000 | 1,275,291 | ||||
Rocket Mortgage LLC / Rocket Mortgage Co.-Issuer, Inc., 2.88%, 10/15/2026(a) | 13,972,000 | 13,433,129 | ||||
United Wholesale Mortgage LLC | ||||||
5.50%, 11/15/2025(a) | 10,028,000 | 10,018,405 | ||||
5.75%, 06/15/2027(a) | 2,737,000 | 2,721,583 | ||||
54,479,368 | ||||||
18 |
Principal Amount | Fair Value | |||||
CORPORATE BONDS - (Continued) | ||||||
Food & Beverage - 0.3% | ||||||
Darling Ingredients, Inc., 5.25%, 04/15/2027(a) | $2,500,000 | $ 2,489,383 | ||||
Post Holdings, Inc. | ||||||
5.63%, 01/15/2028(a) | 660,000 | 666,212 | ||||
5.50%, 12/15/2029(a) | 2,999,000 | 2,979,731 | ||||
6,135,326 | ||||||
Healthcare: Equipment & Supplies - 0.2% | ||||||
Medline Borrower LP/Medline Co.-Issuer, Inc., 6.25%, 04/01/2029(a) | 2,417,000 | 2,493,916 | ||||
Teleflex, Inc., 4.25%, 06/01/2028(a) | 2,006,000 | 1,945,310 | ||||
4,439,226 | ||||||
Healthcare: Facilities - 4.0% | ||||||
Acadia Healthcare Co., Inc. | ||||||
5.50%, 07/01/2028(a) | 4,980,000 | 4,854,104 | ||||
5.00%, 04/15/2029(a) | 926,000 | 883,820 | ||||
CHS/Community Health Systems, Inc., 5.63%, 03/15/2027(a) | 12,497,000 | 12,307,437 | ||||
Encompass Health Corp., 5.75%, 09/15/2025 | 511,000 | 510,094 | ||||
HCA, Inc. | ||||||
7.69%, 06/15/2025 | 658,000 | 670,083 | ||||
7.58%, 09/15/2025 | 2,251,000 | 2,308,231 | ||||
Heartland Dental LLC / Heartland Dental Finance Corp., 10.50%, 04/30/2028(a) | 6,636,000 | 7,109,213 | ||||
Legacy LifePoint Health LLC, 4.38%, 02/15/2027(a) | 2,576,000 | 2,527,515 | ||||
Prime Healthcare Services, Inc., 9.38%, 09/01/2029(a) | 1,397,000 | 1,444,515 | ||||
Select Medical Corp., 6.25%, 08/15/2026(a) | 11,639,000 | 11,719,193 | ||||
Tenet Healthcare Corp. | ||||||
6.25%, 02/01/2027 | 24,925,000 | 24,984,969 | ||||
5.13%, 11/01/2027 | 5,212,000 | 5,196,347 | ||||
74,515,521 | ||||||
Healthcare: Life Sciences - 1.5% | ||||||
Catalent Pharma Solutions, Inc., 5.00%, 07/15/2027(a) | 3,610,000 | 3,595,111 | ||||
IQVIA, Inc. | ||||||
5.00%, 10/15/2026(a) | 22,510,000 | 22,469,543 | ||||
5.00%, 05/15/2027(a) | 1,981,000 | 1,974,271 | ||||
28,038,925 | ||||||
Healthcare: Pharma & Biotech - 1.3% | ||||||
Bausch Health Cos., Inc. | ||||||
5.50%, 11/01/2025(a) | 2,751,000 | 2,694,741 | ||||
9.00%, 12/15/2025(a) | 3,515,000 | 3,384,056 | ||||
Principal Amount | Fair Value | |||||
Teva Pharmaceutical Finance Netherlands III BV | ||||||
7.13%, 01/31/2025 | $3,721,000 | $ 3,726,224 | ||||
3.15%, 10/01/2026 | 15,566,000 | 14,974,276 | ||||
24,779,297 | ||||||
Healthcare: REITs - 0.8% | ||||||
MPT Operating Partnership LP / MPT Finance Corp. | ||||||
5.25%, 08/01/2026 | 10,305,000 | 9,847,862 | ||||
5.00%, 10/15/2027 | 894,000 | 804,248 | ||||
Sabra Health Care LP, 5.13%, 08/15/2026 | 5,090,000 | 5,120,742 | ||||
15,772,852 | ||||||
Industrial Machinery - 1.7% | ||||||
Enpro, Inc., 5.75%, 10/15/2026 | 11,006,000 | 10,934,218 | ||||
Esab Corp., 6.25%, 04/15/2029(a) | 1,813,000 | 1,864,475 | ||||
Madison IAQ LLC, 4.13%, 06/30/2028 (a) | 4,364,000 | 4,214,702 | ||||
Regal Rexnord Corp., 6.05%, 02/15/2026 | 7,441,000 | 7,558,639 | ||||
TK Elevator US Newco, Inc., 5.25%, 07/15/2027(a) | 4,157,000 | 4,116,637 | ||||
WESCO Distribution, Inc., 6.38%, 03/15/2029(a) | 2,700,000 | 2,793,347 | ||||
31,482,018 | ||||||
Leisure: Casinos & Gaming - 7.1% | ||||||
Allwyn Entertainment Financing UK PLC, 7.88%, 04/30/2029(a) | 3,650,000 | 3,848,998 | ||||
Boyd Gaming Corp., 4.75%, 12/01/2027 | 3,777,000 | 3,741,908 | ||||
Caesars Entertainment, Inc. | ||||||
8.13%, 07/01/2027(a) | 22,562,000 | 23,038,731 | ||||
4.63%, 10/15/2029(a) | 2,749,000 | 2,616,356 | ||||
Churchill Downs, Inc. | ||||||
5.50%, 04/01/2027(a) | 14,372,000 | 14,330,160 | ||||
4.75%, 01/15/2028(a) | 2,177,000 | 2,136,075 | ||||
International Game Technology PLC | ||||||
4.13%, 04/15/2026(a) | 18,997,000 | 18,763,736 | ||||
6.25%, 01/15/2027(a) | 11,350,000 | 11,595,330 | ||||
Light & Wonder International, Inc., 7.00%, 05/15/2028(a) | 13,923,000 | 14,060,378 | ||||
MGM Resorts International | ||||||
5.75%, 06/15/2025 | 6,078,000 | 6,101,844 | ||||
4.63%, 09/01/2026 | 427,000 | 424,577 | ||||
5.50%, 04/15/2027 | 1,385,000 | 1,390,655 | ||||
Penn Entertainment, Inc., 5.63%, 01/15/2027(a) | 7,521,000 | 7,454,437 | ||||
Raptor Acquisition Corp. / Raptor Co.-Issuer LLC, 4.88%, 11/01/2026(a) | 4,033,000 | 3,917,566 | ||||
Station Casinos LLC, 4.50%, 02/15/2028(a) | 4,766,000 | 4,605,599 | ||||
19 |
Principal Amount | Fair Value | |||||
CORPORATE BONDS - (Continued) | ||||||
Leisure: Casinos & Gaming - (Continued) | ||||||
VICI Properties LP / VICI Note Co., Inc. | ||||||
4.63%, 06/15/2025(a) | $5,805,000 | $ 5,776,743 | ||||
4.50%, 09/01/2026(a) | 2,405,000 | 2,396,451 | ||||
4.25%, 12/01/2026(a) | 5,240,000 | 5,193,433 | ||||
3.75%, 02/15/2027(a) | 1,255,000 | 1,225,175 | ||||
132,618,152 | ||||||
Leisure: Hotels - 7.2% | ||||||
Carnival Corp. | ||||||
5.75%, 03/01/2027(a) | 2,766,000 | 2,804,069 | ||||
7.88%, 06/01/2027 | 1,180,000 | 1,254,977 | ||||
7.00%, 08/15/2029(a) | 5,757,000 | 6,121,712 | ||||
Carnival Holdings Bermuda Ltd., 10.38%, 05/01/2028(a) | 16,093,000 | 17,397,434 | ||||
Cedar Fair LP / Canada's Wonderland Co. / Magnum Management Corp. / Millennium Op, 5.38%, 04/15/2027 | 2,855,000 | 2,848,866 | ||||
Hilton Domestic Operating Co., Inc., 5.38%, 05/01/2025(a) | 4,980,000 | 4,976,473 | ||||
Marriott Ownership Resorts, Inc. | ||||||
4.75%, 01/15/2028 | 1,654,000 | 1,590,764 | ||||
4.50%, 06/15/2029(a) | 1,856,000 | 1,747,379 | ||||
NCL Corp. Ltd. | ||||||
3.63%, 12/15/2024(a) | 5,186,000 | 5,181,628 | ||||
5.88%, 02/15/2027(a) | 3,270,000 | 3,283,479 | ||||
8.38%, 02/01/2028(a) | 2,044,000 | 2,148,491 | ||||
8.13%, 01/15/2029(a) | 880,000 | 942,120 | ||||
Park Intermediate Holdings LLC / PK Domestic Property LLC / PK Finance Co.-Issuer, 5.88%, 10/01/2028(a) | 4,393,000 | 4,389,683 | ||||
RHP Hotel Properties LP / RHP Finance Corp. | ||||||
4.75%, 10/15/2027 | 5,565,000 | 5,502,719 | ||||
7.25%, 07/15/2028(a) | 2,904,000 | 3,041,104 | ||||
RLJ Lodging Trust LP, 3.75%, 07/01/2026(a) | 12,301,000 | 12,030,558 | ||||
Royal Caribbean Cruises Ltd. | ||||||
4.25%, 07/01/2026(a) | 2,642,000 | 2,614,062 | ||||
5.50%, 08/31/2026(a) | 8,099,000 | 8,182,063 | ||||
5.38%, 07/15/2027(a) | 7,328,000 | 7,397,059 | ||||
Sabre GLBL, Inc., 8.63%, 06/01/2027(a) | 4,775,000 | 4,685,854 | ||||
Service Properties Trust | ||||||
5.25%, 02/15/2026 | 5,242,000 | 5,156,315 | ||||
4.75%, 10/01/2026 | 687,000 | 660,867 | ||||
5.50%, 12/15/2027 | 1,421,000 | 1,354,226 | ||||
Six Flags Entertainment Corp., 5.50%, 04/15/2027(a) | 3,600,000 | 3,580,297 | ||||
Six Flags Theme Parks, Inc., 7.00%, 07/01/2025(a) | 2,681,000 | 2,688,949 | ||||
Principal Amount | Fair Value | |||||
Travel + Leisure Co. | ||||||
6.60%, 10/01/2025(d) | $3,498,000 | $ 3,535,606 | ||||
6.63%, 07/31/2026(a) | 9,610,000 | 9,797,530 | ||||
6.00%, 04/01/2027 | 1,435,000 | 1,453,976 | ||||
Viking Cruises Ltd., 5.88%, 09/15/2027 (a) | 1,873,000 | 1,873,026 | ||||
VOC Escrow Ltd., 5.00%, 02/15/2028(a) | 2,362,000 | 2,336,514 | ||||
Wyndham Hotels & Resorts, Inc., 4.38%, 08/15/2028(a) | 3,588,000 | 3,464,106 | ||||
134,041,906 | ||||||
Leisure: Restaurants - 1.0% | ||||||
1011778 BC ULC / New Red Finance, Inc., 4.38%, 01/15/2028(a) | 3,506,000 | 3,410,424 | ||||
CEC Entertainment LLC, 6.75%, 05/01/2026(a) | 7,405,000 | 7,360,888 | ||||
Dave & Buster's, Inc., 7.63%, 11/01/2025(a) | 8,680,000 | 8,693,723 | ||||
19,465,035 | ||||||
Media: Broadcasting - 3.3% | ||||||
Graham Holdings Co., 5.75%, 06/01/2026(a) | 4,145,000 | 4,147,376 | ||||
Nexstar Media, Inc., 5.63%, 07/15/2027 (a) | 8,791,000 | 8,714,612 | ||||
Sirius XM Radio, Inc. | ||||||
3.13%, 09/01/2026(a) | 12,260,000 | 11,848,422 | ||||
5.00%, 08/01/2027(a) | 14,843,000 | 14,613,186 | ||||
4.00%, 07/15/2028(a) | 1,900,000 | 1,794,099 | ||||
TEGNA, Inc. | ||||||
4.75%, 03/15/2026(a) | 3,590,000 | 3,546,506 | ||||
4.63%, 03/15/2028 | 3,897,000 | 3,733,211 | ||||
Univision Communications, Inc., 6.63%, 06/01/2027(a) | 13,936,000 | 13,999,269 | ||||
62,396,681 | ||||||
Media: Cable & Satellite - 3.5% | ||||||
C&W Senior Finance Ltd., 6.88%, 09/15/2027(a) | 10,625,000 | 10,597,357 | ||||
CCO Holdings LLC / CCO Holdings Capital Corp. | ||||||
5.50%, 05/01/2026(a) | 19,036,000 | 19,013,868 | ||||
5.13%, 05/01/2027(a) | 7,237,000 | 7,127,962 | ||||
5.00%, 02/01/2028(a) | 2,730,000 | 2,657,708 | ||||
Connect Finco Sarl / Connect US Finco LLC | ||||||
6.75%, 10/01/2026(a) | 6,711,000 | 6,711,000 | ||||
9.00%, 09/15/2029(a) | 4,278,000 | 4,147,026 | ||||
Directv Financing LLC / Directv Financing Co.-Obligor, Inc., 5.88%, 08/15/2027(a) | 3,751,000 | 3,687,110 | ||||
DISH DBS Corp., 5.88%, 11/15/2024 | 2,448,000 | 2,434,474 | ||||
20 |
Principal Amount | Fair Value | |||||
CORPORATE BONDS - (Continued) | ||||||
Media: Cable & Satellite - (Continued) | ||||||
Sable International Finance Ltd., 5.75%, 09/07/2027(a) | $4,478,000 | $ 4,470,810 | ||||
Viasat, Inc., 5.63%, 09/15/2025(a) | 5,100,000 | 5,083,289 | ||||
65,930,604 | ||||||
Media: Diversified - 1.3% | ||||||
Match Group Holdings II LLC | ||||||
5.00%, 12/15/2027(a) | 7,316,000 | 7,254,916 | ||||
5.63%, 02/15/2029(a) | 1,014,000 | 1,015,081 | ||||
McGraw-Hill Education, Inc., 5.75%, 08/01/2028(a) | 4,917,000 | 4,862,949 | ||||
Neptune Bidco US, Inc., 9.29%, 04/15/2029(a) | 2,570,000 | 2,523,348 | ||||
Outfront Media Capital LLC / Outfront Media Capital Corp., 5.00%, 08/15/2027(a) | 9,221,000 | 9,175,468 | ||||
24,831,762 | ||||||
Media: Entertainment - 1.6% | ||||||
Live Nation Entertainment, Inc. | ||||||
4.88%, 11/01/2024(a) | 11,376,000 | 11,363,732 | ||||
5.63%, 03/15/2026(a) | 9,423,000 | 9,432,029 | ||||
6.50%, 05/15/2027(a) | 500,000 | 510,297 | ||||
4.75%, 10/15/2027(a) | 6,479,000 | 6,387,634 | ||||
Playtika Holding Corp., 4.25%, 03/15/2029(a) | 1,660,000 | 1,524,963 | ||||
29,218,655 | ||||||
Metals & Mining - 0.3% | ||||||
Alcoa Nederland Holding BV, 5.50%, 12/15/2027(a) | 3,363,000 | 3,378,552 | ||||
Novelis Corp., 3.25%, 11/15/2026(a) | 2,000,000 | 1,931,678 | ||||
5,310,230 | ||||||
Midstream: Storage & Transport - 3.7% | ||||||
Blue Racer Midstream LLC / Blue Racer Finance Corp., 7.00%, 07/15/2029(a) | 2,400,000 | 2,496,785 | ||||
Buckeye Partners LP | ||||||
4.35%, 10/15/2024 | 2,094,000 | 2,096,659 | ||||
4.13%, 03/01/2025(a) | 8,367,000 | 8,304,277 | ||||
3.95%, 12/01/2026 | 4,209,000 | 4,089,654 | ||||
Energy Transfer LP, 5.63%, 05/01/2027 (a) | 1,799,000 | 1,809,101 | ||||
EQM Midstream Partners LP | ||||||
6.00%, 07/01/2025(a) | 3,214,000 | 3,221,955 | ||||
7.50%, 06/01/2027(a) | 7,341,000 | 7,562,059 | ||||
6.38%, 04/01/2029(a) | 256,000 | 264,533 | ||||
Genesis Energy LP / Genesis Energy Finance Corp., 8.00%, 01/15/2027 | 1,568,000 | 1,606,389 | ||||
Kinetik Holdings LP, 6.63%, 12/15/2028 (a) | 400,000 | 415,719 | ||||
NuStar Logistics LP, 5.75%, 10/01/2025 | 9,099,000 | 9,120,028 | ||||
Principal Amount | Fair Value | |||||
Summit Midstream Holdings LLC, 8.63%, 10/31/2029(a) | $1,440,000 | $ 1,507,065 | ||||
Sunoco LP, 7.00%, 05/01/2029(a) | 3,472,000 | 3,630,604 | ||||
Sunoco LP / Sunoco Finance Corp. | ||||||
6.00%, 04/15/2027 | 2,341,000 | 2,350,942 | ||||
7.00%, 09/15/2028(a) | 9,279,000 | 9,624,105 | ||||
Venture Global LNG, Inc. | ||||||
8.13%, 06/01/2028(a) | 5,542,000 | 5,782,032 | ||||
9.50%, 02/01/2029(a) | 4,896,000 | 5,503,667 | ||||
69,385,574 | ||||||
Packaging - 2.0% | ||||||
Berry Global, Inc. | ||||||
4.50%, 02/15/2026(a) | 7,539,000 | 7,450,942 | ||||
4.88%, 07/15/2026(a) | 10,054,000 | 10,054,058 | ||||
5.63%, 07/15/2027(a) | 55,000 | 54,996 | ||||
Crown Americas LLC / Crown Americas Capital Corp. V, 4.25%, 09/30/2026 | 943,000 | 928,778 | ||||
Crown Americas LLC / Crown Americas Capital Corp. VI, 4.75%, 02/01/2026 | 8,670,000 | 8,648,556 | ||||
Crown Cork & Seal Co., Inc., 7.38%, 12/15/2026 | 2,293,000 | 2,415,815 | ||||
LABL, Inc., 6.75%, 07/15/2026(a) | 4,184,000 | 4,183,171 | ||||
Mativ Holdings, Inc., 8.00%, 10/01/2029 (a) | 1,275,000 | 1,302,777 | ||||
Mauser Packaging Solutions Holding Co., 7.88%, 04/15/2027(a) | 1,744,000 | 1,801,956 | ||||
Sealed Air Corp. | ||||||
5.50%, 09/15/2025(a) | 205,000 | 205,346 | ||||
4.00%, 12/01/2027(a) | 810,000 | 785,853 | ||||
37,832,248 | ||||||
Paper & Forest Products - 0.1% | ||||||
Glatfelter Corp., 4.75%, 11/15/2029(a) | 934,000 | 839,558 | ||||
Real Estate: Homebuilding - 0.4% | ||||||
LGI Homes, Inc., 8.75%, 12/15/2028(a) | 800,000 | 857,325 | ||||
M/I Homes, Inc., 4.95%, 02/01/2028 | 1,409,000 | 1,386,271 | ||||
Shea Homes LP / Shea Homes Funding Corp., 4.75%, 02/15/2028 | 582,000 | 569,758 | ||||
Taylor Morrison Communities, Inc. | ||||||
5.88%, 06/15/2027(a) | 1,189,000 | 1,214,825 | ||||
5.75%, 01/15/2028(a) | 890,000 | 906,302 | ||||
Tri Pointe Homes, Inc., 5.25%, 06/01/2027 | 3,334,000 | 3,353,130 | ||||
8,287,611 | ||||||
Real Estate: Management - 0.2% | ||||||
Cushman & Wakefield US Borrower LLC, 6.75%, 05/15/2028(a) | 2,836,000 | 2,876,283 | ||||
21 |
Principal Amount | Fair Value | ||||||||
CORPORATE BONDS - (Continued) | |||||||||
Retail: Food & Drug - 1.7% | |||||||||
Albertsons Cos., Inc. / Safeway, Inc. / New Albertsons LP / Albertsons LLC | |||||||||
3.25%, 03/15/2026(a) | $3,565,000 | $ 3,450,446 | |||||||
7.50%, 03/15/2026(a) | 13,468,000 | 13,607,434 | |||||||
4.63%, 01/15/2027(a) | 2,325,000 | 2,267,798 | |||||||
6.50%, 02/15/2028(a) | 5,260,000 | 5,367,341 | |||||||
US Foods, Inc., 6.88%, 09/15/2028(a) | 3,278,000 | 3,420,622 | |||||||
Walgreens Boots Alliance, Inc. | |||||||||
3.80%, 11/18/2024 | 2,500,000 | 2,493,426 | |||||||
3.45%, 06/01/2026 | 1,187,000 | 1,142,728 | |||||||
31,749,795 | |||||||||
Retailing - 0.8% | |||||||||
Bath & Body Works, Inc., 9.38%, 07/01/2025(a) | 6,442,000 | 6,629,056 | |||||||
Mavis Tire Express Services Topco Corp., 6.50%, 05/15/2029(a) | 1,000,000 | 961,733 | |||||||
PetSmart, Inc. / PetSmart Finance Corp. | |||||||||
4.75%, 02/15/2028(a) | 4,716,000 | 4,525,805 | |||||||
7.75%, 02/15/2029(a) | 1,700,000 | 1,679,859 | |||||||
Wayfair LLC, 7.25%, 10/31/2029(a) | 1,115,000 | 1,145,490 | |||||||
14,941,943 | |||||||||
Technology Hardware - 1.0% | |||||||||
Seagate HDD Cayman | |||||||||
4.75%, 01/01/2025 | 3,428,000 | 3,415,245 | |||||||
8.25%, 12/15/2029 | 4,194,000 | 4,561,424 | |||||||
Western Digital Corp., 4.75%, 02/15/2026 | 9,962,000 | 9,922,128 | |||||||
17,898,797 | |||||||||
Technology: Software & Services - 3.5% | |||||||||
Cloud Software Group, Inc., 6.50%, 03/31/2029(a) | 2,821,000 | 2,804,752 | |||||||
Consensus Cloud Solutions, Inc. | |||||||||
6.00%, 10/15/2026(a) | 6,557,000 | 6,532,792 | |||||||
6.50%, 10/15/2028(a) | 2,294,000 | 2,294,801 | |||||||
Fair Isaac Corp., 4.00%, 06/15/2028(a) | 2,000,000 | 1,936,883 | |||||||
Gen Digital, Inc. | |||||||||
5.00%, 04/15/2025(a) | 7,902,000 | 7,863,937 | |||||||
6.75%, 09/30/2027(a) | 11,994,000 | 12,336,728 | |||||||
Go Daddy Operating Co. LLC / GD Finance Co., Inc., 5.25%, 12/01/2027 (a) | 2,960,000 | 2,951,580 | |||||||
Open Text Corp., 6.90%, 12/01/2027(a) | 8,475,000 | 8,946,727 | |||||||
PTC, Inc., 3.63%, 02/15/2025(a) | 8,277,000 | 8,258,391 | |||||||
Shift4 Payments LLC / Shift4 Payments Finance Sub, Inc., 4.63%, 11/01/2026 (a) | 10,719,000 | 10,617,426 | |||||||
64,544,017 | |||||||||
Principal Amount | Fair Value | |||||
Telecom Services: Diversified - 2.5% | ||||||
Altice France SA, 8.13%, 02/01/2027(a) | $2,070,000 | $ 1,694,406 | ||||
Cogent Communications Group LLC, 3.50%, 05/01/2026(a) | 6,857,000 | 6,690,230 | ||||
Frontier Communications Holdings LLC | ||||||
5.88%, 10/15/2027(a) | 1,420,000 | 1,427,111 | ||||
5.00%, 05/01/2028(a) | 1,079,000 | 1,071,728 | ||||
8.75%, 05/15/2030(a) | 2,700,000 | 2,879,636 | ||||
Iliad Holding SASU | ||||||
6.50%, 10/15/2026(a) | 6,402,000 | 6,477,390 | ||||
7.00%, 10/15/2028(a) | 2,384,000 | 2,427,112 | ||||
LCPR Senior Secured Financing DAC, 6.75%, 10/15/2027(a) | 2,609,000 | 2,388,964 | ||||
SBA Communications Corp., 3.88%, 02/15/2027 | 2,500,000 | 2,438,092 | ||||
Uniti Group LP / Uniti Group Finance, Inc. / CSL Capital LLC, 10.50%, 02/15/2028(a) | 4,729,000 | 5,050,718 | ||||
Videotron Ltd., 5.13%, 04/15/2027(a) | 11,684,000 | 11,654,010 | ||||
Ziggo Bond Co. BV, 6.00%, 01/15/2027 (a) | 2,710,000 | 2,710,740 | ||||
46,910,137 | ||||||
Telecom Services: Wireless - 0.1% | ||||||
Sprint Capital Corp., 6.88%, 11/15/2028 | 1,578,000 | 1,724,263 | ||||
Sprint LLC, 7.63%, 03/01/2026 | 660,000 | 682,286 | ||||
2,406,549 | ||||||
Transportation - 2.2% | ||||||
GXO Logistics, Inc., 6.25%, 05/06/2029 | 629,000 | 661,978 | ||||
Mileage Plus Holdings LLC / Mileage Plus Intellectual Property Assets Ltd., 6.50%, 06/20/2027(a) | 3,897,850 | 3,949,302 | ||||
RXO, Inc., 7.50%, 11/15/2027(a) | 2,247,000 | 2,319,443 | ||||
Uber Technologies, Inc. | ||||||
8.00%, 11/01/2026(a) | 22,503,000 | 22,552,619 | ||||
7.50%, 09/15/2027(a) | 4,220,000 | 4,308,915 | ||||
XPO, Inc., 6.25%, 06/01/2028(a) | 6,124,000 | 6,269,574 | ||||
40,061,831 | ||||||
Utilities: Power - 2.3% | ||||||
Calpine Corp. | ||||||
5.25%, 06/01/2026(a) | 10,638,000 | 10,606,673 | ||||
4.50%, 02/15/2028(a) | 1,000,000 | 976,496 | ||||
NRG Energy, Inc., 6.63%, 01/15/2027 | 7,986,000 | 8,003,369 | ||||
22 |
Principal Amount | Fair Value | |||||
CORPORATE BONDS - (Continued) | ||||||
Utilities: Power - (Continued) | ||||||
Vistra Operations Co. LLC | ||||||
5.50%, 09/01/2026(a) | $6,639,000 | $ 6,641,573 | ||||
5.63%, 02/15/2027(a) | 10,641,000 | 10,631,802 | ||||
5.00%, 07/31/2027(a) | 5,520,000 | 5,497,786 | ||||
42,357,699 | ||||||
Utilities: Propane - 1.2% | ||||||
AmeriGas Partners LP / AmeriGas Finance Corp. | ||||||
5.50%, 05/20/2025 | 5,831,000 | 5,815,006 | ||||
5.88%, 08/20/2026 | 7,030,000 | 6,975,794 | ||||
5.75%, 05/20/2027 | 5,418,000 | 5,320,950 | ||||
9.38%, 06/01/2028(a) | 3,531,000 | 3,711,459 | ||||
Suburban Propane Partners LP/Suburban Energy Finance Corp., 5.88%, 03/01/2027 | 1,177,000 | 1,176,158 | ||||
22,999,367 | ||||||
TOTAL CORPORATE BONDS (Cost $1,588,143,092) | 1,611,261,010 | |||||
BANK LOANS - 9.0%(f) | ||||||
Aerospace & Defense - 0.3% | ||||||
TransDigm, Inc., Senior Secured First Lien, 7.35% (3 mo. SOFR US + 2.75%), 08/24/2028 | 4,918,975 | 4,922,443 | ||||
Automotive - 0.2% | ||||||
First Brands Group LLC, Senior Secured First Lien | ||||||
10.78% (3 mo. SOFR US + 5.00%), 03/30/2027 | 2,819,193 | 2,794,088 | ||||
10.78% (3 mo. SOFR US + 5.00%), 03/30/2027 | 1,672,186 | 1,657,554 | ||||
4,451,642 | ||||||
Building Products - 0.1% | ||||||
Standard Industries, Inc., Senior Secured First Lien, 7.03% (1 mo. SOFR US + 2.00%), 09/22/2028 | 1,987,472 | 1,994,001 | ||||
Commercial Services - 0.9% | ||||||
AlixPartners LLP, Senior Secured First Lien, 7.57% (1 mo. SOFR US + 2.50%), 02/04/2028 | 4,562,522 | 4,572,788 | ||||
Dun & Bradstreet Corp., Senior Secured First Lien, 7.61% (1 mo. SOFR US + 2.75%), 01/18/2029 | 7,741,010 | 7,743,177 | ||||
Garda World Security Corp., Senior Secured First Lien, 8.60% (1 mo. SOFR US + 3.50%), 02/01/2029 | 4,861,868 | 4,867,338 | ||||
17,183,303 | ||||||
Principal Amount | Fair Value | |||||
Environmental & Facilities Services - 0.1% | ||||||
Reworld Holding Corp., Senior Secured First Lien | ||||||
7.35% (1 mo. SOFR US + 2.50%), 11/30/2028 | $ 1,960,094 | $ 1,963,926 | ||||
7.59% (6 mo. SOFR US + 2.50%), 11/30/2028 | 153,145 | 153,445 | ||||
7.59% (6 mo. SOFR US + 2.50%), 11/30/2028 | 38,384 | 38,459 | ||||
2,155,830 | ||||||
Financials: Diversified - 0.6% | ||||||
Ascensus Holdings, Inc., Senior Secured First Lien, 8.57% (1 mo. SOFR US + 3.50%), 08/02/2028 | 4,052,075 | 4,057,160 | ||||
Castlelake Aviation One DAC, Senior Secured First Lien, 7.45% (3 mo. SOFR US + 2.50%), 10/22/2026 | 4,839,246 | 4,855,603 | ||||
Corp. Service Co., Senior Secured First Lien, 7.95% (1 mo. SOFR US + 2.50%), 11/03/2027 | 1,078,846 | 1,078,846 | ||||
Edelman Financial Engines Center LLC, Senior Secured Second Lien, 10.10% (1 mo. SOFR US + 5.25%), 10/06/2028 | 1,700,000 | 1,699,295 | ||||
11,690,904 | ||||||
Financials: Insurance - 0.8% | ||||||
Acrisure LLC, Senior Secured First Lien, 7.96% (1 mo. SOFR US + 3.00%), 02/16/2027 | 9,493,260 | 9,483,387 | ||||
Asurion LLC, Senior Secured First Lien | ||||||
8.32% (1 mo. SOFR US + 3.25%), 12/23/2026 | 3,363,803 | 3,364,914 | ||||
8.61% (1 mo. Term SOFR + 3.25%), 07/30/2027 | 1,806,320 | 1,783,994 | ||||
9.05% (1 mo. SOFR US + 4.00%), 08/21/2028 | 1,090,460 | 1,074,300 | ||||
15,706,595 | ||||||
Food & Beverage - 0.2% | ||||||
Delivery Hero Finco LLC, Senior Secured First Lien, 10.10% (3 mo. SOFR US + 5.00%), 12/12/2029 | 4,745,479 | 4,773,003 | ||||
Healthcare: Equipment & Supplies - 0.5% | ||||||
AthenaHealth Group, Inc., Senior Secured First Lien, 8.50% (1 mo. SOFR US + 3.25%), 02/15/2029 | 2,990,702 | 2,977,005 | ||||
Medline Borrower LP, Senior Secured First Lien, 7.60% (1 mo. SOFR US + 2.75%), 10/23/2028 | 3,616,336 | 3,621,887 | ||||
23 |
Principal Amount | Fair Value | |||||
BANK LOANS - (Continued) | ||||||
Healthcare: Equipment & Supplies - (Continued) | ||||||
Waystar Technologies, Inc., Senior Secured First Lien, 7.60% (1 mo. SOFR US + 2.75%), 10/22/2029 | $2,631,327 | $ 2,636,273 | ||||
9,235,165 | ||||||
Healthcare: Facilities - 0.3% | ||||||
Global Medical Response, Inc., Senior Secured First Lien, 9.71% (0.75% PIK) (1 mo. SOFR US + 4.75%), 10/02/2028 | 2,250,191 | 2,240,876 | ||||
Select Medical Corp., Senior Secured First Lien, 8.25% (1 mo. SOFR US + 3.00%), 03/05/2027 | 1,867,070 | 1,876,788 | ||||
Surgery Center Holdings, Inc., Senior Secured First Lien, 7.67% (1 mo. SOFR US + 2.75%), 12/19/2030 | 2,376,060 | 2,380,337 | ||||
6,498,001 | ||||||
Healthcare: Life Sciences - 0.4% | ||||||
Catalent Pharma Solutions, Inc., Senior Secured First Lien | ||||||
7.15% (1 mo. SOFR US + 2.00%), 02/22/2028 | 2,302,225 | 2,303,307 | ||||
7.92% (1 mo. SOFR US + 3.00%), 02/22/2028 | 4,398,102 | 4,406,349 | ||||
6,709,656 | ||||||
Healthcare: Pharma & Biotech - 0.3% | ||||||
Jazz Financing Lux Sarl, Senior Secured First Lien, 7.10% (1 mo. SOFR US + 2.25%), 05/05/2028 | 6,349,358 | 6,349,929 | ||||
Industrial Machinery - 0.2% | ||||||
Vertiv Group Corp., Senior Secured First Lien, 7.20% (1 mo. SOFR US + 2.00%), 03/02/2027 | 3,693,621 | 3,700,546 | ||||
Leisure: Hotels - 0.3% | ||||||
Carnival Corp., Senior Secured First Lien, 8.00% (1 mo. SOFR US + 2.75%), 10/18/2028 | 1,796,992 | 1,802,796 | ||||
Hilton Grand Vacations Borrower LLC, Senior Secured First Lien, 7.46% (1 mo. SOFR US + 2.50%), 08/02/2028 | 1,794,388 | 1,786,170 | ||||
Sabre GLBL, Inc., Senior Secured First Lien, 10.05% (1 mo. SOFR US + 5.00%), 06/30/2028 | 1,508,000 | 1,438,790 | ||||
5,027,756 | ||||||
Leisure: Restaurants- 0.7% | ||||||
IRB Holding Corp., Senior Secured First Lien, 8.20% (1 mo. SOFR US + 2.75%), 12/15/2027 | 12,278,077 | 12,276,358 | ||||
Principal Amount | Fair Value | |||||
Media: Broadcasting - 0.2% | ||||||
Univision Communications, Inc., Senior Secured First Lien, 8.32% (1 mo. SOFR US + 3.25%), 03/13/2026 | $ 3,972,255 | $ 3,975,869 | ||||
Media: Diversified - 0.1% | ||||||
McGraw-Hill Education, Inc., Senior Secured First Lien, 8.70% (3 mo. SOFR US + 4.00%), 08/06/2031 | 1,133,541 | 1,139,209 | ||||
Media: Entertainment - 0.9% | ||||||
Playtika Holding Corp., Senior Secured First Lien, 7.82% (1 mo. SOFR US + 2.75%), 03/13/2028 | 5,650,765 | 5,620,901 | ||||
UFC Holdings LLC, Senior Secured First Lien, 8.55% (3 mo. SOFR US + 2.75%), 04/29/2026 | 3,741,555 | 3,749,244 | ||||
William Morris Endeavor Entertainment LLC, Senior Secured First Lien | ||||||
7.82% (1 mo. SOFR US + 2.75%), 05/19/2025 | 4,217,549 | 4,225,457 | ||||
7.82% (1 mo. SOFR US + 2.75%), 05/19/2025 | 2,027,755 | 2,031,557 | ||||
7.82% (1 mo. SOFR US + 2.75%), 05/19/2025 | 385,012 | 385,734 | ||||
7.82% (1 mo. SOFR US + 2.75%), 05/19/2025 | 185,111 | 185,458 | ||||
16,198,351 | ||||||
Retailing - 0.2% | ||||||
PetSmart LLC, Senior Secured First Lien, 8.80% (1 mo. SOFR US + 3.75%), 02/14/2028 | 3,579,704 | 3,554,449 | ||||
Technology Hardware - 0.3% | ||||||
Synaptics, Inc., Senior Secured First Lien, 7.79% (1 mo. SOFR US + 2.25%), 12/04/2028 | 5,496,248 | 5,492,126 | ||||
Technology: Software & Services - 0.9% | ||||||
Cloud Software Group, Inc., Senior Secured First Lien | ||||||
8.60% (3 mo. SOFR US + 4.00%), 03/29/2029 | 2,997,080 | 2,988,328 | ||||
8.60% (3 mo. SOFR US + 4.00%), 03/29/2029 | 7,530 | 7,509 | ||||
MH Sub I LLC, Senior Secured First Lien, 9.10% (1 mo. SOFR US + 4.25%), 05/03/2028 | 5,563,815 | 5,535,189 | ||||
24 |
Principal Amount | Fair Value | |||||
BANK LOANS - (Continued) | ||||||
Technology: Software & Services - (Continued) | ||||||
Polaris Newco LLC, Senior Secured First Lien, 9.63% (3 mo. SOFR US + 4.00%), 06/05/2028 | $8,751,492 | $ 8,617,069 | ||||
17,148,095 | ||||||
Telecom Services: Diversified - 0.1% | ||||||
Frontier Communications Holdings LLC, Senior Secured First Lien, 8.76% (3 mo. SOFR US + 3.50%), 07/01/2031 | 1,475,125 | 1,488,033 | ||||
Transportation - 0.3% | ||||||
AAdvantage Loyalty IP Ltd., Senior Secured First Lien, 10.56% (3 mo. SOFR US + 4.75%), 04/20/2028 | 4,189,409 | 4,313,332 | ||||
SkyMiles IP Ltd., Senior Secured First Lien, 9.03% (3 mo. SOFR US + 3.75%), 10/20/2027 | 543,485 | 554,219 | ||||
4,867,551 | ||||||
Utilities: Power - 0.1% | ||||||
Calpine Corp., Senior Secured First Lien, 6.85% (1 mo. SOFR US + 2.00%), 12/16/2027 | 2,245,000 | 2,238,691 | ||||
TOTAL BANK LOANS (Cost $168,553,503) | 168,777,506 | |||||
CONVERTIBLE BONDS - 1.2% | ||||||
Healthcare: Equipment & Supplies - 0.1% | ||||||
Teladoc Health, Inc., 1.25%, 06/01/2027 | 2,051,000 | 1,781,294 | ||||
Leisure: Hotels - 0.4% | ||||||
Marriott Vacations Worldwide Corp., 6.09%, 01/15/2026(b) | 3,135,000 | 2,924,935 | ||||
Sabre GLBL, Inc., 4.00%, 04/15/2025 | 2,047,000 | 2,037,788 | ||||
TripAdvisor, Inc., 0.25%, 04/01/2026 | 1,527,000 | 1,425,262 | ||||
6,387,985 | ||||||
Technology: Software & Services- 0.7% | ||||||
DigitalOcean Holdings, Inc., 8.11%, 12/01/2026(b) | 9,522,000 | 8,455,536 | ||||
Pegasystems, Inc., 0.75%, 03/01/2025 | 912,000 | 896,040 | ||||
Perficient, Inc., 0.13%, 11/15/2026 | 4,213,000 | 4,151,911 | ||||
13,503,487 | ||||||
TOTAL CONVERTIBLE BONDS (Cost $21,062,927) | 21,672,766 | |||||
Shares | Fair Value | |||||
SHORT-TERM INVESTMENTS - 0.9%(e) | ||||||
Money Market Funds - 0.9% | ||||||
First American Government Obligations Fund - Class X, 4.82%(c) | 16,464,346 | $16,464,346 | ||||
TOTAL SHORT-TERM INVESTMENTS (Cost $16,464,346) | 16,464,346 | |||||
TOTAL INVESTMENTS - 97.4% (Cost $1,794,223,868) | 1,818,175,628 | |||||
Other Assets in Excess of Liabilities - 2.6% | 48,764,147 | |||||
TOTAL NET ASSETS - 100.0% | $1,866,939,775 | |||||
(a) | Security is exempt from registration pursuant to Rule 144A under the Securities Act of 1933, as amended. These securities may only be resold in transactions exempt from registration to qualified institutional investors. As of September 30, 2024, the value of these securities total $1,237,854,313 or 66.3% of the Fund’s net assets. |
(b) | Zero coupon bonds make no periodic interest payments. Rate shown is the weighted average amortized yield as of September 30, 2024. |
(c) | The rate shown represents the 7-day annualized effective yield as of September 30, 2024. |
(d) | Step-up bond; pays one interest rate for a certain period and a different rate thereafter. |
(e) | All or a portion is posted as collateral for delayed settlement securities. |
(f) | Rates for senior loans will typically have interest rates that redetermine periodically by reference to a base lending rate plus a spread. Senior loans that reference SOFR may be subject to a credit spread adjustment, particularly to legacy LIBOR bank loans that have transitioned to SOFR as the base lending rate. |
25 |
Shenkman Capital Floating Rate High Income Fund | Shenkman Capital Short Duration High Income Fund | |||||
ASSETS: | ||||||
Investments, at value (cost $281,866,297 and $1,794,223,868, respectively) | $281,100,898 | $1,818,175,628 | ||||
Cash | 5,429 | 157 | ||||
Receivables | ||||||
Securities sold | 6,714,957 | 35,212,006 | ||||
Interest | 2,430,320 | 27,982,883 | ||||
Fund shares sold | 347,789 | 9,210,663 | ||||
Prepaid expenses | 26,345 | 102,691 | ||||
Total assets | 290,625,738 | 1,890,684,028 | ||||
LIABILITIES: | ||||||
Payables | ||||||
Securities purchased | 15,875,991 | 16,129,580 | ||||
Fund shares redeemed | 70,970 | 1,906,886 | ||||
Distributions payable | 173,455 | 4,428,610 | ||||
Administration and accounting expenses | 25,722 | 108,891 | ||||
Advisory fees (Note 4) | 74,221 | 817,927 | ||||
Audit | 27,300 | 30,600 | ||||
Transfer agent fees and expenses | 9,233 | 64,516 | ||||
Compliance fees | 1,042 | 1,042 | ||||
Printing and mailing | 6,149 | 28,534 | ||||
Legal | 1,625 | 1,625 | ||||
Shareholder servicing fees | 353 | 55,357 | ||||
12b-1 distribution fees | — | 148,657 | ||||
Custody fees | 1,936 | 19,460 | ||||
Trustee fees and expenses | 1,694 | 1,694 | ||||
Other accrued expenses and other liabilities | 1,054 | 874 | ||||
Total liabilities | 16,270,745 | 23,744,253 | ||||
NET ASSETS | $274,354,993 | $1,866,939,775 | ||||
NET ASSETS CONSIST OF: | ||||||
Capital stock | $299,340,463 | $1,887,951,768 | ||||
Total accumulated deficit | (24,985,470) | (21,011,993) | ||||
Total net assets | $274,354,993 | $1,866,939,775 | ||||
NET ASSETS | ||||||
Class A: | ||||||
Net assets applicable to outstanding Class A shares | — | $32,783,894 | ||||
Shares issued and outstanding | — | 3,317,356 | ||||
Net asset value, redemption price per share(1) | — | $9.88 | ||||
Maximum offering price per share (net asset value divided by 97.00%) | — | $10.19 | ||||
26 |
Shenkman Capital Floating Rate High Income Fund | Shenkman Capital Short Duration High Income Fund | |||||
Class C: | ||||||
Net assets applicable to outstanding Class C shares | — | $22,665,720 | ||||
Shares issued and outstanding | — | 2,301,551 | ||||
Net asset value, offering price and redemption price per share(1) | — | $9.85 | ||||
Class F: | ||||||
Net assets applicable to outstanding Class F shares | $10,792,620 | $762,692,900 | ||||
Shares issued and outstanding | $1,179,316 | 77,377,219 | ||||
Net asset value, offering price and redemption price per share(1) | $9.15 | $9.86 | ||||
Institutional Class: | ||||||
Net assets applicable to outstanding Institutional Class shares | $263,562,373 | $1,048,797,261 | ||||
Shares issued and outstanding | 28,799,755 | 106,275,504 | ||||
Net asset value, offering price and redemption price per share(1) | $9.15 | $9.87 | ||||
(1) | A redemption fee of 1.00% is assessed against shares redeemed within 30 days of purchase. |
27 |
Shenkman Capital Floating Rate High Income Fund | Shenkman Capital Short Duration High Income Fund | |||||
INVESTMENT INCOME: | ||||||
Interest income | $23,611,819 | $118,955,633 | ||||
Consent and term loan fee income | 139,398 | 712,926 | ||||
Total investment income | 23,751,217 | 119,668,559 | ||||
EXPENSES: | ||||||
Investment advisory fees (Note 4) | 1,351,551 | 10,207,323 | ||||
Administration and accounting fees (Note 4) | 304,860 | 1,220,270 | ||||
Transfer agent fees and expenses (Note 4) | 120,672 | 651,319 | ||||
Federal and state registration fees | 38,660 | 125,347 | ||||
Audit fees | 27,300 | 30,599 | ||||
Reports to shareholders | 21,367 | 76,207 | ||||
Custody fees (Note 4) | 22,905 | 109,316 | ||||
Trustee fees and expenses | 19,304 | 18,844 | ||||
Chief Compliance Officer fees (Note 4) | 12,500 | 12,500 | ||||
Miscellaneous expenses | 9,345 | 25,549 | ||||
Insurance expense | 7,390 | 29,311 | ||||
Legal fees | 9,267 | 8,867 | ||||
Service fees - Class A (Note 6) | — | 17,234 | ||||
Service fees - Class C (Note 6) | — | 11,559 | ||||
Service fees - Class F (Note 6) | 2,258 | 553,756 | ||||
12b-1 distribution fees - Class A (Note 5) | — | 69,038 | ||||
12b-1 distribution fees - Class C (Note 5) | — | 215,718 | ||||
Total expenses before advisory fee waiver | 1,947,379 | 13,382,757 | ||||
Advisory fee recoupment/(waiver) by Advisor (Note 4) | (485,445) | (452,254) | ||||
Net expenses | 1,461,934 | 12,930,503 | ||||
NET INVESTMENT INCOME | 22,289,283 | 106,738,056 | ||||
NET REALIZED AND UNREALIZED GAIN/(LOSS): | ||||||
Net realized loss on investments | (2,848,774) | (2,132,614) | ||||
Change in unrealized appreciation/depreciation on investments | 3,263,927 | 56,448,961 | ||||
Net realized and unrealized gain on investments | 415,153 | 54,316,347 | ||||
NET INCREASE IN NET ASSETS RESULTING FROM OPERATIONS | $22,704,436 | $161,054,403 | ||||
28 |
Year Ended September 30, | ||||||
2024 | 2023 | |||||
OPERATIONS: | ||||||
Net investment income | $22,289,283 | $22,912,805 | ||||
Net realized loss on investments | (2,848,774) | (5,635,402) | ||||
Change in unrealized appreciation/depreciation on investments | 3,263,927 | 15,725,745 | ||||
Net increase in net assets resulting from operations | 22,704,436 | 33,003,148 | ||||
DISTRIBUTIONS TO SHAREHOLDERS: | ||||||
Class F | (842,215) | (762,241) | ||||
Institutional Class | (21,554,060) | (22,010,261) | ||||
Total distributions | (22,396,275) | (22,772,502) | ||||
CAPITAL SHARE TRANSACTIONS: | ||||||
Proceeds from shares sold: | ||||||
Class F | 2,970,835 | 6,914,839 | ||||
Institutional Class | 22,876,124 | 47,076,543 | ||||
Proceeds from shares issued to holders in reinvestment of dividends: | ||||||
Class F | 652,004 | 705,077 | ||||
Institutional Class | 19,292,510 | 18,514,960 | ||||
Cost of shares redeemed: | ||||||
Class F | (2,798,873) | (7,113,416) | ||||
Institutional Class | (62,054,611) | (82,336,061) | ||||
Redemption fees retained: | ||||||
Class F | 182 | 294 | ||||
Institutional Class | 4,706 | 8,178 | ||||
Net decrease in net assets derived from capital share transactions | (19,057,123) | (16,229,586) | ||||
TOTAL DECREASE IN NET ASSETS | (18,748,962) | (5,998,940) | ||||
NET ASSETS: | ||||||
Beginning of period | 293,103,955 | 299,102,895 | ||||
End of year | $274,354,993 | $293,103,955 | ||||
CHANGES IN SHARES OUTSTANDING: | ||||||
Shares sold: | ||||||
Class F | 324,177 | 760,238 | ||||
Institutional Class | 2,489,604 | 5,190,582 | ||||
Shares issued to holders as reinvestment of dividends: | ||||||
Class F | 71,280 | 78,031 | ||||
Institutional Class | 2,109,021 | 2,048,535 | ||||
Shares redeemed: | ||||||
Class F | (305,386) | (784,375) | ||||
Institutional Class | (6,775,482) | (9,102,540) | ||||
Net decrease in shares outstanding | (2,086,786) | (1,809,529) | ||||
29 |
Year Ended September 30, | ||||||
2024 | 2023 | |||||
OPERATIONS: | ||||||
Net investment income | $106,738,056 | $76,561,652 | ||||
Net realized loss on investments | (2,132,614) | (23,139,973) | ||||
Change in unrealized appreciation/depreciation on investments | 56,448,961 | 65,221,376 | ||||
Net increase in net assets resulting from operations | 161,054,403 | 118,643,055 | ||||
DISTRIBUTIONS TO SHAREHOLDERS: | ||||||
Class A | (1,566,288) | (1,034,024) | ||||
Class C | (1,032,667) | (699,829) | ||||
Class F | (46,686,772) | (38,077,343) | ||||
Institutional Class | (57,643,525) | (36,437,362) | ||||
Total distributions | (106,929,252) | (76,248,558) | ||||
CAPITAL SHARE TRANSACTIONS: | ||||||
Proceeds from shares sold: | ||||||
Class A | 22,246,388 | 10,804,489 | ||||
Class C | 8,318,323 | 7,315,741 | ||||
Class F | 338,941,604 | 477,580,347 | ||||
Institutional Class | 570,102,388 | 178,124,165 | ||||
Proceeds from shares issued to holders in reinvestment of dividends: | ||||||
Class A | 861,768 | 493,032 | ||||
Class C | 597,548 | 345,521 | ||||
Class F | 22,825,682 | 17,376,094 | ||||
Institutional Class | 31,028,586 | 26,039,542 | ||||
Cost of shares redeemed: | ||||||
Class A | (12,224,883) | (11,847,737) | ||||
Class C | (5,417,149) | (5,195,575) | ||||
Class F | (419,665,944) | (401,743,737) | ||||
Institutional Class | (315,814,736) | (208,559,114) | ||||
Redemption fees retained: | ||||||
Class A | 134 | 46 | ||||
Class C | 105 | 36 | ||||
Class F | 3,902 | 1,530 | ||||
Institutional Class | 4,868 | 1,501 | ||||
Net increase in net assets derived from capital share transactions | 241,808,584 | 90,735,881 | ||||
TOTAL INCREASE IN NET ASSETS | 295,933,735 | 133,130,378 | ||||
NET ASSETS: | ||||||
Beginning of period | 1,571,006,040 | 1,437,875,662 | ||||
End of year | $1,866,939,775 | $1,571,006,040 | ||||
30 |
Year Ended September 30, | ||||||
2024 | 2023 | |||||
CHANGES IN SHARES OUTSTANDING: | ||||||
Shares sold: | ||||||
Class A | $2,279,003 | $1,128,525 | ||||
Class C | 858,165 | 769,034 | ||||
Class F | 34,776,272 | 49,996,967 | ||||
Institutional Class | 58,419,935 | 18,624,644 | ||||
Shares issued to holders as reinvestment of dividends: | ||||||
Class A | 88,230 | 51,502 | ||||
Class C | 61,434 | 36,194 | ||||
Class F | 2,343,754 | 1,819,274 | ||||
Institutional Class | 3,184,111 | 2,724,334 | ||||
Shares redeemed: | ||||||
Class A | (1,251,092) | (1,236,421) | ||||
Class C | (555,834) | (545,272) | ||||
Class F | (42,999,513) | (42,107,107) | ||||
Institutional Class | (32,256,518) | (21,870,090) | ||||
Net increase in shares outstanding | 24,947,947 | 9,391,584 | ||||
31 |
Year Ended September 30, | |||||||||||||||
2024 | 2023 | 2022 | 2021 | 2020 | |||||||||||
PER SHARE DATA: | |||||||||||||||
Net asset value, beginning of year | $9.14 | $8.83 | $9.50 | $9.22 | $9.56 | ||||||||||
Income from investment operations: | |||||||||||||||
Net investment income(1) | 0.76 | 0.69 | 0.37 | 0.30 | 0.41 | ||||||||||
Net realized and unrealized gain/(loss) on investments | 0.01 | 0.31 | (0.67) | 0.29 | (0.34) | ||||||||||
Total from investment operations | 0.77 | 1.00 | (0.30) | 0.59 | 0.07 | ||||||||||
Less distributions: | |||||||||||||||
From net investment income | (0.76) | (0.69) | (0.37) | (0.31) | (0.42) | ||||||||||
Total distributions | (0.76) | (0.69) | (0.37) | (0.31) | (0.42) | ||||||||||
Redemption fees retained | 0.00(1)(2) | 0.00(1)(2) | 0.00(1)(2) | 0.00(1)(2) | 0.01(1) | ||||||||||
Net asset value, end of year | $9.15 | $9.14 | $8.83 | $9.50 | $9.22 | ||||||||||
TOTAL RETURN | 8.77% | 11.75% | −3.26% | 6.44% | 1.04% | ||||||||||
SUPPLEMENTAL DATA AND RATIOS: | |||||||||||||||
Net assets, end of year (thousands) | $10,793 | $9,956 | $9,141 | $10,312 | $2,265 | ||||||||||
Ratio of expenses to average net assets: | |||||||||||||||
Before advisory fee waiver | 0.74% | 0.72% | 0.71% | 0.82% | 0.78% | ||||||||||
After advisory fee waiver | 0.56% | 0.56% | 0.54% | 0.60% | 0.56% | ||||||||||
Ratio of net investment income to average net assets: | |||||||||||||||
Before advisory fee waiver | 8.05% | 7.51% | 3.78% | 2.92% | 4.12% | ||||||||||
After advisory fee waiver | 8.23% | 7.67% | 3.95% | 3.14% | 4.34% | ||||||||||
Portfolio turnover rate | 70% | 40% | 39% | 59% | 47% | ||||||||||
(1) | Based on average shares outstanding. |
(2) | Amount is less than $0.01 per share. |
32 |
Year Ended September 30, | |||||||||||||||
2024 | 2023 | 2022 | 2021 | 2020 | |||||||||||
PER SHARE DATA: | |||||||||||||||
Net asset value, beginning of year | $9.14 | $8.83 | $9.50 | $9.22 | $9.56 | ||||||||||
Income from investment operations: | |||||||||||||||
Net investment income(1) | 0.76 | 0.70 | 0.37 | 0.31 | 0.40 | ||||||||||
Net realized and unrealized gain/(loss) on investments | 0.01 | 0.31 | (0.67) | 0.28 | (0.32) | ||||||||||
Total from investment operations | 0.77 | 1.01 | (0.30) | 0.59 | 0.08 | ||||||||||
Less distributions: | |||||||||||||||
From net investment income | (0.76) | (0.70) | (0.37) | (0.31) | (0.42) | ||||||||||
Total distributions | (0.76) | (0.70) | (0.37) | (0.31) | (0.42) | ||||||||||
Redemption fees retained | 0.00(1)(2) | 0.00(1)(2) | 0.00(1)(2) | 0.00(1)(2) | 0.00(1)(2) | ||||||||||
Net asset value, end of year | $9.15 | $9.14 | $8.83 | $9.50 | $9.22 | ||||||||||
TOTAL RETURN | 8.79% | 11.77% | −3.26% | 6.48% | 0.94% | ||||||||||
SUPPLEMENTAL DATA AND RATIOS: | |||||||||||||||
Net assets, end of year (thousands) | $263,562 | $283,148 | $289,962 | $277,303 | $230,854 | ||||||||||
Ratio of expenses to average net assets: | |||||||||||||||
Before advisory fee waiver | 0.72% | 0.70% | 0.71% | 0.76% | 0.76% | ||||||||||
After advisory fee waiver | 0.54% | 0.54% | 0.54% | 0.54% | 0.54% | ||||||||||
Ratio of net investment income to average net assets: | |||||||||||||||
Before advisory fee waiver | 8.07% | 7.52% | 3.83% | 3.05% | 4.14% | ||||||||||
After advisory fee waiver | 8.25% | 7.68% | 4.00% | 3.27% | 4.36% | ||||||||||
Portfolio turnover rate | 70% | 40% | 39% | 59% | 47% | ||||||||||
(1) | Based on average shares outstanding. |
(2) | Amount is less than $0.01 per share. |
33 |
Year Ended September 30, | |||||||||||||||
2024 | 2023 | 2022 | 2021 | 2020 | |||||||||||
PER SHARE DATA: | |||||||||||||||
Net asset value, beginning of year | $9.58 | $9.30 | $10.09 | $9.93 | $10.06 | ||||||||||
Income from investment operations: | |||||||||||||||
Net investment income(1) | 0.53 | 0.45 | 0.30 | 0.26 | 0.31 | ||||||||||
Net realized and unrealized gain/(loss) on investments | 0.31 | 0.28 | (0.79) | 0.16 | (0.13) | ||||||||||
Total from investment operations | 0.84 | 0.73 | (0.49) | 0.42 | 0.18 | ||||||||||
Less distributions: | |||||||||||||||
From net investment income | (0.54) | (0.45) | (0.30) | (0.26) | (0.31) | ||||||||||
Total distributions | (0.54) | (0.45) | (0.30) | (0.26) | (0.31) | ||||||||||
Redemption fees retained | 0.00(1)(2) | 0.00(1)(2) | 0.00(1)(2) | 0.00(1)(2) | 0.00(1)(2) | ||||||||||
Net asset value, end of year | $9.88 | $9.58 | $9.30 | $10.09 | $9.93 | ||||||||||
TOTAL RETURN | 8.93% | 7.99% | −4.99% | 4.25% | 1.86% | ||||||||||
SUPPLEMENTAL DATA AND RATIOS: | |||||||||||||||
Net assets, end of year (thousands) | $32,784 | $21,087 | $20,992 | $20,580 | $15,946 | ||||||||||
Ratio of expenses to average net assets: | |||||||||||||||
Before advisory fee recoupment/waiver | 0.99% | 0.96% | 0.96% | 0.98% | 1.02% | ||||||||||
After advisory fee recoupment/waiver | 0.96% | 0.96% | 0.95% | 0.96% | 0.97% | ||||||||||
Ratio of net investment income to average net assets: | |||||||||||||||
Before advisory fee recoupment/waiver | 5.46% | 4.76% | 3.03% | 2.59% | 3.06% | ||||||||||
After advisory fee recoupment/waiver | 5.49% | 4.76% | 3.04% | 2.61% | 3.11% | ||||||||||
Portfolio turnover rate | 59% | 51% | 50% | 80% | 100% | ||||||||||
(1) | Based on average shares outstanding. |
(2) | Amount is less than $0.01 per share. |
34 |
Year Ended September 30, | |||||||||||||||
2024 | 2023 | 2022 | 2021 | 2020 | |||||||||||
PER SHARE DATA: | |||||||||||||||
Net asset value, beginning of year | $9.55 | $9.27 | $10.06 | $9.90 | $10.03 | ||||||||||
Income from investment operations: | |||||||||||||||
Net investment income(1) | 0.46 | 0.38 | 0.23 | 0.19 | 0.23 | ||||||||||
Net realized and unrealized gain/(loss) on investments | 0.30 | 0.28 | (0.80) | 0.15 | (0.12) | ||||||||||
Total from investment operations | 0.76 | 0.66 | (0.57) | 0.34 | 0.11 | ||||||||||
Less distributions: | |||||||||||||||
From net investment income | (0.46) | (0.38) | (0.22) | (0.18) | (0.24) | ||||||||||
Total distributions | (0.46) | (0.38) | (0.22) | (0.18) | (0.24) | ||||||||||
Redemption fees retained | 0.00(1)(2) | 0.00(1)(2) | 0.00(1)(2) | 0.00(1)(2) | 0.00(1)(2) | ||||||||||
Net asset value, end of year | $9.85 | $9.55 | $9.27 | $10.06 | $9.90 | ||||||||||
TOTAL RETURN | 8.16% | 7.23% | −5.71% | 3.49% | 1.10% | ||||||||||
SUPPLEMENTAL DATA AND RATIOS: | |||||||||||||||
Net assets, end of year (thousands) | $22,666 | $18,502 | $15,554 | $16,546 | $13,615 | ||||||||||
Ratio of expenses to average net assets: | |||||||||||||||
Before advisory fee recoupment/waiver | 1.73% | 1.70% | 1.70% | 1.73% | 1.77% | ||||||||||
After advisory fee recoupment/waiver | 1.70% | 1.70% | 1.69% | 1.71% | 1.72% | ||||||||||
Ratio of net investment income to average net assets: | |||||||||||||||
Before advisory fee recoupment/waiver | 4.72% | 4.03% | 2.30% | 1.84% | 2.32% | ||||||||||
After advisory fee recoupment/waiver | 4.75% | 4.03% | 2.31% | 1.86% | 2.37% | ||||||||||
Portfolio turnover rate | 59% | 51% | 50% | 80% | 100% | ||||||||||
(1) | Based on average shares outstanding. |
(2) | Amount is less than $0.01 per share. |
35 |
Year Ended September 30, | |||||||||||||||
2024 | 2023 | 2022 | 2021 | 2020 | |||||||||||
PER SHARE DATA: | |||||||||||||||
Net asset value, beginning of year | $9.56 | $9.28 | $10.06 | $9.91 | $10.04 | ||||||||||
Income from investment operations: | |||||||||||||||
Net investment income(1) | 0.56 | 0.47 | 0.32 | 0.28 | 0.33 | ||||||||||
Net realized and unrealized gain/(loss) on investments | 0.30 | 0.28 | (0.78) | 0.15 | (0.13) | ||||||||||
Total from investment operations | 0.86 | 0.75 | (0.46) | 0.43 | 0.20 | ||||||||||
Less distributions: | |||||||||||||||
From net investment income | (0.56) | (0.47) | (0.32) | (0.28) | (0.33) | ||||||||||
Total distributions | (0.56) | (0.47) | (0.32) | (0.28) | (0.33) | ||||||||||
Redemption fees retained | 0.00(1)(2) | 0.00(1)(2) | 0.00(1)(2) | 0.00(1)(2) | 0.00(1)(2) | ||||||||||
Net asset value, end of year | $9.86 | $9.56 | $9.28 | $10.06 | $9.91 | ||||||||||
TOTAL RETURN | 9.21% | 8.25% | −4.79% | 4.49% | 2.09% | ||||||||||
SUPPLEMENTAL DATA AND RATIOS: | |||||||||||||||
Net assets, end of year (thousands) | $762,693 | $795,530 | $682,182 | $671,520 | $446,802 | ||||||||||
Ratio of expenses to average net assets: | |||||||||||||||
Before advisory fee recoupment/ waiver | 0.74% | 0.73% | 0.74% | 0.76% | 0.79% | ||||||||||
After advisory fee recoupment/ waiver | 0.71% | 0.73% | 0.73% | 0.74% | 0.74% | ||||||||||
Ratio of net investment income to average net assets: | |||||||||||||||
Before advisory fee recoupment/ waiver | 5.70% | 5.00% | 3.27% | 2.81% | 3.29% | ||||||||||
After advisory fee recoupment/ waiver | 5.73% | 5.00% | 3.28% | 2.83% | 3.34% | ||||||||||
Portfolio turnover rate | 59% | 51% | 50% | 80% | 100% | ||||||||||
(1) | Based on average shares outstanding. |
(2) | Amount is less than $0.01 per share. |
36 |
Year Ended September 30, | |||||||||||||||
2024 | 2023 | 2022 | 2021 | 2020 | |||||||||||
PER SHARE DATA: | |||||||||||||||
Net asset value, beginning of year | $9.57 | $9.29 | $10.07 | $9.92 | $10.05 | ||||||||||
Income from investment operations: | |||||||||||||||
Net investment income(1) | 0.57 | 0.49 | 0.33 | 0.29 | 0.34 | ||||||||||
Net realized and unrealized gain/(loss) on investments | 0.30 | 0.27 | (0.79) | 0.15 | (0.13) | ||||||||||
Total from investment operations | 0.87 | 0.76 | (0.46) | 0.44 | 0.21 | ||||||||||
Less distributions: | |||||||||||||||
From net investment income | (0.57) | (0.48) | (0.32) | (0.29) | (0.34) | ||||||||||
Total distributions | (0.57) | (0.48) | (0.32) | (0.29) | (0.34) | ||||||||||
Redemption fees retained | 0.00(1)(2) | 0.00(1)(2) | 0.00(1)(2) | 0.00(1)(2) | 0.00(1)(2) | ||||||||||
Net asset value, end of year | $9.87 | $9.57 | $9.29 | $10.07 | $9.92 | ||||||||||
TOTAL RETURN | 9.28% | 8.32% | −4.62% | 4.47% | 2.18% | ||||||||||
SUPPLEMENTAL DATA AND RATIOS: | |||||||||||||||
Net assets, end of year (thousands) | $1,048,797 | $724,207 | $719,148 | $620,753 | $274,166 | ||||||||||
Ratio of expenses to average net assets: | |||||||||||||||
Before advisory fee recoupment/ waiver | 0.68% | 0.65% | 0.66% | 0.67% | 0.70% | ||||||||||
After advisory fee recoupment/ waiver | 0.65% | 0.65% | 0.65% | 0.65% | 0.65% | ||||||||||
Ratio of net investment income to average net assets: | |||||||||||||||
Before advisory fee recoupment/ waiver | 5.77% | 5.07% | 3.38% | 2.89% | 3.38% | ||||||||||
After advisory fee recoupment/ waiver | 5.80% | 5.07% | 3.39% | 2.91% | 3.43% | ||||||||||
Portfolio turnover rate | 59% | 51% | 50% | 80% | 100% | ||||||||||
(1) | Based on average shares outstanding. |
(2) | Amount is less than $0.01 per share. |
37 |
38 |
39 |
| Level 1 – | Unadjusted quoted prices in active markets for identical assets or liabilities that the Funds have the ability to access. |
| Level 2 – | Observable inputs other than quoted prices included in Level 1 that are observable for the asset or liability, either directly or indirectly. These inputs may include quoted prices for the identical instrument on an inactive market, prices for similar instruments, interest rates, prepayment speeds, credit risk, yield curves, default rates and similar data. |
| Level 3 – | Unobservable inputs for the asset or liability, to the extent relevant observable inputs are not available, representing the Funds’ own assumptions about the assumptions a market participant would use in valuing the asset or liability, and would be based on the best information available. |
40 |
Level 1 | Level 2 | Level 3 | Total | |||||||||
Investments: | ||||||||||||
Bank Loans | $— | $232,586,399 | $— | $232,586,399 | ||||||||
Corporate Bonds | — | 34,927,963 | — | 34,927,963 | ||||||||
Money Market Funds | 13,586,536 | — | — | 13,586,536 | ||||||||
Total Investments | $13,586,536 | $267,514,362 | $— | $281,100,898 | ||||||||
Level 1 | Level 2 | Level 3 | Total | |||||||||
Investments: | ||||||||||||
Corporate Bonds | $— | $1,611,261,010 | $— | $1,611,261,010 | ||||||||
Bank Loans | — | 168,777,506 | — | 168,777,506 | ||||||||
Convertible Bonds | — | 21,672,766 | — | 21,672,766 | ||||||||
Money Market Funds | 16,464,346 | — | — | 16,464,346 | ||||||||
Total Investments | $16,464,346 | $1,801,711,282 | $— | $1,818,175,628 | ||||||||
41 |
Bank Loans | |||
Balance as of September 30, 2023 | $635,325 | ||
Change in unrealized appreciation/(depreciation) | 809 | ||
Transfer out at September 30, 2024 | (636,134) | ||
Balance as of September 30, 2024 | $— | ||
Change in unrealized appreciation/(depreciation) during the period for Level 3 investments held at September 30, 2024 | $— | ||
42 |
Floating Rate High Income Fund | 0.50% | ||
Short Duration High Income Fund | 0.55% | ||
Floating Rate High Income Fund: | 0.54% | ||
Short Duration High Income Fund: | 0.65% | ||
9/30/2025 | 9/30/2026 | 9/30/2027 | Total | |||||||||
Floating Rate High Income Fund | $524,312 | $464,935 | $485,445 | $1,474,692 | ||||||||
Short Duration High Income Fund | 62,257 | 49,094 | 482,885 | 594,236 | ||||||||
43 |
Purchases | Sales | |||||
Floating Rate High Income Fund | $186,017,338 | $207,577,161 | ||||
Short Duration High Income Fund | 1,269,431,561 | 1,035,779,869 | ||||
44 |
Floating Rate High Income Fund | Short Duration High Income Fund | |||||
Cost of investments | $281,938,896 | $1,794,441,502 | ||||
Gross unrealized appreciation | 2,755,572 | 27,834,956 | ||||
Gross unrealized depreciation | (3,593,570) | (4,100,830) | ||||
Net unrealized appreciation/(depreciation) | (837,998) | 23,734,126 | ||||
Undistributed ordinary income | 231,106 | 4,722,090 | ||||
Total distributable earnings | 231,106 | 4,722,090 | ||||
Other accumulated losses | (24,378,578) | (49,468,209) | ||||
Total accumulated earnings/(losses) | $(24,985,470) | $(21,011,993) | ||||
Capital Loss Carryover | ||||||||||||
Long-Term | Short-Term | Total | Expiration Date | |||||||||
Floating Rate High Income Fund | $23,049,867 | $1,155,256 | $24,205,123 | No Expiration | ||||||||
Short Duration High Income Fund | 32,064,595 | 12,975,004 | 45,039,599 | No Expiration | ||||||||
Year Ended September 30, | ||||||
2024 | 2023 | |||||
Ordinary income | $ 22,396,275 | $22,772,502 | ||||
Total distributions paid | $22,396,275 | $22,772,502 | ||||
Year Ended September 30, | ||||||
2024 | 2023 | |||||
Ordinary income | $106,929,252 | $76,248,558 | ||||
Total distributions paid | $106,929,252 | $76,248,558 | ||||
Fund | Shareholder | Percent of Shares Held | ||||
Floating Rate High Income Fund | National Financial Services LLC | 36.42% | ||||
45 |
46 |
47 |
48 |
49 |
50 |
Outstanding Shares | Total Shares Voted(1) | |||||
610,254,146.13 | 422,548,104.53 | 69.24% | ||||
(1) | To approve the election of three Trustees to serve until his or her successor is elected and qualified. |
FOR(2) | WITHHOLD | |||||||||||||||||
Shares Voted | % of Voted Shares | % of Outstanding Shares | Shares Voted | % of Voted Shares | % of Outstanding Shares | |||||||||||||
(01) Craig Wainscott | 420,753,222.93 | 99.58% | 68.95% | 1,794,881.60 | 0.42% | 0.29% | ||||||||||||
(02) Anne Kritzmire | 420,814,806.36 | 99.59% | 68.96% | 1,733,298.17 | 0.41% | 0.28% | ||||||||||||
(03) Michele Rackey | 419,476,647.18 | 99.27% | 68.74% | 3,071,457.36 | 0.73% | 0.50% | ||||||||||||
(1) | Quorum: |
(2) | Vote Required: |
51 |

52 |
(b) Financial Highlights are included within the financial statements filed under Item 7 of this Form.
Item 8. Changes in and Disagreements with Accountants for Open-End Investment Companies.
There were no changes in or disagreements with accountants during the period covered by this report.
Item 9. Proxy Disclosure for Open-End Investment Companies.
See Item 7(a).
Item 10. Remuneration Paid to Directors, Officers, and Others of Open-End Investment Companies.
See Item 7(a).
Item 11. Statement Regarding Basis for Approval of Investment Advisory Contract.
Not applicable.
Item 12. Disclosure of Proxy Voting Policies and Procedures for Closed-End Management Investment Companies.
Not applicable to open-end investment companies.
Item 13. Portfolio Managers of Closed-End Management Investment Companies.
Not applicable to open-end investment companies.
Item 14. Purchases of Equity Securities by Closed-End Management Investment Company and Affiliated Purchasers.
Not applicable to open-end investment companies.
Item 15. Submission of Matters to a Vote of Security Holders.
There have been no material changes to the procedures by which shareholders may recommend nominees to the Registrant’s Board of Trustees.
Item 16. Controls and Procedures.
| (a) | The Registrant’s President/Chief Executive Officer/Principal Executive Officer and Vice President/Treasurer/Principal Financial Officer have reviewed the Registrant’s disclosure controls and procedures (as defined in Rule 30a-3(c) under the Investment Company Act of 1940, as amended, (the “Act”)) as of a date within 90 days of the filing of this report, as required by Rule 30a-3(b) under the Act and Rules 13a-15(b) or 15d-15(b) under the Securities Exchange Act of 1934. Based on their review, such officers have concluded that the disclosure controls and procedures are effective in ensuring that information required to be disclosed in this report is appropriately recorded, processed, summarized and reported and made known to them by others within the Registrant and by the Registrant’s service provider. |
| (b) | There were no changes in the Registrant’s internal control over financial reporting (as defined in Rule 30a-3(d) under the Act) that occurred during the period covered by this report that have materially affected, or are reasonably likely to materially affect, the Registrant’s internal control over financial reporting. |
Item 17. Disclosure of Securities Lending Activities for Closed-End Management Investment Companies.
Not applicable to open-end investment companies.
Item 18. Recovery of Erroneously Awarded Compensation.
Not applicable.
Item 19. Exhibits.
(2) Any policy required by the listing standards adopted pursuant to Rule 10D-1 under the Exchange Act (17 CFR 240.10D-1) by the registered national securities exchange or registered national securities association upon which the registrant’s securities are listed.
Not applicable.
(4) Any written solicitation to purchase securities under Rule 23c-1 under the Act sent or given during the period covered by the report by or on behalf of the registrant to 10 or more persons. Not applicable.
| (5) | Change in the registrant’s independent public accountant. Provide the information called for by Item 4 of Form 8-K under the Exchange Act (17 CFR 249.308). Unless otherwise specified by Item 4, or related to and necessary for a complete understanding of information not previously disclosed, the information should relate to events occurring during the reporting period. Not applicable. |
| (b) | Certifications pursuant to Section 906 of the Sarbanes-Oxley Act of 2002. Furnished herewith. |
SIGNATURES
Pursuant to the requirements of the Securities Exchange Act of 1934 and the Investment Company Act of 1940, the registrant has duly caused this report to be signed on its behalf by the undersigned, thereunto duly authorized.
| (Registrant) | Advisors Series Trust |
| By (Signature and Title)* | /s/ Jeffrey T. Rauman | ||
| Jeffrey T. Rauman, President/Chief Executive Officer/Principal Executive Officer |
| Date | 12/4/2024 |
Pursuant to the requirements of the Securities Exchange Act of 1934 and the Investment Company Act of 1940, this report has been signed below by the following persons on behalf of the registrant and in the capacities and on the dates indicated.
| By (Signature and Title)* | /s/ Jeffrey T. Rauman | ||
| Jeffrey T. Rauman, President/Chief Executive Officer/Principal Executive Officer |
| Date | 12/4/2024 |
| By (Signature and Title) * | /s/ Kevin J. Hayden | ||
| Kevin J. Hayden, Vice President/Treasurer/Principal Financial Officer |
| Date | 12/6/2024 |
* Print the name and title of each signing officer under his or her signature.