UNITED STATES
SECURITIES AND EXCHANGE COMMISSION
Washington, D.C. 20549
FORM N-CSR
CERTIFIED SHAREHOLDER REPORT OF REGISTERED
MANAGEMENT INVESTMENT COMPANIES
Investment Company Act file number 811-07959
Advisors Series Trust
(Exact name of registrant as specified in charter)
615 East Michigan Street
Milwaukee, WI 53202
(Address of principal executive offices) (Zip code)
Jeffrey T. Rauman, President/Chief Executive Officer
Advisors Series Trust
c/o U.S. Bancorp Fund Services, LLC
777 East Wisconsin Avenue, 4th Floor
Milwaukee, WI 53202
(Name and address of agent for service)
(626) 914-7235
Registrant’s telephone number, including area code
Date of fiscal year end: September 30, 2024
Date of reporting period: September 30, 2024
Item 1. Reports to Stockholders.
| | |
| Poplar Forest Partners Fund | |
| Class A | PFPFX |
| Annual Shareholder Report | September 30, 2024 |
This annual shareholder report contains important information about the Poplar Forest Partners Fund for the period of October 1, 2023, to September 30, 2024. You can find additional information about the Fund at https://poplarforestfunds.com/resources/. You can also request this information by contacting us at 1-877-522-8860.
WHAT WERE THE FUND COSTS FOR THE PAST YEAR? (based on a hypothetical $10,000 investment)
| | |
Class Name | Costs of a $10,000 investment | Costs paid as a percentage of a $10,000 investment |
| Class A | $132 | 1.20% |
HOW DID THE FUND PERFORM LAST YEAR AND WHAT AFFECTED ITS PERFORMANCE?
For the trailing 12-month period ending September 30, 2024, the Partners Fund Class A shares delivered a 20.59% no-load return. The Partners Fund uses a contrarian value approach to build a concentrated investment portfolio of undervalued companies designed to deliver attractive returns over full market cycles. While not outpacing the benchmark in the past year, we are pleased with the Fund’s performance given our defensive, value-based approach.
WHAT FACTORS INFLUENCED PERFORMANCE
The Fund delivered strong absolute performance with the greatest returns in the Financials, Healthcare, and Utilities sectors. On a relative basis, a performance detractor was Information Technology. The Information Technology weighting in the S&P 500 is more than 31% and excitement over artificial intelligence drove sector performance up more than 50%. The Fund’s weighting at September 30, 2024 in Information Technology was only 9.5%.
| |
Top Contributors |
| | Allstate Financial |
| | International Business Machines |
| | Equitable Holdings |
| |
Top Detractors |
| | Dollar Tree |
| | Intel |
| | Vishay Intertechnology |
The Fund’s performance relative to its benchmark reflects our commitment to absolute value investing in a market environment that has rewarded growth companies.
HOW DID THE FUND PERFORM OVER THE PAST 10 YEARS?*
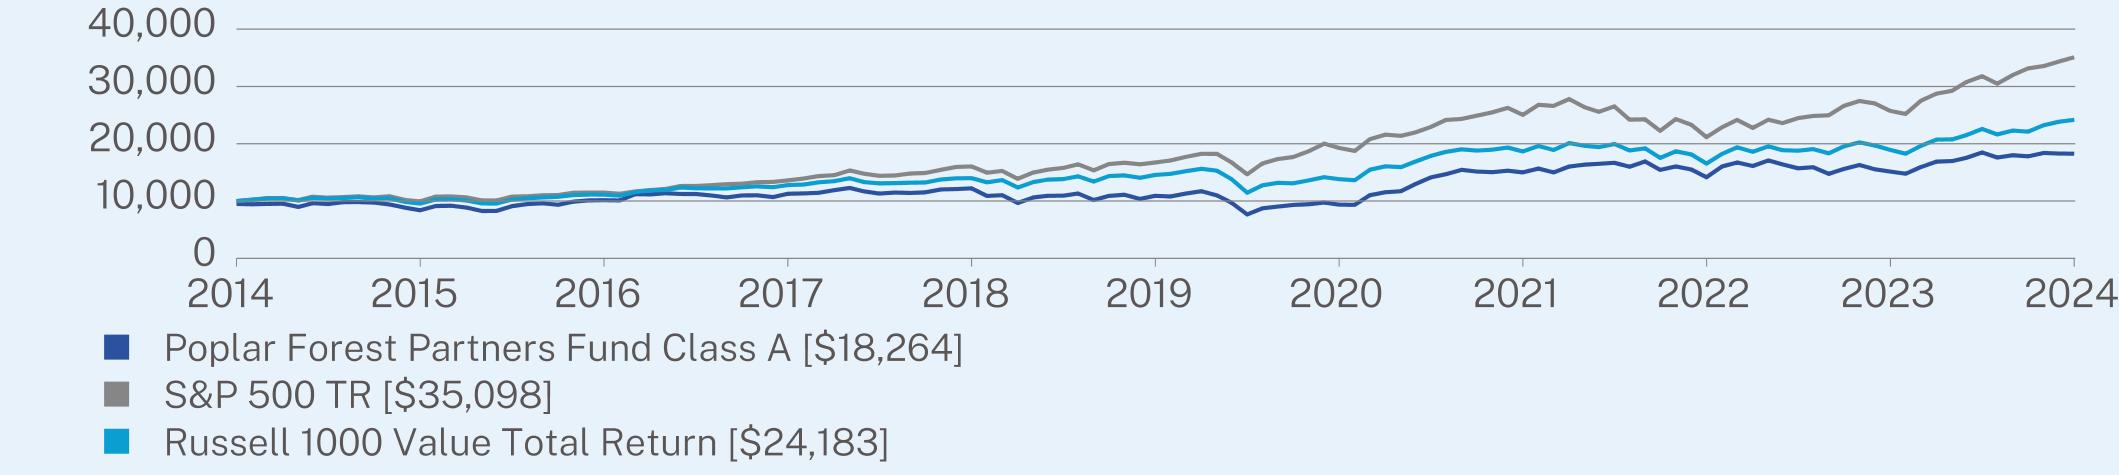
The $10,000 chart reflects a hypothetical $10,000 investment in the class of shares noted and assumes the maximum sales charge. The chart uses total return NAV performance and assumes reinvestment of dividends and capital gains. Fund expenses, including 12b-1 fees, management fees and other expenses were deducted.
| Poplar Forest Partners Fund | PAGE 1 | TSR-AR-00768D814 |
CUMULATIVE PERFORMANCE (Initial Investment of $10,000)
ANNUAL AVERAGE TOTAL RETURN (%)
| | | |
| | 1 Year | 5 Year | 10 Year |
Class A (without sales charge) | 20.59 | 10.84 | 6.75 |
Class A (with sales charge) | 14.56 | 9.71 | 6.21 |
S&P 500 TR | 36.35 | 15.98 | 13.38 |
Russell 1000 Value Total Return | 27.76 | 10.69 | 9.23 |
Visit https://poplarforestfunds.com/resources/ for more recent performance information.
| * | The Fund’s past performance is not a good predictor of the Fund’s future performance. The returns do not reflect the deduction of taxes that a shareholder would pay on Fund distributions or redemption of Fund shares. |
KEY FUND STATISTICS (as of September 30, 2024)
| |
Net Assets | $313,479,427 |
Number of Holdings | 30 |
Net Advisory Fee | $2,243,733 |
Portfolio Turnover | 28% |
Visit https://poplarforestfunds.com/resources/ for more recent performance information.
WHAT DID THE FUND INVEST IN? (as of September 30, 2024)*
| |
Top 10 Securities | (%) |
United Therapeutics Corp. | 5.5% |
Equitable Holdings, Inc. | 5.2% |
Allstate Corp. | 5.2% |
AT&T, Inc. | 4.8% |
National Fuel Gas Co. | 4.8% |
Dominion Energy, Inc. | 4.7% |
International Business Machines Corp. | 4.6% |
Tyson Foods, Inc. - Class A | 4.5% |
Kraft Heinz Co. | 4.2% |
CVS Health Corp. | 4.2% |
| |
Top Sectors | (%) |
Financials | 21.8% |
Health Care | 17.1% |
Consumer Staples | 10.8% |
Utilities | 9.5% |
Information Technology | 9.5% |
Energy | 6.0% |
Industrials | 6.0% |
Consumer Discretionary | 5.2% |
Communication Services | 4.8% |
Cash & Other | 9.3% |
| * | Expressed as a percent of net assets. |
For additional information about the Fund; including its prospectus, financial information, holdings and proxy information, scan the QR code or visit https://poplarforestfunds.com/resources/.
| Poplar Forest Partners Fund | PAGE 2 | TSR-AR-00768D814 |
HOUSEHOLDING
To reduce Fund expenses, only one copy of most shareholder documents may be mailed to shareholders with multiple accounts at the same address (Householding). If you would prefer that your Poplar Forest Capital documents not be householded, please contact Poplar Forest Capital at 1-877-522-8860, or contact your financial intermediary. Your instructions will typically be effective within 30 days of receipt by Poplar Forest Capital or your financial intermediary.
| Poplar Forest Partners Fund | PAGE 3 | TSR-AR-00768D814 |
9501838610152112741222710918936015001141481514518264100009939114721360716044167271926025040211652574135098100009558111051278513993145531382218661165401892924183
| | |
| Poplar Forest Partners Fund | |
| Institutional Class | IPFPX |
| Annual Shareholder Report | September 30, 2024 |
This annual shareholder report contains important information about the Poplar Forest Partners Fund for the period of October 1, 2023, to September 30, 2024. You can find additional information about the Fund at https://poplarforestfunds.com/resources/. You can also request this information by contacting us at 1-877-522-8860.
WHAT WERE THE FUND COSTS FOR THE PAST YEAR? (based on a hypothetical $10,000 investment)
| | |
Class Name | Costs of a $10,000 investment | Costs paid as a percentage of a $10,000 investment |
| Institutional Class | $105 | 0.95% |
HOW DID THE FUND PERFORM LAST YEAR AND WHAT AFFECTED ITS PERFORMANCE?
For the trailing 12-month period ending September 30, 2024, the Partners Fund Institutional Class delivered a 20.89% return. The Partners Fund uses a contrarian value approach to build a concentrated investment portfolio of undervalued companies designed to deliver attractive returns over full market cycles. While not outpacing the benchmark in the past year, we are pleased with the Fund’s performance given our defensive, value-based approach.
WHAT FACTORS INFLUENCED PERFORMANCE
The Fund delivered strong absolute performance with the greatest returns in the Financials, Healthcare, and Utilities sectors. On a relative basis, a performance detractor was Information Technology. The Information Technology weighting in the S&P 500 is more than 31% and excitement over artificial intelligence drove sector performance up more than 50%. The Fund’s weighting at September 30, 2024 in Information Technology was only 9.5%.
| |
Top Contributors |
| | Allstate Financial |
| | International Business Machines |
| | Equitable Holdings |
| |
Top Detractors |
| | Dollar Tree |
| | Intel |
| | Vishay Intertechnology |
The Fund’s performance relative to its benchmark reflects our commitment to absolute value investing in a market environment that has rewarded growth companies.
HOW DID THE FUND PERFORM OVER THE PAST 10 YEARS?*
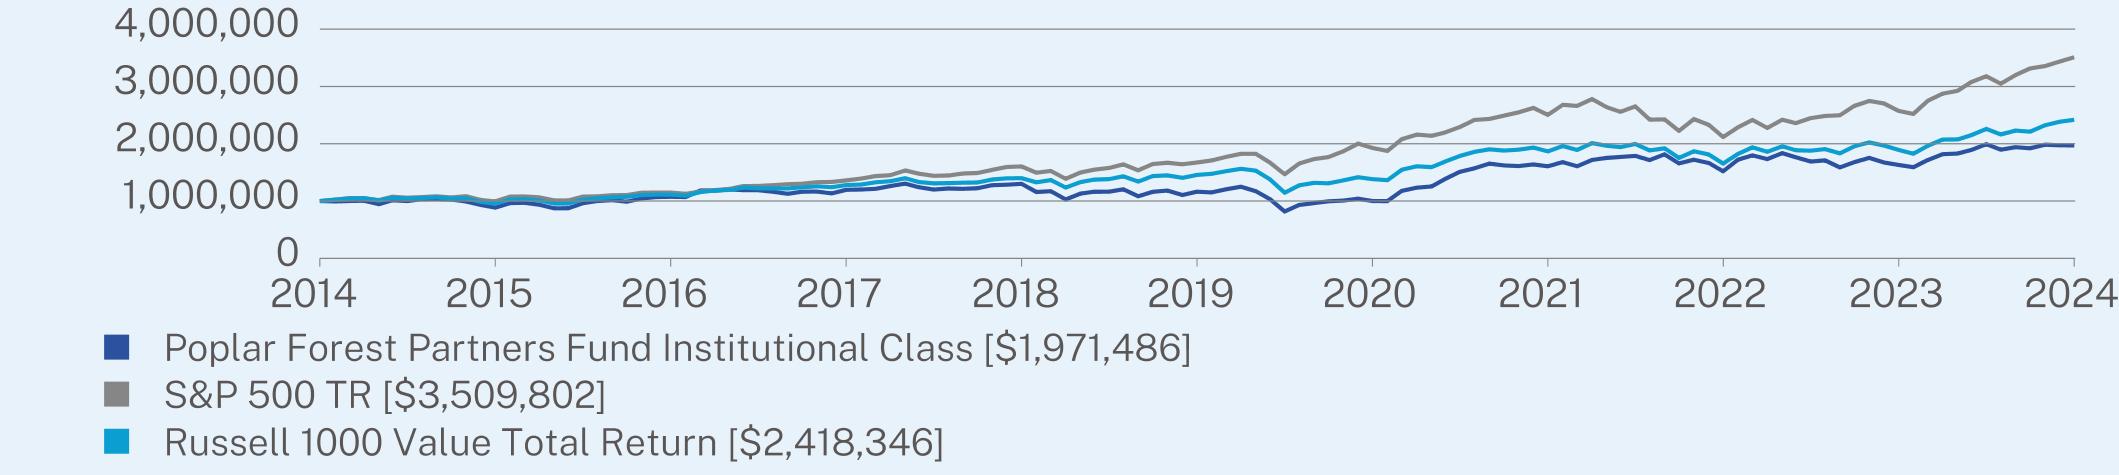
The $10,000 chart reflects a hypothetical $10,000 investment in the class of shares noted and assumes the maximum sales charge. The chart uses total return NAV performance and assumes reinvestment of dividends and capital gains. Fund expenses, including management fees and other expenses were deducted.
| Poplar Forest Partners Fund | PAGE 1 | TSR-AR-00768D798 |
CUMULATIVE PERFORMANCE (Initial Investment of $10,000)
ANNUAL AVERAGE TOTAL RETURN (%)
| | | |
| | 1 Year | 5 Year | 10 Year |
Institutional Class | 20.89 | 11.12 | 7.02 |
S&P 500 TR | 36.35 | 15.98 | 13.38 |
Russell 1000 Value Total Return | 27.76 | 10.69 | 9.23 |
Visit https://poplarforestfunds.com/resources/ for more recent performance information.
| * | The Fund’s past performance is not a good predictor of the Fund’s future performance. The returns do not reflect the deduction of taxes that a shareholder would pay on Fund distributions or redemption of Fund shares. |
KEY FUND STATISTICS (as of September 30, 2024)
| |
Net Assets | $313,479,427 |
Number of Holdings | 30 |
Net Advisory Fee | $2,243,733 |
Portfolio Turnover | 28% |
Visit https://poplarforestfunds.com/resources/ for more recent performance information.
WHAT DID THE FUND INVEST IN? (as of September 30, 2024)*
| |
Top 10 Securities | (%) |
United Therapeutics Corp. | 5.5% |
Equitable Holdings, Inc. | 5.2% |
Allstate Corp. | 5.2% |
AT&T, Inc. | 4.8% |
National Fuel Gas Co. | 4.8% |
Dominion Energy, Inc. | 4.7% |
International Business Machines Corp. | 4.6% |
Tyson Foods, Inc. - Class A | 4.5% |
Kraft Heinz Co. | 4.2% |
CVS Health Corp. | 4.2% |
| |
Top Sectors | (%) |
Financials | 21.8% |
Health Care | 17.1% |
Consumer Staples | 10.8% |
Utilities | 9.5% |
Information Technology | 9.5% |
Energy | 6.0% |
Industrials | 6.0% |
Consumer Discretionary | 5.2% |
Communication Services | 4.8% |
Cash & Other | 9.3% |
| * | Expressed as a percent of net assets. |
For additional information about the Fund; including its prospectus, financial information, holdings and proxy information, scan the QR code or visit https://poplarforestfunds.com/resources/.
| Poplar Forest Partners Fund | PAGE 2 | TSR-AR-00768D798 |
HOUSEHOLDING
To reduce Fund expenses, only one copy of most shareholder documents may be mailed to shareholders with multiple accounts at the same address (Householding). If you would prefer that your Poplar Forest Capital documents not be householded, please contact Poplar Forest Capital at 1-877-522-8860, or contact your financial intermediary. Your instructions will typically be effective within 30 days of receipt by Poplar Forest Capital or your financial intermediary.
| Poplar Forest Partners Fund | PAGE 3 | TSR-AR-00768D798 |
100000088498910739231195832130004811636061000391160696315196311630880197148610000009938551147211136069916044061672655192604725039562116543257408335098021000000955763111055012784891399313145529313821631866085165404618928622418346
| | |
| Poplar Forest Cornerstone Fund | |
| Investor Class | IPFCX |
| Annual Shareholder Report | September 30, 2024 |
This annual shareholder report contains important information about the Poplar Forest Cornerstone Fund for the period of October 1, 2023, to September 30, 2024. You can find additional information about the Fund at https://poplarforestfunds.com/resources/. You can also request this information by contacting us at 1-877-522-8860.
WHAT WERE THE FUND COSTS FOR THE PAST YEAR? (based on a hypothetical $10,000 investment)
| | |
Class Name | Costs of a $10,000 investment | Costs paid as a percentage of a $10,000 investment |
| Investor Class | $98 | 0.90% |
HOW DID THE FUND PERFORM LAST YEAR AND WHAT AFFECTED ITS PERFORMANCE?
For the trailing 12-month period ending September 30, 2024, the Cornerstone Fund Investor Class delivered an 18.20% return. The balanced fund uses a contrarian value approach to build a concentrated investment portfolio of equity securities that we believe are undervalued and will deliver attractive returns over full market cycles. The equity weighting is currently 58%. The strategy’s remaining allocation is to fixed income and cash. Our fixed income strategy also applies a contrarian value approach where we look for discounted bonds where we expect full repayment at maturity. While not outpacing the 60%/40% S&P 500/Bloomberg US Aggregate Bond Index benchmark in the past year, we are pleased with the Fund’s absolute performance given our defensive, value-based approach.
WHAT FACTORS INFLUENCED PERFORMANCE
The Fund delivered strong absolute performance with the greatest returns in the Financials, Healthcare, and Utilities sectors. On a relative basis, the biggest performance detractor was Information Technology. The Information Technology weighting in the S&P 500 is more than 31% and excitement over artificial intelligence drove sector performance up more than 50%. The Fund’s weighting in Information Technology was less than 10%.
| |
Top Contributors |
| | Allstate Financial |
| | International Business Machines |
| | Equitable Holdings |
| |
Top Detractors |
| | Dollar Tree |
| | Intel |
| | Vishay Intertechnology |
The Fund’s performance relative to its benchmark reflects our commitment to absolute value investing in a market environment that has rewarded growth companies.
HOW DID THE FUND PERFORM SINCE INCEPTION?*
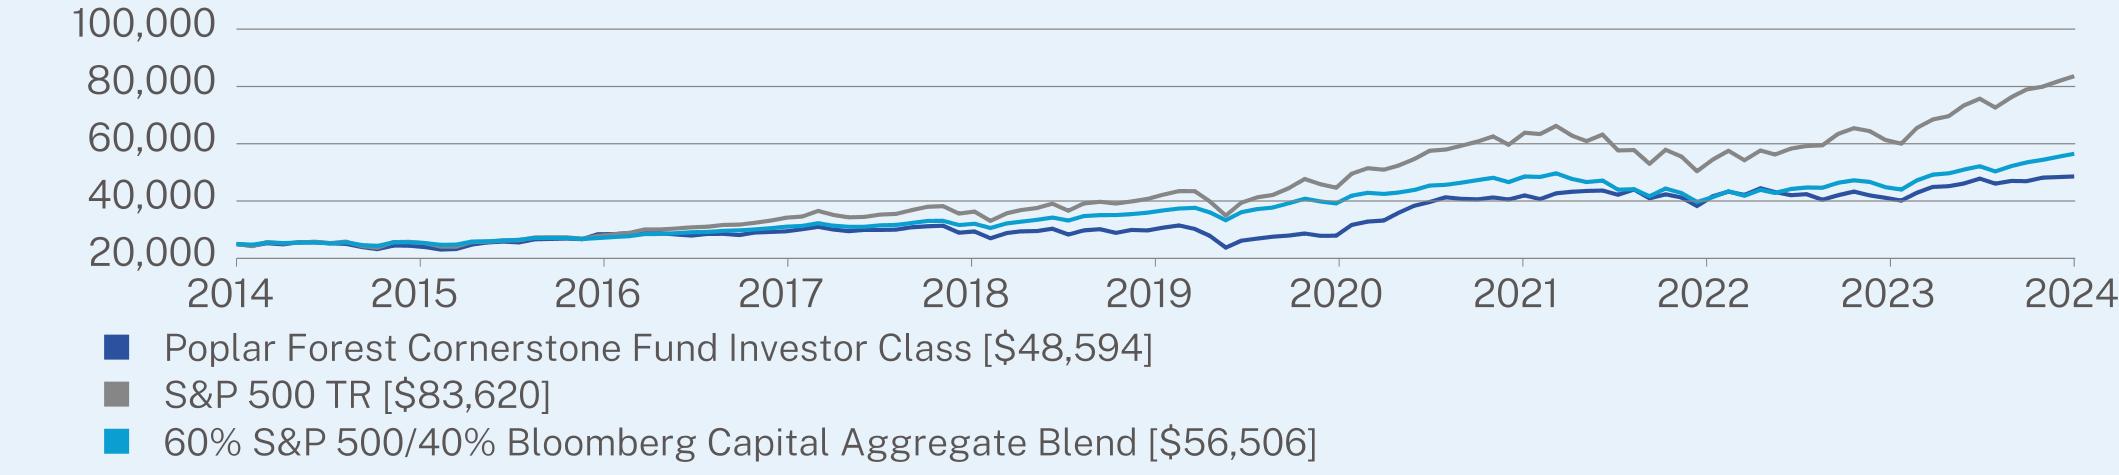
The $10,000 chart reflects a hypothetical $10,000 investment in the class of shares noted and assumes the maximum sales charge. The chart uses total return NAV performance and assumes reinvestment of dividends and capital gains. Fund expenses, including 12b-1 fees, management fees and other expenses were deducted.
| Poplar Forest Cornerstone Fund | PAGE 1 | TSR-AR-00770X535 |
CUMULATIVE PERFORMANCE (Initial Investment of $10,000)
ANNUAL AVERAGE TOTAL RETURN (%)
| | | |
| | 1 Year | 5 Year | Since Inception
(12/31/2014) |
Investor Class | 18.20 | 10.19 | 7.06 |
S&P 500 TR | 36.35 | 15.98 | 13.19 |
60% S&P 500/40% Bloomberg Capital Aggregate Blend | 25.98 | 9.78 | 8.73 |
Visit https://poplarforestfunds.com/resources/ for more recent performance information.
| * | The Fund’s past performance is not a good predictor of the Fund’s future performance. The returns do not reflect the deduction of taxes that a shareholder would pay on Fund distributions or redemption of Fund shares. |
KEY FUND STATISTICS (as of September 30, 2024)
| |
Net Assets | $35,154,138 |
Number of Holdings | 56 |
Net Advisory Fee | $89,115 |
Portfolio Turnover | 31% |
30-Day SEC Yield | 2.58% |
30-Day SEC Yield Unsubsidized | 2.06% |
Visit https://poplarforestfunds.com/resources/ for more recent performance information.
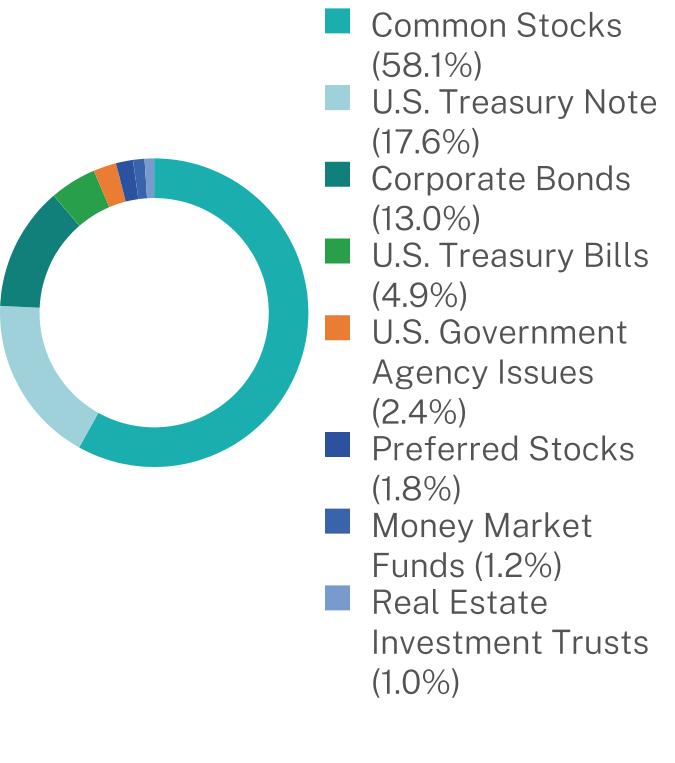
WHAT DID THE FUND INVEST IN? (as of September 30, 2024)*
| |
Top 10 Issuers | (%) |
United States Treasury Note/Bond | 17.6% |
National Fuel Gas Co. | 5.2% |
United States Treasury Bill | 4.9% |
Allstate Corp. | 3.2% |
Equitable Holdings, Inc. | 3.1% |
Ally Financial, Inc. | 3.1% |
AT&T, Inc. | 3.1% |
Citigroup, Inc. | 2.9% |
Dominion Energy, Inc. | 2.9% |
International Business MachinesCorp. | 2.8% |
Security Type Breakdown (%)
| |
Top Sectors | (%) |
Government | 20.0% |
Financials | 17.1% |
Health Care | 11.7% |
Utilities | 11.4% |
Consumer Staples | 9.1% |
Information Technology | 5.7% |
Consumer Discretionary | 5.6% |
Industrials | 3.9% |
Communication Services | 3.1% |
Cash & Other | 12.4% |
| * | Expressed as a percent of net assets. |
| Poplar Forest Cornerstone Fund | PAGE 2 | TSR-AR-00770X535 |
For additional information about the Fund; including its prospectus, financial information, holdings and proxy information, scan the QR code or visit https://poplarforestfunds.com/resources/.
HOUSEHOLDING
To reduce Fund expenses, only one copy of most shareholder documents may be mailed to shareholders with multiple accounts at the same address (Householding). If you would prefer that your Poplar Forest Capital documents not be householded, please contact Poplar Forest Capital at 1-877-522-8860, or contact your financial intermediary. Your instructions will typically be effective within 30 days of receipt by Poplar Forest Capital or your financial intermediary.
| Poplar Forest Cornerstone Fund | PAGE 3 | TSR-AR-00770X535 |
23210269122901931386299082784940530382584111148594236782733232418382253985145888596565042661327836202434427126300833308835437398674661039690448535650658.117.613.04.92.41.81.21.0
Item 2. Code of Ethics.
The registrant has adopted a code of ethics that applies to the registrant’s principal executive officer and principal financial officer. The registrant has not made any substantive amendments to its code of ethics during the period covered by this report. The registrant has not granted any waivers from any provisions of the code of ethics during the period covered by this report.
A copy of the registrant’s Code of Ethics is filed herewith.
Item 3. Audit Committee Financial Expert.
The registrant’s Board of Trustees has determined that there is at least one audit committee financial expert serving on its audit committee. Mr. Joe D. Redwine, Ms. Michele Rackey, Ms. Anne Kritzmire, and Mr. Craig Wainscott are the “audit committee financial experts” and are considered to be “independent” as each term is defined in Item 3 of Form N-CSR.
Item 4. Principal Accountant Fees and Services.
The registrant has engaged its principal accountant to perform audit services, audit-related services, tax services and other services during the past two fiscal years. “Audit services” refer to performing an audit of the registrant’s annual financial statements or services that are normally provided by the accountant in connection with statutory and regulatory filings or engagements for those fiscal years. “Audit-related services” refer to the assurance and related services by the principal accountant that are reasonably related to the performance of the audit. “Tax services” refer to professional services rendered by the principal accountant including the review of federal income tax returns, review of federal excise tax returns, review of state tax returns, if any, and assistance with calculation of required income, capital gain and excise distributions. There were no “other services” provided by the principal accountant. The following table details the aggregate fees billed or expected to be billed for each of the last two fiscal years for audit fees, audit-related fees, tax fees and other fees by the principal accountant.
| | FYE 9/30/2024 | FYE 9/30/2023 |
| (a) Audit Fees | $36,500 | $36,300 |
| (b) Audit-Related Fees | N/A | N/A |
| (c) Tax Fees | $7,200 | $7,200 |
| (d) All Other Fees | N/A | N/A |
(e)(1) The audit committee has adopted pre-approval policies and procedures that require the audit committee to pre-approve all audit and non-audit services of the registrant, including services provided to any entity affiliated with the registrant.
(e)(2) The percentage of fees billed by Tait, Weller, & Baker LLP applicable to non-audit services pursuant to waiver of pre-approval requirement were as follows:
| | FYE 9/30/2024 | FYE 9/30/2023 |
| Audit-Related Fees | 0% | 0% |
| Tax Fees | 0% | 0% |
| All Other Fees | 0% | 0% |
(f) During the audit of the registrant’s financial statements, 100 percent of the hours were attributed to work performed by persons other than full-time permanent employees of the principal accountant.
(g) The following table indicates the non-audit fees billed or expected to be billed by the registrant’s accountant for services to the registrant and to the registrant’s investment adviser (and any other controlling entity, etc.—not sub-adviser) for the last two years.
| Non-Audit Related Fees | FYE 9/30/2024 | FYE 9/30/2023 |
| Registrant | N/A | N/A |
| Registrant’s Investment Adviser | $6,000 | $6,000 |
(h) The audit committee of the board of trustees/directors has considered whether the provision of non-audit services that were rendered to the registrant’s investment adviser is compatible with maintaining the principal accountant’s independence and has concluded that the provision of such non-audit services by the accountant has not compromised the accountant’s independence.
The registrant has not been identified by the U.S. Securities and Exchange Commission as having filed an annual report issued by a registered public accounting firm branch or office that is located in a foreign jurisdiction where the Public Company Accounting Oversight Board is unable to inspect or completely investigate because of a position taken by an authority in that jurisdiction.
The registrant is not a foreign issuer.
Item 5. Audit Committee of Listed Registrants.
Not applicable.
Item 6. Investments.
| (a) | Schedule of Investments is included as part of the report to shareholders filed under Item 7 of this Form. |
| | |
Item 7. Financial Statements and Financial Highlights for Open-End Investment Companies.
Poplar Forest Funds
Poplar Forest Partners Fund
Poplar Forest Cornerstone Fund
Core Financial Statements
September 30, 2024
TABLE OF CONTENTS
Poplar Forest Partners Fund
Schedule of Investments
September 30, 2024
| | | | | | | |
COMMON STOCKS - 94.6%
| | | | | | |
Air Freight & Logistics - 3.2%
| | | | | | |
FedEx Corp. | | | 36,500 | | | $9,989,320 |
Banks - 3.4%
| | | | | | |
Citigroup, Inc. | | | 168,500 | | | 10,548,100 |
Biotechnology - 5.5%
| | | | | | |
United Therapeutics Corp.(a) | | | 48,000 | | | 17,200,800 |
Capital Markets - 1.1%
| | | | | | |
LPL Financial Holdings, Inc. | | | 14,000 | | | 3,256,820 |
Chemicals - 3.9%
| | | | | | |
Dow, Inc. | | | 225,000 | | | 12,291,750 |
Consumer Finance - 2.3%
| | | | | | |
Ally Financial, Inc. | | | 198,000 | | | 7,046,820 |
Consumer Staples Distribution & Retail - 2.1%
|
Dollar Tree, Inc.(a) | | | 94,000 | | | 6,610,080 |
Diversified Telecommunication Services - 4.8%
|
AT&T, Inc. | | | 686,000 | | | 15,092,000 |
Electrical Equipment - 2.8%
| | | | | | |
Sensata Technologies Holding PLC | | | 245,500 | | | 8,803,630 |
Electronic Equipment, Instruments & Components - 2.7%
| | | | | | |
Vishay Intertechnology, Inc. | | | 449,000 | | | 8,490,590 |
Financial Services - 9.8%
| | | | | | |
Equitable Holdings, Inc. | | | 390,000 | | | 16,391,700 |
Fidelity National Information Services, Inc. | | | 104,000 | | | 8,710,000 |
Global Payments, Inc. | | | 54,500 | | | 5,581,890 |
| | | | | | 30,683,590 |
Food Products - 8.7%
| | | | | | |
Kraft Heinz Co. | | | 379,000 | | | 13,306,690 |
Tyson Foods, Inc. - Class A | | | 236,000 | | | 14,056,160 |
| | | | | | 27,362,850 |
Gas Utilities - 4.8%
| | | | | | |
National Fuel Gas Co. | | | 248,000 | | | 15,031,280 |
Health Care Providers & Services - 7.9%
|
Cencora, Inc. | | | 52,000 | | | 11,704,160 |
CVS Health Corp. | | | 207,000 | | | 13,016,160 |
| | | | | | 24,720,320 |
Hotels, Restaurants & Leisure - 2.9%
| | | | | | |
Las Vegas Sands Corp. | | | 182,500 | | | 9,187,050 |
Insurance - 5.2%
| | | | | | |
Allstate Corp. | | | 86,000 | | | 16,309,900 |
IT Services - 4.6%
| | | | | | |
International Business Machines Corp. | | | 65,500 | | | 14,480,740 |
| | | | | | | |
| | | | | | | |
Multi-Utilities - 4.7%
| | | | | | |
Dominion Energy, Inc. | | | 256,000 | | | $14,794,240 |
Oil, Gas & Consumable Fuels - 6.0%
| | | | | | |
Chevron Corp. | | | 85,500 | | | 12,591,585 |
Murphy Oil Corp. | | | 185,000 | | | 6,241,900 |
| | | | | | 18,833,485 |
Pharmaceuticals - 3.7%
| | | | | | |
Merck & Co., Inc. | | | 102,900 | | | 11,685,324 |
Semiconductors & Semiconductor Equipment - 2.2%
| | | | | | |
Intel Corp. | | | 285,000 | | | 6,686,100 |
Textiles, Apparel & Luxury Goods - 2.3%
|
Tapestry, Inc. | | | 154,000 | | | 7,234,920 |
TOTAL COMMON STOCKS
(Cost $220,173,962) | | | | | | 296,339,709 |
REAL ESTATE INVESTMENT TRUSTS - 1.7%
|
Sun Communities, Inc. | | | 40,000 | | | 5,406,000 |
TOTAL REAL ESTATE INVESTMENT TRUSTS
(Cost $4,477,663) | | | | | | 5,406,000 |
SHORT-TERM INVESTMENTS - 3.7%
|
Money Market Funds - 2.7%
| | | | | | |
Morgan Stanley Institutional Liquidity Funds - Treasury Portfolio – Institutional Class, 4.76%(b) | | | 8,439,706 | | | 8,439,706 |
| | | | | | | |
| | | | | | | |
U.S. Treasury Bills - 1.0%
| | | | | | |
4.82%, 12/26/2024(c) | | | $3,240,000 | | | 3,205,127 |
TOTAL SHORT-TERM INVESTMENTS
|
(Cost $11,644,141) | | | | | | 11,644,833 |
TOTAL INVESTMENTS - 100.0%
(Cost $236,295,766) | | | | | | $313,390,542 |
Other Assets in Excess of
Liabilities - 0.0%(d) | | | | | | 88,885 |
TOTAL NET ASSETS - 100.0% | | | | | | $313,479,427 |
| | | | | | | |
Percentages are stated as a percent of net assets.
The Global Industry Classification Standard (“GICS®”) was developed by and/or is the exclusive property of MSCI, Inc. (“MSCI”) and Standard & Poor’s Financial Services LLC (“S&P”). GICS® is a service mark of MSCI and S&P and has been licensed for use by U.S. Bank Global Fund Services.
PLC - Public Limited Company
(a)
| Non-income producing security. |
(b)
| The rate shown represents the 7-day annualized effective yield as of September 30, 2024. |
(c)
| The rate shown is the effective yield as of September 30, 2024. |
(d)
| Represents less than 0.05% of net assets. |
The accompanying notes are an integral part of these financial statements.
TABLE OF CONTENTS
Poplar Forest Cornerstone Fund
Schedule of Investments
September 30, 2024
| | | | | | | |
COMMON STOCKS - 58.1%
| | | | | | |
Air Freight & Logistics - 2.3%
| | | | | | |
FedEx Corp. | | | 2,900 | | | $793,672 |
Banks - 2.9%
| | | | | | |
Citigroup, Inc. | | | 16,300 | | | 1,020,380 |
Biotechnology - 2.7%
| | | | | | |
United Therapeutics Corp.(a) | | | 2,700 | | | 967,545 |
Capital Markets - 0.9%
| | | | | | |
LPL Financial Holdings, Inc. | | | 1,300 | | | 302,419 |
Chemicals - 2.3%
| | | | | | |
Dow, Inc. | | | 15,100 | | | 824,913 |
Consumer Finance - 1.3%
| | | | | | |
Ally Financial, Inc. | | | 13,200 | | | 469,788 |
Consumer Staples Distribution & Retail - 1.3%
|
Dollar Tree, Inc.(a) | | | 6,300 | | | 443,016 |
Diversified Telecommunication Services - 3.1%
|
AT&T, Inc. | | | 48,800 | | | 1,073,600 |
Electrical Equipment - 1.6%
| | | | | | |
Sensata Technologies Holding PLC | | | 15,900 | | | 570,174 |
Electronic Equipment, Instruments & Components - 1.7%
| | | | | | |
Vishay Intertechnology, Inc. | | | 31,700 | | | 599,447 |
Financial Services - 7.0%
| | | | | | |
Apollo Global Management, Inc. | | | 3,460 | | | 432,189 |
Equitable Holdings, Inc. | | | 26,000 | | | 1,092,780 |
Fidelity National Information Services,
Inc. | | | 6,900 | | | 577,875 |
Global Payments, Inc. | | | 3,500 | | | 358,470 |
| | | | | | 2,461,314 |
Food Products - 5.1%
| | | | | | |
Kraft Heinz Co. | | | 25,600 | | | 898,816 |
Tyson Foods, Inc. - Class A | | | 15,000 | | | 893,400 |
| | | | | | 1,792,216 |
Gas Utilities - 3.0%
| | | | | | |
National Fuel Gas Co. | | | 17,300 | | | 1,048,553 |
Health Care Providers & Services - 4.6%
|
Cencora, Inc. | | | 3,600 | | | 810,288 |
CVS Health Corp. | | | 12,600 | | | 792,288 |
| | | | | | 1,602,576 |
Hotels, Restaurants & Leisure - 1.6%
| | | | | | |
Las Vegas Sands Corp. | | | 11,000 | | | 553,740 |
Insurance - 3.2%
| | | | | | |
Allstate Corp. | | | 6,000 | | | 1,137,900 |
| | | | | | | |
| | | | | | | |
IT Services - 2.8%
| | | | | | |
International Business Machines
Corp. | | | 4,400 | | | $972,752 |
Multi-Utilities - 2.9%
| | | | | | |
Dominion Energy, Inc. | | | 17,600 | | | 1,017,104 |
Oil, Gas & Consumable Fuels - 3.0%
| | | | | | |
Chevron Corp. | | | 4,800 | | | 706,896 |
Murphy Oil Corp. | | | 10,800 | | | 364,392 |
| | | | | | 1,071,288 |
Pharmaceuticals - 2.1%
| | | | | | |
Merck & Co., Inc. | | | 6,600 | | | 749,496 |
Semiconductors & Semiconductor Equipment - 1.2%
| | | | | | |
Intel Corp. | | | 17,600 | | | 412,896 |
Textiles, Apparel & Luxury Goods - 1.5%
|
Tapestry, Inc. | | | 11,200 | | | 526,176 |
TOTAL COMMON STOCKS
(Cost $15,333,167) | | | | | | 20,410,965 |
| | | | | | | |
| | | | | | | |
U.S. TREASURY NOTE - 17.6%
| | | | | | |
U.S. Treasury Note TIPS,
0.25%, 07/15/2029 | | | $922,245 | | | 874,579 |
U.S. Treasury Notes
| | | | | | |
4.13%, 01/31/2025 | | | 800,000 | | | 798,722 |
2.63%, 04/15/2025 | | | 300,000 | | | 297,428 |
3.88%, 02/15/2043 | | | 770,000 | | | 742,268 |
4.13%, 08/15/2053 | | | 815,000 | | | 810,734 |
United States Treasury Note/Bond
| | | | | | |
4.38%, 07/31/2026 | | | 875,000 | | | 885,561 |
4.13%, 07/31/2031 | | | 875,000 | | | 898,926 |
4.38%, 05/15/2034 | | | 850,000 | | | 889,379 |
TOTAL U.S. TREASURY NOTE
(Cost $6,178,827) | | | | | | 6,197,597 |
CORPORATE BONDS - 13.0%
| | | | | | |
Electric Utilities - 3.3%
| | | | | | |
Dominion Energy South Carolina, Inc., 4.25%, 08/15/2028 | | | 300,000 | | | 300,931 |
DTE Electric Co.,
3.00%, 03/01/2032 | | | 925,000 | | | 845,992 |
| | | | | | 1,146,923 |
Food Products - 2.7%
| | | | | | |
Kellanova, 5.75%, 05/16/2054 | | | 865,000 | | | 937,998 |
Gas Utilities - 2.2%
| | | | | | |
National Fuel Gas Co.,
3.95%, 09/15/2027 | | | 800,000 | | | 786,206 |
| | | | | | | |
The accompanying notes are an integral part of these financial statements.
TABLE OF CONTENTS
Poplar Forest Cornerstone Fund
Schedule of Investments
September 30, 2024(Continued)
| | | | | | | |
CORPORATE BONDS - (Continued)
|
Pharmaceuticals - 2.3%
| | | | | | |
Bristol-Myers Squibb Co.,
6.13%, 05/01/2038 | | | $725,000 | | | $812,558 |
Specialty Retail - 2.5%
| | | | | | |
Dick's Sporting Goods, Inc.,
3.15%, 01/15/2032 | | | 1,000,000 | | | 900,479 |
TOTAL CORPORATE BONDS
(Cost $4,362,120) | | | | | | 4,584,164 |
U.S. GOVERNMENT AGENCY ISSUES - 2.4%
|
Federal Home Loan Banks,
6.10%, 04/24/2034 | | | 850,000 | | | 850,224 |
TOTAL U.S. GOVERNMENT AGENCY ISSUES
(Cost $850,000) | | | | | | 850,224 |
| | | Shares | | | |
PREFERRED STOCKS - 1.8%
| | | | | | |
Consumer Finance - 1.8%
| | | | | | |
Ally Financial, Inc., Series B, 4.70% to 05/15/2026 then 5 yr. CMT Rate + 3.87%, Perpetual | | | 700,000 | | | 620,993 |
TOTAL PREFERRED STOCKS
(Cost $713,345) | | | | | | 620,993 |
REAL ESTATE INVESTMENT TRUSTS - 1.0%
| | | | | | |
Sun Communities, Inc. | | | 2,600 | | | 351,390 |
TOTAL REAL ESTATE INVESTMENT TRUSTS
(Cost $278,900) | | | | | | 351,390 |
SHORT-TERM INVESTMENTS - 6.1%
|
Money Market Funds - 1.2%
| | | | | | |
Morgan Stanley Institutional Liquidity Funds - Treasury Portfolio – Institutional Class, 4.76%(b) | | | 414,692 | | | 414,692 |
| | | Par | | | |
U.S. Treasury Bills - 4.9%
|
5.47%, 10/03/2024(c) | | | $165,000 | | | 164,957 |
5.19%, 11/29/2024(c) | | | 155,000 | | | 153,815 |
4.82%, 12/26/2024(c) | | | 175,000 | | | 173,116 |
4.93%, 02/20/2025(c) | | | 175,000 | | | 172,011 |
5.06%, 03/20/2025(c) | | | 180,000 | | | 176,368 |
5.15%, 05/15/2025(c) | | | 180,000 | | | 175,525 |
5.17%, 06/12/2025(c) | | | 175,000 | | | 170,241 |
5.02%, 07/10/2025(c) | | | 180,000 | | | 174,555 |
| | | | | | | |
| | | | | | | |
4.45%, 08/07/2025(c) | | | $180,000 | | | $174,007 |
4.33%, 09/04/2025(c) | | | 180,000 | | | 173,508 |
| | | | | | 1,708,103 |
TOTAL SHORT-TERM INVESTMENTS
(Cost $2,117,199) | | | | | | 2,122,795 |
TOTAL INVESTMENTS - 100.0% (Cost $29,833,558) | | | | | | $35,138,128 |
Other Assets in Excess of
Liabilities - 0.0%(d) | | | | | | 16,010 |
TOTAL NET ASSETS - 100.0% | | | | | | $35,154,138 |
| | | | | | | |
Percentages are stated as a percent of net assets.
The Global Industry Classification Standard (“GICS®”) was developed by and/or is the exclusive property of MSCI, Inc. (“MSCI”) and Standard & Poor’s Financial Services LLC (“S&P”). GICS® is a service mark of MSCI and S&P and has been licensed for use by U.S. Bank Global Fund Services.
CMT - Constant Maturity Treasury Rate
PLC - Public Limited Company
TIPS - Treasury Inflation Protected Securities
(a)
| Non-income producing security. |
(b)
| The rate shown represents the 7-day annualized effective yield as of September 30, 2024. |
(c)
| The rate shown is the effective yield as of September 30, 2024. |
(d)
| Represents less than 0.05% of net assets. |
The accompanying notes are an integral part of these financial statements.
TABLE OF CONTENTS
Poplar Forest Fund
Statements of Assets and Liabilities
at September 30, 2024
| | | | | | | |
ASSETS
| | | | | | |
Investments in securities, at value (identified cost $236,295,766 and
$29,833,558, respectively) | | | $313,390,542 | | | $35,138,128 |
Receivables
| | | | | | |
Fund shares issued | | | 7,956 | | | — |
Dividends and interest | | | 418,542 | | | 148,109 |
Prepaid expenses | | | 24,728 | | | 5,331 |
Total assets | | | 313,841,768 | | | 35,291,568 |
LIABILITIES
| | | | | | |
Payables
| | | | | | |
Fund shares redeemed | | | 21,850 | | | 79,161 |
Due to Adviser | | | 186,307 | | | 7,659 |
12b-1 fees | | | 18,117 | | | — |
Custody fees | | | 6,385 | | | 980 |
Administration and fund accounting fees | | | 44,359 | | | 16,316 |
Transfer agent fees and expenses | | | 42,074 | | | 3,852 |
Audit fees | | | 22,500 | | | 21,000 |
Chief Compliance Officer fee | | | 2,084 | | | 2,083 |
Trustee fees and expenses | | | 1,855 | | | 1,855 |
Accrued expenses | | | 16,810 | | | 4,524 |
Total liabilities | | | 362,341 | | | 137,430 |
NET ASSETS | | | $ 313,479,427 | | | $35,154,138 |
CALCULATION OF NET ASSET VALUE PER SHARE
| | | | | | |
Class A Shares
| | | | | | |
Net assets applicable to shares outstanding | | | $23,663,405 | | | $— |
Shares issued and outstanding [unlimited number of shares (par value $0.01) authorized] | | | 437,395 | | | — |
Net asset value and redemption price per share | | | $54.10 | | | $— |
Maximum offering price per share (Net asset value per share divided
by 95.00%) | | | $56.95 | | | $— |
Investor Class Shares
| | | | | | |
Net assets applicable to shares outstanding | | | — | | | $35,154,138 |
Shares issued and outstanding [unlimited number of shares (par value $0.01) authorized] | | | — | | | 1,157,284 |
Net asset value, offering and redemption price per share | | | $— | | | $30.38 |
Institutional Class Shares
| | | | | | |
Net assets applicable to shares outstanding | | | $289,816,022 | | | $— |
Shares issued and outstanding [unlimited number of shares (par value $0.01) authorized] | | | 5,345,498 | | | — |
Net asset value, offering and redemption price per share | | | $54.22 | | | $— |
COMPONENTS OF NET ASSETS
| | | | | | |
Paid-in capital | | | $210,160,891 | | | $27,617,590 |
Total distributable earnings | | | 103,318,536 | | | 7,536,548 |
Net assets | | | $313,479,427 | | | $35,154,138 |
| | | | | | | |
The accompanying notes are an integral part of these financial statements.
TABLE OF CONTENTS
Poplar Forest Funds
STATEMENTS OF OPERATIONS
For the Year Ended September 30, 2024
| | | | | | | |
INVESTMENT INCOME
| | | | | | |
Income | | | | | | |
Dividends | | | $8,434,219 | | | $569,199 |
Interest | | | 709,319 | | | 626,010 |
Total income | | | 9,143,538 | | | 1,195,209 |
Expenses
| | | | | | |
Advisory fees (Note 4) | | | 2,578,841 | | | 267,008 |
Administration and fund accounting fees (Note 4) | | | 274,219 | | | 98,796 |
Transfer agent fees and expenses (Note 4) | | | 144,639 | | | 22,967 |
Sub-transfer agent fees (Note 4) | | | 80,710 | | | 822 |
12b-1 fees - Class A shares (Note 5) | | | 59,303 | | | — |
Registration fees | | | 35,356 | | | 8,788 |
Custody fees (Note 4) | | | 34,556 | | | 5,850 |
Audit fees | | | 22,499 | | | 21,001 |
Printing and mailing expense | | | 18,791 | | | 4,748 |
Trustees fees and expenses | | | 17,137 | | | 17,138 |
Chief Compliance Officer fee (Note 4) | | | 12,500 | | | 12,500 |
Insurance expense | | | 8,404 | | | 3,574 |
Legal fees | | | 7,874 | | | 7,874 |
Miscellaneous | | | 30,903 | | | 7,213 |
Total expenses | | | 3,325,732 | | | 478,279 |
Less: advisory fees waived (Note 4) | | | (335,108) | | | (177,893) |
Net expenses | | | 2,990,624 | | | 300,386 |
Net investment income | | | 6,152,914 | | | 894,823 |
REALIZED AND UNREALIZED GAIN ON INVESTMENTS
| | | | | | |
Net realized gain from investments | | | 23,082,234 | | | 1,419,920 |
Net change in unrealized appreciation/(depreciation) on investments | | | 28,442,435 | | | 3,199,166 |
Net realized and unrealized gain on investments | | | 51,524,669 | | | 4,619,086 |
Net Increase in Net Assets Resulting from Operations | | | $ 57,677,583 | | | $5,513,909 |
| | | | | | | |
The accompanying notes are an integral part of these financial statements.
TABLE OF CONTENTS
Poplar Forest Partners Fund
STATEMENTS OF CHANGES IN NET ASSETS
| | | | |
NET INCREASE IN NET ASSETS FROM:
| | | | | | |
OPERATIONS
| | | | | | |
Net investment income | | | $6,152,914 | | | $6,803,816 |
Net realized gain from investments | | | 23,082,234 | | | 7,661,715 |
Net change in unrealized appreciation/(depreciation) on investments | | | 28,442,435 | | | 8,554,026 |
Net increase in net assets resulting from operations | | | 57,677,583 | | | 23,019,557 |
DIVIDENDS AND DISTRIBUTIONS TO SHAREHOLDERS
| | | | | | |
Net dividends and distributions to shareholders - Class A Shares | | | (854,360) | | | (1,490,955) |
Net dividends and distributions to shareholders - Institutional Class Shares | | | (10,852,184) | | | (18,740,307) |
Total dividends and distributions to shareholders | | | (11,706,544) | | | (20,231,262) |
CAPITAL SHARE TRANSACTIONS
| | | | | | |
Net increase/(decrease) in net assets derived from net change in outstanding shares(a) | | | (22,481,713) | | | (12,650,817) |
Total increase/(decrease) in net assets | | | 23,489,326 | | | (9,862,522) |
NET ASSETS
| | | | | | |
Beginning of year | | | 289,990,101 | | | 299,852,623 |
End of year | | | $ 313,479,427 | | | $289,990,101 |
| | | | | | | |
(a)
| A summary of share transactions is as follows: |
Class A Shares
| | | | | | | |
Shares sold | | | 24,604 | | | $1,238,530 | | | 39,588 | | | $1,959,738 |
Shares issued on reinvestments of distributions | | | 14,489 | | | 692,307 | | | 24,537 | | | 1,225,624 |
Shares redeemed | | | (89,488) | | | (4,530,898) | | | (83,934) | | | (4,111,423) |
Net increase/(decrease) | | | (50,395) | | | $(2,600,061) | | | (19,809) | | | $(926,061) |
| | | | | | | | | | | | | |
Institutional Class Shares
| | | | | | | |
Shares sold | | | 424,030 | | | $21,537,528 | | | 996,167 | | | $49,799,303 |
Shares issued on reinvestments of distributions | | | 163,247 | | | 7,799,939 | | | 267,033 | | | 13,340,977 |
Shares redeemed | | | (968,033) | | | (49,219,119) | | | (1,526,866) | | | (74,865,036) |
Net increase/(decrease) | | | (380,756) | | | $(19,881,652) | | | (263,666) | | | $(11,724,756) |
| | | | | | | | | | | | | |
The accompanying notes are an integral part of these financial statements.
TABLE OF CONTENTS
Poplar Forest CORNERSTONE Fund
STATEMENTS OF CHANGES IN NET ASSETS (Continued)
| | | | |
NET INCREASE/(DECREASE) IN NET ASSETS FROM:
| | | | | | |
OPERATIONS
| | | | | | |
Net investment income | | | $894,823 | | | $746,234 |
Net realized gain from investments | | | 1,419,920 | | | 503,400 |
Net change in unrealized appreciation/(depreciation) on investments | | | 3,199,166 | | | 799,623 |
Net increase in net assets resulting from operations | | | 5,513,909 | | | 2,049,257 |
DIVIDENDS AND DISTRIBUTIONS TO SHAREHOLDERS
| | | | | | |
Net dividends and distributions to shareholders - Investor Class Shares | | | (1,348,373) | | | (2,422,156) |
Total dividends and distributions to shareholders | | | (1,348,373) | | | (2,422,156) |
CAPITAL SHARE TRANSACTIONS
| | | | | | |
Net increase in net assets derived from net change in outstanding shares(a) | | | 267,918 | | | 2,987,055 |
Total increase in net assets | | | 4,433,454 | | | 2,614,156 |
NET ASSETS | | | | | | |
Beginning of year | | | 30,720,684 | | | 28,106,528 |
End of year | | | $ 35,154,138 | | | $30,720,684 |
| | | | | | | |
(a)
| A summary of share transactions is as follows: |
Investor Class Shares
| | | | | | | |
Shares sold | | | 8,947 | | | $266,876 | | | 70,046 | | | $1,974,059 |
Shares issued on reinvestments of distributions | | | 48,473 | | | 1,315,060 | | | 85,138 | | | 2,355,782 |
Shares redeemed | | | (45,640) | | | (1,314,018) | | | (47,594) | | | (1,342,786) |
Net increase | | | 11,780 | | | $267,918 | | | 107,590 | | | $2,987,055 |
| | | | | | | | | | | | | |
The accompanying notes are an integral part of these financial statements.
TABLE OF CONTENTS
Poplar Forest Partners Fund
FINANCIAL HIGHLIGHTS
Class A Shares
For a share outstanding throughout each year
| | | | |
Net asset value, beginning of year | | | $46.57 | | | $46.07 | | | $55.97 | | | $35.69 | | | $42.22 |
Income from investment operations:
| | | | | | | | | | | | | | | |
Net investment income^ | | | 0.89 | | | 0.90 | | | 0.69 | | | 0.74 | | | 0.74 |
Net realized and unrealized gain/(loss) on investments | | | 8.45 | | | 2.54 | | | (3.18) | | | 20.48 | | | (6.65) |
Total from investment operations | | | 9.34 | | | 3.44 | | | (2.49) | | | 21.22 | | | (5.91) |
Less distributions:
| | | | | | | | | | | | | | | |
From net investment income | | | (1.06) | | | (0.50) | | | (0.94) | | | (0.94) | | | (0.62) |
From net realized gain on investments | | | (0.75) | | | (2.44) | | | (6.47) | | | — | | | — |
Total distributions | | | (1.81) | | | (2.94) | | | (7.41) | | | (0.94) | | | (0.62) |
Net asset value, end of year | | | $54.10 | | | $46.57 | | | $46.07 | | | $55.97 | | | $35.69 |
Total return | | | 20.59% | | | 7.05% | | | −5.68% | | | 60.26% | | | −14.27% |
Ratios/supplemental data:
| | | | | | | | | | | | | | | |
Net assets, end of year (thousands) | | | $23,663 | | | $22,717 | | | $23,387 | | | $24,098 | | | $16,840 |
Ratio of expenses to average net assets:
| | | | | | | | | | | | | | | |
Before fee waiver | | | 1.31% | | | 1.30% | | | 1.29% | | | 1.34% | | | 1.43% |
After fee waiver | | | 1.20% | | | 1.20% | | | 1.20% | | | 1.21% | | | 1.25% |
Ratio of net investment income to average net assets:
| | | | | | | | | | | | | | | |
Before fee waiver | | | 1.64% | | | 1.73% | | | 1.21% | | | 1.35% | | | 1.75% |
After fee waiver | | | 1.75% | | | 1.83% | | | 1.30% | | | 1.48% | | | 1.93% |
Portfolio turnover rate | | | 27.75% | | | 35.12% | | | 30.29% | | | 40.94% | | | 40.35% |
| | | | | | | | | | | | | | | | |
^
| Based on average shares outstanding. |
The accompanying notes are an integral part of these financial statements.
TABLE OF CONTENTS
Poplar Forest Partners Fund
FINANCIAL HIGHLIGHTS
Institutional Class
For a share outstanding throughout each year
| | | | |
Net asset value, beginning of year | | | $46.68 | | | $46.16 | | | $56.07 | | | $35.75 | | | $42.29 |
Income from investment operations:
| | | | | | | | | | | | | | | |
Net investment income^ | | | 1.02 | | | 1.03 | | | 0.83 | | | 0.86 | | | 0.84 |
Net realized and unrealized gain/(loss) on investments | | | 8.46 | | | 2.55 | | | (3.19) | | | 20.50 | | | (6.65) |
Total from investment operations | | | 9.48 | | | 3.58 | | | (2.36) | | | 21.36 | | | (5.81) |
Less distributions:
| | | | | | | | | | | | | | | |
From net investment income | | | (1.19) | | | (0.62) | | | (1.08) | | | (1.04) | | | (0.73) |
From net realized gain on investments | | | (0.75) | | | (2.44) | | | (6.47) | | | — | | | — |
Total distributions | | | (1.94) | | | (3.06) | | | (7.55) | | | (1.04) | | | (0.73) |
Net asset value, end of year | | | $54.22 | | | $46.68 | | | $46.16 | | | $56.07 | | | $35.75 |
Total return | | | 20.89% | | | 7.32% | | | −5.43% | | | 60.63% | | | −14.03% |
Ratios/supplemental data:
| | | | | | | | | | | | | | | |
Net assets, end of year (thousands) | | | $289,816 | | | $267,273 | | | $276,465 | | | $289,502 | | | $192,576 |
Ratio of expenses to average net assets:
| | | | | | | | | | | | | | | |
Before fee waiver | | | 1.06% | | | 1.05% | | | 1.04% | | | 1.09% | | | 1.18% |
After fee waiver | | | 0.95% | | | 0.95% | | | 0.95% | | | 0.96% | | | 1.00% |
Ratio of net investment income to average net assets:
| | | | | | | | | | | | | | | |
Before fee waiver | | | 1.89% | | | 1.98% | | | 1.46% | | | 1.59% | | | 2.00% |
After fee waiver | | | 2.00% | | | 2.08% | | | 1.55% | | | 1.72% | | | 2.18% |
Portfolio turnover rate | | | 27.75% | | | 35.12% | | | 30.29% | | | 40.94% | | | 40.35% |
| | | | | | | | | | | | | | | | |
^
| Based on average shares outstanding. |
The accompanying notes are an integral part of these financial statements.
TABLE OF CONTENTS
Poplar Forest CORNERSTONE Fund
FINANCIAL HIGHLIGHTS
Investor Shares
For a share outstanding throughout each year
| | | | |
Net asset value, beginning of year | | | $26.82 | | | $27.08 | | | $32.49 | | | $22.76 | | | $25.58 |
Income from investment operations:
| | | | | | | | | | | | | | | |
Net investment income^ | | | 0.77 | | | 0.66 | | | 0.54 | | | 0.60 | | | 0.45 |
Net realized and unrealized gain/(loss) on investments | | | 3.97 | | | 1.43 | | | (2.03) | | | 9.64 | | | (2.11) |
Total from investment operations | | | 4.74 | | | 2.09 | | | (1.49) | | | 10.24 | | | (1.66) |
Less distributions:
| | | | | | | | | | | | | | | |
From net investment income | | | (0.79) | | | (0.45) | | | (0.72) | | | (0.51) | | | (0.34) |
From net realized gain on investments | | | (0.39) | | | (1.90) | | | (3.20) | | | — | | | (0.82) |
Total distributions | | | (1.18) | | | (2.35) | | | (3.92) | | | (0.51) | | | (1.16) |
Net asset value, end of year | | | $30.38 | | | $26.82 | | | $27.08 | | | $32.49 | | | $22.76 |
Total return | | | 18.20% | | | 7.46% | | | −5.60% | | | 45.53% | | | −6.89% |
Ratios/supplemental data:
| | | | | | | | | | | | | | | |
Net assets, end of year (thousands) | | | $35,154 | | | $30,721 | | | $28,107 | | | $29,443 | | | $22,084 |
Ratio of expenses to average net assets:
| | | | | | | | | | | | | | | |
Before fee waiver | | | 1.43% | | | 1.45% | | | 1.44% | | | 1.53%# | | | 1.76% |
After fee waiver | | | 0.90% | | | 0.90% | | | 0.90% | | | 0.90%# | | | 0.90% |
Ratio of net investment income to average net assets:
| | | | | | | | | | | | | | | |
Before fee waiver | | | 2.15% | | | 1.83% | | | 1.22% | | | 1.38% | | | 1.05% |
After fee waiver | | | 2.68% | | | 2.38% | | | 1.76% | | | 2.01% | | | 1.91% |
Portfolio turnover rate | | | 30.74% | | | 36.43% | | | 29.73% | | | 36.13% | | | 39.97% |
| | | | | | | | | | | | | | | | |
^
| Based on average shares outstanding.
|
#
| Includes expenses of Class A Shares which converted to Investor Class Shares on October 30, 2020. |
The accompanying notes are an integral part of these financial statements.
TABLE OF CONTENTS
Poplar Forest Funds
NOTES TO FINANCIAL STATEMENTS
at September 30, 2024
NOTE 1 – ORGANIZATION
The Poplar Forest Partners Fund (the “Partners Fund”) and the Poplar Forest Cornerstone Fund (“Cornerstone Fund”), (each, a “Fund” and collectively, the “Funds”) are diversified series of Advisors Series Trust (the “Trust”), which is registered under the Investment Company Act of 1940, as amended, (the “1940 Act”) as an open-end management investment company. Each Fund is an investment company and accordingly follows the investment company accounting and reporting guidance of the Financial Accounting Standards Board (FASB) Accounting Standard Codification Topic 946 “Financial Services – Investment Companies.”
The investment objective of the Partners Fund is to seek long-term growth of capital. The investment objective of the Cornerstone Fund is to seek to achieve current income and long-term growth of capital. The Partners Fund currently offers Class A shares and Institutional Class shares. The Cornerstone Fund currently offers Investor Class shares. Class A shares are subject to a maximum front-end sales load of 5.00%, which decreases depending on the amount invested. The Partner Fund’s Class A shares and Institutional Class shares commenced operations on December 31, 2009.
The Cornerstone Fund’s Class A shares and Institutional Class shares commenced operations on December 31, 2014. At the close of business on October 30, 2020, the Cornerstone Fund’s Class A shares converted to the Institutional Class shares. On January 28, 2021, the class name changed from Institutional Class to Investor Class.
NOTE 2 – SIGNIFICANT ACCOUNTING POLICIES
The following is a summary of significant accounting policies consistently followed by the Funds. These policies are in conformity with accounting principles generally accepted in the United States of America.
A.
| Security Valuation: All investments in securities are recorded at their estimated fair value, as described in Note 3. |
B.
| Federal Income Taxes: It is the Funds’ policy to comply with the requirements of Subchapter M of the Internal Revenue Code applicable to regulated investment companies and to distribute substantially all of its taxable income to its shareholders. Therefore, no Federal income or excise tax provision is required. |
The Funds recognize the tax benefits of uncertain tax positions only where the position is “more likely than not” to be sustained assuming examination by tax authorities. The tax returns of the Funds’ prior three fiscal years are open for examination. Management has reviewed all open tax years in major jurisdictions and concluded that there is no impact on the Funds’ net assets and no tax liability resulting from unrecognized tax events relating to uncertain income tax positions taken or expected to be taken on a tax return. The Funds identify their major tax jurisdictions as U.S. Federal and the state of Wisconsin. The Funds are not aware of any tax positions for which it is reasonably possible that the total amounts of unrecognized tax benefits will change materially in the next twelve months.
C.
| Security Transactions, Income and Distributions: Security transactions are accounted for on the trade date. Realized gains and losses on securities sold are calculated on the basis of specific cost. Interest income is recorded on an accrual basis. Discounts and premiums on securities purchased are accreted/amortized over the life of the respective security using the effective interest method, except for premiums on certain callable debt securities that are amortized to the earliest call date. Dividend income, income and capital gain distributions from underlying funds, and distributions to shareholders are recorded on the ex-dividend date. Withholding taxes on foreign dividends have been provided for in accordance with the Funds’ understanding of the applicable country’s tax rules and rates. |
Investment income, expenses (other than those specific to the class of shares), and realized and unrealized gains and losses on investments are allocated to the separate classes of each Fund based upon their relative net assets on the date income is earned or expensed and realized and unrealized gains and losses are incurred.
Each Fund is charged for those expenses that are directly attributable to the Fund, such as investment advisory, custody and transfer agent fees. Expenses that are not attributable to a Fund are typically allocated among the Funds in proportion to their respective net assets. Common expenses of the Trust are typically allocated among the funds in the Trust based on a fund’s respective net assets, or by other equitable means.
TABLE OF CONTENTS
Poplar Forest Funds
NOTES TO FINANCIAL STATEMENTS
at September 30, 2024(Continued)
The Funds distribute substantially all net investment income, if any, and net realized gains, if any, annually. Distributions from net realized gains for book purposes may include short-term capital gains. All short-term capital gains are included in ordinary income for tax purposes.
The amount of dividends and distributions to shareholders from net investment income and net realized capital gains is determined in accordance with Federal income tax regulations which differ from accounting principles generally accepted in the United States of America. To the extent these book/tax differences are permanent, such amounts are reclassified within the capital accounts based on their Federal tax treatment.
D.
| Reclassification of Capital Accounts: Accounting principles generally accepted in the United States of America require that certain components of net assets relating to permanent differences be reclassified between financial and tax reporting. These reclassifications have no effect on net assets or net asset value per share. |
For the year ended September 30, 2024, the Funds made the following permanent tax adjustments on the statements of assets and liabilities:
| | | | | | | |
Partners Fund | | | $(2,084,833) | | | $2,084,833 |
Cornerstone Fund | | | $(34,935) | | | $34,935 |
| | | | | | | |
E.
| Use of Estimates: The preparation of financial statements in conformity with accounting principles generally accepted in the United States of America requires management to make estimates and assumptions that affect the reported amounts of assets and liabilities at the date of the financial statements and the reported amounts of increases and decreases in net assets during the reporting period. Actual results could differ from those estimates. |
F.
| Events Subsequent to the Fiscal Year End: In preparing the financial statements as of September 30, 2024, management considered the impact of subsequent events for potential recognition or disclosure in the financial statements. Management has determined there were no subsequent events that would need to be disclosed in the Funds’ financial statements. |
NOTE 3 – SECURITIES VALUATION
The Funds have adopted authoritative fair value accounting standards which establish an authoritative definition of fair value and set out a hierarchy for measuring fair value. These standards require additional disclosures about the various inputs and valuation techniques used to develop the measurements of fair value, a discussion in changes in valuation techniques and related inputs during the period and expanded disclosure of valuation levels for major security types. These inputs are summarized in the three broad levels listed below:
Level 1 –
Unadjusted quoted prices in active markets for identical assets or liabilities that the Funds have the ability to access.
Level 2 –
Observable inputs other than quoted prices included in level 1 that are observable for the asset or liability, either directly or indirectly. These inputs may include quoted prices for the identical instrument on an inactive market, prices for similar instruments, interest rates, prepayment speeds, credit risk, yield curves, default rates and similar data.
Level 3 –
Unobservable inputs for the asset or liability, to the extent relevant observable inputs are not available, representing each Fund’s own assumptions about the assumptions a market participant would use in valuing the asset or liability, and would be based on the best information available.
Following is a description of the valuation techniques applied to the Funds’ major categories of assets and liabilities measured at fair value on a recurring basis.
Each Fund determines the fair value of its investments and computes its net asset value per share as of the close of regular trading on the New York Stock Exchange (4:00 pm EST).
TABLE OF CONTENTS
Poplar Forest Funds
NOTES TO FINANCIAL STATEMENTS
at September 30, 2024(Continued)
Equity Securities: The Funds’ investments are carried at fair value. Equity securities that are primarily traded on a national securities exchange shall be valued at the last sale price on the exchange on which they are primarily traded on the day of valuation or, if there has been no sale on such day, at the mean between the bid and asked prices. Securities primarily traded in the NASDAQ Global Market System for which market quotations are readily available shall be valued using the NASDAQ Official Closing Price (“NOCP”). If the NOCP is not available, such securities shall be valued at the last sale price on the day of valuation, or if there has been no sale on such day, at the mean between the bid and asked prices. Over-the-counter (“OTC”) securities which are not traded in the NASDAQ Global Market System shall be valued at the most recent sales price. To the extent these securities are actively traded and valuation adjustments are not applied, they are categorized in level 1 of the fair value hierarchy.
Investment Companies: Investments in open-end mutual funds, including money market funds, are generally priced at their net asset value per share provided by the service agent of the funds and will be classified in level 1 of the fair value hierarchy.
Debt Securities: Debt securities are valued at the mean of the bid and asked prices furnished by an independent pricing service using valuation methods that are designed to represent fair value. These valuation methods can include matrix pricing and other analytical pricing models, market transactions, and dealer-supplied valuations. The pricing service may consider recently executed transactions in securities of the issuer or comparable issuers, market price quotations (where observable), bond spreads, and fundamental data relating to the issuer. Most debt securities are categorized in level 2 of the fair value hierarchy.
Short-Term Securities: Short-term debt securities, including those securities having a maturity of 60 days or less, are valued at the evaluated mean between the bid and asked prices. To the extent the inputs are observable and timely, these securities would be classified in level 2 of the fair value hierarchy.
The Board of Trustees (the “Board”) has adopted a valuation policy for use by the Funds and its Valuation Designee (as defined below) in calculating each Fund’s net asset value (“NAV”). Pursuant to Rule 2a-5 under the 1940 Act, the Board has designated the Funds’ investment adviser, Poplar Forest Capital, LLC (“Adviser”), as the “Valuation Designee” to perform all of the fair value determinations as well as to perform all of the responsibilities that may be performed by the Valuation Designee in accordance with Rule 2a-5, subject to the Board’s oversight. The Adviser, as Valuation Designee, is authorized to make all necessary determinations of the fair values of portfolio securities and other assets for which market quotations are not readily available or if it is deemed that the prices obtained from brokers and dealers or independent pricing services are unreliable.
Depending on the relative significance of the valuation inputs, fair valued securities may be classified in either level 2 or level 3 of the fair value hierarchy.
The inputs or methodology used for valuing securities are not an indication of the risk associated with investing in those securities. The following is a summary of the inputs used to value the Funds’ securities as of September 30, 2024:
Poplar Partners
| | | | | | | | | | | | | |
Investments:
| | | | | | | | | | | | |
Common Stocks | | | $296,339,709 | | | $— | | | $ — | | | $296,339,709 |
Real Estate Investment Trusts | | | 5,406,000 | | | — | | | — | | | 5,406,000 |
Money Market Funds | | | 8,439,706 | | | — | | | — | | | 8,439,706 |
U.S. Treasury Bills | | | — | | | 3,205,127 | | | — | | | 3,205,127 |
Total Investments | | | $310,185,415 | | | $3,205,127 | | | $— | | | $313,390,542 |
| | | | | | | | | | | | | |
TABLE OF CONTENTS
Poplar Forest Funds
NOTES TO FINANCIAL STATEMENTS
at September 30, 2024(Continued)
Poplar Cornerstone
| | | | | | | | | | | | | |
Investments:
| | | | | | | | | | | | |
Common Stocks | | | $20,410,965 | | | $— | | | $ — | | | $20,410,965 |
U.S. Treasury Note | | | — | | | 6,197,597 | | | — | | | 6,197,597 |
Corporate Bonds | | | — | | | 4,584,164 | | | — | | | 4,584,164 |
U.S. Government Agency Issues | | | — | | | 850,224 | | | — | | | 850,224 |
Preferred Stocks | | | — | | | 620,993 | | | — | | | 620,993 |
Real Estate Investment Trusts | | | 351,390 | | | — | | | — | | | 351,390 |
Money Market Funds | | | 414,692 | | | — | | | — | | | 414,692 |
U.S. Treasury Bills | | | — | | | 1,708,103 | | | — | | | 1,708,103 |
Total Investments | | | $21,177,047 | | | $13,961,081 | | | $— | | | $35,138,128 |
| | | | | | | | | | | | | |
Refer to the Funds’ schedules of investments for a detailed break-out of securities by industry classification.
The Trust Rule 18f-4 Compliance Policy (“Trust Policy”) governs the use of derivatives by the Funds. The Trust Policy imposes limits on the amount of derivatives a fund can enter into, eliminates the asset segregation framework currently used by a fund to comply with Section 18 of the 1940 Act, treats derivatives as senior securities and requires funds whose use of derivatives is more than a limited specified exposure amount to establish and maintain a comprehensive derivatives risk management program and appoint a derivatives risk manager. Each Fund is considered a limited derivatives user under the Trust Policy and therefore, is required to limit its derivatives exposure to no more than 10% of each Fund’s net assets. For the year ended September 30, 2024, the Funds did not enter into derivatives transactions.
In June 2022, FASB issued Accounting Standards Update 2022-03, which amends Fair Value Measurement (Topic 820): Fair Value Measurement of Equity Securities Subject to Contractual Sale Restrictions (“ASU 2022-03”). ASU 2022-03 clarifies guidance for fair value measurement of an equity security subject to a contractual sale restriction and establishes new disclosure requirements for such equity securities. ASU 2022-03 is effective for fiscal years beginning after December 15, 2023 and for interim periods within those fiscal years, with early adoption permitted. Management is currently evaluating the impact of these amendments on the Funds’ financial statements.
In October 2022, the Securities and Exchange Commission (the “SEC”) adopted a final rule relating to Tailored Shareholder Reports for Mutual Funds and Exchange-Traded Funds; Fee Information in Investment Company Advertisements. The rule and form amendments will, among other things, require the Fund to transmit concise and visually engaging shareholder reports that highlight key information. The amendments will require that funds tag information in a structured data format and that certain more in-depth information be made available online and available for delivery free of charge to investors on request. The amendments became effective January 24, 2023. The Funds have implemented these requirements as of the compliance date of July 24, 2024.
NOTE 4 – INVESTMENT ADVISORY FEE AND OTHER TRANSACTIONS WITH AFFILIATES
The Adviser provides the Funds with investment management services under an investment advisory agreement. The Adviser furnishes all investment advice, office space, facilities, and provides most of the personnel needed by the Funds. As compensation for its services, each Fund pays the Adviser a monthly management fee. For the Partners Fund, the fees are calculated at an annual rate of 0.85% of average daily net assets for the first $250 million of assets, 0.775% of the Fund’s average daily net assets for the next $750 million of assets, and 0.70% of the Fund’s average daily net assets in excess of $1 billion. For the Cornerstone Fund, the fees are calculated at an annual rate of 0.80% of average daily net assets for the first $250 million of assets, 0.70% of the Fund’s average daily net assets for the next $750 million of assets, and 0.60% of the Fund’s average daily net assets in excess of $1 billion. For the year ended September 30, 2024, the advisory fees incurred by the Funds are disclosed in the statement of operations. Any amount due from the Adviser is paid monthly to the Funds.
The Funds are responsible for their own operating expenses. The Adviser has contractually agreed to reduce fees payable to it by the Funds and to pay Fund operating expenses (excluding acquired fund fees and expenses, interest
TABLE OF CONTENTS
Poplar Forest Funds
NOTES TO FINANCIAL STATEMENTS
at September 30, 2024(Continued)
expense, taxes, extraordinary expenses, Rule 12b-1 fees, shareholder servicing fees, and other class-specific expenses) to the extent necessary to limit each Fund’s aggregate annual operating expenses as a percent of average daily net assets as follows:
| | | | |
Partners Fund | | | 0.95% |
Cornerstone Fund | | | 0.90% |
| | | | |
Any such reduction made by the Adviser in its fees or payment of expenses which are a Fund’s obligation are subject to reimbursement by the Fund to the Adviser, if so requested by the Adviser, in any subsequent month in the 36-month period from the date of the management fee reduction and expense payment if the aggregate amount actually paid by the Fund toward the operating expenses for such fiscal year (taking into account the reimbursement) will not cause the Fund to exceed the lesser of (1) the expense limitation in place at the time of the management fee reduction and expense payment; or (2) the expense limitation in place at the time of the reimbursement. Any such reimbursement is also contingent upon Board of Trustees review and approval. Such reimbursement may not be paid prior to the Funds’ payment of current ordinary operating expenses. For the year ended September 30, 2024, the Adviser reduced its fees in the amount of $335,108 and $177,893 in the Partners Fund and the Cornerstone Fund, respectively. No amounts were recouped by the Adviser. The expense limitation will remain in effect through at least January 28, 2025, and may be terminated only by the Trust’s Board of Trustees. The Adviser may recapture portions of the amounts shown below no later than the corresponding dates:
| | | | | | | | | | | | | |
Partners Fund | | | $295,589 | | | $322,385 | | | $335,108 | | | $953,082 |
Cornerstone Fund | | | $168,782 | | | $172,569 | | | $177,893 | | | $519,244 |
| | | | | | | | | | | | | |
U.S. Bancorp Fund Services, LLC, doing business as U.S. Bank Global Fund Services (“Fund Services”) serves as the Funds’ administrator, fund accountant and transfer agent. U.S. Bank N.A. serves as custodian (the “Custodian”) to the Funds. The Custodian is an affiliate of Fund Services. Fund Services maintains the Funds’ books and records, calculates the Funds’ NAV, prepares various federal and state regulatory filings, coordinates the payment of fund expenses, reviews expense accruals and prepares materials supplied to the Board of Trustees. The officers of the Trust, including the Chief Compliance Officer, are employees of Fund Services. Fees paid by the Funds for administration and accounting, transfer agency, custody and compliance services for the year ended September 30, 2024, are disclosed in the statement of operations.
Quasar Distributors, LLC (“Quasar” or the “Distributor”) acts as the Funds’ principal underwriter in a continuous public offering of the Funds’ shares. Quasar is a wholly-owned subsidiary of Foreside Financial Group, LLC, doing business as ACA Group.
The Funds have entered into agreements with various brokers, dealers, and financial intermediaries in connection with the sale of shares of the Funds. The agreements provide for periodic payments by the Funds to the brokers, dealers, and financial intermediaries for providing certain shareholder maintenance services (sub-transfer agent fees). These shareholder services include the pre-processing and quality control of new accounts, shareholder correspondence, answering customer inquiries regarding account status, and facilitating shareholder telephone transactions. The sub-transfer agent fees expensed by the Funds during the year ended September 30, 2024 are included in the statement of operations.
NOTE 5 – DISTRIBUTION AGREEMENT AND PLAN
The Funds have adopted a Distribution Plan pursuant to Rule 12b-1 (the “Plan”). The Plan permits the Partners Fund to pay the Distributor for distribution and related expenses at an annual rate of up to 0.25% of the average daily net assets of the Fund’s Class A shares. The expenses covered by the Plan may include the cost in connection with the promotion and distribution of shares and the provision of personal services to shareholders, including, but not necessarily limited to, advertising, compensation to underwriters, dealers and selling personnel, the printing and mailing of prospectuses to other than current Fund shareholders, and the printing and mailing of sales literature. Payments made pursuant to the Plan will represent compensation for distribution and service activities, not
TABLE OF CONTENTS
Poplar Forest Funds
NOTES TO FINANCIAL STATEMENTS
at September 30, 2024(Continued)
reimbursements for specific expenses incurred. The 12b-1 fees accrued by the Fund’s Class A shares for the year ended September 30, 2024 are disclosed in the statement of operations.
NOTE 6 – PURCHASES AND SALES OF SECURITIES
For the year ended September 30, 2024, the cost of purchases and the proceeds from sales of securities, excluding short-term securities, were as follows.
| | | | | | | |
Partners Fund | | | $— | | | $82,078,054 | | | $— | | | $108,969,626 |
Cornerstone Fund | | | 3,453,686 | | | 5,933,478 | | | 2,655,043 | | | 7,292,040 |
| | | | | | | | | | | | | |
NOTE 7 – LINES OF CREDIT
The Partners Fund and the Cornerstone Fund have secured lines of credit in the amount of $45,000,000 and $4,000,000, respectively. Borrowing on each line of credit is limited to the lower of 15% of portfolio market value or 33.33% of unencumbered assets. These lines of credit are intended to provide short-term financing, if necessary, subject to certain restrictions, in connection with shareholder redemptions. The credit facility is with the Funds’ custodian, U.S. Bank N.A. During the year ended September 30, 2024, the Funds did not draw upon their lines of credit. At September 30, 2024, the Funds had no outstanding loan amounts.
NOTE 8 – INCOME TAXES AND DISTRIBUTIONS TO SHAREHOLDERS
The tax character of distributions paid by the Funds during the years ended September 30, 2024 and September 30, 2023 was as follows:
Partners Fund
| | | | |
Ordinary income | | | $7,143,791 | | | $4,025,828 |
Long-term capital gains | | | 4,562,753 | | | 16,205,434 |
| | | | | | | |
Cornerstone Fund
| | | | |
Ordinary income | | | $903,418 | | | $461,847 |
Long-term capital gains | | | 444,955 | | | 1,960,309 |
| | | | | | | |
As of September 30, 2024, the components of capital on a tax basis were as follows:
| | | | | | | |
Cost of investments(a) | | | $236,491,988 | | | $29,652,755 |
Gross unrealized appreciation | | | 84,716,631 | | | 6,190,748 |
Gross unrealized depreciation | | | (7,818,077) | | | (705,375) |
Net unrealized appreciation(a) | | | 76,898,554 | | | 5,485,373 |
Undistributed ordinary income | | | 5,751,331 | | | 757,300 |
Undistributed long-term capital gains | | | 20,668,651 | | | 1,293,875 |
Total distributable earnings | | | 26,419,982 | | | 2,051,175 |
Other accumulated gains/(losses) | | | — | | | — |
Total accumulated earnings/(losses) | | | $103,318,536 | | | $7,536,548 |
| | | | | | | |
(a)
| The difference between book-basis and tax-basis cost and net unrealized appreciation is attributable primarily to the tax deferral of losses on wash sale adjustments and tax adjustments related to a transfer in-kind. |
TABLE OF CONTENTS
Poplar Forest Funds
NOTES TO FINANCIAL STATEMENTS
at September 30, 2024(Continued)
NOTE 9 – PRINCIPAL RISKS
Below is a summary of some, but not all, of the principal risks of investing in the Funds, each of which may adversely affect a Fund’s net asset value and total return. The Funds’ most recent prospectus provides further descriptions of each Fund’s investment objective, principal investment strategies and principal risks.
General Market Risk – Economies and financial markets throughout the world are becoming increasingly interconnected, which increases the likelihood that events or conditions in one country or region will adversely impact markets or issuers in other countries or regions. Securities in each Fund’s portfolio may underperform in comparison to securities in general financial markets, a particular financial market or other asset classes due to a number of factors, including: inflation (or expectations for inflation); interest rates; global demand for particular products or resources; natural disasters or events; pandemic diseases; terrorism; regulatory events; and government controls. U.S. and international markets have experienced significant periods of volatility in recent years and months due to a number of economic, political and global macro factors, which has resulted in disruptions to business operations and supply chains, stress on the global healthcare system, growth concerns in the U.S. and overseas, staffing shortages and the inability to meet consumer demand, and widespread concern and uncertainty. Continuing uncertainties regarding interest rates, rising inflation, political events, rising government debt in the U.S. and trade tensions also contribute to market volatility. Conflict, loss of life and disaster connected to ongoing armed conflict between Ukraine and Russia in Europe and Israel and Hamas in the Middle East could have severe adverse effects on the region, including significant adverse effects on the regional or global economies and the markets for certain securities. The U.S. and the European Union imposed sanctions on certain Russian individuals and companies, including certain financial institutions, and have limited certain exports and imports to and from Russia. The war has contributed to recent market volatility and may continue to do so.
Value-Style Investing Risk (Both Funds) – Value stocks can perform differently from the market as a whole and from other types of stocks. Value stocks may be purchased based upon the belief that a given security may be out of favor; that belief may be misplaced or the security may stay out of favor for an extended period of time.
Debt Securities Risk (Both Funds) – The following risks are associated with the Funds’ investment in debt securities.
| • | Prepayment and Extension Risk. The risk that the securities may be paid off earlier or later than expected. Either situation could cause securities to pay lower-than-market rates of interest, which could hurt the Fund’s yield or share price. |
| • | Interest Rate Risk. The Funds’ investments in fixed income securities will change in value based on changes in interest rates. If rates increase, the value of these investments generally declines. Securities with greater interest rate sensitivity and longer maturities generally are subject to greater fluctuations in value. |
| • | Credit Risk. The risk of loss on an investment due to the deterioration of an issuer’s financial strength. Such a deterioration of financial strength may result in a reduction of the credit rating of the issuer’s securities and may lead to the issuer’s inability to honor its contractual obligations, including making timely payment of interest and principal. |
| • | High-Yield Securities Risk. Debt securities that are rated below investment grade (i.e., “junk bonds”) are subject to additional risk factors due to the speculative nature of these securities, such as increased possibility of default liquidation of the security, and changes in value based on public perception of the issuer. |
Large-Sized Companies Risk (Partners Fund) – Larger, more established companies may be unable to respond quickly to new competitive challenges like changes in consumer tastes or innovative smaller competitors. In addition, large-cap companies are sometimes unable to attain the high growth rates of successful, smaller companies, especially during extended periods of economic expansion.
Medium-Sized Companies Risk (Both Funds) – Investing in securities of medium-sized companies may involve greater risk than investing in larger, more established companies because they can be subject to greater share price volatility than larger, more established companies.
TABLE OF CONTENTS
Poplar Forest Funds
NOTES TO FINANCIAL STATEMENTS
at September 30, 2024(Continued)
NOTE 10 – CONTROL OWNERSHIP
The beneficial ownership, either directly or indirectly of more than 25% of the voting securities of a Fund creates a presumption of control of the Fund, under Section 2(a)(9) of the 1940 Act. The following table reflects shareholders that maintain accounts of more than 25% of the voting securities of a Fund as of September 30, 2024:
| | | | | | | |
Cornerstone Fund | | | Charles Schwab & Co. | | | 48.51% |
Cornerstone Fund | | | The Kirby Jones Foundation Delaware | | | 26.44% |
| | | | | | | |
NOTE 11 – OFFICERS
Effective June 6, 2024, Ms. Cheryl King retired from her service as Assistant Treasurer of the Trust.
NOTE 12 – REPORT OF THE FUNDS’ SPECIAL SHAREHOLDER MEETING (Unaudited)
At the board meeting held on June 27, 2024, the Board of Trustees (the “Board”) nominated two new Independent Trustees, Anne Kritzmire and Craig Wainscott, as well as one current Independent Trustee, Michele Rackey for election and appointment by shareholders of the Trust. At a special shareholder meeting held on August 27, 2024, shareholders voted to elect and appoint the three nominees as Independent Trustees to the Board. The vote results were as follows:
| | | | |
610,254,146.13 | | | 422,548,104.53 69.24% |
| | | | |
(1)
| To approve the election of three Trustees to serve until his or her successor is elected and qualified. |
| | | | | | | |
(01) Craig Wainscott | | | 420,753,222.93 | | | 99.58% | | | 68.95% | | | 1,794,881.60 | | | 0.42% | | | 0.29% |
(02) Anne Kritzmire | | | 420,814,806.36 | | | 99.59% | | | 68.96% | | | 1,733,298.17 | | | 0.41% | | | 0.28% |
(03) Michele Rackey | | | 419,476,647.18 | | | 99.27% | | | 68.74% | | | 3,071,457.36 | | | 0.73% | | | 0.50% |
| | | | | | | | | | | | | | | | | | | |
Forty percent of the shares of the Trust entitled to vote, present in person or represented by proxy, constitutes a quorum.
The nominees will be elected as Trustees of the Trust if they receive a plurality of the votes cast by all shares of the Trust to be voted in the aggregate.
TABLE OF CONTENTS
REPORT OF INDEPENDENT REGISTERED PUBLIC ACCOUNTING FIRM
To the Shareholders of
Poplar Forest Partners Fund
Poplar Forest Cornerstone Fund
and Board of Directors
of Advisors Series Trust
Opinion on the Financial Statements
We have audited the accompanying statements of assets and liabilities of the Poplar Forest Partners Fund and the Poplar Forest Cornerstone Fund (the “Funds”), each a series of Advisors Series Trust (the “Trust”), including the schedules of investments, as of September 30, 2024, the related statement of operations for the year then ended, the statements of changes in net assets for each of the two years in the period then ended, and the financial highlights for each of the five years in the period then ended, and the related notes (collectively referred to as the “financial statements”). In our opinion, the financial statements present fairly, in all material respects, the financial position of the Funds as of September 30, 2024, the results of their operations for the year then ended, the changes in their net assets for each of the two years in the period then ended, and their financial highlights for each of the five years in the period then ended, in conformity with accounting principles generally accepted in the United States of America.
Basis for Opinion
These financial statements are the responsibility of the Funds’ management. Our responsibility is to express an opinion on the Funds’ financial statements based on our audits. We are a public accounting firm registered with the Public Company Accounting Oversight Board (United States) (“PCAOB”) and are required to be independent with respect to the Funds in accordance with the U.S. federal securities laws and the applicable rules and regulations of the Securities and Exchange Commission and the PCAOB. We have served as the auditor of one or more of the funds in the Trust since 2003.
We conducted our audits in accordance with the standards of the PCAOB. Those standards require that we plan and perform the audits to obtain reasonable assurance about whether the financial statements are free of material misstatement, whether due to error or fraud. The Funds are not required to have, nor were we engaged to perform, an audit of the Funds’ internal control over financial reporting. As part of our audits we are required to obtain an understanding of internal control over financial reporting, but not for the purpose of expressing an opinion on the effectiveness of the Funds’ internal control over financial reporting. Accordingly, we express no such opinion.
Our audits included performing procedures to assess the risks of material misstatement of the financial statements, whether due to error or fraud, and performing procedures that respond to those risks. Such procedures included examining, on a test basis, evidence regarding the amounts and disclosures in the financial statements. Our audits also included evaluating the accounting principles used and significant estimates made by management, as well as evaluating the overall presentation of the financial statements. Our procedures included confirmation of securities owned as of September 30, 2024 by correspondence with the custodian. We believe that our audits provide a reasonable basis for our opinion.
TAIT, WELLER & BAKER LLP
Philadelphia, Pennsylvania
November 27, 2024
| (b) | Financial Highlights are included within the financial statements filed under Item 7 of this Form. |
Item 8. Changes in and Disagreements with Accountants for Open-End Investment Companies.
There were no changes in or disagreements with accountants during the period covered by this report.
Item 9. Proxy Disclosure for Open-End Investment Companies.
See Item 7(a).
Item 10. Remuneration Paid to Directors, Officers, and Others of Open-End Investment Companies.
See Item 7(a).
Item 11. Statement Regarding Basis for Approval of Investment Advisory Contract.
Not applicable.
Item 12. Disclosure of Proxy Voting Policies and Procedures for Closed-End Management Investment Companies.
Not applicable to open-end investment companies.
Item 13. Portfolio Managers of Closed-End Management Investment Companies.
Not applicable to open-end investment companies.
Item 14. Purchases of Equity Securities by Closed-End Management Investment Company and Affiliated Purchasers.
Not applicable to open-end investment companies.
Item 15. Submission of Matters to a Vote of Security Holders.
There have been no material changes to the procedures by which shareholders may recommend nominees to the Registrant’s Board of Trustees.
Item 16. Controls and Procedures.
| (a) | The Registrant’s President/Chief Executive Officer/Principal Executive Officer and Vice President/Treasurer/Principal Financial Officer have reviewed the Registrant’s disclosure |
controls and procedures (as defined in Rule 30a-3(c) under the Investment Company Act of 1940, as amended, (the “Act”)) as of a date within 90 days of the filing of this report, as required by Rule 30a-3(b) under the Act and Rules 13a-15(b) or 15d-15(b) under the Securities Exchange Act of 1934. Based on their review, such officers have concluded that the disclosure controls and procedures are effective in ensuring that information required to be disclosed in this report is appropriately recorded, processed, summarized and reported and made known to them by others within the Registrant and by the Registrant’s service provider.
| (b) | There were no changes in the Registrant’s internal control over financial reporting (as defined in Rule 30a-3(d) under the Act) that occurred during the period covered by this report that have materially affected, or are reasonably likely to materially affect, the Registrant’s internal control over financial reporting. |
Item 17. Disclosure of Securities Lending Activities for Closed-End Management Investment Companies.
Not applicable to open-end investment companies.
Item 18. Recovery of Erroneously Awarded Compensation.
Not applicable.
Item 19. Exhibits.
(2) Any policy required by the listing standards adopted pursuant to Rule 10D-1 under the Exchange Act (17 CFR 240.10D-1) by the registered national securities exchange or registered national securities association upon which the registrant’s securities are listed. Not applicable.
(3) A separate certification for each principal executive officer and principal financial officer of the registrant as required by Rule 30a-2(a) under the Investment Company Act of 1940 (17 CFR 270.30a-2(a)). Filed herewith.
(4) Any written solicitation to purchase securities under Rule 23c-1 under the Act sent or given during the period covered by the report by or on behalf of the registrant to 10 or more persons. Not applicable.
(5) Change in the registrant’s independent public accountant. Provide the information called for by Item 4 of Form 8-K under the Exchange Act (17 CFR 249.308). Unless otherwise specified by Item 4, or related to and necessary for a complete understanding of information not previously disclosed, the information should relate to events occurring during the reporting period. Not applicable.
SIGNATURES
Pursuant to the requirements of the Securities Exchange Act of 1934 and the Investment Company Act of 1940, the registrant has duly caused this report to be signed on its behalf by the undersigned, thereunto duly authorized.
| | (Registrant) | Advisors Series Trust | |
| | By (Signature and Title)* | /s/ Jeffrey T. Rauman | |
| | | Jeffrey T. Rauman, President/Chief Executive Officer/Principal Executive Officer | |
Pursuant to the requirements of the Securities Exchange Act of 1934 and the Investment Company Act of 1940, this report has been signed below by the following persons on behalf of the registrant and in the capacities and on the dates indicated.
| | By (Signature and Title)* | /s/ Jeffrey T. Rauman | |
| | | Jeffrey T. Rauman, President/Chief Executive Officer/Principal Executive Officer | |
| | By (Signature and Title)* | /s/ Kevin J. Hayden | |
| | | Kevin J. Hayden, Vice President/Treasurer/Principal Financial Officer | |
* Print the name and title of each signing officer under his or her signature.