Scharf Fund
Scharf Multi-Asset Opportunity Fund
Scharf Global Opportunity Fund
Core Financial Statements
September 30, 2024
UNITED STATES
SECURITIES AND EXCHANGE COMMISSION
Washington, D.C. 20549
FORM N-CSR
CERTIFIED SHAREHOLDER REPORT OF REGISTERED
MANAGEMENT INVESTMENT COMPANIES
Investment Company Act file number 811-07959
Advisors Series Trust
(Exact name of registrant as specified in charter)
615 East Michigan Street
Milwaukee, WI 53202
(Address of principal executive offices) (Zip code)
Jeffrey T. Rauman, President/Chief Executive Officer
Advisors Series Trust
c/o U.S. Bancorp Fund Services, LLC
777 East Wisconsin Avenue, 4th Floor
Milwaukee, WI 53202
(Name and address of agent for service)
(626) 914-7235
Registrant’s telephone number, including area code
Date of fiscal year end: September 30, 2024
Date of reporting period: September 30, 2024
Item 1. Reports to Stockholders.
| (a) |
 | Scharf Fund |  |
| Retail Class | LOGRX | ||
| Annual Shareholder Report | September 30, 2024 |
Class Name | Costs of a $10,000 investment | Costs paid as a percentage of a $10,000 investment |
| Retail Class | $126 | 1.14% |
Top Contributors | |
| ↑ | Brookfield Corporation |
| ↑ | Fiserv, Inc. |
| ↑ | Oracle Corporation |
Top Detractors | |
| ↓ | Samsung Electronics Co., Ltd. |
| ↓ | CVS Health Corporation |
| ↓ | Heineken NV |
| Scharf Fund | PAGE 1 | TSR-AR-00770X527 |
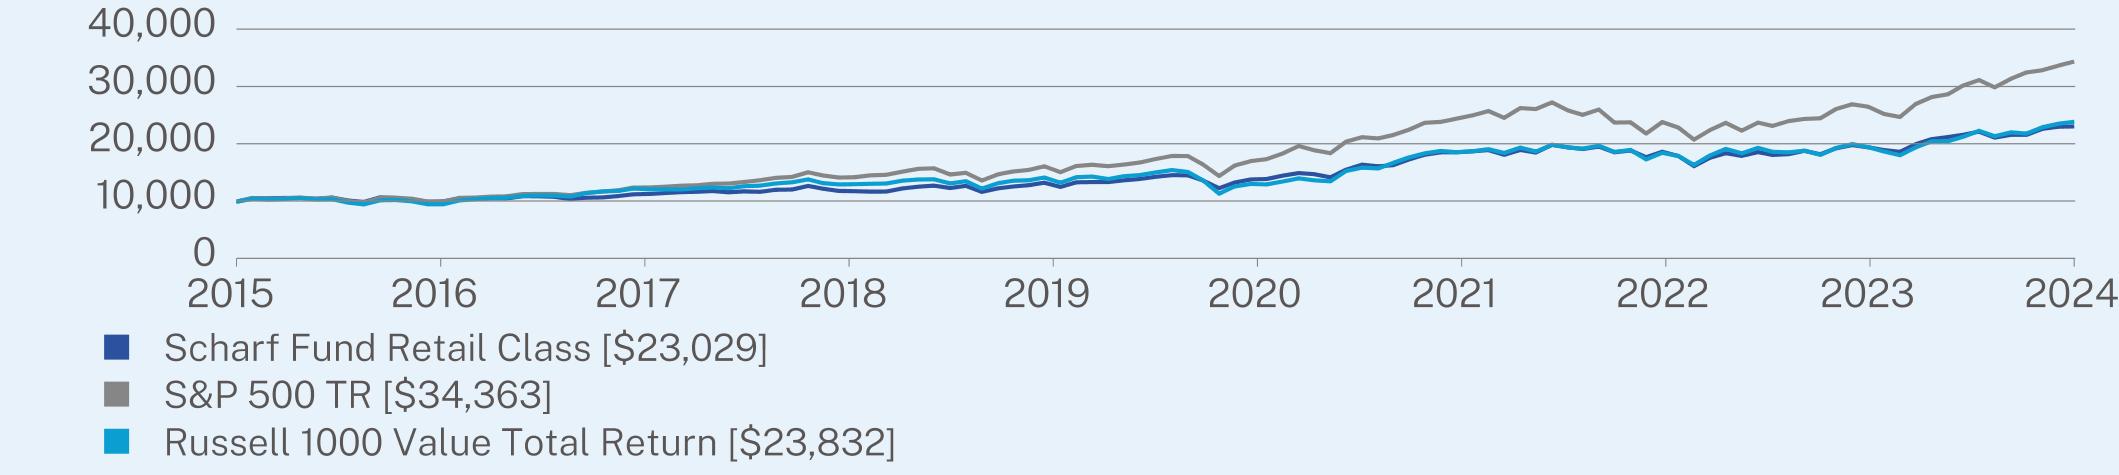
1 Year | 5 Year | Since Inception (01/28/2015) | |
Retail Class | 21.80 | 11.08 | 9.01 |
S&P 500 TR | 36.35 | 15.98 | 13.61 |
Russell 1000 Value Total Return | 27.76 | 10.69 | 9.40 |
| * | The Fund’s past performance is not a good predictor of how the Fund will perform in the future.The graph and table do not reflect the deduction of taxes that a shareholder would pay on Fund distributions or redemption of Fund shares. |
Net Assets | $448,274,346 |
Number of Holdings | 31 |
Net Advisory Fee | $2,926,686 |
Portfolio Turnover | 33% |
Top 10 Issuers | (%) |
Fiserv, Inc. | 6.1% |
Brookfield Corp. | 5.6% |
McKesson Corp. | 5.5% |
Berkshire Hathaway, Inc. | 5.2% |
Comcast Corp. | 4.9% |
Microsoft Corp. | 4.7% |
Oracle Corp. | 4.6% |
Air Products and Chemicals, Inc. | 4.1% |
Centene Corp. | 4.1% |
Heineken N.V. | 3.8% |
Top Sectors | (%) |
Financials | 29.4% |
Health Care | 18.5% |
Information Technology | 12.5% |
Industrials | 10.6% |
Consumer Discretionary | 6.7% |
Communication Services | 6.4% |
Materials | 4.1% |
Consumer Staples | 3.8% |
Real Estate | 3.4% |
Cash & Other | 4.6% |
| * | Expressed as a percentage of net assets. |
| Scharf Fund | PAGE 2 | TSR-AR-00770X527 |
| Scharf Fund | PAGE 3 | TSR-AR-00770X527 |
 | Scharf Fund |  |
| Institutional Class | LOGIX | ||
| Annual Shareholder Report | September 30, 2024 |
Class Name | Costs of a $10,000 investment | Costs paid as a percentage of a $10,000 investment |
| Institutional Class | $97 | 0.87% |
Top Contributors | |
| ↑ | Brookfield Corporation |
| ↑ | Fiserv, Inc. |
| ↑ | Oracle Corporation |
Top Detractors | |
| ↓ | Samsung Electronics Co., Ltd. |
| ↓ | CVS Health Corporation |
| ↓ | Heineken NV |
| Scharf Fund | PAGE 1 | TSR-AR-00768D384 |
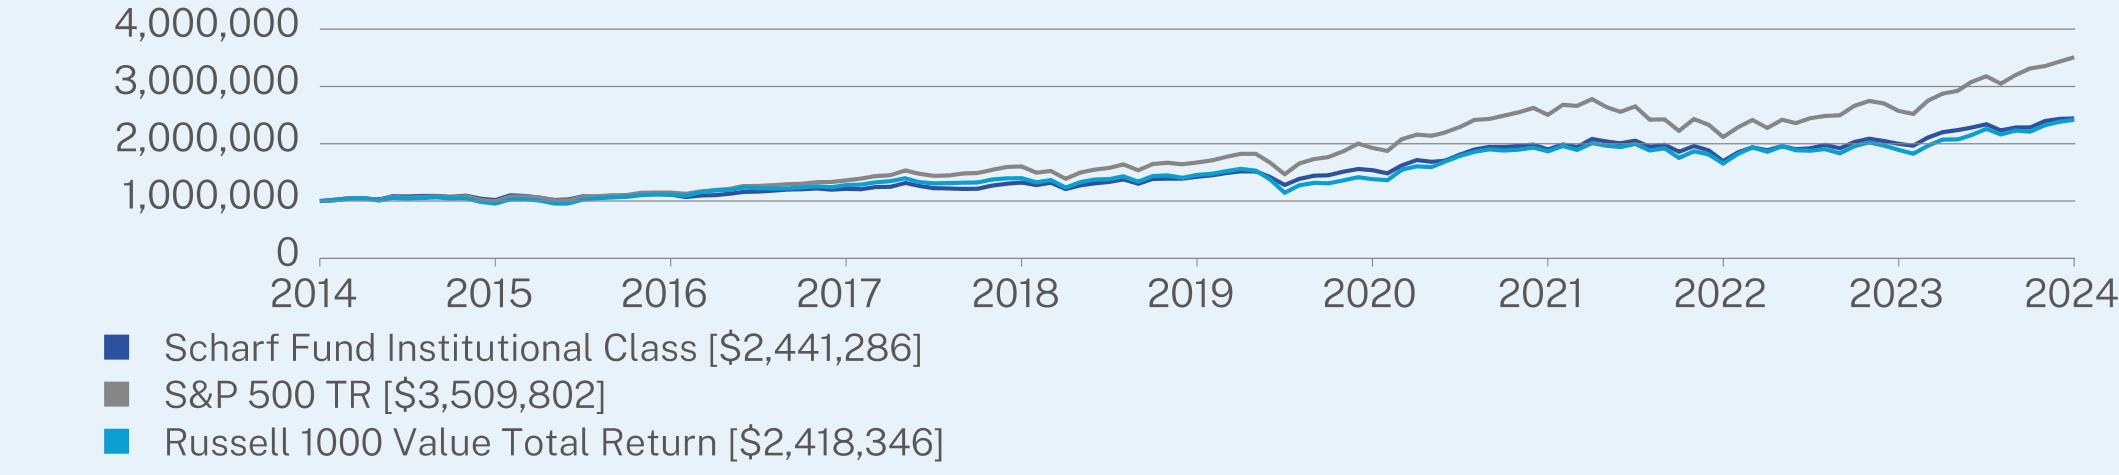
1 Year | 5 Year | 10 Year | |
Institutional Class | 22.13 | 11.39 | 9.34 |
S&P 500 TR | 36.35 | 15.98 | 13.38 |
Russell 1000 Value Total Return | 27.76 | 10.69 | 9.23 |
| * | The Fund’s past performance is not a good predictor of how the Fund will perform in the future.The graph and table do not reflect the deduction of taxes that a shareholder would pay on Fund distributions or redemption of Fund shares. |
Net Assets | $448,274,346 |
Number of Holdings | 31 |
Net Advisory Fee | $2,926,686 |
Portfolio Turnover | 33% |
Top 10 Issuers | (%) |
Fiserv, Inc. | 6.1% |
Brookfield Corp. | 5.6% |
McKesson Corp. | 5.5% |
Berkshire Hathaway, Inc. | 5.2% |
Comcast Corp. | 4.9% |
Microsoft Corp. | 4.7% |
Oracle Corp. | 4.6% |
Air Products and Chemicals, Inc. | 4.1% |
Centene Corp. | 4.1% |
Heineken N.V. | 3.8% |
Top Sectors | (%) |
Financials | 29.4% |
Health Care | 18.5% |
Information Technology | 12.5% |
Industrials | 10.6% |
Consumer Discretionary | 6.7% |
Communication Services | 6.4% |
Materials | 4.1% |
Consumer Staples | 3.8% |
Real Estate | 3.4% |
Cash & Other | 4.6% |
| * | Expressed as a percentage of net assets. |
| Scharf Fund | PAGE 2 | TSR-AR-00768D384 |
| Scharf Fund | PAGE 3 | TSR-AR-00768D384 |
 | Scharf Multi-Asset Opportunity Fund |  |
| Retail Class | LOGBX | ||
| Annual Shareholder Report | September 30, 2024 |
Class Name | Costs of a $10,000 investment | Costs paid as a percentage of a $10,000 investment |
| Retail Class | $131 | 1.20% |
Top Contributors | |
| ↑ | Brookfield Corporation |
| ↑ | Fiserv, Inc. |
| ↑ | Oracle Corporation |
Top Detractors | |
| ↓ | Samsung Electronics Co., Ltd. |
| ↓ | CVS Health Corporation |
| ↓ | Heineken NV |
| Scharf Multi-Asset Opportunity Fund | PAGE 1 | TSR-AR-00770X451 |
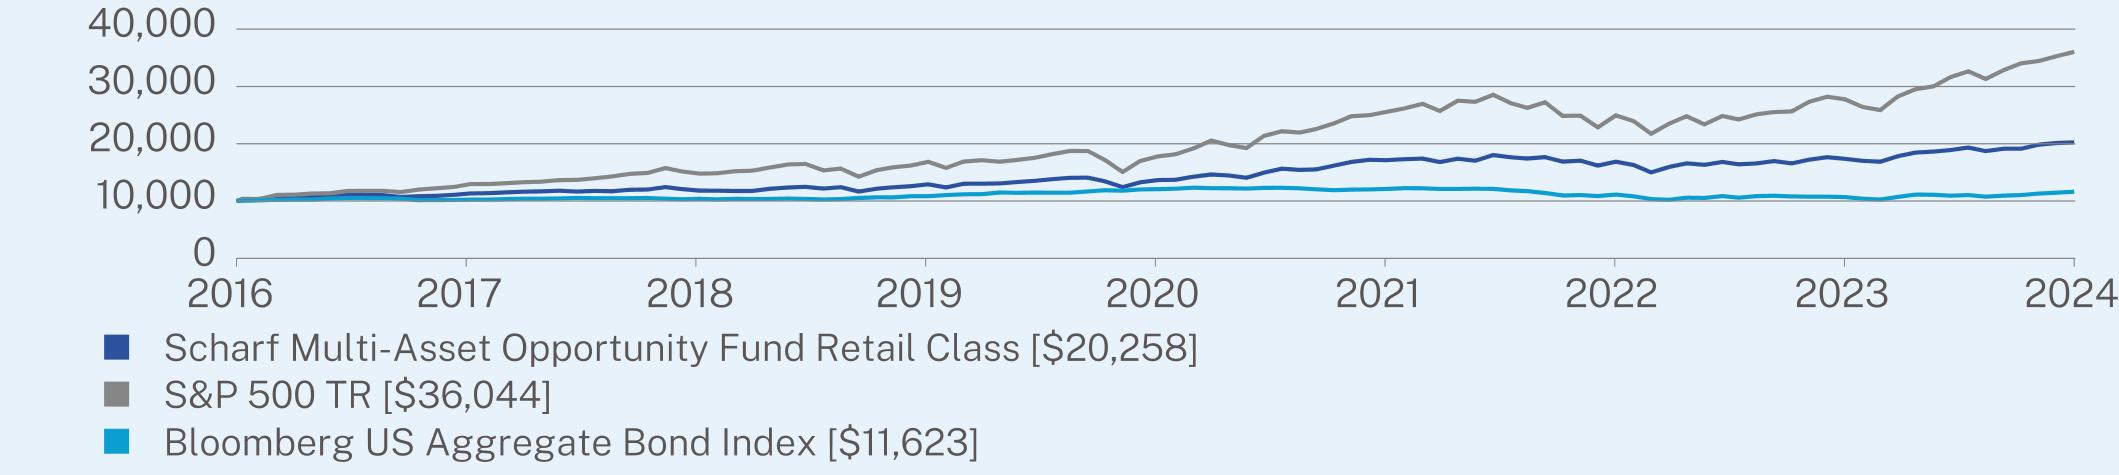
1 Year | 5 Year | Since Inception (01/21/2016) | |
Retail Class | 19.00 | 8.77 | 8.46 |
S&P 500 TR | 36.35 | 15.98 | 15.89 |
Bloomberg US Aggregate Bond Index | 11.57 | 0.33 | 1.74 |
| * | The Fund’s past performance is not a good predictor of how the Fund will perform in the future.The graph and table do not reflect the deduction of taxes that a shareholder would pay on Fund distributions or redemption of Fund shares. |
Net Assets | $50,668,312 |
Number of Holdings | 73 |
Net Advisory Fee | $220,987 |
Portfolio Turnover | 27% |
Top 10 Issuers | (%) |
United States Treasury Bill | 4.6% |
Fiserv, Inc. | 4.3% |
Brookfield Corp. | 4.1% |
McKesson Corp. | 3.9% |
Berkshire Hathaway, Inc. | 3.7% |
Comcast Corp. | 3.4% |
Microsoft Corp. | 3.4% |
Oracle Corp. | 3.3% |
United States Treasury Note/Bond | 3.0% |
Tennessee Valley Authority | 2.9% |
Top Sectors | (%) |
Financials | 21.7% |
Health Care | 13.2% |
Government | 10.6% |
Information Technology | 9.3% |
Industrials | 7.4% |
Consumer Discretionary | 4.8% |
Communication Services | 4.5% |
Utilities | 3.7% |
Consumer Staples | 3.0% |
Cash & Other | 21.8% |
| * | Expressed as a percentage of net assets. |
| Scharf Multi-Asset Opportunity Fund | PAGE 2 | TSR-AR-00770X451 |
| Scharf Multi-Asset Opportunity Fund | PAGE 3 | TSR-AR-00770X451 |
 | Scharf Multi-Asset Opportunity Fund |  |
| Institutional Class | LOGOX | ||
| Annual Shareholder Report | September 30, 2024 |
Class Name | Costs of a $10,000 investment | Costs paid as a percentage of a $10,000 investment |
| Institutional Class | $103 | 0.94% |
Top Contributors | |
| ↑ | Brookfield Corporation |
| ↑ | Fiserv, Inc. |
| ↑ | Oracle Corporation |
Top Detractors | |
| ↓ | Samsung Electronics Co., Ltd. |
| ↓ | CVS Health Corporation |
| ↓ | Heineken NV |
| Scharf Multi-Asset Opportunity Fund | PAGE 1 | TSR-AR-00770X808 |
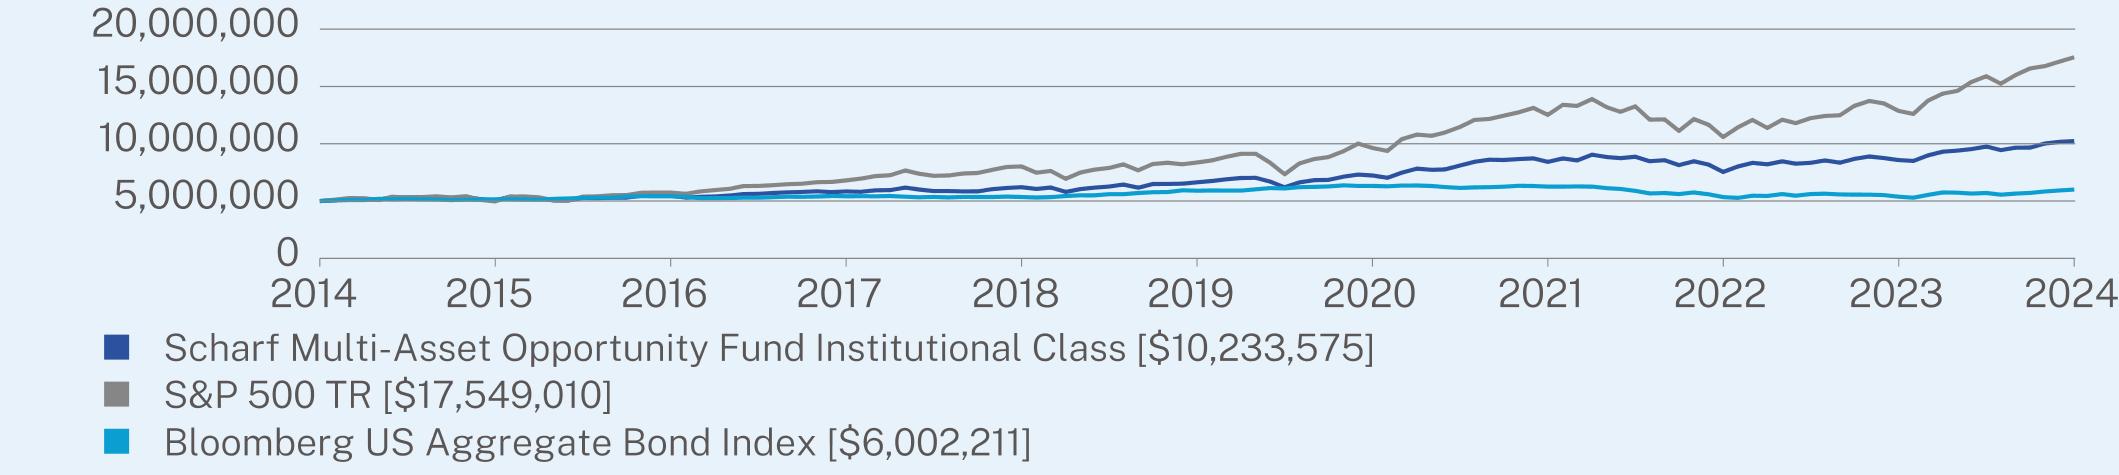
1 Year | 5 Year | 10 Year | |
Institutional Class | 19.29 | 9.06 | 7.43 |
S&P 500 TR | 36.35 | 15.98 | 13.38 |
Bloomberg US Aggregate Bond Index | 11.57 | 0.33 | 1.84 |
| * | The Fund’s past performance is not a good predictor of how the Fund will perform in the future.The graph and table do not reflect the deduction of taxes that a shareholder would pay on Fund distributions or redemption of Fund shares. |
Net Assets | $50,668,312 |
Number of Holdings | 73 |
Net Advisory Fee | $220,987 |
Portfolio Turnover | 27% |
Top 10 Issuers | (%) |
United States Treasury Bill | 4.6% |
Fiserv, Inc. | 4.3% |
Brookfield Corp. | 4.1% |
McKesson Corp. | 3.9% |
Berkshire Hathaway, Inc. | 3.7% |
Comcast Corp. | 3.4% |
Microsoft Corp. | 3.4% |
Oracle Corp. | 3.3% |
United States Treasury Note/Bond | 3.0% |
Tennessee Valley Authority | 2.9% |
Top Sectors | (%) |
Financials | 21.7% |
Health Care | 13.2% |
Government | 10.6% |
Information Technology | 9.3% |
Industrials | 7.4% |
Consumer Discretionary | 4.8% |
Communication Services | 4.5% |
Utilities | 3.7% |
Consumer Staples | 3.0% |
Cash & Other | 21.8% |
| * | Expressed as a percentage of net assets. |
| Scharf Multi-Asset Opportunity Fund | PAGE 2 | TSR-AR-00770X808 |
| Scharf Multi-Asset Opportunity Fund | PAGE 3 | TSR-AR-00770X808 |
 | Scharf Global Opportunity Fund |  |
| Institutional Class | WRLDX | ||
| Annual Shareholder Report | September 30, 2024 |
Class Name | Costs of a $10,000 investment | Costs paid as a percentage of a $10,000 investment |
| Institutional Class | $63 | 0.57% |
Top Contributors | |
| ↑ | Brookfield Corporation |
| ↑ | Fiserv, Inc. |
| ↑ | Oracle Corporation |
Top Detractors | |
| ↓ | Samsung Electronics Co., Ltd. |
| ↓ | CVS Health Corporation |
| ↓ | Heineken NV |
| Scharf Global Opportunity Fund | PAGE 1 | TSR-AR-00770X584 |
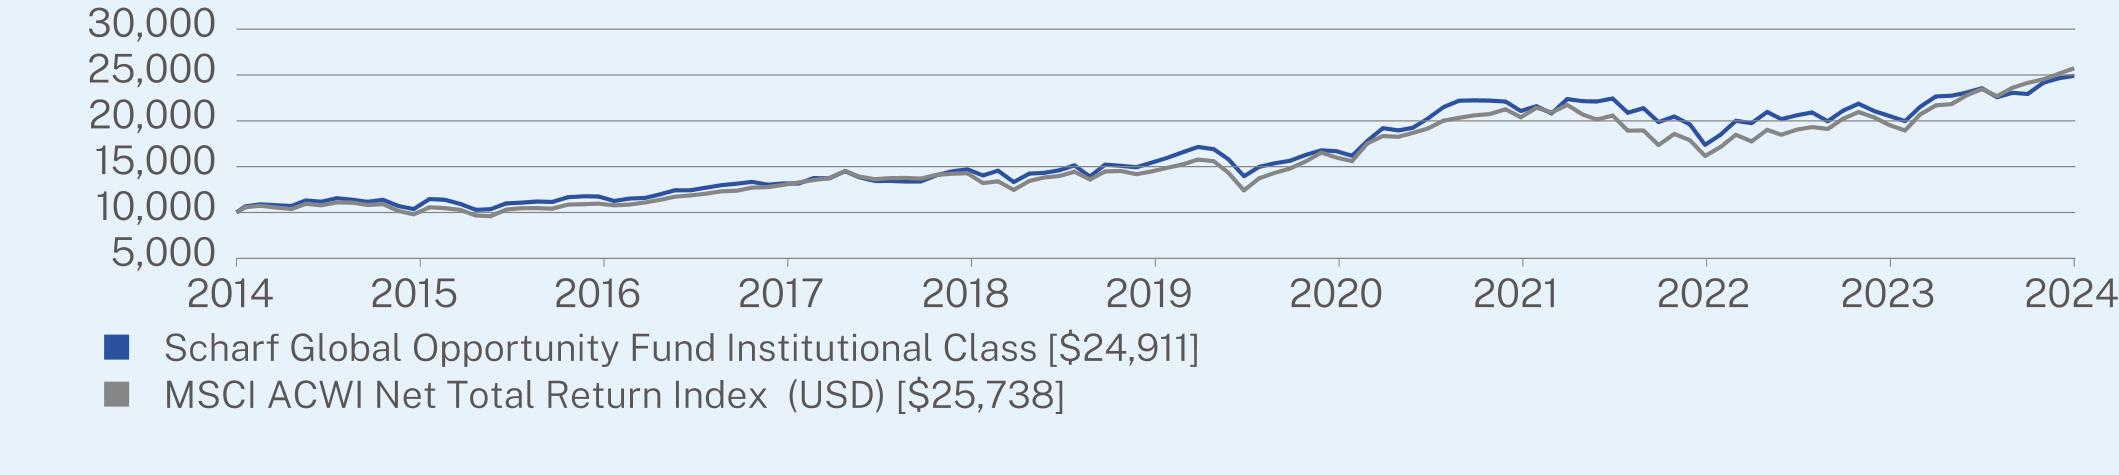
1 Year | 5 Year | Since Inception (10/14/2014) | |
Institutional Class | 21.37 | 10.05 | 9.60 |
MSCI ACWI Net Total Return Index (USD) | 31.76 | 12.19 | 9.96 |
| * | The Fund’s past performance is not a good predictor of how the Fund will perform in the future.The graph and table do not reflect the deduction of taxes that a shareholder would pay on Fund distributions or redemption of Fund shares. |
Net Assets | $28,619,174 |
Number of Holdings | 33 |
Net Advisory Fee | $0 |
Portfolio Turnover | 32% |
Top 10 Issuers | (%) |
Brookfield Corp. | 6.9% |
Samsung Electronics Co. Ltd. | 5.0% |
Fiserv, Inc. | 4.9% |
Oracle Corp. | 4.6% |
Berkshire Hathaway, Inc. | 4.1% |
Centene Corp. | 4.1% |
Comcast Corp. | 4.1% |
Smith & Nephew PLC | 4.1% |
Compass Group PLC | 3.9% |
Markel Group, Inc. | 3.8% |
Top Sectors | (%) |
Financials | 29.3% |
Health Care | 17.2% |
Information Technology | 11.9% |
Industrials | 11.4% |
Communication Services | 8.8% |
Consumer Discretionary | 7.6% |
Real Estate | 3.7% |
Consumer Staples | 3.6% |
Materials | 3.4% |
Cash & Other | 3.1% |
| * | Expressed as a percentage of net assets. |
| Scharf Global Opportunity Fund | PAGE 2 | TSR-AR-00770X584 |
| (b) | Not applicable. |
Item 2. Code of Ethics.
The registrant has adopted a code of ethics that applies to the registrant’s principal executive officer and principal financial officer. The registrant has not made any substantive amendments to its code of ethics during the period covered by this report. The registrant has not granted any waivers from any provisions of the code of ethics during the period covered by this report.
A copy of the registrant’s Code of Ethics is filed herewith.
Item 3. Audit Committee Financial Expert.
The registrant’s Board of Trustees has determined that there is at least one audit committee financial expert serving on its audit committee. Mr. Joe D. Redwine, Ms. Michele Rackey, Ms. Anne Kritzmire, and Mr. Craig Wainscott are the “audit committee financial experts” and are considered to be “independent” as each term is defined in Item 3 of Form N-CSR.
Item 4. Principal Accountant Fees and Services.
The registrant has engaged its principal accountant to perform audit services, audit-related services, tax services and other services during the past two fiscal years. “Audit services” refer to performing an audit of the registrant’s annual financial statements or services that are normally provided by the accountant in connection with statutory and regulatory filings or engagements for those fiscal years. “Audit-related services” refer to the assurance and related services by the principal accountant that are reasonably related to the performance of the audit. “Tax services” refer to professional services rendered by the principal accountant including the review of federal income tax returns, review of federal excise tax returns, review of state tax returns, if any, and assistance with calculation of required income, capital gain and excise distributions. There were no “other services” provided by the principal accountant. The following table details the aggregate fees billed or expected to be billed for each of the last two fiscal years for audit fees, audit-related fees, tax fees and other fees by the principal accountant.
| FYE 9/30/2024 | FYE 9/30/2023 | |
| (a) Audit Fees | $55,500 | $55,200 |
| (b) Audit-Related Fees | N/A | N/A |
| (c) Tax Fees | $10,800 | $10,800 |
| (d) All Other Fees | N/A | N/A |
(e)(1) The audit committee has adopted pre-approval policies and procedures that require the audit committee to pre-approve all audit and non-audit services of the registrant, including services provided to any entity affiliated with the registrant.
(e)(2) The percentage of fees billed by Tait, Weller & Baker LLP applicable to non-audit services pursuant to waiver of pre-approval requirement were as follows:
| FYE 9/30/2024 | FYE 9/30/2023 | |
| Audit-Related Fees | 0% | 0% |
| Tax Fees | 0% | 0% |
| All Other Fees | 0% | 0% |
(f) During the audit of the registrant’s financial statements, 100 percent of the hours were attributed to work performed by persons other than full-time permanent employees of the principal accountant.
(g) The following table indicates the non-audit fees billed or expected to be billed by the registrant’s accountant for services to the registrant and to the registrant’s investment adviser (and any other controlling entity, etc.—not sub-adviser) for the last two years.
| Non-Audit Related Fees | FYE 9/30/2024 | FYE 9/30/2023 |
| Registrant | N/A | N/A |
| Registrant’s Investment Adviser | N/A | N/A |
(h) The audit committee of the board of trustees/directors has considered whether the provision of non-audit services that were rendered to the registrant’s investment adviser is compatible with maintaining the principal accountant’s independence and has concluded that the provision of such non-audit services by the accountant has not compromised the accountant’s independence.
The registrant has not been identified by the U.S. Securities and Exchange Commission as having filed an annual report issued by a registered public accounting firm branch or office that is located in a foreign jurisdiction where the Public Company Accounting Oversight Board is unable to inspect or completely investigate because of a position taken by an authority in that jurisdiction.
The registrant is not a foreign issuer.
Item 5. Audit Committee of Listed Registrants.
Not applicable.
Item 6. Investments.
| (a) | Schedules of Investments is included within the financial statements filed under Item 7 of this Form. |
| (b) | Not applicable. |
Item 7. Financial Statements and Financial Highlights for Open-End Investment Companies.
| (a) |
Page | |||
Shares | Value | |||||
COMMON STOCKS - 90.8% | ||||||
Aerospace & Defense - 3.0% | ||||||
Lockheed Martin Corp. | 22,721 | $13,281,788 | ||||
Automobile Components - 1.7% | ||||||
Gentex Corp. | 248,908 | 7,390,078 | ||||
Beverages - 3.8% | ||||||
Heineken N.V. | 193,624 | 17,165,042 | ||||
Capital Markets - 8.3% | ||||||
Brookfield Corp. | 474,522 | 25,220,844 | ||||
CME Group, Inc. | 53,820 | 11,875,383 | ||||
37,096,227 | ||||||
Chemicals - 4.1% | ||||||
Air Products and Chemicals, Inc. | 62,416 | 18,583,740 | ||||
Commercial Services & Supplies - 0.7% | ||||||
MillerKnoll, Inc. | 130,246 | 3,224,891 | ||||
Entertainment - 1.5% | ||||||
Walt Disney Co. | 70,077 | 6,740,707 | ||||
Financial Services - 15.0% | ||||||
Berkshire Hathaway, Inc. - Class B(a) | 51,002 | 23,474,181 | ||||
Fiserv, Inc.(a) | 151,765 | 27,264,582 | ||||
Visa, Inc. - Class A | 60,439 | 16,617,703 | ||||
67,356,466 | ||||||
Ground Transportation - 6.9% | ||||||
U-Haul Holding Co. | 206,631 | 14,877,432 | ||||
Union Pacific Corp. | 65,477 | 16,138,771 | ||||
31,016,203 | ||||||
Health Care Equipment & Supplies - 2.5% | ||||||
Smith & Nephew PLC | 724,395 | 11,215,014 | ||||
Health Care Providers & Services - 12.5% | ||||||
Centene Corp.(a) | 243,690 | 18,344,983 | ||||
CVS Health Corp. | 211,687 | 13,310,879 | ||||
McKesson Corp. | 49,422 | 24,435,225 | ||||
56,091,087 | ||||||
Hotels, Restaurants & Leisure - 5.0% | ||||||
Booking Holdings, Inc. | 2,240 | 9,435,149 | ||||
Compass Group PLC | 398,697 | 12,760,948 | ||||
22,196,097 | ||||||
Insurance - 6.1% | ||||||
Aon PLC - Class A | 29,515 | 10,211,895 | ||||
Markel Group, Inc.(a) | 10,832 | 16,990,858 | ||||
27,202,753 | ||||||
Shares | Value | |||||
Media - 4.9% | ||||||
Comcast Corp. - Class A | 530,850 | $22,173,604 | ||||
Oil, Gas & Consumable Fuels - 1.9% | ||||||
Occidental Petroleum Corp. | 165,818 | 8,546,260 | ||||
Personal Care Products - 0.0%(b) | ||||||
Kenvue, Inc. | 1 | 23 | ||||
Pharmaceuticals - 3.5% | ||||||
Novartis AG - ADR | 137,327 | 15,795,351 | ||||
Software - 9.4% | ||||||
Microsoft Corp. | 49,327 | 21,225,408 | ||||
Oracle Corp. | 121,939 | 20,778,406 | ||||
42,003,814 | ||||||
TOTAL COMMON STOCKS (Cost $272,621,731) | 407,079,145 | |||||
REAL ESTATE INVESTMENT TRUSTS - 3.4% | ||||||
Realty Income Corp. | 237,363 | 15,053,562 | ||||
TOTAL REAL ESTATE INVESTMENT TRUSTS (Cost $13,135,598) | 15,053,562 | |||||
PREFERRED STOCKS - 3.1% | ||||||
Technology Hardware, Storage & Peripherals - 3.1% | ||||||
Samsung Electronics Co. Ltd. 2.88%, | 363,260 | 14,139,278 | ||||
TOTAL PREFERRED STOCKS (Cost $10,398,107) | 14,139,278 | |||||
SHORT-TERM INVESTMENTS - 1.9% | ||||||
Money Market Funds - 0.7% | ||||||
First American Treasury Obligations Fund - Class Z, 4.75%(c) | 3,361,652 | 3,361,652 | ||||
Par | ||||||
U.S. Treasury Bills - 1.2% | ||||||
5.11%, 01/23/2025(d) | $5,000,000 | 4,930,162 | ||||
TOTAL SHORT-TERM INVESTMENTS (Cost $8,283,495) | 8,291,814 | |||||
TOTAL INVESTMENTS - 99.2% (Cost $304,438,931) | 444,563,799 | |||||
Other Assets in Excess of Liabilities - 0.8% | 3,710,547 | |||||
TOTAL NET ASSETS - 100.0% | $448,274,346 | |||||
1 |
(a) | Non-income producing security. |
(b) | Represents less than 0.05% of net assets. |
(c) | The rate shown represents the 7-day annualized effective yield as of September 30, 2024. |
(d) | The rate shown is the effective yield as of September 30, 2024. |
2 |
Shares | Value | |||||
COMMON STOCKS - 63.6% | ||||||
Aerospace & Defense - 2.0% | ||||||
Lockheed Martin Corp. | 1,779 | $1,039,932 | ||||
Automobile Components - 1.2% | ||||||
Gentex Corp. | 19,774 | 587,090 | ||||
Beverages - 2.7% | ||||||
Heineken N.V. | 15,391 | 1,364,434 | ||||
Capital Markets - 5.9% | ||||||
Brookfield Corp. | 38,649 | 2,054,194 | ||||
CME Group, Inc. | 4,275 | 943,279 | ||||
2,997,473 | ||||||
Chemicals - 2.9% | ||||||
Air Products and Chemicals, Inc. | 4,964 | 1,477,981 | ||||
Commercial Services & Supplies - 0.6% | ||||||
MillerKnoll, Inc. | 12,217 | 302,493 | ||||
Electric Utilities - 0.7% | ||||||
Portland General Electric Co. | 7,969 | 381,715 | ||||
Entertainment - 1.1% | ||||||
Walt Disney Co. | 5,903 | 567,810 | ||||
Financial Services - 10.7% | ||||||
Berkshire Hathaway, Inc. - Class B(a) | 4,106 | 1,889,828 | ||||
Fiserv, Inc.(a) | 12,197 | 2,191,191 | ||||
Visa, Inc. - Class A | 4,869 | 1,338,731 | ||||
5,419,750 | ||||||
Ground Transportation - 4.8% | ||||||
U-Haul Holding Co. | 16,642 | 1,198,224 | ||||
Union Pacific Corp. | 4,999 | 1,232,154 | ||||
2,430,378 | ||||||
Health Care Equipment & Supplies - 1.9% | ||||||
Smith & Nephew PLC | 61,040 | 945,016 | ||||
Health Care Providers & Services - 8.8% | ||||||
Centene Corp.(a) | 19,914 | 1,499,126 | ||||
CVS Health Corp. | 16,301 | 1,025,007 | ||||
McKesson Corp. | 3,963 | 1,959,386 | ||||
4,483,519 | ||||||
Hotels, Restaurants & Leisure - 3.3% | ||||||
Booking Holdings, Inc. | 175 | 737,121 | ||||
Compass Group PLC | 28,572 | 914,494 | ||||
1,651,615 | ||||||
Insurance - 4.4% | ||||||
Aon PLC - Class A | 2,338 | 808,924 | ||||
Markel Group, Inc.(a) | 891 | 1,397,605 | ||||
2,206,529 | ||||||
Shares | Value | |||||
Media - 3.4% | ||||||
Comcast Corp. - Class A | 41,412 | $1,729,779 | ||||
Personal Care Products - 0.0%(b) | ||||||
Kenvue, Inc. | 1 | 23 | ||||
Pharmaceuticals - 2.5% | ||||||
Novartis AG - ADR | 11,111 | 1,277,987 | ||||
Software - 6.7% | ||||||
Microsoft Corp. | 3,949 | 1,699,255 | ||||
Oracle Corp. | 9,925 | 1,691,220 | ||||
3,390,475 | ||||||
TOTAL COMMON STOCKS (Cost $20,783,361) | 32,253,999 | |||||
Par | ||||||
MUNICIPAL BONDS - 6.5% | ||||||
California Health Facilities Financing Authority, Revenue Bonds, Persons with Developmental Disabilities, 7.88%, 02/01/2026 | $65,000 | 65,196 | ||||
California Infrastructure & Economic Development Bank, 3.25%, 07/01/2026 (Obligor: Scripps Research Inst) | 130,000 | 128,223 | ||||
City of New York, General Obligation, Build America Bonds | ||||||
5.89%, 12/01/2024 | 175,000 | 175,143 | ||||
5.42%, 03/01/2025 | 35,000 | 35,014 | ||||
City of Pasadena CA, Series B, 4.63%, 05/01/2038 | 100,000 | 100,025 | ||||
City of San Jose CA, 2.60%, 09/01/2027 | 175,000 | 169,369 | ||||
City of Seattle WA Drainage & Wastewater Revenue, 5.55%, 11/01/2039 | 150,000 | 158,037 | ||||
Lake of Elsinore California Improvement Bond Act 1915, 1.15%, 09/02/2025 | 150,000 | 145,500 | ||||
Los Angeles Unified School District/CA, 5.72%, 05/01/2027 | 230,000 | 236,837 | ||||
San Francisco City & County Airport Comm-San Francisco International Airport, 2.29%, 05/01/2028 | 180,000 | 169,920 | ||||
San Jose Redevelopment Agency Successor Agency, 3.18%, 08/01/2026 | 250,000 | 246,781 | ||||
State of California | ||||||
3.38%, 04/01/2025 | 100,000 | 99,552 | ||||
2.65%, 04/01/2026 | 200,000 | 196,354 | ||||
2.38%, 10/01/2026 | 145,000 | 141,172 | ||||
6.00%, 03/01/2030 | 200,000 | 219,784 | ||||
7.50%, 04/01/2034 | 150,000 | 179,994 | ||||
5.13%, 03/01/2038 | 150,000 | 154,074 | ||||
3 |
Par | Value | |||||
MUNICIPAL BONDS - (Continued) | ||||||
State of California, Build America Bonds, 4.99%, 04/01/2039 | $15,000 | $14,982 | ||||
State of Georgia, School Construction Bonds, 4.35%, 02/01/2029 | 15,000 | 15,006 | ||||
State of Mississippi, 4.51%, 11/01/2024 | 100,000 | 99,935 | ||||
State of Oregon, 5.05%, 08/01/2043 | 300,000 | 307,844 | ||||
Toledo City School District, General Obligation Bond, Taxable, 5.00%, 12/01/2024 | 225,000 | 225,267 | ||||
TOTAL MUNICIPAL BONDS (Cost $3,251,812) | 3,284,009 | |||||
Shares | ||||||
PREFERRED STOCKS - 5.7% | ||||||
Closed-end Funds - 0.7% | ||||||
GDL Fund Series C, 4.00%, 03/26/2025(c) | 6,900 | 343,116 | ||||
Independent Power and Renewable Electricity Producers - 3.0% | ||||||
Tennessee Valley Authority | ||||||
Series A, 2.22% (30 yr. CMT Rate + 0.84%), 05/01/2029 | 33,100 | 750,046 | ||||
Series D, 2.13% (30 yr. CMT Rate + 0.94%), 06/01/2028 | 32,700 | 749,484 | ||||
1,499,530 | ||||||
Technology Hardware, Storage & Peripherals - 2.0% | ||||||
Samsung Electronics Co. Ltd. 2.88%, | 26,643 | 1,037,034 | ||||
TOTAL PREFERRED STOCKS (Cost $2,382,555) | 2,879,680 | |||||
Par | ||||||
CORPORATE BONDS - 5.4% | ||||||
Beverages - 0.3% | ||||||
Coca-Cola Consolidated, Inc., 3.80%, 11/25/2025 | $150,000 | 148,953 | ||||
Beverages-Non-alcoholic - 0.2% | ||||||
Coca-Cola Refreshments USA LLC, 6.75%, 09/15/2028 | 125,000 | 136,135 | ||||
Broadline Retail - 0.3% | ||||||
Amazon.com, Inc., 5.20%, 12/03/2025 | 150,000 | 151,761 | ||||
Capital Markets - 0.7% | ||||||
Charles Schwab Corp., 5.38% to 06/01/2025 then 5 yr. CMT Rate + 4.97%, Perpetual | 350,000 | 350,183 | ||||
Par | Value | |||||
Cosmetics & Toiletries - 0.3% | ||||||
Conopco, Inc., 7.25%, 12/15/2026 | $150,000 | $160,150 | ||||
Diversified Banking Instruments - 1.7% | ||||||
Goldman Sachs Group, Inc., 6.04% (3 mo. Term SOFR + 1.03%), Perpetual | 1,001,000 | 847,237 | ||||
Finance-Investment Banking-Brokerages - 0.2% | ||||||
JPMorgan Chase Financial Co. LLC, 5.00%, 09/16/2027 | 100,000 | 99,737 | ||||
IT Services - 0.3% | ||||||
International Business Machines Corp., 7.00%, 10/30/2025 | 150,000 | 154,289 | ||||
Retail-Petroleum Prod - 1.1% | ||||||
Murphy Oil USA, Inc., 5.63%, 05/01/2027 | 557,000 | 556,748 | ||||
Technology Hardware, Storage & Peripherals - 0.3% | ||||||
Apple, Inc., 0.70%, 02/08/2026 | 145,000 | 139,044 | ||||
TOTAL CORPORATE BONDS (Cost $2,653,726) | 2,744,237 | |||||
Shares | ||||||
EXCHANGE-TRADED FUNDS - 4.9% | ||||||
iShares Silver Trust(a) | 35,295 | 1,002,731 | ||||
SPDR Gold Shares(a) | 6,143 | 1,493,117 | ||||
TOTAL EXCHANGE-TRADED FUNDS (Cost $1,344,878) | 2,495,848 | |||||
Par | ||||||
U.S. TREASURY SECURITIES - 4.1% | ||||||
United States Treasury Inflation Indexed Bonds, 1.75%, 01/15/2034 | $532,095 | 537,479 | ||||
United States Treasury Note/Bond | ||||||
5.00%, 10/31/2025 | 960,000 | 970,763 | ||||
4.63%, 06/30/2026 | 540,000 | 548,311 | ||||
TOTAL U.S. TREASURY SECURITIES (Cost $2,020,672) | 2,056,553 | |||||
Shares | ||||||
REAL ESTATE INVESTMENT TRUSTS - 2.4% | ||||||
Orion Office REIT, Inc. | 1 | 4 | ||||
Realty Income Corp. | 19,188 | 1,216,903 | ||||
TOTAL REAL ESTATE INVESTMENT TRUSTS (Cost $1,117,112) | 1,216,907 | |||||
4 |
Shares | Value | |||||
SHORT-TERM INVESTMENTS - 5.4% | ||||||
Money Market Funds - 0.9% | ||||||
First American Treasury Obligations Fund - Class Z, 4.75%(d) | 434,001 | $434,001 | ||||
Par | ||||||
U.S. Treasury Bills - 4.5% | ||||||
5.11%, 10/31/2024(e) | $1,030,000 | 1,025,991 | ||||
5.00%, 01/23/2025(e) | 1,300,000 | 1,281,842 | ||||
2,307,833 | ||||||
TOTAL SHORT-TERM INVESTMENTS (Cost $2,739,737) | 2,741,834 | |||||
TOTAL INVESTMENTS - 98.0% (Cost $36,293,853) | 49,673,067 | |||||
Other Assets in Excess of Liabilities - 2.0% | 995,245 | |||||
TOTAL NET ASSETS - 100.0% | $50,668,312 | |||||
(a) | Non-income producing security. |
(b) | Represents less than 0.05% of net assets. |
(c) | Coupon rate is variable or floats based on components including but not limited to reference rate and spread. These securities may not indicate a reference rate and/or spread in their description. The rate disclosed is as of September 30, 2024. |
(d) | The rate shown represents the 7-day annualized effective yield as of September 30, 2024. |
(e) | The rate shown is the effective yield as of September 30, 2024. |
5 |
Shares | Value | |||||
COMMON STOCKS - 88.2% | ||||||
Aerospace & Defense - 1.9% | ||||||
Airbus SE - ADR | 15,200 | $555,256 | ||||
Beverages - 3.6% | ||||||
Heineken Holding NV | 13,480 | 1,017,358 | ||||
Building Products - 3.0% | ||||||
Assa Abloy AB - Class B | 25,603 | 861,177 | ||||
Capital Markets - 9.6% | ||||||
Brookfield Corp. | 37,390 | 1,987,279 | ||||
CME Group, Inc. | 3,420 | 754,623 | ||||
2,741,902 | ||||||
Chemicals - 3.4% | ||||||
Air Products and Chemicals, Inc. | 3,227 | 960,807 | ||||
Commercial Services & Supplies - 1.2% | ||||||
MillerKnoll, Inc. | 14,355 | 355,430 | ||||
Entertainment - 1.6% | ||||||
Walt Disney Co. | 4,639 | 446,225 | ||||
Financial Services - 12.3% | ||||||
Berkshire Hathaway, Inc. - Class B(a) | 2,556 | 1,176,424 | ||||
Fiserv, Inc.(a) | 7,826 | 1,405,941 | ||||
Visa, Inc. - Class A | 3,428 | 942,529 | ||||
3,524,894 | ||||||
Ground Transportation - 5.3% | ||||||
U-Haul Holding Co. | 10,837 | 780,264 | ||||
Union Pacific Corp. | 2,954 | 728,102 | ||||
1,508,366 | ||||||
Health Care Equipment & Supplies - 4.1% | ||||||
Smith & Nephew PLC | 75,455 | 1,168,187 | ||||
Health Care Providers & Services - 9.8% | ||||||
Centene Corp.(a) | 15,593 | 1,173,841 | ||||
CVS Health Corp. | 12,795 | 804,549 | ||||
McKesson Corp. | 1,678 | 829,637 | ||||
2,808,027 | ||||||
Hotels, Restaurants & Leisure - 5.7% | ||||||
Booking Holdings, Inc. | 123 | 518,091 | ||||
Compass Group PLC | 34,856 | 1,115,623 | ||||
1,633,714 | ||||||
Household Durables - 1.9% | ||||||
Sony Corp. - ADR | 5,662 | 546,779 | ||||
Insurance - 7.4% | ||||||
AIA Group, Ltd. | 43,290 | 387,858 | ||||
Aon PLC - Class A | 1,840 | 636,622 | ||||
Markel Group, Inc.(a) | 695 | 1,090,163 | ||||
2,114,643 | ||||||
Shares | Value | |||||
Interactive Media & Services - 3.1% | ||||||
Baidu, Inc. - ADR(a) | 3,034 | $319,450 | ||||
Tencent Holdings, Ltd. | 9,910 | 566,770 | ||||
886,220 | ||||||
Media - 4.1% | ||||||
Comcast Corp. - Class A | 28,037 | 1,171,106 | ||||
Pharmaceuticals - 3.3% | ||||||
Novartis AG - ADR | 8,330 | 958,117 | ||||
Software - 6.4% | ||||||
Microsoft Corp. | 1,215 | 522,814 | ||||
Oracle Corp. | 7,769 | 1,323,838 | ||||
1,846,652 | ||||||
Technology Hardware, Storage & Peripherals - 0.5% | ||||||
Samsung Electronics Co. Ltd. | 2,760 | 129,800 | ||||
TOTAL COMMON STOCKS (Cost $17,787,186) | 25,234,660 | |||||
PREFERRED STOCKS - 5.0% | ||||||
Technology Hardware, Storage & Peripherals - 5.0% | ||||||
Samsung Electronics Co. Ltd. 2.88%, | 37,020 | 1,440,940 | ||||
TOTAL PREFERRED STOCKS (Cost $957,803) | 1,440,940 | |||||
REAL ESTATE INVESTMENT TRUSTS - 3.7% | ||||||
Realty Income Corp. | 16,640 | 1,055,309 | ||||
TOTAL REAL ESTATE INVESTMENT TRUSTS (Cost $960,067) | 1,055,309 | |||||
SHORT-TERM INVESTMENTS - 3.1% | ||||||
Money Market Funds - 3.1% | ||||||
First American Treasury Obligations Fund - Class Z, 4.75%(b) | 890,497 | 890,497 | ||||
TOTAL SHORT-TERM INVESTMENTS (Cost $890,497) | 890,497 | |||||
TOTAL INVESTMENTS - 100.0% (Cost $20,595,553) | 28,621,406 | |||||
Liabilities in Excess of Other Assets - (0.0)%(c) | (2,232) | |||||
TOTAL NET ASSETS - 100.0% | $28,619,174 | |||||
6 |
(a) | Non-income producing security. |
(b) | The rate shown represents the 7-day annualized effective yield as of September 30, 2024. |
(c) | Represents less than 0.05% of net assets. |
United States | $17,566,812 | 61.3% | ||||
United Kingdom | 2,283,810 | 8.0 | ||||
Canada | 1,987,279 | 7.0 | ||||
South Korea | 1,570,740 | 5.5 | ||||
Netherlands | 1,017,358 | 3.6 | ||||
Switzerland | 958,117 | 3.3 | ||||
China | 886,220 | 3.1 | ||||
Sweden | 861,177 | 3.0 | ||||
France | 555,256 | 1.9 | ||||
Japan | 546,779 | 1.9 | ||||
Hong Kong | 387,858 | 1.4 | ||||
Liabilities in Excess of Other Assets | (2,232) | (0.0)(a) | ||||
$28,619,174 | 100.0% | |||||
(a) | Represents less than 0.05% of net assets. |
7 |
Scharf Fund | Scharf Multi-Asset Opportunity Fund | |||||
ASSETS | ||||||
Investments in securities, at value (identified cost $304,438,931 and $36,293,853, respectively) | $444,563,799 | $49,673,067 | ||||
Receivables: | ||||||
Investments sold | 3,584,021 | 953,536 | ||||
Fund shares issued | 60,879 | — | ||||
Dividends and interest | 213,864 | 121,321 | ||||
Dividend tax reclaim | 358,495 | 10,247 | ||||
Prepaid expenses | 21,254 | 6,391 | ||||
Total assets | 448,802,312 | 50,764,562 | ||||
LIABILITIES | ||||||
Payables: | ||||||
Fund shares redeemed | 124,693 | — | ||||
Advisory fees | 246,737 | 19,229 | ||||
Administration and fund accounting fees | 35,725 | 10,802 | ||||
Audit fees | 22,500 | 22,500 | ||||
12b-1 distribution fees | 6,394 | 16,577 | ||||
Chief Compliance Officer fee | 1,875 | 1,875 | ||||
Custody fees | 3,805 | 2,337 | ||||
Directors fees | 3,359 | 3,359 | ||||
Shareholder reporting | — | 1,686 | ||||
Shareholder servicing fees | 73,152 | 14,512 | ||||
Transfer agent fees and expenses | 7,956 | 2,265 | ||||
Accrued other expenses | 1,770 | 1,108 | ||||
Total liabilities | 527,966 | 96,250 | ||||
NET ASSETS | $ 448,274,346 | $50,668,312 | ||||
CALCULATION OF NET ASSET VALUE PER SHARE | ||||||
Institutional Shares | ||||||
Net assets applicable to shares outstanding | $438,863,267 | $39,489,792 | ||||
Shares issued and outstanding [unlimited number of shares (par value $0.01) authorized] | 7,893,759 | 1,051,547 | ||||
Net asset value, offering and redemption price per share | $55.60 | $37.55 | ||||
Retail Shares | ||||||
Net assets applicable to shares outstanding | $9,411,079 | $11,178,520 | ||||
Shares issued and outstanding [unlimited number of shares (par value $0.01) authorized] | 170,069 | 298,650 | ||||
Net asset value, offering and redemption price per share | $55.34 | $37.43 | ||||
COMPOSITION OF NET ASSETS | ||||||
Paid-in capital | $291,260,057 | $35,033,108 | ||||
Total distributable earnings | 157,014,289 | 15,635,204 | ||||
Net assets | $448,274,346 | $50,668,312 | ||||
8 |
Scharf Global Opportunity Fund | |||
ASSETS | |||
Investments in securities, at value (identified cost $20,595,553) | $28,621,406 | ||
Receivables: | |||
Dividends and interest | 18,134 | ||
Dividend tax reclaim | 8,830 | ||
Due from Adviser (Note 4) | 645 | ||
Prepaid expenses | 14,263 | ||
Total assets | 28,663,278 | ||
LIABILITIES | |||
Payables: | |||
Audit fees | 21,000 | ||
Shareholder servicing fees | 5,473 | ||
Administration and fund accounting fees | 6,954 | ||
Chief Compliance Officer fee | 1,875 | ||
Custody fees | 2,568 | ||
Transfer agent fees and expenses | 1,128 | ||
Shareholder reporting | 1,538 | ||
Trustee fees and expenses | 3,359 | ||
Accrued other expenses | 209 | ||
Total liabilities | 44,104 | ||
NET ASSETS | $ 28,619,174 | ||
CALCULATION OF NET ASSET VALUE PER SHARE | |||
Institutional Shares | |||
Net assets applicable to shares outstanding | $28,619,174 | ||
Shares issued and outstanding [unlimited number of shares (par value $0.01) authorized] | 765,776 | ||
Net asset value, offering and redemption price per share | $37.37 | ||
COMPOSITION OF NET ASSETS | |||
Paid-in capital | $19,637,130 | ||
Total distributable earnings | 8,982,044 | ||
Net assets | $ 28,619,174 | ||
9 |
Scharf Fund | Scharf Multi-Asset Opportunity Fund | |||||
INVESTMENT INCOME | ||||||
Income | ||||||
Dividends (net of foreign tax withheld and issuance fees of $226,987 and $18,969, respectively) | $5,989,835 | $550,161 | ||||
Interest | 821,984 | 530,962 | ||||
Total income | 6,811,819 | 1,081,123 | ||||
Expenses | ||||||
Advisory fees (Note 4) | 3,299,373 | 317,556 | ||||
Shareholder servicing fees - Institutional Class (Note 6) | 335,366 | 34,281 | ||||
Shareholder servicing fees - Retail Class (Note 6) | 7,323 | 10,764 | ||||
Administration and fund accounting fees (Note 4) | 179,960 | 62,510 | ||||
Transfer agent fees and expenses (Note 4) | 49,116 | 14,359 | ||||
Custody fees (Note 4) | 44,275 | 13,421 | ||||
Registration fees | 37,907 | 30,475 | ||||
Audit fees | 22,500 | 22,500 | ||||
Reports to shareholders | 18,531 | 3,909 | ||||
12b-1 distribution fees - Retail Class (Note 5) | 18,309 | 26,912 | ||||
Trustee fees and expenses | 18,172 | 18,173 | ||||
Miscellaneous expenses | 12,871 | 7,406 | ||||
Chief Compliance Officer fee (Note 4) | 11,199 | 11,198 | ||||
Insurance expense | 9,552 | 3,732 | ||||
Legal fees | 6,574 | 6,574 | ||||
Interest expense (Note 7) | 1,087 | 23 | ||||
Total expenses | 4,072,115 | 583,793 | ||||
Less: advisory fee waiver (Note 4) | (372,687) | (96,569) | ||||
Net expenses | 3,699,428 | 487,224 | ||||
Net investment income | 3,112,391 | 593,899 | ||||
REALIZED AND UNREALIZED GAIN ON INVESTMENTS AND FOREIGN CURRENCY | ||||||
Net realized gain on: | ||||||
Investments | 24,716,308 | 2,702,970 | ||||
Foreign currency | 18,034 | 661 | ||||
Net change in unrealized appreciation/(depreciation) on: | ||||||
Investments | 54,827,068 | 5,293,989 | ||||
Foreign currency | 1,364 | 240 | ||||
Net realized and unrealized gain on investments and foreign currency | 79,562,774 | 7,997,860 | ||||
Net Increase in Net Assets Resulting from Operations | $ 82,675,165 | $8,591,759 | ||||
10 |
Scharf Global Opportunity Fund | |||
INVESTMENT INCOME | |||
Income | |||
Dividends (net of foreign tax withheld and issuance fees of $24,235) | $404,483 | ||
Interest | 44,855 | ||
Total income | 449,338 | ||
Expenses | |||
Advisory fees (Note 4) | 187,940 | ||
Administration and fund accounting fees (Note 4) | 41,065 | ||
Audit fees | 21,000 | ||
Registration fees | 18,787 | ||
Trustee fees and expenses | 18,172 | ||
Custody fees (Note 4) | 13,769 | ||
Shareholder servicing fees - Institutional Class (Note 6) | 13,424 | ||
Chief Compliance Officer fee (Note 4) | 11,199 | ||
Transfer agent fees and expenses (Note 4) | 8,619 | ||
Miscellaneous expenses | 8,116 | ||
Legal fees | 6,374 | ||
Reports to shareholders | 3,694 | ||
Insurance expense | 3,380 | ||
Interest expense (Note 7) | 1,601 | ||
Total expenses | 357,140 | ||
Less: advisory fee waiver and expense reimbursement (Note 4) | (204,103) | ||
Net expenses | 153,037 | ||
Net investment income | 296,301 | ||
REALIZED AND UNREALIZED GAIN/(LOSS) ON INVESTMENTS AND FOREIGN CURRENCY | |||
Net realized gain/(loss) on: | |||
Investments | 727,598 | ||
Foreign currency | (1,063) | ||
Net change in unrealized appreciation/(depreciation) on: | |||
Investments | 4,184,271 | ||
Foreign currency | 241 | ||
Net realized and unrealized gain on investments and foreign currency | 4,911,047 | ||
Net Increase in Net Assets Resulting from Operations | $ 5,207,348 | ||
11 |
Year Ended September 30, | ||||||
2024 | 2023 | |||||
INCREASE/(DECREASE) IN NET ASSETS FROM: | ||||||
OPERATIONS | ||||||
Net investment income | $3,112,391 | $2,932,501 | ||||
Net realized gain/(loss) from: | ||||||
Investments | 24,716,308 | 28,510,148 | ||||
Foreign currency | 18,034 | (13,637) | ||||
Net change in unrealized appreciation/(depreciation) on: | ||||||
Investments | 54,827,068 | 32,706,978 | ||||
Foreign currency | 1,364 | 18,886 | ||||
Net increase in net assets resulting from operations | 82,675,165 | 64,154,876 | ||||
DISTRIBUTIONS TO SHAREHOLDERS | ||||||
Net dividends and distributions to shareholders - Institutional Class shares | (33,598,363) | (19,726,638) | ||||
Net dividends and distributions to shareholders - Retail Class shares | (538,833) | (269,886) | ||||
Total distributions to shareholders | (34,137,196) | (19,996,524) | ||||
CAPITAL SHARE TRANSACTIONS | ||||||
Net increase/(decrease) in net assets derived from net change in outstanding shares(a) | 11,914,049 | (17,918,948) | ||||
Total Increase in Net Assets | 60,452,018 | 26,239,404 | ||||
NET ASSETS | ||||||
Beginning of year | 387,822,328 | 361,582,924 | ||||
End of year | $ 448,274,346 | $387,822,328 | ||||
(a) | A summary of share transactions is as follows: |
12 |
Year Ended September 30, | ||||||||||||
2024 | 2023 | |||||||||||
Shares | Paid-in Capital | Shares | Paid-in Capital | |||||||||
Shares sold | 1,194,954 | $62,261,804 | 850,977 | $41,201,237 | ||||||||
Shares issued on reinvestments of distributions | 685,340 | 33,259,569 | 413,212 | 19,615,179 | ||||||||
Shares redeemed* | (1,662,785) | (85,966,325) | (1,609,151) | (78,812,272) | ||||||||
Net increase/(decrease) | 217,509 | $9,555,048 | (344,962) | $(17,995,856) | ||||||||
* Net of redemption fees of^ | $13 | $812 | ||||||||||
Year Ended September 30, | ||||||||||||
2024 | 2023 | |||||||||||
Shares | Paid-in Capital | Shares | Paid-in Capital | |||||||||
Shares sold | 68,690 | $3,602,854 | 25,502 | $1,231,141 | ||||||||
Shares issued on reinvestments of distributions | 11,131 | 538,833 | 5,312 | 251,594 | ||||||||
Shares redeemed* | (34,757) | (1,782,686) | (28,770) | (1,405,827) | ||||||||
Net increase | 45,064 | $2,359,001 | 2,044 | $76,908 | ||||||||
* Net of redemption fees of^ | $— | $13 | ||||||||||
^ | Prior to January 28, 2024, a redemption fee of 2.00% was assessed against shares redeemed within 60 days of purchase. |
13 |
Year Ended September 30, | ||||||
2024 | 2023 | |||||
INCREASE/(DECREASE) IN NET ASSETS FROM: | ||||||
OPERATIONS | ||||||
Net investment income | $593,899 | $550,628 | ||||
Net realized gain from: | ||||||
Investments | 2,702,970 | 3,084,207 | ||||
Foreign currency | 661 | 2,174 | ||||
Net change in unrealized appreciation/(depreciation) on: | ||||||
Investments | 5,293,989 | 2,580,005 | ||||
Foreign currency | 240 | 718 | ||||
Net increase in net assets resulting from operations | 8,591,759 | 6,217,732 | ||||
DISTRIBUTIONS TO SHAREHOLDERS | ||||||
Net dividends and distributions to shareholders - Institutional Class | (3,119,907) | (1,304,574) | ||||
Net dividends and distributions to shareholders - Retail Class | (843,003) | (315,956) | ||||
Total distributions to shareholders | (3,962,910) | (1,620,530) | ||||
CAPITAL SHARE TRANSACTIONS | ||||||
Net decrease in net assets derived from net change in outstanding shares(a) | (1,054,382) | (4,312,035) | ||||
Total increase in net assets | 3,574,467 | 285,167 | ||||
NET ASSETS | ||||||
Beginning of year | 47,093,845 | 46,808,678 | ||||
End of year | $ 50,668,312 | $47,093,845 | ||||
(a) | A summary of share transactions is as follows: |
14 |
Year Ended September 30, | ||||||||||||
2024 | 2023 | |||||||||||
Shares | Paid-in Capital | Shares | Paid-in Capital | |||||||||
Shares sold | 44,637 | $1,568,138 | 17,419 | $589,736 | ||||||||
Shares issued on reinvestments of distributions | 91,274 | 3,026,633 | 39,023 | 1,290,490 | ||||||||
Shares redeemed | (154,215) | (5,398,267) | (166,843) | (5,552,746) | ||||||||
Net decrease | (18,304) | $(803,496) | (110,401) | $(3,672,520) | ||||||||
Year Ended September 30, | ||||||||||||
2024 | 2023 | |||||||||||
Shares | Paid-in Capital | Shares | Paid-in Capital | |||||||||
Shares sold | 459 | $15,592 | 2,066 | $68,767 | ||||||||
Shares issued on reinvestments of distributions | 25,453 | 843,003 | 9,566 | 315,956 | ||||||||
Shares redeemed | (31,755) | (1,109,481) | (30,402) | (1,024,238) | ||||||||
Net decrease | (5,843) | $(250,886) | (18,770) | $(639,515) | ||||||||
15 |
Year Ended September 30, | ||||||
2024 | 2023 | |||||
INCREASE/(DECREASE) IN NET ASSETS FROM: | ||||||
OPERATIONS | ||||||
Net investment income | $296,301 | $275,346 | ||||
Net realized gain/(loss) from: | ||||||
Investments | 727,598 | 237,000 | ||||
Foreign currency | (1,063) | (1,834) | ||||
Net change in unrealized appreciation/(depreciation) on: | ||||||
Investments | 4,184,271 | 3,249,709 | ||||
Foreign currency | 241 | 945 | ||||
Net increase in net assets resulting from operations | 5,207,348 | 3,761,166 | ||||
DISTRIBUTIONS TO SHAREHOLDERS | ||||||
Net dividends and distributions to shareholders | (656,740) | (258,154) | ||||
Total distributions to shareholders | (656,740) | (258,154) | ||||
CAPITAL SHARE TRANSACTIONS | ||||||
Net increase/(decrease) in net assets derived from net change in outstanding shares (a) | (1,997,329) | 1,628,984 | ||||
Total increase in net assets | 2,553,279 | 5,131,996 | ||||
NET ASSETS | ||||||
Beginning of year | 26,065,895 | 20,933,899 | ||||
End of year | $ 28,619,174 | $26,065,895 | ||||
(a) | A summary of share transactions is as follows: |
Year Ended September 30, | ||||||||||||
2024 | 2023 | |||||||||||
Shares | Paid-in Capital | Shares | Paid-in Capital | |||||||||
Shares sold | 55,762 | $1,859,797 | 85,620 | $2,707,814 | ||||||||
Shares issued on reinvestments of distributions | 15,701 | 513,719 | 5,860 | 180,553 | ||||||||
Shares redeemed* | (130,262) | (4,370,845) | (40,505) | (1,259,383) | ||||||||
Net increase/(decrease) | (58,799) | $(1,997,329) | 50,975 | $1,628,984 | ||||||||
*Net of redemption fees of^ | $— | $568 | ||||||||||
^ | Prior to January 28, 2024, a redemption fee of 2.00% was assessed against shares redeemed within 15 days of purchase. |
16 |
Year Ended September 30, | |||||||||||||||
2024 | 2023 | 2022 | 2021 | 2020 | |||||||||||
Net asset value, beginning of year | $49.72 | $44.40 | $54.78 | $46.02 | $46.21 | ||||||||||
Income from investment operations: | |||||||||||||||
Net investment income^ | 0.38 | 0.36 | 0.29 | 0.39 | 0.34 | ||||||||||
Net realized and unrealized gain/(loss) on investments and foreign currency | 9.97 | 7.44 | (5.26) | 10.14 | 3.35 | ||||||||||
Total from investment operations | 10.35 | 7.80 | (4.97) | 10.53 | 3.69 | ||||||||||
Less distributions: | |||||||||||||||
From net investment income | (0.40) | (0.31) | (0.38) | (0.37) | (0.24) | ||||||||||
From net realized gain on investments | (4.07) | (2.17) | (5.03) | (1.40) | (3.64) | ||||||||||
Total distributions | (4.47) | (2.48) | (5.41) | (1.77) | (3.88) | ||||||||||
Paid-in capital from redemption fees^#+ | 0.00 | 0.00 | 0.00 | 0.00 | 0.00 | ||||||||||
Net asset value, end of year | $55.60 | $49.72 | $44.40 | $54.78 | $46.02 | ||||||||||
Total return | 22.13% | 17.83% | −10.69% | 23.43% | 8.12% | ||||||||||
Ratios/supplemental data: | |||||||||||||||
Net assets, end of year (thousands) | $438,863 | $381,635 | $356,162 | $328,886 | $282,746 | ||||||||||
Ratio of expenses to average net assets: | |||||||||||||||
Before fee waivers | 0.96% | 0.95% | 0.94% | 0.94% | 1.00% | ||||||||||
After fee waivers | 0.87% | 0.86% | 0.86% | 0.86% | 0.90% | ||||||||||
Ratio of net investment income to average net assets: | |||||||||||||||
Before fee waivers | 0.65% | 0.65% | 0.48% | 0.66% | 0.68% | ||||||||||
After fee waivers | 0.74% | 0.74% | 0.56% | 0.74% | 0.78% | ||||||||||
Portfolio turnover rate | 32.94 % | 35.49% | 22.66% | 29.21% | 52.15% | ||||||||||
| ^ | Based on average shares outstanding. |
| # | Amount is less than $0.01. |
| + | The Fund stopped collecting a redemption fee on January 28, 2024. |
17 |
Year Ended September 30, | |||||||||||||||
2024 | 2023 | 2022 | 2021 | 2020 | |||||||||||
Net asset value, beginning of year | $49.50 | $44.09 | $54.44 | $45.74 | $45.95 | ||||||||||
Income from investment operations: | |||||||||||||||
Net investment income^ | 0.23 | 0.23 | 0.15 | 0.24 | 0.22 | ||||||||||
Net realized and unrealized gain/(loss) on investments and foreign currency | 9.94 | 7.38 | (5.25) | 10.09 | 3.33 | ||||||||||
Total from investment operations | 10.17 | 7.61 | (5.10) | 10.33 | 3.55 | ||||||||||
Less distributions: | |||||||||||||||
From net investment income | (0.26) | (0.03) | (0.22) | (0.23) | (0.12) | ||||||||||
From net realized gain on investments | (4.07) | (2.17) | (5.03) | (1.40) | (3.64) | ||||||||||
Total distributions | (4.33) | (2.20) | (5.25) | (1.63) | (3.76) | ||||||||||
Paid-in capital from redemption fees+ | — | 0.00^# | 0.00^# | 0.00^# | 0.00^# | ||||||||||
Net asset value, end of year | $55.34 | $49.50 | $44.09 | $54.44 | $45.74 | ||||||||||
Total return | 21.80% | 17.49% | −10.96% | 23.08% | 7.83% | ||||||||||
Ratios/supplemental data: | |||||||||||||||
Net assets, end of year (thousands) | $9,411 | $6,187 | $5,421 | $71,730 | $66,531 | ||||||||||
Ratio of expenses to average net assets: | |||||||||||||||
Before fee waivers | 1.23% | 1.23% | 1.22% | 1.22% | 1.29% | ||||||||||
After fee waivers | 1.14% | 1.14% | 1.14% | 1.14% | 1.19% | ||||||||||
Ratio of net investment income to average net assets: | |||||||||||||||
Before fee waivers | 0.36% | 0.39% | 0.20% | 0.38% | 0.39% | ||||||||||
After fee waivers | 0.45% | 0.48% | 0.28% | 0.46% | 0.49% | ||||||||||
Portfolio turnover rate | 32.94% | 35.49% | 22.66% | 29.21% | 52.15% | ||||||||||
| ^ | Based on average shares outstanding. |
| # | Amount is less than $0.01. |
| + | The Fund stopped collecting a redemption fee on January 28, 2024. |
18 |
Year Ended September 30, | |||||||||||||||
2024 | 2023 | 2022 | 2021 | 2020 | |||||||||||
Net asset value, beginning of year | $34.29 | $31.16 | $38.14 | $34.01 | $33.55 | ||||||||||
Income from investment operations: | |||||||||||||||
Net investment income^ | 0.45 | 0.40 | 0.19 | 0.28 | 0.33 | ||||||||||
Net realized and unrealized gain/(loss) on investments and foreign currency | 5.77 | 3.86 | (3.69) | 5.18 | 2.60 | ||||||||||
Total from investment operations | 6.22 | 4.26 | (3.50) | 5.46 | 2.93 | ||||||||||
Less distributions: | |||||||||||||||
From net investment income | (0.45) | (0.22) | (0.30) | (0.31) | (0.43) | ||||||||||
From net realized gain on investments | (2.51) | (0.91) | (3.18) | (1.02) | (2.04) | ||||||||||
Total distributions | (2.96) | (1.13) | (3.48) | (1.33) | (2.47) | ||||||||||
Paid-in capital from redemption fees+ | — | — | 0.00^# | — | — | ||||||||||
Net asset value, end of year | $37.55 | $34.29 | $31.16 | $38.14 | $34.01 | ||||||||||
Total return | 19.29% | 13.81% | −10.48% | 16.46% | 8.99% | ||||||||||
Ratios/supplemental data: | |||||||||||||||
Net assets, end of year (thousands) | $39,490 | $36,686 | $36,772 | $43,738 | $40,450 | ||||||||||
Ratio of expenses to average net assets: | |||||||||||||||
Before fee waivers | 1.14% | 1.23% | 1.43% | 1.46% | 1.47% | ||||||||||
After fee waivers | 0.94% | 0.95% | 0.97% | 0.97% | 0.96% | ||||||||||
Ratio of net investment income to average net assets: | |||||||||||||||
Before fee waivers | 1.07% | 0.91% | 0.08% | 0.28% | 0.50% | ||||||||||
After fee waivers | 1.27% | 1.19% | 0.54% | 0.77% | 1.01% | ||||||||||
Portfolio turnover rate | 26.87% | 28.37% | 20.53% | 28.67% | 48.02% | ||||||||||
| ^ | Based on average shares outstanding. |
| # | Amount is less than $0.01. |
| + | The Fund stopped collecting a redemption fee on January 28, 2024. |
19 |
Year Ended September 30, | |||||||||||||||
2024 | 2023 | 2022 | 2021 | 2020 | |||||||||||
Net asset value, beginning of year | $34.18 | $31.05 | $38.02 | $33.91 | $33.47 | ||||||||||
Income from investment operations: | |||||||||||||||
Net investment income^ | 0.36 | 0.31 | 0.09 | 0.19 | 0.24 | ||||||||||
Net realized and unrealized gain/(loss) on investments and foreign currency | 5.76 | 3.85 | (3.68) | 5.17 | 2.59 | ||||||||||
Total from investment operations | 6.12 | 4.16 | (3.59) | 5.36 | 2.83 | ||||||||||
Less distributions: | |||||||||||||||
From net investment income | (0.36) | (0.12) | (0.20) | (0.23) | (0.35) | ||||||||||
From net realized gain on investments | (2.51) | (0.91) | (3.18) | (1.02) | (2.04) | ||||||||||
Total distributions | (2.87) | (1.03) | (3.38) | (1.25) | (2.39) | ||||||||||
Paid-in capital from redemption fees+ | — | — | 0.00^# | — | 0.00^# | ||||||||||
Net asset value, end of year | $37.43 | $34.18 | $31.05 | $38.02 | $33.91 | ||||||||||
Total return | 19.00% | 13.51% | −10.74% | 16.18% | 8.68% | ||||||||||
Ratios/supplemental data: | |||||||||||||||
Net assets, end of year (thousands) | $11,178 | $10,408 | $10,037 | $6,805 | $7,359 | ||||||||||
Ratio of expenses to average net assets: | |||||||||||||||
Before fee waivers | 1.40% | 1.49% | 1.69% | 1.72% | 1.74% | ||||||||||
After fee waivers | 1.20% | 1.21% | 1.23% | 1.23% | 1.23% | ||||||||||
Ratio of net investment income/(loss) to average net assets: | |||||||||||||||
Before fee waivers | 0.82% | 0.65% | (0.20)% | 0.03% | 0.23% | ||||||||||
After fee waivers | 1.02% | 0.93% | 0.26% | 0.52% | 0.74% | ||||||||||
Portfolio turnover rate | 26.87% | 28.37% | 20.53% | 28.67% | 48.02% | ||||||||||
| ^ | Based on average shares outstanding. |
| # | Amount is less than $0.01. |
| + | The Fund stopped collecting a redemption fee on January 28, 2024. |
20 |
Year Ended September 30, | |||||||||||||||
2024 | 2023 | 2022 | 2021 | 2020 | |||||||||||
Net asset value, beginning of year | $31.61 | $27.06 | $36.25 | $29.32 | $29.98 | ||||||||||
Income from investment operations: | |||||||||||||||
Net investment income | 0.38^ | 0.35^ | 0.32^ | 0.31 | 0.28 | ||||||||||
Net realized and unrealized gain/(loss) on investments and foreign currency | 6.25 | 4.53 | (5.98) | 7.31 | 2.22 | ||||||||||
Total from investment operations | 6.63 | 4.88 | (5.66) | 7.62 | 2.50 | ||||||||||
Less distributions: | |||||||||||||||
From net investment income | (0.41) | (0.33) | (0.30) | (0.23) | (0.41) | ||||||||||
From net realized gain on investments | (0.46) | — | (3.23) | (0.46) | (2.75) | ||||||||||
Total distributions | (0.87) | (0.33) | (3.53) | (0.69) | (3.16) | ||||||||||
Paid-in capital from redemption fees+ | — | 0.00^# | 0.00^# | — | — | ||||||||||
Net asset value, end of year | $37.37 | $31.61 | $27.06 | $36.25 | $29.32 | ||||||||||
Total return | 21.37% | 18.08% | (17.53)% | 26.33% | 8.09% | ||||||||||
Ratios/supplemental data: | |||||||||||||||
Net assets, end of year (thousands) | $28,619 | $26,066 | $20,934 | $25,643 | $18,706 | ||||||||||
Ratio of expenses to average net assets: | |||||||||||||||
Before fee waivers and expense reimbursement | 1.33% | 1.44% | 1.66% | 1.84% | 1.99% | ||||||||||
After fee waivers and expense reimbursement | 0.57% | 0.59% | 0.65% | 0.76% | 0.70% | ||||||||||
Ratio of net investment income/(loss) to average net assets: | |||||||||||||||
Before fee waivers and expense reimbursement | 0.34% | 0.25% | (0.06)% | (0.16)% | (0.42)% | ||||||||||
After fee waivers and expense reimbursement | 1.10% | 1.10% | 0.95% | 0.92% | 0.87% | ||||||||||
Portfolio turnover rate | 31.87% | 34.13% | 29.86% | 37.42% | 60.69% | ||||||||||
| ^ | Based on average shares outstanding. |
| # | Amount is less than $0.01. |
| * | Formerly Retail Class. |
| + | The Fund stopped collecting a redemption fee on January 28, 2024. |
21 |
| A. | Security Valuation: All investments in securities are recorded at their estimated fair value, as described in Note 3. |
| B. | Federal Income Taxes: It is the Funds’ policy to comply with the requirements of Subchapter M of the Internal Revenue Code applicable to regulated investment companies and to distribute substantially all of its taxable income to its shareholders. Therefore, no Federal income or excise tax provision is required. |
| C. | Securities Transactions, Income and Distributions: Securities transactions are accounted for on the trade date. Realized gains and losses on securities sold are calculated on the basis of specified cost. Interest income is recorded on an accrual basis. Discounts and premiums on securities purchased are accreted/amortized over the life of the respective security using the effective interest method, except for premiums on certain callable debt securities that are amortized to the earliest call date. Dividend income, income and capital gain distributions from underlying funds and distributions to shareholders are recorded on the ex–dividend date. Withholding taxes on foreign dividends have been provided for in accordance with each Fund's understanding of the applicable country’s tax rules and rates. |
22 |
| D. | Reclassification of Capital Accounts: Accounting principles generally accepted in the United States of America require that certain components of net assets relating to permanent differences be reclassified between financial and tax reporting. These reclassifications have no effect on net assets or net asset value per share. |
Distributable Earnings | Paid-in Capital | |||||
Scharf Fund | $(2,430,158) | $2,430,158 | ||||
Scharf Multi-Asset Opportunity Fund | (216,021) | 216,021 | ||||
Scharf Global Opportunity Fund | (132,761) | 132,761 | ||||
| E. | Use of Estimates: The preparation of financial statements in conformity with accounting principles generally accepted in the United States of America requires management to make estimates and assumptions that affect the reported amounts of assets and liabilities at the date of the financial statements and the reported amounts of increases and decreases in net assets during the reporting period. Actual results could differ from those estimates. |
| F. | Redemption Fees: Effective January 28, 2024, the Funds’ redemption fee has been eliminated. Prior to January 28, 2024, the Scharf Fund charged a 2.00% redemption fee to shareholders who redeemed shares held for 60 days or less, and the Scharf Multi-Asset Opportunity Fund and the Scharf Global Opportunity Fund each charged a 2.00% redemption fee to shareholders who redeemed shares held for 15 days or less. Such fees were retained by the Funds and accounted for as an addition to paid-in capital. Redemption fees retained are disclosed in the statements of changes. |
| G. | Foreign Currency: Investment securities and other assets and liabilities denominated in foreign currencies are translated into U.S. dollar amounts at the date of valuation. Purchases and sales of investment securities and income and expense items denominated in foreign currencies are translated to U.S. dollar amounts on the respective dates of such transactions. |
| H. | Accounting Pronouncements: In June 2022, the FASB issued Accounting Standards Update 2022-03, which amends Fair Value Measurement (Topic 820): Fair Value Measurement of Equity Securities Subject to Contractual Sale Restrictions (“ASU 2022-03”). ASU 2022-03 clarifies guidance for fair value measurement of an equity security subject to a contractual sale restriction and establishes new disclosure requirements for such equity securities. ASU 2022-03 is effective for fiscal years beginning after December 15, 2023, and for interim periods within those fiscal years, with early adoption permitted. Management is currently evaluating the impact of these amendments on the Fund’s financial statements. |
23 |
| I. | Events Subsequent to the Fiscal Year End: In preparing the financial statements as of September 30, 2024, management considered the impact of subsequent events for potential recognition or disclosure in the financial statements. Management has determined there were no subsequent events that would need to be disclosed in the Funds’ financial statements. |
24 |
Level 1 | Level 2 | Level 3 | Total | |||||||||
Common Stocks | $407,079,145 | $— | $ — | $407,079,145 | ||||||||
Real Estate Investment Trusts | 15,053,562 | — | — | 15,053,562 | ||||||||
Preferred Stock | 14,139,278 | — | — | 14,139,278 | ||||||||
Money Market Funds | 3,361,652 | — | — | 3,361,652 | ||||||||
U.S. Treasury Bills | — | 4,930,162 | — | 4,930,162 | ||||||||
Total Investments in Securities | $439,633,637 | $4,930,162 | $— | $444,563,799 | ||||||||
Level 1 | Level 2 | Level 3 | Total | |||||||||
Common Stocks | $32,253,999 | $— | $ — | $32,253,999 | ||||||||
Municipal Bonds | — | 3,284,009 | — | 3,284,009 | ||||||||
Preferred Stocks | 2,879,680 | — | — | 2,879,680 | ||||||||
Corporate Bonds | — | 2,744,237 | — | 2,744,237 | ||||||||
Exchange-Traded Funds | 2,495,848 | — | — | 2,495,848 | ||||||||
25 |
Level 1 | Level 2 | Level 3 | Total | |||||||||
U.S. Treasury Securities | $— | $2,056,553 | $— | $2,056,553 | ||||||||
Real Estate Investment Trusts | 1,216,907 | — | — | 1,216,907 | ||||||||
Money Market Funds | 434,001 | — | — | 434,001 | ||||||||
U.S. Treasury Bills | — | 2,307,833 | — | 2,307,833 | ||||||||
Total Investments in Securities | $39,280,435 | $10,392,632 | $ — | $49,673,067 | ||||||||
Level 1 | Level 2 | Level 3 | Total | |||||||||
Common Stocks | $25,234,660 | $ — | $ — | $25,234,660 | ||||||||
Preferred Stocks | 1,440,940 | — | — | 1,440,940 | ||||||||
Real Estate Investment Trusts | 1,055,309 | — | — | 1,055,309 | ||||||||
Money Market Fund | 890,497 | — | — | 890,497 | ||||||||
Total Investments | $28,621,406 | $— | $— | $28,621,406 | ||||||||
Expense Caps | |||
Scharf Fund | 0.79% | ||
Scharf Multi-Asset Opportunity Fund | 0.85% | ||
Scharf Global Opportunity Fund | 0.52% | ||
26 |
Scharf Fund | Scharf Multi-Asset Opportunity Fund | Scharf Global Opportunity Fund | |||||||||||||
Year | Amount | Year | Amount | Year | Amount | ||||||||||
9/30/25 | $338,354 | 9/30/25 | $245,090 | 9/30/25 | $262,343 | ||||||||||
9/30/26 | 345,233 | 9/30/26 | 134,869 | 9/30/26 | 212,097 | ||||||||||
9/30/27 | 372,687 | 9/30/27 | 96,569 | 9/30/27 | 204,103 | ||||||||||
$1,056,274 | $476,528 | $678,543 | |||||||||||||
27 |
Purchases | Sales | |||||
Scharf Fund | $134,253,362 | $160,041,715 | ||||
Scharf Multi-Asset Opportunity Fund | 11,956,866 | 15,205,128 | ||||
Scharf Global Opportunity Fund | 8,313,891 | 11,343,281 | ||||
Scharf Fund | Scharf Multi-Asset Opportunity Fund | Scharf Global Opportunity Fund | |||||||
Cost of investments(a) | $306,748,638 | $36,386,063 | $20,686,762 | ||||||
Gross unrealized appreciation | 144,489,311 | 13,691,187 | 8,177,090 | ||||||
Gross unrealized depreciation | (6,674,150) | (404,183) | (242,446) | ||||||
Net unrealized appreciation(a) | 137,815,161 | 13,287,004 | 7,934,644 | ||||||
Net unrealized appreciation on foreign currency | 1,172 | 86 | 129 | ||||||
Undistributed ordinary income | 2,475,683 | 445,792 | 217,298 | ||||||
Undistributed long-term capital gains | 16,722,273 | 1,844,334 | 584,373 | ||||||
Total distributable earnings | 19,197,956 | 2,290,126 | 801,671 | ||||||
Other accumulated gains/(losses) | — | 57,988 | 245,600 | ||||||
Total accumulated earnings/(losses) | $157,014,289 | $15,635,204 | $8,982,044 | ||||||
(a) | The difference between book-basis and tax-basis cost and unrealized appreciation is attributable primarily to the tax deferral of losses on wash sales, tax adjustments related to partnerships, tax equalization and transfer in-kind. |
28 |
September 30, 2024 | September 30, 2023 | |||||||||||
Ordinary Income | Long-Term Capital Gains | Ordinary Income | Long-Term Capital Gains | |||||||||
Scharf Fund | $3,037,333 | $31,099,863 | $2,449,143 | $17,547,381 | ||||||||
Scharf Multi-Asset Opportunity Fund | 583,831 | 3,379,079 | 289,803 | 1,330,727 | ||||||||
Scharf Global Opportunity Fund | 319,928 | 336,812 | 258,154 | — | ||||||||
Scharf Fund | |||
National Financial Services LLC | 33.75% | ||
Morgan Stanley Smith Barney LLC | 30.16% | ||
Scharf Multi-Asset Opportunity Fund | |||
Charles Schwab & Co., Inc. | 80.96% | ||
Scharf Global Opportunity Fund | |||
Charles Schwab & Co., Inc. | 53.08% | ||
| • | Foreign and Emerging Market Securities Risk. The Fund may invest a portion (or all, with respect to the Global Opportunity Fund) of its total assets in securities of foreign issuers. Securities of foreign issuers may be denominated in U.S. dollars or in currencies other than U.S. dollars. Investments in securities of foreign issuers present certain risks not ordinarily associated with investments in securities of U.S. issuers. These risks include fluctuations in foreign currency exchange rates, political, economic or legal developments (including war or other instability, expropriation of assets, nationalization and confiscatory taxation), the imposition of foreign exchange limitations (including currency blockage), withholding taxes on income or capital transactions or other restrictions, higher transaction costs (including higher brokerage, custodial and settlement costs and currency conversion costs) and possible difficulty in enforcing contractual obligations or taking judicial action. Securities of foreign issuers may not be as liquid and may be more volatile than comparable securities of domestic issuers. |
| • | Investment Style Risk. Stocks with relatively low valuations may perform differently from the market as a whole and from other types of stocks. At times when these securities are out of favor, the Fund may |
29 |
| • | Small- and Medium-Sized Company Risk. The securities of smaller or medium-sized companies may be subject to more abrupt or erratic market movements than securities of larger-sized companies or the market averages in general. In addition, such companies typically are subject to a greater degree of change in earnings and business prospects than are larger companies. Thus, to the extent the Fund invests in smaller or medium-sized companies, the Fund may be subject to greater investment risk than that assumed through investment in the equity securities of larger-sized companies. |
| • | Special Situations Risk. Investments in special situations may involve greater risks when compared to the Fund’s other strategies due to a variety of factors. Mergers, reorganizations, liquidations, or recapitalizations may not be completed on the terms originally contemplated, or may fail. Expected developments may not occur in a timely manner, or at all. Transactions may take longer than originally anticipated, resulting in lower annualized returns than contemplated at the time of investment. Furthermore, failure to anticipate changes in the circumstances affecting these types of investments may result in permanent loss of capital, where the Fund may be unable to recoup some or all of its investment, producing a loss for the Fund. In addition, investments in special situation companies may be illiquid and difficult to value, which will require the Fund to employ fair value procedures to value its holdings in such investments. |
| • | General Market Risk. Economies and financial markets throughout the world are becoming increasingly interconnected, which increases the likelihood that events or conditions in one country or region will adversely impact markets or issuers in other countries or regions. Securities in a Fund’s portfolio may underperform in comparison to securities in general financial markets, a particular financial market or other asset classes due to a number of factors, including: inflation (or expectations for inflation); interest rates; global demand for particular products or resources; natural disasters or events; pandemic diseases; terrorism; regulatory events; and government controls. U.S. and international markets have experienced significant periods of volatility in recent years and months due to a number of economic, political and global macro factors, which has resulted in disruptions to business operations and supply chains, stress on the global healthcare system, growth concerns in the U.S. and overseas, staffing shortages and the inability to meet consumer demand, and widespread concern and uncertainty. Continuing uncertainties regarding interest rates, rising inflation, political events, rising government debt in the U.S. and trade tensions also contribute to market volatility. Conflict, loss of life and disaster connected to ongoing armed conflict between Ukraine and Russia in Europe and Israel and Hamas in the Middle East could have severe adverse effects on the region, including significant adverse effects on the regional or global economies and the markets for certain securities. The U.S. and the European Union imposed sanctions on certain Russian individuals and companies, including certain financial institutions, and have limited certain exports and imports to and from Russia. The war has contributed to recent market volatility and may continue to do so. |
Outstanding Shares | Total Shares Voted(1) | |||||
610,254,146.13 | 422,548,104.53 | 69.24% | ||||
(1) | To approve the election of three Trustees to serve until his or her successor is elected and qualified. |
30 |
FOR(2) | WITHHOLD | |||||||||||||||||
Shares Voted | % of Voted Shares | % of Outstanding Shares | Shares Voted | % of Voted Shares | % of Outstanding Shares | |||||||||||||
(1) Craig Wainscott | 420,753,222.93 | 99.58% | 68.95% | 1,794,881.60 | 0.42% | 0.29% | ||||||||||||
(2) Anne Kritzmire | 420,814,806.36 | 99.59% | 68.96% | 1,733,298.17 | 0.41% | 0.28% | ||||||||||||
(3) Michele Rackey | 419,476,647.18 | 99.27% | 68.74% | 3,071,457.36 | 0.73% | 0.50% | ||||||||||||
(1) | Quorum: |
(2) | Vote Required: |
31 |
32 |
(b) Financial Highlights are included within the financial statements filed under Item 7 of this Form.
Item 8. Changes in and Disagreements with Accountants for Open-End Investment Companies.
There were no changes in or disagreements with accountants during the period covered by this report.
Item 9. Proxy Disclosure for Open-End Investment Companies.
See Item 7(a).
Item 10. Remuneration Paid to Directors, Officers, and Others of Open-End Investment Companies.
See Item 7(a).
Item 11. Statement Regarding Basis for Approval of Investment Advisory Contract.
Not applicable.
Item 12. Disclosure of Proxy Voting Policies and Procedures for Closed-End Management Investment Companies.
Not applicable to open-end investment companies.
Item 13. Portfolio Managers of Closed-End Management Investment Companies.
Not applicable to open-end investment companies.
Item 14. Purchases of Equity Securities by Closed-End Management Investment Company and Affiliated Purchasers.
Not applicable to open-end investment companies.
Item 15. Submission of Matters to a Vote of Security Holders.
There have been no material changes to the procedures by which shareholders may recommend nominees to the Registrant’s Board of Trustees.
Item 16. Controls and Procedures.
| (a) | The Registrant’s President/Chief Executive Officer/Principal Executive Officer and Vice President/Treasurer/Principal Financial Officer have reviewed the Registrant’s disclosure controls and procedures (as defined in Rule 30a-3(c) under the Investment Company Act of 1940, as amended, (the “Act”)) as of a date within 90 days of the filing of this report, as required by Rule 30a-3(b) under the Act and Rules 13a-15(b) or 15d-15(b) under the Securities Exchange Act of 1934. Based on their review, such officers have concluded that the disclosure controls and procedures are effective in ensuring that information required to be disclosed in this report is appropriately recorded, processed, summarized and reported and made known to them by others within the Registrant and by the Registrant’s service provider. |
| (b) | There were no changes in the Registrant’s internal control over financial reporting (as defined in Rule 30a-3(d) under the Act) that occurred during the period covered by this report that have materially affected, or are reasonably likely to materially affect, the Registrant’s internal control over financial reporting. |
Item 17. Disclosure of Securities Lending Activities for Closed-End Management Investment Companies.
Not applicable to open-end investment companies.
Item 18. Recovery of Erroneously Awarded Compensation.
Not applicable.
Item 19. Exhibits.
(2) Any policy required by the listing standards adopted pursuant to Rule 10D-1 under the Exchange Act (17 CFR 240.10D-1) by the registered national securities exchange or registered national securities association upon which the registrant’s securities are listed.
Not applicable.
(4) Any written solicitation to purchase securities under Rule 23c-1 under the Act sent or given during the period covered by the report by or on behalf of the registrant to 10 or more persons. Not applicable.
| (5) | Change in the registrant’s independent public accountant. Provide the information called for by Item 4 of Form 8-K under the Exchange Act (17 CFR 249.308). Unless otherwise specified by Item 4, or related to and necessary for a complete understanding of information not previously disclosed, the information should relate to events occurring during the reporting period. Not applicable. |
| (b) | Certifications pursuant to Section 906 of the Sarbanes-Oxley Act of 2002. Furnished herewith. |
SIGNATURES
Pursuant to the requirements of the Securities Exchange Act of 1934 and the Investment Company Act of 1940, the registrant has duly caused this report to be signed on its behalf by the undersigned, thereunto duly authorized.
| (Registrant) | Advisors Series Trust |
| By (Signature and Title)* | /s/ Jeffrey T. Rauman | ||
| Jeffrey T. Rauman, President/Chief Executive Officer/Principal Executive Officer |
| Date | 12/4/24 |
Pursuant to the requirements of the Securities Exchange Act of 1934 and the Investment Company Act of 1940, this report has been signed below by the following persons on behalf of the registrant and in the capacities and on the dates indicated.
| By (Signature and Title)* | /s/ Jeffrey T. Rauman | ||
| Jeffrey T. Rauman, President/Chief Executive Officer/Principal Executive Officer |
| Date | 12/4/24 |
| By (Signature and Title)* | /s/ Kevin J. Hayden | ||
| Kevin J. Hayden, Vice President/Treasurer/Principal Financial Officer |
| Date | 12/6/24 |
* Print the name and title of each signing officer under his or her signature.