Washington, D.C. 20549
220 East 42nd Street, New York, N.Y. 10017
| | | |
| | | |
| INVESTMENT ADVISER | EULAV Asset Management, LLC 220 East 42nd Street New York, NY 10017-5891 | S E M I – A N N U A L R E P O R T |
| | J u n e 3 0, 2 0 0 9 |
| | |
| DISTRIBUTOR | EULAV Securities, Inc. | |
| | 220 East 42nd Street | |
| | New York, NY 10017-5891 | |
| | | |
| CUSTODIAN BANK | State Street Bank and Trust Co. | |
| | 225 Franklin Street | |
| | Boston, MA 02110 | Value Line Larger Companies Fund, Inc. |
| | |
| SHAREHOLDER | State Street Bank and Trust Co. |
| SERVICING AGENT | c/o BFDS |
| | P.O. Box 219729 |
| | Kansas City, MO 64121-9729 |
| | |
| INDEPENDENT | PricewaterhouseCoopers LLP |
| REGISTERED PUBLIC | 300 Madison Avenue |
| ACCOUNTING FIRM | New York, NY10017 |
| | |
| LEGAL COUNSEL | Peter D. Lowenstein, Esq. |
| | 496 Valley Road |
| | Cos Cob, CT 06807-0272 |
| | |
| DIRECTORS | Joyce E. Heinzerling |
| | Francis C. Oakley |
| | David H. Porter |
| | Paul Craig Roberts |
| | Thomas T. Sarkany |
| | Nancy-Beth Sheerr |
| | Daniel S. Vandivort |
| | |
| OFFICERS | Mitchell E. Appel |
| | President |
| | Howard A. Brecher | |
| | Vice President and Secretary | |
| | Emily D. Washington | |
| | Treasurer | |
| | | |
| | | |
| This unaudited report is issued for information to shareholders. It is not authorized for distribution to prospective investors unless preceded or accompanied by a currently effective prospectus of the Fund (obtainable from the Distributor). | |
| #00067210 | |
Value Line Larger Companies Fund, Inc.
To Our Shareholders (unaudited):
Enclosed is your semi-annual report for the period ended June 30, 2009. I encourage you to carefully review this report, which includes economic observations, your Fund’s performance data and highlights, schedule of investments, and financial statements.
The Value Line Larger Companies Fund (The “Fund”) had a loss of 0.76% for the first six months of 2009, compared with a gain of 3.16% for the S&P 500 Index.(1)
The first half of 2009 continued to be quite volatile for the US equity markets as we worked our way through a deep recession. Government stimulus programs, along with record low borrowing rates provided by the Federal Reserve, finally seem to be taking hold and we expect an economic recovery, albeit probably weaker than normal, to begin in the second half of the year. However, continued headwinds from rising unemployment, further credit market loss writedowns, and the existence of record excess industrial capacity will likely lead to a continued challenging investment environment.
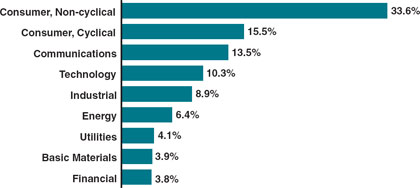
The Fund generally invests in large-capitalized equities and selects from stocks that are ranked in the higher categories for price performance (Rank 1 and 2) over the next six to twelve months by the Value Line Timeliness Ranking System. The System favors stocks with strong price and earnings momentum relative to those of all other companies in the Value Line Investment Survey of approximately 1,700 stocks. Currently, the Fund has a significant weighting in the Consumer Discretionary area. The Fund is also notably underweighted in the financial sector due to the effects of a tight credit environment.
As always, your confidence in the Value Line Funds is appreciated. We continue to welcome the opportunity to serve your long-term investment goals.
| | Sincerely, | |
| | | |
| | /s/ Mitchell Appel | |
| | Mitchell Appel, President | |
| | | |
| | July 29, 2009 | |
| | |
| (1) | The Standard & Poor’s 500 Index consists of 500 stocks which are traded on the New York Stock Exchange, American Stock Exchange and the NASDAQ National Market System and is representative of the broad stock market. This is an unmanaged index and does not reflect charges, expenses or taxes. It is not possible to directly invest in this index. |
Value Line Larger Companies Fund, Inc.
| Companies Fund Shareholders |
Economic Observations (unaudited)
The deep and prolonged recession, which commenced during the latter part of 2007, had produced declines of 6.3% and 5.5% in the U.S. gross domestic product in the fourth quarter of 2008 and the first quarter of this year, respectively. Our sense is that following a more limited business setback in the second quarter, GDP will edge back into positive territory, with a gain of perhaps 1%, or so, in the July-through-September period. GDP should then move gingerly up the ladder with a possible increase of 1%-2% over the final three months of this year. It is worth noting that prospective rates of GDP growth would be well below the historical norms of 3-4%. There is just too much aggregate weakness in certain core sectors, notably housing and employment, for more significant rates of improvement, in our opinion.
The recession was traceable to several events, beginning with some sharp declines in housing construction, home sales, and real estate prices. We also experienced a large reduction in credit availability, a high level of bank failures, increasing foreclosure rates, surging unemployment, slumping retail activity, and weak manufacturing. Unfortunately, some of these problems are likely to linger through at least the next 12 to 18 months—most notably the decline in home prices and the increase in unemployment. Such ongoing difficulties underscore why we expect below-trend rates of economic growth of 2%, or so, though 2010. Encouragingly, though, the majority of economic indicators are now either stabilizing or improving modestly. It is much the same overseas, where severe business declines have been seen across Europe and Asia. Those setbacks, which generally got under way several months after our own reversal commenced, should run their course by late this year or during the initial months of 2010. Following this initially tepid business recovery we would expect enough brightening in both the housing and the employment pictures to underpin a far more definitive global economic recovery in 2011.
Meantime, inflation, which had moved higher in this country last year, following dramatic increases in oil, food, and commodity prices, has moderated noticeably in more recent months, thanks to selective declines in keypricing categories. However, pricing remains quite volatile, with the sharp up and down swings in oil being illustrative. Overall, we do not think prices will escalate as sharply in the months to come, but we do think that some upward pricing pressure probably will accompany any sustained expansion in economic strength over the next several years. The Federal Reserve, which senses that the recession may well be ending, is unlikely to start raising interest rates for another several quarters. The risks to the sustainability of the nascent economic up cycle would seem too great at this point for the Fed to consider tightening the credit reins.
Value Line Larger Companies Fund, Inc.
| |
| |
| FUND EXPENSES (unaudited): |
Example
As a shareholder of the Fund, you incur ongoing costs, including management fees, distribution and service (12b-1) fees, and other Fund expenses. This Example is intended to help you understand your ongoing costs (in dollars) of investing in the Fund and to compare these costs with the ongoing costs of investing in other mutual funds.
The Example is based on an investment of $1,000 invested at the beginning of the period and held for the entire period (January 1, 2009 through June 30, 2009).
Actual Expenses
The first line of the table below provides information about actual account values and actual expenses. You may use the information in this line, together with the amount you invested, to estimate the expenses that you paid over the period. Simply divide your account value by $1,000 (for example an $8,600 account value divided by $1,000 = 8.6), then multiply the result by the number in the first line under the heading “Expenses Paid During Period” to estimate the expenses you paid on your account during this period.
Hypothetical Example for Comparison Purposes
The second line of the table below provides information about hypothetical account values and hypothetical expenses based on the Fund’s actual expense ratio and an assumed rate of return of 5% per year before expenses, which is not the Fund’s actual return. The hypothetical account values and expenses may not be used to estimate the actual ending account balance or expenses you paid for the period. You may use this information to compare the ongoing costs of investing in the Fund and other funds. To do so, compare this 5% hypothetical example with the 5% hypothetical examples that appear in the shareholder reports of the other funds.
Please note that the expenses shown in the table are meant to highlight your ongoing costs only and do not reflect any transactional costs, such as sales charges (loads), redemption fees, or exchange fees. Therefore, the table is useful in comparing ongoing costs only and will not help you determine the relative total costs of owning different funds. In addition, if transactional costs were included, your costs would have been higher.
| | | | Beginning account value 1/1/09 | | Ending account value 6/30/09 | | | Expenses paid during period 1/1/09 thru 6/30/09* | |
| | | | | | | | | | | | | |
| Actual | | | $1,000.00 | | | $ | 992.41 | | | | $4.84 | |
| Hypothetical (5% return before expenses) | | | $1,000.00 | | | $ | 1,019.93 | | | | $4.91 | |
| | |
| * | Expenses are equal to the Fund’s annualized expense ratio of 0.98% multiplied by the average account value over the period, multiplied by 181/365 to reflect the one-half year period. This expense ratio may differ from the expense ratio shown in the Financial Highlights. |
Value Line Larger Companies Fund, Inc.
| Portfolio Highlights at June 30, 2009 (Unaudited) |
Ten Largest Holdings
| | | | | | | | | | | |
| Issue | | | Shares | | Value | | | Percentage of Net Assets |
| Laboratory Corporation of America Holdings | | | 32,000 | | $ | 2,169,280 | | | 1.16 | % |
| St. Jude Medical, Inc. | | | 52,000 | | $ | 2,137,200 | | | 1.15 | % |
| DIRECTV Group, Inc. (The) | | | 86,000 | | $ | 2,125,060 | | | 1.14 | % |
| Oracle Corp. | | | 98,000 | | $ | 2,099,160 | | | 1.13 | % |
| Alcon, Inc. | | | 18,000 | | $ | 2,090,160 | | | 1.12 | % |
| FPL Group, Inc. | | | 36,000 | | $ | 2,046,960 | | | 1.10 | % |
| Telefonica S.A. ADR | | | 30,000 | | $ | 2,036,700 | | | 1.09 | % |
| Intuit, Inc. | | | 72,000 | | $ | 2,027,520 | | | 1.09 | % |
| Coca-Cola Co. (The) | | | 42,000 | | $ | 2,015,580 | | | 1.08 | % |
| Amazon.com, Inc. | | | 24,000 | | $ | 2,007,840 | | | 1.08 | % |
| | | | | | | | | | | |
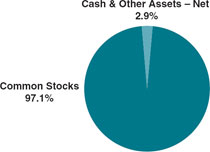
Asset Allocation – Percentage of Net Assets
| Sector Weightings – Percentage of Total Investment Securities |
Value Line Larger Companies Fund, Inc.
| Schedule of Investments (unaudited) |
| Shares | | | | Value | |
| | | | | | | |
| COMMON STOCKS (97.1%) | | | | |
| | | | | | | |
| | | ADVERTISING (0.9%) | | | | |
| 54,000 | | Omnicom Group, Inc. | | $ | 1,705,320 | |
| | | | | | | |
| | | AEROSPACE/DEFENSE (4.7%) | | | | |
| 23,000 | | L-3 Communications Holdings, Inc. | | | 1,595,740 | |
| 24,000 | | Lockheed Martin Corp. | | | 1,935,600 | |
| 23,000 | | Precision Castparts Corp. | | | 1,679,690 | |
| 43,000 | | Raytheon Co. | | | 1,910,490 | |
| 40,000 | | Rockwell Collins, Inc. | | | 1,669,200 | |
| | | | | | 8,790,720 | |
| | | | | | | |
| | | BEVERAGE - ALCOHOLIC (0.9%) | | | | |
| 40,000 | | Molson Coors Brewing Co. Class B | | | 1,693,200 | |
| | | | | | | |
| | | BEVERAGE - SOFT DRINK (2.0%) | | | | |
| 42,000 | | Coca-Cola Co. (The) | | | 2,015,580 | |
| 105,000 | | Coca-Cola Enterprises, Inc. | | | 1,748,250 | |
| | | | | | 3,763,830 | |
| | | | | | | |
| | | BIOTECHNOLOGY (1.0%) | | | | |
| 34,000 | | Amgen, Inc. * | | | 1,799,960 | |
| | | | | | | |
| | | BUILDING MATERIALS (0.9%) | | | | |
| 33,000 | | Fluor Corp. | | | 1,692,570 | |
| | | | | | | |
| | | CABLE TV (3.1%) | | | | |
| 133,000 | | Comcast Corp. Class A | | | 1,875,300 | |
| 86,000 | | DIRECTV Group, Inc. (The) * | | | 2,125,060 | |
| 100,000 | | Shaw Communications, Inc. Class B | | | 1,686,000 | |
| | | | | | 5,686,360 | |
| | | CHEMICAL - SPECIALTY (2.0%) | | | | |
| 50,000 | | Ecolab, Inc. | | | 1,949,500 | |
| 26,000 | | Praxair, Inc. | | | 1,847,820 | |
| | | | | | 3,797,320 | |
| | | COAL (0.9%) | | | | |
| 51,000 | | CONSOL Energy, Inc. | | | 1,731,960 | |
| | | | | | | |
| | | COMPUTER & PERIPHERALS (2.0%) | | | | |
| 14,000 | | Apple, Inc. * | | | 1,994,020 | |
| 17,000 | | International Business Machines Corp. | | | 1,775,140 | |
| | | | | | 3,769,160 | |
| Shares | | | | Value | |
| | | | | | | |
| | | COMPUTER SOFTWARE & SERVICES (9.0%) | | | | |
| 51,000 | | Automatic Data Processing, Inc. | | $ | 1,807,440 | |
| 100,000 | | CA, Inc. | | | 1,743,000 | |
| 71,000 | | Cognizant Technology Solutions Corp. Class A * | | | 1,895,700 | |
| 40,000 | | Computer Sciences Corp. * | | | 1,772,000 | |
| 40,000 | | Fiserv, Inc. * | | | 1,828,000 | |
| 48,000 | | Infosys Technologies Ltd. ADR | | | 1,765,440 | |
| 72,000 | | Intuit, Inc. * | | | 2,027,520 | |
| 45,000 | | McAfee, Inc. * | | | 1,898,550 | |
| 98,000 | | Oracle Corp. | | | 2,099,160 | |
| | | | | | 16,836,810 | |
| | | | | | | |
| | | DRUG (7.6%) | | | | |
| 37,000 | | Allergan, Inc. | | | 1,760,460 | |
| 35,000 | | Biogen Idec, Inc. * | | | 1,580,250 | |
| 80,000 | | Bristol-Myers Squibb Co. | | | 1,624,800 | |
| 48,000 | | Eli Lilly & Co. | | | 1,662,720 | |
| 40,000 | | Gilead Sciences, Inc. * | | | 1,873,600 | |
| 36,000 | | Novo Nordisk A/S ADR | | | 1,960,560 | |
| 61,000 | | Sanofi-Aventis ADR | | | 1,798,890 | |
| 40,000 | | Teva Pharmaceutical Industries Ltd. ADR | | | 1,973,600 | |
| | | | | | 14,234,880 | |
| | | | | | | |
| | | EDUCATIONAL SERVICES (1.0%) | | | | |
| 26,000 | | Apollo Group, Inc. Class A * | | | 1,849,120 | |
| | | | | | | |
| | | ELECTRICAL EQUIPMENT (0.9%) | | | | |
| 21,000 | | W.W. Grainger, Inc. | | | 1,719,480 | |
| | | | | | | |
| | | ELECTRICAL UTILITY - EAST (2.1%) | | | | |
| 36,000 | | FPL Group, Inc. | | | 2,046,960 | |
| 55,000 | | Public Service Enterprise Group, Inc. | | | 1,794,650 | |
| | | | | | 3,841,610 | |
| | | | | | | |
| | | ELECTRICAL UTILITY - WEST (1.9%) | | | | |
| 37,000 | | Sempra Energy | | | 1,836,310 | |
| 90,000 | | Xcel Energy, Inc. | | | 1,656,900 | |
| | | | | | 3,493,210 | |
| | | | | | | |
| | | ENTERTAINMENT (0.9%) | | | | |
| 75,000 | | Viacom, Inc. Class B * | | | 1,702,500 | |
See Notes to Financial Statements.
6
Value Line Larger Companies Fund, Inc.
| Shares | | | | Value | |
| | | | | | | |
| | | FINANCIAL SERVICES - DIVERSIFIED (1.8%) | | | | |
| 10,000 | | MasterCard, Inc. Class A | | $ | 1,673,100 | |
| 104,000 | | Western Union Co. (The) | | | 1,705,600 | |
| | | | | | 3,378,700 | |
| | | | | | | |
| | | FOOD PROCESSING (2.0%) | | | | |
| 94,000 | | ConAgra Foods, Inc. | | | 1,791,640 | |
| 40,000 | | Kellogg Co. | | | 1,862,800 | |
| | | | | | 3,654,440 | |
| | | | | | | |
| | | HOUSEHOLD PRODUCTS (2.0%) | | | | |
| 32,000 | | Clorox Co. (The) | | | 1,786,560 | |
| 26,000 | | Colgate-Palmolive Co. | | | 1,839,240 | |
| | | | | | 3,625,800 | |
| | | | | | | |
| | | INDUSTRIAL SERVICES (2.9%) | | | | |
| 38,000 | | C.H. Robinson Worldwide, Inc. | | | 1,981,700 | |
| 50,000 | | Expeditors International of Washington, Inc. | | | 1,667,000 | |
| 94,000 | | SAIC, Inc. * | | | 1,743,700 | |
| | | | | | 5,392,400 | |
| | | | | | | |
| | | INTERNET (3.1%) | | | | |
| 24,000 | | Amazon.com, Inc. * | | | 2,007,840 | |
| 100,000 | | eBay, Inc. * | | | 1,713,000 | |
| 4,750 | | Google, Inc. Class A * | | | 2,002,553 | |
| | | | | | 5,723,393 | |
| | | | | | | |
| | | MEDICAL SERVICES (4.2%) | | | | |
| 32,000 | | Laboratory Corporation of America Holdings * | | | 2,169,280 | |
| 35,000 | | Quest Diagnostics, Inc. | | | 1,975,050 | |
| 68,000 | | UnitedHealth Group, Inc. | | | 1,698,640 | |
| 39,000 | | WellPoint, Inc. * | | | 1,984,710 | |
| | | | | | 7,827,680 | |
| | | | | | | |
| | | MEDICAL SUPPLIES (5.2%) | | | | |
| 18,000 | | Alcon, Inc. | | | 2,090,160 | |
| 26,000 | | Becton, Dickinson & Co. | | | 1,854,060 | |
| 31,000 | | Johnson & Johnson | | | 1,760,800 | |
| 46,000 | | Life Technologies Corp. * | | | 1,919,120 | |
| | | | | | | |
| Shares | | | | | Value | |
| | | | | | | |
| 52,000 | | St. Jude Medical, Inc. * | | $ | 2,137,200 | |
| | | | | | 9,761,340 | |
| | | | | | | |
| | | NATURAL GAS - DISTRIBUTION (1.0%) | | | | |
| 72,000 | | Enterprise Products Partners, L.P. | | | 1,795,680 | |
| | | | | | | |
| | | NATURAL GAS - DIVERSIFIED (0.8%) | | | | |
| 40,000 | | Southwestern Energy Co. * | | | 1,554,000 | |
| | | | | | | |
| | | OIL/GAS DISTRIBUTION (0.9%) | | | | |
| 39,000 | | Energy Transfer Partners L.P. | | | 1,579,110 | |
| | | | | | | |
| | | OILFIELD SERVICES/EQUIPMENT (1.8%) | | | | |
| 21,000 | | Diamond Offshore Drilling, Inc. | | | 1,744,050 | |
| 54,000 | | Noble Corp. | | | 1,633,500 | |
| | | | | | 3,377,550 | |
| | | | | | | |
| | | PHARMACY SERVICES (4.0%) | | | | |
| 56,000 | | CVS Caremark Corp. | | | 1,784,720 | |
| 28,000 | | Express Scripts, Inc. * | | | 1,925,000 | |
| 40,000 | | Medco Health Solutions, Inc. * | | | 1,824,400 | |
| 62,000 | | Walgreen Co. | | | 1,822,800 | |
| | | | | | 7,356,920 | |
| | | | | | | |
| | | POWER (0.9%) | | | | |
| 10,000 | | First Solar, Inc. * | | | 1,621,200 | |
| | | | | | | |
| | | PRECIOUS METALS (1.8%) | | | | |
| 47,000 | | AngloGold Ashanti Ltd. ADR | | | 1,721,610 | |
| 46,000 | | Goldcorp, Inc. | | | 1,598,500 | |
| | | | | | 3,320,110 | |
| | | RAILROAD (1.0%) | | | | |
| 44,000 | | Canadian National Railway Co. | | | 1,890,240 | |
| | | | | | | |
| | | RESTAURANT (2.9%) | | | | |
| 31,000 | | McDonald’s Corp. | | | 1,782,190 | |
| 128,000 | | Starbucks Corp. * | | | 1,777,920 | |
| 53,000 | | Yum! Brands, Inc. | | | 1,767,020 | |
| | | | | | 5,327,130 | |
| | | | | | | |
| | | RETAIL - AUTOMOTIVE (1.0%) | | | | |
| 12,000 | | AutoZone, Inc. * | | | 1,813,320 | |
See Notes to Financial Statements.
7
Value Line Larger Companies Fund, Inc.
| Schedule of Investments (unaudited) |
| Shares | | | | Value | |
| | | | | | | |
| | | RETAIL - SPECIAL LINES (4.6%) | | | | |
| 56,000 | | Bed Bath & Beyond, Inc. * | | $ | 1,722,000 | |
| 47,000 | | Best Buy Co., Inc. | | | 1,574,030 | |
| 63,000 | | Coach, Inc. | | | 1,693,440 | |
| 105,000 | | Gap, Inc. (The) | | | 1,722,000 | |
| 61,000 | | TJX Companies, Inc. (The) | | | 1,919,060 | |
| | | | | | 8,630,530 | |
| | | | | | | |
| | | RETAIL STORE (2.8%) | | | | |
| 40,000 | | Kohl’s Corp. * | | | 1,710,000 | |
| 27,000 | | Sears Holdings Corp. * | | | 1,796,040 | |
| 36,000 | | Wal-Mart Stores, Inc. | | | 1,743,840 | |
| | | | | | 5,249,880 | |
| | | | | | | |
| | | SECURITIES BROKERAGE (3.7%) | | | | |
| 5,250 | | CME Group, Inc. | | | 1,633,327 | |
| 12,500 | | Goldman Sachs Group, Inc. (The) | | | 1,843,000 | |
| 15,000 | | IntercontinentalExchange, Inc. * | | | 1,713,600 | |
| 100,000 | | TD Ameritrade Holding Corp. * | | | 1,754,000 | |
| | | | | | 6,943,927 | |
| | | | | | | |
| | | SHOE (0.9%) | | | | |
| 34,000 | | NIKE, Inc. Class B | | | 1,760,520 | |
| | | | | | | |
| | | TELECOMMUNICATION SERVICES (2.1%) | | | | |
| 60,000 | | American Tower Corp. Class A * | | | 1,891,800 | |
| 30,000 | | Telefonica S.A. ADR | | | 2,036,700 | |
| | | | | | 3,928,500 | |
| | | | | | | |
| | | TELECOMMUNICATIONS EQUIPMENT (2.0%) | | | | |
| 97,000 | | Cisco Systems, Inc. * | | | 1,808,080 | |
| 41,000 | | QUALCOMM, Inc. | | | 1,853,200 | |
| | | | | | 3,661,280 | |
| | | | | | | |
| | | TOBACCO (1.0%) | | | | |
| 34,000 | | British American Tobacco PLC ADR | | | 1,897,200 | |
| | | | | | | |
| Shares | | | | | Value | |
| | | | | | | |
| | | WIRELESS NETWORKING (0.9%) | | | | |
| 23,000 | | Research In Motion Ltd. * | | $ | 1,634,150 | |
| | | | | | | |
| | | TOTAL COMMON STOCKS AND TOTAL INVESTMENT SECURITIES (97.1%) (Cost $178,379,350) | | $ | 180,813,010 | |
| | | | | | | | |
Principal Amount | | | | Value | |
| | | | | | | | |
| SHORT-TERM INVESTMENTS (2.8%) | | | | |
| | | | U.S. GOVERNMENT AGENCY OBLIGATIONS (2.8%) | | | | |
| $ | 5,300,000 | | Tennessee Valley Authority Discount Note, 0.22%, 9/17/09 | | | 5,298,622 | |
| | | | TOTAL SHORT-TERM INVESTMENTS (Cost $5,298,622) | | $ | 5,298,622 | |
| | | | | | | | |
| CASH AND OTHER ASSETS IN EXCESS OF LIABILITIES (0.1%) | | | 131,178 | |
| NET ASSETS (100%) | | $ | 186,242,810 | |
NET ASSET VALUE OFFERING AND REDEMPTION PRICE, PER OUTSTANDING SHARE ($186,242,810 ÷ 14,243,710 shares outstanding) | | $ | 13.08 | |
| * | Non-income producing. |
| ADR | American Depositary Receipt. |
See Notes to Financial Statements.
8
Value Line Larger Companies Fund, Inc.
Statement of Assets and Liabilities at June 30, 2009 (unaudited) | | | | |
| | | | | |
| Assets: | | | | |
| Investment securities, at value | | | | |
| (Cost - $178,379,350) | | $ | 180,813,010 | |
| Short-term investments | | | | |
| (Cost - $5,298,622) | | | 5,298,622 | |
| Cash | | | 50,642 | |
| Receivable for securities sold | | | 2,175,883 | |
| Dividends receivable | | | 175,138 | |
| Prepaid expenses | | | 18,368 | |
| Receivable for capital shares sold | | | 15,418 | |
| Total Assets | | | 188,547,081 | |
| | | | | |
| Liabilities: | | | | |
| Payable for securities purchased | | | 2,075,565 | |
| Payable for capital shares repurchased | | | 67,980 | |
| Accrued expenses: | | | | |
| Advisory fee | | | 115,777 | |
| Directors’ fees and expenses | | | 7,789 | |
| Other | | | 37,160 | |
| Total Liabilities | | | 2,304,271 | |
| Net Assets | | $ | 186,242,810 | |
| | | | | |
| Net assets consist of: | | | | |
| Capital stock, at $1.00 par value (authorized 50,000,000, outstanding 14,243,710 shares) | | $ | 14,243,710 | |
| Additional paid-in capital | | | 249,288,796 | |
| Undistributed net investment income | | | 2,348,753 | |
| Accumulated net realized loss on investments and foreign currency | | | (82,072,107 | ) |
| Net unrealized appreciation of investments and foreign currency translations | | | 2,433,658 | |
| Net Assets | | $ | 186,242,810 | |
| | | | | |
| Net Asset Value, Offering and Redemption Price per Outstanding Share ($186,242,810 ÷ 14,243,710 shares outstanding) | | $ | 13.08 | |
| | | | | |
| Statement of Operations | | | | |
| for the Six Months Ended June 30, 2009 (unaudited) | | | | |
| | | | | |
| Investment Income: | | | | |
| Dividends (net of foreign withholding tax of $59,394) | | $ | 1,886,027 | |
| Interest | | | 3,127 | |
| Total Income | | | 1,889,154 | |
| | | | | |
| Expenses: | | | | |
| Advisory fee | | | 675,830 | |
| Service and distribution plan fees | | | 225,277 | |
| Auditing and legal fees | | | 59,703 | |
| Transfer agent fees | | | 51,879 | |
| Printing and postage | | | 40,115 | |
| Registration and filing fees | | | 14,377 | |
| Directors’ fees and expenses | | | 12,188 | |
| Custodian fees | | | 10,870 | |
| Insurance | | | 8,931 | |
| Other | | | 6,542 | |
| Total Expenses Before Custody Credits and Fees Waived | | | 1,105,712 | |
| Less: Service and Distribution Plan Fees Waived. | | | (225,277 | ) |
| Less: Custody Credits | | | (35 | ) |
| Net Expenses | | | 880,400 | |
| Net Investment Income | | | 1,008,754 | |
| | | | | |
| Net Realized and Unrealized Gain/(Loss) on Investments and Foreign Exchange Transactions: | | | | |
| Net Realized Loss | | | (27,533,040 | ) |
| Change in Net Unrealized Appreciation/(Depreciation) | | | 24,802,989 | |
| Net Realized Loss and Change in Net Unrealized Appreciation/(Depreciation) on Investments and Foreign Exchange Transactions | | | (2,730,051 | ) |
| Net Decrease in Net Assets from Operations | | $ | (1,721,297 | ) |
See Notes to Financial Statements.
9
Value Line Larger Companies Fund, Inc.
Statement of Changes in Net Assets for the Six Months Ended June 30, 2009 (unaudited) and for the Year Ended December 31, 2008 |
| | | Six Months Ended June 30, 2009 (unaudited) | | Year Ended December 31, 2008 | |
| Operations: | | | | | | | |
| Net investment income | | $ | 1,008,754 | | $ | 1,340,889 | |
| Net realized loss on investments and foreign currency | | | (27,533,040 | ) | | (54,431,760 | ) |
| Change in net unrealized appreciation/(depreciation) | | | 24,802,989 | | | (62,014,346 | ) |
| Net decrease in net assets from operations | | | (1,721,297 | ) | | (115,105,217 | ) |
| | | | | | | | |
| Distributions to Shareholders: | | | | | | | |
| Net investment income | | | — | | | (366,573 | ) |
| Net realized gain from investment transactions | | | — | | | (2,468,087 | ) |
| Total Distributions | | | — | | | (2,834,660 | ) |
| | | | | | | | |
| Capital Share Transactions: | | | | | | | |
| Proceeds from sale of shares | | | 9,039,632 | | | 28,860,067 | |
| Proceeds from reinvestment of dividends and distributions to shareholders | | | — | | | 2,715,111 | |
| Cost of shares repurchased | | | (13,025,911 | ) | | (25,876,542 | ) |
| Net increase/(decrease) in net assets from capital share transactions | | | (3,986,279 | ) | | 5,698,636 | |
| Total Decrease in Net Assets | | | (5,707,576 | ) | | (112,241,241 | ) |
| Net Assets: | | | | | | | |
| Beginning of period | | | 191,950,386 | | | 304,191,627 | |
| End of period | | $ | 186,242,810 | | $ | 191,950,386 | |
| Undistributed net investment income, at end of period | | $ | 2,348,753 | | $ | 1,339,999 | |
See Notes to Financial Statements.
10
Value Line Larger Companies Fund, Inc.
| Notes to Financial Statements (unaudited) |
1. Significant Accounting Policies
Value Line Larger Companies Fund, Inc., (the “Fund”) (formally known as the Value Line Leveraged Growth Investors, Inc.) is registered under the Investment Company Act of 1940, as amended, as a diversified, open-end management investment company whose sole investment objective is to realize capital growth.
The preparation of financial statements in conformity with generally accepted accounting principles requires management to make estimates and assumptions that affect the reported amounts of assets and liabilities and disclosure of contingent assets and liabilities at the date of the financial statements and the reported amounts of revenues and expenses during the reporting period. Actual results could differ from those estimates. The following is a summary of significant accounting policies consistently followed by the Fund in the preparation of its financial statements.
(A) Security Valuation: Securities listed on a securities exchange are valued at the closing sales prices on the date as of which the net asset value is being determined. Securities traded on the NASDAQ Stock Market are valued at the NASDAQ Official Closing Price. In the absence of closing sales prices for such securities and for securities traded in the over-the-counter market, the security is valued at the midpoint between the latest available and representative asked and bid prices. Short-term instruments with maturities of 60 days or less at the date of purchase are valued at amortized cost which approximates market value. Short-term instruments with maturities greater than 60 days at the date of purchase are valued at the midpoint between the latest available and representative asked and bid prices, and commencing 60 days prior to maturity such securities are value at amortized cost. Securities for which market quotations are not readily available or that are not readily marketable and all other assets of the Fund are valued at fair value as the Board of Directors may determine in good faith. In addition, the Fund may use the fair value of a security when the closing market price on the primary exchange where the security is traded no longer accurately reflects the value of a security due to factors affecting one or more relevant securities markets or the specific issuer.
(B) Fair Value Measurements: The Fund adopted Financial Accounting Standards Board Statement of Financial Accounting Standards No. 157, Fair Value Measurements (“FAS 157”), effective January 1, 2008. In accordance with FAS 157, fair value is defined as the price that the Fund would receive upon selling an investment in a timely transaction to an independent buyer in the principal or most advantageous market of the investment. FAS 157 established a three-tier hierarchy to maximize the use of observable market data and minimize the use of unobservable inputs and to establish classification of fair value measurements for disclosure purposes. Inputs refer broadly to the assumptions that market participants would use in pricing the asset or liability, including assumptions about risk, for example, the risk inherent in a particular valuation technique used to measure fair value including such a pricing model and/or the risk inherent in the inputs to the valuation technique. Inputs may be observable or unobservable. Observable inputs are inputs that reflect the assumptions market participants would use in pricing the asset or liability developed based on market data obtained from sources independent of the reporting entity. Unobservable inputs are inputs that reflect the reporting entity’s own assumptions about the assumptions market participants would use in pricing the asset or liability developed based on the best information available in the circumstances. The three-tier hierarchy of inputs is summarized in the three broad Levels listed below.
| ● | Level 1 — quoted prices in active markets for identical investments |
| | |
| Level 2 — other significant observable inputs (including quoted prices for similar investments, interest rates, prepayment speeds, credit risk, etc.) |
Value Line Larger Companies Fund, Inc.
| Level 3 — significant unobservable inputs (including the Fund’s own assumptions in determining the fair value of investments) |
The following is a summary of the inputs used as of June 30, 2009 in valuing the Fund’s investments carried at value:
ASSETS VALUATION INPUT
| Description | | Level 1 | | Level 2 | |
| Common Stocks | | | | | | | |
| Advertising | | $ | 1,705,320 | | $ | — | |
| Aerospace/Defense | | | 8,790,720 | | | — | |
| Beverage - Alcoholic | | | 1,693,200 | | | — | |
| Beverage - Soft Drink | | | 3,763,830 | | | — | |
| Biotechnology | | | 1,799,960 | | | — | |
| Building Materials | | | 1,692,570 | | | — | |
| Cable TV | | | 5,686,360 | | | — | |
| Chemical - Specialty | | | 3,797,320 | | | — | |
| Coal | | | 1,731,960 | | | — | |
| Computer & Peripherals | | | 3,769,160 | | | — | |
| Computer Software & Services | | | 16,836,810 | | | — | |
| Drug | | | 14,234,880 | | | — | |
| Educational Services | | | 1,849,120 | | | — | |
| Electrical Equipment | | | 1,719,480 | | | — | |
| Electrical Utility - East | | | 3,841,610 | | | — | |
| Electrical Utility - West | | | 3,493,210 | | | — | |
| Entertainment | | | 1,702,500 | | | — | |
| Financial Services - Diversified | | | 3,378,700 | | | — | |
| Food Processing | | | 3,654,440 | | | — | |
| Household Products | | | 3,625,800 | | | — | |
| Industrial Services | | | 5,392,400 | | | — | |
| Internet | | | 5,723,393 | | | — | |
| Medical Services | | | 7,827,680 | | | — | |
| Medical Supplies | | | 9,761,340 | | | — | |
| Natural Gas - Distribution | | | 1,795,680 | | | — | |
| Natural Gas - Diversified | | | 1,554,000 | | | — | |
| Oil/Gas Distribution | | | 1,579,110 | | | — | |
| Oilfield Services/Equipment | | | 3,377,550 | | | — | |
| Pharmacy Services | | | 7,356,920 | | | — | |
| Power | | | 1,621,200 | | | — | |
| Precious Metals | | | 3,320,110 | | | — | |
| Railroad | | | 1,890,240 | | | — | |
| Restaurant | | | 5,327,130 | | | — | |
| Retail - Automotive | | | 1,813,320 | | | — | |
| Retail - Special Lines | | | 8,630,530 | | | — | |
| Retail Store | | | 5,249,880 | | | — | |
| | | | | | |
| Description | | Level 1 | | Level 2 | |
| Common Stocks (continued) | | | | | | | |
| Securities Brokerage | | $ | 6,943,927 | | $ | — | |
| Shoe | | | 1,760,520 | | | — | |
| Telecommunication Services | | | 3,928,500 | | | — | |
| Telecommunications Equipment | | | 3,661,280 | | | — | |
| Tobacco | | | 1,897,200 | | | — | |
| Wireless Networking | | | 1,634,150 | | | — | |
| Total Common Stocks | | | 180,813,010 | | | — | |
| Short-Term Investments U.S. Government Agency Obligations | | | — | | | 5,298,622 | |
| Total Short-Term Investments | | | — | | | 5,298,622 | |
| Total | | $ | 180,813,010 | | $ | 5,298,622 | |
For the six months ended June 30, 2009, there were no Level 3 investments.
(C) Repurchase Agreements: In connection with transactions in repurchase agreements, the Fund’s custodian takes possession of the underlying collateral securities, the value of which exceeds the principal amount of the repurchase transaction, including accrued interest. To the extent that any repurchase transaction exceeds one business day, it is the Fund’s policy to mark-to-market the collateral on a daily basis to ensure the adequacy of the collateral. In the event of default of the obligation to repurchase, the Fund has the right to liquidate the collateral and apply the proceeds in satisfaction of the obligation. Under certain circumstances, in the event of default or bankruptcy by the other party to the agreement, realization and/or retention of the collateral or proceeds may be subject to legal proceedings. There were no open repurchase agreements at June 30, 2009.
(D) Federal Income Taxes: It is the Fund’s policy to comply with the requirements of the Internal Revenue Code applicable to regulated investment companies, including the distribution requirements of the Tax Reform Act of 1986, and to distribute all of its taxable income to its shareholders. Therefore, no federal income tax provision is required.
Value Line Larger Companies Fund, Inc.
| Notes to Financial Statements (unaudited) |
(E) Security Transactions and Distributions: Security transactions are accounted for on the date the securities are purchased or sold. Interest income is accrued as earned. Realized gains and losses on sales of securities are calculated for financial accounting and federal income tax purposes on the identified cost basis. Dividend income and distributions to shareholders are recorded on the ex-dividend date. Distributions are determined in accordance with income tax regulations which may differ from generally accepted accounting principles.
(F) Foreign Currency Translation: The books and records of the Fund are maintained in U.S. dollars. Assets and liabilities which are denominated in foreign currencies are translated to U.S. dollars at the prevailing rates of exchange. The Fund does not isolate changes in the value of investments caused by foreign exchange rate differences from the changes due to other circumstances.
Income and expenses are translated to U.S. dollars based upon the rates of exchange on the respective dates of such transactions.
Net realized foreign exchange gains or losses arise from currency fluctuations realized between the trade and settlement dates on securities transactions, the differences between the U.S. dollar amounts of dividends, interest, and foreign withholding taxes recorded by the Fund, and the U.S. dollar equivalent of the amounts actually received or paid. Net unrealized foreign exchange gains and losses arise from changes in the value of assets and liabilities, other than investments, at the end of the fiscal period, resulting from changes in the exchange rates. The effect of the change in foreign exchange rates on the value of investments is included in realized gain/loss on investments and change in net unrealized appreciation/depreciation on investments.
(G) Representations and Indemnifications: In the normal course of business, the Fund enters into contracts that contain a variety of representations and warranties which provide general indemnifications. The Fund’s maximum exposure under these arrangements is unknown, as this would involve future claims that may be made against the Fund that have not yet occurred. However, based on experience, the Fund expects the risk of loss to be remote.
(H) Foreign Taxes: The Fund may be subject to foreign taxes on income, gains on investments, or currency repatriation, a portion of which may be recoverable. The Fund will accrue such taxes and recoveries as applicable, based upon its current interpretation of tax rules and regulations that exist in the markets in which it invests.
(I) Subsequent Events: In accordance with the provision set forth in the FAS 165 Subsequent Events, management has evaluated the possibility of subsequent events existing in the Fund’s financial statements through August 28, 2009. Management has determined that there are no material events that would require disclosure in the Fund’s financial statements through this date.
Value Line Larger Companies Fund, Inc.
| 2. | Capital Share Transactions, Dividends and Distributions to Shareholders |
Transactions in capital stock were as follows:
| | | Six Months Ended June 30, 2009 (unaudited) | | Year Ended December 31, 2008 | |
| Shares sold | | | 729,354 | | | 1,776,472 | |
| Shares issued to shareholders in reinvestment of dividends and distributions | | | — | | | 213,750 | |
| | | | 729,354 | | | 1,990,222 | |
| Shares repurchased | | | (1,052,402 | ) | | (1,488,578 | ) |
| Net increase/(decrease) | | | (323,048 | ) | | 501,644 | |
| Dividends per share from net Investment income | | | — | | $ | 0.0256 | |
| Distributions per share from net realized gains | | | — | | $ | 0.1721 | |
| 3. | Purchases and Sales of Securities |
Purchases and sales of investment securities, excluding short-term securities, were as follows:
| | | Six Months Ended June 30, 2009 (unaudited) | |
| Purchases: | | | | |
| Investment Securities | | $ | 136,070,740 | |
| | | | | |
| Sales: | | | | |
| Investment Securities | | $ | 138,119,280 | |
| 4. | Income Taxes (unaudited) |
At June 30, 2009, information on the tax components of capital is as follows:
| | | | | |
| Cost of investments for tax purposes | | $ | 183,677,972 | |
| Gross tax unrealized appreciation | | $ | 12,132,961 | |
| Gross tax unrealized depreciation | | | (9,699,301 | ) |
| Net tax unrealized appreciation on investments | | $ | 2,433,660 | |
| 5. | Investment Advisory Fees, Service and Distribution Fees, and Transactions With Affiliates |
An advisory fee of $675,830 was paid or payable to EULAV Asset Management, LLC, (the “Adviser”) for the six months ended June 30, 2009. This was computed at the rate of 3/4 of 1% of the average daily net assets for the period and paid monthly. The Adviser provides research, investment programs, supervision of the investment portfolio and pays costs of administrative services, office space, equipment and compensation of administrative, bookkeeping, and clerical personnel necessary for managing the affairs of the Fund. The Adviser also provides persons, satisfactory to the Fund’s Board of Directors, to act as officers and employees of the Fund and pays their salaries and wages. Direct expenses of the Fund are charged to the Fund while common expenses of the Value Line Funds are allocated proportionately based upon the Funds’ respective net assets. The Fund bears all other costs and expenses.
The Fund has a Service and Distribution Plan (the “Plan”), adopted pursuant to Rule 12b-1 under the Investment Company Act of 1940, for the payment of certain expenses incurred by EULAV Securities, Inc. (the “Distributor”), formerly Value Line Securities, Inc. prior to May 5, 2009, a wholly-owned subsidiary of Value Line for advertising, marketing and distributing the Fund’s shares and for servicing the Fund’s shareholders at an annual rate of 0.25% of the Fund’s average daily net assets. For the six months ended June 30, 2009, fees amounting to $225,277, before fee waivers, were accrued under the Plan. Effective May 1, 2007, 2008 and 2009, the Distributor contractually agreed to waive the Fund’s 12b-1 fee for one year periods. For the six months ended June 30, 2009, the fees waived amounted to $225,277. The Distributor has no right to recoup prior waivers.
Value Line Larger Companies Fund, Inc.
| Notes to Financial Statements (unaudited) |
For the six months ended June 30, 2009, the Fund’s expenses were reduced by $35 under a custody credit agreement with the custodian.
Certain officers, employees and a director of Value Line and/or affiliated companies are also officers and a director of the Fund.
The Adviser and/or affiliated companies and the Value Line Profit Sharing and Savings Plan owned 128,758 shares of the Fund’s capital stock, representing less than 1% of the outstanding shares at June 30, 2009. In addition, officers and directors of the Fund as a group owned 181 shares of the Fund, representing less than 1% of the outstanding shares.
6. Borrowing Arrangement
Prior to September 22, 2006, the Fund had a line of credit agreement with State Street Bank and Trust.
7. Other
By letter dated June 15, 2005, the staff of the Northeast Regional Office of the Securities and Exchange Commission (“SEC”) informed Value Line that it was conducting an investigation in the matter of the Distributor. Value Line has supplied numerous documents to the SEC in response to its requests and various individuals, including employees and former employees of Value Line, directors of the Fund and others, have provided testimony to the SEC. On May 8, 2008, the SEC issued a formal order of private investigation regarding whether the Distributor’s brokerage charges and related expense reimbursements from the Value Line Funds (“Funds”) during periods prior to 2005 were excessive and whether adequate disclosure was made to the SEC and the Boards of Directors and shareholders of the Funds. Thereafter, certain officers of Value Line, who are former officers of the Funds, asserted their constitutional privilege not to provide testimony. Value Line has informed the Funds that it believes that the SEC has completed the fact finding phase of its investigation and Value Line has held discussions with the staff of the SEC in an effort to settle the foregoing investigation. There can be no assurance that Value Line and the SEC will be able to reach a mutually agreeable settlement. Although management of Value Line cannot estimate an amount or range of reasonably possible loss that the investigation may have on Value Line’s financial statements, in light of settlement discussions to date, Value Line has concluded it is reasonably possible that any settlement may have a material negative effect on its financial statements. Value Line has indicated that it has substantial liquid assets from which it could pay a settlement of the SEC investigation if a mutually satisfactory settlement can be reached. Value Line has informed the Funds of its belief that there are no loss contingencies that should be accrued or disclosed in the Fund’s financial statements and that the resolution of this matter is not likely to have a material adverse effect on the ability of the Adviser or the Distributor to perform their respective contracts with the Fund.
Value Line Larger Companies Fund, Inc.
Selected data for a share of capital stock outstanding throughout each period:
| | | Six Months Ended June 30, 2009 (unaudited) | | | | | | | | | | | | | | | | |
| | | | Years Ended December 31, |
| | | | 2008 | | 2007 | | 2006 | | 2005 | | 2004 | |
| Net asset value, beginning of period | | $ | 13.18 | | $ | 21.63 | | $ | 21.37 | | $ | 22.24 | | $ | 25.53 | | $ | 27.96 | |
| | | | | | | | | | | | | | | | | | | | |
| Income from investment operations: | | | | | | | | | | | | | | | | | | | |
| Net investment income/(loss) | | | 0.07 | | | 0.09 | | | 0.11 | | | (0.02 | ) | | (0.15 | ) | | (0.10 | ) |
| Net gains or (losses) on securities (both realized and unrealized) | | | (0.17 | ) | | (8.34 | ) | | 3.15 | | | 2.55 | | | 2.82 | | | 2.51 | |
| Total from investment operations | | | (0.10 | ) | | (8.25 | ) | | 3.26 | | | 2.53 | | | 2.67 | | | 2.41 | |
| | | | | | | | | | | | | | | | | | | | |
| Less distributions: | | | | | | | | | | | | | | | | | | | |
| Dividends from net investment income | | | — | | | (0.03 | ) | | (0.08 | ) | | — | | | — | | | — | |
| Distributions from net realized gains | | | — | | | (0.17 | ) | | (2.92 | ) | | (3.40 | ) | | (5.96 | ) | | (4.84 | ) |
| Total distributions | | | — | | | (0.20 | ) | | (3.00 | ) | | (3.40 | ) | | (5.96 | ) | | (4.84 | ) |
| Net asset value, end of period | | $ | 13.08 | | $ | 13.18 | | $ | 21.63 | | $ | 21.37 | | $ | 22.24 | | $ | 25.53 | |
| | | | | | | | | | | | | | | | | | | | |
| Total return | | | (0.76 | )%(5) | | (38.12 | )% | | 15.55 | % | | 11.31 | % | | 10.28 | % | | 8.64 | % |
| | | | | | | | | | | | | | | | | | | | |
| Ratios/Supplemental Data: | | | | | | | | | | | | | | | | | | | |
| Net assets, end of period (in thousands) | | $ | 186,243 | | $ | 191,950 | | $ | 304,192 | | $ | 298,601 | | $ | 300,411 | | $ | 318,600 | |
Ratio of expenses to average net assets (including interest expense)(1) | | | 1.23 | %(3)(6) | | 1.18 | %(3) | | 1.13 | %(3) | | 1.30 | %(3) | | 1.19 | % | | 1.16 | % |
Ratio of expenses to average net assets (excluding interest expense)(2) | | | 1.23 | %(4)(6) | | 1.18 | %(4) | | 1.13 | %(4) | | 1.17 | %(4) | | 1.16 | % | | 1.15 | % |
| Ratio of net investment income/(loss) to average net assets | | | 1.12 | %(6) | | 0.53 | % | | 0.47 | % | | (0.11 | )% | | (0.67 | )% | | (0.39 | )% |
| Portfolio turnover rate | | | 77 | %(5) | | 157 | % | | 112 | % | | 203 | % | | 218 | % | | 200 | % |
| (1) | Ratio reflects expenses grossed up for the custody credit arrangement. The ratio of expenses to average net assets net of custody credits would have been 1.17% for the year ended December 31, 2008, 1.29% for the year ended December 31, 2006 and would not have changed for the other periods shown. |
| | |
| (2) | Ratio reflects expenses grossed up for the custody credit arrangement. The ratio of expenses to average net assets net of custody credits would have been 1.17% for the year ended December 31, 2008, and would not have changed for the other periods shown. |
| | |
| (3) | Ratio reflects expenses grossed up for the waiver of the service and distribution plan fees by the Distributor. The ratio of expenses to average net assets, net of the fee waiver, but exclusive of the custody credit arrangement, would have been 0.98% for the six months ended June 30, 2009, 0.93% for the year ended December 31, 2008, 0.88% for the year ended December 31, 2007 and 1.21% for the year ended December 31, 2006. |
| | |
| (4) | Ratio reflects expenses grossed up for the waiver of the service and distribution plan fees by the Distributor. The ratio of expenses to average net assets, net of the fee waiver, but exclusive of the custody credit arrangement, would have been 0.98% for the six months ended June 30, 2009, 0.93% for the year ended December 31, 2008, 0.88% for the year ended December 31, 2007 and 1.09% for the year ended December 31, 2006. |
| | |
| (5) | Not annualized. |
| | |
| (6) | Annualized. |
See Notes to Financial Statements.
16
Value Line Larger Companies Fund, Inc.
| Factors Considered by the Board in Approving the Investment Advisory Agreement for Value Line Larger Companies Fund, Inc. |
The Investment Company Act of 1940 (the “1940 Act”) requires the Board of Directors, including a majority of Directors who are not “interested persons” of Value Line Larger Companies Fund, Inc. (the “Fund”), as that term is defined in the 1940 Act (the “Independent Directors”), annually to consider the investment advisory agreement (the “Agreement”) between the Fund and its investment adviser, EULAV Asset Management, LLC1 (the “Adviser”). As required by the 1940 Act, the Board requested and the Adviser provided such information as the Board deemed to be reasonably necessary to evaluate the terms of the Agreement. At meetings held throughout the year, including the meeting specifically focused upon the review of the Agreement, the Independent Directors met in executive sessions separately from the non-Independent Director of the Fund and any officers of the Adviser. In selecting the Adviser and approving the continuance of the Agreement, the Independent Directors relied upon the assistance of counsel to the Independent Directors.
Both in the meetings which specifically addressed the approval of the Agreement and at other meetings held during the course of the year, the Board, including the Independent Directors, received materials relating to the Adviser’s investment and management services under the Agreement. These materials included information on: (i) the investment performance of the Fund, compared to a peer group of funds consisting of the Fund and all retail and institutional large-cap growth funds regardless of asset size or primary channel of distribution (the “Performance Universe”), and its benchmark index, each as classified by Lipper Inc., an independent evaluation service (“Lipper”); (ii) the investment process, portfolio holdings, investment restrictions, valuation procedures, and financial statements for the Fund; (iii) sales and redemption data with respect to the Fund; (iv) the general investment outlook in the markets in which the Fund invests; (v) arrangements with respect to the distribution of the Fund’s shares; (vi) the allocation and cost of the Fund’s brokerage (none of which was effected through any affiliate of the Adviser); and (vii) the overall nature, quality and extent of services provided by the Adviser.
1 On June 30, 2008, Value Line, Inc., the Fund’s former investment adviser, reorganized its investment management division into EULAV Asset Management, LLC, a newly formed wholly-owned subsidiary located at 220 East 42nd Street, New York, NY 10017. As part of the reorganization, the Fund’s investment advisory agreement was transferred from Value Line, Inc. to EULAV Asset Management, LLC, and EULAV Asset Management, LLC replaced Value Line, Inc. as the Fund’s investment adviser. For periods prior to June 30, 2008, the term “Adviser” refers to Value Line, Inc.
Value Line Larger Companies Fund, Inc.
As part of the review of the continuance of the Agreement, the Board requested, and the Adviser provided, additional information in order to evaluate the quality of the Adviser’s services and the reasonableness of its fees under the Agreement. In a separate executive session, the Independent Directors reviewed information, which included data comparing: (i) the Fund’s management fee rate, transfer agent and custodian fee rates, service fee (including 12b-1 fees) rates, and the rate of the Fund’s other non-management fees, to those incurred by a peer group of funds consisting of the Fund and 14 other retail no-load large-cap growth funds, as selected objectively by Lipper (“Expense Group”), and a peer group of funds consisting of the Fund, the Expense Group and all other retail no-load large-cap growth funds (excluding outliers), as selected objectively by Lipper (“Expense Universe”); (ii) the Fund’s expense ratio to those of its Expense Group and Expense Universe; and (iii) the Fund’s investment performance over various time periods to the average performance of the Performance Universe as well as the appropriate Lipper Index, as selected objectively by Lipper (the “Lipper Index”). In the separate executive session, the Independent Directors also reviewed information regarding: (a) the Adviser’s financial results and condition, including the Adviser’s and certain of its affiliates’ profitability from the services that have been performed for the Fund as well as the Value Line family of funds; (b) the Fund’s current investment management staffing; and (c) the Fund’s potential for achieving economies of scale. In support of its review of the statistical information, the Board was provided with a detailed description of the methodology used by Lipper to determine the Expense Group, the Expense Universe and the Performance Universe to prepare its information. The Independent Directors also requested and reviewed information provided by the Adviser relating to an investigation by the Securities and Exchange Commission in the matter of Value Line Securities, Inc.2, the Fund’s principal underwriter and affiliate of the Adviser (the “Distributor”), and a representation by Value Line, Inc. that the resolution of this matter is not likely to have a materially adverse effect on the ability of the Adviser or the Distributor to perform their respective contracts with the Fund.
The following summarizes matters considered by the Board in connection with its renewal of the Agreement. However, the Board did not identify any single factor as all-important or controlling, and the summary does not detail all the matters that were considered.
Investment Performance. The Board reviewed the Fund’s overall investment performance and compared it to its Performance Universe and the Lipper Index. The Board noted that the Fund outperformed both the Performance Universe average and the Lipper Index for the one-year, three-year, five-year and ten-year periods ended December 31, 2008.
The Adviser’s Personnel and Methods. The Board reviewed the background of the portfolio manager responsible for the daily management of the Fund’s portfolio, seeking to achieve the Fund’s investment objective and adhering to the Fund’s investment strategies. The Independent Directors also engaged in discussions with the Adviser’s senior management responsible for the overall functioning of the Fund’s investment operations. The Board concluded that the Fund’s management team and the Adviser’s overall resources were adequate and that the Adviser had investment management capabilities and personnel essential to performing its duties under the Agreement.
Management Fee and Expenses. The Board considered the Adviser’s fee under the Agreement relative to the management fees charged by its Expense Group and Expense Universe averages. Although the Fund’s management fee rate for the most recent fiscal year was higher than that of the Expense Universe average, it was slightly lower than the Expense Group average.
2 On May 6, 2009, Value Line Securities, Inc. changed its name to EULAV Securities, Inc. No other change was made to the Distributor’s organization, including its operations and personnel.
Value Line Larger Companies Fund, Inc.
The Board also considered the Fund’s total expense ratio relative to its Expense Group and Expense Universe averages. The Board noted that, effective August 31, 2006, the Distributor voluntarily agreed to waive all of the Fund’s Rule 12b-1 fee, thereby reducing the Fund’s Rule 12b-1 fee rate from 0.25% to 0.00% of the Fund’s average daily net assets. In addition, the Board noted that the Distributor and the Board previously agreed that the Fund’s Rule 12b-1 fee waiver, as described above, would be contractually imposed for each of the one-year periods ended April 30, 2008 and April 30, 2009, so that such waiver could not be changed without the Board’s approval during such periods, and that the Distributor and the Board have currently agreed to extend this contractual 12b-1 fee waiver through April 30, 2010. As a result of the Rule 12b-1 fee waiver, the Board noted that the Fund’s total expense ratio after giving effect to this waiver was less than that of the Expense Group average and the Expense Universe average. The Board concluded that the average expense ratio was satisfactory for the purpose of approving the continuance of the Agreement for the coming year.
Nature and Quality of Other Services. The Board considered the nature, quality, cost and extent of other services provided by the Adviser and the Distributor. At meetings held throughout the year, the Board reviewed the effectiveness of the Adviser’s overall compliance program, as well as the services provided by the Distributor. The Board also reviewed the services provided by the Adviser and its affiliates in supervising third party service providers. Based on this review, the Board concluded that the nature, quality, cost and extent of such other services provided by the Adviser and its affiliates were satisfactory, reliable and beneficial to the Fund’s shareholders.
Profitability. The Board considered the level of profitability of the Adviser and its affiliates with respect to the Fund individually and in the aggregate for all the funds within the Value Line group of funds, including the impact of certain actions taken during prior years. These actions included the Adviser’s reduction (voluntary in some instances and contractual in other instances) of management and/or Rule 12b-1 fees for certain funds, the Adviser’s termination of the use of soft dollar research, and the cessation of trading through the Distributor. The Board concluded that the profitability of the Adviser and its affiliates with respect to the Fund, including the financial results derived from the Fund’s Agreement, were within a range the Board considered reasonable.
Other Benefits. The Board also considered the character and amount of other direct and incidental benefits received by the Adviser and its affiliates from their association with the Fund. The Board concluded that potential “fall-out” benefits that the Adviser and its affiliates may receive, such as greater name recognition, appear to be reasonable, and may in some cases benefit the Fund.
Economies of Scale. The Board noted that, given the current and anticipated size of the Fund, any perceived and potential economies of scale were not yet a significant consideration for the Fund and the addition of break points was determined not to be necessary at this time.
Fees and Services Provided for Other Comparable Funds/Accounts Managed by the Adviser and its Affiliates. In addition to comparing the Fund’s management fee rate to unaffiliated mutual funds included in the Fund’s Expense Group and Expense Universe, the Board was informed by the Adviser that the Adviser and its affiliates do not manage any investment companies comparable to the Fund. The Adviser informed the Board that it manages three general equity non-mutual fund asset management accounts. The Board noted that the Fund’s management fee rate was below that charged to the non-mutual fund asset management accounts.
Conclusion. The Board, in light of the Adviser’s overall performance, considered it appropriate to continue to retain the Adviser as the Fund’s investment adviser. Based on their evaluation of all material factors deemed relevant, and with the advice of independent counsel, the Board determined that the Fund’s management fee rate payable to the Adviser under the Agreement does not constitute fees that are so disproportionately large as to bear no reasonable relationship to the services rendered and that could not have been the product of arm’s-length bargaining, and concluded that the management fee rate under the Agreement is fair and reasonable. Further, the Board concluded that the Fund’s Agreement is fair and reasonable and approved the continuation of the Agreement for another year.
Value Line Larger Companies Fund, Inc.
The Fund files its complete schedule of portfolio holdings with the Securities and Exchange Commission (“SEC”) for the first and third quarters of each fiscal year on Form N-Q. The Fund’s Forms N-Q are available on the SEC’s website at http://www.sec.gov and may be reviewed and copied at the SEC’s Public Reference Room in Washington, D.C. Information on the operation of the Public Reference Room may be obtained by calling 1-800-SEC-0330.
A description of the policies and procedures that the Fund uses to determine how to vote proxies relating to portfolio securities, and information regarding how the Fund voted these proxies during the most recent 12-month period ended June 30 is available through the Fund’s website at http://www.vlfunds.com and on the SEC’s website at http://www.sec.gov. The description of the policies and procedures is also available without charge, upon request, by calling 1-800-243-2729.
Value Line Larger Companies Fund, Inc.
MANAGEMENT INFORMATION
The business and affairs of the Fund are managed by the Fund’s officers under the direction of the Board of Directors. The following table sets forth information on each Director and Officer of the Fund. Each Director serves as a director or trustee of each of the 14 Value Line Funds. Each Director serves until his or her successor is elected and qualified.
| | | | | | | | | |
| Name, Address, and Age | | Position | | Length of Time Served | | Principal Occupation During the Past 5 Years | | Other Directorships Held by Director |
| Interested Director* | | | | | | | | |
Thomas T. Sarkany Age 63 | | Director | | Since 2008 | | Mutual Fund Marketing Director of EULAV Securities, Inc. (the “Distributor”), formerly Value Line Securities, Inc. | | None |
| Non-Interested Directors | | | | | | | | |
Joyce E. Heinzerling New York, NY 10162 Age 53 | | Director | | Since 2008 | | President, Meridian Fund Advisers LLC. (consultants) since April 2009; General Counsel, Archery Capital LLC (private investment fund) until April 2009. | | Burnham Investors Trust, since 2004 (4 funds). |
Francis C. Oakley 54 Scott Hill Road Williamstown, MA 01267 Age 77 | | Director (Lead Independent Director since 2008) | | Since 1993 | | Professor of History, Williams College, (1961-2002). Professor Emeritus since 2002; President Emeritus since 1994 and President, (1985-1994) Chairman (1993-1997) and Interim President (2002-2003) of the American Council of Learned Societies. Trustee since 1997 and Chairman of the Board since 2005, National Humanities Center. | | None |
David H. Porter 5 Birch Run Drive Saratoga Springs, NY 12866 Age 73 | | Director | | Since 1997 | | Professor, Skidmore College, since 2008; Visiting Professor of Classics, Williams College, (1999-2008); President Emeritus, Skidmore College since 1999 and President, (1987-1998). | | None |
Paul Craig Roberts 169 Pompano St. Panama City Beach, FL 32413 Age 70 | | Director | | Since 1983 | | Chairman, Institute for Political Economy. | | None |
Nancy-Beth Sheerr 1409 Beaumont Drive Gladwyne, PA 19035 Age 60 | | Director | | Since 1996 | | Senior Financial Advisor, Veritable L.P. (Investment Adviser) since 2004; Senior Financial Advisor, Hawthorn, (2001-2004). | | None |
Value Line Larger Companies Fund, Inc.
| Name, Address, and Age | | Position | | Length of Time Served | | Principal Occupation During the Past 5 Years | | Other Directorships Held by Director |
Daniel S. Vandivort 59 Indian Head Road Riverside, CT 06878 Age 55 | | Director | | Since 2008 | | President, Chief Investment Officer, Weiss, Peck and Greer/Robeco Investment Management 2005-2007; Managing Director, Weiss, Peck and Greer, 1995-2005. | | None |
| Officers | | | | | | | | |
Mitchell E. Appel Age 39 | | President | | Since 2008 | | President of each of the Value Line Funds since June 2008; Chief Financial Officer of Value Line since April 2008 and from September 2005 to November 2007; Treasurer from June 2005 to September 2005; Chief Financial Officer of XTF Asset Management from November 2007 to April 2008; Chief Financial Officer of Circle Trust Company from 2003 through May 2005; Chief Financial Officer of the Distributor since April 2008 and President since February 2009; President of the Adviser since February 2009. | | |
Howard A. Brecher Age 55 | | Vice President and Secretary | | Since 2008 | | Vice President and Secretary of each of the Value Line Funds since June 2008; Vice President, Secretary and a Director of Value Line; Secretary of the Adviser since February 2009; Vice President, Secretary, Treasurer, General Counsel and a Director of Arnold Bernhard & Co., Inc. | | |
Emily D. Washington Age 30 | | Treasurer | | Since 2008 | | Treasurer and Chief Financial Officer (Principal Financial and Accounting Officer) of the Value Line Funds since August 2008; Associate Director of Mutual Fund Accounting at Value Line until August 2008. | | |
| * | Mr. Sarkany is an “interested person” as defined in the Investment Company Act of 1940 by virtue of his position with the Distributor. |
| | |
| Unless otherwise indicated, the address for each of the above officers is c/o Value Line Funds, 220 East 42nd Street, New York, NY 10017. |
| | |
| The Fund’s Statement of Additional Information (SAI) includes additional information about the Fund’s Directors and is available, without charge, upon request by calling 1-800-243-2729 or on the Fund’s website, www.vlfunds.com. |
Value Line Larger Companies Fund, Inc.
[This Page Intentionally Left Blank.]
Value Line Larger Companies Fund, Inc.
| The Value Line Family of Funds |
1950 — The Value Line Fund seeks long-term growth of capital. Current income is a secondary objective.
1952 — Value Line Income and Growth Fund’s primary investment objective is income, as high and dependable as is consistent with reasonable risk. Capital growth to increase total return is a secondary objective.
1956 — Value Line Premier Growth Fund seeks long-term growth of capital. No consideration is given to current income in the choice of investments.
1972 — Value Line Larger Companies Fund’s sole investment objective is to realize capital growth.
1979 — The Value Line Cash Fund, a money market fund, seeks to secure as high a level of current income as is consistent with maintaining liquidity and preserving capital. An investment in the Fund is not insured or guaranteed by the Federal Deposit Insurance Corporation or any other government agency. Although the Fund seeks to preserve the value of your investment at $1.00 per share, it is possible to lose money by investing in the Fund.
1981 — Value Line U.S. Government Securities Fund seeks maximum income without undue risk to capital. Under normal conditions, at least 80% of the value of its net assets will be invested in securities issued or guaranteed by the U.S. Government and its agencies and instrumentalities.
1983 — Value Line Centurion Fund* seeks long-term growth of capital.
1984 — The Value Line Tax Exempt Fund seeks to provide investors with the maximum income exempt from federal income taxes while avoiding undue risk to principal. The fund may be subject to state and local taxes and the Alternative Minimum Tax (if applicable).
1985 — Value Line Convertible Fund seeks high current income together with capital appreciation primarily from convertible securities ranked 1 or 2 for year-ahead performance by the Value Line Convertible Ranking System.
1986 — Value Line Aggressive Income Trust seeks to maximize current income.
1987 — Value Line New York Tax Exempt Trust seeks to provide New York taxpayers with the maximum income exempt from New York State, New York City and federal income taxes while avoiding undue risk to principal. The Trust may be subject to state and local taxes and the Alternative Minimum Tax (if applicable).
1987 — Value Line Strategic Asset Management Trust* seeks to achieve a high total investment return consistent with reasonable risk.
1993 — Value Line Emerging Opportunities Fund invests primarily in common stocks or securities convertible into common stock, with its primary objective being long-term growth of capital.
1993 — Value Line Asset Allocation Fund seeks high total investment return, consistent with reasonable risk. The Fund invests in stocks, bonds and money market instruments utilizing quantitative modeling to determine the asset mix.
| | |
| * | Only available through the purchase of Guardian Investor, a tax deferred variable annuity, or ValuePlus, a variable life insurance policy. |
For more complete information about any of the Value Line Funds, including charges and expenses, send for a prospectus from EULAV Securities, Inc., 220 East 42nd Street, New York, New York 10017-5891 or call 1-800-243-2729, 9am–5pm CST, Monday–Friday, or visit us at www.vlfunds.com. Read the prospectus carefully before you invest or send money.