Washington, D.C. 20549
220 East 42nd Street, New York, N.Y. 10017
| | | | | | | | |
| | | | | | | | |
| | | | | | | | |
| | INVESTMENT ADVISER | | EULAV Asset Management, LLC | | S E M I – A N N U A L R E P O R T | | |
| | | | 220 East 42nd Street | | J u n e 3 0 , 2 0 1 0 | | |
| | | | New York, NY 10017-5891 | | |
| | | | | | |
| | DISTRIBUTOR | | EULAV Securities, Inc. | | |
| | | | 220 East 42nd Street | | |
| | | | New York, NY 10017-5891 | | |
| | | | | | |
| | CUSTODIAN BANK | | State Street Bank and Trust Co. | | |
| | | | 225 Franklin Street | | |
| | | | Boston, MA 02110 | | |
| | | | | | |
| | SHAREHOLDER | | State Street Bank and Trust Co. | | |
| | SERVICING AGENT | | c/o BFDS | | |
| | | | P.O. Box 219729 | | |
| | | | Kansas City, MO 64121-9729 | | |
| | | | | | |
| | INDEPENDENT | | PricewaterhouseCoopers LLP | | |
| | REGISTERED PUBLIC | | 300 Madison Avenue | Value Line Larger Companies Fund, Inc. | |
| | ACCOUNTING FIRM | | New York, NY 10017 | |
| | LEGAL COUNSEL | | Peter D. Lowenstein, Esq. | |
| | | | 496 Valley Road | |
| | | | Cos Cob, CT 06807-0272 | |
| | | | | |
| | DIRECTORS | | Joyce E. Heinzerling | |
| | | | Francis C. Oakley | |
| | | | David H. Porter | | |
| | | | Paul Craig Roberts | | |
| | | | Thomas T. Sarkany | | |
| | | | Nancy-Beth Sheerr | | |
| | | | Daniel S. Vandivort | | |
| | | | | | |
| | OFFICERS | | Mitchell E. Appel | | |
| | | | President | | |
| | | | Howard A. Brecher | | |
| | | | Vice President and Secretary | | |
| | | | Michael J. Wagner | |
| | | | Chief Compliance Officer | |
| | | | Emily D. Washington | |
| | | | Treasurer | |
| | | | | |
| | | | | |
| | | | | |
| | | | | |
| | | | | |
| | This unaudited report is issued for information to shareholders. It is not authorized for distribution to prospective investors unless preceded or accompanied by a currently effective prospectus of the Fund (obtainable from the Distributor). | |
| | #00072832 | | |
Value Line Larger Companies Fund, Inc.
| |
| To Our Value Line Larger |
| |
| To Our Shareholders (unaudited): |
Enclosed is your semi-annual report for the six-month period ended June 30, 2010. We encourage you to carefully review this report, which includes economic observations, your Fund’s performance data and highlights, schedule of investments, and financial statements.
The Value Line Larger Companies Fund, Inc. (the “Fund”) had a loss of 7.60% for the first six months of 2010, compared with a loss of 6.65% for the Standard & Poor’s 500 stock Index .(1)
The first half of 2010 continued to be quite volatile for the US equity markets as worries persist about the possibility of a double-dip recession. High unemployment levels, combined with the conclusion of several government stimulus programs, seem to be muting the growth momentum of the US economy. With record low borrowing rates and large cash positions on corporate balance sheets, we believe companies have ample capital to be invested in the event of another market correction.
The Value Line Larger Companies Fund generally invests in large-capitalized equities and selects from stocks that are ranked in the higher categories for price performance (Rank 1 and 2) over the next six to twelve months by the Value Line Timeliness Ranking System. The System favors stocks with strong price and earnings momentum relative to those of all other companies in the Value Line Investment Survey of approximately 1,700 stocks. Currently, the Fund has a significant weighting in the Consumer Discretionary and Information Technology sectors. The Fund is also notably underweighted in the Energy sector.
As always, we appreciate your continued investment.
| | | |
| | Sincerely, | |
| | | |
| | /s/ Mitchell Appel | |
| | Mitchell Appel, President | |
| | | |
| | /s/ Bradley Brooks | |
| | Bradley Brooks, Portfolio Manager | |
(1) | The Standard & Poor’s 500 Index consists of 500 stocks which are traded on the New York Stock Exchange, American Stock Exchange and the NASDAQ National Market System and is representative of the broad stock market. This is an unmanaged index and does not reflect charges, expenses or taxes. It is not possible to directly invest in this index. |
Value Line Larger Companies Fund, Inc.
| |
| Companies Fund Shareholders |
| |
| Economic Observations (unaudited) |
The recession, which commenced in the latter stages of 2007 and proved long and disruptive, ended last year to all intents and purposes, although the National Bureau of Economic Research, which assigns beginning and ending dates to such downturns, has yet to rule officially on the matter. In all, the business contraction—which produced a succession of quarterly declines in the U.S. gross domestic product along with countless other upheavals—apparently concluded with the restoration of GDP growth in the final half of 2009 and the first three months of this year. The nascent up cycle in this country has been underpinned so far by a positive swing in the inventory cycle, a strengthening in business equipment spending, generally better results on the industrial and consumer fronts, and some selective signs of stability on the h ousing front—which remains among the weakest links in the economic recovery chain.
Going forward, the upturn should be supported by improving consumer and industrial activity, and further stabilization in the troubled housing sector. It is worth noting that the prospective rate of GDP growth in 2010 is likely to be 3%, or so which is modestly below the historical norm of 3%-4%. The slight underperformance is traceable to lingering softness in the aforementioned housing market and the employment sector. Until those areas show more sustained strength, we may not see the materially higher levels of consumer spending needed for stronger business growth.
The long and painful recession was traceable to several events, beginning with sharp declines in housing construction, home sales, and real estate prices. Other contributing factors included a large reduction in credit availability, a high level of bank failures, increasing foreclosures and bank repossessions, a multi-decade high in the unemployment rate, weak retail activity, and trendless manufacturing. Unfortunately, several of these problems are likely to stay with us for some months yet—notably the aforementioned weakness in housing and job growth. Such prospective difficulties underscore why we expect modestly below-trend rates of GDP growth for now. Encouragingly, though, most business barometers are now either stabilizing or improving.
Meanwhile, one evolving concern, and a reason we are taking a somewhat cautious view of things at the moment, is the deterioration in the outlook across parts of Europe stemming from the proliferation of sovereign-debt worries in Greece, and to a lesser degree in Portugal, Spain, Ireland, and the United Kingdom. True, the European Union recently has fashioned a bailout package for Greece and other troubled nations in the euro zone. However, at this point, it is too soon to gauge whether these ambitious steps will be sufficient to stem the tide of concern on the Continent. It is also premature to make a determination as to whether or not Europe’s woes will have an effect along our shores. Our sense, at this point, is that our own recovery will not be seriously threatened. However, some fallout is likely, especially as the sinking euro makes our exports more costly overseas, potentially reducing a key source of our own prosperity.
Finally, inflation, which moved up sharply last year, following dramatic gains in oil, food, and commodity prices, has now moved onto a more stable and largely benign path. Going forward, we expect pricing to chart an uneven course, with often sizable swings in oil and commodities being the norm, as the economy’s evolving expansion most likely continues. On average, we think prices will increase less sharply over the next year or two than they did before the 2007-2009 recession. Looking further out, we see pricing pressures developing later on in the business up cycle—as is only natural—as demand for labor and materials revives. The Federal Reserve, meanwhile, continues to express support for an accommodative monetary approach. As a result, we now think the Fed is unlikely to raise interest rates until early next year . Once it does opt to tighten, we believe it will do so gingerly. That is because the risks to the sustainability of the up cycle seem too great for the lead bank to move to a materially tighter monetary policy anytime soon—particularly given the volatility in Europe.
Value Line Larger Companies Fund, Inc.
| |
| |
| FUND EXPENSES (unaudited): |
Example
As a shareholder of the Fund, you incur ongoing costs, including management fees, distribution and service (12b-1) fees, and other Fund expenses. This Example is intended to help you understand your ongoing costs (in dollars) of investing in the Fund and to compare these costs with the ongoing costs of investing in other mutual funds.
The Example is based on an investment of $1,000 invested at the beginning of the period and held for the entire period (January 1, 2010 through June 30, 2010).
Actual Expenses
The first line of the table below provides information about actual account values and actual expenses. You may use the information in this line, together with the amount you invested, to estimate the expenses that you paid over the period. Simply divide your account value by $1,000 (for example an $8,600 account value divided by $1,000 = 8.6), then multiply the result by the number in the first line under the heading “Expenses Paid During Period” to estimate the expenses you paid on your account during this period.
Hypothetical Example for Comparison Purposes
The second line of the table below provides information about hypothetical account values and hypothetical expenses based on the Fund’s actual expense ratio and an assumed rate of return of 5% per year before expenses, which is not the Fund’s actual return. The hypothetical account values and expenses may not be used to estimate the actual ending account balance or expenses you paid for the period. You may use this information to compare the ongoing costs of investing in the Fund and other funds. To do so, compare this 5% hypothetical example with the 5% hypothetical examples that appear in the shareholder reports of the other funds.
Please note that the expenses shown in the table are meant to highlight your ongoing costs only and do not reflect any transactional costs, such as sales charges (loads), redemption fees, or exchange fees. Therefore, the table is useful in comparing ongoing costs only and will not help you determine the relative total costs of owning different funds. In addition, if transactional costs were included, your costs would have been higher.
| | | | | | | | | | | |
| | | Beginning account value 1/1/10 | | Ending account value 6/30/10 | | Expenses paid during period 1/1/10 thru 6/30/10* | |
| | | | | | | | | | | |
| Actual | | $ | 1,000.00 | | $ | 924.03 | | $ | 4.01 | |
| Hypothetical (5% return before expenses) | | $ | 1,000.00 | | $ | 1,020.63 | | $ | 4.21 | |
* | Expenses are equal to the Fund’s annualized expense ratio of 0.84% multiplied by the average account value over the period, multiplied by 181/365 to reflect the one-half year period. This expense ratio may differ from the expense ratio shown in the Financial Highlights. The annualized expense ratio would have been 0.92% gross of nonrecurring legal fee reimbursement. |
Value Line Larger Companies Fund, Inc.
| |
| Portfolio Highlights at June 30, 2010 (Unaudited) |
Ten Largest Holdings
| | | | | | | | | | | |
| Issue | | Shares | | Value | | Percentage of Net Assets | |
| Hospira, Inc. | | | 36,000 | | $ | 2,068,200 | | | 1.2 | % |
| Altera Corp. | | | 78,000 | | $ | 1,935,180 | | | 1.1 | % |
| Xilinx, Inc. | | | 76,000 | | $ | 1,919,760 | | | 1.1 | % |
| Infosys Technologies Ltd. ADR | | | 32,000 | | $ | 1,917,120 | | | 1.1 | % |
| Newmont Mining Corp. | | | 31,000 | | $ | 1,913,940 | | | 1.1 | % |
| McDonald’s Corp. | | | 29,000 | | $ | 1,910,230 | | | 1.1 | % |
| Barrick Gold Corp. | | | 42,000 | | $ | 1,907,220 | | | 1.1 | % |
| Cognizant Technology Solutions Corp. Class A | | | 38,000 | | $ | 1,902,280 | | | 1.1 | % |
| Apple, Inc. | | | 7,500 | | $ | 1,886,475 | | | 1.1 | % |
| DaVita, Inc. | | | 30,000 | | $ | 1,873,200 | | | 1.1 | % |
| | | | | | | | | | | |
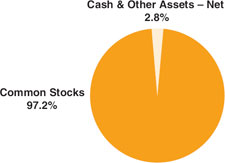
| Asset Allocation – Percentage of Net Assets |
| |
| Sector Weightings – Percentage of Total Investment Securities |
Value Line Larger Companies Fund, Inc.
| |
| Schedule of Investments (unaudited) |
| Shares | | | | Value | |
| COMMON STOCKS (97.2%) | | | | |
| | | | | |
| | | | CONSUMER DISCRETIONARY (28.8%) | | | | |
| | 13,500 | | Amazon.com, Inc. * | | $ | 1,475,010 | |
| | 9,500 | | AutoZone, Inc. * | | | 1,835,590 | |
| | 44,000 | | Bed Bath & Beyond, Inc. * | | | 1,631,520 | |
| | 44,000 | | Coach, Inc. | | | 1,608,200 | |
| | 105,000 | | Comcast Corp. Class A | | | 1,725,150 | |
| | 41,000 | | Darden Restaurants, Inc. | | | 1,592,850 | |
| | 50,000 | | DIRECTV Class A * | | | 1,696,000 | |
| | 84,000 | | DISH Network Corp. Class A | | | 1,524,600 | |
| | 140,000 | | Ford Motor Co. * | | | 1,411,200 | |
| | 82,000 | | Gap, Inc. (The) | | | 1,595,720 | |
| | 75,000 | | Las Vegas Sands Corp. * | | | 1,660,500 | |
| | 62,000 | | Ltd. Brands, Inc. | | | 1,368,340 | |
| | 25,000 | | Magna International, Inc. Class A | | | 1,649,000 | |
| | 85,000 | | Mattel, Inc. | | | 1,798,600 | |
| | 29,000 | | McDonald’s Corp. | | | 1,910,230 | |
| | 17,000 | | Netflix, Inc. * | | | 1,847,050 | |
| | 26,000 | | NIKE, Inc. Class B | | | 1,756,300 | |
| | 35,000 | | O’Reilly Automotive, Inc. * | | | 1,664,600 | |
| | 22,000 | | Polo Ralph Lauren Corp. Class A | | | 1,605,120 | |
| | 8,000 | | Priceline.com, Inc. * | | | 1,412,320 | |
| | 34,000 | | Ross Stores, Inc. | | | 1,811,860 | |
| | 70,000 | | Starbucks Corp. | | | 1,701,000 | |
| | 33,000 | | Target Corp. | | | 1,622,610 | |
| | 53,000 | | Tim Hortons, Inc. | | | 1,696,000 | |
| | 43,000 | | TJX Companies, Inc. (The) | | | 1,803,850 | |
| | 48,000 | | Urban Outfitters, Inc. * | | | 1,650,720 | |
| | 54,000 | | Viacom, Inc. Class B | | | 1,693,980 | |
| | 17,000 | | Whirlpool Corp. | | | 1,492,940 | |
| | 21,500 | | Wynn Resorts Ltd. | | | 1,639,805 | |
| | 44,000 | | Yum! Brands, Inc. | | | 1,717,760 | |
| | | | | | | 49,598,425 | |
| | | | CONSUMER STAPLES (5.8%) | | | | |
| | 29,000 | | Estee Lauder Companies, Inc. (The) Class A | | | 1,616,170 | |
| | 37,000 | | Hershey Co. (The) | | | 1,773,410 | |
| | 120,000 | | Sara Lee Corp. | | | 1,692,000 | |
| | 58,000 | | Sysco Corp. | | | 1,657,060 | |
| | 98,000 | | Tyson Foods, Inc. Class A | | | 1,606,220 | |
| | 45,000 | | Whole Foods Market, Inc. * | | | 1,620,900 | |
| | | | | | | 9,965,760 | |
| Shares | | | | Value | |
| | | | ENERGY (2.0%) | | | | |
| | 24,000 | | Cimarex Energy Co. | | $ | 1,717,920 | |
| | 35,000 | | Newfield Exploration Co. * | | | 1,710,100 | |
| | | | | | | 3,428,020 | |
| | | | FINANCIALS (7.4%) | | | | |
| | 36,000 | | AFLAC, Inc. | | | 1,536,120 | |
| | 43,000 | | Capital One Financial Corp. | | | 1,732,900 | |
| | 68,000 | | CNA Financial Corp. * | | | 1,738,080 | |
| | 100,000 | | Genworth Financial, Inc. Class A * | | | 1,307,000 | |
| | 15,000 | | IntercontinentalExchange, Inc. * | | | 1,695,450 | |
| | 60,000 | | Lincoln National Corp. | | | 1,457,400 | |
| | 100,000 | | New York Community Bancorp, Inc. | | | 1,527,000 | |
| | 31,000 | | Prudential Financial, Inc. | | | 1,663,460 | |
| | | | | | | 12,657,410 | |
| | | | HEALTH CARE (15.4%) | | | | |
| | 58,000 | | AmerisourceBergen Corp. | | | 1,841,500 | |
| | 23,000 | | Cerner Corp. * | | | 1,745,470 | |
| | 30,000 | | DaVita, Inc. * | | | 1,873,200 | |
| | 33,000 | | Edwards Lifesciences Corp. * | | | 1,848,660 | |
| | 38,000 | | Express Scripts, Inc. * | | | 1,786,760 | |
| | 36,000 | | Hospira, Inc. * | | | 2,068,200 | |
| | 5,500 | | Intuitive Surgical, Inc. * | | | 1,735,910 | |
| | 38,000 | | Life Technologies Corp. * | | | 1,795,500 | |
| | 45,000 | | Medtronic, Inc. | | | 1,632,150 | |
| | 22,000 | | Novo Nordisk A/S ADR | | | 1,782,440 | |
| | 36,000 | | Stryker Corp. | | | 1,802,160 | |
| | 30,000 | | Teva Pharmaceutical Industries Ltd. ADR | | | 1,559,700 | |
| | 35,000 | | Thermo Fisher Scientific, Inc. * | | | 1,716,750 | |
| | 34,000 | | Varian Medical Systems, Inc. * | | | 1,777,520 | |
| | 25,000 | | Waters Corp. * | | | 1,617,500 | |
| | | | | | | 26,583,420 | |
| | | | INDUSTRIALS (10.3%) | | | | |
| | 30,000 | | Canadian National Railway Co. | | | 1,721,400 | |
| | 58,000 | | CNH Global N.V. * | | | 1,313,700 | |
| | 26,000 | | Cummins, Inc. | | | 1,693,380 | |
| | 44,000 | | Danaher Corp. | | | 1,633,280 | |
| | 31,000 | | Deere & Co. | | | 1,726,080 | |
| | 125,000 | | Delta Air Lines, Inc. * | | | 1,468,750 | |
See Notes to Financial Statements.
Value Line Larger Companies Fund, Inc.
| Shares | | | | Value | |
| | 59,000 | | Koninklijke Philips Electronics N.V. | | $ | 1,760,560 | |
| | 20,000 | | L-3 Communications Holdings, Inc. | | | 1,416,800 | |
| | 27,000 | | Northrop Grumman Corp. | | | 1,469,880 | |
| | 150,000 | | Southwest Airlines Co. | | | 1,666,500 | |
| | 26,000 | | Union Pacific Corp. | | | 1,807,260 | |
| | | | | | | 17,677,590 | |
| | | | INFORMATION TECHNOLOGY (21.5%) | | | | |
| | 40,000 | | Akamai Technologies, Inc. * | | | 1,622,800 | |
| | 78,000 | | Altera Corp. | | | 1,935,180 | |
| | 42,000 | | Amphenol Corp. Class A | | | 1,649,760 | |
| | 7,500 | | Apple, Inc. * | | | 1,886,475 | |
| | 53,000 | | Broadcom Corp. Class A | | | 1,747,410 | |
| | 38,000 | | Cognizant Technology Solutions Corp. Class A * | | | 1,902,280 | |
| | 103,000 | | Corning, Inc. | | | 1,663,450 | |
| | 24,000 | | Cree, Inc. * | | | 1,440,720 | |
| | 29,000 | | Dolby Laboratories, Inc. Class A * | | | 1,818,010 | |
| | 38,000 | | Harris Corp. | | | 1,582,700 | |
| | 32,000 | | Infosys Technologies Ltd. ADR | | | 1,917,120 | |
| | 81,000 | | Intel Corp. | | | 1,575,450 | |
| | 50,000 | | Intuit, Inc. * | | | 1,738,500 | |
| | 100,000 | | Marvell Technology Group Ltd. * | | | 1,576,000 | |
| | 180,000 | | Micron Technology, Inc. * | | | 1,528,200 | |
| | 48,000 | | NetApp, Inc. * | | | 1,790,880 | |
| | 75,000 | | Oracle Corp. | | | 1,609,500 | |
| | 40,000 | | SanDisk Corp. * | | | 1,682,800 | |
| | 100,000 | | Seagate Technology * | | | 1,304,000 | |
| | 26,000 | | VMware, Inc. Class A * | | | 1,627,340 | |
| | 180,000 | | Xerox Corp. | | | 1,447,200 | |
| | 76,000 | | Xilinx, Inc. | | | 1,919,760 | |
| | | | | | | 36,965,535 | |
| | | | MATERIALS (5.0%) | | | | |
| | 42,000 | | Barrick Gold Corp. | | | 1,907,220 | |
| | 30,000 | | Cliffs Natural Resources, Inc. | | | 1,414,800 | |
| | 21,000 | | Lubrizol Corp. (The) | | | 1,686,510 | |
| | 31,000 | | Newmont Mining Corp. | | | 1,913,940 | |
| | 25,000 | | Sherwin-Williams Co. (The) | | | 1,729,750 | |
| | | | | | | 8,652,220 | |
| Shares | | | | Value | |
| | | | TELECOMMUNICATION SERVICES (1.0%) | | | | |
| | 59,000 | | BCE, Inc. | | $ | 1,726,930 | |
| | | | TOTAL COMMON STOCKS AND TOTAL INVESTMENT SECURITIES (1) (97.2%) | | | | |
| | | | (Cost $164,866,966) | | $ | 167,255,310 | |
| | | | | | |
Principal Amount | | | | Value | |
| SHORT-TERM INVESTMENTS (2.9%) | | | | |
| | | | | |
| | | | REPURCHASE AGREEMENTS (2.9%) | | | | |
| $ | 4,900,000 | | With Morgan Stanley, 0.005%, dated 6/30/10, due 7/01/10, delivery value $4,900,001 (collateralized by $4,970,000 U.S. Treasury Notes 0.8750%, due 03/31/11, with a value of $5,002,556) | | | 4,900,000 | |
| | | | TOTAL SHORT-TERM INVESTMENTS (2)
(Cost $4,900,000) (2.9%) | | $ | 4,900,000 | |
| EXCESS OF LIABILITIES OVER CASH AND OTHER ASSETS (-0.1%) | | | (114,523 | ) |
| NET ASSETS (100%) | | $ | 172,040,787 | |
| | | | | |
| NET ASSET VALUE OFFERING AND REDEMPTION PRICE, PER OUTSTANDING SHARE ($172,040,787 ÷ 12,090,581 shares outstanding) | | $ | 14.23 | |
| * | Non-income producing. |
| (1) | Unless otherwise indicated, the values of the Portfolio are determined based on Level 1 inputs established by FASB ASC 820-10, Fair Value Measurements and Disclosures. |
| (2) | Values determined based on Level 2 inputs established by FASB ASC 820-10, Fair Value Measurements and Disclosures. |
| ADR | American Depositary Receipt. |
See Notes to Financial Statements.
Value Line Larger Companies Fund, Inc.
| |
Statement of Assets and Liabilities at June 30, 2010 (unaudited) |
| Assets: | | | | |
Investment securities, at value
(Cost - $164,866,966) | | $ | 167,255,310 | |
Repurchase agreement
(Cost - $4,900,000) | | | 4,900,000 | |
| Cash | | | 122,738 | |
| Receivable for securities sold | | | 3,447,929 | |
| Interest and dividends receivable | | | 161,529 | |
| Other Receivable | | | 62,588 | |
| Prepaid expenses | | | 20,519 | |
| Receivable for capital shares sold | | | 708 | |
| Total Assets | | | 175,971,321 | |
| | | | | |
| Liabilities: | | | | |
| Payable for securities purchased | | | 3,577,180 | |
| Payable for capital shares redeemed | | | 161,881 | |
| Accrued expenses: | | | | |
| Advisory fee | | | 113,045 | |
| Directors’ fees and expenses | | | 10,664 | |
| Other | | | 67,764 | |
| Total Liabilities | | | 3,930,534 | |
| | | | | |
| Net Assets | | $ | 172,040,787 | |
| | | | | |
| Net assets consist of: | | | | |
Capital stock, at $1.00 par value
(authorized 50,000,000, outstanding 12,090,581 shares) | | $ | 12,090,581 | |
| Additional paid-in capital | | | 219,299,628 | |
| Undistributed net investment income | | | 1,414,669 | |
| Accumulated net realized loss on investments and foreign currency | | | (63,151,870 | ) |
| Net unrealized appreciation of investments and foreign currency translations | | | 2,387,779 | |
| Net Assets | | $ | 172,040,787 | |
| Net Asset Value, Offering and Redemption Price per Outstanding Share ($172,040,787 ÷ 12,090,581 shares outstanding) | | $ | 14.23 | |
Statement of Operations for the Six Months Ended June 30, 2010 (unaudited) |
| Investment Income: | | | | |
| Dividends (net of foreign withholding tax of $25,890) | | $ | 1,047,573 | |
| Interest | | | 2,486 | |
| Total Income | | | 1,050,059 | |
| | | | | |
| Expenses: | | | | |
| Advisory fee | | | 720,634 | |
| Service and distribution plan fees | | | 240,211 | |
| Auditing and legal fees | | | 63,637 | |
| Transfer agent fees | | | 50,794 | |
| Registration and filing fees | | | 17,403 | |
| Custodian fees | | | 16,174 | |
| Directors’ fees and expenses | | | 8,072 | |
| Other | | | 7,808 | |
| Total Expenses Before Custody Credits and Fees Waived | | | 1,124,733 | |
| Less: Legal Fee Reimbursement | | | (79,415 | ) |
| Less: Service and Distribution Plan Fees Waived | | | (240,211 | ) |
| Less: Custody Credits | | | (107 | ) |
| Net Expenses | | | 805,000 | |
| Net Investment Income | | | 245,059 | |
| Net Realized and Unrealized Gain/(Loss) on Investments and Foreign Exchange Transactions: | | | | |
| Net Realized Gain | | | 12,378,602 | |
| Change in Net Unrealized Appreciation/(Depreciation) | | | (26,772,443 | ) |
| Net Realized Gain and Change in Net Unrealized Appreciation/(Depreciation) on Investments and Foreign Exchange Transactions | | | (14,393,841 | ) |
| Net Decrease in Net Assets from Operations | | $ | (14,148,782 | ) |
See Notes to Financial Statements.
8
Value Line Larger Companies Fund, Inc.
| |
Statement of Changes in Net Assets for the Six Months Ended June 30, 2010 (unaudited) and for the Year Ended December 31, 2009 |
| | | Six Months Ended June 30, 2010 (unaudited) | | Year Ended December 31, 2009 | |
| Operations: | | | | | | | |
| Net investment income | | $ | 245,059 | | $ | 1,169,010 | |
| Net realized gain/(loss) on investments and foreign currency | | | 12,378,602 | | | (20,990,805 | ) |
| Change in net unrealized appreciation/(depreciation) | | | (26,772,443 | ) | | 51,529,553 | |
| Net increase/(decrease) in net assets from operations | | | (14,148,782 | ) | | 31,707,758 | |
| | | | | | | | |
| Distributions to Shareholders: | | | | | | | |
| Net investment income | | | — | | | (1,339,992 | ) |
| | | | | | | | |
| Capital Share Transactions: | | | | | | | |
| Proceeds from sale of shares | | | 1,219,369 | | | 10,112,763 | |
| Proceeds from reinvestment of dividends to shareholders | | | 28 | | | 1,288,152 | |
| Cost of shares redeemed | | | (17,483,419 | ) | | (31,265,476 | ) |
| Net decrease in net assets from capital share transactions | | | (16,264,022 | ) | | (19,864,561 | ) |
| Total Increase/(Decrease) in Net Assets | | | (30,412,804 | ) | | 10,503,205 | |
| Net Assets: | | | | | | | |
| Beginning of period | | | 202,453,591 | | | 191,950,386 | |
| End of period | | $ | 172,040,787 | | $ | 202,453,591 | |
| Undistributed net investment income, at end of period | | $ | 1,414,669 | | $ | 1,169,610 | |
See Notes to Financial Statements.
| Value Line Larger Companies Fund, Inc. |
| |
| Notes to Financial Statements (unaudited) |
1. Significant Accounting Policies
Value Line Larger Companies Fund, Inc., (the “Fund”) is registered under the Investment Company Act of 1940, as amended, as a diversified, open-end management investment company whose sole investment objective is to realize capital growth.
The preparation of financial statements in conformity with generally accepted accounting principles requires management to make estimates and assumptions that affect the reported amounts of assets and liabilities and disclosure of contingent assets and liabilities at the date of the financial statements and the reported amounts of revenues and expenses during the reporting period. Actual results could differ from those estimates. The following is a summary of significant accounting policies consistently followed by the Fund in the preparation of its financial statements.
(A) Security Valuation: Securities listed on a securities exchange are valued at the closing sales prices on the date as of which the net asset value is being determined. Securities traded on the NASDAQ Stock Market are valued at the NASDAQ Official Closing Price. In the absence of closing sales prices for such securities and for securities traded in the over-the-counter market, the security is valued at the midpoint between the latest available and representative asked and bid prices. Short-term instruments with maturities of 60 days or less at the date of purchase are valued at amortized cost which approximates market value. Short-term instruments with maturities greater th an 60 days at the date of purchase are valued at the midpoint between the latest available and representative asked and bid prices, and commencing 60 days prior to maturity such securities are value at amortized cost. Securities for which market quotations are not readily available or that are not readily marketable and all other assets of the Fund are valued at fair value as the Board of Directors may determine in good faith. In addition, the Fund may use the fair value of a security when the closing market price on the primary exchange where the security is traded no longer accurately reflects the value of a security due to factors affecting one or more relevant securities markets or the specific issuer.
(B) Fair Value Measurements: In accordance with Financial Accounting Standards Board Accounting Standards Codification (FASB ASC 820-10), Fair Value Measurements and Disclosures, (formerly Statement of Financial Accounting Standards (“SFAS”) No. 157), the Fund discloses the fair value of its investments in a hierarchy that prioritizes the inputs to valuation techniques used to measure the fair value. The hierarchy gives the highest priority to valuations based upon unadjusted quoted prices in active markets for identical assets or liabilities (level 1 measurement) and the lowest priority to valuations based upon unobservable inputs that are significant to the valu ation (level 3 measurements). FASB ASC 820-10-35-39 to 55 provides three levels of the fair value hierarchy as follows:
| | |
| ● | Level 1 — Inputs that reflect unadjusted quoted prices in active markets for identical assets or liabilities that the Fund has the ability to access at the measurement date; |
| ● | Level 2 — Inputs other than quoted prices that are observable for the asset or liability either directly or indirectly, including inputs in markets that are not considered to be active; |
| ● | Level 3 — Inputs that are unobservable. |
During the six months ended June 30, 2010, the Fund adopted the authoritative guidance included in FASB ASC 820-10, Fair Value Measurements and Disclosures, on determining fair value when the volume and level of activity for the asset or liability have significantly decreased and identifying transactions that are not orderly (formerly FSP FAS 157-4). FASB ASC 820-10-35-51A to 51H indicates that if an entity determines that either the volume and/or level of activity for an asset or liability has significantly decreased (from normal conditions for that asset or liability) or price quotations or observable inputs are not associated with orderly transactions, increased analysis and management judgment will be required to estimate fair value.
| Value Line Larger Companies Fund, Inc. |
| |
| June 30, 2010 |
Valuation techniques such as an income approach might be appropriate to supplement or replace a market approach in those circumstances. It provides a list of factors to determine whether there has been a significant decrease in relation to normal market activity. Regardless, however, of the valuation technique and inputs used, the objective for the fair value measurement in those circumstances is unchanged from what it would be if markets were operating at normal activity levels and/or transactions were orderly; that is, to determine the current exit price as promulgated by FASB ASC 820-10.
The following is a summary of the inputs used as of June 30, 2010 in valuing the Fund’s investments carried at value:
| | | | | | | | | | | | | | |
| Investments in Securities: | | Level 1 | | Level 2 | | Level 3 | | Total | |
| Assets | | | | | | | | | | | | | |
| Common Stocks | | $ | 167,255,310 | | $ | 0 | | $ | 0 | | $ | 167,255,310 | |
| Short Term Investments | | | 0 | | | 4,900,000 | | | 0 | | | 4,900,000 | |
| | | | | | | | | | | | | | |
| Total Investments in Securities | | $ | 167,255,310 | | $ | 4,900,000 | | $ | 0 | | $ | 172,155,310 | |
As of June 30, 2010, there was no significant security transfer activity from Level 1 to Level 2 or from Level 2 to Level 1.
For the six months ended June 30, 2010, there were no Level 3 investments. The types of inputs used to value each security are identified in the Schedule of Investments, which also includes a breakdown of the Schedule’s investments by category.
(C) Repurchase Agreements: In connection with transactions in repurchase agreements, the Fund’s custodian takes possession of the underlying collateral securities, the value of which exceeds the principal amount of the repurchase transaction, including accrued interest. To the extent that any repurchase transaction exceeds one business day, it is the Fund’s policy to mark-to-market the collateral on a daily basis to ensure the adequacy of the collateral. In the event of default of the obligation to repurchase, the Fund has the right to liquidate the collateral and apply the proceeds in satisfaction of the obligation. Under certain circumstances, in the event of de fault or bankruptcy by the other party to the agreement, realization and/or retention of the collateral or proceeds may be subject to legal proceedings.
(D) Federal Income Taxes: It is the Fund’s policy to comply with the requirements of the Internal Revenue Code applicable to regulated investment companies, including the distribution requirements of the Tax Reform Act of 1986, and to distribute all of its taxable income to its shareholders. Therefore, no federal income tax provision is required.
(E) Security Transactions and Distributions: Security transactions are accounted for on the date the securities are purchased or sold. Interest income is accrued as earned. Realized gains and losses on sales of securities are calculated for financial accounting and federal income tax purposes on the identified cost basis. Dividend income and distributions to shareholders are recorded on the ex-dividend date. Distributions are determined in accordance with income tax regulations which may differ from generally accepted accounting principles.
(F) Foreign Currency Translation: The books and records of the Fund are maintained in U.S. dollars. Assets and liabilities which are denominated in foreign currencies are translated to U.S. dollars at the prevailing rates of exchange. The Fund does not isolate changes in the value of investments caused by foreign exchange rate differences from the changes due to other circumstances. Income and expenses are translated to U.S. dollars based upon the rates of exchange on the respective dates of such transactions.
| Value Line Larger Companies Fund, Inc. |
| |
| Notes to Financial Statements (unaudited) |
Net realized foreign exchange gains or losses arise from currency fluctuations realized between the trade and settlement dates on securities transactions, the differences between the U.S. dollar amounts of dividends, interest, and foreign withholding taxes recorded by the Fund, and the U.S. dollar equivalent of the amounts actually received or paid. Net unrealized foreign exchange gains and losses arise from changes in the value of assets and liabilities, other than investments, at the end of the fiscal period, resulting from changes in the exchange rates. The effect of the change in foreign exchange rates on the value of investments is included in realized gain/loss on investments and change in net unrealized appreciation/ depreciation on investments.
(G) Representations and Indemnifications: In the normal course of business, the Fund enters into contracts that contain a variety of representations and warranties which provide general indemnifications. The Fund’s maximum exposure under these arrangements is unknown, as this would involve future claims that may be made against the Fund that have not yet occurred. However, based on experience, the Fund expects the risk of loss to be remote.
(H) Foreign Taxes: The Fund may be subject to foreign taxes on income, gains on investments, or currency repatriation, a portion of which may be recoverable. The Fund will accrue such taxes and recoveries as applicable, based upon its current interpretation of tax rules and regulations that exist in the markets in which it invests.
(I) Other: On November 4, 2009, the Securities and Exchange Commission (“SEC”), Value Line, Inc. (“Value Line or VLI”), the Distributor and two former directors and officers of Value Line settled a matter related to brokerage commissions charged by the Distributor to certain Value Line mutual funds (“Funds”), from 1986 through November of 2004 involving alleged misleading disclosures provided by Value Line to the Boards of Directors/Trustees and shareholders of the Funds regarding such brokerage commissions. Value Line paid disgorgement, interest and penalty of $43.7 million in connection with the settlement, which amounts are expected to c onstitute a “Fair Fund” to be distributed to investors in the Funds who were disadvantaged by such brokerage practices. Value Line will bear all costs associated with any Fair Fund distribution, including retaining a third-party consultant approved by the SEC staff to administer any Fair Fund distribution.
On March 11, 2010, VLI and the Boards of Trustees/Directors of the Value Line Funds entered into an agreement pursuant to which VLI will reimburse the Funds in the aggregate amount of $917,302 for various expenses incurred by the Funds in connection with the SEC matter dated November 4, 2009. The receivable for this expense reimbursement was accrued on March 11, 2010 by the applicable Funds that incurred the expenses and will be paid by VLI in twelve monthly installments commencing April 1, 2010. The Fund accrued $79,415 in expense reimbursements from VLI.
(J) Subsequent Events: On July 20, 2010, the Board of Directors of Value Line approved a transaction involving its wholly owned subsidiaries, EULAV Asset Management, LLC (“EULAV”) and EULAV Securities, Inc. (“ESI”). Completion of the transaction is subject to various conditions. If the transaction is completed, Value Line will contribute all of the outstanding stock of ESI to EULAV, EULAV will be converted to a Delaware statutory trust named EULAV Asset Management (“EAM”), Value Line will restructure its ownership of EAM so that it has no voting authority with respect to the election or removal of the trustees of EAM and retains only intere sts in the revenues and residual profits of EAM and EAM will grant residual profits interests to five individuals selected by the independent directors of Value Line.
| Value Line Larger Companies Fund, Inc. |
| |
| June 30, 2010 |
Value Line has informed the Boards of Directors/Trustees of the Value Line Funds (the “Fund Board”) that, after the closing of the proposed restructuring, Value Line will no longer control EAM, which will result in the automatic termination of the Fund’s investment advisory agreements in accordance with the requirements of the Investment Company Act of 1940. On July 20, 2010, the Fund Board considered matters relevant to the proposed restructuring and approved new investment advisory agreements between the Funds and EAM to take effect upon the closing of the restructuring. The effectiveness of each investment advisory agreement is also contingent upon approval by shareholders of the applicable Value Line mutual fund. Toward this end, a special shareholder meeting for each Value Line mutual fund will be held at which s hareholders as of the record date will vote on the proposed new investment advisory agreements with EAM and to elect three persons as members of the Fund Board. It is anticipated that in September 2010, a proxy statement describing the proposals will be sent to each shareholder of record as of the record date. Shareholders who did not own shares as of the record date will not be entitled to notice of, or to vote at, the special shareholder meetings.
| | |
| 2. | Capital Share Transactions, Dividends and Distributions to Shareholders |
Transactions in capital stock were as follows:
| | | | | | | | |
| | | Six Months Ended June 30, 2010 (unaudited) | | Year Ended December 31, 2009 | |
| Shares sold | | | 78,496 | | | 803,201 | |
| Shares issued to shareholders in reinvestment of dividends and distributions | | | 2 | | | 83,701 | |
| Shares redeemed | | | (1,132,180 | ) | | (2,309,397 | ) |
| Net decrease | | | (1,053,682 | ) | | (1,422,495 | ) |
| Dividends per share from net investment income | | $ | — | | $ | 0.1020 | |
| 3. | Purchases and Sales of Securities |
Purchases and sales of investment securities, excluding short-term securities, were as follows:
| | | | | |
| | | Six Months Ended June 30, 2010 (unaudited) | |
| Purchases: | | | | |
| Investment Securities | | | 205,537,355 | |
| Sales: | | | | |
| Investment Securities | | | 221,027,825 | |
| Value Line Larger Companies Fund, Inc. |
| |
| Notes to Financial Statements (unaudited) |
At June 30, 2010, information on the tax components of capital is as follows:
| | | | | |
| Cost of investments for tax purposes | | $ | 169,766,966 | |
| Gross tax unrealized appreciation | | $ | 13,965,377 | |
| Gross tax unrealized depreciation | | | (11,577,033 | ) |
| Net tax unrealized appreciation on investments | | $ | 2,388,344 | |
| 5. | Investment Advisory Fees, Service and Distribution Fees, and Transactions With Affiliates |
An advisory fee of $720,634 was paid or payable to EULAV Asset Management, LLC (the “Adviser”) for the six months ended June 30, 2010. This was computed at the rate of 0.75% of the average daily net assets for the period and paid monthly. The Adviser provides research, investment programs, supervision of the investment portfolio and pays costs of administrative services, office space, equipment and compensation of administrative, bookkeeping, and clerical personnel necessary for managing the affairs of the Fund. The Adviser also provides persons, satisfactory to the Fund’s Board of Directors, to act as officers and employees of the Fund and pays their salaries.
The Fund has a Service and Distribution Plan (the “Plan”), adopted pursuant to Rule 12b-1 under the Investment Company Act of 1940, which compensates EULAV Securities, Inc. (the “Distributor”) for advertising, marketing and distributing the Fund’s shares and for servicing the Fund’s shareholders at an annual rate of 0.25% of the Fund’s average daily net assets. For the six months ended June 30, 2010, fees amounting to $240,211, before fee waivers, were accrued under the Plan. Effective May 1, 2007, 2008 and 2009, the Distributor contractually agreed to waive the Fund’s 12b-1 fee for one year periods. On March 11, 2010, with an effective date of May 1, 2010, the Distributor contractually agreed to waive 0.25% of the Rule 12b-1 fee for a one year period. For the six months ended June 30, 20 10, the fees waived amounted to $240,211. The Distributor has no right to recoup prior waivers.
For the six months ended June 30, 2010, the Fund’s expenses were reduced by $107 under a custody credit agreement with the custodian.
Direct expenses of the Fund are charged to the Fund while common expenses of the Value Line Funds are allocated proportionately based upon the Funds’ respective net assets. The Fund bears all other costs and expenses.
Certain officers, employees and directors of Value Line and/or affiliated companies are also officers and a director of the Fund.
The Adviser and/or affiliated companies and the Value Line Profit Sharing and Savings Plan owned 101,796 shares of the Fund’s capital stock, representing less than 1% of the outstanding shares at June 30, 2010. In addition, officers and directors of the Fund as a group owned 500 shares of the Fund, representing less than 1% of the outstanding shares.
Prior to September 22, 2006, the Fund had a line of credit agreement with State Street Bank and Trust.
| Value Line Larger Companies Fund, Inc. |
| |
| Financial Highlights |
Selected data for a share of capital stock outstanding throughout each period:
| | | | | | | | | | | | | | | | | | | | |
| | | Six Months Ended
June 30, 2010 (unaudited) | | | | | | | | | | | | | | | | |
| | | | Years Ended December 31, | |
| | | | 2009 | | 2008 | | 2007 | | 2006 | | 2005 | |
| Net asset value, beginning of period | | $ | 15.40 | | $ | 13.18 | | $ | 21.63 | | $ | 21.37 | | $ | 22.24 | | $ | 25.53 | |
| | | | | | | | | | | | | | | | | | | | |
| Income from investment operations: | | | | | | | | | | | | | | | | | | | |
| Net investment income/(loss) | | | 0.03 | | | 0.10 | | | 0.09 | | | 0.11 | | | (0.02 | ) | | (0.15 | ) |
| Net gains or (losses) on securities (both realized and unrealized) | | | (1.20 | ) | | 2.22 | | | (8.34 | ) | | 3.15 | | | 2.55 | | | 2.82 | |
| Total from investment operations | | | (1.17 | ) | | 2.32 | | | (8.25 | ) | | 3.26 | | | 2.53 | | | 2.67 | |
| | | | | | | | | | | | | | | | | | | | |
| Less distributions: | | | | | | | | | | | | | | | | | | | |
| Dividends from net investment income | | | — | | | (0.10 | ) | | (0.03 | ) | | (0.08 | ) | | — | | | — | |
| Distributions from net realized gains | | | — | | | — | | | (0.17 | ) | | (2.92 | ) | | (3.40 | ) | | (5.96 | ) |
| Total distributions | | | — | | | (0.10 | ) | | (0.20 | ) | | (3.00 | ) | | (3.40 | ) | | (5.96 | ) |
| Net asset value, end of period | | $ | 14.23 | | $ | 15.40 | | $ | 13.18 | | $ | 21.63 | | $ | 21.37 | | $ | 22.24 | |
| | | | | | | | | | | | | | | | | | | | |
| Total return | | | (7.60) | %(5) | | 17.62 | % | | (38.12 | )% | | 15.55 | % | | 11.31 | % | | 10.28 | % |
| | | | | | | | | | | | | | | | | | | | |
| Ratios/Supplemental Data: | | | | | | | | | | | | | | | | | | | |
| Net assets, end of period (in thousands) | | $ | 172,041 | | $ | 202,454 | | $ | 191,950 | | $ | 304,192 | | $ | 298,601 | | $ | 300,411 | |
Ratio of expenses to average net assets (including interest expense)(1) | | | 1.17 | %(3) (6) | | 1.26 | %(3) | | 1.18 | %(3) | | 1.13 | %(3) | | 1.30 | %(3) | | 1.19 | % |
Ratio of expenses to average net assets(2) | | | 0.84 | %(6) | | 1.26 | %(4) | | 1.18 | %(4) | | 1.13 | %(4) | | 1.17 | %(4) | | 1.16 | % |
| Ratio of net investment income/(loss) to average net assets | | | 0.26 | %(6) | | 0.62 | % | | 0.53 | % | | 0.47 | % | | (0.11 | )% | | (0.67 | )% |
| Portfolio turnover rate | | | 111 | %(5) | | 157 | % | | 157 | % | | 112 | % | | 203 | % | | 218 | % |
| (1) | Ratio reflects expenses grossed up for the custody credit arrangement. The ratio of expenses to average net assets net of custody credits, would have been 1.17% for the year ended December 31, 2008, 1.29% for the year ended December 31, 2006 and would not have changed for the other periods shown. |
| | |
| (2) | Ratio reflects expenses grossed up for the custody credit arrangement. The ratio of expenses to average net assets net of custody credits would have been 1.17% for the year ended December 31, 2008 and would not have changed for the other periods shown. |
| | |
| (3) | Ratio reflects expenses grossed up for the waiver of the service and distribution plan fees by the Distributor and the reimbursement of a portion of the legal fees. The ratio of expenses to average net assets, net of the fee waivers, but exclusive of the custody credit arrangement, would have been 0.84% for the six months ended June 30, 2010, 1.01% for the year ended December 31, 2009, 0.93% for the year ended December 31, 2008, 0.88% for the year ended December 31, 2007 and 1.21% for the year ended December 31, 2006. |
| | |
| (4) | Ratio reflects expenses grossed up for the waiver of the service and distribution plan fees by the Distributor and the reimbursement of a portion of the legal fees. The ratio of expenses to average net assets, net of the fee waivers, but exclusive of the custody credit arrangement, would have been 1.01% for the year ended December 31, 2009, 0.93% for the year ended December 31, 2008, 0.88% for the year ended December 31, 2007 and 1.09% for the year ended December 31, 2006 and would not have changed for the other periods shown. |
| | |
| (5) | Not annualized. |
| | |
| (6) | Annualized. |
See Notes to Financial Statements.
Value Line Larger Companies Fund, Inc.
| |
| Factors Considered by the Board in Approving the Investment Advisory Agreement for Value Line Larger Companies Fund, Inc. |
The Investment Company Act of 1940 (the “1940 Act”) requires the Board of Directors, including a majority of Directors who are not “interested persons” of Value Line Larger Companies Fund, Inc. (the “Fund”), as that term is defined in the 1940 Act (the “Independent Directors”), annually to consider the investment advisory agreement (the “Agreement”) between the Fund and its investment adviser, EULAV Asset Management, LLC (the “Adviser”). As required by the 1940 Act, the Board requested and the Adviser provided such information as the Board deemed to be reasonably necessary to evaluate the terms of the Agreement. At meetings held throughout the year, including the meeting specifically focused upon the review of the Agreement, the Independent Directors met in executi ve sessions separately from the non-Independent Director of the Fund and any officers of the Adviser. In selecting the Adviser and approving the continuance of the Agreement, the Independent Directors relied upon the assistance of counsel to the Independent Directors.
Both in the meetings which specifically addressed the approval of the Agreement and at other meetings held during the course of the year, the Board, including the Independent Directors, received materials relating to the Adviser’s investment and management services under the Agreement. These materials included information on: (i) the investment performance of the Fund, compared to a peer group of funds consisting of the Fund and all retail and institutional large-cap growth funds regardless of asset size or primary channel of distribution (the “Performance Universe”), and its benchmark index, each as classified by Lipper Inc., an independent evaluation service (“Lipper”); (ii) the investment process, portfolio holdings, investment restrictions, valuation procedures, and financial statements for the Fund; ( iii) sales and redemption data with respect to the Fund; (iv) the general investment outlook in the markets in which the Fund invests; (v) arrangements with respect to the distribution of the Fund’s shares; (vi) the allocation and cost of the Fund’s brokerage (none of which was effected through any affiliate of the Adviser); and (vii) the overall nature, quality and extent of services provided by the Adviser.
As part of the review of the continuance of the Agreement, the Board requested, and the Adviser provided, additional information in order to evaluate the quality of the Adviser’s services and the reasonableness of its fees under the Agreement. In a separate executive session, the Independent Directors reviewed information, which included data comparing: (i) the Fund’s management fee rate, transfer agent and custodian fee rates, service fee (including 12b-1 fees) rates, and the rate of the Fund’s other non-management fees, to those incurred by a peer group of funds consisting of the Fund and 14 other retail no-load large-cap growth funds, as selected objectively by Lipper (“Expense Group”), and a peer group of funds consisting of the Fund, the Expense Group and all other retail no-load large-cap growth fund s (excluding outliers), as selected objectively by Lipper (“Expense Universe”); (ii) the Fund’s expense ratio to those of its Expense Group and Expense Universe; and (iii) the Fund’s investment performance over various time periods to the average performance of the Performance Universe as well as the appropriate Lipper Index, as selected objectively by Lipper (the “Lipper Index”). In the separate executive session, the Independent Directors also reviewed information regarding: (a) the financial results and condition of the Adviser’s parent company, the Adviser’s and certain of its affiliates’ profitability from the services that have been performed for the Fund as well as the Value Line family of funds; (b) the Fund’s current investment management staffing; and (c) the Fund’s potential for achieving economies of scale. In support of its review of the statistical information, the Board was provided with a detailed description of the methodology used by Lipper to determine the Expense Group, the Expense Universe and the Performance Universe to prepare its information. The Independent Directors also requested and reviewed information provided by the Adviser relating to the settlement of a matter brought by the Securities and Exchange Commission regarding Value Line Securities, Inc.1, the Fund’s principal underwriter and affiliate of the Adviser (the “Distributor”), Value Line, Inc., and two former directors and officers of Value Line, Inc. Value Line, Inc. informed the Board that it and the Adviser continue to have adequate liquid assets, and that the resolution of this matter did not have a materially adverse effect on the ability of the Adviser or the Distributor to perform their respective contracts with the Fund.| | | |
| 1 | On May 6, 2009, Value Line Securities, Inc. changed its name to EULAV Securities, Inc. No other change was made to the Distributor’s organization, including its operations and personnel. |
Value Line Larger Companies Fund, Inc.
The following summarizes matters considered by the Board in connection with its renewal of the Agreement. However, the Board did not identify any single factor as all-important or controlling, and the summary does not detail all the matters that were considered.
Investment Performance. The Board reviewed the Fund’s overall investment performance and compared it to its Performance Universe and the Lipper Index. The Board noted that the Fund performed below both the Performance Universe average and the Lipper Index for the one-year, three-year and five-year periods ended December 31, 2009. The Board also noted that the Fund outperformed the Lipper Index and performed below the Performance Universe average for the ten-year period ended December 31, 2009.
The Adviser’s Personnel and Methods. The Board reviewed the background of the portfolio manager responsible for the daily management of the Fund’s portfolio, seeking to achieve the Fund’s investment objective and adhering to the Fund’s investment strategies. The Independent Directors also engaged in discussions with the Adviser’s senior management responsible for the overall functioning of the Fund’s investment operations. The Board concluded that the Fund’s management team and the Adviser’s overall resources were adequate and that the Adviser had investment management capabilities and personnel essential to performing its duties under the Agreement.
Management Fee and Expenses. The Board considered the Adviser’s fee under the Agreement relative to the management fees charged by its Expense Group and Expense Universe averages. Fund’s management fee rate for the most recent fiscal year was higher than that of both the Expense Universe average and the Expense Group average.
The Board also considered the Fund’s total expense ratio relative to its Expense Group and Expense Universe averages. The Board noted that the Distributor and the Board previously agreed that the Distributor would contractually waive a portion of the Fund’s Rule 12b-1 fee, effectively reducing the Fund’s Rule 12b-1 fee rate from 0.25% to 0.00% of the Fund’s average daily net assets for the one-year period ending April 30, 2010. The Distributor and the Board have currently agreed to extend this contractual 12b-1 fee waiver through April 30, 2011. Such waiver can not be changed without the Board’s approval during the contractual waiver period. As a result of the Rule 12b-1 fee waiver, the Board noted that the Fund’s total expense ratio after giving effect to this waiver was less than that of the Expens e Group average and the Expense Universe average. The Board concluded that the average expense ratio was satisfactory for the purpose of approving the continuance of the Agreement for the coming year.
Value Line Larger Companies Fund, Inc.
Nature and Quality of Other Services. The Board considered the nature, quality, cost and extent of other services provided by the Adviser and the Distributor. At meetings held throughout the year, the Board reviewed the effectiveness of the Adviser’s overall compliance program, as well as the services provided by the Distributor. The Board viewed favorably the increased emphasis being placed by the Adviser on its overall compliance program as well as steps being undertaken to enhance the shareholders’ experience with the Fund, such as a more robust website. The Board also reviewed the services provided by the Adviser and its affiliates in supervising third party service providers. Based on this review, the Board concluded that the nature, quality, cost and extent of such other services provided by the Adviser and its affiliates were satisfactory, reliable and beneficial to the Fund’s shareholders.
Profitability. The Board considered the level of profitability of the Adviser and its affiliates with respect to the Fund individually and in the aggregate for all the funds within the Value Line group of funds, including the impact of certain actions taken during prior years. These actions included the Adviser’s reduction (voluntary in some instances and contractual in other instances) of management and/or Rule 12b-1 fees for certain funds, the Adviser’s termination of the use of soft dollar research, and the cessation of trading thro ugh the Distributor. The Board concluded that the profitability of the Adviser and its affiliates with respect to the Fund, including the financial results derived from the Fund’s Agreement, were within a range the Board considered reasonable.
Other Benefits. The Board also considered the character and amount of other direct and incidental benefits received by the Adviser and its affiliates from their association with the Fund. The Board concluded that potential “fall-out” benefits that the Adviser and its affiliates may receive, such as greater name recognition, appear to be reasonable, and may in some cases benefit the Fund.
Economies of Scale. The Board noted that, given the current and anticipated size of the Fund, any perceived and potential economies of scale were not yet a significant consideration for the Fund and the addition of break points was determined not to be necessary at this time.
Fees and Services Provided for Other Comparable Funds/Accounts Managed by the Adviser and its Affiliates. In addition to comparing the Fund’s management fee rate to unaffiliated mutual funds included in the Fund’s Expense Group and Expense Universe, the Board was informed by the Adviser that the Adviser and its affiliates do not manage any investment companies or other institutional accounts comparable to the Fund.
Conclusion. The Board, in light of the Adviser’s overall performance, considered it appropriate to continue to retain the Adviser as the Fund’s investment adviser. Based on their evaluation of all material factors deemed relevant, and with the advice of independent counsel, the Board determined that the Fund’s management fee rate payable to the Adviser under the Agreement does not constitute fees that are so disproportionately large as to bear no reasonable relationship to the services rendered and that could not have been the pr oduct of arm’s-length bargaining, and concluded that the management fee rate under the Agreement is fair and reasonable. Further, the Board concluded that the Fund’s Agreement is fair and reasonable and approved the continuation of the Agreement for another year.
Value Line Larger Companies Fund, Inc.
The Fund files its complete schedule of portfolio holdings with the Securities and Exchange Commission (“SEC”) for the first and third quarters of each fiscal year on Form N-Q. The Fund’s Forms N-Q are available on the SEC’s website at http://www.sec.gov and may be reviewed and copied at the SEC’s Public Reference Room in Washington, D.C. Information on the operation of the Public Reference Room may be obtained by calling 1-800-SEC-0330.
A description of the policies and procedures that the Fund uses to determine how to vote proxies relating to portfolio securities, and information regarding how the Fund voted these proxies for the 12-month period ended June 30 is available through the Fund’s website at http://www.vlfunds.com and on the SEC’s website at http://www.sec.gov. The description of the policies and procedures is also available without charge, upon request, by calling 1-800-243-2729.
Value Line Larger Companies Fund, Inc.
MANAGEMENT INFORMATION
The business and affairs of the Fund are managed by the Fund’s officers under the direction of the Board of Directors. The following table sets forth information on each Director and Officer of the Fund. Each Director serves as a director or trustee of each of the 14 Value Line Funds. Each Director serves until his or her successor is elected and qualified.
| | | | | | | | | |
| Name, Address, and DOB | | Position | | Length of Time Served | | Principal Occupation During the Past 5 Years | | Other Directorships Held by Director |
Interested Director* | | | | | | | | | | |
Thomas T. Sarkany DOB: June 1946 | | Director | | Since 2008 | | Director of Mutual Fund Marketing, Director of EULAV Securities, Inc. (the “Distributor”), Secretary of Value Line, Inc. since January 2010 and Director since February 2010. | | Value Line, Inc. |
Non-Interested Directors | | | | | | | | | |
Joyce E. Heinzerling 500 East 77th Street New York, NY 10162 DOB: January 1956 | | Director | | Since 2008 | | President, Meridian Fund Advisers LLC. (consultants) since April 2009; General Counsel, Archery Capital LLC (private investment fund) until April 2009. | | Burnham Investors Trust, since 2004
(4 funds). |
Francis C. Oakley 54 Scott Hill Road Williamstown, MA 01267 DOB: October 1931 | | Director | | Since 2000 | | Professor of History, Williams College, (1961-2002). Professor Emeritus since 2002; President Emeritus since 1994 and President, (1985-1994); Chairman (1993-1997) and Interim President (2002-2003) of the American Council of Learned Societies. Trustee since 1997 and Chairman of the Board since 2005, National Humanities Center. | | None |
David H. Porter 5 Birch Run Drive Saratoga Springs, NY 12866 DOB: October 1935 | | Director | | Since 1997 | | Professor, Skidmore College since 2008; Visiting Professor of Classics, Williams College, (1999-2008); President Emeritus, Skidmore College since 1999 and President, (1987-1998). | | None |
Paul Craig Roberts 169 Pompano St. Panama City Beach, FL 32413 DOB: April 1939 | | Director | | Since 1985 | | Chairman, Institute for Political Economy. | | None |
Value Line Larger Companies Fund, Inc.
| Name, Address, and DOB | | Position | | Length of Time Served | | Principal Occupation During the Past 5 Years | | Other Directorships Held by Director |
Nancy-Beth Sheerr 1409 Beaumont Drive Gladwyne, PA 19035 DOB: March 1949 | | Director | | Since 1996 | | Senior Financial Adviser, Veritable L.P. (Investment adviser). | | None |
Daniel S. Vandivort 59 Indian Head Road Riverside, CT 06878 DOB: July 1954 | | Director (Chairman of Board since March 2010) | | Since 2008 | | President, Chief Investment Officer, Weiss, Peck and Greer/Robeco Investment Management (2005-2007); Managing Director, Weiss, Peck and Greer,
(1995-2005). | | None |
Officers | | | | | | | |
Mitchell E. Appel DOB: August 1970 | | President | | Since 2008 | | President of each of the Value Line Funds since June 2008; Chief Financial Officer of Value Line, Inc. since April 2008 and from September 2005 to November 2007; Treasurer from June 2005 to September 2005; Director since February 2010; Chief Financial Officer of XTF Asset Management from November 2007 to April 2008; Chief Financial Officer of the Distributor since April 2008 and President since February 2009; President of the Adviser since February 2009. |
Howard A. Brecher DOB: October 1953 | | Vice President and Secretary | | Since 2008 | | Vice President and Secretary of each of the Value Line Funds since June 2008; Chief Legal Officer; Vice President; Director of Value Line, Inc.; Acting Chairman and Acting CEO of Value Line, Inc. since November 2009; Secretary until January 2010; Secretary and Treasurer of the Adviser since February 2009; Vice President, Secretary, Treasurer, General Counsel and a Director of Arnold Bernhard & Co., Inc. |
Michael J. Wagner DOB: November 1950 | | Chief Compliance Officer | | Since 2009 | | Chief Compliance Officer of Value Line Funds since June 2009; President of Northern Lights Compliance Service, LLC (formerly Fund Compliance Services, LLC (2006 - present)) and Senior Vice President (2004 - 2006) and President and Chief Operations Officer (2003 - 2006) of Gemini Fund Services, LLC; Director of Constellation Trust Company until 2008. |
Emily D. Washington DOB: January 1979 | | Treasurer | | Since 2008 | | Treasurer and Chief Financial Officer (Principal Financial and Accounting Officer) of each of the Value Line Funds since August 2008; Associate Director of Mutual Fund Accounting at Value Line until August 2008. |
| * | Mr. Sarkany is an “interested person” as defined in the Investment Company Act of 1940 by virtue of his position with the Distributor. |
| |
Unless otherwise indicated, the address for each of the above officers is c/o Value Line Funds, 220 East 42nd Street, New York, NY 10017. |
| The Fund’s Statement of Additional Information (SAI) includes additional information about the Fund’s Directors and is available, without charge, upon request by calling 1-800-243-2729 or on the Fund’s website, www.vlfunds.com. |
Value Line Larger Companies Fund, Inc.
[This Page Intentionally Left Blank.]
Value Line Larger Companies Fund, Inc.
[This Page Intentionally Left Blank.]
Value Line Larger Companies Fund, Inc.
| |
| The Value Line Family of Funds |
1950 — The Value Line Fund seeks long-term growth of capital. Current income is a secondary objective.
1952 — Value Line Income and Growth Fund’s primary investment objective is income, as high and dependable as is consistent with reasonable risk. Capital growth to increase total return is a secondary objective.
1956 — Value Line Premier Growth Fund seeks long-term growth of capital. No consideration is given to current income in the choice of investments.
1972 — Value Line Larger Companies Fund’s sole investment objective is to realize capital growth.
1979 — Value Line U.S. Government Money Market Fund**, a money market fund, seeks to secure as high a level of current income as is consistent with maintaining liquidity and preserving capital. An investment in the Fund is not insured or guaranteed by the Federal Deposit Insurance Corporation or any other government agency. Although the Fund seeks to preserve the value of your investment at $1.00 per share, it is possible to lose money by investing in the Fund.
1981 — Value Line U.S. Government Securities Fund seeks maximum income without undue risk to capital. Under normal conditions, at least 80% of the value of its net assets will be invested in securities issued or guaranteed by the U.S. Government and its agencies and instrumentalities.
1983 — Value Line Centurion Fund* seeks long-term growth of capital.
1984 — The Value Line Tax Exempt Fund seeks to provide investors with the maximum income exempt from federal income taxes while avoiding undue risk to principal. The fund may be subject to state and local taxes and the Alternative Minimum Tax (if applicable).
1985 — Value Line Convertible Fund seeks high current income together with capital appreciation primarily from convertible securities ranked 1, 2 or 3 for the year-ahead performance by the Value Line Convertible Ranking System.
1986 — Value Line Aggressive Income Trust seeks to maximize current income.
1987 — Value Line New York Tax Exempt Trust seeks to provide New York taxpayers with the maximum income exempt from New York State, New York City and federal income taxes while avoiding undue risk to principal. The Trust may be subject to state and local taxes and the Alternative Minimum Tax (if applicable).
1987 — Value Line Strategic Asset Management Trust* seeks to achieve a high total investment return consistent with reasonable risk.
1993 — Value Line Emerging Opportunities Fund invests in US common stocks of small capitalization companies, with its primary objective being long-term growth of capital.
1993 — Value Line Asset Allocation Fund seeks high total investment return, consistent with reasonable risk. The Fund invests in stocks, bonds and money market instruments utilizing quantitative modeling to determine the asset mix.
| | |
| * | Only available through the purchase of Guardian Investor, a tax deferred variable annuity, or ValuePlus, a variable life insurance policy. |
| | |
| ** | Effective August 19, 2009, The Value Line Cash Fund, Inc. changed its name to the Value Line U.S. Government Money Market Fund, Inc. |
For more complete information about any of the Value Line Funds, including charges and expenses, send for a prospectus from EULAV Securities, Inc., 220 East 42nd Street, New York, New York 10017-5891 or call 1-800-243-2729, 9am–5pm CST, Monday–Friday, or visit us at www.vlfunds.com. Read the prospectus carefully before you invest or send money.