Value Line Larger Companies Fund, Inc.
To Our Shareholders (unaudited):
Enclosed is your semi-annual report for the six month period ending June 30, 2011. We encourage you to carefully review this report, which includes economic highlights, your Fund’s performance data and highlights, schedule of investments, and financial statements.
The Value Line Larger Companies Fund (the “Fund”) had a total return of 8.82% for the first six months of 2011 which compares to a total return of 6.02% for the Standard & Poor’s 500 Index(1).
Prospects of a slow yet continuing economic recovery coupled with better than expected corporate profit reports boosted stock prices for the first six months of the year. Many companies reported record profits and cash flows driven by improved demand and in some cases, higher commodity prices. Results in the Fund for the first six months of year benefitted from good stock selection, particularly in the healthcare and consumer discretionary sectors. An underweighted position in the financial services sector also benefitted the Fund. However, an underweighted position in the energy sector and an over weighted position in materials detracted from the Fund’s results as those stocks, while still generally posting positive returns, underperformed the overall market for the period.
We continue to emphasize larger-capitalized stocks in the Fund that generally are ranked in the higher categories of 1, 2 or 3 in the Value Line Timeliness Ranking System. The Fund ended the period with over weighted positions in the consumer discretionary, healthcare, materials, and technology sectors, while being underweighted in the consumer staples, energy, and financial services sectors.
We believe the current environment is especially conducive to a well-diversified portfolio. Our goal is to generating solid returns through capital growth across economic cycles.
Thank you for investing with the Value Line Funds.
| | Sincerely, |
| | |
| | /s/ Mitchell Appel |
| | Mitchell Appel, President |
| | |
| | /s/ Mark Spellman |
| | Mark Spellman, Portfolio Manager |
| (1) | The Standard & Poor’s 500 Index consists of 500 stocks which are traded on the New York Stock Exchange, American Stock Exchange and the NASDAQ National Market System and is representative of the broad stock market. This is an unmanaged index and does not reflect charges, expenses or taxes. It is not possible to directly invest in this index. |
Value Line Larger Companies Fund, Inc.
| Companies Fund Shareholders |
Economic Highlights (unaudited)
The first half of 2011 saw the broad US stock market rising on the heels of strengthening corporate profits. The S&P 500 returned 6% for the first six months of the year despite significant global economic concerns. Several members of the European Union continued to face a serious debt crisis including Greece, Portugal, Ireland, and Spain. Further, the nuclear disaster in Japan and the geopolitical upheaval in commodity markets added to investor concerns. At home, disappointing job growth in the United States kept the national unemployment rate firmly above 9% for the second quarter.
By mid-year there was mounting evidence that the US recovery had slowed to a crawl. Consumer spending, which accounts for roughly 70% of economic activity, declined in June for the first time in 2 years. First quarter GDP was up by only 0.4%, and second quarter GDP growth was only modestly better at 1.3%. Employment growth in July lagged June numbers, and it was reported that the level of new factory orders decreased. By August, only 58% of the population was working, the lowest level in nearly 3 decades. Housing prices remained almost uniformly weak.
Much of the summer was consumed by the drama of the U.S. debt ceiling negotiations, resulting in an 11th hour deal that appears to satisfy few constituents. It surely did not satisfy Standard & Poors who felt that the $2.1 trillion deficit reduction over 10 years was insufficient to solve the country’s debt problem. The rating agency proceeded to downgrade U.S. Treasury debt from AAA to AA+. This downgrade did not affect short-term Treasuries. Within a few days the rating agency imposed the same rating cut on the long-term debt of several U.S. Agencies including Fannie Mae and Freddie Mac. The other major rating agencies, Moody’s and Fitch, maintained AAA ratings for U.S. Treasury debt as well as for the U.S. Agencies. Investor confidence plunged on the heels of the debt ceiling debacle and the US Treasury debt downgrade. Returns for the S&P 500 turned negative in August giving up its returns for the year.
The bond market rallied as stocks took a dive. Yields fell and prices rose across fixed income markets as investors looked for safer havens. Despite the rating downgrade, investor demand for Treasuries soared, pushing interest rates down to the lowest levels in 2 years.
Value Line Larger Companies Fund, Inc.
| |
| FUND EXPENSES (unaudited): |
Example
As a shareholder of the Fund, you incur ongoing costs, including management fees, distribution and service (12b-1) fees, and other Fund expenses. This Example is intended to help you understand your ongoing costs (in dollars) of investing in the Fund and to compare these costs with the ongoing costs of investing in other mutual funds.
The Example is based on an investment of $1,000 invested at the beginning of the period and held for the entire period (January 1, 2011 through June 30, 2011).
Actual Expenses
The first line of the table below provides information about actual account values and actual expenses. You may use the information in this line, together with the amount you invested, to estimate the expenses that you paid over the period. Simply divide your account value by $1,000 (for example an $8,600 account value divided by $1,000 = 8.6), then multiply the result by the number in the first line under the heading “Expenses Paid During Period” to estimate the expenses you paid on your account during this period.
Hypothetical Example for Comparison Purposes
The second line of the table below provides information about hypothetical account values and hypothetical expenses based on the Fund’s actual expense ratio and an assumed rate of return of 5% per year before expenses, which is not the Fund’s actual return. The hypothetical account values and expenses may not be used to estimate the actual ending account balance or expenses you paid for the period. You may use this information to compare the ongoing costs of investing in the Fund and other funds. To do so, compare this 5% hypothetical example with the 5% hypothetical examples that appear in the shareholder reports of other funds.
Please note that the expenses shown in the table are meant to highlight your ongoing costs only and do not reflect any transactional costs, such as sales charges (loads), redemption fees, or exchange fees. Therefore, the table is useful in comparing ongoing costs only and will not help you determine the relative total costs of owning different funds. In addition, if transactional costs were included, your costs would have been higher.
| | | Beginning account value 1/1/11 | | | Ending account value 6/30/11 | | | Expenses paid during period 1/1/11 thru 6/30/11* | |
| Actual | | $ | 1,000.00 | | | $ | 1,088.20 | | | $ | 4.97 | |
| Hypothetical (5% return before expenses) | | $ | 1,000.00 | | | $ | 1,020.03 | | | $ | 4.81 | |
* | Expenses are equal to the Fund’s annualized expense ratio of 0.96% multiplied by the average account value over the period, multiplied by 181/365 to reflect the one-half year period. This expense ratio may differ from the expense ratio shown in the Financial Highlights. |
Value Line Larger Companies Fund, Inc.
| Portfolio Highlights at June 30, 2011 (Unaudited) |
Ten Largest Holdings
| | | | | | | | | | |
| Issue | | Shares | | | Value | | | Percentage of Net Assets | |
| Agilent Technologies, Inc. | | | 51,000 | | | $ | 2,606,610 | | | | 1.2 | % |
| Marathon Oil Corp. | | | 48,000 | | | $ | 2,528,640 | | | | 1.2 | % |
| Union Pacific Corp. | | | 24,000 | | | $ | 2,505,600 | | | | 1.2 | % |
| Accenture PLC | | | 41,000 | | | $ | 2,477,220 | | | | 1.2 | % |
| Biogen Idec, Inc. | | | 23,000 | | | $ | 2,459,160 | | | | 1.2 | % |
| Starbucks Corp. | | | 62,000 | | | $ | 2,448,380 | | | | 1.2 | % |
| Altera Corp. | | | 52,000 | | | $ | 2,410,200 | | | | 1.2 | % |
| Canadian National Railway Co. | | | 30,000 | | | $ | 2,397,000 | | | | 1.1 | % |
| Chevron Corp. | | | 23,000 | | | $ | 2,365,320 | | | | 1.1 | % |
| Netflix, Inc. | | | 9,000 | | | $ | 2,364,210 | | | | 1.1 | % |
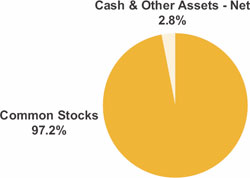
| Asset Allocation - Percentage of Net Assets |
| |
|
| |
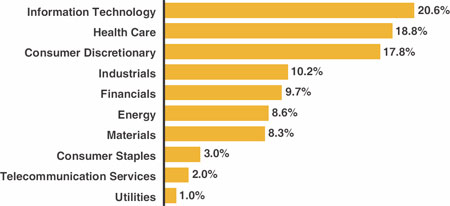
| Sector Weightings - Percentage of Total Investment Securities |
| |
|
| Value Line Larger Companies Fund, Inc. |
| |
| Notes to Financial Statements (unaudited) |
1. Significant Accounting Policies
Value Line Larger Companies Fund, Inc., (the “Fund”) is registered under the Investment Company Act of 1940, as amended, as a diversified, open-end management investment company whose sole investment objective is to realize capital growth.
The preparation of financial statements in conformity with generally accepted accounting principles requires management to make estimates and assumptions that affect the reported amounts of assets and liabilities and disclosure of contingent assets and liabilities at the date of the financial statements and the reported amounts of revenues and expenses during the reporting period. Actual results could differ from those estimates. The following is a summary of significant accounting policies consistently followed by the Fund in the preparation of its financial statements.
(A) Security Valuation: Securities listed on a securities exchange are valued at the closing sales prices on the date as of which the net asset value is being determined. Securities traded on the NASDAQ Stock Market are valued at the NASDAQ Official Closing Price. In the absence of closing sales prices for such securities and for securities traded in the over-the-counter market, the security is valued at the midpoint between the latest available and representative asked and bid prices. Short-term instruments with maturities 60 days or less at the date of purchase are valued at amortized cost, which approximates market value. Short-term instruments with maturities greater than 60 days at the date of purchase are valued at the midpoint between the latest available and representative asked and bid prices, and commencing 60 days prior to maturity such securities are value at amortized cost. Securities for which market quotations are not readily available or that are not readily marketable and all other assets of the Fund are valued at fair value as the Board of Directors may determine in good faith. In addition, the Fund may use the fair value of a security when the closing market price on the primary exchange where the security is traded no longer accurately reflects the value of a security due to factors affecting one or more relevant securities markets or the specific issuer.
(B) Fair Value Measurements: The Fund follows fair valuation accounting standards (FASB ASC 820-10) which establish a definition of fair value and set out a hierarchy for measuring fair value. These standards require additional disclosures about the various inputs and valuation techniques used to develop the measurements of fair value and a discussion of changes in valuation techniques and related inputs during the period. These inputs are summarized in the three broad levels listed below:
| | |
| • | Level 1 — Inputs that reflect unadjusted quoted prices in active markets for identical assets or liabilities that the Fund has the ability to access at the measurement date; |
| • | Level 2 — Inputs other than quoted prices that are observable for the asset or liability either directly or indirectly, including inputs in markets that are not considered to be active; |
| • | Level 3 — Inputs that are unobservable. |
Transfers between investment levels may occur as the markets fluctuate and/or the availability of data used in an investment’s valuation changes. The inputs or methodologies used for valuing securities are not necessarily an indication of the risk associated with investing in those securities.
The following table summarizes the inputs used to value the Fund’s investments in securities as of June 30, 2011:
| Investments in Securities: | | Level 1 | | | Level 2 | | | Level 3 | | | Total | |
| Assets | | | | | | | | | | | | |
| Common Stocks | | $ | 202,958,582 | | | $ | 0 | | | $ | 0 | | | $ | 202,958,582 | |
| Short-Term Investments | | | 0 | | | | 5,600,000 | | | | 0 | | | | 5,600,000 | |
| Total Investments in Securities | | $ | 202,958,582 | | | $ | 5,600,000 | | | $ | 0 | | | $ | 208,558,582 | |
| Value Line Larger Companies Fund, Inc. |
| |
| June 30, 2011 |
The Fund follows the updated provisions surrounding fair value measurements and disclosures on transfers in and out of all levels of the fair value hierarchy on a gross basis and the reasons for the transfers as well as to disclosures about the valuation techniques and inputs used to measure fair value for investments that fall in either Level 2 or Level 3 fair value hierarchy.
For the six months ended June 30, 2011, there was no significant transfer activity between Level 1 and Level 2.
For the six months ended June 30, 2011, there were no Level 3 investments. The Schedule of Investments includes a breakdown of the Schedule’s investments by category.
(C) Repurchase Agreements: In connection with transactions in repurchase agreements, the Fund’s custodian takes possession of the underlying collateral securities, the value of which exceeds the principal amount of the repurchase transaction, including accrued interest. To the extent that any repurchase transaction exceeds one business day, it is the Fund’s policy to mark-to-market on a daily basis to ensure the adequacy of the collateral. In the event of default of the obligation to repurchase, the Fund has the right to liquidate the collateral and apply the proceeds in satisfaction of the obligation. Under certain circumstances, in the event of default or bankruptcy by the other party to the agreement, realization and/or retention of the collateral or proceeds may be subject to legal proceedings.
(D) Federal Income Taxes: It is the Fund’s policy to comply with the requirements of the Internal Revenue Code applicable to regulated investment companies, including the distribution requirements of the Tax Reform Act of 1986, and to distribute all of its taxable income and capital gains to its shareholders. Therefore, no federal income tax provision is required.
(E) Security Transactions and Distributions: Security transactions are accounted for on the date the securities are purchased or sold. Interest income is accrued as earned. Realized gains and losses on sales of securities are calculated for financial accounting and federal income tax purposes on the identified cost basis. Dividend income and distributions to shareholders are recorded on the ex-dividend date. Distributions are determined in accordance with income tax regulations which may differ from generally accepted accounting principles.
(F) Foreign Currency Translation: The books and records of the Fund are maintained in U.S. dollars. Assets and liabilities which are denominated in foreign currencies are translated to U.S. dollars at the prevailing rates of exchange. The Fund does not isolate changes in the value of investments caused by foreign exchange rate differences from the changes due to other circumstances.
Income and expenses are translated to U.S. dollars based upon the rates of exchange on the respective dates of such transactions.
Net realized foreign exchange gains or losses arise from currency fluctuations realized between the trade and settlement dates on securities transactions, the differences between the U.S. dollar amounts of dividends, interest, and foreign withholding taxes recorded by the Fund, and the U.S. dollar equivalent of the amounts actually received or paid. Net unrealized foreign exchange gains and losses arise from changes in the value of assets and liabilities, other than investments, at the end of the fiscal period, resulting from changes in the exchange rates. The effect of the change in foreign exchange rates on the value of investments is included in realized gain/loss on investments and change in net unrealized appreciation/depreciation on investments.
(G) Representations and Indemnifications: In the normal course of business, the Fund enters into contracts that contain a variety of representations and warranties which provide general indemnifications. The Fund’s maximum exposure under these arrangements is unknown, as this would involve future claims that may be made against the Fund that have not yet occurred. However, based on experience, the Fund expects the risk of loss to be remote.
| Value Line Larger Companies Fund, Inc. |
| |
| Notes to Financial Statements (unaudited) |
(H) Foreign Taxes: The Fund may be subject to foreign taxes on income, gains on investments, or currency repatriation, a portion of which may be recoverable. The Fund will accrue such taxes and recoveries as applicable, based upon its current interpretation of tax rules and regulations that exist in the markets in which it invests.
(I) Subsequent Events: Management has evaluated all subsequent transactions and events through the date on which these financial statements were issued, and except as already included in the notes to these financial statements, has determined that no additional items require disclosure.
2. Capital Share Transactions, Dividends and Distributions to Shareholders
Transactions in capital stock were as follows:
| | | Six Months Ended | | | | |
| | | June 30, 2011 | | | Year Ended | |
| | | (unaudited) | | | December 31, 2010 | |
| Shares sold | | | 177,789 | | | | 187.259 | |
Shares issued to shareholders in reinvestment of dividends and distributions | | | — | | | | 62,344 | |
| | | (615,192 | ) | | | (1,973,150 | ) |
| Net decrease | | | (437,403 | ) | | | (1,723,547 | ) |
Dividends per share from net investment income | | $ | — | | | $ | 0.1003 | |
3. Purchases and Sales of Securities
Purchases and sales of investment securities, excluding short-term securities, were as follows:
| | | Six Months Ended | |
| | | June 30, 2011 | |
| | | (unaudited) | |
| Purchases: | | | |
| Investment Securities | | $ | 34,128,659 | |
| Sales: | | | | |
| Investment Securities | | $ | 45,410,885 | |
4. Income Taxes
At June 30, 2011, information on the tax components of capital is as follows:
| Cost of investments for tax purposes | | $ | 162,078,041 | |
| Gross tax unrealized appreciation | | $ | 48,704,816 | |
| Gross tax unrealized depreciation | | | (2,224,275 | ) |
| Net tax unrealized appreciation on investments | | $ | 46,480,541 | |
5. Investment Advisory Fees, Service and Distribution Fees, and Transactions With Affiliates
An advisory fee of $767,626 was paid or payable to EULAV Asset Management (the “Adviser”) for the six months ended June 30, 2011. This was computed at an annual rate of 0.75% of the daily net assets during the period and paid monthly. The Adviser provides research, investment programs, supervision of the investment portfolio and pays costs of administrative services, office space, equipment and compensation of administrative, bookkeeping, and clerical personnel necessary for managing the affairs of the Fund. The Adviser also provides persons, satisfactory to the Fund’s Board of Directors, to act as officers and employees of the Fund and pays their salaries.
| Value Line Larger Companies Fund, Inc. |
| |
| June 30, 2011 |
The Fund has a Service and Distribution Plan (the “Plan”), adopted pursuant to Rule 12b-1 under the Investment Company Act of 1940, which compensates EULAV Securities LLC (the “Distributor”) for advertising, marketing and distributing the Fund’s shares and for servicing the Fund’s shareholders at an annual rate of 0.25% of the Fund’s average daily net assets. For the six months ended June 30, 2011, fees amounting to $255,875, before fee waivers, were accrued under the Plan. Effective May 1, 2007 through April 30, 2012, the Distributor contractually agreed to waive the Fund’s 12b-1 fee for one year periods. For the six months ended June 30, 2011, the fees waived amounted to $255,875. The Distributor has no right to recoup prior waivers.
For the six months ended June 30, 2011, the Fund’s expenses were reduced by $74 under a custody credit agreement with the custodian.
Direct expenses of the Fund are charged to the Fund while common expenses of the Value Line Funds are allocated proportionately based upon the Funds’ respective net assets. The Fund bears all other costs and expenses.
Certain officers and a Trustee of the Adviser are also officers and directors of the Fund. At June 30, 2011, the officers and directors as a group owned 556 shares of the Fund, representing less than 1% of the outstanding shares.
6. Borrowing Arrangement
Prior to September 22, 2006, the Fund had a line of credit agreement with State Street Bank and Trust.
| Value Line Larger Companies Fund, Inc. |
| |
| Financial Highlights |
Selected data for a share of capital stock outstanding throughout each period:
| | | Six Months Ended | | | | | | | | | | | | | | | | |
| | | June 30, 2011 | | | Years Ended December 31, | |
| | | (unaudited) | | | 2010 | | | 2009 | | | 2008 | | | 2007 | | | 2006 | |
| Net asset value, beginning of period | | $ | 17.47 | | | $ | 15.40 | | | $ | 13.18 | | | $ | 21.63 | | | $ | 21.37 | | | $ | 22.24 | |
| Income from investment operations: | | | | | | | | | | | | | | | | | | | | | | | | |
| Net investment income/(loss) | | | 0.05 | | | | 0.09 | | | | 0.10 | | | | 0.09 | | | | 0.11 | | | | (0.02 | ) |
| Net gains or (losses) on securities | | | | | | | | | | | | | | | | | | | | | | | | |
| (both realized and unrealized) | | | 1.49 | | | | 2.08 | | | | 2.22 | | | | (8.34 | ) | | | 3.15 | | | | 2.55 | |
| Total from investment operations | | | 1.54 | | | | 2.17 | | | | 2.32 | | | | (8.25 | ) | | | 3.26 | | | | 2.53 | |
| | | | | | | | | | | | | | | | | | | | | | | | | |
| Less distributions: | | | | | | | | | | | | | | | | | | | | | | | | |
| Dividends from net investment income | | | — | | | | (0.10 | ) | | | (0.10 | ) | | | (0.03 | ) | | | (0.08 | ) | | | — | |
| Distributions from net realized gains | | | — | | | | — | | | | — | | | | (0.17 | ) | | | (2.92 | ) | | | (3.40 | ) |
| Total distributions | | | — | | | | (0.10 | ) | | | (0.10 | ) | | | (0.20 | ) | | | (3.00 | ) | | | (3.40 | ) |
| Net asset value, end of period | | $ | 19.01 | | | $ | 17.47 | | | $ | 15.40 | | | $ | 13.18 | | | $ | 21.63 | | | $ | 21.37 | |
| Total return | | | 8.82 | %(5) | | | 14.09 | % | | | 17.62 | % | | | (38.12 | )% | | | 15.55 | % | | | 11.31 | % |
| Ratios/Supplemental Data: | | | | | | | | | | | | | | | | | | | | | | | | |
| Net assets, end of period (in thousands) | | $ | 208,767 | | | $ | 199,524 | | | $ | 202,454 | | | $ | 191,950 | | | $ | 304,192 | | | $ | 298,601 | |
| Ratio of expenses to average net assets | | | | | | | | | | | | | | | | | | | | | | | | |
(including interest expense)(1) | | | 1.21 | %(3)(6) | | | 1.21 | %(3)(7) | | | 1.26 | %(3) | | | 1.18 | %(3) | | | 1.13 | %(3) | | | 1.30 | %(3) |
Ratio of expenses to average net assets(2) | | | 1.21 | %(4)(6) | | | 1.21 | %(4)(8) | | | 1.26 | %(4) | | | 1.18 | %(4) | | | 1.13 | %(4) | | | 1.17 | %(4) |
| Ratio of net investment income/(loss) | | | | | | | | | | | | | | | | | | | | | | | | |
| to average net assets | | | 0.56 | %(6) | | | 0.44 | % | | | 0.62 | % | | | 0.53 | % | | | 0.47 | % | | | (0.11 | )% |
| Portfolio turnover rate | | | 17 | %(5) | | | 153 | % | | | 157 | % | | | 157 | % | | | 112 | % | | | 203 | % |
| (1) | Ratio reflects expenses grossed up for the custody credit arrangement. The ratio of expenses to average net assets net of custody credits, would have been 1.17% for the year ended December 31, 2008, 1.29% for the year ended December 31, 2006 and would not have changed for the other years shown. |
| (2) | Ratio reflects expenses grossed up for the custody credit arrangement. The ratio of expenses to average net assets net of custody credits would have been 1.17% for the year ended December 31, 2008, and would not have changed for the other years shown. |
| (3) | Ratio reflects expenses grossed up for the waiver of the service and distribution plan fees by the Distributor. The ratio of expenses to average net assets, net of the fee waivers, but exclusive of the custody credit arrangement, would have been 0.96% for the six months ended June 30, 2011, 0.92% for the year ended December 31, 2010, 1.01% for the year ended December 31, 2009, 0.93% for the year ended December 31, 2008, 0.88% for the year ended December 31, 2007 and 1.21% for the year ended December 31, 2006. |
| (4) | Ratio reflects expenses grossed up for the waiver of the service and distribution plan fees by the Distributor. The ratio of expenses to average net assets, net of the fee waivers, but exclusive of the custody credit arrangement, would have been 0.96% for the six months ended June 30, 2011, 0.92% for the year ended December 31, 2010, 1.01% for the year ended December 31, 2009, 0.93% for the year ended December 31, 2008, 0.88% for the year ended December 31, 2007 and 1.09% for the year ended December 31, 2006. |
| (5) | Not annualized. |
| (6) | Annualized. |
| (7) | Ratio reflects expenses grossed up for the reimbursement by Value Line, Inc. of certain expenses incurred by the Fund. |
| (8) | Ratio reflects expenses net of the reimbursement by Value Line, Inc. of certain expenses incurred by the Fund. |
See Notes to Financial Statements.
| Value Line Larger Companies Fund, Inc. |
| |
The Fund files its complete schedule of portfolio holdings with the Securities and Exchange Commission (“SEC”) for the first and third quarters of each fiscal year on Form N-Q. The Fund’s Forms N-Q are available on the SEC’s website at http://www.sec.gov and may be reviewed and copied at the SEC’s Public Reference Room in Washington, D.C. Information on the operation of the Public Reference Room may be obtained by calling 1-800-SEC-0330.
A description of the policies and procedures that the Fund uses to determine how to vote proxies relating to portfolio securities, and information regarding how the Fund voted these proxies for the 12-month period ended June 30 is available through the Fund’s website at http://www.vlfunds.com and on the SEC’s website at http://www.sec.gov. The description of the policies and procedures is also available without charge, upon request, by calling 1-800-243-2729.
| |
| Value Line Larger Companies Fund, Inc. |
| |
| Management of the Fund |
MANAGEMENT INFORMATION
The business and affairs of the Fund are managed by the Fund’s officers under the direction of the Board of Directors. The following table sets forth information on each Director and Officer of the Fund. Each Director serves as a director or trustee of each of the 14 Value Line Funds. Each Director serves until his or her successor is elected and qualified.
| | | | | | | | | Other |
| | | | | Length of | | Principal Occupation | | Directorships |
| Name, Address, and YOB | | Position | | Time Served | | During the Past 5 Years | | Held by Director |
| Interested Director* | | | | | | | | |
Mitchell E. Appel YOB: 1970 | | Director | | Since 2010 | | President of each of the Value Line Funds since June 2008; President of the Adviser and Distributor since February 2009; Chief Financial Officer of Value Line, Inc. (“Value Line”) from April 2008 to December 2010 and from September 2005 to November 2007; Director of Value Line, Inc. February 2010 to December 2010 and Treasurer from June 2005 to September 2005; Chief Financial Officer of XTF Asset Management from November 2007 to April 2008. | | None |
| Non-Interested Directors | | | | | | | | |
Joyce E. Heinzerling 500 East 77th Street New York, NY 10162 YOB: 1956 | | Director | | Since 2008 | | President, Meridian Fund Advisers LLC. (consultants) since April 2009; General Counsel, Archery Capital LLC (private investment fund) until April 2009. | | Burnham Investors Trust, since 2004 (4 funds). |
Francis C. Oakley 54 Scott Hill Road Williamstown, MA 01267 YOB: 1931 | | Director | | Since 2000 | | Professor of History, Williams College, (1961-2002). Professor Emeritus since 2002; President Emeritus since 1994 and President, (1985-1994); Chairman (1993-1997) and Interim President (2002-2003) of the American Council of Learned Societies. Trustee since 1997 and Chairman of the Board since 2005, National Humanities Center. | | None |
David H. Porter 5 Birch Run Drive Saratoga Springs, NY 12866 YOB: 1935 | | Director | | Since 1997 | | Professor, Skidmore College since 2008; Visiting Professor of Classics, Williams College, (1999-2008); President Emeritus, Skidmore College since 1999 and President, (1987-1998). | | None |
Paul Craig Roberts 169 Pompano St. Panama City Beach, FL 32413 YOB: 1939 | | Director | | Since 1983 | | Chairman, Institute for Political Economy. | | None |
| |
| Value Line Larger Companies Fund, Inc. |
| |
| Management of the Fund |
| | | | | | | | | Other |
| | | | | Length of | | Principal Occupation | | Directorships |
| Name, Address, and YOB | | Position | | Time Served | | During the Past 5 Years | | Held by Director |
Nancy-Beth Sheerr 1409 Beaumont Drive Gladwyne, PA 19035 YOB: 1949 | | Director | | Since 1996 | | Senior Financial Adviser, Veritable L.P. (Investment Adviser). | | None |
Daniel S. Vandivort 59 Indian Head Road Riverside, CT 06878 YOB: 1954 | | Director (Chairman of Board since 2010) | | Since 2008 | | President, Chief Investment Officer, Weiss, Peck and Greer/Robeco Investment Management (2005-2007); Managing Director, Weiss, Peck and Greer, (1995-2005). | | None |
| Officers | | | | | | | | |
Mitchell E. Appel YOB: 1970 | | President | | Since 2008 | | President of each of the Value Line Funds since June 2008; President of the Adviser and Distributor since February 2009; Chief Financial Officer of Value Line, Inc. (“Value Line”) from April 2008 to December 2010 and from September 2005 to November 2007; Director of Value Line, Inc. February 2010 to December 2010 and Treasurer from June 2005 to September 2005; Chief Financial Officer of XTF Asset Management from November 2007 to April 2008. |
Michael J. Wagner YOB: 1950 | | Chief Compliance Officer | | Since 2009 | | Chief Compliance Officer of Value Line Funds since June 2009; President of Northern Lights Compliance Services, LLC (formerly Fund Compliance Services, LLC (2006 – present)) and Senior Vice President (2004- 2006) and President and Chief Operations Officer (2003-2006) of Gemini Fund Services, LLC; Director of Constellation Trust Company until 2008. |
Emily D. Washington YOB: 1979 | | Treasurer and Secretary | | Since 2008 | | Treasurer and Chief Financial Officer (Principal Financial and Accounting Officer) of each of the Value Line Funds since August 2008 and Secretary since 2010; Associate Director of Mutual Fund Accounting at Value Line until August 2008. |
| * | Mr. Appel is an “interested person” as defined in the Investment Company Act of 1940 by virtue of his position with the Adviser and Distributor. |
Unless otherwise indicated, the address for each of the above officers is c/o Value Line Funds, 7 Times Square, New York, NY 10036.
| The Fund’s Statement of Additional Information (SAI) includes additional information about the Fund’s Directors and is available, without charge, upon request by calling 1-800-243-2729 or on the Fund’s website, www.vlfunds.com. |
| Value Line Larger Companies Fund, Inc. |
[This Page Intentionally Left Blank.]
| Value Line Larger Companies Fund, Inc. |
[This Page Intentionally Left Blank.]
| Value Line Larger Companies Fund, Inc. |
| The Value Line Family of Funds |
1950 — The Value Line Fund seeks long-term growth of capital. Current income is a secondary objective.
1952 — Value Line Income and Growth Fund’s primary investment objective is income, as high and dependable as is consistent with reasonable risk. Capital growth to increase total return is a secondary objective.
1956 — Value Line Premier Growth Fund seeks long-term growth of capital. No consideration is given to current income in the choice of investments.
1972 — Value Line Larger Companies Fund’s sole investment objective is to realize capital growth.
1979 — Value Line U.S. Government Money Market Fund a money market fund, seeks to secure as high a level of current income as is consistent with maintaining liquidity and preserving capital. An investment in the Fund is not insured or guaranteed by the Federal Deposit Insurance Corporation or any other government agency. Although the Fund seeks to preserve the value of your investment at $1.00 per share, it is possible to lose money by investing in the Fund.
1981 — Value Line U.S. Government Securities Fund seeks maximum income without undue risk to capital. Under normal conditions, at least 80% of the value of its net assets will be invested in securities issued or guaranteed by the U.S. Government and its agencies and instrumentalities.
1983 — Value Line Centurion Fund* seeks long-term growth of capital.
1984 — The Value Line Tax Exempt Fund seeks to provide investors with the maximum income exempt from federal income taxes while avoiding undue risk to principal. The fund may be subject to state and local taxes and the Alternative Minimum Tax (if applicable).
1985 — Value Line Convertible Fund seeks high current income together with capital appreciation primarily from convertible securities ranked 1, 2 or 3 for the year-ahead performance by the Value Line Convertible Ranking System.
1986 — Value Line Aggressive Income Trust seeks to maximize current income.
1987 — Value Line New York Tax Exempt Trust seeks to provide New York taxpayers with the maximum income exempt from New York State, New York City and federal income taxes while avoiding undue risk to principal. The Trust may be subject to state and local taxes and the Alternative Minimum Tax (if applicable).
1987 — Value Line Strategic Asset Management Trust* seeks to achieve a high total investment return consistent with reasonable risk.
1993 — Value Line Emerging Opportunities Fund invests in US common stocks of small capitalization companies, with its primary objective being long-term growth of capital.
1993 — Value Line Asset Allocation Fund seeks high total investment return, consistent with reasonable risk. The Fund invests in stocks, bonds and money market instruments utilizing quantitative modeling to determine the asset mix.
| | |
| * | Only available through the purchase of Guardian Investor, a tax deferred variable annuity, or ValuePlus, a variable life insurance policy. |
For more complete information about any of the Value Line Funds, including charges and expenses, send for a prospectus from EULAV Securities LLC, 7 Times Square, New York, New York 10036-6524 or call 1-800-243-2729, 9am–5pm CST, Monday–Friday, or visit us at www.vlfunds.com. Read the prospectus carefully before you invest or send money.