united states
securities and exchange commission
washington, d.c. 20549
form n-csr
certified shareholder report of registered management
investment companies
Investment Company Act file number 811-08037
AdvisorOne Funds
(Exact name of registrant as specified in charter)
17605 Wright Street, Omaha, NE 68130
(Address of principal executive offices) (Zip code)
Gemini Fund Services, LLC., 81 Arkay Drive., Hauppauge, NY 11788
(Name and address of agent for service)
Registrant's telephone number, including area code: 402-493-3313
Date of fiscal year end: 4/30
Date of reporting period:10/31/19
This Form N-CSR/A for AdvisorOne Funds is being filed as an amendment of the Form N-CSR filed on January 9, 2020 to update the Portfolio Composition for CLS Global Aggressive Equity Fund (Series S000026623). The reports mailed to shareholders were correct.
Item 1. Reports to Stockholders.
Beginning on January 1, 2021, as permitted by regulations adopted by the Securities and Exchange Commission, paper copies of the Funds’ shareholder reports like this one will no longer be sent by mail, unless you specifically request paper copies of the reports. Instead, the reports will be made available on the Funds’ website Advisoronefunds.com, and you will be notified by mail each time a report is posted and provided with a website link to access the report.
If you already elected to receive shareholder reports electronically, you will not be affected by this change and you need not take any action. You may elect to receive shareholder reports and other communications from the Funds electronically by contacting your financial intermediary (such as a broker-dealer or bank) or, if you are a direct investor, by following the instructions included with paper Fund documents that have been mailed to you. You may also elect to receive all future reports in paper free of charge.
| AdvisorOne Funds Semi-Annual Report |
Table of Contents
| Letter from the Portfolio Management Team | 1 |
| CLS Global Aggressive Equity Fund | |
| Portfolio Summary | 4 |
| Performance Update | 5 |
| CLS Global Diversified Equity Fund | |
| Portfolio Summary | 6 |
| Performance Update | 7 |
| CLS Growth and Income Fund | |
| Portfolio Summary | 8 |
| Performance Update | 9 |
| CLS Flexible Income Fund | |
| Portfolio Summary | 10 |
| Performance Update | 11 |
| CLS Shelter Fund | |
| Portfolio Summary | 12 |
| Performance Update | 13 |
| CLS Strategic Global Equity Fund | |
| Portfolio Summary | 14 |
| Performance Update | 15 |
| Schedule of Investments | |
| CLS Global Aggressive Equity Fund | 16 |
| CLS Global Diversified Equity Fund | 18 |
| CLS Growth and Income Fund | 20 |
| CLS Flexible Income Fund | 23 |
| CLS Shelter Fund | 26 |
| CLS Strategic Global Equity Fund | 27 |
i
| AdvisorOne Funds Semi-Annual Report |
Table of Contents(Continued)
| Statements of Assets and Liabilities | 29 |
| Statements of Operations | 31 |
| Statements of Changes in Net Assets | |
| CLS Global Aggressive Equity Fund | 33 |
| CLS Global Diversified Equity Fund | 33 |
| CLS Growth and Income Fund | 34 |
| CLS Flexible Income Fund | 34 |
| CLS Shelter Fund | 35 |
| CLS Strategic Global Equity Fund | 35 |
| Financial Highlights | |
| CLS Global Aggressive Equity Fund | 36 |
| CLS Global Diversified Equity Fund | 38 |
| CLS Growth and Income Fund | 40 |
| CLS Flexible Income Fund | 42 |
| CLS Shelter Fund | 44 |
| CLS Strategic Global Equity Fund | 46 |
| Notes to Financial Statements | 47 |
| Shareholder Expense Example | 68 |
ii
| AdvisorOne Funds Semi-Annual Report |
Letter from the Portfolio Management Team
Dear Shareholders:
The last six months ended October 31, 2019 (the “period) brought many alarming headlines, including renewed China trade wars, political uncertainty regarding Brexit, attacks on Saudi oil fields, problems in the repo market, and the possible impeachment of the president of the United States.
But despite all the noise, the U.S. economy is holding up well, and the U.S. stock market (as defined by the Morningstar U.S. Market Index) was up 3.62% over the period.
Uncertainty about trade wars has contributed to market volatility and reduced corporate confidence. This is one reason we expect below-average future economic growth. But we believe the Federal Reserve (Fed) and other developed-market central banks from around the world are committed to maintaining loose monetary policies, thereby lowering the probability of a recession. This was highlighted by both the Fed and European Central Bank’s reduction of target policy rates in September 2019.
Interest rates fell further over the period as central banks across the world acted in response to slowing global growth. One of the most staggering data points was that the amount of negative-yielding sovereign debt was roughly $13 trillion as of October 31, 2019.
Over the six-month period that ended October 31, 2019, the overall global market (as defined by 60% Morningstar U.S. Market Index and 40% Morningstar Global ex-U.S. Index) was up 3.19%. As mentioned, the U.S. stock market gained 3.62%, as larger companies rose 4.45% (as defined by Morningstar U.S. Large Cap), while smaller market capitalization companies dropped 0.85% (as defined by Morningstar U.S. Small Cap). One interesting highlight was that value stocks outperformed growth stocks, suggesting the pendulum may be swinging back toward value.
International equity markets (as defined by the Morningstar Global ex-U.S. Index) gained 2.21% over the period. Developed international markets (as defined by the Morningstar Developed ex-U.S. Index), such as Europe and Japan, gained 3.41%, while emerging markets (as defined by the Morningstar Emerging Markets Index), such as China and India, lost 0.73% amidst trade uncertainty.
The Bloomberg Barclays U.S. Aggregate Bond Index (a proxy for the U.S. investment-grade bond market) saw continued gains as yields moved lower, ending the period up by 5.71%. The 10-year U.S. Treasury yield ended the period at 1.69%, while the three-month U.S. Treasury yield ended the month at 1.52%.
Within diversified asset classes, commodities (as defined by the Morningstar Long-Only Commodity Index) fell 2.71% amid weakness in agriculture, while alternatives (as defined by the Morningstar Diversified Alternatives Index) diversified well against volatility, ending the period up 1.53%. Real estate (as defined by the Morningstar U.S. Real Estate Index) continued its strong performance, up 9.85%.
In general, the AdvisorOne Funds continued to show positive absolute performance, particularly with the help of value stocks outperformance of growth stocks. However, CLS’s emphasis on international stocks, particularly emerging markets, generally detracted from performance.
1
| AdvisorOne Funds Semi-Annual Report |
The CLS Approach
Let’s break down our beliefs into a bit more detail as they inform our approach to portfolio management of the AdvisorOne Funds.
| 1) | Helping Investors Succeed |
We believe risk-budgeted, global, balanced portfolios, along with clear and transparent communication help investors achieve success. Our Risk Budget process involves measuring investment risk relative to the risk of the global markets, using a combination of beta and relative standard deviation, and we aim to keep investment risk stable. If portfolios behave as expected, investors are more likely to stay the course with their investment plans.
| 2) | Global |
We believe diversification across domestic and international markets should provide smoother returns and ultimately higher risk-adjusted performance than domestic-only portfolios over time.
| 3) | Balanced |
We believe multi-asset allocations – and managing the proper balance between assets depending on a portfolio’s mandate – work for investors. Again, smoother returns can translate into better investor experiences and results.
We also believe in the power of teamwork and discipline. All AdvisorOne Funds are team managed using disciplined processes that we believe are key to long-term success.
Investment Outlook
As active, multi-asset allocators, we build our various portfolios around the CLS Investment Themes. These Themes are approved by the CLS Investment Committee and guide our approach to managing the AdvisorOne Funds. Our current themes:
| 1) | Be Active |
We believe investors need to be active, not passive, when building investment portfolios due to constant evolution in the global stock and bond markets’ expected risks and returns. For example, CLS portfolio allocations differ from the broad market as some markets are more expensive and carry more risk than others.
2
| AdvisorOne Funds Semi-Annual Report |
One way we are currently different is in our emphasis on value-oriented stocks, i.e., companies that can be bought for a lower multiple of sales or earnings, and international stocks (U.S. stocks are the most expensive they have been in decades). In addition, when building portfolios of exchange-traded funds (ETFs), CLS emphasizes smart beta ETFs, which are rules-based funds, such as those that only buy securities with the lowest price-to-sales ratios. We also emphasize actively managed ETFs, which are funds that try to be different from their underlying benchmarks in the attempt to outperform over time.
| 2) | Be Resilient |
This theme essentially has two parts. First, the bull market in stocks, which now comprises a 10-year climb without a 20% pullback, and the economic expansion are mature. It doesn’t mean that the demise of either is necessarily imminent, but CLS is nonetheless making its portfolios more resilient in anticipation of late-cycle market behavior. This means that CLS portfolios will place more emphasis on non-cyclical sectors that we believe should perform better in this anticipated environment. These sectors include consumer staples and healthcare.
Second, fixed income (bonds) remains vital to helping stabilize and manage portfolio risk. Nonetheless, interest rates are low by historical standards. Thus, we believe investors need to be creative in diversifying equity risk. CLS will achieve this by placing more emphasis on alternative investment strategies, such as merger arbitrage, which has low volatility like the bond market, and real assets, such as commodities and real estate investment trusts. Like the stock market, real assets tend to be more volatile, but since they often have a different rhythm to price movement, they may help reduce overall portfolio volatility. They may also provide some insurance for changes in inflation and inflation expectations.
| 3) | Be Innovative |
Despite the anticipated slower growth in the immediate year(s) ahead, we believe the future remains especially bright for the global economy and markets. Due to innovative technologies, the economy is being reshaped, and new opportunities are being presented in a variety of industries, including cybersecurity, clean energy, healthcare, fintech, artificial intelligence, robotics, biotech, and many more.
Thank you for your trust and confidence in managing your funds.
Sincerely,
CLS Investments Portfolio Management Team
9036-NLD-12/9/2019
1413-CLS-12/9/2019
3
| AdvisorOne Funds Semi-Annual Report |
CLS Global Aggressive Equity Fund- Portfolio Summary
Portfolio Commentary
CLS Global Aggressive Equity returned 0.14% over the six-month period ended October 31, 2019. The Fund has a Risk Budget of 110 (over time, it assumes 110% of the risk of a diversified stock portfolio consisting of 60% domestic equities and 40% international equities).
The Fund underperformed its Risk Budget benchmark during this time frame. Exposure to energy companies, emerging markets (specifically in Asia), and international value-oriented companies detracted from performance. Domestic exposure to higher quality value firms, financial, and retail companies contributed positively.
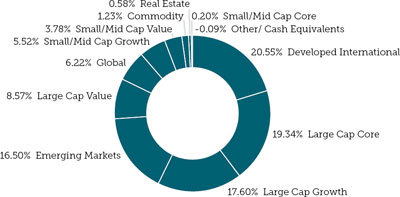
The largest sector tilts remain in financials, health care, energy, and the consumer sectors. Regionally, allocations to Asia – both developed and emerging – remain the largest overweight. Developed Europe and Japan remain underweights. The Fund remains positioned in asset classes with significant valuation discounts, and therefore areas we believe have the highest expected returns going forward.
Turnover for the Fund over the past six months ended October 31, 2019 was 34%.
| * | Based on total net asset value as of October 31, 2019. Portfolio holdings are subject to change and should not be a recommendation to buy individual securities. Concentrating in a small number of investments increases the Fund’s risk because each investment has a greater effect on the Fund’s performance. Refer to the Schedule of Investments for a detailed listing of the Fund’s holdings. |
Investors cannot directly invest in an index and unmanaged index returns do not reflect any fees, expenses or sales charges. Past performance does not guarantee future results and there is no assurance that the Fund will achieve its investment objective.
Portfolio Composition*
| Top Ten Portfolio Holdings* | *Percentages based on Net Assets |
| VanEck Vectors Morningstar Wide Moat ETF | 9.62% |
| The Fund is a rules-based, equal weighted index intended to offer exposure to the 20 most attractively price companies with sustainable competitive advantages. | |
| iShares Edge MSCI International Value Factor ETF | 5.88% |
| The Fund seeks to track the investment results of an index composed of international developed large- and mid-capitalization stocks with value characteristics and relatively lower valuations. | |
| iShares MSCI All Country Asia ex Japan ETF | 5.70% |
| The Fund seeks to track the investment results of an index composed of Asian equities, excluding Japan. | |
| VanEck Vectors Retail ETF | 5.69% |
| The Fund seeks to replicate as closely as possible, before fees and expenses, the price and yield performance of the MVIS®US Listed Retail 25 Index (MVRTHTR), which is intended to track the overall performance of companies involved in retail distribution, wholesalers, on-line, direct mail and TV retailers, multi-line retailers, specialty retailers and food and other staples retailers. | |
| VanEck Vectors Pharmaceutical ETF | 5.20% |
| The Fund seeks to replicate as closely as possible, before fees and expenses, the price and yield performance of the MVIS®US Listed Pharmaceutical 25 Index (MVPPHTR), which is intended to track the overall performance of companies involved in pharmaceuticals, including pharmaceutical research and development as well a production, marketing and sales of pharmaceuticals. | |
| iShares U.S. Financial Services ETF | 4.99% |
| The Fund seeks to track the investment results of an index composed of U.S. equities in the financial sector. | |
| iShares Edge MSCI International Momentum Factor ETF | 4.91% |
| seeks to track the performance of large- and mid- capitalization developed international stocks exhibiting relatively higher momentum characteristics, before fees and expenses | |
| Invesco FTSE RAFI Emerging Markets ETF | 4.18% |
| The Fund is based on the FTSE RAFI Emerging Markets Index (Index). The Fund will normally invest at least 90% of its total assets in securities that comprise the Index and American Depository Receipts (ADRs) based on the securities in the Index. | |
| Davis Select International ETF | 3.91% |
| The Fund seeks long-term capital growth and capital preservation. | |
| First Trust Cloud Computing ETF | 3.91% |
| to seek investment results that correspond generally to the price and yield, before the Fund’s fees and expenses, of an equity index called the ISE CTA Cloud Computing Index | |
4
| AdvisorOne Funds Semi-Annual Report |
CLS Global Aggressive Equity Fund - Performance Update
Annualized Total Returns as of October 31, 2019
| Since | ||||||
| 3 Year | 5 Year | 10 Year | Inception | |||
| 6 Months | 1 Year | (Annualized) | (Annualized) | (Annualized) | (12/7/18-10/31/19) | |
| Class N Shares1 | 0.14% | 7.63% | 9.44% | 6.37% | 9.11% | NA |
| Class T Shares1 | 0.14% | NA | NA | NA | N/A | 9.88% |
| MSCI ACWI Index | 2.94% | 12.59% | 11.33% | 7.08% | 8.81% | 14.91% |
| Risk Budget Benchmark* | 3.19% | 13.14% | 12.29% | 8.38% | 10.69% | 15.45% |
| 1 | Class N and Class T Shares are not subject to an initial sales charge or a CDSC. |
The performance data quoted is historical. Past performance is no guarantee of future results. Current performance may be higher or lower than the performance data quoted. The principal value and investment return of an investment will fluctuate so that your shares, when redeemed, may be worth more or less than their original cost. The returns shown do not reflect the deduction of taxes that a shareholder would pay on Fund distributions or on the redemptions of Fund shares. Returns greater than 1 year are annualized. The Fund’s total annual operating expenses are 1.79% for Class N shares and 1.64% for Class T shares per the September 1, 2019 prospectus. This material must be proceeded or accompanied by a prospectus. Please read it carefully before investing. For performance information current to the most recent month-end, please call 1-866-811-0225.
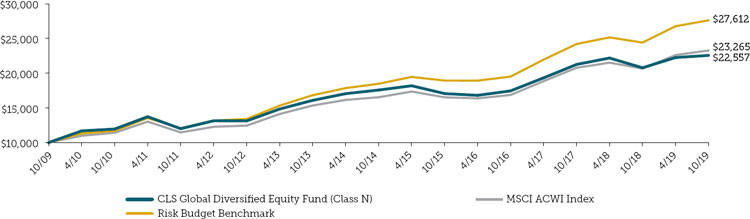
Growth of a $10,000 Investment
This chart illustrates a comparison of a hypothetical investment of $10,000 in the CLS Global Aggressive Equity Fund (assuming reinvestment of all dividends and distributions) versus the Fund’s benchmark index.
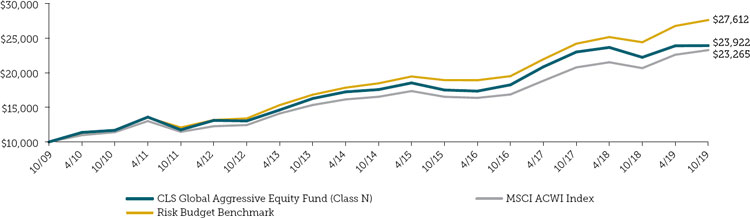
| The MSCI ACWI Index represents the Modern Index Strategy and captures all sources of equity returns in 23 developed and 24 emerging markets. |
| * | Performance of the risk budget benchmark shows how the Fund’s performance compares to an index with similar investment strategies and underlying holdings as the Fund. The risk budget benchmark consists of 110% of a blended benchmark consisting of 60% of the Morningstar U.S. Market Index and 40% of the Morningstar Global Market ex US Lg-Mid Index. The Morningstar U.S. Market Index is an index that measures the performance of U.S. securities and targets 97% market capitalization coverage of the investable universe. It is a diversified broad market index. The Morningstar Global ex U.S. Large-Mid Index is an index that measures the performance of Global Markets (ex-U.S.) equity markets targeting the top 90% of stocks by market capitalization. |
5
| AdvisorOne Funds Semi-Annual Report |
CLS Global Diversified Equity Fund - Portfolio Summary
Portfolio Commentary
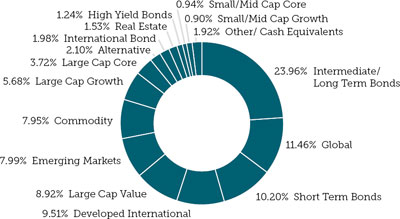
CLS Global Diversified Equity returned 1.39% for the six-month period ended October 31, 2019. The Fund has a Risk Budget of 100 (over time, it is approximately as risky as a diversified equity portfolio consisting of 60% domestic equities and 40% international equities).
The Fund underperformed its Risk Budget benchmark during this time frame. Exposure to international equities, specifically in Asian emerging markets, and commodities detracted from performance. Exposure to health care, real estate, and European emerging markets contributed positively to performance.
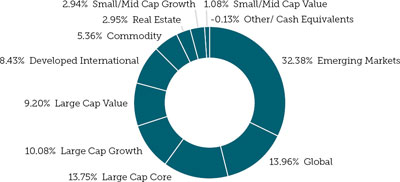
Regarding our equity positioning among sectors, the largest sector tilts remain financials, health care, and real estate. Within regional positioning, the largest tilt remains Asia, both developed and emerging. Developed Europe and Japan remain underweights. The Fund remains positioned in asset classes with significant valuation discounts, and therefore areas we believe have the highest expected returns going forward.
Turnover for the Fund over the last six months ended October 31, 2019 was 17%.
| * | Based on total net asset value as of October 31, 2019. Portfolio holdings are subject to change and should not be a recommendation to buy individual securities. Concentrating in a small number of investments increases the Fund’s risk because each investment has a greater effect on the Fund’s performance. Refer to the Schedule of Investments for a detailed listing of the Fund’s holdings. |
Investors cannot directly invest in an index and unmanaged index returns do not reflect any fees, expenses or sales charges. Past performance does not guarantee future results and there is no assurance that the Fund will achieve its investment objective.
Portfolio Composition*
| Top Ten Portfolio Holdings* | *Percentages based on Net Assets |
| SPDR S&P Emerging Markets Dividend ETF | 9.83% |
| The Fund seeks to provide investment results that, before fees and expenses, correspond generally to the total return performance of the S&P® Emerging Markets Dividend Opportunities Index. | |
| iShares Exponential Technologies ETF | 7.35% |
| seeks to track the investment results of an index composed of developed and emerging market companies that create or use exponential technologies | |
| Schwab Fundamental Emerging Markets Large Company Index ETF | 6.35% |
| The goal is to track as closely as possible, before fees and expenses, the total return of the Russell RAFI™ Emerging Markets Large Company Index | |
| iShares Edge MSCI USA Quality Factor ETF | 5.93% |
| The Fund seeks to track the investment results of an index that measures the performance of U.S. large- and mid-capitalization stocks as identified through three fundamental variables: return on equity, earnings variability and debt-to-equity. | |
| Davis Select Financial ETF | 5.81% |
| The Fund seeks long-term capital growth and capital preservation. | |
| iShares Edge MSCI USA Value Factor ETF | 4.91% |
| The Fund seeks to track the performance of an index that measures the performance of U.S. large- and mid-capitalization stocks with value characteristics and relatively lower valuations, before fees and expenses | |
| iShares Global Healthcare ETF | 4.89% |
| The Fund seeks to track the investment results of an index composed of global equities in the healthcare sector. | |
| Goldman Sachs ActiveBeta Emerging Markets Equity ETF | 4.35% |
| The Fund seeks to provide investment results that closely correspond, before fees and expenses, to the performance of the Goldman Sachs ActiveBeta® Emerging Markets Equity Index. | |
| SPDR S&P Emerging Asia Pacific ETF | 4.34% |
| The Fund seeks to provide investment results that, before fees and expenses, correspond generally to the total return performance of the S&P® Asia Pacific Emerging BMI Index. | |
| Invesco DB Commodity Index Tracking Fund | 4.10% |
| The Fund seeks to track changes, whether positive or negative, in the level of the DBIQ Optimum Yield Diversified Commodity Index Excess Return™ (DBIQ Opt Yield Diversified Comm Index ER) plus the interest income from the Fund’s holdings of primarily US Treasury securities and money market income less the Fund’s expenses. The Fund is designed for investors who want a cost-effective and convenient way to invest in commodity futures | |
6
| AdvisorOne Funds Semi-Annual Report |
CLS Global Diversified Equity Fund - Performance Update
Annualized Total Returns as of October 31, 2019
| Since | ||||||
| 3 Year | 5 Year | 10 Year | Inception | |||
| 6 Months | 1 Year | (Annualized) | (Annualized) | (Annualized) | (12/7/18-10/31/19) | |
| Class N Shares1 | 1.39% | 8.59% | 8.94% | 5.13% | 8.47% | NA |
| Class T Shares1 | 1.39% | NA | NA | NA | NA | 10.00% |
| MSCI ACWI Index | 2.94% | 12.59% | 11.33% | 7.08% | 8.81% | 14.91% |
| Risk Budget Benchmark* | 3.19% | 13.14% | 12.29% | 8.38% | 10.69% | 15.45% |
| 1 | Class N and Class T Shares are not subject to an initial sales charge or a CDSC. |
The performance data quoted is historical. Past performance is no guarantee of future results. Current performance may be higher or lower than the performance data quoted. The principal value and investment return of an investment will fluctuate so that your shares, when redeemed, may be worth more or less than their original cost. The returns shown do not reflect the deduction of taxes that a shareholder would pay on Fund distributions or on the redemptions of Fund shares. Returns greater than 1 year are annualized. The Fund’s total annual operating expenses are 1.55% for Class N shares and 1.42% for Class T shares per the September 1, 2019 prospectus. This material must be proceeded or accompanied by a prospectus. Please read it carefully before investing. For performance information current to the most recent month-end, please call 1-866-811-0225.
Growth of a $10,000 Investment
This chart illustrates a comparison of a hypothetical investment of $10,000 in the CLS Global Diversified Equity Fund (assuming reinvestment of all dividends and distributions) versus the Fund’s benchmark index.
| The MSCI ACWI Index represents the Modern Index Strategy and captures all sources of equity returns in 23 developed and 24 emerging markets. |
| * | Performance of the risk budget benchmark shows how the Fund’s performance compares to an index with similar investment strategies and underlying holdings as the Fund. The risk budget benchmark consists of 60% of the Morningstar U.S. Market Index and 40% of the Morningstar Global Market ex US Lg-Mid Index. The Morningstar U.S. Market Index is an index that measures the performance of U.S. securities and targets 97% market capitalization coverage of the investable universe. It is a diversified broad market index. The Morningstar Global ex U.S. Large-Mid Index is an index that measures the performance of Global Markets (ex-U.S.) equity markets targeting the top 90% of stocks by market capitalization. |
7
| AdvisorOne Funds Semi-Annual Report |
CLS Growth and Income Fund - Portfolio Summary
Portfolio Commentary
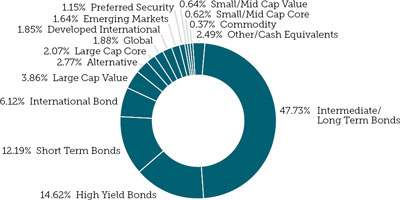
CLS Growth and Income returned 2.11% for the six-month period, ended October 31, 2019. The Fund has a Risk Budget of 55 (over time, it is approximately 55% as risky as a diversified stock portfolio consisting of 60% domestic equities and 40% international equities).
The Fund underperformed its Risk Budget Benchmark during this time frame. Exposure to global healthcare stocks, U.S. momentum stocks, and active fixed income contributed positively to performance over the period. The Fund was negatively impacted by exposure to commodities and international securities, particularly in emerging markets.
Regarding key portfolio positioning, the Fund remains overweight international securities relative to its global benchmark. The largest sector tilts come from an overweight to healthcare and an underweight to technology stocks. Within regional positioning, the largest tilt is an overweight to emerging market countries, including China. Healthcare and emerging market equities continue to look attractive on a number of relative valuation and fundamental characteristics.
Within fixed income, the Fund’s interest-rate sensitivity is below the overall bond market. This means the fund is positioned to outperform if interest rates move higher. The Fund is positioned in higher quality U.S. bonds, but also has an overweight to emerging market bonds, which was beneficial to performance during the six-month period.
Turnover for the Fund over the last six months ended October 31, 2019 was 18%.
| * | Based on total net asset value as of October 31, 2019. Portfolio holdings are subject to change and should not be a recommendation to buy individual securities. Concentrating in a small number of investments increases the Fund’s risk because each investment has a greater effect on the Fund’s performance. Refer to the Schedule of Investments for a detailed listing of the Fund’s holdings. |
Investors cannot directly invest in an index and unmanaged index returns do not reflect any fees, expenses or sales charges. Past performance does not guarantee future results and there is no assurance that the Fund will achieve its investment objective.
Portfolio Composition*
| Top Ten Portfolio Holdings* | *Percentages based on Net Assets |
| Fidelity Total Bond ETF | 8.47% |
| The Fund seeks to provide a high level of current income. The fund normally invests at least 80% of its assets in debt securities of all types and repurchase agreements for those securities. | |
| iShares Edge MSCI USA Value Factor ETF | 7.99% |
| The Fund seeks to track the performance of an index that measures the performance of U.S. large- and mid- capitalization stocks with value characteristics and relatively lower valuations, before fees and expenses. | |
| PIMCO Enhanced Short Maturity Active Exchange-Traded Fund | 5.11% |
| The Fund seeks maximum current income, consistent with preservation of capital and daily liquidity. | |
| First Trust TCW Opportunistic Fixed Income ETF | 4.91% |
| The Fund seeks to maximize long-term total return. Under normal market conditions, the Fund pursues its objective by investing at least 80% of its net assets (including investment borrowings) in fixed income securities. | |
| iShares Edge MSCI USA Quality Factor ETF | 4.59% |
| The Fund seeks to track the investment results of an index that measures the performance of U.S. large- and mid-capitalization stocks as identified through three fundamental variables: return on equity, earnings variability and debt-to-equity. | |
| Invesco FTSE RAFI Emerging Markets ETF | 3.98% |
| The Fund is based on the FTSE RAFI Emerging Markets Index (Index). The Fund will normally invest at least 90% of its total assets in securities that comprise the Index and American Depository Receipts (ADRs) based on the securities in the Index. | |
| Invesco Optimum Yield Diversified Commodity Strategy No K-1 ETF | 3.97% |
| The Fund seeks to provide long-term capital appreciation using an investment strategy designed to exceed the performance of DBIQ Optimum Yield Diversified Commodity Index Excess Return™ (DBIQ Opt Yield Diversified Comm Index ER) (Benchmark), an index composed of futures contracts on 14 heavily traded commodities across the energy, precious metals, industrial metals and agriculture sectors. | |
| FlexShares Global Upstream Natural Resources Index Fund | 3.63% |
| The Fund seeks investment results that correspond generally to the price and yield performance, before fees and expenses, of the Morningstar® Global Upstream Natural Resources IndexSM (Underlying Index). | |
| SPDR Doubleline Total Return Tactical ETF | 3.58% |
| The Fund seeks to maximize total return. | |
| iShares Exponential Technologies ETF | 3.39% |
| seeks to track the investment results of an index composed of developed and emerging market companies that create or use exponential technologies | |
8
| AdvisorOne Funds Semi-Annual Report |
CLS Growth and Income Fund - Performance Update
Annualized Total Returns as of October 31, 2019
| Since | ||||||
| 3 Year | 5 Year | 10 Year | Inception | |||
| 6 Months | 1 Year | (Annualized) | (Annualized) | (Annualized) | (12/7/18-10/31/19) | |
| Class N Shares1 | 2.11% | 7.24% | 5.29% | 3.64% | 5.89% | NA |
| Class T Shares1 | 2.11% | NA | NA | NA | NA | 8.54% |
| MSCI ACWI Index | 2.94% | 12.59% | 11.33% | 7.08% | 8.81% | 14.91% |
| Risk Budget Benchmark* | 2.38% | 8.45% | 7.50% | 5.16% | 6.22% | 9.53% |
| 1 | Class N and Class T Shares are not subject to an initial sales charge or a CDSC. |
The performance data quoted is historical. Past performance is no guarantee of future results. Current performance may be higher or lower than the performance data quoted. The principal value and investment return of an investment will fluctuate so that your shares, when redeemed, may be worth more or less than their original cost. The returns shown do not reflect the deduction of taxes that a shareholder would pay on Fund distributions or on the redemptions of Fund shares. Returns greater than 1 year are annualized. The Fund’s total annual operating expenses are 1.57% for Class N shares and 1.43% for Class T shares per the September 1, 2019 prospectus. This material must be proceeded or accompanied by a prospectus. Please read it carefully before investing. For performance information current to the most recent month-end, please call 1-866-811-0225.
Growth of a $10,000 Investment
This chart illustrates a comparison of a hypothetical investment of $10,000 in the CLS Growth and Income Fund (assuming reinvestment of all dividends and distributions) versus the Fund’s benchmark index.
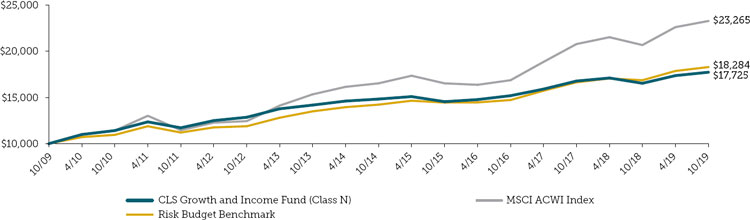
| The MSCI ACWI Index represents the Modern Index Strategy and captures all sources of equity returns in 23 developed and 24 emerging markets. |
| * | Performance of the risk budget benchmark shows how the Fund’s performance compares to an index with similar investment strategies and underlying holdings as the Fund. The risk budget benchmark consists of (i) 55% of a blended benchmark consisting of 60% of the Morningstar U.S. Market Index and 40% of the Morningstar Global Market ex US Lg-Mid Index, and (ii) 45% of the 1-3 month Treasury Bill index. The weightings against this benchmark are consistent with the risk level of the Fund and these indexes are utilized to reflect the Fund’s broad exposure to the global equity market. The index includes both developed and emerging markets. The Morningstar U.S. Market Index is an index that measures the performance of U.S. securities and targets 97% market capitalization coverage of the investable universe. It is a diversified broad market index. The Morningstar Global ex U.S. Large-Mid Index is an index that measures the performance of Global Markets (ex-U.S.) equity markets targeting the top 90% of stocks by market capitalization. The 1-3 Month Treasury Bill Index includes all publicly issued zero-coupon U.S. Treasury Bills that have a remaining maturity of less than 3 months and more than 1 month, are rated investment grade, and have $250 million or more of outstanding face value. |
9
| AdvisorOne Funds Semi-Annual Report |
CLS Flexible Income Fund - Portfolio Summary
Portfolio Commentary
CLS Flexible Income returned 3.54% for the six-month period, ended October 31, 2019. The Fund has a Risk Budget of 20 (over time, it is approximately 20% as risky as a diversified stock portfolio consisting of 60% domestic equities and 40% international equities).
The Fund outperformed its Risk Budget Benchmark during this time frame. Exposure to U.S. Treasuries, Corporate Debt, and active fixed income contributed positively to performance over the period. The Fund was negatively impacted by exposure to commodities and emerging market securities, particularly to China.
Regarding key portfolio positioning, the Fund remains overweight emerging market securities relative to its global benchmark and to corporate debt relative to the U.S. Aggregate Bond. The largest sector tilts come from an overweight to financials and an underweight to technology stocks. Emerging Market securities continue to look attractive due to valuation and fundamental characteristics.
Within fixed income positioning, the largest tilt is an overweight to investment grade corporate debt and international sovereigns, which contributed positively to Fund performance for this time frame. The Fund’s interest rate sensitivity is below that of the overall bond market, meaning the Fund takes on less interest risk and is shorter in duration. We remain positive on the outlook for corporate bonds and are confident in their continued ability to service that debt.
Turnover for the Fund over the last six months ended October 31, 2019 was 6%.
| * | Based on total net asset value as of October 31, 2019. Portfolio holdings are subject to change and should not be a recommendation to buy individual securities. Concentrating in a small number of investments increases the Fund’s risk because each investment has a greater effect on the Fund’s performance. Refer to the Schedule of Investments for a detailed listing of the Fund’s holdings. |
Investors cannot directly invest in an index and unmanaged index returns do not reflect any fees, expenses or sales charges. Past performance does not guarantee future results and there is no assurance that the Fund will achieve its investment objective.
Portfolio Composition*
| Top Ten Portfolio Holdings* | *Percentages based on Net Assets |
| SPDR Doubleline Total Return Tactical ETF | 10.01% |
| The Fund seeks to maximize total return. | |
| PIMCO Active Bond Exchange-Traded Fund | 8.52% |
| The Fund is a diversified portfolio of high quality bonds that is actively managed, seeking current income and long-term capital appreciation, consistent with prudent investment management. | |
| PIMCO Enhanced Short Maturity Active Exchange-Traded Fund | 7.87% |
| The Fund seeks maximum current income, consistent with preservation of capital and daily liquidity. | |
| SPDR Blackstone / GSO Senior Loan ETF | 6.50% |
| The Fund seeks to provide current income consistent with the preservation of capital. | |
| iShares 3-7 Year Treasury Bond ETF | 6.41% |
| The Fund seeks to track the investment results of an index composed of U.S. Treasury bonds with remaining maturities between three and seven years. | |
| Vanguard Intermediate-Term Corporate Bond ETF | 5.06% |
| The Fund seeks to track the performance of a market-weighted corporate bond index with an intermediate-term dollar-weighted average maturity. | |
| iShares Intermediate-Term Corporate Bond ETF | 4.94% |
| The Fund seeks to track the investment results of an index composed of U.S. dollar-denominated investment-grade corporate bonds with remaining maturities between five and ten years. | |
| Janus Henderson Short Duration Income ETF | 4.32% |
| The Fund is an actively managed fixed income ETF which seeks to provide a steady income stream with low volatility and capital preservation across economic cycles. It is designed to move beyond conventional constraints and provide positive absolute returns. | |
| Invesco Emerging Markets Sovereign Debt ETF | 3.38% |
| is based on the DBIQ Emerging Market USD Liquid Balanced Index. The Fund will normally invest at least 80% of its total assets in securities that comprise the Index (the “Index”). The Index tracks the potential returns of a theoretical portfolio of liquid emerging markets US dollar-denominated government bonds issued by more than 20 emerging-market countries. The countries in the Index are selected annually pursuant to a proprietary index methodology. The Fund and the Index are rebalanced and reconstituted quarterly. | |
| iShares 20+ Year Treasury Bond ETF | 3.06% |
| seeks to track the investment results of an index composed of U.S. Treasury bonds with remaining maturities greater than twenty years | |
10
| AdvisorOne Funds Semi-Annual Report |
CLS Flexible Income Fund - Performance Update
Annualized Total Returns as of October 31, 2019
| Since | ||||||
| 3 Year | 5 Year | 10 Year | Inception | |||
| 6 Months | 1 Year | (Annualized) | (Annualized) | (Annualized) | (12/7/18-10/31/19) | |
| Class N Shares1 | 3.54% | 8.55% | 3.31% | 2.72% | 3.28% | NA |
| Class T Shares1 | 3.50% | NA | NA | NA | N/A | 8.44% |
| Bloomberg Barclays Aggregate Bond Index | 5.71% | 11.51% | 3.29% | 3.24% | 3.73% | 9.91% |
| Risk Budget Benchmark* | 1.62% | 4.59% | 3.72% | 2.52% | 2.62% | 4.81% |
| 1 | Class N and Class T Shares are not subject to an initial sales charge or a CDSC. |
The performance data quoted is historical. Past performance is no guarantee of future results. Current performance may be higher or lower than the performance data quoted. The principal value and investment return of an investment will fluctuate so that your shares, when redeemed, may be worth more or less than their original cost. The returns shown do not reflect the deduction of taxes that a shareholder would pay on Fund distributions or on the redemptions of Fund shares. Returns greater than 1 year are annualized. The Fund’s total annual operating expenses are 1.19% for Class N shares and 1.06% for Class T shares per the September 1, 2019 prospectus. This material must be proceeded or accompanied by a prospectus. Please read it carefully before investing. For performance information current to the most recent month-end, please call 1-866-811-0225.
Growth of a $10,000 Investment
This chart illustrates a comparison of a hypothetical investment of $10,000 in the CLS Flexible Income Fund (assuming reinvestment of all dividends and distributions) versus the Fund’s benchmark index.
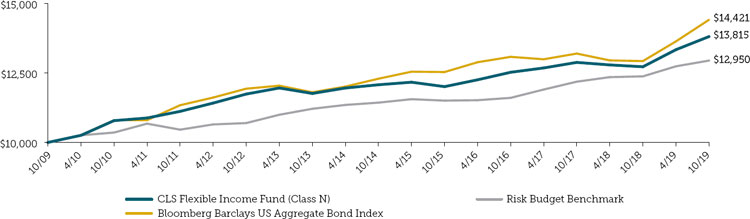
| The Bloomberg Barclays US Aggregate Bond Index is a market-capitalization-weighted index that covers the USD-denominated, investment-grade (rated Baa3 or above by Moddy’s), fixed-rate, and taxable areas of the bond market. Prior to August 24, 2016, the Index was known as Barclays Aggregate Bond Index. |
| * | Performance of the risk budget benchmark shows how the Fund’s performance compares to an index with similar investment strategies and underlying holdings as the Fund. The risk budget benchmark consists of (i) 20% of a blended benchmark consisting of 60% of the Morningstar U.S. Market Index and 40% of the Morningstar Global Market ex US Lg-Mid Index, and (ii) 80% of the 1-3 month Treasury Bill index. The Morningstar U.S. Market Index is an index that measures the performance of U.S. securities and targets 97% market capitalization coverage of the investable universe. It is a diversified broad market index. The Morningstar Global ex U.S. Large-Mid Index is an index that measures the performance of Global Markets (ex-U.S.) equity markets targeting the top 90% of stocks by market capitalization. The 1-3 Month Treasury Bill Index includes all publicly issued zero-coupon U.S. Treasury Bills that have a remaining maturity of less than 3 months and more than 1 month, are rated investment grade, and have $250 million or more of outstanding face value. |
11
| AdvisorOne Funds Semi-Annual Report |
CLS Shelter Fund- Portfolio Summary
Portfolio Commentary
CLS Shelter returned 3.76% for the six-month period ended October 31, 2019. The Fund has a risk-based benchmark consisting of 75% global equities and 25% Treasury bills. The global equity portion of the benchmark is represented by a blend of 80% domestic equity and 20% international equities.
During this time frame, there was a fair amount of volatility, with the Fund trading between various levels of low and minimum volatility securities throughout. The portion of the Fund with low volatility securities began the period at 25%, peaked at 50% in May, and was as little as 5% in July and September. The Fund ended the period with 25% in low volatility securities, which are securities that have a lower standard deviation relative to the market of which they are based, over a period of time as defined in the prospectus of the securities invested in. Market declines were relatively modest, so there were no moves to Treasury bills.
Turnover for the Fund over the last six months ended October 31, 2019 was 153%.
Performance of low and minimum volatility securities was strong during the six-month period, particularly on a risk-adjusted basis. Exposure to global real estate was also beneficial to the Fund, as was exposure to domestic large-cap equities, while owned. Detracting from performance was emerging markets exposure, as well as developed Asia while owned. Exposure to value stocks and broad developed international exposures, while positive for the period, under-performed on a risk-adjusted basis.
| * | Based on total net asset value as of October 31, 2019. Portfolio holdings are subject to change and should not be a recommendation to buy individual securities. Concentrating in a small number of investments increases the Fund’s risk because each investment has a greater effect on the Fund’s performance. Refer to the Schedule of Investments for a detailed listing of the Fund’s holdings. |
Investors cannot directly invest in an index and unmanaged index returns do not reflect any fees, expenses or sales charges. Past performance does not guarantee future results and there is no assurance that the Fund will achieve its investment objective.
Portfolio Composition*
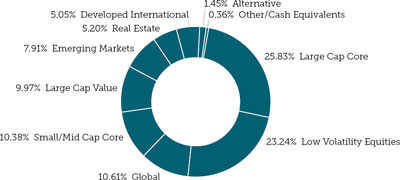
| Top Ten Portfolio Holdings* | *Percentages based on Net Assets |
| Invesco Russell 1000 R Dynamic Multifactor ETF | 15.59% |
| seeks to provide results that correspond to Russell 1000 OFI Dynamic MultiFactor Index. The Index is constructed by selecting equity securities from the Russell 1000 Index. It consists of one of four pre-determined factor configurations that emphasize a subset of five investment style factors | |
| iShares Exponential Technologies ETF | 10.61% |
| seeks to track the investment results of an index composed of developed and emerging market companies that create or use exponential technologies | |
| John Hancock Multi-Factor Mid Cap ETF | 10.38% |
| The Fund provides investment results that closely correspond, before fees and expenses, to the performance of the John Hancock Dimensional Mid Cap Index. | |
| SPDR MSCI USA StrategicFactors ETF | 10.25% |
| The index is designed to measure the equity market performance of large- and mid-cap companies across the U.S. equity market. It aims to represent the performance of a combination of three factors: value, quality, and low quality | |
| iShares Edge MSCI USA Value Factor ETF | 9.97% |
| The Fund seeks to track the performance of an index that measures the performance of U.S. large- and mid-capitalization stocks with value characteristics and relatively lower valuations, before fees and expenses. | |
| iShares Edge MSCI Min Vol Global ETF | 9.95% |
| The Fund seeks to track the investment results of an index composed of developed and emerging market equities that, in the aggregate, have lower volatility characteristics relative to the broader developed and emerging equity markets. | |
| Invesco S&P 500 Low Volatility ETF | 9.51% |
| The Fund seeks to track the investment results (before fees and expenses) of the S&P 500® Low Volatility Index (the “underlying index”). The fund generally will invest at least 90% of its total assets in common stocks that comprise the underlying index. Volatility is a statistical measurement of the magnitude of up and down asset price fluctuations (increases or decreases in a stock’s price) over time. It generally invests in all of the securities comprising the underlying index in proportion to their weightings in the underlying index. | |
| Invesco FTSE RAFI Emerging Markets ETF | 7.91% |
| The Fund is based on the FTSE RAFI Emerging Markets Index (Index). The Fund will normally invest at least 90% of its total assets in securities that comprise the Index and American Depository Receipts (ADRs) based on the securities in the Index. | |
| Vanguard Global ex-U.S. Real Estate ETF | 5.20% |
| seeks to track the performance of a benchmark index that measures the investment return of international real estate stocks | |
| Hartford Multifactor Developed Markets ex-US ETF | 5.05% |
| The Fund seeks to provide investment results that, before fees and expenses, correspond to the total return performance of the Hartford Risk-Optimized Multifactor Developed Markets (ex-US) Index (Bloomberg Ticker: LRODMX), which tracks the performance of companies located in major developed markets of Europe, Canada, and the Pacific Region. | |
12
| AdvisorOne Funds Semi-Annual Report |
CLS Shelter Fund - Performance Update
Annualized Total Returns as of October 31, 2019
| Since | Since | ||||||
| 3 Year | 5 Year | 10 Year | Inception | Inception | |||
| 6 Months | 1 Year | (Annualized) | (Annualized) | (Annualized) | (12/30/09-10/31/19) | (12/7/18-10/31/19) | |
| Class N Shares1 | 3.76% | 7.11% | 9.57% | 6.45% | N/A | 6.04% | NA |
| Class T Shares1 | 3.76% | NA | NA | NA | N/A | NA | 8.78% |
| MSCI ACWI Index | 2.94% | 12.59% | 11.33% | 7.08% | N/A | 8.28% | 14.91% |
| Risk Based Benchmark* | 2.93% | 10.90% | 10.51% | 7.39% | N/A | 8.80% | 12.76% |
| 1 | Class N and Class T Shares are not subject to an initial sales charge or a CDSC. |
The performance data quoted is historical. Past performance is no guarantee of future results. Current performance may be higher or lower than the performance data quoted. The principal value and investment return of an investment will fluctuate so that your shares, when redeemed, may be worth more or less than their original cost. The returns shown do not reflect the deduction of taxes that a shareholder would pay on Fund distributions or on the redemptions of Fund shares. Returns greater than 1 year are annualized. The Fund’s total annual operating expenses are 1.43% for Class N shares and 1.30% for Class T shares per the September 1, 2019 prospectus. This material must be proceeded or accompanied by a Prospectus. Please read it carefully before investing. For performance information current to the most recent month-end, please call 1-866-811-0225.
Growth of a $10,000 Investment
This chart illustrates a comparison of a hypothetical investment of $10,000 in the CLS Shelter Fund (assuming reinvestment of all dividends and distributions) versus the Fund’s benchmark index.
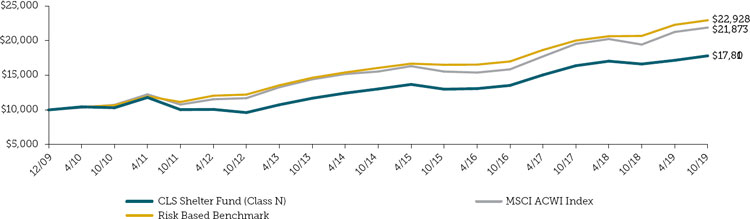
| The MSCI ACWI Index represents the Modern Index Strategy and captures all sources of equity returns in 23 developed and 24 emerging markets. |
| * | Performance of the risk based benchmark shows how the Fund’s performance compares to an index with similar investment strategies and underlying holdings as the Fund. The risk based benchmark consists of (i) 75% of a blended benchmark consisting of 80% of the Morningstar U.S. Market Index and 20% of the Morningstar Global Market ex US Lg-Mid Index, and (ii) 25% of the 1-3 month Treasury Bill index. The Morningstar U.S. Market Index is an index that measures the performance of U.S. securities and targets 97% market capitalization coverage of the investable universe. It is a diversified broad market index. The Morningstar Global ex U.S. Large-Mid Index is an index that measures the performance of Global Markets (ex-U.S.) equity markets targeting the top 90% of stocks by market capitalization. The 1-3 Month Treasury Bill Index includes all publicly issued zero-coupon U.S. Treasury Bills that have a remaining maturity of less than 3 months and more than 1 month, are rated investment grade, and have $250 million or more of outstanding face value. |
13
| AdvisorOne Funds Semi-Annual Report |
CLS Strategic Global Equity Fund - Portfolio Summary
Portfolio Commentary
CLS Strategic Global Equity returned 6.10% for the period starting since inception on May 15, 2019 and ended October 31, 2019. The Fund has a Risk Budget of 100 (over time, it is approximately as risky as a diversified equity portfolio consisting of 60% domestic equities and 40% international equities).
The Fund underperformed its Risk Budget benchmark during this time frame. Exposure to the energy sector, small-cap stocks, and emerging market equities detracted from performance. Exposure to large-cap growth stocks and more defensive equities, such as those in the utilities and health care sectors, contributed positively to performance.
The Fund has tilts toward value and small-cap equities within the allocation, which are asset classes that currently trade at valuation discounts and thus have higher expected returns.
Turnover for the Fund over the last five and a half months ended October 31, 2019 was 2%.
| * | Based on total net asset value as of October 31, 2019. Portfolio holdings are subject to change and should not be a recommendation to buy individual securities. Concentrating in a small number of investments increases the Fund’s risk because each investment has a greater effect on the Fund’s performance. Refer to the Schedule of Investments for a detailed listing of the Fund’s holdings. |
Investors cannot directly invest in an index and unmanaged index returns do not reflect any fees, expenses or sales charges. Past performance does not guarantee future results and there is no assurance that the Fund will achieve its investment objective.
Portfolio Composition*
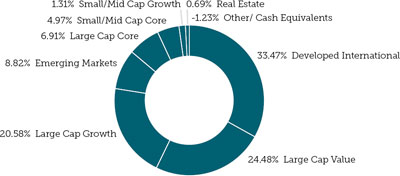
| Top Ten Portfolio Holdings* | *Percentages based on Net Assets |
| Vanguard FTSE Developed Markets ETF | 14.86% |
| seek to track the performance of a benchmark index that measures the investment return of stocks issued by companies located in Canada and the major markets of Europe and the Pacific region | |
| Vanguard Mega Cap Value ETF | 14.64% |
| seeks to track the performance of a benchmark that measures the investment return of the largest-capitalization value stocks in the United States | |
| Vanguard Mega Cap Growth ETF | 13.30% |
| seeks to track the performance of a benchmark index that measures the investment return of the largest-capitalization growth stocks in the United States | |
| Vanguard FTSE Emerging Markets ETF | 5.67% |
| seeks to track the performance of a benchmark index that measures the investment return of stocks issued by companies located in emerging market countries | |
| Vanguard FTSE Europe ETF | 3.99% |
| European Stock Index Fund seeks to track the performance of a benchmark index that measures the investment return of stocks issued by companies located in the major of Europe | |
| Vanguard International High Dividend Yield ETF | 3.93% |
| seeks to track the performance of the FTSE All-Work ex US High Dividend Yield Index. Provides a convenient way to get exposure to international stocks that are forecasted to have above-average dividend yields | |
| John Hancock MultiFactor Developed International ETF | 3.80% |
| to pursue results that closely correspond, before fees and expenses, to the performance of the John Hancock Dimensional Developed International Index | |
| Vanguard FTSE Pacific ETF | 3.60% |
| seeks to track the performance of a benchmark index that measures the investment return of stocks issued by companies located in the major markets of the pacific region | |
| John Hancock Multifactor Emerging Markets ETF | 3.14% |
| to pursue results that closely correspond, before fees and expenses, to the performance of the John Hancock Dimensional Emerging Markets Index | |
| John Hancock Multi-Factor Large Cap ETF | 3.09% |
| passively managed ETF designed to provide broad exposure to the Large Cap Blend segment of the US equity market | |
14
| AdvisorOne Funds Semi-Annual Report |
CLS Strategic Global Equity Fund - Performance Update
Annualized Total Returns as of October 31, 2019
| Since | ||||||
| 3 Year | 5 Year | 10 Year | Inception | |||
| 6 Months | 1 Year | (Annualized) | (Annualized) | (Annualized) | (5/15/19-10/31/19) | |
| Class N Shares1 | N/A | N/A | N/A | N/A | N/A | 6.10% |
| MSCI ACWI Index | N/A | N/A | N/A | N/A | N/A | 6.46% |
| Risk Based Benchmark* | N/A | N/A | N/A | N/A | N/A | 6.62% |
| 1 | Class N Shares are not subject to an initial sales charge or a CDSC. |
The performance data quoted is historical. Past performance is no guarantee of future results. Current performance may be higher or lower than the performance data quoted. The principal value and investment return of an investment will fluctuate so that your shares, when redeemed, may be worth more or less than their original cost. The returns shown do not reflect the deduction of taxes that a shareholder would pay on Fund distributions or on the redemptions of Fund shares. Returns greater than 1 year are annualized. The Fund’s total annual operating expenses are 1.82% for Class N shares, per the September 1, 2019 prospectus. This material must be proceeded or accompanied by a Prospectus. Please read it carefully before investing. For performance information current to the most recent month-end, please call 1-866-811-0225.
Growth of a $10,000 Investment
This chart illustrates a comparison of a hypothetical investment of $10,000 in the CLS Strategic Global Equity Fund (assuming reinvestment of all dividends and distributions) versus the Fund’s benchmark index.
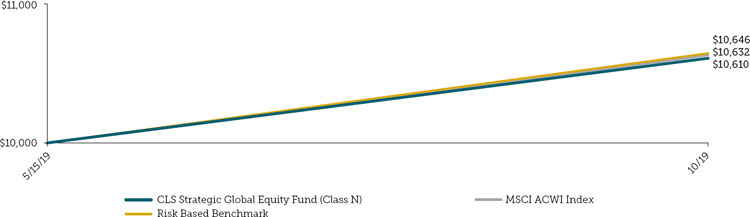
| The MSCI ACWI Index represents the Modern Index Strategy and captures all sources of equity returns in 23 developed and 24 emerging markets. |
| * | Performance of the risk budget benchmark shows how the Fund’s performance compares to an index with similar investment strategies and underlying holdings as the Fund. The risk budget benchmark consists of 60% of the Morningstar U.S. Market Index and 40% of the Morningstar Global Market ex US lg-Mid Index. The Morningstar U.S. Market Index is an index that measures the performance of U.S. securities and targets 97% market capitalization coverage of the investable universe. It is a diversified broad market index. The Morningstar Global ex U.S. Large-Mid Index is an index that measures the performance of Global Markets (ex-U.S.) equity markets targeting the top 90% of stocks by market capitalization. |
15
| AdvisorOne Funds Semi-Annual Report |
Schedule of Investments -CLS Global Aggressive Equity Fund (Unaudited)
October 31, 2019
| Shares | Fair Value ($) | |||||||
| Equity Funds - 100.09% | ||||||||
| Commodity Funds - 1.23% | ||||||||
| Teucrium Soybean Fund* | 50,000 | $ | 786,000 | |||||
| United States Commodity Index Fund* | 28,000 | 1,016,960 | ||||||
| 1,802,960 | ||||||||
| Developed International - 20.55% | ||||||||
| Davis Select International ETF | 320,000 | 5,752,000 | ||||||
| Franklin FTSE United Kingdom ETF^ | 139,525 | 3,385,016 | ||||||
| iShares Edge MSCI International Momentum Factor ETF | 240,000 | 7,221,600 | ||||||
| iShares Edge MSCI International Value Factor ETF+ | 365,000 | 8,643,200 | ||||||
| iShares MSCI Australia ETF | 164,500 | 3,706,185 | ||||||
| iShares MSCI Spain ETF | 26,000 | 743,600 | ||||||
| iShares MSCI Turkey ETF+ | 31,000 | 766,940 | ||||||
| 30,218,541 | ||||||||
| Emerging Markets - 16.50% | ||||||||
| Hartford Multifactor Emerging Markets ETF^ | 177,000 | 4,024,201 | ||||||
| Invesco FTSE RAFI Emerging Markets ETF | 294,000 | 6,153,420 | ||||||
| iShares MSCI All Country Asia ex Japan ETF+ | 121,000 | 8,385,300 | ||||||
| iShares MSCI India ETF+ | 58,000 | 2,009,700 | ||||||
| SPDR S&P Emerging Asia Pacific ETF+ | 38,000 | 3,692,840 | ||||||
| 24,265,461 | ||||||||
| Global - 6.22% | ||||||||
| Cambria Global Value ETF | 232,100 | 5,315,090 | ||||||
| Global X Funds Global X Social Media ETF* | 15,000 | 476,700 | ||||||
| iShares Global Clean Energy ETF | 315,000 | 3,357,900 | ||||||
| 9,149,690 | ||||||||
| Large Cap Core - 19.34% | ||||||||
| Invesco S&P 500 Equal Weight Consumer Staples ETF+ | 20,000 | 2,775,000 | ||||||
| iShares U.S. Oil & Gas Exploration & Production ETF+ | 70,000 | 3,555,300 | ||||||
| Salt HighTrubeta US Market ETF | 12,000 | 309,637 | ||||||
| VanEck Vectors Morningstar Wide Moat ETF+ | 271,000 | 14,151,620 | ||||||
| VanEck Vectors Pharmaceutical ETF+ | 129,000 | 7,647,120 | ||||||
| 28,438,677 | ||||||||
| Large Cap Growth - 17.60% | ||||||||
| Fidelity Momentum Factor ETF | 158,000 | 5,536,320 | ||||||
| First Trust Cloud Computing ETF+ | 100,000 | 5,750,000 | ||||||
| iShares PHLX Semiconductor ETF+ | 25,500 | 5,720,925 | ||||||
| VanEck Vectors Gold Miners ETF | 18,000 | 506,700 | ||||||
| VanEck Vectors Retail ETF+^ | 72,000 | 8,372,606 | ||||||
| 25,886,551 | ||||||||
| Large Cap Value - 8.57% | ||||||||
| Fidelity Value Factor ETF+ | 148,000 | 5,267,320 | ||||||
| iShares U.S. Financial Services ETF+ | 52,000 | 7,333,560 | ||||||
| 12,600,880 | ||||||||
| 16 | Refer to the Notes to Financial Statements in this Report for further information regarding the values set forth above. |
| AdvisorOne Funds Semi-Annual Report |
Schedule of Investments -CLS Global Aggressive Equity Fund (Unaudited) (Continued)
October 31, 2019
| Shares | Fair Value ($) | |||||||
| Real Estate - 0.58% | ||||||||
| IQ US Real Estate Small Cap ETF | 32,000 | $ | 845,552 | |||||
| Small/Mid Cap Core - 0.20% | ||||||||
| Vanguard US Liquidity Factor ETF | 3,500 | 292,172 | ||||||
| Small/Mid Cap Growth - 5.52% | ||||||||
| ARK Genomic Revolution ETF | 167,000 | 5,003,320 | ||||||
| ARK Innovation ETF | 70,448 | 3,115,915 | ||||||
| 8,119,235 | ||||||||
| Small/Mid Cap Value - 3.78% | ||||||||
| iShares U.S. Insurance ETF | 61,000 | 4,231,326 | ||||||
| Legg Mason Small-Cap Quality Value ETF^ | 50,000 | 1,323,500 | ||||||
| 5,554,826 | ||||||||
| Total Equity Funds (cost $124,460,985) | 147,174,545 | |||||||
| Money Market Fund - 0.05% | ||||||||
| Short-Term Cash - 0.05% | ||||||||
| Federated Government Obligations Fund Institutional Class, 1.71%** | 66,394 | 66,394 | ||||||
| Total Money Market Fund (cost $66,394) | 66,394 | |||||||
| Collateral for Securities Loaned - 16.21% | ||||||||
| Dreyfus Government Cash Management Institutional Class, 1.63%** | 681,641 | 681,641 | ||||||
| Milestone Treasury Obligations Fund Institutional Class, 1.65%** ! | 23,155,000 | 23,155,000 | ||||||
| Total Collateral for Securities Loaned (cost $23,836,641) | 23,836,641 | |||||||
| Total Investments (cost $148,364,020) - 116.35% | $ | 171,077,580 | ||||||
| Liabilities in Excess of Other Assets - Net - (16.35)% | (24,037,354 | ) | ||||||
| NET ASSETS - 100.00% | $ | 147,040,226 | ||||||
| + | All or a portion of this security is on loan. Total loaned securities had a value of $23,303,597 at October 31, 2019. The loaned securities were secured with cash collateral of $23,836,641. |
| * | Non-income producing security. |
| ** | Money Market Fund; Interest rate reflects seven-day effective yield on October 31, 2019. |
| ^ | Affiliated issuer due to ownership. |
| ! | Affiliated issuer due to 5% ownership and related management. |
ETF - Exchange Traded Fund
FTSE - Financial Times and Stock Exchange
MSCI - Morgan Stanley Capital International
PHLX - Philadelphia Stock Exchange
RAFI - Research Affiliates Fundamental Indexation
SPDR - Standard & Poor’s Depositary Receipts
| 17 | Refer to the Notes to Financial Statements in this Report for further information regarding the values set forth above. |
| AdvisorOne Funds Semi-Annual Report |
Schedule of Investments -CLS Global Diversified Equity Fund (Unaudited)
October 31, 2019
| Shares | Fair Value ($) | |||||||
| Equity Funds - 100.13% | ||||||||
| Commodity Funds - 5.36% | ||||||||
| Invesco DB Agriculture Fund+ | 340,000 | $ | 5,419,600 | |||||
| Invesco DB Commodity Index Tracking Fund+ | 1,149,000 | 17,614,170 | ||||||
| 23,033,770 | ||||||||
| Developed International - 8.43% | ||||||||
| Davis Select International ETF | 350,000 | 6,291,250 | ||||||
| Franklin FTSE Canada ETF+^ | 26,000 | 662,659 | ||||||
| iShares MSCI Canada ETF+ | 250,000 | 7,195,000 | ||||||
| iShares MSCI Hong Kong ETF | 103,000 | 2,449,340 | ||||||
| iShares MSCI Spain ETF+ | 75,000 | 2,145,000 | ||||||
| iShares MSCI Turkey ETF | 70,000 | 1,731,800 | ||||||
| iShares MSCI United Kingdom ETF+ | 173,400 | 5,640,702 | ||||||
| Vanguard FTSE Europe ETF | 182,000 | 10,131,940 | ||||||
| 36,247,691 | ||||||||
| Emerging Markets - 32.38% | ||||||||
| Goldman Sachs ActiveBeta Emerging Markets Equity ETF | 574,000 | 18,706,660 | ||||||
| Invesco DWA Emerging Markets Markets Momentum ETF+ | 50,500 | 939,805 | ||||||
| Invesco FTSE RAFI Emerging Markets ETF | 250,000 | 5,232,500 | ||||||
| iShares Edge MSCI Min Vol Emerging Markets ETF | 90,000 | 5,252,400 | ||||||
| iShares MSCI Emerging Markets Small-Cap ETF | 95,800 | 4,172,090 | ||||||
| iShares MSCI Russia ETF | 165,500 | 6,904,660 | ||||||
| iShares MSCI Taiwan ETF+ | 72,600 | 2,818,332 | ||||||
| Schwab Fundamental Emerging Markets Large Company Index ETF | 951,400 | 27,305,180 | ||||||
| SPDR S&P Emerging Asia Pacific ETF | 192,000 | 18,658,560 | ||||||
| SPDR S&P Emerging Markets Dividend ETF+^ | 1,375,000 | 42,267,500 | ||||||
| VanEck Vectors Russia ETF | 101,300 | 2,439,304 | ||||||
| WisdomTree Emerging Markets Quality Dividend Growth Fund^ | 185,500 | 4,502,085 | ||||||
| 139,199,076 | ||||||||
| Global - 13.96% | ||||||||
| Cambria Global Value ETF+ | 136,864 | 3,134,185 | ||||||
| iShares Exponential Technologies ETF | 790,000 | 31,584,200 | ||||||
| iShares Global Clean Energy ETF | 400,000 | 4,264,000 | ||||||
| iShares Global Healthcare ETF+ | 328,000 | 21,031,360 | ||||||
| 60,013,745 | ||||||||
| Large Cap Core - 13.75% | ||||||||
| Davis Select Financial ETF^ | 1,025,000 | 24,963,875 | ||||||
| ERShares Entrepreneur 30 ETF | 204,072 | 3,504,937 | ||||||
| John Hancock Multi-Factor Health Care ETF^ | 300,000 | 10,320,270 | ||||||
| SPDR SSGA Gender Diversity Index ETF^ | 145,000 | 10,770,600 | ||||||
| Vanguard Dividend Appreciation ETF+ | 80,000 | 9,568,800 | ||||||
| 59,128,482 | ||||||||
| Large Cap Growth - 10.08% | ||||||||
| ClearBridge All Cap Growth ETF+ | 50,000 | 1,620,500 | ||||||
| Fidelity MSCI Information Technology Index ETF+ | 56,000 | 3,703,280 | ||||||
| iShares Edge MSCI USA Quality Factor ETF | 270,000 | 25,498,800 | ||||||
| SPDR MFS Systematic Growth Equity ETF^ | 150,000 | 12,531,735 | ||||||
| 43,354,315 | ||||||||
| 18 | Refer to the Notes to Financial Statements in this Report for further information regarding the values set forth above. |
| AdvisorOne Funds Semi-Annual Report |
Schedule of Investments -CLS Global Diversified Equity Fund(Unaudited) (Continued)
October 31, 2019
| Shares | Fair Value ($) | |||||||
| Large Cap Value - 9.20% | ||||||||
| DBX ETF Trust - Xtrackers Russell 1000 US Quality at a Reasonable Price ETF | 150,000 | $ | 4,239,000 | |||||
| Invesco Russell 1000 Yield Factor ETF^ | 35,000 | 969,934 | ||||||
| iShares Edge MSCI USA Value Factor ETF | 250,000 | 21,092,500 | ||||||
| John Hancock Multifactor Consumer Staples ETF^ | 220,000 | 6,338,662 | ||||||
| SPDR S&P Global Natural Resources ETF | 157,500 | 6,912,675 | ||||||
| 39,552,771 | ||||||||
| Real Estate - 2.95% | ||||||||
| FlexShares Global Quality Real Estate Index Fund+ | 127,000 | 8,465,896 | ||||||
| Hartford Multifactor REIT ETF^ | 250,000 | 4,203,850 | ||||||
| 12,669,746 | ||||||||
| Small/Mid Cap Growth - 2.94% | ||||||||
| SPDR S&P Kensho New Economies Composite ETF+^ | 375,000 | 12,648,750 | ||||||
| Small/Mid Cap Value - 1.08% | ||||||||
| VictoryShares USAA MSCI USA Small Cap Value Momentum ETF | 90,000 | 4,627,854 | ||||||
| Total Equity Funds (cost $373,544,820) | 430,476,200 | |||||||
| Money Market Fund - 0.07% | ||||||||
| Short-Term Cash - 0.07% | ||||||||
| Federated Government Obligations Fund Institutional Class, 1.71%** | 308,733 | 308,733 | ||||||
| Total Money Market Fund (cost $308,733) | 308,733 | |||||||
| Collateral for Securities Loaned - 6.56% | ||||||||
| Dreyfus Government Cash Management Institutional Class, 1.63%** | 823,973 | 823,973 | ||||||
| Milestone Treasury Obligations Fund Institutional Class, 1.65%** ! | 27,373,500 | 27,373,500 | ||||||
| Total Collateral for Securities Loaned (cost $28,197,473) | 28,197,473 | |||||||
| Total Investments (cost $402,051,026) - 106.76% | $ | 458,982,406 | ||||||
| Liabilities in Excess of Other Assets - Net - (6.76)% | (29,055,740 | ) | ||||||
| NET ASSETS - 100.00% | $ | 429,926,666 | ||||||
| + | All or a portion of this security is on loan. Total loaned securities had a value of $36,421,829 at October 31, 2019. The loaned securities were secured with cash collateral of $23,836,641. |
| * | Non-income producing security. |
| ** | Money Market Fund; Interest rate reflects seven-day effective yield on October 31, 2019. |
| ^ | Affiliated issuer due to 5% ownership. |
| ! | Affiliated issuer due to 5% ownership and related management. |
| DB - Deutsche Bank |
| DWA - Dorsey Wright & Associates |
| ETF - Exchange Traded Fund |
| FTSE - Financial Times Stock Exchange |
| MFS - Massachusetts Financial Services Co. |
| MSCI - Morgan Stanley Capital International |
| RAFI - Research Affiliates |
| REIT - Real Estate Investment Trust |
| SPDR - Standard & Poor’s Depositary Receipts |
| SSGA - State Street Global Advisors |
| USAA - United Services Automobile Association |
| 19 | Refer to the Notes to Financial Statements in this Report for further information regarding the values set forth above. |
| AdvisorOne Funds Semi-Annual Report |
Schedule of Investments -CLS Growth and Income Fund (Unaudited)
October 31, 2019
| Shares | Fair Value ($) | |||||||
| Bond Funds - 37.38% | ||||||||
| High Yield Bonds - 1.24% | ||||||||
| SPDR Blackstone / GSO Senior Loan ETF+ | 110,000 | $ | 5,045,700 | |||||
| Intermediate/Long Term Bonds - 23.96% | ||||||||
| Fidelity Total Bond ETF | 664,963 | 34,451,733 | ||||||
| First Trust TCW Opportunistic Fixed Income ETF+ | 380,000 | 19,969,000 | ||||||
| iShares 3-7 Year Treasury Bond ETF+ | 17,000 | 2,158,490 | ||||||
| iShares 7-10 Year Treasury Bond ETF+ | 22,000 | 2,475,220 | ||||||
| iShares TIPS Bond ETF | 12,300 | 1,427,538 | ||||||
| PIMCO Active Bond Exchange-Traded Fund+ | 117,500 | 12,760,500 | ||||||
| Schwab US TIPS ETF+ | 170,381 | 9,657,195 | ||||||
| SPDR Doubleline Total Return Tactical ETF+ | 296,922 | 14,578,870 | ||||||
| 97,478,546 | ||||||||
| International Bond - 1.98% | ||||||||
| Invesco Emerging Markets Sovereign Debt ETF | 206,429 | 6,015,341 | ||||||
| VanEck Vectors J.P. Morgan EM Local Currency Bond ETF | 60,000 | 2,036,400 | ||||||
| 8,051,741 | ||||||||
| Short Term Bonds - 10.20% | ||||||||
| iShares 1-3 Year Treasury Bond ETF+ | 93,000 | 7,900,350 | ||||||
| Janus Henderson Short Duration Income ETF+ | 173,234 | 8,640,912 | ||||||
| PIMCO Enhanced Short Maturity Active Exchange-Traded Fund | 204,257 | 20,787,235 | ||||||
| SPDR Bloomberg Barclays Investment Grade Floating Rate ETF | 135,000 | 4,153,950 | ||||||
| 41,482,447 | ||||||||
| Total Bond Funds (cost $147,256,771) | 152,058,434 | |||||||
| Equity Funds - 60.70% | ||||||||
| Alternative - 2.10% | ||||||||
| IQ Merger Arbitrage ETF* | 146,874 | 4,786,624 | ||||||
| JPMorgan Diversified Alternatives ETF+* | 150,000 | 3,742,500 | ||||||
| 8,529,124 | ||||||||
| Commodity Funds - 7.95% | ||||||||
| First Trust Global Tactical Commodity Strategy Fund | 200,000 | 3,698,000 | ||||||
| Invesco DB Commodity Index Tracking Fund+ | 575,000 | 8,814,750 | ||||||
| Invesco Optimum Yield Diversified Commodity Strategy No K-1 ETF | 1,015,000 | 16,138,500 | ||||||
| WisdomTree Continuous Commodity Index Fund* | 205,000 | 3,675,650 | ||||||
| 32,326,900 | ||||||||
| Developed International - 9.51% | ||||||||
| Davis Select International ETF+ | 55,000 | 988,625 | ||||||
| Franklin FTSE Canada ETF+ | 10,000 | 254,869 | ||||||
| Hartford Multifactor Developed Markets ex-US ETF+ | 230,000 | 6,573,400 | ||||||
| iShares MSCI EAFE Value ETF+ | 275,000 | 13,476,375 | ||||||
| iShares MSCI Turkey ETF+ | 45,000 | 1,113,300 | ||||||
| SPDR Solactive Canada ETF+^ | 75,000 | 4,505,490 | ||||||
| Vanguard FTSE Europe ETF+ | 211,500 | 11,774,205 | ||||||
| 38,686,264 | ||||||||
| 20 | Refer to the Notes to Financial Statements in this Report for further information regarding the values set forth above. |
| AdvisorOne Funds Semi-Annual Report |
Schedule of Investments -CLS Growth and Income Fund (Unaudited) (Continued)
October 31, 2019
| Shares | Fair Value ($) | |||||||
| Emerging Markets - 7.99% | ||||||||
| Invesco FTSE RAFI Emerging Markets ETF+ | 772,800 | $ | 16,174,704 | |||||
| iShares Core MSCI Emerging Markets ETF | 175,200 | 8,964,984 | ||||||
| iShares MSCI Russia ETF | 87,000 | 3,629,640 | ||||||
| Schwab Fundamental Emerging Markets Large Company Index ETF | 30,000 | 861,000 | ||||||
| Xtrackers Harvest CSI 300 China A-Shares ETF+ | 103,500 | 2,889,720 | ||||||
| 32,520,048 | ||||||||
| Global - 11.46% | ||||||||
| Davis Select Worldwide ETF+ | 100,000 | 2,359,500 | ||||||
| FlexShares Global Upstream Natural Resources Index Fund | 470,000 | 14,753,300 | ||||||
| Global X FinTech ETF | 101,584 | 2,905,303 | ||||||
| iShares Exponential Technologies ETF | 345,000 | 13,793,100 | ||||||
| iShares Global Clean Energy ETF+ | 270,000 | 2,878,200 | ||||||
| iShares Global Healthcare ETF | 155,000 | 9,938,600 | ||||||
| 46,628,003 | ||||||||
| Large Cap Core - 3.72% | ||||||||
| Invesco S&P 500 Equal Weight Consumer Staples ETF+ | 65,000 | 9,018,750 | ||||||
| Salt Low Trubeta US Market ETF* | 6,500 | 181,378 | ||||||
| VanEck Vectors Pharmaceutical ETF+ | 100,000 | 5,928,000 | ||||||
| 15,128,128 | ||||||||
| Large Cap Growth - 5.68% | ||||||||
| Invesco Dynamic Biotechnology & Genome ETF* | 27,000 | 1,377,780 | ||||||
| Invesco S&P 500 Equal Weight Health Care ETF | 15,000 | 3,078,900 | ||||||
| iShares Edge MSCI USA Quality Factor ETF | 197,613 | 18,662,572 | ||||||
| 23,119,252 | ||||||||
| Large Cap Value - 8.92% | ||||||||
| Financial Select Sector SPDR Fund+ | 50,607 | 1,452,421 | ||||||
| iShares Edge MSCI USA Value Factor ETF | 385,200 | 32,499,324 | ||||||
| John Hancock Multi-Factor Financials ETF | 60,000 | 2,337,870 | ||||||
| 36,289,615 | ||||||||
| Real Estate - 1.53% | ||||||||
| FlexShares Global Quality Real Estate Index Fund+ | 21,638 | 1,442,402 | ||||||
| Schwab U.S. REIT ETF+ | 100,000 | 4,768,000 | ||||||
| 6,210,402 | ||||||||
| Small/Mid Cap Core - 0.94% | ||||||||
| Schwab Fundamental U.S. Small Company Index ETF+ | 100,000 | 3,840,000 | ||||||
| Small/Mid Cap Growth - 0.90% | ||||||||
| SPDR S&P Homebuilders ETF+ | 80,000 | 3,642,400 | ||||||
| Total Equity Funds (cost $218,094,146) | 246,920,136 | |||||||
| 21 | Refer to the Notes to Financial Statements in this Report for further information regarding the values set forth above. |
| AdvisorOne Funds Semi-Annual Report |
Schedule of Investments -CLS Growth and Income Fund (Unaudited) (Continued)
October 31, 2019
| Shares | Fair Value ($) | |||||||
| Money Market Fund - 1.99% | ||||||||
| Short-Term Cash - 1.99% | ||||||||
| Federated Government Obligations Fund Institutional Class, 1.71%** | 8,088,658 | $ | 8,088,658 | |||||
| Total Money Market Fund (cost $8,088,658) | 8,088,658 | |||||||
| Collateral for Securities Loaned - 10.16% | ||||||||
| Dreyfus Government Cash Management Institutional Class, 1.63%** | 1,174,460 | 1,174,460 | ||||||
| Milestone Treasury Obligations Fund Institutional Class, 1.65%** ! | 40,146,900 | 40,146,900 | ||||||
| Total Collateral for Securities Loaned (cost $41,321,360) | 41,321,360 | |||||||
| Total Investments (cost $414,760,935) - 110.23% | $ | 448,388,588 | ||||||
| Liabilities in Excess of Other Assets - Net - (10.23)% | (41,603,416 | ) | ||||||
| NET ASSETS - 100.00% | $ | 406,785,172 | ||||||
| + | All or a portion of this security is on loan. Total loaned securities had a value of $47,974,488 at October 31, 2019. The loaned securities were secured with cash collateral of $41,321,360 and non-cash collateral of $7,738,574. The non-cash collateral consists of short-term investments and long-term bonds and is held for benefit of the Fund at the Fund’s custodian, The Fund cannot pledge or resell the collateral. |
| * | Non-income producing security. |
| ** | Money Market Fund; Interest rate reflects seven-day effective yield on October 31, 2019. |
| ^ | Affiliated issuer due to 5% ownership. |
| ! | Affiliated issuer due to 5% ownership and related management. |
DB - Deutsche Bank
EAFE - Europe, Australasia, Far East
ETF - Exchange Traded Fund
FTSE - Financial Times Stock Exchange
MLP - Master Limited Partnership
MSCI - Morgan Stanley Capital International
RAFI - Research Affiliates
REIT - Real Estate Investment Trust
SPDR - Standard & Poor’s Depositary Receipts
TIPS - Treasury Inflation-Protected Securities
| 22 | Refer to the Notes to Financial Statements in this Report for further information regarding the values set forth above. |
| AdvisorOne Funds Semi-Annual Report |
Schedule of Investments -CLS Flexible Income Fund (Unaudited)
October 31, 2019
| Shares | Fair Value ($) | |||||||
| Bond Funds - 81.81% | ||||||||
| High Yield Bonds - 14.62% | ||||||||
| BlackRock Corporate High Yield Fund Inc+ | 78,416 | $ | 857,087 | |||||
| iShares iBoxx High Yield Corporate Bond ETF | 58,080 | 5,041,925 | ||||||
| PIMCO 0-5 Year High Yield Corporate Bond Index Exchange-Traded Fund | 56,295 | 5,577,146 | ||||||
| SPDR Blackstone / GSO Senior Loan ETF+ | 301,216 | 13,816,778 | ||||||
| SPDR Bloomberg Barclays Short Term High Yield Bond ETF+ | 216,775 | 5,807,402 | ||||||
| 31,100,338 | ||||||||
| Intermediate/Long Term Bonds - 47.73% | ||||||||
| iShares 20+ Year Treasury Bond ETF+ | 46,100 | 6,511,164 | ||||||
| iShares 3-7 Year Treasury Bond ETF+ | 107,300 | 13,623,881 | ||||||
| iShares 7-10 Year Treasury Bond ETF | 38,000 | 4,275,380 | ||||||
| iShares Broad USD Investment Grade Corporate Bond ETF | 66,900 | 3,904,953 | ||||||
| iShares Intermediate-Term Corporate Bond ETF+ | 180,760 | 10,509,386 | ||||||
| iShares TIPS Bond ETF | 19,617 | 2,276,749 | ||||||
| Nuveen Enhanced Yield US Aggregate Bond ETF | 124,400 | 3,092,584 | ||||||
| PIMCO Active Bond Exchange-Traded Fund | 166,909 | 18,126,317 | ||||||
| SPDR Doubleline Total Return Tactical ETF | 433,619 | 21,290,693 | ||||||
| Vanguard Intermediate-Term Corporate Bond ETF | 117,483 | 10,761,443 | ||||||
| Vanguard Mortgage-Backed Securities ETF | 41,000 | 2,186,530 | ||||||
| Vanguard Total Bond Market ETF | 58,485 | 4,942,567 | ||||||
| 101,501,647 | ||||||||
| International Bond - 6.12% | ||||||||
| Invesco Emerging Markets Sovereign Debt ETF | 246,371 | 7,179,251 | ||||||
| iShares JP Morgan EM Local Currency Bond ETF | 27,400 | 1,250,262 | ||||||
| iShares JP Morgan USD Emerging Markets Bond ETF | 40,350 | 4,583,760 | ||||||
| 13,013,273 | ||||||||
| Preferred Security - 1.15% | ||||||||
| First Trust Preferred Securities and Income ETF | 123,400 | 2,453,192 | ||||||
| Short-Term Bonds - 12.19% | ||||||||
| Janus Henderson Short Duration Income ETF | 184,000 | 9,177,920 | ||||||
| PIMCO Enhanced Short Maturity Active Exchange-Traded Fund | 164,522 | 16,743,404 | ||||||
| 25,921,324 | ||||||||
| Total Bond Funds (cost $170,652,618) | 173,989,774 | |||||||
| Equity Funds - 15.70% | ||||||||
| Alternative - 2.77% | ||||||||
| IQ Merger Arbitrage ETF* | 180,731 | 5,890,023 | ||||||
| Commodity Funds - 0.37% | ||||||||
| WisdomTree Continuous Commodity Index Fund* | 43,200 | 774,576 | ||||||
| Developed International - 1.85% | ||||||||
| iShares MSCI EAFE Value ETF | 62,000 | 3,038,310 | ||||||
| JPMorgan Diversified Return International Equity ETF+ | 16,100 | 885,339 | ||||||
| 3,923,649 | ||||||||
| 23 | Refer to the Notes to Financial Statements in this Report for further information regarding the values set forth above. |
| AdvisorOne Funds Semi-Annual Report |
Schedule of Investments -CLS Flexible Income Fund (Unaudited) (Continued)
October 31, 2019
| Shares | Fair Value ($) | |||||||
| Emerging Markets - 1.64% | ||||||||
| iShares China Large-Cap ETF+ | 27,000 | $ | 1,111,050 | |||||
| Vanguard FTSE Emerging Markets ETF | 57,000 | 2,385,450 | ||||||
| 3,496,500 | ||||||||
| Global - 1.88% | ||||||||
| iShares Exponential Technologies ETF | 70,300 | 2,810,594 | ||||||
| iShares Global Healthcare ETF+ | 18,600 | 1,192,632 | ||||||
| 4,003,226 | ||||||||
| Large Cap Core - 2.07% | ||||||||
| Goldman Sachs ActiveBeta U.S. Large Cap Equity ETF+ | 72,100 | 4,407,473 | ||||||
| Large Cap Value - 3.86% | ||||||||
| Fidelity MSCI Financials Index ETF+ | 62,000 | 2,576,100 | ||||||
| Invesco S&P 500 Pure Value ETF+ | 33,100 | 2,167,388 | ||||||
| Vanguard High Dividend Yield ETF+ | 17,000 | 1,524,220 | ||||||
| Vanguard Value ETF+ | 17,105 | 1,945,523 | ||||||
| 8,213,231 | ||||||||
| Small/Mid Cap Core - 0.62% | ||||||||
| Royce Value Trust, Inc. | 93,574 | 1,308,165 | ||||||
| Small/Mid Cap Value - 0.64% | ||||||||
| Alerian MLP ETF+ | 159,500 | 1,362,130 | ||||||
| Total Equity Funds (cost $32,011,699) | 33,378,973 | |||||||
| Principal ($) | Fair Value ($) | |||||||
| U.S. Government and Agency Obligations - 2.38% | ||||||||
| Fannie Mae Pool, 3.50%, due 07/01/2032 | $ | 311,033 | 323,963 | |||||
| Fannie Mae Pool, 3.50%, due 12/01/2030 | 136,786 | 140,452 | ||||||
| Fannie Mae Pool, 4.00%, due 02/01/2040 | 170,269 | 182,280 | ||||||
| Fannie Mae Pool, 4.00%, due 06/01/2041 | 294,459 | 315,259 | ||||||
| Fannie Mae Pool, 4.00%, due 09/01/2041 | 288,378 | 308,706 | ||||||
| Fannie Mae Pool, 4.00%, due 10/01/2040 | 137,165 | 146,843 | ||||||
| Fannie Mae Pool, 4.00%, due 12/01/2041 | 191,907 | 205,287 | ||||||
| Fannie Mae Pool, 5.00%, due 02/01/2040 | 213,706 | 236,297 | ||||||
| Fannie Mae Pool, 5.00%, due 11/01/2039 | 162,645 | 179,774 | ||||||
| Fannie Mae Pool, 5.50%, due 04/01/2040 | 111,245 | 124,567 | ||||||
| Fannie Mae Pool, 5.50%, due 12/01/2039 | 94,192 | 105,814 | ||||||
| Fannie Mae Pool, 6.00%, due 12/01/2035 | 147,012 | 169,048 | ||||||
| Fannie Mae Pool, 6.00%, due 12/01/2038 | 53,420 | 61,332 | ||||||
| Federal Home Loan Mortgage Corp, 2.00%, due 03/12/2020 | 1,000,000 | 1,001,462 | ||||||
| Federal National Mortgage Association, 2.00%, due 08/28/2020 | 1,000,000 | 1,002,298 | ||||||
| Freddie Mac Gold Pool, 4.50%, due 02/01/2041 | 167,715 | 181,990 | ||||||
| Freddie Mac Gold Pool, 5.50%, due 06/01/2034 | 132,120 | 148,763 | ||||||
| Freddie Mac Gold Pool, 6.00%, due 05/01/2037 | 44,136 | 50,788 | ||||||
| Freddie Mac Gold Pool, 6.50%, due 04/01/2039 | 60,796 | 69,101 | ||||||
| Government National Mortgage Association, 3.50%, due 07/16/2039 | 52,141 | 53,519 | ||||||
| Government National Mortgage Association, 4.00%, due 02/20/2039 | 48,892 | 49,569 | ||||||
| Total U.S. Government and Agency Obligations (cost $4,934,942) | 5,057,112 | |||||||
| 24 | Refer to the Notes to Financial Statements in this Report for further information regarding the values set forth above. |
| AdvisorOne Funds Semi-Annual Report |
Schedule of Investments -CLS Flexible Income Fund (Unaudited) (Continued)
October 31, 2019
| Shares | Fair Value ($) | |||||||
| Money Market Fund - 0.31% | ||||||||
| Short-Term Cash - 0.31% | ||||||||
| Federated Government Obligations Fund Institutional Class, 1.71%** | 664,418 | $ | 664,418 | |||||
| Total Money Market Fund (cost $664,418) | 664,418 | |||||||
| Collateral for Securities Loaned - 12.07% | ||||||||
| Dreyfus Government Cash Management Institutional Class, 1.63%** | 668,719 | 668,719 | ||||||
| Milestone Treasury Obligations Fund Institutional Class, 1.65%** ! | 25,003,800 | 25,003,800 | ||||||
| Total Collateral for Securities Loaned (cost $25,672,519) | 25,672,519 | |||||||
| Total Investments (cost $233,936,196) - 112.27% | $ | 238,762,796 | ||||||
| Liabilities in Excess of Other Assets - Net - (12.27)% | (26,084,835 | ) | ||||||
| NET ASSETS - 100.00% | $ | 212,677,961 | ||||||
| + | All or a portion of this security is on loan. Total loaned securities had a value of $31,427,528 at October 31, 2019. The loaned securities were secured with cash collateral of $25,672,519 and non-cash collateral of $6,445,588. The non-cash collateral consists of short-term investments and long-term bonds and is held for benefit of the Fund at the Fund’s custodian, The Fund cannot pledge or resell the collateral. |
| * | Non-income producing security. |
| ** | Money Market Fund; Interest rate reflects seven-day effective yield on October 31, 2019. |
| ! | Affiliated issuer due to 5% ownership and related management. |
EAFE - Europe, Australasia, Far East
EM - Emerging Markets
ETF - Exchange Traded Fund
FTSE - Financial Times Stock Exchange
MLP - Master Limited Partnership
MSCI - Morgan Stanley Capital International
SPDR - Standard & Poors’ Depositary Receipts
TIPS - Treasury Inflation-Protected Security
| 25 | Refer to the Notes to Financial Statements in this Report for further information regarding the values set forth above. |
| AdvisorOne Funds Semi-Annual Report |
Schedule of Investments -CLS Shelter Fund (Unaudited)
October 31, 2019
| Shares | Fair Value ($) | |||||||
| Equity Funds - 99.64% | ||||||||
| Alternative - 1.45% | ||||||||
| Innovator S&P 500 Power Buffer ETF - August+* | 125,000 | $ | 3,190,000 | |||||
| Developed International - 5.05% | ||||||||
| Hartford Multifactor Developed Markets ex-US ETF | 389,240 | 11,124,479 | ||||||
| Emerging Markets - 7.91% | ||||||||
| Invesco FTSE RAFI Emerging Markets ETF | 831,500 | 17,403,295 | ||||||
| Global - 10.61% | ||||||||
| iShares Exponential Technologies ETF | 584,300 | 23,360,314 | ||||||
| Large Cap Core - 25.83% | ||||||||
| Invesco Russell 1000 Dynamic Multifactor ETF | 1,098,600 | 34,309,278 | ||||||
| SPDR MSCI USA StrategicFactors ETF+ | 250,000 | 22,557,500 | ||||||
| 56,866,778 | ||||||||
| Large Cap Value - 9.97% | ||||||||
| iShares Edge MSCI USA Value Factor ETF | 260,100 | 21,944,637 | ||||||
| Low Volatility Equities - 23.24% | ||||||||
| Invesco S&P 500 Low Volatility ETF | 363,770 | 20,942,239 | ||||||
| iShares Edge MSCI Min Vol Global ETF+ | 229,000 | 21,906,140 | ||||||
| iShares Edge MSCI Min Vol USA ETF | 130,000 | 8,313,500 | ||||||
| 51,161,879 | ||||||||
| Real Estate - 5.20% | ||||||||
| Vanguard Global ex-U.S. Real Estate ETF | 188,100 | 11,455,290 | ||||||
| Small/Mid Cap Core - 10.38% | ||||||||
| John Hancock Multi-Factor Mid Cap ETF | 614,000 | 22,840,800 | ||||||
| Total Equity Funds (cost $212,882,518) | 219,347,472 | |||||||
| Money Market Fund - 0.68% | ||||||||
| Short-Term Cash - 0.68% | ||||||||
| Federated Prime Cash Obligations Fund Institutional Class, 1.71%** | 1,493,079 | 1,493,079 | ||||||
| Total Money Market Fund (cost $1,493,079) | 1,493,079 | |||||||
| Collateral for Securities Loaned - 9.89% | ||||||||
| Dreyfus Government Cash Management Institutional Class, 1.63%** | 627,588 | 627,588 | ||||||
| Milestone Treasury Obligations Fund Institutional Class, 1.65%** ! | 21,148,400 | 21,148,400 | ||||||
| Total Collateral for Securities Loaned (cost $21,775,988) | 21,775,988 | |||||||
| Total Investments (cost $236,151,585) - 110.21% | $ | 242,616,539 | ||||||
| Liabilities in Excess of Other Assets - Net - (10.21)% | (22,477,409 | ) | ||||||
| NET ASSETS - 100.00% | $ | 220,139,130 | ||||||
| + | All or a portion of this security is on loan. Total loaned securities had a value of $21,271,129 at October 31, 2019. The loaned securities were secured with cash collateral of $21,775,988. |
| * | Non-income producing security. |
| ** | Money Market Fund; Interest rate reflects seven-day effective yield on October 31, 2019. |
| ! | Affiliated issuer due to 5% ownership and related management. |
ETF - Exchange Traded Fund
FTSE - Financial Times Stock Exchange
MSCI - Morgan Stanley Capital International
RAFI - Research Affiliates
| 26 | Refer to the Notes to Financial Statements in this Report for further information regarding the values set forth above. |
| AdvisorOne Funds Semi-Annual Report |
Schedule of Investments -CLS Strategic Global Equity Fund (Unaudited)
October 31, 2019
| Shares | Fair Value ($) | |||||||
| Equity Funds - 101.23% | ||||||||
| Developed International - 33.47% | ||||||||
| John Hancock MultiFactor Developed International ETF | 35 | $ | 1,008 | |||||
| Vanguard FTSE All World ex-US Small-Cap ETF | 5 | 528 | ||||||
| Vanguard FTSE Developed Markets ETF | 93 | 3,943 | ||||||
| Vanguard FTSE Europe ETF | 19 | 1,058 | ||||||
| Vanguard FTSE Pacific ETF | 14 | 955 | ||||||
| Vanguard International Dividend Appreciation ETF | 5 | 345 | ||||||
| Vanguard International High Dividend Yield ETF | 17 | 1,043 | ||||||
| 8,880 | ||||||||
| Emerging Markets - 8.82% | ||||||||
| John Hancock Multifactor Emerging Markets ETF | 33 | 833 | ||||||
| Vanguard FTSE Emerging Markets ETF | 36 | 1,506 | ||||||
| 2,339 | ||||||||
| Large Cap Core - 6.91% | ||||||||
| John Hancock Multi-Factor Health Care ETF | 19 | 654 | ||||||
| John Hancock Multifactor Industrials ETF | 8 | 306 | ||||||
| John Hancock Multi-Factor Large Cap ETF | 21 | 821 | ||||||
| Vanguard ESG US Stock ETF | 1 | 53 | ||||||
| 1,834 | ||||||||
| Large Cap Growth - 20.58% | ||||||||
| John Hancock Multi-Factor Consumer Discretionary ETF | 14 | 477 | ||||||
| John Hancock Multi-Factor Technology ETF | 15 | 770 | ||||||
| Vanguard Growth ETF | 4 | 682 | ||||||
| Vanguard Mega Cap Growth ETF | 26 | 3,530 | ||||||
| 5,459 | ||||||||
| Large Cap Value - 24.48% | ||||||||
| John Hancock Multifactor Consumer Staples ETF | 13 | 374 | ||||||
| John Hancock Multifactor Energy ETF | 10 | 224 | ||||||
| John Hancock Multi-Factor Financials ETF | 17 | 662 | ||||||
| John Hancock Multifactor Utilities ETF | 8 | 273 | ||||||
| Vanguard Communication Services ETF | 2 | 179 | ||||||
| Vanguard High Dividend Yield ETF | 5 | 448 | ||||||
| Vanguard Mega Cap Value ETF | 47 | 3,884 | ||||||
| Vanguard U.S. Minimum Volatility ETF | 5 | 452 | ||||||
| 6,496 | ||||||||
| Real Estate - 0.69% | ||||||||
| Vanguard Global ex-U.S. Real Estate ETF | 3 | 183 | ||||||
| Small/Mid Cap Core - 4.97% | ||||||||
| John Hancock Multifactor Materials ETF | 8 | 265 | ||||||
| John Hancock Multi-Factor Mid Cap ETF | 14 | 521 | ||||||
| John Hancock Multifactor Small Cap ETF | 20 | 533 | ||||||
| 1,319 | ||||||||
| 27 | Refer to the Notes to Financial Statements in this Report for further information regarding the values set forth above. |
| AdvisorOne Funds Semi-Annual Report |
Schedule of Investments -CLS Strategic Global Equity Fund (Unaudited) (Continued)
October 31, 2019
| Shares | Fair Value ($) | |||||||
| Small/Mid Cap Growth - 1.31% | ||||||||
| Vanguard Small-Cap Growth ETF | 1 | $ | 185 | |||||
| Vanguard US Momentum Factor ETF | 1 | 82 | ||||||
| Vanguard Wellington Fund-Vanguard US Quality Factor ETF | 1 | 81 | ||||||
| 348 | ||||||||
| Total Equity Funds (cost $25,847) | 26,858 | |||||||
| Money Market Fund - 0.03% | ||||||||
| Short-Term Cash - 0.03% | ||||||||
| Federated Prime Cash Obligations Fund Institutional Class, 1.71%* | 9 | 9 | ||||||
| Total Money Market Fund (cost $9) | 9 | |||||||
| Total Investments (cost $25,856) - 101.26% | $ | 26,867 | ||||||
| Liabilities in Excess of Other Assets - Net - (1.26)% | (334 | ) | ||||||
| NET ASSETS - 100.00% | $ | 26,533 | ||||||
| * | Money Market Fund; Interest rate reflects seven-day effective yield on October 31, 2019. |
ETF - Exchange Traded Fund
FTSE - Financial Times Stock Exchange
ESG - Environmental, Social, and Governance
| 28 | Refer to the Notes to Financial Statements in this Report for further information regarding the values set forth above. |
| AdvisorOne Funds Semi-Annual Report |
Statements of Assets and Liabilities (Unaudited)
October 31, 2019
| CLS Global | CLS Global | CLS | ||||||||||
| Aggressive | Diversified | Growth and | ||||||||||
| Equity Fund | Equity Fund | Income Fund | ||||||||||
| Assets: | ||||||||||||
| Unaffiliated investments, at cost | $ | 110,081,811 | $ | 258,359,368 | $ | 370,495,792 | ||||||
| Affiliated Investments, at cost | 38,282,209 | 143,691,658 | 44,265,143 | |||||||||
| Unaffiliated investments in securities, at value* | $ | 130,817,256 | $ | 301,428,986 | $ | 403,736,198 | ||||||
| Affiliated Investments in securities, at value | 40,260,324 | 157,553,420 | 44,652,390 | |||||||||
| Receivable for securities sold | 6,857,498 | — | 398,897 | |||||||||
| Receivable for fund shares sold | 78,334 | 167,664 | 109,170 | |||||||||
| Receivable for security lending | 24,220 | 27,334 | 81,431 | |||||||||
| Interest and dividends receivable | 388 | 857 | 84,949 | |||||||||
| Prepaid expenses and other assets | 19,182 | 34,425 | 32,215 | |||||||||
| Total Assets | 178,057,202 | 459,212,686 | 449,095,250 | |||||||||
| Liabilities: | ||||||||||||
| Securities lending collateral (Note 8) | 23,836,641 | 28,197,473 | 41,321,360 | |||||||||
| Payable for securities purchased | 6,768,630 | — | — | |||||||||
| Accrued advisory fees | 190,357 | 536,241 | 544,101 | |||||||||
| Payable for fund shares redeemed | 90,063 | 266,420 | 236,721 | |||||||||
| Accrued shareholder servicing fees | 60,183 | 176,342 | 168,240 | |||||||||
| Payable to related parties | 38,100 | 74,009 | 2,997 | |||||||||
| Accrued expenses and other liabilities | 33,002 | 35,535 | 36,659 | |||||||||
| Total Liabilities | 31,016,976 | 29,286,020 | 42,310,078 | |||||||||
| Net Assets | $ | 147,040,226 | $ | 429,926,666 | $ | 406,785,172 | ||||||
| Composition of Net Assets: | ||||||||||||
| Paid in capital ($0 par value, unlimited shares authorized) | $ | 119,394,425 | $ | 357,199,751 | $ | 363,997,738 | ||||||
| Accumulated earnings | 27,645,801 | 72,726,915 | 42,787,434 | |||||||||
| Net Assets | $ | 147,040,226 | $ | 429,926,666 | $ | 406,785,172 | ||||||
| Class N Shares: | ||||||||||||
| Net assets | $ | 147,040,210 | $ | 429,926,647 | $ | 406,785,160 | ||||||
| Net asset value, offering price, and redemption price per share (Net assets ÷ Total shares of beneficial interest outstanding) | $ | 14.20 | $ | 16.78 | $ | 11.13 | ||||||
| Total shares outstanding at end of period | 10,357,659 | 25,620,826 | 36,550,989 | |||||||||
| Class T Shares: | ||||||||||||
| Net assets | $ | 16 | $ | 19 | $ | 12 | ||||||
| Net asset value, offering price, and redemption price per share (Net assets ÷ Total shares of beneficial interest outstanding)** | $ | 14.20 | $ | 16.78 | $ | 11.13 | ||||||
| Total shares outstanding at end of period | 1 | 1 | 1 | |||||||||
| * | Includes Securities Loaned $23,303,597; $36,421,829; $43,298,802. |
| ** | NAV does not recalculate due to rounding of shares of beneficial interest outstanding. |
| 29 | Refer to the Notes to Financial Statements in this Report for further information regarding the values set forth above. |
| AdvisorOne Funds Semi-Annual Report |
Statements of Assets and Liabilities (Unaudited) (Continued)
October 31, 2019
| CLS | CLS | |||||||||||
| Flexible | CLS | Strategic Global | ||||||||||
| Income Fund | Shelter Fund | Equity Fund | ||||||||||
| Assets: | ||||||||||||
| Unaffiliated investments, at cost | $ | 208,932,396 | $ | 215,003,185 | $ | 25,856 | ||||||
| Affiliated Investments, at cost | 25,003,800 | 21,148,400 | — | |||||||||
| Unaffiliated investments in securities, at value* | $ | 213,758,996 | $ | 221,468,139 | $ | 26,867 | ||||||
| Affiliated Investments in securities, at value | 25,003,800 | 21,148,400 | — | |||||||||
| Receivable for fund shares sold | 80,331 | 57,858 | — | |||||||||
| Receivable for security lending | 23,628 | 10,439 | — | |||||||||
| Interest and dividends receivable | 17,467 | 3,692 | — | |||||||||
| Receivable due from advisor | — | — | 16,739 | |||||||||
| Prepaid expenses and other assets | 23,238 | 19,920 | — | |||||||||
| Total Assets | 238,907,460 | 242,708,448 | 43,606 | |||||||||
| Liabilities: | ||||||||||||
| Securities lending collateral (Note 8) | 25,672,519 | 21,775,988 | — | |||||||||
| Payable for securities purchased | — | — | — | |||||||||
| Accrued advisory fees | 142,250 | 272,394 | — | |||||||||
| Payable for fund shares redeemed | 245,313 | 355,669 | — | |||||||||
| Accrued shareholder servicing fees | 88,812 | 89,451 | 27 | |||||||||
| Payable to related parties | 46,205 | 42,797 | 6,352 | |||||||||
| Accrued expenses and other liabilities | 34,400 | 33,019 | 10,694 | |||||||||
| Total Liabilities | 26,229,499 | 22,569,318 | 17,073 | |||||||||
| Net Assets | $ | 212,677,961 | $ | 220,139,130 | $ | 26,533 | ||||||
| Composition of Net Assets: | ||||||||||||
| Paid in capital ($0 par value, unlimited shares authorized) | $ | 208,607,261 | $ | 220,856,763 | $ | 25,000 | ||||||
| Accumulated earnings (losses) | 4,070,700 | (717,633 | ) | 1,533 | ||||||||
| Net Assets | $ | 212,677,961 | $ | 220,139,130 | $ | 26,533 | ||||||
| Class N Shares: | ||||||||||||
| Net assets | $ | 212,677,950 | $ | 220,139,115 | $ | 26,533 | ||||||
| Net asset value, offering price, and redemption price per share (Net assets ÷ Total shares of beneficial interest outstanding) | $ | 10.48 | $ | 12.14 | $ | 10.61 | ||||||
| Total shares outstanding at end of period | 20,294,132 | 18,126,594 | 2,500 | |||||||||
| Class T Shares: | ||||||||||||
| Net assets | $ | 11 | $ | 15 | $ | — | ||||||
| Net asset value, offering price, and redemption price per share (Net assets ÷ Total shares of beneficial interest outstanding)** | $ | 10.48 | $ | 12.14 | $ | — | ||||||
| Total shares outstanding at end of period | 1 | 1 | — | |||||||||
| * | Includes Securities Loaned $31,427,528; $21,271,129; $0. |
| ** | NAV does not recalculate due to rounding of shares of beneficial interest outstanding. |
| 30 | Refer to the Notes to Financial Statements in this Report for further information regarding the values set forth above. |
| AdvisorOne Funds Semi-Annual Report |
Statements of Operations (Unaudited)
For the Six Months Ended October 31, 2019
| CLS Global | CLS Global | CLS | ||||||||||
| Aggressive | Diversified | Growth and | ||||||||||
| Equity Fund | Equity Fund | Income Fund | ||||||||||
| Investment Income: | ||||||||||||
| Dividend income - Unaffiliated | $ | 1,396,927 | $ | 3,298,064 | $ | 5,556,470 | ||||||
| Dividend income - Affiliated | 51,552 | 2,042,774 | 45,478 | |||||||||
| Interest income | 1,722 | 4,269 | 27,784 | |||||||||
| Securities lending income-net* | 188,566 | 217,415 | 508,851 | |||||||||
| Total investment income | 1,638,767 | 5,562,522 | 6,138,583 | |||||||||
| Expenses: | ||||||||||||
| Investment advisory fees | 551,443 | 1,626,200 | 1,544,678 | |||||||||
| Shareholder Service Fees: | ||||||||||||
| Class N | 183,814 | 542,067 | 514,892 | |||||||||
| Administration fees | 74,369 | 171,908 | 63,094 | |||||||||
| Accounting fees | 18,172 | 27,310 | 27,204 | |||||||||
| Transfer agent fees | 15,209 | 26,753 | 18,802 | |||||||||
| Printing and postage expense | 19,100 | 30,801 | 17,324 | |||||||||
| Professional fees | 14,728 | 15,152 | 16,042 | |||||||||
| Trustees’ fees | 15,908 | 15,738 | 15,757 | |||||||||
| Registration & filing fees | 18,574 | 23,453 | 21,697 | |||||||||
| Custodian fees | 6,301 | 16,792 | 17,156 | |||||||||
| Chief compliance officer fees | 3,759 | 7,960 | 6,866 | |||||||||
| Insurance expense | 8,014 | 20,880 | 17,300 | |||||||||
| Miscellaneous fees and expenses | 26 | 32 | 60 | |||||||||
| Total Expenses | 929,417 | 2,525,046 | 2,280,872 | |||||||||
| Less: Fees waived and/or expenses reimbursed by the Advisor | (10,606 | ) | — | 61,799 | ||||||||
| Net Expenses | 918,811 | 2,525,046 | 2,342,671 | |||||||||
| Net Investment Income | 719,956 | 3,037,476 | 3,795,912 | |||||||||
| Net Realized and Unrealized Gain (Loss) on Investments: | ||||||||||||
| Net realized gains on: | ||||||||||||
| Investments - Unaffiliated | 2,422,211 | 11,064,215 | 5,483,408 | |||||||||
| Total net realized gain | 2,422,211 | 11,064,215 | 5,483,408 | |||||||||
| Net change in unrealized appreciation (depreciation) on: | ||||||||||||
| Investments - Unaffiliated | (756,208 | ) | (9,603,976 | ) | (971,757 | ) | ||||||
| Investments - Affiliated | (2,429,501 | ) | 862,586 | (19,797 | ) | |||||||
| Total net change in unrealized depreciation | (3,185,709 | ) | (8,741,390 | ) | (991,554 | ) | ||||||
| Net Realized and Unrealized Gain (Loss) on Investments | (763,498 | ) | 2,322,825 | 4,491,854 | ||||||||
| Net Increase (Decrease) in Net Assets Resulting from Operations | $ | (43,542 | ) | $ | 5,360,301 | $ | 8,287,766 | |||||
| * | A portion of securities lending income is from affiliated issuer. |
| 31 | Refer to the Notes to Financial Statements in this Report for further information regarding the values set forth above. |
| AdvisorOne Funds Semi-Annual Report |
Statements of Operations (Unaudited) (Continued)
For the Six Months Ended October 31, 2019
| CLS | CLS | |||||||||||
| Flexible | CLS | Strategic Global | ||||||||||
| Income Fund | Shelter Fund | Equity Fund | ||||||||||
| Investment Income: | ||||||||||||
| Dividend income - Unaffiliated | $ | 3,609,586 | $ | 2,906,160 | $ | 325 | ||||||
| Dividend income - Affiliated | — | — | — | |||||||||
| Interest income | 88,831 | 23,466 | 7 | |||||||||
| Securities lending income-net* | 150,194 | 58,053 | — | |||||||||
| Total investment income | 3,848,611 | 2,987,679 | 332 | |||||||||
| Expenses: | ||||||||||||
| Investment advisory fees | 431,793 | 814,860 | 88 | |||||||||
| Shareholder Service Fees: | ||||||||||||
| Class N | 269,871 | 271,620 | 29 | |||||||||
| Administration fees | 104,122 | 102,370 | 3,926 | |||||||||
| Accounting fees | 20,390 | 20,302 | 2,250 | |||||||||
| Transfer agent fees | 22,515 | 4,348 | 1,334 | |||||||||
| Printing and postage expense | 18,496 | 6,345 | 1,555 | |||||||||
| Professional fees | 15,048 | 15,006 | 2,000 | |||||||||
| Trustees’ fees | 15,845 | 15,745 | 15,700 | |||||||||
| Registration & filing fees | 17,852 | 22,253 | — | |||||||||
| Custodian fees | 8,961 | 8,439 | 11,421 | |||||||||
| Chief compliance officer fees | 4,555 | 4,358 | 4,200 | |||||||||
| Insurance expense | 12,278 | 9,408 | — | |||||||||
| Miscellaneous fees and expenses | 599 | 24 | — | |||||||||
| Total Expenses | 942,325 | 1,295,078 | 42,503 | |||||||||
| Less: Fees waived and/or expenses reimbursed by the Advisor | — | — | (42,326 | ) | ||||||||
| Net Expenses | 942,325 | 1,295,078 | 177 | |||||||||
| Net Investment Income | 2,906,286 | 1,692,601 | 155 | |||||||||
| Net Realized and Unrealized Gain (Loss) on Investments: | ||||||||||||
| Net realized gains on: | ||||||||||||
| Investments - Unaffiliated | 503,482 | 8,421,916 | 367 | |||||||||
| Total net realized gain | 503,482 | 8,421,916 | 367 | |||||||||
| Net change in unrealized appreciation (depreciation) on: | ||||||||||||
| Investments - Unaffiliated | 4,119,063 | (1,646,660 | ) | 1,011 | ||||||||
| Investments - Affiliated | — | (402,633 | ) | — | ||||||||
| Total net change in unrealized appreciation (depreciation) | 4,119,063 | (2,049,293 | ) | 1,011 | ||||||||
| Net Realized and Unrealized Gain on Investments | 4,622,545 | 6,372,623 | 1,378 | |||||||||
| Net Increase in Net Assets Resulting from Operations | $ | 7,528,831 | $ | 8,065,224 | $ | 1,533 | ||||||
| * | A portion of securities lending income is from affiliated issuer. |
| 32 | Refer to the Notes to Financial Statements in this Report for further information regarding the values set forth above. |
| AdvisorOne Funds Semi-Annual Report |
Statements of Changes in Net Assets
| CLS Global Aggressive | CLS Global Diversified | |||||||||||||||
| Equity Fund | Equity Fund | |||||||||||||||
| Six Months Ended | Six Months Ended | |||||||||||||||
| October 31, 2019 | Year Ended | October 31, 2019 | Year Ended | |||||||||||||
| (Unaudited) | April 30, 2019 | (Unaudited) | April 30, 2019 | |||||||||||||
| Increase (Decrease) in Net Assets: | ||||||||||||||||
| From Operations: | ||||||||||||||||
| Net investment income | $ | 719,956 | $ | 1,779,477 | $ | 3,037,476 | $ | 6,339,607 | ||||||||
| Net realized gain on investments | 2,422,211 | 6,314,183 | 11,064,215 | 13,807,163 | ||||||||||||
| Distributions of realized gains by underlying investment companies | — | 87,221 | — | 382,720 | ||||||||||||
| Net change in unrealized depreciation on investments | (3,185,709 | ) | (6,850,037 | ) | (8,741,390 | ) | (21,282,969 | ) | ||||||||
| Net increase (decrease) in net assets resulting from operations | (43,542 | ) | 1,330,844 | 5,360,301 | (753,479 | ) | ||||||||||
| Distributions to Shareholders: | ||||||||||||||||
| Total Distributions Paid | ||||||||||||||||
| Class N | — | (13,442,665 | ) | — | (43,921,076 | ) | ||||||||||
| Class T | — | (1 | ) | — | (2 | ) | ||||||||||
| Total Dividends and Distributions to Shareholders | — | (13,442,666 | ) | — | (43,921,078 | ) | ||||||||||
| From Fund Share Transactions (Note 7) | (7,057,404 | ) | (4,097,688 | ) | (28,426,864 | ) | 36,340,552 | |||||||||
| Total Decrease in Net Assets | (7,100,946 | ) | (16,209,510 | ) | (23,066,563 | ) | (8,334,005 | ) | ||||||||
| Net Assets: | ||||||||||||||||
| Beginning of period | 154,141,172 | 170,350,682 | 452,993,229 | 461,327,234 | ||||||||||||
| End of period | $ | 147,040,226 | $ | 154,141,172 | $ | 429,926,666 | $ | 452,993,229 | ||||||||
| 33 | Refer to the Notes to Financial Statements in this Report for further information regarding the values set forth above. |
| AdvisorOne Funds Semi-Annual Report |
Statements of Changes in Net Assets (Continued)
| CLS Growth | CLS Flexible | |||||||||||||||
| and Income Fund | Income Fund | |||||||||||||||
| Six Months Ended | Six Months Ended | |||||||||||||||
| October 31, 2019 | Year Ended | October 31, 2019 | Year Ended | |||||||||||||
| (Unaudited) | April 30, 2019 | (Unaudited) | April 30, 2019 | |||||||||||||
| Increase (Decrease) in Net Assets: | ||||||||||||||||
| From Operations: | ||||||||||||||||
| Net investment income | $ | 3,795,912 | $ | 8,395,842 | $ | 2,906,286 | $ | 6,399,448 | ||||||||
| Net realized gain (loss) on investments | 5,483,408 | (229,507 | ) | 503,482 | (188,088 | ) | ||||||||||
| Distributions of realized gains by underlying investment companies | — | 275,560 | — | 72,151 | ||||||||||||
| Net change in unrealized appreciation (depreciation) on investments | (991,554 | ) | (3,146,981 | ) | 4,119,063 | 2,700,511 | ||||||||||
| Net increase (decrease) in net assets resulting from operations | 8,287,766 | 5,294,914 | 7,528,831 | 8,984,022 | ||||||||||||
| Distributions to Shareholders: | ||||||||||||||||
| Total Distributions Paid | ||||||||||||||||
| Class N | — | (21,601,305 | ) | (2,910,446 | ) | (6,514,772 | ) | |||||||||
| Class T | — | (1 | ) | — | (1 | ) | ||||||||||
| Total Dividends and Distributions to Shareholders | — | (21,601,306 | ) | (2,910,446 | ) | (6,514,773 | ) | |||||||||
| From Fund Share Transactions (Note 7) | (22,933,795 | ) | (30,252,406 | ) | (8,644,415 | ) | (21,792,258 | ) | ||||||||
| Total Decrease in Net Assets | (14,646,029 | ) | (46,558,798 | ) | (4,026,030 | ) | (19,323,009 | ) | ||||||||
| Net Assets: | ||||||||||||||||
| Beginning of period | 421,431,201 | 467,989,999 | 216,703,991 | 236,027,000 | ||||||||||||
| End of period | $ | 406,785,172 | $ | 421,431,201 | $ | 212,677,961 | $ | 216,703,991 | ||||||||
| 34 | Refer to the Notes to Financial Statements in this Report for further information regarding the values set forth above. |
| AdvisorOne Funds Semi-Annual Report |
Statements of Changes in Net Assets (Continued)
| CLS | CLS Strategic | |||||||||||||||
| Shelter Fund | Global Equity Fund | |||||||||||||||
| Six Months Ended | Period Ended | |||||||||||||||
| October 31, 2019 | Year Ended | October 31, 2019* | ||||||||||||||
| (Unaudited) | April 30, 2019 | (Unaudited) | ||||||||||||||
| Increase (Decrease) in Net Assets: | ||||||||||||||||
| From Operations: | ||||||||||||||||
| Net investment income | $ | 1,692,601 | $ | 2,419,264 | $ | 155 | ||||||||||
| Net realized gain (loss) on investments | 8,421,916 | (9,874,794 | ) | 367 | ||||||||||||
| Net change in unrealized appreciation (depreciation) on investments | (2,049,293 | ) | 9,128,043 | 1,011 | ||||||||||||
| Net increase in net assets resulting from operations | 8,065,224 | 1,672,513 | 1,533 | |||||||||||||
| Distributions to Shareholders: | ||||||||||||||||
| Total Distributions Paid | ||||||||||||||||
| Class N | — | (39,248,487 | ) | — | ||||||||||||
| Class T | — | (3 | ) | — | ||||||||||||
| Total Dividends and Distributions to Shareholders | — | (39,248,490 | ) | — | ||||||||||||
| From Fund Share Transactions (Note 7) | (7,578,192 | ) | 56,865,903 | 25,000 | ||||||||||||
| Total Increase in Net Assets | 487,032 | 19,289,926 | 26,533 | |||||||||||||
| Net Assets: | ||||||||||||||||
| Beginning of period | 219,652,098 | 200,362,172 | — | |||||||||||||
| End of Period | $ | 220,139,130 | $ | 219,652,098 | $ | 26,533 | ||||||||||
| * | Fund commenced operations May 15, 2019 |
| 35 | Refer to the Notes to Financial Statements in this Report for further information regarding the values set forth above. |
| AdvisorOne Funds Semi-Annual Report |
Financial Highlights
CLS Global Aggressive Equity Fund
Selected data based on a share outstanding throughout each period indicated.
| Class N Shares | ||||||||||||||||||||||||
| Six Months | ||||||||||||||||||||||||
| Ended | ||||||||||||||||||||||||
| October 31, | Fiscal Years Ended April 30, | |||||||||||||||||||||||
| 2019 | 2019 | 2018 | 2017 | 2016 | 2015 | |||||||||||||||||||
| (Unaudited) | ||||||||||||||||||||||||
| Net asset value, beginning of period | $ | 14.18 | $ | 15.56 | $ | 14.38 | $ | 12.26 | $ | 13.73 | $ | 13.47 | ||||||||||||
| Income (loss) from investment operations: | ||||||||||||||||||||||||
| Net investment income(a)(b) | 0.07 | 0.17 | 0.15 | 0.17 | 0.26 | 0.24 | ||||||||||||||||||
| Net realized and unrealized gain (loss) on investments | (0.05 | ) | (0.22 | ) | 1.78 | 2.29 | (1.14 | ) | 0.74 | |||||||||||||||
| Total income (loss) from investment operations | 0.02 | (0.05 | ) | 1.93 | 2.46 | (0.88 | ) | 0.98 | ||||||||||||||||
| Less distributions from: | ||||||||||||||||||||||||
| Net investment income | — | (0.23 | ) | (0.13 | ) | (0.19 | ) | (0.25 | ) | (0.22 | ) | |||||||||||||
| Net realized gains | — | (1.10 | ) | (0.62 | ) | (0.15 | ) | (0.34 | ) | (0.50 | ) | |||||||||||||
| Total distributions from net investment income and net realized gains | — | (1.33 | ) | (0.75 | ) | (0.34 | ) | (0.59 | ) | (0.72 | ) | |||||||||||||
| Net asset value, end of period | $ | 14.20 | $ | 14.18 | $ | 15.56 | $ | 14.38 | $ | 12.26 | $ | 13.73 | ||||||||||||
| Total return(c) | 0.14 | %(f) | 0.99 | % | 13.44 | % | 20.23 | % | (6.39 | )% | 7.50 | % | ||||||||||||
| Ratios and Supplemental Data: | ||||||||||||||||||||||||
| Net assets, end of period (in 000’s) | $ | 147,040 | $ | 154,141 | $ | 170,351 | $ | 159,246 | $ | 100,444 | $ | 101,201 | ||||||||||||
| Ratio of net expenses to average net assets after expense reimbursement(d) | 1.25 | %(e) | 1.16 | % | 1.15 | % | 1.15 | % | 1.15 | % | 1.15 | % | ||||||||||||
| Ratio of expenses to average net assets before waivers and reimbursements(d) | 1.26 | %(e) | 1.27 | % | 1.23 | % | 1.40 | % | 1.38 | % | 1.36 | % | ||||||||||||
| Ratio of net investment income to average net assets(b) | 0.97 | %(e) | 1.13 | % | 0.99 | % | 1.30 | % | 2.10 | % | 1.81 | % | ||||||||||||
| Portfolio turnover rate | 34 | %(f) | 17 | % | 28 | % | 32 | % | 35 | % | 50 | % | ||||||||||||
| (a) | Net investment income has been calculated using the average shares method, which more appropriately presents the per share data for the period. |
| (b) | Recognition of net investment income by the Fund is affected by the timing of the declaration of dividends by the underlying investment companies in which the Fund invests. |
| (c) | Total returns are historical and assume changes in share price, reinvestment of dividends and capital gains distributions, and assume no sales charge. Had the advisor not waived a portion of the Fund’s expenses, total returns would have been lower. |
| (d) | Does not include the expenses of the investment companies in which the Fund invests. |
| (e) | Annualized for periods less than one year. |
| (f) | Not annualized. |
| 36 | Refer to the Notes to Financial Statements in this Report for further information regarding the values set forth above. |
| AdvisorOne Funds Semi-Annual Report |
Financial Highlights
CLS Global Aggressive Equity Fund
Selected data based on a share outstanding throughout each period indicated.
| Class T Shares | ||||||||
| Six Months | Period | |||||||
| Ended | Ended | |||||||
| October 31, | April 30, | |||||||
| 2019 | 2019(a) | |||||||
| (Unaudited) | ||||||||
| Net asset value, beginning of period | $ | 14.18 | $ | 14.32 | ||||
| Income from investment operations: | ||||||||
| Net investment income(b)(c) | 0.07 | 0.10 | ||||||
| Net realized and unrealized gain on investments | (0.05 | ) | 1.09 | |||||
| Total income from investment operations | 0.02 | 1.19 | ||||||
| Less distributions from: | ||||||||
| Net investment income | — | (0.23 | ) | |||||
| Net realized gains | — | (1.10 | ) | |||||
| Total distributions from net investment income and net realized gains | — | (1.33 | ) | |||||
| Net asset value, end of period | $ | 14.20 | $ | 14.18 | ||||
| Total return(d) | 0.14 | %(f) | 9.73 | %(g) | ||||
| Ratios and Supplemental Data: | ||||||||
| Net assets, end of period | $ | 16 | $ | 16 | ||||
| Ratio of net expenses to average net assets after expense reimbursement(e) | 1.10 | %(f) | 1.01 | %(f) | ||||
| Ratio of expenses to average net assets before waivers and reimbursements(e) | 1.11 | %(f) | 1.12 | %(f) | ||||
| Ratio of net investment income to average net assets(c) | 1.13 | %(f) | 1.28 | %(f) | ||||
| Portfolio turnover rate | 34 | %(g) | 17 | %(g) | ||||
| (a) | Class T commenced operations on 12/7/18. |
| (b) | Net investment income has been calculated using the average shares method, which more appropriately presents the per share data for the period. |
| (c) | Recognition of net investment income by the Fund is affected by the timing of the declaration of dividends by the underlying investment companies in which the Fund invests. |
| (d) | Total returns are historical and assume changes in share price, reinvestment of dividends and capital gains distributions, and assume no sales charge. Had the advisor not waived a portion of the Fund’s expenses, total returns would have been lower. |
| (e) | Does not include the expenses of the investment companies in which the Fund invests. |
| (f) | Annualized for periods less than one year. |
| (g) | Not annualized. |
| 37 | Refer to the Notes to Financial Statements in this Report for further information regarding the values set forth above. |
| AdvisorOne Funds Semi-Annual Report |
Financial Highlights
CLS Global Diversified Equity Fund
Selected data based on a share outstanding throughout each period indicated.
| Class N Shares | ||||||||||||||||||||||||
| Six Months | ||||||||||||||||||||||||
| Ended | ||||||||||||||||||||||||
| October 31, | Fiscal Years Ended April 30, | |||||||||||||||||||||||
| 2019 | 2019 | 2018 | 2017 | 2016 | 2015 | |||||||||||||||||||
| (Unaudited) | ||||||||||||||||||||||||
| Net asset value, beginning of period | $ | 16.55 | $ | 18.75 | $ | 17.94 | $ | 16.15 | $ | 18.26 | $ | 17.61 | ||||||||||||
| Income (loss) from investment operations: | ||||||||||||||||||||||||
| Net investment income(a)(b) | 0.11 | 0.27 | 0.22 | 0.28 | 0.27 | 0.21 | ||||||||||||||||||
| Net realized and unrealized gain (loss) on investments | 0.12 | (0.47 | ) | 2.42 | 2.09 | (1.66 | ) | 0.95 | ||||||||||||||||
| Total income (loss) from investment operations | 0.23 | (0.20 | ) | 2.64 | 2.37 | (1.39 | ) | 1.16 | ||||||||||||||||
| Less distributions from: | ||||||||||||||||||||||||
| Net investment income | — | (0.34 | ) | (0.28 | ) | (0.49 | ) | (0.13 | ) | (0.34 | ) | |||||||||||||
| Net realized gains | — | (1.66 | ) | (1.55 | ) | (0.09 | ) | (0.59 | ) | (0.17 | ) | |||||||||||||
| Total distributions from net investment income and net realized gains | — | (2.00 | ) | (1.83 | ) | (0.58 | ) | (0.72 | ) | (0.51 | ) | |||||||||||||
| Net asset value, end of period | $ | 16.78 | $ | 16.55 | $ | 18.75 | $ | 17.94 | $ | 16.15 | $ | 18.26 | ||||||||||||
| Total return(c) | 1.39 | %(f) | 0.31 | % | 14.84 | % | 14.95 | % | (7.59 | )% | 6.68 | % | ||||||||||||
| Ratios and Supplemental Data: | ||||||||||||||||||||||||
| Net assets, end of period (in 000’s) | $ | 429,927 | $ | 452,993 | $ | 461,327 | $ | 434,938 | $ | 424,701 | $ | 567,510 | ||||||||||||
| Ratio of net expenses to average net assets after expense reimbursement/recapture(d) | 1.16 | %(e) | 1.15 | % | 1.15 | % | 1.15 | % | 1.15 | % | 1.15 | % | ||||||||||||
| Ratio of expenses to average net assets before waivers and reimbursements/recapture(d) | 1.16 | %(e) | 1.16 | % | 1.13 | % | 1.20 | % | 1.19 | % | 1.17 | % | ||||||||||||
| Ratio of net investment income to average net assets(b) | 1.40 | %(e) | 1.52 | % | 1.15 | % | 1.64 | % | 1.59 | % | 1.19 | % | ||||||||||||
| Portfolio turnover rate | 17 | %(f) | 35 | % | 24 | % | 41 | % | 58 | % | 33 | % | ||||||||||||
| (a) | Net investment income has been calculated using the average shares method, which more appropriately presents the per share data for the period. |
| (b) | Recognition of net investment income by the Fund is affected by the timing of the declaration of dividends by the underlying investment companies in which the Fund invests. |
| (c) | Total returns are historical and assume changes in share price, reinvestment of dividends and capital gains distributions, and assume no sales charge. Had the advisor not waived a portion of the Fund’s expenses, total returns would have been lower. |
| (d) | Does not include the expenses of the investment companies in which the Fund invests. |
| (e) | Annualized for periods less than one year. |
| (f) | Not annualized. |
| 38 | Refer to the Notes to Financial Statements in this Report for further information regarding the values set forth above. |
| AdvisorOne Funds Semi-Annual Report |
Financial Highlights
CLS Global Diversified Equity Fund
Selected data based on a share outstanding throughout each period indicated.
| Class T Shares | ||||||||
| Six Months | Period | |||||||
| Ended | Ended | |||||||
| October 31, | April 30, | |||||||
| 2019 | 2019(a) | |||||||
| (Unaudited) | ||||||||
| Net asset value, beginning of period | $ | 16.55 | $ | 17.34 | ||||
| Income from investment operations: | ||||||||
| Net investment income(b)(c) | 0.11 | 0.15 | ||||||
| Net realized and unrealized gain on investments | 0.12 | 1.06 | ||||||
| Total income from investment operations | 0.23 | 1.21 | ||||||
| Less distributions from: | ||||||||
| Net investment income | — | (0.34 | ) | |||||
| Net realized gains | — | (1.66 | ) | |||||
| Total distributions from net investment income and net realized gains | — | (2.00 | ) | |||||
| Net asset value, end of period | $ | 16.78 | $ | 16.55 | ||||
| Total return(d) | 1.39 | %(g) | 8.49 | %(g) | ||||
| Ratios and Supplemental Data: | ||||||||
| Net assets, end of period | $ | 19 | $ | 19 | ||||
| Ratio of net expenses to average net assets after expense reimbursement(e) | 1.01 | %(f) | 1.00 | %(f) | ||||
| Ratio of expenses to average net assets before waivers and reimbursements(e) | 1.01 | %(f) | 1.03 | %(f) | ||||
| Ratio of net investment income to average net assets(c) | 1.55 | %(f) | 2.75 | %(f) | ||||
| Portfolio turnover rate | 17 | %(g) | 35 | %(g) | ||||
| (a) | Class T commenced operations on 12/7/18. |
| (b) | Net investment income has been calculated using the average shares method, which more appropriately presents the per share data for the period. |
| (c) | Recognition of net investment income by the Fund is affected by the timing of the declaration of dividends by the underlying investment companies in which the Fund invests. |
| (d) | Total returns are historical and assume changes in share price, reinvestment of dividends and capital gains distributions, and assume no sales charge. Had the advisor not waived a portion of the Fund’s expenses, total returns would have been lower. |
| (e) | Does not include the expenses of the investment companies in which the Fund invests. |
| (f) | Annualized for periods less than one year. |
| (g) | Not annualized. |
| 39 | Refer to the Notes to Financial Statements in this Report for further information regarding the values set forth above. |
| AdvisorOne Funds Semi-Annual Report |
Financial Highlights
CLS Growth and Income Fund
Selected data based on a share outstanding throughout each period indicated.
| Class N Shares | ||||||||||||||||||||||||
| Six Months | ||||||||||||||||||||||||
| Ended | ||||||||||||||||||||||||
| October 31, | Fiscal Years Ended April 30, | |||||||||||||||||||||||
| 2019 | 2019 | 2018 | 2017 | 2016 | 2015 | |||||||||||||||||||
| (Unaudited) | ||||||||||||||||||||||||
| Net asset value, beginning of period | $ | 10.90 | $ | 11.35 | $ | 11.12 | $ | 10.55 | $ | 10.99 | $ | 10.82 | ||||||||||||
| Income (loss) from investment operations: | ||||||||||||||||||||||||
| Net investment income(a)(b) | 0.10 | 0.21 | 0.16 | 0.19 | 0.15 | 0.14 | ||||||||||||||||||
| Net realized and unrealized gain (loss) on investments | 0.13 | (0.09 | ) | 0.68 | 0.61 | (0.40 | ) | 0.22 | ||||||||||||||||
| Total income (loss) from investment operations | 0.23 | 0.12 | 0.84 | 0.80 | (0.25 | ) | 0.36 | |||||||||||||||||
| Less distributions from: | ||||||||||||||||||||||||
| Net investment income | — | (0.19 | ) | (0.18 | ) | (0.21 | ) | (0.13 | ) | (0.11 | ) | |||||||||||||
| Net realized gains | — | (0.38 | ) | (0.43 | ) | (0.02 | ) | (0.06 | ) | (0.08 | ) | |||||||||||||
| Total distributions from net investment income and net realized gains | — | (0.57 | ) | (0.61 | ) | (0.23 | ) | (0.19 | ) | (0.19 | ) | |||||||||||||
| Net asset value, end of period | $ | 11.13 | $ | 10.90 | $ | 11.35 | $ | 11.12 | $ | 10.55 | $ | 10.99 | ||||||||||||
| Total return(c) | 2.11 | %(f) | 1.51 | % | 7.55 | % | 7.68 | % | (2.14 | )% | 3.31 | % | ||||||||||||
| Ratios and Supplemental Data: | ||||||||||||||||||||||||
| Net assets, end of period (in 000’s) | $ | 406,785 | $ | 421,431 | $ | 467,990 | $ | 445,759 | $ | 365,609 | $ | 423,486 | ||||||||||||
| Ratio of net expenses to average net assets after expense reimbursement/recapture(d) | 1.13 | %(e) | 1.15 | % | 1.15 | % | 1.15 | % | 1.15 | % | 1.15 | % | ||||||||||||
| Ratio of expenses to average net assets before waivers and reimbursements/recapture(d) | 1.10 | %(e) | 1.16 | % | 1.14 | % | 1.21 | % | 1.19 | % | 1.19 | % | ||||||||||||
| Ratio of net investment income to average net assets(b) | 1.83 | %(e) | 1.93 | % | 1.38 | % | 1.75 | % | 1.42 | % | 1.33 | % | ||||||||||||
| Portfolio turnover rate | 18 | %(f) | 28 | % | 23 | % | 45 | % | 56 | % | 31 | % | ||||||||||||
| (a) | Net investment income has been calculated using the average shares method, which more appropriately presents the per share data for the period. |
| (b) | Recognition of net investment income by the Fund is affected by the timing of the declaration of dividends by the underlying investment companies in which the Fund invests. |
| (c) | Total returns are historical and assume changes in share price, reinvestment of dividends and capital gains distributions, and assume no sales charge. Had the advisor not waived a portion of the Fund’s expenses, total returns would have been lower. |
| (d) | Does not include the expenses of the investment companies in which the Fund invests. |
| (e) | Annualized for periods less than one year. |
| (f) | Not annualized. |
| 40 | Refer to the Notes to Financial Statements in this Report for further information regarding the values set forth above. |
| AdvisorOne Funds Semi-Annual Report |
Financial Highlights
CLS Growth and Income Fund
Selected data based on a share outstanding throughout each period indicated.
| Class T Shares | ||||||||
| Six Months | Period | |||||||
| Ended | Ended | |||||||
| October 31, | April 30, | |||||||
| 2019 | 2019(a) | |||||||
| (Unaudited) | ||||||||
| Net asset value, beginning of period | $ | 10.90 | $ | 10.83 | ||||
| Income from investment operations: | ||||||||
| Net investment income(b)(c) | 0.09 | 0.09 | ||||||
| Net realized and unrealized gain on investments | 0.14 | 0.55 | ||||||
| Total income from investment operations | 0.23 | 0.64 | ||||||
| Less distributions from: | ||||||||
| Net investment income | — | (0.19 | ) | |||||
| Net realized gains | — | (0.38 | ) | |||||
| Total distributions from net investment income and net realized gains | — | (0.57 | ) | |||||
| Net asset value, end of period | $ | 11.13 | $ | 10.90 | ||||
| Total return(d) | 2.11 | %(g) | 6.38 | %(g) | ||||
| Ratios and Supplemental Data: | ||||||||
| Net assets, end of period | $ | 12 | $ | 11 | ||||
| Ratio of net expenses to average net assets after expense reimbursement(e) | 0.98 | %(f) | 1.00 | %(f) | ||||
| Ratio of expenses to average net assets before waivers and reimbursements(e) | 0.98 | %(f) | 1.02 | %(f) | ||||
| Ratio of net investment income to average net assets(c) | 1.98 | %(f) | 2.19 | %(f) | ||||
| Portfolio turnover rate | 18 | %(g) | 28 | %(g) | ||||
| (a) | Class T commenced operations on 12/7/18. |
| (b) | Net investment income has been calculated using the average shares method, which more appropriately presents the per share data for the period. |
| (c) | Recognition of net investment income by the Fund is affected by the timing of the declaration of dividends by the underlying investment companies in which the Fund invests. |
| (d) | Total returns are historical and assume changes in share price, reinvestment of dividends and capital gains distributions, and assume no sales charge. Had the advisor not waived a portion of the Fund’s expenses, total returns would have been lower. |
| (e) | Does not include the expenses of the investment companies in which the Fund invests. |
| (f) | Annualized for periods less than one year. |
| (g) | Not annualized. |
| 41 | Refer to the Notes to Financial Statements in this Report for further information regarding the values set forth above. |
| AdvisorOne Funds Semi-Annual Report |
Financial Highlights
CLS Flexible Income Fund
Selected data based on a share outstanding throughout each period indicated.
| Class N Shares | ||||||||||||||||||||||||
| Six Months | ||||||||||||||||||||||||
| Ended | ||||||||||||||||||||||||
| October 31, | Fiscal Years Ended April 30, | |||||||||||||||||||||||
| 2019 | 2019 | 2018 | 2017 | 2016 | 2015 | |||||||||||||||||||
| (Unaudited) | ||||||||||||||||||||||||
| Net asset value, beginning of period | $ | 10.26 | $ | 10.13 | $ | 10.28 | $ | 10.18 | $ | 10.35 | $ | 10.40 | ||||||||||||
| Income (loss) from investment operations: | ||||||||||||||||||||||||
| Net investment income(a)(b) | 0.14 | 0.29 | 0.24 | 0.24 | 0.24 | 0.23 | ||||||||||||||||||
| Net realized and unrealized gain (loss) on investments | 0.22 | 0.13 | (0.15 | ) | 0.11 | (0.17 | ) | (0.05 | ) | |||||||||||||||
| Total income (loss) from investment operations | 0.36 | 0.42 | 0.09 | 0.35 | 0.07 | 0.18 | ||||||||||||||||||
| Less distributions from: | ||||||||||||||||||||||||
| Net investment income | (0.14 | ) | (0.29 | ) | (0.24 | ) | (0.25 | ) | (0.24 | ) | (0.23 | ) | ||||||||||||
| Total distributions from net investment income and net realized gains | (0.14 | ) | (0.29 | ) | (0.24 | ) | (0.25 | ) | (0.24 | ) | (0.23 | ) | ||||||||||||
| Net asset value, end of period | $ | 10.48 | $ | 10.26 | $ | 10.13 | $ | 10.28 | $ | 10.18 | $ | 10.35 | ||||||||||||
| Total return(c) | 3.54 | %(f) | 4.29 | % | 0.86 | % | 3.48 | % | 0.71 | % | 1.75 | % | ||||||||||||
| Ratios and Supplemental Data: | ||||||||||||||||||||||||
| Net assets, end of period (in 000’s) | $ | 212,678 | $ | 216,704 | $ | 236,027 | $ | 228,142 | $ | 194,603 | $ | 197,700 | ||||||||||||
| Ratio of net expenses to average net assets after expense reimbursement(d) | 0.87 | %(e) | 0.81 | % | 0.80 | % | 0.80 | % | 0.80 | % | 0.80 | % | ||||||||||||
| Ratio of expenses to average net assets before waivers and reimbursements(d) | 0.87 | %(e) | 0.88 | % | 0.86 | % | 0.99 | % | 0.94 | % | 0.93 | % | ||||||||||||
| Ratio of net investment income to average net assets(b) | 2.69 | %(e) | 2.86 | % | 2.32 | % | �� | 2.35 | % | 2.33 | % | 2.24 | % | |||||||||||
| Portfolio turnover rate | 6 | %(f) | 22 | % | 13 | % | 9 | % | 19 | % | 5 | % | ||||||||||||
| (a) | Net investment income has been calculated using the average shares method, which more appropriately presents the per share data for the period. |
| (b) | Recognition of net investment income by the Fund is affected by the timing of the declaration of dividends by the underlying investment companies in which the Fund invests. |
| (c) | Total returns are historical and assume changes in share price, reinvestment of dividends and capital gains distributions, and assume no sales charge. Had the advisor not waived a portion of the Fund’s expenses, total returns would have been lower. |
| (d) | Does not include the expenses of the investment companies in which the Fund invests. |
| (e) | Annualized for periods less than one year. |
| (f) | Not annualized. |
| 42 | Refer to the Notes to Financial Statements in this Report for further information regarding the values set forth above. |
| AdvisorOne Funds Semi-Annual Report |
Financial Highlights
CLS Flexible Income Fund
Selected data based on a share outstanding throughout each period indicated.
| Class T Shares | ||||||||
| Six Months | Period | |||||||
| Ended | Ended | |||||||
| October 31, | April 30, | |||||||
| 2019 | 2019(a) | |||||||
| (Unaudited) | ||||||||
| Net asset value, beginning of period | $ | 10.26 | $ | 9.93 | ||||
| Income from investment operations: | ||||||||
| Net investment income(b)(c) | 0.11 | 0.11 | ||||||
| Net realized and unrealized gain on investments | 0.25 | 0.35 | ||||||
| Total income from investment operations | 0.36 | 0.46 | ||||||
| Less distributions from: | ||||||||
| Net investment income | (0.14 | ) | (0.13 | ) | ||||
| Total distributions from net investment income and net realized gains | (0.14 | ) | (0.13 | ) | ||||
| Net asset value, end of period | $ | 10.48 | $ | 10.26 | ||||
| Total return(d) | 3.50 | %(g) | 4.68 | %(g) | ||||
| Ratios and Supplemental Data: | ||||||||
| Net assets, end of period | $ | 11 | $ | 10 | ||||
| Ratio of net expenses to average net assets after expense reimbursement(e) | 0.72 | %(f) | 0.67 | %(f) | ||||
| Ratio of expenses to average net assets before waivers and reimbursements(e) | 0.72 | %(f) | 0.75 | %(f) | ||||
| Ratio of net investment income to average net assets(c) | 2.84 | %(f) | 2.95 | %(f) | ||||
| Portfolio turnover rate | 6 | %(g) | 22 | %(g) | ||||
| (a) | Class T commenced operations on 12/7/18. |
| (b) | Net investment income has been calculated using the average shares method, which more appropriately presents the per share data for the period. |
| (c) | Recognition of net investment income by the Fund is affected by the timing of the declaration of dividends by the underlying investment companies in which the Fund invests. |
| (d) | Total returns are historical and assume changes in share price, reinvestment of dividends and capital gains distributions, and assume no sales charge. Had the advisor not waived a portion of the Fund’s expenses, total returns would have been lower. |
| (e) | Does not include the expenses of the investment companies in which the Fund invests. |
| (f) | Annualized for periods less than one year. |
| (g) | Not annualized. |
| 43 | Refer to the Notes to Financial Statements in this Report for further information regarding the values set forth above. |
| AdvisorOne Funds Semi-Annual Report |
Financial Highlights
CLS Shelter Fund
Selected data based on a share outstanding throughout each period indicated.
| Class N Shares | ||||||||||||||||||||||||
| Six Months | ||||||||||||||||||||||||
| Ended | ||||||||||||||||||||||||
| October 31, | Fiscal Years Ended April 30, | |||||||||||||||||||||||
| 2019 | 2019 | 2018 | 2017 | 2016 | 2015 | |||||||||||||||||||
| (Unaudited) | ||||||||||||||||||||||||
| Net asset value, beginning of period | $ | 11.70 | $ | 14.51 | $ | 13.10 | $ | 11.65 | $ | 13.35 | $ | 12.21 | ||||||||||||
| Income (loss) from investment operations: | ||||||||||||||||||||||||
| Net investment income(a)(b) | 0.09 | 0.15 | 0.16 | 0.10 | 0.15 | 0.13 | ||||||||||||||||||
| Net realized and unrealized gain (loss) on investments | 0.35 | (0.31 | ) | 1.56 | 1.64 | (0.75 | ) | 1.10 | ||||||||||||||||
| Total income (loss) from investment operations | 0.44 | (0.16 | ) | 1.72 | 1.74 | (0.60 | ) | 1.23 | ||||||||||||||||
| Less distributions from: | ||||||||||||||||||||||||
| Net investment income | — | — | (0.16 | ) | (0.11 | ) | (0.22 | ) | (0.09 | ) | ||||||||||||||
| Net realized gains | — | (2.65 | ) | (0.15 | ) | (0.18 | ) | (0.88 | ) | — | ||||||||||||||
| Total distributions from net investment income and net realized gains | — | (2.65 | ) | (0.31 | ) | (0.29 | ) | (1.10 | ) | (0.09 | ) | |||||||||||||
| Net asset value, end of period | $ | 12.14 | $ | 11.70 | $ | 14.51 | $ | 13.10 | $ | 11.65 | $ | 13.35 | ||||||||||||
| Total return(c) | 3.76 | %(f) | 0.81 | % | 13.11 | % | 15.11 | % | (4.43 | )% | 10.11 | % | ||||||||||||
| Ratios and Supplemental Data: | ||||||||||||||||||||||||
| Net assets, end of period (in 000’s) | $ | 220,139 | $ | 219,652 | $ | 200,362 | $ | 129,378 | $ | 94,329 | $ | 98,241 | ||||||||||||
| Ratio of net expenses to average net assets after expense reimbursement(d) | 1.19 | %(e) | 1.16 | % | 1.15 | % | 1.15 | % | 1.15 | % | 1.15 | % | ||||||||||||
| Ratio of expenses to average net assets before waivers and reimbursements(d) | 1.19 | %(e) | 1.20 | % | 1.18 | % | 1.24 | % | 1.24 | % | 1.27 | % | ||||||||||||
| Ratio of net investment income to average net assets(b) | 1.55 | %(e) | 1.15 | % | 1.14 | % | 0.83 | % | 1.19 | % | 0.99 | % | ||||||||||||
| Portfolio turnover rate | 153 | %(f) | 316 | % | 172 | % | 147 | % | 346 | % | 106 | % | ||||||||||||
| (a) | Net investment income has been calculated using the average shares method, which more appropriately presents the per share data for the period. |
| (b) | Recognition of net investment income by the Fund is affected by the timing of the declaration of dividends by the underlying investment companies in which the Fund invests. |
| (c) | Total returns are historical and assume changes in share price, reinvestment of dividends and capital gains distributions, and assume no sales charge. Had the advisor not waived a portion of the Fund’s expenses, total returns would have been lower. |
| (d) | Does not include the expenses of the investment companies in which the Fund invests. |
| (e) | Annualized for periods less than one year. |
| (f) | Not annualized. |
| 44 | Refer to the Notes to Financial Statements in this Report for further information regarding the values set forth above. |
| AdvisorOne Funds Semi-Annual Report |
Financial Highlights
CLS Shelter Fund
Selected data based on a share outstanding throughout each period indicated.
| Class T Shares | ||||||||
| Six Months | Period | |||||||
| Ended | Ended | |||||||
| October 31, | April 30, | |||||||
| 2019 | 2019(a) | |||||||
| (Unaudited) | ||||||||
| Net asset value, beginning of period | $ | 11.70 | $ | 13.95 | ||||
| Income from investment operations: | ||||||||
| Net investment income(b)(c) | 0.06 | 0.06 | ||||||
| Net realized and unrealized gain on investments | 0.38 | 0.34 | ||||||
| Total income from investment operations | 0.44 | 0.40 | ||||||
| Less distributions from: | ||||||||
| Net realized gains | — | (2.65 | ) | |||||
| Total distributions from net investment income and net realized gains | — | (2.65 | ) | |||||
| Net asset value, end of period | $ | 12.14 | $ | 11.70 | ||||
| Total return(d) | 3.76 | %(g) | 4.84 | %(g) | ||||
| Ratios and Supplemental Data: | ||||||||
| Net assets, end of period | $ | 15 | $ | 15 | ||||
| Ratio of net expenses to average net assets after expense reimbursement(e) | 1.04 | %(f) | 1.02 | %(f) | ||||
| Ratio of expenses to average net assets before waivers and reimbursements(e) | 1.04 | %(f) | 1.07 | %(f) | ||||
| Ratio of net investment income to average net assets(c) | 1.70 | %(f) | 1.46 | %(f) | ||||
| Portfolio turnover rate | 153 | %(g) | 316 | %(g) | ||||
| (a) | Class T commenced operations on 12/7/18. |
| (b) | Net investment income has been calculated using the average shares method, which more appropriately presents the per share data for the period. |
| (c) | Recognition of net investment income by the Fund is affected by the timing of the declaration of dividends by the underlying investment companies in which the Fund invests. |
| (d) | Total returns are historical and assume changes in share price, reinvestment of dividends and capital gains distributions, and assume no sales charge. Had the advisor not waived a portion of the Fund’s expenses, total returns would have been lower. |
| (e) | Does not include the expenses of the investment companies in which the Fund invests. |
| (f) | Annualized for periods less than one year. |
| (g) | Not annualized. |
| 45 | Refer to the Notes to Financial Statements in this Report for further information regarding the values set forth above. |
| AdvisorOne Funds Semi-Annual Report |
Financial Highlights
CLS Strategic Global Equity Fund
Selected data based on a share outstanding throughout each period indicated.
| Class N Shares | ||||
| Period | ||||
| Ended | ||||
| October 31, | ||||
| 2019(a) | ||||
| Net asset value, beginning of period | $ | 10.00 | ||
| Income from investment operations: | ||||
| Net investment income(b)(c) | 0.06 | |||
| Net realized and unrealized gain on investments | 0.55 | |||
| Total income from investment operations | 0.61 | |||
| Net asset value, end of period | $ | 10.61 | ||
| Total return(d) | 6.10 | %(g) | ||
| Ratios and Supplemental Data: | ||||
| Net assets, end of period (in 000’s) | $ | 27 | ||
| Ratio of net expenses to average net assets after expense reimbursement(e) | 1.50 | %(f) | ||
| Ratio of expenses to average net assets before waivers and reimbursements(e) | 359.83 | %(f) | ||
| Ratio of net investment income to average net assets(c) | 1.31 | %(f) | ||
| Portfolio turnover rate | 2 | %(g) | ||
| (a) | Class N commenced operations on 5/15/19. |
| (b) | Net investment income has been calculated using the average shares method, which more appropriately presents the per share data for the period. |
| (c) | Recognition of net investment income by the Fund is affected by the timing of the declaration of dividends by the underlying investment companies in which the Fund invests. |
| (d) | Total returns are historical and assume changes in share price, reinvestment of dividends and capital gains distributions, and assume no sales charge. Had the advisor not waived a portion of the Fund’s expenses, total returns would have been lower. |
| (e) | Does not include the expenses of the investment companies in which the Fund invests. |
| (f) | Annualized for periods less than one year. |
| (g) | Not annualized. |
| 46 | Refer to the Notes to Financial Statements in this Report for further information regarding the values set forth above. |
| AdvisorOne Funds Semi-Annual Report |
Notes to Financial Statements (Unaudited)
October 31, 2019
| 1. | Organization |
AdvisorOne Funds (the “Trust” or the “Funds”) was organized as a Delaware Business Trust in December 1996 and is registered under the Investment Company Act of 1940 (the “1940 Act”), as amended, as an open-end management investment company. The CLS Global Aggressive Equity Fund, CLS Global Diversified Equity Fund, CLS Growth and Income Fund, CLS Flexible Income Fund, CLS Shelter Fund, and CLS Strategic Global Equity Fund, collectively the “Funds” and each individually a “Fund” are each a diversified series of the Trust. The Funds each offer an unlimited number of shares of beneficial interest without par value. Each Fund offers Class N shares, and CLS Global Aggressive Equity Fund, CLS Global Diversified Equity Fund, CLS Growth and Income Fund, CLS Flexible Income Fund and CLS Shelter Fund offer Class T shares.
| Fund | The primary investment objective of each Fund is as follows: |
| CLS Global Aggressive Equity Fund | Long-term growth |
| CLS Global Diversified Equity Fund | Long-term growth of capital without regard to current income |
| CLS Growth and Income Fund | Combination of current income and growth of capital |
| CLS Flexible Income Fund | Total return, consisting of capital growth and income, consistent with preservation of capital |
| CLS Shelter Fund | Limiting the impact of large equity market declines. The Fund’s secondary investment objective is growth of capital. |
| CLS Strategic Global Equity Fund | Long-term growth of capital |
| 2. | Summary of Significant Accounting Policies |
The following is a summary of significant accounting policies followed by the Funds in the preparation of their financial statements. These policies are in conformity with accounting principles generally accepted in the United States of America (“GAAP”). The preparation of financial statements requires management to make estimates and assumptions that affect the reported amounts of assets and liabilities and disclosure of contingent assets and liabilities at the date of the financial statements and the reported amounts of income and expenses for the year. The Funds are investment companies and accordingly follow the investment companies accounting and reporting guidance of the Financial Accounting Standards Board (“FASB”) Accounting Standards Codification Topic 946 “Financial Services – Investment Companies” including FASB Accounting Standards Update (“ASU”) 2013-08.
Security Valuation – Securities listed on an exchange are valued at the last reported sale price at the close of the regular trading session of the exchange on the business day the value is being determined, or in the case of securities listed on NASDAQ at the NASDAQ Official Closing Price. In the absence of a sale, such securities shall be valued at the mean between the current bid and
47
| AdvisorOne Funds Semi-Annual Report |
| Notes to Financial Statements (Unaudited) (Continued) |
| October 31, 2019 |
ask prices on the primary exchange on the day of valuation. Short-term investments that mature in 60 days or less may be valued at amortized cost, provided such valuations represent fair value. Under the amortized cost method, a portfolio instrument is valued at cost and any premium or discount is amortized to maturity. Amortization of premium and accretion of market discount are charged to income. Debt securities (other than short-term obligations) are valued each day by an independent pricing service approved by the Trust’s Board of Trustees (the “Board”) based on methods which include consideration of: yields or prices of securities of comparable quality, coupon, maturity and type, indications as to values from dealers, and general market conditions or market quotations from a major market maker in the securities.
The Funds may hold securities, such as private investments, interests in commodity pools, other non-traded securities or temporarily illiquid securities, for which market quotations are not readily available or are determined to be unreliable. These securities will be valued using the “fair value” procedures approved by the Board. The Board has delegated execution of these procedures to a fair value committee composed of one or more representatives from each of the (i) Trust, (ii) administrator, and (iii) advisor. The committee may also enlist third party consultants such as a valuation specialist at a public accounting firm, valuation consultant or financial officer of a security issuer on an as-needed basis to assist in determining a security-specific fair value. The Board reviews and ratifies the execution of this process and the resultant fair value prices at least quarterly to assure the process produces reliable results.
Fair Valuation Process – As noted above, the fair value committee is composed of one or more representatives from each of the (i) Trust, (ii) administrator, and (iii) advisor. The applicable investments are valued collectively via inputs from each of these groups. For example, fair value determinations are required for the following securities: (i) securities for which market quotations are insufficient or not readily available on a particular business day (including securities for which there is a short and temporary lapse in the provision of a price by the regular pricing source), (ii) securities for which, in the judgment of the advisor, the prices or values available do not represent the fair value of the instrument. Factors which may cause the advisor to make such a judgment include, but are not limited to, the following: only a bid price or an ask price is available; the spread between bid and ask prices is substantial; the frequency of sales; the thinness of the market; the size of reported trades; and actions of the securities markets, such as the suspension or limitation of trading; (iii) securities determined to be illiquid; (iv) securities with respect to which an event that will affect the value thereof has occurred (a “significant event”) since the closing prices were established on the principal exchange on which they are traded, but prior to a Fund’s calculation of its net asset value. Specifically, interests in commodity pools or managed futures pools are valued on a daily basis by reference to the closing market prices of each futures contract or other asset held by a pool, as adjusted for pool expenses. Restricted or illiquid securities, such as private placements or non-traded securities are valued via inputs from the advisor based upon
48
| AdvisorOne Funds Semi-Annual Report |
| Notes to Financial Statements (Unaudited) (Continued) |
| October 31, 2019 |
the current bid for the security from two or more independent dealers or other parties reasonably familiar with the facts and circumstances of the security (who should take into consideration all relevant factors as may be appropriate under the circumstances). If the advisor is unable to obtain a current bid from such independent dealers or other independent parties, the fair value team shall determine the fair value of such security using the following factors: (i) the type of security; (ii) the cost at date of purchase; (iii) the size and nature of a Fund’s holdings; (iv) the discount from market value of unrestricted securities of the same class at the time of purchase and subsequent thereto; (v) information as to any transactions or offers with respect to the security; (vi) the nature and duration of restrictions on disposition of the security and the existence of any registration rights; (vii) how the yield of the security compares to similar securities of companies of similar or equal creditworthiness; (viii) the level of recent trades of similar or comparable securities; (ix) the liquidity characteristics of the security; (x) current market conditions; and (xi) the market value of any securities into which the security is convertible or exchangeable.
Valuation of Fund of Funds — The Funds may invest in portfolios of open-end or closed-end investment companies (the “Underlying Funds”). The Underlying Funds value securities in their portfolios for which market quotations are readily available at their market values (generally the last reported sale price) and all other securities and assets at their fair value to the methods established by the board of directors of the Underlying Funds.
Open-end investment companies are valued at their respective net asset values as reported by such investment companies. The shares of many closed-end investment companies, after their initial public offering, frequently trade at a price per share that is different than the net asset value per share. The difference represents a market premium or market discount of such shares. There can be no assurances that the market discount or market premium on shares of any closed-end investment company purchased by their Funds will not change.
The Funds utilize various methods to measure the fair value of all of its investments on a recurring basis. GAAP establishes a hierarchy that prioritizes inputs to valuation methods. The three levels of input are:
Level 1 – Unadjusted quoted prices in active markets for identical assets and liabilities that a Fund has the ability to access.
Level 2 – Observable inputs other than quoted prices included in Level 1 that are observable for the asset or liability, either directly or indirectly. These inputs may include quoted prices for the identical instrument in an inactive market, prices for similar instruments, interest rates, prepayment speeds, credit risk, yield curves, default rates and similar data.
49
| AdvisorOne Funds Semi-Annual Report |
Notes to Financial Statements (Unaudited) (Continued)
October 31, 2019
Level 3 – Unobservable inputs for the asset or liability, to the extent relevant observable inputs are not available, representing a Fund’s own assumptions about the assumptions a market participant would use in valuing the asset or liability, and would be based on the best information available.
The availability of observable inputs can vary from security to security and is affected by a wide variety of factors, including, for example, the type of security, whether the security is new and not yet established in the marketplace, the liquidity of markets, and other characteristics particular to the security. To the extent that valuation is based on models or inputs that are less observable or unobservable in the market, the determination of fair value requires more judgment.
Accordingly, the degree of judgment exercised in determining fair value is greatest for instruments categorized in Level 3.
The inputs used to measure fair value may fall into different levels of the fair value hierarchy. In such cases, for disclosure purposes, the level in the fair value hierarchy within which the fair value measurement falls in its entirety, is determined based on the lowest level input that is significant to the fair value measurement in its entirety.
The inputs or methodology used for valuing securities are not necessarily an indication of the risk associated with investing in those securities. The following table summarizes the inputs used as of October 31, 2019 for the Funds’ investments measured at fair value:
CLS Global Aggressive Equity Fund
| Assets* | Level 1 | Level 2 | Level 3 | Total | ||||||||||||
| Equity Funds | $ | 147,174,545 | $ | — | $ | — | $ | 147,174,545 | ||||||||
| Money Market Funds | 66,394 | — | — | 66,394 | ||||||||||||
| Collateral for Securities Loaned | 23,836,641 | — | — | 23,836,641 | ||||||||||||
| Total | $ | 171,077,580 | $ | — | $ | — | $ | 171,077,580 | ||||||||
CLS Global Diversified Equity Fund
| Assets* | Level 1 | Level 2 | Level 3 | Total | ||||||||||||
| Equity Funds | $ | 430,476,200 | $ | — | $ | — | $ | 430,476,200 | ||||||||
| Money Market Funds | 308,733 | — | — | 308,733 | ||||||||||||
| Collateral for Securities Loaned | 28,197,473 | — | — | 28,197,473 | ||||||||||||
| Total | $ | 458,982,406 | $ | — | $ | — | $ | 458,982,406 | ||||||||
50
| AdvisorOne Funds Semi-Annual Report |
Notes to Financial Statements (Unaudited) (Continued)
October 31, 2019
CLS Growth and Income Fund
| Assets* | Level 1 | Level 2 | Level 3 | Total | ||||||||||||
| Bond Funds | $ | 152,058,434 | $ | — | $ | — | $ | 152,058,434 | ||||||||
| Equity Funds | 246,920,136 | — | — | 246,920,136 | ||||||||||||
| Money Market Funds | 8,088,658 | — | — | 8,088,658 | ||||||||||||
| Collateral for Securities Loaned | 41,321,360 | — | 41,321,360 | |||||||||||||
| Total | $ | 448,388,588 | $ | — | $ | — | $ | 448,388,588 | ||||||||
CLS Flexible Income Fund
| Assets* | Level 1 | Level 2 | Level 3 | Total | ||||||||||||
| Bond Funds | $ | 173,989,774 | $ | — | $ | — | $ | 173,989,774 | ||||||||
| Equity Funds | 33,378,973 | — | — | 33,378,973 | ||||||||||||
| U.S. Government & Agency Obligations | — | 5,057,112 | — | 5,057,112 | ||||||||||||
| Money Market Funds | 664,418 | — | — | 664,418 | ||||||||||||
| Collateral for Securities Loaned | 25,672,519 | — | — | 25,672,519 | ||||||||||||
| Total | $ | 233,705,684 | $ | 5,057,112 | $ | — | $ | 238,762,796 | ||||||||
CLS Shelter Fund
| Assets* | Level 1 | Level 2 | Level 3 | Total | ||||||||||||
| Equity Funds | $ | 219,347,472 | $ | — | $ | — | $ | 219,347,472 | ||||||||
| Money Market Funds | 1,493,079 | — | — | 1,493,079 | ||||||||||||
| Collateral for Securities Loaned | 21,775,988 | — | — | 21,775,988 | ||||||||||||
| Total | $ | 242,616,539 | $ | — | $ | — | $ | 242,616,539 | ||||||||
CLS Strategic Global Equity Fund
| Assets* | Level 1 | Level 2 | Level 3 | Total | ||||||||||||
| Equity Funds | $ | 26,858 | $ | — | $ | — | $ | 26,858 | ||||||||
| Money Market Funds | 9 | — | — | 9 | ||||||||||||
| Total | $ | 26,867 | $ | — | $ | — | $ | 26,867 | ||||||||
The Funds did not hold any Level 3 securities during the period.
| * | Refer to the Schedules of Investments for security classifications. |
51
| AdvisorOne Funds Semi-Annual Report |
Notes to Financial Statements (Unaudited) (Continued)
October 31, 2019
Exchange Traded Funds
The Funds may invest in exchange traded funds (“ETFs”). ETFs are a type of fund bought and sold on a securities exchange. An ETF trades like common stock and may be actively managed or represent a fixed portfolio of securities. A Fund may purchase an ETF to temporarily gain exposure to a portion of the U.S. or a foreign market while awaiting purchase of underlying securities. The risks of owning an ETF generally reflect the risks of owning the underlying securities they are designed to track, although the lack of liquidity on an ETF could result in it being more volatile. Additionally, ETFs have fees and expenses that reduce their value.
Income Taxes
It is each Fund’s policy to comply with all sections of the Internal Revenue Code applicable to regulated investment companies and to distribute all of its taxable income and gains to its shareholders and therefore, no provision for federal income tax has been made. Each Fund is treated as a separate taxpayer for federal income tax purposes.
The Funds recognize the tax benefits of uncertain tax positions only where the position is “more likely than not” to be sustained assuming examination by tax authorities. Management has analyzed the Funds’ tax positions and has concluded that no liability for unrecognized tax benefits should be recorded related to uncertain tax positions taken on returns filed for open tax years (2017-2019), or expected to be taken in the Funds’ 2020 tax returns. The Funds identified their major tax jurisdictions as U.S. federal, Nebraska and foreign jurisdictions where the Funds make significant investments; however, the Funds are not aware of any tax positions for which it is reasonably possible that the total amounts of unrecognized tax benefits will change materially in the next twelve months.
Security Transactions and Related Income
Investment security transactions are accounted for on a trade date basis. Cost is determined and gains and losses are based upon the specific identification method for both financial statement and federal income tax purposes. Dividend income is recorded on the ex-dividend date and interest income is recorded on an accrual basis. Purchase discounts and premiums on securities are accreted and amortized over the life of the respective securities.
Expenses
Expenses of the Trust that are directly identifiable to a specific fund are charged to that fund. Expenses that are not readily identifiable to a specific fund are allocated in such a manner as deemed equitable, taking into consideration the nature and type of expense and the relative sizes of the funds. Each Fund’s income, expenses (other than the class specific distribution and shareholder service fees) and realized and unrealized gains and losses are allocated proportionally each day between the classes based upon the relative net assets of each class.
52
| AdvisorOne Funds Semi-Annual Report |
Notes to Financial Statements (Unaudited) (Continued)
October 31, 2019
Distributions to Shareholders
Income will normally be declared and distributed at least annually for all Funds with the exception of the CLS Flexible Income Fund. Income will normally be declared and distributed monthly for the CLS Flexible Income Fund. The Funds declare and pay net realized capital gains, if any, annually. The character of income and gains to be distributed is determined in accordance with income tax regulations which may differ from GAAP. These differences are primarily due to the treatment of wash sale losses, grantor trust and partnership income.
Indemnification
The Trust indemnifies its officers and Trustees for certain liabilities that may arise from the performance of their duties to the Trust. Additionally, in the normal course of business, the Funds enter into contracts that contain a variety of representations and warranties and which provide general indemnities. A Fund’s maximum exposure under these arrangements is unknown, as this would involve future claims that may be made against the Funds that have not yet occurred. However, based on experience, the Trust expects the risk of loss due to these warranties and indemnities to be remote.
| 3. | Investment Advisory Agreement and Transactions with Related Parties |
Advisory Fees
The Trust has entered into an Investment Advisory Agreement with CLS Investments, LLC (the “Advisor”, formerly Clarke Lanzen Skalla Investment Firm, LLC), a subsidiary of NorthStar Financial Services Group, LLC. As compensation for the services rendered, facilities furnished, and expenses borne by the Advisor, the Funds pay the Advisor a fee accrued daily and paid monthly, at the annualized rate of 0.75% of net assets for CLS Global Aggressive Equity Fund, CLS Global Diversified Equity Fund, CLS Growth and Income Fund, CLS Shelter Fund, and CLS Strategic Global Equity; and for CLS Flexible Income at the annualized rate of 0.40%. During the six month period ended October 31, 2019, the Advisor earned the following fees:
| Fund | Advisory Fee | |||
| CLS Global Aggressive Equity Fund | $ | 551,443 | ||
| CLS Global Diversified Equity Fund | 1,626,200 | |||
| CLS Growth and Income Fund | 1,544,678 | |||
| CLS Flexible Income Fund | 431,793 | |||
| CLS Shelter Fund | 814,860 | |||
| CLS Strategic Global Equity Fund | 88 | |||
53
| AdvisorOne Funds Semi-Annual Report |
Notes to Financial Statements (Unaudited) (Continued)
October 31, 2019
The Trustees have adopted, on behalf of the Funds, a Shareholder Servicing Plan (“Shareholder Servicing Plan”). The Shareholder Servicing Plan allows each of the Funds to use part of its assets for the payment of certain shareholder servicing expenses, including administrative or other shareholder support services. For these services under the Shareholder Servicing Plan, each Fund pays CLS an amount up to 0.25% of average net assets attributable to Class N Shares, and an amount up to 0.10% of average net assets for Class T Shares of the respective Funds on an annualized basis. CLS uses monies to compensate other parties that have entered into shareholder servicing agreements with CLS with respect to the servicing of Fund shares. During the six months ended October 31, 2019, the Funds’ Class N Shares paid the following Shareholder Servicing Plan Fees:
| Fund | Shareholder Servicing Fee | |||
| CLS Global Aggressive Equity Fund | $ | 183,814 | ||
| CLS Global Diversified Equity Fund | 542,067 | |||
| CLS Growth and Income Fund | 514,892 | |||
| CLS Flexible Income Fund | 269,871 | |||
| CLS Shelter Fund | 271,620 | |||
| CLS Strategic Global Equity Fund | 29 | |||
The Advisor has contractually agreed to waive or limit its management fees and to reimburse expenses, other than expenses relating to dividends on short sales, interest expense, indirect fees and expenses of underlying funds, and extraordinary or non-recurring expenses, through August 31, 2020 for Class N and Class T Shares so that the annual operating expenses of the Funds do not exceed the percentage of the average daily net assets as indicated below:
| Expense Limitation | ||||
| Class N | ||||
| CLS Global Aggressive Equity, CLS Global Diversified Equity, | ||||
| CLS Growth and Income, and CLS Shelter | 1.25 | % | ||
| Class N | ||||
| CLS Flexible Income Fund | 0.90 | % | ||
| Class N | ||||
| CLS Strategic Global Equity Fund | 1.50 | % | ||
| Class T | ||||
| CLS Global Aggressive Equity, CLS Global Diversified Equity, | ||||
| CLS Growth and Income, and CLS Shelter | 1.10 | % | ||
| Class T | ||||
| CLS Flexible Income Fund | 0.75 | % | ||
54
| AdvisorOne Funds Semi-Annual Report |
Notes to Financial Statements (Unaudited) (Continued)
October 31, 2019
The fee waivers and expense reimbursements, if any, pursuant to this contractual agreement for the six months ended October 31, 2019, were as follows:
| Fund | Waiver/Reimbursement | |||
| CLS Global Aggressive Equity Fund | $ | 10,606 | ||
| CLS Global Diversified Equity Fund | — | |||
| CLS Growth and Income Fund | — | |||
| CLS Flexible Income Fund | — | |||
| CLS Shelter Fund | — | |||
| CLS Strategic Global Equity Fund | 42,326 | |||
Fees waived or expenses reimbursed may be recouped by the Advisor from a Fund for a period up to three years from the date the fee or expense was waived or reimbursed. However, no recoupment payment will be made by a Fund if it would result in the Fund exceeding lesser of (i) the expense limitation at the time of waiver/reimbursement or (ii) the current expense limitation. During the six months ended October 31, 2019, the Advisor recaptured $61,799 from the CLS Growth and Income Fund. The table below contains the amounts of fee waivers and expense reimbursements subject to recapture by the Advisor through April 30 of the years indicated:
| Fund | 2019 | 2020 | 2021 | Total | ||||||||||||
| CLS Global Aggressive Equity Fund | $ | 262,430 | $ | 140,153 | $ | 170,936 | $ | 573,519 | ||||||||
| CLS Global Diversified Equity Fund | 199,886 | — | 59,706 | 259,592 | ||||||||||||
| CLS Growth and Income Fund | 203,858 | — | 23,454 | 227,312 | ||||||||||||
| CLS Flexible Income Fund | 359,396 | 132,609 | 156,065 | 648,070 | ||||||||||||
| CLS Shelter Fund | 94,615 | 56,398 | 89,703 | 240,716 | ||||||||||||
55
| AdvisorOne Funds Semi-Annual Report |
Notes to Financial Statements (Unaudited) (Continued)
October 31, 2019
Distributor
The distributor of the Funds, Northern Lights Distributors, LLC (“NLD”), serves as principal underwriter for each Fund and maintains all records required to be maintained pursuant to the Funds’ Shareholder Services Plan.
Administration, Fund Accounting, Transfer Agent, Custody Administration Fees
Gemini Fund Services, LLC (“GFS”), an affiliate of NLD, provides administration, fund accounting, and transfer agent services to the Trust. Pursuant to a separate servicing agreement with GFS, the Funds pay GFS customary fees for providing administration, fund accounting, and transfer agency services to the Funds. Certain officers of the Trust are also officers of GFS and are not paid any fees directly by the Funds for serving in such capacities.
In addition, certain affiliates of the distributor provide ancillary services to the Funds as follows:
Blu Giant, LLC (“Blu Giant”), an affiliate of NLD and GFS, provides EDGAR conversion and filing services as well as print management services for the Funds on an ad-hoc basis. For the provision of these services, Blu Giant receives customary fees from the Funds.
Chief Compliance Officer
Northern Lights Compliance Services, LLC (“NLCS”), an affiliate of NLD and GFS, provides a chief compliance officer to the Trust, as well as related compliance services, pursuant to a consulting agreement between NLCS and the Trust. Under the terms of such agreement, NLCS receives customary fees from the Funds.
On February 1, 2019, NorthStar Financial Services Group, LLC, the parent company of GFS and its affiliated companies including NLD, NLCS and Blu Giant (collectively, the “Gemini Companies”), sold its interest in the Gemini Companies to a third party private equity firm that contemporaneously acquired Ultimus Fund Solutions, LLC (an independent mutual fund administration firm) and its affiliates (collectively, the “Ultimus Companies”). As a result of these separate transactions, the Gemini Companies and the Ultimus Companies are now indirectly owned through a common parent entity, The Ultimus Group, LLC.
Trustees Fees
The Trust pays each Trustee of the Trust who was not an interested person an annual fee of $50,000 per year paid in quarterly installments. The Trust also reimburses the Trustees for travel and other expenses incurred in attending meetings of the Board. Officers of the Trust and Trustees who are interested persons of the Trust do not receive any direct compensation from the Trust.
56
| AdvisorOne Funds Semi-Annual Report |
Notes to Financial Statements (Unaudited) (Continued)
October 31, 2019
| 4. | Aggregate Unrealized Appreciation and Depreciation |
The identified cost of investments in securities owned by each Fund for federal income tax purposes, and their respective gross unrealized appreciation and depreciation at October 31, 2019, were as follows:
| Gross | Gross | Net Unrealized | ||||||||||||||
| Unrealized | Unrealized | Appreciation/ | ||||||||||||||
| Fund | Tax Cost | Appreciation | Depreciation | (Depreciation) | ||||||||||||
| CLS Global Aggressive Equity Fund | $ | 148,233,911 | $ | 23,035,665 | $ | (191,996 | ) | $ | 22,843,669 | |||||||
| CLS Global Diversified Equity Fund | 400,800,203 | 58,357,361 | (175,158 | ) | 58,182,203 | |||||||||||
| CLS Growth and Income Fund | 412,133,184 | 36,981,467 | (726,063 | ) | 36,255,404 | |||||||||||
| CLS Flexible Income Fund | 233,122,079 | 7,972,251 | (2,331,534 | ) | 5,640,717 | |||||||||||
| CLS Shelter Fund | 236,151,585 | 6,494,750 | (29,796 | ) | 6,464,954 | |||||||||||
| CLS Strategic Global Equity Fund | 25,856 | 1,047 | (36 | ) | 1,011 | |||||||||||
| 5. | Investment Transactions |
The cost of purchases and the proceeds from sales of investments, other than short-term securities, for the six month period ended October 31, 2019, were as follows:
| Fund | Purchases | Sales | ||||||
| CLS Global Aggressive Equity Fund | $ | 49,381,411 | $ | 56,937,910 | ||||
| CLS Global Diversified Equity Fund | 71,498,976 | 97,030,389 | ||||||
| CLS Growth and Income Fund | 71,617,104 | 100,816,461 | ||||||
| CLS Flexible Income Fund | 12,571,646 | 21,402,165 | ||||||
| CLS Shelter Fund | 327,625,615 | 331,862,583 | ||||||
| CLS Strategic Global Equity Fund | 26,432 | 596 | ||||||
57
| AdvisorOne Funds Semi-Annual Report |
Notes to Financial Statements (Unaudited) (Continued)
October 31, 2019
| 6. | Investments in Affiliated Companies |
An affiliated company is a company in which a Fund has ownership of at least 5% of the voting securities. Companies that are affiliates at October 31, 2019 are noted in the Funds’ Portfolio of Investments. Transactions during the year with companies that are affiliates are as follows:
CLS Global Aggressive Equity
| Change in | Shares | |||||||||||||||||||||||||||||||||
| Value- | Dividends | Realized | Unrealized | Value- | held at | |||||||||||||||||||||||||||||
| Beginning | Sales | Credited | Gain | Appreciation/ | End | End of | ||||||||||||||||||||||||||||
| CUSIP | Description | of Period | Purchases | Proceeds | to Income | (Loss) | (Depreciation) | of Period | Period | |||||||||||||||||||||||||
| 00764F383 | Milestone Treasury Obligations Fund* | $ | 24,324,400 | $ | — | $ | (1,169,400 | ) | $ | — | $ | — | $ | — | $ | 23,155,000 | 23,155,000 | |||||||||||||||||
| 35473P678 | Franklin FTSE United Kingdom ETF | — | 3,292,790 | — | — | — | 92,226 | 3,385,016 | 139,525 | |||||||||||||||||||||||||
| 518416201 | Hartford Multifactor Emerging Markets ETF | 3,332,740 | 804,871 | — | 46,350 | — | (159,760 | ) | 4,024,201 | 177,000 | ||||||||||||||||||||||||
| 92189F684 | VanEck Vectors Retail ETF | 7,793,280 | — | — | — | — | 579,326 | 8,372,606 | 72,000 | |||||||||||||||||||||||||
| 52468L877 | Legg Mason Small—Cap Quality Value ETF | 580,230 | 755,937 | — | 5,203 | — | (17,870 | ) | 1,323,500 | 50,000 | ||||||||||||||||||||||||
| Total | $ | 36,030,650 | $ | 4,853,598 | $ | (1,169,400 | ) | $ | 51,553 | $ | — | $ | 493,922 | 40,260,323 | 23,593,525 | |||||||||||||||||||
58
| AdvisorOne Funds Semi-Annual Report |
Notes to Financial Statements (Unaudited) (Continued)
October 31, 2019
CLS Global Diversified Equity
| Change in | Shares | |||||||||||||||||||||||||||||||||
| Value- | Dividends | Realized | Unrealized | Value- | held at | |||||||||||||||||||||||||||||
| Beginning | Sales | Credited | Gain | Appreciation/ | End | End of | ||||||||||||||||||||||||||||
| CUSIP | Description | of Period | Purchases | Proceeds | to Income | (Loss) | (Depreciation) | of Period | Period | |||||||||||||||||||||||||
| 00764F383 | Milestone Treasury Obligations Fund* | $ | 22,088,900 | $ | 5,284,600 | $ | — | $ | — | $ | — | $ | — | $ | 27,373,500 | 27,373,500 | ||||||||||||||||||
| 35473P827 | Franklin FTSE Canada ETF | 652,077 | — | — | 6,020 | — | 4,562 | 662,659 | 26,000 | |||||||||||||||||||||||||
| 78463X533 | SPDR S&P Emerging Markets Dividend ETF | 44,082,500 | — | — | 1,413,426 | — | (3,228,426 | ) | 42,267,500 | 137,500 | ||||||||||||||||||||||||
| 97717W323 | WisdomTree Emerging Markets Quality Dividend Growth Fund | 4,670,890 | — | — | 86,258 | — | (255,063 | ) | 4,502,085 | 185,500 | ||||||||||||||||||||||||
| 23908L108 | Davis Select Financial ETF | 23,790,000 | 572,330 | — | — | — | 601,545 | 24,963,875 | 1,025,000 | |||||||||||||||||||||||||
| 47804J503 | John Hancock Multi-Factor Health Care ETF | 9,993,000 | — | — | 201,372 | — | 125,898 | 10,320,270 | 300,000 | |||||||||||||||||||||||||
| 78468R747 | SPDR SSGA Gender Diversity Index ETF | 10,619,800 | — | — | 105,229 | — | 45,571 | 10,770,600 | 145,000 | |||||||||||||||||||||||||
| 78467V889 | SPDR MFS Systematic Growth Equity ETF | 12,562,335 | — | — | 84,039 | — | (114,639 | ) | 12,531,735 | 150,000 | ||||||||||||||||||||||||
| 46138G714 | Invesco Russell 1000 Yield Factor ETF | — | — | — | 14,529 | — | 955,405 | 969,934 | 35,000 | |||||||||||||||||||||||||
| 47804J875 | John Hancock Multifactor Consumer Staples ETF | 6,160,000 | — | — | 63,890 | — | 114,772 | 6,338,662 | 220,000 | |||||||||||||||||||||||||
| 518416300 | Hartford Multifactor REIT ETF | 3,854,400 | — | — | 51,966 | — | 297,484 | 4,203,850 | 250,000 | |||||||||||||||||||||||||
| 78468R648 | SPDR S&P Kensho New Economies Composite ETF | 816,763 | 11,552,200 | — | 16,045 | — | 263,742 | 12,648,750 | 375,000 | |||||||||||||||||||||||||
| Total | $ | 139,290,665 | $ | 17,409,130 | $ | — | $ | 2,042,774 | $ | — | $ | (1,189,149 | ) | $ | 157,553,420 | 30,222,500 | ||||||||||||||||||
59
| AdvisorOne Funds Semi-Annual Report |
Notes to Financial Statements (Unaudited) (Continued)
October 31, 2019
CLS Growth and Income
| Change in | Shares | |||||||||||||||||||||||||||||||||
| Value- | Dividends | Realized | Unrealized | Value- | held at | |||||||||||||||||||||||||||||
| Beginning | Sales | Credited | Gain | Appreciation/ | End | End of | ||||||||||||||||||||||||||||
| CUSIP | Description | of Period | Purchases | Proceeds | to Income | (Loss) | (Depreciation) | of Period | Period | |||||||||||||||||||||||||
| 00764F383 | Milestone Treasury Obligations Fund* | $ | 56,535,600 | $ | — | $ | (16,388,700 | ) | $ | — | $ | — | $ | — | $ | 40,146,900 | 40,146,900 | |||||||||||||||||
| 78463X376 | SPDR Solactive Canada ETF | 4,464,953 | — | — | 45,478 | — | (4,941 | ) | 4,505,490 | 75,000 | ||||||||||||||||||||||||
| Total | $ | 61,000,553 | $ | — | $ | (16,388,700 | ) | $ | 45,478 | $ | — | $ | (4,941 | ) | $ | 44,652,390 | 40,221,900 | |||||||||||||||||
CLS Flexible Income
| Change in | Shares | |||||||||||||||||||||||||||||||||
| Value- | Dividends | Realized | Unrealized | Value- | held at | |||||||||||||||||||||||||||||
| Beginning | Sales | Credited | Gain | Appreciation/ | End | End of | ||||||||||||||||||||||||||||
| CUSIP | Description | of Period | Purchases | Proceeds | to Income | (Loss) | (Depreciation) | of Period | Period | |||||||||||||||||||||||||
| 00764F383 | Milestone Treasury Obligations Fund* | $ | 30,555,400 | $ | — | $ | (5,551,600 | ) | $ | — | $ | — | $ | — | $ | 25,003,800 | 25,003,800 | |||||||||||||||||
CLS Shelter Fund
| Change in | Shares | |||||||||||||||||||||||||||||||||
| Value- | Dividends | Realized | Unrealized | Value- | held at | |||||||||||||||||||||||||||||
| Beginning | Sales | Credited | Gain | Appreciation/ | End | End of | ||||||||||||||||||||||||||||
| CUSIP | Description | of Period | Purchases | Proceeds | to Income | (Loss) | (Depreciation) | of Period | Period | |||||||||||||||||||||||||
| 00764F383 | Milestone Treasury Obligations Fund* | $ | 14,212,300 | $ | 6,936,100 | $ | — | $ | — | $ | — | $ | — | $ | 21,148,400 | 21,148,400 | ||||||||||||||||||
| * | Related management |
60
| AdvisorOne Funds Semi-Annual Report |
| Notes to Financial Statements (Unaudited) (Continued) |
| October 31, 2019 |
| 7. | Shareholders’ Transactions |
As of October 31, 2019, the Funds had an unlimited number of shares authorized. Following is a summary of shareholder transactions for each Fund:
| Six Months Ended | Year Ended | |||||||||||||||
| October 31, 2019 | April 30, 2019 | |||||||||||||||
| Shares | Dollars | Shares | Dollars | |||||||||||||
| CLS Global Aggressive Equity Fund | ||||||||||||||||
| Class N Shares: | ||||||||||||||||
| Shares Sold | 776,200 | $ | 10,780,210 | 1,795,988 | $ | 26,186,715 | ||||||||||
| Shares issued to shareholders in reinvestment | — | — | 1,091,873 | 13,430,034 | ||||||||||||
| Shares redeemed | (1,290,783 | ) | (17,837,614 | ) | (2,967,084 | ) | (43,714,453 | ) | ||||||||
| Net decrease | (514,583 | ) | $ | (7,057,404 | ) | (79,223 | ) | $ | (4,097,704 | ) | ||||||
| Class T Shares: | ||||||||||||||||
| Shares Sold | — | $ | — | 1 | $ | 15 | ||||||||||
| Shares issued to shareholders in reinvestment | — | — | — | 1 | ||||||||||||
| Net increase | — | $ | — | 1 | $ | 16 | ||||||||||
| CLS Global Diversified Equity Fund | ||||||||||||||||
| Class N Shares: | ||||||||||||||||
| Shares Sold | 1,801,433 | $ | 29,504,133 | 3,570,893 | $ | 61,926,246 | ||||||||||
| Shares issued to shareholders | — | — | 3,262,115 | 53,924,399 | ||||||||||||
| Shares issued due to merger | ||||||||||||||||
| (Note 11) in reinvestment | — | — | 2,995,379 | 43,822,398 | ||||||||||||
| Shares redeemed | (3,553,518 | ) | (57,930,997 | ) | (7,063,173 | ) | (123,332,510 | ) | ||||||||
| Net increase (decrease) | (1,752,085 | ) | $ | (28,426,864 | ) | 2,765,214 | $ | 36,340,533 | ||||||||
| Class T Shares: | ||||||||||||||||
| Shares Sold | — | $ | — | 1 | $ | 17 | ||||||||||
| Shares issued to shareholders in reinvestment | — | — | — | 2 | ||||||||||||
| Net increase | — | $ | — | 1 | $ | 19 | ||||||||||
| CLS Growth and Income Fund | ||||||||||||||||
| Class N Shares: | ||||||||||||||||
| Shares Sold | 2,698,196 | $ | 29,531,934 | 5,747,089 | $ | 63,258,037 | ||||||||||
| Shares issued to shareholders in reinvestment | — | — | 2,160,909 | 21,565,872 | ||||||||||||
| Shares redeemed | (4,812,934 | ) | (52,465,730 | ) | (10,459,265 | ) | (115,076,326 | ) | ||||||||
| Net decrease | (2,114,738 | ) | $ | (22,933,796 | ) | (2,551,267 | ) | $ | (30,252,417 | ) | ||||||
| Class T Shares: | ||||||||||||||||
| Shares Sold | — | $ | — | 1 | $ | 11 | ||||||||||
| Net increase | — | $ | — | 1 | $ | 11 | ||||||||||
61
| AdvisorOne Funds Semi-Annual Report |
| Notes to Financial Statements (Unaudited) (Continued) |
| October 31, 2019 |
| Six Months Ended | Year Ended | |||||||||||||||
| October 31, 2019 | April 30, 2019 | |||||||||||||||
| Shares | Dollars | Shares | Dollars | |||||||||||||
| CLS Flexible Income Fund | ||||||||||||||||
| Class N Shares: | ||||||||||||||||
| Shares Sold | 1,662,792 | $ | 17,291,329 | 3,813,258 | $ | 38,506,872 | ||||||||||
| Shares issued to shareholders in reinvestment | 279,479 | 2,905,338 | 647,528 | 6,499,388 | ||||||||||||
| Shares redeemed | (2,775,715 | ) | (28,841,083 | ) | (6,633,437 | ) | (66,798,528 | ) | ||||||||
| Net decrease | (833,444 | ) | $ | (8,644,416 | ) | (2,172,651 | ) | $ | (21,792,268 | ) | ||||||
| Class T Shares: | ||||||||||||||||
| Shares Sold | — | $ | — | 1 | $ | 10 | ||||||||||
| Net increase | — | $ | — | 1 | $ | 10 | ||||||||||
| CLS Shelter Fund | ||||||||||||||||
| Class N Shares: | ||||||||||||||||
| Shares Sold | 1,756,228 | $ | 20,648,137 | 4,798,632 | $ | 63,763,370 | ||||||||||
| Shares issued to shareholders in reinvestment | — | — | 3,686,112 | 39,072,791 | ||||||||||||
| Shares redeemed | (2,398,577 | ) | (28,226,329 | ) | (3,520,391 | ) | (45,970,275 | ) | ||||||||
| Net increase (decrease) | (642,349 | ) | $ | (7,578,192 | ) | 4,964,353 | $ | 56,865,886 | ||||||||
| Class T Shares: | ||||||||||||||||
| Shares Sold | — | $ | — | 1 | $ | 14 | ||||||||||
| Shares issued to shareholders in reinvestment | — | — | — | 1 | ||||||||||||
| Net increase | — | $ | — | 1 | $ | 15 | ||||||||||
| CLS Strategic Global Fund | ||||||||||||||||
| Class N Shares: | ||||||||||||||||
| Shares Sold | 2,500 | $ | 25,000 | — | $ | — | ||||||||||
| Shares issued to shareholders in reinvestment | — | — | — | — | ||||||||||||
| Shares redeemed | — | — | — | — | ||||||||||||
| Net increase | 2,500 | $ | 25,000 | — | $ | — | ||||||||||
| 8. | Securities Lending |
The CLS Global Aggressive Equity Fund, CLS Global Diversified Equity Fund, CLS Growth and Income Fund, CLS Flexible Income Fund, and CLS Shelter Fund have entered into a securities lending arrangement with The Bank of New York Mellon (the “Lending Agent”). Under the terms of the agreement, the Funds are authorized to loan securities through the Lending Agent to approved third-party borrowers. In exchange, the Funds receive cash collateral in the amount of at least 102% of the value of the securities loaned. The value of securities loaned is disclosed in a footnote on the statement of Assets & Liabilities and on the Schedule of Investments. Securities lending income is disclosed in the Funds’ Statements of Operations. Although risk is mitigated by the collateral, the Funds could experience a delay in recovering their securities and possible loss of income or value if the borrower fails to return them.
62
| AdvisorOne Funds Semi-Annual Report |
| Notes to Financial Statements (Unaudited) (Continued) |
| October 31, 2019 |
The Lending Agent may invest the cash collateral received in connection with securities lending transactions in the Milestone Treasury Obligations Fund. The Milestone Treasury Obligations Fund is deemed an affiliate of the Trust and is managed by the Advisor. The Milestone Treasury Obligations Fund is registered under the 1940 Act as an open-end management investment company and is subject to Rule 2a-7 under the 1940 Act. The Advisor, pursuant to an Investment Advisory Agreement with the Trust, may receive an investment advisory fee of up to 0.10% on an annualized basis of the average daily net assets of the Milestone Treasury Obligations Fund.
The Funds have adopted the disclosure provisions of FASB ASU 2014-11, “Transfers & Servicing (Topic 860): Repurchase-to-Maturity Transactions, Repurchase Financings, and Disclosures.” ASU No. 2014-11 is intended to provide increased transparency about the types of collateral pledged in securities lending transactions and other similar transactions that are accounted for as secured borrowing.
The following table displays a breakdown of transactions accounted for as secured borrowings, the gross obligations by class of collateral pledged, and the remaining contractual maturity of those transactions as of October 31, 2019:
| CLS Global Aggressive Equity Fund | Remaining Contractual Maturity of the Agreements as of October 31, 2019 | |||||||||||||||||||
| Overnight and | Between | |||||||||||||||||||
| Securities Lending Transactions | Continuous | < 30 days | 30 & 90 days | > 90 days | Total | |||||||||||||||
| Exchange Traded Funds | $ | 23,303,597 | $ | — | $ | — | $ | — | $ | 23,303,597 | ||||||||||
| Total Borrowings | $ | 23,303,597 | $ | — | $ | — | $ | — | $ | 23,303,597 | ||||||||||
| Gross amount of recognized liabilities for securities lending transactions | $ | 23,303,597 | ||||||||||||||||||
| CLS Global Diversified Equity Fund | Remaining Contractual Maturity of the Agreements as of October 31, 2019 | |||||||||||||||||||
| Overnight and | Between | |||||||||||||||||||
| Securities Lending Transactions | Continuous | < 30 days | 30 & 90 days | > 90 days | Total | |||||||||||||||
| Exchange Traded Funds | $ | 36,421,829 | $ | — | $ | — | $ | — | $ | 36,421,829 | ||||||||||
| Total Borrowings | $ | 36,421,829 | $ | — | $ | — | $ | — | $ | 36,421,829 | ||||||||||
| Gross amount of recognized liabilities for securities lending transactions | $ | 36,421,829 | ||||||||||||||||||
| CLS Growth and Income Fund | Remaining Contractual Maturity of the Agreements as of October 31, 2019 | |||||||||||||||||||
| Overnight and | Between | |||||||||||||||||||
| Securities Lending Transactions | Continuous | < 30 days | 30 & 90 days | > 90 days | Total | |||||||||||||||
| Exchange Traded Funds | $ | 47,974,488 | $ | — | $ | — | $ | — | $ | 47,974,488 | ||||||||||
| Total Borrowings | $ | 47,974,488 | $ | — | $ | — | $ | — | $ | 47,974,488 | ||||||||||
| Gross amount of recognized liabilities for securities lending transactions | $ | 47,974,488 | ||||||||||||||||||
63
| AdvisorOne Funds Semi-Annual Report |
| Notes to Financial Statements (Unaudited) (Continued) |
| October 31, 2019 |
| CLS Flexible Income Fund | Remaining Contractual Maturity of the Agreements as of October 31, 2019 | |||||||||||||||||||
| Overnight and | Between | |||||||||||||||||||
| Securities Lending Transactions | Continuous | < 30 days | 30 & 90 days | > 90 days | Total | |||||||||||||||
| Exchange Traded Funds | $ | 31,427,528 | $ | — | $ | — | $ | — | $ | 31,427,528 | ||||||||||
| Total Borrowings | $ | 31,427,528 | $ | — | $ | — | $ | — | $ | 31,427,528 | ||||||||||
| Gross amount of recognized liabilities for securities lending transactions | $ | 31,427,528 | ||||||||||||||||||
| CLS Shelter Fund | Remaining Contractual Maturity of the Agreements as of October 31, 2019 | |||||||||||||||||||
| Overnight and | Between | |||||||||||||||||||
| Securities Lending Transactions | Continuous | < 30 days | 30 & 90 days | > 90 days | Total | |||||||||||||||
| Exchange Traded Funds | $ | 21,775,988 | $ | — | $ | — | $ | — | $ | 21,775,988 | ||||||||||
| Total Borrowings | $ | 21,775,988 | $ | — | $ | — | $ | — | $ | 21,775,988 | ||||||||||
| Gross amount of recognized liabilities for securities lending transactions | $ | 21,775,988 | ||||||||||||||||||
Securities lending income represents a portion of total investment income and may not continue in the future due to market conditions.
| Gross Amounts | Gross Amounts not offset in the | |||||||||||||||
| Recognized | Statement of Assets & Liabilities | |||||||||||||||
| in Statements | Financial | Cash | ||||||||||||||
| of Assets & | Instruments | Collateral | Net Amount | |||||||||||||
| Fund | Liabilities | Pledged | Pledged | of Assets | ||||||||||||
| CLS Global Aggressive Equity Fund | $ | 23,303,597 | (1) | $ | 23,303,597 | (2) | $ | — | $ | — | ||||||
| CLS Global Diversified Equity Fund | 36,421,829 | (1) | 36,421,829 | (2) | — | — | ||||||||||
| CLS Growth and Income Fund | 43,298,802 | (1) | 43,298,802 | (2) | — | — | ||||||||||
| CLS Flexible Income Fund | 31,427,528 | (1) | 31,427,528 | (2) | — | — | ||||||||||
| CLS Shelter Fund | 21,271,129 | (1) | 21,271,129 | (2) | — | — | ||||||||||
| (1) | Collateral for Securities Loaned at value as presented in the Schedule of Investments. |
| (2) | The amount is limited to the liability balance and accordingly, does not include excess collateral pledged. |
64
| AdvisorOne Funds Semi-Annual Report |
| Notes to Financial Statements (Unaudited) (Continued) |
| October 31, 2019 |
| 9. | Distributions to Shareholders and Tax Components of Capital |
The tax character of distributions paid for the year ended April 30, 2019 and April 30, 2018 was as follows:
| For the year ended April 30, 2019: | ||||||||||||
| Long-Term | ||||||||||||
| Portfolio | Ordinary Income | Capital Gains | Total | |||||||||
| CLS Global Aggressive Equity Fund | $ | 2,196,138 | $ | 11,246,528 | $ | 13,442,666 | ||||||
| CLS Global Diversified Equity Fund | 6,399,931 | 37,521,147 | 43,921,078 | |||||||||
| CLS Growth and Income Fund | 7,801,866 | 13,799,440 | 21,601,306 | |||||||||
| CLS Flexible Income Fund | 6,514,773 | — | 6,514,773 | |||||||||
| CLS Shelter Fund | 14,855,742 | 24,392,748 | 39,248,490 | |||||||||
| For the year ended April 30, 2018: | ||||||||||||
| Long-Term | ||||||||||||
| Portfolio | Ordinary Income | Capital Gains | Total | |||||||||
| CLS Global Aggressive Equity Fund | $ | 1,933,764 | $ | 6,086,010 | $ | 8,019,774 | ||||||
| CLS Global Diversified Equity Fund | 6,159,421 | 35,696,516 | 41,855,937 | |||||||||
| CLS Growth and Income Fund | 9,913,987 | 13,813,230 | 23,727,217 | |||||||||
| CLS Flexible Income Fund | 5,382,624 | — | 5,382,624 | |||||||||
| CLS Shelter Fund | 3,694,454 | — | 3,694,454 | |||||||||
As of April 30, 2019, the components of accumulated earnings/ (deficit) on a tax basis were as follows:
| Post | ||||||||||||||||||||||||||||
| October | Capital | Total | ||||||||||||||||||||||||||
| Undistributed | Undistributed | Loss and | Loss | Other | Unrealized | Accumulated | ||||||||||||||||||||||
| Ordinary | Long-Term | Late Year | Carry | Book/Tax | Appreciation/ | Earnings/ | ||||||||||||||||||||||
| Portfolio | Income | Capital Gains | Loss | Forwards | Differences | (Depreciation) | (Deficits) | |||||||||||||||||||||
| CLS Global Aggressive Equity Fund | $ | — | $ | 1,834,754 | $ | (174,789 | ) | $ | — | $ | — | $ | 26,029,378 | $ | 27,689,343 | |||||||||||||
| CLS Global Diversified Fund | — | 3,505,368 | — | — | (2,195,636 | ) | 66,923,593 | 68,233,325 | ||||||||||||||||||||
| CLS Growth and Income Fund | 1,791,996 | — | (4,262,621 | ) | (276,665 | ) | — | 37,246,958 | 34,499,668 | |||||||||||||||||||
| CLS Flexible Income Fund | 95,549 | — | (97,178 | ) | (2,067,710 | ) | — | 1,521,654 | (547,685 | ) | ||||||||||||||||||
| CLS Shelter Fund | 2,417,758 | — | (5,867,350 | ) | (13,847,512 | ) | — | 8,514,247 | (8,782,857 | ) | ||||||||||||||||||
65
| AdvisorOne Funds Semi-Annual Report |
| Notes to Financial Statements (Unaudited) (Continued) |
| October 31, 2019 |
The difference between book basis and tax basis undistributed net investment income/loss, accumulated net realized gain/(loss), and unrealized appreciation/(depreciation) from investments is primarily attributable to the tax deferral of losses on wash sales, tax deferral of capital losses related to a Fund merger, and adjustments for partnerships and C-Corporation return of capital distributions.
Late year losses incurred after December 31 within the fiscal year are deemed to arise on the first business day of the following fiscal year for tax purposes. The Funds incurred and elected to defer such late year losses as follows:
| Portfolio | Late Year Losses | |||
| CLS Global Aggressive Equity Fund | $ | 174,789 | ||
Capital losses incurred after October 31 within the fiscal year are deemed to arise on the first business day of the following fiscal year for tax purposes. The Funds incurred and elected to defer such capital losses as follows:
| Post October | ||||
| Portfolio | Losses | |||
| CLS Growth and Income Fund | $ | 4,262,621 | ||
| CLS Flexible Income Fund | 97,178 | |||
| CLS Shelter Fund | 5,867,350 | |||
At April 30, 2019, the Funds had capital loss carry forwards for federal income tax purposes available to offset future capital gains and utilized as follows:
| Non-Expiring | ||||||||||||||||||||
| CLCF | CLCF | |||||||||||||||||||
| Portfolio | Short-Term | Long-Term | Total | Utilized | Limitation | |||||||||||||||
| CLS Global Diversified Equity Fund | $ | — | $ | — | $ | — | $ | 4,241 | $ | 2,195,636 | ||||||||||
| CLS Growth and Income Fund | 276,665 | — | 276,665 | — | — | |||||||||||||||
| CLS Flexible Income Fund | 269,029 | 1,798,681 | 2,067,710 | — | — | |||||||||||||||
| CLS Shelter Fund | 13,847,512 | — | 13,847,512 | — | — | |||||||||||||||
66
| AdvisorOne Funds Semi-Annual Report |
| Notes to Financial Statements (Unaudited) (Continued) |
| October 31, 2019 |
Permanent book and tax difference are primarily attributable to tax adjustments related to the merger with CLS International Equity Fund.
| Paid In | Accumulated | |||||||
| Portfolio | Capital | Earnings (Losses) | ||||||
| CLS Global Diversified Equity Fund | $ | 2,233,753 | $ | (2,233,753 | ) | |||
The Fund acquired $2,199,877 of capital loss carryforwards related to the merger with the CLS International Equity Fund and has $2,195,636 of such losses remaining to be recognized over the next two years. These amounts are subject to an annual limitation of $1,548,096 under current tax rules.
| 11. | Fund Reorganization |
The Board, after careful consideration, approved the reorganization of the CLS International Equity Fund (“International Equity Fund”), into the CLS Global Diversified Equity Fund. The plan of reorganization provides for the transfer of all of the assets and the assumption of the liabilities of the CLS International Equity Fund by the CLS Global Diversified Equity Fund. The following table illustrates the specifics of the reorganization that occurred on April 29, 2019:
| Shares Issued to | Diversified Equity Fund | |||||||||||||||
| CLS International | Shareholders of | Combined | ||||||||||||||
| Equity Fund | CLS International | (Post Merger) | Tax Status | |||||||||||||
| Net Assets | Equity Fund | Pre Merger | Net Assets | of Transfer | ||||||||||||
| $ | 53,940,618 | (1) | 3,262,115 | $ | 401,345,352 | $ | 455,285,970 | Non-taxable | ||||||||
| (1) | includes unrealized appreciation in the amount of $866,411 |
| 12. | Subsequent Events |
Subsequent events after the date of the Statement of Assets and Liabilities have been evaluated through the date the financial statements were issued. Management has determined that no events or transactions occurred requiring adjustment or disclosure in the financial statements.
67
| AdvisorOne Funds Semi-Annual Report |
| Shareholder Expense Example (Unaudited) |
As a shareholder of the Funds you may incur ongoing costs, including management fees; shareholder servicing expenses and other Fund expenses. This Example is intended to help you understand your ongoing costs (in dollars) of investing in each Fund and to compare these costs with the ongoing costs of investing in other mutual funds.
This Example is based on an investment of $1,000 invested at the beginning of the period and held for the entire period as indicated below.
Actual Expenses: The “actual” line of each row in the table provides information about actual account values and actual expenses. You may use the information in this line, together with the amount you invested, to estimate the expenses that you paid over the period. Simply divide your account value by $1,000 (for example, an $8,600 account value divided by $1,000 = 8.6), then multiply the result by the applicable number under the heading entitled “Expenses Paid During the Period” to estimate the expenses you paid on your account during the period.
Hypothetical Examples for Comparison Purposes: The “hypothetical” line of each row in the table below provides information about hypothetical account values and hypothetical expenses based on each Fund’s actual expense ratio and an assumed rate of return of 5% per year before expenses, which is not the Fund’s actual return. The hypothetical account values and expenses may not be used to estimate the actual ending account balance or expenses you paid for the period. You may use this information to compare the ongoing costs of investing in the Fund and other funds. To do so, compare this 5% hypothetical example with the 5% hypothetical examples that appear in the shareholder reports of the other funds.
Please note that the expenses shown in the table are meant to highlight your ongoing costs only and do not reflect any transactional costs, such as sales charges (loads), or contingent deferred sales charges on redemptions. Therefore, the “hypothetical” line of each row in the table are useful in comparing ongoing costs only, and will not help you determine the relative total costs of owning different funds. In addition, if these transactional costs were included, your costs would have been higher.
68
| AdvisorOne Funds Semi-Annual Report |
| Shareholder Expense Example (Unaudited) (Continued) |
| Beginning | Ending | Expense | Expenses | |||||||||||||
| Account Value | Account Value | Ratio | Paid During | |||||||||||||
| 5/1/2019 | 10/31/2019 | (Annualized) | the Period | |||||||||||||
| CLS Global Aggressive Equity Fund | ||||||||||||||||
| Actual: | ||||||||||||||||
| Class N | $ | 1,000.00 | $ | 1,001.40 | 1.25 | % | $ | 6.29 | * | |||||||
| Class T | 1,000.00 | 1,001.40 | 1.10 | % | 5.53 | * | ||||||||||
| Hypothetical (5% return before expenses): | ||||||||||||||||
| Class N | 1,000.00 | 1,018.85 | 1.25 | % | 6.34 | * | ||||||||||
| Class T | 1,000.00 | 1,019.61 | 1.10 | % | 5.58 | * | ||||||||||
| CLS Global Diversified Fund | ||||||||||||||||
| Actual: | ||||||||||||||||
| Class N | $ | 1,000.00 | $ | 1,013.90 | 1.16 | % | $ | 5.87 | * | |||||||
| Class T | 1,000.00 | 1,013.90 | 1.01 | % | 5.11 | * | ||||||||||
| Hypothetical (5% return before expenses): | ||||||||||||||||
| Class N | 1,000.00 | 1,019.30 | 1.16 | % | 5.89 | * | ||||||||||
| Class T | 1,000.00 | 1,020.06 | 1.01 | % | 5.13 | * | ||||||||||
| CLS Growth and Income Fund | ||||||||||||||||
| Actual: | ||||||||||||||||
| Class N | $ | 1,000.00 | $ | 1,021.10 | 1.13 | % | $ | 5.74 | * | |||||||
| Class T | 1,000.00 | 1,021.10 | 0.98 | % | 4.98 | * | ||||||||||
| Hypothetical (5% return before expenses): | ||||||||||||||||
| Class N | 1,000.00 | 1,019.46 | 1.13 | % | 5.74 | * | ||||||||||
| Class T | 1,000.00 | 1,020.21 | 0.98 | % | 4.98 | * | ||||||||||
| CLS Flexible Income Fund | ||||||||||||||||
| Actual: | ||||||||||||||||
| Class N | $ | 1,000.00 | $ | 1,035.40 | 0.87 | % | $ | 4.45 | * | |||||||
| Class T | 1,000.00 | 1,035.40 | 0.72 | % | 3.68 | * | ||||||||||
| Hypothetical (5% return before expenses): | ||||||||||||||||
| Class N | 1,000.00 | 1,020.76 | 0.87 | % | 4.42 | * | ||||||||||
| Class T | 1,000.00 | 1,021.52 | 0.72 | % | 3.66 | * | ||||||||||
| CLS Shelter Fund | ||||||||||||||||
| Actual: | ||||||||||||||||
| Class N | $ | 1,000.00 | $ | 1,037.60 | 1.19 | % | $ | 6.09 | * | |||||||
| Class T | 1,000.00 | 1,037.60 | 1.04 | % | 5.33 | * | ||||||||||
| Hypothetical (5% return before expenses): | ||||||||||||||||
| Class N | 1,000.00 | 1,019.15 | 1.19 | % | 6.04 | * | ||||||||||
| Class T | 1,000.00 | 1,019.91 | 1.04 | % | 5.28 | * | ||||||||||
| CLS Strategic Global Equity Fund | ||||||||||||||||
| Actual: | ||||||||||||||||
| Class N | $ | 1,000.00 | $ | 1,061.00 | 1.50 | % | $ | 7.77 | * | |||||||
| Hypothetical (5% return before expenses): | ||||||||||||||||
| Class N | 1,000.00 | 1,017.60 | 1.50 | % | 7.61 | * | ||||||||||
| * | Expenses are equal to each Fund’s respective annual expense ratios for the most recent six month period, multiplied by the average account value over the period, multiplied by 184/366. |
69
THIS PAGE INTENTIONALLY LEFT BLANK
70
| AdvisorOne Funds Semi-Annual Report |
Proxy Voting Policy
Information regarding how the Funds voted proxies relating to portfolio securities for the most recent twelve month period ended June 30 as well as a description of the policies and procedures that the Funds use to determine how to vote proxies is available without charge, upon request, by calling 1-866-811-0225 or by referring to the Securities and Exchange Commission’s (“SEC”) website at http://www.sec.gov.
Portfolio Holdings
The Funds file their complete schedule of portfolio holdings with the SEC for the first and third quarters of each fiscal year on Form N-PORT. Form N-PORT is available on the SEC’s website at http://www.sec.gov. The information on Form N-PORT is available without charge, upon request, by calling 1-866-811-0225.
71
ABOUT CLS
CLS Investments (CLS) is a third party investment manager, ETF strategist, and long-time trusted partner in the financial industry. CLS’s extensive risk management experience, active asset allocation approach, and customizable strategy offerings have led clients to entrust their portfolios to CLS since 1989.
Through CLS’s partnership structure, your financial advisor maintains a direct relationship with you, while CLS’s portfolio management and analytics teams take on the day-to-day research, trading, and operations required to manage your account. Together, you and your advisor use the tools CLS provides to determine the investing strategy, investment types, and risk tolerance level most appropriate for you. Your advisor provides this information to CLS so we can accordingly make timely active asset allocation decisions within your portfolio. Through this mutually beneficial connection, CLS enhances your advisor’s service to you.
| 1989 |
| Founded |
| $9.4B* |
| Assets Under Management |
| 45K+ |
| CLS clients |
| 12 |
| Portfolio managers & analysts |
| *As of 10/31/19 |
| 888.455.4244 | CLSinvest.com | Follow us: @clsinvestments | A |  | Company |
Item 2. Code of Ethics.Not required for semi-annual reports.
Item 3. Audit Committee Financial Expert.Not required for semi-annual reports.
Item 4. Principal Accountant Fees and Services.Not required for semi-annual reports.
Item 5. Audit Committee of Listed Companies.Not applicable to open-end investment companies.
Item 6. Schedule of Investments.Schedule of investments in securities of unaffiliated issuers is included under Item 1.
Item 7. Disclosure of Proxy Voting Policies and Procedures for Closed-End Funds. Not applicable to open-end investment companies.
Item 8. Portfolio Managers of Closed-End Funds. Not applicable to open-end investment companies.
Item 9. Purchases of Equity Securities by Closed-End Funds. Not applicable to open-end investment companies.
Item 10. Submission of Matters to a Vote of Security Holders. None
Item 11. Controls and Procedures.
(a) Based on an evaluation of the registrant’s disclosure controls and procedures as of a date within 90 days of filing date of this Form N-CSR, the disclosure controls and procedures are reasonably designed to ensure that the information required in filings on Forms N-CSR is recorded, processed, summarized, and reported on a timely basis.
(b) There were no significant changes in the registrant’s internal control over financial reporting that occurred during the registrant’s last fiscal half-year that have materially affected, or are reasonably likely to materially affect, the registrant’s internal control over financial reporting.
Item 12. Disclosure of Securities Lending Activities for Closed-End Management Investment Companies. Not applicable to open-end investment companies.
Item 13. Exhibits.
(a)(1) Not required for semi-annual reports.
(a)(3) Not applicable.
SIGNATURES
Pursuant to the requirements of the Securities Exchange Act of 1934 and the Investment Company Act of 1940, the registrant has duly caused this report to be signed on its behalf by the undersigned, thereunto duly authorized.
(Registrant)AdvisorOne Funds
By (Signature and Title)
/s/ Ryan Beach, Principal Executive Officer/President
Ryan Beach, Principal Executive Officer/ President
Date 1/27/20
Pursuant to the requirements of the Securities Exchange Act of 1934 and the Investment Company Act of 1940, this report has been signed below by the following persons on behalf of the registrant and in the capacities and on the dates indicated.
By (Signature and Title)
/s/ Ryan Beach, Principal Executive Officer/President
Ryan Beach, Principal Executive Officer/President
Date 1/27/20
By (Signature and Title)
/s/ Reid Peters
Reid Peters, Principal Financial Officer/Treasurer
Date 1/27/20