united states
securities and exchange commission
washington, d.c. 20549
form n-csr
certified shareholder report of registered management
investment companies
Investment Company Act file number 811-08037
AdvisorOne Funds
(Exact name of registrant as specified in charter)
17605 Wright Street, Omaha, NE 68130
(Address of principal executive offices) (Zip code)
Gemini Fund Services, LLC., 4221 North 203rd Street, Suite 100, Elkhorn, NE 68022
(Name and address of agent for service)
Registrant's telephone number, including area code: 402-493-3313
Date of fiscal year end: 4/30
Date of reporting period: 10/31/20
Form N-CSR is to be used by management investment companies to file reports with the Commission not later than 10 days after the transmission to stockholders of any report that is required to be transmitted to stockholders under Rule 30e-1 under the Investment Company Act of 1940 (17 CFR 270.30e-1). The Commission may use the information provided on Form N-CSR in its regulatory, disclosure review, inspection and policymaking roles.
A registrant is required to disclose the information specified by Form N-CSR, and the Commission will make this information public. A registrant is not required to respond to the collection of information contained in Form N-CSR unless the Form displays a currently valid Office of Management and Budget ("OMB") control number. Please direct comments concerning the accuracy of the information collection burden estimate and any suggestions for reducing the burden to Secretary, Securities and Exchange Commission, 450 Fifth Street, NW, Washington, DC 20549-0609. The OMB has reviewed this collection of information under the clearance requirements of 44 U.S.C. § 3507.
Item 1. Reports to Stockholders.
Beginning on January 1, 2021, as permitted by regulations adopted by the Securities and Exchange Commission, paper copies of the Funds’ shareholder reports like this one will no longer be sent by mail, unless you specifically request paper copies of the reports. Instead, the reports will be made available on the Funds’ website Advisoronefunds.com, and you will be notified by mail each time a report is posted and provided with a website link to access the report.
If you already elected to receive shareholder reports electronically, you will not be affected by this change and you need not take any action. You may elect to receive shareholder reports and other communications from the Funds electronically by contacting your financial intermediary (such as a broker-dealer or bank) or, if you are a direct investor, by following the instructions included with paper Fund documents that have been mailed to you. You may also elect to receive all future reports in paper free of charge.
| AdvisorOne Funds Semi-Annual Report |
Table of Contents
| Letter from the Portfolio Management Team | 1 |
| | |
| CLS Global Aggressive Equity Fund | |
| Portfolio Summary | 4 |
| Performance Update | 5 |
| | |
| CLS Global Diversified Equity Fund | |
| Portfolio Summary | 6 |
| Performance Update | 7 |
| | |
| CLS Growth and Income Fund | |
| Portfolio Summary | 8 |
| Performance Update | 9 |
| | |
| CLS Flexible Income Fund | |
| Portfolio Summary | 10 |
| Performance Update | 11 |
| | |
| CLS Shelter Fund | |
| Portfolio Summary | 12 |
| Performance Update | 13 |
| | |
| Schedule of Investments | |
| CLS Global Aggressive Equity Fund | 14 |
| CLS Global Diversified Equity Fund | 16 |
| CLS Growth and Income Fund | 18 |
| CLS Flexible Income Fund | 21 |
| CLS Shelter Fund | 24 |
| | |
| Statements of Assets and Liabilities | 25 |
| | |
| Statements of Operations | 27 |
| AdvisorOne Funds Semi-Annual Report |
Table of Contents (Continued)
| Statements of Changes in Net Assets | |
| CLS Global Aggressive Equity Fund | 29 |
| CLS Global Diversified Equity Fund | 29 |
| CLS Growth and Income Fund | 30 |
| CLS Flexible Income Fund | 30 |
| CLS Shelter Fund | 31 |
| | |
| Financial Highlights | |
| CLS Global Aggressive Equity Fund | 32 |
| CLS Global Diversified Equity Fund | 34 |
| CLS Growth and Income Fund | 36 |
| CLS Flexible Income Fund | 38 |
| CLS Shelter Fund | 40 |
| | |
| Notes to Financial Statements | 42 |
| | |
| Shareholder Expense Example | 62 |
| | |
| Supplemental Information | 64 |
| AdvisorOne Funds Semi-Annual Report |
Letter from the Portfolio Management Team
Dear Shareholders:
Another eventful six months is in the books. The global economy continues to recover from the trough created by the coronavirus pandemic, just as the U.S. election came in focus. The strong recovery in stocks around the world has rewarded those who have stayed in the market, despite the volatility. Global markets are pricing in a hopeful future, as vaccine results show strong efficacy.
Over the six-month period that ended October 31, 2020, the global stock market1 added 14%, with U.S. stocks2 gaining 15% and international stocks3 gaining 13%. U.S. Small cap stocks4 and Emerging markets5 both performed well over the period, adding 18% and 21% respectively. Developed international stocks6 were the weak spot, although they managed a still-impressive 10% gain.
The U.S. aggregate bond market7 saw continued gains as yields moved lower, ending the period up by just over 1%. The 10-year U.S. Treasury yield8 ended the period at 0.87% while the three-month U.S. Treasury yield9 ended the period at a measly 0.09%.
Within diversified asset classes, commodities10 rebounded strongly on hopes of increased demand, rising 18%. Alternatives11 added just under 3%, and real estate12 managed just over a 3% return.
The AdvisorOne Funds continued to show positive absolute performance. However, the emphasis on value and developed international equities generally detracted from performance.
Outlook and Positioning
At Brinker Capital Investments, our positioning remains fairly consistent with previous periods. We are favoring areas such as international stocks with an emphasis in emerging markets, small-caps, and in particular value stocks. In fixed income, we prefer to be shorter duration with higher credit quality, although we are comfortable taking some credit risk as opportunities arise. We are also maintaining positions in commodities and alternatives as diversifiers in the face of very low bond yields and signs of upward inflationary pressures.
| 1 | Morningstar US Large Cap |
| 3 | Morningstar Gbl Mkt xUS Lg-Mid |
| 4 | Morningstar US Small Cap |
| 6 | Morningstar DM xUS Lg-Mid |
| 7 | Bloomberg Barclays Aggregate Bond |
| 10 | Bloomberg Barclays Commodity |
| 11 | Morningstar Diversified Alt |
| 12 | Morningstar Gbl Real Estate |
| AdvisorOne Funds Semi-Annual Report |
As the economy and market recover, areas tied to economic growth are recovering, too. Value, small-caps, commodities, emerging market stocks and specific sectors are all explicitly linked to global economic growth and should reflect that in performance. However, there are always outliers. Technology stocks have become far and away the biggest sector of the U.S. market and as a result are dragging the market up with their movement, making it more difficult to parse out other, more attractively valued areas that are recovering.
On the other end, value stocks in general have been dragged down by energy companies struggling mightily due to supply and demand issues. Financial companies have also struggled as yields have been reduced to zero by the Federal Reserve. We see value in both sectors, but investors must be selective and patient. However, there are still areas that have attractive valuations and are beginning to show signs of responding to the cyclical recovery.
Within fixed income we prefer to be shorter duration. Even with the Fed on hold for the foreseeable future, we believe the incremental yield gained by extending maturities is not worth the risk of doing so. If economic growth and/or inflation pick up meaningfully, longer-dated bond yields may move higher while the Federal Reserve is fixated on the short end of the yield curve. Instead of duration risk, we prefer the incremental yield pickup from credit, as there are still areas recovering from the worst of the pandemic that offer some value.
A meager outlook for fixed income and the potential for increasing inflation have prompted us to maintain allocations to commodities and alternatives. Commodities have been a very divergent asset class this year, more so than usual, so security selection matters. We prefer diversified approaches that provide more exposure to precious metals, industrial metals, and agriculture.
Thank you for your trust and confidence in managing your funds.
Sincerely,
Brinker Capital Investments Portfolio Management Team
7467-NLD-12/1/2020
3234-CLS-12/1/2020
| AdvisorOne Funds Semi-Annual Report |
THIS PAGE INTENTIONALLY LEFT BLANK
| AdvisorOne Funds Semi-Annual Report |
| |
| CLS Global Aggressive Equity Fund - Portfolio Summary |
| |
Portfolio Commentary
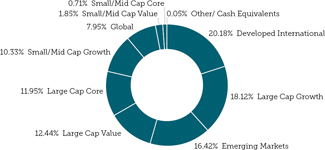
CLS Global Aggressive Equity gained 17.94% over the six-month period ended October 31, 2020. The Fund has a Risk Budget of 110 (over time, it assumes 110% of the risk of a diversified stock portfolio consisting of 60% domestic equities and 40% international equities).
The Fund outperformed its benchmark and peers during this time frame. Exposure to Innovative companies in areas such as clean energy, biotechnology, and semiconductors were positive for performance. International allocations in emerging Asia were also beneficial to performance. Allocations to energy, value stocks globally, and pharmaceutical companies detracted from performance.
The Fund’s largest sector tilts are in financials, health care, and discretionary. Regionally, allocations to Asia – both developed and emerging – remain the largest overweight. Developed Europe and Japan remain underweight. The Fund remains allocated to a balance of asset classes with attractive valuation and momentum characteristics.
Turnover for the Fund over the six months ended October 31, 2020 was 9%.
| * | Based on total net asset value as of October 31, 2020. Portfolio holdings are subject to change and should not be a recommendation to buy individual securities. Concentrating in a small number of investments increases the Fund’s risk because each investment has a greater effect on the Fund’s performance. Refer to the Schedule of Investments for a detailed listing of the Fund’s holdings. |
Investors cannot directly invest in an index and unmanaged index returns do not reflect any fees, expenses or sales charges. Past performance does not guarantee future results and there is no assurance that the Fund will achieve its investment objective.
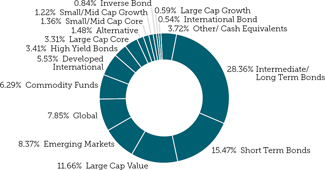
Portfolio Composition*
| Top Ten Portfolio Holdings* | *Percentages based on Net Assets |
| VanEck Vectors Morningstar Wide Moat ETF | 8.63% |
| The Fund seeks to track the overall performance of attractively priced companies with sustainable competitive advantages according to Morningstar’s equity research team | | |
| Schwab Fundamental International Large Company Index ETF | 6.95% |
| The Fund seeks to track as closely as possible, before fees and expenses, the total return of the Russell Fundamental Developed ex-U.S. Large Company Index. The Fund will concentrate its investments in a group of sectors approximating the Index and achieve over time a correlation with the Index’s performance. | | |
| iShares MSCI International Momentum Factor ETF | 6.84% |
| The iShares MSCI Intl Momentum Factor ETF seeks to track the performance of an index that measures the performance of large- and mid-capitalization developed international stocks exhibiting relatively higher momentum characteristics, before fees and expenses. | | |
| iShares MSCI All Country Asia ex Japan ETF | 6.52% |
| The Fund seeks to track the investment results of an index composed of Asian equities, excluding Japan. | | |
| Davis Select International ETF | | 6.38% |
| The investment seeks long-term growth of capital. The fund’s investment adviser uses the Davis Investment Discipline to invest the fund’s portfolio principally in common stocks (including indirect holdings of common stock through depositary receipts) issued by foreign companies, including countries with developed or emerging markets. The fund may invest in large, medium or small companies without regard to market capitalization. | | |
| VanEck Vectors Retail ETF | 6.18% |
| The Fund seeks to replicate as closely as possible, before fees and expenses, the price and yield performance of the MVIS® US Listed Retail 25 Index (MVRTHTR), which is intended to track the overall performance of companies involved in retail distribution, wholesalers, on-line, direct mail and TV retailers, multi-line retailers, specialty retailers and food and other staples retailers. | | |
| iShares PHLX Semiconductor ETF | 5.34% |
| The iShares PHLX Semiconductor ETF seeks to track the investment results of an index composed of U.S. equities in the semiconductor sector. | | |
| Invesco FTSE RAFI Emerging Markets ETF | 5.32% |
| The Fund is based on the FTSE RAFI Emerging Markets Index (Index). The Fund will normally invest at least 90% of its total assets in securities that comprise the Index and American Depository Receipts (ADRs) based on the securities in the Index. | | |
| iShares U.S. Financial Services ETF | 4.26% |
| The iShares U.S. Financial Services ETF seeks to track the investment results of an index composed of U.S. equities in the financial services sector. | | |
| iShares Global Clean Energy ETF | 4.22% |
| The iShares Global Clean Energy ETF (ICLN) seeks to track the investment results of an index composed of global equities in the clean energy sector. | | |
| AdvisorOne Funds Semi-Annual Report |
| |
| CLS Global Aggressive Equity Fund - Performance Update |
| |
Annualized Total Returns as of October 31, 2020
| | | | | | | Since |
| | | | 3 Year | 5 Year | 10 Year | Inception |
| | 6 Months | 1 Year | (Annualized) | (Annualized) | (Annualized) | (12/7/18-10/31/20) |
| Class N Shares1 | 17.94% | 8.15% | 4.00% | 8.13% | 8.27% | NA |
| Class T Shares1 | 17.94% | 8.15% | NA | NA | N/A | 9.52% |
| MSCI ACWI Index | 13.61% | 4.89% | 5.52% | 8.11% | 7.90% | 10.33% |
| Risk Budget Benchmark* | 15.64% | 5.36% | 6.51% | 9.47% | 10.02% | 10.67% |
| | | | | | | |
| 1 | Class N and Class T Shares are not subject to an initial sales charge or a CDSC. |
The performance data quoted is historical. Past performance is no guarantee of future results. Current performance may be higher or lower than the performance data quoted. The principal value and investment return of an investment will fluctuate so that your shares, when redeemed, may be worth more or less than their original cost. The returns shown do not reflect the deduction of taxes that a shareholder would pay on Fund distributions or on the redemptions of Fund shares. Returns greater than 1 year are annualized. The Fund’s total annual operating expenses are 1.73% for Class N shares and 1.58% for Class T shares per the September 1, 2020 prospectus. This material must be proceeded or accompanied by a prospectus. Please read it carefully before investing. For performance information current to the most recent month-end, please call 1-866-811-0225.
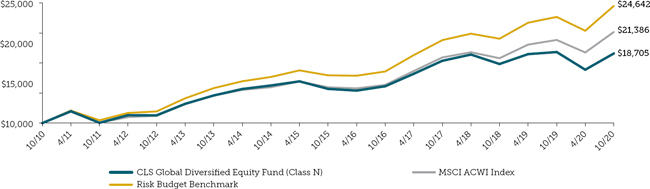
Growth of a $10,000 Investment
This chart illustrates a comparison of a hypothetical investment of $10,000 in the CLS Global Aggressive Equity Fund (assuming reinvestment of all dividends and distributions) versus the Fund’s benchmark index.
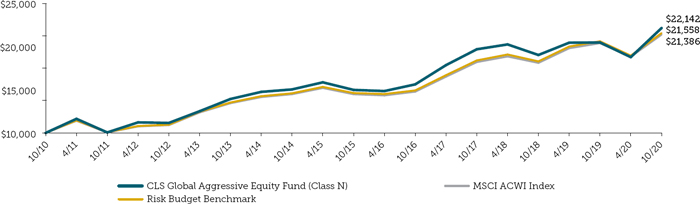
The MSCI ACWI Index is designed to provide a broad measure of global equity market performance by capturing all sources of equity returns across 23 developed and 27 emerging markets.
| * | Performance of the risk budget benchmark shows how the Fund’s performance compares to an index with similar investment strategies and underlying holdings as the Fund. The risk budget benchmark consists of 110% of a blended benchmark consisting of 60% of the Morningstar U.S. Market Index and 40% of the Morningstar Global ex US Lg-Mid Index. The Morningstar U.S. Market Index is an index that measures the performance of U.S. securities and targets 97% market capitalization coverage of the investable universe. It is a diversified broad market index. The Morningstar Global ex U.S. Large-Mid Index is an index that measures the performance of Global Markets (ex-U.S.) equity markets targeting the top 90% of stocks by market capitalization. |
| AdvisorOne Funds Semi-Annual Report |
| |
| CLS Global Diversified Equity Fund - Portfolio Summary |
| |
Portfolio Commentary
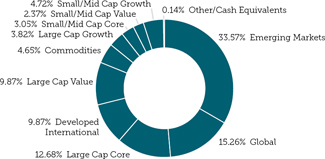
CLS Global Diversified Equity returned 12.20% for the six-month period ended October 31, 2020. The Fund has a Risk Budget of 100 (over time, it is approximately as risky as a diversified equity portfolio consisting of 60% domestic equities and 40% international equities).
The Fund underperformed its benchmark during this time frame. Exposure to global value stocks, health care, and financials detracted from performance. Exposure to innovative companies and emerging markets, particularly in Asia, contributed positively to performance.
The Fund’s largest sector tilts are in financials, health care, and materials. Regionally, allocations to Asia – both developed and emerging – remain the largest overweight. Developed Europe and Japan remain underweights. The Fund remains positioned in asset classes with significant valuation discounts, and therefore areas we believe have the potential for higher returns going forward.
Turnover for the Fund over the six months ended October 31, 2020 was 8%.
| * | Based on total net asset value as of October 31, 2020. Portfolio holdings are subject to change and should not be a recommendation to buy individual securities. Concentrating in a small number of investments increases the Fund’s risk because each investment has a greater effect on the Fund’s performance. Refer to the Schedule of Investments for a detailed listing of the Fund’s holdings. |
Investors cannot directly invest in an index and unmanaged index returns do not reflect any fees, expenses or sales charges. Past performance does not guarantee future results and there is no assurance that the Fund will achieve its investment objective.
Portfolio Composition*
| Top Ten Portfolio Holdings* | *Percentages based on Net Assets |
| Invesco FTSE RAFI Emerging Markets ETF | 9.74% |
| The Fund is based on the FTSE RAFI Emerging Markets Index (Index). The Fund will normally invest at least 90% of its total assets in securities that comprise the Index and American Depository Receipts (ADRs) based on the securities in the Index. | | |
| iShares Exponential Technologies ETF | 7.00% |
| The Fund seeks to track the investment results of an index composed of developed and emerging market companies that create or use exponential technologies | | |
| Fidelity Value Factor ETF | 6.98% |
| The Fund seeks to provide investment returns that correspond, before fees and expenses, generally to the performance of the Fidelity U.S. Value Factor IndexSM. Normally investing at least 80% of assets in securities included in the Fidelity U.S. Value Factor Index, which is designed to reflect the performance of stocks of large and mid-capitalization U.S. companies that have attractive valuations. | | |
| Davis Select Financial ETF | 6.64% |
| The Fund seeks long-term capital growth and capital preservation. | | |
| SPDR S&P Emerging Asia Pacific ETF | 5.93% |
| The Fund seeks to provide investment results that, before fees and expenses, correspond generally to the total return performance of the S&P® Asia Pacific Emerging BMI Index. | | |
| Goldman Sachs ActiveBeta Emerging Markets Equity ETF | 5.43% |
| The Fund seeks to provide investment results that closely correspond, before fees and expenses, to the performance of the Goldman Sachs ActiveBeta® Emerging Markets Equity Index. | | |
| WisdomTree Emerging Markets High Dividend Fund | 4.88% |
| The Fund seeks to track the price and yield performance of the WisdomTree Emerging Markets High Dividend Index which comprised of the highest dividend-yielding common stocks selected from WisdomTree Emerging Markets Dividend Index | | |
| Invesco DB Commodity Index Tracking Fund | 4.65% |
| The Invesco DB Commodity Index Tracking (Fund) seeks to track changes, whether positive or negative, in the level of the DBIQ Optimum Yield Diversified Commodity Index Excess Return™ (DBIQ Opt Yield Diversified Comm Index ER or Index) plus the interest income from the Fund’s holdings of primarily US Treasury securities and money market income less the Fund’s expenses. The Fund is designed for investors who want a cost-effective and convenient way to invest in commodity futures. The Index is a rules-based index composed of futures contracts on 14 of the most heavily traded and important physical commodities in the world. The Fund and the Index are rebalanced and reconstituted annually in November. | | |
| SPDR S&P Kensho New Economies Composite ETF | 4.38% |
| The Fund seeks to provide investment results that, before fees and expenses, correspond generally to the total return performance of the Kensho New Economics Composite Index. Under normal market conditions, the Fund invests substantially all, but at least 80%, of its total assets in the securities comprising the Index. | | |
| PIMCO RAFI Dynamic Multi-Factor Emerging Markets Equity ETF | 3.63% |
| The Fund seeks to track the investment results of the RAFI Dynamic Multi-Factor Emerging Markets Index. The Underlying Index is designed to provide long-only exposure to multiple equity factors that seek to produce attractive long-term returns, and which may lower risk compared to less diversified strategies. | | |
| AdvisorOne Funds Semi-Annual Report |
| |
| CLS Global Diversified Equity Fund - Performance Update |
| |
Annualized Total Returns as of October 31, 2020
| | | | | | | Since |
| | | | 3 Year | 5 Year | 10 Year | Inception |
| | 6 Months | 1 Year | (Annualized) | (Annualized) | (Annualized) | (12/7/18-10/31/20) |
| Class N Shares1 | 12.20% | (0.92)% | 1.69% | 5.55% | 6.46% | NA |
| Class T Shares1 | 12.20% | (0.92)% | NA | NA | NA | 4.64% |
| MSCI ACWI Index | 13.61% | 4.89% | 5.52% | 8.11% | 7.90% | 10.33% |
| Risk Budget Benchmark* | 14.41% | 5.92% | 6.55% | 9.06% | 9.44% | 10.48% |
| | | | | | | |
| 1 | Class N and Class T Shares are not subject to an initial sales charge or a CDSC. |
The performance data quoted is historical. Past performance is no guarantee of future results. Current performance may be higher or lower than the performance data quoted. The principal value and investment return of an investment will fluctuate so that your shares, when redeemed, may be worth more or less than their original cost. The returns shown do not reflect the deduction of taxes that a shareholder would pay on Fund distributions or on the redemptions of Fund shares. Returns greater than 1 year are annualized. The Fund’s total annual operating expenses are 1.60% for Class N shares and 1.45% for Class T shares per the September 1, 2020 prospectus. This material must be proceeded or accompanied by a prospectus. Please read it carefully before investing. For performance information current to the most recent month-end, please call 1-866-811-0225.
Growth of a $10,000 Investment
This chart illustrates a comparison of a hypothetical investment of $10,000 in the CLS Global Diversified Equity Fund (assuming reinvestment of all dividends and distributions) versus the Fund’s benchmark index.
The MSCI ACWI Index is designed to provide a broad measure of global equity market performance by capturing all sources of equity returns across 23 developed and 27 emerging markets.
| * | Performance of the risk budget benchmark shows how the Fund’s performance compares to an index with similar investment strategies and underlying holdings as the Fund. The risk budget benchmark consists of 60% of the Morningstar U.S. Market Index and 40% of the Morningstar Global Market ex US Lg-Mid Index. The Morningstar U.S. Market Index is an index that measures the performance of U.S. securities and targets 97% market capitalization coverage of the investable universe. It is a diversified broad market index. The Morningstar Global ex U.S. Large-Mid Index is an index that measures the performance of Global Markets (ex-U.S.) equity markets targeting the top 90% of stocks by market capitalization. |
| AdvisorOne Funds Semi-Annual Report |
| |
| CLS Growth and Income Fund - Portfolio Summary |
| |
Portfolio Commentary
CLS Growth and Income returned 7.01% for the six-month period ended October 31, 2020. The Fund has a Risk Budget of 55 (over time, it is approximately 55% as risky as a diversified stock portfolio consisting of 60% domestic equities and 40% international equities).
Exposure to Chinese equities, as well as global innovative stocks, and portfolio diversifiers such as merger arbitrage and commodities contributed positively to performance during the period. Value stocks in the US and within emerging markets hurt performance. An overweight to healthcare was also a detractor to performance.
The Fund’s largest sector tilts are to health care and financial stocks. Technology and communication services remain the largest underweights. Geographically, the Fund continues to favor emerging markets including China as the largest overweight. The Fund remains positioned in asset classes with significant valuation discounts, and therefore areas we believe have the potential for higher returns going forward.
Within fixed income, the Fund’s interest-rate sensitivity is below the overall bond market. The Fund is positioned in higher quality US bonds, but also has an overweight to senior bank loans, which was beneficial to performance during the six-month period.
Turnover for the Fund over the six months ended October 31, 2020 was 8%.
| * | Based on total net asset value as of October 31, 2020. Portfolio holdings are subject to change and should not be a recommendation to buy individual securities. Concentrating in a small number of investments increases the Fund’s risk because each investment has a greater effect on the Fund’s performance. Refer to the Schedule of Investments for a detailed listing of the Fund’s holdings. |
Investors cannot directly invest in an index and unmanaged index returns do not reflect any fees, expenses or sales charges. Past performance does not guarantee future results and there is no assurance that the Fund will achieve its investment objective.
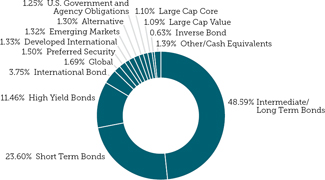
Portfolio Composition*
| Top Ten Portfolio Holdings* | *Percentages based on Net Assets |
| Fidelity Total Bond ETF | 10.60% |
| The Fund seeks to provide a high level of current income. The fund normally invests at least 80% of its assets in debt securities of all types and repurchase agreements for those securities. | | |
| iShares MSCI USA Value Factor ETF | 8.26% |
| The Fund seeks to track the performance of an index that measures the performance of U.S. large- and mid- capitalization stocks with value characteristics and relatively lower valuations, before fees and expenses. | | |
| PIMCO Enhanced Short Maturity Active ETF | 6.12% |
| The Fund seeks maximum current income, consistent with preservation of capital and daily liquidity. | | |
| First Trust TCW Opportunistic Fixed Income ETF | 6.11% |
| The Fund seeks to maximize long-term total return. Under normal market conditions, the Fund pursues its objective by investing at least 80% of its net assets (including investment borrowings) in fixed income securities. | | |
| iShares Exponential Technologies ETF | 4.84% |
| The Fund seeks to track the investment results of an index composed of developed and emerging market companies that create or use exponential technologies | | |
| Janus Henderson Short Duration Income ETF | 4.79% |
| The Fund seeks to provide a steady income stream with capital preservation across various market cycles, and consistently outperform the LIBOR 3-month rate by a moderate amount through various market cycles while providing low volatility. The average portfolio duration generally will be within 0-2 year of LIBOR. | | |
| SPDR Doubleline Total Return Tactical ETF | 4.29% |
| The Fund seeks to maximize total return. | | |
| Invesco Optimum Yield Diversified Commodity Strategy No K-1 ETF | 4.27% |
| The Fund is an actively managed ETF that seeks to achieve its investment objective by investing in commodity-linked futures and other financial instruments that provide economic exposure to a diverse group of the world’s most heavily traded commodities. The Fund seeks to provide long-term capital appreciation using an investment strategy designed to exceed the performance of DBIW Optimum Yield Diversified Commodity Index Excess Return, an index composed of future contracts on 14 heavily traded commodities across the energy, precious metals, industrial metals and agriculture sectors. | | |
| Vanguard Short-Term Inflation-Protected Securities ETF | 4.25% |
| Vanguard Short-Term Inflation-Protected Securities ETF seeks to track the performance of a benchmark index that measures the investment return of inflation-protected public obligations of the U.S. Treasury with remaining maturities of less than five years. | | |
| Schwab Fundamental International Large Company Index ETF | 4.00% |
| The fund’s goal is to track as closely as possible, before fees and expenses, the total return of the Russell RAFI™ Developed ex US Large Company Index. | | |
| AdvisorOne Funds Semi-Annual Report |
| |
| CLS Growth and Income Fund - Performance Update |
| |
Annualized Total Returns as of October 31, 2020
| | | | | | | Since |
| | | | 3 Year | 5 Year | 10 Year | Inception |
| | 6 Months | 1 Year | (Annualized) | (Annualized) | (Annualized) | (12/7/18-10/31/20) |
| Class N Shares1 | 6.91% | (1.54)% | 1.33% | 3.72% | 4.34% | NA |
| Class T Shares1 | 6.91% | (1.54)% | NA | NA | NA | 3.56% |
| MSCI ACWI Index | 13.61% | 4.89% | 5.52% | 8.11% | 7.90% | 10.33% |
| Risk Budget Benchmark* | 7.91% | 4.58% | 4.73% | 5.75% | 5.65% | 6.96% |
| | | | | | | |
| 1 | Class N and Class T Shares are not subject to an initial sales charge or a CDSC. |
The performance data quoted is historical. Past performance is no guarantee of future results. Current performance may be higher or lower than the performance data quoted. The principal value and investment return of an investment will fluctuate so that your shares, when redeemed, may be worth more or less than their original cost. The returns shown do not reflect the deduction of taxes that a shareholder would pay on Fund distributions or on the redemptions of Fund shares. Returns greater than 1 year are annualized. The Fund’s total annual operating expenses are 1.56% for Class N shares and 1.41% for Class T shares per the September 1, 2020 prospectus. This material must be proceeded or accompanied by a prospectus. Please read it carefully before investing. For performance information current to the most recent month-end, please call 1-866-811-0225.
Growth of a $10,000 Investment
This chart illustrates a comparison of a hypothetical investment of $10,000 in the CLS Growth and Income Fund (assuming reinvestment of all dividends and distributions) versus the Fund’s benchmark index.
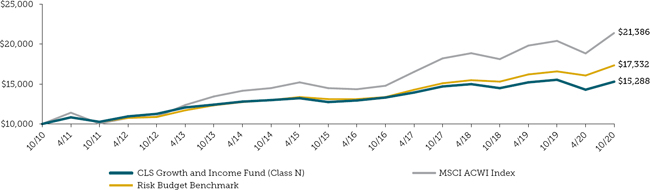
The MSCI ACWI Index is designed to provide a broad measure of global equity market performance by capturing all sources of equity returns across 23 developed and 27 emerging markets.
| * | Performance of the risk budget benchmark shows how the Fund’s performance compares to an index with similar investment strategies and underlying holdings as the Fund. The risk budget benchmark consists of (i) 55% of a blended benchmark consisting of 60% of the Morningstar U.S. Market Index and 40% of the Morningstar Global Market ex US Lg-Mid Index, and (ii) 45% of the Morningstar Cash Index. The weightings against this benchmark are consistent with the risk level of the Fund and these indexes are utilized to reflect the Fund’s broad exposure to the global equity market. The index includes both developed and emerging markets. The Morningstar U.S. Market Index is an index that measures the performance of U.S. securities and targets 97% market capitalization coverage of the investable universe. It is a diversified broad market index. The Morningstar Global ex U.S. Large-Mid Index is an index that measures the performance of Global Markets (ex-U.S.) equity markets targeting the top 90% of stocks by market capitalization. The Morningstar Cash Index is an index that measures the performance of a Treasury Bill with six to eight weeks until maturity in the U.S. Market. |
| AdvisorOne Funds Semi-Annual Report |
| |
| CLS Flexible Income Fund - Portfolio Summary |
| |
Portfolio Commentary
CLS Flexible Income Fund returned 4.11% for the six-month period ended October 31, 2020. The Fund has a Risk Budget of 20 (i.e., over time the Fund is approximately 20% as risky as a diversified stock portfolio consisting of 60% domestic equities and 40% international equities).
Within fixed income, exposure to emerging market debt, high- yield bonds, and preferred stocks contributed positively to the performance. In equities, innovative companies as well as emerging market stocks were strong. The Fund was negatively impacted by exposure to treasuries, mortgage-backed securities, and healthcare equities.
In terms of portfolio positioning, the Fund has an overweight to international equities relative to its global benchmark. Within fixed income sector, corporate bonds remain the largest overweight and an underweight to treasuries. The Fund continues to have a lower duration than the broad bond market and slightly higher credit exposure as well which was beneficial to performance during the six-month period.
Turnover for the Fund over the six months ended October 31, 2020 was 15%.
| * | Based on total net asset value as of October 31, 2020. Portfolio holdings are subject to change and should not be a recommendation to buy individual securities. Concentrating in a small number of investments increases the Fund’s risk because each investment has a greater effect on the Fund’s performance. Refer to the Schedule of Investments for a detailed listing of the Fund’s holdings. |
Investors cannot directly invest in an index and unmanaged index returns do not reflect any fees, expenses or sales charges. Past performance does not guarantee future results and there is no assurance that the Fund will achieve its investment objective.
Portfolio Composition*
| Top Ten Portfolio Holdings* | *Percentages based on Net Assets |
| PIMCO Active Bond ETF | 9.81% |
| The Fund is a diversified portfolio of high quality bonds that is actively managed, seeking current income and long-term capital appreciation, consistent with prudent investment management. | | |
| Janus Henderson Short Duration Income ETF | 9.41% |
| The Fund is an actively managed fixed income ETF which seeks to provide a steady income stream with low volatility and capital preservation across economic cycles. It is designed to move beyond conventional constraints and provide positive absolute returns. | | |
| PIMCO Enhanced Short Maturity Active ETF | 8.24% |
| The Fund seeks maximum current income, consistent with preservation of capital and daily liquidity. | | |
| iShares 3-7 Year Treasury Bond ETF | 7.52% |
| The Fund seeks to track the investment results of an index composed of U.S. Treasury bonds with remaining maturities between three and seven years. | | |
| Vanguard Short-Term Inflation-Protected Securities ETF | 5.96% |
| Vanguard Short-Term Inflation-Protected Securities ETF seeks to track the performance of a benchmark index that measures the investment return of inflation-protected public obligations of the U.S. Treasury with remaining maturities of less than five years. | | |
| Vanguard Intermediate-Term Corporate Bond ETF | 5.91% |
| The Fund seeks to track the performance of a market-weighted corporate bond index with an intermediate-term dollar-weighted average maturity. | | |
| iShares 5-10 Year Investment Grade Corporate Bond ETF | 5.77% |
| The iShares 5-10 Year Investment Grade Corporate Bond ETF seeks to track the investment results of an index composed of U.S. dollar-denominated investment-grade corporate bonds with remaining maturities between five and ten years. | | |
| SPDR Blackstone / GSO Senior Loan ETF | 5.42% |
| The Fund seeks to provide current income consistent with the preservation of capital. | | |
| Quadratic Interest Rate Volatility and Inflation ETF | 3.08% |
| The Fund seeks to hedge the risk of increased fixed income volatility and rising inflation and to profit from rising long-term interest rates or falling short-term interest rates, often referred to as a steepening of the U.S. interest rate curve, while providing inflation-protected income.. | | |
| iShares 0-5 Year High Yield Corporate Bond ETF | 2.86% |
| The Fund seeks to track the investment results of Markit iBoxx USD Liquid High Yield 0-5 Index. The Index composed of US dollar-denominated, high yield corporate bonds with remaining maturities of less than five years. The Index is designed to reflect the performance of US dollar-denominated high yield corporate debt. | | |
| AdvisorOne Funds Semi-Annual Report |
| |
| CLS Flexible Income Fund - Performance Update |
| |
Annualized Total Returns as of October 31, 2020
| | | | | | | Since |
| | | | 3 Year | 5 Year | 10 Year | Inception |
| | 6 Months | 1 Year | (Annualized) | (Annualized) | (Annualized) | (12/7/18-10/31/20) |
| Class N Shares1 | 4.11% | 2.07% | 3.05% | 3.26% | 2.72% | NA |
| Class T Shares1 | 4.21% | 2.17% | NA | NA | N/A | 5.54% |
| Bloomberg Barclays Aggregate Bond Index | 1.27% | 6.19% | 5.06% | 4.08% | 3.55% | 8.57% |
| Risk Budget Benchmark* | 2.90% | 2.40% | 2.82% | 2.87% | 2.48% | 3.60% |
| | | | | | | |
| 1 | Class N and Class T Shares are not subject to an initial sales charge or a CDSC. |
The performance data quoted is historical. Past performance is no guarantee of future results. Current performance may be higher or lower than the performance data quoted. The principal value and investment return of an investment will fluctuate so that your shares, when redeemed, may be worth more or less than their original cost. The returns shown do not reflect the deduction of taxes that a shareholder would pay on Fund distributions or on the redemptions of Fund shares. Returns greater than 1 year are annualized. The Fund’s total annual operating expenses are 1.22% for Class N shares and 1.07% for Class T shares per the September 1, 2020 prospectus. This material must be proceeded or accompanied by a prospectus. Please read it carefully before investing. For performance information current to the most recent month-end, please call 1-866-811-0225.
Growth of a $10,000 Investment
This chart illustrates a comparison of a hypothetical investment of $10,000 in the CLS Flexible Income Fund (assuming reinvestment of all dividends and distributions) versus the Fund’s benchmark index.
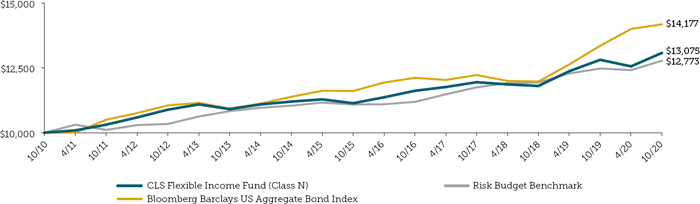
The Bloomberg Barclays US Aggregate Bond Index is a market-capitalization-weighted index that covers the USD-denominated, investment-grade (rated Baa3 or above by Moddy’s), fixed-rate, and taxable areas of the bond market. Prior to August 24, 2016, the Index was known as Barclays Aggregate Bond Index.
| * | Performance of the risk budget benchmark shows how the Fund’s performance compares to an index with similar investment strategies and underlying holdings as the Fund. The risk budget benchmark consists of (i) 20% of a blended benchmark consisting of 60% of the Morningstar U.S. Market Index and 40% of the Morningstar Global Market ex US Lg-Mid Index, and (ii) 80% of the Morningstar Cash Index. The Morningstar U.S. Market Index is an index that measures the performance of U.S. securities and targets 97% market capitalization coverage of the investable universe. It is a diversified broad market index. The Morningstar Global ex U.S. Large-Mid Index is an index that measures the performance of Global Markets (ex-U.S.) equity markets targeting the top 90% of stocks by market capitalization. The Morningstar Cash Index is an index that measures the performance of a Treasury Bill with six to eight weeks until maturity in the U.S. market. |
| AdvisorOne Funds Semi-Annual Report |
| |
| CLS Shelter Fund - Portfolio Summary |
| |
Portfolio Commentary
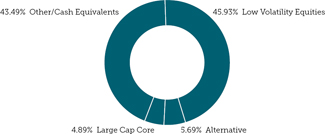
CLS Shelter returned 0.28% for the six-month period ended October 31, 2020. The Fund has a risk-based benchmark of 75% of a blended benchmark consisting of 80% domestic equities and 20% international equities.
After the sharp drawdown in the market earlier this year, the Fund was at the lowest risk posture going into the period with 50% of the Fund invested in low and minimum volatility equities and 50% in cash. During this time frame, the market was moving in an upward trajectory but continued to experience a fair amount of volatility. While the Fund was able to participate a portion of the market upside, that participation was limited. The Fund continued to be allocated to 50% low and minimum volatility equities and between 50% and 25% cash throughout the period.
The Fund experienced 14 different moves between protection levels, resulting in turnover of 135% during the six months ended October 31, 2020.
Performance of low and minimum volatility underperformed during the six-month period, particularly on a risk-adjusted basis. Exposure to small cap and emerging market equities also detracted from performance during the short holding periods. However, the cash drag on the Fund was the biggest detractor during the period as the market rebounded strongly.
| * | Based on total net asset value as of October 31, 2020. Portfolio holdings are subject to change and should not be a recommendation to buy individual securities. Concentrating in a small number of investments increases the Fund’s risk because each investment has a greater effect on the Fund’s performance. Refer to the Schedule of Investments for a detailed listing of the Fund’s holdings. |
Investors cannot directly invest in an index and unmanaged index returns do not reflect any fees, expenses or sales charges. Past performance does not guarantee future results and there is no assurance that the Fund will achieve its investment objective.
Portfolio Composition*
| Top Ten Portfolio Holdings* | *Percentages based on Net Assets |
| iShares MSCI Global Min Vol Factor ETF | 20.63% |
| The investment seeks to track the investment results of the MSCI ACWI Minimum Volatility (USD) Index. The fund generally will invest at least 90% of its assets in the component securities of the underlying index and in investments that have economic characteristics that are substantially identical to the component securities of the underlying index. The index measures the combined performance of equity securities in both developed and emerging markets that, in the aggregate, have lower volatility relative to the large- and mid-cap developed and emerging markets. | | |
| iShares MSCI USA Min Vol Factor ETF | 10.31% |
| The iShares MSCI USA Min Vol Factor ETF seeks to track the investment results of an index composed of U.S. equities that, in the aggregate, have lower volatility characteristics relative to the broader U.S. equity market. | | |
| Invesco S&P 500 Low Volatility ETF | 9.69% |
| The Invesco S&P 500® Low Volatility ETF (the “Fund”) is based on the S&P 500® Low Volatility Index (the “Index”). The Fund will invest at least 90% of its total assets in the securities that comprise the Index. The Index is compiled, maintained and calculated by Standard & Poor’s and consists of the 100 securities from the S&P 500® Index with the lowest realized volatility over the past 12 months. Volatility is a statistical measurement of the magnitude of up and down asset price fluctuations over time. The Fund and the Index are rebalanced and reconstituted quarterly in February, May, August and November. | | |
| Innovator S&P 500 Power Buffer ETF – January | 5.69% |
| The Fund seeks to provide returns that match those of the S&P 500 Price Index while providing a buffer against the first 15% of S&P 500 Index losses, from January 1, 2019 to December 31, 2019. The Fund invests at least 80% of its net assets in Flexible Exchange Options that reference the S&P 500 Price Return Index. | | |
| iShares MSCI EAFE Min Vol Factor ETF | 5.30% |
| The iShares MSCI EAFE Min Vol Factor ETF seeks to track the investment results of an index composed of developed market equities that, in the aggregate, have lower volatility characteristics relative to the broader developed equity markets, excluding the U.S. and Canada. | | |
| John Hancock Multi-Factor Large Cap ETF | 4.89% |
| The iShares MSCI EAFE Min Vol Factor ETF seeks to track the investment results of an index composed of developed market equities that, in the aggregate, have lower volatility characteristics relative to the broader developed equity markets, excluding the U.S. and Canada. | | |
| AdvisorOne Funds Semi-Annual Report |
| |
| CLS Shelter Fund - Performance Update |
| |
Annualized Total Returns as of October 31, 2020
| | | | | | | Since |
| | | | 3 Year | 5 Year | 10 Year | Inception |
| | 6 Months | 1 Year | (Annualized) | (Annualized) | (Annualized) | (12/7/18-10/31/20) |
| Class N Shares1 | 0.28% | (10.44)% | (0.89)% | 4.18% | 4.46% | NA |
| Class T Shares1 | 0.37% | (10.36)% | NA | NA | N/A | (1.32)% |
| MSCI ACWI Index | 13.61% | 4.89% | 5.52% | 8.11% | 7.90% | 10.33% |
| Risk Based Benchmark* | 11.11% | 7.34% | 7.16% | 8.32% | 8.73% | 9.76% |
| | | | | | | |
| 1 | Class N and Class T Shares are not subject to an initial sales charge or a CDSC. |
The performance data quoted is historical. Past performance is no guarantee of future results. Current performance may be higher or lower than the performance data quoted. The principal value and investment return of an investment will fluctuate so that your shares, when redeemed, may be worth more or less than their original cost. The returns shown do not reflect the deduction of taxes that a shareholder would pay on Fund distributions or on the redemptions of Fund shares. Returns greater than 1 year are annualized. The Fund’s total annual operating expenses are 1.47% for Class N shares and 1.32% for Class T shares per the September 1, 2020 prospectus. This material must be proceeded or accompanied by a prospectus. Please read it carefully before investing. For performance information current to the most recent month-end, please call 1-866-811-0225.
Growth of a $10,000 Investment
This chart illustrates a comparison of a hypothetical investment of $10,000 in the CLS Shelter Fund (assuming reinvestment of all dividends and distributions) versus the Fund’s benchmark index.
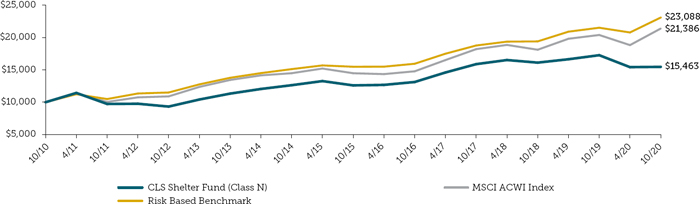
The MSCI ACWI Index is designed to provide a broad measure of global equity market performance by capturing all sources of equity returns across 23 developed and 27 emerging markets.
| * | Performance of the risk based benchmark shows how the Fund’s performance compares to an index with similar investment strategies and underlying holdings as the Fund. The risk based benchmark consists of (i) 75% of a blended benchmark consisting of 80% of the Morningstar U.S. Market Index and 20% of the Morningstar Global Market ex US Lg-Mid Index, and (ii) 25% of the Morningstar Cash Index. The Morningstar U.S. Market Index is an index that measures the performance of U.S. securities and targets 97% market capitalization coverage of the investable universe. It is a diversified broad market index. The Morningstar Global ex U.S. Large-Mid Index is an index that measures the performance of Global Markets (ex-U.S.) equity markets targeting the top 90% of stocks by market capitalization. The Morningstar Cash Index is an index that measures the performance of a Treasury Bill with six to eight weeks until maturity in the U.S. market. |
| AdvisorOne Funds Semi-Annual Report |
| |
| Schedule of Investments - CLS Global Aggressive Equity Fund (Unaudited) |
| October 31, 2020 |
| | | Shares | | | Fair Value | |
| Equity Funds - 99.95% | | | | | | | | |
| Developed International - 20.18% | | | | | | | | |
| Davis Select International ETF + | | | 450,000 | | | $ | 9,315,000 | |
| iShares MSCI International Momentum Factor ETF + | | | 305,000 | | | | 9,982,650 | |
| Schwab Fundamental International Large Company Index ETF + | | | 425,000 | | | | 10,149,000 | |
| | | | | | | | 29,446,650 | |
| Emerging Markets - 16.42% | | | | | | | | |
| Invesco FTSE RAFI Emerging Markets ETF + | | | 444,000 | | | | 7,770,000 | |
| iShares MSCI All Country Asia ex Japan ETF | | | 121,000 | | | | 9,510,600 | |
| PIMCO RAFI Dynamic Multi-Factor Emerging Markets Equity ETF + | | | 120,000 | | | | 2,684,184 | |
| SPDR S&P Emerging Asia Pacific ETF | | | 35,000 | | | | 4,003,300 | |
| | | | | | | | 23,968,084 | |
| Global - 7.95% | | | | | | | | |
| Cambria Global Value ETF ^ | | | 343,000 | | | | 5,439,980 | |
| iShares Global Clean Energy ETF + | | | 315,000 | | | | 6,161,400 | |
| | | | | | | | 11,601,380 | |
| Large Cap Core - 11.95% | | | | | | | | |
| Pacer Salt High truBeta US Market ETF ^ | | | 96,000 | | | | 2,786,160 | |
| VanEck Vectors Morningstar Wide Moat ETF + | | | 237,000 | | | | 12,594,180 | |
| VanEck Vectors Pharmaceutical ETF + | | | 35,000 | | | | 2,061,850 | |
| | | | | | | | 17,442,190 | |
| Large Cap Growth - 18.12% | | | | | | | | |
| Fidelity Momentum Factor ETF ^ | | | 131,000 | | | | 5,105,463 | |
| First Trust Cloud Computing ETF + | | | 59,500 | | | | 4,529,735 | |
| iShares PHLX Semiconductor ETF + | | | 25,500 | | | | 7,789,740 | |
| VanEck Vectors Retail ETF ^+ | | | 62,500 | | | | 9,014,375 | |
| | | | | | | | 26,439,313 | |
| Large Cap Value - 12.44% | | | | | | | | |
| Fidelity Value Factor ETF + | | | 148,000 | | | | 5,160,760 | |
| iShares U.S. Financial Services ETF + | | | 52,000 | | | | 6,213,480 | |
| John Hancock Multi-Factor Financials ETF ^ | | | 95,000 | | | | 3,191,782 | |
| Vanguard U.S. Value Factor | | | 57,000 | | | | 3,581,293 | |
| | | | | | | | 18,147,315 | |
| Small/Mid Cap Core - 0.71% | | | | | | | | |
| John Hancock Multifactor Materials ETF | | | 30,000 | | | | 1,038,132 | |
| | | | | | | | | |
| Small/Mid Cap Growth - 10.33% | | | | | | | | |
| ARK Genomic Revolution ETF + | | | 91,000 | | | | 5,982,340 | |
| ARK Innovation ETF | | | 64,000 | | | | 5,810,560 | |
| SPDR S&P Transportation ETF | | | 56,000 | | | | 3,279,920 | |
| | | | | | | | 15,072,820 | |
| Small/Mid Cap Value - 1.85% | | | | | | | | |
| VictoryShares USAA MSCI USA Small Cap Value Momentum ETF | | | 55,000 | | | | 2,694,879 | |
| | | | | | | | | |
| Total Equity Funds (cost $111,761,100) | | | | | | | 145,850,763 | |
| | 14 | Refer to the Notes to Financial Statements in this Report for further information regarding the values set forth above. |
| AdvisorOne Funds Semi-Annual Report |
| |
| Schedule of Investments - CLS Global Aggressive Equity Fund (Unaudited) (Continued) |
| October 31, 2020 |
| | | Shares | | | Fair Value | |
| Collateral for Securities Loaned - 17.93% | | | | | | | | |
| Dreyfus Government Cash Management Institutional Class, 0.02% * | | | 2,566,668 | | | $ | 2,566,668 | |
| Milestone Treasury Obligations Fund Institutional Class, 0.01% * ! | | | 23,604,000 | | | | 23,604,000 | |
| Total Collateral for Securities Loaned (cost $26,170,668) | | | | | | | 26,170,668 | |
| | | | | | | | | |
| Total Investments (cost $137,931,768) - 117.88% | | | | | | $ | 172,021,431 | |
| Liabilities in Excess of Other Assets - Net - (17.88)% | | | | | | | (26,096,736 | ) |
| NET ASSETS - 100.00% | | | | | | $ | 145,924,695 | |
| + | All or a portion of this security is on loan. Total loaned securities had a value of $25,612,008 at October 31, 2020. The loaned securities were secured with cash collateral of $26,170,668. The Fund cannot pledge or resell the collateral. |
| * | Money Market Fund; Interest rate reflects seven-day effective yield on October 31, 2020 |
| ^ | Affiliated issuer due to 5% ownership. |
| ! | Affiliated issuer due to 5% ownership and related management. |
ETF - Exchange Traded Fund
FTSE - Financial Times Stock Exchange
MSCI - Morgan Stanley Capital International
PHLX - Philadelphia Stock Exchange
PIMCO - Pacific Investment Management Company
RAFI - Research Affiliates Fundamental Indexation
SPDR - Standard & Poor’s Depositary Receipts
S&P - Standard & Poor’s
| | 15 | Refer to the Notes to Financial Statements in this Report for further information regarding the values set forth above. |
| AdvisorOne Funds Semi-Annual Report |
| |
| Schedule of Investments - CLS Global Diversified Equity Fund (Unaudited) |
| October 31, 2020 |
| | | Shares | | | Fair Value | |
| Equity Funds - 99.86% | | | | | | | | |
| Commodities - 4.65% | | | | | | | | |
| Invesco DB Commodity Index Tracking Fund | | | 1,360,000 | | | $ | 17,204,000 | |
| | | | | | | | | |
| Developed International - 9.87% | | | | | | | | |
| Alpha Architect International Quantitative Value ETF | | | 110,000 | | | | 2,615,624 | |
| Goldman Sachs ActiveBeta Europe Equity ETF ^ | | | 135,000 | | | | 3,707,586 | |
| Invesco FTSE RAFI Developed Markets ex-US ETF | | | 313,000 | | | | 10,723,380 | |
| iShares MSCI Hong Kong ETF + | | | 103,000 | | | | 2,214,500 | |
| iShares MSCI Turkey ETF + | | | 70,000 | | | | 1,241,800 | |
| iShares MSCI United Kingdom ETF + | | | 375,000 | | | | 9,127,500 | |
| JPMorgan BetaBuilders Canada ETF + | | | 300,000 | | | | 6,915,000 | |
| | | | | | | | 36,545,390 | |
| Emerging Markets - 33.57% | | | | | | | | |
| Goldman Sachs ActiveBeta Emerging Markets Equity ETF + | | | 609,000 | | | | 20,084,820 | |
| Invesco FTSE RAFI Emerging Markets ETF + | | | 2,060,000 | | | | 36,050,000 | |
| iShares MSCI Russia ETF | | | 165,500 | | | | 4,926,935 | |
| iShares MSCI Taiwan ETF | | | 72,600 | | | | 3,278,616 | |
| PIMCO RAFI Dynamic Multi-Factor Emerging Markets Equity ETF | | | 600,000 | | | | 13,420,920 | |
| SPDR S&P Emerging Asia Pacific ETF | | | 192,000 | | | | 21,960,960 | |
| VanEck Vectors Russia ETF | | | 101,300 | | | | 1,970,791 | |
| WisdomTree Emerging Markets High Dividend Fund + | | | 520,000 | | | | 18,054,400 | |
| WisdomTree Emerging Markets Quality Dividend Growth Fund ^ | | | 185,500 | | | | 4,513,215 | |
| | | | | | | | 124,260,657 | |
| Global - 15.26% | | | | | | | | |
| Davis Select Worldwide ETF | | | 375,000 | | | | 9,866,250 | |
| FlexShares Global Upstream Natural Resources Index Fund + | | | 430,000 | | | | 11,506,800 | |
| iShares Exponential Technologies ETF | | | 542,000 | | | | 25,907,600 | |
| iShares Global Healthcare ETF | | | 135,000 | | | | 9,213,750 | |
| | | | | | | | 56,494,400 | |
| Large Cap Core - 12.68% | | | | | | | | |
| Davis Select Financial ETF ^ | | | 1,275,000 | | | | 24,594,750 | |
| ERShares Entrepreneur 30 ETF | | | 204,072 | | | | 4,917,952 | |
| John Hancock Multi-Factor Health Care ETF ^ | | | 300,000 | | | | 11,678,400 | |
| John Hancock Multi-Factor Industrials ETF ^ | | | 150,000 | | | | 5,730,240 | |
| | | | | | | | 46,921,342 | |
| Large Cap Growth - 3.82% | | | | | | | | |
| ClearBridge All Cap Growth ETF | | | 50,000 | | | | 1,889,555 | |
| Fidelity MSCI Information Technology Index ETF | | | 46,000 | | | | 4,053,060 | |
| SPDR MFS Systematic Growth Equity ETF ^ | | | 80,000 | | | | 8,206,344 | |
| | | | | | | | 14,148,959 | |
| Large Cap Value - 9.87% | | | | | | | | |
| DBX ETF Trust - Xtrackers Russell 1000 US Quality at a Reasonable Price ETF | | | 150,000 | | | | 4,362,330 | |
| Direxion Russell 1000 Value Over Growth ETF ^ | | | 100,000 | | | | 4,139,580 | |
| Fidelity Value Factor ETF ^ | | | 741,000 | | | | 25,838,670 | |
| John Hancock Multi-Factor Financials ETF ^ | | | 65,000 | | | | 2,183,850 | |
| | | | | | | | 36,524,430 | |
| | 16 | Refer to the Notes to Financial Statements in this Report for further information regarding the values set forth above. |
| AdvisorOne Funds Semi-Annual Report |
| |
| Schedule of Investments - CLS Global Diversified Equity Fund (Unaudited) (Continued) |
| October 31, 2020 |
| | | Shares | | | Fair Value | |
| Small/Mid Cap Core - 3.05% | | | | | | | | |
| Schwab Fundamental U.S. Small Company Index ETF + | | | 334,000 | | | $ | 11,295,880 | |
| | | | | | | | | |
| Small/Mid Cap Growth - 4.72% | | | | | | | | |
| SPDR S&P Kensho Future Security ETF ^ | | | 35,000 | | | | 1,246,014 | |
| SPDR S&P Kensho New Economies Composite ETF | | | 375,000 | | | | 16,218,750 | |
| | | | | | | | 17,464,764 | |
| Small/Mid Cap Value - 2.37% | | | | | | | | |
| First Trust Financial AlphaDEX Fund + | | | 321,000 | | | | 8,760,090 | |
| | | | | | | | | |
| Total Equity Funds (cost $317,725,293) | | | | | | | 369,619,912 | |
| | | | | | | | | |
| Collateral for Securities Loaned - 5.19% | | | | | | | | |
| Milestone Treasury Obligations Fund Institutional Class, 0.01% * ! | | | 19,225,000 | | | | 19,225,000 | |
| Total Collateral for Securities Loaned (cost $19,225,000) | | | | | | | 19,225,000 | |
| | | | | | | | | |
| Total Investments (cost $336,950,293) - 105.05% | | | | | | $ | 388,844,912 | |
| Liabilities in Excess of Other Assets - Net - (5.05)% | | | | | | | (18,700,826 | ) |
| NET ASSETS - 100.00% | | | | | | $ | 370,144,086 | |
| + | All or a portion of this security is on loan. Total loaned securities had a value of $18,159,200 at October 31, 2020. The loaned securities were secured with cash collateral of $19,225,000 and non-cash collateral of $540,705. The non-cash collateral consists of short-term investments and long-term bonds and is held for benefit of the Fund at the Fund’s custodian. The Fund cannot pledge or resell the collateral. |
| * | Money Market Fund; Interest rate reflects seven-day effective yield on October 31, 2020. |
| ^ | Affiliated issuer due to 5% ownership. |
| ! | Affiliated issuer due to 5% ownership and related management. |
DB - Deutsche Bank
ETF - Exchange Traded Fund
FTSE - Financial Times Stock Exchange
MFS - Massachusetts Financial Services Co.
MSCI - Morgan Stanley Capital International
PIMCO - Pacific Investment Management Company
RAFI - Research Affiliates Fundamental Indexation
SPDR - Standard & Poor’s Depositary Receipts
S&P - Standard & Poor’s
| | 17 | Refer to the Notes to Financial Statements in this Report for further information regarding the values set forth above. |
| AdvisorOne Funds Semi-Annual Report |
| |
| Schedule of Investments - CLS Growth and Income Fund (Unaudited) |
| October 31, 2020 |
| | | Shares | | | Fair Value | |
| Bond Funds - 48.62% | | | | | | | | |
| High Yield Bonds - 3.41% | | | | | | | | |
| First Trust Exchange-Traded Fund IV First Trust Tactical High Yield ETF + | | | 24,150 | | | $ | 1,138,190 | |
| SPDR Blackstone / GSO Senior Loan ETF + | | | 210,000 | | | | 9,294,600 | |
| VanEck Vectors High Yield Muni ETF + | | | 20,000 | | | | 1,189,000 | |
| | | | | | | | 11,621,790 | |
| Intermediate/Long Term Bonds - 28.36% | | | | | | | | |
| Fidelity Total Bond ETF + | | | 664,963 | | | | 36,100,841 | |
| First Trust TCW Opportunistic Fixed Income ETF | | | 380,000 | | | | 20,812,600 | |
| iShares TIPS Bond ETF + | | | 12,300 | | | | 1,540,329 | |
| PIMCO Active Bond ETF + | | | 117,500 | | | | 13,097,725 | |
| Schwab US TIPS ETF | | | 170,381 | | | | 10,401,760 | |
| SPDR Doubleline Total Return Tactical ETF + | | | 296,922 | | | | 14,602,624 | |
| | | | | | | | 96,555,879 | |
| International Bond - 0.54% | | | | | | | | |
| VanEck Vectors J.P. Morgan EM Local Currency Bond ETF | | | 60,000 | | | | 1,844,400 | |
| | | | | | | | | |
| Inverse Bond - 0.84% | | | | | | | | |
| ProShares Short 20+ Year Treasury + | | | 179,400 | | | | 2,850,666 | |
| | | | | | | | | |
| Short Term Bonds - 15.47% | | | | | | | | |
| Janus Henderson Short Duration Income ETF + | | | 323,234 | | | | 16,297,458 | |
| PIMCO Enhanced Short Maturity Active ETF + | | | 204,257 | | | | 20,826,044 | |
| SPDR Bloomberg Barclays Investment Grade Floating Rate ETF | | | 35,000 | | | | 1,070,300 | |
| Vanguard Short-Term Inflation-Protected Securities ETF | | | 286,000 | | | | 14,483,040 | |
| | | | | | | | 52,676,842 | |
| | | | | | | | | |
| Total Bond Funds (cost $157,674,244) | | | | | | | 165,549,577 | |
| | 18 | Refer to the Notes to Financial Statements in this Report for further information regarding the values set forth above. |
| AdvisorOne Funds Semi-Annual Report |
| |
| Schedule of Investments - CLS Growth and Income Fund (Unaudited) (Continued) |
| October 31, 2020 |
| | | Shares | | | Fair Value | |
| Equity Funds - 47.66% | | | | | | | | |
| Alternative - 1.48% | | | | | | | | |
| IQ Merger Arbitrage ETF *+ | | | 146,874 | | | $ | 5,024,560 | |
| | | | | | | | | |
| Commodity Funds - 6.29% | | | | | | | | |
| Invesco DB Commodity Index Tracking Fund + | | | 155,000 | | | | 1,960,750 | |
| Invesco Optimum Yield Diversified Commodity Strategy No K-1 ETF | | | 1,100,000 | | | | 14,553,000 | |
| iShares Gold Trust *+ | | | 275,000 | | | | 4,919,750 | |
| | | | | | | | 21,433,500 | |
| Developed International - 5.53% | | | | | | | | |
| JPMorgan BetaBuilders Europe ETF | | | 240,000 | | | | 5,200,800 | |
| Schwab Fundamental International Large Company Index ETF + | | | 570,000 | | | | 13,611,600 | |
| | | | | | | | 18,812,400 | |
| Emerging Markets - 8.37% | | | | | | | | |
| Invesco FTSE RAFI Emerging Markets ETF | | | 232,800 | | | | 4,074,000 | |
| iShares Core MSCI Emerging Markets ETF | | | 175,200 | | | | 9,367,944 | |
| iShares MSCI Russia ETF | | | 42,000 | | | | 1,250,340 | |
| Schwab Fundamental Emerging Markets Large Company Index ETF + | | | 430,000 | | | | 10,096,400 | |
| Xtrackers Harvest CSI 300 China A-Shares ETF + | | | 103,500 | | | | 3,706,335 | |
| | | | | | | | 28,495,019 | |
| Global - 7.85% | | | | | | | | |
| Davis Select Worldwide ETF | | | 100,000 | | | | 2,631,000 | |
| Global X FinTech ETF *+ | | | 59,068 | | | | 2,146,531 | |
| iShares Exponential Technologies ETF | | | 345,000 | | | | 16,491,000 | |
| iShares Global Healthcare ETF | | | 80,000 | | | | 5,460,000 | |
| | | | | | | | 26,728,531 | |
| Large Cap Core - 3.31% | | | | | | | | |
| Davis Select US Equity ETF | | | 160,176 | | | | 4,046,046 | |
| John Hancock Multifactor Industrials ETF | | | 30,000 | | | | 1,146,048 | |
| Pacer Salt Low truBeta US Market ETF | | | 6,500 | | | | 172,299 | |
| VanEck Vectors Pharmaceutical ETF + | | | 100,000 | | | | 5,891,000 | |
| | | | | | | | 11,255,393 | |
| Large Cap Growth - 0.59% | | | | | | | | |
| iShares MSCI USA Quality Factor ETF | | | 20,000 | | | | 2,021,000 | |
| | | | | | | | | |
| Large Cap Value - 11.66% | | | | | | | | |
| Financial Select Sector SPDR Fund + | | | 130,607 | | | | 3,116,283 | |
| iShares MSCI USA Value Factor ETF + | | | 385,200 | | | | 28,115,748 | |
| John Hancock Multi-Factor Financials ETF ^ | | | 60,000 | | | | 2,015,862 | |
| SPDR S&P Global Natural Resources ETF | | | 177,500 | | | | 6,455,675 | |
| | | | | | | | 39,703,568 | |
| Small/Mid Cap Core - 1.36% | | | | | | | | |
| John Hancock Multifactor Small Cap ETF | | | 185,000 | | | | 4,623,150 | |
| | | | | | | | | |
| Small/Mid Cap Growth - 1.22% | | | | | | | | |
| SPDR S&P Homebuilders ETF + | | | 80,000 | | | | 4,158,400 | |
| | | | | | | | | |
| Total Equity Funds (cost $143,924,396) | | | | | | | 162,255,521 | |
| | 19 | Refer to the Notes to Financial Statements in this Report for further information regarding the values set forth above. |
| AdvisorOne Funds Semi-Annual Report |
| |
| Schedule of Investments - CLS Growth and Income Fund (Unaudited) (Continued) |
| October 31, 2020 |
| | | Shares | | | Fair Value | |
| Money Market Fund - 3.86% | | | | | | | | |
| Short-Term Cash - 3.86% | | | | | | | | |
| Federated Government Obligations Fund Institutional Class, 0.01% ** | | | 13,127,767 | | | $ | 13,127,767 | |
| Total Money Market Fund (cost $13,127,767) | | | | | | | 13,127,767 | |
| | | | | | | | | |
| Collateral for Securities Loaned - 14.77% | | | | | | | | |
| Dreyfus Government Cash Management Institutional Class, 0.02% ** | | | 5,070,963 | | | | 5,070,963 | |
| Milestone Treasury Obligations Fund Institutional Class, 0.01% ** ! | | | 45,213,000 | | | | 45,213,000 | |
| Total Collateral for Securities Loaned (cost $50,283,963) | | | | | | | 50,283,963 | |
| | | | | | | | | |
| Total Investments (cost $365,010,370) - 114.91% | | | | | | $ | 391,216,828 | |
| Liabilities in Excess of Other Assets - Net - (14.91)% | | | | | | | (50,750,275 | ) |
| NET ASSETS - 100.00% | | | | | | $ | 340,466,553 | |
| + | All or a portion of this security is on loan. Total loaned securities had a value of $50,569,237 at October 31, 2020. The loaned securities were secured with cash collateral of $50,283,963 and non-cash collateral of $1,380,011. The non-cash collateral consists of short-term investments and long-term bonds and is held for benefit of the Fund at the Fund’s custodian. The Fund cannot pledge or resell the collateral. |
| * | Non-income producing security. |
| ** | Money Market Fund; Interest rate reflects seven-day effective yield on October 31, 2020. |
| ^ | Affiliated issuer due to 5% ownership. |
| ! | Affiliated issuer due to 5% ownership and related management. |
DB - Deutsche Bank
EM - Emerging Markets
ETF - Exchange Traded Fund
FTSE - Financial Times Stock Exchange
MSCI - Morgan Stanley Capital International
PIMCO - Pacific Investment Management Company
RAFI - Research Affiliates Fundamental Indexation
SPDR - Standard & Poor’s Depositary Receipts
S&P - Standard & Poor’s
TIPS - Treasury Inflation-Protected Securities
| | 20 | Refer to the Notes to Financial Statements in this Report for further information regarding the values set forth above. |
| AdvisorOne Funds Semi-Annual Report |
| |
| Schedule of Investments - CLS Flexible Income Fund (Unaudited) |
| October 31, 2020 |
| | | Shares | | | Fair Value | |
| Bond Funds - 89.53% | | | | | | | | |
| High Yield Bonds - 11.46% | | | | | | | | |
| iShares 0-5 Year High Yield Corporate Bond ETF | | | 123,500 | | | $ | 5,421,650 | |
| PIMCO 0-5 Year High Yield Corporate Bond Index ETF + | | | 20,145 | | | | 1,890,407 | |
| SPDR Blackstone / GSO Senior Loan ETF + | | | 232,439 | | | | 10,287,750 | |
| VanEck Vectors High Yield Muni ETF + | | | 39,700 | | | | 2,360,165 | |
| Xtrackers USD High Yield Corporate Bond ETF + | | | 36,800 | | | | 1,769,712 | |
| | | | | | | | 21,729,684 | |
| Intermediate/Long Term Bonds - 48.59% | | | | | | | | |
| iShares 20+ Year Treasury Bond ETF | | | 33,150 | | | | 5,223,445 | |
| iShares 3-7 Year Treasury Bond ETF + | | | 107,300 | | | | 14,261,243 | |
| iShares 5-10 Year Investment Grade Corporate Bond ETF | | | 180,760 | | | | 10,946,826 | |
| iShares 7-10 Year Treasury Bond ETF + | | | 38,000 | | | | 4,562,280 | |
| iShares Broad USD Investment Grade Corporate Bond ETF | | | 66,900 | | | | 4,042,767 | |
| Janus Henderson Mortgage-Backed Securities ETF | | | 37,500 | | | | 2,009,438 | |
| Nuveen Enhanced Yield US Aggregate Bond ETF | | | 124,400 | | | | 3,162,248 | |
| PIMCO Active Bond ETF | | | 166,909 | | | | 18,605,346 | |
| Quadratic Interest Rate Volatility and Inflation ETF + | | | 213,200 | | | | 5,850,208 | |
| SPDR Doubleline Total Return Tactical ETF + | | | 100,689 | | | | 4,951,885 | |
| Vanguard Intermediate-Term Corporate Bond ETF + | | | 117,483 | | | | 11,214,927 | |
| Vanguard Mortgage-Backed Securities ETF | | | 41,000 | | | | 2,219,330 | |
| Vanguard Total Bond Market ETF | | | 58,485 | | | | 5,122,116 | |
| | | | | | | | 92,172,059 | |
| International Bond - 3.75% | | | | | | | | |
| Invesco Emerging Markets Sovereign Debt ETF | | | 57,471 | | | | 1,540,223 | |
| iShares JP Morgan EM Local Currency Bond ETF | | | 27,400 | | | | 1,141,758 | |
| iShares JP Morgan USD Emerging Markets Bond ETF | | | 40,350 | | | | 4,439,307 | |
| | | | | | | | 7,121,288 | |
| Inverse Bond - 0.63% | | | | | | | | |
| ProShares Short 20+ Year Treasury | | | 75,000 | | | | 1,191,750 | |
| | | | | | | | | |
| Preferred Security - 1.50% | | | | | | | | |
| First Trust Preferred Securities and Income ETF | | | 148,500 | | | | 2,846,745 | |
| | | | | | | | | |
| Short Term Bonds - 23.60% | | | | | | | | |
| Janus Henderson Short Duration Income ETF | | | 354,150 | | | | 17,856,243 | |
| PIMCO Enhanced Short Maturity Active ETF | | | 153,222 | | | | 15,622,515 | |
| Vanguard Short-Term Inflation-Protected Securities ETF | | | 223,100 | | | | 11,297,784 | |
| | | | | | | | 44,776,542 | |
| | | | | | | | | |
| Total Bond Funds (cost $162,670,301) | | | | | | | 169,838,068 | |
| | 21 | Refer to the Notes to Financial Statements in this Report for further information regarding the values set forth above. |
| AdvisorOne Funds Semi-Annual Report |
| |
| Schedule of Investments - CLS Flexible Income Fund (Unaudited) (Continued) |
| October 31, 2020 |
| | | Shares | | | Fair Value | |
| Equity Funds - 7.83% | | | | | | | | |
| Alternative - 1.30% | | | | | | | | |
| IQ Merger Arbitrage ETF *+ | | | 72,131 | | | $ | 2,467,601 | |
| | | | | | | | | |
| Developed International - 1.33% | | | | | | | | |
| Schwab Fundamental International Large Company Index ETF | | | 105,900 | | | | 2,528,892 | |
| | | | | | | | | |
| Emerging Markets - 1.32% | | | | | | | | |
| Vanguard FTSE Emerging Markets ETF | | | 57,000 | | | | 2,497,170 | |
| | | | | | | | | |
| Global - 1.69% | | | | | | | | |
| iShares Exponential Technologies ETF | | | 49,732 | | | | 2,377,190 | |
| iShares Global Healthcare ETF | | | 11,900 | | | | 812,175 | |
| | | | | | | | 3,189,365 | |
| Large Cap Core - 1.10% | | | | | | | | |
| Goldman Sachs ActiveBeta U.S. Large Cap Equity ETF + | | | 31,520 | | | | 2,091,352 | |
| | | | | | | | | |
| Large Cap Value - 1.09% | | | | | | | | |
| Invesco S&P 500 Pure Value ETF | | | 23,700 | | | | 1,183,341 | |
| Vanguard High Dividend Yield ETF | | | 11,200 | | | | 890,848 | |
| | | | | | | | 2,074,189 | |
| | | | | | | | | |
| Total Equity Funds (cost $13,787,299) | | | | | | | 14,848,569 | |
| | 22 | Refer to the Notes to Financial Statements in this Report for further information regarding the values set forth above. |
| AdvisorOne Funds Semi-Annual Report |
| |
| Schedule of Investments - CLS Flexible Income Fund (Unaudited) (Continued) |
| October 31, 2020 |
| | | Principal ($) | | | Fair Value | |
| U.S. Government and Agency Obligations - 1.25% | | | | | | | | |
| Fannie Mae Pool 3.5%, Due 12/01/2030 | | $ | 106,989 | | | $ | 113,925 | |
| Fannie Mae Pool 3.5%, Due 07/01/2032 | | | 242,290 | | | | 261,612 | |
| Fannie Mae Pool 4%, Due 02/01/2040 | | | 130,173 | | | | 143,389 | |
| Fannie Mae Pool 4%, Due 10/01/2040 | | | 100,106 | | | | 109,903 | |
| Fannie Mae Pool 4%, Due 06/01/2041 | | | 242,658 | | | | 267,610 | |
| Fannie Mae Pool 4%, Due 09/01/2041 | | | 205,083 | | | | 225,021 | |
| Fannie Mae Pool 4%, Due 12/01/2041 | | | 141,998 | | | | 156,484 | |
| Fannie Mae Pool 5%, Due 11/01/2039 | | | 127,501 | | | | 147,198 | |
| Fannie Mae Pool 5%, Due 02/01/2040 | | | 149,534 | | | | 171,645 | |
| Fannie Mae Pool 5.5%, Due 12/01/2039 | | | 78,262 | | | | 90,514 | |
| Fannie Mae Pool 5.5%, Due 04/01/2040 | | | 81,866 | | | | 94,335 | |
| Fannie Mae Pool 6%, Due 12/01/2035 | | | 118,899 | | | | 140,727 | |
| Fannie Mae Pool 6%, Due 12/01/2038 | | | 45,100 | | | | 52,629 | |
| Freddie Mac Gold Pool 4.5%, Due 02/01/2041 | | | 127,276 | | | | 143,188 | |
| Freddie Mac Gold Pool 5.5%, Due 06/01/2034 | | | 103,526 | | | | 121,912 | |
| Freddie Mac Gold Pool 6%, Due 05/01/2037 | | | 34,746 | | | | 41,037 | |
| Freddie Mac Gold Pool 6.5%, Due 04/01/2039 | | | 46,031 | | | | 53,147 | |
| Government National Mortgage Association 3.5%, Due 07/16/2039 | | | 39,593 | | | | 41,999 | |
| Total U.S. Government and Agency Obligations (cost $2,207,130) | | | | | | | 2,376,275 | |
| | | | | | | | | |
| | | | Shares | | | | | |
| Money Market Fund - 1.48% | | | | | | | | |
| Short-Term Cash - 1.48% | | | | | | | | |
| Federated Government Obligations Fund Institutional Class, 0.01% ** | | | 2,805,267 | | | | 2,805,267 | |
| Total Money Market Fund (cost $2,805,267) | | | | | | | 2,805,267 | |
| | | | | | | | | |
| Collateral for Securities Loaned - 12.05% | | | | | | | | |
| Dreyfus Government Cash Management Institutional Class, 0.02% ** | | | 2,283,089 | | | | 2,283,089 | |
| Milestone Treasury Obligations Fund Institutional Class, 0.01% ** ! | | | 20,573,000 | | | | 20,573,000 | |
| Total Collateral for Securities Loaned (cost $22,856,089) | | | | | | | 22,856,089 | |
| | | | | | | | | |
| Total Investments (cost $204,326,086) - 112.14% | | | | | | $ | 212,724,268 | |
| Liabilities in Excess of Other Assets - Net - (12.14)% | | | | | | | (23,034,136 | ) |
| NET ASSETS - 100.00% | | | | | | $ | 189,690,132 | |
| + | All or a portion of this security is on loan. Total loaned securities had a value of $22,386,741 at October 31, 2020. The loaned securities were secured with cash collateral of $22,856,089. The Fund cannot pledge or resell the collateral. |
| * | Non-income producing security. |
| ** | Money Market Fund; Interest rate reflects seven-day effective yield on October 31, 2020. |
| ! | Affiliated issuer due to 5% ownership and related management. |
EM - Emerging Markets
ETF - Exchange Traded Fund
FTSE - Financial Times Stock Exchange
PIMCO - Pacific Investment Management Company
SPDR - Standard & Poors’ Depositary Receipts
S&P - Standard & Poor’s
| | 23 | Refer to the Notes to Financial Statements in this Report for further information regarding the values set forth above. |
| AdvisorOne Funds Semi-Annual Report |
| |
| Schedule of Investments - CLS Shelter Fund (Unaudited) |
| October 31, 2020 |
| | | Shares | | | Fair Value | |
| Equity Funds - 56.51% | | | | | | | | |
| Alternative - 5.69% | | | | | | | | |
| Innovator S&P 500 Power Buffer ETF - January * | | | 366,700 | | | $ | 10,615,965 | |
| | | | | | | | | |
| Large Cap Core - 4.89% | | | | | | | | |
| John Hancock Multi-Factor Large Cap ETF | | | 222,000 | | | | 9,115,320 | |
| | | | | | | | | |
| Low Volatility Equities - 45.93% | | | | | | | | |
| Invesco S&P 500 Low Volatility ETF + | | | 347,100 | | | | 18,059,613 | |
| iShares MSCI EAFE Min Vol Factor ETF | | | 151,000 | | | | 9,888,990 | |
| iShares MSCI Global Min Vol Factor ETF | | | 429,800 | | | | 38,449,908 | |
| iShares MSCI USA Min Vol Factor ETF + | | | 311,700 | | | | 19,219,422 | |
| | | | | | | | 85,617,933 | |
| | | | | | | | | |
| Total Equity Funds (cost $108,953,274) | | | | | | | 105,349,218 | |
| | | | | | | | | |
| Money Market Fund - 38.75% | | | | | | | | |
| Short-Term Cash - 38.75% | | | | | | | | |
| Federated Prime Cash Obligations Fund Institutional Class, 0.01% * | | | 72,238,685 | | | | 72,238,685 | |
| Total Money Market Fund (cost $72,238,685) | | | | | | | 72,238,685 | |
| | | | | | | | | |
| Collateral for Securities Loaned - 6.34% | | | | | | | | |
| Dreyfus Government Cash Management Institutional Class, 0.02% * | | | 1,155,421 | | | | 1,155,421 | |
| Milestone Treasury Obligations Fund Institutional Class, 0.01% * ! | | | 10,654,000 | | | | 10,654,000 | |
| Total Collateral for Securities Loaned (cost $11,809,421) | | | | | | | 11,809,421 | |
| | | | | | | | | |
| Total Investments (cost $193,001,380) - 101.60% | | | | | | $ | 189,397,324 | |
| Liabilities in Excess of Other Assets - Net - (1.60)% | | | | | | | (2,980,500 | ) |
| NET ASSETS - 100.00% | | | | | | $ | 186,416,824 | |
| + | All or a portion of this security is on loan. Total loaned securities had a value of $11,517,221 at October 31, 2020. The loaned securities were secured with cash collateral of $11,809,421. |
| * | Money Market Fund; Interest rate reflects seven-day effective yield on October 31, 2020. |
| ^ | Affiliated issuer due to 5% ownership. |
| ! | Affiliated issuer due to 5% ownership and related management. |
EAFE - Europe, Australasia, Far East
ETF - Exchange Traded Fund
MSCI - Morgan Stanley Capital International
S&P - Standard & Poor’s
| | 24 | Refer to the Notes to Financial Statements in this Report for further information regarding the values set forth above. |
| AdvisorOne Funds Semi-Annual Report |
| |
| Statements of Assets and Liabilities |
| October 31, 2020 |
| | | CLS Global | | | CLS Global | | | CLS | |
| | | Aggressive | | | Diversified | | | Growth and | |
| | | Equity Fund | | | Equity Fund | | | Income Fund | |
| Assets: | | | | | | | | | | | | |
| Unaffiliated investments, at cost | | $ | 92,975,019 | | | $ | 232,609,123 | | | $ | 317,441,236 | |
| Affiliated Investments, at cost | | | 44,956,749 | | | | 104,341,170 | | | | 47,569,134 | |
| Unaffiliated investments in securities, at value * | | $ | 122,879,671 | | | $ | 277,781,263 | | | $ | 343,987,966 | |
| Affiliated Investments in securities, at value | | | 49,141,760 | | | | 111,063,649 | | | | 47,228,862 | |
| Receivable for securities sold | | | 294,373 | | | | 1,365,880 | | | | — | |
| Receivable for security lending | | | 65,139 | | | | 70,629 | | | | 76,038 | |
| Receivable for fund shares sold | | | 40,452 | | | | 116,487 | | | | 86,342 | |
| Interest and dividends receivable | | | — | | | | 1 | | | | 64,615 | |
| Prepaid expenses and other assets | | | 36,882 | | | | 37,777 | | | | 38,904 | |
| Total Assets | | | 172,458,277 | | | | 390,435,686 | | | | 391,482,727 | |
| | | | | | | | | | | | | |
| Liabilities: | | | | | | | | | | | | |
| Securities lending collateral (Note 8) | | | 26,170,668 | | | | 19,225,000 | | | | 50,283,963 | |
| Payable for fund shares redeemed | | | 167,427 | | | | 402,789 | | | | 330,601 | |
| Due to custodian | | | 779 | | | | 215,953 | | | | — | |
| Accrued advisory fees | | | 117,073 | | | | 294,848 | | | | 268,147 | |
| Accrued shareholder servicing fees | | | 32,697 | | | | 82,181 | | | | 74,346 | |
| Payable to related parties | | | 14,818 | | | | 36,245 | | | | 47,398 | |
| Accrued expenses and other liabilities | | | 30,120 | | | | 34,584 | | | | 11,719 | |
| Total Liabilities | | | 26,533,582 | | | | 20,291,600 | | | | 51,016,174 | |
| Net Assets | | $ | 145,924,695 | | | $ | 370,144,086 | | | $ | 340,466,553 | |
| | | | | | | | | | | | | |
| Composition of Net Assets: | | | | | | | | | | | | |
| Paid in capital ($0 par value, unlimited shares authorized) | | $ | 112,688,605 | | | $ | 321,941,780 | | | $ | 313,586,417 | |
| Accumulated earnings | | | 33,236,090 | | | | 48,202,306 | | | | 26,880,136 | |
| Net Assets | | $ | 145,924,695 | | | $ | 370,144,086 | | | $ | 340,466,553 | |
| | | | | | | | | | | | | |
| Class N Shares: | | | | | | | | | | | | |
| Net assets | | $ | 145,924,678 | | | $ | 370,144,067 | | | $ | 340,466,541 | |
| Net asset value, offering price, and redemption price per share (Net assets ÷ Total shares of beneficial interest outstanding) | | $ | 14.79 | | | $ | 15.82 | | | $ | 10.67 | |
| Total shares outstanding at end of year | | | 9,864,207 | | | | 23,399,875 | | | | 31,894,480 | |
| | | | | | | | | | | | | |
| Class T Shares: | | | | | | | | | | | | |
| Net assets | | $ | 17 | | | $ | 19 | | | $ | 12 | |
| Net asset value, offering price, and redemption price per share (Net assets ÷ Total shares of beneficial interest outstanding)** | | $ | 14.79 | | | $ | 15.82 | | | $ | 10.67 | |
| Total shares outstanding at end of year | | | 1 | | | | 1 | | | | 1 | |
| * | Includes Securities Loaned $25,612,008; $18,159,200; $50,569,237. |
| ** | NAV does not recalculate due to rounding of shares of beneficial interest outstanding. |
| | 25 | Refer to the Notes to Financial Statements in this Report for further information regarding the values set forth above. |
| AdvisorOne Funds Semi-Annual Report |
| |
| Statements of Assets and Liabilities (Continued) |
| October 31, 2020 |
| | | CLS | | | | |
| | | Flexible | | | CLS | |
| | | Income Fund | | | Shelter Fund | |
| Assets: | | | | | | | | |
| Unaffiliated investments, at cost | | $ | 183,753,086 | | | $ | 182,347,380 | |
| Affiliated Investments, at cost | | | 20,573,000 | | | | 10,654,000 | |
| Unaffiliated investments in securities, at value * | | $ | 192,151,268 | | | $ | 178,743,324 | |
| Affiliated Investments in securities, at value | | | 20,573,000 | | | | 10,654,000 | |
| Receivable for securities sold | | | — | | | | 9,253,100 | |
| Receivable for security lending | | | 34,530 | | | | 9,061 | |
| Receivable for fund shares sold | | | 81,603 | | | | 38,758 | |
| Interest and dividends receivable | | | 8,011 | | | | 539 | |
| Prepaid expenses and other assets | | | 37,596 | | | | 27,583 | |
| Total Assets | | | 212,886,008 | | | | 198,726,365 | |
| | | | | | | | | |
| Liabilities: | | | | | | | | |
| Securities lending collateral (Note 8) | | | 22,856,089 | | | | 11,809,421 | |
| Payable for fund shares redeemed | | | 173,705 | | | | 260,278 | |
| Due to custodian | | | — | | | | — | |
| Accrued advisory fees | | | 78,538 | | | | 148,562 | |
| Accrued shareholder servicing fees | | | 40,912 | | | | 40,644 | |
| Payable to related parties | | | 14,534 | | | | 19,655 | |
| Accrued expenses and other liabilities | | | 32,098 | | | | 30,981 | |
| Total Liabilities | | | 23,195,876 | | | | 12,309,541 | |
| Net Assets | | $ | 189,690,132 | | | $ | 186,416,824 | |
| | | | | | | | | |
| Composition of Net Assets: | | | | | | | | |
| Paid in capital ($0 par value, unlimited shares authorized) | | $ | 186,548,192 | | | $ | 212,800,320 | |
| Accumulated earnings/(losses) | | | 3,141,940 | | | | (26,383,496 | ) |
| Net Assets | | $ | 189,690,132 | | | $ | 186,416,824 | |
| | | | | | | | | |
| Class N Shares: | | | | | | | | |
| Net assets | | $ | 189,690,121 | | | $ | 182,055,859 | |
| Net asset value, offering price, and redemption price per share (Net assets ÷ Total shares of beneficial interest outstanding) | | $ | 10.46 | | | $ | 10.76 | |
| Total shares outstanding at end of year | | | 18,129,502 | | | | 16,912,373 | |
| | | | | | | | | |
| Class T Shares: | | | | | | | | |
| Net assets | | $ | 11 | | | $ | 4,360,965 | |
| Net asset value, offering price, and redemption price per share (Net assets ÷ Total shares of beneficial interest outstanding) | | $ | 10.47 | ** | | $ | 10.77 | |
| Total shares outstanding at end of year | | | 1 | | | | 405,036 | |
| * | Includes Securities Loaned $22,386,741; $11,517,221. |
| ** | NAV does not recalculate due to rounding of shares of beneficial interest outstanding. |
| | 26 | Refer to the Notes to Financial Statements in this Report for further information regarding the values set forth above. |
| AdvisorOne Funds Semi-Annual Report |
| |
| Statements of Operations |
| For the Six Months Ended October 31, 2020 |
| | | CLS Global | | | CLS Global | | | CLS | |
| | | Aggressive | | | Diversified | | | Growth and | |
| | | Equity Fund | | | Equity Fund | | | Income Fund | |
| Investment Income: | | | | | | | | | | | | |
| Dividend income — Unaffiliated | | $ | 756,801 | | | $ | 3,479,146 | | | $ | 3,143,295 | |
| Dividend income — Affiliated | | | 165,425 | | | | 623,928 | | | | 20,938 | |
| Interest income | | | 27 | | | | 66 | | | | 3,155 | |
| Securities lending income—net * | | | 347,460 | | | | 337,485 | | | | 492,191 | |
| Total investment income | | | 1,269,713 | | | | 4,440,625 | | | | 3,659,579 | |
| | | | | | | | | | | | | |
| Expenses: | | | | | | | | | | | | |
| Investment advisory fees | | | 573,205 | | | | 1,461,939 | | | | 1,333,889 | |
| Shareholder Service Fees: | | | | | | | | | | | | |
| Class N | | | 191,068 | | | | 487,313 | | | | 444,630 | |
| Administration fees | | | 96,478 | | | | 226,516 | | | | 242,460 | |
| Trustees’ fees | | | 31,508 | | | | 31,824 | | | | 31,548 | |
| Printing and postage expense | | | 15,775 | | | | 23,800 | | | | 23,759 | |
| Registration & filing fees | | | 14,378 | | | | 16,642 | | | | 18,767 | |
| Professional fees | | | 13,694 | | | | 14,704 | | | | 14,639 | |
| Custodian fees | | | 5,707 | | | | 15,730 | | | | 14,252 | |
| Insurance expense | | | 5,660 | | | | 15,920 | | | | 14,882 | |
| Chief compliance officer fees | | | 4,835 | | | | 12,505 | | | | 11,815 | |
| Miscellaneous fees and expenses | | | 647 | | | | 647 | | | | 647 | |
| Total Expenses | | | 952,955 | | | | 2,307,540 | | | | 2,151,288 | |
| Plus: Recapture of fees previously waived by the Advisor | | | — | | | | — | | | | — | |
| Net Expenses | | | 952,955 | | | | 2,307,540 | | | | 2,151,288 | |
| Net Investment Income | | | 316,758 | | | | 2,133,085 | | | | 1,508,291 | |
| | | | | | | | | | | | | |
| Net Realized and Unrealized Gain on Investments: | | | | | | | | | | | | |
| Net realized gains on: | | | | | | | | | | | | |
| Investments — Unaffiliated | | | 4,596,902 | | | | 13,001,183 | | | | 1,735,278 | |
| Investments — Affiliated | | | 813,462 | | | | 1,676,299 | | | | — | |
| Distributions of realized gains by underlying investment companies | | | — | | | | — | | | | — | |
| Total net realized gain | | | 5,410,364 | | | | 14,677,482 | | | | 1,735,278 | |
| Net change in unrealized appreciation on: | | | | | | | | | | | | |
| Investments — Unaffiliated | | | 15,902,557 | | | | 21,597,706 | | | | 20,087,150 | |
| Investments — Affiliated | | | 3,240,080 | | | | 5,793,256 | | | | 438,637 | |
| Total net change in unrealized appreciation | | | 19,142,637 | | | | 27,390,962 | | | | 20,525,787 | |
| Net Realized and Unrealized Gain on Investments | | | 24,553,001 | | | | 42,068,444 | | | | 22,261,065 | |
| Net Increase in Net Assets Resulting from Operations | | $ | 24,869,759 | | | $ | 44,201,529 | | | $ | 23,769,356 | |
| * | A portion of securities lending income is from affiliated issuer. |
| | 27 | Refer to the Notes to Financial Statements in this Report for further information regarding the values set forth above. |
| AdvisorOne Funds Semi-Annual Report |
| |
| Statements of Operations (Continued) |
| For the Six Months Ended October 31, 2020 |
| | | CLS | | | | |
| | | Flexible | | | CLS | |
| | | Income Fund | | | Shelter Fund | |
| Investment Income: | | | | | | | | |
| Dividend income — Unaffiliated | | $ | 2,297,496 | | | $ | 1,161,236 | |
| Dividend income — Affiliated | | | — | | | | — | |
| Interest income | | | 57,680 | | | | 20,986 | |
| Securities lending income—net * | | | 287,414 | | | | 35,453 | |
| Total investment income | | | 2,642,590 | | | | 1,217,675 | |
| | | | | | | | | |
| Expenses: | | | | | | | | |
| Investment advisory fees | | | 392,085 | | | | 738,295 | |
| Shareholder Service Fees: | | | | | | | | |
| Class N | | | 245,053 | | | | 245,493 | |
| Administration fees | | | 131,492 | | | | 119,490 | |
| Trustees’ fees | | | 31,508 | | | | 31,508 | |
| Printing and postage expense | | | 15,783 | | | | 5,347 | |
| Registration & filing fees | | | 15,625 | | | | 15,408 | |
| Professional fees | | | 13,946 | | | | 13,950 | |
| Custodian fees | | | 8,327 | | | | 8,214 | |
| Insurance expense | | | 8,060 | | | | 7,891 | |
| Chief compliance officer fees | | | 6,453 | | | | 6,426 | |
| Miscellaneous fees and expenses | | | 647 | | | | 647 | |
| Total Expenses | | | 868,979 | | | | 1,192,669 | |
| Plus: Recapture of fees previously waived by the Advisor | | | — | | | | — | |
| Net Expenses | | | 868,979 | | | | 1,192,669 | |
| Net Investment Income | | | 1,773,611 | | | | 25,006 | |
| | | | | | | | | |
| Net Realized and Unrealized Gain (Loss) on Investments: | | | | | | | | |
| Net realized gains (losses) on: | | | | | | | | |
| Investments — Unaffiliated | | | 113,856 | | | | (3,813,238 | ) |
| Investments — Affiliated | | | — | | | | — | |
| Distributions of realized gains by underlying investment companies | | | — | | | | — | |
| Total net realized gain (loss) | | | 113,856 | | | | (3,813,238 | ) |
| Net change in unrealized appreciation on: | | | | | | | | |
| Investments — Unaffiliated | | | 6,000,281 | | | | 3,784,650 | |
| Investments — Affiliated | | | — | | | | 460,784 | |
| Total net change in unrealized appreciation | | | 6,000,281 | | | | 4,245,434 | |
| Net Realized and Unrealized Gain on Investments | | | 6,114,137 | | | | 432,196 | |
| Net Increase in Net Assets Resulting from Operations | | $ | 7,887,748 | | | $ | 457,202 | |
| * | A portion of securities lending income is from affiliated issuer. |
| | 28 | Refer to the Notes to Financial Statements in this Report for further information regarding the values set forth above. |
| AdvisorOne Funds Semi-Annual Report |
| |
| Statements of Changes in Net Assets |
| | | CLS Global Aggressive | | | CLS Global Diversified | |
| | | Equity Fund | | | Equity Fund | |
| | | Six Months Ended | | | | | | Six Months Ended | | | | |
| | | October 31, 2020 | | | Year Ended | | | October 31, 2020 | | | Year Ended | |
| | | (Unaudited) | | | April 30, 2020 | | | (Unaudited) | | | April 30, 2020 | |
| Increase (Decrease) in Net Assets: | | | | | | | | | | | | | | | | |
| | | | | | | | | | | | | | | | | |
| From Operations: | | | | | | | | | | | | | | | | |
| Net investment income | | $ | 316,758 | | | $ | 1,847,534 | | | $ | 2,133,085 | | | $ | 6,330,713 | |
| Net realized gain (loss) on investments | | | 5,410,364 | | | | (4,247,985 | ) | | | 14,677,482 | | | | (8,057,525 | ) |
| Distributions of realized gains by underlying investment companies | | | — | | | | 90,240 | | | | — | | | | 290,920 | |
| Net change in unrealized appreciation (depreciation) on investments | | | 19,142,637 | | | | (10,952,243 | ) | | | 27,390,962 | | | | (41,169,113 | ) |
| Net increase (decrease) in net assets resulting from operations | | | 24,869,759 | | | | (13,262,454 | ) | | | 44,201,529 | | | | (42,605,005 | ) |
| | | | | | | | | | | | | | | | | |
| Distributions to Shareholders: | | | | | | | | | | | | | | | | |
| Total Distributions Paid | | | | | | | | | | | | | | | | |
| Class N | | | — | | | | (6,157,128 | ) | | | — | | | | (21,847,359 | ) |
| Class T | | | — | | | | (1 | ) | | | — | | | | (1 | ) |
| Total Dividends and Distributions to Shareholders | | | — | | | | (6,157,129 | ) | | | — | | | | (21,847,360 | ) |
| From Fund Share Transactions (Note 7) | | | (18,480,187 | ) | | | 4,813,534 | | | | (37,133,615 | ) | | | (25,464,692 | ) |
| Total Increase (Decrease) in Net Assets | | | 6,389,572 | | | | (14,606,049 | ) | | | 7,067,914 | | | | (89,917,057 | ) |
| | | | | | | | | | | | | | | | | |
| Net Assets: | | | | | | | | | | | | | | | | |
| Beginning of Year/Period | | | 139,535,123 | | | | 154,141,172 | | | | 363,076,172 | | | | 452,993,229 | |
| End of Year/Period | | $ | 145,924,695 | | | $ | 139,535,123 | | | $ | 370,144,086 | | | $ | 363,076,172 | |
| | 29 | Refer to the Notes to Financial Statements in this Report for further information regarding the values set forth above. |
| AdvisorOne Funds Semi-Annual Report |
| |
| Statements of Changes in Net Assets (Continued) |
| | | CLS Growth | | | CLS Flexible | |
| | | and Income Fund | | | Income Fund | |
| | | Six Months Ended | | | | | | Six Months Ended | | | | |
| | | October 31, 2020 | | | Year Ended | | | October 31, 2020 | | | Year Ended | |
| | | (Unaudited) | | | April 30, 2020 | | | (Unaudited) | | | April 30, 2020 | |
| Increase (Decrease) in Net Assets: | | | | | | | | | | | | | | | | |
| | | | | | | | | | | | | | | | | |
| From Operations: | | | | | | | | | | | | | | | | |
| Net investment income | | $ | 1,508,291 | | | $ | 7,431,615 | | | $ | 1,773,611 | | | $ | 5,510,976 | |
| Net realized gain (loss) on investments | | | 1,735,278 | | | | (941,995 | ) | | | 113,856 | | | | (4,228,873 | ) |
| Distributions of realized gains by underlying investment companies | | | — | | | | 22,762 | | | | — | | | | 63,381 | |
| Net change in unrealized appreciation (depreciation) on investments | | | 20,525,787 | | | | (28,938,536 | ) | | | 6,000,281 | | | | 1,690,364 | |
| Net increase (decrease) in net assets resulting from operations | | | 23,769,356 | | | | (22,426,154 | ) | | | 7,887,748 | | | | 3,035,848 | |
| | | | | | | | | | | | | | | | | |
| Distributions to Shareholders: | | | | | | | | | | | | | | | | |
| Total Distributions Paid | | | | | | | | | | | | | | | | |
| Class N | | | — | | | | (10,297,728 | ) | | | (1,787,058 | ) | | | (5,598,869 | ) |
| Class T | | | — | | | | (1 | ) | | | — | | | | (1 | ) |
| Total Dividends and Distributions to Shareholders | | | — | | | | (10,297,729 | ) | | | (1,787,058 | ) | | | (5,598,870 | ) |
| From Fund Share Transactions (Note 7) | | | (23,955,713 | ) | | | (48,054,408 | ) | | | (7,993,198 | ) | | | (22,558,329 | ) |
| Total Decrease in Net Assets | | | (186,357 | ) | | | (80,778,291 | ) | | | (1,892,508 | ) | | | (25,121,351 | ) |
| | | | | | | | | | | | | | | | | |
| Net Assets: | | | | | | | | | | | | | | | | |
| Beginning of Year/Period | | | 340,652,910 | | | | 421,431,201 | | | | 191,582,640 | | | | 216,703,991 | |
| End of Year/Period | | $ | 340,466,553 | | | $ | 340,652,910 | | | $ | 189,690,132 | | | $ | 191,582,640 | |
| | 30 | Refer to the Notes to Financial Statements in this Report for further information regarding the values set forth above. |
| AdvisorOne Funds Semi-Annual Report |
| |
| Statements of Changes in Net Assets (Continued) |
| | | CLS | |
| | | Shelter Fund | |
| | | Six Months Ended | | | | |
| | | October 31, 2020 | | | Year Ended | |
| | | (Unaudited) | | | April 30, 2020 | |
| Increase (Decrease) in Net Assets: | | | | | | | | |
| | | | | | | | | |
| From Operations: | | | | | | | | |
| Net investment income | | $ | 25,006 | | | $ | 3,057,487 | |
| Net realized loss on investments | | | (3,813,238 | ) | | | (2,333,302 | ) |
| Net change in unrealized appreciation (depreciation) on investments | | | 4,245,434 | | | | (16,363,737 | ) |
| Net increase (decrease) in net assets resulting from operations | | | 457,202 | | | | (15,639,552 | ) |
| | | | | | | | | |
| Distributions to Shareholders: | | | | | | | | |
| Total Distributions Paid | | | | | | | | |
| Class N | | | — | | | | (2,418,288 | ) |
| Class T | | | — | | | | (1 | ) |
| Total Dividends and Distributions to Shareholders | | | — | | | | (2,418,289 | ) |
| From Fund Share Transactions (Note 7) | | | (7,168,442 | ) | | | (8,466,193 | ) |
| Total Decrease in Net Assets | | | (6,711,240 | ) | | | (26,524,034 | ) |
| | | | | | | | | |
| Net Assets: | | | | | | | | |
| Beginning of Year/Period | | | 193,128,064 | | | | 219,652,098 | |
| End of Year/Period | | $ | 186,416,824 | | | $ | 193,128,064 | |
| | 31 | Refer to the Notes to Financial Statements in this Report for further information regarding the values set forth above. |
| AdvisorOne Funds Semi-Annual Report |
| |
| Financial Highlights |
| CLS Global Aggressive Equity Fund |
Selected data based on a share outstanding throughout each year/period indicated.
| | | Class N Shares | |
| | | Six Months | | | | | | | | | | | | | | | | |
| | | Ended | | | | | | | | | | | | | | | | |
| | | October 31, | | | Fiscal Years Ended April 30, | |
| | | 2020 | | | 2020 | | | 2019 | | | 2018 | | | 2017 | | | 2016 | |
| | | (Unaudited) | | | | | | | | | | | | | | | | |
| Net asset value, beginning of year/period | | $ | 12.54 | | | $ | 14.18 | | | $ | 15.56 | | | $ | 14.38 | | | $ | 12.26 | | | $ | 13.73 | |
| Income (loss) from investment operations: | | | | | | | | | | | | | | | | | | | | | | | | |
| Net investment income (a)(b) | | | 0.03 | | | | 0.17 | | | | 0.17 | | | | 0.15 | | | | 0.17 | | | | 0.26 | |
| Net realized and unrealized gain (loss) on investments | | | 2.22 | | | | (1.25 | ) | | | (0.22 | ) | | | 1.78 | | | | 2.29 | | | | (1.14 | ) |
| Total income (loss) from investment operations | | | 2.25 | | | | (1.08 | ) | | | (0.05 | ) | | | 1.93 | | | | 2.46 | | | | (0.88 | ) |
| Less distributions from: | | | | | | | | | | | | | | | | | | | | | | | | |
| Net investment income | | | — | | | | (0.16 | ) | | | (0.23 | ) | | | (0.13 | ) | | | (0.19 | ) | | | (0.25 | ) |
| Net realized gains | | | — | | | | (0.40 | ) | | | (1.10 | ) | | | (0.62 | ) | | | (0.15 | ) | | | (0.34 | ) |
| Total distributions from net investment income and net realized gains | | | — | | | | (0.56 | ) | | | (1.33 | ) | | | (0.75 | ) | | | (0.34 | ) | | | (0.59 | ) |
| Net asset value, end of year/period | | $ | 14.79 | | | $ | 12.54 | | | $ | 14.18 | | | $ | 15.56 | | | $ | 14.38 | | | $ | 12.26 | |
| Total return (c) | | | 17.94 | % (f) | | | (8.17 | )% | | | 0.99 | % (g) | | | 13.44 | % (g) | | | 20.23 | % (g) | | | (6.39 | )% (g) |
| Ratios and Supplemental Data: | | | | | | | | | | | | | | | | | | | | | | | | |
| Net assets, end of year/period (in 000’s) | | $ | 145,925 | | | $ | 139,535 | | | $ | 154,141 | | | $ | 170,351 | | | $ | 159,246 | | | $ | 100,444 | |
| Ratio of net expenses to average net assets after expense reimbursement (d) | | | 1.25 | % (e) | | | 1.24 | % | | | 1.16 | % | | | 1.15 | % | | | 1.15 | % | | | 1.15 | % |
| Ratio of expenses to average net assets before waivers and reimbursements (d) | | | 1.25 | % (e) | | | 1.24 | % | | | 1.27 | % | | | 1.23 | % | | | 1.40 | % | | | 1.38 | % |
| Ratio of net investment income to average net assets (b) | | | 0.41 | % (e) | | | 1.25 | % | | | 1.13 | % | | | 0.99 | % | | | 1.30 | % | | | 2.10 | % |
| Portfolio turnover rate | | | 9 | % (f) | | | 63 | % | | | 17 | % | | | 28 | % | | | 32 | % | | | 35 | % |
| (a) | Net investment income has been calculated using the average shares method, which more appropriately presents the per share data for the period. |
| (b) | Recognition of net investment income by the Fund is affected by the timing of the declaration of dividends by the underlying investment companies in which the Fund invests. |
| (c) | Total returns are historical and assume changes in share price, reinvestment of dividends and capital gains distributions, and assume no sales charge. |
| (d) | Does not include the expenses of the investment companies in which the Fund invests. |
| (e) | Annualized for periods less than one year. |
| (g) | Had the advisor not waived a portion of the Fund’s expenses, total returns would have been lower. |
| | 32 | Refer to the Notes to Financial Statements in this Report for further information regarding the values set forth above. |
| AdvisorOne Funds Semi-Annual Report |
| |
| Financial Highlights |
| CLS Global Aggressive Equity Fund |
Selected data based on a share outstanding throughout each year/period indicated.
| | | Class T Shares | |
| | | Six Months | | | Year | | | Period | |
| | | Ended | | | Ended | | | Ended | |
| | | October 31, | | | April 30, | | | April 30, | |
| | | 2020 | | | 2020 | | | 2019(a) | |
| | | (Unaudited) | | | | | | | |
| Net asset value, beginning of year/period | | $ | 12.54 | | | $ | 14.18 | | | $ | 14.32 | |
| Income (loss) from investment operations: | | | | | | | | | | | | |
| Net investment income (b)(c) | | | 0.03 | | | | 0.17 | | | | 0.10 | |
| Net realized and unrealized gain (loss) on investments | | | 2.22 | | | | (1.25 | ) | | | 1.09 | |
| Total income (loss) from investment operations | | | 2.25 | | | | (1.08 | ) | | | 1.19 | |
| Less distributions from: | | | | | | | | | | | | |
| Net investment income | | | — | | | | (0.16 | ) | | | (0.23 | ) |
| Net realized gains | | | — | | | | (0.40 | ) | | | (1.10 | ) |
| Total distributions from net investment income and net realized gains | | | — | | | | (0.56 | ) | | | (1.33 | ) |
| Net asset value, end of year/period | | $ | 14.79 | | | $ | 12.54 | | | $ | 14.18 | |
| Total return (d) | | | 17.94 | % (g) | | | (8.17 | )% | | | 9.73 | % (g,h) |
| Ratios and Supplemental Data: | | | | | | | | | | | | |
| Net assets, end of year/period | | $ | 17 | | | $ | 14 | | | $ | 16 | |
| Ratio of net expenses to average net assets after expense reimbursement(e) | | | 1.10 | % (f) | | | 1.09 | % | | | 1.01 | % (f) |
| Ratio of expenses to average net assets before waivers and reimbursements(e) | | | 1.10 | % (f) | | | 1.09 | % | | | 1.12 | % (f) |
| Ratio of net investment income to average net assets (c) | | | 0.56 | % (f) | | | 1.40 | % | | | 1.28 | % (f) |
| Portfolio turnover rate | | | 9 | % (g) | | | 63 | % | | | 17 | % (g) |
| (a) | Class T commenced operations on 12/7/18. |
| (b) | Net investment income has been calculated using the average shares method, which more appropriately presents the per share data for the period. |
| (c) | Recognition of net investment income by the Fund is affected by the timing of the declaration of dividends by the underlying investment companies in which the Fund invests. |
| (d) | Total returns are historical and assume changes in share price, reinvestment of dividends and capital gains distributions, and assume no sales charge. |
| (e) | Does not include the expenses of the investment companies in which the Fund invests. |
| (f) | Annualized for periods less than one year. |
| (h) | Had the advisor not waived a portion of the Fund’s expenses, total returns would have been lower. |
| | 33 | Refer to the Notes to Financial Statements in this Report for further information regarding the values set forth above. |
| AdvisorOne Funds Semi-Annual Report |
| |
| Financial Highlights |
| CLS Global Diversified Equity Fund |
Selected data based on a share outstanding throughout each year/period indicated.
| | | Class N Shares | |
| | | Six Months | | | | | | | | | | | | | | | | |
| | | Ended | | | | | | | | | | | | | | | | |
| | | October 31, | | | Fiscal Years Ended April 30, | |
| | | 2020 | | | 2020 | | | 2019 | | | 2018 | | | 2017 | | | 2016 | |
| | | (Unaudited) | | | | | | | | | | | | | | | | |
| Net asset value, beginning of year/period | | $ | 14.10 | | | $ | 16.55 | | | $ | 18.75 | | | $ | 17.94 | | | $ | 16.15 | | | $ | 18.26 | |
| Income (loss) from investment operations: | | | | | | | | | | | | | | | | | | | | | | | | |
| Net investment income (a)(b) | | | 0.09 | | | | 0.24 | | | | 0.27 | | | | 0.22 | | | | 0.28 | | | | 0.27 | |
| Net realized and unrealized gain (loss) on investments | | | 1.63 | | | | (1.82 | ) | | | (0.47 | ) | | | 2.42 | | | | 2.09 | | | | (1.66 | ) |
| Total income (loss) from investment operations | | | 1.72 | | | | (1.58 | ) | | | (0.20 | ) | | | 2.64 | | | | 2.37 | | | | (1.39 | ) |
| Less distributions from: | | | | | | | | | | | | | | | | | | | | | | | | |
| Net investment income | | | — | | | | (0.25 | ) | | | (0.34 | ) | | | (0.28 | ) | | | (0.49 | ) | | | (0.13 | ) |
| Net realized gains | | | — | | | | (0.62 | ) | | | (1.66 | ) | | | (1.55 | ) | | | (0.09 | ) | | | (0.59 | ) |
| Total distributions from net investment income and net realized gains | | | — | | | | (0.87 | ) | | | (2.00 | ) | | | (1.83 | ) | | | (0.58 | ) | | | (0.72 | ) |
| Net asset value, end of year/period | | $ | 15.82 | | | $ | 14.10 | | | $ | 16.55 | | | $ | 18.75 | | | $ | 17.94 | | | $ | 16.15 | |
| Total return (c) | | | 12.20 | % (f) | | | (10.47 | )% | | | 0.31 | % (g) | | | 14.84 | % (g) | | | 14.95 | % (g) | | | (7.59 | )% (g) |
| Ratios and Supplemental Data: | | | | | | | | | | | | | | | | | | | | | | | | |
| Net assets, end of year/period (in 000’s) | | $ | 370,144 | | | $ | 363,076 | | | $ | 452,993 | | | $ | 461,327 | | | $ | 434,938 | | | $ | 424,701 | |
| Ratio of net expenses to average net assets after expense reimbursements/recapture (d) | | | 1.18 | % (e) | | | 1.17 | % | | | 1.15 | % | | | 1.15 | % | | | 1.15 | % | | | 1.15 | % |
| Ratio of expenses to average net assets before waivers and reimbursements/recapture (d) | | | 1.18 | % (e) | | | 1.17 | % | | | 1.16 | % | | | 1.13 | % | | | 1.20 | % | | | 1.19 | % |
| Ratio of net investment income to average net assets (b) | | | 1.09 | % (e) | | | 1.51 | % | | | 1.52 | % | | | 1.15 | % | | | 1.64 | % | | | 1.59 | % |
| Portfolio turnover rate | | | 8 | % (f) | | | 77 | % | | | 35 | % | | | 24 | % | | | 41 | % | | | 58 | % |
| (a) | Net investment income has been calculated using the average shares method, which more appropriately presents the per share data for the period. |
| (b) | Recognition of net investment income by the Fund is affected by the timing of the declaration of dividends by the underlying investment companies in which the Fund invests. |
| (c) | Total returns are historical and assume changes in share price, reinvestment of dividends and capital gains distributions, and assume no sales charge. |
| (d) | Does not include the expenses of the investment companies in which the Fund invests. |
| (e) | Annualized for periods less than one year. |
| (g) | Had the advisor not waived a portion of the Fund’s expenses, total returns would have been lower. |
| | 34 | Refer to the Notes to Financial Statements in this Report for further information regarding the values set forth above. |
| AdvisorOne Funds Semi-Annual Report |
| |
| Financial Highlights |
| CLS Global Diversified Equity Fund |
Selected data based on a share outstanding throughout each year/period indicated.
| | | Class T Shares | |
| | | Six Months | | | Year | | | Period | |
| | | Ended | | | Ended | | | Ended | |
| | | October 31, | | | April 30, | | | April 30, | |
| | | 2020 | | | 2020 | | | 2019(a) | |
| | | (Unaudited) | | | | | | | |
| Net asset value, beginning of year/period | | $ | 14.10 | | | $ | 16.55 | | | $ | 17.34 | |
| Income (loss) from investment operations: | | | | | | | | | | | | |
| Net investment income (b)(c) | | | 0.09 | | | | 0.24 | | | | 0.15 | |
| Net realized and unrealized gain (loss) on investments | | | 1.63 | | | | (1.82 | ) | | | 1.06 | |
| Total income (loss) from investment operations | | | 1.72 | | | | (1.58 | ) | | | 1.21 | |
| Less distributions from: | | | | | | | | | | | | |
| Net investment income | | | — | | | | (0.25 | ) | | | (0.34 | ) |
| Net realized gains | | | — | | | | (0.62 | ) | | | (1.66 | ) |
| Total distributions from net investment income and net realized gains | | | — | | | | (0.87 | ) | | | (2.00 | ) |
| Net asset value, end of year/period | | $ | 15.82 | | | $ | 14.10 | | | $ | 16.55 | |
| Total return (d) | | | 12.20 | % (g) | | | (10.47 | )% | | | 8.49 | % (g,h) |
| Ratios and Supplemental Data: | | | | | | | | | | | | |
| Net assets, end of year/period | | $ | 19 | | | $ | 17 | | | $ | 19 | |
| Ratio of net expenses to average net assets after expense reimbursement(e) | | | 1.03 | % (f) | | | 1.02 | % | | | 1.00 | % (f) |
| Ratio of expenses to average net assets before waivers and reimbursements(e) | | | 1.03 | % (f) | | | 1.02 | % | | | 1.03 | % (f) |
| Ratio of net investment income to average net assets (c) | | | 1.24 | % (f) | | | 1.66 | % | | | 2.75 | % (f) |
| Portfolio turnover rate | | | 8 | % (g) | | | 77 | % | | | 35 | % (g) |
| (a) | Class T commenced operations on 12/7/18. |
| (b) | Net investment income has been calculated using the average shares method, which more appropriately presents the per share data for the period. |
| (c) | Recognition of net investment income by the Fund is affected by the timing of the declaration of dividends by the underlying investment companies in which the Fund invests. |
| (d) | Total returns are historical and assume changes in share price, reinvestment of dividends and capital gains distributions, and assume no sales charge. |
| (e) | Does not include the expenses of the investment companies in which the Fund invests. |
| (f) | Annualized for periods less than one year. |
| (h) | Had the advisor not waived a portion of the Fund’s expenses, total returns would have been lower. |
| | 35 | Refer to the Notes to Financial Statements in this Report for further information regarding the values set forth above. |
| AdvisorOne Funds Semi-Annual Report |
| |
| Financial Highlights |
| CLS Growth and Income Fund |
Selected data based on a share outstanding throughout each year/period indicated.
| | | Class N Shares | |
| | | Six Months | | | | | | | | | | | | | | | | |
| | | Ended | | | | | | | | | | | | | | | | |
| | | October 31, | | | Fiscal Years Ended April 30, | |
| | | 2020 | | | 2020 | | | 2019 | | | 2018 | | | 2017 | | | 2016 | |
| | | (Unaudited) | | | | | | | | | | | | | | | | |
| Net asset value, beginning of year/period | | $ | 9.98 | | | $ | 10.90 | | | $ | 11.35 | | | $ | 11.12 | | | $ | 10.55 | | | $ | 10.99 | |
| Income (loss) from investment operations: | | | | | | | | | | | | | | | | | | | | | | | | |
| Net investment income (a)(b) | | | 0.05 | | | | 0.20 | | | | 0.21 | | | | 0.16 | | | | 0.19 | | | | 0.15 | |
| Net realized and unrealized gain (loss) on investments | | | 0.64 | | | | (0.83 | ) | | | (0.09 | ) | | | 0.68 | | | | 0.61 | | | | (0.40 | ) |
| Total income (loss) from investment operations | | | 0.69 | | | | (0.63 | ) | | | 0.12 | | | | 0.84 | | | | 0.80 | | | | (0.25 | ) |
| Less distributions from: | | | | | | | | | | | | | | | | | | | | | | | | |
| Net investment income | | | — | | | | (0.24 | ) | | | (0.19 | ) | | | (0.18 | ) | | | (0.21 | ) | | | (0.13 | ) |
| Net realized gains | | | — | | | | (0.05 | ) | | | (0.38 | ) | | | (0.43 | ) | | | (0.02 | ) | | | (0.06 | ) |
| Total distributions from net investment income and net realized gains | | | — | | | | (0.29 | ) | | | (0.57 | ) | | | (0.61 | ) | | | (0.23 | ) | | | (0.19 | ) |
| Net asset value, end of year/period | | $ | 10.67 | | | $ | 9.98 | | | $ | 10.90 | | | $ | 11.35 | | | $ | 11.12 | | | $ | 10.55 | |
| Total return (c) | | | 6.91 | % (f) | | | (6.05 | )% (h) | | | 1.51 | % (g) | | | 7.55 | % (h) | | | 7.68 | % (g) | | | (2.14 | )% (g) |
| Ratios and Supplemental Data: | | | | | | | | | | | | | | | | | | | | | | | | |
| Net assets, end of year/period (in 000’s) | | $ | 340,467 | | | $ | 340,653 | | | $ | 421,431 | | | $ | 467,990 | | | $ | 445,759 | | | $ | 365,609 | |
| Ratio of net expenses to average net assets after expense reimbursement/recapture (d) | | | 1.21 | % (e) | | | 1.15 | % | | | 1.15 | % | | | 1.15 | % | | | 1.15 | % | | | 1.15 | % |
| Ratio of expenses to average net assets before waivers and reimbursements/recapture (d) | | | 1.21 | % (e) | | | 1.11 | % | | | 1.16 | % | | | 1.14 | % | | | 1.21 | % | | | 1.19 | % |
| Ratio of net investment income to average net assets (b) | | | 0.85 | % (e) | | | 1.88 | % | | | 1.93 | % | | | 1.38 | % | | | 1.75 | % | | | 1.42 | % |
| Portfolio turnover rate | | | 8 | % (f) | | | 42 | % | | | 28 | % | | | 23 | % | | | 45 | % | | | 56 | % |
| (a) | Net investment income has been calculated using the average shares method, which more appropriately presents the per share data for the period. |
| (b) | Recognition of net investment income by the Fund is affected by the timing of the declaration of dividends by the underlying investment companies in which the Fund invests. |
| (c) | Total returns are historical and assume changes in share price, reinvestment of dividends and capital gains distributions, and assume no sales charge. |
| (d) | Does not include the expenses of the investment companies in which the Fund invests. |
| (e) | Annualized for periods less than one year. |
| (g) | Had the advisor not waived a portion of the Fund’s expenses, total returns would have been lower. |
| (h) | Had the advisor not recaptured a portion of the Fund’s previously waived expenses, total returns would have been lower. |
| | 36 | Refer to the Notes to Financial Statements in this Report for further information regarding the values set forth above. |
| AdvisorOne Funds Semi-Annual Report |
| |
| Financial Highlights |
| CLS Growth and Income Fund |
Selected data based on a share outstanding throughout each year/period indicated.
| | | Class T Shares | |
| | | Six Months | | | Year | | | Period | |
| | | Ended | | | Ended | | | Ended | |
| | | October 31, | | | April 30, | | | April 30, | |
| | | 2020 | | | 2020 | | | 2019(a) | |
| | | (Unaudited) | | | | | | | |
| Net asset value, beginning of year/period | | $ | 9.98 | | | $ | 10.90 | | | $ | 10.83 | |
| Income (loss) from investment operations: | | | | | | | | | | | | |
| Net investment income (b)(c) | | | 0.05 | | | | 0.20 | | | | 0.09 | |
| Net realized and unrealized gain (loss) on investments | | | 0.64 | | | | (0.83 | ) | | | 0.55 | |
| Total income (loss) from investment operations | | | 0.69 | | | | (0.63 | ) | | | 0.64 | |
| Less distributions from: | | | | | | | | | | | | |
| Net investment income | | | — | | | | (0.24 | ) | | | (0.19 | ) |
| Net realized gains | | | — | | | | (0.05 | ) | | | (0.38 | ) |
| Total distributions from net investment income and net realized gains | | | — | | | | (0.29 | ) | | | (0.57 | ) |
| Net asset value, end of year/period | | $ | 10.67 | | | $ | 9.98 | | | $ | 10.90 | |
| Total return (d) | | | 6.91 | % (g) | | | (6.05 | )% (i) | | | 6.38 | % (g,h) |
| Ratios and Supplemental Data: | | | | | | | | | | | | |
| Net assets, end of year/period | | $ | 12 | | | $ | 11 | | | $ | 11 | |
| Ratio of net expenses to average net assets after expense reimbursement/recapture (e) | | | 1.06 | % (f) | | | 1.00 | % | | | 1.00 | % (f) |
| Ratio of expenses to average net assets before waivers and reimbursements/recapture (e) | | | 1.06 | % (f) | | | 0.96 | % | | | 1.02 | % (f) |
| Ratio of net investment income to average net assets (c) | | | 1.00 | % (f) | | | 2.03 | % | | | 2.19 | % (f) |
| Portfolio turnover rate | | | 8 | % (g) | | | 42 | % | | | 28 | % (g) |
| (a) | Class T commenced operations on 12/7/18. |
| (b) | Net investment income has been calculated using the average shares method, which more appropriately presents the per share data for the period. |
| (c) | Recognition of net investment income by the Fund is affected by the timing of the declaration of dividends by the underlying investment companies in which the Fund invests. |
| (d) | Total returns are historical and assume changes in share price, reinvestment of dividends and capital gains distributions, and assume no sales charge. |
| (e) | Does not include the expenses of the investment companies in which the Fund invests. |
| (f) | Annualized for periods less than one year. |
| (h) | Had the advisor not waived a portion of the Fund’s expenses, total returns would have been lower. |
| (i) | Had the advisor not recaptured a portion of the Fund’s previously waived expenses, total returns would have been lower. |
| | 37 | Refer to the Notes to Financial Statements in this Report for further information regarding the values set forth above. |
| AdvisorOne Funds Semi-Annual Report |
| |
| Financial Highlights |
| CLS Flexible Income Fund |
Selected data based on a share outstanding throughout each year/period indicated.
| | | Class N Shares | |
| | | Six Months | | | | | | | | | | | | | | | | |
| | | Ended | | | | | | | | | | | | | | | | |
| | | October 31, | | | Fiscal Years Ended April 30, | |
| | | 2020 | | | 2020 | | | 2019 | | | 2018 | | | 2017 | | | 2016 | |
| | | (Unaudited) | | | | | | | | | | | | | | | | |
| Net asset value, beginning of year/period | | $ | 10.14 | | | $ | 10.26 | | | $ | 10.13 | | | $ | 10.28 | | | $ | 10.18 | | | $ | 10.35 | |
| Income (loss) from investment operations: | | | | | | | | | | | | | | | | | | | | | | | | |
| Net investment income(a)(b) | | | 0.10 | | | | 0.27 | | | | 0.29 | | | | 0.24 | | | | 0.24 | | | | 0.24 | |
| Net realized and unrealized gain (loss) on investments | | | 0.32 | | | | (0.11 | ) | | | 0.13 | | | | (0.15 | ) | | | 0.11 | | | | (0.17 | ) |
| Total income from investment operations | | | 0.42 | | | | 0.16 | | | | 0.42 | | | | 0.09 | | | | 0.35 | | | | 0.07 | |
| Less distributions from: | | | | | | | | | | | | | | | | | | | | | | | | |
| Net investment income | | | (0.10 | ) | | | (0.28 | ) | | | (0.29 | ) | | | (0.24 | ) | | | (0.25 | ) | | | (0.24 | ) |
| Total distributions from net investment income and net realized gains | | | (0.10 | ) | | | (0.28 | ) | | | (0.29 | ) | | | (0.24 | ) | | | (0.25 | ) | | | (0.24 | ) |
| Net asset value, end of year/period | | $ | 10.46 | | | $ | 10.14 | | | $ | 10.26 | | | $ | 10.13 | | | $ | 10.28 | | | $ | 10.18 | |
| Total return (c) | | | 4.11 | % (f) | | | 1.51 | % | | | 4.29 | % (g) | | | 0.86 | % (g) | | | 3.48 | % (g) | | | 0.71 | % (g) |
| Ratios and Supplemental Data: | | | | | | | | | | | | | | | | | | | | | | | | |
| Net assets, end of year/period (in 000’s) | | $ | 189,690 | | | $ | 191,583 | | | $ | 216,704 | | | $ | 236,027 | | | $ | 228,142 | | | $ | 194,603 | |
| Ratio of net expenses to average net assets after expense reimbursement (d) | | | 0.89 | % (e) | | | 0.87 | % | | | 0.81 | % | | | 0.80 | % | | | 0.80 | % | | | 0.80 | % |
| Ratio of expenses to average net assets before waivers and reimbursements (d) | | | 0.89 | % (e) | | | 0.87 | % | | | 0.88 | % | | | 0.86 | % | | | 0.99 | % | | | 0.94 | % |
| Ratio of net investment income to average net assets (b) | | | 1.81 | % (e) | | | 2.62 | % | | | 2.86 | % | | | 2.32 | % | | | 2.35 | % | | | 2.33 | % |
| Portfolio turnover rate | | | 15 | % (f) | | | 15 | % | | | 22 | % | | | 13 | % | | | 9 | % | | | 19 | % |
| (a) | Net investment income has been calculated using the average shares method, which more appropriately presents the per share data for the period. |
| (b) | Recognition of net investment income by the Fund is affected by the timing of the declaration of dividends by the underlying investment companies in which the Fund invests. |
| (c) | Total returns are historical and assume changes in share price, reinvestment of dividends and capital gains distributions, and assume no sales charge. |
| (d) | Does not include the expenses of the investment companies in which the Fund invests. |
| (e) | Annualized for periods less than one year. |
| (g) | Had the advisor not waived a portion of the Fund’s expenses, total returns would have been lower. |
| | 38 | Refer to the Notes to Financial Statements in this Report for further information regarding the values set forth above. |
| AdvisorOne Funds Semi-Annual Report |
| |
| Financial Highlights |
| CLS Flexible Income Fund |
Selected data based on a share outstanding throughout each year/period indicated.
| | | Class T Shares | |
| | | Six Months | | | Year | | | Period | |
| | | Ended | | | Ended | | | Ended | |
| | | October 31, | | | April 30, | | | April 30, | |
| | | 2020 | | | 2020 | | | 2019(a) | |
| | | (Unaudited) | | | | | | | |
| Net asset value, beginning of year/period | | $ | 10.14 | | | $ | 10.26 | | | $ | 9.93 | |
| Income from investment operations: | | | | | | | | | | | | |
| Net investment income (b)(c) | | | 0.10 | | | | 0.27 | | | | 0.11 | |
| Net realized and unrealized gain (loss) on investments | | | 0.33 | | | | (0.11 | ) | | | 0.35 | |
| Total income from investment operations | | | 0.43 | | | | 0.16 | | | | 0.46 | |
| Less distributions from: | | | | | | | | | | | | |
| Net investment income | | | (0.10 | ) | | | (0.28 | ) | | | (0.13 | ) |
| Total distributions from net investment income and net realized gains | | | (0.10 | ) | | | (0.28 | ) | | | (0.13 | ) |
| Net asset value, end of year/period | | $ | 10.47 | | | $ | 10.14 | | | $ | 10.26 | |
| Total return (d) | | | 4.21 | % (g) | | | 1.51 | % | | | 4.68 | % (g,h) |
| Ratios and Supplemental Data: | | | | | | | | | | | | |
| Net assets, end of year/period | | $ | 11 | | | $ | 11 | | | $ | 10 | |
| Ratio of net expenses to average net assets after expense reimbursement (e) | | | 0.74 | % (f) | | | 0.72 | % | | | 0.67 | % (f) |
| Ratio of expenses to average net assets before waivers and reimbursements (e) | | | 0.74 | % (f) | | | 0.72 | % | | | 0.75 | % (f) |
| Ratio of net investment income to average net assets (c) | | | 1.96 | % (f) | | | 2.77 | % | | | 2.95 | % (f) |
| Portfolio turnover rate | | | 15 | % (g) | | | 15 | % | | | 22 | % (g) |
| (a) | Class T commenced operations on 12/7/18. |
| (b) | Net investment income has been calculated using the average shares method, which more appropriately presents the per share data for the period. |
| (c) | Recognition of net investment income by the Fund is affected by the timing of the declaration of dividends by the underlying investment companies in which the Fund invests. |
| (d) | Total returns are historical and assume changes in share price, reinvestment of dividends and capital gains distributions, and assume no sales charge. |
| (e) | Does not include the expenses of the investment companies in which the Fund invests. |
| (f) | Annualized for periods less than one year. |
| (h) | Had the advisor not waived a portion of the Fund’s expenses, total returns would have been lower. |
| | 39 | Refer to the Notes to Financial Statements in this Report for further information regarding the values set forth above. |
| AdvisorOne Funds Semi-Annual Report |
| |
| Financial Highlights |
| CLS Shelter Fund |
Selected data based on a share outstanding throughout each year/period indicated.
| | | Class N Shares | |
| | | Six Months | | | | | | | | | | | | | | | | |
| | | Ended | | | | | | | | | | | | | | | | |
| | | October 31, | | | Fiscal Years Ended April 30, | |
| | | 2020 | | | 2020 | | | 2019 | | | 2018 | | | 2017 | | | 2016 | |
| | | (Unaudited) | | | | | | | | | | | | | | | | |
| Net asset value, beginning of year/period | | $ | 10.73 | | | $ | 11.70 | | | $ | 14.51 | | | $ | 13.10 | | | $ | 11.65 | | | $ | 13.35 | |
| Income (loss) from investment operations: | | | | | | | | | | | | | | | | | | | | | | | | |
| Net investment income (a)(b) | | | 0.00 | (g) | | | 0.17 | | | | 0.15 | | | | 0.16 | | | | 0.10 | | | | 0.15 | |
| Net realized and unrealized gain (loss) on investments | | | 0.03 | | | | (1.01 | ) | | | (0.31 | ) | | | 1.56 | | | | 1.64 | | | | (0.75 | ) |
| Total income (loss) from investment operations | | | 0.03 | | | | (0.84 | ) | | | (0.16 | ) | | | 1.72 | | | | 1.74 | | | | (0.60 | ) |
| Less distributions from: | | | | | | | | | | | | | | | | | | | | | | | | |
| Net investment income | | | — | | | | (0.13 | ) | | | — | | | | (0.16 | ) | | | (0.11 | ) | | | (0.22 | ) |
| Net realized gains | | | — | | | | — | | | | (2.65 | ) | | | (0.15 | ) | | | (0.18 | ) | | | (0.88 | ) |
| Total distributions from net investment income and net realized gains | | | — | | | | (0.13 | ) | | | (2.65 | ) | | | (0.31 | ) | | | (0.29 | ) | | | (1.10 | ) |
| Net asset value, end of year/period | | $ | 10.76 | | | $ | 10.73 | | | $ | 11.70 | | | $ | 14.51 | | | $ | 13.10 | | | $ | 11.65 | |
| Total return (c) | | | 0.28 | % (f) | | | (7.33 | )% | | | 0.81 | % (h) | | | 13.11 | % (h) | | | 15.11 | % (h) | | | (4.43 | )% (h) |
| Ratios and Supplemental Data: | | | | | | | | | | | | | | | | | | | | | | | | |
| Net assets, end of year/period (in 000’s) | | $ | 182,056 | | | $ | 193,128 | | | $ | 219,652 | | | $ | 200,362 | | | $ | 129,378 | | | $ | 94,329 | |
| Ratio of net expenses to average net assets after expense reimbursement (d) | | | 1.21 | % (e) | | | 1.19 | % | | | 1.16 | % | | | 1.15 | % | | | 1.15 | % | | | 1.15 | % |
| Ratio of expenses to average net assets before waivers and reimbursements (d) | | | 1.21 | % (e) | | | 1.19 | % | | | 1.20 | % | | | 1.18 | % | | | 1.24 | % | | | 1.24 | % |
| Ratio of net investment income to average net assets (b) | | | 0.03 | % (e) | | | 1.42 | % | | | 1.15 | % | | | 1.14 | % | | | 0.83 | % | | | 1.19 | % |
| Portfolio turnover rate | | | 135 | % (f) | | | 257 | % | | | 316 | % | | | 172 | % | | | 147 | % | | | 346 | % |
| (a) | Net investment income has been calculated using the average shares method, which more appropriately presents the per share data for the period. |
| (b) | Recognition of net investment income by the Fund is affected by the timing of the declaration of dividends by the underlying investment companies in which the Fund invests. |
| (c) | Total returns are historical and assume changes in share price, reinvestment of dividends and capital gains distributions, and assume no sales charge. |
| (d) | Does not include the expenses of the investment companies in which the Fund invests. |
| (e) | Annualized for periods less than one year. |
| (g) | Represents amount less than $0.01. |
| (h) | Had the advisor not waived a portion of the Fund’s expenses, total returns would have been lower. |
| | 40 | Refer to the Notes to Financial Statements in this Report for further information regarding the values set forth above. |
| AdvisorOne Funds Semi-Annual Report |
| |
| Financial Highlights |
| CLS Shelter Fund |
Selected data based on a share outstanding throughout each year/period indicated.
| | | Class T Shares | |
| | | Six Months | | | Year | | | Period | |
| | | Ended | | | Ended | | | Ended | |
| | | October 31, | | | April 30, | | | April 30, | |
| | | 2020 | | | 2020 | | | 2019(a) | |
| | | (Unaudited) | | | | | | | |
| Net asset value, beginning of year/period | | $ | 10.73 | | | $ | 11.70 | | | $ | 13.95 | |
| Income from investment operations: | | | | | | | | | | | | |
| Net investment income (b)(c) | | | 0.00 | (h) | | | 0.17 | | | | 0.06 | |
| Net realized and unrealized gain (loss) on investments | | | 0.04 | | | | (1.01 | ) | | | 0.34 | |
| Total income (loss) from investment operations | | | 0.04 | | | | (0.84 | ) | | | 0.40 | |
| Less distributions from: | | | | | | | | | | | | |
| Net investment income | | | — | | | | (0.13 | ) | | | — | |
| Net realized gains | | | — | | | | — | | | | (2.65 | ) |
| Total distributions from net investment income and net realized gains | | | — | | | | (0.13 | ) | | | (2.65 | ) |
| Net asset value, end of year/period | | $ | 10.77 | | | $ | 10.73 | | | $ | 11.70 | |
| Total return (d) | | | 0.37 | % (g) | | | (7.33 | )% | | | 4.84 | % (g,i) |
| Ratios and Supplemental Data: | | | | | | | | | | | | |
| Net assets, end of year/period | | $ | 4,360,965 | | | $ | 14 | | | $ | 15 | |
| Ratio of net expenses to average net assets after expense reimbursement (e) | | | 1.06 | % (f) | | | 1.04 | % | | | 1.02 | % (f) |
| Ratio of expenses to average net assets before waivers and reimbursements (e) | | | 1.06 | % (f) | | | 1.04 | % | | | 1.07 | % (f) |
| Ratio of net investment income to average net assets (c) | | | 0.18 | % (f) | | | 1.57 | % | | | 1.46 | % (f) |
| Portfolio turnover rate | | | 135 | % (g) | | | 257 | % | | | 316 | % (g) |
| (a) | Class T commenced operations on 12/7/18. |
| (b) | Net investment income has been calculated using the average shares method, which more appropriately presents the per share data for the period. |
| (c) | Recognition of net investment income by the Fund is affected by the timing of the declaration of dividends by the underlying investment companies in which the Fund invests. |
| (d) | Total returns are historical and assume changes in share price, reinvestment of dividends and capital gains distributions, and assume no sales charge. |
| (e) | Does not include the expenses of the investment companies in which the Fund invests. |
| (f) | Annualized for periods less than one year. |
| (h) | Represents amount less than $0.01. |
| (i) | Had the advisor not waived a portion of the Fund’s expenses, total returns would have been lower. |
| | 41 | Refer to the Notes to Financial Statements in this Report for further information regarding the values set forth above. |
| AdvisorOne Funds Semi-Annual Report |
| |
| Notes to Financial Statements (Unaudited) |
| October 31, 2020 |
AdvisorOne Funds (the “Trust” or the “Funds”) was organized as a Delaware Business Trust in December 1996 and is registered under the Investment Company Act of 1940, as amended (the “1940 Act”), as an open-end management investment company. The CLS Global Aggressive Equity Fund, CLS Global Diversified Equity Fund, CLS Growth and Income Fund, CLS Flexible Income Fund, and CLS Shelter Fund, (collectively the “Funds” and each individually a “Fund”) are each a diversified series of the Trust. The Funds each offer an unlimited number of shares of beneficial interest without par value. Each Fund offers both Class N and Class T shares. Each share of each Fund’s two classes represents an undivided, proportionate interest in the Fund. All income, expenses (other than class specific expenses), and realized gains or losses are allocated daily to each class of shares based on the relative value of the shares of each class. A Fund’s class specific expenses include shareholder service fees. In addition, there are differences among the classes of shares with respect to the minimum investment required and voting rights affecting each class.
| Fund | | The primary investment objective of each Fund is as follows: |
| CLS Global Aggressive Equity Fund | | Long-term growth |
| CLS Global Diversified Equity Fund | | Long-term growth of capital without regard to current income |
| CLS Growth and Income Fund | | Combination of current income and growth of capital |
| CLS Flexible Income Fund | | Total return, consisting of income and capital growth, consistent with preservation of capital |
| CLS Shelter Fund | | Limiting the impact of large equity market declines. |
| | | The Fund’s secondary investment objective is growth of capital. |
| 2. | Summary of Significant Accounting Policies |
The following is a summary of significant accounting policies followed by the Funds in the preparation of their financial statements. These policies are in conformity with accounting principles generally accepted in the United States of America (“GAAP”). The preparation of financial statements requires management to make estimates and assumptions that affect the reported amounts of assets and liabilities and disclosure of contingent assets and liabilities at the date of the financial statements and the reported amounts of income and expenses for the year. The Funds are investment companies and accordingly follow the investment companies accounting and reporting guidance of the Financial Accounting Standards Board (“FASB”) Accounting Standards Codification Topic 946 “Financial Services – Investment Companies” including FASB Accounting Standards Update (“ASU”) 2013-08.
| AdvisorOne Funds Semi-Annual Report |
| |
| Notes to Financial Statements (Unaudited) (Continued) |
| October 31, 2020 |
Security Valuation – Securities listed on an exchange are valued at the last reported sale price at the close of the regular trading session of the exchange on the business day the value is being determined, or in the case of securities listed on NASDAQ at the NASDAQ Official Closing Price. In the absence of a sale, such securities shall be valued at the mean between the current bid and ask prices on the primary exchange on the day of valuation. Short-term investments that mature in 60 days or less may be valued at amortized cost, provided such valuations represent fair value. Under the amortized cost method, a portfolio instrument is valued at cost and any premium or discount is amortized to maturity. Amortization of premium and accretion of market discount are charged to income. Debt securities (other than short-term obligations) are valued each day by an independent pricing service approved by the Trust’s Board of Trustees (the “Board” or the “Trustees”) based on methods which include consideration of: yields or prices of securities of comparable quality, coupon, maturity and type, indications as to values from dealers, and general market conditions or market quotations from a major market maker in the securities.
The Funds may hold securities, such as private investments, interests in commodity pools, other non-traded securities or temporarily illiquid securities, for which market quotations are not readily available or are determined to be unreliable. These securities will be valued using the “fair value” procedures approved by the Board. The Board has delegated execution of these procedures to a fair value committee composed of one or more representatives from each of the (i) Trust, (ii) administrator, and (iii) advisor. The committee may also enlist third party consultants such as a valuation specialist at a public accounting firm, valuation consultant or financial officer of a security issuer on an as-needed basis to assist in determining a security-specific fair value. The Board reviews and ratifies the execution of this process and the resultant fair value prices at least quarterly to assure the process produces reliable results.
Fair Valuation Process – As noted above, the fair value committee is composed of one or more representatives from each of the (i) Trust, (ii) administrator, and (iii) advisor. The applicable investments are valued collectively via inputs from each of these groups. For example, fair value determinations are required for the following securities: (i) securities for which market quotations are insufficient or not readily available on a particular business day (including securities for which there is a short and temporary lapse in the provision of a price by the regular pricing source), (ii) securities for which, in the judgment of the advisor, the prices or values available do not represent the fair value of the instrument. Factors which may cause the advisor to make such a judgment include, but are not limited to, the following: only a bid price or an ask price is available; the spread between bid and ask prices is substantial; the frequency of sales; the thinness of the market; the size of reported trades; and actions of the securities markets, such as the suspension or
| AdvisorOne Funds Semi-Annual Report |
| |
| Notes to Financial Statements (Unaudited) (Continued) |
| October 31, 2020 |
limitation of trading; (iii) securities determined to be illiquid; (iv) securities with respect to which an event that will affect the value thereof has occurred (a “significant event”) since the closing prices were established on the principal exchange on which they are traded, but prior to a Fund’s calculation of its net asset value. Specifically, interests in commodity pools or managed futures pools are valued on a daily basis by reference to the closing market prices of each futures contract or other asset held by a pool, as adjusted for pool expenses. Restricted or illiquid securities, such as private placements or non-traded securities are valued via inputs from the advisor based upon the current bid for the security from two or more independent dealers or other parties reasonably familiar with the facts and circumstances of the security (who should take into consideration all relevant factors as may be appropriate under the circumstances). If the advisor is unable to obtain a current bid from such independent dealers or other independent parties, the fair value committee shall determine the fair value of such security using the following factors: (i) the type of security; (ii) the cost at date of purchase; (iii) the size and nature of a Fund’s holdings; (iv) the discount from market value of unrestricted securities of the same class at the time of purchase and subsequent thereto; (v) information as to any transactions or offers with respect to the security; (vi) the nature and duration of restrictions on disposition of the security and the existence of any registration rights; (vii) how the yield of the security compares to similar securities of companies of similar or equal creditworthiness; (viii) the level of recent trades of similar or comparable securities; (ix) the liquidity characteristics of the security; (x) current market conditions; and (xi) the market value of any securities into which the security is convertible or exchangeable.
Valuation of Fund of Funds – The Funds may invest in portfolios of open-end or closed-end investment companies (the “Underlying Funds”). The Underlying Funds value securities in their portfolios for which market quotations are readily available at their market values (generally the last reported sale price) and all other securities and assets at their fair value to the methods established by the board of directors of the Underlying Funds.
Open-end investment companies are valued at their respective net asset values as reported by such investment companies. The shares of many closed-end investment companies, after their initial public offering, frequently trade at a price per share that is different than the net asset value per share. The difference represents a market premium or market discount of such shares. There can be no assurances that the market discount or market premium on shares of any closed-end investment company purchased by their Funds will not change.
| AdvisorOne Funds Semi-Annual Report |
| |
| Notes to Financial Statements (Unaudited) (Continued) |
| October 31, 2020 |
The Funds utilize various methods to measure the fair value of all of their investments on a recurring basis. GAAP establishes a hierarchy that prioritizes inputs to valuation methods. The three levels of input are:
Level 1 – Unadjusted quoted prices in active markets for identical assets and liabilities that a Fund has the ability to access.
Level 2 – Observable inputs other than quoted prices included in Level 1 that are observable for the asset or liability, either directly or indirectly. These inputs may include quoted prices for the identical instrument in an inactive market, prices for similar instruments, interest rates, prepayment speeds, credit risk, yield curves, default rates and similar data.
Level 3 – Unobservable inputs for the asset or liability, to the extent relevant observable inputs are not available, representing a Fund’s own assumptions about the assumptions a market participant would use in valuing the asset or liability, and would be based on the best information available.
The availability of observable inputs can vary from security to security and is affected by a wide variety of factors, including, for example, the type of security, whether the security is new and not yet established in the marketplace, the liquidity of markets, and other characteristics particular to the security. To the extent that valuation is based on models or inputs that are less observable or unobservable in the market, the determination of fair value requires more judgment.
Accordingly, the degree of judgment exercised in determining fair value is greatest for instruments categorized in Level 3.
The inputs used to measure fair value may fall into different levels of the fair value hierarchy. In such cases, for disclosure purposes, the level in the fair value hierarchy within which the fair value measurement falls in its entirety, is determined based on the lowest level input that is significant to the fair value measurement in its entirety.
| AdvisorOne Funds Semi-Annual Report |
| |
| Notes to Financial Statements (Unaudited) (Continued) |
| October 31, 2020 |
The inputs or methodology used for valuing securities are not necessarily an indication of the risk associated with investing in those securities. The following table summarizes the inputs used as of October 31, 2020 for the Funds’ investments measured at fair value:
| CLS Global Aggressive Equity Fund | |
| | | | | | | | | | | | | |
| Assets* | | Level 1 | | | Level 2 | | | Level 3 | | | Total | |
| Equity Funds | | $ | 145,850,763 | | | $ | — | | | $ | — | | | $ | 145,850,763 | |
| Collateral for Securities Loaned | | | 26,170,668 | | | | — | | | | — | | | | 26,170,668 | |
| Total | | $ | 172,021,431 | | | $ | — | | | $ | — | | | $ | 172,021,431 | |
| | | | | | | | | | | | | | | | | |
| CLS Global Diversified Equity Fund | |
| | | | | | | | | | | | | |
| Assets* | | Level 1 | | | Level 2 | | | Level 3 | | | Total | |
| Equity Funds | | $ | 369,619,912 | | | $ | — | | | $ | — | | | $ | 369,619,912 | |
| Collateral for Securities Loaned | | | 19,225,000 | | | | — | | | | — | | | | 19,225,000 | |
| Total | | $ | 388,844,912 | | | $ | — | | | $ | — | | | $ | 388,844,912 | |
| | | | | | | | | | | | | | | | | |
| CLS Growth and Income Fund | |
| | | | | | | | | | | | | |
| Assets* | | Level 1 | | | Level 2 | | | Level 3 | | | Total | |
| Bond Funds | | $ | 165,549,577 | | | $ | — | | | $ | — | | | $ | 165,549,577 | |
| Equity Funds | | | 162,255,521 | | | | — | | | | — | | | | 162,255,521 | |
| Money Market Fund | | | 13,127,767 | | | | — | | | | — | | | | 13,127,767 | |
| Collateral for Securities Loaned | | | 50,283,963 | | | | — | | | | — | | | | 50,283,963 | |
| Total | | $ | 391,216,828 | | | $ | — | | | $ | — | | | $ | 391,216,828 | |
| | | | | | | | | | | | | | | | | |
| CLS Flexible Income Fund | |
| | | | | | | | | | | | | |
| Assets* | | Level 1 | | | Level 2 | | | Level 3 | | | Total | |
| Bond Funds | | $ | 169,838,068 | | | $ | — | | | $ | — | | | $ | 169,838,068 | |
| Equity Funds | | | 14,848,569 | | | | — | | | | — | | | | 14,848,569 | |
| U.S. Government & Agency Obligations | | | — | | | | 2,376,275 | | | | — | | | | 2,376,275 | |
| Money Market Fund | | | 2,805,267 | | | | — | | | | — | | | | 2,805,267 | |
| Collateral for Securities Loaned | | | 22,856,089 | | | | — | | | | — | | | | 22,856,089 | |
| Total | | $ | 210,347,993 | | | $ | 2,376,275 | | | $ | — | | | $ | 212,724,268 | |
| | | | | | | | | | | | | | | | | |
| CLS Shelter Fund | |
| | | | | | | | | | | | | |
| Assets* | | Level 1 | | | Level 2 | | | Level 3 | | | Total | |
| Equity Funds | | $ | 105,349,218 | | | $ | — | | | $ | — | | | $ | 105,349,218 | |
| Money Market Fund | | | 72,238,685 | | | | — | | | | — | | | | 72,238,685 | |
| Collateral for Securities Loaned | | | 11,809,421 | | | | — | | | | — | | | | 11,809,421 | |
| Total | | $ | 189,397,324 | | | $ | — | | | $ | — | | | $ | 189,397,324 | |
The Funds did not hold any Level 3 securities during the period.
| * | Refer to the Schedules of Investments for security classifications. |
| AdvisorOne Funds Semi-Annual Report |
| |
| Notes to Financial Statements (Unaudited) (Continued) |
| October 31, 2020 |
Exchange Traded Funds
The Funds may invest in exchange traded funds (“ETFs”). ETFs are a type of fund bought and sold on a securities exchange. An ETF trades like common stock and may be actively managed or represent a fixed portfolio of securities. A Fund may purchase an ETF to temporarily gain exposure to a portion of the U.S. or a foreign market while awaiting purchase of underlying securities. The risks of owning an ETF generally reflect the risks of owning the underlying securities they are designed to track, although the lack of liquidity on an ETF could result in it being more volatile. Additionally, ETFs have fees and expenses that reduce their value.
Income Taxes
It is each Fund’s policy to comply with all sections of the Internal Revenue Code applicable to regulated investment companies and to distribute all of its taxable income and gains to its shareholders and therefore, no provision for federal income tax has been made. Each Fund is treated as a separate taxpayer for federal income tax purposes.
The Funds recognize the tax benefits of uncertain tax positions only where the position is “more likely than not” to be sustained assuming examination by tax authorities. Management has analyzed the Funds’ tax positions and has concluded that no liability for unrecognized tax benefits should be recorded related to uncertain tax positions taken on returns filed for open tax years (2018-2020), or expected to be taken in the Funds’ 2021 tax returns. The Funds identified their major tax jurisdictions as U.S. federal, Nebraska and foreign jurisdictions where the Funds make significant investments; however, the Funds are not aware of any tax positions for which it is reasonably possible that the total amounts of unrecognized tax benefits will change materially in the next twelve months.
Security Transactions and Related Income
Investment security transactions are accounted for on a trade date basis. Cost is determined and gains and losses are based upon the specific identification method for both financial statement and federal income tax purposes. Dividend income is recorded on the ex-dividend date and interest income is recorded on an accrual basis. Purchase discounts and premiums on securities are accreted and amortized over the life of the respective securities.
Expenses
Expenses of the Trust that are directly identifiable to a specific fund are charged to that fund. Expenses that are not readily identifiable to a specific fund are allocated in such a manner as deemed equitable, taking into consideration the nature and type of expense and the relative sizes of the funds. Each fund’s income, expenses (other than the class specific distribution and shareholder service fees) and realized and unrealized gains and losses are allocated proportionally each day between the classes based upon the relative net assets of each class.
| AdvisorOne Funds Semi-Annual Report |
| |
| Notes to Financial Statements (Unaudited) (Continued) |
| October 31, 2020 |
Distributions to Shareholders
Income will normally be declared and distributed at least annually for all Funds with the exception of the CLS Flexible Income Fund. Income will normally be declared and distributed monthly for the CLS Flexible Income Fund. The Funds declare and pay net realized capital gains, if any, annually. The character of income and gains to be distributed is determined in accordance with income tax regulations which may differ from GAAP. These differences are primarily due to the treatment of wash sale losses, grantor trust and partnership income.
Indemnification
The Trust indemnifies its officers and Trustees for certain liabilities that may arise from the performance of their duties to the Trust. Additionally, in the normal course of business, the Funds enter into contracts that contain a variety of representations and warranties and which provide general indemnities. A Fund’s maximum exposure under these arrangements is unknown, as this would involve future claims that may be made against the Funds that have not yet occurred. However, based on experience, the Trust expects the risk of loss due to these warranties and indemnities to be remote.
| 3. | Investment Advisory Agreement and Transactions with Related Parties |
Advisory Fees
The Trust has entered into an Investment Advisory Agreement with Brinker Capital Investments, LLC (the “Advisor” or “Brinker”, formerly CLS Investments, LLC), a subsidiary of Orion Advisor Solutions, Inc. As compensation for the services rendered, facilities furnished, and expenses borne by the Advisor, the Funds pay the Advisor a fee accrued daily and paid monthly, at the annualized rate of 0.75% of net assets for CLS Global Aggressive Equity Fund, CLS Global Diversified Equity Fund, CLS Growth and Income Fund, and CLS Shelter Fund; and at an annualized rate of 0.40% for CLS Flexible Income Fund. During the six months ended October 31, 2020, the Advisor earned the following fees:
| Fund | | Advisory Fee | |
| CLS Global Aggressive Equity Fund | | $ | 573,205 | |
| CLS Global Diversified Equity Fund | | | 1,461,939 | |
| CLS Growth and Income Fund | | | 1,333,889 | |
| CLS Flexible Income Fund | | | 392,085 | |
| CLS Shelter Fund | | | 738,295 | |
On September 24, 2020, CLS Investments, LLC (and its affiliates) and Brinker Capital, Inc. (“BCI”) were acquired by Orion Advisor Solutions, Inc. (“Orion”), a newly formed company controlled by funds affiliated with Genstar Capital Partners LLC and TA Associates (the “Change of Control Transaction”). Prior to the Change of Control Transaction, BCI was an unaffiliated registered investment adviser, wholly-owned by Brinker Capital Holdings, Inc., whose principal owner was
| AdvisorOne Funds Semi-Annual Report |
| |
| Notes to Financial Statements (Unaudited) (Continued) |
| October 31, 2020 |
Irwin Charles Widger. Immediately following the Change of Control Transaction, BCI merged into CLS, and the combined entity changed its name to Brinker Capital Investments, LLC, a Nebraska limited liability company. The Change of Control Transaction did not result in any changes to any Fund’s investment objectives, principal strategies or risks.
The Trustees, on behalf of the Funds, have adopted a Shareholder Servicing Plan (“Shareholder Servicing Plan”). The Shareholder Servicing Plan allows each of the Funds to use part of its assets for the payment of certain shareholder servicing expenses, including administrative or other shareholder support services. For these services under the Shareholder Servicing Plan, each Fund pays Brinker an amount up to 0.25% of average net assets attributable to Class N Shares, and an amount up to 0.10% of average net assets for Class T Shares of the respective Funds on an annualized basis. Brinker uses these shareholder servicing fees to compensate other parties that have entered into shareholder servicing agreements with Brinker with respect to the servicing of Fund shares. During the six months ended October 31, 2020, the Funds paid the following Shareholder Servicing Plan fees:
| | | Shareholder | |
| Fund | | Servicing Fee | |
| CLS Global Aggressive Equity Fund | | $ | 191,068 | |
| CLS Global Diversified Equity Fund | | | 487,313 | |
| CLS Growth and Income Fund | | | 444,630 | |
| CLS Flexible Income Fund | | | 245,053 | |
| CLS Shelter Fund | | | 245,493 | |
The Advisor has contractually agreed to waive or limit its management fees and to reimburse expenses, other than expenses relating to dividends on short sales, interest expense, indirect fees and expenses of underlying funds, and extraordinary or non-recurring expenses, through August 31, 2021 for Class N and Class T Shares so that the annual operating expenses of the Funds do not exceed the percentage of the average daily net assets as indicated below:
| | | Expense Limitation | |
| Class N | | | | |
| CLS Global Aggressive Equity, CLS Global Diversified Equity, | | | | |
| CLS Growth and Income, and CLS Shelter | | | 1.25 | % |
| Class N | | | | |
| CLS Flexible Income Fund | | | 0.90 | % |
| Class T | | | | |
| CLS Global Aggressive Equity, CLS Global Diversified Equity, | | | | |
| CLS Growth and Income, and CLS Shelter | | | 1.10 | % |
| Class T | | | | |
| CLS Flexible Income Fund | | | 0.75 | % |
There were no fee waivers or expense reimbursements within any of the Funds pursuant to this contractual agreement for the six months ended October 31, 2020.
| AdvisorOne Funds Semi-Annual Report |
| |
| Notes to Financial Statements (Unaudited) (Continued) |
| October 31, 2020 |
Fees waived or expenses reimbursed may be recouped by the Advisor from a Fund for a period up to three years from the date the fee or expense was waived or reimbursed. However, no recoupment payment will be made by a Fund if it would result in the Fund exceeding lesser of (i) the expense limitation at the time of waiver/reimbursement or (ii) the current expense limitation. The table below contains the amounts of fee waivers and expense reimbursements subject to recapture by the Advisor through April 30 of the years indicated:
| Fund | | 2021 | | | 2022 | | | 2023 | | | Total | |
| CLS Global Aggressive Equity Fund | | $ | 56,908 | | | $ | 26,567 | | | $ | — | | | $ | 83,475 | |
| CLS Global Diversified Equity Fund | | | — | | | | — | | | | — | | | | — | |
| CLS Growth and Income Fund | | | — | | | | — | | | | — | | | | — | |
| CLS Flexible Income Fund | | | 44,973 | | | | — | | | | — | | | | 44,973 | |
| CLS Shelter Fund | | | 27,720 | | | | — | | | | — | | | | 27,720 | |
Distributor
The distributor of the Funds, Northern Lights Distributors, LLC (“NLD”), serves as principal underwriter for each Fund Trust and maintains all records required to be maintained pursuant to the Funds’ Shareholder Services Plan. For the six months ended October 31, 2020, no underwriting commission were paid for sales of shares.
Administration, Fund Accounting, Transfer Agent, Custody Administration Fees
Gemini Fund Services, LLC (“GFS”), an affiliate of NLD, provides administration, fund accounting, and transfer agent services to the Trust. Pursuant to a separate servicing agreement with GFS, the Funds pay GFS customary fees for providing administration, fund accounting, and transfer agency services to the Funds. Certain officers of the Trust are also officers of GFS and are not paid any fees directly by the Funds for serving in such capacities.
In addition, certain affiliates of the distributor provide ancillary services to the Funds as follows:
Blu Giant, LLC (“Blu Giant”), an affiliate of NLD and GFS, provides EDGAR conversion and filing services as well as print management services for the Funds on an ad-hoc basis. For the provision of these services, Blu Giant receives customary fees from the Funds.
Chief Compliance Officer
Northern Lights Compliance Services, LLC (“NLCS”), an affiliate of NLD and GFS, provides a chief compliance officer to the Trust, as well as related compliance services, pursuant to a consulting agreement between NLCS and the Trust. Under the terms of such agreement, NLCS receives customary fees from the Funds.
| AdvisorOne Funds Semi-Annual Report |
| |
| Notes to Financial Statements (Unaudited) (Continued) |
| October 31, 2020 |
Trustees Fees
Prior to January 1, 2020, the Trust paid each Trustee who was not an “interested person” as that term is defined in the 1940 Act an annual fee of $50,000 per year paid in quarterly installments. Beginning January 1, 2020, the annual fee was increased to $80,000 per year paid in quarterly installments. The Trust also reimburses the Trustees for travel and other expenses incurred in attending meetings of the Board. Officers of the Trust and Trustees who are interested persons of the Trust do not receive any direct compensation from the Trust.
| 4. | Aggregate Unrealized Appreciation and Depreciation |
The identified cost of investments in securities owned by each Fund for federal income tax purposes, and their respective gross unrealized appreciation and depreciation at October 31, 2020, were as follows:
| | | | | | Gross | | | Gross | | | Net Unrealized | |
| | | | | | Unrealized | | | Unrealized | | | Appreciation/ | |
| Fund | | Tax Cost | | | Appreciation | | | Depreciation | | | (Depreciation) | |
| CLS Global Aggressive Equity Fund | | $ | 137,801,659 | | | $ | 36,537,823 | | | $ | (2,318,051 | ) | | $ | 34,219,772 | |
| CLS Global Diversified Equity Fund | | | 335,699,470 | | | | 54,951,306 | | | | (1,805,864 | ) | | | 53,145,442 | |
| CLS Growth and Income Fund | | | 362,382,619 | | | | 30,458,167 | | | | (1,623,958 | ) | | | 28,834,209 | |
| CLS Flexible Income Fund | | | 203,511,969 | | | | 10,813,182 | | | | (1,600,883 | ) | | | 9,212,299 | |
| CLS Shelter Fund | | | 193,001,380 | | | | 294,619 | | | | (3,898,675 | ) | | | (3,604,056 | ) |
| 5. | Investment Transactions |
The cost of purchases and the proceeds from sales of investments, other than short-term securities, for the six months ended October 31, 2020, were as follows:
| Fund | | Purchases | | | Sales | |
| CLS Global Aggressive Equity Fund | | $ | 13,930,415 | | | $ | 31,818,852 | |
| CLS Global Diversified Equity Fund | | | 31,591,942 | | | | 66,455,900 | |
| CLS Growth and Income Fund | | | 27,338,746 | | | | 59,640,082 | |
| CLS Flexible Income Fund | | | 27,744,118 | | | | 37,904,133 | |
| CLS Shelter Fund | | | 157,017,238 | | | | 150,364,051 | |
| AdvisorOne Funds Semi-Annual Report |
| |
| Notes to Financial Statements (Unaudited) (Continued) |
| October 31, 2020 |
| 6. | Investments in Affiliated Companies |
An affiliated company is a company in which a Fund has ownership of at least 5% of the voting securities. Companies that are affiliates at October 31, 2020 are noted in the Funds’ Schedules of Investments. Transactions during the period with companies that are affiliates are as follows:
CLS Global Aggressive Equity
| | | | | | | | | | | | | | | | | | | | Change in | | | | | | Shares | |
| | | | | Value at | | | | | | | | | Dividends | | | Realized | | | Unrealized | | | Value at | | | held at | |
| | | | | April 30, | | | | | | Sales | | | Credited | | | Gain | | | Appreciation/ | | | October | | | October | |
| CUSIP | | Description | | 2020 | | | Purchases | | | Proceeds | | | to Income | | | (Loss) | | | (Depreciation) | | | 31, 2020 | | | 31, 2020 | |
| 132061409 | | Cambria Global Value ETF | | $ | 6,397,975 | | | $ | — | | | $ | 874,444 | | | $ | 105,995 | | | $ | (35,433 | ) | | $ | (48,118 | ) | | $ | 5,439,980 | | | | 343,000 | |
| 316092816 | | Fidelity Momentum Factor ETF | | | 5,289,210 | | | | — | | | | 844,782 | | | | 26,279 | | | | 229,442 | | | | 431,593 | | | | 5,105,463 | | | | 131,000 | |
| 47804J404 | | John Hancock Multi-Factor Financials ETF | | | 2,981,632 | | | | — | | | | — | | | | 33,151 | | | | — | | | | 210,150 | | | | 3,191,782 | | | | 95,000 | |
| 00764F383 | | Milestone Treasury Obligations Fund * | | | — | | | | 23,604,000 | | | | — | | | | — | | | | — | | | | — | | | | 23,604,000 | | | | 23,604,000 | |
| 69374H618 | | Pacer Salt High truBeta U.S. Market ETF | | | 2,225,520 | | | | — | | | | — | | | | — | | | | — | | | | 560,640 | | | | 2,786,160 | | | | 96,000 | |
| 92189F684 | | Vaneck Vectors Retail ETF | | | 8,702,640 | | | | — | | | | 1,355,703 | | | | — | | | | 619,453 | | | | 1,047,985 | | | | 9,014,375 | | | | 62,500 | |
| Total affiliated at October 31, 2020 | | $ | 25,596,977 | | | $ | 23,604,000 | | | $ | 3,074,929 | | | $ | 165,425 | | | $ | 813,462 | | | $ | 2,202,250 | | | $ | 49,141,760 | | | | 24,331,500 | |
| | | | | | | | | | | | | | | | | | | | | | | | | | | | | | | | | |
| 23908L405 | | Davis Select International ETF^ | | $ | 7,302,375 | | | $ | — | | | $ | — | | | $ | — | | | $ | — | | | $ | 2,012,625 | | | $ | 9,315,000 | | | | 450,000 | |
| 47804J701 | | John Hancock Multi-Factor Energy ETF# | | | 2,512,656 | | | | — | | | | 2,051,055 | | | | 37,026 | | | | (1,156,527 | ) | | | — | | | | — | | | | — | |
| 52468L877 | | Legg Mason Small-Cap Quality Value ETF# | | | 1,450,083 | | | | — | | | | 1,696,328 | | | | 8,980 | | | | (146,300 | ) | | | — | | | | — | | | | — | |
| Total including securities affiliated at April 30, 2020 | | $ | 36,862,091 | | | $ | 23,604,000 | | | $ | 6,822,312 | | | $ | 211,431 | | | $ | (489,365 | ) | | $ | 4,214,875 | | | | | | | | | |
| AdvisorOne Funds Semi-Annual Report |
| |
| Notes to Financial Statements (Unaudited) (Continued) |
| October 31, 2020 |
CLS Global Diversified Equity
| | | | | | | | | | | | | | | | | | | | Change in | | | | | | Shares | |
| | | | | Value at | | | | | | | | | Dividends | | | Realized | | | Unrealized | | | Value at | | | held at | |
| | | | | April 30, | | | | | | Sales | | | Credited | | | Gain | | | Appreciation/ | | | October | | | October | |
| CUSIP | | Description | | 2020 | | | Purchases | | | Proceeds | | | to Income | | | (Loss) | | | (Depreciation) | | | 31, 2020 | | | 31, 2020 | |
| 23908L108 | | Davis Select Financial ETF | | $ | 25,080,000 | | | $ | — | | | $ | 1,932,582 | | | $ | — | | | $ | (213,418 | ) | | $ | 1,660,750 | | | $ | 24,594,750 | | | | 1,275,000 | |
| 25460E455 | | Direxion Russell 1000 Value Over Growth ETF | | | — | | | | 4,284,500 | | | | — | | | | 32,812 | | | | — | | | | (144,920 | ) | | | 4,139,580 | | | | 100,000 | |
| 316092782 | | Fidelity Value Factor ETF | | | 22,741,300 | | | | 990,295 | | | | — | | | | 248,976 | | | | — | | | | 2,107,075 | | | | 25,838,670 | | | | 741,000 | |
| 381430305 | | Goldman Sachs ActiveBeta Europe Equity ETF | | | 3,432,740 | | | | — | | | | — | | | | 51,755 | | | | — | | | | 274,846 | | | | 3,707,586 | | | | 135,000 | |
| 47804J404 | | John Hancock Multi-Factor Financials ETF | | | 2,040,064 | | | | — | | | | — | | | | 22,682 | | | | — | | | | 143,786 | | | | 2,183,850 | | | | 65,000 | |
| 47804J503 | | John Hancock Multi-Factor Health Care ETF | | | 11,094,900 | | | | — | | | | — | | | | 134,949 | | | | — | | | | 583,500 | | | | 11,678,400 | | | | 300,000 | |
| 47804J883 | | John Hancock Multi-Factor Industrials ETF | | | — | | | | 5,788,500 | | | | — | | | | — | | | | — | | | | (58,260 | ) | | | 5,730,240 | | | | 150,000 | |
| 00764F383 | | Milestone Treasury Obligations Fund * | | | — | | | | 19,225,000 | | | | — | | | | — | | | | — | | | | — | | | | 19,225,000 | | | | 19,225,000 | |
| 78467V889 | | SPDR MFS Systematic Growth Equity ETF | | | 13,344,075 | | | | — | | | | 7,359,317 | | | | 50,454 | | | | 1,889,717 | | | | 331,869 | | | | 8,206,344 | | | | 80,000 | |
| 78468R671 | | SPDR S&P Kensho Future Security ETF | | | 680,794 | | | | 516,375 | | | | — | | | | 679 | | | | — | | | | 48,845 | | | | 1,246,014 | | | | 35,000 | |
| 97717W323 | | WisdomTree Emerging Markets Quality Dividend Growth Fund | | | 3,884,259 | | | | — | | | | — | | | | 81,620 | | | | — | | | | 628,956 | | | | 4,513,215 | | | | 185,500 | |
| Total affiliated at October 31, 2020 | | $ | 82,298,132 | | | $ | 30,804,670 | | | $ | 9,291,899 | | | $ | 623,927 | | | $ | 1,676,299 | | | $ | 5,576,447 | | | $ | 111,063,649 | | | | 22,291,500 | |
| | | | | | | | | | | | | | | | | | | | | | | | | | | | | | | | | |
| 35473P827 | | Franklin FTSE Canada ETF# | | $ | 563,420 | | | $ | — | | | $ | 628,016 | | | $ | 6,730 | | | $ | (25,643 | ) | | $ | — | | | $ | — | | | | — | |
| 78468R648 | | SPDR S&P Kensho New Economies Composite ETF^ | | | 12,221,250 | | | | — | | | | — | | | | 48,493 | | | | — | | | | 3,997,500 | | | | 16,218,750 | | | | 375,000 | |
| 78468R747 | | SPDR SSGA Gender Diversity Index ETF# | | | 6,696,210 | | | | — | | | | 6,791,850 | | | | — | | | | 159,850 | | | | — | | | | — | | | | — | |
| Total including securities affiliated at April 30, 2020 | | $ | 101,779,012 | | | $ | 30,804,670 | | | $ | 16,711,765 | | | $ | 679,150 | | | $ | 1,810,506 | | | $ | 9,573,947 | | | | | | | | | |
| AdvisorOne Funds Semi-Annual Report |
| |
| Notes to Financial Statements (Unaudited) (Continued) |
| October 31, 2020 |
CLS Growth and Income
| | | | | | | | | | | | | | | | | | | | Change in | | | | | | Shares | |
| | | | | Value at | | | | | | | | | Dividends | | | Realized | | | Unrealized | | | Value at | | | held at | |
| | | | | April 30, | | | | | | Sales | | | Credited | | | Gain | | | Appreciation/ | | | October | | | October | |
| CUSIP | | Description | | 2020 | | | Purchases | | | Proceeds | | | to Income | | | (Loss) | | | (Depreciation) | | | 31, 2020 | | | 31, 2020 | |
| 47804J404 | | John Hancock Multi-Factor Financials ETF | | $ | 1,883,136 | | | $ | — | | | $ | — | | | $ | 20,938 | | | $ | — | | | $ | 132,726 | | | $ | 2,015,862 | | | | 60,000 | |
| 00764F383 | | Milestone Treasury Obligations Fund * | | | — | | | | 45,213,000 | | | | — | | | | — | | | | — | | | | — | | | | 45,213,000 | | | | 45,213,000 | |
| Total affiliated at October 31, 2020 | | $ | 1,883,136 | | | $ | 45,213,000 | | | $ | — | | | $ | 20,938 | | | $ | — | | | $ | 132,726 | | | $ | 47,228,862 | | | | 45,273,000 | |
| | | | | | | | | | | | | | | | | | | | | | | | | | | | | | | | | | | |
| 78463X376 | | SPDR Solactive Canada ETF# | | $ | 3,812,332 | | | $ | — | | | $ | 4,122,770 | | | $ | 34,162 | | | $ | 4,527 | | | $ | — | | | $ | — | | | | — | |
| Total including securities affiliated at April 30, 2020 | | $ | 5,695,468 | | | $ | 45,213,000 | | | $ | 4,122,770 | | | $ | 55,100 | | | $ | 4,527 | | | $ | 132,726 | | | | | | | | | |
| | | | | | | | | | | | | | | | | | | | | | | | | | | | | | | | | | | |
| CLS Flexible Income | |
| | | | | | | | | | | | | | | | | | | | | | | | | | | | | | | | | | | |
| | | | | | | | | | | | | | | | | | | | Change in | | | | | | Shares | |
| | | | | Value at | | | | | | | | | Dividends | | | Realized | | | Unrealized | | | Value at | | | held at | |
| | | | | April 30, | | | | | | Sales | | | Credited | | | Gain | | | Appreciation/ | | | October | | | October | |
| CUSIP | | Description | | 2020 | | | Purchases | | | Proceeds | | | to Income | | | (Loss) | | | (Depreciation) | | | 31, 2020 | | | 31, 2020 | |
| 00764F383 | | Milestone Treasury Obligations Fund* | | $ | — | | | $ | 20,573,000 | | | $ | — | | | $ | — | | | $ | — | | | $ | — | | | $ | 20,573,000 | | | | 20,573,000 | |
| Total affiliated at October 31, 2020 | | $ | — | | | $ | 20,573,000 | | | $ | — | | | $ | — | | | $ | — | | | $ | — | | | $ | 20,573,000 | | | | 20,573,000 | |
| | | | | | | | | | | | | | | | | | | | | | | | | | | | | | | | | | | |
| CLS Shelter Fund | |
| | | | | | | | | | | | | | | | | | | | | | | | | | | | | | | | | | | |
| | | | | | | | | | | | | | | | | | | | Change in | | | | | | Shares | |
| | | | | Value at | | | | | | | | | Dividends | | | Realized | | | Unrealized | | | Value at | | | held at | |
| | | | | April 30, | | | | | | Sales | | | Credited | | | Gain | | | Appreciation/ | | | October | | | October | |
| CUSIP | | Description | | 2020 | | | Purchases | | | Proceeds | | | to Income | | | (Loss) | | | (Depreciation) | | | 31, 2020 | | | 31, 2020 | |
| 00764F383 | | Milestone Treasury Obligations Fund * | | $ | — | | | $ | 10,654,000 | | | $ | — | | | $ | — | | | $ | — | | | $ | — | | | $ | 10,654,000 | | | | 10,654,000 | |
| Total affiliated at October 31, 2020 | | $ | — | | | $ | 10,654,000 | | | $ | — | | | $ | — | | | $ | — | | | $ | — | | | $ | 10,654,000 | | | | 10,654,000 | |
| | | | | | | | | | | | | | | | | | | | | | | | | | | | | | | | | | | |
| 45782C508 | | Innovator S&P 500 Power Buffer ETF - January# | | $ | 9,860,563 | | | $ | — | | | $ | — | | | $ | — | | | $ | — | | | $ | 755,402 | | | $ | 10,615,965 | | | | 366,700 | |
| Total including securities affiliated at April 30, 2020 | | $ | 9,860,563 | | | $ | 10,654,000 | | | $ | — | | | $ | — | | | $ | — | | | $ | 755,402 | | | | | | | | | |
| ^ | This security was considered an affiliate during the period but is no longer an affiliate at October 31, 2020. |
| # | Security position was sold in full during the period ending October 31, 2020. |
| AdvisorOne Funds Semi-Annual Report |
| |
| Notes to Financial Statements (Unaudited) (Continued) |
| October 31, 2020 |
| 7. | Shareholders’ Transactions |
As of October 31, 2020, the Funds had an unlimited number of shares authorized. Following is a summary of shareholder transactions for each Fund:
| | | Period Ended | | | Year Ended | |
| | | October 31, 2020 | | | April 30, 2020 | |
| | | Shares | | | Dollars | | | Shares | | | Dollars | |
| CLS Global Aggressive Equity Fund | | | | | | | | | | | | | | | | |
| Class N Shares: | | | | | | | | | | | | | | | | |
| Shares Sold | | | 412,570 | | | $ | 5,877,645 | | | | 2,572,386 | | | $ | 35,917,256 | |
| Shares issued to shareholders in reinvestment | | | — | | | | — | | | | 419,348 | | | | 6,147,642 | |
| Shares redeemed | | | (1,675,252 | ) | | | (24,357,832 | ) | | | (2,737,088 | ) | | | (37,251,364 | ) |
| Net increase (decrease) | | | (1,262,682 | ) | | $ | (18,480,187 | ) | | | 254,646 | | | $ | 4,813,534 | |
| | | | | | | | | | | | | | | | | |
| Class T Shares: | | | | | | | | | | | | | | | | |
| Shares Sold | | | — | | | $ | — | | | | — | | | $ | — | |
| Shares issued to shareholders in reinvestment | | | — | | | | — | | | | — | | | | — | |
| Net increase | | | — | | | $ | — | | | | — | | | $ | — | |
| | | | | | | | | | | | | | | | | |
| CLS Global Diversified Equity Fund | | | | | | | | | | | | | | | | |
| Class N Shares: | | | | | | | | | | | | | | | | |
| Shares Sold | | | 1,105,267 | | | $ | 17,269,437 | | | | 4,138,494 | | | $ | 64,846,364 | |
| Shares issued to shareholders in reinvestment | | | — | | | | — | | | | 1,282,075 | | | | 21,795,288 | |
| Shares redeemed | | | (3,446,722 | ) | | | (54,403,052 | ) | | | (7,052,150 | ) | | | (112,106,344 | ) |
| Net (decrease) | | | (2,341,455 | ) | | $ | (37,133,615 | ) | | | (1,631,581 | ) | | $ | (25,464,692 | ) |
| | | | | | | | | | | | | | | | | |
| Class T Shares: | | | | | | | | | | | | | | | | |
| Shares Sold | | | — | | | $ | — | | | | — | | | $ | — | |
| Shares issued to shareholders in reinvestment | | | — | | | | — | | | | — | | | | — | |
| Net increase | | | — | | | $ | — | | | | — | | | $ | — | |
| | | | | | | | | | | | | | | | | |
| CLS Growth and Income Fund | | | | | | | | | | | | | | | | |
| Class N Shares: | | | | | | | | | | | | | | | | |
| Shares Sold | | | 2,023,832 | | | $ | 21,578,203 | | | | 5,098,635 | | | $ | 55,188,888 | |
| Shares issued to shareholders in reinvestment | | | — | | | | — | | | | 912,289 | | | | 10,272,367 | |
| Shares redeemed | | | (4,271,913 | ) | | | (45,533,916 | ) | | | (10,534,090 | ) | | | (113,515,663 | ) |
| Net decrease | | | (2,248,081 | ) | | $ | (23,955,713 | ) | | | (4,523,166 | ) | | $ | (48,054,408 | ) |
| | | | | | | | | | | | | | | | | |
| Class T Shares: | | | | | | | | | | | | | | | | |
| Shares Sold | | | — | | | $ | — | | | | — | | | $ | — | |
| Net increase | | | — | | | $ | — | | | | — | | | $ | — | |
| AdvisorOne Funds Semi-Annual Report |
| |
| Notes to Financial Statements (Unaudited) (Continued) |
| October 31, 2020 |
| | | Period Ended | | | Year Ended | |
| | | October 31, 2020 | | | April 30, 2020 | |
| | | Shares | | | Dollars | | | Shares | | | Dollars | |
| CLS Flexible Income Fund | | | | | | | | | | | | | | | | |
| Class N Shares: | | | | | | | | | | | | | | | | |
| Shares Sold | | | 1,687,016 | | | $ | 17,703,099 | | | | 3,421,424 | | | $ | 35,542,103 | |
| Shares issued to shareholders in reinvestment | | | 170,589 | | | | 1,781,234 | | | | 538,647 | | | | 5,586,530 | |
| Shares redeemed | | | (2,625,847 | ) | | | (27,477,531 | ) | | | (6,189,902 | ) | | | (63,686,962 | ) |
| Net decrease | | | (768,242 | ) | | $ | (7,993,198 | ) | | | (2,229,831 | ) | | $ | (22,558,329 | ) |
| | | | | | | | | | | | | | | | | |
| Class T Shares: | | | | | | | | | | | | | | | | |
| Shares Sold | | | — | | | $ | — | | | | — | | | $ | — | |
| Net increase | | | — | | | $ | — | | | | — | | | $ | — | |
| | | | | | | | | | | | | | | | | |
| CLS Shelter Fund | | | | | | | | | | | | | | | | |
| Class N Shares: | | | | | | | | | | | | | | | | |
| Shares Sold | | | 2,588,427 | | | $ | 28,192,211 | | | | 3,940,541 | | | $ | 46,016,685 | |
| Shares issued to shareholders in reinvestment | | | — | | | | — | | | | 189,202 | | | | 2,404,758 | |
| Shares redeemed | | | (3,666,951 | ) | | | (39,876,503 | ) | | | (4,907,789 | ) | | | (56,887,636 | ) |
| Net (decrease) | | | (1,078,524 | ) | | $ | (11,684,292 | ) | | | (778,046 | ) | | $ | (8,466,193 | ) |
| | | | | | | | | | | | | | | | | |
| Class T Shares: | | | | | | | | | | | | | | | | |
| Shares Sold | | | 422,069 | | | $ | 4,702,473 | | | | — | | | $ | — | |
| Shares issued to shareholders in reinvestment | | | — | | | | — | | | | — | | | | — | |
| Shares redeemed | | | (17,034 | ) | | | (186,623 | ) | | | — | | | | — | |
| Net increase | | | 405,035 | | | $ | 4,515,850 | | | | — | | | $ | — | |
The CLS Global Aggressive Equity Fund, CLS Global Diversified Equity Fund, CLS Growth and Income Fund, CLS Flexible Income Fund, and CLS Shelter Fund have entered into a securities lending arrangement with The Bank of New York Mellon (the “Lending Agent”). Under the terms of the agreement, the Funds are authorized to loan securities through the Lending Agent to approved third-party borrowers. In exchange, the Funds receive cash collateral in the amount of at least 102% of the value of the securities loaned. The value of securities loaned is disclosed in a footnote on the statement of Assets & Liabilities and on the Schedule of Investments. Securities lending income is disclosed in the Funds’ Statements of Operations. Although risk is mitigated by the collateral, the Funds could experience a delay in recovering their securities and possible loss of income or value if the borrower fails to return them.
| AdvisorOne Funds Semi-Annual Report |
| |
| Notes to Financial Statements (Unaudited) (Continued) |
| October 31, 2020 |
The Lending Agent may invest the cash collateral received in connection with securities lending transactions in the Milestone Treasury Obligations Fund. The Milestone Treasury Obligations Fund is deemed an affiliate of the Trust and is managed by the Advisor. The Milestone Treasury Obligations Fund is registered under the 1940 Act as an open end investment company, is subject to Rule 2a-7 under the 1940 Act, which the Advisor may receive an investment advisory fee of up to 0.10% on an annualized basis of the average daily net assets of the Milestone Treasury Obligations Fund.
The Funds have adopted the disclosure provisions of FASB ASU 2014-11, “Transfers & Servicing (Topic 860): Repurchase-to-Maturity Transactions, Repurchase Financings, and Disclosures.” ASU No. 2014-11 is intended to provide increased transparency about the types of collateral pledged in securities lending transactions and other similar transactions that are accounted for as secured borrowing.
The following table displays a breakdown of transactions accounted for as secured borrowings, the gross obligations by class of collateral pledged, and the remaining contractual maturity of those transactions as of October 31, 2020:
| CLS Global Aggressive Equity Fund | | Remaining Contractual Maturity of the Agreements as of October 31, 2020 | |
| | | Overnight and | | | | | | Between | | | | | | | |
| Securities Lending Transactions | | Continuous | | | < 30 days | | | 30 & 90 days | | | > 90 days | | | Total | |
| Exchange Traded Funds | | $ | 25,612,008 | | | $ | — | | | $ | — | | | $ | — | | | $ | 25,612,008 | |
| Total Borrowings | | $ | 25,612,008 | | | $ | — | | | $ | — | | | $ | — | | | $ | 25,612,008 | |
| Gross amount of recognized liabilities for securities lending transactions | | | $ | 25,612,008 | |
| | | | | | | | | | | | | | | | | | | | | |
| CLS Global Diversified Equity Fund | | Remaining Contractual Maturity of the Agreements as of October 31, 2020 | |
| | | Overnight and | | | | | | Between | | | | | | | |
| Securities Lending Transactions | | Continuous | | | < 30 days | | | 30 & 90 days | | | > 90 days | | | Total | |
| Exchange Traded Funds | | $ | 18,159,200 | | | $ | — | | | $ | — | | | $ | — | | | $ | 18,159,200 | |
| Total Borrowings | | $ | 18,159,200 | | | $ | — | | | $ | — | | | $ | — | | | $ | 18,159,200 | |
| Gross amount of recognized liabilities for securities lending transactions | | | $ | 18,159,200 | |
| | | | | | | | | | | | | | | | | | | | | |
| CLS Growth and Income Fund | | Remaining Contractual Maturity of the Agreements as of October 31, 2020 | |
| | | Overnight and | | | | | | Between | | | | | | | |
| Securities Lending Transactions | | Continuous | | | < 30 days | | | 30 & 90 days | | | > 90 days | | | Total | |
| Exchange Traded Funds | | $ | 50,569,237 | | | $ | — | | | $ | — | | | $ | — | | | $ | 50,569,237 | |
| Total Borrowings | | $ | 50,569,237 | | | $ | — | | | $ | — | | | $ | — | | | $ | 50,569,237 | |
| Gross amount of recognized liabilities for securities lending transactions | | | $ | 50,569,237 | |
| AdvisorOne Funds Semi-Annual Report |
| |
| Notes to Financial Statements (Unaudited) (Continued) |
| October 31, 2020 |
| CLS Flexible Income Fund | | Remaining Contractual Maturity of the Agreements as of October 31, 2020 | |
| | | Overnight and | | | | | | Between | | | | | | | |
| Securities Lending Transactions | | Continuous | | | < 30 days | | | 30 & 90 days | | | > 90 days | | | Total | |
| Exchange Traded Funds | | $ | 22,386,741 | | | $ | — | | | $ | — | | | $ | — | | | $ | 22,386,741 | |
| Total Borrowings | | $ | 22,386,741 | | | $ | — | | | $ | — | | | $ | — | | | $ | 22,386,741 | |
| Gross amount of recognized liabilities for securities lending transactions | | | $ | 22,386,741 | |
| | | | | | | | | | | | | | | | | | | | | |
| CLS Shelter Fund | | Remaining Contractual Maturity of the Agreements as of October 31, 2020 | |
| | | Overnight and | | | | | | Between | | | | | | | |
| Securities Lending Transactions | | Continuous | | | < 30 days | | | 30 & 90 days | | | > 90 days | | | Total | |
| Exchange Traded Funds | | $ | 11,517,221 | | | $ | — | | | $ | — | | | $ | — | | | $ | 11,517,221 | |
| Total Borrowings | | $ | 11,517,221 | | | $ | — | | | $ | — | | | $ | — | | | $ | 11,517,221 | |
| Gross amount of recognized liabilities for securities lending transactions | | | $ | 11,517,221 | |
Securities lending income represents a portion of total investment income and may not continue in the future due to market conditions.
| | | Gross Amounts | | | Gross Amounts not offset in the | | | | |
| | | Recognized | | | Statement of Assets & Liabilities | | | | |
| | | in Statements | | | Financial | | | Cash | | | | |
| | | of Assets & | | | Instruments | | | Collateral | | | Net Amount | |
| Fund | | Liabilities | | | Pledged | | | Pledged | | | of Assets | |
| CLS Global Aggressive Equity Fund | | $ | 26,170,668 | (1) | | $ | 26,170,668 | (2) | | $ | — | | | $ | — | |
| CLS Global Diversified Equity Fund | | | 19,225,000 | (1) | | | 19,225,000 | (2) | | | — | | | | — | |
| CLS Growth and Income Fund | | | 50,283,963 | (1) | | | 50,283,963 | (2) | | | — | | | | — | |
| CLS Flexible Income Fund | | | 22,856,089 | (1) | | | 22,856,089 | (2) | | | — | | | | — | |
| CLS Shelter Fund | | | 11,809,421 | (1) | | | 11,809,421 | (2) | | | — | | | | — | |
| (1) | Collateral for Securities Loaned at value as presented in the Schedule of Investments. |
| (2) | The amount is limited to the liability balance and accordingly, does not include excess collateral pledged. |
| AdvisorOne Funds Semi-Annual Report |
| |
| Notes to Financial Statements (Unaudited) (Continued) |
| October 31, 2020 |
| 9. | Distributions to Shareholders and Tax Components of Capital |
The tax character of distributions paid for the year ended April 30, 2020 and April 30, 2019 was as follows:
| For the year ended April 30, 2020: |
| | | Ordinary | | | Long-Term | | | Return | | | Tax-Exempt | | | | |
| Portfolio | | Income | | | Capital Gains | | | of Capital | | | Income | | | Total | |
| CLS Global Aggressive Equity Fund | | $ | 1,769,038 | | | $ | 4,388,091 | | | $ | — | | | $ | — | | | $ | 6,157,129 | |
| CLS Global Diversified Equity Fund | | | 6,495,264 | | | | 15,352,096 | | | | — | | | | — | | | | 21,847,360 | |
| CLS Growth and Income Fund | | | 8,962,734 | | | | 1,334,995 | | | | — | | | | — | | | | 10,297,729 | |
| CLS Flexible Income Fund | | | 5,598,870 | | | | — | | | | — | | | | — | | | | 5,598,870 | |
| CLS Shelter Fund | | | 2,418,289 | | | | — | | | | — | | | | — | | | | 2,418,289 | |
| | | | | | | | | | | | | | | | | | | | | |
| For the year ended April 30, 2019: |
| | | Ordinary | | | Long-Term | | | Return | | | Tax-Exempt | | | | |
| Portfolio | | Income | | | Capital Gains | | | of Capital | | | Income | | | Total | |
| CLS Global Aggressive Equity Fund | | $ | 2,196,138 | | | $ | 11,246,528 | | | $ | — | | | $ | — | | | $ | 13,442,666 | |
| CLS Global Diversified Equity Fund | | | 6,399,931 | | | | 37,521,147 | | | | — | | | | — | | | | 43,921,078 | |
| CLS Growth and Income Fund | | | 7,801,866 | | | | 13,799,440 | | | | — | | | | — | | | | 21,601,306 | |
| CLS Flexible Income Fund | | | 6,514,773 | | | | — | | | | — | | | | — | | | | 6,514,773 | |
| CLS Shelter Fund | | | 14,855,742 | | | | 24,392,748 | | | | — | | | | — | | | | 39,248,490 | |
As of April 30, 2020, the components of accumulated earnings/ (deficit) on a tax basis were as follows:
| | | Undistributed | | | | | | | | | Post October | | | | | | | | | | | | Total | |
| | | Ordinary | | | Undistributed | | | Undistributed | | | Loss and | | | Capital | | | Other | | | Unrealized | | | Accumulated | |
| | | Tax-Exempt | | | Ordinary | | | Long-Term | | | Late | | | Loss Carry | | | Book/Tax | | | Appreciation/ | | | Earnings/ | |
| Portfolio | | Income | | | Income | | | Capital Gains | | | Year Loss | | | Forwards | | | Differences | | | (Depreciation) | | | (Deficits) | |
| CLS Global Aggressive Equity Fund | | $ | — | | | $ | — | | | $ | — | | | $ | (6,580,695 | ) | | $ | — | | | $ | — | | | $ | 14,947,026 | | | $ | 8,366,331 | |
| CLS Global Diversified Equity Fund | | | — | | | | — | | | | — | | | | (18,245,072 | ) | | | — | | | | (647,540 | ) | | | 22,893,389 | | | | 4,000,777 | |
| CLS Growth and Income Fund | | | — | | | | — | | | | — | | | | — | | | | (1,877,601 | ) | | | — | | | | 4,988,381 | | | | 3,110,780 | |
| CLS Flexible Income Fund | | | — | | | | — | | | | — | | | | (4,309,220 | ) | | | (995,165 | ) | | | — | | | | 2,345,635 | | | | (2,958,750 | ) |
| CLS Shelter Fund | | | — | | | | 3,056,956 | | | | — | | | | (11,981,653 | ) | | | (10,066,511 | ) | | | — | | | | (7,849,490 | ) | | | (26,840,698 | ) |
| AdvisorOne Funds Semi-Annual Report |
| |
| Notes to Financial Statements (Unaudited) (Continued) |
| October 31, 2020 |
The difference between book basis and tax basis undistributed net investment income/ loss, accumulated net realized gain/(loss), and unrealized appreciation/(depreciation) from investments is primarily attributable to the tax deferral of losses on wash sales, tax deferral of capital losses related to a Fund merger, and adjustments for partnerships.
Late year losses incurred after December 31 within the fiscal year are deemed to arise on the first business day of the following fiscal year for tax purposes. The Funds incurred and elected to defer such late year losses as follows:
| | | Late Year | |
| Portfolio | | Losses | |
| CLS Global Aggressive Equity Fund | | $ | 6,580,695 | |
| CLS Global Diversified Equity Fund | | | 18,245,072 | |
| CLS Growth and Income Fund | | | — | |
| CLS Flexible Income Fund | | | 4,309,220 | |
| CLS Shelter Fund | | | 11,981,653 | |
At April 30, 2020, the Funds had capital loss carry forwards for federal income tax purposes available to offset future capital gains and utilized as follows:
| | | Non-Expiring | | | | | | CLCF | |
| Portfolio | | Short-Term | | | Long-Term | | | Total | | | Utilized | |
| CLS Global Aggressive Equity Fund | | $ | — | | | $ | — | | | $ | — | | | $ | — | |
| CLS Global Diversified Equity Fund | | | — | | | | — | | | | — | | | | — | |
| CLS Growth and Income Fund | | | 1,877,601 | | | | — | | | | 1,877,601 | | | | — | |
| CLS Flexible Income Fund | | | 114,516 | | | | 880,649 | | | | 995,165 | | | | 1,072,545 | |
| CLS Shelter Fund | | | 10,066,511 | | | | — | | | | 10,066,511 | | | | 3,781,001 | |
Permanent book and tax differences, primarily attributable to the tax reclassification of Fund distributions resulted in reclassifications for the funds for the year ended April 30, 2020 as follows:
| | | Paid In | | | Accumulated | |
| Portfolio | | Capital | | | Earnings (Losses) | |
| CLS Global Aggressive Equity Fund | | $ | (96,571 | ) | | $ | 96,571 | |
| CLS Global Diversified Equity Fund | | | (219,817 | ) | | | 219,817 | |
| CLS Growth and Income Fund | | | (1,334,995 | ) | | | 1,334,995 | |
| CLS Flexible Income Fund | | | (151,957 | ) | | | 151,957 | |
| CLS Shelter Fund | | | — | | | | — | |
| AdvisorOne Funds Semi-Annual Report |
| |
| Notes to Financial Statements (Unaudited) (Continued) |
| October 31, 2020 |
The Fund acquired $2,199,877 of capital loss carryforwards related to the merger with the CLS International Equity Fund and has $647,540 of such losses remaining to be recognized over the next year. These amounts were subject to an annual limitation of $1,548,096 under current tax rules.
| 10. | Underlying Investment in Other Investment Companies |
The CLS Shelter Fund currently seeks to achieve its investment objective by investing a portion of its assets in Federated Prime Cash Obligations Fund Institutional Class (the “Security”). The Fund may redeem its investments from the Security at any time if the Advisor determines that it is in the best interest of the Fund and its shareholders to do so.
The performance of the CLS Shelter Fund will be directly affected by the performance of the Security. The annual report of the Security, along with the report of the independent registered public accounting firm is included in the Security’s N-CSR’s available at “www.sec.gov”. As of October 31, 2020, the percentage of the CLS Shelter Fund’s net assets invested in the security was 38.75%.
Subsequent events after the date of the Statement of Assets and Liabilities have been evaluated through the date the financial statements were issued. Management has determined that no events or transactions occurred requiring adjustment or disclosure in the financial statements.
| AdvisorOne Funds Semi-Annual Report |
| |
| Shareholder Expense Example (Unaudited) |
As a shareholder of one or more of the Funds you may incur ongoing costs, including management fees; shareholder servicing expenses and other Fund expenses. This Example is intended to help you understand your ongoing costs (in dollars) of investing in each Fund and to compare these costs with the ongoing costs of investing in other mutual funds.
This Example is based on an investment of $1,000 invested at the beginning of the period and held for the entire period as indicated below.
Actual Expenses: The “actual” line of each row in the table provides information about actual account values and actual expenses. You may use the information in this line, together with the amount you invested, to estimate the expenses that you paid over the period. Simply divide your account value by $1,000 (for example, an $8,600 account value divided by $1,000 = 8.6), then multiply the result by the applicable number under the heading entitled “Expenses Paid During the Period” to estimate the expenses you paid on your account during the period.
Hypothetical Examples for Comparison Purposes: The “hypothetical” line of each row in the table below provides information about hypothetical account values and hypothetical expenses based on each Fund’s actual expense ratio and an assumed rate of return of 5% per year before expenses, which is not the Fund’s actual return. The hypothetical account values and expenses may not be used to estimate the actual ending account balance or expenses you paid for the period. You may use this information to compare the ongoing costs of investing in the Fund and other funds. To do so, compare this 5% hypothetical example with the 5% hypothetical examples that appear in the shareholder reports of the other funds.
Please note that the expenses shown in the table are meant to highlight your ongoing costs only and do not reflect any transactional costs, such as sales charges (loads), or contingent deferred sales charges on redemptions. Therefore, the “hypothetical” line of each row in the table are useful in comparing ongoing costs only, and will not help you determine the relative total costs of owning different funds. In addition, if these transactional costs were included, your costs would have been higher.
| AdvisorOne Funds Semi-Annual Report |
| |
| Shareholder Expense Example (Unaudited) (Continued) |
| | | Beginning | | | Ending | | | Expense | | Expenses | |
| | | Account Value | | | Account Value | | | Ratio | | Paid During | |
| | | 5/1/2020 | | | 10/31/2020 | | | (Annualized) | | the Period | |
| CLS Global Aggressive Equity Fund | | | | | | | | | | | | | | |
| Actual: | | | | | | | | | | | | | | |
| Class N | | $ | 1,000.00 | | | $ | 1,179.40 | | | 1.25% | | $ | 6.87 | * |
| Class T | | | 1,000.00 | | | | 1,179.40 | | | 1.10% | | | 6.04 | * |
| Hypothetical (5% return before expenses): | | | | | | | | | | | | | | |
| Class N | | | 1,000.00 | | | | 1,018.90 | | | 1.25% | | | 6.36 | * |
| Class T | | | 1,000.00 | | | | 1,019.66 | | | 1.10% | | | 5.60 | * |
| | | | | | | | | | | | | | | |
| CLS Global Diversified Equity Fund | | | | | | | | | | | | | | |
| Actual: | | | | | | | | | | | | | | |
| Class N | | $ | 1,000.00 | | | $ | 1,122.00 | | | 1.18% | | $ | 6.31 | * |
| Class T | | | 1,000.00 | | | | 1,122.00 | | | 1.03% | | | 5.51 | * |
| Hypothetical (5% return before expenses): | | | | | | | | | | | | | | |
| Class N | | | 1,000.00 | | | | 1,019.26 | | | 1.18% | | | 6.01 | * |
| Class T | | | 1,000.00 | | | | 1,020.01 | | | 1.03% | | | 5.24 | * |
| | | | | | | | | | | | | | | |
| CLS Growth and Income Fund | | | | | | | | | | | | | | |
| Actual: | | | | | | | | | | | | | | |
| Class N | | $ | 1,000.00 | | | $ | 1,069.10 | | | 1.21% | | $ | 6.31 | * |
| Class T | | | 1,000.00 | | | | 1,069.10 | | | 1.06% | | | 5.53 | * |
| Hypothetical (5% return before expenses): | | | | | | | | | | | | | | |
| Class N | | | 1,000.00 | | | | 1,019.11 | | | 1.21% | | | 6.16 | * |
| Class T | | | 1,000.00 | | | | 1,019.86 | | | 1.06% | | | 5.40 | * |
| | | | | | | | | | | | | | | |
| CLS Flexible Income Fund | | | | | | | | | | | | | | |
| Actual: | | | | | | | | | | | | | | |
| Class N | | $ | 1,000.00 | | | $ | 1,041.10 | | | 0.89% | | $ | 4.58 | * |
| Class T | | | 1,000.00 | | | | 1,042.10 | | | 0.74% | | | 3.81 | * |
| Hypothetical (5% return before expenses): | | | | | | | | | | | | | | |
| Class N | | | 1,000.00 | | | | 1,020.72 | | | 0.89% | | | 4.53 | * |
| Class T | | | 1,000.00 | | | | 1,021.48 | | | 0.74% | | | 3.77 | * |
| | | | | | | | | | | | | | | |
| CLS Shelter Fund | | | | | | | | | | | | | | |
| Actual: | | | | | | | | | | | | | | |
| Class N | | $ | 1,000.00 | | | $ | 1,002.80 | | | 1.21% | | $ | 6.11 | * |
| Class T | | | 1,000.00 | | | | 1,003.70 | | | 1.06% | | | 5.35 | * |
| Hypothetical (5% return before expenses): | | | | | | | | | | | | | | |
| Class N | | | 1,000.00 | | | | 1,019.11 | | | 1.21% | | | 6.16 | * |
| Class T | | | 1,000.00 | | | | 1,019.86 | | | 1.06% | | | 5.40 | * |
| * | Expenses are equal to each Fund’s respective annual expense ratios for the most recent six-month period, multiplied by the average account value over the period, multiplied by 184/365. |
| AdvisorOne Funds Semi-Annual Report |
| |
| Supplemental Information (Unaudited) |
At a video conference (the “Meeting”) of the Board of Trustees (the “Board” or the “Trustees”) of the AdvisorOne Funds (the “Trust”) held on July 16, 2020, the Board, including those Trustees who are not “interested persons” as that term is defined in the Investment Company Act of 1940, as revised (the “Independent Trustees”), considered the renewal of the Investment Advisory Agreement between the Trust and CLS Investments, LLC (“CLS”) on behalf of the CLS Global Diversified Equity Fund (“Global Diversified Equity”), CLS Growth and Income Fund (“Growth and Income”), CLS Global Aggressive Equity Fund (“Global Aggressive Equity”), CLS Flexible Income Fund (“Flexible Income”), and CLS Shelter Fund (“Shelter”), (collectively the “Core Funds”), and Milestone Treasury Obligations Fund (“Milestone”) (Core Funds and Milestone are collectively referred to herein as the “Funds”) (“Advisory Agreement”).
In considering an interim advisory agreement between the Trust, on behalf of the Funds, and CLS (the “Interim Advisory Agreement”) as permitted by Rule 15a-4 under the 1940 Act, and (ii) new advisory agreement (“New Advisory Agreement”), to take effect upon the later of shareholder approval or the completion of the Change of Control Transaction, and reaching their conclusions, the Trustees reviewed and analyzed various factors that they determined were relevant, including the factors enumerated below. They also interviewed representatives of CLS and Brinker to confirm their understanding of the Change of Control Transaction. In their deliberations considering the New Advisory Agreement, the Trustees did not identify any one factor as all important, but rather considered these factors collectively, and each Trustee may have attributed different weights to the various factors. The Board, in their deliberations referred to the investment adviser as “CLS” acknowledging that upon completion of the Change of Control Transaction, the entity will be named Brinker Capital Investments, LLC.
Nature, Extent and Quality of Services. The Trustees discussed the credentials and experience of CLS personnel, noting that several members of the portfolio management team had advanced credentials including Chartered Financial Analyst, Chartered Market Technician, Certified Investment Management Analyst and Chartered Alternative Investment Analyst. The Trustees reviewed materials provided by Brinker that described the personnel, history, and capabilities of Brinker, and discussed how those resource could complement those of CLS. The Trustees expressed confidence in the current portfolio management team, citing the collaborative and open portfolio management process resulting in quality portfolio selection, analysis, and compliance monitoring. They observed that the resources of Brinker would be additive to those of CLS. The Trustees considered CLS’s investment management strategies including the Risk Budgeting methodology and the technical and fundamental factors used to manage the non-risk budgeted funds. The Trustees considered the financial stability and organizational resources that were available to CLS through its ownership structure and the additional talent and experience that would be gained by the merger of CLS and Brinker. The Trustees agreed that the nature and quality of services provided by CLS had been satisfactory, and that after the Change of Control Transaction, CLS would continue to have adequate investment, compliance and financial resources to successfully manage the Funds.
| AdvisorOne Funds Semi-Annual Report |
| |
| Supplemental Information (Unaudited) (Continued) |
Performance. The Board reviewed information on the investment performance of each Fund versus its respective benchmark and peer group year to date through June 30, 2020. In connection with its most recent approval of the continuation of the Current Advisory Agreement in April 2020, the Board was provided with reports regarding each Fund’s performance over various time periods. The Trustees determined it was appropriate to rely on their review and deliberations of CLS’s performance at prior meetings, as supplemented in the current materials. In doing so, and in conjunction with CLS’s representation that the Funds’ strategies were not expected to change following the Change of Control Transaction, the Trustees determined that the performance of each Fund was reasonable.
Costs of Advisory Services, Profitability and Economies of Scale. With respect to the cost of advisory services, the Board considered that the investment advisory fee payable to CLS under the New Agreement was the same as the investment advisory fee payable to CLS under the Current Advisory Agreement and the expense caps under the expense limitation agreements would not change after the Change of Control Transaction. With respect to profitability of CLS and economies of scale, the Board considered CLS’s profitability and economies of scale from its management of the Funds when it most recently approved the continuation of the Current Advisory Agreement. The Board recognized that CLS’s overall profitability and economies of scale may change as a result of the Change of Control Transaction, but that CLS had represented to the Board that its profitability with respect to the Funds was unlikely to change, and CLS did not expect to realize any additional economies of scale as a result of the Change of Control Transaction. After discussion, it was the consensus of the Board that the fees paid by each Fund, and the profits realized by CLS, were not unreasonable and that it would not request any changes to the management fee structure at this time.
Conclusion. Having requested and received such information from CLS as the Board believed to be reasonably necessary to evaluate the terms of the New Advisory Agreement, and as assisted by the advice of independent counsel, the Board, including a majority of the Independent Trustees, determined that, with respect to the New Advisory Agreement, (a) the terms of the New Advisory Agreement are reasonable; (b) the Change of Control Transaction would not result in the imposition of an unfair burden on any of the Funds or their respective shareholders; and (c) the New Advisory Agreement was in the best interests of each Fund and its shareholders. They concluded that the Change of Control Transaction was not expected to have any negative impact on shareholders and could benefit shareholders if CLS is strengthened as a result of the Change of Control Transaction. Accordingly, the Board concluded to approve the New Advisory Agreement and recommend the New Advisory Agreement to shareholders for approval.
| AdvisorOne Funds Semi-Annual Report |
| |
| Supplemental Information (Unaudited) (Continued) |
At a special meeting of shareholders of CLS Global Diversified Equity Fund, CLS Growth and Income Fund, CLS Flexible Income Fund and CLS Global Aggressive Equity Fund held on November 13, 2020, shareholders of record as of the close of business on July 27, 2020, voted to approve the following proposal:
Proposal 1: To approve a new advisory agreement between the AdvisorOne Funds, on behalf of each Fund and CLS Investments, LLC.
| | | Shares | | | Shares | | | Percentage | | | | | | | | | | |
| | | Outstanding As | | | Present In | | | of Shares | | | | | | | | | | |
| | | of Record Date | | | Person or | | | Present for | | | Votes | | | Votes | | | | |
| Fund | | (July 27, 2020) | | | By Proxy | | | Quorum | | | For | | | Against | | | Abstain | |
| CLS Flexible Income Fund | | | 18,487,278 | | | | 9,636,498 | | | | 52.13 | % | | | 7,662,296 | | | | 76,576 | | | | 1,897,626 | |
| CLS Global Aggressive Equity Fund | | | 10,727,203 | | | | 5,372,676 | | | | 50.08 | % | | | 4,109,328 | | | | 31,814 | | | | 1,231,534 | |
| Global Diversified Equity Fund | | | 24,942,135 | | | | 13,399,687 | | | | 53.72 | % | | | 9,405,238 | | | | 78,051 | | | | 3,916,398 | |
| CLS Growth and Income Fund | | | 33,365,608 | | | | 17,128,712 | | | | 51.34 | % | | | 13,388,371 | | | | 109,534 | | | | 3,630,807 | |
At a special meeting of shareholders of CLS Shelter Fund held on December 3, 2020, shareholders of record as of the close of business on July 27, 2020, voted to approve the following proposal:
Proposal 1: To approve a new advisory agreement between the AdvisorOne Funds, on behalf of the Fund and CLS Investments, LLC.
| | | Shares | | | Shares | | | Percentage | | | | | | | | | | |
| | | Outstanding As | | | Present In | | | of Shares | | | | | | | | | | |
| | | of Record Date | | | Person or | | | Present for | | | Votes | | | Votes | | | | |
| Fund | | (July 27, 2020) | | | By Proxy | | | Quorum | | | For | | | Against | | | Abstain | |
| CLS Shelter Fund | | | 17,842,667 | | | | 8,949,256 | | | | 50.16 | % | | | 6,860,117 | | | | 177,293 | | | | 1,911,846 | |
| AdvisorOne Funds Semi-Annual Report |
THIS PAGE INTENTIONALLY LEFT BLANK
Advisor
Brinker Capital Investments, LLC
17605 Wright Street
Omaha, NE 68130
| Administrator | Custodian |
| Gemini Fund Services, LLC | Fifth Third Bancorp |
| 80 Arkay Drive, Suite 110 | 38 Fountain Square Plaza |
| Hauppauge, NY 11788 | Cincinnati, OH 45263 |
| | |
| Distributor | Legal Counsel |
| Northern Lights Distributors, LLC | Thompson Hine LLP |
| 4221 North 203rd Street, Suite 100 | 41 South High Street, Suite 1700 |
| Elkhorn, NE 68022-3474 | Columbus, OH 43215 |
| 1-866-811-0225 | |
| | |
| Transfer Agent | Independent Registered Public |
| Gemini Fund Services, LLC | Accounting Firm |
| 4221 North 203rd Street, Suite 100 | Tait, Weller & Baker LLP |
| Elkhorn, NE 68022-3474 | 50 South 16th Street, Suite 2900 |
| 1-866-811-0225 | Philadelphia, PA 19102 |
Proxy Voting Policy
Information regarding how the Funds voted proxies relating to portfolio securities for the most recent twelve month period ended June 30 as well as a description of the policies and procedures that the Funds use to determine how to vote proxies is available without charge, upon request, by calling 1-866-811-0225 or by referring to the Securities and Exchange Commission’s (“SEC”) website at http://www.sec.gov.
Portfolio Holdings
The Funds file their complete schedule of portfolio holdings with the SEC for the first and third quarters of each fiscal year on Form N-PORT. Form N-PORT is available on the SEC’s website at http://www.sec.gov. The information on Form N-PORT is available without charge, upon request, by calling 1-866-811-0225.
AdvisorOne Funds
4221 North 203rd Street, Suite 100
Elkhorn, NE 68022-3474
1-866-811-0225
Item 2. Code of Ethics. Not required for semi-annual reports.
Item 3. Audit Committee Financial Expert. Not required for semi-annual reports.
Item 4. Principal Accountant Fees and Services. Not required for semi-annual reports.
Item 5. Audit Committee of Listed Companies. Not applicable to open-end investment companies.
Item 6. Schedule of Investments. Schedule of investments in securities of unaffiliated issuers is included under Item 1.
Item 7. Disclosure of Proxy Voting Policies and Procedures for Closed-End Funds. Not applicable to open-end investment companies.
Item 8. Portfolio Managers of Closed-End Funds. Not applicable to open-end investment companies.
Item 9. Purchases of Equity Securities by Closed-End Funds. Not applicable to open-end investment companies.
Item 10. Submission of Matters to a Vote of Security Holders. None
Item 11. Controls and Procedures.
(a) Based on an evaluation of the registrant’s disclosure controls and procedures as of a date within 90 days of filing date of this Form N-CSR, the disclosure controls and procedures are reasonably designed to ensure that the information required in filings on Forms N-CSR is recorded, processed, summarized, and reported on a timely basis.
(b) There were no significant changes in the registrant’s internal control over financial reporting that occurred during the registrant’s last fiscal half-year that have materially affected, or are reasonably likely to materially affect, the registrant’s internal control over financial reporting.
Item 12. Disclosure of Securities Lending Activities for Closed-End Management Investment Companies. Not applicable to open-end investment companies.
Item 13. Exhibits.
(a)(1) Not required for semi-annual reports.
(a)(2) Certifications required by Section 302 of the Sarbanes-Oxley Act of 2002 (and Item 11(a)(2) of Form N-CSR) are filed herewith..
(a)(3) Not applicable.
(b) Certifications required by Section 906 of the Sarbanes-Oxley Act of 2002 (and Item 11(b) of Form N-CSR) are filed herewith.
SIGNATURES
Pursuant to the requirements of the Securities Exchange Act of 1934 and the Investment Company Act of 1940, the registrant has duly caused this report to be signed on its behalf by the undersigned, thereunto duly authorized.
(Registrant) AdvisorOne Funds
By (Signature and Title)
/s/ Ryan Beach
Ryan Beach, Principal Executive Officer/ President
Date 1/8/21
Pursuant to the requirements of the Securities Exchange Act of 1934 and the Investment Company Act of 1940, this report has been signed below by the following persons on behalf of the registrant and in the capacities and on the dates indicated.
By (Signature and Title)
/s/ Ryan Beach
Ryan Beach, Principal Executive Officer/President
Date 1/8/21
By (Signature and Title)
/s/ Reid Peters
Reid Peters, Principal Financial Officer/Treasurer
Date 1/8/21