
Financial GuidanceFocused on Our Future Investor FactBook – Published November 8, 202117
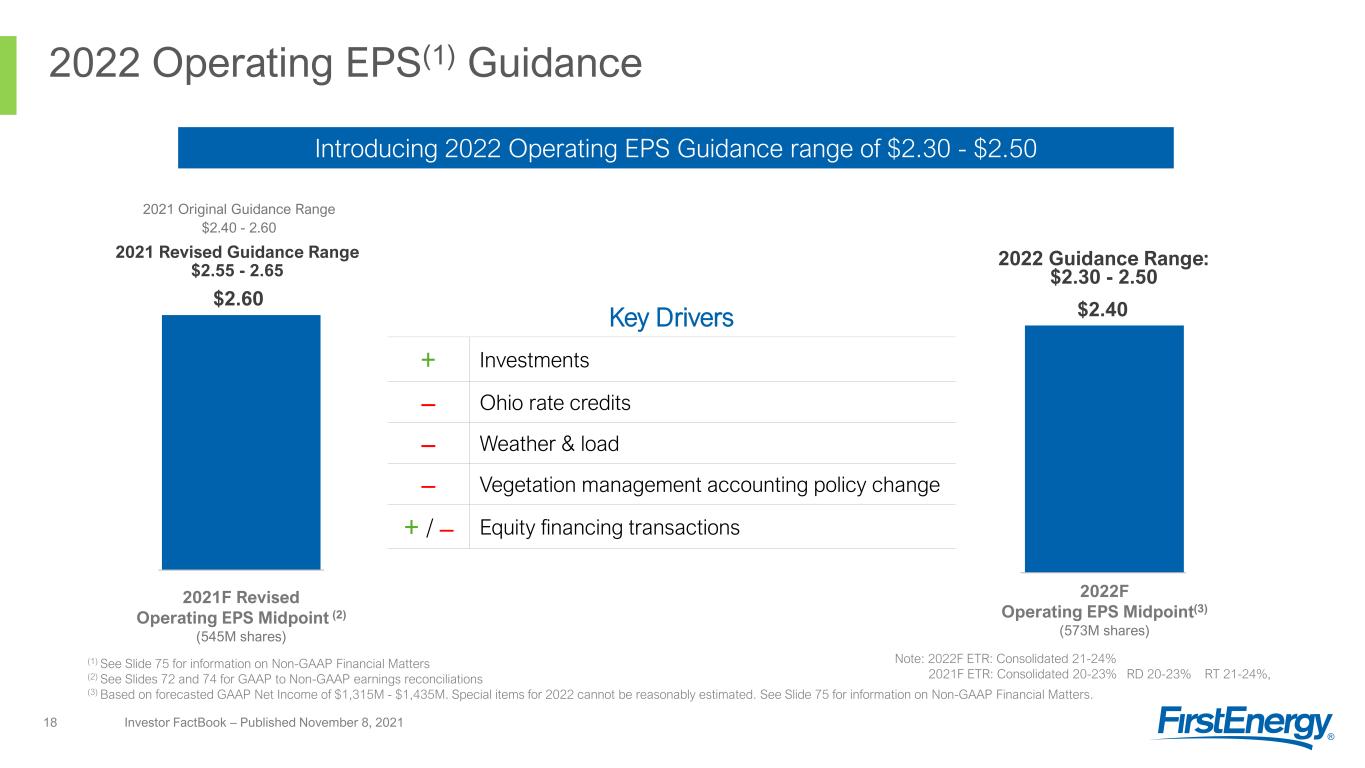
2022 Operating EPS(1) Guidance Investor FactBook – Published November 8, 202118 2021F Revised Operating EPS Midpoint (2) (545M shares) 2022 Guidance Range: $2.30 - 2.50 2022F Operating EPS Midpoint(3) (573M shares) (1) See Slide 75 for information on Non-GAAP Financial Matters (2) See Slides 72 and 74 for GAAP to Non-GAAP earnings reconciliations (3) Based on forecasted GAAP Net Income of $1,315M - $1,435M. Special items for 2022 cannot be reasonably estimated. See Slide 75 for information on Non-GAAP Financial Matters. $2.60 $2.40 2021 Revised Guidance Range $2.55 - 2.65 Introducing 2022 Operating EPS Guidance range of $2.30 - $2.50 2021 Original Guidance Range $2.40 - 2.60 Key Drivers + Investments – Ohio rate credits – Weather & load – Vegetation management accounting policy change + / – Equity financing transactions Note: 2022F ETR: Consolidated 21-24% 2021F ETR: Consolidated 20-23% RD 20-23% RT 21-24%,

Dividend Overview Investor FactBook – Published November 8, 202119 ■ 2019: ~6% dividend increase ■ 2020: ~3% dividend increase ■ 2021F: Maintain dividend at $1.56 per share ■ 2022F: Maintain dividend at $1.56 per share Dividend payments are subject to declaration by the Board of Directors, which will consider the risks and uncertainties of the government investigations, among other matters $1.44/sh $1.52/sh $1.56/sh $1.56/sh $1.56/sh 2014-2018 2019 2020 2021 2022F Annual Dividends Per Share Expected Payout Ratio: 65%60% ■ Current dividend yield of ~4% (as of 11/5/2021) ■ Sustained commitment to a strong dividend ■ Goal to continue dividend growth within the payout ratio, as earnings increase

Sustainable Investment Plan (2021-2025) Investor FactBook – Published November 8, 202120 (1) Includes capital-like investments that earn a return (2) Subject to future regulatory approvals Note: Does not include JCP&L’s proposal to support NJ offshore wind projects Will be deployed to strengthen the grid and enable the energy transition over the 2021-2025 period …with an increasing share focused on sustainable investments ~$17B Grid Modernization & Resiliency: $8.5B ▪ OH Grid Modernization supporting distribution automation and volt/var optimization ▪ Rebuilding critical infrastructure in PA ▪ Hardening and making our transmission system more resilient through Energizing the Future Conservation & Clean Energy Transition Enablement(1): $1.7B ▪ Two-thirds of our total customers will have smart meters by 2025(2) ▪ 100% of streetlights owned by FE converted to smart LEDs by 2030(2) ▪ EV Charging Station pilots ongoing in MD and pending in NJ ▪ Pursuing 50MW blocks of solar capacity in WV ▪ Transmission upgrades to support retirement of existing generation ▪ Energy efficiency programs that help customers achieve cumulative reductions in electricity savings in excess of 7.5 million MWh between 2021 and 2025 Base Customer (1): $6.6B ▪ Base reliability investments ▪ Vegetation management in WV ▪ Focus on economic development by attracting new business 51% 10% 39% Grid Mod & Resiliency Conservation & Clean Energy Transition Enablement Base Customer

Investment Plan Summary (2021-2025) Investor FactBook – Published November 8, 202121 ($M) 2021F 2022F 2023F 2024F 2025F RD $1,770 $1,790 $1,725 $1,770 $1,830 RT 1,070 1,490 1,600 1,695 1,750 Corp/Other 90 65 55 55 55 FE Consolidated ~$2.9B ~$3.3B ~$3.4B ~$3.5B ~$3.6B ~$17B investment plan to strengthen the grid and enable the energy transition Increasing the percentage of formula rate investments; Targeting ~75% in 2025 ~25% increase in 2025 vs. 2021; including ~65% increase at RT segment Notes: Includes capital-like investments that earn a return We expect to update the forecast over the period for items such as regulatory filings and approvals, and other changes.

Rate Base Summary (2021-2025) Investor FactBook – Published November 8, 202122 Notes: Amounts exclude average CWIP balances of $500M - $750M per year for RD and $500M - $1,400M per year for RT. Includes capital-like investments that earn a return. We expect to update the forecast over the period for items such as regulatory filings and approvals, and other changes. $B $16.3 $17.0 $17.7 $18.2 $18.9 $8.2 $9.0 $9.8 $10.7 $11.6 0 10 20 30 2021F 2022F 2023F 2024F 2025F RD RT ~$26B ~$25B ~$28B ~$29B ~$31B Strong rate base growth driven by ~$17B investment plan to strengthen the grid and enable the energy transition ~6% average annual Rate Base growth through 2025 (~4% RD, ~9% RT)

2021-2022 RD Support Investor FactBook – Published November 8, 202123 Notes: Rate base amounts exclude average CWIP balances of $500M - $550M per year, except in MD. Includes capital-like investments that earn a return. We expect to update the forecast over the period for items such as regulatory filings and approvals, and other changes. $3.9 $4.3 $6.3 $6.5 $2.8 $2.9 $2.8 $2.8 $0.5 $0.5 0 4 8 12 16 20 2021F 2022F OH PA NJ WV MD Investments to support the grid of the future and improve the customer experience Targeting ~$1.8B of investments in 2022 $B $17B $16.3B Rate BaseInvestments ($M) 2021F 2022F OH $580 $580 PA $540 $510 NJ $265 $285 WV / MD $385 $415 RD Segment $1,770 $1,790
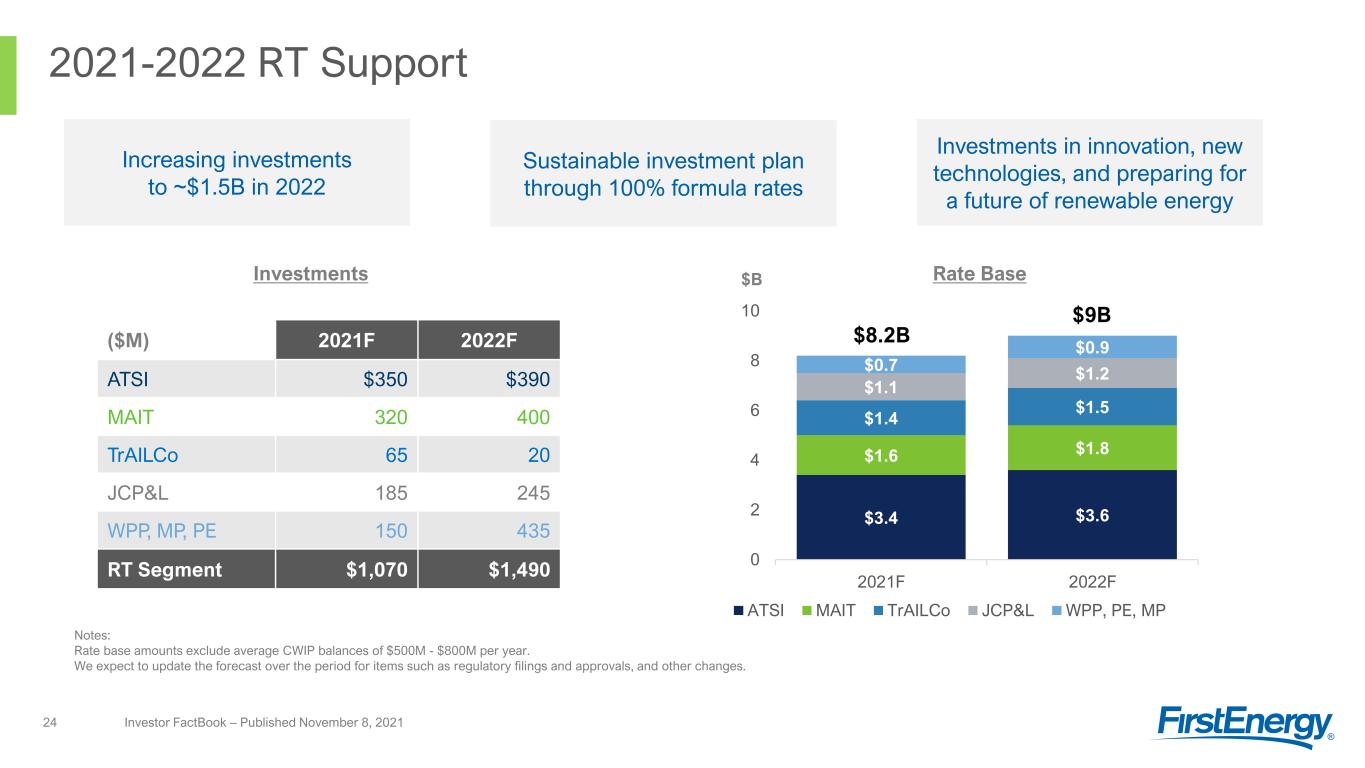
2021-2022 RT Support Investor FactBook – Published November 8, 202124 Investments in innovation, new technologies, and preparing for a future of renewable energy Sustainable investment plan through 100% formula rates Increasing investments to ~$1.5B in 2022 ($M) 2021F 2022F ATSI $350 $390 MAIT 320 400 TrAILCo 65 20 JCP&L 185 245 WPP, MP, PE 150 435 RT Segment $1,070 $1,490 $B $3.4 $3.6 $1.6 $1.8 $1.4 $1.5 $1.1 $1.2 $0.7 $0.9 0 2 4 6 8 10 2021F 2022F ATSI MAIT TrAILCo JCP&L WPP, PE, MP $9B $8.2B Notes: Rate base amounts exclude average CWIP balances of $500M - $800M per year. We expect to update the forecast over the period for items such as regulatory filings and approvals, and other changes. Rate BaseInvestments

2021-2022 Debt Financing Plan ($M) Investor FactBook – Published November 8, 202125 (1) Maturity date 01/15/2022 2022F Entity Refinancing New Total Segment OE $- $300 $300 RD: $400PP 100 - 100 FE $100 $300 $400FE 2021F Entity Refinancing New Total Segment ✓ FET $- $500 $500 RT: $1,250 ✓ MAIT - 150 150 ATSI 400(1) 200 600 ✓ MP $74 $126 $200 RD: $850 ✓ TE - 150 150 ✓ JCP&L - 500 500 FE $474 $1,626 $2,100FE 2021 plan on track with 5 of 6 deals completed and all priced at Investment-Grade levels 2022 Financing plan includes FE Corp. Debt paydowns of $1.35B ($500M due July 2022, $850M due March 2023)
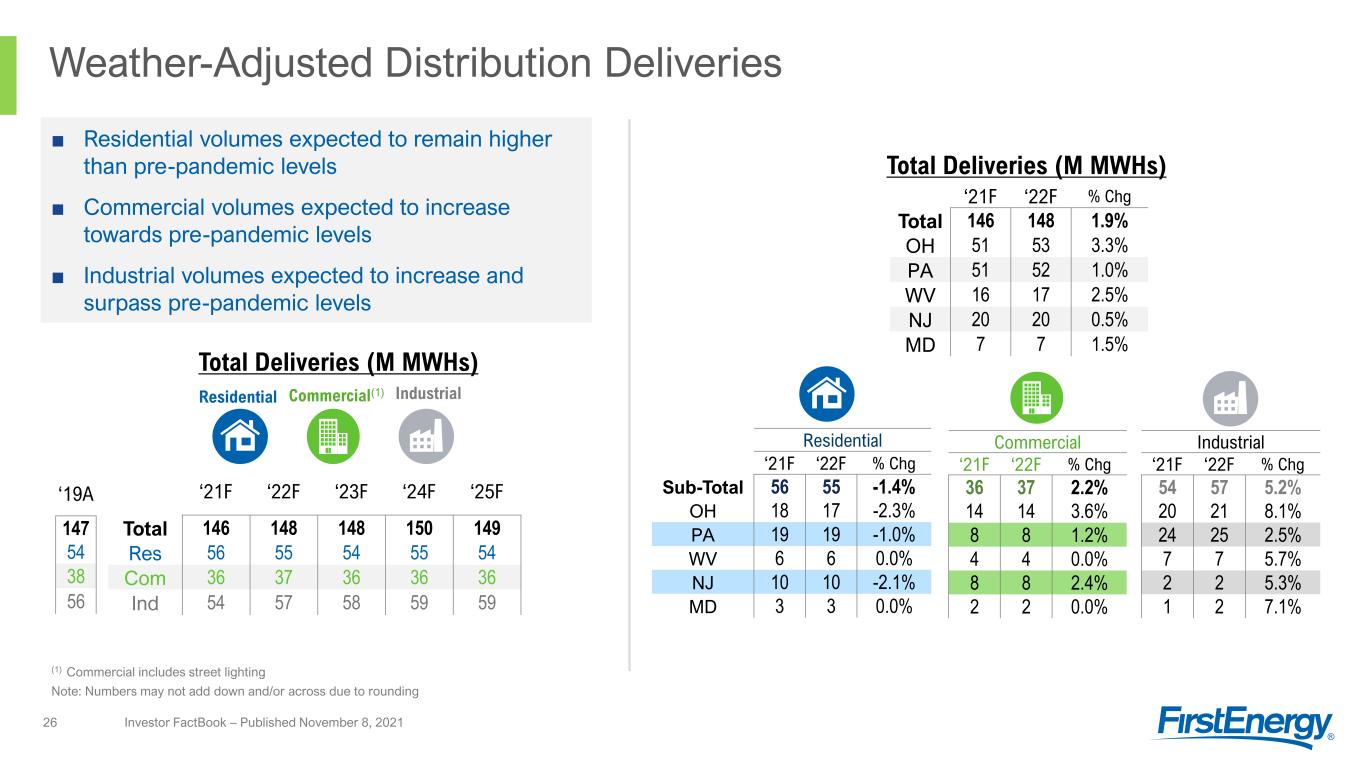
Weather-Adjusted Distribution Deliveries Investor FactBook – Published November 8, 202126 Total Deliveries (M MWHs) (1) Commercial includes street lighting ‘21F ‘22F ‘23F ‘24F ‘25F Total 146 148 148 150 149 Res 56 55 54 55 54 Com 36 37 36 36 36 Ind 54 57 58 59 59 Residential ‘21F ‘22F % Chg Sub-Total 56 55 -1.4% OH 18 17 -2.3% PA 19 19 -1.0% WV 6 6 0.0% NJ 10 10 -2.1% MD 3 3 0.0% Commercial ‘21F ‘22F % Chg 36 37 2.2% 14 14 3.6% 8 8 1.2% 4 4 0.0% 8 8 2.4% 2 2 0.0% Industrial ‘21F ‘22F % Chg 54 57 5.2% 20 21 8.1% 24 25 2.5% 7 7 5.7% 2 2 5.3% 1 2 7.1% ■ Residential volumes expected to remain higher than pre-pandemic levels ■ Commercial volumes expected to increase towards pre-pandemic levels ■ Industrial volumes expected to increase and surpass pre-pandemic levels Note: Numbers may not add down and/or across due to rounding ‘21F ‘22F % Chg Total 146 148 1.9% OH 51 53 3.3% PA 51 52 1.0% WV 16 17 2.5% NJ 20 20 0.5% MD 7 7 1.5% ‘19A 147 54 38 56 Total Deliveries (M MWHs) Commercial(1) IndustrialResidential

2021-2022 Guidance Sensitivities RD Segment Investor FactBook – Published November 8, 202127 ■ ~80-90% of Commercial and Industrial revenues are based on fixed charges ■ Residential class is more sensitive to changes in volume due to a higher percentage of volume-based revenues Weather Impact on Residential/Commercial Sales Volumes + / - 80 HDD vs. normal (Dec-Mar) ~$0.01/share + / - 26 CDD vs. normal (June-Sept) ~$0.01/share Estimated Impact of Annual Retail Sales Volumes + / - 1% Change in Residential Deliveries ~$0.03/share + / - 1% Change in Commercial Deliveries ~$0.01/share + / - 1% Change in Industrial Deliveries ~$0.005/share 17% 81% 91% 40% 83% 19% 9% 60% Res. Com. Ind. Total Non-Energy Based Volumetric 2020 Annual Base Distribution Revenues

2021F GAAP to Operating (Non-GAAP) Earnings(1) Reconciliation Investor FactBook – Published November 8, 202172 (1) Operating earnings exclude special items as described in the reconciliation table above and is a non-GAAP financial measure. (2) Estimate based on a discount rate of ~3% and actual investment performance through 9/30/2021. If the discount rate was to increase (or decrease) by 25 bps, FirstEnergy would expect the pre-tax mark-to- market gain to increase (or decrease) by ~$370M. Per share amounts for the special items above are based on the after-tax effect of each item divided by the number of shares outstanding for the period. The current and deferred income tax effect was calculated by applying the subsidiaries' statutory tax rate to the pre-tax amount if deductible/taxable. The income tax rates range from 21% to 29%. 2021F (In $M, except per share amounts) Regulated Distribution Regulated Transmission Corporate/ Other FirstEnergy Consolidated 2021F Net Income (Loss) (GAAP) $1,225 - $1,260 $405 - $410 ($465) - ($450) $1,165 - $1,220 2021F Earning (Loss) Per Share (545M shares) $2.25 - $2.32 $0.74 - $0.75 ($0.85) - ($0.83) $2.14 - $2.24 Excluding Special Items: Regulatory Charges $0.01 $0.09 - $0.10 Asset Impairments - - $0.01 $0.01 Exit of Generation - - ($0.11) ($0.11) State Tax Legislative Changes - - $0.02 $0.02 Investigation and Other Related Costs - - $0.51 $0.51 Mark-to-market adjustments – Pension/OPEB actuarial assumptions(2) ($0.02) - ($0.10) ($0.12) Total Special Items ($0.01) $0.09 $0.33 $0.41 2021F Operating Earnings (Loss) Per Share – Non-GAAP (545M shares) $2.24 - $2.31 $0.83 - $0.84 ($0.52) - ($0.50) $2.55 - $2.65
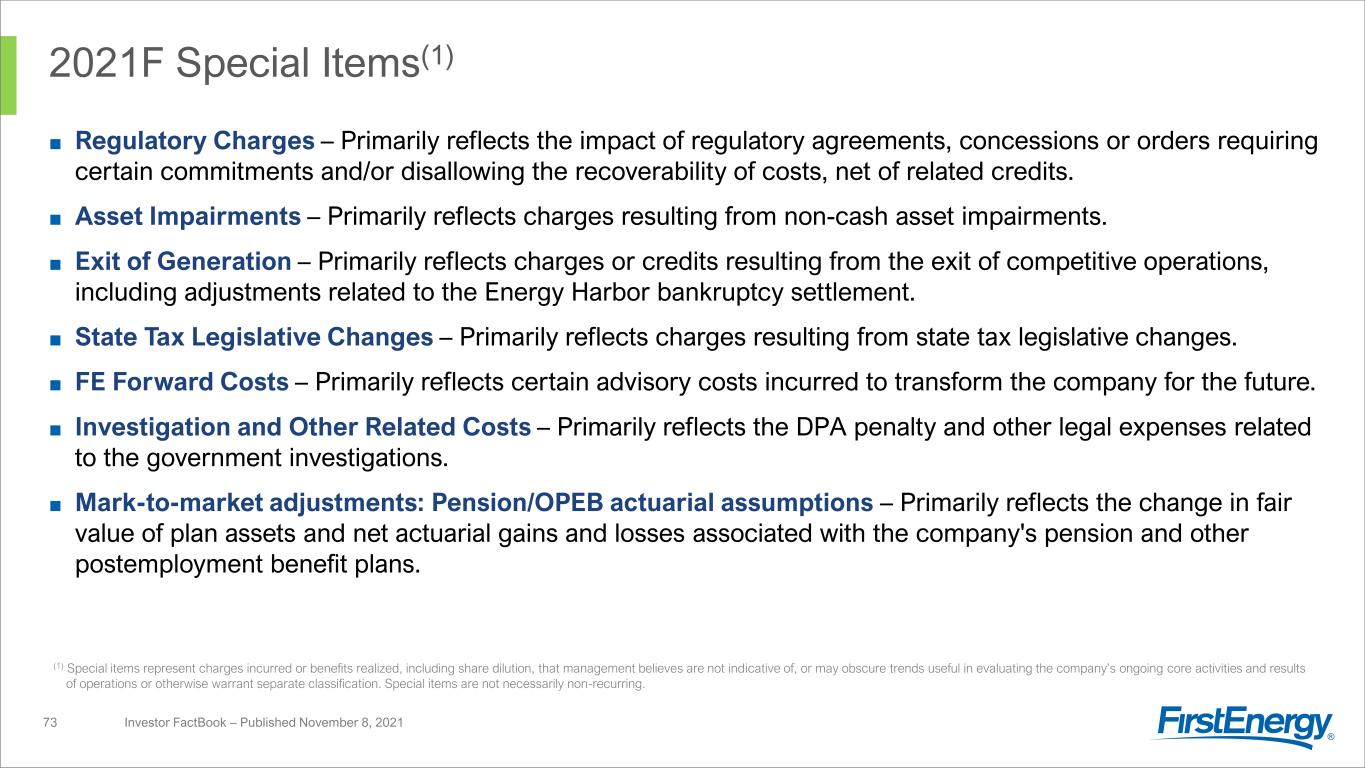
2021F Special Items(1) Investor FactBook – Published November 8, 202173 (1) Special items represent charges incurred or benefits realized, including share dilution, that management believes are not indicative of, or may obscure trends useful in evaluating the company’s ongoing core activities and results of operations or otherwise warrant separate classification. Special items are not necessarily non-recurring. ■ Regulatory Charges – Primarily reflects the impact of regulatory agreements, concessions or orders requiring certain commitments and/or disallowing the recoverability of costs, net of related credits. ■ Asset Impairments – Primarily reflects charges resulting from non-cash asset impairments. ■ Exit of Generation – Primarily reflects charges or credits resulting from the exit of competitive operations, including adjustments related to the Energy Harbor bankruptcy settlement. ■ State Tax Legislative Changes – Primarily reflects charges resulting from state tax legislative changes. ■ FE Forward Costs – Primarily reflects certain advisory costs incurred to transform the company for the future. ■ Investigation and Other Related Costs – Primarily reflects the DPA penalty and other legal expenses related to the government investigations. ■ Mark-to-market adjustments: Pension/OPEB actuarial assumptions – Primarily reflects the change in fair value of plan assets and net actuarial gains and losses associated with the company's pension and other postemployment benefit plans.

Forward-Looking Statements Investor FactBook – Published November 8, 202174 This FactBook includes forward-looking statements within the meaning of the Private Securities Litigation Reform Act of 1995 based on information currently available to management. Such statements are subject to certain risks and uncertainties and readers are cautioned not to place undue reliance on these forward-looking statements. These statements include declarations regarding management’s intents, beliefs and current expectations. These statements typically contain, but are not limited to, the terms “anticipate,” “potential,” “expect,” “forecast,” “target,” “will,” “intend,” “believe,” “project,” “estimate,” “plan,” and similar words. Forward-looking statements involve estimates, assumptions, known and unknown risks, uncertainties and other factors that may cause actual results, performance or achievements to be materially different from any future results, performance or achievements expressed or implied by such forward-looking statements, which may include the following: the potential liabilities, increased costs and unanticipated developments resulting from governmental investigations and agreements, including those associated with compliance with or failure to comply with the Deferred Prosecution Agreement entered into on July 21, 2021 with the U.S. Attorney’s Office for the Southern District of Ohio; the risks and uncertainties associated with government investigations regarding House Bill 6, as passed by Ohio’s 133rd General Assembly, and related matters, including potential adverse impacts on federal or state regulatory matters, including, but not limited to, matters relating to rates; the potential of non compliance with debt covenants in our credit facilities; the risks and uncertainties associated with litigation, arbitration, mediation and similar proceedings; legislative and regulatory developments, including, but not limited to, matters related to rates, compliance and enforcement activity, including the final approval by the Public Utilities Commission of Ohio (“PUCO”) of the Unanimous Stipulation and Recommendation filed by the Company and eleven other parties with the PUCO on November 1, 2021; the ability to accomplish or realize anticipated benefits from our FE Forward initiative and our other strategic and financial goals, including, but not limited to, maintaining financial flexibility, overcoming current uncertainties and challenges associated with the ongoing government investigations, executing our transmission and distribution investment plans, greenhouse gas reduction goals, controlling costs, improving our credit metrics, growing earnings, and strengthening our balance sheet, including the ability to complete the transactions contemplated by the recently announced agreements governing the sale of a minority interest in FirstEnergy Transmission, LLC and the common stock issuance on the anticipated terms and timing or at all, including the receipt of regulatory approvals; economic and weather conditions affecting future operating results, such as a recession, significant weather events and other natural disasters, and associated regulatory events or actions in response to such conditions; mitigating exposure for remedial activities associated with retired and formerly owned electric generation assets; the ability to access the public securities and other capital and credit markets in accordance with our financial plans, the cost of such capital and overall condition of the capital and credit markets affecting us, including the increasing number of financial institutions evaluating the impact of climate change on their investment decisions; the extent and duration of the COVID-19 pandemic and the impacts to our business, operations and financial condition resulting from the outbreak of COVID-19, including, but not limited to, disruption of businesses in our territories and governmental and regulatory responses to the pandemic; the effectiveness of our pandemic and business continuity plans, the precautionary measures we are taking on behalf of our customers, contractors and employees, our customers’ ability to make their utility payment and the potential for supply-chain disruptions; actions that may be taken by credit rating agencies that could negatively affect either our access to or terms of financing or our financial condition and liquidity; changes in assumptions regarding economic conditions within our territories, the reliability of our transmission and distribution system, or the availability of capital or other resources supporting identified transmission and distribution investment opportunities; changes in customers’ demand for power, including, but not limited to, the impact of climate change or energy efficiency and peak demand reduction mandates; changes in national and regional economic conditions, including inflationary pressure, affecting us and/or our customers and those vendors with which we do business; the risks associated with cyber-attacks and other disruptions to our, or our vendors’, information technology system, which may compromise our operations, and data security breaches of sensitive data, intellectual property and proprietary or personally identifiable information; the ability to comply with applicable reliability standards and energy efficiency and peak demand reduction mandates; changes to environmental laws and regulations, including, but not limited to, those related to climate change; changing market conditions affecting the measurement of certain liabilities and the value of assets held in our pension trusts, or causing us to make contributions sooner, or in amounts that are larger, than currently anticipated; labor disruptions by our unionized workforce; changes to significant accounting policies; any changes in tax laws or regulations, or adverse tax audit results or rulings; and the risks and other factors discussed from time to time in our Securities and Exchange Commission (“SEC”) filings. Dividends declared from time to time on FirstEnergy’s common stock during any period may in the aggregate vary from prior periods due to circumstances considered by FirstEnergy’s board of directors at the time of the actual declarations. A security rating is not a recommendation to buy or hold securities and is subject to revision or withdrawal at any time by the assigning rating agency. Each rating should be evaluated independently of any other rating. These forward-looking statements are also qualified by, and should be read together with, the risk factors included in FirstEnergy’s filings with the SEC, including, but not limited to, the most recent Annual Report on Form 10-K and any subsequent Quarterly Reports on Form 10-Q and Current Reports on Form 8-K. The foregoing review of factors also should not be construed as exhaustive. New factors emerge from time to time, and it is not possible for management to predict all such factors, nor assess the impact of any such factor on FirstEnergy’s business or the extent to which any factor, or combination of factors, may cause results to differ materially from those contained in any forward-looking statements. FirstEnergy expressly disclaims any obligation to update or revise, except as required by law, any forward-looking statements contained herein or in the information incorporated by reference as a result of new information, future events or otherwise.
Non-GAAP Financial Matters Investor FactBook – Published November 8, 202175 This presentation contains references to non-GAAP financial measures including, among others, Operating earnings (loss), Operating earnings (loss) per share (EPS), Operating earnings (loss) per share (EPS) by segment, Free Cash Flow (FCF), Funds from Operations (FFO) and Adjusted Cash from Operations. Generally, a non-GAAP financial measure is a numerical measure of a company’s historical or future financial performance, financial position, or cash flows that either excludes or includes amounts that are not normally excluded or included in the most directly comparable measure calculated and presented in accordance with accounting principles generally accepted in the United States (GAAP). Operating earnings (loss), Operating earnings (loss) per share, Operating earnings (loss) per share by segment, FCF and Adjusted Cash from Operations are not calculated in accordance with GAAP to the extent they exclude the impact of “special items.” Special items represent charges incurred or benefits realized that management believes are not indicative of, or may obscure trends useful in evaluating the company’s ongoing core activities and results of operations or otherwise warrant separate classification. Special items are not necessarily non-recurring. FE Management cannot estimate on a forward-looking basis the impact of these items in the context of Operating earnings per share guidance for 2022 and future annual projected earnings growth because these items, which could be significant are difficult to predict and may be highly variable. Consequently, the Company is unable to reconcile Operating earnings per share guidance for 2022 and future annual projected earnings growth to a GAAP measure without unreasonable effort. Basic (GAAP) EPS and Operating EPS and Basic (GAAP) EPS and Operating EPS for each segment are calculated by dividing Operating earnings (loss), which excludes special items as discussed above, by 545 million shares for 2021 and 573 million shares for 2022. Management uses non-GAAP financial measures such as Operating earnings (loss), Operating earnings (loss) per share, FCF, and Adjusted Cash from Operations to evaluate the Company’s performance and manage its operations and frequently references these non-GAAP financial measures in its decision-making, using them to facilitate historical and ongoing performance comparisons. Additionally, management uses Operating earnings (loss) per share by segment to further evaluate the Company’s performance by segment and references this non-GAAP financial measure in its decision-making. Management believes that the non-GAAP financial measures of Operating earnings (loss), Operating earnings (loss) per share and Operating earnings (loss) per share by segment, Free Cash Flow, and Adjusted Cash from Operations provide consistent and comparable measures of performance of its businesses on an ongoing basis. Management also believes that such measures are useful to shareholders and other interested parties to understand performance trends and evaluate the Company against its peer group by presenting period-over-period operating results without the effect of certain charges or benefits that may not be consistent or comparable across periods or across the Company’s peer group. All of these non-GAAP financial measures are intended to complement, and are not considered as alternatives to, the most directly comparable GAAP financial measures. Also, the non-GAAP financial measures may not be comparable to similarly titled measures used by other entities. Pursuant to the requirements of Regulation G, FE has provided, where possible without unreasonable effort, quantitative reconciliations within this presentation of the non-GAAP financial measures to the most directly comparable GAAP financial measures.


