through the early part of 2004 before stocks lost ground in the first quarter. The slow rate of job creation in the U.S. (and its implications for the sustainability of consumer spending) weighed on stocks, as did heightened terrorism concerns in the wake of the Madrid train bombing. Global stocks fell during the early part of the second quarter of 2004, based on concerns regarding rising inflation and tightening monetary policy in the U.S. Stronger economic data and signs of a resurgence in inflation led investors to expect that the U.S. Federal Reserve would raise interest rates sooner than anticipated, which weighed on stocks. Moreover, Chinese authorities announced measures aimed at curbing excessive investment, which had the effect of increasing investors’ perception of risk. This was felt particularly strongly in the emerging markets.
Global stocks reached their lows for the year in August, based on concerns that sharply rising oil prices would hurt corporate earnings and, potentially, reverse the global economic recovery. Concerns over potential terrorist attacks at the Olympics and the U.S. political conventions also weighed on stocks. Even as oil prices stayed stubbornly high, stocks began to rally in mid-August and, in a November post-election rally, finally broke out of the trading range they had been mired in throughout 2004. The definitive outcome of the U.S. election cheered investors who feared a disputed result, as in 2000, and a decline in oil prices further fueled the rally.
Global stocks ended the year with a return of nearly 15%, although a significant portion of the advance resulted from the dollar’s decline against currencies such as the euro and the Japanese yen. Energy stocks were strong during the year, as oil prices rose sharply. In contrast, technology stocks lagged, as corporate spending on IT products hasn’t significantly rebounded. Utilities benefited from investor demand for dividend yield, since most fixed income securities offered yields that were very low relative to historical norms. However, yield support did not help health care stocks, which were hurt due to concerns over drug safety following Merck’s high profile recall of Vioxx. In addition, several major pharmaceutical companies face uncertainty in the wake of pending legal suits from increasingly aggressive generic drug manufacturers. These lawsuits threaten to overturn highly profitable patents for some of their most important drugs. On a regional basis, European markets generally outperformed, helped by the rising euro, while the Japanese market lagged on concerns over the sustainability of the economic rebound.
For the year, emerging markets rose by over 25%, and the vast majority of countries recorded an increase. The asset class has now sustained its first two-year period of consecutive positive returns since 1993 and 1994, which is attracting further interest from global investors. Although the discounted valuations and positive outlook encourage us to remain constructive over the medium- and long-term, it is worth noting that the emerging markets asset class is no longer extraordinarily inexpensive. Small caps stocks also continued to outperform large caps in 2004, as they have for nearly five years. As with the emerging markets, valuations are no longer as compelling as they were before the period of outperformance, but calling turning points in the cap cycle is notoriously difficult.
For the year ended December 31, 2004, Lazard Retirement Equity Portfolio posted a total return of 11.79%, as compared with the 10.88% return of the S&P 500 Index.
U.S. stocks spent most of 2004 in a trading range, as strong earnings growth was offset by concerns over rising interest rates and the sustainability of a global economic rebound. However, a rally following the outcome of the U.S. presidential election drove equities to modest gains for the year. Energy stocks were strong, as oil prices rose sharply, and technology stocks lagged, as corporate spending on IT products has yet to significantly rebound.
During 2004, the Portfolio benefited from stock selection in health care by avoiding some of the many large stocks in the sector that experienced weakness due to drug safety issues and patent expirations. The Portfolio also benefited from stock selection and an overweight position in energy. Conversely, stock selection in materials hurt performance as more economically-sensitive stocks outperformed during the year.
While small and mid cap stocks continued to outperform in 2004, we are confident that the relative performance of large caps will improve.
Lazard Retirement Series, Inc.
Investment Overviews (continued)
|
Lazard Retirement Small Cap Portfolio
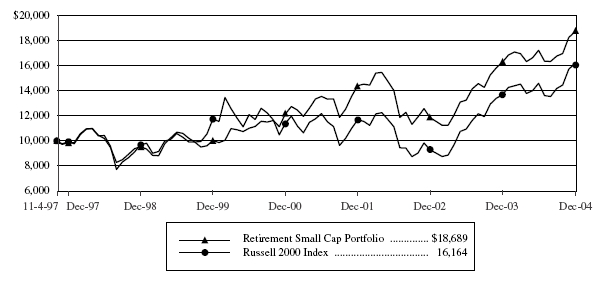
For the year ended December 31, 2004, Lazard Retirement Small Cap Portfolio posted a total return of 14.89%, as compared with the 18.33% return of Russell 2000 Index.
The Portfolio underperformed the Index by more than 300 basis points, with sector attribution acting as a small positive. The Portfolio benefited from stock selection in health care and technology. In health care, Neighborcare Inc., a distributor of drugs to alternative care settings and Inveresk Research, a provider of clinical research services to the pharmaceutical industry, both received takeover offers at substantial premiums from industry competitors. In the technology sector, DRS Technologies, a provider of electronics to the defense industry, continued to post strong earnings gains, and received an indication of acquisition interest from industry competitor, L3 Communications.
In financial services, results were negatively impacted by our holdings in eSpeed, Inc. and Knight Trading Group. Both companies offer trade execution services for the fixed income and equity marketplace, and were adversely affected by declining trading volumes following the strong market rally of 2003 and early 2004. Additionally, eSpeed faced increased pricing pressure from one of its competitors.
Materials/processing results were hurt by our focus away from the commodity producers of chemicals, metals, and precious metals. Producers of commodity goods continued to benefit from strong global demand, especially from China, and years of under-investment in production infrastructure. We continue our underweight position in this sector, although we have found select names, such as Chicago Bridge & Iron, which we believe may continue to benefit from infrastructure-related builds.
In consumer discretionary, our holding in Leapfrog Enterprises, a leading supplier of educational toys to the K–6th grade marketplace, declined due to disappointing sales of its products and continued logistical missteps. Additionally, Alliance Gaming, a manufacturer of gaming systems for casinos, also declined as sales of existing products slowed and the company increased investment spending on its next generation products.
While the small cap market has currently outperformed the large cap market for the past six years, relative valuations are still only near average historical levels and, thus, we believe that we may continue to see small caps perform admirably over the course of 2005. Despite the quick market rally of the second half of 2004, earnings growth expectations for 2005 look reasonable as the domestic economy continues to expand and absolute valuations, while not at the significant discount of a few years past, are well within historical norms. We believe that the pickup in merger and acquisitions activity that was seen in 2004 should continue to be a positive backdrop for small cap performance in 2005.
Lazard Retirement International Equity Portfolio
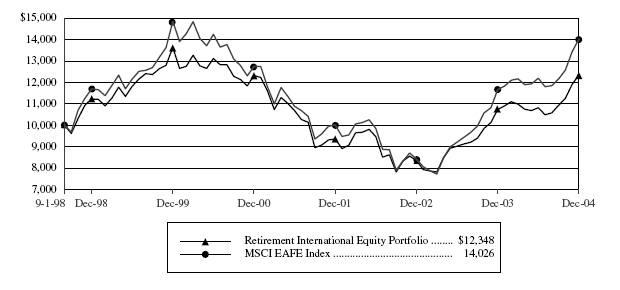
For the year ended December 31, 2004, Lazard Retirement International Equity Portfolio posted a total return of 14.98%, as compared with the 20.25% return of the MSCI EAFE Index.
International stocks spent most of 2004 in a trading range, as strong earnings growth was offset by concerns over rising interest rates, rising oil prices, and the sustainability of the global economic rebound. However, stocks ended 2004 with their best quarterly performance of the year as oil prices crested, easing concerns that higher energy costs would restrain earnings and economic growth. The rally started right after the U.S. presidential election, as uncertainty over the election’s outcome was lifted. Energy stocks were strong during the year, since oil prices rose sharply and utilities also performed well as investors sought out yield in a low interest rate environment. In contrast, technology stocks lagged as corporate spending on IT products has yet to significantly rebound. Health care stocks were hurt by the concerns over drug safety following Merck’s high profile recall of Vioxx. On a regional basis, European markets generally outperformed, helped by the rising euro, while the Japanese market lagged the broad index on concerns over the sustainability of the economic rebound.
During 2004, stock selection in health care helped the Portfolio by avoiding problem stocks like AstraZeneca, as well as from gains in Schering, which rose due to ongoing restructuring and the recent approval of its birth control pill. Also, Aventis gained based on expectations of revenue and cost synergies from the since
4
Lazard Retirement Series, Inc.
Investment Overviews (continued)
|
completed acquisition by Sanofi-Synthelabo. Conversely, stock selection in financials hurt performance when reinsurers Swiss Re and Munich Re were hurt by the rash of hurricanes hitting Florida. However, while the hurricanes cause near-term costs as payments are made to their reinsurance clients, the longer-term outlook for these companies’ earnings is positive, since the upfront costs to the industry remove capacity and improve pricing discipline going forward. Stock selection in consumer discretionary also detracted from returns, as Nissan declined due to concerns regarding the steel shortage caused by the increased demand for the metal in China. However, the company stated that the shortage should have a relatively small impact on sales in the U.S., its biggest market.
For 2004 overall, the Portfolio was hurt by its overweight position in large cap stocks, while small and mid cap stocks continued to outperform. However, we are confident that the performance of large caps may improve, since their relative valuation versus small caps is very attractive, based on historical norms.
Lazard Retirement Emerging Markets Portfolio
For the year ended December 31, 2004, Lazard Retirement Emerging Markets Portfolio posted a total return of 30.59%, as compared with the 25.55% return of the MSCI EM Index.
Over the past twelve months, the emerging markets asset class has witnessed a wide swing in investor sentiment and returns. The asset class rose despite government elections in Taiwan (which included an assassination attempt), India, Indonesia and the Philip-pines, a new Prime Minister and cabinet in Russia, election protests in the Ukraine, a new government in Egypt, and impeachment proceedings in South Korea. In addition, the market had to overcome fears of a Chi-nese hard landing, the death of Yasser Arafat, and the devastating Tsunami in Southeast Asia. Yet with all of these events, the Index finished the year up by more than 25%.
The Portfolio benefited from good stock selection in energy, consumer discretionary, industrials, materials, and Brazil. Our underweight position in information technology and overweight positions in Hungary, Indonesia, Egypt, Brazil, and telecommunications also added value. Strong share performance was exhibited in Caemi and CVRD (both Brazilian) based on increased iron demand as well as future price hikes; ABSA Group (South Africa), after Barclay’s Bank made an offer for the company; and Steinhoff International and Edgars (both South African) as domestic demand for retail products has increased as interest rates decline.
Conversely, poor stock selection in health care and consumer staples, and in Hungary, subtracted value. Additional detractors included: share price declines in Delta Electronics (Thailand), as a previous acquisition has continued to have problems integrating; Harmony Gold (South Africa), which declined after making a hostile bid for Gold Fields; and Pliva (Croatia), which has witnessed increased competition and eroding profits in its core pharmaceutical generics business.
In the first quarter of 2004, the Index rose by more than 9.5% . By region, Eastern European stocks generated a particularly robust return, with especially impressive performance from Russian, Hungarian, and Czech stocks. In both Asia and Latin America, the results were decent, although less dramatic. Positive individual country performances were generated in South Korea, as well as in Malaysia, Colombia, Venezuela, and Mexico. In Taiwan, the market rose despite the bizarre assassination attempt. Only a few countries, including Brazil, India, Thailand, and China, exhibited profit taking.
In response to warnings by U.S. Federal Reserve Chairman, Alan Greenspan, over the likelihood of a new, somewhat inflationary environment, and the probability of interest rates rises, emerging markets equities experienced significant profit taking in the second quarter. Moreover, Chinese authorities announced measures aimed at curbing excessive investment, which had the effect of increasing investors’ perception of risk. After having risen almost 10% in the first quarter, the Index fell by over 10% in the second quarter. All regional markets experienced sizeable corrections, the largest ones occurring in Eastern Europe and Asia. Economically sensitive sectors, such as energy, materials, consumer discretionary, and information technology, fared poorly. Defensive sectors, such as health care and consumer staples, performed relatively well. The U.S. dollar also rallied strongly after a sustained period of weakness.
5
Lazard Retirement Series, Inc.
Investment Overviews (concluded)
|
Emerging markets experienced a strong third quarter after a turbulent second quarter. Eastern European and, especially, Latin American equities led the way with significantly better performance than Asian shares. The quarter began with weak share price performance and investor caution based on several issues, including higher crude oil prices, threats of terrorism, uncertainty over the outcome of the U.S. election, and the risk of a prolonged slowdown in China. However, emerging markets equities continued to generate gains as investors re-entered commodity stocks, as concern over slowing Chinese growth moderated. The most notable feature of the quarter was record high crude oil prices.
Emerging markets equities rallied strongly during the fourth quarter of 2004, especially in the aftermath of the U.S. presidential election and lower crude oil prices. The Index rose by almost 17%, with especially good performance in Latin America. Asian markets recovered, aided by generally strong currencies and good performance in India and Indonesia. Markets in Eastern Europe lagged, although several countries finished with strong gains. South African equities moved sharply higher, aided by the strong rand. All sectors rose, with the most pronounced increases in financial services and telecommunications services. For the year, the vast majority of emerging market countries recorded an increase. The emerging markets asset class has currently sustained its first two-year period of consecutive positive returns since 1993 and 1994, which may be attracting further interest from global investors.
By sector, energy, consumer discretionary, industrials, materials, telecommunications, information technology, and financials outperformed. Conversely, health care and consumer staples underperformed.
Notes to Investment Overviews:All returns are for the year ended December 31, 2004 and reflect reinvestment of all dividends and distributions, if any. Certain expenses of the Portfolios have been waived or reimbursed by the Fund’s Investment Manager or Administrator; without such waiver/reimbursement of expenses, the Portfolio’s returns would have been lower. Performance information does not reflect the fees and charges imposed by participating insurance companies at the separate account level, and such charges will have the effect of reducing performance.
The performance data of the indices and other market data have been prepared from sources and data that the Investment Manager believes to be reliable, but no representation is made as to their accuracy. These indices are unmanaged, have no fees or costs and are not available for investment.
Past performance is not indicative, nor a guarantee, of future results.
6
Lazard Retirement Series, Inc.
Performance Overviews
|
Lazard Retirement Equity Portfolio
Comparison of Changes in Value of $10,000 Investment in Lazard Retirement Equity Portfolio
and S&P 500® Index*

|
| Average Annual Total Returns* |
| Periods Ended December 31, 2004 |
| | | One | | Five | | Since |
| | | Year | | Years | | Inception** |
| |
|
| |
|
| |
|
|
| Retirement Equity Portfolio | | 11.79 | % | | 1.43 | % | | 3.79 | % |
| S&P 500 Index | | 10.88 | | | (2.30 | ) | | 3.15 | |
|
|
| * | All returns reflect reinvestment of all dividends and distributions, if any. Certain expenses of the Portfolio have been waived or reimbursed by the Portfolio’s Investment Manager or Administrator; without such waiver/reimbursement of expenses, the Portfolio’s returns would have been lower. Performance information does not reflect the fees and charges imposed by participating insurance companies at the separate account level, and such charges will have the effect of reducing performance. |
| |
| | Past performance is not indicative, nor a guarantee, of future results; the investment return and principle value of the Portfolio will fluctu- ate, so that an investor’s shares in the Portfolio, when redeemed, may be worth more or less than their original cost. Within the longer periods illustrated there may have been short-term fluctuations, counter to the overall trend of investment results, and no single period of any length may be taken as typical of what may be expected in future periods. |
| |
| | The performance data of the index has been prepared from sources and data that the Investment Manager believes to be reliable, but no representation is made as to its accuracy. The index is unmanaged, has no fees or costs and is not available for investment. The S&P 500 Index is a market capitalization-weighted index of 500 common stocks, designed to measure performance of the broad domestic econo- my through changes in the aggregate market value of these stocks, which represent all major industries. |
| |
| ** | The Portfolio’s inception date was March 18, 1998. |
| |
7
Lazard Retirement Series, Inc.
Performance Overviews (continued)
|
Lazard Retirement Small Cap Portfolio
Comparison of Changes in Value of $10,000 Investment in Lazard Retirement Small Cap Portfolio
and Russell 2000® Index*
|
| Average Annual Total Returns* |
| Periods Ended December 31, 2004 |
| | | One | | Five | | Since |
| | | Year | | Years | | Inception** |
| |
| |
|
| |
|
|
| Retirement Small Cap Portfolio | | 14.89 | % | | 13.26 | % | | 9.13 | % |
| Russell 2000 Index | | 18.33 | | | 6.61 | | | 6.93 | |
|
|
| * | All returns reflect reinvestment of all dividends and distributions, if any. Certain expenses of the Portfolio have been waived or reimbursed by the Portfolio’s Investment Manager or Administrator; without such waiver/reimbursement of expenses, the Portfolio’s returns would have been lower. Performance information does not reflect the fees and charges imposed by participating insurance companies at the separate account level, and such charges will have the effect of reducing performance. |
| |
| | Past performance is not indicative, nor a guarantee, of future results; the investment return and principle value of the Portfolio will fluctuate, so that an investor’s shares in the Portfolio, when redeemed, may be worth more or less than their original cost. Within the longer periods illustrated there may have been short-term fluctuations, counter to the overall trend of investment results, and no single period of any length may be taken as typical of what may be expected in future periods. |
| |
| The performance data of the index has been prepared from sources and data that the Investment Manager believes to be reliable, but no representation is made as to its accuracy. The index is unmanaged, has no fees or costs and is not available for investment. The Russell 2000 Index is comprised of the 2,000 smallest U.S. companies included in the Russell 3000® Index (which consists of the 3,000 largest U.S. companies by capitalization). |
| |
| ** | The Portfolio’s inception date was November 4, 1997. |
| |
8
Lazard Retirement Series, Inc.
Performance Overviews (continued)
|
Lazard Retirement International Equity Portfolio
Comparison of Changes in Value of $10,000 Investment in Lazard Retirement International Equity Portfolio
and Morgan Stanley Capital International (MSCI®) Europe, Australasia and Far East (EAFE®) Index*
|
| Average Annual Total Returns* |
| Periods Ended December 31, 2004 |
| | | One | | Five | | Since |
| | | Year | | Years | | Inception** |
| |
|
| |
|
| |
|
|
| Retirement International Equity Portfolio | | 14.98 | % | | (1.96 | )% | | 3.39 | % |
| MSCI EAFE Index. | | 20.25 | | | (1.13 | ) | | 5.48 | |
|
|
| * | All returns reflect reinvestment of all dividends and distributions, if any. Certain expenses of the Portfolio have been waived or reimbursed by the Portfolio’s Investment Manager or Administrator; without such waiver/reimbursement of expenses, the Portfolio’s returns would have been lower. Performance information does not reflect the fees and charges imposed by participating insurance companies at the separate account level, and such charges will have the effect of reducing performance. |
| |
| | Past performance is not indicative, nor a guarantee, of future results; the investment return and principle value of the Portfolio will fluctuate, so that an investor’s shares in the Portfolio, when redeemed, may be worth more or less than their original cost. Within the longer periods illustrated there may have been short-term fluctuations, counter to the overall trend of investment results, and no sin- gle period of any length may be taken as typical of what may be expected in future periods. |
| |
| | The performance data of the index has been prepared from sources and data that the Investment Manager believes to be reliable, but no representation is made as to its accuracy. The index is unmanaged, has no fees or costs and is not available for investment. The MSCI EAFE Index is a broadly diversified international index comprised of equity securities of approximately 1,000 companies located outside the United States. |
| |
| ** | The Portfolio’s inception date was September 1, 1998. |
| |
9
Lazard Retirement Series, Inc.
Performance Overviews (concluded)
|
Lazard Retirement Emerging Markets Portfolio
Comparison of Changes in Value of $10,000 Investment in Lazard Retirement Emerging Markets Portfolio
and MSCI Emerging Markets (EM®) Index*

|
| Average Annual Total Returns* |
| Periods Ended December 31, 2004 |
| | | One | | Five | | Since |
| | | Year | | Years | | Inception** |
| |
|
| |
|
| |
|
|
| Retirement Emerging Markets Portfolio | | 30.59 | % | | 6.08 | % | | 5.85 | % |
| MSCI EM Index | | 25.55 | | | 4.34 | | | 5.27 | |
|
|
| * | All returns reflect reinvestment of all dividends and distributions, if any. Certain expenses of the Portfolio have been waived or reimbursed by the Portfolio’s Investment Manager or Administrator; without such waiver/reimbursement of expenses, the Portfolio’s returns would have been lower. Performance information does not reflect the fees and charges imposed by participating insurance companies at the separate account level, and such charges will have the effect of reducing performance. |
| |
| | Past performance is not indicative, nor a guarantee, of future results; the investment return and principle value of the Portfolio will fluctuate, so that an investor’s shares in the Portfolio, when redeemed, may be worth more or less than their original cost. Within the longer periods illustrated there may have been short-term fluctuations, counter to the overall trend of investment results, and no single period of any length may be taken as typical of what may be expected in future periods. |
| |
| | The performance data of the index has been prepared from sources and data that the Investment Manager believes to be reliable, but no representation is made as to its accuracy. The index is unmanaged, has no fees or costs and is not available for investment. The MSCI EM Index is comprised of emerging market securities in countries open to non-local investors. |
| |
| ** | The Portfolio’s inception date was November 4, 1997. |
| |
10
Lazard Retirement Series, Inc.
Information About Your Fund’s Expenses
|
Expense Example
As a shareholder of the Fund, you incur ongoing costs including management fees; distribution and service (12b-1) fees; and other Fund expenses. This Example is intended to help you understand your ongoing costs (in dollars) of investing in the Fund and to compare these costs with the ongoing costs of investing in other mutual funds. The Example is based on an investment of $1,000 invested at the beginning of the period and held for the entire period from July 1, 2004 through December 31, 2004.
Actual Expenses
For each Portfolio of the Fund, the first line of the table below provides information about actual account values and actual expenses. You may use the information in this line, together with the amount you invested, to estimate the expenses that you paid over the period. Simply divide your account value by $1,000 (for example, an $8,600 account value divided by $1,000=8.6), then multiply the result by the number in the first line under the heading entitled “Expenses Paid During Period” to estimate the expenses you paid on your account during this period.
Hypothetical Example for Comparison Purposes
For each Portfolio of the Fund, the second line of the table below provides information about hypothetical account values and hypothetical expenses based on each Portfolio’s actual expense ratio and an assumed rate of return of 5% per year before expenses, which is not the Portfolio’s actual return. The hypothetical account values and expenses may not be used to estimate the actual ending account balance or expenses you paid for the period. You may use this information to compare the ongoing costs of investing in the Portfolio and other funds. To do so, compare this 5% hypothetical example with the 5% hypothetical examples that appear in the shareholder reports of the other funds.
Please note that you also bear fees and charges imposed by insurance companies at the separate account level, which are described in the separate prospectuses issued by the insurance companies. Such charges will have the effect of reducing Account Value.
| | | | | | | | | | | | Annualized |
| | | Beginning | | Ending | | Expenses Paid | | Expense Ratio |
| | | Account Value | | Account Value | | During Period* | | During Period |
| |
|
| |
|
| |
|
| |
|
|
| | | 7/1/04 | | 12/31/04 | | 7/1/04–12/31/04 | | 7/1/04–12/31/04 |
| |
|
| |
|
| |
|
| |
|
|
| Retirement Equity Portfolio | | | | | | | | | | | | |
| Actual | | $ | 1,000.00 | | $ | 1,073.50 | | $ | 6.52 | | 1.25 | % |
| Hypothetical (5% Return Before Expenses) | | $ | 1,000.00 | | $ | 1,018.85 | | $ | 6.34 | | 1.25 | % |
| |
| Retirement Small Cap Portfolio | | | | | | | | | | | | |
| Actual | | $ | 1,000.00 | | $ | 1,085.40 | | $ | 6.55 | | 1.25 | % |
| Hypothetical (5% Return Before Expenses) | | $ | 1,000.00 | | $ | 1,018.85 | | $ | 6.34 | | 1.25 | % |
| |
| Retirement International Equity Portfolio | | | | | | | | | | | | |
| Actual | | $ | 1,000.00 | | $ | 1,141.00 | | $ | 6.73 | | 1.25 | % |
| Hypothetical (5% Return Before Expenses) | | $ | 1,000.00 | | $ | 1,018.85 | | $ | 6.34 | | 1.25 | % |
| |
| Retirement Emerging Markets Portfolio | | | | | | | | | | | | |
| Actual | | $ | 1,000.00 | | $ | 1,318.20 | | $ | 9.32 | | 1.60 | % |
| Hypothetical (5% Return Before Expenses) | | $ | 1,000.00 | | $ | 1,017.09 | | $ | 8.11 | | 1.60 | % |
|
| * | Expenses are equal to the Portfolio’s annualized expense ratio multiplied by the average account value over the period, multiplied by 184/366 (to reflect one-half year period). |
| |
11
Lazard Retirement Series, Inc.
Portfolio Holdings Presented by Sector
December 31, 2004
|
| | | | | | | | | Lazard | | Lazard |
| | | Lazard | | Lazard | | Retirement | | Retirement |
| | | Retirement | | Retirement | | International | | Emerging |
| | | Equity | | Small Cap | | Equity | | Markets |
| Sector* | | Portfolio | | Portfolio | | Portfolio | | Portfolio |
| |
|
| |
|
| |
|
| |
|
|
| Commercial Services | | 3.4 | % | | 10.9 | % | | 1.0 | % | | 2.4 | % |
| Consumer Discretionary | | 11.8 | | | 12.8 | | | 7.2 | | | 7.0 | |
| Consumer Durables | | — | | | — | | | 5.4 | | | 2.8 | |
| Consumer Staples | | 8.5 | | | 0.6 | | | 8.9 | | | 10.2 | |
| Energy | | 10.4 | | | 7.5 | | | 11.5 | | | 6.0 | |
| Financials | | 27.2 | | | 18.9 | | | 25.7 | | | 16.4 | |
| Health Care | | 6.5 | | | 10.0 | | | 8.6 | | | 1.8 | |
| Process Industry | | 5.2 | | | 6.4 | | | 3.8 | | | 16.1 | |
| Producer Manufacturing | | 7.7 | | | 5.1 | | | 5.6 | | | 0.9 | |
| Technology | | 7.4 | | | 12.8 | | | 3.8 | | | 12.4 | |
| Telecommunications | | 4.1 | | | 2.8 | | | 10.1 | | | 15.8 | |
| Transportation | | 1.0 | | | 4.2 | | | 0.9 | | | 1.6 | |
| Utilities | | 3.8 | | | 1.9 | | | 5.4 | | | 1.1 | |
| Short-Term Investments | | 3.0 | | | 6.1 | | | 2.1 | | | 5.5 | |
| |
|
| |
|
| |
|
| |
|
|
| Total Investments | | 100.0 | % | | 100.0 | % | | 100.0 | % | | 100.0 | % |
| |
|
| |
|
| |
|
| |
|
|
|
| * | Represents percentage of total investments. |
| |
12
Lazard Retirement Series, Inc.
Portfolios of Investments
December 31, 2004
|
| Description | Shares | | | Value |
|
|
|
|
|
| Lazard Retirement Equity Portfolio | | | | |
| Common Stocks—97.0% | | | | |
| Aerospace & Defense—2.2% | | | | |
| Goodrich Corp. | 700 | | $ | 22,848 |
| Lockheed Martin Corp. | 650 | | | 36,108 |
| United Technologies Corp. | 450 | | | 46,507 |
| | |
|
|
| | | | | 105,463 |
| | |
|
|
| Airlines—0.5% | | | | |
| Southwest Airlines Co. | 1,500 | | | 24,420 |
| | |
|
|
| Apparel & Textiles—0.4% | | | | |
| Reebok International, Ltd. | 400 | | | 17,600 |
| | |
|
|
| Banking—10.0% | | | | |
| Bank of America Corp. | 2,400 | | | 112,776 |
| Golden West Financial Corp. | 1,000 | | | 61,420 |
| M&T Bank Corp. | 250 | | | 26,960 |
| North Fork Bancorporation, Inc. | 2,100 | | | 60,585 |
| Northern Trust Corp. | 1,450 | | | 70,441 |
| SunTrust Banks, Inc. | 850 | | | 62,798 |
| U.S. Bancorp | 800 | | | 25,056 |
| Wells Fargo & Co. | 1,100 | | | 68,365 |
| | |
|
|
| | | | | 488,401 |
| | |
|
|
| Business Services & Supplies—4.2% | | | | |
| ARAMARK Corp., Class B | 2,000 | | | 53,020 |
| Automatic Data Processing, Inc. | 1,100 | | | 48,785 |
| First Data Corp. | 800 | | | 34,032 |
| IAC/InterActiveCorp. (a) | 1,000 | | | 27,620 |
| Iron Mountain, Inc. (a) | 600 | | | 18,294 |
| Pitney Bowes, Inc. | 500 | | | 23,140 |
| | |
|
|
| | | | | 204,891 |
| | |
|
|
| Cable & Broadcasting—1.1% | | | | |
| Comcast Corp., Class A (a) | 1,600 | | | 52,544 |
| | |
|
|
| Chemicals—1.7% | | | | |
| Du Pont (E.I.) de Nemours & Co. | 950 | | | 46,598 |
| Praxair, Inc. | 800 | | | 35,320 |
| | |
|
|
| | | | | 81,918 |
| | |
|
|
| Computer Software—2.3% | | | | |
| Microsoft Corp. | 3,100 | | | 82,801 |
| Oracle Corp. (a) | 2,150 | | | 29,498 |
| | |
|
|
| | | | | 112,299 |
| | |
|
|
| Computers & Business Equipment—3.1% | | | |
| Cisco Systems, Inc. (a) | 1,800 | | | 34,740 |
| Hewlett-Packard Co. | 1,900 | | | 39,843 |
| International Business Machines Corp. . | 775 | | | 76,399 |
| | |
|
|
| | | | | 150,982 |
| | |
|
|
| Consumer Products—0.9% | | | | |
| Altria Group, Inc. | 750 | | | 45,825 |
| | |
|
|
| Containers—1.3% | | | | |
| Pactiv Corp. (a) | 1,000 | | | 25,290 |
| Sealed Air Corp. (a) | 750 | | | 39,953 |
| | |
|
|
| | | | | 65,243 |
| | |
|
|
| Cosmetics & Toiletries—1.5% | | | | |
| Avon Products, Inc. | 1,400 | | | 54,180 |
| Colgate-Palmolive Co. | 400 | | | 20,464 |
| | |
|
|
| | | | | 74,644 |
| | |
|
|
| Diversified—4.5% | | | | |
| Emerson Electric Co. | 500 | | | 35,050 |
| General Electric Co. | 2,950 | | | 107,675 |
| Honeywell International, Inc. | 600 | | | 21,246 |
| Tyco International, Ltd. | 1,600 | | | 57,184 |
| | |
|
|
| | | | | 221,155 |
| | |
|
|
| Drugs & Health Care—3.3% | | | | |
| GlaxoSmithKline PLC ADR | 700 | | | 33,173 |
| Medco Health Solutions, Inc. (a) | 1,200 | | | 49,920 |
| Novartis AG ADR | 600 | | | 30,324 |
| Pfizer, Inc. | 1,750 | | | 47,057 |
| | |
|
|
| | | | | 160,474 |
| | |
|
|
| Environmental—1.3% | | | | |
| Republic Services, Inc. | 1,900 | | | 63,726 |
| | |
|
|
| Financial Services—12.0% | | | | |
| American Express Co. | 1,500 | | | 84,555 |
| Citigroup, Inc. | 2,600 | | | 125,268 |
| Fifth Third Bancorp | 2,000 | | | 94,560 |
| JPMorgan Chase & Co. | 2,854 | | | 111,335 |
| MBNA Corp. | 1,700 | | | 47,923 |
| Merrill Lynch & Co., Inc. | 800 | | | 47,816 |
| Morgan Stanley | 1,350 | | | 74,952 |
| | |
|
|
| | | | | 586,409 |
| | |
|
|
| Food & Beverages—5.0% | | | | |
| General Mills, Inc. | 1,300 | | | 64,623 |
| H.J. Heinz Co. | 950 | | | 37,040 |
| PepsiCo, Inc. | 525 | | | 27,405 |
| Sara Lee Corp. | 1,000 | | | 24,140 |
| Sysco Corp. | 600 | | | 22,902 |
| The Coca-Cola Co. | 1,300 | | | 54,119 |
| The Pepsi Bottling Group, Inc. | 500 | | | 13,520 |
| | |
|
|
| | | | | 243,749 |
| | |
|
|
| Forest & Paper Products—1.1% | | | | |
| International Paper Co. | 1,300 | | | 54,600 |
| | |
|
|
The accompanying notes are an integral part of these financial statements.
13
Lazard Retirement Series, Inc.
Portfolios of Investments (continued)
December 31, 2004
|
| Description | Shares | | | Value |
|
|
|
|
|
| Lazard Retirement Equity Portfolio (concluded) | | | |
| Insurance—6.0% | | | | |
| American International Group, Inc. | 1,100 | | $ | 72,237 |
| Berkshire Hathaway, Inc., Class B (a) | 23 | | | 67,528 |
| Jefferson-Pilot Corp. | 700 | | | 36,372 |
| RenaissanceRe Holdings, Ltd. | 1,000 | | | 52,080 |
| The St. Paul Travelers Cos., Inc. | 700 | | | 25,949 |
| WellPoint, Inc. (a) | 325 | | | 37,375 |
| | |
|
|
| | | | | 291,541 |
| | |
|
|
| Leisure & Entertainment—0.5% | | | | |
| Mattel, Inc. | 1,300 | | | 25,337 |
| | |
|
|
| Machinery—0.5% | | | | |
| Deere & Co. | 350 | | | 26,040 |
| | |
|
|
| Medical Products & Services—2.5% | | | | |
| Baxter International, Inc. | 1,000 | | | 34,540 |
| Johnson & Johnson | 1,000 | | | 63,420 |
| MedImmune, Inc. (a) | 800 | | | 21,688 |
| | |
|
|
| | | | | 119,648 |
| | |
|
|
| Metals & Mining—1.1% | | | | |
| Alcoa, Inc. | 1,700 | | | 53,414 |
| | |
|
|
| Multimedia—6.1% | | | | |
| Clear Channel Communications, Inc. | 600 | | | 20,094 |
| News Corp., Class A | 7,400 | | | 138,084 |
| Time Warner, Inc. (a) | 2,800 | | | 54,432 |
| Tribune Co. | 900 | | | 37,926 |
| Viacom, Inc., Class B | 1,300 | | | 47,307 |
| | |
|
|
| | | | | 297,843 |
| | |
|
|
| Oil & Gas—10.3% | | | | |
| Burlington Resources, Inc. | 1,300 | | | 56,550 |
| ChevronTexaco Corp. | 1,300 | | | 68,263 |
| ConocoPhillips | 750 | | | 65,122 |
| Exxon Mobil Corp. | 3,000 | | | 153,780 |
| GlobalSantaFe Corp. | 1,950 | | | 64,565 |
| Marathon Oil Corp. | 300 | | | 11,283 |
| Occidental Petroleum Corp. | 300 | | | 17,508 |
| Schlumberger, Ltd. | 400 | | | 26,780 |
| Unocal Corp. | 950 | | | 41,078 |
| | |
|
|
| | | | | 504,929 |
| | |
|
|
| Restaurants—1.1% | | | | |
| Brinker International, Inc. (a) | 700 | | | 24,549 |
| Darden Restaurants, Inc. | 1,000 | | | 27,740 |
| | |
|
|
| | | | | 52,289 |
| | |
|
|
| Retail—3.1% | | | | |
| Sears, Roebuck & Co. | 500 | | | 25,515 |
| Target Corp. | 500 | | | 25,965 |
| The Home Depot, Inc. | 1,300 | | | 55,562 |
| Wal-Mart Stores, Inc. | 850 | | | 44,897 |
| | |
|
|
| | | | | 151,939 |
| | |
|
|
| Semiconductors & Components—2.0% | | | |
| Intel Corp. | 1,500 | | | 35,085 |
| Novellus Systems, Inc. (a) | 1,400 | | | 39,046 |
| Texas Instruments, Inc. | 1,000 | | | 24,620 |
| | |
|
|
| | | | | 98,751 |
| | |
|
|
| Telecommunications—3.0% | | | | |
| BellSouth Corp. | 1,200 | | | 33,348 |
| Nextel Communications, Inc., Class A (a) | 400 | | | 12,000 |
| Sprint Corp. | 1,100 | | | 27,335 |
| Verizon Communications, Inc. | 1,850 | | | 74,944 |
| | |
|
|
| | | | | 147,627 |
| | |
|
|
| Transportation—0.6% | | | | |
| Union Pacific Corp. | 400 | | | 26,900 |
| | |
|
|
| Utilities—3.8% | | | | |
| Ameren Corp. | 500 | | | 25,070 |
| Duke Energy Corp. | 600 | | | 15,198 |
| Entergy Corp. | 500 | | | 33,795 |
| KeySpan Corp. | 1,400 | | | 55,230 |
| The Southern Co. | 1,650 | | | 55,308 |
| | |
|
|
| | | | | 184,601 |
| | |
|
|
| Total Common Stocks | | | | |
| (Identified cost $3,980,667) | | | | 4,735,202 |
| | | |
|
|
| Warrant—0.0% | | | | |
| Computers & Business Equipment—0.0% | | | |
| Lucent Technologies, Inc., | | | | |
| 12/10/07 | | | | |
| (Identified cost $0) (a), (d) | 267 | | | 422 |
| | |
|
|
| | Principal | | |
| | Amount | | |
| | (000) | | |
|
|
| | |
| Repurchase Agreement—3.0% | | | | |
| State Street Bank and Trust Co., | | | | |
| 1.40%, 01/03/05 | | | | |
| (Dated 12/31/04, collateralized by | | | | |
| $140,000 United States Treasury | | | | |
| Note, 6.625%, 05/15/07, with a | | | | |
| value of $152,160) | | | | |
| Proceeds of $146,017 | | | | |
| (Identified cost $146,000) | $146 | | | 146,000 |
| | |
|
|
| Total Investments | | | | |
| (Identified cost $4,126,667) (b) | 100.0 | % | $ | 4,881,624 |
| Cash and Other Assets in Excess | | | | |
| of Liabilities | — | | | 1,131 |
|
|
|
|
|
| Net Assets | 100.0 | % | $ | 4,882,755 |
|
|
|
|
|
The accompanying notes are an integral part of these financial statements.
14
Lazard Retirement Series, Inc.
Portfolios of Investments (continued)
December 31, 2004
|
| Description | Shares | | | Value |
|
|
|
|
|
| Lazard Retirement Small Cap Portfolio | | | | |
| Common Stocks—95.0% | | | | |
| Aerospace & Defense—2.2% | | | | |
| DRS Technologies, Inc. (a) | 27,600 | | $ | 1,178,796 |
| Esterline Technologies Corp. (a) | 12,400 | | | 404,860 |
| The Titan Corp. (a) | 55,100 | | | 892,620 |
| | |
|
|
| | | | | 2,476,276 |
| | |
|
|
| Agriculture—0.8% | | | | |
| Delta & Pine Land Co. | 33,900 | | | 924,792 |
| | |
|
|
| Apparel & Textiles—4.8% | | | | |
| AnnTaylor Stores Corp. (a) | 28,200 | | | 607,146 |
| Hot Topic, Inc. (a) | 51,900 | | | 892,161 |
| K-Swiss, Inc., Class A | 19,400 | | | 564,928 |
| The Gymboree Corp. (a) | 59,000 | | | 756,380 |
| The Sports Authority, Inc. (a) | 34,600 | | | 890,950 |
| The Timberland Co., Class A (a) | 13,000 | | | 814,710 |
| The Warnaco Group, Inc. (a) | 39,500 | | | 853,200 |
| | |
|
|
| | | | | 5,379,475 |
| | |
|
|
| Automotive—2.2% | | | | |
| CSK Auto Corp. (a) | 43,500 | | | 728,190 |
| Rush Enterprises, Inc., Class A (a) | 26,600 | | | 431,718 |
| TBC Corp. (a) | 27,300 | | | 758,940 |
| Winnebago Industries, Inc. | 13,600 | | | 531,216 |
| | |
|
|
| | | | | 2,450,064 |
| | |
|
|
| Banking—7.3% | | | | |
| Bank of the Ozarks, Inc. | 2,200 | | | 74,866 |
| First Community Bancorp | 13,200 | | | 563,640 |
| First Midwest Bancorp, Inc. | 20,600 | | | 747,574 |
| First Republic Bank | 11,700 | | | 620,100 |
| Hudson United Bancorp | 7,800 | | | 307,164 |
| MB Financial, Inc. | 13,500 | | | 569,025 |
| Provident Bankshares Corp. | 18,900 | | | 687,393 |
| Sterling Bancshares, Inc. | 69,200 | | | 987,484 |
| Texas Regional Bancshares, Inc., | | | | |
| Class A | 17,400 | | | 568,632 |
| Umpqua Holdings Corp. | 18,800 | | | 473,948 |
| United Bankshares, Inc. | 25,700 | | | 980,455 |
| W Holding Co., Inc. | 26,068 | | | 598,003 |
| Westamerica Bancorporation | 16,100 | | | 938,791 |
| | |
|
|
| | | | | 8,117,075 |
| | |
|
|
| Building & Construction—1.5% | | | | |
| Chicago Bridge & Iron Co. NV, | | | | |
| NY Shares | 19,800 | | | 792,000 |
| The Shaw Group, Inc. (a) | 48,500 | | | 865,725 |
| | |
|
|
| | | | | 1,657,725 |
| | |
|
|
| Business Services & Supplies—8.4% | | | | |
| ADVO, Inc. | 38,900 | | | 1,386,785 |
| Arbitron, Inc. (a) | 30,700 | | | 1,202,826 |
| BearingPoint, Inc. (a) | 72,400 | | | 581,372 |
| Herman Miller, Inc. | 38,000 | | | 1,049,940 |
| MPS Group, Inc. (a) | 76,000 | | | 931,760 |
| ProQuest Co. (a) | 22,100 | | | 656,370 |
| Tetra Tech, Inc. (a) | 64,300 | | | 1,076,382 |
| The BISYS Group, Inc. (a) | 49,000 | | | 806,050 |
| Veritas DGC, Inc. (a) | 35,400 | | | 793,314 |
| Watson Wyatt & Co. Holdings | 32,000 | | | 862,400 |
| | |
|
|
| | | | | 9,347,199 |
| | |
|
|
| Chemicals—2.5% | | | | |
| Ferro Corp. | 19,300 | | | 447,567 |
| Olin Corp. | 41,900 | | | 922,638 |
| PolyOne Corp. (a) | 67,500 | | | 611,550 |
| Spartech Corp. | 30,500 | | | 826,245 |
| | |
|
|
| | | | | 2,808,000 |
| | |
|
|
| Coal—0.7% | | | | |
| Foundation Coal Holdings, Inc. | 31,500 | | | 726,390 |
| | |
|
|
| Computer Software—2.5% | | | | |
| Avocent Corp. (a) | 13,800 | | | 559,176 |
| Catapult Communications Corp. (a) | 6,200 | | | 149,792 |
| JDA Software Group, Inc. (a) | 32,000 | | | 435,840 |
| SERENA Software, Inc. (a) | 41,500 | | | 898,060 |
| Verity, Inc. (a) | 52,200 | | | 684,864 |
| | |
|
|
| | | | | 2,727,732 |
| | |
|
|
| Computers & Business Equipment—2.5% | | | |
| Advanced Digital Information | | | | |
| Corp. (a) | 54,300 | | | 544,086 |
| Black Box Corp. | 1,600 | | | 76,832 |
| Foundry Networks, Inc. (a) | 50,700 | | | 667,212 |
| Komag, Inc. (a) | 46,300 | | | 869,514 |
| Photon Dynamics, Inc. (a) | 27,500 | | | 667,700 |
| | |
|
|
| | | | | 2,825,344 |
| | |
|
|
| Consumer Products—1.1% | | | | |
| Jarden Corp. (a) | 8,300 | | | 360,552 |
| The Scotts Co., Class A (a) | 12,200 | | | 896,944 |
| | |
|
|
| | | | | 1,257,496 |
| | |
|
|
| Diversified—0.9% | | | | |
| The Liberty Corp. | 21,800 | | | 958,328 |
| | |
|
|
The accompanying notes are an integral part of these financial statements.
15
Lazard Retirement Series, Inc.
Portfolios of Investments (continued)
December 31, 2004
|
| Description | Shares | | | Value |
|
|
|
|
|
| Lazard Retirement Small Cap Portfolio (continued) |
| Drugs & Health Care—6.6% | | | | |
| Able Laboratories, Inc. (a) | 28,000 | | $ | 637,000 |
| Andrx Corp. (a) | 43,200 | | | 943,056 |
| Beverly Enterprises, Inc. (a) | 115,700 | | | 1,058,655 |
| Kindred Healthcare, Inc. (a) | 34,000 | | | 1,018,300 |
| LifePoint Hospitals, Inc. (a) | 39,300 | | | 1,368,426 |
| MIM Corp. (a) | 85,800 | | | 544,830 |
| Select Medical Corp. | 63,600 | | | 1,119,360 |
| Taro Pharmaceutical Industries, Ltd. (a) | 17,100 | | | 581,913 |
| | |
|
|
| | | | | 7,271,540 |
| | |
|
|
| Education—2.0% | | | | |
| Corinthian Colleges, Inc. (a) | 40,700 | | | 766,992 |
| DeVry, Inc. (a) | 31,400 | | | 545,104 |
| Leapfrog Enterprises, Inc. (a) | 1,500 | | | 20,400 |
| Learning Tree International, Inc. (a) | 67,900 | | | 909,860 |
| | |
|
|
| | | | | 2,242,356 |
| | |
|
|
| Electrical Equipment—2.8% | | | | |
| Coherent, Inc. (a) | 26,000 | | | 791,440 |
| General Cable Corp. (a) | 12,300 | | | 170,355 |
| GrafTech International, Ltd. (a) | 56,800 | | | 537,328 |
| Plexus Corp. (a) | 52,700 | | | 685,627 |
| Rogers Corp. (a) | 20,700 | | | 892,170 |
| | |
|
|
| | | | | 3,076,920 |
| | |
|
|
| Electronics—1.8% | | | | |
| Metrologic Instruments, Inc. (a) | 33,700 | | | 716,125 |
| TTM Technologies, Inc. (a) | 104,400 | | | 1,231,920 |
| | |
|
|
| | | | | 1,948,045 |
| | |
|
|
| Environmental—0.5% | | | | |
| Waste Connections, Inc. (a) | 15,950 | | | 546,288 |
| | |
|
|
| Equipment Rental—0.4% | | | | |
| United Rentals, Inc. (a) | 25,200 | | | 476,280 |
| | |
|
|
| Financial Services—5.0% | | | | |
| Calamos Asset Management, Inc., | | | | |
| Class A | 23,300 | | | 629,100 |
| eSpeed, Inc., Class A (a) | 67,300 | | | 832,501 |
| Financial Federal Corp. (a) | 17,000 | | | 666,400 |
| IndyMac Bancorp, Inc. | 13,200 | | | 454,740 |
| Knight Trading Group, Inc., Class A (a) | 103,700 | | | 1,135,515 |
| MAF Bancorp, Inc. | 20,100 | | | 900,882 |
| The South Financial Group, Inc. | 28,200 | | | 917,346 |
| | |
|
|
| | | | | 5,536,484 |
| | |
|
|
| Food & Beverages—0.6% | | | | |
| Performance Food Group Co. (a) | 25,400 | | | 683,514 |
| | |
|
|
| Forest & Paper Products—0.5% | | | | |
| Packaging Corp. of America | 22,400 | | | 527,520 |
| | |
|
|
| Household Products & Home | | | | |
| Furnishings—0.4% | | | | |
| Cost Plus, Inc. (a) | 14,100 | | | 453,033 |
| | |
|
|
| Industrial & Machinery—1.9% | | | | |
| Roper Industries, Inc. | 18,100 | | | 1,099,937 |
| Tecumseh Products Co., Class A | 21,300 | | | 1,018,140 |
| | |
|
|
| | | | | 2,118,077 |
| | |
|
|
| Insurance—3.3% | | | | |
| Arch Capital Group, Ltd. (a) | 28,800 | | | 1,114,560 |
| Assured Guaranty, Ltd. | 49,200 | | | 967,764 |
| Bristol West Holdings, Inc. | 7,800 | | | 156,000 |
| Max Re Capital, Ltd. | 30,700 | | | 654,831 |
| Reinsurance Group of America, Inc. | 15,900 | | | 770,355 |
| | |
|
|
| | | | | 3,663,510 |
| | |
|
|
| Leisure & Entertainment—1.1% | | | | |
| Alliance Gaming Corp. (a) | 57,400 | | | 792,694 |
| WMS Industries, Inc. (a) | 13,200 | | | 442,728 |
| | |
|
|
| | | | | 1,235,422 |
| | |
|
|
| Medical Products & Services—3.5% | | | | |
| Bio-Rad Laboratories, Inc., Class A (a) | 800 | | | 45,896 |
| Charles River Laboratories | | | | |
| International, Inc. (a) | 6,288 | | | 289,311 |
| Cutera, Inc. | 7,900 | | | 98,592 |
| DJ Orthopedics, Inc. (a) | 42,000 | | | 899,640 |
| Hanger Orthopedic Group, Inc. (a) | 12,900 | | | 104,490 |
| INAMED Corp. (a) | 15,950 | | | 1,008,837 |
| Martek Biosciences Corp. (a) | 8,600 | | | 440,320 |
| PSS World Medical, Inc. (a) | 72,400 | | | 906,086 |
| Respironics, Inc. (a) | 800 | | | 43,488 |
| Viasys Healthcare, Inc. (a) | 4,000 | | | 76,000 |
| | |
|
|
| | | | | 3,912,660 |
| | |
|
|
| Oil & Gas—6.9% | | | | |
| Bill Barrett Corp. | 7,300 | | | 233,527 |
| Denbury Resources, Inc. (a) | 20,500 | | | 562,725 |
| Energy Partners, Ltd. (a) | 21,200 | | | 429,724 |
| Forest Oil Corp. (a) | 20,900 | | | 662,948 |
| Grey Wolf, Inc. (a) | 104,300 | | | 549,661 |
| Hanover Compressor Co. (a) | 51,400 | | | 726,282 |
| Key Energy Services, Inc. (a) | 108,800 | | | 1,283,840 |
| Kinder Morgan Management, LLC (a) | 21,484 | | | 874,399 |
| Maverick Tube Corp. (a) | 13,800 | | | 418,140 |
| Range Resources Corp. | 28,500 | | | 583,110 |
| The Houston Exploration Co. (a) | 12,000 | | | 675,720 |
| Whiting Petroleum Corp. (a) | 22,700 | | | 686,675 |
| | |
|
|
| | | | | 7,686,751 |
| | |
|
|
The accompanying notes are an integral part of these financial statements.
16
Lazard Retirement Series, Inc.
Portfolios of Investments (continued)
December 31, 2004
|
| Description | Shares | | | Value |
|
|
|
|
|
| Lazard Retirement Small Cap Portfolio (concluded) |
| Printing & Publishing—1.9% | | | | |
| Journal Register Co. (a) | 56,668 | | $ | 1,095,392 |
| R. H. Donnelley Corp. (a) | 17,700 | | | 1,045,185 |
| | |
|
|
| | | | | 2,140,577 |
| | |
|
|
| Real Estate—3.1% | | | | |
| Alexandria Real Estate Equities, Inc. | 5,500 | | | 409,310 |
| Capital Automotive REIT | 10,400 | | | 369,460 |
| CarrAmerica Realty Corp. | 15,100 | | | 498,300 |
| Inland Real Estate Corp. | 21,800 | | | 347,710 |
| Lexington Corporate Properties Trust | 25,300 | | | 571,274 |
| Prentiss Properties Trust | 8,200 | | | 313,240 |
| The Mills Corp. | 14,500 | | | 924,520 |
| | |
|
|
| | | | | 3,433,814 |
| | |
|
|
| Restaurants—0.6% | | | | |
| CBRL Group, Inc. | 15,900 | | | 665,415 |
| | |
|
|
| Retail—1.5% | | | | |
| 99 Cents Only Stores (a) | 50,500 | | | 816,080 |
| Tractor Supply Co. (a) | 22,300 | | | 829,783 |
| | |
|
|
| | | | | 1,645,863 |
| | |
|
|
| Semiconductors & Components—3.5% | | | |
| AMIS Holdings, Inc. (a) | 53,300 | | | 880,516 |
| Benchmark Electronics, Inc. (a) | 20,700 | | | 705,870 |
| Brooks Automation, Inc. (a) | 41,400 | | | 712,908 |
| Exar Corp. (a) | 81,000 | | | 1,149,390 |
| Ultratech, Inc. (a) | 22,600 | | | 426,010 |
| | |
|
|
| | | | | 3,874,694 |
| | |
|
|
| Steel—0.6% | | | | |
| Schnitzer Steel Industries, Inc., | | | | |
| Class A | 9,400 | | | 318,942 |
| Steel Dynamics, Inc. | 8,400 | | | 318,192 |
| | |
|
|
| | | | | 637,134 |
| | |
|
|
| Telecommunications—2.9% | | | | |
| C-COR, Inc. (a) | 109,500 | | | 1,018,350 |
| CommScope, Inc. (a) | 52,900 | | | 999,810 |
| Ditech Communications Corp. (a) | 28,700 | | | 429,065 |
| Oplink Communications, Inc. (a) | 104,000 | | | 204,880 |
| Wireless Facilities, Inc. (a) | 56,800 | | | 536,192 |
| | |
|
|
| | | | | 3,188,297 |
| | |
|
|
| Transportation—4.2% | | | | | | |
| AirTran Holdings, Inc. (a) | 72,500 | | | | 775,750 | |
| Forward Air Corp. (a) | 17,100 | | | | 764,370 | |
| OMI Corp. | 40,900 | | | | 689,165 | |
| Overnite Corp. | 18,500 | | | | 688,940 | |
| Pacer International, Inc. (a) | 55,800 | | | | 1,186,308 | |
| Swift Transportation Co., Inc. (a) | 26,200 | | | | 562,776 | |
| | | |
|
| |
| | | | | | 4,667,309 | |
| | | |
|
| |
| Utilities—2.0% | | | | | | |
| AGL Resources, Inc. | 22,000 | | | | 731,280 | |
| Cleco Corp. | 39,400 | | | | 798,244 | |
| New Jersey Resources Corp. | 15,100 | | | | 654,434 | |
| | | |
|
| |
| | | | | | 2,183,958 | |
| | | |
|
| |
| Total Common Stocks | | | | | | |
| (Identified cost $91,811,517) | | | | | 105,471,357 | |
| | | | |
|
| |
| | Principal | | | | |
| | Amount | | | | |
| | (000) | | | | |
|
|
| | | | |
| Repurchase Agreement—6.2% | | | | | | |
| State Street Bank and Trust Co., | | | | | | |
| 1.40%, 01/03/05 | | | | | | |
| (Dated 12/31/04, collateralized by | | | | | | |
| $6,995,000 United States Treasury | | | | | | |
| Note, 2.50%, 09/30/06, with a | | | | | | |
| value of $6,976,897) | | | | | | |
| Proceeds of $6,840,798 | | | | | | |
| (Identified cost $6,840,000) | $6,840 | | | | 6,840,000 | |
| | | |
|
| |
| Total Investments | | | | | | |
| (Identified cost $98,651,517) (b) | 101.2 | % | | $ | 112,311,357 | |
| Liabilities in Excess of Cash and | | | | | | |
| Other Assets | (1.2 | ) | | | (1,329,486 | ) |
|
| | |
|
| |
| Net Assets | 100.0 | % | | $ | 110,981,871 | |
|
| | |
|
| |
The accompanying notes are an integral part of these financial statements.
17
Lazard Retirement Series, Inc.
Portfolios of Investments (continued)
December 31, 2004
|
| Description | Shares | | | Value |
|
|
|
|
|
| Lazard Retirement International Equity Portfolio |
| Common Stocks—97.4% | | | | |
| Finland—4.4% | | | | |
| Nokia Oyj | 409,300 | | $ | 6,464,681 |
| Stora Enso Oyj, R Shares | 174,700 | | | 2,676,185 |
| | |
|
|
| Total Finland | | | | 9,140,866 |
| | |
|
|
| France—11.6% | | | | |
| Carrefour SA | 66,900 | | | 3,186,321 |
| Credit Agricole SA | 126,900 | | | 3,829,251 |
| Lagardere SCA | 27,930 | | | 2,015,880 |
| Sanofi-Aventis | 60,308 | | | 4,820,050 |
| Schneider Electric SA | 16,800 | | | 1,169,172 |
| Total SA | 25,993 | | | 5,677,688 |
| Vivendi Universal SA (a) | 102,900 | | | 3,285,471 |
| | |
|
|
| Total France | | | | 23,983,833 |
| | |
|
|
| Germany—10.9% | | | | |
| Deutsche Telekom AG (a) | 253,500 | | | 5,737,087 |
| E.ON AG | 52,100 | | | 4,748,982 |
| Schering AG | 61,200 | | | 4,576,066 |
| Siemens AG | 41,400 | | | 3,510,306 |
| Volkswagen AG | 87,000 | | | 3,943,795 |
| | |
|
|
| Total Germany | | | | 22,516,236 |
| | |
|
|
| Ireland—2.8% | | | | |
| Bank of Ireland | 224,900 | | | 3,744,767 |
| CRH PLC | 80,847 | | | 2,164,858 |
| | |
|
|
| Total Ireland | | | | 5,909,625 |
| | |
|
|
| Italy—4.2% | | | | |
| Enel SpA | 217,600 | | | 2,138,437 |
| Eni SpA | 203,375 | | | 5,091,977 |
| Terna SpA | 476,400 | | | 1,366,323 |
| | |
|
|
| Total Italy | | | | 8,596,737 |
| | |
|
|
| Japan—19.4% | | | | |
| ACOM Co., Ltd. | 24,360 | | | 1,823,375 |
| Aiful Corp. | 8,800 | | | 967,854 |
| East Japan Railway Co. | 347 | | | 1,930,223 |
| Fanuc, Ltd. | 50,300 | | | 3,288,865 |
| Fujitsu, Ltd. | 434,800 | | | 2,830,210 |
| Mitsubishi Estate Co., Ltd. | 260,000 | | | 3,044,793 |
| Murata Manufacturing Co., Ltd. | 63,100 | | | 3,528,477 |
| NEC Electronics Corp. | 29,000 | | | 1,415,048 |
| Nissan Motor Co., Ltd. | 360,900 | | | 3,923,515 |
| Nomura Holdings, Inc. | 300,000 | | | 4,373,963 |
| NTT DoCoMo, Inc. | 1,370 | | | 2,526,886 |
| Shin-Etsu Chemical Co., Ltd. | 75,500 | | | 3,094,564 |
| Takeda Pharmaceutical Co., Ltd. | 42,700 | | | 2,150,210 |
| The Sumitomo Trust and | | | | |
| Banking Co., Ltd. | 280,000 | | | 2,024,788 |
| Tokyo Gas Co., Ltd. | 753,000 | | | 3,086,367 |
| | |
|
|
| Total Japan | | | | 40,009,138 |
| | |
|
|
| Netherlands—6.3% | | | | |
| Heineken NV | 55,463 | | | 1,849,269 |
| Koninklijke (Royal) Philips | | | | |
| Electronics NV | 133,650 | | | 3,544,259 |
| Royal Dutch Petroleum Co. | 133,200 | | | 7,667,555 |
| | |
|
|
| Total Netherlands | | | | 13,061,083 |
| | |
|
|
| Norway—1.9% | | | | |
| DnB NOR ASA | 145,300 | | | 1,433,412 |
| Statoil ASA | 157,500 | | | 2,470,425 |
| | |
|
|
| Total Norway | | | | 3,903,837 |
| | |
|
|
| Singapore—1.2% | | | | |
| Oversea-Chinese Banking Corp., Ltd. | 294,050 | | | 2,431,803 |
| | |
|
|
| Switzerland—6.8% | | | | |
| Compagnie Financiere Richemont AG, | | | | |
| A Shares | 66,000 | | | 2,196,904 |
| Credit Suisse Group (a) | 127,170 | | | 5,345,815 |
| Nestle SA | 11,000 | | | 2,877,935 |
| Swiss Re | 51,300 | | | 3,658,808 |
| | |
|
|
| Total Switzerland | | | | 14,079,462 |
| | |
|
|
| United Kingdom—27.9% | | | | |
| Barclays PLC | 434,900 | | | 4,892,896 |
| BP PLC | 292,420 | | | 2,852,002 |
| Cadbury Schweppes PLC | 218,740 | | | 2,036,802 |
| Diageo PLC | 311,975 | | | 4,450,283 |
| EMAP PLC | 81,500 | | | 1,276,029 |
| GlaxoSmithKline PLC | 271,000 | | | 6,357,985 |
| HSBC Holdings PLC | 361,186 | | | 6,095,352 |
| Imperial Tobacco Group PLC | 105,080 | | | 2,878,876 |
| Kesa Electricals PLC | 197,420 | | | 1,070,751 |
| Marks & Spencer Group PLC | 271,500 | | | 1,787,899 |
| Prudential PLC | 396,783 | | | 3,450,883 |
| Rentokil Initial PLC | 715,700 | | | 2,030,194 |
| Rio Tinto PLC | 67,800 | | | 1,995,496 |
| Royal Bank of Scotland Group PLC | 176,400 | | | 5,933,510 |
| Unilever PLC | 440,700 | | | 4,327,805 |
| Vodafone Group PLC | 2,311,900 | | | 6,269,552 |
| | |
|
|
| Total United Kingdom | | | | 57,706,315 |
| | |
|
|
| Total Common Stocks | | | | |
| (Identified cost $170,534,249) | | | | 201,338,935 |
| | | |
|
|
| Preferred Stock—0.5% | | | | |
| Germany—0.5% | | | | |
| Porsche AG | | | | |
| (Identified cost $873,939) | 1,680 | | | 1,072,122 |
| | |
|
|
The accompanying notes are an integral part of these financial statements.
18
Lazard Retirement Series, Inc.
Portfolios of Investments (continued)
December 31, 2004
|
| | Principal | | | |
| | Amount | | | |
| Description | (000) | | | Value |
|
|
|
|
|
| Lazard Retirement International Equity Portfolio | | |
| (concluded) | | | | |
Repurchase Agreement—2.1% | | | | |
| State Street Bank and Trust Co., | | | | |
| 1.40%, 01/03/05 | | | | |
| (Dated 12/31/04, collateralized by | | | | |
| $4,375,000 United States Treasury | | | | |
| Note, 2.50%, 09/30/06, with a | | | | |
| value of $4,363,678) | | | | |
| Proceeds of $4,276,499 | | | | |
| (Identified cost $4,276,000) | $ | 4,276 | | $ | 4,276,000 |
|
| |
|
|
| Description | | | | | Value | |
|
|
|
|
|
|
|
| Total Investments | | | | | | |
| (Identified cost $175,684,188) (b) | 100.0 | % | | $ | 206,687,057 | |
| Liabilities in Excess of Cash and | | | | | | |
| Other Assets | — | | | | (62,185 | ) |
|
|
| |
|
| |
| Net Assets | 100.0 | % | | $ | 206,624,872 | |
|
|
| |
|
| |
The accompanying notes are an integral part of these financial statements.
19
Lazard Retirement Series, Inc.
Portfolios of Investments (continued)
December 31, 2004
|
| Description | Shares | | | Value |
|
|
|
|
|
| Lazard Retirement Emerging Markets Portfolio | | | |
| Common Stocks—86.4% | | | | |
| Brazil—8.2% | | | | |
| Brasil Telecom Participacoes SA ADR | 5,400 | | $ | 206,010 |
| Companhia de Concessoes | | | | |
| Rodoviarias | 11,400 | | | 249,375 |
| Companhia Vale do Rio Doce ADR | 31,200 | | | 905,112 |
| Empresa Brasileira de Aeronautica SA | | | | |
| ADR | 8,200 | | | 274,208 |
| Grendene SA (a) | 15,000 | | | 177,899 |
| Petroleo Brasileiro SA ADR | 10,900 | | | 433,602 |
| Souza Cruz SA | 27,700 | | | 371,489 |
| | |
|
|
| Total Brazil | | | | 2,617,695 |
| | |
|
|
| Chile—1.0% | | | | |
| Administradora de Fondos de Pensiones | | | | |
| Provida SA Sponsored ADR | 11,360 | | | 323,760 |
| | |
|
|
| China—0.8% | | | | |
| People’s Food Holdings, Ltd. | 278,000 | | | 255,452 |
| | |
|
|
| Croatia—0.7% | | | | |
| Pliva d.d. GDR (c) | 17,400 | | | 224,860 |
| | |
|
|
| Czech Republic—0.8% | | | | |
| Cesky Telecom AS | 14,900 | | | 247,552 |
| | |
|
|
| Egypt—4.1% | | | | |
| Commercial International Bank | 88,400 | | | 565,789 |
| Orascom Construction Industries | 33,000 | | | 394,043 |
| Orascom Telecom Holding SAE (a) | 8,200 | | | 344,413 |
| | |
|
|
| Total Egypt | | | | 1,304,245 |
| | |
|
|
| Hong Kong—4.3% | | | | |
| China Mobile (Hong Kong), Ltd. | | | | |
| Sponsored ADR | 21,820 | | | 374,431 |
| China Netcom Group Corp. | | | | |
| (Hong Kong), Ltd. | 40,000 | | | 54,293 |
| CNOOC, Ltd. ADR | 4,700 | | | 254,693 |
| Hutchison Telecommunications | | | | |
| International, Ltd. (a) | 243,000 | | | 220,406 |
| Pacific Basin Shipping, Ltd. | 586,000 | | | 252,563 |
| Texwinca Holdings, Ltd. | 222,000 | | | 209,927 |
| | |
|
|
| Total Hong Kong | | | | 1,366,313 |
| | |
|
|
| Hungary—2.0% | | | | |
| Gedeon Richter Rt. | 2,700 | | | 339,135 |
| MOL Magyar Olaj-es Gazipari Rt. | 4,000 | | | 281,312 |
| | |
|
|
| Total Hungary | | �� | | 620,447 |
| | |
|
|
| India—8.1% | | | | |
| Hero Honda Motors, Ltd. | 22,650 | | | 297,571 |
| Hindalco Industries, Ltd. GDR (c) | 12,800 | | | 421,504 |
| Hindustan Lever, Ltd. | 75,600 | | | 249,565 |
| Reliance Industries, Ltd. | 38,500 | | | 472,770 |
| Satyam Computer Services, Ltd. | 48,900 | | | 461,102 |
| State Bank of India | 45,300 | | | 679,917 |
| | |
|
|
| Total India | | | | 2,582,429 |
| | |
|
|
| Indonesia—3.7% | | | | |
| PT Hanjaya Mandala Sampoerna Tbk | 923,900 | | | 661,884 |
| PT Telekomunikasi Indonesia Tbk | | | | |
| Sponsored ADR | 24,500 | | | 514,990 |
| | |
|
|
| Total Indonesia | | | | 1,176,874 |
| | |
|
|
| Israel—1.0% | | | | |
| Bank Hapoalim, Ltd. | 90,300 | | | 304,553 |
| | |
|
|
| Mexico—6.5% | | | | |
| America Telecom SA de CV, | | | | |
| Series A1 Shares (a) | 80,200 | | | 230,304 |
| Fomento Economico Mexicano SA | | | | |
| de CV Sponsored ADR | 4,810 | | | 253,054 |
| Grupo Televisa SA Sponsored ADR | 5,600 | | | 338,800 |
| Kimberly-Clark de Mexico SA de CV, | | | | |
| Series A Shares | 68,800 | | | 237,624 |
| Telefonos de Mexico SA de CV, | | | | |
| Series L Shares Sponsored ADR | 19,000 | | | 728,080 |
| Urbi, Desarrollos Urbanos, SA de CV | 63,400 | | | 276,988 |
| | |
|
|
| Total Mexico | | | | 2,064,850 |
| | |
|
|
| Morocco—0.1% | | | | |
| Maroc Telecom | 2,500 | | | 26,306 |
| | |
|
|
| Netherlands—0.2% | | | | |
| Efes Breweries International | | | | |
| Sponsored GDR (a), (c) | 2,100 | | | 63,000 |
| | |
|
|
| Peru—0.8% | | | | |
| Credicorp, Ltd. | 15,600 | | | 246,636 |
| | |
|
|
| Philippines—0.7% | | | | |
| Philippine Long Distance Telephone Co. | | | | |
| Sponsored ADR (a) | 9,000 | | | 224,370 |
| | |
|
|
| Russia—2.1% | | | | |
| LUKOIL Sponsored ADR | 3,720 | | | 455,700 |
| Mobile TeleSystems Sponsored ADR | 400 | | | 55,404 |
| Wimm-Bill-Dann Foods OJSC ADR (a) | 10,300 | | | 147,393 |
| | |
|
|
| Total Russia | | | | 658,497 |
| | |
|
|
The accompanying notes are an integral part of these financial statements.
20
Lazard Retirement Series, Inc.
Portfolios of Investments (concluded)
December 31, 2004
|
| Description | Shares | | | Value |
|
|
|
|
|
| Lazard Retirement Emerging Markets Portfolio (concluded) |
| South Africa—12.0% | | | | |
| Edgars Consolidated Stores, Ltd. | 9,100 | | $ | 488,214 |
| Harmony Gold Mining Co., Ltd. | | | | |
| Sponsored ADR | 6,800 | | | 63,036 |
| Impala Platinum Holdings, Ltd. | 6,400 | | | 544,149 |
| Kumba Resources, Ltd. | 53,500 | | | 417,839 |
| Old Mutual PLC | 213,600 | | | 543,371 |
| Sanlam, Ltd. | 107,100 | | | 247,136 |
| Sappi, Ltd. | 32,300 | | | 475,864 |
| Sasol, Ltd. | 20,800 | | | 446,736 |
| Steinhoff International Holdings, Ltd. | 258,603 | | | 578,371 |
| | |
|
|
| Total South Africa | | | | 3,804,716 |
| | |
|
|
| South Korea—18.9% | | | | |
| Daewoo Shipbuilding & Marine | | | | |
| Engineering Co., Ltd. GDR (c) | 13,600 | | | 357,000 |
| Hite Brewery Co., Ltd. | 2,900 | | | 239,519 |
| Hyundai Motor Co. | 6,050 | | | 324,358 |
| Kookmin Bank (a) | 22,090 | | | 864,224 |
| KT Corp. Sponsored ADR | 14,090 | | | 307,303 |
| LG Chem, Ltd. | 6,900 | | | 274,947 |
| LG Electronics, Inc. | 3,600 | | | 222,913 |
| LG Household & Health Care, Ltd. | 10,000 | | | 265,166 |
| LG Philips LCD Co., Ltd. ADR | 12,500 | | | 224,875 |
| POSCO ADR | 8,190 | | | 364,701 |
| Samsung Electronics Co., Ltd. GDR (c) | 5,826 | | | 1,275,894 |
| Samsung Fire & Marine | | | | |
| Insurance Co., Ltd. | 4,542 | | | 357,586 |
| Samsung SDI Co., Ltd. | 2,360 | | | 257,612 |
| SK Telecom Co., Ltd. | 1,800 | | | 342,543 |
| SK Telecom Co., Ltd. ADR | 13,945 | | | 310,276 |
| | |
|
|
| Total South Korea | | | | 5,988,917 |
| | |
|
|
| Taiwan—7.2% | | | | |
| Advantech Co., Ltd. | 149,645 | | | 363,606 |
| Chinatrust Financial Holding Co., Ltd. | 223,080 | | | 266,795 |
| Compal Electronics, Inc. | 94,783 | | | 94,813 |
| Compal Electronics, Inc. GDR | 17,683 | | | 87,884 |
| Fubon Financial Holding Co., Ltd. | 311,000 | | | 318,949 |
| Hon Hai Precision Industry Co., Ltd. | 113,249 | | | 525,327 |
| Taiwan Semiconductor Manufacturing | | | | |
| Co., Ltd. | 403,000 | | | 642,206 |
| | |
|
|
| Total Taiwan | | | | 2,299,580 |
| | |
|
|
| Thailand—0.5% | | | | |
| Thai Union Frozen Products PCL | 262,900 | | | 167,823 |
| | |
|
|
| Turkey—1.5% | | | | | |
| Akbank TAS | 77,400,850 | | | | 479,271 |
| | | |
|
|
| Venezuela—1.2% | | | | | |
| Compania Anonima Nacional | | | | | |
| Telefonos de Venezuela ADR | 16,485 | | | | 369,099 |
| | | |
|
|
| Total Common Stocks | | | | | |
| (Identified cost $21,068,664) | | | | | 27,417,245 |
| | | | |
|
|
| Preferred Stocks—7.9% | | | | | |
| Brazil—7.9% | | | | | |
| Caemi Mineracao | | | | | |
| e Metalurgia SA (a) | 1,031,050 | | | | 885,088 |
| Companhia Brasileira de | | | | | |
| Distribuicao Grupo Pao de | | | | | |
| Acucar Sponsored ADR | 8,400 | | | | 215,040 |
| Companhia de Bebidas das | | | | | |
| Americas ADR | 11,270 | | | | 319,279 |
| Companhia Paranaense de | | | | | |
| Energia-Copel Sponsored ADR | 77,000 | | | | 344,190 |
| Telemar Norte Leste SA | 17,142 | | | | 435,972 |
| Usinas Siderurgicas de Minas | | | | | |
| Gerais SA | 15,000 | | | | 304,688 |
| | | |
|
|
| Total Brazil | | | | | 2,504,257 |
| | | |
|
|
| Total Preferred Stocks | | | | | |
| (Identified cost $1,509,519) | | | | | 2,504,257 |
| | | |
|
|
| |
| | Principal | | | |
| | Amount | | | |
| | (000) | | | |
|
|
| | | |
| Repurchase Agreement—5.5% | | | | | |
| State Street Bank and Trust Co., | | | | | |
| 1.40%, 01/03/05 | | | | | |
| (Dated 12/31/04, collateralized by | | | | | |
| $1,775,000 United States Treasury | | | | | |
| Note, 2.50%, 09/30/06, with a | | | | | |
| value of $1,770,406) | | | | | |
| Proceeds of $1,735,202 | | | | | |
| (Identified cost $1,735,000) | $1,735 | | | | 1,735,000 |
| | | |
|
|
| Total Investments | | | | | |
| (Identified cost $24,313,183) (b) | 99.8 | % | | $ | 31,656,502 |
| Cash and Other Assets in Excess | | | | | |
| of Liabilities | 0.2 | | | | 53,479 |
|
| | |
|
|
| Net Assets | 100.0 | % | | $ | 31,709,981 |
|
| | |
|
|
The accompanying notes are an integral part of these financial statements.
21
Lazard Retirement Series, Inc.
Notes to Portfolios of Investments
December 31, 2004
|
| (a) | Non-income producing security. |
| |
| (b) | For federal income tax purposes, the aggregate cost, aggregate gross unrealized appreciation, aggregate gross unrealized depreciation and the net unrealized appreciation is as follows: |
| |
| | | | | | Aggregate | | Aggregate | | | |
| | | | | | Gross | | Gross | | Net |
| | | Aggregate | | Unrealized | | Unrealized | | Unrealized |
| Portfolio | | Cost | | Appreciation | | Depreciation | | Appreciation |
| |
|
| |
|
| |
|
| |
|
|
| Retirement Equity | | $ | 4,192,403 | | $ | 729,521 | | $ | 40,300 | | $ | 689,221 |
| Retirement Small Cap | | | 98,857,945 | | | 15,407,233 | | | 1,953,821 | | | 13,453,412 |
| Retirement International Equity | | | 176,783,171 | | | 31,168,558 | | | 1,264,672 | | | 29,903,886 |
| Retirement Emerging Markets | | | 24,744,863 | | | 7,025,003 | | | 113,364 | | | 6,911,639 |
| (c) | Pursuant to Rule 144A under the Securities Act of 1933, these securities may only be traded among “qualified institutional buyers.” |
| |
| (d) | Date shown is the expiration date. |
| |
Security Abbreviations:
ADR —American Depositary Receipt
GDR—Global Depositary Receipt
REIT—Real Estate Investment Trust
|
The accompanying notes are an integral part of these financial statements.
22
Lazard Retirement Series, Inc.
Notes to Portfolios of Investments (concluded)
December 31, 2004
|
Portfolio holdings by industry, for those Portfolios previously presented by country:
| | | Lazard | | Lazard |
| | | Retirement | | Retirement |
| | | International | | Emerging |
| | | Equity | | Markets |
| | | Portfolio | | Portfolio |
| |
|
| |
|
|
| Industry | | | | | | |
| Aerospace & Defense | | — | % | | 0.9 | % |
| Apparel & Textiles | | — | | | 2.8 | |
| Automotive | | 4.3 | | | 2.0 | |
| Banking | | 16.1 | | | 10.0 | |
| Brewery | | 0.9 | | | 2.8 | |
| Broadcasting | | — | | | 1.1 | |
| Building & Construction | | 1.0 | | | 2.1 | |
| Chemicals | | 1.5 | | | 2.4 | |
| Computers & Business Equipment | | 1.4 | | | 4.8 | |
| Diversified | | 5.7 | | | — | |
| Drugs & Health Care | | 8.7 | | | 1.8 | |
| Electrical Equipment | | 0.6 | | | — | |
| Electronics | | 3.3 | | | 6.2 | |
| Financial Services | | 4.6 | | | 2.8 | |
| Food & Beverages | | 4.5 | | | 1.8 | |
| Forest & Paper Products | | 1.3 | | | 2.2 | |
| Household Products & Home Furnishings | | — | | | 3.4 | |
| Insurance | | 3.4 | | | 3.6 | |
| Metals & Mining | | 1.0 | | | 10.2 | |
| Multimedia | | 1.6 | | | — | |
| Oil & Gas | | 11.5 | | | 5.9 | |
| Printing & Publishing | | 0.6 | | | — | |
| Real Estate | | 1.5 | | | — | |
| Retail | | 4.0 | | | 0.7 | |
| Semiconductors & Components | | 2.4 | | | 2.0 | |
| Shipbuilding | | — | | | 1.1 | |
| Steel | | — | | | 2.1 | |
| Telecommunications | | 10.2 | | | 15.7 | |
| Tobacco | | 1.4 | | | 3.2 | |
| Transportation | | 0.9 | | | 1.6 | |
| Utilities | | 5.5 | | | 1.1 | |
| |
|
| |
|
|
| Subtotal | | 97.9 | | | 94.3 | |
| Repurchase Agreements | | 2.1 | | | 5.5 | |
| |
|
| |
|
|
| Total Investments | | 100.0 | % | | 99.8 | % |
| |
|
| |
|
|
The accompanying notes are an integral part of these financial statements.
23
Lazard Retirement Series, Inc.
Statements of Assets and Liabilities
December 31, 2004
|
| | | | | | | | | Lazard | | | Lazard | |
| | | Lazard | | | Lazard | | | Retirement | | | Retirement | |
| | | Retirement | | | Retirement | | | International | | | Emerging | |
| | | Equity | | | Small Cap | | | Equity | | | Markets | |
| | | Portfolio | | | Portfolio | | | Portfolio | | | Portfolio | |
|
|
|
|
|
|
|
|
|
|
|
|
|
| ASSETS | | | | | | | | | | | | |
| Investments in securities, at value | $ | 4,881,624 | | $ | 112,311,357 | | $ | 206,687,057 | | $ | 31,656,502 | |
| Cash | | 1,119 | | | 752 | | | — | | | 1,203 | |
| Foreign currency | | — | | | — | | | 242,959 | | | 112,333 | |
| Receivables for: | | | | | | | | | | | | |
| Investments sold | | — | | | 570,618 | | | — | | | 131,661 | |
| Dividends and interest | | 6,027 | | | 56,374 | | | 322,298 | | | 62,269 | |
| Capital stock sold | | — | | | 52,675 | | | 59,423 | | | 106,019 | |
| Amount due from Investment Manager | | 4,528 | | | — | | | — | | | 4,320 | |
|
|
| |
|
| |
|
| |
|
| |
| Total assets | | 4,893,298 | | | 112,991,776 | | | 207,311,737 | | | 32,074,307 | |
|
|
| |
|
| |
|
| |
|
| |
| LIABILITIES | | | | | | | | | | | | |
| Payables for: | | | | | | | | | | | | |
| Amount due to Custodian | | — | | | — | | | 382 | | | — | |
| Management fees | | — | | | 56,271 | | | 102,186 | | | — | |
| Accrued distribution fees | | 1,018 | | | 22,761 | | | 42,457 | | | 6,207 | |
| Accrued directors’ fees | | 20 | | | 427 | | | 803 | | | 112 | |
| Investments purchased | | — | | | 1,769,911 | | | 242,960 | | | 324,795 | |
| Capital stock repurchased | | 1,644 | | | 135,640 | | | 247,039 | | | 7,707 | |
| Other accrued expenses and payables | | 7,861 | | | 24,895 | | | 51,038 | | | 25,505 | |
|
|
| |
|
| |
|
| |
|
| |
| Total liabilities | | 10,543 | | | 2,009,905 | | | 686,865 | | | 364,326 | |
|
|
| |
|
| |
|
| |
|
| |
| Net assets | $ | 4,882,755 | | $ | 110,981,871 | | $ | 206,624,872 | | $ | 31,709,981 | |
|
|
| |
|
| |
|
| |
|
| |
| NET ASSETS | | | | | | | | | | | | |
| Paid in capital | $ | 4,798,135 | | $ | 88,038,952 | | $ | 170,895,397 | | $ | 22,688,191 | |
| Undistributed net investment income | | 34,626 | | | 39,674 | | | 1,560,474 | | | 164,174 | |
| Accumulated undistributed net realized gain (loss) | | (704,963 | ) | | 9,243,405 | | | 3,155,893 | | | 1,515,253 | |
| Net unrealized appreciation (depreciation) on: | | | | | | | | | | | | |
| Investments | | 754,957 | | | 13,659,840 | | | 31,002,869 | | | 7,343,319 | |
| Foreign currency | | — | | | — | | | 10,239 | | | (956 | ) |
|
|
| |
|
| |
|
| |
|
| |
| Net assets | $ | 4,882,755 | | $ | 110,981,871 | | $ | 206,624,872 | | $ | 31,709,981 | |
|
|
| |
|
| |
|
| |
|
| |
| |
| Shares of capital stock outstanding* | | 454,488 | | | 6,567,766 | | | 17,398,250 | | | 2,279,740 | |
| Net asset value, offering and redemption price per share | $ | 10.74 | | $ | 16.90 | | $ | 11.88 | | $ | 13.91 | |
| |
| Cost of investments in securities | $ | 4,126,667 | | $ | 98,651,517 | | $ | 175,684,188 | | $ | 24,313,183 | |
| Cost of foreign currency | $ | — | | $ | — | | $ | 243,130 | | $ | 112,010 | |
*$0.001 par value, 500,000,000 shares authorized for the Portfolios in total.
The accompanying notes are an integral part of these financial statements.
24
Lazard Retirement Series, Inc.
Statements of Operations
For the year ended December 31, 2004
|
| | | | | | | | | | | Lazard | | | | Lazard | |
| | | Lazard | | | | Lazard | | | | Retirement | | | | Retirement | |
| | | Retirement | | | | Retirement | | | | International | | | | Emerging | |
| | | Equity | | | | Small Cap | | | | Equity | | | | Markets | |
| | | Portfolio | | | | Portfolio | | | | Portfolio | | | | Portfolio | |
|
|
|
|
|
|
|
|
|
|
|
|
|
|
|
|
| INVESTMENT INCOME (LOSS) | | | | | | | | | | | | | | | |
| Income: | | | | | | | | | | | | | | | |
| Dividends | $ | 90,579 | | | $ | 742,437 | | | $ | 3,705,472 | | | $ | 562,266 | |
| Interest | | 2,112 | | | | 58,173 | | | | 82,505 | | | | 13,206 | |
|
|
| | |
|
| | |
|
| | |
|
| |
| Total investment income* | | 92,691 | | | | 800,610 | | | | 3,787,977 | | | | 575,472 | |
|
|
| | |
|
| | |
|
| | |
|
| |
| Expenses: | | | | | | | | | | | | | | | |
| Management fees. | | 34,831 | | | | 667,426 | | | | 1,236,363 | | | | 211,039 | |
| Administration fees | | 38,482 | | | | 55,453 | | | | 70,672 | | | | 41,790 | |
| Distribution fees | | 11,611 | | | | 222,475 | | | | 412,121 | | | | 52,760 | |
| Custodian fees | | 38,221 | | | | 94,933 | | | | 265,696 | | | | 138,048 | |
| Professional services | | 27,629 | | | | 61,307 | | | | 85,715 | | | | 33,431 | |
| Shareholders’ services | | 13,891 | | | | 14,868 | | | | 13,875 | | | | 14,066 | |
| Shareholders’ reports | | 480 | | | | 9,411 | | | | 17,819 | | | | 2,243 | |
| Directors’ fees and expenses | | 350 | | | | 6,749 | | | | 12,536 | | | | 1,605 | |
| Registration fees | | — | | | | 2,250 | | | | 5,800 | | | | 1,000 | |
| Other | | 833 | | | | 3,595 | | | | 5,975 | | | | 1,334 | |
|
|
| | |
|
| | |
|
| | |
|
| |
| Total gross expenses | | 166,328 | | | | 1,138,467 | | | | 2,126,572 | | | | 497,316 | |
| Management fees waived and expenses reimbursed | | (89,352 | ) | | | (26,295 | ) | | | (65,602 | ) | | | (143,986 | ) |
| Administration fees waived | | (18,750 | ) | | | — | | | | — | | | | (15,625 | ) |
| Expense reductions | | (161 | ) | | | (116 | ) | | | (42 | ) | | | — | |
|
|
| | |
|
| | |
|
| | |
|
| |
| Total net expenses | | 58,065 | | | | 1,112,056 | | | | 2,060,928 | | | | 337,705 | |
|
|
| | |
|
| | |
|
| | |
|
| |
| Net investment income (loss) | | 34,626 | | | | (311,446 | ) | | | 1,727,049 | | | | 237,767 | |
|
|
| | |
|
| | |
|
| | |
|
| |
NET REALIZED AND UNREALIZED GAIN (LOSS) ON | | | | | | | | | | | | | | | |
| INVESTMENTS AND FOREIGN CURRENCY | | | | | | | | | | | | | | | |
| Net realized gain (loss) on: | | | | | | | | | | | | | | | |
| Investments** | | 360,960 | | | | 12,747,580 | | | | 13,341,333 | | | | 2,469,511 | |
| Foreign currency | | — | | | | — | | | | (294,530 | ) | | | (33,736 | ) |
| Net change in unrealized appreciation (depreciation) on: | | | | | | | | | | | | | | | |
| Investments | | 122,238 | | | | 987,411 | | | | 10,932,536 | | | | 3,885,037 | |
| Foreign currency | | — | | | | — | | | | (1,169 | ) | | | (882 | ) |
|
|
| | |
|
| | |
|
| | |
|
| |
| Net realized and unrealized gain on | | | | | | | | | | | | | | | |
| investments and foreign currency | | 483,198 | | | | 13,734,991 | | | | 23,978,170 | | | | 6,319,930 | |
|
|
| | |
|
| | |
|
| | |
|
| |
| Net increase in net assets resulting from operations | $ | 517,824 | | | $ | 13,423,545 | | | $ | 25,705,219 | | | $ | 6,557,697 | |
|
|
| | |
|
| | |
|
| | |
|
| |
| *Net of foreign withholding taxes of | $ | 215 | | | $ | 1,352 | | | $ | 469,354 | | | $ | 63,972 | |
|
|
| | |
|
| | |
|
| | |
|
| |
| **Net of foreign capital gains taxes of | $ | — | | | $ | — | | | $ | — | | | $ | 40,192 | |
|
|
| | |
|
| | |
|
| | |
|
| |
The accompanying notes are an integral part of these financial statements.
25
Lazard Retirement Series, Inc.
Statements of Changes in Net Assets
|
| | | Lazard Retirement | | | | Lazard Retirement | |
| | | Equity Portfolio | | | | Small Cap Portfolio | |
|
|
|
| |
|
|
|
| | | Year Ended | | | | Year Ended | | | | Year Ended | | | Year Ended | |
| | | December 31, | | | | December 31, | | | | December 31, | | | December 31, | |
| | | 2004 | | | | 2003 | | | | 2004 | | | | 2003 | |
|
|
|
|
|
|
|
|
|
|
|
|
|
|
|
|
| INCREASE IN NET ASSETS | | | | | | | | | | | | | | | |
| Operations: | | | | | | | | | | | | | | | |
| Net investment income (loss) | $ | 34,626 | | | $ | 28,647 | | | $ | (311,446 | ) | | $ | 18,430 | |
| Net realized gain (loss) on investments and | | | | | | | | | | | | | | | |
| foreign currency | | 360,960 | | | | (92,184 | ) | | | 12,747,580 | | | | 686,179 | |
| Net change in unrealized appreciation on investments | | | | | | | | | | | | | | | |
| and foreign currency | | 122,238 | | | | 902,615 | | | | 987,411 | | | | 17,431,107 | |
|
|
| | |
|
| | |
|
| | |
|
| |
| Net increase in net assets resulting from operations | | 517,824 | | | | 839,078 | | | | 13,423,545 | | | | 18,135,716 | |
|
|
| | |
|
| | |
|
| | |
|
| |
| Distributions to shareholders: | | | | | | | | | | | | | | | |
| From net investment income | | (28,362 | ) | | | (27,594 | ) | | | — | | | | — | |
|
|
| | |
|
| | |
|
| | |
|
| |
| Net decrease in net assets resulting from distributions | | (28,362 | ) | | | (27,594 | ) | | | — | | | | — | |
|
|
| | |
|
| | |
|
| | |
|
| |
| Capital stock transactions: | | | | | | | | | | | | | | | |
| Net proceeds from sales | | 903,217 | | | | 1,551,110 | | | | 33,080,756 | | | | 26,651,205 | |
| Net proceeds from reinvestment of distributions | | 28,362 | | | | 27,594 | | | | — | | | | — | |
| Cost of shares redeemed | | (1,128,942 | ) | | | (1,549,867 | ) | | | (12,157,934 | ) | | (15,604,009 | ) |
|
|
| | |
|
| | |
|
| | |
| |
| Net increase (decrease) in net assets from | | | | | | | | | | | | | | | |
| capital stock transactions | | (197,363 | ) | | | 28,837 | | | | 20,922,822 | | | | 11,047,196 | |
|
|
| | |
|
| | |
|
| | |
|
| |
| Total increase in net assets | | 292,099 | | | | 840,321 | | | | 34,346,367 | | | | 29,182,912 | |
| Net assets at beginning of year | | 4,590,656 | | | | 3,750,335 | | | | 76,635,504 | | | | 47,452,592 | |
|
|
| | |
|
| | |
|
| | |
|
| |
| Net assets at end of year* | $ | 4,882,755 | | | $ | 4,590,656 | | | $ | 110,981,871 | | | $ | 76,635,504 | |
|
|
| | |
|
| | |
|
| | |
| |
| *Includes undistributed net investment income | $ | 34,626 | | | $ | 28,362 | | | $ | 39,674 | | | $ | 25,784 | |
|
|
| | |
|
| | |
|
| | |
|
| |
| |
| |
| Shares issued and repurchased: | | | | | | | | | | | | | | | |
| Shares outstanding at beginning of year | | 474,564 | | | | 477,899 | | | | 5,208,046 | | | | 4,426,956 | |
|
|
| | |
|
| | |
|
| | |
|
| |
| Shares sold | | 90,351 | | | | 183,710 | | | | 2,159,611 | | | | 2,115,827 | |
| Shares issued to shareholders from reinvestment | | | | | | | | | | | | | | | |
| of distributions | | 2,976 | | | | 3,146 | | | | — | | | | — | |
| Shares repurchased | | (113,403 | ) | | | (190,191 | ) | | | (799,891 | ) | | | (1,334,737 | ) |
|
|
| | |
|
| | |
|
| | |
|
| |
| Net increase (decrease) | | (20,076 | ) | | | (3,335 | ) | | | 1,359,720 | | | | 781,090 | |
|
|
| | |
|
| | |
|
| | |
|
| |
| Shares outstanding at end of year | | 454,488 | | | | 474,564 | | | | 6,567,766 | | | | 5,208,046 | |
|
|
| | |
|
| | |
|
| | |
|
| |
The accompanying notes are an integral part of these financial statements.
26
Lazard Retirement Series, Inc.
Statements of Changes in Net Assets (concluded)
|
| | | Lazard Retirement | | | | Lazard Retirement | |
| | | International Equity Portfolio | | | | Emerging Markets Portfolio | |
|
|
|
| |
|
|
|
| | | Year Ended | | | | Year Ended | | | | Year Ended | | | | Year Ended | |
| | | December 31, | | | | December 31, | | | | December 31, | | | | December 31, | |
| | | 2004 | | | | 2003 | | | | 2004 | | | | 2003 | |
|
|
|
|
|
|
|
|
|
|
|
|
|
|
|
|
| INCREASE IN NET ASSETS | | | | | | | | | | | | | | | |
| Operations: | | | | | | | | | | | | | | | |
| Net investment income | $ | 1,727,049 | | | $ | 974,620 | | | $ | 237,767 | | | $ | 173,586 | |
| Net realized gain (loss) on investments and | | | | | | | | | | | | | | | |
| foreign currency | | 13,046,803 | | | | (280,978 | ) | | | 2,435,775 | | | | 725,996 | |
| Net change in unrealized appreciation on investments | | | | | | | | | | | | | | | |
| and foreign currency | | 10,931,367 | | | | 22,845,803 | | | | 3,884,155 | | | | 3,845,344 | |
|
|
| | |
|
| | |
|
| | |
|
| |
| Net increase in net assets resulting from operations | | 25,705,219 | | | | 23,539,445 | | | | 6,557,697 | | | | 4,744,926 | |
|
|
| | |
|
| | |
|
| | |
|
| |
| Distributions to shareholders: | | | | | | | | | | | | | | | |
| From net investment income | | (902,561 | ) | | | (277,086 | ) | | | (149,218 | ) | | | (6,053 | ) |
|
|
|
| |
|
| | |
|
| | |
|
| |
| Net decrease in net assets resulting from distributions | | (902,561 | ) | | | (277,086 | ) | | | (149,218 | ) | | | (6,053 | ) |
|
|
| | |
|
| | |
|
| | |
|
| |
| Capital stock transactions: | | | | | | | | | | | | | | | |
| Net proceeds from sales | | 53,897,043 | | | | 63,763,176 | | | | 15,109,672 | | | | 7,220,084 | |
| Net proceeds from reinvestment of distributions | | 902,561 | | | | 277,085 | | | | 149,218 | | | | 6,053 | |
| Cost of shares redeemed | | (3,420,702 | ) | | | (5,772,339 | ) | | | (5,894,616 | ) | | | (3,993,091 | ) |
|
|
| | |
|
| | |
|
| | |
|
| |
| Net increase in net assets from capital | | | | | | | | | | | | | | | |
| stock transactions | | 51,378,902 | | | | 58,267,922 | | | | 9,364,274 | | | | 3,233,046 | |
|
|
| | |
|
| | |
|
| | |
|
| |
| Total increase in net assets | | 76,181,560 | | | | 81,530,281 | | | | 15,772,753 | | | | 7,971,919 | |
| Net assets at beginning of year | | 130,443,312 | | | | 48,913,031 | | | | 15,937,228 | | | | 7,965,309 | |
|
|
| | |
|
| | |
|
| | |
|
| |
| Net assets at end of year* | $ | 206,624,872 | | | $ | 130,443,312 | | | $ | 31,709,981 | | | $ | 15,937,228 | |
|
|
| | |
|
| | |
|
| | |
|
| |
| *Includes undistributed net investment income | $ | 1,560,474 | | | $ | 673,334 | | | $ | 164,174 | | | $ | 149,552 | |
|
|
| | |
|
| | |
|
| | |
|
| |
| |
| |
| Shares issued and repurchased: | | | | | | | | | | | | | | | |
| Shares outstanding at beginning of year | | 12,557,244 | | | | 6,029,034 | | | | 1,485,424 | | | | 1,134,215 | |
|
|
| | |
|
| | |
|
| | |
|
| |
| Shares sold | | 5,070,060 | | | | 7,205,275 | | | | 1,304,409 | | | | 846,872 | |
| Shares issued to shareholders from reinvestment | | | | | | | | | | | | | | | |
| of distributions | | 90,528 | | | | 30,822 | | | | 14,198 | | | | 711 | |
| Shares repurchased | | (319,582 | ) | | | (707,887 | ) | | | (524,291 | ) | | | (496,374 | ) |
|
|
| | |
|
| | |
|
| | |
|
| |
| Net increase | | 4,841,006 | | | | 6,528,210 | | | | 794,316 | | | | 351,209 | |
|
|
| | |
|
| | |
|
| | |
|
| |
| Shares outstanding at end of year | | 17,398,250 | | | | 12,557,244 | | | | 2,279,740 | | | | 1,485,424 | |
|
|
| | |
|
| | |
|
| | |
|
| |
The accompanying notes are an integral part of these financial statements.
27
Lazard Retirement Series, Inc.
Financial Highlights
Selected data for a share of capital stock outstanding throughout each year:
|
LAZARD RETIREMENT EQUITY PORTFOLIO
| | | | | | | | | | | | Year Ended | | | | | | | | | |
| |
|
|
|
|
|
|
|
|
|
|
|
|
|
|
|
|
|
|
|
| | | | 12/31/04 | | | | 12/31/03 | | | | 12/31/02 | | | | 12/31/01 | | | | 12/31/00 | |
| |
|
|
| |
|
|
| |
|
|
| |
|
|
| |
|
|
|
| Net asset value, beginning of year | | $ | 9.67 | | | $ | 7.85 | | | $ | 9.38 | | | $ | 10.20 | | | $ | 11.53 | |
| |
|
| | |
|
| | |
|
| | |
|
| | |
|
| |
| Income (loss) from investment operations: | | | | | | | | | | | | | | | | | | | | |
| Net investment income | | | 0.08 | | | | 0.06 | | | | 0.06 | | | | 0.06 | | | | 0.07 | |
| Net realized and unrealized gain (loss) | | | 1.05 | | | | 1.82 | | | | (1.58 | ) | | | (0.82 | ) | | | (0.10 | ) |
| |
|
| | |
|
| | |
|
| | |
|
| | |
|
| |
| Total from investment operations | | | 1.13 | | | | 1.88 | | | | (1.52 | ) | | | (0.76 | ) | | | (0.03 | ) |
| |
|
| | |
|
| | |
|
| | |
|
| | |
|
| |
| Less distributions from: | | | | | | | | | | | | | | | | | | | | |
| Net investment income | | | (0.06 | ) | | | (0.06 | ) | | | (0.01 | ) | | | (0.06 | ) | | | (0.07 | ) |
| Net realized gains | | | — | | | | — | | | | — | | | | — | | | | (1.23 | ) |
| |
|
| | |
|
| | |
|
| | |
|
| | |
|
| |
| Total distributions | | | (0.06 | ) | | | (0.06 | ) | | | (0.01 | ) | | | (0.06 | ) | | | (1.30 | ) |
| |
|
| | |
|
| | |
|
| | |
|
| | |
|
| |
| Net asset value, end of year | | $ | 10.74 | | | $ | 9.67 | | | $ | 7.85 | | | $ | 9.38 | | | $ | 10.20 | |
| |
|
| | |
|
| | |
|
| | |
|
| | |
|
| |
| Total Return (a) | | | 11.79 | % | | | 24.01 | % | | | (16.25 | )% | | | (7.47 | )% | | | (0.09 | )% |
| Ratios and Supplemental Data: | | | | | | | | | | | | | | | | | | | | |
| Net assets, end of year (in thousands) | | $ | 4,883 | | | $ | 4,591 | | | $ | 3,750 | | | $ | 5,015 | | | $ | 3,232 | |
| Ratios to average net assets: | | | | | | | | | | | | | | | | | | | | |
| Net expenses | | | 1.25 | % | | | 1.25 | % | | | 1.25 | % | | | 1.25 | % | | | 1.25 | % |
| Gross expenses | | | 3.58 | % | | | 3.89 | % | | | 3.74 | % | | | 3.25 | % | | | 5.07 | % |
| Net investment income | | | 0.75 | % | | | 0.73 | % | | | 0.58 | % | | | 0.63 | % | | | 0.74 | % |
| Portfolio turnover rate | | | 59 | % | | | 56 | % | | | 94 | % | | | 141 | % | | | 133 | % |
| |
| LAZARD RETIREMENT SMALL CAP PORTFOLIO | | | | | | | | | | | | | | | | | | | | |
| | | Year Ended |
| |
|
|
|
|
|
|
|
|
|
|
|
|
|
|
|
|
|
|
|
| | | | 12/31/04 | | | | 12/31/03 | | | | 12/31/02 | | | | 12/31/01 | | | | 12/31/00 | |
| |
|
|
| |
|
|
| |
|
|
| |
|
|
| |
|
|
|
| Net asset value, beginning of year | | $ | 14.71 | | | $ | 10.72 | | | $ | 13.08 | | | $ | 11.75 | | | $ | 9.82 | |
| |
|
|
| |
|
|
| |
|
|
| |
|
|
| |
|
|
|
| Income (loss) from investment operations: | | | | | | | | | | | | | | | | | | | | |
| Net investment income | | | — | (b) | | | — | (b) | | | 0.01 | | | | 0.01 | | | | 0.03 | |
| Net realized and unrealized gain (loss) | | | 2.19 | | | | 3.99 | | | | (2.32 | ) | | | 2.15 | | | | 2.03 | |
| |
|
| | |
|
| | |
|
| | |
|
| | |
|
| |
| Total from investment operations | | | 2.19 | | | | 3.99 | | | | (2.31 | ) | | | 2.16 | | | | 2.06 | |
| |
|
| | |
|
| | |
|
| | |
|
| | |
|
| |
| Less distributions from: | | | | | | | | | | | | | | | | | | | | |
| Net investment income | | | — | | | | — | | | | — | | | | (0.01 | ) | | | (0.03 | ) |
| Net realized gains | | | — | | | | — | | | | (0.05 | ) | | | (0.82 | ) | | | (0.10 | ) |
| |
|
| | |
|
| | |
|
| | |
|
| | |
|
| |
| Total distributions | | | — | | | | — | | | | (0.05 | ) | | | (0.83 | ) | | | (0.13 | ) |
| |
|
| | |
|
| | |
|
| | |
|
| | |
|
| |
| Net asset value, end of year | | $ | 16.90 | | | $ | 14.71 | | | $ | 10.72 | | | $ | 13.08 | | | $ | 11.75 | |
| |
|
| | |
|
| | |
|
| | |
|
| | |
|
| |
| Total Return (a) | | | 14.89 | % | | | 37.22 | % | | | (17.68 | )% | | | 18.63 | % | | | 21.05 | % |
| Ratios and Supplemental Data: | | | | | | | | | | | | | | | | | | | | |
| Net assets, end of year (in thousands) | | $ | 110,982 | | | $ | 76,636 | | | $ | 47,453 | | | $ | 42,164 | | | $ | 15,205 | |
| Ratios to average net assets: | | | | | | | | | | | | | | | | | | | | |
| Net expenses | | | 1.25 | % | | | 1.25 | % | | | 1.25 | % | | | 1.25 | % | | | 1.25 | % |
| Gross expenses | | | 1.28 | % | | | 1.37 | % | | | 1.42 | % | | | 1.67 | % | | | 2.76 | % |
| Net investment income (loss) | | | (0.35 | )% | | | 0.03 | % | | | (0.17 | )% | | | 0.09 | % | | | 0.42 | % |
| Portfolio turnover rate | | | 98 | % | | | 78 | % | | | 108 | % | | | 78 | % | | | 67 | % |
| (a) | Total returns reflect reinvestment of all dividends and distributions, if any. Certain expenses of the Portfolio have been waived or reim- |
| | bursed by the Portfolio’s Investment Manager or Administrator; without such waiver/reimbursement of expenses, the Portfolio’s returns |
| | would have been lower. Performance information does not reflect the fees and charges imposed by participating insurance companies at |
| | the separate account level, and such charges will have the effect of reducing performance. |
| | |
| (b) | Amount is less than $0.01 per share. |
The accompanying notes are an integral part of these financial statements.
28
Lazard Retirement Series, Inc.
Financial Highlights (concluded)
Selected data for a share of capital stock outstanding throughout each year:
|
LAZARD RETIREMENT INTERNATIONAL EQUITY PORTFOLIO
| | | | | | | | | | | | Year Ended | | | | | | | | | |
| |
|
|
|
|
|
|
|
|
|
|
|
|
|
|
|
|
|
|
|
| | | | 12/31/04 | | | | 12/31/03 | | | | 12/31/02 | | | | 12/31/01 | | | | 12/31/00 | |
| |
|
|
| |
|
|
| |
|
|
| |
|
|
| |
|
|
|
| Net asset value, beginning of year | | $ | 10.39 | | | $ | 8.11 | | | $ | 9.09 | | | $ | 12.01 | | | $ | 13.49 | |
| |
|
| | |
|
| | |
|
| | |
|
| | |
|
| |
| Income (loss) from investment operations: | | | | | | | | | | | | | | | | | | | | |
| Net investment income | | | 0.09 | | | | 0.04 | | | | 0.05 | | | | 0.01 | | | | 0.10 | |
| Net realized and unrealized gain (loss) | | | 1.46 | | | | 2.27 | | | | (1.02 | ) | | | (2.90 | ) | | | (1.40 | ) |
| |
|
| | |
|
| | |
|
| | |
|
| | |
|
| |
| Total from investment operations | | | 1.55 | | | | 2.31 | | | | (0.97 | ) | | | (2.89 | ) | | | (1.30 | ) |
| |
|
| | |
|
| | |
|
| | |
|
| | |
|
| |
| Less distributions from: | | | | | | | | | | | | | | | | | | | | |
| Net investment income | | | (0.06 | ) | | | (0.03 | ) | | | (0.01 | ) | | | — | (b) | | | (0.08 | ) |
| Net realized gains | | | — | | | | — | | | | — | | | | (0.03 | ) | | | (0.10 | ) |
| |
|
| | |
|
| | |
|
| | |
|
| | |
|
| |
| Total distributions | | | (0.06 | ) | | | (0.03 | ) | | | (0.01 | ) | | | (0.03 | ) | | | (0.18 | ) |
| |
|
| | |
|
| | |
|
| | |
|
| | |
|
| |
| Net asset value, end of year | | $ | 11.88 | | | $ | 10.39 | | | $ | 8.11 | | | $ | 9.09 | | | $ | 12.01 | |
| |
|
| | |
|
| | |
|
| | |
|
| | |
|
| |
| Total Return (a) | | | 14.98 | % | | | 28.52 | % | | | (10.71 | )% | | | (24.06 | )% | | | (9.62 | )% |
| Ratios and Supplemental Data: | | | | | | | | | | | | | | | | | | | | |
| Net assets, end of year (in thousands) | | $ | 206,625 | | | $ | 130,443 | | | $ | 48,913 | | | $ | 32,311 | | | $ | 20,937 | |
| Ratios to average net assets: | | | | | | | | | | | | | | | | | | | | |
| Net expenses | | | 1.25 | % | | | 1.25 | % | | | 1.25 | % | | | 1.25 | % | | | 1.25 | % |
| Gross expenses | | | 1.29 | % | | | 1.40 | % | | | 1.65 | % | | | 1.94 | % | | | 2.32 | % |
| Net investment income | | | 1.05 | % | | | 1.25 | % | | | 0.98 | % | | | 0.50 | % | | | 0.72 | % |
| Portfolio turnover rate | | | 53 | % | | | 38 | % | | | 49 | % | | | 58 | % | | | 32 | % |
| |
| LAZARD RETIREMENT EMERGING MARKETS PORTFOLIO | | | | | | | | | | | | | | | | | | | | |
| | | | | | | | | | | | Year Ended | | | | | | | | | |
| |
|
|
|
|
|
|
|
|
|
|
|
|
|
|
|
|
|
|
|
| | | | 12/31/04 | | | | 12/31/03 | | | | 12/31/02 | | | | 12/31/01 | | | | 12/31/00 | |
| |
|
|
| |
|
|
| |
|
|
| |
|
|
| |
|
|
|
| Net asset value, beginning of year | | $ | 10.73 | | | $ | 7.02 | | | $ | 7.17 | | | $ | 7.59 | | | $ | 11.01 | |
| |
|
| | |
|
| | |
|
| | |
|
| | |
|
| |
| Income (loss) from investment operations: | | | | | | | | | | | | | | | | | | | | |
| Net investment income | | | 0.05 | | | | 0.10 | | | | 0.05 | | | | 0.03 | | | | 0.03 | |
| Net realized and unrealized gain (loss) | | | 3.21 | | | | 3.61 | | | | (0.16 | ) | | | (0.42 | ) | | | (3.12 | ) |
| |
|
| | |
|
| | |
|
| | |
|
| | |
|
| |
| Total from investment operations | | | 3.26 | | | | 3.71 | | | | (0.11 | ) | | | (0.39 | ) | | | (3.09 | ) |
| |
|
| | |
|
| | |
|
| | |
|
| | |
|
| |
| Less distributions from: | | | | | | | | | | | | | | | | | | | | |
| Net investment income | | | (0.08 | ) | | | — | (b) | | | (0.04 | ) | | | (0.03 | ) | | | (0.01 | ) |
| Net realized gains | | | — | | | | — | | | | — | | | | — | | | | (0.32 | ) |
| |
|
| | |
|
| | |
|
| | |
|
| | |
|
| |
| Total distributions | | | (0.08 | ) | | | — | | | | (0.04 | ) | | | (0.03 | ) | | | (0.33 | ) |
| |
|
| | |
|
| | |
|
| | |
|
| | |
|
| |
| Net asset value, end of year | | $ | 13.91 | | | $ | 10.73 | | | $ | 7.02 | | | $ | 7.17 | | | $ | 7.59 | |
| |
|
| | |
|
| | |
|
| | |
|
| | |
|
| |
| Total Return (a) | | | 30.59 | % | | | 52.94 | % | | | (1.50 | )% | | | (5.07 | )% | | | (28.07 | )% |
| Ratios and Supplemental Data: | | | | | | | | | | | | | | | | | | | | |
| Net assets, end of year (in thousands) | | $ | 31,710 | | | $ | 15,937 | | | $ | 7,965 | | | $ | 4,907 | | | $ | 4,789 | |
| Ratios to average net assets: | | | | | | | | | | | | | | | | | | | | |
| Net expenses | | | 1.60 | % | | | 1.60 | % | | | 1.60 | % | | | 1.60 | % | | | 1.60 | % |
| Gross expenses | | | 2.36 | % | | | 2.96 | % | | | 3.92 | % | | | 4.21 | % | | | 4.15 | % |
| Net investment income | | | 1.13 | % | | | 1.69 | % | | | 0.95 | % | | | 0.52 | % | | | 0.42 | % |
| Portfolio turnover rate | | | 43 | % | | | 41 | % | | | 53 | % | | | 63 | % | | | 54 | % |
| (a) | Total returns reflect reinvestment of all dividends and distributions, if any. Certain expenses of the Portfolio have been waived or reim- |
| bursed by the Portfolio’s Investment Manager or Administrator; without such waiver/reimbursement of expenses, the Portfolio’s returns |
| would have been lower. Performance information does not reflect the fees and charges imposed by participating insurance companies at |
| the separate account level, and such charges will have the effect of reducing performance. |
| | |
| (b) | Amount is less than $0.01 per share. |
The accompanying notes are an integral part of these financial statements.
29
Lazard Retirement Series, Inc.
Notes to Financial Statements
December 31, 2004
|
1. Organization
Lazard Retirement Series, Inc. (the “Fund”) was incorporated in Maryland on February 13, 1997 and is registered under the Investment Company Act of 1940, as amended (the “Act”), as an open-end management investment company. The Fund is comprised of seven no-load portfolios (each referred to as a “Portfolio”), which are offered only to separate accounts established by insurance companies to fund variable annuity contracts and variable life insurance policies. The Fund may also be offered to certain qualified pension and retirement plans and accounts permitting accumulation of assets on a tax-deferred basis. Currently, only the following four Portfolios, each of which is “diversified”, as defined in the Act, are offered: Lazard Retirement Equity Portfolio (“Equity Portfolio”), Lazard Retirement Small Cap Portfolio (“Small Cap Portfolio”), Lazard Retirement International Equity Portfolio (“International Equity Portfolio”) and Lazard Retirement Emerging Markets Portfolio (“Emerging Markets Portfolio”). Each of the other three Portfolios had not commenced operations as of December 31, 2004.
2. Significant Accounting Policies
The following is a summary of significant accounting policies:
(a) Valuation of Investments—Market values for equity securities listed on the New York Stock Exchange (“NYSE”), NASDAQ national market or other U.S. exchanges or markets are based on the closing market price on the principal exchange or market on which the security is traded, generally as of the close of regular trading on the NYSE (normally 4:00 p.m. Eastern time) on each valuation date; securities not traded on the valuation date are valued at the closing bid price. Any securities not listed, for which current over-the-counter market quotations or bids are readily available, are valued at the last quoted bid price or, if available, the mean of two such prices. Securities listed on foreign exchanges are valued at the last reported sales price, except as described below.
If events materially affecting the value of securities occur between the close of the exchange or market on which the security is principally traded and the time when a Portfolio’s net asset value is calculated, such securities will be valued at their fair values as determined by, or in accordance with procedures approved by, the Board of Directors. The fair value of foreign securities may be determined with the assistance of a pricing service, using correlations between the movement of prices of such securities and indices of domestic securities and other appropriate indicators, such as closing market prices of relevant ADRs or futures contracts. The effect of using fair value pricing is that the net asset value of a Portfolio will reflect the affected securities’ values as determined in the judgment of the Board of Directors or its designee instead of being determined by the market. Using a fair value pricing methodology to price securities may result in a value that is different from the most recent closing price of a security and from the prices used by other investment companies to calculate their portfolios’ net asset values.
Securities for which current market quotations are not readily available are valued at fair value as determined in good faith in accordance with procedures approved by the Board of Directors.
Under these procedures, in the event that Lazard Asset Management LLC, the Fund’s investment manager (the “Investment Manager”) and a majority-owned subsidiary of Lazard Frères & Co. LLC (“Lazard”), determines that a significant event has occurred after the close of a market on which a foreign security is traded but before the close of regular trading on the NYSE, such that current market quotations for a security or securities are not readily available, a Valuation Committee of the Investment Manager will evaluate a variety of factors to determine the fair value of the affected securities. These factors include, but are not limited to, the type of security, the value of comparable securities, observations from financial institutions and relevant news events. Input from the Investment Manager’s analysts will also be considered.
(b) Portfolio Securities Transactions and Investment Income—Portfolio securities transactions are accounted for on trade date. Realized gain (loss) on sales of investments are recorded on a specific identification basis. Dividend income is recorded on the ex-dividend date and interest income is accrued daily.
(c) Repurchase Agreements—In connection with transactions in repurchase agreements, the Fund’s custodian takes possession of the underlying collateral securities, the fair value of which at all times is required to be at least equal to the principal amount, plus accrued interest, of the repurchase transaction. If the seller defaults, and the fair value of the collateral declines, realization of the collateral by a Portfolio may be delayed or limited.
(d) Foreign Currency Translation—The accounting records of the Portfolios are maintained in U.S. dollars. Portfolio securities and other assets and liabilities denominated in a foreign currency are translated daily into U.S. dollars at the prevailing rates of exchange. Purchases and sales of securities, income receipts and expense payments are translated into U.S. dollars at the prevailing exchange rates on the respective transaction dates.
30
Lazard Retirement Series, Inc.
Notes to Financial Statements (continued)
December 31, 2004
|
The Portfolios do not isolate the portion of operations resulting from changes in foreign exchange rates on investments from the fluctuations arising from changes in their market prices. Such fluctuations are included in net realized and unrealized gain (loss) on investments. Net realized gain (loss) on foreign currency transactions represents net foreign currency gain (loss) from disposition of foreign currencies, currency gain (loss) realized between the trade and settlement dates on securities transactions, and the difference between the amount of dividends, interest and foreign withholding taxes recorded on a Portfolio’s accounting records and the U.S. dollar equivalent amounts actually received or paid. Net unrealized foreign currency gain (loss) arises from changes in the value of assets and liabilities, other than investments in securities, as a result of changes in exchange rates.
(e) Federal Income Taxes—The Fund’s policy is to continue to have each Portfolio qualify as a regulated investment company under Subchapter M of the Internal Revenue Code and to distribute all of its taxable income, including any realized net capital gains, to shareholders. Therefore, no federal income tax provision is required.
At December 31, 2004, the following Portfolio had available for federal income tax purposes unused realized capital losses which can be used to offset future realized capital gains as follows:
| Portfolio | | Expiring 2010 | | Expiring 2011 |
| |
| |
|
| Equity | | $ 521,864 | | $ 114,878 |
Under current tax law, certain capital and net foreign currency losses realized after October 31 within the taxable year may be deferred and treated as occurring on the first day of the following tax year. For the tax year ended December 31, 2004, the Equity Portfolio elected to defer net capital and currency losses of $2,482 arising between November 1, 2004 and December 31, 2004.
(f) Dividends and Distributions—Each Portfolio intends to declare and to pay dividends annually from net investment income. During any particular year, net realized gains from investment transactions in excess of available capital loss carryforwards would be taxable to the Portfolio if not distributed. The Portfolios intend to declare and distribute these amounts, at least annually, to shareholders; however, to avoid taxation, a second distribution may be required.
Income dividends and capital gains distributions are determined in accordance with federal income tax regulations which may differ from U.S. generally accepted accounting principles . These book/tax differences, which may result in distribution reclassifications, are primarily due to differing treatments of foreign currency transactions. Book/tax differences relating to shareholder distributions may result in reclassifications among certain capital accounts.
The tax character of dividends and distributions paid during the years ended December 31 was as follows:
| | | Ordinary Income |
| |
|
|
| Portfolio | | 2004 | | 2003 |
| |
|
| |
|
|
| Equity | | $ | 28,362 | | $ | 27,594 |
| Small Cap | | | — | | | — |
| International Equity | | | 902,561 | | | 277,086 |
| Emerging Markets | | | 149,218 | | | 6,053 |
At December 31, 2004, the components of distributable earnings (excluding unrealized appreciation (depreciation)) on a tax basis were as follows:
| | | | | | | Undistributed |
| | | Undistributed | | Long-Term |
| Portfolio | | Ordinary Income | | Capital Gain |
| |
| |
|
|
|
| Equity | | $ | 34,626 | | | $ | — | |
| Small Cap | | | 2,220,767 | | | | 7,268,741 | |
| International Equity | | | 3,660,074 | | | | 2,155,276 | |
| Emerging Markets | | | 499,742 | | | | 1,610,551 | |
(g) Allocation of Expenses—Expenses not directly chargeable to a specific Portfolio are allocated among the Portfolios primarily on the basis of relative net assets.
(h) Expense Reductions—Portfolios leaving excess cash in demand deposit accounts may receive credits which are available to offset custody expenses. The Statements of Operations report gross custody expenses, and report the amount of such credits separately as an expense reduction.
(i) Estimates—The preparation of financial statements in conformity with U.S. generally accepted accounting principles requires the Fund to make estimates and assumptions that affect the reported amounts of assets and liabilities and disclosure of contingent assets and liabilities at the date of the financial statements and the reported amounts of increases and decreases in net assets from operations during the reporting period. Actual results could differ from those estimates.
3. Investment Management, Administrative and Distribution Agreements
The Fund has entered into an investment management agreement (the “Management Agreement”) with the Investment Manager. Pursuant to the Management Agreement, the Investment Manager regularly provides each Portfolio with investment research, advice and supervision and furnishes continuously an investment program for each Portfolio consistent with its investment objective and policies, including the purchase, retention and disposition of
31
Lazard Retirement Series, Inc.
Notes to Financial Statements (continued)
December 31, 2004
|
securities. Each Portfolio pays the Investment Manager a management fee, accrued daily and payable monthly, at the annual rate set forth below as a percentage of its average daily net assets:
| Portfolio | | Annual Rate |
| |
|
|
| Equity | | 0.75 | % |
| Small Cap | | 0.75 | |
| International Equity | | 0.75 | |
| Emerging Markets | | 1.00 | |
The Investment Manager has voluntarily agreed to reduce its fees and, if necessary, reimburse the following Portfolios if annualized operating expenses exceed the following percentages of average daily net assets:
| | | Annual |
| Portfolio | | Operating Expenses |
| |
|
|
| Equity | | 1.25 | % |
| Small Cap | | 1.25 | |
| International Equity | | 1.25 | |
| Emerging Markets | | 1.60 | |
The Fund has entered into an administrative agreement with State Street Bank and Trust Company (“State Street”) to provide certain administrative services. Each Portfolio bears the cost of such services at a fixed annual rate of $37,500, plus 0.02% of average daily net assets up to $1 billion and 0.01% of average daily net assets over $1 billion. State Street agreed to waive one half of the $37,500 base fee for each of the Equity and Emerging Markets Portfolios until each Portfolio’s net assets reach $25 million. In November 2004, Emerging Markets Portfolio’s net asset exceeded $25 million and the full monthly base fee became effective.
The Fund has a distribution agreement with Lazard Asset Management Securities LLC (the “Distributor”), a wholly-owned subsidiary of the Investment Manager, to serve as the distributor of each Portfolio’s shares and bears the cost of printing and mailing prospectuses to potential investors and of certain expenses in connection with the offering of Portfolio shares.
Under a Distribution and Servicing Plan in accordance with Rule 12b-1 under the Act (the “Plan”), each Portfolio pays a monthly fee to the Distributor, at an annual rate of 0.25% of the average daily net assets of the Portfolio, for distribution and servicing of accounts. The Distributor may make payments to participating insurance companies, certain financial institutions, securities dealers and other industry professionals for providing these services.
4. Directors’ Compensation
Certain Directors of the Fund are Managing Directors or other employees of the Investment Manager. The Fund pays each Director who is not an employee or an affiliated person of the Investment Manager its allocated portion of a fixed fee of $50,000 per year, plus $2,500 per meeting attended ($1,000 per meeting attended by telephone) for the Fund, The Lazard Funds, Inc. and Lazard Global Total Return & Income Fund, Inc. (“LGI”) (collectively, the “Lazard Funds”), each a registered management investment company advised by the Investment Manager, and reimburses such Directors for travel and other out of pocket expenses. In addition, the Chairman of the Audit Committees for the Lazard Funds also receives an annual fee of $5,000.
5. Securities Transactions and Transactions with Affiliates
Purchases and sales of portfolio securities (excluding short-term securities) for the year ended December 31, 2004 were as follows:
| Portfolio | | Purchases | | Sales |
| |
|
| |
|
|
| Equity | | $ | 2,658,194 | | $ | 2,866,921 |
| Small Cap | | | 102,400,199 | | | 84,293,386 |
| International Equity | | | 137,539,224 | | | 85,086,003 |
| Emerging Markets | | | 17,104,298 | | | 8,702,914 |
For the year ended December 31, 2004, brokerage commissions of $185 were paid to Lazard for portfolio transactions executed on behalf of the Small Cap Portfolio.
6. Foreign Securities Investment Risk
Certain Portfolios invest in securities of foreign entities and securities denominated in foreign currencies which involve risks not typically involved in domestic investments. Foreign securities carry special risks, such as exposure to currency fluctuations, less developed or less efficient trading markets, political instability, a lack of company information, differing auditing and legal standards and, potentially, less liquidity. To the extent a Portfolio invests in companies in emerging market countries, it is exposed to additional volatility. A Portfolio’s performance will be influenced by political, social and economic factors affecting companies in emerging market countries. Emerging market countries generally have economic structures that are less diverse and mature, and political systems that are less stable, than those of developed countries.
32
Lazard Retirement Series, Inc.
Notes to Financial Statements (concluded)
December 31, 2004
|
7. Proxy Voting (unaudited)
A description of the policies and procedures that the Fund uses to determine how to vote proxies relating to its portfolio securities is available (1) without charge, upon request, by calling (800) 823-6300 or (2) on the Securities and Exchange Commission (“SEC”) website at www.sec.gov.
The Fund’s proxy voting record for the most recent 12-month period ended June 30 is available (1) without charge, upon request, by calling (800) 823-6300 or (2) on the SEC’s website at www.sec.gov. Information as of June 30 each year will generally be available by the following August 31.
8. Form N-Q (unaudited)
The Fund files a complete schedule of each Portfolio’s holdings for the first and third quarters of its fiscal year with the SEC on Form N-Q. The Fund’s Form N-Q is available on the SEC’s website at www.sec.gov and may be reviewed and copied at the SEC’s Public Reference Room in Washington, DC. Information on the operation of the SEC’s Public Reference Room may be obtained by calling 1-800-SEC-0330.
33
Lazard Retirement Series, Inc.
Report of Independent Registered Public Accounting Firm
|
The Board of Directors and Shareholders
Lazard Retirement Series, Inc.
We have audited the accompanying statements of assets and liabilities, including the portfolios of investments, of Lazard Retirement Series, Inc. (comprised of Lazard Retirement Equity Portfolio, Lazard Retirement Small Cap Portfolio, Lazard Retirement International Equity Portfolio and Lazard Retirement Emerging Markets Portfolio) as of December 31, 2004 and the related statements of operations for the year then ended, the statements of changes in net assets for each of the two years in the period then ended and the financial highlights for each of the five years in the period then ended. These financial statements and financial highlights are the responsibility of the Fund’s management. Our responsibility is to express an opinion on these financial statements and financial highlights based on our audits.
We conducted our audits in accordance with standards of the Public Company Accounting Oversight Board (United States). Those standards require that we plan and perform the audit to obtain reasonable assurance about whether the financial statements and financial highlights are free of material misstatement. An audit includes examining, on a test basis, evidence supporting the amounts and disclosures in the financial statements. Our procedures included confirmation of securities owned as of December 31, 2004, by correspondence with the custodian and brokers. An audit also includes assessing the accounting principles used and significant estimates made by management, as well as evaluating the overall financial statement presentation. We believe that our audits provide a reasonable basis for our opinion.
In our opinion, the financial statements and financial highlights as stated above, present fairly, in all material respects, the financial position of each of the respective portfolios constituting Lazard Retirement Series, Inc. as of December 31, 2004, the results of their operations for the year then ended, changes in their net assets for each of the two years in the period then ended and the financial highlights for each of the five years in the period then ended in conformity with U.S. generally accepted accounting principles.
ANCHIN, BLOCK & ANCHIN LLP
New York, New York
January 28, 2005
|
34
Lazard Retirement Series, Inc.
Board of Directors and Officers Information
(unaudited)
|
| Name (Age) | | Position(s) and Term | | Principal Occupation(s) During Past 5 Years |
| Address(1) | | with the Fund(2) | | and Other Directorships Held |
|
|
|
|
|
| Non-Interested Directors: | | | | |
| |
| John J. Burke (76) | | Director | | Lawyer and Private Investor; Director, Lazard Alternative Strategies Fund, |
| | | | | LLC; Director, Pacific Steel & Recycling; Director, Sletten Construction |
| | | | | Company; Trustee Emeritus, The University of Montana Foundation. |
| |
| Kenneth S. Davidson (59) | | Director | | President, Davidson Capital Management Corporation; Trustee, The Juilliard |
| | | | | School; Chairman of the Board, Bridgehampton Chamber Music Festival; |
| | | | | Trustee, American Friends of the National Gallery/London. |
| |
| William Katz (50) | | Director | | Retired President and Chief Executive Officer, BBDO New York, an |
| | | | | advertising agency; Retired Director, BBDO Worldwide. |
| |
| Lester Z. Lieberman (74) | | Director | | Private Investor; Chairman, Healthcare Foundation of NJ; Director, Cives |
| | | | | Steel Co.; Director, Northside Power Transmission Co.; Advisory Trustee, New |
| | | | | Jersey Medical School; Director, Public Health Research Institute; Trustee |
| | | | | Emeritus, Clarkson University; Council of Trustees, New Jersey Performing |
| | | | | Arts Center. |
| |
| Richard Reiss, Jr. (60) | | Director | | Chairman, Georgica Advisors LLC, an investment manager; Director, Lazard |
| | | | | Alternative Strategies Fund, LLC; Director, O’Charley’s, Inc., a restaurant |
| | | | | chain. |
| |
| Robert M. Solmson (57) | | Director | | Director, Colonial Williamsburg Co.; Former Chief Executive Officer and |
| | | | | Chairman, RFS Hotel Investors, Inc.; Former Director, Morgan Keegan, Inc.; |
| | | | | Former Director, Independent Bank, Memphis. |
| |
| Interested Directors(3): | | | | |
| |
| Charles Carroll (44) | | President and Director | | Managing Director and Deputy Chairman, Head of Global Marketing of the |
| | | | | Investment Manager. |
| |
| Norman Eig (63) | | Chairman of the Board | | Senior Adviser of the Investment Manager; Previously Chairman and Co- |
| | | | | Chief Executive Officer of the Investment Manager and Member of the |
| | | | | Management Committee of Lazard. |
| (1) | The address of each Director is Lazard Asset Management LLC, 30 Rockefeller Plaza, New York, New York 10112-6300. |
| |
| (2) | Each Director became a Director in April 1997, except that Mr. Solmson became a Director in September 2004 and Mr. Carroll became President and Director in June 2004, and serves as a Director for each of the Lazard Funds (total comprised of 18 investment portfolios). Each Director serves an indefinite term, until his successor is elected, and serves in the same capacity for the other Lazard Funds. |
| |
| |
| (3) | Mr. Carroll and Mr. Eig are “interested persons” (as defined in the Act) of the Fund because of their positions with the Investment Manager. |
| |
The Fund’s Statement of Additional Information contains further information about the Directors and is available without charge by calling 800-887-4929.
35
Lazard Retirement Series, Inc.
Board of Directors and Officers Information (concluded)
(unaudited)
|
| Name (Age) | | Position(s) and Term | | |
| Address(1) | | with the Fund(2) | | Principal Occupation(s) During Past 5 Years |
|
|
|
|
|
| Officers: | | | | |
| |
| Nathan A. Paul (31) | | Vice President | | Managing Director and General Counsel of the Investment Manager; from |
| | | and Secretary | | September 1997 to October 2000, an Associate at Schulte Roth & Zabel LLP, |
| | | since April 2002 | | a law firm. |
| |
| Stephen St. Clair (46) | | Treasurer | | Vice President of the Investment Manager. |
| | | since April 2003 | | |
| |
| Brian D. Simon (42) | | Assistant Secretary | | Senior Vice President of the Investment Manager; from July 1999 to October |
| | | since November 2002 | | 2002, Vice President, Law & Regulation at J. & W. Seligman & Co. |
| |
| Cesar A. Trelles (30) | | Assistant Treasurer | | Fund Administration Manager of the Investment Manager since September |
| | | since December 2004 | | 2004; from August 1998 to August 2004, a manager for Mutual Fund Finance |
| | | | | Group at UBS Global Asset Management. |
| |
| John Blevins (39) | | Chief Compliance Officer | | Senior Vice President and Chief Compliance Officer of the Investment |
| | | since September 2004 | | Manager since 2000; Director of Compliance for North America, Citi Asset |
| | | | | Management Group from November 1999 to July 2000. |
| (1) | The address of each officer is Lazard Asset Management LLC, 30 Rockefeller Plaza, New York, New York 10112-6300. |
| (2) | Each officer serves for an indefinite term, until his successor is elected and qualified, and serves in the same capacity for the other Lazard Funds, except that Mr. Paul is not Vice President of LGI. |
| |
| |
36
Lazard Retirement Series, Inc.
30 Rockefeller Plaza
New York, New York 10112-6300
Telephone: 800-887-4929
http://www.LazardNet.com Investment Manager
Lazard Asset Management LLC
30 Rockefeller Plaza
New York, New York 10112-6300
Telephone: 800-887-4929 Distributor
Lazard Asset Management Securities LLC
30 Rockefeller Plaza
New York, New York 10112-6300 Custodian
State Street Bank and Trust Company
225 Franklin Street
Boston, Massachusetts 02110 Transfer Agent and Dividend Disbursing Agent
Boston Financial Data Services, Inc.
P.O. Box 8514
Boston, Massachusetts 02266-8514
Telephone: 800-986-3455 Independent Registered Public Accounting Firm
Anchin, Block & Anchin LLP
1375 Broadway
New York, New York 10018
http://www.anchin.com Legal Counsel
Stroock & Stroock & Lavan LLP
180 Maiden Lane
New York, New York 10038-4982
http://www.stroock.com
|
| | | |
| Lazard Retirement Series, Inc. | 30 Rockefeller Plaza | Tel 800-887-4929 |
| | New York, NY 10112- 6300 | www.LazardNet.com |
R T 0 3 1 0 1
The Registrant has adopted a code of ethics that applies to the Registrant's principal executive officer, principal financial officer, principal accounting officer or controller, or persons performing similar functions.
ITEM 3. AUDIT COMMITTEE FINANCIAL EXPERT.
|
The Registrant's Board of Directors (the "Board") has determined that Lester Z. Lieberman, John J. Burke and Robert Solmson, members of the Audit Committee of the Board, are audit committee financial experts as defined by the Securities and Exchange Commission (the "SEC"). Mr. Lieberman, Mr. Burke and Mr. Solmson are "independent" as defined by the SEC for purposes of audit committee financial expert determinations.
ITEM 4. PRINCIPAL ACCOUNTANT FEES AND SERVICES.
(a) Audit Fees. The aggregate fees billed for each of the last two fiscal years (the "Reporting Periods") for professional services rendered by the Registrant's principal accountant (the "Auditor") for the audit of the Registrant's annual financial statements, or services that are normally provided by the Auditor in connection with the statutory and regulatory filings or engagements for the Reporting Periods, were $79,200 in 2003 and $81,900 in 2004.
(b) Audit-Related Fees. There were no fees billed in the Reporting Periods by the Auditor to the Registrant for assurance and related services that are reasonably related to the performance of the audit of the Registrant's financial statements and are not reported under paragraph (a) of this Item 4.
There were no fees billed in the Reporting Periods for assurance and related services by the Auditor to the Registrant's investment adviser or any entity controlling, controlled by or under common control with the investment adviser that provides ongoing services to the Registrant ("Service Affiliates").
(c) Tax Fees. The aggregate fees billed in the Reporting Periods by the Auditor to the Registrant for professional services rendered by the Auditor for tax compliance, tax advice and tax planning ("Tax Services") were $20,800 in 2003 and $21,500 in 2004. These services consisted of (i) review or preparation of U.S. federal, state, local and excise tax returns; (ii) U.S. federal, state and local tax planning, advice and assistance regarding statutory, regulatory or administrative developments, and (iii) tax advice regarding tax qualification matters and/or treatment of various financial instruments held or proposed to be acquired or held.
There were no fees billed in the Reporting Periods for Tax Services by the Auditor to Service Affiliates.
Certain of such services may not have been pre-approved prior to May 6, 2003, when such services were required to be pre-approved. For comparative purposes, the fees shown assume that all such services were pre-approved, including services that were not pre-approved prior to the compliance date of the pre-approval requirement.
(d) All Other Fees. There were no fees billed in the Reporting Periods by the Auditor to the Registrant for products and services other than the services reported in paragraphs (a) through (c) of this Item.
There were no fees billed in the Reporting Periods by the Auditor to Service Affiliates.
(e) Audit Committee Pre-Approval Policies and Procedures. The Registrant's Audit Committee pre-approves the Auditor's engagements for audit and non-audit services to the Registrant and, as required, non-audit services to Service Affiliates on a case-by-case basis. Pre-approval considerations include whether the proposed services are compatible with maintaining the Auditor's independence.
(f) None.
(g) Non-Audit Fees. The aggregate non-audit fees billed by the Auditor for services rendered to the Registrant for the Reporting Periods were $20,800 in 2003 and $21,500 in 2004. There were no fees billed in the Reporting Periods by the Auditor to Service Affiliates. On and after May 6, 2003, 100% of all services provided by the Auditor were pre-approved as required. There were no services provided by the Auditor that were approved pursuant to (c)(7)(i)(C) of Rule 2-01 of Regulation S-X.
(h) Auditor Independence. There were no services rendered by the Auditor to Service Affiliates during the Reporting Periods.
ITEM 5. AUDIT COMMITTEE OF LISTED REGISTRANTS.
Not applicable.
ITEM 6. SCHEDULE OF INVESTMENTS
ITEM 7. DISCLOSURE OF PROXY VOTING POLICIES AND PROCEDURES FOR CLOSED END MANAGEMENT INVESTMENTCOMPANIES.
ITEM 8. PORTFOLIO MANAGERS OF CLOSED-END MANAGEMENT INVESTMENT COMPANIES.
ITEM 9. PURCHASES OF EQUITY SECURITIES BY CLOSED-END MANAGEMENT INVESTMENT COMPANY AND AFFILIATED PURCHASERS.
ITEM 10. SUBMISSION OF MATTERS TO A VOTE OF SECURITY HOLDERS.
The Registrant has a Nominating Committee (the "Committee") of the Board which is currently comprised of all of the Directors who are not "interested persons" (as defined in the Investment Company Act of 1940, as amended) of the Registrant. The Committee's function is to select and nominate candidates for election to the Board. The Committee will consider recommendations for nominees from stockholders sent to the Secretary of the Registrant, 30 Rockefeller Plaza, New York, New York 10112. Nominations may be submitted only by a stockholder or group of stockholders that, individually or as a group, has beneficially owned the lesser of (a) 1% of the Registrant's outstanding shares or (b) $500,000 of the Registrant's shares for at least one year prior to the date such stockholder or group submits a candidate for nomination. Not more than one nominee for Director may be submitted by such a stockholder or group each calendar year.
In evaluating potential nominees, including any nominees recommended by stockholders, the Committee takes into consideration the factors listed in the Nominating Committee Charter, including character and integrity, business and professional experience, and whether the Committee believes that the person has the ability to apply sound and independent business judgment and would act in the interest of the Registrant and its stockholders. A nomination submission must include all information relating to the recommended nominee that is required to be disclosed in solicitations or proxy statements for the election of Directors, as well as information sufficient to evaluate the factors listed above. Nomination submissions must be accompanied by a written consent of the individual to stand for election if nominated by the Board and to serve if elected by the stockholders, and such additional information must be provided regarding the recommended nominee as reasonably requested by the Committee.
ITEM 11. CONTROLS AND PROCEDURES.
|
(a) The Registrant's principal executive and principal financial officers have concluded, based on their evaluation of the Registrant's disclosure controls and procedures as of a date within 90 days of the filing date of this report, that the Registrant's disclosure controls and procedures are reasonably designed to ensure that information required to be disclosed by the Registrant on Form N-CSR is recorded, processed, summarized and reported within the required time periods and that information required to be disclosed by the Registrant in the reports that it files or submits on Form N-CSR is accumulated and communicated to the Registrant's management, including its principal executive and principal financial officers, as appropriate to allow timely decisions regarding required disclosure.
(b) There were no changes to the Registrant's internal control over financial reporting that occurred during the second fiscal quarter of the period covered by this report that have materially affected, or are reasonably likely to materially affect, the Registrant's internal control over financial reporting.
(a)(1) Code of Ethics referred to in Item 2.
(a)(2) Certifications of principal executive and principal financial officers as required by Rule 30a-2(a) under the Investment Company Act of 1940.
(a)(3) Not applicable.
(b) Certifications of principal executive and principal financial officers as required by Rule 30a-2(b) under the Investment Company Act of 1940.
Pursuant to the requirements of the Securities Exchange Act of 1934 and the Investment Company Act of 1940, the registrant has duly caused this report to be signed on its behalf by the undersigned, thereunto duly authorized.
Lazard Retirement Series, Inc.
|
| By | | /s/ Charles Carroll |
| | | Charles Carroll |
| | | Chief Executive Officer |
| |
| Date | | March 4, 2005 |
Pursuant to the requirements of the Securities Exchange Act of 1934 and the Investment Company Act of 1940, this report has been signed below by the following persons on behalf of the registrant and in the capacities and on the dates indicated.
| By | | /s/ Charles Carroll |
| | | Charles Carroll |
| | | Chief Executive Officer |
| |
| Date | | March 4, 2005 |
| |
| By | | /s/ Stephen St. Clair |
| | | Stephen St. Clair |
| | | Chief Financial Officer |
| |
| Date | | March 4, 2005 |
