attractive when compared to their historical norms. Inflation seems to be under control despite the high cost of raw materials and energy. In order to preempt inflation, central banks have responded to strong global growth with rate hikes (including the European Central Bank). Increases in U.S. short-term rates have been well-digested by the markets. Increases in interest rates outside the United States may raise the level of uncertainty about the earnings potential of smaller, more volatile companies. Thus, going forward, we would expect a market rotation away from smaller, more volatile companies towards larger, more consistently profitable companies, as the economic recovery matures and corporate-earnings growth slows from the current robust rate. In the United States, large-cap stocks have begun to outperform small-cap stocks.
At the end of 2005, emerging markets equity logged in four consecutive years of dramatic outperformance. Although emerging markets equities still trade at a valuation discount to developed markets, their relative valuation is at the high end of its historical range. In our opinion, investors have become most enthusiastic about this asset class. Evidence of this optimism is the large number of recent initial public offerings and the heightened coverage of the asset class in the popular press. The excitement over the bull market in commodities, many of which are sourced from emerging markets, is also a sign of investor optimism. Historically, emerging markets equities have often performed poorly during periods of tightening monetary policy in the United States. Thus, we have reservations concerning the immediate term for this asset class. However, we remain constructive over the medium-and long-term, as there are powerful drivers that appear to be leading to a secular re-rating of emerging markets valuations to the levels of the developed markets. Among these drivers are improvements in corporate governance, rule of law, exchange-rate policies, and debt management.
We maintain our view that this is a stock picker’s market rather than one that favors sector rotation or other short-term timing strategies. We do not see excessive over or under valuations between sectors or industries. Valuation levels between domestic and international stocks have narrowed, but stock selection overseas remains a critical prerequisite to success. We believe that market leadership is likely to be narrower than in previous cycles, with only the highest quality and most attractively valued companies delivering outperformance.
In the first half of 2005, global stocks were unable to sustain a strong advance and finished with a small negative return. Signs of positive economic growth and improving company earnings were generally not reflected in stock prices, a result of macro-economic concerns that weighed on the markets. Persistent worries that high oil prices would slow economic growth continued to unnerve investors as oil prices topped $60 a barrel, driven by increased demand from China and fears over supply disruptions. The sustainability of European integration and the euro itself came under scrutiny after the rejection of the proposed E.U. Constitution by Dutch and French voters. Anxiety about the prospects for the euro contributed to a rally in the U.S. dollar, which strengthened considerably, based on positive U.S. economic data and encouraging signals from the U.S. Federal Reserve regarding the interest rate hikes.
During the third quarter, global equity markets witnessed solid gains, as investors became more confident regarding the prospects for global growth. Energy stocks outpaced the market during the quarter, as the price of oil briefly topped $70 per barrel after hurricanes Katrina and Rita devastated the Gulf shores, crippling U.S. oil production and refining in the area. Consumer confidence fell in September, as higher gasoline prices in the United States threatened to curtail consumer spending. However, European economies showed positive signs of growth, benefiting from a weak euro that made their goods more attractive abroad. In Germany, business confidence rose to a new high in September. Unemployment in Italy reached a new low, and consumer spending in France was improved. Japanese markets rallied sharply during the quarter, as this country’s economy began to show signs of improvement.
World markets moved higher in the fourth quarter, as the outlook for most global economies continued to be robust, and inflation appeared to be under control, despite high energy and raw-materials costs. The U.S. dollar was strong versus most major currencies, continuing the trend that started at the beginning of the
Lazard Retirement Series, Inc.
Investment Overviews (continued)
year. Central banks responded to stronger global growth with rate hikes in an effort to preempt inflation. The U.S. Federal Reserve raised rates twice during the fourth quarter for a total of thirteen rate increases over the last eighteen months. The European Central Bank raised interest rates in December for the first time in many years. While Japan has yet to tighten its monetary policy, continued signs of economic recovery led to speculation that Japan would end its zero interest-rate policy fairly soon. Smaller-cap stocks continued to outperform large-cap stocks for the quarter and for the year, on a global basis. However, this long-term trend waned in the United States, as large and small caps performed roughly in line for the year.
From a sector perspective, energy, industrials, financials, and materials all outperformed for the year. The only sector that witnessed a negative return was tele-com services, as the industry has become increasingly competitive. The highest performing regions of the MSCI World® Index, for the first half of 2005, were Japan, Australasia, and the Far East. Trailing were Europe, the United Kingdom and, lastly, North America.
For the second half of 2005, Japan was again the top-performer. Quite a bit behind, from a performance perspective, but in second place, was Europe, followed by Australasia, North America, the United Kingdom, and the Far East.
Emerging market equities had a solid, but volatile, first quarter of 2005. After solid gains over the first two months of the year, March witnessed a pullback due to concerns over the pace of interest-rate increases in the United States and their future impact on the global economy. In April, emerging markets equities fell modestly, but rebounded in both May and June. Notable events over the quarter included a continued increase in the price of oil, which climbed above $60 a barrel, and considerable strength in the U.S. dollar against many world currencies. Emerging markets shares experienced a powerful third quarter, as investor excitement over commodity prices generated a return for the MSCI EM Index in excess of 18%. The quarter included newsworthy events such as terrorist attacks in the London Underground and the Sharm El Sheikh Resort in Egypt, the death of King Fahd of Saudi Ara-bia, and record high crude oil prices. Emerging markets equities also experienced a robust fourth
quarter, as the Index rose by more than 7%, to finish the year with a 34% return. Regionally, all countries ended the year higher, except for Venezuela. Latin American and Eastern European equities posted the largest returns, with Asian emerging markets also performing well. All sectors finished the year significantly higher. However, energy, consumer staples, health care, and utilities outperformed the Index. Lagging sectors included telecom services, information technology, materials, financials, and consumer discretionary.
Lazard Retirement Equity Portfolio
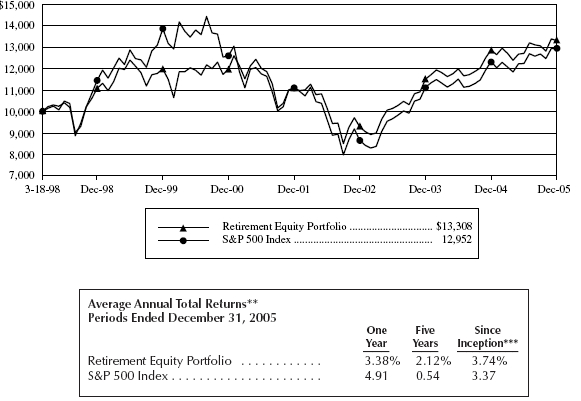
For the year ended December 31, 2005, Lazard Retirement Equity Portfolio posted a total return of 3.38%, as compared with the 4.91% return of the S&P 500 Index.
Despite a robust domestic economy and solid corporate-profit growth, the U.S. stock market was among the few that did not enjoy a year-end rally. Instead, U.S. equities had a lackluster year, posting rather modest positive returns. The U.S. economy proved remarkably resilient in 2005, overcoming progressive monetary tightening, waning fiscal stimulus, hurricanes, and a brutal run-up in oil prices. As a result of higher energy costs, there was also considerable worry about an overall decline in consumer spending and a dismal holiday shopping season. However, economic growth re-accelerated in the third quarter, due to gains in consumer spending, business investment, and residential construction. Fortunately, consumers were not as affected by higher energy costs as had been expected, in part because gasoline prices declined after September.
Despite high energy and raw-material costs, the economy continued to be robust through December, and inflation appeared to be under control. Mergers and acquisitions activity boomed, and the value of announced transactions for 2005 was the largest in the last five years. Larger-cap stocks performed roughly in-line with small caps for the year, breaking the multi-year trend of smaller-cap outperformance. Weakness in energy and utility companies during the last few months of the year was in sharp contrast to the earlier part of the year, when these companies dominated market returns. Still, the energy sector contributed almost 50% of the total annual return of the S&P 500 Index in 2005, although the price of oil declined to
4
Lazard Retirement Series, Inc.
Investment Overviews (continued)
approximately $60 from its peak. From a sector perspective, energy, utilities and financials outperformed, while consumer discretionary and technology witnessed negative returns for the year.
An overweight position in energy benefited the Portfolio, as this was the best-performing sector for the year due to rising oil prices. Stock selection in energy also boosted returns, as the Portfolio’s holdings in Global-SantaFe Corp. and BJ Services performed well. The Portfolio also benefited from stock selection in health care, as holdings such as Allergan and Medimmune performed well. An overweight position in consumer discretionary, particularly media, detracted from returns, as this was the worst performing sector for the year. Holdings such as News Corp., Tribune, and Westwood One declined during the year. Shares of Westwood One steadily declined during the year, due to negative sentiment regarding the radio-advertising market. More recently, in December, CEO Shane Coppola resigned. At the same time, the company announced that it would not meet fourth-quarter guidance, as revenues would be weaker than expected. Despite lower guidance, we believe that Westwood One is undervalued given the negative sentiment. We also believe that investors may be rewarded as the advertising market begins to turn around. Stock selection in financials detracted from performance, as the Portfolio’s insurance holdings declined on losses they experienced from the Gulf Coast hurricanes.
We view the outlook for equities to be positive, as earnings growth and cash generation remain strong, and valuations appear relatively attractive compared to historical norms. However, we would expect a market rotation away from more highly leveraged, volatile companies toward more consistently profitable companies, as the economic recovery matures and corporate-earnings growth slows from the current robust rate.
Lazard Retirement Small Cap Portfolio
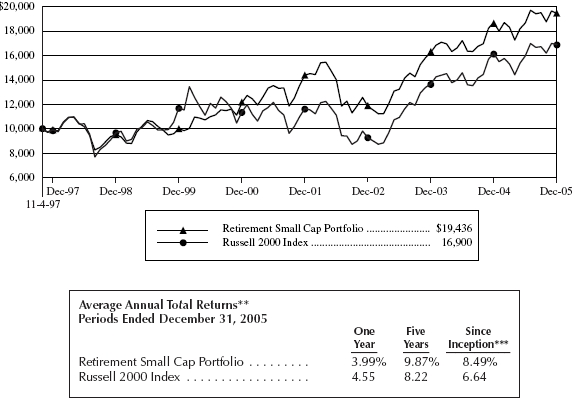
For the year ended December 31, 2005, Lazard Retirement Small Cap Portfolio posted a total return of 3.99%, as compared with the 4.55% return of the Russell 2000 Index. 2005 brought investors a seesaw pattern of peaks and troughs through most of the year with equity markets producing choppy returns. Small cap stocks were no exception.
For the year, mid-cap stocks led the way, with the Rus-sell Midcap® Index up 12.5%, followed by large-cap stocks, up 4.9% (as measured by the S&P 500 Index), and small cap stocks (as measured by the Russell 2000 Index) slightly lower than that, up 4.5% .
The Portfolio benefited from its overweight positions in both the energy and industrial sectors. Climbing commodity prices buoyed the energy sector, as both exploration and production companies and oil-services companies witnessed solid earnings and cash flow growth. We continue to overweight the energy sector, as we believe that global economic growth will continue to be robust, which should help maintain commodity prices at record high levels. The industrial sector also continues to benefit from solid economic growth and multiple years of restructuring, which have helped many companies profit from an upturn in sales activity. We continue to overweight the industrial sector.
Stock selection in several sectors also boosted the Portfolio’s performance during the year. The shares of RTI International Metals, a fabricator of titanium parts primarily serving the aerospace industry, rose, as the company continues to benefit from increased volumes shipped to Boeing and Airbus. Veritas DGC, a provider of seismic services to the oil and gas industry, was another solid contributor to performance. Due to surging commodity prices, many exploration and production companies are trying to find new energy deposits or seeking to enlarge existing fields. Veritas’ data helps its customers see underground deposits more clearly. Despite all the negative news regarding the airline industry, the shares of AirTran, a domestic airline carrier, posted solid gains for the year. AirTran is a low-cost carrier that is gaining market share at the expense of rivals, particularly as Delta cuts back its schedule out of its Atlanta hub. The Portfolio continues to hold positions in all three of these companies.
An overweight position in technology hardware detracted from performance, as the technology sector
5
Lazard Retirement Series, Inc.
Investment Overviews (continued)
continued to face slowing growth and increasing competitive issues. We continue to believe that broader technology shares can rally in 2006, as valuations are reasonable and economic growth should boost capital expenditures in this sector after four years of weak demand. Stock selection in health care hurt returns, as the shares of generic drug manufacturers, Taro Pharmaceuticals and Able Labs, declined. The shares of Amerigroup, a provider of managed-care services to Medicaid populations, also fell, due to deteriorating cost trends in its business. We exited all three positions over the course of 2005.
Lazard Retirement International Equity Portfolio
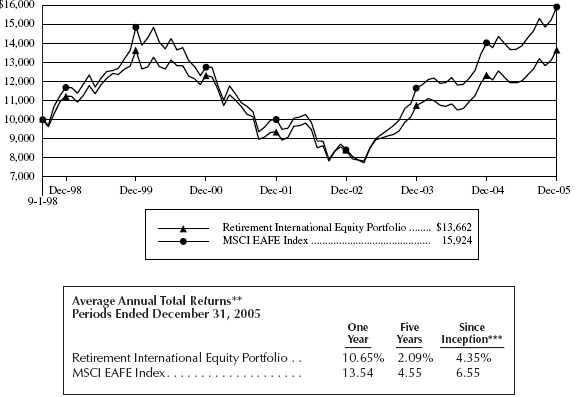
For the year ended December 31, 2005, Lazard Retirement International Equity Portfolio posted a total return of 10.65%, as compared with the 13.54% return of the MSCI EAFE Index.
2005 saw another strong performance from international stocks, which posted their third consecutive year of gains. Japanese stocks led the way, as the Nikkei 225 Index rose 40% in the year. Japan’s outperformance has coincided with the re-election of Prime Minister Koizumi and the reshuffling of his cabinet. Investors feel that Koizumi’s strong showing in the polls has given him a clear mandate to continue the restructuring of the Japanese economy and further reinforces the belief that corporate profitability may be about to improve. European markets also posted solid gains, driven by corporate restructuring, low interest rates, favorable profit-growth, and a boom in mergers and acquisitions (M&A) activity. Globally, the value of announced M&A transactions for 2005 was the largest in the last five years. Based on these signs of improving economic conditions, the European Central Bank raised interest rates in December, for the first time in five years, in an effort to curb inflation. While Japan has yet to tighten its monetary policy, continued signs of economic recovery have led to speculation that Japan will end its zero interest-rate policy fairly soon. From a sector perspective, materials, industrials, financials, and energy all outperformed for the year, as the outlook for global growth looks positive. The only sector that witnessed a negative return was telecom services, as the industry has become increasingly competitive. Regionally, Japan was the top-performing country, while the United Kingdom lagged. In Europe, Switzerland, Denmark, and Norway posted solid gains, while Ireland and Spain were the only countries that witnessed negative returns.
Stock selection in technology benefited the Portfolio, as one of its holdings (Hoya Corp.) continued to post solid earnings results throughout the year, in addition to doubling its dividend payout and announcing a share buy back. The demand for the company’s glass templates, which are used to make liquid crystal displays, remains robust. The shares of Nidec, a Japanese manufacturer of motors for IT products, also rose, after the company announced solid second-quarter results. We believe that the company should continue to benefit from the strength of its HDD (hard disk drive) motors business, as demand for digital music players continues to be strong. Stock selection in consumer discretionary also helped performance: the shares of a large Japanese automobile company, Toyota, were purchased in a timely fashion prior to Japan’s recent strong rally and the shares of Marks and Spencer, a large U.K. clothing retailer, also rose sharply, due to the company reporting better-than-expected earnings. The CEO’s restructuring efforts have begun to bear fruit, and the company is benefiting from a rebound in U.K. consumer confidence. Shares of Richemont, a Swiss luxury goods holding, also rose, as the company benefits from heavy demand from affluent consumers. Stock selection in telecom services detracted from performance, as this group has been weakened by an increasingly competitive landscape in European wireless services and continued declines in wire-line telephony. However, we believe that the Portfolio’s holdings in this sector are undervalued, particularly in relation to their robust free-cash generation, and that investors’ outlook for the group is overly pessimistic. An underweight position in materials also hurt returns, as this was one of the top-performing sectors.
The international economy demonstrated tremendous resiliency in 2005, as growth remained strong even as energy prices soared and central banks around the world continued to tighten monetary policy. Our outlook on international stocks remains positive, as earnings growth and cash generation remain healthy, and valuations appear relatively attractive compared to historical norms. However, increases in interest rates outside the United States may raise the level of uncertainty about the earnings potential of smaller, more
6
Lazard Retirement Series, Inc.
Investment Overviews (concluded)
volatile companies. Thus, we would expect a market rotation away from such companies and toward larger, more consistently profitable companies, as the economic recovery matures and corporate earnings growth slows from its current hardy rate.
Lazard Retirement Emerging Markets Portfolio
For the year ended December 31, 2005, Lazard Retirement Emerging Markets Portfolio posted a total return of 40.78%, as compared with the 34.00% return of the MSCI EM Index.
During the year, the Portfolio benefited from significant appreciation in several individual holdings. The shares of Orascom Telecom (Egypt) rose, based on the positive trends for subscriber growth in its cellular concessions. Shares of Petrobras (Brazil), Petrokazakhstan (Kazakhstan), and LUKOIL (Russia) rose sharply, based on higher crude-oil prices. Shares in iron ore companies Vale do Rio Doce and Caemi (both in Brazil), and Kumba (South Africa) increased due to buoyant iron ore prices, as well as optimism concerning upcoming negotiations. Satyam (India) shares benefited from positive and improving business conditions in the software industry. Shares of LG Household & Health (South Korea) climbed higher, based on investors’ optimism regarding a business turnaround under a new CEO. Delta Electronics (Taiwan) shares rose markedly, based on news concerning new orders. The Portfolio’s overweight positions in Brazil and Egypt, and underweight positions in China, Malaysia, and Taiwan, also added value. Good stock selection in Brazil, South Africa, and Taiwan, as well as in consumer staples, financials, industrials, materials, information technology, and telecom services also helped performance.
Weak stock selection in Russia, China, and the consumer discretionary sector detracted from performance in 2005. An overweight position in Venezuela and an underweight position in energy also subtracted value. Poor stock performance was registered in the shares of Anonima Nacional Telefonos (Venezuela), after the company faced Venezuela Supreme Court legal challenges concerning its pension fund. Shares in Taiwanese financial companies Fubon Financial Group and Chinatrust fell, based on investor concerns regarding worsening credit card asset quality. Shares of Grendene (Brazil) and People’s Food (China) performed poorly, as investors became concerned over both companies’ guidance. PT Bank Mandiri (Indone-sia) shares fell, after its CEO was removed and its asset quality was markedly downgraded. Sappi (South Africa) shares dropped in expectation of a poor earnings announcement.
Notes to Investment Overviews:
All returns are for the year ended December 31, 2005 and reflect reinvestment of all dividends and distributions, if any. Certain expenses of the Portfolios have been waived or reimbursed by the Fund’s Investment Manager or Administrator; without such waiver/reimbursement of expenses, the Portfolio’s returns would have been lower. Performance information does not reflect the fees and charges imposed by participating insurance companies at the separate account level, and such charges will have the effect of reducing performance. Past performance is not indicative, nor a guarantee, of future results.
The performance data of the indices and other market data have been prepared from sources and data that the Investment Manager believes to be reliable, but no representation is made as to their accuracy. These indices are unmanaged, have no fees or costs and are not available for investment.
The views of the Fund’s management and the portfolio holdings described in this report are as of December 31, 2005; these views and portfolio holdings may have changed subsequent to this date. Nothing herein should be construed as a recommendation to buy, sell, or hold a particular security. There is no assurance that the securities discussed herein will remain in each Portfolio at the time you receive this report, or that securities sold will have not been repurchased. The specific portfolio securities may in aggregate represent only a small percentage of each Portfolio’s holdings. It should not be assumed that investments in the securities identified and discussed were, or will be, profitable, or that the investment decisions we make in the future will be profitable, or equal the investment performance of the securities discussed herein.
The views and opinions expressed are provided for general information only, and do not constitute specific tax, legal, or investment advice to, or recommendations for, any person. There can be no guarantee as to the accuracy of the outlooks for markets, sectors and securities as discussed herein. You should read the Fund’s prospectus for a more detailed discussion of each Portfolio’s investment objective, strategies, risks and fees.
7
Lazard Retirement Series, Inc.
Performance Overviews
Lazard Retirement Equity Portfolio*
Comparison of Changes in Value of $10,000 Investment in Lazard Retirement Equity Portfolio
and S&P 500® Index**
| * | See Note 8 under Notes to Financial Statements. |
| |
| ** | All returns reflect reinvestment of all dividends and distributions, if any. Certain expenses of the Portfolio have been waived or reim- bursed by the Portfolio’s Investment Manager or Administrator; without such waiver/reimbursement of expenses, the Portfolio’s returns would have been lower. Performance information does not reflect the fees and charges imposed by participating insurance companies at the separate account level, and such charges will have the effect of reducing performance. |
| |
| | Past performance is not indicative, nor a guarantee, of future results; the investment return and principle value of the Portfolio will fluctuate, so that an investor’s shares in the Portfolio, when redeemed, may be worth more or less than their original cost. Within the longer peri- ods illustrated there may have been short-term fluctuations, counter to the overall trend of investment results, and no single period of any length may be taken as typical of what may be expected in future periods. |
| |
| | The performance data of the index has been prepared from sources and data that the Investment Manager believes to be reliable, but no representation is made as to its accuracy. The index is unmanaged, has no fees or costs and is not available for investment. The S&P 500 Index is a market capitalization-weighted index of 500 common stocks, designed to measure performance of the broad domestic econo- my through changes in the aggregate market value of these stocks, which represent all major industries. |
| |
| *** | The Portfolio’s inception date was March 18, 1998. |
| |
8
Lazard Retirement Series, Inc.
Performance Overviews (continued)
Lazard Retirement Small Cap Portfolio*
Comparison of Changes in Value of $10,000 Investment in Lazard Retirement Small Cap Portfolio
and Russell 2000® Index**
| * | See Note 8 under Notes to Financial Statements. |
| |
| ** | All returns reflect reinvestment of all dividends and distributions, if any. Certain expenses of the Portfolio have been waived or reim- bursed by the Portfolio’s Investment Manager or Administrator; without such waiver/reimbursement of expenses, the Portfolio’s returns would have been lower. Performance information does not reflect the fees and charges imposed by participating insurance companies at the separate account level, and such charges will have the effect of reducing performance. |
| |
| | Past performance is not indicative, nor a guarantee, of future results; the investment return and principle value of the Portfolio will fluctuate, so that an investor’s shares in the Portfolio, when redeemed, may be worth more or less than their original cost. Within the longer peri- ods illustrated there may have been short-term fluctuations, counter to the overall trend of investment results, and no single period of any length may be taken as typical of what may be expected in future periods. |
| |
| | The performance data of the index has been prepared from sources and data that the Investment Manager believes to be reliable, but no representation is made as to its accuracy. The index is unmanaged, has no fees or costs and is not available for investment. The Russell 2000 Index is comprised of the 2,000 smallest U.S. companies included in the Russell 3000® Index (which consists of the 3,000 largest U.S. companies by capitalization). |
| |
| *** | The Portfolio’s inception date was November 4, 1997. |
| |
9
Lazard Retirement Series, Inc.
Performance Overviews (continued)
Lazard Retirement International Equity Portfolio*
Comparison of Changes in Value of $10,000 Investment in Lazard Retirement International Equity Portfolio
and Morgan Stanley Capital International (MSCI®) Europe, Australasia and Far East (EAFE®) Index**
| * | See Note 8 under Notes to Financial Statements. |
| |
| ** | All returns reflect reinvestment of all dividends and distributions, if any. Certain expenses of the Portfolio have been waived or reim- bursed by the Portfolio’s Investment Manager or Administrator; without such waiver/reimbursement of expenses, the Portfolio’s returns would have been lower. Performance information does not reflect the fees and charges imposed by participating insurance companies at the separate account level, and such charges will have the effect of reducing performance. |
| |
| | Past performance is not indicative, nor a guarantee, of future results; the investment return and principle value of the Portfolio will fluc- tuate, so that an investor’s shares in the Portfolio, when redeemed, may be worth more or less than their original cost. Within the longer periods illustrated there may have been short-term fluctuations, counter to the overall trend of investment results, and no single period of any length may be taken as typical of what may be expected in future periods. |
| |
| | The performance data of the index has been prepared from sources and data that the Investment Manager believes to be reliable, but no representation is made as to its accuracy. The index is unmanaged, has no fees or costs and is not available for investment. The MSCI EAFE Index is a broadly diversified international index comprised of equity securities of approximately 1,000 companies located outside the United States. |
| |
| *** | The Portfolio’s inception date was September 1, 1998. |
| |
10
Lazard Retirement Series, Inc.
Performance Overviews (concluded)
Lazard Retirement Emerging Markets Portfolio*
Comparison of Changes in Value of $10,000 Investment in Lazard Retirement Emerging Markets Portfolio
and MSCI Emerging Markets (EM®) Index**

| * | See Note 8 under Notes to Financial Statements. |
| |
| ** | All returns reflect reinvestment of all dividends and distributions, if any. Certain expenses of the Portfolio have been waived or reimbursed by the Portfolio’s Investment Manager or Administrator; without such waiver/reimbursement of expenses, the Portfolio’s returns would have been lower. Performance information does not reflect the fees and charges imposed by participating insurance companies at the separate account level, and such charges will have the effect of reducing performance. |
| |
| | Past performance is not indicative, nor a guarantee, of future results; the investment return and principle value of the Portfolio will fluctuate, so that an investor’s shares in the Portfolio, when redeemed, may be worth more or less than their original cost. Within the longer peri- ods illustrated there may have been short-term fluctuations, counter to the overall trend of investment results, and no single period of any length may be taken as typical of what may be expected in future periods. |
| |
| | The performance data of the index has been prepared from sources and data that the Investment Manager believes to be reliable, but no representation is made as to its accuracy. The index is unmanaged, has no fees or costs and is not available for investment. The MSCI EM Index is comprised of emerging market securities in countries open to non-local investors. |
| |
| *** | The Portfolio’s inception date was November 4, 1997. |
| |
11
Lazard Retirement Series, Inc.
Information About Your Fund’s Expenses
Expense Example
As a shareholder in a Portfolio of the Fund, you incur ongoing costs, include management fees, distribution and service (12b-1) fees, and other expenses. This Example is intended to help you understand your ongoing costs (in dollars) of investing in a Portfolio and to compare these costs with the ongoing costs of investing in other mutual funds. The Example is based on an investment of $1,000 invested at the beginning of the six month period from July 1, 2005 through December 31, 2005 and held for the entire period.
Actual Expenses
For each Portfolio of the Fund, the first line of the table below provides information about actual account values and actual expenses. You may use the information in this line, together with the amount you invested, to estimate the expenses that you paid over the period. Simply divide your account value by $1,000 (for example, an $8,600 account value divided by $1,000=8.6), then multiply the result by the number in the first line under the heading entitled “Expenses Paid During Period” to estimate the expenses you paid on your account during this period.
Hypothetical Example for Comparison Purposes
For each Portfolio of the Fund, the second line of the table below provides information about hypothetical account values and hypothetical expenses based on each Portfolio’s actual expense ratio and an assumed rate of return of 5% per year before expenses, which is not the Portfolio’s actual return. The hypothetical account values and expenses may not be used to estimate the actual ending account balance or expenses you paid for the period. You may use this information to compare the ongoing costs of investing in the Portfolio and other mutual funds. To do so, compare this 5% hypothetical example with the 5% hypothetical examples that appear in the shareholder reports of the other funds.
Please note that you also bear fees and charges imposed by participating insurance companies at the separate account level, which are described in the separate prospectuses issued by the insurance companies. Such charges will have the effect of reducing Account Value.
| | | | | | | | Annualized |
| | Beginning | | Ending | | Expenses Paid | | Expense Ratio |
| | Account Value | | Account Value | | During Period* | | During Period |
|
|
| | 7/1/05 | | 12/31/05 | | 7/1/05-12/31/05 | | 7/1/05-12/31/05 |
|
|
| Retirement Equity Portfolio** | | | | | | | |
| Actual | $1,000.00 | | $1,042.50 | | $6.44 | | 1.25% |
| Hypothetical (5% Return Before Expenses) | $1,000.00 | | $1,018.90 | | $6.36 | | 1.25% |
| |
| Retirement Small Cap Portfolio** | | | | | | | |
| Actual | $1,000.00 | | $1,034.40 | | $6.12 | | 1.19% |
| Hypothetical (5% Return Before Expenses) | $1,000.00 | | $1,019.19 | | $6.07 | | 1.19% |
| |
| Retirement International Equity Portfolio** | | | | | | | |
| Actual | $1,000.00 | | $1,140.10 | | $6.37 | | 1.18% |
| Hypothetical (5% Return Before Expenses) | $1,000.00 | | $1,019.25 | | $6.01 | | 1.18% |
| |
| Retirement Emerging Markets Portfolio** | | | | | | | |
| Actual | $1,000.00 | | $1,280.70 | | $9.20 | | 1.60% |
| Hypothetical (5% Return Before Expenses) | $1,000.00 | | $1,017.14 | | $8.13 | | 1.60% |
| * | Expenses are equal to the Portfolio’s annualized expense ratio multiplied by the average account value over the period, multiplied by 184/365 (to reflect one-half year period). |
| |
| ** | See Note 8 under Notes to Financial Statements. |
| |
12
Lazard Retirement Series, Inc.
Portfolio Holdings Presented by Sector
December 31, 2005
| | | | | | | | Lazard | | Lazard |
| | Lazard | | Lazard | | Retirement | | Retirement |
| | Retirement | | Retirement | | International | | Emerging |
| | Equity | | Small Cap | | Equity | | Markets |
| Sector* | Portfolio | | Portfolio | | Portfolio | | Portfolio |
|
| Commercial Services | 4.2 | % | | 10.7 | % | | — | % | | 2.0 | % |
| Consumer Discretionary | 14.9 | | | 11.2 | | | 9.4 | | | 10.3 | |
| Consumer Durables | 1.1 | | | 1.5 | | | 7.3 | | | 2.5 | |
| Consumer Staples | 4.4 | | | 1.1 | | | 7.9 | | | 10.1 | |
| Energy | 12.6 | | | 8.2 | | | 9.6 | | | 9.2 | |
| Financials | 21.5 | | | 17.7 | | | 29.7 | | | 16.6 | |
| Health Care | 8.5 | | | 10.4 | | | 7.0 | | | 0.9 | |
| Process Industry | 3.7 | | | 6.3 | | | 0.6 | | | 10.4 | |
| Producer Manufacturing | 8.4 | | | 9.5 | | | 5.3 | | | 0.9 | |
| Technology | 16.3 | | | 14.2 | | | 6.3 | | | 13.5 | |
| Telecommunications | 4.4 | | | — | | | 7.2 | | | 15.9 | |
| Transportation | — | | | 5.0 | | | 3.7 | | | 1.8 | |
| Utilities | — | | | 1.5 | | | 3.7 | | | — | |
| Short-Term Investments | — | | | 2.7 | | | 2.3 | | | 5.9 | |
|
|
| Total Investments | 100.0 | % | | 100.0 | % | | 100.0 | % | | 100.0 | % |
|
|
* Represents percentage of total investments.13
Lazard Retirement Series, Inc.
Portfolios of Investments
December 31, 2005
| Description | Shares | | | Value |
|
| Lazard Retirement Equity Portfolio | | | | |
| Common Stocks—98.7% | | | | |
| Alcohol & Tobacco—1.0% | | | | |
| Altria Group, Inc. | 550 | | $ | 41,096 |
| |
|
| Banking—6.5% | | | | |
| Bank of America Corp. | 3,005 | | | 138,680 |
| Golden West Financial Corp. | 1,105 | | | 72,930 |
| The Bank of New York Co., Inc. | 2,155 | | | 68,637 |
| |
|
| | | | | 280,247 |
| |
|
| Building & Construction—1.1% | | | | |
| Masco Corp. | 1,510 | | | 45,587 |
| |
|
| Chemicals—1.3% | | | | |
| Cabot Corp. | 675 | | | 24,165 |
| Du Pont (E.I.) de Nemours & Co. | 735 | | | 31,238 |
| |
|
| | | | | 55,403 |
| |
|
| Commercial Services—3.8% | | | | |
| ARAMARK Corp., Class B | 2,190 | | | 60,838 |
| Automatic Data Processing, Inc. | 1,400 | | | 64,246 |
| Republic Services, Inc. | 1,035 | | | 38,864 |
| |
|
| | | | | 163,948 |
| |
|
| Computer Software—7.7% | | | | |
| Computer Associates International, Inc. | 1,145 | | | 32,278 |
| Microsoft Corp. | 7,425 | | | 194,164 |
| Oracle Corp. (a) | 6,835 | | | 83,455 |
| Symantec Corp. (a) | 1,300 | | | 22,750 |
| |
|
| | | | | 332,647 |
| |
|
| Consumer Products—1.7% | | | | |
| The Procter & Gamble Co. | 1,280 | | | 74,086 |
| |
|
| Drugs—4.1% | | | | |
| Abbott Laboratories | 500 | | | 19,715 |
| Bristol-Myers Squibb Co. | 1,200 | | | 27,576 |
| Merck & Co., Inc. | 1,000 | | | 31,810 |
| Pfizer, Inc. | 4,175 | | | 97,361 |
| |
|
| | | | | 176,462 |
| |
|
| Energy Integrated—7.7% | | | | |
| Chevron Corp. | 1,190 | | | 67,556 |
| ConocoPhillips | 1,485 | | | 86,398 |
| Exxon Mobil Corp. | 2,565 | | | 144,076 |
| Marathon Oil Corp. | 565 | | | 34,448 |
| |
|
| | | | | 332,478 |
| |
|
| Energy Services—4.7% | | | | |
| BJ Services Co. | 1,325 | | | 48,588 |
| GlobalSantaFe Corp. | 920 | | | 44,298 |
| Halliburton Co. | 770 | | | 47,709 |
| The Williams Cos., Inc. | 2,765 | | | 64,065 |
| |
|
| | | | | 204,660 |
| |
|
| Financial Services—10.1% | | | | |
| Ameriprise Financial, Inc. | 760 | | | 31,160 |
| Citigroup, Inc. | 2,465 | | | 119,627 |
| JPMorgan Chase & Co. | 2,454 | | | 97,399 |
| MBNA Corp. | 2,080 | | | 56,472 |
| Mellon Financial Corp. | 1,325 | | | 45,381 |
| Merrill Lynch & Co., Inc. | 330 | | | 22,351 |
| The Bear Stearns Cos., Inc. | 540 | | | 62,386 |
| |
|
| | | | | 434,776 |
| |
|
| Food & Beverages—0.6% | | | | |
| The Pepsi Bottling Group, Inc. | 915 | | | 26,178 |
| |
|
| Forest & Paper Products—3.4% | | | | |
| Ball Corp. | 1,100 | | | 43,692 |
| International Paper Co. | 1,735 | | | 58,313 |
| Kimberly-Clark Corp. | 750 | | | 44,738 |
| |
|
| | | | | 146,743 |
| |
|
| Health Services—1.0% | | | | |
| Laboratory Corp. of America | | | | |
| Holdings (a) | 840 | | | 45,234 |
| |
|
| Insurance—4.6% | | | | |
| American International Group, Inc. | 1,430 | | | 97,569 |
| The Allstate Corp. | 800 | | | 43,256 |
| The St. Paul Travelers Cos., Inc. | 600 | | | 26,802 |
| XL Capital, Ltd., Class A | 450 | | | 30,321 |
| |
|
| | | | | 197,948 |
| |
|
| Leisure & Entertainment—8.4% | | | | |
| Clear Channel Communications, Inc. | 2,090 | | | 65,730 |
| Expedia, Inc. (a) | 1,585 | | | 37,977 |
| McDonald’s Corp. | 1,260 | | | 42,487 |
| News Corp., Class A | 6,295 | | | 97,887 |
| Tribune Co. | 1,145 | | | 34,648 |
| Viacom, Inc., Class B (a) | 1,075 | | | 35,045 |
| Westwood One, Inc. | 2,900 | | | 47,270 |
| |
|
| | | | | 361,044 |
| |
|
The accompanying notes are an integral part of these financial statements.
14
Lazard Retirement Series, Inc.
Portfolios of Investments (continued)
December 31, 2005
| Description | Shares | | | Value |
|
| Lazard Retirement Equity Portfolio (concluded) | | | |
| Manufacturing—8.2% | | | | |
| Dover Corp. | 1,030 | | $ | 41,705 |
| General Electric Co. | 2,665 | | | 93,408 |
| Honeywell International, Inc. | 1,475 | | | 54,944 |
| Ingersoll-Rand Co., Ltd., Class A | 1,165 | | | 47,031 |
| Tyco International, Ltd. | 1,865 | | | 53,824 |
| United Technologies Corp. | 1,160 | | | 64,855 |
| |
|
| | | | | 355,767 |
| |
|
| Medical Products—3.3% | | | | |
| Becton, Dickinson & Co. | 730 | | | 43,858 |
| Johnson & Johnson | 1,605 | | | 96,461 |
| |
|
| | | | | 140,319 |
| |
|
| Printing & Publishing—0.4% | | | | |
| Dex Media, Inc. | 610 | | | 16,525 |
| |
|
| Retail—6.4% | | | | |
| Dollar Tree Stores, Inc. (a) | 2,095 | | | 50,154 |
| Liz Claiborne, Inc. | 825 | | | 29,552 |
| Sears Holdings Corp. (a) | 185 | | | 21,373 |
| The Home Depot, Inc. | 2,680 | | | 108,486 |
| Wal-Mart Stores, Inc. | 1,405 | | | 65,754 |
| |
|
| | | | | 275,319 |
| |
|
Semiconductors & Components—1.5% | | | | |
| Intel Corp. | 2,590 | | | 64,646 |
| |
|
| Technology—2.0% | | | | |
| International Business Machines Corp. | 1,050 | | | 86,310 |
| |
|
| Technology Hardware—4.9% | | | | |
| Avaya, Inc. (a) | 7,380 | | | 78,745 |
| Cisco Systems, Inc. (a) | 4,330 | | | 74,130 |
| Hewlett-Packard Co. | 1,980 | | | 56,687 |
| |
|
| | | | | 209,562 |
| |
|
| Telecommunications—4.3% | | | | |
| ALLTEL Corp. | 755 | | | 47,641 |
| Sprint Nextel Corp. | 3,439 | | | 80,335 |
| Verizon Communications, Inc. | 1,960 | | | 59,035 |
| |
|
| | | | | 187,011 |
| |
|
| Total Common Stocks | | | | |
| (Identified cost $3,918,030) | | | | 4,253,996 |
| | | |
|
|
| Total Investments—98.7% | | | | |
| (Identified cost $3,918,030) (b) | | | $ | 4,253,996 |
| Cash and Other Assets in Excess | | | | |
| of Liabilities—1.3% | | | | 57,434 |
| |
|
| Net Assets—100.0% | | | $ | 4,311,430 |
| |
|
The accompanying notes are an integral part of these financial statements.
15
Lazard Retirement Series, Inc.
Portfolios of Investments (continued)
December 31, 2005
| Description | Shares | | | Value |
|
| Lazard Retirement Small Cap Portfolio | | | |
| Common Stocks—97.3% | | | | |
| Agriculture—0.6% | | | | |
| Delta & Pine Land Co. | 35,950 | | $ | 827,210 |
| |
|
| Banking—8.3% | | | | |
| Bank of the Ozarks, Inc. | 25,800 | | | 952,020 |
| BankUnited Financial Corp., Class A . | 59,800 | | | 1,588,886 |
| Boston Private Financial Holdings, Inc. | 30,400 | | | 924,768 |
| First Community Bancorp | 15,200 | | | 826,424 |
| First Midwest Bancorp, Inc. | 23,000 | | | 806,380 |
| MB Financial, Inc. | 39,400 | | | 1,394,760 |
| Provident Bankshares Corp. | 19,800 | | | 668,646 |
| Sterling Bancshares, Inc. | 63,000 | | | 972,720 |
| Texas Regional Bancshares, Inc., | | | | |
| Class A | 46,850 | | | 1,325,855 |
| The South Financial Group, Inc. | 48,500 | | | 1,335,690 |
| United Bankshares, Inc. | 17,850 | | | 629,034 |
| |
|
| | | | | 11,425,183 |
| Building & Construction—2.0% | | | | |
| Levitt Corp., Class A | 42,300 | | | 961,902 |
| Perini Corp. (a) | 27,800 | | | 671,370 |
| Texas Industries, Inc. | 21,900 | | | 1,091,496 |
| |
|
| | | | | 2,724,768 |
| |
|
| Chemicals—2.1% | | | | |
| PolyOne Corp. (a) | 118,700 | | | 763,241 |
| Rogers Corp. (a) | 30,700 | | | 1,202,826 |
| Westlake Chemical Corp. | 33,300 | | | 959,373 |
| |
|
| | | | | 2,925,440 |
| |
|
| Commercial Services—9.3% | | | | |
| ADVO, Inc. | 54,775 | | | 1,543,559 |
| Arbitron, Inc. | 29,400 | | | 1,116,612 |
| Learning Tree International, Inc. (a) | 80,700 | | | 1,035,381 |
| MPS Group, Inc. (a) | 65,300 | | | 892,651 |
| Rush Enterprises, Inc., Class A (a) | 3,100 | | | 46,128 |
| Tetra Tech, Inc. (a) | 57,800 | | | 905,726 |
| The BISYS Group, Inc. (a) | 67,700 | | | 948,477 |
| United Rentals, Inc. (a) | 55,300 | | | 1,293,467 |
| Waste Connections, Inc. (a) | 18,100 | | | 623,726 |
| Watson Wyatt Worldwide, Inc. | 48,700 | | | 1,358,730 |
| WESCO International, Inc. (a) | 23,600 | | | 1,008,428 |
| Wireless Facilities, Inc. (a) | 227,000 | | | 1,157,700 |
| Wright Express Corp. | 39,500 | | | 869,000 |
| |
|
| | | | | 12,799,585 |
| | | |
|
|
| Computer Software—1.8% | | | | |
| Agile Software Corp. (a) | 164,300 | | | 982,514 |
| Openwave Systems, Inc. (a) | 27,100 | | | 473,437 |
| WebEx Communications, Inc. (a) | 45,050 | | | 974,431 |
| |
|
| | | | | 2,430,382 |
| |
|
| Consumer Products—3.9% | | | | |
| Elizabeth Arden, Inc. (a) | 42,100 | | | 844,526 |
| Fossil, Inc. (a) | 57,000 | | | 1,226,070 |
| Matthews International Corp., Class A | 17,600 | | | 640,816 |
| Take-Two Interactive Software, Inc. (a) | 53,800 | | | 952,260 |
| Tempur-Pedic International, Inc. (a) | 47,000 | | | 540,500 |
| WMS Industries, Inc. (a) | 45,200 | | | 1,134,068 |
| |
|
| | | | | 5,338,240 |
| |
|
| Drugs—2.0% | | | | |
| First Horizon Pharmaceutical Corp. (a) | 98,600 | | | 1,700,850 |
| K-V Pharmaceutical Co., Class A (a) | 47,700 | | | 982,620 |
| |
|
| | | | | 2,683,470 |
| |
|
| | | | | |
| Energy Exploration & Production—2.9% | | | | |
| Brigham Exploration Co. (a) | 64,200 | | | 761,412 |
| Denbury Resources, Inc. (a) | 29,200 | | | 665,176 |
| Energy Partners, Ltd. (a) | 29,400 | | | 640,626 |
| Forest Oil Corp. (a) | 16,000 | | | 729,120 |
| Penn Virginia Corp. | 8,500 | | | 487,900 |
| Range Resources Corp. | 27,450 | | | 723,033 |
| |
|
| | | | | 4,007,267 |
| |
|
| Energy Services—5.3% | | | | |
| Dresser-Rand Group, Inc. | 58,600 | | | 1,416,948 |
| Grey Wolf, Inc. (a) | 105,700 | | | 817,061 |
| Hercules Offshore, Inc. | 14,500 | | | 411,945 |
| Key Energy Services, Inc. (a) | 65,850 | | | 886,999 |
| Kinder Morgan Management, LLC (a) | 23,469 | | | 1,066,901 |
| Oil States International, Inc. (a) | 20,200 | | | 639,936 |
| Todco, Class A | 33,800 | | | 1,286,428 |
| Veritas DGC, Inc. (a) | 19,800 | | | 702,702 |
| |
|
| | | | | 7,228,920 |
| |
|
| Financial Services—1.7% | | | | |
| Financial Federal Corp. | 20,150 | | | 895,668 |
| Waddell & Reed Financial, Inc. | 67,300 | | | 1,411,281 |
| |
|
| | | | | 2,306,949 |
| |
|
| Food & Beverages—0.5% | | | | |
| Performance Food Group Co. (a) | 22,400 | | | 635,488 |
| |
|
The accompanying notes are an integral part of these financial statements.
16
Lazard Retirement Series, Inc.
Portfolios of Investments (continued)
December 31, 2005
| Description | Shares | | | Value |
|
| Lazard Retirement Small Cap Portfolio (continued) |
| Health Services—5.0% | | | | |
| Alderwoods Group, Inc. (a) | 58,900 | | $ | 934,743 |
| BioScrip, Inc. (a) | 94,700 | | | 714,038 |
| Gentiva Health Services, Inc. (a) | 23,500 | | | 346,390 |
| Hanger Orthopedic Group, Inc. (a) | 128,300 | | | 732,593 |
| Kindred Healthcare, Inc. (a) | 47,600 | | | 1,226,176 |
| LifePoint Hospitals, Inc. (a) | 46,500 | | | 1,743,750 |
| Ventiv Health, Inc. (a) | 49,900 | | | 1,178,638 |
| |
|
| | | | | 6,876,328 |
| |
|
| Insurance—4.4% | | | | |
| Arch Capital Group, Ltd. (a) | 18,300 | | | 1,001,925 |
| Aspen Insurance Holdings, Ltd. | 49,700 | | | 1,176,399 |
| Assured Guaranty, Ltd. | 46,300 | | | 1,175,557 |
| Bristol West Holdings, Inc. | 61,400 | | | 1,168,442 |
| Scottish Re Group, Ltd. | 59,600 | | | 1,463,180 |
| |
|
| | | | | 5,985,503 |
| |
|
| Leisure & Entertainment—3.4% | | | | |
| Alliance Gaming Corp. (a) | 109,100 | | | 1,420,482 |
| Carmike Cinemas, Inc. | 2,500 | | | 63,400 |
| CBRL Group, Inc. | 26,500 | | | 931,475 |
| Journal Register Co. | 14,868 | | | 222,277 |
| RARE Hospitality International, Inc. (a) | 33,500 | | | 1,018,065 |
| Ruby Tuesday, Inc. | 40,500 | | | 1,048,545 |
| |
|
| | | | | 4,704,244 |
| |
|
| Manufacturing—9.5% | | | | |
| Acuity Brands, Inc. | 25,100 | | | 798,180 |
| Applied Signal Technology, Inc. | 52,900 | | | 1,200,830 |
| Columbus McKinnon Corp. (a) | 41,000 | | | 901,180 |
| DRS Technologies, Inc. | 18,950 | | | 974,409 |
| Esterline Technologies Corp. (a) | 33,300 | | | 1,238,427 |
| Kennametal, Inc. | 18,100 | | | 923,824 |
| Knoll, Inc. | 71,700 | | | 1,226,787 |
| Ladish Co., Inc. (a) | 32,700 | | | 730,845 |
| RBC Bearings, Inc. | 53,000 | | | 861,250 |
| Regal-Beloit Corp. | 31,100 | | | 1,100,940 |
| RTI International Metals, Inc. (a) | 54,700 | | | 2,075,865 |
| Wabash National Corp. | 50,000 | | | 952,500 |
| |
|
| | | | | 12,985,037 |
| |
|
| Medical Products—4.1% | | | | |
| Advanced Medical Optics, Inc. (a) | 32,900 | | | 1,375,220 |
| Candela Corp. (a) | 54,400 | | | 785,536 |
| Encore Medical Corp. (a) | 74,600 | | | 369,270 |
| PSS World Medical, Inc. (a) | 81,000 | | | 1,202,040 |
| Symmetry Medical, Inc. (a) | 59,800 | | | 1,159,522 |
| Wright Medical Group, Inc. (a) | 36,200 | | | 738,480 |
| |
|
| | | | | 5,630,068 |
| |
|
| Metals & Mining—3.6% | | | | |
| Cleveland-Cliffs, Inc. | 8,300 | | | 735,131 |
| NS Group, Inc. (a) | 30,500 | | | 1,275,205 |
| Olin Corp. | 46,750 | | | 920,040 |
| Oregon Steel Mills, Inc. (a) | 25,800 | | | 759,036 |
| Quanex Corp. | 8,600 | | | 429,742 |
| Steel Dynamics, Inc. | 21,600 | | | 767,016 |
| |
|
| | | | | 4,886,170 |
| |
|
| Printing & Publishing—0.9% | | | | |
| R.H. Donnelley Corp. (a) | 19,600 | | | 1,207,752 |
| |
|
| Real Estate—3.3% | | | | |
| Alexandria Real Estate Equities, Inc. | 14,000 | | | 1,127,000 |
| BioMed Realty Trust, Inc. | 24,500 | | | 597,800 |
| Brandywine Realty Trust | 34,200 | | | 954,522 |
| Cousins Properties, Inc. | 22,600 | | | 639,580 |
| Lexington Corporate Properties Trust | 33,800 | | | 719,940 |
| The Mills Corp. | 10,750 | | | 450,855 |
| |
|
| | | | | 4,489,697 |
| |
|
| Retail—3.8% | | | | |
| CSK Auto Corp. (a) | 53,300 | | | 803,764 |
| Dick’s Sporting Goods, Inc. (a) | 21,800 | | | 724,632 |
| Hot Topic, Inc. (a) | 59,000 | | | 840,750 |
| PETCO Animal Supplies, Inc. (a) | 46,900 | | | 1,029,455 |
| The Finish Line, Inc. | 55,500 | | | 966,810 |
| The Talbots, Inc. | 29,400 | | | 817,908 |
| |
|
| | | | | 5,183,319 |
| |
|
| Semiconductors & Components—7.5% | | | | |
| Actel Corp. (a) | 77,800 | | | 990,394 |
| Benchmark Electronics, Inc. (a) | 47,000 | | | 1,580,610 |
| Coherent, Inc. (a) | 39,900 | | | 1,184,232 |
| Exar Corp. (a) | 89,000 | | | 1,114,280 |
| FARO Technologies, Inc. (a) | 21,700 | | | 434,000 |
| Integrated Device Technology, Inc. (a) . | 153,100 | | | 2,017,858 |
| Microsemi Corp. (a) | 28,700 | | | 793,842 |
| TTM Technologies, Inc. (a) | 121,600 | | | 1,143,040 |
| Zoran Corp. (a) | 59,100 | | | 958,011 |
| |
|
| | | | | 10,216,267 |
| | | |
|
|
| Technology Hardware—4.9% | | | | |
| ADE Corp. (a) | 32,400 | | | 779,544 |
| Avocent Corp. (a) | 45,000 | | | 1,223,550 |
| Brooks Automation, Inc. (a) | 54,100 | | | 677,873 |
| C-COR, Inc. (a) | 145,000 | | | 704,700 |
| Dot Hill Systems Corp. (a) | 163,100 | | | 1,130,283 |
| Photon Dynamics, Inc. (a) | 42,900 | | | 784,212 |
| SafeNet, Inc. (a) | 45,800 | | | 1,475,676 |
| |
|
| | | | | 6,775,838 |
| |
|
The accompanying notes are an integral part of these financial statements.
17
Lazard Retirement Series, Inc.
Portfolios of Investments (continued)
December 31, 2005
| Description | Shares | | | Value | |
|
| Lazard Retirement Small Cap Portfolio (concluded) |
| Transportation—5.0% | | | | | |
| AirTran Holdings, Inc. (a) | 83,200 | | $ | 1,333,696 | |
| American Commercial Lines, Inc. (a) | 39,600 | | | 1,199,484 | |
| Genco Shipping & Trading, Ltd. | 27,000 | | | 470,880 | |
| Hub Group, Inc., Class A (a) | 15,000 | | | 530,250 | |
| OMI Corp. | 99,500 | | | 1,805,925 | |
| Pacer International, Inc. | 35,900 | | | 935,554 | |
| Swift Transportation Co., Inc. (a) | 29,250 | | | 593,775 | |
| |
|
| | | | | 6,869,564 | |
| |
|
| Utilities—1.5% | | | | | |
| Cleco Corp. | 67,100 | | | 1,399,035 | |
| New Jersey Resources Corp. | 16,500 | | | 691,185 | |
| |
|
| | | | | 2,090,220 | |
| |
|
| Total Common Stocks | | | | | |
| (Identified cost $123,873,689) | | | | 133,232,909 | |
| | | |
|
| |
| | | | | | |
| | Principal | | | | |
| | Amount | | | | |
| | (000) | | | | |
| |
| | | | |
Repurchase Agreement—2.7% | | | | | |
| State Street Bank and Trust Co., | | | | | |
| 3.25%, 01/03/06 | | | | | |
| (Dated 12/30/05, collateralized by | | | | | |
| $3,875,000 United States Treasury | | | | | |
| Note, 4.00%, 11/15/12, with a | | | | | |
| value of $3,821,719) | | | | | |
| Proceeds of $3,743,351 | | | | | |
| (Identified cost $3,742,000) | $3,742 | | $ | 3,742,000 | |
|
|
Total Investments—100.0% | | | | | |
| (Identified cost $127,615,689) (b) | | | $ | 136,974,909 | |
Liabilities in Excess of Cash and | | | | | |
| Other Assets | | | | (4,846 | ) |
|
|
| Net Assets—100.0% | | | $ | 136,970,063 | |
|
|
The accompanying notes are an integral part of these financial statements.
18
Lazard Retirement Series, Inc.
Portfolios of Investments (continued)
December 31, 2005
| Description | Shares | | | Value |
|
| Lazard Retirement International Equity Portfolio | |
| Common Stocks—97.7% | | | | |
| Belgium—1.7% | | | | |
| Belgacom SA | 69,200 | | $ | 2,248,765 |
| InBev NV | 52,600 | | | 2,281,370 |
| |
|
| Total Belgium | | | | 4,530,135 |
| |
|
| France—15.3% | | | | |
| Axa | 97,300 | | | 3,128,636 |
| BNP Paribas SA | 64,800 | | | 5,224,321 |
| France Telecom SA | 157,800 | | | 3,906,931 |
| Lafarge SA | 42,800 | | | 3,836,840 |
| Lagardere SCA | 50,930 | | | 3,904,841 |
| Sanofi-Aventis | 38,708 | | | 3,378,693 |
| Schneider Electric SA | 39,500 | | | 3,510,724 |
| Total SA | 36,593 | | | 9,159,246 |
| Vivendi Universal SA | 153,100 | | | 4,778,387 |
| |
|
| Total France | | | 40,828,619 |
| |
|
| Germany—5.3% | | | | |
| Deutsche Bank AG | 27,100 | | | 2,617,999 |
| Siemens AG | 79,900 | | | 6,823,413 |
| Volkswagen AG | 90,800 | | | 4,777,871 |
| |
|
| Total Germany | | | 14,219,283 |
| |
|
| Ireland—2.0% | | | | |
| Bank of Ireland | 146,700 | | | 2,303,162 |
| CRH PLC | 99,547 | | | 2,917,903 |
| |
|
| Total Ireland | | | | 5,221,065 |
| |
|
| Italy—8.6% | | | | |
| Assicurazioni Generali SpA | 80,900 | | | 2,816,963 |
| Banco Popolare di Verona e Novara Scrl | 136,077 | | | 2,743,109 |
| Enel SpA | 328,100 | | | 2,567,814 |
| Eni SpA | 189,775 | | | 5,244,784 |
| Mediolanum SpA | 49,700 | | | 326,534 |
| Telecom Italia SpA | 1,590,500 | | | 4,615,142 |
| UniCredito Italiano SpA | 658,475 | | | 4,520,418 |
| |
|
| Total Italy | | | 22,834,764 |
| |
|
| Japan—25.9% | | | | |
| East Japan Railway Co. | 611 | | | 4,198,263 |
| Fujitsu, Ltd. | 449,800 | | | 3,422,184 |
| Hoya Corp. | 133,600 | | | 4,799,322 |
| Mitsubishi UFJ Financial Group, Inc. | . 678 | | | 9,190,884 |
| Murata Manufacturing Co., Ltd. | 70,300 | | | 4,502,821 |
| Nidec Corp. | 44,200 | | | 3,756,045 |
| Nomura Holdings, Inc. | 273,100 | | | 5,229,230 |
| NTT DoCoMo, Inc. | 1,520 | | | 2,318,055 |
| Shin-Etsu Chemical Co., Ltd. | 30,300 | | | 1,609,599 |
| Shinsei Bank, Ltd. | 389,000 | | | 2,247,717 |
| Sony Corp. | 95,800 | | | 3,912,192 |
| Takeda Pharmaceutical Co., Ltd. | 83,500 | | | 4,513,514 |
| The Sumitomo Trust and Banking | | | | |
| Co., Ltd. | 332,000 | | | 3,389,477 |
| Tokyo Gas Co., Ltd. | 882,000 | | | 3,915,682 |
| Toyota Motor Corp. | 151,400 | | | 7,850,275 |
| Yokogawa Electric Corp. | 244,200 | | | 4,158,621 |
| |
|
| | | | | |
| Total Japan | | | | 69,013,881 |
| Netherlands—3.3% | | |
|
|
| Royal Dutch Shell PLC, A Shares | 104,100 | | | 3,165,556 |
| TNT NV | 182,600 | | | 5,686,185 |
| |
|
| Total Netherlands | | | | 8,851,741 |
| |
|
| Norway—2.7% | | | | |
| DNB NOR ASA | 354,700 | | | 3,771,593 |
| Statoil ASA | 146,800 | | | 3,360,384 |
| |
|
| Total Norway | | | | 7,131,977 |
| |
|
| Singapore—1.3% | | | | |
| Oversea-Chinese Banking Corp., Ltd. | 852,920 | | | 3,436,712 |
| |
|
| Switzerland—10.5% | | | | |
| Compagnie Financiere Richemont AG, | | | | |
| A Shares | 75,300 | | | 3,268,075 |
| Credit Suisse Group | 143,070 | | | 7,273,182 |
| Nestle SA | 18,840 | | | 5,617,907 |
| Novartis AG | 142,200 | | | 7,450,139 |
| Zurich Financial Services AG (a) | 20,800 | | | 4,418,984 |
| |
|
| Total Switzerland | | | | 28,028,287 |
| |
|
| United Kingdom—21.1% | | | | |
| Barclays PLC | 600,400 | | | 6,297,801 |
| BP PLC | 445,020 | | | 4,729,086 |
| Cadbury Schweppes PLC | 341,040 | | | 3,217,215 |
| Diageo PLC | 438,975 | | | 6,349,167 |
| GlaxoSmithKline PLC | 127,100 | | | 3,205,342 |
| Imperial Tobacco Group PLC | 118,380 | | | 3,530,085 |
| Marks & Spencer Group PLC | 567,400 | | | 4,919,124 |
| National Grid PLC | 355,324 | | | 3,467,869 |
| Prudential PLC | 319,083 | | | 3,012,822 |
| Royal Bank of Scotland Group PLC | 233,200 | | | 7,026,074 |
| Tesco PLC | 729,200 | | | 4,149,896 |
| Vodafone Group PLC | 2,873,190 | | | 6,190,349 |
| |
|
| Total United Kingdom | | | | 56,094,830 |
| |
|
| Total Common Stocks | | | | |
| (Identified cost $219,192,322) | | | | 260,191,294 |
| |
|
The accompanying notes are an integral part of these financial statements.
19
Lazard Retirement Series, Inc.
Portfolios of Investments (continued)
December 31, 2005
| | | Principal | | | |
| | | Amount | | | |
| Description | | (000) | | | Value |
|
| Lazard Retirement International Equity Portfolio | | | |
| (concluded) | | | | | |
Repurchase Agreement—2.3% | | | | | |
| State Street Bank and Trust Co., | | | | | |
| 3.25%, 01/03/06 | | | | | |
| (Dated 12/30/05, collateralized by | | | | | |
| $6,420,000 United States Treasury | | | | | |
| Note, 4.00%, 11/15/12, with a | | | | | |
| value of $6,331,725) | | | | | |
| Proceeds of $6,208,241 | | | | | |
| (Identified cost $6,206,000) | $ | 6,206 | | $ | 6,206,000 |
| | | | |
|
| Total Investments—100.0% | | | | | |
| (Identified cost $225,398,322) (b) | | | | $ | 266,397,294 |
| Cash and Other Assets in Excess | | | | | |
| of Liabilities | | | | | 39,505 |
| | | |
|
| Net Assets—100.0% | | | | $ | 266,436,799 |
| | | |
|
The accompanying notes are an integral part of these financial statements.
20
Lazard Retirement Series, Inc.
Portfolios of Investments (continued)
December 31, 2005
| Description | Shares | | | Value |
|
| Lazard Retirement Emerging Markets Portfolio | | | |
| Common Stocks—82.2% | | | | |
| Brazil—8.4% | | | | |
| Brasil Telecom Participacoes SA ADR | 29,700 | | $ | 1,109,295 |
| Companhia de Bebidas das Americas ADR | 2,754 | | | 90,056 |
| Companhia de Concessoes Rodoviarias | 29,200 | | | 925,198 |
| Companhia Vale do Rio Doce ADR | 36,000 | | | 1,481,040 |
| Grendene SA | 45,800 | | | 440,448 |
| Petroleo Brasileiro SA ADR | 30,200 | | | 2,152,354 |
| Souza Cruz SA | 61,600 | | | 764,890 |
| |
|
| Total Brazil | | | | 6,963,281 |
| |
|
| Chile—0.5% | | | | |
| Administradora de Fondos de | | | | |
| Pensiones Provida SA Sponsored ADR | 13,560 | | | 385,104 |
| |
|
| China—1.8% | | | | |
| People’s Food Holdings, Ltd. | 1,181,000 | | | 759,965 |
| Yanzhou Coal Mining Co., Ltd | 1,118,900 | | | 717,933 |
| |
|
| Total China | | | | 1,477,898 |
| |
|
| Egypt—4.2% | | | | |
| Commercial International Bank | 111,900 | | | 1,145,567 |
| Eastern Tobacco | 19,544 | | | 1,123,855 |
| Orascom Telecom Holding SAE | 11,700 | | | 1,213,069 |
| |
|
| Total Egypt | | | | 3,482,491 |
| |
|
| Hong Kong—3.3% | | | | |
| China Netcom Group Corp. | | | | |
| (Hong Kong), Ltd. | 301,000 | | | 479,438 |
| CNOOC, Ltd. ADR | 11,700 | | | 795,249 |
| Hutchison Telecommunications | | | | |
| International, Ltd. (a) | 590,000 | | | 852,255 |
| Texwinca Holdings, Ltd. | 884,000 | | | 638,469 |
| |
|
| Total Hong Kong | | | | 2,765,411 |
| |
|
| Hungary—1.6% | | | | |
| Gedeon Richter Rt. | 4,100 | | | 733,996 |
| MOL Magyar Olaj-es Gazipari Rt. | 6,600 | | | 615,216 |
| |
|
| Total Hungary | | | | 1,349,212 |
| |
|
| India—7.1% | | | | |
| Hero Honda Motors, Ltd. | 41,710 | | | 789,626 |
| Hindalco Industries, Ltd. GDR (c) | 281,800 | | | 876,398 |
| Hindustan Lever, Ltd. | 120,900 | | | 527,813 |
| Oil and Natural Gas Corp., Ltd. | 34,782 | | | 907,995 |
| Satyam Computer Services, Ltd. | 80,082 | | | 1,318,391 |
| State Bank of India | 71,200 | | | 1,432,226 |
| |
|
| Total India | | | | 5,852,449 |
| |
|
| Indonesia—4.8% | | | | |
| PT Bank Mandiri | 4,798,500 | | | 799,750 |
| PT Bumi Resources | 8,339,000 | | | 644,069 |
| PT Telekomunikasi Indonesia Sponsored ADR | 76,600 | | | 1,827,676 |
| PT United Tractors | 1,944,400 | | | 726,186 |
| |
|
| Total Indonesia | | | | 3,997,681 |
| |
|
| Israel—1.7% | | | | |
| Bank Hapoalim BM | 297,000 | | | 1,379,280 |
| |
|
| Mexico—5.2% | | | | |
| America Telecom SA de CV, Series A1 Shares (a) | 139,700 | | | 678,956 |
| Desarrolladora Homex SA de CV ADR (a) | 24,790 | | | 760,557 |
| Fomento Economico Mexicano SA de | | | | |
| CV Sponsored ADR | 14,335 | | | 1,039,431 |
| Grupo Mexico SA de CV | 153,300 | | | 357,395 |
| Grupo Televisa SA Sponsored ADR | 13,800 | | | 1,110,900 |
| Kimberly-Clark de Mexico SA de CV | 97,100 | | | 346,862 |
| Urbi, Desarrollos Urbanos, SA de CV (a) | 6,600 | | | 45,602 |
| |
|
| Total Mexico | | | | 4,339,703 |
| |
|
| Morocco—0.8% | | | | |
| Maroc Telecom | 64,500 | | | 695,800 |
| |
|
| Peru—0.5% | | | | |
| Credicorp, Ltd. | 19,400 | | | 442,126 |
| |
|
| Philippines—1.3% | | | | |
| Philippine Long Distance Telephone | | | | |
| Co. Sponsored ADR | 31,200 | | | 1,046,448 |
| |
|
| Russia—3.3% | | | | |
| Evraz Group SA GDR | 40,700 | | | 736,670 |
| LUKOIL Sponsored ADR | 16,380 | | | 966,420 |
| Mobile TeleSystems Sponsored ADR | 30,000 | | | 1,050,000 |
| |
|
| Total Russia | | | | 2,753,090 |
| |
|
| South Africa—7.2% | | | | |
| Edgars Consolidated Stores, Ltd. | 203,100 | | | 1,125,896 |
| Kumba Resources, Ltd. | 40,100 | | | 644,887 |
| Murray & Roberts Holdings, Ltd. | 294,190 | | | 909,125 |
| Old Mutual PLC | 462,500 | | | 1,308,110 |
| Sanlam, Ltd. | 164,330 | | | 393,563 |
| Steinhoff International Holdings, Ltd. | 531,903 | | | 1,572,437 |
| |
|
| Total South Africa | | | | 5,954,018 |
| |
|
The accompanying notes are an integral part of these financial statements.
21
Lazard Retirement Series, Inc.
Portfolios of Investments (concluded)
December 31, 2005
| Description | Shares | | | Value |
|
| Lazard Retirement Emerging Markets Portfolio | | | |
| (concluded) | | | | |
| South Korea—18.0% | | | | |
| Hite Brewery Co., Ltd. | 5,000 | | $ | 712,272 |
| Hyundai Motor Co. | 6,150 | | | 591,972 |
| Kangwon Land, Inc. | 54,240 | | | 1,102,668 |
| Kookmin Bank | 40,790 | | | 3,086,942 |
| KT Corp. Sponsored ADR | 33,190 | | | 715,244 |
| LG Electronics, Inc. | 17,100 | | | 1,510,640 |
| LG Household & Health Care, Ltd. | 21,900 | | | 1,191,571 |
| LG.Philips LCD Co., Ltd. ADR (a) | 40,300 | | | 864,838 |
| Samsung Electronics Co., Ltd. GDR | 700 | | | 230,650 |
| Samsung Electronics Co., Ltd. GDR (c) | 10,326 | | | 3,402,417 |
| Samsung SDI Co., Ltd. | 6,960 | | | 802,137 |
| SK Corp. | 14,000 | | | 721,571 |
| |
|
| Total South Korea | | | | 14,932,922 |
| |
|
| Taiwan—7.8% | | | | |
| Advantech Co., Ltd. | 245,502 | | | 695,177 |
| Chinatrust Financial Holding Co., Ltd. | 934,369 | | | 739,689 |
| Chunghwa Telecom Co., Ltd. | | | | |
| Sponsored ADR | 29,200 | | | 535,820 |
| Delta Electronics, Inc. | 247,000 | | | 506,138 |
| Delta Electronics, Inc. Sponsored GDR | 31,551 | | | 313,932 |
| Fubon Financial Holding Co., Ltd. | 840,000 | | | 721,250 |
| Hon Hai Precision Industry Co., Ltd. | 215,922 | | | 1,183,386 |
| Taiwan Semiconductor Manufacturing | | | | |
| Co., Ltd. | 703,299 | | | 1,338,373 |
| Taiwan Semiconductor Manufacturing | | | | |
| Co., Ltd. Sponsored ADR | 39,900 | | | 395,409 |
| |
|
| Total Taiwan | | | | 6,429,174 |
| |
|
| Thailand—0.6% | | | | |
| Thai Union Frozen Products PCL | 670,800 | | | 499,010 |
| |
|
| Turkey—3.7% | | | | |
| Akbank TAS | 221,300 | | | 1,801,184 |
| Turkcell Iletisim Hizmetleri AS ADR | 81,132 | | | 1,246,187 |
| |
|
| Total Turkey | | | | 3,047,371 |
| |
|
| Venezuela—0.4% | | | | |
| Compania Anonima Nacional Telefonos | | | | |
| de Venezuela ADR | 22,485 | | | 321,536 |
| |
|
| Total Common Stocks | | | | |
| (Identified cost $53,120,680) | | | | 68,114,005 |
| |
|
| Preferred Stocks—10.8% | | | | |
| Brazil—10.0% | | | | |
| All America Latina Logistica SA Units | 11,900 | | | 508,253 |
| Caemi Mineracao e Metalurgia SA | 1,852,350 | | | 2,704,566 |
| Companhia Brasileira de Distribuicao | | | | |
| Grupo Pao de Acucar Sponsored ADR | 27,700 | | | 911,330 |
| Companhia de Bebidas das Americas ADR | 31,470 | | | 1,197,433 |
| Gerdau SA Sponsored ADR | 63,800 | | | 1,064,184 |
| Telemar Norte Leste SA | 48,042 | | | 1,306,216 |
| Usinas Siderurgicas de Minas Gerais SA | 25,100 | | | 597,542 |
|
|
| Total Brazil | | | | 8,289,524 |
|
|
| South Korea—0.8% | | | | |
| Hyundai Motor Co. | 10,380 | | | 667,458 |
|
|
| Total Preferred Stocks | | | | |
| (Identified cost $6,067,207) | | | | 8,956,982 |
|
|
| Warrant—0.1% | | | | |
| India—0.1% | | | | |
| Hindalco Industries, Ltd. Right, | | | | |
| 01/05/06 | | | | |
| (Identified cost $0) (a), (d) | 70,450 | | | 54,951 |
|
|
| |
| | Principal | | | |
| | Amount | | | |
| | (000) | | | |
| |
| | | |
| Repurchase Agreement—5.9% | | | | |
| State Street Bank and Trust Co., | | | | |
| 3.25%, 01/03/06 | | | | |
| (Dated 12/30/05, collateralized by | | | | |
| $5,045,000 United States Treasury | | | | |
| Note, 4.00%, 11/15/12, with a | | | | |
| value of $4,975,631) | | | | |
| Proceeds of $4,876,760 | | | | |
| (Identified cost $4,875,000) | $4,875 | | | 4,875,000 |
|
|
| Total Investments—99.0% | | | | |
| (Identified cost $64,062,887) (b) | | | $ | 82,000,938 |
| Cash and Other Assets in Excess | | | | |
| of Liabilities—1.0% | | | | 811,272 |
|
|
| Net Assets—100.0% | | | $ | 82,812,210 |
|
|
The accompanying notes are an integral part of these financial statements.
22
Lazard Retirement Series, Inc.
Notes to Portfolios of Investments
December 31, 2005
| (a) | Non-income producing security. |
| |
| (b) | For federal income tax purposes, the aggregate cost, aggregate gross unrealized appreciation, aggregate gross unrealized depreciation and the net unrealized appreciation is as follows: |
| |
| | | | | Aggregate | | Aggregate | | | |
| | | | | Gross | | Gross | | Net |
| | Aggregate | | Unrealized | | Unrealized | | Unrealized |
| Portfolio | Cost | | Appreciation | | Depreciation | | Appreciation |
|
| Retirement Equity | $ | 3,967,821 | | $ | 383,249 | | $ | 97,074 | | $ | 286,175 |
| Retirement Small Cap | | 128,530,630 | | | 13,924,566 | | | 5,480,287 | | | 8,444,279 |
| Retirement International Equity | | 225,609,429 | | | 44,615,704 | | | 3,827,839 | | | 40,787,865 |
| Retirement Emerging Markets | | 64,236,055 | | | 18,234,645 | | | 469,762 | | | 17,764,883 |
| (c) | Pursuant to Rule 144A under the Securities Act of 1933, these securities may only be traded among “qualified institutional buyers.” |
| |
| (d) | Date shown is the expiration date. |
| |
Security Abbreviations:
ADR — American Depositary Receipt
GDR — Global Depositary Receipt
The accompanying notes are an integral part of these financial statements.
23
Lazard Retirement Series, Inc.
Notes to Portfolios of Investments (concluded)
December 31, 2005
Portfolio holdings by industry (as percentage of net assets), for those Portfolios previously presented by country:| | | | | | |
| | Lazard | | Lazard |
| | Retirement | | Retirement |
| | International | | Emerging |
| | Equity | | Markets |
| | Portfolio | | Portfolio |
| |
| |
|
| Industry | | | | | |
| Alcohol & Tobacco | 4.6 | % | | 4.7 | % |
| Apparel & Textiles | — | | | 0.8 | |
| Automotive | 4.7 | | | 2.4 | |
| Banking | 21.1 | | | 13.1 | |
| Building & Construction | 2.6 | | | 2.1 | |
| Chemicals | 0.6 | | | — | |
| Consumer Products | — | | | 5.8 | |
| Drugs | 7.0 | | | 0.9 | |
| Energy Exploration & Production | — | | | 2.1 | |
| Energy Integrated. | 9.6 | | | 7.0 | |
| Financial Services | 3.4 | | | 3.4 | |
| Food & Beverages | 3.3 | | | 2.8 | |
| Forest & Paper Products | — | | | 0.4 | |
| Insurance. | 5.1 | | | — | |
| Leisure & Entertainment | 3.3 | | | 2.6 | |
| Manufacturing | 3.9 | | | 0.9 | |
| Metals & Mining | — | | | 10.3 | |
| Retail | 4.6 | | | 3.0 | |
| Semiconductors & Components. | 5.1 | | | 9.3 | |
| Technology | 2.9 | | | 1.6 | |
| Technology Hardware | 1.3 | | | 2.4 | |
| Telecommunications | 7.2 | | | 15.8 | |
| Transportation | 3.7 | | | 1.7 | |
| Utilities | 3.7 | | | — | |
| |
| |
|
| Subtotal | 97.7 | | | 93.1 | |
| Repurchase Agreements | 2.3 | | | 5.9 | |
| |
| |
|
| Total Investments | 100.0 | % | | 99.0 | % |
|
| |
|
The accompanying notes are an integral part of these financial statements.
24
Lazard Retirement Series, Inc.
Statements of Assets and Liabilities
December 31, 2005
| | | | | | | | | | Lazard | | | | Lazard |
| | | Lazard | | | | Lazard | | | Retirement | | | | Retirement |
| | | Retirement | | | | Retirement | | | International | | | | Emerging |
| | | Equity | | | | Small Cap | | | Equity | | | | Markets |
| | | Portfolio | | | | Portfolio | | | Portfolio | | | | Portfolio |
|
| |
| ASSETS | | | | | | | | | | | | | |
| Investments in securities, at value | $ | 4,253,996 | | | $ | 136,974,909 | | $ | 266,397,294 | | | $ | 82,000,938 |
| Cash | | 65,004 | | | | 660 | | | 711 | | | | 105 |
| Foreign currency | | — | | | | — | | | 50,131 | | | | 1,025,913 |
| Receivables for: | | | | | | | | | | | | | |
| Investments sold | | — | | | | 417,629 | | | — | | | | 1,312,875 |
| Dividends and interest | | 4,716 | | | | 90,674 | | | 353,422 | | | | 218,105 |
| Capital stock sold | | 7 | | | | 14,911 | | | 110,266 | | | | 7,928 |
| Amount due from Investment Manager | | 3,152 | | | | — | | | — | | | | — |
|
|
| Total assets | | 4,326,875 | | | | 137,498,783 | | | 266,911,824 | | | | 84,565,864 |
|
|
| LIABILITIES | | | | | | | | | | | | | |
| Payables for: | | | | | | | | | | | | | |
| Management fees | | — | | | | 88,528 | | | 168,368 | | | | 53,610 |
| Accrued distribution fees | | 956 | | | | 29,509 | | | 56,123 | | | | 16,917 |
| Accrued directors’ fees | | 18 | | | | 525 | | | 995 | | | | 272 |
| Investments purchased | | — | | | | 282,324 | | | 174,845 | | | | 1,437,223 |
| Capital stock repurchased | | 238 | | | | 79,561 | | | 222 | | | | 131,226 |
| Other accrued expenses and payables | | 14,233 | | | | 48,273 | | | 74,472 | | | | 114,406 |
|
|
| Total liabilities | | 15,445 | | | | 528,720 | | | 475,025 | | | | 1,753,654 |
|
|
| Net assets | $ | 4,311,430 | | | $ | 136,970,063 | | $ | 266,436,799 | | | $ | 82,812,210 |
|
|
| NET ASSETS | | | | | | | | | | | | | |
| Paid in capital | $ | 4,120,747 | | | $ | 116,445,486 | | $ | 210,535,407 | | | $ | 57,260,765 |
| Undistributed net investment income | | 27,495 | | | | 21,746 | | | 2,929,782 | | | | 585,559 |
| Accumulated undistributed net realized gain (loss) | | (172,778 | ) | | | 11,143,611 | | | 11,980,550 | | | | 7,029,268 |
| Net unrealized appreciation (depreciation) on: | | | | | | | | | | | | | |
| Investments | | 335,966 | | | | 9,359,220 | | | 40,998,972 | | | | 17,931,699 |
| Foreign currency | | — | | | | — | | | (7,912 | ) | | | 4,919 |
|
|
| Net assets | $ | 4,311,430 | | | $ | 136,970,063 | | $ | 266,436,799 | | | $ | 82,812,210 |
|
|
| |
| Shares of capital stock outstanding* | | 391,371 | | | | 8,395,800 | | | 20,774,060 | | | | 4,403,558 |
| Net asset value, offering and redemption price per share | $ | 11.02 | | | $ | 16.31 | | $ | 12.83 | | | $ | 18.81 |
| |
| Cost of investments in securities | $ | 3,918,030 | | | $ | 127,615,689 | | $ | 225,398,322 | | | $ | 64,062,887 |
| Cost of foreign currency | $ | — | | | $ | — | | $ | 50,146 | | | $ | 1,023,923 |
| |
| *$0.001 par value, 500,000,000 shares authorized for the Portfolios in total. | | | | | | | | | | | |
The accompanying notes are an integral part of these financial statements.
25
Lazard Retirement Series, Inc.
Statements of Operations
For the year ended December 31, 2005
| | | | | | | | | | | Lazard | | | | Lazard | |
| | | Lazard | | | | Lazard | | | | Retirement | | | | Retirement | |
| | | Retirement | | | | Retirement | | | | International | | | | Emerging | |
| | | Equity | | | | Small Cap | | | | Equity | | | | Markets | |
| | | Portfolio | | | | Portfolio | | | | Portfolio | | | | Portfolio | |
|
| |
| INVESTMENT INCOME (LOSS) | | | | | | | | | | | | | | | |
| Income: | | | | | | | | | | | | | | | |
| Dividends | $ | 82,600 | | | $ | 1,046,895 | | | $ | 5,981,506 | | | $ | 1,413,458 | |
| Interest | | 3,101 | | | | 138,686 | | | | 213,768 | | | | 73,822 | |
|
|
| Total investment income* | | 85,701 | | | | 1,185,581 | | | | 6,195,274 | | | | 1,487,280 | |
|
|
| Expenses: | | | | | | | | | | | | | | | |
| Management fees | | 34,921 | | | | 930,362 | | | | 1,743,897 | | | | 498,128 | |
| Distribution fees | | 11,640 | | | | 310,121 | | | | 581,299 | | | | 124,532 | |
| Custodian fees | | 38,120 | | | | 101,324 | | | | 249,241 | | | | 232,452 | |
| Administration fees | | 38,431 | | | | 62,341 | | | | 84,191 | | | | 47,463 | |
| Professional services | | 27,917 | | | | 52,175 | | | | 74,025 | | | | 36,475 | |
| Shareholders’ reports | | 831 | | | | 20,570 | | | | 38,985 | | | | 7,509 | |
| Shareholders’ services | | 13,338 | | | | 14,136 | | | | 13,385 | | | | 13,529 | |
| Directors’ fees and expenses | | 422 | | | | 11,116 | | | | 20,864 | | | | 4,324 | |
| Registration fees. | | — | | | | 3,307 | | | | 4,532 | | | | 3,700 | |
| Other | | 834 | | | | 4,722 | | | | 7,927 | | | | 2,043 | |
|
|
| Total gross expenses | | 166,454 | | | | 1,510,174 | | | | 2,818,346 | | | | 970,155 | |
| Management fees waived and expenses reimbursed | | (89,112 | ) | | | — | | | | — | | | | (173,035 | ) |
| Administration fees waived | | (18,750 | ) | | | — | | | | — | | | | — | |
| Expense reductions | | (388 | ) | | | (887 | ) | | | (654 | ) | | | (121 | ) |
|
|
| Total net expenses | | 58,204 | | | | 1,509,287 | | | | 2,817,692 | | | | 796,999 | |
|
|
| Net investment income (loss) | | 27,497 | | | | (323,706 | ) | | | 3,377,582 | | | | 690,281 | |
|
|
NET REALIZED AND UNREALIZED GAIN (LOSS) ON | | | | | | | | | | | | | | | |
| INVESTMENTS AND FOREIGN CURRENCY | | | | | | | | | | | | | | | |
| Net realized gain (loss) on: | | | | | | | | | | | | | | | |
| Investments** | | 532,185 | | | | 11,695,519 | | | | 12,942,461 | | | | 7,474,569 | |
| Foreign currency | | — | | | | — | | | | (310,558 | ) | | | (119,131 | ) |
| Net change in unrealized appreciation (depreciation) on: | | | | | | | | | | | | | | | |
| Investments*** | | (418,991 | ) | | | (5,014,880 | ) | | | 9,996,103 | | | | 10,588,380 | |
| Foreign currency | | — | | | | — | | | | (18,151 | ) | | | 5,875 | |
|
|
| Net realized and unrealized gain on investments and | | | | | | | | | | | | | | | |
| foreign currency | | 113,194 | | | | 6,680,639 | | | | 22,609,855 | | | | 17,949,693 | |
|
|
| Net increase in net assets resulting from operations | $ | 140,691 | | | $ | 6,356,933 | | | $ | 25,987,437 | | | $ | 18,639,974 | |
|
|
| * Net of foreign withholding taxes of | $ | 79 | | | $ | 455 | | | $ | 550,781 | | | $ | 136,792 | |
|
|
| ** Net of foreign capital gains taxes of | $ | — | | | $ | — | | | $ | — | | | $ | 13,599 | |
|
|
| *** Net of unrealized foreign capital gains taxes of | $ | — | | | $ | — | | | $ | — | | | $ | 6,352 | |
|
|
The accompanying notes are an integral part of these financial statements.
26
Lazard Retirement Series, Inc.
Statements of Changes in Net Assets
| | | Lazard Retirement | | | | Lazard Retirement | |
| | | Equity Portfolio | | | | Small Cap Portfolio | |
| |
| |
|
| | | Year Ended | | | | Year Ended | | | | Year Ended | | | | Year Ended | |
| | | December 31, | | | | December 31, | | | | December 31, | | | | December 31, | |
| | | 2005 | | | | 2004 | | | | 2005 | | | | 2004 | |
|
| INCREASE (DECREASE) IN NET ASSETS | | | | | | | | | | | | | | | |
| Operations: | | | | | | | | | | | | | | | |
| Net investment income (loss) | $ | 27,497 | | | $ | 34,626 | | | $ | (323,706 | ) | | $ | (311,446 | ) |
| Net realized gain on investments | | 532,185 | | | | 360,960 | | | | 11,695,519 | | | | 12,747,580 | |
| Net change in unrealized appreciation (depreciation) | | | | | | | | | | | | | | | |
| on investments | | (418,991 | ) | | | 122,238 | | | | (5,014,880 | ) | | | 987,411 | |
|
|
| Net increase in net assets resulting from operations | | 140,691 | | | | 517,824 | | | | 6,356,933 | | | | 13,423,545 | |
|
|
| Distributions to shareholders: | | | | | | | | | | | | | | | |
| From net investment income | | (34,628 | ) | | | (28,362 | ) | | | — | | | | — | |
| From net realized gains | | — | | | | — | | | | (9,489,535 | ) | | | — | |
|
|
| Net decrease in net assets resulting from distributions | | (34,628 | ) | | | (28,362 | ) | | | (9,489,535 | ) | | | — | |
|
|
| Capital stock transactions: | | | | | | | | | | | | | | | |
| Net proceeds from sales | | 1,080,761 | | | | 903,217 | | | | 26,254,947 | | | | 33,080,756 | |
| Net proceeds in connection with acquisition of | | | | | | | | | | | | | | | |
| Phoenix-Lazard Small-Cap Value Series | | — | | | | — | | | | 12,046,680 | | | | — | |
| Net proceeds from reinvestment of distributions | | 34,628 | | | | 28,362 | | | | 9,489,535 | | | | — | |
| Cost of shares redeemed | | (1,792,777 | ) | | | (1,128,942 | ) | | | (18,670,368 | ) | | | (12,157,934 | ) |
|
|
| Net increase (decrease) in net assets from capital | | | | | | | | | | | | | | | |
| stock transactions | | (677,388 | ) | | | (197,363 | ) | | | 29,120,794 | | | | 20,922,822 | |
|
|
| Total increase (decrease) in net assets. | | (571,325 | ) | | | 292,099 | | | | 25,988,192 | | | | 34,346,367 | |
| Net assets at beginning of year | | 4,882,755 | | | | 4,590,656 | | | | 110,981,871 | | | | 76,635,504 | |
|
|
| Net assets at end of year* | $ | 4,311,430 | | | $ | 4,882,755 | | | $ | 136,970,063 | | | $ | 110,981,871 | |
|
|
| *Includes undistributed net investment income | $ | 27,495 | | | $ | 34,626 | | | $ | 21,746 | | | $ | 39,674 | |
|
|
| |
| |
| |
| Shares issued and repurchased: | | | | | | | | | | | | | | | |
| Shares outstanding at beginning of year | | 454,488 | | | | 474,564 | | | | 6,567,766 | | | | 5,208,046 | |
|
|
| Shares sold | | 100,566 | | | | 90,351 | | | | 1,596,698 | | | | 2,159,611 | |
| Shares issued in connection with acquisition of | | | | | | | | | | | | | | | |
| Phoenix-Lazard Small-Cap Value Series | | — | | | | — | | | | 771,728 | | | | — | |
| Shares issued to shareholders from reinvestment | | | | | | | | | | | | | | | |
| of distributions | | 3,209 | | | | 2,976 | | | | 591,617 | | | | — | |
| Shares repurchased | | (166,892 | ) | | | (113,403 | ) | | | (1,132,009 | ) | | | (799,891 | ) |
|
|
| Net increase (decrease) | | (63,117 | ) | | | (20,076 | ) | | | 1,828,034 | | | | 1,359,720 | |
|
|
| Shares outstanding at end of year | | 391,371 | | | | 454,488 | | | | 8,395,800 | | | | 6,567,766 | |
|
|
The accompanying notes are an integral part of these financial statements.
27
Lazard Retirement Series, Inc.
Statements of Changes in Net Assets (concluded)
| | | Lazard Retirement | | | | Lazard Retirement | |
| | | International Equity Portfolio | | | | Emerging Markets Portfolio | |
| |
| |
|
| |
| | | Year Ended | | | | Year Ended | | | | Year Ended | | | | Year Ended | |
| | | December 31, | | | | December 31, | | | | December 31, | | | | December 31, | |
| | | 2005 | | | | 2004 | | | | 2005 | | | | 2004 | |
|
| INCREASE IN NET ASSETS | | | | | | | | | | | | | | | |
| Operations: | | | | | | | | | | | | | | | |
| Net investment income. | $ | 3,377,582 | | | $ | 1,727,049 | | | $ | 690,281 | | | $ | 237,767 | |
| Net realized gain on investments and foreign currency | | 12,631,903 | | | | 13,046,803 | | | | 7,355,438 | | | | 2,435,775 | |
| Net change in unrealized appreciation (depreciation) | | | | | | | | | | | | | | | |
| on investments and foreign currency | | 9,977,952 | | | | 10,931,367 | | | | 10,594,255 | | | | 3,884,155 | |
|
|
| Net increase in net assets resulting from operations | | 25,987,437 | | | | 25,705,219 | | | | 18,639,974 | | | | 6,557,697 | |
|
|
| Distributions to shareholders: | | | | | | | | | | | | | | | |
| From net investment income | | (2,305,204 | ) | | | (902,561 | ) | | | (163,364 | ) | | | (149,218 | ) |
| From net realized gains | | (3,510,316 | ) | | | — | | | | (1,946,955 | ) | | | — | |
|
|
| Net decrease in net assets resulting from distributions | | (5,815,520 | ) | | | (902,561 | ) | | | (2,110,319 | ) | | | (149,218 | ) |
|
|
| Capital stock transactions: | | | | | | | | | | | | | | | |
| Net proceeds from sales | | 41,338,382 | | | | 53,897,043 | | | | 42,369,454 | | | | 15,109,672 | |
| Net proceeds from reinvestment of distributions | | 5,815,520 | | | | 902,561 | | | | 2,110,319 | | | | 149,218 | |
| Cost of shares redeemed | | (7,513,892 | ) | | | (3,420,702 | ) | | | (9,907,199 | ) | | | (5,894,616 | ) |
|
|
| Net increase in net assets from capital stock transactions | | 39,640,010 | | | | 51,378,902 | | | | 34,572,574 | | | | 9,364,274 | |
|
|
| Total increase in net assets | | 59,811,927 | | | | 76,181,560 | | | | 51,102,229 | | | | 15,772,753 | |
| Net assets at beginning of year | | 206,624,872 | | | | 130,443,312 | | | | 31,709,981 | | | | 15,937,228 | |
|
|
| Net assets at end of year* | $ | 266,436,799 | | | $ | 206,624,872 | | | $ | 82,812,210 | | | $ | 31,709,981 | |
|
|
| *Includes undistributed net investment income | $ | 2,929,782 | | | $ | 1,560,474 | | | $ | 585,559 | | | $ | 164,174 | |
|
|
| |
| |
| Shares issued and repurchased: | | | | | | | | | | | | | | | |
| Shares outstanding at beginning of year | | 17,398,250 | | | | 12,557,244 | | | | 2,279,740 | | | | 1,485,424 | |
|
|
| Shares sold | | 3,497,964 | | | | 5,070,060 | | | | 2,630,021 | | | | 1,304,409 | |
| Shares issued to shareholders from reinvestment | | | | | | | | | | | | | | | |
| of distributions | | 495,782 | | | | 90,528 | | | | 134,931 | | | | 14,198 | |
| Shares repurchased | | (617,936 | ) | | | (319,582 | ) | | | (641,134 | ) | | | (524,291 | ) |
|
|
| Net increase | | 3,375,810 | | | | 4,841,006 | | | | 2,123,818 | | | | 794,316 | |
|
|
| Shares outstanding at end of year | | 20,774,060 | | | | 17,398,250 | | | | 4,403,558 | | | | 2,279,740 | |
|
|
The accompanying notes are an integral part of these financial statements.
28
Lazard Retirement Series, Inc.
Financial Highlights
Selected data for a share of capital stock outstanding throughout each year:
| LAZARD RETIREMENT EQUITY PORTFOLIO | | | | | | | | | | | | | | | | | | | |
| | Year Ended |
|
|
| | 12/31/05 | | | 12/31/04 | | | 12/31/03 | | | 12/31/02 | | | 12/31/01 | |
|
|
| Net asset value, beginning of year | $ | 10.74 | | | $ | 9.67 | | | $ | 7.85 | | | $ | 9.38 | | | $ | 10.20 | |
|
|
| Income (loss) from investment operations: | | | | | | | | | | | | | | | | | | | |
| Net investment income | | 0.08 | | | | 0.08 | | | | 0.06 | | | | 0.06 | | | | 0.06 | |
| Net realized and unrealized gain (loss) | | 0.28 | | | | 1.05 | | | | 1.82 | | | | (1.58 | ) | | | (0.82 | ) |
|
|
| Total from investment operations | | 0.36 | | | | 1.13 | | | | 1.88 | | | | (1.52 | ) | | | (0.76 | ) |
|
|
| Less distributions from: | | | | | | | | | | | | | | | | | | | |
| Net investment income | | (0.08 | ) | | | (0.06 | ) | | | (0.06 | ) | | | (0.01 | ) | | | (0.06 | ) |
|
|
| Total distributions | | (0.08 | ) | | | (0.06 | ) | | | (0.06 | ) | | | (0.01 | ) | | | (0.06 | ) |
|
|
| Net asset value, end of year | $ | 11.02 | | | $ | 10.74 | | | $ | 9.67 | | | $ | 7.85 | | | $ | 9.38 | |
|
|
| Total Return (a) | | 3.38 | % | | | 11.79 | % | | | 24.01 | % | | | (16.25 | )% | | | (7.47 | )% |
| Ratios and Supplemental Data: | | | | | | | | | | | | | | | | | | | |
| Net assets, end of year (in thousands) | $ | 4,311 | | | $ | 4,883 | | | $ | 4,591 | | | $ | 3,750 | | | $ | 5,015 | |
| Ratios to average net assets: | | | | | | | | | | | | | | | | | | | |
| Net expenses | | 1.25 | % | | | 1.25 | % | | | 1.25 | % | | | 1.25 | % | | | 1.25 | % |
| Gross expenses | | 3.57 | % | | | 3.58 | % | | | 3.89 | % | | | 3.74 | % | | | 3.25 | % |
| Net investment income | | 0.59 | % | | | 0.75 | % | | | 0.73 | % | | | 0.58 | % | | | 0.63 | % |
| Portfolio turnover rate | | 75 | % | | | 59 | % | | | 56 | % | | | 94 | % | | | 141 | % |
| |
| LAZARD RETIREMENT SMALL CAP PORTFOLIO | | | | | | | | | | | | | | | | | | | |
| | Year Ended |
|
|
| | 12/31/05 | | | 12/31/04 | | | 12/31/03 | | | 12/31/02 | | | 12/31/01 | |
|
|
| Net asset value, beginning of year | $ | 16.90 | | | $ | 14.71 | | | $ | 10.72 | | | $ | 13.08 | | | $ | 11.75 | |
|
|
| Income (loss) from investment operations: | | | | | | | | | | | | | | | | | | | |
| Net investment income (loss) | | (0.04 | ) | | | — | (b) | | | — | (b) | | | 0.01 | | | | 0.01 | |
| Net realized and unrealized gain (loss) | | 0.69 | | | | 2.19 | | | | 3.99 | | | | (2.32 | ) | | | 2.15 | |
|
|
| Total from investment operations | | 0.65 | | | | 2.19 | | | | 3.99 | | | | (2.31 | ) | | | 2.16 | |
|
|
| Less distributions from: | | | | | | | | | | | | | | | | | | | |
| Net investment income | | — | | | | — | | | | — | | | | — | | | | (0.01 | ) |
| Net realized gains | | (1.24 | ) | | | — | | | | — | | | | (0.05 | ) | | | (0.82 | ) |
|
|
| Total distributions | | (1.24 | ) | | | — | | | | — | | | | (0.05 | ) | | | (0.83 | ) |
|
|
| Net asset value, end of year | $ | 16.31 | | | $ | 16.90 | | | $ | 14.71 | | | $ | 10.72 | | | $ | 13.08 | |
|
|
| Total Return (a) | | 3.99 | % | | | 14.89 | % | | | 37.22 | % | | | (17.68 | )% | | | 18.63 | % |
| Ratios and Supplemental Data: | | | | | | | | | | | | | | | | | | | |
| Net assets, end of year (in thousands) | $ | 136,970 | | | $ | 110,982 | | | $ | 76,636 | | | $ | 47,453 | | | $ | 42,164 | |
| Ratios to average net assets: | | | | | | | | | | | | | | | | | | | |
| Net expenses | | 1.22 | % | | | 1.25 | % | | �� | 1.25 | % | | | 1.25 | % | | | 1.25 | % |
| Gross expenses | | 1.22 | % | | | 1.28 | % | | | 1.37 | % | | | 1.42 | % | | | 1.67 | % |
| Net investment income (loss) | | (0.26 | )% | | | (0.35 | )% | | | 0.03 | % | | | (0.17 | )% | | | 0.09 | % |
| Portfolio turnover rate | | 93 | % | | | 98 | % | | | 78 | % | | | 108 | % | | | 78 | % |
| (a) | Total returns reflect reinvestment of all dividends and distributions, if any. Certain expenses of the Portfolio have been waived or reimbursed by the Portfolio’s Investment Manager or Administrator; without such waiver/reimbursement of expenses, the Portfolio’s returns would have been lower. Performance information does not reflect the fees and charges imposed by participating insurance companies at the separate account level, and such charges will have the effect of reducing performance. |
| |
| (b) | Amount is less than $0.01 per share. |
| |
The accompanying notes are an integral part of these financial statements.
29
Lazard Retirement Series, Inc.
Financial Highlights (concluded)
Selected data for a share of capital stock outstanding throughout each year:
| LAZARD RETIREMENT INTERNATIONAL EQUITY PORTFOLIO | | | | | | | | | | | | |
| | Year Ended |
|
|
| | 12/31/05 | | | 12/31/04 | | | 12/31/03 | | | 12/31/02 | | | 12/31/01 | |
|
|
|
| Net asset value, beginning of year | $ | 11.88 | | | $ | 10.39 | | | $ | 8.11 | | | $ | 9.09 | | | $ | 12.01 | |
|
|
| Income (loss) from investment operations: | | | | | | | | | | | | | | | | | | | |
| Net investment income | | 0.15 | | | | 0.09 | | | | 0.04 | | | | 0.05 | | | | 0.01 | |
| Net realized and unrealized gain (loss) | | 1.08 | | | | 1.46 | | | | 2.27 | | | | (1.02 | ) | | | (2.90 | ) |
|
|
| Total from investment operations | | 1.23 | | | | 1.55 | | | | 2.31 | | | | (0.97 | ) | | | (2.89 | ) |
|
|
| Less distributions from: | | | | | | | | | | | | | | | | | | | |
| Net investment income | | (0.11 | ) | | | (0.06 | ) | | | (0.03 | ) | | | (0.01 | ) | | | — | (b) |
| Net realized gains | | (0.17 | ) | | | — | | | | — | | | | — | | | | (0.03 | ) |
|
|
| Total distributions | | (0.28 | ) | | | (0.06 | ) | | | (0.03 | ) | | | (0.01 | ) | | | (0.03 | ) |
|
|
| Net asset value, end of year | $ | 12.83 | | | $ | 11.88 | | | $ | 10.39 | | | $ | 8.11 | | | $ | 9.09 | |
|
|
| Total Return (a) | | 10.65 | % | | | 14.98 | % | | | 28.52 | % | | | (10.71 | )% | | | (24.06 | )% |
| Ratios and Supplemental Data: | | | | | | | | | | | | | | | | | | | |
| Net assets, end of year (in thousands) | $ | 266,437 | | | $ | 206,625 | | | $ | 130,443 | | | $ | 48,913 | | | $ | 32,311 | |
| Ratios to average net assets: | | | | | | | | | | | | | | | | | | | |
| Net expenses | | 1.21 | % | | | 1.25 | % | | | 1.25 | % | | | 1.25 | % | | | 1.25 | % |
| Gross expenses | | 1.21 | % | | | 1.29 | % | | | 1.40 | % | | | 1.65 | % | | | 1.94 | % |
| Net investment income | | 1.45 | % | | | 1.05 | % | | | 1.25 | % | | | 0.98 | % | | | 0.50 | % |
| Portfolio turnover rate | | 54 | % | | | 53 | % | | | 38 | % | | | 49 | % | | | 58 | % |
| |
| LAZARD RETIREMENT EMERGING MARKETS PORTFOLIO | | | | | | | | | | | | | |
| | Year Ended |
|
|
| | 12/31/05 | | | 12/31/04 | | | 12/31/03 | | | 12/31/02 | | | 12/31/01 | |
|
|
|
| Net asset value, beginning of year | $ | 13.91 | | | $ | 10.73 | | | $ | 7.02 | | | $ | 7.17 | | | $ | 7.59 | |
|
|
| Income (loss) from investment operations: | | | | | | | | | | | | | | | | | | | |
| Net investment income | | 0.13 | | | | 0.05 | | | | 0.10 | | | | 0.05 | | | | 0.03 | |
| Net realized and unrealized gain (loss) | | 5.41 | | | | 3.21 | | | | 3.61 | | | | (0.16 | ) | | | (0.42 | ) |
|
|
| Total from investment operations | | 5.54 | | | | 3.26 | | | | 3.71 | | | | (0.11 | ) | | | (0.39 | ) |
|
|
| Less distributions from: | | | | | | | | | | | | | | | | | | | |
| Net investment income | | (0.05 | ) | | | (0.08 | ) | | | — | (b) | | | (0.04 | ) | | | (0.03 | ) |
| Net realized gains | | (0.59 | ) | | | — | | | | — | | | | — | | | | — | |
|
|
| Total distributions | | (0.64 | ) | | | (0.08 | ) | | | — | | | | (0.04 | ) | | | (0.03 | ) |
|
|
| Net asset value, end of year | $ | 18.81 | | | $ | 13.91 | | | $ | 10.73 | | | $ | 7.02 | | | $ | 7.17 | |
|
|
| Total Return (a) | | 40.78 | % | | | 30.59 | % | | | 52.94 | % | | | (1.50 | )% | | | (5.07 | )% |
| Ratios and Supplemental Data: | | | | | | | | | | | | | | | | | | | |
| Net assets, end of year (in thousands) | $ | 82,812 | | | $ | 31,710 | | | $ | 15,937 | | | $ | 7,965 | | | $ | 4,907 | |
| Ratios to average net assets: | | | | | | | | | | | | | | | | | | | |
| Net expenses | | 1.60 | % | | | 1.60 | % | | | 1.60 | % | | | 1.60 | % | | | 1.60 | % |
| Gross expenses | | 1.95 | % | | | 2.36 | % | | | 2.96 | % | | | 3.92 | % | | | 4.21 | % |
| Net investment income | | 1.39 | % | | | 1.13 | % | | | 1.69 | % | | | 0.95 | % | | | 0.52 | % |
| Portfolio turnover rate | | 51 | % | | | 43 | % | | | 41 | % | | | 53 | % | | | 63 | % |
| (a) | Total returns reflect reinvestment of all dividends and distributions, if any. Certain expenses of the Portfolio have been waived or reimbursed by the Portfolio’s Investment Manager or Administrator; without such waiver/reimbursement of expenses, the Portfolio’s returns would have been lower. Performance information does not reflect the fees and charges imposed by participating insurance companies at the separate account level, and such charges will have the effect of reducing performance. |
| |
| (b) | Amount is less than $0.01 per share. |
| |
The accompanying notes are an integral part of these financial statements.
30
Lazard Retirement Series, Inc.
Notes to Financial Statements
December 31, 2005
1. Organization
Lazard Retirement Series, Inc. (the “Fund”) was incorporated in Maryland on February 13, 1997 and is registered under the Investment Company Act of 1940, as amended (the “Act”), as an open-end management investment company. The Fund is comprised of nine no-load portfolios (each referred to as a “Portfolio”), which are offered only to separate accounts established by insurance companies to fund variable annuity contracts and variable life insurance policies. The Fund may also be offered to certain qualified pension and retirement plans and accounts permitting accumulation of assets on a tax-deferred basis. Currently, only the following four Portfolios, each of which is “diversified”, as defined in the Act, are offered: Lazard Retirement Equity Portfolio (“Equity Portfolio”), Lazard Retirement Small Cap Portfolio (“Small Cap Portfolio”), Lazard Retirement International Equity Portfolio (“International Equity Portfolio”) and Lazard Retirement Emerging Markets Portfolio (“Emerging Markets Portfolio”). Each of the other five Portfolios had not commenced operations as of December 31, 2005.
2. Significant Accounting Policies
The following is a summary of significant accounting policies:
(a) Valuation of Investments—Market values for equity securities listed on the New York Stock Exchange (“NYSE”), NASDAQ national market or other U.S. exchanges or markets are generally based on the closing market price on the principal exchange or market on which the security is traded, generally as of the close of regular trading on the NYSE (normally 4:00 p.m. Eastern time) on each valuation date; securities not traded on the valuation date are valued at the closing bid price. Any securities not listed, for which current over-the-counter market quotations or bids are readily available, are valued at the last quoted bid price or, if available, the mean of two such prices. Securities listed on foreign exchanges are valued at the last reported sales price, except as described below.
If events materially affecting the value of securities occur between the close of the exchange or market on which the security is principally traded and the time when a Portfolio’s net asset value is calculated, such securities will be valued at their fair values as determined by, or in accordance with procedures approved by, the Board of Directors. The fair value of foreign securities may be determined with the assistance of a pricing service, using correlations between the movement of prices of such securities and indices of domestic securities and other appropriate indicators, such as closing market prices of relevant ADRs or futures contracts. The effect of using fair value pricing is that the net asset value of a Portfolio will reflect the affected securities’ values as determined in the judgment of the Board of Directors or its designee instead of being determined by the market. Using a fair value pricing methodology to price securities may result in a value that is different from the most recent closing price of a security and from the prices used by other investment companies to calculate their portfolios’ net asset values.
Securities for which current market quotations are not readily available are valued at fair value as determined in good faith in accordance with procedures approved by the Board of Directors.
Under these procedures, in the event that Lazard Asset Management LLC, the Fund’s investment manager (the “Investment Manager”) and a wholly-owned subsidiary of Lazard Frères & Co. LLC, determines that a significant event has occurred after the close of a market on which a foreign security is traded but before the close of regular trading on the NYSE, such that current market quotations for a security or securities are not readily available, a Valuation Committee of the Investment Manager will evaluate a variety of factors to determine the fair value of the affected securities. These factors include, but are not limited to, the type of security, the value of comparable securities, observations from financial institutions and relevant news events. Input from the Investment Manager’s analysts will also be considered.
(b) Portfolio Securities Transactions and Investment Income—Portfolio securities transactions are accounted for on trade date. Realized gain (loss) on sales of investments are recorded on a specific identification basis. Dividend income is recorded on the ex-dividend date and interest income is accrued daily.
The Portfolios may be subject to taxes imposed by foreign countries in which they invest. Such taxes are generally based on income earned or capital gains, realized or unrealized. The Portfolios accrue and apply such taxes to net investment income, net realized gains and net unrealized gains concurrent with the recognition of income or capital gains (realized and unrealized) from the applicable portfolio securities.
(c) Repurchase Agreements—In connection with transactions in repurchase agreements, the Fund’s custodian takes possession of the underlying collateral securities, the fair value of which at all times is required to be at least equal to the principal amount, plus accrued interest, of the repurchase transaction. If the seller defaults, and the fair value of the collateral declines, realization of the collateral by a Portfolio may be delayed or limited.
31
Lazard Retirement Series, Inc.
Notes to Financial Statements (continued)
December 31, 2005
(d) Foreign Currency Translation—The accounting records of the Portfolios are maintained in U.S. dollars. Portfolio securities and other assets and liabilities denominated in a foreign currency are translated daily into U.S. dollars at the prevailing rates of exchange. Purchases and sales of securities, income receipts and expense payments are translated into U.S. dollars at the prevailing exchange rates on the respective transaction dates.
The Portfolios do not isolate the portion of operations resulting from changes in foreign exchange rates on investments from the fluctuations arising from changes in their market prices. Such fluctuations are included in net realized and unrealized gain (loss) on investments. Net realized gain (loss) on foreign currency transactions represents net foreign currency gain (loss) from disposition of foreign currencies, currency gain (loss) realized between the trade and settlement dates on securities transactions, and the difference between the amount of dividends, interest and foreign withholding taxes recorded on a Portfolio’s accounting records and the U.S. dollar equivalent amounts actually received or paid. Net unrealized foreign currency gain (loss) arises from changes in the value of assets and liabilities, other than investments in securities, as a result of changes in exchange rates.
(e) Federal Income Taxes—The Fund’s policy is to continue to have each Portfolio qualify as a regulated investment company under Subchapter M of the Internal Revenue Code and to distribute all of its taxable income, including any realized net capital gains, to shareholders. Therefore, no federal income tax provision is required.
At December 31, 2005, the following Portfolio had available for federal income tax purposes unused realized capital losses which can be used to offset future realized capital gains as follows:
| Portfolio | Expiring 2010 | | Expiring 2011 |
|
| Equity | $ | 8,107 | | $ | 114,878 |
Under current tax law, certain capital and net foreign currency losses realized after October 31 within the taxable year may be deferred and treated as occurring on the first day of the following tax year. For the tax year ended December 31, 2005, the Portfolios did not elect to defer net capital and currency losses arising between November 1, 2005 and December 31, 2005.
(f) Dividends and Distributions—Each Portfolio intends to declare and to pay dividends annually from net investment income. During any particular year, net realized gains from investment transactions in excess of available capital loss carryforwards would be taxable to the Portfolio if not distributed. The Portfolios intend to declare and distribute these amounts, at least annually, to shareholders; however, to avoid taxation, a second distribution may be required.
Income dividends and capital gains distributions are determined in accordance with federal income tax regulations which may differ from U.S. generally accepted accounting principles. These book/tax differences, which may result in distribution reclassifications, are primarily due to differing treatments of foreign currency transactions and wash sales. Book/tax differences relating to shareholder distributions may result in reclassifications among certain capital accounts.
The tax character of dividends and distributions paid during the years ended December 31 was as follows:
| | | | | | | | | Long-Term |
| | Ordinary Income | | Capital Gains |
|
|
| Portfolio | 2005 | | 2004 | | 2005 | | 2004 |
|
| Equity | $ | 34,628 | | $ | 28,362 | | $ | — | | $ | — |
| Small Cap | | 2,220,767 | | | — | | | 7,268,768 | | — |
| International Equity | | 3,660,173 | | | 902,561 | | | 2,155,347 | | — |
| Emerging Markets | | 499,760 | | | 149,218 | | | 1,610,559 | | — |
At December 31, 2005, the components of distributable earnings (excluding unrealized appreciation (depreciation)) on a tax basis were as follows:
| | | | | Undistributed |
| | Undistributed | | Long-Term |
| Portfolio | Ordinary Income | | Capital Gain |
|
| Equity | $ | 27,495 | | $ | — |
| Small Cap | | 5,508,707 | | | 5,857,330 |
| International Equity | | 6,461,100 | | | 8,660,339 |
| Emerging Markets | | 3,507,704 | | | 4,280,039 |
(g) Allocation of Expenses—Expenses not directly chargeable to a specific Portfolio are allocated among the Portfolios primarily on the basis of relative net assets.
(h) Expense Reductions—Portfolios leaving excess cash in demand deposit accounts may receive credits which are available to offset custody expenses. The Statements of Operations report gross custody expenses, and report the amount of such credits separately as an expense reduction.
(i) Estimates—The preparation of financial statements in conformity with U.S. generally accepted accounting principles requires the Fund to make estimates and assumptions that affect the reported amounts of assets and liabilities and disclosure of contingent assets and liabilities at the date of the financial statements and the reported amounts of increases and decreases in net assets from
32
Lazard Retirement Series, Inc.
Notes to Financial Statements (continued)
December 31, 2005
operations during the reporting period. Actual results could differ from those estimates.
3. Investment Management, Administrative and Distribution Agreements
The Fund has entered into an investment management agreement (the “Management Agreement”) with the Investment Manager. Pursuant to the Management Agreement, the Investment Manager regularly provides each Portfolio with investment research, advice and supervision and furnishes continuously an investment program for each Portfolio consistent with its investment objective and policies, including the purchase, retention and disposition of securities. For its services provided to the Fund, the Investment Manager earns a management fee, accrued daily and payable by each Portfolio monthly, at the annual rate set forth below as a percentage of its average daily net assets:
| Portfolio | | Annual Rate | |
| |
| |
| Equity | | 0.75 | % | |
| Small Cap | | 0.75 | | |
| International Equity | | 0.75 | | |
| Emerging Markets | | 1.00 | | |
The Investment Manager has voluntarily agreed to reduce its fees and, if necessary, reimburse the following Portfolios if annualized operating expenses exceed the following percentages of average daily net assets:
| | | Annual | |
| Portfolio | | Operating Expenses | |
| |
| |
| Equity | | 1.25 | % | |
| Small Cap | | 1.25 | | |
| International Equity | | 1.25 | | |
| Emerging Markets | | 1.60 | | |
The Fund has entered into an administrative agreement with State Street Bank and Trust Company (“State Street”) to provide certain administrative services. Each Portfolio bears the cost of such services at a fixed annual rate of $37,500, plus 0.02% of average daily net assets up to $1 billion and 0.01% of average daily net assets over $1 billion. State Street agreed to waive one half of the $37,500 base fee for the Equity Portfolio until the Portfolio’s net assets reach $25 million.
The Fund has a distribution agreement with Lazard Asset Management Securities LLC (the “Distributor”), a wholly-owned subsidiary of the Investment Manager, to serve as the distributor for shares of each Portfolio and bears the cost of printing and mailing prospectuses to potential investors and of certain expenses in connection with the offering of Portfolio shares.
Under a Distribution and Servicing Plan in accordance with Rule 12b-1 under the Act, each Portfolio pays a monthly fee to the Distributor, at an annual rate of 0.25% of the average daily net assets of the Portfolio, for distribution and servicing of accounts. The Distributor may make payments to participating insurance companies, certain financial institutions, securities dealers and other industry professionals for providing these services.
4. Directors’ Compensation
Certain Directors of the Fund are Managing Directors of the Investment Manager. The Fund pays each Director who is not an employee or an affiliated person of the Investment Manager its allocated portion of a fixed fee of $50,000 per year, plus $2,500 per meeting attended ($1,000 per meeting attended by telephone) for the Fund, The Lazard Funds, Inc., Lazard Global Total Return and Income Fund, Inc. and Lazard World Dividend & Income Fund Inc. (collectively, the “Lazard Funds”), each a registered management investment company advised by the Investment Manager, and reimburses such Directors for travel and other out of pocket expenses. In addition, the Chairman of the Audit Committees for the Lazard Funds also receives an annual fee of $5,000.
5. Securities Transactions and Transactions with Affiliates
Purchases and sales of portfolio securities (excluding short-term securities) for the year ended December 31, 2005 were as follows:
| Portfolio | | Purchases | | Sales |
| |
| |
|
| Equity | | $ | 3,431,745 | | $ | 4,026,014 |
| Small Cap | | | 120,970,720 | | | 111,711,534 |
| International Equity | | | 156,920,209 | | | 122,077,996 |
| Emerging Markets | | | 53,562,694 | | | 24,440,029 |
For the year ended December 31, 2005, no brokerage commissions were paid to affiliates of the Investment Manager or other affiliates of the Fund for portfolio transactions executed on behalf of the Fund.
6. Foreign Securities Investment Risks
Certain Portfolios invest in securities of foreign entities and instruments denominated in foreign currencies which involve risks not typically involved in domestic investments. Foreign investments carry special risks, such as exposure to currency fluctuations, less developed or less efficient trading markets, political instability, a lack of company information, differing auditing and legal standards and, potentially, less liquidity. A Portfolio’s investments in emerging markets are exposed to additional volatility. A Portfolio’s performance will be influenced by
33
Lazard Retirement Series, Inc.
Notes to Financial Statements (concluded)
December 31, 2005
political, social and economic factors affecting emerging markets. Emerging market countries generally have economic structures that are less diverse and mature, and political systems that are less stable, than those of developed countries.
7. Reorganization
On April 29, 2005, Small Cap Portfolio acquired the net assets of Phoenix-Lazard Small-Cap Value Series (“Phoenix Portfolio”), a series of The Phoenix Edge Series Fund, pursuant to a plan of reorganization approved by Phoenix Portfolio shareholders on April 26, 2005. The acquisition was accomplished by a tax-free exchange of 771,728 shares (valued at $12,046,680) of Small Cap Portfolio for the 960,107 shares of Phoenix Portfolio outstanding on April 29, 2005. Phoenix Portfolio’s net assets at that date, including $714,260 of unrealized appreciation and $254,282 of accumulated realized net gain, were combined with those of Small Cap Portfolio. The aggregate net assets of Small Cap Portfolio and Phoenix Portfolio immediately before the reorganization were $104,311,297 and $12,046,680, respectively. The aggregate net assets of Small Cap Portfolio immediately after the reorganization were $116,357,977.
8. Subsequent Event
Effective January 31, 2006, the Fund designated its existing class of shares as Service Shares and commenced offering Investor Shares. All references to Fund shares in this annual report, and related net asset value and performance of such shares, are to the existing class of shares at December 31, 2005.
34
Lazard Retirement Series, Inc.
Report of Independent Registered Public Accounting Firm
The Board of Directors and Shareholders
Lazard Retirement Series, Inc.
We have audited the accompanying statements of assets and liabilities, including the portfolios of investments, of Lazard Retirement Series, Inc. (the “Fund,” comprised of Lazard Retirement Equity Portfolio, Lazard Retirement Small Cap Portfolio, Lazard Retirement International Equity Portfolio and Lazard Retirement Emerging Markets Portfolio) as of December 31, 2005 and the related statements of operations for the year then ended, the statements of changes in net assets for each of the two years in the period then ended and the financial highlights for each of the five years in the period then ended. These financial statements and financial highlights are the responsibility of the Fund’s management. Our responsibility is to express an opinion on these financial statements and financial highlights based on our audits.
We conducted our audits in accordance with standards of the Public Company Accounting Oversight Board (United States). Those standards require that we plan and perform the audit to obtain reasonable assurance about whether the financial statements and financial highlights are free of material misstatement. An audit includes examining, on a test basis, evidence supporting the amounts and disclosures in the financial statements. Our procedures included confirmation of securities owned as of December 31, 2005, by correspondence with the custodian and brokers. An audit also includes assessing the accounting principles used and significant estimates made by management, as well as evaluating the overall financial statement presentation. We believe that our audits provide a reasonable basis for our opinion.
In our opinion, the financial statements and financial highlights as stated above, present fairly, in all material respects, the financial position of each of the respective portfolios constituting Lazard Retirement Series, Inc. as of December 31, 2005, the results of their operations for the year then ended, changes in their net assets for each of the two years in the period then ended and the financial highlights for each of the five years in the period then ended in conformity with U.S. generally accepted accounting principles.
ANCHIN, BLOCK & ANCHIN LLP
New York, New York
February 17, 2006
35
Lazard Retirement Series, Inc.
Proxy Voting Results
(unaudited)
A special meeting of shareholders was held on September 15, 2005, to vote on the following proposals. The proposals received the required number of votes of shareholders and were adopted.
| Proposal 1: | To approve a new Investment Management Agreement between the Fund and the Investment Manager. |
| | | | | | | | |
| | Portfolio | | For | | Against | | Abstain |
| |
| |
| |
| |
|
| | Equity | | 370,857.013 | | 1,862.565 | | 21,027.605 |
| | Small Cap | | 4,992,533.669 | | 83,330.383 | | 217,226.214 |
| | International Equity | | 17,570,452.795 | | 1,586,855.424 | | 56,772.450 |
| | Emerging Markets | | 2,794,605.423 | | 26,401.304 | | 4,587.865 |
| | | | | | | | |
| Proposal 2: | On the election to the Board of Directors of Charles Carroll and Robert M. Solmson. |
| | | | | | | | |
| | Director | | For | | Withhold Authority | | |
| |
| |
| |
| | |
| | Charles Carroll | | 25,933,387.877 | | 1,793,124.833 | | |
| | Robert M. Solmson | | 25,914,037.334 | | 1,812,475.376 | | |
| | | | | | | | |
36
Lazard Retirement Series, Inc.
Board of Directors and Officers Information
(unaudited)
| Name (Age) | | Position(s) and Term | | Principal Occupation(s) During Past 5 Years |
| Address(1) | | with the Fund(2) | | and Other Directorships Held |
|
| |
| Non-Interested Directors: | | | | |
| |
| John J. Burke (77) | | Director | | Lawyer and Private Investor; Director, Lazard Alternative Strategies Fund, |
| | | | | LLC; Director, Pacific Steel & Recycling; Director, Sletten Construction Com- |
| | | | | pany; Trustee Emeritus, The University of Montana Foundation. |
| |
| Kenneth S. Davidson (60) | | Director | | President, Davidson Capital Management Corporation; Trustee, The Juilliard |
| | | | | School; Chairman of the Board, Bridgehampton Chamber Music Festival; |
| | | | | Trustee, American Friends of the National Gallery/London; Founding Mem- |
| | | | | ber, Aquiline Holdings LLC; Trustee, The Spence School. |
| |
| Lester Z. Lieberman (75) | | Director | | Private Investor; Chairman, Healthcare Foundation of New Jersey; Director, |
| | | | | Cives Steel Co.; Director, Northside Power Transmission Co.; Advisory |
| | | | | Trustee, New Jersey Medical School; Director, Public Health Research Insti- |
| | | | | tute; Trustee Emeritus, Clarkson University; Council of Trustees, New Jersey |
| | | | | Performing Arts Center. |
| |
| Richard Reiss, Jr. (61) | | Director | | Chairman, Georgica Advisors LLC, an investment manager; Director, Lazard |
| | | | | Alternative Strategies Fund, LLC; Director, O’Charley’s, Inc., a restaurant |
| | | | | chain. |
| |
| Robert M. Solmson (58) | | Director | | Director, Lazard Alternative Strategies Fund, LLC; Director, Colonial |
| | | | | Williamsburg Co.; Former Chief Executive Officer and Chairman, RFS Hotel |
| | | | | Investors, Inc.; Former Director, Morgan Keegan, Inc.; Former Director, Inde- |
| | | | | pendent Bank, Memphis. |
| |
| Interested Directors(3): | | | | |
| |
| Charles Carroll (45) | | Chief Executive Officer, | | Deputy Chairman and Head of Global Marketing of the Investment Manager. |
| | | President and Director | | |
| |
| Ashish Bhutani (45) | | Director | | Chief Executive Officer of the Investment Manager; from 2001 to December |
| | | | | 2002, Co-Chief Executive Officer North America of Dresdner Kleinwort |
| | | | | Wasserstein and member of its Global Corporate and Markets Board and the |
| | | | | Global Executive Committee; from 1995 to 2001, Chief Executive Officer of |
| | | | | Wasserstein Perella Securities; and from 1989 to 2001, Deputy Chairman of |
| | | | | Wasserstein Perella Group. |
| (1) | The address of each Director is Lazard Asset Management LLC, 30 Rockefeller Plaza, New York, New York 10112-6300. |
| |
| (2) | Each Director became a Director in April 1997, except Messrs. Carroll, Solmson and Bhutani, who became Directors in June 2004, September 2004 and July 2005, respectively. Each Director also serves as a Director for each of the Lazard Funds (comprised of 24 investment portfolios), and serves an indefinite term, until his successor is elected. |
| |
| (3) | Messrs. Bhutani and Carroll are “interested persons” (as defined in the Act) of the Fund because of their positions with the Investment Manager. |
| |
The Fund’s Statement of Additional Information contains further information about the Directors and is available without charge by calling 800-887-4929.
37
Lazard Retirement Series, Inc.
Board of Directors and Officers Information (concluded)
(unaudited)
| Name (Age) | | Position(s) and Term | | |
| Address(1) | | with the Fund(2) | | Principal Occupation(s) During Past 5 Years |
|
| |
| Officers: | | | | |
| |
| Nathan A. Paul (32) | | Vice President | | Managing Director and General Counsel of the Investment Manager. |
| | | and Secretary | | |
| | | since April 2002 | | |
| |
| Stephen St. Clair (47) | | Treasurer since May 2003 | | Vice President of the Investment Manager. |
| |
| John H. Blevins (40) | | Chief Compliance Officer | | Director and Chief Compliance Officer of the Investment Manager. |
| | | since September 2004 | | |
| |
| Brian D. Simon (43) | | Assistant Secretary | | Director of the Investment Manager; Vice President, Law & Regulations |
| | | since November 2002 | | at J. & W. Seligman & Co., from July 1999 to October 2002. |
| |
| David A. Kurzweil (31) | | Assistant Secretary | | Vice President of the Investment Manager; Associate at Kirkpatrick & |
| | | since April 2005 | | Lockhart LLP, a law firm, from August 1999 to January 2003. |
| |
| Cesar A. Trelles (31) | | Assistant Treasurer | | Fund Administration Manager of the Investment Manager; Manager for |
| | | since December 2004 | | Mutual Fund Finance Group at UBS Global Asset Management, from August |
| | | | | 1998 to August 2004. |
| (1) | The address of each officer is Lazard Asset Management LLC, 30 Rockefeller Plaza, New York, New York 10112-6300. |
| |
| (2) | Each officer serves for an indefinite term, until his successor is elected and qualified, and serves in the same capacity for the other Lazard Funds. |
| |
38
Lazard Retirement Series, Inc.
Other Information
(unaudited)
Proxy Voting
A description of the policies and procedures used to determine how proxies relating to Fund portfolio securities are voted is available (1) without charge, upon request, by calling (800) 823-6300 or (2) on the Securities and Exchange Commission (“SEC”) website at www.sec.gov.
The Fund’s proxy voting record for the most recent 12-month period ended June 30 is available (1) without charge, upon request, by calling (800) 823-6300 or (2) on the SEC’s website at www.sec.gov. Information as of June 30 each year will generally be available by the following August 31.
Form N-Q
The Fund files a complete schedule of each Portfolio’s holdings for the first and third quarters of its fiscal year with the SEC on Form N-Q. The Fund’s Form N-Q is available on the SEC’s website at www.sec.gov and may be reviewed and copied at the SEC’s Public Reference Room in Washington, D.C. Information on the operation of the SEC’s Public Reference Room may be obtained by calling 1-800-SEC-0330.
Board Consideration of Management Agreements
Over the course of two separate meetings of the Fund’s Board of Directors held on July 26, 2005 and for September 13, 2005, the Board considered the approval of new Management Agreements for two new portfolios of the Fund, U.S. Equity Value and International Strategic Equity Portfolios (the “New Portfolios”), with the Investment Manager. The Directors who are not “interested persons” (as defined in the Act) of the Fund (the “Independent Directors”) were assisted in their review by independent legal counsel and met with counsel in executive session separate from representatives of the Investment Manager.
Services Provided
The Investment Manager’s representatives referred the Directors to presentations and materials from the Investment Manager on its advisory business at recent Board of Directors meetings for the Fund and other investment companies managed by the Investment Manager having the same Boards of Directors as the Fund, in connection with approval of investment management agreements for those investment companies.
Representatives of the Investment Manager reviewed the previous discussions in connection with the approval of those management agreements, including previous discussions with the Board about (1) the nature, extent and quality of services that the Investment Manager provides the Fund and the other investment companies managed by the Investment Manager (of which the Lazard Funds comprised approximately $4 billion of the approximately $74 billion of total assets then under the management of the Investment Manager and its global affiliates), which would apply as relevant, to each New Portfolio; (2) the Investment Manager’s global structure, including technology and operational support; and (3) the Investment Manager’s research and portfolio management capabilities and that the Investment Manager also provides oversight of the day-to-day fund operations, including fund accounting and administration and assistance in meeting legal and regulatory requirements. The Directors also had considered the Investment Manager’s extensive administrative, accounting and compliance infrastructure and agreed that the Fund benefits, and that the New Portfolios also could benefit, from all of the services of the Investment Manager’s global platforms, and that such services would be different than those provided to a fund if it were not managed by a global firm such as the Investment Manager.
A number of other factors had been considered in previous discussions, including: the scope of the services to be provided by the Investment Manager; the personnel, resources, technology utilization, business reputation, financial condition and experience of the Investment Manager; and benefits that may accrue to the Investment Manager or its affiliates by virtue of their relationship with the Fund, including the benefits of brokerage relationships with affiliates of the Investment Manager and any research and similar service arrangements with brokers who execute transactions on behalf of the New Portfolios. At each meeting, the representatives of the Investment Manager confirmed for the Board that there had been no significant changes in the referenced information and noted the applicability of the information, discussions and considerations to the services that would be provided to the New Portfolios.
39
Lazard Retirement Series, Inc.
Other Information (continued)
(unaudited)
Comparative Performance and Fees and Expenses
The Directors reviewed and placed significant emphasis on the relative performance and advisory fees and expense ratios for each New Portfolio, including comparative information prepared by Lipper.
Performance. Representatives of the Investment Manager reviewed with the Directors the Investment Manager’s written materials detailing its equity and international equity products, management teams and resources and composite performance and the strategies that would be employed in managing the New Portfolios. The Board considered the separately managed account historic performance of the U.S. Equity Value and International Strategic Equity products as compared to their relevant benchmarks. It was noted in particular that the separately managed account performance of the International Strategic Equity product was excellent as compared to its benchmark, outperforming it for the one- and three-year periods shown.
Advisory Fees and Expenses. The Directors also discussed the advisory fees and anticipated expense ratios for the New Portfolios and the comparisons provided by Lipper comparing projected expenses and contractual management fees for each New Portfolio to a comparison group chosen by Lipper, noting the assumptions used in the comparisons.
The Directors assessed the proposed advisory fees and estimated expense ratios for the New Portfolios and the comparisons provided by Lipper. It was noted that the proposed advisory fees and estimated expense ratios for the New Portfolios, after application of the Investment Manager’s contractual agreement to waive fees and reimburse expenses for each New Portfolio, were generally within the median ranges of the relevant Lipper comparison group and category average. A discussion ensued of the fees charged and services provided under the proposed Management Agreements with respect to the New Portfolios in light of the criteria discussed at previous meetings, and the Board analyzed the fee and expense information. The Board discussed with the Investment Manager’s representatives the impact of 12b-1 fees on the expense information shown. It was noted that the proposed advisory fees for each New Portfolio were consistent with the fees for other similar portfolios of the Fund.
The Directors also considered comparison groups composed solely of funds sub-advised by the Investment Manager in the same Lipper category as each New Portfolio, as well as the Investment Manager’s separately managed accounts with similar investment objectives, policies and strategies (for each New Portfolio, collectively with such funds sub-advised by the Investment Manager, “Similar Accounts”), and the Investment Manager’s representatives referred to previous discussions of the differences, from the Investment Manager’s perspective, in management of the different types of Similar Accounts as compared to management of the New Portfolios. The Directors considered the relevance of the fee information provided for Similar Accounts to evaluate the appropriateness and reasonableness of each New Portfolio’s advisory fees and recognized that any differences in fees paid by Similar Accounts was consistent with the differences in the services provided.
Investment Manager Profitability and Economies of Scale
Representatives of the Investment Manager noted previous discussions regarding considerations of profitability and economies of scale and noted that because each New Portfolio is newly formed, had not commenced operations, and the eventual aggregate amount of New Portfolio assets was uncertain, the Investment Manager was not able to provide the Board with specific information concerning the cost of services to be provided to each New Portfolio and the expected profits to be realized by the Investment Manager and its affiliates from their relationships with the New Portfolio and the extent to which economies of scale would be realized as each New Portfolio grows and whether fee levels would reflect such economies of scale, if any. The Board determined that it would revisit this issue no later than when it next reviews the investment advisory fee in connection with renewal of the Management Agreements and noted that the Investment Manager would provide profitability information in connection with the renewal of the Management Agreements. The Independent Directors also considered potential benefits to the Investment Manager and its affiliates from acting as investment adviser to the New Portfolios and noted that the Investment Manager does obtain soft dollar research.
At the conclusion of these discussions, each of the Independent Directors expressed the opinion that he had been furnished with sufficient information to make an informed business decision with respect to the approval of a Management Agreement with respect to each New Portfolio. Based on its discussions and considerations as described above, the Board made the following conclusions and determinations.
40
Lazard Retirement Series, Inc.
Other Information (concluded)
(unaudited)
- The Board concluded that the nature, extent and quality of the services to be provided by the Investment Manager are adequate and appropriate, especially including the benefits of advisory and research services associated with a $74 billion asset management business.
- The Board was satisfied with the overall performance of the Investment Manager’s U.S. Equity Value and International Strategic Equity products and the resources the Investment Manager was to devote to management of the investment portfolios of the New Portfolios.
- The Board concluded that each New Portfolio’s fee to be paid to the Investment Manager was reasonable in light of comparative expense and advisory fee information and anticipated benefits to be derived by the Investment Manager from the relationship with the New Portfolio.
- The Board recognized that economies of scale may be realized as the assets of the New Portfolios increase. The Board determined they would seek to share material economies of scale with the New Portfolios.
The Directors considered these conclusions and determinations and, without any one factor being dispositive, the Board determined that approval of a Management Agreement with respect to each New Portfolio was in the best interests of the New Portfolio and its shareholders.
41
[This page intentionally left blank]
[This page intentionally left blank]
[This page intentionally left blank]
Lazard Retirement Series, Inc.
30 Rockefeller Plaza
New York, New York 10112-6300
Telephone: 800-887-4929
http://www.LazardNet.com
Investment Manager
Lazard Asset Management LLC
30 Rockefeller Plaza
New York, New York 10112-6300
Telephone: 800-887-4929
Distributor
Lazard Asset Management Securities LLC
30 Rockefeller Plaza
New York, New York 10112-6300
Custodian
State Street Bank and Trust Company
One Lincoln Street
Boston, Massachusetts 02111
Transfer Agent and Dividend Disbursing Agent
Boston Financial Data Services, Inc.
P.O. Box 8514
Boston, Massachusetts 02266-8514
Telephone: 800-986-3455
Independent Registered Public Accounting Firm
Anchin, Block & Anchin LLP
1375 Broadway
New York, New York 10018
http://www.anchin.com
Legal Counsel
Stroock & Stroock & Lavan LLP
180 Maiden Lane
New York, New York 10038-4982
http://www.stroock.com
Performance information as of the most recent month end is available online at www.LazardNet.com.

| Lazard Retirement Series, Inc. | | 30 Rockefeller Plaza | | Tel 800-887-4929 | | |
| | | | New York, NY 10112- 6300 | | www.LazardNet.com | | R T 0 3 1 0 1 |
ITEM 2. CODE OF ETHICS.
The Registrant has adopted a code of ethics that applies to the Registrant's principal executive officer, principal financial officer, principal accounting officer or controller, or persons performing similar functions.
ITEM 3. AUDIT COMMITTEE FINANCIAL EXPERT.
The Registrant's Board of Directors (the “Board”) has determined that Lester Z. Lieberman, John J. Burke and Robert M. Solmson, members of the Audit Committee of the Board, are audit committee financial experts as defined by the Securities and Exchange Commission (the "SEC"). Mr. Lieberman, Mr. Burke and Mr. Solmson are "independent" as defined by the SEC for purposes of audit committee financial expert determinations.
ITEM 4. PRINCIPAL ACCOUNTANT FEES AND SERVICES.
(a) Audit Fees. The aggregate fees billed for each of the last two fiscal years (the "Reporting Periods") for professional services rendered by the Registrant's principal accountant (the "Auditor") for the audit of the Registrant's annual financial statements, or services that are normally provided by the Auditor in connection with the statutory and regulatory filings or engagements for the Reporting Periods, were $81,900 in 2004 and $85,200 in 2005.
(b) Audit-Related Fees. There were no fees billed in the Reporting Periods by the Auditor to the Registrant for assurance and related services that are reasonably related to the performance of the audit of the Registrant's financial statements and are not reported under paragraph (a) of this Item 4. There were no fees billed in the Reporting Periods for assurance and related services by the Auditor to the Registrant's investment adviser or any entity controlling, controlled by or under common control with the investment adviser that provides ongoing services to the Registrant ("Service Affiliates").
(c) Tax Fees. The aggregate fees billed in the Reporting Periods by the Auditor to the Registrant for professional services rendered by the Auditor for tax compliance, tax advice and tax planning ("Tax Services") were $21,500 in 2004 and $22,400 in 2005. These services consisted of (i) review or preparation of U.S. federal, state, local and excise tax returns; (ii) U.S. federal, state and local tax planning, advice and assistance regarding statutory, regulatory or administrative developments, and (iii) tax advice regarding tax qualification matters and/or treatment of various financial instruments held or proposed to be acquired or held.
There were no fees billed in the Reporting Periods for Tax Services by the Auditor to Service Affiliates.
(d) All Other Fees. There were no fees billed in the Reporting Periods by the Auditor to the Registrant for products and services other than the services reported in paragraphs (a) through (c) of this Item.
There were no fees billed in the Reporting Periods by the Auditor to Service Affiliates.
(e) Audit Committee Pre-Approval Policies and Procedures. The Registrant's Audit Committee pre-approves the Auditor's engagements for audit and non-audit services to the Registrant and, as required, non-audit services to Service Affiliates on a case-by-case basis. Pre-approval considerations include whether the proposed services are compatible with maintaining the Auditor's independence.
(f) None.
(g) Non-Audit Fees. The aggregate non-audit fees billed by the Auditor for services rendered to the Registrant for the Reporting Periods were $21,500 in 2004 and $22,400 in 2005. There were no fees billed in the Reporting Periods by the Auditor to Service Affiliates. There were no services provided by the Auditor that were approved pursuant to (c)(7)(i)(C) of Rule 2-01 of Regulation S-X.
(h) Auditor Independence. There were no services rendered by the Auditor to Service Affiliates during the Reporting Periods.
ITEM 5. AUDIT COMMITTEE OF LISTED REGISTRANTS.Not applicable.
ITEM 6. SCHEDULE OF INVESTMENTS
Not applicable.
ITEM 7. DISCLOSURE OF PROXY VOTING POLICIES AND PROCEDURES FOR CLOSED END MANAGEMENT INVESTMENTCOMPANIES.
Not applicable.
ITEM 8. PORTFOLIO MANAGERS OF CLOSED-END MANAGEMENT INVESTMENT COMPANIES.
Not applicable.
ITEM 9. PURCHASES OF EQUITY SECURITIES BY CLOSED-END MANAGEMENT INVESTMENT COMPANY AND AFFILIATED PURCHASERS.
Not applicable.
ITEM 10. SUBMISSION OF MATTERS TO A VOTE OF SECURITY HOLDERS.
The Registrant has a Nominating Committee (the "Committee") of the Board, which is currently comprised of all of the Directors who are not "interested persons" (as defined in the Investment Company Act of 1940, as amended) of the Registrant. The Committee's function is to select and nominate candidates for election to the Board. The Committee will consider recommendations for nominees from stockholders sent to the Secretary of the Registrant, 30 Rockefeller Plaza, New York, New York 10112. Nominations may be submitted only by a stockholder or group of stockholders that, individually or as a group, has beneficially owned the lesser of (a) 1% of the Registrant's outstanding shares or (b) $500,000 of the Registrant's shares for at least one year prior to the date such stockholder or group submits a candidate for nomination. Not more than one nominee for Director may be submitted by such a stockholder or group each calendar year.
In evaluating potential nominees, including any nominees recommended by stockholders, the Committee takes into consideration the factors listed in the Nominating Committee Charter and Procedures, including character and integrity, business and professional experience, and whether the Committee believes that the person has
the ability to apply sound and independent business judgment and would act in the interests of the Registrant and its stockholders. A nomination submission must include all information relating to the recommended nominee that is required to be disclosed in solicitations or proxy statements for the election of Directors, as well as information sufficient to evaluate the factors listed above. Nomination submissions must be accompanied by a written consent of the individual to stand for election if nominated by the Board and to serve if elected by the stockholders, and such additional information must be provided regarding the recommended nominee as reasonably requested by the Committee.
ITEM 11. CONTROLS AND PROCEDURES.
(a) The Registrant's principal executive and principal financial officers have concluded, based on their evaluation of the Registrant's disclosure controls and procedures as of a date within 90 days of the filing date of this report, that the Registrant's disclosure controls and procedures are reasonably designed to ensure that information required to be disclosed by the Registrant on Form N-CSR is recorded, processed, summarized and reported within the required time periods and that information required to be disclosed by the Registrant in the reports that it files or submits on Form N-CSR is accumulated and communicated to the Registrant's management, including its principal executive and principal financial officers, as appropriate to allow timely decisions regarding required disclosure.
(b) There were no changes to the Registrant's internal control over financial reporting that occurred during the second fiscal quarter of the period covered by this report that have materially affected, or are reasonably likely to materially affect, the Registrant's internal control over financial reporting.
ITEM 12. EXHIBITS.
(a)(1) Code of Ethics referred to in Item 2.
(a)(2) Certifications of principal executive and principal financial officers as required by Rule 30a-2(a) under the Investment Company Act of 1940.
(a)(3) Not applicable.
(b) Certifications of principal executive and principal financial officers as required by Rule 30a-2(b) under the Investment Company Act of 1940.
SIGNATURES
Pursuant to the requirements of the Securities Exchange Act of 1934 and the Investment Company Act of 1940, the Registrant has duly caused this report to be signed on its behalf by the undersigned, thereunto duly authorized.
| Lazard Retirement Series, Inc. |
| |
| By | | /s/ Charles Carroll |
| | | Charles Carroll |
| | | Chief Executive Officer |
| |
| Date | | March 6, 2006 |
Pursuant to the requirements of the Securities Exchange Act of 1934 and the Investment Company Act of 1940, this report has been signed below by the following persons on behalf of the Registrant and in the capacities and on the dates indicated.
| By | | /s/ Charles Carroll |
| Charles Carroll |
| | | Chief Executive Officer |
| |
| Date | | March 6, 2006 |
| |
| By | | /s/ Stephen St. Clair |
| Stephen St. Clair |
| Chief Financial Officer |
| |
| Date | | March 6, 2006 |