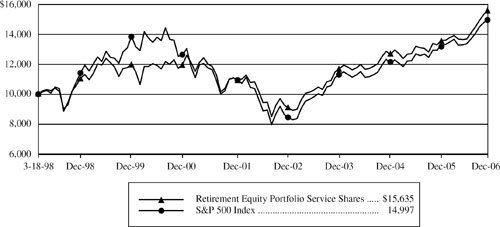
For the year ended December 31, 2006, Lazard Retirement Equity Portfolio Service Shares posted a total return of 17.48%, as compared with the 15.79% return of the S&P 500 Index.
Stock selection in technology was beneficial for performance, as some of the Portfolio’s larger-cap industry leaders, in areas such as software and networking, performed well after a period of extended weakness. Investors have begun to appreciate the strong competitive positions of these companies and the resilience of their diversified business models. Cisco reported better-than-expected year-on-year revenue growth, due to broad-based strength across all geographies, customer segments, and products. Shares of Oracle rose, as investors gained confidence in the company’s acquisition strategy, which was supported by better-than-expected recent earnings. Shares of Avaya also posted strong gains. The company reported solid sales growth, due to continued robust demand for its IP (Internet Protocol) products, and better-than-expected earnings were driven by improved margins, resulting from aggressive cost cutting by new management. Stock selection in the financials sector also helped performance, as shares of MasterCard rose sharply during the period. MasterCard’s third-quarter earnings results exceeded analysts’ expectations, as the company benefited from a secular shift from paper to plastic transactions, coupled with improving margins and a heightened focus on profitability. MasterCard was sold from the Portfolio after it reached our target valuation. An underweight position and stock selection in health care also boosted returns, as shares of Sepracor rose sharply. This pharmaceutical company released better-than-expected third-quarter earnings, and it continues to gain market share in the sleep-aid market, due to accelerating prescription growth for Lunesta. This was followed by a recent favorable decision from the Centers for Medicare and Medicaid Services, regarding reimbursement for the company’s asthma drug, Xopenex. Stock selection in telecom services detracted from performance, as Sprint shares declined in the third quarter after the company reported disappointing earnings. The product of a merger between Sprint and Nextel, the combined company has been hurt by slowing subscriber growth, due to the defection of a sizable number of Nextel’s lower-spending retail customers to other service providers.
Overall, the valuation of the broader stock market is reasonable, in the context of historic valuations. However, looking forward, our concern is that the historically high margins and returns in many cyclical stocks and sectors are not sustainable, especially given the beginning of an economic slowdown. The focus of the Portfolio will continue to be on those companies with valuations that are attractive and earnings that are more sustainable. We will seek to avoid those areas of the market where we believe earnings to be unsustainably high. As ever, good stock selection will be the key factor to a successful year ahead. Our investment process is focused on individual stock selection, which is based on company fundamentals, not on macroeconomic considerations. A complicating factor, from a fundamental perspective, is the continuation of a strong equity market and abundant liquidity, which is fuelling an extraordinary merger and acquisition cycle.
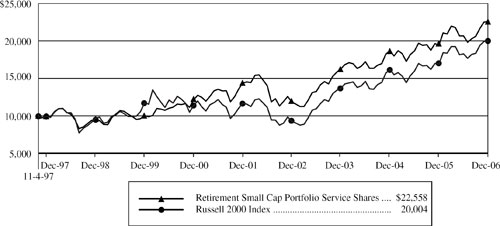
For the year ended December 31, 2006, Lazard Retirement Small Cap Portfolio Service Shares posted a total return of 16.07%, as compared with the 18.37% return of the Russell 2000 Index.
Stock selection in industrials helped performance, as shares of American Commercial Lines, a provider of inland waterway transportation, as well as a manufacturer of barges, rose significantly. The company was aided by tight conditions in both of its businesses, which helped to increase utilization and raise pricing. Stock selection in materials also helped returns, as shares of Oregon Steel, a manufacturer of oil-country tubular goods and other steel-related products, also rose sharply over the year. Oregon Steel benefited from strong demand for its products from its energy customers and, in November, it received a takeover bid from a Russian steel company, Evraz, at a substantial premium. We sold Oregon Steel into this strength, as it has exceeded our target valuation. An overweight position was beneficial to performance, as this was one of the best-performing sectors during the period. Finally, stock selection in technology also boosted returns, as shares of C-COR rose strongly. The company’s cable and telecom services customers continue to require C-COR’s equipment for building out their next generation networks to provide additional voice, data, and video
|
|
Lazard Retirement Series, Inc. |
|
Investment Overviews (continued) |
|
|
services to their customers. Stock selection in telecom services and financials detracted from performance over the period. Within telecom services, performance was hurt by lack of exposure to stocks of Regional Local Exchange Carriers (RLEC). RLEC shares posted solid gains over the period, as business conditions stabilized, and investors became more attracted to and confident in their high yields. Additionally, the Portfolio owned Wireless Facilities, a provider of design and engineering services to the telecom services industry, which declined substantially over the year, as customer activity slowed dramatically. Wireless Facilities was sold from the Portfolio, as we believed this slowdown was likely to persist. Within financials, bank holdings faced a difficult environment owing to a yield curve that is pressuring margins across a wide spectrum of companies. We expect the negative environment for banks to subside, in time, preferably as the Federal Reserve decides to lower short-term funding rates. Therefore, we maintain a reasonable exposure to banks in growing geographies with proven management teams.
The primary risk for small caps continues to be a slowdown in the economy, which would slow the earnings-growth differential relative to large caps, as well as raise the risk premium for investing in the small-cap market. As always, we continue to seek out small-cap companies with above-average prospects that can prosper over the long term, even if the market environment should turn more difficult.
Lazard Retirement International Equity Portfolio
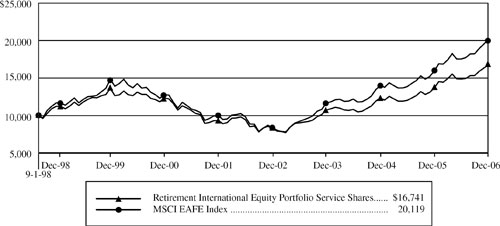
For the year ended December 31, 2006, Lazard Retirement International Equity Portfolio Service Shares posted a total return of 22.53%, as compared with the 26.34% return of the MSCI EAFE Index.
Helping performance was stock selection in consumer staples, as Gallaher shares posted solid gains. This U.K. tobacco company received a takeover bid from Japan Tobacco in December. Shares of InBev also continued to perform well, after the Belgian-based brewer announced profits that far exceeded analysts’ estimates. Shares of U.K. supermarket retailer, Tesco, also performed well. In addition, stock selection in materials boosted returns, as shares of Lafarge, the world’s largest cement maker, posted solid gains. Due to higher cement prices, the company’s third-quarter earnings increased by 32% and exceeded analysts’ expectations. Shares of building-materials supplier, CRH, also rose, after the company announced solid progress in integrating its largest acquisition to date. And, exposure to emerging-markets stocks also added value in the period. Conversely, stock selection in industrials detracted from performance, as shares of Yamato Holdings fell, due to disappointing quarterly-earnings results. Factors that negatively impacted the company’s results included rising personnel expenses, weakness in non-core businesses, and pricing declines in door-to-door delivery services. This stock was sold from the Portfolio, as we believed that our investment thesis for Yamato Holdings was no longer valid. THK Co., Ltd. shares also declined, as slowing momentum in the company’s monthly order data, in addition to general macroeconomic concerns, resulted in significant multiple contraction, despite better-than-expected results in the latest quarter. Stock selection in financials detracted from performance, as Japanese holdings, such as Mitsubishi UFJ, Sumitomo Mitsui, and Nomura, underperformed along with the overall Japanese market. An overweight position and stock selection in health care was detrimental to performance, as the shares of Sanofi-Aventis declined. The company reported lower-than-expected sales, due, in part, to cuts in government health spending in France and Germany and the late delivery of U.S. flu vaccines. We believe that the stock’s attractive valuation already reflects much of this bad news, but does not adequately recognize the positive impact that the company’s pipeline of new drug therapies could have on future earnings. Shares of Swiss pharmaceutical maker Novartis AG also fell. The company reported that the FDA required three more months to determine whether problems encountered by animals taking its oral diabetes drug, Galvus, may pose risks to humans.
In the context of historic valuations, the current valuation of the broader stock market is reasonable. Yet, we are concerned that the historically high margins and returns in many cyclical stocks and sectors are not sustainable, especially given the beginning of an economic slowdown. However, the Portfolio’s performance continues to be driven by stock selection, and we continue to look for an attractive balance of valuation and financial productivity. In a period when many companies are generating record returns, we are also very focused on the sustainability of returns,
5
|
|
Lazard Retirement Series, Inc. |
|
Investment Overviews (concluded) |
|
|
which we believe will be key to performance, going forward. Although we were disappointed by the Portfolio’s relative performance in 2006, we believe that the Portfolio enters 2007 well positioned to achieve its investment objective.
Lazard Retirement Emerging Markets Portfolio
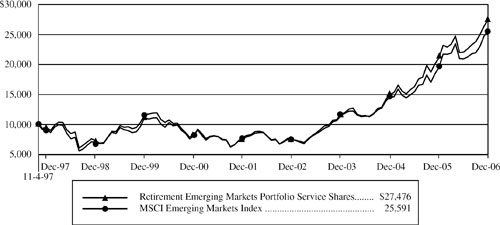
For the year ended December 31, 2006, Lazard Retirement Emerging Markets Portfolio’s Service Shares posted a total return of 29.95%, as compared with the 32.17% return of the MSCI Emerging Markets Index. The Portfolio’s Investor Shares (first offered on May 1, 2006) posted a total return of 10.64%, as compared with the 8.17% return of the Index during that period.
The Portfolio benefited from strong stock selection within the industrials and materials sectors. From a regional perspective, performance was enhanced by good stock selection within South Africa and Israel, and from a higher-than-index weight in Brazil. Petro-Bras, a Brazilian energy company, performed well, based on strong oil prices and a favorable outlook for reserve growth. Shares of Telekom Indonesia also rose sharply, due to robust cellular demand. Shares of Caemi, a Brazilian iron ore mining company, performed well, due to continued strong pricing for the metal. During the period, Caemi was acquired by CVRD, which was also held by the Portfolio. Conversely, performance was hurt by poor stock selection within the financials and consumer discretionary sectors and within South Korea and India. A lower-than-index weight to China was also a detractor. We saw poor stock performance in some of our South Korean holdings, such as Lotte Shopping, which declined on slow consumption levels within South Korea; LG Electronics, which declined due to concerns about handset prices; and Hyundai, which fell due to investors’ concerns about the strong won and increased competition.
2006 was very robust for emerging-markets equities. We remain positive over the medium- and long-term, based upon reasonable valuations and continuing high financial productivity.
Notes to Investment Overviews:1 “European Shares Set New Record,” October 13, 2006, “European Stocks Drop Sharply,” November 24, 2006, “Stocks Get Lift from Oil’s Slide,” August 28, 2006, “Stocks Decline as Oil Slides,” October 27, 2006, “NASDAQ Reaches New Five-Year High,” October 26, 2006, “Stocks Weaken as Dollar’s Fall Chills Investors,” November 25, 2006, “Japan Hits Fresh Seven-Month High,” December 26, 2006, “Foreigners Sell Japan Shares,” June 13, 2006, http://www.online.wsj.com/home/us/.
All returns reflect reinvestment of all dividends and distributions, if any. Certain expenses of the Portfolios have been waived or reimbursed by the Fund’s Investment Manager or Administrator; without such waiver/reimbursement of expenses, the Portfolios’ returns would have been lower. Performance information does not reflect the fees and charges imposed by participating insurance companies at the separate account level, and such charges will have the effect of reducing performance. Past performance is not indicative, nor a guarantee, of future results.
The performance data of the indices and other market data have been prepared from sources and data that the Investment Manager believes to be reliable, but no representation is made as to their accuracy. These indices are unmanaged, have no fees or costs and are not available for investment.
The views of the Fund’s management and the portfolio holdings described in this report are as of December 31, 2006; these views and portfolio holdings may have changed subsequent to this date. Nothing herein should be construed as a recommendation to buy, sell, or hold a particular security. There is no assurance that the securities discussed herein will remain in each Portfolio at the time you receive this report, or that securities sold will have not been repurchased. The specific portfolio securities may in aggregate represent only a small percentage of each Portfolio’s holdings. It should not be assumed that investments in the securities identified and discussed were, or will be, profitable, or that the investment decisions we make in the future will be profitable, or equal the investment performance of the securities discussed herein.
The views and opinions expressed are provided for general information only, and do not constitute specific tax, legal, or investment advice to, or recommendations for, any person. There can be no guarantee as to the accuracy of the outlooks for markets, sectors and securities as discussed herein. You should read the Fund’s prospectus for a more detailed discussion of each Portfolio’s investment objective, strategies, risks and fees.
6
|
|
Lazard Retirement Series, Inc. |
|
Performance Overviews |
|
|
|
Lazard Retirement Equity Portfolio |
Comparison of Changes in Value of $10,000 Investment in the Service Shares of
Lazard Retirement Equity Portfolio and S&P 500® Index*
| | | | | | | | | |
Average Annual Total Returns*
Periods Ended December 31, 2006 | |
| | One
Year | | Five
Years | | Since
Inception** | |
| |
| |
| |
| |
Retirement Equity Portfolio Service Shares | | 17.48 | % | 7.12 | % | | 5.21 | % | |
S&P 500 Index | | 15.79 | | 6.19 | | | 4.72 | | |
| |
|
* | All returns reflect reinvestment of all dividends and distributions, if any. Certain expenses of the Portfolio have been waived or reimbursed by the Portfolio’s Investment Manager or Administrator; without such waiver/reimbursement of expenses, the Portfolio’s returns would have been lower. Performance information does not reflect the fees and charges imposed by participating insurance companies at the separate account level, and such charges will have the effect of reducing performance. |
| |
| The performance quoted represents past performance. Current performance may be lower or higher than the performance quoted. Past performance is not indicative, nor a guarantee, of future results; the investment return and principle value of the Portfolio will fluctuate, so that Portfolio shares, when redeemed, may be worth more or less than their original cost. Within the longer periods illustrated there may have been short-term fluctuations, counter to the overall trend of investment results, and no single period of any length may be taken as typical of what may be expected in future periods. |
| |
| The performance data of the index has been prepared from sources and data that the Investment Manager believes to be reliable, but no representation is made as to its accuracy. The S&P 500 Index is a market capitalization-weighted index of 500 common stocks, designed to measure performance of the broad domestic economy through changes in the aggregate market value of these stocks, which represent all major industries. The index is unmanaged, has no fees or costs and is not available for investment. |
| |
** | The Portfolio’s inception date was March 18, 1998. |
7
|
|
Lazard Retirement Series, Inc. |
|
Performance Overviews (continued) |
|
|
|
Lazard Retirement Small Cap Portfolio |
Comparison of Changes in Value of $10,000 Investment in the Service Shares of
Lazard Retirement Small Cap Portfolio and Russell 2000® Index*
| | | | | | | | | |
Average Annual Total Returns*
Periods Ended December 31, 2006 | |
| | One
Year | | Five
Years | | Since
Inception** | |
| |
| |
| |
| |
Retirement Small Cap Portfolio Service Shares | | 16.07 | % | 9.39 | % | | 9.29 | % | |
Russell 2000 Index | | 18.37 | | 11.39 | | | 7.86 | | |
| |
|
* | All returns reflect reinvestment of all dividends and distributions, if any. Certain expenses of the Portfolio have been waived or reimbursed by the Portfolio’s Investment Manager or Administrator; without such waiver/reimbursement of expenses, the Portfolio’s returns would have been lower. Performance information does not reflect the fees and charges imposed by participating insurance companies at the separate account level, and such charges will have the effect of reducing performance. |
| |
| The performance quoted represents past performance. Current performance may be lower or higher than the performance quoted. Past performance is not indicative, nor a guarantee, of future results; the investment return and principle value of the Portfolio will fluctuate, so that Portfolio shares, when redeemed, may be worth more or less than their original cost. Within the longer periods illustrated there may have been short-term fluctuations, counter to the overall trend of investment results, and no single period of any length may be taken as typical of what may be expected in future periods. |
| |
| The performance data of the index has been prepared from sources and data that the Investment Manager believes to be reliable, but no representation is made as to its accuracy. The Russell 2000 Index is comprised of the 2,000 smallest U.S. companies included in the Russell 3000® Index (which consists of the 3,000 largest U.S. companies by capitalization). The index is unmanaged, has no fees or costs and is not available for investment. |
| |
** | The Portfolio’s inception date was November 4, 1997. |
8
|
|
Lazard Retirement Series, Inc. |
|
Performance Overviews (continued) |
|
|
|
Lazard Retirement International Equity Portfolio |
Comparison of Changes in Value of $10,000 Investment in the Service Shares of Lazard Retirement
International Equity Portfolio and Morgan Stanley Capital International (MSCI®) Europe,
Australasia and Far East (EAFE®) Index*
| | | | | | | | | |
Average Annual Total Returns*
Periods Ended December 31, 2006 | |
| | One
Year | | Five
Years | | Since
Inception** | |
| |
| |
| |
| |
Retirement International Equity Portfolio Service Shares | | 22.53 | % | 12.34 | % | | 6.38 | % | |
MSCI EAFE Index | | 26.34 | | 14.98 | | | 8.75 | | |
| |
|
* | All returns reflect reinvestment of all dividends and distributions, if any. Certain expenses of the Portfolio have been waived or reimbursed by the Portfolio’s Investment Manager or Administrator; without such waiver/reimbursement of expenses, the Portfolio’s returns would have been lower. Performance information does not reflect the fees and charges imposed by participating insurance companies at the separate account level, and such charges will have the effect of reducing performance. |
| |
| The performance quoted represents past performance. Current performance may be lower or higher than the performance quoted. Past performance is not indicative, nor a guarantee, of future results; the investment return and principle value of the Portfolio will fluctuate, so that Portfolio shares, when redeemed, may be worth more or less than their original cost. Within the longer periods illustrated there may have been short-term fluctuations, counter to the overall trend of investment results, and no single period of any length may be taken as typical of what may be expected in future periods. |
| |
| The performance data of the index has been prepared from sources and data that the Investment Manager believes to be reliable, but no representation is made as to its accuracy. The MSCI EAFE Index is a broadly diversified international index comprised of equity securities of approximately 1,000 companies located outside the United States. The index is unmanaged, has no fees or costs and is not available for investment. |
| |
** | The Portfolio’s inception date was September 1, 1998. |
9
|
|
Lazard Retirement Series, Inc. |
|
Performance Overviews (concluded) |
|
|
|
Lazard Retirement Emerging Markets Portfolio |
Comparison of Changes in Value of $10,000 Investment in the Service Shares of Lazard Retirement
Emerging Markets Portfolio and MSCI Emerging Markets Index*
| | | | | | | | | |
Average Annual Total Returns*
Periods Ended December 31, 2006 | | | | | |
| | Service Shares | | Investor Shares | |
| |
| |
| |
| | One
Year | | Five
Years | | Since
Inception† | | Since
Inception† | |
| |
| |
| |
| |
| |
Retirement Emerging Markets Portfolio** | | 29.95 | % | 29.19 | % | 11.67 | % | | 10.64 | % | |
MSCI Emerging Markets Index | | 32.17 | | 26.59 | | 10.80 | | | 8.17 | | |
| |
|
* | All returns reflect reinvestment of all dividends and distributions, if any. Certain expenses of the Portfolio have been waived or reimbursed by the Portfolio’s Investment Manager or Administrator; without such waiver/reimbursement of expenses, the Portfolio’s returns would have been lower. Performance information does not reflect the fees and charges imposed by participating insurance companies at the separate account level, and such charges will have the effect of reducing performance. |
| |
| The performance quoted represents past performance. Current performance may be lower or higher than the performance quoted. Past performance is not indicative, nor a guarantee, of future results; the investment return and principle value of the Portfolio will fluctuate, so that Portfolio shares, when redeemed, may be worth more or less than their original cost. Within the longer periods illustrated there may have been short-term fluctuations, counter to the overall trend of investment results, and no single period of any length may be taken as typical of what may be expected in future periods. |
| |
| The performance data of the index has been prepared from sources and data that the Investment Manager believes to be reliable, but no representation is made as to its accuracy. The MSCI Emerging Markets Index is comprised of emerging market securities in countries open to non-local investors. The index is unmanaged, has no fees or costs and is not available for investment. |
| |
** | The performance of Service Shares may be greater than or less than the performance of Investor Shares, based on the differences in fees borne by shareholders investing in different classes. |
| |
† | The inception date for Service Shares was November 4, 1997 and for Investor Shares was May 1, 2006. |
10
|
|
Lazard Retirement Series, Inc. |
|
Information About Your Portfolio’s Expenses |
|
|
Expense Example
As a shareholder in a Portfolio of the Fund, you incur ongoing costs, including management fees, distribution and service (12b-1) fees (Service Shares only), and other expenses. This Example is intended to help you understand your ongoing costs (in dollars) of investing in a Portfolio and to compare these costs with the ongoing costs of investing in other mutual funds. The Example is based on an investment of $1,000 invested at the beginning of the six month period from July 1, 2006 through December 31, 2006 and held for the entire period.
Actual Expenses
For each Share class of the Portfolios, the first line of the table below provides information about actual account values and actual expenses. You may use the information in this line, together with the amount you invested, to estimate the expenses that you paid over the period. Simply divide your account value by $1,000 (for example, an $8,600 account value divided by $1,000=8.6), then multiply the result by the number in the first line under the heading entitled “Expenses Paid During Period” to estimate the expenses you paid on your account during this period.
Hypothetical Example for Comparison Purposes
For each Share class of the Portfolios, the second line of the table below provides information about hypothetical account values and hypothetical expenses based on the class’ actual expense ratio and an assumed rate of return of 5% per year before expenses, which is not the Portfolio’s actual return. The hypothetical account values and expenses may not be used to estimate the actual ending account balance or expenses you paid for the period. You may use this information to compare the ongoing costs of investing in the Portfolio and other mutual funds. To do so, compare this 5% hypothetical example with the 5% hypothetical examples that appear in the shareholders reports of the other funds.
Please note that you also bear fees and charges imposed by participating insurance companies at the separate account level, which are described in the separate prospectuses issued by the insurance companies. Such charges will have the effect of reducing Account Value.
| | | | | | | | | | | | | | | |
| | Beginning
Account Value | | Ending
Account Value | | Expenses Paid
During Period* | | Annualized
Expense Ratio
During Period |
| |
| |
| |
| |
|
| | 7/1/06 | | 12/31/06 | | 7/1/06-12/31/06 | | 7/1/06-12/31/06 |
| |
| |
| |
| |
|
Retirement Equity Portfolio Service Shares | | | | | | | | | | | | |
Actual | | $ | 1,000.00 | | | $ | 1,144.70 | | | $ | 6.76 | | | 1.25 | % |
Hypothetical (5% Return Before Expenses) | | $ | 1,000.00 | | | $ | 1,018.90 | | | $ | 6.37 | | | 1.25 | % |
| | | | | | | | | | | | | | | |
Retirement Small Cap Portfolio Service Shares | | | | | | | | | | | | | | | |
Actual | | $ | 1,000.00 | | | $ | 1,091.70 | | | $ | 6.30 | | | 1.19 | % |
Hypothetical (5% Return Before Expenses) | | $ | 1,000.00 | | | $ | 1,019.19 | | | $ | 6.08 | | | 1.19 | % |
| | | | | | | | | | | | | | | |
Retirement International Equity Portfolio
Service Shares | | | | | | | | | | | | | | | |
Actual | | $ | 1,000.00 | | | $ | 1,126.10 | | | $ | 6.71 | | | 1.25 | % |
Hypothetical (5% Return Before Expenses) | | $ | 1,000.00 | | | $ | 1,018.90 | | | $ | 6.37 | | | 1.25 | % |
| | | | | | | | | | | | | | | |
Retirement Emerging Markets Portfolio
Service Shares | | | | | | | | | | | | | | | |
Actual | | $ | 1,000.00 | | | $ | 1,245.20 | | | $ | 9.06 | | | 1.60 | % |
Hypothetical (5% Return Before Expenses) | | $ | 1,000.00 | | | $ | 1,017.14 | | | $ | 8.14 | | | 1.60 | % |
Investor Shares | | | | | | | | | | | | | | | |
Actual | | $ | 1,000.00 | | | $ | 1,247.30 | | | $ | 7.64 | | | 1.35 | % |
Hypothetical (5% Return Before Expenses) | | $ | 1,000.00 | | | $ | 1,018.41 | | | $ | 6.86 | | | 1.35 | % |
| |
|
* | Expenses are equal to the Portfolio’s annualized expense ratio multiplied by the average account value over the period, multiplied by 184/365 (to reflect one-half year period). |
11
|
|
Lazard Retirement Series, Inc. |
|
Portfolio Holdings Presented by Sector |
December 31, 2006 |
| | | | | | | | | | | | | | | | |
|
|
|
|
|
|
|
|
|
Sector* | | Lazard
Retirement
Equity
Portfolio | | Lazard
Retirement
Small Cap
Portfolio | | Lazard
Retirement
International
Equity
Portfolio | | Lazard
Retirement
Emerging
Markets
Portfolio |
|
|
|
|
|
|
|
|
|
Commercial Services | | | 5.8 | % | | | 10.4 | % | | | — | % | | | 4.0 | % |
Consumer Discretionary | | | 10.1 | | | | 14.5 | | | | 11.1 | | | | 11.4 | |
Consumer Durables | | | 0.9 | | | | 1.9 | | | | 6.5 | | | | 5.0 | |
Consumer Staples | | | 6.2 | | | | — | | | | 11.0 | | | | 2.8 | |
Energy | | | 8.6 | | | | 4.4 | | | | 8.9 | | | | 9.1 | |
Financials | | | 20.6 | | | | 20.6 | | | | 25.8 | | | | 17.3 | |
Health Care | | | 10.4 | | | | 6.6 | | | | 8.3 | | | | 1.0 | |
Process Industry | | | 5.7 | | | | 2.5 | | | | — | | | | 11.7 | |
Producer Manufacturing | | | 9.9 | | | | 8.0 | | | | 5.0 | | | | 1.4 | |
Technology | | | 17.0 | | | | 23.0 | | | | 2.1 | | | | 10.2 | |
Telecommunications | | | 4.8 | | | | 0.6 | | | | 10.2 | | | | 14.2 | |
Transportation | | | — | | | | 2.3 | | | | 2.5 | | | | 2.5 | |
Utilities | | | — | | | | 0.2 | | | | 5.6 | | | | 0.9 | |
Short-Term Investments | | | — | | | | 5.0 | | | | 3.0 | | | | 8.5 | |
| | |
| | | |
| | | |
| | | |
| |
Total Investments | | | 100.0 | % | | | 100.0 | % | | | 100.0 | % | | | 100.0 | % |
| | |
| | | |
| | | |
| | | |
| |
| |
|
* | Represents percentage of total investments. |
12
|
|
Lazard Retirement Series, Inc. |
|
Portfolios of Investments |
December 31, 2006 |
|
| | | | | | | |
Description | | Shares | | Value | |
|
|
|
|
|
|
Lazard Retirement Equity Portfolio | | | | | | | |
Common Stocks—99.5% | | | | | | | |
Alcohol & Tobacco—1.7% | | | | | | | |
Altria Group, Inc. | | | 1,000 | | $ | 85,820 | |
| | | | |
|
| |
Banking—5.5% | | | | | | | |
Bank of America Corp. | | | 2,906 | | | 155,151 | |
The Bank of New York Co., Inc. | | | 2,275 | | | 89,567 | |
Washington Mutual, Inc. | | | 800 | | | 36,392 | |
| | | | |
|
| |
| | | | | | 281,110 | |
| | | | |
|
| |
Building & Construction—0.9% | | | | | | | |
Masco Corp. | | | 1,590 | | | 47,493 | |
| | | | |
|
| |
Chemicals—3.3% | | | | | | | |
Cabot Corp. | | | 715 | | | 31,153 | |
Du Pont (E.I.) de Nemours & Co. | | | 775 | | | 37,750 | |
Sigma-Aldrich Corp. | | | 650 | | | 50,518 | |
The Dow Chemical Co. | | | 1,170 | | | 46,730 | |
| | | | |
|
| |
| | | | | | 166,151 | |
| | | | |
|
| |
Commercial Services—4.7% | | | | | | | |
Automatic Data Processing, Inc. | | | 2,050 | | | 100,962 | |
DST Systems, Inc. (a) | | | 400 | | | 25,052 | |
First Data Corp. | | | 2,200 | | | 56,144 | |
Idearc, Inc. (a) | | | 1,900 | | | 54,435 | |
| | | | |
|
| |
| | | | | | 236,593 | |
| | | | |
|
| |
Computer Software—7.2% | | | | | | | |
Microsoft Corp. | | | 8,855 | | | 264,410 | |
Oracle Corp. (a) | | | 5,915 | | | 101,383 | |
| | | | |
|
| |
| | | | | | 365,793 | |
| | | | |
|
| |
Consumer Products—1.8% | | | | | | | |
Fortune Brands, Inc. | | | 640 | | | 54,650 | |
The Stanley Works | | | 690 | | | 34,700 | |
| | | | |
|
| |
| | | | | | 89,350 | |
| | | | |
|
| |
Drugs—6.1% | | | | | | | |
Biogen Idec, Inc. (a) | | | 850 | | | 41,812 | |
Bristol-Myers Squibb Co. | | | 1,710 | | | 45,007 | |
Pfizer, Inc. | | | 2,335 | | | 60,476 | |
Sepracor, Inc. (a) | | | 960 | | | 59,117 | |
Wyeth | | | 2,000 | | | 101,840 | |
| | | | |
|
| |
| | | | | | 308,252 | |
| | | | |
|
| |
Energy Integrated—5.7% | | | | | | | |
Chevron Corp. | | | 1,460 | | | 107,354 | |
ConocoPhillips | | | 1,405 | | | 101,090 | |
Hess Corp. | | | 700 | | | 34,699 | |
Massey Energy Co. | | | 2,040 | | | 47,389 | |
| | | | |
|
| |
| | | | | | 290,532 | |
| | | | |
|
| |
| | | | | | | |
Description | | Shares | | Value | |
|
|
|
|
|
|
Energy Services—2.8% | | | | | | | |
BJ Services Co. | | | 1,415 | | $ | 41,488 | |
Halliburton Co. | | | 850 | | | 26,393 | |
The Williams Cos., Inc. | | | 2,895 | | | 75,617 | |
| | | | |
|
| |
| | | | | | 143,498 | |
| | | | |
|
| |
Financial Services—9.7% | | | | | | | |
A.G. Edwards, Inc. | | | 1,050 | | | 66,454 | |
American Express Co. | | | 900 | | | 54,603 | |
Citigroup, Inc. | | | 1,915 | | | 106,665 | |
JPMorgan Chase & Co. | | | 1,304 | | | 62,983 | |
Legg Mason, Inc. | | | 250 | | | 23,763 | |
Mellon Financial Corp. | | | 2,865 | | | 120,760 | |
The Bear Stearns Cos., Inc. | | | 345 | | | 56,159 | |
| | | | |
|
| |
| | | | | | 491,387 | |
| | | | |
|
| |
Food & Beverages—3.0% | | | | | | | |
Coca-Cola Enterprises, Inc. | | | 4,700 | | | 95,974 | |
The Coca-Cola Co. | | | 1,140 | | | 55,005 | |
| | | | |
|
| |
| | | | | | 150,979 | |
| | | | |
|
| |
Forest & Paper Products—3.8% | | | | | | | |
Ball Corp. | | | 1,160 | | | 50,576 | |
Kimberly-Clark Corp. | | | 1,110 | | | 75,425 | |
Louisiana-Pacific Corp. | | | 3,210 | | | 69,111 | |
| | | | |
|
| |
| | | | | | 195,112 | |
| | | | |
|
| |
Health Services—2.3% | | | | | | | |
Laboratory Corp. of America Holdings (a) | | | 880 | | | 64,654 | |
Service Corp. International | | | 2,600 | | | 26,650 | |
WellPoint, Inc. (a) | | | 350 | | | 27,541 | |
| | | | |
|
| |
| | | | | | 118,845 | |
| | | | |
|
| |
Insurance—5.3% | | | | | | | |
American International Group, Inc. | | | 700 | | | 50,162 | |
Aon Corp. | | | 1,150 | | | 40,641 | |
Lincoln National Corp. | | | 570 | | | 37,848 | |
PartnerRe, Ltd. | | | 413 | | | 29,335 | |
The Allstate Corp. | | | 960 | | | 62,506 | |
The St. Paul Travelers Cos., Inc. | | | 880 | | | 47,247 | |
| | | | |
|
| |
| | | | | | 267,739 | |
| | | | |
|
| |
Leisure & Entertainment—4.1% | | | | | | | |
Gannett Co., Inc. | | | 1,010 | | | 61,065 | |
News Corp., Class A | | | 3,965 | | | 85,168 | |
Time Warner, Inc. | | | 2,810 | | | 61,202 | |
| | | | |
|
| |
| | | | | | 207,435 | |
| | | | |
|
| |
The accompanying notes are an integral part of these financial statements.
13
|
|
Lazard Retirement Series, Inc. |
|
Portfolios of Investments (continued) |
December 31, 2006 |
|
| | | | | | | |
Description | | | Shares | | | Value | |
|
|
|
|
|
|
|
|
Lazard Retirement Equity Portfolio (concluded) | | | | | | | |
Manufacturing—9.8% | | | | | | | |
General Electric Co. | | | 4,345 | | $ | 161,678 | |
Honeywell International, Inc. | | | 1,555 | | | 70,348 | |
Ingersoll-Rand Co., Ltd., Class A | | | 1,470 | | | 57,521 | |
Pitney Bowes, Inc. | | | 1,600 | | | 73,904 | |
Tyco International, Ltd. | | | 1,965 | | | 59,736 | |
United Technologies Corp. | | | 1,210 | | | 75,649 | |
| | | | |
|
| |
| | | | | | 498,836 | |
| | | | |
|
| |
Medical Products—2.0% | | | | | | | |
Johnson & Johnson | | | 1,515 | | | 100,020 | |
| | | | |
|
| |
Printing & Publishing—1.1% | | | | | | | |
R.H. Donnelley Corp. (a) | | | 872 | | | 54,701 | |
| | | | |
|
| |
Retail—4.2% | | | | | | | |
CVS Corp. | | | 2,050 | | | 63,365 | |
Dollar Tree Stores, Inc. (a) | | | 1,605 | | | 48,311 | |
Liz Claiborne, Inc. | | | 1,175 | | | 51,065 | |
The Kroger Co. | | | 2,300 | | | 53,061 | |
| | | | |
|
| |
| | | | | | 215,802 | |
| | | | |
|
| |
Semiconductors & Components—1.8% | | | | | | | |
Flextronics International, Ltd. (a) | | | 2,280 | | | 26,174 | |
Intel Corp. | | | 2,030 | | | 41,108 | |
Solectron Corp. (a) | | | 7,270 | | | 23,409 | |
| | | | |
|
| |
| | | | | | 90,691 | |
| | | | |
|
| |
| | | | | | | |
Description | | Shares | | Value | |
|
|
|
|
|
|
Technology—2.2% | | | | | | | |
International Business Machines Corp. | | | 1,160 | | $ | 112,694 | |
| | | | |
|
| |
Technology Hardware—5.7% | | | | | | | |
Avaya, Inc. (a) | | | 4,800 | | | 67,104 | |
Cisco Systems, Inc. (a) | | | 3,210 | | | 87,730 | |
Dell, Inc. (a) | | | 1,970 | | | 49,427 | |
EMC Corp. (a) | | | 4,600 | | | 60,720 | |
Sun Microsystems, Inc. (a) | | | 4,850 | | | 26,287 | |
| | | | |
|
| |
| | | | | | 291,268 | |
| | | | |
|
| |
Telecommunications—4.8% | | | | | | | |
ALLTEL Corp. | | | 1,485 | | | 89,813 | |
Sprint Nextel Corp. | | | 4,699 | | | 88,764 | |
Verizon Communications, Inc. | | | 1,750 | | | 65,170 | |
| | | | |
|
| |
| | | | | | 243,747 | |
| | | | |
|
| |
Total Common Stocks
(Identified cost $4,551,245) | | | | | | 5,053,848 | |
| | | | |
|
| |
Total Investments—99.5%
(Identified cost $4,551,245) (b) | | | | | $ | 5,053,848 | |
Cash and Other Assets in Excess of Liabilities—0.5% | | | | | | 24,465 | |
| | | | |
|
| |
Net Assets—100.0% | | | | | $ | 5,078,313 | |
| | | | |
|
| |
The accompanying notes are an integral part of these financial statements.
14
|
|
Lazard Retirement Series, Inc. |
|
Portfolios of Investments (continued) |
December 31, 2006 |
|
| | | | | | | |
Description | | Shares | | Value | |
|
|
|
|
|
|
Lazard Retirement Small Cap Portfolio | | | | | | | |
Common Stocks—94.8% | | | | | | | |
Banking—10.0% | | | | | | | |
Bank of the Ozarks, Inc. | | | 37,800 | | $ | 1,249,668 | |
BankUnited Financial Corp., Class A | | | 33,200 | | | 928,272 | |
First Community Bancorp | | | 21,400 | | | 1,118,578 | |
Franklin Bank Corp. (a) | | | 35,300 | | | 725,062 | |
Prosperity Bancshares, Inc. | | | 20,300 | | | 700,553 | |
Provident Bankshares Corp. | | | 20,500 | | | 729,800 | |
Sterling Bancshares, Inc. | | | 84,300 | | | 1,097,586 | |
United Bankshares, Inc. | | | 14,350 | | | 554,627 | |
Wintrust Financial Corp. | | | 23,100 | | | 1,109,262 | |
| | | | |
|
| |
| | | | | | 8,213,408 | |
| | | | |
|
| |
Building & Construction—2.7% | | | | | | | |
AMCOL International Corp. | | | 25,900 | | | 718,466 | |
Builders FirstSource, Inc. (a) | | | 12,400 | | | 221,092 | |
Perini Corp. (a) | | | 21,500 | | | 661,770 | |
Watsco, Inc. | | | 13,500 | | | 636,660 | |
| | | | |
|
| |
| | | | | | 2,237,988 | |
| | | | |
|
| |
Commercial Services—9.6% | | | | | | | |
Arbitron, Inc. | | | 13,800 | | | 599,472 | |
G & K Services, Inc. | | | 28,300 | | | 1,100,587 | |
John H. Harland Co. | | | 21,400 | | | 1,074,280 | |
Navigant Consulting, Inc. (a) | | | 41,700 | | | 823,992 | |
Rollins, Inc. | | | 41,200 | | | 910,932 | |
Tetra Tech, Inc. (a) | | | 28,400 | | | 513,756 | |
United Rentals, Inc. (a) | | | 19,700 | | | 500,971 | |
Waste Connections, Inc. (a) | | | 21,200 | | | 880,860 | |
Watson Wyatt Worldwide, Inc. | | | 9,200 | | | 415,380 | |
Wright Express Corp. (a) | | | 34,100 | | | 1,062,897 | |
| | | | |
|
| |
| | | | | | 7,883,127 | |
| | | | |
|
| |
Computer Software—1.7% | | | | | | | |
Agile Software Corp. (a) | | | 100,400 | | | 617,460 | |
Secure Computing Corp. (a) | | | 125,000 | | | 820,000 | |
| | | | |
|
| |
| | | | | | 1,437,460 | |
| | | | |
|
| |
Consumer Products—7.2% | | | | | | | |
Central Garden & Pet Co. (a) | | | 23,800 | | | 1,152,396 | |
Ethan Allen Interiors, Inc. | | | 9,800 | | | 353,878 | |
Fossil, Inc. (a) | | | 30,100 | | | 679,658 | |
Matthews International Corp., Class A | | | 18,900 | | | 743,715 | |
Physicians Formula Holdings, Inc. | | | 46,500 | | | 869,085 | |
Polaris Industries, Inc. | | | 17,200 | | | 805,476 | |
Sealy Corp. | | | 48,800 | | | 719,800 | |
WMS Industries, Inc. (a) | | | 18,600 | | | 648,396 | |
| | | | |
|
| |
| | | | | | 5,972,404 | |
| | | | |
|
| |
Electric—0.2% | | | | | | | |
Cleco Corp. | | | 5,100 | | | 128,673 | |
| | | | |
|
| |
| | | | | | | |
Description | | Shares | | Value | |
|
|
|
|
|
|
Energy Exploration & Production—1.8% | | | | | | | |
Brigham Exploration Co. (a) | | | 76,600 | | $ | 559,946 | |
The Exploration Co. of Delaware (a) | | | 70,347 | | | 938,429 | |
| | | | |
|
| |
| | | | | | 1,498,375 | |
| | | | |
|
| |
Energy Integrated—0.4% | | | | | | | |
Foundation Coal Holdings, Inc. | | | 11,700 | | | 371,592 | |
| | | | |
|
| |
Energy Services—2.1% | | | | | | | |
Complete Production Services, Inc. | | | 32,400 | | | 686,880 | |
Hercules Offshore, Inc. (a) | | | 12,300 | | | 355,470 | |
W-H Energy Services, Inc. (a) | | | 14,500 | | | 706,005 | |
| | | | |
|
| |
| | | | | | 1,748,355 | |
| | | | |
|
| |
Financial Services—1.9% | | | | | | | |
Waddell & Reed Financial, Inc. | | | 57,800 | | | 1,581,408 | |
| | | | |
|
| |
Forest & Paper Products—0.5% | | | | | | | |
Silgan Holdings, Inc. | | | 8,500 | | | 373,320 | |
| | | | |
|
| |
Gas Utilities—0.0% | | | | | | | |
South Jersey Industries, Inc. | | | 700 | | | 23,387 | |
| | | | |
|
| |
Health Services—3.9% | | | | | | | |
BioScrip, Inc. (a) | | | 66,000 | | | 228,360 | |
Centene Corp. (a) | | | 28,600 | | | 702,702 | |
Five Star Quality Care, Inc. (a) | | | 77,500 | | | 864,125 | |
Hanger Orthopedic Group, Inc. (a) | | | 67,900 | | | 511,287 | |
inVentiv Health, Inc. (a) | | | 3,800 | | | 134,330 | |
LifePoint Hospitals, Inc. (a) | | | 24,200 | | | 815,540 | |
| | | | |
|
| |
| | | | | | 3,256,344 | |
| | | | |
|
| |
Insurance—3.3% | | | | | | | |
Arch Capital Group, Ltd. (a) | | | 12,600 | | | 851,886 | |
Aspen Insurance Holdings, Ltd. | | | 29,000 | | | 764,440 | |
Max Re Capital, Ltd. | | | 28,100 | | | 697,442 | |
RLI Corp. | | | 7,900 | | | 445,718 | |
| | | | |
|
| |
| | | | | | 2,759,486 | |
| | | | |
|
| |
Leisure & Entertainment—2.2% | | | | | | | |
Bally Technologies, Inc. (a) | | | 26,000 | | | 485,680 | |
CBRL Group, Inc. | | | 15,500 | | | 693,780 | |
RARE Hospitality International, Inc. (a) | | | 18,100 | | | 596,033 | |
| | | | |
|
| |
| | | | | | 1,775,493 | |
| | | | |
|
| |
Manufacturing—8.0% | �� | | | | | | |
Altra Holdings, Inc. | | | 34,600 | | | 486,130 | |
Applied Signal Technology, Inc. | | | 50,800 | | | 714,248 | |
Columbus McKinnon Corp. (a) | | | 27,100 | | | 569,642 | |
DRS Technologies, Inc. | | | 12,750 | | | 671,670 | |
Esterline Technologies Corp. (a) | | | 13,500 | | | 543,105 | |
Insteel Industries, Inc. | | | 39,700 | | | 706,263 | |
Kennametal, Inc. | | | 9,600 | | | 564,960 | |
Knoll, Inc. | | | 41,800 | | | 919,600 | |
Ladish Co., Inc. (a) | | | 26,100 | | | 967,788 | |
RBC Bearings, Inc. (a) | | | 14,700 | | | 421,302 | |
| | | | |
|
| |
| | | | | | 6,564,708 | |
| | | | |
|
| |
The accompanying notes are an integral part of these financial statements.
15
|
|
Lazard Retirement Series, Inc. |
|
Portfolios of Investments (continued) |
December 31, 2006 |
|
| | | | | | | |
Description | | | Shares | | Value | |
|
|
|
|
| |
Lazard Retirement Small Cap Portfolio (concluded) | | | | | | | |
Medical Products—2.7% | | | | | | | |
American Medical Systems Holdings, Inc. (a) | | | 20,000 | | $ | 370,400 | |
Pharmanet Development Group, Inc. (a) | | | 27,100 | | | 598,097 | |
Symmetry Medical, Inc. (a) | | | 49,500 | | | 684,585 | |
Wright Medical Group, Inc. (a) | | | 23,400 | | | 544,752 | |
| | | | |
|
| |
| | | | | | 2,197,834 | |
| | | | |
|
| |
Metals & Mining—2.0% | | | | | | | |
Cleveland-Cliffs, Inc. | | | 9,200 | | | 445,648 | |
Coeur d’Alene Mines Corp. (a) | | | 116,200 | | | 575,190 | |
Quanex Corp. | | | 18,400 | | | 636,456 | |
| | | | |
|
| |
| | | | | | 1,657,294 | |
| | | | |
|
| |
Real Estate—5.4% | | | | | | | |
Ashford Hospitality Trust | | | 86,300 | | | 1,074,435 | |
Brandywine Realty Trust | | | 22,000 | | | 731,500 | |
Cousins Properties, Inc. | | | 23,000 | | | 811,210 | |
Healthcare Realty Trust, Inc. | | | 21,300 | | | 842,202 | |
MFA Mortgage Investments, Inc. | | | 127,200 | | | 978,168 | |
| | | | |
|
| |
| | | | | | 4,437,515 | |
| | | | |
|
| |
Retail—5.1% | | | | | | | |
Guitar Center, Inc. (a) | | | 27,200 | | | 1,236,512 | |
Pacific Sunwear of California, Inc. (a) | | | 43,100 | | | 843,898 | |
Stein Mart, Inc. | | | 16,100 | | | 213,486 | |
The Finish Line, Inc. | | | 43,000 | | | 614,040 | |
The Timberland Co. (a) | | | 22,500 | | | 710,550 | |
Tractor Supply Co. (a) | | | 12,800 | | | 572,288 | |
| | | | |
|
| |
| | | | | | 4,190,774 | |
| | | | |
|
| |
Semiconductors & Components—10.2% | | | | | | | |
Actel Corp. (a) | | | 32,500 | | | 590,200 | |
Benchmark Electronics, Inc. (a) | | | 29,850 | | | 727,146 | |
Coherent, Inc. (a) | | | 31,000 | | | 978,670 | |
CPI International, Inc. | | | 57,900 | | | 868,500 | |
Exar Corp. (a) | | | 65,300 | | | 848,900 | |
FARO Technologies, Inc. (a) | | | 30,800 | | | 740,432 | |
Integrated Device Technology, Inc. (a) | | | 49,300 | | | 763,164 | |
Microsemi Corp. (a) | | | 38,000 | | | 746,700 | |
Plexus Corp. (a) | | | 26,600 | | | 635,208 | |
Semtech Corp. (a) | | | 66,400 | | | 867,848 | |
TTM Technologies, Inc. (a) | | | 58,000 | | | 657,140 | |
| | | | |
|
| |
| | | | | | 8,423,908 | |
| | | | |
|
| |
Services—1.0% | | | | | | | |
Perot Systems Corp., Class A (a) | | | 51,500 | | | 844,085 | |
| | | | |
|
| |
| | | | | | | |
Description | | | Shares | | Value | |
|
|
|
|
| |
Technology Hardware—10.0% | | | | | | | |
Avid Technology, Inc. (a) | | | 14,700 | | $ | 547,722 | |
Avocent Corp. (a) | | | 29,500 | | | 998,575 | |
Brightpoint, Inc. (a) | | | 50,100 | | | 673,845 | |
C-COR, Inc. (a) | | | 42,900 | | | 477,906 | |
Emulex Corp. (a) | | | 9,700 | | | 189,247 | |
FEI Electronics Corp. (a) | | | 34,600 | | | 912,402 | |
Houston Wire & Cable Co. | | | 27,300 | | | 570,570 | |
Ixia (a) | | | 54,000 | | | 518,400 | |
Komag, Inc. (a) | | | 22,200 | | | 840,936 | |
LTX Corp. (a) | | | 70,300 | | | 393,680 | |
Powerwave Technologies, Inc. (a) | | | 104,900 | | | 676,605 | |
Rogers Corp. (a) | | | 9,700 | | | 573,755 | |
SafeNet, Inc. (a) | | | 35,500 | | | 849,870 | |
| | | | |
|
| |
| | | | | | 8,223,513 | |
| | | | |
|
| |
Telecommunications—0.6% | | | | | | | |
Alaska Communications Systems Group, Inc. | | | 35,300 | | | 536,207 | |
| | | | |
|
| |
Transportation—2.3% | | | | | | | |
AirTran Holdings, Inc. (a) | | | 91,500 | | | 1,074,210 | |
American Commercial Lines, Inc. (a) | | | 6,000 | | | 393,060 | |
Hub Group, Inc., Class A (a) | | | 15,100 | | | 416,005 | |
| | | | |
|
| |
| | | | | | 1,883,275 | |
| | | | |
|
| |
Total Common Stocks
(Identified cost $72,874,188) | | | | | | 78,219,933 | |
| | | | |
|
| |
| | | | | | | |
| | Principal
Amount
(000) | | | | |
| |
|
| | | | |
Repurchase Agreement—5.0% | | | | | | | |
State Street Bank and Trust Co.,
4.30%, 01/02/07 (Dated 12/29/06, collateralized by $3,450,000 United States Treasury Bond, 7.50%, 11/15/16, with a value of $4,220,506) Proceeds of $4,136,976 (Identified cost $4,135,000) | | $ | 4,135 | | | 4,135,000 | |
| | | | |
|
| |
Total Investments—99.8%
(Identified cost $77,009,188) (b) | | | | | $ | 82,354,933 | |
Cash and Other Assets in Excess of Liabilities—0.2% | | | | | | 159,040 | |
| | | | |
|
| |
Net Assets—100.0% | | | | | $ | 82,513,973 | |
| | | | |
|
| |
The accompanying notes are an integral part of these financial statements.
16
|
|
Lazard Retirement Series, Inc. |
|
Portfolios of Investments (continued) |
December 31, 2006 |
|
| | | | | | | |
Description | | | Shares | | Value | |
|
|
|
|
| |
Lazard Retirement International Equity Portfolio | | | | | | | |
Common Stocks—95.6% | | | | | | | |
Belgium—1.8% | | | | | | | |
InBev NV | | | 82,200 | | $ | 5,413,150 | |
| | | | |
|
| |
Brazil—0.6% | | | | | | | |
Petroleo Brasileiro SA ADR | | | 17,200 | | | 1,771,428 | |
| | | | |
|
| |
Egypt—0.7% | | | | | | | |
Orascom Telecom Holding SAE GDR | | | 30,600 | | | 2,019,600 | |
| | | | |
|
| |
Finland—0.9% | | | | | | | |
Fortum Oyj | | | 99,200 | | | 2,820,267 | |
| | | | |
|
| |
France—13.7% | | | | | | | |
Axa | | | 72,623 | | | 2,937,093 | |
BNP Paribas | | | 56,800 | | | 6,190,432 | |
France Telecom SA | | | 222,000 | | | 6,132,912 | |
Lafarge SA | | | 20,769 | | | 3,086,521 | |
Sanofi-Aventis | | | 77,480 | | | 7,146,725 | |
Total SA | | | 131,872 | | | 9,503,257 | |
Vivendi | | | 185,700 | | | 7,250,702 | |
| | | | |
|
| |
Total France | | | | | | 42,247,642 | |
| | | | |
|
| |
Germany—4.1% | | | | | | | |
Adidas AG | | | 57,500 | | | 2,860,780 | |
Allianz AG | | | 14,500 | | | 2,959,078 | |
DaimlerChrysler AG | | | 70,400 | | | 4,344,584 | |
KarstadtQuelle AG (a) | | | 86,373 | | | 2,501,152 | |
| | | | |
|
| |
Total Germany | | | | | | 12,665,594 | |
| | | | |
|
| |
Ireland—2.2% | | | | | | | |
Bank of Ireland | | | 137,058 | | | 3,162,803 | |
CRH PLC | | | 87,147 | | | 3,624,465 | |
| | | | |
|
| |
Total Ireland | | | | | | 6,787,268 | |
| | | | |
|
| |
Italy—7.3% | | | | | | | |
Banco Popolare di Verona e Novara Scrl | | | 114,477 | | | 3,283,275 | |
Capitalia SpA | | | 319,696 | | | 3,022,638 | |
Enel SpA | | | 521,150 | | | 5,370,583 | |
Eni SpA | | | 151,675 | | | 5,096,161 | |
UniCredito Italiano SpA | | | 657,372 | | | 5,755,844 | |
| | | | |
|
| |
Total Italy | | | | | | 22,528,501 | |
| | | | |
|
| |
| | | | | | | |
Description | | | Shares | | Value | |
|
|
|
|
| |
Japan—17.9% | | | | | | | |
Daito Trust Construction Co., Ltd. | | | 52,100 | | $ | 2,387,361 | |
East Japan Railway Co. | | | 358 | | | 2,388,570 | |
Hoya Corp. | | | 89,400 | | | 3,481,314 | |
Keyence Corp. | | | 13,100 | | | 3,242,155 | |
Mitsubishi UFJ Financial Group, Inc. | | | 315 | | | 3,886,115 | |
Nidec Corp. | | | 53,900 | | | 4,161,638 | |
Nissan Motor Co., Ltd. | | | 457,600 | | | 5,503,259 | |
Nomura Holdings, Inc. | | | 240,800 | | | 4,536,914 | |
Sega Sammy Holdings, Inc. | | | 112,700 | | | 3,036,104 | |
Sumitomo Mitsui Financial Group, Inc. | | | 618 | | | 6,327,557 | |
Takeda Pharmaceutical Co., Ltd. | | | 43,700 | | | 2,996,341 | |
The Sumitomo Trust and Banking Co., Ltd. | | | 470,000 | | | 4,922,664 | |
THK Co., Ltd. | | | 81,400 | | | 2,097,251 | |
Tokyo Gas Co., Ltd. | | | 770,000 | | | 4,090,554 | |
Yamada Denki Co., Ltd. | | | 27,400 | | | 2,322,521 | |
| | | | |
|
| |
Total Japan | | | | | | 55,380,318 | |
| | | | |
|
| |
Netherlands—1.7% | | | | | | | |
TNT NV | | | 122,600 | | | 5,267,097 | |
| | | | |
|
| |
New Zealand—1.1% | | | | | | | |
Telecom Corp. of New Zealand, Ltd. | | | 958,300 | | | 3,283,888 | |
| | | | |
|
| |
Norway—0.9% | | | | | | | |
Statoil ASA | | | 108,650 | | | 2,883,618 | |
| | | | |
|
| |
Russia—0.5% | | | | | | | |
Mobile TeleSystems Sponsored ADR | | | 32,700 | | | 1,641,213 | |
| | | | |
|
| |
Singapore—1.2% | | | | | | | |
Singapore Telecommunications, Ltd. | | | 1,809,000 | | | 3,867,249 | |
| | | | |
|
| |
South Korea—1.3% | | | | | | | |
Hyundai Motor Co., Ltd. GDR (a) | | | 50,600 | | | 1,033,758 | |
Kookmin Bank Sponsored ADR | | | 36,200 | | | 2,919,168 | |
| | | | |
|
| |
Total South Korea | | | | | | 3,952,926 | |
| | | | |
|
| |
Spain—2.0% | | | | | | | |
Banco Bilbao Vizcaya Argentaria SA | | | 255,904 | | | 6,155,051 | |
| | | | |
|
| |
Sweden—1.0% | | | | | | | |
Telefonaktiebolaget LM Ericsson, B Shares | | | 749,000 | | | 3,026,428 | |
| | | | |
|
| |
The accompanying notes are an integral part of these financial statements.
17
|
|
Lazard Retirement Series, Inc. |
|
Portfolios of Investments (continued) |
December 31, 2006 |
|
| | | | | | | |
Description | | | Shares | | Value | |
|
|
|
|
| |
Lazard Retirement International Equity Portfolio (concluded) | | | | | | | |
Switzerland—9.7% | | | | | | | |
Compagnie Financiere Richemont AG, A Shares | | | 65,800 | | $ | 3,827,148 | |
Credit Suisse Group | | | 109,612 | | | 7,654,971 | |
Nestle SA | | | 19,844 | | | 7,038,955 | |
Novartis AG | | | 151,700 | | | 8,730,175 | |
Zurich Financial Services AG | | | 9,800 | | | 2,633,243 | |
| | | | |
|
| |
Total Switzerland | | | | | | 29,884,492 | |
| | | | |
|
| |
Turkey—0.9% | | | | | | | |
Turkcell Iletisim Hizmetleri AS ADR | | | 216,036 | | | 2,890,562 | |
| | | | |
|
| |
United Kingdom—26.1% | | | | | | | |
BAE Systems PLC | | | 716,500 | | | 5,970,284 | |
BP PLC | | | 487,920 | | | 5,419,243 | |
Diageo PLC | | | 300,375 | | | 5,893,487 | |
Friends Provident PLC | | | 693,500 | | | 2,945,305 | |
Gallaher Group PLC | | | 195,041 | | | 4,376,472 | |
GlaxoSmithKline PLC | | | 252,700 | | | 6,647,045 | |
Imperial Tobacco Group PLC | | | 147,780 | | | 5,813,476 | |
ITV PLC | | | 1,169,000 | | | 2,436,623 | |
Kingfisher PLC | | | 417,400 | | | 1,948,341 | |
Lloyds TSB Group PLC | | | 268,900 | | | 3,007,677 | |
Marks & Spencer Group PLC | | | 231,519 | | | 3,248,852 | |
National Grid PLC | | | 528,523 | | | 7,623,520 | |
Northern Rock PLC | | | 121,800 | | | 2,808,127 | |
Old Mutual PLC | | | 1,286,357 | | | 4,386,907 | |
Reckitt Benckiser PLC | | | 101,200 | | | 4,622,804 | |
Tesco PLC | | | 656,900 | | | 5,200,462 | |
Vodafone Group PLC | | | 2,993,866 | | | 8,291,115 | |
| | | | |
|
| |
Total United Kingdom | | | | | | 80,639,740 | |
| | | | |
|
| |
Total Common Stocks
(Identified cost $239,306,851) | | | | | | 295,126,032 | |
| | | | |
|
| |
| | | | | | | |
Description | | | Shares | | Value | |
|
|
|
|
| |
Preferred Stock—1.0% | | | | | | | |
Brazil—1.0% | | | | | | | |
Tele Norte Leste Participacoes SA ADR (Identified cost $3,105,388) | | | 214,100 | | $ | 3,194,372 | |
| | | | |
|
| |
| | | | | | |
| | Principal
Amount
(000) | | | | |
| |
| | | | |
Repurchase Agreement—3.0% | | | | | | | |
State Street Bank and Trust Co.,4.30%, 01/02/07 (Dated 12/29/06, collateralized by $7,675,000 United States Treasury Bond, 7.50%, 11/15/16, with a value of $9,389,096) Proceeds of $9,207,397 (Identified cost $9,203,000) | | $ | 9,203 | | | 9,203,000 | |
| | | | |
|
| |
Total Investments—99.6%
(Identified cost $251,615,239) (b) | | | | | $ | 307,523,404 | |
Cash and Other Assets in Excess of Liabilities—0.4% | | | | | | 1,169,457 | |
| | | | |
|
| |
Net Assets—100.0% | | | | | $ | 308,692,861 | |
| | | | |
|
| |
The accompanying notes are an integral part of these financial statements.
18
|
|
Lazard Retirement Series, Inc. |
|
Portfolios of Investments (continued) |
December 31, 2006 |
|
| | | | | | | |
Description | | Shares | | Value | |
|
Lazard Retirement Emerging Markets Portfolio | | | | | | | |
Common Stocks—81.7% | | | | | | | |
Argentina—0.7% | | | | | | | |
Banco Macro SA ADR | | | 39,900 | | $ | 1,245,279 | |
| | | | |
|
| |
Bahrain—0.6% | | | | | | | |
Investcorp Bank BSC GDR (a) | | | 3,904 | | | 103,456 | |
Investcorp Bank BSC GDR (a), (c) | | | 35,584 | | | 942,976 | |
| | | | |
|
| |
Total Bahrain | | | | | | 1,046,432 | |
| | | | |
|
| |
Brazil—6.8% | | | | | | | |
Brasil Telecom Participacoes SA ADR | | | 56,400 | | | 2,407,716 | |
Companhia de Concessoes Rodoviarias | | | 135,800 | | | 1,835,049 | |
Petroleo Brasileiro SA ADR | | | 42,500 | | | 4,377,075 | |
Souza Cruz SA | | | 94,034 | | | 1,675,875 | |
Ultrapar Participacoes SA Sponsored ADR | | | 56,200 | | | 1,292,600 | |
| | | | |
|
| |
Total Brazil | | | | | | 11,588,315 | |
| | | | |
|
| |
Chile—0.1% | | | | | | | |
Administradora de Fondos de Pensiones Provida SA Sponsored ADR | | | 3,660 | | | 94,099 | |
| | | | |
|
| |
China—1.3% | | | | | | | |
CNOOC, Ltd. ADR | | | 23,500 | | | 2,223,805 | |
| | | | |
|
| |
Egypt—4.0% | | | | | | | |
Eastern Tobacco | | | 29,534 | | | 1,603,071 | |
Orascom Construction Industries | | | 55,949 | | | 2,702,794 | |
Orascom Telecom Holding SAE | | | 38,800 | | | 2,564,791 | |
| | | | |
|
| |
Total Egypt | | | | | | 6,870,656 | |
| | | | |
|
| |
Hong Kong—1.0% | | | | | | | |
China Netcom Group Corp. (Hong Kong), Ltd. | | | 478,000 | | | 1,281,468 | |
Pacific Basin Shipping, Ltd. | | | 760,000 | | | 478,833 | |
| | | | |
|
| |
Total Hong Kong | | | | | | 1,760,301 | |
| | | | |
|
| |
Hungary—2.0% | | | | | | | |
Gedeon Richter Nyrt. | | | 7,285 | | | 1,659,939 | |
MOL Hungarian Oil and Gas Nyrt. | | | 15,237 | | | 1,726,339 | |
| | | | |
|
| |
Total Hungary | | | | | | 3,386,278 | |
| | | | |
|
| |
| | | | | | | |
Description | | Shares | | Value | |
|
India—6.6% | | | | | | | |
Hero Honda Motors, Ltd. | | | 77,721 | | $ | 1,332,811 | |
Hindustan Lever, Ltd. | | | 205,332 | | | 1,005,320 | |
Oil and Natural Gas Corp., Ltd. | | | 125,853 | | | 2,459,621 | |
Punjab National Bank, Ltd. | | | 6,700 | | | 76,749 | |
Satyam Computer Services, Ltd. | | | 252,164 | | | 2,762,352 | |
State Bank of India | | | 128,863 | | | 3,624,818 | |
| | | | |
|
| |
Total India | | | | | | 11,261,671 | |
| | | | |
|
| |
Indonesia—3.2% | | | | | | | |
PT Bank Mandiri Tbk | | | 7,148,000 | | | 2,304,909 | |
PT Telekomunikasi Indonesia Tbk Sponsored ADR | | | 38,700 | | | 1,764,720 | |
PT United Tractors Tbk | | | 2,023,400 | | | 1,473,650 | |
| | | | |
|
| |
Total Indonesia | | | | | | 5,543,279 | |
| | | | |
|
| |
Israel—2.8% | | | | | | | |
Bank Hapoalim BM | | | 688,436 | | | 3,241,332 | |
Israel Chemicals, Ltd. | | | 238,969 | | | 1,494,123 | |
| | | | |
|
| |
Total Israel | | | | | | 4,735,455 | |
| | | | |
|
| |
Kazakhstan—1.1% | | | | | | | |
KazMunaiGas Exploration | | | | | | | |
Production GDR | | | 51,700 | | | 1,264,582 | |
KazMunaiGas Exploration Production GDR (c) | | | 24,200 | | | 591,932 | |
| | | | |
|
| |
Total Kazakhstan | | | | | | 1,856,514 | |
| | | | |
|
| |
Mexico—6.0% | | | | | | | |
Cemex SAB de CV Sponsored ADR (a) | | | 113,734 | | | 3,853,308 | |
Desarrolladora Homex SA de CV ADR (a) | | | 23,390 | | | 1,381,648 | |
Grupo Mexico SAB de CV, Series B | | | 316,700 | | | 1,158,348 | |
Grupo Televisa SA Sponsored ADR | | | 79,300 | | | 2,141,893 | |
Kimberly-Clark de Mexico SAB de CV, Series A | | | 389,300 | | | 1,794,241 | |
| | | | |
|
| |
Total Mexico | | | | | | 10,329,438 | |
| | | | |
|
| |
Morocco—0.0% | | | | | | | |
Maroc Telecom | | | 4,900 | | | 75,095 | |
| | | | |
|
| |
Peru—0.7% | | | | | | | |
Credicorp, Ltd. | | | 30,400 | | | 1,244,576 | |
| | | | |
|
| |
Philippines—1.5% | | | | | | | |
Philippine Long Distance Telephone Co. Sponsored ADR | | | 50,300 | | | 2,571,839 | |
| | | | |
|
| |
The accompanying notes are an integral part of these financial statements.
19
|
|
Lazard Retirement Series, Inc. |
|
Portfolios of Investments (concluded) |
December 31, 2006 |
|
| | | | | | | |
Description | | Shares | | Value | |
|
Lazard Retirement Emerging Markets Portfolio (concluded) | | | | | | | |
Russia—3.0% | | | | | | | |
Evraz Group SA GDR | | | 53,900 | | $ | 1,384,691 | |
Mobile TeleSystems Sponsored ADR | | | 73,000 | | | 3,663,870 | |
| | | | |
|
| |
Total Russia | | | | | | 5,048,561 | |
| | | | |
|
| |
South Africa—9.6% | | | | | | | |
Aquarius Platinum, Ltd. | | | 122,334 | | | 2,655,234 | |
Edgars Consolidated Stores, Ltd. | | | 598,755 | | | 3,312,759 | |
Exxaro Resources, Ltd. | | | 42,085 | | | 334,257 | |
Imperial Holdings, Ltd. (a) | | | 80,400 | | | 1,869,985 | |
Kumba Iron Ore, Ltd. (a) | | | 140,934 | | | 2,223,722 | |
Murray & Roberts Holdings, Ltd. | | | 240,467 | | | 1,367,617 | |
Sanlam, Ltd. | | | 248,530 | | | 645,052 | |
Steinhoff International Holdings, Ltd. | | | 721,853 | | | 2,544,133 | |
Truworths International, Ltd. | | | 319,656 | | | 1,452,580 | |
| | | | |
|
| |
Total South Africa | | | | | | 16,405,339 | |
| | | | |
|
| |
South Korea—15.8% | | | | | | | |
Hite Brewery Co., Ltd. | | | 7,500 | | | 963,710 | |
Hyundai Motor Co., Ltd. | | | 30,740 | | | 2,227,824 | |
Kangwon Land, Inc. | | | 102,010 | | | 2,215,701 | |
Kookmin Bank | | | 61,558 | | | 4,957,736 | |
KT Corp. Sponsored ADR | | | 48,790 | | | 1,236,826 | |
LG Electronics, Inc. | | | 23,070 | | | 1,364,355 | |
Lotte Shopping Co., Ltd. GDR (a), (c) | | | 101,900 | | | 2,068,570 | |
Samsung Electronics Co., Ltd. GDR | | | 5,700 | | | 1,875,300 | |
Samsung Electronics Co., Ltd. GDR (c) | | | 13,126 | | | 4,318,454 | |
Shinhan Financial Group Co., Ltd. | | | 83,070 | | | 4,242,822 | |
SK Corp. | | | 20,800 | | | 1,632,688 | |
| | | | |
|
| |
Total South Korea | | | | | | 27,103,986 | |
| | | | |
|
| |
Sweden—2.0% | | | | | | | |
Oriflame Cosmetics SA SDR | | | 81,200 | | | 3,346,252 | |
| | | | |
|
| |
Taiwan—8.5% | | | | | | | |
Advantech Co., Ltd. | | | 453,388 | | | 1,627,939 | |
Chinatrust Financial Holding Co., Ltd. | | | 4,009,493 | | | 3,353,036 | |
Chunghwa Telecom Co., Ltd. ADR | | | 16,116 | | | 317,969 | |
Fubon Financial Holding Co., Ltd. | | | 2,713,000 | | | 2,539,405 | |
Hon Hai Precision Industry Co., Ltd. | | | 481,506 | | | 3,435,634 | |
Taiwan Semiconductor Manufacturing Co., Ltd. | | | 1,359,848 | | | 2,816,932 | |
Taiwan Semiconductor Manufacturing Co., Ltd. Sponsored ADR | | | 49,027 | | | 535,865 | |
| | | | |
|
| |
Total Taiwan | | | | | | 14,626,780 | |
| | | | |
|
| |
| | | | | | | |
Description | | Shares | | Value | |
|
Thailand—0.8% | | | | | | | |
Kasikornbank PCL | | | 514,500 | | $ | 889,523 | |
Thai Union Frozen Products PCL | | | 709,800 | | | 490,871 | |
| | | | |
|
| |
Total Thailand | | | | | | 1,380,394 | |
| | | | |
|
| |
Turkey—3.6% | | | | | | | |
Enka Insaat ve Sanayi AS | | | 122,662 | | | 1,307,586 | |
Turkcell Iletisim Hizmetleri AS | | | 529,401 | | | 2,672,232 | |
Turkcell Iletisim Hizmetleri AS ADR | | | 161,578 | | | 2,161,914 | |
| | | | |
|
| |
Total Turkey | | | | | | 6,141,732 | |
| | | | |
|
| |
Total Common Stocks
(Identified cost $109,093,654) | | | | | | 139,886,076 | |
| | | | |
|
| |
Preferred Stocks—9.2% | | | | | | | |
Brazil—8.6% | | | | | | | |
AES Tiete SA | | | 50,269,689 | | | 1,466,886 | |
Bradespar SA | | | 38,005 | | | 1,797,895 | |
Companhia Vale do Rio Doce, A Shares | | | 203,700 | | | 5,198,882 | |
Iochpe Maxion SA | | | 98,200 | | | 834,815 | |
Klabin SA | | | 774,400 | | | 1,940,534 | |
Tele Norte Leste Participacoes SA ADR | | | 91,700 | | | 1,368,164 | |
Telemar Norte Leste SA | | | 94,742 | | | 2,156,656 | |
| | | | |
|
| |
Total Brazil | | | | | | 14,763,832 | |
| | | | |
|
| |
South Korea—0.6% | | | | | | | |
Hyundai Motor Co., Ltd. | | | 25,450 | | | 1,086,414 | |
| | | | |
|
| |
Total Preferred Stocks
(Identified cost $13,830,124) | | | | | | 15,850,246 | |
| | | | |
|
| |
| | | | | | | |
| | Principal
Amount
(000) | | | | |
| |
| | | | |
Repurchase Agreement—8.4% | | | | | | | |
State Street Bank and Trust Co., 4.30%, 01/02/07 (Dated 12/29/06, collateralized by $12,055,000 United States Treasury Bond, 7.50%, 11/15/16, with a value of $14,747,303) Proceeds of $14,459,905 (Identified cost $14,453,000) | | $ | 14,453 | | | 14,453,000 | |
| | | | |
|
| |
Total Investments—99.3%
(Identified cost $137,376,778) (b) | | | | | $ | 170,189,322 | |
Cash and Other Assets in Excess of Liabilities—0.7% | | | | | | 1,125,682 | |
| | | | |
|
| |
Net Assets—100.0% | | | | | $ | 171,315,004 | |
| | | | |
|
| |
The accompanying notes are an integral part of these financial statements.
20
|
|
Lazard Retirement Series, Inc. |
|
Notes to Portfolios of Investments |
December 31, 2006 |
|
| |
(a) | Non-income producing security. |
| |
(b) | For federal income tax purposes, the aggregate cost, aggregate gross unrealized appreciation, aggregate gross unrealized depreciation and the net unrealized appreciation are as follows: |
| | | | | | | | | | | | | | |
| Portfolio | | Aggregate
Cost | | Aggregate
Gross
Unrealized
Appreciation | | Aggregate
Gross
Unrealized
Depreciation | | Net
Unrealized
Appreciation | |
|
| |
| |
| |
| |
| |
| Retirement Equity | | $ | 4,580,937 | | $ | 502,857 | | $ | 29,946 | | $ | 472,911 | |
| Retirement Small Cap | | | 77,729,064 | | | 7,215,231 | | | 2,589,362 | | | 4,625,869 | |
| Retirement International Equity | | | 251,806,030 | | | 58,709,146 | | | 2,991,772 | | | 55,717,374 | |
| Retirement Emerging Markets | | | 137,597,679 | | | 33,576,156 | | | 984,513 | | | 32,591,643 | |
| |
(c) | Pursuant to Rule 144A under the Securities Act of 1933, these securities may only be traded among “qualified institutional buyers.” At December 31, 2006, these securities amounted to 4.6% of net assets and are considered to be liquid for Lazard Retirement Emerging Markets Portfolio. |
Security Abbreviations:
ADR — American Depositary Receipt
GDR — Global Depositary Receipt
SDR — Swedish Depositary Receipt
The accompanying notes are an integral part of these financial statements.
21
|
|
Lazard Retirement Series, Inc. |
|
Notes to Portfolios of Investments (concluded) |
December 31, 2006 |
|
|
Portfolio holdings by industry (as percentage of net assets), for those Portfolios previously presented by country: |
| | | | | | | |
| | Lazard
Retirement
International
Equity
Portfolio | | Lazard
Retirement
Emerging
Markets
Portfolio | |
| |
| |
| |
Industry | | | | | | | |
Agriculture | | — | % | | 0.9 | % | |
Alcohol & Tobacco | | 7.0 | | | 2.5 | | |
Automotive | | 3.5 | | | 2.7 | | |
Banking | | 18.2 | | | 12.2 | | |
Building & Construction | | 2.9 | | | 6.2 | | |
Consumer Products | | 3.7 | | | 4.8 | | |
Drugs | | 8.3 | | | 1.0 | | |
Electric | | 4.2 | | | 0.9 | | |
Energy Exploration & Production | | — | | | 2.7 | | |
Energy Integrated | | 8.9 | | | 6.4 | | |
Financial Services | | 3.9 | | | 5.0 | | |
Food & Beverages | | 2.3 | | | 0.3 | | |
Forest & Paper Products | | — | | | 2.2 | | |
Gas Utilities | | 1.3 | | | — | | |
Insurance | | 3.7 | | | — | | |
Leisure & Entertainment | | 3.1 | | | 2.5 | | |
Manufacturing | | 3.7 | | | 1.3 | | |
Metals & Mining | | — | | | 8.6 | | |
Retail | | 5.9 | | | 4.0 | | |
Semiconductors & Components | | 1.1 | | | 6.5 | | |
Technology | | 1.3 | | | 1.6 | | |
Technology Hardware | | 1.0 | | | 2.0 | | |
Telecommunications | | 10.1 | | | 14.2 | | |
Transportation | | 2.5 | | | 2.4 | | |
| |
|
| |
|
| |
Subtotal | | 96.6 | | | 90.9 | | |
Repurchase Agreements | | 3.0 | | | 8.4 | | |
| |
|
| |
|
| |
Total Investments | | 99.6 | % | | 99.3 | % | |
| |
|
| |
|
| |
The accompanying notes are an integral part of these financial statements.
22
|
|
Lazard Retirement Series, Inc. |
|
Statements of Assets and Liabilities |
December 31, 2006 |
| | | | | | | | | | | | | |
|
|
| | Lazard
Retirement
Equity
Portfolio | | Lazard
Retirement
Small Cap
Portfolio | | Lazard
Retirement
International
Equity
Portfolio | | Lazard
Retirement
Emerging
Markets
Portfolio | |
|
ASSETS | | | | | | | | | | | | | |
Investments in securities, at value | | $ | 5,053,848 | | $ | 82,354,933 | | $ | 307,523,404 | | $ | 170,189,322 | |
Cash | | | 23,598 | | | 349 | | | 744 | | | 257 | |
Foreign currency | | | — | | | — | | | 4,393 | | | 208 | |
Receivables for: | | | | | | | | | | | | | |
Investments sold | | | — | | | 475,546 | | | 1,904,723 | | | 566,964 | |
Dividends and interest | | | 5,677 | | | 51,141 | | | 699,768 | | | 423,402 | |
Capital stock sold | | | — | | | 24 | | | 55,539 | | | 502,982 | |
Amount due from Investment Manager (Note 3) | | | 13,128 | | | — | | | — | | | — | |
| |
|
| |
|
| |
|
| |
|
| |
Total assets | | | 5,096,251 | | | 82,881,993 | | | 310,188,571 | | | 171,683,135 | |
| |
|
| |
|
| |
|
| |
|
| |
| | | | | | | | | | | | | |
LIABILITIES | | | | | | | | | | | | | |
Payables for: | | | | | | | | | | | | | |
Management fees | | | — | | | 52,764 | | | 194,282 | | | 111,691 | |
Accrued distribution fees | | | 1,125 | | | 17,588 | | | 64,761 | | | 26,158 | |
Accrued directors’ fees | | | 12 | | | 274 | | | 665 | | | 307 | |
Investments purchased | | | — | | | 224,008 | | | 1,154,352 | | | 79,505 | |
Capital stock redeemed | | | 36 | | | 43,367 | | | 183 | | | 11,280 | |
Other accrued expenses and payables | | | 16,765 | | | 30,019 | | | 81,467 | | | 139,190 | |
| |
|
| |
|
| |
|
| |
|
| |
Total liabilities | | | 17,938 | | | 368,020 | | | 1,495,710 | | | 368,131 | |
| |
|
| |
|
| |
|
| |
|
| |
Net assets | | $ | 5,078,313 | | $ | 82,513,973 | | $ | 308,692,861 | | $ | 171,315,004 | |
| |
|
| |
|
| |
|
| |
|
| |
| | | | | | | | | | | | | |
NET ASSETS | | | | | | | | | | | | | |
Paid in capital | | $ | 4,183,652 | | $ | 53,528,081 | | $ | 210,067,669 | | $ | 122,870,904 | |
Undistributed net investment income | | | 31,239 | | | 3 | | | 4,086,576 | | | 1,276,939 | |
Accumulated undistributed net realized gain | | | 360,819 | | | 23,640,144 | | | 38,618,924 | | | 14,407,021 | |
Net unrealized appreciation on: | | | | | | | | | | | | | |
Investments | | | 502,603 | | | 5,345,745 | | | 55,908,165 | | | 32,759,060 | |
Foreign currency | | | — | | | — | | | 11,527 | | | 1,080 | |
| |
|
| |
|
| |
|
| |
|
| |
Net assets | | $ | 5,078,313 | | $ | 82,513,973 | | $ | 308,692,861 | | $ | 171,315,004 | |
| |
|
| |
|
| |
|
| |
|
| |
| | | | | | | | | | | | | |
Service Shares | | | | | | | | | | | | | |
Net assets | | $ | 5,078,313 | | $ | 82,513,973 | | $ | 308,692,861 | | $ | 129,305,604 | |
Shares of capital stock outstanding* | | | 394,810 | | | 4,767,452 | | | 20,736,302 | | | 5,698,332 | |
Net asset value, offering and redemption price per share | | $ | 12.86 | | $ | 17.31 | | $ | 14.89 | | $ | 22.69 | |
| | | | | | | | | | | | | |
Investor Shares | | | | | | | | | | | | | |
Net assets | | | — | | | — | | | — | | $ | 42,009,400 | |
Shares of capital stock outstanding* | | | — | | | — | | | — | | | 1,849,829 | |
Net asset value, offering and redemption price per share | | | — | | | — | | | — | | $ | 22.71 | |
| | | | | | | | | | | | | |
Cost of investments in securities | | $ | 4,551,245 | | $ | 77,009,188 | | $ | 251,615,239 | | $ | 137,376,778 | |
Cost of foreign currency | | $ | — | | $ | — | | $ | 4,296 | | $ | 205 | |
* $0.001 par value, 500,000,000 shares authorized for the Portfolios in total.
The accompanying notes are an integral part of these financial statements.
23
|
|
Lazard Retirement Series, Inc. |
|
Statements of Operations |
For the year ended December 31, 2006 |
| | | | | | | | | | | | | |
|
|
| | Lazard
Retirement
Equity
Portfolio | | Lazard
Retirement
Small Cap
Portfolio | | Lazard
Retirement
International
Equity
Portfolio | | Lazard
Retirement
Emerging
Markets
Portfolio | |
|
INVESTMENT INCOME (LOSS) | | | | | | | | | | | | | |
| | | | | | | | | | | | | |
Income: | | | | | | | | | | | | | |
Dividends | | $ | 82,741 | | $ | 1,125,380 | | $ | 7,435,678 | | $ | 3,005,387 | |
Interest | | | 5,829 | | | 158,928 | | | 325,279 | | | 278,905 | |
| |
|
| |
|
| |
|
| |
|
| |
Total investment income* | | | 88,570 | | | 1,284,308 | | | 7,760,957 | | | 3,284,292 | |
| |
|
| |
|
| |
|
| |
|
| |
| | | | | | | | | | | | | |
Expenses: | | | | | | | | | | | | | |
Management fees | | | 34,405 | | | 1,002,287 | | | 2,155,567 | | | 1,136,450 | |
Distribution fees (Service Shares) | | | 11,468 | | | 334,096 | | | 718,522 | | | 260,869 | |
Custodian fees | | | 58,690 | | | 77,047 | | | 131,005 | | | 298,229 | |
Administration fees | | | 53,907 | | | 80,091 | | | 111,243 | | | 75,968 | |
Shareholders’ reports | | | 761 | | | 14,071 | | | 211,943 | | | 26,033 | |
Professional services | | | 28,752 | | | 42,827 | | | 58,782 | | | 73,024 | |
Shareholders’ services | | | 13,848 | | | 15,497 | | | 13,859 | | | 22,707 | |
Directors’ fees and expenses | | | 278 | | | 8,340 | | | 17,532 | | | 6,810 | |
Other | | | 2,037 | | | 5,461 | | | 8,939 | | | 4,910 | |
| |
|
| |
|
| |
|
| |
|
| |
Total gross expenses | | | 204,146 | | | 1,579,717 | | | 3,427,392 | | | 1,905,000 | |
Management fees waived and expenses reimbursed | | | (127,575 | ) | | — | | | — | | | (109,711 | ) |
Administration fees waived | | | (18,750 | ) | | — | | | — | | | — | |
Expense reductions | | | (490 | ) | | — | | | (1,481 | ) | | — | |
| |
|
| |
|
| |
|
| |
|
| |
Total net expenses | | | 57,331 | | | 1,579,717 | | | 3,425,911 | | | 1,795,289 | |
| |
|
| |
|
| |
|
| |
|
| |
Net investment income (loss) | | | 31,239 | | | (295,409 | ) | | 4,335,046 | | | 1,489,003 | |
| |
|
| |
|
| |
|
| |
|
| |
| | | | | | | | | | | | | |
NET REALIZED AND UNREALIZED GAIN (LOSS) ON INVESTMENTS AND FOREIGN CURRENCY | | | | | | | | | | | | | |
Net realized gain (loss) on: | | | | | | | | | | | | | |
Investments** | | | 533,597 | | | 24,136,236 | | | 38,830,031 | | | 14,580,022 | |
Foreign currency | | | — | | | — | | | (248,470 | ) | | (212,149 | ) |
Net change in unrealized appreciation (depreciation) on: | | | | | | | | | | | | | |
Investments*** | | | 166,637 | | | (4,013,475 | ) | | 14,909,193 | | | 14,827,361 | |
Foreign currency | | | — | | | — | | | 19,439 | | | (3,839 | ) |
| |
|
| |
|
| |
|
| |
|
| |
Net realized and unrealized gain on investments and foreign currency | | | 700,234 | | | 20,122,761 | | | 53,510,193 | | | 29,191,395 | |
| |
|
| |
|
| |
|
| |
|
| |
Net increase in net assets resulting from operations | | $ | 731,473 | | $ | 19,827,352 | | $ | 57,845,239 | | $ | 30,680,398 | |
| |
|
| |
|
| |
|
| |
|
| |
| | | | | | | | | | | | | |
* Net of foreign withholding taxes of | | $ | — | | $ | 7 | | $ | 742,485 | | $ | 253,509 | |
| |
|
| |
|
| |
|
| |
|
| |
** Net of foreign capital gains taxes of | | $ | — | | $ | — | | $ | — | | $ | 168 | |
| |
|
| |
|
| |
|
| |
|
| |
*** Net change in unrealized foreign capital gains taxes of | | $ | — | | $ | — | | $ | — | | $ | 47,132 | |
| |
|
| |
|
| |
|
| |
|
| |
The accompanying notes are an integral part of these financial statements.
24
|
|
Lazard Retirement Series, Inc. |
|
Statements of Changes in Net Assets |
| | | | | | | | | | | | | |
|
|
| | Lazard Retirement
Equity Portfolio | | Lazard Retirement
Small Cap Portfolio | |
| |
| |
| |
| | Year Ended
December 31,
2006 | | Year Ended
December 31,
2005 | | Year Ended
December 31,
2006 | | Year Ended
December 31,
2005 | |
|
INCREASE (DECREASE) IN NET ASSETS | | | | | | | | | | | | | |
| | | | | | | | | | | | | |
Operations: | | | | | | | | | | | | | |
Net investment income (loss) | | $ | 31,239 | | $ | 27,497 | | $ | (295,409 | ) | $ | (323,706 | ) |
Net realized gain on investments | | | 533,597 | | | 532,185 | | | 24,136,236 | | | 11,695,519 | |
Net change in unrealized appreciation (depreciation) on investments | | | 166,637 | | | (418,991 | ) | | (4,013,475 | ) | | (5,014,880 | ) |
| |
|
| |
|
| |
|
| |
|
| |
Net increase in net assets resulting from operations | | | 731,473 | | | 140,691 | | | 19,827,352 | | | 6,356,933 | |
| |
|
| |
|
| |
|
| |
|
| |
| | | | | | | | | | | | | |
Distributions to shareholders: | | | | | | | | | | | | | |
Service Shares | | | | | | | | | | | | | |
From net investment income | | | (27,495 | ) | | (34,628 | ) | | — | | | — | |
From net realized gains | | | — | | | — | | | (11,366,037 | ) | | (9,489,535 | ) |
| |
|
| |
|
| |
|
| |
|
| |
Net decrease in net assets resulting from distributions | | | (27,495 | ) | | (34,628 | ) | | (11,366,037 | ) | | (9,489,535 | ) |
| |
|
| |
|
| |
|
| |
|
| |
| | | | | | | | | | | | | |
Capital stock transactions: | | | | | | | | | | | | | |
Service Shares | | | | | | | | | | | | | |
Net proceeds from sales | | | 2,684,257 | | | 1,080,761 | | | 19,184,681 | | | 26,254,947 | |
Net proceeds in connection with acquisition of Phoenix-Lazard Small-Cap Value Series | | | — | | | — | | | — | | | 12,046,680 | |
Net proceeds from reinvestment of distributions | | | 27,495 | | | 34,628 | | | 11,366,037 | | | 9,489,535 | |
Cost of shares redeemed | | | (2,648,847 | ) | | (1,792,777 | ) | | (93,468,123 | ) | | (18,670,368 | ) |
| |
|
| |
|
| |
|
| |
|
| |
Net increase (decrease) in net assets from capital stock transactions | | | 62,905 | | | (677,388 | ) | | (62,917,405 | ) | | 29,120,794 | |
| |
|
| |
|
| |
|
| |
|
| |
Total increase (decrease) in net assets | | | 766,883 | | | (571,325 | ) | | (54,456,090 | ) | | 25,988,192 | |
Net assets at beginning of year | | | 4,311,430 | | | 4,882,755 | | | 136,970,063 | | | 110,981,871 | |
| |
|
| |
|
| |
|
| |
|
| |
Net assets at end of year* | | $ | 5,078,313 | | $ | 4,311,430 | | $ | 82,513,973 | | $ | 136,970,063 | |
| |
|
| |
|
| |
|
| |
|
| |
*Includes undistributed net investment income | | $ | 31,239 | | $ | 27,495 | | $ | 3 | | $ | 21,746 | |
| |
|
| |
|
| |
|
| |
|
| |
| | | | | | | | | | | | | |
Shares issued and redeemed: | | | | | | | | | | | | | |
Service Shares: | | | | | | | | | | | | | |
Shares outstanding at beginning of year | | | 391,371 | | | 454,488 | | | 8,395,800 | | | 6,567,766 | |
| |
|
| |
|
| |
|
| |
|
| |
Shares sold | | | 226,132 | | | 100,566 | | | 1,120,630 | | | 1,596,698 | |
Shares issued in connection with acquisition of Phoenix-Lazard Small-Cap Value Series | | | — | | | — | | | — | | | 771,728 | |
Shares issued to shareholders from reinvestment of distributions | | | 2,376 | | | 3,209 | | | 745,317 | | | 591,617 | |
Shares redeemed | | | (225,069 | ) | | (166,892 | ) | | (5,494,295 | ) | | (1,132,009 | ) |
| |
|
| |
|
| |
|
| |
|
| |
Net increase (decrease) | | | 3,439 | | | (63,117 | ) | | (3,628,348 | ) | | 1,828,034 | |
| |
|
| |
|
| |
|
| |
|
| |
Shares outstanding at end of year | | | 394,810 | | | 391,371 | | | 4,767,452 | | | 8,395,800 | |
| |
|
| |
|
| |
|
| |
|
| |
The accompanying notes are an integral part of these financial statements.
25
|
|
Lazard Retirement Series, Inc. |
|
Statements of Changes in Net Assets (concluded) |
| | | | | | | | | | | | | |
|
|
|
|
|
|
| | Lazard Retirement
International Equity Portfolio | | Lazard Retirement
Emerging Markets Portfolio | |
| |
| |
| |
| | Year Ended
December 31,
2006 | | Year Ended
December 31,
2005 | | Year Ended
December 31,
2006 | | Year Ended
December 31,
2005 | |
|
|
|
|
|
|
|
|
|
|
INCREASE IN NET ASSETS | | | | | | | | | | | | | |
|
Operations: | | | | | | | | | | | | | |
Net investment income | | $ | 4,335,046 | | $ | 3,377,582 | | $ | 1,489,003 | | $ | 690,281 | |
Net realized gain on investments and foreign currency | | | 38,581,561 | | | 12,631,903 | | | 14,367,873 | | | 7,355,438 | |
Net change in unrealized appreciation (depreciation) on investments and foreign currency | | | 14,928,632 | | | 9,977,952 | | | 14,823,522 | | | 10,594,255 | |
| |
|
| |
|
| |
|
| |
|
| |
Net increase in net assets resulting from operations | | | 57,845,239 | | | 25,987,437 | | | 30,680,398 | | | 18,639,974 | |
| |
|
| |
|
| |
|
| |
|
| |
Distributions to shareholders: | | | | | | | | | | | | | |
From net investment income | | | | | | | | | | | | | |
Service Shares | | | (2,929,782 | ) | | (2,305,204 | ) | | (508,630 | ) | | (163,364 | ) |
Investor Shares | | | — | | | — | | | (49,478 | ) | | — | |
From net realized gains | | | | | | | | | | | | | |
Service Shares | | | (12,191,657 | ) | | (3,510,316 | ) | | (6,647,965 | ) | | (1,946,955 | ) |
Investor Shares | | | — | | | — | | | (581,670 | ) | | — | |
| |
|
| |
|
| |
|
| |
|
| |
Net decrease in net assets resulting from distributions | | | (15,121,439 | ) | | (5,815,520 | ) | | (7,787,743 | ) | | (2,110,319 | ) |
| |
|
| |
|
| |
|
| |
|
| |
Capital stock transactions: | | | | | | | | | | | | | |
Net proceeds from sales | | | | | | | | | | | | | |
Service Shares | | | 29,502,896 | | | 41,338,382 | | | 50,674,749 | | | 42,369,454 | |
Investor Shares | | | — | | | — | | | 40,132,516 | | | — | |
Net proceeds from reinvestment of distributions | | | | | | | | | | | | | |
Service Shares | | | 15,121,439 | | | 5,815,520 | | | 7,154,647 | | | 2,110,319 | |
Investor Shares | | | — | | | — | | | 633,069 | | | — | |
Cost of shares redeemed | | | | | | | | | | | | | |
Service Shares | | | (45,092,073 | ) | | (7,513,892 | ) | | (30,795,545 | ) | | (9,907,199 | ) |
Investor Shares | | | — | | | — | | | (2,189,297 | ) | | — | |
| |
|
| |
|
| |
|
| |
|
| |
Net increase (decrease) in net assets from capital stock transactions | | | (467,738 | ) | | 39,640,010 | | | 65,610,139 | | | 34,572,574 | |
| |
|
| |
|
| |
|
| |
|
| |
Total increase in net assets | | | 42,256,062 | | | 59,811,927 | | | 88,502,794 | | | 51,102,229 | |
Net assets at beginning of year | | | 266,436,799 | | | 206,624,872 | | | 82,812,210 | | | 31,709,981 | |
| |
|
| |
|
| |
|
| |
|
| |
Net assets at end of year* | | $ | 308,692,861 | | $ | 266,436,799 | | $ | 171,315,004 | | $ | 82,812,210 | |
| |
|
| |
|
| |
|
| |
|
| |
*Includes undistributed net investment income | | $ | 4,086,576 | | $ | 2,929,782 | | $ | 1,276,939 | | $ | 585,559 | |
| |
|
| |
|
| |
|
| |
|
| |
Shares issued and redeemed: | | | | | | | | | | | | | |
Service Shares: | | | | | | | | | | | | | |
Shares outstanding at beginning of year | | | 20,774,060 | | | 17,398,250 | | | 4,403,558 | | | 2,279,740 | |
| |
|
| |
|
| |
|
| |
|
| |
Shares sold | | | 2,088,551 | | | 3,497,964 | | | 2,452,613 | | | 2,630,021 | |
Shares issued to shareholders from reinvestment of distributions | | | 1,120,953 | | | 495,782 | | | 375,375 | | | 134,931 | |
Shares redeemed | | | (3,247,262 | ) | | (617,936 | ) | | (1,533,214 | ) | | (641,134 | ) |
| |
|
| |
|
| |
|
| |
|
| |
Net increase (decrease) | | | (37,758 | ) | | 3,375,810 | | | 1,294,774 | | | 2,123,818 | |
| |
|
| |
|
| |
|
| |
|
| |
Shares outstanding at end of year | | | 20,736,302 | | | 20,774,060 | | | 5,698,332 | | | 4,403,558 | |
| |
|
| |
|
| |
|
| |
|
| |
Investor Shares**: | | | | | | | | | | | | | |
Shares outstanding at beginning of period | | | | | | | | | — | | | | |
| | | | | | | |
|
| | | | |
Shares sold | | | | | | | | | 1,923,577 | | | | |
Shares issued to shareholders from reinvestment of distributions | | | | | | | | | 33,215 | | | | |
Shares redeemed | | | | | | | | | (106,963 | ) | | | |
| | | | | | | |
|
| | | | |
Net increase | | | | | | | | | 1,849,829 | | | | |
| | | | | | | |
|
| | | | |
Shares outstanding at end of period | | | | | | | | | 1,849,829 | | | | |
| | | | | | | |
|
| | | | |
**The inception date for Lazard Retirement Emerging Markets Portfolio Investor Shares was May 1, 2006.
The accompanying notes are an integral part of these financial statements.
26
|
|
Lazard Retirement Series, Inc. |
|
Financial Highlights |
Selected data for a share of capital stock outstanding throughout each year: |
|
| | | | | | | | | | | | | | | | |
LAZARD RETIREMENT EQUITY PORTFOLIO | | |
|
| | Year Ended | |
| |
| |
Service Shares | | 12/31/06 | | 12/31/05 | | 12/31/04 | | 12/31/03 | | 12/31/02 | |
| |
| |
| |
| |
| |
| |
Net asset value, beginning of year | | $ | 11.02 | | $ | 10.74 | | $ | 9.67 | | $ | 7.85 | | $ | 9.38 | |
| |
|
| |
|
| |
|
| |
|
| |
|
| |
Income (loss) from investment operations: | | | | | | | | | | | | | | | | |
Net investment income | | | 0.09 | | | 0.08 | | | 0.08 | | | 0.06 | | | 0.06 | |
Net realized and unrealized gain (loss) | | | 1.83 | | | 0.28 | | | 1.05 | | | 1.82 | | | (1.58 | ) |
| |
|
| |
|
| |
|
| |
|
| |
|
| |
Total from investment operations | | | 1.92 | | | 0.36 | | | 1.13 | | | 1.88 | | | (1.52 | ) |
| |
|
| |
|
| |
|
| |
|
| |
|
| |
Less distributions from: | | | | | | | | | | | | | | | | |
Net investment income | | | (0.08 | ) | | (0.08 | ) | | (0.06 | ) | | (0.06 | ) | | (0.01 | ) |
| |
|
| |
|
| |
|
| |
|
| |
|
| |
Total distributions | | | (0.08 | ) | | (0.08 | ) | | (0.06 | ) | | (0.06 | ) | | (0.01 | ) |
| |
|
| |
|
| |
|
| |
|
| |
|
| |
Net asset value, end of year | | $ | 12.86 | | $ | 11.02 | | $ | 10.74 | | $ | 9.67 | | $ | 7.85 | |
| |
|
| |
|
| |
|
| |
|
| |
|
| |
Total Return (a) | | | 17.48 | % | | 3.38 | % | | 11.79 | % | | 24.01 | % | | (16.25 | )% |
Ratios and Supplemental Data: | | | | | | | | | | | | | | | | |
Net assets, end of year (in thousands) | | $ | 5,078 | | $ | 4,311 | | $ | 4,883 | | $ | 4,591 | | $ | 3,750 | |
Ratios to average net assets: | | | | | | | | | | | | | | | | |
Net expenses | | | 1.25 | % | | 1.25 | % | | 1.25 | % | | 1.25 | % | | 1.25 | % |
Gross expenses | | | 4.45 | % | | 3.57 | % | | 3.58 | % | | 3.89 | % | | 3.74 | % |
Net investment income | | | 0.68 | % | | 0.59 | % | | 0.75 | % | | 0.73 | % | | 0.58 | % |
Portfolio turnover rate | | | 102 | % | | 75 | % | | 59 | % | | 56 | % | | 94 | % |
| | | | | | | | | | | | | | | | |
LAZARD RETIREMENT SMALL CAP PORTFOLIO | | | | | | | | | | | | |
|
| | Year Ended | |
| |
| |
Service Shares | | 12/31/06 | | 12/31/05 | | 12/31/04 | | 12/31/03 | | 12/31/02 | |
| |
| |
| |
| |
| |
| |
Net asset value, beginning of year | | $ | 16.31 | | $ | 16.90 | | $ | 14.71 | | $ | 10.72 | | $ | 13.08 | |
| |
|
| |
|
| |
|
| |
|
| |
|
| |
Income (loss) from investment operations: | | | | | | | | | | | | | | | | |
Net investment income (loss) | | | (0.06 | ) | | (0.04 | ) | | — | (b) | | — | (b) | | 0.01 | |
Net realized and unrealized gain (loss) | | | 2.49 | | | 0.69 | | | 2.19 | | | 3.99 | | | (2.32 | ) |
| |
|
| |
|
| |
|
| |
|
| |
|
| |
Total from investment operations | | | 2.43 | | | 0.65 | | | 2.19 | | | 3.99 | | | (2.31 | ) |
| |
|
| |
|
| |
|
| |
|
| |
|
| |
Less distributions from: | | | | | | | | | | | | | | | | |
Net realized gains | | | (1.43 | ) | | (1.24 | ) | | — | | | — | | | (0.05 | ) |
| |
|
| |
|
| |
|
| |
|
| |
|
| |
Total distributions | | | (1.43 | ) | | (1.24 | ) | | — | | | — | | | (0.05 | ) |
| |
|
| |
|
| |
|
| |
|
| |
|
| |
Net asset value, end of year | | $ | 17.31 | | $ | 16.31 | | $ | 16.90 | | $ | 14.71 | | $ | 10.72 | |
| |
|
| |
|
| |
|
| |
|
| |
|
| |
Total Return (a) | | | 16.07 | % | | 3.99 | % | | 14.89 | % | | 37.22 | % | | (17.68 | )% |
Ratios and Supplemental Data: | | | | | | | | | | | | | | | | |
Net assets, end of year (in thousands) | | $ | 82,514 | | $ | 136,970 | | $ | 110,982 | | $ | 76,636 | | $ | 47,453 | |
Ratios to average net assets: | | | | | | | | | | | | | | | | |
Net expenses | | | 1.18 | % | | 1.22 | % | | 1.25 | % | | 1.25 | % | | 1.25 | % |
Gross expenses | | | 1.18 | % | | 1.22 | % | | 1.28 | % | | 1.37 | % | | 1.42 | % |
Net investment income (loss) | | | (0.22 | )% | | (0.26 | )% | | (0.35 | )% | | 0.03 | % | | (0.17 | )% |
Portfolio turnover rate | | | 87 | % | | 93 | % | | 98 | % | | 78 | % | | 108 | % |
| |
(a) | Total returns reflect reinvestment of all dividends and distributions, if any. Certain expenses of the Portfolio have been waived or reimbursed by the Portfolio’s Investment Manager or Administrator; without such waiver/reimbursement of expenses, the Portfolio’s returns would have been lower. |
| |
| Performance information does not reflect the fees and charges imposed by participating insurance companies at the separate account level, and such charges will have the effect of reducing performance. |
| |
(b) | Amount is less than $0.01 per share |
The accompanying notes are an integral part of these financial statements.
27
|
|
Lazard Retirement Series, Inc. |
|
Financial Highlights (continued) |
Selected data for a share of capital stock outstanding throughout each year: |
|
LAZARD RETIREMENT INTERNATIONAL EQUITY PORTFOLIO
| | | | | | | | | | | | | | | | |
| | Year Ended | |
| |
| |
Service Shares | | 12/31/06 | | 12/31/05 | | 12/31/04 | | 12/31/03 | | 12/31/02 | |
| |
| |
| |
| |
| |
| |
Net asset value, beginning of year | | $ | 12.83 | | $ | 11.88 | | $ | 10.39 | | $ | 8.11 | | $ | 9.09 | |
| |
|
| |
|
| |
|
| |
|
| |
|
| |
Income (loss) from investment operations: | | | | | | | | | | | | | | | | |
Net investment income | | | 0.21 | | | 0.15 | | | 0.09 | | | 0.04 | | | 0.05 | |
Net realized and unrealized gain (loss) | | | 2.61 | | | 1.08 | | | 1.46 | | | 2.27 | | | (1.02 | ) |
| |
|
| |
|
| |
|
| |
|
| |
|
| |
Total from investment operations | | | 2.82 | | | 1.23 | | | 1.55 | | | 2.31 | | | (0.97 | ) |
| |
|
| |
|
| |
|
| |
|
| |
|
| |
Less distributions from: | | | | | | | | | | | | | | | | |
Net investment income | | | (0.15 | ) | | (0.11 | ) | | (0.06 | ) | | (0.03 | ) | | (0.01 | ) |
Net realized gains | | | (0.61 | ) | | (0.17 | ) | | — | | | — | | | — | |
| |
|
| |
|
| |
|
| |
|
| |
|
| |
Total distributions | | | (0.76 | ) | | (0.28 | ) | | (0.06 | ) | | (0.03 | ) | | (0.01 | ) |
| |
|
| |
|
| |
|
| |
|
| |
|
| |
Net asset value, end of year | | $ | 14.89 | | $ | 12.83 | | $ | 11.88 | | $ | 10.39 | | $ | 8.11 | |
| |
|
| |
|
| |
|
| |
|
| |
|
| |
Total Return (a) | | | 22.53 | % | | 10.65 | % | | 14.98 | % | | 28.52 | % | | (10.71 | )% |
Ratios and Supplemental Data: | | | | | | | | | | | | | | | | |
Net assets, end of year (in thousands) | | $ | 308,693 | | $ | 266,437 | | $ | 206,625 | | $ | 130,443 | | $ | 48,913 | |
Ratios to average net assets: | | | | | | | | | | | | | | | | |
Net expenses | | | 1.19 | % | | 1.21 | % | | 1.25 | % | | 1.25 | % | | 1.25 | % |
Gross expenses | | | 1.19 | % | | 1.21 | % | | 1.29 | % | | 1.40 | % | | 1.65 | % |
Net investment income | | | 1.51 | % | | 1.45 | % | | 1.05 | % | | 1.25 | % | | 0.98 | % |
Portfolio turnover rate | | | 75 | % | | 54 | % | | 53 | % | | 38 | % | | 49 | % |
| |
(a) | Total returns reflect reinvestment of all dividends and distributions, if any. Certain expenses of the Portfolio have been waived or reimbursed by the Portfolio’s Investment Manager or Administrator; without such waiver/reimbursement of expenses, the Portfolio’s returns would have been lower. Performance information does not reflect the fees and charges imposed by participating insurance companies at the separate account level, and such charges will have the effect of reducing performance. |
The accompanying notes are an integral part of these financial statements.
28
|
|
Lazard Retirement Series, Inc. |
|
Financial Highlights (concluded) |
Selected data for a share of capital stock outstanding throughout each period: |
|
LAZARD RETIREMENT EMERGING MARKETS PORTFOLIO
| | | | | | | | | | | | | | | | |
| | Year Ended | |
| |
| |
Service Shares | | 12/31/06 | | 12/31/05 | | 12/31/04 | | 12/31/03 | | 12/31/02 | |
| |
| |
| |
| |
| |
| |
Net asset value, beginning of year | | $ | 18.81 | | $ | 13.91 | | $ | 10.73 | | $ | 7.02 | | $ | 7.17 | |
| |
|
| |
|
| |
|
| |
|
| |
|
| |
Income (loss) from investment operations: | | | | | | | | | | | | | | | | |
Net investment income (a) | | | 0.27 | | | 0.13 | | | 0.05 | | | 0.10 | | | 0.05 | |
Net realized and unrealized gain (loss) | | | 5.08 | | | 5.41 | | | 3.21 | | | 3.61 | | | (0.16 | ) |
| |
|
| |
|
| |
|
| |
|
| |
|
| |
Total from investment operations | | | 5.35 | | | 5.54 | | | 3.26 | | | 3.71 | | | (0.11 | ) |
| |
|
| |
|
| |
|
| |
|
| |
|
| |
Less distributions from: | | | | | | | | | | | | | | | | |
Net investment income | | | (0.10 | ) | | (0.05 | ) | | (0.08 | ) | | — | (c) | | (0.04 | ) |
Net realized gains | | | (1.37 | ) | | (0.59 | ) | | — | | | — | | | — | |
| |
|
| |
|
| |
|
| |
|
| |
|
| |
Total distributions | | | (1.47 | ) | | (0.64 | ) | | (0.08 | ) | | — | | | (0.04 | ) |
| |
|
| |
|
| |
|
| |
|
| |
|
| |
Net asset value, end of year | | $ | 22.69 | | $ | 18.81 | | $ | 13.91 | | $ | 10.73 | | $ | 7.02 | |
| |
|
| |
|
| |
|
| |
|
| |
|
| |
Total Return (b) | | | 29.95 | % | | 40.78 | % | | 30.59 | % | | 52.94 | % | | (1.50 | )% |
Ratios and Supplemental Data: | | | | | | | | | | | | | | | | |
Net assets, end of year (in thousands) | | $ | 129,306 | | $ | 82,812 | | $ | 31,710 | | $ | 15,937 | | $ | 7,965 | |
Ratios to average net assets: | | | | | | | | | | | | | | | | |
Net expenses | | | 1.60 | % | | 1.60 | % | | 1.60 | % | | 1.60 | % | | 1.60 | % |
Gross expenses | | | 1.69 | % | | 1.95 | % | | 2.36 | % | | 2.96 | % | | 3.92 | % |
Net investment income | | | 1.30 | % | | 1.39 | % | | 1.13 | % | | 1.69 | % | | 0.95 | % |
Portfolio turnover rate | | | 48 | % | | 51 | % | | 43 | % | | 41 | % | | 53 | % |
| | | | | | | | | | | | | | | | |
Investor Shares | | For the Period
5/1/06* to
12/31/06 | | | | | | | | | | | | | |
| |
| | | | | | | | | | | | | |
Net asset value, beginning of period | | $ | 22.13 | | | | | | | | | | | | | |
| |
|
| | | | | | | | | | | | | |
Income from investment operations: | | | | | | | | | | | | | | | | |
Net investment income (a) | | | 0.19 | | | | | | | | | | | | | |
Net realized and unrealized gain | | | 1.88 | | | | | | | | | | | | | |
| |
|
| | | | | | | | | | | | | |
Total from investment operations | | | 2.07 | | | | | | | | | | | | | |
| |
|
| | | | | | | | | | | | | |
Less distributions from: | | | | | | | | | | | | | | | | |
Net investment income | | | (0.12 | ) | | | | | | | | | | | | |
Net realized gains | | | (1.37 | ) | | | | | | | | | | | | |
| |
|
| | | | | | | | | | | | | |
Total distributions | | | (1.49 | ) | | | | | | | | | | | | |
| |
|
| | | | | | | | | | | | | |
Net asset value, end of period | | $ | 22.71 | | | | | | | | | | | | | |
| |
|
| | | | | | | | | | | | | |
Total Return (b) | | | 10.64 | % | | | | | | | | | | | | |
Ratios and Supplemental Data: | | | | | | | | | | | | | | | | |
Net assets, end of period (in thousands) | | $ | 42,009 | | | | | | | | | | | | | |
Ratios to average net assets: | | | | | | | | | | | | | | | | |
Net expenses (d) | | | 1.35 | % | | | | | | | | | | | | |
Gross expenses (d) | | | 1.54 | % | | | | | | | | | | | | |
Net investment income (d) | | | 1.38 | % | | | | | | | | | | | | |
Portfolio turnover rate | | | 48 | % | | | | | | | | | | | | |
* | The inception date for Investor Shares was May 1, 2006. |
| |
(a) | Net investment income has been computed using the average shares method for year 2006. |
| |
(b) | Total returns reflect reinvestment of all dividends and distributions, if any. Certain expenses of the Portfolio have been waived or reimbursed by the Portfolio’s Investment Manager or Administrator; without such waiver/reimbursement of expenses, the Portfolio’s returns would have been lower. Performance information does not reflect the fees and charges imposed by participating insurance companies at the separate account level, and such charges will have the effect of reducing performance. Period of less than one year is not annualized. |
| |
(c) | Amount is less than $0.01 per share. |
| |
(d) | Annualized for period of less than one year. |
The accompanying notes are an integral part of these financial statements.
29
|
|
Lazard Retirement Series, Inc.
|
|
Notes to Financial Statements |
December 31, 2006 |
|
1. Organization
Lazard Retirement Series, Inc. (the “Fund”) was incorporated in Maryland on February 13, 1997 and is registered under the Investment Company Act of 1940, as amended (the “Act”), as an open-end management investment company. The Fund is comprised of ten no-load portfolios (each referred to as a “Portfolio”), which are offered only to separate accounts established by insurance companies to fund variable annuity contracts and variable life insurance policies. The Fund may also be offered to certain qualified pension and retirement plans and accounts permitting accumulation of assets on a tax-deferred basis. Effective January 31, 2006, the Fund designated its existing class of shares as Service Shares and commenced offering Investor Shares. Investor Shares and Service Shares are identical, except as to the services offered to and expenses borne by each class of shares. Currently, only the following four Portfolios, each of which is “diversified”, as defined in the Act, are offered: Lazard Retirement Equity Portfolio (“Equity Portfolio”), Lazard Retirement Small Cap Portfolio (“Small Cap Portfolio”), Lazard Retirement International Equity Portfolio (“International Equity Portfolio”) and Lazard Retirement Emerging Markets Portfolio (“Emerging Markets Portfolio”). Each of the other six Portfolios had not commenced operations as of December 31, 2006.
2. Significant Accounting Policies
The following is a summary of significant accounting policies:
(a) Valuation of Investments—Market values for securities listed on the New York Stock Exchange (“NYSE”), NASDAQ national market or other U.S. exchanges or markets are generally based on the last reported sales price on the principal exchange or market on which the security is traded, generally as of the close of regular trading on the NYSE (normally 4:00 p.m. Eastern time) on each valuation date; securities not traded on the valuation date are valued at the closing bid price. The Fund values NASDAQ-traded securities at the NASDAQ Official Closing Price, which may not be the last reported sales price in certain instances. Any securities not listed, for which current over-the-counter market quotations or bids are readily available, are valued at the last quoted bid price or, if available, the mean of two such prices. Securities listed on foreign exchanges are valued at the last reported sales price except as described below; securities not traded on the valuation date are valued at the last quoted bid price.
If a significant event materially affecting the value of securities occurs between the close of the exchange or market on which the security is principally traded and the time when a Portfolio’s net asset value is calculated, or when current market quotations otherwise are determined not to be readily available or reliable, such securities will be valued at their fair values as determined by, or in accordance with procedures approved by, the Board of Directors. The Valuation Committee of Lazard Asset Management LLC, the Fund’s investment manager (the “Investment Manager”) and a wholly-owned subsidiary of Lazard Frères & Co. LLC, may evaluate a variety of factors to determine the fair value of securities for which market quotations are determined not to be readily available or reliable. These factors include, but are not limited to, the type of security, the value of comparable securities, observations from financial institutions and relevant news events. Input from the Investment Manager’s analysts will also be considered. Fair valuing of foreign securities may be determined with the assistance of a pricing service, using correlations between the movement of prices of such securities and indices of domestic securities and other appropriate indicators, such as closing market prices of relevant ADRs or futures contracts. The effect of using fair value pricing is that the net asset value of a Portfolio will reflect the affected securities’ values as determined in the judgment of the Board of Directors, or its designee, instead of being determined by the market. Using a fair value pricing methodology to price securities may result in a value that is different from the most recent closing price of a security and from the prices used by other investment companies to calculate their portfolios’ net asset values.
(b) Portfolio Securities Transactions and Investment Income—Portfolio securities transactions are accounted for on trade date. Realized gain (loss) on sales of investments are recorded on a specific identification basis. Dividend income is recorded on the ex-dividend date and interest income is accrued daily.
The Portfolios may be subject to taxes imposed by foreign countries in which they invest. Such taxes are generally based upon income earned or capital gains, realized or unrealized. The Portfolios accrue and apply such taxes to net investment income, net realized gains and net unrealized gains concurrent with the recognition of income or capital gains (realized and unrealized) from the applicable portfolio securities.
(c) Repurchase Agreements—In connection with transactions in repurchase agreements, the Fund’s custodian takes possession of the underlying collateral securities, the fair value of which at all times is required to be at least equal to the principal amount, plus accrued interest, of the repurchase transaction. If the seller defaults, and the fair value of the collateral declines, realization of the collateral by a Portfolio may be delayed or limited.
30
|
|
Lazard Retirement Series, Inc.
|
|
Notes to Financial Statements (continued) |
December 31, 2006 |
|
(d) Foreign Currency Translation—The accounting records of the Portfolios are maintained in U.S. dollars. Portfolio securities and other assets and liabilities denominated in a foreign currency are translated daily into U.S. dollars at the prevailing rates of exchange. Purchases and sales of securities, income receipts and expense payments are translated into U.S. dollars at the prevailing exchange rates on the respective transaction dates.
The Portfolios do not isolate the portion of operations resulting from changes in foreign exchange rates on investments from the fluctuations arising from changes in their market prices. Such fluctuations are included in net realized and unrealized gain (loss) on investments. Net realized gain (loss) on foreign currency transactions represents net foreign currency gain (loss) from disposition of foreign currencies, currency gain (loss) realized between the trade and settlement dates on securities transactions, and the difference between the amount of dividends, interest and foreign withholding taxes recorded on a Portfolio’s accounting records and the U.S. dollar equivalent amounts actually received or paid. Net unrealized foreign currency gain (loss) arises from changes in the value of assets and liabilities, other than investments in securities, as a result of changes in exchange rates.
(e) Federal Income Taxes—The Fund’s policy is to continue to have each Portfolio qualify as a regulated investment company under Subchapter M of the Internal Revenue Code and to distribute all of its taxable income, including any net realized capital gains, to shareholders. Therefore, no federal income tax provision is required.
At December 31, 2006, the Fund had no unused capital loss carryforwards.
Under current tax law, certain capital and net foreign currency losses realized after October 31 within the taxable year may be deferred and treated as occurring on the first day of the following tax year. For the tax year ended December 31, 2006, the Portfolios did not elect to defer net capital and currency losses arising between November 1, 2006 and December 31, 2006.
(f) Dividends and Distributions—Each Portfolio intends to declare and to pay dividends annually from net investment income. During any particular year, net realized gains from investment transactions in excess of available capital loss carryforwards would be taxable to the Portfolio if not distributed. The Portfolios intend to declare and distribute these amounts, at least annually, to shareholders; however, to avoid taxation, a second distribution may be required.
Income dividends and capital gains distributions are determined in accordance with federal income tax regulations which may differ from U.S. generally accepted accounting principles. These book/tax differences, which may result in distribution reclassifications, are primarily due to differing treatments of foreign currency transactions and wash sales. Book/tax differences relating to shareholder distributions may result in reclassifications among certain capital accounts.
The tax character of dividends and distributions paid during the years ended December 31 was as follows:
| | | | | | | | | | | | | |
| | Ordinary Income | | Long-Term
Capital Gains | |
| |
| |
| |
Portfolio | | 2006 | | 2005 | | 2006 | | 2005 | |
| |
| |
| |
| |
| |
Equity | | $ | 27,495 | | $ | 34,628 | | $ | — | | $ | — | |
Small Cap | | | 5,508,707 | | | 2,220,767 | | | 5,857,330 | | | 7,268,768 | |
International Equity | | | 6,461,100 | | | 3,660,173 | | | 8,660,339 | | | 2,155,347 | |
Emerging Markets | | | 3,480,506 | | | 499,760 | | | 4,307,237 | | | 1,610,559 | |
At December 31, 2006, the components of distributable earnings (excluding unrealized appreciation (depreciation)) on a tax basis were as follows:
| | | | | | | | | |
Portfolio | | Undistributed
Ordinary Income | | Undistributed
Long-Term
Capital Gain | |
| |
| |
| |
Equity | | | $ | 33,784 | | | $ | 387,968 | |
Small Cap | | | | 9,991,518 | | | | 14,368,502 | |
International Equity | | | | 15,724,332 | | | | 27,167,887 | |
Emerging Markets | | | | 7,532,052 | | | | 8,320,440 | |
(g) Allocation of Expenses—Expenses not directly chargeable to a specific Portfolio are allocated among the Portfolios primarily on the basis of relative net assets. A Portfolio accrues distribution and service (12b-1) fees to its Service Shares. Each Portfolio’s income, expenses (other than class specific expenses) and realized and unrealized gains and losses are allocated proportionally each day between the classes based upon the relative net assets of each class.
(h) Expense Reductions—Portfolios leaving excess cash in demand deposit accounts may receive credits which are available to offset custody expenses. The Statements of Operations report gross custody expenses, and report the amount of such credits separately as an expense reduction.
(i) Estimates—The preparation of financial statements in conformity with U.S. generally accepted accounting principles requires the Fund to make estimates and assumptions that affect the reported amounts of assets and
31
|
|
Lazard Retirement Series, Inc. |
|
Notes to Financial Statements (continued) |
December 31, 2006 |
|
liabilities and disclosure of contingent assets and liabilities at the date of the financial statements and the reported amounts of increases and decreases in net assets from operations during the reporting period. Actual results could differ from those estimates.
3. Investment Management, Administrative and Distribution Agreements
The Fund, on behalf of the Portfolios, has entered into an investment management agreement (the “Management Agreement”) with the Investment Manager. Pursuant to the Management Agreement, the Investment Manager regularly provides each Portfolio with investment research, advice and supervision and furnishes continuously an investment program for each Portfolio consistent with its investment objective and policies, including the purchase, retention and disposition of securities. For its services provided to the Fund, the Investment Manager earns a management fee, accrued daily and payable by each Portfolio monthly, at the annual rate set forth below as a percentage of its average daily net assets:
| | | |
Portfolio | | Annual Rate |
| |
|
Equity | | 0.75 | % |
Small Cap | | 0.75 | |
International Equity | | 0.75 | |
Emerging Markets | | 1.00 | |
The Investment Manager has voluntarily agreed to reduce its fees and, if necessary, reimburse the following Portfolios if annualized operating expenses exceed the following percentages of average daily net assets for the respective Shares:
| | | | | | |
Portfolio | | Service Shares | | Investor Shares |
| |
| |
|
Equity | | 1.25 | % | | N/A | |
Small Cap | | 1.25 | | | N/A | |
International Equity | | 1.25 | | | N/A | |
Emerging Markets | | 1.60 | | | 1.35 | % |
During the period ended December 31, 2006, the Investment Manager waived its management fee and reimbursed the following Portfolios for other expenses as follows:
| | | | | | |
Portfolio | | Service Shares | | Investor Shares |
| |
| |
|
Equity | | $ | 127,575 | | | | N/A | |
Emerging Markets | | | 92,077 | | | $ | 17,634 | |
The Fund has entered into an administrative agreement with State Street Bank and Trust Company (“State Street”) to provide certain administrative services. Each Portfolio bears the cost of such services at a total fixed annual rate of $42,500, plus 0.02% of average daily net assets up to $1 billion and 0.01% of average daily net assets over $1 billion. State Street has agreed to waive $18,750 of its fee for the Equity Portfolio until the Portfolio’s net assets reach $25 million.
The Fund has a distribution agreement with Lazard Asset Management Securities LLC (the “Distributor”), a wholly-owned subsidiary of the Investment Manager, to serve as the distributor for shares of each Portfolio and bears the cost of printing and mailing prospectuses to potential investors and of certain expenses in connection with the offering of Portfolio shares.
Under a Distribution and Servicing Plan in accordance with Rule 12b-1 under the Act, each Portfolio pays a monthly fee to the Distributor, at an annual rate of 0.25% of the average daily net assets of its Service Shares, for distribution and servicing of accounts. The Distributor may make payments to participating insurance companies, certain financial institutions, securities dealers and other industry professionals for providing these services.
4. Directors’ Compensation
Certain Directors of the Fund are officers of the Investment Manager. The Fund pays each Director who is not an employee or an affiliated person of the Investment Manager its allocated portion of a fixed fee of $50,000 per year, plus $2,500 per meeting attended ($1,000 per meeting attended by telephone) for the Fund, The Lazard Funds, Inc., Lazard Global Total Return and Income Fund, Inc. and Lazard World Dividend & Income Fund, Inc. (collectively, the “Lazard Funds”), each a registered management investment company advised by the Investment Manager, and reimburses such Directors for travel and other out of pocket expenses. In addition, the Chairman of the Audit Committees for the Lazard Funds also receives an annual fee of $5,000.
5. Securities Transactions and Transactions with Affiliates
Purchases and sales of portfolio securities (excluding short-term securities) for the year ended December 31, 2006 were as follows:
| | | | | | |
Portfolio | | Purchases | | Sales |
| |
| |
|
Equity | | $ | 4,645,342 | | $ | 4,543,361 |
Small Cap | | | 112,530,656 | | | 187,665,303 |
International Equity | | | 210,205,369 | | | 225,815,368 |
Emerging Markets | | | 101,492,557 | | | 52,369,194 |
For the year ended December 31, 2006, no brokerage commissions were paid to affiliates of the Investment Manager or other affiliates of the Fund for portfolio transactions executed on behalf of the Fund.
32
|
|
Lazard Retirement Series, Inc. |
|
Notes to Financial Statements (concluded) |
December 31, 2006 |
|
6. Foreign Securities Investment Risks
Certain Portfolios invest in securities of foreign entities and instruments denominated in foreign currencies which involve risks not typically involved in domestic investments. Foreign investments carry special risks, such as exposure to currency fluctuations, less developed or less efficient trading markets, political instability, a lack of company information, differing auditing and legal standards and, potentially, less liquidity. A Portfolio’s investments in emerging markets are exposed to additional volatility. A Portfolio’s performance will be influenced by political, social and economic factors affecting emerging markets. Emerging market countries generally have economic structures that are less diverse and mature, and political systems that are less stable, than those of developed countries.
7. Reorganization
On April 29, 2005, Small Cap Portfolio acquired the net assets of Phoenix-Lazard Small-Cap Value Series (“Phoenix Portfolio”), a series of The Phoenix Edge Series Fund, pursuant to a plan of reorganization approved by Phoenix Portfolio shareholders on April 26, 2005. The acquisition was accomplished by a tax-free exchange of 771,728 shares (valued at $12,046,680) of Small Cap Portfolio for the 960,107 shares of Phoenix Portfolio outstanding on April 29, 2005. Phoenix Portfolio’s net assets at that date, including $714,260 of unrealized appreciation and $254,282 of accumulated realized net gain, were combined with those of Small Cap Portfolio. The aggregate net assets of Small Cap Portfolio and Phoenix Portfolio immediately before the reorganization were $104,311,297 and $12,046,680, respectively. The aggregate net assets of Small Cap Portfolio immediately after the reorganization were $116,357,977.
8. Recent Accounting Pronouncements
On July 13, 2006, the Financial Accounting Standards Board (“FASB”) released FASB Interpretation No. 48 “Accounting for Uncertainty in Income Taxes” (“FIN 48”). FIN 48 provides guidance for how uncertain tax positions should be recognized, measured, presented and disclosed in the financial statements. FIN 48 requires the evaluation of tax positions taken or expected to be taken in the course of preparing the Portfolios’ tax returns to determine whether the tax positions are “more-likely-than-not” of being sustained by the applicable tax authority. Tax positions not deemed to meet the more-likely-than-not threshold would be recorded as a tax benefit or expense in the current year. Adoption of FIN 48 is required beginning with the last net asset value per share calculation in the first required financial statement reporting period for fiscal years beginning after December 15, 2006 and is to be applied to all open tax years as of the effective date. At this time, management has determined that the Fund does not have any uncertain tax positions.
On September 20, 2006, the FASB released Statement of Financial Accounting Standards No. 157 “Fair Value Measurements” (“FAS 157”). FAS 157 establishes an authoritative definition of fair value, sets out a framework for measuring fair value, and requires additional disclosures about fair-value measurements. The application of FAS 157 is required for fiscal years beginning after November 15, 2007 and interim periods within those fiscal years. Management is evaluating the application of FAS 157 to the Portfolios, and believes the impact resulting from the adoption of FAS 157 will be limited to expanded disclosures in the Fund’s financial statements.
33
|
|
Lazard Retirement Series, Inc. |
|
Report of Independent Registered Public Accounting Firm |
|
|
The Board of Directors and Shareholders
Lazard Retirement Series, Inc.
We have audited the accompanying statements of assets and liabilities, including the schedules of investments, of Lazard Retirement Series, Inc. (the “Fund”, comprised of Lazard Retirement Equity Portfolio, Lazard Retirement Small Cap Portfolio, Lazard Retirement International Equity Portfolio and Lazard Retirement Emerging Markets Portfolio) as of December 31, 2006 and the related statements of operations for the year then ended, the statements of changes in net assets for each of the two years in the period then ended and the financial highlights for each of the five years in the period then ended. These financial statements and financial highlights are the responsibility of the Fund’s management. Our responsibility is to express an opinion on these financial statements and financial highlights based on our audits.
We conducted our audits in accordance with standards of the Public Company Accounting Oversight Board (United States). Those standards require that we plan and perform the audit to obtain reasonable assurance about whether the financial statements and financial highlights are free of material misstatement. The Fund is not required to have, nor were we engaged to perform, an audit of its internal control over financial reporting. Our audits included consideration of internal control over financial reporting as a basis for designing audit procedures that are appropriate in the circumstances, but not for the purpose of expressing an opinion on the effectiveness of the Fund’s internal control over financial reporting. Accordingly, we express no such opinion. An audit also includes examining, on a test basis, evidence supporting the amounts and disclosures in the financial statements, assessing the accounting principles used and significant estimates made by management, as well as evaluating the overall financial statement presentation. Our procedures included confirmation of securities owned as of December 31, 2006, by correspondence with the custodian and brokers or by other appropriate auditing procedures where replies from brokers were not received. We believe that our audits provide a reasonable basis for our opinion.
In our opinion, the financial statements and financial highlights as stated above, present fairly, in all material respects, the financial position of each of the respective portfolios constituting Lazard Retirement Series, Inc. as of December 31, 2006, the results of their operations for the year then ended, changes in their net assets for each of the two years in the period then ended and the financial highlights for each of the five years in the period then ended in conformity with U.S. generally accepted accounting principles.
ANCHIN, BLOCK & ANCHIN LLP
New York, New York
February 15, 2007
34
|
|
Lazard Retirement Series, Inc. |
|
Board of Directors and Officers Information |
(unaudited) |
|
| | | | |
Name (Age)
Address(1) | | Position(s) and Term
with the Fund(2) | | Principal Occupation(s) During Past 5 Years
and Other Directorships Held |
|
|
|
|
|
Non-Interested Directors: | | | | |
| | | | |
Kenneth S. Davidson (61) | | Director
since April 1997 | | President, Davidson Capital Management Corporation; President, Aquiline Advisors LLC; Trustee, The Juilliard School; Chairman of the Board, Bridge- hampton Chamber Music Festival; Trustee, American Friends of the National Gallery/London. |
| | | | |
| | | | |
Lester Z. Lieberman (76) | | Director
since April 1997 | | Private Investor; Chairman, Healthcare Foundation of New Jersey; Director, Cives Steel Co.; Director, Northside Power Transmission Co.; Advisory Trustee, New Jersey Medical School; Director, Public Health Research Institute; Trustee Emeritus, Clarkson University; Council of Trustees, New Jersey Performing Arts Center. |
| | | | |
Leon M. Pollack (66) | | Director
since August 2006 | | Former Managing Director, Donaldson, Lufkin & Jenrette. |
| | | | |
Richard Reiss, Jr. (62) | | Director
since April 1997 | | Chairman, Georgica Advisors LLC, an investment manager; Director, O’Charley’s, Inc., a restaurant chain. |
| | | | |
Robert M. Solmson (59) | | Director
since September 2004 | | Director, Colonial Williamsburg Co.; Former Chief Executive Officer and Chairman, RFS Hotel Investors, Inc.; Former Director, Morgan Keegan, Inc.; Former Director, Independent Bank, Memphis. |
Interested Directors(3): | | | | |
| | | | |
Charles Carroll (46) | | Chief Executive Officer,
President and Director
since June 2004 | | Deputy Chairman and Head of Global Marketing of the Investment Manager. |
| | | | |
Ashish Bhutani (46) | | Director
since July 2005 | | Chief Executive Officer of the Investment Manager; from 2001 to December 2002, Co-Chief Executive Officer North America of Dresdner Kleinwort Wasserstein and member of its Global Corporate and Markets Board and the Global Executive Committee. |
| |
(1) | The address of each Director is Lazard Asset Management LLC, 30 Rockefeller Plaza, New York, New York 10112-6300. |
| |
(2) | Each Director also serves as a Director for each of the Lazard Funds (comprised of 17 investment portfolios). All of the Independent Directors, except Mr. Lieberman, are also board members of Lazard Alternative Strategies Fund, LLC, a privately-offered fund registered under the Act advised by an affiliate of the Investment Manager. Each Director serves an indefinite term, until his successor is elected. |
| |
(3) | Messrs. Bhutani and Carroll are “interested persons” (as defined in the Act) of the Fund because of their positions with the Investment Manager. |
The Fund’s Statement of Additional Information contains further information about the Directors and is available without charge by calling 800-887-4929.
35
|
|
Lazard Retirement Series, Inc. |
|
Board of Directors and Officers Information (concluded) |
(unaudited) |
|
| | | | |
Name (Age)
Address(1) | | Position(s) and Term
with the Fund(2) | | Principal Occupation(s) During Past 5 Years |
|
|
|
|
|
Officers: | | | | |
| | | | |
Nathan A. Paul (34) | | Vice President
and Secretary
since April 2002 | | Managing Director and General Counsel of the Investment Manager. |
| | | | |
Stephen St. Clair (48) | | Treasurer
since May 2003 | | Vice President of the Investment Manager. |
| | | | |
Brian Kawakami (57) | | Chief Compliance
Officer
since August 2006 | | Senior Vice President and Chief Compliance Officer of the Investment Manager; Chief Compliance Officer at INVESCO, from July 2002 to April 2006; Chief Compliance Officer at Aeltus Investment Management, from 1993 to July 2002. |
| | | | |
Brian D. Simon (44) | | Assistant Secretary
since November 2002 | | Director of the Investment Manager; Vice President, Law & Regulations at
J. & W. Seligman & Co., from July 1999 to October 2002. |
| | | | |
David A. Kurzweil (32) | | Assistant Secretary
since April 2005 | | Vice President of the Investment Manager; Associate at Kirkpatrick &
Lockhart LLP, a law firm, from August 1999 to January 2003. |
| | | | |
Cesar A. Trelles (32) | | Assistant Treasurer
since December 2004 | | Fund Administration Manager of the Investment Manager; Manager for
Mutual Fund Finance Group at UBS Global Asset Management, from August
1998 to August 2004. |
| |
(1) | The address of each officer is Lazard Asset Management LLC, 30 Rockefeller Plaza, New York, New York 10112-6300. |
| |
(2) | Each officer serves for an indefinite term, until his successor is elected and qualified, and serves in the same capacity for the other Lazard Funds. |
36
|
|
Lazard Retirement Series, Inc. |
|
Other Information |
(unaudited) |
|
Proxy Voting
A description of the policies and procedures used to determine how proxies relating to Fund portfolio securities are voted is available (1) without charge, upon request, by calling (800) 823-6300 or (2) on the Securities and Exchange Commission (“SEC”) website at http://www.sec.gov.
The Fund’s proxy voting record for the most recent 12-month period ended June 30 is available (1) without charge, upon request, by calling (800) 823-6300 or (2) on the SEC’s website at http://www.sec.gov. Information as of June 30 each year will generally be available by the following August 31.
Form N-Q
The Fund files a complete schedule of each Portfolio’s holdings for the first and third quarters of its fiscal year with the SEC on Form N-Q. The Fund’s Form N-Q is available on the SEC’s website at http://www.sec.gov and may be reviewed and copied at the SEC’s Public Reference Room in Washington, D.C. Information on the operation of the SEC’s Public Reference Room may be obtained by calling 1-800-SEC-0330.
Board Consideration of Management Agreements
At the meeting of the Fund’s Board of Directors held on November 8, 2006, the Board considered the approval, for an additional annual period, of the Management Agreement between the Fund, on behalf of the Portfolios, and the Investment Manager (the “Management Agreement”). The Directors who are not interested persons (as defined in the Act) of the Fund (the “Independent Directors”) were assisted in their review by independent legal counsel and met with counsel in executive session separate from representatives of the Investment Manager.
Services Provided
Representatives of the Investment Manager gave a presentation to the Board about the nature, extent and quality of services that the Investment Manager provides the Fund, including a discussion of the Investment Manager and its clients (of which the Lazard Funds comprise less than $6 billion of the approximately $88 billion of total assets under the management of the Investment Manager and its global affiliates) and outline of the Investment Manager’s global structure, including technology and operational support and significant marketing infrasturcture across broad distribution channels, all of which provide realized benefits through investment in the Investment Manager’s investment advisory business. The Directors also considered information provided by the Investment Manager regarding its personnel, resources, business reputation, financial condition and experience. The Directors agreed that the Fund benefits from all of the services of the Investment Manager’s global platforms, and that such services would be different than those provided to a $6 billion fund complex. The representatives of the Investment Manager reviewed the Fund’s distribution channels and the relationships the Investment Manager has with various intermediaries and the different needs of each. The representatives of the Investment Manager reviewed the asset growth or decline in each Portfolio.
The Directors discussed the nature, extent and quality of the services provided by the Investment Manager to each Portfolio. The Directors considered the various services provided by the Investment Manager to each Portfolio and considered the Investment Manager’s research and portfolio management capabilities and that the Investment Manager also provides oversight of day-to-day operations of the Fund and its Portfolios, including fund accounting and administration and assistance in meeting legal and regulatory requirements. The Directors also considered the Investment Manager’s extensive administrative, accounting and compliance infrastructure and agreed that the Fund benefits from all of the services of the Investment Manager’s global platforms, and that such services would be different than those provided to a fund if it were not managed by a global firm such as the Investment Manager.
Comparative Performance and Fees and Expenses
The Directors reviewed and placed significant emphasis on the relative performance and advisory fees and expense ratios for each Portfolio, including comparative information prepared by Lipper.
Performance. The Directors noted that the Equity and Emerging Markets Portfolios each had achieved competitive long-term performance on a relative basis and were generally within the median ranges of the relevant Lipper comparison group (“Group”) and Lipper category (“Category”).
37
|
|
Lazard Retirement Series, Inc. |
|
Other Information (continued) |
(unaudited) |
|
It was noted that the performance of the Small Cap Portfolio has been below the medians of the Group and Category for one-, two-, three- and four-year performance periods, but that more recent relative performance for shorter time periods had been improving. Representatives of the Investment Manager also reviewed personnel additions that had been made to its U.S. Small Cap Equity team. Performance of the International Equity Portfolio was below the Group and Category medians for all time periods reported by Lipper. The Directors received a special presentation from one of the Portfolio’s primary portfolio managers who had begun managing the Portfolio within the last year, and he described the Investment Manager’s efforts to improve the Portfolio’s performance, which included broadening the Portfolio’s investment universe to include emerging markets securities.
Advisory Fees and Expenses. The Directors also discussed the advisory fees and current expense ratios for each Portfolio, noting the assumptions used in the comparisons, and it was noted that they are generally within the median ranges of each Portfolio’s Group, with the exception of the Equity Portfolio which, due to its small asset size, had relatively higher expenses. The Investment Manager’s representatives noted that the advisory fees for the Portfolios, except Equity Portfolio, are competitive within each Portfolio’s Group. For Equity Portfolio, it was noted that although the Portfolio’s contractual advisory fees were higher than most of the funds in its Group, the Investment Manager had waived all of its advisory fees for the measurement period. It was noted that the Investment Manager also is waiving fees and reimbursing expenses of Emerging Markets Portfolio.
An extended discussion of the fees charged and services provided under the Management Agreement ensued as the Directors considered and evaluated the historical performance and expense ratios of the Portfolios.
The Directors also considered advisory fees paid to the Investment Manager by funds advised or sub-advised by the Investment Manager in the same Lipper category as each Portfolio, as well as the Investment Manager’s separately managed accounts with similar investment objectives, policies and strategies (for each Portfolio, collectively with such funds, “Similar Accounts”). For each Portfolio, the Directors discussed the fee paid to the Investment Manager compared to the fee paid to the Investment Manager by Similar Accounts. For each Portfolio the Directors reviewed the nature of the Similar Accounts and the differences, from the Investment Manager’s perspective, in management of the different types of Similar Accounts as compared to management of the Portfolio. The Directors considered the relevance of the fee information provided for Similar Accounts managed by the Investment Manager to evaluate the appropriateness and reasonableness of each Portfolio’s advisory fees. A discussion ensued with respect to each Portfolio, as a consequence of which the Board recognized that any differences in fees paid by Similar Accounts was consistent with the differences in the services provided.
Investment Manager Profitability and Economies of Scale
The Directors reviewed information prepared by the Investment Manager for each Portfolio concerning the costs to and profits realized by the Investment Manager and its affiliates resulting from the Management Agreement, reviewing the projected dollar amount of expenses allocated and profit received by the Investment Manager and the method used to determine such expenses and profit. The representatives of the Investment Manager stated that neither the Investment Manager nor its affiliates, including Lazard, receive any significant indirect benefits from managing the Portfolios. The Investment Manager’s representatives stated that Lazard is not currently used for brokerage purposes and that there is no ability for the Investment Manager to benefit from any money flow (float) in connection with transactions in the Portfolios’ shares. The Investment Manager’s representatives noted that the Investment Manager does obtain soft dollar research, as reviewed by the Board each quarter. The Directors agreed that the information provided substantiated statements of the Investment Manager’s representatives.
The representatives of the Investment Manager reminded the Board that the Investment Manager is continuing to support distribution relationships through direct payments from its own resources to third parties in connection with shareholder servicing and other administrative and recordkeeping services and noted that the Fund does not bear any related costs other than the 0.25% fees pursuant to the Distribution and Servicing Plan adopted for the Portfolios’ Service Shares.
It was noted that for each Portfolio the profitability percentages were within ranges determined by appropriate court cases not to be so disproportionately large that they bore no reasonable relationship to the services rendered and, given the overall service levels, were thought not to be excessive, and the Board concurred with this analysis.
38
|
|
Lazard Retirement Series, Inc. |
|
Other Information (concluded) |
(unaudited) |
|
The Directors considered the Investment Manager’s projected profitability with respect to each Portfolio as part of their evaluation of whether the Portfolio’s fee under the Management Agreement bears a reasonable relationship to the mix of services provided by the Investment Manager, including the nature, extent and quality of such services. The Directors evaluated the costs of the services to be provided and profits to be realized by the Investment Manager and its affiliates from the relationship with the Fund in light of the relevant circumstances for each Portfolio, including the trend in asset growth or decline, the extent to which economies of scale would be realized as the Portfolio grows and whether economies of scale are shared with the Portfolio. It was noted that a discussion of economies of scale should be predicated on increasing assets and that if a Portfolio’s assets had been decreasing, the extent to which the Investment Manager may have realized any economies of scale would be muted.
At the conclusion of these discussions, each of the Independent Directors expressed the opinion that he had been furnished with sufficient information to make an informed business decision with respect to the renewal of the Management Agreement. Based on its discussions and considerations as described above, the Board made the following conclusions and determinations.
| |
• | The Board concluded that the nature, extent and quality of the services provided by the Investment Manager are adequate and appropriate, especially including the benefits of advisory and research services associated with a $88 billion asset management business. |
| |
• | The Board was satisfied with each of the Equity Portfolio’s and Emerging Markets Portfolio’s overall performance, which was generally within the median ranges of the relevant Group and Category. While the Board was satisfied with the Investment Manager’s efforts to improve performance of Small Cap Portfolio and International Equity Portfolio, the Board would continue to monitor these Portfolios’ performance. |
| |
• | The Board concluded that each Portfolio’s fee paid to the Investment Manager was reasonable in light of comparative performance and expense and advisory fee information, costs of the services provided and profits to be realized and benefits derived or to be derived by the Investment Manager from the relationship with the Fund. |
| |
• | The Board recognized that economies of scale may be realized as the assets of the Portfolios increase. They believed, based on relatively stable profitability levels and the enhanced services and increased investment in the Fund’s business, that there was no evidence that economies of scale were not being shared. The Board determined that, to the extent that material economies of scale had not been shared with the Fund, the Board would seek to do so. |
The Board considered these conclusions and determinations and, without any one factor being dispositive, determined that approval of the Management Agreement for the Fund was in the best interests of the Fund and its shareholders.
39
[This page intentionally left blank]
| |
Lazard Retirement Series, Inc. | |
30 Rockefeller Plaza | |
New York, New York 10112-6300 | |
Telephone: 800-887-4929 | |
http://www.LazardNet.com | |
| |
Investment Manager | |
Lazard Asset Management LLC | |
30 Rockefeller Plaza | |
New York, New York 10112-6300 | |
Telephone: 800-887-4929 | |
| |
Distributor | |
Lazard Asset Management Securities LLC | |
30 Rockefeller Plaza | |
New York, New York 10112-6300 | |
| |
Custodian | |
State Street Bank and Trust Company | |
One Lincoln Street | |
Boston, Massachusetts 02111 | |
| |
Transfer Agent and Dividend Disbursing Agent | |
Boston Financial Data Services, Inc. | |
P.O. Box 8514 | |
Boston, Massachusetts 02266-8514 | |
Telephone: 800-986-3455 | |
| |
Independent Registered Public Accounting Firm | |
Anchin, Block & Anchin LLP | |
1375 Broadway | |
New York, New York 10018 | |
http://www.anchin.com | |
| |
Legal Counsel | |
Stroock & Stroock & Lavan LLP | |
180 Maiden Lane | |
New York, New York 10038-4982 | |
http://www.stroock.com | |
Performance information as of the most recent month end is available online at www.LazardNet.com.

| | | |

| Lazard Retirement Series, Inc. | 30 Rockefeller Plaza | Tel 800-887-4929 |
| New York, NY 10112-6300 | www.LazardNet.com |
R T 0 3 1 0 1
ITEM 2. CODE OF ETHICS.
The Registrant has adopted a code of ethics that applies to the Registrant’s principal executive officer, principal financial officer, principal accounting officer or controller, or persons performing similar functions.
ITEM 3. AUDIT COMMITTEE FINANCIAL EXPERT.
The Registrant’s Board of Directors (the “Board”) has determined that Lester Z. Lieberman and Robert M. Solmson, members of the Audit Committee of the Board, are audit committee financial experts as defined by the Securities and Exchange Commission (the “SEC”). Mr. Lieberman and Mr. Solmson are “independent” as defined by the SEC for purposes of audit committee financial expert determinations.
ITEM 4. PRINCIPAL ACCOUNTANT FEES AND SERVICES.
(a) Audit Fees. The aggregate fees billed for each of the last two fiscal years (the “Reporting Periods”) for professional services rendered by the Registrant’s principal accountant (the “Auditor”) for the audit of the Registrant’s annual financial statements, or services that are normally provided by the Auditor in connection with the statutory and regulatory filings or engagements for the Reporting Periods, were $85,200 in 2005 and $89,600 in 2006.
(b) Audit-Related Fees. There were no fees billed in the Reporting Periods by the Auditor to the Registrant for assurance and related services that are reasonably related to the performance of the audit of the Registrant’s financial statements and are not reported under paragraph (a) of this Item 4. There were no fees billed in the Reporting Periods for assurance and related services by the Auditor to the Registrant’s investment adviser or any entity controlling, controlled by or under common control with the investment adviser that provides ongoing services to the Registrant (“Service Affiliates”).
(c) Tax Fees. The aggregate fees billed in the Reporting Periods by the Auditor to the Registrant for professional services rendered by the Auditor for tax compliance, tax advice and tax planning (“Tax Services”) were $22,400 in 2005 and $23,500 in 2006. These services consisted of (i) review or preparation of U.S. federal, state, local and excise tax returns; (ii) U.S. federal, state and local tax planning, advice and assistance regarding statutory, regulatory or administrative developments, and (iii) tax advice regarding tax qualification matters and/or treatment of various financial instruments held or proposed to be acquired or held.
There were no fees billed in the Reporting Periods for Tax Services by the Auditor to Service Affiliates.
(d) All Other Fees. There were no fees billed in the Reporting Periods by the Auditor to the Registrant for products and services other than the services reported in paragraphs (a) through (c) of this Item.
There were no fees billed in the Reporting Periods by the Auditor to Service Affiliates.
(e) Audit Committee Pre-Approval Policies and Procedures. The Registrant’s Audit Committee pre-approves the Auditor’s engagements for audit and non-audit services to the Registrant and, as required, non-audit
services to Service Affiliates on a case-by-case basis. Pre-approval considerations include whether the proposed services are compatible with maintaining the Auditor’s independence. There were no services provided by the Auditor that were approved pursuant to (c)(7)(i)(C) of Rule 2-01 of Regulation S-X.
(f) None.
(g) Non-Audit Fees. The aggregate non-audit fees billed by the Auditor for services rendered to the Registrant for the Reporting Periods were $22,400 in 2005 and $23,500 in 2006. There were no fees billed in the Reporting Periods by the Auditor to Service Affiliates.
(h) Not applicable.
ITEM 5. AUDIT COMMITTEE OF LISTED REGISTRANTS.
Not applicable.
ITEM 6. SCHEDULE OF INVESTMENTS
Not applicable.
ITEM 7. DISCLOSURE OF PROXY VOTING POLICIES AND PROCEDURES FOR CLOSED END MANAGEMENT INVESTMENTCOMPANIES.
Not applicable.
ITEM 8. PORTFOLIO MANAGERS OF CLOSED-END MANAGEMENT INVESTMENT COMPANIES.
Not applicable.
ITEM 9. PURCHASES OF EQUITY SECURITIES BY CLOSED-END MANAGEMENT INVESTMENT COMPANY AND AFFILIATED PURCHASERS.
Not applicable.
ITEM 10. SUBMISSION OF MATTERS TO A VOTE OF SECURITY HOLDERS.
The Registrant has a Nominating Committee (the “Committee”) of the Board, which is currently comprised of all of the Directors who are not “interested persons” (as defined in the Investment Company Act of 1940, as amended) of the Registrant. The Committee’s function is to select and nominate candidates for election to the Board. The Committee will consider recommendations for nominees from stockholders sent to the Secretary of the Registrant, 30 Rockefeller Plaza, New York, New York 10112. Nominations may be submitted only by a stockholder or group of stockholders that, individually or as a group, has beneficially owned the lesser of (a) 1% of the Registrant’s outstanding shares or (b) $500,000 of the Registrant’s shares for at least one year prior to the date such stockholder or group submits a candidate for nomination. Not more than one nominee for Director may be submitted by such a stockholder or group each calendar year.
In evaluating potential nominees, including any nominees recommended by stockholders, the Committee takes into consideration the factors listed in the Nominating Committee Procedures and Charter, including character and integrity, business and professional experience, and whether the Committee believes that the person has the ability to apply sound and independent business judgment and would act in the interests of the Registrant and its stockholders. A nomination submission must include all information relating to the recommended nominee that is required to be disclosed in solicitations or proxy statements for the election of Directors, as well as information sufficient to evaluate the factors listed above. Nomination submissions must be accompanied by a written consent of the individual to stand for election if nominated by the Board and to serve if elected by the stockholders, and such additional information must be provided regarding the recommended nominee as reasonably requested by the Committee.
ITEM 11. CONTROLS AND PROCEDURES.
(a) The Registrant’s principal executive and principal financial officers have concluded, based on their evaluation of the Registrant’s disclosure controls and procedures as of a date within 90 days of the filing date of this report, that the Registrant’s disclosure controls and procedures are reasonably designed to ensure that information required to be disclosed by the Registrant on Form N-CSR is recorded, processed, summarized and reported within the required time periods and that information required to be disclosed by the Registrant in the reports that it files or submits on Form N-CSR is accumulated and communicated to the Registrant’s management, including its principal executive and principal financial officers, as appropriate to allow timely decisions regarding required disclosure.
(b) There were no changes to the Registrant’s internal control over financial reporting that occurred during the second fiscal quarter of the period covered by this report that have materially affected, or are reasonably likely to materially affect, the Registrant’s internal control over financial reporting.
ITEM 12. EXHIBITS.
(a)(1) Code of Ethics referred to in Item 2.
(a)(2) Certifications of principal executive and principal financial officers as required by Rule 30a-2(a) under the Investment Company Act of 1940.
(a)(3) Not applicable.
(b) Certifications of principal executive and principal financial officers as required by Rule 30a-2(b) under the Investment Company Act of 1940.
SIGNATURES
Pursuant to the requirements of the Securities Exchange Act of 1934 and the Investment Company Act of 1940, the registrant has duly caused this report to be signed on its behalf by the undersigned, thereunto duly authorized.
Lazard Retirement Series, Inc.
| By | /s/ Charles Carroll |
| | Charles Carroll |
| | Chief Executive Officer |
| |
| Date | March 6, 2007 |
Pursuant to the requirements of the Securities Exchange Act of 1934 and the Investment Company Act of 1940, this report has been signed below by the following persons on behalf of the registrant and in the capacities and on the dates indicated.
| By | /s/ Charles Carroll |
| | Charles Carroll |
| | Chief Executive Officer |
| |
| Date | March 6, 2007 |
| |
| By | /s/ Stephen St. Clair |
| | Stephen St. Clair |
| | Chief Financial Officer |
| |
| Date | March 6, 2007 |