UNITED STATES SECURITIES AND EXCHANGE COMMISSION
Washington, D.C. 20549
FORM N-CSR
CERTIFIED SHAREHOLDER REPORT OF REGISTERED MANAGEMENT INVESTMENT COMPANIES
Investment Company Act file number 811-08071
Lazard Retirement Series, Inc.
(Exact name of registrant as specified in charter)
30 Rockefeller Plaza
New York, New York 10112
(Address of principal executive offices) (Zip code)
Mark R. Anderson, Esq.
Lazard Asset Management LLC
30 Rockefeller Plaza
New York, New York 10112
(Name and address of agent for service)
Registrant’s telephone number, including area code: (212) 632-6000
Date of fiscal year end: 12/31
Date of reporting period: 6/30/19
ITEM 1. REPORTS TO STOCKHOLDERS.
Lazard Retirement Series
Semi-Annual Report
June 30, 2019
Equity
Lazard Retirement Emerging Markets Equity Portfolio
Lazard Retirement International Equity Portfolio
Lazard Retirement US Equity Select Portfolio
Lazard Retirement US Small-Mid Cap Equity Portfolio
Multi-Asset
Lazard Retirement Global Dynamic Multi-Asset Portfolio

Lazard Retirement Series, Inc.Table of Contents
Shares of the Portfolios are currently offered only to separate accounts established by insurance companies to fund variable annuity contracts and variable life insurance policies. Portfolio shares may also be offered to certain qualified pension and retirement plans and accounts permitting accumulation of assets on a tax-deferred basis.
Please consider a Portfolio’s investment objectives, risks, charges and expenses carefully before investing. For more complete information about Lazard Retirement Series, Inc. (the “Fund”), you may obtain a prospectus or summary prospectus by calling 800-823-6300, or online, at www.lazardassetmanagement.com. Read the prospectus or each Portfolio’s summary prospectus carefully before you invest. The prospectus and each Portfolio’s summary prospectus contain the investment objectives, risks, charges, expenses and other information about each Portfolio of the Fund, which are not detailed in this report.
Distributed by Lazard Asset Management Securities LLC.
Semi-Annual Report 1
Lazard Retirement Series, Inc.A Message from Lazard
Dear Shareholder,
Global markets registered strong gains in the first half of 2019. They reached near-record highs in April, thanks to strong corporate earnings and better-than-expected quarterly US GDP growth. However, heightened trade tensions and mixed economic data gave investors pause in May as China and the United States again raised tariffs on each other’s imports after trade talks stalled.
The US equity market rose strongly during the period, boosted by hopes that renewed trade negotiations and a potential interest rate cut by the Federal Reserve in July would keep the United States on strong economic footing. Financials, materials, and technology outperformed, while energy lagged against a backdrop of falling oil prices, concerns about global demand, and rising inventories. Volatility as measured by the CBOE Volatility Index (VIX) rose mildly but remained well below levels at the end of 2018.
European equity markets have been caught in the middle of opposing forces, mainly growing tensions around global trade and increasingly dovish central banks. This has pushed European government bond yields to fresh lows and caused bond-sensitive sectors to climb higher, further stretching valuations.
Emerging markets equities gained more than 10% year to date. The asset class’s performance was volatile over the latter half of the period, reflecting extraordinary uncertainty among investors about the geopolitical environment, particularly US actions on trade in May and early June. Emerging markets debt also delivered strong year-to-date returns, supported by liquidity from central banks. However, the global growth outlook has become more uncertain and current valuations provide less compensation for the increased risks.
In this environment, we believe it is becoming increasingly important for investors to be discerning, to focus on fundamentals and not short-term macro drivers, particularly as sentiment is vulnerable to rapid shifts. We are privileged that you have turned to Lazard for your investment needs and value your continued confidence in our investment management capabilities.
Sincerely,
Nathan Paul
Director, CEO and President of Lazard Retirement Series, Inc.
2 Semi-Annual Report
Lazard Retirement Series, Inc.Performance Overviews (unaudited)
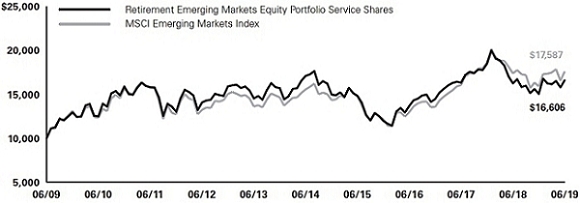
Lazard Retirement Emerging Markets Equity Portfolio
Comparison of Changes in Value of $10,000 Investment in the Service Shares of Lazard Retirement Emerging Markets Equity Portfolio and MSCI Emerging Markets®Index*
Average Annual Total Returns*
Periods Ended June 30, 2019
| | | One
Year | | Five
Years | | Ten
Years | |
| Service Shares** | | 2.24% | | –0.57% | | 5.20% | |
| Investor Shares** | | 2.47% | | –0.33% | | 5.46% | |
| MSCI Emerging Markets Index | | 1.21% | | 2.49% | | 5.81% | |
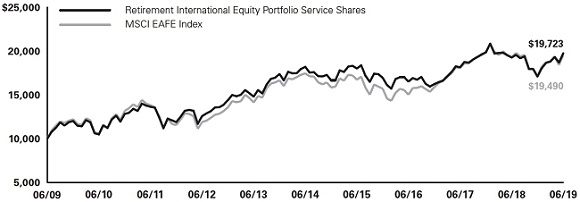
Lazard Retirement International Equity Portfolio
Comparison of Changes in Value of $10,000 Investment in the Service Shares of Lazard Retirement International Equity Portfolio and MSCI EAFE®Index*
Average Annual Total Returns*
Periods Ended June 30, 2019
| | | One
Year | | Five
Years | | Ten
Years | |
| Service Shares | | 2.53% | | 1.64% | | 7.03% | |
| MSCI EAFE Index | | 1.08% | | 2.25% | | 6.90% | |
Semi-Annual Report 3
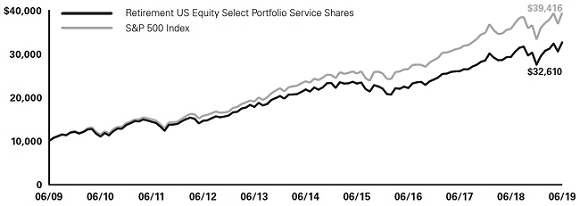
Lazard Retirement US Equity Select Portfolio
Comparison of Changes in Value of $10,000 Investment in the Service Shares of Lazard Retirement US Equity Select Portfolio and S&P 500®Index*
Average Annual Total Returns*
Periods Ended June 30, 2019
| | | One
Year | | Five
Years | | Ten
Years | |
| Service Shares | | 11.38% | | 8.36% | | 12.55% | |
| S&P 500 Index | | 10.42% | | 10.71% | | 14.70% | |
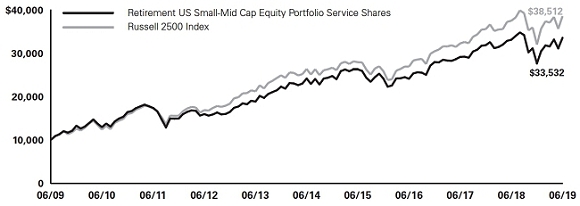
Lazard Retirement US Small-Mid Cap Equity Portfolio
Comparison of Changes in Value of $10,000 Investment in the Service Shares of Lazard Retirement US Small-Mid Cap Equity Portfolio, Russell 2500®Index and Russell 2000/2500 Linked Index*
Average Annual Total Returns*
Periods Ended June 30, 2019
| | | One
Year | | Five
Years | | Ten
Years | |
| Service Shares | | 1.28% | | 6.77% | | 12.86% | |
| Russell 2500 Index | | 1.77% | | 7.66% | | 14.44% | |
4 Semi-Annual Report
Lazard Retirement Global Dynamic Multi-Asset Portfolio
Comparison of Changes in Value of $10,000 Investment in the Service Shares of Lazard Retirement Global Dynamic Multi-Asset Portfolio, MSCI World®Index and GDMA Index*
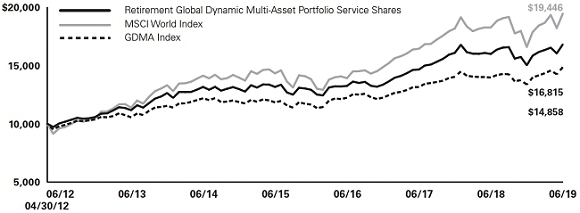
Average Annual Total Returns*
Periods Ended June 30, 2019
| | | One
Year | | Five
Years | | Since
Inception | † |
| Service Shares** | | 5.16% | | 5.02% | | 7.52% | |
| Investor Shares** | | N/A | | N/A | | 11.89% | |
| MSCI World Index | | 6.33% | | 6.60% | | 9.72% | |
| GDMA Index | | 6.47% | | 4.05% | | 5.68% | |
| † | The inception date for the Service Shares was April 30, 2012 and for the Investor Shares was December 30, 2018. |
Notes to Performance Overviews:
| * | Total returns reflect reinvestment of all dividends and distributions, if any. Certain expenses of the Portfolio may have been waived or reimbursed by Lazard Asset Management LLC, the Fund’s investment manager (the “Investment Manager”), State Street Bank and Trust Company, the Fund’s administrator (“State Street”), or DST Asset Manager Solutions, Inc., the Fund’s transfer and dividend distributing agent (“DST”); without such waiver/reimbursement of expenses, the Portfolio’s returns would have been lower. Performance information does not reflect the fees and charges imposed by participating insurance companies at the separate account level, and such charges will have the effect of reducing performance. Returns for a period of less than one year are not annualized. |
| | |
| | Performance results do not include adjustments made for financial reporting purposes in accordance with US Generally Accepted Accounting Principles (“GAAP”), if any, and also exclude one-time adjustments related to reimbursed custodian out-of-pocket expenses (Note 3 in the Notes to Financial Statements) for Lazard Retirement Emerging Markets Equity Portfolio and may differ from amounts reported in the financial highlights. |
| | |
| | The performance quoted represents past performance. Current performance may be lower or higher than the performance quoted. Past performance is not indicative, or a guarantee, of future results; the investment return and principal value of the Portfolio will fluctuate, so that Portfolio shares, when redeemed may be worth more or less than their original cost. Within the longer periods illustrated there may have been short-term fluctuations, counter to the overall trend of investment results, and no single period of any length may be taken as typical of what may be expected in future periods. |
Semi-Annual Report 5
| | The performance data of the indices have been prepared from sources and data that the Investment Manager believes to be reliable, but no representation is made as to their accuracy. The indices are unmanaged, have no fees or costs and are not available for investment. |
| | |
| | The MSCI Emerging Markets Index is a free-float-adjusted market capitalization index that is designed to measure equity market performance in the global emerging markets. The MSCI Emerging Markets Index consists of 26 emerging markets country indices. |
| | |
| | The MSCI EAFE Index (Europe, Australasia, Far East) is a free-float-adjusted market capitalization index that is designed to measure developed markets equity performance, excluding the United States and Canada. The MSCI EAFE Index consists of 21 developed markets country indices. |
| | |
| | The S&P 500 Index is a market capitalization-weighted index of 500 companies in leading industries of the US economy. |
| | |
| | The Russell 2500 Index measures the performance of the small-to mid-cap segment of the US equity universe, commonly referred to as “smid” cap. The Russell 2500 Index is a subset of the Russell 3000®Index. The Russell 3000 Index measures the performance of the largest 3000 US companies, representing approximately 98% of the investable US equity market. The Russell 2500 Index includes approximately 2500 of the smallest securities based on a combination of their market cap and current index membership. |
| | |
| | The MSCI World Index is a free-float-adjusted market capitalization index that is designed to measure global developed markets equity performance. The MSCI World Index consists of 23 developed markets country indices. |
| | |
| | The GDMA Index is a blended index constructed by the Investment Manager that is comprised of 50% MSCI World Index and 50% Bloomberg Barclays Global Aggregate®Index and is rebalanced monthly. The Bloomberg Barclays Global Aggregate Index provides a broad-based measure of global investment-grade fixed-income debt markets, including government-related debt, corporate debt, securitized debt and global Treasury. |
| | |
| ** | The performance of Service Shares and Investor Shares may vary, primarily based on the differences in fees borne by shareholders investing in different classes. |
6 Semi-Annual Report
Lazard Retirement Series, Inc.
Information About Your Portfolio’s Expenses (unaudited)
Expense Example
As a shareholder in a Portfolio of the Fund, you incur ongoing costs, including management fees, distribution and service (12b-1) fees (Service Shares only), and other expenses. This Example is intended to help you understand your ongoing costs (in dollars) of investing in a Portfolio and to compare these costs with the ongoing costs of investing in other mutual funds. The Example is based on an investment of $1,000 invested at the beginning of the six month period from January 1, 2019 through June 30, 2019 and held for the entire period.
Actual Expenses
For each Share class of the Portfolios, the first line of the accompanying table provides information about actual account values and actual expenses. You may use the information in this line, together with the amount you invested, to estimate the expenses that you paid over the period. Simply divide your account value by $1,000 (for example, an $8,600 account value divided by $1,000=8.6), then multiply the result by the number in the first line under the heading entitled “Expenses Paid During Period” to estimate the expenses you paid on your account during this period.
Hypothetical Example for Comparison Purposes
For each Share class of the Portfolios, the second line of the table below provides information about hypothetical account values and hypothetical expenses based on the class’ actual expense ratio and an assumed rate of return of 5% per year before expenses, which is not the Portfolio’s actual return. The hypothetical account values and expenses may not be used to estimate the actual ending account balance or expenses you paid for the period. You may use this information to compare the ongoing costs of investing in the Portfolio and other mutual funds. To do so, compare this 5% hypothetical example with the 5% hypothetical examples that appear in the shareholders reports of other mutual funds.
Please note that you also bear fees and charges imposed by participating insurance companies at the separate account level, which are described in the separate prospectuses issued by the participating insurance companies. Such charges will have the effect of reducing account value.
Semi-Annual Report 7
| Portfolio | | Beginning
Account Value
1/1/19 | | Ending
Account
Value
6/30/19 | | Expenses Paid
During Period*
1/1/19 - 6/30/19 | | Annualized
Expense Ratio
During Period
1/1/19 - 6/30/19 |
| | | | | | | | | |
| Emerging Markets Equity | | | | | | | | |
| Service Shares | | | | | | | | |
| Actual | | $1,000.00 | | $1,103.70 | | $7.35 | | 1.41% |
| Hypothetical (5% Return Before Expenses) | | $1,000.00 | | $ 1,017.80 | | $7.05 | | 1.41% |
| Investor Shares | | | | | | | | |
| Actual | | $1,000.00 | | $1,104.40 | | $6.05 | | 1.16% |
| Hypothetical (5% Return Before Expenses) | | $1,000.00 | | $1,019.04 | | $5.81 | | 1.16% |
| | | | | | | | | |
| International Equity | | | | | | | | |
| Service Shares | | | | | | | | |
| Actual | | $1,000.00 | | $1,155.80 | | $5.88 | | 1.10% |
| Hypothetical (5% Return Before Expenses) | | $1,000.00 | | $1,019.34 | | $5.51 | | 1.10% |
| | | | | | | | | |
| US Equity Select | | | | | | | | |
| Service Shares | | | | | | | | |
| Actual | | $1,000.00 | | $1,184.80 | | $5.42 | | 1.00% |
| Hypothetical (5% Return Before Expenses) | | $1,000.00 | | $1,019.84 | | $5.01 | | 1.00% |
| | | | | | | | | |
| US Small-Mid Cap Equity | | | | | | | | |
| Service Shares | | | | | | | | |
| Actual | | $1,000.00 | | $1,213.60 | | $6.31 | | 1.15% |
| Hypothetical (5% Return Before Expenses) | | $1,000.00 | | $1,019.09 | | $5.76 | | 1.15% |
| | | | | | | | | |
| Global Dynamic Multi-Asset | | | | | | | | |
| Service Shares | | | | | | | | |
| Actual | | $1,000.00 | | $ 1,118.90 | | $5.52 | | 1.05% |
| Hypothetical (5% Return Before Expenses) | | $1,000.00 | | $1,019.59 | | $5.26 | | 1.05% |
| Investor Shares | | | | | | | | |
| Actual | | $1,000.00 | | $ 1,118.90 | | $4.73 | | 0.90% |
| Hypothetical (5% Return Before Expenses) | | $1,000.00 | | $1,020.33 | | $4.51 | | 0.90% |
| * | Expenses are equal to the annualized expense ratio, net of expenses waivers and reimbursements, of each Share class multiplied by the average account value over the period, multiplied by 181/365 (to reflect one-half year period). |
8 Semi-Annual Report
Lazard Retirement Series, Inc.
Portfolio Holdings Presented by Sector June 30, 2019 (unaudited)
| Sector* | | Lazard
Retirement
Emerging
Markets
Equity
Portfolio | | Lazard
Retirement
International
Equity
Portfolio | | Lazard
Retirement
US Equity
Select
Portfolio | | Lazard
Retirement
US Small-
Mid Cap
Equity
Portfolio |
| | | | | | | | | | | | | | | | | |
| Communication Services | | | 12.5 | % | | | 7.8 | % | | | 7.0 | % | | | 2.4 | % |
| Consumer Discretionary | | | 6.7 | | | | 7.1 | | | | 9.5 | | | | 10.2 | |
| Consumer Staples | | | 6.6 | | | | 9.1 | | | | 7.8 | | | | 0.8 | |
| Energy | | | 11.3 | | | | 6.3 | | | | 6.1 | | | | 1.7 | |
| Financials | | | 28.1 | | | | 18.4 | | | | 13.2 | | | | 15.7 | |
| Health Care | | | 0.6 | | | | 9.8 | | | | 19.1 | | | | 14.1 | |
| Industrials | | | 5.3 | | | | 17.9 | | | | 9.4 | | | | 16.7 | |
| Information Technology | | | 19.1 | | | | 7.2 | | | | 21.4 | | | | 14.7 | |
| Materials | | | 6.3 | | | | 7.4 | | | | 0.9 | | | | 6.3 | |
| Real Estate | | | — | | | | 2.8 | | | | 1.7 | | | | 12.3 | |
| Utilities | | | 1.0 | | | | 2.7 | | | | — | | | | 4.1 | |
| Short-Term Investments | | | 2.5 | | | | 3.5 | | | | 3.9 | | | | 1.0 | |
| Total Investments | | | 100.0 | % | | | 100.0 | % | | | 100.0 | % | | | 100.0 | % |
| | | | | | | | | | | | | | | | | |
| Sector* | | | Lazard
Retirement
Global
Dynamic
Multi-Asset
Portfolio | | | | | | | | | | | | |
| | | | | | | | | | | | | | | | | |
| Communication Services | | | 6.0 | % | | | | | | | | | | | | |
| Consumer Discretionary | | | 8.8 | | | | | | | | | | | | | |
| Consumer Staples | | | 8.9 | | | | | | | | | | | | | |
| Energy | | | 2.9 | | | | | | | | | | | | | |
| Financials | | | 13.4 | | | | | | | | | | | | | |
| Health Care | | | 10.2 | | | | | | | | | | | | | |
| Industrials | | | 10.2 | | | | | | | | | | | | | |
| Information Technology | | | 11.2 | | | | | | | | | | | | | |
| Materials | | | 2.3 | | | | | | | | | | | | | |
| Real Estate | | | 3.0 | | | | | | | | | | | | | |
| Utilities | | | 3.4 | | | | | | | | | | | | | |
| Municipal | | | 0.7 | | | | | | | | | | | | | |
| Sovereign Debt | | | 15.0 | | | | | | | | | | | | | |
| US Government Securities | | | 0.4 | | | | | | | | | | | | | |
| US Treasury Securities | | | 2.4 | | | | | | | | | | | | | |
| Short-Term Investments | | | 1.2 | | | | | | | | | | | | | |
| Total Investments | | | 100.0 | % | | | | | | | | | | | | | |
| * | Represents percentage of total investments. |
Semi-Annual Report 9
Lazard Retirement Series, Inc.Portfolios of Investments
June 30, 2019 (unaudited)
| | | | | | | |
| Description | | Shares | | | Fair
Value | |
| | | | | | | | | |
| Lazard Retirement Emerging Markets Equity Portfolio | | | | | | | | |
| | | | | | | | | |
| Common Stocks | 97.1% | | | | | | | | |
| | | | | | | | | |
| Argentina | 1.9% | | | | | | | | |
| YPF SA Sponsored ADR | | | 613,140 | | | $ | 11,165,279 | |
| | | | | | | | | |
| Brazil | 8.8% | | | | | | | | |
| Ambev SA ADR | | | 1,477,377 | | | | 6,899,351 | |
| Banco do Brasil SA | | | 1,522,221 | | | | 21,382,726 | |
| BB Seguridade Participacoes SA | | | 1,200,100 | | | | 10,119,725 | |
| CCR SA | | | 2,388,950 | | | | 8,498,303 | |
| Cielo SA | | | 2,360,984 | | | | 4,131,776 | |
| | | | | | | | 51,031,881 | |
| China | 19.3% | | | | | | | | |
| AAC Technologies Holdings, Inc. | | | 857,979 | | | | 4,885,215 | |
| Anhui Conch Cement Co., Ltd., Class H | | | 1,443,375 | | | | 9,053,852 | |
| Baidu, Inc. Sponsored ADR (*) | | | 39,409 | | | | 4,625,040 | |
| China Construction Bank Corp., Class H | | | 32,386,126 | | | | 27,830,941 | |
| China Merchants Bank Co., Ltd., Class H | | | 1,076,500 | | | | 5,375,202 | |
| China Mobile, Ltd. Sponsored ADR | | | 206,646 | | | | 9,358,997 | |
| China Shenhua Energy Co., Ltd., Class H | | | 2,087,775 | | | | 4,362,547 | |
| CNOOC, Ltd. | | | 3,632,679 | | | | 6,249,799 | |
| ENN Energy Holdings, Ltd. | | | 578,295 | | | | 5,631,744 | |
| Hengan International Group Co., Ltd. | | | 786,027 | | | | 5,771,517 | |
| NetEase, Inc. ADR | | | 66,636 | | | | 17,043,490 | |
| Weichai Power Co., Ltd., Class H | | | 6,497,958 | | | | 10,998,114 | |
| | | | | | | | 111,186,458 | |
| Egypt | 1.1% | | | | | | | | |
| Commercial International Bank Egypt SAE GDR | | | 1,492,698 | | | | 6,344,543 | |
| | | | | | | | | |
| Hong Kong | 1.0% | | | | | | | | |
| ASM Pacific Technology, Ltd. | | | 590,488 | | | | 6,053,959 | |
| | | | | | | | | |
| Hungary | 1.6% | | | | | | | | |
| OTP Bank Nyrt. | | | 231,529 | | | | 9,211,058 | |
The accompanying notes are an integral part of these financial statements.
10 Semi-Annual Report
| | | | | | | |
| Description | | Shares | | | Fair
Value | |
| | | | | | | |
| Lazard Retirement Emerging Markets Equity Portfolio (continued) | | | | | | | | |
| | | | | | | | | |
| India | 10.9% | | | | | | | | |
| Axis Bank, Ltd. (*) | | | 695,159 | | | $ | 8,162,829 | |
| Bajaj Auto, Ltd. | | | 124,563 | | | | 5,103,927 | |
| Bharat Petroleum Corp., Ltd. | | | 751,551 | | | | 4,265,034 | |
| Coal India, Ltd. | | | 1,299,801 | | | | 4,784,833 | |
| HCL Technologies, Ltd. | | | 456,931 | | | | 7,048,463 | |
| Hero MotoCorp, Ltd. | | | 185,384 | | | | 6,933,016 | |
| Infosys, Ltd. Sponsored ADR | | | 553,930 | | | | 5,927,051 | |
| Oil and Natural Gas Corp., Ltd. | | | 2,416,961 | | | | 5,873,677 | |
| Tata Consultancy Services, Ltd. | | | 373,758 | | | | 12,061,731 | |
| UPL, Ltd. | | | 199,395 | | | | 2,708,576 | |
| | | | | | | | 62,869,137 | |
| Indonesia | 5.7% | | | | | | | | |
| PT Astra International Tbk | | | 13,747,004 | | | | 7,251,640 | |
| PT Bank Mandiri (Persero) Tbk | | | 20,625,430 | | | | 11,729,857 | |
| PT Semen Indonesia (Persero) Tbk | | | 4,082,371 | | | | 3,348,290 | |
| PT Telekomunikasi Indonesia (Persero) Tbk Sponsored ADR | | | 354,656 | | | | 10,370,142 | |
| | | | | | | | 32,699,929 | |
| Luxembourg | 0.7% | | | | | | | | |
| Ternium SA Sponsored ADR | | | 178,608 | | | | 4,006,177 | |
| | | | | | | | | |
| Malaysia | 0.6% | | | | | | | | |
| British American Tobacco Malaysia Berhad | | | 517,000 | | | | 3,603,672 | |
| | | | | | | | | |
| Mexico | 3.5% | | | | | | | | |
| America Movil SAB de CV, Class L Sponsored ADR | | | 757,264 | | | | 11,025,764 | |
| Grupo Mexico SAB de CV, Series B | | | 1,489,346 | | | | 3,955,035 | |
| Kimberly-Clark de Mexico SAB de CV, Series A | | | 2,659,789 | | | | 4,945,770 | |
| | | | | | | | 19,926,569 | |
| Pakistan | 0.7% | | | | | | | | |
| Habib Bank, Ltd. | | | 1,406,270 | | | | 996,999 | |
| Oil & Gas Development Co., Ltd. | | | 512,500 | | | | 421,835 | |
| Pakistan Petroleum, Ltd. | | | 3,109,162 | | | | 2,812,534 | |
| | | | | | | | 4,231,368 | |
The accompanying notes are an integral part of these financial statements.
Semi-Annual Report 11
| | | | | | | |
| Description | | Shares | | | Fair
Value | |
| | | | | | | |
| Lazard Retirement Emerging Markets Equity Portfolio (continued) | | | | | | | | |
| | | | | | | | | |
| Philippines | 0.8% | | | | | | | | |
| PLDT, Inc. Sponsored ADR | | | 190,547 | | | $ | 4,729,377 | |
| | | | | | | | | |
| Russia | 9.7% | | | | | | | | |
| ALROSA PAO (*) | | | 5,214,294 | | | | 7,102,875 | |
| Gazprom PJSC Sponsored ADR | | | 1,274,826 | | | | 9,340,056 | |
| LUKOIL PJSC Sponsored ADR | | | 103,967 | | | | 8,777,368 | |
| Magnit PJSC Sponsored GDR | | | 300,431 | | | | 4,378,497 | |
| Mobile TeleSystems PJSC Sponsored ADR | | | 957,357 | | | | 8,912,994 | |
| Sberbank of Russia PJSC | | | 4,678,418 | | | | 17,637,589 | |
| | | | | | | | 56,149,379 | |
| South Africa | 7.6% | | | | | | | | |
| Imperial Logistics, Ltd. | | | 149,577 | | | | 546,399 | |
| Life Healthcare Group Holdings, Ltd. | | | 2,168,022 | | | | 3,456,532 | |
| Motus Holdings, Ltd. | | | 425,448 | | | | 2,210,429 | |
| Nedbank Group, Ltd. | | | 275,990 | | | | 4,968,220 | |
| PPC, Ltd. (*) | | | 2,861,470 | | | | 938,587 | |
| Sanlam, Ltd. | | | 1,053,740 | | | | 5,855,020 | |
| Shoprite Holdings, Ltd. | | | 629,792 | | | | 7,051,072 | |
| Standard Bank Group, Ltd. | | | 409,991 | | | | 5,726,295 | |
| The Bidvest Group, Ltd. | | | 367,907 | | | | 4,946,962 | |
| Vodacom Group, Ltd. | | | 677,197 | | | | 5,754,692 | |
| Woolworths Holdings, Ltd. | | | 602,415 | | | | 2,091,986 | |
| | | | | | | | 43,546,194 | |
| South Korea | 14.5% | | | | | | | | |
| Hanwha Life Insurance Co., Ltd. | | | 535,515 | | | | 1,518,298 | |
| Hyundai Mobis Co., Ltd. | | | 41,849 | | | | 8,548,050 | |
| KB Financial Group, Inc. | | | 222,392 | | | | 8,811,969 | |
| KT&G Corp. | | | 60,421 | | | | 5,156,668 | |
| Samsung Electronics Co., Ltd. | | | 657,069 | | | | 26,790,001 | |
| Shinhan Financial Group Co., Ltd. | | | 263,464 | | | | 10,246,262 | |
| SK Hynix, Inc. | | | 269,180 | | | | 16,215,170 | |
| Woongjin Coway Co., Ltd. | | | 91,594 | | | | 6,141,334 | |
| | | | | | | | 83,427,752 | |
The accompanying notes are an integral part of these financial statements.
12 Semi-Annual Report
| | | | | | | |
| Description | | Shares | | | Fair
Value | |
| | | | | | | |
| Lazard Retirement Emerging Markets Equity Portfolio (concluded) | | | | | | | | |
| | | | | | | | | |
| Taiwan | 4.7% | | | | | | | | |
| Catcher Technology Co., Ltd. | | | 785,000 | | | $ | 5,632,304 | |
| Hon Hai Precision Industry Co., Ltd. | | | 2,692,320 | | | | 6,718,456 | |
| Taiwan Semiconductor Manufacturing Co., Ltd. | | | 1,902,642 | | | | 14,514,365 | |
| | | | | | | | 26,865,125 | |
| Thailand | 1.8% | | | | | | | | |
| Kasikornbank Public Co. Ltd. | | | 873,169 | | | | 5,395,468 | |
| The Siam Cement Public Co. Ltd. (‡) | | | 326,908 | | | | 5,031,404 | |
| | | | | | | | 10,426,872 | |
| Turkey | 2.2% | | | | | | | | |
| KOC Holding AS | | | 1,852,884 | | | | 5,614,029 | |
| Tupras Turkiye Petrol Rafinerileri AS | | | 355,255 | | | | 7,056,513 | |
| | | | | | | | 12,670,542 | |
Total Common Stocks
(Cost $525,372,586) | | | | | | | 560,145,271 | |
| | | | | | | | | |
| Short-Term Investments | 2.5% | | | | | | | | |
State Street Institutional Treasury Money Market Fund, Premier Class, 2.17% (7 day yield)
(Cost $14,458,578) | | | 14,458,578 | | | | 14,458,578 | |
| | | | | | | | | |
Total Investments | 99.6%
(Cost $539,831,164) | | | | | | $ | 574,603,849 | |
| | | | | | | | | |
| Cash and Other Assets in Excess of Liabilities | 0.4% | | | | | | | 2,167,708 | |
| | | | | | | | | |
| Net Assets | 100.0% | | | | | | $ | 576,771,557 | |
The accompanying notes are an integral part of these financial statements.
Semi-Annual Report 13
| | | | | | | |
| Description | | Shares | | | Fair
Value | |
| | | | | | | |
| Lazard Retirement International Equity Portfolio | | | | | | | | |
| | | | | | | | | |
| Common Stocks | 94.3% | | | | | | | | |
| | | | | | | | | |
| Australia | 2.6% | | | | | | | | |
| Amcor, Ltd. | | | 177,323 | | | $ | 2,015,487 | |
| BHP Group PLC | | | 97,030 | | | | 2,476,437 | |
| | | | | | | | 4,491,924 | |
| Belgium | 2.6% | | | | | | | | |
| Anheuser-Busch InBev SA/NV | | | 50,715 | | | | 4,491,573 | |
| | | | | | | | | |
| Canada | 5.3% | | | | | | | | |
| Canadian National Railway Co. | | | 20,690 | | | | 1,914,878 | |
| National Bank of Canada | | | 42,500 | | | | 2,018,957 | |
| Rogers Communications, Inc., Class B | | | 33,800 | | | | 1,809,309 | |
| Suncor Energy, Inc. | | | 106,040 | | | | 3,307,803 | |
| | | | | | | | 9,050,947 | |
| China | 1.7% | | | | | | | | |
| Ping An Insurance (Group) Co. of China, Ltd., Class H | | | 236,500 | | | | 2,846,452 | |
| | | | | | | | | |
| Denmark | 1.6% | | | | | | | | |
| Carlsberg A/S, Class B | | | 19,904 | | | | 2,639,281 | |
| | | | | | | | | |
| Finland | 2.5% | | | | | | | | |
| Nordea Bank Abp | | | 250,621 | | | | 1,820,927 | |
| Sampo Oyj, A Shares | | | 50,576 | | | | 2,386,822 | |
| | | | | | | | 4,207,749 | |
| France | 12.9% | | | | | | | | |
| Air Liquide SA | | | 18,778 | | | | 2,627,647 | |
| Atos SE | | | 22,440 | | | | 1,876,243 | |
| Cie Generale des Etablissements Michelin SCA | | | 13,700 | | | | 1,738,090 | |
| Engie SA | | | 145,341 | | | | 2,207,126 | |
| Safran SA | | | 26,834 | | | | 3,932,026 | |
| Sanofi | | | 47,586 | | | | 4,116,612 | |
| Vinci SA | | | 23,808 | | | | 2,440,979 | |
| Vivendi SA | | | 111,393 | | | | 3,070,187 | |
| | | | | | | | 22,008,910 | |
The accompanying notes are an integral part of these financial statements.
14 Semi-Annual Report
| | | | | | | |
| Description | | Shares | | | Fair
Value | |
| | | | | | | |
| Lazard Retirement International Equity Portfolio (continued) | | | | | | | | |
| | | | | | | | | |
| Germany | 5.0% | | | | | | | | |
| Fresenius SE & Co. KGaA | | | 22,301 | | | $ | 1,208,191 | |
| SAP SE | | | 44,902 | | | | 6,172,278 | |
| Vonovia SE | | | 22,385 | | | | 1,069,067 | |
| | | | | | | | 8,449,536 | |
| India | 1.1% | | | | | | | | |
| ICICI Bank, Ltd. Sponsored ADR | | | 151,720 | | | | 1,910,155 | |
| | | | | | | | | |
| Ireland | 1.1% | | | | | | | | |
| Ryanair Holdings PLC Sponsored ADR (*) | | | 28,554 | | | | 1,831,454 | |
| | | | | | | | | |
| Israel | 1.2% | | | | | | | | |
| Bank Leumi Le-Israel BM | | | 273,369 | | | | 1,975,325 | |
| | | | | | | | | |
| Japan | 12.8% | | | | | | | | |
| Daiwa House Industry Co., Ltd. | | | 125,592 | | | | 3,667,815 | |
| Hitachi, Ltd. | | | 35,000 | | | | 1,286,319 | |
| Kao Corp. | | | 28,220 | | | | 2,152,908 | |
| Makita Corp. | | | 57,200 | | | | 1,948,922 | |
| Nexon Co., Ltd. (*) | | | 159,300 | | | | 2,312,669 | |
| Pan Pacific International Holdings Corp. | | | 24,381 | | | | 1,549,680 | |
| Shin-Etsu Chemical Co., Ltd. | | | 32,100 | | | | 2,997,130 | |
| Sumitomo Mitsui Financial Group, Inc. | | | 73,300 | | | | 2,595,551 | |
| Suzuki Motor Corp. | | | 36,500 | | | | 1,718,021 | |
| Yamaha Corp. | | | 32,200 | | | | 1,533,155 | |
| | | | | | | | 21,762,170 | |
| Netherlands | 7.4% | | | | | | | | |
| ABN AMRO Group NV | | | 74,177 | | | | 1,587,213 | |
| Koninklijke DSM NV | | | 19,237 | | | | 2,378,522 | |
| Royal Dutch Shell PLC, A Shares | | | 173,623 | | | | 5,685,241 | |
| Wolters Kluwer NV | | | 39,907 | | | | 2,905,331 | |
| | | | | | | | 12,556,307 | |
| Norway | 2.3% | | | | | | | | |
| Equinor ASA | | | 81,477 | | | | 1,614,220 | |
| Telenor ASA | | | 111,680 | | | | 2,373,278 | |
| | | | | | | | 3,987,498 | |
The accompanying notes are an integral part of these financial statements.
Semi-Annual Report 15
| | | | | | | |
| Description | | Shares | | | Fair
Value | |
| | | | | | | |
| Lazard Retirement International Equity Portfolio (continued) | | | | | | | | |
| | | | | | | | | |
| Singapore | 2.7% | | | | | | | | |
| DBS Group Holdings, Ltd. | | | 162,860 | | | $ | 3,126,359 | |
| NetLink NBN Trust | | | 2,115,100 | | | | 1,391,292 | |
| | | | | | | | 4,517,651 | |
| South Korea | 1.2% | | | | | | | | |
| Samsung Electronics Co., Ltd. | | | 50,440 | | | | 2,056,538 | |
| | | | | | | | | |
| Spain | 1.4% | | | | | | | | |
| Red Electrica Corporacion SA | | | 116,865 | | | | 2,433,055 | |
| | | | | | | | | |
| Sweden | 3.5% | | | | | | | | |
| Assa Abloy AB, Class B | | | 164,863 | | | | 3,732,259 | |
| Epiroc AB, Class A | | | 217,784 | | | | 2,267,645 | |
| | | | | | | | 5,999,904 | |
| Switzerland | 4.8% | | | | | | | | |
| ABB, Ltd. | | | 70,320 | | | | 1,412,084 | |
| Novartis AG | | | 73,437 | | | | 6,717,063 | |
| | | | | | | | 8,129,147 | |
| United Arab Emirates | 0.5% | | | | | | | | |
| Network International Holdings PLC | | | 115,103 | | | | 867,334 | |
| | | | | | | | | |
| United Kingdom | 13.4% | | | | | | | | |
| Compass Group PLC | | | 103,077 | | | | 2,470,262 | |
| Diageo PLC | | | 51,185 | | | | 2,204,244 | |
| Howden Joinery Group PLC | | | 120,477 | | | | 775,765 | |
| Informa PLC | | | 213,484 | | | | 2,266,415 | |
| Prudential PLC | | | 183,149 | | | | 3,989,108 | |
| RELX PLC | | | 180,904 | | | | 4,396,731 | |
| RSA Insurance Group PLC | | | 227,662 | | | | 1,671,643 | |
| The Weir Group PLC | | | 55,171 | | | | 1,083,758 | |
| Unilever PLC | | | 64,221 | | | | 3,987,988 | |
| | | | | | | | 22,845,914 | |
The accompanying notes are an integral part of these financial statements.
16 Semi-Annual Report
| | | | | | | |
| Description | | Shares | | | Fair
Value | |
| | | | | | | |
| Lazard Retirement International Equity Portfolio (concluded) | | | | | | | | |
| | | | | | | | | |
| United States | 6.7% | | | | | | | | |
| Aon PLC | | | 26,975 | | | $ | 5,205,635 | |
| Ferguson PLC (*) | | | 23,498 | | | | 1,674,913 | |
| Medtronic PLC | | | 47,200 | | | | 4,596,808 | |
| | | | | | | | 11,477,356 | |
Total Common Stocks
(Cost $139,812,517) | | | | | | | 160,536,180 | |
| | | | | | | | | |
| Preferred Stocks | 1.8% | | | | | | | | |
| | | | | | | | | |
| Germany | 1.8% | | | | | | | | |
Volkswagen AG
(Cost $3,284,508) | | | 17,631 | | | | 2,971,264 | |
| | | | | | | | | |
| Short-Term Investments | 3.5% | | | | | | | | |
State Street Institutional Treasury Money Market Fund, Premier Class, 2.17% (7 day yield)
(Cost $5,914,572) | | | 5,914,572 | | | | 5,914,572 | |
| | | | | | | | | |
Total Investments | 99.6%
(Cost $149,011,597) | | | | | | $ | 169,422,016 | |
| | | | | | | | | |
| Cash and Other Assets in Excess of Liabilities | 0.4% | | | | | | | 748,172 | |
| | | | | | | | | |
| Net Assets | 100.0% | | | | | | $ | 170,170,188 | |
The accompanying notes are an integral part of these financial statements.
Semi-Annual Report 17
| | | | | | | |
| Description | | Shares | | | Fair
Value | |
| | | | | | | |
| Lazard Retirement US Equity Select Portfolio | | | | | | | | |
| | | | | | | | | |
| Common Stocks | 96.3% | | | | | | | | |
| | | | | | | | | |
| Aerospace & Defense | 1.7% | | | | | | | | |
| Raytheon Co. | | | 875 | | | $ | 152,145 | |
| | | | | | | | | |
| Auto Components | 0.8% | | | | | | | | |
| Aptiv PLC | | | 924 | | | | 74,687 | |
| | | | | | | | | |
| Banks | 7.6% | | | | | | | | |
| Bank of America Corp. | | | 10,934 | | | | 317,086 | |
| Citizens Financial Group, Inc. | | | 2,605 | | | | 92,113 | |
| Commerce Bancshares, Inc. | | | 2,046 | | | | 122,064 | |
| JPMorgan Chase & Co. | | | 1,475 | | | | 164,905 | |
| | | | | | | | 696,168 | |
| Beverages | 3.8% | | | | | | | | |
| The Coca-Cola Co. | | | 6,880 | | | | 350,329 | |
| | | | | | | | | |
| Capital Markets | 3.6% | | | | | | | | |
| Intercontinental Exchange, Inc. | | | 3,815 | | | | 327,861 | |
| | | | | | | | | |
| Communications Equipment | 4.3% | | | | | | | | |
| Cisco Systems, Inc. | | | 5,405 | | | | 295,816 | |
| Motorola Solutions, Inc. | | | 570 | | | | 95,036 | |
| | | | | | | | 390,852 | |
| Construction Materials | 0.9% | | | | | | | | |
| Vulcan Materials Co. | | | 619 | | | | 84,995 | |
| | | | | | | | | |
| Electrical Equipment | 1.0% | | | | | | | | |
| Eaton Corp. PLC | | | 1,095 | | | | 91,192 | |
| | | | | | | | | |
| Entertainment | 2.6% | | | | | | | | |
| Activision Blizzard, Inc. | | | 1,165 | | | | 54,988 | |
| Electronic Arts, Inc. (*) | | | 677 | | | | 68,553 | |
| The Walt Disney Co. | | | 830 | | | | 115,901 | |
| | | | | | | | 239,442 | |
The accompanying notes are an integral part of these financial statements.
18 Semi-Annual Report
| | | | | | | |
| | | | | | Fair | |
| Description | | Shares | | | Value | |
| | | | | | | | | |
| Lazard Retirement US Equity Select Portfolio (continued) | | | | | | | | |
| | | | | | | | | |
| Equity Real Estate Investment Trusts (REITs) | 1.7% | | | | | | | | |
| Prologis, Inc. | | | 1,945 | | | $ | 155,794 | |
| | | | | | | | | |
| Food Products | 1.1% | | | | | | | | |
| Mondelez International, Inc., Class A | | | 1,890 | | | | 101,871 | |
| | | | | | | | | |
| Health Care Equipment & Supplies | 5.5% | | | | | | | | |
| Danaher Corp. | | | 1,197 | | | | 171,075 | |
| Medtronic PLC | | | 3,405 | | | | 331,613 | |
| | | | | | | | 502,688 | |
| Health Care Providers & Services | 4.2% | | | | | | | | |
| Anthem, Inc. | | | 410 | | | | 115,706 | |
| CVS Health Corp. | | | 1,215 | | | | 66,205 | |
| Humana, Inc. | | | 393 | | | | 104,263 | |
| Laboratory Corp. of America Holdings (*) | | | 565 | | | | 97,689 | |
| | | | | | | | 383,863 | |
| Hotels, Restaurants & Leisure | 3.6% | | | | | | | | |
| McDonald’s Corp. | | | 1,568 | | | | 325,611 | |
| | | | | | | | | |
| Household Products | 2.9% | | | | | | | | |
| The Procter & Gamble Co. | | | 2,380 | | | | 260,967 | |
| | | | | | | | | |
| Industrial Conglomerates | 3.3% | | | | | | | | |
| Honeywell International, Inc. | | | 1,720 | | | | 300,295 | |
| | | | | | | | | |
| Insurance | 2.0% | | | | | | | | |
| Aon PLC | | | 948 | | | | 182,945 | |
| | | | | | | | | |
| Interactive Media & Services | 4.4% | | | | | | | | |
| Alphabet, Inc., Class A (*) | | | 370 | | | | 400,636 | |
| | | | | | | | | |
| Internet & Direct Marketing Retail | 0.7% | | | | | | | | |
| eBay, Inc. | | | 1,590 | | | | 62,805 | |
The accompanying notes are an integral part of these financial statements.
Semi-Annual Report 19
| | | | | | | |
| | | | | | Fair | |
| Description | | Shares | | | Value | |
| | | | | | | |
| Lazard Retirement US Equity Select Portfolio (continued) | | | | | | | | |
| | | | | | | | | |
| IT Services | 4.2% | | | | | | | | |
| Accenture PLC, Class A | | | 532 | | | $ | 98,297 | |
| Visa, Inc., Class A | | | 1,383 | | | | 240,020 | |
| Worldpay, Inc., Class A (*) | | | 394 | | | | 48,285 | |
| | | | | | | | 386,602 | |
| Life Sciences Tools & Services | 1.1% | | | | | | | | |
| Thermo Fisher Scientific, Inc. | | | 351 | | | | 103,082 | |
| | | | | | | | | |
| Machinery | 1.8% | | | | | | | | |
| Deere & Co. | | | 1,000 | | | | 165,710 | |
| | | | | | | | | |
| Multiline Retail | 1.1% | | | | | | | | |
| Dollar General Corp. | | | 748 | | | | 101,100 | |
| | | | | | | | | |
| Oil, Gas & Consumable Fuels | 6.1% | | | | | | | | |
| Chevron Corp. | | | 2,515 | | | | 312,966 | |
| ConocoPhillips | | | 1,830 | | | | 111,630 | |
| EOG Resources, Inc. | | | 1,485 | | | | 138,343 | |
| | | | | | | | 562,939 | |
| Pharmaceuticals | 8.4% | | | | | | | | |
| Elanco Animal Health, Inc. | | | 2,805 | | | | 94,809 | |
| Johnson & Johnson | | | 2,430 | | | | 338,450 | |
| Pfizer, Inc. | | | 4,290 | | | | 185,843 | |
| Zoetis, Inc. | | | 1,283 | | | | 145,608 | |
| | | | | | | | 764,710 | |
| Road & Rail | 1.6% | | | | | | | | |
| Norfolk Southern Corp. | | | 739 | | | | 147,305 | |
| | | | | | | | | |
| Semiconductors & Semiconductor Equipment | 3.5% | | | | | | | | |
| Analog Devices, Inc. | | | 1,763 | | | | 198,990 | |
| Skyworks Solutions, Inc. | | | 850 | | | | 65,679 | |
| Texas Instruments, Inc. | | | 495 | | | | 56,806 | |
| | | | | | | | 321,475 | |
The accompanying notes are an integral part of these financial statements.
20 Semi-Annual Report
| | | | | | | |
| | | | | | Fair | |
| Description | | Shares | | | Value | |
| | | | | | | | | |
| Lazard Retirement US Equity Select Portfolio (concluded) | | | | | | | | |
| | | | | | | | | |
| Software | 6.8% | | | | | | | | |
| Microsoft Corp. | | | 3,845 | | | $ | 515,076 | |
| Palo Alto Networks, Inc. (*) | | | 520 | | | | 105,955 | |
| | | | | | | | 621,031 | |
| Specialty Retail | 3.4% | | | | | | | | |
| Lowe’s Cos., Inc. | | | 1,847 | | | | 186,381 | |
| Ross Stores, Inc. | | | 1,232 | | | | 122,116 | |
| | | | | | | | 308,497 | |
| Technology Hardware, Storage & Peripherals | 2.6% | | | | | | | | |
| Apple, Inc. | | | 1,215 | | | | 240,473 | |
| | | | | | | | | |
Total Common Stocks
(Cost $7,290,529) | | | | | | | 8,808,070 | |
| | | | | | | | | |
| Short-Term Investments | 3.9% | | | | | | | | |
State Street Institutional Treasury Money Market Fund, Premier Class, 2.17% (7 day yield)
(Cost $358,233) | | | 358,233 | | | | 358,233 | |
| | | | | | | | | |
Total Investments | 100.2%
(Cost $7,648,762) | | | | | | $ | 9,166,303 | |
| | | | | | | | | |
| Liabilities in Excess of Cash and Other Assets | (0.2)% | | | | | | | (15,373 | ) |
| | | | | | | | | |
| Net Assets | 100.0% | | | | | | $ | 9,150,930 | |
The accompanying notes are an integral part of these financial statements.
Semi-Annual Report 21
| | | | | | | |
| | | | | | Fair | |
| Description | | Shares | | | Value | |
| | | | | | | | | |
| Lazard Retirement US Small-Mid Cap Equity Portfolio | | | | | | | | |
| | | | | | | | | |
| Common Stocks | 99.0% | | | | | | | | |
| | | | | | | | | |
| Aerospace & Defense | 1.1% | | | | | | | | |
| Curtiss-Wright Corp. | | | 4,775 | | | $ | 607,046 | |
| | | | | | | | | |
| Air Freight & Logistics | 0.8% | | | | | | | | |
| Echo Global Logistics, Inc. (*) | | | 22,410 | | | | 467,697 | |
| | | | | | | | | |
| Airlines | 1.7% | | | | | | | | |
| Alaska Air Group, Inc. | | | 14,650 | | | | 936,282 | |
| | | | | | | | | |
| Auto Components | 1.1% | | | | | | | | |
| Modine Manufacturing Co. (*) | | | 43,975 | | | | 629,282 | |
| | | | | | | | | |
| Banks | 8.1% | | | | | | | | |
| Cadence BanCorp | | | 21,605 | | | | 449,384 | |
| Comerica, Inc. | | | 7,530 | | | | 546,979 | |
| Commerce Bancshares, Inc. | | | 16,124 | | | | 961,958 | |
| PacWest Bancorp | | | 22,235 | | | | 863,385 | |
| Sterling Bancorp | | | 39,890 | | | | 848,859 | |
| Wintrust Financial Corp. | | | 11,220 | | | | 820,855 | |
| | | | | | | | 4,491,420 | |
| Biotechnology | 2.3% | | | | | | | | |
| Cellectis SA ADR (*) | | | 17,120 | | | | 267,072 | |
| Emergent Biosolutions, Inc. (*) | | | 14,555 | | | | 703,152 | |
| Exelixis, Inc. (*) | | | 14,640 | | | | 312,857 | |
| | | | | | | | 1,283,081 | |
| Building Products | 2.5% | | | | | | | | |
| Armstrong World Industries, Inc. | | | 7,985 | | | | 776,142 | |
| PGT Innovations, Inc. (*) | | | 37,975 | | | | 634,942 | |
| | | | | | | | 1,411,084 | |
| Capital Markets | 2.4% | | | | | | | | |
| E*TRADE Financial Corp. | | | 12,000 | | | | 535,200 | |
| Morningstar, Inc. | | | 5,655 | | | | 817,939 | |
| | | | | | | | 1,353,139 | |
The accompanying notes are an integral part of these financial statements.
22 Semi-Annual Report
| | | | | | | |
| | | | | | Fair | |
| Description | | Shares | | | Value | |
| | | | | | | | | |
| Lazard Retirement US Small-Mid Cap Equity Portfolio (continued) | | | | | | | | |
| | | | | | | | | |
| Chemicals | 3.5% | | | | | | | | |
| Ingevity Corp. (*) | | | 8,780 | | | $ | 923,393 | |
| Innospec, Inc. | | | 11,485 | | | | 1,047,891 | |
| | | | | | | | 1,971,284 | |
| Commercial Services & Supplies | 1.3% | | | | | | | | |
| The Brink’s Co. | | | 8,560 | | | | 694,901 | |
| | | | | | | | | |
| Communications Equipment | 1.3% | | | | | | | | |
| Ciena Corp. (*) | | | 16,900 | | | | 695,097 | |
| | | | | | | | | |
| Construction Materials | 1.8% | | | | | | | | |
| Eagle Materials, Inc. | | | 10,635 | | | | 985,864 | |
| | | | | | | | | |
| Containers & Packaging | 1.0% | | | | | | | | |
| Graphic Packaging Holding Co. | | | 38,235 | | | | 534,525 | |
| | | | | | | | | |
| Electric Utilities | 4.1% | | | | | | | | |
| OGE Energy Corp. | | | 27,050 | | | | 1,151,248 | |
| PNM Resources, Inc. | | | 22,390 | | | | 1,139,875 | |
| | | | | | | | 2,291,123 | |
| Electrical Equipment | 4.0% | | | | | | | | |
| Atkore International Group, Inc. (*) | | | 32,905 | | | | 851,252 | |
| EnerSys | | | 10,785 | | | | 738,773 | |
| Regal Beloit Corp. | | | 7,945 | | | | 649,186 | |
| | | | | | | | 2,239,211 | |
| Electronic Equipment, Instruments & Components | 1.5% | | | | | | | | |
| FLIR Systems, Inc. | | | 15,020 | | | | 812,582 | |
| | | | | | | | | |
| Energy Equipment & Services | 0.7% | | | | | | | | |
| Cactus, Inc., Class A (*) | | | 11,400 | | | | 377,568 | |
| | | | | | | | | |
| Entertainment | 2.4% | | | | | | | | |
| Take-Two Interactive Software, Inc. (*) | | | 8,175 | | | | 928,108 | |
| The Marcus Corp. | | | 12,900 | | | | 425,184 | |
| | | | | | | | 1,353,292 | |
The accompanying notes are an integral part of these financial statements.
Semi-Annual Report 23
| | | | | | | |
| | | | | | Fair | |
| Description | | Shares | | | Value | |
| | | | | | | | | |
| Lazard Retirement US Small-Mid Cap Equity Portfolio (continued) | | | | | | | | |
| | | | | | | | | |
| Equity Real Estate Investment Trusts (REITs) | 12.3% | | | | | | | | |
| Alexandria Real Estate Equities, Inc. | | | 9,355 | | | $ | 1,319,897 | |
| Brixmor Property Group, Inc. | | | 47,720 | | | | 853,234 | |
| Camden Property Trust | | | 13,060 | | | | 1,363,333 | |
| Hudson Pacific Properties, Inc. | | | 27,215 | | | | 905,443 | |
| Kilroy Realty Corp. | | | 13,830 | | | | 1,020,792 | |
| PS Business Parks, Inc. | | | 8,215 | | | | 1,384,474 | |
| | | | | | | | 6,847,173 | |
| Food Products | 0.8% | | | | | | | | |
| The Simply Good Foods Co. (*) | | | 18,465 | | | | 444,637 | |
| | | | | | | | | |
| Health Care Equipment & Supplies | 4.4% | | | | | | | | |
| AngioDynamics, Inc. (*) | | | 32,640 | | | | 642,682 | |
| Avanos Medical, Inc. (*) | | | 10,685 | | | | 465,973 | |
| Lantheus Holdings, Inc. (*) | | | 15,735 | | | | 445,300 | |
| STERIS PLC | | | 6,025 | | | | 897,002 | |
| | | | | | | | 2,450,957 | |
| Health Care Providers & Services | 3.3% | | | | | | | | |
| Henry Schein, Inc. (*) | | | 11,550 | | | | 807,345 | |
| Laboratory Corp. of America Holdings (*) | | | 5,810 | | | | 1,004,549 | |
| | | | | | | | 1,811,894 | |
| Hotels, Restaurants & Leisure | 3.2% | | | | | | | | |
| Papa John’s International, Inc. | | | 11,850 | | | | 529,932 | |
| Penn National Gaming, Inc. (*) | | | 33,700 | | | | 649,062 | |
| The Cheesecake Factory, Inc. | | | 14,375 | | | | 628,475 | |
| | | | | | | | 1,807,469 | |
| Household Durables | 1.7% | | | | | | | | |
| Leggett & Platt, Inc. | | | 25,260 | | | | 969,226 | |
| | | | | | | | | |
| Insurance | 5.2% | | | | | | | | |
| Arch Capital Group, Ltd. (*) | | | 26,790 | | | | 993,373 | |
| Brown & Brown, Inc. | | | 27,845 | | | | 932,807 | |
| Reinsurance Group of America, Inc. | | | 6,360 | | | | 992,351 | |
| | | | | | | | 2,918,531 | |
The accompanying notes are an integral part of these financial statements.
24 Semi-Annual Report
| | | | | | | |
| | | | | | Fair | |
| Description | | Shares | | | Value | |
| | | | | | | | | |
| Lazard Retirement US Small-Mid Cap Equity Portfolio (continued) | | | | | | | | |
| | | | | | | | | |
| IT Services | 5.0% | | | | | | | | |
| CoreLogic, Inc. (*) | | | 20,714 | | | $ | 866,467 | |
| Leidos Holdings, Inc. | | | 16,220 | | | | 1,295,167 | |
| Sabre Corp. | | | 29,150 | | | | 647,130 | |
| | | | | | | | 2,808,764 | |
| Life Sciences Tools & Services | 1.4% | | | | | | | | |
| Cambrex Corp. (*) | | | 16,735 | | | | 783,365 | |
| | | | | | | | | |
| Machinery | 2.5% | | | | | | | | |
| Gardner Denver Holdings, Inc. (*) | | | 14,610 | | | | 505,506 | |
| Kennametal, Inc. | | | 9,695 | | | | 358,618 | |
| TriMas Corp. (*) | | | 17,645 | | | | 546,466 | |
| | | | | | | | 1,410,590 | |
| Oil, Gas & Consumable Fuels | 1.0% | | | | | | | | |
| Parsley Energy, Inc., Class A (*) | | | 28,400 | | | | 539,884 | |
| | | | | | | | | |
| Pharmaceuticals | 2.8% | | | | | | | | |
| Catalent, Inc. (*) | | | 16,960 | | | | 919,402 | |
| Elanco Animal Health, Inc. | | | 18,800 | | | | 635,440 | |
| | | | | | | | 1,554,842 | |
| Professional Services | 1.1% | | | | | | | | |
| FTI Consulting, Inc. (*) | | | 7,570 | | | | 634,669 | |
| | | | | | | | | |
| Semiconductors & Semiconductor Equipment | 2.3% | | | | | | | | |
| Maxim Integrated Products, Inc. | | | 10,500 | | | | 628,110 | |
| MKS Instruments, Inc. | | | 8,245 | | | | 642,203 | |
| | | | | | | | 1,270,313 | |
| Software | 4.7% | | | | | | | | |
| CyberArk Software, Ltd. (*) | | | 4,330 | | | | 553,547 | |
| j2 Global, Inc. | | | 10,235 | | | | 909,789 | |
| RealPage, Inc. (*) | | | 12,350 | | | | 726,798 | |
| SolarWinds Corp. | | | 24,100 | | | | 441,994 | |
| | | | | | | | 2,632,128 | |
The accompanying notes are an integral part of these financial statements.
Semi-Annual Report 25
| | | | | | | |
| | | | | | Fair | |
| Description | | Shares | | | Value | |
| | | | | | | | | |
| Lazard Retirement US Small-Mid Cap Equity Portfolio (concluded) | | | | | | | | |
| | | | | | | | | |
| Specialty Retail | 1.8% | | | | | | | | |
| Floor & Decor Holdings, Inc., Class A (*) | | | 14,325 | | | $ | 600,218 | |
| Foot Locker, Inc. | | | 10,020 | | | | 420,038 | |
| | | | | | | | 1,020,256 | |
| Textiles, Apparel & Luxury Goods | 2.3% | | | | | | | | |
| Carter’s, Inc. | | | 6,230 | | | | 607,674 | |
| Steven Madden, Ltd. | | | 19,177 | | | | 651,059 | |
| | | | | | | | 1,258,733 | |
| Trading Companies & Distributors | 1.6% | | | | | | | | |
| Air Lease Corp. | | | 22,000 | | | | 909,480 | |
| | | | | | | | | |
Total Common Stocks
(Cost $49,780,203) | | | | | | | 55,207,389 | |
| | | | | | | | | |
| Short-Term Investments | 1.0% | | | | | | | | |
State Street Institutional Treasury Money Market Fund, Premier Class, 2.17% (7 day yield)
(Cost $563,161) | | | 563,161 | | | | 563,161 | |
| | | | | | | | | |
Total Investments | 100.0%
(Cost $50,343,364) | | | | | | $ | 55,770,550 | |
| | | | | | | | | |
| Liabilities in Excess of Cash and Other Assets | 0.0% | | | | | | | (27,408 | ) |
| | | | | | | | | |
| Net Assets | 100.0% | | | | | | $ | 55,743,142 | |
The accompanying notes are an integral part of these financial statements.
26 Semi-Annual Report
| | | | | | | |
| | | | | | Fair | |
| Description | | Shares | | | Value | |
| | | | | | | | | |
| Lazard Retirement Global Dynamic Multi-Asset Portfolio | | | | | | | | |
| | | | | | | | | |
| Common Stocks | 73.5% | | | | | | | | |
| | | | | | | | | |
| Australia | 2.3% | | | | | | | | |
| AGL Energy, Ltd. | | | 143,663 | | | $ | 2,019,505 | |
| Appen, Ltd. | | | 23,313 | | | | 460,104 | |
| BHP Group, Ltd. | | | 8,629 | | | | 249,971 | |
| BlueScope Steel, Ltd. | | | 26,300 | | | | 223,249 | |
| CIMIC Group, Ltd. | | | 27,884 | | | | 878,135 | |
| Cochlear, Ltd. | | | 1,546 | | | | 224,887 | |
| CSL, Ltd. | | | 4,789 | | | | 724,503 | |
| Evolution Mining, Ltd. | | | 100,122 | | | | 307,079 | |
| Fortescue Metals Group, Ltd. | | | 37,146 | | | | 236,449 | |
| Iluka Resources, Ltd. | | | 39,060 | | | | 296,030 | |
| Inghams Group, Ltd. | | | 73,095 | | | | 206,539 | |
| JB Hi-Fi, Ltd. | | | 16,286 | | | | 295,915 | |
| Qantas Airways, Ltd. | | | 159,887 | | | | 606,794 | |
| Regis Resources, Ltd. | | | 85,734 | | | | 318,773 | |
| Sandfire Resources NL | | | 42,640 | | | | 200,948 | |
| Santos, Ltd. | | | 51,218 | | | | 255,239 | |
| Saracen Mineral Holdings, Ltd. (*) | | | 266,153 | | | | 688,892 | |
| Shopping Centres Australasia Property Group REIT | | | 117,441 | | | | 197,248 | |
| Vicinity Centres REIT | | | 135,704 | | | | 233,776 | |
| Whitehaven Coal, Ltd. | | | 47,775 | | | | 123,431 | |
| Woolworths Group, Ltd. | | | 22,841 | | | | 533,722 | |
| | | | | | | | 9,281,189 | |
| Belgium | 0.8% | | | | | | | | |
| Anheuser-Busch InBev SA Sponsored ADR | | | 17,645 | | | | 1,561,759 | |
| Colruyt SA | | | 13,745 | | | | 797,643 | |
| Proximus SADP | | | 9,081 | | | | 268,023 | |
| Telenet Group Holding NV | | | 5,957 | | | | 332,231 | |
| UCB SA | | | 4,751 | | | | 393,967 | |
| | | | | | | | 3,353,623 | |
| Canada | 3.4% | | | | | | | | |
| Air Canada (*) | | | 10,922 | | | | 331,025 | |
| B2Gold Corp. (*) | | | 95,247 | | | | 289,476 | |
| BRP, Inc. | | | 14,921 | | | | 533,239 | |
| CAE, Inc. | | | 49,695 | | | | 1,334,808 | |
The accompanying notes are an integral part of these financial statements.
Semi-Annual Report 27
| | | | | | | |
| | | | | | Fair | |
| Description | | Shares | | | Value | |
| | | | | | | | | |
| Lazard Retirement Global Dynamic Multi-Asset Portfolio (continued) | | | | | | | | |
| | | | | | | | | |
| Canadian National Railway Co. | | | 21,450 | | | $ | 1,983,696 | |
| Canadian Natural Resources, Ltd. | | | 4,994 | | | | 134,655 | |
| CGI, Inc. (*) | | | 12,519 | | | | 962,478 | |
| Colliers International Group, Inc. | | | 3,487 | | | | 249,313 | |
| Constellation Software, Inc. | | | 797 | | | | 751,172 | |
| Granite Real Estate Investment Trust | | | 12,063 | | | | 555,365 | |
| H&R Real Estate Investment Trust | | | 27,765 | | | | 484,252 | |
| Kirkland Lake Gold, Ltd. | | | 9,992 | | | | 430,490 | |
| National Bank of Canada | | | 6,724 | | | | 319,423 | |
| Parex Resources, Inc. (*) | | | 31,679 | | | | 508,248 | |
| Rogers Communications, Inc., Class B | | | 35,463 | | | | 1,898,329 | |
| Teck Resources, Ltd., Class B | | | 24,860 | | | | 573,685 | |
| The Toronto-Dominion Bank | | | 39,341 | | | | 2,296,976 | |
| | | | | | | | 13,636,630 | |
| China | 0.1% | | | | | | | | |
| Yangzijiang Shipbuilding Holdings, Ltd. | | | 236,700 | | | | 268,370 | |
| | | | | | | | | |
| Denmark | 0.4% | | | | | | | | |
| Coloplast A/S, Class B | | | 2,630 | | | | 297,869 | |
| H. Lundbeck A/S | | | 5,908 | | | | 233,632 | |
| Novo Nordisk A/S, Class B | | | 17,603 | | | | 897,925 | |
| SimCorp AS | | | 3,977 | | | | 384,629 | |
| | | | | | | | 1,814,055 | |
| Finland | 0.4% | | | | | | | | |
| Nordea Bank Abp Sponsored ADR | | | 110,200 | | | | 796,746 | |
| Sampo Oyj, A Shares ADR | | | 41,390 | | | | 974,528 | |
| | | | | | | | 1,771,274 | |
| France | 1.6% | | | | | | | | |
| Electricite de France SA | | | 29,268 | | | | 369,133 | |
| Engie SA | | | 7,328 | | | | 111,282 | |
| Faurecia SA | | | 2,853 | | | | 132,433 | |
| Hermes International | | | 374 | | | | 269,743 | |
| Ipsen SA | | | 3,158 | | | | 430,934 | |
| Peugeot SA | | | 38,235 | | | | 942,335 | |
| Total SA | | | 53,938 | | | | 3,017,890 | |
| Ubisoft Entertainment SA ADR (*) | | | 70,760 | | | | 1,101,026 | |
| Veolia Environnement SA | | | 6,115 | | | | 149,088 | |
| | | | | | | | 6,523,864 | |
The accompanying notes are an integral part of these financial statements.
28 Semi-Annual Report
| | | | | | | |
| Description | | Shares | | | Fair
Value | |
| | | | | | | | | |
| Lazard Retirement Global Dynamic Multi-Asset Portfolio (continued) | | | | | | | | |
| | | | | | | | | |
| Germany | 1.0% | | | | | | | | |
| Allianz SE | | | 2,053 | | | $ | 494,804 | |
| Covestro AG | | | 2,291 | | | | 116,458 | |
| CTS Eventim AG & Co. KGaA | | | 4,332 | | | | 201,598 | |
| Deutsche Lufthansa AG | | | 36,763 | | | | 629,974 | |
| Deutsche Telekom AG | | | 8,987 | | | | 155,524 | |
| Muenchener Rueckversicherungs AG | | | 1,336 | | | | 335,302 | |
| Rheinmetall AG | | | 3,940 | | | | 482,291 | |
| RWE AG | | | 5,705 | | | | 140,638 | |
| SAP SE | | | 1,119 | | | | 153,819 | |
| Siltronic AG | | | 1,907 | | | | 139,433 | |
| Symrise AG ADR | | | 47,680 | | | | 1,147,181 | |
| | | | | | | | 3,997,022 | |
| Hong Kong | 1.2% | | | | | | | | |
| AIA Group, Ltd. Sponsored ADR | | | 43,710 | | | | 1,886,086 | |
| CK Hutchison Holdings, Ltd. | | | 21,000 | | | | 206,612 | |
| Hang Seng Bank, Ltd. Sponsored ADR | | | 58,750 | | | | 1,457,587 | |
| Jardine Matheson Holdings, Ltd. | | | 2,900 | | | | 182,778 | |
| Swire Pacific, Ltd., Class A | | | 78,000 | | | | 959,733 | |
| | | | | | | | 4,692,796 | |
| Israel | 0.6% | | | | | | | | |
| Bank Leumi Le-Israel BM | | | 79,888 | | | | 577,259 | |
| Israel Discount Bank, Ltd., ADR | | | 26,945 | | | | 1,098,952 | |
| Israel Discount Bank, Ltd., Class A | | | 198,179 | | | | 810,310 | |
| | | | | | | | 2,486,521 | |
| Italy | 1.5% | | | | | | | | |
| Assicurazioni Generali SpA | | | 7,428 | | | | 139,697 | |
| Enel SpA | | | 495,272 | | | | 3,460,585 | |
| Hera SpA | | | 84,034 | | | | 321,620 | |
| Italgas SpA | | | 86,263 | | | | 579,153 | |
| Poste Italiane SpA | | | 70,103 | | | | 738,515 | |
| Terna SpA | | | 101,980 | | | | 649,746 | |
| UniCredit SpA | | | 15,580 | | | | 191,794 | |
| | | | | | | | 6,081,110 | |
The accompanying notes are an integral part of these financial statements.
Semi-Annual Report 29
| | | | | | | |
| Description | | Shares | | | Fair
Value | |
| | | | | | | |
| Lazard Retirement Global Dynamic Multi-Asset Portfolio (continued) | | | | | | | | |
| | | | | | | | | |
| Japan | 5.5% | | | | | | | | |
| Amano Corp. | | | 10,300 | | | $ | 284,950 | |
| ANA Holdings, Inc. | | | 6,000 | | | | 198,830 | |
| Canon, Inc. | | | 5,600 | | | | 164,014 | |
| Capcom Co., Ltd. | | | 7,500 | | | | 150,851 | |
| Daito Trust Construction Co., Ltd. | | | 2,800 | | | | 356,438 | |
| Daiwa House Industry Co., Ltd. | | | 26,100 | | | | 762,230 | |
| Daiwa House Industry Co., Ltd. ADR | | | 37,370 | | | | 1,100,173 | |
| Dip Corp. | | | 12,000 | | | | 201,355 | |
| East Japan Railway Co. | | | 8,000 | | | | 749,203 | |
| Fukuoka Financial Group, Inc. | | | 30,100 | | | | 553,248 | |
| Japan Airlines Co., Ltd. | | | 12,600 | | | | 403,088 | |
| Japan Post Holdings Co., Ltd. | | | 66,500 | | | | 753,436 | |
| Japan Prime Realty Investment Corp. REIT | | | 58 | | | | 251,252 | |
| JFE Holdings, Inc. | | | 33,800 | | | | 497,574 | |
| Juki Corp. | | | 6,200 | | | | 57,358 | |
| Kao Corp., ADR | | | 71,125 | | | | 1,077,544 | |
| Kinden Corp. | | | 7,500 | | | | 115,536 | |
| Kyushu Electric Power Co., Inc. | | | 15,300 | | | | 150,065 | |
| Marvelous, Inc. | | | 14,700 | | | | 111,943 | |
| McDonald’s Holdings Co. Japan, Ltd. | | | 10,200 | | | | 449,842 | |
| Mitsubishi Heavy Industries, Ltd. | | | 5,300 | | | | 231,041 | |
| Mitsubishi UFJ Financial Group, Inc. | | | 120,300 | | | | 575,101 | |
| Mizuho Financial Group, Inc. | | | 144,500 | | | | 209,642 | |
| Nintendo Co., Ltd. | | | 600 | | | | 220,578 | |
| Nissan Chemical Corp. | | | 5,100 | | | | 230,291 | |
| Nomura Holdings, Inc. | | | 44,700 | | | | 158,774 | |
| NTT DOCOMO, Inc. | | | 147,682 | | | | 3,446,688 | |
| ORIX Corp. | | | 16,000 | | | | 239,177 | |
| SAMTY Co., Ltd. | | | 21,000 | | | | 319,886 | |
| Seven & I Holdings Co., Ltd. | | | 23,600 | | | | 799,929 | |
| Shikoku Electric Power Co., Inc. | | | 13,200 | | | | 122,171 | |
| Shin-Etsu Chemical Co., Ltd. | | | 8,000 | | | | 746,948 | |
| Shionogi & Co., Ltd. | | | 3,400 | | | | 196,322 | |
| Showa Denko KK | | | 5,700 | | | | 169,037 | |
| SoftBank Group Corp. | | | 4,100 | | | | 197,574 | |
The accompanying notes are an integral part of these financial statements.
30 Semi-Annual Report
| | | | | | | |
| Description | | Shares | | | Fair
Value | |
| | | | | | | |
| Lazard Retirement Global Dynamic Multi-Asset Portfolio (continued) | | | | | | | | |
| | | | | | | | | |
| Sompo Holdings, Inc. | | | 9,196 | | | $ | 355,897 | |
| Stanley Electric Co., Ltd. | | | 5,100 | | | | 125,733 | |
| Sumitomo Heavy Industries, Ltd. | | | 9,000 | | | | 310,487 | |
| Sumitomo Mitsui Construction Co., Ltd. | | | 48,500 | | | | 269,180 | |
| Sumitomo Mitsui Trust Holdings, Inc. | | | 8,000 | | | | 290,598 | |
| Suzuken Co., Ltd. | | | 3,700 | | | | 217,469 | |
| Taisei Corp. | | | 6,200 | | | | 225,665 | |
| TechnoPro Holdings Inc., ADR | | | 107,355 | | | | 1,137,963 | |
| Teijin, Ltd. | | | 8,800 | | | | 150,242 | |
| The Chiba Bank, Ltd. | | | 64,100 | | | | 313,933 | |
| The Chugoku Electric Power Co., Inc. | | | 10,300 | | | | 129,994 | |
| The Dai-ichi Life Insurance Co., Ltd. | | | 46,600 | | | | 705,021 | |
| The Gunma Bank, Ltd. | | | 58,500 | | | | 205,519 | |
| Tosoh Corp. | | | 12,600 | | | | 177,799 | |
| Yamaha Corp. Sponsored ADR | | | 33,855 | | | | 1,618,269 | |
| | | | | | | | 22,485,858 | |
| Netherlands | 1.1% | | | | | | | | |
| Euronext NV | | | 4,837 | | | | 366,057 | |
| Koninklijke Ahold Delhaize NV | | | 14,946 | | | | 336,145 | |
| Royal Dutch Shell PLC, A Shares | | | 28,111 | | | | 920,488 | |
| Wolters Kluwer NV | | | 1,427 | | | | 103,889 | |
| Wolters Kluwer NV Sponsored ADR | | | 35,805 | | | | 2,601,591 | |
| | | | | | | | 4,328,170 | |
| Norway | 0.6% | | | | | | | | |
| Aker BP ASA | | | 5,896 | | | | 170,000 | |
| DNO ASA | | | 88,662 | | | | 161,212 | |
| Equinor ASA | | | 26,048 | | | | 516,062 | |
| Leroy Seafood Group ASA | | | 33,484 | | | | 221,920 | |
| Salmar ASA | | | 7,554 | | | | 328,515 | |
| Telenor ASA | | | 39,708 | | | | 843,823 | |
| TGS NOPEC Geophysical Co. ASA | | | 4,981 | | | | 139,811 | |
| | | | | | | | 2,381,343 | |
| | | | | | | | | |
| Puerto Rico | 0.1% | | | | | | | | |
| EVERTEC, Inc. | | | 11,358 | | | | 371,407 | |
The accompanying notes are an integral part of these financial statements.
Semi-Annual Report 31
| | | | | | | |
| Description | | Shares | | | Fair
Value | |
| | | | | | | |
| Lazard Retirement Global Dynamic Multi-Asset Portfolio (continued) | | | | | | | | |
| | | | | | | | | |
| Singapore | 0.7% | | | | | | | | |
| Jardine Cycle & Carriage, Ltd. | | | 12,600 | | | $ | 338,022 | |
| Oversea-Chinese Banking Corp., Ltd. | | | 17,700 | | | | 149,652 | |
| Oversea-Chinese Banking Corp., Ltd. ADR | | | 87,785 | | | | 1,466,887 | |
| Singapore Technologies Engineering, Ltd. | | | 232,900 | | | | 713,899 | |
| | | | | | | | 2,668,460 | |
| Spain | 0.2% | | | | | | | | |
| Amadeus IT Group SA | | | 1,979 | | | | 156,610 | |
| CIE Automotive SA | | | 6,505 | | | | 188,353 | |
| Corporacion Financiera Alba SA | | | 1,792 | | | | 93,941 | |
| Iberdrola SA | | | 50,991 | | | | 508,629 | |
| | | | | | | | 947,533 | |
| Sweden | 0.9% | | | | | | | | |
| Assa Abloy AB ADR | | | 81,670 | | | | 917,562 | |
| Axfood AB | | | 17,176 | | | | 339,878 | |
| Boliden AB | | | 4,809 | | | | 122,990 | |
| Epiroc AB ADR | | | 114,425 | | | | 1,181,553 | |
| Hexagon AB ADR | | | 20,630 | | | | 1,144,140 | |
| | | | | | | | 3,706,123 | |
| Switzerland | 1.9% | | | | | | | | |
| Alcon, Inc. (*) | | | 10,759 | | | | 667,596 | |
| Helvetia Holding AG | | | 1,921 | | | | 241,378 | |
| Novartis AG | | | 9,492 | | | | 868,205 | |
| Novartis AG Sponsored ADR | | | 20,670 | | | | 1,887,378 | |
| Partners Group Holding AG | | | 687 | | | | 539,821 | |
| Roche Holding AG | | | 10,542 | | | | 2,966,163 | |
| The Swatch Group AG | | | 4,644 | | | | 251,460 | |
| Zurich Insurance Group AG | | | 1,383 | | | | 481,578 | |
| | | | | | | | 7,903,579 | |
| United Kingdom | 4.6% | | | | | | | | |
| Admiral Group PLC | | | 13,469 | | | | 378,419 | |
| Anglo American PLC | | | 18,628 | | | | 532,837 | |
| Associated British Foods PLC | | | 5,378 | | | | 168,569 | |
| Auto Trader Group PLC | | | 38,201 | | | | 266,237 | |
| Britvic PLC | | | 19,554 | | | | 220,826 | |
| Bunzl PLC Sponsored ADR | | | 40,405 | | | | 1,082,450 | |
The accompanying notes are an integral part of these financial statements.
32 Semi-Annual Report
| | | | | | | |
| Description | | Shares | | | Fair
Value | |
| | | | | | | |
| Lazard Retirement Global Dynamic Multi-Asset Portfolio (continued) | | | | | | | | |
| | | | | | | | | |
| Centrica PLC | | | 195,326 | | | $ | 217,760 | |
| Coca-Cola European Partners PLC | | | 25,965 | | | | 1,467,022 | |
| Compass Group PLC | | | 20,589 | | | | 493,420 | |
| Compass Group PLC Sponsored ADR | | | 55,352 | | | | 1,326,234 | |
| Diageo PLC Sponsored ADR | | | 17,035 | | | | 2,935,471 | |
| Howden Joinery Group PLC | | | 59,816 | | | | 385,162 | |
| Imperial Brands PLC | | | 13,717 | | | | 322,079 | |
| International Consolidated Airlines Group SA | | | 42,486 | | | | 257,259 | |
| International Consolidated Airlines Group SA | | | 28,012 | | | | 169,925 | |
| National Grid PLC | | | 34,259 | | | | 364,076 | |
| Prudential PLC ADR | | | 24,385 | | | | 1,068,551 | |
| RELX PLC Sponsored ADR | | | 80,420 | | | | 1,963,052 | |
| Rio Tinto, Ltd. | | | 9,758 | | | | 712,032 | |
| Royal Bank of Scotland Group PLC | | | 51,170 | | | | 142,860 | |
| RSA Insurance Group PLC ADR | | | 111,880 | | | | 816,724 | |
| SSP Group PLC | | | 43,254 | | | | 377,282 | |
| The Weir Group PLC Sponsored ADR | | | 58,265 | | | | 580,319 | |
| Unilever PLC Sponsored ADR | | | 35,265 | | | | 2,185,372 | |
| WH Smith PLC | | | 11,842 | | | | 296,284 | |
| | | | | | | | 18,730,222 | |
| United States | 44.6% | | | | | | | | |
| 3M Co. | | | 1,796 | | | | 311,319 | |
| AbbVie, Inc. | | | 12,337 | | | | 897,147 | |
| Accenture PLC, Class A | | | 11,280 | | | | 2,084,206 | |
| ACI Worldwide, Inc. N Ap (*) | | | 7,260 | | | | 249,308 | |
| AES Corp. | | | 39,652 | | | | 664,568 | |
| Aflac, Inc. | | | 17,926 | | | | 982,524 | |
| Akamai Technologies, Inc. (*) | | | 16,737 | | | | 1,341,303 | |
| Align Technology, Inc. (*) | | | 1,140 | | | | 312,018 | |
| Alphabet, Inc., Class A (*) | | | 2,207 | | | | 2,389,740 | |
| Alphabet, Inc., Class C (*) | | | 267 | | | | 288,603 | |
| Altria Group, Inc. | | | 6,108 | | | | 289,214 | |
| Amazon.com, Inc. (*) | | | 1,576 | | | | 2,984,361 | |
| American Express Co. | | | 9,123 | | | | 1,126,143 | |
| American Tower Corp. REIT | | | 3,769 | | | | 770,572 | |
| Ameriprise Financial, Inc. | | | 5,170 | | | | 750,477 | |
The accompanying notes are an integral part of these financial statements.
Semi-Annual Report 33
| | | | | | | |
| Description | | Shares | | | Fair
Value | |
| | | | | | | |
| Lazard Retirement Global Dynamic Multi-Asset Portfolio (continued) | | | | | | | | |
| | | | | | | | | |
| Amgen, Inc. | | | 2,267 | | | $ | 417,763 | |
| Aon PLC | | | 21,309 | | | | 4,112,211 | |
| Apple, Inc. | | | 20,957 | | | | 4,147,809 | |
| Applied Materials, Inc. | | | 4,079 | | | | 183,188 | |
| AutoZone, Inc. (*) | | | 1,064 | | | | 1,169,836 | |
| Avnet, Inc. | | | 6,754 | | | | 305,754 | |
| AXA Equitable Holdings, Inc. | | | 25,129 | | | | 525,196 | |
| Bank of America Corp. | | | 35,486 | | | | 1,029,094 | |
| Baxter International, Inc. | | | 2,034 | | | | 166,585 | |
| Best Buy Co., Inc. | | | 2,331 | | | | 162,541 | |
| Booking Holdings, Inc. (*) | | | 113 | | | | 211,842 | |
| BorgWarner, Inc. | | | 3,886 | | | | 163,134 | |
| Boston Scientific Corp. (*) | | | 37,185 | | | | 1,598,211 | |
| Brinker International, Inc. | | | 7,784 | | | | 306,300 | |
| Bristol-Myers Squibb Co. | | | 17,565 | | | | 796,573 | |
| Broadcom, Inc. | | | 1,802 | | | | 518,724 | |
| Broadridge Financial Solutions, Inc. | | | 2,311 | | | | 295,068 | |
| Burlington Stores, Inc. (*) | | | 1,475 | | | | 250,971 | |
| Cable One, Inc. | | | 219 | | | | 256,447 | |
| Cadence Design Systems, Inc. (*) | | | 9,922 | | | | 702,577 | |
| Cardinal Health, Inc. | | | 4,552 | | | | 214,399 | |
| Caterpillar, Inc. | | | 6,659 | | | | 907,555 | |
| CBRE Group, Inc., Class A (*) | | �� | 24,047 | | | | 1,233,611 | |
| CDW Corp. | | | 2,926 | | | | 324,786 | |
| Cerner Corp. | | | 5,179 | | | | 379,621 | |
| Chevron Corp. | | | 19,401 | | | | 2,414,260 | |
| Church & Dwight Co., Inc. | | | 3,721 | | | | 271,856 | |
| Cigna Corp. | | | 5,022 | | | | 791,216 | |
| Cisco Systems, Inc. | | | 26,565 | | | | 1,453,902 | |
| Citigroup, Inc. | | | 7,888 | | | | 552,397 | |
| Citizens Financial Group, Inc. | | | 3,589 | | | | 126,907 | |
| Colgate-Palmolive Co. | | | 11,121 | | | | 797,042 | |
| Comcast Corp., Class A | | | 53,935 | | | | 2,280,372 | |
| Comerica, Inc. | | | 18,280 | | | | 1,327,859 | |
| ConocoPhillips | | | 27,719 | | | | 1,690,859 | |
| CoreLogic, Inc. (*) | | | 20,350 | | | | 851,240 | |
The accompanying notes are an integral part of these financial statements.
34 Semi-Annual Report
| | | | | | | |
| Description | | Shares | | | Fair
Value | |
| | | | | | | |
| Lazard Retirement Global Dynamic Multi-Asset Portfolio (continued) | | | | | | | | |
| | | | | | | | | |
| Costco Wholesale Corp. | | | 1,671 | | | $ | 441,578 | |
| Cummins, Inc. | | | 3,292 | | | | 564,051 | |
| Darden Restaurants, Inc. | | | 12,004 | | | | 1,461,247 | |
| Delta Air Lines, Inc. | | | 7,645 | | | | 433,854 | |
| Discover Financial Services | | | 6,569 | | | | 509,689 | |
| Dollar General Corp. | | | 8,490 | | | | 1,147,508 | |
| E*TRADE Financial Corp. | | | 5,327 | | | | 237,584 | |
| Eaton Corp. PLC | | | 10,065 | | | | 838,213 | |
| eBay, Inc. | | | 24,415 | | | | 964,392 | |
| Edison International | | | 20,133 | | | | 1,357,166 | |
| Electronic Arts, Inc. (*) | | | 2,309 | | | | 233,809 | |
| Eli Lilly & Co. | | | 17,884 | | | | 1,981,368 | |
| Encompass Health Corp. | | | 8,802 | | | | 557,695 | |
| EPR Properties REIT | | | 3,303 | | | | 246,371 | |
| Exelon Corp. | | | 16,517 | | | | 791,825 | |
| Exponent, Inc. | | | 3,987 | | | | 233,399 | |
| F5 Networks, Inc. (*) | | | 5,634 | | | | 820,479 | |
| Facebook, Inc., Class A (*) | | | 7,704 | | | | 1,486,872 | |
| FactSet Research Systems, Inc. | | | 1,024 | | | | 293,437 | |
| Fidelity National Information Services, Inc. | | | 4,757 | | | | 583,589 | |
| GreenSky, Inc., Class A (*) | | | 14,880 | | | | 182,875 | |
| HCA Healthcare, Inc. | | | 3,713 | | | | 501,886 | |
| HEICO Corp., Class A | | | 2,361 | | | | 244,057 | |
| Honeywell International, Inc. | | | 14,687 | | | | 2,564,203 | |
| Huntsman Corp. | | | 22,746 | | | | 464,928 | |
| IDEXX Laboratories, Inc. (*) | | | 2,157 | | | | 593,887 | |
| Insperity, Inc. | | | 2,348 | | | | 286,785 | |
| Intel Corp. | | | 35,145 | | | | 1,682,391 | |
| Intercontinental Exchange, Inc. | | | 23,790 | | | | 2,044,513 | |
| International Business Machines Corp. | | | 7,838 | | | | 1,080,860 | |
| Intuit, Inc. | | | 8,967 | | | | 2,343,346 | |
| IQVIA Holdings, Inc. (*) | | | 17,924 | | | | 2,883,972 | |
| Johnson & Johnson | | | 41,395 | | | | 5,765,496 | |
| Jones Lang LaSalle, Inc. | | | 4,047 | | | | 569,372 | |
| JPMorgan Chase & Co. | | | 1,237 | | | | 138,297 | |
| Kellogg Co. | | | 4,343 | | | | 232,655 | |
The accompanying notes are an integral part of these financial statements.
Semi-Annual Report 35
| | | | | | | |
| Description | | Shares | | | Fair
Value | |
| | | | | | | |
| Lazard Retirement Global Dynamic Multi-Asset Portfolio (continued) | | | | | | | | |
| | | | | | | | | |
| Keysight Technologies, Inc. (*) | | | 2,884 | | | $ | 259,012 | |
| Kimberly-Clark Corp. | | | 9,138 | | | | 1,217,913 | |
| Kimco Realty Corp. REIT | | | 12,599 | | | | 232,830 | |
| Kohl’s Corp. | | | 2,851 | | | | 135,565 | |
| Laboratory Corp. of America Holdings (*) | | | 8,546 | | | | 1,477,603 | |
| Lamb Weston Holdings, Inc. | | | 3,100 | | | | 196,416 | |
| Life Storage, Inc. REIT | | | 3,101 | | | | 294,843 | |
| Lincoln National Corp. | | | 6,705 | | | | 432,137 | |
| Lockheed Martin Corp. | | | 8,096 | | | | 2,943,220 | |
| Lowe’s Cos., Inc. | | | 10,150 | | | | 1,024,236 | |
| LPL Financial Holdings, Inc. | | | 6,085 | | | | 496,353 | |
| Lululemon Athletica, Inc. (*) | | | 7,573 | | | | 1,364,730 | |
| MarketAxess Holdings, Inc. | | | 934 | | | | 300,206 | |
| MasterCard, Inc., Class A | | | 14,839 | | | | 3,925,361 | |
| Maxim Integrated Products, Inc. | | | 2,810 | | | | 168,094 | |
| McDonald’s Corp. | | | 9,860 | | | | 2,047,528 | |
| McGrath RentCorp | | | 4,239 | | | | 263,454 | |
| Mellanox Technologies, Ltd. (*) | | | 2,979 | | | | 329,686 | |
| Merck & Co., Inc. | | | 31,963 | | | | 2,680,098 | |
| MetLife, Inc. | | | 13,228 | | | | 657,035 | |
| Microsoft Corp. | | | 37,254 | | | | 4,990,546 | |
| MKS Instruments, Inc. | | | 2,630 | | | | 204,851 | |
| Moody’s Corp. | | | 1,910 | | | | 373,042 | |
| Morgan Stanley | | | 10,109 | | | | 442,875 | |
| Morningstar, Inc. | | | 1,649 | | | | 238,511 | |
| Motorola Solutions, Inc. | | | 13,645 | | | | 2,275,031 | |
| Nasdaq, Inc. | | | 3,325 | | | | 319,765 | |
| NetApp, Inc. | | | 7,925 | | | | 488,972 | |
| NIKE, Inc., Class B | | | 10,383 | | | | 871,653 | |
| Nordstrom, Inc. | | | 7,165 | | | | 228,277 | |
| Northrop Grumman Corp. | | | 8,080 | | | | 2,610,729 | |
| NVIDIA Corp. | | | 3,729 | | | | 612,414 | |
| NVR, Inc. (*) | | | 51 | | | | 171,883 | |
| Occidental Petroleum Corp. | | | 8,742 | | | | 439,548 | |
| Omnicom Group, Inc. | | | 5,425 | | | | 444,579 | |
| Paycom Software, Inc. (*) | | | 962 | | | | 218,105 | |
The accompanying notes are an integral part of these financial statements.
36 Semi-Annual Report
| | | | | | | |
| Description | | Shares | | | Fair
Value | |
| | | | | | | |
| Lazard Retirement Global Dynamic Multi-Asset Portfolio (continued) | | | | | | |
| | | | | | | |
| PayPal Holdings, Inc. (*) | | | 1,732 | | | $ | 198,245 | |
| PepsiCo, Inc. | | | 12,180 | | | | 1,597,163 | |
| Philip Morris International, Inc. | | | 18,658 | | | | 1,465,213 | |
| Phillips 66 | | | 1,918 | | | | 179,410 | |
| Pinnacle West Capital Corp. | | | 15,415 | | | | 1,450,397 | |
| Pioneer Natural Resources Co. | | | 2,716 | | | | 417,884 | |
| PotlatchDeltic Corp. REIT | | | 3,234 | | | | 126,061 | |
| Premier, Inc., Class A (*) | | | 14,308 | | | | 559,586 | |
| Prudential Financial, Inc. | | | 6,244 | | | | 630,644 | |
| Public Service Enterprise Group, Inc. | | | 4,955 | | | | 291,453 | |
| Radian Group, Inc. | | | 6,926 | | | | 158,259 | |
| Ralph Lauren Corp. | | | 2,556 | | | | 290,336 | |
| Raytheon Co. | | | 1,082 | | | | 188,138 | |
| Regions Financial Corp. | | | 46,282 | | | | 691,453 | |
| Republic Services, Inc. | | | 17,218 | | | | 1,491,768 | |
| Rockwell Automation, Inc. | | | 9,970 | | | | 1,633,385 | |
| Ross Stores, Inc. | | | 5,622 | | | | 557,253 | |
| S&P Global, Inc. | | | 7,280 | | | | 1,658,311 | |
| Schlumberger, Ltd. | | | 18,835 | | | | 748,503 | |
| Seagate Technology PLC | | | 4,436 | | | | 209,024 | |
| Simon Property Group, Inc. REIT | | | 19,540 | | | | 3,121,710 | |
| Skyworks Solutions, Inc. | | | 1,846 | | | | 142,640 | |
| Starbucks Corp. | | | 37,402 | | | | 3,135,410 | |
| Stryker Corp. | | | 2,931 | | | | 602,555 | |
| Synchrony Financial | | | 24,103 | | | | 835,651 | |
| Synovus Financial Corp. | | | 13,055 | | | | 456,925 | |
| Sysco Corp. | | | 20,778 | | | | 1,469,420 | |
| T-Mobile US, Inc. (*) | | | 21,961 | | | | 1,628,189 | |
| Taubman Centers, Inc. REIT | | | 7,035 | | | | 287,239 | |
| TE Connectivity, Ltd. | | | 4,368 | | | | 418,367 | |
| Teradyne, Inc. | | | 3,854 | | | | 184,645 | |
| Texas Instruments, Inc. | | | 8,970 | | | | 1,029,397 | |
| The Coca-Cola Co. | | | 45,700 | | | | 2,327,044 | |
| The Estee Lauder Cos., Inc., Class A | | | 18,356 | | | | 3,361,167 | |
| The Hershey Co. | | | 10,858 | | | | 1,455,298 | |
| The Kroger Co. | | | 13,200 | | | | 286,572 | |
The accompanying notes are an integral part of these financial statements.
Semi-Annual Report 37
| | | | | | | | | |
| Description | | Shares | | | Fair
Value | |
| | | | | | | | | |
| Lazard Retirement Global Dynamic Multi-Asset Portfolio (continued) | | | | | | | | |
| | | | | | | | | |
| The Procter & Gamble Co. | | | 32,652 | | | $ | 3,580,292 | |
| The Progressive Corp. | | | 4,111 | | | | 328,592 | |
| The TJX Cos., Inc. | | | 58,601 | | | | 3,098,821 | |
| The Walt Disney Co. | | | 6,196 | | | | 865,209 | |
| Thermo Fisher Scientific, Inc. | | | 9,955 | | | | 2,923,584 | |
| Tractor Supply Co. | | | 12,211 | | | | 1,328,557 | |
| Tyson Foods, Inc., Class A | | | 6,375 | | | | 514,717 | |
| Ulta Salon Cosmetics & Fragrance, Inc. (*) | | | 614 | | | | 212,990 | |
| United Continental Holdings, Inc. (*) | | | 4,558 | | | | 399,053 | |
| United Rentals, Inc. (*) | | | 871 | | | | 115,521 | |
| UnitedHealth Group, Inc. | | | 1,281 | | | | 312,577 | |
| Universal Health Services, Inc., Class B | | | 3,639 | | | | 474,489 | |
| Unum Group | | | 6,505 | | | | 218,243 | |
| USANA Health Sciences, Inc. (*) | | | 3,239 | | | | 257,274 | |
| Varian Medical Systems, Inc. (*) | | | 1,649 | | | | 224,478 | |
| Verizon Communications, Inc. | | | 41,083 | | | | 2,347,072 | |
| Vertex Pharmaceuticals, Inc. (*) | | | 948 | | | | 173,844 | |
| Viacom, Inc., Class B | | | 5,555 | | | | 165,928 | |
| Visa, Inc., Class A | | | 14,149 | | | | 2,455,559 | |
| VMware, Inc., Class A | | | 1,267 | | | | 211,855 | |
| Vocera Communications, Inc. (*) | | | 9,612 | | | | 306,815 | |
| Vulcan Materials Co. | | | 2,362 | | | | 324,326 | |
| Walgreens Boots Alliance, Inc. | | | 3,762 | | | | 205,669 | |
| Walmart, Inc. | | | 4,244 | | | | 468,920 | |
| Waste Management, Inc. | | | 9,967 | | | | 1,149,893 | |
| WW Grainger, Inc. | | | 1,407 | | | | 377,400 | |
| Zions BanCorp. | | | 3,320 | | | | 152,654 | |
| Zoetis, Inc. | | | 24,841 | | | | 2,819,205 | |
| | | | | | | | 181,818,211 | |
Total Common Stocks
(Cost $275,508,245) | | | | | | | 299,247,360 | |
The accompanying notes are an integral part of these financial statements.
38 Semi-Annual Report
| Description | | Security
Currency | | Principal Amount
(000) | | | Fair
Value | |
| | | | | | | | | |
| Lazard Retirement Global Dynamic Multi-Asset Portfolio (continued) | | | | | | | | |
| | | | | | | | | |
| Corporate Bonds | 6.8% | | | | | | | | |
| | | | | | | | | |
| Australia | 0.1% | | | | | | | | |
Telstra Corp., Ltd.,
4.000%, 09/16/22 | | AUD | | | 800 | | | $ | 596,769 | |
| | | | | | | | | | | |
| Canada | 0.5% | | | | | | | | | | |
Canadian Imperial Bank of Commerce,
2.900%, 09/14/21 | | CAD | | | 1,645 | | | | 1,281,833 | |
Rogers Communications, Inc.,
3.250%, 05/01/29 | | CAD | | | 695 | | | | 544,202 | |
| | | | | | | | | | 1,826,035 | |
| France | 0.3% | | | | | | | | | | |
Schneider Electric SE,
2.950%, 09/27/22 | | USD | | | 1,275 | | | | 1,297,073 | |
| | | | | | | | | | | |
| Germany | 0.3% | | | | | | | | | | |
BMW Finance NV,
0.875%, 08/16/22 | | GBP | | | 970 | | | | 1,211,784 | |
| | | | | | | | | | | |
| Netherlands | 0.5% | | | | | | | | | | |
BNG Bank NV,
5.000%, 09/16/20 | | NZD | | | 1,227 | | | | 855,334 | |
Nederlandse Waterschapsbank NV,
3.125%, 12/05/22 (#) | | USD | | | 1,145 | | | | 1,191,604 | |
| | | | | | | | | | 2,046,938 | |
| New Zealand | 0.2% | | | | | | | | | | |
| Fonterra Cooperative Group, Ltd.: | | | | | | | | | | |
| 5.500%, 02/26/24 | | AUD | | | 1,000 | | | | 807,460 | |
| 4.000%, 11/02/27 | | AUD | | | 100 | | | | 77,420 | |
| | | | | | | | | | 884,880 | |
| Switzerland | 0.3% | | | | | | | | | | |
ABB Finance USA, Inc.,
3.375%, 04/03/23 | | USD | | | 1,110 | | | | 1,148,112 | |
The accompanying notes are an integral part of these financial statements.
Semi-Annual Report 39
| Description | | Security
Currency | | Principal
Amount
(000) | | | Fair
Value | |
| | | | | | | | | |
| Lazard Retirement Global Dynamic Multi-Asset Portfolio (continued) | | | | | | | | |
| | | | | | | | | |
| United Kingdom | 0.6% | | | | | | | | | | |
Ashtead Capital, Inc.,
4.125%, 08/15/25 | | USD | | | 1,010 | | | $ | 1,022,625 | |
Unilever Capital Corp.,
3.250%, 03/07/24 | | USD | | | 1,310 | | | | 1,362,583 | |
| | | | | | | | | | 2,385,208 | |
| United States | 4.0% | | | | | | | | | | |
Apple, Inc.,
3.850%, 05/04/43 | | USD | | | 1,525 | | | | 1,618,315 | |
Bank of America Corp.,
3.499%, 05/17/22 (§) | | USD | | | 1,270 | | | | 1,295,098 | |
Citigroup, Inc.,
3.095% (BBSW 3 Month + 1.550%), 05/04/21 (§) | | AUD | | | 1,661 | | | | 1,183,248 | |
John Deere Canada Funding, Inc.,
2.050%, 09/17/20 | | CAD | | | 1,630 | | | | 1,245,611 | |
Johnson & Johnson,
3.625%, 03/03/37 | | USD | | | 1,215 | | | | 1,299,339 | |
JPMorgan Chase & Co.,
4.500%, 01/24/22 | | USD | | | 855 | | | | 900,638 | |
McDonald’s Corp.,
3.125%, 03/04/25 | | CAD | | | 1,635 | | | | 1,291,557 | |
Microsoft Corp.,
4.450%, 11/03/45 | | USD | | | 1,365 | | | | 1,635,089 | |
Morgan Stanley,
3.625%, 01/20/27 | | USD | | | 1,380 | | | | 1,449,484 | |
NIKE, Inc.,
2.375%, 11/01/26 | | USD | | | 1,455 | | | | 1,458,163 | |
Starbucks Corp.,
4.450%, 08/15/49 | | USD | | | 1,010 | | | | 1,104,644 | |
The Goldman Sachs Group, Inc.,
3.625%, 01/22/23 | | USD | | | 615 | | | | 637,737 | |
Verizon Communications, Inc.,
3.875%, 02/08/29 | | USD | | | 1,220 | | | | 1,307,936 | |
| | | | | | | | | | 16,426,859 | |
Total Corporate Bonds
(Cost $26,743,881) | | | | | | | | | 27,823,658 | |
| | | | | | | | | | | |
The accompanying notes are an integral part of these financial statements.
40 Semi-Annual Report
| Description | | Security
Currency | | Principal
Amount
(000) | | | Fair
Value | |
| | | | | | | | | |
| Lazard Retirement Global Dynamic Multi-Asset Portfolio (continued) | | | | | | | | |
| | | | | | | | | |
| Foreign Government Obligations | 11.8% | | | | | | | | |
| | | | | | | | | |
| Australia | 0.3% | | | | | | | | |
Queensland Treasury Corp.,
3.000%, 03/22/24 (#) | | AUD | | | 1,545 | | | $ | 1,168,042 | |
| | | | | | | | | | | |
| Bermuda | 1.0% | | | | | | | | | | |
| Government of Bermuda: | | | | | | | | | | |
| 4.854%, 02/06/24 | | USD | | | 2,780 | | | | 3,009,350 | |
| 3.717%, 01/25/27 | | USD | | | 840 | | | | 853,650 | |
| | | | | | | | | | 3,863,000 | |
| Canada | 1.4% | | | | | | | | | | |
City of Vancouver,
2.900%, 11/20/25 | | CAD | | | 780 | | | | 624,935 | |
Province of Ontario,
2.450%, 06/29/22 | | USD | | | 545 | | | | 552,549 | |
| Province of Quebec: | | | | | | | | | | |
| 3.500%, 07/29/20 | | USD | | | 2,210 | | | | 2,243,791 | |
| 1.650%, 03/03/22 | | CAD | | | 830 | | | | 633,869 | |
| 2.500%, 04/20/26 | | USD | | | 1,510 | | | | 1,540,363 | |
| | | | | | | | | | 5,595,507 | |
| Chile | 0.8% | | | | | | | | | | |
Bonos de la Tesoreria de la Republica en pesos,
4.500%, 03/01/26 | | CLP | | | 865,000 | | | | 1,381,894 | |
Republic of Chile,
3.125%, 01/21/26 | | USD | | | 1,835 | | | | 1,910,694 | |
| | | | | | | | | | 3,292,588 | |
| Czech Republic | 0.8% | | | | | | | | | | |
| Czech Republic: | | | | | | | | | | |
| 2.150% (PRIBOR 6 Month - 0.100%), 11/19/27 (§) | | CZK | | | 23,360 | | | | 1,056,754 | |
| 2.500%, 08/25/28 | | CZK | | | 44,100 | | | | 2,144,252 | |
| | | | | | | | | | 3,201,006 | |
The accompanying notes are an integral part of these financial statements.
Semi-Annual Report 41
| Description | | Security
Currency | | Principal
Amount
(000) | | | Fair
Value | |
| | | | | | | | | |
| Lazard Retirement Global Dynamic Multi-Asset Portfolio (continued) | | | | | | | | |
| | | | | | | | | |
| France | 0.6% | | | | | | | | |
Government of France,
1.750%, 06/25/39 | | EUR | | | 1,665 | | | $ | 2,306,516 | |
| | | | | | | | | | | |
| Hungary | 0.8% | | | | | | | | | | |
Hungary,
6.375%, 03/29/21 | | USD | | | 1,140 | | | | 1,216,574 | |
| Hungary Government Bonds: | | | | | | | | | | |
| 3.000%, 10/27/27 | | HUF | | | 285,420 | | | | 1,064,264 | |
| 3.000%, 08/21/30 | | HUF | | | 292,950 | | | | 1,068,497 | |
| | | | | | | | | | 3,349,335 | |
| Ireland | 0.8% | | | | | | | | | | |
| Ireland Government Bonds: | | | | | | | | | | |
| 1.350%, 03/18/31 | | EUR | | | 855 | | | | 1,081,522 | |
| 1.700%, 05/15/37 | | EUR | | | 1,755 | | | | 2,309,680 | |
| | | | | | | | | | 3,391,202 | |
| Italy | 0.3% | | | | | | | | | | |
Italy Government International Bonds,
6.875%, 09/27/23 | | USD | | | 1,125 | | | | 1,271,770 | |
| | | | | | | | | | | |
| Japan | 0.6% | | | | | | | | | | |
| Japan International Cooperation Agency: | | | | | | | | | | |
| 1.875%, 11/13/19 | | USD | | | 1,460 | | | | 1,457,065 | |
| 2.125%, 10/20/26 | | USD | | | 1,030 | | | | 1,012,306 | |
| | | | | | | | | | 2,469,371 | |
| Mexico | 0.2% | | | | | | | | | | |
United Mexican States,
6.750%, 02/06/24 | | GBP | | | 565 | | | | 854,058 | |
| | | | | | | | | | | |
| New Zealand | 0.3% | | | | | | | | | | |
New Zealand Government Bonds,
6.000%, 05/15/21 | | NZD | | | 1,400 | | | | 1,017,276 | |
The accompanying notes are an integral part of these financial statements.
42 Semi-Annual Report
| Description | | Security
Currency | | | Principal
Amount
(000) | | | | Fair
Value | |
| | | | | | | | | | | |
| Lazard Retirement Global Dynamic Multi-Asset Portfolio (continued) | | | | | | | | | | |
| | | | | | | | | | | |
| Norway | 1.3% | | | | | | | | | | |
Kommunalbanken AS,
1.375%, 10/26/20 (#) | | USD | | | 820 | | | $ | 812,948 | |
| Oslo Kommune: | | | | | | | | | | |
| 3.650%, 11/08/23 | | NOK | | | 4,000 | | | | 502,393 | |
| 2.300%, 03/14/24 | | NOK | | | 7,000 | | | | 831,019 | |
| 2.350%, 09/04/24 | | NOK | | | 12,000 | | | | 1,429,539 | |
| 2.600%, 11/12/25 | | NOK | | | 4,000 | | | | 484,379 | |
| 1.870%, 05/06/26 (§) | | NOK | | | 12,000 | | | | 1,420,975 | |
| | | | | | | | | | 5,481,253 | |
| Panama | 0.6% | | | | | | | | | | |
Republic of Panama,
4.000%, 09/22/24 | | USD | | | 2,365 | | | | 2,522,420 | |
| | | | | | | | | | | |
| Poland | 0.5% | | | | | | | | | | |
Poland Government Bonds,
2.500%, 07/25/26 | | PLN | | | 7,902 | | | | 2,150,312 | |
| | | | | | | | | | | |
| Romania | 0.2% | | | | | | | | | | |
Romania Government Bonds,
2.375%, 04/19/27 | | EUR | | | 535 | | | | 658,918 | |
| | | | | | | | | | | |
| Singapore | 0.3% | | | | | | | | | | |
Singapore Government Bonds,
3.375%, 09/01/33 | | SGD | | | 1,260 | | | | 1,053,511 | |
| | | | | | | | | | | |
| Spain | 0.5% | | | | | | | | | | |
Spain Government Bonds,
1.400%, 04/30/28 | | EUR | | | 1,785 | | | | 2,228,815 | |
| | | | | | | | | | | |
| United Kingdom | 0.5% | | | | | | | | | | |
| United Kingdom Gilt: | | | | | | | | | | |
| 1.750%, 09/07/37 | | GBP | | | 820 | | | | 1,108,318 | |
| 1.500%, 07/22/47 | | GBP | | | 875 | | | | 1,117,406 | |
| | | | | | | | | | 2,225,724 | |
Total Foreign Government Obligations
(Cost $46,366,696) | | | | | | | | | 48,100,624 | |
The accompanying notes are an integral part of these financial statements.
Semi-Annual Report 43
| Description | | Security
Currency | | Principal
Amount
(000) | | | Fair
Value | |
| | | | | | | | | |
| Lazard Retirement Global Dynamic Multi-Asset Portfolio (continued) | | | | | | | | |
| | | | | | | | | |
| Quasi Government Bonds | 0.5% | | | | | | | | |
| | | | | | | | | |
| Canada | 0.5% | | | | | | | | |
Export Development Canada,
1.800%, 09/01/22
(Cost $1,865,817) | | CAD | | | 2,500 | | | $ | 1,919,362 | |
| | | | | | | | | | | |
| Supranational Bonds | 2.7% | | | | | | | | | | |
African Development Bank,
2.375%, 09/23/21 | | USD | | | 1,216 | | | | 1,229,964 | |
| Asian Development Bank: | | | | | | | | | | |
| 1.000%, 12/15/22 | | GBP | | | 1,040 | | | | 1,324,485 | |
| 2.125%, 03/19/25 | | USD | | | 1,865 | | | | 1,886,792 | |
European Investment Bank,
1.125%, 09/16/21 (#) | | CAD | | | 1,650 | | | | 1,246,981 | |
| International Bank for Reconstruction & Development: | | | | | | | | | | |
| 3.500%, 01/22/21 | | NZD | | | 950 | | | | 656,898 | |
| 2.500%, 08/03/23 | | CAD | | | 2,620 | | | | 2,061,588 | |
| 2.900%, 11/26/25 | | AUD | | | 865 | | | | 655,697 | |
| International Finance Corp.: | | | | | | | | | | |
| 3.625%, 05/20/20 | | NZD | | | 1,290 | | | | 882,330 | |
| 2.700%, 03/15/23 | | AUD | | | 1,415 | | | | 1,041,181 | |
| | | | | | | | | | | |
Total Supranational Bonds
(Cost $10,853,587) | | | | | | | | | 10,985,916 | |
| | | | | | | | | | | |
| US Government Securities | 0.4% | | | | | | | | | | |
Federal National Mortgage Association,
2.625%, 09/06/24
(Cost $1,609,268) | | USD | | | 1,630 | | | | 1,690,978 | |
The accompanying notes are an integral part of these financial statements.
44 Semi-Annual Report
| Description | | Security
Currency | | Principal
Amount
(000) | | | Fair
Value | |
| | | | | | | | | | | |
| Lazard Retirement Global Dynamic Multi-Asset Portfolio (continued) | | | | | | | | | | |
| | | | | | | | | | | |
| US Municipal Bonds | 0.7% | | | | | | | | | | |
| | | | | | | | | | | |
| California | 0.6% | | | | | | | | | | |
California State Build America Bonds,
7.500%, 04/01/34 | | USD | | | 940 | | | $ | 1,418,836 | |
State of California,
4.500%, 04/01/33 | | USD | | | 900 | | | | 1,017,792 | |
| | | | | | | | | | 2,436,628 | |
| Georgia | 0.1% | | | | | | | | | | |
Georgia State Build America Bonds Series B,
2.380%, 02/01/27 | | USD | | | 350 | | | | 347,095 | |
| | | | | | | | | | | |
| Pennsylvania | 0.0% | | | | | | | | | | |
Pennsylvania State Build America Bonds Third Series B,
5.850%, 07/15/30 | | USD | | | 50 | | | | 51,776 | |
| | | | | | | | | | | |
| Wisconsin | 0.0% | | | | | | | | | | |
Wisconsin State Build America Bonds Series D,
5.400%, 05/01/28 | | USD | | | 175 | | | | 179,233 | |
| | | | | | | | | | | |
Total US Municipal Bonds
(Cost $2,888,307) | | | | | | | | | 3,014,732 | |
| | | | | | | | | | | |
| US Treasury Securities | 2.4% | | | | | | | | | | |
| US Treasury Notes: | | | | | | | | | | |
| 2.125%, 05/15/25 | | USD | | | 5,050 | | | | 5,132,457 | |
| 2.875%, 08/15/28 | | USD | | | 3,145 | | | | 3,377,927 | |
| 3.125%, 11/15/41 | | USD | | | 948 | | | | 1,060,019 | |
| | | | | | | | | | | |
Total US Treasury Securities
(Cost $9,028,571) | | | | | | | | | 9,570,403 | |
The accompanying notes are an integral part of these financial statements.
Semi-Annual Report 45
| | | | | | | |
| Description | | Shares | | | Fair
Value | |
| | | | | | | |
| Lazard Retirement Global Dynamic Multi-Asset Portfolio (continued) | | | | | | |
| | | | | | | |
| Short-Term Investments | 1.2% | | | | | | |
State Street Institutional Treasury Money Market Fund, Premier Class, 2.17% (7 day yield)
(Cost $4,946,678) | | | 4,946,678 | | | $ | 4,946,678 | |
| | | | | | | | | |
Total Investments | 100.0%
(Cost $379,811,050) (») | | | | | | $ | 407,299,711 | |
| | | | | | | | | |
| Liabilities in Excess of Cash and Other Assets | 0.0% | | | | | | | (48,679 | ) |
| | | | | | | | | |
| Net Assets | 100.0% | | | | | | $ | 407,251,032 | |
Forward Currency Contracts open at June 30, 2019:
| | | | | | | | | | | | | | | | | | | | |
| Currency Purchased | | Quantity | | | Currency
Sold | | Quantity | | | Counterparty | | Settlement
Date | | Unrealized
Appreciation | | Unrealized
Depreciation |
| | | | | | | | | | | | | | | | | | | | | | | | | |
| AUD | | | 1,294,164 | | | USD | | | 906,122 | | | | HSB | | | 08/14/19 | | $ | 3,733 | | | $ | — | |
| AUD | | | 897,336 | | | USD | | | 627,496 | | | | JPM | | | 08/14/19 | | | 3,371 | | | | — | |
| AUD | | | 522,023 | | | USD | | | 364,800 | | | | MSC | | | 08/14/19 | | | 2,205 | | | | — | |
| CAD | | | 776,396 | | | USD | | | 581,500 | | | | JPM | | | 08/14/19 | | | 11,911 | | | | — | |
| CAD | | | 1,935,052 | | | USD | | | 1,472,557 | | | | JPM | | | 08/14/19 | | | 6,432 | | | | — | |
| CAD | | | 2,074,867 | | | USD | | | 1,586,917 | | | | SSB | | | 09/26/19 | | | — | | | | 74 | |
| CHF | | | 432,615 | | | USD | | | 433,895 | | | | HSB | | | 08/14/19 | | | 11,027 | | | | — | |
| CLP | | | 126,623,208 | | | USD | | | 186,320 | | | | CIT | | | 07/25/19 | | | 608 | | | | — | |
| CZK | | | 27,177,234 | | | EUR | | | 1,052,500 | | | | JPM | | | 07/25/19 | | | 16,852 | | | | — | |
| CZK | | | 9,812,635 | | | USD | | | 437,920 | | | | JPM | | | 07/25/19 | | | 1,107 | | | | — | |
| EUR | | | 816,120 | | | USD | | | 921,000 | | | | CIT | | | 07/11/19 | | | 7,718 | | | | — | |
| EUR | | | 2,555,825 | | | USD | | | 2,891,328 | | | | CIT | | | 07/11/19 | | | 17,115 | | | | — | |
| EUR | | | 755,630 | | | USD | | | 855,204 | | | | HSB | | | 07/11/19 | | | 4,678 | | | | — | |
| EUR | | | 1,347,468 | | | USD | | | 1,518,085 | | | | HSB | | | 07/11/19 | | | 15,289 | | | | — | |
| EUR | | | 12,814,122 | | | USD | | | 14,495,014 | | | | HSB | | | 07/11/19 | | | 87,027 | | | | — | |
| EUR | | | 1,943,995 | | | USD | | | 2,230,112 | | | | HSB | | | 09/26/19 | | | — | | | | 4,739 | |
| EUR | | | 190,829 | | | USD | | | 215,272 | | | | JPM | | | 07/11/19 | | | 1,885 | | | | — | |
The accompanying notes are an integral part of these financial statements.
46 Semi-Annual Report
Lazard Retirement Global Dynamic Multi-Asset Portfolio (continued)
| | | | | | | | | | | | | | | | | | | | |
Currency
Purchased | | Quantity | | | Currency
Sold | | Quantity | | | Counterparty | | Settlement
Date | | Unrealized
Appreciation | | Unrealized
Depreciation |
| | | | | | | | | | | | | | | | | | | | | | | | | |
| EUR | | | 1,016,609 | | | USD | | | 1,156,015 | | | | JPM | | | 07/11/19 | | $ | 851 | | | $ | — | |
| EUR | | | 1,708,994 | | | USD | | | 1,933,556 | | | | JPM | | | 07/11/19 | | | 11,222 | | | | — | |
| GBP | | | 182,599 | | | USD | | | 234,200 | | | | JPM | | | 08/14/19 | | | — | | | | 1,833 | |
| GBP | | | 1,797,583 | | | USD | | | 2,283,548 | | | | JPM | | | 08/14/19 | | | 3,975 | | | | — | |
| GBP | | | 285,237 | | | USD | | | 364,420 | | | | SSB | | | 09/26/19 | | | — | | | | 812 | |
| GBP | | | 1,085,276 | | | USD | | | 1,385,194 | | | | SSB | | | 09/26/19 | | | — | | | | 1,731 | |
| HUF | | | 79,725,609 | | | USD | | | 280,668 | | | | JPM | | | 08/08/19 | | | 604 | | | | — | |
| HUF | | | 91,117,425 | | | USD | | | 321,057 | | | | JPM | | | 08/08/19 | | | 405 | | | | — | |
| IDR | | | 4,914,986,000 | | | USD | | | 341,200 | | | | HSB | | | 09/11/19 | | | 3,920 | | | | — | |
| JPY | | | 95,938,009 | | | USD | | | 899,645 | | | | CIT | | | 08/14/19 | | | — | | | | 6,942 | |
| JPY | | | 1,598,840,467 | | | USD | | | 14,750,037 | | | | CIT | | | 08/14/19 | | | 127,170 | | | | — | |
| JPY | | | 879,005,700 | | | USD | | | 8,109,582 | | | | HSB | | | 08/14/19 | | | 69,564 | | | | — | |
| JPY | | | 59,849,671 | | | USD | | | 561,257 | | | | HSB | | | 09/26/19 | | | — | | | | 2,669 | |
| JPY | | | 89,585,508 | | | USD | | | 837,600 | | | | JPM | | | 08/14/19 | | | — | | | | 4,007 | |
| JPY | | | 66,588,261 | | | USD | | | 624,409 | | | | SSB | | | 09/26/19 | | | — | | | | 2,929 | |
| KRW | | | 1,664,418,920 | | | USD | | | 1,412,200 | | | | HSB | | | 08/05/19 | | | 30,733 | | | | — | |
| MXN | | | 6,339,110 | | | USD | | | 325,076 | | | | HSB | | | 08/14/19 | | | 2,870 | | | | — | |
| NOK | | | 717,303 | | | USD | | | 82,235 | | | | HSB | | | 08/14/19 | | | 1,965 | | | | — | |
| NOK | | | 3,240,995 | | | USD | | | 371,802 | | | | HSB | | | 08/14/19 | | | 8,637 | | | | — | |
| NZD | | | 659,168 | | | USD | | | 435,400 | | | | HSB | | | 08/14/19 | | | 7,832 | | | | — | |
| NZD | | | 705,619 | | | USD | | | 472,039 | | | | JPM | | | 08/14/19 | | | 2,427 | | | | — | |
| PLN | | | 1,113,181 | | | USD | | | 297,022 | | | | HSB | | | 08/14/19 | | | 1,450 | | | | — | |
| SEK | | | 4,988,726 | | | USD | | | 529,600 | | | | MSC | | | 08/14/19 | | | 9,325 | | | | — | |
| SGD | | | 194,025 | | | USD | | | 143,395 | | | | JPM | | | 08/14/19 | | | 113 | | | | — | |
| USD | | | 255,000 | | | AUD | | | 365,880 | | | | HSB | | | 08/14/19 | | | — | | | | 2,230 | |
| USD | | | 4,177,639 | | | AUD | | | 5,985,413 | | | | HSB | | | 08/14/19 | | | — | | | | 30,375 | |
| USD | | | 2,933,152 | | | AUD | | | 4,201,561 | | | | HSB | | | 09/26/19 | | | — | | | | 24,043 | |
| USD | | | 1,128,872 | | | AUD | | | 1,617,267 | | | | JPM | | | 08/14/19 | | | — | | | | 8,139 | |
| USD | | | 305,160 | | | AUD | | | 437,148 | | | | SSB | | | 09/26/19 | | | — | | | | 2,518 | |
| USD | | | 718,293 | | | CAD | | | 966,418 | | | | CIT | | | 08/14/19 | | | — | | | | 20,355 | |
| USD | | | 382,500 | | | CAD | | | 503,573 | | | | HSB | | | 08/14/19 | | | — | | | | 2,388 | |
| USD | | | 5,286,677 | | | CAD | | | 7,108,835 | | | | HSB | | | 08/14/19 | | | — | | | | 146,712 | |
| USD | | | 4,720,721 | | | CAD | | | 6,220,306 | | | | HSB | | | 09/26/19 | | | — | | | | 36,523 | |
| USD | | | 3,431,608 | | | CAD | | | 4,614,504 | | | | JPM | | | 08/14/19 | | | — | | | | 95,326 | |
| USD | | | 345,486 | | | CAD | | | 455,213 | | | | SSB | | | 09/26/19 | | | — | | | | 2,657 | |
| USD | | | 1,513,559 | | | CLP | | | 1,011,920,323 | | | | CIT | | | 07/25/19 | | | 19,707 | | | | — | |
The accompanying notes are an integral part of these financial statements.
Semi-Annual Report 47
Lazard Retirement Global Dynamic Multi-Asset Portfolio (concluded)
| | | | | | | | | | | | | | | | | | | | | | |
Currency
Purchased | | Quantity | | | Currency
Sold | | Quantity | | | Counterparty | | Settlement
Date | | Unrealized
Appreciation | | Unrealized
Depreciation |
| | | | | | | | | | | | | | | | | | | | | | | | | | | |
| USD | | | 439,200 | | | CZK | | | 9,828,620 | | | | JPM | | | 07/25/19 | | | $ | — | | | | $ | 542 | |
| USD | | | 1,189,164 | | | CZK | | | 27,105,812 | | | | JPM | | | 07/25/19 | | | | — | | | | | 23,577 | |
| USD | | | 1,201,428 | | | EUR | | | 1,060,479 | | | | HSB | | | 07/11/19 | | | | — | | | | | 5,362 | |
| USD | | | 2,599,806 | | | EUR | | | 2,302,873 | | | | HSB | | | 07/11/19 | | | | — | | | | | 20,787 | |
| USD | | | 2,762,900 | | | EUR | | | 2,426,875 | | | | HSB | | | 07/11/19 | | | | 1,198 | | | | | — | |
| USD | | | 4,485,000 | | | EUR | | | 3,943,131 | | | | HSB | | | 07/11/19 | | | | — | | | | | 2,151 | |
| USD | | | 807,600 | | | GBP | | | 634,551 | | | | HSB | | | 08/14/19 | | | | 98 | | | | | — | |
| USD | | | 1,266,401 | | | GBP | | | 973,413 | | | | HSB | | | 08/14/19 | | | | 27,679 | | | | | — | |
| USD | | | 157,764 | | | GBP | | | 121,258 | | | | JPM | | | 08/14/19 | | | | 3,457 | | | | | — | |
| USD | | | 574,398 | | | HUF | | | 165,064,807 | | | | HSB | | | 08/08/19 | | | | — | | | | | 7,951 | |
| USD | | | 1,984,548 | | | HUF | | | 570,200,199 | | | | JPM | | | 08/08/19 | | | | — | | | | | 27,122 | |
| USD | | | 679,485 | | | ILS | | | 2,434,120 | | | | HSB | | | 09/26/19 | | | | — | | | | | 6,145 | |
| USD | | | 2,323,700 | | | JPY | | | 248,050,327 | | | | HSB | | | 08/14/19 | | | | 15,592 | | | | | — | |
| USD | | | 4,069,202 | | | JPY | | | 441,064,826 | | | | HSB | | | 08/14/19 | | | | — | | | | | 34,906 | |
| USD | | | 1,176,800 | | | JPY | | | 126,758,847 | | | | MSC | | | 08/14/19 | | | | — | | | | | 2,691 | |
| USD | | | 297,500 | | | NOK | | | 2,537,006 | | | | HSB | | | 08/14/19 | | | | — | | | | | 303 | |
| USD | | | 357,647 | | | NOK | | | 3,120,427 | | | | HSB | | | 08/14/19 | | | | — | | | | | 8,640 | |
| USD | | | 2,212,245 | | | NOK | | | 19,296,621 | | | | HSB | | | 08/14/19 | | | | — | | | | | 52,859 | |
| USD | | | 2,690,640 | | | NOK | | | 22,793,221 | | | | HSB | | | 09/26/19 | | | | 12,462 | | | | | — | |
| USD | | | 1,855,788 | | | NZD | | | 2,818,190 | | | | CIT | | | 08/14/19 | | | | — | | | | | 39,195 | |
| USD | | | 929,479 | | | NZD | | | 1,411,585 | | | | HSB | | | 08/14/19 | | | | — | | | | | 19,686 | |
| USD | | | 783,470 | | | NZD | | | 1,189,760 | | | | JPM | | | 08/14/19 | | | | — | | | | | 16,538 | |
| USD | | | 2,090,792 | | | PLN | | | 7,996,360 | | | | HSB | | | 08/14/19 | | | | — | | | | | 53,238 | |
| USD | | | 348,790 | | | SGD | | | 477,222 | | | | CIT | | | 08/14/19 | | | | — | | | | | 4,183 | |
| USD | | | 281,022 | | | SGD | | | 384,461 | | | | HSB | | | 08/14/19 | | | | — | | | | | 3,341 | |
| USD | | | 1,195,767 | | | SGD | | | 1,616,677 | | | | HSB | | | 09/26/19 | | | | — | | | | | 643 | |
| USD | | | 270,639 | | | SGD | | | 370,363 | | | | JPM | | | 08/14/19 | | | | — | | | | | 3,296 | |
| Total gross unrealized appreciation/depreciation on Forward Currency Contracts | | | $ | 554,214 | | | | $ | 730,158 | |
The accompanying notes are an integral part of these financial statements.
48 Semi-Annual Report
Lazard Retirement Series, Inc.Notes to Portfolios of Investments
June 30, 2019 (unaudited)
| (*) | Non-income producing security. |
| | |
| (‡) | Security valued using Level 2 inputs, based on reference to a similar security which was trading on an active market, under GAAP hierarchy — see Note 8 in the Notes to Financial Statements. |
| | |
| (#) | Pursuant to Rule 144A under the Securities Act of 1933, these securities may only be traded among “qualified institutional buyers.” At June 30, 2019, these securities amounted to 1.1% of net assets f Lazard Retirement Global Dynamic Multi-Asset Portfolio. |
| | |
| (§) | Variable and floating rate securities are securities for which interest rate changes are based on changes in a designated base rate. The rates shown are those in effect on June 30, 2019. |
| | |
| (») | The Portfolio, at all times, maintains portfolio securities in sufficient amount to cover its obligations related to investments in forward currency contracts. |
| Security Abbreviations: | | |
| ADR | — American Depositary Receipt | | |
| BBSW | — Bank Bill Swap Reference Rate | | |
| GDR | — Global Depositary Receipt | | |
| PJSC | — Public Joint Stock Company | | |
| PRIBOR | — Prague Interbank Offered Rate | | |
| REIT | — Real Estate Investment Trust | | |
| | | | |
| Currency Abbreviations: | | |
| AUD | — Australian Dollar | ILS | — Israeli Shekel |
| CAD | — Canadian Dollar | JPY | — Japanese Yen |
| CHF | — Swiss Franc | KRW | — South Korean Won |
| CLP | — Chilean Peso | MXN | — Mexican New Peso |
| CZK | — Czech Koruna | NOK | — Norwegian Krone |
| EUR | — Euro | NZD | — New Zealand Dollar |
| GBP | — British Pound Sterling | PLN | — Polish Zloty |
| HUF | — Hungarian Forint | SEK | — Swedish Krone |
| IDR | — Indonesian Rupiah | SGD | — Singapore Dollar |
| ILS | — Israeli Shekel | USD | — United States Dollar |
| Counterparty Abbreviations: |
| CIT | — Citibank NA |
| HSB | — HSBC Bank USA NA |
| JPM | — JPMorgan Chase Bank NA |
| MSC | — Morgan Stanley & Co. Inc. |
| SSB | — State Street Bank and Trust Co. |
The accompanying notes are an integral part of these financial statements.
Semi-Annual Report 49
Portfolio holdings by industry (as a percentage of net assets), for those Portfolios previously presented by country:
| Industry† | | Lazard
Retirement
Emerging
Markets
Equity
Portfolio | | Lazard
Retirement
International
Equity
Portfolio | | Lazard
Retirement
Global
Dynamic
Multi-Asset
Portfolio |
| | | | | | | | | | | | | |
| Common & Preferred Stocks and Corporate & Quasi Government Bonds | | | | | | | | | | | | |
| Aerospace & Defense | | | — | % | | | 2.3 | % | | | 2.0 | % |
| Air Freight & Logistics | | | 0.1 | | | | — | | | | — | |
| Airlines | | | — | | | | 1.1 | | | | 0.8 | |
| Auto Components | | | 1.5 | | | | 1.0 | | | | 0.1 | |
| Automobiles | | | 3.3 | | | | 2.8 | | | | 0.5 | |
| Banks | | | 24.9 | | | | 8.8 | | | | 5.6 | |
| Beverages | | | 1.2 | | | | 5.5 | | | | 2.5 | |
| Biotechnology | | | — | | | | — | | | | 0.5 | |
| Building Products | | | — | | | | 2.2 | | | | 0.2 | |
| Capital Markets | | | — | | | | — | | | | 2.5 | |
| Chemicals | | | 0.5 | | | | 4.7 | | | | 0.8 | |
| Commercial Services & Suppliers | | | — | | | | — | | | | 1.0 | |
| Communications Equipment | | | — | | | | — | | | | 1.1 | |
| Construction & Engineering | | | — | | | | 1.4 | | | | 0.4 | |
| Construction Materials | | | 3.2 | | | | — | | | | 0.1 | |
| Consumer Finance | | | — | | | | — | | | | 0.6 | |
| Containers & Packaging | | | — | | | | 1.2 | | | | — | |
| Distributors | | | — | | | | — | | | | 0.1 | |
| Diversified Financial Services | | | — | | | | — | | | | 1.0 | |
| Diversified Telecommunication Services | | | 1.8 | | | | 2.2 | | | | 1.4 | |
| Electric Utilities | | | — | | | | 1.4 | | | | 2.2 | |
| Electrical Equipment | | | — | | | | 0.8 | | | | 0.9 | |
| Electronic Equipment, Instruments & Components | | | 2.0 | | | | 0.8 | | | | 0.7 | |
| Energy Equipment & Services | | | — | | | | — | | | | 0.2 | |
| Entertainment | | | 2.9 | | | | 3.2 | | | | 0.7 | |
| Equity Real Estate Investment Trusts (REITs) | | | — | | | | — | | | | 1.7 | |
| Food & Staples Retailing | | | 2.0 | | | | — | | | | 1.4 | |
| Food Products | | | — | | | | — | | | | 1.0 | |
| Gas Utilities | | | 1.0 | | | | — | | | | 0.1 | |
| Health Care Equipment & Supplies | | | — | | | | 2.7 | | | | 1.2 | |
| Health Care Providers & Services | | | 0.6 | | | | 0.7 | | | | 1.3 | |
| Health Care Technology | | | — | | | | — | | | | 0.2 | |
| Hotels, Restaurants & Leisure | | | — | | | | 1.5 | | | | 2.9 | |
| Household Durables | | | 1.1 | | | | — | | | | — | |
| Household Products | | | 0.9 | | | | — | | | | 1.4 | |
The accompanying notes are an integral part of these financial statements.
50 Semi-Annual Report
| Industry† | | Lazard
Retirement
Emerging
Markets
Equity
Portfolio | | Lazard
Retirement
International
Equity
Portfolio | | Lazard
Retirement
Global
Dynamic
Multi-Asset
Portfolio | |
| | | | | | | | | | | |
| Independent Power & Renewable Electricity Producers | | | — | % | | | — | % | | | 0.2 | % | |
| Industrial Conglomerates | | | 1.8 | | | | — | | | | 0.9 | | |
| Insurance | | | 3.0 | | | | 9.5 | | | | 4.1 | | |
| Interactive Media & Services | | | 0.8 | | | | — | | | | 1.1 | | |
| Internet & Direct Marketing Retail | | | — | | | | — | | | | 1.0 | | |
| IT Services | | | 5.1 | | | | 1.6 | | | | 3.7 | | |
| Leisure Products | | | — | | | | 0.9 | | | | 0.5 | | |
| Life Sciences Tools & Services | | | — | | | | — | | | | 1.4 | | |
| Machinery | | | 1.9 | | | | 3.1 | | | | 1.3 | | |
| Media | | | — | | | | 1.3 | | | | 0.8 | | |
| Metals & Mining | | | 2.6 | | | | 1.5 | | | | 1.4 | | |
| Multiline Retail | | | 0.3 | | | | 0.9 | | | | 0.4 | | |
| Multi-Utilities | | | — | | | | 1.3 | | | | 0.9 | | |
| Oil, Gas & Consumable Fuels | | | 11.3 | | | | 6.2 | | | | 2.7 | | |
| Personal Products | | | 1.0 | | | | 3.6 | | | | 2.0 | | |
| Pharmaceuticals | | | — | | | | 6.4 | | | | 5.7 | | |
| Professional Services | | | — | | | | 4.3 | | | | 1.6 | | |
| Real Estate Management & Development | | | — | | | | 2.8 | | | | 1.4 | | |
| Road & Rail | | | — | | | | 1.1 | | | | 0.7 | | |
| Semiconductors & Semiconductor Equipment | | | 6.4 | | | | — | | | | 1.3 | | |
| Software | | | — | | | | 3.6 | | | | 2.9 | | |
| Specialty Retail | | | 0.4 | | | | — | | | | 2.1 | | |
| Technology Hardware, Storage & Peripherals | | | 5.6 | | | | 1.2 | | | | 1.6 | | |
| Textiles, Apparel & Luxury Goods | | | — | | | | — | | | | 1.1 | | |
| Tobacco | | | 1.5 | | | | — | | | | 0.5 | | |
| Trading Companies & Distributors | | | — | | | | 1.4 | | | | 0.5 | | |
| Transportation Infrastructure | | | 1.5 | | | | — | | | | — | | |
| Wireless Telecommunication Services | | | 6.9 | | | | 1.1 | | | | 1.9 | | |
| Subtotal | | | 97.1 | | | | 96.1 | | | | 80.8 | | |
| Foreign Government Obligations | | | — | | | | — | | | | 11.8 | | |
| Supranational Bonds | | | — | | | | — | | | | 2.7 | | |
| US Government Securities | | | — | | | | — | | | | 0.4 | | |
| US Municipal Bonds | | | — | | | | — | | | | 0.7 | | |
| US Treasury Securities | | | — | | | | — | | | | 2.4 | | |
| Short-Term Investments | | | 2.5 | | | | 3.5 | | | | 1.2 | | |
| Total Investments | | | 99.6 | % | | | 99.6 | % | | | 100.0 | % | |
| | |
| † | Industry classifications may be different than those used for compliance monitoring purposes. |
The accompanying notes are an integral part of these financial statements.
Semi-Annual Report 51
Lazard Retirement Series, Inc.Statements of Assets and Liabilities (unaudited)
| June 30, 2019 | | Lazard
Retirement
Emerging Markets
Equity Portfolio | | Lazard
Retirement
International
Equity Portfolio | |
| | | | | | | | | | |
| ASSETS | | | | | | | | | | | |
| Investments in securities, at fair value | | | $ | 574,603,849 | | | | $ | 169,422,016 | | |
| Cash | | | | 78,101 | | | | | — | | |
| Foreign currency, at fair value | | | | 365,191 | | | | | 152,448 | | |
| Receivables for: | | | | | | | | | | | |
| Dividends and interest | | | | 2,734,162 | | | | | 933,647 | | |
| Investments sold | | | | 675,498 | | | | | 567,293 | | |
| Capital stock sold | | | | 153,718 | | | | | 12,355 | | |
| Amount due from Investment Manager (Note 3) | | | | — | | | | | — | | |
| Gross unrealized appreciation on forward currency contracts | | | | — | | | | | — | | |
| Prepaid expenses | | | | — | | | | | — | | |
| Total assets | | | | 578,610,519 | | | | | 171,087,759 | | |
| | | | | | | | | | | | |
| LIABILITIES | | | | | | | | | | | |
| Payables for: | | | | | | | | | | | |
| Foreign capital gains taxes | | | | 591,447 | | | | | — | | |
| Management fees | | | | 465,791 | | | | | 96,502 | | |
| Capital stock redeemed | | | | 402,008 | | | | | 32,317 | | |
| Accrued custodian fees | | | | 111,578 | | | | | 8,083 | | |
| Accrued distribution fees | | | | 82,152 | | | | | 34,497 | | |
| Accrued professional services | | | | 68,156 | | | | | 27,164 | | |
| Accrued shareholders’ reports | | | | 49,803 | | | | | 13,752 | | |
| Investments purchased | | | | 41,449 | | | | | 696,706 | | |
| Gross unrealized depreciation on forward currency contracts | | | | — | | | | | — | | |
| Other accrued expenses and payables | | | | 26,578 | | | | | 8,550 | | |
| Total liabilities | | | | 1,838,962 | | | | | 917,571 | | |
| Net assets | | | $ | 576,771,557 | | | | $ | 170,170,188 | | |
| | | | | | | | | | | | |
| NET ASSETS | | | | | | | | | | | |
| Paid in capital | | | $ | 561,936,126 | | | | $ | 147,458,105 | | |
| Distributable earnings (Accumulated loss) | | | | 14,835,431 | | | | | 22,712,083 | | |
| Net assets | | | $ | 576,771,557 | | | | $ | 170,170,188 | | |
| | | | | | | | | | | | |
| Service Shares | | | | | | | | | | | |
| Net assets | | | $ | 404,042,663 | | | | $ | 170,170,188 | | |
| Shares of capital stock outstanding* | | | | 19,472,623 | | | | | 17,127,799 | | |
| Net asset value, offering and redemption price per share | | | $ | 20.75 | | | | $ | 9.94 | | |
| | | | | | | | | | | | |
| Investor Shares | | | | | | | | | | | |
| Net assets | | | $ | 172,728,894 | | | | | — | | |
| Shares of capital stock outstanding** | | | | 8,415,644 | | | | | — | | |
| Net asset value, offering and redemption price per share | | | $ | 20.52 | | | | | — | | |
| | | | | | | | | | | | |
| Cost of investments in securities | | | $ | 539,831,164 | | | | $ | 149,011,597 | | |
| Cost of foreign currency | | | $ | 362,981 | | | | $ | 152,187 | | |
| * | $0.001 par value, 2,550,000,000 shares authorized for the Portfolios in total. |
| † | Shares values are rounded for presentation purposes. |
The accompanying notes are an integral part of these financial statements.
52 Semi-Annual Report
| | Lazard
Retirement
US Equity
Select Portfolio | | Lazard
Retirement
US Small-Mid Cap
Equity Portfolio | | Lazard
Retirement
Global Dynamic
Multi-Asset Portfolio | |
| | | | | | | | | | | | | |
| | $ | 9,166,303 | | | $ | 55,770,550 | | | $ | 407,299,711 | | |
| | | — | | | | — | | | | 175,855 | | |
| | | — | | | | — | | | | 67,093 | | |
| | | | | | | | | | | | | |
| | | 5,063 | | | | 53,602 | | | | 1,477,702 | | |
| | | — | | | | — | | | | 1,461,433 | | |
| | | 13,482 | | | | 6,051 | | | | 63,463 | | |
| | | 3,080 | | | | — | | | | — | | |
| | | | | | | | | | | | | |
| | | — | | | | — | | | | 554,214 | | |
| | | 3,237 | | | | — | | | | — | | |
| | | 9,191,165 | | | | 55,830,203 | | | | 411,099,471 | | |
| | | | | | | | | | | | | |
| | | | | | | | | | | | | |
| | | | | | | | | | | | | |
| | | — | | | | — | | | | — | | |
| | | — | | | | 29,580 | | | | 221,998 | | |
| | | 2,187 | | | | 8,519 | | | | 422,738 | | |
| | | 5,834 | | | | 5,768 | | | | 45,324 | | |
| | | 1,852 | | | | 11,279 | | | | 82,729 | | |
| | | 22,080 | | | | 22,605 | | | | 32,822 | | |
| | | 3,947 | | | | 6,368 | | | | 28,033 | | |
| | | — | | | | — | | | | 2,265,347 | | |
| | | | | | | | | | | | | |
| | | — | | | | — | | | | 730,158 | | |
| | | 4,335 | | | | 2,942 | | | | 19,290 | | |
| | | 40,235 | | | | 87,061 | | | | 3,848,439 | | |
| | $ | 9,150,930 | | | $ | 55,743,142 | | | $ | 407,251,032 | | |
| | | | | | | | | | | | | |
| | | | | | | | | | | | | |
| | $ | 7,198,403 | | | $ | 47,326,647 | | | $ | 375,402,226 | | |
| | | 1,952,527 | | | | 8,416,495 | | | | 31,848,806 | | |
| | $ | 9,150,930 | | | $ | 55,743,142 | | | $ | 407,251,032 | | |
| | | | | | | | | | | | | |
| | | | | | | | | | | | | |
| | $ | 9,150,930 | | | $ | 55,743,142 | | | $ | 407,247,271 | | |
| | | 699,471 | | | | 7,109,540 | | | | 31,341,543 | | |
| | | | | | | | | | | | | |
| | $ | 13.08 | | | $ | 7.84 | | | $ | 12.99 | | |
| | | | | | | | | | | | | |
| | | | | | | | | | | | | |
| | | — | | | | — | | | $ | 3,761 | | |
| | | — | | | | — | | | | 290 | † | |
| | | | | | | | | | | | | |
| | | — | | | | — | | | $ | 12.99 | | |
| | | | | | | | | | | | | |
| | $ | 7,648,762 | | | $ | 50,343,364 | | | $ | 379,811,050 | | |
| | $ | — | | | $ | — | | | $ | 67,079 | | |
Semi-Annual Report 53
Lazard Retirement Series, Inc.Statements of Operations (unaudited)
| For the Six Months Ended June 30, 2019 | | Lazard
Retirement
Emerging Markets
Equity Portfolio | | Lazard
Retirement
International
Equity Portfolio | |
| | | | | | | | | | | | |
| Investment Income (Loss) | | | | | | | | | | | |
| Income | | | | | | | | | | | |
| Dividends | | | $ | 10,233,110 | | | | $ | 3,563,722 | | |
| Interest | | | | — | | | | | — | | |
| Total investment income* | | | | 10,233,110 | | | | | 3,563,722 | | |
| Expenses | | | | | | | | | | | |
| Management fees (Note 3) | | | | 2,890,505 | | | | | 630,313 | | |
| Distribution fees (Service Shares) | | | | 508,647 | | | | | 210,104 | | |
| Custodian fees | | | | 196,503 | | | | | 37,139 | | |
| Professional services | | | | 116,757 | | | | | 40,811 | | |
| Shareholders’ reports | | | | 70,950 | | | | | 16,433 | | |
| Administration fees | | | | 43,494 | | | | | 16,382 | | |
| Directors’ fees and expenses | | | | 15,738 | | | | | 6,402 | | |
| Shareholders’ services | | | | 8,496 | | | | | 1,891 | | |
| Other | | | | 11,345 | | | | | 3,200 | | |
| Total gross expenses | | | | 3,862,435 | | | | | 962,675 | | |
| Management fees waived and expenses reimbursed | | | | — | | | | | (38,218 | ) | |
| Shareholders’ services fees waived | | | | — | | | | | — | | |
| Total net expenses | | | | 3,862,435 | | | | | 924,457 | | |
| Net investment income (loss) | | | | 6,370,675 | | | | | 2,639,265 | | |
| Net Realized and Unrealized Gain (Loss) on Investments, Foreign Currency Transactions and Forward Currency Contracts | | | | | | | | | | | |
| Net realized gain (loss) on: | | | | | | | | | | | |
| Investments** | | | | 11,247,252 | | | | | 1,639,171 | | |
| Foreign currency transactions | | | | (66,583 | ) | | | | (10,772 | ) | |
| Forward currency contracts | | | | — | | | | | — | | |
| Total net realized gain (loss) on investments, foreign currency transactions and forward currency contracts | | | | 11,180,669 | | | | | 1,628,399 | | |
| Net change in unrealized appreciation (depreciation) on: | | | | | | | | | | | |
| Investments† | | | | 40,260,789 | | | | | 20,389,063 | | |
| Foreign currency translations | | | | 27,163 | | | | | 6,871 | | |
| Forward currency contracts | | | | — | | | | | — | | |
| Total net change in unrealized appreciation (depreciation) on investments, foreign currency translations and forward currency contracts | | | | 40,287,952 | | | | | 20,395,934 | | |
| Net realized and unrealized gain (loss) on investments, foreign currency transactions and forward currency contracts | | | | 51,468,621 | | | | | 22,024,333 | | |
| Net increase (decrease) in net assets resulting from operations | | | $ | 57,839,296 | | | | $ | 24,663,598 | | |
| * Net of foreign withholding taxes of | | | $ | 1,440,446 | | | | $ | 407,863 | | |
| ** Net of foreign capital gains taxes of | | | $ | 520,479 | | | | $ | — | | |
| † Includes net change in unrealized appreciation (depreciation) of foreign capital gains taxes of | | | $ | 1,589,351 | | | | $ | — | | |
The accompanying notes are an integral part of these financial statements.
54 Semi-Annual Report
| | Lazard
Retirement
US Equity
Select Portfolio | | Lazard
Retirement
US Small-Mid Cap
Equity Portfolio | | Lazard
Retirement
Global Dynamic
Multi-Asset Portfolio | |
| | | | | | | | | | | | | |
| | $ | 81,895 | | | $ | 395,575 | | | $ | 3,308,431 | | |
| | | — | | | | — | | | | 1,743,163 | | |
| | | 81,895 | | | | 395,575 | | | | 5,051,594 | | |
| | | | | | | | | | | | | |
| | | 28,871 | | | | 204,457 | | | | 1,596,115 | | |
| | | 11,104 | | | | 68,152 | | | | 498,784 | | |
| | | 13,421 | | | | 15,492 | | | | 105,923 | | |
| | | 19,128 | | | | 24,252 | | | | 71,216 | | |
| | | 7,282 | | | | 8,789 | | | | 30,817 | | |
| | | 6,432 | | | | 9,285 | | | | 30,816 | | |
| | | 2,688 | | | | 3,633 | | | | 11,336 | | |
| | | 1,594 | | | | 1,747 | | | | 6,765 | | |
| | | 1,119 | | | | 1,663 | | | | 6,521 | | |
| | | 91,639 | | | | 337,470 | | | | 2,358,293 | | |
| | | (47,223 | ) | | | (23,969 | ) | | | (260,327 | ) | |
| | | — | | | | — | | | | (3,067 | ) | |
| | | 44,416 | | | | 313,501 | | | | 2,094,899 | | |
| | | 37,479 | | | | 82,074 | | | | 2,956,695 | | |
| | | | | | | | | | | | | |
| | | 362,066 | | | | 2,058,670 | | | | 4,658,847 | | |
| | | — | | | | — | | | | (32,224 | ) | |
| | | — | | | | — | | | | 161,817 | | |
| | | | | | | | | | | | | |
| | | 362,066 | | | | 2,058,670 | | | | 4,788,440 | | |
| | | | | | | | | | | | | |
| | | 1,127,810 | | | | 8,472,478 | | | | 38,423,344 | | |
| | | — | | | | — | | | | 6,337 | | |
| | | — | | | | — | | | | (1,205,079 | ) | |
| | | | | | | | | | | | | |
| | | 1,127,810 | | | | 8,472,478 | | | | 37,224,602 | | |
| | | | | | | | | | | | | |
| | | 1,489,876 | | | | 10,531,148 | | | | 42,013,042 | | |
| | | | | | | | | | | | | |
| | $ | 1,527,355 | | | $ | 10,613,222 | | | $ | 44,969,737 | | |
| | $ | — | | | $ | — | | | $ | 238,295 | | |
| | $ | — | | | $ | — | | | $ | — | | |
| | | | | | | | | | | | | |
| | $ | — | | | $ | — | | | $ | — | | |
Semi-Annual Report 55
Lazard Retirement Series, Inc.Statements of Changes in Net Assets (unaudited)
| | | Lazard Retirement
Emerging Markets Equity Portfolio | |
| | | Six Months Ended
June 30, 2019
(unaudited) | | Year Ended
December 31,
2018 | |
| | | | | | | | | | | | |
| Increase (Decrease) in Net Assets | | | | | | | | | | | |
| Operations | | | | | | | | | | | |
| Net investment income (loss) | | | $ | 6,370,675 | | | | $ | 19,464,845 | | |
| Net realized gain (loss) on investments and foreign currency transactions | | | | 11,180,669 | | | | | (11,195,956 | ) | |
| Net change in unrealized appreciation (depreciation) on investments and foreign currency translations | | | | 40,287,952 | | | | | (218,152,661 | ) | |
| Net increase (decrease) in net assets resulting from operations | | | | 57,839,296 | | | | | (209,883,772 | ) | |
| Distributions to shareholders (Note 2(e)) | | | | | | | | | | | |
| Service Shares | | | | — | | | | | (9,378,846 | ) | |
| Investor Shares | | | | — | | | | | (4,002,664 | ) | |
| Net decrease in net assets resulting from distributions | | | | — | | | | | (13,381,510 | ) | |
| Capital stock transactions | | | | | | | | | | | |
| Net proceeds from sales | | | | | | | | | | | |
| Service Shares | | | | 27,488,824 | | | | | 151,585,003 | | |
| Investor Shares | | | | 9,088,142 | | | | | 29,848,287 | | |
| Net proceeds from reinvestment of distributions | | | | | | | | | | | |
| Service Shares | | | | — | | | | | 9,378,846 | | |
| Investor Shares | | | | — | | | | | 4,002,663 | | |
| Cost of shares redeemed | | | | | | | | | | | |
| Service Shares | | | | (68,113,710 | ) | | | | (521,420,248 | ) | |
| Investor Shares | | | | (18,657,503 | ) | | | | (62,231,548 | ) | |
| Net increase (decrease) in net assets from capital stock transactions | | | | (50,194,247 | ) | | | | (388,836,997 | ) | |
| Total increase (decrease) in net assets | | | | 7,645,049 | | | | | (612,102,279 | ) | |
| Net assets at beginning of period | | | | 569,126,508 | | | | | 1,181,228,787 | | |
| Net assets at end of period | | | $ | 576,771,557 | | | | $ | 569,126,508 | | |
| | | | | | | | | | | | |
| Shares issued and redeemed | | | | | | | | | | | |
| | | | | | | | | | | | |
| Service Shares | | | | | | | | | | | |
| Shares outstanding at beginning of period | | | | 21,481,506 | | | | | 39,964,765 | | |
| Shares sold | | | | 1,358,886 | | | | | 6,929,890 | | |
| Shares issued to shareholders from reinvestment of distributions | | | | — | | | | | 499,204 | | |
| Shares redeemed | | | | (3,367,769 | ) | | | | (25,912,353 | ) | |
| Net increase (decrease) | | | | (2,008,883 | ) | | | | (18,483,259 | ) | |
| Shares outstanding at end of period | | | | 19,472,623 | | | | | 21,481,506 | | |
| | | | | | | | | | | | |
| Investor Shares | | | | | | | | | | | |
| Shares outstanding at beginning of period | | | | 8,890,959 | | | | | 10,240,090 | | |
| Shares sold | | | | 454,696 | | | | | 1,343,615 | | |
| Shares issued to shareholders from reinvestment of distributions | | | | — | | | | | 216,835 | | |
| Shares redeemed | | | | (930,011 | ) | | | | (2,909,581 | ) | |
| Net increase (decrease) | | | | (475,315 | ) | | | | (1,349,131 | ) | |
| Shares outstanding at end of period | | | | 8,415,644 | | | | | 8,890,959 | | |
The accompanying notes are an integral part of these financial statements.
56 Semi-Annual Report
| | Lazard Retirement
International Equity Portfolio | | Lazard Retirement
US Equity Select Portfolio | |
| | Six Months Ended
June 30, 2019
(unaudited) | | Year Ended
December 31,
2018 | | Six Months Ended
June 30, 2019
(unaudited) | | Year Ended
December 31,
2018 | |
| | | | | | | | | | | | | | | | | |
| | $ | 2,639,265 | | | $ | 3,317,663 | | | $ | 37,479 | | | $ | 84,560 | | |
| | | | | | | | | | | | | | | | | |
| | | 1,628,399 | | | | 7,899,915 | | | | 362,066 | | | | 819,771 | | |
| | | | | | | | | | | | | | | | | |
| | | 20,395,934 | | | | (39,866,439 | ) | | | 1,127,810 | | | | (1,300,023 | ) | |
| | | | | | | | | | | | | | | | | |
| | | 24,663,598 | | | | (28,648,861 | ) | | | 1,527,355 | | | | (395,692 | ) | |
| | | | | | | | | | | | | | | | | |
| | | — | | | | (13,042,984 | ) | | | — | | | | (1,155,414 | ) | |
| | | — | | | | — | | | | — | | | | — | | |
| | | — | | | | (13,042,984 | ) | | | — | | | | (1,155,414 | ) | |
| | | | | | | | | | | | | | | | | |
| | | 4,599,580 | | | | 24,869,486 | | | | 489,646 | | | | 2,868,448 | | |
| | | — | | | | — | | | | — | | | | — | | |
| | | | | | | | | | | | | | | | | |
| | | — | | | | 13,042,984 | | | | — | | | | 1,155,414 | | |
| | | — | | | | — | | | | — | | | | — | | |
| | | | | | | | | | | | | | | | | |
| | | (28,791,262 | ) | | | (47,828,950 | ) | | | (2,262,163 | ) | | | (2,906,868 | ) | |
| | | — | | | | — | | | | — | | | | — | | |
| | | | | | | | | | | | | | | | | |
| | | (24,191,682 | ) | | | (9,916,480 | ) | | | (1,772,517 | ) | | | 1,116,994 | | |
| | | 471,916 | | | | (51,608,325 | ) | | | (245,162 | ) | | | (434,112 | ) | |
| | | 169,698,272 | | | | 221,306,597 | | | | 9,396,092 | | | | 9,830,204 | | |
| | $ | 170,170,188 | | | $ | 169,698,272 | | | $ | 9,150,930 | | | $ | 9,396,092 | | |
| | | | | | | | | | | | | | | | | |
| | | 19,737,430 | | | | 20,441,925 | | | | 851,298 | | | | 757,010 | | |
| | | 489,807 | | | | 2,352,199 | | | | 39,128 | | | | 210,360 | | |
| | | | | | | | | | | | | | | | | |
| | | — | | | | 1,544,829 | | | | — | | | | 102,227 | | |
| | | (3,099,438 | ) | | | (4,601,523 | ) | | | (190,955 | ) | | | (218,299 | ) | |
| | | (2,609,631 | ) | | | (704,495 | ) | | | (151,827 | ) | | | 94,288 | | |
| | | 17,127,799 | | | | 19,737,430 | | | | 699,471 | | | | 851,298 | | |
| | | | | | | | | | | | | | | | | |
| | | — | | | | — | | | | — | | | | — | | |
| | | — | | | | — | | | | — | | | | — | | |
| | | | | | | | | | | | | | | | | |
| | | — | | | | — | | | | — | | | | — | | |
| | | — | | | | — | | | | — | | | | — | | |
| | | — | | | | — | | | | — | | | | — | | |
| | | — | | | | — | | | | — | | | | — | | |
Semi-Annual Report 57
| | | Lazard Retirement
US Small-Mid Cap Equity Portfolio | |
| | | Six Months Ended
June 30, 2019
(unaudited) | | Year Ended
December 31,
2018 | |
| | | | | | | | | | | | |
| Increase (Decrease) in Net Assets | | | | | | | | | | | |
| | | | | | | | | | | | |
| Operations | | | | | | | | | | | |
| Net investment income (loss) | | | $ | 82,074 | | | | $ | 86,375 | | |
| Net realized gain (loss) on investments, foreign currency transactions and forward currency contracts | | | | 2,058,670 | | | | | 4,042,894 | | |
| Net change in unrealized appreciation (depreciation) on investments, foreign currency translations and forward currency contracts | | | | 8,472,478 | | | | | (12,106,742 | ) | |
| Net increase (decrease) in net assets resulting from operations | | | | 10,613,222 | | | | | (7,977,473 | ) | |
| | | | | | | | | | | | |
| Distributions to shareholders (Note 2(e)) | | | | | | | | | | | |
| Service Shares | | | | — | | | | | (6,347,972 | ) | |
| Net decrease in net assets resulting from distributions | | | | — | | | | | (6,347,972 | ) | |
| | | | | | | | | | | | |
| Capital stock transactions | | | | | | | | | | | |
| Net proceeds from sales | | | | | | | | | | | |
| Service Shares | | | | 1,869,202 | | | | | 8,271,028 | | |
| Investor Shares | | | | — | | | | | — | | |
| Net proceeds from reinvestment of distributions | | | | | | | | | | | |
| Service Shares | | | | — | | | | | 6,347,972 | | |
| Cost of shares redeemed | | | | | | | | | | | |
| Service Shares | | | | (8,532,211 | ) | | | | (15,369,200 | ) | |
| Investor Shares | | | | — | | | | | — | | |
| Net increase (decrease) in net assets from capital stock transactions | | | | (6,663,009 | ) | | | | (750,200 | ) | |
| Total increase (decrease) in net assets | | | | 3,950,213 | | | | | (15,075,645 | ) | |
| Net assets at beginning of period | | | | 51,792,929 | | | | | 66,868,574 | | |
| Net assets at end of period | | | $ | 55,743,142 | | | | $ | 51,792,929 | | |
| | | | | | | | | | | | |
| Shares issued and redeemed | | | | | | | | | | | |
| | | | | | | | | | | | |
| Service Shares | | | | | | | | | | | |
| Shares outstanding at beginning of period | | | | 8,019,612 | | | | | 8,031,487 | | |
| Shares sold | | | | 258,283 | | | | | 988,855 | | |
| Shares issued to shareholders from reinvestment of distributions | | | | — | | | | | 874,346 | | |
| Shares redeemed | | | | (1,168,355 | ) | | | | (1,875,076 | ) | |
| Net increase (decrease) | | | | (910,072 | ) | | | | (11,875 | ) | |
| Shares outstanding at end of period | | | | 7,109,540 | | | | | 8,019,612 | | |
| | | | | | | | | | | | |
| Investor Shares† | | | | | | | | | | | |
| Shares outstanding at beginning of period | | | | — | | | | | — | | |
| Shares sold | | | | — | | | | | — | | |
| Shares redeemed | | | | — | | | | | — | | |
| Net increase (decrease) | | | | — | | | | | — | | |
| Shares outstanding at end of period | | | | — | | | | | — | | |
| † | The inception date for the Retirement Global Dynamic Multi-Asset Portfolio Investor Shares was December 31, 2018. |
The accompanying notes are an integral part of these financial statements.
58 Semi-Annual Report
| | Lazard Retirement
Global Dynamic Multi-Asset Portfolio | |
| | Six Months Ended
June 30, 2019
(unaudited) | | Year Ended
December 31,
2018 | |
| | | | | | | | | |
| | $ | 2,939,510 | | | $ | 4,962,292 | | |
| | | | | | | | | |
| | | 4,788,440 | | | | 21,597,919 | | |
| | | | | | | | | |
| | | 37,241,787 | | | | (54,367,107 | ) | |
| | | | | | | | | |
| | | 44,969,737 | | | | (27,806,896 | ) | |
| | | | | | | | | |
| | | — | | | | (30,140,660 | ) | |
| | | — | | | | (30,140,660 | ) | |
| | | | | | | | | |
| | | 13,333,283 | | | | 97,760,849 | | |
| | | 2,562 | | | | 1,000 | | |
| | | | | | | | | |
| | | — | | | | 30,140,660 | | |
| | | | | | | | | |
| | | (37,957,481 | ) | | | (67,259,767 | ) | |
| | | (10 | ) | | | — | | |
| | | | | | | | | |
| | | (24,621,646 | ) | | | 60,642,742 | | |
| | | 20,348,091 | | | | 2,695,186 | | |
| | | 386,902,941 | | | | 384,207,755 | | |
| | $ | 407,251,032 | | | $ | 386,902,941 | | |
| | | | | | | | | |
| | | 33,321,445 | | | | 28,474,543 | | |
| | | 1,066,000 | | | | 7,208,760 | | |
| | | | | | | | | |
| | | — | | | | 2,632,693 | | |
| | | (3,045,902 | ) | | | (4,994,551 | ) | |
| | | (1,979,902 | ) | | | 4,846,902 | | |
| | | 31,341,543 | | | | 33,321,445 | | |
| | | | | | | | | |
| | | 86 | | | | — | | |
| | | 205 | | | | 86 | | |
| | | (1 | ) | | | — | | |
| | | 204 | | | | 86 | | |
| | | 290 | | | | 86 | | |
Semi-Annual Report 59
Lazard Retirement Series, Inc.Financial Highlights (unaudited)
LAZARD RETIREMENT EMERGING MARKETS EQUITY PORTFOLIO
Selected data for a
share of capital stock
outstanding | | Six Months
Ended | | Year Ended | |
| throughout each period | | 6/30/19† | | 12/31/18 | | | 12/31/17 | | | 12/31/16 | | | 12/31/15 | | | 12/31/14 | |
| | | | | | | | | | | | | | | | | | | | | | | | | |
| Service Shares | | | | | | | | | | | | | | | | | | | | | | | | |
| Net asset value, beginning of period | | $ | 18.80 | | | $ | 23.59 | | | $ | 18.78 | | | $ | 15.70 | | | $ | 19.96 | | | $ | 21.51 | |
| Income (Loss) from investment operations: | | | | | | | | | | | | | | | | | | | | | | | | |
| Net investment income (loss) (a) | | | 0.21 | | | | 0.42 | | | | 0.31 | | | | 0.23 | ^ | | | 0.27 | | | | 0.37 | |
| Net realized and unrealized gain (loss) | | | 1.74 | | | | (4.80 | ) | | | 4.89 | | | | 3.04 | | | | (4.27 | ) | | | (1.35 | ) |
| Total from investment operations | | | 1.95 | | | | (4.38 | ) | | | 5.20 | | | | 3.27 | | | | (4.00 | ) | | | (0.98 | ) |
| Less distributions from: | | | | | | | | | | | | | | | | | | | | | | | | |
| Net investment income | | | — | | | | (0.41 | ) | | | (0.39 | ) | | | (0.19 | ) | | | (0.21 | ) | | | (0.37 | ) |
| Net realized gains | | | — | | | | — | | | | — | | | | — | | | | (0.05 | ) | | | (0.20 | ) |
| Total distributions | | | — | | | | (0.41 | ) | | | (0.39 | ) | | | (0.19 | ) | | | (0.26 | ) | | | (0.57 | ) |
| Net asset value, end of period | | $ | 20.75 | | | $ | 18.80 | | | $ | 23.59 | | | $ | 18.78 | | | $ | 15.70 | | | $ | 19.96 | |
| Total Return (b) | | | 10.37 | % | | | –18.56 | % | | | 27.76 | % | | | 20.84 | %^ | | | –20.05 | % | | | –4.64 | % |
| | | | | | | | | | | | | | | | | | | | | | | | | |
| Ratios and Supplemental Data: | | | | | | | | | | | | | | | | | | | | | | | | |
| Net assets, end of period (in thousands) | | $ | 404,043 | | | $ | 403,949 | | | $ | 942,572 | | | $ | 880,047 | | | $ | 754,835 | | | $ | 859,747 | |
| Ratios to average net assets (c): | | | | | | | | | | | | | | | | | | | | | | | | |
| Net expenses | | | 1.41 | % | | | 1.36 | % | | | 1.38 | % | | | 1.37 | %^ | | | 1.39 | % | | | 1.38 | % |
| Gross expenses | | | 1.41 | % | | | 1.36 | % | | | 1.38 | % | | | 1.38 | % | | | 1.39 | % | | | 1.38 | % |
| Net investment income (loss) | | | 2.12 | % | | | 1.89 | % | | | 1.45 | % | | | 1.29 | %^ | | | 1.43 | % | | | 1.66 | % |
| Portfolio turnover rate | | | 9 | % | | | 16 | % | | | 10 | % | | | 12 | % | | | 9 | % | | | 12 | % |
The accompanying notes are an integral part of these financial statements.
60 Semi-Annual Report
Selected data for a
share of capital stock
outstanding | | Six Months
Ended | | Year Ended | |
| throughout each period | | 6/30/19† | | 12/31/18 | | | 12/31/17 | | | 12/31/16 | | | 12/31/15 | | | 12/31/14 | |
| | | | | | | | | | | | | | | | | | | | | | | | | |
| Investor Shares | | | | | | | | | | | | | | | | | | | | | | | | |
| Net asset value, beginning of period | | $ | 18.58 | | | $ | 23.31 | | | $ | 18.56 | | | $ | 15.51 | | | $ | 19.74 | | | $ | 21.28 | |
| Income (Loss) from investment operations: | | | | | | | | | | | | | | | | | | | | | | | | |
| Net investment income (loss) (a) | | | 0.24 | | | | 0.45 | | | | 0.37 | | | | 0.26 | ^ | | | 0.32 | | | | 0.42 | |
| Net realized and unrealized gain (loss) | | | 1.70 | | | | (4.72 | ) | | | 4.83 | | | | 3.02 | | | | (4.25 | ) | | | (1.34 | ) |
| Total from investment operations | | | 1.94 | | | | (4.27 | ) | | | 5.20 | | | | 3.28 | | | | (3.93 | ) | | | (0.92 | ) |
| Less distributions from: | | | | | | | | | | | | | | | | | | | | | | | | |
| Net investment income | | | — | | | | (0.46 | ) | | | (0.45 | ) | | | (0.23 | ) | | | (0.25 | ) | | | (0.42 | ) |
| Net realized gains | | | — | | | | — | | | | — | | | | — | | | | (0.05 | ) | | | (0.20 | ) |
| Total distributions | | | — | | | | (0.46 | ) | | | (0.45 | ) | | | (0.23 | ) | | | (0.30 | ) | | | (0.62 | ) |
| Net asset value, end of period | | $ | 20.52 | | | $ | 18.58 | | | $ | 23.31 | | | $ | 18.56 | | | $ | 15.51 | | | $ | 19.74 | |
| Total Return (b) | | | 10.44 | % | | | –18.32 | % | | | 28.07 | % | | | 21.18 | %^ | | | –19.90 | % | | | –4.38 | % |
| | | | | | | | | | | | | | | | | | | | | | | | | |
| Ratios and Supplemental Data: | | | | | | | | | | | | | | | | | | | | | | | | |
| Net assets, end of period (in thousands) | | $ | 172,729 | | | $ | 165,177 | | | $ | 238,656 | | | $ | 187,408 | | | $ | 158,018 | | | $ | 229,855 | |
| Ratios to average net assets (c): | | | | | | | | | | | | | | | | | | | | | | | | |
| Net expenses | | | 1.16 | % | | | 1.11 | % | | | 1.14 | % | | | 1.12 | %^ | | | 1.15 | % | | | 1.14 | % |
| Gross expenses | | | 1.16 | % | | | 1.11 | % | | | 1.14 | % | | | 1.14 | % | | | 1.15 | % | | | 1.14 | % |
| Net investment income (loss) | | | 2.40 | % | | | 2.09 | % | | | 1.74 | % | | | 1.52 | %^ | | | 1.71 | % | | | 1.91 | % |
| Portfolio turnover rate | | | 9 | % | | | 16 | % | | | 10 | % | | | 12 | % | | | 9 | % | | | 12 | % |
| † | Unaudited. |
| ^ | Refer to Note 3 in the Notes to Financial Statements for discussion of prior period custodian out-of-pocket expenses that were reimbursed to the Portfolio in the period. The amount of the reimbursement was less than $0.005 per share. There was a 0.06% impact on the total return of the Portfolio. There was a 0.02% impact on the net expenses and net investment income (loss) ratios of the Portfolio. |
| (a) | Net investment income (loss) has been computed using the average shares method. |
| (b) | Total returns reflect reinvestment of all dividends and distributions, if any. Performance information does not reflect the fees and charges imposed by participating insurance companies at the separate account level, and such charges will have the effect of reducing performance. Return for a period of less than one year is not annualized. |
| (c) | Annualized for periods less than one year. |
The accompanying notes are an integral part of these financial statements.
Semi-Annual Report 61
LAZARD RETIREMENT INTERNATIONAL EQUITY PORTFOLIO
Selected data for a
share of capital stock
outstanding | | Six Months
Ended | | Year Ended | |
| throughout each period | | 6/30/19† | | 12/31/18 | | | 12/31/17 | | | 12/31/16 | | | 12/31/15 | | | 12/31/14 | |
| | | | | | | | | | | | | | | | | | | | | | | | | |
| Service Shares | | | | | | | | | | | | | | | | | | | | | | | | |
| Net asset value, beginning of period | | $ | 8.60 | | | $ | 10.83 | | | $ | 11.57 | | | $ | 12.28 | | | $ | 12.50 | | | $ | 13.26 | |
| Income (Loss) from investment operations: | | | | | | | | | | | | | | | | | | | | | | | | |
| Net investment income (loss) | | | 0.16 | | | | 0.18 | | | | 0.31 | | | | 0.19 | ^ | | | 0.19 | | | | 0.21 | |
| Net realized and unrealized gain (loss) | | | 1.18 | | | | (1.70 | ) | | | 2.24 | | | | (0.71 | ) | | | 0.02 | | | | (0.76 | ) |
| Total from investment operations | | | 1.34 | | | | (1.52 | ) | | | 2.55 | | | | (0.52 | ) | | | 0.21 | | | | (0.55 | ) |
| Less distributions from: | | | | | | | | | | | | | | | | | | | | | | | | |
| Net investment income | | | — | | | | (0.17 | ) | | | (0.33 | ) | | | (0.16 | ) | | | (0.21 | ) | | | (0.21 | ) |
| Net realized gains | | | — | | | | (0.54 | ) | | | (2.96 | ) | | | (0.03 | ) | | | (0.22 | ) | | | — | |
| Total distributions | | | — | | | | (0.71 | ) | | | (3.29 | ) | | | (0.19 | ) | | | (0.43 | ) | | | (0.21 | ) |
| Net asset value, end of period | | $ | 9.94 | | | $ | 8.60 | | | $ | 10.83 | | | $ | 11.57 | | | $ | 12.28 | | | $ | 12.50 | |
| Total Return (b) | | | 15.58 | % | | | –13.91 | % | * | | 22.33 | % | | | –4.29 | %^ | | | 1.75 | % | | | –4.21 | % |
| | | | | | | | | | | | | | | | | | | | | | | | | |
| Ratios and Supplemental Data: | | | | | | | | | | | | | | | | | | | | | | | | |
| Net assets, end of period (in thousands) | | $ | 170,170 | | | $ | 169,698 | | | $ | 221,307 | | | $ | 653,014 | | | $ | 682,012 | | | $ | 690,324 | |
| Ratios to average net assets (b): | | | | | | | | | | | | | | | | | | | | | | | | |
| Net expenses | | | 1.10 | % | | | 1.12 | % | | | 1.11 | % | | | 1.08 | %^ | | | 1.11 | % | | | 1.09 | % |
| Gross expenses | | | 1.15 | % | | | 1.14 | % | | | 1.12 | % | | | 1.09 | % | | | 1.11 | % | | | 1.09 | % |
| Net investment income (loss) | | | 3.14 | % | | | 1.62 | % | | | 1.11 | % | | | 1.59 | %^ | | | 1.42 | % | | | 1.59 | % |
| Portfolio turnover rate | | | 15 | % | | | 33 | % | | | 44 | % | | | 28 | % | | | 37 | % | | | 34 | % |
| † | Unaudited. |
| ^ | Refer to Note 3 in the Notes to Financial Statements for discussion of prior period custodian out-of-pocket expenses that were reimbursed to the Portfolio in the period. The amount of the reimbursement was less than $0.005 per share. There was no impact on the total return of the Portfolio. There was a 0.01% impact on the net expenses and net investment income (loss) ratios of the Portfolio. |
| * | The Portfolio received settlement proceeds from a foreign exchange trading class action lawsuit. The proceeds from the settlement represented a realized gain and was recorded in the period received. There was a 0.10% impact on the total return of the Portfolio. |
| (a) | Total returns reflect reinvestment of all dividends and distributions, if any. Certain expenses of the Portfolio may have been waived or reimbursed by the Investment Manager, State Street or DST; without such waiver/reimbursement of expenses, the Portfolio’s returns would have been lower. Performance information does not reflect the fees and charges imposed by participating insurance companies at the separate account level, and such charges will have the effect of reducing performance. Return for a period of less than one year is not annualized. |
| (b) | Annualized for periods less than one year. |
The accompanying notes are an integral part of these financial statements.
62 Semi-Annual Report
LAZARD RETIREMENT US EQUITY SELECT PORTFOLIO
Selected data for a
share of capital stock
outstanding | | Six Months
Ended | | Year Ended | |
| throughout each period | | 6/30/19† | | 12/31/18 | | | 12/31/17 | | | 12/31/16 | | | 12/31/15 | | | 12/31/14 | |
| | | | | | | | | | | | | | | | | | | | | | | | | |
| Service Shares | | | | | | | | | | | | | | | | | | | | | | | | |
| Net asset value, beginning of period | | $ | 11.04 | | | $ | 12.99 | | | $ | 11.51 | | | $ | 10.64 | | | $ | 12.15 | | | $ | 12.02 | |
| Income (Loss) from investment operations: | | | | | | | | | | | | | | | | | | | | | | | | |
| Net investment income (loss) | | | 0.06 | | | | 0.11 | | | | 0.13 | | | | 0.10 | | | | 0.06 | | | | 0.09 | |
| Net realized and unrealized gain (loss) | | | 1.98 | | | | (0.53 | ) | | | 1.94 | | | | 0.90 | | | | (0.73 | ) | | | 1.68 | |
| Total from investment operations | | | 2.04 | | | | (0.42 | ) | | | 2.07 | | | | 1.00 | | | | (0.67 | ) | | | 1.77 | |
| Less distributions from: | | | | | | | | | | | | | | | | | | | | | | | | |
| Net investment income | | | — | | | | (0.10 | ) | | | (0.20 | ) | | | (0.01 | ) | | | (0.05 | ) | | | (0.09 | ) |
| Net realized gains | | | — | | | | (1.43 | ) | | | (0.39 | ) | | | (0.12 | ) | | | (0.79 | ) | | | (1.55 | ) |
| Total distributions | | | — | | | | (1.53 | ) | | | (0.59 | ) | | | (0.13 | ) | | | (0.84 | ) | | | (1.64 | ) |
| Net asset value, end of period | | $ | 13.08 | | | $ | 11.04 | | | $ | 12.99 | | | $ | 11.51 | | | $ | 10.64 | | | $ | 12.15 | |
| Total Return (b) | | | 18.48 | % | | | –3.32 | % | | | 18.10 | % | | | 9.42 | % | | | –5.44 | % | | | 14.71 | % |
| | | | | | | | | | | | | | | | | | | | | | | | | |
| Ratios and Supplemental Data: | | | | | | | | | | | | | | | | | | | | | | | | |
| | | | | | | | | | | | | | | | | | | | | | | | | |
| Net assets, end of period (in thousands) | | $ | 9,151 | | | $ | 9,396 | | | $ | 9,830 | | | $ | 10,438 | | | $ | 11,529 | | | $ | 12,391 | |
| Ratios to average net assets (b): | | | | | | | | | | | | | | | | | | | | | | | | |
| Net expenses | | | 1.00 | % | | | 1.00 | % | | | 1.00 | % | | | 1.00 | % | | | 1.00 | % | | | 1.00 | % |
| Gross expenses | | | 2.06 | % | | | 2.07 | % | | | 2.14 | % | | | 2.48 | % | | | 2.31 | % | | | 2.59 | % |
| Net investment income (loss) | | | 0.84 | % | | | 0.86 | % | | | 0.84 | % | | | 0.86 | % | | | 0.53 | % | | | 0.79 | % |
| Portfolio turnover rate | | | 17 | % | | | 67 | % | | | 76 | % | | | 58 | % | | | 86 | % | | | 72 | % |
| † | Unaudited. |
| (a) | Total returns reflect reinvestment of all dividends and distributions, if any. Certain expenses of the Portfolio may have been waived or reimbursed by the Investment Manager, State Street or DST; without such waiver/reimbursement of expenses, the Portfolio’s returns would have been lower. Performance information does not reflect the fees and charges imposed by participating insurance companies at the separate account level, and such charges will have the effect of reducing performance. Return for a period of less than one year is not annualized. |
| (b) | Annualized for periods less than one year. |
The accompanying notes are an integral part of these financial statements.
Semi-Annual Report 63
LAZARD RETIREMENT US SMALL- MID CAP EQUITY PORTFOLIO
Selected data for a
share of capital stock
outstanding | | Six Months
Ended | | Year Ended | |
| throughout each period | | 6/30/19† | | 12/31/18 | | | 12/31/17 | | | 12/31/16 | | | 12/31/15 | | | 12/31/14 | |
| | | | | | | | | | | | | | | | | | | | | | | | | |
| Service Shares | | | | | | | | | | | | | | | | | | | | | | | | |
| Net asset value, beginning of period | | $ | 6.46 | | | $ | 8.33 | | | $ | 8.09 | | | $ | 7.39 | | | $ | 8.18 | | | $ | 8.71 | |
| Income (Loss) from investment operations: | | | | | | | | | | | | | | | | | | | | | | | | |
| Net investment income (loss) | | | 0.01 | | | | 0.01 | | | | 0.01 | | | | 0.03 | ^ | | | (0.02 | ) | | | (0.02 | ) |
| Net realized and unrealized gain (loss) | | | 1.37 | | | | (1.04 | ) | | | 1.07 | | | | 1.09 | | | | (0.19 | ) | | | 0.94 | |
| Total from investment operations | | | 1.38 | | | | (1.03 | ) | | | 1.08 | | | | 1.12 | | | | (0.21 | ) | | | 0.92 | |
| Less distributions from: | | | | | | | | | | | | | | | | | | | | | | | | |
| Net investment income | | | — | | | | — | (a) | | | (0.03 | ) | | | — | | | | — | | | | — | |
| Net realized gains | | | — | | | | (0.84 | ) | | | (0.81 | ) | | | (0.42 | ) | | | (0.58 | ) | | | (1.45 | ) |
| Total distributions | | | — | | | | (0.84 | ) | | | (0.84 | ) | | | (0.42 | ) | | | (0.58 | ) | | | (1.45 | ) |
| Net asset value, end of period | | $ | 7.84 | | | $ | 6.46 | | | $ | 8.33 | | | $ | 8.09 | | | $ | 7.39 | | | $ | 8.18 | |
| Total Return (b) | | | 21.36 | % | | | –13.24 | % | | | 13.95 | % | | | 15.78 | %^ | | | –2.38 | % | | | 11.03 | % |
| | | | | | | | | | | | | | | | | | | | | | | | | |
| Ratios and Supplemental Data: | | | | | | | | | | | | | | | | | | | | | | | | |
| Net assets, end of period (in thousands) | | $ | 55,743 | | | $ | 51,793 | | | $ | 66,869 | | | $ | 65,478 | | | $ | 59,499 | | | $ | 63,491 | |
| Ratios to average net assets (c): | | | | | | | | | | | | | | | | | | | | | | | | |
| Net expenses | | | 1.15 | % | | | 1.15 | % | | | 1.19 | % | | | 1.25 | %^ | | | 1.25 | % | | | 1.25 | % |
| Gross expenses | | | 1.24 | % | | | 1.23 | % | | | 1.25 | % | | | 1.32 | % | | | 1.35 | % | | | 1.32 | % |
| Net investment income (loss) | | | 0.30 | % | | | 0.14 | % | | | 0.09 | % | | | 0.46 | %^ | | | –0.22 | % | | | –0.20 | % |
| Portfolio turnover rate | | | 29 | % | | | 81 | % | | | 79 | % | | | 94 | % | | | 89 | % | | | 92 | % |
| † | Unaudited. |
| ^ | Refer to Note 3 in the Notes to Financial Statements for discussion of prior period custodian out-of-pocket expenses that were reimbursed to the Portfolio in the period. The amount of the reimbursement was less than $0.005 per share. There was no impact on the total return of the Portfolio. The net expenses and net investment income (loss) ratios of the Portfolio would be unchanged as the change to period custodian fees was offset against current period expense waivers/reimbursements with no impact to net expenses or net investment income (loss). |
| (a) | Amount is less than $0.01. |
| (b) | Total returns reflect reinvestment of all dividends and distributions, if any. Certain expenses of the Portfolio may have been waived or reimbursed by the Investment Manager, State Street or DST; without such waiver/reimbursement of expenses, the Portfolio’s returns would have been lower. Performance information does not reflect the fees and charges imposed by participating insurance companies at the separate account level, and such charges will have the effect of reducing performance. Return for a period of less than one year is not annualized. |
| (c) | Annualized for periods less than one year. |
The accompanying notes are an integral part of these financial statements.
64 Semi-Annual Report
LAZARD RETIREMENT GLOBAL DYNAMIC MULTI-ASSET PORTFOLIO
Selected data for a
share of capital stock
outstanding | | Six Months
Ended | | Year Ended | |
| throughout each period | | 6/30/19† | | 12/31/18 | | | 12/31/17 | | | 12/31/16 | | | 12/31/15 | | | 12/31/14 | |
| | | | | | | | | | | | | | | | | | | | | | | | | |
| Service Shares | | | | | | | | | | | | | | | | | | | | | | | | |
| Net asset value, beginning of period | | $ | 11.61 | | | $ | 13.49 | | | $ | 11.82 | | | $ | 11.51 | | | $ | 11.86 | | | $ | 12.30 | |
| Income (Loss) from investment operations: | | | | | | | | | | | | | | | | | | | | | | | | |
| Net investment income (loss) (a) | | | 0.09 | | | | 0.16 | | | | 0.17 | | | | 0.14 | | | | 0.13 | | | | 0.11 | |
| Net realized and unrealized gain (loss) | | | 1.29 | | | | (1.06 | ) | | | 2.25 | | | | 0.24 | | | | (0.19 | ) | | | 0.23 | |
| Total from investment operations | | | 1.38 | | | | (0.90 | ) | | | 2.42 | | | | 0.38 | | | | (0.06 | ) | | | 0.34 | |
| Less distributions from: | | | | | | | | | | | | | | | | | | | | | | | | |
| Net investment income | | | — | | | | (0.18 | ) | | | — | | | | (0.03 | ) | | | — | | | | (0.07 | ) |
| Net realized gains | | | — | | | | (0.80 | ) | | | (0.75 | ) | | | (0.04 | ) | | | (0.29 | ) | | | (0.71 | ) |
| Total distributions | | | — | | | | (0.98 | ) | | | (0.75 | ) | | | (0.07 | ) | | | (0.29 | ) | | | (0.78 | ) |
| Net asset value, end of period | | $ | 12.99 | | | $ | 11.61 | | | $ | 13.49 | | | $ | 11.82 | | | $ | 11.51 | | | $ | 11.86 | |
| Total Return (b) | | | 11.89 | % | | | –6.57 | % | | | 20.53 | % | | | 3.30 | % | | | –0.44 | % | | | 2.70 | % |
| | | | | | | | | | | | | | | | | | | | | | | | | |
| Ratios and Supplemental Data: | | | | | | | | | | | | | | | | | | | | | | | | |
| | | | | | | | | | | | | | | | | | | | | | | | | |
| Net assets, end of period (in thousands) | | $ | 407,247 | | | $ | 386,902 | | | $ | 384,208 | | | $ | 293,286 | | | $ | 222,666 | | | $ | 176,669 | |
| Ratios to average net assets (c): | | | | | | | | | | | | | | | | | | | | | | | | |
| Net expenses | | | 1.05 | % | | | 1.05 | % | | | 1.05 | % | | | 1.05 | % | | | 1.05 | % | | | 1.05 | % |
| Gross expenses | | | 1.18 | % | | | 1.17 | % | | | 1.19 | % | | | 1.25 | % | | | 1.31 | % | | | 1.33 | % |
| Net investment income (loss) | | | 1.48 | % | | | 1.22 | % | | | 1.28 | % | | | 1.23 | % | | | 1.18 | % | | | 1.19 | % |
| Portfolio turnover rate | | | 49 | % | | | 110 | % | | | 104 | % | | | 105 | % | | | 114 | % | | | 105 | % |
The accompanying notes are an integral part of these financial statements.
Semi-Annual Report 65
Selected data for a
share of capital stock
outstanding
throughout each period | | Six Months
Ended
6/30/19† | | Period
Ended
12/31/18* | | | | | | | | | | | | | | | | | |
| | | | | | | | | | | | | | | | | | | | | | | | | |
| Investor Shares | | | | | | | | | | | | | | | | | | | | | | | | |
| Net asset value, beginning of period | | $ | 11.61 | | | $ | 11.61 | | | | | | | | | | | | | | | | | |
| Income (Loss) from investment operations: | | | | | | | | | | | | | | | | | | | | | | | | |
| Net investment income (loss) (a) | | | 0.09 | | | | — | | | | | | | | | | | | | | | | | |
| Net realized and unrealized gain (loss) | | | 1.29 | | | | — | (d) | | | | | | | | | | | | | | | | |
| Total from investment operations | | | 1.38 | | | | — | (d) | | | | | | | | | | | | | | | | |
| Net asset value, end of period | | $ | 12.99 | | | $ | 11.61 | | | | | | | | | | | | | | | | | |
| Total Return (b) | | | 11.89 | % | | | 0.00 | % | | | | | | | | | | | | | | | | |
| | | | | | | | | | | | | | | | | | | | | | | | | |
| Ratios and Supplemental Data: | | | | | | | | | | | | | | | | | | | | | | | | |
| | | | | | | | | | | | | | | | | | | | | | | | | |
| Net assets, end of period (in thousands) | | $ | 4 | | | $ | 1 | | | | | | | | | | | | | | | | | |
| Ratios to average net assets (c): | | | | | | | | | | | | | | | | | | | | | | | | |
| Net expenses | | | 0.90 | % | | | 0.00 | % | | | | | | | | | | | | | | | | |
| Gross expenses | | | 573.33 | % | | | 0.00 | % | | | | | | | | | | | | | | | | |
| Net investment income (loss) | | | 1.51 | % | | | 0.00 | % | | | | | | | | | | | | | | | | |
| Portfolio turnover rate | | | 49 | % | | | N/A | % | | | | | | | | | | | | | | | | |
| † | Unaudited. |
| * | The inception date for the Investor Shares was December 31, 2018. |
| (a) | Net investment income (loss) has been computed using the average shares method. |
| (b) | Total returns reflect reinvestment of all dividends and distributions, if any. Certain expenses of the Portfolio may have been waived or reimbursed by the Investment Manager, State Street or DST; without such waiver/reimbursement of expenses, the Portfolio’s returns would have been lower. Performance information does not reflect the fees and charges imposed by participating insurance companies at the separate account level, and such charges will have the effect of reducing performance. Return for a period of less than one year is not annualized. |
| (c) | Annualized for periods less than one year. |
| (d) | Amount is less than $0.01 per share. |
The accompanying notes are an integral part of these financial statements.
66 Semi-Annual Report
Lazard Retirement Series, Inc.Notes to Financial Statements
June 30, 2019 (unaudited)
1. Organization
Lazard Retirement Series, Inc. (the “Fund”), was incorporated in Maryland on February 13, 1997 and is registered under the Investment Company Act of 1940, as amended (the “1940 Act”), as an open-end management investment company. The Fund, comprised of twenty-four no-load portfolios (each referred to as a “Portfolio”), is currently offered only to separate accounts established by insurance companies to fund variable annuity contracts and variable life insurance policies. Portfolio shares may also be offered to certain qualified pension and retirement plans and accounts permitting accumulation of assets on a tax-deferred basis. Currently, only the following five Portfolios, each of which is “diversified”, as defined in the 1940 Act, are offered: Lazard Retirement Emerging Markets Equity Portfolio (“Emerging Markets Equity Portfolio”), Lazard Retirement International Equity Portfolio (“International Equity Portfolio”), Lazard Retirement US Equity Select Portfolio (formerly, Lazard Retirement US Strategic Equity Portfolio) (“US Equity Select Portfolio”), Lazard Retirement US Small-Mid Cap Equity Portfolio (“US Small-Mid Cap Equity Portfolio”), and Lazard Retirement Global Dynamic Multi-Asset Portfolio (“Global Dynamic Multi-Asset Portfolio”). Each of the other nineteen Portfolios had not commenced operations as of June 30, 2019. Effective January 31, 2006, the Fund designated its existing class of shares as Service Shares and commenced offering Investor Shares. Investor Shares and Service Shares are identical, except as to the services offered to and expenses borne by each class of shares. As of June 30, 2019, only Lazard Retirement Emerging Markets Equity and Lazard Retirement Global Dynamic Multi-Asset Portfolios had issued Investor Shares.
2. Significant Accounting Policies
The accompanying financial statements are presented in conformity with US Generally Accepted Accounting Principles (“GAAP”). The Fund is an investment company and therefore applies specialized accounting guidance in accordance with Accounting Standards Codification Topic 946. The following is a summary of significant accounting policies consistently followed by the Fund in the preparation of the financial statements:
Semi-Annual Report 67
(a) Valuation of Investments—Equity securities traded on a securities exchange or market, including exchange-traded option contracts, rights and warrants, are valued at the last reported sales price (for domestic equity securities) or the closing price (for foreign equity securities) on the exchange or market on which the security is principally traded or, for securities trading on the NASDAQ National Market System (“NASDAQ”), the NASDAQ Official Closing Price. If there is no available closing price for a foreign equity security, the last reported sales price is used. If there are no reported sales of a security on the valuation date, the security is valued at the most recent quoted bid price on such date reported by such principal exchange or market. Forward currency contracts generally are valued using quotations from an independent pricing service. Investments in money market funds are valued at the fund’s net asset value (“NAV”) per share.
Bonds and other fixed-income securities that are not exchange-traded are valued on the basis of prices provided by independent pricing services which are based on, among other things, trading in securities with similar characteristics, brokers’ quotations and/or a matrix system which considers such factors as other security prices, yields and maturities.
Calculation of a Portfolio’s NAV may not take place contemporaneously with the determination of the prices of portfolio assets used in such calculation. Trading on Europe, Latin and South America and Far East securities exchanges and in over-the-counter markets ordinarily is completed well before the close of business on each business day in New York (i.e., a day on which the New York Stock Exchange (the “NYSE”) is open). In addition, European or Far Eastern securities trading generally, or in a particular country or countries, may not take place on all business days in New York and on which the NAV of a Portfolio is calculated.
The Valuation Committee of Lazard Asset Management LLC (the “Investment Manager”), which meets periodically under the direction of the Board of Directors (the “Board”), may evaluate a variety of factors to determine the fair value of securities for which market quotations are determined not to be readily available or reliable. These factors include, but are not limited to, the type of
68 Semi-Annual Report
security, the value of comparable securities, observations from financial institutions and relevant news events. Input from the Investment Manager’s portfolio managers/analysts also will be considered.
If a significant event materially affecting the value of securities occurs between the close of the exchange or market on which the security is principally traded and the time when a Portfolio’s NAV is calculated, or when current market quotations otherwise are determined not to be readily available or reliable (including restricted or other illiquid securities such as certain derivative instruments), such securities will be valued at their fair value as determined by, or in accordance with procedures approved by, the Board. The fair value of non-US securities may be determined with the assistance of an independent pricing service using correlations between the movement of prices of such securities and indices of US securities and other appropriate indicators, such as closing market prices of relevant American Depositary Receipts or futures contracts. Non-US securities may trade on days when a Portfolio is not open for business, thus affecting the value of the Portfolio’s assets on days when Portfolio shareholders may not be able to buy or sell Portfolio shares.
The effect of using fair value pricing is that the NAV of a Portfolio will reflect the affected securities’ values as determined in the judgment of the Board or its designee instead of being determined by the market. Using a fair value pricing methodology to price securities may result in a value that is different from the most recent closing price of a security and from the prices used by other investment companies to calculate their portfolios’ NAVs.
(b) Portfolio Securities Transactions and Investment Income—Portfolio securities transactions are accounted for on trade date. Realized gain (loss) on sales of investments are recorded on a specific identification basis. Dividend income is recorded on the ex-dividend date except for certain dividends from non-US securities where the dividend rate is not available. In such cases, the dividend is recorded as soon as the information is received by a Portfolio. Interest income, if any, is accrued daily. A Portfolio amortizes
Semi-Annual Report 69
premiums and accretes discounts on fixed-income securities using the effective yield method.
A Portfolio may be subject to taxes imposed by non-US countries in which it invests. Such taxes are generally based upon income earned or capital gains (realized and/or unrealized). An affected Portfolio accrues and applies such taxes to net investment income, net realized gains and net unrealized gains concurrent with the recognition of income earned or capital gains (realized and/or unrealized) from the applicable portfolio securities.
As a result of several court cases in certain countries across the European Union, some Portfolios have filed tax reclaims for previously withheld taxes on dividends earned in certain European Union countries. These filings are subject to various administrative proceedings by the local jurisdictions’ tax authorities within the European Union, as well as a number of related judicial proceedings. Uncertainty exists as to the ultimate resolution of these proceedings, the likelihood of receipt of these claims, and the potential timing of payment, and accordingly no amounts are reflected in the financial statements. Such amounts, if and when recorded, could result in an increase in a Portfolio’s NAV per share.
(c) Foreign Currency Translation and Forward Currency Contracts—The accounting records of the Fund are maintained in US dollars. Portfolio securities and other assets and liabilities denominated in a foreign currency are translated daily into US dollars at the prevailing rates of exchange. Purchases and sales of securities, income receipts and expense payments are translated into US dollars at the prevailing exchange rates on the respective transaction dates.
The Portfolios do not isolate the portion of operations resulting from changes in foreign exchange rates on investments from the fluctuations arising from changes in their market prices. Such fluctuations are included in net realized and unrealized gain (loss) on investments. Net realized gain (loss) on foreign currency transactions and forward currency contracts represent net foreign currency gain (loss) from forward currency contracts, disposition of foreign currencies, currency gain (loss) realized between the trade and settlement dates on securities transactions, and the difference
70 Semi-Annual Report
between the amount of dividends, interest and foreign withholding taxes recorded on the Portfolios’ accounting records and the US dollar equivalent amounts actually received or paid. Net change in unrealized appreciation (depreciation) on foreign currency translations reflects the impact of changes in exchange rates on the value of assets and liabilities, other than investments in securities, during the period.
A forward currency contract is an agreement between two parties to buy or sell currency at a set price on a future date. Upon entering into these contracts, risks may arise from the potential inability of counterparties to meet the terms of their contracts and from unanticipated movements in the value of the foreign currency relative to the US dollar.
The US dollar value of forward currency contracts is determined using quotations provided by an independent pricing service. Daily fluctuations in the value of such contracts are recorded as unrealized appreciation (depreciation) on forward currency contracts. When the contract is closed, a Portfolio records a realized gain (loss) equal to the difference between the value at the time it was opened and the value at the time it was closed.
During the period ended June 30, 2019, the Global Dynamic Multi-Asset Portfolio traded in forward currency contracts.
(d) Federal Income Taxes—The Fund’s policy is to have each Portfolio qualify as a regulated investment company under Subchapter M of the Internal Revenue Code (the “Code”) and to distribute all of its taxable income, including any net realized capital gains, to shareholders. Therefore, no federal income tax provision is required.
At December 31, 2018, the following Portfolio had unused realized capital loss carryovers which, for federal income tax purposes, could be used to offset future realized capital gains with no expiration date as follows:
| Portfolio | | Short-Term | | Long-Term | |
| | | | | | | | | |
| Emerging Markets Equity | | $ | (3,146,131 | ) | | $ | (30,177,508 | ) |
Semi-Annual Report 71
Under current tax law, post-October capital losses or certain late-year ordinary losses, as defined by the Code, within the taxable year may be deferred and treated as occurring on the first day of the following tax year. For the tax year ended December 31, 2018, the following Portfolio elected to defer such losses as follows:
| Portfolio | | Post-October
Capital Loss
Deferral | | Late-Year
Ordinary Loss
Deferral |
| | | | | | | | | |
| International Equity | | | $(1,982,922 | ) | | | $— | |
For federal income tax purposes, the aggregate cost, aggregate gross unrealized appreciation, aggregate gross unrealized depreciation and the net unrealized appreciation (depreciation) were as follows:
| Portfolio | | Aggregate
Cost | | | Aggregate
Gross
Unrealized
Appreciation | | | Aggregate
Gross
Unrealized
Depreciation | | | Net
Unrealized
Appreciation
(Depreciation) | |
| | | | | | | | | | | | | | | | | |
| Emerging Markets Equity | | $ | 539,831,164 | | | $ | 98,113,211 | | | $ | 63,340,526 | | | $ | 34,772,685 | |
| International Equity | | | 149,011,597 | | | | 25,082,164 | | | | 4,671,745 | | | | 20,410,419 | |
| US Equity Select | | | 7,648,762 | | | | 1,601,923 | | | | 84,382 | | | | 1,517,541 | |
| US Small-Mid Cap Equity | | | 50,343,364 | | | | 7,562,939 | | | | 2,135,753 | | | | 5,427,186 | |
| Global Dynamic Multi-Asset | | | 379,811,050 | | | | 36,484,895 | | | | 9,172,178 | | | | 27,312,717 | |
Management has analyzed the Portfolios’ tax positions, and has concluded that no liability for unrecognized tax benefits should be recorded related to uncertain tax positions taken on tax returns filed for any open tax years (or expected to be taken on future tax returns). Open tax years are those that remain subject to examination and are based on each tax jurisdiction’s statute of limitations. Each Portfolio files a US federal income tax return annually after its fiscal year-end, which is subject to examination by the Internal Revenue Service for a period of three years from the date of filing.
(e) Dividends and Distributions—Dividends from net investment income, if any, will be declared and paid annually. During any particular year, net realized gains from investment transactions in
72 Semi-Annual Report
excess of available capital loss carryforwards would be taxable to the Portfolios, if not distributed. The Portfolios intend to declare and distribute these amounts, at least annually, to shareholders; however, to avoid taxation, a second distribution may be required. Differences in per share distributions, by class, are generally due to differences in class specific expenses.
Income and capital gains distributions are determined in accordance with federal income tax regulations which may differ from GAAP. These book/tax differences, which may result in distribution reclassifications, are primarily due to differing treatments of foreign currency transactions, wash sales, passive foreign investment companies and distributions from real estate investment trusts. The book/tax differences relating to shareholder distributions may result in reclassifications among certain capital accounts.
(f) Allocation of Expenses—Expenses common to the Fund, The Lazard Funds, Inc., Lazard Global Total Return and Income Fund, Inc. and Lazard World Dividend & Income Fund, Inc. (each a “Lazard Fund” and collectively, the “Lazard Fund Complex”), each a registered management investment company advised by the Investment Manager, not directly chargeable to one or more specific Lazard Funds are allocated to the Fund and among its Portfolios primarily on the basis of relative net assets. Expenses of the Fund not directly chargeable to one or more Portfolios are similarly allocated among the Portfolios on the basis of relative net assets. Portfolios accrue distribution and service (12b-1) fees to Service Shares. The Portfolios’ income, expenses (other than class specific expenses) and realized and unrealized gains and losses are allocated proportionally each day between the classes based upon the relative net assets of each class.
(g) Estimates—The preparation of financial statements in conformity with GAAP requires management to make estimates and assumptions that affect the reported amounts of assets and liabilities and disclosure of contingent assets and liabilities at the date of the financial statements and the reported amounts of increases and decreases in net assets resulting from operations during the reporting period. Actual results could differ from those estimates.
Semi-Annual Report 73
(h) Net Asset Value—NAV per share for each class of each Portfolio is determined each day the NYSE is open for trading as of the close of regular trading on the NYSE (generally 4:00 p.m. Eastern time). The Fund will not treat an intraday unscheduled disruption in NYSE trading as a closure of the NYSE, and will price its shares as of 4:00 p.m., if the particular disruption directly affects only the NYSE. NAV per share is determined by dividing the value of the total assets of the Portfolio represented by such class, less all liabilities, by the total number of Portfolio shares of such class outstanding.
3. Investment Management, Administration, Custody, Distribution and Transfer Agency Agreements
The Fund, on behalf of the Portfolios, has entered into a management agreement (the “Management Agreement”) with the Investment Manager. Pursuant to the Management Agreement, the Investment Manager regularly provides each Portfolio with investment research, advice and supervision and furnishes continuously an investment program for each Portfolio consistent with its investment objectives and policies, including the purchase, retention and disposition of securities, and provides the Portfolios with administrative, operational and compliance assistance services. For its services provided to the Portfolios, the Investment Manager earns a management fee, accrued daily as a percentage of each Portfolio’s average daily net assets and payable by each Portfolio monthly, at the annual rate set forth below:
| Portfolio | | Annual Rate | | |
| | | | | | |
| Emerging Markets Equity | | | 1.00 | % | |
| International Equity | | | 0.75 | | |
| US Equity Select | | | 0.65 | | |
| US Small-Mid Cap Equity | | | 0.75 | | |
| Global Dynamic Multi-Asset | | | 0.80 | | |
The Investment Manager has voluntarily agreed to waive its fees and, if necessary, reimburse the Portfolios until May 1, 2020 if the aggregate direct expenses of the Portfolios, exclusive of taxes, brokerage, interest on borrowings, fees and expenses of “Acquired Funds” (as defined in Form N-1A) and extraordinary expenses (including, for purposes of the expense limitation agreement only, fees related to filing foreign tax reclaims), but exceed
74 Semi-Annual Report
the percentages of the value of the Portfolio’s average daily net assets set forth opposite the Portfolio’s name on table below, the Fund, on behalf of the Portfolio, may deduct from the payment to be made to the Investment Manager under the Management Agreement, or the Investment Manager will bear, such excess expense.
| Portfolio | | Service Shares | | Investor Shares |
| | | | | |
| Emerging Markets Equity | | | 1.50 | % | | | 1.20 | % |
| International Equity | | | 1.10 | | | | N/A | |
| US Equity Select | | | 1.00 | | | | N/A | |
| US Small-Mid Cap Equity | | | 1.15 | | | | N/A | |
| Global Dynamic Multi-Asset | | | 1.05 | | | | 0.90 | |
During the period ended June 30, 2019, the Investment Manager waived its management fees and reimbursed the following Portfolios for other expenses as follows:
| | | Service Shares | | Investor Shares | | |
| Portfolio | | Management
Fee Waived | | Expenses
Reimbursed | | Management
Fee Waived | | Expenses
Reimbursed | |
| | | | | | | | | | | | | | | | | | |
| International Equity | | $ | 38,218 | | | $ | — | | | $ | — | | | $ | — | | |
| US Equity Select | | | 28,871 | | | | 18,352 | | | | — | | | | — | | |
| US Small-Mid Cap Equity | | | 23,969 | | | | — | | | | — | | | | — | | |
| Global Dynamic Multi-Asset | | | 258,852 | | | | — | | | | 6 | | | | 1,469 | | |
The aforementioned waivers and/or reimbursements are not subject to recoupment by the Investment Manager.
State Street Bank and Trust Company (“State Steet”) provides the Fund with custody and certain fund administration and accounting services.
In December 2015, State Street announced that it had identified inconsistencies in the way in which clients were invoiced for custody out-of-pocket expenses from 1998 until 2015. The dollar amount difference between what was charged and what should have been charged, plus interest, was recorded as a reimbursement when determined in 2016. Pursuant to the expense limitations described above, certain Portfolios experienced management fee waivers during the year ended December 31, 2016. Accord-
Semi-Annual Report 75
ingly, the reimbursement of out-of-pocket expenses resulted in the reduction in the waiver of management fees for certain Portfolios for the year ended December 31, 2016.
The Fund has a distribution agreement with Lazard Asset Management Securities LLC (the “Distributor”), a wholly-owned subsidiary of the Investment Manager, to serve as the distributor for shares of each Portfolio. The Distributor bears the cost of printing and mailing prospectuses to potential investors and certain expenses in connection with the offering of Portfolio shares.
Under a distribution and servicing plan adopted pursuant to Rule 12b-1 under the 1940 Act, each Portfolio pays a monthly fee to the Distributor, at an annual rate of 0.25% of the average daily net assets of its Service Shares, for distribution and servicing of accounts. The Distributor may make payments to participating insurance companies, certain financial institutions, securities dealers and other industry professionals for providing these services.
DST Asset Manager Solutions, Inc. (“DST”) is the Fund’s transfer and dividend disbursing agent. During the period ended June 30, 2019, DST waived $3,067 of its fees for the Global Dynamic Multi-Asset Portfolio.
4. Directors’ Compensation
Certain Directors of the Fund are officers of the Investment Manager. For the period ended June 30, 2019, each Director who is not an affiliated person of the Investment Manager or any of its affiliates was paid by all of the funds in the Lazard Fund Complex: (1) an annual retainer of $232,000, (2) an additional annual fee of $33,000 to the lead Independent Director (an “Independent Director” is a Director who is not an “interested person” (as defined in the 1940 Act) of the Fund), and (3) an additional annual fee of $23,000 to the Audit Committee Chair. The Independent Directors may be paid additional compensation for participation on ad hoc committees or other work performed on behalf of the Board. The Independent Directors also are reimbursed for travel and other out-of-pocket expenses for attending Board and committee meetings. The Directors do not receive benefits from the Fund pursuant to any pension, retirement or similar arrangement. Independent
76 Semi-Annual Report
Directors’ fees are allocated among the funds in the Lazard Fund Complex at a rate of $5,000 per fund with the remainder allocated based upon each fund’s proportionate share of combined net assets. The Statements of Operations show the Independent Directors’ fees and expenses paid by each Portfolio.
5. Securities Transactions and Transactions with Affiliates
Purchases and sales of portfolio securities (excluding short-term investments) for the period ended June 30, 2019 were as follows:
| Portfolio | | Purchases | | | Sales | |
| | | | | | | | | |
| Emerging Markets Equity | | $ | 48,118,664 | | | $ | 84,261,203 | |
| International Equity | | | 24,544,333 | | | | 46,269,940 | |
| US Equity Select | | | 1,535,816 | | | | 359,334 | |
| US Small-Mid Cap Equity | | | 15,308,987 | | | | 21,040,372 | |
| Global Dynamic Multi-Asset | | | 183,323,727 | | | | 187,868,306 | |
| | | | | | | | | |
| | | US Treasury Securities | |
| Portfolio | | Purchases | | | Sales | |
| | | | | | | | | |
| Global Dynamic Multi-Asset | | | $8,721,922 | | | | $18,264,215 | |
For the period ended June 30, 2019, the Portfolios did not engage in any cross-trades in accordance with Rule 17a-7 under the 1940 Act, and no brokerage commissions were paid to affiliates of the Investment Manager or other affiliates of the Fund for portfolio transactions executed on behalf of the Fund.
6. Investment Risks
(a) Non-US Securities Risk—A Portfolio’s performance will be influenced by political, social and economic factors affecting the non-US countries and companies in which the Portfolio invests. Non-US securities carry special risks, such as less developed or less efficient trading markets, political instability, a lack of company information, differing auditing and legal standards, and, potentially, less liquidity.
(b) Emerging Market Risk—Emerging market countries generally have economic structures that are less diverse and mature, and political systems that are less stable, than those of developed countries. The economies of countries with emerging markets may
Semi-Annual Report 77
be based predominantly on only a few industries, may be highly vulnerable to changes in local or global trade conditions, and may suffer from extreme debt burdens or volatile inflation rates. The securities markets of emerging market countries have historically been extremely volatile. These market conditions may continue or worsen. Investments in these countries may be subject to political, economic, legal, market and currency risks. The risks may include less protection of property rights and uncertain political and economic policies, the imposition of capital controls and/or foreign investment limitations by a country, nationalization of businesses and the imposition of sanctions by other countries, such as the US. Significant devaluation of emerging market currencies against the US dollar may occur subsequent to acquisition of investments denominated in emerging market currencies.
(c) Foreign Currency Risk—Investments denominated in currencies other than US dollars may experience a decline in value, in US dollar terms, due solely to fluctuations in currency exchange rates. A Portfolio’s currency investments could be adversely affected by delays in, or a refusal to grant, repatriation of funds or conversion of emerging market currencies. The Investment Manager generally does not intend to actively hedge the Portfolios’ foreign currency exposure.
(d) Fixed-Income and Debt Securities Risk—The market value of a debt security may decline due to general market conditions that are not specifically related to a particular company, such as real or perceived adverse economic conditions, changes in the outlook for corporate earnings, changes in interest or currency rates or adverse investor sentiment generally. The debt securities market can be susceptible to increases in volatility and decreases in liquidity. Liquidity can decline unpredictably in response to overall economic conditions or credit tightening.
Prices of bonds and other debt securities tend to move inversely with changes in interest rates. Typically, a rise in rates will adversely affect debt securities and, accordingly, will cause the value of a Portfolio’s investments in these securities to decline. Interest rate risk is usually greater for fixed-income securities with
78 Semi-Annual Report
longer maturities or durations. A rise in interest rates (or the expectation of a rise in interest rates) may result in periods of volatility, decreased liquidity and increased redemptions, and, as a result, the Portfolio may have to liquidate portfolio securities at disadvantageous prices. During periods of reduced market liquidity, a Portfolio may not be able to readily sell debt securities at prices at or near their perceived value. An unexpected increase in Portfolio redemption requests, including a single large request for a significant percentage of a Portfolio’s shares, which may be triggered by market turmoil or an increase in interest rates, could cause the Portfolio to sell its holdings at a loss or at undesirable prices and adversely affect the Portfolio’s share price and increase the Portfolio’s liquidity risk and/or Portfolio expenses. Economic and other developments can adversely affect debt securities markets.
A Portfolio’s investments in lower-rated, higher-yielding securities (“junk bonds”) are subject to greater credit risk than its higher-rated investments. Credit risk is the risk that the issuer will not make interest or principal payments, or will not make payments on a timely basis. Non-investment grade securities tend to be more volatile, less liquid and are considered speculative. If there is a decline, or perceived decline, in the credit quality of a debt security (or any guarantor of payment on such security), the security’s value could fall, potentially lowering a Portfolio’s share price. The prices of non-investment grade securities, unlike investment grade debt securities, may fluctuate unpredictably and not necessarily inversely with changes in interest rates. The prices of high yield securities can fall in response to negative news about the issuer or its industry, or the economy in general to a greater extent than those of higher-rated securities. The market for these securities may be less liquid and therefore these securities may be harder to value or sell at an acceptable price, especially during times of market volatility or decline.
Some fixed-income securities may give the issuer the option to call, or redeem, the securities before their maturity. If securities held by a Portfolio are called during a time of declining interest rates (which is typically the case when issuers exercise options to call outstanding securities), the Portfolio may have to reinvest the
Semi-Annual Report 79
proceeds in an investment offering a lower yield (and the Portfolio may not fully benefit from any increase in the value of its portfolio holdings as a result of declining interest rates).
Adjustable rate securities provide a Portfolio with a certain degree of protection against rises in interest rates, although such securities will participate in any declines in interest rates as well. Certain adjustable rate securities, such as those with interest rates that fluctuate directly or indirectly based on multiples of a stated index, are designed to be highly sensitive to changes in interest rates and can subject the holders thereof to extreme reductions of yield and possibly loss of principal.
Forward Currency Contracts Risk—Forward currency contracts may increase volatility or reduce returns, perhaps substantially, particularly since most derivatives have a leverage component that provides investment exposure in excess of the amount invested. Forward currency contracts are subject to the risk of default by the counterparty to the contracts and can be illiquid. These contracts are subject to many of the risks of, and can be highly sensitive to changes in the value of, the related currency. As such, a small investment could have a potentially large impact on the Portfolio’s performance. Derivatives transactions incur costs, either explicitly or implicitly, which reduce return. Successful use of derivatives is subject to the Investment Manager’s ability to predict correctly movements in the direction of the relevant reference asset or market. Use of forward currency contracts, even when entered into for hedging purposes, may cause the Portfolio to experience losses greater than if the Portfolio had not engaged in such transactions.
7. Contractual Obligations
The Fund enters into contracts in the normal course of business that contain a variety of indemnification provisions. A Portfolio’s maximum exposure under these arrangements is unknown. Management has reviewed the Fund’s existing contracts and expects the risk of loss to be remote.
80 Semi-Annual Report
8. Fair Value Measurements
Fair value is defined as the price that a Portfolio would receive to sell an asset, or would pay to transfer a liability, in an orderly transaction between market participants at the date of measurement. The Fair Value Measurements and Disclosures provisions of GAAP also establish a framework for measuring fair value, and a three-level hierarchy for fair value measurement that is based upon the transparency of inputs to the valuation of an asset or liability. Inputs may be observable or unobservable and refer, broadly, to the assumptions that market participants would use in pricing the asset or liability. Observable inputs reflect the assumptions that market participants would use in pricing the asset or liability based on market data obtained from sources independent of the Fund. Unobservable inputs reflect the Fund’s own assumptions about the assumptions that market participants would use in pricing the asset or liability, developed based on the best information available in the circumstances. The fair value measurement level within the fair value hierarchy for the assets and liabilities of the Fund is based on the lowest level of any input that is significant to the overall fair value measurement. The three-level hierarchy of inputs is summarized below:
| • | Level 1 – unadjusted quoted prices in active markets for identical assets and liabilities |
| | |
| • | Level 2 – other significant observable inputs (including unadjusted quoted prices for similar assets and liabilities, interest rates, prepayment speeds, credit risk, etc.) |
| | |
| • | Level 3 – significant unobservable inputs (including the Fund’s own assumptions in determining the fair value of assets and liabilities) |
Changes in valuation technique may result in transfers into or out of the current assigned level within the hierarchy.
The inputs or methodology used for valuing securities are not necessarily an indication of the risks associated with investing in these securities.
Semi-Annual Report 81
The following table summarizes the valuation of the Portfolios’ assets and liabilities by each fair value hierarchy level as of June 30, 2019:
| Description | | Unadjusted
Quoted Prices in
Active Markets
for Identical
Assets
and Liabilities
(Level 1) | | Significant
Other
Observable
Inputs
(Level 2) | | Significant
Unobservable
Inputs
(Level 3) | | Balance as of
June 30, 2019 |
| | | | | | | | | | | | | | | | | | |
| Emerging Markets Equity Portfolio | | | | | | | | | | | | | | | | | |
| Common Stocks* | | | | | | | | | | | | | | | | | |
| Argentina | | | $ | 11,165,279 | | | $ | — | | | $ | — | | | $ | 11,165,279 | |
| Brazil | | | | 51,031,881 | | | | — | | | | — | | | | 51,031,881 | |
| China | | | | 31,027,527 | | | | 80,158,931 | | | | — | | | | 111,186,458 | |
| Egypt | | | | — | | | | 6,344,543 | | | | — | | | | 6,344,543 | |
| Hong Kong | | | | — | | | | 6,053,959 | | | | — | | | | 6,053,959 | |
| Hungary | | | | — | | | | 9,211,058 | | | | — | | | | 9,211,058 | |
| India | | | | 5,927,051 | | | | 56,942,086 | | | | — | | | | 62,869,137 | |
| Indonesia | | | | 10,370,142 | | | | 22,329,787 | | | | — | | | | 32,699,929 | |
| Luxembourg | | | | 4,006,177 | | | | — | | | | — | | | | 4,006,177 | |
| Malaysia | | | | — | | | | 3,603,672 | | | | — | | | | 3,603,672 | |
| Mexico | | | | 19,926,569 | | | | — | | | | — | | | | 19,926,569 | |
| Pakistan | | | | — | | | | 4,231,368 | | | | — | | | | 4,231,368 | |
| Philippines | | | | 4,729,377 | | | | — | | | | — | | | | 4,729,377 | |
| Russia | | | | 8,912,994 | | | | 47,236,385 | | | | — | | | | 56,149,379 | |
| South Africa | | | | — | | | | 43,546,194 | | | | — | | | | 43,546,194 | |
| South Korea | | | | — | | | | 83,427,752 | | | | — | | | | 83,427,752 | |
| Taiwan | | | | — | | | | 26,865,125 | | | | — | | | | 26,865,125 | |
| Thailand | | | | — | | | | 10,426,872 | | | | — | | | | 10,426,872 | |
| Turkey | | | | — | | | | 12,670,542 | | | | — | | | | 12,670,542 | |
| Short-Term Investments | | | | 14,458,578 | | | | — | | | | — | | | | 14,458,578 | |
| Total | | | $ | 161,555,575 | | | $ | 413,048,274 | | | $ | — | | | $ | 574,603,849 | |
82Semi-Annual Report
| Description | | Unadjusted
Quoted Prices in
Active Markets
for Identical
Assets
and Liabilities
(Level 1) | | Significant
Other
Observable
Inputs
(Level 2) | | Significant
Unobservable
Inputs
(Level 3) | | Balance as of
June 30, 2019 |
| | | | | | | | | | | | | | | | | | |
| International Equity Portfolio | | | | | | | | | | | | | | | | | |
| Common Stocks* | | | | | | | | | | | | | | | | | |
| Australia | | | $ | 2,015,487 | | | $ | 2,476,437 | | | $ | — | | | $ | 4,491,924 | |
| Belgium | | | | — | | | | 4,491,573 | | | | — | | | | 4,491,573 | |
| Canada | | | | 9,050,947 | | | | — | | | | — | | | | 9,050,947 | |
| China | | | | — | | | | 2,846,452 | | | | — | | | | 2,846,452 | |
| Denmark | | | | — | | | | 2,639,281 | | | | — | | | | 2,639,281 | |
| Finland | | | | — | | | | 4,207,749 | | | | — | | | | 4,207,749 | |
| France | | | | — | | | | 22,008,910 | | | | — | | | | 22,008,910 | |
| Germany | | | | — | | | | 8,449,536 | | | | — | | | | 8,449,536 | |
| India | | | | 1,910,155 | | | | — | | | | — | | | | 1,910,155 | |
| Ireland | | | | 1,831,454 | | | | — | | | | — | | | | 1,831,454 | |
| Israel | | | | — | | | | 1,975,325 | | | | — | | | | 1,975,325 | |
| Japan | | | | — | | | | 21,762,170 | | | | — | | | | 21,762,170 | |
| Netherlands | | | | — | | | | 12,556,307 | | | | — | | | | 12,556,307 | |
| Norway | | | | — | | | | 3,987,498 | | | | — | | | | 3,987,498 | |
| Singapore | | | | — | | | | 4,517,651 | | | | — | | | | 4,517,651 | |
| South Korea | | | | — | | | | 2,056,538 | | | | — | | | | 2,056,538 | |
| Spain | | | | — | | | | 2,433,055 | | | | — | | | | 2,433,055 | |
| Sweden | | | | — | | | | 5,999,904 | | | | — | | | | 5,999,904 | |
| Switzerland | | | | — | | | | 8,129,147 | | | | — | | | | 8,129,147 | |
| United Arab Emirates | | | | — | | | | 867,334 | | | | — | | | | 867,334 | |
| United Kingdom | | | | — | | | | 22,845,914 | | | | — | | | | 22,845,914 | |
| United States | | | | 9,802,443 | | | | 1,674,913 | | | | — | | | | 11,477,356 | |
| Preferred Stocks* | | | | | | | | | | | | | | | | | |
| Germany | | | | — | | | | 2,971,264 | | | | — | | | | 2,971,264 | |
| Short-Term Investments | | | | 5,914,572 | | | | — | | | | — | | | | 5,914,572 | |
| Total | | | $ | 30,525,058 | | | $ | 138,896,958 | | | $ | — | | | $ | 169,422,016 | |
| US Equity Select Portfolio | | | | | | | | | | | | | | | | | |
| Common Stocks* | | | $ | 8,808,070 | | | $ | — | | | $ | — | | | $ | 8,808,070 | |
| Short-Term Investments | | | | 358,233 | | | | — | | | | — | | | | 358,233 | |
| Total | | | $ | 9,166,303 | | | $ | — | | | $ | — | | | $ | 9,166,303 | |
| US Small-Mid Cap Equity Portfolio | | | | | | | | | | | | | | | | | |
| Common Stocks* | | | $ | 55,207,389 | | | $ | — | | | $ | — | | | $ | 55,207,389 | |
| Short-Term Investments | | | | 563,161 | | | | — | | | | — | | | | 563,161 | |
| Total | | | $ | 55,770,550 | | | $ | — | | | $ | — | | | $ | 55,770,550 | |
Semi-Annual Report 83
| Description | | Unadjusted
Quoted Prices in
Active Markets
for Identical
Assets
and Liabilities
(Level 1) | | Significant
Other
Observable
Inputs
(Level 2) | | Significant
Unobservable
Inputs
(Level 3) | | Balance as of
June 30, 2019 |
| | | | | | | | | | | | | | |
| Global Dynamic Multi Asset Portfolio | | | | | | | | | | | | | | | | | |
| Assets: | | | | | | | | | | | | | | | | | |
| Common Stocks* | | | | | | | | | | | | | | | | | |
| Australia | | | $ | 6,226,699 | | | $ | 3,054,490 | | | $ | — | | | $ | 9,281,189 | |
| Belgium | | | | 3,021,392 | | | | 332,231 | | | | — | | | | 3,353,623 | |
| Canada | | | | 13,636,630 | | | | — | | | | — | | | | 13,636,630 | |
| China | | | | 268,370 | | | | — | | | | — | | | | 268,370 | |
| Denmark | | | | 618,261 | | | | 1,195,794 | | | | — | | | | 1,814,055 | |
| Finland | | | | 1,771,274 | | | | — | | | | — | | | | 1,771,274 | |
| France | | | | 1,801,703 | | | | 4,722,161 | | | | — | | | | 6,523,864 | |
| Germany | | | | 2,388,417 | | | | 1,608,605 | | | | — | | | | 3,997,022 | |
| Hong Kong | | | | 4,303,406 | | | | 389,390 | | | | — | | | | 4,692,796 | |
| Israel | | | | 1,909,262 | | | | 577,259 | | | | — | | | | 2,486,521 | |
| Italy | | | | 4,199,100 | | | | 1,882,010 | | | | — | | | | 6,081,110 | |
| Japan | | | | 13,732,584 | | | | 8,753,274 | | | | — | | | | 22,485,858 | |
| Netherlands | | | | 3,303,793 | | | | 1,024,377 | | | | — | | | | 4,328,170 | |
| Norway | | | | 711,647 | | | | 1,669,696 | | | | — | | | | 2,381,343 | |
| Puerto Rico | | | | 371,407 | | | | — | | | | — | | | | 371,407 | |
| Singapore | | | | 2,180,786 | | | | 487,674 | | | | — | | | | 2,668,460 | |
| Spain | | | | 759,180 | | | | 188,353 | | | | — | | | | 947,533 | |
| Sweden | | | | 3,706,123 | | | | — | | | | — | | | | 3,706,123 | |
| Switzerland | | | | 6,495,553 | | | | 1,408,026 | | | | — | | | | 7,903,579 | |
| United Kingdom | | | | 16,214,053 | | | | 2,516,169 | | | | — | | | | 18,730,222 | |
| United States | | | | 181,818,211 | | | | — | | | | — | | | | 181,818,211 | |
| Corporate Bonds* | | | | — | | | | 27,823,658 | | | | — | | | | 27,823,658 | |
| Foreign Government Obligations* | | | | — | | | | 48,100,624 | | | | — | | | | 48,100,624 | |
| Quasi Government Bonds* | | | | — | | | | 1,919,362 | | | | — | | | | 1,919,362 | |
| Supranational Bonds | | | | — | | | | 10,985,916 | | | | — | | | | 10,985,916 | |
| US Government Securities | | | | — | | | | 1,690,978 | | | | — | | | | 1,690,978 | |
| US Municipal Bonds | | | | — | | | | 3,014,732 | | | | — | | | | 3,014,732 | |
| US Treasury Securities | | | | — | | | | 9,570,403 | | | | — | | | | 9,570,403 | |
| Short-Term Investments | | | | 4,946,678 | | | | — | | | | — | | | | 4,946,678 | |
| Other Financial Instruments† | | | | | | | | | | | | | | | | | |
| Forward Currency Contracts | | | | — | | | | 554,214 | | | | — | | | | 554,214 | |
| Total | | | $ | 274,384,529 | | | $ | 133,469,396 | | | $ | — | | | $ | 407,853,925 | |
| Liabilities: | | | | | | | | | | | | | | | | | |
| Other Financial | | | | | | | | | | | | | | | | | |
| Instruments† | | | | | | | | | | | | | | | | | |
| Forward Currency Contracts | | | $ | — | | | $ | (730,158 | ) | | $ | — | | | $ | (730,158 | ) |
| * | Please refer to Portfolios of Investments and Notes to Portfolios of Investments for portfolio holdings by country and industry. |
| † | Other financial instruments are derivative instruments which are valued at their respective unrealized appreciation (depreciation). |
84 Semi-Annual Report
Certain equity securities to which footnote (‡) in the Notes to Portfolios of Investments applies are included in Level 2 and were valued based on reference to similar securities that were trading on active markets.
9. Derivative Instruments
The Global Dynamic Multi-Asset Portfolio may use derivative instruments, including forward currency contracts.
Forward currency contracts may be used for hedging purposes or to seek to increase returns.
During the period ended June 30, 2019, the approximate average monthly notional exposure for derivative instruments was as follows:
| Forward currency contracts: | |
| Average amounts purchased | $66,900,000 |
| Average amounts sold | $63,900,000 |
The following table summarizes the fair value of derivative instruments on the Statement of Assets and Liabilities as of June 30, 2019:
| Assets – Derivative Financial Instruments | | Total |
| Forward currency contracts | Unrealized appreciation on forward currency contracts | $554,214 |
| Liabilities – Derivative Financial Instruments | | Total |
| Forward currency contracts | Unrealized depreciation on forward currency contracts | $730,158 |
The effect of derivative instruments on the Statement of Operations for the period ended June 30, 2019 was:
| Net Realized Gain (Loss) from: | Total |
| Forward currency contracts | $161,817 |
| Net Change in Unrealized Appreciation (Depreciation) on: | Total | |
| Forward currency contracts | $(1,205,079 | ) |
None of the other Portfolios presented traded in derivative instruments during the period ended June 30, 2019.
Semi-Annual Report 85
As of June 30, 2019, the Global Dynamic Multi-Asset Portfolio held derivative instruments that are eligible for offset in the Statement of Assets and Liabilities and are subject to master netting arrangements. A master netting arrangement is an agreement between two counterparties who have multiple contracts with each other that provides for the net settlement of all contracts, as well as any cash collateral, through a single payment in the event of default on, or termination of, any one contract.
The required information for the affected Portfolio is presented in the below table, as of June 30, 2019:
| Description | | Gross Amounts of
Recognized Assets | | Gross Amounts Offset
in the Statement of
Assets and Liabilities | | Net Amounts of
Assets Presented
in the Statement of
Assets and Liabilities |
| Forward Currency Contracts | | | $ | 554,214 | | | | $ | — | | | $ | 554,214 | |
| | | | | | | Amounts Not Offset
in the Statement of
Assets and Liabilities | | |
| Counterparty | | Net Amounts of
Assets Presented
in the Statement of
Assets and Liabilities | | Financial
Instruments | | Collateral
Received | | Net Amounts of
Derivative Assets |
| Citibank NA | | | $ | 172,318 | | | | $ | (70,675 | ) | | $ | — | | | $ | 101,643 | |
| HSBC Bank USA NA | | | | 305,754 | | | | | (305,754 | ) | | | — | | | | — | |
| JPMorgan Chase Bank NA | | | | 64,612 | | | | | (64,612 | ) | | | — | | | | — | |
| Morgan Stanley & Co. Inc. | | | | 11,530 | | | | | (2,691 | ) | | | — | | | | 8,839 | |
| Total | | | $ | 554,214 | | | | $ | (443,732 | ) | | $ | — | | | $ | 110,482 | |
| Description | | Gross Amounts of
Recognized Liabilities | | | Gross Amounts Offset
in the Statement of
Assets and Liabilities | | Net Amounts of
Liabilities Presented
in the Statement of
Assets and Liabilities |
| Forward Currency Contracts | | | $730,158 | | | | $ | — | | | $ | 730,158 | |
| | | | | | | | | | | | | | | |
86 Semi-Annual Report
| | | | | | | | Amounts Not Offset
in the Statement of
Assets and Liabilities | | | |
| Counterparty | | Net Amounts of
Assets Presented
in the Statement of
Assets and Liabilities | | Financial
Instruments | | Collateral
Received | | Net Amounts of
Derivative Assets |
| Citibank NA | | | $ | 70,675 | | | | $ | (70,675 | ) | | $ | — | | | $ | — | |
| HSBC Bank USA NA | | | | 465,691 | | | | | (305,754 | ) | | | — | | | | 159,937 | |
| JPMorgan Chase Bank NA | | | | 180,380 | | | | | (64,612 | ) | | | — | | | | 115,768 | |
| Morgan Stanley & Co. Inc. | | | | 2,691 | | | | | (2,691 | ) | | | — | | | | — | |
| State Street Bank and Trust Co. | | | | 10,721 | | | | | — | | | | — | | | | 10,721 | |
| Total | | | $ | 730,158 | | | | $ | (443,732 | ) | | $ | — | | | $ | 286,426 | |
10. Accounting Pronouncements
In March 2017, the Financial Accounting Standards Board (“FASB”) issued Accounting Standards Update (“ASU”) 2017-08,Nonrefundable Fees and Other Costs (Subtopic 310-20): Premium Amortization on Purchased Callable Debt Securities, which amends the amortization period for certain purchased callable debt securities. Management has evaluated the impact of the amendments and has adopted these amendments and incorporated the changes in the current financial statements and related disclosures. For public business entities, the amendments in this ASU became effective for fiscal years, and interim periods within those fiscal years, beginning after December 15, 2018.
In August 2018, the FASB issued, ASU 2018-13,Fair Value Measurement (Topic 820): Disclosure Framework—Changes to the Disclosure Requirements for Fair Value Measurement, which removes, modifies and adds disclosures to Topic 820. The amendments in this ASU apply to all entities that are required, under existing GAAP, to make disclosures about recurring or nonrecurring fair value measurements. The amendments in this ASU are effective for all entities for fiscal years, and interim periods within those fiscal years, beginning after December 15, 2019. Early adoption is permitted. Management has evaluated the impact of the amendments and has elected to adopt these amendments and incorporate the changes in the current financial statements.
Semi-Annual Report 87
11. Subsequent Events
Management has evaluated subsequent events affecting the Fund through the issuance of the financial statements and has determined that there were no subsequent events that required adjustment or disclosure.
88 Semi-Annual Report
Lazard Retirement Series, Inc.
Board of Directors and Officers Information (unaudited)
Name (Year of Birth)
Address(1) | | Position(s) with the
Fund (Since) and Term(2) | | Principal Occupation(s) and Other Public
Company Directorships Held During the
Past Five Years(2) |
| | | | | |
| Independent Directors(3): | | | | |
| | | | | |
| Franci J. Blassberg (1953) | | Director
(August 2014) | | Debevoise & Plimpton LLP, a law firm,Of Counsel(2013 – present) |
| | | | | |
| | | | | Cornell Law School,AdjunctProfessor(2013 – 2016, 2019) |
| | | | | |
| | | | | The Buchmann Faculty of Law, Tel Aviv University,VisitingProfessor(2019) |
| | | | | |
| | | | | University of California, Berkeley School of Law,Adjunct Professor (Spring 2017) |
| | | | | |
| Kenneth S. Davidson (1945) | | Director
(April 1997) | | Davidson Capital Management Corporation, an investment manager,President (1978 – present) |
| | | | | |
| | | | | Landseer Advisors LLC, an investment manager,Senior Advisor(2012 – 2014) |
| | | | | |
| Nancy A. Eckl (1962) | | Director
(May 2007) | | College Retirement Equities Fund (eight accounts),Trustee (2007 – present) |
| | | | | |
| | | | | TIAA-CREF Funds (69 funds) and TIAA-CREF Life Funds (11 funds),Trustee(2007 – present) |
| | | | | |
| | | | | TIAA Separate Account VA-1,Member of the ManagementCommittee(2007 – present) |
| | | | | |
| Trevor W. Morrison (1971) | | Director
(April 2014) | | New York University School of Law,DeanandEric M. and Laurie B.Roth Professor of Law (2013 – present) |
| | | | | |
| | | | | Columbia Law School,Professorof Law(2008 – 2013) |
| | | | | |
| Richard Reiss, Jr. (1944) | | Director
(April 1997) | | Georgica Advisors LLC, an investment manager,Chairman(1997 – present) |
| | | | | |
| | | | | Resource America, Inc., a real estate asset management company,Director(2016 – 2018) |
Semi-Annual Report 89
Name (Year of Birth)
Address(1) | | Position(s) with the
Fund (Since) and Term(2) | | Principal Occupation(s) and Other Public
Company Directorships Held During the
Past Five Years(2) |
| | | | | |
| Robert M. Solmson (1947) | | Director
(September 2004) | | Fairwood Capital, LLC, a private investment corporation engaged primarily in real estate and hotel investments,Co-Managing Partner andManaging Director (2008 – present) |
| | | | | |
| Interested Directors(4): | | | | |
| | | | | |
| Ashish Bhutani (1960) | | Director
(July 2005) | | Investment Manager,ChiefExecutive Officer (2004 – present) |
| | | | | |
| | | | | Lazard Ltd,Vice ChairmanandDirector(2010 – present) |
| | | | | |
| Nathan A. Paul (1973) | | Director
(October 2017), Chief Executive Officer and President | | Investment Manager,ChiefBusiness Officer (April 2017–present) andManaging Director (2003–present) |
| | | (February 2017; previously, Vice President and Secretary since April 2002) | | Investment Manager,GeneralCounsel(2002–April 2017) |
| (1) | The address of each Director of the Fund is Lazard Asset Management LLC, 30 Rockefeller Plaza, New York, New York 10112-6300. |
| (2) | Each Director serves as a Director for each of the funds in the Lazard Fund Complex (comprised of, as of July 31, 2019, 39 active investment portfolios). Each Director serves an indefinite term, until his or her successor is elected, and each Director serves in the same capacity for the other funds in the Lazard Fund Complex. |
| (3) | “Independent Directors” are not “interested persons” (as defined in the 1940 Act) of the Fund. |
| (4) | Messrs. Bhutani and Paul are “interested persons” (as defined in the 1940 Act) of the Fund because of their positions with the Investment Manager. |
The Fund’s Statement of Additional Information contains further information about the Directors and is available without charge by calling 800-823-6300, or online, at www.lazardassetmanagement.com.
90 Semi-Annual Report
Name (Year of Birth)
Address(1) | | Position(s) with the Fund
(Since) and Term(2) | | Principal Occupation(s)
During the Past Five Years |
| | | | | |
| Officers(3): | | | | |
| | | | | |
| Mark R. Anderson (1970) | | Chief Compliance Officer (September 2014), Vice President and Secretary (February 2017) | | Managing Director (since February 2017, previously Director), Chief Compliance Officer (since September 2014) and General Counsel (since April 2017) of the Investment Manager |
| | | | | |
| | | | | Senior Vice President, Counsel and Deputy Chief Compliance Officer of AllianceBernstein L.P. (2004 – August 2014) |
| | | | | |
| Christopher Snively (1984) | | Chief Financial Officer
(March 2016) | | Senior Vice President of the Investment Manager (since November 2015) |
| | | | | |
| | | | | Assurance Manager at PricewaterhouseCoopers LLP (2008 – November 2015) |
| | | | | |
| Stephen St. Clair (1958) | | Treasurer
(May 2003) | | Vice President of the Investment Manager |
| | | | | |
| Shari L. Soloway (1981) | | Assistant Secretary
(November 2015) | | Head of Legal, North America (since January 2019, previously Senior Vice President, Legal and Compliance (since September 2015)) of the Investment Manager |
| | | | | |
| | | | | Vice President and Associate General Counsel of GE Asset Management (July 2011 – September 2015) |
| | | | | |
| Jessica A. Falzone (1989) | | Assistant Secretary
(January 2019) | | Vice President, Legal and Compliance, of the Investment Manager (since March 2018) |
| | | | | |
| | | | | Associate at Schulte Roth & Zabel LLP (2014 – March 2018) |
| | | | | |
| Cesar A. Trelles (1975) | | Assistant Treasurer
(December 2004) | | Vice President of the Investment Manager |
| (1) | The address of each officer of the Fund is Lazard Asset Management LLC, 30 Rockefeller Plaza, New York, New York 10112-6300. |
| (2) | Each officer serves for an indefinite term, until his or her successor is elected and qualifies or until his or her earlier resignation or removal. Each officer serves in the same capacity for the other funds in the Lazard Fund Complex. |
| (3) | In addition to Nathan A. Paul, Chief Executive Officer and President (since February 2017; previously, Vice President and Secretary since April 2002), whose information is included in the Interested Directors section above. |
Semi-Annual Report 91
Lazard Retirement Series, Inc.Other Information (unaudited)
Proxy Voting
A description of the policies and procedures used to determine how proxies relating to Fund portfolio securities are voted is available (1) without charge, upon request, by calling (800) 823-6300 or (2) on the U.S. Securities and Exchange Commission (the “SEC”) website at https://www.sec.gov.
The Fund’s proxy voting record for the most recent 12-month period ended June 30 is available (1) without charge, upon request, by calling (800) 823-6300 or (2) on the SEC’s website at https://www.sec.gov. Information as of June 30 each year will generally be available by the following August 31.
Schedule of Portfolio Holdings
The Fund files its complete schedule of Portfolio’s holdings with the SEC for the first and third quarters of each fiscal year as an exhibit to its reports on Form N-PORT. The Fund’s Form N-PORT reports are available on the SEC’s website at https://www.sec.gov.
Board Consideration of New Management Agreements
All Portfolios except Lazard Retirement International Equity Value Portfolio and Lazard Retirement International Quality Growth Portfolio.
At meetings of the Board held on May 22, 2019 and June 5, 2019, the Board considered the approval, for an additional annual period, of the Management Agreement between the Fund, on behalf of the Portfolios, and the Investment Manager. The Independent Directors were assisted in their review by independent legal counsel, who advised the Board on relevant legal standards and met with the Independent Directors in executive sessions separate from representatives of the Investment Manager.
Representatives of the Investment Manager discussed with the Board the Investment Manager’s written materials provided in advance of the meetings, including, at the June 5, 2019 meeting,
92 Semi-Annual Report
additional information requested by the Independent Directors at the May 22, 2019 meeting.
Services Provided
The Investment Manager’s materials addressed, among other matters, the nature, extent and quality of services that the Investment Manager provides the Fund, including a discussion of the Investment Manager and its clients (of which the Lazard Funds complex of 39 active funds comprised approximately $29 billion of the approximately $235 billion of total assets under the management of the Investment Manager and its global affiliates as of March 31, 2019).
The Board considered the various services provided by the Investment Manager including the Investment Manager’s research, portfolio management and trading capabilities and oversight of day-to-day operations, including supervision of fund accounting and administration-related services and assistance in meeting legal and regulatory requirements, as well as regular reporting to, and support of, the Board. The Investment Manager’s representatives stated that the Investment Manager believes that the Fund and its shareholders continue to be able to obtain significant benefits as a result of the resources and support of the Investment Manager’s global research, portfolio management, trading, operations, risk management, technology and legal and compliance infrastructure. The Board also considered information provided by the Investment Manager regarding its personnel, resources, financial condition and experience; the Fund’s distribution channels and the relationships with various intermediaries; marketing and shareholder servicing activities on behalf of the Portfolios; and Portfolio asset flows and the growth or decline in asset levels. The Board accepted the assertion of representatives of the Investment Manager that the Fund benefits from the services and infrastructure provided by the Investment Manager and that such services and infrastructure are greater than those typically provided to a $29 billion fund complex not managed by a large, global firm such as the Investment Manager.
Semi-Annual Report 93
Comparative Fee, Expense Ratio and Performance Information
The Board reviewed information prepared by Strategic Insight, an independent provider of investment company data, comparing, for the fiscal year ended December 31, 2018, for each of the five active Portfolios (the Emerging Markets Equity, Global Dynamic Multi-Asset, International Equity, US Small-Mid Cap Equity and US Equity Select Portfolios), each Portfolio’s:
| • | contractual management fee (i.e.,without giving effect to any fee waivers), referred to in the Strategic Insight materials as “advisor fee,” expense ratio (net of any fee waivers or expense reimbursements) and performance (for one-, three-, five- and ten-year periods ended March 31, 2019, as applicable) to those of a group of comparison funds selected by Strategic Insight (a “Group”); |
| | |
| • | advisor fee and expense ratio to a broader group of funds based on the Portfolio’s Morningstar category (an “Expense Universe”); and |
| | |
| • | performance (for the one-, three-, five- and ten-year periods ended March 31, 2019, as applicable) to that of the variable annuity underlying funds in the Portfolio’s Morningstar category (a “Category”) and benchmark index and the Portfolio’s performance for each of the four most recently completed calendar years, as applicable, and the first quarter of 2019, to the Portfolio’s benchmark index. |
The Strategic Insight materials outlined the process of construction of the Groups, Expense Universes and Categories, and representatives of the Investment Manager and independent legal counsel had previously discussed with the Board in further detail the methodologies used by Strategic Insight in constructing the Groups, Expense Universes and Categories, including how the methodologies could affect the results of the comparisons.
For the inactive Portfolios, comparisons consisted of each Portfolio’s: advisor fee and estimated expense ratio to the Portfolio’s Group and the Portfolio’s Expense Universe (there was no performance to analyze). The Board determined to defer considera-
94 Semi-Annual Report
tion of advisor fees in the Management Agreement (and review of expense ratios) until a Portfolio was to commence operations, at which time current information regarding advisor fees and the estimated expense ratio would be provided and considered. Accordingly, the following discussion of advisor fees, expense ratios and performance was limited to those of the five active Portfolios, although it was noted that the Investment Manager proposed to lower the expense limitation for the Emerging Markets Income Portfolio (an inactive Portfolio).
Advisor Fees and Expense Ratios.Representatives of the Investment Manager discussed the results of the Strategic Insight advisor fee and expense ratio comparisons with the Board, which showed that the advisor fees and expense ratios of the Portfolios were generally competitive within each Portfolio’s respective Group. The Board considered the comparisons, additional perspectives in information prepared by, and in discussions with, representatives of the Investment Manager and that the Investment Manager continues to voluntarily enter into expense limitation agreements for all of the Portfolios, pursuant to which the Investment Manager was waiving advisor fees and/or reimbursing expenses for certain Portfolios.
As applicable, the Board also considered fees paid to the Investment Manager by any funds advised or sub-advised by the Investment Manager utilizing the same investment strategies as the Portfolios, as well as any separately managed accounts of the Investment Manager with similar investment objectives, policies and strategies (for each Portfolio, collectively with such funds, “Similar Accounts”). Representatives of the Investment Manager discussed the nature of the Similar Accounts and the significant differences in services provided by the Investment Manager to the different types of Similar Accounts as compared to the services provided to the Portfolios. The Board considered the relevance of the fee information provided for Similar Accounts, in light of the Investment Manager’s discussion of the significant differences in services provided, to evaluate the fees paid to the Investment Manager by the Portfolios.
Semi-Annual Report 95
Performance.When evaluating the performance of each Portfolio, the Board considered Strategic Insight’s performance analysis along with other information provided by the Investment Manager, including additional performance information, as well as additional perspectives in information prepared by, and in discussions with, representatives of the Investment Manager. The Board also received and would continue to receive regular updates and/or additional information (as requested by the Board) from the Investment Manager in respect of Portfolios with relative underperformance compared to the relevant Group, as well as any other Portfolios for which the Board requested additional information.
Investment Manager Profitability and Economies of Scale
The Board reviewed information prepared by the Investment Manager for each active Portfolio concerning the estimated profitability percentage of the Management Agreement to the Investment Manager and its affiliates for the calendar year ended December 31, 2018 and the Investment Manager’s cost allocation methodology to compute an estimate of each Portfolio’s costs to the Investment Manager. The Investment Manager’s representatives reviewed with the Board information provided on the Investment Manager’s brokerage practices and the Portfolios’ brokerage allocation, commission payments and soft dollar commissions and benefits. The Investment Manager’s representatives stated that neither the Investment Manager nor its affiliates receive any other significant indirect benefits from the Investment Manager acting as investment manager to the Portfolios. The representatives of the Investment Manager reminded the Board that the Investment Manager is continuing to support distribution relationships through direct payments from its or its affiliates’ own resources to third parties in connection with distribution and shareholder servicing and/or administrative and recordkeeping services, and noted that the Fund does not bear any related costs other than the 0.25% 12b1 fee pursuant to the Distribution and Servicing Plan adopted for the Portfolios’ Service Shares.
The profitability percentages were within ranges determined by relevant court cases not to be so disproportionately large that they
96 Semi-Annual Report
bore no reasonable relationship to the services rendered. The Board (1) considered the Investment Manager’s estimated profitability with respect to each Portfolio as part of their evaluation of the Portfolio’s fee under the Management Agreement, considered in relation to the mix of services provided by the Investment Manager (including the nature, extent and quality of such services), and (2) evaluated the profitability in light of the relevant circumstances for each Portfolio. Representatives of the Investment Manager and the Board discussed ways economies of scale could be realized and how they could be shared, including the Investment Manager’s reinvestment of profits back into its business, waiving or reducing Portfolio management fees and/or reimbursing expenses, adding discounts to a Portfolio’s management fee schedule as a Portfolio’s assets increase or by instituting management fees at inception that account for future scale. It was noted that each Portfolio had declining or generally stable assets over the past calendar year so that the potential that the Investment Manager may have realized any economies of scale was reduced.
At the conclusion of these discussions, the Board expressed the opinion that it had been furnished with such information as may reasonably be necessary to make an informed business decision with respect to evaluation of the renewal of the Management Agreement. Based on its discussions and considerations as described above, with the assistance of independent legal counsel and in the exercise of its business judgment, the Board made the following conclusions and determinations.
| • | The Board concluded that the nature, extent and quality of the services provided by the Investment Manager are adequate and appropriate, noting the benefits of the significant services and infrastructure associated with an approximately $235 billion global asset management business. |
| | |
| • | For the active Portfolios, the Board concluded that each Portfolio’s fee paid to the Investment Manager was appropriate under the circumstances and in light of the factors and the totality of the services provided. |
Semi-Annual Report 97
| • | The Board, after considering the information provided and the totality of the relevant circumstances for each Portfolio, concluded that the investment performance of each Portfolio was acceptable or that, for any Portfolios that were not performing in accordance with expectations, the Board accepted that the Investment Manager was taking steps intended to improve performance and the Board would continue to monitor performance. |
| | |
| • | The Board recognized that economies of scale may be realized, particularly as the assets of the Portfolios increase and determined that they would continue to consider potential material economies of scale. |
In evaluating the Management Agreement, the Board relied on the information described above, in addition to information provided by the Investment Manager throughout the year relating to the operations of the Fund and the investment management and other services provided under the Management Agreement, including information on the investment performance of the Portfolios in comparison to similar mutual funds and benchmark performance indices over various time periods; general market outlook as applicable to the Portfolios; and compliance reports. The Board also relied on its previous knowledge, gained through meetings and other interactions with the Investment Manager, of the Investment Manager and the services provided to the Fund by the Investment Manager. The Board considered these conclusions and determinations in their totality and determined to approve the Fund’s Management Agreement for each Portfolio. In deciding whether to vote to approve the Management Agreement for each Portfolio, each Director may have accorded different weights to different factors so that each Director may have had a different basis for his or her decision.
98 Semi-Annual Report
Lazard Retirement Series, Inc.
30 Rockefeller Plaza
New York, New York 10112-6300
Telephone: 800-823-6300
https://www.lazardassetmanagement.com
Investment Manager
Lazard Asset Management LLC
30 Rockefeller Plaza
New York, New York 10112-6300
Telephone: 800-823-6300
Distributor
Lazard Asset Management Securities LLC
30 Rockefeller Plaza
New York, New York 10112-6300
Custodian
State Street Bank and Trust Company
One Iron Street
Boston, Massachusetts 02210
Transfer Agent and Dividend Disbursing Agent
DST Asset Manager Solutions, Inc.
2000 Crown Colony Drive
Quincy, Massachusetts 02169
Telephone: 617-483-7000
Independent Registered Public Accounting Firm
Deloitte & Touche LLP
30 Rockefeller Plaza
New York, New York 10112-0015
Legal Counsel
Proskauer Rose LLP
Eleven Times Square
New York, New York 10036-8299
http://www.proskauer.com


| Lazard Asset Management LLC • 30 Rockefeller Plaza • New York, NY 10112 • www.lazardassetmanagement.com | | |
Performance information as of the most recent month end is available online at www. lazardassetmanagement.com.
LZDPS010 |  | We Recycle
This document is printed on recycled paper. |
ITEM 2. CODE OF ETHICS.
Not applicable.
ITEM 3. AUDIT COMMITTEE FINANCIAL EXPERT.
Not applicable.
ITEM 4. PRINCIPAL ACCOUNTANT FEES AND SERVICES.
Not applicable.
ITEM 5. AUDIT COMMITTEE OF LISTED REGISTRANTS.
Not applicable.
ITEM 6. INVESTMENTS
Not applicable.
ITEM 7. DISCLOSURE OF PROXY VOTING POLICIES AND PROCEDURES FOR CLOSED END MANAGEMENT INVESTMENT COMPANIES.
Not applicable.
ITEM 8. PORTFOLIO MANAGERS OF CLOSED-END MANAGEMENT INVESTMENT COMPANIES.
Not applicable.
ITEM 9. PURCHASES OF EQUITY SECURITIES BY CLOSED-END MANAGEMENT INVESTMENT COMPANY AND AFFILIATED PURCHASERS.
Not applicable.
ITEM 10. SUBMISSION OF MATTERS TO A VOTE OF SECURITY HOLDERS.
There were no material changes to the procedures by which shareholders may recommend nominees to the Registrant’s Board of Directors during the period covered by this report.
ITEM 11. CONTROLS AND PROCEDURES.
(a) The Registrant’s principal executive and principal financial officers have concluded, based on their evaluation of the Registrant’s disclosure controls and procedures as of a date within 90 days of the filing date of this report, that the Registrant’s disclosure controls and procedures are reasonably designed to ensure that information required to be disclosed by the Registrant on Form N-CSR is recorded, processed, summarized and reported within the required time periods and that information required to be disclosed by the Registrant in the reports that it files or submits on Form N-CSR is accumulated and communicated to the Registrant’s management, including its principal executive and principal financial officers, as appropriate to allow timely decisions regarding required disclosure.
(b) There were no changes to the Registrant’s internal control over financial reporting that occurred during the second fiscal quarter of the period covered by this report that have materially affected, or are reasonably likely to materially affect, the Registrant’s internal control over financial reporting.
ITEM 12. DISCLOSURE OF SECURITIES LENDING ACTIVITIES FOR CLOSED-END MANAGEMENT INVESTMENT COMPANIES.
Not applicable.
ITEM 13. EXHIBITS.
(a)(1) Not applicable.
(a)(2) Certifications of principal executive and principal financial officers as required by Rule 30a-2(a) under the Investment Company Act of 1940.
(a)(3) Not applicable.
(b) Certifications of principal executive and principal financial officers as required by Rule 30a-2(b) under the Investment Company Act of 1940.
SIGNATURES
Pursuant to the requirements of the Securities Exchange Act of 1934 and the Investment Company Act of 1940, the Registrant has duly caused this report to be signed on its behalf by the undersigned, thereunto duly authorized.
Lazard Retirement Series, Inc.
By /s/ Nathan A. Paul
Nathan A. Paul
Chief Executive Officer
Date August 22, 2019
Pursuant to the requirements of the Securities Exchange Act of 1934 and the Investment Company Act of 1940, this report has been signed below by the following persons on behalf of the Registrant and in the capacities and on the dates indicated.
By /s/ Nathan A. Paul
Nathan A. Paul
Chief Executive Officer
Date August 22, 2019
By /s/ Christopher Snively
Christopher Snively
Chief Financial Officer
Date August 22, 2019