UNITED STATES
SECURITIES AND EXCHANGE COMMISSION
Washington, D.C. 20549
FORM N-CSR
CERTIFIED SHAREHOLDER REPORT OF REGISTERED MANAGEMENT
INVESTMENT COMPANIES
Investment Company Act file number 811-08071
Lazard Retirement Series, Inc.
(Exact name of registrant as specified in charter)
30 Rockefeller Plaza
New York, New York 10112
(Address of principal executive offices) (Zip code)
Mark R. Anderson, Esq.
Lazard Asset Management LLC
30 Rockefeller Plaza
New York, New York 10112
(Name and address of agent for service)
Registrant’s telephone number, including area code: (212) 632-6000
Date of fiscal year end: 12/31
Date of reporting period: 6/30/17
ITEM 1. REPORTS TO STOCKHOLDERS.

Lazard Retirement Series
Semi-Annual Report
June 30, 2017
| | US Equity Lazard Retirement US Strategic Equity Portfolio
Lazard Retirement US Small-Mid Cap Equity Portfolio
International Equity Lazard Retirement International Equity Portfolio | | Emerging Markets
Lazard Retirement Emerging Markets Equity Portfolio
Asset Allocation
Lazard Retirement Global Dynamic Multi-Asset Portfolio |
Lazard Retirement Series, Inc. Table of Contents
Shares of the Portfolios are currently offered only to separate accounts established by insurance companies to fund variable annuity contracts and variable life insurance policies. Portfolio shares may also be offered to certain qualified pension and retirement plans and accounts permitting accumulation of assets on a tax-deferred basis.
Please consider a Portfolio’s investment objective, risks, charges and expenses carefully before investing. For more complete information about Lazard Retirement Series, Inc. (the “Fund”), you may obtain a prospectus or summary prospectus by calling 800-823-6300, or online, at www.LazardNet.com. Read the prospectus or each Portfolio’s summary prospectus carefully before you invest. The prospectus and each Portfolio’s summary prospectus contain the investment objective, risks, charges, expenses and other information about each Portfolio of the Fund, which are not detailed in this report.
Distributed by Lazard Asset Management Securities LLC.
Semi-Annual Report 1
Lazard Retirement Series, Inc. A Message from Lazard
Dear Shareholder,
In the first half of 2017, global markets generally performed well, led by widespread gains that were most pronounced in emerging markets and Europe. During this time, the global economic recovery showed signs of broadening beyond the United States to other regions of the world. In this backdrop, US equities extended their multi-year advance, but rose less than their counterparts globally.
Emerging markets equity and debt benefited from continued global economic growth and improvements in corporate and sovereign fundamentals, notably rising earnings growth and stronger country balance sheets. The drivers of these broad improvements appear sustainable and valuations remain compelling among the securities we research. While the outlook is encouraging, our emerging markets investment teams are vigilant about potential risks, such as potential weakness in commodity prices and tighter-than-expected US monetary policy in 2018.
Europe’s economic and investment prospects appear to be at their strongest since the 2007–2008 period, with the consensus outlook largely positive. European economic data and key leading indicators are improving across the board. Policy statements from the European Central Bank suggests that monetary authorities are becoming more optimistic about growth, although policy is expected to remain accommodative over the near-to-medium term. Political risk has subsided but remains. During the first half, a market-friendly result to France’s presidential election helped buoy European sentiment. The results of the UK snap election, meanwhile, created concerns about Britain’s political outlook and the potential effect on Brexit negotiations. Elsewhere, our Tokyo-based team expects Japanese companies to yield strong returns as a result of better growth prospects, improving corporate governance, and stronger fundamentals.
The US economy appears to be in better shape than is commonly appreciated and our US equity team continues to find compelling value across the US market, which consists of companies that are among the world’s most financially productive and well managed. Our US fixed income specialists expect long-term US interest rates to eventually normalize at higher levels as global rate pressures subside in line with Europe’s improving growth outlook.
We are privileged that you have turned to Lazard for your investment needs and value your continued confidence in our investment management capabilities. Be assured that our specialist investment teams, supported by our global infrastructure, are committed to delivering the long-term patterns of performance that you expect.
Sincerely,
Lazard Asset Management LLC
2 Semi-Annual Report
Lazard Retirement Series, Inc. Investment Overviews
US Equities
The S&P 500® Index rose during the first half of the year. The pace of the market’s post-election rally was tempered by increasing skepticism over the Trump administration’s ability to pass many of its key policy priorities, with congressional support for the latest health care bill proposal viewed as underwhelming. However, markets continued to advance as corporate earnings and economic data were generally positive. Auto sales, a key driver of the economic recovery, showed signs of slowing in the new year. Employment data remained strong, with the economy adding more jobs than expected and the unemployment rate falling to a 16-year low of 4.3% in June. The US economy continued to grow at an uneven pace, however, as the two most recent quarterly GDP reports showed an underwhelming pace of growth. In light of an improving employment and inflation picture during the first half of the year, the Federal Open Market Committee elected to raise interest rates in March and again in June.
International Equities
International equities rose during the first half of the year, despite investors cooling on the more cyclical areas of the market. Tightening policy in China has rolled commodity prices such as iron ore, which, alongside fading hopes of US stimulus from the new Government, has dampened reflation expectations. This saw bond yields fall back, driving gains in more stable sectors, such as consumer staples, and weaker performance in the commodity-related sectors of materials and energy. Technology stocks were the strongest performers, as investors increasingly view them as structural winners regardless of the shorter-term cycle. Auto stocks were hurt by the rollover of US auto sales volumes in an environment where auto companies need to continue investing in electric and autonomous vehicles.
Emerging Markets Equities
Buoyed by investor optimism over the direction of global economic activity, emerging markets equities recorded robust performance in the first half of 2017. The MSCI Emerging Markets® Index (the “EM Index”) rose by more than 18% over the period in US dollar terms. Asian shares performed particularly well and
climbed by more than 23% as exporters and Chinese internet-related firms were favored. Despite some weakness in some commodity prices, Latin American markets still recorded a return of more than 10%. Lower crude oil prices and political rhetoric over Russia resulted in weak overall returns in Eastern Europe, despite strong performance in some central European nations following an improved environment in the aftermath of Emmanuel Macron’s presidential victory in France.
Returns in European emerging markets were extraordinarily mixed during the six-month period. Weakness in crude oil prices and accusations that Russia hacked the US election brought up the possibility of further sanctions and depressed share prices. Emmanuel Macron’s impressive victory as French president relieved markets and buffeted stock prices in Poland and Hungary. In Turkey, a constitutional vote giving President Erdogan considerably greater powers narrowly passed and was followed by an improbable relief rally.
All Latin American markets recorded positive returns over the period. Share prices in Brazil rose early in the year as investors anticipated the passing of several fiscal, tax, and labor reforms. However, the market became less confident about the likely success of these reforms in March and April, causing periods of weakness. In May, a recording of a conversation between President Temer and a corporate executive was released, which appeared to implicate Temer in corruption, and the Brazilian real and share prices reacted negatively. Temer strongly repudiated the accusation and stocks recovered, but he will still likely face a lower house vote on whether he should face a trial in the Supreme Court. Mexican shares were helped by a rebound in the peso after investors became more optimistic that a North American Free Trade Agreement (NAFTA) renegotiation would not be onerous.
All major Asian markets increased during the period. Export-oriented markets such as South Korea, Taiwan, and China performed particularly well, helped by a series of smartphone launches and despite North Korean missile launches and the impeachment of South Korea’s President. Chinese equities were helped first by
Semi-Annual Report 3
government measures aimed at helping corporate profitability and then by considerable investor interest in internet-related firms which witnessed strong share price increases. In India, positive election results in several state elections for the Bharatiya Janata Party and Prime Minister Modi helped generate strong returns.
From a sector perspective, information technology dramatically outperformed all other sectors, while the energy sector, pressured by lower crude oil prices, was the worst performing sector during the period.
Multi-Asset
Markets have been well supported throughout the first half of 2017, despite multiple geopolitical hotspots. Underpinning this has been evidence of economic growth synchronized across major countries, as well as extremely low volatility in equity and fixed income markets. Rising trade volumes provided further support to emerging markets despite some political concerns and weak energy prices dragging some countries. A generally weaker US dollar over the period has lifted international currencies and improved local liquidity environments, while US multinationals have benefited from improved export earnings. In this setting, most major central banks remain highly accommodative.
Politics had provided an initial boost in the United States due to expectations of lower regulations and taxes from the new Republican administration. Disappointment here has led to some consolidation in sectors such as financials, though technology companies have continued to be well supported. The long bond also rallied as the “reflation trade” lost steam and the market became more sanguine about medium-term inflationary pressures. In Europe, initial fears about the results of multiple elections in the region proved unfounded, following the defeat of populist candidates in the Netherlands and France, leading to strong inflows into the region’s equity and corporate credit markets. Japanese earnings have recovered well, leading to market support. Chinese officials are keeping the country on a steady path ahead of the November Party plenum, despite the central bank draining local liquidity.
Lazard Retirement US Strategic Equity Portfolio
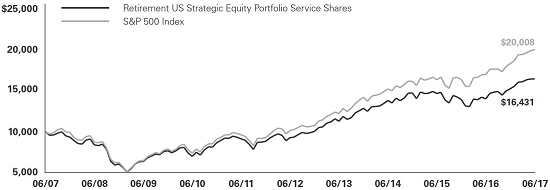
For the six months ended June 30, 2017, the Lazard Retirement US Strategic Equity Portfolio’s Service Shares posted a total return of 7.91%, as compared with the 9.34% return for the S&P 500 Index.
Stock selection in the financials sector contributed to performance. Shares of diversified financial services provider Citigroup rose amid optimism around industry deregulation and the prospect of stronger capital returns following the Federal Reserve’s annual stress tests. An overweight position in the information technology sector also helped returns. Shares of Skyworks Solutions rose after the company reported strong earnings, with organic growth exceeding expectations, driven by increasing mobile content, rising data complexity, and a broadening customer base.
In contrast, stock selection in the consumer discretionary sector detracted from performance. Shares of Advance Auto Parts fell along with the auto parts space more broadly due to weaker winter demand, delayed tax refunds, and pressure from Amazon’s expansion into the auto parts space. Stock selection in the consumer staples sector also hurt returns. Shares of Molson Coors fell after management issued medium-term EBITDA margin guidance that was below expectations, citing reinvestments to drive top-line growth and the need for increased capital flexibility.
Lazard Retirement US Small-Mid Cap Equity Portfolio
For the six months ended June 30, 2017, the Lazard Retirement US Small-Mid Cap Equity Portfolio’s Service Shares posted a total return of 4.20%, as compared with the 5.97% return for the Russell 2500® Index.
Stock selection in the industrials sector contributed to performance. Shares of Proto Labs rose after the company reported quarterly earnings above expectations, driven by strong revenues. Stock selection and an underweight position in the consumer staples sector also contributed to performance. Shares of Sprouts Farmers Market rose amid speculation that the company could be a potential acquisition target.
In contrast, stock selection in the consumer discretionary sector detracted from performance. Shares of
4 Semi-Annual Report
Advance Auto Parts fell along with the auto parts space more broadly due to weaker winter demand, delayed tax refunds, and pressure from Amazon’s expansion into the auto parts space. Stock selection in the financials sector also hurt returns. Shares of PacWest Bancorp fell after the company reported second quarter earnings below expectations, as reserves and loan prepayments came in higher than expected.
Lazard Retirement International Equity Portfolio
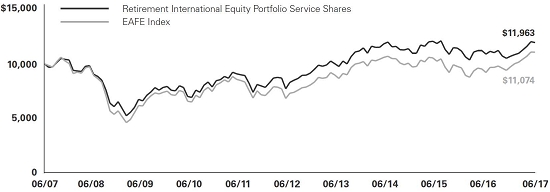
For the six months ended June 30, 2017, the Lazard Retirement International Equity Portfolio’s Service Shares posted a total return of 11.84%, as compared with the 13.81% return for the MSCI EAFE® Index (the “EAFE Index”).
During the period, the Portfolio rose strongly in absolute terms but lagged the benchmark. Stock selection in the health care sector detracted from relative returns as British pharmaceutical company Shire underperformed. The company offers an attractive mix of treatments for rare diseases. This gives them critical pricing power, which is increasingly challenging to find in global pharmaceuticals. We believe the market remains skeptical about the company’s ability to integrate Baxalta and pay down the debt incurred to fund the acquisition. The company’s fundamentals remain strong and the valuations are very attractive in our view. We continue to own a significant position in the stock. Stock selection in the materials sector also detracted from relative performance, as shares of Anglo/Australian miner BHP fell as an employee strike halted production at one of the company’s Chilean copper mines. Elsewhere, shares of UK-based mobile operator BT Group fell after reporting mixed results. Lastly, a higher-than-benchmark exposure to the poor-performing energy sector hurt relative returns.
In contrast, stock selection in the real estate sector was additive to relative returns as shares of Japanese developer Daiwa House performed well on an increased dividend and as results highlighted strong growth in commercial facilities and logistics. Stock selection in the industrials sector was also beneficial to relative returns. Shares of Vinci, a French toll-road, airport operator, and infrastructure company, continued higher on robust growth in air traffic while the
company’s contracting/construction business also saw revenues rise. Additionally in the sector, shares of Irish discount airline Ryanair rose on good results and on the announcement of a new stock buyback program. Elsewhere, in the consumer discretionary sector, shares of Japanese media and electronics company Sony rose on strong fourth quarter results. Lastly, positioning in emerging markets was additive to the Portfolio’s relative returns as shares of Taiwan Semiconductor Manufacturing rose on strong demand for mobile phone chips.
Lazard Retirement Emerging Markets Equity Portfolio
For the six months ended June 30, 2017, the Lazard Retirement Emerging Markets Equity Portfolio’s Service Shares posted a total return of 13.00%, while Investor Shares posted a total return of 13.15%, as compared with the 18.43% return for the EM Index.
During the period, shares of Samsung Electronics, a Korean manufacturer of electronic goods, rose on expectations for a strong second quarter and firm memory pricing for the second half of the year. NetEase, a Chinese developer and distributor of computer and online games, has strong second-half expectations given its rich pipeline of new games, including Minecraft. Shares of Taiwan Semiconductor Manufacturing, a Taiwanese semiconductor manufacturer, gained amid expectations for a strong Apple-led ramp-up in the second half of the year. SK Hynix, a Korean Semiconductor manufacturer, benefited from strong demand for DRAM and expectations for pricing to remain firm in the second half of the year. Shares of YPF, an Argentine energy company, gained on the back of optimism for increased international interest for joint ventures related to the Vaca Muerta, and the potential for further cost cutting post a deal reached with the unions.
In contrast, shares of Sberbank, a Russian bank, declined as the risk of increased provisions from corporate loans rose, and after the US Senate approved the imposition of new sanctions against Russia. Lukoil, a Russian energy company, experienced profit taking along with the Russian market on the back of increased volatility in oil prices. Shares of Gazprom, a Russian gas company, declined as hopes for an
Semi-Annual Report 5
increased dividend payout ratio diminished. Magnit, a Russian food retailer, declined after reporting lower margins for the quarter. Shares of Pakistan Petroleum, a Pakistani energy company, retreated on the back of volatile oil prices and a delay in the gas price revision for one of its larger assets. A higher-than-index exposure to Russia and Brazil detracted from returns. Stock selection within the information technology and financial sectors and within China also hurt performance. Information technology stock underperformance was predominantly due to the companies not held in the Portfolio during the period. These include Alibaba and Tencent, which were up 60% and 47% respectively through the end of June. Each of these stocks cost the Portfolio significantly in relative performance as they have meaningful weights in the EM Index.
Lazard Retirement Global Dynamic Multi-Asset Portfolio
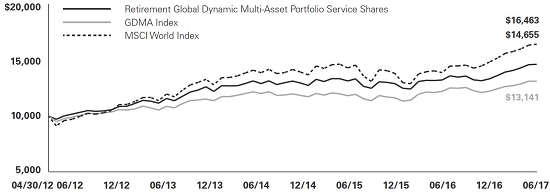
For the six months ended June 30, 2017, the Lazard Retirement Global Dynamic Multi-Asset Portfolio’s Service Shares posted a total return of 9.81%, as compared with the 7.50% return of its blended benchmark, which is a 50/50 blend of the MSCI World® Index and the Bloomberg Barclays Global Aggregate® Index (the “GDMA Index”).
Changes to the market forecast during the first half of 2017 reflected a shift from cautious to more upbeat
views in several of our considerations. Many factors were involved in our assessment, including economic data from Europe and Japan, liquidity trends on credit availability and consumer credit on the demand side, as well as sentiment indicators relevant to geopolitical risk and factors affecting regulations in different regions.
Stock selection in the financials, health care, and industrials sectors helped performance, as did an underweight to the energy sector and stock selection in Australia, Canada, and Germany. In fixed income, an underweight across the euro zone and Japan, overweight exposure to Singapore, Mexico, and New Zealand, an underweight to government bonds and overweight positioning in diversified global credit sectors added to returns. Security selection, within fixed income, in the United States and the euro zone, and tactical positioning in the Mexican peso, Japanese yen, Swedish krona, and Australian dollar also raised performance.
In contrast, stock selection in the consumer staples, information technology, and telecommunication services sectors, stock selection in Norway, and currency exposure within fixed income (small underweight positioning in the Canadian dollar and the euro) hurt performance. The positions in currencies are implemented using non-deliverable forward contracts.
Notes to Investment Overviews:
All Portfolios’ total returns reflect reinvestment of all dividends and distributions, if any. Certain expenses of a Portfolio may have been waived or reimbursed by Lazard Asset Management LLC, the Fund’s investment manager (the “Investment Manager”), State Street Bank and Trust Company, the Fund’s administrator (“State Street”), or Boston Financial Data Services, Inc., the Fund’s transfer and dividend disbursing agent (“BFDS”); without such waiver/reimbursement of expenses, such Portfolio’s returns would have been lower. Performance information does not reflect the fees and charges imposed by participating insurance companies at the separate account level, and such charges will have the effect of reducing performance. Past performance is not indicative, or a guarantee, of future results. Return for a period of less than one year is not annualized.
The performance data of the indices and other market data have been prepared from sources and data that the Investment Manager believes to be reliable, but no representation is made as to their accuracy. These indices are unmanaged, have no fees or costs and are not available for investment.
The views of the Investment Manager and the securities described in this report are as of June 30, 2017; these views and portfolio holdings may have changed subsequent to this date. Nothing herein should be construed as a recommendation to buy, sell, or hold a particular security. There is no assurance that the securities discussed herein will remain in a Portfolio at the time you receive this report, or that securities sold will not have been repurchased. The specific securities discussed may, in aggregate, represent only a small percentage of a Portfolio’s holdings. It should not be assumed that securities identified and discussed were, or will be, profitable, or that the investment decisions made in the future will be profitable, or equal the investment performance of the securities discussed herein.
The views and opinions expressed are provided for general information only, and do not constitute specific tax, legal, or investment advice to, or recommendations for, any person. There can be no guarantee as to the accuracy of any outlooks for markets, sectors and securities as discussed herein. You should read the Fund’s prospectus or each Portfolio’s summary prospectus for a more detailed discussion of each Portfolio’s investment objective, strategies, risks and fees.
6 Semi-Annual Report
Lazard Retirement Series, Inc. Performance Overviews (unaudited)
Lazard Retirement US Strategic Equity Portfolio
Comparison of Changes in Value of $10,000 Investment in the Service Shares of Lazard Retirement US Strategic Equity Portfolio and S&P 500® Index*
Average Annual Total Returns*
Periods Ended June 30, 2017
| | One | Five | Ten | |
| | Year | Years | Years | |
| Service Shares | 17.41% | 12.20% | 5.09% | |
| S&P 500 Index | 17.90% | 14.63% | 7.18% | |
| * | Total returns reflect reinvestment of all dividends and distributions, if any. Certain expenses of the Portfolio may have been waived or reimbursed by the Investment Manager, State Street or BFDS; without such waiver/reimbursement of expenses, the Portfolio’s returns would have been lower. Performance information does not reflect the fees and charges imposed by participating insurance companies at the separate account level, and such charges will have the effect of reducing performance. |
| | |
| | Performance results do not include adjustments made for financial reporting purposes in accordance with accounting principles generally accepted in the United States of America (“GAAP”) and may differ from amounts reported in the financial highlights. |
| | |
| | The performance quoted represents past performance. Current performance may be lower or higher than the performance quoted. Past performance is not indicative, or a guarantee, of future results; the investment return and principal value of the Portfolio will fluctuate, so that Portfolio shares, when redeemed, may be worth more or less than their original cost. Within the longer periods illustrated there may have been short-term fluctuations, counter to the overall trend of investment results, and no single period of any length may be taken as typical of what may be expected in future periods. |
| | |
| | The performance data of the index has been prepared from sources and data that the Investment Manager believes to be reliable, but no representation is made as to its accuracy. The S&P 500 Index is a market capitalization-weighted index of 500 companies in leading industries of the US economy. The index is unmanaged, has no fees or costs and is not available for investment. |
Semi-Annual Report 7
Lazard Retirement US Small-Mid Cap Equity Portfolio
Comparison of Changes in Value of $10,000 Investment in the Service Shares of Lazard Retirement US Small-Mid Cap Equity Portfolio, Russell 2500® Index and Russell 2000/2500 Linked Index*
Average Annual Total Returns*
Periods Ended June 30, 2017
| | One | Five | Ten | |
| | Year | Years | Years | |
| Service Shares | 20.81% | 12.79% | 6.46% | |
| Russell 2500 Index | 19.84% | 14.04% | 7.42% | |
| Russell 2000/2500 Linked Index | 19.84% | 14.04% | 7.39% | |
| * | Total returns reflect reinvestment of all dividends and distributions, if any. Certain expenses of the Portfolio may have been waived or reimbursed by the Investment Manager, State Street or BFDS; without such waiver/reimbursement of expenses, the Portfolio’s returns would have been lower. Performance information does not reflect the fees and charges imposed by participating insurance companies at the separate account level, and such charges will have the effect of reducing performance. |
| | |
| | Performance results do not include adjustments made for financial reporting purposes in accordance with GAAP and may differ from amounts reported in the financial highlights. |
| | |
| | The performance quoted represents past performance. Current performance may be lower or higher than the performance quoted. Past performance is not indicative, or a guarantee, of future results; the investment return and principal value of the Portfolio will fluctuate, so that Portfolio shares, when redeemed, may be worth more or less than their original cost. Within the longer periods illustrated there may have been short-term fluctuations, counter to the overall trend of investment results, and no single period of any length may be taken as typical of what may be expected in future periods. |
| | |
| | The Portfolio was previously known as Lazard Retirement U.S. Small Cap Equity Portfolio. As of June 1, 2009, the Portfolio changed its name to Lazard Retirement U.S. Small-Mid Cap Equity Portfolio and changed its investment strategy to invest in equity securities of small-mid cap US companies. |
| | |
| | The performance data of the indices have been prepared from sources and data that the Investment Manager believes to be reliable, but no representation is made as to their accuracy. The Russell 2500 Index measures the performance of the small-to mid-cap segment of the US equity universe, commonly referred to as “smid” cap. The Russell 2500 Index is a subset of the Russell 3000® Index. The Russell 3000 Index measures the performance of the largest 3,000 US companies, representing approximately 98% of the investable US equity market. It includes approximately 2,500 of the smallest securities based on a combination of their market cap and current index membership. The Russell 2000/2500 Linked Index is an unmanaged index created by the Investment Manager, which links the performance of the Russell 2000® Index for all periods through May 31, 2009 (when the Portfolio’s investment focus was changed from small cap companies to small-mid cap companies) and the Russell 2500 Index for all periods thereafter. The Russell 2000 Index includes approximately 2,000 of the smallest securities in the Russell 3000 Index, representing roughly 10% of the total market capitalization of Russell 3,000 companies. The indices are unmanaged, have no fees or costs and are not available for investment. |
8 Semi-Annual Report
Lazard Retirement International Equity Portfolio
Comparison of Changes in Value of $10,000 Investment in the Service Shares of Lazard Retirement International Equity Portfolio and EAFE Index*
Average Annual Total Returns*
Periods Ended June 30, 2017
| | One | Five | Ten | |
| | Year | Years | Years | |
| Service Shares | 9.82% | 7.60% | 1.81% | |
| EAFE Index | 20.27% | 8.69% | 1.03% | |
| * | Total returns reflect reinvestment of all dividends and distributions, if any. Certain expenses of the Portfolio may have been waived or reimbursed by the Investment Manager, State Street or BFDS; without such waiver/reimbursement of expenses, the Portfolio’s returns would have been lower. Performance information does not reflect the fees and charges imposed by participating insurance companies at the separate account level, and such charges will have the effect of reducing performance. |
| | |
| | Performance results do not include adjustments made for financial reporting purposes in accordance with GAAP and may differ from amounts reported in the financial highlights. |
| | |
| | The performance quoted represents past performance. Current performance may be lower or higher than the performance quoted. Past performance is not indicative, or a guarantee, of future results; the investment return and principal value of the Portfolio will fluctuate, so that Portfolio shares, when redeemed, may be worth more or less than their original cost. Within the longer periods illustrated there may have been short-term fluctuations, counter to the overall trend of investment results, and no single period of any length may be taken as typical of what may be expected in future periods. |
| | |
| | The performance data of the index has been prepared from sources and data that the Investment Manager believes to be reliable, but no representation is made as to its accuracy. The EAFE Index is a free float-adjusted market capitalization index that is designed to measure developed markets equity performance, excluding the United States and Canada. The EAFE Index consists of 21 developed markets country indices. The index is unmanaged, has no fees or costs and is not available for investment. |
Semi-Annual Report 9
Lazard Retirement Emerging Markets Equity Portfolio
Comparison of Changes in Value of $10,000 Investment in the Service Shares of Lazard Retirement Emerging Markets Equity Portfolio and EM Index*
Average Annual Total Returns*
Periods Ended June 30, 2017
| | One | Five | Ten | |
| | Year | Years | Years | |
| Service Shares** | 19.44% | 3.03% | 2.22% | |
| Investor Shares** | 19.75% | 3.28% | 2.47% | |
| EM Index | 23.75% | 3.96% | 1.91% | |
| * | Total returns reflect reinvestment of all dividends and distributions, if any. Certain expenses of the Portfolio may have been waived or reimbursed by the Investment Manager, State Street or BFDS; without such waiver/reimbursement of expenses, the Portfolio’s returns would have been lower. Performance information does not reflect the fees and charges imposed by participating insurance companies at the separate account level, and such charges will have the effect of reducing performance. |
| | |
| | Performance results do not include adjustments made for financial reporting purposes in accordance with GAAP, also exclude adjustments related to reimbursed custodian out-of-pocket expenses (Note 3 in the Notes to Financial Statements), and may differ from amounts reported in the financial highlights. |
| | |
| | The performance quoted represents past performance. Current performance may be lower or higher than the performance quoted. Past performance is not indicative, or a guarantee, of future results; the investment return and principal value of the Portfolio will fluctuate, so that Portfolio shares, when redeemed, may be worth more or less than their original cost. Within the longer periods illustrated there may have been short-term fluctuations, counter to the overall trend of investment results, and no single period of any length may be taken as typical of what may be expected in future periods. |
| | |
| | The performance data of the index has been prepared from sources and data that the Investment Manager believes to be reliable, but no representation is made as to its accuracy. The EM Index is a free float-adjusted market capitalization index that is designed to measure equity market performance in the global emerging markets. The EM Index consists of 23 emerging-market country indices. The index is unmanaged, has no fees or costs and is not available for investment. |
| | |
| ** | The performance of Service Shares and Investor Shares may vary, primarily based on the differences in fees borne by shareholders investing in different classes. |
10 Semi-Annual Report
Lazard Retirement Global Dynamic Multi-Asset Portfolio
Comparison of Changes in Value of $10,000 Investment in the Service Shares of Lazard Retirement Global Dynamic Multi-Asset Portfolio, GDMA Index and MSCI World® Index*
Average Annual Total Returns*
Periods Ended June 30, 2017
| | One | Five | Since | |
| | Year | Years | Inception† | |
| Service Shares | 10.65% | 7.90% | 7.67% | |
| GDMA Index | 7.61% | 6.08% | 5.43% | |
| MSCI World Index | 18.20% | 11.38% | 10.13% | |
| * | Total returns reflect reinvestment of all dividends and distributions, if any. Certain expenses of the Portfolio may have been waived or reimbursed by the Investment Manager, State Street or BFDS; without such waiver/reimbursement of expenses, the Portfolio’s returns would have been lower. Performance information does not reflect the fees and charges imposed by participating insurance companies at the separate account level, and such charges will have the effect of reducing performance. |
| | |
| | Performance results do not include adjustments made for financial reporting purposes in accordance with GAAP and may differ from amounts reported in the financial highlights. |
| | |
| | The performance quoted represents past performance. Current performance may be lower or higher than the performance quoted. Past performance is not indicative, or a guarantee, of future results; the investment return and principal value of the Portfolio will fluctuate, so that Portfolio shares, when redeemed, may be worth more or less than their original cost. Within the longer periods illustrated there may have been short-term fluctuations, counter to the overall trend of investment results, and no single period of any length may be taken as typical of what may be expected in future periods. |
| | |
| | The performance data of the indices have been prepared from sources and data that the Investment Manager believes to be reliable, but no representation is made as to their accuracy. The GDMA Index is an unmanaged index created by the Investment Manager and is a 50/50 blend of MSCI World Index and the Bloomberg Barclays Global Aggregate® Index. The MSCI World Index is a free float-adjusted market capitalization index that is designed to measure global developed markets equity performance. The MSCI World Index consists of 23 developed markets country indices. The Bloomberg Barclays Global Aggregate Index provides a broad-based measure of global investment-grade fixed-income debt markets, including government-related debt, corporate debt, securitized debt and global Treasury. The indices are unmanaged, have no fees or costs and are not available for investment. |
| | |
| | Before April 30, 2014, the Portfolio was known as Lazard Retirement Multi-Asset Targeted Volatility Portfolio. |
| | |
| † | The inception date for the Portfolio was April 30, 2012. |
Semi-Annual Report 11
Lazard Retirement Series, Inc. Information About Your Portfolio’s Expenses (unaudited)
Expense Example
As a shareholder in a Portfolio of the Fund, you incur ongoing costs, including management fees, distribution and service (12b-1) fees (Service Shares only), and other expenses. This Example is intended to help you understand your ongoing costs (in dollars) of investing in a Portfolio and to compare these costs with the ongoing costs of investing in other mutual funds. The Example is based on an investment of $1,000 invested at the beginning of the six month period from January 1, 2017 through June 30, 2017 and held for the entire period.
Actual Expenses
For each Share class of the Portfolios, the first line of the table below provides information about actual account values and actual expenses. You may use the information in this line, together with the amount you invested, to estimate the expenses that you paid over the period. Simply divide your account value by $1,000 (for example, an $8,600 account value divided by $1,000=8.6), then multiply the result by the number in the first line under the heading entitled “Expenses Paid During Period” to estimate the expenses you paid on your account during this period.
Hypothetical Example for Comparison Purposes
For each Share class of the Portfolios, the second line of the table below provides information about hypothetical account values and hypothetical expenses based on the class’ actual expense ratio and an assumed rate of return of 5% per year before expenses, which is not the Portfolio’s actual return. The hypothetical account values and expenses may not be used to estimate the actual ending account balance or expenses you paid for the period. You may use this information to compare the ongoing costs of investing in the Portfolio and other mutual funds. To do so, compare this 5% hypothetical example with the 5% hypothetical examples that appear in the shareholders reports of other mutual funds.
Please note that you also bear fees and charges imposed by participating insurance companies at the separate account level, which are described in the separate prospectuses issued by the participating insurance companies. Such charges will have the effect of reducing account value.
12 Semi-Annual Report
| Portfolio | Beginning
Account Value
1/1/17 | Ending
Account Value
6/30/17 | Expenses Paid
During Period*
1/1/17 - 6/30/17 | Annualized Expense
Ratio During Period
1/1/17 - 6/30/17 |
| |
| US Strategic Equity | | | | |
| Service Shares | | | | |
| Actual | $1,000.00 | $1,079.10 | $5.16 | 1.00% |
| Hypothetical (5% Return Before Expenses) | $1,000.00 | $1,019.84 | $5.01 | 1.00% |
| | | | | |
| US Small-Mid Cap Equity | | | | |
| Service Shares | | | | |
| Actual | $1,000.00 | $1,042.00 | $6.28 | 1.24% |
| Hypothetical (5% Return Before Expenses) | $1,000.00 | $1,018.65 | $6.21 | 1.24% |
| | | | | |
| International Equity | | | | |
| Service Shares | | | | |
| Actual | $1,000.00 | $1,118.40 | $5.83 | 1.11% |
| Hypothetical (5% Return Before Expenses) | $1,000.00 | $1,019.29 | $5.56 | 1.11% |
| | | | | |
| Emerging Markets Equity | | | | |
| Service Shares | | | | |
| Actual | $1,000.00 | $1,130.00 | $7.29 | 1.38% |
| Hypothetical (5% Return Before Expenses) | $1,000.00 | $1,017.95 | $6.90 | 1.38% |
| Investor Shares | | | | |
| Actual | $1,000.00 | $1,131.50 | $6.02 | 1.14% |
| Hypothetical (5% Return Before Expenses) | $1,000.00 | $1,019.14 | $5.71 | 1.14% |
| | | | | |
| Global Dynamic Multi-Asset | | | | |
| Service Shares | | | | |
| Actual | $1,000.00 | $1,098.10 | $5.46 | 1.05% |
| Hypothetical (5% Return Before Expenses) | $1,000.00 | $1,019.59 | $5.26 | 1.05% |
| * | Expenses are equal to the annualized expense ratio, net of expense waivers and reimbursements, of each Share class multiplied by the average account value over the period, multiplied by 181/365 (to reflect one-half year period). |
Semi-Annual Report 13
Lazard Retirement Series, Inc. Portfolio Holdings Presented by Sector June 30, 2017 (unaudited)
| Sector* | | Lazard
Retirement
US Strategic
Equity Portfolio | | Lazard
Retirement
US Small-Mid Cap
Equity Portfolio | | Lazard
Retirement
International
Equity Portfolio | | Lazard
Retirement
Emerging Markets
Equity Portfolio |
| | | | | | | | | | |
| Consumer Discretionary | | | 7.9 | % | | | 10.2 | % | | | 13.2 | % | | | 8.3 | % | |
| Consumer Staples | | | 11.6 | | | | 1.1 | | | | 11.4 | | | | 6.2 | | |
| Energy | | | 4.9 | | | | 5.4 | | | | 6.8 | | | | 7.6 | | |
| Financials | | | 11.3 | | | | 15.9 | | | | 18.6 | | | | 27.8 | | |
| Health Care | | | 13.3 | | | | 7.4 | | | | 8.9 | | | | 0.7 | | |
| Industrials | | | 13.0 | | | | 19.7 | | | | 18.6 | | | | 5.8 | | |
| Information Technology | | | 28.3 | | | | 15.6 | | | | 6.1 | | | | 25.1 | | |
| Materials | | | 3.5 | | | | 7.4 | | | | 3.7 | | | | 3.0 | | |
| Real Estate | | | 1.3 | | | | 10.4 | | | | 2.9 | | | | — | | |
| Telecommunication Services | | | 2.5 | | | | — | | | | 4.2 | | | | 11.2 | | |
| Utilities | | | — | | | | 4.8 | | | | 0.9 | | | | 0.6 | | |
| Short-Term Investments | | | 2.4 | | | | 2.1 | | | | 4.7 | | | | 3.7 | | |
| Total Investments | | | 100.0 | % | | | 100.0 | % | | | 100.0 | % | | | 100.0 | % | |
| Sector* | | Lazard Retirement
Global Dynamic
Multi-Asset
Portfolio |
| | | | | | |
| Consumer Discretionary | | | 11.1 | % | |
| Consumer Staples | | | 7.9 | | |
| Energy | | | 4.4 | | |
| Financials | | | 15.6 | | |
| Health Care | | | 10.2 | | |
| Industrials | | | 11.4 | | |
| Information Technology | | | 12.8 | | |
| Materials | | | 3.4 | | |
| Real Estate | | | 2.9 | | |
| Telecommunication Services | | | 3.1 | | |
| Utilities | | | 4.8 | | |
| Municipal | | | 0.6 | | |
| Sovereign Debt | | | 7.7 | | |
| US Treasury Securities | | | 1.3 | | |
| Short-Term Investments | | | 2.8 | | |
| Total Investments | | | 100.0 | % | |
* Represents percentage of total investments.
14 Semi-Annual Report
Lazard Retirement Series, Inc. Portfolios of Investments June 30, 2017 (unaudited)
| Description | | Shares | | | Fair
Value | |
| |
| Lazard Retirement US Strategic Equity Portfolio | | | |
| |
| Common Stocks | 98.3% | | | | | | |
| |
| Aerospace & Defense | 2.3% | | | | | | | | |
| United Technologies Corp. | | | 1,820 | | | $ | 222,240 | |
| |
| Air Freight & Logistics | 2.7% | | | | | | | | |
| United Parcel Service, Inc., Class B | | | 2,385 | | | | 263,757 | |
| |
| Auto Components | 1.0% | | | | | | | | |
| Delphi Automotive PLC | | | 1,120 | | | | 98,168 | |
| |
| Banks | 6.3% | | | | | | | | |
| Bank of America Corp. | | | 4,700 | | | | 114,022 | |
| Citigroup, Inc. | | | 4,790 | | | | 320,355 | |
| Citizens Financial Group, Inc. | | | 2,375 | | | | 84,740 | |
| SunTrust Banks, Inc. | | | 1,675 | | | | 95,006 | |
| | | | | | | | 614,123 | |
| Beverages | 7.4% | | | | | | | | |
| Molson Coors Brewing Co., Class B | | | 3,365 | | | | 290,534 | |
| The Coca-Cola Co. | | | 9,400 | | | | 421,590 | |
| | | | | | | | 712,124 | |
| Biotechnology | 2.0% | | | | | | | | |
| Biogen, Inc. (a) | | | 350 | | | | 94,976 | |
| Celgene Corp. (a) | | | 410 | | | | 53,247 | |
| Gilead Sciences, Inc. | | | 675 | | | | 47,776 | |
| | | | | | | | 195,999 | |
| Building Products | 1.6% | | | | | | | | |
| Johnson Controls International PLC | | | 3,525 | | | | 152,844 | |
| |
| Capital Markets | 3.7% | | | | | | | | |
| Intercontinental Exchange, Inc. | | | 3,445 | | | | 227,094 | |
| Morgan Stanley | | | 2,875 | | | | 128,110 | |
| | | | | | | | 355,204 | |
| Chemicals | 1.5% | | | | | | | | |
| Agrium, Inc. | | | 505 | | | | 45,697 | |
| PPG Industries, Inc. | | | 925 | | | | 101,713 | |
| | | | | | | | 147,410 | |
| Commercial Services & Supplies | 0.7% | | | | | | | | |
| Copart, Inc. (a) | | | 2,095 | | | | 66,600 | |
| |
| Communications Equipment | 6.4% | | | | | | | | |
| Cisco Systems, Inc. | | | 10,830 | | | | 338,979 | |
| Motorola Solutions, Inc. | | | 2,710 | | | | 235,065 | |
| Palo Alto Networks, Inc. (a) | | | 355 | | | | 47,503 | |
| | | | | | | | 621,547 | |
| Description | | Shares | | | Fair
Value | |
| |
| Containers & Packaging | 1.9% | | | | | | | | |
| Crown Holdings, Inc. (a) | | | 3,080 | | | $ | 183,753 | |
| | | | | | | | | |
| Diversified Telecommunication Services | 2.5% | | | | | | | | |
| AT&T, Inc. | | | 6,545 | | | | 246,943 | |
| | | | | | | | | |
| Electrical Equipment | 1.9% | | | | | | | | |
| Eaton Corp. PLC | | | 2,375 | | | | 184,846 | |
| | | | | | | | | |
| Energy Equipment & Services | 1.6% | | | | | | | | |
| Schlumberger, Ltd. | | | 2,320 | | | | 152,749 | |
| | | | | | | | | |
| Equity Real Estate Investment Trusts (REITs) | 1.3% | | | | | | | | |
| Prologis, Inc. | | | 2,180 | | | | 127,835 | |
| | | | | | | | | |
| Food & Staples Retailing | 2.1% | | | | | | | | |
| Walgreens Boots Alliance, Inc. | | | 2,625 | | | | 205,564 | |
| | | | | | | | | |
| Food Products | 2.2% | | | | | | | | |
| Kellogg Co. | | | 3,015 | | | | 209,422 | |
| | | | | | | | | |
| Health Care Equipment & Supplies | 3.8% | | | | | | | | |
| Medtronic PLC | | | 3,005 | | | | 266,694 | |
| Stryker Corp. | | | 695 | | | | 96,452 | |
| | | | | | | | 363,146 | |
| Health Care Providers & Services | 1.2% | | | | | | | | |
| Humana, Inc. | | | 475 | | | | 114,294 | |
| | | | | | | | | |
| Hotels, Restaurants & Leisure | 2.2% | | | | | | | | |
| McDonald’s Corp. | | | 1,360 | | | | 208,298 | |
| | | | | | | | | |
| Industrial Conglomerates | 2.0% | | | | | | | | |
| General Electric Co. | | | 3,350 | | | | 90,484 | |
| Honeywell International, Inc. | | | 780 | | | | 103,966 | |
| | | | | | | | 194,450 | |
| Insurance | 1.3% | | | | | | | | |
| Aon PLC | | | 955 | | | | 126,967 | |
| | | | | | | | | |
| Internet Software & Services | 8.1% | | | | | | | | |
| Alphabet, Inc., Class A (a) | | | 535 | | | | 497,379 | |
| Alphabet, Inc., Class C (a) | | | 43 | | | | 39,075 | |
| eBay, Inc. (a) | | | 6,995 | | | | 244,266 | |
| | | | | | | | 780,720 | |
The accompanying notes are an integral part of these financial statements.
Semi-Annual Report 15
| Description | | Shares | | | Fair
Value | |
| |
| Lazard Retirement US Strategic Equity Portfolio (concluded) |
| |
| IT Services | 5.2% | | | | | | | | |
| CoreLogic, Inc. (a) | | | 470 | | | $ | 20,389 | |
| DXC Technology Co. | | | 1,540 | | | | 118,149 | |
| Vantiv, Inc., Class A (a) | | | 1,825 | | | | 115,595 | |
| Visa, Inc., Class A | | | 2,685 | | | | 251,799 | |
| | | | | | | | 505,932 | |
| Machinery | 0.9% | | | | | | | | |
| Deere & Co. | | | 740 | | | | 91,457 | |
| |
| Marine | 0.5% | | | | | | | | |
| Kirby Corp. (a) | | | 695 | | | | 46,461 | |
| |
| Media | 1.1% | | | | | | | | |
| The Madison Square Garden Co. Class A (a) | | | 530 | | | | 104,357 | |
| |
| Metals & Mining | 0.1% | | | | | | | | |
| Steel Dynamics, Inc. | | | 400 | | | | 14,324 | |
| |
| Oil, Gas & Consumable Fuels | 3.4% | | | | | | | | |
| Cimarex Energy Co. | | | 480 | | | | 45,125 | |
| ConocoPhillips | | | 1,600 | | | | 70,336 | |
| EOG Resources, Inc. | | | 1,225 | | | | 110,887 | |
| Pioneer Natural Resources Co. | | | 630 | | | | 100,535 | |
| | | | | | | | 326,883 | |
| Pharmaceuticals | 6.4% | | | | | | | | |
| Allergan PLC | | | 555 | | | | 134,915 | |
| Pfizer, Inc. | | | 10,050 | | | | 337,579 | |
| Zoetis, Inc. | | | 2,363 | | | | 147,404 | |
| | | | | | | | 619,898 | |
| Road & Rail | 0.5% | | | | | | | | |
| Union Pacific Corp. | | | 450 | | | | 49,010 | |
| |
| Semiconductors & Semiconductor Equipment | 3.2% |
| Applied Materials, Inc. | | | 1,585 | | | | 65,476 | |
| Cypress Semiconductor Corp. | | | 5,395 | | | | 73,642 | |
| Skyworks Solutions, Inc. | | | 1,780 | | | | 170,791 | |
| | | | | | | | 309,909 | |
| Description | | Shares | | | Fair
Value | |
| |
| Software | 3.2% | | | | | | | | |
| Microsoft Corp. | | | 4,430 | | | $ | 305,360 | |
| |
| Specialty Retail | 2.8% | | | | | | | | |
| Advance Auto Parts, Inc. | | | 583 | | | | 67,972 | |
| AutoZone, Inc. (a) | | | 145 | | | | 82,717 | |
| Lowe’s Cos., Inc. | | | 1,515 | | | | 117,458 | |
| | | | | | | | 268,147 | |
| Technology Hardware, Storage & Peripherals | 2.4% | | | | | | | | |
| Apple, Inc. | | | 1,609 | | | | 231,728 | |
| |
| Textiles, Apparel & Luxury Goods | 0.9% |
| Carter’s, Inc. | | | 340 | | | | 30,243 | |
| Lululemon Athletica, Inc. (a) | | | 940 | | | | 56,090 | |
| | | | | | | | 86,333 | |
Total Common Stocks
(Cost $8,347,189) | | | | | | | 9,508,802 | |
| |
| Short-Term Investments | 2.5% | | | | | | | | |
State Street Institutional Treasury Money Market Fund, Premier Class, 0.83% (7 day yield)
(Cost $237,784) | | | 237,784 | | | | 237,784 | |
| |
Total Investments | 100.8%
(Cost $8,584,973) (b) | | | | | | $ | 9,746,586 | |
| |
| Liabilities in Excess of Cash and Other Assets | (0.8)% | | | | (79,406 | ) |
| |
| Net Assets | 100.0% | | | | | | $ | 9,667,180 | |
The accompanying notes are an integral part of these financial statements.
16 Semi-Annual Report
| Description | | Shares | | | Fair
Value | |
| |
| Lazard Retirement US Small-Mid Cap Equity Portfolio |
| |
| Common Stocks | 97.9% | | | | | | | | |
| |
| Air Freight & Logistics | 1.2% | | | | | | | | |
| Echo Global Logistics, Inc. (a) | | | 37,390 | | | $ | 744,061 | |
| |
| Airlines | 1.7% | | | | | | | | |
| Alaska Air Group, Inc. | | | 12,050 | | | | 1,081,608 | |
| |
| Auto Components | 2.3% | | | | | | | | |
| Fox Factory Holding Corp. (a) | | | 15,720 | | | | 559,632 | |
| Modine Manufacturing Co. (a) | | | 57,180 | | | | 946,329 | |
| | | | | | | | 1,505,961 | |
| Banks | 8.7% | | | | | | | | |
| BankUnited, Inc. | | | 23,110 | | | | 779,038 | |
| Comerica, Inc. | | | 13,025 | | | | 953,951 | |
| Commerce Bancshares, Inc. | | | 18,775 | | | | 1,066,983 | |
| FCB Financial Holdings, Inc., Class A (a) | | | 20,550 | | | | 981,262 | |
| Home BancShares, Inc. | | | 33,065 | | | | 823,319 | |
| PacWest Bancorp | | | 21,890 | | | | 1,022,263 | |
| | | | | | | | 5,626,816 | |
| Biotechnology | 1.6% | | | | | | | | |
| Cellectis SA ADR (a) | | | 21,460 | | | | 554,097 | |
| Eagle Pharmaceuticals, Inc. (a) | | | 6,300 | | | | 497,007 | |
| | | | | | | | 1,051,104 | |
| Building Products | 3.3% | | | | | | | | |
| Continental Building Products, Inc. (a) | | | 23,735 | | | | 553,026 | |
| Owens Corning | | | 11,485 | | | | 768,576 | |
| PGT Innovations, Inc. (a) | | | 64,385 | | | | 824,128 | |
| | | | | | | | 2,145,730 | |
| Capital Markets | 1.0% | | | | | | | | |
| Morningstar, Inc. | | | 8,095 | | | | 634,162 | |
| |
| Chemicals | 4.0% | | | | | | | | |
| Ingevity Corp. (a) | | | 9,955 | | | | 571,417 | |
| Innospec, Inc. | | | 14,650 | | | | 960,308 | |
| Valvoline, Inc. | | | 44,685 | | | | 1,059,928 | |
| | | | | | | | 2,591,653 | |
| Commercial Services & Supplies | 1.5% |
| Deluxe Corp. | | | 13,755 | | | | 952,121 | |
| |
| Communications Equipment | 0.8% | | | | | | | | |
| Ciena Corp. (a) | | | 20,015 | | | | 500,775 | |
| Description | | Shares | | | Fair
Value | |
| |
| Containers & Packaging | 3.4% | | | | | | | | |
| Crown Holdings, Inc. (a) | | | 20,980 | | | $ | 1,251,667 | |
| Graphic Packaging Holding Co. | | | 68,050 | | | | 937,729 | |
| | | | | | | | 2,189,396 | |
| Electric Utilities | 1.7% | | | | | | | | |
| PNM Resources, Inc. | | | 28,200 | | | | 1,078,650 | |
| |
| Electrical Equipment | 3.4% | | | | | | | | |
| Atkore International Group, Inc. (a) | | | 32,810 | | | | 739,866 | |
| Generac Holdings, Inc. (a) | | | 19,615 | | | | 708,690 | |
| Regal-Beloit Corp. | | | 9,515 | | | | 775,948 | |
| | | | | | | | 2,224,504 | |
| Electronic Equipment, Instruments & Components | 3.2% |
| Belden, Inc. | | | 10,065 | | | | 759,203 | |
| FLIR Systems, Inc. | | | 23,395 | | | | 810,871 | |
| Littelfuse, Inc. | | | 2,965 | | | | 489,225 | |
| | | | | | | | 2,059,299 | |
| Energy Equipment & Services | 3.1% | | | | | | | | |
| NCS Multistage Holdings, Inc. (a) | | | 33,050 | | | | 832,199 | |
| Newpark Resources, Inc. (a) | | | 81,965 | | | | 602,443 | |
| Oceaneering International, Inc. | | | 24,510 | | | | 559,808 | |
| | | | | | | | 1,994,450 | |
| Equity Real Estate Investment Trusts (REITs) | 10.4% | | | | | |
| American Campus Communities, Inc. | | | 16,410 | | | | 776,193 | |
| Camden Property Trust | | | 11,600 | | | | 991,916 | |
| DCT Industrial Trust, Inc. | | | 20,300 | | | | 1,084,832 | |
| Extra Space Storage, Inc. | | | 12,745 | | | | 994,110 | |
| Healthcare Realty Trust, Inc. | | | 30,410 | | | | 1,038,501 | |
| Kilroy Realty Corp. | | | 13,185 | | | | 990,853 | |
| UDR, Inc. | | | 21,740 | | | | 847,208 | |
| | | | | | | | 6,723,613 | |
| Food & Staples Retailing | 1.1% | | | | | | | | |
| Sprouts Farmers Market, Inc. (a) | | | 30,995 | | | | 702,657 | |
| |
| Health Care Equipment & Supplies | 1.4% | | | | |
| STERIS PLC | | | 11,330 | | | | 923,395 | |
| |
| Health Care Providers & Services | 1.4% |
| AMN Healthcare Services, Inc. (a) | | | 23,420 | | | | 914,551 | |
| |
| Hotels, Restaurants & Leisure | 0.7% | | | | | | | | |
| Bloomin’ Brands, Inc. | | | 22,770 | | | | 483,407 | |
| |
| Household Durables | 1.1% | | | | | | | | |
| Leggett & Platt, Inc. | | | 13,650 | | | | 717,034 | |
The accompanying notes are an integral part of these financial statements.
Semi-Annual Report 17
| | | | | |
| | | | | Fair |
| Description | | Shares | | | Value |
| | | | | |
| Lazard Retirement US Small-Mid Cap Equity Portfolio (concluded) | |
| | | | | | | | | |
| Independent Power & Renewable Electricity Producers | 1.6% | | | | | | | | |
| Pattern Energy Group, Inc. | | | 43,705 | | | $ | 1,041,927 | |
| | | | | | | | | |
| Insurance | 4.6% | | | | | | | | |
| Arch Capital Group, Ltd. (a) | | | 10,595 | | | | 988,408 | |
| Reinsurance Group of America, Inc. | | | 7,525 | | | | 966,135 | |
| Validus Holdings, Ltd. | | | 19,585 | | | | 1,017,832 | |
| | | | | | | | 2,972,375 | |
| Internet Software & Services | 1.3% | | | | | | | | |
| j2 Global, Inc. | | | 9,570 | | | | 814,311 | |
| | | | | | | | | |
| IT Services | 3.3% | | | | | | | | |
| CoreLogic, Inc. (a) | | | 16,985 | | | | 736,809 | |
| Leidos Holdings, Inc. | | | 14,705 | | | | 760,102 | |
| Vantiv, Inc., Class A (a) | | | 9,845 | | | | 623,582 | |
| | | | | | | | 2,120,493 | |
| Life Sciences Tools & Services | 1.5% | | | | | | | | |
| INC Research Holdings, Inc., Class A (a) | | | 16,390 | | | | 958,815 | |
| | | | | | | | | |
| Machinery | 6.4% | | | | | | | | |
| Altra Industrial Motion Corp. | | | 7,645 | | | | 304,271 | |
| Mueller Water Products, Inc., Class A | | | 55,850 | | | | 652,328 | |
| Proto Labs, Inc. (a) | | | 9,770 | | | | 657,033 | |
| Snap-on, Inc. | | | 2,925 | | | | 462,150 | |
| TriMas Corp. (a) | | | 29,115 | | | | 607,048 | |
| Wabtec Corp. | | | 8,695 | | | | 795,592 | |
| Woodward, Inc. | | | 9,840 | | | | 664,987 | |
| | | | | | | | 4,143,409 | |
| Marine | 1.5% | | | | | | | | |
| Kirby Corp. (a) | | | 14,595 | | | | 975,676 | |
| | | | | | | | | |
| Media | 2.3% | | | | | | | | |
| Emerald Expositions Events, Inc. | | | 30,000 | | | | 657,000 | |
| Scholastic Corp. | | | 19,225 | | | | 838,018 | |
| | | | | | | | 1,495,018 | |
| Multi-Utilities | 1.5% | | | | | | | | |
| CMS Energy Corp. | | | 20,435 | | | | 945,119 | |
| | | | | | | | | |
| Oil, Gas & Consumable Fuels | 2.3% | | | | | | | | |
| HollyFrontier Corp. | | | 34,235 | | | | 940,435 | |
| Matador Resources Co. (a) | | | 26,445 | | | | 565,130 | |
| | | | | | | | 1,505,565 | |
| | | | | |
| | | | | Fair |
| Description | | Shares | | | Value |
| | | | | |
| Pharmaceuticals | 1.5% | | | | |
| Catalent, Inc. (a) | | | 26,715 | | | $ | 937,696 | |
| | | | | | | | | |
| Professional Services | 0.7% | | | | | | | | |
| FTI Consulting, Inc. (a) | | | 13,800 | | | | 482,448 | |
| | | | | | | | | |
| Semiconductors & Semiconductor Equipment | 4.8% | | | | | | | | |
| Cypress Semiconductor Corp. | | | 59,730 | | | | 815,315 | |
| MACOM Technology Solutions Holdings, Inc. (a) | | | 10,605 | | | | 591,441 | |
| Microsemi Corp. (a) | | | 15,795 | | | | 739,206 | |
| Versum Materials, Inc. | | | 28,935 | | | | 940,387 | |
| | | | | | | | 3,086,349 | |
| Software | 2.3% | | | | | | | | |
| Bottomline Technologies de, Inc. (a) | | | 37,320 | | | | 958,751 | |
| BroadSoft, Inc. (a) | | | 11,935 | | | | 513,801 | |
| | | | | | | | 1,472,552 | |
| Specialty Retail | 1.2% | | | | | | | | |
| Advance Auto Parts, Inc. | | | 3,115 | | | | 363,178 | |
| Chico’s FAS, Inc. | | | 45,695 | | | | 430,447 | |
| | | | | | | | 793,625 | |
| Textiles, Apparel & Luxury Goods | 2.5% | | | | | | | | |
| Carter’s, Inc. | | | 8,450 | | | | 751,628 | |
| Steven Madden, Ltd. (a) | | | 21,235 | | | | 848,338 | |
| | | | | | | | 1,599,966 | |
| Thrifts & Mortgage Finance | 1.6% | | | | | | | | |
| Washington Federal, Inc. | | | 31,995 | | | | 1,062,234 | |
| | | | | | | | | |
Total Common Stocks
(Cost $55,722,534) | | | | | | | 63,252,525 | |
| | | | | | | | | |
| Short-Term Investments | 2.1% | | | | | | | | |
State Street Institutional Treasury Money Market Fund, Premier Class, 0.83% (7 day yield)
(Cost $1,347,971) | | | 1,347,971 | | | | 1,347,971 | |
| | | | | | | | | |
Total Investments | 100.0%
(Cost $57,070,505) (b) | | | | | | $ | 64,600,496 | |
| | | | | | | | | |
| Cash and Other Assets in Excess of Liabilities | 0.0% | | | | | | | 28,863 | |
| | | | | | | | | |
| Net Assets | 100.0% | | | | | | $ | 64,629,359 | |
The accompanying notes are an integral part of these financial statements.
18 Semi-Annual Report
| | | | | |
| | | | | Fair |
| Description | | Shares | | | Value |
| | | | | |
| Lazard Retirement International Equity Portfolio |
| | | | | |
| Common Stocks | 95.5% | | | | |
| | | | | |
| Australia | 3.0% | | | | | | | | |
| BHP Billiton PLC | | | 262,397 | | | $ | 4,020,061 | |
| Caltex Australia, Ltd. | | | 82,322 | | | | 1,997,801 | |
| | | | | | | | 6,017,862 | |
| Belgium | 2.6% | | | | | | | | |
| Anheuser-Busch InBev SA/NV | | | 32,904 | | | | 3,640,996 | |
| KBC Group NV | | | 20,230 | | | | 1,535,683 | |
| | | | | | | | 5,176,679 | |
| Brazil | 1.0% | | | | | | | | |
| BB Seguridade Participacoes SA | | | 234,200 | | | | 2,025,364 | |
| | | | | | | | | |
| Canada | 4.2% | | | | | | | | |
| Canadian National Railway Co. | | | 34,190 | | | | 2,774,115 | |
| National Bank of Canada | | | 60,200 | | | | 2,531,390 | |
| Suncor Energy, Inc. | | | 112,940 | | | | 3,299,889 | |
| | | | | | | | 8,605,394 | |
| Denmark | 2.3% | | | | | | | | |
| AP Moller-Maersk A/S, Class B | | | 1,120 | | | | 2,263,134 | |
| Carlsberg A/S, Class B | | | 23,362 | | | | 2,500,909 | |
| | | | | | | | 4,764,043 | |
| Finland | 1.5% | | | | | | | | |
| Sampo Oyj, A Shares | | | 58,256 | | | | 2,994,773 | |
| | | | | | | | | |
| France | 11.4% | | | | | | | | |
| Air Liquide SA | | | 28,324 | | | | 3,519,898 | |
| Airbus SE | | | 20,211 | | | | 1,665,318 | |
| Capgemini SE | | | 41,710 | | | | 4,333,960 | |
| Cie Generale des Etablissements Michelin | | | 27,580 | | | | 3,666,723 | |
| Valeo SA | | | 79,034 | | | | 5,361,136 | |
| Vinci SA | | | 54,020 | | | | 4,614,399 | |
| | | | | | | | 23,161,434 | |
| Germany | 3.4% | | | | | | | | |
| Deutsche Post AG | | | 46,506 | | | | 1,745,089 | |
| SAP SE | | | 50,249 | | | | 5,251,983 | |
| | | | | | | | 6,997,072 | |
| Ireland | 3.9% | | | | | | | | |
| Ryanair Holdings PLC Sponsored ADR (a) | | | 24,914 | | | | 2,680,995 | |
| Shire PLC | | | 96,210 | | | | 5,300,646 | |
| | | | | | | | 7,981,641 | |
| Italy | 1.5% | | | | | | | | |
| UniCredit SpA (a) | | | 166,604 | | | | 3,141,687 | |
| | | | | |
| | | | | Fair |
| Description | | Shares | | | Value |
| | | | | | | | | |
| Japan | 17.2% | | | | | | | | |
| ABC-Mart, Inc. | | | 32,400 | | | $ | 1,909,021 | |
| Daiwa House Industry Co., Ltd. | | | 175,360 | | | | 5,999,882 | |
| Don Quijote Holdings Co., Ltd. | | | 113,000 | | | | 4,287,909 | |
| Hoshizaki Corp. | | | 16,600 | | | | 1,502,677 | |
| Isuzu Motors, Ltd. | | | 236,200 | | | | 2,921,386 | |
| Kao Corp. | | | 34,620 | | | | 2,057,695 | |
| KDDI Corp. | | | 97,200 | | | | 2,575,031 | |
| Makita Corp. | | | 79,800 | | | | 2,954,981 | |
| Seven & I Holdings Co., Ltd. | | | 46,200 | | | | 1,904,993 | |
| Sony Corp. | | | 106,900 | | | | 4,077,692 | |
| Sumitomo Mitsui Financial Group, Inc. | | | 85,600 | | | | 3,348,736 | |
| United Arrows, Ltd. | | | 41,000 | | | | 1,329,866 | |
| | | | | | | | 34,869,869 | |
| Luxembourg | 1.3% | | | | | | | | |
| RTL Group SA | | | 16,506 | | | | 1,248,358 | |
| Tenaris SA | | | 91,334 | | | | 1,424,340 | |
| | | | | | | | 2,672,698 | |
| Netherlands | 5.1% | | | | | | | | |
| Koninklijke KPN NV | | | 505,997 | | | | 1,623,651 | |
| Royal Dutch Shell PLC, A Shares | | | 184,981 | | | | 4,913,660 | |
| Wolters Kluwer NV | | | 90,167 | | | | 3,821,038 | |
| | | | | | | | 10,358,349 | |
| Norway | 2.4% | | | | | | | | |
| Statoil ASA | | | 126,891 | | | | 2,108,933 | |
| Telenor ASA | | | 163,619 | | | | 2,713,610 | |
| | | | | | | | 4,822,543 | |
| Philippines | 0.0% | | | | | | | | |
| Alliance Global Group, Inc. | | | 175,700 | | | | 49,798 | |
| | | | | | | | | |
| Singapore | 1.5% | | | | | | | | |
| DBS Group Holdings, Ltd. | | | 201,500 | | | | 3,035,775 | |
| | | | | | | | | |
| Spain | 0.9% | | | | | | | | |
| Red Electrica Corporacion SA | | | 91,464 | | | | 1,915,362 | |
| | | | | | | | | |
| Sweden | 3.9% | | | | | | | | |
| Assa Abloy AB, Class B | | | 189,803 | | | | 4,172,218 | |
| Nordea Bank AB | | | 289,524 | | | | 3,694,684 | |
| | | | | | | | 7,866,902 | |
| Switzerland | 6.1% | | | | | | | | |
| Julius Baer Group, Ltd. | | | 37,634 | | | | 1,983,384 | |
| Novartis AG | | | 74,443 | | | | 6,216,658 | |
| Wolseley PLC | | | 66,847 | | | | 4,110,900 | |
| | | | | | | | 12,310,942 | |
The accompanying notes are an integral part of these financial statements.
Semi-Annual Report 19
| | | | | |
| | | | | Fair |
| Description | | Shares | | | Value |
| | | |
| Lazard Retirement International Equity Portfolio (concluded) |
| | | |
| Taiwan | 1.4% | | | | | | | | |
| Taiwan Semiconductor Manufacturing Co., Ltd. Sponsored ADR | | | 81,100 | | | $ | 2,835,256 | |
| | | | | | | | | |
| Turkey | 0.7% | | | | | | | | |
| Turkiye Garanti Bankasi AS | | | 522,944 | | | | 1,454,820 | |
| | | | | | | | | |
| United Kingdom | 15.9% | | | | | | | | |
| British American Tobacco PLC | | | 90,276 | | | | 6,146,183 | |
| BT Group PLC | | | 438,415 | | | | 1,683,576 | |
| ConvaTec Group PLC | | | 535,593 | | | | 2,227,319 | |
| Diageo PLC | | | 100,038 | | | | 2,957,261 | |
| Howden Joinery Group PLC | | | 267,891 | | | | 1,420,789 | |
| Informa PLC | | | 233,666 | | | | 2,037,814 | |
| Provident Financial PLC | | | 27,970 | | | | 886,841 | |
| Prudential PLC | | | 296,659 | | | | 6,815,268 | |
| RELX PLC | | | 189,975 | | | | 4,111,045 | |
| Unilever PLC | | | 75,372 | | | | 4,082,651 | |
| | | | | | | | 32,368,747 | |
| | | | | |
| | | | | Fair |
| Description | | Shares | | | Value |
| | | | | | | | | |
| United States | 4.3% | | | | | | | | |
| Aon PLC | | | 33,075 | | | $ | 4,397,321 | |
| Medtronic PLC | | | 49,180 | | | | 4,364,725 | |
| | | | | | | | 8,762,046 | |
Total Common Stocks
(Cost $171,396,881) | | | | | | | 194,189,056 | |
| | | | | | | | | |
| Short-Term Investments | 4.7% | | | | | | | | |
| State Street Institutional Treasury Money Market Fund, Premier Class, 0.83% (7 day yield) (Cost $9,559,306) | | | 9,559,306 | | | | 9,559,306 | |
| | | | | | | | | |
Total Investments | 100.2%
(Cost $180,956,187) (b) | | | | | | $ | 203,748,362 | |
| | | | | | | | | |
| Liabilities in Excess of Cash and Other Assets | (0.2)% | | | | | | | (452,854 | ) |
| | | | | | | | | |
| Net Assets | 100.0% | | | | | | $ | 203,295,508 | |
The accompanying notes are an integral part of these financial statements.
20 Semi-Annual Report
| | | | | |
| | | | | Fair |
| Description | | Shares | | | Value |
| | | | | | | | | |
| Lazard Retirement Emerging Markets Equity Portfolio |
| | | | | | | | | |
| Common Stocks | 95.7% | | | | | | | | |
| | | | | | | | | |
| Argentina | 1.7% | | | | | | | | |
| YPF SA Sponsored ADR | | | 821,734 | | | $ | 17,995,975 | |
| | | | | | | | | |
| Brazil | 10.4% | | | | | | | | |
| Ambev SA ADR | | | 2,575,900 | | | | 14,141,691 | |
| Banco do Brasil SA | | | 2,904,766 | | | | 23,498,364 | |
| BB Seguridade Participacoes SA | | | 2,101,700 | | | | 18,175,528 | |
| CCR SA | | | 3,486,400 | | | | 17,785,070 | |
| Cielo SA | | | 2,926,884 | | | | 21,733,631 | |
| Localiza Rent a Car SA | | | 758,356 | | | | 10,335,284 | |
| Natura Cosmeticos SA | | | 497,800 | | | | 3,861,710 | |
| | | | | | | | 109,531,278 | |
| China | 15.6% | | | | | | | | |
| AAC Technologies Holdings, Inc. | | | 763,500 | | | | 9,507,848 | |
| Baidu, Inc. Sponsored ADR (a) | | | 153,300 | | | | 27,419,238 | |
| China Construction Bank Corp., Class H | | | 50,681,390 | | | | 39,287,894 | |
| China Mobile, Ltd. Sponsored ADR | | | 479,949 | | | | 25,480,492 | |
| China Shenhua Energy Co., Ltd., Class H | | | 4,175,829 | | | | 9,297,286 | |
| CNOOC, Ltd. | | | 5,536,000 | | | | 6,073,932 | |
| ENN Energy Holdings, Ltd. | | | 996,000 | | | | 6,023,933 | |
| Hengan International Group Co., Ltd. | | | 59,500 | | | | 438,985 | |
| NetEase, Inc. ADR | | | 97,165 | | | | 29,210,714 | |
| Weichai Power Co., Ltd., Class H | | | 13,003,864 | | | | 11,397,872 | |
| | | | | | | | 164,138,194 | |
| Egypt | 0.9% | | | | | | | | |
| Commercial International Bank Egypt SAE GDR (London) | | | 2,032,761 | | | | 9,149,646 | |
| Commercial International Bank Egypt SAE GDR (United States) | | | 144,531 | | | | 650,391 | |
| | | | | | | | 9,800,037 | |
| Hungary | 1.9% | | | | | | | | |
| OTP Bank Nyrt. | | | 589,564 | | | | 19,724,465 | |
| | | | | | | | | |
| India | 9.9% | | | | | | | | |
| Axis Bank, Ltd. | | | 2,369,138 | | | | 18,948,235 | |
| Bajaj Auto, Ltd. | | | 210,031 | | | | 9,071,748 | |
| Bharat Heavy Electricals, Ltd. | | | 1,594,028 | | | | 3,330,069 | |
| HCL Technologies, Ltd. | | | 969,326 | | | | 12,754,861 | |
| Hero MotoCorp, Ltd. | | | 308,534 | | | | 17,652,397 | |
| Punjab National Bank (a) | | | 5,074,230 | | | | 10,788,373 | |
| Tata Consultancy Services, Ltd. | | | 883,863 | | | | 32,305,620 | |
| | | | | | | | 104,851,303 | |
| | | | | |
| | | | | Fair |
| Description | | Shares | | | Value |
| | | | | | | | | |
| Indonesia | 5.6% | | | | | | | | |
| PT Astra International Tbk | | | 20,971,700 | | | $ | 14,020,664 | |
| PT Bank Mandiri (Persero) Tbk | | | 18,720,629 | | | | 17,863,768 | |
| PT Semen Indonesia (Persero) Tbk | | | 8,504,600 | | | | 6,374,108 | |
| PT Telekomunikasi Indonesia (Persero) Tbk Sponsored ADR | | | 618,500 | | | | 20,824,895 | |
| | | | | | | | 59,083,435 | |
| Malaysia | 0.7% | | | | | | | | |
| British American Tobacco Malaysia Berhad | | | 707,100 | | | | 7,151,454 | |
| | | | | | | | | |
| Mexico | 3.4% | | | | | | | | |
| America Movil SAB de CV, Class L Sponsored ADR | | | 1,295,327 | | | | 20,621,606 | |
| Grupo Mexico SAB de CV, Series B | | | 2,335,697 | | | | 6,572,576 | |
| Kimberly-Clark de Mexico SAB de CV, Series A | | | 3,908,062 | | | | 8,268,866 | |
| | | | | | | | 35,463,048 | |
| Pakistan | 1.6% | | | | | | | | |
| Habib Bank, Ltd. | | | 2,671,570 | | | | 6,856,432 | |
| Oil & Gas Development Co., Ltd. | | | 3,080,300 | | | | 4,130,531 | |
| Pakistan Petroleum, Ltd. | | | 4,532,002 | | | | 6,411,133 | |
| | | | | | | | 17,398,096 | |
| Philippines | 0.9% | | | | | | | | |
| PLDT, Inc. Sponsored ADR | | | 272,000 | | | | 9,604,320 | |
| | | | | | | | | |
| Russia | 7.6% | | | | | | | | |
| ALROSA PAO | | | 5,241,300 | | | | 7,691,980 | |
| Gazprom PJSC Sponsored ADR | | | 1,897,624 | | | | 7,524,645 | |
| LUKOIL PJSC Sponsored ADR | | | 377,233 | | | | 18,400,475 | |
| Magnit PJSC Sponsored GDR (c), (d) | | | 89,175 | | | | 3,031,950 | |
| Magnit PJSC Sponsored GDR (London) | | | 123,182 | | | | 4,192,615 | |
| Magnit PJSC Sponsored GDR (United States) | | | 2,884 | | | | 98,056 | |
| Mobile TeleSystems PJSC Sponsored ADR | | | 1,669,220 | | | | 13,988,064 | |
| Sberbank of Russia PJSC | | | 10,104,416 | | | | 25,030,164 | |
| | | | | | | | 79,957,949 | |
| South Africa | 8.5% | | | | | | | | |
| Imperial Holdings, Ltd. | | | 741,806 | | | | 9,126,126 | |
| Life Healthcare Group Holdings, Ltd. | | | 3,602,445 | | | | 7,059,560 | |
| Nedbank Group, Ltd. | | | 510,169 | | | | 8,147,426 | |
| PPC, Ltd. (a) | | | 7,743,992 | | | | 3,133,488 | |
| Sanlam, Ltd. | | | 1,837,285 | | | | 9,100,416 | |
The accompanying notes are an integral part of these financial statements.
Semi-Annual Report 21
| | | | | |
| | | | | Fair |
| Description | | Shares | | | Value |
| | | | | | | | | |
| Lazard Retirement Emerging Markets Equity Portfolio (concluded) |
| | | | | | | | | |
| Shoprite Holdings, Ltd. | | | 1,098,098 | | | $ | 16,734,822 | |
| Standard Bank Group, Ltd. | | | 849,394 | | | | 9,359,568 | |
| The Bidvest Group, Ltd. | | | 702,877 | | | | 8,465,334 | |
| Vodacom Group, Ltd. | | | 913,251 | | | | 11,466,267 | |
| Woolworths Holdings, Ltd. | | | 1,506,966 | | | | 7,105,108 | |
| | | | | | | | 89,698,115 | |
| South Korea | 14.9% | | | | | | | | |
| Coway Co., Ltd. | | | 165,071 | | | | 15,005,267 | |
| Hanwha Life Insurance Co., Ltd. | | | 1,456,114 | | | | 8,864,986 | |
| Hyundai Mobis Co., Ltd. | | | 69,072 | | | | 15,089,091 | |
| KB Financial Group, Inc. | | | 281,905 | | | | 14,194,674 | |
| KT&G Corp. | | | 67,472 | | | | 6,895,122 | |
| Samsung Electronics Co., Ltd. | | | 24,115 | | | | 50,033,379 | |
| Shinhan Financial Group Co., Ltd. | | | 558,248 | | | | 24,100,204 | |
| SK Hynix, Inc. | | | 383,065 | | | | 22,581,143 | |
| | | | | | | | 156,763,866 | |
| Taiwan | 5.4% | | | | | | | | |
| Hon Hai Precision Industry Co., Ltd. | | | 3,048,151 | | | | 11,652,436 | |
| Taiwan Semiconductor Manufacturing Co., Ltd. | | | 6,702,642 | | | | 45,738,430 | |
| | | | | | | | 57,390,866 | |
| Thailand | 1.2% | | | | | | | | |
| Kasikornbank Public Co. Ltd. | | | 976,836 | | | | 5,736,257 | |
| The Siam Cement Public Co. Ltd. | | | 510,050 | | | | 7,566,874 | |
| | | | | | | | 13,303,131 | |
| | | | | |
| | | | | Fair |
| Description | | Shares | | | Value |
| | | | | | | | | |
| Turkey | 5.5% | | | | | | | | |
| Akbank TAS | | | 4,064,274 | | | $ | 11,318,074 | |
| KOC Holding AS | | | 2,050,156 | | | | 9,431,670 | |
| Tupras-Turkiye Petrol Rafinerileri AS | | | 362,267 | | | | 10,418,712 | |
| Turk Telekomunikasyon AS (a) | | | 4,239,784 | | | | 7,514,433 | |
| Turkcell Iletisim Hizmetleri AS | | | 2,468,000 | | | | 8,111,022 | |
| Turkiye Is Bankasi, C Shares | | | 5,314,850 | | | | 11,251,553 | |
| | | | | | | | 58,045,464 | |
Total Common Stocks
(Cost $916,388,067) | | | | | | | 1,009,900,996 | |
| | | | | | | | | |
| Short-Term Investments | 3.7% | | | | | | | | |
State Street Institutional Treasury Money Market Fund, Premier Class, 0.83% (7 day yield)
(Cost $38,842,314) | | | 38,842,314 | | | | 38,842,314 | |
| | | | | | | | | |
Total Investments | 99.4%
(Cost $955,230,381) (b) | | | | | | $ | 1,048,743,310 | |
| | | | | | | | | |
| Cash and Other Assets in Excess of Liabilities | 0.6% | | | | | | | 5,929,366 | |
| | | | | | | | | |
| Net Assets | 100.0% | | | | | | $ | 1,054,672,676 | |
The accompanying notes are an integral part of these financial statements.
22 Semi-Annual Report
| Description | | Shares | | | Fair
Value | |
| | | | | | | |
| Lazard Retirement Global Dynamic Multi-Asset Portfolio | |
| | | | | | | | | |
| Common Stocks | 81.7% | | | | | | | | |
| | | | | | | | | |
| Argentina | 0.2% | | | | | | | | |
| MercadoLibre, Inc. | | | 3,000 | | | $ | 752,640 | |
| | | | | | | | | |
| Australia | 2.6% | | | | | | | | |
| AGL Energy, Ltd. | | | 7,270 | | | | 142,597 | |
| Aristocrat Leisure, Ltd. | | | 67,326 | | | | 1,166,509 | |
| Cochlear, Ltd. | | | 8,776 | | | | 1,049,361 | |
| Computershare, Ltd. | | | 57,547 | | | | 624,590 | |
| CSL, Ltd. | | | 18,255 | | | | 1,939,719 | |
| Investa Office Fund REIT | | | 34,452 | | | | 116,286 | |
| JB Hi-Fi, Ltd. | | | 7,795 | | | | 140,103 | |
| Magellan Financial Group, Ltd. | | | 19,546 | | | | 432,922 | |
| Newcrest Mining, Ltd. | | | 9,992 | | | | 155,123 | |
| Resolute Mining, Ltd. | | | 243,705 | | | | 224,067 | |
| Sandfire Resources NL | | | 24,182 | | | | 104,892 | |
| Stockland REIT | | | 330,558 | | | | 1,112,133 | |
| Telstra Corp., Ltd. | | | 54,376 | | | | 180,054 | |
| Woodside Petroleum, Ltd. | | | 43,214 | | | | 990,631 | |
| | | | | | | | 8,378,987 | |
| Austria | 0.1% | | | | | | | | |
| Lenzing AG | | | 2,309 | | | | 414,145 | |
| | | | | | | | | |
| Belgium | 0.0% | | | | | | | | |
| Proximus SADP | | | 3,824 | | | | 133,776 | |
| | | | | | | | | |
| Canada | 3.2% | | | | | | | | |
| Alimentation Couche-Tard, Inc., Class B | | | 4,193 | | | | 200,985 | |
| Atco, Ltd., Class I | | | 8,305 | | | | 324,758 | |
| BCE, Inc. | | | 12,348 | | | | 556,079 | |
| Canadian Imperial Bank of Commerce | | | 2,167 | | | | 176,111 | |
| Canadian National Railway Co. | | | 22,570 | | | | 1,830,186 | |
| CI Financial Corp. | | | 52,050 | | | | 1,109,394 | |
| Colliers International Group, Inc. | | | 2,672 | | | | 151,031 | |
| Constellation Software, Inc. | | | 244 | | | | 127,647 | |
| Dollarama, Inc. | | | 1,995 | | | | 190,623 | |
| Enbridge Income Fund Holdings, Inc. | | | 4,455 | | | | 110,585 | |
| Enbridge, Inc. | | | 2,624 | | | | 104,531 | |
| First Quantum Minerals, Ltd. | | | 17,757 | | | | 150,212 | |
| Genworth MI Canada, Inc. | | | 20,062 | | | | 551,984 | |
| George Weston, Ltd. | | | 1,351 | | | | 122,296 | |
| Intact Financial Corp. | | | 1,327 | | | | 100,241 | |
| Kirkland Lake Gold, Ltd. | | | 42,361 | | | | 400,809 | |
| Description | | Shares | | | Fair
Value | |
| | | | | | | |
| Magna International, Inc. | | | 13,181 | | | $ | 610,567 | |
| Metro, Inc. | | | 3,887 | | | | 127,928 | |
| Royal Bank of Canada | | | 19,301 | | | | 1,401,436 | |
| Saputo, Inc. | | | 6,242 | | | | 198,552 | |
| Suncor Energy, Inc. | | | 37,156 | | | | 1,085,627 | |
| Teck Resources, Ltd., Class B | | | 6,125 | | | | 106,177 | |
| Thomson Reuters Corp. | | | 3,250 | | | | 150,470 | |
| TransCanada Corp. | | | 9,272 | | | | 442,007 | |
| | | | | | | | 10,330,236 | |
| Denmark | 0.9% | | | | | | | | |
| Carlsberg A/S, Class B Sponsored ADR | | | 38,055 | | | | 815,138 | |
| Danske Bank A/S | | | 3,499 | | | | 135,067 | |
| Jyske Bank A/S | | | 2,623 | | | | 152,035 | |
| Nets A/S | | | 29,529 | | | | 586,723 | |
| Novo Nordisk A/S Sponsored ADR | | | 13,020 | | | | 558,428 | |
| Novo Nordisk A/S, Class B | | | 2,816 | | | | 120,792 | |
| Vestas Wind Systems A/S | | | 7,306 | | | | 676,925 | |
| | | | | | | | 3,045,108 | |
| Finland | 0.5% | | | | | | | | |
| Outokumpu OYJ | | | 21,094 | | | | 169,060 | |
| Sampo Oyj, A Shares ADR | | | 50,190 | | | | 1,292,393 | |
| | | | | | | | 1,461,453 | |
| France | 2.4% | | | | | | | | |
| Air France-KLM (a) | | | 60,691 | | | | 867,420 | |
| AXA SA | | | 39,838 | | | | 1,097,904 | |
| BNP Paribas SA | | | 1,939 | | | | 141,027 | |
| Credit Agricole SA | | | 43,944 | | | | 714,497 | |
| Faurecia | | | 7,980 | | | | 405,325 | |
| LVMH Moet Hennessy Louis Vuitton SA | | | 3,351 | | | | 840,638 | |
| Peugeot SA | | | 24,560 | | | | 490,269 | |
| Societe Generale SA | | | 21,946 | | | | 1,193,220 | |
| TOTAL SA | | | 37,977 | | | | 1,881,628 | |
| Valeo SA | | | 3,932 | | | | 266,721 | |
| | | | | | | | 7,898,649 | |
| Germany | 2.1% | | | | | | | | |
| Bayer AG | | | 11,048 | | | | 1,429,435 | |
| Continental AG | | | 1,571 | | | | 339,034 | |
| Continental AG Sponsored ADR | | | 26,380 | | | | 1,145,947 | |
| Covestro AG | | | 7,116 | | | | 513,851 | |
| Deutsche Lufthansa AG | | | 25,188 | | | | 575,166 | |
| Infineon Technologies AG | | | 24,487 | | | | 518,918 | |
| MTU Aero Engines AG | | | 680 | | | | 96,218 | |
| Muenchener Rueckversicherungs AG | | | 614 | | | | 123,876 | |
| ProSiebenSat.1 Media SE | | | 3,861 | | | | 161,572 | |
| Rheinmetall AG | | | 2,495 | | | | 237,013 | |
| SAP SE | | | 2,077 | | | | 217,086 | |
The accompanying notes are an integral part of these financial statements.
Semi-Annual Report 23
| Description | | Shares | | | Fair
Value | |
| | | | | | | |
| Lazard Retirement Global Dynamic Multi-Asset Portfolio (continued) |
| | | | | | | | | |
| Siltronic AG (a) | | | 5,401 | | | $ | 458,214 | |
| Symrise AG ADR | | | 57,710 | | | | 1,025,507 | |
| | | | | | | | 6,841,837 | |
| Hong Kong | 1.8% | | | | | | | | |
| AIA Group, Ltd. Sponsored ADR | | | 34,190 | | | | 1,004,331 | |
| ASM Pacific Technology, Ltd. | | | 9,700 | | | | 130,950 | |
| CLP Holdings, Ltd. | | | 28,500 | | | | 301,551 | |
| Jardine Matheson Holdings, Ltd. | | | 4,100 | | | | 263,300 | |
| Link Real Estate Investment Trust | | | 39,000 | | | | 296,731 | |
| The Wharf Holdings, Ltd. | | | 229,000 | | | | 1,898,269 | |
| Wheelock & Co., Ltd. | | | 172,000 | | | | 1,297,929 | |
| Xinyi Glass Holdings, Ltd. | | | 494,000 | | | | 489,836 | |
| Yue Yuen Industrial Holdings, Ltd. | | | 32,500 | | | | 134,876 | |
| | | | | | | | 5,817,773 | |
| Ireland | 0.4% | | | | | | | | |
| Ryanair Holdings PLC Sponsored ADR (a) | | | 1,053 | | | | 113,313 | |
| Shire PLC ADR | | | 7,930 | | | | 1,310,591 | |
| | | | | | | | 1,423,904 | |
| Israel | 0.3% | | | | | | | | |
| Bank Hapoalim BM | | | 23,702 | | | | 159,762 | |
| Israel Discount Bank, Ltd., ADR (a) | | | 21,850 | | | | 571,432 | |
| Israel Discount Bank, Ltd., Class A (a) | | | 63,351 | | | | 166,767 | |
| Nice, Ltd. | | | 1,381 | | | | 109,547 | |
| | | | | | | | 1,007,508 | |
| Italy | 0.6% | | | | | | | | |
| Assicurazioni Generali SpA | | | 53,935 | | | | 891,206 | |
| Intesa Sanpaolo SpA | | | 287,446 | | | | 916,988 | |
| Recordati SpA | | | 4,646 | | | | 189,039 | |
| | | | | | | | 1,997,233 | |
| Japan | 7.4% | | | | | | | | |
| Amano Corp. | | | 5,600 | | | | 116,650 | |
| ANA Holdings, Inc. | | | 33,000 | | | | 114,770 | |
| Asahi Glass Co., Ltd. | | | 33,000 | | | | 1,392,667 | |
| Astellas Pharma, Inc. | | | 23,700 | | | | 290,187 | |
| Central Japan Railway Co. | | | 2,500 | | | | 407,894 | |
| Daito Trust Construction Co., Ltd. | | | 11,200 | | | | 1,743,004 | |
| Daiwa House Industry Co., Ltd. | | | 5,100 | | | | 174,495 | |
| Daiwa House Industry Co., Ltd. ADR | | | 41,220 | | | | 1,407,045 | |
| Dowa Holdings Co., Ltd. | | | 15,000 | | | | 113,501 | |
| Foster Electric Co., Ltd. | | | 7,900 | | | | 136,450 | |
| Fujitsu, Ltd. | | | 81,000 | | | | 598,001 | |
| Haseko Corp. | | | 75,500 | | | | 918,115 | |
| Hazama Ando Corp. | | | 16,800 | | | | 105,992 | |
| Heiwa Corp. | | | 5,900 | | | | 131,643 | |
| Description | | Shares | | | Fair
Value | |
| | | | | | | |
| Hitachi, Ltd. | | | 118,000 | | | $ | 725,659 | |
| Idemitsu Kosan Co., Ltd. | | | 20,300 | | | | 575,180 | |
| JXTG Holdings, Inc. | | | 25,500 | | | | 111,571 | |
| Kaken Pharmaceutical Co., Ltd. | | | 2,800 | | | | 152,940 | |
| Kao Corp. | | | 2,000 | | | | 118,873 | |
| Kao Corp. Sponsored ADR | | | 11,085 | | | | 658,615 | |
| KDDI Corp. | | | 5,300 | | | | 140,408 | |
| KDDI Corp. ADR | | | 80,345 | | | | 1,058,947 | |
| Kyushu Electric Power Co., Inc. | | | 30,800 | | | | 374,335 | |
| Maruha Nichiro Corp. | | | 4,200 | | | | 110,927 | |
| MCJ Co., Ltd. | | | 17,000 | | | | 179,266 | |
| Mitsubishi Chemical Holdings Corp. | | | 61,000 | | | | 506,592 | |
| Mitsubishi Gas Chemical Co., Inc. | | | 10,000 | | | | 211,957 | |
| Mitsubishi UFJ Financial Group, Inc. | | | 359,000 | | | | 2,420,960 | |
| Mitsui Chemicals, Inc. | | | 55,000 | | | | 292,005 | |
| Mitsui Mining & Smelting Co., Ltd. | | | 210,000 | | | | 824,272 | |
| Nichirei Corp. | | | 13,700 | | | | 384,189 | |
| Nihon Chouzai Co., Ltd. | | | 8,700 | | | | 276,244 | |
| Nippon Chemi-Con Corp. | | | 168,000 | | | | 610,735 | |
| Nippon Denko Co., Ltd. | | | 143,800 | | | | 508,976 | |
| Nippon Telegraph & Telephone Corp. | | | 4,000 | | | | 189,216 | |
| Nissan Motor Co., Ltd. | | | 14,800 | | | | 147,549 | |
| Oji Holdings Corp. | | | 19,000 | | | | 98,318 | |
| ORIX Corp. | | | 19,700 | | | | 306,217 | |
| Osaka Gas Co., Ltd. | | | 178,000 | | | | 728,373 | |
| Osaki Electric Co., Ltd. | | | 15,000 | | | | 112,394 | |
| Penta-Ocean Construction Co., Ltd. | | | 20,600 | | | | 117,196 | |
| Rengo Co., Ltd. | | | 40,000 | | | | 232,240 | |
| Ryohin Keikaku Co., Ltd. ADR | | | 21,935 | | | | 1,094,995 | |
| Takeuchi Manufacturing Co., Ltd. | | | 10,100 | | | | 185,771 | |
| Teijin, Ltd. | | | 41,600 | | | | 801,178 | |
| The Chugoku Electric Power Co., Inc. | | | 29,200 | | | | 322,057 | |
| The Kansai Electric Power Co., Inc. | | | 18,000 | | | | 248,224 | |
| Toho Gas Co., Ltd. | | | 16,000 | | | | 116,541 | |
| Tohoku Electric Power Co., Inc. | | | 9,300 | | | | 128,838 | |
| Tokyo Gas Co., Ltd. | | | 208,000 | | | | 1,083,248 | |
| Yodogawa Steel Works, Ltd. | | | 5,200 | | | | 137,714 | |
| | | | | | | | 23,943,134 | |
| Malta | 0.0% | | | | | | | | |
| Kindred Group PLC | | | 10,028 | | | | 113,461 | |
| | | | | | | | | |
| Netherlands | 0.9% | | | | | | | | |
| NN Group NV | | | 15,862 | | | | 564,753 | |
| Royal Dutch Shell PLC, A Shares | | | 42,477 | | | | 1,128,319 | |
| Wolters Kluwer NV | | | 2,650 | | | | 112,300 | |
| Wolters Kluwer NV Sponsored ADR | | | 23,630 | | | | 1,002,975 | |
| | | | | | | | 2,808,347 | |
The accompanying notes are an integral part of these financial statements.
24 Semi-Annual Report
| Description | | Shares | | | Fair
Value | |
| | | | | | | |
| Lazard Retirement Global Dynamic Multi-Asset Portfolio (continued) |
| | | | | | | | | |
| Norway | 1.0% | | | | | | | | |
| Aker BP ASA | | | 48,448 | | | $ | 718,184 | |
| DNB ASA | | | 9,764 | | | | 166,639 | |
| Leroy Seafood Group ASA | | | 20,030 | | | | 108,779 | |
| Marine Harvest ASA | | | 6,580 | | | | 112,625 | |
| Salmar ASA | | | 4,149 | | | | 102,884 | |
| Statoil ASA | | | 115,443 | | | | 1,918,667 | |
| | | | | | | | 3,127,778 | |
| Portugal | 0.1% | | | | | | | | |
| EDP - Energias de Portugal SA | | | 40,169 | | | | 131,421 | |
| Galp Energia SGPS SA | | | 9,473 | | | | 143,887 | |
| | | | | | | | 275,308 | |
| Singapore | 0.8% | | | | | | | | |
| Best World International, Ltd. | | | 233,400 | | | | 240,909 | |
| BOC Aviation, Ltd. | | | 80,000 | | | | 423,196 | |
| CapitaLand, Ltd. | | | 51,100 | | | | 129,918 | |
| DBS Group Holdings, Ltd. | | | 50,900 | | | | 766,853 | |
| Singapore Airlines, Ltd. | | | 38,000 | | | | 279,383 | |
| United Overseas Bank, Ltd. | | | 26,100 | | | | 438,506 | |
| Venture Corp., Ltd. | | | 30,300 | | | | 265,204 | |
| | | | | | | | 2,543,969 | |
| South Africa | 0.0% | | | | | | | | |
| Mediclinic International PLC | | | 8,770 | | | | 84,682 | |
| | | | | | | | | |
| Spain | 0.7% | | | | | | | | |
| Banco Santander SA | | | 189,356 | | | | 1,260,668 | |
| Corporacion Financiera Alba SA | | | 968 | | | | 58,494 | |
| Gamesa Corp. Tecnologica SA | | | 9,663 | | | | 207,005 | |
| Mapfre SA | | | 60,711 | | | | 212,166 | |
| Telefonica SA | | | 37,090 | | | | 383,495 | |
| | | | | | | | 2,121,828 | |
| Sweden | 1.0% | | | | | | | | |
| Assa Abloy AB ADR | | | 98,935 | | | | 1,088,285 | |
| Axfood AB | | | 7,216 | | | | 120,624 | |
| Electrolux AB, Series B | | | 23,846 | | | | 784,180 | |
| Hexagon AB ADR | | | 14,740 | | | | 705,309 | |
| Intrum Justitia AB | | | 3,939 | | | | 134,332 | |
| Mycronic AB | | | 20,611 | | | | 187,919 | |
| Svenska Cellulosa AB SCA, Class B | | | 31,330 | | | | 237,695 | |
| | | | | | | | 3,258,344 | |
| Switzerland | 1.9% | | | | | | | | |
| Julius Baer Group, Ltd. ADR | | | 52,255 | | | | 549,461 | |
| Partners Group Holding AG | | | 2,181 | | | | 1,352,179 | |
| Roche Holding AG | | | 14,189 | | | | 3,622,964 | |
| Description | | Shares | | | Fair
Value | |
| | | | | | | |
| STMicroelectronics NV | | | 30,423 | | | $ | 436,248 | |
| Swiss Life Holding AG | | | 399 | | | | 134,799 | |
| | | | | | | | 6,095,651 | |
| United Kingdom | 6.2% | | | | | | | | |
| Admiral Group PLC | | | 28,504 | | | | 743,888 | |
| Ashtead Group PLC ADR | | | 9,435 | | | | 786,360 | |
| British American Tobacco PLC Sponsored ADR | | | 23,365 | | | | 1,601,437 | |
| BT Group PLC | | | 121,860 | | | | 467,960 | |
| Centrica PLC | | | 758,862 | | | | 1,978,087 | |
| Cineworld Group PLC | | | 9,446 | | | | 86,411 | |
| Coca-Cola European Partners PLC | | | 14,270 | | | | 580,361 | |
| Compass Group PLC | | | 17,497 | | | | 369,444 | |
| Compass Group PLC Sponsored ADR | | | 43,313 | | | | 929,919 | |
| Crest Nicholson Holdings PLC | | | 30,674 | | | | 209,201 | |
| CVS Group PLC | | | 11,199 | | | | 183,704 | |
| Diageo PLC Sponsored ADR | | | 8,375 | | | | 1,003,576 | |
| Electrocomponents PLC | | | 92,012 | | | | 692,493 | |
| Fevertree Drinks PLC | | | 26,382 | | | | 586,473 | |
| G4S PLC | | | 143,782 | | | | 611,753 | |
| Hargreaves Lansdown PLC | | | 18,353 | | | | 311,419 | |
| Howden Joinery Group PLC | | | 71,992 | | | | 381,817 | |
| International Consolidated Airlines Group SA | | | 103,516 | | | | 823,345 | |
| International Consolidated Airlines Group SA Sponsored ADR | | | 7,855 | | | | 124,345 | |
| JD Sports Fashion PLC | | | 85,968 | | | | 391,985 | |
| Land Securities Group PLC | | | 15,826 | | | | 208,904 | |
| Lloyds Banking Group PLC | | | 952,995 | | | | 822,556 | |
| Moneysupermarket.com Group PLC | | | 26,023 | | | | 119,860 | |
| Prudential PLC ADR | | | 19,320 | | | | 888,913 | |
| Redrow PLC | | | 60,699 | | | | 432,653 | |
| RELX NV Sponsored ADR | | | 53,135 | | | | 1,098,832 | |
| Rightmove PLC | | | 3,164 | | | | 175,242 | |
| Severn Trent PLC | | | 10,637 | | | | 302,519 | |
| SSE PLC | | | 48,764 | | | | 922,221 | |
| Subsea 7 SA | | | 65,433 | | | | 882,140 | |
| Taylor Wimpey PLC | | | 179,254 | | | | 411,544 | |
| Unilever PLC Sponsored ADR | | | 13,050 | | | | 706,266 | |
| Wm Morrison Supermarkets PLC | | | 45,134 | | | | 141,908 | |
| | | | | | | | 19,977,536 | |
| United States | 46.6% | | | | | | | | |
| 3M Co. | | | 20,209 | | | | 4,207,312 | |
| AbbVie, Inc. | | | 19,219 | | | | 1,393,570 | |
| Accenture PLC, Class A | | | 22,399 | | | | 2,770,308 | |
| Adobe Systems, Inc. (a) | | | 4,159 | | | | 588,249 | |
The accompanying notes are an integral part of these financial statements.
Semi-Annual Report 25
| Description | | Shares | | | Fair
Value | |
| | | | | | | |
| Lazard Retirement Global Dynamic Multi-Asset Portfolio (continued) |
| | | | | | | | | |
| Advanced Energy Industries, Inc. (a) | | | 1,633 | | | $ | 105,639 | |
| Air Lease Corp. | | | 5,309 | | | | 198,344 | |
| Akamai Technologies, Inc. (a) | | | 2,572 | | | | 128,111 | |
| Allergan PLC | | | 1,859 | | | | 451,904 | |
| Ally Financial, Inc. | | | 5,612 | | | | 117,291 | |
| Alphabet, Inc., Class A (a) | | | 1,977 | | | | 1,837,977 | |
| Alphabet, Inc., Class C (a) | | | 315 | | | | 286,250 | |
| Altria Group, Inc. | | | 1,566 | | | | 116,620 | |
| Amdocs, Ltd. | | | 2,349 | | | | 151,417 | |
| Ameren Corp. | | | 56,921 | | | | 3,111,871 | |
| American Axle & Manufacturing Holdings, Inc. (a) | | | 6,542 | | | | 102,055 | |
| American Electric Power Co., Inc. | | | 2,505 | | | | 174,022 | |
| American Express Co. | | | 15,877 | | | | 1,337,478 | |
| Ameriprise Financial, Inc. | | | 3,824 | | | | 486,757 | |
| Amgen, Inc. | | | 1,952 | | | | 336,193 | |
| Aon PLC | | | 12,134 | | | | 1,613,215 | |
| Apple, Inc. | | | 28,772 | | | | 4,143,743 | |
| Applied Materials, Inc. | | | 38,217 | | | | 1,578,744 | |
| AT&T, Inc. | | | 127,051 | | | | 4,793,634 | |
| Atkore International Group, Inc. (a) | | | 7,048 | | | | 158,932 | |
| AutoZone, Inc. (a) | | | 1,045 | | | | 596,131 | |
| Baker Hughes, Inc. | | | 21,806 | | | | 1,188,645 | |
| Bank of America Corp. | | | 63,413 | | | | 1,538,399 | |
| Baxter International, Inc. | | | 3,803 | | | | 230,234 | |
| Benchmark Electronics, Inc. (a) | | | 3,571 | | | | 115,343 | |
| Biogen, Inc. (a) | | | 2,130 | | | | 577,997 | |
| Bloomin’ Brands, Inc. | | | 6,015 | | | | 127,698 | |
| Bristol-Myers Squibb Co. | | | 12,595 | | | | 701,793 | |
| C.R. Bard, Inc. | | | 1,853 | | | | 585,752 | |
| Campbell Soup Co. | | | 5,055 | | | | 263,618 | |
| Cardtronics PLC, Class A (a) | | | 3,193 | | | | 104,922 | |
| Carnival Corp. | | | 13,701 | | | | 898,375 | |
| Carnival PLC | | | 7,935 | | | | 525,413 | |
| Celgene Corp. (a) | | | 9,138 | | | | 1,186,752 | |
| Centene Corp. (a) | | | 5,805 | | | | 463,703 | |
| Cigna Corp. | | | 3,248 | | | | 543,683 | |
| Cirrus Logic, Inc. (a) | | | 1,772 | | | | 111,140 | |
| Cisco Systems, Inc. | | | 21,135 | | | | 661,526 | |
| Citigroup, Inc. | | | 34,369 | | | | 2,298,599 | |
| Colgate-Palmolive Co. | | | 1,680 | | | | 124,538 | |
| Comcast Corp., Class A | | | 91,206 | | | | 3,549,738 | |
| Comerica, Inc. | | | 13,165 | | | | 964,205 | |
| Commerce Bancshares, Inc. | | | 8,575 | | | | 487,317 | |
| Description | | Shares | | | Fair
Value | |
| | | | | | | |
| Consolidated Edison, Inc. | | | 5,358 | | | $ | 433,034 | |
| Crown Holdings, Inc. (a) | | | 11,830 | | | | 705,778 | |
| Cummins, Inc. | | | 14,128 | | | | 2,291,844 | |
| Darden Restaurants, Inc. | | | 5,385 | | | | 487,019 | |
| Devon Energy Corp. | | | 11,774 | | | | 376,415 | |
| DTE Energy Co. | | | 1,404 | | | | 148,529 | |
| DXC Technology Co. | | | 10,450 | | | | 801,724 | |
| Eaton Corp. PLC | | | 9,910 | | | | 771,295 | |
| eBay, Inc. (a) | | | 17,405 | | | | 607,783 | |
| EchoStar Corp., Class A (a) | | | 5,792 | | | | 351,574 | |
| Eli Lilly & Co. | | | 2,659 | | | | 218,836 | |
| EOG Resources, Inc. | | | 6,825 | | | | 617,799 | |
| Everest Re Group, Ltd. | | | 1,626 | | | | 413,963 | |
| Exelon Corp. | | | 6,815 | | | | 245,817 | |
| F5 Networks, Inc. (a) | | | 1,934 | | | | 245,734 | |
| Facebook, Inc., Class A (a) | | | 16,526 | | | | 2,495,095 | |
| Fifth Third Bancorp | | | 14,108 | | | | 366,244 | |
| Finisar Corp. (a) | | | 6,179 | | | | 160,530 | |
| Fiserv, Inc. (a) | | | 6,644 | | | | 812,827 | |
| Five Below, Inc. (a) | | | 9,935 | | | | 490,491 | |
| Foot Locker, Inc. | | | 3,485 | | | | 171,741 | |
| Fresh Del Monte Produce, Inc. | | | 4,110 | | | | 209,240 | |
| General Mills, Inc. | | | 7,941 | | | | 439,931 | |
| General Motors Co. | | | 18,690 | | | | 652,842 | |
| Genworth Financial, Inc., Class A (a) | | | 49,637 | | | | 187,132 | |
| GoDaddy, Inc., Class A (a) | | | 2,978 | | | | 126,327 | |
| Hasbro, Inc. | | | 6,263 | | | | 698,387 | |
| HCA Holdings, Inc. (a) | | | 12,614 | | | | 1,099,941 | |
| Honeywell International, Inc. | | | 9,195 | | | | 1,225,602 | |
| HRG Group, Inc. (a) | | | 50,424 | | | | 893,009 | |
| Humana, Inc. | | | 2,365 | | | | 569,066 | |
| Huntington Ingalls Industries, Inc. | | | 2,595 | | | | 483,085 | |
| IDEXX Laboratories, Inc. (a) | | | 2,069 | | | | 333,978 | |
| II-VI, Inc. (a) | | | 3,179 | | | | 109,040 | |
| Intel Corp. | | | 23,056 | | | | 777,909 | |
| Intercontinental Exchange, Inc. | | | 18,785 | | | | 1,238,307 | |
| Intuit, Inc. | | | 19,456 | | | | 2,583,951 | |
| J.B. Hunt Transport Services, Inc. | | | 2,579 | | | | 235,669 | |
| JetBlue Airways Corp. (a) | | | 5,196 | | | | 118,625 | |
| Johnson & Johnson | | | 34,516 | | | | 4,566,122 | |
| Johnson Controls International PLC | | | 20,746 | | | | 899,547 | |
| JPMorgan Chase & Co. | | | 32,597 | | | | 2,979,366 | |
| Juniper Networks, Inc. | | | 11,540 | | | | 321,735 | |
| KB Home | | | 8,068 | | | | 193,390 | |
| Kellogg Co. | | | 6,265 | | | | 435,167 | |
| Kimberly-Clark Corp. | | | 11,029 | | | | 1,423,954 | |
The accompanying notes are an integral part of these financial statements.
26 Semi-Annual Report
| Description | | Shares | | | Fair
Value | |
| | | | | | | | | |
| Lazard Retirement Global Dynamic Multi-Asset Portfolio (continued) |
| | | | | | | | | |
| Koppers Holdings, Inc. (a) | | | 4,718 | | | $ | 170,556 | |
| Las Vegas Sands Corp. | | | 5,146 | | | | 328,778 | |
| Lear Corp. | | | 3,331 | | | | 473,268 | |
| Lockheed Martin Corp. | | | 1,767 | | | | 490,537 | |
| Lowe’s Cos., Inc. | | | 15,832 | | | | 1,227,455 | |
| Marsh & McLennan Cos., Inc. | | | 5,178 | | | | 403,677 | |
| Masimo Corp. (a) | | | 1,317 | | | | 120,084 | |
| MasterCard, Inc., Class A | | | 1,270 | | | | 154,242 | |
| Medtronic PLC | | | 10,195 | | | | 904,806 | |
| Merck & Co., Inc. | | | 8,812 | | | | 564,761 | |
| MetLife, Inc. | | | 22,461 | | | | 1,234,007 | |
| Microsoft Corp. | | | 28,569 | | | | 1,969,261 | |
| Molson Coors Brewing Co., Class B | | | 9,326 | | | | 805,207 | |
| Monsanto Co. | | | 5,180 | | | | 613,105 | |
| Morgan Stanley | | | 25,449 | | | | 1,134,007 | |
| Motorola Solutions, Inc. | | | 7,740 | | | | 671,368 | |
| MSCI, Inc. | | | 2,187 | | | | 225,239 | |
| Newfield Exploration Co. (a) | | | 5,812 | | | | 165,410 | |
| NIKE, Inc., Class B | | | 1,799 | | | | 106,141 | |
| Nordstrom, Inc. | | | 2,967 | | | | 141,912 | |
| Northrop Grumman Corp. | | | 5,829 | | | | 1,496,363 | |
| O’Reilly Automotive, Inc. (a) | | | 366 | | | | 80,059 | |
| Omnicom Group, Inc. | | | 4,186 | | | | 347,019 | |
| Paychex, Inc. | | | 4,701 | | | | 267,675 | |
| PayPal Holdings, Inc. (a) | | | 3,172 | | | | 170,241 | |
| PepsiCo, Inc. | | | 51,600 | | | | 5,959,284 | |
| PG&E Corp. | | | 10,020 | | | | 65,027 | |
| Pinnacle West Capital Corp. | | | 2,145 | | | | 182,668 | |
| PPG Industries, Inc. | | | 6,095 | | | | 670,206 | |
| Prudential Financial, Inc. | | | 14,149 | | | | 1,530,073 | |
| Quest Diagnostics, Inc. | | | 1,066 | | | | 118,497 | |
| Quintiles IMS Holdings, Inc. (a) | | | 10,945 | | | | 979,578 | |
| Raytheon Co. | | | 873 | | | | 140,972 | |
| Regions Financial Corp. | | | 29,799 | | | | 436,257 | |
| Republic Services, Inc. | | | 5,606 | | | | 357,270 | |
| Rockwell Automation, Inc. | | | 6,135 | | | | 993,625 | |
| Rockwell Collins, Inc. | | | 8,218 | | | | 863,547 | |
| Ross Stores, Inc. | | | 15,148 | | | | 874,494 | |
| Royal Caribbean Cruises, Ltd. | | | 5,664 | | | | 618,679 | |
| S&P Global, Inc. | | | 7,310 | | | | 1,067,187 | |
| Schlumberger, Ltd. | | | 14,885 | | | | 980,028 | |
| Silgan Holdings, Inc. | | | 10,672 | | | | 339,156 | |
| Description | | Shares | | | Fair
Value | |
| | | | | | | | | |
| Simon Property Group, Inc. REIT | | | 6,449 | | | $ | 1,043,190 | |
| Sirius XM Holdings, Inc. | | | 99,593 | | | | 544,774 | |
| Skyworks Solutions, Inc. | | | 12,501 | | | | 1,199,471 | |
| Snap-on, Inc. | | | 4,175 | | | | 659,650 | |
| Southwest Airlines Co. | | | 3,609 | | | | 224,263 | |
| Southwestern Energy Co. (a) | | | 29,936 | | | | 182,011 | |
| Starbucks Corp. | | | 14,454 | | | | 842,813 | |
| Synopsys, Inc. (a) | | | 8,823 | | | | 643,461 | |
| Sysco Corp. | | | 25,455 | | | | 1,281,150 | |
| Tailored Brands, Inc. | | | 16,196 | | | | 180,747 | |
| Tallgrass Energy GP LP | | | 8,338 | | | | 212,035 | |
| Texas Instruments, Inc. | | | 22,672 | | | | 1,744,157 | |
| The Boeing Co. | | | 12,061 | | | | 2,385,063 | |
| The Charles Schwab Corp. | | | 21,415 | | | | 919,988 | |
| The Chemours Co. | | | 2,620 | | | | 99,350 | |
| The Coca-Cola Co. | | | 29,455 | | | | 1,321,057 | |
| The Estee Lauder Cos., Inc., Class A | | | 6,737 | | | | 646,617 | |
| The Kroger Co. | | | 13,986 | | | | 326,154 | |
| The Procter & Gamble Co. | | | 1,193 | | | | 103,970 | |
| The Scotts Miracle-Gro Co. | | | 7,843 | | | | 701,635 | |
| The TJX Cos., Inc. | | | 42,585 | | | | 3,073,359 | |
| The Toro Co. | | | 7,319 | | | | 507,134 | |
| The Walt Disney Co. | | | 17,076 | | | | 1,814,325 | |
| Thermo Fisher Scientific, Inc. | | | 5,765 | | | | 1,005,820 | |
| Time Warner, Inc. | | | 8,513 | | | | 854,790 | |
| Tyson Foods, Inc., Class A | | | 3,182 | | | | 199,289 | |
| United Continental Holdings, Inc. (a) | | | 2,937 | | | | 221,009 | |
| United Rentals, Inc. (a) | | | 3,484 | | | | 392,682 | |
| United Technologies Corp. | | | 8,400 | | | | 1,025,724 | |
| UnitedHealth Group, Inc. | | | 19,938 | | | | 3,696,904 | |
| Validus Holdings, Ltd. | | | 2,881 | | | | 149,726 | |
| Vantiv, Inc., Class A (a) | | | 14,605 | | | | 925,081 | |
| Versum Materials, Inc. | | | 10,678 | | | | 347,035 | |
| Visa, Inc., Class A | | | 11,914 | | | | 1,117,295 | |
| VMware, Inc., Class A (a) | | | 3,865 | | | | 337,917 | |
| Wal-Mart Stores, Inc. | | | 4,358 | | | | 329,813 | |
| Waste Management, Inc. | | | 6,005 | | | | 440,467 | |
| WEC Energy Group, Inc. | | | 1,855 | | | | 113,860 | |
| Welbilt, Inc. (a) | | | 29,170 | | | | 549,855 | |
| Xcel Energy, Inc. | | | 44,779 | | | | 2,054,461 | |
| Zoetis, Inc. | | | 21,260 | | | | 1,326,199 | |
| | | | | | | | 150,836,578 | |
Total Common Stocks
(Cost $243,831,715) | | | | | | | 264,689,865 | |
The accompanying notes are an integral part of these financial statements.
Semi-Annual Report 27
| Description | | Security
Currency | | Principal
Amount
(000) | | | Fair
Value | |
| | | | | | | | | |
| Lazard Retirement Global Dynamic Multi-Asset Portfolio (continued) |
| | | | | | | | | | | |
| Corporate Bonds | 5.6% | | | | | | | | | | |
| | | | | | | | | | | |
| Australia | 0.3% | | | | | | | | | | |
| Telstra Corp., Ltd.: | | | | | | | | | | |
| 4.000%, 11/15/17 | | AUD | | | 310 | | | $ | 239,900 | |
| 4.000%, 09/16/22 | | AUD | | | 670 | | | | 533,607 | |
Toyota Finance Australia, Ltd.,
4.250%, 05/15/19 | | AUD | | | 422 | | | | 334,286 | |
| | | | | | | | | | 1,107,793 | |
| Belgium | 0.4% | | | | | | | | | | |
| Anheuser-Busch InBev Finance, Inc.: | | | | | | | | | | |
| 2.375%, 01/25/18 | | CAD | | | 730 | | | | 565,806 | |
| 2.650%, 02/01/21 | | USD | | | 635 | | | | 643,460 | |
| | | | | | | | | | 1,209,266 | |
| Canada | 0.2% | | | | | | | | | | |
| The Toronto-Dominion Bank: | | | | | | | | | | |
| 2.250%, 11/05/19 | | USD | | | 410 | | | | 413,060 | |
| 2.621%, 12/22/21 | | CAD | | | 495 | | | | 390,274 | |
| | | | | | | | | | 803,334 | |
| Denmark | 0.1% | | | | | | | | | | |
Carlsberg Breweries A/S,
2.500%, 05/28/24 | | EUR | | | 370 | | | | 459,891 | |
| | | | | | | | | | | |
| France | 0.2% | | | | | | | | | | |
Orange SA,
5.375%, 07/08/19 | | USD | | | 598 | | | | 636,426 | |
| | | | | | | | | | | |
| Germany | 0.5% | | | | | | | | | | |
BMW Finance NV,
3.375%, 12/14/18 | | GBP | | | 650 | | | | 875,827 | |
Daimler Finance North America LLC,
3.875%, 09/15/21 | | USD | | | 575 | | | | 605,420 | |
| | | | | | | | | | 1,481,247 | |
| Mexico | 0.1% | | | | | | | | | | |
America Movil SAB de CV,
6.450%, 12/05/22 | | MXN | | | 7,500 | | | | 384,004 | |
| | | | | | | | | | | |
| Netherlands | 0.1% | | | | | | | | | | |
Bank Nederlandse Gemeenten NV,
5.000%, 09/16/20 | | NZD | | | 455 | | | | 351,319 | |
| Description | | Security
Currency | | Principal
Amount
(000) | | | Fair
Value | |
| | | | | | | | | |
| New Zealand | 0.3% |
Fonterra Cooperative Group, Ltd.,
5.500%, 02/26/24 | | AUD | | | 1,000 | | | $ | 846,229 | |
| | | | | | | | | | | |
| Norway | 0.3% | | | | | | | | | | |
Statoil ASA,
3.700%, 03/01/24 | | USD | | | 385 | | | | 404,437 | |
Telenor ASA,
1.750%, 05/22/18 | | USD | | | 480 | | | | 478,188 | |
| | | | | | | | | | 882,625 | |
| Spain | 0.1% | | | | | | | | | | |
Iberdrola International BV,
1.125%, 04/21/26 | | EUR | | | 400 | | | | 452,010 | |
| United Kingdom | 0.5% | | | | | | | | | | |
Centrica PLC,
7.000%, 09/19/18 | | GBP | | | 50 | | | | 69,761 | |
Rolls-Royce PLC,
6.750%, 04/30/19 | | GBP | | | 502 | | | | 721,334 | |
SSE PLC,
5.000%, 10/01/18 | | GBP | | | 520 | | | | 710,664 | |
| | | | | | | | | | 1,501,759 | |
| United States | 2.5% | | | | | | | | | | |
Alphabet, Inc.,
3.625%, 05/19/21 | | USD | | | 225 | | | | 238,163 | |
Amazon.com, Inc.,
3.800%, 12/05/24 | | USD | | | 480 | | | | 511,714 | |
| Apple, Inc.: | | | | | | | | | | |
| 2.850%, 02/23/23 | | USD | | | 132 | | | | 134,272 | |
| 3.850%, 05/04/43 | | USD | | | 575 | | | | 575,666 | |
Citigroup, Inc.,
3.285%, 05/04/21 | | AUD | | | 720 | | | | 560,540 | |
| John Deere Canada Funding, Inc.: | | | | | | | | | | |
| 2.300%, 01/17/18 | | CAD | | | 200 | | | | 155,128 | |
| 2.050%, 09/17/20 | | CAD | | | 330 | | | | 255,099 | |
John Deere Capital Corp.,
2.300%, 09/16/19 | | USD | | | 240 | | | | 242,793 | |
Johnson & Johnson,
3.625%, 03/03/37 | | USD | | | 300 | | | | 314,090 | |
JPMorgan Chase & Co.,
4.500%, 01/24/22 | | USD | | | 405 | | | | 438,508 | |
Microsoft Corp.,
4.450%, 11/03/45 | | USD | | | 733 | | | | 816,780 | |
The accompanying notes are an integral part of these financial statements.
28 Semi-Annual Report
| Description | | Security
Currency | | Principal
Amount
(000) | | | Fair
Value | |
| | | | | | | | | | | |
| Lazard Retirement Global Dynamic Multi-Asset Portfolio (continued) |
| | | | | | | | | | | |
Morgan Stanley,
3.625%, 01/20/27 | | USD | | | 510 | | | $ | 513,255 | |
NIKE, Inc.,
2.375%, 11/01/26 | | USD | | | 540 | | | | 512,330 | |
| The Goldman Sachs Group, Inc.: | | | | | |
| 5.200%, 12/17/19 | | NZD | | | 645 | | | | 493,113 | |
| 3.625%, 01/22/23 | | USD | | | 520 | | | | 536,634 | |
The Home Depot, Inc.,
2.625%, 06/01/22 | | USD | | | 540 | | | | 548,102 | |
Union Pacific Corp.,
4.163%, 07/15/22 | | USD | | | 500 | | | | 540,972 | |
Wells Fargo & Co.,
3.065%, 07/27/21 (e) | | AUD | | | 525 | | | | 407,956 | |
Wells Fargo Canada Corp.,
3.040%, 01/29/21 | | CAD | | | 360 | | | | 287,486 | |
| | | | | | | | | | 8,082,601 | |
Total Corporate Bonds
(Cost $18,253,347) | | | | | | | | | 18,198,504 | |
| | | | | | | | | | | |
| Foreign Government Obligations | 6.9% | | | | | |
| | | | | | | | | | | |
| Australia | 0.6% | | | | | | | | | | |
| Queensland Treasury Corp.: | | | | | |
| 5.500%, 06/21/21 | | AUD | | | 820 | | | | 705,798 | |
| 3.000%, 03/22/24 | | AUD | | | 600 | | | | 468,797 | |
Western Australian Treasury Corp.,
6.000%, 10/16/23 | | AUD | | | 735 | | | | 670,637 | |
| | | | | | | | | | 1,845,232 | |
| Bermuda | 0.3% | | | | | | | | | | |
Government of Bermuda,
4.854%, 02/06/24 | | USD | | | 1,015 | | | | 1,097,042 | |
| | | | | | | | | | | |
| Canada | 1.0% | | | | | | | | | | |
City of Vancouver,
2.900%, 11/20/25 | | CAD | | | 415 | | | | 328,640 | |
Province of Alberta,
4.000%, 12/01/19 | | CAD | | | 1,065 | | | | 871,069 | |
Province of Ontario,
1.950%, 01/27/23 | | CAD | | | 990 | | | | 760,700 | |
| Province of Quebec: | | | | | | | | | | |
| 1.650%, 03/03/22 | | CAD | | | 330 | | | | 252,241 | |
| 2.500%, 04/20/26 | | USD | | | 1,075 | | | | 1,057,241 | |
| | | | | | | | | | 3,269,891 | |
| Description | | Security
Currency | | Principal
Amount
(000) | | | Fair
Value | |
| | | | | | | | | | | |
| Cayman Islands | 0.1% |
Cayman Islands Government Bonds,
5.950%, 11/24/19 | | USD | | | 360 | | | $ | 388,800 | |
| | | | | | | | | | | |
| Chile | 0.2% | | | | | | | | | | |
Republic of Chile,
3.125%, 01/21/26 | | USD | | | 500 | | | | 509,375 | |
| | | | | | | | | | | |
| Colombia | 0.1% | | | | | | | | | | |
Republic of Colombia,
2.625%, 03/15/23 | | USD | | | 375 | | | | 366,563 | |
| | | | | | | | | | | |
| Czech Republic | 0.2% | | | | | |
Czech Republic,
2.500%, 08/25/28 | | CZK | | | 15,580 | | | | 780,933 | |
| | | | | | | | | | | |
| Hungary | 0.2% | | | | | | | | | | |
Hungary Government Bonds,
5.500%, 06/24/25 | | HUF | | | 128,350 | | | | 567,517 | |
| | | | | | | | | | | |
| Ireland | 0.3% | | | | | | | | | | |
Irish Treasury,
3.400%, 03/18/24 | | EUR | | | 625 | | | | 854,371 | |
| | | | | | | | | | | |
| Lithuania | 0.1% | | | | | | | | | | |
Republic of Lithuania,
6.625%, 02/01/22 | | USD | | | 300 | | | | 352,875 | |
| | | | | | | | | | | |
| Mexico | 0.5% | | | | | | | | | | |
Mexican Bonos,
6.500%, 06/09/22 | | MXN | | | 11,410 | | | | 625,606 | |
United Mexican States,
6.750%, 02/06/24 | | GBP | | | 640 | | | | 1,016,953 | |
| | | | | | | | | | 1,642,559 | |
| New Zealand | 0.4% | | | | | | | | | | |
| New Zealand Government Bonds: | | | | | |
| 6.000%, 05/15/21 | | NZD | | | 1,145 | | | | 931,770 | |
| 4.500%, 04/15/27 | | NZD | | | 670 | | | | 518,234 | |
| | | | | | | | | | 1,450,004 | |
| Norway | 0.6% | | | | | | | | | | |
Kommunalbanken AS,
1.375%, 10/26/20 (d) | | USD | | | 600 | | | | 590,742 | |
| Oslo Kommune: | | | | | |
| 3.550%, 02/12/21 | | NOK | | | 3,000 | | | | 381,132 | |
| 3.650%, 11/08/23 | | NOK | | | 3,000 | | | | 388,238 | |
| 2.350%, 09/04/24 | | NOK | | | 4,000 | | | | 481,557 | |
| | | | | | | | | | 1,841,669 | |
The accompanying notes are an integral part of these financial statements.
Semi-Annual Report 29
| Description | | Security
Currency | | Principal
Amount
(000) | | | Fair
Value | |
| | | | | | | | | | | |
| Lazard Retirement Global Dynamic Multi-Asset Portfolio (continued) |
| | | | | | | | | | | |
| Panama | 0.3% | | | | | | | | | | |
Republic of Panama,
4.000%, 09/22/24 | | USD | | | 855 | | | $ | 895,612 | |
| | | | | | | | | | | |
| Poland | 0.5% | | | | | | | | | | |
| Poland Government Bonds: | | | | | |
| 1.810%, 01/25/21 (e) | | PLN | | | 3,930 | | | | 1,053,501 | |
| 2.500%, 07/25/26 | | PLN | | | 2,090 | | | | 533,214 | |
| | | | | | | | | | 1,586,715 | |
| Romania | 0.2% | | | | | |
Romanian Government Bonds,
2.875%, 10/28/24 | | EUR | | | 420 | | | | 520,478 | |
| | | | | | | | | | | |
| Singapore | 0.7% | | | | | |
Singapore Government Bonds,
3.000%, 09/01/24 | | SGD | | | 2,740 | | | | 2,137,469 | |
| | | | | | | | | | | |
| Spain | 0.3% | | | | | | | | | | |
| Spain Government Bonds: | | | | | |
| 1.600%, 04/30/25 | | EUR | | | 451 | | | | 533,499 | |
| 1.950%, 07/30/30 | | EUR | | | 471 | | | | 538,802 | |
| | | | | | | | | | 1,072,301 | |
| Sweden | 0.2% | | | | | |
Kommuninvest I Sverige AB,
1.500%, 04/23/19 (d) | | USD | | | 500 | | | | 498,324 | |
| | | | | | | | | | | |
| United Kingdom | 0.1% | | | | | |
United Kingdom Gilt,
1.500%, 07/22/47 | | GBP | | | 400 | | | | 477,105 | |
| | | | | | | | | | | |
| | | | | |
Total Foreign Government Obligations
(Cost $22,260,122) | | | | | | | | | 22,154,835 | |
| | | | | | | | | | | |
| Quasi Government Bonds | 0.6% | | | | | |
| | | | | | | | | | | |
| Chile | 0.2% | | | | | | | | | | |
Corp. Nacional del Cobre de Chile,
4.500%, 08/13/23 | | USD | | | 630 | | | | 675,857 | |
| | | | | | | | | | | |
| Mexico | 0.2% | | | | | |
Nacional Financiera SNC,
3.375%, 11/05/20 | | USD | | | 500 | | | | 514,500 | |
| Description | | Security
Currency | | Principal
Amount
(000) | | | Fair
Value | |
| | | | | | | | | | | |
| Singapore | 0.2% |
Temasek Financial I, Ltd.,
4.300%, 10/25/19 | | USD | | | 795 | | | $ | 835,293 | |
| | | | | | | | | | | |
Total Quasi Government Bonds
(Cost $2,034,314) | | | | | | | | | 2,025,650 | |
| | | | | | | | | | | |
| Supranationals | 0.9% | | | | | |
African Development Bank,
2.375%, 09/23/21 | | USD | | | 510 | | | | 517,783 | |
Asian Development Bank,
2.125%, 03/19/25 | | USD | | | 735 | | | | 720,414 | |
Corporacion Andina de Fomento,
4.375%, 06/15/22 | | USD | | | 235 | | | | 254,110 | |
European Investment Bank,
1.125%, 09/16/21 (d) | | CAD | | | 790 | | | | 594,119 | |
International Bank for Reconstruction & Development,
3.500%, 01/22/21 | | NZD | | | 250 | | | | 186,545 | |
| | | | | |
International Finance Corp.,
3.625%, 05/20/20 | | NZD | | | 695 | | | | 520,526 | |
| | | | | | | | | | | |
Total Supranationals
(Cost $2,798,966) | | | | | | | | | 2,793,497 | |
| | | | | | | | | | | |
| US Municipal Bonds | 0.6% | | | | | |
| | | | | | | | | | | |
| California | 0.3% | | | | | | | | | | |
California State Build America Bonds,
7.500%, 04/01/34 | | USD | | | 575 | | | | 836,976 | |
| | | | | | | | | | | |
| Georgia | 0.2% | | | | | |
| Georgia State Build America Bonds: | | | | | |
Series B,
2.380%, 02/01/27 | | USD | | | 350 | | | | 335,940 | |
Series H,
5.014%, 11/01/27 | | USD | | | 420 | | | | 496,646 | |
| | | | | | | | | | 832,586 | |
| Pennsylvania | 0.0% | | | | | |
Pennsylvania State Build America Bonds Third Series B,
5.850%, 07/15/30 | | USD | | | 50 | | | | 54,765 | |
The accompanying notes are an integral part of these financial statements.
30 Semi-Annual Report
| Description | | Security
Currency | | Principal
Amount
(000) | | | Fair
Value | |
| | | | | | | | | | | |
| Lazard Retirement Global Dynamic Multi-Asset Portfolio (continued) |
| | | | | | | | | | | |
| Texas | 0.0% | | | | | | | | | | |
Texas State Build America Bonds Series A,
4.123%, 04/01/25 | | USD | | | 100 | | | $ | 109,938 | |
| | | | | | | | | | | |
| Wisconsin | 0.1% | | | | | |
| Wisconsin State Build America Bonds Series D, 5.400%, 05/01/28 | | USD | | | 175 | | | | 190,183 | |
| | | | | | | | | | | |
| | | | | |
Total US Municipal Bonds
(Cost $2,044,619) | | | | | | | | | 2,024,448 | |
| | | | | | | | | | | |
| US Treasury Securities | 1.3% | | | | | |
| US Treasury Notes: | | | | | |
| 2.125%, 05/15/25 | | USD | | | 2,255 | | | | 2,240,555 | |
| 1.625%, 05/15/26 | | USD | | | 1,130 | | | | 1,071,249 | |
| 2.500%, 05/15/46 | | USD | | | 855 | | | | 796,853 | |
| | | | | | | | | | | |
Total US Treasury Securities
(Cost $4,175,813) | | | | | | | | | 4,108,657 | |
| Description | | Shares | | | Fair
Value | |
| | | | | | | | | |
| Short-Term Investments | 2.8% | | | | | | | | |
State Street Institutional Treasury Money Market Fund, Premier Class, 0.83% (7 day yield)
(Cost $9,098,435) | | | 9,098,435 | | | $ | 9,098,435 | |
| | | | | | | | | |
Total Investments | 100.4%
(Cost $304,497,331) (b), (f) | | | | | | $ | 325,093,891 | |
| | | | | | | | | |
| Liabilities in Excess of Cash and Other Assets | (0.4)% | | | | | | | (1,226,506 | ) |
| | | | | | | | | |
| Net Assets | 100.0% | | | | | | $ | 323,867,385 | |
The accompanying notes are an integral part of these financial statements.
Semi-Annual Report 31
Lazard Retirement Global Dynamic Multi-Asset Portfolio (concluded)
Forward Currency Contracts open at June 30, 2017:
Currency
Purchased | | Quantity | | | Currency
Sold | | Quantity | | | Counterparty | | | Settlement
Date | | Unrealized
Appreciation | | | Unrealized
Depreciation | |
| | | | | | | | | | | | | | | | | | | | | | | | | |
| CHF | | | 348,132 | | | USD | | | 359,124 | | | | HSB | | | 08/24/17 | | $ | 5,062 | | | $ | — | |
| CZK | | | 1,549,311 | | | USD | | | 63,750 | | | | CIT | | | 07/11/17 | | | 4,018 | | | | — | |
| CZK | | | 1,326,253 | | | USD | | | 57,198 | | | | HSB | | | 07/11/17 | | | 813 | | | | — | |
| CZK | | | 6,786,655 | | | USD | | | 272,850 | | | | JPM | | | 07/11/17 | | | 24,001 | | | | — | |
| EUR | | | 146 | | | USD | | | 165 | | | | HSB | | | 08/24/17 | | | 2 | | | | — | |
| EUR | | | 364,928 | | | USD | | | 413,000 | | | | HSB | | | 08/24/17 | | | 4,873 | | | | — | |
| EUR | | | 638,899 | | | USD | | | 726,100 | | | | HSB | | | 08/24/17 | | | 5,492 | | | | — | |
| EUR | | | 780,862 | | | USD | | | 881,425 | | | | HSB | | | 08/24/17 | | | 12,725 | | | | — | |
| EUR | | | 2,686,666 | | | USD | | | 3,023,848 | | | | HSB | | | 09/28/17 | | | 58,459 | | | | — | |
| EUR | | | 7,382,810 | | | USD | | | 8,333,236 | | | | SSB | | | 08/24/17 | | | 120,683 | | | | — | |
| GBP | | | 64,241 | | | USD | | | 83,894 | | | | CIT | | | 08/24/17 | | | — | | | | 95 | |
| GBP | | | 285,237 | | | USD | | | 364,305 | | | | SSB | | | 09/28/17 | | | 8,173 | | | | — | |
| JPY | | | 1,001,316,626 | | | USD | | | 9,045,685 | | | | CIT | | | 08/24/17 | | | — | | | | 124,492 | |
| JPY | | | 58,534,313 | | | USD | | | 528,646 | | | | HSB | | | 08/24/17 | | | — | | | | 7,137 | |
| JPY | | | 77,444,595 | | | USD | | | 698,866 | | | | SSB | | | 09/28/17 | | | — | | | | 7,755 | |
| KRW | | | 684,045,600 | | | USD | | | 603,300 | | | | HSB | | | 07/17/17 | | | — | | | | 5,347 | |
| MXN | | | 1,191,226 | | | USD | | | 62,755 | | | | HSB | | | 08/24/17 | | | 2,366 | | | | — | |
| NZD | | | 412,914 | | | USD | | | 291,100 | | | | CIT | | | 08/24/17 | | | 11,213 | | | | — | |
| PLN | | | 1,970,428 | | | USD | | | 528,237 | | | | HSB | | | 08/24/17 | | | 3,367 | | | | — | |
| SEK | | | 4,990,792 | | | USD | | | 573,793 | | | | CIT | | | 08/24/17 | | | 20,251 | | | | — | |
| SEK | | | 4,021,041 | | | USD | | | 462,369 | | | | HSB | | | 08/24/17 | | | 16,247 | | | | — | |
| USD | | | 1,445,847 | | | AUD | | | 1,940,526 | | | | CIT | | | 08/24/17 | | | — | | | | 44,704 | |
| USD | | | 2,523,431 | | | AUD | | | 3,386,628 | | | | HSB | | | 08/24/17 | | | — | | | | 77,896 | |
| USD | | | 660,212 | | | AUD | | | 873,199 | | | | HSB | | | 09/28/17 | | | — | | | | 10,212 | |
| USD | | | 330,527 | | | AUD | | | 437,148 | | | | SSB | | | 09/28/17 | | | — | | | | 5,106 | |
| USD | | | 3,086,856 | | | CAD | | | 4,158,150 | | | | HSB | | | 08/24/17 | | | — | | | | 122,314 | |
| USD | | | 2,770,481 | | | CAD | | | 3,667,638 | | | | HSB | | | 09/28/17 | | | — | | | | 61,505 | |
| USD | | | 343,864 | | | CAD | | | 455,213 | | | | SSB | | | 09/28/17 | | | — | | | | 7,631 | |
| USD | | | 1,119,163 | | | CZK | | | 26,576,756 | | | | JPM | | | 07/11/17 | | | — | | | | 43,317 | |
| USD | | | 123,944 | | | EUR | | | 110,286 | | | | HSB | | | 08/24/17 | | | — | | | | 2,342 | |
| USD | | | 250,739 | | | EUR | | | 223,107 | | | | HSB | | | 08/24/17 | | | — | | | | 4,737 | |
| USD | | | 275,093 | | | GBP | | | 210,651 | | | | CIT | | | 08/24/17 | | | 311 | | | | — | |
| USD | | | 290,658 | | | GBP | | | 222,570 | | | | CIT | | | 08/24/17 | | | 329 | | | | — | |
| USD | | | 227,800 | | | GBP | | | 174,481 | | | | HSB | | | 08/24/17 | | | 200 | | | | — | |
| USD | | | 501,089 | | | GBP | | | 383,866 | | | | HSB | | | 08/24/17 | | | 358 | | | | — | |
| USD | | | 1,634,158 | | | HKD | | | 12,715,543 | | | | SSB | | | 09/28/17 | | | 1,746 | | | | — | |
| USD | | | 593,559 | | | HUF | | | 162,365,663 | | | | JPM | | | 08/24/17 | | | — | | | | 8,111 | |
| USD | | | 701,000 | | | JPY | | | 77,350,933 | | | | HSB | | | 08/24/17 | | | 11,845 | | | | — | |
| USD | | | 600,748 | | | JPY | | | 66,588,262 | | | | HSB | | | 09/28/17 | | | 6,518 | | | | — | |
| USD | | | 871,329 | | | MXN | | | 16,539,662 | | | | HSB | | | 08/24/17 | | | — | | | | 32,854 | |
| USD | | | 1,255,273 | | | NOK | | | 10,481,682 | | | | HSB | | | 08/24/17 | | | — | | | | 1,452 | |
| USD | | | 523,430 | | | NZD | | | 729,265 | | | | HSB | | | 08/24/17 | | | — | | | | 10,498 | |
| USD | | | 2,092,685 | | | NZD | | | 3,023,848 | | | | HSB | | | 08/24/17 | | | — | | | | 121,212 | |
| USD | | | 525,200 | | | PLN | | | 1,977,273 | | | | HSB | | | 08/24/17 | | | — | | | | 8,251 | |
| USD | | | 1,472,143 | | | PLN | | | 5,491,388 | | | | HSB | | | 08/24/17 | | | — | | | | 9,384 | |
| USD | | | 2,144,550 | | | SGD | | | 2,971,184 | | | | SSB | | | 08/24/17 | | | — | | | | 15,223 | |
| Total gross unrealized appreciation/depreciation on Forward Currency Contracts | | $ | 319,052 | | | $ | 731,575 | |
The accompanying notes are an integral part of these financial statements.
32 Semi-Annual Report
Lazard Retirement Series, Inc. Notes to Portfolios of Investments June 30, 2017 (unaudited)
| (a) | Non-income producing security. |
| | |
| (b) | For federal income tax purposes, the aggregate cost, aggregate gross unrealized appreciation, aggregate gross unrealized depreciation and the net unrealized appreciation (depreciation) were as follows: |
| | Portfolio | | Aggregate
Cost | | Aggregate Gross
Unrealized
Appreciation | | Aggregate Gross
Unrealized
Depreciation | | Net Unrealized
Appreciation
(Depreciation) | |
| | | | | | | | | | | | | | | | | | | |
| | US Strategic Equity | | $ | 8,584,973 | | | $ | 1,290,257 | | | $ | 128,644 | | | $ | 1,161,613 | | |
| | US Small-Mid Cap Equity | | | 57,070,505 | | | | 8,205,992 | | | | 676,001 | | | | 7,529,991 | | |
| | International Equity | | | 180,956,187 | | | | 24,534,676 | | | | 1,742,501 | | | | 22,792,175 | | |
| | Emerging Markets Equity | | | 955,230,381 | | | | 183,371,960 | | | | 89,859,031 | | | | 93,512,929 | | |
| | Global Dynamic Multi-Asset | | | 304,497,331 | | | | 25,658,851 | | | | 5,062,291 | | | | 20,596,560 | | |
| (c) | Security valued using Level 2 inputs, based on reference to a similar security which was trading on an active market, under GAAP hierarchy — see Note 8 in the Notes to Financial Statements. |
| | |
| (d) | Pursuant to Rule 144A under the Securities Act of 1933, these securities may only be traded among “qualified institutional buyers.” At June 30, 2017, the percentage of net assets for each Portfolio was as follows: |
| | Portfolio | | Percentage of
Net Assets | |
| | | | | | | |
| | Emerging Markets Equity | | | 0.3 | % | |
| | Global Dynamic Multi-Asset | | | 0.5 | | |
| (e) | Variable and floating rate securities are securities for which interest rate changes are based on changes in a designated base rate. The rates shown are those in effect on June 30, 2017. |
| | |
| (f) | The Portfolio, at all times, maintains portfolio securities in sufficient amount to cover its obligations related to investments in forward currency contracts. |
| Security Abbreviations: | | | | |
| ADR | — | American Depositary Receipt | | | | |
| GDR | — | Global Depositary Receipt | | | | |
| PJSC | — | Public Joint Stock Company | | | | |
| REIT | — | Real Estate Investment Trust | | | | |
| | | | | | | |
| Currency Abbreviations: | | | | |
| AUD | — | Australian Dollar | | KRW | — | South Korean Won |
| CAD | — | Canadian Dollar | | MXN | — | Mexican New Peso |
| CHF | — | Swiss Franc | | NOK | — | Norwegian Krone |
| CZK | — | Czech Koruna | | NZD | — | New Zealand Dollar |
| EUR | — | Euro | | PLN | — | Polish Zloty |
| GBP | — | British Pound Sterling | | SEK | — | Swedish Krone |
| HKD | — | Hong Kong Dollar | | SGD | — | Singapore Dollar |
| HUF | — | Hungarian Forint | | USD | — | United States Dollar |
| JPY | — | Japanese Yen | | | | |
| | | | | | | |
Counterparty Abbreviations: | | | | |
| CIT | — | Citibank NA | | | | |
| HSB | — | HSBC Bank USA NA | | | | |
| JPM | — | JPMorgan Chase Bank NA | | | | |
| SSB | — | State Street Bank and Trust Co. | | | | |
The accompanying notes are an integral part of these financial statements.
Semi-Annual Report 33
Portfolio holdings by industry (as a percentage of net assets), for those Portfolios previously presented by country:
| Industry* | | Lazard
Retirement
International
Equity
Portfolio | | Lazard
Retirement
Emerging
Markets Equity
Portfolio | | Lazard
Retirement Global
Dynamic
Multi-Asset
Portfolio |
| | | | | | | | | | | | | | |
| Aerospace & Defense | | | 0.8 | % | | | — | % | | | 2.4 | % | |
| Air Freight & Logistics | | | 0.9 | | | | — | | | | — | | |
| Airlines | | | 1.3 | | | | — | | | | 1.1 | | |
| Auto Components | | | 4.4 | | | | 1.4 | | | | 1.2 | | |
| Automobiles | | | 1.4 | | | | 3.9 | | | | 0.9 | | |
| Banks | | | 9.2 | | | | 24.3 | | | | 7.3 | | |
| Beverages | | | 4.5 | | | | 1.3 | | | | 3.9 | | |
| Biotechnology | | | 2.6 | | | | — | | | | 2.1 | | |
| Building Products | | | 2.1 | | | | — | | | | 1.0 | | |
| Capital Markets | | | 1.0 | | | | — | | | | 3.5 | | |
| Chemicals | | | 1.7 | | | | — | | | | 1.9 | | |
| Commercial Services & Suppliers | | | — | | | | — | | | | 0.5 | | |
| Communications Equipment | | | — | | | | — | | | | 0.7 | | |
| Construction & Engineering | | | 2.3 | | | | — | | | | 0.1 | | |
| Construction Materials | | | — | | | | 1.6 | | | | — | | |
| Consumer Finance | | | 0.4 | | | | — | | | | 0.4 | | |
| Containers & Packaging | | | — | | | | — | | | | 0.4 | | |
| Distributors | | | — | | | | 0.9 | | | | — | | |
| Diversified Financial Services | | | — | | | | — | | | | 0.2 | | |
| Diversified Telecommunication Services | | | 3.0 | | | | 2.7 | | | | 2.6 | | |
| Electric Utilities | | | 0.9 | | | | — | | | | 2.1 | | |
| Electrical Equipment | | | — | | | | 0.3 | | | | 0.9 | | |
| Electronic Equipment, Instruments & Components | | | — | | | | 2.0 | | | | 1.1 | | |
| Energy Equipment & Services | | | 0.7 | | | | — | | | | 0.9 | | |
| Equity Real Estate Investment Trusts (REITs) | | | — | | | | — | | | | 0.9 | | |
| Food & Staples Retailing | | | 0.9 | | | | 2.3 | | | | 0.9 | | |
| Food Products | | | — | | | | — | | | | 1.1 | | |
| Gas Utilities | | | — | | | | 0.6 | | | | 0.6 | | |
| Health Care Equipment & Supplies | | | 3.2 | | | | — | | | | 1.0 | | |
| Health Care Providers & Services | | | — | | | | 0.7 | | | | 2.1 | | |
| Hotels, Restaurants & Leisure | | | — | | | | — | | | | 2.0 | | |
| Household Durables | | | 2.0 | | | | 1.4 | | | | 0.9 | | |
| Household Products | | | — | | | | 0.8 | | | | 0.8 | | |
| Industrial Conglomerates | | | — | | | | 1.7 | | | | 1.8 | | |
| Insurance | | | 8.0 | | | | 3.4 | | | | 3.9 | | |
| Internet & Catalog Retail | | | — | | | | — | | | | 0.2 | | |
| Internet Software & Services | | | — | | | | 5.4 | | | | 2.1 | | |
| IT Services | | | 2.1 | | | | 6.3 | | | | 2.8 | | |
| Leisure Products | | | — | | | | — | | | | 0.3 | | |
| Life Sciences Tools & Services | | | — | | | | — | | | | 0.6 | | |
| Machinery | | | 2.2 | | | | 1.1 | | | | 1.5 | | |
| Marine | | | 1.1 | | | | — | | | | — | | |
| Media | | | 1.6 | | | | — | | | | 2.3 | | |
| Metals & Mining | | | 2.0 | | | | 1.3 | | | | 1.1 | | |
The accompanying notes are an integral part of these financial statements.
34 Semi-Annual Report
| Industry* | | Lazard
Retirement
International
Equity
Portfolio | | Lazard
Retirement
Emerging
Markets Equity
Portfolio | | Lazard
Retirement Global
Dynamic
Multi-Asset
Portfolio |
| | | | | | | | | | | | | | |
| Multiline Retail | | | 2.1 | % | | | 0.7 | % | | | 0.4 | % | |
| Multi-Utilities | | | — | | | | — | | | | 1.9 | | |
| Oil, Gas & Consumable Fuels | | | 6.1 | | | | 7.6 | | | | 3.4 | | |
| Paper & Forest Products | | | — | | | | — | | | | 0.1 | | |
| Personal Products | | | 3.0 | | | | 0.4 | | | | 0.7 | | |
| Pharmaceuticals | | | 3.1 | | | | — | | | | 4.5 | | |
| Professional Services | | | 3.9 | | | | — | | | | 0.7 | | |
| Real Estate Management & Development | | | 3.0 | | | | — | | | | 2.1 | | |
| Road & Rail | | | 1.4 | | | | 1.0 | | | | 0.9 | | |
| Semiconductors & Semiconductor Equipment | | | 1.4 | | | | 6.5 | | | | 2.3 | | |
| Software | | | 2.6 | | | | — | | | | 2.3 | | |
| Specialty Retail | | | 1.6 | | | | — | | | | 2.4 | | |
| Technology Hardware, Storage & Peripherals | | | — | | | | 4.7 | | | | 1.6 | | |
| Textiles, Apparel & Luxury Goods | | | — | | | | — | | | | 0.5 | | |
| Thrifts & Mortgage Finance | | | — | | | | — | | | | 0.2 | | |
| Tobacco | | | 3.0 | | | | 1.3 | | | | 0.5 | | |
| Trading Companies & Distributors | | | 2.7 | | | | — | | | | 0.7 | | |
| Transportation Infrastructure | | | — | | | | 1.7 | | | | — | | |
| Water Utilities | | | — | | | | — | | | | 0.1 | | |
| Wireless Telecommunication Services | | | 1.3 | | | | 8.4 | | | | 0.5 | | |
| Subtotal | | | 95.5 | | | | 95.7 | | | | 87.9 | | |
| Foreign Government Obligations | | | — | | | | — | | | | 6.9 | | |
| Supranationals | | | — | | | | — | | | | 0.9 | | |
| US Municipal Bonds | | | — | | | | — | | | | 0.6 | | |
| US Treasury Securities | | | — | | | | — | | | | 1.3 | | |
| Short-Term Investments | | | 4.7 | | | | 3.7 | | | | 2.8 | | |
| Total Investments | | | 100.2 | % | | | 99.4 | % | | | 100.4 | % | |
* Industry classifications may be different than those used for compliance monitoring purposes.
The accompanying notes are an integral part of these financial statements.
Semi-Annual Report 35
Lazard Retirement Series, Inc. Statements of Assets and Liabilities (unaudited)
| June 30, 2017 | | Lazard
Retirement
US Strategic
Equity Portfolio | | Lazard
Retirement
US Small-Mid Cap
Equity Portfolio |
| | | | | | | | | |
| ASSETS | | | | | | | | |
| Investments in securities, at fair value | | $ | 9,746,586 | | | $ | 64,600,496 | |
| Foreign currency, at fair value | | | — | | | | — | |
| Receivables for: | | | | | | | | |
| Dividends and interest | | | 10,136 | | | | 67,320 | |
| Investments sold | | | 9,382 | | | | 77,341 | |
| Capital stock sold | | | 3,641 | | | | 23,471 | |
| Amount due from Investment Manager (Note 3) | | | 11,203 | | | | — | |
| Gross unrealized appreciation on forward currency contracts | | | — | | | | — | |
| Prepaid expenses | | | — | | | | — | |
| Total assets | | | 9,780,948 | | | | 64,768,628 | |
| |
| LIABILITIES | | | | | | | | |
| Foreign currency due to custodian | | | — | | | | — | |
| Payables for: | | | | | | | | |
| Management fees | | | — | | | | 32,366 | |
| Accrued distribution fees | | | 2,026 | | | | 13,324 | |
| Accrued custodian fees | | | 6,203 | | | | 8,680 | |
| Accrued administration fees | | | 4,225 | | | | 9,029 | |
| Accrued professional services | | | 20,318 | | | | 20,957 | |
| Accrued shareholders’ reports | | | 4,618 | | | | 8,648 | |
| Capital stock redeemed | | | 1,399 | | | | 41,592 | |
| Investments purchased | | | 70,580 | | | | — | |
| Gross unrealized depreciation on forward currency contracts | | | — | | | | — | |
| Other accrued expenses and payables | | | 4,399 | | | | 4,673 | |
| Total liabilities | | | 113,768 | | | | 139,269 | |
| Net assets | | $ | 9,667,180 | | | $ | 64,629,359 | |
| |
| NET ASSETS | | | | | | | | |
| Paid in capital | | $ | 8,103,793 | | | $ | 51,199,468 | |
| Undistributed (distributions in excess of) net investment income (loss) | | | 122,682 | | | | 239,380 | |
| Accumulated net realized gain (loss) | | | 279,092 | | | | 5,660,520 | |
| Net unrealized appreciation (depreciation) on: | | | | | | | | |
| Investments | | | 1,161,613 | | | | 7,529,991 | |
| Foreign currency translations and forward currency contracts | | | — | | | | — | |
| Net assets | | $ | 9,667,180 | | | $ | 64,629,359 | |
| |
| Service Shares | | | | | | | | |
| Net assets | | $ | 9,667,180 | | | $ | 64,629,359 | |
| Shares of capital stock outstanding* | | | 778,215 | | | | 7,665,554 | |
| Net asset value, offering and redemption price per share | | $ | 12.42 | | | $ | 8.43 | |
| |
| Investor Shares | | | | | | | | |
| Net assets | | | — | | | | — | |
| Shares of capital stock outstanding* | | | — | | | | — | |
| Net asset value, offering and redemption price per share | | | — | | | | — | |
| |
| Cost of investments in securities | | $ | 8,584,973 | | | $ | 57,070,505 | |
| Cost of foreign currency | | $ | — | | | $ | — | |
| * $0.001 par value, 2,450,000,000 shares authorized for the Portfolios in total. | | | | | | | | |
The accompanying notes are an integral part of these financial statements.
36 Semi-Annual Report
| | Lazard
Retirement
International
Equity Portfolio | | Lazard
Retirement
Emerging Markets
Equity Portfolio | | Lazard
Retirement
Global Dynamic
Multi-Asset Portfolio |
| | |
| | $ | 203,748,362 | | | $ | 1,048,743,310 | | | $ | 325,093,891 | |
| | | — | | | | 105,935 | | | | 114,537 | |
| | |
| | | 1,621,689 | | | | 7,295,523 | | | | 1,000,375 | |
| | | 2,235 | | | | 742,436 | | | | 171 | |
| | | 93,667 | | | | 686,298 | | | | 318,836 | |
| | | — | | | | — | | | | — | |
| | | — | | | | — | | | | 319,052 | |
| | | 21,239 | | | | — | | | | 4,445 | |
| | | 205,487,192 | | | | 1,057,573,502 | | | | 326,851,307 | |
| | |
| | | 214,245 | | | | — | | | | — | |
| | |
| | | 108,062 | | | | 869,188 | | | | 174,266 | |
| | | 44,579 | | | | 174,283 | | | | 66,117 | |
| | | 28,085 | | | | 114,883 | | | | 38,635 | |
| | | 13,301 | | | | 40,081 | | | | 17,521 | |
| | | 35,912 | | | | 33,543 | | | | 24,703 | |
| | | 68,306 | | | | 32,465 | | | | 30,187 | |
| | | 725,421 | | | | 1,426,607 | | | | 746,204 | |
| | | 945,203 | | | | — | | | | 1,152,082 | |
| | | — | | | | — | | | | 731,575 | |
| | | 8,570 | | | | 209,776 | | | | 2,632 | |
| | | 2,191,684 | | | | 2,900,826 | | | | 2,983,922 | |
| | $ | 203,295,508 | | | $ | 1,054,672,676 | | | $ | 323,867,385 | |
| | |
| | $ | 118,643,195 | | | $ | 1,013,595,907 | | | $ | 291,648,986 | |
| | | 5,087,255 | | | | 15,872,659 | | | | (1,224,718 | ) |
| | | 56,774,398 | | | | (68,070,516 | ) | | | 13,247,326 | |
| | |
| | | 22,792,175 | | | | 93,317,899 | | | | 20,596,560 | |
| | | (1,515 | ) | | | (43,273 | ) | | | (400,769 | ) |
| | $ | 203,295,508 | | | $ | 1,054,672,676 | | | $ | 323,867,385 | |
| | |
| | $ | 203,295,508 | | | $ | 831,848,310 | | | $ | 323,867,385 | |
| | | 15,709,274 | | | | 39,214,645 | | | | 24,942,628 | |
| | $ | 12.94 | | | $ | 21.21 | | | $ | 12.98 | |
| | |
| | | — | | | $ | 222,824,366 | | | | — | |
| | | — | | | | 10,615,409 | | | | — | |
| | | — | | | $ | 20.99 | | | | — | |
| | |
| | $ | 180,956,187 | | | $ | 955,230,381 | | | $ | 304,497,331 | |
| | $ | — | | | $ | 106,099 | | | $ | 114,895 | |
Semi-Annual Report 37
Lazard Retirement Series, Inc. Statements of Operations (unaudited)
| For the Six Months Ended June 30, 2017 | | Lazard
Retirement
US Strategic
Equity Portfolio | | Lazard
Retirement
US Small-Mid Cap
Equity Portfolio |
| |
| Investment Income (Loss) | | | | | | | | |
| |
| Income | | | | | | | | |
| Dividends | | $ | 93,190 | | | $ | 404,293 | |
| Interest | | | — | | | | — | |
| Total investment income* | | | 93,190 | | | | 404,293 | |
| |
| Expenses | | | | | | | | |
| Management fees (Note 3) | | | 35,890 | | | | 239,799 | |
| Distribution fees (Service Shares) | | | 12,818 | | | | 79,933 | |
| Custodian fees | | | 22,324 | | | | 30,696 | |
| Administration fees | | | 22,178 | | | | 27,470 | |
| Professional services | | | 17,836 | | | | 20,540 | |
| Shareholders’ reports | | | 4,741 | | | | 9,336 | |
| Directors’ fees and expenses | | | 2,667 | | | | 3,638 | |
| Shareholders’ services | | | 6,404 | | | | 6,558 | |
| Other | | | 1,367 | | | | 1,990 | |
| Total gross expenses | | | 126,225 | | | | 419,960 | |
| Management fees waived and expenses reimbursed | | | (65,576 | ) | | | (24,577 | ) |
| Administration fees waived | | | (9,375 | ) | | | — | |
| Total net expenses | | | 51,274 | | | | 395,383 | |
| Net investment income (loss) | | | 41,916 | | | | 8,910 | |
| |
| Net Realized and Unrealized Gain (Loss) on Investments, Foreign Currency Transactions and Forward Currency Contracts | | | | | | | | |
| Net realized gain (loss) on: | | | | | | | | |
| Investments** | | | 801,015 | | | | 3,349,124 | |
| Foreign currency transactions and forward currency contracts | | | — | | | | — | |
| Total net realized gain (loss) on investments, foreign currency transactions and forward currency contracts | | | 801,015 | | | | 3,349,124 | |
| Net change in unrealized appreciation (depreciation) on: | | | | | | | | |
| Investments† | | | (69,570 | ) | | | (690,245 | ) |
| Foreign currency translations and forward currency contracts | | | — | | | | — | |
| Total net change in unrealized appreciation (depreciation) on investments, foreign currency translations and forward currency contracts | | | (69,570 | ) | | | (690,245 | ) |
| Net realized and unrealized gain (loss) on investments, foreign currency transactions and forward currency contracts | | | 731,445 | | | | 2,658,879 | |
| Net increase (decrease) in net assets resulting from operations | | $ | 773,361 | | | $ | 2,667,789 | |
| * Net of foreign withholding taxes of | | $ | 66 | | | $ | — | |
| ** Net of foreign capital gains taxes of | | $ | — | | | $ | — | |
| † Includes net change in unrealized appreciation (depreciation) of foreign capital gains taxes of | | $ | — | | | $ | — | |
The accompanying notes are an integral part of these financial statements.
38 Semi-Annual Report
| | Lazard
Retirement
International
Equity Portfolio | | Lazard
Retirement
Emerging Markets
Equity Portfolio | | Lazard
Retirement
Global Dynamic
Multi-Asset Portfolio |
| | |
| | $ | 5,065,268 | | | $ | 18,345,982 | | | $ | 3,365,226 | |
| | | — | | | | — | | | | 636,920 | |
| | | 5,065,268 | | | | 18,345,982 | | | | 4,002,146 | |
| | |
| | | 1,494,849 | | | | 5,361,469 | | | | 1,228,363 | |
| | | 487,776 | | | | 1,075,966 | | | | 383,863 | |
| | | 87,466 | | | | 406,818 | | | | 104,552 | |
| | | 60,938 | | | | 124,279 | | | | 51,785 | |
| | | 68,496 | | | | 77,821 | | | | 36,490 | |
| | | 40,192 | | | | 60,804 | | | | 19,615 | |
| | | 14,014 | | | | 22,046 | | | | 7,789 | |
| | | 8,227 | | | | 16,301 | | | | 7,081 | |
| | | 8,433 | | | | 12,892 | | | | 4,424 | |
| | | 2,270,391 | | | | 7,158,396 | | | | 1,843,962 | |
| | | (58,678 | ) | | | — | | | | (231,702 | ) |
| | | — | | | | — | | | | — | |
| | | 2,211,713 | | | | 7,158,396 | | | | 1,612,260 | |
| | | 2,853,555 | | | | 11,187,586 | | | | 2,389,886 | |
| | |
| | | 80,370,358 | | | | 14,514,852 | | | | 12,462,812 | |
| | | (403,549 | ) | | | 71,214 | | | | (454,628 | ) |
| | |
| | | 79,966,809 | | | | 14,586,066 | | | | 12,008,184 | |
| | |
| | | (40,695,427 | ) | | | 109,854,698 | | | | 13,854,356 | |
| | | 75,733 | | | | (46,193 | ) | | | 479,558 | |
| | |
| | | (40,619,694 | ) | | | 109,808,505 | | | | 14,333,914 | |
| | |
| | | 39,347,115 | | | | 124,394,571 | | | | 26,342,098 | |
| | $ | 42,200,670 | | | $ | 135,582,157 | | | $ | 28,731,984 | |
| | $ | 556,484 | | | $ | 2,660,405 | | | $ | 203,721 | |
| | $ | — | | | $ | 229,589 | | | $ | — | |
| | $ | — | | | $ | 372,783 | | | $ | — | |
Semi-Annual Report 39
Lazard Retirement Series, Inc. Statements of Changes in Net Assets
| | | Lazard Retirement US Strategic Equity Portfolio | | Lazard Retirement US Small-Mid Cap Equity Portfolio | |
| | | Six Months Ended
June 30, 2017
(unaudited) | | Year Ended
December 31,
2016 | | Six Months Ended
June 30, 2017
(unaudited) | | Year Ended
December 31,
2016 | |
| | | | | | | | | | | | | | | | | | | |
| Increase (Decrease) in Net Assets | | | | | | | | | | | | | | | | | | |
| | | | | | | | | | | | | | | | | | | |
| Operations | | | | | | | | | | | | | | | | | | |
| Net investment income (loss) | | | $ | 41,916 | | | $ | 88,366 | | | $ | 8,910 | | | $ | 263,186 | | |
| Net realized gain (loss) on investments, foreign currency transactions and forward currency contracts | | | | 801,015 | | | | (517,325 | ) | | | 3,349,124 | | | | 2,528,724 | | |
| Net change in unrealized appreciation (depreciation) on investments, foreign currency translations and forward currency contracts | | | | (69,570 | ) | | | 1,326,163 | | | | (690,245 | ) | | | 5,915,148 | | |
| Net increase (decrease) in net assets resulting from operations | | | | 773,361 | | | | 897,204 | | | | 2,667,789 | | | | 8,707,058 | | |
| | | | | | | | | | | | | | | | | | | |
| Distributions to shareholders | | | | | | | | | | | | | | | | | | |
| From net investment income | | | | | | | | | | | | | | | | | | |
| Service Shares | | | | — | | | | (10,679 | ) | | | — | | | | — | | |
| Investor Shares | | | | — | | | | — | | | | — | | | | — | | |
| From net realized gains | | | | | | | | | | | | | | | | | | |
| Service Shares | | | | — | | | | (105,677 | ) | | | — | | | | (3,171,705 | ) | |
| Net decrease in net assets resulting from distributions | | | | — | | | | (116,356 | ) | | | — | | | | (3,171,705 | ) | |
| | | | | | | | | | | | | | | | | | | |
| Capital stock transactions | | | | | | | | | | | | | | | | | | |
| Net proceeds from sales | | | | | | | | | | | | | | | | | | |
| Service Shares | | | | 1,509,442 | | | | 1,106,595 | | | | 5,490,043 | | | | 12,126,952 | | |
| Investor Shares | | | | — | | | | — | | | | — | | | | — | | |
| Net proceeds from reinvestment of distributions | | | | | | | | | | | | | | | | | | |
| Service Shares | | | | — | | | | 116,356 | | | | — | | | | 3,171,705 | | |
| Investor Shares | | | | — | | | | — | | | | — | | | | — | | |
| Cost of shares redeemed | | | | | | | | | | | | | | | | | | |
| Service Shares | | | | (3,053,416 | ) | | | (3,094,973 | ) | | | (9,006,557 | ) | | | (14,855,237 | ) | |
| Investor Shares | | | | — | | | | — | | | | — | | | | — | | |
| Net increase (decrease) in net assets from capital stock transactions | | | | (1,543,974 | ) | | | (1,872,022 | ) | | | (3,516,514 | ) | | | 443,420 | | |
| Total increase (decrease) in net assets | | | | (770,613 | ) | | | (1,091,174 | ) | | | (848,725 | ) | | | 5,978,773 | | |
| Net assets at beginning of period | | | | 10,437,793 | | | | 11,528,967 | | | | 65,478,084 | | | | 59,499,311 | | |
| Net assets at end of period* | | | $ | 9,667,180 | | | $ | 10,437,793 | | | $ | 64,629,359 | | | $ | 65,478,084 | | |
| *Includes undistributed (distributions in excess of) net investment income (loss) of | | | $ | 122,682 | | | $ | 80,766 | | | $ | 239,380 | | | $ | 230,470 | | |
| | | | | | | | | | | | | | | | | | | |
| Shares issued and redeemed | | | | | | | | | | | | | | | | | | |
| Service Shares | | | | | | | | | | | | | | | | | | |
| Shares outstanding at beginning of period | | | | 906,860 | | | | 1,083,612 | | | | 8,090,372 | | | | 8,047,591 | | |
| Shares sold | | | | 122,830 | | | | 103,039 | | | | 672,152 | | | | 1,607,794 | | |
| Shares issued to shareholders from reinvestment of distributions | | | | — | | | | 10,370 | | | | — | | | | 430,938 | | |
| Shares redeemed | | | | (251,475 | ) | | | (290,161 | ) | | | (1,096,970 | ) | | | (1,995,951 | ) | |
| Net increase (decrease) | | | | (128,645 | ) | | | (176,752 | ) | | | (424,818 | ) | | | 42,781 | | |
| Shares outstanding at end of period | | | | 778,215 | | | | 906,860 | | | | 7,665,554 | | | | 8,090,372 | | |
| | | | | | | | | | | | | | | | | | | |
| Investor Shares | | | | | | | | | | | | | | | | | | |
| Shares outstanding at beginning of period | | | | | | | | | | | | | | | | | | |
| Shares sold | | | | | | | | | | | | | | | | | | |
| Shares issued to shareholders from reinvestment of distributions | | | | | | | | | | | | | | | | | | |
| Shares redeemed | | | | | | | | | | | | | | | | | | |
| Net increase (decrease) | | | | | | | | | | | | | | | | | | |
| Shares outstanding at end of period | | | | | | | | | | | | | | | | | | |
The accompanying notes are an integral part of these financial statements.
40 Semi-Annual Report
| | Lazard Retirement International Equity Portfolio | | Lazard Retirement Emerging Markets Equity Portfolio | | Lazard Retirement Global Dynamic Multi-Asset Portfolio | |
| | Six Months Ended
June 30, 2017
(unaudited) | | Year Ended
December 31,
2016 | | Six Months Ended
June 30, 2017
(unaudited) | | Year Ended
December 31,
2016 | | Six Months Ended
June 30, 2017
(unaudited) | | Year Ended
December 31,
2016 | |
| | | | | | | | | | | | | | | | | | | | | | | | | |
| | $ | 2,853,555 | | | $ | 10,521,699 | | | $ | 11,187,586 | | | $ | 13,425,531 | | | $ | 2,389,886 | | | $ | 3,153,466 | | |
| | | | | | | | | | | | | | | | | | | | | | | | | |
| | | 79,966,809 | | | | (22,285,589 | ) | | | 14,586,066 | | | | (56,173,874 | ) | | | 12,008,184 | | | | (2,369,317 | ) | |
| | | | | | | | | | | | | | | | | | | | | | | | | |
| | | (40,619,694 | ) | | | (18,237,459 | ) | | | 109,808,505 | | | | 230,280,518 | | | | 14,333,914 | | | | 6,954,180 | | |
| | | | | | | | | | | | | | | | | | | | | | | | | |
| | | 42,200,670 | | | | (30,001,349 | ) | | | 135,582,157 | | | | 187,532,175 | | | | 28,731,984 | | | | 7,738,329 | | |
| | | | | | | | | | | | | | | | | | | | | | | | | |
| | | — | | | | (8,837,795 | ) | | | — | | | | (8,897,841 | ) | | | — | | | | (728,536 | ) | |
| | | — | | | | — | | | | — | | | | (2,325,656 | ) | | | — | | | | — | | |
| | | | | | | | | | | | | | | | | | | | | | | | | |
| | | — | | | | (1,500,336 | ) | | | — | | | | — | | | | — | | | | (911,504 | ) | |
| | | — | | | | (10,338,131 | ) | | | — | | | | (11,223,497 | ) | | | — | | | | (1,640,040 | ) | |
| | | | | | | | | | | | | | | | | | | | | | | | | |
| | | 58,865,697 | | | | 88,994,820 | | | | 100,839,855 | | | | 155,198,810 | | | | 34,993,369 | | | | 109,767,981 | | |
| | | — | | | | — | | | | 29,642,437 | | | | 39,888,122 | | | | — | | | | — | | |
| | | | | | | | | | | | | | | | | | | | | | | | | |
| | | — | | | | 10,338,131 | | | | — | | | | 8,897,841 | | | | — | | | | 1,640,041 | | |
| | | — | | | | — | | | | — | | | | 2,325,656 | | | | — | | | | — | | |
| | | | | | | | | | | | | | | | | | | | | | | | | |
| | | (550,785,134 | ) | | | (87,990,969 | ) | | | (259,717,598 | ) | | | (185,865,415 | ) | | | (33,144,262 | ) | | | (46,886,208 | ) | |
| | | — | | | | — | | | | (19,128,920 | ) | | | (42,152,216 | ) | | | — | | | | — | | |
| | | | | | | | | | | | | | | | | | | | | | | | | |
| | | (491,919,437 | ) | | | 11,341,982 | | | | (148,364,226 | ) | | | (21,707,202 | ) | | | 1,849,107 | | | | 64,521,814 | | |
| | | (449,718,767 | ) | | | (28,997,498 | ) | | | (12,782,069 | ) | | | 154,601,476 | | | | 30,581,091 | | | | 70,620,103 | | |
| | | 653,014,275 | | | | 682,011,773 | | | | 1,067,454,745 | | | | 912,853,269 | | | | 293,286,294 | | | | 222,666,191 | | |
| | $ | 203,295,508 | | | $ | 653,014,275 | | | $ | 1,054,672,676 | | | $ | 1,067,454,745 | | | $ | 323,867,385 | | | $ | 293,286,294 | | |
| | | | | | | | | | | | | | | | | | | | | | | | | |
| | $ | 5,087,255 | | | $ | 2,233,700 | | | $ | 15,872,659 | | | $ | 4,685,073 | | | $ | (1,224,718 | ) | | $ | (3,614,604 | ) | |
| | | | | | | | | | | | | | | | | | | | | | | | | |
| | | 56,443,790 | | | | 55,520,320 | | | | 46,868,834 | | | | 48,088,227 | | | | 24,807,688 | | | | 19,352,557 | | |
| | | 4,907,935 | | | | 7,425,970 | | | | 4,889,463 | | | | 8,776,015 | | | | 2,783,608 | | | | 9,323,596 | | |
| | | | | | | | | | | | | | | | | | | | | | | | | |
| | | — | | | | 883,446 | | | | — | | | | 477,613 | | | | — | | | | 136,853 | | |
| | | (45,642,451 | ) | | | (7,385,946 | ) | | | (12,543,652 | ) | | | (10,473,021 | ) | | | (2,648,668 | ) | | | (4,005,318 | ) | |
| | | (40,734,516 | ) | | | 923,470 | | | | (7,654,189 | ) | | | (1,219,393 | ) | | | 134,940 | | | | 5,455,131 | | |
| | | 15,709,274 | | | | 56,443,790 | | | | 39,214,645 | | | | 46,868,834 | | | | 24,942,628 | | | | 24,807,688 | | |
| | | | | | | | | | | | | | | | | | | | | | | | | |
| | | | | | | | | | | 10,098,734 | | | | 10,186,142 | | | | | | | | | | |
| | | | | | | | | | | 1,453,690 | | | | 2,210,607 | | | | | | | | | | |
| | | | | | | | | | | | | | | | | | | | | | | | | |
| | | | | | | | | | | — | | | | 126,551 | | | | | | | | | | |
| | | | | | | | | | | (937,015 | ) | | | (2,424,566 | ) | | | | | | | | | |
| | | | | | | | | | | 516,675 | | | | (87,408 | ) | | | | | | | | | |
| | | | | | | | | | | 10,615,409 | | | | 10,098,734 | | | | | | | | | | |
Semi-Annual Report 41
Lazard Retirement Series, Inc. Financial Highlights
LAZARD RETIREMENT US STRATEGIC EQUITY PORTFOLIO
| | Six Months | | | | | | | | | | |
| Selected data for a share of capital | | Ended | | Year Ended | |
| stock outstanding throughout each period | | 6/30/17† | | 12/31/16 | | 12/31/15 | | 12/31/14 | | 12/31/13 | | 12/31/12 | |
| | | | | | | | | | | | | | | | | | | | | | | | | | |
| Service Shares | | | | | | | | | | | | | | | | | | | | | | | | | |
| Net asset value, beginning of period | | $ | 11.51 | | | $ | 10.64 | | | $ | 12.15 | | | $ | 12.02 | | | $ | 10.44 | | | $ | 9.26 | | |
| Income (loss) from investment operations: | | | | | | | | | | | | | | | | | | | | | | | | | |
| Net investment income (loss) | | | 0.07 | | | | 0.10 | | | | 0.06 | | | | 0.09 | | | | 0.11 | | | | 0.12 | | |
| Net realized and unrealized gain (loss) | | | 0.84 | | | | 0.90 | | | | (0.73 | ) | | | 1.68 | | | | 2.80 | | | | 1.18 | | |
| | | | | | | | | | | | | | | | | | | | | | | | | | |
| Total from investment operations | | | 0.91 | | | | 1.00 | | | | (0.67 | ) | | | 1.77 | | | | 2.91 | | | | 1.30 | | |
| Less distributions from: | | | | | | | | | | | | | | | | | | | | | | | | | |
| Net investment income | | | — | | | | (0.01 | ) | | | (0.05 | ) | | | (0.09 | ) | | | (0.11 | ) | | | (0.12 | ) | |
| Net realized gains | | | — | | | | (0.12 | ) | | | (0.79 | ) | | | (1.55 | ) | | | (1.22 | ) | | | — | | |
| | | | | | | | | | | | | | | | | | | | | | | | | | |
| Total distributions | | | — | | | | (0.13 | ) | | | (0.84 | ) | | | (1.64 | ) | | | (1.33 | ) | | | (0.12 | ) | |
| | | | | | | | | | | | | | | | | | | | | | | | | | |
| Net asset value, end of period | | $ | 12.42 | | | $ | 11.51 | | | $ | 10.64 | | | $ | 12.15 | | | $ | 12.02 | | | $ | 10.44 | | |
| | | | | | | | | | | | | | | | | | | | | | | | | | |
| Total Return (a) | | | 7.91 | % | | | 9.42 | % | | | -5.44 | % | | | 14.71 | % | | | 28.07 | % | | | 14.01 | % | |
| | | | | | | | | | | | | | | | | | | | | | | | | | |
| Ratios and Supplemental Data: | | | | | | | | | | | | | | | | | | | | | | | | | |
| Net assets, end of period (in thousands) | | $ | 9,667 | | | $ | 10,438 | | | $ | 11,529 | | | $ | 12,391 | | | $ | 8,944 | | | $ | 6,702 | | |
| Ratios to average net assets (b): | | | | | | | | | | | | | | | | | | | | | | | | | |
| Net expenses | | | 1.00 | % | | | 1.00 | % | | | 1.00 | % | | | 1.00 | % | | | 1.00 | % | | | 1.00 | % | |
| Gross expenses | | | 2.46 | % | | | 2.48 | % | | | 2.31 | % | | | 2.59 | % | | | 2.88 | % | | | 3.23 | % | |
| Net investment income (loss) | | | 0.82 | % | | | 0.86 | % | | | 0.53 | % | | | 0.79 | % | | | 0.97 | % | | | 1.16 | % | |
| Portfolio turnover rate | | | 37 | % | | | 58 | % | | | 86 | % | | | 72 | % | | | 66 | % | | | 59 | % | |
| (a) | Total returns reflect reinvestment of all dividends and distributions, if any. Certain expenses of the Portfolio may have been waived or reimbursed by the Investment Manager, State Street or BFDS; without such waiver/reimbursement of expenses, the Portfolio’s returns would have been lower. Performance information does not reflect the fees and charges imposed by participating insurance companies at the separate account level, and such charges will have the effect of reducing performance. Return for a period of less than one year is not annualized. |
| (b) | Annualized for a period of less than one year. |
The accompanying notes are an integral part of these financial statements.
42 Semi-Annual Report
LAZARD RETIREMENT US SMALL-MID CAP EQUITY PORTFOLIO
| | | Six Months | | | | | | | | | | | |
| Selected data for a share of capital | | Ended | | Year Ended | |
| stock outstanding throughout each period | | 6/30/17† | | 12/31/16 | | 12/31/15 | | 12/31/14 | | 12/31/13 | | 12/31/12 | |
| | | | | | | | | | | | | | | | | | | | | | | | | | |
| Service Shares | | | | | | | | | | | | | | | | | | | | | | | | | |
| Net asset value, beginning of period | | $ | 8.09 | | | $ | 7.39 | | | $ | 8.18 | | | $ | 8.71 | | | $ | 7.30 | | | $ | 9.26 | | |
| Income (loss) from investment operations: | | | | | | | | | | | | | | | | | | | | | | | | | |
| Net investment income (loss) | | | — | (a) | | | 0.03 | ^ | | | (0.02 | ) | | | (0.02 | ) | | | (0.03 | ) | | | (0.01 | ) | |
| Net realized and unrealized gain (loss) | | | 0.34 | | | | 1.09 | | | | (0.19 | ) | | | 0.94 | | | | 2.53 | | | | 0.95 | | |
| | | | | | | | | | | | | | | | | | | | | | | | | | |
| Total from investment operations | | | 0.34 | | | | 1.12 | | | | (0.21 | ) | | | 0.92 | | | | 2.50 | | | | 0.94 | | |
| Less distributions from: | | | | | | | | | | | | | | | | | | | | | | | | | |
| Net realized gains | | | — | | | | (0.42 | ) | | | (0.58 | ) | | | (1.45 | ) | | | (1.09 | ) | | | (2.90 | ) | |
| | | | | | | | | | | | | | | | | | | | | | | | | | |
| Total distributions | | | — | | | | (0.42 | ) | | | (0.58 | ) | | | (1.45 | ) | | | (1.09 | ) | | | (2.90 | ) | |
| | | | | | | | | | | | | | | | | | | | | | | | | | |
| Net asset value, end of period | | $ | 8.43 | | | $ | 8.09 | | | $ | 7.39 | | | $ | 8.18 | | | $ | 8.71 | | | $ | 7.30 | | |
| | | | | | | | | | | | | | | | | | | | | | | | | | |
| Total Return (b) | | | 4.20 | % | | | 15.78 | %^ | | | -2.38 | % | | | 11.03 | % | | | 35.08 | % | | | 10.38 | % | |
| | | | | | | | | | | | | | | | | | | | | | | | | | |
| Ratios and Supplemental Data: | | | | | | | | | | | | | | | | | | | | | | | | | |
| Net assets, end of period (in thousands) | | $ | 64,629 | | | $ | 65,478 | | | $ | 59,499 | | | $ | 63,491 | | | $ | 58,923 | | | $ | 46,978 | | |
| Ratios to average net assets (c): | | | | | | | | | | | | | | | | | | | | | | | | | |
| Net expenses | | | 1.24 | % | | | 1.25 | %^ | | | 1.25 | % | | | 1.25 | % | | | 1.25 | % | | | 1.20 | % | |
| Gross expenses | | | 1.31 | % | | | 1.32 | % | | | 1.35 | % | | | 1.32 | % | | | 1.35 | % | | | 1.20 | % | |
| Net investment income (loss) | | | 0.03 | % | | | 0.46 | %^ | | | -0.22 | % | | | -0.20 | % | | | -0.33 | % | | | -0.06 | % | |
| Portfolio turnover rate | | | 43 | % | | | 94 | % | | | 89 | % | | | 92 | % | | | 101 | % | | | 74 | % | |
| ^ | Refer to Note 3 in the Notes to Financial Statements for discussion of prior period custodian out-of-pocket expenses that were reimbursed to the Portfolio in the current period. The amount of the reimbursement was on a per share basis at less than $0.005 per share. There was no impact on the total return of the Portfolio. The net expenses and net investment income (loss) ratios of the Portfolio would be unchanged as the change to current period custodian fees was offset against current period expense waivers/reimbursements with no impact to net expenses or net investment income (loss). |
| (a) | Amount is less than $0.01 per share. |
| (b) | Total returns reflect reinvestment of all dividends and distributions, if any. Certain expenses of the Portfolio may have been waived or reimbursed by the Investment Manager, State Street or BFDS; without such waiver/reimbursement of expenses, the Portfolio’s returns would have been lower. Performance information does not reflect the fees and charges imposed by participating insurance companies at the separate account level, and such charges will have the effect of reducing performance. Return for a period of less than one year is not annualized. |
| (c) | Annualized for a period of less than one year. |
The accompanying notes are an integral part of these financial statements.
Semi-Annual Report 43
LAZARD RETIREMENT INTERNATIONAL EQUITY PORTFOLIO
| | | Six Months | | | | | | | | | | | |
| Selected data for a share of capital | | Ended | | Year Ended | |
| stock outstanding throughout each period | | 6/30/17† | | 12/31/16 | | 12/31/15 | | 12/31/14 | | 12/31/13 | | 12/31/12 | |
| | | | | | | | | | | | | | | | | | | | | | | | | | |
| Service Shares | | | | | | | | | | | | | | | | | | | | | | | | | |
| Net asset value, beginning of period | | $ | 11.57 | | | $ | 12.28 | | | $ | 12.50 | | | $ | 13.26 | | | $ | 11.12 | | | $ | 9.33 | | |
| Income (loss) from investment operations: | | | | | | | | | | | | | | | | | | | | | | | | | |
| Net investment income (loss) | | | 0.28 | | | | 0.19 | ^ | | | 0.19 | | | | 0.21 | | | | 0.17 | | | | 0.19 | | |
| Net realized and unrealized gain (loss) | | | 1.09 | | | | (0.71 | ) | | | 0.02 | | | | (0.76 | ) | | | 2.13 | | | | 1.78 | | |
| | | | | | | | | | | | | | | | | | | | | | | | | | |
| Total from investment operations | | | 1.37 | | | | (0.52 | ) | | | 0.21 | | | | (0.55 | ) | | | 2.30 | | | | 1.97 | | |
| Less distributions from: | | | | | | | | | | | | | | | | | | | | | | | | | |
| Net investment income | | | — | | | | (0.16 | ) | | | (0.21 | ) | | | (0.21 | ) | | | (0.16 | ) | | | (0.18 | ) | |
| Net realized gains | | | — | | | | (0.03 | ) | | | (0.22 | ) | | | — | | | | — | | | | — | | |
| | | | | | | | | | | | | | | | | | | | | | | | | | |
| Total distributions | | | — | | | | (0.19 | ) | | | (0.43 | ) | | | (0.21 | ) | | | (0.16 | ) | | | (0.18 | ) | |
| | | | | | | | | | | | | | | | | | | | | | | | | | |
| Net asset value, end of period | | $ | 12.94 | | | $ | 11.57 | | | $ | 12.28 | | | $ | 12.50 | | | $ | 13.26 | | | $ | 11.12 | | |
| | | | | | | | | | | | | | | | | | | | | | | | | | |
| Total Return (a) | | | 11.84 | % | | | -4.29 | %^ | | | 1.75 | % | | | -4.21 | % | | | 20.76 | % | | | 21.11 | % | |
| | | | | | | | | | | | | | | | | | | | | | | | | | |
| Ratios and Supplemental Data: | | | | | | | | | | | | | | | | | | | | | | | | | |
| Net assets, end of period (in thousands) | | $ | 203,296 | | | $ | 653,014 | | | $ | 682,012 | | | $ | 690,324 | | | $ | 689,512 | | | $ | 592,437 | | |
| Ratios to average net assets (b): | | | | | | | | | | | | | | | | | | | | | | | | | |
| Net expenses | | | 1.11 | % | | | 1.08 | %^ | | | 1.11 | % | | | 1.09 | % | | | 1.10 | % | | | 1.10 | % | |
| Gross expenses | | | 1.14 | % | | | 1.09 | % | | | 1.11 | % | | | 1.09 | % | | | 1.10 | % | | | 1.10 | % | |
| Net investment income (loss) | | | 1.43 | % | | | 1.59 | %^ | | | 1.42 | % | | | 1.59 | % | | | 1.41 | % | | | 1.80 | % | |
| Portfolio turnover rate | | | 28 | % | | | 28 | % | | | 37 | % | | | 34 | % | | | 40 | % | | | 43 | % | |
| ^ | Refer to Note 3 in the Notes to Financial Statements for discussion of prior period custodian out-of-pocket expenses that were reimbursed to the Portfolio in the current period. The amount of the reimbursement was on a per share basis at less than $0.005 per share. There was no impact on the total return of the Portfolio. There was a 0.01% impact on the net expenses and net investment income (loss) ratios of the Portfolio. |
| (a) | Total returns reflect reinvestment of all dividends and distributions, if any. Certain expenses of the Portfolio may have been waived or reimbursed by the Investment Manager, State Street or BFDS; without such waiver/reimbursement of expenses, the Portfolio’s returns would have been lower. Performance information does not reflect the fees and charges imposed by participating insurance companies at the separate account level, and such charges will have the effect of reducing performance. Return for a period of less than one year is not annualized. |
| (b) | Annualized for a period of less than one year. |
The accompanying notes are an integral part of these financial statements.
44 Semi-Annual Report
LAZARD RETIREMENT EMERGING MARKETS EQUITY PORTFOLIO
| | | Six Months | | | | | | | | | | | |
| Selected data for a share of capital | | Ended | | Year Ended | |
| stock outstanding throughout each period | | 6/30/17† | | 12/31/16 | | 12/31/15 | | 12/31/14 | | 12/31/13 | | 12/31/12 | |
| | | | | | | | | | | | | | | | | | | | | | | | | | |
| Service Shares | | | | | | | | | | | | | | | | | | | | | | | | | |
| Net asset value, beginning of period | | $ | 18.78 | | | $ | 15.70 | | | $ | 19.96 | | | $ | 21.51 | | | $ | 22.22 | | | $ | 18.71 | | |
| Income (loss) from investment operations: | | | | | | | | | | | | | | | | | | | | | | | | | |
| Net investment income (loss) (a) | | | 0.21 | | | | 0.23 | ^ | | | 0.27 | | | | 0.37 | | | | 0.31 | | | | 0.33 | | |
| Net realized and unrealized gain (loss) | | | 2.22 | | | | 3.04 | | | | (4.27 | ) | | | (1.35 | ) | | | (0.58 | ) | | | 3.78 | | |
| | | | | | | | | | | | | | | | | | | | | | | | | | |
| Total from investment operations | | | 2.43 | | | | 3.27 | | | | (4.00 | ) | | | (0.98 | ) | | | (0.27 | ) | | | 4.11 | | |
| Less distributions from: | | | | | | | | | | | | | | | | | | | | | | | | | |
| Net investment income | | | — | | | | (0.19 | ) | | | (0.21 | ) | | | (0.37 | ) | | | (0.31 | ) | | | (0.35 | ) | |
| Net realized gains | | | — | | | | — | | | | (0.05 | ) | | | (0.20 | ) | | | (0.13 | ) | | | (0.25 | ) | |
| | | | | | | | | | | | | | | | | | | | | | | | | | |
| Total distributions | | | — | | | | (0.19 | ) | | | (0.26 | ) | | | (0.57 | ) | | | (0.44 | ) | | | (0.60 | ) | |
| | | | | | | | | | | | | | | | | | | | | | | | | | |
| Net asset value, end of period | | $ | 21.21 | | | $ | 18.78 | | | $ | 15.70 | | | $ | 19.96 | | | $ | 21.51 | | | $ | 22.22 | | |
| | | | | | | | | | | | | | | | | | | | | | | | | | |
| Total Return (b) | | | 12.94 | % | | | 20.84 | %^ | | | -20.05 | % | | | -4.64 | % | | | -1.24 | % | | | 22.05 | % | |
| | | | | | | | | | | | | | | | | | | | | | | | | | |
| Ratios and Supplemental Data: | | | | | | | | | | | | | | | | | | | | | | | | | |
| Net assets, end of period (in thousands) | | $ | 831,848 | | | $ | 880,047 | | | $ | 754,835 | | | $ | 859,747 | | | $ | 846,233 | | | $ | 734,699 | | |
| Ratios to average net assets (c): | | | | | | | | | | | | | | | | | | | | | | | | | |
| Net expenses | | | 1.38 | % | | | 1.37 | %^ | | | 1.39 | % | | | 1.38 | % | | | 1.38 | % | | | 1.39 | % | |
| Gross expenses | | | 1.38 | % | | | 1.38 | % | | | 1.39 | % | | | 1.38 | % | | | 1.38 | % | | | 1.39 | % | |
| Net investment income (loss) | | | 2.01 | % | | | 1.29 | %^ | | | 1.43 | % | | | 1.66 | % | | | 1.42 | % | | | 1.57 | % | |
| Portfolio turnover rate | | | 7 | % | | | 12 | % | | | 9 | % | | | 12 | % | | | 14 | % | | | 23 | % | |
| | | Six Months | | | | | | | | | | | |
| Selected data for a share of capital | | Ended | | Year Ended | |
| stock outstanding throughout each period | | 6/30/17† | | 12/31/16 | | 12/31/15 | | 12/31/14 | | 12/31/13 | | 12/31/12 | |
| | | | | | | | | | | | | | | | | | | | | | | | | | |
| Investor Shares | | | | | | | | | | | | | | | | | | | | | | | | | |
| Net asset value, beginning of period | | $ | 18.56 | | | $ | 15.51 | | | $ | 19.74 | | | $ | 21.28 | | | $ | 21.99 | | | $ | 18.52 | | |
| Income (loss) from investment operations: | | | | | | | | | | | | | | | | | | | | | | | | | |
| Net investment income (loss) (a) | | | 0.24 | | | | 0.26 | ^ | | | 0.32 | | | | 0.42 | | | | 0.37 | | | | 0.38 | | |
| Net realized and unrealized gain (loss) | | | 2.19 | | | | 3.02 | | | | (4.25 | ) | | | (1.34 | ) | | | (0.59 | ) | | | 3.74 | | |
| | | | | | | | | | | | | | | | | | | | | | | | | | |
| Total from investment operations | | | 2.43 | | | | 3.28 | | | | (3.93 | ) | | | (0.92 | ) | | | (0.22 | ) | | | 4.12 | | |
| Less distributions from: | | | | | | | | | | | | | | | | | | | | | | | | | |
| Net investment income | | | — | | | | (0.23 | ) | | | (0.25 | ) | | | (0.42 | ) | | | (0.36 | ) | | | (0.40 | ) | |
| Net realized gains | | | — | | | | — | | | | (0.05 | ) | | | (0.20 | ) | | | (0.13 | ) | | | (0.25 | ) | |
| | | | | | | | | | | | | | | | | | | | | | | | | | |
| Total distributions | | | — | | | | (0.23 | ) | | | (0.30 | ) | | | (0.62 | ) | | | (0.49 | ) | | | (0.65 | ) | |
| | | | | | | | | | | | | | | | | | | | | | | | | | |
| Net asset value, end of period | | $ | 20.99 | | | $ | 18.56 | | | $ | 15.51 | | | $ | 19.74 | | | $ | 21.28 | | | $ | 21.99 | | |
| | | | | | | | | | | | | | | | | | | | | | | | | | |
| Total Return (b) | | | 13.09 | % | | | 21.18 | %^ | | | -19.90 | % | | | -4.38 | % | | | -1.01 | % | | | 22.34 | % | |
| | | | | | | | | | | | | | | | | | | | | | | | | | |
| Ratios and Supplemental Data: | | | | | | | | | | | | | | | | | | | | | | | | | |
| Net assets, end of period (in thousands) | | $ | 222,824 | | | $ | 187,408 | | | $ | 158,018 | | | $ | 229,855 | | | $ | 260,330 | | | $ | 282,596 | | |
| Ratios to average net assets (c): | | | | | | | | | | | | | | | | | | | | | | | | | |
| Net expenses | | | 1.14 | % | | | 1.12 | %^ | | | 1.15 | % | | | 1.14 | % | | | 1.14 | % | | | 1.14 | % | |
| Gross expenses | | | 1.14 | % | | | 1.14 | % | | | 1.15 | % | | | 1.14 | % | | | 1.14 | % | | | 1.14 | % | |
| Net investment income (loss) | | | 2.39 | % | | | 1.52 | %^ | | | 1.71 | % | | | 1.91 | % | | | 1.71 | % | | | 1.85 | % | |
| Portfolio turnover rate | | | 7 | % | | | 12 | % | | | 9 | % | | | 12 | % | | | 14 | % | | | 23 | % | |
| ^ | Refer to Note 3 in the Notes to Financial Statements for discussion of prior period custodian out-of-pocket expenses that were reimbursed to the Portfolio in the current period. The amount of the reimbursement was on a per share basis at less than $0.005 per share. There was a 0.06% impact on the total return of the Portfolio. There was a 0.02% impact on the net expenses and net investment income (loss) ratios of the Portfolio. |
| (a) | Net investment income (loss) has been computed using the average shares method. |
| (b) | Total returns reflect reinvestment of all dividends and distributions, if any. Performance information does not reflect the fees and charges imposed by participating insurance companies at the separate account level, and such charges will have the effect of reducing performance. Return for a period of less than one year is not annualized. |
| (c) | Annualized for a period of less than one year. |
The accompanying notes are an integral part of these financial statements.
Semi-Annual Report 45
LAZARD RETIREMENT GLOBAL DYNAMIC MULTI-ASSET PORTFOLIO
| | | Six Months | | | | | | | | | | | |
| Selected data for a share of capital | | Ended | | Year Ended | |
| stock outstanding throughout each period | | 6/30/17† | | 12/31/16 | | 12/31/15 | | 12/31/14 | | 12/31/13 | | 12/31/12 | |
| | | | | | | | | | | | | | | | | | | | | | | | | | |
| Service Shares | | | | | | | | | | | | | | | | | | | | | | | | | |
| Net asset value, beginning of period | | $ | 11.82 | | | $ | 11.51 | | | $ | 11.86 | | | $ | 12.30 | | | $ | 10.54 | | | $ | 10.00 | | |
| Income (loss) from investment operations: | | | | | | | | | | | | | | | | | | | | | | | | | |
| Net investment income (loss) | | | 0.10 | | | | 0.14 | | | | 0.13 | | | | 0.11 | | | | 0.06 | | | | 0.03 | | |
| Net realized and unrealized gain (loss) | | | 1.06 | | | | 0.24 | | | | (0.19 | ) | | | 0.23 | | | | 1.99 | | | | 0.54 | | |
| | | | | | | | | | | | | | | | | | | | | | | | | | |
| Total from investment operations | | | 1.16 | | | | 0.38 | | | | (0.06 | ) | | | 0.34 | | | | 2.05 | | | | 0.57 | | |
| Less distributions from: | | | | | | | | | | | | | | | | | | | | | | | | | |
| Net investment income | | | — | | | | (0.03 | ) | | | — | | | | (0.07 | ) | | | (0.04 | ) | | | — | (a) | |
| Net realized gains | | | — | | | | (0.04 | ) | | | (0.29 | ) | | | (0.71 | ) | | | (0.25 | ) | | | (0.03 | ) | |
| | | | | | | | | | | | | | | | | | | | | | | | | | |
| Total distributions | | | — | | | | (0.07 | ) | | | (0.29 | ) | | | (0.78 | ) | | | (0.29 | ) | | | (0.03 | ) | |
| | | | | | | | | | | | | | | | | | | | | | | | | | |
| Net asset value, end of period | | $ | 12.98 | | | $ | 11.82 | | | $ | 11.51 | | | $ | 11.86 | | | $ | 12.30 | | | $ | 10.54 | | |
| | | | | | | | | | | | | | | | | | | | | | | | | | |
| Total Return (b) | | | 9.81 | % | | | 3.30 | % | | | -0.44 | % | | | 2.70 | % | | | 19.49 | % | | | 5.74 | % | |
| | | | | | | | | | | | | | | | | | | | | | | | | | |
| Ratios and Supplemental Data: | | | | | | | | | | | | | | | | | | | | | | | | | |
| Net assets, end of period (in thousands) | | $ | 323,867 | | | $ | 293,286 | | | $ | 222,666 | | | $ | 176,669 | | | $ | 99,760 | | | $ | 30,262 | | |
| Ratios to average net assets (c): | | | | | | | | | | | | | | | | | | | | | | | | | |
| Net expenses | | | 1.05 | % | | | 1.05 | % | | | 1.05 | % | | | 1.05 | % | | | 1.05 | % | | | 1.05 | % | |
| Gross expenses | | | 1.20 | % | | | 1.25 | % | | | 1.31 | % | | | 1.33 | % | | | 1.70 | % | | | 3.80 | % | |
| Net investment income (loss) | | | 1.56 | % | | | 1.23 | % | | | 1.18 | % | | | 1.19 | % | | | 1.01 | % | | | 1.03 | % | |
| Portfolio turnover rate | | | 67 | % | | | 105 | % | | | 114 | % | | | 105 | % | | | 62 | % | | | 45 | % | |
| (a) | Amount is less than $0.01 per share. |
| (b) | Total returns reflect reinvestment of all dividends and distributions, if any. Certain expenses of the Portfolio may have been waived or reimbursed by the Investment Manager, State Street or BFDS; without such waiver/reimbursement of expenses, the Portfolio’s returns would have been lower. Performance information does not reflect the fees and charges imposed by participating insurance companies at the separate account level, and such charges will have the effect of reducing performance. Return for a period of less than one year is not annualized. |
| (c) | Annualized for a period of less than one year. |
The accompanying notes are an integral part of these financial statements.
46 Semi-Annual Report
Lazard Retirement Series, Inc. Notes to Financial Statements June 30, 2017 (unaudited)
1. Organization
Lazard Retirement Series, Inc. (the “Fund”) was incorporated in Maryland on February 13, 1997 and is registered under the Investment Company Act of 1940, as amended (the “1940 Act”), as an open-end management investment company. The Fund, comprised of twenty-two no-load portfolios (each referred to as a “Portfolio”), is currently offered only to separate accounts established by insurance companies to fund variable annuity contracts and variable life insurance policies. Portfolio shares may also be offered to certain qualified pension and retirement plans and accounts permitting accumulation of assets on a tax-deferred basis. Effective January 31, 2006, the Fund designated its existing class of shares as Service Shares and commenced offering Investor Shares. Investor Shares and Service Shares are identical, except as to the services offered to and expenses borne by each class of shares. As of June 30, 2017, only the Lazard Retirement Emerging Markets Equity Portfolio had issued Investor Shares. Currently, only the following five Portfolios, each of which is “diversified”, as defined in the 1940 Act, are offered: Lazard Retirement US Strategic Equity Portfolio (“US Strategic Equity Portfolio”), Lazard Retirement US Small-Mid Cap Equity Portfolio (“US Small-Mid Cap Equity Portfolio”), Lazard Retirement International Equity Portfolio (“International Equity Portfolio”), Lazard Retirement Emerging Markets Equity Portfolio (“Emerging Markets Equity Portfolio”), and Lazard Retirement Global Dynamic Multi-Asset Portfolio (“Global Dynamic Multi-Asset Portfolio”). Each of the other seventeen Portfolios had not commenced operations as of June 30, 2017.
2. Significant Accounting Policies
The accompanying financial statements are presented in conformity with GAAP. The Fund is an investment company and therefore applies specialized accounting guidance in accordance with Accounting Standards Codification Topic 946. The following is a summary of significant accounting policies consistently followed by the Fund in the preparation of the financial statements:
(a) Valuation of Investments—Equity securities traded on a securities exchange or market, including exchange-traded option contracts, rights and war-
rants, are valued at the last reported sales price (for domestic equity securities) or the closing price (for foreign equity securities) on the exchange or market on which the security is principally traded or, for securities trading on the NASDAQ National Market System (“NASDAQ”), the NASDAQ Official Closing Price. If there is no available closing price for a foreign equity security, the last reported sales price is used. If there are no reported sales of a security on the valuation date, the security is valued at the most recent quoted bid price on such date reported by such principal exchange or market. Forward currency contracts generally are valued using quotations from an independent pricing service. Investments in money market funds are valued at the fund’s net asset value (“NAV”) per share.
Bonds and other fixed-income securities that are not exchange-traded are valued on the basis of prices provided by independent pricing services which are based on, among other things, trading in securities with similar characteristics, brokers’ quotations and/or a matrix system which considers such factors as other security prices, yields and maturities.
Calculation of a Portfolio’s NAV may not take place contemporaneously with the determination of the prices of portfolio assets used in such calculation. Trading on Europe, Latin and South America and Far East securities exchanges and in over-the-counter markets ordinarily is completed well before the close of business on each business day in New York (i.e., a day on which the New York Stock Exchange (the “NYSE”) is open). In addition, European or Far Eastern securities trading generally or in a particular country or countries may not take place on all business days in New York and on which the NAV of a Portfolio is calculated.
The Valuation Committee of the Investment Manager, which meets periodically under the direction of the Board of Directors (the “Board”), may evaluate a variety of factors to determine the fair value of securities for which market quotations are determined not to be readily available or reliable. These factors include, but are not limited to, the type of security, the value of comparable securities, observations from financial
Semi-Annual Report 47
institutions and relevant news events. Input from the Investment Manager’s portfolio managers/analysts also will be considered.
If a significant event materially affecting the value of securities occurs between the close of the exchange or market on which the security is principally traded and the time when a Portfolio’s NAV is calculated, or when current market quotations otherwise are determined not to be readily available or reliable (including restricted or other illiquid securities such as certain derivative instruments), such securities will be valued at their fair value as determined by, or in accordance with procedures approved by, the Board. The fair value of non-US securities may be determined with the assistance of an independent pricing service using correlations between the movement of prices of such securities and indices of US securities and other appropriate indicators, such as closing market prices of relevant ADRs or futures contracts. Non-US securities may trade on days when a Portfolio is not open for business, thus affecting the value of the Portfolio’s assets on days when Portfolio shareholders may not be able to buy or sell Portfolio shares.
The effect of using fair value pricing is that the NAV of a Portfolio will reflect the affected securities’ values as determined in the judgment of the Board or its designee instead of being determined by the market. Using a fair value pricing methodology to price securities may result in a value that is different from the most recent closing price of a security and from the prices used by other investment companies to calculate their portfolios’ NAVs.
(b) Portfolio Securities Transactions and Investment Income—Portfolio securities transactions are accounted for on trade date. Realized gain (loss) on sales of investments are recorded on a specific identification basis. Dividend income is recorded on the ex-dividend date except for certain dividends from non-US securities where the dividend rate is not available. In such cases, the dividend is recorded as soon as the information is received by a Portfolio. Interest income, if any, is accrued daily. A Portfolio amortizes premiums and accretes discounts on fixed-income securities using the effective yield method.
A Portfolio may be subject to taxes imposed by non-US countries in which it invests. Such taxes are generally based upon income earned or capital gains (realized or unrealized). An affected Portfolio accrues and applies such taxes to net investment income, net realized gains and net unrealized gains concurrent with the recognition of income earned or capital gains (realized and unrealized) from the applicable portfolio securities.
As a result of several court cases in certain countries across the European Union, the International Equity Portfolio has filed tax reclaims for previously withheld taxes on dividends earned in those countries. These filings are subject to various administrative proceedings by the local jurisdictions’ tax authorities within the European Union, as well as a number of related judicial proceedings. Uncertainty exists as to the ultimate resolution of these proceedings, the likelihood of receipt of these claims, and the potential timing of payment, and accordingly no amounts are reflected in the financial statements. Such amounts, if and when recorded, could result in an increase in the International Equity Portfolio’s NAV per share.
(c) Foreign Currency Translation and Forward Currency Contracts—The accounting records of the Fund are maintained in US dollars. Portfolio securities and other assets and liabilities denominated in a foreign currency are translated daily into US dollars at the prevailing rates of exchange. Purchases and sales of securities, income receipts and expense payments are translated into US dollars at the prevailing exchange rates on the respective transaction dates.
The Portfolios do not isolate the portion of operations resulting from changes in foreign exchange rates on investments from the fluctuations arising from changes in their market prices. Such fluctuations are included in net realized and unrealized gain (loss) on investments. Net realized gain (loss) on foreign currency transactions and forward currency contracts represents net foreign currency gain (loss) from forward currency contracts, disposition of foreign currencies, currency gain (loss) realized between the trade and settlement dates on securities transactions, and the difference between the amount of dividends, interest
48 Semi-Annual Report
and foreign withholding taxes recorded on the Portfolios’ accounting records and the US dollar equivalent amounts actually received or paid. Net change in unrealized appreciation (depreciation) on foreign currency translations reflects the impact of changes in exchange rates on the value of assets and liabilities, other than investments in securities, during the period.
A forward currency contract is an agreement between two parties to buy or sell currency at a set price on a future date. Upon entering into these contracts, risks may arise from the potential inability of counterparties to meet the terms of their contracts and from unanticipated movements in the value of the foreign currency relative to the US dollar.
The US dollar value of forward currency contracts is determined using quotations provided by an independent pricing service. Daily fluctuations in the value of such contracts are recorded as unrealized appreciation (depreciation) on forward currency contracts. When the contract is closed, a Portfolio records a realized gain (loss) equal to the difference between the value at the time it was opened and the value at the time it was closed.
During the period ended June 30, 2017, the Global Dynamic Multi-Asset Portfolio traded in forward currency contracts.
(d) Federal Income Taxes—The Fund’s policy is to continue to have each Portfolio qualify as a regulated investment company under Subchapter M of the Internal Revenue Code (the “Code”) and to distribute all of its taxable income, including any net realized capital gains, to shareholders. Therefore, no federal income tax provision is required.
At December 31, 2016, the following Portfolios had unused realized capital loss carryovers which, for federal income tax purposes, could be used to offset future realized capital gains with no expiration date as follows:
| Portfolio | | Short-Term | | | Long-Term | |
| | | | | | | | | |
| US Strategic Equity | | $ | 292,328 | | | $ | 211,350 | |
| International Equity | | | 15,195,915 | | | | 7,015,348 | |
| Emerging Markets Equity | | | 2,389,844 | | | | 77,306,735 | |
Under current tax law, post-October capital losses or certain late-year ordinary losses, as defined by the Code, within the taxable year may be deferred and treated as occurring on the first day of the following tax year. For the tax year ended December 31, 2016, the following Portfolio elected to defer such losses as follows:
| | | Post-October | | Late-Year |
| | | Capital Loss | | Ordinary Loss |
| Portfolio | | Deferral | | Deferral |
| Global Dynamic Multi-Asset | | $ | — | | | $ | (4,449,624 | ) |
Management has analyzed the Portfolios’ tax positions, and has concluded that no liability for unrecognized tax benefits should be recorded related to uncertain tax positions taken on tax returns filed for any open tax years (or expected to be taken on future tax returns). Open tax years are those that remain subject to examination and are based on each tax jurisdiction’s statute of limitations.
(e) Dividends and Distributions—Dividends from net investment income, if any, will be declared and paid annually. During any particular year, net realized gains from investment transactions in excess of available capital loss carryforwards would be taxable to the Portfolios, if not distributed. The Portfolios intend to declare and distribute these amounts, at least annually, to shareholders; however, to avoid taxation, a second distribution may be required. Differences in per share distributions, by class, are generally due to differences in class specific expenses.
Income and capital gains distributions are determined in accordance with federal income tax regulations which may differ from GAAP. These book/tax differences, which may result in distribution reclassifications, are primarily due to differing treatments of foreign currency transactions, wash sales, passive foreign investment companies and distributions from real estate investment trusts. The book/tax differences relating to shareholder distributions may result in reclassifications among certain capital accounts.
(f) Allocation of Expenses—Expenses not directly chargeable to a specific Portfolio are allocated among all Portfolios primarily on the basis of relative net
Semi-Annual Report 49
assets. Portfolios accrue distribution and service (12b-1) fees to Service Shares. The Portfolios’ income, expenses (other than class specific expenses) and realized and unrealized gains and losses are allocated proportionally each day between the classes based upon the relative net assets of each class.
(g) Estimates—The preparation of financial statements in conformity with GAAP requires management to make estimates and assumptions that affect the reported amounts of assets and liabilities and disclosure of contingent assets and liabilities at the date of the financial statements and the reported amounts of increases and decreases in net assets resulting from operations during the reporting period. Actual results could differ from those estimates.
(h) Net Asset Value—NAV per share for each class of each Portfolio is determined each day the NYSE is open for trading as of the close of regular trading on the NYSE (generally 4:00 p.m. Eastern time). The Fund will not treat an intraday unscheduled disruption in NYSE trading as a closure of the NYSE, and will price its shares as of 4:00 p.m., if the particular disruption directly affects only the NYSE. NAV per share is determined by dividing the value of the total assets of the Portfolio represented by such class, less all liabilities, by the total number of Portfolio shares of such class outstanding.
3. Investment Management, Administration, Custody, Distribution and Transfer Agency Agreements
The Fund, on behalf of the Portfolios, has entered into a management agreement (the “Management Agreement”) with the Investment Manager. Pursuant to the Management Agreement, the Investment Manager regularly provides each Portfolio with investment research, advice and supervision and furnishes continuously an investment program for each Portfolio consistent with its investment objective and policies, including the purchase, retention and disposition of securities, and provides the Portfolios with administrative, operational and compliance assistance services. For its services provided to the Portfolios, the Investment Manager earns a management fee, accrued daily as a percentage of its average daily net
assets and payable by each Portfolio monthly, at the annual rate set forth below:
| Portfolio | | Annual Rate |
| | | | | |
| US Strategic Equity | | | 0.70 | % |
| US Small-Mid Cap Equity | | | 0.75 | |
| International Equity | | | 0.75 | |
| Emerging Markets Equity | | | 1.00 | |
| Global Dynamic Multi-Asset | | | 0.80 | |
The Investment Manager has voluntarily agreed to waive its fees and, if necessary, reimburse the Portfolios until May 1, 2018 if annualized operating expenses, exclusive of taxes, brokerage, interest on borrowings, fees and expenses of “Acquired Funds” (as defined in Form N-1A) and extraordinary expenses, but including the management fee stated in the Management Agreement between the Investment Manager and the Fund, on behalf of the Portfolios, exceed the following percentages of the value of the Portfolios’ average daily net assets for the respective shares:
| Portfolio | | Service Shares | | Investor Shares |
| | | | | | | | | |
| US Strategic Equity | | | 1.00 | % | | | N/A | |
| US Small-Mid Cap Equity (a) | | | 1.15 | | | | N/A | |
| International Equity | | | 1.10 | | | | N/A | |
| Emerging Markets Equity | | | 1.55 | | | | 1.30 | % |
| Global Dynamic Multi-Asset | | | 1.05 | | | | N/A | |
| (a) From January 1, 2017 to June 6, 2017, percentage was 1.25%. |
During the period ended June 30, 2017, the Investment Manager waived its management fees and reimbursed the following Portfolios for other expenses as follows:
| | | Service Shares | |
| Portfolio | | Management
Fees Waived | | Expenses
Reimbursed | |
| | | | | | | | | |
| US Strategic Equity | | $ | 35,890 | | | $ | 29,686 | |
| US Small-Mid Cap Equity | | | 24,577 | | | | — | |
| International Equity | | | 58,678 | | | | — | |
| Global Dynamic Multi-Asset | | | 231,702 | | | | — | |
The aforementioned waivers and/or reimbursements are not subject to recoupment by the Investment Manager.
The Fund has entered into an administration agreement with State Street to provide certain administrative services. Each Portfolio bears the cost of such
50 Semi-Annual Report
services at a fixed annual rate of $42,500, plus 0.02% of average daily net assets up to $1 billion and 0.01% of average daily net assets over $1 billion. State Street has agreed to waive up to $18,750 of the $42,500 annual fee for the US Strategic Equity Portfolio until the Portfolio’s net assets reach $25 million. During the period ended June 30, 2017, State Street waived $9,375 of its fee for the US Strategic Equity Portfolio.
State Street also serves as custodian for the Fund in accordance with a custodian agreement to provide certain custody services.
In December 2015, State Street announced that it had identified inconsistencies in the way in which clients were invoiced for out-of-pocket expenses from 1998 until 2015. The dollar amount difference between what was charged and what should have been charged, plus interest, was paid to the affected Portfolios directly in April 2017 as a reimbursement. Pursuant to the expense limitations described in Note 3, certain Portfolios have experienced management fee waivers during the year ended December 31, 2016. Accordingly, the reimbursement of out-of-pocket expenses resulted in the reduction in the waiver of management fees for certain Portfolios for the year ended December 31, 2016.
The Fund has a distribution agreement with Lazard Asset Management Securities LLC (the “Distributor”), a wholly-owned subsidiary of the Investment Manager, to serve as the distributor for shares of each Portfolio. The Distributor bears the cost of printing and mailing prospectuses to potential investors and certain expenses in connection with the offering of Portfolio shares.
Under a distribution and servicing plan adopted pursuant to Rule 12b-1 under the 1940 Act, each Portfolio pays a monthly fee to the Distributor, at an annual rate of 0.25% of the average daily net assets of its Service Shares, for distribution and servicing of accounts. The Distributor may make payments to participating insurance companies, certain financial institutions, securities dealers and other industry professionals for providing these services.
BFDS is the Fund’s transfer and dividend disbursing agent. For its services, BFDS receives a monthly fee computed on the basis of the number of shareholder accounts it maintains, subject to a minimum fee amount per share class in each Portfolio, and is reimbursed for certain out-of-pocket expenses. BFDS has agreed to waive the monthly minimum fee for the first six months after a new Portfolio or share class has commenced operations.
4. Directors’ Compensation
Certain Directors of the Fund are officers of the Investment Manager. Effective January 1, 2017, each Director who is not an affiliated person of the Investment Manager or any of its affiliates is paid by the Fund, The Lazard Funds, Inc., Lazard Global Total Return and Income Fund, Inc. and Lazard World Dividend & Income Fund, Inc. (collectively with the Fund, the “Lazard Fund Complex”), each a registered management investment company advised by the Investment Manager: (1) an annual retainer of $210,000, (2) an additional annual fee of $30,000 to the lead Independent Director (an “Independent Director” is a Director who is not an “interested person” (as defined in the 1940 Act) of the Fund), and (3) an additional annual fee of $20,000 to the Audit Committee Chair. The Independent Directors may be paid additional compensation for participation on ad hoc committees or other work performed on behalf of the Board. The Independent Directors also are reimbursed for travel and other out-of-pocket expenses for attending Board and committee meetings. The Directors do not receive benefits from the Fund pursuant to any pension, retirement or similar arrangement. Independent Directors’ fees are allocated among the portfolios in the Lazard Fund Complex at a rate of $5,000 per portfolio with the remainder allocated based upon each portfolio’s proportionate share of combined net assets. The Statements of Operations show the Independent Directors’ fees and expenses paid by each Portfolio.
5. Securities Transactions and Transactions with Affiliates
Purchases and sales of portfolio securities (excluding short-term investments) for the period ended June 30, 2017 were as follows:
Semi-Annual Report 51
| Portfolio | | Purchases | | Sales |
| | | | | | | | | |
| US Strategic Equity | | $ | 3,675,534 | | | $ | 5,003,615 | |
| US Small-Mid Cap Equity | | | 26,987,761 | | | | 29,850,688 | |
| International Equity | | | 106,601,552 | | | | 574,761,240 | |
| Emerging Markets Equity | | | 71,611,465 | | | | 211,112,636 | |
| Global Dynamic Multi-Asset | | | 204,612,250 | | | | 200,976,463 | |
| | | US Treasury Securities | |
| Portfolio | | Purchases | | Sales |
| Global Dynamic Multi-Asset | | $ | 1,028,318 | | | $ | 1,022,125 | |
For the period ended June 30, 2017, the Portfolios did not engage in any cross-trades in accordance with Rule 17a-7 under the 1940 Act, and no brokerage commissions were paid to affiliates of the Investment Manager or other affiliates of the Fund for portfolio transactions executed on behalf of the Fund.
6. Investment Risks
(a) Non-US Securities Risk—A Portfolio’s performance will be influenced by political, social and economic factors affecting the non-US countries and companies in which the Portfolio invests. Non-US securities carry special risks, such as less developed or less efficient trading markets, political instability, a lack of company information, differing auditing and legal standards, and, potentially, less liquidity.
(b) Emerging Market Risk—Emerging market countries can generally have economic structures that are less diverse and mature, and political systems that are less stable, than those of developed countries. The economies of countries with emerging markets may be based predominantly on only a few industries, may be highly vulnerable to changes in local or global trade conditions, and may suffer from extreme debt burdens or volatile inflation rates. The securities markets of emerging market countries have historically been extremely volatile. These market conditions may continue or worsen. Significant devaluation of emerging market currencies against the US dollar may occur subsequent to acquisition of investments denominated in emerging market currencies.
(c) Foreign Currency Risk—Investments denominated in currencies other than US dollars may experience a decline in value, in US dollar terms, due solely to fluc-
tuations in currency exchange rates. A Portfolio’s currency investments could be adversely affected by delays in, or a refusal to grant, repatriation of funds or conversion of emerging market currencies. The Investment Manager does not intend to actively hedge the Portfolios’ foreign currency exposure.
(d) Fixed-Income and Debt Securities Risk—The market value of a debt security may decline due to general market conditions that are not specifically related to a particular company, such as real or perceived adverse economic conditions, changes in the outlook for corporate earnings, changes in interest or currency rates or adverse investor sentiment generally. The debt securities market can be susceptible to increases in volatility and decreases in liquidity. Liquidity can decline unpredictably in response to overall economic conditions or credit tightening.
Prices of bonds and other debt securities tend to move inversely with changes in interest rates. Typically, a rise in rates will adversely affect debt securities and, accordingly, will cause the value of a Portfolio’s investments in these securities to decline. Interest rate risk is usually greater for fixed-income securities with longer maturities or durations. A rise in interest rates (or the expectation of a rise in interest rates) may result in periods of volatility, decreased liquidity and increased redemptions, and, as a result, the Portfolio may have to liquidate portfolio securities at disadvantageous prices. Risks associated with rising interest rates are heightened given that interest rates in the US and other countries are at or near historic lows.
A Portfolio’s investments in lower-rated, higher-yielding securities (“junk bonds”) are subject to greater credit risk than its higher-rated investments. Credit risk is the risk that the issuer will not make interest or principal payments, or will not make payments on a timely basis. Non-investment grade securities tend to be more volatile, less liquid and are considered speculative. If there is a decline, or perceived decline, in the credit quality of a debt security (or any guarantor of payment on such security), the security’s value could fall, potentially lowering the Portfolio’s share price. The prices of non-investment grade securities, unlike investment grade debt securities, may fluctuate
52 Semi-Annual Report
unpredictably and not necessarily inversely with changes in interest rates. The market for these securities may be less liquid and therefore these securities may be harder to value or sell at an acceptable price, especially during times of market volatility or decline.
Some fixed-income securities may give the issuer the option to call, or redeem, the securities before their maturity. If securities held by a Portfolio are called during a time of declining interest rates (which is typically the case when issuers exercise options to call outstanding securities), the Portfolio may have to reinvest the proceeds in an investment offering a lower yield (and the Portfolio may not fully benefit from any increase in the value of its portfolio holdings as a result of declining interest rates).
(e) Derivatives and Hedging Risk—Derivatives transactions, including those entered into for hedging purposes (i.e., seeking to protect Portfolio investments), may increase volatility, reduce returns, limit gains or magnify losses, perhaps substantially, particularly since most derivatives have a leverage component that provides investment exposure in excess of the amount invested. Over-the-counter swap agreements, forward currency contracts, writing or purchasing over-the-counter options on securities, indexes and currencies and other over-the-counter derivatives transactions are subject to the risk of default by the counterparty and can be illiquid. Changes in liquidity may result in significant, rapid and unpredictable changes in the prices for derivatives. These derivatives transactions, as well as the exchange-traded futures and options in which a Portfolio may invest, are subject to many of the risks of, and can be highly sensitive to changes in the value of, the related index, currency, security or other reference asset. As such, a small investment could have a potentially large impact on the Portfolio’s performance. In fact, many derivatives may be subject to greater risks than those associated with investing directly in the underlying or other reference asset. Derivatives transactions incur costs, either explicitly or implicitly, which reduce returns, and costs of engaging in such transactions may outweigh any gains or any losses averted from hedging activities. Successful use of derivatives, whether for hedging or for other investment purposes, is subject to the Invest-
ment Manager’s ability to predict correctly movements in the direction of the relevant reference asset or market and, for hedging activities, correlation of the derivative instruments used with the investments seeking to be hedged. Use of derivatives transactions, even if entered into for hedging purposes, may cause a Portfolio to experience losses greater than if the Portfolio had not engaged in such transactions.
7. Contractual Obligations
The Fund enters into contracts in the normal course of business that contain a variety of indemnification provisions. A Portfolio’s maximum exposure under these arrangements is unknown. Management has reviewed the Fund’s existing contracts and expects the risk of loss to be remote.
8. Fair Value Measurements
Fair value is defined as the price that a Portfolio would receive to sell an asset, or would pay to transfer a liability, in an orderly transaction between market participants at the date of measurement. The Fair Value Measurements and Disclosures provisions of GAAP also establish a framework for measuring fair value, and a three-level hierarchy for fair value measurement that is based upon the transparency of inputs to the valuation of an asset or liability. Inputs may be observable or unobservable and refer, broadly, to the assumptions that market participants would use in pricing the asset or liability. Observable inputs reflect the assumptions that market participants would use in pricing the asset or liability based on market data obtained from sources independent of the Fund. Unobservable inputs reflect the Fund’s own assumptions about the assumptions that market participants would use in pricing the asset or liability, developed based on the best information available in the circumstances. The fair value measurement level within the fair value hierarchy for the assets and liabilities of the Fund is based on the lowest level of any input that is significant to the overall fair value measurement. The three-level hierarchy of inputs is summarized below:
| • | Level 1 – unadjusted quoted prices in active markets for identical assets and liabilities |
Semi-Annual Report 53
| • | Level 2 – other significant observable inputs (including unadjusted quoted prices for similar assets and liabilities, interest rates, prepayment speeds, credit risk, etc.) |
| • | Level 3 – significant unobservable inputs (including the Fund’s own assumptions in determining the fair value of assets and liabilities) |
Changes in valuation technique may result in transfers into or out of the current assigned level within the hierarchy.
The inputs or methodology used for valuing securities are not necessarily an indication of the risks associated with investing in these securities.
The following table summarizes the valuation of the Portfolios’ assets and liabilities by each fair value hierarchy level as of June 30, 2017:
| Description | | Unadjusted
Quoted Prices in
Active Markets
for Identical Assets
and Liabilities
(Level 1) | | Significant Other
Observable
Inputs
(Level 2) | | Significant
Unobservable
Inputs
(Level 3) | | Balance as of
June 30, 2017 |
| | | | | | | | | | | | | | | | | |
| US Strategic Equity Portfolio | | | | | | | | | | | | | | | | |
| Common Stocks* | | $ | 9,508,802 | | | $ | — | | | $ | — | | | $ | 9,508,802 | |
| Short-Term Investments | | | 237,784 | | | | — | | | | — | | | | 237,784 | |
| Total | | $ | 9,746,586 | | | $ | — | | | $ | — | | | $ | 9,746,586 | |
| US Small-Mid Cap Equity Portfolio | | | | | | | | | | | | | | | | |
| Common Stocks* | | $ | 63,252,525 | | | $ | — | | | $ | — | | | $ | 63,252,525 | |
| Short-Term Investments | | | 1,347,971 | | | | — | | | | — | | | | 1,347,971 | |
| Total | | $ | 64,600,496 | | | $ | — | | | $ | — | | | $ | 64,600,496 | |
| International Equity Portfolio | | | | | | | | | | | | | | | | |
| Common Stocks* | | | | | | | | | | | | | | | | |
| Australia | | $ | — | | | $ | 6,017,862 | | | $ | — | | | $ | 6,017,862 | |
| Belgium | | | — | | | | 5,176,679 | | | | — | | | | 5,176,679 | |
| Brazil | | | 2,025,364 | | | | — | | | | — | | | | 2,025,364 | |
| Canada | | | 8,605,394 | | | | — | | | | — | | | | 8,605,394 | |
| Denmark | | | — | | | | 4,764,043 | | | | — | | | | 4,764,043 | |
| Finland | | | — | | | | 2,994,773 | | | | — | | | | 2,994,773 | |
| France | | | — | | | | 23,161,434 | | | | — | | | | 23,161,434 | |
| Germany | | | — | | | | 6,997,072 | | | | — | | | | 6,997,072 | |
| Ireland | | | 2,680,995 | | | | 5,300,646 | | | | — | | | | 7,981,641 | |
| Italy | | | — | | | | 3,141,687 | | | | — | | | | 3,141,687 | |
| Japan | | | — | | | | 34,869,869 | | | | — | | | | 34,869,869 | |
| Luxembourg | | | — | | | | 2,672,698 | | | | — | | | | 2,672,698 | |
| Netherlands | | | — | | | | 10,358,349 | | | | — | | | | 10,358,349 | |
| Norway | | | — | | | | 4,822,543 | | | | — | | | | 4,822,543 | |
| Philippines | | | — | | | | 49,798 | | | | — | | | | 49,798 | |
| Singapore | | | — | | | | 3,035,775 | | | | — | | | | 3,035,775 | |
| Spain | | | — | | | | 1,915,362 | | | | — | | | | 1,915,362 | |
| Sweden | | | — | | | | 7,866,902 | | | | — | | | | 7,866,902 | |
| Switzerland | | | — | | | | 12,310,942 | | | | — | | | | 12,310,942 | |
| Taiwan | | | 2,835,256 | | | | — | | | | — | | | | 2,835,256 | |
| Turkey | | | — | | | | 1,454,820 | | | | — | | | | 1,454,820 | |
| United Kingdom | | | — | | | | 32,368,747 | | | | — | | | | 32,368,747 | |
| United States | | | 8,762,046 | | | | — | | | | — | | | | 8,762,046 | |
| Short-Term Investments | | | 9,559,306 | | | | — | | | | — | | | | 9,559,306 | |
| Total | | $ | 34,468,361 | | | $ | 169,280,001 | | | $ | — | | | $ | 203,748,362 | |
54 Semi-Annual Report
| Description | | Unadjusted
Quoted Prices in
Active Markets
for Identical Assets
and Liabilities
(Level 1) | | Significant Other
Observable
Inputs
(Level 2) | | Significant
Unobservable
Inputs
(Level 3) | | Balance as of
June 30, 2017 |
| | | | | | | | | | | | | | | | | |
| Emerging Markets Equity Portfolio | | | | | | | | | | | | | | | | |
| Common Stocks* | | | | | | | | | | | | | | | | |
| Argentina | | $ | 17,995,975 | | | $ | — | | | $ | — | | | $ | 17,995,975 | |
| Brazil | | | 109,531,278 | | | | — | | | | — | | | | 109,531,278 | |
| China | | | 82,110,444 | | | | 82,027,750 | | | | — | | | | 164,138,194 | |
| Egypt | | | 650,391 | | | | 9,149,646 | | | | — | | | | 9,800,037 | |
| Hungary | | | — | | | | 19,724,465 | | | | — | | | | 19,724,465 | |
| India | | | — | | | | 104,851,303 | | | | — | | | | 104,851,303 | |
| Indonesia | | | 20,824,895 | | | | 38,258,540 | | | | — | | | | 59,083,435 | |
| Malaysia | | | — | | | | 7,151,454 | | | | — | | | | 7,151,454 | |
| Mexico | | | 35,463,048 | | | | — | | | | — | | | | 35,463,048 | |
| Pakistan | | | — | | | | 17,398,096 | | | | — | | | | 17,398,096 | |
| Philippines | | | 9,604,320 | | | | — | | | | — | | | | 9,604,320 | |
| Russia | | | 14,086,120 | | | | 65,871,829 | | | | — | | | | 79,957,949 | |
| South Africa | | | — | | | | 89,698,115 | | | | — | | | | 89,698,115 | |
| South Korea | | | — | | | | 156,763,866 | | | | — | | | | 156,763,866 | |
| Taiwan | | | — | | | | 57,390,866 | | | | — | | | | 57,390,866 | |
| Thailand | | | — | | | | 13,303,131 | | | | — | | | | 13,303,131 | |
| Turkey | | | — | | | | 58,045,464 | | | | — | | | | 58,045,464 | |
| Short-Term Investments | | | 38,842,314 | | | | — | | | | — | | | | 38,842,314 | |
| Total | | $ | 329,108,785 | | | $ | 719,634,525 | | | $ | — | | | $ | 1,048,743,310 | |
| Global Dynamic Multi-Asset Portfolio | | | | | | | | | | | | | | | | |
| Assets: | | | | | | | | | | | | | | | | |
| Common Stocks* | | | | | | | | | | | | | | | | |
| Argentina | | $ | 752,640 | | | $ | — | | | $ | — | | | $ | 752,640 | |
| Australia | | | — | | | | 8,378,987 | | | | — | | | | 8,378,987 | |
| Austria | | | — | | | | 414,145 | | | | — | | | | 414,145 | |
| Belgium | | | — | | | | 133,776 | | | | — | | | | 133,776 | |
| Canada | | | 10,330,236 | | | | — | | | | — | | | | 10,330,236 | |
| Denmark | | | 1,373,566 | | | | 1,671,542 | | | | — | | | | 3,045,108 | |
| Finland | | | 1,292,393 | | | | 169,060 | | | | — | | | | 1,461,453 | |
| France | | | — | | | | 7,898,649 | | | | — | | | | 7,898,649 | |
| Germany | | | 2,171,454 | | | | 4,670,383 | | | | — | | | | 6,841,837 | |
| Hong Kong | | | 1,004,331 | | | | 4,813,442 | | | | — | | | | 5,817,773 | |
| Ireland | | | 1,423,904 | | | | — | | | | — | | | | 1,423,904 | |
| Israel | | | 571,432 | | | | 436,076 | | | | — | | | | 1,007,508 | |
| Italy | | | — | | | | 1,997,233 | | | | — | | | | 1,997,233 | |
| Japan | | | 4,219,602 | | | | 19,723,532 | | | | — | | | | 23,943,134 | |
| Malta | | | — | | | | 113,461 | | | | — | | | | 113,461 | |
| Netherlands | | | 1,002,975 | | | | 1,805,372 | | | | — | | | | 2,808,347 | |
| Norway | | | — | | | | 3,127,778 | | | | — | | | | 3,127,778 | |
| Portugal | | | — | | | | 275,308 | | | | — | | | | 275,308 | |
| Singapore | | | — | | | | 2,543,969 | | | | — | | | | 2,543,969 | |
| South Africa | | | — | | | | 84,682 | | | | — | | | | 84,682 | |
| Spain | | | — | | | | 2,121,828 | | | | — | | | | 2,121,828 | |
| Sweden | | | 1,793,594 | | | | 1,464,750 | | | | — | | | | 3,258,344 | |
| Switzerland | | | 1,901,640 | | | | 4,194,011 | | | | — | | | | 6,095,651 | |
| United Kingdom | | | 7,720,009 | | | | 12,257,527 | | | | — | | | | 19,977,536 | |
| United States | | | 150,311,165 | | | | 525,413 | | | | — | | | | 150,836,578 | |
| Corporate Bonds* | | | — | | | | 18,198,504 | | | | — | | | | 18,198,504 | |
| Foreign Government Obligations* | | | — | | | | 22,154,835 | | | | — | | | | 22,154,835 | |
| Quasi Government Bonds* | | | — | | | | 2,025,650 | | | | — | | | | 2,025,650 | |
| Supranationals | | | — | | | | 2,793,497 | | | | — | | | | 2,793,497 | |
| US Municipal Bonds | | | — | | | | 2,024,448 | | | | — | | | | 2,024,448 | |
| US Treasury Securities | | | — | | | | 4,108,657 | | | | — | | | | 4,108,657 | |
| Short-Term Investments | | | 9,098,435 | | | | — | | | | — | | | | 9,098,435 | |
| Other Financial Instruments† | | | | | | | | | | | | | | | | |
| Forward Currency Contracts | | | — | | | | 319,052 | | | | — | | | | 319,052 | |
| Total | | $ | 194,967,376 | | | $ | 130,445,567 | | | $ | — | | | $ | 325,412,943 | |
| Liabilities: | | | | | | | | | | | | | | | | |
| Other Financial Instruments† | | | | | | | | | | | | | | | | |
| Forward Currency Contracts | | $ | — | | | $ | (731,575 | ) | | $ | — | | | $ | (731,575 | ) |
| * | Please refer to Portfolios of Investments and Notes to Portfolios of Investments for portfolio holdings by country and industry. |
| † | Other financial instruments are derivative instruments which are valued at their respective unrealized appreciation (depreciation). |
Semi-Annual Report 55
Certain equity securities to which footnote (c) in the Notes to Portfolios of Investments applies are included in Level 2 and were valued based on reference to similar securities that were trading on active markets.
In connection with the implementation of fair value pricing procedures with respect to non-US securities (see Note 2(a)), certain equity securities (other than those securities described in footnote (c) in the Notes to Portfolios of Investments) in the International Equity, Emerging Markets Equity and Global Dynamic Multi-Asset Portfolios can transfer from Level 1 to Level 2 as a result of fair value pricing procedures and would revert to Level 1 when the fair value pricing procedures are no longer used. Accordingly, a significant portion of the Portfolios’ investments are categorized as Level 2 investments. A Portfolio recognizes all transfers between levels as though they were transferred at the beginning of the reporting period.
During the period ended June 30, 2017, securities valued at the following amounts were transferred from Level 1 to Level 2:
| Portfolio | | Amount | |
| | | | | |
| International Equity | | | $485,052,005 | |
| Emerging Markets Equity | | | 662,794,522 | |
| Global Dynamic Multi-Asset | | | 39,834,954 | |
There were no other transfers into or out of Levels 1, 2 or 3 during the period ended June 30, 2017.
For further information regarding security characteristics see Portfolios of Investments.
9. Derivative Instruments
Certain Portfolios may use derivative instruments, including forward currency contracts.
Forward currency contracts may be used for hedging purposes or to seek to increase returns.
Global Dynamic Multi-Asset Portfolio
During the period ended June 30, 2017, the approximate average monthly notional exposure for derivative instruments was as follows:
| Forward currency contracts | $88,300,000 |
The following table summarizes the fair value of derivative instruments on the Statement of Assets and Liabilities as of June 30, 2017:
| | | Fair Value | |
| | | | | |
| Asset Derivatives | | | | |
| Foreign Exchange Risk: | | | | |
| Gross unrealized appreciation on forward currency contracts | | $ | 319,052 | |
| Liability Derivatives | | | | |
| Foreign Exchange Risk: | | | | |
| Gross unrealized depreciation on forward currency contracts | | $ | 731,575 | |
The effect of derivative instruments on the Statement of Operations for the period ended June 30, 2017 was:
| | | Amount | |
| | | | | |
| Realized Gain (Loss) on Derivatives | | | | |
| Foreign Exchange Risk: | | | | |
| Net realized gain (loss) on foreign currency transactions and forward currency contracts | | $ | (519,308 | ) |
| Net Change in Unrealized Appreciation (Depreciation) on Derivatives | | | | |
| Foreign Exchange Risk: | | | | |
| Net change in unrealized appreciation (depreciation) on foreign currency translations and forward currency contracts | | $ | 467,028 | |
See Note 2(c) and the Portfolios of Investments for additional disclosures about derivative instruments.
None of the other Portfolios presented traded in derivative instruments during the period ended June 30, 2017.
As of June 30, 2017, the Global Dynamic Multi-Asset Portfolio held derivative instruments that are eligible for offset in the Statement of Assets and Liabilities and are subject to master netting arrangements. A master netting arrangement is an agreement between two counterparties who have multiple contracts with each other that provides for the net settlement of all contracts, as well as any cash collateral, through a single payment in the event of default on, or termination of, any one contract.
56 Semi-Annual Report
The required information for the affected Portfolio is presented in the below table, as of June 30, 2017:
| Description | | Gross Amounts of Recognized Assets | | Gross Amounts Offset
in the Statement of
Assets and Liabilities | | Net Amounts of
Assets Presented
in the Statement of
Assets and Liabilities |
| Forward Currency Contracts | | | $ 319,052 | | | | $ — | | | | $319,052 | |
| | | | | | | Amounts Not Offset in the
Statement of Assets and Liabilities | | | |
| Counterparty | Net Amounts of
Assets Presented
in the Statement of
Assets and Liabilities | | Financial
Instruments | | Collateral
Received | | Net Amounts of
Derivative Assets |
| | | | | | | | | | | | | | | | | |
| Citibank NA | | $ | 36,122 | | | $ | (36,122 | ) | | $ | — | | | $ | — | |
| HSBC Bank USA NA | | | 128,327 | | | | (128,327 | ) | | | — | | | | — | |
| JPMorgan Chase Bank NA | | | 24,001 | | | | (24,001 | ) | | | — | | | | — | |
| State Street Bank and Trust Co. | | | 130,602 | | | | (35,715 | ) | | | — | | | | 94,887 | |
| Total | | $ | 319,052 | | | $ | (224,165 | ) | | $ | — | | | $ | 94,887 | |
| Description | | Gross Amounts of
Recognized Liabilities | | Gross Amounts Offset
in the Statement of
Assets and Liabilities | | Net Amounts of
Liabilities Presented
in the Statement of
Assets and Liabilities |
| Forward Currency Contracts | | | $ 731,575 | | | | $ — | | | | $ 731,575 | |
| | | | | | | Amounts Not Offset in the
Statement of Assets and Liabilities | | | | |
| Counterparty | Net Amounts of
Liabilities Presented
in the Statement of
Assets and Liabilities | | Financial
Instruments | | Collateral
Pledged | | Net Amounts of
Derivative Liabilities |
| | | | | | | | | | | | | | | | | |
| Citibank NA | | $ | 169,291 | | | $ | (36,122 | ) | | $ | — | | | $ | 133,169 | |
| HSBC Bank USA NA | | | 475,141 | | | | (128,327 | ) | | | — | | | | 346,814 | |
| JPMorgan Chase Bank NA | | | 51,428 | | | | (24,001 | ) | | | — | | | | 27,427 | |
| State Street Bank and Trust Co. | | | 35,715 | | | | (35,715 | ) | | | — | | | | — | |
| Total | | $ | 731,575 | | | $ | (224,165 | ) | | $ | — | | | $ | 507,410 | |
10. Accounting Pronouncements
In October 2016, the U.S. Securities and Exchange Commission (the “SEC”) adopted new rules and amended existing rules (together, “final rules”) intended to modernize the reporting and disclosure of information by registered investment companies. In part, the final rules amend Regulation S-X and require standardized, enhanced disclosure about derivatives in investment company financial statements, as well as other amendments. The compliance date for the amendments to Regulation S-X is August 1, 2017. The
Investment Manager does not expect that the adoption of the amendments to Regulation S-X will have a material impact on the Fund’s financial statements and related disclosures.
11. Subsequent Events
Management has evaluated subsequent events affecting the Fund through the issuance of the financial statements and has determined that there were no subsequent events that required adjustment or disclosure.
Semi-Annual Report 57
Lazard Retirement Series, Inc. Board of Directors and Officers Information (unaudited)
| | | | | |
| Name (Age) | | Position(s) with the Fund | | Principal Occupation(s) and Other Public Company |
| Address(1) | | (Since) and Term(2) | | Directorships Held During the Past Five Years(2) |
| | | | | |
| Independent Directors(3): | | | | |
| | | | | |
| Franci J. Blassberg (63) | | Director
(August 2014) | | Debevoise & Plimpton LLP, a law firm, Of Counsel (2013 – present); previously, Partner (through 2012) |
| | | | | |
| | | | | University of California, Berkeley School of Law, Lecturer (Spring 2017) |
| | | | | |
| | | | | Cornell Law School, Visiting Professor of Practice (2015 – 2016); previously, Distinguished Practitioner in Residence (Fall 2013 and Fall 2014) |
| | | | | |
| Kenneth S. Davidson (72) | | Director
(April 1997) | | Davidson Capital Management Corporation, an investment manager, President (1978 – present) |
| | | | | |
| | | | | Landseer Advisors LLC, an investment manager, Senior Advisor (2012 – 2014) |
| | | | | |
| | | | | Aquiline Holdings LLC, an investment manager, Partner (2006 – 2012) |
| | | | | |
| Nancy A. Eckl (54) | | Director
(May 2007) | | College Retirement Equities Fund (eight accounts), Trustee (2007 – present) TIAA-CREF Funds (68 funds) and TIAA-CREF Life Funds (11 funds), Trustee (2007 – present) |
| | | | | |
| | | | | TIAA Separate Account VA-1, Member of the Management Committee (2007 – present) |
| | | | | |
| | | | | American Beacon Advisors, Inc. (“American Beacon”) and certain funds advised by American Beacon, Vice President (1990 – 2006) |
| | | | | |
| Trevor W. Morrison (46) | | Director
(April 2014) | | New York University School of Law, Dean and Eric M. and Laurie B. Roth Professor of Law (2013 – present) |
| | | | | |
| | | | | Columbia Law School, Professor of Law (2008 – 2013) |
| | | | | |
| Richard Reiss, Jr. (73) | | Director
(April 1997) | | Georgica Advisors LLC, an investment manager, Chairman (1997 – present) Resource America, Inc., a real estate asset management company, Director (2016 – present) |
| | | | | |
| | | | | O’Charley’s, Inc., a restaurant chain, Director (1984 – 2012) |
| | | | | |
| Robert M. Solmson (69) | | Director
(September 2004) | | Fairwood Capital, LLC, a private investment corporation engaged primarily in real estate and hotel investments, President (2008 – present) |
58 Semi-Annual Report
| | | | | |
| Name (Age) | | Position(s) with the Fund | | Principal Occupation(s) and Other Public Company |
| Address(1) | | (Since) and Term(2) | | Directorships Held During the Past Five Years(2) |
| | | | | |
| Interested Director(4): | | | | |
| | | | | |
| Ashish Bhutani (57) | | Director
(July 2005) | | Investment Manager, Chief Executive Officer (2004 – present) Lazard Ltd, Vice Chairman and Director (2010 – present) |
| (1) | The address of each Director of the Fund is Lazard Asset Management LLC, 30 Rockefeller Plaza, New York, New York 10112-6300. |
| | |
| (2) | Each Director serves as a Director for each of the funds in the Lazard Fund Complex (comprised of, as of July 31, 2017, 40 active investment portfolios). Each Director serves an indefinite term, until his or her successor is elected, and each Director serves in the same capacity for the other funds in the Lazard Fund Complex. |
| | |
| (3) | “Independent Directors” are not “interested persons” (as defined in the 1940 Act) of the Fund. |
| | |
| (4) | Mr. Bhutani is an “interested person” (as defined in the 1940 Act) of the Fund because of his position with the Investment Manager. |
The Fund’s Statement of Additional Information contains further information about the Directors and is available without charge by calling 800-823-6300, or online, at www.LazardNet.com.
Semi-Annual Report 59
| | | | | |
| Name (Age) | | Position(s) with the Fund | | |
| Address(1) | | (Since) and Term(2) | | Principal Occupation(s) During the Past Five Years |
| | | | | |
| Officers: | | | | |
| | | | | |
| Nathan A. Paul (44) | | Chief Executive Officer and President (February 2017; previously, Vice President and Secretary since April 2002) | | Chief Business Officer (since April 2017) and Managing Director of the Investment Manager General Counsel of the Investment Manager (2002 – March 2017) |
| | | | | |
| Christopher Snively (32) | | Chief Financial Officer (March 2016) | | Senior Vice President of the Investment Manager (since November 2015) Assurance Manager at PricewaterhouseCoopers LLP (2008 – November 2015) |
| | | | | |
| Stephen St. Clair (58) | | Treasurer (May 2003) | | Vice President of the Investment Manager |
| | | | | |
| Mark R. Anderson (47) | | Chief Compliance Officer (September 2014), Vice President and Secretary (February 2017) | | Managing Director (since February 2017, previously Director), General Counsel (since April 2017) and Chief Compliance Officer (since September 2014) of the Investment Manager Senior Vice President, Counsel and Deputy Chief Compliance Officer of AllianceBernstein L.P. (2004 – August 2014) |
| | | | | |
| Tamar Goldstein (42) | | Assistant Secretary (February 2009) | | Director (since February 2016, previously Senior Vice President), and Director of Legal Affairs (since July 2015) of the Investment Manager |
| | | | | |
| Shari L. Soloway (35) | | Assistant Secretary (November 2015) | | Senior Vice President, Legal and Compliance, of the Investment Manager (since September 2015) |
| | | | | |
| | | | | Vice President and Associate General Counsel of GE Asset Management (July 2011 – September 2015) |
| | | | | |
| Cesar A. Trelles (42) | | Assistant Treasurer (December 2004) | | Vice President of the Investment Manager |
| (1) | The address of each officer of the Fund is Lazard Asset Management LLC, 30 Rockefeller Plaza, New York, New York 10112-6300. |
| | |
| (2) | Each officer serves for an indefinite term, until his or her successor is elected and qualifies or until his or her earlier resignation or removal. Each officer serves in the same capacity for the other funds in the Lazard Fund Complex. Mr. Paul also serves as a Director of Lazard Global Total Return and Income Fund, Inc. and Lazard World Dividend & Income Fund, Inc. |
60 Semi-Annual Report
Lazard Retirement Series, Inc. Other Information (unaudited)
Proxy Voting
A description of the policies and procedures used to determine how proxies relating to Fund portfolio securities are voted is available (1) without charge, upon request, by calling (800) 823-6300 or (2) on the SEC website at http://www.sec.gov.
The Fund’s proxy voting record for the most recent 12-month period ended June 30 is available (1) without charge, upon request, by calling (800) 823-6300 or (2) on the SEC’s website at http://www.sec.gov. Information as of June 30 each year will generally be available by the following August 31.
Form N-Q
The Fund files a complete schedule of each Portfolio’s holdings for the first and third quarters of its fiscal year with the SEC on Form N-Q. The Fund’s Forms N-Q are available on the SEC’s website at http://www.sec.gov and may be reviewed and copied at the SEC’s Public Reference Room in Washington, D.C. Information on the operation of the SEC’s Public Reference Room may be obtained by calling 1-800-SEC-0330.
Board Consideration of Management Agreement
All Portfolios except Lazard Retirement Real Assets and Pricing Opportunities Portfolio
At a meeting of the Board held on June 6-7, 2017 the Board considered the approval, for an additional annual period, of the Management Agreement between the Fund, on behalf of the Portfolios, and the Investment Manager. The Independent Directors were assisted in their review by independent legal counsel, who advised the Board on relevant legal standards and met with the Independent Directors in executive session separate from representatives of the Investment Manager.
Services Provided
Representatives of the Investment Manager discussed with the Board the Investment Manager’s written presentation provided in advance of the meeting addressing, among other matters, the nature, extent and quality of services that the Investment Manager provides the Fund, including a discussion of the Investment Manager and its clients (of which the
Lazard Funds complex of 40 active funds comprises approximately $33 billion of the approximately $215 billion of total assets under the management of the Investment Manager and its global affiliates as of March 31, 2017). The Investment Manager’s representatives stated that the Investment Manager believes that the Fund and its shareholders continue to be able to obtain significant benefits as a result of the resources and support of the Investment Manager’s global research, portfolio management, operations, technology, legal and compliance and marketing infrastructure. The Directors also considered information provided by the Investment Manager regarding its personnel, resources, financial condition and experience; the Fund’s distribution channels and the relationships with various intermediaries; marketing activities on behalf of the Portfolios; and Portfolio asset flows and the growth or decline in asset levels.
The Directors considered the various services provided by the Investment Manager including the Investment Manager’s research and portfolio management capabilities and oversight of day-to-day operations, including supervision of fund accounting and administration-related services and assistance in meeting legal and regulatory requirements. The Directors also considered the Investment Manager’s infrastructure and agreed that the Fund benefits from the services and infrastructure provided by the Investment Manager. The Directors accepted management’s assertion that such services and infrastructure are greater than those typically provided to a $33 billion fund complex not managed by a large, global firm such as the Investment Manager.
Comparative Fee, Expense Ratio and Performance Information
The Directors reviewed comparative fee and expense ratio (each through December 31, 2016) and performance (through March 31, 2017) information prepared by Strategic Insight, an independent provider of investment company data, noting the limitations of certain Strategic Insight comparison groups (each, a “Group”) and broader Morningstar categories (each, a “Category”).They noted the methodology and assumptions used by Strategic Insight, including that comparisons ranked each Portfolio in a quintile of the applicable Group or Category (with the first quintile
Semi-Annual Report 61
being the most favorable quintile and the fifth quintile being the least favorable). Strategic Insight’s analyses were for the Service Shares class of each Portfolio except for the Emerging Markets Equity Portfolio, which has both Service Shares and Investor Shares classes outstanding.
Advisory Fees and Expense Ratios. The Directors discussed the management fees paid to the Investment Manager (referred to in the Strategic Insight materials as “advisory fees”) and expense ratios (as limited by the Investment Manager (“net”)) for each Portfolio and the comparisons provided by Strategic Insight, which compared the contractual (gross) advisory fee and net expense ratios for each Portfolio to its respective Group and Category median(s). The Directors considered that the Investment Manager continues to voluntarily enter into expense limitation agreements for all of the active Portfolios and that for certain of these Portfolios the Investment Manager was waiving advisory fees and/or reimbursing expenses.
For the inactive Portfolios (all Portfolios other than the Emerging Markets Equity, Global Dynamic Multi-Asset, International Equity, US Small-Mid Cap Equity and US Strategic Equity Portfolios), the Directors determined to defer consideration of advisory fees in the Management Agreement (and review of expense ratios) until a Portfolio was to commence operations, at which time additional information regarding advisory fees and expense ratios would be provided and considered. Accordingly, discussion of advisory fees and expense ratios in this section is limited to those of the five active Portfolios.
Except for the Global Dynamic Multi-Asset Portfolios, the gross advisory fee of each active Portfolio ranked in one of the first three quintiles of the relevant Group. For the Global Dynamic Multi-Asset Portfolio, the Investment Manager representatives presented a supplemental comparison against peer funds, the Investment Manager believed were more appropriate than those comprising the Portfolio’s Group (a subset of the funds in the Portfolio’s Group), which showed the Portfolio’s advisory fee to be closer to the median advisory fee of the peer fund subset.
Except for the Global Dynamic Multi-Asset and US Small-Mid Cap Equity Portfolios, the expense ratio(s) of each active Portfolio ranked in one of the first three quintiles of the relevant Group. However, due to the compression of fees in the Group for the Global Dynamic Multi-Asset Portfolio, its expense ratio was less than a basis point above the Group median. In addition, the Investment Manager proposed to lower the expense limitation for the US Small-Mid Cap Portfolio by ten basis points, which would place the expense ratio for the Portfolio within approximately five basis points of the Group median.
The Directors also considered fees paid to the Investment Manager by funds advised or sub-advised by the Investment Manager utilizing the same investment strategies as the Portfolios, as well as the Investment Manager’s separately managed accounts with similar investment objectives, policies and strategies (for each Portfolio, collectively with such funds, “Similar Accounts”).The Directors discussed the fees paid to the Investment Manager by the Fund’s Portfolios compared to the fees paid to the Investment Manager by Similar Accounts. Representatives of the Investment Manager discussed the nature of the Similar Accounts and the extensive differences, from the Investment Manager’s perspective, in services provided to the different types of Similar Accounts as compared to the services provided to the Portfolios. The Directors considered the relevance of the fee information provided for Similar Accounts managed by the Investment Manager, in light of the significant differences in services provided, to evaluate the fees paid to the Investment Manager by the Portfolios.
Performance. Strategic Insight’s performance analyses compared each Portfolio’s performance to those of the funds in the relevant Group and Category over one-, three-, five- and ten-year periods ended March 31, 2017 (as applicable).
The Directors considered that performance of each active Portfolio was in the fourth or fifth quintile of its Group for the three- and/or five-year periods (as applicable), except for the Global Dynamic Multi-Asset Portfolio. However, the Emerging Markets Equity Port-
62 Semi-Annual Report
folio (both share classes) was in the first quintile of both the Group and Category for the one- and ten-year periods; the International Equity Portfolio ranked in the third quintile of the Group and Category in the five-year period and in the second and first quintile of the Group and Category, respectively, for the ten-year period; and representatives of the Investment Manager represented that the performance of the US Strategic Equity Portfolio had shown improvement in 2017. Representatives of the Investment Manager discussed with the Directors the reasons for relative underperformance of each Portfolio, noting that the Investment Manager believed the peer group for the Global Dynamic Multi-Asset Portfolio was not the most appropriate comparison group.
At the meeting, the Directors received and would continue to receive regular updates on the Investment Manager’s efforts in respect of underperforming Portfolios.
Investment Manager Profitability and Economies of Scale
The Directors reviewed information prepared by the Investment Manager for each Portfolio concerning profits realized by the Investment Manager and its affiliates resulting from the Management Agreement, calculated using the actual revenues received for the calendar year ended December 31, 2016 and the Investment Manager’s cost allocation methodology to compute an estimate of each Portfolio’s costs to the Investment Manager. The Investment Manager’s representatives reviewed with the Board information provided on the Investment Manager’s brokerage practices and the Portfolios’ brokerage allocation, commission payments and soft dollar commissions and benefits. The Investment Manager’s representatives stated that neither the Investment Manager nor its affiliates receive any other significant indirect benefits from the Investment Manager acting as investment adviser to the Portfolios. The representatives of the Investment Manager reminded the Board that the Investment Manager is continuing to support distribution relationships through direct payments from its or its affiliates’ own resources to third parties in connection with distribution and shareholder servicing and/or administrative and recordkeeping services,
and noted that the Fund does not bear any related costs other than the 0.25% 12b-1 fee pursuant to the Distribution and Servicing Plan adopted for the Portfolios’ Service Shares.
The profitability percentages were within ranges determined by relevant court cases not to be so disproportionately large that they bore no reasonable relationship to the services rendered. Representatives of the Investment Manager stated that the Investment Manager believed the profits are not unreasonable in light of the services provided and other factors. The Directors considered the Investment Manager’s estimated profitability with respect to each Portfolio as part of their evaluation of whether the Portfolio’s fee under the Management Agreement, considered in relation to the mix of services provided by the Investment Manager, including the nature, extent and quality of such services, and evaluated profitability in light of the relevant circumstances for each Portfolio, including the size of each Portfolio and the trend in asset growth or decline, supported the renewal of the Management Agreement. Representatives of the Investment Manager and the Directors discussed ways economies of scale could be realized and how they could be shared, including the Investment Manager’s reinvestment of money back into its business, waiving or reimbursing Portfolio management fees and expenses (including for some Portfolios amending the Management Agreement to lower contractual management fees), adding discounts to a Portfolio’s management fee schedule as a Portfolio’s assets increase or by instituting relatively low management fees from inception. It was noted that, for Portfolios with declining or stable assets or a low level of assets, the extent to which the Investment Manager may have realized any economies of scale would be reduced.
At the conclusion of these discussions, each of the Directors expressed the opinion that he or she had been furnished with such information as may reasonably be necessary to make an informed business decision with respect to evaluation of the renewal of the Management Agreement. Based on its discussions and considerations as described above, the Board made the following conclusions and determinations.
Semi-Annual Report 63
| • | The Board concluded that the nature, extent and quality of the services provided by the Investment Manager are adequate and appropriate, noting the benefits of advisory and research services and other services and infrastructure (as discussed above) associated with an approximately $215 billion global asset management business. |
| | |
| • | For the active Portfolios, the Board generally was satisfied with the overall performance of most of the Portfolios, either because relative performance in the Group and/or Category was satisfactory or performance was otherwise consistent with the investment approach employed for a Portfolio. For certain Portfolios that were not performing in accordance with expectations, the Board would continue to monitor performance. |
| | |
| • | For the active Portfolios, the Board concluded that each Portfolio’s fee paid to the Investment Manager supported the renewal of the Management Agreement in light of the considerations discussed above. |
| | |
| • | The Board recognized that economies of scale may be realized as the assets of the Portfolios increase and determined that they would continue to consider potential material economies of scale. |
In evaluating the Management Agreement, the Board relied on the information described above as well as other information provided by the Investment Manager, in addition to information received on a routine and regular basis throughout the year relating to the operations of the Fund and the investment management and other services provided under the Management Agreement, including information on the investment performance of the Portfolios in comparison to similar mutual funds and benchmark performance indices; general market outlook as applicable to the Portfolios; and compliance reports. The Board also relied on its previous knowledge, gained through meetings and other interactions with the Investment Manager, of the Fund and the services provided to the Fund by the Investment Manager. The Board considered these conclusions and determinations in their totality and determined to approve the Fund’s Management Agreement for each Portfolio. In deciding whether to vote to approve the Management Agreement for each Portfolio, each Director may have accorded different weights to different factors so that each Director may have had a different basis for his or her decision.
64 Semi-Annual Report
Lazard Retirement Series, Inc.
30 Rockefeller Plaza
New York, New York 10112-6300
Telephone: 800-823-6300
http://www.LazardNet.com
Investment Manager
Lazard Asset Management LLC
30 Rockefeller Plaza
New York, New York 10112-6300
Telephone: 800-823-6300
Distributor
Lazard Asset Management Securities LLC
30 Rockefeller Plaza
New York, New York 10112-6300
Custodian
State Street Bank and Trust Company
One Iron Street
Boston, Massachusetts 02210
Transfer Agent and Dividend Disbursing Agent
Boston Financial Data Services, Inc.
P.O. Box 8514
Boston, Massachusetts 02266-8514
Telephone: 800-986-3455
Independent Registered Public Accounting Firm
Deloitte & Touche LLP
30 Rockefeller Plaza
New York, New York 10112-0015
Legal Counsel
Proskauer Rose LLP
Eleven Times Square
New York, New York 10036-8299
http://www.proskauer.com

Performance information as of the most recent month end is available online at www.LazardNet.com.

Lazard Asset Management LLC • 30 Rockefeller Plaza • New York NY 10112 • www.lazardnet.com
LZDPS010
ITEM 2. CODE OF ETHICS.
Not applicable.
ITEM 3. AUDIT COMMITTEE FINANCIAL EXPERT.
Not applicable.
ITEM 4. PRINCIPAL ACCOUNTANT FEES AND SERVICES.
Not applicable.
ITEM 5. AUDIT COMMITTEE OF LISTED REGISTRANTS.
Not applicable.
ITEM 6. INVESTMENTS
Not applicable.
ITEM 7. DISCLOSURE OF PROXY VOTING POLICIES AND PROCEDURES FOR CLOSED END MANAGEMENT INVESTMENT COMPANIES.
Not applicable.
ITEM 8. PORTFOLIO MANAGERS OF CLOSED-END MANAGEMENT INVESTMENT COMPANIES.
Not applicable.
ITEM 9. PURCHASES OF EQUITY SECURITIES BY CLOSED-END MANAGEMENT INVESTMENT COMPANY AND AFFILIATED PURCHASERS.
Not applicable.
ITEM 10. SUBMISSION OF MATTERS TO A VOTE OF SECURITY HOLDERS.
There were no material changes to the procedures by which shareholders may recommend nominees to the Registrant’s Board of Directors during the period covered by this report.
ITEM 11. CONTROLS AND PROCEDURES.
(a) The Registrant’s principal executive and principal financial officers have concluded, based on their evaluation of the Registrant’s disclosure controls and procedures as of a date within 90 days of the filing date of this report, that the Registrant’s disclosure controls and procedures are reasonably designed to ensure that information required to be disclosed by the Registrant on Form N-CSR is recorded, processed, summarized and reported within the required time periods and that information required to be disclosed by the Registrant in the reports that it files or submits on Form N-CSR is accumulated and communicated to the Registrant’s management, including its principal executive and principal financial officers, as appropriate to allow timely decisions regarding required disclosure.
(b) There were no changes to the Registrant’s internal control over financial reporting that occurred during the second fiscal quarter of the period covered by this report that have materially affected, or are reasonably likely to materially affect, the Registrant’s internal control over financial reporting.
ITEM 12. EXHIBITS.
(a)(1) Not applicable.
(a)(2) Certifications of principal executive and principal financial officers as required by Rule 30a-2(a) under the Investment Company Act of 1940.
(a)(3) Not applicable.
(b) Certifications of principal executive and principal financial officers as required by Rule 30a-2(b) under the Investment Company Act of 1940.
SIGNATURES
Pursuant to the requirements of the Securities Exchange Act of 1934 and the Investment Company Act of 1940, the Registrant has duly caused this report to be signed on its behalf by the undersigned, thereunto duly authorized.
Lazard Retirement Series, Inc.
| By | /s/ Nathan A. Paul |
| | Nathan A. Paul |
| | Chief Executive Officer |
| | |
| Date | September 5, 2017 |
Pursuant to the requirements of the Securities Exchange Act of 1934 and the Investment Company Act of 1940, this report has been signed below by the following persons on behalf of the Registrant and in the capacities and on the dates indicated.
| By | /s/ Nathan A. Paul |
| | Nathan A. Paul |
| | Chief Executive Officer |
| | |
| Date | September 5, 2017 |
| By | /s/ Christopher Snively |
| | Christopher Snively |
| | Chief Financial Officer |
| | |
| Date | September 5, 2017 |