UNITED STATES
SECURITIES AND EXCHANGE COMMISSION
Washington, D.C. 20549
FORM N-CSR
CERTIFIED SHAREHOLDER REPORT OF REGISTERED MANAGEMENT INVESTMENT COMPANIES
| Investment Company Act file number | 811-08071 |
Lazard Retirement Series, Inc.
(Exact name of registrant as specified in charter)
30 Rockefeller Plaza
New York, New York 10112
(Address of principal executive offices) (Zip code)
Nathan A. Paul, Esq.
Lazard Asset Management LLC
30 Rockefeller Plaza
New York, New York 10112
(Name and address of agent for service)
Registrant’s telephone number, including area code: (212) 632-6000
| Date of fiscal year end: | 12/31 |
| | |
| Date of reporting period: | 6/30/15 |
ITEM 1. REPORTS TO STOCKHOLDERS.

Lazard Retirement Series
Semi-Annual Report
June 30, 2015
| | US Equity | | Emerging Markets |
| | Lazard Retirement US Strategic Equity Portfolio
Lazard Retirement US Small-Mid Cap Equity Portfolio | | Lazard Retirement Emerging Markets Equity Portfolio |
| | | | Asset Allocation |
| | International Equity | | Lazard Retirement Global Dynamic Multi Asset Portfolio |
| | Lazard Retirement International Equity Portfolio | | |
Lazard Retirement Series, Inc. Table of Contents
Shares of the Portfolios are currently offered only to separate accounts established by insurance companies to fund variable annuity contracts and variable life insurance policies. Portfolio shares may also be offered to certain qualified pension and retirement plans and accounts permitting accumulation of assets on a tax-deferred basis.
Please consider a Portfolio’s investment objective, risks, charges and expenses carefully before investing. For more complete information about Lazard Retirement Series, Inc. (the “Fund”), you may obtain a prospectus or summary prospectus by calling 800-823-6300, or online, at www.LazardNet.com. Read the prospectus or each Portfolio’s summary prospectus carefully before you invest. The prospectus and summary prospectus contain the investment objective, risks, charges, expenses and other information about Portfolios of the Fund, which is not detailed in this report.
Distributed by Lazard Asset Management Securities LLC.
Semi-Annual Report 1
Lazard Retirement Series, Inc. A Message from Lazard
Dear Shareholder,
During the first half of 2015, global equity markets were supported by monetary easing measures in many countries and the stabilization of oil prices. In Europe, equities performed well as the European Central Bank’s quantitative easing program appeared to forestall deflation. Japanese equities continued their impressive streak as Abenomics reforms began to pay dividends. US equity markets rose as corporate earnings generally exceeded expectations. Despite concerns about the possibility of higher US short-term interest rates, heightened volatility in the Chinese stock market, and a potential debt default by Greece, emerging markets performed in line with developed markets.
Globally, fixed-income markets staged impressive rallies during the first quarter of 2015 amid weak growth in the United States due to another harsh winter and continued downward pressure on inflation worldwide. However, the action-packed second quarter, particularly in Greece, created some volatility in global bonds. Meanwhile, there was significant divergence between the winners and losers in emerging markets debt. From a global bond standpoint, fundamental challenges in Turkey, Brazil, and South Africa are likely to persist while some eastern European countries, including Hungary, the Czech Republic, and Poland, are benefiting from monetary stimulus, structural reforms, and economic and business ties to Germany. Currency markets were volatile during the period as investors either reassessed or rebalanced their overweight positions to the US dollar. Notably, central banks cut rates in more than thirty countries.
At Lazard Asset Management LLC, we remain focused on active management and are committed to you, our valued shareholders, and we continue to focus our strengths in pursuing the Portfolios’ investment objectives. As always, we appreciate your continued confidence in our investment management capabilities, and feel privileged that you have turned to Lazard for your investment needs.
Sincerely,
Lazard Asset Management LLC
2 Semi-Annual Report
Lazard Retirement Series, Inc. Investment Overviews
US Equities
The S&P 500® Index rose 1.2% during the first half of 2015. Markets rose modestly as corporate earnings generally exceeded lowered expectations. Economic data during the six month period was mixed. The unemployment rate fell to 5.4% in May, and fourth quarter GDP growth exceeded expectations. However, the economy contracted in the first quarter, though this was largely attributed to severe winter weather and the West Coast port labor conflict. Investors continued to focus on when the Federal Reserve would begin raising interest rates, but were largely reassured that rate hikes would occur in a measured manner. The prospect that Greece may default on payments to its creditors spurred an uptick in volatility in markets globally towards the end of the period.
International Equities
During the first half of 2015, international equity markets rose overall, with the most significant rises occurring in local currencies. Japanese equities were among the best performers, as data showed the economy expanding during the first quarter at a faster rate than initially expected. Additionally, improving corporate governance at a number of Japanese companies helped lift share prices. British equities also performed well after the surprise victory of the incumbent, and traditionally business-friendly, Conservative Party. The euro zone is standing up relatively well despite the Greek debt stand-off with its creditors, with better-than-expected economic data. Emerging markets lagged developed markets during the period, as equities in Brazil and Greece were both among the worst performers globally. In Brazil, the central bank raised interest rates to a six year high as consumer prices in the country soared in January by more than 7%. Additionally, a corruption probe is reaching almost all corners of the Brazilian government.
Equities in the health care and consumer discretionary sectors performed well, while the utilities and energy sectors lagged.
Emerging Markets Equities
Continuing worries about world economic activity and the possibility of higher US short-term interest rates resulted in modest returns for emerging markets in
the first half of 2015. Additional issues over the potential default of Greece and heightened volatility in the Chinese stock market made the period under review even more complex. The MSCI Emerging Markets® Index (the “EM Index”) rose by just under 3%, as measured in US dollar terms during the first half of 2015. Asian emerging markets finished positively, aided by a strong though volatile market in China. Despite the focus on Greece, eastern European equities were the strongest region, helped by a powerful recovery in Russian and Hungarian shares.
All Latin American markets fell during the first half of 2015. Despite a recovery in the second quarter, an investigation at Petrobras and concerns over political repercussions resulted in a decrease of almost 9% for the Brazilian market. Colombian equities fared even worse, suffering from the effect of lower crude oil prices early in the year. Slightly negative returns were recorded in Mexico, though its status as a “safe haven” benefited from its trade relationship with the United States.
Performance varied widely in Asian markets during the first half of 2015. Indonesian shares were hit by concerns over economic growth, government policy, and the execution of eight drug traffickers. Malaysian equities were hurt by worries over exports as well as lower oil prices towards the end of the period. Decent technology sector performance helped the Taiwanese and South Korean markets. The opening of the Shanghai Connect system, a means for foreign investors to purchase China A-shares and for mainland China investors to buy Chinese shares in Hong Kong caused those markets to rise sharply. Investors in both categories eagerly participated, resulting in large increases in trading volumes and significant speculation. By the end of the period under review, the Chinese markets were experiencing some days of heavy selling, causing the authorities to reduce interest rates, lower reserve requirements, and increase the allowable equity investment exposure for local funds.
Markets in eastern Europe, the Middle East, and Africa also experienced wide differences in return during the period. A delicate cease-fire in Ukraine and a modest recovery in crude oil prices allowed Russian equities
Semi-Annual Report 3
and the ruble to rebound solidly. An improved outlook for the Hungarian economy with a possible end to the additional bank tax resulted in strong returns. However, in Turkey, President Recep Tayyip Erdogan’s comments on interest rates undermined the independence of the central bank and forced the lira markedly downwards. Greek equities plunged amid sharp volatility as the Syriza government and the European Union discussed economic terms for further financing. Ultimately, Syriza decided to leave the decision to the Greek populace in a referendum.
By sector, the energy, consumer staples, and information technology sectors outperformed the EM Index, while the utilities, materials, and consumer discretionary sectors underperformed.
Lazard Retirement US Strategic Equity Portfolio
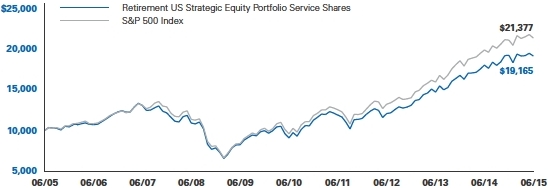
For the six months ended June 30, 2015, the Lazard Retirement US Strategic Equity Portfolio’s Service Shares posted a total return of -0.49%, as compared with the 1.23% return for the S&P 500 Index.
A lack of exposure to utilities helped returns, as the sector was the worst performer in the S&P 500 Index during the period. Stock selection in the health care sector also contributed to performance. Shares of pharmaceutical company Mylan rose after the company had two strategic options become available; the company announced a bid to purchase drug maker Perrigo, and competitor Teva made a separate bid to purchase Mylan. Shares of animal health company Zoetis rose after the company reported earnings which exceeded expectations. Investors were also heartened as the company announced a cost restructuring plan.
In contrast, stock selection in the information technology sector detracted from performance. Shares of business solutions provider Xerox fell after the company reported disappointing quarter earnings, driven by lower service revenues, and management lowered guidance. Stock selection in the financials sector also hurt returns. Shares of card-network operator American Express fell after management issued guidance for heavier-than-expected investment this year, pressuring earnings. The company also announced that its contract with Costco would not be renewed beyond 2016.
Lazard Retirement US Small-Mid Cap Equity Portfolio
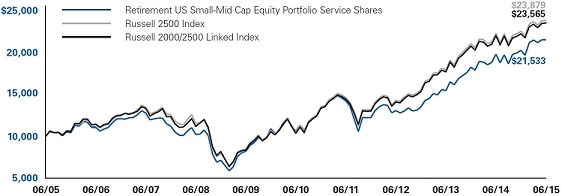
For the six months ended June 30, 2015, the Lazard Retirement US Small-Mid Cap Equity Portfolio’s Service Shares posted a total return of 6.23%, as compared with the 4.81% return for the Russell 2500® Index.
Stock selection in the financials sector contributed to performance. Shares of regional bank Comerica rose after the company reported quarterly results. While earnings were in line with expectations, investors were encouraged by solid net interest margin expansion. Stock selection in the information technology sector also helped returns. Shares of display maker Universal Display rose after the company announced an OLED technology licensing agreement with LG through 2022. The company also reported solid quarterly earnings, driven by stronger revenues.
In contrast, stock selection in the materials sector detracted from performance. Shares of chemical maker Tronox fell after the company reported disappointing earnings, as unfavorable pricing hurt results. Stock selection and an underweight position in the health care sector also hurt returns. Shares of medical technology maker Fluidigm fell after the company reported earnings that were below expectations and management lowered its revenue guidance for the year, citing weakness in its BioMark electronic identification business.
Lazard Retirement International Equity Portfolio
For the six months ended June 30, 2015, the Lazard Retirement International Equity Portfolio’s Service Shares posted a total return of 8.08%, as compared with the 5.52% return for the MSCI EAFE® Index (the “EAFE Index”).
Stock selection in the consumer staples sector was additive to returns as shares of Japan Tobacco hit a record high on news that the company would sell its vending machine business and two of its beverage brands to Suntory Beverage & Foods. Within the financials sector, shares of Japanese real estate construction company Daiwa House Industry performed well on earnings that were better than expected, driven by a recovery in logistics, housing, and condos. The company also issued well-received company guidance and
4 Semi-Annual Report
raised its dividend. Lastly, in the information technology sector, shares of Netherlands-based company NXP Semiconductors rallied on news that they would acquire Texas-based competitor Freescale. The deal would bolster the combined company’s position to be the largest supplier in the automotive industry, which is growing strongly as technology assumes a larger role in automobile components.
In contrast, stock selection in the telecommunication services sector detracted from returns. Shares of Canadian mobile and cable-television provider Rogers Communications declined despite earnings which highlighted higher average revenues per customer, while shares of Turkish mobile phone operator Turkcell declined along with the Turkish equity market over political concerns. Rogers Communications was sold in favor of other higher-conviction ideas after a series of operational disappointments. Positioning in emerging markets subdued returns as shares of Brazilian private education company Estacio declined in January after the government made an unexpected, negative change to its student loan program, which delayed payment of loans for four-year enrollments to six years. The stock later recovered somewhat, on earnings that highlighted higher average tuition fees and strong performance in the distance-learning segment, and was subsequently sold. Lastly, shares of Greek bank Piraeus, which was also sold during the period, declined due to the anti-austerity posturing of the new government.
Lazard Retirement Emerging Markets Equity Portfolio
For the six months ended June 30, 2015, the Lazard Retirement Emerging Markets Equity Portfolio’s Investor Shares posted a total return of -0.91%, while Service Shares posted a total return of -1.00%, as compared with the 2.95% return for the EM Index.
During the period, NetEase, a Chinese online gaming company, benefited from the huge success of its mobile Fantasy Westward Journey game, which is ranked first at the iOS store in China and fourth globally. Shares of China Construction Bank, a Chinese state owned bank, performed well due to expectations of continued government stimulus to stabilize the economy. Mobile TeleSystems and Sberbank, a Russian
telecom services company and bank, respectively, rebounded from prior weakness as oil prices bounced from their recent lows, and as the market was hopeful that the signing of Minsk II agreement would ease tensions in Ukraine. OTP Bank, a Hungarian bank, benefited from improving returns in Hungary and Bulgaria as well as a reduction of the special banking tax in 2016. A higher-than-index exposure to Russia helped performance.
In contrast, Punjab National Bank, an Indian bank, declined due to continued pressure on asset quality and lower levels of growth. Shares of Pacific Rubiales, a Canadian energy company with assets primarily based in Colombia and Latin America, declined sharply due to concerns that debt covenants could be eventually breached unless oil prices rebounded from the recent lows. Wynn Macau, a Chinese casino operator, experienced a greater-than-expected decline in gross gaming revenues following a government crack down on corruption and transit visa changes. Shares of Via Varejo declined as sales continue to decline due to a lackluster economic environment. Shares of Turkiye Is Bankasi, a Turkish bank, fell on the back of macroeconomic concerns after the Turkish President publicly admonished the Central Bank and questioned its need to be independent. Stock selection in the energy and consumer discretionary sectors detracted from performance and a lower-than-index exposure to China hurt returns.
Lazard Retirement Global Dynamic Multi Asset Portfolio
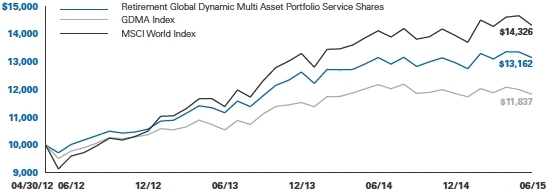
For the six months ended June 30, 2015, the Lazard Retirement Global Dynamic Multi Asset Portfolio’s Service Shares posted a total return of 1.43%, as compared with the -0.19% return of its blended benchmark, which is a 50/50 blend of the MSCI World® Index and the Barclays Capital Global Aggregate Bond® Index (the “GDMA Index”).
The Portfolio is managed using a combination of certain US and non-US equity and fixed-income strategies which considers a market forecast based on four categories pertinent to allocation decisions among the strategies: Economy, Valuation, Liquidity, and Sentiment.
Semi-Annual Report 5
Changes made to the market forecast during the first half of 2015 reflected a consideration of many factors, including monetary policies of central banks around the globe; global macro data readings (particularly the Purchasing Managers Index, which measures economic activity) in China, the United States, the euro zone, and Japan; fiscal policy in developed and emerging markets; geopolitical events and risks; and equity and fixed income valuations, along with other data.
For the first six months of 2015, stock selection in information technology, financials, consumer staples, and energy and an underweight exposure to the energy sector added value within the equity allocation, as did stock selection in the United States, the United Kingdom, and Japan. Within fixed-income, performance was helped by country allocations to
Canada, Mexico, Australia, and New Zealand, underweight duration positioning in the United States and the euro zone, no exposure to Japanese rates, yield curve positioning in core markets (underweight exposure to long maturity bonds) and currency management (tactical Swiss franc exposure)—implemented via derivative instruments—as well as an underweight to the euro (in favor of the US dollar). In contrast, stock selection in the health care and materials sectors, and stock selection in Canada, the Netherlands, and Denmark and an overweight exposure to Canada detracted from performance; within fixed-income, performance was hurt by overweight exposure to the Norwegian bond and currency market—the latter implemented via derivative instruments—and modest exposure to the Australian dollar, Canadian dollar, and New Zealand dollar.
Notes to Investment Overviews:
All returns reflect reinvestment of all dividends and distributions, if any. Certain expenses of a Portfolio may have been waived or reimbursed by Lazard Asset Management LLC, the Fund’s investment manager (the “Investment Manager”), State Street Bank and Trust Company, the Fund’s Administrator (“State Street”), or Boston Financial Data Services, Inc., the Fund’s transfer and dividend disbursing agent (“BFDS”); without such waiver/reimbursement of expenses, such Portfolio’s returns would have been lower. Performance information does not reflect the fees and charges imposed by participating insurance companies at the separate account level, and such charges will have the effect of reducing performance. Past performance is not indicative, or a guarantee, of future results. A period of less than one year is not annualized.
The performance data of the indices and other market data have been prepared from sources and data that the Investment Manager believes to be reliable, but no representation is made as to their accuracy. These indices are unmanaged, have no fees or costs and are not available for investment.
The views of the Investment Manager and the securities described in this report are as of June 30, 2015; these views and portfolio holdings may have changed subsequent to this date. Nothing herein should be construed as a recommendation to buy, sell, or hold a particular security. There is no assurance that the securities discussed herein will remain in a Portfolio at the time you receive this report, or that securities sold will not have been repurchased. The specific securities discussed may, in aggregate, represent only a small percentage of a Portfolio’s holdings. It should not be assumed that securities identified and discussed were, or will be, profitable, or that the investment decisions made in the future will be profitable, or equal the investment performance of the securities discussed herein.
The views and opinions expressed are provided for general information only, and do not constitute specific tax, legal, or investment advice to, or recommendations for, any person. There can be no guarantee as to the accuracy of any outlooks for markets, sectors and securities as discussed herein. You should read the Fund’s prospectus or each Portfolio’s summary prospectus for a more detailed discussion of each Portfolio’s investment objective, strategies, risks and fees.
6 Semi-Annual Report
Lazard Retirement Series, Inc. Performance Overviews (unaudited)
Lazard Retirement US Strategic Equity Portfolio
Comparison of Changes in Value of $10,000 Investment in the Service Shares of Lazard Retirement US Strategic Equity Portfolio and S&P 500® Index*
Average Annual Total Returns*
Periods Ended June 30, 2015
| | One | Five | Ten | |
| | Year | Years | Years | |
| Service Shares | 6.19% | 16.05% | 6.72% | |
| S&P 500 Index | 7.42% | 17.34% | 7.89% | |
| * | All returns reflect reinvestment of all dividends and distributions, if any. Certain expenses of the Portfolio have been waived or reimbursed by the Portfolio’s Investment Manager or State Street; without such waiver/reimbursement of expenses, the Portfolio’s returns would have been lower. Performance information does not reflect the fees and charges imposed by participating insurance companies at the separate account level, and such charges will have the effect of reducing performance. |
| | |
| | The performance quoted represents past performance. Current performance may be lower or higher than the performance quoted. Past performance is not indicative, or a guarantee, of future results; the investment return and principal value of the Portfolio will fluctuate, so that Portfolio shares, when redeemed, may be worth more or less than their original cost. Within the longer periods illustrated there may have been short-term fluctuations, counter to the overall trend of investment results, and no single period of any length may be taken as typical of what may be expected in future periods. |
| | |
| | The performance data of the index has been prepared from sources and data that the Investment Manager believes to be reliable, but no representation is made as to its accuracy. The S&P 500 Index is a market capitalization-weighted index of 500 common stocks, designed to measure performance of the broad domestic economy through changes in the aggregate market value of these stocks, which represent all major industries. The index is unmanaged, has no fees or costs and is not available for investment. |
| | |
| | Before May 1, 2007, the Portfolio was known as Lazard Retirement Equity Portfolio and had a different investment strategy. |
Semi-Annual Report 7
Lazard Retirement US Small-Mid Cap Equity Portfolio
Comparison of Changes in Value of $10,000 Investment in the Service Shares of Lazard Retirement US Small-Mid Cap Equity Portfolio, Russell 2500® Index and Russell 2000/2500 Linked Index*
Average Annual Total Returns*
Periods Ended June 30, 2015
| | One | Five | Ten | |
| | Year | Years | Years | |
| Service Shares | 8.71% | 15.20% | 7.97% | |
| Russell 2500 Index | 5.92% | 17.86% | 9.09% | |
| Russell 2000/2500 Linked Index | 5.92% | 17.85% | 8.95% | |
| * | All returns reflect reinvestment of all dividends and distributions, if any. Certain expenses of the Portfolio have been waived or reimbursed by the Portfolio’s Investment Manager; without such waiver/reimbursement of expenses, the Portfolio’s returns would have been lower. Performance information does not reflect the fees and charges imposed by participating insurance companies at the separate account level, and such charges will have the effect of reducing performance. |
| | |
| | The performance quoted represents past performance. Current performance may be lower or higher than the performance quoted. Past performance is not indicative, or a guarantee, of future results; the investment return and principal value of the Portfolio will fluctuate, so that Portfolio shares, when redeemed, may be worth more or less than their original cost. Within the longer periods illustrated there may have been short-term fluctuations, counter to the overall trend of investment results, and no single period of any length may be taken as typical of what may be expected in future periods. |
| | |
| | The Portfolio was previously known as Lazard Retirement U.S. Small Cap Equity Portfolio. As of June 1, 2009, the Portfolio changed its name to Lazard Retirement U.S. Small-Mid Cap Equity Portfolio and changed its investment strategy to invest in equity securities of small-mid cap US companies. |
| | |
| | The performance data of the indices have been prepared from sources and data that the Investment Manager believes to be reliable, but no representation is made as to their accuracy. The Russell 2500 Index is comprised of the 2,500 smallest US companies included in the Russell 3000® Index (which consists of the 3,000 largest US companies by capitalization). The Russell 2000/2500 Linked Index is an index created by the Portfolio’s Investment Manager, which links the performance of the Russell 2000® Index for all periods through May 31, 2009 and the Russell 2500 Index for all periods thereafter. The Russell 2000 Index is comprised of the 2,000 smallest US companies included in the Russell 3000 Index. The indices are unmanaged, have no fees or costs and are not available for investment. |
8 Semi-Annual Report
Lazard Retirement International Equity Portfolio
Comparison of Changes in Value of $10,000 Investment in the Service Shares of Lazard Retirement International Equity Portfolio and EAFE Index*
Average Annual Total Returns*
Periods Ended June 30, 2015
| | One | Five | Ten | |
| | Year | Years | Years | |
| Service Shares | -1.09% | 11.41% | 5.86% | |
| EAFE Index | -4.23% | 9.54% | 5.12% | |
| * | All returns reflect reinvestment of all dividends and distributions, if any. Performance information does not reflect the fees and charges imposed by participating insurance companies at the separate account level, and such charges will have the effect of reducing performance. |
| | |
| | The performance quoted represents past performance. Current performance may be lower or higher than the performance quoted. Past performance is not indicative, or a guarantee, of future results; the investment return and principal value of the Portfolio will fluctuate, so that Portfolio shares, when redeemed, may be worth more or less than their original cost. Within the longer periods illustrated there may have been short-term fluctuations, counter to the overall trend of investment results, and no single period of any length may be taken as typical of what may be expected in future periods. |
| | |
| | The performance data of the index has been prepared from sources and data that the Investment Manager believes to be reliable, but no representation is made as to its accuracy. The EAFE Index is a broadly diversified international index comprised of equity securities of approximately 1,000 companies located in developed countries outside the United States. The index is unmanaged, has no fees or costs and is not available for investment. |
Semi-Annual Report 9
Lazard Retirement Emerging Markets Equity Portfolio
Comparison of Changes in Value of $10,000 Investment in the Service Shares of Lazard Retirement Emerging Markets Equity Portfolio and EM Index*
Average Annual Total Returns*
Periods Ended June 30, 2015
| | Service Shares | Investor Shares | |
| | One | Five | Ten | One | Five | Since | |
| | Year | Years | Years | Year | Years | Inception | † |
| Retirement Emerging Markets Equity Portfolio** | -13.29% | 3.46% | 8.38% | -13.10% | 3.72% | 4.54% | |
| EM Index | -5.13% | 3.68% | 8.11% | -5.13% | 3.68% | 3.84% | |
| * | All returns reflect reinvestment of all dividends and distributions, if any. Certain expenses of the Portfolio have been waived or reimbursed by the Portfolio’s Investment Manager; without such waiver/reimbursement of expenses, the Portfolio’s returns would have been lower. Performance information does not reflect the fees and charges imposed by participating insurance companies at the separate account level, and such charges will have the effect of reducing performance. |
| | |
| | The performance quoted represents past performance. Current performance may be lower or higher than the performance quoted. Past performance is not indicative, or a guarantee, of future results; the investment return and principal value of the Portfolio will fluctuate, so that Portfolio shares, when redeemed, may be worth more or less than their original cost. Within the longer periods illustrated there may have been short-term fluctuations, counter to the overall trend of investment results, and no single period of any length may be taken as typical of what may be expected in future periods. |
| | |
| | The performance data of the index has been prepared from sources and data that the Investment Manager believes to be reliable, but no representation is made as to its accuracy. The EM Index is comprised of emerging market securities in countries open to non-local investors. The index is unmanaged, has no fees or costs and is not available for investment. |
| | |
| ** | The performance of Service Shares may be greater than or less than the performance of Investor Shares, primarily based on the differences in fees borne by shareholders investing in different classes. |
| | |
| † | The inception date for Investor Shares was May 1, 2006. |
10 Semi-Annual Report
Lazard Retirement Global Dynamic Multi Asset Portfolio
Comparison of Changes in Value of $10,000 Investment in the Service Shares of Lazard Retirement Global Dynamic Multi Asset Portfolio, GDMA Index and MSCI World® Index*
Average Annual Total Returns*
Periods Ended June 30, 2015
| | One | Since | |
| | Year | Inception | † |
| Service Shares | 0.02% | 9.05% | |
| GDMA Index | -2.85% | 5.47% | |
| MSCI World Index | 1.43% | 12.02% | |
| * | All returns reflect reinvestment of all dividends and distributions, if any. Certain expenses of the Portfolio have been waived or reimbursed by the Portfolio’s Investment Manager, State Street or BFDS; without such waiver/reimbursement of expenses, the Portfolio’s returns would have been lower. Performance information does not reflect the fees and charges imposed by participating insurance companies at the separate account level, and such charges will have the effect of reducing performance. |
| | |
| | The performance quoted represents past performance. Current performance may be lower or higher than the performance quoted. Past performance is not indicative, or a guarantee, of future results; the investment return and principal value of the Portfolio will fluctuate, so that Portfolio shares, when redeemed, may be worth more or less than their original cost. Within the longer periods illustrated there may have been short-term fluctuations, counter to the overall trend of investment results, and no single period of any length may be taken as typical of what may be expected in future periods. |
| | |
| | The performance data of the indices have been prepared from sources and data that the Investment Manager believes to be reliable, but no representation is made as to their accuracy. The GDMA Index is a 50/50 blend of the MSCI World Index and the Barclays Capital Global Aggregate Bond® Index. The MSCI World Index is a free float-adjusted market capitalization weighted index that is designed to measure the equity market performance of developed markets. The Barclays Capital Global Aggregate Bond Index provides a broad-based measure of global investment-grade fixed-income debt markets, including government-related debt, corporate debt, securitized debt and global Treasury, with maturities of no less than one year. The indices are unmanaged, have no fees or costs and are not available for investment. |
| | |
| | Before April 30, 2014, the Portfolio was known as Lazard Retirement Multi-Asset Targeted Volatility Portfolio. |
| | |
| † | The inception date for the Portfolio was April 30, 2012. |
Semi-Annual Report 11
Lazard Retirement Series, Inc. Information About Your Portfolio’s Expenses (unaudited)
Expense Example
As a shareholder in a Portfolio of the Fund, you incur ongoing costs, including management fees, distribution and service (12b-1) fees (Service Shares only), and other expenses. This Example is intended to help you understand your ongoing costs (in dollars) of investing in a Portfolio and to compare these costs with the ongoing costs of investing in other mutual funds. The Example is based on an investment of $1,000 invested at the beginning of the six month period from January 1, 2015 through June 30, 2015 and held for the entire period.
Actual Expenses
For each Share class of the Portfolios, the first line of the table below provides information about actual account values and actual expenses. You may use the information in this line, together with the amount you invested, to estimate the expenses that you paid over the period. Simply divide your account value by $1,000 (for example, an $8,600 account value divided by $1,000=8.6), then multiply the result by the number in the first line under the heading entitled “Expenses Paid During Period” to estimate the expenses you paid on your account during this period.
Hypothetical Example for Comparison Purposes
For each Share class of the Portfolios, the second line of the table below provides information about hypothetical account values and hypothetical expenses based on the class’ actual expense ratio and an assumed rate of return of 5% per year before expenses, which is not the Portfolio’s actual return. The hypothetical account values and expenses may not be used to estimate the actual ending account balance or expenses you paid for the period. You may use this information to compare the ongoing costs of investing in the Portfolio and other mutual funds. To do so, compare this 5% hypothetical example with the 5% hypothetical examples that appear in the shareholders reports of the other funds.
Please note that you also bear fees and charges imposed by participating insurance companies at the separate account level, which are described in the separate prospectuses issued by the insurance companies. Such charges will have the effect of reducing account value.
12 Semi-Annual Report
| | | Beginning | | Ending | | Expenses Paid | | Annualized Expense |
| | | Account Value | | Account Value | | During Period* | | Ratio During Period |
| Portfolio | | 1/1/15 | | 6/30/15 | | 1/1/15 - 6/30/15 | | 1/1/15 - 6/30/15 |
| | | | | | | | | | | | | | | | | |
| US Strategic Equity | | | | | | | | | | | | | | | | |
| Service Shares | | | | | | | | | | | | | | | | |
| Actual | | $ | 1,000.00 | | | $ | 995.10 | | | | $4.95 | | | | 1.00 | % |
| Hypothetical (5% Return Before Expenses) | | $ | 1,000.00 | | | $ | 1,019.84 | | | | $5.01 | | | | 1.00 | % |
| | | | | | | | | | | | | | | | | |
| US Small-Mid Cap Equity | | | | | | | | | | | | | | | | |
| Service Shares | | | | | | | | | | | | | | | | |
| Actual | | $ | 1,000.00 | | | $ | 1,062.30 | | | | $6.39 | | | | 1.25 | % |
| Hypothetical (5% Return Before Expenses) | | $ | 1,000.00 | | | $ | 1,018.60 | | | | $6.26 | | | | 1.25 | % |
| | | | | | | | | | | | | | | | | |
| International Equity | | | | | | | | | | | | | | | | |
| Service Shares | | | | | | | | | | | | | | | | |
| Actual | | $ | 1,000.00 | | | $ | 1,080.80 | | | | $5.62 | | | | 1.09 | % |
| Hypothetical (5% Return Before Expenses) | | $ | 1,000.00 | | | $ | 1,019.39 | | | | $5.46 | | | | 1.09 | % |
| | | | | | | | | | | | | | | | | |
| Emerging Markets Equity | | | | | | | | | | | | | | | | |
| Service Shares | | | | | | | | | | | | | | | | |
| Actual | | $ | 1,000.00 | | | $ | 990.00 | | | | $6.81 | | | | 1.38 | % |
| Hypothetical (5% Return Before Expenses) | | $ | 1,000.00 | | | $ | 1,017.95 | | | | $6.90 | | | | 1.38 | % |
| Investor Shares | | | | | | | | | | | | | | | | |
| Actual | | $ | 1,000.00 | | | $ | 990.90 | | | | $5.63 | | | | 1.14 | % |
| Hypothetical (5% Return Before Expenses) | | $ | 1,000.00 | | | $ | 1,019.14 | | | | $5.71 | | | | 1.14 | % |
| | | | | | | | | | | | | | | | | |
| Global Dynamic Multi Asset | | | | | | | | | | | | | | | | |
| Service Shares | | | | | | | | | | | | | | | | |
| Actual | | $ | 1,000.00 | | | $ | 1,014.30 | | | | $5.24 | | | | 1.05 | % |
| Hypothetical (5% Return Before Expenses) | | $ | 1,000.00 | | | $ | 1,019.59 | | | | $5.26 | | | | 1.05 | % |
| * | Expenses are equal to the annualized expense ratio of each Share class multiplied by the average account value over the period, multiplied by 181/365 (to reflect one-half year period). |
Semi-Annual Report 13
Lazard Retirement Series, Inc. Portfolio Holdings Presented by Sector June 30, 2015 (unaudited)
| | Lazard | | Lazard | | Lazard | | Lazard |
| | Retirement | | Retirement | | Retirement | | Retirement |
| | US Strategic | | US Small-Mid Cap | | International | | Emerging Markets |
| Sector* | Equity Portfolio | | Equity Portfolio | | Equity Portfolio | | Equity Portfolio |
| | | | | | | | | | | | | | | | | | |
| Consumer Discretionary | | | 16.8 | % | | | 18.8 | % | | | 15.1 | % | | | 8.4 | % | |
| Consumer Staples | | | 5.2 | | | | 1.3 | | | | 10.2 | | | | 9.6 | | |
| Energy | | | 5.9 | | | | 3.3 | | | | 4.7 | | | | 7.5 | | |
| Financials | | | 19.7 | | | | 23.1 | | | | 23.9 | | | | 29.0 | | |
| Health Care | | | 14.0 | | | | 8.8 | | | | 12.9 | | | | — | | |
| Industrials | | | 8.1 | | | | 22.0 | | | | 11.5 | | | | 5.2 | | |
| Information Technology | | | 24.6 | | | | 11.6 | | | | 4.4 | | | | 21.1 | | |
| Materials | | | 2.9 | | | | 4.8 | | | | 3.8 | | | | 4.7 | | |
| Telecommunication Services | | | — | | | | — | | | | 8.4 | | | | 10.4 | | |
| Utilities | | | — | | | | 2.5 | | | | 0.9 | | | | 0.6 | | |
| Short-Term Investments | | | 2.8 | | | | 3.8 | | | | 4.2 | | | | 3.5 | | |
| Total Investments | | | 100.0 | % | | | 100.0 | % | | | 100.0 | % | | | 100.0 | % | |
| | | Lazard Retirement |
| | | Global Dynamic |
| | | Multi Asset |
| Sector* | | Portfolio |
| | | | | | |
| Consumer Discretionary | | | 12.0 | % | |
| Consumer Staples | | | 7.5 | | |
| Energy | | | 5.2 | | |
| Financials | | | 19.8 | | |
| Health Care | | | 10.6 | | |
| Industrials | | | 9.9 | | |
| Information Technology | | | 9.3 | | |
| Materials | | | 3.0 | | |
| Telecommunication Services | | | 4.4 | | |
| Utilities | | | 3.1 | | |
| Municipal | | | 0.6 | | |
| Sovereign Debt | | | 11.1 | | |
| Short-Term Investment | | | 3.5 | | |
| Total Investments | | | 100.0 | % | |
| * | Represents percentage of total investments. |
14 Semi-Annual Report
Lazard Retirement Series, Inc. Portfolios of Investments June 30, 2015 (unaudited)
| Description | | Shares | | | Value | |
| | | | | | | |
| Lazard Retirement US Strategic Equity Portfolio | | | |
| | | | | | | | | |
| Common Stocks | 97.2% | | | | | | | | |
| | | | | | | | | |
| Alcohol & Tobacco | 1.5% | | | | | | | | |
| Molson Coors Brewing Co., Class B | | | 2,665 | | | $ | 186,044 | |
| | | | | | | | | |
| Automotive | 0.6% | | | | | | | | |
| Harley-Davidson, Inc. | | | 1,350 | | | | 76,073 | |
| | | | | | | | | |
| Banking | 2.2% | | | | | | | | |
| Comerica, Inc. | | | 5,405 | | | | 277,385 | |
| | | | | | | | | |
| Chemicals | 1.7% | | | | | | | | |
| Eastman Chemical Co. | | | 2,510 | | | | 205,368 | |
| | | | | | | | | |
| Commercial Services | 4.4% | | | | | | | | |
| Corrections Corp. of America | | | 7,348 | | | | 243,072 | |
| ServiceMaster Global Holdings, Inc. (a) | | | 3,375 | | | | 122,074 | |
| The ADT Corp. | | | 1,825 | | | | 61,265 | |
| Tyco International PLC | | | 3,115 | | | | 119,865 | |
| | | | | | | | 546,276 | |
| Computer Software | 0.7% | | | | | | | | |
| Symantec Corp. | | | 3,800 | | | | 88,350 | |
| | | | | | | | | |
| Energy Exploration & Production | 4.6% | | | | | | | | |
| Anadarko Petroleum Corp. | | | 1,735 | | | | 135,434 | |
| Apache Corp. | | | 2,585 | | | | 148,974 | |
| Devon Energy Corp. | | | 2,755 | | | | 163,895 | |
| EOG Resources, Inc. | | | 1,460 | | | | 127,823 | |
| | | | | | | | 576,126 | |
| Energy Services | 1.3% | | | | | | | | |
| Dril-Quip, Inc. (a) | | | 2,155 | | | | 162,164 | |
| | | | | | | | | |
| Financial Services | 11.9% | | | | | | | | |
| Ally Financial, Inc. (a) | | | 5,890 | | | | 132,113 | |
| American Express Co. | | | 1,580 | | | | 122,797 | |
| CBOE Holdings, Inc. | | | 3,285 | | | | 187,968 | |
| Citigroup, Inc. | | | 5,140 | | | | 283,933 | |
| Intercontinental Exchange, Inc. | | | 1,050 | | | | 234,790 | |
| Morgan Stanley | | | 3,520 | | | | 136,541 | |
| Springleaf Holdings, Inc. (a) | | | 3,525 | | | | 161,833 | |
| State Street Corp. | | | 850 | | | | 65,450 | |
| Visa, Inc., Class A | | | 2,305 | | | | 154,781 | |
| | | | | | | | 1,480,206 | |
| Description | | Shares | | | Value | |
| | | | | | | |
| Food & Beverages | 2.4% | | | | | | | | |
| Kellogg Co. | | | 4,800 | | | $ | 300,960 | |
| | | | | | | | | |
| Forest & Paper Products | 1.3% | | | | | | | | |
| International Paper Co. | | | 3,270 | | | | 155,619 | |
| | | | | | | | | |
| Household & Personal Products | 1.3% | | | | | | | | |
| The Procter & Gamble Co. | | | 2,085 | | | | 163,130 | |
| | | | | | | | | |
| Insurance | 4.8% | | | | | | | | |
| Aon PLC | | | 1,515 | | | | 151,015 | |
| The Hartford Financial Services Group, Inc. | | | 5,265 | | | | 218,866 | |
| Voya Financial, Inc. | | | 5,000 | | | | 232,350 | |
| | | | | | | | 602,231 | |
| Leisure & Entertainment | 7.9% | | | | | | | | |
| Houghton Mifflin Harcourt Co. (a) | | | 4,910 | | | | 123,732 | |
| Norwegian Cruise Line Holdings, Ltd. (a) | | | 4,890 | | | | 274,035 | |
| The Madison Square Garden Co., Class A (a) | | | 1,730 | | | | 144,438 | |
| Viacom, Inc., Class B | | | 6,780 | | | | 438,259 | |
| | | | | | | | 980,464 | |
| Manufacturing | 5.3% | | | | | | | | |
| Honeywell International, Inc. | | | 3,160 | | | | 322,225 | |
| Parker Hannifin Corp. | | | 1,620 | | | | 188,455 | |
| Rockwell Automation, Inc. | | | 1,160 | | | | 144,582 | |
| | | | | | | | 655,262 | |
| Medical Products | 3.1% | | | | | | | | |
| Baxter International, Inc. | | | 5,535 | | | | 387,063 | |
| | | | | | | | | |
| Pharmaceutical & Biotechnology | 10.9% | | | | | | | | |
| Eli Lilly & Co. | | | 3,890 | | | | 324,776 | |
| Mylan NV (a) | | | 2,555 | | | | 173,382 | |
| Pfizer, Inc. | | | 12,730 | | | | 426,837 | |
| Zoetis, Inc. | | | 8,828 | | | | 425,686 | |
| | | | | | | | 1,350,681 | |
| Retail | 7.4% | | | | | | | | |
| Advance Auto Parts, Inc. | | | 4,183 | | | | 666,310 | |
| Deckers Outdoor Corp. (a) | | | 875 | | | | 62,974 | |
| Dick’s Sporting Goods, Inc. | | | 2,250 | | | | 116,482 | |
| J.C. Penney Co., Inc. (a) | | | 8,250 | | | | 69,878 | |
| | | | | | | | 915,644 | |
| Semiconductors & Components | 4.7% | | | | | | | | |
| Maxim Integrated Products, Inc. | | | 3,740 | | | | 129,311 | |
| NXP Semiconductors NV (a) | | | 920 | | | | 90,344 | |
| Xerox Corp. | | | 34,085 | | | | 362,664 | |
| | | | | | | | 582,319 | |
The accompanying notes are an integral part of these financial statements.
Semi-Annual Report 15
| Description | | Shares | | | Value | |
| | | | | | | |
| Lazard Retirement US Strategic Equity Portfolio (concluded) | |
| | | | | | | | | |
| Technology | 3.4% | | | | | | | | |
| Citrix Systems, Inc. (a) | | | 1,875 | | | $ | 131,550 | |
| Google, Inc., Class A (a) | | | 381 | | | | 205,755 | |
| Google, Inc., Class C (a) | | | 168 | | | | 87,446 | |
| | | | | | | | 424,751 | |
| Technology Hardware | 14.5% | | | | | | | | |
| Apple, Inc. | | | 2,009 | | | | 251,979 | |
| Applied Materials, Inc. | | | 4,550 | | | | 87,451 | |
| Cisco Systems, Inc. | | | 12,910 | | | | 354,508 | |
| EMC Corp. | | | 13,070 | | | | 344,917 | |
| Hewlett-Packard Co. | | | 5,375 | | | | 161,304 | |
| International Business Machines Corp. | | | 1,500 | | | | 243,990 | |
| Qualcomm, Inc. | | | 2,435 | | | | 152,504 | |
| Teradyne, Inc. | | | 10,455 | | | | 201,677 | |
| | | | | | | | 1,798,330 | |
| Transportation | 1.3% | | | | | | | | |
| American Airlines Group, Inc. | | | 2,775 | | | | 110,820 | |
| Union Pacific Corp. | | | 600 | | | | 57,222 | |
| | | | | | | | 168,042 | |
Total Common Stocks
(Identified cost $11,445,362) | | | | | | | 12,082,488 | |
| Description | | Shares | | | Value | |
| | | | | | | |
| Short-Term Investment | 2.8% | | | | | | | | |
State Street Institutional Treasury
Money Market Fund
(Identified cost $353,943) | | | 353,943 | | | $ | 353,943 | |
| | | | | | | | | |
| Total Investments | 100.0% | | | | | | | | |
| (Identified cost $11,799,305) (b) | | | | | | $ | 12,436,431 | |
| | | | | | | | | |
Liabilities in Excess of Cash and
Other Assets | 0.0% | | | | | | | (4,629 | ) |
| | | | | | | | | |
| Net Assets | 100.0% | | | | | | $ | 12,431,802 | |
The accompanying notes are an integral part of these financial statements.
16 Semi-Annual Report
| Description | | Shares | | | Value | |
| | | | | | | |
| Lazard Retirement US Small-Mid Cap Equity Portfolio | |
| | | | | | | | | |
| Common Stocks | 95.6% | | | | | | | | |
| | | | | | | | | |
| Aerospace & Defense | 0.8% | | | | | | | | |
| B/E Aerospace, Inc. | | | 10,385 | | | $ | 570,136 | |
| | | | | | | | | |
| Automotive | 3.4% | | | | | | | | |
| Gentherm, Inc. (a) | | | 14,905 | | | | 818,434 | |
| Modine Manufacturing Co. (a) | | | 73,900 | | | | 792,947 | |
| Tenneco, Inc. (a) | | | 12,150 | | | | 697,896 | |
| | | | | | | | 2,309,277 | |
| Banking | 9.8% | | | | | | | | |
| Comerica, Inc. | | | 18,980 | | | | 974,054 | |
| East West Bancorp, Inc. | | | 21,715 | | | | 973,266 | |
| Great Western Bancorp, Inc. | | | 40,900 | | | | 986,099 | |
| IBERIABANK Corp. | | | 11,495 | | | | 784,304 | |
| PacWest Bancorp | | | 21,990 | | | | 1,028,252 | |
| Signature Bank (a) | | | 6,800 | | | | 995,452 | |
| Wintrust Financial Corp. | | | 18,265 | | | | 974,986 | |
| | | | | | | | 6,716,413 | |
| Chemicals | 2.5% | | | | | | | | |
| Calgon Carbon Corp. | | | 54,550 | | | | 1,057,179 | |
| Tronox, Ltd., Class A | | | 44,970 | | | | 657,911 | |
| | | | | | | | 1,715,090 | |
| Commercial Services | 10.7% | | | | | | | | |
| Applied Industrial Technologies, Inc. | | | 15,510 | | | | 614,971 | |
| Blackhawk Network Holdings, Inc. (a) | | | 25,030 | | | | 1,031,236 | |
| EVERTEC, Inc. | | | 32,770 | | | | 696,035 | |
| Huron Consulting Group, Inc. (a) | | | 15,040 | | | | 1,054,154 | |
| LifeLock, Inc. (a) | | | 41,720 | | | | 684,208 | |
| MDC Partners, Inc., Class A | | | 40,110 | | | | 790,167 | |
| Morningstar, Inc. | | | 6,445 | | | | 512,700 | |
| On Assignment, Inc. (a) | | | 23,415 | | | | 919,741 | |
| ServiceMaster Global Holdings, Inc. (a) | | | 29,425 | | | | 1,064,302 | |
| | | | | | | | 7,367,514 | |
| Computer Software | 1.6% | | | | | | | | |
| j2 Global, Inc. | | | 15,875 | | | | 1,078,547 | |
| | | | | | | | | |
| Construction & Engineering | 2.2% | | | | | | | | |
| EMCOR Group, Inc. | | | 11,595 | | | | 553,893 | |
| Quanta Services, Inc. (a) | | | 34,105 | | | | 982,906 | |
| | | | | | | | 1,536,799 | |
| Consumer Products | 1.4% | | | | | | | | |
| Fox Factory Holding Corp. (a) | | | 58,675 | | | | 943,494 | |
| Description | | Shares | | | Value | |
| | | | | | | |
| Energy Exploration & Production | 1.4% | | | | | | |
| Memorial Resource Development Corp. (a) | | | 48,575 | | | $ | 921,468 | |
| | | | | | | | | |
| Energy Services | 1.0% | | | | | | | | |
| Tesco Corp. | | | 63,120 | | | | 688,008 | |
| | | | | | | | | |
| Financial Services | 5.2% | | | | | | | | |
| Air Lease Corp. | | | 31,435 | | | | 1,065,646 | |
| CBOE Holdings, Inc. | | | 18,730 | | | | 1,071,731 | |
| Springleaf Holdings, Inc. (a) | | | 21,175 | | | | 972,144 | |
| TAL International Group, Inc. | | | 14,455 | | | | 456,778 | |
| | | | | | | | 3,566,299 | |
| Food & Beverages | 1.3% | | | | | | | | |
| SunOpta, Inc. (a) | | | 82,505 | | | | 885,279 | |
| | | | | | | | | |
| Forest & Paper Products | 2.2% | | | | | | | | |
| KapStone Paper and Packaging Corp. | | | 26,955 | | | | 623,200 | |
| Schweitzer-Mauduit International, Inc. | | | 22,950 | | | | 915,246 | |
| | | | | | | | 1,538,446 | |
| Gas Utilities | 2.5% | | | | | | | | |
| Dynegy, Inc. (a) | | | 25,545 | | | | 747,191 | |
| New Jersey Resources Corp. | | | 34,470 | | | | 949,649 | |
| | | | | | | | 1,696,840 | |
| Health Services | 3.1% | | | | | | | | |
| Brookdale Senior Living, Inc. (a) | | | 27,820 | | | | 965,354 | |
| Quintiles Transnational Holdings, Inc. (a) | | | 14,530 | | | | 1,055,023 | |
| Teladoc, Inc. (a) | | | 4,800 | | | | 91,200 | |
| | | | | | | | 2,111,577 | |
| Housing | 2.9% | | | | | | | | |
| Continental Building Products, Inc. (a) | | | 38,425 | | | | 814,226 | |
| FMSA Holdings, Inc. | | | 74,800 | | | | 612,612 | |
| PGT, Inc. (a) | | | 38,085 | | | | 552,613 | |
| | | | | | | | 1,979,451 | |
| Insurance | 3.0% | | | | | | | | |
| Arch Capital Group, Ltd. (a) | | | 15,030 | | | | 1,006,409 | |
| Argo Group International Holdings, Ltd. | | | 18,920 | | | | 1,053,844 | |
| | | | | | | | 2,060,253 | |
| Leisure & Entertainment | 3.6% | | | | | | | | |
| Bloomin’ Brands, Inc. | | | 34,765 | | | | 742,233 | |
| Hyatt Hotels Corp., Class A (a) | | | 18,195 | | | | 1,031,474 | |
| Scholastic Corp. | | | 16,220 | | | | 715,789 | |
| | | | | | | | 2,489,496 | |
The accompanying notes are an integral part of these financial statements.
Semi-Annual Report 17
| Description | | Shares | | | Value | |
| | | | | | | |
| Lazard Retirement US Small-Mid Cap Equity Portfolio (concluded) | |
| | | | | | | | | |
| Manufacturing | 10.2% | | | | | | | | |
| Actuant Corp., Class A | | | 30,590 | | | $ | 706,323 | |
| Advanced Drainage Systems, Inc. | | | 14,790 | | | | 433,790 | |
| Altra Industrial Motion Corp. | | | 24,705 | | | | 671,482 | |
| FLIR Systems, Inc. | | | 37,590 | | | | 1,158,524 | |
| Joy Global, Inc. | | | 16,110 | | | | 583,182 | |
| KLX, Inc. (a) | | | 11,107 | | | | 490,152 | |
| Littelfuse, Inc. | | | 4,780 | | | | 453,574 | |
| The Toro Co. | | | 12,460 | | | | 844,539 | |
| TriMas Corp. (a) | | | 25,140 | | | | 744,144 | |
| Woodward, Inc. | | | 17,115 | | | | 941,154 | |
| | | | | | | | 7,026,864 | |
| Medical Products | 1.2% | | | | | | | | |
| Sirona Dental Systems, Inc. (a) | | | 7,815 | | | | 784,782 | |
| | | | | | | | | |
| Pharmaceutical & Biotechnology | 4.5% | | | | | | | | |
| AMAG Pharmaceuticals, Inc. (a) | | | 8,060 | | | | 556,624 | |
| Cellectis SA ADR | | | 14,675 | | | | 529,474 | |
| Fluidigm Corp. (a) | | | 20,045 | | | | 485,089 | |
| Phibro Animal Health Corp., Class A | | | 17,115 | | | | 666,458 | |
| United Therapeutics Corp. (a) | | | 4,970 | | | | 864,531 | |
| | | | | | | | 3,102,176 | |
| Real Estate | 7.2% | | | | | | | | |
| DCT Industrial Trust, Inc. REIT | | | 28,065 | | | | 882,363 | |
| Extra Space Storage, Inc. REIT | | | 14,095 | | | | 919,276 | |
| Jones Lang LaSalle, Inc. | | | 6,300 | | | | 1,077,300 | |
| Kilroy Realty Corp. REIT | | | 16,265 | | | | 1,092,195 | |
| LaSalle Hotel Properties REIT | | | 28,000 | | | | 992,880 | |
| | | | | | | | 4,964,014 | |
| Retail | 5.9% | | | | | | | | |
| Advance Auto Parts, Inc. | | | 5,365 | | | | 854,591 | |
| Carter’s, Inc. | | | 6,725 | | | | 714,868 | |
| Chico’s FAS, Inc. | | | 53,010 | | | | 881,556 | |
| Dick’s Sporting Goods, Inc. | | | 16,905 | | | | 875,172 | |
| Steven Madden, Ltd. (a) | | | 17,290 | | | | 739,666 | |
| | | | | | | | 4,065,853 | |
| Description | | Shares | | | Value | |
| | | | | | | |
| Semiconductors & Components | 2.5% | | | | | | | | |
| M/A-COM Technology Solutions Holdings, Inc. (a) | | | 14,220 | | | $ | 543,915 | |
| Microsemi Corp. (a) | | | 15,055 | | | | 526,172 | |
| Universal Display Corp. (a) | | | 12,795 | | | | 661,886 | |
| | | | | | | | 1,731,973 | |
| Technology | 2.6% | | | | | | | | |
| BroadSoft, Inc. (a) | | | 28,445 | | | | 983,344 | |
| Vantiv, Inc., Class A (a) | | | 20,360 | | | | 777,548 | |
| | | | | | | | 1,760,892 | |
| Transportation | 2.9% | | | | | | | | |
| Alaska Air Group, Inc. | | | 17,425 | | | | 1,122,693 | |
| Echo Global Logistics, Inc. (a) | | | 27,350 | | | | 893,251 | |
| | | | | | | | 2,015,944 | |
| Total Common Stocks | | | | | | | | |
| (Identified cost $57,472,717) | | | | | | | 65,626,885 | |
| | | | | | | | | |
| Short-Term Investment | 3.8% | | | | | | | | |
State Street Institutional Treasury
Money Market Fund
(Identified cost $2,599,236) | | | 2,599,236 | | | | 2,599,236 | |
| | | | | | | | | |
| Total Investments | 99.4% | | | | | | | | |
| (Identified cost $60,071,953) (b) | | | | | | $ | 68,226,121 | |
| | | | | | | | | |
Cash and Other Assets in Excess
of Liabilities | 0.6% | | | | | | | 390,036 | |
| | | | | | | | | |
| Net Assets | 100.0% | | | | | | $ | 68,616,157 | |
The accompanying notes are an integral part of these financial statements.
18 Semi-Annual Report
| Description | | Shares | | | Value | |
| | | | | | | |
| Lazard Retirement International Equity Portfolio | |
| | | | | | | | | |
| Common Stocks | 96.8% | | | | | | | | |
| | | | | | | | | |
| Australia | 3.3% | | | | | | | | |
| Ansell, Ltd. | | | 328,163 | | | $ | 6,099,449 | |
| Caltex Australia, Ltd. | | | 436,575 | | | | 10,728,339 | |
| James Hardie Industries PLC | | | 520,096 | | | | 6,950,172 | |
| | | | | | | | 23,777,960 | |
| Austria | 0.6% | | | | | | | | |
| UNIQA Insurance Group AG | | | 491,072 | | | | 4,428,496 | |
| | | | | | | | | |
| Belgium | 3.9% | | | | | | | | |
| Anheuser-Busch InBev NV | | | 166,898 | | | | 20,002,112 | |
| KBC Groep NV | | | 112,975 | | | | 7,549,451 | |
| | | | | | | | 27,551,563 | |
| Brazil | 0.7% | | | | | | | | |
| BB Seguridade Participacoes SA | | | 459,300 | | | | 5,037,512 | |
| | | | | | | | | |
| Canada | 2.0% | | | | | | | | |
| Encana Corp. | | | 564,000 | | | | 6,217,998 | |
| MacDonald Dettwiler & Associates, Ltd. | | | 114,600 | | | | 8,374,333 | |
| | | | | | | | 14,592,331 | |
| Denmark | 1.0% | | | | | | | | |
| Carlsberg A/S, Class B | | | 81,830 | | | | 7,428,641 | |
| | | | | | | | | |
| Finland | 1.7% | | | | | | | | |
| Sampo Oyj, A Shares | | | 265,402 | | | | 12,501,070 | |
| | | | | | | | | |
| France | 6.3% | | | | | | | | |
| BNP Paribas SA | | | 175,330 | | | | 10,584,515 | |
| Cap Gemini SA | | | 146,097 | | | | 12,927,482 | |
| Valeo SA | | | 75,333 | | | | 11,871,275 | |
| Vinci SA | | | 174,160 | | | | 10,073,135 | |
| | | | | | | | 45,456,407 | |
| Germany | 4.5% | | | | | | | | |
| Bayer AG | | | 142,609 | | | | 19,960,891 | |
| Continental AG | | | 28,857 | | | | 6,828,340 | |
| RTL Group SA | | | 57,323 | | | | 5,180,263 | |
| | | | | | | | 31,969,494 | |
| Ireland | 0.8% | | | | | | | | |
| Ryanair Holdings PLC Sponsored ADR | | | 78,542 | | | | 5,603,972 | |
| | | | | | | | | |
| Israel | 3.2% | | | | | | | | |
Teva Pharmaceutical Industries, Ltd.
Sponsored ADR | | | 385,640 | | | | 22,791,324 | |
| Description | | Shares | | | Value | |
| | | | | | | |
| Italy | 2.1% | | | | | | | | |
| Atlantia SpA | | | 248,765 | | | $ | 6,145,756 | |
| Azimut Holding SpA | | | 295,364 | | | | 8,640,476 | |
| | | | | | | | 14,786,232 | |
| | | | | | | | | |
| Japan | 20.3% | | | | | | | | |
| Daikin Industries, Ltd. | | | 136,200 | | | | 9,803,373 | |
| Daiwa House Industry Co., Ltd. | | | 753,100 | | | | 17,556,026 | |
| Don Quijote Holdings Co., Ltd. | | | 427,600 | | | | 18,203,179 | |
| Isuzu Motors, Ltd. | | | 529,800 | | | | 6,958,806 | |
| Japan Tobacco, Inc. | | | 257,400 | | | | 9,170,999 | |
| KDDI Corp. | | | 856,400 | | | | 20,670,880 | |
| Makita Corp. | | | 106,300 | | | | 5,767,308 | |
| Seven & I Holdings Co., Ltd. | | | 271,700 | | | | 11,677,428 | |
| SoftBank Corp. | | | 186,900 | | | | 11,009,209 | |
| Sony Corp. (a) | | | 422,800 | | | | 11,958,346 | |
| Sumitomo Mitsui Financial Group, Inc. | | | 387,000 | | | | 17,262,189 | |
| United Arrows, Ltd. | | | 175,600 | | | | 5,502,521 | |
| | | | | | | | 145,540,264 | |
| Netherlands | 3.9% | | | | | | | | |
| Koninklijke KPN NV | | | 3,108,502 | | | | 11,886,707 | |
| NXP Semiconductors NV (a) | | | 68,913 | | | | 6,670,328 | |
| Wolters Kluwer NV | | | 324,831 | | | | 9,649,159 | |
| | | | | | | | 28,206,194 | |
| Norway | 1.4% | | | | | | | | |
| Telenor ASA | | | 456,656 | | | | 10,006,250 | |
| | | | | | | | | |
| Philippines | 1.0% | | | | | | | | |
| Alliance Global Group, Inc. | | | 15,231,400 | | | | 7,330,259 | |
| | | | | | | | | |
| Spain | 0.9% | | | | | | | | |
| Red Electrica Corporacion SA | | | 80,098 | | | | 6,418,684 | |
| | | | | | | | | |
| Sweden | 3.6% | | | | | | | | |
| Assa Abloy AB, Class B | | | 664,842 | | | | 12,519,145 | |
| Swedbank AB, A Shares | | | 568,632 | | | | 13,259,174 | |
| | | | | | | | 25,778,319 | |
| Switzerland | 6.6% | | | | | | | | |
| Credit Suisse Group AG | | | 305,545 | | | | 8,398,852 | |
| GAM Holding AG | | | 43,491 | | | | 914,058 | |
| Glencore PLC | | | 1,283,707 | | | | 5,149,463 | |
| Novartis AG | | | 329,519 | | | | 32,477,861 | |
| | | | | | | | 46,940,234 | |
| Taiwan | 1.6% | | | | | | | | |
| Taiwan Semiconductor Manufacturing Co., Ltd. Sponsored ADR | | | 500,000 | | | | 11,355,000 | |
The accompanying notes are an integral part of these financial statements.
Semi-Annual Report 19
| Description | | Shares | | | Value | |
| | | | |
| Lazard Retirement International Equity Portfolio (concluded) | |
| | | | | | | | | |
| Thailand | 0.6% | | | | | | | | |
| Krung Thai Bank Public Co. Ltd. | | | 7,846,200 | | | $ | 3,972,407 | |
| | | | | | | | | |
| Turkey | 1.0% | | | | | | | | |
| Turkcell Iletisim Hizmetleri AS | | | 1,615,132 | | | | 7,442,588 | |
| | | | | | | | | |
| United Kingdom | 25.8% | | | | | | | | |
| Anglo American PLC | | | 351,968 | | | | 5,079,578 | |
| Aon PLC | | | 72,395 | | | | 7,216,334 | |
| BG Group PLC | | | 486,304 | | | | 8,095,694 | |
| British American Tobacco PLC | | | 317,091 | | | | 17,014,527 | |
| Direct Line Insurance Group PLC | | | 999,885 | | | | 5,275,652 | |
| Informa PLC | | | 1,091,553 | | | | 9,373,035 | |
| International Consolidated Airlines Group SA (a) | | | 762,494 | | | | 5,926,846 | |
| Lloyds Banking Group PLC | | | 16,755,919 | | | | 22,441,762 | |
| Provident Financial PLC | | | 181,147 | | | | 8,331,038 | |
| Prudential PLC | | | 828,092 | | | | 19,939,962 | |
| Reed Elsevier PLC | | | 665,464 | | | | 10,822,066 | |
| Rexam PLC | | | 1,211,754 | | | | 10,509,905 | |
| Description | | Shares | | | Value | |
| | | | | | | | | |
| Royal Dutch Shell PLC, A Shares | | | 321,110 | | | $ | 9,013,680 | |
| Shire PLC | | | 151,913 | | | | 12,161,423 | |
| Taylor Wimpey PLC | | | 1,330,084 | | | | 3,883,024 | |
| Unilever PLC | | | 204,892 | | | | 8,788,867 | |
| William Hill PLC | | | 1,498,952 | | | | 9,493,925 | |
| Wolseley PLC | | | 178,998 | | | | 11,427,211 | |
| | | | | | | | 184,794,529 | |
| Total Common Stocks | | | | | | | | |
| (Identified cost $562,501,088) | | | | | | | 693,709,730 | |
| | | | | | | | | |
| Short-Term Investment | 4.3% | | | | | | | | |
State Street Institutional Treasury
Money Market Fund
(Identified cost $30,731,539) | | | 30,731,539 | | | | 30,731,539 | |
| | | | | | | | | |
| Total Investments | 101.1% | | | | | | | | |
| (Identified cost $593,232,627) (b) | | | | | | $ | 724,441,269 | |
| | | | | | | | | |
Liabilities in Excess of Cash and
Other Assets | (1.1)% | | | | | | | (8,218,937 | ) |
| | | | | | | | | |
| Net Assets | 100.0% | | | | | | $ | 716,222,332 | |
The accompanying notes are an integral part of these financial statements.
20 Semi-Annual Report
| Description | | Shares | | | Value | |
| | | | | | | |
| Lazard Retirement Emerging Markets Equity Portfolio |
| | | | | | | |
| Common Stocks | 96.2% | | | | | | |
| | | | | | | |
| Argentina | 1.1% | | | | | | |
| YPF Sociedad Anonima Sponsored ADR | | | 410,234 | | | $ | 11,252,719 | |
| | | | | | | | | |
| Brazil | 13.0% | | | | | | | | |
| Ambev SA ADR | | | 2,762,900 | | | | 16,853,690 | |
| Banco do Brasil SA | | | 3,869,866 | | | | 30,221,076 | |
| BB Seguridade Participacoes SA | | | 1,924,200 | | | | 21,104,249 | |
| CCR SA | | | 1,669,400 | | | | 8,005,775 | |
| CEMIG SA Sponsored ADR | | | 1,653,600 | | | | 6,300,216 | |
| Cielo SA | | | 1,894,512 | | | | 26,701,462 | |
| Localiza Rent a Car SA | | | 600,395 | | | | 5,926,513 | |
| Natura Cosmeticos SA | | | 643,800 | | | | 5,702,696 | |
| Souza Cruz SA | | | 1,204,627 | | | | 9,465,452 | |
| Vale SA Sponsored ADR | | | 873,700 | | | | 5,146,093 | |
| Via Varejo SA | | | 1,009,500 | | | | 3,646,291 | |
| | | | | | | | 139,073,513 | |
| China | 12.0% | | | | | | | | |
| Baidu, Inc. Sponsored ADR (a) | | | 161,300 | | | | 32,111,604 | |
| China Construction Bank Corp., Class H | | | 48,689,390 | | | | 44,534,032 | |
| China Shenhua Energy Co., Ltd., Class H | | | 3,446,000 | | | | 7,859,754 | |
| CNOOC, Ltd. | | | 9,799,000 | | | | 13,930,760 | |
| NetEase, Inc. ADR | | | 164,800 | | | | 23,873,752 | |
| Weichai Power Co., Ltd., Class H | | | 1,970,400 | | | | 6,596,343 | |
| | | | | | | | 128,906,245 | |
| Colombia | 0.1% | | | | | | | | |
| Pacific Rubiales Energy Corp. | | | 347,300 | | | | 1,309,674 | |
| | | | | | | | | |
| Egypt | 1.3% | | | | | | | | |
Commercial International Bank Egypt
SAE GDR | | | 1,921,769 | | | | 14,125,002 | |
| | | | | | | | | |
| Hong Kong | 3.4% | | | | | | | | |
| China Mobile, Ltd. Sponsored ADR | | | 458,249 | | | | 29,369,178 | |
| Huabao International Holdings, Ltd. | | | 11,410,000 | | | | 6,859,351 | |
| | | | | | | | 36,228,529 | |
| Description | | Shares | | | Value | |
| | | | | | | |
| Hungary | 1.2% | | | | | | |
| OTP Bank Nyrt. | | | 658,555 | | | $ | 13,034,885 | |
| | | | | | | | | |
| India | 9.6% | | | | | | | | |
| Axis Bank, Ltd. | | | 2,612,372 | | | | 22,891,074 | |
| Bajaj Auto, Ltd. | | | 224,029 | | | | 8,918,944 | |
| Bharat Heavy Electricals, Ltd. | | | 2,269,139 | | | | 8,792,557 | |
| HCL Technologies, Ltd. | | | 657,402 | | | | 9,498,674 | |
| Hero MotoCorp, Ltd. | | | 313,782 | | | | 12,399,760 | |
| Punjab National Bank | | | 5,505,984 | | | | 12,031,371 | |
| Tata Consultancy Services, Ltd. | | | 714,924 | | | | 28,684,529 | |
| | | | | | | | 103,216,909 | |
| Indonesia | 6.3% | | | | | | | | |
| PT Astra International Tbk | | | 21,782,500 | | | | 11,559,061 | |
| PT Bank Mandiri (Persero) Tbk | | | 20,624,429 | | | | 15,546,635 | |
| PT Semen Indonesia (Persero) Tbk | | | 8,506,700 | | | | 7,656,509 | |
| PT Telekomunikasi Indonesia (Persero) Tbk Sponsored ADR | | | 555,600 | | | | 24,107,484 | |
| PT United Tractors Tbk | | | 5,918,340 | | | | 9,044,529 | |
| | | | | | | | 67,914,218 | |
| Macau | 0.7% | | | | | | | | |
| Wynn Macau, Ltd. | | | 4,387,600 | | | | 7,290,450 | |
| | | | | | | | | |
| Malaysia | 0.7% | | | | | | | | |
| British American Tobacco Malaysia Berhad | | | 442,500 | | | | 7,271,402 | |
| | | | | | | | | |
| Mexico | 1.8% | | | | | | | | |
| Grupo Mexico SAB de CV, Series B | | | 3,724,397 | | | | 11,205,773 | |
| Kimberly-Clark de Mexico SAB de CV, Series A | | | 3,866,762 | | | | 8,362,096 | |
| | | | | | | | 19,567,869 | |
| Pakistan | 2.0% | | | | | | | | |
| Habib Bank, Ltd. | | | 4,085,800 | | | | 8,611,193 | |
| Oil & Gas Development Co., Ltd. | | | 2,968,600 | | | | 5,228,411 | |
| Pakistan Petroleum, Ltd. | | | 4,657,002 | | | | 7,504,282 | |
| | | | | | | | 21,343,886 | |
| Philippines | 1.7% | | | | | | | | |
Philippine Long Distance Telephone Co.
Sponsored ADR | | | 294,000 | | | | 18,316,200 | |
The accompanying notes are an integral part of these financial statements.
Semi-Annual Report 21
| Description | | Shares | | | Value | |
| | | | | | | |
| Lazard Retirement Emerging Markets Equity Portfolio (concluded) | |
| | | | | | | | | |
| Russia | 7.6% | | | | | | | | |
| ALROSA AO | | | 6,084,106 | | | $ | 6,947,909 | |
| Eurasia Drilling Co., Ltd. GDR | | | 16,904 | | | | 278,409 | |
| Gazprom OAO Sponsored ADR | | | 3,130,245 | | | | 16,120,762 | |
| Lukoil OAO Sponsored ADR | | | 190,575 | | | | 8,386,253 | |
| Magnit PJSC Sponsored GDR | | | 47,942 | | | | 2,668,452 | |
| Magnit PJSC Sponsored GDR (c), (d) | | | 108,375 | | | | 6,032,152 | |
| MegaFon OAO GDR | | | 65,376 | | | | 908,726 | |
| MegaFon OAO GDR (c), (d) | | | 421,946 | | | | 5,865,049 | |
| Mobile TeleSystems OJSC Sponsored ADR | | | 1,266,520 | | | | 12,386,566 | |
| Sberbank of Russia (a) | | | 16,628,779 | | | | 21,725,733 | |
| | | | | | | | 81,320,011 | |
| South Africa | 8.5% | | | | | | | | |
| Imperial Holdings, Ltd. | | | 564,151 | | | | 8,601,842 | |
| Nedbank Group, Ltd. | | | 455,093 | | | | 9,045,001 | |
| PPC, Ltd. | | | 2,985,394 | | | | 4,331,103 | |
| Sanlam, Ltd. | | | 1,329,398 | | | | 7,249,076 | |
| Shoprite Holdings, Ltd. | | | 1,187,399 | | | | 16,933,563 | |
| Standard Bank Group, Ltd. | | | 760,593 | | | | 10,013,495 | |
| The Bidvest Group, Ltd. | | | 365,122 | | | | 9,248,097 | |
| Tiger Brands, Ltd. | | | 205,209 | | | | 4,781,744 | |
| Vodacom Group, Ltd. | | | 743,481 | | | | 8,476,148 | |
| Woolworths Holdings, Ltd. | | | 1,451,010 | | | | 11,759,789 | |
| | | | | | | | 90,439,858 | |
| South Korea | 12.8% | | | | | | | | |
| Coway Co., Ltd. | | | 136,733 | | | | 11,203,905 | |
| Hanwha Life Insurance Co., Ltd. | | | 1,977,821 | | | | 14,060,801 | |
| Hyundai Mobis Co., Ltd. | | | 72,837 | | | | 13,843,242 | |
| KB Financial Group, Inc. | | | 453,694 | | | | 15,008,569 | |
| KT&G Corp. | | | 160,541 | | | | 13,658,471 | |
| Samsung Electronics Co., Ltd. | | | 25,847 | | | | 29,381,860 | |
| Shinhan Financial Group Co., Ltd. | | | 562,307 | | | | 20,945,677 | |
| SK Hynix, Inc. | | | 510,510 | | | | 19,359,517 | |
| | | | | | | | 137,462,042 | |
| Description | | Shares | | | Value | |
| | | | | | | |
| Taiwan | 5.2% | | | | | | |
| Hon Hai Precision Industry Co., Ltd. | | | 3,655,370 | | | $ | 11,491,708 | |
| Taiwan Semiconductor Manufacturing Co., Ltd. | | | 9,687,642 | | | | 44,113,944 | |
| | | | | | | | 55,605,652 | |
| Thailand | 2.9% | | | | | | | | |
| CP All Public Co. Ltd. (c) | | | 7,844,400 | | | | 10,741,618 | |
| Kasikornbank Public Co. Ltd. | | | 774,800 | | | | 4,335,604 | |
PTT Exploration & Production Public
Co. Ltd. (c) | | | 2,482,335 | | | | 8,010,970 | |
| The Siam Cement Public Co. Ltd. | | | 499,400 | | | | 7,659,078 | |
| | | | | | | | 30,747,270 | |
| Turkey | 4.3% | | | | | | | | |
| Akbank TAS | | | 4,520,775 | | | | 13,072,649 | |
| KOC Holding AS | | | 2,007,289 | | | | 9,287,110 | |
| Turkcell Iletisim Hizmetleri AS | | | 2,584,102 | | | | 11,907,637 | |
| Turkiye Is Bankasi AS, C Shares | | | 5,767,078 | | | | 12,136,234 | |
| | | | | | | | 46,403,630 | |
| Total Common Stocks | | | | | | | | |
| (Identified cost $1,075,195,212) | | | | | | | 1,030,829,964 | |
| | | | | | | | | |
| Short-Term Investment | 3.4% | | | | | | | | |
State Street Institutional Treasury
Money Market Fund
(Identified cost $36,977,833) | | | 36,977,833 | | | | 36,977,833 | |
| | | | | | | | | |
| Total Investments | 99.6% | | | | | | | | |
| (Identified cost $1,112,173,045) (b) | | | | | | $ | 1,067,807,797 | |
| | | | | | | | | |
Cash and Other Assets in Excess
of Liabilities | 0.4% | | | | | | | 4,754,410 | |
| | | | | | | | | |
| Net Assets | 100.0% | | | | | | $ | 1,072,562,207 | |
The accompanying notes are an integral part of these financial statements.
22 Semi-Annual Report
| Description | | Shares | | | Value | |
| | | | | | | | | |
| Lazard Retirement Global Dynamic Multi Asset Portfolio | |
| | | | | | | | | |
| Common Stocks | 75.2% | | | | | | | | |
| | | | | | | | | |
| Australia | 2.6% | | | | | | | | |
| AGL Energy, Ltd. | | | 16,270 | | | $ | 195,201 | |
| BC Iron, Ltd. | | | 4,660 | | | | 1,043 | |
| CSL, Ltd. | | | 15,850 | | | | 1,057,448 | |
| CSR, Ltd. | | | 31,090 | | | | 87,314 | |
| Downer EDI, Ltd. | | | 71,302 | | | | 262,962 | |
| Echo Entertainment Group, Ltd. | | | 92,266 | | | | 310,379 | |
| Evolution Mining, Ltd. | | | 209,599 | | | | 185,974 | |
| GPT Group | | | 126,459 | | | | 417,597 | |
| Independence Group NL | | | 73,281 | | | | 235,772 | |
| Magellan Financial Group, Ltd. | | | 5,030 | | | | 67,528 | |
| Newcrest Mining, Ltd. (a) | | | 5,306 | | | | 53,302 | |
| Primary Health Care, Ltd. | | | 14,156 | | | | 55,047 | |
| Qantas Airways, Ltd. (a) | | | 88,865 | | | | 216,662 | |
| Regis Resources, Ltd. (a) | | | 71,559 | | | | 59,628 | |
| Telstra Corp., Ltd. | | | 387,648 | | | | 1,836,412 | |
| Woodside Petroleum, Ltd. | | | 8,722 | | | | 230,349 | |
| | | | | | | | 5,272,618 | |
| Austria | 0.0% | | | | | | | | |
| IMMOFINANZ AG (a) | | | 28,928 | | | | 68,113 | |
| | | | | | | | | |
| Belgium | 0.7% | | | | | | | | |
| Anheuser-Busch InBev NV Sponsored ADR | | | 11,330 | | | | 1,367,191 | |
| bpost SA | | | 1,659 | | | | 45,573 | |
| Telenet Group Holding NV (a) | | | 2,066 | | | | 112,377 | |
| | | | | | | | 1,525,141 | |
| Bermuda | 0.9% | | | | | | | | |
| Assured Guaranty, Ltd. | | | 4,767 | | | | 114,360 | |
| Everest Re Group, Ltd. | | | 6,751 | | | | 1,228,750 | |
| PartnerRe, Ltd. | | | 1,061 | | | | 136,338 | |
| Validus Holdings, Ltd. | | | 6,007 | | | | 264,248 | |
| | | | | | | | 1,743,696 | |
| Canada | 4.1% | | | | | | | | |
| Baytex Energy Corp. | | | 9,705 | | | | 150,975 | |
| Canadian Apartment Properties REIT | | | 846 | | | | 18,695 | |
| Canadian National Railway Co. | | | 10,692 | | | | 616,866 | |
| Canadian Natural Resources, Ltd. | | | 39,253 | | | | 1,065,394 | |
| Capital Power Corp. | | | 4,254 | | | | 73,364 | |
| CCL Industries, Inc., Class B | | | 765 | | | | 93,833 | |
| CI Financial Corp. | | | 28,793 | | | | 774,575 | |
| Cineplex, Inc. | | | 5,035 | | | | 189,548 | |
| Description | | Shares | | | Value | |
| | | | | | | | | |
| Cogeco Cable, Inc. | | | 1,105 | | | $ | 63,911 | |
| Colliers International Group, Inc. | | | 8,840 | | | | 338,312 | |
| Constellation Software, Inc. | | | 178 | | | | 70,667 | |
| Crescent Point Energy Corp. | | | 3,102 | | | | 63,654 | |
| Dollarama, Inc. | | | 9,937 | | | | 602,267 | |
| Dominion Diamond Corp. | | | 6,122 | | | | 85,777 | |
| Empire Co., Ltd., Class A | | | 3,516 | | | | 247,640 | |
| Imperial Oil, Ltd. | | | 7,773 | | | | 300,278 | |
| Intact Financial Corp. | | | 6,644 | | | | 461,676 | |
| Magna International, Inc. | | | 10,250 | | | | 575,280 | |
| Metro, Inc. | | | 10,788 | | | | 289,523 | |
| Royal Bank of Canada | | | 35,588 | | | | 2,176,310 | |
| Suncor Energy, Inc. | | | 2,096 | | | | 57,728 | |
| | | | | | | | 8,316,273 | |
| China | 0.1% | | | | | | | | |
| Yangzijiang Shipbuilding Holdings, Ltd. | | | 115,200 | | | | 121,029 | |
| | | | | | | | | |
| Denmark | 1.0% | | | | | | | | |
| AP Moeller-Maersk A/S, Class B | | | 118 | | | | 213,715 | |
| Coloplast A/S, Class B | | | 5,114 | | | | 335,564 | |
| Novo Nordisk A/S Sponsored ADR | | | 9,940 | | | | 544,314 | |
| Novo Nordisk A/S, Class B | | | 7,306 | | | | 398,059 | |
| Topdanmark A/S ADR (a) | | | 160,780 | | | | 423,253 | |
| William Demant Holding A/S (a) | | | 1,654 | | | | 126,177 | |
| | | | | | | | 2,041,082 | |
| Finland | 0.8% | | | | | | | | |
| Elisa Oyj | | | 10,163 | | | | 322,118 | |
| Kone Oyj, Class B | | | 17,695 | | | | 718,072 | |
| Sampo Oyj, A Shares ADR | | | 24,430 | | | | 575,327 | |
| | | | | | | | 1,615,517 | |
| France | 1.5% | | | | | | | | |
| Airbus Group SE | | | 8,965 | | | | 581,687 | |
| BNP Paribas SA | | | 8,428 | | | | 508,791 | |
| Bureau Veritas SA | | | 12,352 | | | | 284,501 | |
| Electricite de France SA | | | 2,883 | | | | 64,282 | |
| GDF Suez | | | 4,543 | | | | 84,278 | |
| Sanofi | | | 3,649 | | | | 358,968 | |
| Societe Generale SA | | | 4,847 | | | | 226,252 | |
| Total SA | | | 13,259 | | | | 644,043 | |
| Valeo SA | | | 1,646 | | | | 259,383 | |
| | | | | | | | 3,012,185 | |
| Germany | 1.4% | | | | | | | | |
| Continental AG Sponsored ADR | | | 20,030 | | | | 957,334 | |
| Daimler AG | | | 1,584 | | | | 144,170 | |
| Dialog Semiconductor PLC (a) | | | 3,776 | | | | 204,127 | |
| HUGO BOSS AG | | | 1,567 | | | | 175,134 | |
The accompanying notes are an integral part of these financial statements.
Semi-Annual Report 23
| Description | | Shares | | | Value | |
| | | | | | | |
| Lazard Retirement Global Dynamic Multi Asset Portfolio (continued) | |
| | | | | | | | | |
| Muenchener Rueckversicherungs AG | | | 3,311 | | | $ | 586,911 | |
| Symrise AG ADR | | | 44,460 | | | | 691,353 | |
| Volkswagen AG | | | 665 | | | | 153,872 | |
| | | | | | | | 2,912,901 | |
| Hong Kong | 1.9% | | | | | | | | |
| Cheung Kong Property Holdings Ltd. (a) | | | 25,000 | | | | 206,733 | |
| CK Hutchison Holdings, Ltd. | | | 25,000 | | | | 368,959 | |
| CLP Holdings, Ltd. | | | 14,500 | | | | 123,085 | |
| Henderson Land Development Co., Ltd. | | | 22,000 | | | | 151,131 | |
| Hopewell Highway Infrastructure, Ltd. | | | 500 | | | | 246 | |
| Hopewell Holdings, Ltd. | | | 10,000 | | | | 36,638 | |
| Jardine Matheson Holdings, Ltd. | | | 3,500 | | | | 198,625 | |
| Michael Kors Holdings, Ltd. (a) | | | 1,615 | | | | 67,975 | |
| PCCW, Ltd. | | | 310,000 | | | | 184,763 | |
| Swire Pacific, Ltd., Class A | | | 11,000 | | | | 138,430 | |
| The Link REIT | | | 260,500 | | | | 1,527,401 | |
| The Wharf Holdings, Ltd. | | | 108,000 | | | | 718,927 | |
| VTech Holdings, Ltd. | | | 4,100 | | | | 54,215 | |
| | | | | | | | 3,777,128 | |
| Ireland | 0.3% | | | | | | | | |
| Bank of Ireland Sponsored ADR (a) | | | 19,000 | | | | 305,520 | |
| ICON PLC (a) | | | 780 | | | | 52,494 | |
| Paddy Power PLC | | | 1,103 | | | | 94,698 | |
| Ryanair Holdings PLC Sponsored ADR | | | 2,913 | | | | 207,842 | |
| | | | | | | | 660,554 | |
| Israel | 0.1% | | | | | | | | |
| Bank Hapoalim BM | | | 9,530 | | | | 51,337 | |
| Bank Leumi Le-Israel BM (a) | | | 12,267 | | | | 51,877 | |
| Frutarom Industries, Ltd. | | | 1,663 | | | | 69,755 | |
| Israel Discount Bank, Ltd., Class A (a) | | | 52,322 | | | | 100,445 | |
| | | | | | | | 273,414 | |
| Italy | 0.4% | | | | | | | | |
| Davide Campari-Milano SpA ADR | | | 137,000 | | | | 527,450 | |
| Eni SpA | | | 16,320 | | | | 289,654 | |
| Moncler SpA | | | 5,164 | | | | 95,683 | |
| | | | | | | | 912,787 | |
| Japan | 7.2% | | | | | | | | |
| Alps Electric Co., Ltd. | | | 9,600 | | | | 296,115 | |
| Asahi Glass Co., Ltd. | | | 10,000 | | | | 60,056 | |
| Asahi Kasei Corp. | | | 20,000 | | | | 164,318 | |
| Astellas Pharma, Inc. | | | 30,100 | | | | 429,297 | |
| Canon, Inc. | | | 18,300 | | | | 595,496 | |
| Central Japan Railway Co. | | | 500 | | | | 90,309 | |
| CKD Corp. | | | 9,200 | | | | 105,542 | |
| Description | | Shares | | | Value | |
| | | | | | | | | |
| Daiichikosho Co., Ltd. | | | 5,300 | | | $ | 186,649 | |
| Daito Trust Construction Co., Ltd. | | | 2,400 | | | | 248,658 | |
| Daiwa House Industry Co., Ltd. | | | 14,400 | | | | 335,688 | |
| Daiwa House Industry Co., Ltd. ADR | | | 88,510 | | | | 2,064,938 | |
| DCM Holdings Co., Ltd. | | | 6,700 | | | | 65,640 | |
| East Japan Railway Co. | | | 600 | | | | 53,977 | |
| Electric Power Development Co., Ltd. | | | 4,400 | | | | 155,493 | |
| Fujitsu General, Ltd. | | | 6,000 | | | | 76,921 | |
| Haseko Corp. | | | 10,800 | | | | 127,427 | |
| Heiwa Corp. | | | 10,700 | | | | 213,152 | |
| Inpex Corp. | | | 10,800 | | | | 122,794 | |
| Japan Airlines Co., Ltd. | | | 13,400 | | | | 467,525 | |
| JVC Kenwood Corp. | | | 34,800 | | | | 94,972 | |
| Kaken Pharmaceutical Co., Ltd. | | | 6,000 | | | | 209,585 | |
| Kawasaki Heavy Industries, Ltd. | | | 44,000 | | | | 205,287 | |
| KDDI Corp. ADR | | | 62,525 | | | | 751,238 | |
| Kobe Steel, Ltd. | | | 66,000 | | | | 111,092 | |
| Kubota Corp. | | | 5,000 | | | | 79,319 | |
| Kumagai Gumi Co., Ltd. | | | 38,000 | | | | 112,089 | |
| Kyokuto Kaihatsu Kogyo Co., Ltd. | | | 9,600 | | | | 104,405 | |
| Kyudenko Corp. | | | 4,000 | | | | 71,904 | |
| Mitsubishi Electric Corp. | | | 12,000 | | | | 155,117 | |
| Mitsubishi Materials Corp. | | | 24,000 | | | | 92,168 | |
| Mitsubishi UFJ Financial Group, Inc. | | | 69,000 | | | | 496,027 | |
| Mitsubishi UFJ Lease & Finance Co., Ltd. | | | 15,230 | | | | 83,377 | |
| Mitsui & Co., Ltd. | | | 5,300 | | | | 71,996 | |
| Mitsui Chemicals, Inc. | | | 16,000 | | | | 59,484 | |
| Mitsui Mining & Smelting Co., Ltd. | | | 60,000 | | | | 162,275 | |
| Murata Manufacturing Co., Ltd. | | | 2,400 | | | | 418,875 | |
| Nippon Telegraph & Telephone Corp. | | | 1,800 | | | | 65,207 | |
| Nipro Corp. | | | 5,300 | | | | 54,262 | |
| Nissan Motor Co., Ltd. | | | 33,500 | | | | 349,001 | |
| NTT Data Corp. | | | 1,700 | | | | 74,315 | |
| OBIC Co., Ltd. | | | 1,400 | | | | 62,459 | |
| Resona Holdings, Inc. | | | 50,400 | | | | 275,298 | |
| Sanyo Special Steel Co., Ltd. | | | 18,000 | | | | 83,834 | |
| Senshu Ikeda Holdings, Inc. | | | 62,800 | | | | 284,790 | |
| Showa Shell Sekiyu KK | | | 6,200 | | | | 54,206 | |
| Sumitomo Heavy Industries, Ltd. | | | 73,000 | | | | 425,886 | |
| Sumitomo Mitsui Financial Group, Inc. | | | 49,900 | | | | 2,225,796 | |
| Sumitomo Mitsui Trust Holdings, Inc. Sponsored ADR | | | 126,060 | | | | 578,615 | |
| Sumitomo Rubber Industries, Ltd. | | | 15,300 | | | | 237,154 | |
| TDK Corp. | | | 700 | | | | 53,593 | |
| The San-In Godo Bank, Ltd. | | | 8,000 | | | | 77,199 | |
| Toshiba Corp. | | | 24,000 | | | | 82,559 | |
| TOTO, Ltd. | | | 8,000 | | | | 144,201 | |
The accompanying notes are an integral part of these financial statements.
24 Semi-Annual Report
| Description | | Shares | | | Value | |
| | | | | | | |
| Lazard Retirement Global Dynamic Multi Asset Portfolio (continued) | |
| | | | | | | | | |
| West Japan Railway Co. | | | 7,300 | | | $ | 467,341 | |
| | | | | | | | 14,734,921 | |
| Luxembourg | 0.0% | | | | | | | | |
| Grand City Properties SA | | | 3,399 | | | | 59,019 | |
| | | | | | | | | |
| Malta | 0.1% | | | | | | | | |
| Unibet Group PLC SDR | | | 2,015 | | | | 122,750 | |
| | | | | | | | | |
| Netherlands | 0.5% | | | | | | | | |
| Cimpress NV (a) | | | 621 | | | | 52,264 | |
| Euronext NV | | | 4,725 | | | | 186,054 | |
| Koninklijke Ahold NV | | | 2,834 | | | | 53,079 | |
| Koninklijke Vopak NV | | | 1,079 | | | | 54,450 | |
| NN Group NV | | | 5,484 | | | | 154,160 | |
| NXP Semiconductors NV (a) | | | 4,790 | | | | 470,378 | |
| Wolters Kluwer NV | | | 3,127 | | | | 92,888 | |
| | | | | | | | 1,063,273 | |
| New Zealand | 0.3% | | | | | | | | |
| Air New Zealand, Ltd. | | | 41,400 | | | | 71,540 | |
| Fisher & Paykel Healthcare Corp., Ltd., Class C | | | 24,485 | | | | 113,657 | |
| Sky Network Television, Ltd. | | | 81,431 | | | | 331,642 | |
| | | | | | | | 516,839 | |
| Norway | 1.2% | | | | | | | | |
| DNB ASA | | | 3,580 | | | | 59,724 | |
| Statoil ASA | | | 68,241 | | | | 1,219,390 | |
| Telenor ASA | | | 9,501 | | | | 208,186 | |
| Telenor ASA ADR | | | 12,345 | | | | 809,894 | |
| Yara International ASA | | | 1,121 | | | | 58,391 | |
| | | | | | | | 2,355,585 | |
| Singapore | 0.8% | | | | | | | | |
| Ascendas Real Estate Investment Trust | | | 29,200 | | | | 53,334 | |
| Avago Technologies, Ltd. | | | 1,626 | | | | 216,144 | |
| CapitaLand, Ltd. | | | 28,400 | | | | 73,802 | |
| ComfortDelGro Corp., Ltd. | | | 266,000 | | | | 618,168 | |
| DBS Group Holdings, Ltd. | | | 21,600 | | | | 331,814 | |
| United Overseas Bank, Ltd. | | | 21,100 | | | | 361,419 | |
| | | | | | | | 1,654,681 | |
| South Africa | 0.1% | | | | | | | | |
| Mondi PLC | | | 11,332 | | | | 244,112 | |
| | | | | | | | | |
| Spain | 0.7% | | | | | | | | |
| Banco Bilbao Vizcaya Argentaria SA | | | 31,810 | | | | 311,794 | |
| Banco Santander SA | | | 9,294 | | | | 64,904 | |
| Description | | Shares | | | Value | |
| | | | | | | | | |
| Bolsas y Mercados Espanoles SA | | | 4,066 | | | $ | 164,456 | |
| Corporacion Financiera Alba SA | | | 122 | | | | 5,658 | |
| Distribuidora Internacional de Alimentacion SA | | | 52,756 | | | | 402,883 | |
| Iberdrola SA | | | 71,974 | | | | 484,811 | |
| | | | | | | | 1,434,506 | |
| Sweden | 0.5% | | | | | | | | |
| Assa Abloy AB ADR | | | 94,935 | | | | 888,592 | |
| Axfood AB | | | 5,086 | | | | 81,230 | |
| | | | | | | | 969,822 | |
| Switzerland | 1.7% | | | | | | | | |
| Actelion, Ltd. ADR | | | 15,125 | | | | 548,705 | |
| Geberit AG | | | 670 | | | | 223,369 | |
| Glencore PLC | | | 67,037 | | | | 268,912 | |
| Kaba Holding AG | | | 89 | | | | 52,975 | |
| Novartis AG | | | 1,154 | | | | 113,740 | |
| Novartis AG Sponsored ADR | | | 12,235 | | | | 1,203,190 | |
| Roche Holding AG | | | 3,483 | | | | 976,037 | |
| | | | | | | | 3,386,928 | |
| United Kingdom | 7.5% | | | | | | | | |
| Aggreko PLC | | | 3,162 | | | | 71,494 | |
| Aon PLC | | | 7,528 | | | | 750,391 | |
| Bellway PLC | | | 21,936 | | | | 817,556 | |
| BT Group PLC | | | 61,570 | | | | 435,532 | |
| Centrica PLC | | | 193,326 | | | | 801,328 | |
| Compass Group PLC | | | 15,751 | | | | 260,604 | |
| Compass Group PLC Sponsored ADR | | | 42,260 | | | | 707,432 | |
| Debenhams PLC | | | 64,127 | | | | 89,928 | |
| Essentra PLC | | | 7,186 | | | | 112,120 | |
| Greggs PLC | | | 8,926 | | | | 165,915 | |
| Howden Joinery Group PLC | | | 75,559 | | | | 614,387 | |
| HSBC Holdings PLC | | | 34,177 | | | | 306,147 | |
| International Consolidated Airlines Group SA Sponsored ADR (a) | | | 3,767 | | | | 146,291 | |
| ITV PLC | | | 131,766 | | | | 545,129 | |
| J Sainsbury PLC | | | 85,558 | | | | 356,651 | |
| Lloyds Banking Group PLC ADR | | | 13,311 | | | | 72,279 | |
| Moneysupermarket.com Group PLC | | | 26,336 | | | | 120,500 | |
| Next PLC | | | 2,313 | | | | 270,755 | |
| Provident Financial PLC | | | 5,389 | | | | 247,843 | |
| Provident Financial PLC Sponsored ADR | | | 16,045 | | | | 744,135 | |
| Prudential PLC ADR | | | 18,680 | | | | 907,101 | |
| Rentokil Initial PLC | | | 196,464 | | | | 456,867 | |
| Royal Dutch Shell PLC, A Shares | | | 70,017 | | | | 1,980,342 | |
| Shire PLC | | | 1,057 | | | | 84,618 | |
| Shire PLC ADR | | | 3,685 | | | | 889,891 | |
| SSE PLC | | | 1,933 | | | | 46,652 | |
The accompanying notes are an integral part of these financial statements.
Semi-Annual Report 25
| Description | | Shares | | | Value | |
| | | | | | | | | |
| Lazard Retirement Global Dynamic Multi Asset Portfolio (continued) | |
| | | | | | | | | |
| Taylor Wimpey PLC | | | 56,207 | | | $ | 164,090 | |
| Unilever NV | | | 45,217 | | | | 1,883,071 | |
| Unilever PLC | | | 5,485 | | | | 235,280 | |
| Unilever PLC Sponsored ADR | | | 24,172 | | | | 1,038,429 | |
| | | | | | | | 15,322,758 | |
| United States | 38.8% | | | | | | | | |
| 3M Co. | | | 19,540 | | | | 3,015,022 | |
| Advance Auto Parts, Inc. | | | 3,290 | | | | 524,064 | |
| Air Lease Corp. | | | 5,212 | | | | 176,687 | |
| American International Group, Inc. | | | 1,456 | | | | 90,010 | |
| Amgen, Inc. | | | 3,951 | | | | 606,558 | |
| Apple, Inc. | | | 24,238 | | | | 3,040,051 | |
| AT&T, Inc. | | | 50,229 | | | | 1,784,134 | |
| AutoZone, Inc. (a) | | | 979 | | | | 652,895 | |
| Ball Corp. | | | 1,292 | | | | 90,634 | |
| Bank of America Corp. | | | 44,636 | | | | 759,705 | |
| Baxter International, Inc. | | | 1,093 | | | | 76,434 | |
| Biogen, Inc. (a) | | | 838 | | | | 338,502 | |
| Blackbaud, Inc. | | | 979 | | | | 55,754 | |
| Bristol-Myers Squibb Co. | | | 8,440 | | | | 561,598 | |
| CBOE Holdings, Inc. | | | 3,002 | | | | 171,774 | |
| Celgene Corp. (a) | | | 3,781 | | | | 437,594 | |
| Centene Corp. (a) | | | 950 | | | | 76,380 | |
| Charter Communications, Inc., Class A (a) | | | 494 | | | | 84,598 | |
| Chemed Corp. | | | 356 | | | | 46,672 | |
| Cirrus Logic, Inc. (a) | | | 3,788 | | | | 128,906 | |
| Cisco Systems, Inc. | | | 29,135 | | | | 800,047 | |
| Citigroup, Inc. | | | 18,115 | | | | 1,000,673 | |
| Colgate-Palmolive Co. | | | 2,105 | | | | 137,688 | |
| Comcast Corp., Class A | | | 5,251 | | | | 315,795 | |
| CR Bard, Inc. | | | 404 | | | | 68,963 | |
| Credit Acceptance Corp. (a) | | | 670 | | | | 164,941 | |
| CVS Health Corp. | | | 6,655 | | | | 697,976 | |
| DIRECTV (a) | | | 1,081 | | | | 100,306 | |
| Dr Pepper Snapple Group, Inc. | | | 7,576 | | | | 552,290 | |
| DTE Energy Co. | | | 1,219 | | | | 90,986 | |
| E.l. du Pont de Nemours & Co. | | | 18,094 | | | | 1,157,111 | |
| Eastman Chemical Co. | | | 3,693 | | | | 302,161 | |
| Eaton Vance Corp. | | | 13,770 | | | | 538,820 | |
| Edison International | | | 3,214 | | | | 178,634 | |
| Edwards Lifesciences Corp. (a) | | | 875 | | | | 124,626 | |
| EMC Corp. | | | 25,094 | | | | 662,231 | |
| Emerson Electric Co. | | | 1,167 | | | | 64,687 | |
| EOG Resources, Inc. | | | 5,165 | | | | 452,196 | |
| Description | | Shares | | | Value | |
| | | | | | | | | |
| Exelon Corp. | | | 4,815 | | | $ | 151,287 | |
| Facebook, Inc., Class A (a) | | | 3,946 | | | | 338,429 | |
| FactSet Research Systems, Inc. | | | 5,810 | | | | 944,183 | |
| FedEx Corp. | | | 2,526 | | | | 430,430 | |
| Fiserv, Inc. (a) | | | 8,166 | | | | 676,390 | |
| FMC Technologies, Inc. (a) | | | 1,721 | | | | 71,404 | |
| Gilead Sciences, Inc. | | | 3,911 | | | | 457,900 | |
| Global Payments, Inc. | | | 4,123 | | | | 426,524 | |
| Google, Inc., Class A (a) | | | 1,553 | | | | 838,682 | |
| Google, Inc., Class C (a) | | | 1,377 | | | | 716,742 | |
| Halliburton Co. | | | 16,335 | | | | 703,548 | |
| Harley-Davidson, Inc. | | | 9,315 | | | | 524,900 | |
| HCA Holdings, Inc. (a) | | | 6,042 | | | | 548,130 | |
| HealthSouth Corp. | | | 9,727 | | | | 448,026 | |
| Honeywell International, Inc. | | | 13,235 | | | | 1,349,573 | |
| Intel Corp. | | | 30,744 | | | | 935,079 | |
| Intercontinental Exchange, Inc. | | | 3,049 | | | | 681,787 | |
| International Business Machines Corp. | | | 2,685 | | | | 436,742 | |
| International Paper Co. | | | 6,893 | | | | 328,038 | |
| Intuit, Inc. | | | 2,140 | | | | 215,648 | |
| Jack in the Box, Inc. | | | 884 | | | | 77,933 | |
| JetBlue Airways Corp. (a) | | | 8,973 | | | | 186,280 | |
| Johnson & Johnson | | | 40,180 | | | | 3,915,943 | |
| Joy Global, Inc. | | | 8,195 | | | | 296,659 | |
| JPMorgan Chase & Co. | | | 22,792 | | | | 1,544,386 | |
| Kellogg Co. | | | 3,680 | | | | 230,736 | |
| Kimberly-Clark Corp. | | | 16,004 | | | | 1,695,944 | |
| Ladder Capital Corp. REIT | | | 10,848 | | | | 188,213 | |
| Lincoln National Corp. | | | 3,694 | | | | 218,759 | |
| Lockheed Martin Corp. | | | 2,149 | | | | 399,499 | |
| Lowe’s Cos., Inc. | | | 11,310 | | | | 757,431 | |
| Marathon Oil Corp. | | | 20,061 | | | | 532,419 | |
| MasterCard, Inc., Class A | | | 11,810 | | | | 1,103,999 | |
| McDonald’s Corp. | | | 3,060 | | | | 290,914 | |
| McGraw Hill Financial, Inc. | | | 14,019 | | | | 1,408,209 | |
| McKesson Corp. | | | 2,470 | | | | 555,281 | |
| Merck & Co., Inc. | | | 812 | | | | 46,227 | |
| MetLife, Inc. | | | 1,030 | | | | 57,670 | |
| Microsoft Corp. | | | 33,401 | | | | 1,474,654 | |
| Molson Coors Brewing Co., Class B | | | 4,046 | | | | 282,451 | |
| Monsanto Co. | | | 4,556 | | | | 485,624 | |
| Mylan NV (a) | | | 8,449 | | | | 573,349 | |
| NetApp, Inc. | | | 2,566 | | | | 80,983 | |
| NIKE, Inc., Class B | | | 1,843 | | | | 199,081 | |
| Northrop Grumman Corp. | | | 5,144 | | | | 815,993 | |
| O’Reilly Automotive, Inc. (a) | | | 851 | | | | 192,309 | |
| Occidental Petroleum Corp. | | | 4,788 | | | | 372,363 | |
The accompanying notes are an integral part of these financial statements.
26 Semi-Annual Report
| Description | | Shares | | | Value | |
| | | | | | | | | |
| Lazard Retirement Global Dynamic Multi Asset Portfolio (continued) | |
| | | | | | | | | |
| Outerwall, Inc. | | | 3,902 | | | $ | 296,981 | |
| Owens-Illinois, Inc. (a) | | | 8,676 | | | | 199,027 | |
| PepsiCo, Inc. | | | 2,542 | | | | 237,270 | |
| Perrigo Co. PLC | | | 293 | | | | 54,155 | |
| PG&E Corp. | | | 28,969 | | | | 1,422,378 | |
| Philip Morris International, Inc. | | | 1,632 | | | | 130,837 | |
| Pinnacle Entertainment, Inc. (a) | | | 8,901 | | | | 331,829 | |
| Public Service Enterprise Group, Inc. | | | 23,095 | | | | 907,172 | |
| Qualcomm, Inc. | | | 9,658 | | | | 604,881 | |
| Quest Diagnostics, Inc. | | | 775 | | | | 56,203 | |
| Quintiles Transnational Holdings, Inc. (a) | | | 10,345 | | | | 751,151 | |
| Regions Financial Corp. | | | 5,879 | | | | 60,906 | |
| Reynolds American, Inc. | | | 16,729 | | | | 1,248,987 | |
| Rockwell Automation, Inc. | | | 4,075 | | | | 507,908 | |
| Ross Stores, Inc. | | | 14,461 | | | | 702,949 | |
| RPC, Inc. | | | 5,376 | | | | 74,350 | |
| Sanderson Farms, Inc. | | | 1,343 | | | | 100,940 | |
| Schlumberger, Ltd. | | | 8,685 | | | | 748,560 | |
| ServiceMaster Global Holdings, Inc. (a) | | | 12,540 | | | | 453,572 | |
| Six Flags Entertainment Corp. | | | 4,676 | | | | 209,719 | |
| Skyworks Solutions, Inc. | | | 5,611 | | | | 584,105 | |
| Spirit AeroSystems Holdings, Inc., Class A (a) | | | 1,108 | | | | 61,062 | |
| Springleaf Holdings, Inc. (a) | | | 9,230 | | | | 423,749 | |
| Starbucks Corp. | | | 30,858 | | | | 1,654,452 | |
| SUPERVALU, Inc. (a) | | | 16,543 | | | | 133,833 | |
| Synopsys, Inc. (a) | | | 2,311 | | | | 117,052 | |
| Team Health Holdings, Inc. (a) | | | 3,768 | | | | 246,163 | |
| The Boeing Co. | | | 1,661 | | | | 230,414 | |
| The Charles Schwab Corp. | | | 11,475 | | | | 374,659 | |
| The Clorox Co. | | | 2,121 | | | | 220,626 | |
| The Estee Lauder Cos., Inc., Class A | | | 820 | | | | 71,061 | |
| The Hartford Financial Services Group, Inc. | | | 18,500 | | | | 769,045 | |
| The J.M. Smucker Co. | | | 4,090 | | | | 443,397 | |
| The Kroger Co. | | | 15,435 | | | | 1,119,192 | |
| The Southern Co. | | | 5,739 | | | | 240,464 | |
| The TJX Cos., Inc. | | | 10,605 | | | | 701,733 | |
| The Walt Disney Co. | | | 18,895 | | | | 2,156,675 | |
| Thermo Fisher Scientific, Inc. | | | 3,690 | | | | 478,814 | |
| Time Warner, Inc. | | | 9,203 | | | | 804,434 | |
| Tyco International PLC | | | 11,170 | | | | 429,822 | |
| Union Pacific Corp. | | | 4,480 | | | | 427,258 | |
| United Rentals, Inc. (a) | | | 2,927 | | | | 256,464 | |
| United Technologies Corp. | | | 4,080 | | | | 452,594 | |
| UnitedHealth Group, Inc. | | | 16,939 | | | | 2,066,558 | |
| Description | | Shares | | | Value | |
| | | | | | | | | |
| Unum Group | | | 2,466 | | | $ | 88,160 | |
| VeriFone Holdings, Inc. (a) | | | 10,572 | | | | 359,025 | |
| Verizon Communications, Inc. | | | 15,374 | | | | 716,582 | |
| Vertex Pharmaceuticals, Inc. (a) | | | 3,680 | | | | 454,406 | |
| Viacom, Inc., Class B | | | 7,150 | | | | 462,176 | |
| Visa, Inc., Class A | | | 13,222 | | | | 887,857 | |
| Voya Financial, Inc. | | | 11,420 | | | | 530,687 | |
| Wabash National Corp. (a) | | | 18,756 | | | | 235,200 | |
| Waters Corp. (a) | | | 1,529 | | | | 196,293 | |
| Wells Fargo & Co. | | | 21,475 | | | | 1,207,754 | |
| Xcel Energy, Inc. | | | 6,095 | | | | 196,137 | |
| Xerox Corp. | | | 31,460 | | | | 334,734 | |
| Zoetis, Inc. | | | 13,510 | | | | 651,452 | |
| | | | | | | | 79,218,718 | |
| Total Common Stocks | | | | | | | | |
| (Identified cost $150,060,477) | | | | | | | 153,336,350 | |
| Description | | | Security
Currency | | | Principal
Amount
(000) | | | Value | |
| | | | | | | | | | | | | |
| Corporate Bonds | 8.5% | | | | | | | | | | | | |
| | | | | | | | | | | | | |
| Australia | 0.6% | | | | | | | | | | | | |
Telstra Corp., Ltd.,
4.000%, 11/15/17 | | | AUD | | | | 980 | | | $ | 775,933 | |
Toyota Finance Australia, Ltd.,
4.250%, 05/15/19 | | | AUD | | | | 660 | | | | 529,243 | |
| | | | | | | | | | | | 1,305,176 | |
| Canada | 1.4% | | | | | | | | | | | | |
Shaw Communications, Inc.,
5.650%, 10/01/19 | | | CAD | | | | 300 | | | | 273,615 | |
Suncor Energy, Inc.,
6.100%, 06/01/18 | | | USD | | | | 425 | | | | 473,260 | |
The Bank of Nova Scotia,
2.125%, 09/11/19 | | | USD | | | | 1,050 | | | | 1,055,845 | |
| The Toronto-Dominion Bank: | | | | | | | | | | | | |
| 1.824%, 04/03/17 | | | CAD | | | | 590 | | | | 476,776 | |
| 2.250%, 11/05/19 | | | USD | | | | 260 | | | | 260,839 | |
Wells Fargo Financial Canada Corp.,
2.774%, 02/09/17 | | | CAD | | | | 440 | | | | 360,321 | |
| | | | | | | | | | | | 2,900,656 | |
| Chile | 0.3% | | | | | | | | | | | | |
Codelco, Inc.,
4.500%, 08/13/23 | | | USD | | | | 500 | | | | 525,965 | |
The accompanying notes are an integral part of these financial statements.
Semi-Annual Report 27
| Description | | | Security
Currency | | | Principal
Amount
(000) | | | Value | |
| | | | | | | | | | | | | |
| Lazard Retirement Global Dynamic Multi Asset Portfolio (continued) | |
| | | | | | | | | | | | | |
| Denmark | 0.2% | | | | | | | | | | | | |
Carlsberg Breweries A/S,
2.500%, 05/28/24 | | | EUR | | | | 300 | | | $ | 341,659 | |
| | | | | | | | | | | | | |
| France | 0.1% | | | | | | | | | | | | |
Orange SA,
5.375%, 07/08/19 | | | USD | | | | 195 | | | | 216,403 | |
| | | | | | | | | | | | | |
| Italy | 0.2% | | | | | | | | | | | | |
Atlantia SpA,
4.375%, 09/16/25 | | | EUR | | | | 320 | | | | 438,269 | |
| | | | | | | | | | | | | |
| Mexico | 0.2% | | | | | | | | | | | | |
America Movil SAB de CV,
6.450%, 12/05/22 | | | MXN | | | | 7,000 | | | | 430,016 | |
| | | | | | | | | | | | | |
| Netherlands | 0.5% | | | | | | | | | | | | |
BMW Finance NV,
3.375%, 12/14/18 | | | GBP | | | | 370 | | | | 611,569 | |
Deutsche Bahn Finance BV,
3.375%, 09/01/16 | | | NOK | | | | 2,400 | | | | 313,115 | |
| | | | | | | | | | | | 924,684 | |
| New Zealand | 0.1% | | | | | | | | | | | | |
Fonterra Cooperative Group, Ltd.,
5.500%, 02/26/24 | | | AUD | | | | 200 | | | | 168,336 | |
| | | | | | | | | | | | | |
| Norway | 0.3% | | | | | | | | | | | | |
Statoil ASA,
3.700%, 03/01/24 | | | USD | | | | 360 | | | | 371,563 | |
Telenor ASA,
1.750%, 05/22/18 | | | USD | | | | 200 | | | | 200,788 | |
| | | | | | | | | | | | 572,351 | |
| Singapore | 0.4% | | | | | | | | | | | | |
Temasek Financial I, Ltd.,
4.300%, 10/25/19 | | | USD | | | | 750 | | | | 822,355 | |
| | | | | | | | | | | | | |
| United Kingdom | 0.8% | | | | | | | | | | | | |
Abbey National Treasury Services PLC,
5.125%, 04/14/21 | | | GBP | | | | 260 | | | | 472,734 | |
Centrica PLC,
7.000%, 09/19/18 | | | GBP | | | | 100 | | | | 181,470 | |
Rolls-Royce PLC,
6.750%, 04/30/19 | | | GBP | | | | 300 | | | | 555,350 | |
| Description | | | Security
Currency | | | Principal
Amount
(000) | | | Value | |
| | | | | | | | | | | | | |
SSE PLC,
5.000%, 10/01/18 | | | GBP | | | | 300 | | | $ | 514,911 | |
| | | | | | | | | | | | 1,724,465 | |
| United States | 3.4% | | | | | | | | | | | | |
Anheuser-Busch InBev Worldwide, Inc.,
3.650%, 01/15/16 | | | CAD | | | | 865 | | | | 701,322 | |
Apple, Inc.,
3.850%, 05/04/43 | | | USD | | | | 420 | | | | 380,809 | |
BMW US Capital LLC,
2.375%, 12/04/15 | | | NOK | | | | 2,090 | | | | 267,339 | |
Daimler Finance North America LLC,
3.875%, 09/15/21 | | | USD | | | | 280 | | | | 295,998 | |
| General Electric Capital Corp.: | | | | | | | | | | | | |
| 6.500%, 09/28/15 | | | NZD | | | | 20 | | | | 13,639 | |
| 5.500%, 02/01/17 | | | NZD | | | | 245 | | | | 170,996 | |
John Deere Capital Corp.,
2.300%, 09/16/19 | | | USD | | | | 200 | | | | 201,144 | |
Marathon Petroleum Corp.,
3.625%, 09/15/24 | | | USD | | | | 230 | | | | 225,835 | |
Morgan Stanley,
2.500%, 01/24/19 | | | USD | | | | 675 | | | | 680,809 | |
Nestle Holdings, Inc.,
2.500%, 07/10/17 | | | NOK | | | | 4,420 | | | | 576,005 | |
Starbucks Corp.,
6.250%, 08/15/17 | | | USD | | | | 410 | | | | 454,050 | |
| The Goldman Sachs Group, Inc.: | | | | | | | | | | | | |
| 5.200%, 12/17/19 | | | NZD | | | | 935 | | | | 654,270 | |
| 3.625%, 01/22/23 | | | USD | | | | 400 | | | | 396,985 | |
The Home Depot, Inc.,
2.625%, 06/01/22 | | | USD | | | | 495 | | | | 486,973 | |
Union Pacific Corp.,
4.163%, 07/15/22 | | | USD | | | | 500 | | | | 536,363 | |
Valero Energy Corp.,
6.125%, 02/01/20 | | | USD | | | | 199 | | | | 227,103 | |
Verizon Communications, Inc.,
1.350%, 06/09/17 | | | USD | | | | 420 | | | | 419,342 | |
Yum! Brands, Inc.,
3.750%, 11/01/21 | | | USD | | | | 180 | | | | 181,008 | |
| | | | | | | | | | | | 6,869,990 | |
Total Corporate Bonds
(Identified cost $17,913,956) | | | | | | | | | | | 17,240,325 | |
The accompanying notes are an integral part of these financial statements.
28 Semi-Annual Report
| Description | | | Security
Currency | | | Principal
Amount
(000) | | | Value | |
| | | | | | | | | | | | | |
| Lazard Retirement Global Dynamic Multi Asset Portfolio (continued) | |
| | | | | | | | | | | | | |
| Foreign Government Obligations | 10.1% | | | | | |
| | | | | | | | | | | | | |
| Australia | 0.8% | | | | | | | | | | | | |
| Queensland Treasury Corp.: | | | | | | | | | | | | |
| 5.500%, 06/21/21 | | | AUD | | | | 725 | | | $ | 635,188 | |
| 4.250%, 07/21/23 | | | AUD | | | | 375 | | | | 307,084 | |
Treasury Corp. of Victoria,
6.000%, 10/17/22 | | | AUD | | | | 780 | | | | 720,727 | |
| | | | | | | | | | | | 1,662,999 | |
| Bahamas | 0.5% | | | | | | | | | | | | |
| Commonwealth of Bahamas: | | | | | | | | | | | | |
| 5.750%, 01/16/24 | | | USD | | | | 650 | | | | 705,250 | |
| 6.950%, 11/20/29 | | | USD | | | | 345 | | | | 406,237 | |
| | | | | | | | | | | | 1,111,487 | |
| Bermuda | 0.5% | | | | | | | | | | | | |
Government of Bermuda,
5.603%, 07/20/20 | | | USD | | | | 840 | | | | 932,400 | |
| | | | | | | | | | | | | |
| Canada | 1.8% | | | | | | | | | | | | |
Province of Alberta,
4.000%, 12/01/19 | | | CAD | | | | 1,640 | | | | 1,466,244 | |
Province of British Columbia,
3.700%, 12/18/20 | | | CAD | | | | 1,095 | | | | 977,820 | |
Province of Ontario,
2.450%, 06/29/22 | | | USD | | | | 685 | | | | 684,728 | |
Province of Quebec,
3.500%, 07/29/20 | | | USD | | | | 475 | | | | 508,662 | |
| | | | | | | | | | | | 3,637,454 | |
| Chile | 0.3% | | | | | | | | | | | | |
Republic of Chile,
1.625%, 01/30/25 | | | EUR | | | | 600 | | | | 655,487 | |
| | | | | | | | | | | | | |
| Colombia | 0.2% | | | | | | | | | | | | |
Republic of Colombia,
2.625%, 03/15/23 | | | USD | | | | 450 | | | | 412,200 | |
| | | | | | | | | | | | | |
| France | 0.2% | | | | | | | | | | | | |
Government of France,
2.500%, 05/25/30 | | | EUR | | | | 370 | | | | 455,950 | |
| | | | | | | | | | | | | |
| Ireland | 0.8% | | | | | | | | | | | | |
| Irish Treasury: | | | | | | | | | | | | |
| 3.400%, 03/18/24 | | | EUR | | | | 730 | | | | 939,090 | |
| 2.400%, 05/15/30 | | | EUR | | | | 625 | | | | 721,086 | |
| | | | | | | | | | | | 1,660,176 | |
| Description | | | Security
Currency | | | Principal
Amount
(000) | | | Value | |
| | | | | | | | | | | | | |
| Mexico | 1.2% | | | | | | | | | | | | |
Mexican Bonos,
4.750%, 06/14/18 | | | MXN | | | | 23,180 | | | $ | 1,480,784 | |
United Mexican States,
6.750%, 02/06/24 | | | GBP | | | | 460 | | | | 894,434 | |
| | | | | | | | | | | | 2,375,218 | |
| New Zealand | 0.4% | | | | | | | | | | | | |
New Zealand Government Bond,
3.000%, 04/15/20 | | | NZD | | | | 1,260 | | | | 850,798 | |
| | | | | | | | | | | | | |
| Norway | 0.6% | | | | | | | | | | | | |
| Oslo Kommune: | | | | | | | | | | | | |
| 4.900%, 11/04/19 | | | NOK | | | | 2,000 | | | | 287,098 | |
| 3.550%, 02/12/21 | | | NOK | | | | 4,000 | | | | 546,601 | |
| 2.400%, 02/13/30 | | | NOK | | | | 4,000 | | | | 485,703 | |
| | | | | | | | | | | | 1,319,402 | |
| Panama | 0.3% | | | | | | | | | | | | |
Republic of Panama,
4.000%, 09/22/24 | | | USD | | | | 600 | | | | 606,750 | |
| | | | | | | | | | | | | |
| Poland | 0.8% | | | | | | | | | | | | |
Poland Government Bond,
2.010%, 01/25/21 | | | PLN | | | | 3,890 | | | | 1,020,194 | |
Republic of Poland,
3.000%, 03/17/23 | | | USD | | | | 730 | | | | 716,714 | |
| | | | | | | | | | | | 1,736,908 | |
| Singapore | 0.4% | | | | | | | | | | | | |
Singapore Government Bond,
3.000%, 09/01/24 | | | SGD | | | | 1,010 | | | | 772,770 | |
| | | | | | | | | | | | | |
| Slovakia | 0.1% | | | | | | | | | | | | |
Slovak Republic,
4.375%, 05/21/22 | | | USD | | | | 200 | | | | 219,488 | |
| | | | | | | | | | | | | |
| Spain | 0.1% | | | | | | | | | | | | |
Spain Government Bond,
1.950%, 07/30/30 | | | EUR | | | | 130 | | | | 129,930 | |
| | | | | | | | | | | | | |
| Sweden | 0.3% | | | | | | | | | | | | |
Svensk Exportkredit AB,
1.875%, 12/21/18 | | | GBP | | | | 335 | | | | 536,473 | |
| | | | | | | | | | | | | |
| United Kingdom | 0.8% | | | | | | | | | | | | |
| United Kingdom Treasury: | | | | | | | | | | | | |
| 1.750%, 07/22/19 | | | GBP | | | | 350 | | | | 559,490 | |
| 2.250%, 09/07/23 | | | GBP | | | | 615 | | | | 988,930 | |
| | | | | | | | | | | | 1,548,420 | |
The accompanying notes are an integral part of these financial statements.
Semi-Annual Report 29
| Description | | | Security
Currency | | | Principal
Amount
(000) | | | Value | |
| | | | | | | | | | | | | |
| Lazard Retirement Global Dynamic Multi Asset Portfolio (continued) | |
| | | | | | | | | | | | | |
Total Foreign Government Obligations
(Identified cost $21,584,830) | | | | | | | $ | 20,624,310 | |
| | | | | | | | | | | | | |
| Quasi Government Bonds | 0.5% | | | | | | | | |
| | | | | | | | | | | | | |
| Canada | 0.4% | | | | | | | | | | | | |
Canada Housing Trust No. 1,
2.400%, 12/15/22 | | | CAD | | | | 600 | | | | 501,478 | |
Hydro-Quebec,
9.625%, 07/15/22 | | | CAD | | | | 243 | | | | 291,608 | |
| | | | | | | | | | | | 793,086 | |
| Germany | 0.1% | | | | | | | | | | | | |
KfW,
2.875%, 10/12/16 | | | NOK | | | | 980 | | | | 127,799 | |
Landeskreditbank Baden- Wuerttemberg Foerderbank,
3.000%, 05/22/17 | | | NOK | | | | 1,180 | | | | 155,438 | |
| | | | | | | | | | | | 283,237 | |
Total Quasi Government Bonds
(Identified cost $1,183,071) | | | | | | | | | | | 1,076,323 | |
| | | | | | | | | | | | | |
| Supranationals | 0.9% | | | | | | | | | | | | |
Asian Development Bank,
2.125%, 03/19/25 | | | USD | | | | 335 | | | | 323,596 | |
Corporacion Andina de Fomento,
4.375%, 06/15/22 | | | USD | | | | 740 | | | | 799,154 | |
Inter-American Development Bank,
6.000%, 12/15/17 | | | NZD | | | | 375 | | | | 270,346 | |
International Bank for Reconstruction & Development,
1.375%, 06/23/19 | | | SEK | | | | 3,760 | | | | 471,347 | |
| | | | | | | | | | | | | |
Total Supranationals
(Identified cost $1,957,950) | | | | | | | | | | | 1,864,443 | |
| | | | | | | | | | | | | |
| US Municipal Bonds | 0.6% | | | | | | | | | | | | |
| | | | | | | | | | | | | |
| New Jersey | 0.1% | | | | | | | | | | | | |
New Jersey State Transportation Trust Fund Authority Build America Bond Series C,
5.754%, 12/15/28 | | | USD | | | | 100 | | | | 105,070 | |
| Description | | | Security
Currency | | | Principal
Amount
(000) | | | Value | |
| | | | | | | | | | | | | |
| Pennsylvania | 0.0% | | | | | | | | | | | | |
Pennsylvania State Build America Bond Third Series B,
5.850%, 07/15/30 | | | USD | | | | 50 | | | $ | 56,178 | |
| | | | | | | | | | | | | |
| Texas | 0.1% | | | | | | | | | | | | |
Texas State Build America Bond Series A,
4.123%, 04/01/25 | | | USD | | | | 100 | | | | 108,735 | |
| | | | | | | | | | | | | |
| Utah | 0.3% | | | | | | | | | | | | |
| Utah State Build America Bonds: | | | | | | | | | | | | |
| Series B, 3.539%, 07/01/25 | | | USD | | | | 295 | | | | 307,142 | |
| Series D, 4.554%, 07/01/24 | | | USD | | | | 460 | | | | 509,648 | |
| | | | | | | | | | | | 816,790 | |
| Wisconsin | 0.1% | | | | | | | | | | | | |
Wisconsin State Build America Bond Series D,
5.400%, 05/01/28 | | | USD | | | | 175 | | | | 191,319 | |
| | | | | | | | | | | | | |
Total US Municipal Bonds
(Identified cost $1,296,556) | | | | | | | | | | | 1,278,092 | |
| | | | | | | | | | | | | |
| Description | | | | | | Shares | | | | Value | |
| | | | | | | | | | | | | |
| Short-Term Investment | 3.5% | | | | | | | | | | | | |
State Street Institutional Treasury Money Market Fund
(Identified cost $7,139,271) | | | | | | | 7,139,271 | | | $ | 7,139,271 | |
| | | | | | | | | | | | | |
Total Investments | 99.3%
(Identified cost $201,136,111) (b), (e) | | | | | | | | | | $ | 202,559,114 | |
| | | | | | | | | | | | | |
Cash and Other Assets in Excess
of Liabilities | 0.7% | | | | | | | | | | | 1,457,394 | |
| | | | | | | | | | | | | |
| Net Assets | 100.0% | | | | | | | | | | $ | 204,016,508 | |
The accompanying notes are an integral part of these financial statements.
30 Semi-Annual Report
Lazard Retirement Global Dynamic Multi Asset Portfolio (continued)
Forward Currency Contracts open at June 30, 2015:
| Currency | | Counterparty | | Expiration
Date | | Foreign
Currency Amount | | U.S. $ Cost
on Origination
Date | | U.S. $
Current
Value | | Unrealized
Appreciation | | Unrealized
Depreciation |
| | | | | | | | | | | | | | | | | | | | | |
| Forward Currency Purchase Contracts | | | | | | | | | | | | | | | | | | | | |
| AUD | | | CAN | | | 08/19/15 | | | 284,837 | | | | $ | 228,867 | | | | $ | 219,194 | | | | $ | — | | | | $ | 9,673 | |
| AUD | | | CAN | | | 08/19/15 | | | 1,654,268 | | | | | 1,279,841 | | | | | 1,273,024 | | | | | — | | | | | 6,817 | |
| CAD | | | RBC | | | 08/19/15 | | | 668,584 | | | | | 536,917 | | | | | 534,955 | | | | | — | | | | | 1,962 | |
| CAD | | | RBC | | | 08/19/15 | | | 1,564,972 | | | | | 1,279,304 | | | | | 1,252,185 | | | | | — | | | | | 27,119 | |
| CZK | | | CIT | | | 08/19/15 | | | 10,331,135 | | | | | 431,390 | | | | | 422,603 | | | | | — | | | | | 8,787 | |
| DKK | | | CIT | | | 08/19/15 | | | 719,955 | | | | | 107,859 | | | | | 107,733 | | | | | — | | | | | 126 | |
| EUR | | | CIT | | | 08/19/15 | | | 117,085 | | | | | 131,030 | | | | | 130,617 | | | | | — | | | | | 413 | |
| EUR | | | CIT | | | 08/19/15 | | | 5,439,616 | | | | | 6,197,300 | | | | | 6,068,277 | | | | | — | | | | | 129,023 | |
| EUR | | | HSB | | | 07/08/15 | | | 1,158,841 | | | | | 1,289,999 | | | | | 1,292,043 | | | | | 2,044 | | | | | — | |
| EUR | | | HSB | | | 08/19/15 | | | 483,399 | | | | | 543,527 | | | | | 539,266 | | | | | — | | | | | 4,261 | |
| EUR | | | HSB | | | 08/19/15 | | | 1,027,575 | | | | | 1,119,999 | | | | | 1,146,332 | | | | | 26,333 | | | | | — | |
| EUR | | | HSB | | | 08/19/15 | | | 1,270,199 | | | | | 1,428,194 | | | | | 1,416,997 | | | | | — | | | | | 11,197 | |
| EUR | | | HSB | | | 08/19/15 | | | 2,487,956 | | | | | 2,835,710 | | | | | 2,775,491 | | | | | — | | | | | 60,219 | |
| GBP | | | CIT | | | 08/19/15 | | | 471,503 | | | | | 743,522 | | | | | 740,600 | | | | | — | | | | | 2,922 | |
| GBP | | | HSB | | | 08/19/15 | | | 446,882 | | | | | 700,416 | | | | | 701,928 | | | | | 1,512 | | | | | — | |
| GBP | | | SSB | | | 07/08/15 | | | 709,992 | | | | | 1,084,520 | | | | | 1,115,526 | | | | | 31,006 | | | | | — | |
| JPY | | | CIT | | | 08/19/15 | | | 107,965,537 | | | | | 879,800 | | | | | 882,668 | | | | | 2,868 | | | | | — | |
| JPY | | | CIT | | | 08/19/15 | | | 672,761,398 | | | | | 5,644,848 | | | | | 5,500,135 | | | | | — | | | | | 144,713 | |
| JPY | | | HSB | | | 07/08/15 | | | 148,510,731 | | | | | 1,184,362 | | | | | 1,213,554 | | | | | 29,192 | | | | | — | |
| JPY | | | HSB | | | 08/19/15 | | | 183,695,887 | | | | | 1,540,633 | | | | | 1,501,798 | | | | | — | | | | | 38,835 | |
| KRW | | | HSB | | | 09/30/15 | | | 179,622,650 | | | | | 161,212 | | | | | 160,707 | | | | | — | | | | | 505 | |
| MXN | | | HSB | | | 08/19/15 | | | 5,388,006 | | | | | 353,757 | | | | | 341,642 | | | | | — | | | | | 12,115 | |
| NOK | | | CIT | | | 08/19/15 | | | 6,676,698 | | | | | 856,976 | | | | | 850,630 | | | | | — | | | | | 6,346 | |
| NOK | | | HSB | | | 08/19/15 | | | 4,361,302 | | | | | 590,709 | | | | | 555,642 | | | | | — | | | | | 35,067 | |
| SEK | | | CIT | | | 08/19/15 | | | 292,653 | | | | | 35,720 | | | | | 35,337 | | | | | — | | | | | 383 | |
| SGD | | | SCB | | | 08/19/15 | | | 9,125 | | | | | 6,904 | | | | | 6,770 | | | | | — | | | | | 134 | |
| Total Forward Currency Purchase Contracts | | | | | $ | 31,193,316 | | | | $ | 30,785,654 | | | | $ | 92,955 | | | | $ | 500,617 | |
| Forward Currency Sale Contracts | | | | | | | | | | | | | | | | | | | | | | | | |
| AUD | | | CAN | | | 08/19/15 | | | 464 | | | | $ | 354 | | | | $ | 356 | | | | $ | — | | | | $ | 2 | |
| AUD | | | CAN | | | 08/19/15 | | | 78,914 | | | | | 60,086 | | | | | 60,728 | | | | | — | | | | | 642 | |
| AUD | | | CAN | | | 08/19/15 | | | 180,547 | | | | | 145,300 | | | | | 138,938 | | | | | 6,362 | | | | | — | |
| AUD | | | CAN | | | 08/19/15 | | | 4,581,638 | | | | | 3,681,346 | | | | | 3,525,749 | | | | | 155,597 | | | | | — | |
| AUD | | | CIT | | | 08/19/15 | | | 218,636 | | | | | 168,300 | | | | | 168,249 | | | | | 51 | | | | | — | |
| AUD | | | HSB | | | 07/08/15 | | | 873,199 | | | | | 665,081 | | | | | 673,485 | | | | | — | | | | | 8,404 | |
| AUD | | | SSB | | | 07/08/15 | | | 2,743,445 | | | | | 2,089,613 | | | | | 2,115,976 | | | | | — | | | | | 26,363 | |
| CAD | | | CIT | | | 08/19/15 | | | 302,838 | | | | | 245,600 | | | | | 242,310 | | | | | 3,290 | | | | | — | |
| CAD | | | HSB | | | 07/08/15 | | | 3,667,638 | | | | | 2,940,132 | | | | | 2,936,218 | | | | | 3,914 | | | | | — | |
| CAD | | | RBC | | | 08/19/15 | | | 61,550 | | | | | 50,673 | | | | | 49,248 | | | | | 1,425 | | | | | — | |
| CAD | | | RBC | | | 08/19/15 | | | 6,386,984 | | | | | 5,258,336 | | | | | 5,110,431 | | | | | 147,905 | | | | | — | |
| CAD | | | SSB | | | 07/08/15 | | | 455,213 | | | | | 364,818 | | | | | 364,432 | | | | | 386 | | | | | — | |
| CZK | | | CIT | | | 08/19/15 | | | 2,775,719 | | | | | 115,904 | | | | | 113,543 | | | | | 2,361 | | | | | — | |
| CZK | | | CIT | | | 08/19/15 | | | 3,642,499 | | | | | 152,097 | | | | | 148,999 | | | | | 3,098 | | | | | — | |
The accompanying notes are an integral part of these financial statements.
Semi-Annual Report 31
Lazard Retirement Global Dynamic Multi Asset Portfolio (concluded)
Forward Currency Contracts open at June 30, 2015 (concluded):
| Currency | | Counterparty | | Expiration
Date | | Foreign
Currency Amount | | U.S. $ Cost
on Origination
Date | | U.S. $
Current
Value | | Unrealized
Appreciation | | Unrealized
Depreciation |
| | | | | | | | | | | | | | | | | | | | | | | | |
| Forward Currency Sale Contracts (concluded) | | | | | | | | | | | | | | | | | | | | | |
| DKK | | | CIT | | | 08/19/15 | | | 195,333 | | | | $ | 29,444 | | | | $ | 29,229 | | | | $ | 215 | | | | $ | — | |
| DKK | | | CIT | | | 08/19/15 | | | 524,622 | | | | | 79,966 | | | | | 78,504 | | | | | 1,462 | | | | | — | |
| EUR | | | CIT | | | 08/19/15 | | | 202,358 | | | | | 228,858 | | | | | 225,745 | | | | | 3,113 | | | | | — | |
| EUR | | | CIT | | | 08/19/15 | | | 245,703 | | | | | 281,084 | | | | | 274,099 | | | | | 6,985 | | | | | — | |
| EUR | | | CIT | | | 08/19/15 | | | 492,820 | | | | | 549,253 | | | | | 549,776 | | | | | — | | | | | 523 | |
| EUR | | | CIT | | | 08/19/15 | | | 500,200 | | | | | 564,451 | | | | | 558,009 | | | | | 6,442 | | | | | — | |
| EUR | | | CIT | | | 08/19/15 | | | 1,909,804 | | | | | 2,147,000 | | | | | 2,130,522 | | | | | 16,478 | | | | | — | |
| EUR | | | HSB | | | 08/19/15 | | | 335,612 | | | | | 378,597 | | | | | 374,399 | | | | | 4,198 | | | | | — | |
| EUR | | | HSB | | | 08/19/15 | | | 759,336 | | | | | 838,800 | | | | | 847,093 | | | | | — | | | | | 8,293 | |
| EUR | | | HSB | | | 08/19/15 | | | 1,436,354 | | | | | 1,630,700 | | | | | 1,602,355 | | | | | 28,345 | | | | | — | |
| GBP | | | CIT | | | 08/19/15 | | | 122,945 | | | | | 193,430 | | | | | 193,113 | | | | | 317 | | | | | — | |
| GBP | | | CIT | | | 08/19/15 | | | 408,385 | | | | | 632,200 | | | | | 641,460 | | | | | — | | | | | 9,260 | |
| GBP | | | CIT | | | 08/19/15 | | | 1,640,357 | | | | | 2,570,160 | | | | | 2,576,546 | | | | | — | | | | | 6,386 | |
| GBP | | | HSB | | | 08/19/15 | | | 354,504 | | | | | 548,400 | | | | | 556,828 | | | | | — | | | | | 8,428 | |
| GBP | | | SSB | | | 07/08/15 | | | 424,755 | | | | | 648,818 | | | | | 667,368 | | | | | — | | | | | 18,550 | |
| JPY | | | CIT | | | 08/19/15 | | | 13,444,122 | | | | | 107,000 | | | | | 109,912 | | | | | — | | | | | 2,912 | |
| JPY | | | CIT | | | 08/19/15 | | | 155,098,518 | | | | | 1,255,400 | | | | | 1,268,002 | | | | | — | | | | | 12,602 | |
| JPY | | | SSB | | | 07/08/15 | | | 103,550,466 | | | | | 825,718 | | | | | 846,162 | | | | | — | | | | | 20,444 | |
| MXN | | | CIT | | | 08/19/15 | | | 1,759,935 | | | | | 113,700 | | | | | 111,594 | | | | | 2,106 | | | | | — | |
| MXN | | | HSB | | | 08/19/15 | | | 24,461,519 | | | | | 1,606,056 | | | | | 1,551,056 | | | | | 55,000 | | | | | — | |
| MXN | | | JPM | | | 08/19/15 | | | 87,937 | | | | | 5,772 | | | | | 5,576 | | | | | 196 | | | | | — | |
| NOK | | | CIT | | | 08/19/15 | | | 429,429 | | | | | 54,500 | | | | | 54,710 | | | | | — | | | | | 210 | |
| NOK | | | HSB | | | 08/19/15 | | | 2,154,737 | | | | | 276,341 | | | | | 274,520 | | | | | 1,821 | | | | | — | |
| NOK | | | HSB | | | 08/19/15 | | | 28,388,710 | | | | | 3,845,932 | | | | | 3,616,801 | | | | | 229,131 | | | | | — | |
| NZD | | | BRC | | | 08/19/15 | | | 1,544,008 | | | | | 1,147,151 | | | | | 1,041,970 | | | | | 105,181 | | | | | — | |
| NZD | | | CAN | | | 08/19/15 | | | 942,751 | | | | | 700,653 | | | | | 636,214 | | | | | 64,439 | | | | | — | |
| NZD | | | CIT | | | 08/19/15 | | | 85,107 | | | | | 59,100 | | | | | 57,434 | | | | | 1,666 | | | | | — | |
| PLN | | | HSB | | | 08/19/15 | | | 3,457,754 | | | | | 973,959 | | | | | 918,456 | | | | | 55,503 | | | | | — | |
| SEK | | | CIT | | | 08/19/15 | | | 561,356 | | | | | 68,200 | | | | | 67,782 | | | | | 418 | | | | | — | |
| SEK | | | CIT | | | 08/19/15 | | | 1,124,000 | | | | | 135,491 | | | | | 135,720 | | | | | — | | | | | 229 | |
| SGD | | | SCB | | | 08/19/15 | | | 1,074,069 | | | | | 812,627 | | | | | 796,891 | | | | | 15,736 | | | | | — | |
| Total Forward Currency Sale Contracts | | | | $ | 39,246,401 | | | | $ | 38,446,508 | | | | | 923,141 | | | | | 123,248 | |
| Gross unrealized appreciation/depreciation on Forward Currency Purchase and Sale Contracts | | | | $ | 1,016,096 | | | | $ | 623,865 | |
The accompanying notes are an integral part of these financial statements.
32 Semi-Annual Report
Lazard Retirement Series, Inc. Notes to Portfolios of Investments June 30, 2015 (unaudited)
| (a) | Non-income producing security. |
| (b) | For federal income tax purposes, the aggregate cost, aggregate gross unrealized appreciation, aggregate gross unrealized depreciation and the net unrealized appreciation (depreciation) were as follows: |
| Portfolio | | Aggregate
Cost | | | Aggregate Gross
Unrealized
Appreciation | | | Aggregate Gross
Unrealized
Depreciation | | | Net Unrealized
Appreciation
(Depreciation) | | |
| | | | | | | | | | | | | | |
| US Strategic Equity | | $ | 11,799,305 | | | $ | 980,629 | | | $ | 343,503 | | | $ | 637,126 | | |
| US Small-Mid Cap Equity | | | 60,071,953 | | | | 10,411,073 | | | | 2,256,905 | | | | 8,154,168 | | |
| International Equity | | | 593,232,627 | | | | 149,675,419 | | | | 18,466,777 | | | | 131,208,642 | | |
| Emerging Markets Equity | | | 1,112,173,045 | | | | 151,624,531 | | | | 195,989,779 | | | | (44,365,248 | ) | |
| Global Dynamic Multi Asset | | | 201,136,111 | | | | 8,443,936 | | | | 7,020,933 | | | | 1,423,003 | | |
| (c) | Security valued using Level 2 inputs, based on reference to a similar security which was trading on an active market, under accounting principles generally accepted in the United States of America (“GAAP”) hierarchy – see Note 8. |
| (d) | Pursuant to Rule 144A under the Securities Act of 1933, these securities may only be traded among “qualified institutional buyers.” At June 30, 2015, these securities amounted to 1.1% of net assets of Emerging Markets Equity Portfolio, and are considered to be liquid. |
| (e) | The Portfolio, at all times, maintains portfolio securities in sufficient amount to cover its obligations related to investments in forward currency contracts. |
Security Abbreviations:
| ADR | — | American Depositary Receipt | | | |
| GDR | — | Global Depositary Receipt | | | |
| OJSC | — | Open Joint Stock Company | | | |
| PJSC | — | Public Joint Stock Company | | | |
| REIT | — | Real Estate Investment Trust | | | |
| SDR | — | Swedish Depositary Receipt | | | |
| | | | | | |
| Currency Abbreviations: | | | |
| AUD | — | Australian Dollar | MXN | — | Mexican New Peso |
| CAD | — | Canadian Dollar | NOK | — | Norwegian Krone |
| CZK | — | Czech Koruna | NZD | — | New Zealand Dollar |
| DKK | — | Danish Krone | PLN | — | Polish Zloty |
| EUR | — | Euro | SEK | — | Swedish Krone |
| GBP | — | British Pound Sterling | SGD | — | Singapore Dollar |
| JPY | — | Japanese Yen | USD | — | United States Dollar |
| KRW | — | South Korean Won | | | |
| | | | | | |
| Counterparty Abbreviations: | | | |
| BRC | — | Barclays Bank PLC | JPM | — | JPMorgan Chase Bank NA |
| CAN | — | Canadian Imperial Bank of Commerce | RBC | — | Royal Bank of Canada |
| CIT | — | Citibank NA | SCB | — | Standard Chartered Bank |
| HSB | — | HSBC Bank USA NA | SSB | — | State Street Bank and Trust Co. |
The accompanying notes are an integral part of these financial statements.
Semi-Annual Report 33
Portfolio holdings by industry (as a percentage of net assets), for those Portfolios previously presented by country:
| Industry* | | Lazard
Retirement
International
Equity
Portfolio | | Lazard
Retirement
Emerging
Markets Equity
Portfolio | | Lazard
Retirement Global
Dynamic
Multi Asset
Portfolio |
| Aerospace & Defense | | | — | % | | | — | % | | | 0.4 | % | |
| Agriculture | | | — | | | | — | | | | 0.3 | | |
| Alcohol & Tobacco | | | 7.5 | | | | 4.4 | | | | 2.2 | | |
| Automotive | | | 3.6 | | | | 3.1 | | | | 2.4 | | |
| Banking | | | 7.3 | | | | 23.0 | | | | 6.7 | | |
| Cable Television | | | — | | | | — | | | | 0.6 | | |
| Chemicals | | | — | | | | 0.7 | | | | 1.3 | | |
| Commercial Services | | | 1.6 | | | | 3.3 | | | | 2.8 | | |
| Computer Software | | | — | | | | 5.2 | | | | 1.0 | | |
| Construction & Engineering | | | 1.4 | | | | — | | | | 0.6 | | |
| Consumer Products | | | 0.8 | | | | — | | | | 0.2 | | |
| Diversified | | | 1.0 | | | | 0.9 | | | | — | | |
| Electric | | | 0.9 | | | | 0.6 | | | | 2.4 | | |
| Energy Exploration & Production | | | 0.9 | | | | 3.4 | | | | 1.6 | | |
| Energy Integrated | | | 3.9 | | | | 4.1 | | | | 2.8 | | |
| Energy Services | | | — | | | | — | | | | 0.8 | | |
| Financial Services | | | 6.8 | | | | 2.6 | | | | 6.4 | | |
| Food & Beverages | | | — | | | | 0.4 | | | | 1.3 | | |
| Forest & Paper Products | | | 1.5 | | | | 0.8 | | | | 1.2 | | |
| Gas Utilities | | | — | | | | — | | | | 0.6 | | |
| Health Services | | | — | | | | — | | | | 2.3 | | |
| Household & Personal Products | | | 1.2 | | | | 2.2 | | | | 1.8 | | |
| Housing | | | 4.0 | | | | 1.1 | | | | 2.0 | | |
| Insurance | | | 7.6 | | | | 3.3 | | | | 3.5 | | |
| Leisure & Entertainment | | | 6.2 | | | | 0.7 | | | | 4.6 | | |
| Machinery | | | — | | | | — | | | | 0.1 | | |
| Manufacturing | | | 4.0 | | | | 3.6 | | | | 5.3 | | |
| Medical Products | | | — | | | | — | | | | 0.7 | | |
| Metals & Glass Containers | | | — | | | | — | | | | 0.1 | | |
| Metals & Mining | | | 1.4 | | | | 2.2 | | | | 0.8 | | |
| Pharmaceutical & Biotechnology | | | 12.2 | | | | — | | | | 7.5 | | |
| Real Estate | | | — | | | | — | | | | 1.8 | | |
| Retail | | | 4.9 | | | | 4.8 | | | | 4.8 | | |
| Semiconductors & Components | | | 2.5 | | | | 8.6 | | | | 2.2 | | |
| Technology | | | 5.0 | | | | 3.6 | | | | 1.0 | | |
| Technology Hardware | | | 1.1 | | | | 1.1 | | | | 3.0 | | |
| Telecommunications | | | 7.0 | | | | 10.4 | | | | 4.5 | | |
| Transportation | | | 2.5 | | | | 2.1 | | | | 2.6 | | |
| Subtotal | | | 96.8 | | | | 96.2 | | | | 84.2 | | |
| Foreign Government Obligations | | | — | | | | — | | | | 10.1 | | |
| Supranationals | | | — | | | | — | | | | 0.9 | | |
| US Municipal Bonds | | | — | | | | — | | | | 0.6 | | |
| Short-Term Investments | | | 4.3 | | | | 3.4 | | | | 3.5 | | |
| Total Investments | | | 101.1 | % | | | 99.6 | % | | | 99.3 | % | |
* Industry classifications may be different than those used for compliance monitoring purposes.
The accompanying notes are an integral part of these financial statements.
34 Semi-Annual Report
[This page intentionally left blank]
Semi-Annual Report 35
Lazard Retirement Series, Inc. Statements of Assets and Liabilities (unaudited)
| | | Lazard | | Lazard |
| | | Retirement | | Retirement |
| | | US Strategic | | US Small-Mid Cap |
| June 30, 2015 | | Equity Portfolio | | Equity Portfolio |
| ASSETS | | | | | | | | | |
| Investments in securities, at value | | | $ | 12,436,431 | | | $ | 68,226,121 | |
| Foreign currency | | | | — | | | | — | |
| Receivables for: | | | | | | | | | |
| Dividends and interest | | | | 19,762 | | | | 53,867 | |
| Investments sold | | | | 27,409 | | | | 537,772 | |
| Capital stock sold | | | | 9,339 | | | | 91,817 | |
| Amount due from Investment Manager (Note 3) | | | | 4,904 | | | | — | |
| Gross unrealized appreciation on forward currency contracts | | | | — | | | | — | |
| Total assets | | | | 12,497,845 | | | | 68,909,577 | |
| | | | | | | | | | |
| LIABILITIES | | | | | | | | | |
| Payables for: | | | | | | | | | |
| Management fees | | | | — | | | | 40,970 | |
| Accrued distribution fees | | | | 2,615 | | | | 14,151 | |
| Accrued directors’ fees | | | | 123 | | | | 629 | |
| Capital stock redeemed | | | | 2,582 | | | | 112,694 | |
| Investments purchased | | | | 23,379 | | | | 91,200 | |
| Gross unrealized depreciation on forward currency contracts | | | | — | | | | — | |
| Other accrued expenses and payables | | | | 37,344 | | | | 33,776 | |
| Total liabilities | | | | 66,043 | | | | 293,420 | |
| Net assets | | | $ | 12,431,802 | | | $ | 68,616,157 | |
| | | | | | | | | | |
| NET ASSETS | | | | | | | | | |
| Paid in capital | | | $ | 10,970,923 | | | $ | 53,498,838 | |
| Undistributed (distributions in excess of) net investment income (loss) | | | | 39,567 | | | | (84,365 | ) |
| Accumulated net realized gain (loss) | | | | 784,186 | | | | 7,047,516 | |
| Net unrealized appreciation (depreciation) on: | | | | | | | | | |
| Investments | | | | 637,126 | | | | 8,154,168 | |
| Foreign currency and forward currency contracts | | | | — | | | | — | |
| Net assets | | | $ | 12,431,802 | | | $ | 68,616,157 | |
| | | | | | | | | | |
| Service Shares | | | | | | | | | |
| Net assets | | | $ | 12,431,802 | | | $ | 68,616,157 | |
| Shares of capital stock outstanding* | | | | 1,028,134 | | | | 7,891,765 | |
| Net asset value, offering and redemption price per share | | | $ | 12.09 | | | $ | 8.69 | |
| | | | | | | | | | |
| Investor Shares | | | | | | | | | |
| Net assets | | | | — | | | | — | |
| Shares of capital stock outstanding* | | | | — | | | | — | |
| Net asset value, offering and redemption price per share | | | | — | | | | — | |
| | | | | | | | | | |
| Cost of investments in securities | | | $ | 11,799,305 | | | $ | 60,071,953 | |
| Cost of foreign currency | | | | — | | | | — | |
* $0.001 par value, 2,450,000,000 shares authorized for the Portfolios in total.
The accompanying notes are an integral part of these financial statements.
36 Semi-Annual Report
| | Lazard | | Lazard | | Lazard |
| | Retirement | | Retirement | | Retirement |
| | International | | Emerging Markets | | Global Dynamic |
| | Equity Portfolio | | Equity Portfolio | | Multi Asset Portfolio |
| | | | | | | | | | | | | |
| | $ | 724,441,269 | | | $ | 1,067,807,797 | | | $ | 202,559,114 | | |
| | | 65,400 | | | | 306,893 | | | | 9,616 | | |
| | | | | | | | | | | | | |
| | | 2,928,494 | | | | 5,754,859 | | | | 679,454 | | |
| | | 2,100,610 | | | | 2,218,714 | | | | 893,082 | | |
| | | 1,185,489 | | | | 1,175,209 | | | | 782,986 | | |
| | | — | | | | — | | | | — | | |
| | | — | | | | — | | | | 1,016,096 | | |
| | | 730,721,262 | | | | 1,077,263,472 | | | | 205,940,348 | | |
| | | | | | | | | | | | | |
| | | 457,025 | | | | 891,452 | | | | 100,392 | | |
| | | 151,476 | | | | 179,840 | | | | 41,388 | | |
| | | 6,649 | | | | 10,627 | | | | 1,751 | | |
| | | 13,572,659 | | | | 3,097,343 | | | | 219,600 | | |
| | | 215,994 | | | | 89,842 | | | | 878,280 | | |
| | | — | | | | — | | | | 623,865 | | |
| | | 95,127 | | | | 432,161 | | | | 58,564 | | |
| | | 14,498,930 | | | | 4,701,265 | | | | 1,923,840 | | |
| | $ | 716,222,332 | | | $ | 1,072,562,207 | | | $ | 204,016,508 | | |
| | | | | | | | | | | | | |
| | $ | 568,562,119 | | | $ | 1,121,356,683 | | | $ | 199,094,612 | | |
| | | 10,394,870 | | | | 12,167,366 | | | | 854,928 | | |
| | | 6,128,205 | | | | (16,396,717 | ) | | | 2,257,163 | | |
| | | | | | | | | | | | | |
| | | 131,208,642 | | | | (44,569,911 | ) | | | 1,423,003 | | |
| | | (71,504 | ) | | | 4,786 | | | | 386,802 | | |
| | $ | 716,222,332 | | | $ | 1,072,562,207 | | | $ | 204,016,508 | | |
| | | | | | | | | | | | | |
| | $ | 716,222,332 | | | $ | 869,603,476 | | | $ | 204,016,508 | | |
| | | 53,028,408 | | | | 44,011,723 | | | | 16,963,706 | | |
| | $ | 13.51 | | | $ | 19.76 | | | $ | 12.03 | | |
| | | | | | | | | | | | | |
| | | — | | | $ | 202,958,731 | | | | — | | |
| | | — | | | | 10,374,864 | | | | — | | |
| | | — | | | $ | 19.56 | | | | — | | |
| | | | | | | | | | | | | |
| | $ | 593,232,627 | | | $ | 1,112,173,045 | | | $ | 201,136,111 | | |
| | $ | 65,780 | | | $ | 306,026 | | | $ | 9,602 | | |
Semi-Annual Report 37
Lazard Retirement Series, Inc. Statements of Operations (unaudited)
| | | Lazard | | Lazard |
| | | Retirement | | Retirement |
| | | US Strategic | | US Small-Mid Cap |
| For the Six Months Ended June 30, 2015 | | Equity Portfolio | | Equity Portfolio |
| | | | | | | | | | |
| Investment Income (Loss) | | | | | | | | | |
| | | | | | | | | | |
| Income | | | | | | | | | |
| Dividends | | | $ | 105,386 | | | $ | 322,433 | |
| Interest | | | | — | | | | 17 | |
| Total investment income* | | | | 105,386 | | | | 322,450 | |
| | | | | | | | | | |
| Expenses | | | | | | | | | |
| Management fees (Note 3) | | | | 46,073 | | | | 244,089 | |
| Distribution fees (Service Shares) | | | | 16,455 | | | | 81,363 | |
| Custodian fees | | | | 28,751 | | | | 26,045 | |
| Administration fees | | | | 22,469 | | | | 27,585 | |
| Professional services | | �� | | 17,768 | | | | 20,797 | |
| Shareholders’ reports | | | | 6,623 | | | | 10,469 | |
| Directors’ fees and expenses | | | | 278 | | | | 1,372 | |
| Shareholders’ services | | | | 6,631 | | | | 7,338 | |
| Other | | | | 1,169 | | | | 1,626 | |
| Total gross expenses | | | | 146,217 | | | | 420,684 | |
| Management fees waived and expenses reimbursed | | | | (71,023 | ) | | | (13,869 | ) |
| Administration fees waived | | | | (9,375 | ) | | | — | |
| Total net expenses | | | | 65,819 | | | | 406,815 | |
| Net investment income (loss) | | | | 39,567 | | | | (84,365 | ) |
| | | | | | | | | | |
| Net Realized and Unrealized Gain (Loss) on Investments, Foreign Currency and Forward Currency Contracts | | | | | | | | | |
| Net realized gain (loss) on: | | | | | | | | | |
| Investments | | | | 829,458 | | | | 4,935,600 | |
| Foreign currency and forward currency contracts | | | | — | | | | — | |
| Total net realized gain (loss) on investments, foreign currency and forward currency contracts | | | | 829,458 | | | | 4,935,600 | |
| Net change in unrealized appreciation (depreciation) on: | | | | | | | | | |
| Investments** | | | | (888,657 | ) | | | (969,170 | ) |
| Foreign currency and forward currency contracts | | | | — | | | | — | |
| Total net change in unrealized appreciation (depreciation) on investments, foreign currency and forward currency contracts | | | | (888,657 | ) | | | (969,170 | ) |
| Net realized and unrealized gain (loss) on investments, foreign currency and forward currency contracts | | | | (59,199 | ) | | | 3,966,430 | |
| Net increase (decrease) in net assets resulting from operations | | | $ | (19,632 | ) | | $ | 3,882,065 | |
| * Net of foreign withholding taxes of | | | $ | — | | | $ | 2,985 | |
| ** Includes net change in unrealized foreign capital gains taxes of | | | $ | — | | | $ | — | |
The accompanying notes are an integral part of these financial statements.
38 Semi-Annual Report
| | Lazard | | Lazard | | Lazard |
| | Retirement | | Retirement | | Retirement |
| | International | | Emerging Markets | | Global Dynamic |
| | Equity Portfolio | | Equity Portfolio | | Multi Asset Portfolio |
| | | | | | | | | | | | | |
| | $ | 12,670,187 | | | $ | 19,497,296 | | | $ | 1,733,727 | | |
| | | 8 | | | | — | | | | 527,258 | | |
| | | 12,670,195 | | | | 19,497,296 | | | | 2,260,985 | | |
| | | | | | | | | | | | | |
| | | 2,695,169 | | | | 5,460,921 | | | | 804,508 | | |
| | | 898,390 | | | | 1,090,916 | | | | 236,620 | | |
| | | 95,093 | | | | 383,140 | | | | 84,312 | | |
| | | 92,947 | | | | 125,274 | | | | 40,005 | | |
| | | 58,190 | | | | 82,037 | | | | 30,511 | | |
| | | 40,411 | | | | 81,502 | | | | 12,805 | | |
| | | 14,940 | | | | 23,339 | | | | 3,890 | | |
| | | 8,643 | | | | 15,406 | | | | 7,951 | | |
| | | 6,862 | | | | 10,792 | | | | 2,594 | | |
| | | 3,910,645 | | | | 7,273,327 | | | | 1,223,196 | | |
| | | — | | | | — | | | | (229,392 | ) | |
| | | — | | | | — | | | | — | | |
| | | 3,910,645 | | | | 7,273,327 | | | | 993,804 | | |
| | | 8,759,550 | | | | 12,223,969 | | | | 1,267,181 | | |
| | | | | | | | | | | | | |
| | | 21,012,129 | | | | (16,288,351 | ) | | | 908,282 | | |
| | | (129,367 | ) | | | (203,516 | ) | | | 291,371 | | |
| | | | | | | | | | | | | |
| | | 20,882,762 | | | | (16,491,867 | ) | | | 1,199,653 | | |
| | | | | | | | | | | | | |
| | | 25,260,001 | | | | (6,024,621 | ) | | | (245,607 | ) | |
| | | 26,382 | | | | 4,477 | | | | 105,848 | | |
| | | | | | | | | | | | | |
| | | 25,286,383 | | | | (6,020,144 | ) | | | (139,759 | ) | |
| | | | | | | | | | | | | |
| | | 46,169,145 | | | | (22,512,011 | ) | | | 1,059,894 | | |
| | $ | 54,928,695 | | | $ | (10,288,042 | ) | | $ | 2,327,075 | | |
| | $ | 1,470,374 | | | $ | 2,677,668 | | | $ | 98,282 | | |
| | $ | — | | | $ | (204,663 | ) | | $ | — | | |
Semi-Annual Report 39
Lazard Retirement Series, Inc. Statements of Changes in Net Assets
| | | Lazard Retirement
US Strategic Equity Portfolio | | Lazard Retirement
US Small-Mid Cap Equity Portfolio | |
| | | Six Months Ended
June 30, 2015
(unaudited) | | Year Ended
December 31,
2014 | | Six Months Ended
June 30, 2015
(unaudited) | | Year Ended
December 31,
2014 | |
| | | | | | | | | | |
| Increase (Decrease) in Net Assets | | | | | | | | | | | | | | | | | | | | | |
| Operations | | | | | | | | | | | | | | | | | | | | | |
| Net investment income (loss) | | | $ | 39,567 | | | | $ | 80,126 | | | | $ | (84,365 | ) | | | $ | (121,840 | ) | |
| Net realized gain (loss) on investments, foreign currency and forward currency contracts | | | | 829,458 | | | | | 1,290,358 | | | | | 4,935,600 | | | | | 8,177,018 | | |
| Net change in unrealized appreciation (depreciation) on investments, foreign currency and forward currency contracts | | | | (888,657 | ) | | | | (35,342 | ) | | | | (969,170 | ) | | | | (1,686,801 | ) | |
| Net increase (decrease) in net assets resulting from operations | | | | (19,632 | ) | | | | 1,335,142 | | | | | 3,882,065 | | | | | 6,368,377 | | |
| Distributions to shareholders | | | | | | | | | | | | | | | | | | | | | |
| From net investment income | | | | | | | | | | | | | | | | | | | | | |
| Service Shares | | | | — | | | | | (77,201 | ) | | | | — | | | | | — | | |
| Investor Shares | | | | — | | | | | — | | | | | — | | | | | — | | |
| From net realized gains | | | | | | | | | | | | | | | | | | | | | |
| Service Shares | | | | — | | | | | (1,404,900 | ) | | | | — | | | | | (10,008,703 | ) | |
| Investor Shares | | | | — | | | | | — | | | | | — | | | | | — | | |
| Net decrease in net assets resulting from distributions | | | | — | | | | | (1,482,101 | ) | | | | — | | | | | (10,008,703 | ) | |
| Capital stock transactions | | | | | | | | | | | | | | | | | | | | | |
| Net proceeds from sales | | | | | | | | | | | | | | | | | | | | | |
| Service Shares | | | | 4,128,495 | | | | | 5,323,595 | | | | | 9,410,572 | | | | | 13,987,149 | | |
| Investor Shares | | | | — | | | | | — | | | | | — | | | | | — | | |
| Net proceeds from reinvestment of distributions | | | | | | | | | | | | | | | | | | | | | |
| Service Shares | | | | — | | | | | 1,482,100 | | | | | — | | | | | 10,008,703 | | |
| Investor Shares | | | | — | | | | | — | | | | | — | | | | | — | | |
| Cost of shares redeemed | | | | | | | | | | | | | | | | | | | | | |
| Service Shares | | | | (4,068,409 | ) | | | | (3,211,241 | ) | | | | (8,167,081 | ) | | | | (15,787,491 | ) | |
| Investor Shares | | | | — | | | | | — | | | | | — | | | | | — | | |
| Net increase (decrease) in net assets from capital stock transactions | | | | 60,086 | | | | | 3,594,454 | | | | | 1,243,491 | | | | | 8,208,361 | | |
| Total increase (decrease) in net assets | | | | 40,454 | | | | | 3,447,495 | | | | | 5,125,556 | | | | | 4,568,035 | | |
| Net assets at beginning of period | | | | 12,391,348 | | | | | 8,943,853 | | | | | 63,490,601 | | | | | 58,922,566 | | |
| Net assets at end of period* | | | $ | 12,431,802 | | | | $ | 12,391,348 | | | | $ | 68,616,157 | | | | $ | 63,490,601 | | |
| *Includes undistributed net investment income (loss) of | | | $ | 39,567 | | | | $ | — | | | | $ | (84,365 | ) | | | $ | — | | |
| Shares issued and redeemed | | | | | | | | | | | | | | | | | | | | | |
| Service Shares | | | | | | | | | | | | | | | | | | | | | |
| Shares outstanding at beginning of period | | | | 1,020,099 | | | | | 743,845 | | | | | 7,764,268 | | | | | 6,761,491 | | |
| Shares sold | | | | 343,170 | | | | | 414,265 | | | | | 1,098,791 | | | | | 1,591,831 | | |
| Shares issued to shareholders from reinvestment of distributions | | | | — | | | | | 120,802 | | | | | — | | | | | 1,207,615 | | |
| Shares redeemed | | | | (335,135 | ) | | | | (258,813 | ) | | | | (971,294 | ) | | | | (1,796,669 | ) | |
| Net increase (decrease) | | | | 8,035 | | | | | 276,254 | | | | | 127,497 | | | | | 1,002,777 | | |
| Shares outstanding at end of period | | | | 1,028,134 | | | | | 1,020,099 | | | | | 7,891,765 | | | | | 7,764,268 | | |
| Investor Shares | | | | | | | | | | | | | | | | | | | | | |
| Shares outstanding at beginning of period Shares sold | | | | | | | | | | | | | | | | | | | | | |
| Shares issued to shareholders from reinvestment of distributions | | | | | | | | | | | | | | | | | | | | | |
| Shares redeemed | | | | | | | | | | | | | | | | | | | | | |
| Net decrease | | | | | | | | | | | | | | | | | | | | | |
| Shares outstanding at end of period | | | | | | | | | | | | | | | | | | | | | |
The accompanying notes are an integral part of these financial statements.
40 Semi-Annual Report
| | Lazard Retirement
International Equity Portfolio | | Lazard Retirement
Emerging Markets Equity Portfolio | | Lazard Retirement
Global Dynamic Multi Asset Portfolio | |
| | Six Months Ended
June 30, 2015
(unaudited) | | Year Ended
December 31,
2014 | | Six Months Ended
June 30, 2015
(unaudited) | | | Year Ended
December 31,
2014 | | Six Months Ended
June 30, 2015
(unaudited) | | Year Ended
December 31,
2014 | |
| | | | | | | | | | | | | | | | | | | | | | | | | | | | | | | | |
| | | $ | 8,759,550 | | | | $ | 10,965,538 | | | | $ | 12,223,969 | | | | | $ | 19,490,320 | | | | $ | 1,267,181 | | | | $ | 1,684,195 | | |
| | | | | | | | | | | | | | | | | | | | | | | | | | | | | | | | |
| | | | 20,882,762 | | | | | 29,508,676 | | | | | (16,491,867 | ) | | | | | 11,690,151 | | | | | 1,199,653 | | | | | 8,973,244 | | |
| | | | | | | | | | | | | | | | | | | | | | | | | | | | | | | | |
| | | | 25,286,383 | | | | | (69,476,408 | ) | | | | (6,020,144 | ) | | | | | (84,430,632 | ) | | | | (139,759 | ) | | | | (6,893,694 | ) | |
| | | | | | | | | | | | | | | | | | | | | | | | | | | | | | | | |
| | | | 54,928,695 | | | | | (29,002,194 | ) | | | | (10,288,042 | ) | | | | | (53,250,161 | ) | | | | 2,327,075 | | | | | 3,763,745 | | |
| | | | | | | | | | | | | | | | | | | | | | | | | | | | | | | | |
| | | | — | | | | | (10,814,146 | ) | | | | — | | | | | | (15,082,247 | ) | | | | — | | | | | (968,080 | ) | |
| | | | — | | | | | — | | | | | — | | | | | | (4,806,075 | ) | | | | — | | | | | — | | |
| | | | | | | | | | | | | | | | | | | | | | | | | | | | | | | | |
| | | | — | | | | | — | | | | | — | | | | | | (8,043,967 | ) | | | | — | | | | | (9,750,513 | ) | |
| | | | — | | | | | — | | | | | — | | | | | | (2,288,572 | ) | | | | — | | | | | — | | |
| | | | — | | | | | (10,814,146 | ) | | | | — | | | | | | (30,220,861 | ) | | | | — | | | | | (10,718,593 | ) | |
| | | | | | | | | | | | | | | | | | | | | | | | | | | | | | | | |
| | | | 48,863,760 | | | | | 111,475,938 | | | | | 90,864,814 | | | | | | 208,283,102 | | | | | 37,317,778 | | | | | 89,974,898 | | |
| | | | — | | | | | — | | | | | 15,443,642 | | | | | | 63,373,754 | | | | | — | | | | | — | | |
| | | | | | | | | | | | | | | | | | | | | | | | | | | | | | | | |
| | | | — | | | | | 10,814,146 | | | | | — | | | | | | 23,126,213 | | | | | — | | | | | 10,718,593 | | |
| | | | — | | | | | — | | | | | — | | | | | | 7,094,647 | | | | | — | | | | | — | | |
| | | | | | | | | | | | | | | | | | | | | | | | | | | | | | | | |
| | | | (77,894,322 | ) | | | | (81,661,844 | ) | | | | (71,984,770 | ) | | | | | (154,832,744 | ) | | | | (12,297,760 | ) | | | | (16,829,184 | ) | |
| | | | — | | | | | — | | | | | (41,075,622 | ) | | | | | (80,535,191 | ) | | | | — | | | | | — | | |
| | | | | | | | | | | | | | | | | | | | | | | | | | | | | | | | |
| | | | (29,030,562 | ) | | | | 40,628,240 | | | | | (6,751,936 | ) | | | | | 66,509,781 | | | | | 25,020,018 | | | | | 83,864,307 | | |
| | | | 25,898,133 | | | | | 811,900 | | | | | (17,039,978 | ) | | | | | (16,961,241 | ) | | | | 27,347,093 | | | | | 76,909,459 | | |
| | | | 690,324,199 | | | | | 689,512,299 | | | | | 1,089,602,185 | | | | | | 1,106,563,426 | | | | | 176,669,415 | | | | | 99,759,956 | | |
| | | $ | 716,222,332 | | | | $ | 690,324,199 | | | | $ | 1,072,562,207 | | | | | $ | 1,089,602,185 | | | | $ | 204,016,508 | | | | $ | 176,669,415 | | |
| | | $ | 10,394,870 | | | | $ | 1,635,320 | | | | $ | 12,167,366 | | | | | $ | (56,603 | ) | | | $ | 854,928 | | | | $ | (412,253 | ) | |
| | | | | | | | | | | | | | | | | | | | | | | | | | | | | | | | |
| | | | 55,231,355 | | | | | 52,011,272 | | | | | 43,075,583 | | | | | | 39,349,938 | | | | | 14,895,028 | | | | | 8,108,458 | | |
| | | | 3,641,543 | | | | | 8,563,877 | | | | | 4,509,940 | | | | | | 9,627,978 | | | | | 3,088,252 | | | | | 7,245,330 | | |
| | | | | | | | | | | | | | | | | | | | | | | | | | | | | | | | |
| | | | — | | | | | 847,713 | | | | | — | | | | | | 1,131,344 | | | | | — | | | | | 893,771 | | |
| | | | (5,844,490 | ) | | | | (6,191,507 | ) | | | | (3,573,800 | ) | | | | | (7,033,677 | ) | | | | (1,019,574 | ) | | | | (1,352,531 | ) | |
| | | | (2,202,947 | ) | | | | 3,220,083 | | | | | 936,140 | | | | | | 3,725,645 | | | | | 2,068,678 | | | | | 6,786,570 | | |
| | | | 53,028,408 | | | | | 55,231,355 | | | | | 44,011,723 | | | | | | 43,075,583 | | | | | 16,963,706 | | | | | 14,895,028 | | |
| | | | | | | | | | | | | | | | | | | | | | | | | | | | | | | | |
| | | | | | | | | | | | | | 11,645,766 | | | | | | 12,235,116 | | | | | | | | | | | | |
| | | | | | | | | | | | | | 774,843 | | | | | | 2,840,650 | | | | | | | | | | | | |
| | | | | | | | | | | | | | | | | | | | | | | | | | | | | | | | |
| | | | | | | | | | | | | | — | | | | | | 350,893 | | | | | | | | | | | | |
| | | | | | | | | | | | | | (2,045,745 | ) | | | | | (3,780,893 | ) | | | | | | | | | | | |
| | | | | | | | | | | | | | (1,270,902 | ) | | | | | (589,350 | ) | | | | | | | | | | | |
| | | | | | | | | | | | | | 10,374,864 | | | | | | 11,645,766 | | | | | | | | | | | | |
Semi-Annual Report 41
Lazard Retirement Series, Inc. Financial Highlights
LAZARD RETIREMENT US STRATEGIC EQUITY PORTFOLIO
| Selected data for a share of capital | | Six Months
Ended | | Year Ended | |
| stock outstanding throughout each period | | 6/30/15† | | 12/31/14 | | 12/31/13 | | 12/31/12 | | 12/31/11 | | 12/31/10 | |
| Service Shares | | | | | | | | | | | | | |
| Net asset value, beginning of period | | $ | 12.15 | | | $ | 12.02 | | | $ | 10.44 | | | $ | 9.26 | | | $ | 9.18 | | | $ | 8.19 | | |
| Income (loss) from investment operations: | | | | | | | | | | | | | | | | | | | | | | | | | |
| Net investment income | | | 0.04 | | | | 0.09 | | | | 0.11 | | | | 0.12 | | | | 0.10 | | | | 0.06 | | |
| Net realized and unrealized gain (loss) | | | (0.10 | ) | | | 1.68 | | | | 2.80 | | | | 1.18 | | | | 0.08 | | | | 0.99 | | |
| | | | | | | | | | | | | | | | | | | | | | | | | | |
| Total from investment operations | | | (0.06 | ) | | | 1.77 | | | | 2.91 | | | | 1.30 | | | | 0.18 | | | | 1.05 | | |
| Less distributions from: | | | | | | | | | | | | | | | | | | | | | | | | | |
| Net investment income | | | — | | | | (0.09 | ) | | | (0.11 | ) | | | (0.12 | ) | | | (0.10 | ) | | | (0.06 | ) | |
| Net realized gains | | | — | | | | (1.55 | ) | | | (1.22 | ) | | | — | | | | — | | | | — | | |
| | | | | | | | | | | | | | | | | | | | | | | | | | |
| Total distributions | | | — | | | | (1.64 | ) | | | (1.33 | ) | | | (0.12 | ) | | | (0.10 | ) | | | (0.06 | ) | |
| | | | | | | | | | | | | | | | | | | | | | | | | | |
| Net asset value, end of period | | $ | 12.09 | | | $ | 12.15 | | | $ | 12.02 | | | $ | 10.44 | | | $ | 9.26 | | | $ | 9.18 | | |
| | | | | | | | | | | | | | | | | | | | | | | | | | |
| Total Return (a) | | | –0.49 | % | | | 14.71 | % | | | 28.07 | % | | | 14.01 | % | | | 1.96 | % | | | 12.85 | % | |
| | | | | | | | | | | | | | | | | | | | | | | | | | |
| Ratios and Supplemental Data: | | | | | | | | | | | | | | | | | | | | | | | | | |
| Net assets, end of period (in thousands) | | $ | 12,432 | | | $ | 12,391 | | | $ | 8,944 | | | $ | 6,702 | | | $ | 6,008 | | | $ | 6,172 | | |
| Ratios to average net assets (b): | | | | | | | | | | | | | | | | | | | | | | | | | |
| Net expenses | | | 1.00 | % | | | 1.00 | % | | | 1.00 | % | | | 1.00 | % | | | 1.00 | % | | | 1.22 | % | |
| Gross expenses | | | 2.22 | % | | | 2.59 | % | | | 2.88 | % | | | 3.23 | % | | | 3.37 | % | | | 3.84 | % | |
| Net investment income | | | 0.60 | % | | | 0.79 | % | | | 0.97 | % | | | 1.16 | % | | | 1.04 | % | | | 0.68 | % | |
| Portfolio turnover rate | | | 41 | % | | | 72 | % | | | 66 | % | | | 59 | % | | | 50 | % | | | 55 | % | |
| † | Unaudited |
| (a) | Total returns reflect reinvestment of all dividends and distributions, if any. Certain expenses of the Portfolio have been waived or reimbursed by the Portfolio’s Investment Manager or State Street; without such waiver/reimbursement of expenses, the Portfolio’s returns would have been lower. Performance information does not reflect the fees and charges imposed by participating insurance companies at the separate account level, and such charges will have the effect of reducing performance. A period of less than one year is not annualized. |
| (b) | Annualized for a period of less than one year. |
The accompanying notes are an integral part of these financial statements.
42 Semi-Annual Report
LAZARD RETIREMENT US SMALL-MID CAP EQUITY PORTFOLIO
| Selected data for a share of capital | | Six Months
Ended | | Year Ended | |
| stock outstanding throughout each period | | 6/30/15† | | 12/31/14 | | 12/31/13 | | 12/31/12 | | 12/31/11 | | 12/31/10 | |
| Service Shares | | | | | | | | | | | | | |
| Net asset value, beginning of period | | $ | 8.18 | | | $ | 8.71 | | | $ | 7.30 | | | $ | 9.26 | | | $ | 11.04 | | | $ | 9.68 | | |
| Income (loss) from investment operations: | | | | | | | | | | | | | | | | | | | | | | | | | |
| Net investment income (loss) | | | (0.01 | ) | | | (0.02 | ) | | | (0.03 | ) | | | (0.01 | ) | | | (0.01 | ) | | | 0.03 | | |
| Net realized and unrealized gain (loss) | | | 0.52 | | | | 0.94 | | | | 2.53 | | | | 0.95 | | | | (1.01 | ) | | | 2.27 | | |
| | | | | | | | | | | | | | | | | | | | | | | | | | |
| Total from investment operations | | | 0.51 | | | | 0.92 | | | | 2.50 | | | | 0.94 | | | | (1.02 | ) | | | 2.30 | | |
| Less distributions from: | | | | | | | | | | | | | | | | | | | | | | | | | |
| Net investment income | | | — | | | | — | | | | — | | | | — | | | | — | | | | (0.03 | ) | |
| Net realized gains | | | — | | | | (1.45 | ) | | | (1.09 | ) | | | (2.90 | ) | | | (0.76 | ) | | | (0.91 | ) | |
| | | | | | | | | | | | | | | | | | | | | | | | | | |
| Total distributions | | | — | | | | (1.45 | ) | | | (1.09 | ) | | | (2.90 | ) | | | (0.76 | ) | | | (0.94 | ) | |
| | | | | | | | | | | | | | | | | | | | | | | | | | |
| Net asset value, end of period | | $ | 8.69 | | | $ | 8.18 | | | $ | 8.71 | | | $ | 7.30 | | | $ | 9.26 | | | $ | 11.04 | | |
| | | | | | | | | | | | | | | | | | | | | | | | | | |
| Total Return (a) | | | 6.23 | % | | | 11.03 | % | | | 35.08 | % | | | 10.38 | % | | | –9.07 | % | | | 23.72 | % | |
| | | | | | | | | | | | | | | | | | | | | | | | | | |
| Ratios and Supplemental Data: | | | | | | | | | | | | | | | | | | | | | | | | | |
| Net assets, end of period (in thousands) | | $ | 68,616 | | | $ | 63,491 | | | $ | 58,923 | | | $ | 46,978 | | | $ | 180,524 | | | $ | 146,644 | | |
| Ratios to average net assets (b): | | | | | | | | | | | | | | | | | | | | | | | | | |
| Net expenses | | | 1.25 | % | | | 1.25 | % | | | 1.25 | % | | | 1.20 | % | | | 1.15 | % | | | 1.18 | % | |
| Gross expenses | | | 1.29 | % | | | 1.32 | % | | | 1.35 | % | | | 1.20 | % | | | 1.15 | % | | | 1.18 | % | |
| Net investment income (loss) | | | –0.26 | % | | | –0.20 | % | | | –0.33 | % | | | –0.06 | % | | | –0.16 | % | | | 0.29 | % | |
| Portfolio turnover rate | | | 41 | % | | | 92 | % | | | 101 | % | | | 74 | % | | | 98 | % | | | 122 | % | |
| † | Unaudited. |
| (a) | Total returns reflect reinvestment of all dividends and distributions, if any. Certain expenses of the Portfolio have been waived or reimbursed by the Portfolio’s Investment Manager; without such waiver/reimbursement of expenses, the Portfolio’s returns would have been lower. |
| | Performance information does not reflect the fees and charges imposed by participating insurance companies at the separate account level, and such charges will have the effect of reducing performance. A period of less than one year is not annualized. |
| (b) | Annualized for a period of less than one year. |
The accompanying notes are an integral part of these financial statements.
Semi-Annual Report 43
LAZARD RETIREMENT INTERNATIONAL EQUITY PORTFOLIO
| Selected data for a share of capital | | Six Months
Ended | | Year Ended | |
| stock outstanding throughout each period | | 6/30/15† | | 12/31/14 | | 12/31/13 | | 12/31/12 | | 12/31/11 | | 12/31/10 | |
| Service Shares | | | | | | | | | | | | | |
| Net asset value, beginning of period | | $ | 12.50 | | | $ | 13.26 | | | $ | 11.12 | | | $ | 9.33 | | | $ | 10.28 | | | $ | 9.76 | | |
| Income (loss) from investment operations: | | | | | | | | | | | | | | | | | | | | | | | | | |
| Net investment income | | | 0.17 | | | | 0.21 | | | | 0.17 | | | | 0.19 | | | | 0.18 | | | | 0.12 | | |
| Net realized and unrealized gain (loss) | | | 0.84 | | | | (0.76 | ) | | | 2.13 | | | | 1.78 | | | | (0.93 | ) | | | 0.53 | | |
| | | | | | | | | | | | | | | | | | | | | | | | | | |
| Total from investment operations | | | 1.01 | | | | (0.55 | ) | | | 2.30 | | | | 1.97 | | | | (0.75 | ) | | | 0.65 | | |
| Less distributions from: | | | | | | | | | | | | | | | | | | | | | | | | | |
| Net investment income | | | — | | | | (0.21 | ) | | | (0.16 | ) | | | (0.18 | ) | | | (0.20 | ) | | | (0.13 | ) | |
| | | | | | | | | | | | | | | | | | | | | | | | | | |
| Total distributions | | | — | | | | (0.21 | ) | | | (0.16 | ) | | | (0.18 | ) | | | (0.20 | ) | | | (0.13 | ) | |
| | | | | | | | | | | | | | | | | | | | | | | | | | |
| Net asset value, end of period | | $ | 13.51 | | | $ | 12.50 | | | $ | 13.26 | | | $ | 11.12 | | | $ | 9.33 | | | $ | 10.28 | | |
| | | | | | | | | | | | | | | | | | | | | | | | | | |
| Total Return (a) | | | 8.08 | % | | | –4.21 | % | | | 20.76 | % | | | 21.11 | % | | | –7.27 | % | | | 6.72 | % | |
| | | | | | | | | | | | | | | | | | | | | | | | | | |
| Ratios and Supplemental Data: | | | | | | | | | | | | | | | | | | | | | | | | | |
| Net assets, end of period (in thousands) | | $ | 716,222 | | | $ | 690,324 | | | $ | 689,512 | | | $ | 592,437 | | | $ | 513,882 | | | $ | 471,030 | | |
| Ratios to average net assets (b): | | | | | | | | | | | | | | | | | | | | | | | | | |
| Net expenses | | | 1.09 | % | | | 1.09 | % | | | 1.10 | % | | | 1.10 | % | | | 1.12 | % | | | 1.14 | % | |
| Gross expenses | | | 1.09 | % | | | 1.09 | % | | | 1.10 | % | | | 1.10 | % | | | 1.12 | % | | | 1.14 | % | |
| Net investment income | | | 2.44 | % | | | 1.59 | % | | | 1.41 | % | | | 1.80 | % | | | 1.89 | % | | | 1.41 | % | |
| Portfolio turnover rate | | | 22 | % | | | 34 | % | | | 40 | % | | | 43 | % | | | 39 | % | | | 53 | % | |
| † | Unaudited. |
| (a) | Total returns reflect reinvestment of all dividends and distributions, if any. Performance information does not reflect the fees and charges imposed by participating insurance companies at the separate account level, and such charges will have the effect of reducing performance. A period of less than one year is not annualized. |
| (b) | Annualized for a period of less than one year. |
The accompanying notes are an integral part of these financial statements.
44 Semi-Annual Report
LAZARD RETIREMENT EMERGING MARKETS EQUITY PORTFOLIO
| Selected data for a share of capital | | Six Months
Ended | | Year Ended | |
| stock outstanding throughout each period | | 6/30/15† | | 12/31/14 | | 12/31/13 | | 12/31/12 | | 12/31/11 | | 12/31/10 | |
| Service Shares | | | | | | | | | | | | | |
| Net asset value, beginning of period | | $ | 19.96 | | | $ | 21.51 | | | $ | 22.22 | | | $ | 18.71 | | | $ | 23.33 | | | $ | 19.23 | | |
| Income (loss) from investment operations: | | | | | | | | | | | | | | | | | | | | | | | | | |
| Net investment income (a) | | | 0.22 | | | | 0.37 | | | | 0.31 | | | | 0.33 | | | | 0.44 | | | | 0.34 | | |
| Net realized and unrealized gain (loss) | | | (0.42 | ) | | | (1.35 | ) | | | (0.58 | ) | | | 3.78 | | | | (4.64 | ) | | | 4.02 | | |
| | | | | | | | | | | | | | | | | | | | | | | | | | |
| Total from investment operations | | | (0.20 | ) | | | (0.98 | ) | | | (0.27 | ) | | | 4.11 | | | | (4.20 | ) | | | 4.36 | | |
| Less distributions from: | | | | | | | | | | | | | | | | | | | | | | | | | |
| Net investment income | | | — | | | | (0.37 | ) | | | (0.31 | ) | | | (0.35 | ) | | | (0.42 | ) | | | (0.26 | ) | |
| Net realized gains | | | — | | | | (0.20 | ) | | | (0.13 | ) | | | (0.25 | ) | | | — | | | | — | | |
| | | | | | | | | | | | | | | | | | | | | | | | | | |
| Total distributions | | | — | | | | (0.57 | ) | | | (0.44 | ) | | | (0.60 | ) | | | (0.42 | ) | | | (0.26 | ) | |
| | | | | | | | | | | | | | | | | | | | | | | | | | |
| Net asset value, end of period | | $ | 19.76 | | | $ | 19.96 | | | $ | 21.51 | | | $ | 22.22 | | | $ | 18.71 | | | $ | 23.33 | | |
| | | | | | | | | | | | | | | | | | | | | | | | | | |
| Total Return (b) | | | –1.00 | % | | | –4.64 | % | | | –1.24 | % | | | 22.05 | % | | | –18.00 | % | | | 22.69 | % | |
| | | | | | | | | | | | | | | | | | | | | | | | | | |
| Ratios and Supplemental Data: | | | | | | | | | | | | | | | | | | | | | | | | | |
| Net assets, end of period (in thousands) | | $ | 869,603 | | | $ | 859,747 | | | $ | 846,233 | | | $ | 734,699 | | | $ | 580,370 | | | $ | 581,859 | | |
| Ratios to average net assets (c): | | | | | | | | | | | | | | | | | | | | | | | | | |
| Net expenses | | | 1.38 | % | | | 1.38 | % | | | 1.38 | % | | | 1.39 | % | | | 1.42 | % | | | 1.46 | % | |
| Gross expenses | | | 1.38 | % | | | 1.38 | % | | | 1.38 | % | | | 1.39 | % | | | 1.42 | % | | | 1.46 | % | |
| Net investment income | | | 2.20 | % | | | 1.66 | % | | | 1.42 | % | | | 1.57 | % | | | 2.04 | % | | | 1.66 | % | |
| Portfolio turnover rate | | | 7 | % | | | 12 | % | | | 14 | % | | | 23 | % | | | 19 | % | | | 27 | % | |
| | | | | | | | | | | | | | | | | | | | | | | | | | |
| Selected data for a share of capital | | Six Months
Ended | | Year Ended | |
| stock outstanding throughout each period | | 6/30/15† | | 12/31/14 | | 12/31/13 | | 12/31/12 | | 12/31/11 | | 12/31/10 | |
| Investor Shares | | | | | | | | | | | | | | | | | | | | | | | | | |
| Net asset value, beginning of period | | $ | 19.74 | | | $ | 21.28 | | | $ | 21.99 | | | $ | 18.52 | | | $ | 23.17 | | | $ | 19.13 | | |
| Income (loss) from investment operations: | | | | | | | | | | | | | | | | | | | | | | | | | |
| Net investment income (a) | | | 0.24 | | | | 0.42 | | | | 0.37 | | | | 0.38 | | | | 0.50 | | | | 0.38 | | |
| Net realized and unrealized gain (loss) | | | (0.42 | ) | | | (1.34 | ) | | | (0.59 | ) | | | 3.74 | | | | (4.62 | ) | | | 4.01 | | |
| | | | | | | | | | | | | | | | | | | | | | | | | | |
| Total from investment operations | | | (0.18 | ) | | | (0.92 | ) | | | (0.22 | ) | | | 4.12 | | | | (4.12 | ) | | | 4.39 | | |
| Less distributions from: | | | | | | | | | | | | | | | | | | | | | | | | | |
| Net investment income | | | — | | | | (0.42 | ) | | | (0.36 | ) | | | (0.40 | ) | | | (0.53 | ) | | | (0.35 | ) | |
| Net realized gains | | | — | | | | (0.20 | ) | | | (0.13 | ) | | | (0.25 | ) | | | — | | | | — | | |
| | | | | | | | | | | | | | | | | | | | | | | | | | |
| Total distributions | | | — | | | | (0.62 | ) | | | (0.49 | ) | | | (0.65 | ) | | | (0.53 | ) | | | (0.35 | ) | |
| | | | | | | | | | | | | | | | | | | | | | | | | | |
| Net asset value, end of period | | $ | 19.56 | | | $ | 19.74 | | | $ | 21.28 | | | $ | 21.99 | | | $ | 18.52 | | | $ | 23.17 | | |
| | | | | | | | | | | | | | | | | | | | | | | | | | |
| Total Return (b) | | | –0.91 | % | | | –4.38 | % | | | –1.01 | % | | | 22.34 | % | | | –17.79 | % | | | 23.05 | % | |
| | | | | | | | | | | | | | | | | | | | | | | | | | |
| Ratios and Supplemental Data: | | | | | | | | | | | | | | | | | | | | | | | | | |
| Net assets, end of period (in thousands) | | $ | 202,959 | | | $ | 229,855 | | | $ | 260,330 | | | $ | 282,596 | | | $ | 244,320 | | | $ | 339,899 | | |
| Ratios to average net assets (c): | | | | | | | | | | | | | | | | | | | | | | | | | |
| Net expenses | | | 1.14 | % | | | 1.14 | % | | | 1.14 | % | | | 1.14 | % | | | 1.17 | % | | | 1.21 | % | |
| Gross expenses | | | 1.14 | % | | | 1.14 | % | | | 1.14 | % | | | 1.14 | % | | | 1.17 | % | | | 1.21 | % | |
| Net investment income | | | 2.39 | % | | | 1.91 | % | | | 1.71 | % | | | 1.85 | % | | | 2.31 | % | | | 1.83 | % | |
| Portfolio turnover rate | | | 7 | % | | | 12 | % | | | 14 | % | | | 23 | % | | | 19 | % | | | 27 | % | |
| † | Unaudited. |
| (a) | Net investment income has been computed using the average shares method. |
| (b) | Total returns reflect reinvestment of all dividends and distributions, if any. Performance information does not reflect the fees and charges imposed by participating insurance companies at the separate account level, and such charges will have the effect of reducing performance. A period of less than one year is not annualized. |
| (c) | Annualized for a period of less than one year. |
The accompanying notes are an integral part of these financial statements.
Semi-Annual Report 45
LAZARD RETIREMENT GLOBAL DYNAMIC MULTI ASSET PORTFOLIO
| | | Six Months | | | | | | For the Period | |
| Selected data for a share of capital | | Ended | | Year Ended | | 4/30/12* to | |
| stock outstanding throughout each period | | 6/30/15† | | 12/31/14 | | 12/31/13 | | 12/31/12 | |
| Service Shares | | | | | | | | | |
| Net asset value, beginning of period | | $ | 11.86 | | | $ | 12.30 | | | $ | 10.54 | | | $ | 10.00 | | |
| Income from investment operations: | | | | | | | | | | | | | | | | | |
| Net investment income | | | 0.08 | | | | 0.11 | | | | 0.06 | | | | 0.03 | | |
| Net realized and unrealized gain | | | 0.09 | | | | 0.23 | | | | 1.99 | | | | 0.54 | | |
| | | | | | | | | | | | | | | | | | |
| Total from investment operations | | | 0.17 | | | | 0.34 | | | | 2.05 | | | | 0.57 | | |
| Less distributions from: | | | | | | | | | | | | | | | | | |
| Net investment income | | | — | | | | (0.07 | ) | | | (0.04 | ) | | | — | (c) | |
| Net realized gains | | | — | | | | (0.71 | ) | | | (0.25 | ) | | | (0.03 | ) | |
| | | | | | | | | | | | | | | | | | |
| Total distributions | | | — | | | | (0.78 | ) | | | (0.29 | ) | | | (0.03 | ) | |
| | | | | | | | | | | | | | | | | | |
| Net asset value, end of period | | $ | 12.03 | | | $ | 11.86 | | | $ | 12.30 | | | $ | 10.54 | | |
| | | | | | | | | | | | | | | | | | |
| Total Return (a) | | | 1.43 | % | | | 2.70 | % | | | 19.49 | % | | | 5.74 | % | |
| | | | | | | | | | | | | | | | | | |
| Ratios and Supplemental Data: | | | | | | | | | | | | | | | | | |
| Net assets, end of period (in thousands) | | $ | 204,017 | | | $ | 176,669 | | | $ | 99,760 | | | $ | 30,262 | | |
| Ratios to average net assets (b): | | | | | | | | | | | | | | | | | |
| Net expenses | | | 1.05 | % | | | 1.05 | % | | | 1.05 | % | | | 1.05 | % | |
| Gross expenses | | | 1.29 | % | | | 1.33 | % | | | 1.70 | % | | | 3.80 | % | |
| Net investment income | | | 1.34 | % | | | 1.19 | % | | | 1.01 | % | | | 1.03 | % | |
| Portfolio turnover rate | | | 75 | % | | | 105 | % | | | 62 | % | | | 45 | % | |
| † | Unaudited. |
| * | The Portfolio commenced operations on April 30, 2012. |
| (a) | Total returns reflect reinvestment of all dividends and distributions, if any. Certain expenses of the Portfolio have been waived or reimbursed by the Portfolio’s Investment Manager, State Street or BFDS; without such waiver/reimbursement of expenses, the Portfolio’s returns would have been lower. Performance information does not reflect the fees and charges imposed by participating insurance companies at the separate account level, and such charges will have the effect of reducing performance. A period of less than one year is not annualized. |
| (b) | Annualized for a period of less than one year. |
| (c) | Amount is less than $0.01 per share. |
The accompanying notes are an integral part of these financial statements.
46 Semi-Annual Report
Lazard Retirement Series, Inc. Notes to Financial Statements June 30, 2015 (unaudited)
1. Organization
Lazard Retirement Series, Inc. (the “Fund”) was incorporated in Maryland on February 13, 1997 and is registered under the Investment Company Act of 1940, as amended (the “Act”), as an open-end management investment company. The Fund, comprised of twenty-three no-load portfolios (each referred to as a “Portfolio”), is currently offered only to separate accounts established by insurance companies to fund variable annuity contracts and variable life insurance policies. Portfolio shares may also be offered to certain qualified pension and retirement plans and accounts permitting accumulation of assets on a tax-deferred basis. Effective January 31, 2006, the Fund designated its existing class of shares as Service Shares and commenced offering Investor Shares. Investor Shares and Service Shares are identical, except as to the services offered to and expenses borne by each class of shares. As of June 30, 2015, only Emerging Markets Equity Portfolio had issued Investor Shares. Currently, only the following five Portfolios, each of which is “diversified”, as defined in the Act, are offered: Lazard Retirement US Strategic Equity Portfolio (“US Strategic Equity Portfolio”), Lazard Retirement US Small-Mid Cap Equity Portfolio (“US Small-Mid Cap Equity Portfolio”), Lazard Retirement International Equity Portfolio (“International Equity Portfolio”), Lazard Retirement Emerging Markets Equity Portfolio (“Emerging Markets Equity Portfolio”), and Lazard Retirement Global Dynamic Multi Asset Portfolio (“Global Dynamic Multi Asset Portfolio”). Each of the other eighteen Portfolios had not commenced operations as of June 30, 2015.
2. Significant Accounting Policies
The accompanying financial statements are presented in conformity with GAAP. The Fund is an investment company and therefore applies specialized accounting guidance in Accounting Standards Codification Topic 946. The following is a summary of significant accounting policies consistently followed by the Fund in the preparation of the financial statements:
(a) Valuation of Investments—Net asset value (“NAV”) per share for each class of each Portfolio is determined on each day the New York Stock Exchange (“NYSE”) is open for business. Market values for securities listed on the NYSE, NASDAQ national market or other US or
foreign exchanges or markets are generally based on the last reported sales price on the exchange or market on which the security is principally traded, generally as of the close of regular trading on the NYSE (normally 4:00 p.m. Eastern time) on each valuation date; securities not traded on the valuation date are valued at the most recent quoted bid price. The Fund values NAS-DAQ-traded securities at the NASDAQ Official Closing Price, which may not be the last reported sales price in certain instances. Forward currency contracts are valued using quotations from an independent pricing service. Investments in money market funds are valued at the fund’s NAV.
Bonds and other fixed-income securities that are not exchange-traded are valued on the basis of prices provided by independent pricing services which are based primarily on institutional trading in similar groups of securities, or by using brokers’ quotations or a matrix system which considers such factors as other security prices, yields and maturities.
The Valuation Committee of the Investment Manager, which meets periodically and acts pursuant to delegated authority from the Board of Directors (the “Board”), may evaluate a variety of factors to determine the fair value of securities for which market quotations are determined not to be readily available or reliable. These factors include, but are not limited to, the type of security, the value of comparable securities, observations from financial institutions and relevant news events. Input from the Investment Manager’s portfolio managers/analysts also will be considered.
If a significant event materially affecting the value of securities occurs between the close of the exchange or market on which the security is principally traded and the time when a Portfolio’s NAV is calculated, or when current market quotations otherwise are determined not to be readily available or reliable (including restricted or other illiquid securities such as certain derivative instruments), such securities will be valued at their fair value as determined by, or in accordance with procedures approved by, the Board. The fair value of non-US securities may be determined with the assistance of an independent pricing service using correlations between the movement of prices of such
Semi-Annual Report 47
securities and indices of US securities and other appropriate indicators, such as closing market prices of relevant ADRs or futures contracts. Non-US securities may trade on days when a Portfolio is not open for business, thus affecting the value of the Portfolio’s assets on days when Portfolio shareholders may not be able to buy or sell Portfolio shares.
The effect of using fair value pricing is that the NAV of a Portfolio will reflect the affected securities’ values as determined in the judgment of the Board or its designee instead of being determined by the market. Using a fair value pricing methodology to price securities may result in a value that is different from the most recent closing price of a security and from the prices used by other investment companies to calculate their portfolios’ NAVs.
(b) Portfolio Securities Transactions and Investment Income—Portfolio securities transactions are accounted for on trade date. Realized gain (loss) on sales of investments are recorded on a specific identification basis. Dividend income is recorded on the ex-dividend date and interest income is accrued daily. The Portfolios amortize premiums and accrete discounts on fixed-income securities using the effective yield method. During the period ended June 30, 2015, only Global Dynamic Multi Asset Portfolio traded in fixed-income securities.
The Portfolios may be subject to taxes imposed by foreign countries in which they invest. Such taxes are generally based upon income earned or capital gains (realized or unrealized). The Portfolios accrue and apply such taxes to net investment income, net realized gains and net unrealized gains concurrent with the recognition of income earned or capital gains (realized and unrealized) from the applicable portfolio securities.
(c) Foreign Currency Translation and Forward Currency Contracts—The accounting records of the Fund are maintained in US dollars. Portfolio securities and other assets and liabilities denominated in a foreign currency are translated daily into US dollars at the prevailing rates of exchange. Purchases and sales of securities, income receipts and expense payments are
translated into US dollars at the prevailing exchange rates on the respective transaction dates.
The Portfolios do not isolate the portion of operations resulting from changes in foreign exchange rates on investments from the fluctuations arising from changes in their market prices. Such fluctuations are included in net realized and unrealized gain (loss) on investments. Net realized gain (loss) on foreign currency and forward currency contracts represents net foreign currency gain (loss) from forward currency contracts, disposition of foreign currencies, currency gain (loss) realized between the trade and settlement dates on securities transactions, and the difference between the amount of dividends, interest and foreign withholding taxes recorded on the Portfolios’ accounting records and the US dollar equivalent amounts actually received or paid. Net change in unrealized appreciation (depreciation) on foreign currency reflects the impact of changes in exchange rates on the value of assets and liabilities, other than investments in securities, during the period.
A forward currency contract is an agreement between two parties to buy or sell currency at a set price on a future date. Upon entering into these contracts, risks may arise from the potential inability of counterparties to meet the terms of their contracts and from unanticipated movements in the value of the foreign currency relative to the US dollar.
The US dollar value of forward currency contracts is determined using quotations provided by an independent pricing service. Daily fluctuations in the value of such contracts are recorded as unrealized appreciation (depreciation) on forward currency contracts. When the contract is closed, a Portfolio records a realized gain (loss) equal to the difference between the value at the time it was opened and the value at the time it was closed.
During the period ended June 30, 2015, only Global Dynamic Multi Asset Portfolio traded in forward currency contracts.
(d) Federal Income Taxes—The Fund’s policy is to continue to have each Portfolio qualify as a regulated
48 Semi-Annual Report
investment company under Subchapter M of the Internal Revenue Code (the “Code”) and to distribute all of its taxable income, including any net realized capital gains, to shareholders. Therefore, no federal income tax provision is required.
The Regulated Investment Company Modernization Act of 2010 (the “RIC Modernization Act”) includes numerous provisions that generally became effective for taxable years beginning after December 22, 2010. Among the provisions, net capital losses may be carried forward indefinitely, and their character is retained as short-term or long-term. Previously, net capital losses were carried forward for eight years and treated as short-term losses. The RIC Modernization Act also requires that post-enactment net capital losses be used before pre-enactment net capital losses. As a result, pre-enactment capital loss carryforwards may expire unused.
At December 31, 2014, the following Portfolio had unused realized capital loss carryovers which, for federal income tax purposes, could be used to offset future realized capital gains as follows:
| Portfolio | | Expiring 2017 | | Expiring 2018 | |
| | | | | | | | | | |
| International Equity | | $ | 6,995,748 | | | $ | 7,205,218 | | |
Under current tax law, certain late year losses, as defined by the Code, within the taxable year may be deferred and treated as occurring on the first day of the following tax year. For the tax year ended December 31, 2014, the following Portfolios elected to defer such losses as follows:
| Portfolio | | Post October
Capital Loss
Deferral | | Late Year
Ordinary Loss
Deferral | |
| | | | | | | | | | |
| US Strategic Equity | | $ | (5,307 | ) | | $ | — | | |
| Emerging Markets Equity | | | — | | | | (56,683 | ) | |
Management has analyzed the Portfolios’ tax positions, and has concluded that no liability for unrecognized tax benefits should be recorded related to uncertain tax positions taken on returns filed for open tax years (2011-2013), or expected to be taken in the Portfolios’ 2014 tax returns.
(e) Dividends and Distributions—Each Portfolio intends to declare and to pay dividends annually from net investment income, if any. During any particular year, net realized gains from investment transactions in excess of available capital loss carryforwards would be taxable to the Portfolios, if not distributed. The Portfolios intend to declare and distribute these amounts, at least annually, to shareholders; however, to avoid taxation, a second distribution may be required.
Income dividends and capital gains distributions are determined in accordance with federal income tax regulations which may differ from GAAP. These book/tax differences, which may result in distribution reclassifications, are primarily due to differing treatments of foreign currency transactions, wash sales, passive foreign investment companies and distributions from real estate investment trusts and partnerships. The book/tax differences relating to shareholder distributions may result in reclassifications among certain capital accounts.
(f) Allocation of Expenses—Expenses not directly chargeable to a specific Portfolio are allocated among all Portfolios primarily on the basis of relative net assets. Portfolios accrue distribution and service (12b-1) fees to Service Shares. The Portfolios’ income, expenses (other than class specific expenses) and realized and unrealized gains and losses are allocated proportionally each day between the classes based upon the relative net assets of each class.
(g) Estimates—The preparation of financial statements in conformity with GAAP requires management to make estimates and assumptions that affect the reported amounts of assets and liabilities and disclosure of contingent assets and liabilities at the date of the financial statements and the reported amounts of increases and decreases in net assets from operations during the reporting period. Actual results could differ from those estimates.
3. Investment Management, Administration, Distribution and Transfer Agency Agreements
The Fund, on behalf of the Portfolios, has entered into an investment management agreement (the “Management Agreement”) with the Investment Manager.
Semi-Annual Report 49
Pursuant to the Management Agreement, the Investment Manager regularly provides each Portfolio with investment research, advice and supervision and furnishes continuously an investment program for each Portfolio consistent with its investment objective and policies, including the purchase, retention and disposition of securities. For its services provided to the Portfolios, the Investment Manager earns a management fee, accrued daily as a percentage of its average daily net assets and payable by each Portfolio monthly, at the annual rate set forth below:
| Portfolio | | Annual Rate | |
| | | | | | |
| US Strategic Equity | | | 0.70 | % | |
| US Small-Mid Cap Equity | | | 0.75 | | |
| International Equity | | | 0.75 | | |
| Emerging Markets Equity | | | 1.00 | | |
| Global Dynamic Multi Asset | | | 0.85 | | |
The Investment Manager has voluntarily agreed to reduce its fees and, if necessary, reimburse the Portfolios through May 1, 2016 if annualized operating expenses exceed the following percentages of average daily net assets for the respective Shares:
| Portfolio | | Service Shares | | Investor Shares | |
| | | | | | | | | | |
| US Strategic Equity | | | 1.00 | % | | | N/A | | |
| US Small-Mid Cap Equity | | | 1.25 | | | | N/A | | |
| International Equity (a) | | | 1.10 | | | | N/A | | |
| Emerging Markets Equity | | | 1.55 | | | | 1.30 | % | |
| Global Dynamic Multi Asset | | | 1.05 | | | | N/A | | |
(a) From January 1, 2015 to February 28, 2015, percentage was 1.25%.
During the period ended June 30, 2015, the Investment Manager waived its management fees and reimbursed the following Portfolios for other expenses as follows:
| | | Service Shares | | |
| | | Management | | Expenses | |
| Portfolio | | Fees Waived | | Reimbursed | |
| | | | | | | | | | |
| US Strategic Equity | | $ | 46,073 | | | | $24,950 | | |
| US Small-Mid Cap Equity | | | 13,869 | | | | — | | |
| Global Dynamic Multi Asset | | | 229,392 | | | | — | | |
The Fund has entered into an administration agreement with State Street to provide certain administrative services. Each Portfolio bears the cost of such services at a fixed annual rate of $42,500, plus 0.02% of average daily net assets up to $1 billion and 0.01%
of average daily net assets over $1 billion. State Street has agreed to waive up to $18,750 of the $42,500 annual fee for the US Strategic Equity Portfolio until the Portfolio’s net assets reach $25 million. During the period ended June 30, 2015, State Street waived $9,375 of its fee for the Portfolio.
The Fund has a distribution agreement with Lazard Asset Management Securities LLC (the “Distributor”), a wholly-owned subsidiary of the Investment Manager, to serve as the distributor for shares of each Portfolio. The Distributor bears the cost of printing and mailing prospectuses to potential investors and certain expenses in connection with the offering of Portfolio shares.
Under a Distribution and Servicing Plan adopted pursuant to Rule 12b-1 under the Act, each Portfolio pays a monthly fee to the Distributor, at an annual rate of 0.25% of the average daily net assets of its Service Shares, for distribution and servicing of accounts. The Distributor may make payments to participating insurance companies, certain financial institutions, securities dealers and other industry professionals for providing these services.
BFDS is the Fund’s transfer and dividend disbursing agent. For its services, BFDS receives a monthly fee computed on the basis of the number of shareholder accounts it maintains, subject to a minimum fee amount per share class in each Portfolio, and is reimbursed for certain out-of-pocket expenses. BFDS has agreed to waive the monthly minimum fee for the first six months after a new Portfolio or share class has commenced operations.
4. Directors’ Compensation
Certain Directors of the Fund are officers of the Investment Manager. Each Director who is not an affiliated person of the Investment Manager or any of its affiliates is paid by the Fund, The Lazard Funds, Inc., Lazard Global Total Return and Income Fund, Inc. and Lazard World Dividend & Income Fund, Inc. (collectively with the Fund, the “Lazard Funds”), each a registered management investment company advised by the Investment Manager, and Lazard Alternative Emerging Markets 1099 Fund, a closed-end registered management investment company advised by an affil-
50 Semi-Annual Report
iate of the Investment Manager (the “1099 Fund”): (1) an annual retainer of $190,000, (2) an additional annual fee of $20,000 to the lead Independent Director, and (3) an additional annual fee of $10,000 to the Audit Committee Chair. The Directors also are reimbursed for travel and other out-of-pocket expenses for attending Board and committee meetings. The Directors do not receive benefits from the Fund pursuant to any pension, retirement or similar arrangement. The Statements of Operations show the Directors’ fees and expenses paid by each Portfolio.
5. Securities Transactions and Transactions with Affiliates
Purchases and sales of portfolio securities (excluding short-term investments) for the period ended June 30, 2015 were as follows:
| Portfolio | | Purchases | | Sales | |
| | | | | | | | | | |
| US Strategic Equity | | $ | 5,169,107 | | | $ | 5,195,398 | | |
| US Small-Mid Cap Equity | | | 26,853,841 | | | | 26,047,373 | | |
| International Equity | | | 150,636,475 | | | | 155,405,497 | | |
| Emerging Markets Equity | | | 94,867,838 | | | | 69,527,365 | | |
| Global Dynamic Multi Asset | | | 161,224,040 | | | | 137,162,043 | | |
For the period ended June 30, 2015, no brokerage commissions were paid to affiliates of the Investment Manager or other affiliates of the Fund for portfolio transactions executed on behalf of the Fund.
6. Investment Risks
(a) Non-US Securities Risk—Certain Portfolios may invest in securities of foreign entities and in instruments denominated in foreign currencies which involve risks not typically associated with investments in US securities. Such Portfolios’ performance will be influenced by political, social and economic factors affecting the non-US countries and companies in which the Portfolios invest. Non-US securities carry special risks, such as less developed or less efficient trading markets, political instability, a lack of company information, differing auditing and legal standards, and, potentially, less liquidity. In addition, investments denominated in currencies other than US dollars may experience a decline in value, in US dollar terms, due solely to fluctuations in currency exchange rates. The Portfolios’ investments could be adversely affected by delays in, or a refusal to grant, repatriation of funds or conversion of emerging market currencies. Emerging
market countries can generally have economic structures that are less diverse and mature, and political systems that are less stable, than those of developed countries. The economies of countries with emerging markets may be based predominantly on only a few industries, may be highly vulnerable to changes in local or global trade conditions, and may suffer from extreme debt burdens or volatile inflation rates. The securities markets of emerging market countries have historically been extremely volatile. These market conditions may continue or worsen. Investments in these countries may be subject to political, economic, legal, market and currency risks. The risks may include less protection of property rights and uncertain political and economic policies, the imposition of capital controls and/or foreign investment limitations by a country, nationalization of businesses and the imposition of sanctions by other countries, such as the US. Significant devaluation of emerging market currencies against the US dollar may occur subsequent to acquisition of investments denominated in emerging market currencies.
(b) Fixed-Income and Debt Securities Risk—Global Dynamic Multi Asset Portfolio invests in fixed-income securities. The market value of a debt security may decline due to general market conditions that are not specifically related to a particular company, such as real or perceived adverse economic conditions, changes in the outlook for corporate earnings, changes in interest or currency rates or adverse investor sentiment generally. The debt securities market can be susceptible to increases in volatility and decreases in liquidity. Prices of bonds and other debt securities tend to move inversely with changes in interest rates. Increases in volatility and decreases in liquidity may be caused by a rise in interest rates (or the expectation of a rise in interest rates). Interest rate risk is usually greater for fixed-income securities with longer maturities or durations.
The Portfolio’s investments in lower-rated, higheryielding securities (“junk bonds”) are subject to greater credit risk than its higher rated investments. Credit risk is the risk that the issuer will not make interest or principal payments, or will not make payments on a timely basis. Non-investment grade secu-
Semi-Annual Report 51
rities tend to be more volatile, less liquid and are considered speculative. If there is a decline, or perceived decline, in the credit quality of a debt security (or any guarantor of payment on such security), the security’s value could fall, potentially lowering the Portfolio’s share price. The prices of non-investment grade securities, unlike investment grade debt securities, may fluctuate unpredictably and not necessarily inversely with changes in interest rates. The market for these securities may be less liquid and therefore these securities may be harder to value or sell at an acceptable price, especially during times of market volatility or decline. Liquidity can decline unpredictably in response to overall economic conditions or credit tightening.
7. Contractual Obligations
The Fund enters into contracts in the normal course of business that contain a variety of indemnifications. A Portfolio’s maximum exposure under these arrangements is unknown. Management has reviewed the Fund’s existing contracts and expects the risk of loss to be remote.
8. Fair Value Measurements
Fair value is defined as the price that a Portfolio would receive to sell an asset, or would pay to transfer a liability, in an orderly transaction between market participants at the date of measurement. The Fair Value Measurements and Disclosures provisions of GAAP also establish a framework for measuring fair value, and a three-level hierarchy for fair value measurement that is based upon the transparency of inputs to the valuation of an asset or liability. Inputs may be
observable or unobservable and refer, broadly, to the assumptions that market participants would use in pricing the asset or liability. Observable inputs reflect the assumptions that market participants would use in pricing the asset or liability based on market data obtained from sources independent of the Fund. Unobservable inputs reflect the Fund’s own assumptions about the assumptions that market participants would use in pricing the asset or liability, developed based on the best information available in the circumstances. Each investment’s fair value measurement level within the fair value hierarchy is based on the lowest level of any input that is significant to the overall fair value measurement. The three-level hierarchy of inputs is summarized below:
| · | Level 1 – unadjusted quoted prices in active markets for identical investments |
| · | Level 2 – other significant observable inputs (including unadjusted quoted prices for similar investments, interest rates, prepayment speeds, credit risk, etc.) |
| · | Level 3 – significant unobservable inputs (including the Fund’s own assumptions in determining the fair value of investments) |
Changes in valuation technique may result in transfer into or out of the current assigned level within the hierarchy.
The inputs or methodology used for valuing securities are not necessarily an indication of the risks associated with investing in these securities.
52 Semi-Annual Report
The following table summarizes the valuation of Portfolios’ investments by each fair value hierarchy level as of June 30, 2015:
| Description | | Unadjusted
Quoted Prices in
Active Markets
for Identical
Investments
(Level 1) | | Significant Other
Observable
Inputs
(Level 2) | | Significant
Unobservable
Inputs
(Level 3) | | Balance as of
June 30, 2015 | |
| US Strategic Equity Portfolio | | | | | | | | | | | | | | | | | |
| Common Stocks* | | $ | 12,082,488 | | | $ | — | | | $ | — | | | $ | 12,082,488 | | |
| Short-Term Investment | | | 353,943 | | | | — | | | | — | | | | 353,943 | | |
| Total | | $ | 12,436,431 | | | $ | — | | | $ | — | | | $ | 12,436,431 | | |
| US Small-Mid Cap Equity Portfolio | | | | | | | | | | | | | | | | | |
| Common Stocks* | | $ | 65,626,885 | | | $ | — | | | $ | — | | | $ | 65,626,885 | | |
| Short-Term Investment | | | 2,599,236 | | | | — | | | | — | | | | 2,599,236 | | |
| Total | | $ | 68,226,121 | | | $ | — | | | $ | — | | | $ | 68,226,121 | | |
| International Equity Portfolio | | | | | | | | | | | | | | | | | |
| Common Stocks* | | $ | 693,709,730 | | | $ | — | | | $ | — | | | $ | 693,709,730 | | |
| Short-Term Investment | | | 30,731,539 | | | | — | | | | — | | | | 30,731,539 | | |
| Total | | $ | 724,441,269 | | | $ | — | | | $ | — | | | $ | 724,441,269 | | |
| Emerging Markets Equity Portfolio | | | | | | | | | | | | | | | | | |
| Common Stocks* | | | | | | | | | | | | | | | | | |
| Russia | | $ | 40,749,168 | | | $ | 40,570,843 | | | $ | — | | | $ | 81,320,011 | | |
| Thailand | | | 11,994,682 | | | | 18,752,588 | | | | — | | | | 30,747,270 | | |
| Other | | | 918,762,683 | | | | — | | | | — | | | | 918,762,683 | | |
| Short-Term Investment | | | 36,977,833 | | | | — | | | | — | | | | 36,977,833 | | |
| Total | | $ | 1,008,484,366 | | | $ | 59,323,431 | | | $ | — | | | $ | 1,067,807,797 | | |
| Global Dynamic Multi Asset Portfolio | | | | | | | | | | | | | | | | | |
| Assets: | | | | | | | | | | | | | | | | | |
| Common Stocks* | | $ | 153,336,350 | | | $ | — | | | $ | — | | | $ | 153,336,350 | | |
| Corporate Bonds* | | | — | | | | 17,240,325 | | | | — | | | | 17,240,325 | | |
| Foreign Government Obligations* | | | — | | | | 20,624,310 | | | | — | | | | 20,624,310 | | |
| Quasi Government Bonds* | | | — | | | | 1,076,323 | | | | — | | | | 1,076,323 | | |
| Supranationals | | | — | | | | 1,864,443 | | | | — | | | | 1,864,443 | | |
| US Municipal Bonds | | | — | | | | 1,278,092 | | | | — | | | | 1,278,092 | | |
| Short-Term Investment | | | 7,139,271 | | | | — | | | | — | | | | 7,139,271 | | |
| Other Financial Instruments** | | | | | | | | | | | | | | | | | |
| Forward Currency Contracts | | | — | | | | 1,016,096 | | | | — | | | | 1,016,096 | | |
| Total | | $ | 160,475,621 | | | $ | 43,099,589 | | | $ | — | | | $ | 203,575,210 | | |
| Liabilities: | | | | | | | | | | | | | | | | | |
| Other Financial Instruments** | | | | | | | | | | | | | | | | | |
| Forward Currency Contracts | | $ | — | | | $ | (623,865 | ) | | $ | — | | | $ | (623,865 | ) | |
| * | | Please refer to Portfolios of Investments (page 15 through 30) and Notes to Portfolios of Investments (page 34) for portfolio holdings by country and industry. |
| ** | | Other financial instruments are derivative instruments which are valued at their respective unrealized appreciation/depreciation. |
Semi-Annual Report 53
Certain common stocks (see footnote (c) in the Notes to Portfolios of Investments) included in Level 2 were valued based on reference to similar securities which were trading on active markets.
In connection with the periodic implementation of fair value pricing procedures with respect to non-US securities (see Note 2(a)), certain equity securities (other than those securities described in footnote (c) in the Notes to Portfolios of Investments) in the International Equity, Emerging Markets Equity and Global Dynamic Multi Asset Portfolios can transfer from Level 1 to Level 2 as a result of fair value pricing procedure triggers being met and would revert to Level 1 when the fair value pricing procedure triggers are no longer met. A Portfolio recognizes all transfers between levels as though they were transferred at the beginning of the reporting period.
At June 30, 2015, securities valued at the following amounts were transferred from Level 2 to Level 1:
| Portfolio | | Amount | |
| | | | | | |
| International Equity | | $ | 518,977,189 | | |
| Emerging Markets Equity | | | 776,899,044 | | |
| Global Dynamic Multi Asset | | | 30,340,432 | | |
There were no other transfers into or out of Levels 1, 2 or 3 during the period ended June 30, 2015.
For further information regarding security characteristics see Portfolios of Investments.
9. Derivative Instruments
Certain Portfolios may use derivative instruments, including forward currency contracts. Forward currency contracts may be used for hedging purposes or to seek to increase returns.
Global Dynamic Multi Asset Portfolio
During the period ended June 30, 2015, the notional amounts of purchases and sales of forward currency contracts were $167,946,063 and $184,313,404, respec-
tively, with average notional exposure of approximately $56,300,000.
The following table summarizes the fair value of derivative instruments on its Statement of Assets and Liabilities as of June 30, 2015:
| | | Fair Value | |
| | | | | | |
| Asset Derivatives | | | | | |
| Foreign Exchange Risk: | | | | | |
| Gross unrealized appreciation on forward currency contracts | | $ | 1,016,096 | | |
| Liability Derivatives | | | | | |
| Foreign Exchange Risk: | | | | | |
| Gross unrealized depreciation on forward currency contracts | | $ | 623,865 | | |
The effect of derivative instruments on its Statement of Operations for the period ended June 30, 2015 was:
| | | Amount | |
| | | | | | |
| Realized Gain (Loss) on Derivatives Recognized in Income | | | | | |
| Foreign Exchange Risk: | | | | | |
| Net realized gain on forward currency contracts | | $ | 410,810 | | |
| Net Change in Unrealized Appreciation (Depreciation) on Derivatives Recognized in Income | | | | | |
| Foreign Exchange Risk: | | | | | |
| Net change in unrealized appreciation on forward currency contracts | | $ | 97,509 | | |
See Note 2(c) and the Portfolios of Investments for additional disclosures about derivative instruments.
As of June 30, 2015, Global Dynamic Multi Asset Portfolio holds derivative instruments that are eligible for offset in the Statement of Assets and Liabilities and are subject to master netting arrangements. A master netting arrangement is an agreement between two counterparties who have multiple contracts with each other that provides for the net settlement of all contracts, as well as any cash collateral, through a single payment in the event of default on, or termination of, any one contract.
54 Semi-Annual Report
The required information for the affected Portfolio is presented in the below table, as of June 30, 2015:
Global Dynamic Multi Asset Portfolio
| | | | | | | | | | | | | Net Amounts of | |
| | | | | | | | | | Gross Amounts Offset | | Assets Presented | |
| | | | | | | Gross Amounts of | | in the Statement of | | in the Statement of | |
| Description | | | | | | Recognized Assets | | Assets and Liabilities | | Assets and Liabilities | |
| Forward Currency Contracts | | | | | | | $ | 1,016,096 | | | $ | — | | | $ | 1,016,096 | | |
| | | | | | | | | | | | | | | | | | |
| | | | | Gross Amounts Not Offset in the
Statement of Assets and Liabilities | | | |
| Counterparty | Net Amounts of
Assets Presented
in Statement of
Assets and Liabilities | | Financial
Instruments | | Collateral
Received | | Net Amounts | |
| Barclays Bank PLC | | $ | 105,181 | | | $ | — | | | $ | — | | | $ | 105,181 | | |
| Canadian Imperial Bank of Commerce | | | 226,398 | | | | (17,134 | ) | | | — | | | | 209,264 | | |
| Citibank NA | | | 50,870 | | | | (50,870 | ) | | | — | | | | — | | |
| HSBC Bank USA NA | | | 436,993 | | | | (187,324 | ) | | | — | | | | 249,669 | | |
| JPMorgan Chase Bank NA | | | 196 | | | | — | | | | — | | | | 196 | | |
| Royal Bank of Canada | | | 149,330 | | | | (29,081 | ) | | | — | | | | 120,249 | | |
| Standard Chartered Bank | | | 15,736 | | | | (134 | ) | | | — | | | | 15,602 | | |
| State Street Bank and Trust Co. | | | 31,392 | | | | (31,392 | ) | | | — | | | | — | | |
| Total | | $ | 1,016,096 | | | $ | (315,935 | ) | | $ | — | | | $ | 700,161 | | |
| | | | | | | | | | | | | | | | | | |
| Description | | | | | Gross Amounts of
Recognized Liabilities | | Gross Amounts Offset
in the Statement of
Assets and Liabilities | | Net Amounts of
Liabilities Presented
in the Statement of
Assets and Liabilities | |
| Forward Currency Contracts | | | | | | | $ | 623,865 | | | $ | — | | | $ | 623,865 | | |
| | | | | | | | | | | | | | | | | | |
| | | | | | Gross Amounts Not Offset in the
Statement of Assets and Liabilities | | | | |
| Counterparty | Net Amounts of
Liabilities Presented
in Statement of
Assets and Liabilities | | Financial
Instruments | | Collateral
Pledged | | Net Amounts | |
| Canadian Imperial Bank of Commerce | | $ | 17,134 | | | $ | (17,134 | ) | | $ | — | | | $ | — | | |
| Citibank NA | | | 324,835 | | | | (50,870 | ) | | | — | | | | 273,965 | | |
| HSBC Bank USA NA | | | 187,324 | | | | (187,324 | ) | | | — | | | | — | | |
| Royal Bank of Canada | | | 29,081 | | | | (29,081 | ) | | | — | | | | — | | |
| Standard Chartered Bank | | | 134 | | | | (134 | ) | | | — | | | | — | | |
| State Street Bank and Trust Co. | | | 65,357 | | | | (31,392 | ) | | | — | | | | 33,965 | | |
| Total | | $ | 623,865 | | | $ | (315,935 | ) | | $ | — | | | $ | 307,930 | | |
10. Subsequent Events
Management has evaluated the possibility of subsequent events affecting the Fund’s financial statements
and has determined that there were no such subsequent events that required adjustment or disclosure in the financial statements.
Semi-Annual Report 55
Lazard Retirement Series, Inc. Board of Directors and Officers Information (unaudited)
| | | |
| Name (Age) | Position(s) with the Fund | Principal Occupation(s) and Other Public Company |
| Address(1) | (Since) and Term(2) | Directorships Held During the Past Five Years(2) |
| Independent Directors(3): | |
| | |
| Franci J. Blassberg (61) | Director (August 2014) | Debevoise & Plimpton LLP, a law firm, Of Counsel (2013 – present); previously, Partner (through 2012) Cornell Law School, Visiting Professor of Practice (2015 – present); previously, Distinguished Practitioner in Residence (Fall 2013 and Fall 2014) |
| | | |
| Kenneth S. Davidson (70) | Director (April 1997) | Davidson Capital Management Corporation, an investment manager, President (1978 – present) Landseer Advisors LLC, an investment manager, Senior Advisor (2012 – 2014) Aquiline Holdings LLC, an investment manager, Partner (2006 – 2012) |
| | | |
| Nancy A. Eckl (52) | Director (May 2007) | College Retirement Equities Fund (eight accounts), Trustee (2007 – present) TIAA-CREF Funds (62 funds) and TIAA-CREF Life Funds (11 funds), Trustee (2007 – present) TIAA Separate Account VA-1, Member of the Management Committee (2007 – present) American Beacon Advisors, Inc. (“American Beacon”) and certain funds advised by American Beacon, Vice President (1990 – 2006) |
| | | |
| Trevor W. Morrison (44) | Director (April 2014) | New York University School of Law, Dean and Eric M. and Laurie B. Roth Professor of Law (2013 – present) Columbia Law School, Professor of Law (2008 – 2013) Office of Counsel to the President, The White House, Associate Counsel to the President (2009) |
| | | |
| Richard Reiss, Jr. (71) | Director (April 1997) | Georgica Advisors LLC, an investment manager, Chairman (1997 – present) O’Charley’s, Inc., a restaurant chain, Director (1984 – 2012) |
| | | |
| Robert M. Solmson (67) | Director (September 2004) | Fairwood Capital, LLC, a private investment corporation engaged primarily in real estate and hotel investments, President (2008 – present) |
56 Semi-Annual Report
| | | |
| Name (Age) | Position(s) with the Fund | Principal Occupation(s) and Other Public Company |
| Address(1) | (Since) and Term(2) | Directorships Held During the Past Five Years(2) |
| Interested Directors(4): | |
| | | |
| Charles L. Carroll (54) | Chief Executive Officer, President and Director
(June 2004) | Investment Manager, Deputy Chairman and Head of Global Marketing (2004 – present) |
| | | |
| Ashish Bhutani (55) | Director
(July 2005) | Investment Manager, Chief Executive Officer (2004 – present) |
| | | |
| | | Lazard Ltd, Vice Chairman and Director (2010 – present) |
| (1) | The address of each Director of the Fund is Lazard Asset Management LLC, 30 Rockefeller Plaza, New York, New York 10112-6300. |
| | |
| (2) | Each Director serves as a Director for each of the Lazard Funds (comprised of, as of July 31, 2015, 41 active investment portfolios). Each Director serves an indefinite term, until his or her successor is elected, and each Director serves in the same capacity for the other Lazard Funds. All of the Independent Directors (as defined below) are also board members of the 1099 Fund. |
| | |
| (3) | “Independent Directors” are not “interested persons” (as defined in the Act) of the Fund. |
| | |
| (4) | Messrs. Bhutani and Carroll are “interested persons” (as defined in the Act) of the Fund because of their positions with the Investment Manager. |
The Fund’s Statement of Additional Information contains further information about the Directors and is available without charge by calling 800-823-6300, or online, at www.LazardNet.com.
| | | |
| Name (Age) | Position(s) with the Fund | |
| Address(1) | (Since) and Term(2) | Principal Occupation(s) During the Past Five Years |
| Officers(3): | | |
| | | |
| Nathan A. Paul (42) | Vice President
and Secretary
(April 2002) | Managing Director and General Counsel of the Investment Manager |
| | | |
| Stephen St. Clair (56) | Treasurer
(May 2003) | Vice President of the Investment Manager |
| | | |
| Mark R. Anderson (44) | Chief Compliance Officer
(September 2014) | Director and Chief Compliance Officer of the Investment Manager (since September 2014) Senior Vice President, Counsel and Deputy Chief Compliance Officer of AllianceBernstein L.P.
(2004 – August 2014) |
| | | |
| Tamar Goldstein (40) | Assistant Secretary
(February 2009) | Senior Vice President (since February 2012, previously Vice President) and Director of Legal Affairs (since July 2015) of the Investment Manager |
| | | |
| Cesar A. Trelles (40) | Assistant Treasurer
(December 2004) | Vice President (since February 2011, previously Fund Administration Manager) of the Investment Manager |
| (1) | The address of each officer of the Fund is Lazard Asset Management LLC, 30 Rockefeller Plaza, New York, New York 10112-6300. |
| | |
| (2) | Each officer serves for an indefinite term, until his or her successor is elected and qualifies or until his or her earlier resignation or removal. Each officer, except Messrs. St. Clair and Trelles, serves in the same capacity for the other Lazard Funds and the 1099 Fund. Messrs. St. Clair and Trelles serve in the same capacity for the other Lazard Funds. |
| | |
| (3) | In addition to Charles L. Carroll, President, whose information is included in the Interested Directors section. |
Semi-Annual Report 57
Lazard Retirement Series, Inc. Other Information (unaudited)
Proxy Voting
A description of the policies and procedures used to determine how proxies relating to Fund portfolio securities are voted is available (1) without charge, upon request, by calling (800) 823-6300 or (2) on the Securities and Exchange Commission’s (the “SEC”) website at http://www.sec.gov.
The Fund’s proxy voting record for the most recent 12-month period ended June 30 is available (1) without charge, upon request, by calling (800) 823-6300 or (2) on the SEC’s website at http://www.sec.gov. Information as of June 30 each year will generally be available by the following August 31.
Form N-Q
The Fund files a complete schedule of its portfolio holdings for the first and third quarters of its fiscal year with the SEC on Form N-Q. The Fund’s Forms N-Q are available on the SEC’s website at http://www.sec.gov and may be reviewed and copied at the SEC’s Public Reference Room in Washington, D.C. Information on the operation of the SEC’s Public Reference Room may be obtained by calling 1-800-SEC-0330.
Board Consideration of Management Agreement
Lazard Retirement International Equity Advantage Portfolio, Lazard Retirement Managed Equity Volatility Portfolio and Lazard Retirement Emerging Markets Equity Advantage Portfolio
At a meeting of the Board held on April 29, 2015 the Board considered the approval of the Management Agreement between the Fund, on behalf of Lazard Retirement International Equity Advantage Portfolio, Lazard Retirement Managed Equity Volatility Portfolio and Lazard Retirement Emerging Markets Equity Advantage Portfolio (the “New Portfolios”), and the Investment Manager (the “New Portfolio Management Agreements”). The Independent Directors were assisted in their review by independent legal counsel and met with counsel in executive session separate from representatives of the Investment Manager.
Services Provided
The Board previously had received and discussed information addressing, among other matters, the
nature, extent and quality of services provided to the Fund by the Investment Manager, including a discussion of the Investment Manager and its clients (of which the existing Lazard Funds complex of 39 active funds comprised approximately $28 billion (as of March 31, 2015) of the approximately $180 billion of total assets under the management of the Investment Manager and its global affiliates as of March 31, 2015); the Investment Manager’s global investment management platform, technology, operational and legal and compliance support and significant marketing infrastructure across broad distribution channels; and the Investment Manager’s personnel, resources, financial condition and experience. The Board received a presentation on the New Portfolios from members of the New Portfolios’ proposed portfolio management team, including the strategies to be employed for the New Portfolios and the New Portfolios’ portfolio management team, including professional biographies.
The Directors considered the various services to be provided by the Investment Manager including the Investment Manager’s research and portfolio management capabilities and oversight of day-to-day operations, including supervision of fund accounting and administration-related services and assistance in meeting legal and regulatory requirements. The Directors also considered the Investment Manager’s infrastructure and agreed that the New Portfolios were expected to benefit from the services and infrastructure provided by the Investment Manager. The Directors accepted management’s assertion that such services and infrastructure would be greater than those typically provided to a $28 billion fund complex not managed by a large, global firm such as the Investment Manager.
Comparative Management Fee, Expense Ratio and Performance Information
The Directors reviewed comparative management fee and expense ratio information prepared by Strategic Insight, an independent provider of investment company data.
Management Fee and Expense Ratios. Representatives of the Investment Manager reviewed the proposed management fees and anticipated expense ratios for the New Portfolios and the comparisons
58 Semi-Annual Report
provided by Strategic Insight, which compared the management fee and expense ratios for each New Portfolio to its respective group1 of comparison funds (“New Portfolio Groups”), and the Directors noted the methodology and assumptions used by Strategic Insight, including that the management fee comparisons and the rankings used therein include administrative fees (which are paid to the Fund’s third party administrator that is not affiliated with the Investment Manager). The proposed contractual management fees and estimated expense ratios for the New Portfolios were below the medians for the New Portfolio Groups (except for the estimated expense ratio for Lazard Retirement International Equity Advantage Portfolio, where the estimated expense ratio was approximately one basis point above the median). The Board also considered the fees paid by the Investment Manager’s client accounts with investment objectives, policies and strategies similar to those of the New Portfolios.
Performance. The Directors considered the performance of accounts managed by the portfolio managers with investment objectives, policies and strategies similar to those contemplated for the New Portfolios compared to relevant indexes.
Investment Manager Profitability and Economies of Scale
Representatives of the Investment Manager noted that because the New Portfolios are newly formed, have not commenced operations and the eventual aggregate amount of the New Portfolios’ assets was uncertain, specific information concerning the cost of services to be provided to the New Portfolios and the expected profits to be realized by the Investment Manager and its affiliates from their relationships with the New Portfolios and economies of scale would be subject to a number of assumptions and would be speculative and not meaningful. The Investment Manager representatives stated that they did not expect the Investment Manager to realize any current profits on the New Portfolios initially, noting the Investment Manager’s agreement to waive its fees and/or reimburse each New Portfolio for at least two years following the New Portfolio’s commencement of operations to maintain the expense ratios reflected in the Strategic Insight materials. The Board determined to revisit
this issue no later than when it next reviewed the investment management fee in connection with renewal of the New Portfolio Management Agreements. The Investment Manager representatives noted that neither the Investment Manager nor its affiliates were expected to receive any significant indirect benefits from the Investment Manager acting as investment adviser to the New Portfolios. The Investment Manager’s representatives reviewed with the Board information provided on the Investment Manager’s brokerage and soft dollar practices. The representatives of the Investment Manager stated that the Investment Manager intends to support distribution relationships through direct payments from its or its affiliates’ own resources to third parties in connection with distribution and shareholder servicing and/or administrative and recordkeeping services, and noted that the New Portfolios would not bear any related costs other than the 0.25% 12b-1 fee pursuant to the Distribution and Servicing Plan adopted for the New Portfolios’ Service Shares.
At the conclusion of these discussions, each of the Directors expressed the opinion that he or she had been furnished with sufficient information to make an informed business decision with respect to the approval of the New Portfolio Management Agreements. Based on its discussions and considerations as described above, the Board made the following conclusions and determinations with regard to the New Portfolio Management Agreements:
| · | The Board concluded that the nature, extent and quality of the services to be provided by the Investment Manager are adequate and appropriate, noting the benefits of advisory and research and other services and infrastructure (as discussed above) associated with an approximately $180 billion global asset management business. |
| | |
| · | The Board was satisfied with the resources the Investment Manager was to devote to management of the New Portfolio. |
| | |
| · | The Board concluded that the New Portfolios’ fees to be paid to the Investment Manager were reasonable in light of the considerations discussed above. |
| 1 | Each of the New Portfolios has one comparison group, corresponding to Service shares. |
Semi-Annual Report 59
| · | The Board recognized that economies of scale may be realized as the assets of the New Portfolios increase. The Board determined it would seek to have the Investment Manager share any material economies of scale with the New Portfolios. |
The Board considered these conclusions and determinations in their totality and, without any one factor being dispositive, determined to approve the New Portfolio Management Agreements.
All Portfolios except Lazard Retirement Emerging Markets Equity Advantage Portfolio, Lazard Retirement Enhanced Opportunities Portfolio, Lazard Retirement Global Strategic Equity Portfolio, Lazard Retirement International Equity Advantage Portfolio, Lazard Retirement International Equity Concentrated Portfolio, Lazard Retirement Managed Equity Volatility Portfolio, Lazard Retirement Master Alternatives Portfolio and Lazard Retirement US Small Cap Equity Growth Portfolio
At a meeting of the Board held on June 8-9, 2015, the Board considered the approval, for an additional annual period, of the Management Agreement between the Fund, on behalf of the Portfolios, and the Investment Manager. The Independent Directors were assisted in their review by independent legal counsel and met with counsel in executive session separate from representatives of the Investment Manager.
Services Provided
Representatives of the Investment Manager discussed with the Board the Investment Manager’s written presentation provided in advance of the meeting addressing, among other matters, the nature, extent and quality of services that the Investment Manager provides the Fund, including a discussion of the Investment Manager and its clients (of which the Lazard Funds complex of 39 active funds comprised approximately $30 billion (as of April 30, 2015) of the approximately $180 billion of total assets under the management of the Investment Manager and its global affiliates as of March 31, 2015). The Investment Manager’s representatives noted that the Investment Manager believes that the Fund continues to benefit significantly from the infrastructure and services pro-
vided by the Investment Manager’s global investment management platform, technology, operational and legal and compliance support and significant marketing infrastructure across broad distribution channels. The Directors also considered information provided by the Investment Manager regarding its personnel, resources, financial condition and experience; the Fund’s distribution channels and the relationships with various intermediaries; marketing activities on behalf of the Portfolios; and Portfolio asset flows and the growth or decline in asset levels.
The Directors considered the various services provided by the Investment Manager including the Investment Manager’s research and portfolio management capabilities and oversight of day-to-day operations, including supervision of fund accounting and administration-related services and assistance in meeting legal and regulatory requirements. The Directors also considered the Investment Manager’s infrastructure and agreed that the Fund benefits from the services and infrastructure provided by the Investment Manager. The Directors accepted management’s assertion that such services and infrastructure are greater than those typically provided to a $30 billion fund complex not managed by a large, global firm such as the Investment Manager.
The Investment Manager representatives noted that the Investment Manager had historically provided certain administrative, operational and compliance assistance services in connection with the operation of the Fund, but that such services had been in addition to the investment advisory and other services that were contractually required by the Management Agreement currently in place. The Investment Manager representatives explained that the Management Agreement, on behalf of each Portfolio for which the Management Agreement is being considered, was proposed to be revised in order to include such services. The Investment Manager representatives reviewed the proposed revisions with the Directors and confirmed that no changes were proposed to the nature, extent or quality of services provided or to the Management Agreement’s terms related to investment advisory services.
60 Semi-Annual Report
Comparative Management Fee, Expense Ratio and Performance Information
The Directors reviewed comparative management fee, expense ratio and performance (through March 31, 2015) information prepared by Strategic Insight, noting the limitations of certain Strategic Insight comparison groups (each, a “Group”) and broader Morningstar categories (each, a “Category”).
Management Fees and Expense Ratios. The Directors discussed the management fees and expense ratios for each Portfolio. They noted the methodology and assumptions used by Strategic Insight, including that management fee comparisons for the Portfolios and the rankings used therein include administrative fees (which, for the Portfolios, include a fixed dollar fee paid to the Fund’s third party administrator that is not affiliated with the Investment Manager). The Directors acknowledged that, for smaller Portfolios, the fixed dollar administrative fee may have a more significant impact on the contractual management fee.
In reviewing Strategic Insight’s analysis (which was for the Service Shares class of all Portfolios except for the Emerging Markets Equity Portfolio, which was for both the Service Shares and Investor Shares classes), it was noted that, except for the Capital Allocator Opportunistic Strategies, US Small-Mid Cap Equity, US Strategic Equity and Global Dynamic Multi Asset Portfolios (of which the Capital Allocator Opportunistic Strategies Portfolio is not an active Portfolio), contractual management fees were at or lower than each Portfolio’s relevant Group median and that, for the active Portfolios, total expenses were at or below the median of the relevant Group, except for the Global Dynamic Multi Asset Portfolio which had total expenses in the fourth quartile of the Group and the US Small-Mid Cap Equity Portfolio which had the highest total expenses in its Group. For the US Strategic Equity and US Small-Mid Cap Equity Portfolios, it was noted that their actual management fees were in the first quartile of the relevant Group (lowest in the Group for US Strategic Equity Portfolio), and that, for US Small-Mid Cap Equity Portfolio, the contractual management fee was only one basis point above the median. For the Global Dynamic Multi Asset Portfolio, the Investment Manager presented a supplemental
peer group comparison containing other funds on the platform for the insurance company that had requested that the Portfolio be launched. It was noted that the total expenses of the Global Dynamic Multi Asset Portfolio were below the supplemental peer group’s median while the contractual management fee was above the supplemental peer group’s median (although within the range of fees in the group). The Directors considered that the Investment Manager continues to voluntarily enter into fee waiver and expense reimbursement agreements for all of the active Portfolios and that for certain of these Portfolios the Investment Manager was waiving management fees and/or reimbursing expenses.
The Directors also considered management fees paid to the Investment Manager by funds advised or sub-advised by the Investment Manager utilizing the same investment strategies as the Portfolios, as well as the Investment Manager’s separately managed accounts with similar investment objectives, policies and strategies (for each Portfolio, collectively with such funds, “Similar Accounts”). The Directors discussed the fees paid to the Investment Manager by the Fund’s Portfolios compared to the fees paid to the Investment Manager by Similar Accounts. Representatives of the Investment Manager discussed the nature of the Similar Accounts and the extensive differences, from the Investment Manager’s perspective, in services provided to the different types of Similar Accounts as compared to the services provided to the Portfolios. The Directors considered the relevance of the fee information provided for Similar Accounts managed by the Investment Manager, in light of the significant differences in services provided, to evaluate the appropriateness and reasonableness of the Portfolios’ management fees.
Performance. Strategic Insight’s performance analyses compared each Portfolio’s investment returns to those of the funds in the relevant Group and Category over measurement periods up to ten years through March 31, 2015. Although year-to-date performance was provided by Strategic Insight the Directors did not consider three-month performance to be relevant to their considerations and focused on longer-term performance.
Semi-Annual Report 61
The Directors noted that performance of the International Equity Portfolio was above or near the Group and Category averages in all periods (first quartile in the Group and Category for all periods except the ten-year period); US Small-Mid Cap Equity Portfolio was above the Group and Category averages for the one-and three-year periods but below the averages for the five- and ten-year periods; performance of the Emerging Markets Equity Portfolio was below the Group and Category averages for the one- and three-year periods and above the averages for all other periods; the US Strategic Equity Portfolio was generally below average in all periods except for the one-year period when it was above the Group and Category averages; and performance of the Global Dynamic Multi Asset Portfolio was below the Group and Category averages for the one-year period. The Directors noted that the Investment Manager believed the peer group for the Global Dynamic Multi Asset Portfolio was not the most appropriate comparison group.
At the meeting, the Directors received and would continue to receive regular updates on the Investment Manager’s efforts in respect of underperforming Portfolios.
Investment Manager Profitability and Economies of Scale
The Directors reviewed information prepared by the Investment Manager for each Portfolio concerning profits realized by the Investment Manager and its affiliates resulting from the Management Agreement, calculated using the actual revenues received for the calendar year ended December 31, 2014 and the Investment Manager’s cost allocation methodology to compute an estimate of each Portfolio’s costs to the Investment Manager. The Investment Manager’s representatives stated that neither the Investment Manager nor its affiliates receive any significant indirect benefits from the Investment Manager acting as investment adviser to the Portfolios. The Investment Manager’s representatives reviewed with the Board information provided on the Investment Manager’s brokerage practices and the Portfolios’ brokerage allocation, commission payments and soft dollar commissions and benefits. The representatives of the Investment Manager reminded the Board that the Investment Manager is continuing to support distribu-
tion relationships through direct payments from its or its affiliates’ own resources to third parties in connection with distribution and shareholder servicing and/or administrative and recordkeeping services, and noted that the Fund does not bear any related costs other than the 0.25% 12b-1 fee pursuant to the Distribution and Servicing Plan adopted for the Portfolios’ Service Shares.
The profitability percentages were within ranges determined by relevant court cases not to be so disproportionately large that they bore no reasonable relationship to the services rendered. Representatives of the Investment Manager stated that the Investment Manager believed the profits are not unreasonable in light of the services provided and other factors. The Directors considered the Investment Manager’s estimated profitability with respect to each Portfolio as part of their evaluation of whether the Portfolio’s fee under the Management Agreement bears a reasonable relationship to the mix of services provided by the Investment Manager, including the nature, extent and quality of such services, and evaluated profitability in light of the relevant circumstances for each Portfolio, including the size of each Portfolio and the trend in asset growth or decline. Representatives of the Investment Manager and the Directors discussed ways economies of scale could be realized and how they could be shared, including the Investment Manager’s reinvestment of money back into its business, waiving or reimbursing Portfolio expenses, adding discounts to a Portfolio’s management fee schedule as a Portfolio’s assets increase or by instituting relatively low management fees from inception. It was noted that, for Portfolios with declining or stable assets or a low level of assets, the extent to which the Investment Manager may have realized any economies of scale would be reduced.
At the conclusion of these discussions, each of the Directors expressed the opinion that he or she had been furnished with such information as may reasonably be necessary to make an informed business decision with respect to evaluation of the renewal of the Management Agreement. Based on its discussions and considerations as described above, the Board made the following conclusions and determinations.
62 Semi-Annual Report
| · | The Board concluded that the nature, extent and quality of the services provided by the Investment Manager are adequate and appropriate, noting the benefits of advisory and research services and other services and infrastructure (as discussed above) associated with an approximately $180 billion global asset management business. |
| | |
| · | The Board was generally satisfied with the overall performance of most of the Portfolios, either because relative performance in the Group and/or Category was satisfactory or performance was otherwise consistent with the investment approach employed for a Portfolio. For certain Portfolios that were not performing in accordance with expectations, the Board would continue to monitor performance. |
| · | The Board concluded that each Portfolio’s fee paid to the Investment Manager was reasonable in light of the considerations discussed above. |
| | |
| · | The Board recognized that economies of scale may be realized as the assets of the Portfolios increase and determined that they would continue to consider potential material economies of scale. |
The Board considered these conclusions and determinations in their totality and determined to approve the Fund’s Management Agreement.
Semi-Annual Report 63
NOTES
64 Semi-Annual Report
Lazard Retirement Series, Inc.
30 Rockefeller Plaza
New York, New York 10112-6300
Telephone: 800-823-6300
http://www.LazardNet.com
Investment Manager
Lazard Asset Management LLC
30 Rockefeller Plaza
New York, New York 10112-6300
Telephone: 800-823-6300
Distributor
Lazard Asset Management Securities LLC
30 Rockefeller Plaza
New York, New York 10112-6300
Custodian
State Street Bank and Trust Company
One Iron Street
Boston, Massachusetts 02210
Transfer Agent and Dividend Disbursing Agent
Boston Financial Data Services, Inc.
P.O. Box 8514
Boston, Massachusetts 02266-8514
Telephone: 800-986-3455
Independent Registered Public Accounting Firm
Deloitte & Touche LLP
30 Rockefeller Plaza
New York, New York 10112-0015
Legal Counsel
Stroock & Stroock & Lavan LLP
180 Maiden Lane
New York, New York 10038-4982
http://www.stroock.com

Performance information as of the most recent month end is available online at www.LazardNet.com.

Lazard Asset Management LLC • 30 Rockefeller Plaza • New York NY 10112 • www.lazardnet.com
LZDPS010
ITEM 2. CODE OF ETHICS.
Not applicable.
ITEM 3. AUDIT COMMITTEE FINANCIAL EXPERT.
Not applicable.
ITEM 4. PRINCIPAL ACCOUNTANT FEES AND SERVICES.
Not applicable.
ITEM 5. AUDIT COMMITTEE OF LISTED REGISTRANTS.
Not applicable.
ITEM 6. INVESTMENTS
Not applicable.
ITEM 7. DISCLOSURE OF PROXY VOTING POLICIES AND PROCEDURES FOR CLOSED END MANAGEMENT INVESTMENT COMPANIES.
Not applicable.
ITEM 8. PORTFOLIO MANAGERS OF CLOSED-END MANAGEMENT INVESTMENT COMPANIES.
Not applicable.
ITEM 9. PURCHASES OF EQUITY SECURITIES BY CLOSED-END MANAGEMENT INVESTMENT COMPANY AND AFFILIATED PURCHASERS.
Not applicable.
ITEM 10. SUBMISSION OF MATTERS TO A VOTE OF SECURITY HOLDERS.
There were no material changes to the procedures by which shareholders may recommend nominees to the Registrant’s Board of Directors during the period covered by this report.
ITEM 11. CONTROLS AND PROCEDURES.
(a) The Registrant’s principal executive and principal financial officers have concluded, based on their evaluation of the Registrant’s disclosure controls and procedures as of a date within 90 days of the filing date of this report, that the Registrant’s disclosure controls and procedures are reasonably designed to ensure that information required to be disclosed by the Registrant on Form N-CSR is recorded, processed, summarized and reported within the required time periods and that information required to be disclosed by the Registrant in the reports that it files or submits on Form N-CSR is accumulated and communicated to the Registrant’s management, including its principal executive and principal financial officers, as appropriate to allow timely decisions regarding required disclosure.
(b) There were no changes to the Registrant’s internal control over financial reporting that occurred during the second fiscal quarter of the period covered by this report that have materially affected, or are reasonably likely to materially affect, the Registrant’s internal control over financial reporting.
ITEM 12. EXHIBITS.
(a)(1) Not applicable.
(a)(2) Certifications of principal executive and principal financial officers as required by Rule 30a-2(a) under the Investment Company Act of 1940.
(a)(3) Not applicable.
(b) Certifications of principal executive and principal financial officers as required by Rule 30a-2(b) under the Investment Company Act of 1940.
SIGNATURES
Pursuant to the requirements of the Securities Exchange Act of 1934 and the Investment Company Act of 1940, the registrant has duly caused this report to be signed on its behalf by the undersigned, thereunto duly authorized.
Lazard Retirement Series, Inc.
| By | /s/ Charles L. Carroll | |
| | Charles L. Carroll | |
| | Chief Executive Officer | |
| | | |
| Date | September 8, 2015 | |
Pursuant to the requirements of the Securities Exchange Act of 1934 and the Investment Company Act of 1940, this report has been signed below by the following persons on behalf of the registrant and in the capacities and on the dates indicated.
| By | /s/ Charles L. Carroll | |
| | Charles L. Carroll | |
| | Chief Executive Officer | |
| | | |
| Date | September 8, 2015 | |
| By | /s/ Stephen St. Clair | |
| | Stephen St. Clair | |
| | Chief Financial Officer | |
| | | |
| Date | September 8, 2015 | |